Daniela Amaral Silva - ERA
410
Novel Biopharmaceutical Development Investigations Towards Drug and Formulation Performance Optimization by Daniela Amaral Silva A thesis submitted in partial fulfillment of the requirements for the degree of Doctor of Philosophy in Pharmaceutical Sciences Faculty of Pharmacy and Pharmaceutical Sciences University of Alberta © Daniela Amaral Silva, 2021
-
Upload
khangminh22 -
Category
Documents
-
view
0 -
download
0
Transcript of Daniela Amaral Silva - ERA

Novel Biopharmaceutical Development Investigations Towards Drug and Formulation
Performance Optimization
by
Daniela Amaral Silva
A thesis submitted in partial fulfillment of the requirements for the degree of
Doctor of Philosophy
in
Pharmaceutical Sciences
Faculty of Pharmacy and Pharmaceutical Sciences
University of Alberta
© Daniela Amaral Silva, 2021
ii
ABSTRACT
For a drug to excerpt pharmacological action after oral intake, it first needs to be released
from the formulation, get into solution (dissolve), be absorbed, and reach the systemic
circulation. Since only solubilized drugs can be absorbed, and thus have therapeutic effect, the
understanding of the dissolution and drug release processes of a drug product is of primary
importance. Such understanding allows a robust formulation development with an ideal in vivo
performance.
In order to meet set standards, the performance assessment of oral drug products, such as
dissolution testing, often applies conditions that are not reflective of the in vivo environment. The
use of non-physiologically relevant dissolution method during the drug product development
phase can be misleading and give poor mechanistic understanding of the in vivo dissolution
process. Hence, we hypothesized that applying physiologically relevant conditions to the
dissolution test would result in more accurate in vivo predictability for a robust and precise
development process.
Since the buffering system in the intestinal lumen operates at low molarity values, phosphate
buffer at low buffer capacity was used as a first approach to an in vivo relevant parameter.
Furthermore, a biphasic system was used, that is, the low buffer capacity medium was paired
with an organic layer (n-octanol) to mimic the concurrent drug absorption that happens with the
in vivo dissolution. Both poorly and highly soluble drugs in immediate release formulations
(ibuprofen and metronidazole, respectively) were tested in this set-up to assess the dissolution in
the aqueous medium and the partitioning to the organic phase.
Additionally, enteric coated formulations were tested in bicarbonate buffer at the in vivo
reported molarities values to assess the impact of buffer species on drug dissolution. The
iii
evaluated parameters were the buffer system (bicarbonate buffer vs. phosphate buffer), buffer
capacity and medium pH. In all approaches, dissolution was also carried out in compendial
buffer for comparison purposes.
Our results demonstrate that the USP-recommended dissolution method greatly lacked
discriminatory power, whereas low buffer capacity media discriminated between manufacturing
methods. The use of an absorptive phase in the biphasic dissolution test assisted in controlling
the medium pH due to the drug removal from the aqueous medium. Hence, the applied non-
compendial methods were more discriminative to drug formulation differences and
manufacturing methods than conventional dissolution conditions. In this study, it was
demonstrated how biphasic dissolution and a low buffer capacity can be used to assess drug
product performance differences. This can be a valuable approach during the early stages of drug
product development for investigating drug release with improved physiological relevance.
Similarly, all the enteric coated formulations displayed a fast release in phosphate buffer and
complied with the compendial performance specifications. On the other hand, they all had a
much slower drug release in bicarbonate buffer and failed the USP acceptance criteria. Also, the
nature of the drug (acid vs base) impacted the dissolution behavior in bicarbonate buffer. This
study indicates that compendial dissolution test for enteric coated tablets lacks physiological
relevance and it needs to be reevaluated. Thus, an in vivo relevant performance method for EC
products is needed.
Overall, the findings of this thesis comprehensively demonstrates that meaningful
differences in performance and accordance to clinical reports were only obtained when
physiological relevant conditions were applied. Hence, our results indicate that the central
hypothesis was answered positively.
iv
PREFACE
This thesis is an original work completed by Daniela Amaral Silva under the supervision of Prof.
Dr. Raimar Lobenberg at the University of Alberta and Prof. Dr. Nadia Bou-Chacra at the
University of Sao Paulo.
Some sections of Chapter 1 of this thesis are part of Chapter 13 “Disintegration, Dissolution and
Drug release” of the next edition of Martin's Physical Pharmacy and Pharmaceutical Sciences
book. This chapter has been revised and rewritten by Daniela and Dr. Löbenberg.
Chapter 2 “Update on biorelevant media and physiologically relevant dissolution conditions” is
a review manuscript accepted for publication as: Amaral Silva D., Davies, N. M., Bou-chacra N.,
Ferraz H. G., Löbenberg R. Dissolution Technol. 2021. Manuscript number: DT-D-21-00013. I
was responsible for the concept formation, literature search as well as the manuscript
composition.
Chapter 3 “The significance of disintegration testing in pharmaceutical development” is a
review article published as: Amaral Silva D., Webster G. K., Bou-chacra N., Löbenberg
R. Dissolution Technol. 2018;25:30–38. I was responsible for the concept formation, literature
search as well as the manuscript composition.
Chapter 4 “Biphasic dissolution as an exploratory method during early drug product
development” has been published as: Amaral Silva D., Al-Gousous, J., Davies, N. M., Chacra,
N. B., Webster, G. K., Lipka, E., Amidon, G. L., & Löbenberg, R. Pharmaceutics, 2020; 12(5),
420. I designed and performed the experiments and was responsible for the data collection,
analysis, and composition of the manuscript.
Chapter 5 “A BCS-based biowaiver approach using biphasic dissolution test” has been accepted
for publication as: Amaral Silva D., Curo Melo K., Bou-chacra N., Ferraz H. G., Davies, N. M.,

v
Löbenberg R. Dissolution Technol. 2021. I was responsible for the data analysis, and
composition of the manuscript.
Chapter 6 “Simulated, biorelevant, clinically relevant or physiologically relevant dissolution
media: The hidden role of bicarbonate buffer” is a review article published as: Amaral Silva D.,
Al-Gousous J., Davies N. M., Bou Chacra N., Webster G. K., Lipka E., Amidon G., Löbenberg
R. Eur. J. Pharm. Biopharm. 2019;142:8–19. I was responsible for the concept formation,
literature search as well as the manuscript composition.
Chapter 7 “Mechanistic understanding of underperforming enteric coated products:
Opportunities to add clinical relevance to the dissolution test” has been published as: Amaral
Silva D., Davies N. M., Doschak M. R., Al-Gousous J., Bou-Chacra N., Löbenberg R. Journal of
Controlled Release. 2020;325:323-34. I designed and performed the experiments and was
responsible for the data collection, analysis, and composition of the manuscript.
Chapter 8 “Physiologically relevant dissolution conditions towards improved in vitro - in vivo
relationship – A case study with enteric coated pantoprazole tablets” has been accepted for
publication as: Amaral Silva D., Gomes Davanço M., Davies N. M., Krämer J., de Oliveira
Carvalho P., Löbenberg R. International Journal of Pharmaceutics.2021;605:120857. I designed
and performed the experiments and was responsible for the data collection, analysis, and
composition of the manuscript.
Chapter 9 “Are Excipients Inert? Phenytoin Pharmaceutical Investigations with New
Incompatibility Insights” has been published as: Amaral Silva D., Löbenberg R, Davies N.
Journal of Pharmacy & Pharmaceutical Sciences. 2018;21(1s):19s-31s. I designed and
performed the experiments and was responsible for the data collection, analysis, and composition
of the manuscript.

vi
Chapter 10 “Application of in Silico Tools in Clinical Practice using Ketoconazole as a Model
Drug” has been published as: Amaral Silva D., Duque M. D., Davies N. M., Löbenberg R.,
Ferraz H. G. Journal of Pharmacy & Pharmaceutical Sciences. 2018;21(1s):242s-53s. I designed
and performed the experiments and was responsible for the data collection, analysis, and
composition of the manuscript.
Appendix 3 “Influences of phytocannabinoids on drug-drug interactions and their clinical
implications” has been published as: Silva DA, Pate DW, Clark RD, Davies NM, El-Kadi A,
Löbenberg R. Pharmacology & Therapeutics. 2020 Jun 30:107621. I was responsible for the
concept formation, literature search as well as the manuscript composition.
vii
DEDICATION
I dedicate this thesis with much love and appreciation to my family and
friends.
“In everything give thanks;
for this is the will of God in Christ Jesus for you”. 1 Thessalonians 5:18
viii
ACKONOWLEDGEMENTS
First and foremost, all thanks goes to God.
I would like to express my sincerest and deepest gratitude to my supervisors Dr. Raimar
Löbenberg and Dr. Neal Davies for their continuous support, guidance, and encouragement
throughout the years. I truly could not have asked for better mentors that led by example and are
role models to me. I feel extremely fortunate to have had the chance to learn from them and to
conduct sound research under their supervision. I am tremendously grateful for all the
opportunities it was provided for me.
Sincere thanks are extended to my supervisory committee members Dr. Nadia Bou-
Chacra, Dr. Lingyun Chen and Dr. Kevin Morin for their insight, valuable suggestions and
professional supervision.
Moreover, I also would like to express my warm appreciation to my “academic mother”
Dr. Vijay Somayaji for all her advice, support, mentorship, steadfast encouragement and
friendship over the years.
I’m grateful to my colleagues and lab mates at the University of Alberta and University
of Sao Paulo that have made this journey much more interesting and pleasant.
I would like to thank Dr. Jozef Al-Gousous, Dr. Gregory K. Webster, Dr. Marcelo Dutra
Duque, Dr. Michele Georges Issa, Dr. Humberto Gomes Ferraz, Dr. David W. Pate, Dr. Robert
D. Clark, Dr. Ayman El-Kadi, Dr. Michael R. Doschak and Dr. Vishwa Somayaji for all the
great collaborative work. I truly appreciate how much I have learned from them.
I extend my gratitude to everyone in the Faculty of Pharmacy and Pharmaceutical
Sciences and the Faculty of Graduate Studies. Special thanks to the administrative staff for
always being available to assist me and give support in all matters.

ix
Finally, I would like to recognize the support from the Office of the Assistant Secretary
of Defense for Health Affairs, through the Breast Cancer Research program, under Award No.
W81XWH-17-1-0470, Alberta Innovates Graduate Student Scholarship and all the University
donors that allowed for institutional scholarships.
x
Table of Contents
SECTION ONE: INTRODUCTION AND OVERVIEW .................................................................................................... 1
CHAPTER ONE .............................................................................................................................................. 1
INTRODUCTION................................................................................................................................................... 1
1.1 Disintegration .......................................................................................................................................... 2
1.2 Drug release ............................................................................................................................................ 3
1.3 Dissolution ............................................................................................................................................... 4 1.3.1 Noyes–Whitney Equation ................................................................................................................................. 4 1.3.2 Sink Conditions ................................................................................................................................................. 6
1.4 Dissolution Methods and Apparatus......................................................................................................... 6
1.5 Intrinsic dissolution .................................................................................................................................. 7
1.6 Non-Quality Control dissolution methods ................................................................................................. 8
1.7 Biopharmaceutics .................................................................................................................................... 9 1.7.1 The Biopharmaceutics Drug Classification System (BCS) ....................................................................................10 1.7.2 BCS Sub-classes ...............................................................................................................................................10 1.7.3 Dose, Dissolution and Absorption Number .......................................................................................................12 1.7.4 Regulatory aspects - Biowaiver ........................................................................................................................13
1.8 Thesis overview ..................................................................................................................................... 14
1.8.1 Rationale and previous studies ............................................................................................................ 14
1.8.2 Hypothesis .......................................................................................................................................... 16
1.8.3 Objectives ........................................................................................................................................... 16
CHAPTER TWO ........................................................................................................................................... 17
UPDATE ON BIORELEVANT MEDIA AND PHYSIOLOGICALLY RELEVANT DISSOLUTION CONDITIONS ........................ 17
2.1 Introduction ........................................................................................................................................... 18
2.2 Physiologically relevant media ............................................................................................................... 21 2.2.1 Gastric Environment ........................................................................................................................................21 2.2.2 Small Intestinal Environment ...........................................................................................................................23
2.2.2.1 Biorelevant dissolution media ..................................................................................................................23 2.2.2.2 Bicarbonate buffer – Physiologically relevant dissolution media ................................................................29
2.3 Conclusion ............................................................................................................................................. 42
CHAPTER THREE ....................................................................................................................................... 43
THE SIGNIFICANCE OF DISINTEGRATION TESTING IN PHARMACEUTICAL DEVELOPMENT ........................................ 43
3.1 Introduction ........................................................................................................................................... 44
3.2 Apparatus specifications and procedures – USP <701> and <2040> ........................................................ 49
3.3 Disintegration as a Quality Control test .................................................................................................. 53
3.4 Disintegration in the real world .............................................................................................................. 54 3.4.1 Early-stage development .................................................................................................................................54 3.4.2 Relationship between disintegration and dissolution ........................................................................................55
3.5 Conclusion ............................................................................................................................................. 60
SECTION TWO: PHYSIOLOGICALLY RELEVANT IN VITRO TESTING: ........................................................................ 61
BUFFER CAPACITY AND BIPHASIC DISSOLUTION TESTING .................................................................................... 61
CHAPTER FOUR .......................................................................................................................................... 61
BIPHASIC DISSOLUTION AS AN EXPLORATORY METHOD DURING EARLY DRUG PRODUCT DEVELOPMENT ............ 61
4.1 Introduction ........................................................................................................................................... 62
4.2 Materials ............................................................................................................................................... 65

xi
4.3 Methods ................................................................................................................................................ 66 4.3.1 Ibuprofen Immediate Release Formulations .....................................................................................................66 4.3.2 Dissolution Tests .............................................................................................................................................68 4.3.3 Statistical Analysis ...........................................................................................................................................69
4.4 Results ................................................................................................................................................... 70 4.4.1 Compendial Dissolution Tests ..........................................................................................................................70 4.4.2 Non-Compendial Dissolution Tests—Physiologically Based Exploratory Methods ..............................................71
4.4.2.1 Monophasic Dissolution With Low Buffer Capacity Medium .....................................................................71 4.4.2.2 Biphasic Dissolution Test with Low Buffer Capacity Medium .....................................................................72 4.4.2.3 Dissolution Medium pH Recovery.............................................................................................................75
4.4.3 Statistical Analysis ...........................................................................................................................................77 4.5 Discussion .............................................................................................................................................. 77
4.6 Conclusions............................................................................................................................................ 85
4.7 Limitations of the Study ......................................................................................................................... 85
CHAPTER FIVE ........................................................................................................................................... 86
A BCS-BASED BIOWAIVER APPROACH USING BIPHASIC DISSOLUTION TEST ......................................................... 86
5.1 Introduction ........................................................................................................................................... 87
5.2 Materials ............................................................................................................................................... 89
5.3 Methods ................................................................................................................................................ 90 5.3.1 Analytical Quantitation ....................................................................................................................................90 5.3.2 Disintegration test ...........................................................................................................................................90 5.3.3 Dissolution tests ..............................................................................................................................................90 5.3.4 Data analysis ...................................................................................................................................................91
5.4 Results ................................................................................................................................................... 92 5.4.1 Assay and disintegration tests ..........................................................................................................................92 5.4.2 Dissolution tests and data analysis ...................................................................................................................92
5.5 Discussion .............................................................................................................................................. 96
5.6 Conclusion ........................................................................................................................................... 100
SECTION THREE: PHYSIOLOGICALLY RELEVANT IN VITRO TESTING: BICARBONATE BUFFER .............................. 101
CHAPTER SIX ............................................................................................................................................ 101 SIMULATED, BIORELEVANT, CLINICALLY RELEVANT OR PHYSIOLOGICALLY RELEVANT DISSOLUTION MEDIA: THE
HIDDEN ROLE OF BICARBONATE BUFFER .......................................................................................................... 101
6.1 Introduction ......................................................................................................................................... 102
6.2 Intestinal lumen environment - What are we trying to reproduce in a dissolution vessel? ...................... 103 6.2.1 Physiology overview of gastrointestinal secretions ......................................................................................... 103
6.3 Buffer species - In vitro considerations ................................................................................................. 105 6.3.1 Peculiarities of the bicarbonate buffer ........................................................................................................... 105
6.3.1.1 Automated systems ............................................................................................................................... 109 6.3.1.2 Understanding the Bicarbonate−CO2 equilibrium .................................................................................... 111
6.3.2 Phosphate buffer ........................................................................................................................................... 113 6.3.2.1 Biorelevant media ................................................................................................................................. 115
6.4 Buffer capacity .................................................................................................................................... 118
6.5 Dissolution tests in phosphate buffer versus bicarbonate buffer ........................................................... 122
6.6 Applicability in the industry .................................................................................................................. 126
6.7 Clinical reports ..................................................................................................................................... 127
6.8 Conclusion ........................................................................................................................................... 131
CHAPTER SEVEN ...................................................................................................................................... 132

xii
MECHANISTIC UNDERSTANDING OF UNDERPERFORMING ENTERIC COATED PRODUCTS: OPPORTUNITIES TO ADD
CLINICAL RELEVANCE TO THE DISSOLUTION TEST. ............................................................................................ 132
7.1 Introduction ......................................................................................................................................... 133
7.2 Materials ............................................................................................................................................. 138
7.3 Methods .............................................................................................................................................. 139 7.3.1 Micro-CT analysis .......................................................................................................................................... 139 7.3.2 Performance tests ......................................................................................................................................... 140
7.3.2.1 Phosphate-based dissolution medium .................................................................................................... 141 7.3.2.2 Bicarbonate-based dissolution medium .................................................................................................. 141
7.4 Results ................................................................................................................................................. 142 7.4.1 Micro-CT analysis .......................................................................................................................................... 142 7.4.2 Performance tests ......................................................................................................................................... 144
7.5 Discussion ............................................................................................................................................ 150
7.6 Conclusion ........................................................................................................................................... 158
CHAPTER EIGHT ...................................................................................................................................... 159
PHYSIOLOGICALLY RELEVANT DISSOLUTION CONDITIONS TOWARDS IMPROVED IN VITRO - IN VIVO RELATIONSHIP –
A CASE STUDY WITH ENTERIC COATED PANTOPRAZOLE TABLETS ...................................................................... 159
8.1 Introduction ......................................................................................................................................... 160
8.2 Materials ............................................................................................................................................. 162
8.3 Methods .............................................................................................................................................. 163 8.3.1 In vitro dissolution testing .............................................................................................................................. 163 8.3.2 Statistical analysis .......................................................................................................................................... 164 8.3.3 Bioequivalence study ..................................................................................................................................... 164 8.3.4 Pharmacokinetic data .................................................................................................................................... 165 8.3.5 In silico studies .............................................................................................................................................. 166 8.3.6 In vitro – In vivo Relationship ......................................................................................................................... 167
8.4 Results ................................................................................................................................................. 167 8.4.1 In vitro dissolution testing .............................................................................................................................. 167 8.4.2 Pharmacokinetic data .................................................................................................................................... 169 8.4.3 Cohorts ......................................................................................................................................................... 170 8.4.4 In silico studies .............................................................................................................................................. 172
8.5 Discussion ............................................................................................................................................ 176
8.6 Conclusion ........................................................................................................................................... 183
8.7 Shortfalls ............................................................................................................................................. 184
SECTION FOUR: OTHER ASPECTS OF IN VIVO DRUG PRODUCT PERFORMANCE.................................................. 185
THE IMPACT OF FORMULATION COMPOSITION AND PHYSIOLOGY STATE ......................................................... 185
CHAPTER NINE ......................................................................................................................................... 185
ARE EXCIPIENTS INERT? PHENYTOIN PHARMACEUTICAL INVESTIGATIONS WITH NEW INCOMPATIBILITY INSIGHTS
...................................................................................................................................................................... 185
9.1 Introduction ......................................................................................................................................... 186
9.2 Materials ............................................................................................................................................. 187
9.3 Methods .............................................................................................................................................. 188 9.3.1 Titration ........................................................................................................................................................ 188 9.3.2 Calorimeters experiments .............................................................................................................................. 188 9.3.3 Dissolution tests ............................................................................................................................................ 189 9.3.4 Statistical analysis .......................................................................................................................................... 190
9.4 Results ................................................................................................................................................. 190
xiii
9.4.1 Titration ........................................................................................................................................................ 190 9.4.2 Calorimeter experiments ............................................................................................................................... 191 9.4.3 Dissolution .................................................................................................................................................... 196
9.5 Discussion ............................................................................................................................................ 198
9.6 Conclusion ........................................................................................................................................... 204
CHAPTER TEN ........................................................................................................................................... 205
APPLICATION OF IN SILICO TOOLS IN CLINICAL PRACTICE USING KETOCONAZOLE AS A MODEL DRUG .............. 205
10.1 Introduction ....................................................................................................................................... 206
10.2 Materials ........................................................................................................................................... 207
10.3 Methods ............................................................................................................................................ 208 10.3.1 Systematic search for clinical studies reporting Ketoconazole malabsorption due to increased gastric pH .... 208 10.3.2 Chemical structure analysis .......................................................................................................................... 208 10.3.3 Computer simulations using GastroPlusTM .................................................................................................... 208
10.3.3.1 Compound Tab .................................................................................................................................... 209 10.3.3.2 Pharmacokinetics Tab .......................................................................................................................... 210 10.3.3.3 Physiology Tab ..................................................................................................................................... 211 10.3.3.4 Simulation and Graph Tab .................................................................................................................... 213
10.3.4 Data analysis ............................................................................................................................................... 214 10.3.5 Solubility test .............................................................................................................................................. 215
10.4 Results ............................................................................................................................................... 215 10.4.1 Chemical structure analysis .......................................................................................................................... 215 10.4.2 PBPK model ................................................................................................................................................. 216
10.4.2.1 Human fasted - Normal intragastric pH - No hypochlorhydria ............................................................... 217 10.4.2.2 Human fasted - Co-administration with PPI - Hypochlorhydria .............................................................. 217
10.4.4 Solubility test .............................................................................................................................................. 219 10.5 Discussion .......................................................................................................................................... 220
10. 6 Conclusion ........................................................................................................................................ 223
SECTION FIVE: GENERAL DISCUSSION, CONCLUSION AND FUTURE DIRECTIONS ................................................ 224
CHAPTER ELEVEN ................................................................................................................................... 224
GENERAL DISCUSSION AND CONCLUSION ........................................................................................................ 224
11.1 General discussion ............................................................................................................................. 225
11.2 Conclusion ......................................................................................................................................... 229
CHAPTER TWELVE .................................................................................................................................. 231
FUTURE DIRECTIONS ...................................................................................................................................... 231
12.1 Bicarbonate buffer and biphasic dissolution ....................................................................................... 232
12.2 Simplification of in vitro tests for Quality Control application – Delayed release and Immediate release
................................................................................................................................................................. 232
REFERENCES ....................................................................................................................................................... 234
APPENDIX 1: FORMULATION OF INHALABLE NANOCRYSTALS TO BE USED AS A THERAPEUTIC STRATEGY AGAINST
BREAST CANCER METASTASIS TO THE LUNGS .................................................................................................... 300
APPENDIX 2: DESIGN OF NANOSTRUCTURED LIPID CARRIERS FOR LYMPHATIC DELIVERY OF TERBINAFINE ...... 310
APPENDIX 3: PHYTOCANNABINOID DRUG-DRUG INTERACTIONS AND THEIR CLINICAL IMPLICATIONS.............. 316
xiv
LIST OF TABLES
Table 2.1. Composition of proposed media to simulate the gastric fluid .................................... 22
Table 2.2. Composition of the snapshot media to simulate the gastric fluid under fed condition 23
Table 2.3. Composition of proposed media to simulate the small intestine fluids in the fasted and
fed state..................................................................................................................................... 28
Table 3.1. Disintegration Mechanisms ...................................................................................... 45
Table 3.2. USP Specifications for Basket-Rack Assembly and Disk for Apparatus A and B ..... 51
Table 3.3. Disintegration Test Specified for Each Dosage Form According to USP Chapters
<701> and <2040> .................................................................................................................... 52
Table 4.1. Excipient composition of IR ibuprofen tablets prepared in-house. Formulations were
named according to the diluent mixture used ............................................................................. 67
Table 4.2. Statistical evaluation for the 90% confidence interval between different formulation
compositions ............................................................................................................................. 77
Table 5.1. Amount partitioned (Q%) into the organic phase for each drug product after
disintegration time..................................................................................................................... 92
Table 5.2. Drug content and disintegration time of different commercially available
metronidazole immediate release tablets .................................................................................... 92
xv
Table 5.3. In-vitro performance comparison between Metronidazole products .......................... 94
Table 6.1. Composition of different bicarbonate buffer systems .............................................. 106
Table 6.2. Composition of Simulated Intestinal Fluids ............................................................ 117
Table 6.3. Delayed release drug products listed as Reference Listed Drug (RLD) by the FDA
Orange book ........................................................................................................................... 128
Table 7.1. Historic table of in vivo studies with EC formulations ............................................ 135
Table 7.2. API properties (BCS class and pKa) and coating polymer of the tested EC products
............................................................................................................................................... 140
Table 7.3. Coat thickness measured prior to dissolution testing using Dataviewer Software
(mean ± SD) ............................................................................................................................ 143
Table 7.4. USP tolerance specification for drug release in the buffer stage and percent released
in PB and BCB ........................................................................................................................ 147
Table 7.5. Non sparged bicarbonate medium pH at time zero (mean ± standard deviation) ..... 148
Table 8.1. Number of subjects per Tmax cohort for both test and reference formulations ........ 171
Table 8.2. Deconvolution statistical results for both Test and Reference ................................. 173
Table 8.3. Convolution validation statistics for Test and Reference......................................... 174
Table 9.1. Powder mixtures composition used in the calorimeter experiments ........................ 189
xvi
Table 9.2. Excipients composition of different approved products of extended release phenytoin
sodium capsules 100 mg in Canada and in the USA, and colour change intensity for the tested
products in Milk, lactose free milk (LFM) and water ............................................................... 203
Table 10.1. Drug properties used as input data in Compound Tab in GastroPlus™ ................. 209
Table 10.2. ACAT parameters used in Physiology Tab for human fasted – PBPK model, normal
and hypochlorhydria physiologies ........................................................................................... 213
Table 10.3. Area under the curve (AUC0-∞), Cmax and Tmax and after oral administration of
ketoconazole 200 mg suspension ............................................................................................. 217
Table 10.4. (AUC0-∞), Cmax and Tmax after oral administration of ketoconazole 200 mg tablet
............................................................................................................................................... 220
xvii
LIST OF FIGURES
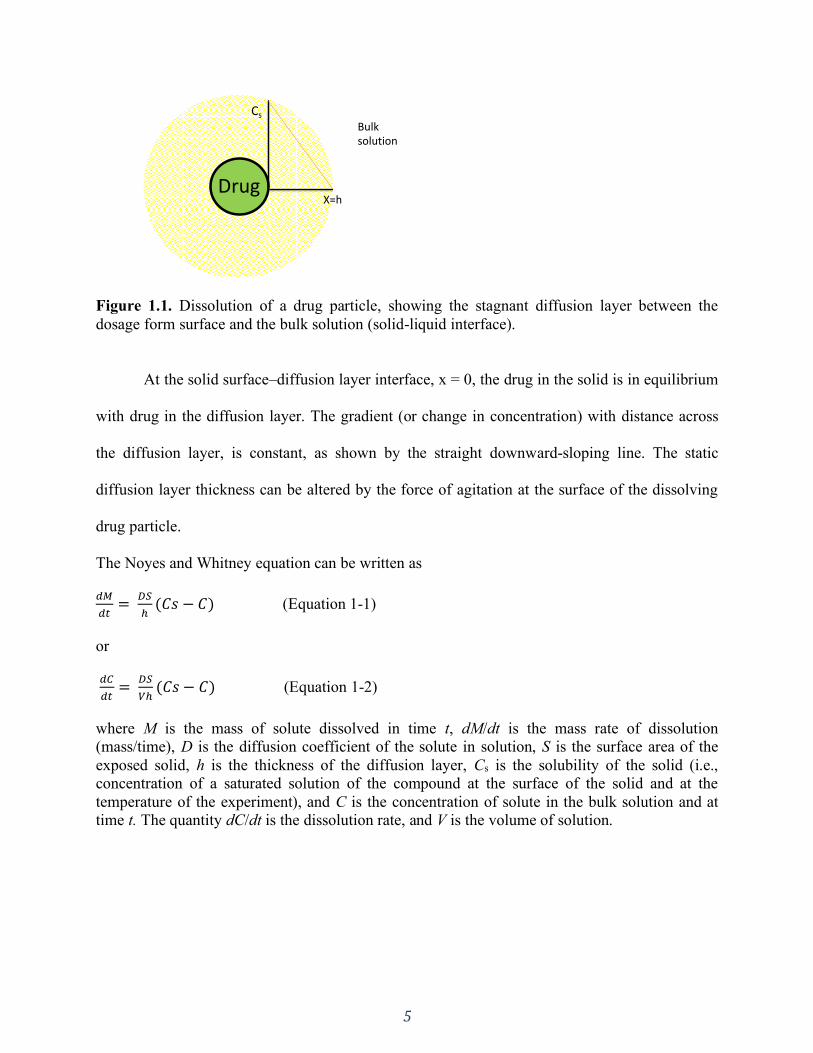
Figure 1.1. Dissolution of a drug particle, showing the stagnant diffusion layer between the
dosage form surface and the bulk solution (solid-liquid interface). ..............................................5
Figure 2.1. Representation of the enclosure and gas delivery system proposed by Scott et al. ... 31
Figure 2.2. Representation of the floating lid device proposed by Sakamoto et al. .................... 32
Figure 2.3. Representation of the solid-liquid interface of a dissolving enteric polymer. N:
Neutral (Unionized carboxylic acid: -COOH); - : Negative charge (Ionized carboxylic acid: -
COO-). From the gel layer to the bulk solution the pH increases and the viscosity. .................... 40
Figure 2.4. Decision tree for establishing a surrogate buffer for EC products. (Adapted from
(79)) .......................................................................................................................................... 41
Figure 3.1. Immediate release tablet disintegration process. Adapted from (3). ......................... 44
Figure 3.2. USP specifications for disintegration apparatus A (a) and apparatus B (b). Reprinted
with permission. ©2017 The United States Pharmacopeial Convention. .................................... 50
Figure 4.1. Simplified approach for dissolution method development for immediate release (IR)
formulations containing acidic and basic drugs (BCS I–IV).FaSSIF: Fasted State Simulated
Intestinal Fluid; FeSSIF: Fed State Simulated Intestinal Fluid; BCS: Biopharmaceutics
Classification System. ............................................................................................................... 65
Figure 4.2. Dissolution profiles of all formulations in 900 mL of compendial buffer (50 mM
phosphate buffer pH 7.2). Error bars represent the standard deviation. ...................................... 70

xviii
Figure 4.3. Dissolution profiles in the 5 mM phosphate buffer (900 mL). (A) MCC formulations,
(B) CaHPO4 formulations, (C) CaSO4 formulations, (D) Dextrose formulations, (E) D
formulations, (F) G formulations. Error bars represent the standard deviation. .......................... 72
Figure 4.4. Organic phase partition profiles in a biphasic dissolution with 200 mL of aqueous
media for G formulations (A) and D formulations (B) and with 900 mL of aqueous media (C).
Oct: Octanol. Error bars represent the standard deviation. ......................................................... 73
Figure 4.5. Aqueous phase dissolution profiles in a biphasic dissolution with 900 mL of aqueous
media (BP aq). (A) MCC formulation, (B) CaHPO4 formulation, (C) CaSO4 formulation, (D)
Dextrose formulation, (E) D formulations, (F) G formulations. Error bars represent the standard
deviation. .................................................................................................................................. 75
Figure 4.6. pH measurements for dissolution tests in a low buffer capacity medium. Dashed line:
monophasic setup. Solid black line: biphasic setup with an aqueous layer at 900 mL. Solid blue
line: biphasic setup with an aqueous layer at 200 mL. ............................................................... 76
Figure 5.1. Dissolution profiles of metronidazole formulations in SIF (solid lines) and low
buffer capacity phosphate buffer (5mM – dashed lines). ............................................................ 93
Figure 5.2. Biphasic dissolution profiles of metronidazole formulations in the aqueous (Aq –
dashed lines) and organic phases (Oct - solid lines). .................................................................. 95
Figure 5.3. Correlation between the comparator pharmaceutical product (CPP) and generic
products of the amount partitioned to the organic phase. Only data after full tablet disintegration
were used. ................................................................................................................................. 96
xix
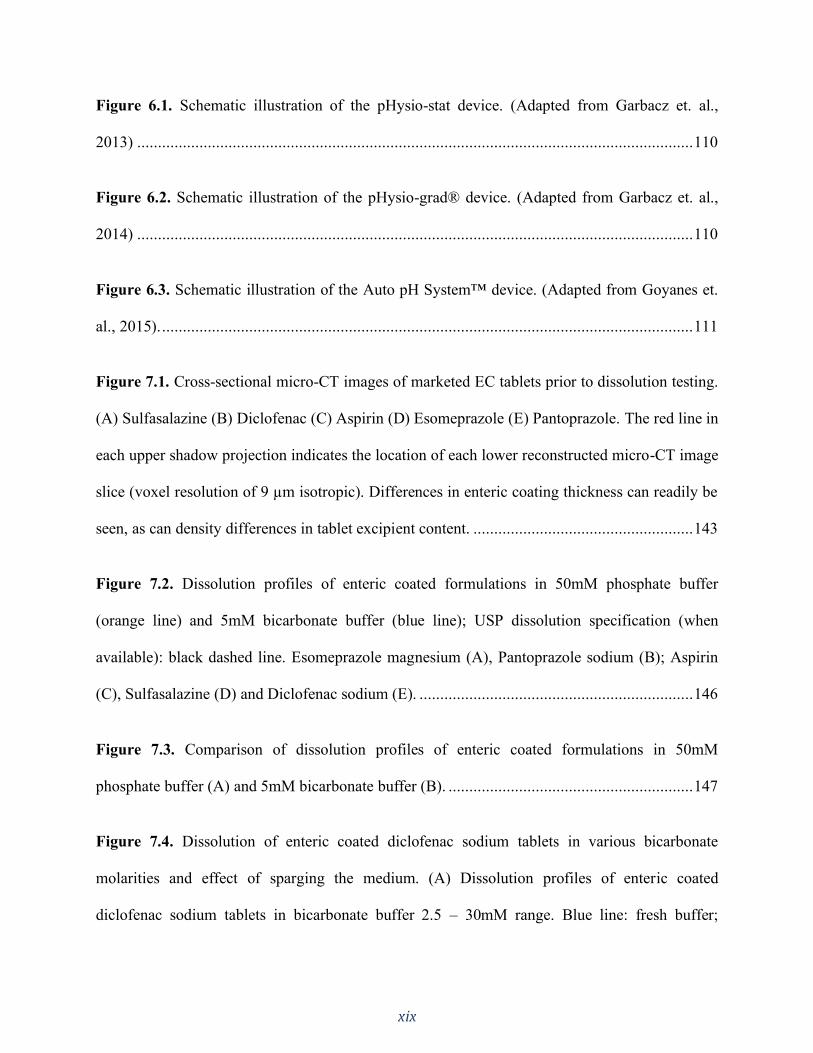
Figure 6.1. Schematic illustration of the pHysio-stat device. (Adapted from Garbacz et. al.,
2013) ...................................................................................................................................... 110
Figure 6.2. Schematic illustration of the pHysio-grad® device. (Adapted from Garbacz et. al.,
2014) ...................................................................................................................................... 110
Figure 6.3. Schematic illustration of the Auto pH System™ device. (Adapted from Goyanes et.
al., 2015). ................................................................................................................................ 111
Figure 7.1. Cross-sectional micro-CT images of marketed EC tablets prior to dissolution testing.
(A) Sulfasalazine (B) Diclofenac (C) Aspirin (D) Esomeprazole (E) Pantoprazole. The red line in
each upper shadow projection indicates the location of each lower reconstructed micro-CT image
slice (voxel resolution of 9 µm isotropic). Differences in enteric coating thickness can readily be
seen, as can density differences in tablet excipient content. ..................................................... 143
Figure 7.2. Dissolution profiles of enteric coated formulations in 50mM phosphate buffer
(orange line) and 5mM bicarbonate buffer (blue line); USP dissolution specification (when
available): black dashed line. Esomeprazole magnesium (A), Pantoprazole sodium (B); Aspirin
(C), Sulfasalazine (D) and Diclofenac sodium (E). .................................................................. 146
Figure 7.3. Comparison of dissolution profiles of enteric coated formulations in 50mM
phosphate buffer (A) and 5mM bicarbonate buffer (B). ........................................................... 147
Figure 7.4. Dissolution of enteric coated diclofenac sodium tablets in various bicarbonate
molarities and effect of sparging the medium. (A) Dissolution profiles of enteric coated
diclofenac sodium tablets in bicarbonate buffer 2.5 – 30mM range. Blue line: fresh buffer;
xx
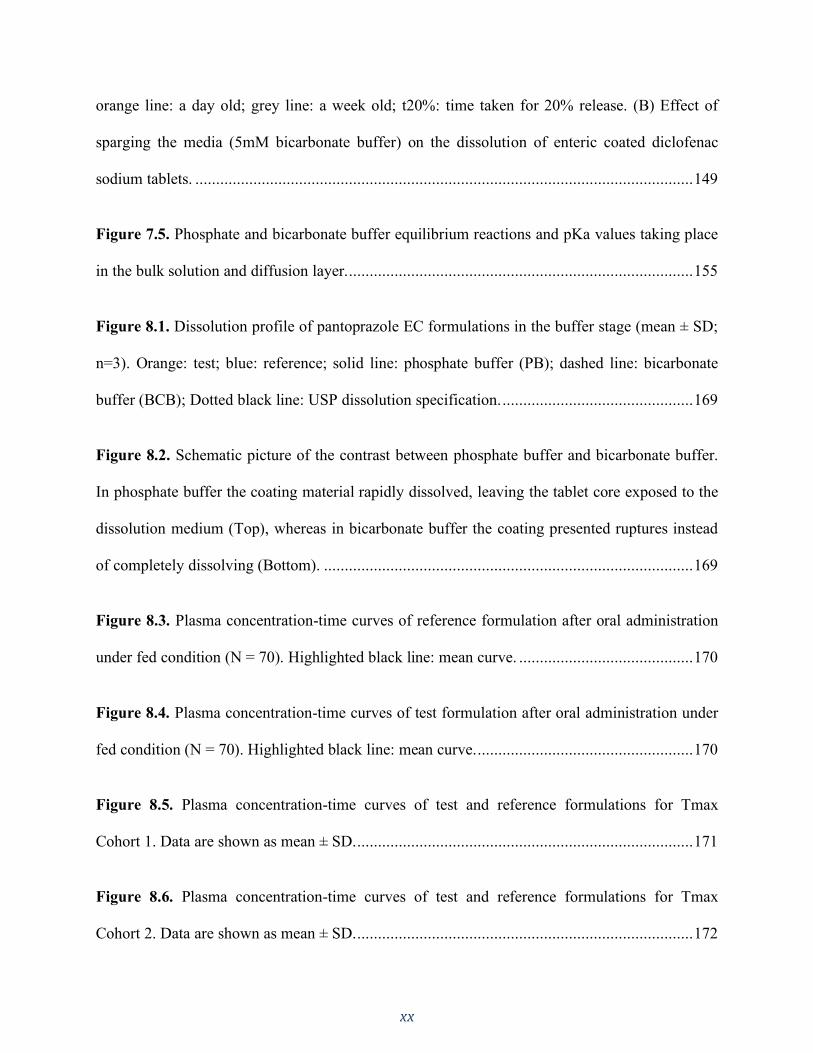
orange line: a day old; grey line: a week old; t20%: time taken for 20% release. (B) Effect of
sparging the media (5mM bicarbonate buffer) on the dissolution of enteric coated diclofenac
sodium tablets. ........................................................................................................................ 149
Figure 7.5. Phosphate and bicarbonate buffer equilibrium reactions and pKa values taking place
in the bulk solution and diffusion layer. ................................................................................... 155
Figure 8.1. Dissolution profile of pantoprazole EC formulations in the buffer stage (mean ± SD;
n=3). Orange: test; blue: reference; solid line: phosphate buffer (PB); dashed line: bicarbonate
buffer (BCB); Dotted black line: USP dissolution specification. .............................................. 169
Figure 8.2. Schematic picture of the contrast between phosphate buffer and bicarbonate buffer.
In phosphate buffer the coating material rapidly dissolved, leaving the tablet core exposed to the
dissolution medium (Top), whereas in bicarbonate buffer the coating presented ruptures instead
of completely dissolving (Bottom). ......................................................................................... 169
Figure 8.3. Plasma concentration-time curves of reference formulation after oral administration
under fed condition (N = 70). Highlighted black line: mean curve. .......................................... 170
Figure 8.4. Plasma concentration-time curves of test formulation after oral administration under
fed condition (N = 70). Highlighted black line: mean curve. .................................................... 170
Figure 8.5. Plasma concentration-time curves of test and reference formulations for Tmax
Cohort 1. Data are shown as mean ± SD. ................................................................................. 171
Figure 8.6. Plasma concentration-time curves of test and reference formulations for Tmax
Cohort 2. Data are shown as mean ± SD. ................................................................................. 172

xxi
Figure 8.7. IVIVR graph. The compendial buffer in vitro data was correlated with the in vivo
data from Cohort 1 and the in vitro data from bicarbonate buffer was correlated with the in vivo
data from Cohort 2. ................................................................................................................. 174
Figure 8.8. IVIVR model predicted (lines) vs. observed (circles, mean ± SD) plasma
concentration-time profiles for Cohort 1 (prediction using phosphate buffer dissolution data). 175
Figure 8.9. IVIVR model predicted (lines) vs. observed (circles, mean ± SD) plasma
concentration-time profiles for Cohort 2 (prediction using bicarbonate buffer dissolution data).
............................................................................................................................................... 176
Figure 9.1. H1NMR spectrum for the precipitate obtained in the titration of phenytoin solution
with CaCl2............................................................................................................................... 191
Figure 9.2. Calorimeter experiments result for the dry powder mixtures. ................................ 192
Figure 9.3. Calorimeter experiments result for the powder mixtures with water added. ........... 193
Figure 9.4. Calorimeter experiments result for the mixtures: milk and phenytoin; milk and
sodium phenytoin. ................................................................................................................... 194
Figure 9.5. Calorimeter experiments result for commercially available extended release
phenytoin sodium capsules (100 mg) in milk. .......................................................................... 195
Figure 9.6. Calorimeter experiments result for commercially available extended release
phenytoin sodium capsules (100 mg) in water and lactose free milk (LFM). ............................ 196
xxii
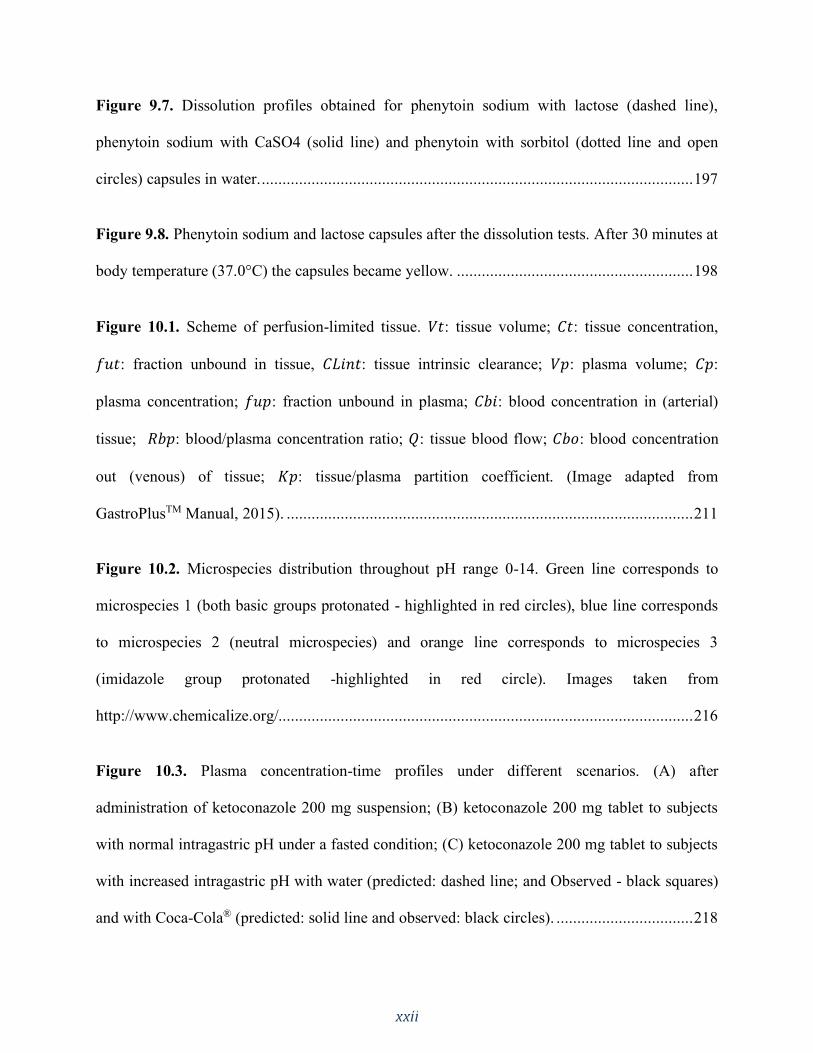
Figure 9.7. Dissolution profiles obtained for phenytoin sodium with lactose (dashed line),
phenytoin sodium with CaSO4 (solid line) and phenytoin with sorbitol (dotted line and open
circles) capsules in water. ........................................................................................................ 197
Figure 9.8. Phenytoin sodium and lactose capsules after the dissolution tests. After 30 minutes at
body temperature (37.0°C) the capsules became yellow. ......................................................... 198
Figure 10.1. Scheme of perfusion-limited tissue. 𝑉𝑡: tissue volume; 𝐶𝑡: tissue concentration,
𝑓𝑢𝑡: fraction unbound in tissue, 𝐶𝐿𝑖𝑛𝑡: tissue intrinsic clearance; 𝑉𝑝: plasma volume; 𝐶𝑝:
plasma concentration; 𝑓𝑢𝑝: fraction unbound in plasma; 𝐶𝑏𝑖: blood concentration in (arterial)
tissue; 𝑅𝑏𝑝: blood/plasma concentration ratio; 𝑄: tissue blood flow; 𝐶𝑏𝑜: blood concentration
out (venous) of tissue; 𝐾𝑝: tissue/plasma partition coefficient. (Image adapted from
GastroPlusTM Manual, 2015). .................................................................................................. 211
Figure 10.2. Microspecies distribution throughout pH range 0-14. Green line corresponds to
microspecies 1 (both basic groups protonated - highlighted in red circles), blue line corresponds
to microspecies 2 (neutral microspecies) and orange line corresponds to microspecies 3
(imidazole group protonated -highlighted in red circle). Images taken from
http://www.chemicalize.org/.................................................................................................... 216
Figure 10.3. Plasma concentration-time profiles under different scenarios. (A) after
administration of ketoconazole 200 mg suspension; (B) ketoconazole 200 mg tablet to subjects
with normal intragastric pH under a fasted condition; (C) ketoconazole 200 mg tablet to subjects
with increased intragastric pH with water (predicted: dashed line; and Observed - black squares)
and with Coca-Cola® (predicted: solid line and observed: black circles). ................................. 218
xxiii
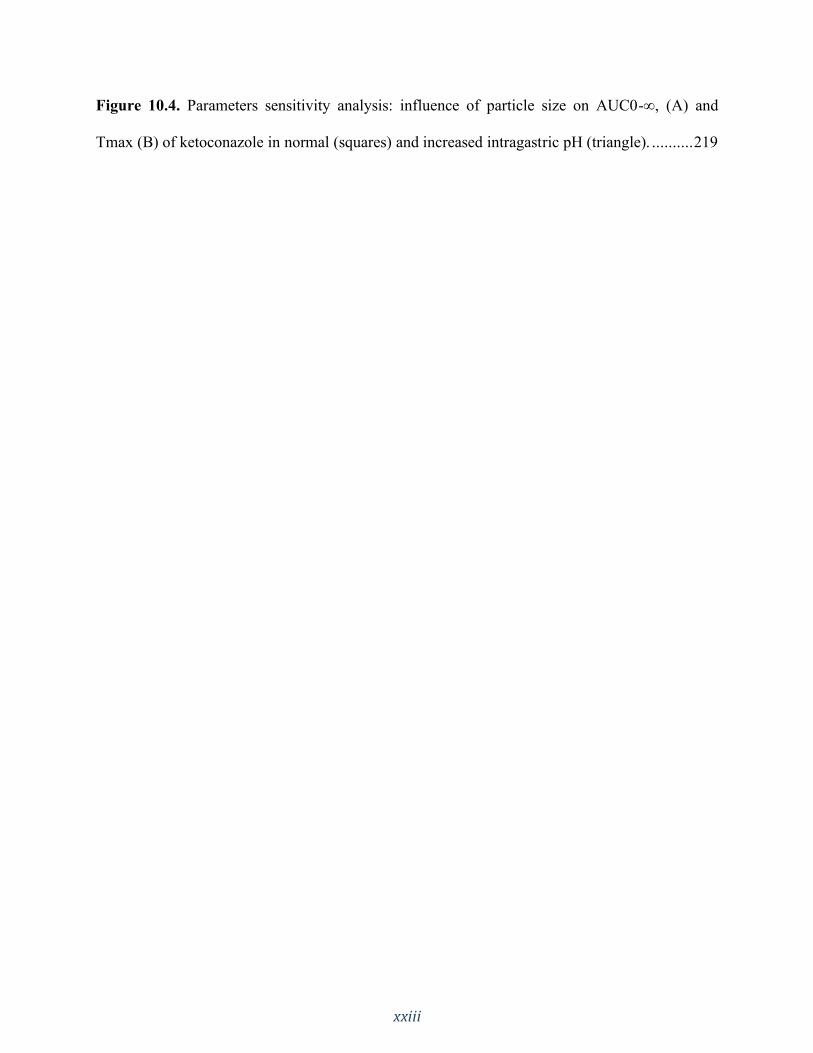
Figure 10.4. Parameters sensitivity analysis: influence of particle size on AUC0-∞, (A) and
Tmax (B) of ketoconazole in normal (squares) and increased intragastric pH (triangle). .......... 219
xxiv
LIST OF ABBREVIATIONS
AGF Artificial Gastric Fluid
ACAT Advanced Compartmental Absorption and Transit
AIC Akaike Information Criterion
An Absorption number
ANDA Abbreviated New Drug Application
API Active Pharmaceutical Ingredient
Aq Aqueous
ASD Artificial Stomach-Duodenum
ASF Absorption Scale Factor
AUC Area Under the Curve
BA Bioavailability
BCB Bicarbonate Buffer
BCS Biopharmaceutics Drug Classification System
BDM Biorelevant Dissolution Media
BE Bioequivalence
BP Biphasic
CAI Carbonic Acid Ionization
CAT Compartmental Absorption and Transit
CI Confidence Interval
CPP Comparator pharmaceutical product
CS Croscarmellose Sodium
xxv
D Direct compression
Dex Dextrose
DF Dosage Form
Dn Dissolution number
Do Dose number
EC Enteric Coated
EMA European Medicines Agency
FaSSGF Fasted State Simulating Gastric Fluid
FaSSIF Fasted State Simulated Intestinal Fluid
FDA Food and Drug Administration
FeSSGF Fed State Simulating Gastric Fluid
FeSSIF Fed State Simulated Intestinal Fluid
G Wet granulation
GI Gastrointestinal
GIS Gastro Intestinal Simulator
GIT Gastrointestinal Tract
HIF Human Intestinal Fluid
HMT Hierarchical Mass Transfer
H1NMR Proton Nuclear Magnetic Resonance
HPLC High-Performance Liquid Chromatography
HPMC Hydroxypropyl methylcellulose
ICH International Council for Harmonisation
xxvi
IDR Intrinsic Dissolution Rate
IR Immediate Release
IRR Irreversible Reaction
IVIVC -in vivo correlation
IVIVR -in vivo relationship
ka Absorption rate coefficient
kp Partitioning rate coefficient
LFM Lactose Free Milk
MAE Mean Absolute Error
MCC Microcrystalline Cellulose
Micro-CT Computerized x-ray microtomography
NLT Not Less Than
NMR Nuclear Magnetic Resonance
NSAID Non-Steroidal Anti-Inflammatory Drug
Oct Octanol
PB Phosphate Buffer
PBPK Physiologically Based Pharmacokinetic
Ph. Int. International Pharmacopoeia
PK Pharmacokinetic
PPI Proton Pump Inhibitor
PSA Parameter Sensitivity Analysis
QbD Quality by Design
xxvii
QC Quality Control
RLD Reference Listed Drug
RMSE Root Mean Squared Error
RNE Reversible Non-Equilibrium
Rsq (R2) Correlation coefficient
SD Standard Deviation
SEIF Simulated Endogenous Intestinal Fluid
SGF Simulated Gastric Fluid
SGFsp Simulated Gastric Fluid without pepsin
SIF Simulated Intestinal Fluid
SLS/SDS Sodium Lauryl Sulphate
SSE Sum of Squared Errors
SUPAC Scale Up and Post Approval Changes
USP United States Pharmacopeia
WHO World Health Organization
1
SECTION ONE: INTRODUCTION AND OVERVIEW
CHAPTER ONE
Introduction

2
For a drug to excerpt pharmacological action after being taken by mouth, it first needs to
be released from the formulation, get into solution (dissolve), be absorbed, and reach systemic
circulation. The processes of disintegration, drug release and dissolution may occur
simultaneously.
Since only solubilized drugs can be absorbed, and thus have therapeutic effect, the
understanding of the dissolution and drug release processes of a drug product is of primary
importance to the pharmaceutical industry. Such understanding will allow a robust formulation
development with an ideal in vivo performance.
Dissolution is the process by which a solid phase (e.g., a tablet or powder) goes into a
solution phase, such as water. Although simple in concept, the rate of dissolution can be affected
by a variety of factors which include, but are not limited to, the type of media in which the drug
is dissolving, temperature, pH, viscosity, agitation rate, and dosage form coatings. Hence, a
dissolution method should be carefully designed to avoid confounding factors. The processes of
disintegration, drug release and dissolution are described below.
1.1 Disintegration
Disintegration is a physical process related to the mechanical breakdown of a tablet into
smaller particles/granules, representing the breakage of inter-particle interactions generated
during tablet compaction or granulation (1), given that the tablet is not a contiguous polymeric
device. After the immersion liquid wets the particle surface and penetrates through the pores,
disintegration takes place in two steps: first, disintegration into smaller granules, and second,
disaggregation or granule disintegration into fine particles. The first step is important to increase
surface area. The increase in surface area compared to the intact tablet or granulate yields a
higher dissolution rate. In the second step, an even faster drug dissolution rate is achieved due to
3
the increased surface area in contact with the medium. If no disintegration would occur, only the
Active Pharmaceutical Ingredient (API) near the surface of the compact or granulate would
dissolve. A more in depth description of disintegration is given in Chapter 3.
In the case of immediate-release dosage forms, such as typical tablets or capsules, the
materials are generally selected and utilized to allow the disintegration and deaggregation
processes to proceed rapidly. Therefore, the dissolution rate of the solid drug is often the limiting
or rate-controlling step in the absorption of drugs with low solubility. However, if disintegration
is slower than dissolution e.g. hydrophilic matrix tablets, then disintegration/surface erosion is
the rate limiting process.
1.2 Drug release
Drug release is the process by which a drug leaves a drug product and is described with
reference to the rate at which drug is available from a particular dosage form. It can be classified
as immediate release or modified release, which includes both delayed and extended-release.
Drug release refers not only to oral drug products, but also to other dosage forms, such as
transdermal and drug-device combinations.
Drug dissolution and release patterns commonly fall into two groups: zero- and first-
order release. Typically in the pharmaceutical sciences, zero-order release is achieved from
nondisintegrating dosage forms such as topical or transdermal delivery systems, implantable
depot systems, or oral controlled-release delivery systems. Sustained-release systems often
attempt to mimic zero-order release by providing drug in a slow first-order manner, that is,
concentration dependent.
4
1.3 Dissolution
Drug dissolution is the process by which drug molecules are liberated from a solid phase
and enter into a solution phase. In general, only drugs in solution can be absorbed, distributed,
metabolized, excreted, and even to exert pharmacologic action. Thus, dissolution is an important
process in the pharmaceutical sciences and is mostly used in the context of oral drug products.
Differences in dissolution performance can cause products not to pass quality control tests and/
or bioequivalence tests. Therefore, dissolution testing is an important performance test.
The quantitative analysis of dissolution rate was firstly introduced by Noyes and Whitney
in the late 19th century (2). The Noyes-Whitney equation related
the rate of dissolution of solids to both the properties of the solid and the dissolution medium.
1.3.1 Noyes–Whitney Equation
In dissolution or mass transfer theory, it is assumed that an aqueous diffusion layer or
stagnant liquid film of thickness h exists at the surface of a solid undergoing dissolution, as
observed in Figure 1.1. This thickness, h, represents a stationary layer of solvent in which the
solute molecules exist in concentrations from Cs to C. Beyond the static diffusion layer, at a
distance of x greater than h, mixing occurs in the solution, and the drug is found at a uniform
concentration, C, throughout the bulk phase.
5
Figure 1.1. Dissolution of a drug particle, showing the stagnant diffusion layer between the
dosage form surface and the bulk solution (solid-liquid interface).
At the solid surface–diffusion layer interface, x = 0, the drug in the solid is in equilibrium
with drug in the diffusion layer. The gradient (or change in concentration) with distance across
the diffusion layer, is constant, as shown by the straight downward-sloping line. The static
diffusion layer thickness can be altered by the force of agitation at the surface of the dissolving
drug particle.
The Noyes and Whitney equation can be written as
𝑑𝑀
𝑑𝑡=
𝐷𝑆
ℎ(𝐶𝑠 − 𝐶) (Equation 1-1)
or
𝑑𝐶
𝑑𝑡=
𝐷𝑆
𝑉ℎ(𝐶𝑠 − 𝐶) (Equation 1-2)
where M is the mass of solute dissolved in time t, dM/dt is the mass rate of dissolution
(mass/time), D is the diffusion coefficient of the solute in solution, S is the surface area of the
exposed solid, h is the thickness of the diffusion layer, Cs is the solubility of the solid (i.e.,
concentration of a saturated solution of the compound at the surface of the solid and at the
temperature of the experiment), and C is the concentration of solute in the bulk solution and at
time t. The quantity dC/dt is the dissolution rate, and V is the volume of solution.
Drug
Cs
X=h
Bulk solution
6
1.3.2 Sink Conditions
The saturation solubility of a drug is a key factor in the Noyes–Whitney (2) equation. The
driving force for dissolution is the concentration gradient across the boundary layer. Therefore,
the driving force depends on the thickness of the boundary layer and the concentration of drug
that is already dissolved. When the concentration of dissolved drug, C, is less than 10% of the
saturation concentration, Cs, the system is said to operate under “sink conditions.” Another
common rule for sink conditions is that the dissolution media is able to dissolve at least 3 times
the amount of drug present in the dosage form.
1.4 Dissolution Methods and Apparatus
A dissolution test is performed to assess a drug product’s performance and to determine
compliance with the dissolution requirements for dosage forms. The United States Pharmacopeia
(USP) general chapter <711> Dissolution (3) lists four dissolution apparatuses, namely:
Apparatus 1 (Basket), Apparatus 2 (Paddle), Apparatus 3 (Reciprocating Cylinder) and
Apparatus 4 (Flow-Through Cell).
These methods for evaluating dissolution first appeared in the 13th edition of the USP in
early 1970. The most commonly used pieces of dissolution equipment are the basket and the
paddle apparatus. They are characterized as “stirred beaker” methods and are simple and well
standardized. They are also “closed systems” because they use a fixed volume of dissolution
medium (4,5). The basket method is generally preferred for capsules, whereas tablet dissolution
is normally performed using the paddle method. Typically used media include (a) water, (b) 0.1
N HCl, (c) buffer solutions, (d) water or buffers with surfactants, and (e) low-content alcoholic
aqueous solutions.

7
The USP Apparatus 3, a reciprocating cylinder, dips a transparent cylinder containing the
dosage form at a rate determined by the operator (3). The tubes have a mesh base to allow the
medium to drain into a sampling reservoir as the tube moves up and down, thus creating
convective forces for dissolution. The cylinders can also be transferred to different media at
specified times, automatically. It is suitable for sustained-/controlled-release dosage forms as it
allows exposure of products to mechanical and physiochemical conditions which may influence
the release of the products throughout the gastrointestinal (GI) tract.
The USP Apparatus 4 (3) is a flow-through cell containing the dosage form that is fed
with dissolution medium from a reservoir. Directing the fluid through a porous glass plate or a
bed of beads produces a dispersed flow of medium. Turbulent or laminar flow can be achieved
by changing the bottom barrier. As with Apparatus 3, the medium can be changed to provide a
pH gradient, surfactants, and other medium components. Limitations of volume and pH change
associated with traditional rotating paddle and basket apparatus prompted the development of the
flow-through cell apparatus. Because it can be run as an “open system” the volume of media in a
dissolution test can be easily adapted to the solubility of the drug and release rate of the product.
This system can be used for various dosage forms such as modified/extended-release tablets,
medical devices, API’s or granules, suppositories, capsules, pellets, hydrogels, among others.
1.5 Intrinsic dissolution
All the aforementioned methods are used to assess the performance of a final drug
product. Intrinsic dissolution testing, however, is used to characterize dissolution properties of a
pure drug substance, not in a dosage form (6). Determining the rate of dissolution is important
because it may allow the prediction of potential bioavailability problems. This method is
described in the USP General Chapter <1087> Intrinsic Dissolution - Dissolution testing
8
procedures for rotating disk and stationary disk (7). A non-disintegrating compact of material is
prepared. The compact and surrounding die assembly are placed in a suitable dissolution medium
and subjected to the desired hydrodynamics near the compact surface. The amount of dissolved
drug as a function of time is measured. The cumulative amount of drug dissolved is plotted
against time and linear regression analysis is performed on data points in the initial linear region
of the dissolution curve. The slope corresponds to the dissolution rate (mass s−1). The dissolution
rate is normalized for surface area to obtain the intrinsic dissolution rate (IDR) (units of mass
cm–2 s–1). This can be used to determine if a drug substance is highly or poorly soluble. IDR
values above 0.0017 mg/s/cm2 indicate a highly soluble drug. This method is independent of the
particle size or shape and therefore ideal in early drug development when the crystal form,
polymorph or particle size distribution requirements are not yet known. There are two types of
apparatus specified in the USP for intrinsic dissolution testing, namely: rotating disk and
stationary disk.
1.6 Non-Quality Control dissolution methods
In addition to USP listed devices, there are a large number of specially designed devices
used in research applications. These methods were developed to attempt to replicate the
environment that the dosage form encounters during its transit through the GI tract and to
address the deficiencies of the traditional methods. The assessment of a drug’s product
performance under physiologically relevant conditions can give better insight of the dynamic
aspects of in vivo dissolution. Some examples of physiologically adapted devices are the
Artificial Stomach-Duodenum (ASD) model, the, Gastro Intestinal Simulator (GIS), the TNO
intestinal model System, the vibrating tube sensor and biphasic dissolution testing (8,9). An
9
overview of physiologically relevant dissolution media, such as bicarbonate based systems, is
covered in Chapter 2.
1.7 Biopharmaceutics
Biopharmaceutics examines the relationship of the physicochemical properties of the
API, dosage form and route of administration on the rate and extent of systemic drug absorption
(10). After a solid dosage form such as a tablet is administered by mouth to a patient, it must in
most cases first disintegrate. Then drug dissolution as a time-dependent process takes over and
represents the final step of drug release, which is ultimately required before a drug can be
absorbed or exert a pharmacologic effect. Several kinetic processes act simultaneously to
determine the amount of drug ultimately absorbed. These include the rates of drug release,
dissolution, transit through the intestine, and the permeability of the drug in the small intestine.
There are two mechanistic cases which have to be differentiated when considering the
bioavailability of a drug. A drug’s bioavailability can be dissolution or absorption controlled. If
drug dissolution is slow compared with drug absorption, the dose may not be totally absorbed
before it has passed through the intestine, especially if the drug is absorbed preferentially in
certain locations (“absorption windows”) of the GI tract. Low absorption due to slower
dissolution can also result in lower drug blood levels. At the same time, if dissolution controls
the absorption process, then -in vivo correlation (IVIVC) can be established, and dissolution
might be able to predict bioavailability (BA). In the case that absorption is slower than
dissolution, dissolution might not be predictive for BA since the gut permeability is the
absorption controlling factor.
10
1.7.1 The Biopharmaceutics Drug Classification System (BCS)
The BCS system was introduced by Amidon and colleagues in 1995 (11). This
classification system is based on the two key physicochemical parameters for oral
bioavailability: Solubility and Permeability. The BCS Classes are defined as: Class I - High
solubility-high permeability drugs; Class II - Low solubility-high permeability drugs, Class III -
High solubility-low permeability drugs, and Class IV - Low solubility-low permeability drugs.
High solubility was defined as the highest dose strength soluble in 250 mL of an aqueous
medium with a pH range of 1–7.5 at 37 ± 1°C (SUPAC) (12). These pH ranges are slightly
different in different guidance documents. High Permeability was defined as: “when the extent of
absorption in humans is determined to be greater or equal to 90% of an administered dose based
on a mass balance determination or in comparison to an intravenous reference dose”. This was
reduced to 85% BA in 2017. The Food and Drug Administration (FDA) accepts in vitro data to
establish permeability while most of the other regulatory agencies require human data only.
Only what is dissolved can get absorbed and reach its target organ, tissue or receptor
triggering a pharmacological response. Since drug dissolution and gastrointestinal permeability
are fundamental parameters in controlling the rate and extent of drug absorption, this system thus
allows not only the correlation of the in vitro drug product dissolution and in vivo bioavailability
but also allows to set standards for the in vitro drug dissolution method which will correlate with
the in vivo process.
1.7.2 BCS Sub-classes
In 2014, Tsume and colleagues (13) proposed an extension of the BCS classes to include
sub-classes of acid (a), base (b) and neutral (c) drugs, especially for classes II and IV. Since
Classes I and III are high solubility drugs, although existent, such subclassification was not

11
emphasised - except for border line solubility cases. This BCS sub-classification is an important
basis to develop in vivo predictive dissolution methods.
In terms of solubility and dissolution, BCS Classes IIa and IVa drugs (pKa values around
4 to 5) are insoluble at low pH values (e.g. fasted stomach) but soluble at higher pH values (e.g.
intestinal pH). With the increase in solubility at intestinal pH values, the dissolution rate of
acidic drugs is also likely to be increased upon entering the intestines. In such cases, dissolution
would likely be faster than gastric emptying rate depending on dose and intrinsic solubility.
Hence, BCS IIa drugs, for example, would behave as a Class I drug in the small intestine, where
the absorption rate would likely reflect gastric emptying time. Due to their high permeability and
high solubility and dissolution rate in the small and large intestine environment, BCS Class IIa
(weak acids) may be completely absorbed, given a sufficient residence time throughout the
whole intestines. Conversely, weak bases under BCS Class IIb exhibit high solubility and
dissolution rates at acidic pH (stomach) and low solubility at higher pH values (intestines). This
may lead to precipitation upon entering the intestines, a process that depends on many factors,
such as formulation and the GI physiological environment at the time of dosing. Immediate
release (IR) oral dosage forms containing basic drugs (~ pKa 3–6) may have sufficient time for
dissolution in the stomach thus exhibiting good absorption in the proximal intestinal region. For
BCS IIb drugs, the absorption rate would likely be impacted by the gastric emptying rate, the
intestinal permeability and the precipitation time. In the case of BCS Class IIc drugs, the
solubility would not be affected by the in vivo pH change, but on the in vivo environment such as
surfactants and lipids.
In terms of absorption, BCS IIa drugs will present an initial lag in absorption because of
the limited dissolution in the stomach. This lag time and variability are dependent on the dosing
12
time relative to the gastric motility phase. The succeeding absorption rate will be mainly
dependent on the gastric emptying and dissolution rate. For BCS IIb drugs, the initial absorption
rate will be dependent on the dissolution in the stomach as well as gastric emptying. Generally,
since dissolution is expected to be rapid in the stomach, the absorption in the duodenum will be
mostly dependent on gastric emptying. After the initial rapid phase, the absorption rate tends to
decrease due to subsequent precipitation, solubilization, dissolution and absorption along the
intestines. BCS Class IIc drugs generally presents a slow and prolonged absorption throughout
the GI tract. Factors that will influence the absorption rate are the in vivo solubilization,
dissolution and motility (transit). Similar generalizations can be made for BCS Class IV drugs
but accounting for the low intestinal permeability, which may play a larger role.
1.7.3 Dose, Dissolution and Absorption Number
Based on the API’s physicochemical properties and some GI physiological parameters,
the BCS defined 3 distinct dimensionless numbers, namely: Dissolution number (Dn), Dose
number (Do) and Absorption number (An) (14). The parameters used to calculate each number
are given in Equations (1-3 to 1-5). These numbers are useful for decision making process in
drug development. If two potential drug candidates have differences in their Dn, Do or An, the
one with the better chances to get bioavailable might be chosen, however other factors such as
stability, polymorphism, toxicology, and pharmacological potency have to be balanced to the
BCS characteristics.
The dissolution number is the ratio between the small intestine transit time (TGI) and the
dissolution time (the longest time at pH 1, 4.5 or 6.8) (TDISS). A Dn < 1.0 indicates that the whole
dose may not be dissolved during transit through the small intestine. Hence, Dn values higher
than 1.0 are desired for complete dissolution in the GI tract.
13
𝐷𝑛 = (3𝐷
𝑟2 ) (𝐶𝑠
𝜌) (𝑇𝐺𝐼) = (
𝑇𝐺𝐼
𝑇𝐷𝐼𝑆𝑆) (Equation 1-3)
The dissolution time is calculated based on the solubility (Cs), diffusivity (D), density (ρ), and
the initial particle radius (r) of a given compound.
The dose number is calculated as the ratio of dose concentration to drug solubility. Do >
1.0 indicates that the dose will not completely dissolve in the accompanying volume of water.
This indicates that the drug presents solubility issues.
𝐷𝑜 = (𝐷
𝑉𝑤𝑎𝑡𝑒𝑟⁄
𝐶𝑠) (Equation 1-4)
The drug concentration is calculated as the dose (D) divided by the accompanying volume of
water (Vwater) (usually 250 ml at the pH of lowest solubility between 1 and 8).
The absorption number is calculated as the ratio between the small intestine transit time (TGI) and
the estimated small intestine absorption time (TABS). An An < 1.0 indicates that all of the drug
may not be absorbed during transit through the small intestine. Hence, An values higher than 1.0
are desired for complete absorption in the GI tract. The time required for complete absorption
(TABS) is defined as the ratio of permeability (Peff) and the gut radius (R).
𝐴𝑛 = (𝑃𝑒𝑓𝑓
𝑅) (𝑇𝐺𝐼) = (
𝑇𝐺𝐼
𝑇𝐴𝐵𝑆) (Equation 1-5)
1.7.4 Regulatory aspects - Biowaiver
The BCS can been seen as the mechanistic foundation of modern drug development (e.g.
Quality by Design (QbD) approaches) and regulatory guidance’s. The system was mentioned for
the first time in an FDA document in 1995 (12). The Scale Up and Post Approval Changes
(SUPAC) guidance allowed to waive bioequivalence studies for formulation changes within
specific ranges, if in vitro similarity for the before and after the change products can be
documented via dissolution tests. This is called a Biowaiver.
14
In 1997 the FDA published another guidance (15) allowing dissolution testing as
surrogate for bioequivalence testing for extended-release formulation if an IVIVC could be
established. Since dissolution controls the absorption of such products, a graph plotting the
fraction dose dissolved vs. fraction dose absorbed should result in a linear relationship. The
Biowaiver for these products are not limited to any BCS class. This guidance was followed by
the 2000 BCS based biowaiver guidance which allowed biowaivers for all BCS class I APIs. The
FDA 2017 guideline changed the BA from 90% to 85% and allowed BCS III drugs.
An early BCS classification and the knowledge of the Do, Dn and An can be very
valuable in drug development. For example, if different drug candidates derived form a lead
molecule have differences in their properties, the biopharmaceutically “better” candidate can be
chosen. On the other hand, biowaivers can be used in drug development to show that
formulations are similar and avoid costly clinical studies and reduce the regulatory burden.
Furthermore, generic drug approval can now be granted based on biowaivers.
1.8 Thesis overview
1.8.1 Rationale and previous studies
The mechanistic understanding of the in vivo drug product performance and API
characteristics is of primary importance for a robust drug development process. This
understanding is gained through the study of the physicochemical properties of the API (as
outlined in the topic 1.7), as well as the study of the drug product in terms of disintegration,
dissolution and drug release.
During the development process, different dissolution methods might be needed, which have
different focuses, such as in vivo predictive dissolution methods and methods for quality control
(QC) purposes. The information obtained in the physiologically based methods can be used to

15
establish appropriate discrimination of the QC method to be applied in late development stage
toward critical quality attributes and process parameters. Hence, incorporating physiological
features to the in vitro test is an excellent approach to understand the in vivo behavior of a drug/
drug product hence gaining clinical insight for a QbD development.
Previous work in the literature has reported the lower buffer capacity of the intestinal fluids
which results in a slower in vivo drug dissolution rate compared to compendial buffers.
Additionally, the matter of absorption is not taken into consideration in a single-phase
dissolution system. The approach of dissolution testing with low buffer capacity has been
reported in the literature, as well as the use of an organic layer on the dissolution vessel to mimic
absorption. However, to the best of our knowledge, the use of low buffer capacity together with
an absorptive phase has not been investigated. Additionally, the application of this system to
highly soluble drugs hasn’t been explored yet. Similarly, it is well known that the intestinal
lumen is buffered by bicarbonate. This has important implications for enteric coated
formulations. Previous studies have reported the further delay on the onset of drug release in
bicarbonate buffer, however, no approach has been taken to address this matter in a mechanistic
way.
This thesis has been divided into three main sections covering aspects of physiologically
relevant testing. Each section is built upon the knowledge gained in the previous one. Firstly, the
matter of buffer capacity was investigated with immediate release formulations, as well as the
use of an additional sink (organic phase). With the lessons learned from the theoretical and
experimental assessment, more complex delivery systems (delayed release) were investigated
addressing both the matter of buffer capacity and buffer species (bicarbonate buffer) on the drug
product performance.
16
1.8.2 Hypothesis
Applying physiologically relevant conditions to the dissolution test results in more
accurate in vivo predictability for a robust and precise development process.
1.8.3 Objectives
Overall objective:
To assess the impact and implications of buffer capacity, buffer species and alternative
dissolution methods on drug dissolution of different dosage forms.
Specific objectives:
1) To investigate the influence of buffer capacity on a model poorly and highly soluble drugs.
2) To investigate the influence of having an organic layer on the dissolution system (to mimic the
in vivo drug absorption) on the drug product performance.
3) To assess the discriminatory power and applicability of biphasic dissolution testing compared
to standard conditions.
4) To mechanistically delineate the performance of enteric coated products in physiologically
relevant bicarbonate buffer.
5) To investigate the impact of formulation composition in terms of drug-excipients interactions.
17
SECTION ONE: INTRODUCTION AND OVERVIEW
CHAPTER TWO
Update on biorelevant media and physiologically relevant dissolution conditions
A version of this chapter has been accepted to be published in:
Dissolution Technol. 2021. Manuscript number: DT-D-21-00013
18
2.1 Introduction
Dissolution testing constitutes one of the most widely used in vitro performance tests
during the drug product development and routine quality control testing. It monitors the rate and
extent of in vitro drug release (batch release test), and it is also often used to ensure consistent in
vivo performance (16,17). The description of standard dissolution apparatus by the United States
Pharmacopeia (USP) in the 1970s together with guidance’s by the United States Food and Drug
Administration (FDA) in the late 90’s propelled its broad application during the various stages of
drug development (17,18). Alongside that, the introduction of the Biopharmaceutics
Classification System (BCS) (11), in 1995, provided a simple but robust way to mechanistically
describe the biopharmaceutical behavior of a drug. Under this system, drugs are classified based
on their solubility and permeability. These parameters can be used to predict the fraction dose
absorbed and consequently its chances to become bioavailable (14,19).
At the time when USP apparatus 1 and 2 were introduced and FDA guidance’s were
published, most of the molecules under development presented good aqueous solubility (BCS
classes 1 and 3) and conventional dosage forms were employed (capsule and tables). Hence,
establishing in vitro dissolution conditions with presumed in vivo relevance was reasonably
simple (17,20). However, the development scenario has changed to molecular entities that are
more potent accompanied with lower aqueous solubility (BCS classes 2 and 4). While these drug
substances have enhanced many therapies by acting on new molecular targets, they also present
significant formulation and process development challenges (21), especially regarding the
biopredictive power of the previous traditional in vitro performance methods. Hence, there was a
need for advancement in the field of dissolution testing (e.g. development of biorelevant and
19
physiologically relevant dissolution methodologies) to address the shortfalls of traditional
methods.
Accordingly, the use of dissolution testing has gained much space outside of the routinely
end-product release application to a comprehensive analysis that can be implemented at the
various stages of the product life cycle (17,19). Changes in the regulatory landscape, such as the
introduction of quality by design (QbD) concept, have also contributed to the progression of
dissolution methodology, linking quality tests to product performance in patients and ultimately
therapeutic outcomes. Hence, there was a shift into developing dissolution media and apparatus
that would mimic the human gastrointestinal (GI) tract to further understand the in vivo
dissolution mechanisms. The innovation in this field has also evolved to the integration of in
vitro dissolution data applying different methods and analytical techniques with modeling and
simulation, correlating it to in vivo data (22–25). This approach is a robust way to select the best
formulation with the desired in vivo performance.
The purpose of a particular dissolution test varies at the different stages of development
(17). As first introduced by Azarmi et al. there might be a need for more than one dissolution test
for the same product (26). For example, a quality control (QC) dissolution test is usually used to
identify possible variations during product manufacturing and/or changes in product storage that
could have an impact on the product’s performance. This method needs to be simple in order to
be used in a typical routine QC environment, such as conventional USP apparatus 1 or 2 and
simple buffer media. At the same time, this method has to demonstrate an appropriate level of
discriminatory power to confirm product consistency. On the other hand, a biorelevant/
physiologically relevant dissolution method applies conditions that mimic the different
physiological environments. These usually consist of non-compendial media and apparatus, such
20
as bicarbonate-based buffers, biphasic dissolution to assess the impact of concurrent drug
absorption and multiple compartmental apparatuses (27–29). This methodology is mostly used to
guide formulation selection and optimization. It typically starts during early development and
may continue through clinical testing and beyond. Lastly, a clinically relevant dissolution
method is any particular method in which a link between in vitro dissolution data with in vivo
pharmacokinetic (PK) data can be established, creating an in vitro - in vivo correlation or
relationship (IVIVC or IVIVR) which is important for lifecycle management.
The in vivo drug dissolution depends on the drug physicochemical properties as well as
on the GI fluid environment. The current understanding of the human GI physiology allowed
biorelevant dissolution media (BDM) to evolve, facilitating the in vitro prediction of in vivo
dissolution performance (24,30–33). The many proposed BDM include various properties of the
human GI tract, such as pH, buffer species, buffer concentration, osmolality, viscosity, surface
tension, concentration and type of bile salts, lipolysis products, as well as physiological state,
such as fasted and fed states (34–37). Evidently conventional dissolution media, such as simple
USP buffers, fall short in mimicking the properties and composition of GI fluids, but at the same
time are referenced in the majority of USP monographs (31). In the realm of in vivo
predictability, compendial methods are most meaningful for the solubility and dissolution
assessment of BCS class I drugs.
A more accurate prediction of the drug product’s in vivo performance is expected the
closer the in vitro conditions are to the in vivo environment. However, depending on the
information one is seeking or on the physicochemical properties of the API (e.g. BCS class I),
simulating all aspects of the GI tract may or may not be necessary to evaluate the drug product
performance. Based on this, Markopoulos et al. (38) have suggested levels of simulation of
21
luminal composition, as follows: Level 0 (pH); Level I (pH and buffer capacity); Level II (pH,
buffer capacity, bile components, dietary lipids, lipid digestion products and osmolarity) and
Level III (pH, buffer capacity, bile components, dietary lipids, lipid digestion products,
osmolarity, proteins, enzymes and viscosity effects).
The purpose of this review is to summarize and update the many physiologically adapted
media and buffers proposed over the years focusing on the upper GI tract, since it is often where
most drug absorption occurs. Emphasis will be given on the application of bicarbonate-based
media, since this is the major buffering species in the human intestinal lumen.
2.2 Physiologically relevant media
2.2.1 Gastric Environment
The composition, pH, and surface tension are important aspects to be considered when
simulating the gastric fluid. The composition of the stomach fluid is not merely hydrochloric
acid; it also contains saliva, digestive enzymes (pepsin and gastric lipase), food and refluxed
fluids from the duodenum (39). The pH of gastric fluids can vary greatly depending on the
physiological state (fed vs fasted), health-related conditions (such as achlorhydria) and
pharmacological treatments (such as anti-acid agents). The reported pH range of gastric fluids is
1.5–1.9 under fasted conditions (4,40,41) and 3.0 – 7.0 under fed conditions (the rate in which
the pH changes is strongly related to the type and size of the meal) (42). The reported surface
tension in gastric fluids ranges from 30 to 46 mN/m (40,43,44). This could be an indicative of
the presence of surface-active agents, such as lecithin and lysolecithin (45).
One of the earliest proposed media to simulate the stomach in the fasted state was the
artificial gastric fluid (AGF), described by Ruby at al. in 1996 (Table 2.1) (46). The compendial
simulated gastric fluid (SGF) and its version without pepsin (SGFsp) described in the USP
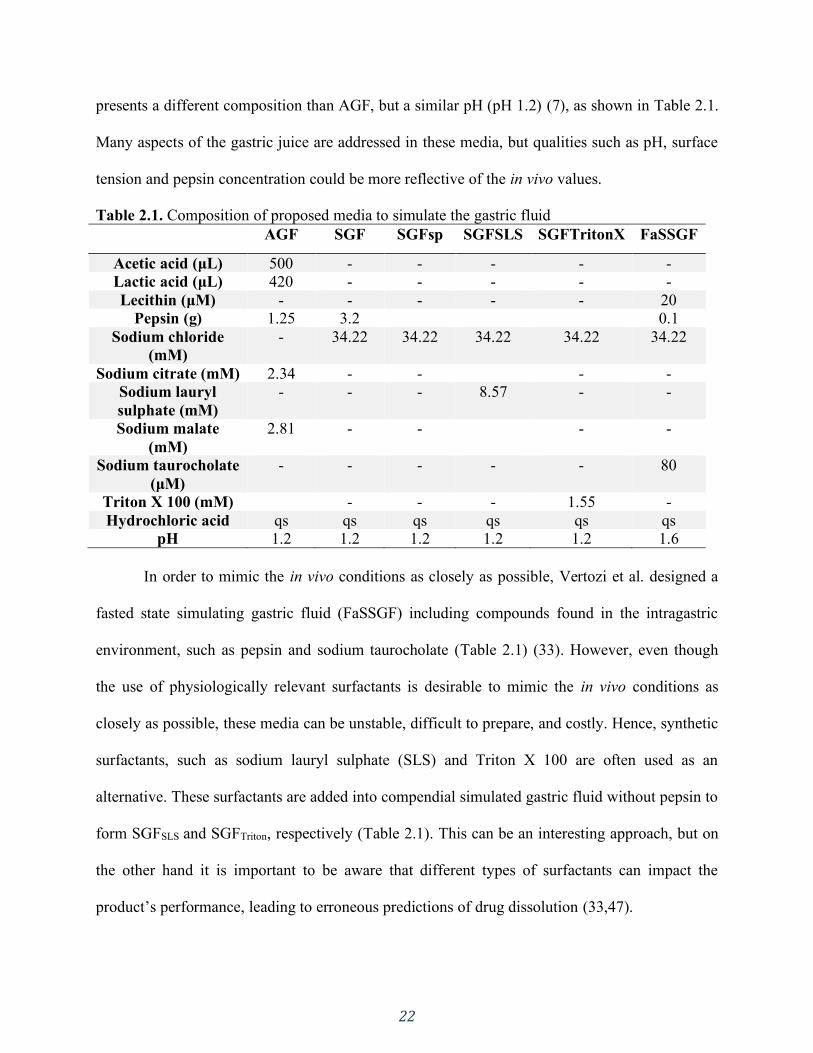
22
presents a different composition than AGF, but a similar pH (pH 1.2) (7), as shown in Table 2.1.
Many aspects of the gastric juice are addressed in these media, but qualities such as pH, surface
tension and pepsin concentration could be more reflective of the in vivo values.
Table 2.1. Composition of proposed media to simulate the gastric fluid
AGF SGF SGFsp SGFSLS SGFTritonX FaSSGF
Acetic acid (μL) 500 - - - - -
Lactic acid (μL) 420 - - - - -
Lecithin (μM) - - - - - 20
Pepsin (g) 1.25 3.2 0.1
Sodium chloride
(mM)
- 34.22 34.22 34.22 34.22 34.22
Sodium citrate (mM) 2.34 - - - -
Sodium lauryl
sulphate (mM)
- - - 8.57 - -
Sodium malate
(mM)
2.81 - - - -
Sodium taurocholate
(μM)
- - - - - 80
Triton X 100 (mM) - - - 1.55 -
Hydrochloric acid qs qs qs qs qs qs
pH 1.2 1.2 1.2 1.2 1.2 1.6
In order to mimic the in vivo conditions as closely as possible, Vertozi et al. designed a
fasted state simulating gastric fluid (FaSSGF) including compounds found in the intragastric
environment, such as pepsin and sodium taurocholate (Table 2.1) (33). However, even though
the use of physiologically relevant surfactants is desirable to mimic the in vivo conditions as
closely as possible, these media can be unstable, difficult to prepare, and costly. Hence, synthetic
surfactants, such as sodium lauryl sulphate (SLS) and Triton X 100 are often used as an
alternative. These surfactants are added into compendial simulated gastric fluid without pepsin to
form SGFSLS and SGFTriton, respectively (Table 2.1). This can be an interesting approach, but on
the other hand it is important to be aware that different types of surfactants can impact the
product’s performance, leading to erroneous predictions of drug dissolution (33,47).
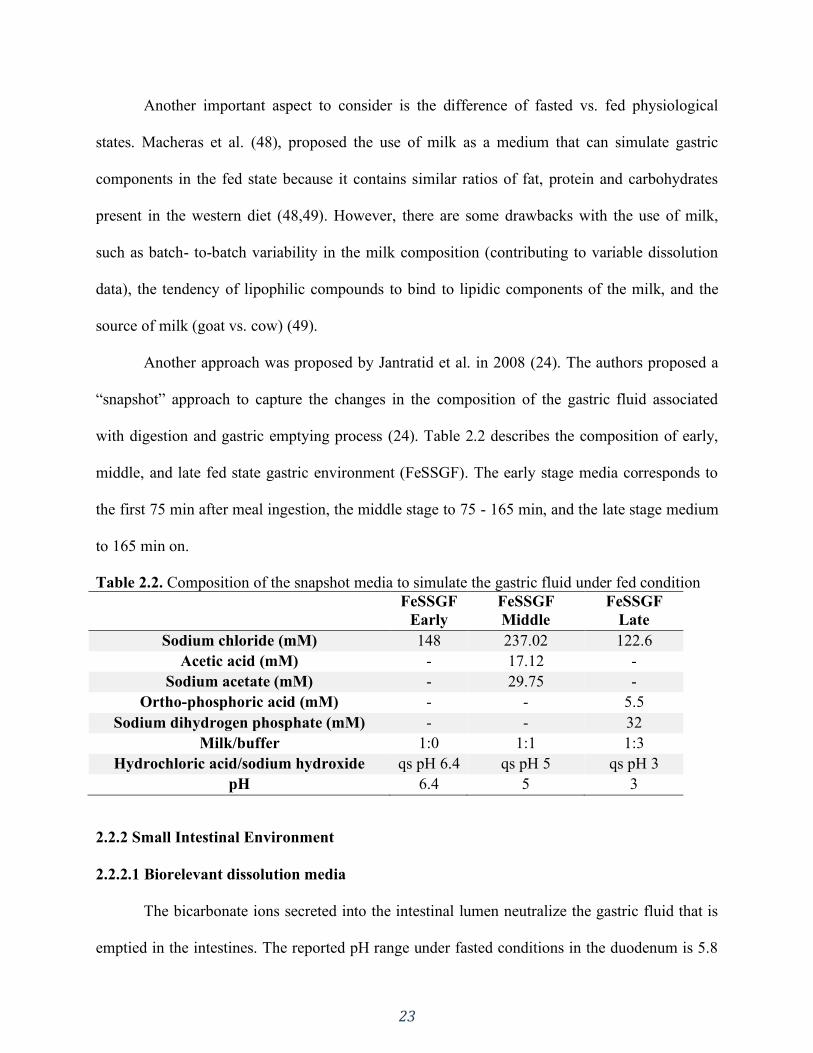
23
Another important aspect to consider is the difference of fasted vs. fed physiological
states. Macheras et al. (48), proposed the use of milk as a medium that can simulate gastric
components in the fed state because it contains similar ratios of fat, protein and carbohydrates
present in the western diet (48,49). However, there are some drawbacks with the use of milk,
such as batch- to-batch variability in the milk composition (contributing to variable dissolution
data), the tendency of lipophilic compounds to bind to lipidic components of the milk, and the
source of milk (goat vs. cow) (49).
Another approach was proposed by Jantratid et al. in 2008 (24). The authors proposed a
“snapshot” approach to capture the changes in the composition of the gastric fluid associated
with digestion and gastric emptying process (24). Table 2.2 describes the composition of early,
middle, and late fed state gastric environment (FeSSGF). The early stage media corresponds to
the first 75 min after meal ingestion, the middle stage to 75 - 165 min, and the late stage medium
to 165 min on.
Table 2.2. Composition of the snapshot media to simulate the gastric fluid under fed condition
FeSSGF
Early
FeSSGF
Middle
FeSSGF
Late
Sodium chloride (mM) 148 237.02 122.6
Acetic acid (mM) - 17.12 -
Sodium acetate (mM) - 29.75 -
Ortho-phosphoric acid (mM) - - 5.5
Sodium dihydrogen phosphate (mM) - - 32
Milk/buffer 1:0 1:1 1:3
Hydrochloric acid/sodium hydroxide qs pH 6.4 qs pH 5 qs pH 3
pH 6.4 5 3
2.2.2 Small Intestinal Environment
2.2.2.1 Biorelevant dissolution media
The bicarbonate ions secreted into the intestinal lumen neutralize the gastric fluid that is
emptied in the intestines. The reported pH range under fasted conditions in the duodenum is 5.8
24
– 6.5, 5.3 – 8.1 in the jejunum and 6.8 – 8.0 in the ileum. Bile salts are also secreted into the
intestines and the formation of micelles results in a much lower surface tension compared to the
gastric fluids. The surface tension of the intestinal fluids is even lower under fed conditions due
to the higher concentration of bile (50). Based on this, biorelevant media, e.g. USP simulated
intestinal fluids, were developed to simulate the pH and include components present in the
human GI tract, such as bile salts and lecithin. Osmolality, pH and surface tension were adjusted
to physiological values. According to the FDA, simulated intestinal fluid with pancreatin (USP-
SIF) and without enzyme (SIF-blank) reflect the physiologic conditions of the small intestine
better than other simpler buffer systems (28,51,52).
Another example of biorelevant media is the fasted and fed simulated intestinal fluid
(FaSSIF and FeSSIF) proposed by Dressman in 1998 and its many adaptations (42). The human
intestinal lumen is buffer by bicarbonate, however, due to pragmatical reasons, other buffers are
typically used to mimic the physiological pH of intestinal fluids (42). E.g., FeSSIF uses acetate
buffer to adjust the pH to 5.0. Moreover, the prevalent bile salt in the human bile is cholic acid,
but sodium taurocholate (conjugate of cholic acid with taurine) was chosen to be the most
representative bile salt in vitro. Biorelevant media contain bile salts and phospholipids and when
simulating the fed state also monoglycerides and free fatty acids. The composition of FaSSIF and
FeSSIF are given in Table 2.3.
The revised version of FaSSIF and FeSSIF (FaSSIF-V2 and FeSSIF-V2, respectively)
was developed in order to address some of the shortcomings of the initially proposed media. For
example, Persson et al. (53) reported that cyclosporine, danazol, griseofulvin and felodipine
presented between 2- to 5-times higher solubility values in fed Human Intestinal Fluid (HIF)
compared to FeSSIF. This could be due to the lack of neutral lipids in the FeSSIF composition.
25
Additionally, the purity of bile salts can also have an impact on the solubility of poorly soluble
drugs. Wei and Löbenberg (54) reported the solubility of glyburide in biorelevant media with
crude bile salts to be over 2-fold higher than when pure bile salts were used in FaSSIF.
Additionally, the reported in vivo bile salt concentration is lower than the concentration used
previously (24,43).
Psachoulias et al. (55) proposed a methodology to predict the concentration and potential
precipitation of lipophilic weak bases using an upgraded version of FaSSIF-V2 (FaSSIF-
V2plus). The proposed in vitro methodology was composed of a gastric and duodenal
compartment along with a reservoir. In the duodenal compartment FaSSIF-V2plus was used. The
composition of FaSSIF-V2plus is very similar to FaSSIF-V2, but in addition to all FaSSIF-V2
components, the “plus” version also contains free fatty acid (sodium oleate, 0.5 mM) and
cholesterol (0.2 mM). The authors concluded that for some weak bases, such as ketoconazole,
FaSSIF-V2plus is a superior fluid for investigating the drug’s intraluminal precipitation.
Later, Fuchs et al. (32) further proposed an updated version of the fasted state biorelevant
media based on the up to date physiological composition of fasted HIF at that time. The
proposed media was named FaSSIF-V3. The surface tension was considered as a surrogate
parameter in establishing the medium’s correctness. A number of prototypes were investigated
containing five different bile salts (taurocholate, glycocholate, tauroursodeoxycholate,
taurochenodeoxycholate and glycochenodeoxycholate), as well as replacing lecithin with its
hydrolysis products (lysolecithin and sodium oleate). Additionally, a mixture of glycocholate and
taurocholate, with or without 0.2 mM cholesterol, were investigated. The authors assessed the
solubility of ten model compounds and observed that the amount and the type of phospholipids
and bile salt significantly impacted the solubility and surface tension in the various prototypes.
26
Additionally, the authors reported that blank buffers tended to underestimate the physiological
solubility of the investigated APIs whereas the SDS solutions overestimated solubility. Finally,
the proposed FaSSIF-V3 composition was the one containing glycocholate and taurocholate with
0.2 mM cholesterol (32).
Cristofoletti and Dressman (56,57) used a FaSSIF-V3 with reduced phosphate buffer
concentration (5.0 mM). The rationale behind this approach was to use a buffer system that
would match the pH at the particle’s surface utilizing physiologically relevant bicarbonate
buffer. For this purpose, ibuprofen was used as the model drug. The authors reported that the
proposed 5.0mM phosphate buffer FaSSIF-V3 was able to predict in vivo differences in peak and
extent of exposure between test and reference ibuprofen formulations (57).
When analysing the fed state, as shown in Table 2.3, the main differences between
FeSSIF and FeSSIF-V2 are the concentrations of bile salts and lecithin (43); the replacement of
phosphate for maleate buffer resulting in lower osmolality and buffer capacity values; and the
addition of glyceryl monooleate and sodium oleate to reflect the presence of lipolysis products.
Similarly to SGF, Jantratid and Dressman also developed snapshot media to simulate the
intestinal fluids in the fed state (Table 2.3). The authors proposed the inclusion of lipolysis
products and changes in parameters such as bile salts concentration, osmolality, buffer capacity,
and fluid pH according to the early, medium and late stages after food intake (24).
The use of biorelevant media has been shown to be very useful in assessing the in vivo
solubility of compounds. Soderlind et al. studied the solubility of 24 molecules in FaSSIF,
FaSSIF-V2 and HIF. FaSSIF-V2 solubilities correlated better with solubilities in HIF for neutral
compounds, while for acidic and basic compounds the solubility in FaSSIF and FaSSIF-V2 were
similar (58). A similar trend was observed by Fagerberg et al. (59). The authors reported that the
27
estimation of the in vivo solubility of poorly soluble compounds was more accurate in
biorelevant media. This was particularly true for bases and neutral molecules, which display
higher solubility in FeSSIF compared to FaSSIF. The opposite was observed for acidic drugs
(59). Biorelevant media have also been widely used to forecast the in vivo performance drugs
(60) (and references cited thereby), achieving good IVIVC in some cases (61–63), but not
always (64). Other biorelevant media have also been proposed to simulate fluids in the fasted
state small intestine, such as the Simulated Endogenous Intestinal Fluid (SEIF), described by
Kossena et al. (65) (Table 2.3). Since the focus of this review is on the upper gastrointestinal
tract, colonic fluids are not included in the table.
The use of bicarbonate based biorelevant media has been proposed in the literature
(66,67). Litou and colleagues assessed a level II biorelevant media based on bicarbonate buffer
to simulate the contents of upper small intestine under conditions of reduced acid secretion in the
stomach. The authors reported that bicarbonates were not important in estimating drug
precipitation and that level II biorelevant media underestimated the concentration of the given
compounds in intestinal human aspirates. However, more data is needed to confirm this finding
as the usefulness of bicarbonate in biorelevant dissolution testing may be compound specific
(67). For example, two year later, Jede et al. (66) also investigated the supersaturation and
precipitation kinetics of weak bases using a transfer model with biorelevant bicarbonate buffer.
The authors compared FaSSIFbicarbonate with the standard FaSSIFphosphate and observed that
bicarbonate-based FaSSIF had a better predictive power compared to phosphate-based. They
concluded that the proposed model is a promising approach to increase the predictive power of in
vitro tests thus contributing to a more biorelevant drug/ drug product development (66).

28
Even though biorelevant media have been extensively used, its preparation can be time-
consuming, costly and it may present a short-shelf life for utility. Furthermore, the buffering
species in the human intestinal lumen is bicarbonate, whereas FaSSIF uses phosphate, FeSSIF
acetate, FaSSIF-V2 and FeSSIF-V2 maleate. Simpler and more physiologically relevant
dissolution media is therefore desired.
Table 2.3. Composition of proposed media to simulate the small intestine fluids in the fasted and
fed state USP
SIF
FaSSIF FeSSIF FaSSIF
V2
FeSSIF
V2
FeSSIF
Early
FeSSIF
Middle
FeSSIF
Late
SEIF
NaOH
(qs pH)
NaOH
(qs pH)
NaOH
(qs pH)
NaOH
(34.8
mM)
NaOH
(81.65
mM)
NaOH
(52.5
mM)
NaOH
(65.3
mM)
NaOH
(72 mM)
NaN3
(6mM)
KH2P
O4
(6.8 g)
KCl
(103.29
mM)
KCl
(203.89m
M)
NaCl
(68.62
mM)
NaCl
(125.5
mM)
NaCl
(145.2
mM)
NaCl
(125.8
mM)
NaCl
(51 mM)
NaCl
(98 mM)
Pancrea
tin
(10.0 g)
Bile salt
(Sodium
taurocholat
e)
(3 mM)
Bile salt
(Sodium
taurochol
ate)
(15 mM)
Bile salt
(Sodium
taurochol
ate)
(3 mM)
Bile salt
(Sodium
taurochol
ate)
(10 mM)
Bile salt
(Sodium
taurochol
ate)
(10 mM)
Bile salt
(Sodium
taurochol
ate)
(7.5 mM)
Bile salt
(Sodium
taurochol
ate)
(4.5 mM)
Bile salts*
(4mM)
Deioniz
ed
water
qs 1L
Phospholip
id
(lecithin)
(0.75 mM)
Phosphol
ipid
(lecithin)
(3.75
mM)
Phosphol
ipid
(lecithin)
(0.2 mM)
Phosphol
ipid
(lecithin)
(2 mM)
Phosphol
ipid
(lecithin)
(3 mM)
Phosphol
ipid
(lecithin)
(2 mM)
Phosphol
ipid
(lecithin)
(0.5 mM)
Phospholipid
(Lyso-
phosphatidylch
oline)
(1mM)
pH 6.8 Potassium dihydrogen
orthophosp
hate (28.66
mM)
Acetic acid
(144.05
mM)
Maleic acid
(19.12
mM)
Maleic acid
(55.02
mM)
Maleic acid
(28.6
mM)
Maleic acid
(44 mM)
Maleic acid
(55.09
mM)
Cholesterol (0.25mM)
Deionized
water qs
1L
Deionize
d water
qs 1L
Deionize
d water
qs 1L
Glyceryl
monoolea
te
(5 mM)
Glyceryl
monoolea
te
(6.5 mM)
Glyceryl
monoolea
te
(5 mM)
Glyceryl
monoolea
te
(1 mM)
Sodium
dihydrogen
phosphate
(18mM)
pH 6.5 pH 5.0 pH 6.5 Sodium
oleate
(0.8 mM)
Sodium
oleate
(40 mM)
Sodium
oleate
(30 mM)
Sodium
oleate
(0.8 mM)
Sodium
hydrogen
phosphate
(12mM)
Deionize
d water
qs 1L
Deionize
d water
qs 1L
Deionize
d water
qs 1L
Deionize
d water
qs 1L
pH 5.8 pH 6.5 pH 5.8 pH 5.4 pH 6.5
*sodium salts of the following conjugates; glycocholate (1mM), glycodeoxycholate (0.7mM), glycochenodeoxycholate (1mM),
taurocholate (0.5mM), taurodeoxycholate (0.3mM), taurochenodeoxycholate (0.5mM).
29
2.2.2.2 Bicarbonate buffer – Physiologically relevant dissolution media
At present, the most widely applied dissolution media are phosphate-based buffers
(28,68). However, the concentration of phosphates in the intestinal luminal fluids is insignificant.
This makes phosphate-based dissolution media poorly representative of the in vivo environment,
failing to reflect in vivo characteristics such as ionic strength, buffer capacity, fluid volume and
viscosity (28). The pH along the gastrointestinal tract is maintained by bicarbonate ions, which
are present in the pancreatic, hepatic and intestinal secretions (69,70). Hence, the development of
suitable in vitro dissolution media based on bicarbonate buffer (BCB) has gained much attention
because it closely mimics the environment of the intestinal fluids and can thus improve in vitro-
in vivo correlations compared to phosphate buffers (70).
In vivo, the pH is held stable by the constant supple of bicarbonate-containing secretions
in the intestines. On the other hand, the application of BCB as an in vitro dissolution medium is
challenging due to the evaporation of CO2(g) from the aqueous phase causing the pH to rise. This
can lead to changes in the buffer strength and poor reproducibility of the dissolution test. Hence,
the first step in establishing a stable BCB is to maintain CO2(aq) and CO2(g) at equilibrium
(Equation 2-1).
CO2 (g)
⇅
H2O(l) + CO2 (aq) ⇄ H2CO3 (aq) ⇄ H+(aq) + HCO3
-(aq) (Equation 2-1)
One of the ways to stabilise the bicarbonate buffer pH is to purge the medium with CO2
gas, thus supplying CO2(g) which compensates its loss from the aqueous medium. Automated
systems have been developed to adjust the pH by sparging gas according to the pH shift and
were reviewed by Amaral Silva et al. (28) (and references cited thereby). However, bubbling
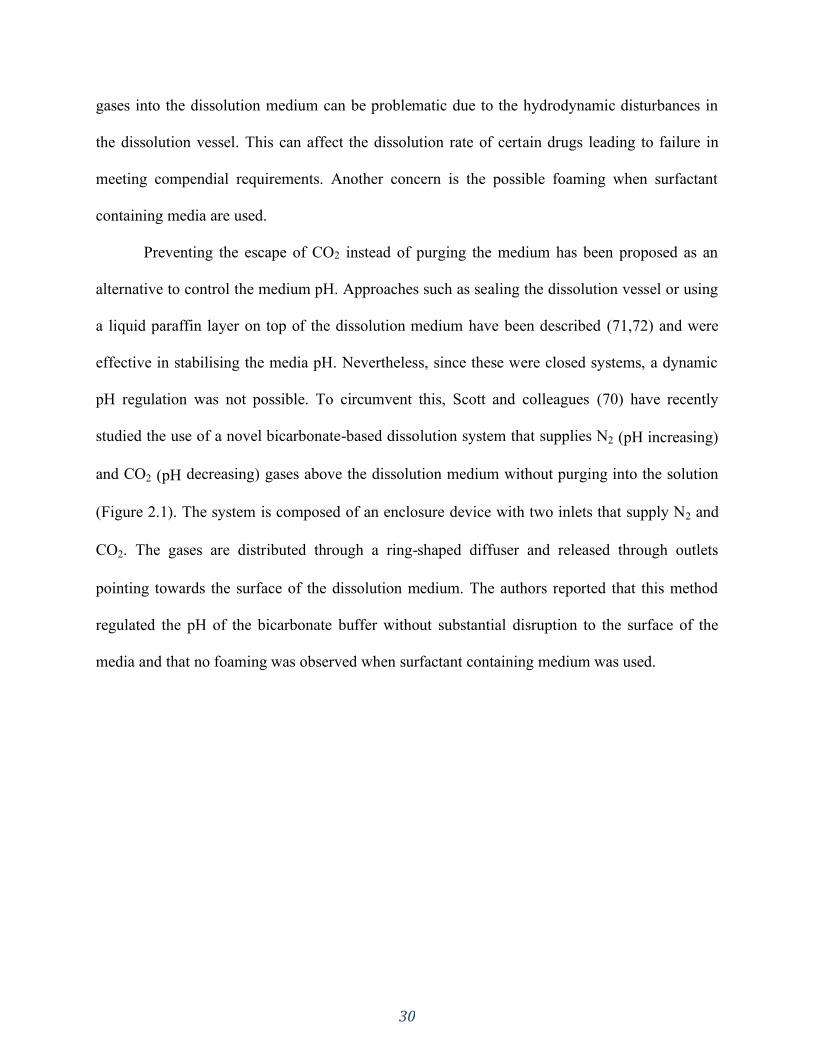
30
gases into the dissolution medium can be problematic due to the hydrodynamic disturbances in
the dissolution vessel. This can affect the dissolution rate of certain drugs leading to failure in
meeting compendial requirements. Another concern is the possible foaming when surfactant
containing media are used.
Preventing the escape of CO2 instead of purging the medium has been proposed as an
alternative to control the medium pH. Approaches such as sealing the dissolution vessel or using
a liquid paraffin layer on top of the dissolution medium have been described (71,72) and were
effective in stabilising the media pH. Nevertheless, since these were closed systems, a dynamic
pH regulation was not possible. To circumvent this, Scott and colleagues (70) have recently
studied the use of a novel bicarbonate-based dissolution system that supplies N2 (pH increasing)
and CO2 (pH decreasing) gases above the dissolution medium without purging into the solution
(Figure 2.1). The system is composed of an enclosure device with two inlets that supply N2 and
CO2. The gases are distributed through a ring-shaped diffuser and released through outlets
pointing towards the surface of the dissolution medium. The authors reported that this method
regulated the pH of the bicarbonate buffer without substantial disruption to the surface of the
media and that no foaming was observed when surfactant containing medium was used.
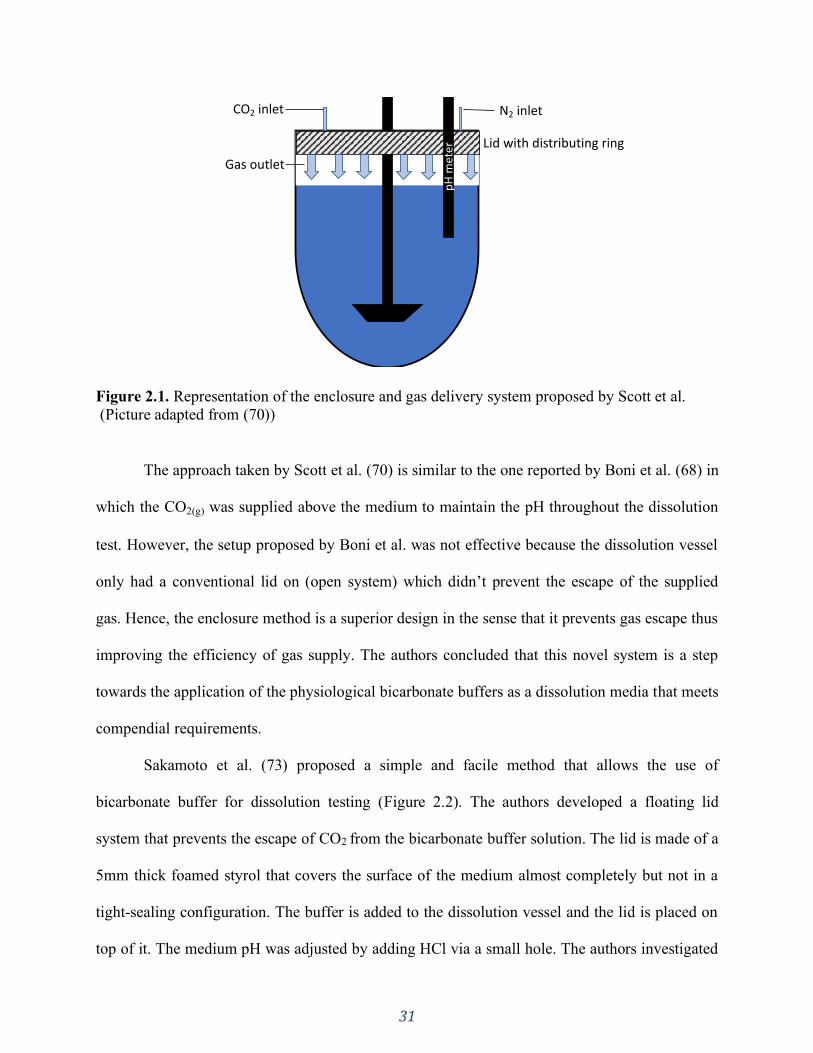
31
Figure 2.1. Representation of the enclosure and gas delivery system proposed by Scott et al.
(Picture adapted from (70))
The approach taken by Scott et al. (70) is similar to the one reported by Boni et al. (68) in
which the CO2(g) was supplied above the medium to maintain the pH throughout the dissolution
test. However, the setup proposed by Boni et al. was not effective because the dissolution vessel
only had a conventional lid on (open system) which didn’t prevent the escape of the supplied
gas. Hence, the enclosure method is a superior design in the sense that it prevents gas escape thus
improving the efficiency of gas supply. The authors concluded that this novel system is a step
towards the application of the physiological bicarbonate buffers as a dissolution media that meets
compendial requirements.
Sakamoto et al. (73) proposed a simple and facile method that allows the use of
bicarbonate buffer for dissolution testing (Figure 2.2). The authors developed a floating lid
system that prevents the escape of CO2 from the bicarbonate buffer solution. The lid is made of a
5mm thick foamed styrol that covers the surface of the medium almost completely but not in a
tight-sealing configuration. The buffer is added to the dissolution vessel and the lid is placed on
top of it. The medium pH was adjusted by adding HCl via a small hole. The authors investigated
pH
met
er
N2 inletCO2 inlet
Lid with distributing ring
Gas outlet

32
the suitability of this method for a 6.0 - 7.5 pH range and 2 – 50mM bicarbonate buffer
concentration. In all cases, the pH change was less than 0.1 pH unit after 3.5 h when the floating
lid method was used whereas without the lid, the pH increased by more than one pH unit within
3.5 h. The authors concluded that the floating lid method would be useful for formulation
development while covering the physiological intestinal and colonic conditions in terms of pH
and buffer concentration.
Figure 2.2. Representation of the floating lid device proposed by Sakamoto et al.
(Picture adapted from (73))
It’s interesting to note that the pH of the medium can be adjusted either by adding
HCl/NaOH or by sparging gases or by a combination of both (70,73,74). In the case of sparging,
when CO2 gas is supplied and diffuses into the medium, the CO2(aq) interacts with water
generating carbonic acid, which in turn dissociates releasing hydrogen ion culminating in the pH
decrease (equilibrium shown in Equation 2-1 is shifted to the right). Reversely, the sparging of a
pH increasing gas (e.g. N2 or He) has an indirect effect in increasing the medium pH (75,76). As
the pH increasing gas is supplied, the partial pressure of CO2 is reduced, decreasing the dissolved
CO2(aq) in the medium, thus increasing the pH (equilibrium shown in Equation 2-1 is shifted to
Floating lid pH
met
er
Sampling port
33
the left). Scott et al. (70) observed that the CO2 supply was much more efficient in decreasing the
medium pH than N2 in increasing the pH. This is most likely due to the indirect effect of N2 thus
taking longer for the pH change to be observed.
Although BCB is physiologically relevant, because of the pragmatical hurdles, its
application has been limited and some authors have doomed it as a medium with restricted
suitability for dissolution testing (77). Matching the effective buffering pKa of bicarbonate at the
solid-liquid surface (diffusion layer) of a dissolving solid with a surrogate buffer system is a way
to simplify the dissolution conditions while maintaining physiologic relevance in terms of
buffering capacity at the diffusion layer (78,79).
When the whole system is at equilibrium, the pKa of the BCB system (Equation 2-1) is
6.04, which is the situation in the bulk solution in a dissolution vessel (28,79). However, in the
diffusion layer around dissolving solutes the interconversion H2O(l) + CO2(aq) ⇄ H2CO3(aq) does
not equilibrate very rapidly compared to the fast diffusional processes. Therefore, bicarbonate
buffer behaves as having an effective pKa in the diffusion layer that is different from that in
bulk. This value is lower than 6.04 (bulk), but higher than the intrinsic pKa of 3.30 (H2CO3(aq) ⇄
H+
(aq) + HCO−
3(aq)). As a result, the ability of BCB in buffering the diffusion layer against
incoming ionizable solute is weakened and the in vivo dissolution rate is slower than in highly
concentrated compendial buffers.
Based on this, investigators have proposed the reduction in the molarity of non-
bicarbonate based surrogate buffers as a possible approach to increase its biopredictability, thus
matching the typically slower in vivo dissolution (27,78,79). For example, Tsume et al. showed
that ibuprofen tablets had slower in vitro dissolution in phosphate 10 mM compared to 50 mM at
a starting pH of 6.0 (80). This can be explained by Mooney’s stagnant film-based dissolution
34
model, i.e. more diluted buffers have a reduced buffer capacity which is translated into a lower
ability in countering the acidifying effect of the dissolving ibuprofen at the diffusion layer pH
(81). In highly concentrated buffer systems, such as compendial buffers, an abundance of the
buffer’s conjugate base species surrounds the drug particle. This, in turn, leads to a prompt
neutralization in the diffusion layer, that is, the buffer species readily consumes the ions formed
on the dissolving drug surface. Hence, the pH in the diffusion layer is similar to the bulk,
resulting in a higher dissolution rate (27,56,82,83). Conversely, when the buffer system is less
concentrated (as in vivo) the neutralization is thus slower.
Different models have been proposed to predict the drug flux thus enabling calculation of
the surrogate buffer molarity to determine a good match to physiological bicarbonate in terms of
drug dissolution. This includes, but is not limited to the equilibrium model (which assumes that
H2CO3 and CO2 are at equilibrium), the carbonic acid ionization (CAI) model (hypothetical
situation where neither hydration or dehydration is assumed), the irreversible reaction (IRR)
transport model and the reversible non-equilibrium (RNE) model.
Krieg et. al. (84) proposed the IRR transport model to develop more physiologically
relevant buffer systems for dissolution testing. This model assumes the dehydration process
(H2CO3(aq) → H2O(l) + CO2(aq)) as an irreversible chemical reaction because it is approximately
500 times faster than the hydration rate. This approximate model yielded improved predictions
for the intrinsic dissolution rates of Ibuprofen, Ketoprofen and Indomethacin in bicarbonate
buffers. However, this assumption was shown by Al-Gousous et al. to not be as accurate (85).
The authors then proposed the RNE model, which does not make any equilibrium assumptions. It
not only includes both the hydration and dehydration rates (H2O(l) + CO2(aq) ⇄ H2CO3(aq)) but
also accounts for the fluxes of all species involved in the mass transfer process.
35
The authors reported that the RNE model predicted the flux values obtained in the
intrinsic dissolution experiments more accurately compared to the other models. It is of crucial
importance to understand the kinetics of bicarbonate at the diffusion layer of a dissolving
particle. For example, in the equilibrium model, BCB would have a pKa close to the bulk pH,
resulting in effective buffering at the surface of the dissolving drugs (overestimation). In the CAI
model, the assumption that hydration and dehydration reactions do not happen means that the
buffer pKa is much lower than the bulk pH, resulting in a very poor ability to buffer the surface
of the dissolving drug, which is an underestimation. Similarly, the IRR transport model would
also underestimate the drug flux, but not to the extent as of the CAI model because it includes an
irreversible dehydration reaction. The RNE model represents an intermediate situation in which
the reactions occur but do not reach equilibrium. In this case, as previously mentioned, this
situation results in BCB not behaving as having a pKa exceeding 6 in terms of promoting the
dissolution of ionizable solids. The RNE model has been shown to successfully estimate the pH
on the surface of a solid particle in BCB, then the Mooney model can be used to estimate the
phosphate concentration that would give the same surface pH (pH0) (79,85). Thus, a proper
surrogate buffer molarity can be used that would give good matches to physiological bicarbonate
in terms of drug dissolution. This shows that in some cases it is feasible to develop surrogate
buffers for bicarbonate.
Furthermore, Salehi et. al. (86) incorporated to the RNE model other properties such as
medium hydrodynamics effect and drug particle size distribution. The authors described it as a
hierarchical mass transfer (HMT) model that considers drug properties (intrinsic solubility, acid/
base character, pKa, particle size, and particle polydispersity) as well as GI fluid properties and
fluid hydrodynamics (bulk pH, buffer species concentration, fluid shear rate, and convection).

36
The findings reported by Alvarez et al. (87) further reinforces that the current compendial
buffers concentrations seem to be too high to correlate with the in vivo carbonate concentration.
The authors investigated the in vitro dissolution of ibuprofen tablets in different pharmacopeial
media at both 50 rpm and 75 rpm rotation speed. The media investigated by the group included
130mM hydrochloric acid pH 1.2; 540mM acetate buffer pH 4.5; and 70mM phosphate buffer
pH 6.8. In all media, the dissolution profiles showed similarity at both rotation speeds. However,
the in vivo bioequivalence studies revealed that only one out of the three test formulations was
bioequivalent to the reference. Hence, these in vitro tests were not able to detect differences
regarding the rate of absorption. Based on this finding, the authors concluded that there remains
a need to develop dissolution conditions that can predict bioequivalence outcomes and that the
application of biowaivers to BCS class IIa drugs would not be feasible because the dissolution
tests did not detect differences in absorption rate.
In contrast, Hofmann et. al. (79) studied the dissolution of Ibuprofen in physiologically
relevant bicarbonate buffer and reported that the in vitro dissolution profiles in bicarbonate
compared reasonably well with the in vivo intestinal dissolution of the tested suspensions. They
concluded that this demonstrates the possible potential toward extending biowaivers to BCS
class IIa compounds.
Amaral Silva et. al. (27) applied a 5mM phosphate buffer as the surrogate buffer for
ibuprofen based on the IRR model described by Krieg et. al. The authors also observed a slower
dissolution rate of Ibuprofen IR tablets in low buffer capacity (5mM) compared to compendial
buffer (50mM) and that compendial buffer lacked discriminatory power (27,79,87). The authors
pointed out that the rapid in vitro dissolution rate cannot be translated to the observed in vivo
dissolution rate of ibuprofen. In contrast from the methodology used by Alvarez at al. (87), in
37
which different absorption rates could not be detected , Amaral Silva and colleagues utilized the
low-capacity surrogate buffer in a biphasic dissolution system. This system is composed of an
organic layer on top of the aqueous medium thus mimicking the concurrent in vivo processes of
drug dissolution and absorption. The addition of the organic phase works as a sink to the aqueous
layer, assisting the medium pH maintenance by the removal of the dissolved drug from the
aqueous medium. Hence, the pH changes that are expected when a low buffer capacity medium
is used are reduced. This is a valuable approach to investigate the drug product performance with
improved physiological relevance (27).
Based on this, we herein suggest the use of a biphasic system with the aqueous layer
composed of BCB. Adding paraffin on top of the buffer has been previously proposed (71) to
prevent the CO2 escape, however drugs do not partition to the liquid paraffin layer. We believe
that the use of BCB coupled with an organic layer (octanol) would not only prevent the escape of
CO2 – thus taking away the need to sparge the medium – but it would also allow assessment of
the drug partitioning (“absorption”). This would be a very robust physiologically relevant
approach and we suggest that future in vitro studies along this line be conducted.
Oversimplification of the dissolution conditions, as for example using a surrogate buffer
instead of BCB, may not be relevant or proper for certain formulations. This is the case for
enteric coated (EC) drug products. Formulations coated with pH responsive polymers have been
shown to have poor in vivo performance (88) (and references cited thereby). One of the reasons
for this is the lack of biopredictability of the buffers used for in vitro performance testing,
preventing suitable in vitro product evaluation (89). The great discrepancy in the performance of
EC products in physiologically relevant BCB vs. phosphate buffer is well recognized in the
literature, as highlighted by Amaral Silva et al. (88). This performance problem persists until
38
today, and recent reports by Scott et al. and Sakamoto et al. have corroborated these previous
findings.
Scott and colleagues investigated the release of enteric coated prednisolone micro-
particles, pellets and tablets (70). They observed that in phosphate buffer the drug release was
immediate after the 2 h acid exposure for the all the tested dosage forms with no significant
difference among the dissolution profiles. On the other hand, in BCB there was a long lag time
for the onset of drug release. An interesting observation highlighted by the authors was a shorter
lag time for the microparticle formulation compared to pellets and tablets which could be
explained by the larger surface area available for polymer dissolution. Similarly, Sakamoto et al.
reported a 30-minute disintegration time and similar release profiles for enteric coated 5-ASA
tablets in a phosphate-based buffer, whereas in BCB the disintegration time was about 4–8 h
with large variation (73).
With this in view, the ideal dissolution media for EC formulations would be a
bicarbonate-based one. As highlighted before, the routine use of BCB is technically difficult and
even unfeasible for disintegration testing and dissolution apparatuses such as reciprocal cylinder
(89). Therefore, similarly to small drug molecules, developing a non-volatile surrogate buffer for
EC products is of great interest. However, enteric polymers, being poly-acids with ionizable
carboxylic groups, are much more complex than small molecules as its dissolution includes
different phases as follows (44,88,90–93). In an environment with low pH values (such as the
stomach) the carboxyl groups are not ionized, therefore the polymer is insoluble resisting
disintegration and dissolution which prevents drug release. When the EC dosage form is exposed
to the intestinal fluids (higher pH and buffered by bicarbonate) and when the pH0 (surface pH) of
the polymer is above its pKa (dissolution pH threshold), its ionization is promoted (88). Due to
39
electrostatic repulsion, the polymer relaxes, swells, and undergoes chain disentanglement
allowing further ionization of other polymer chains which diffuse away to the bulk solution
(90,92). This consists of the dissolution phases of pH-responsive polymers ultimately leading to
the disintegration and dissolution of the dosage form.
Recently, Blechar et al. (89) proposed a mechanistic approach to enable the development
of surrogate buffers for EC products with little bench work. As described before, the effective
pKa of BCB in the diffusion layer (pKaeff) is different from other buffers such as phosphate and
maleate (pKa’s of 6.8 and 5.8, respectively) and different from the bulk where everything is at
equilibrium. For small molecules under regular hydrodynamic conditions the pKaeff of
bicarbonate lies between 4 and 5 (89,93). However, the complex behavior of enteric polymers
makes it difficult for a direct calculation.
Besides the diffusion layer, a viscoelastic gel layer is formed on a polymer’s surface
(Figure 2.3), as opposed to only a diffusion layer on a particle’s surface. The gel layer presents
an increased diffusional resistance which reduces the diffusion rate of the buffer species.
Consequently, the time available for the interconversion between CO2 and H2CO3 is increased
allowing “H2O(l) + CO2(aq) ⇄ H2CO3(aq)” to approach equilibrium. As a result, the pKa of
bicarbonate in the gel layer is increased compared to the pKaeff in the diffusion layer. Finally,
both the pKaeff (diffusion layer) and higher pKa in the gel layer will control the polymer’s
surface pH. Therefore, the gel layer increases the effective interfacial buffering pKa of
bicarbonate.

40
Figure 2.3. Representation of the solid-liquid interface of a dissolving enteric polymer. N:
Neutral (Unionized carboxylic acid: -COOH); - : Negative charge (Ionized carboxylic acid: -
COO-). From the gel layer to the bulk solution the pH increases and the viscosity. Adapted from
(89).
The authors performed dissolution experiments in maleate (pKa 5.8), citrate (pKa 5.7),
succinate (pKa 5.2), and acetate (pKa 4.6) buffers to find a buffer species that would promote
similar dissolution as bicarbonate. The time taken for 5% release (t5%) for comparison was used
because it is most representative of the coat dissolution as opposed to the whole dissolution
profile. The observed trend of dissolution based on t5% was that succinate matched bicarbonate
buffer well for relatively fast dissolving formulations while citrate would be a good estimate for
relatively slow dissolving ones. These media could be used as good starting points. Based on
these findings, the authors proposed a “decision tree” in establishing a surrogate buffer (Figure
2.4).
N N
N N
NN
N
N
N-
-
--
-
N
N
N
N
N
-
-
-
-
-
N
N
N
-
-
-
-
N
N
N N
N N
NN
N
N
N
N
Glassy polymer phase Gel layer Diffusion Layer Bulk Solution
N
--
--

41
Figure 2.4. Decision tree for establishing a surrogate buffer for EC products. (Adapted from
(89))
A physiologically relevant approach is of primary importance not only to predict the in
vivo performance of a formulation under development, but also to assess the similarity of
reference and test formulations in a bioequivalence (BE) study. Our group assessed clinical data
of a failed BE study for EC pantoprazole tablets (submitted). The formulations used in the
dissolution study were from the same batch as those used in the BE study. Both formulations
complied with the USP specifications and had a somewhat similar performance in phosphate
buffer, but when tested in vivo they did were not bioequivalent. Hence, solely satisfying the in
vitro standard for drug dissolution does not guarantee similar in vivo behavior. On the other
hand, when these formulations were tested in BCB, a great discrepancy was observed, where the
test formulation had a much more delayed onset of dissolution than the reference. The use of
non-physiologically relevant dissolution method during the drug product development phase can
be misleading, causing poor selection of prototype formulations. Therefore, it was further
evidenced that using BCB can de-risk the development of generic EC formulations, increasing
the likelihood for a successful BE.
Bicarbonate vs. Succinate
Succinate < Bicarbonate
Succinate > Bicarbonate
Succinate = Bicarbonate
SuccinateBuffer with higher pKa
(citrate)
=Bicarbonate
>Bicarbonate
Use citrate Test mixture of citrate and
succinate
Buffer with lower pKa(acetate)
=Bicarbonate
<Bicarbonate
Use acetate Test mixture of acetate
and succinate
42
2.3 Conclusion
The evolution of media and buffers to be used in dissolution testing to achieve physiological
relevance was herein presented. There are many important factors to be considered when
developing a biorelevant dissolution method such as, pH, buffer species, buffer concentration,
osmolality, viscosity, surface tension, concentration and type of bile salts, lipolysis products, as
well as physiological state, such as fasted and fed states. Physiologically relevant methods
usually don’t apply compendial conditions and its use is most meaningful in the development
phase, rather than in a QC environment for batch release, for example. One of the major
disconnects between the in vivo environment and in vitro conditions is the buffer species and
concentration. While the human intestinal lumen is buffered by bicarbonate at low molarities,
highly concentrated phosphate buffers is often used in dissolution testing, which can give
misleading results during the drug product development. This is especially true for enteric coated
formulations. Hence, using BCB would be the most ideal in terms of physiological relevance. On
the other hand, one has to keep in mind that a biorelevant test will not necessarily be a clinically
relevant dissolution test, but the chances are higher to capture critical quality attributes. The
pragmatical hurdles of using BCB makes it desirous to develop a surrogate method with simpler
buffer systems. This can be achieved on a case-by-case study by comparing the drug flux in BCB
and other buffer solutions (which are often more diluted systems compared to compendial
buffers). Precise mechanistic understanding of the in vivo and in vitro dissolution processes is
imperative to set physiological relevance to the dissolution methodology. Using such conditions
can de-risk the drug product development which increases the likelihood to select formulations
with improved in vivo performance.
43
SECTION ONE: INTRODUCTION AND OVERVIEW
CHAPTER THREE
The significance of disintegration testing in pharmaceutical development
A version of this chapter is published in:
Dissolution Technol. 2018;(August):30–8. dx.doi.org/10.14227/DT250318P30
Reprinted from reference (1).
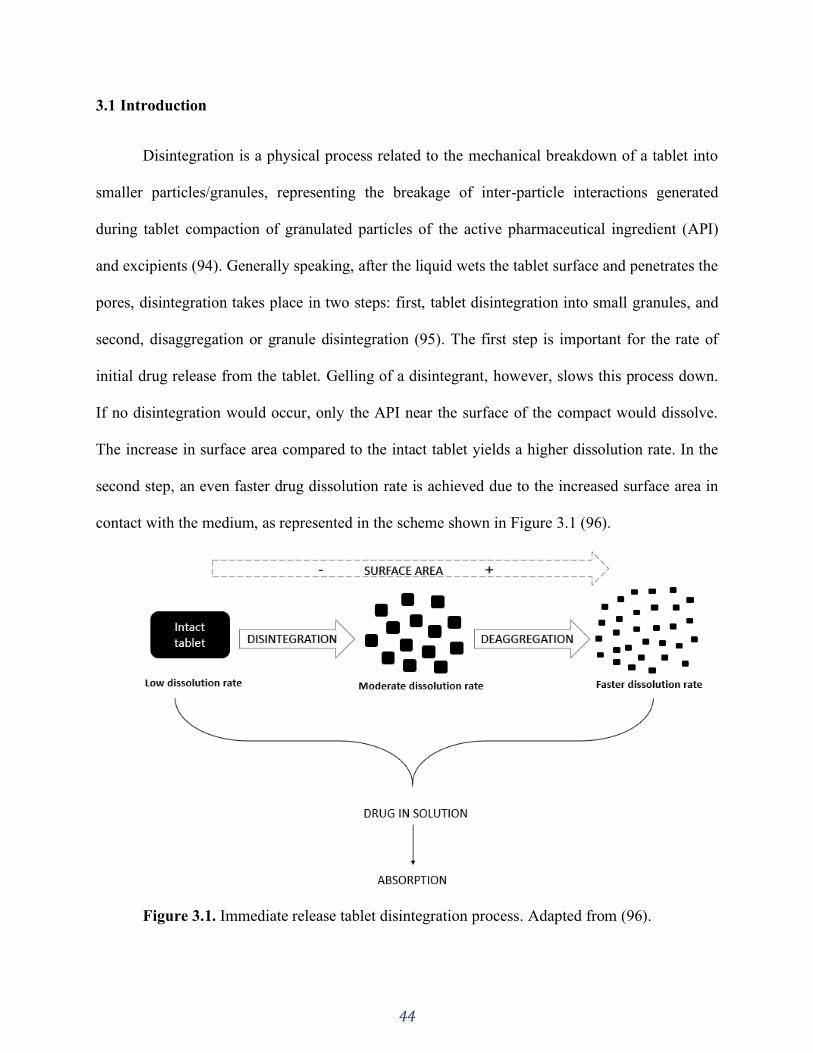
44
3.1 Introduction
Disintegration is a physical process related to the mechanical breakdown of a tablet into
smaller particles/granules, representing the breakage of inter-particle interactions generated
during tablet compaction of granulated particles of the active pharmaceutical ingredient (API)
and excipients (94). Generally speaking, after the liquid wets the tablet surface and penetrates the
pores, disintegration takes place in two steps: first, tablet disintegration into small granules, and
second, disaggregation or granule disintegration (95). The first step is important for the rate of
initial drug release from the tablet. Gelling of a disintegrant, however, slows this process down.
If no disintegration would occur, only the API near the surface of the compact would dissolve.
The increase in surface area compared to the intact tablet yields a higher dissolution rate. In the
second step, an even faster drug dissolution rate is achieved due to the increased surface area in
contact with the medium, as represented in the scheme shown in Figure 3.1 (96).
Figure 3.1. Immediate release tablet disintegration process. Adapted from (96).
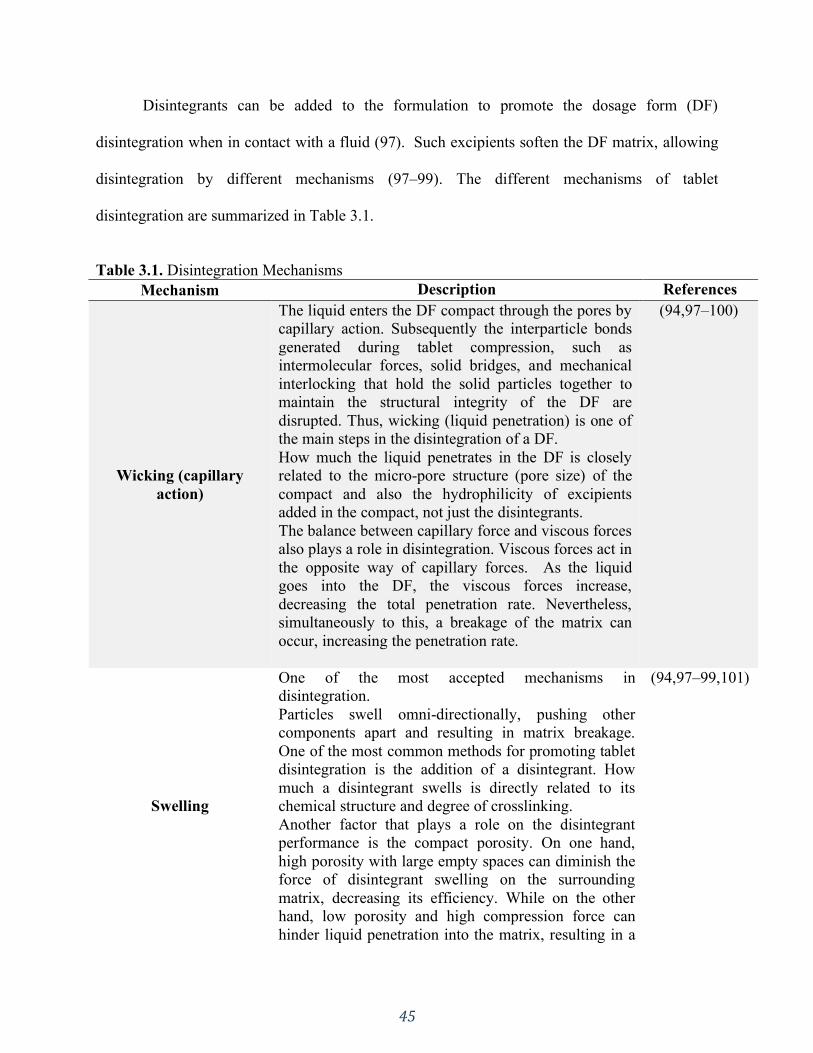
45
Disintegrants can be added to the formulation to promote the dosage form (DF)
disintegration when in contact with a fluid (97). Such excipients soften the DF matrix, allowing
disintegration by different mechanisms (97–99). The different mechanisms of tablet
disintegration are summarized in Table 3.1.
Table 3.1. Disintegration Mechanisms
Mechanism Description References
Wicking (capillary
action)
The liquid enters the DF compact through the pores by
capillary action. Subsequently the interparticle bonds
generated during tablet compression, such as
intermolecular forces, solid bridges, and mechanical
interlocking that hold the solid particles together to
maintain the structural integrity of the DF are
disrupted. Thus, wicking (liquid penetration) is one of
the main steps in the disintegration of a DF.
How much the liquid penetrates in the DF is closely
related to the micro-pore structure (pore size) of the
compact and also the hydrophilicity of excipients
added in the compact, not just the disintegrants.
The balance between capillary force and viscous forces
also plays a role in disintegration. Viscous forces act in
the opposite way of capillary forces. As the liquid
goes into the DF, the viscous forces increase,
decreasing the total penetration rate. Nevertheless,
simultaneously to this, a breakage of the matrix can
occur, increasing the penetration rate.
(94,97–100)
Swelling
One of the most accepted mechanisms in
disintegration.
Particles swell omni-directionally, pushing other
components apart and resulting in matrix breakage.
One of the most common methods for promoting tablet
disintegration is the addition of a disintegrant. How
much a disintegrant swells is directly related to its
chemical structure and degree of crosslinking.
Another factor that plays a role on the disintegrant
performance is the compact porosity. On one hand,
high porosity with large empty spaces can diminish the
force of disintegrant swelling on the surrounding
matrix, decreasing its efficiency. While on the other
hand, low porosity and high compression force can
hinder liquid penetration into the matrix, resulting in a
(94,97–99,101)
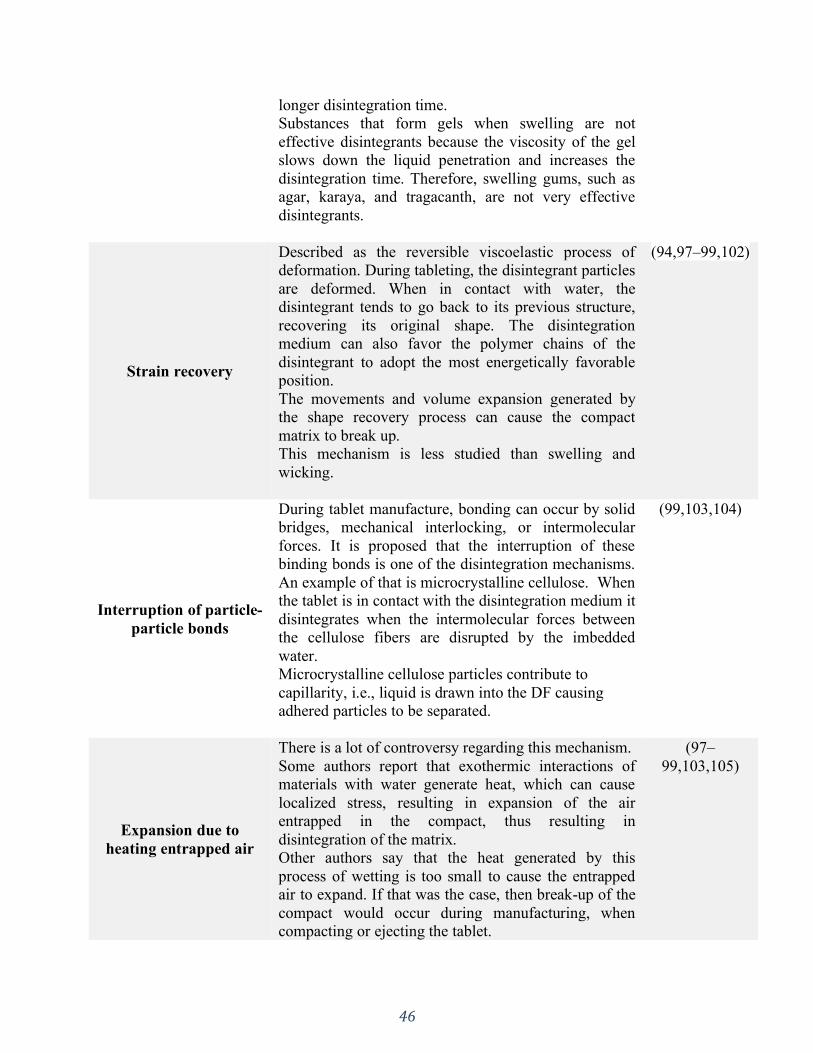
46
longer disintegration time.
Substances that form gels when swelling are not
effective disintegrants because the viscosity of the gel
slows down the liquid penetration and increases the
disintegration time. Therefore, swelling gums, such as
agar, karaya, and tragacanth, are not very effective
disintegrants.
Strain recovery
Described as the reversible viscoelastic process of
deformation. During tableting, the disintegrant particles
are deformed. When in contact with water, the
disintegrant tends to go back to its previous structure,
recovering its original shape. The disintegration
medium can also favor the polymer chains of the
disintegrant to adopt the most energetically favorable
position.
The movements and volume expansion generated by
the shape recovery process can cause the compact
matrix to break up.
This mechanism is less studied than swelling and
wicking.
(94,97–99,102)
Interruption of particle-
particle bonds
During tablet manufacture, bonding can occur by solid
bridges, mechanical interlocking, or intermolecular
forces. It is proposed that the interruption of these
binding bonds is one of the disintegration mechanisms.
An example of that is microcrystalline cellulose. When
the tablet is in contact with the disintegration medium it
disintegrates when the intermolecular forces between
the cellulose fibers are disrupted by the imbedded
water.
Microcrystalline cellulose particles contribute to
capillarity, i.e., liquid is drawn into the DF causing
adhered particles to be separated.
(99,103,104)
Expansion due to
heating entrapped air
There is a lot of controversy regarding this mechanism.
Some authors report that exothermic interactions of
materials with water generate heat, which can cause
localized stress, resulting in expansion of the air
entrapped in the compact, thus resulting in
disintegration of the matrix.
Other authors say that the heat generated by this
process of wetting is too small to cause the entrapped
air to expand. If that was the case, then break-up of the
compact would occur during manufacturing, when
compacting or ejecting the tablet.
(97–
99,103,105)
47
DF, dosage form.
In immediate release (IR) systems, drug release from the DF begins with the liquid
wetting the solid and subsequent disintegration; thus, this step is of primary importance and a
prerequisite for dissolution followed by absorption and bioavailability of the API (94). Although
it cannot measure the amount of drug released, disintegration is, for IR tablets, the first process
before dissolution can occur. The disintegration test basically consists of placing a DF in an
immersion medium under defined experimental conditions and measuring the time taken for the
DF to disintegrate (106). The time in which the tablet or capsule should disintegrate is defined in
the applicable monograph. The United States Pharmacopoeia (USP) defines complete
disintegration as the “state in which any residue of the unit, except fragments of insoluble
coating or capsule shell, remaining on the screen of the test apparatus or adhering to the lower
surface of the disk, if used, is a soft mass having no palpably firm core” (7). Nevertheless,
complete disintegration does not necessarily imply complete API dissolution (107).
Disintegration testing goes back as far as 1907 when it was first mentioned in the Swiss
Pharmacopoeia describing the test in water (108). It was then incorporated in the British
Pharmacopoeia (BP) in 1948 which described the test using test tubes (109). In the 1950’s, the
USP described the test using the basket-rack assembly apparatus, which is still used today to
perform disintegration tests of DFs administered orally (110). In addition to the disintegration
Release of gaseous
materials
Effervescent tablets are made in such a way that when
in contact with water they release CO2, resulting in
rapid disintegration.
This is triggered by a reaction between an acid and
carbonate or bicarbonate.
(97)
Enzymatic action
Enzymes which break down tablet components can be
added to the product.
(97)
48
test, a rupture test is used as a performance test of soft-shell capsules for dietary supplements, as
directed in USP General Chapter <2040>, “Disintegration and Dissolution of Dietary
Supplements”, first published in USP 30–NF 25 in 2017 (111).
The dimensions and measurements of the apparatus’ components used for the
disintegration test were changed quite a few times in the USP in order to harmonize with the
European Pharmacopoeia and Japanese Pharmacopoeia (106). The apparatus consists of a
basket-rack assembly, a low-form beaker (1000 mL), a thermostatic arrangement for heating the
fluid, and a device for raising and lowering the basket in the immersion fluid at a constant
defined frequency rate. The basket-rack assembly moves vertically along its axis with no
appreciable horizontal motion or movement of the axis from the vertical (112).
There are two types of basket-rack assemblies, which are denominated as apparatus A
and apparatus B. The European Pharmacopoeia, USP general chapter <701>, and Japanese
Pharmacopoeia describe apparatus A while only the European Pharmacopoeia and Dietary
Supplements chapter <2040> of the USP describe apparatus B (112,113). According to USP
chapter <2040>, apparatus A should be used for tablets or capsules that are not greater than 18
mm long. For larger tablets or capsules, apparatus B should be used.
As mentioned above, disintegration testing is described in two chapters in the USP,
general chapter <701> and <2040> for dietary supplements. There are some differences between
the two chapters. For example, for hard gelatin capsules, chapter <701> uses water as the
immersion medium, whereas chapter <2040> uses acetate buffer pH 4.5. For soft gelatin
capsules, chapter <701> recommends this DF to be tested like uncoated tablets while chapter
<2040> uses a rupture test. In order to explore these differences and other parameters,
Almukainzi et al. systematically investigated how the basket assembly (apparatus A and B) and
49
other parameters impact the disintegration of different commercially available dietary
supplement products (114). After this thorough study, many of the products tested had the
disintegration time impacted by the different test conditions. This led to the conclusion that “the
current harmonized ICH specifications for the disintegration test are insufficient to make the
disintegration test into reliable test for dietary supplements” (114).
3.2 Apparatus specifications and procedures – USP <701> and <2040>
The 1-L low-form beaker should have 138 to 160 mm in height and an inside diameter of 97 to
115 mm for the immersion fluid. The immersion fluid temperature should be between 35 ºC and
39 ºC, and the immersion frequency should be between 29 and 32 cycles per minute through a
distance of not less than 53 mm and not more than 57 mm. The volume of the fluid in the vessel
is such that at the highest point of the upward stroke of the wire mesh remains at least 15 mm
below the surface of the fluid and descends to not less than 25 mm from the bottom of the vessel
on the downward stroke. At no time should the top of the basket-rack assembly become
submerged. The time required for the upward stroke is equal to the time required for the
downward stroke, and the change in stroke direction is a smooth transition, rather than an abrupt
reversal of motion. The specifications for each apparatus regarding the basket-rack assembly and
disks are summarized in Table 3.2 and illustrated in Figure 3.2 (112,113).
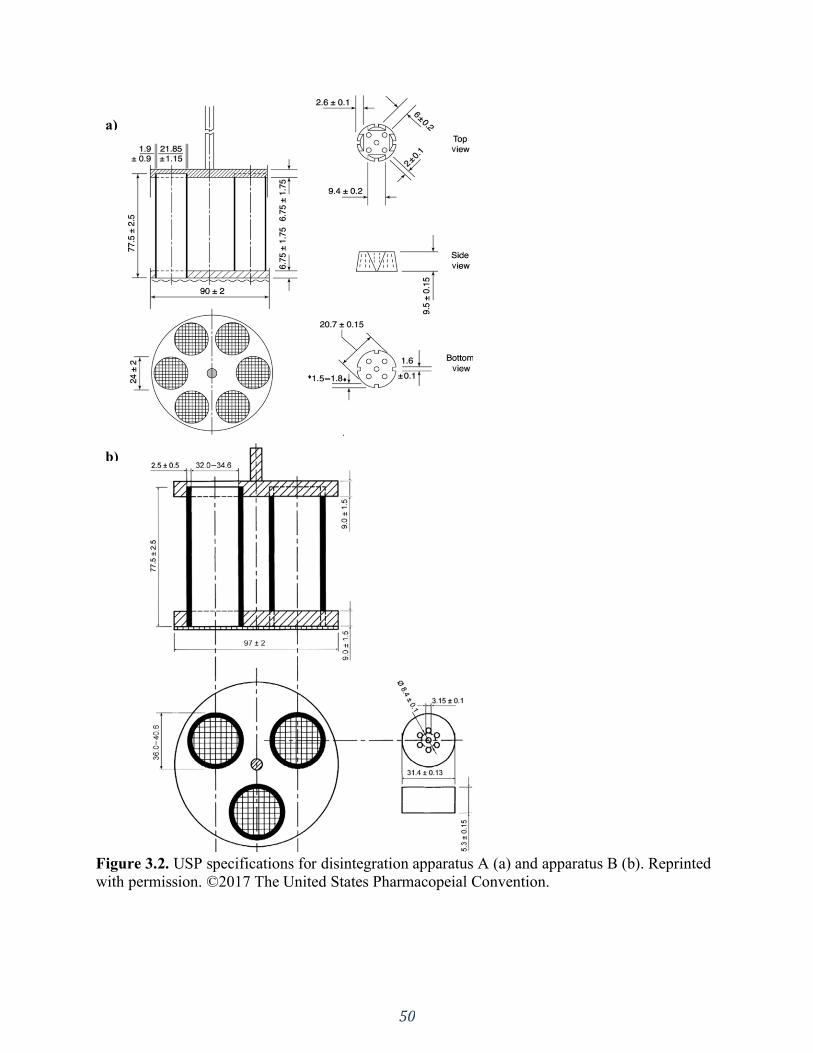
50
Figure 3.2. USP specifications for disintegration apparatus A (a) and apparatus B (b). Reprinted
with permission. ©2017 The United States Pharmacopeial Convention.
a)
b)
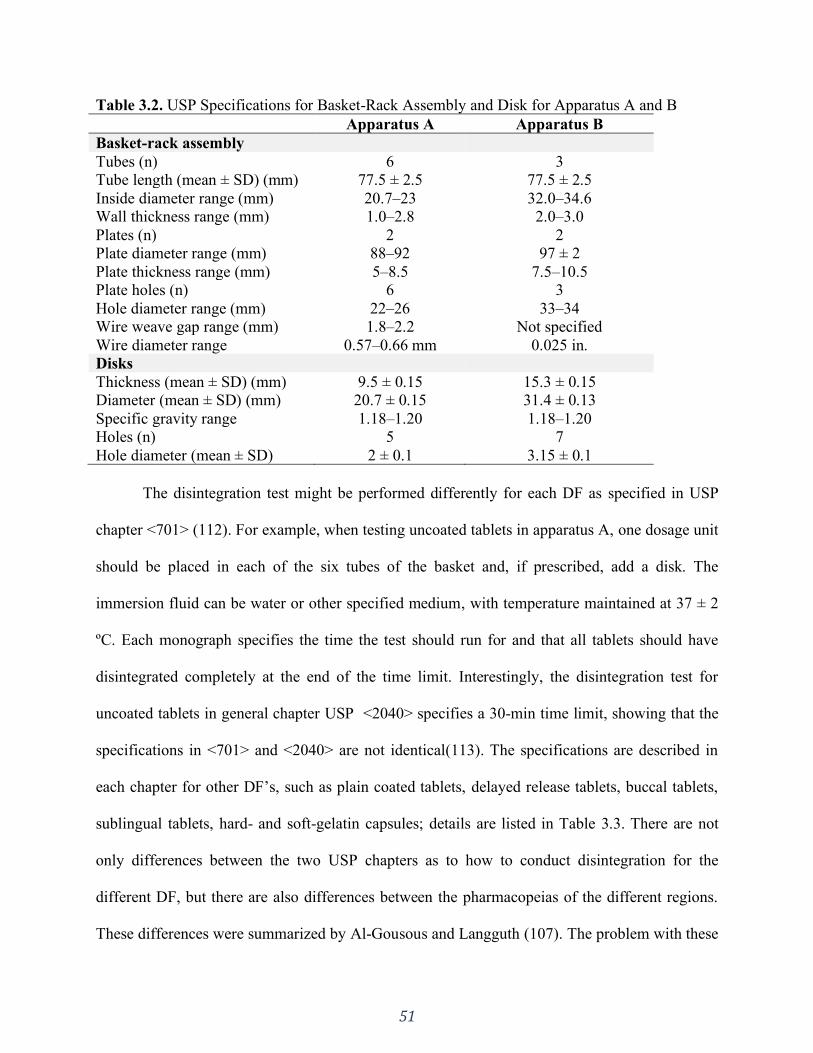
51
Table 3.2. USP Specifications for Basket-Rack Assembly and Disk for Apparatus A and B
Apparatus A Apparatus B
Basket-rack assembly
Tubes (n) 6 3
Tube length (mean ± SD) (mm) 77.5 ± 2.5 77.5 ± 2.5
Inside diameter range (mm) 20.7–23 32.0–34.6
Wall thickness range (mm) 1.0–2.8 2.0–3.0
Plates (n) 2 2
Plate diameter range (mm) 88–92 97 ± 2
Plate thickness range (mm) 5–8.5 7.5–10.5
Plate holes (n) 6 3
Hole diameter range (mm) 22–26 33–34
Wire weave gap range (mm) 1.8–2.2 Not specified
Wire diameter range 0.57–0.66 mm 0.025 in.
Disks
Thickness (mean ± SD) (mm) 9.5 ± 0.15 15.3 ± 0.15
Diameter (mean ± SD) (mm) 20.7 ± 0.15 31.4 ± 0.13
Specific gravity range 1.18–1.20 1.18–1.20
Holes (n) 5 7
Hole diameter (mean ± SD) 2 ± 0.1 3.15 ± 0.1
The disintegration test might be performed differently for each DF as specified in USP
chapter <701> (112). For example, when testing uncoated tablets in apparatus A, one dosage unit
should be placed in each of the six tubes of the basket and, if prescribed, add a disk. The
immersion fluid can be water or other specified medium, with temperature maintained at 37 ± 2
ºC. Each monograph specifies the time the test should run for and that all tablets should have
disintegrated completely at the end of the time limit. Interestingly, the disintegration test for
uncoated tablets in general chapter USP <2040> specifies a 30-min time limit, showing that the
specifications in <701> and <2040> are not identical(113). The specifications are described in
each chapter for other DF’s, such as plain coated tablets, delayed release tablets, buccal tablets,
sublingual tablets, hard- and soft-gelatin capsules; details are listed in Table 3.3. There are not
only differences between the two USP chapters as to how to conduct disintegration for the
different DF, but there are also differences between the pharmacopeias of the different regions.
These differences were summarized by Al-Gousous and Langguth (107). The problem with these
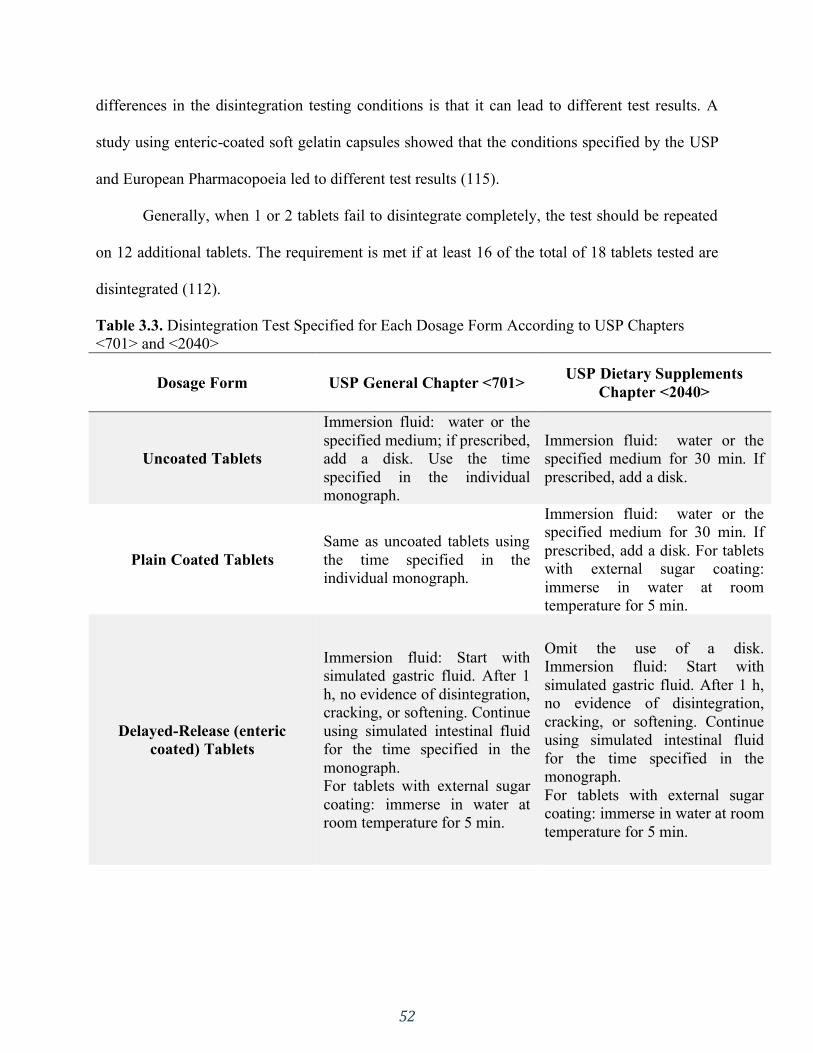
52
differences in the disintegration testing conditions is that it can lead to different test results. A
study using enteric-coated soft gelatin capsules showed that the conditions specified by the USP
and European Pharmacopoeia led to different test results (115).
Generally, when 1 or 2 tablets fail to disintegrate completely, the test should be repeated
on 12 additional tablets. The requirement is met if at least 16 of the total of 18 tablets tested are
disintegrated (112).
Table 3.3. Disintegration Test Specified for Each Dosage Form According to USP Chapters
<701> and <2040>
Dosage Form USP General Chapter <701> USP Dietary Supplements
Chapter <2040>
Uncoated Tablets
Immersion fluid: water or the
specified medium; if prescribed,
add a disk. Use the time
specified in the individual
monograph.
Immersion fluid: water or the
specified medium for 30 min. If
prescribed, add a disk.
Plain Coated Tablets
Same as uncoated tablets using
the time specified in the
individual monograph.
Immersion fluid: water or the
specified medium for 30 min. If
prescribed, add a disk. For tablets
with external sugar coating:
immerse in water at room
temperature for 5 min.
Delayed-Release (enteric
coated) Tablets
Immersion fluid: Start with
simulated gastric fluid. After 1
h, no evidence of disintegration,
cracking, or softening. Continue
using simulated intestinal fluid
for the time specified in the
monograph.
For tablets with external sugar
coating: immerse in water at
room temperature for 5 min.
Omit the use of a disk.
Immersion fluid: Start with
simulated gastric fluid. After 1 h,
no evidence of disintegration,
cracking, or softening. Continue
using simulated intestinal fluid
for the time specified in the
monograph.
For tablets with external sugar
coating: immerse in water at room
temperature for 5 min.
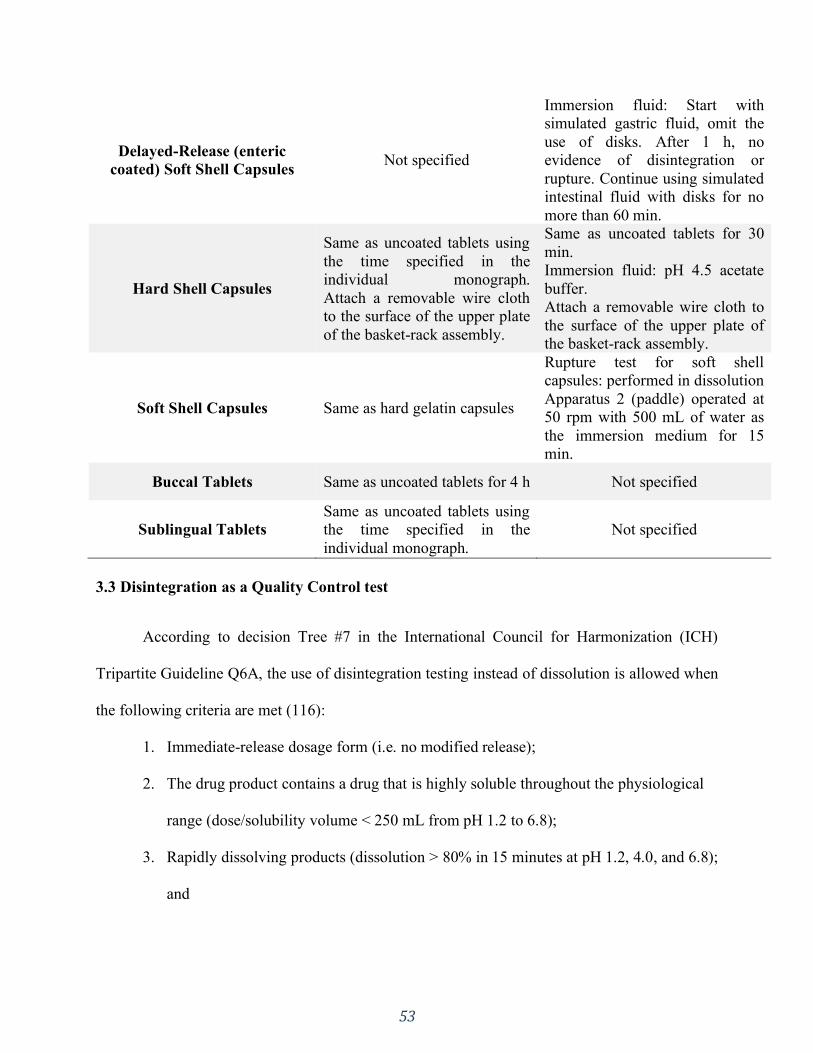
53
Delayed-Release (enteric
coated) Soft Shell Capsules Not specified
Immersion fluid: Start with
simulated gastric fluid, omit the
use of disks. After 1 h, no
evidence of disintegration or
rupture. Continue using simulated
intestinal fluid with disks for no
more than 60 min.
Hard Shell Capsules
Same as uncoated tablets using
the time specified in the
individual monograph.
Attach a removable wire cloth
to the surface of the upper plate
of the basket-rack assembly.
Same as uncoated tablets for 30
min.
Immersion fluid: pH 4.5 acetate
buffer.
Attach a removable wire cloth to
the surface of the upper plate of
the basket-rack assembly.
Soft Shell Capsules Same as hard gelatin capsules
Rupture test for soft shell
capsules: performed in dissolution
Apparatus 2 (paddle) operated at
50 rpm with 500 mL of water as
the immersion medium for 15
min.
Buccal Tablets Same as uncoated tablets for 4 h Not specified
Sublingual Tablets
Same as uncoated tablets using
the time specified in the
individual monograph.
Not specified
3.3 Disintegration as a Quality Control test
According to decision Tree #7 in the International Council for Harmonization (ICH)
Tripartite Guideline Q6A, the use of disintegration testing instead of dissolution is allowed when
the following criteria are met (116):
1. Immediate-release dosage form (i.e. no modified release);
2. The drug product contains a drug that is highly soluble throughout the physiological
range (dose/solubility volume < 250 mL from pH 1.2 to 6.8);
3. Rapidly dissolving products (dissolution > 80% in 15 minutes at pH 1.2, 4.0, and 6.8);
and

54
4. Establishment of a relationship between disintegration and dissolution or when
disintegration is shown to be more discriminating than dissolution.
The FDA draft guideline on dissolution testing also allows replacement of dissolution by
disintegration testing for BCS class I and III drug products using the same criterion of rapid
dissolution specification (Q = 80% in 15 minutes). When this criterion is met, the product
should completely disintegrate within 5 min in 0.01 M HCl (via USP apparatus) (117).
USP chapter <2>, Oral drug products – Product quality test, states that disintegration testing
is used only as a quality control test and not as a product performance test following the ICH
guidance criteria for tablets (118). Furthermore, it states that “only when disintegration has been
correlated with dissolution of a dosage form can a disintegration test be used as a product
performance test”, also following the ICH guidance criteria. Since disintegration tests are less
complicated and less time consuming than dissolution tests, its use is desirable in a quality-by-
design (QbD) approach. Due to its simplicity, concentrating more efforts and research on
disintegration testing could result in time and resource saving for quality control (QC)
departments in pharmaceutical industries throughout the product’s lifecycle (107). Nevertheless,
when using disintegration as a quality control test, it must be reproducible within the set
specifications (106).
3.4 Disintegration in the real world
3.4.1 Early-stage development
Commonly, at early stages of drug development, there are restricted or no
pharmacokinetic data from the IR formulation under development. Not much data exist about the
solubility in different media (19). For that reason, dissolution testing for quality control is
unfeasible at this stage. Scientists from Pfizer name this first stage in the development process as
55
the “exploratory development” stage. The focus of this stage is to reach ‘proof-of-concept’ to
decide “as to whether the candidate is suitable for further development” (119). As stated by
Klute, at this point in early drug development, the “API characteristics such as particle size and
disintegration are monitored to ensure batch quality for Pfizer immediate release solid oral
dosage forms, therefore dissolution is no longer the default method of choice to ensure product
performance” (119).
As shown in Figure 3.1, in order to have the API in solution for absorption, the tablet has
to first disintegrate into primary particles, and then API particles can dissolve. Thus, the critical
quality attributes for drug solubilization are the tablet disintegration rate and API dissolution
rate. For Pfizer, if rapid disintegrating tablet formulation is used and the API particle size is
small enough to completely dissolve, the disintegration test is a suitable surrogate for tablet
performance and is adequate for early stage development (119). QC dissolution testing at this
stage is negated. Instead, the key QC test to certify tablet performance is disintegration testing,
which is included “as the key performance test on the drug product specification as part of
clinical applications submitted in support of early clinical studies using IR tablets” (119). In the
cases where the ‘proof-of-concept’ is positive, the drug candidate will undergo further
development, where a QC dissolution test is more appropriate and is used as a tool to predict the
formulation bioperformance (119).
3.4.2 Relationship between disintegration and dissolution
Drugs that have high solubility (BCS classes I and III) and high dissolution number
dissolve within the gastrointestinal tract and may not have dissolution as the rate limiting step, as
long as the DF disintegrates and releases the API particles (106). For BCS class I and III, it is
expected that the drug’s highest dose dissolves within the physiological pH; BCS class II and IV
56
drugs might not dissolve within the small intestinal passage. Here, formulation approaches are
often used to increase API dissolution. In all cases, dissolution will happen after disintegration,
i.e., after liberation of the API from the DF (106,107). Hence, when facing the scenario where
the API dissolution is not dependent on the formulation but is dependent on the drug particle
properties, particle size or surface area disintegration might be the appropriate parameter to
predict API dissolution (120).
The experiment set up, such as media composition and pH, may also play a role in the
disintegration test result. Stamatakis et al. investigated the influence of the medium pH on the
disintegration time of commercially available phosphate binder formulations (121). Tablet
formulations of calcium carbonate, calcium acetate, and aluminum hydroxide, and capsule
formulations of aluminum hydroxide were analyzed using three different media: simulated
gastric fluid (pH 1.5), distilled water (pH 5.1), and simulated intestinal fluid (pH 7.5). The USP
standard disintegration apparatus at the time (USP 23–NF 18) was used. Their results showed
that nine out of the 15 products tested were sensitive to changes in pH, showing differences in
disintegration time. They concluded that “the pH significantly affected in vitro disintegration in
the majority of phosphate binders tested”. This study, thus, portrays how the disintegration time
can vary depending on the immersion medium pH.
In a study done in 1971 by Alam and Parrott, the disintegration time of
hydrochlorothiazide tablets (granulated with acacia, polyvinylpyrrolidone, or starch as biding
agents) was measured in four different media: distilled water, 0.1 N HCl, simulated intestinal
fluid, and borate buffer at pH 10 (122). The average disintegration time for the tablets granulated
with all three binders was faster than the USP disintegration time, according to the available USP
57
at the time. Besides that, each formulation had significant differences on the disintegration time
throughout the media tested.
Furthermore, Zuo et al. demonstrated how the media composition can affect the
disintegration time (123). In their study, they used different beverages (alcoholic beverages,
regular cola (Pepsi), and orange juice (Minute Maid)) as media and compared it to the
pharmacopeial immersion medium water, which is the USP reference medium in <701> and for
dietary supplements formulated as tablets (112,113). Four commercial tablet products, calcium
citrate, Ester-C, Boswellia serrata extract, and cinnamon extract were analyzed in the cited
media. Orange juice and high alcohol content in particular extended the disintegration times. For
orange juice, the extension was attributed to the increased viscosity of the orange juice but could
also be an effect of the low pH. For high alcoholic beverages the hydration of disintegrants could
be impacted, which in turn impacts DF disintegration. The study concluded that “with the
exception of 5% alcohol, all beverages had a significant effect on the disintegration time of
calcium citrate and Ester-C. Only cola, orange juice, and 40% alcohol significantly influenced
the disintegration time of the cinnamon extract. Therefore, the tested beverages should not be
used to replace water when ingesting therapeutic products” (123). Taking these results into
consideration, experimental conditions must be carefully chosen because they impact the test
results (123,124).
Regarding the rupture test as a performance test for soft-shell capsules established in USP
30–NF 25 (2007) under the General Chapter <2040>, Bachour et al. evaluated the use of this test
as a quality control tool for long-term stability samples using different enzymes (125). The
rupture test for soft-shell capsules can fail for samples that were exposed to stability conditions,
an aging problem that has already been reported by the nutraceutical industry. This may be due

58
to gelatin cross-linking, as stated in the USP General Chapter <711>, which states “Gelatin, in
the presence of certain compounds and/or in certain storage conditions, including but not
restricted to high humidity and temperature, may present cross-linking. A pellicle may form on
the external and/or internal surface of the gelatin capsule shell or on the dosage form that
prevents the drug from being released during dissolution testing” (3). With this in view, Bachour
performed a rupture test and compared oil-based, oral multivitamin soft-shell capsules with
stability samples of the same product. The immersion medium was water and enzyme-containing
media (pepsin, pancreatin, papain, and bromelain) as used for rupture and dissolution testing of
gelatin-based capsules. The stability sample capsules failed to pass the requirements in all tested
media, while the commercial capsules passed. Nevertheless, the study also reports that “the
cross-linked capsules ruptured readily when emptied out of the vessel, thus the capsules would
likely rupture in the stomach, […] even if cross-linked” (125). This indicates that the observed
“fail to rupture” might not represent the in-vivo conditions where the capsule is exposed to
motility forces. Therefore, in vitro, the rupture test can detect gelatin cross-linking in long-term
stability samples but new or modified test methods are needed to assess the performance of aged
soft-shell gelatin capsules when using the rupture test.
The requirements of ICH/FDA and USP to substitute dissolution testing with
disintegration testing require the establishment of a relationship between disintegration and
dissolution. This may not be an easy task to accomplish, given that the dissolution rate of IR
solid formulations is not necessarily determined by disintegration, as shown by Radwan et al.
(126). Nevertheless, Nickerson et al. was able to obtain a relationship between disintegration and
dissolution for a rapidly dissolving immediate-release tablet with a highly soluble drug (BCS
class I), thus justifying the use of disintegration in lieu of dissolution testing (127). In their work,

59
given the stated characteristics, drug release from the DF was shown to be limited by
disintegration. The authors reported a linear relationship between disintegration and dissolution
results for that particular drug product, concluding that disintegration would be an appropriate
drug product quality control method to evaluate drug release from that DF.
Gupta et al., however, compared 12 different IR tablet formulations of Verapamil
hydrochloride and no direct relationship was obtained between the disintegration and dissolution
across all formulations (128). This was attributed to the interactions between different
formulation components, which showed that the dissolution process depends not only on the
disintegrating agent but also on formulation components. In this study, only one out of the 12
formulations met the ICH Q6A criteria, therefore being the only formulation suitable to use for
the disintegration test instead of dissolution as the QC test (128). Thus, it becomes clear that the
determination of a relationship between disintegration and dissolution test is not an easy task,
and a systematic study is needed before using disintegration testing as part of the drug product
specifications.
Uebbing et al. went further and demonstrated that if disintegration occurs first, and if
dissolution is controlled by the drug particle properties based on API characteristics and not on
formulation factors, then disintegration can be used as a performance test for rapidly
disintegrating tablets beyond the current FDA criteria (120). Their mechanistic study
differentiated between API controlled dissolution behavior and DF impacted/controlled
dissolution. They concluded that if the formulation interferes with dissolution, then the
dissolution test should be used as the QC test. Similar to this study, Han and Gallery described
the use of disintegration instead of dissolution testing for liquid-filled gelatin capsules (129).
Although it was an encapsulated poorly soluble drug, they argued that if the product was to be
60
administered in a spoon instead of a capsule, no dissolution test would be required. This case
study also shows how a disintegration test can be used beyond ICH criteria as a surrogate for
dissolution testing.
3.5 Conclusion
Further work is still needed to establish the scientific framework for using disintegration
testing as a performance test for different DFs. Disintegration is an important quality control test
today. In the future, disintegration testing could become a release test for formulations with API-
controlled dissolution. Hence, in cases like this, disintegration is the critical quality attribute of
the DF and determines the onset of dissolution, and dissolution is only determined by API
properties.
With a proper understanding and demonstration or justification of the mechanistic details
of drug dissolution from the DF, dissolution testing might be replaced by disintegration testing
for certain DFs as a performance test. Disintegration testing can save time and cost for QC
departments in the pharmaceutical industry due to its simplicity.
In order to harmonize the disintegration test throughout the different pharmacopeias,
many specification changes have been made in the USP. These changes still need to be
thoroughly investigated as to how much – especially the current beaker specifications – they
might impact the disintegration time of dosage forms. To make this matter clearer, more research
is needed to make disintegration test results less variable. This will improve the mechanistic
understanding of the disintegration process and might lead to an in vivo predictive disintegration
test.

61
SECTION TWO: PHYSIOLOGICALLY RELEVANT IN VITRO TESTING:
BUFFER CAPACITY AND BIPHASIC DISSOLUTION TESTING
CHAPTER FOUR
Biphasic Dissolution as an Exploratory Method during Early Drug Product
Development
A version of this chapter is published in:
Pharmaceutics. 2020;12(5):420. doi:10.3390/pharmaceutics12050420
Reprinted from reference (27).

62
4.1 Introduction
In the modern drug development process, a major tool used to assess a drug product’s
performance is dissolution testing. The test was developed in the late 1950s/early 1960s and
accepted by the United States Pharmacopeia (USP) convention in 1970 (130). Ever since, in
vitro dissolution testing has been used as a quality control (QC) test for solid oral dosage
forms and it plays a critical role in enhanced product understanding (131). The different
compendial dissolution equipment includes the basket (USP apparatus 1), the paddle (USP
apparatus 2), the reciprocating cylinder (USP apparatus 3), and the flow-through cell (USP
apparatus 4). The latter two are used for extended-release products, whereas apparatus 2 is
the most widely applied method (130). However, compendial equipment and methods use
conditions that may limit both the method’s discriminatory power and its ability to emulate
aspects of in vivo dissolution. Thus, the quality control aspects of the dissolution
methodologies are mostly meaningful in a commercial environment of finished drug product
release. Nevertheless, during the drug product development process, in vivo predictive
methods are needed for the creation of products of predictable quality (131). In this realm,
dissolution testing is a major tool used to assess a drug product’s performance.
When testing poorly soluble drugs, conditions in which the medium is not saturated
should be maintained to ensure the method robustness. These are later used to test the
finished product to comply with regulatory guidance (132,133). Different strategies are often
adopted to obtain such conditions throughout the dissolution test, such as the addition of
solubility modifiers (e.g., surfactants) and the use of large volumes of dissolution medium
among other strategies (134) that result in conditions with little physiologic resemblance.
Within this context, the matter of buffer strength stands out (35).
63
In vivo studies demonstrate that the buffer capacity of gastrointestinal fluids is much
lower than that of compendial buffers (35,36). Not only that, but the buffer species also
differ; bicarbonate is the predominant buffer species in the human small intestine (28). This
finding was linked to slower drug dissolution rates in vivo, which has important implications
for the oral drug delivery of both acidic and basic drugs, and it should be considered in the
in vitro dissolution studies during the drug product development process (35). Although the
intestines are buffered by bicarbonate, when possible the use of simpler buffer systems, such
as phosphate, is preferred for pragmatic reasons. According to Krieg et. al., the phosphate
buffer concentration range needed to match ibuprofen dissolution in physiologically relevant
bicarbonate buffers is 4–8 mM (83).
Furthermore, while the drug dissolves in the intestinal fluids, it is also absorbed through
the gut wall. Biphasic dissolution is one of the possible approaches to assess the concurrent
in vivo drug absorption process. It is composed of a two-phase system in which the
simultaneous evaluation of drug dissolution and partitioning into an organic phase is studied,
and it can be used as a non-compendial exploratory dissolution method. This approach was
first described in the early 60s and its use has gained much attention in recent years (133–
143).
The information obtained from the physiologically based dissolution test is used to
identify what aspects of the drug substance, formulation composition, and process are most
important to achieve the desired target release profile. In this way, variables that are likely to
impact the drug dissolution can be identified early on in the development, allowing the
ranking of formulation prototypes under physiologic-like conditions.
64
As suggested by Azarmi et al., two different dissolution methods might be needed, one
for formulation predictive dissolution and the other for QC purposes, which is the current
practice in pharmaceutical companies (26,131). The information obtained from early stage
dissolution methods (exploratory and physiologically based) can be then used to establish
appropriate discrimination of the QC method to be applied in the late development stage to
critical dosage form attributes and other parameters (Figure 4.1).
In this exploratory study, the hypothesis was two-fold in order to evaluate both the
influence of manufacturing methods and the excipient composition on the dissolution
behavior of the tablets. Regarding the manufacturing process, we hypothesized that direct
compression vs. wet granulation would result in different dissolution behavior, whereas
excipients would create with the model drug a microclimate, also resulting in different
profiles. Therefore, we screened the different tablets using compendial and physiologically
based methods to identify which performance test method had the highest discriminatory
power. Considering that the majority of molecules in the discovery pipeline are poorly
water-soluble (144) and the knowledge gained with poorly soluble drug in previous work
(35), ibuprofen (BCS IIa) was used as a model drug.
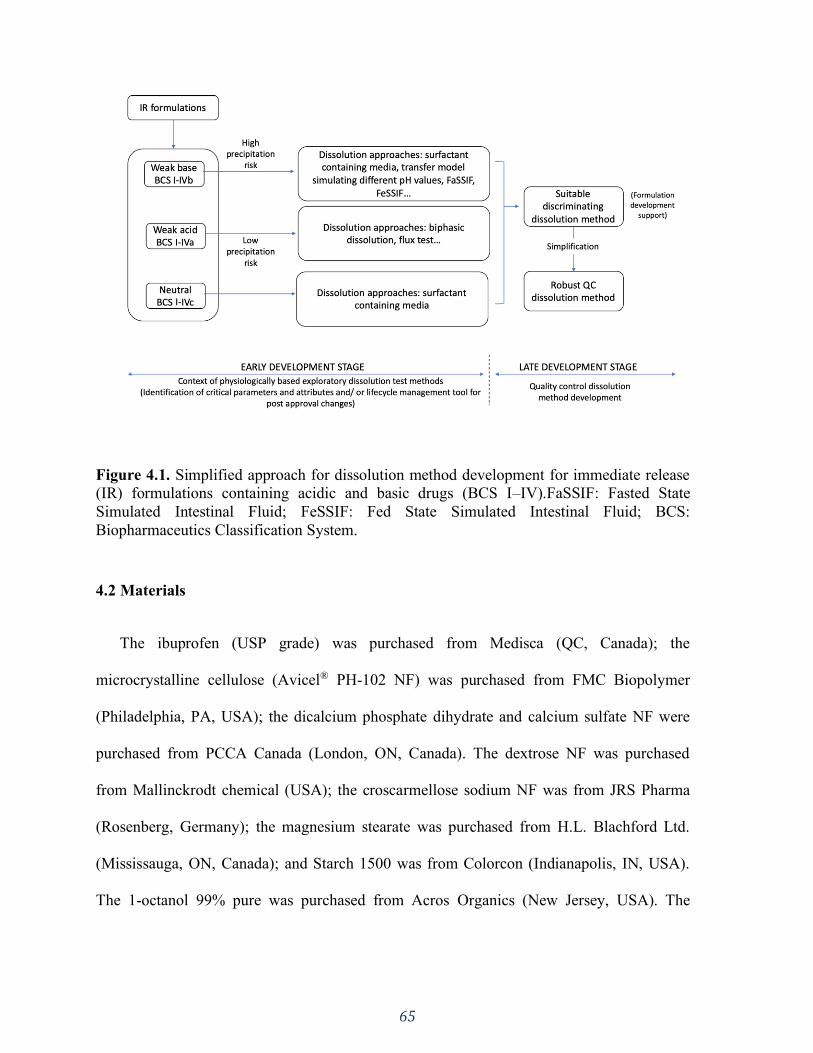
65
Figure 4.1. Simplified approach for dissolution method development for immediate release
(IR) formulations containing acidic and basic drugs (BCS I–IV).FaSSIF: Fasted State
Simulated Intestinal Fluid; FeSSIF: Fed State Simulated Intestinal Fluid; BCS:
Biopharmaceutics Classification System.
4.2 Materials
The ibuprofen (USP grade) was purchased from Medisca (QC, Canada); the
microcrystalline cellulose (Avicel® PH-102 NF) was purchased from FMC Biopolymer
(Philadelphia, PA, USA); the dicalcium phosphate dihydrate and calcium sulfate NF were
purchased from PCCA Canada (London, ON, Canada). The dextrose NF was purchased
from Mallinckrodt chemical (USA); the croscarmellose sodium NF was from JRS Pharma
(Rosenberg, Germany); the magnesium stearate was purchased from H.L. Blachford Ltd.
(Mississauga, ON, Canada); and Starch 1500 was from Colorcon (Indianapolis, IN, USA).
The 1-octanol 99% pure was purchased from Acros Organics (New Jersey, USA). The
66
buffer solutions were prepared with purified water (Elgastat Maxima UF and an Elgastat
Option 3B water purifier by ELGA Laboratories Ltd. (Mississauga, ON, Canada)).
4.3 Methods
4.3.1 Ibuprofen Immediate Release Formulations
The formulations used in this study differed in their excipient composition and
manufacturing process (Table 4.1). The selection of excipient was based on their chemical
characteristics in terms of basicity and acidity. Granulating BCS IIa drugs (such as
ibuprofen) with acidic excipients could create a microclimate with a lower pH, reducing the
drug dissolution. On the other hand, basic excipients could create a higher microclimate pH,
increasing the dissolution, whereas neutral excipients would not impact the microclimate
pH. Dextrose was chosen as the acidic excipient, CaSO4 and CaHPO4 as basic excipients,
and microcrystalline cellulose as neutral.
In order to analyze the manufacturing method, the tablets were prepared by direct
compression and wet granulation. The direct compressed tablets (D) were prepared by
mixing all the ingredients (except for the lubricant) for 6 min using a mortar and pestle until
a homogenous mixture was obtained. The lubricant (magnesium stearate) was added last and
mixed in for another minute to avoid the coating of the active pharmaceutical ingredient
(API).
The tablets obtained by wet granulation (G) were prepared by mixing all the ingredients
in the same manner as D. Ethanol 70% was used as the granulation solution and the wet
powder mixture was granulated through a N60 sieve. The granules were dried for one hour
in a 37 °C oven and sieved again through a N60 sieve. The lubricant (magnesium stearate)
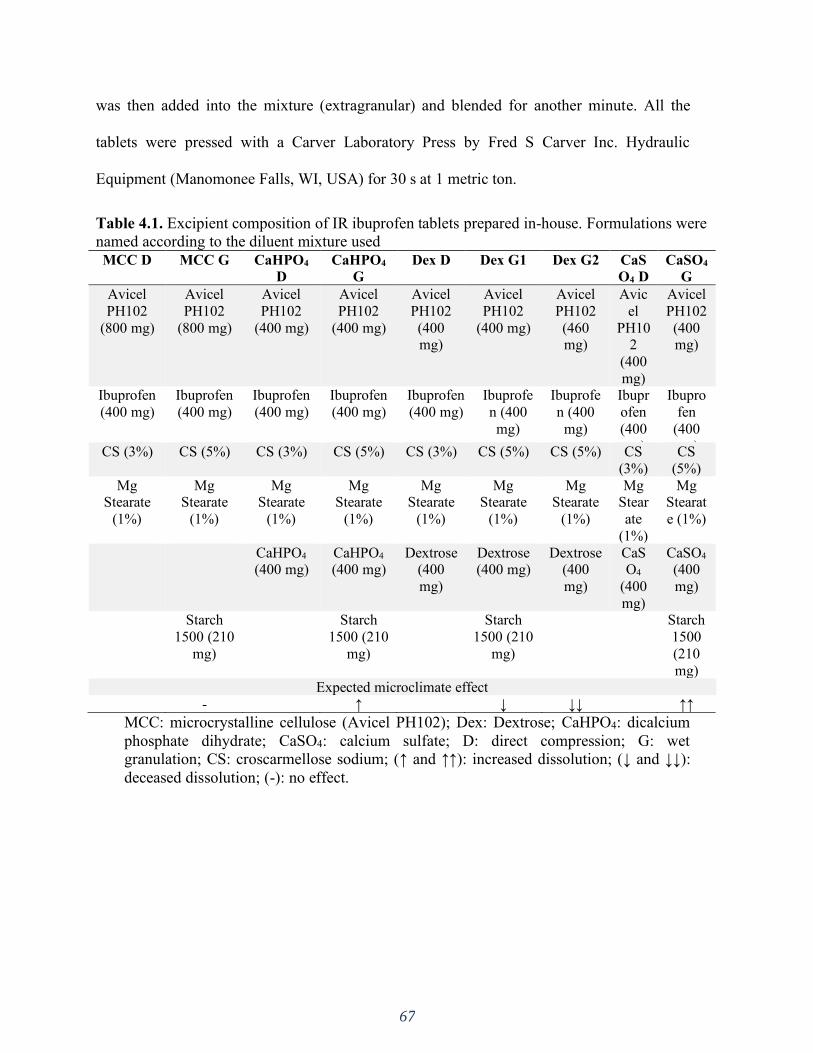
67
was then added into the mixture (extragranular) and blended for another minute. All the
tablets were pressed with a Carver Laboratory Press by Fred S Carver Inc. Hydraulic
Equipment (Manomonee Falls, WI, USA) for 30 s at 1 metric ton.
Table 4.1. Excipient composition of IR ibuprofen tablets prepared in-house. Formulations were
named according to the diluent mixture used
MCC D MCC G CaHPO4
D
CaHPO4
G
Dex D Dex G1 Dex G2 CaS
O4 D
CaSO4
G
Avicel
PH102
(800 mg)
Avicel
PH102
(800 mg)
Avicel
PH102
(400 mg)
Avicel
PH102
(400 mg)
Avicel
PH102
(400 mg)
Avicel
PH102
(400 mg)
Avicel
PH102
(460 mg)
Avic
el
PH102
(400
mg)
Avicel
PH102
(400 mg)
Ibuprofen
(400 mg)
Ibuprofen
(400 mg)
Ibuprofen
(400 mg)
Ibuprofen
(400 mg)
Ibuprofen
(400 mg)
Ibuprofe
n (400
mg)
Ibuprofe
n (400
mg)
Ibupr
ofen
(400
mg)
Ibupro
fen
(400
mg) CS (3%) CS (5%) CS (3%) CS (5%) CS (3%) CS (5%) CS (5%) CS
(3%)
CS
(5%)
Mg Stearate
(1%)
Mg Stearate
(1%)
Mg Stearate
(1%)
Mg Stearate
(1%)
Mg Stearate
(1%)
Mg Stearate
(1%)
Mg Stearate
(1%)
Mg Stear
ate
(1%)
Mg Stearat
e (1%)
CaHPO4 (400 mg)
CaHPO4 (400 mg)
Dextrose (400
mg)
Dextrose (400 mg)
Dextrose (400
mg)
CaSO4
(400
mg)
CaSO4 (400
mg)
Starch
1500 (210
mg)
Starch
1500 (210
mg)
Starch
1500 (210
mg)
Starch
1500
(210
mg) Expected microclimate effect
- ↑ ↓ ↓↓ ↑↑
MCC: microcrystalline cellulose (Avicel PH102); Dex: Dextrose; CaHPO4: dicalcium
phosphate dihydrate; CaSO4: calcium sulfate; D: direct compression; G: wet
granulation; CS: croscarmellose sodium; (↑ and ↑↑): increased dissolution; (↓ and ↓↓):
deceased dissolution; (-): no effect.
68
4.3.2 Dissolution Tests
All the dissolution tests were performed in triplicate using a USP apparatus II
(ERWEKA, GmbH) with a 75 rpm rotation speed at 37 °C. All buffer media were filtered by
vacuum and degassed in an ultrasonic bath.
Compendial Dissolution Method
The USP-recommended method for ibuprofen immediate release (IR) tablets is 900
mL of phosphate buffer with a pH of 7.2 (50 mM) with not less than 80% of the labeled
amount dissolved in 60 min (7).
Non-Compendial Dissolution Methods—Physiologically Based Exploratory Methods
Monophasic Dissolution with a Low Buffer Capacity Medium
The literature reports that a phosphate buffer with a pH of 6.5 at concentrations between
4–8 mM matches the ibuprofen dissolution in physiologically relevant bicarbonate buffer
(83). Hence, 5 mM of phosphate buffer with a pH of 6.5 (900 mL) was used as a non-
compendial and physiologically relevant dissolution medium for comparison reasons.
Samples (5 mL) were collected at specific time points (5, 10, 15, 20, 30, 45, 60 min)
with media replacement after each sampling time. The amount of dissolved drug was
determined by a UV-spectrophotometer at 221 nm. Since a low buffer capacity medium was
being used, the pH was monitored throughout the dissolution test.
69
Biphasic Dissolution with Low Buffer Capacity Medium
Biphasic dissolution tests were performed in a 5 mM phosphate buffer with a pH of 6.5
with 100 mL of n-octanol on top. The aqueous layer mimicked the intestinal fluids and the
organic layer mimicked the absorption compartment. A mini-paddle (kindly donated by
Sotax AG) was mounted on the regular compendial paddle to obtain sufficient
hydrodynamics in both phases.
The aqueous layer volume was also taken into consideration in order to increase the
physiologic relevance. Considering the reported intestinal fluid volume of 77 mL (77 +/− 15
mL) (145), a lower volume of 200 mL was used in an attempt to better approximate that of
the intestinal fluids. For comparison reasons, the dissolution experiments were also
conducted at 900 mL.
Samples from the aqueous phase (5 mL) and the organic phase (1 mL) were collected at
specific time points (5, 10, 15, 20, 30, 45, 60 min). The amount of the drug was determined
by a UV-spectrophotometer at 221 nm for the aqueous phase and 272 nm for the organic
phase. The pH of the aqueous phase was monitored throughout the dissolution test.
4.3.3 Statistical Analysis
The difference between the mean dissolution values at early exposure was measured
through the 90% confidence interval (CI) of difference method using the Excel Add-In
DDSolver (146,147). In order to compare the manufacturing methods, the % release at 15
min in the 5mM phosphate buffer was compared between the G and D formulations of the
same composition. Furthermore, in order to compare the differences in the excipient
composition, we analyzed both the early exposure (5 min) between the G formulations and

70
at 15 min between the D formulations. The 5 min selection was based on the fact that, even
though the granular disintegration/deaggregation was still happening, the microclimate
effect was most meaningful and expected to be strongest at this time point. The 15 min time
point was selected to be able to analyze the early exposure, but was later than disintegration
time.
4.4 Results
4.4.1 Compendial Dissolution Tests
All the profiles were similar in the compendial buffer, as >85% dissolved in 15 min
(Figure 4.2). This method presented a low discriminatory power in differentiating between
manufacturing methods as well as excipient compositions.
Figure 4.2. Dissolution profiles of all formulations in 900 mL of compendial buffer (50 mM
phosphate buffer pH 7.2). Error bars represent the standard deviation. Ibuprofen was the active
ingredient in all formulations.
71
4.4.2 Non-Compendial Dissolution Tests—Physiologically Based Exploratory Methods
4.4.2.1 Monophasic Dissolution With Low Buffer Capacity Medium
Overall, the dissolution rate of ibuprofen was much slower in the low buffer capacity
medium compared to in the USP buffer (this observation is discussed in more detail in
Section 4). The release pattern among the direct compressed formulations was very similar,
which points out to a dissolution controlled by the API properties rather than a formulation-
driven dissolution (Figure 4.3E). Interestingly enough, the G formulations presented a higher
rate and extent of release compared to the D formulations (Figure 4.3A–D), which might
have been due to a reduction in the drug particle size as a consequence of the granulating
process itself. The higher level of disintegrant (crosscarmellose sodium) in the granulated
formulations could also have contributed to the higher release. However, it is worth noticing
that a higher level of disintegrant would primarily impact the dissolution rate (especially at
early time points) rather than the extent. An additional factor was that the soluble fraction of
Starch1500 could have enhanced the wettability of the ibuprofen particles.
The manufacturing methods were evaluated by granulating ibuprofen, with excipients
that could modulate the drug dissolution in terms of a microclimate pH (Table 4.1). A
pronounced effect was observed at early exposure (5–10 min), particularly for the DexG2
formulation, which presented a lower release compared to the other formulations (Figure
4.3F).
As expected, given that ibuprofen is a weak acid dissolving in a low buffer capacity
medium, a drop in pH was observed.
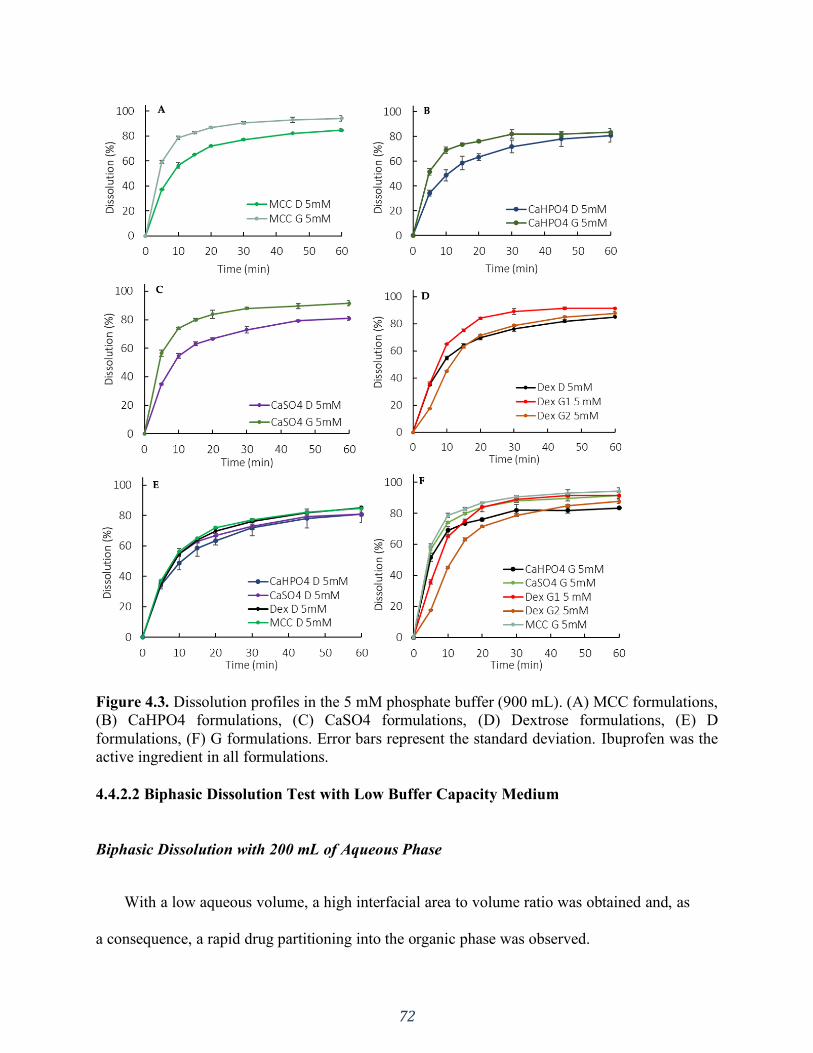
72
Figure 4.3. Dissolution profiles in the 5 mM phosphate buffer (900 mL). (A) MCC formulations,
(B) CaHPO4 formulations, (C) CaSO4 formulations, (D) Dextrose formulations, (E) D
formulations, (F) G formulations. Error bars represent the standard deviation. Ibuprofen was the
active ingredient in all formulations.
4.4.2.2 Biphasic Dissolution Test with Low Buffer Capacity Medium
Biphasic Dissolution with 200 mL of Aqueous Phase
With a low aqueous volume, a high interfacial area to volume ratio was obtained and, as
a consequence, a rapid drug partitioning into the organic phase was observed.

73
Manufacturing method and formulation composition differences were captured in the
partition profiles of the drug to the organic phase (Figure 4.4A and B). A lower partitioning
for dextrose containing G formulations was observed at early exposure (5–15 min). An
overall lower partitioning for CaHPO4-containing formulations (both D and G) was
observed (Figure 4.4A and B).
Figure 4.4. Organic phase partition profiles in a biphasic dissolution with 200 mL of aqueous
media for G formulations (A) and D formulations (B) and with 900 mL of aqueous media (C).
Oct: Octanol. Error bars represent the standard deviation. Ibuprofen was the active ingredient in
all formulations.

74
Biphasic Dissolution with 900 mL of Aqueous Phase
Similarly to the monophasic dissolution, the G formulations presented a higher rate and
extent of release compared to the D formulations (Figure 4.5 A–D). However, the higher
release was not accompanied by an increased partitioning into the organic phase. Actually,
the partitioning profiles of the organic phase were similar for all formulations (different
excipients and manufacturing processes) (Figure 4.4C). Thus, in this setup, the organic
phase didn’t seem suitable for formulation differentiation purposes. Instead, the organic
phase added a sink to the system through the removal of the dissolved drug from the
aqueous phase, reducing the pH shift observed in the monophasic dissolution.
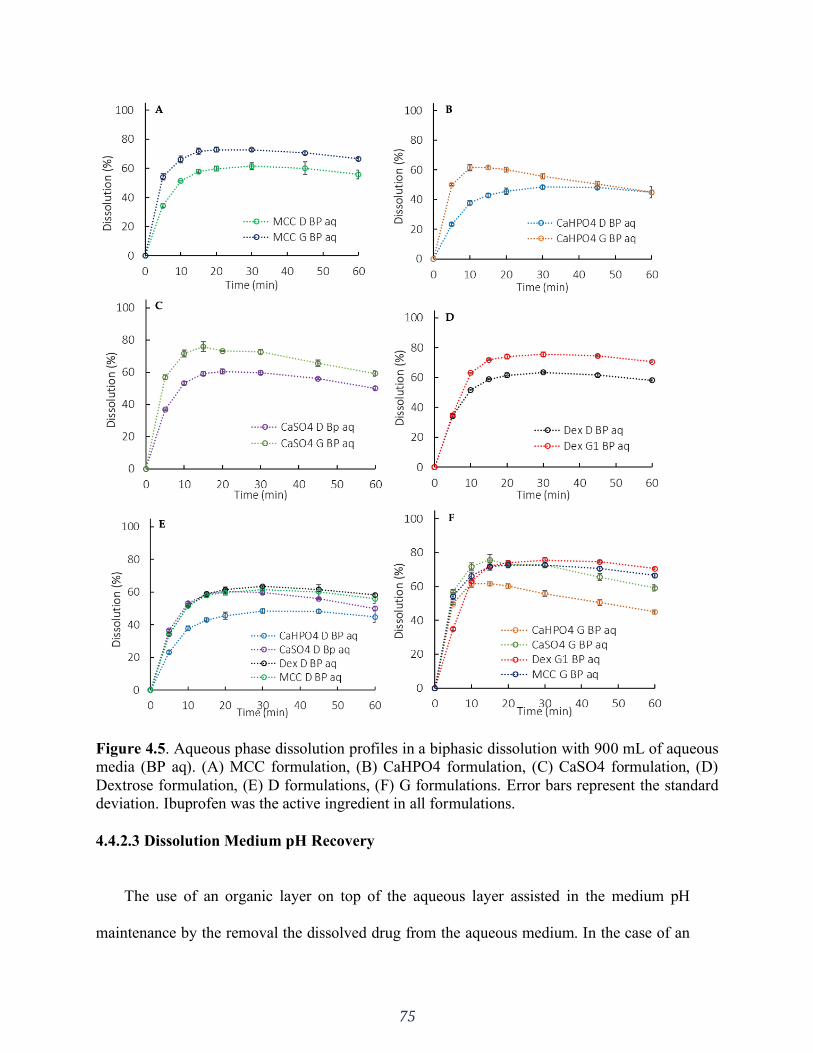
75
Figure 4.5. Aqueous phase dissolution profiles in a biphasic dissolution with 900 mL of aqueous
media (BP aq). (A) MCC formulation, (B) CaHPO4 formulation, (C) CaSO4 formulation, (D)
Dextrose formulation, (E) D formulations, (F) G formulations. Error bars represent the standard
deviation. Ibuprofen was the active ingredient in all formulations.
4.4.2.3 Dissolution Medium pH Recovery
The use of an organic layer on top of the aqueous layer assisted in the medium pH
maintenance by the removal the dissolved drug from the aqueous medium. In the case of an
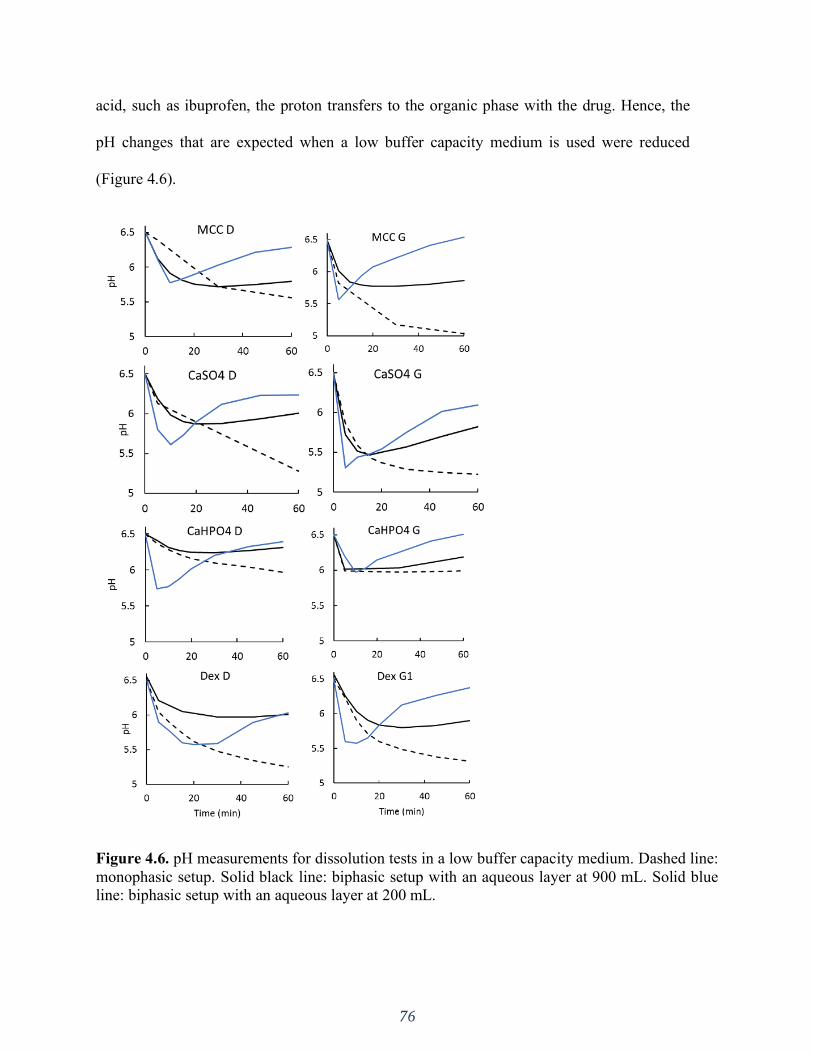
76
acid, such as ibuprofen, the proton transfers to the organic phase with the drug. Hence, the
pH changes that are expected when a low buffer capacity medium is used were reduced
(Figure 4.6).
Figure 4.6. pH measurements for dissolution tests in a low buffer capacity medium. Dashed line:
monophasic setup. Solid black line: biphasic setup with an aqueous layer at 900 mL. Solid blue
line: biphasic setup with an aqueous layer at 200 mL.
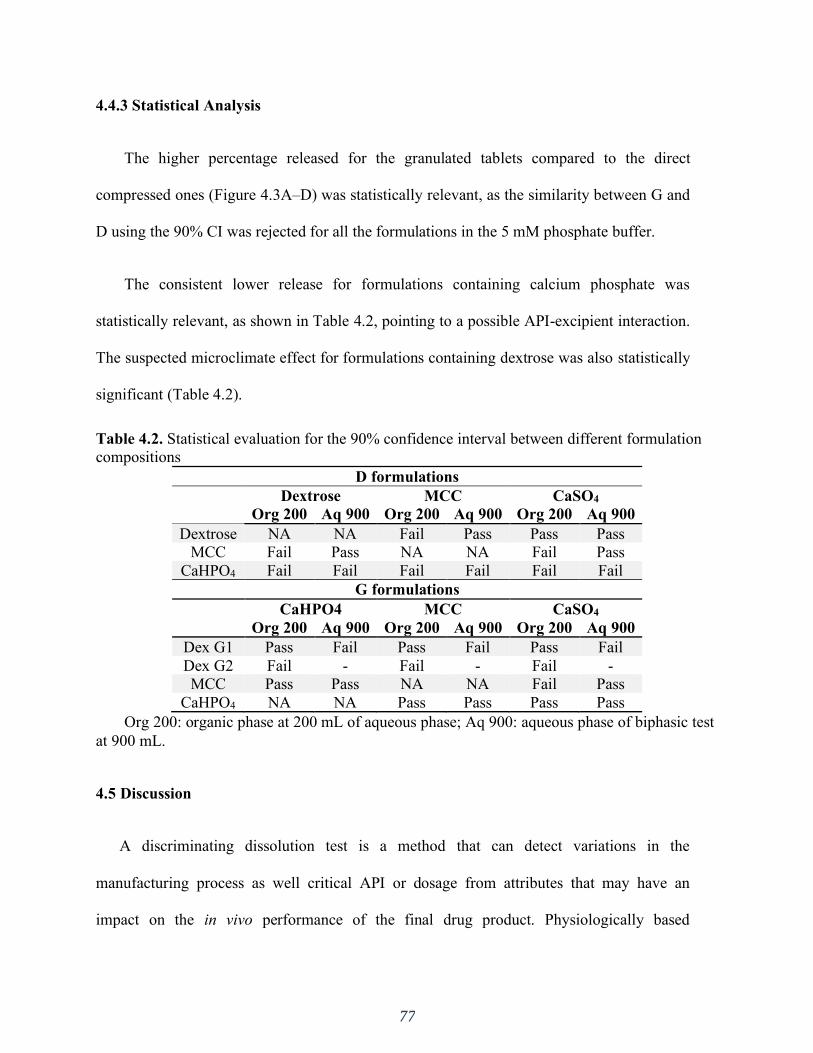
77
4.4.3 Statistical Analysis
The higher percentage released for the granulated tablets compared to the direct
compressed ones (Figure 4.3A–D) was statistically relevant, as the similarity between G and
D using the 90% CI was rejected for all the formulations in the 5 mM phosphate buffer.
The consistent lower release for formulations containing calcium phosphate was
statistically relevant, as shown in Table 4.2, pointing to a possible API-excipient interaction.
The suspected microclimate effect for formulations containing dextrose was also statistically
significant (Table 4.2).
Table 4.2. Statistical evaluation for the 90% confidence interval between different formulation
compositions
D formulations Dextrose MCC CaSO4 Org 200 Aq 900 Org 200 Aq 900 Org 200 Aq 900
Dextrose NA NA Fail Pass Pass Pass
MCC Fail Pass NA NA Fail Pass
CaHPO4 Fail Fail Fail Fail Fail Fail
G formulations CaHPO4 MCC CaSO4 Org 200 Aq 900 Org 200 Aq 900 Org 200 Aq 900
Dex G1 Pass Fail Pass Fail Pass Fail
Dex G2 Fail - Fail - Fail -
MCC Pass Pass NA NA Fail Pass
CaHPO4 NA NA Pass Pass Pass Pass
Org 200: organic phase at 200 mL of aqueous phase; Aq 900: aqueous phase of biphasic test
at 900 mL.
4.5 Discussion
A discriminating dissolution test is a method that can detect variations in the
manufacturing process as well critical API or dosage from attributes that may have an
impact on the in vivo performance of the final drug product. Physiologically based

78
exploratory dissolution methods used in early product development often follow a generic
approach (17). Thus, in the absence of a link to in vivo drug product performance, the degree
of discriminating power is often unknown. In such cases, risk assessments and prior
knowledge, as well as modeling and simulation, may be helpful to guide the necessary
adjustments to increase the method’s sensitivity towards certain critical API attributes,
manufacturing method, and/or formulation composition (17,131).
In contrast, the pharmacopoeial experimental conditions applied in a QC setting aim at
the whole amount of drug being released from the dosage form. For such purposes, a high
buffer concentration (50 mM) and capacity are used. Such conditions prevent pH shifts
caused by the API dissolution that could hinder or increase the dissolution, resulting in a
biased data interpretation caused by the dissolution method rather than due to poor drug
product performance. In the compendial conditions used in this study, a similar release was
obtained for the different ibuprofen formulations, achieving the “expected release” in a QC
manner (Figure 4.2). Nevertheless, it showed a poor discriminatory power in identifying the
possible effect of critical API attributes and manufacturing methods on drug dissolution.
Accordingly, Cristofoletti and Dressman have demonstrated that in the case of ionizable
compounds, the pH at the solid–liquid interface is as a key parameter in predicting the
dissolution rate. The authors showed that the in vitro dissolution of ibuprofen (weak acid) in
phosphate buffer is a function of the pH in the diffusion layer, which is, in turn, affected by
the properties of both the drug and the medium (56). The reported pH at the surface of the
dissolving drug (ibuprofen) in a physiologically relevant bicarbonate buffer can be achieved
by reducing the phosphate buffer concentration to 5 mM. Hence, using the appropriate
79
buffer concentration for in vitro experiments would likely increase the physiological
relevance of this important biopharmaceutics performance test method (56).
A rapid in vitro dissolution rate cannot be translated to the in vivo dissolution rate of
ibuprofen. An in vivo study, in which the gastrointestinal (GI) drug dissolution and systemic
absorption of ibuprofen was evaluated, demonstrated that the drug could still be found in the
GI tract fluids even after 7 h of aspiration, pointing out that BCS II drugs may undergo a
slower dissolution in the GI tract due to their low water solubility (35,134,135). This slow
dissolution rate was linked to the very low buffer capacity of luminal fluids.
This observation reflects what is going on in the drug particle diffusion layer. In highly
concentrated buffer systems, the drug particle is surrounded by an abundance of the buffer’s
conjugate base species. This leads to a ready neutralization in the diffusion layer around the
particle, that is, the H+ ions formed on the dissolving drug surface are readily consumed by a
buffer species. This causes the pH in the diffusion layer to be similar to the bulk solution
pH, yielding a higher dissolution (56,81). However, in a less concentrated buffer (as in the
human GI tract) the neutralization is slower, which is an important physiological aspect that
should be taken into account in the drug development process. Selecting the right buffer
system is, therefore, of primary importance (35), since the in vitro buffer system largely
affects the surface pH of the drug particle, which in turn affects its dissolution (84,148).
As previously highlighted, it has been reported that a phosphate buffer pH of 6.5 at 5
mM matches ibuprofen dissolution in physiologically relevant bicarbonate buffer (83). The
observed slower dissolution in 5 mM phosphate buffer (900 mL) compared to a USP-
strength buffer (50 mM) (Figure 4.2 vs. Figure 4.3) is in line with the aforementioned in vivo
findings (35). Thus, using a low buffer capacity is an alternative approach to bring
80
physiologically relevant components into the early stage exploratory dissolution tests.
Clinically relevant specifications were not required at the time that ibuprofen was introduced
to the market (late 60s/early 70s) and the developed dissolution method was a suitable test at
the time.
On the other hand, as ibuprofen dissolves, the medium pH tends to decrease due to the
acidic characteristics of the API (Figure 4.6). The pH drop observed in a low buffer capacity
medium is unlikely to occur in the intestinal lumen due to neutralization mechanisms in the
gut as well as the concurrent drug absorption (149). Attempts to maintain the pH by titrating
the medium with NaOH have been made (56), however it can be experimentally difficult
and impractical. In cases of dissolution methods based on other buffers systems, such as
bicarbonate buffer, the medium pH can be regulated by sparging the medium (28).
Combining the low buffer capacity medium with an absorptive phase adds another
aspect of the in vivo gastrointestinal environment, that is, drug absorption as it dissolves in
the intraluminal fluids (and in the case of an acid, such as ibuprofen, the proton transfers to
the organic phase with the drug). Thus, the organic phase serves as an additional sink for the
pH recovery (Figure 4.6).
Ibuprofen dissolution in 5 mM phosphate buffer was characterized through the D
formulations, since they presented an API-controlled dissolution (Figures 4.3E and 4.5E), as
described by Uebbing (120). Considering that ibuprofen is a class II drug, a reduction in
particle size may increase the drug dissolution, which could be the reason for the statistically
relevant higher release observed in the G formulations (Figures 4.3A–D and 4.5A–D). The
overall slower dissolution rate in 5 mM buffer enabled the characterization of a critical API
attribute that affects in vitro dissolution.

81
The manufacturing method can also impact the dosage form performance. During a wet
granulation process, the API and excipients come in close contact in such a way that the
excipients can influence the API dissolution. After the tablet disintegrates, the drug
dissolution depends also on the granules disintegration/deaggregation (1,150). As a result, a
microclimate can be created around the granulate particle, which was seen in the dextrose
formulations. Since dextrose is acidic (151), the pH around the dissolving drug particle
could be lower than the bulk pH, impacting the API dissolution. This effect was observed
primarily at early exposure, when the granules were being deaggregated (Table 4.2). A
lower dissolution was observed during the first time points in both the 50 mM and 5 mM
phosphate buffer, and the drug partitioning into the organic phase was also affected (Figures
4.2, 4.3D, 4.4D, and 4.5D). Early exposure is important and should be further explored in
future studies. This is in accordance with Valizadeh et. al., who described the impact of the
microclimate on the dissolution of solid dispersions of indomethacin with different
excipients, such as PEG 6000, Myrj 52, Lactose, Sorbitol, Dextrin, and Eudragit1 E100
(150).
Overall, formulations containing calcium phosphate presented a statistically relevant
lower release, regardless of the manufacturing process used. In this case, another excipient-
API interaction might have occurred. Even though it behaves neutrally (pH 7.4), the surface
of CaHPO4 is alkaline (151). Since ibuprofen is a weak acid, drug particles could have
adsorbed onto the CaHPO4 particles due to their alkaline surface, resulting in the observed
lower dissolution. It has been reported that various ions and molecules can be adsorbed onto
the CaHPO4 surface. Furthermore, ibuprofen adsorption onto calcium phosphate beads for
bone substitutes in targeted drug delivery applications has been described (152).

82
Incompatibilities between CaHPO4 and other acidic drugs, such as indomethacin and aspirin,
have also been reported (151,153).
In the exploratory method used in the study, the sensitivity in discriminating dosage
forms was seen in the octanol phase when applying 200 mL of the aqueous phase, whereas
at 900 mL the differences were more pronounced in the aqueous phase. The low surface area
to volume ratio at 900 mL and the hydrodynamics in the vessel with a paddle dissolution
apparatus resulted in slower drug partitioning (drug removal) compared to at 200 mL
(Figures 4.4A-B vs. 4.4C) (154,155). Consequently, in 900 mL partitioning is the rate-
limiting step for the overall process of mass transfer between the solid, the aqueous and the
octanol phases.
On the other hand, using a lower aqueous phase volume at the same rotational speed
resulted in the aqueous phase experiencing a higher overall magnitude of shear stress. This
might be a contributing factor to the 200 mL tending to be less discriminatory in comparing
G vs. D formulations when compared on the basis of total dissolution (i.e., aqueous +
organic).
Mudie et. al. described the drug transport phenomenon associated with the biphasic
dissolution method, assuming first-order absorption kinetics (141). The in vitro partitioning
rate coefficient (kp) represents the drug partitioning rate into the organic phase. The
physiological relevance of this is that the in vitro kp approximates the in vivo absorption rate
coefficient (ka), as shown in Equation 4-1.
𝐾𝑝 = ( 𝐴𝐼
𝑉𝑎 𝑃𝐼)
𝑖𝑛 𝑣𝑖𝑡𝑟𝑜= 𝐾𝑎 = (
𝐴
𝑉 𝑃𝑒𝑓𝑓)
𝑖𝑛 𝑣𝑖𝑣𝑜 (Equation 4-1)
83
PI: drug interfacial permeation rate across the aqueous and organic diffusion layers; AI:
surface area of the aqueous–organic interface; Va: total volume of aqueous medium;
Peff: permeation rate in vivo; A/V: area to volume ratio in vivo.
When ka and PI are known (or can be estimated), AI/Va can be adjusted so that kp and
ka become similar or equal when possible. For ibuprofen, the theoretical PI reported in the
literature is 23.6 × 10⁻⁴ cm/s (141). Hence, the calculated kps for 900 mL (kp900) and 200
mL (kp200) are 2.1 × 10⁻⁴ s−1 and 9.35 × 10⁻⁴ s−1, respectively. In a recent human in vivo
study, Hofmann and coworkers determined the real intestinal ka for ibuprofen of 2.6 × 10⁻³
s−1 (79). Thus, the 900 mL underestimates the ka by a factor of 12.3, whereas the 200 mL
underestimates it only by a factor of 2.8, making it much closer to the in vivo scenario. Not
only that, but the pH recovery was much faster and better controlled in the 200 mL than in
the 900 mL (Figure 4.6).
An effective drug development process aligns the best formulation strategies to obtain a
suitable pharmaceutical dosage form with an adequate biopharmaceutical performance
(156). Based on this study, for an ibuprofen IR dosage form, a granulation process would be
chosen over direct compression and excipients such as dextrose and CaHPO4 would be
avoided.
The discriminatory power of biphasic dissolution is well acknowledged in the literature.
Deng et. al. (2017) observed a high discriminatory power in the organic phase for minor
formulation changes using racecadotril as a BCS II model drug (135). Three granule
formulations of the lipophilic drug were prepared with equivalent compositions but using
different manufacturing processes. The compendial tests lacked discrimination, whereas a
remarkable discrimination between the granule formulations was observed in the octanol
84
phase of the biphasic dissolution system. The test was performed in a USP II apparatus with
400 mL of phosphate buffer (50mM, pH 6.8) as the aqueous layer and 100 mL of 1-octanol
as the upper organic phase. The authors also correlated the organic phase profiles to in vivo
pharmacokinetics data, which resulted in a good in vitro-in vivo correlation (IVIVC), and
they concluded that “the release profiles from the organic phase could serve as an indicator
for in vivo drug absorption” (135).
Several studies utilizing the biphasic system have reported its ability to obtain good
IVIVCs and to be more discriminative than compendial methods (134,135,138,143,157–
162). Vangani et al. investigated the formulation changes of several compounds using the
flow through apparatus (USP IV) coupled with the USP paddle apparatus in a biphasic
system. An excellent rank order correlation was obtained between the in vitro release and
the in vivo absorption of the drugs (158). Al Durdunji et al. used a similar dissolution test
method, i.e., USP IV coupled with USP II in a biphasic dissolution medium for a BCS II
compound (Deferasirox). Similarly, the authors were able to differentiate between the
formulations and establish an IVIVC (163).
Gao and coworkers reported the evaluation of several poorly soluble drugs also using a
biphasic system combining USP apparatus IV (flow cell) with USP apparatus II (138–
140,158,159,162). Using the biphasic dissolution-partition test method, an excellent IVIVC
and IVIVR (in vitro–in vivo relationship) were obtained for a number of poorly soluble
drugs, such as fenofibrate, celecoxib, and ritonavir. The authors also reported little relevance
of the QC dissolution test results to pharmacokinetic observations in pre-clinical and clinical
studies of the prototype formulations (162). This showcases how biphasic dissolution has the
85
potential to reflect the in vivo environment, linking the in vitro performance to clinical
relevance.
4.6 Conclusions
In light of the up-to-date mechanistic understanding of in vivo dissolution, there is a
current need to rethink how product specifications and performance can be linked through
physiologically relevant parameters. This study revisited the rationale of using lower buffer
capacity media to increase the physiological relevance of in vitro testing. This system was
demonstrated to have a superior discriminatory power regarding the manufacturing method
and excipient effects. The use of an absorptive phase added a sink to the low buffer capacity
media, which decreased pH shifts while the test was performed.
Hence, biphasic dissolution systems using low buffer capacity dissolution media have
the potential to be used as early stage discriminatory methods to investigate the impact of
excipient effects and the manufacturing method on the in vitro drug release with improved
physiological relevance.
4.7 Limitations of the Study
The authors recognize that whether the difference between formulations identified by the
biphasic dissolution systems with a low buffering capacity translates to in vivo difference
has yet to be assessed through IVIVC. However, the biphasic dissolution tests were clearly
able to discriminate between the excipient and manufacturing methods under physiologically
relevant conditions which may translate into different in vivo behavior, highlighting the
importance of such method for drug performance verification.

86
SECTION TWO: PHYSIOLOGICALLY RELEVANT IN VITRO TESTING:
BUFFER CAPACITY AND BIPHASIC DISSOLUTION TESTING
CHAPTER FIVE
A BCS-based biowaiver approach using biphasic dissolution test

87
5.1 Introduction
The understanding of the physicochemical properties of drugs through the establishment
of the Biopharmaceutics Classification system (BCS) (11) made a risk based in vitro assessment
of bioequivalence for oral drug products possible. Biowaivers based on BCS class can be used to
establish therapeutic equivalence. A biowaiver means that in vivo bioavailability and/or
bioequivalence (BA/BE) studies may be waived based on in vitro dissolution testing (14,164).
Here dissolution tests are used as a surrogate to determine if two pharmaceutical equivalent
products are interchangeable/ bioequivalent instead of conducting expensive and time-
consuming in vivo BE studies. Thus, the BCS-based biowaiver approach is intended to reduce in
vivo BE studies and emphasises the importance of in vitro testing for predicting in vivo
performance.
In 2000, the Food and Drug Administration (FDA) in the United States drafted the
guidance document for industry “Waiver of In Vivo Bioavailability and Bioequivalence Studies
for Immediate-Release Solid Oral Dosage Forms Based on a Biopharmaceutics Classification
System”(165). The European Medicines Agency (EMA) and the World Health Organization
(WHO) followed the FDA approach, implementing their own guidance documents in 2002 and
2006, respectively (166,167). These first guidance documents differed from each other, for
example, while the FDA and EMA only allowed BCS-based biowaiver for BCS class I drugs, the
WHO guidance also included BCS class III and BCS class IIA (168). However, the BCS class
IIA was removed in the WHO guidance in 2015. Also, the different guidance documents define
“highly soluble” differently by using either the highest available strength (i.e. highest dose
available) or the highest single therapeutic dose (i.e. the administered dose, e.g. 2 tablets of
50mg, hence the therapeutic dose would be 100mg) (19). This can cause the same drug product
88
to be classified differently in different regions of the world, harmonization was recommended
(19).
Even though they have been updated (165,169,170), in attempt to harmonize these
various guidelines, the ICH published the “ICH M9 Guideline on Biopharmaceutics
Classification System-based Biowaivers” for consultation in 2018 which has recently reached
step 5 (implementation) of the ICH process (171). This guideline is applicable to immediate
release solid oral dosage forms or suspensions containing BCS classes I and III drugs, i.e. drug
products with highly soluble drug substance(s).
In 2012, Löbenberg et. al. (172) conducted a study to examine the in vitro performance of
three widely used drug products marketed in different countries of the Americas, being them
metronidazole, zidovudine and amoxicillin (all classified as BCS class I and WHO list of
essential medicines). The generic products in the Americas were compared to the US comparator
pharmaceutical product (CPP) and to each other to determine if they met in vitro bioequivalence
criteria. The authors hypothesized that the different drug products would meet the criteria due to
their BCS class. However, none of the tested metronidazole products were in vitro equivalent to
the CPP or to other manufacturers. Thus, since the in vitro studies did not signal that
bioequivalence criteria would be met, further clinical studies would be needed in order to
confirm their interchangeability.
We hypothesized that whereas in vitro bioequivalence was not achieved in compendial
methods (172), the partitioning profile to the organic phase in the biphasic system might signal in
vitro equivalence among the drug products and CPP.
The objective of the present study was to replicate the aforementioned study using
biphasic dissolution testing and metronidazole as the model drug. This is an innovative and more
89
physiologically relevant in vitro approach that has been developed to more effectively predict in
vivo performance of drug products (27,133–135,138,141,143,158,159,163). The system is
consisted of immiscible aqueous and organic phases in which the drug dissolves in the aqueous
layer and partitions into the organic phase, thus maintaining sink conditions. The organic layer
mimics the gastrointestinal (GI) membrane and the dissolution-partition process between the two
phases resembles the in vivo drug dissolution and absorption process (27). Hence, the approach
taken in this manuscript was to have scientific insight and mechanistic understanding rather than
strict regulatory application.
5.2 Materials
Metronidazole (USP grade) was obtained from Medisca (Quebec, Canada). Commercial
Metronidazole tablets were purchased: Flagyl 250 mg (Pfizer USA Inc, lot # C071094), Flagyl
500 mg (Sanofi Aventis Mexico Inc, lot # 888575), Flagenase 500 mg (Laboratorios Liomont,
S.A. Mexico Inc, lot # 7009), Colpofilin 500 mg (Laboratorio Lazar Argentina Inc) and Metral
500 mg (Laboratorio Pablo Cassara Inc, lot # 77). Acetonitrile HPLC grade and 1-octanol 99%
were purchased from Acros Organics (New Jersey, USA). The buffer solutions were prepared
with purified water (Elgastat Maxima UF and an Elgastat Option 3B water purifier by ELGA
Laboratories Ltd. Mississauga, ON, Canada).
The excipient composition of each drug product as listed in the package insert is as
follows: Flagyl-USP (Cellulose, Fd&C Blue,Hydroxypropyl Cellulose, Hypromellose, PEG,
Stearic Acid, Titanium Dioxide); Colpofilin (Lactose, MCC, DOSSNa, Povidone,
Crosscarmelose Sodium, Talcum, Mg-Stearate); Flagyl-Mex, Flagenase and Colpofilin
(Excipients).
90
5.3 Methods
5.3.1 Analytical Quantitation
The metronidazole content in the tablets was evaluated using liquid chromatograph
Shimadzu LC-10AS (Tokyo, Japan) and Shimadzu SPD-M10AVP Diode Array Detector
(Tokyo, Japan) UV-Vis detection at 254 nm using a LiChrospher® 60 RP-Select B 5μm (25 cmx
4,0mm) column (Merck - Darmstadt, Germany). The mobile phase consisted of acetonitrile and
water (34:66), filtered and degassed. The flow rate used was 1.0 mL/min, the injection volume
was 20 µL and the retention time was 6.83 min. A standard solution was prepared from an
accurately weighed quantity of the reference chemical substance, using the methanol as diluent
to obtain a solution of 1.00 mg/mL.
5.3.2 Disintegration test
The test was performed according to USP general chapter <701> (112). Disintegration
time was measured in a disintegration tester (Eureka, Germany) using 900 mL of phosphate
buffer pH 6.8 at 37 ± 2 °C as medium. Six tablets of each drug product were tested.
5.3.3 Dissolution tests
All dissolution tests were performed in triplicate using a USP apparatus II (ERWEKA,
GmbH), 75 rpm rotation speed at 37 °C. All buffer media were filtered by vacuum and degassed
in an ultrasonic bath.
The commercial metronidazole tablets were tested in compendial Simulated Intestinal
Fluid (SIF) (50mM phosphate buffer at pH 6.8, 900 mL) without enzyme, as well as in
physiological buffer capacity (5mM phosphate buffer at pH 6.8, 900 mL). The tablets were also

91
tested in a biphasic dissolution system in which the aqueous layer was composed of 200 mL of 5
mM phosphate buffer (pH 6.8) with 100 mL of n-octanol on top. A mini-paddle (kindly donated
by Sotax AG) was mounted on the regular compendial paddle to obtain sufficient hydrodynamics
in both phases. The volume of 200 mL was chosen in an attempt to better approximate that of the
intestinal fluids (77 +/− 15 mL) while still being experimentally feasible (145).
For both compendial and biphasic dissolution tests, samples from the aqueous phase and
the organic phase were collected at specific time points (5, 10, 15, 20, 30, 45, 60 min).
5.3.4 Data analysis
The Microsoft ExcelTM add-in DDSolver was used to compare the dissolution profiles by
ƒ2 statistics. The ƒ2 factor measures the closeness between two profiles and, according to the
FDA criteria, ƒ2 values between 50-100 indicate similarity between two dissolution profiles.
The API has to be released from the formulation and dissolve in the aqueous medium in
order to partition to the organic phase. Hence, formulation disintegration is of crucial importance
for drug release, especially for immediate release tablets. With this in mind, the amount
portioned into the organic phase of the CPP was correlated to the amount portioned of each one
of the generic products after disintegration (see Table 5.2). The CPP (Flagyl-USP) had a 5.32
minutes disintegration time, hence the percent partitioned from 10 minutes on (next data point
after 5.32 minutes) was considered. The same rationale was used for the other products: Flagyl-
Mex: 20 minutes on; Colpofilin: 5 minutes on; Flagenase and Metral: 15 minutes on. Table 5.1
shows the amount partitioned for each drug product used in the correlation. The correlation was
done by linear regression.
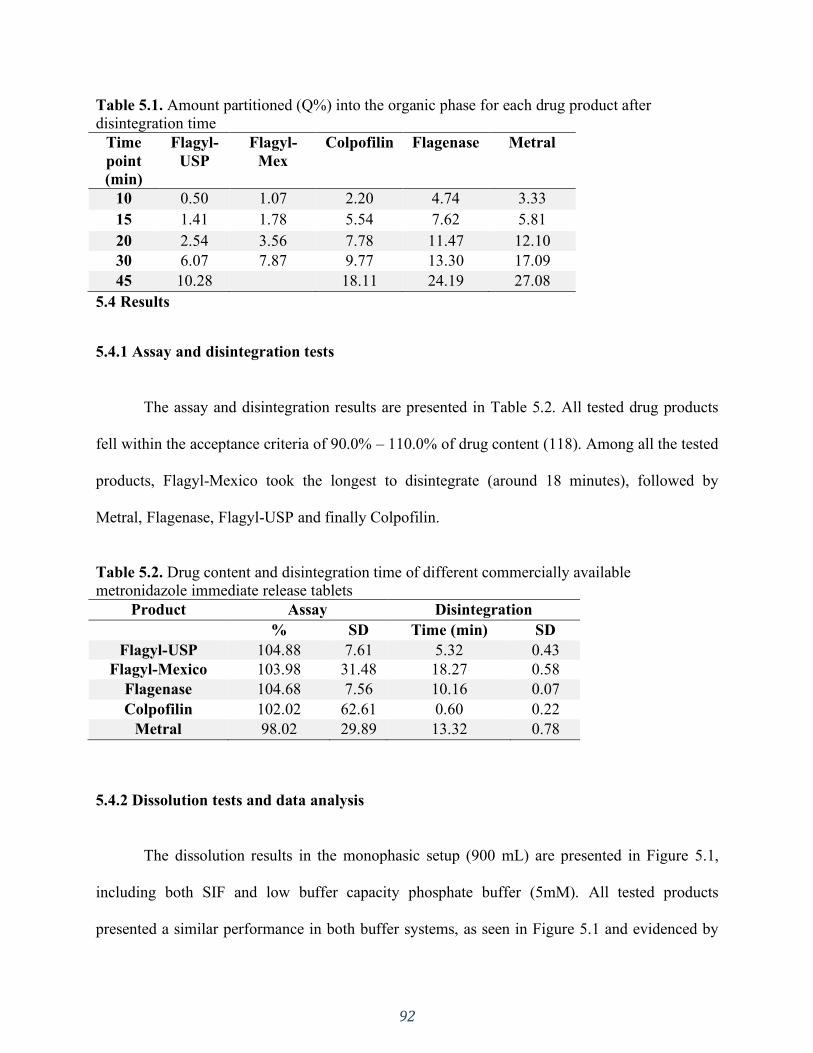
92
Table 5.1. Amount partitioned (Q%) into the organic phase for each drug product after
disintegration time
Time
point
(min)
Flagyl-
USP
Flagyl-
Mex
Colpofilin Flagenase Metral
10 0.50 1.07 2.20 4.74 3.33
15 1.41 1.78 5.54 7.62 5.81
20 2.54 3.56 7.78 11.47 12.10
30 6.07 7.87 9.77 13.30 17.09
45 10.28
18.11 24.19 27.08
5.4 Results
5.4.1 Assay and disintegration tests
The assay and disintegration results are presented in Table 5.2. All tested drug products
fell within the acceptance criteria of 90.0% – 110.0% of drug content (118). Among all the tested
products, Flagyl-Mexico took the longest to disintegrate (around 18 minutes), followed by
Metral, Flagenase, Flagyl-USP and finally Colpofilin.
Table 5.2. Drug content and disintegration time of different commercially available
metronidazole immediate release tablets
Product Assay Disintegration
% SD Time (min) SD
Flagyl-USP 104.88 7.61 5.32 0.43
Flagyl-Mexico 103.98 31.48 18.27 0.58
Flagenase 104.68 7.56 10.16 0.07
Colpofilin 102.02 62.61 0.60 0.22
Metral 98.02 29.89 13.32 0.78
5.4.2 Dissolution tests and data analysis
The dissolution results in the monophasic setup (900 mL) are presented in Figure 5.1,
including both SIF and low buffer capacity phosphate buffer (5mM). All tested products
presented a similar performance in both buffer systems, as seen in Figure 5.1 and evidenced by
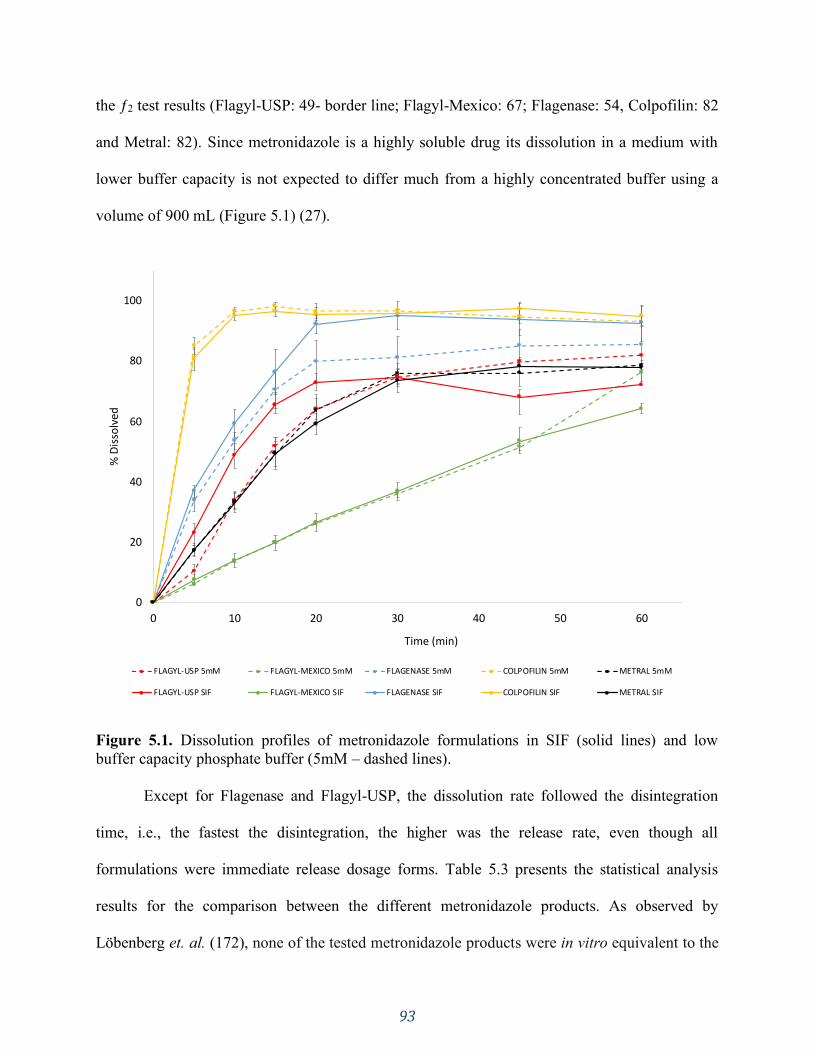
93
the ƒ2 test results (Flagyl-USP: 49- border line; Flagyl-Mexico: 67; Flagenase: 54, Colpofilin: 82
and Metral: 82). Since metronidazole is a highly soluble drug its dissolution in a medium with
lower buffer capacity is not expected to differ much from a highly concentrated buffer using a
volume of 900 mL (Figure 5.1) (27).
Figure 5.1. Dissolution profiles of metronidazole formulations in SIF (solid lines) and low
buffer capacity phosphate buffer (5mM – dashed lines).
Except for Flagenase and Flagyl-USP, the dissolution rate followed the disintegration
time, i.e., the fastest the disintegration, the higher was the release rate, even though all
formulations were immediate release dosage forms. Table 5.3 presents the statistical analysis
results for the comparison between the different metronidazole products. As observed by
Löbenberg et. al. (172), none of the tested metronidazole products were in vitro equivalent to the
0
20
40
60
80
100
0 10 20 30 40 50 60
% D
isso
lved
Time (min)
FLAGYL-USP 5mM FLAGYL-MEXICO 5mM FLAGENASE 5mM COLPOFILIN 5mM METRAL 5mM
FLAGYL-USP SIF FLAGYL-MEXICO SIF FLAGENASE SIF COLPOFILIN SIF METRAL SIF

94
CPP or to other manufacturers in both monophasic dissolution experiments, with one exception
of Flagyl-USP (CPP) and Metral in low buffer capacity (ƒ2=73).
Table 5.3. In-vitro performance comparison between Metronidazole products
USP SIF (ƒ2 test)
Flagyl-USP Flagyl-
Mexico Flagenase Colpofilin
Flagyl-USP NA - - -
Flagyl-
Mexico 24 NA - -
Flagenase 37 16 NA -
Colpofilin 23 10 32 NA
Metral 48 30 32 19
Low buffer capacity (ƒ2 test)
Flagyl-USP NA - - -
Flagyl-
Mexico 28 NA - -
Flagenase 41 20 NA -
Colpofilin 18 09 27 NA
Metral 73 29 41 18
SIF: Simulated Intestinal Fluid; NA: Not applicable; -: repeated.
The biphasic dissolution test results are presented in Figure 5.2. A similar pattern to the
monophasic dissolution test was observed in the aqueous phase, i.e., Colpofilin having the
highest dissolution rate, followed by Flagenase, Flagyl-USP and Metral in the middle and finally,
Flagyl-Mexico. Similarly, the partition profile followed the dissolution trend in aqueous phase
and Metral was an exception.
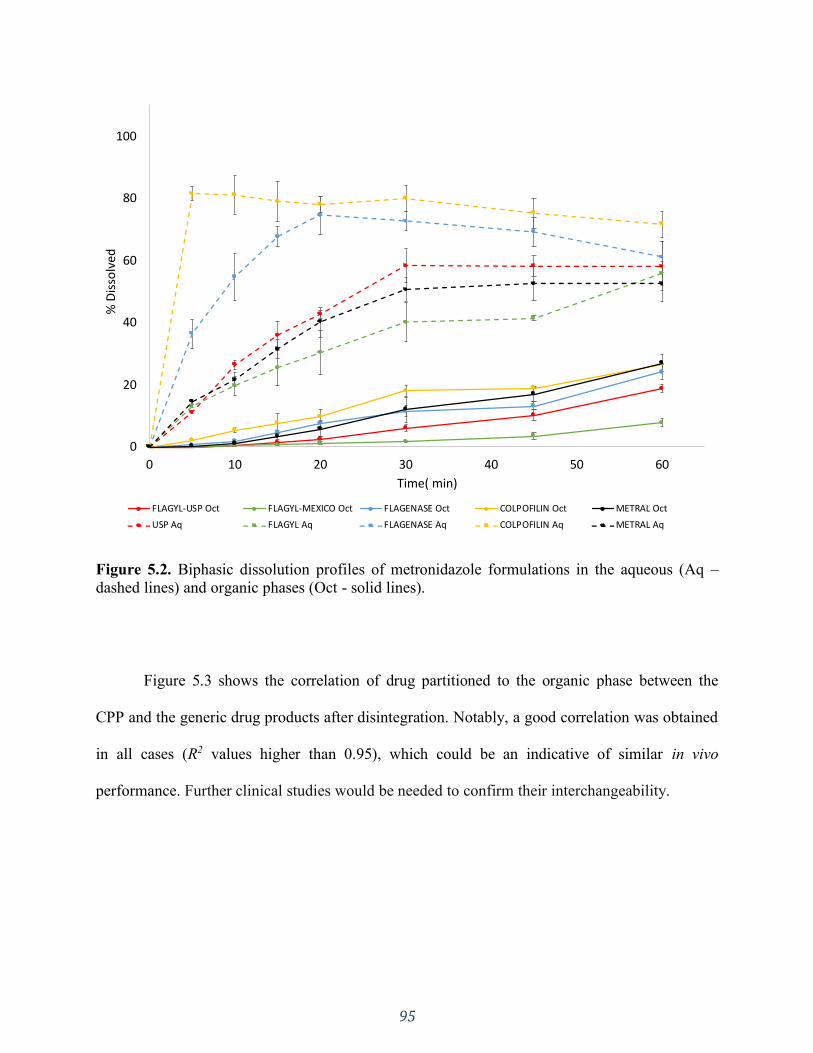
95
Figure 5.2. Biphasic dissolution profiles of metronidazole formulations in the aqueous (Aq –
dashed lines) and organic phases (Oct - solid lines).
Figure 5.3 shows the correlation of drug partitioned to the organic phase between the
CPP and the generic drug products after disintegration. Notably, a good correlation was obtained
in all cases (R2 values higher than 0.95), which could be an indicative of similar in vivo
performance. Further clinical studies would be needed to confirm their interchangeability.
0
20
40
60
80
100
0 10 20 30 40 50 60
% D
isso
lved
Time( min)
FLAGYL-USP Oct FLAGYL-MEXICO Oct FLAGENASE Oct COLPOFILIN Oct METRAL Oct
USP Aq FLAGYL Aq FLAGENASE Aq COLPOFILIN Aq METRAL Aq
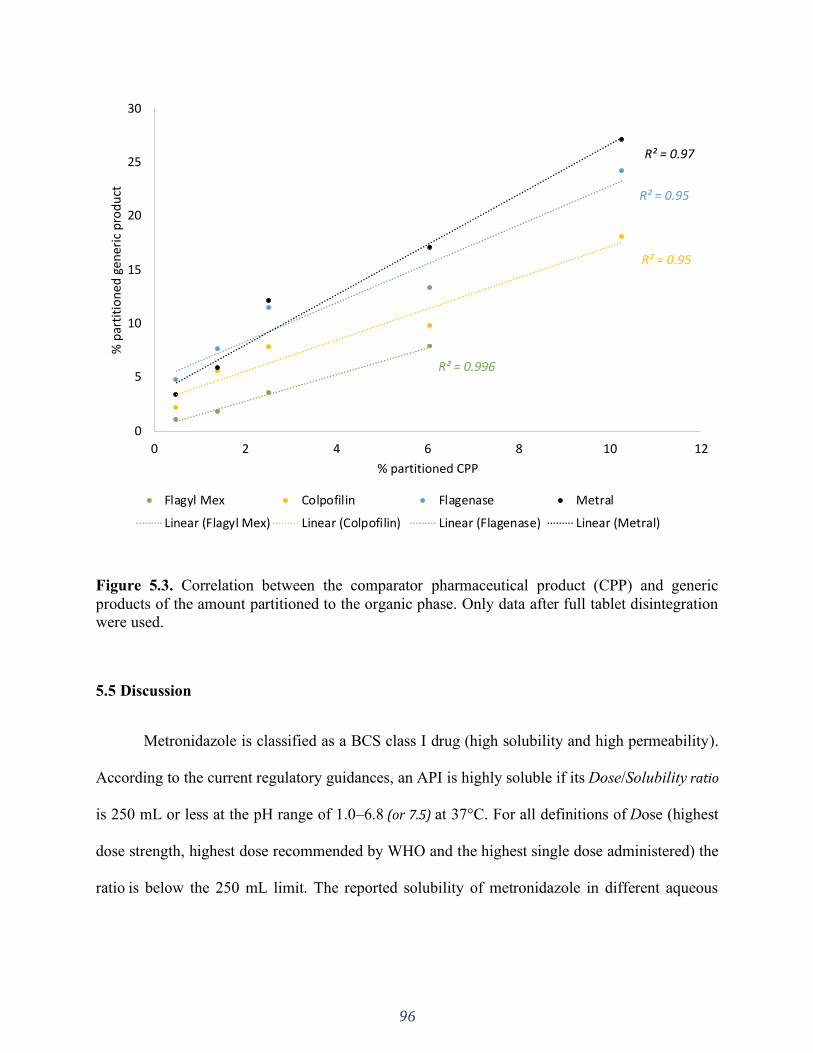
96
Figure 5.3. Correlation between the comparator pharmaceutical product (CPP) and generic
products of the amount partitioned to the organic phase. Only data after full tablet disintegration
were used.
5.5 Discussion
Metronidazole is classified as a BCS class I drug (high solubility and high permeability).
According to the current regulatory guidances, an API is highly soluble if its Dose/Solubility ratio
is 250 mL or less at the pH range of 1.0–6.8 (or 7.5) at 37°C. For all definitions of Dose (highest
dose strength, highest dose recommended by WHO and the highest single dose administered) the
ratio is below the 250 mL limit. The reported solubility of metronidazole in different aqueous
R² = 0.996
R² = 0.95
R² = 0.95
R² = 0.97
0
5
10
15
20
25
30
0 2 4 6 8 10 12
% p
arti
tio
ne
d g
ener
ic p
rod
uct
% partitioned CPP
Flagyl Mex Colpofilin Flagenase Metral
Linear (Flagyl Mex) Linear (Colpofilin) Linear (Flagenase) Linear (Metral)
97
medium at 37°C is 30.6 mg/mL (pH 1.0); 14.1 mg/mL (pH 3.0); 12.8 mg/mL (pH 5.0); 11.6
mg/mL (pH 7.0). The reported log P value for metronidazole is 0.75 for n‐octanol/water (173).
When applying the BCS based biowaiver approach to immediate release dosage forms
containing highly soluble drugs, the in vitro dissolution tests are to be conducted in at least three
pharmacopeial buffer systems of pH 1.2 (SGF), pH 4.5 (acetate buffer) and pH 6.8 (SIF). In all
the aforementioned media, Löbenberg et. al. (172) reported that none of the tested metronidazole
products were in vitro equivalent to the CPP.
According to the USP definition, an IR drug product is “a term for a dosage form in
which no deliberate effort has been made to modify the drug substance release rate”. This
definition lacks any mechanistic information, as pointed out by Uebbing et. al. (120). A
mechanistic understanding of the drug release is of primary importance because in cases in
which the drug release is controlled by the API properties, disintegration is the most important
dosage form attribute. Hence, it could be used as a surrogate test for dissolution testing where the
IR formulation (containing a highly soluble drug) presents a fast disintegration, such as
Colpofilin (0.60 minutes). As shown in Table 5.2 and Figure 5.1, the disintegration time and
release rate were quite different between the formulations. In this case, even though they were all
identified/labelled as IR products, dissolution seems to be controlled by the formulation rather
than the API itself, except for Colpofilin (120).
The similar performance of Colpofilin in both compendial buffer and 5mM phosphate
buffer indicates that buffer capacity does not seem to affect the API’s dissolution, since
metronidazole is freely soluble in aqueous medium. Additionally, the other products’
performance were also not affected by buffer capacity. These results clearly indicate that
aqueous dissolution is overdiscriminating.
98
With this in mind, using a more physiologically relevant dissolution system could be an
additional in vitro testing before rendering the formulations in vitro inequivalent based solely on
the compendial methods. In this study we used a biphasic dissolution system as a physiological
relevant test, applying 5mM phosphate buffer (low buffer capacity) as the aqueous phase and n-
octanol as the organic phase (27). The free drug concentration in the aqueous phase dictates the
amount of drug that partitions to the organic phase, which acts as an “absorptive compartment”,
mimicking the in vivo dissolution-absorption process in the intestinal lumen (27,35,141). Since
the drug is freely soluble in aqueous medium, the lipid dissolution could be the rate determining
step for in vivo performance.
The stomach residence time value for half emptying under fasted state reported in the
literature ranges from 11.5 – 17 minutes (174). The longest disintegration time among the
products was 18 minutes for Flagyl-Mexico. This means that, for all products, most likely the
disintegration will take place within the stomach and metronidazole will be released out of the
formulation and dissolved by the time it gets to the intestines. Hence, in the intestinal lumen,
absorption would be the most important aspect.
In the biphasic test, the organic phase profiles relate to the in vivo absorption. In the same
way that only solubilized drug can be absorbed in vivo, only dissolved API molecules can
partition to the organic phase. Disintegration and dissolution may occur simultaneously with the
release of a drug from the dosage form. The drug particles that are on the surface of the tablet
can be readily dissolved, however disintegration is of utmost importance to release the “bulk
drug” that is in the tablet. Accordingly, as seen in Figure 5.2, even though drug dissolution and
further partitioning can take place before complete disintegration of the dosage form
(disintegration times presented in Table 5.2), the dissolution rate seems to follow disintegration

99
time. Hence, it’s most meaningful to correlate the partition profiles after each formulation after
disintegration time (Figure 5.3). When taking this mechanistic approach great correlation was
obtained between the CPP and the other formulations, which could be an indicator of similar in
vivo performance. However, in order to assess the therapeutic equivalence among these products,
an in vivo BE study should be conducted to corroborate the in vitro similarity in terms of
partitioning profile.
There are many studies reporting the application of biphasic dissolution for poorly
soluble drugs in various dosage forms (e.g., capsule, tablet, solution, suspension, etc.) with
higher discriminating capacity, as well as better in vitro in vivo relationships (135). However,
there are not many studies using this model applied to BCS class I drugs, due to the good
solubility of such drugs and the assumption that pharmacopeial methods might be sufficient to
discriminate between biopharmaceutical properties. Hence, the results of the present study
broaden the application of biphasic dissolution demonstrating that it is a plausible alternative for
highly soluble drugs.
In the case of poorly soluble drugs, the organic phase acts as an additional sink as the
drug is removed from the aqueous phase, preventing aqueous saturation. Since metronidazole is
a highly soluble drug, the drug removal from the aqueous phase had low to neglectable effects on
the aqueous dissolution. It was then further evidenced that for most products the formulation was
the factor of pivotal importance in controlling the dissolution rate. After disintegration,
metronidazole quickly dissolves, and permeability is then the most crucial aspect. A mechanistic
formulation evaluation and understanding of the dissolution controlling factors together with the
understanding of the in vivo events highlights that biphasic systems might be also used for highly
soluble drugs. Our results delineate the potential in vitro equivalence between different
100
manufacturers and CPP, indicating that the compendial methods utilized previously might have
been overdiscriminating and can be further optimized.
5.6 Conclusion
None of the tested metronidazole products demonstrated in vitro equivalence to the CPP
in the monophasic dissolution methods, i.e. SIF and physiological buffer capacity. Hence, the
monophasic aqueous systems seem to be overdiscriminating. On the other hand, the correlation
of the organic phase of the biphasic system did present a similar partitioning pattern for all the
different drug products and CPP, which could indicate in vitro equivalence. The application of
biphasic dissolution to highly soluble drug and formulations has beneficial attributes to estimate
the in vitro behavior and performance. Further in vitro studies with other products are needed to
confirm and refine these findings. An in vivo BE study is needed to assess the therapeutic
equivalence among these products.
101
SECTION THREE: PHYSIOLOGICALLY RELEVANT IN VITRO
TESTING: BICARBONATE BUFFER
CHAPTER SIX
Simulated, biorelevant, clinically relevant or physiologically relevant dissolution
media: The hidden role of bicarbonate buffer
A version of this chapter is published in:
Eur J Pharm Biopharm. 2019;142:8–19. https://doi.org/10.1016/j.ejpb.2019.06.006
Reprinted from reference (28).
102
6.1 Introduction
In-vitro dissolution testing of pharmaceutical formulations has been used as a quality
control test for many years. During the drug development process, it is often used to optimize
formulations according to a desired release profile (68). Additionally, dissolution experiments
can also be used with a prognostic purpose of the dosage form's performance in the
gastrointestinal tract, known as in vivo predictive dissolution testing (13). Drug dissolution in the
gastrointestinal (GI) fluids is a prerequisite for drug absorption and subsequent pharmacokinetic
and pharmacodynamic response. An in vitro dissolution test reflects the in vivo performance of a
drug product when the in vitro dissolution rate is corresponding to the in vivo dissolution rate.
This is the basis to establish an in vitro-in vivo relationship/ correlation (IVIVR/ IVIVC) (20).
At early drug product development, in vivo predictive dissolution testing can be used for
guidance to rational selection of candidate formulations that best fit the desired in vivo
dissolution characteristics. Such an approach can later serve as a surrogate for clinical studies by
requesting a biowaiver.
In order to achieve this, in vitro dissolution test methods of oral products should be
reflective of the in vivo situation, establishing conditions that closely reflect the physiological
environment of the gastrointestinal tract (GIT) (20). Nevertheless, this is rather difficult to
achieve in practice due to the inherent physiological complexity and variability of the GIT.
Gastrointestinal transit time, unsteady hydrodynamics and changing fluid contents are a complex
physiological system to attempt to experimentally mimic (20,43,53,175–177). It is important for
the predictive in vitro dissolution test media to closely match the pH, buffer species and
concentration, bile salts/ lipid content, electrolytes and enzymes of the GI fluids (20).
103
At present, the most widely applied dissolution media are phosphate-based buffers and, in
some cases, the result of dissolution tests performed in such media have demonstrated
reasonable/acceptable IVIVCs (19,20,68). This is true for dosage forms in which the choice of
dissolution buffer is essential in achieving IVIVC. However, the concentration of phosphates in
human GI luminal fluids is insignificant, which makes the use of such phosphate-containing
media poorly representative of the in vivo environment. Thus, these media might fail to reflect in
vivo characteristics including ionic strength, buffer capacity, fluid volume and viscosity
(41,52,176,178).
The gastrointestinal lumen has long been shown to be buffered by bicarbonate, which
maintains the pH gradient along the GIT (20,69). Hence, much interest has been drawn to the
development of suitable biorelevant in vitro dissolution media (20,42,179–182). This review
focuses on the use of bicarbonate-based buffer in clinically relevant dissolution tests and as a
potentially biorelevant media as well as key determinants to in vivo predictive dissolution testing.
6.2 Intestinal lumen environment - What are we trying to reproduce in a dissolution vessel?
6.2.1 Physiology overview of gastrointestinal secretions
There are different anatomical components that make up the gastrointestinal tract with
different functions, such as production of mucus and secretion of digestive enzymes. Complex
glands and organs (salivary glands, pancreas and liver) assist with the digestion and
emulsification of food. Secretions coming from the pancreas and the liver are emptied into the
upper part of the small intestine (duodenum) through the pancreatic and hepatic duct. These two
ducts join together immediately before the duodenum.
The pancreatic secretions are composed of various digestive enzymes and a large volume
of sodium bicarbonate solution. The bicarbonate ions are important in neutralizing the acidity of
104
the content coming from the stomach (132). On the other hand, the hepatic secretions are
primarily composed of bile. When secreted into the duodenum, the bile plays an important role
in fat digestion and absorption. Similarly to the pancreatic secretion, a sodium bicarbonate
solution is added to the initial bile (132). This solution is secreted by epithelial cells in the ducts.
This additional quantity of bicarbonate ions supplement the bicarbonate ions in the pancreatic
secretion for neutralizing the acid that empties into the duodenum from the stomach.
In addition to the hepatic and pancreatic secretion, the intestinal fluids are also composed
of secretions by the epithelial cells of the duodenum. These secretions are an alkaline mucus to
protect the duodenal wall from the highly acidic gastric juices. This mucus contains a large
excess of bicarbonate ions, which adds to the bicarbonate ions from pancreatic and hepatic
secretion in neutralizing the hydrochloric acid entering the duodenum from the stomach
(69,149,183–188).
Consequently, the net result is in the duodenum follows the neutralization equation
(Equation 6-1):
CO2 (g)
⇅
HCl+NaHCO3→ NaCl + H2O(l) + CO2(aq) ⇄ H2CO3(aq) ⇄ H+(aq) + HCO3
-(aq) (Equation 6-
1)
The carbonic acid promptly dissociates into carbon dioxide (CO2) and water. The CO2 can
be absorbed into the systemic circulation and released through the respiratory system. In this
way, a neutral solution of sodium chloride is left in the duodenum and the acid contents from
the stomach become neutralized (149).This results in an overall effect where the luminal fluids
of the small intestine are predominantly buffered by bicarbonate (72).
105
6.3 Buffer species - In vitro considerations
Even though the human small intestinal fluid is buffered primarily by bicarbonate buffer,
this buffer has been rarely used in dissolution studies (148,189). This is mainly due to the
challenges involved with carrying dissolutions tests using bicarbonate buffer.
6.3.1 Peculiarities of the bicarbonate buffer
In a bicarbonate buffer system, carbon dioxide (CO2) has an inherent tendency to leave
the aqueous solution (Equation 6-1) and, consequently, the medium has to be continuously
purged with CO2 gas at a constant rate. This maintains the concentration of CO2(aq) in solution in
an equilibrium with HCO3-, avoiding a pH increase (148,189). Additionally, both the escape and
sparging of CO2(g) in the medium can potentially form bubbles in the medium, which can affect
the dissolution process by building bubbles on the surface of the dosage form or powder particles
and altering surface tension.
Different models of physiological bicarbonate buffers have been proposed, such as Hanks
and Krebs buffers, varying in composition (Table 6.1) (19). Hanks buffer composition is similar
to the proximal small intestine with respect to electrolyte composition. Nevertheless,
modifications to the Hanks balanced salt solution (pH 7.4) is needed to match the physiological
pH of 6.8 and to adjust its low buffer capacity (1 mmol/L/ΔpH) to the human jejunal fluids
(3.2mmol/L/ΔpH) (72,190). This can be accomplished by following the Henderson–Hasselbalch
equation (Equation 6-2), i.e. adjusting the concentration of the acid (H2CO3) and its conjugate
base (HCO3-) by purging CO2(g) into the medium, which shifts the equilibrium (Equation 6-1)
towards formation of H2CO3 (aq), thus decreasing the pH of the buffer system (71,72,76,190,191).

106
Table 6.1. Composition of different bicarbonate buffer systems
Buffer component (mM) Hanks buffer
(19)
Krebs buffer
(190)
KH2PO4 1.18 0.441
Na2HPO4.2H2O - 0.337
NaHCO3 24.97 4.17
NaCl 118.07 136.99
KCl 4.69 5.37
CaCl2 2.52 1.26
MgSO4.7H2O 1.18 0.812
Ionic Strength 0.161 0.155
Buffer Capacity (mmol/L/ΔpH) 3.7 1.0
𝑝𝐻 = 𝑝𝐾𝑎 + 𝑙𝑜𝑔[𝐻𝐶𝑂3
−]
p𝐶𝑂2 (Equation 6-2)
Another example of bicarbonate-based buffer is the Krebs buffer, which has a different
salt composition and buffer capacity than Hanks buffer (Table 6.1) (190). Krebs buffer resembles
the distal small intestine and approximates the ionic composition and buffer capacity of human
small intestinal luminal fluids (19,71). Nevertheless, the system still has to be stabilized in terms
of maintaining the pH and CO2(aq). Purging CO2(g) into the medium is one way of accomplishing
it. Garbacz et. al. investigated the pH shift caused by CO2 loss in different bicarbonate buffer
systems, including Krebs buffer. The authors reported that the evaporated CO2 can be partly
substituted by sparging the bicarbonate buffer with gas mixtures, such as 5% (vol/vol) CO2 and
N2 (191). When appropriate partial pressure of CO2 is applied, such purging maintains the
bicarbonate equilibrium in the buffer solution, which, in turn, prevents the upward shift in pH.
Another way to maintain the desired pH level is to prevent the CO2 escape. Fadda et. al. (2009)
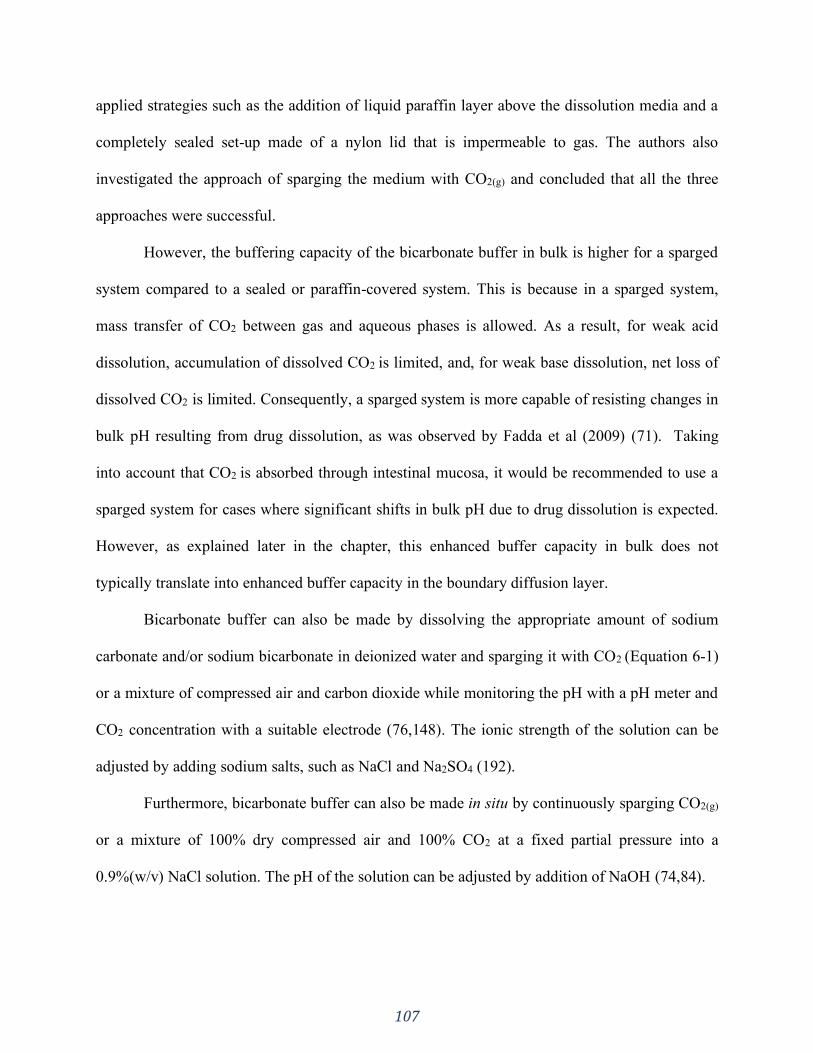
107
applied strategies such as the addition of liquid paraffin layer above the dissolution media and a
completely sealed set-up made of a nylon lid that is impermeable to gas. The authors also
investigated the approach of sparging the medium with CO2(g) and concluded that all the three
approaches were successful.
However, the buffering capacity of the bicarbonate buffer in bulk is higher for a sparged
system compared to a sealed or paraffin-covered system. This is because in a sparged system,
mass transfer of CO2 between gas and aqueous phases is allowed. As a result, for weak acid
dissolution, accumulation of dissolved CO2 is limited, and, for weak base dissolution, net loss of
dissolved CO2 is limited. Consequently, a sparged system is more capable of resisting changes in
bulk pH resulting from drug dissolution, as was observed by Fadda et al (2009) (71). Taking
into account that CO2 is absorbed through intestinal mucosa, it would be recommended to use a
sparged system for cases where significant shifts in bulk pH due to drug dissolution is expected.
However, as explained later in the chapter, this enhanced buffer capacity in bulk does not
typically translate into enhanced buffer capacity in the boundary diffusion layer.
Bicarbonate buffer can also be made by dissolving the appropriate amount of sodium
carbonate and/or sodium bicarbonate in deionized water and sparging it with CO2 (Equation 6-1)
or a mixture of compressed air and carbon dioxide while monitoring the pH with a pH meter and
CO2 concentration with a suitable electrode (76,148). The ionic strength of the solution can be
adjusted by adding sodium salts, such as NaCl and Na2SO4 (192).
Furthermore, bicarbonate buffer can also be made in situ by continuously sparging CO2(g)
or a mixture of 100% dry compressed air and 100% CO2 at a fixed partial pressure into a
0.9%(w/v) NaCl solution. The pH of the solution can be adjusted by addition of NaOH (74,84).
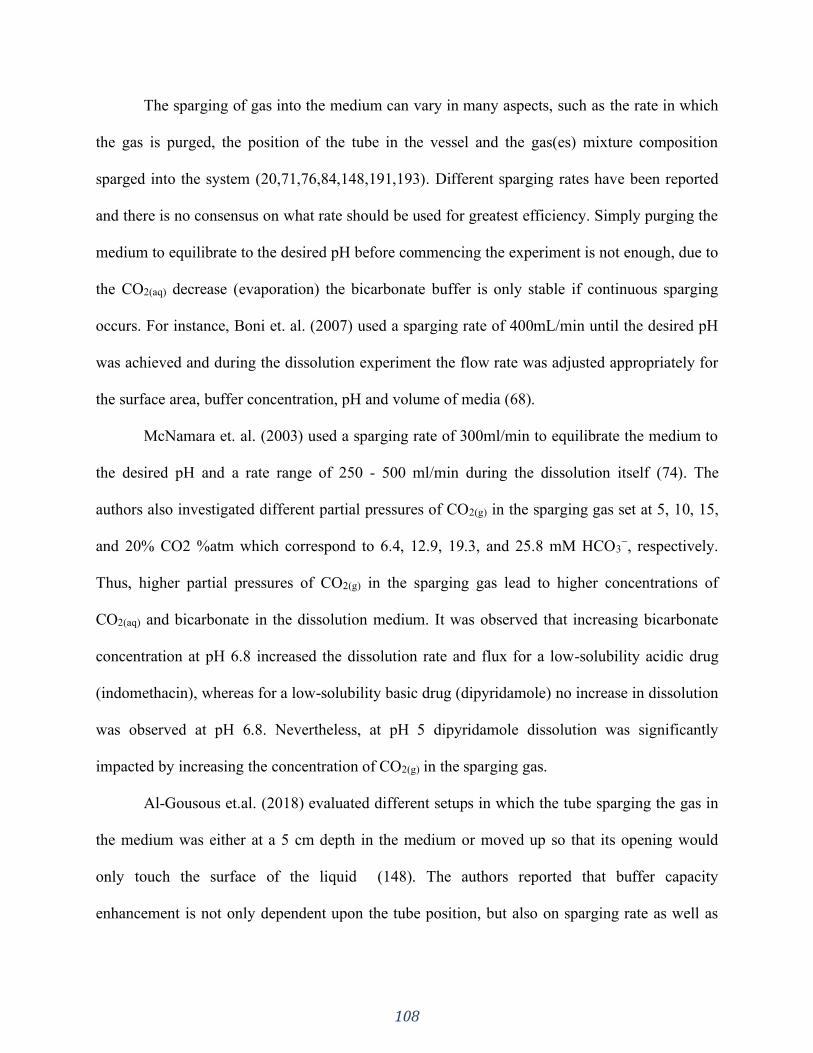
108
The sparging of gas into the medium can vary in many aspects, such as the rate in which
the gas is purged, the position of the tube in the vessel and the gas(es) mixture composition
sparged into the system (20,71,76,84,148,191,193). Different sparging rates have been reported
and there is no consensus on what rate should be used for greatest efficiency. Simply purging the
medium to equilibrate to the desired pH before commencing the experiment is not enough, due to
the CO2(aq) decrease (evaporation) the bicarbonate buffer is only stable if continuous sparging
occurs. For instance, Boni et. al. (2007) used a sparging rate of 400mL/min until the desired pH
was achieved and during the dissolution experiment the flow rate was adjusted appropriately for
the surface area, buffer concentration, pH and volume of media (68).
McNamara et. al. (2003) used a sparging rate of 300ml/min to equilibrate the medium to
the desired pH and a rate range of 250 - 500 ml/min during the dissolution itself (74). The
authors also investigated different partial pressures of CO2(g) in the sparging gas set at 5, 10, 15,
and 20% CO2 %atm which correspond to 6.4, 12.9, 19.3, and 25.8 mM HCO3−, respectively.
Thus, higher partial pressures of CO2(g) in the sparging gas lead to higher concentrations of
CO2(aq) and bicarbonate in the dissolution medium. It was observed that increasing bicarbonate
concentration at pH 6.8 increased the dissolution rate and flux for a low-solubility acidic drug
(indomethacin), whereas for a low-solubility basic drug (dipyridamole) no increase in dissolution
was observed at pH 6.8. Nevertheless, at pH 5 dipyridamole dissolution was significantly
impacted by increasing the concentration of CO2(g) in the sparging gas.
Al-Gousous et.al. (2018) evaluated different setups in which the tube sparging the gas in
the medium was either at a 5 cm depth in the medium or moved up so that its opening would
only touch the surface of the liquid (148). The authors reported that buffer capacity
enhancement is not only dependent upon the tube position, but also on sparging rate as well as

109
the titration rate. Accordingly, Boni et. al. (2007) conducted the dissolution experiments
supplying the carbon dioxide above the liquid level to avoid noticeable bubble formation in the
medium caused by inflow and evaporation of gas (68). Both authors reported that finer bubbles
can be produced by using a gas inlet frit instead of direct sparging.
6.3.1.1 Automated systems
Different automated systems to monitor the pH and regulate bicarbonate buffers have
been proposed in the literature. Garbacz et. al. (2013) developed a device called “pHysio-stat®”
to adjust the bicarbonate buffer pH in a dissolution vessel (191). The system is composed of a pH
electrode, a gas diffuser, a digital microcontroller and a valve system, as illustrated in Figure 6.1.
In this setup the pH electrode and the gas diffuser remain at a 35mm depth in the medium during
the dissolution test. Throughout the experiment, the potential of the electrode is measured and
the CO2 introduced into the dissolution medium via the diffuser is regulated accordingly.
The authors concluded that the pHysio-stat® system was able to monitor and adjust the
pH in bicarbonate buffers, thus being a useful tool for routine applications in dissolution tests
based on bicarbonate buffers.
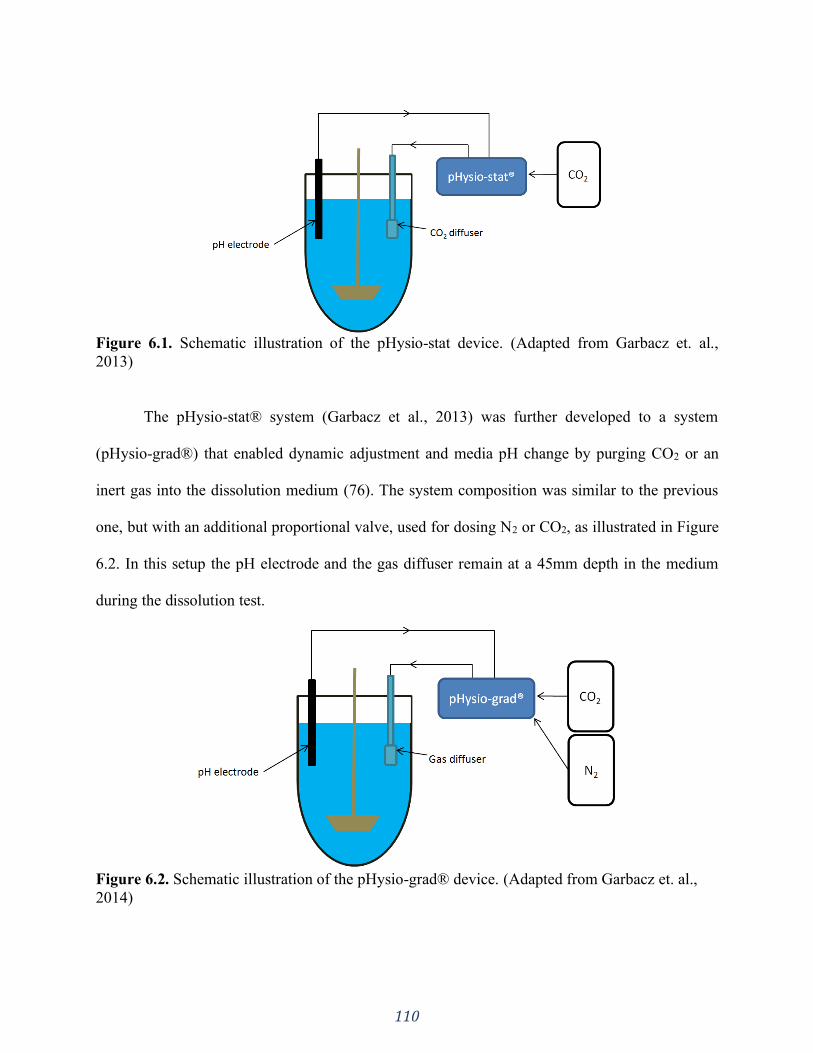
110
Figure 6.1. Schematic illustration of the pHysio-stat device. (Adapted from Garbacz et. al.,
2013)
The pHysio-stat® system (Garbacz et al., 2013) was further developed to a system
(pHysio-grad®) that enabled dynamic adjustment and media pH change by purging CO2 or an
inert gas into the dissolution medium (76). The system composition was similar to the previous
one, but with an additional proportional valve, used for dosing N2 or CO2, as illustrated in Figure
6.2. In this setup the pH electrode and the gas diffuser remain at a 45mm depth in the medium
during the dissolution test.
Figure 6.2. Schematic illustration of the pHysio-grad® device. (Adapted from Garbacz et. al.,
2014)
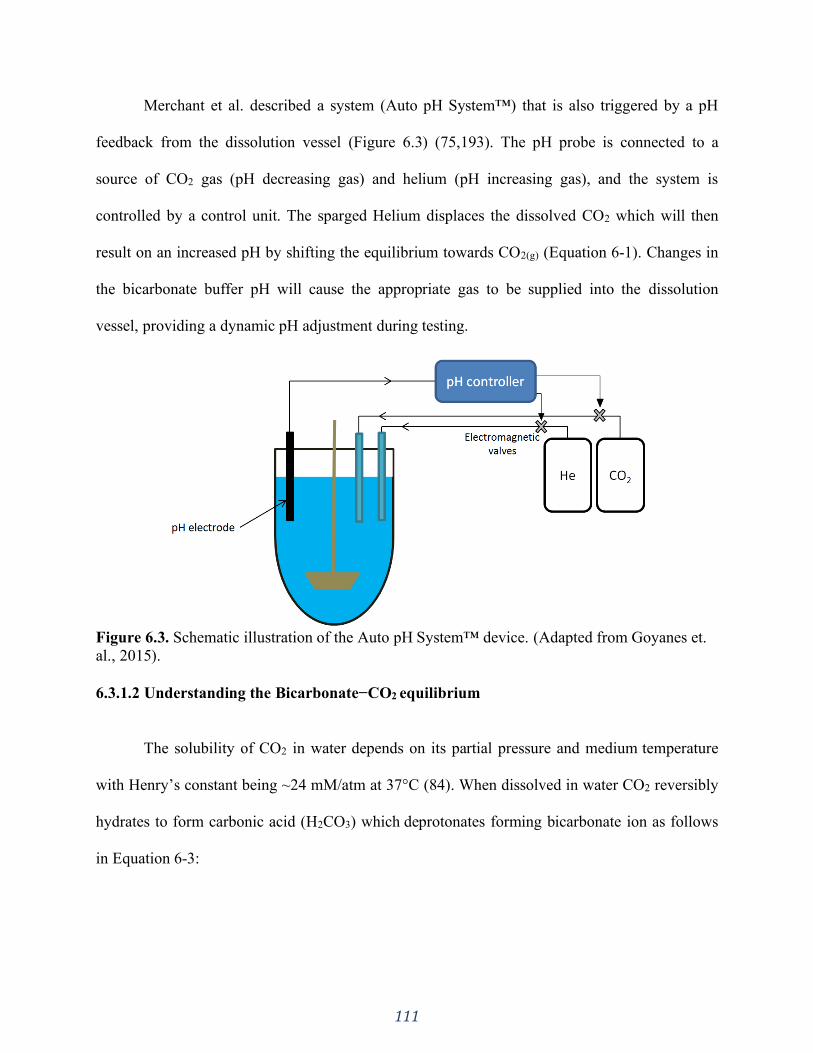
111
Merchant et al. described a system (Auto pH System™) that is also triggered by a pH
feedback from the dissolution vessel (Figure 6.3) (75,193). The pH probe is connected to a
source of CO2 gas (pH decreasing gas) and helium (pH increasing gas), and the system is
controlled by a control unit. The sparged Helium displaces the dissolved CO2 which will then
result on an increased pH by shifting the equilibrium towards CO2(g) (Equation 6-1). Changes in
the bicarbonate buffer pH will cause the appropriate gas to be supplied into the dissolution
vessel, providing a dynamic pH adjustment during testing.
Figure 6.3. Schematic illustration of the Auto pH System™ device. (Adapted from Goyanes et.
al., 2015).
6.3.1.2 Understanding the Bicarbonate−CO2 equilibrium
The solubility of CO2 in water depends on its partial pressure and medium temperature
with Henry’s constant being ~24 mM/atm at 37°C (84). When dissolved in water CO2 reversibly
hydrates to form carbonic acid (H2CO3) which deprotonates forming bicarbonate ion as follows
in Equation 6-3:
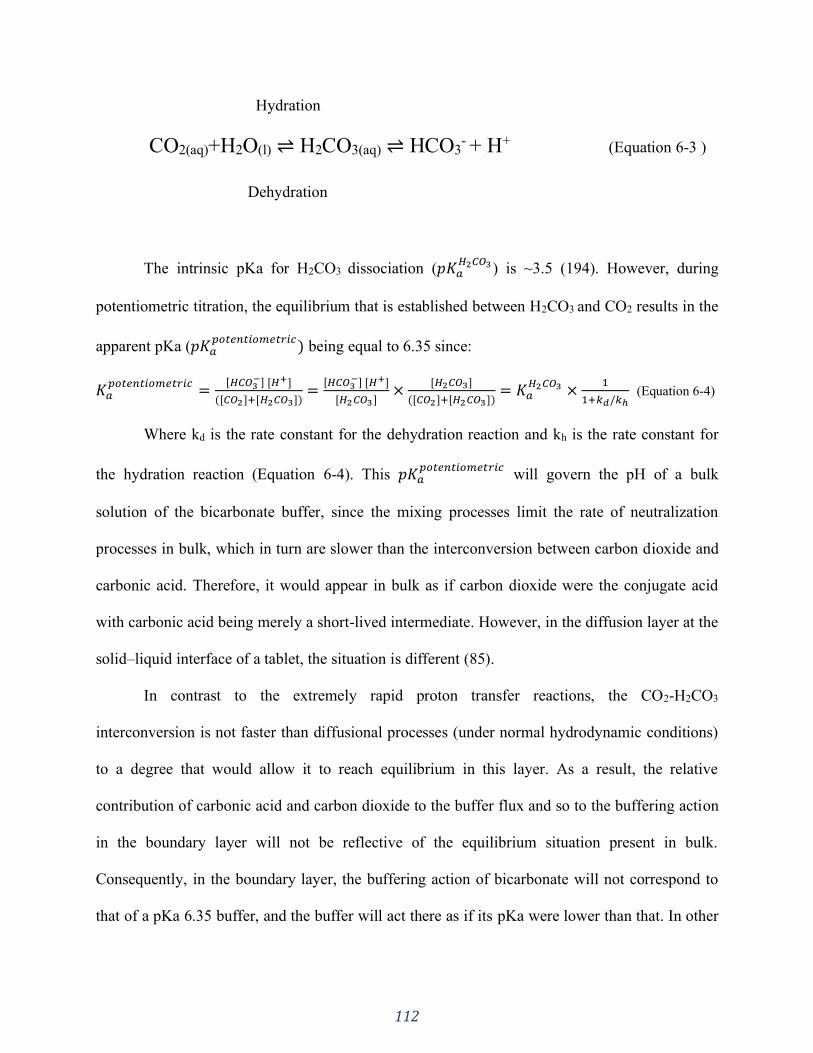
112
Hydration
CO2(aq)+H2O(l) ⇌ H2CO3(aq) ⇌ HCO3- + H+ (Equation 6-3 )
Dehydration
The intrinsic pKa for H2CO3 dissociation (𝑝𝐾𝑎𝐻2𝐶𝑂3 ) is ~3.5 (194). However, during
potentiometric titration, the equilibrium that is established between H2CO3 and CO2 results in the
apparent pKa (𝑝𝐾𝑎𝑝𝑜𝑡𝑒𝑛𝑡𝑖𝑜𝑚𝑒𝑡𝑟𝑖𝑐
) being equal to 6.35 since:
𝐾𝑎𝑝𝑜𝑡𝑒𝑛𝑡𝑖𝑜𝑚𝑒𝑡𝑟𝑖𝑐
=[𝐻𝐶𝑂3
−] [𝐻+]
([𝐶𝑂2]+[𝐻2𝐶𝑂3])=
[𝐻𝐶𝑂3−] [𝐻+]
[𝐻2𝐶𝑂3]×
[𝐻2𝐶𝑂3]
([𝐶𝑂2]+[𝐻2𝐶𝑂3])= 𝐾𝑎
𝐻2𝐶𝑂3 ×1
1+𝑘𝑑/𝑘ℎ (Equation 6-4)
Where kd is the rate constant for the dehydration reaction and kh is the rate constant for
the hydration reaction (Equation 6-4). This 𝑝𝐾𝑎𝑝𝑜𝑡𝑒𝑛𝑡𝑖𝑜𝑚𝑒𝑡𝑟𝑖𝑐
will govern the pH of a bulk
solution of the bicarbonate buffer, since the mixing processes limit the rate of neutralization
processes in bulk, which in turn are slower than the interconversion between carbon dioxide and
carbonic acid. Therefore, it would appear in bulk as if carbon dioxide were the conjugate acid
with carbonic acid being merely a short-lived intermediate. However, in the diffusion layer at the
solid–liquid interface of a tablet, the situation is different (85).
In contrast to the extremely rapid proton transfer reactions, the CO2-H2CO3
interconversion is not faster than diffusional processes (under normal hydrodynamic conditions)
to a degree that would allow it to reach equilibrium in this layer. As a result, the relative
contribution of carbonic acid and carbon dioxide to the buffer flux and so to the buffering action
in the boundary layer will not be reflective of the equilibrium situation present in bulk.
Consequently, in the boundary layer, the buffering action of bicarbonate will not correspond to
that of a pKa 6.35 buffer, and the buffer will act there as if its pKa were lower than that. In other
113
words, the apparent effective pKa governing the buffering action of bicarbonate in the diffusion
layer will not be the potentiometrically determined value of 6.35 but lower. According to a
recently published model this apparent effective pKa (at 37°C and ionic strength of 0.15 M)
would be equal to (85):
pKa = 3.3 + log (1 +𝐷𝐶𝑂2
𝐷𝐻2𝐶𝑂3
×𝑘𝑑
𝑘ℎ+(2𝐷𝐶𝑂2
ℎ2 )) ) (Equation 6-5)
Where 𝐷𝐶𝑂2 and 𝐷𝐻2𝐶𝑂3
are the diffusion coefficients of carbon dioxide and carbonic acid
respectively and h is the boundary layer thickness (Equation 6-5).
Accordingly, its buffering capacity in the diffusion layer against the dissolving
drug/excipient will be lower, since the effective pKa values is shifted away from the intestinal
pH range of 6-7.5. This means that while the buffer capacity of bicarbonate is enhanced in bulk,
it is weakened in the diffusion layer, which further adds to the complexity of the system. This is
of particular significance for enteric coated dosage forms. For, based on the equation above, in a
30 micron-thick diffusion layer, the apparent effective pKa of bicarbonate would be around 4.6,
which will make it difficult for proximal intestinal bicarbonate molarities to maintain the surface
of a dissolving enteric polymer at pH values exceeding 5.5. Therefore, obtaining prompt release
from enteric-coated dosage forms at bicarbonate molarities present in the proximal small
intestine is difficult as shown by data in literature (78).
6.3.2 Phosphate buffer
Dissolution testing for quality control (QC) as a performance test is used to ensure lot-to-
lot consistency and batch compliance to the defined specifications for the drug product
(26,195,196). For this purpose, compendial dissolution media (simple media), such as phosphate
buffers, are used in most cases (195,197). Nevertheless, considering the concept of biorelevant
114
media, phosphate buffers are not physiologically relevant, since the buffering system in the
human intestines is bicarbonate-based. Even though, many phosphate-based dissolution media
have been proposed to be biorelevant, such as the USP simulated intestinal fluids (SIFs) (Table
6.2), which were developed to simulate the GI pH and bile salts concentration (discussed in the
next section) (20,42,177,179–182). According to the FDA, simulated intestinal fluid with
pancreatin (USP-SIF) and without enzyme (SIF-blank) better reflect the physiologic conditions
of the small intestine than other buffers (19,51).
The different pharmacopoeias recommend different salts to make buffers. In the USP,
SIF-blank and phosphate buffer pH 6.8 are made with the potassium salt, whereas the
International Pharmacopoeia (Ph. Int.) recommends the use of sodium salt (195,198).
Nevertheless, osmolality, ionic strength, and buffer capacity are similar between these buffers, as
shown by Stippler et al. (198). The author considered the media to be interchangeable for the
dissolution test of the tested drugs (ibuprofen, metronidazole, and indomethacin - immediate-
release solid oral dosage form). Substitution of the two cations (Na+ and K+) is only necessary
in cases where solubility is known to be affected by the cation. This is also true for surfactant
containing media. Ropers et al. reported that surfactant precipitation can occur as a result of
counter-ion interaction. The use of sodium buffer instead of a potassium buffer seems to avoid
this issue (19,199). The counterion effect on surfactants has a lot to do with their micelle
formation in aqueous media. The counterions of surfactant polar head groups have strong
influence on their packing and thermodynamic behavior because each particular type of
counterion possess different binding energy to the respective head group, causing structural
changes which affect the surfactant self-assembly process.
115
The disintegration of HPMC (Hydroxypropyl methylcellulose) capsules containing
carrageenan as gelling agent is also affected by the type of cation used in the buffer. Potassium
ions are a gelling promoter for carrageenan, which causes delay in capsule opening along with
increased variability of dissolution. Hence, the presence of potassium cations in the dissolution
media hinders drug release from such capsules (200–203). This issue can be easily overcome by
avoiding the use of potassium salt in the test media.
Almukainzi et.al. reported the impact on disintegration time of cellulose-based hard shell
capsules based on the use of sodium and potassium buffers and SIF. Different salts caused
different disintegration times of capsules, which will likely cause differences in dissolution
behavior (114).
Furthermore, adding enzymes to the dissolution medium can be technically challenging
when testing gelatin capsules. Gelatin can cross-link in the presence of aldehydes, or in high
temperature and humidity conditions. Cross-linking is characterized by a covalent bonding
between gelatin chains which creates water insoluble pellicles/ membranes on the internal or
external surface of the capsule shell during the dissolution test. Cross-linking can cause slower
drug release from the gelatin capsule or even no release altogether. Several examples of cross-
linking are reported in the literature (125,204–206).
6.3.2.1 Biorelevant media
As mentioned before, biorelevant media were made to simulate the GI tract pH and
components likely to be found in the human GI tract, such as bile salts and lecithin. Osmolality,
pH and surface tension are adapted to physiological values (207). Food can have an impact on a
drug’s in vivo dissolution and further absorption. In the fed state the physiological environment
116
of the GIT differs in many ways, such as prolonged gastric emptying time, increased stomach
pH, increased bile secretion into the small intestine, and increased hepatic blood flow, which can
affect drug metabolism. In order to obtain meaningful in vitro dissolution results, the media used
should reflect the in vivo dissolution environment and account for such factors and changes
(208).
In 1998, Dressman et. al. proposed the first generation of biorelevant media know as
fasted state simulated intestinal fluid and fed state simulated intestinal fluid (FaSSIF and FeSSIF,
respectively) (Table 6.2).The dissolution tests performed using such media aimed to be an in
vitro method that would serve as a surrogate for in vivo release (29,195). Later on FaSSIF and
FeSSIF were updated and are now described as FaSSIF-V2 and FeSSIF-V2 (19,209)(Table 6.2).
FaSSIF-V2 contains a reduced amount of lecithin (195,210) and FeSSIF-V2 contains two
additional digestion components: glyceryl monooleate and sodium oleate.
Biorelevant media has been used both in solubility tests and dissolution experiments (19).
Several studies have reported successful in vitro/in vivo correlations (IVIVC) using biorelevant
media for poorly soluble drugs. Biorelevant media seems to be able to mimic the in vivo
dissolution more effectively compared to other media (24,54,211,212). On the other hand, the
purity of the surfactants present in biorelevant media highly impact the solubility and dissolution
of certain drugs (213,214). Other factors such as the preparation methods can also impact the
dissolution testing results. Kloefer et al. investigated different media preparation methods and
observed that standard preparation methods resulted in reproducible dissolution profiles.
However, the different methods yielded differences in the micelle sizes which may impact the
dissolution behavior of other drugs (215). The current composition of biorelevant media falls
deficient in some aspects, such as the fact that only taurocholic acid is present as the only bile
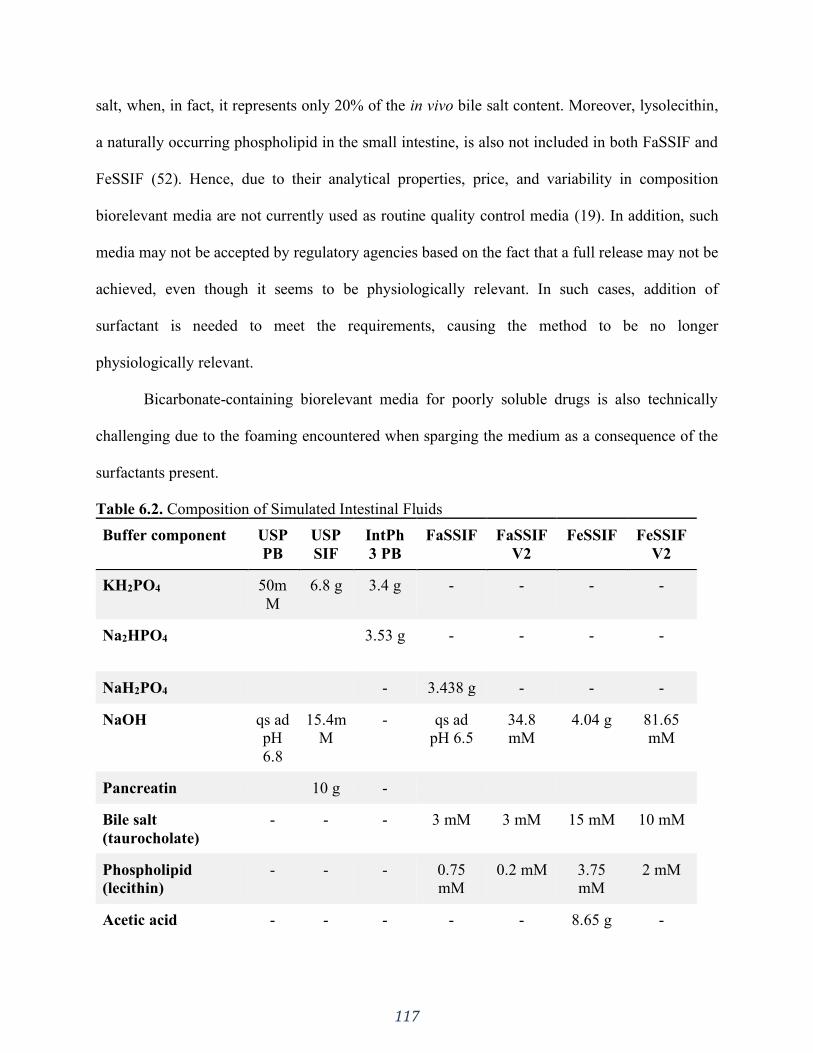
117
salt, when, in fact, it represents only 20% of the in vivo bile salt content. Moreover, lysolecithin,
a naturally occurring phospholipid in the small intestine, is also not included in both FaSSIF and
FeSSIF (52). Hence, due to their analytical properties, price, and variability in composition
biorelevant media are not currently used as routine quality control media (19). In addition, such
media may not be accepted by regulatory agencies based on the fact that a full release may not be
achieved, even though it seems to be physiologically relevant. In such cases, addition of
surfactant is needed to meet the requirements, causing the method to be no longer
physiologically relevant.
Bicarbonate-containing biorelevant media for poorly soluble drugs is also technically
challenging due to the foaming encountered when sparging the medium as a consequence of the
surfactants present.
Table 6.2. Composition of Simulated Intestinal Fluids
Buffer component USP
PB
USP
SIF
IntPh
3 PB
FaSSIF FaSSIF
V2
FeSSIF FeSSIF
V2
KH2PO4 50m
M
6.8 g 3.4 g - - - -
Na2HPO4 3.53 g - - - -
NaH2PO4 - 3.438 g - - -
NaOH qs ad
pH
6.8
15.4m
M
- qs ad
pH 6.5
34.8
mM
4.04 g 81.65
mM
Pancreatin 10 g -
Bile salt
(taurocholate)
- - - 3 mM 3 mM 15 mM 10 mM
Phospholipid
(lecithin)
- - - 0.75
mM
0.2 mM 3.75
mM
2 mM
Acetic acid - - - - - 8.65 g -
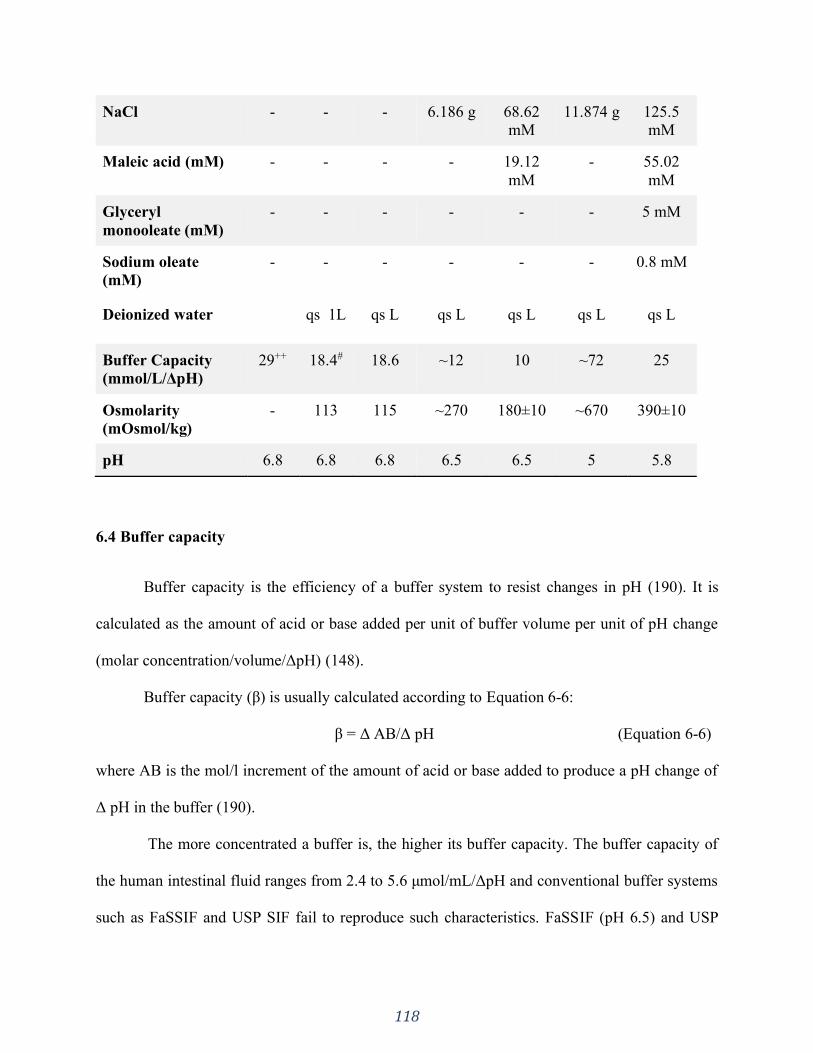
118
NaCl - - - 6.186 g 68.62
mM
11.874 g 125.5
mM
Maleic acid (mM) - - - - 19.12
mM
- 55.02
mM
Glyceryl
monooleate (mM)
- - - - - - 5 mM
Sodium oleate
(mM)
- - - - - - 0.8 mM
Deionized water qs 1L qs L qs L qs L qs L qs L
Buffer Capacity
(mmol/L/ΔpH)
29++ 18.4# 18.6 ~12 10 ~72 25
Osmolarity
(mOsmol/kg)
- 113 115 ~270 180±10 ~670 390±10
pH 6.8 6.8 6.8 6.5 6.5 5 5.8
6.4 Buffer capacity
Buffer capacity is the efficiency of a buffer system to resist changes in pH (190). It is
calculated as the amount of acid or base added per unit of buffer volume per unit of pH change
(molar concentration/volume/ΔpH) (148).
Buffer capacity (β) is usually calculated according to Equation 6-6:
β = Δ AB/Δ pH (Equation 6-6)
where AB is the mol/l increment of the amount of acid or base added to produce a pH change of
Δ pH in the buffer (190).
The more concentrated a buffer is, the higher its buffer capacity. The buffer capacity of
the human intestinal fluid ranges from 2.4 to 5.6 μmol/mL/ΔpH and conventional buffer systems
such as FaSSIF and USP SIF fail to reproduce such characteristics. FaSSIF (pH 6.5) and USP

119
SIF (pH 6.8) have strong buffer capacities (Table 6.2), which is, respectively, 5 and 7.7 times
higher than the buffer capacity of human intestinal fluids (24,35,80).
Due to such high buffer concentration (USP SIF: 50mM and FaSSIF: 29mM) it is likely
to overestimate the dissolution of BCS II weak acids, particularly drugs with pKa values less
than 6.5. Therefore, in spite of the fact that biorelevant media such as USP SIF buffer and
FaSSIF may reflect the small intestine fluids pH, the buffer composition and concentration also
significantly impacts the dissolution behaviour of BCS II weakly acidic drugs. Moreover, the
discrepancy between the buffering capacity of bicarbonate in bulk and in the boundary layer (as
explained in sections 3.1 and 3.1.2) also needs to be taken into account. Hence, not only the pH
but, as importantly, the buffer species and concentrations should be carefully considered when
making in vivo predictive dissolution media, especially in the case of poorly soluble and
ionizable drugs. Sheng et. al. (2008) evaluated the difference between the phosphate buffers and
the gastrointestinal bicarbonates in dissolution of ketoprofen and indomethacin and observed that
even with FaSSIF (lower phosphate buffer concentration of 29 mM) the dissolution of
ketoprofen and indomethacin demonstrated a higher rate than in the bicarbonate, that is, in vitro
dissolution testing with either USP SIF or FaSSIF was overestimating the true dissolution rates
of both drugs in vivo (20). There are many other reports in the literature about differences in
dissolution rate when varying the buffer capacity (192,216–218). Ashford et al. compared the in
vitro release characteristics of tablets coated with Eudragit S in different buffers varying the
buffer’s capacity and composition and observed that increasing phosphate concentration also
causes a dissolution rate increase (219). Hamed et. al. (2016) tested carvedilol (BCS IIb - weak
base) in phosphate buffer with varying capacities and observed that lowering the buffer capacity
resulted in a decrease in carvedilol solubility and dissolution rate (220).
120
In a high buffer capacity medium there is an abundance of the buffer conjugate base
species in the diffusion layer of a dissolving drug particle. In the case of BCS class IIa drugs
(weak acids), a prompt neutralization of H+ at the solid–liquid interface occurs, preventing a pH
shift in the microclimate around the dissolving particle. As a result, the pH in the diffusion layer
is similar to the bulk solution pH, which can lead to higher dissolution rates (56).
When considering in vivo predictive dissolution media both species and capacity are
equally important. As already mentioned, the human intestine is chiefly buffered by a
bicarbonate buffer system. The preparation of physiologically relevant bicarbonate buffer is
complex, a generally slow process, and there is the potential formation of gas bubbles at the
solid–liquid interface, which can affect the dissolution of drug product/particles. Hence, the use
of a non-bicarbonate based surrogate buffer that produces equivalent buffer effect on drug
dissolution may be preferable (83).
Phosphate is usually the buffer of choice and it is also the buffer proposed by US FDA to
be used for in vivo biowaivers (83,221). Since its pKa of 6.8 falls right within the pH range of the
small intestine, phosphate is a suitable buffer to be considered for physiologically relevant
dissolution tests. Phosphate buffer is present in both USP SIF at pH 6.8, and FaSSIF at pH 6.5
with concentrations/buffer capacities of 50 mM/29 mM/ΔpH and 29 mM/15 mM/ΔpH,
respectively (Table 6.2) (30,83).
On the other hand, the average concentrations/buffer capacity of bicarbonate buffer in the
small intestine are approximately 6–20 mM/ 2.5–8.5 mM/ΔpH at a pH of 6.5 (34,222–224). But,
as discussed before, the buffer capacity of bicarbonate buffer at the diffusion layer does not
correspond to that in bulk. As a result, lower buffer capacities would be necessary for the
121
surrogate phosphate buffer to be equivalent to bicarbonate buffer, and an additional external pH
control may be needed to maintain the bulk solution pH (83).
Krieg et al. (2015) studied several different weak acid and weak base drugs and reported
that it is possible to match the dissolution rate of weak acid/base drugs in bicarbonate buffer
systems to phosphate buffer (83). This is a complex interdependence of buffer pH and pKa, drug
pKa and solubility, and diffusion layer thickness. For weak acid drugs, the authors observed that
phosphate buffer concentrations between 1– 25 mM are more physiologically relevant and may
translate the impact of bicarbonate buffer on their dissolution. This means that the dissolution
rate of the drug in phosphate buffer 1-25mM matches the drug dissolution rate in a
physiologically relevant bicarbonate buffer. For weak base drugs, very low phosphate buffer
concentrations of <2 mM would be necessary to match bicarbonate buffer. This study concluded
that, in light of their findings, the current phosphate buffer concentrations used in dissolution
testing (50 mM) does not seem to accurately reflect the dissolution media and conditions of the
human intestine fluids that the drug is exposed to.
Sheng et. al. (2009) also evaluated the difference between phosphate buffer and
bicarbonate buffer in the dissolution of ketoprofen and indomethacin (20). The author
recommended the use of phosphate buffers of 13-15 mM and 3-4 mM for ketoprofen and
indomethacin, respectively, to reflect the in vivo dissolution of both drugs in gastrointestinal
bicarbonates, with special applications to the development of buffer systems for BCS II weak
acids, which might allow later on the development of in vitro biowaiver dissolution
methodology.

122
6.5 Dissolution tests in phosphate buffer versus bicarbonate buffer
There are many cases in the literature reporting differences in the dissolution profile of
various drugs and dosage forms when tested in phosphate buffer vs. bicarbonate buffer
(20,60,71,72,74,83,190,225,226).
McNamara et. al. investigated the use of stable bicarbonate buffer to characterize the
dissolution of low-solubility ionizable drugs (74). The authors reported that dissolution of
indomethacin in phosphate-based buffers (SIF and FaSSIF) with controlled pH yielded higher
intrinsic dissolution rates than what can be expected at the same physiologic pH (pH 6.8),
overestimating what occurs in vivo in a bicarbonate buffer system. Though SIF and FaSSIF may
mimic the intestinal physiologic pH, the buffer composition and concentrations may not be
physiologic, impacting the dissolution of ionizable compounds.
Karkossa and Klein assessed the drug release from commercial immediate-release (IR)
and enteric-coated (EC) aspirin tablets in media with different composition and ionic strength
(192). The authors conducted a systematic study in phosphate buffer pH 6.0 and 6.8 at three
different ionic strengths of 75mM, 150mM and 300mM, and in bicarbonate buffer also pH 6.0
and 6.8 at three different ionic strengths of 10mM, 85mM and 235mM. For the IR tablets,
dissolution was >85% within 15 min in all cases independent of the media composition and pH,
indicating very rapid dissolution. The tested EC tablets presented a highly variable drug release
performance and it was affected by both media pH and buffer species. In all cases, the release
profile in a bicarbonate buffer system displayed longer lag times compared to phosphate-based
buffers. After the coating had dissolved, the drug release was complete (100%) in bicarbonate
buffer and at least >85% in phosphate buffers. In both buffer systems, higher ionic strength
resulted higher release rate. The authors remarked that changes in the drug release behavior were

123
not attributed to the tablet core, but to the functional coating of the EC tablets. Hence, it was
concluded that the dissolution behavior of enteric coating materials strongly depends not only on
the pH but also on the dissolution medium composition (buffer species and ionic strength).
The impact of the buffer system utilized to test EC dosage forms has important
implications. Rudolph et al. tested the release of 5-aminosalicylic acid formulations coated with
Eudragit S in phosphate-based biorelevant media to simulate biological surfactants in intestinal
fluids (30,190,225). No differences in drug release of Eudragit S coated formulations were
observed, even with increasing ionic strength. Even though the prediction of in vivo dissolution
processes of poorly soluble drugs can be enhanced in such media (49,190); it does not simulate
the buffer composition of the GIT, failing to represent the in vivo performance of a given dosage
form. Liu et al. tested the dissolution of prednisolone tablets coated with various enteric
polymers in both pH 6.8 phosphate and modified Hanks bicarbonate buffer (72). The authors
observed rapid and comparable dissolution profiles for the various polymers in pH 6.8 phosphate
buffer. In the bicarbonate-based buffer, drug release was delayed and marked differences
between the various coated tablets were observed. The in vitro bicarbonate dissolution results
demonstrated a better fit with the in vivo observed data. Similarly, Ibekwe et al. 2006 tested the
drug release of prednisolone tablets coated with different Eudragit polymer systems in phosphate
buffer and Hanks buffer (227). The authors also observed similar drug release from the polymer
coated tablets in the phosphate compendial media, whereas in the physiological buffer the drug
release differed and was slower for all the coated tablets compared to the compendial buffer.
Chan et al. also observed significantly faster drug release rate in phosphate buffer than in Hank's
solution (bicarbonate-based) for EudragitS100 coated capsules (226).
124
Fadda and Basit investigated the drug release profiles of commercial Eudragit S coated
mesalazine tablets (Asacol MR, Mesren MR and Ipocol) in different media: phosphate and
physiological bicarbonate buffers (Hanks and Krebs) (190). Similarly to the above cited studies,
the drug release profiles were substantially faster in phosphate buffer compared to physiological
bicarbonate buffers. The buffer salts and concentrations in the two physiological buffers resulted
in different dissolution profiles for the tested products.
Therefore, there is the need to adequately choose the ionic composition of dissolution
media to match as closely as possible the intestinal fluid composition. The differences
encountered in the dissolution profiles in phosphate vs. carbonate buffer can have relevant
pharmaceutical implications. For instance, there are many reports in the literature of non-
responsiveness or even "resistance” to aspirin when enteric coated (EC) products are
administered (228–231). Studies have shown a decreased bioavailability (BA) of EC aspirin both
in healthy volunteers and in patients and they do not recommend the use of EC aspirin in
conditions requiring rapid onset of action (228,230). Failure of enteric coated formulations is a
long known problem, dating back to 1964, where EC aspirin tablets did not pass the USP
disintegration test, which was used to assess its physiologic availability (232). This problem has
continued to persist with many cases of inadequate BA of EC products found in the literature:
Wagner et. al. 1973, Maree et. al. 2005, Cox et. al. 2006, Grosser et. al. 2013, Bhatt et. al. 2017
(229,230,233–235). A particularly striking case was the report of slow release aspirin in the
elderly(236). The study measured the plasma salicylate concentrations of a group of 77 elderly
and no salicylate was detected in 26 of 77 patients. At the time, poor compliance was considered
as one of the possible explanations for the undetected salicylate plasma level. However, the test
was repeated in a subgroup to ensure compliance. In three of the six patients, absence of

125
detectable plasma salicylate was confirmed. Hence, there is strong evidence that this is a clinical
drug product performance issue that has not yet been resolved.
The study conducted by Karkossa and Klein revealed that aspirin release from marketed
EC products was strongly affected by the buffer species (192). The lag times before onset of
drug release in phosphate-based buffers ranged from 10 to 20 min, whereas in bicarbonate-based
buffers with the same pH, lag times of ~60 min were observed. Correlating the observations
made in the above cited studies with in-vitro dissolution profiles obtained from standard tests
using compendial buffers indicates that such in-vitro dissolution profiles are not predictive of the
in-vivo release behavior of EC formulations. The poor outcome of the in-vitro experiments can
be attributed to the buffer species and concentrations used in compendial dissolution tests (237–
239). Hence, while resistance is claimed with EC aspirin formulations, the reduced BA could
rather be linked to the dissolution behavior of the coating materials in the GI fluid.
In 1988 Bochner et. al. assessed the pharmacokinetics of Aspirin in man when
administered in solution, modified release tablet (EC) and intravenously. The formulation and
route of administration profoundly influenced several pharmacokinetic parameters of aspirin,
with a 6-fold decrease in Cmax, 1.8 fold decrease in AUC and 12-fold increase in Tmax for the
modified release tablet compared to the oral solution (240). Further on Bochner et. al. (1991)
compared the pharmacokinetics of four commercially available oral aspirin formulations, in
which two of the formulations were rapid release and the other two were EC formulations (241).
The authors observed marked differences in the plasma concentration-time profiles between the
rapid release compared to the EC formulations. Interestingly, a comparison between the rapid
release formulations, demonstrated no significant differences in Tmax were found, whereas
126
Tmax was significantly prolonged for the EC formulations, and it presented great variability in
the plasma concentration vs time profiles.
An additional factor that needs to be taken into account when comparing dissolution in
bicarbonate to that in phosphate is that some drugs the possibility of CO2(g) generation when
bicarbonate reacts with a drug that has a combination of low pKa and high intrinsic solubility.
This could lead to the solid dosage form experiencing an additional disintegrating force in
bicarbonate that is difficult to simulate using phosphate (242).
6.6 Applicability in the industry
A biorelevant dissolution method is the one that attempts to mimic the different
physiological environments that the drug will encounter throughout its passage in the GI tract.
The overall goal is guidance during formulation selection and optimization. Nevertheless, this
does not necessarily mean that the method will be predictive of clinical outcomes. As the
formulation development advances, a superior dissolution method can be development, which is
able to model the in vivo performance more accurately yielding a good IVIVC/IVIVR. Hence,
such a dissolution test is clinically relevant; i.e. it links the in vitro data with in vivo
pharmacokinetic performance data, creating an IVIVC or IVIVR (17). When a level A IVIVC
can be achieved then this method is predictive of the in vivo drug release in humans.
Bicarbonate buffer often falls under the biorelevant umbrella, contributing to an efficient
design of drug formulations (243). Accordingly, the aforementioned studies demonstrate that
bicarbonate buffer has its place and importance during the drug development process.
Considering the differences and outcomes when using phosphate and bicarbonate buffers the role

127
and need of the latter should be revisited in a QC manner in cases in which it models in vivo
performance more accurately, such as EC formulations (244).
6.7 Clinical reports
There are many different EC products from various classes of drugs that require further
experimental scrutiny. A compilation of delayed release (enteric coated) products listed as
Reference Listed Drug (RLD) by the FDA is shown in Table 6.3. According to the FDA, an RLD
is “an approved drug product to which new generic versions are compared to show, among other
things, that they are bioequivalent. A drug company seeking approval to market a generic
equivalent must refer to the RLD in its Abbreviated New Drug Application (ANDA)”.
Biowaivers are not applied to EC products. However, caution has to be taken as to which EC
formulation is to be used in a bioequivalence study. Similar dissolution profiles in phosphate
buffer may not render bioequivalence, as pointed out by Gelderen et. al., that compared the
relative BA of four different diclofenac EC products (245). The authors reported that only one
generic product was fully bioequivalent with the reference product Voltaren. The European
Pharmacopeia test at the time did not detect any differences between the products. Elkoshi et. al.,
evaluated the bioequivalence of two enteric-coated formulations of omeprazole, Losec®
(reference) and Omepradex® (test) (246). Surprisingly, the two products differed in both their
rate and extent of absorption after a single dose and following multiple doses. The products
failed the bioequivalence test for area under the plasma concentration-time curve (AUC) and
maximum plasma drug concentration (Cmax) after a single and multiple doses. The authors
concluded that the two products may not be considered either therapeutically equivalent or
interchangeable.
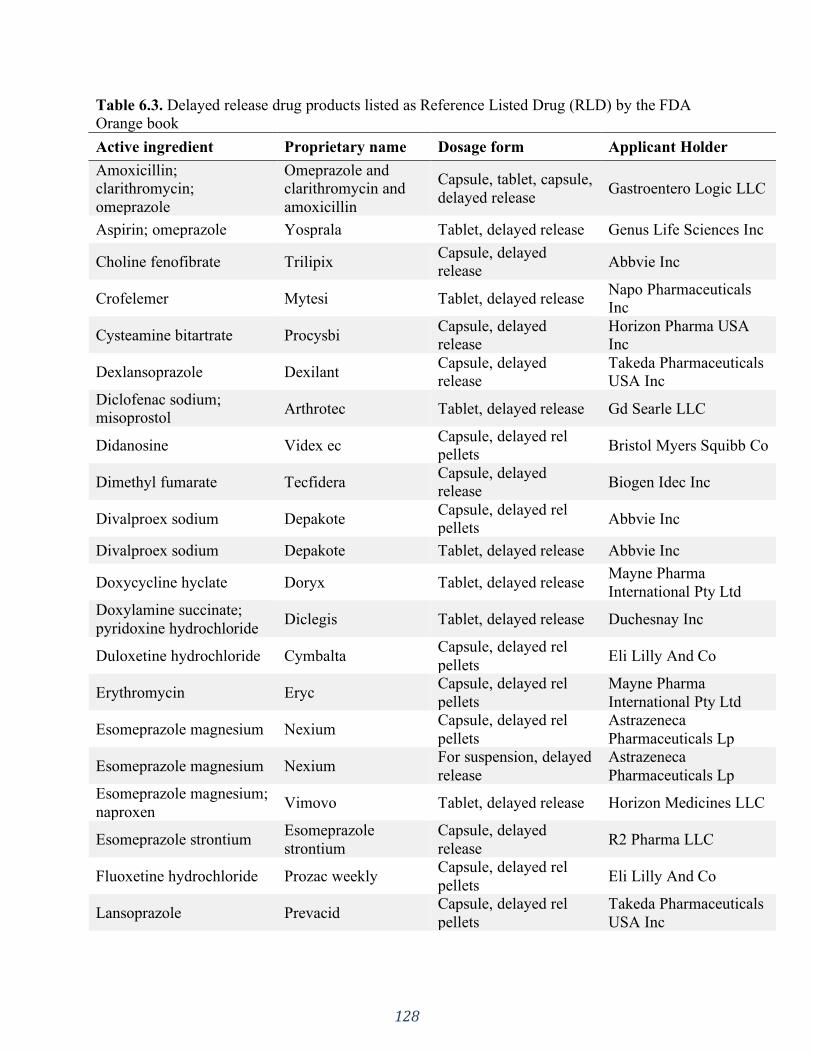
128
Table 6.3. Delayed release drug products listed as Reference Listed Drug (RLD) by the FDA
Orange book
Active ingredient Proprietary name Dosage form Applicant Holder
Amoxicillin;
clarithromycin;
omeprazole
Omeprazole and
clarithromycin and
amoxicillin
Capsule, tablet, capsule,
delayed release Gastroentero Logic LLC
Aspirin; omeprazole Yosprala Tablet, delayed release Genus Life Sciences Inc
Choline fenofibrate Trilipix Capsule, delayed
release Abbvie Inc
Crofelemer Mytesi Tablet, delayed release Napo Pharmaceuticals
Inc
Cysteamine bitartrate Procysbi Capsule, delayed
release
Horizon Pharma USA
Inc
Dexlansoprazole Dexilant Capsule, delayed
release
Takeda Pharmaceuticals
USA Inc
Diclofenac sodium;
misoprostol Arthrotec Tablet, delayed release Gd Searle LLC
Didanosine Videx ec Capsule, delayed rel
pellets Bristol Myers Squibb Co
Dimethyl fumarate Tecfidera Capsule, delayed
release Biogen Idec Inc
Divalproex sodium Depakote Capsule, delayed rel
pellets Abbvie Inc
Divalproex sodium Depakote Tablet, delayed release Abbvie Inc
Doxycycline hyclate Doryx Tablet, delayed release Mayne Pharma
International Pty Ltd
Doxylamine succinate;
pyridoxine hydrochloride Diclegis Tablet, delayed release Duchesnay Inc
Duloxetine hydrochloride Cymbalta Capsule, delayed rel
pellets Eli Lilly And Co
Erythromycin Eryc Capsule, delayed rel
pellets
Mayne Pharma
International Pty Ltd
Esomeprazole magnesium Nexium Capsule, delayed rel
pellets
Astrazeneca
Pharmaceuticals Lp
Esomeprazole magnesium Nexium For suspension, delayed
release
Astrazeneca
Pharmaceuticals Lp
Esomeprazole magnesium;
naproxen Vimovo Tablet, delayed release Horizon Medicines LLC
Esomeprazole strontium Esomeprazole
strontium
Capsule, delayed
release R2 Pharma LLC
Fluoxetine hydrochloride Prozac weekly Capsule, delayed rel
pellets Eli Lilly And Co
Lansoprazole Prevacid Capsule, delayed rel
pellets
Takeda Pharmaceuticals
USA Inc

129
Lansoprazole Prevacid
Tablet, orally
disintegrating, delayed
release
Takeda Pharmaceuticals
USA Inc
Mesalamine Delzicol Capsule, delayed
release
Allergan
Pharmaceuticals
International Ltd
Mesalamine Asacol hd Tablet, delayed release
Allergan
Pharmaceuticals
International Ltd
Mesalamine Lialda Tablet, delayed release Shire Development Inc
Mycophenolic acid Myfortic Tablet, delayed release Novartis
Pharmaceuticals Corp
Naproxen Ec-naprosyn Tablet, delayed release Atnahs Pharma US Ltd
Omeprazole magnesium Prilosec For suspension, delayed
release Covis Pharma Bv
Pancrelipase
(amylase;lipase;protease) Creon
Capsule, delayed
release Abbvie Inc
Pancrelipase
(amylase;lipase;protease) Pancreaze
Capsule, delayed
release Vivus Inc
Pancrelipase
(amylase;lipase;protease) Pertzye
Capsule, delayed
release Digestive Care Inc
Pancrelipase
(amylase;lipase;protease) Zenpep
Capsule, delayed
release Forest Laboratories Inc
Pantoprazole sodium Protonix For suspension, delayed
release
Wyeth Pharmaceuticals
LLC
Pantoprazole sodium Protonix Tablet, delayed release Wyeth Pharmaceuticals
LLC
Posaconazole Noxafil Tablet, delayed release Merck Sharp And
Dohme Corp
Prednisone Rayos Tablet, delayed release Horizon Pharma Inc
Rabeprazole sodium Aciphex sprinkle Capsule, delayed
release Cerecor Inc
Rabeprazole sodium Aciphex Tablet, delayed release Eisai Inc
Rifamycin Aemcolo Tablet, delayed release Cosmo Technologies
Ltd
Risedronate sodium Atelvia Tablet, delayed release
Allergan
Pharmaceuticals
International Ltd
Sulfasalazine Azulfidine en-tabs Tablet, delayed release Pharmacia And Upjohn
Co
Esomeprazole magnesium Nexium 24hr Capsule, delayed
release Astrazeneca Lp
Esomeprazole magnesium Nexium 24hr Tablet, delayed release Astrazeneca Lp
Lansoprazole Prevacid 24 hr Capsule, delayed rel Glaxosmithkline
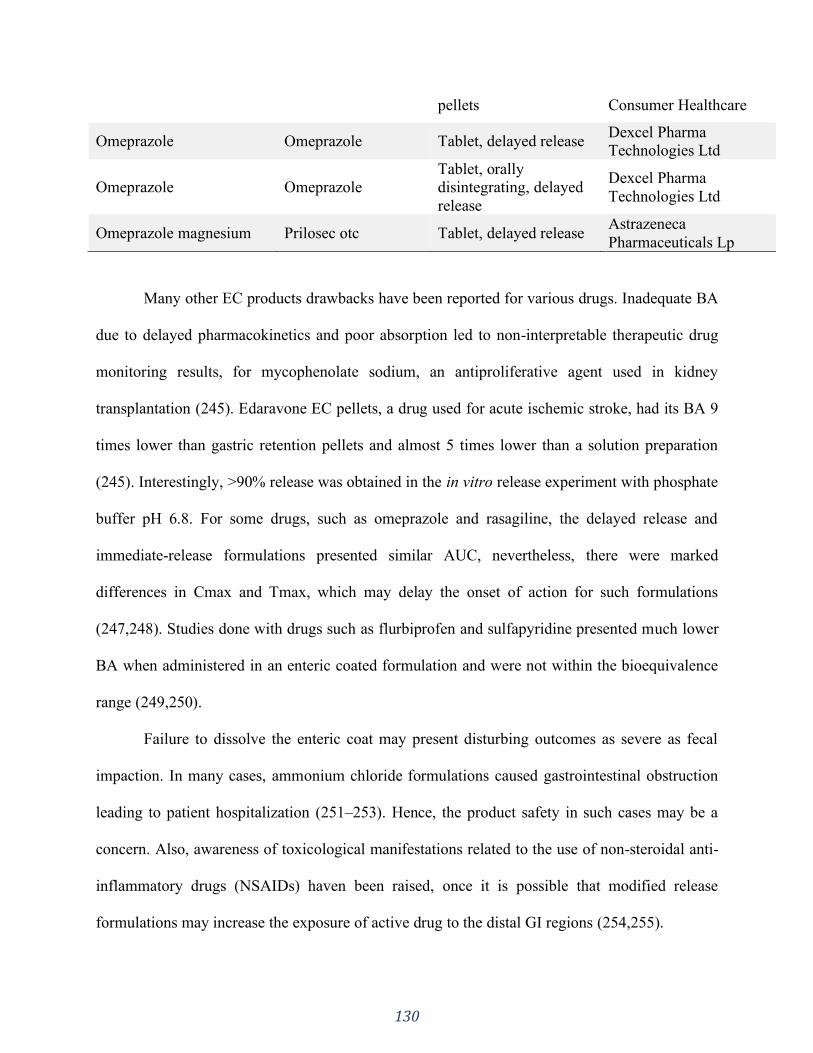
130
pellets Consumer Healthcare
Omeprazole Omeprazole Tablet, delayed release Dexcel Pharma
Technologies Ltd
Omeprazole Omeprazole
Tablet, orally
disintegrating, delayed
release
Dexcel Pharma
Technologies Ltd
Omeprazole magnesium Prilosec otc Tablet, delayed release Astrazeneca
Pharmaceuticals Lp
Many other EC products drawbacks have been reported for various drugs. Inadequate BA
due to delayed pharmacokinetics and poor absorption led to non-interpretable therapeutic drug
monitoring results, for mycophenolate sodium, an antiproliferative agent used in kidney
transplantation (245). Edaravone EC pellets, a drug used for acute ischemic stroke, had its BA 9
times lower than gastric retention pellets and almost 5 times lower than a solution preparation
(245). Interestingly, >90% release was obtained in the in vitro release experiment with phosphate
buffer pH 6.8. For some drugs, such as omeprazole and rasagiline, the delayed release and
immediate-release formulations presented similar AUC, nevertheless, there were marked
differences in Cmax and Tmax, which may delay the onset of action for such formulations
(247,248). Studies done with drugs such as flurbiprofen and sulfapyridine presented much lower
BA when administered in an enteric coated formulation and were not within the bioequivalence
range (249,250).
Failure to dissolve the enteric coat may present disturbing outcomes as severe as fecal
impaction. In many cases, ammonium chloride formulations caused gastrointestinal obstruction
leading to patient hospitalization (251–253). Hence, the product safety in such cases may be a
concern. Also, awareness of toxicological manifestations related to the use of non-steroidal anti-
inflammatory drugs (NSAIDs) haven been raised, once it is possible that modified release
formulations may increase the exposure of active drug to the distal GI regions (254,255).
131
6.8 Conclusion
Herein was presented an overview of promising trends in developing in vivo predictive
dissolution media by means of using bicarbonate-based buffer systems. When assessing a dosage
form’s performance, the buffer media must be carefully considered. Currently, many studies are
conducted in non-bicarbonate buffer systems, such as the so called “biorelevant” media.
However, there have been many drawbacks related to these systems likely due to their
sometimes limited in vivo predictability.
Bicarbonate-based buffers can be superior in predicting the in vivo behavior of certain
dosage forms, like enteric coated formulations. This is possible owing to its composition, which
resembles the intestinal fluids in terms of buffer species and buffer capacity. Nonetheless, the
inherent difficulties associated with bicarbonate buffers make it difficult for routine dissolution
testing. Hence, using simpler buffer systems as surrogate to produce equivalent buffer effects on
drug dissolution remains preferred. Given inherent obstacles and drawbacks, each product has
to be studied on a case-by-case basis.
Understanding the in vivo dissolution process may assist in setting clinically relevant in
vitro dissolution testing methodologies. There is a major opportunity in utilizing bicarbonate-
based buffers for in vivo predictive dissolution of EC dosage forms and further studies are still
needed to assess its potential in a QC environment.

132
SECTION THREE: PHYSIOLOGICALLY RELEVANT IN VITRO TESTING:
BICARBONATE BUFFER
CHAPTER SEVEN
Mechanistic understanding of underperforming enteric coated products:
Opportunities to add clinical relevance to the dissolution test.
A version of this chapter is published in:
J Control Release. 2020;325:323–34. https://doi.org/10.1016/j.jconrel.2020.06.031
Reprinted from reference (88).
133
7.1 Introduction
Enteric coated (EC) products are modified release dosage forms used to delay the release
of drug substances after oral administration (7). As such, they resist disintegration and
dissolution in the gastric media, releasing the drug only after reaching the small intestine where
the pH increases. Enteric coatings are generally used to maintain the stability of the active
pharmaceutical ingredient (API) against the acidic gastric environment; or to protect the gastric
mucosa against irritating effects of some APIs; or to target the drug release to a specific segment
in the intestines (256).
Enteric coating polymers are poly-acids containing ionizable carboxylic groups. The
theory behind how such polymers work is that in the low pH of the stomach the carboxyl groups
are un-ionized, therefore insoluble, resisting dissolution and preventing drug release. As the
dosage form travels through the gastrointestinal (GI) tract, it passes through the pylorus, reaching
the duodenum, where the pH increases (44,91). When the fluid’s pH is above the polymer’s pKa,
its ionization is promoted (256). Due to electrostatic repulsion, the polymer relaxes, undergoes
chain disentanglement, which allows further ionization of polymer chains at its interface, and
these chains diffuse away to the bulk solution. This process consists of the dissolution phases of
pH-responsive polymers (90,92,257). Hence, according to this theory, the main factors
influencing the enteric coat opening with further drug release are the polymer’s pKa and the
medium pH.
Based on this assumption, enteric polymers are designed with different ratios of
carboxylic acid groups to set a dissolution pH threshold (usually reported by the manufacturer)
enabling the development of dosage forms with targeted drug delivery (258). However, EC
products are known to have unpredictable in vivo behaviour and several case reports of

134
therapeutic failure and other drawbacks involving such formulations have been reported in the
literature throughout the years, dating back to 1946 and persist until the present (259) (Table
7.1).
The effect of the poor in vivo performance of EC products can range from patients having
lower Cmax and Area Under the Curve (AUC) to complete therapeutic failure with zero plasma
concentration (Table 7.1). Completely undissolved tablets egested in the stool have also been
reported which, in more severe cases, evolved to fecal impaction requiring medical intervention
to resolve dangerous gut bleeding (251).
It is worth highlighting a study conducted in 2013 where the authors suspected that
patients would have a phenotype that lead to pharmacological resistance to enteric coated aspirin,
which would be explained by genetic causes (234). A total of 400 subjects participated in this
study, however the authors failed to identify a single subject who satisfied the genetic criteria.
On the other hand, they observed that variable absorption caused a high frequency of “apparent
resistance” to a single dose of 325-mg enteric coated aspirin (up to 49%) but not to immediate
release aspirin (0%). They state: “Delayed and reduced drug absorption was common after
ingestion of enteric coated aspirin” (234).
Enteric coated formulations can also pose some challenges for acid-labile API’s, such as
omeprazole. The acidic groups present in the enteric coating can jeopardize omeprazole’s
stability, decreasing its content in the dosage form over time. To overcome this, AstraZeneca
developed a formulation to enhance the stability of the API in the dosage form during storage. It
was composed of a core containing the drug plus alkaline reacting compounds, a water-soluble
subcoating (to prevent dissolution of the enteric coating), and the outer enteric coating. This
formulation presented both good storage stability and sufficient gastric acid resistance. The

135
company held patents both on the API itself and the formulation. Anticipating the expiration of
the API patents, eight generic drug manufacturers filed Abbreviated New Drug Applications
(ANDA) with the Food and Drug Administration (FDA) seeking permission to manufacture and
sell omeprazole. However, their applications infringed the formulation patents held by the
innovator, which resulted in a major patent litigation case of AstraZeneca against the eight
generic companies.
Table 7.1. Historic table of in vivo studies with EC formulations
Year Clinical observation API Reference
1946 Enteric-coated ammonium chloride tablets passed
unchanged through the GIT which lead to low
effective absorption.
Ammonium
chloride
(259)
1950 Tablets failed to disintegrate in the small intestine
and became deposited in the large bowel,
disturbing the normal fecal flow and causing
fecal impaction.
Ammonium
chloride
(251)
1963 Patients with myxedema frequently have re-
lapses that are hazardous to them and puzzling to
clinicians.
In this study relapses were a result from impaired
absorption of desiccated thyroid due to the use of
enteric coated tablets.
Desiccated
thyroid
(260)
1964 Enteric coated tablets were physiologically
unavailable
Aspirin (232)
1972 Enteric coated tablets had lower rate and extent
of absorption
Aspirin (261)
1973 Plasma samples of all eight subjects at each
sampling time assayed “zero” for both drug and
metabolite following oral administration of the
enteric-coated tablet.
Aminosalicylic
acid
(235)
1979 Enteric coated formulations presented 6 hours
delay in Tmax and 50% lower Cmax
Sulfasalazine (250)
1979 This case illustrates the necessity for awareness
of possible drug malabsorption. The poor clinical
response to prednisolone suggested poor
prednisolone absorption. This study showed
impaired bioavailability following the enteric
coated preparation but normal bioavailability
following the standard oral preparation. The
Prednisolone (262)
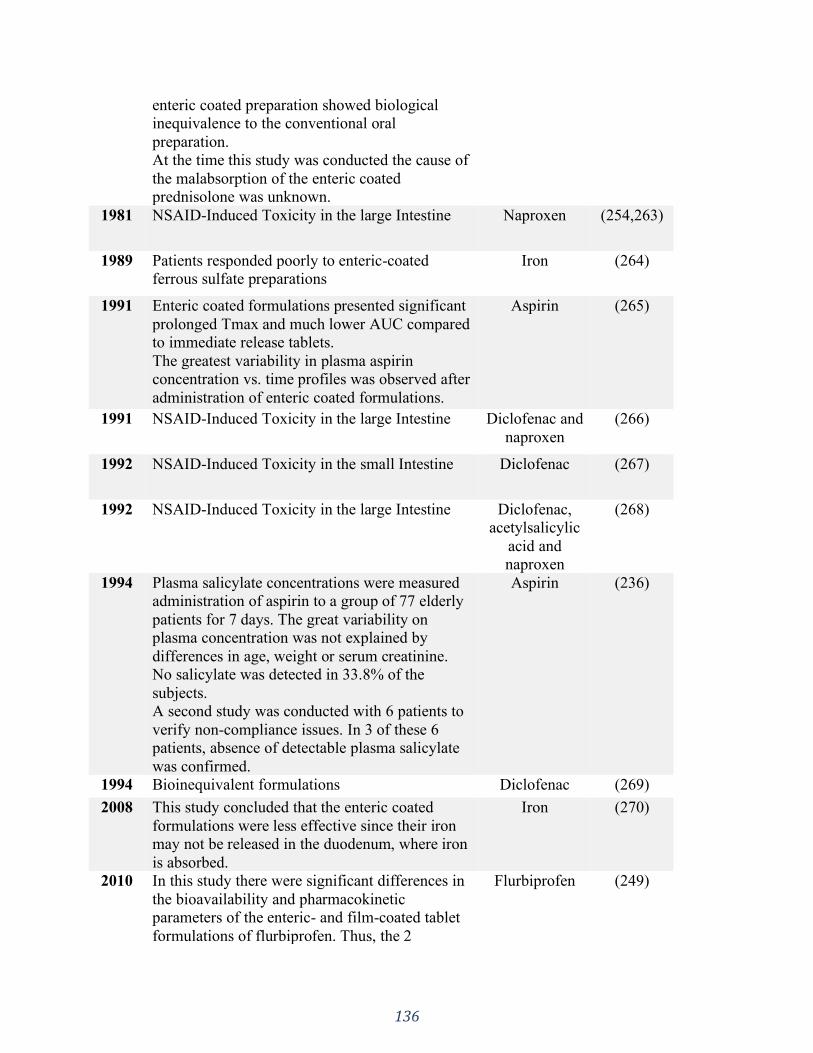
136
enteric coated preparation showed biological
inequivalence to the conventional oral
preparation.
At the time this study was conducted the cause of
the malabsorption of the enteric coated
prednisolone was unknown.
1981 NSAID-Induced Toxicity in the large Intestine Naproxen (254,263)
1989 Patients responded poorly to enteric-coated
ferrous sulfate preparations
Iron (264)
1991 Enteric coated formulations presented significant
prolonged Tmax and much lower AUC compared
to immediate release tablets.
The greatest variability in plasma aspirin
concentration vs. time profiles was observed after
administration of enteric coated formulations.
Aspirin (265)
1991 NSAID-Induced Toxicity in the large Intestine Diclofenac and
naproxen
(266)
1992 NSAID-Induced Toxicity in the small Intestine Diclofenac (267)
1992 NSAID-Induced Toxicity in the large Intestine Diclofenac,
acetylsalicylic
acid and
naproxen
(268)
1994 Plasma salicylate concentrations were measured
administration of aspirin to a group of 77 elderly
patients for 7 days. The great variability on
plasma concentration was not explained by
differences in age, weight or serum creatinine.
No salicylate was detected in 33.8% of the
subjects.
A second study was conducted with 6 patients to
verify non-compliance issues. In 3 of these 6
patients, absence of detectable plasma salicylate
was confirmed.
Aspirin (236)
1994 Bioinequivalent formulations Diclofenac (269)
2008 This study concluded that the enteric coated
formulations were less effective since their iron
may not be released in the duodenum, where iron
is absorbed.
Iron (270)
2010 In this study there were significant differences in
the bioavailability and pharmacokinetic
parameters of the enteric- and film-coated tablet
formulations of flurbiprofen. Thus, the 2
Flurbiprofen (249)
137
formulations could not be considered
bioequivalent.
2013 This study failed to identify a single case of true
drug resistance. However, delayed and reduced
drug absorption was observed in enteric coated
formulations but not with immediate release
aspirin administration.
Aspirin (234)
2017 A high proportion of patients (52.8%) treated
with EC aspirin failed to achieve the desired
therapeutic effect due to incomplete absorption.
Aspirin (230)
The majority of the clinical observations presented in Table 7.1 involved marketed EC
products, pointing out that there seems to be a hidden performance problem with these products.
This has been a clinically recognized but neglected problem for over 70 years, even though all
the products had passed the performance tests both for registration and market release
(232,235,260). Hence there is a gap between clinical observations and the quality control
testing.
Considering that the human intestine is buffered by bicarbonate buffer (BCB), it is
reasonable to use bicarbonate-based systems for the performance test of drug products (28,271).
However, the handling of BCB is delicate and requires constant sparging of CO2 to maintain the
medium pH. This is why this buffer is not the first choice in quality control (QC) testing and
phosphate buffer took its place, as seen by the wide use of compendial simulated intestinal fluid
(19,28).
In addition to the traditional quality control tests for tablets, other non-invasive
technologies and techniques can be used for the characterization of physical-mechanical
properties of tablets. Examples are near infrared spectroscopy, Raman spectroscopy, X-ray
microtomography, nuclear magnetic resonance (NMR) imaging, terahertz pulsed imaging, laser-
induced breakdown spectroscopy, and various acoustic- and thermal-based techniques (272). In

138
the present study, computerized x-ray microtomography (micro-CT) was used as a non-invasive
method to accurately measure tablet coat thickness before dissolution testing.
The current pilot study mechanistically investigated the performance of five EC products
available in the Canadian market. The evaluated parameters were the buffer system (bicarbonate
buffer vs. phosphate buffer), buffer capacity and medium pH.
We hypothesized that the performance of EC products in BCB would be different
compared with compendial phosphate buffer, giving more physiological insight. API properties
(acid vs. base) would additionally impact the dissolution behavior in BCB.
The objectives of this study were to firstly apply physiologically relevant conditions to
examine the effect of the aforementioned parameters on the release pattern of commercially
available EC products and compare the results with the current United States Pharmacopeia
(USP) test for EC dosage forms. Secondly, we aimed to establish a first step towards making the
use of bicarbonate-based systems feasible in a quality control setting.
7.2 Materials
Sodium phosphate monobasic monohydrate and sodium hydroxide were purchased from
Fisher Scientific (New Jersey, USA), sodium bicarbonate was purchased from Caledon (Ontario,
Canada), sulfasalazine, pantoprazole sodium, acetylsalicylic acid and esomeprazole magnesium
were purchased from Sigma-Aldrich Co. (Montana, USA), diclofenac sodium was purchased
from Medisca (Quebec, Canada).
EC products obtained from the market were: Teva-Pantoprazole (T) 40mg (Teva Canada
Limited, LOT: 0691118), PMS-Sulfasalazine EC 500mg (Pharmascience Inc., LOT: 1037737),
APO-Esomeprazole Magnesium DR 40mg (Apotex Inc., LOT: NV2183), Diclofenac sodium
139
(Sandoz Canada Inc., LOT: JN9884), Aspirin EC 81mg (Bayer Inc., LOT: NAA68A2 and
NAA72T6).
Buffer solutions were prepared with purified water (Elgastat Maxima UF and an Elgastat
Option 3B water purifier by ELGA Laboratories Ltd. (Mississauga, ON, Canada)).
7.3 Methods
7.3.1 Micro-CT analysis
Tablet coat properties, such as coat thickness, may affect the drug release from the
dosage form. Hence, all five products were micro-CT scanned prior to dissolution testing in
order to measure the coat thickness and to assess the coat structure in correlation with subsequent
coat failure.
Tablets were mounted on a styrofoam holder and analyzed using a Micro-CT imager
(SkyScan 1076; Bruker-Skyscan, Kontich, Belgium) at 9 μm voxel image resolution with the x-
ray tube set to 45 kV, 555 μA, with a 0.2 mm aluminum filter used to remove low energy
photons. Tablets were scanned through 180° with a sampling rotation step of 0.5°. The scans
were reconstructed using a modified Feldkamp back-projection algorithm with vendor-bundled
software with a cross section to image conversion threshold of 0.0 to 0.046 (NRecon, Bruker-
Skyscan, version 1.6.3.3). After reconstruction, tablet CT slices were viewed and measured.
Representative slice subsets of the whole tablet were chosen by selecting an upper and lower
bound slice for different regions of the tablet. The collected data was analyzed using the CT
Analyzer software (CTan, Bruker-Skyscan, version 1.17.7.2 [16 bit]). In the cross-section
images, the software allows to assess the coat thickness by converting pixels into μm.
Measurements were done in four different regions of each tablet (mid-point of top and bottom
and both sides).

140
7.3.2 Performance tests
All four biopharmaceutics classification system (BCS) classes were considered as well as
physicochemical parameters (pKa – acid vs. base), as summarized in Table 7.2.
Table 7.2. API properties (BCS class and pKa) and coating polymer of the tested EC products
Drug product BCS
class
pKa API structure Coating
polymer
Dissolution
pH threshold#
Aspirin
(Bayer Inc.)
I 3.41
(Acid)
(273)
Methacrylic
acid and
ethyl acrylate
copolymer
5.5
(274)
Esomeprazole
magnesium
(Apotex Inc.)
II 14.7
(Base)
(275)
Methacrylic
acid and
ethyl acrylate
copolymer
5.5
(274)
Diclofenac
sodium
(Sandoz Inc.)
II 4.15
(Base)
(276)
Undisclosed ?*
Pantoprazole
sodium
(Teva Ltd.)
III 8.19
(Base)
(277)
Methacrylic
acid and
ethyl acrylate
copolymer
5.5
(274)
Sulfasalazine
(PMS Inc.)
IV 3.23
(Acid)
(278)
Acryl resin ?*
*The exact polymer used is not disclosed by the manufacturer. # Value specified by the manufacturer. It is the pH value in which the polymer starts to dissolve.
All dissolution tests were performed in a VK 7020 system from Varian Inc. dissolution
tester coupled to a VK 8000 autosampler. USP apparatus II with 75 rpm rotation speed was used
with dissolution media temperature set at 37 °C.

141
In order to test the gastric resistance and coat integrity, the pharmacopeial test method for
EC formulations establishes an acid stage prior to the buffer stage. Hence, for all experiments,
the EC tablets were exposed to 0.1 N hydrochloric acid for 2 hours prior to the buffer stage, as
specified by the USP. The drug release was determined by UV-spec at the end of the 2 hours
using the appropriate wavelength for each drug. The tablets were then transferred to vessels
containing 900 ml of pre-heated buffer solutions. The buffer stage was performed as described
below.
7.3.2.1 Phosphate-based dissolution medium
Dissolution testing was performed according to the <USP 711> two stage procedure in
acid and buffer. The recommended buffer media for enteric coated dosage forms is 50mM
phosphate buffer pH 6.8, except for sulfasalazine tablets, which were tested in 50mM phosphate
buffer pH 7.2, as specified in its monograph. The drug release at specific time points was
determined by UV-spectroscopy using the appropriate wavelength for each drug (aspirin: 283nm,
esomeprazole: 304.5nm, pantoprazole: 288nm, sulfasalazine: 359nm and diclofenac: 276nm).
7.3.2.2 Bicarbonate-based dissolution medium
Based on the reported values of BCB molarity and pH values at the human proximal
intestine, the dissolution tests were performed in 5mM bicarbonate buffer pH 6.5 (44).
The bicarbonate buffer was prepared by dissolving the appropriate amount of sodium
bicarbonate in deionized water to obtain a 5mM concentration. The dissolution medium was
poured into the dissolution vessels allowing the temperature to equilibrate before commencing
the experiments. The pH was adjusted to 6.5 by sparging the medium with CO2(g) and it was
142
continuously monitored and maintained throughout the dissolution tests by sparging CO2(g) as
needed. The pH was monitored using an accumet® AB250 pH-meter from Fisher Scientific (Fair
Lawn, NJ, USA). The drug release at specific time points was determined by UV-spectroscopy
using the appropriate wavelength for each drug (aspirin: 283nm, esomeprazole: 304.5nm,
pantoprazole: 288nm, sulfasalazine: 359nm and diclofenac: 276nm).
7.3.2.2.1 Effect of buffer molarity and pH
In order to assess the effect of buffer molarity and pH on the enteric polymer dissolution,
diclofenac sodium tablets were tested in BCB in a molarity range reflective of the one found
along the human GI tract (i.e. 2.5, 5, 10, 15, 20 and 30mM) (52,222,279–286). The media was
not sparged, hence presenting a higher bulk pH.
The dissolution experiments were conducted with freshly prepared buffer, one day and one
week old to investigate if buffer age has any impact on the dissolution, as reported in literature
(1). The buffer pH was measured before and monitored during the dissolution tests. Because
there was no sparging with CO2(g), the medium pH was not maintained.
7.4 Results
7.4.1 Micro-CT analysis
The coat thickness measured for each tablet is presented in Table 7.3 and the scans results
for all the products are shown in Figure 7.1. The coat could be easily distinguished due to the
difference in density between the coating material and the tablet core. The outer denser region in
Figure 7.1B and C represent a coloured film coating that was washed off during the acid stage.
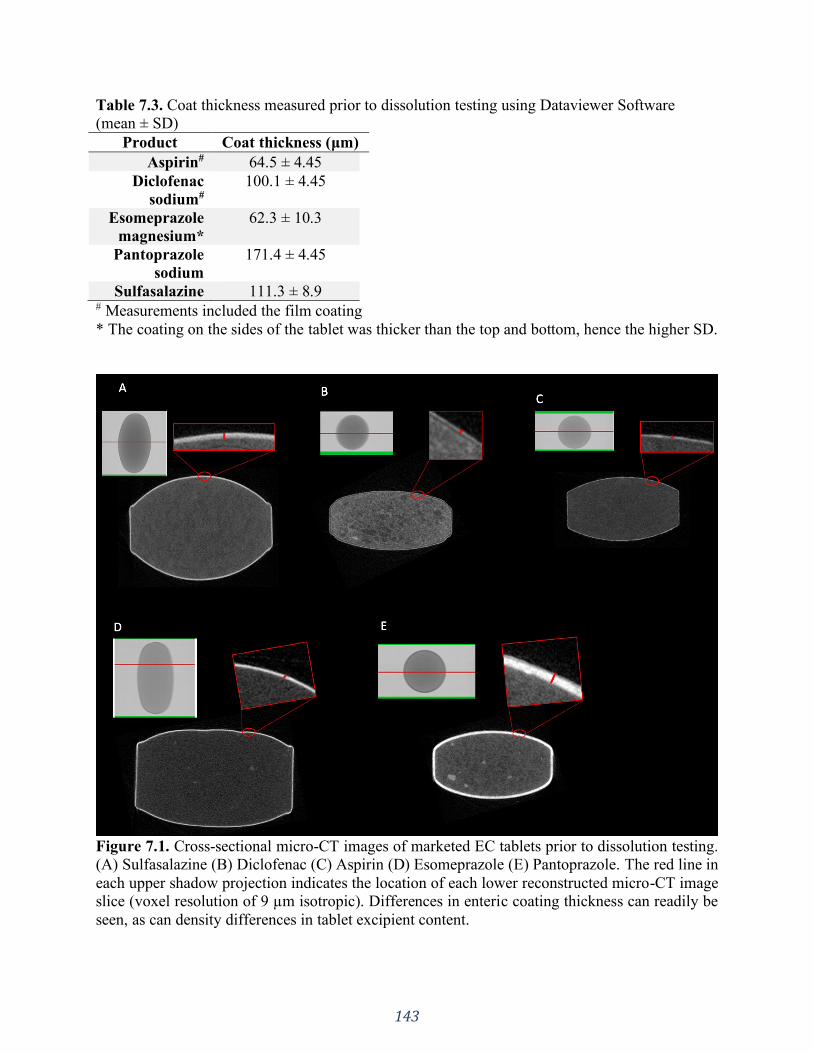
143
Table 7.3. Coat thickness measured prior to dissolution testing using Dataviewer Software
(mean ± SD)
Product Coat thickness (μm)
Aspirin# 64.5 ± 4.45
Diclofenac
sodium#
100.1 ± 4.45
Esomeprazole
magnesium*
62.3 ± 10.3
Pantoprazole
sodium
171.4 ± 4.45
Sulfasalazine 111.3 ± 8.9 # Measurements included the film coating
* The coating on the sides of the tablet was thicker than the top and bottom, hence the higher SD.
Figure 7.1. Cross-sectional micro-CT images of marketed EC tablets prior to dissolution testing.
(A) Sulfasalazine (B) Diclofenac (C) Aspirin (D) Esomeprazole (E) Pantoprazole. The red line in
each upper shadow projection indicates the location of each lower reconstructed micro-CT image
slice (voxel resolution of 9 µm isotropic). Differences in enteric coating thickness can readily be
seen, as can density differences in tablet excipient content.

144
7.4.2 Performance tests
The pharmacopeial tolerance specification for the acid stage is not more than 10% release
after 2 hours exposure to 0.1N HCl. Esomeprazole magnesium and sulfasalazine tablets
presented holes (defects) in the coat after the acid stage, however, the criteria of not more than
10% released was still met. The coatings of the other products (aspirin, pantoprazole sodium and
diclofenac sodium) were intact after the acid stage (i.e., no release). Hence, all products passed
the USP acid stage criteria showing no drug release or less than 10% within the 2h exposure to
0.1M HCl (data not shown).
In phosphate buffer the various EC products displayed rapid dissolution and were compliant
to the USP tolerance specifications for drug release in the buffer stage (described in each drug’s
respective monograph) (Figure 7.2 and Table 7.4). On the contrary, the dissolution results in
bicarbonate buffer failed to meet the current USP criteria for the tested EC products. An
interesting visual observation was the distinct pattern of coat opening between the two media. In
phosphate buffer the coat rapidly dissolved away, leaving the tablet core completely exposed to
the dissolution medium. In BCB, however, the coat firstly presented ruptures through which the
water could penetrate and reach the tablet core. Instead of completely dissolving, we observed
parts of the coating “peeling off” of the tablet core and floating in the dissolution medium and
other parts remained on the dosage form (especially the bottom side of the tablet that was in
contact with the dissolution vessel). This highlights the slower dissolution rate that EC polymers
present in BCB.
The comparative dissolution for each formulation in phosphate buffer 50mM vs. BCB
5mM is presented in Figure 7.2. For all formulations, the onset of drug release was delayed in
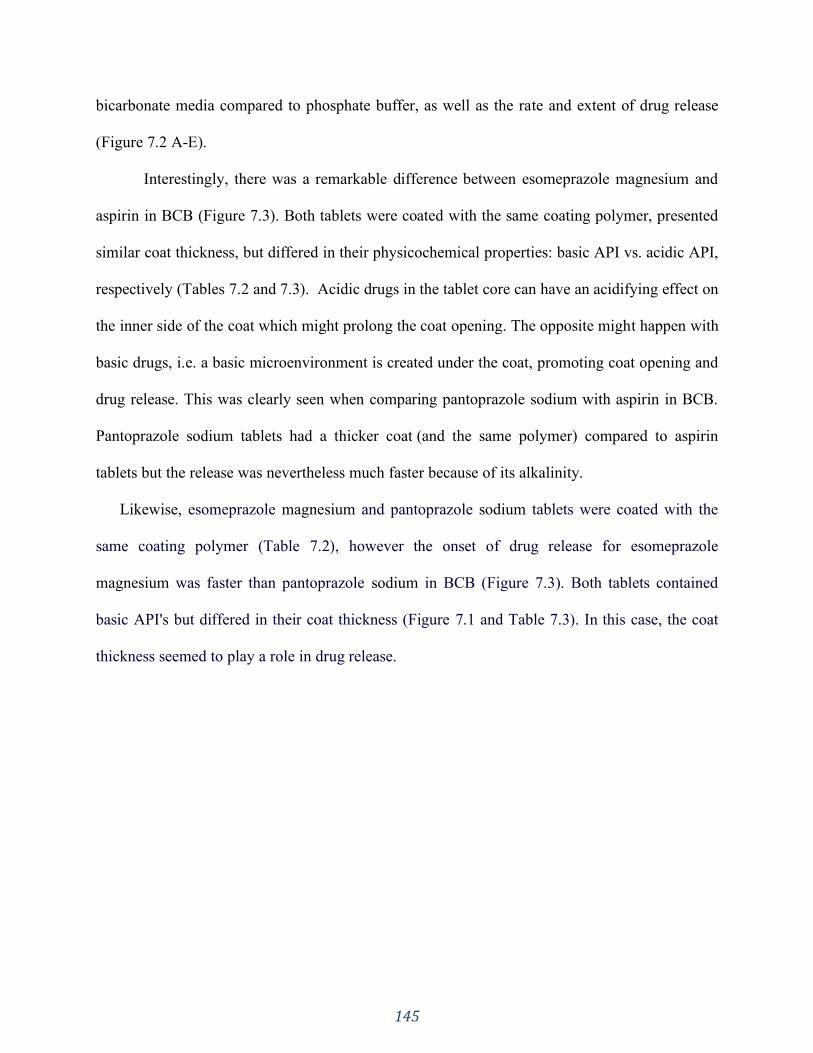
145
bicarbonate media compared to phosphate buffer, as well as the rate and extent of drug release
(Figure 7.2 A-E).
Interestingly, there was a remarkable difference between esomeprazole magnesium and
aspirin in BCB (Figure 7.3). Both tablets were coated with the same coating polymer, presented
similar coat thickness, but differed in their physicochemical properties: basic API vs. acidic API,
respectively (Tables 7.2 and 7.3). Acidic drugs in the tablet core can have an acidifying effect on
the inner side of the coat which might prolong the coat opening. The opposite might happen with
basic drugs, i.e. a basic microenvironment is created under the coat, promoting coat opening and
drug release. This was clearly seen when comparing pantoprazole sodium with aspirin in BCB.
Pantoprazole sodium tablets had a thicker coat (and the same polymer) compared to aspirin
tablets but the release was nevertheless much faster because of its alkalinity.
Likewise, esomeprazole magnesium and pantoprazole sodium tablets were coated with the
same coating polymer (Table 7.2), however the onset of drug release for esomeprazole
magnesium was faster than pantoprazole sodium in BCB (Figure 7.3). Both tablets contained
basic API's but differed in their coat thickness (Figure 7.1 and Table 7.3). In this case, the coat
thickness seemed to play a role in drug release.
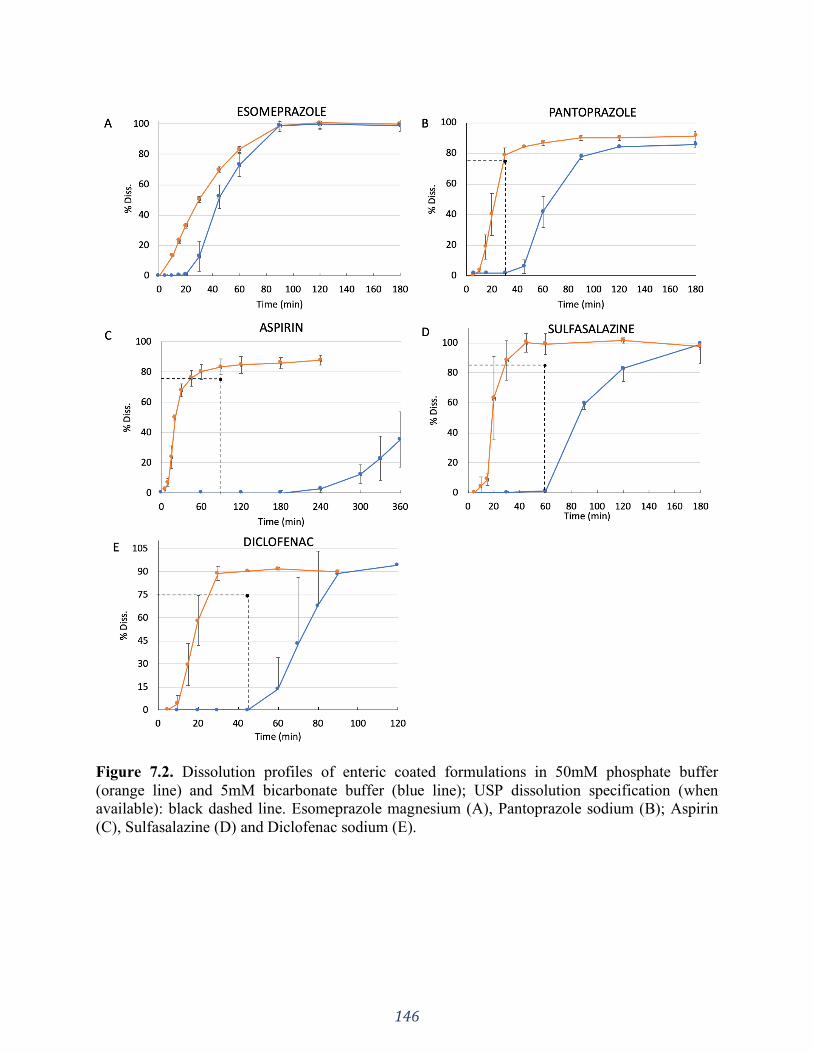
146
Figure 7.2. Dissolution profiles of enteric coated formulations in 50mM phosphate buffer
(orange line) and 5mM bicarbonate buffer (blue line); USP dissolution specification (when
available): black dashed line. Esomeprazole magnesium (A), Pantoprazole sodium (B); Aspirin
(C), Sulfasalazine (D) and Diclofenac sodium (E).
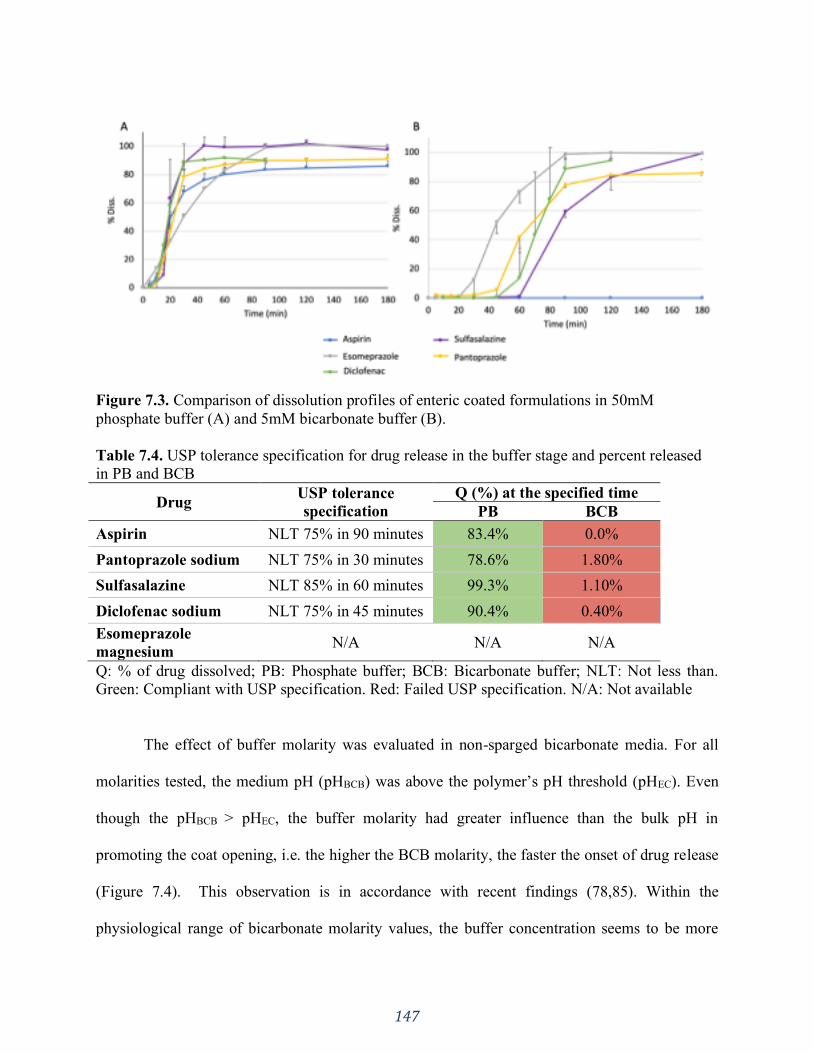
147
Figure 7.3. Comparison of dissolution profiles of enteric coated formulations in 50mM
phosphate buffer (A) and 5mM bicarbonate buffer (B).
Table 7.4. USP tolerance specification for drug release in the buffer stage and percent released
in PB and BCB
Drug USP tolerance
specification
Q (%) at the specified time
PB BCB
Aspirin NLT 75% in 90 minutes 83.4% 0.0%
Pantoprazole sodium NLT 75% in 30 minutes 78.6% 1.80%
Sulfasalazine NLT 85% in 60 minutes 99.3% 1.10%
Diclofenac sodium NLT 75% in 45 minutes 90.4% 0.40%
Esomeprazole
magnesium N/A N/A N/A
Q: % of drug dissolved; PB: Phosphate buffer; BCB: Bicarbonate buffer; NLT: Not less than.
Green: Compliant with USP specification. Red: Failed USP specification. N/A: Not available
The effect of buffer molarity was evaluated in non-sparged bicarbonate media. For all
molarities tested, the medium pH (pHBCB) was above the polymer’s pH threshold (pHEC). Even
though the pHBCB > pHEC, the buffer molarity had greater influence than the bulk pH in
promoting the coat opening, i.e. the higher the BCB molarity, the faster the onset of drug release
(Figure 7.4). This observation is in accordance with recent findings (78,85). Within the
physiological range of bicarbonate molarity values, the buffer concentration seems to be more
148
important than the bulk buffer pH for the opening of the enteric coat, given that pHBCB > pHEC is
established.
The higher the molarity of the BCB buffer was the higher the final pH was. However, the
differences between the lowest and highest pH value was only 0.58 pH units, which is not
surprising based on the inherently amphoteric nature of the bicarbonate species.
Table 7.5. Non sparged bicarbonate medium pH at time zero (mean ± standard deviation) 2.5mM 5mM 10mM 15mM 20mM 30mM
Fresh 7.85 ± 0.026 7.94 ± 0.03 8.16 ± 0.01 8.13 ± 0 8.29 ± 0.01 8.27 ± 0.01
1 day old 7.75 ± 0.14 8.04 ± 0.02 8.12 ± 0.02 8.20 ± 0.02 8.28 ± 0.02 8.33 ± 0.01
1 week old 7.85 ± 0.021 7.97 ± 0.03 8.27 ± 0.01 8.31 ± 0.04 8.41 ± 0.02 8.28 ± 0.03
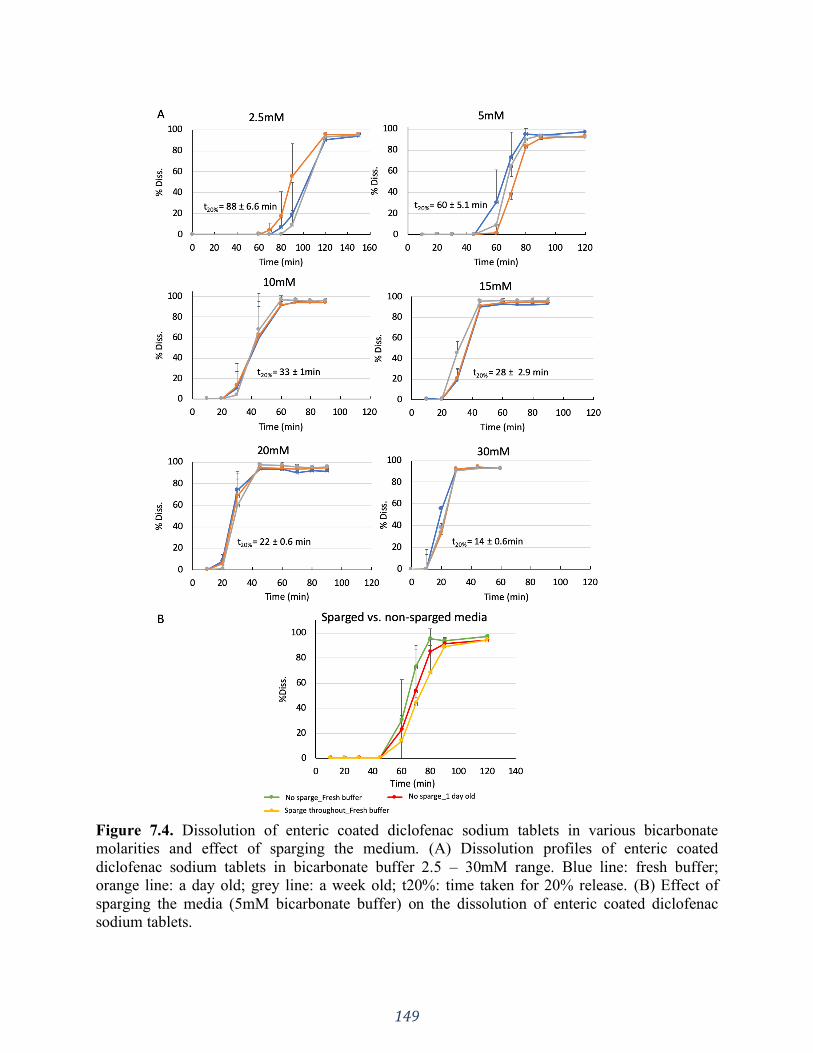
149
Figure 7.4. Dissolution of enteric coated diclofenac sodium tablets in various bicarbonate
molarities and effect of sparging the medium. (A) Dissolution profiles of enteric coated
diclofenac sodium tablets in bicarbonate buffer 2.5 – 30mM range. Blue line: fresh buffer;
orange line: a day old; grey line: a week old; t20%: time taken for 20% release. (B) Effect of
sparging the media (5mM bicarbonate buffer) on the dissolution of enteric coated diclofenac
sodium tablets.
150
7.5 Discussion
In our mechanistic evaluation of a limited set enteric coated products, the buffer system,
buffer capacity and medium pH were studied for acidic and basic drugs belonging to different
BCS classes. Micro-CT was used to measure the tablet coat thickness due to its non-invasive and
non-destructive capacity. This technique has been used to examine various properties of solid
dosage forms such as tablet density, pore structures, deformation behavior of polymorphs,
uniformity of API distribution in tablets and coating thickness (287–290). Because of the
contrast between the coating polymer and the tablet core, the coat thickness can be measured.
The advantage of using such technique is that it’s a non-destructive and non-invasive
tomographic tool that reveals the three-dimensional structure of various objects at a high spatial
resolution (291).
The coat thickness seemed to matter when comparing esomeprazole magnesium and
pantoprazole sodium tablets, which were coated with the same coating polymer and both are
basic API's. As expected, the thicker coat on the pantoprazole sodium tablets took longer to open
than esomeprazole magnesium (45 min vs. 30 min, respectively). On the other hand, the greater
thickness of the coating of pantoprazole sodium tablets makes it difficult to determine to which
extent the greater basicity of esomeprazole magnesium contribute to its faster release.
This was not the case when comparing pantoprazole sodium and aspirin tablets. They
were also coated with the same coating material, but even though pantoprazole sodium tablets
had a much thicker coat, the onset of drug release was much faster than for aspirin tablets (45
min vs. 4 hours). The major difference lies on the physicochemical properties of the APIs, i.e.,
base vs. acid. In this case, the physicochemical properties seem to outweigh the coat thickness.
151
Both esomeprazole magnesium and aspirin tablets were coated with the same coating
material, presented comparable coat thickness and differed only in the API physicochemical
properties. There was a significant difference in the onset of drug release between the two
formulations: 30 minutes vs. 4 hours, respectively (Figure 7.2A vs 7.2C). At the end of a 2 hours
period, esomeprazole magnesium tablets presented some ruptures in the coat layer, which could
expedite the drug release in the buffer stage. Due to the openings in the coat, the dissolution
medium can penetrate to the tablet core surface, causing it to expand and physically break the
coat, which is an additional force besides the coat dissolution. In addition to that, the basicity of
the API could also have played a role. As shown in Figure 7.3B, it is very noticeable that the
release of the acidic APIs aspirin is further delayed in BCB. This is most likely due to an
acidifying effect of such API on the inner side of the enteric coat, which can be an additional
hindrance to the polymer’s dissolution (150). In contrast, basic APIs such as esomeprazole
magnesium and pantoprazole sodium could increase the coat dissolution process by buffering it
from the inside, which was evidenced by the faster onset of drug release (Figure 7.3B). Basic
APIs can accept protons formed from the carboxyl groups ionization, thus promoting faster coat
opening than acidic APIs.
Liu and coworkers have reported similar observations (292). The use of an inner coating
(composed of a partially neutralized anionic polymeric material) under the outer enteric coating
(composed of an anionic polymeric material which is less or not at all neutralized than the inner
coating) helped to disintegrate and to release the drug earlier compared to a formulation having
no subcoat. Rapid disintegration upon entry into the small intestine is not the case for
“conventional EC dosage forms”, the authors proposed the use of such a subcoat for promoting
drug release already at the entry of the intestine (292).

152
After oral administration, an EC dosage form first reaches the stomach, where it resides
between 0.1-3 hours depending on the presence of food and other physiological and disease
states (293,294). After gastric emptying, it moves on to the small intestines where the drug
release takes place. Based on this, the USP recommended dissolution test for enteric coated
products is a two-stage procedure (295). In the first stage, the acid stage (2 hours), HCl 0.1N (pH
~ 1) is used as the dissolution medium, which is followed by the buffer stage in compendial
phosphate buffer pH 6.8 (unless otherwise specified in the individual monograph) (7). The first
stage mimics the dosage form’s passage through the stomach and the latter the intestine. Even
though the acid stage pH value (around 1) is at the lower range of the fasting gastric pH in vivo,
conducting the acid stage at the upper range values (around 2.9) is not likely to result in more
release because this value is still below the pH threshold for coat opening (starting from 5.5)
(44).
This procedure is also based on the premise that an enteric coating is insoluble under
acidic conditions, thus resisting dissolution, but would readily dissolve at more basic conditions
of the intestinal tract (296).
Our investigation shows that, in compendial phosphate buffer the drug release is rapid
with little discrimination for the dissolution behaviour between different EC formulations
(Figure 7.3A) (72). However, phosphate buffer lacks physiological relevance in many aspects,
such as buffer species and molarity (27). The main buffering system in the human intestinal fluid
is bicarbonate-based and the in vivo molarity values are much lower than the 50mM used in
compendial buffers (31,149). The bicarbonate concentration in the human intestine has been
reported to range from 2-15 mM in the duodenum, 2-30 mM in the jejunum and 30-75 mM in the
ileum (52,222,279–286). Hence, testing EC dosage forms in BCB can give much more

153
physiological insight to understand the pronounced discrepancies between the and in vivo
performance of EC dosage forms, as observed in the numerous case reports (Table 7.1). Many of
the in vivo failures of EC products were related to a lower rate and extent of drug absorption. As
shown in Figure 7.2, the coat opening is promptly promoted in phosphate buffer. On the other
hand, the lower rate and extent of drug absorption observed in vivo was reflected when applying
physiologically relevant conditions using BCB with different molarities (Figures 7.2 and 7.4).
Hence, there is a disconnect between the and in vivo performance of EC products.
The clinical irrelevance of phosphate buffer to predict the in vivo performance of EC
dosage forms lies on the fact that phosphate has an equilibrium kinetics completely different
from bicarbonate. Due to its pKa of 6.8 (under physiological ionic strength) (20), dihydrogen
phosphate (H2PO4-) is usually the species of choice in phosphate buffers. In aqueous medium
H2PO4- dissociates, forming monohydrogen phosphate ion (HPO4
-2) and a proton (Figure 7.5 Eq.
A) (297).
The pKa of the BCB system (Figure 7.5 Eq.B) reported in the literature is around 6.04
(72,84,85). This value is obtained when measuring the pKa with a potentiometric method at
physiological temperature and ionic strength. Because the titration procedure used in the
potentiometric determination of pKa is relatively slow, carbonic acid and carbon dioxide are at
equilibrium. That is the situation in the bulk solution in a dissolution vessel, where the pKa of
BCB is 6.04 (Eq. B in Figure 7.5) (78).
However, as reported by Al-Gousous et. al., at the solid-liquid interface (diffusion layer)
around dissolving solutes (e.g. drug or EC polymer) the situation is more complex. In contrast to
the very rapid ionization reactions, the CO2 hydration and H2CO3 dehydration processes are
much slower, with dehydration being up to 800 times faster than hydration (Fig. 7.6 Eq. C)

154
(298,299). The consequence of this is that, even though the hydration/dehydration reaction
(H2CO3(aq) ⇄ H2O(l) + CO2(aq)) occurs, it does not typically reach equilibrium within the effective
diffusion layer. This results in the effective pKa of bicarbonate in the diffusion layer to be lower
than the bulk value of 6.04 but higher than the intrinsic pKa of 3.30 (H2CO3(aq) ⇄ H+(aq) + HCO-
3(aq)). Therefore, the buffering capacity of bicarbonate in the boundary layer is governed by a
pKa value that is lower than the interfacial pH value needed for the EC polymer’s dissolution
(92). This means that BCB has a limited ability to buffer the pH of the dissolving polymer’s
surface and cannot promote prompt dissolution, which presents a major difference between BCB
and phosphate buffer and is clearly seen in the dissolution behavior shown in Figure 7.2.
Evidently, the opening of the enteric coat is very dependent on the medium properties,
however factors such as the intrinsic solubilities and pKa's of both the drug and polymer also
play a role (300–303). Hence, the assumption that an EC formulation rapidly disintegrates in the
intestines, behaving like an immediate release is a misconception (292).
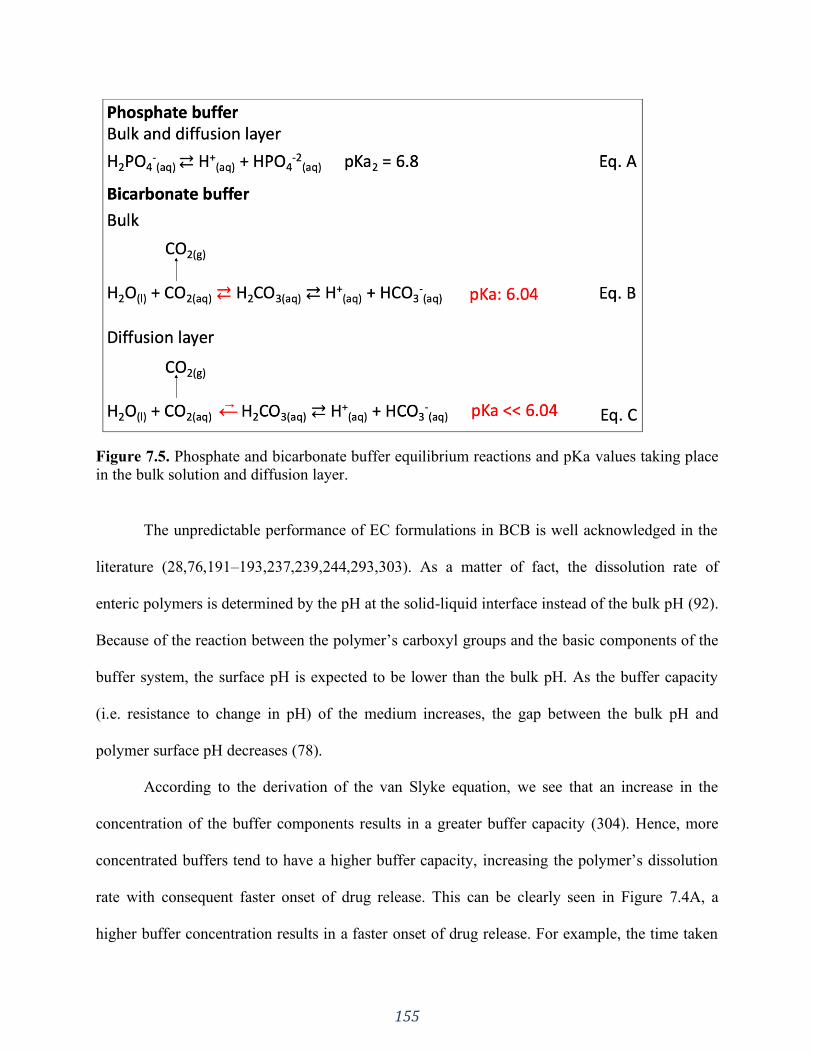
155
Figure 7.5. Phosphate and bicarbonate buffer equilibrium reactions and pKa values taking place
in the bulk solution and diffusion layer.
The unpredictable performance of EC formulations in BCB is well acknowledged in the
literature (28,76,191–193,237,239,244,293,303). As a matter of fact, the dissolution rate of
enteric polymers is determined by the pH at the solid-liquid interface instead of the bulk pH (92).
Because of the reaction between the polymer’s carboxyl groups and the basic components of the
buffer system, the surface pH is expected to be lower than the bulk pH. As the buffer capacity
(i.e. resistance to change in pH) of the medium increases, the gap between the bulk pH and
polymer surface pH decreases (78).
According to the derivation of the van Slyke equation, we see that an increase in the
concentration of the buffer components results in a greater buffer capacity (304). Hence, more
concentrated buffers tend to have a higher buffer capacity, increasing the polymer’s dissolution
rate with consequent faster onset of drug release. This can be clearly seen in Figure 7.4A, a
higher buffer concentration results in a faster onset of drug release. For example, the time taken
156
to reach 20% of drug release in BCB 2.5mM was 88 ± 6.6 minutes, whereas in 5mM, double the
molarity but comparable pH values (Table 7.5), the time went down to 60 ± 5.1 minutes. Here
we see that the coat opening was more dependent on buffer molarity than on bulk pH. This is in
accordance with Al-Gousous and coworkers who have also observed the more predominant
effect of BCB molarity on the release properties of EC formulations over bulk pH (78),
particularly when the bulk pH is above the polymer’s dissolution pH threshold value (which is an
interfacial rather than bulk pH value).
However, working with BCB can be experimentally challenging. Due to the loss of
CO2(aq) to the gas phase, the medium pH increases, hence it needs to be sparged with CO2 to
maintain the bulk pH at the desired pH value (243). Different dissolution method set-ups have
been proposed in order to overcome this difficulty, all of which are focused on re-establishing
the bulk pH (28). On the other hand, it is acknowledged that the enteric coating in vivo
dissolution is primarily limited by the surface pH and buffer molarity rather than bulk pH.
Hence, sparging the medium to maintain the bulk pH may not be as essential as using an
adequate BCB molarity in the dissolution test. We studied the use of non-sparged medium in
order to determine whether it could be an alternative to sparged medium, which would make the
use of bicarbonate-based medium more feasible.
Since buffer molarity (not pH, if above the threshold pH value) seems to be the limiting
factor for enteric coat opening, we tested EC diclofenac sodium formulations in BCB in a 2.5 –
30 mM range (biological range of bicarbonate concentration) without sparging the media. When
the bicarbonate-based medium was not sparged with CO2, the bulk pH could not be maintained.
Nonetheless, because the medium is not sparged, the pCO2 is lower, which leads to a decreased
157
escape of CO2 compared to the sparged medium. Consequently, the pH fluctuation in the non-
sparged medium was much less noticeable.
We assessed the effect of CO2 loss by preparing the buffer freshly and storing it for one
day and a week prior to the dissolution test (Figure 7.4A). The older the BCB is the higher the
CO2 loss, however the time points for onset and total drug release in freshly prepared buffer vs. 1
day old vs. a week old were similar (Figure 7.4A). As long as the pH was above the
recommended pH threshold, only buffer molarity was found to be important to meet the USP
criteria (NTL 75% release in 45 minutes). Currently, USP specifies 1 time point collection,
hence the variability observed in between would not be a concern.
In order to assess the influence of sparging the media, we fixed the buffer molarity at
5mM and compared the drug release in non-sparged buffer (fresh and a day old) versus freshly
prepared media with sparging throughout the dissolution test to maintain the bulk pH at 6.5
(Figure 7.4B). The onset of drug release was very similar between the tested media (i.e. after 45
minutes) as well as the time for total release (80-90 minutes). Considering the overall
performance, sparging the medium to maintain the bulk pH did not influence much.
Therefore, while the principle of “dissolution will happen as long as the fluid pH is
greater that the polymer’s dissolution pH threshold” (256) may be true in 50 mM phosphate
buffer and high molarity BCB, our results show that different BCB molarities significantly
impact the performance of EC products (as a result of the larger gap between the bulk and
interfacial pH values in BCB systems). These results are in line with in vivo observations of EC
products. Considering the results presented herein and the “lessons learned” from the many case
reports of in vivo failure of EC products, setting a molarity threshold rather than a bulk pH
threshold might be a better approach in the development of enteric coated dosage forms (78).
158
Moreover, the use BCB may be indispensable in the performance testing of EC formulations
during product development and quality control. Non sparged BCB set at an adequate molarity
may be a first step towards more physiologically relevant dissolution test for many and maybe
even most EC products. Further investigations need to be performed in this regard.
7.6 Conclusion
In this pilot study we demonstrated that there is a considerable delay in the onset of drug
release from EC formulations in BCB compared to compendial phosphate buffer. The delay in
BCB was additionally impacted by the nature of the API (acid vs base), which seems to
outweigh the coat thickness. This demonstrates that the coat opening is influenced by the
properties of the immersion medium (composition, pH and molarity) and the internal pH at the
tablet/coat interface.
Enteric coat dissolution is prompt in compendial buffer, revealing that USP dissolution test
for enteric coated tablets seems to be clinically irrelevant and it needs to be reevaluated. Using
BCB to test EC formulations is, therefore, a more physiologically relevant test condition.
The reported in vivo failures of EC products known in the literature seem to be due to, at
least in part, poor performance in the intestinal fluids, which is buffered by bicarbonate at low
buffer molarity. Testing these products in a fluid that closely resembles the intestinal lumen can
provide crucial insight on how the formulation would behave in the physiological environment
thus bringing clinical relevance to the test since the systemic therapeutic effect can only occur
after the drug has been released, dissolved, and absorbed. An in vivo relevant performance test
for EC products needs to be developed. Special consideration should be taken for acidic drugs
once its release could be further delayed.
159
SECTION THREE: PHYSIOLOGICALLY RELEVANT IN VITRO TESTING:
BICARBONATE BUFFER
CHAPTER EIGHT
Physiologically relevant dissolution conditions towards improved in vitro - in vivo
relationship – A case study with enteric coated pantoprazole tablets
A version of this chapter has been accepted to be published in:
International Journal of Pharmaceutics. 2021. Manuscript number: IJPHARM-D-21-01038
160
8.1 Introduction
Delayed release formulations have been used for many years both for medication and
nutrition supplements (e.g. iron) (305). This formulation technology is applied in cases which
there is a need to protect the formulated compound from the acid in the stomach; or to protect the
gastric mucosa; or to target the drug release to a particular segment in the intestines (305). The
drug release is not expected to take place in the stomach, only in the intestines, hence the
“delayed” terminology (306,307). The delayed release characteristic of such formulations is
usually obtained through the coating of the tablet core with a pH responsive polymer, which are
referred as enteric coating (EC) polymers. Such polymers are designed to dissolve when the
medium pH is above its dissolution pH threshold, thus allowing drug release (305). Examples of
polymers used for enteric coating are cellulose derivatives (e.g. cellulose acetate phthalate,
cellulose acetate trimellitate, hydroxyl propyl methyl cellulose phthalate and hydroxyl propyl
methyl cellulose acetate succinate), polyvinyl acetate phthalate and methacrylic acid copolymers,
which is one of the most widely used polymers for the intended purpose.
However, concern has been raised regarding delayed release formulations due to many
therapeutic failures reported over the years, including bioequivalence (BE) studies (88). A recent
study from our group (88) and other groups (68,71,75,78,191,192,239) suggest that this
drawback seems to be related to the poor in vivo performance of EC formulations. The human
intestinal juice is mainly composed of pancreatic and hepatic secretions. The pancreatic secretion
contains a large volume of sodium bicarbonate solution along with of various digestive enzymes.
Similarly, sodium bicarbonate is also added to the hepatic secretion (bile). Furthermore, the
epithelial cells of the duodenum secrete an alkaline mucus to protect the duodenal wall from the
acidic content coming from the stomach. This mucus contains bicarbonate ions, which adds to
161
the bicarbonate ions from the pancreatic and hepatic secretions. This results in an overall effect
where the luminal fluids of the small intestine are predominantly buffered by bicarbonate at low
molarity values (28,149).
In contrast, during the drug product development process, formulations are tested in
highly concentrated pharmacopeial phosphate-based buffers (e.g. 50mM phosphate buffer).
However, the concentration of phosphates in the human gastrointestinal luminal fluids is
insignificant, which makes the use of phosphate-containing media poorly representative of the
human intestines. Hence, there is a disconnect between the in vivo environment that the product
is exposed to and the in vitro test setting regarding buffer species (carbonate vs. phosphate) and
buffer molarity (88). Using buffer systems that are not reflective of the in vivo environment
during the pharmaceutical development phase can be misleading and cause poor selection of
prototype formulations for a BE study.
Another important aspect to consider is the physicochemical properties of the active
pharmaceutical ingredient (API). Acidic APIs can create a low pH microenvironment on the
inner side of the coat, which can be a further hindrance to the coat dissolution (88). Since
bicarbonate buffer (BCB) does not promote prompt dissolution of the enteric coating, such
acidifying effect is pronounced in physiological environments.
In vitro - in vivo correlation/ relationship (IVIVC/R) constitute an important tool for
formulation development, mainly for modified-release systems, aiming to optimize prototypes,
reduce the number of BE studies during the development, supporting post-approval changes and
setting dissolution limits (308,309). In this context, IVIVC/R works as a powerful mathematical
model linking an in vitro property of a dosage form to a relevant in vivo response, making
possible a rational development based on in vitro biopredictive conditions (29). Despite of its

162
powerful application in the development of formulations, an IVIVC/R with significant
predictability power is more difficult to obtain for highly variable drug and drug products
(29,310), especially when these formulations are administered with meals. In such cases in vitro
- in vivo relationships can be valuable.
In this study we reassessed two pantoprazole EC formulations from a failed BE study
under fed conditions. These were chosen as model formulations because they were coated with
methacrylic acid - ethyl acrylate copolymer (widely used as coating materials) and pantoprazole
is a basic API, hence an API acidifying effect on the inner side of the coat can be ruled out. The
provided in vivo data presented an extremely delayed opening of the formulations together with
a great variability. We hypothesized that the release profile in physiologically relevant BCB
would detect possible performance differences between test and reference formulations enabling
more accurate IVIVR results and predictability. Thus, the objective of this study was to establish
a relationship between the in vitro performance of test and reference formulations (both in BCB
and pharmacopeial phosphate buffer) with the in vivo BE study results using the IVIVC module
present on GastroPlus®.
8.2 Materials
Sodium phosphate monobasic monohydrate and sodium hydroxide were purchased from
Fisher Scientific (New Jersey, USA), sodium bicarbonate was purchased from Caledon (Ontario,
Canada), pantoprazole sodium was purchased from Sigma-Aldrich Co. (Montana, USA). The EC
pantoprazole formulations were kindly donated by a pharmaceutical industry. Both formulations
were coated with the same polymer (methacrylic acid - ethyl acrylate copolymer). Buffer
solutions were prepared with purified water (Elgastat Maxima UF and an Elgastat Option 3B
water purifier by ELGA Laboratories Ltd. (Mississauga, ON, Canada).
163
The excipient compositions of the formulations as available in the drug leaflet are
described below.
Reference: sodium carbonate, mannitol, povidone, calcium stearate, hypromellose, titanium
dioxide, iron oxide (yellow), propylene glycol, methacrylic acid-ethyl acrylate copolymer,
sodium laureth sulfate, polysorbate 80 and triethyl citrate.
Test: sodium carbonate, triethyl citrate, iron oxide (yellow), crospovidone, silicon dioxide,
titanium dioxide, calcium stearate, mannitol, hypromellose, macrogol, methacrylic acid-ethyl
acrylate copolymer and povidone.
8.3 Methods
8.3.1 In vitro dissolution testing
The EC pantoprazole formulations used in the dissolution study were from the same lot
as those used in the BE studies and were still within its shelf-life period.
All dissolution tests were performed in a VK 7020 system from Varian Inc. dissolution
tester coupled to a VK 8000 autosampler. USP apparatus II with 75 rpm rotation speed was used
with dissolution media temperature set at 37 °C.
Dissolution testing was performed according to USP <711> two stage procedure in an
acid stage followed by a buffer stage. The acid stage was carried out in 0.1N HCl for 2 hours
prior to the buffer stage. The drug release was determined by UV-spec at the end of the 2 hours.
The tablets were then transferred to vessels containing 900 ml of pre-heated buffer solutions. The
buffer stage was composed of either pharmacopeial phosphate buffer (50mM concentration at pH
6.8) or bicarbonate buffer. The reported bicarbonate concentration in the duodenum under fed
state is 10mM with a wide pH range of 3.1 - 6.7 (37,44,186). Hence, a 10mM BCB was used
with pH adjusted to 6 by sparging the medium with CO2(g). The phosphate buffer system was
164
composed of sodium phosphate monobasic monohydrate (50mM) and sodium hydroxide to
adjust the solution’s pH. The bicarbonate buffer system was composed of sodium bicarbonate
(10mM) dissolved in filtered water.
The pH was monitored using an accumet® AB250 pH-meter from Fisher Scientific (Fair
Lawn, NJ, USA). The drug release at specific time points was determined by UV-spectroscopy
(288nm wavelength).
8.3.2 Statistical analysis
The Microsoft ExcelTM add-in DDSolver was used to compare the dissolution profiles by
f2 statistics (147). The factor f2 is a similarity factor that measures the closeness between two
profiles. Similarity is indicated by a f2 value between 50-100.
8.3.3 Bioequivalence study
The plasma concentration-time data for two pantoprazole EC formulations (test and
reference) were used in order to investigate a failed BE result under fed condition. The study
design was randomized, single dose, two-treatment, two-sequence, four-period (2x2x4) full
replicated crossover with a 7-day washout period. Forty-four (44) adult healthy subjects of both
genders were enrolled in the study and thirty-five (35) completed the study (70 individual PK
data considering the replicated design). Serial blood samples were collected up to 36h post-dose.
The study was approved by a Research Ethics Committee and followed the Good Clinical
Practices Guidelines (311) and the ethical principles for medical research involving human
subjects stated in the Declaration of Helsinki (312). The study followed standard guideline for
BE study under fed conditions (313).

165
8.3.4 Pharmacokinetic data
Since the pharmacokinetics (PK) results were extremely scattered with some subjects
peaking much later than others (refer to Figures 8.3 and 8.4 under “Results” section), the mean
curve presented an “artificial” double peak. Hence, the mean curve was not reflective of the real
absorption pattern of the EC pantoprazole formulations, thence not suitable to be used in the
IVIVR studies.
For this reason, the subjects were divided into three cohorts of Tmax, namely: (1) 2.0-
3.5h, (2) 4.0-5.5h, and after (3) 6.0h. The cohorts were chosen based on the first observed Tmax
among all the subjects (i.e. 2 hours) and a 1.5h increment size was used as the cut off between
the cohorts.
Cohort 1 represents those subjects that would have the “expected” plasma curve profile if
the enteric coating would rapidly dissolve upon reaching the intestines, where the fluid’s pH is
above the polymer’s dissolution pH threshold. In other words, there would be no additional delay
on the drug release and absorption process once the dosage form has transitioned to the intestines
(high pH environment). Hence, the mean plasma curve obtained from the subjects in cohort 1
was correlated with the release profile in phosphate buffer, including the 2 hours period in HCl
(in which there was no release).
Cohort 2 represents subjects that had a further delay on the drug release and absorption
process. Low buffering capacity and intestinal fluid composition could be the one of the causes
for the much more delayed coat opening with further drug release. Hence, the mean plasma
curve obtained from the subjects in cohort 2 was correlated with the release profile in
bicarbonate buffer. Finally, cohort 3 is a miscellaneous group which includes subjects peaking at
various time points, even after 12 hours.
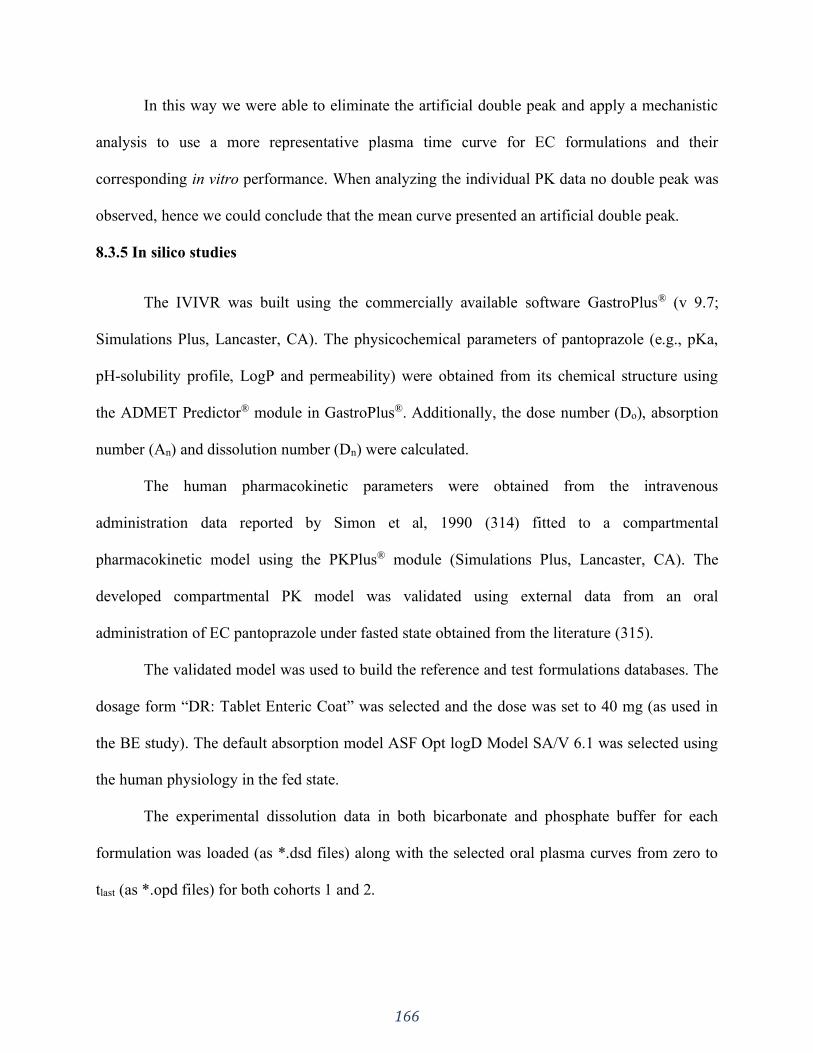
166
In this way we were able to eliminate the artificial double peak and apply a mechanistic
analysis to use a more representative plasma time curve for EC formulations and their
corresponding in vitro performance. When analyzing the individual PK data no double peak was
observed, hence we could conclude that the mean curve presented an artificial double peak.
8.3.5 In silico studies
The IVIVR was built using the commercially available software GastroPlus® (v 9.7;
Simulations Plus, Lancaster, CA). The physicochemical parameters of pantoprazole (e.g., pKa,
pH-solubility profile, LogP and permeability) were obtained from its chemical structure using
the ADMET Predictor® module in GastroPlus®. Additionally, the dose number (Do), absorption
number (An) and dissolution number (Dn) were calculated.
The human pharmacokinetic parameters were obtained from the intravenous
administration data reported by Simon et al, 1990 (314) fitted to a compartmental
pharmacokinetic model using the PKPlus® module (Simulations Plus, Lancaster, CA). The
developed compartmental PK model was validated using external data from an oral
administration of EC pantoprazole under fasted state obtained from the literature (315).
The validated model was used to build the reference and test formulations databases. The
dosage form “DR: Tablet Enteric Coat” was selected and the dose was set to 40 mg (as used in
the BE study). The default absorption model ASF Opt logD Model SA/V 6.1 was selected using
the human physiology in the fed state.
The experimental dissolution data in both bicarbonate and phosphate buffer for each
formulation was loaded (as *.dsd files) along with the selected oral plasma curves from zero to
tlast (as *.opd files) for both cohorts 1 and 2.
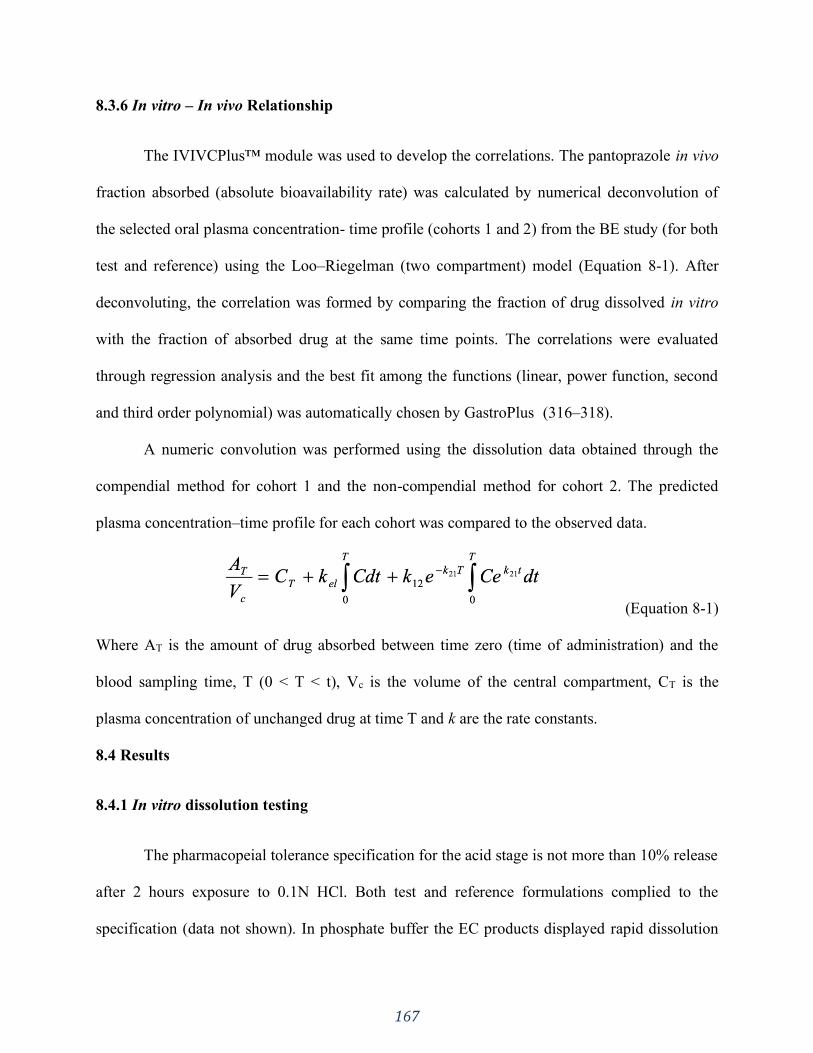
167
8.3.6 In vitro – In vivo Relationship
The IVIVCPlus™ module was used to develop the correlations. The pantoprazole in vivo
fraction absorbed (absolute bioavailability rate) was calculated by numerical deconvolution of
the selected oral plasma concentration- time profile (cohorts 1 and 2) from the BE study (for both
test and reference) using the Loo–Riegelman (two compartment) model (Equation 8-1). After
deconvoluting, the correlation was formed by comparing the fraction of drug dissolved in vitro
with the fraction of absorbed drug at the same time points. The correlations were evaluated
through regression analysis and the best fit among the functions (linear, power function, second
and third order polynomial) was automatically chosen by GastroPlus (316–318).
A numeric convolution was performed using the dissolution data obtained through the
compendial method for cohort 1 and the non-compendial method for cohort 2. The predicted
plasma concentration–time profile for each cohort was compared to the observed data.
(Equation 8-1)
Where AT is the amount of drug absorbed between time zero (time of administration) and the
blood sampling time, T (0 < T < t), Vc is the volume of the central compartment, CT is the
plasma concentration of unchanged drug at time T and k are the rate constants.
8.4 Results
8.4.1 In vitro dissolution testing
The pharmacopeial tolerance specification for the acid stage is not more than 10% release
after 2 hours exposure to 0.1N HCl. Both test and reference formulations complied to the
specification (data not shown). In phosphate buffer the EC products displayed rapid dissolution

168
and were compliant to the USP tolerance specifications for drug release in the buffer stage of not
less than 75% in 45 min (Figure 8.1). However, the f2 test failed (f2 = 45). Similarly, the
dissolution results in bicarbonate buffer failed the f2 test (f2=11). The comparative dissolution
for both formulations in phosphate buffer 50mM vs. BCB 10mM is presented in Figure 8.1. Not
only was the onset of drug release much more delayed in bicarbonate media compared to
phosphate buffer, but the difference in performance between test and reference products was
much more evidenced in BCB, making it clear that these formulations don’t have a similar in
vitro dissolution performance. The shape of the curves also differed.
The delayed opening of the formulations in BCB can be linked to the distinct pattern of coat
dissolution between the two media. In phosphate buffer the coat around the tablet rapidly
dissolved and the tablet core was exposed to the dissolution medium, allowing fast disintegration
and drug release. In BCB, however, the coat did not dissolve instantly, but presented ruptures
through which the water could penetrate and reach the tablet core. The ruptures (“tearing” on the
coating material) were detected by visual inspection of the tablets in the dissolution vessel
(schematic picture is shown in Figure 8.2). This was reflected in the slower disintegration of the
dosage form further delaying the drug release. This points out to the slower dissolution rate that
EC polymers have in BCB.
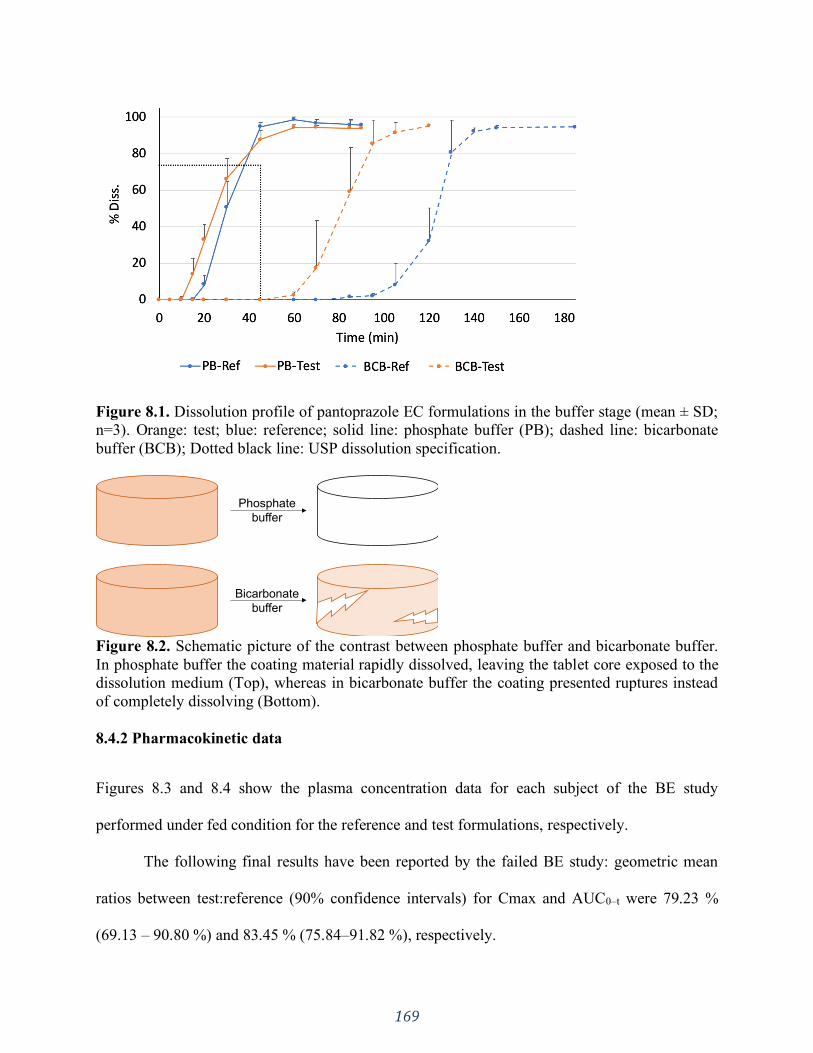
169
Figure 8.1. Dissolution profile of pantoprazole EC formulations in the buffer stage (mean ± SD;
n=3). Orange: test; blue: reference; solid line: phosphate buffer (PB); dashed line: bicarbonate
buffer (BCB); Dotted black line: USP dissolution specification.
Figure 8.2. Schematic picture of the contrast between phosphate buffer and bicarbonate buffer.
In phosphate buffer the coating material rapidly dissolved, leaving the tablet core exposed to the
dissolution medium (Top), whereas in bicarbonate buffer the coating presented ruptures instead
of completely dissolving (Bottom).
8.4.2 Pharmacokinetic data
Figures 8.3 and 8.4 show the plasma concentration data for each subject of the BE study
performed under fed condition for the reference and test formulations, respectively.
The following final results have been reported by the failed BE study: geometric mean
ratios between test:reference (90% confidence intervals) for Cmax and AUC0–t were 79.23 %
(69.13 – 90.80 %) and 83.45 % (75.84–91.82 %), respectively.
Phosphate
buffer
Bicarbonate
buffer
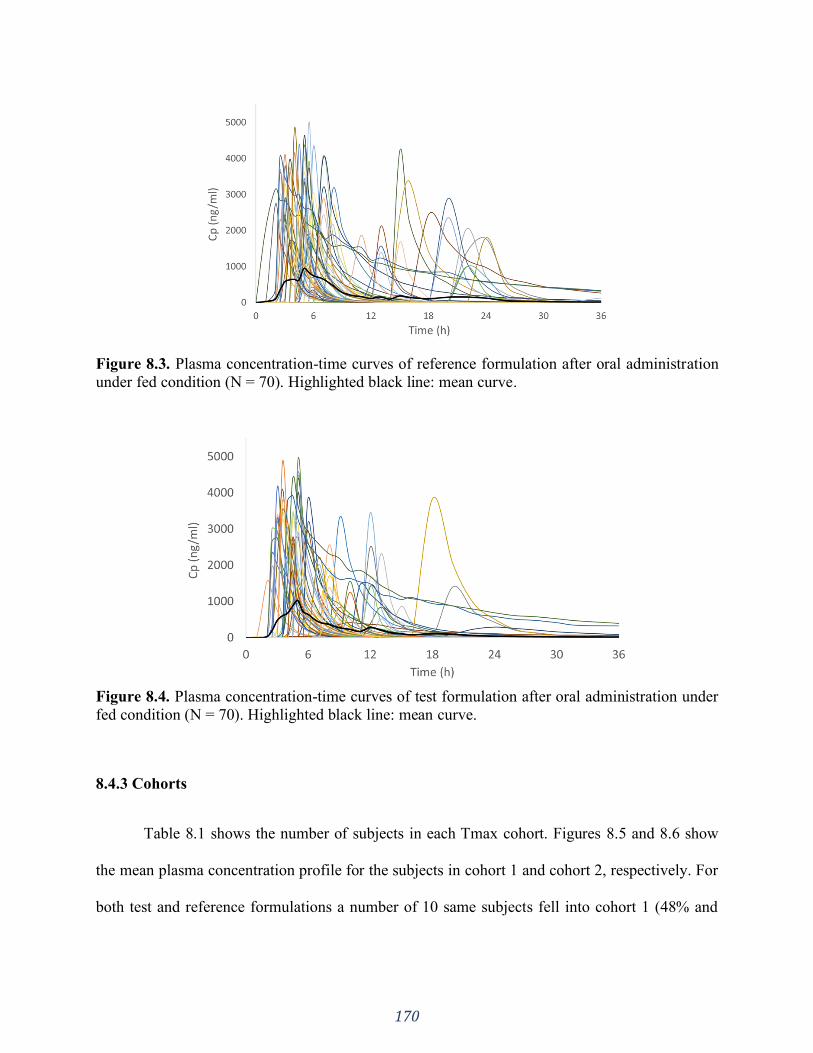
170
Figure 8.3. Plasma concentration-time curves of reference formulation after oral administration
under fed condition (N = 70). Highlighted black line: mean curve.
Figure 8.4. Plasma concentration-time curves of test formulation after oral administration under
fed condition (N = 70). Highlighted black line: mean curve.
8.4.3 Cohorts
Table 8.1 shows the number of subjects in each Tmax cohort. Figures 8.5 and 8.6 show
the mean plasma concentration profile for the subjects in cohort 1 and cohort 2, respectively. For
both test and reference formulations a number of 10 same subjects fell into cohort 1 (48% and
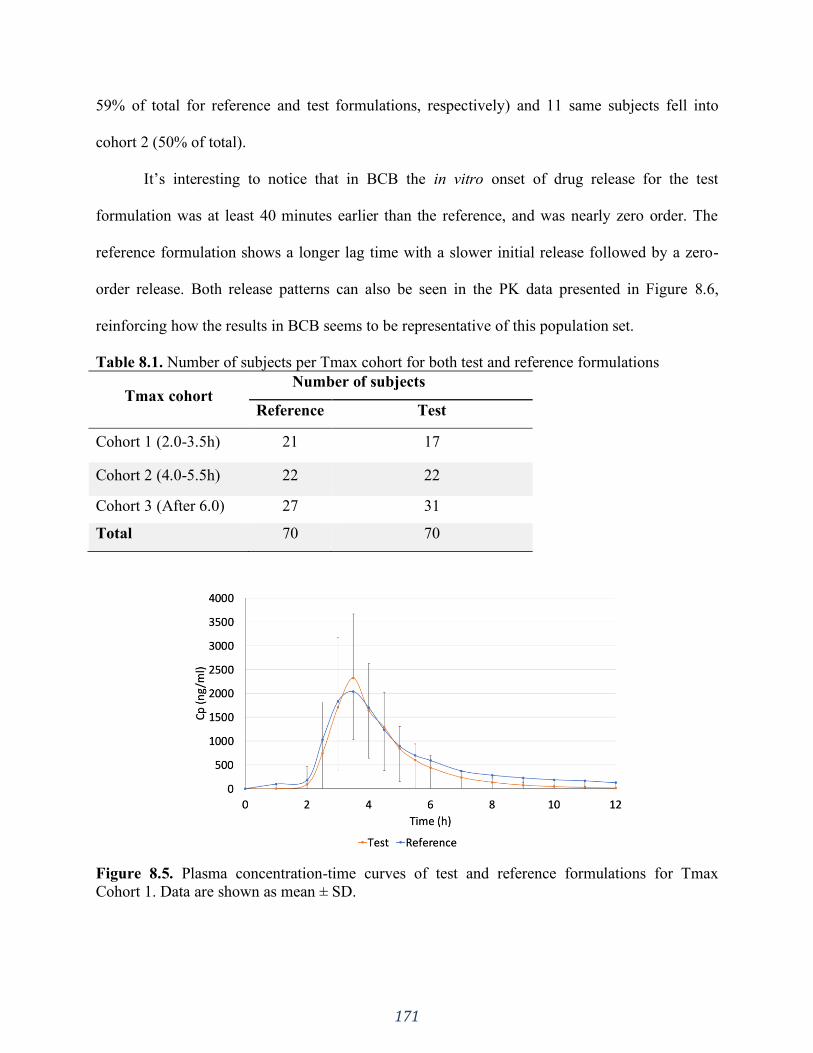
171
59% of total for reference and test formulations, respectively) and 11 same subjects fell into
cohort 2 (50% of total).
It’s interesting to notice that in BCB the in vitro onset of drug release for the test
formulation was at least 40 minutes earlier than the reference, and was nearly zero order. The
reference formulation shows a longer lag time with a slower initial release followed by a zero-
order release. Both release patterns can also be seen in the PK data presented in Figure 8.6,
reinforcing how the results in BCB seems to be representative of this population set.
Table 8.1. Number of subjects per Tmax cohort for both test and reference formulations
Tmax cohort Number of subjects
Reference Test
Cohort 1 (2.0-3.5h) 21 17
Cohort 2 (4.0-5.5h) 22 22
Cohort 3 (After 6.0) 27 31
Total 70 70
Figure 8.5. Plasma concentration-time curves of test and reference formulations for Tmax
Cohort 1. Data are shown as mean ± SD.
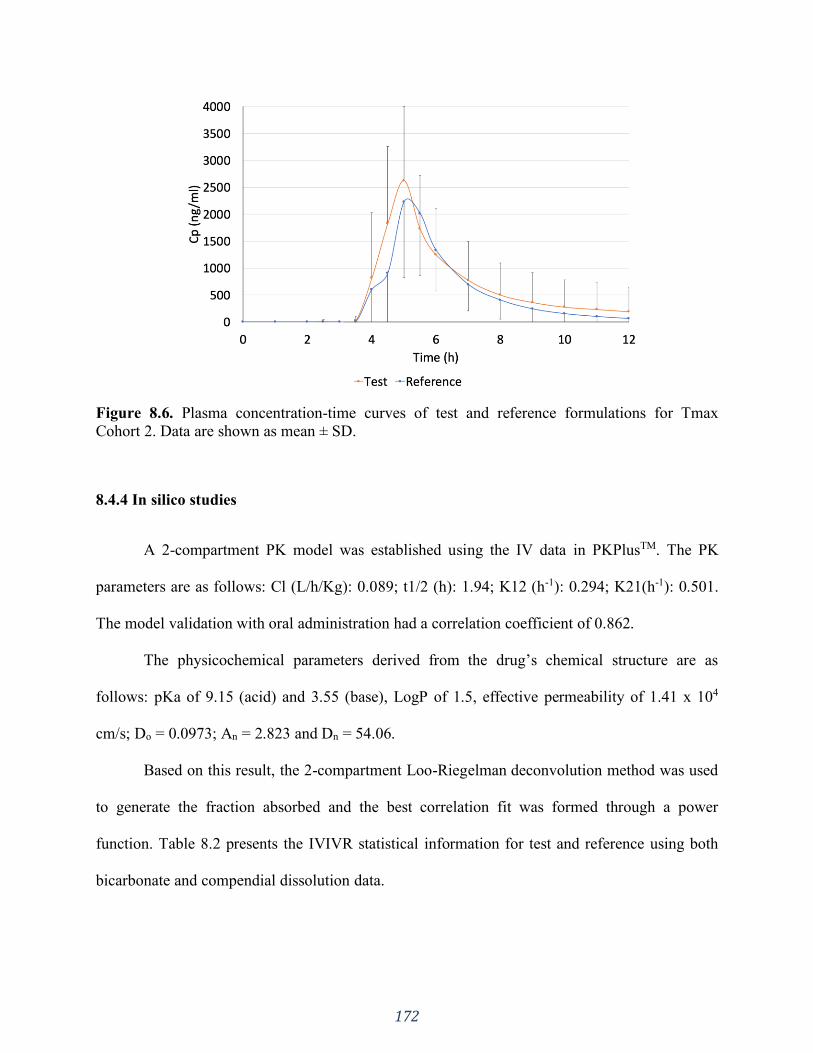
172
Figure 8.6. Plasma concentration-time curves of test and reference formulations for Tmax
Cohort 2. Data are shown as mean ± SD.
8.4.4 In silico studies
A 2-compartment PK model was established using the IV data in PKPlusTM. The PK
parameters are as follows: Cl (L/h/Kg): 0.089; t1/2 (h): 1.94; K12 (h-1): 0.294; K21(h-1): 0.501.
The model validation with oral administration had a correlation coefficient of 0.862.
The physicochemical parameters derived from the drug’s chemical structure are as
follows: pKa of 9.15 (acid) and 3.55 (base), LogP of 1.5, effective permeability of 1.41 x 10⁴
cm/s; Do = 0.0973; An = 2.823 and Dn = 54.06.
Based on this result, the 2-compartment Loo-Riegelman deconvolution method was used
to generate the fraction absorbed and the best correlation fit was formed through a power
function. Table 8.2 presents the IVIVR statistical information for test and reference using both
bicarbonate and compendial dissolution data.
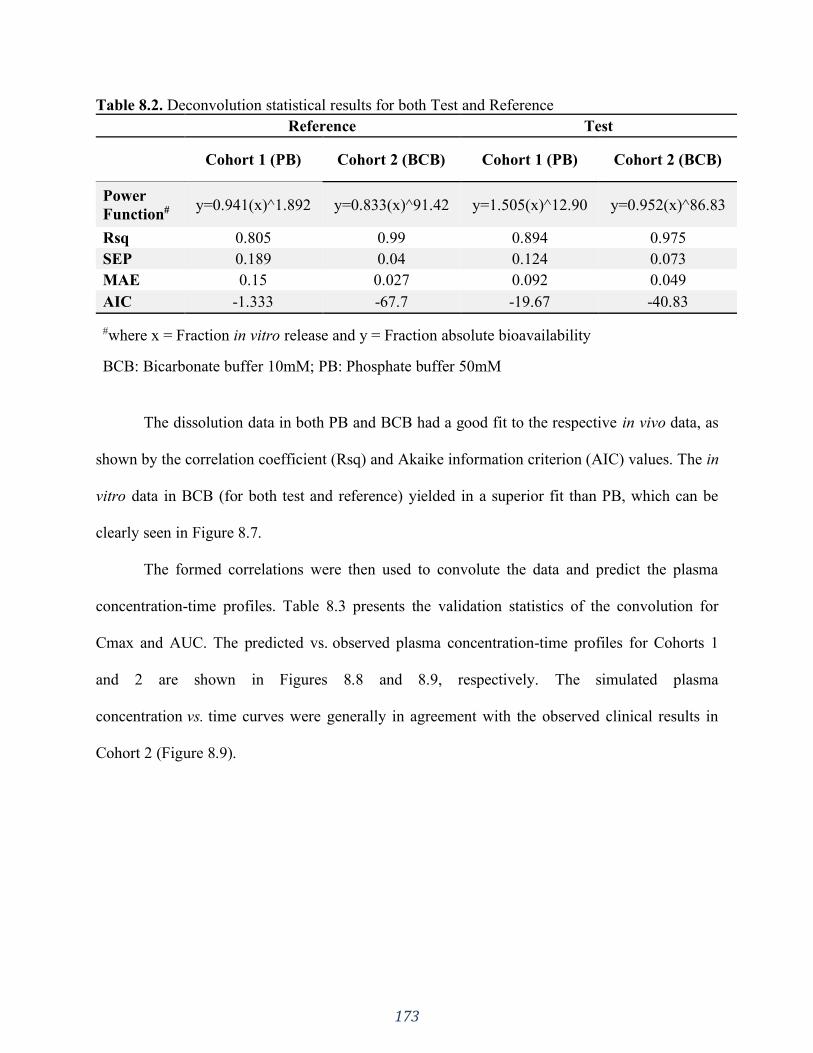
173
Table 8.2. Deconvolution statistical results for both Test and Reference
Reference Test
Cohort 1 (PB) Cohort 2 (BCB) Cohort 1 (PB) Cohort 2 (BCB)
Power
Function# y=0.941(x)^1.892 y=0.833(x)^91.42 y=1.505(x)^12.90 y=0.952(x)^86.83
Rsq 0.805 0.99 0.894 0.975
SEP 0.189 0.04 0.124 0.073
MAE 0.15 0.027 0.092 0.049
AIC -1.333 -67.7 -19.67 -40.83
#where x = Fraction in vitro release and y = Fraction absolute bioavailability
BCB: Bicarbonate buffer 10mM; PB: Phosphate buffer 50mM
The dissolution data in both PB and BCB had a good fit to the respective in vivo data, as
shown by the correlation coefficient (Rsq) and Akaike information criterion (AIC) values. The in
vitro data in BCB (for both test and reference) yielded in a superior fit than PB, which can be
clearly seen in Figure 8.7.
The formed correlations were then used to convolute the data and predict the plasma
concentration-time profiles. Table 8.3 presents the validation statistics of the convolution for
Cmax and AUC. The predicted vs. observed plasma concentration-time profiles for Cohorts 1
and 2 are shown in Figures 8.8 and 8.9, respectively. The simulated plasma
concentration vs. time curves were generally in agreement with the observed clinical results in
Cohort 2 (Figure 8.9).
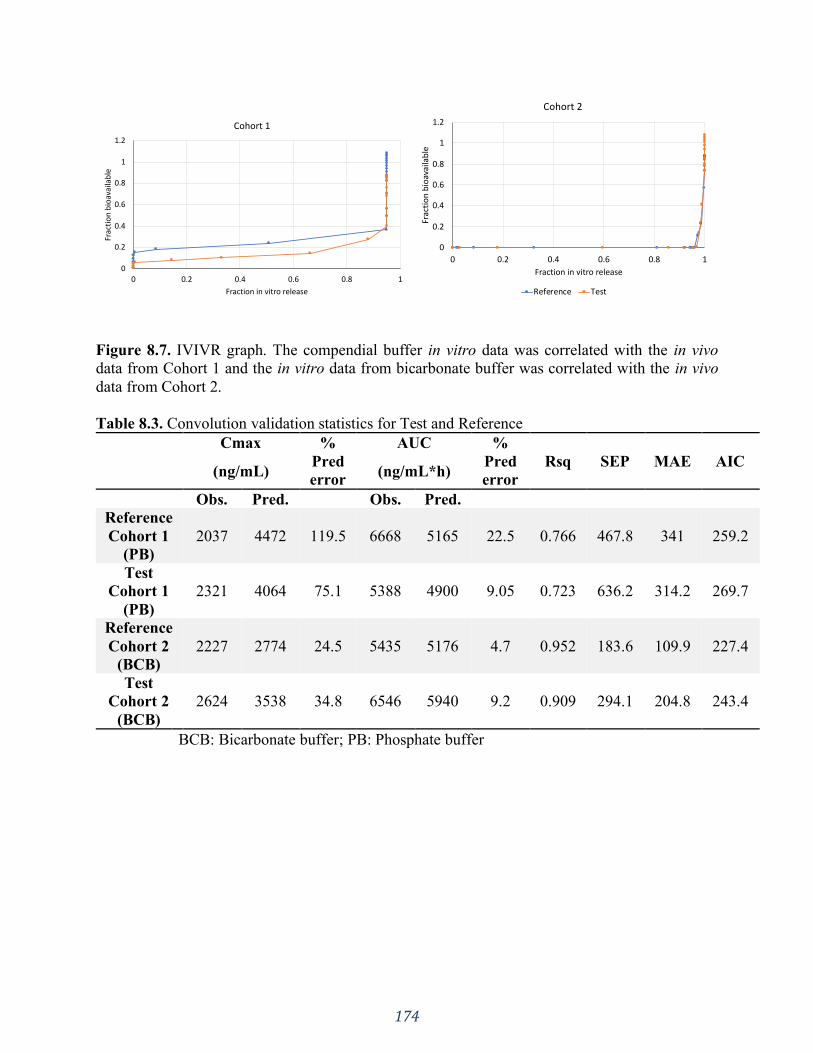
174
Figure 8.7. IVIVR graph. The compendial buffer in vitro data was correlated with the in vivo
data from Cohort 1 and the in vitro data from bicarbonate buffer was correlated with the in vivo
data from Cohort 2.
Table 8.3. Convolution validation statistics for Test and Reference
Cmax %
Pred
error
AUC %
Pred
error
Rsq SEP MAE AIC (ng/mL) (ng/mL*h)
Obs. Pred. Obs. Pred.
Reference
Cohort 1
(PB)
2037 4472 119.5 6668 5165 22.5 0.766 467.8 341 259.2
Test
Cohort 1
(PB)
2321 4064 75.1 5388 4900 9.05 0.723 636.2 314.2 269.7
Reference
Cohort 2
(BCB)
2227 2774 24.5 5435 5176 4.7 0.952 183.6 109.9 227.4
Test
Cohort 2
(BCB)
2624 3538 34.8 6546 5940 9.2 0.909 294.1 204.8 243.4
BCB: Bicarbonate buffer; PB: Phosphate buffer
0
0.2
0.4
0.6
0.8
1
1.2
0 0.2 0.4 0.6 0.8 1
Frac
tio
n b
ioav
aila
ble
Fraction in vitro release
Cohort 1
0
0.2
0.4
0.6
0.8
1
1.2
0 0.2 0.4 0.6 0.8 1
Frac
tio
n b
ioav
aila
ble
Fraction in vitro release
Cohort 2
Reference Test
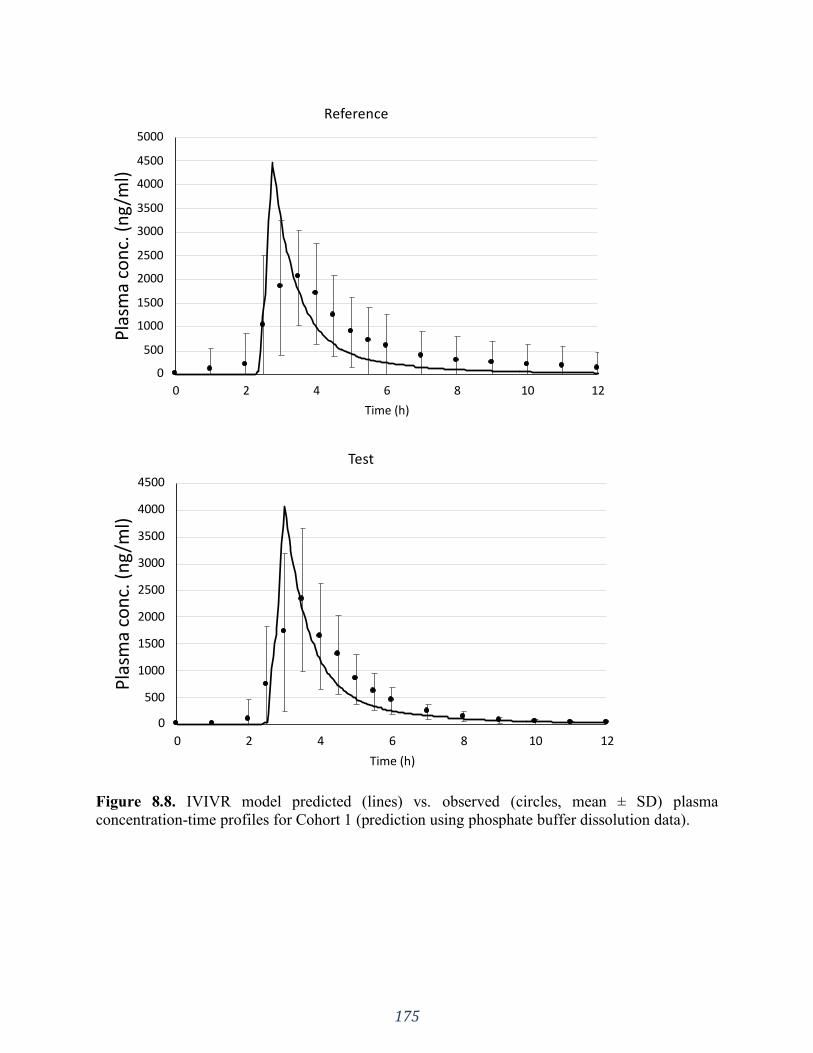
175
Figure 8.8. IVIVR model predicted (lines) vs. observed (circles, mean ± SD) plasma
concentration-time profiles for Cohort 1 (prediction using phosphate buffer dissolution data).
0
500
1000
1500
2000
2500
3000
3500
4000
4500
5000
0 2 4 6 8 10 12
Pla
sma
con
c. (
ng
/ml)
Time (h)
Reference
0
500
1000
1500
2000
2500
3000
3500
4000
4500
0 2 4 6 8 10 12
Pla
sma
con
c. (
ng
/ml)
Time (h)
Test
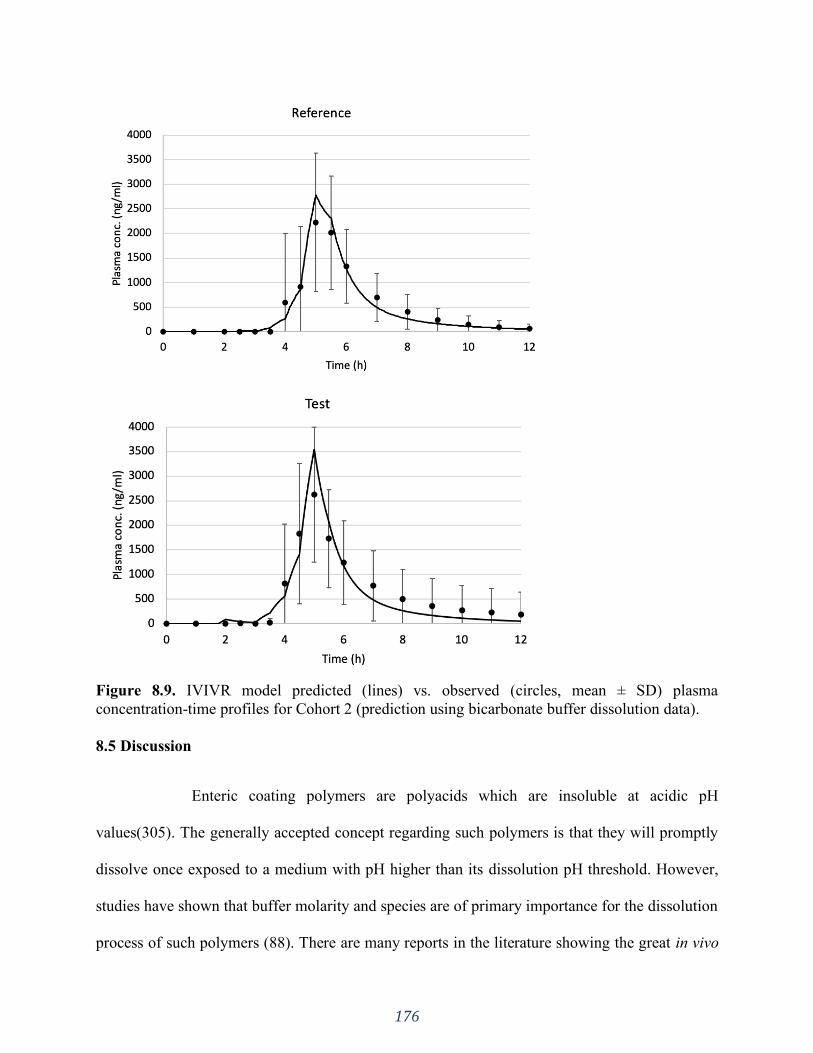
176
Figure 8.9. IVIVR model predicted (lines) vs. observed (circles, mean ± SD) plasma
concentration-time profiles for Cohort 2 (prediction using bicarbonate buffer dissolution data).
8.5 Discussion
Enteric coating polymers are polyacids which are insoluble at acidic pH
values(305). The generally accepted concept regarding such polymers is that they will promptly
dissolve once exposed to a medium with pH higher than its dissolution pH threshold. However,
studies have shown that buffer molarity and species are of primary importance for the dissolution
process of such polymers (88). There are many reports in the literature showing the great in vivo
177
variability related to EC formulations, both intra and inter subject (28,88) (and references cited
thereby). This may be due, in part, to the intestinal buffer composition. The buffer system in the
human gastrointestinal tract is mainly bicarbonate based and the performance of EC formulations
in this system can be quite different compared to compendial phosphate buffer (88,239) (Figure
8.1), which is often used in the drug product development.
Considering this, using more physiologically relevant dissolution conditions can give a
better mechanistic understanding of the in vivo performance of a given formulation (38).
Physiologically relevant conditions can be defined as one that simulates the in vivo dissolution
environment in one or more aspects beyond the typical quality control/batch release method (17).
More complex formulations, such as delayed release, can be best evaluated using such conditions
that incorporate the main parameters driving in vivo drug release and dissolution (319).
The selection of a prototype formulation to proceed to a BE study relies mostly on the
similarity of the in vitro performance of test and reference. In most cases, the generic industry
seeks for the simplest, quickest and cheapest in vitro methods and standards (17). Additionally, a
one-time point collection at the USP specification is usually the practice in the industry instead
of drawing the whole profile and, many times, meeting the specification is “good enough”.
However, as this study has shown, similar in vitro performance using compendial conditions and
compliance with USP specifications does not guarantee similar in vivo behavior, which may lead
to failure in a BE study.
The USP specification for delayed release tablets is >75% release at 45 minutes (7). This
means that the products being compared could release the API faster than the other, while
satisfying the standard for drug dissolution. The results in Figure 8.1 and the f2 statical analysis
clearly show that, in spite of the fact that the test and reference formulations met the compendial
178
specification, they already failed f2 in phosphate buffer. This was even more pronounced in
BCB, where a clear distinction between the two formulations can be seen. Based on the f2 results
we can see that BCB, a physiologically relevant system, could differentiate the in vitro
performance of test and reference products more clearly than the compendial conditions.
However, even with bicarbonate-based media, a case by case study is a more valuable
approach instead of using a “one fits all” condition and specification (319,320). In the last
decades, many non-compendial dissolution methods have been proposed in attempt to mimic the
in vivo environment and the incorporation of such data into in silico PK models is an ongoing
challenge (319).
Due to the high buffer capacity of compendial PB, the coat opening with further drug
release is readily prompted. Differently, the equilibrium kinetics of BCB at the solid-liquid
interface (diffusion layer) results in an effective bicarbonate pKa lower than the interfacial pH
value needed for the EC polymer's dissolution (85,88). The pKa of the BCB system in the bulk
solution is around 6.04. However, at the solid-liquid interface (diffusion layer) around the
dissolving EC polymer the hydration/dehydration reaction (H2CO3(aq) ⇄ H2O(l) + CO2(aq)) does
not typically reach equilibrium. This results in the effective pKa of bicarbonate in the diffusion
layer to be lower than the bulk value (6.04) but higher than the intrinsic pKa of 3.30 (H2CO3(aq)
⇄ H+(aq) + HCO-
3(aq)). Therefore, BCB has a limited ability to buffer the pH of the dissolving
polymer’s surface and cannot promote prompt dissolution and opening of the coat. This presents
a major difference between BCB and phosphate buffer and is clearly seen in Figure 8.1. Such
delay in the coat opening/dissolution was captured in the physiologically relevant dissolution
medium.

179
The main difference in the release profiles in the compendial vs. non-compendial
methods was the onset of drug release, and not the API dissolution rate / extent released. Once
the coating polymer starts to dissolve/ open the drug can be released from the tablet core.
Pantoprazole is a BCS class III drug (high solubility/ low permeability) (315), hence the API
dissolution, once release from the dosage form, is not likely to be a major issue but cannot be
ruled out completely. The dose Do of 0.0973 indicates that pantoprazole is a drug with high
solubility. The calculated dissolution number refers to the time required for drug dissolution
(ratio of the intestinal residence time to the dissolution time). Hence, the higher the dissolution
number the higher will be the fraction-dose absorbed. The calculated Dn of 54.06 indicates that
dissolution is faster than transit.
If pantoprazole is a BCS III drug, then permeation across the GI membrane could be a
rate-determining step to absorption for the formulations studied. However, according to ADMET
predictor, pantoprazole has a calculated Peff of 1.41 x 104 cm/s, which is roughly on the
borderline of low/high effective permeation rate. Additionally, An An larger than 1 suggests
complete absorption. The calculated An was 2.823, which indicates that, even though
pantoprazole is a borderline BCS III drug, it is well and completely absorbed. These observations
make it evident that the main issue with the tested products is the opening of the coat.
On one hand, there were a number of subjects (cohort 1) in which the in vitro results in
phosphate buffer correlated with the in vivo data, as shown in Table 8.3 and Figure 8.8. Even
though there was an overprediction for Cmax, the overall behavior and AUC had a good fit.
However, this would only be predictive of a small portion of the entire study group, which can
be misleading and eventually culminated in the failed BE study – if decisions were taken solely
based the compendial results. Such data represent the “text book” knowledge concerning EC
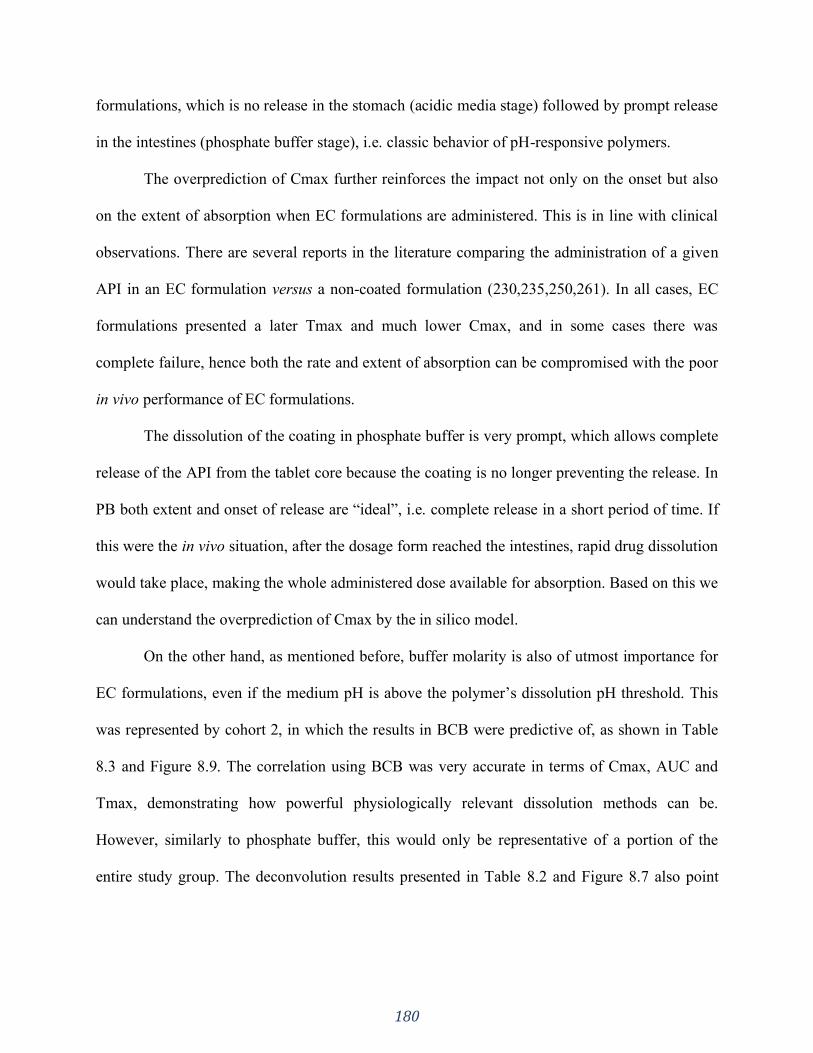
180
formulations, which is no release in the stomach (acidic media stage) followed by prompt release
in the intestines (phosphate buffer stage), i.e. classic behavior of pH-responsive polymers.
The overprediction of Cmax further reinforces the impact not only on the onset but also
on the extent of absorption when EC formulations are administered. This is in line with clinical
observations. There are several reports in the literature comparing the administration of a given
API in an EC formulation versus a non-coated formulation (230,235,250,261). In all cases, EC
formulations presented a later Tmax and much lower Cmax, and in some cases there was
complete failure, hence both the rate and extent of absorption can be compromised with the poor
in vivo performance of EC formulations.
The dissolution of the coating in phosphate buffer is very prompt, which allows complete
release of the API from the tablet core because the coating is no longer preventing the release. In
PB both extent and onset of release are “ideal”, i.e. complete release in a short period of time. If
this were the in vivo situation, after the dosage form reached the intestines, rapid drug dissolution
would take place, making the whole administered dose available for absorption. Based on this we
can understand the overprediction of Cmax by the in silico model.
On the other hand, as mentioned before, buffer molarity is also of utmost importance for
EC formulations, even if the medium pH is above the polymer’s dissolution pH threshold. This
was represented by cohort 2, in which the results in BCB were predictive of, as shown in Table
8.3 and Figure 8.9. The correlation using BCB was very accurate in terms of Cmax, AUC and
Tmax, demonstrating how powerful physiologically relevant dissolution methods can be.
However, similarly to phosphate buffer, this would only be representative of a portion of the
entire study group. The deconvolution results presented in Table 8.2 and Figure 8.7 also point
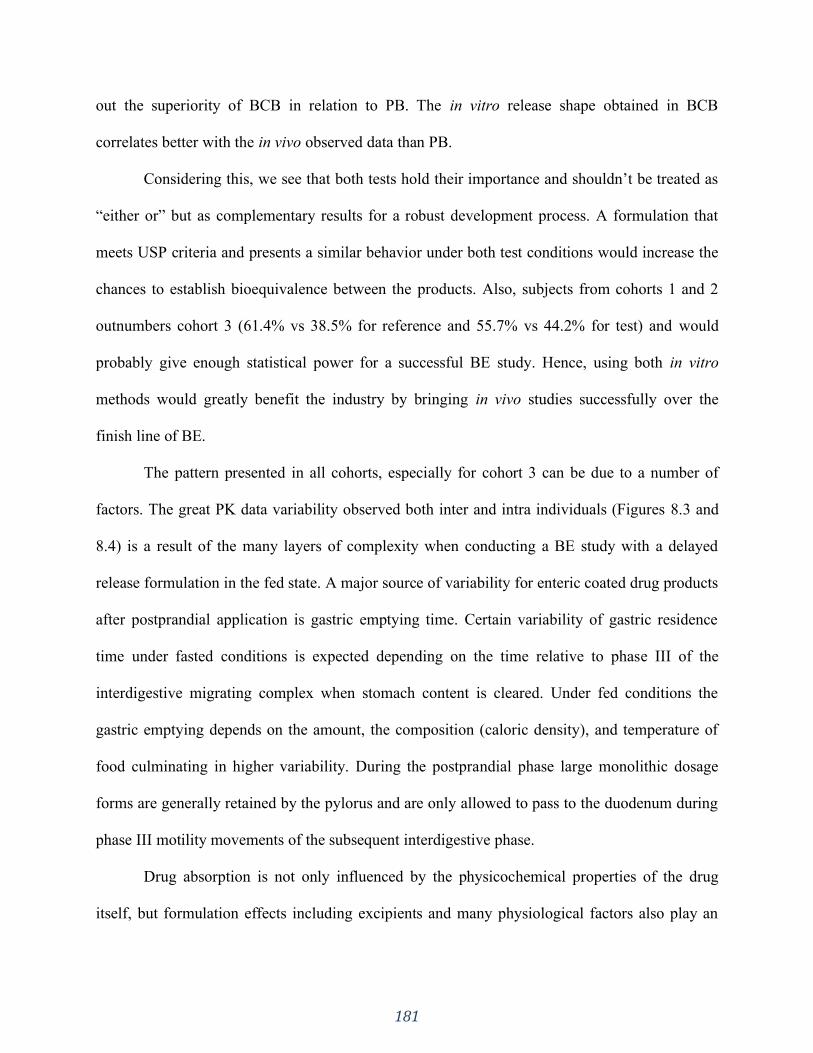
181
out the superiority of BCB in relation to PB. The in vitro release shape obtained in BCB
correlates better with the in vivo observed data than PB.
Considering this, we see that both tests hold their importance and shouldn’t be treated as
“either or” but as complementary results for a robust development process. A formulation that
meets USP criteria and presents a similar behavior under both test conditions would increase the
chances to establish bioequivalence between the products. Also, subjects from cohorts 1 and 2
outnumbers cohort 3 (61.4% vs 38.5% for reference and 55.7% vs 44.2% for test) and would
probably give enough statistical power for a successful BE study. Hence, using both in vitro
methods would greatly benefit the industry by bringing in vivo studies successfully over the
finish line of BE.
The pattern presented in all cohorts, especially for cohort 3 can be due to a number of
factors. The great PK data variability observed both inter and intra individuals (Figures 8.3 and
8.4) is a result of the many layers of complexity when conducting a BE study with a delayed
release formulation in the fed state. A major source of variability for enteric coated drug products
after postprandial application is gastric emptying time. Certain variability of gastric residence
time under fasted conditions is expected depending on the time relative to phase III of the
interdigestive migrating complex when stomach content is cleared. Under fed conditions the
gastric emptying depends on the amount, the composition (caloric density), and temperature of
food culminating in higher variability. During the postprandial phase large monolithic dosage
forms are generally retained by the pylorus and are only allowed to pass to the duodenum during
phase III motility movements of the subsequent interdigestive phase.
Drug absorption is not only influenced by the physicochemical properties of the drug
itself, but formulation effects including excipients and many physiological factors also play an
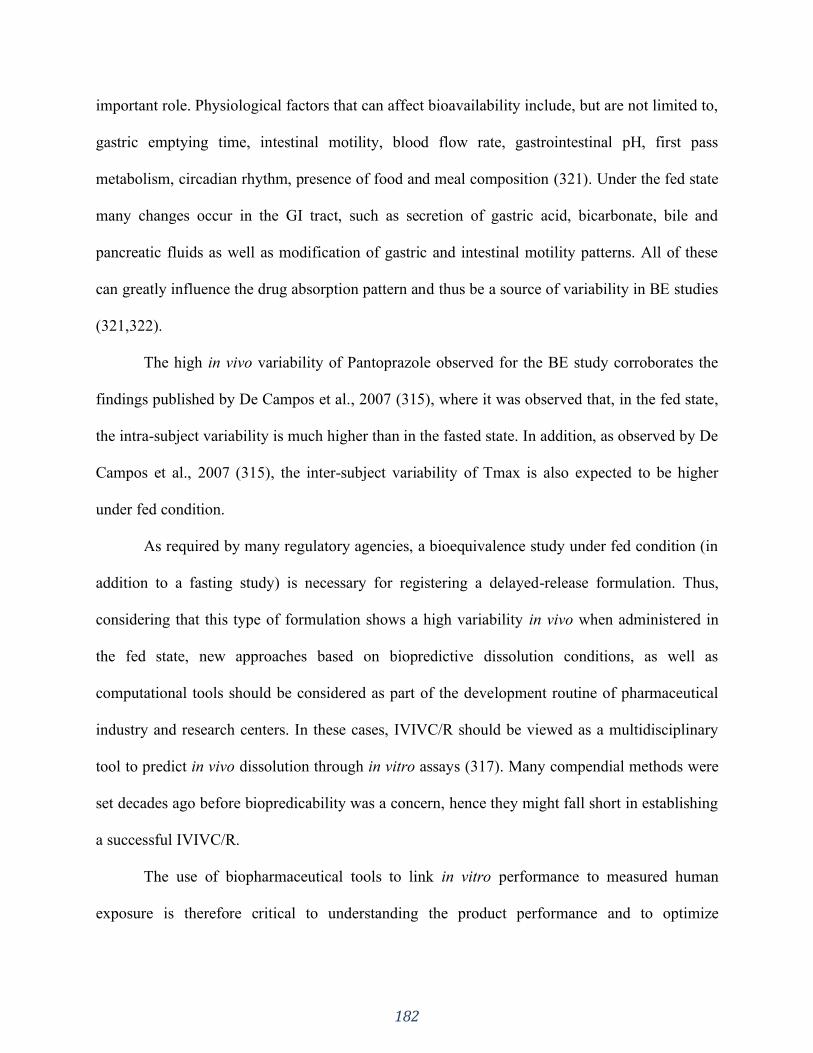
182
important role. Physiological factors that can affect bioavailability include, but are not limited to,
gastric emptying time, intestinal motility, blood flow rate, gastrointestinal pH, first pass
metabolism, circadian rhythm, presence of food and meal composition (321). Under the fed state
many changes occur in the GI tract, such as secretion of gastric acid, bicarbonate, bile and
pancreatic fluids as well as modification of gastric and intestinal motility patterns. All of these
can greatly influence the drug absorption pattern and thus be a source of variability in BE studies
(321,322).
The high in vivo variability of Pantoprazole observed for the BE study corroborates the
findings published by De Campos et al., 2007 (315), where it was observed that, in the fed state,
the intra-subject variability is much higher than in the fasted state. In addition, as observed by De
Campos et al., 2007 (315), the inter-subject variability of Tmax is also expected to be higher
under fed condition.
As required by many regulatory agencies, a bioequivalence study under fed condition (in
addition to a fasting study) is necessary for registering a delayed-release formulation. Thus,
considering that this type of formulation shows a high variability in vivo when administered in
the fed state, new approaches based on biopredictive dissolution conditions, as well as
computational tools should be considered as part of the development routine of pharmaceutical
industry and research centers. In these cases, IVIVC/R should be viewed as a multidisciplinary
tool to predict in vivo dissolution through in vitro assays (317). Many compendial methods were
set decades ago before biopredicability was a concern, hence they might fall short in establishing
a successful IVIVC/R.
The use of biopharmaceutical tools to link in vitro performance to measured human
exposure is therefore critical to understanding the product performance and to optimize
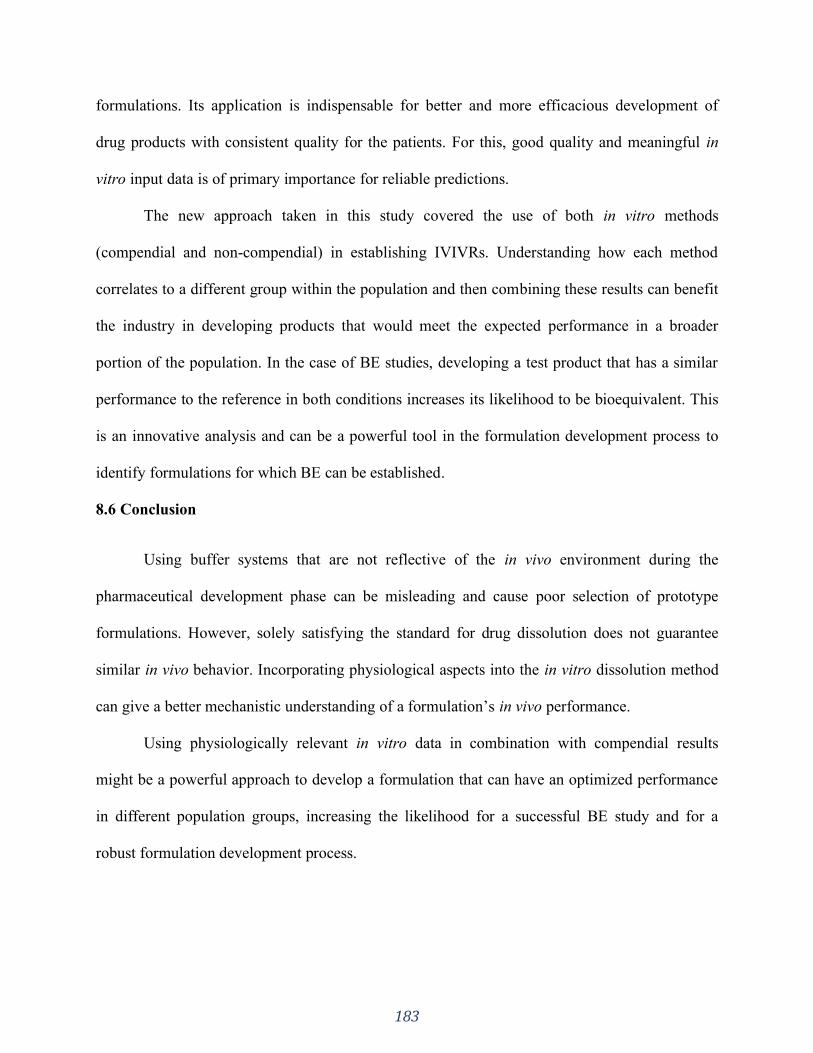
183
formulations. Its application is indispensable for better and more efficacious development of
drug products with consistent quality for the patients. For this, good quality and meaningful in
vitro input data is of primary importance for reliable predictions.
The new approach taken in this study covered the use of both in vitro methods
(compendial and non-compendial) in establishing IVIVRs. Understanding how each method
correlates to a different group within the population and then combining these results can benefit
the industry in developing products that would meet the expected performance in a broader
portion of the population. In the case of BE studies, developing a test product that has a similar
performance to the reference in both conditions increases its likelihood to be bioequivalent. This
is an innovative analysis and can be a powerful tool in the formulation development process to
identify formulations for which BE can be established.
8.6 Conclusion
Using buffer systems that are not reflective of the in vivo environment during the
pharmaceutical development phase can be misleading and cause poor selection of prototype
formulations. However, solely satisfying the standard for drug dissolution does not guarantee
similar in vivo behavior. Incorporating physiological aspects into the in vitro dissolution method
can give a better mechanistic understanding of a formulation’s in vivo performance.
Using physiologically relevant in vitro data in combination with compendial results
might be a powerful approach to develop a formulation that can have an optimized performance
in different population groups, increasing the likelihood for a successful BE study and for a
robust formulation development process.
184
8.7 Shortfalls
The authors recognize that using visual assessment to select the cohorts may seem arbitrary. The
cut off at 3.5h for cohort 1 and 5.5h for cohort 2 was done in order to maintain same size of 1.5h
increment. The design of the clinical trial seemed to be a highly variable in vivo model. This
could have decreased the statistical power in detecting differences in the products’
biopharmaceutical qualities. The approach taken in this manuscript was done in order to have
scientific insight and mechanistic understanding rather than a regulatory application.
185
SECTION FOUR: OTHER ASPECTS OF IN VIVO DRUG PRODUCT
PERFORMANCE
The impact of formulation composition and physiology state
CHAPTER NINE
Are Excipients Inert? Phenytoin Pharmaceutical Investigations with New
Incompatibility Insights
A version of this chapter is published in:
J Pharm Pharm Sci. 2018;21(1s):29745. https://doi.org/10.18433/jpps29745
Reprinted from reference (396).
186
9.1 Introduction
The U.S. Pharmacopeia defines excipients as substances other than the active pharmaceutic
ingredient (API) that are added in a drug delivery system in order to aid in the manufacturing
process and enhance stability, bioavailability, safety, effectiveness and delivery of the drug.
These substances have been appropriately evaluated for safety (7).
Although excipients are well characterized and evaluated for safety, they can interact with
the API chemically or physically (323). An incompatibility can possibly affect the drug delivery
performance and bioavailability, leading to loss of quality and potency, and compromising the
safety and efficacy of the medication (324,325). Thus, choosing the right excipients based on
their function and compatibility with the API is of primary importance for a good quality drug
product.
Phenytoin is an anti-epileptic drug related to the barbiturates in its chemical structure (326).
Its therapeutic window ranges from 10 to 20 ug/ml. This narrow safety margin makes therapeutic
drug monitoring of utmost importance for this drug to maintain drug efficacy and safety (327).
The 1968 phenytoin intoxication outbreak in Brisbane, Australia, is a classic example of an
API – excipient interaction (328–330). According to Bochner et. al. (330) and the known
evidence at the time, patients taking a certain brand of diphenylhydantoin (phenytoin) showed
characteristic signs of intoxication related to the medication they were taking. After an extensive
investigation the authors concluded that a change in excipient of the medication was the reason
behind the changes in bioavailability and resultant intoxication. Studies (330) showed that when
administered with CaSO4 as an excipient the absorption of phenytoin was jeopardized due to an
interaction between the API and the calcium salt. When CaSO4 was replaced in the formulation
187
by lactose, the amount of phenytoin absorbed was much higher, resulting in the observed
intoxication.
Bochner et. al. (329) investigated capsules containing CaSO4 as an excipient taken by the
patients and compared the solubility of the API in the formulation with that of phenytoin sodium.
The study concluded that the solubility of phenytoin sodium had changed prior to ingestion and
absorption was reduced. This finding alongside the recovery of phenytoin from the patient’s
feces confirmed their hypothesis of decreased alimentary absorption of phenytoin. The authors
speculated that the formation of a calcium salt of phenytoin might be responsible for the much
lower solubility.
The purpose of this study was to investigate further the interactions between excipients and
phenytoin to mechanistically re-examine the hypothesis and interpretations of the previous
studies.
9.2 Materials
Phenytoin USP grade and Calcium Sulfate NF were purchased from PCCA, USA (Houston, TX,
USA; LOT: C172948 and LOT: C178073, respectively). Phenytoin sodium USP grade was
obtained from Medisca® (Saint-Laurent, QC, Canada; LOT: 612840/A). Calcium chloride was
purchased from Sigma-Aldrich. Lactose monohydrate was used from Meggle Wasserburg,
Germany. Parteck® SI 150 (Sorbitol) was purchased from EMD Chemicals Inc. (Darmstadt,
Germany; LOT: M285083). Regular milk and lactose free milk was purchased from a local
grocery store and used before the expiration date. The powder mixture samples were put in glass
ampoules and analyzed by thermal activity monitor III (TAM III) (TA instruments, USA).
Commercial extended phenytoin sodium capsules were purchased: Dilantin (Pfizer Canada Inc,
lot # T25924, exp. 05/2019), APO-Phenytoin Sodium (Apotex Inc. Toronto, Canada, lot #
188
NH9926, exp. 01/2019), Taro Pharmaceuticals U.S.A. Inc. (lot # 316157, exp.03/01/19), Akyma
Pharmaceuticals (Amneal), U.S.A., LLC. (lot # HL16617, exp.03/01/19).
Water for the dissolution tests and high-performance liquid chromatography (HPLC)
analysis was purified by Elgastat Maxima UF and an Elgastat Option 3B water purifier by ELGA
Laboratories Ltd. (Mississauga, ON, Canada) and then filtered. Gelatin capsules size 0 were used
for the dissolution tests.
9.3 Methods
9.3.1 Titration
A phenytoin solution was prepared by adding 1.4g of phenytoin into a 250 mL of an alkaline
NaOH solution. One portion of the phenytoin solution was titrated with calcium chloride (CaCl2)
in solution and the other portion with lactose solution. H1NMR was performed to analyze the
precipitate obtained in the titration with the CaCl2 solution.
9.3.2 Calorimeters experiments
Samples were analyzed by thermal activity monitor III (TAM III) (TA instruments, USA) to
investigate excipient-API interactions, e.g. as solid-state reactions or in solution. The
microcalorimeter ampoule experiment was selected and the experiments were performed at
40°C.
Two scenarios were investigated: dry powder mixtures and water (1 ml) added to the
powders mixtures, as described in Table 9.1. After adding the given compound combination into
the ampoules, they were vortexed yielding a homogenous mixture, and then put into measuring
position in the calorimeter. The experiments ran for a minimum of three days and ended after a
flat line was obtained.
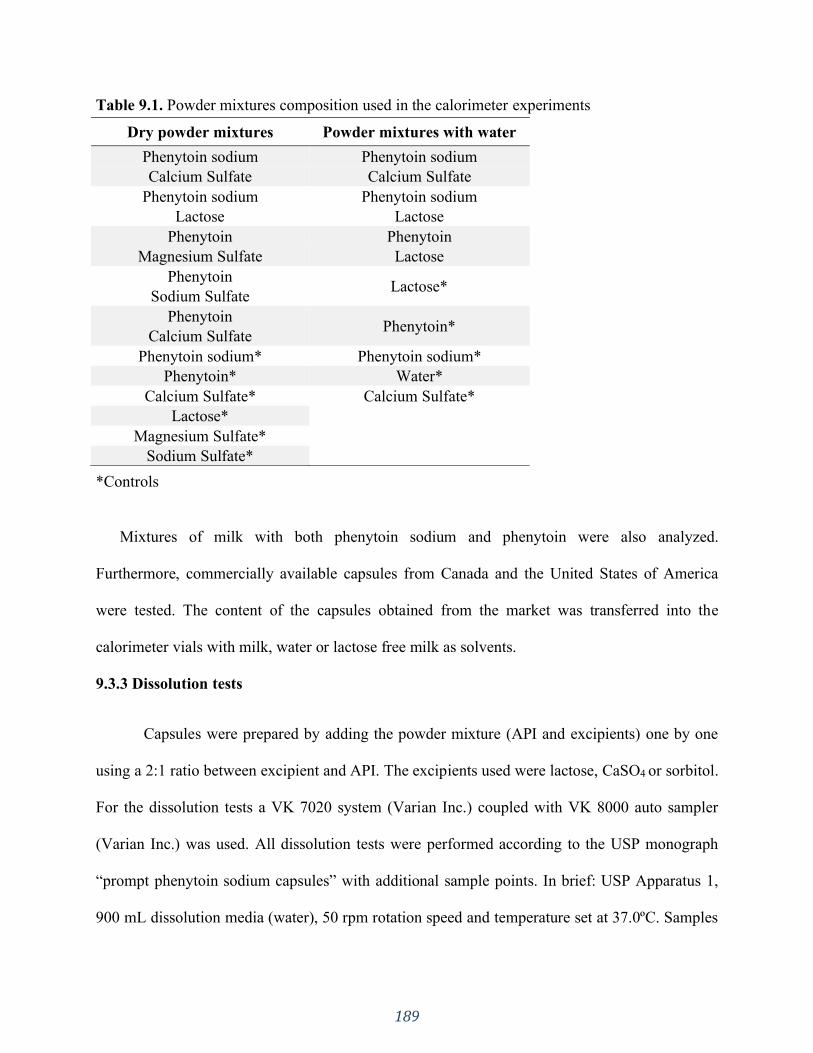
189
Table 9.1. Powder mixtures composition used in the calorimeter experiments
*Controls
Mixtures of milk with both phenytoin sodium and phenytoin were also analyzed.
Furthermore, commercially available capsules from Canada and the United States of America
were tested. The content of the capsules obtained from the market was transferred into the
calorimeter vials with milk, water or lactose free milk as solvents.
9.3.3 Dissolution tests
Capsules were prepared by adding the powder mixture (API and excipients) one by one
using a 2:1 ratio between excipient and API. The excipients used were lactose, CaSO4 or sorbitol.
For the dissolution tests a VK 7020 system (Varian Inc.) coupled with VK 8000 auto sampler
(Varian Inc.) was used. All dissolution tests were performed according to the USP monograph
“prompt phenytoin sodium capsules” with additional sample points. In brief: USP Apparatus 1,
900 mL dissolution media (water), 50 rpm rotation speed and temperature set at 37.0ºC. Samples
Dry powder mixtures Powder mixtures with water
Phenytoin sodium Phenytoin sodium
Calcium Sulfate Calcium Sulfate
Phenytoin sodium Phenytoin sodium
Lactose Lactose
Phenytoin Phenytoin
Magnesium Sulfate Lactose
Phenytoin Lactose*
Sodium Sulfate
Phenytoin Phenytoin*
Calcium Sulfate
Phenytoin sodium* Phenytoin sodium*
Phenytoin* Water*
Calcium Sulfate* Calcium Sulfate*
Lactose*
Magnesium Sulfate* Sodium Sulfate*
190
were collected at 5, 10, 15, 20, 30 minutes and quantified in a VP-class Shimadzu Scientific
Instruments (Kyoto, Japan) liquid chromatograph, equipped with a Lichrospher® 60 RP Select B
column (5 μm, 12.5×4 mm).
9.3.4 Statistical analysis
The Microsoft ExcelTM add-in DDSolver was used to analyze the dissolution data. The
dissolution profiles for the lactose and CaSO4 containing formulations were compared by f2
statistics. The factor f2 is a similarity factor that measures the closeness between two profiles
(331). According to the FDA criteria, f2 value between 50-100 indicates similarity between two
dissolution profiles.
9.4 Results
9.4.1 Titration
The titration experiments with CaCl2 and lactose were performed to verify the precipitation of
phenytoin. A precipitate was only obtained when performing the titration with the calcium salt,
confirming that, in solution, phenytoin interacted with calcium forming a product compound
with low solubility (189,332). Figure 9.1 shows H1NMR result of the precipitate with calcium
chloride, confirming that the precipitate was phenytoin.
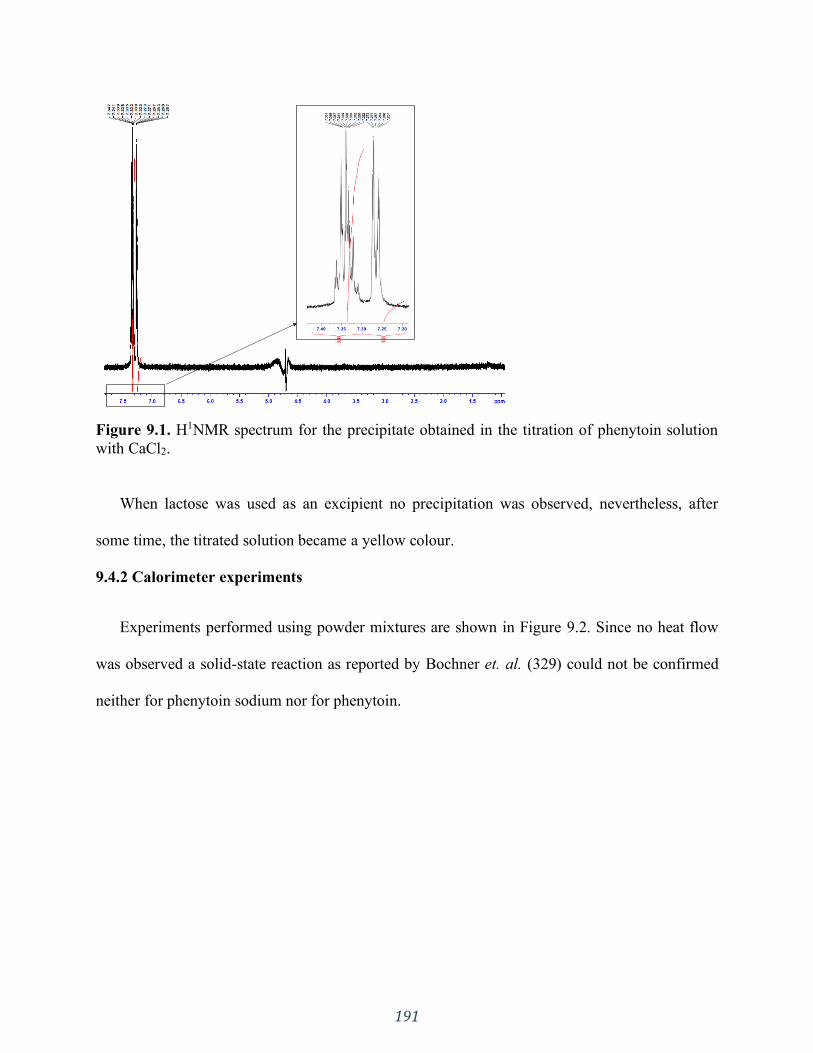
191
Figure 9.1. H1NMR spectrum for the precipitate obtained in the titration of phenytoin solution
with CaCl2.
When lactose was used as an excipient no precipitation was observed, nevertheless, after
some time, the titrated solution became a yellow colour.
9.4.2 Calorimeter experiments
Experiments performed using powder mixtures are shown in Figure 9.2. Since no heat flow
was observed a solid-state reaction as reported by Bochner et. al. (329) could not be confirmed
neither for phenytoin sodium nor for phenytoin.
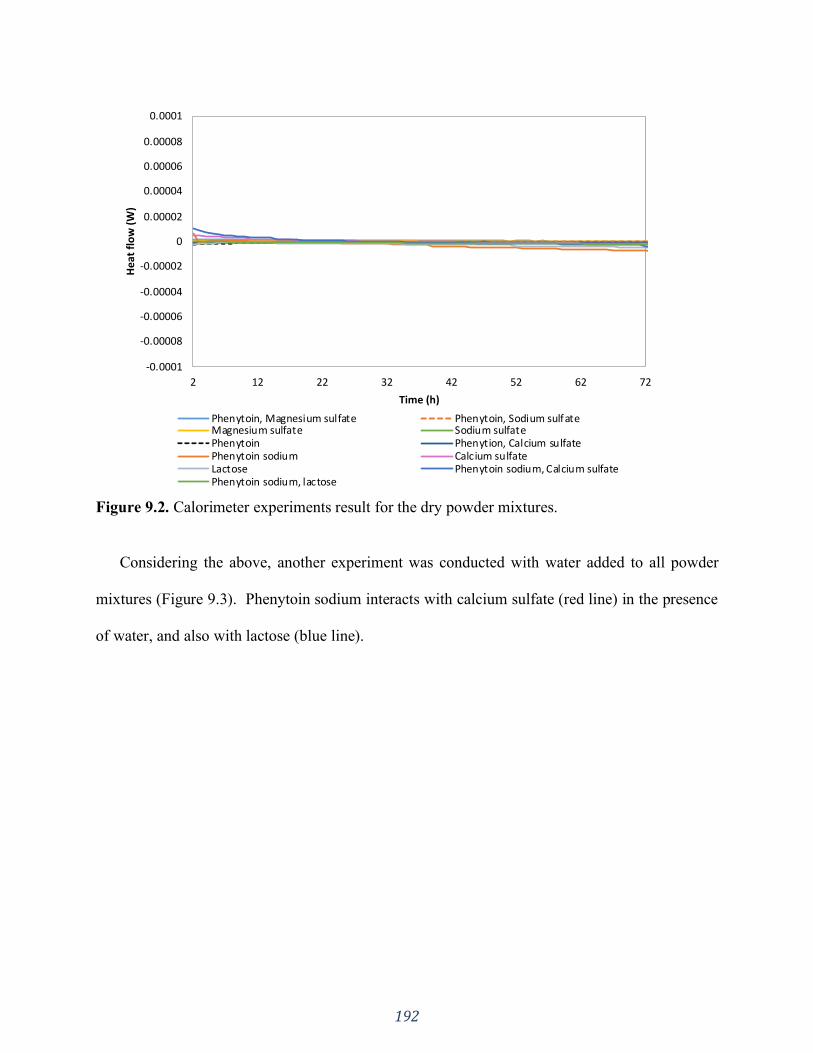
192
Figure 9.2. Calorimeter experiments result for the dry powder mixtures.
Considering the above, another experiment was conducted with water added to all powder
mixtures (Figure 9.3). Phenytoin sodium interacts with calcium sulfate (red line) in the presence
of water, and also with lactose (blue line).
-0.0001
-0.00008
-0.00006
-0.00004
-0.00002
0
0.00002
0.00004
0.00006
0.00008
0.0001
2 12 22 32 42 52 62 72
He
at f
low
(W
)
Time (h)
Phenytoin, Magnesium sulfate Phenytoin, Sodium sulfateMagnesium sulfate Sodium sulfatePhenytoin Phenytion, Calcium sulfatePhenytoin sodium Calcium sulfateLactose Phenytoin sodium, Calcium sulfatePhenytoin sodium, lactose

193
Figure 9.3. Calorimeter experiments result for the powder mixtures with water added.
The ampoule containing phenytoin sodium, calcium sulfate and water mixture formed
crystals on the wall of the vial. Hence, both the heat flow (red line in Figure 9.3) and the crystals
formed suggest that phenytoin sodium interacts with CaSO4 in aqueous medium.
The increased heat flow in Figure 9.3 (blue line) corresponds to the mixture of phenytoin
sodium, lactose and water. After experimental completion, the inside of the ampoule
demonstrated the presence of a brown compound formed, suggesting a Maillard reaction in
aqueous medium between phenytoin sodium and lactose. The heat flow (blue line in Figure 9.3)
and the brown compound formed suggest that phenytoin sodium not only is incompatible with
CaSO4 and precipitates, but it is also incompatible with lactose and reacts. This was further
confirmed and verified by HPLC. No phenytoin peak was detected (data not shown) when the
brown compound was analyzed, suggesting that phenytoin sodium had been converted into
another compound.
-0.0005
0
0.0005
0.001
0.0015
0.002
2 22 42 62 82 102
Hea
t fl
ow
(W
)
Time (h)
Water Calcium sulfate, waterPhenytoin sodium, Calcium sulfate, water Phenytoin sodium, Lactose, WaterPhenytoin sodium, water Lactose, waterPhenytoin, water Phenytoin, Lactose, water
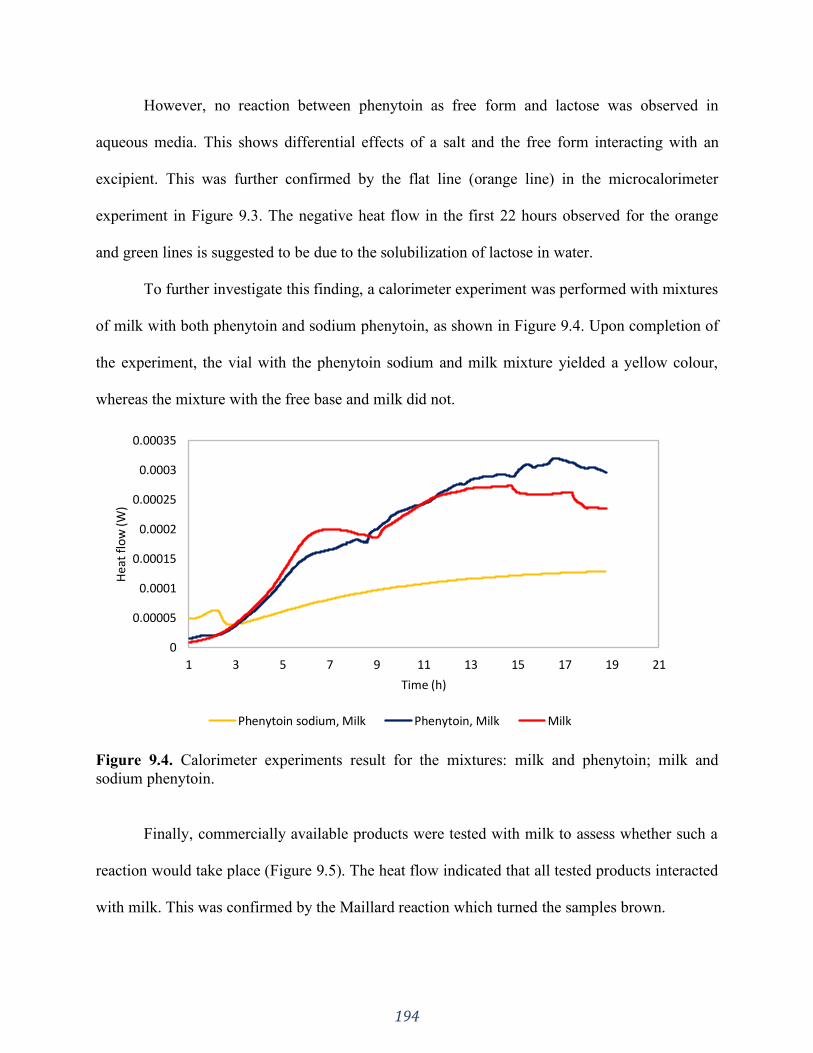
194
However, no reaction between phenytoin as free form and lactose was observed in
aqueous media. This shows differential effects of a salt and the free form interacting with an
excipient. This was further confirmed by the flat line (orange line) in the microcalorimeter
experiment in Figure 9.3. The negative heat flow in the first 22 hours observed for the orange
and green lines is suggested to be due to the solubilization of lactose in water.
To further investigate this finding, a calorimeter experiment was performed with mixtures
of milk with both phenytoin and sodium phenytoin, as shown in Figure 9.4. Upon completion of
the experiment, the vial with the phenytoin sodium and milk mixture yielded a yellow colour,
whereas the mixture with the free base and milk did not.
Figure 9.4. Calorimeter experiments result for the mixtures: milk and phenytoin; milk and
sodium phenytoin.
Finally, commercially available products were tested with milk to assess whether such a
reaction would take place (Figure 9.5). The heat flow indicated that all tested products interacted
with milk. This was confirmed by the Maillard reaction which turned the samples brown.
0
0.00005
0.0001
0.00015
0.0002
0.00025
0.0003
0.00035
1 3 5 7 9 11 13 15 17 19 21
Hea
t fl
ow
(W)
Time (h)
Phenytoin sodium, Milk Phenytoin, Milk Milk
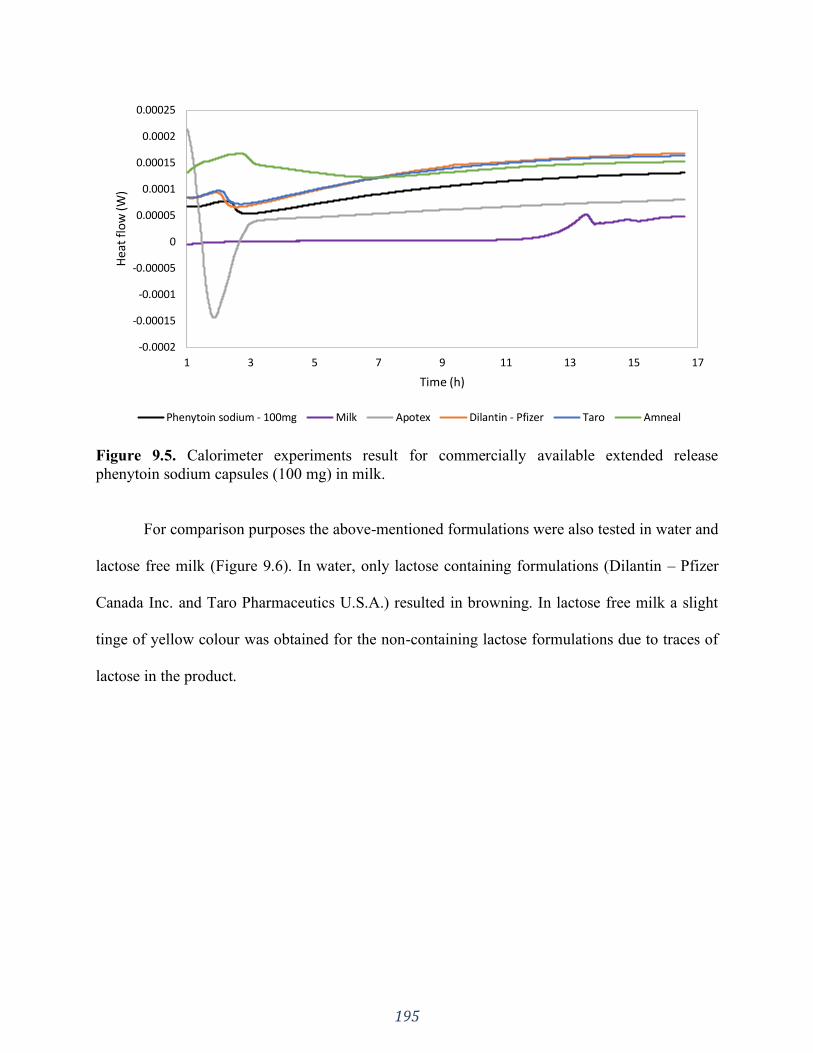
195
Figure 9.5. Calorimeter experiments result for commercially available extended release
phenytoin sodium capsules (100 mg) in milk.
For comparison purposes the above-mentioned formulations were also tested in water and
lactose free milk (Figure 9.6). In water, only lactose containing formulations (Dilantin – Pfizer
Canada Inc. and Taro Pharmaceutics U.S.A.) resulted in browning. In lactose free milk a slight
tinge of yellow colour was obtained for the non-containing lactose formulations due to traces of
lactose in the product.
-0.0002
-0.00015
-0.0001
-0.00005
0
0.00005
0.0001
0.00015
0.0002
0.00025
1 3 5 7 9 11 13 15 17
Hea
t fl
ow
(W)
Time (h)
Phenytoin sodium - 100mg Milk Apotex Dilantin - Pfizer Taro Amneal

196
Figure 9.6. Calorimeter experiments result for commercially available extended release
phenytoin sodium capsules (100 mg) in water and lactose free milk (LFM).
9.4.3 Dissolution
Dissolution tests using USP apparatus 1, 50 rpm and water 900 mL are the USP
recommended parameters for “prompt release phenytoin sodium capsules” (6), this monograph
was recently withdrawn from the USP because this dosage form is not used for human use in the
United States. However, the capsules prepared by adding the powder mixture (API and
excipients) one by one using a 2:1 ratio between excipient and API showed a suitable dissolution
profile using this method (Figure 9.7) rather than the official USP method which is for extended
release capsules.
As shown in Figure 9.7 and according to the f2 test performed (f2: 52) for the lactose and
CaSO4 containing formulations the dissolution profiles were similar when using water as the
-0.0003
-0.0002
-0.0001
0
0.0001
0.0002
0.0003
0.0004
0.0005
1 3 5 7 9 11 13
Hea
t fl
ow
(W)
Time (h)Water Apotex, water Dilantin, waterApotex, LFM Dilantin,LFM LFMPhenytoin Sodium, LFM Amneal, LFM Taro, Water
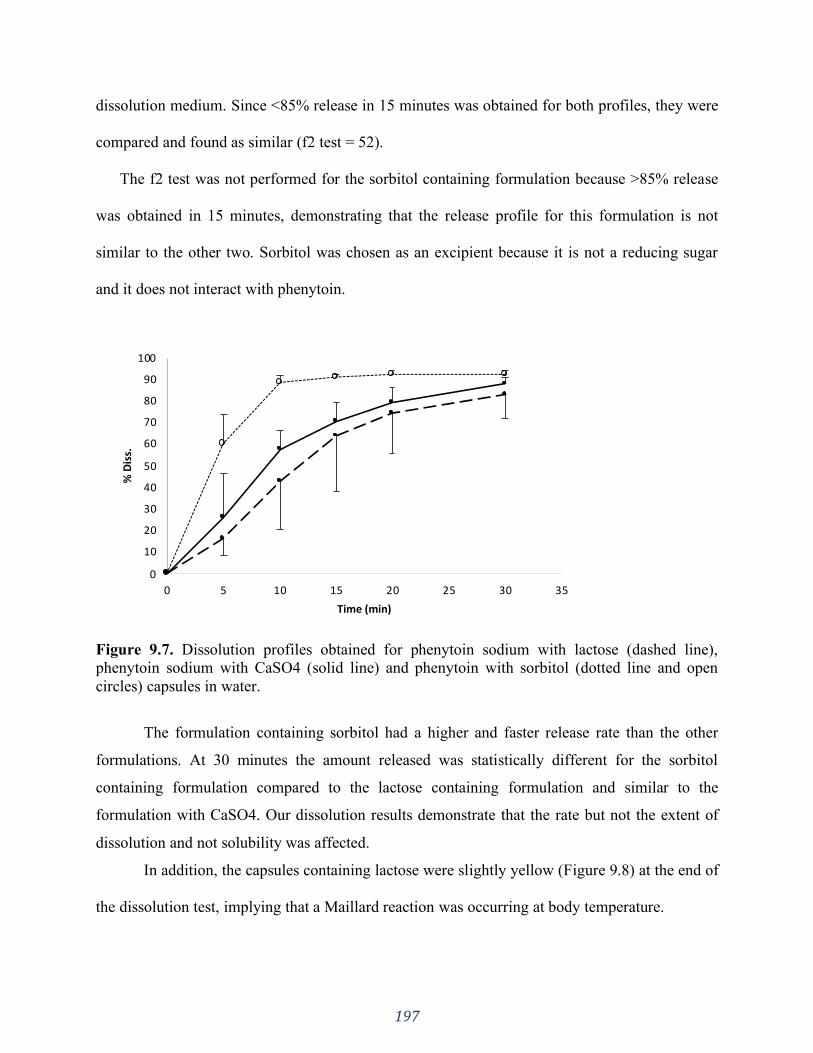
197
dissolution medium. Since <85% release in 15 minutes was obtained for both profiles, they were
compared and found as similar (f2 test = 52).
The f2 test was not performed for the sorbitol containing formulation because >85% release
was obtained in 15 minutes, demonstrating that the release profile for this formulation is not
similar to the other two. Sorbitol was chosen as an excipient because it is not a reducing sugar
and it does not interact with phenytoin.
Figure 9.7. Dissolution profiles obtained for phenytoin sodium with lactose (dashed line),
phenytoin sodium with CaSO4 (solid line) and phenytoin with sorbitol (dotted line and open
circles) capsules in water.
The formulation containing sorbitol had a higher and faster release rate than the other
formulations. At 30 minutes the amount released was statistically different for the sorbitol
containing formulation compared to the lactose containing formulation and similar to the
formulation with CaSO4. Our dissolution results demonstrate that the rate but not the extent of
dissolution and not solubility was affected.
In addition, the capsules containing lactose were slightly yellow (Figure 9.8) at the end of
the dissolution test, implying that a Maillard reaction was occurring at body temperature.
0
10
20
30
40
50
60
70
80
90
100
0 5 10 15 20 25 30 35
% D
iss.
Time (min)

198
Figure 9.8. Phenytoin sodium and lactose capsules after the dissolution tests. After 30 minutes at
body temperature (37.0°C) the capsules became yellow.
9.5 Discussion
In 1972, after studying the phenytoin excipient effect in patients, Bochner et al (329)
concluded that CaSO4 interacted with phenytoin sodium forming a compound with different
solubility than phenytoin sodium. They reported that, prior to ingestion, the capsules containing
CaSO4 had almost 25% of phenytoin with altered solubility properties, however, the mechanism
by which the conversion occurred was not experimentally delineated.
As shown in Figure 9.2, our data cannot confirm a solid-state reaction between CaSO4
and phenytoin sodium. Our results demonstrated that a reaction occurs (red line in Figure 9.3) in
the presence of water. Thus, it is suggested that the interaction between phenytoin sodium and
CaSO4 could occur in situ or in a manufacturing process where humidity is used, such as wet
granulation. However, we know from discussions with a manufacturer that humidity in the
manufacturing process is strictly controlled due to the hygroscopic properties of the API. (Dr. J.
Cook, personal communication, November 28, 2017)
A possible explanation for the reduced solubility of phenytoin sodium prior to ingestion
in the capsules containing CaSO4 is the absorption of moisture and CO2 from the atmosphere
providing the needed conditions for the API-excipient interaction to occur (333). Newton DW et.
al. (333) has already reported that in bottles of phenytoin sodium powder the solubility decreased
over time due to absorption of moisture and transformation of phenytoin sodium to the free form.
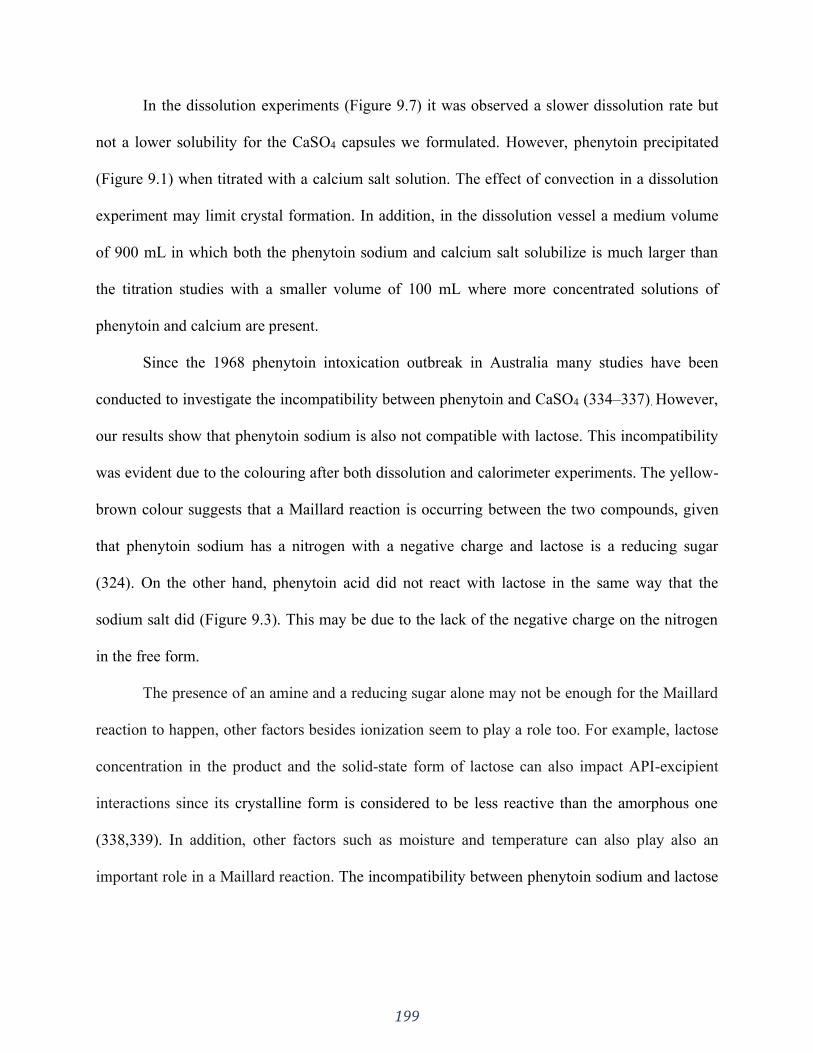
199
In the dissolution experiments (Figure 9.7) it was observed a slower dissolution rate but
not a lower solubility for the CaSO4 capsules we formulated. However, phenytoin precipitated
(Figure 9.1) when titrated with a calcium salt solution. The effect of convection in a dissolution
experiment may limit crystal formation. In addition, in the dissolution vessel a medium volume
of 900 mL in which both the phenytoin sodium and calcium salt solubilize is much larger than
the titration studies with a smaller volume of 100 mL where more concentrated solutions of
phenytoin and calcium are present.
Since the 1968 phenytoin intoxication outbreak in Australia many studies have been
conducted to investigate the incompatibility between phenytoin and CaSO4 (334–337). However,
our results show that phenytoin sodium is also not compatible with lactose. This incompatibility
was evident due to the colouring after both dissolution and calorimeter experiments. The yellow-
brown colour suggests that a Maillard reaction is occurring between the two compounds, given
that phenytoin sodium has a nitrogen with a negative charge and lactose is a reducing sugar
(324). On the other hand, phenytoin acid did not react with lactose in the same way that the
sodium salt did (Figure 9.3). This may be due to the lack of the negative charge on the nitrogen
in the free form.
The presence of an amine and a reducing sugar alone may not be enough for the Maillard
reaction to happen, other factors besides ionization seem to play a role too. For example, lactose
concentration in the product and the solid-state form of lactose can also impact API-excipient
interactions since its crystalline form is considered to be less reactive than the amorphous one
(338,339). In addition, other factors such as moisture and temperature can also play also an
important role in a Maillard reaction. The incompatibility between phenytoin sodium and lactose

200
could represent a loss of drug when patients take such formulation since this reaction can occur
at body temperature (Figure 9.8).
Continuing with the investigation on how this reaction would take place, phenytoin
sodium was mixed with milk and analyzed through microcalorimetry. The heat flow of milk only
and phenytoin/milk mixture were similar while the phenytoin sodium/milk mixture demonstrated
a reduced heat flow pattern. The vials containing milk and phenytoin with milk did not show any
difference in colour. The blue and red lines in Figure 9.4 could represent bacteria growth, since
the pattern is similar to the ones obtained in other milk calorimetry studies (340,341). Maillard
reactions are exothermic (342–344) and this explains the higher heat flow in the first two hours
in the phenytoin sodium/milk sample mixture (yellow line in Figure 9.4). The lactose readily
reacted with phenytoin sodium and the heat flow is taking place at a lower rate (yellow line
Figure 9.4 from 3 hours on) due to the decreased amount of lactose.
Furthermore, the calorimetry experiments performed with commercial products showed
that phenytoin sodium interacted with milk regardless of the formulation composition (Figure
9.5). When tested in water, only the lactose containing products showed browning, confirming,
once again, the incompatibility between API and excipient.
According to the Canadian Food Inspection Agency “lactose- free means that there is no
detectable lactose in the food using an acceptable analytical method”. Therefore, lactose free
milk can have some acceptable remaining amount of lactose. This explains the slight colouration
observed for the Apotex and Amneal products with lactose free milk. The more evident
browning for Dilantin in lactose free milk may be due to interaction with the additional lactose in
the formulation, as colour change was observed in water. The negative heat flow for the Apotex
201
product can be attributed to the disintegration process of the minitablets. The colour change
intensity for each formulation in the different tested media is summarized in Table 9.2.
In previous studies by Macheras et al. the authors investigated the effect of milk on the
solubility of phenytoin sodium (345). They report a significant increase in solubility, but
surprisingly no incompatibility between the API and milk is reported. However, in an in vivo
study administering 200 mg phenytoin sodium capsules with water or milk a significant decrease
in AUC and Cmax were observed when milk was used. The AUC dropped from 151.2 ±72.2 µg
h mL-1 (control with water) to 81.9 µg h ml-1 (±21.3) (control with milk) and Cmax dropped
from 3.3 (±0.7) µg ml-1 to 2.6 (±0.5) µg ml-1. This indicates a food effect with milk for the
tested formulations due likely to the presence of both and lactose and calcium.
In another study by Neuvonen et al. (346) patients received phenytoin as a free acid with
milk or water. No differences in Cmax were observed. The authors concluded that “a direct
physicochemical interaction between phenytoin and milk constituents is unlikely" since the
absorption of phenytoin was not changed. This is consistent with and corroborates our results
regarding the lack of interaction between phenytoin free acid and lactose.
The change in excipients (from CaSO4 to lactose) by Parke-Davis was undertaken in the
early 1960’s (329,330) and ever since the reference product Dilantin (Pfizer) contains lactose as
an excipient (347). Its monograph in Canada was last revised in August, 2017 (347).
Interestingly, in Canada, the generic brands Apotex Canada Inc. and Taro Pharmaceuticals Inc.
of extended phenytoin sodium capsule do not contain lactose as an excipient (from package
insert). It is noteworthy that the formulations with and without lactose were bioequivalent, which
is different than the food effect observed with milk. The bioequivalence results might be due to
202
the slow release of the drug from the formulation. The USP requires an release of 45, 65 and 70
% at 30, 60, 120 min. In vivo the lactose and the API might dissolve at different rates.
Also, the innovator product was bioequivalence tested in a fasted / fed study (348) with
milk as one of the components of the meal. No bioequivalence problems were observed. This
might be due to the dilution of the milk throughout the entire meal, which could be at variance
with the study (345) where only milk was utilized. In addition, according to a query to the
Canada Vigilance Program no reports of lactose or milk interactions with phenytoin were found
from 1965 – 2017 (349).
Moreover, the other marketed products in the USA also don’t contain lactose as an
excipient, with exception of Taro Pharmaceuticals (information taken from products’ package
insert), which is intriguing, as their approved product in Canada does not contain lactose in its
formulation. In a food effect study comparing the innovator product to a particular generic
product, it was found that the generic formulation was within the bioequivalence criteria of the
FDA. However, the author state: “when taking phenytoin sodium with food, product switches
may result in either side effects or loss of seizure control” (350). How much of this (if any) can
be attributed to excipient API effects or the API dissolution is not known.
The published literature appears to be contradictory and the amount of lactose necessary
to cause an interaction that results in a change in bioavailability remains unanswered. The tests
may be overly discriminatory for the in vivo performance. Our results suggest that amounts of
dissolved API and lactose at the same location within the gastrointestinal tract may facilitate a
Maillard reaction. Nevertheless, the lactose amount needed for the reaction to happen in vivo
affecting the drug’s bioavailability is unknown, once it is a different milieu than the conditions
of a dissolution vessel.
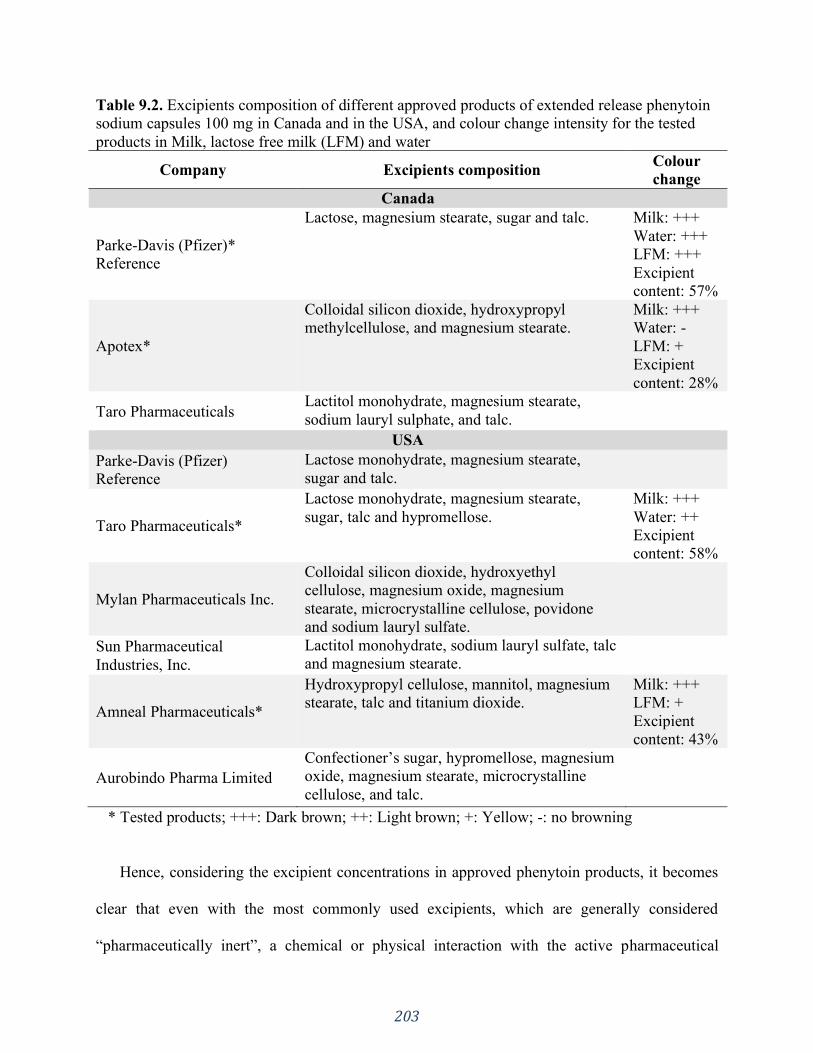
203
Table 9.2. Excipients composition of different approved products of extended release phenytoin
sodium capsules 100 mg in Canada and in the USA, and colour change intensity for the tested
products in Milk, lactose free milk (LFM) and water
Company Excipients composition Colour
change
Canada
Parke-Davis (Pfizer)*
Reference
Lactose, magnesium stearate, sugar and talc. Milk: +++
Water: +++
LFM: +++
Excipient
content: 57%
Apotex*
Colloidal silicon dioxide, hydroxypropyl
methylcellulose, and magnesium stearate.
Milk: +++
Water: -
LFM: +
Excipient
content: 28%
Taro Pharmaceuticals Lactitol monohydrate, magnesium stearate,
sodium lauryl sulphate, and talc.
USA
Parke-Davis (Pfizer)
Reference
Lactose monohydrate, magnesium stearate,
sugar and talc.
Taro Pharmaceuticals*
Lactose monohydrate, magnesium stearate,
sugar, talc and hypromellose.
Milk: +++
Water: ++
Excipient
content: 58%
Mylan Pharmaceuticals Inc.
Colloidal silicon dioxide, hydroxyethyl
cellulose, magnesium oxide, magnesium
stearate, microcrystalline cellulose, povidone
and sodium lauryl sulfate.
Sun Pharmaceutical
Industries, Inc.
Lactitol monohydrate, sodium lauryl sulfate, talc
and magnesium stearate.
Amneal Pharmaceuticals*
Hydroxypropyl cellulose, mannitol, magnesium
stearate, talc and titanium dioxide.
Milk: +++
LFM: +
Excipient
content: 43%
Aurobindo Pharma Limited
Confectioner’s sugar, hypromellose, magnesium
oxide, magnesium stearate, microcrystalline
cellulose, and talc.
* Tested products; +++: Dark brown; ++: Light brown; +: Yellow; -: no browning
Hence, considering the excipient concentrations in approved phenytoin products, it becomes
clear that even with the most commonly used excipients, which are generally considered
“pharmaceutically inert”, a chemical or physical interaction with the active pharmaceutical
204
ingredient could compromise the dissolution testing and potentially alter bioavailability and
bioequivalence. Bioequivalence and bioavailability tests can delineate the effect of potential
interactions, an awareness of the issue at the development level could save time and cost.
However, despite evidence of this interaction and potential interaction in vivo there does not yet
appear to be any definitive reduction of bioavailability for contemporary commercial Canadian
and USA brands that contain lactose leading to bioinequivalence issues nor, to the best of our
knowledge, any therapeutic failure due to the interaction of phenytoin products with milk/lactose
has been reported.
9.6 Conclusion
Our study mechanistically investigated previous reports of excipient-API interactions
with phenytoin. The calorimeter experiments results indicate that phenytoin sodium interacts
with CaSO4 in aqueous media. Furthermore, phenytoin sodium also interacts with lactose
through a Maillard reaction at body temperature which could possibly lead to bioavailability
variations if administered with lactose containing milk. In Canada and the USA, the reference
product still has lactose as an excipient in the formulation listed since it was changed in the
1960’s, whereas all Canadian and most USA generic formulations do not contain lactose.
The current bioequivalence data do not suggest that a potential lactose-phenytoin sodium
interaction challenges the therapeutic equivalence between the available products. However,
assuming that the commonly used excipients are so called inert could still cause potential
development issues. Phenytoin was first introduced as drug product in 1938 and much has been
learned about drug-excipient incompatibility with calcium, but even after of eighty years of
clinical use a new incompatibility between phenytoin and lactose has been experimentally
delineated .
205
SECTION FOUR: OTHER ASPECTS OF IN VIVO DRUG PRODUCT
PERFORMANCE:
The impact of formulation composition and physiology state
CHAPTER TEN
Application of in Silico Tools in Clinical Practice using Ketoconazole as a Model
Drug
A version of this chapter is published in:
J Pharm Pharm Sci. 2018;21(1S):242s-253s. https://doi.org/10.18433/jpps30227
Reprinted from reference (397).

206
10.1 Introduction
Hypochlorhydria is a physiological state in which the hydrochloric acid production in the
stomach is low, causing an increase in the intragastric pH. Disease state (gastric mucosal
infection caused by Helicobacter pylori and AIDS patients), ethnicity, age and administration of
antisecretory agents, such as omeprazole, a Proton Pump Inhibitor (PPI), may induce
hypochlorhydria (351–353). Changes in physiological properties such as stomach pH can impact
the in vivo drug product performance, especially from dosage forms with API controlled
dissolution (120,354). Thus, antisecretory agents can affect the absorption of orally co-
administered drugs, given that gastric acidity plays a major role in the process of dissolution
sequentially followed by absorption of various drugs (355). This is the case for drugs that are
primarily weak bases.
A clinical example of this is the administration of ketoconazole in PPI-induced
hypochlorhydria states. Several studies (353,356–358) have reported its reduced absorption
under such conditions. Ketoconazole is an antifungal agent with a broad-spectrum activity
against various fungal infections (359). It is used to treat both mucocutaneous and systemic
opportunistic fungal infections that commonly occur in immunocompromised patient
(357,358,360). It is a chiral imidazole piperazine compound, which is a weak dibasic compound
(358), and within the Biopharmaceutics Classification System (BCS), it is a low soluble and
highly permeable drug (class II) (30). Since ketoconazole solubility is pH dependent, its
absorption after oral administration is variable, achieving the highest plasma concentrations at
low gastric pH (357,361). Due to its high lipophilicity, ketoconazole is readily absorbed after
conversion to the water-soluble salt by gastric acid (362–364).
207
Under this scenario of different physiological conditions, physiologically based
pharmacokinetic (PBPK) computer models are useful tools to help predict the plasma
concentration–time profiles of a given drug. GastroPlusTM (Simulations Plus Inc., Lancaster, CA,
USA) is an example of commercially available software that includes PBPK models (365).Using
pre-determined parameters and physiology, PBPK modeling can predict in vivo data, improving
the therapeutic outcomes by designing different disposition profiles (352,366). Much attention
has been drawn to the use of such models for drug development and formulation development
process (367–371), nevertheless there is a great opportunity in using simulations to investigate
different clinical approaches by clinical practitioners.
In order to predict drug absorption from the gastrointestinal (GI) tract, GastroPlusTM
includes the Advanced Compartmental Absorption and Transit (ACAT) model (372), which is a
refinement of the Compartmental Absorption and Transit (CAT) model (373,374). This model
takes into consideration factors that impact drug bioavailability and absorption, such as
physicochemical attributes of the compound (e.g. solubility), physiological properties of the GI
tract (e.g. pH ) and formulation characteristics (e.g. particle size).
The purpose of this study was to demonstrate the use of in silico studies to support
changes in clinical practice with a mechanistic approach in view. The selection of ketoconazole
was based on in vivo data availability reported in the literature.
10.2 Materials
Ketoconazole USP grade was purchased from Medisca, (Saint-Laurent, QC; LOT:
613650/D. Coca Cola® and Orange juice (Minute Maid®) were bought at a local store In
Edmonton, Canada. Water for the high-performance liquid chromatography (HPLC) assay was
purified by Elgastat Maxima UF and an Elgastat Option 3B water purifier by ELGA Laboratories

208
Ltd. (Mississauga, ON, Canada) and then filtered using 0.45 µm pore size filter. Methanol and
acetonitrile used were HPLC grade and were purchased from Fisher Scientific (Fair Lawn, NJ,
USA).
10.3 Methods
10.3.1 Systematic search for clinical studies reporting Ketoconazole malabsorption due to
increased gastric pH
Databases such as Medline, Scopus, Web of Science, Google Scholar, Sciencedirect and
Scifinder were systematically searched to identify relevant studies using key-words alone and in
combination with each other such as: pH, absorption, solubility, antisecretory therapy,
ketoconazole, omeprazole, ranitidine, cimetidine, gastric pH and co-administration. Clinical
studies performed on adult humans reporting ketoconazole malabsorption due to gastric acid
secretion inhibition by the use of PPIs and ⁄ or Histamine2-receptor antagonists were selected.
10.3.2 Chemical structure analysis
The database chemicalize (http://www.chemicalize.org/) was used to analyze
ketoconazole chemical structure and its ionization characteristics throughout the pH range 0- 14.
10.3.3 Computer simulations using GastroPlusTM
GastroPlus™ version 9.0 (Simulations Plus Inc., Lancaster, CA, USA) is a computer
program that allows the prediction of drug absorption from oral administration of dosage forms
when physicochemical and biopharmaceutical properties of drugs are available
(214,294,317,365,366,375,376). The program is composed of different input tabs, such as
Compound Tab, Gut Physiology and Pharmacokinetics. The other two tabs (Simulation and
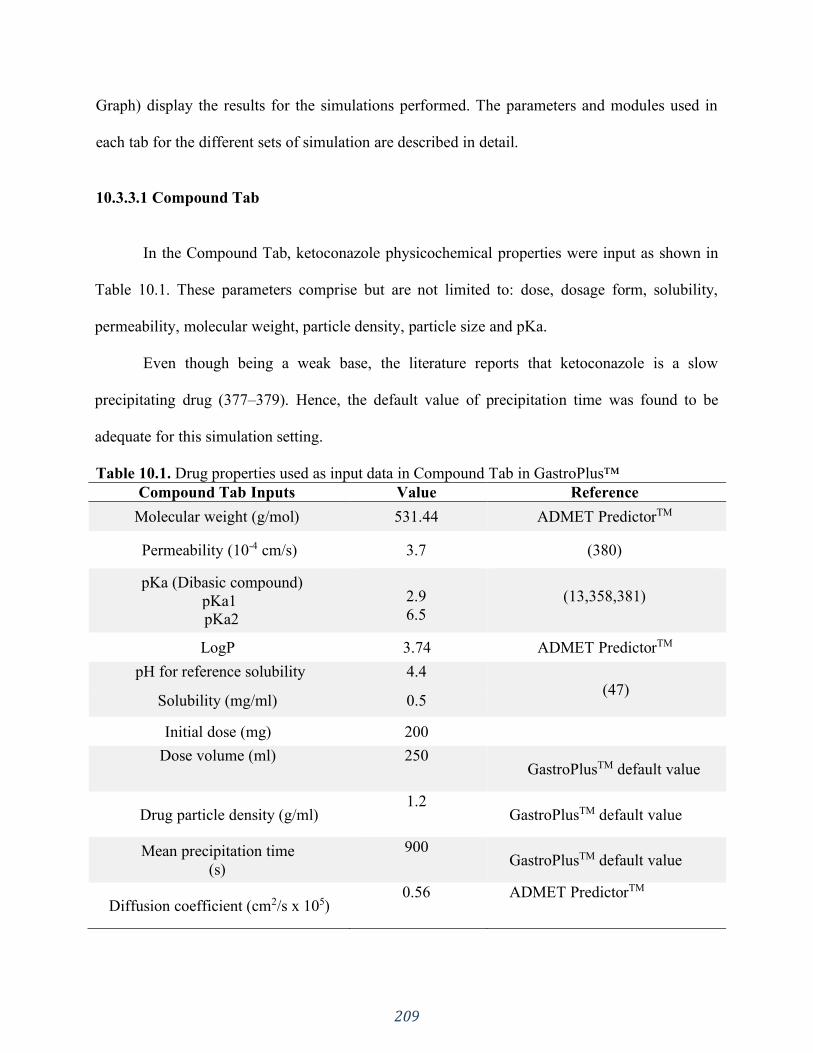
209
Graph) display the results for the simulations performed. The parameters and modules used in
each tab for the different sets of simulation are described in detail.
10.3.3.1 Compound Tab
In the Compound Tab, ketoconazole physicochemical properties were input as shown in
Table 10.1. These parameters comprise but are not limited to: dose, dosage form, solubility,
permeability, molecular weight, particle density, particle size and pKa.
Even though being a weak base, the literature reports that ketoconazole is a slow
precipitating drug (377–379). Hence, the default value of precipitation time was found to be
adequate for this simulation setting.
Table 10.1. Drug properties used as input data in Compound Tab in GastroPlus™
Compound Tab Inputs Value Reference
Molecular weight (g/mol) 531.44 ADMET PredictorTM
Permeability (10-4 cm/s) 3.7 (380)
pKa (Dibasic compound)
pKa1
pKa2
2.9
6.5
(13,358,381)
LogP 3.74 ADMET PredictorTM
pH for reference solubility 4.4
(47) Solubility (mg/ml) 0.5
Initial dose (mg) 200
Dose volume (ml) 250 GastroPlusTM default value
Drug particle density (g/ml) 1.2
GastroPlusTM default value
Mean precipitation time
(s)
900 GastroPlusTM default value
Diffusion coefficient (cm2/s x 105) 0.56 ADMET PredictorTM
210
10.3.3.2 Pharmacokinetics Tab
Since no intravenous human study has been reported to date (379), published data with
the administration of ketoconazole 200 mg oral suspension (382) was used to set the human
pharmacokinetics of ketoconazole using the PBPK model in GastroPlus™. In the Compound
Tab the Dosage Form selected was Immediate Release (IR) Suspension.
PBPKPlus™ (Simulations Plus Inc., Lancaster, CA, USA) is an additional module in
GastroPlus™ that enables the prediction of the drug’s distribution and clearance for all tissue
compartments such as gut, lung, adipose tissue, muscle, liver, spleen, heart, brain, kidney, skin,
and rest of the body that are interconnected by the systemic vasculature circulation
(365,379,383).
When using PBPK simulations for small molecules a partition coefficient between tissue
and plasma has to be set. This tissue/plasma partition coefficient (𝐾𝑝) is a mean to measure the
amount of drug in the tissue and it can be estimated from physicochemical properties such as
logP, pKa, unbound fraction of drug in plasma and blood/plasma concentration ratio (383). A
modified Rodgers and Rowland predictive method present in GastroPlusTM was selected to
calculate the 𝐾𝑝𝑠.
Perfusion-limited kinetics with no concentration gradient in the tissue was used, given
that ketoconazole is a highly lipophilic and highly permeable molecule and is classified as a BCS
class II compound (379). Therefore it is reasonable to assume that the amount of drug that
partitions into the tissue is limited by the blood flow rate through the tissue (perfusion rate)
rather than permeability and surface area and partitioning is instantaneous (383).. The scheme in
Figure 10.1 helps to illustrate this process.

211
Figure 10.1. Scheme of perfusion-limited tissue. 𝑉𝑡: tissue volume; 𝐶𝑡: tissue concentration,
𝑓𝑢𝑡: fraction unbound in tissue, 𝐶𝐿𝑖𝑛𝑡: tissue intrinsic clearance; 𝑉𝑝: plasma volume; 𝐶𝑝:
plasma concentration; 𝑓𝑢𝑝: fraction unbound in plasma; 𝐶𝑏𝑖: blood concentration in (arterial)
tissue; 𝑅𝑏𝑝: blood/plasma concentration ratio; 𝑄: tissue blood flow; 𝐶𝑏𝑜: blood concentration
out (venous) of tissue; 𝐾𝑝: tissue/plasma partition coefficient. (Image adapted from
GastroPlusTM Manual, 2015).
Ketoconazole’s major route of excretion is through the bile into the GI tract with more
than 50% being excreted in the feces (384,385). Hence the hepatic clearance (CLhep) was set
equal to oral clearance (CLpo) of 12.5 L/h for a 200 mg dose (380,382). The default physiology
(Human Physiological Fasted) was used.
10.3.3.3 Physiology Tab
Three sets of simulations were performed, and the predicted absorption was compared to
the experimental data for the different physiology conditions in the stomach. The first set of
simulations aimed to build a PBPK model using published data of ketoconazole 200 mg
suspension administration (382). Once the model was built, the same pharmacokinetics
parameters obtained were used to run further simulations. The other two sets of simulations
comprised of ketoconazole 200 mg in an immediate release (IR) tablet dosage form for both
normal and increased stomach pH. For those two sets of simulation, the dosage form in the
compound tab was set to “IR: Tablet”.
212
These three sets of simulations: PBPK model; human fasted – no hypochlorhydria
physiology and human fasted - hypochlorhydria physiology are described below and presented in
Table 10.2.
10.3.3.3.1 Physiology Based Pharmacokinetics (PBPK) model
As mentioned above, a clinical study using ketoconazole 200mg oral suspension (382)
was selected to build the PBPK model. Since this study was conducted in humans in a fasted
state, the default values in GastroPlusTM for human fasted physiology were used, as shown in
Table 10.2. The default absorption model (Opt logD Model SA/V 6.1 model) and perfusion
limited kinetics were used.
10.3.3.3.2 Human fasted - Normal intragastric pH - No hypochlorhydria
Experimental data were taken from a published study using ketoconazole tablets 200 mg
(Nizoral; Janssen Pharmaceutica Inc., Mississauga,Ontario, Canada) (358). A parameter
sensitivity analysis (PSA) was performed on gastric transit time since the dosage form was
changed from suspension to tablet, and it was set to one hour. It is reasonable to use a longer
gastric transit time given that a solid oral dosage form takes longer to be emptied out of the
stomach when compared to a suspension.
10.3.3.3.3 Human fasted - Co-administration with PPI – Hypochlorhydria
Data from a study performed in subjects receiving 60 mg of omeprazole (Losec; Astra
Pharma Inc.) on the night prior to receiving ketoconazole 200 mg was used (358). The
experimental data were compared with the simulations performed at increased intragastric pH.
Stomach pH was set to 6.9, as reported in the study (Table 10.2). Besides that, gastric retention
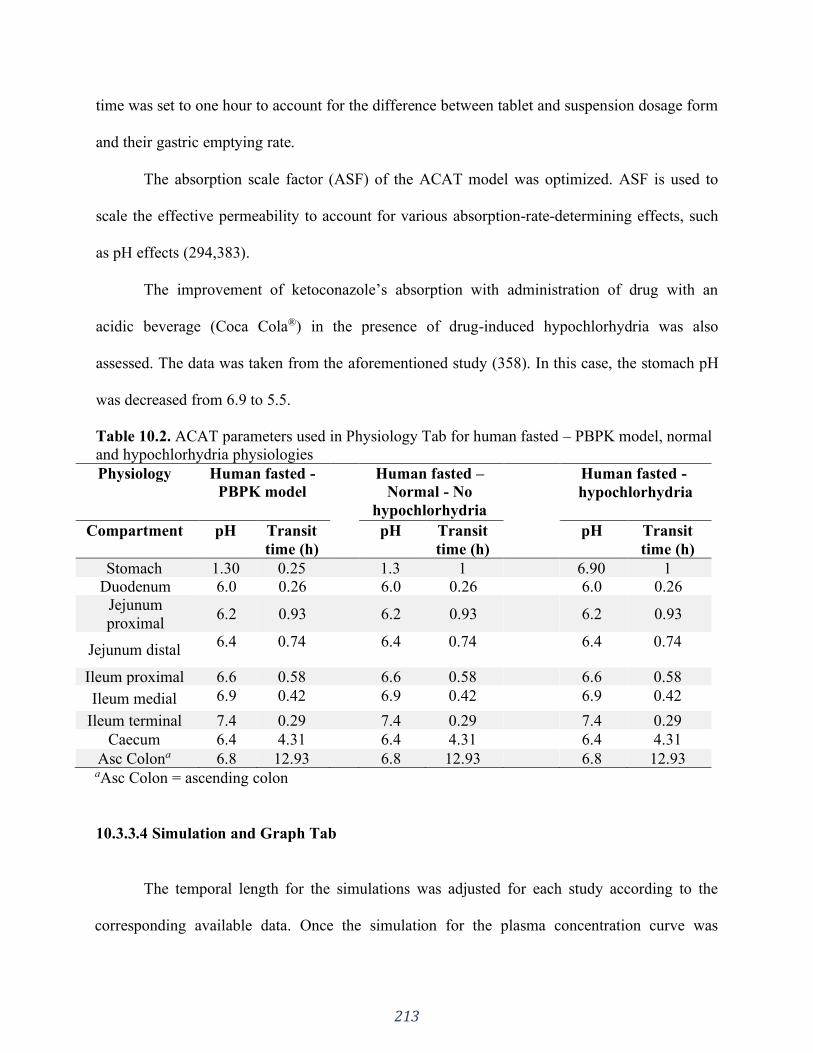
213
time was set to one hour to account for the difference between tablet and suspension dosage form
and their gastric emptying rate.
The absorption scale factor (ASF) of the ACAT model was optimized. ASF is used to
scale the effective permeability to account for various absorption-rate-determining effects, such
as pH effects (294,383).
The improvement of ketoconazole’s absorption with administration of drug with an
acidic beverage (Coca Cola®) in the presence of drug-induced hypochlorhydria was also
assessed. The data was taken from the aforementioned study (358). In this case, the stomach pH
was decreased from 6.9 to 5.5.
Table 10.2. ACAT parameters used in Physiology Tab for human fasted – PBPK model, normal
and hypochlorhydria physiologies
Physiology Human fasted -
PBPK model
Human fasted –
Normal - No
hypochlorhydria
Human fasted -
hypochlorhydria
Compartment pH Transit
time (h)
pH Transit
time (h)
pH Transit
time (h)
Stomach 1.30 0.25 1.3 1 6.90 1
Duodenum 6.0 0.26 6.0 0.26 6.0 0.26
Jejunum
proximal 6.2 0.93 6.2 0.93 6.2 0.93
Jejunum distal 6.4 0.74 6.4 0.74 6.4 0.74
Ileum proximal 6.6 0.58 6.6 0.58 6.6 0.58
Ileum medial 6.9 0.42 6.9 0.42 6.9 0.42
Ileum terminal 7.4 0.29 7.4 0.29 7.4 0.29
Caecum 6.4 4.31 6.4 4.31 6.4 4.31
Asc Colona 6.8 12.93 6.8 12.93 6.8 12.93 aAsc Colon = ascending colon
10.3.3.4 Simulation and Graph Tab
The temporal length for the simulations was adjusted for each study according to the
corresponding available data. Once the simulation for the plasma concentration curve was
214
complete, the predicted curve was displayed in the Graph tab, which automatically generates the
regression coefficient (R2) between predicted and observed data, along with other statistical
parameters: sum of squared errors (SSE), root mean squared error (RMSE) and mean absolute
error (MAE).
Since ketoconazole is a BCS class II drug the influence of particle size on drug
absorption was investigated by running a PSA. The particle size range analyzed was 2-250 µm.
After running a PSA, the Graph tab displayed the results delineating the particle size statistics
effect on ketoconazole’s pharmacokinetics.
10.3.4 Data analysis
The data was analyzed through statistical parameters such as SSE, RMSE and MAE. The
SSE measures the discrepancy between the model and data. Therefore, the smaller the value, the
better the fit is. The differences between the predicted values and observed values is given by the
RMSE. It combines the magnitude of the errors for the various time points into a single measure.
It is a non-negative value and the closer to zero the better the fit. MAE, as the name indicates, is
the average of all absolute errors.
Besides that, the pharmacokinetic parameters AUC, Tmax and Cmax were assessed in
terms of the fold error between the observed and the predicted values, according to Equation 10-
1. As it is widely applied within pharmaceutical industries, a two-fold error was considered to be
an acceptable prediction (386,387).
𝐹𝑜𝑙𝑑 𝐸𝑟𝑟𝑜𝑟 =𝑃𝑟𝑒𝑑𝑖𝑐𝑡𝑒𝑑 𝑣𝑎𝑙𝑢𝑒
𝑂𝑏𝑠𝑒𝑟𝑣𝑒𝑑 𝑣𝑎𝑙𝑢𝑒 Equation 10-1

215
10.3.5 Solubility test
The solubility of ketoconazole was determined using the equilibrium solubility test
(Shake flask method). Four different media were tested in triplicate: Simulated gastric fluid
(SGF) pH 1.2, SGF pH 5.0, Coca-Cola® and Orange Juice (Minute Maid®), the latter two were
utilized directly from the commercial products. Each medium (5ml) was saturated with
ketoconazole pure drug powder and there was no mixture of media. The flasks were shaken for
24 hours at room temperature to assure equilibrium. At equilibrium, the pH in each flask was
measured.
Samples from each medium (SGF pH1.2; SGF pH 5; Orange juice and Coca-Cola) were
centrifuged for 10 min at 11900xg and the supernatant was diluted. The supernatant of Orange
juice and Coca-Cola samples was diluted with methanol and the supernatant from SGF pH 1.2
and pH 5 was diluted with acetonitrile. The diluted supernatant from all samples was then
centrifuged again for 10 min at 4400xg. The resulting supernatant was used in the HPLC assay.
The mobile phase for the HPLC assay was composed of methanol, water and diethylamine
74:26:0.1 (v/v/v) and a Lichrospher® 60 RP Select B column (5 μm, 12.5×4 mm) column was
used (388).
10.4 Results
10.4.1 Chemical structure analysis
The graph below (Figure 10.2), retrieved from the Chemicalize database
(http://www.chemicalize.org/), shows the result for the ionization microspecies distribution
throughout the pH range 0 to 14. The green line represents the microspecies with both basic
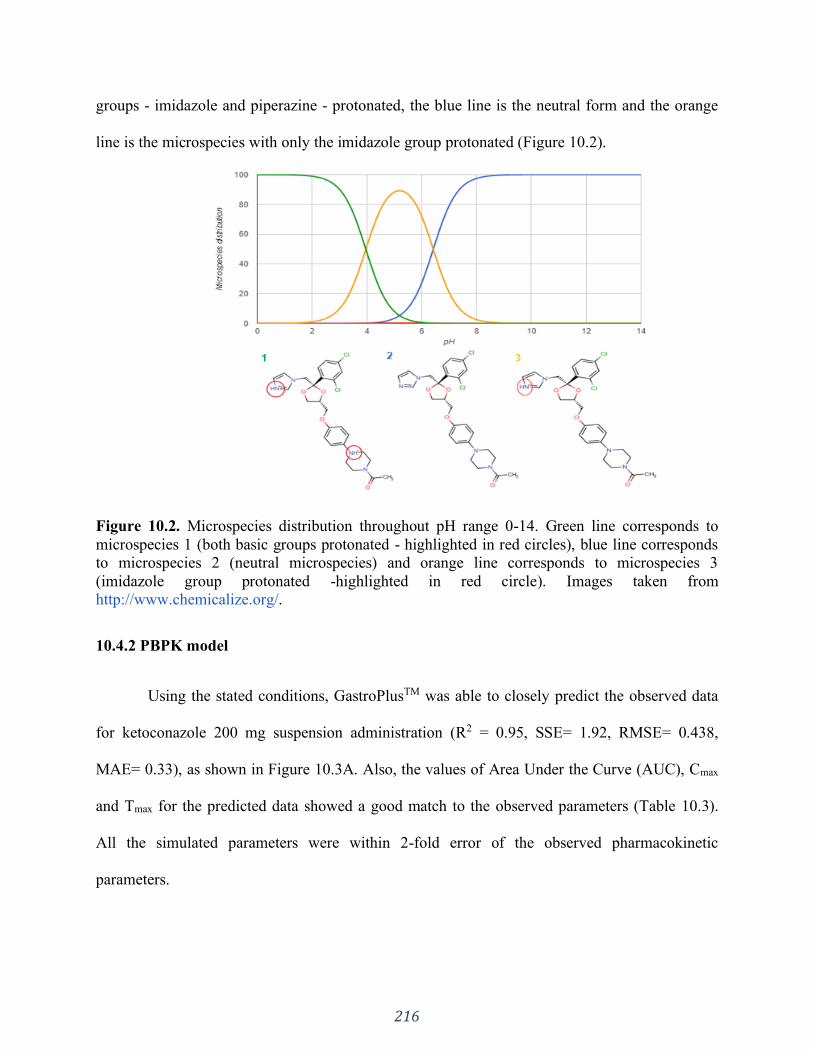
216
groups - imidazole and piperazine - protonated, the blue line is the neutral form and the orange
line is the microspecies with only the imidazole group protonated (Figure 10.2).
Figure 10.2. Microspecies distribution throughout pH range 0-14. Green line corresponds to
microspecies 1 (both basic groups protonated - highlighted in red circles), blue line corresponds
to microspecies 2 (neutral microspecies) and orange line corresponds to microspecies 3
(imidazole group protonated -highlighted in red circle). Images taken from
http://www.chemicalize.org/.
10.4.2 PBPK model
Using the stated conditions, GastroPlusTM was able to closely predict the observed data
for ketoconazole 200 mg suspension administration (R2 = 0.95, SSE= 1.92, RMSE= 0.438,
MAE= 0.33), as shown in Figure 10.3A. Also, the values of Area Under the Curve (AUC), Cmax
and Tmax for the predicted data showed a good match to the observed parameters (Table 10.3).
All the simulated parameters were within 2-fold error of the observed pharmacokinetic
parameters.

217
Table 10.3. Area under the curve (AUC0-∞), Cmax and Tmax and after oral administration of
ketoconazole 200 mg suspension
Parameter Observed* Predicted
AUC0-∞ (µg*h/mL) 15.84 (± 7.05) 12.65
Cmax (µg/mL) 5.04 (±1.58) 4.73
Tmax (h) 1.2 (±0.5) 1.36
*Observed parameters were taken from Huang et al.
10.4.2.1 Human fasted - Normal intragastric pH - No hypochlorhydria
The simulated plasma concentration curve for ketoconazole in normal gastric pH state
resulted in a very good prediction for the observed plasmatic concentration curve (R2 = 0.913,
SSE= 2.776; RMSE= 0.502; MAE= 0.394) (Figure 10.3B). The pharmacokinetics parameters
AUC0-∞, Cmax and Tmax and are summarized in Table 10.4, showing a well-defined match
between the predicted and observed data. All the simulated parameters were within 2-fold error
of the observed pharmacokinetic parameters.
10.4.2.2 Human fasted - Co-administration with PPI - Hypochlorhydria
Figure 10.3C shows the observed and simulated plasma concentration time curve for
ketoconazole in hypochlorhydria state and the plasma concentration time curve for the
administration of the drug with Coca-Cola®. Both resulted in a good match (R2 = 0.89; SSE=
0.45; RMSE= 0.20; MAE= 0.156 and R2 = 0.965; SSE= 0.26; RMSE= 0.161; MAE= 0.125,
respectively). Values of AUC, Cmax and Tmax for the predicted and observed data are summarized
in Table 10.4. All the simulated parameters were within 2-fold error of the observed
pharmacokinetic parameters.
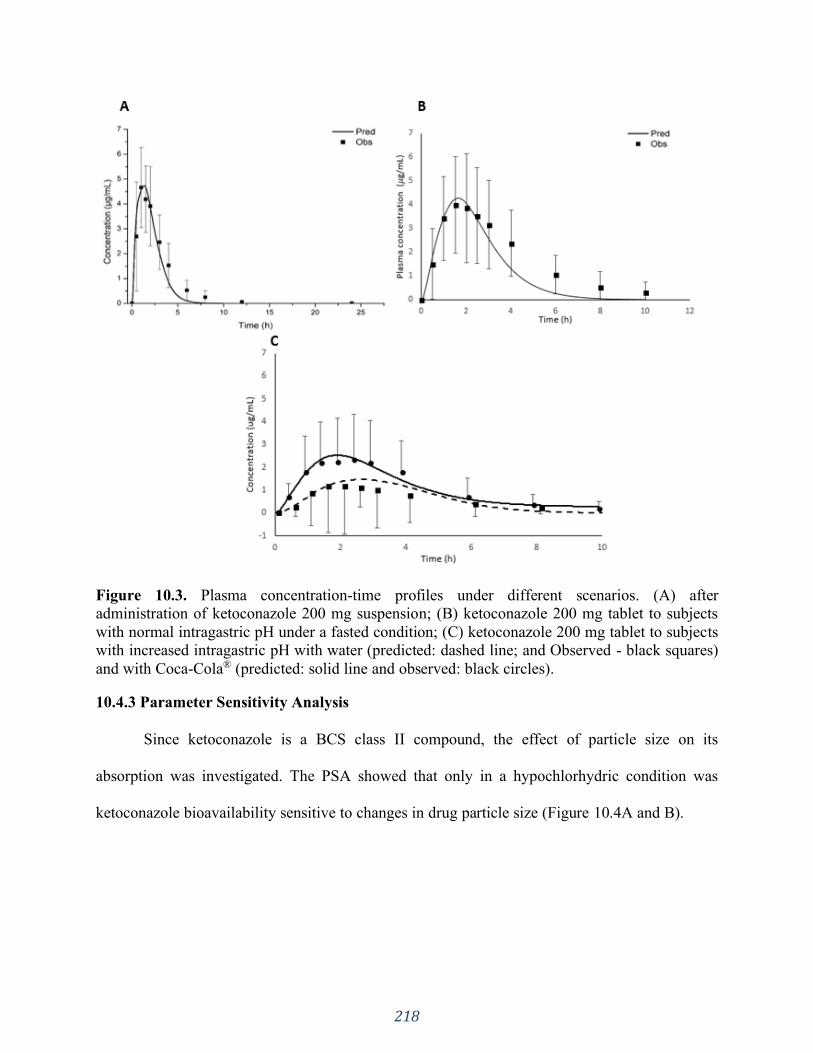
218
Figure 10.3. Plasma concentration-time profiles under different scenarios. (A) after
administration of ketoconazole 200 mg suspension; (B) ketoconazole 200 mg tablet to subjects
with normal intragastric pH under a fasted condition; (C) ketoconazole 200 mg tablet to subjects
with increased intragastric pH with water (predicted: dashed line; and Observed - black squares)
and with Coca-Cola® (predicted: solid line and observed: black circles).
10.4.3 Parameter Sensitivity Analysis
Since ketoconazole is a BCS class II compound, the effect of particle size on its
absorption was investigated. The PSA showed that only in a hypochlorhydric condition was
ketoconazole bioavailability sensitive to changes in drug particle size (Figure 10.4A and B).

219
Figure 10.4. Parameters sensitivity analysis: influence of particle size on AUC0-∞, (A) and
Tmax (B) of ketoconazole in normal (squares) and increased intragastric pH (triangle).
10.4.4 Solubility test
Ketoconazole had its highest solubility in SGF pH 1.2 (48 mg/mL ± 0.68); followed by
Orange Juice and Coca-Cola® (2.6 mg/mL ± 0.027; 2.23 mg/mL ± 0.024, respectively) and
finally SGF pH 5.0 (0.43 mg/mL ± 0.032) in which it presented the lowest solubility. The
measured equilibrium pH for the media was 2.8; 4.3; 3.62 and 5.7, respectively. The mean
solubility of ketoconazole was ~5 times higher in Coca-Cola® and orange juice than its solubility
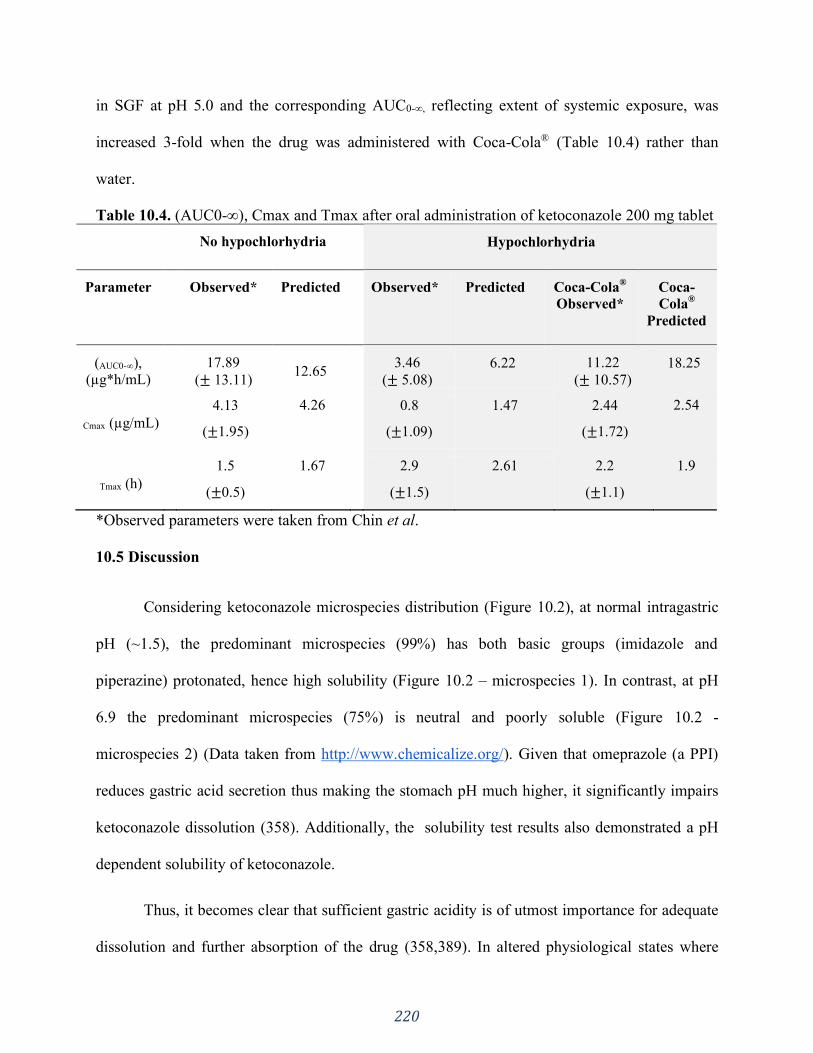
220
in SGF at pH 5.0 and the corresponding AUC0-∞, reflecting extent of systemic exposure, was
increased 3-fold when the drug was administered with Coca-Cola® (Table 10.4) rather than
water.
Table 10.4. (AUC0-∞), Cmax and Tmax after oral administration of ketoconazole 200 mg tablet
No hypochlorhydria Hypochlorhydria
Parameter Observed* Predicted Observed* Predicted
Coca-Cola®
Observed*
Coca-
Cola®
Predicted
(AUC0-∞), (µg*h/mL)
17.89
(± 13.11) 12.65
3.46
(± 5.08)
6.22
11.22
(± 10.57)
18.25
Cmax (µg/mL)
4.13
(±1.95)
4.26 0.8
(±1.09)
1.47 2.44
(±1.72)
2.54
Tmax (h)
1.5
(±0.5)
1.67 2.9
(±1.5)
2.61 2.2
(±1.1)
1.9
*Observed parameters were taken from Chin et al.
10.5 Discussion
Considering ketoconazole microspecies distribution (Figure 10.2), at normal intragastric
pH (~1.5), the predominant microspecies (99%) has both basic groups (imidazole and
piperazine) protonated, hence high solubility (Figure 10.2 – microspecies 1). In contrast, at pH
6.9 the predominant microspecies (75%) is neutral and poorly soluble (Figure 10.2 -
microspecies 2) (Data taken from http://www.chemicalize.org/). Given that omeprazole (a PPI)
reduces gastric acid secretion thus making the stomach pH much higher, it significantly impairs
ketoconazole dissolution (358). Additionally, the solubility test results also demonstrated a pH
dependent solubility of ketoconazole.
Thus, it becomes clear that sufficient gastric acidity is of utmost importance for adequate
dissolution and further absorption of the drug (358,389). In altered physiological states where

221
gastric acidity isn’t enough to solubilize BCS class II compounds, in this case, ketoconazole, the
drug’s bioavailability may be reduced. A central tenet of clinical pharmacology is the
relationship between drug concentration and pharmacological/ toxicological effects. Hence, the
therapeutic outcome of the given treatment will be altered as a consequence (381). The built in
silico PBPK model properly predicted ketoconazole malabsorption caused by the
hypochlorhydria state (Figure 10.3C), consistent with the primary role of gastric dissolution on
the absorption of weak bases.
A common strategy used to circumvent the hypochlorhydric effect on the drug’s
bioavailability is to administer it with low pH drinks, such as Coca-Cola®, in order to decrease
the pH of the gastric fluid, thus increasing ketoconazole’s dissolution and further absorption, as
shown by Chin et al. The model was able to predict the increased bioavailability when
administering the drug with Coca-Cola® (Figure 10.3C). This demonstrates the utility of in silico
methods in further delineating different clinical strategies to avoid therapeutic failures.
As shown in Figure 10.4A, once sufficient gastric acidity is provided to facilitate
complete ketoconazole dissolution, its absorption is not affected by particle size (squares), rather
it depends on gastric transit time (55,359). Nevertheless, if the gastric pH is not acidic enough to
completely dissolve ketoconazole in the stomach, it will depend on intestinal dissolution to be
absorbed, where the particle size matters (triangles in Figure 10.4A). Due to its low solubility at
intestinal pH, incomplete absorption will occur (showed by a smaller AUC) (381,390).
It is already known that particle size can influence drug absorption, mainly for BCS class
II compounds (390). In API driven dissolution dosage forms, the drug’s properties such as
particle size and surface area will have an impact on determining drug dissolution. Thus, the
drug product performance will depend on such properties in addition to the physiological
222
environment that the drug is exposed to. Our results corroborate that stomach and intestinal pH
play a major role in ketoconazole dissolution followed by absorption process. Particle size,
however, seems to play a role only under a hypochlorhydric condition.
Furthermore, both results from the PSA performed (Figure 10.4B) and predicted plasma
concentration time curves (Figures 10.3B and 10.3C), show that the hypochlorhydria condition
also results in a slower absorption rate, indicated by a longer Tmax when compared to the one in
normal intragastric pH (Table 10.4).
Hence, impaired absorption can occur when weakly basic drugs are administered to
patients that have reduced gastric acidity, leading to a potential therapeutic failure due to
subtherapeutic plasma concentrations (61,353,358,391).
For that reason, the development of formulations that can overcome the hypochlorhydric
stomach environment is of primary importance to obtain the desired therapeutic result and
efficacy (391).
As demonstrated by Mitra et al. (391) and Kou et al. (352) the use of in silico tools, such
as GastroPlusTM, can help to predict the in vivo performance of such formulations in humans,
using PBPK and ACAT models to mimic the given patient’s physiology (294). On one hand,
combining in silico results with tests can be a powerful tool to select the most promising
formulation to further continue studies (e.g. bioequivalence studies), on the other hand it can
also be used to design different clinical approaches in order to reduce therapeutic failures
(30,366,380,391). In this study we showed that rather simple computer simulations are a useful
adjunctive tool when evaluating BCS II drug absorption when co-administered with a PPI. All
weak bases would potentially behave in this manner; however, this could be compensated with
223
the use of low pH beverages instead of water. Therefore, simulations come in handy to assess
alternative clinical dosing approaches.
In the clinical environment PBPK models have gained much importance to enable
personalized medicine and to assess drug-drug/ drug-disease interactions (392–395). For these
purposes, its usefulness rely on its ability to determine the importance of subpopulations and to
optimize the formulation to obtain the targeted drug plasma concentration profile (392).
Nevertheless, not much attention has been drawn to the utility of computer models when
designing alternative clinical approaches.
10. 6 Conclusion
Physiologically based pharmacokinetic computer modeling using the software
GastroPlusTM was able to accurately predict the plasma concentration vs. time profiles for
ketoconazole tablets under different physiological states (normal gastric acid secretion and
hypochlorhydria), capturing how well the drug would be absorbed and how the pharmaceutical
product would perform under each condition. As experimentally observed, the simulated profiles
showed a much lower ketoconazole absorption when the gastric acid secretion was low
(hypochlorhydria) compared to individuals with a normal gastric pH. The model was also able to
analyze the success of a different clinical approach (use of another beverage) showing the use of
in silico models to support changes in clinical practice. Thus, reliable PBPK models can be used
to predict possible pharmacokinetic pitfalls, which opens up additional approaches to explore
different dosing strategies in clinical practice.
224
SECTION FIVE: GENERAL DISCUSSION, CONCLUSION AND
FUTURE DIRECTIONS
CHAPTER ELEVEN
General Discussion and Conclusion
225
11.1 General discussion
This thesis outlines many important aspects that need to be considered when developing
physiologically relevant in vitro conditions. Such methods usually don’t apply compendial
conditions such as highly concentrated buffers. Hence, its use is most meaningful during the
development phase rather than for QC purposes, such as batch release, for example (17). The
approach taken in this work was such that allowed a mechanistic understanding of the underlying
science behind clinical observations, such as slower in vivo dissolution, therapeutic failures,
drug-excipient interaction, and the impact of physiological state.
In this thesis, initially, we investigated the matter of buffer capacity as an in vivo relevant
parameter, since the buffering system in the intestinal lumen operates at low molarity values. For
drugs with low solubility, such as Ibuprofen (Chapter 4), the buffer capacity impacted the
dissolution rate in a manner that correlated with the observed slower in vivo dissolution rate. On
the other hand, for highly soluble drugs, such as Metronidazole (Chapter 5) buffer capacity
seemed not to be as important for the in vitro dissolution rate. Metronidazole and ibuprofen were
used as representatives of BCS classes I and II, respectively. However, future studies with other
drugs should be conducted.
The dissolution of a poorly soluble drugs is mainly affected by the surface pH around the
drug particle (319). In compendial conditions (highly concentrated buffers) the interfacial pH is
very similar to the bulk pH, resulting in a fast dissolution rate, which is known not to be the in
vivo situation. As the drug is being dissolved, it is also absorbed in the gut, allowing bulk pH
control with further drug dissolution and absorption in vivo. On the other hand, for highly soluble
drugs the difference of surface pH and bulk pH would not have such a prominent impact on the
dissolution rate because the drug is freely soluble. Hence, the absorption would mostly depend
226
on gastric emptying time and, once in the intestines, the parameter of most relevance would be
absorption (79).
Going a step further intro building physiological relevance to the in vitro system, the
low buffer capacity medium was paired with an organic layer (n-octanol) to mimic the
concurrent drug absorption that happens with the in vivo dissolution. Not only did this
system present improved physiological relevance, but the use of an absorptive phase also
added a sink to the low buffer capacity media, which decreased pH shifts while the
dissolution test was performed (27).
This mechanistic analysis of the in vivo processes for different BCS class drugs (I and
II) was undertaken with the proposed biphasic method in Chapters 4 and 5. For a poorly
soluble drug, not only was the bulk pH shift better controlled due to drug partitioning – a
process which likely occurs in vivo – but this method was also able to capture differences in
formulation that might impact in vivo performance. In a similar manner, for IR formulations
containing BCS I drugs, we demonstrated that compendial conditions might have been
overdiscriminating and that the formulations were similar in terms of partitioning. Since this
process correlates to the in vivo absorption, the formulations might have been equivalent. In
vivo studies are needed to confirm these findings.
With the lessons learned from the theoretical and experimental assessment of buffer
capacity and IR formulations, we studied more complex delivery systems addressing both
the matter of buffer capacity and buffer species on the drug product performance (Chapter 7
and 8). The intestinal buffering system is bicarbonate based, hence we used bicarbonate
buffer at in vivo molarities values to study enteric coated formulations, due to the

227
overwhelming evidence of the disconnect between in vitro conditions and clinical
observations (Chapter 6).
We demonstrated that there is a considerable delay in the onset of drug release from EC
formulations in BCB compared to compendial phosphate buffer. This is a result of the poor
ability of BCB in buffering the dissolution of enteric coating polymers. Our in vitro findings
are in line with in vivo observations of therapeutic failures with this kind of formulation,
showing that the problem lies on their poor performance in the intestinal fluids leading to
lower to no absorption (78,88).
The mechanistic understanding of the performance of EC products in BCB allowed us
to delineate some of the main parameters that seem to affect the coat opening. The nature of
the API (acid vs. base) can have a pronounced impact due to a microenvironment pH at the
tablet/coat interface. This seems to outweigh the coat thickness when comparing acidic and
basic drugs. However, the coat thickness matters for EC formulations containing the same
API or APIs with similar physicochemical properties. Besides that, parameters such as the
composition, pH and molarity of the immersion medium have to be factored in for
physiological insight (88).
To provide further evidence of these observations, we tested EC pantoprazole
formulations in BCB and compendial conditions and correlated it with in vivo data from a
failed BE study (Chapter 8). Enteric coat dissolution was prompt in compendial buffer and
both test and reference formulations complied with the pharmacopeial specifications.
Evidently, solely satisfying the standard for drug dissolution does not guarantee similar in
vivo behavior. In BCB, however, test and reference products presented remarkably different
228
performances and the release in BCB correlated better with the in vivo data. This shows the
importance of using buffer systems reflective of the in vivo environment during the
pharmaceutical development phase to avoid poor selection of prototype formulations.
Finally, we report the mechanistic assessment of other important aspects of in vivo drug
product performance, such as formulation composition and physiology state (Chapters 9 and 10).
Again, taking a mechanistic approach led to a more thorough understanding of the clinical
observations. In terms of formulation properties, we not only confirmed an excipient-drug
interaction that culminated in an intoxication outbreak in Australia, but also delineated a new
incompatibility between phenytoin and lactose, that could cause potential development issues
(396).
In respect of physiology state, the understanding of the interplay between the
physicochemical properties of the API and the GI tract conditions at the time of dosing is of
primary importance to achieve proper therapeutic outcome (Chapter 10). As expounded in
Chapter 1, a basic drug, such as ketoconazole (BCS Class IIb) is good soluble in the acidic
stomach environment but may precipitate upon transit through the intestines where the pH is less
favourable to its dissolution. When there is sufficient time for dissolution in the stomach, good
absorption in the proximal intestinal region is expected. However, in altered physiology state,
such as decreased stomach acidity, the dissolution in the gastric environment is compromised,
thus compromising drug absorption. In this scenario, PBPK modeling is a valuable mechanistic
approach to investigate the success of different clinical approaches and alternative dosing
strategies (380,397).
229
11.2 Conclusion
In this thesis, we showed the importance of a mechanistic understanding of the in vivo
drug dissolution process to set physiologically relevant conditions to the in vitro performance
tests. The first thing addressed was the matter of buffer capacity. It is well known that the
buffering system in the human intestines is bicarbonate based at low molarity values. Literature
reports have shown that in vivo drug dissolution might occur at a slower rate for poorly soluble
drugs due to the reduced buffer capacity of the intestinal luminal fluids compared to compendial
conditions. In our work we have demonstrated that the high buffer concentration used in
compendial methods (to maintain sink conditions) causes a prompt drug dissolution. However,
when applying a physiologically relevant buffer strength, the dissolution rate was slower, which
is in line with the observed in vivo data. Additionally, because of the slower dissolution rate,
differences between the formulations (composition and manufacturing process) were captured,
which was not the case for compendial buffer, thus making this method more discriminative. The
organic layer, mimicking the in vivo absorption process, acted as an additional sink that allowed
pH control throughout the test. Subsequently, using biphasic dissolution test for IR formulations
containing highly soluble drugs was shown to have beneficial attributes to estimate the in vitro
behavior and performance of formulations as an alternative BCS-based biowaiver approach.
A fundamental consideration of this dissertation has been the behaviour of drug products
in bicarbonate buffer, given that this system is the most representative of the luminal fluids. Due
to the inherent pragmatical difficulties with this buffer system, it is desirable to design a
surrogate buffer that can give the same physiological insight as bicarbonate-based buffers. When
possible, this approach was taken in our studies. However, there are cases in which the
peculiarities and kinetics of BCB play an essential role in drug dissolution, making it difficult to
230
find a proper buffer replacement, which is the case for enteric coated formulations. We
demonstrated that BCB has a limited ability to buffer the dissolution of enteric coating polymers
due to a lower pKa value at the solid-liquid interface compared to the bulk. This resulted in a
considerable delay in the onset of drug release from EC formulations compared to compendial
phosphate buffer. Again, our findings were in line with clinical observations. Hence, the reported
in vivo failures of EC products known in the literature seem to be due to, at least in part, poor
performance in the intestinal fluids.
Using the conditions outlined in the USP dissolution method resulted in a very prompt
release. Hence, the compendial method for enteric coated tablets seems to be clinically irrelevant
and it needs to be reevaluated. Using buffer systems that are not reflective of the in vivo
environment during the pharmaceutical development phase can be misleading and cause poor
selection of prototype formulations. Hence, an in vivo relevant performance test for EC products
needs to be developed.
Overall, the findings of this thesis comprehensively demonstrates that meaningful
differences in in vitro performance and accordance to clinical reports were only obtained when
physiological relevant conditions were applied. Hence, our results indicate that the central
hypothesis was answered positively.

231
SECTION FIVE: GENERAL DISCUSSION, CONCLUSION AND FUTURE
DIRECTIONS
CHAPTER TWELVE
Future Directions
232
12.1 Bicarbonate buffer and biphasic dissolution
As mentioned previously, the need of purging bicarbonate buffer media to maintain the pH
makes its use difficult and unfeasible at times. Hence, we herein suggest the use of a biphasic
system with the aqueous layer composed of bicarbonate buffer. We believe that the coupling of
BCB with an organic layer (octanol) would prevent the escape of CO2, thus taking away the need
to sparge the medium. This approach would also allow the assessment of the drug partitioning,
correlating to the absorption process. This would be a very robust physiologically relevant
approach and we suggest that future in vitro studies along this line be conducted.
12.2 Simplification of in vitro tests for Quality Control application – Delayed release and
Immediate release
We have demonstrated in Chapter 7 that buffer molarity seems to play a bigger role than bulk
pH for the dissolution of enteric coated products. For a QC approach, there may not be the need
to sparge the medium, as long as the buffer capacity of the system is carefully controlled. Future
steps into developing a QC method for delayed release formulations would involve the study of a
broader range of formulations in sparged vs. non sparged BCB media to set release
specifications. Furthermore, the development of surrogate buffers should be conducted to find a
system that matches the pKa of BCB at the boundary layer, which is a case-by-case study, as
shown in the decision tree in Figure 2.4.
As shown in Chapters 3 and 5, for immediate release formulations that present an API-controlled
dissolution, disintegration is the critical quality attribute of the dosage form and determines the
onset of dissolution. Since the dissolution would be determined by the API properties,
disintegration testing could become a release test for such formulations. After disintegration is
completed, dissolution can be linked to API properties since the dosage form has limited impact

233
on the product performance. In this scenario, well established mass transport models (such as
Noyes-Whitney) can be used to estimate and predict dissolution behavior if parameters such as
medium pH, viscosity and surfactant concentrations are known. Hence, future studies need to be
conducted to establish the scientific framework for using disintegration testing as a performance
test, which would result in saving time and cost. A thorough investigation should be conducted
to establish the test specifications for less variable results, such as beaker specifications, medium
composition, medium viscosity, surface tension, time specification, among others.
234
REFERENCES
1. Amaral Silva D, Webster GK, Bou-chacra N, Löbenberg R. The Significance
of Disintegration Testing in Pharmaceutical Development. Dissolution
Technol. 2018;(August):30–8.
2. Noyes AA, Whitney WR. The rate of solution of solid substances in their
own solutions. J Am Chem Soc. 1897 Dec 1;19(12):930–4.
3. <711> Dissolution. United States Pharmacopeia and National Formulary
USP43-NF38 2S; The United States Pharmacopeial Convention, Inc.:
Rockville, MD, 2020.
4. Hörter D, Dressman JB. Influence of physicochemical properties on
dissolution of drugs in the gastrointestinal tract. Adv Drug Deliv Rev. 2001
Mar;46(1–3):75–87.
5. Shiu GK. Dissolution Methodology: Apparatus and Conditions. Drug Inf J
[Internet]. 1996 Oct 1;30(4):1045–54. Available from:
https://doi.org/10.1177/009286159603000421
6. Issa MG, Ferraz HG. Intrinsic dissolution as a tool for evaluating drug
solubility in accordance with the biopharmaceutics classification system.
Dissolution Technol. 2011;18(3):6–13.
235
7. The United States Pharmacopeia and National Formulary USP43-NF38 2S;
The United States Pharmacopeial Convention, Inc.: Rockville, MD, 2020.
8. Blanquet S, Zeijdner E, Beyssac E, Meunier J-P, Denis S, Havenaar R, et al.
A dynamic artificial gastrointestinal system for studying the behavior of
orally administered drug dosage forms under various physiological
conditions. Pharm Res. 2004 Apr;21(4):585–91.
9. Sperry DC, Hawley M. Dynamic artificial stomach and intestine model to
evaluate the bioavailability of drugs and formulations. In: ABSTRACTS OF
PAPERS OF THE AMERICAN CHEMICAL SOCIETY. AMER
CHEMICAL SOC 1155 16TH ST, NW, WASHINGTON, DC 20036 USA;
2000. p. U81–U81.
10. Shargel L, Yu ABC. Applied Biopharmaceutics & Pharmacokinetics, 7e.
Chapter 1. Introduction to Biopharmaceutics and Pharmacokinetics.
McGraw-Hill Education; 2016.
11. Amidon GL, Lennernäs H, Shah VP, Crison JR. A theoretical basis for a
biopharmaceutic drug classification: the correlation of in vitro drug product
dissolution and in vivo bioavailability. Pharm Res. 1995;12(3):413–20.
12. Immediate Release Solid Oral Dosage Forms Scale-Up and Postapproval
Changes: Chemistry, Manufacturing, and Controls, In Vitro Dissolution
236
Testing, and In Vivo BioequivalenceDocumentation, Center for Drug
Evaluation and Research (CDER), FDA. 1995.
13. Tsume Y, Mudie DM, Langguth P, Amidon GE, Amidon GL. The
Biopharmaceutics Classification System: Subclasses for in vivo predictive
dissolution (IPD) methodology and IVIVC. Eur J Pharm Sci. 2014;57:152–
63.
14. Löbenberg R, Amidon GL. Modern bioavailability, bioequivalence and
biopharmaceutics classification system. New scientific approaches to
international regulatory standards. Eur J Pharm Biopharm. 2000;50(1):3–12.
15. Guidance for Industry: SUPAC-MR: Modified Release Solid Oral Dosage
Forms, US Department of Health and Human Services, Food and Drug
Administration, Center for Drug Evaluation and Research (CDER),
Rockville, Md, USA, 1997.
16. Anand O, Yu LX, Conner DP, Davit BM. Dissolution testing for generic
drugs: an FDA perspective. AAPS J. 2011/04/09. 2011 Sep;13(3):328–35.
17. Grady H, Elder D, Webster GK, Mao Y, Lin Y, Flanagan T, et al. Industry’s
View on Using Quality Control, Biorelevant, and Clinically Relevant
Dissolution Tests for Pharmaceutical Development, Registration, and
Commercialization. J Pharm Sci. 2018;107(1):34–41.

237
18. Marroum PJ. History and evolution of the dissolution test. Dissolution
Technol. 2014;21(3):11–6.
19. Bou-Chacra N, Melo KJC, Morales IAC, Stippler ES, Kesisoglou F,
Yazdanian M, et al. Evolution of Choice of Solubility and Dissolution Media
After Two Decades of Biopharmaceutical Classification System. AAPS J.
2017;19(4):989–1001.
20. Sheng JJ, McNamara DP, Amidon GL. Toward an In Vivo dissolution
methodology: A comparison of phosphate and bicarbonate buffers. Mol
Pharm. 2009;6(1):29–39.
21. Wu C-Y, Benet LZ. Predicting Drug Disposition via Application of BCS:
Transport/Absorption/Elimination Interplay and Development of a
Biopharmaceutics DrugDisposition Classification System. Pharm Res.
2005;22(1):11–23.
22. Boetker JP, Rantanen J, Rades T, Müllertz A, Østergaard J, Jensen H. A New
Approach to Dissolution Testing by UV Imaging and Finite Element
Simulations. Pharm Res. 2013;30(5):1328–37.
23. Dorożyński PP, Kulinowski P, Mendyk A, Młynarczyk A, Jachowicz R.
Novel Application of MRI Technique Combined with Flow-Through Cell
Dissolution Apparatus as Supportive Discriminatory Test for Evaluation of
238
Controlled Release Formulations. AAPS PharmSciTech. 2010;11(2):588–97.
24. Jantratid E, Janssen N, Reppas C, Dressman JB. Dissolution Media
Simulating Conditions in the Proximal Human Gastrointestinal Tract: An
Update. Pharm Res. 2008;25(7):1663.
25. Reppas C, Friedel H-D, Barker AR, Buhse LF, Cecil TL, Keitel S, et al.
Biorelevant In Vitro Performance Testing of Orally Administered Dosage
Forms—Workshop Report. Pharm Res. 2014;31(7):1867–76.
26. Azarmi S, Roa W, Löbenberg R. Current perspectives in dissolution testing
of conventional and novel dosage forms. Int J Pharm. 2007;328:12–21.
27. Amaral Silva D, Al-Gousous J, Davies NM, Bou Chacra N, Webster GK,
Lipka E, et al. Biphasic Dissolution as an Exploratory Method during Early
Drug Product Development. Pharmaceutics. 2020;12(5):420.
28. Amaral Silva D, Al-Gousous J, Davies NM, Bou Chacra N, Webster GK,
Lipka E, et al. Simulated, biorelevant, clinically relevant or physiologically
relevant dissolution media: The hidden role of bicarbonate buffer. Eur J
Pharm Biopharm. 2019;142(May):8–19.
29. Fotaki N, Vertzoni M. Biorelevant dissolution methods and their applications
in in vitro in vivo correlations for oral formulations. Open Drug Deliv J.
239
2010;2:2–13.
30. Galia E, Nicolaides E, Hörter D, Löbenberg R, Reppas C, Dressman JB.
Evaluation of Various Disssolution Media for Predicting In Vivo
Performance of Class I and II Drugs. Pharm Res. 1998;15(5):698–705.
31. Mudie DM, Samiei N, Marshall DJ, Amidon GE, Bergström CAS. Selection
of In Vivo Predictive Dissolution Media Using Drug Substance and
Physiological Properties. AAPS J. 2020 Mar 27;22(2):34.
32. Fuchs A, Leigh M, Kloefer B, Dressman JB. Advances in the design of fasted
state simulating intestinal fluids: FaSSIF-V3. Eur J Pharm Biopharm.
2015;94:229–40.
33. Vertzoni M, Dressman J, Butler J, Hempenstall J, Reppas C. Simulation of
fasting gastric conditions and its importance for the in vivo dissolution of
lipophilic compounds. Eur J Pharm Biopharm Off J Arbeitsgemeinschaft fur
Pharm Verfahrenstechnik eV. 2005 Aug;60(3):413–7.
34. Fuchs A, Dressman JB. Composition and physicochemical properties of
fasted-state human duodenal and jejunal fluid: a critical evaluation of the
available data. J Pharm Sci. 2014 Nov;103(11):3398–411.
35. Hens B, Tsume Y, Bermejo M, Paixao P, Koenigsknecht MJ, Baker JR, et al.

240
Low Buffer Capacity and Alternating Motility along the Human
Gastrointestinal Tract: Implications for in Vivo Dissolution and Absorption of
Ionizable Drugs. Mol Pharm. 2017;14:4281–94.
36. Koenigsknecht M, Baker J, Wen B et al. In Vivo Dissolution and Systemic
Absorption of Immediate Release Ibuprofen in Human Gastrointestinal Tract
under Fed and Fasted Conditions. Mol Pharm. 2017;14(12):4295–304.
37. Riethorst D, Mols R, Duchateau G, Tack J, Brouwers J, Augustijns P.
Characterization of Human Duodenal Fluids in Fasted and Fed State
Conditions. J Pharm Sci. 2016 Feb 1;105(2):673–81.
38. Markopoulos C, Andreas CJ, Vertzoni M, Dressman J, Reppas C. In-vitro
simulation of luminal conditions for evaluation of performance of oral drug
products: Choosing the appropriate test media. Eur J Pharm Biopharm.
2015;93:173–82.
39. Lambert R, Martin F, Vagne M. Relationship between hydrogen ion and
pepsin concentration in human gastric secretion. Digestion. 1968;1(2):65–
77.
40. Efentakis M, Dressman JB. Gastric juice as a dissolution medium: Surface
tension and pH. Eur J Drug Metab Pharmacokinet. 1998;23(2):97–102.
241
41. Dressman JB, Berardi RR, Dermentzoglou LC, Russell TL, Schmaltz SP,
Barnett JL, et al. Upper gastrointestinal (GI) pH in young, healthy men and
women. Pharm Res. 1990 Jul;7(7):756–61.
42. Dressman JB, Amidon GL, Reppas C, Shah VP. Dissolution Testing as a
Prognostic Tool for Oral Drug Absorption: Immediate Release Dosage
Forms. Pharm Res. 1998;15(1):11–22.
43. Kalantzi L, Goumas K, Kalioras V, Abrahamsson B, Dressman JB, Reppas
C. Characterization of the human upper gastrointestinal contents under
conditions simulating bioavailability/bioequivalence studies. Pharm Res.
2006 Jan;23(1):165–76.
44. Mudie DM, Amidon GL, Amidon GE. Physiological parameters for oral
delivery and in vitro testing. Mol Pharm. 2010;7(5):1388–405.
45. Gibaldi M, Feldman S. Mechanisms of surfactant effects on drug absorption.
J Pharm Sci. 1970 May;59(5):579–89.
46. Ruby M V, Davis A, Schoof R, Eberle S, Sellstone CM. Estimation of Lead
and Arsenic Bioavailability Using a Physiologically Based Extraction Test.
Environ Sci Technol. 1996 Jan 1;30(2):422–30.
47. Vertzoni M, Pastelli E, Psachoulias D, Kalantzi L, Reppas C. Estimation of
242
Intragastric Solubility of Drugs : In What Medium ? Pharm Res.
2007;24(5):909–17.
48. Macheras P, Koupparis M, Tsaprounis C. Drug dissolution studies in milk
using the automated flow injection serial dynamic dialysis technique. Int J
Pharm. 1986;33(1):125–36.
49. Nicolaides E, Galia E, Efthymiopoulos C, Dressman JB, Reppas C.
Forecasting the in vivo performance of four low solubility drugs from their in
vitro dissolution data. Pharm Res. 1999 Dec;16(12):1876–82.
50. Kalantzi L, Persson E, Polentarutti B, Abrahamsson B, Goumas K, Dressman
JB, et al. Canine intestinal contents vs. simulated media for the assessment of
solubility of two weak bases in the human small intestinal contents. Pharm
Res. 2006 Jun;23(6):1373–81.
51. U.S. Food and Drug Administration. Guidance for Industry: Dissolution
testing of immediate release solid oral dosage forms.Center for Drug
Evaluation and Research (CDER),1997.
52. McConnell EL, Fadda HM, Basit AW. Gut instincts: Explorations in
intestinal physiology and drug delivery. Int J Pharm. 2008;364(2):213–26.
53. Persson EM, Gustafsson A-S, Carlsson AS, Nilsson RG, Knutson L, Forsell
243
P, et al. The effects of food on the dissolution of poorly soluble drugs in
human and in model small intestinal fluids. Pharm Res. 2005
Dec;22(12):2141–51.
54. Wei H, Löbenberg R. Biorelevant dissolution media as a predictive tool for
glyburide a class II drug. Eur J Pharm Sci. 2006 Sep;29(1):45–52.
55. Psachoulias D, Vertzoni M, Butler J, Busby D, Symillides M, Dressman J, et
al. An In Vitro Methodology for Forecasting Luminal Concentrations and
Precipitation of Highly Permeable Lipophilic Weak Bases in the Fasted
Upper Small Intestine. Pharm Res. 2012;29(12):3486–98.
56. Cristofoletti R, Dressman JB. Matching phosphate and maleate buffer
systems for dissolution of weak acids: Equivalence in terms of buffer
capacity of bulk solution or surface pH? Eur J Pharm Biopharm.
2016;103:104–8.
57. Cristofoletti R, Dressman JB. FaSSIF-V3, but not compendial media,
appropriately detects differences in the peak and extent of exposure between
reference and test formulations of ibuprofen. Eur J Pharm Biopharm.
2016;105:134–40.
58. Söderlind E, Karlsson E, Carlsson A, Kong R, Lenz A, Lindborg S, et al.
Simulating fasted human intestinal fluids: understanding the roles of lecithin
244
and bile acids. Mol Pharm. 2010 Oct;7(5):1498–507.
59. Fagerberg JH, Tsinman O, Sun N, Tsinman K, Avdeef A, Bergström CAS.
Dissolution rate and apparent solubility of poorly soluble drugs in biorelevant
dissolution media. Mol Pharm. 2010 Oct;7(5):1419–30.
60. Klein S. The Use of Biorelevant Dissolution Media to Forecast the In Vivo
Performance of a Drug. AAPS J. 2010;12(3):397–406.
61. Dressman JB, Reppas C. In vitro–in vivo correlations for lipophilic, poorly
water-soluble drugs. Eur J Pharm Sci. 2000;11:S73–80.
62. Lue B-M, Nielsen FS, Magnussen T, Schou HM, Kristensen K, Jacobsen LO,
et al. Using biorelevant dissolution to obtain IVIVC of solid dosage forms
containing a poorly-soluble model compound. Eur J Pharm Biopharm.
2008;69(2):648–57.
63. Nicolaides E, Symillides M, Dressman JB, Reppas C. Biorelevant
Dissolution Testing to Predict the Plasma Profile of Lipophilic Drugs After
Oral Administration. Pharm Res. 2001;18(3):380–8.
64. Khan MZI, Rausl D, Zanoski R, Zidar S, Mikulcić JH, Krizmanić L, et al.
Classification of loratadine based on the biopharmaceutics drug classification
concept and possible in vitro-in vivo correlation. Biol Pharm Bull. 2004
245
Oct;27(10):1630–5.
65. Kossena GA, Charman WN, Boyd BJ, Dunstan DE, Porter CJH. Probing
drug solubilization patterns in the gastrointestinal tract after administration of
lipid‐based delivery systems: A phase diagram approach. J Pharm Sci.
2004;93(2):332–48.
66. Jede C, Wagner C, Kubas H, Weigandt M, Weber C, Lecomte M, et al.
Improved Prediction of in Vivo Supersaturation and Precipitation of Poorly
Soluble Weakly Basic Drugs Using a Biorelevant Bicarbonate Buffer in a
Gastrointestinal Transfer Model. Mol Pharm. 2019 Sep 3;16(9):3938–47.
67. Litou C, Vertzoni M, Xu W, Kesisoglou F, Reppas C. The impact of reduced
gastric acid secretion on dissolution of salts of weak bases in the fasted upper
gastrointestinal lumen: Data in biorelevant media and in human aspirates. Eur
J Pharm Biopharm. 2017;115:94–101.
68. Boni JE, Brickl RS, Dressman J. Is bicarbonate buffer suitable as a
dissolution medium? J Pharm Pharmacol. 2007 Oct 1;59(10):1375–82.
69. Allen A, Flemström G. Gastroduodenal mucus bicarbonate barrier: protection
against acid and pepsin. Am J Physiol - Cell Physiol. 2005;288:C1–19.
70. Scott N, Patel K, Sithole T, Xenofontos K, Mohylyuk V, Liu F. Regulating
246
the pH of bicarbonate solutions without purging gases: Application to
dissolution testing of enteric coated tablets, pellets and microparticles. Int J
Pharm. 2020;585:119562.
71. Fadda HM, Merchant HA, Arafat BT, Basit AW. Physiological bicarbonate
buffers: stabilisation and use as dissolution media for modified release
systems. Int J Pharm. 2009;382:56–60.
72. Liu F, Merchant HA, Kulkarni RP, Alkademi M, Basit AW. Evolution of a
physiological pH6.8 bicarbonate buffer system: Application to the dissolution
testing of enteric coated products. Eur J Pharm Biopharm. 2011;78(1):151–7.
73. Sakamoto A, Izutsu K, Yoshida H, Abe Y, Inoue D, Sugano K. Simple
bicarbonate buffer system for dissolution testing: Floating lid method and its
application to colonic drug delivery system. J Drug Deliv Sci Technol.
2021;63:102447.
74. McNamara DP, Whitney KM, Goss SL. Use of a Physiologic Bicarbonate
Buffer System for Dissolution Characterization of Ionizable Drugs. Pharm
Res. 2003;20(10):1641–6.
75. Goyanes A, Hatton GB, Merchant HA, Basit AW. Gastrointestinal release
behaviour of modified-release drug products: Dynamic dissolution testing of
mesalazine formulations. Int J Pharm. 2015;484:103–8.
247
76. Garbacz G, Kołodziej B, Koziolek M, Weitschies W, Klein S. A dynamic
system for the simulation of fasting luminal pH-gradients using hydrogen
carbonate buffers for dissolution testing of ionisable compounds. Eur J
Pharm Sci. 2014;51:224–31.
77. Boni JE, Brickl RS, Dressman J. Is bicarbonate buffer suitable as a
dissolution medium? J Pharm Pharmacol. 2007;59:1375–82.
78. Al-Gousous J, Ruan H, Blechar JA, Sun KX, Salehi N, Langguth P, et al.
Mechanistic analysis and experimental verification of bicarbonate-controlled
enteric coat dissolution: Potential in vivo implications. Eur J Pharm
Biopharm. 2019;139:47–58.
79. Hofmann M, García MA, Al-Gousous J, Ruiz-Picazo A, Thieringer F,
Nguyen MA, et al. In vitro prediction of in vivo absorption of ibuprofen from
suspensions through rational choice of dissolution conditions. Eur J Pharm
Biopharm. 2020;149:229–37.
80. Tsume Y, Langguth P, Garcia-Arietac A, Amidon GL. In silico prediction of
drug dissolution and absorption with variation in intestinal pH for BCS class
II weak acid drugs: ibuprofen and ketoprofen. Biopharm Drug Dispos.
2012;33:366–377.
81. Mooney KG, Mintun MA, Himmelstein KJ, Stella VJ. Dissolution Kinetics
248
of Carboxylic Acids II: Effect of Buffers. J Pharm Sci. 1981;70(1):22–32.
82. Mooney KG, Mintun MA, Himmelstein KJ, Stella VJ. Dissolution kinetics of
carboxylic acids I: Effect of pH under unbuffered conditions. J Pharm Sci.
1981;70(1):13–22.
83. Krieg BJ, Taghavi SM, Amidon GL, Amidon GE. In Vivo Predictive
Dissolution: Comparing the Effect of Bicarbonate and Phosphate Buffer on
the Dissolution of Weak Acids and Weak Bases. J Pharm Sci.
2015;104:2894–904.
84. Krieg BJ, Taghavi SM, Amidon GL, Amidon GE. In vivo predictive
dissolution: Transport analysis of the CO2, bicarbonate in vivo buffer system.
J Pharm Sci. 2014;103:3473–90.
85. Al-Gousous J, Salehi N, Amidon GE, Ziff RM, Langguth P, Amidon GL.
Mass Transport Analysis of Bicarbonate Buffer: Effect of the CO 2 –H 2 CO
3 Hydration–Dehydration Kinetics in the Fluid Boundary Layer and the
Apparent Effective p K a Controlling Dissolution of Acids and Bases. Mol
Pharm. 2019 Jun 3;16(6):2626–35.
86. Salehi N, Al-Gousous J, Mudie DM, Amidon GL, Ziff RM, Amidon GE.
Hierarchical Mass Transfer Analysis of Drug Particle Dissolution,
Highlighting the Hydrodynamics, pH, Particle Size, and Buffer Effects for

249
the Dissolution of Ionizable and Nonionizable Drugs in a Compendial
Dissolution Vessel. Mol Pharm. 2020 Oct 5;17(10):3870–84.
87. Alvarez C, Núñez I, Torrado JJ, Gordon J, Potthast H, García-Arieta A.
Investigation on the possibility of biowaivers for ibuprofen. J Pharm Sci.
2011 Jun;100(6):2343–9.
88. Amaral Silva D, Davies NM, Doschak MR, Al-Gousous J, Bou-Chacra N,
Löbenberg R. Mechanistic understanding of underperforming enteric coated
products: Opportunities to add clinical relevance to the dissolution test. J
Control Release. 2020;325:323–34.
89. Blechar JA, Al-Gousous J, Wilhelmy C, Postina AM, Getto M, Langguth P.
Toward Mechanistic Design of Surrogate Buffers for Dissolution Testing of
pH-Dependent Drug Delivery Systems. Vol. 12, Pharmaceutics . 2020.
90. Aghabegi Moghanjoughi A, Khoshnevis D, Zarrabi A. A concise review on
smart polymers for controlled drug release. Drug Deliv Transl Res.
2016;6(3):333–40.
91. Ibekwe VC, Fadda HM, McConnell EL, Khela MK, Evans DF, Basit AW.
Interplay between intestinal pH, transit time and feed status on the in vivo
performance of pH responsive ileo-colonic release systems. Pharm Res.
2008;25(8):1828–35.
250
92. Nguyen DA, Fogler HS. Facilitated diffusion in the dissolution of carboxylic
polymers. AIChE J. 2005;51(2):415–25.
93. Sugano K. Theoretical comparison of hydrodynamic diffusion layer models
used for dissolution simulation in drug discovery and development. Int J
Pharm. 2008;363(1):73–7.
94. Markl D, Zeitler JA. A Review of Disintegration Mechanisms and
Measurement Techniques. Pharm Res. 2017;34(5):890–917.
95. RUBINSTEIN MH, BODEY DM. Disaggregation of Compressed Tablets. J
Pharm Sci. 1976;65(12):1749-1753. DOI: 10.1002/jps.2600651214.
96. Aulton ME, Taylor K. Aulton ’ s Pharmaceutics. The Design and
Manufacture of Medicines. Churchill Livingstone; 2013.
97. Quodbach J, Kleinebudde P. A critical review on tablet disintegration. Pharm
Dev Technol. 2016;21(6):763-774. DOI: 10.3109/10837450.2015.1045618.
98. Lowenthal W. Disintegration of Tablets. J Pharm Sci. 1972;61(11):1695-
1711. DOI: 10.1002/jps.2600611102.
99. Desai PM, Liew CV, Heng PWS. Review of Disintegrants and the
Disintegration Phenomena. J Pharm Sci. 2016;105(9):2545-2555. DOI:
10.1016/j.xphs.2015.12.019.
251
100. Kissa E. Wetting and wicking. Text Res J. 1996;66(10):660-668. DOI:
10.1177/004051759606601008.
101. Patel N, Hopponent R. Mechanism of action of starch as a disintegrating
agent in aspirin tablets. J Pharm Sci. 1966;55(10):1065–1068. DOI:
10.1002/jps.2600551015.
102. Patel S, Kaushal A, Bansal A. Effect of particle size and compression force
on compaction behavior and derived mathematical parameters of
compressibility. Pharm Res. 2007;24(1):111–24.
103. Lowenthal W. Mechanism of action of tablet disintegrants. Pharm Acta Helv.
1973;48(11–12):589–609.
104. Ferrari F, Bertoni M, Bonferoni M, Rossi S, Caramella C, Nyström C.
Investigation on bonding and disintegration properties of pharmaceutical
materials. Int J Pharm. 1996;136(1–2):71-79. DOI: 10.1016/0378-
5173(96)04489-4.
105. Matsumaru H. Studies on the mechanism of tablet compression and
disintegration IV evolution of wetting heat and its reduction by
Compressional force. Yakugaku Zasshi. 1959;79(1):63-64. DOI:
10.1248/yakushi1947.79.1_63.
252
106. Donauer N, Löbenberg R. A mini review of scientific and pharmacopeial
requirements for the disintegration test. Int J Pharm. 2007;345(1–2):2-8.
DOI:10.1016/j.ijpharm.2007.08.045.
107. Al-Gousous J, Langguth P. Oral Solid Dosage Form Disintegration Testing -
The Forgotten Test. J Pharm Sci. 2015;104(9):2664-2675. DOI:
10.1002/jps.24303.
108. Pharmacopoeia Helvetica. 1907. Bern, Switzerland: The Swiss
Pharmacopoeia Commission.
109. British Pharmacopoeia (BP). 1948. London, United Kingdom: The General
Council of Medical education and Registration of the United Kingdom.
110. Gershberg S, Stoll FD. Apparatus, for Tablet Disintegration, and for
Shaking-Out Extractions. J Am Pharm Assoc (Scientific ed). 1946;35(9):284-
287. DOI: 10.1002/jps.3030350910.
111. Almukainzi M, Salehi M, Chacra NAB, Löbenberg R. Comparison of the
rupture and disintegration tests for soft-shell capsules. Dissolution Technol.
2011;18(1):21-25. DOI: 10.14227/DT180111P21.
112. <701> Disintegration.In The United States Pharmacopeia and National
Formulary USP43-NF38 2S; The United States Pharmacopeial Convention,
253
Inc.: Rockville, MD, 2020.
113. <2040> Disintegration and Dissolution of Dietary Supplements. In The
United States Pharmacopeia and National Formulary USP43-NF38 2S; The
United States Pharmacopeial Convention, Inc.: Rockville, MD, 2020.
114. Almukainzi M, Salehi M, Araci Bou-Chacra N, Löbenberg R. Investigation
of the Performance of the Disintegration Test for Dietary Supplements.
AAPS J. 2010;12(4):602–7.
115. Al-Gousous J, Langguth P. European versus United States Pharmacopeia
disintegration testing methods for enteric-coated soft gelatin capsules.
Dissolution Technol. 2015;22(3):6-8. DOI: 10.14227/DT220315P6.
116. International Conference on Harmonisation. 1999. ICH Q6A Guideline:
Specifications: Test procedures and acceptance criteria for new drug
substances and new drug products: Chemical substances.
117. Dissolution Testing and Specification Criteria for Immediate-Release Solid
Oral Dosage Forms Containing BCS Class 1 and 3 Drugs: Guidance for
Industry; U.S. Department of Health and Human Services, Food and Drug
Administration, CDER, 2015.
118. ⟨2⟩ ORAL DRUG PRODUCTS—PRODUCT QUALITY TESTS. In The
254
United States Pharmacopeia and National Formulary USP43-NF38 2S; The
United States Pharmacopeial Convention, Inc.: Rockville, MD, 2020.
119. Klute AS. Disintegration Testing : Release Dosage Forms in Exploratory
Development. Am Pharm Rev. 2009;(August):90–3.
120. Uebbing L, Klumpp L, Webster GK, Löbenberg R. Justification of
disintegration testing beyond current FDA criteria using in vitro and in silico
models. Drug Des Devel Ther. 2017;11:1163–74.
121. Stamatakis MK, Alderman JM, Meyer-Stout PJ. Influence of pH on In Vitro
Disintegration of Phosphate Binders. Am J Kidney Dis. 1998;32(5):808-812.
DOI: 10.1016/S0272-6386(98)70137-4.
122. Alam AS, Parrott EL. Effect of dissolution media on disintegration and
dissolution of hydrochlorothiazide tablets. J Pharm Sci. 1971;60(5):795-797.
DOI: 10.1002/jps.2600600531.
123. Zuo J, Gao Y, Almukainzi M, Löbenberg R. Investigation of the
disintegration behavior of dietary supplements in different beverages.
Dissolution Technol. 2013;20(4):6-9. DOI:10.14227/DT200413P6.
124. Schmid K, Löbenberg R. Influence of the Changed USP Test Performance.
Dissolution Technol. 2010;17(1):6-10. DOI: 10.14227/DT170110P6.

255
125. Bachour G, Bou-Chacra NA, Löbenberg R. Evaluation of the rupture test for
stability studies of soft-shell capsules. Dissolution Technol. 2017;24:16–9.
126. Radwan A, Wagner M, Amidon GL, Langguth P. Bio-predictive tablet
disintegration: Effect of water diffusivity, fluid flow, food composition and
test conditions. Eur J Pharm Sci. 2014;57(1):273-279. DOI:
10.1016/j.ejps.2013.08.038.
127. Nickerson B, Kong A, Gerst P, Kao S. Correlation of dissolution and
disintegration results for an immediate-release tablet. J Pharm Biomed Anal.
2018;150:333-340. DOI: 10.1016/j.jpba.2017.12.017.
128. Gupta A, Hunt RL, Shah RB, Sayeed VA, Khan MA. Disintegration of
Highly Soluble Immediate Release Tablets: A Surrogate for Dissolution.
AAPS PharmSciTech. 2009;10(2):495-499. DOI: 10.1208/s12249-009-9227–
0.
129. Han J, Gallery J. A risk-based approach to in vitro performance testing: A
case study on the use of dissolution vs. disintegration for liquid-filled gelatin
capsules. Am Pharm Rev. 2006;9:152–7.
130. Dokoumetzidis A, Macheras P. A century of dissolution research: from
Noyes and Whitney to the Biopharmaceutics Classification System. Int J
Pharm. 2006;321(1):1–11.
256
131. Abend A, Curran D, Kuiper J, Lu X, Li H, Hermans A, et al. Dissolution
Testing in Drug Product Development: Workshop Summary Report. AAPS J.
2019;21(2):1–12.
132. Gibaldi BM, Feldman S. Establishment of Sink Conditions in Dissolution
Rate Determinations. J Pharm Sci. 1967;56(10):1238–42.
133. Phillips DJ, Pygall SR, Cooper VB, Mann JC. Overcoming sink limitations in
dissolution testing: A review of traditional methods and the potential utility
of biphasic systems. J Pharm Pharmacol. 2012;64(11):1549–59.
134. Pestieau A, Evrard B. In vitro biphasic dissolution tests and their suitability
for establishing in vitro-in vivo correlations: A historical review. Eur J Pharm
Sci. 2017;102:203–19.
135. Deng J, Staufenbiel S, Hao S, Wang B, Dashevskiy A, Bodmeier R.
Development of a discriminative biphasic in vitro dissolution test and
correlation with in vivo pharmacokinetic studies for differently formulated
racecadotril granules. J Control Release. 2017;255:202–9.
136. Tsume Y, Igawa N, Drelich AJ, Ruan H, Amidon GE, Amidon GL. The in
vivo predictive dissolution for immediate release dosage of donepezil and
danazol, BCS class IIc drugs, with the GIS and the USP II with biphasic
dissolution apparatus. J Drug Deliv Sci Technol. 2019 Jan;In
257
press.(https://doi.org/10.1016/j.jddst.2019.01.035).
137. Tsume Y, Igawa N, Drelich AJ, Amidon GE, Amidon GL. The Combination
of GIS and Biphasic to Better Predict In Vivo Dissolution of BCS Class IIb
Drugs, Ketoconazole and Raloxifene. J Pharm Sci. 2018;107(1):307–16.
138. Xu H, Shi Y, Vela S, Marroum P, Gao P. Developing Quantitative In Vitro–
In Vivo Correlation for Fenofibrate Immediate-Release Formulations With
the Biphasic Dissolution-Partition Test Method. J Pharm Sci.
2018;107(1):476–87.
139. Xu H, Krakow S, Shi Y, Rosenberg J, Gao P. In vitro characterization of
ritonavir formulations and correlation to in vivo performance in dogs. Eur J
Pharm Sci. 2018;115:286–95.
140. Xu H, Vela S, Shi Y, Marroum P, Gao P. In Vitro Characterization of
Ritonavir Drug Products and Correlation to Human in Vivo Performance.
Mol Pharm. 2017;14:3801–14.
141. Mudie DM, Shi Y, Ping H, Gao P, Amidon GL, Amidon GE. Mechanistic
analysis of solute transport in an in vitro physiological two-phase dissolution
apparatus. Biopharm Drug Dispos. 2012;33:378–402.
142. Doluisio JT, Swintosky JV. Drug partitioning II in vitro model for drug

258
absorption. J Pharm Sci. 1964;53:597 – 601.
143. Deng J, Staufenbiel S, Bodmeier R. Evaluation of a biphasic in vitro
dissolution test for estimating the bioavailability of carbamazepine
polymorphic forms. Eur J Pharm Sci. 2017;105:64–70.
144. Kalepu S, Nekkanti V. Insoluble drug delivery strategies: Review of recent
advances and business prospects. Acta Pharm Sin B. 2015;5(5):442–53.
145. Mudie DM, Murray K, Hoad CL, Pritchard SE, Garnett MC, Amidon GL, et
al. Quantification of Gastrointestinal Liquid Volumes and Distribution
Following a 240 mL Dose of Water in the Fasted State. Mol Pharm
[Internet]. 2014 Sep 2;11(9):3039–47. Available from:
https://pubs.acs.org/doi/10.1021/mp500210c
146. Zuo J, Gao Y, Bou-Chacra N, Löbenberg R. Evaluation of the DDSolver
software applications. Biomed Res Int. 2014/04/27. 2014;2014:204925.
147. Zhang Y, Huo M, Zhou J, Zou A, Li W, Yao C, et al. DDSolver: an add-in
program for modeling and comparison of drug dissolution profiles. AAPS J.
2010/04/06. 2010 Sep;12(3):263–71.
148. Al-Gousous J, Sun KX, McNamara DP, Hens B, Salehi N, Langguth P, et al.
Mass Transport Analysis of the Enhanced Buffer Capacity of the

259
Bicarbonate–CO 2 Buffer in a Phase-Heterogenous System: Physiological
and Pharmaceutical Significance. Mol Pharm [Internet]. 2018 Nov
5;15(11):5291–301. Available from:
https://pubs.acs.org/doi/10.1021/acs.molpharmaceut.8b00783
149. Guyton and Hall Textbook of Medical Physiology, Thirteenth Edition
Chapter 65. Secretory Functions of the Alimentary Tract. 2016. Philadelphia,
PA: Elsevier.
150. Valizadeh H, Nokhodchi A, Qarakhani N, Zakeri-Milani P, Azarmi S,
Hassanzadeh D, et al. Physicochemical Characterization of Solid Dispersions
of Indomethacin with PEG 6000, Myrj 52, Lactose, Sorbitol, Dextrin, and
Eudragit® E100. Drug Dev Ind Pharm. 2004;30(3):303–17.
151. Rowe R, Sheskey P, Owen S. Handbook of Pharmaceutical Excipients, 5th
ed. Pharmaceutical Press; 2006. 96–100 p.
152. Baradari H, Damia C, Dutreih-colas M, Laborde E, Pécout N, Champion E,
et al. Calcium phosphate porous pellets as drug delivery systems : Effect of
drug carrier composition on drug loading and in vitro release. J Eur Ceram
Soc. 2012;32:2679–90.
153. Choi AH, Ben-Nissan B, Matinlinna JP, Conway RC. Current perspectives:
Calcium phosphate nanocoatings and nanocomposite coatings in dentistry. J
260
Dent Res. 2013;92(10):853–9.
154. Mccarthy LG, Kosiol C, Healy AM, Bradley G, Sexton JC, Corrigan I.
Simulating the Hydrodynamic Conditions in the United States Pharmacopeia
Paddle Dissolution Apparatus. AAPS PharmSciTech. 2003;4(2):1–16.
155. Todaro V, Persoons T, Grove G, Healy AM, D’Arcy DM. Characterization
and Simulation of Hydrodynamics in the Paddle, Basket and Flow-Through
Dissolution Testing Apparatuses - A Review. Dissolution Technol.
2017;August:24–36.
156. Sjögren E, Abrahamsson B, Augustijns P, Becker D, Bolger MB, Brewster
M, et al. In vivo methods for drug absorption - Comparative physiologies,
model selection, correlations with in vitro methods (IVIVC), and applications
for formulation/API/excipient characterization including food effects. Eur J
Pharm Sci. 2014;57(1):99–151.
157. Pestieau A, Lebrun S, Cahay B, Brouwers A, Streel B, Cardot J-M, et al.
Evaluation of different in vitro dissolution tests based on level A in vitro – in
vivo correlations for fenofibrate self-emulsifying lipid-based formulations.
Eur J Pharm Biopharm. 2017;112:18–29.
158. Vangani S, Li X, Zhou P, Del-Barrio M-A, Chiu R, Cauchon N, et al.
Dissolution of poorly water-soluble drugs in biphasic media using USP 4 and
261
fiber optic system. Clin Res Regul Aff. 2009 Jun 1;26(1–2):8–19.
159. Shi Y, Gao P, Gong Y, Ping H. Application of a biphasic test for
characterization of in vitro drug release of immediate release formulations of
celecoxib and its relevance to in vivo absorption. Mol Pharm.
2010;7(5):1458–65.
160. Ullah I, Cadwallader DE. Dissolution of Slightly Soluble Powders under
Sink Conditions ll: Griseofulvin Powders. J Pharm Sci. 1971;60(2):230–3.
161. Ullah I, Cadwallader DE. Dissolution of Slightly Soluble Powders under
Sink Conditions lll: Transport of Drug Solution across Screens and
Membrane Barriers. J Pharm Sci. 1971;60(10):1496–9.
162. Shi Y, Erickson B, Jayasankar A, Lu L, Marsh K, Menon R, et al. Assessing
Supersaturation and Its Impact on In Vivo Bioavailability of a Low-Solubility
Compound ABT-072 With a Dual pH , Two-Phase Dissolution Method. J
Pharm Sci. 2016;105(9):2886–95.
163. Al Durdunji A, Alkhatib HS, Al-Ghazawi M. Development of a biphasic
dissolution test for Deferasirox dispersible tablets and its application in
establishing an in vitro-in vivo correlation. Eur J Pharm Biopharm.
2016;102:9–18.
262
164. Gupta E, Barends DM, Yamashita E, Lentz KA, Harmsze AM, Shah VP, et
al. Review of global regulations concerning biowaivers for immediate release
solid oral dosage forms. Eur J Pharm Sci. 2006;29(3):315–24.
165. Food and Drug Administration (FDA) Center for Drug Evaluation and
Research Guidance for industry: waiver of in vivo bioavailability and
bioequivalence studies for immediate-release solid oral dosage forms based
on a biopharmaceutics classification system. 2017.
166. European Medicines Agency (EMA) Note for guidance on the investigation
of bioavailability and bioequivalence. 2002.
167. WHO Expert Committee on Specifications for Pharmaceutical Preparations
Technical report series 40th report: Annex 7 Multisource (generic)
pharmaceutical products: guidelines on registration requirements to establish
interchangeability. 2006.
168. Hofsäss MA, Dressman JB. The Discriminatory Power of the BCS-Based
Biowaiver: A Retrospective With Focus on Essential Medicines. J Pharm Sci.
2019;108(9):2824–37.
169. European Medicines Agency (EMA) Committee for medicinal products for
human use (CHMP), guideline on the investigation of bioequivalence. 2010.

263
170. WHO Expert Committee on Specifications for Pharmaceutical Preparations
Technical report series 51st report. 2017.
171. ICH M9 guideline on biopharmaceutics classification system-based
biowaivers. 2020.
172. Löbenberg R, Chacra NB, Stippler ES, Shah VP, DeStefano AJ, Hauck WW,
et al. Toward global standards for comparator pharmaceutical products: case
studies of amoxicillin, metronidazole, and zidovudine in the Americas.
AAPS J. 2012/04/19. 2012 Sep;14(3):462–72.
173. Rediguieri CF, Porta V, G. Nunes DS, Nunes TM, Junginger HE, Kopp S, et
al. Biowaiver monographs for immediate release solid oral dosage forms:
Metronidazole. J Pharm Sci. 2011 May 1;100(5):1618–27.
174. Steingoetter A, Fox M, Treier R, Weishaupt D, Marincek B, Boesiger P, et
al. Effects of posture on the physiology of gastric emptying: a magnetic
resonance imaging study. Scand J Gastroenterol. 2006 Oct;41(10):1155–64.
175. Pedersen BL, Brøndsted H, Lennernäs H, Christensen FN, Müllertz A,
Kristensen HG. Dissolution of Hydrocortisone in Human and Simulated
Intestinal Fluids. Pharm Res. 2000;17(2):183–9.
176. Lindahl A, Ungell A-L, Knutson L, Lennernäs H. Characterization of fluids
264
from the stomach and proximal jejunum in men and women. Pharm Res.
1997;14(4):497–502.
177. Vertzoni M, Fotaki N, Nicolaides E, Reppas C, Kostewicz E, Stippler E, et
al. Dissolution media simulating the intralumenal composition of the small
intestine: physiological issues and practical aspects. J Pharm Pharmacol.
2004;56:453–62.
178. Schiller C, Fröhlich CP, Giessmann T, Siegmund W, Mönnikes H, Hosten N,
et al. Intestinal fluid volumes and transit of dosage forms as assessed by
magnetic resonance imaging. Aliment Pharmacol Ther. 2005;22:971–9.
179. Sheng JJ, Kasim NA, Chandrasekharan R, Amidon GL. Solubilization and
dissolution of insoluble weak acid, ketoprofen: Effects of pH combined with
surfactant. Eur J Pharm Sci. 2006;29:306–14.
180. Ozturk SS, Palsson BO DJ. Dissolution of Ionizable drugs in buffered and
unbuferred solutions. Pharm Res. 1988;5(5):272-82.
181. Balakrishnan A, Rege BD, Amidon GL, Polli JE. Surfactant-mediated
dissolution: Contributions of solubility enhancement and relatively low
micelle diffusivity. J Pharm Sci. 2004;93(8):2064–75.
182. Jinno J, Oh DM, Crison JR, Amidon GL. Dissolution of ionizable water-
265
insoluble drugs: The combined effect of pH and surfactant. J Pharm Sci.
2000;89(2):268–74.
183. HOGAN DL, AINSWORTH MA, ISENBERG JI. Review article:
gastroduodenal bicarbonate secretion. Aliment Pharmacol Ther. 1994;8:475–
88.
184. Isenberg, J. I.; Hogan, D. L.; Thomas FJ. Duodenal mucosal bicarbonate
secretion in humans: a brief review. Scand J Gastroenterol. 1986;Suppl.
125:106–9.
185. Rees WDW, Botham D, Turnberg LA. A demonstration of bicarbonate
production by the normal human stomach in vivo. Dig Dis Sci.
1982;27(11):961–6.
186. Rune SJ. Acid-Base Parameters of Duodenal Contents in Man.
Gastroenterology. 1972;62(4):533–9.
187. Flemstrom, G. Gastric and duodenal mucosal secretion of bicarbonate; Raven
Press: New York, 1994.
188. Rune, S. J. The duodenal PCO2 in duodenal ulcer patients and normal
subjects. Acta Hepato-Gastroenterol. 1972, 19, 386 – 387.
189. Bastami SM, Groves MJ. Some factors influencing the in vitro release of
266
phenytoin from formulations. Int J Pharm. 1978;1(3):151–64.
190. Fadda HM, Basit AW. Dissolution of pH responsive formulations in media
resembling intestinal fluids: bicarbonate versus phosphate buffers. J Drug
Deliv Sci Technol. 2005;15(4):273–9.
191. Garbacz G, Kolodziej B, Koziolek M, Weitschies W, Klein S. An automated
system for monitoring and regulating the pH of bicarbonate buffers. AAPS
PharmSciTech. 2013;14:517–22.
192. Karkossa F, Klein S. Assessing the influence of media composition and ionic
strength on drug release from commercial immediate-release and enteric-
coated aspirin tablets. J Pharm Pharmacol. 2017;69:1327–40.
193. Merchant HA, Goyanes A, Parashar N, Basit AW. Predicting the
gastrointestinal behaviour of modified-release products: Utility of a novel
dynamic dissolution test apparatus involving the use of bicarbonate buffers.
Int J Pharm. 2014;475:585–91.
194. Pines D, Ditkovich J, Mukra T, Miller Y, Kiefer PM, Daschakraborty S, et al.
How Acidic Is Carbonic Acid ? J Phys Chem B. 2016;(120):2440–51.
195. Almukainzi M, Bou-chacra NA, Walker RB, Löbenberg R. Therapeutic
Delivery Solutions. Chapter 12 BIORELEVANT DISSOLUTION

267
TESTING. 1st ed. Chan CC, Chow K, Mckay B, Fung M, editors. John
Wiley & Sons, Inc.; 2014. 335–365 p.
196. Tong C, Lozano R, Yun M, Mirza T, Löbenberg R, Nickerson B, Gray V
WQ. The value of in vitro dissolution in drug development. Pharm Technol.
2009;33(4):52–64.
197. Gray V, Kelly G, Xia M, Butler C, Thomas S, Mayock S. The science of
USP 1 and 2 dissolution: Present challenges and future relevance. Pharm Res.
2009;26(6):1289–302.
198. Stippler E, Kopp S, Dressman J. Comparison of US Pharmacopeia simulated
intestinal fluid TS (without pancreatin) and phosphate standard buffer pH
6.8, TS of the International Pharmacopoeia with respect to Their Use in In
Vitro Dissolution Testing. Dissolution Technol. 2004;(May):6–10.
199. Ropers MH, Czichocki G, Brezesinski G. Counterion Effect on the
Thermodynamics of Micellization of Alkyl Sulfates. J Phys Chem B.
2003;107:5281–8.
200. Ku MS, Lu Q, Li W, Chen Y. Performance qualification of a new
hypromellose capsule : Part II . Disintegration and dissolution comparison
between two types of hypromellose capsules. Int J Pharm. 2011;416(1):16–
24.
268
201. Tochio, S., Nagata, S., Yamashita, S., 2002. The influence of the composition
of test fluids on dissolution from HPMC capsules. AAPS PharmSci. 4
(abstract W4340).
202. Honkanen, O., Seppä, H., Eerikäinen, S., Tuominen, R., Marvola, M., 2001.
Bioavailability of ibuprofen from orally and rectally administered
hydroxypropyl methyl cellulose capsules compared to corresponding gelatin
capsules. STP Pharma Sci. 11, 181 – 185.
203. Cole, E.T., Scott, R.A., Cade, D., Connor, A.L., Wilding, I., 2004. In vitro
and in vivo pharmacoscintigraphic evaluation of ibuprofen hypromellose and
gelatin capsules. Pharm. Res. 21, 793 – 798.
204. Marques MRC. Enzymes in the Dissolution Testing of Gelatin Capsules.
AAPS PharmSciTech. 2014;15(6):1410–6.
205. Lu X, Shah P. Dissolution of gelatin capsules: Evidence and confirmation of
cross-linking. Dissolution Technol. 2017;24:6–21.
206. Marchais H, Cayzeele G, Legendre JY, Skiba M, Arnaud P. Cross-linking of
hard gelatin carbamazepine capsules: Effect of dissolution conditions on in
vitro drug release. Eur J Pharm Sci. 2003;19:129–32.
207. Khan MZI, Raušl D, Radošević S, Filić D, Danilovski A, Dumić M, et al.
269
Classification of torasemide based on the Biopharmaceutics Classification
System and evaluation of the FDA biowaiver provision for generic products
of Class I drugs. J Pharm Pharmacol. 2006;58:1475–82.
208. Fang JB, Robertson VK, Rawat A, Flick T, Tang ZJ, Cauchon NS, et al.
Development and application of a biorelevant dissolution method using USP
apparatus 4 in early phase formulation development. Mol Pharm.
2010;7(5):1466–77.
209. Leigh M, Kloefer B, Schaich M. Comparison of the solubility and dissolution
of drugs in fasted-state biorelevant media (FaSSIF and FaSSIF-V2).
Dissolution Technol. 2013;20:44–50.
210. Fotaki N. Flow-Through Cell Apparatus (USP Apparatus 4): Operation and
Features. Dissolution Technol. 2011;46–9.
211. Sunesen VH, Pedersen BL, Kristensen HG, Müllertz A. In vivo in vitro
correlations for a poorly soluble drug, danazol, using the flow-through
dissolution method with biorelevant dissolution media. Eur J Pharm Sci.
2005;24:305–13.
212. Alsenz J, Haenel E, Anedda A, Du Castel P, Cirelli G. Miniaturized INtrinsic
DISsolution Screening (MINDISS) assay for preformulation. Eur J Pharm
Sci. 2016;87:3–13.

270
213. Hammad MA, Müller BW. Increasing drug solubility by means of bile salt-
phosphatidylcholine-based mixed micelles. Eur J Pharm Biopharm.
1998;46:361–7.
214. Okumu A, DiMaso M, Löbenberg R. Dynamic dissolution testing to establish
in vitro/in vivo correlations for montelukast sodium, a poorly soluble drug.
Pharm Res. 2008;25(12):2778–85.
215. Kloefer B, Hoogevest P Van, Moloney R, Kuentz M, Leigh MLS, Dressman
J. Study of a Standardized Taurocholate– Lecithin Powder for Preparing the
Biorelevant Media FeSSIF and FaSSIF. Dissolution Technol. 2010;6–13.
216. Ramtoola Z, Corrigan OI. Influence of the buffering capacity of the medium
on the dissolution of drug-excipient mixtures. Drug Dev Ind Pharm.
1989;15(14–16):2359–74.
217. Levis KA, Lane ME, Corrigan OI. Effect of buffer media composition on the
solubility and effective permeability coefficient of ibuprofen. Int J Pharm.
2003;253:49–59.
218. Corrigan OI, Devlin Y, Butler J. Influence of dissolution medium buffer
composition on ketoprofen release from ER products and in vitro-in vivo
correlation. Int J Pharm. 2003;254(2):147–54.
271
219. Ashford M, Fell JT, Attwood D, Sharma H, Woodhead PJ. An in vivo
investigation into the suitability of pH dependent polymers for colonic
targeting. Int J Pharm. 1993;91:241–5.
220. Hamed R, Awadallah A, Sunoqrot S, Tarawneh O, Nazzal S, AlBaraghthi T,
et al. pH-Dependent Solubility and Dissolution Behavior of Carvedilol—
Case Example of a Weakly Basic BCS Class II Drug. AAPS PharmSciTech.
2016;17(2):418–26.
221. Waiver of the in vivo bioavailability and bioequivalence studies for
immediate-release solid oral dosage forms based on a biopharmaceutics
classification system. Guidance for industry. U.S. Department of Health and
Human Services. FDA. Available from:
https://www.fda.gov/downloads/Drugs/Guidances/ucm070246.pdf
222. McGee LC, Hastings AB. The carbon dioxide tension and acid-base balance
of jejunal secretions in man. J Biol Chem. 1942;142:893–904.
223. Perez de la Cruz Moreno M, Oth M, Deferme S, Lammert F, Tack J,
Dressman J AP. Characterization of fasted-state human intestinal fluids
collected from duodenum and jejunum. J Pharm Pharmacol.
2006;58(8):1079–1089.
224. Bergstrom C, Holm R, Jorgensen SA, Andersson SBE, Artursson P, Beato S,
272
Borde A, Box K, Brewster M, Dressman J, Feng K-I, Halbert G, Kostewicz
E, McAllister M, Muenster U, Thinnes J, Taylor R M, A. Early
pharmaceutical profiling to predict oral drug absorption: Current status and
unmet needs. Eur J Pharm Sci. 2014;57:173–199.
225. Rudolph MW, Klein S, Beckert TE, Petereit HD. A new 5-aminosalicylic
acid multi-unit dosage form for the therapy of ulcerative colitis. Eur J Pharm
Biopharm. 2001;51:183–90.
226. Chan WA et al. Comparison of the release profiles of a water soluble drug
carried by Eudragit-coated capsules in different in-vitro dissolution liquids.
Powder Technol. 2001;119:26–32.
227. Ibekwe VC, Fadda HM, Parsons GE, Basit AW. A comparative in vitro
assessment of the drug release performance of pH-responsive polymers for
ileo-colonic delivery. Int J Pharm. 2006;308:52–60.
228. Jirmař R, Widimský P. Enteric-coated aspirin in cardiac patients: Is it less
effective than plain aspirin? Cor Vasa. 2018;60:e165–8.
229. Maree AO, Curtin RJ, Dooley M, Conroy RM, Crean P, Cox D, et al. Platelet
response to low-dose enteric-coated aspirin in patients with stable
cardiovascular disease. J Am Coll Cardiol. 2005;47(7):1258–63.
273
230. Bhatt DL, Grosser T, Dong J, Logan D, Jeske W, Angiolillo DJ, et al. Enteric
Coating and Aspirin Nonresponsiveness in Patients With Type 2 Diabetes
Mellitus. J Am Coll Cardiol. 2017;69(6):603–12.
231. Cerit L, Duygu H. Collapse of the Aspirin Empire. J Am Coll Cardiol.
2017;69(23):2878–9.
232. Levy G, Hollister L. Failure of U.S.P. disintegration test to assess
physiologic availability of enteric coated tablets. N Y State J Med.
1964;64:3002–5.
233. Cox D, Maree AO, Dooley M, Conroy R, Byrne MF, Fitzgerald DJ. Effect of
enteric coating on antiplatelet activity of low-dose aspirin in healthy
volunteers. Stroke. 2006;37:2153–8.
234. Grosser T, Fries S, Lawson JA, Kapoor SC, Grant GR, FitzGerald GA. Drug
resistance and pseudoresistance: an unintended consequence of enteric
coating aspirin. Circulation. 2012/12/04. 2013;127(3):377–85.
235. Wagner JG, Wilkinson PK, Sedman AJ, Stoll RG. Failure of USP Tablet
Disintegration Test to Predict Performance in Man. J Pharm Sci.
1973;62(5):859–60.
236. Aihie AP, Halpern SM, Streete PJ, Crome P. Slow release aspirin in the
274
elderly. J R Soc Med. 1994;87(3):183.
237. Varum FJO, Merchant HA, Goyanes A, Assi P, Zboranová V, Basit AW.
Accelerating the dissolution of enteric coatings in the upper small intestine:
Evolution of a novel PH 5.6 bicarbonate buffer system to assess drug release.
Int J Pharm. 2014;468:172–7.
238. Cole ET, Scott RA, Connor AL, Wilding IR, Petereit HU, Schminke C, et al.
Enteric coated HPMC capsules designed to achieve intestinal targeting. Int J
Pharm. 2002;231:83–95.
239. Al-Gousous J, Amidon GL, Langguth P. Toward Biopredictive Dissolution
for Enteric Coated Dosage Forms. Mol Pharm. 2016;13:1927–36.
240. Bochner F, Williams DB, Morris PMA, Siebert DM, Lloyd J V.
Pharmacokinetics of Low-Dose Oral Modified Release , Soluble and
Intravenous Aspirin in Man , and Effects on Platelet Function. Eur J Clin
Pharmacol. 1988;35:287–94.
241. Bochner F, Somogyi AA, Wilson KM. Bioinequivalence of Four 100mg Oral
Aspirin Formulations in Healthy Volunteers. Clin Pharmacokinet.
1991;21(5):394–9.
242. Al-Gousous J, Ruan H, Blechar JA, Sun KX, Salehi N, Langguth P, et al.
275
Mechanistic analysis and experimental verification of bicarbonate-controlled
enteric coat dissolution: Potential in vivo implications. Eur J Pharm
Biopharm. 2019;139:47–58.
243. Shibata H, Yoshida H, Izutsu KI, Goda Y. Use of bicarbonate buffer systems
for dissolution characterization of enteric-coated proton pump inhibitor
tablets. J Pharm Pharmacol. 2016;68:467–74.
244. Karkossa F, Klein S. Individualized in vitro and in silico methods for
predicting in vivo performance of enteric-coated tablets containing a narrow
therapeutic index drug. Eur J Pharm Biopharm. 2019;135:13–24.
245. Gelderen M Van, Olling M, Barends D, Meulenbelt J, Salomons P, Rauws A.
The bioavailability of diclofenac from enteric coated products in healthy
volunteers with normal and artificially decreased gastric acidity. Biopharm
Drug Dispos. 1994;15:775–88.
246. Elkoshi Z, Behr D, Mirimsky A, Tsvetkov I, Danon A. Multiple-Dose
Studies can be a More Sensitive Assessment for Bioequivalence than Single-
Dose Studies. The Case with Omeprazole. Clin Drug Invest. 2002;22(9):585–
92.
247. Liu Z, Ding L, Zhong S, Cao X, Jiang L, Duan H. Pharmacokinetics of a
New Immediate-release Compound Omeprazole Capsule and its Comparison
276
with the Enteric-coated Formulation under Fasting and Fed Conditions. Drug
Res. 2013;63:370–5.
248. Licht D, Cohen R, Spiegelstein O, Rabinovich-guilatt L, Zholkovsky M,
Gilbert A, et al. Is it possible to achieve bio-equivalence between an oral
solid immediate-release and an analogue enteric-coated formulation ? J
Pharm Pharmacol. 2016;68:1278–89.
249. Ahmad M, Pervaiz F. Comparative bioavailability and pharmacokinetics of
investigational enteric- and film-coated formulations of flurbiprofen 100-mg
tablets: a single-dose, randomized, open-label, two-period, two-way
crossover study in healthy Pakistani male volunteers. Clin Ther.
2010;32(3):607-13.
250. Pieniaszek HJ, Resetarits D, Wilferth W, Blumenthal H, Bates. T. Relative
Systemic Availability of Sulfapyridine from Commercial Enteric-Coated and
Uncoated Sulfasalazine Tablets. J Clin Pharmacoly. 1979;19(1):39–45.
251. Schwade LJ. Enteric-coated pills as a cause of fecal impaction. Am J Surg.
1950;79(1):184–5.
252. Fraaces L. Selye. The absorption of enteric-coated ammonium chloride.
Canad M A J. 1946;55:445–7.
277
253. Burnikel RH, Sprecher HC. The value of proctosigmoidoscopic examination
in the management of intestinal obstruction. Am J Surg. 1953;85(1):35-42.
254. Davies N. Sustained release and enteric coated NSAIDs: are they really GI
safe? J Pharm Pharm Sci. 1999;2(1):5–14.
255. Davies NM. Toxicity of Nonsteroidal Anti-Inflammatory Drugs in the Large
Intestine. Dis Colon Rectum. 1995;38(12):1311–21.
256. Porter S, Sackett G, Liu L. Chapter 33 - Development, Optimization, and
Scale-up of Process Parameters: Pan Coating. Qiu Y, Chen Y, Zhang GGZ,
Liu L, Porter WRBT, editors. Developing Solid Oral Dosage Forms:
Pharmaceutical Theory and Practice, Academic Press, Burlington. San
Diego: Academic Press; 2009. 761–805 p.
257. Peter J. Tarcha E. Polymers for controlled drug delivery. CRC Press, Boca
Raton, FL. CRC Press, Boca Raton, FL.; 1991. 39–64 p.
258. Yoshida T, Lai TC, Kwon GS, Sako K. pH- and ion-sensitive polymers for
drug delivery. Expert Opin Drug Deliv. 2013;10(11):1497–513.
259. Selye FL. The absorption of enteric coated ammonium chloride. Can Med
Assoc J. 1946;55(5):445–7.
260. Corbus HF. Enteric coated thyroid as a cause of relapse in myxedema. Calif
278
Med. 1964;100(5):364–5.
261. Graham G, Rowland M. Application of Salivary Salicylate Data to
Biopharmaceutical Studies of Salicylates. J Pharm Sci. 1972;61(8):1219–22.
262. Al-Habet S, Kinsella HC, Rogers HJ, Trounce JR. Malabsorption of
prednisolone from enteric-coated tablets after ileostomy. Br Med J.
1980;281(6244):843–4.
263. Schwartz H. Lower gastrointestinal side effects of nonsteroidal
antiinflammatory drugs. J Rheumatol. 1981;8:952–4.
264. Walker SE, Paton TW, Cowan DH, Manuel MA, Dranitsaris G.
Bioavailability of iron in oral ferrous sulfate preparations in healthy
volunteers. CMAJ. 1989;141(6):543–7.
265. Bochner F, Somogyi AA WK. Bioinequivalence of four 100 mg oral aspirin
formulations in healthy volunteers. Clin Pharmacokinet. 1991;21:394–9.
266. Stamm C, Pearce W, Larsen B et. al. Colonic ulcerations associated with
non-steroidal anti-inflammatory ingestion. Gastrointest Endosc. 1991;37:260.
267. Matsuhashi N, Yamada A, Hiraishi M et al. Multiple Strictures of the small
intestine after long-term nonsteroidal anti-inflammatory drug therapy. Am J
Gastro. 1992;87:1183–6.

279
268. Ridell R, Tanaka M, Mazzoleni G. Nonsteroidal anti-inflammatory drugs as
possible cause of collagenous colitis: a case control study. Gut. 1992;683-6.
269. Van Gelderen MEM, Olling M, Barends DM, Meulenbelt J, Salomons P,
Rauws AG. The bioavailability of diclofenac from enteric coated products in
healthy volunteers with normal and artificially decreased gastric acidity.
Biopharm Drug Dispos. 1994;15(9):775–88.
270. Alleyne M, Horne MK, Miller JL. Individualized treatment for iron-
deficiency anemia in adults. Am J Med. 2008;121(11):943–8.
271. Al-Gousous J, Tsume Y, Fu M, Salem II, Langguth P. Unpredictable
Performance of pH-Dependent Coatings Accentuates the Need for Improved
Predictive in Vitro Test Systems. Mol Pharm. 2017 Dec 4;14(12):4209–19.
272. Dave VS, Shahin HI, Youngren-Ortiz SR, Chougule MB, Haware R V.
Emerging technologies for the non-invasive characterization of physical-
mechanical properties of tablets. Int J Pharm. 2017;532(1):299–312.
273. Available at: https://www.drugbank.ca/drugs/DB00945. Accessed on
February 22, 2020.
274. Available at:
https://healthcare.evonik.com/sites/lists/NC/DocumentsHC/Evonik-
280
Eudragit_brochure.pdf. Accessed on May 06, 2020.
275. Available at: https://www.drugbank.ca/salts/DBSALT001222. Accessed on
February 22, 2020.
276. Available at: https://www.drugbank.ca/drugs/DB00586. Accessed on
February 22, 2020.
277. European Medicines Agency_Assessment report for Pantozol
Control_Procedure No. EMEA/H/C/001013_May 2009.
278. Available at: https://www.drugbank.ca/drugs/DB00795. Accessed on
February 22, 2020.
279. Johnson, L. R. Fluid and Electrolyte Absorption. In Gastrointestinal
Physiology, 6th ed.; Johnson, L. R., Ed.; Mosby: St. Louis, 2001; pp 143−
154.
280. West, J. B. Absorption. In Best and Taylor’s Physiological Basis of Medical
Practice, 11th ed.; Williams & Wilkins: Baltimore, 1985; pp 751− 790.
281. Davenport, H. W. Digestion and Absorption. In Physiology of the Digestive
Tract; Year Book Medical Publishers, Inc.: Chicago, 1982; pp 179− 235.
282. Rune SJ, Henriksen FW. Carbon Dioxide Tensions in the Proximal Part of
the Canine Gastrointestinal Tract. Gastroenterology. 1969;56(4):758–62.
281
283. Banwell JG, Gorbach SL, Pierce NF, Mitra R, Mondal A. Acute
undifferentiated human diarrhea in the tropics: II. Alterations in intestinal
fluid and electrolyte movements. J Clin Invest. 1971;50(4):890–900.
284. White, A.; Handler, P.; Smith, E. L. Specialized Extracellular Fluids. In
Principles of Biochemistry, 4th ed.; McGraw-Hill: New York, 1968; pp 806−
827.
285. Bucher GR, Flynn JC, Robinson CS. The action of the human small intestine
in altering the composition of physiological saline. J Biol Chem.
1944;155:305–13.
286. Repishti M, Hogan DL, Pratha V, Davydova L, Donowitz M, Tse CM, et al.
Human duodenal mucosal brush border Na+/H+ exchangers NHE2 and
NHE3 alter net bicarbonate movement. Am J Physiol Liver Physiol.
2001;281(1):G159–63.
287. Russe I-S, Brock D, Knop K, Kleinebudde P, Zeitler JA. Validation of
Terahertz Coating Thickness Measurements Using X-ray Microtomography.
Mol Pharm. 2012;9(12):3551–9.
288. Radtke J, Wiedey R, Kleinebudde P. Effect of coating time on inter- and
intra-tablet coating uniformity. Eur J Pharm Sci. 2019;137:104970.

282
289. Novikova A, Markl D, Zeitler JA, Rades T, Leopold CS. A non-destructive
method for quality control of the pellet distribution within a MUPS tablet by
terahertz pulsed imaging. Eur J Pharm Sci. 2018;111:549–55.
290. Yin X-Z, Wu L, Li Y, Guo T, Li H-Y, Xiao T-Q, et al. Visualization and
quantification of deformation behavior of clopidogrel bisulfate polymorphs
during tableting. Sci Rep. 2016;6(1):21770.
291. Wu Y, Adeeb S, Doschak M. Using Micro-CT Derived Bone
Microarchitecture to Analyze Bone Stiffness - A Case Study on Osteoporosis
Rat Bone. Vol. 6, Frontiers in Endocrinology. 2015. p. 80.
292. Liu F, Basit AW, Lizio R, Petereit H-U, Meier C, Damm M. SOLID
DOSAGE FORMS COMPRISING AN ENTERC COATING WITH
ACCELERATED DRUG RELEASE. 2013. p. United StatesUS
2013/0058986 A1.
293. Chen Y, Gao Z, Duan JZ. Chapter 13 - Dissolution Testing of Solid Products.
In: Qiu Y, Chen Y, Zhang GGZ, Yu L, Mantri R V, editors. Developing
Solid Oral Dosage Forms. Second Ed. Boston: Academic Press; 2017. p.
355–80.
294. Almukainzi M, Jamali F, Aghazadeh-Habashi A, Löbenberg R. Disease
specific modeling: Simulation of the pharmacokinetics of meloxicam and

283
ibuprofen in disease state vs. healthy conditions. Eur J Pharm Biopharm.
2016;100:77–84.
295. Friedel HD, Brown CK, Barker AR, Buhse LF, Keitel S, Kraemer J, et al.
FIP Guidelines for Dissolution Testing of Solid Oral Products. J Pharm Sci.
2018;107(12):2995–3002.
296. Chen Y, Gao Z, Duan JZ. Dissolution testing of solid products. In:
Developing Solid Oral Dosage Forms: Pharmaceutical Theory and Practice:
Second Edition. 2017. p. 355–80.
297. Popat SC, Ki D, Young MN, Rittmann BE, Torres CI. Buffer pKa and
Transport Govern the Concentration Overpotential in Electrochemical
Oxygen Reduction at Neutral pH. ChemElectroChem. 2014;1(11):1909–15.
298. Soli AL, Byrne RH. CO2 system hydration and dehydration kinetics and the
equilibrium CO2/H2CO3 ratio in aqueous NaCl solution. Mar Chem.
2002;78(2):65–73.
299. Roughton FJW. The Kinetics and Rapid Thermochemistry of Carbonic Acid.
J Am Chem Soc. 1941;63(11):2930–4.
300. Dukić-Ott A, De Beer T, Remon JP, Baeyens W, Foreman P, Vervaet C. In-
vitro and in-vivo evaluation of enteric-coated starch-based pellets prepared

284
via extrusion/spheronisation. Eur J Pharm Biopharm. 2008;70(1):302–12.
301. Ariyasu A, Hattori Y, Otsuka M. Non-destructive prediction of enteric
coating layer thickness and drug dissolution rate by near-infrared
spectroscopy and X-ray computed tomography. Int J Pharm.
2017;525(1):282–90.
302. Sinha VR, Kumria R. Coating polymers for colon specific drug delivery: A
comparative in vitro evaluation. Acta Pharm. 2003;53(1):41–7.
303. Ozturk SS, Palsson BO, Donohoe B, Dressman JB. Kinetics of Release from
Enteric-Coated Tablets. Pharm Res. 1988;5(9):550–65.
304. Chapter 8 - Buffered and isotonic solutions. In: Martin’s physical pharmacy
and pharmaceutical sciences : physical chemical and biopharmaceutical
principles in the pharmaceutical sciences. 6th ed. editor, Patrick J. Sinko ; ;
assistant editor, Yashveer Si. In.
305. Agyilirah GA, Banker GS. Polymers for enteric coating applications. Polym
Control drug Deliv. 1991;3:39–66.
306. ⟨1151⟩ PHARMACEUTICAL DOSAGE FORMS. In The United States
Pharmacopeia and National Formulary USP42-NF37 2S; The United States
Pharmacopeial Convention, Inc.: Rockville, MD, 2019.

285
307. Shargel L, Wu-Pong S, Yu ABC. Chapter 17. Modified-Release Drug
Products. In: Applied Biopharmaceutics & Pharmacokinetics, 6e. New
York, NY: The McGraw-Hill Companies; 2012.
308. Cardot JM, Garrait G, Beyssac E. Use of IVIVC to Optimize Generic
Development. Dissolution Technol. 2015;22:44–8.
309. Davanço MG, Campos DR, Carvalho P de O. In vitro – In vivo correlation in
the development of oral drug formulation: A screenshot of the last two
decades. Int J Pharm. 2020;580:119210.
310. Cardot J-M, Davit BM. In vitro–In Vivo Correlations: Tricks and Traps.
AAPS J. 2012;14(3):491–9.
311. International Conference of Harmonization (ICH) of Technical Requirements
for Registration of Pharmaceuticals for Human Use. ICH Harmonized
Guidelines. Integrated Addendum to ICH E6(R1): Guideline for Good
Clinical Practices.
312. World Medical Association. World Medical Association Declaration of
Helsinki: Ethical Principles for Medical Research Involving Human Subjects.
JAMA. 2013;310(20):2191– 2194.
313. Food and Drug Administrations – FDA. Guidance for Industry: Food-Effect
286
Bioavailability and Fed Bioequivalence Studies. December 2002. A.
314. SIMON B, MÜLLER P, BLIESATH H, LÜHMANN R, HARTMANN M,
HUBER R, et al. Single intravenous administration of the H+, K+-ATPase
inhibitor BY 1023/SK&F 96022—inhibition of pentagastrin-stimulated
gastric acid secretion and pharmacokinetics in man. Aliment Pharmacol Ther.
1990;4(3):239–45.
315. de Campos DR, Vieira NR, Bernasconi G, Barros FAP, Meurer EC,
Marchioretto MA, et al. Bioequivalence of two enteric coated formulations of
pantoprazole in healthy volunteers under fasting and fed conditions.
Arzneimittelforschung. 2007;57(6):309—314.
316. Grbic S, Parojcic J, Ibric S, Djuric Z. In Vitro–In Vivo Correlation for
Gliclazide Immediate-Release Tablets Based on Mechanistic Absorption
Simulation. AAPS PharmSciTech. 2011;12(1):165–71.
317. Honório T da S, Pinto EC, Rocha HVA, Esteves VSD, dos Santos TC, Castro
HCR, et al. In Vitro–In Vivo Correlation of Efavirenz Tablets Using
GastroPlus®. AAPS PharmSciTech. 2013;14(3):1244–54.
318. Hussain A, Shakeel F, Singh SK, Alsarra IA, Faruk A, Alanazi FK, et al.
Solidified SNEDDS for the oral delivery of rifampicin: Evaluation, proof of
concept, in vivo kinetics, and in silico GastroPlusTM simulation. Int J Pharm.

287
2019;566:203–17.
319. Pepin XJH, Dressman J, Parrott N, Delvadia P, Mitra A, Zhang X, et al. In
Vitro Biopredictive Methods: A Workshop Summary Report. J Pharm Sci.
2020;
320. Pearce GA, McLachlan AJ, Ramzan I. Bioequivalence: How, Why, and What
Does it Really Mean? J Pharm Pract Res. 2004 Sep 1;34(3):195–200.
321. Karalis V, Macheras P, Van Peer A, Shah VP. Bioavailability and
Bioequivalence: Focus on Physiological Factors and Variability. Pharm Res.
2008;25(8):1956–62.
322. Van Peer A. Variability and Impact on Design of Bioequivalence Studies.
Basic Clin Pharmacol Toxicol. 2010 Mar 1;106(3):146–53.
323. Fathima N, Mamatha T, Qureshi HK, Anitha N, Venkateswara Rao J. Drug-
excipient interaction and its importance in dosage form development. J Appl
Pharm Sci. 2011;1(6):66–71.
324. Hotha KK, Roychowdhury S, Subramanian V. Drug-Excipient Interactions:
Case Studies and Overview of Drug Degradation Pathways. Am J Anal
Chem. 2016;07(01):107–40.
325. Narang AS, Yamniuk A, Zhang L, Comezoglu SN, Bindra DS, Varia SA, et

288
al. Chapter 2: Drug Excipient Interactions. In: Excipient Applications in
Formulation Design and Drug Delivery. 2015. p. 13–23.
326. Dilantin® [package insert]. Parke-Davis, Division of Pfizer, Inc., New York,
NY; 2009.
327. Neuvonen PJ. Bioavailability of Phenytoin : Clinical Pharmacokinetic and
Therapeutic Implications. Clin Pharmacokinet. 1979;4(2):91–103.
328. Tyrer JH, Eadie MJ, Sutherland JM, Hooper WD. Outbreak of anticonvulsant
intoxication in an Australian city. Br Med J. 1970;4(5730):271–3.
329. Bochner F, Hooper WD, Tyrer JH, Eadie MJ. Factors Involved in an
Outbreak of Phenytoin Intoxication. J Neurol Sci. 1972;16(4):481–7.
330. Bochner F, Hooper W, Tyrer J, Eadie M. The explanation of the 1968
Australian outbreak of diphenylhydantoin intoxication. Proc Aust Assoc
Neurol. 1973;9:165–70.
331. Shah VP, Tsong Y, Sathe P, Liu JP. In vitro dissolution profile comparison-
Statistics and analysis of the similarity factor, f2. Pharm Res.
1998;15(6):889–96.
332. Soryal I, Richens A. Bioavailability and dissolution of proprietary and
generic formulations of phenytoin. J Neurol Neurosurg Psychiatry.
289
1992;55(8):688–91.
333. Newton D. Phenyton injections: From compounding to Cerebyx. Int J Pharm
Compd. 2002;6(6):410–3.
334. Besag FMC. Is generic prescribing acceptable in epilepsy? Drug Saf.
2000;23(3):173–82.
335. Borgherini G. The bioequivalence and therapeutic efficacy of generic versus
brand-name psychoactive drugs. Clin Ther. 2003;25(6):1578–92.
336. LeLorier J, Duh MS, Paradis PE, Lefebvre P, Weiner J, Manjunath R, et al.
Clinical consequences of generic substitution of lamotrigine for patients with
epilepsy. Health Care (Don Mills). 2008;2179–86.
337. Richens A. Clinical Pharmacokinetics of Phenytoin. Clin Pharmacokinet.
1979;4(3):153–69.
338. Bharate SS, Bharate SB, Bajaj AN. Interactions and incompatibilities of
pharmaceutical excipients with active pharmaceutical ingredients : a
comprehensive review. J excipients food Chem. 2010;1(3):3–26.
339. Chowdhury DK, Sarker H, Schwartz P. Regulatory Notes on Impact of
Excipients on Drug Products and the Maillard Reaction. AAPS
PharmSciTech [Internet]. 2017; Available from:

290
http://link.springer.com/10.1208/s12249-017-0878-y
340. Berridge NJ, Cousins CM, Cliffe AJ. Microcalorimetry applied to certain
species of bacteria growing in sterilized separated milk. J Dairy Res.
1974;41(2):203–15.
341. Stulova I, Kabanova N, Krisciunaite T, Adamberg K, Laht TM, Vilu R.
Microcalorimetric study of the growth of Streptococcus thermophilus in
renneted milk. Front Microbiol. 2015;6:3389.
342. Vickery RD, Maurin MB. Utility of microcalorimetry in the characterization
of the browning reaction. J Pharm Biomed Anal. 1999;20(1–2):385–8.
343. Choma CT. Characterization of Drug-Excipient Compatibility _ TA
Instruments, 109 Lukens Drive, New Castle, DE 19720, USA.
344. Cavatur R, Murti Vemuri N, Chrzan Z. Use of isothermal microcalorimetry
in pharmaceutical preformulation studies part III. Evaluation of excipient
compatibility of a new chemical entity. J Therm Anal Calorim.
2004;78(1):63–72.
345. Macheras P, Ismailos G, Reppas C. Bioavailability study of a freeze-dried
sodium phenytoin-milk formulation. Biopharm Drug Dispos. 1991;12:687–
95.

291
346. Neuvonen P, Lehtovaara R, Bardy A. Effect of Some Gastrointestinal Factors
on Serum Phenytoin Concentration. Antiepileptic Ther Adv Drug Monit.
1980;149–59.
347. Dilantin® [Product monograph]. Pfizer Canada Inc., Licensee Kirkland,
Québec; 2017.
348. Cook J, Randinitis E, Wilder BJ. Effect of food on the bioavailability of 100-
mg Dilantin Kapseals. Neurology. 2001;57:698–700.
349. Health Canada, Canada Vigilance program –
http://www.healthcanada.gc.ca/medeffect. Query number CV-2018-0060.
350. Wilder BJ, Leppik I, Hietpas TJ, Cloyd JC, Randinitis EJ, Cook J. Effect of
food on absorption of Dilantin Kapseals and Mylan extended phenytoin
sodium capsules. Neurology. 2001;57:582–9.
351. Garnett WR. Considerations for long-term use of proton-pump inhibitors.
Am J Heal Pharm. 1998;55(21):2268–79.
352. Kou D, Dwaraknath S, Fischer Y, Nguyen D, Kim M, Yiu H, et al.
Biorelevant Dissolution Models for a Weak Base To Facilitate Formulation
Development and Overcome Reduced Bioavailability Caused by
Hypochlordyria or Achlorhydria. Mol Pharm. 2017;14(10):3577–87.

292
353. Lahner E, Annibale B, Delle Fave G. Systematic review: Impaired drug
absorption related to the co-administration of antisecretory therapy. Aliment
Pharmacol Ther. 2009;29(12):1219–29.
354. Almukainzi M, Löbenberg R, Lukacova V. Modelling the Absorption of
Metformin with Patients Post Gastric Bypass Surgery. J Diabetes Metab.
2014;5:353.
355. Golub AL, Frost RW, Betlach CJ, Gonzalez MA. Physiologic considerations
in drug absorption from the gastrointestinal tract. J ALLERGY CLIN
IMMUNOL. 1986;78(4 Pt 2):689–94.
356. Zhou R, Moench P, Heran C, Lu X, Mathias N, Faria TN, et al. pH-
Dependent dissolution in Vitro and absorption in Vivo of weakly basic drugs:
Development of a canine model. Pharm Res. 2005;22(2):188–92.
357. Piscitelli SC, Goss TF, Wilton JH, D’Andrea DT, Goldstein H, Schentag JJ.
Effects of ranitidine and sucralfate on ketoconazole bioavailability.
Antimicrob Agents Chemother. 1991;35(9):1765–71.
358. Chin TWF, Loeb M, Fong IW. Effects of an acidic beverage (Coca-Cola) on
absorption of ketoconazole. Antimicrob Agents Chemother.
1995;39(8):1671–5.
293
359. Psachoulias D, Vertzoni M, Goumas K, Kalioras V, Beato S, Butler J, et al.
Precipitation in and supersaturation of contents of the upper small intestine
after administration of two weak bases to fasted adults. Pharm Res.
2011;28(12):3145–58.
360. Como J, Dismukes W. Oral azole drugs as systemic antifungal therapy. N
Engl J Med. 1994;330(4):263–72.
361. Daneshmend TK, Warnock DW. Clinical Pharmacokinetics of Ketoconazole.
Clin Pharmacokinet. 1988;14(1):13–34.
362. Ingels F, Beck B, Oth M, Augustijns P. Effect of simulated intestinal fluid on
drug permeability estimation across Caco-2 monolayers. Int J Pharm.
2004;274:221–32.
363. Harris R, Jones HE, Artis WM. Orally Administered Ketoconazole : Route of
Delivery to the Human Stratum Corneum. Antimicrob Agents Chemother.
1983;24(6):876–82.
364. Chan ECY, Tan WL, Ho PC, Fang LJ. Modeling Caco-2 permeability of
drugs using immobilized artificial membrane chromatography and
physicochemical descriptors. J Chromatogr A. 2005;1072:159–68.
365. Kostewicz ES, Aarons L, Bergstrand M, Bolger MB, Galetin A, Hatley O, et
294
al. PBPK models for the prediction of in vivo performance of oral dosage
forms. Eur J Pharm Sci. 2014;57:300–21.
366. Kesisoglou F, Chung J, van Asperen J, Heimbach T. Physiologically Based
Absorption Modeling to Impact Biopharmaceutics and Formulation
Strategies in Drug Development—Industry Case Studies. J Pharm Sci.
2016;105(9):2723–34.
367. Medarevi D, Cviji S, Dobri V, Mitri M, Djuri J, Ibri S. Assessing the
potential of solid dispersions to improve dissolution rate and bioavailability
of valsartan : In vitro - in silico approach. Eur J Pharm Sci. 2018;124:188–98.
368. Jones HM, Chen Y, Gibson C, Heimbach T, Parrott N, Peters SA, et al.
Physiologically Based Pharmacokinetic Modeling in Drug Discovery and
Development : A Pharmaceutical Industry Perspective. Clin Pharmacol Ther.
2015;97(3):247–62.
369. Tsume Y, Patel S, Fotaki N, Bergstr C, Amidon GL, Brasseur JG, et al.
Meeting Report In Vivo Predictive Dissolution and Simulation Workshop
Report : Facilitating the Development of Oral Drug Formulation and the
Prediction of Oral Bioperformance. AAPS J. 2018;20(100):1–8.
370. Fotaki N. Pros and cons of methods used for the prediction of oral drug
absorption. Expert Rev Clin Pharmacol. 2009;2(2):195–208.

295
371. Cvijic S, Ibric S, Parojcic J, Djuris J. An in vitro - in silico approach for the
formulation and characterization of ranitidine gastroretentive delivery
systems. J Drug Deliv Sci Technol. 2018;45:1–10.
372. Agoram B, Woltosz WS, Bolger MB. Predicting the impact of physiological
and biochemical processes on oral drug bioavailability. Adv Drug Deliv Rev.
2001;50:S41–67.
373. Yu LX, Amidon GL. A compartmental absorption and transit model for
estimating oral drug absorption. Int J Pharm. 1999;186:119–25.
374. Yu LX, Amidon GL. Characterization of small intestinal transit time
distribution in humans. Int J Pharm. 1998;171:157–63.
375. Okumu A, DiMaso M, Löbenberg R. Computer simulations using
GastroPlusTM to justify a biowaiver for etoricoxib solid oral drug products.
Eur J Pharm Biopharm. 2009;72(1):91–8.
376. Wei H, Dalton C, Di Maso M, Kanfer I, Löbenberg R. Physicochemical
characterization of five glyburide powders: A BCS based approach to predict
oral absorption. Eur J Pharm Biopharm. 2008;69(3):1046–56.
377. Ruff A, Fiolka T, Kostewicz ES. Prediction of Ketoconazole absorption
using an updated in vitro transfer model coupled to physiologically based

296
pharmacokinetic modelling. Eur J Pharm Sci. 2017;100:42–55.
378. Pathak SM, Ru A, Kostewicz ES, Patel N, Turner DB. Model-Based
Analysis of Biopharmaceutic Experiments To Improve Mechanistic Oral
Absorption Modeling: An Integrated in Vitro in Vivo Extrapolation
Perspective Using Ketoconazole as a Model Drug. Mol Pharm.
2017;14:4305–20.
379. Cristofoletti R, Patel N, Dressman JB. Differences in Food Effects for 2
Weak Bases With Similar BCS Drug-Related Properties : What Is Happening
in the Intestinal Lumen ? J Pharm Sci. 2016;105(9):2712–22.
380. Cristofoletti R, Patel N, Dressman JB. Assessment of Bioequivalence of
Weak Base Formulations Under Various Dosing Conditions Using
Physiologically Based Pharmacokinetic Simulations in Virtual Populations .
Case Examples : Ketoconazole and Posaconazole. J Pharm Sci.
2017;106(2):560–9.
381. Adachi M, Hinatsu Y, Kusamori K, Katsumi H, Sakane T, Nakatani M, et al.
Improved dissolution and absorption of ketoconazole in the presence of
organic acids as pH-modifiers. Eur J Pharm Sci. 2015;76:225–30.
382. Huang Y, Colaizzi JL, Bierman RH, Woestenborghs R, Heykants J.
Pharmacokinetics and Dose Proportionality of Ketoconazole in Normal
297
Volunteers. Antimicrob Agents Chemother. 1986;30(2):206–10.
383. GastroPlus TM Manual, 2015. Simulations Plus Inc., Lancaster, CA, USA.
384. Medication Guide: NIZORAL, JANSSEN PHARMACEUTICALS Inc.
2013.
385. Graybill JR, Galgiani JN, Jorgensen JH, Strandberg DA. Ketoconazole
therapy for fungal urinary tract infections. J Urol. 1983;129(1):68–70.
386. Fahmi OA, Maurer TS, Kish M, Cardenas E, Boldt S, Nettleton D. A
Combined Model for Predicting CYP3A4 Clinical Net Drug-Drug Interaction
Based on CYP3A4 Inhibition , Inactivation , and Induction Determined in
Vitro. Drug Metab Dispos. 2008;36(8):1698–708.
387. Heikkinen AT, Baneyx G, Caruso A, Parrott N. Application of PBPK
modeling to predict human intestinal metabolism of CYP3A substrates – An
evaluation and case study using GastroPlus TM. Eur J Pharm Sci.
2012;47(2):375–86.
388. Vertzoni M V., Reppas C, Archontaki HA. Optimization and validation of a
high-performance liquid chromatographic method with UV detection for the
determination of ketoconazole in canine plasma. J Chromatogr B.
2006;839(1–2):62–7.
298
389. Mannisto PT, Mantyla R, Nykanen S, Lamminsivu U, Ottoila P. Impairing
effect of food on ketoconazole absorption. Antimicrob Agents Chemother.
1982;21(5):730–3.
390. Rasenack N, Müller BW. Dissolution rate enhancement byin situ
micronization of poorly water-soluble drugs. Pharm Res. 2002;19(12):1894–
1900.
391. Mitra A, Kesisoglou F, Beauchamp M, Zhu W, Chiti F, Wu Y. Using
absorption simulation and gastric pH modulated dog model for formulation
development to overcome achlorhydria effect. Mol Pharm. 2011;8(6):2216–
23.
392. Hartmanshenn C, Scherholz M, Androulakis IP. Physiologically-based
pharmacokinetic models : approaches for enabling personalized medicine. J
Pharmacokinet Pharmacodyn. 2016;43(5):481–504.
393. Johnson TN, Rostami-hodjegan A. Resurgence in the use of physiologically
based pharmacokinetic models in pediatric clinical pharmacology : parallel
shift in incorporating the knowledge of biological elements and increased
applicability to drug development and clinical practice. Pediatr Anesth.
2011;21:291–301.
394. Marsousi N, Desmeules JA, Rudaz S, Daali Y. Usefulness of PBPK

299
Modeling in Incorporation of Clinical Conditions in Personalized Medicine. J
Pharm Sci. 2017;106(9):2380–91.
395. Xu R, Ge W, Jiang Q. Application of physiologically based pharmacokinetic
modeling to the prediction of drug-drug and drug-disease interactions for
rivaroxaban. Eur J Clin Pharmacol. 2018;74:755–65.
396. Amaral Silva D, Löbenberg R, Davies N. Are Excipients Inert? Phenytoin
Pharmaceutical Investigations with New Incompatibility Insights. J Pharm
Pharm Sci [Internet]. 2018;21(1s):29745. Available from:
http://www.ncbi.nlm.nih.gov/pubmed/29702046
397. Amaral Silva D, Duque M, Davies N, Löbenberg R, Ferraz H. Application of
in silico tools in clinical practice using ketoconazole as a model drug. J
Pharm Pharm Sci. 2018;21(1S):242s-253s.

300
APPENDIX 1: Formulation of inhalable nanocrystals to be used as a
therapeutic strategy against breast cancer metastasis to the lungs
301
Background
Breast cancer is a significant problem worldwide, being the number one diagnosed cancer
in American women and number two cause of cancer-related death (A1.1). The majority of these
deaths is a result of metastasis. Recent studies (A1.2- A1.3) show that patients with more
aggressive types of breast cancer present an enhanced propensity for lung metastasis, negatively
impacting the patient’s morbidity and mortality. Advanced lung metastases are difficult to treat,
highlighting the need to better understand the molecular drivers of this process and the need for
effective new therapies, especially in the area of nanotechnology applied to pharmaceuticals
Recent research (A1.4- A1.5) has shown the importance of lung-derived factors on breast
cancer metastatic behavior. These lung microenvironment factors, such as soluble proteins
(particularly selectins), seem to contribute to the breast cancer cells spreading. Hence, targeting
the metastatic microenvironment is an attractive alternative to prevent cancer cells spreading to
the lungs. Direct delivery to the secondary metastatic organ (i.e., the lungs) can greatly reduce
systemic toxicities with increased organ-specificity. In this context, the lung has the unique
advantage of being targetable through inhalable drug delivery. Even though inhaled drugs have
been used in the treatment of airway diseases (A1.6), this route of administration remains nearly
underexplored in cancer treatment. Additionally, the use of nanoparticles for cancer treatment
has been extensively studied, however the application of nanotechnology for inhalable drug
delivery in cancer is seldom explored. Hence, in this project we aim to develop and characterize
an inhalable system containing bimosiamose (a selectin inhibitor) nanoparticles as a novel anti-
metastatic strategy.
302
Chemotherapeutics are often poorly water-soluble compounds and such molecules are
difficult to formulate using conventional approaches (A1.7). Formulating these compounds as
pure drug nanoparticles is one of the newer drug-delivery strategies applied to this class of
molecules (A1.7). Nanoparticles are an interesting approach for cancer treatment because they
present enhanced permeability and retention, allowing accumulation in the target tissue rather
than systemic diffusion (A1.8). In this research project, bimosiamose nanoparticles are used in
crystalline form, known as nanocrystals. Due to increased surface area to volume ratio,
nanocrystals can improve solubility and increase cellular uptake due to their size (A1.8- A1.11).
On the other hand, due to their reduced size, inhaled nanocrystals would not reach the
deep lung where the drug needs to be deposited. Thus, the nanocrystals are loaded into an
inhalable carrier using spray-freeze drying technique to maintain the drug activity and ensure
uniform distribution throughout the carrier particles (A1.12). These carriers are bigger in size
(micro range) and such an approach can be used for the local delivery of nanoparticles to the
lungs (A1.13- A1.14).
To the best of our knowledge a preventive approach against lung metastasis using
inhalable bimosiamose nanocrystals has never been used before. This innovative research will
greatly contribute to the knowledge in the field of nanotechnology applied to pharmaceuticals.
Methods and Results
Preparation of nanosuspension by miniaturized wet bead milling method.
The nanocrystals were obtained through a modified wet bead milling process which
consists of an aqueous media in which the drug is insoluble, a stabilizer, the drug powder,
303
milling pearls (zirconia beads) and high speed magnetic stirring (A1.9). In this method, the
particle size reduction is caused by mechanical forces, i.e. by physically breaking down coarse
particles to finer ones. The system was stirred for a length of time and the particle size reduction
was monitored through laser diffraction scattering method. Since bimosiamose is extremely
poorly water soluble, this would be the most adequate method for particle size reduction (A1.10-
A1.11).
The system contained bimosiamose (10 mg), zirconia beads (0.5 g) and a stabilizer
aqueous solution (0.5 mL) (HPC, PVA, PVP, Poloxamer 188 or Povacoat). The milling chamber
consisted of a 2 mL glass vial containing two magnetic stir bars, polygon-shaped (8x2 mm). The
system was stirred at 800 rpm at room temperature up to 48hrs depending on the stabilizer used.
For HPC, PVA, PVP and Povacoat, the proportion between stabilizer and drug was 4:1
and for Poloxamer 3:1.
Particle size distribution and stabilizer screening.
The particle size distribution (PSD) as well as the polydispersity index (PdI) were measured by
dynamic light scattering using a photon correlation spectrometer (Zetasizer HAS 3000) from
Malvern instruments. Samples were diluted to a suitable concentration, indicated by the best
attenuation coefficient. The PSD results are indicated as size distribution by volume.
Povacoat
For Povacoat, the samples were collected for analysis at 1h, 24hrs, 36hrs and 48 hrs.
Table 1 shows the Z-average for the PSD of the nanosuspension system (done in triplicate) at the
different collection time points. Different populations could be identified during the first hour of
stirring.
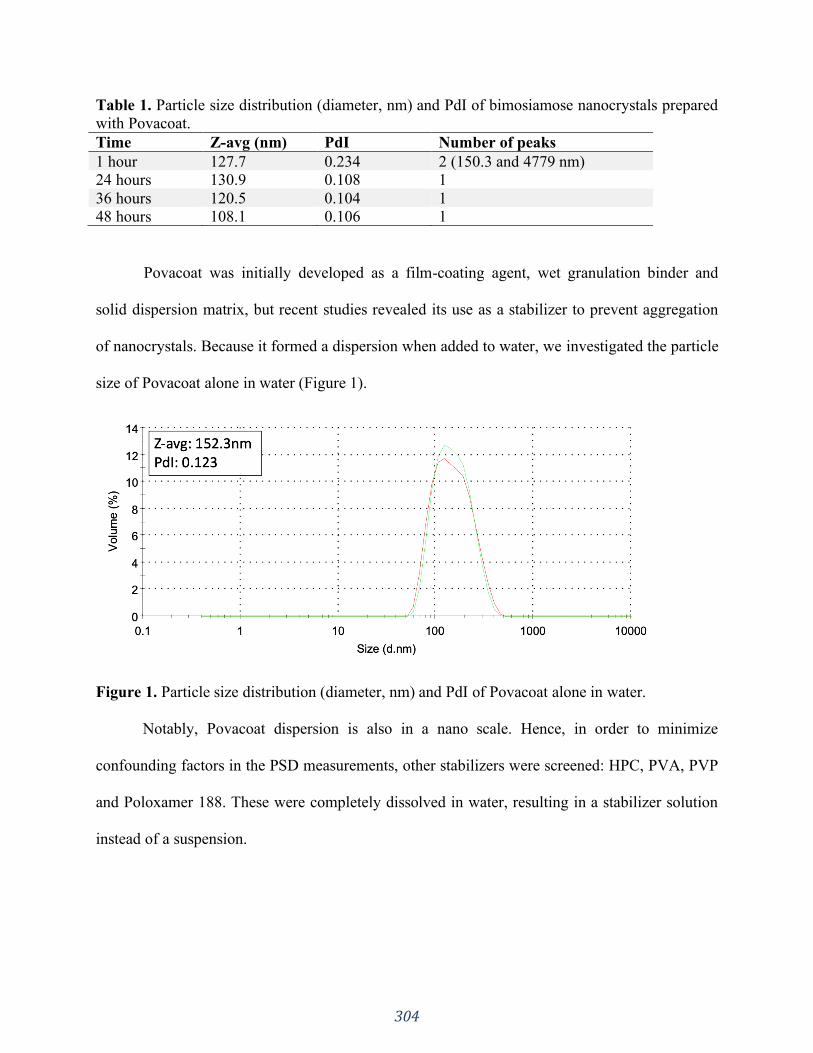
304
Table 1. Particle size distribution (diameter, nm) and PdI of bimosiamose nanocrystals prepared
with Povacoat.
Time Z-avg (nm) PdI Number of peaks
1 hour 127.7 0.234 2 (150.3 and 4779 nm)
24 hours 130.9 0.108 1
36 hours 120.5 0.104 1
48 hours 108.1 0.106 1
Povacoat was initially developed as a film-coating agent, wet granulation binder and
solid dispersion matrix, but recent studies revealed its use as a stabilizer to prevent aggregation
of nanocrystals. Because it formed a dispersion when added to water, we investigated the particle
size of Povacoat alone in water (Figure 1).
Figure 1. Particle size distribution (diameter, nm) and PdI of Povacoat alone in water.
Notably, Povacoat dispersion is also in a nano scale. Hence, in order to minimize
confounding factors in the PSD measurements, other stabilizers were screened: HPC, PVA, PVP
and Poloxamer 188. These were completely dissolved in water, resulting in a stabilizer solution
instead of a suspension.
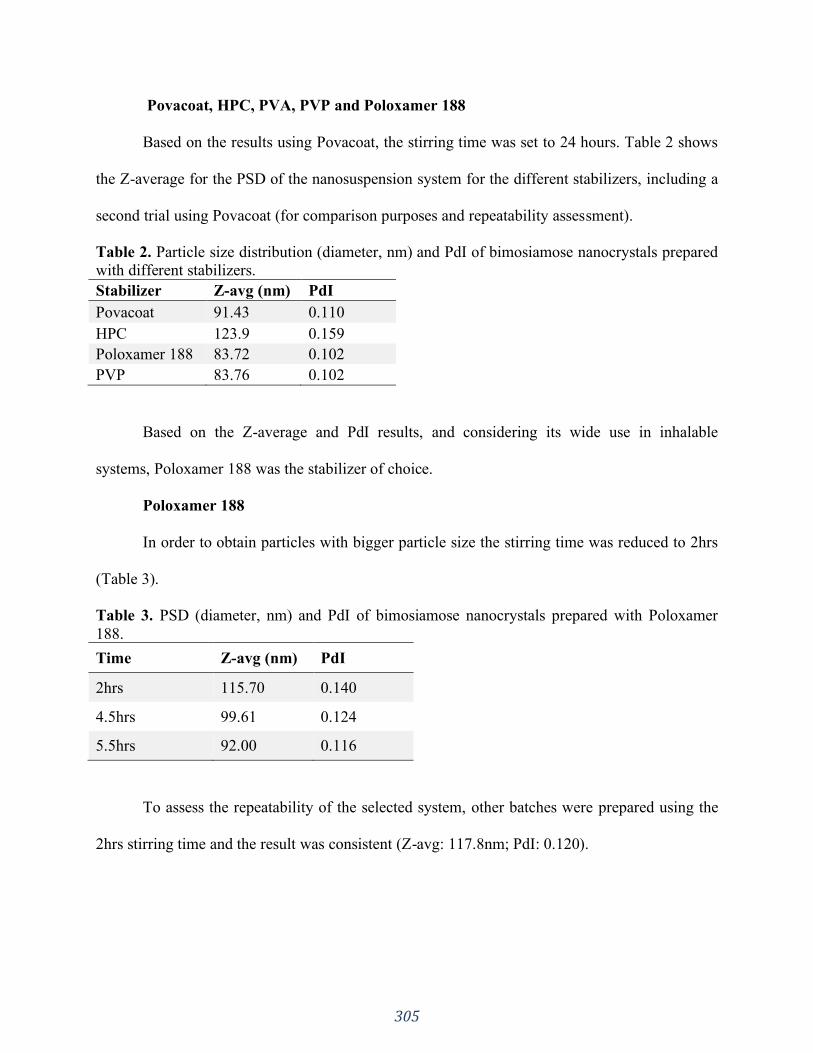
305
Povacoat, HPC, PVA, PVP and Poloxamer 188
Based on the results using Povacoat, the stirring time was set to 24 hours. Table 2 shows
the Z-average for the PSD of the nanosuspension system for the different stabilizers, including a
second trial using Povacoat (for comparison purposes and repeatability assessment).
Table 2. Particle size distribution (diameter, nm) and PdI of bimosiamose nanocrystals prepared
with different stabilizers.
Stabilizer Z-avg (nm) PdI
Povacoat 91.43 0.110
HPC 123.9 0.159
Poloxamer 188 83.72 0.102
PVP 83.76 0.102
Based on the Z-average and PdI results, and considering its wide use in inhalable
systems, Poloxamer 188 was the stabilizer of choice.
Poloxamer 188
In order to obtain particles with bigger particle size the stirring time was reduced to 2hrs
(Table 3).
Table 3. PSD (diameter, nm) and PdI of bimosiamose nanocrystals prepared with Poloxamer
188.
Time Z-avg (nm) PdI
2hrs 115.70 0.140
4.5hrs 99.61 0.124
5.5hrs 92.00 0.116
To assess the repeatability of the selected system, other batches were prepared using the
2hrs stirring time and the result was consistent (Z-avg: 117.8nm; PdI: 0.120).
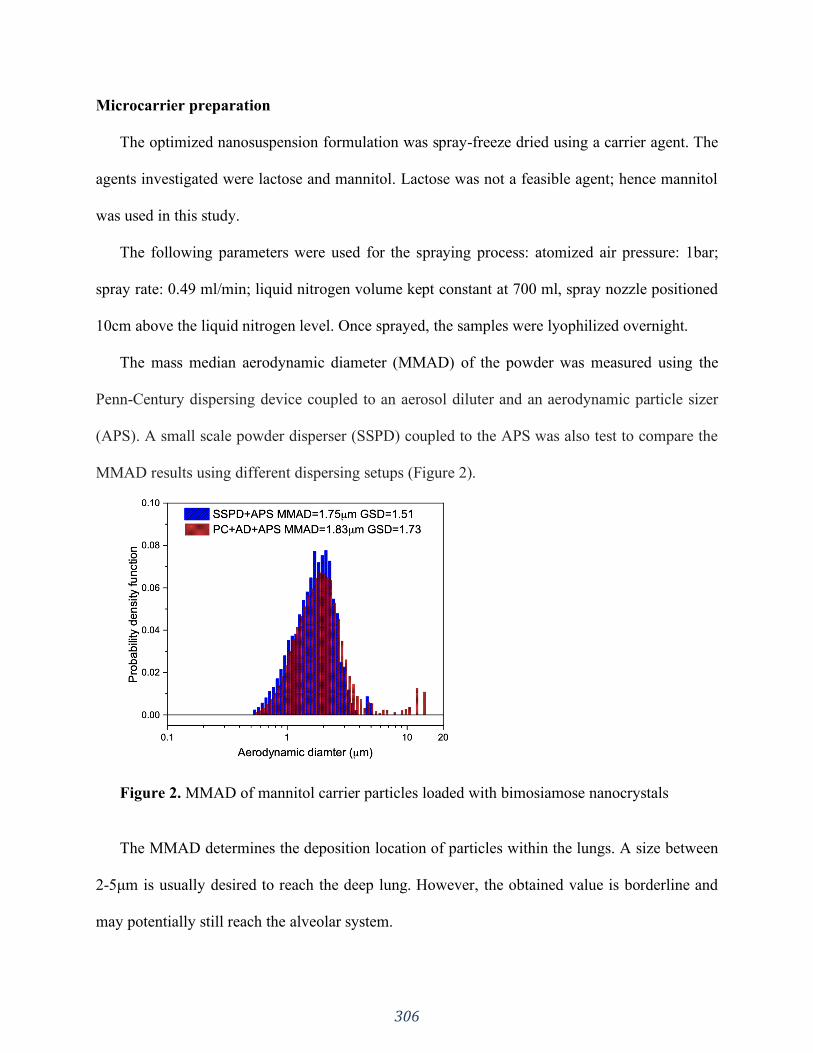
306
Microcarrier preparation
The optimized nanosuspension formulation was spray-freeze dried using a carrier agent. The
agents investigated were lactose and mannitol. Lactose was not a feasible agent; hence mannitol
was used in this study.
The following parameters were used for the spraying process: atomized air pressure: 1bar;
spray rate: 0.49 ml/min; liquid nitrogen volume kept constant at 700 ml, spray nozzle positioned
10cm above the liquid nitrogen level. Once sprayed, the samples were lyophilized overnight.
The mass median aerodynamic diameter (MMAD) of the powder was measured using the
Penn-Century dispersing device coupled to an aerosol diluter and an aerodynamic particle sizer
(APS). A small scale powder disperser (SSPD) coupled to the APS was also test to compare the
MMAD results using different dispersing setups (Figure 2).
Figure 2. MMAD of mannitol carrier particles loaded with bimosiamose nanocrystals
The MMAD determines the deposition location of particles within the lungs. A size between
2-5μm is usually desired to reach the deep lung. However, the obtained value is borderline and
may potentially still reach the alveolar system.

307
After characterization of inhalable powder and loading into the delivery device through the
optimized method, the samples were sent for preclinical animal study, which are being
conducted in our collaborator’s facility in Western University where animal ethics approval has
been granted.
308
References
A1.1. Retrived from National Breast Cancer Foundation, Inc. Available at:
https://www.nationalbreastcancer.org/ breast-cancer-facts
A1.2. Kennecke, H., Yerushalmi, R., Woods, R., Cheang, M. C. U., Voduc, D., Speers, C. H., ...
& Gelmon, K. (2010). Metastatic behavior of breast cancer subtypes. Journal of clinical
oncology, 28(20), 3271-3277.
A1.3. Minn, A. J., Gupta, G. P., Padua, D., Bos, P., Nguyen, D. X., Nuyten, D., ... & Foekens, J.
A. (2007). Lung metastasis genes couple breast tumor size and metastatic spread. Proceedings of
the National Academy of Sciences, 104(16), 6740-6745.
A1.4. Chambers, A. F., Groom, A. C., & MacDonald, I. C. (2002). Dissemination and growth of
cancer cells in metastatic sites. Nature Reviews Cancer, 2(8), 563-572.
A1.5. Chu, J. E., Xia, Y., Chin-Yee, B., Goodale, D., Croker, A. K., & Allan, A. L. (2014).
Lung-derived factors mediate breast cancer cell migration through CD44 receptor-ligand
interactions in a novel ex vivo system for analysis of organ-specific soluble proteins. Neoplasia
(New York, N.Y.), 16(2), 180–191.
A1.6. Trapani, A., Di Gioia, S., Castellani, S., Carbone, A., Cavallaro, G., Trapani, G., &
Conese, M. (2014). Nanocarriers for respiratory diseases treatment: recent advances and current
challenges. Current topics in medicinal chemistry, 14(9), 1133-1147.
A1.7. Merisko-Liversidge, E. M., & Liversidge, G. G. (2008). Drug nanoparticles: formulating
poorly water- soluble compounds. Toxicologic pathology, 36(1), 43-48.
A1.8. Roa, W. H., Azarmi, S., Al-Hallak, M. K., Finlay, W. H., Magliocco, A. M., & Lobenberg,
R. (2011). Inhalable nanoparticles, a non-invasive approach to treat lung cancer in a mouse
model. Journal of controlled release, 150(1), 49-55.
309
A1.9. Azarmi, S., Tao, X., Chen, H., Wang, Z., Finlay, W. H., Lobenberg, R., & Roa, W. H.
(2006). Formulation and cytotoxicity of doxorubicin nanoparticles carried by dry powder aerosol
particles. International journal of pharmaceutics, 319(1-2), 155-161.
A1.10. Wang, G. D., Mallet, F. P., Ricard, F., & Heng, J. Y. (2012). Pharmaceutical
nanocrystals. Current Opinion in Chemical Engineering, 1(2), 102-107.
A1.11. Gupta, M., Sharma, V., Chauhan, D. N., Chauhan, N. S., Shah, K., & Goyal, R. K.
(2019). Nanotechnological-Based Drug Delivery System for Magical Molecule Curcumin:
Delivery, Possibilities and Challenges. Novel Drug Delivery Systems for Phytoconstituents, 313.
A1.12. Sweeney, L. G., Wang, Z., Loebenberg, R., Wong, J. P., Lange, C. F., & Finlay, W. H.
(2005). Spray- freeze-dried liposomal ciprofloxacin powder for inhaled aerosol drug delivery.
International journal of pharmaceutics, 305(1-2), 180-185.
A1.13. Ely, L., Roa, W., Finlay, W. H., & Lobenberg, R. (2007). Effervescent dry powder for
respiratory drug delivery. European Journal of Pharmaceutics and Biopharmaceutics, 65(3), 346-
353.
A1.14. Sham, J. O. H., Zhang, Y., Finlay, W. H., Roa, W. H., & Lobenberg, R. (2004).
Formulation and characterization of spray-dried powders containing nanoparticles for aerosol
delivery to the lung. International Journal of Pharmaceutics, 269(2), 457-467.

310
APPENDIX 2: Design of nanostructured lipid carriers for lymphatic
delivery of Terbinafine

311
Background
After oral administration of a given medication, the active pharmaceutical ingredient
(API) is released from the dosage form, dissolved in the gut lumen and absorbed through the gut
wall by the enterocytes. After that, it goes to the portal vein, passing through the liver (where pre
systemic metabolism may occur) to finally reach the systemic circulation. When pre systemic
metabolism happens, the amount of drug reaching the systemic circulations is decreased, hence
the therapeutic compound will have a lower bioavailability. Highly lipophilic molecules are
more prone to undergo such pre systemic metabolism (A2.1). In the current drug development
pipeline, many of the lead compounds are highly lipophilic molecules, which pose a major
development challenge to the pharmaceutical industry.
Selecting a lead compound which may undergo extensive pre systemic metabolism is not
attractive to the industry, even if they present high potency, because the low bioavailability will
require high doses, which can be toxic. Additionally, many drug-drug interactions (DDI) at the
metabolizing enzymes level may occur. These molecules also present low aqueous solubility,
which is a challenge for the formulation development process. Therefore, the great need to
address this matter affords an opportunity to explore alternative pathways of absorption with
innovative drug delivery systems.
In the intestines the lymphatic system plays an essential role in the absorption of long-
chain fatty acids, triglycerides, cholesterol esters, lipid soluble vitamins, and highly lipophilic
xenobiotics (A2.2). Consequently, targeting the drug delivery to the lymphatic system is
advantageous in terms of increasing bioavailability (bypass of first-pass metabolism in the liver)
thus reducing the dose, decreasing potential DDIs, and the ability to target diseases that spread

312
through this system, such as certain types of cancer and human immunodeficiency virus (A2.3-
A2.9).
The absorption of highly lipophilic compounds through the lymphatics is very likely to
occur similarly to the intestinal lipid transport system. Briefly, lipids are hydrolysed in the
stomach and small intestine to the corresponding monoglyceride and fatty acid, which are
absorbed into the enterocyte and re-esterified into triglyceride. These are then ‘packaged’ into
intestinal lipoproteins, known as chylomicrons (CM), which are finally secreted into the lymph
and then to the blood (A2.10).
In order to target this route, lipid-based formulations can be applied. Due to their lipidic
content, such formulations stimulate the production of CM in the enterocytes. During this
process, lipophilic drugs enter the lymphatic system in association with the triglyceride core of
the formed CM and eventually reach the systemic circulation. Alternatively, the delivery system
itself can mimic a CM, and hence be transported through the lymphatic system (A2.11). In light
of the increasing trend towards highly potent, lipophilic drug candidates, exploring the lymphatic
route is becoming more and more attractive, which is evidenced by the exponential increase in
the number of studies on lipid-based delivery systems. Hence, the aim of this study is to develop
an oral nanostructured lipid carrier for Terbinafine with lymphotropic ingredients to increase the
lymphatic uptake of Terbinafine.
Methods and results
Selection of Liquid and Solid Lipids
The solubility of Terbinafine HCl was assessed in various liquid lipids using the shake
flask method. Briefly: Each medium (5ml) was saturated with the pure drug powder and there

313
was no mixture of media. The flasks were shaken for 72 hours at room temperature to assure
equilibrium. Samples from each medium (Labrasol, Oleic Acid, Castor Oil, Peceol and Maisine)
were centrifuged and the supernatant was diluted, and the saturation solubility was assessed
through UV-Spectroscopy (Table 1).
Table 1. Solubility of Terbinafine HCl in liquid lipids Labrasol Oleic Acid Castor Oil Peceol Maisine
Solubility (mg/g)
9.698 5.963 5.668 14.165 18.275
SD 0.030 0.074 0.308 3.637 2.377
Drug solubility in solid lipids was carried out by using Differential Scanning Calorimeter.
Terbinafine HCl thermal behavior and solid lipids and 1:1 physical mixtures (PM) were
characterized in a DSC (Perkin Elmer) cell (Perkin Elmer Corp., Norwalk, CT, USA), under a
dynamic N2 atmosphere (50 mL⋅min−1), using sealed aluminum capsules with about 2 mg of
samples. DSC curves were obtained at a heating rate of 10∘C min−1 in the temperature range
from 25 to 290∘C. An empty sealed pan was used as a reference.
The crystallinity indexes (CI) were calculated in percentage according to the following equation
and are presented in Table 2:
𝐶𝐼 (%) =ΔH Terb PM ∗ D
ΔH Terb 100%∗ 100
where ΔH Terb PM is the enthalpy of fusion (J⋅g−1) of Terbinafine HCl in the binary physical
mixture of the drug and solid lipid. ΔH Terb 100% is the enthalpy of fusion (J⋅g−1) of pure drug.
𝐷 is the dilution of Terbinafine in the PM, for example, 1:1: dilution of 2.
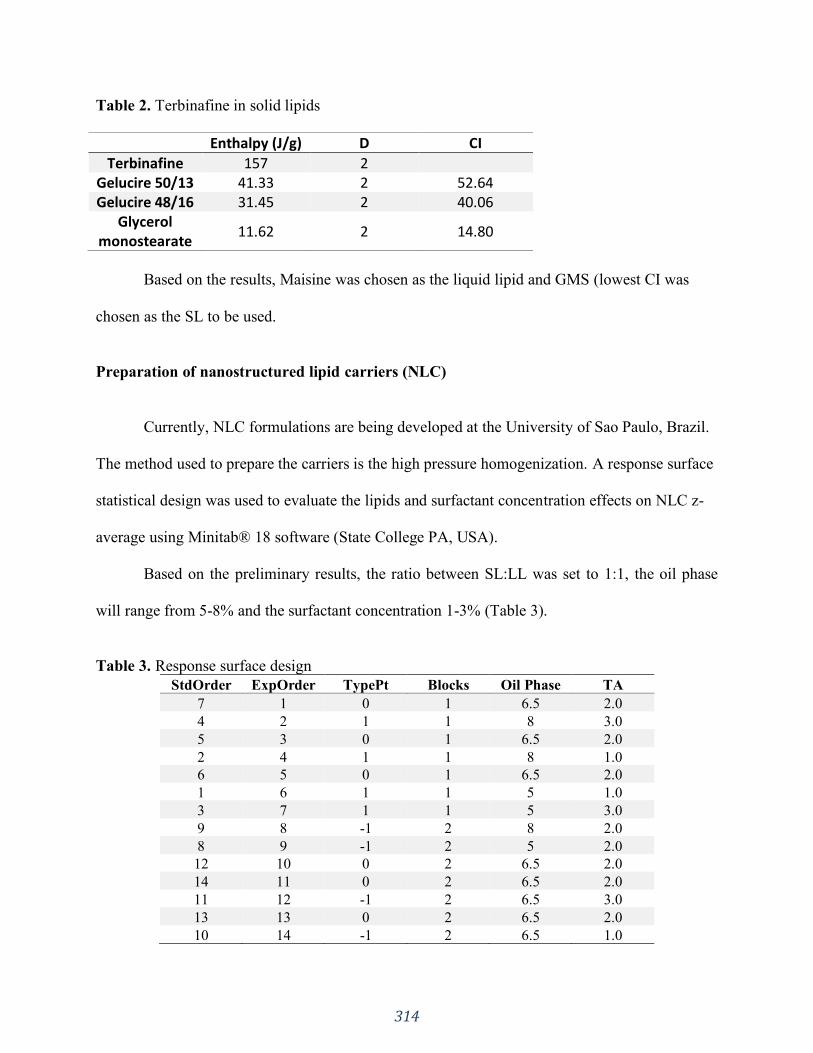
314
Table 2. Terbinafine in solid lipids
Enthalpy (J/g) D CI
Terbinafine 157 2
Gelucire 50/13 41.33 2 52.64 Gelucire 48/16 31.45 2 40.06
Glycerol monostearate
11.62 2 14.80
Based on the results, Maisine was chosen as the liquid lipid and GMS (lowest CI was
chosen as the SL to be used.
Preparation of nanostructured lipid carriers (NLC)
Currently, NLC formulations are being developed at the University of Sao Paulo, Brazil.
The method used to prepare the carriers is the high pressure homogenization. A response surface
statistical design was used to evaluate the lipids and surfactant concentration effects on NLC z-
average using Minitab® 18 software (State College PA, USA).
Based on the preliminary results, the ratio between SL:LL was set to 1:1, the oil phase
will range from 5-8% and the surfactant concentration 1-3% (Table 3).
Table 3. Response surface design
StdOrder ExpOrder TypePt Blocks Oil Phase TA
7 1 0 1 6.5 2.0
4 2 1 1 8 3.0
5 3 0 1 6.5 2.0
2 4 1 1 8 1.0
6 5 0 1 6.5 2.0
1 6 1 1 5 1.0
3 7 1 1 5 3.0
9 8 -1 2 8 2.0
8 9 -1 2 5 2.0
12 10 0 2 6.5 2.0
14 11 0 2 6.5 2.0
11 12 -1 2 6.5 3.0
13 13 0 2 6.5 2.0
10 14 -1 2 6.5 1.0
315
References
A2.1. Porter, C. J. H. & Charman, W. N. Uptake of drugs into the intestinal lymphatics after oral
administration. Adv. Drug Deliv. Rev. 25, 71–89 (1997).
A2.2. Khan, A. A., Mudassir, J., Mohtar, N. & Darwis, Y. Advanced drug delivery to the
lymphatic system: Lipid-based nanoformulations. Int. J. Nanomedicine 8, 2733–2744 (2013).
A2.3. Zgair, A. et al. Oral administration of cannabis with lipids leads to high levels of
cannabinoids in the intestinal lymphatic system and prominent immunomodulation. Sci. Rep. 7,
1–12 (2017).
A2.4. Attili-Qadri, S. et al. Oral delivery system prolongs blood circulation of docetaxel
nanocapsules via lymphatic absorption. Proc. Natl. Acad. Sci. U. S. A. 110, 17498–17503 (2013).
A2.5. Bhalekar, M. R. et al. In-vivo bioavailability and lymphatic uptake evaluation of lipid
nanoparticulates of darunavir. Drug Deliv. 23, 2581–2586 (2016).
A2.6. Gao, F. et al. Nanoemulsion improves the oral absorption of candesartan cilexetil in rats:
Performance and mechanism. J. Control. Release 149, 168–174 (2011).
A2.7. Makwana, V., Jain, R., Patel, K., Nivsarkar, M. & Joshi, A. Solid lipid nanoparticles
(SLN) of Efavirenz as lymph targeting drug delivery system: Elucidation of mechanism of
uptake using chylomicron flow blocking approach. Int. J. Pharm. 495, 439–446 (2015).
A2.8. Mishra, A., Vuddanda, P. R. & Singh, S. Intestinal lymphatic delivery of praziquantel by
solid lipid nanoparticles: Formulation design, in vitro and in vivo studies. J. Nanotechnol. 2014,
(2014).
A2.9. Sitrin, M. D., Pollack, K. L., Bolt, M. J. G. & Rosenberg, I. H. Comparison of vitamin D
and 25-hydroxyvitamin D absorption in the rat. Am. J. Physiol. - Gastrointest. Liver Physiol. 5,
(1982).
A2.10. O’Driscoll, C. M. Lipid-based formulations for intestinal lymphatic delivery. Eur. J.
Pharm. Sci. 15, 405–415 (2002).
A2.11. Hussain, M. M. A proposed model for the assembly of chylomicrons. Atherosclerosis
148, 1–15 (2000).
316
APPENDIX 3: Phytocannabinoid drug-drug interactions and their
clinical implications
A version of this chapter is published in:
Pharmacology & Therapeutics. 2020 Jun 30:107621.
https://doi.org/10.1016/j.pharmthera.2020.107621
317
1. INTRODUCTION
Cannabis is a plant with a long history of human pharmacological use, both for
recreational purposes and as a medicinal remedy (Balabanova, Parsche, & Pirsig, 1992; ElSohly
& Slade, 2005; Grotenhermen, 2007; Hazekamp & Grotenhermen, 2010; Liskow, 1973; Raharjo
& Verpoorte, 2004; Sharma, Murthy, & Bharath, 2012). Its two major chemical constituents are
cannabidiol (CBD), the definitive structure of which was reported in 1963 (Mechoulam & Shvo,
1963) and Δ-9-trans-tetrahydrocannabinol (THC) which was elucidated in the following year
(Gaoni & Mechoulam, 1964). These early discoveries opened the way for exploration of many
similar plant-specific compounds which were ultimately termed collectively as
“phytocannabinoids” (Pate, 1999), to differentiate them from the endogenous
“endocannabinoids” discovered during the 1990s (Mechoulam, Hanus, Pertwee, & Howlett,
2014). The most important psychoactive phytocannabinoid is THC, usually accompanied by
varying amounts of CBD, a relatively non-psychoactive compound which is able to modulate
some of the psychotropic effects of THC (Eichler et al., 2012). THC is useful for several clinical
indications, such as pain management, and as an antiemetic, antispasmodic and appetite
stimulant (Clark, Ware, Yazer, Murray, & Lynch, 2004; Eichler et al., 2012; ElSohly, 2002;
ElSohly & Slade, 2005; Furler, Einarson, Millson, Walmsley, & Bendayan, 2004; Russo, 2001,
2002; Tramer et al., 2001; Ware, Adams, & Guy, 2005; Wood, 2004). The use of high-THC
content cannabis for glaucoma and asthma has been suggested (Appendino, Chianese, &
Taglialatela-Scafati, 2011; Sharma et al., 2012) and the whole plant extract (as Epidiolex®) of a
high-CBD Cannabis variety has recently been approved (FDANewsRelease, 2018; Gaston &
Friedman, 2017; Koltai, Poulin, & Namdar, 2019) by the United States Food and Drug
Administration (U.S. FDA) for application to certain forms of epilepsy.

318
Currently, there exist several cannabis inspired or based commercial pharmaceutical
products for a range of medical indications. Dronabinol is synthetic THC and has been sold for
decades as the pharmaceutical product Marinol®. It is indicated to ameliorate anorexia in
patients with AIDS, and for the treatment of nausea and vomiting in cancer chemotherapy
patients not responding to conventional antiemetic treatments (Dronabinol, 2019; Rong et al.,
2018). Nabilone is a synthetic analog of THC which is marketed as the pharmaceutical product
Cesamet®. Although distinct in molecular structure from THC, nabilone mimics THC
pharmacological activity and is approved by the U.S. FDA for treatment of the same indications
(Nabilone, 2019). Sativex® (generically known as “nabiximols”) is a whole plant extract derived
from Cannabis which is used for the treatment of neuropathic pain originating from multiple
sclerosis, and for intractable cancer pain. It is marketed as an oro-mucosal pump spray having a
1:1 ratio of THC:CBD (Nabiximols, 2019; Rong et al., 2018). Many other potential applications
for cannabis have been proposed, and are currently under investigation (Medical Cannabis, 2019;
Sharma et al., 2012; Zou & Kumar, 2018).
The rich chemical content of the Cannabis plant (more than 400 compounds) illustrates
the possibility of a wide range of pharmacological applications (Sharma et al., 2012), as well as
many possible interactions. The most well-known and most specific class of these compounds is
the C21/22 terpenophenolic phytocannabinoids (ElSohly & Slade, 2005; Mechoulam & Gaoni,
1967). These compounds are classified according to their molecular structure into several types,
for which THC, CBD, cannabichromene (CBC), cannabigerol (CBG) and their homologues are
representative.
Interestingly, in fresh Cannabis plant extracts, these terpenophenolic phytocannabinoids
per se are not abundantly present, but rather found mostly as their 2-carboxy form (Figure A.1),
319
which are the only demonstrated biogenetic compounds. Of these, Δ-9-trans-
tetrahydrocannabinolic acid (THCA) represents the majority of the collective total
phytocannabinoids contained within tropically derived plants, which accumulate mainly on the
flowers (exceeding a dry weight content of 20% in some recreational varieties) and leaves, and
apparently serve plant protective functions (Moreno-Sanz, 2016; Pate, 1994). Cannabidiolic acid
(CBDA) is predominant (at more than 10% by dry weight in a few medical strains) in plants
from temperate regions. Neither compound is psychoactive per se, but both of these carboxylated
compounds can be transformed into THC and CBD, respectively, through a degradative process
which occurs slowly upon storage, but rapidly upon heating (Grotenhermen, 2003; Moreno-Sanz,
2016). Under field conditions, and with mild processing and cold storage, the extent of this
decarboxylation is only nominal (~2–5%), which means that more carboxylic acid than phenolic
forms are to be found in the oral fluid, serum, and urine of raw cannabis medical consumers
(Dussy, Hamberg, Luginbühl, Schwerzmann, & Briellmann, 2005; Jung, Kempf, Mahler, &
Weinmann, 2007; Moore, Rana, & Coulter, 2007; Moreno-Sanz, 2016). However, substantial to
complete in situ decarboxylation occurs under the conditions of smoking or in baked goods.
Additionally, THC can be oxidized to cannabinol (CBN) via prolonged exposure to heat,
oxygen and light (Russo, 2011). Hence, the presence of CBN indicates that a specimen is old,
although most THC loss is due to the formation of polymers. The reported (Russo, 2011)
pharmacological effect of CBN is mainly sedative, but this compound may also have application
as an antibacterial, and may possibly decrease keratinocytes in cases of psoriasis.
Cannabichromenic acid (CBCA) is usually the third most abundant biogenetic
phytocannabinoid in the Cannabis plant (McPartland & Russo, 2001), but that rank varies
according to plant latitudinal origin, often being more abundant than CBDA in tropical
320
specimens. As its decarboxylated form, CBC appears to potentiate some THC effects in vivo and
has modest anti-nociceptive and anti-inflammatory effects (Hatoum, Davis, Elsohly, & Turner,
1981). Even though very little is known about its pharmacology, CBC has been shown to have
the potential to stimulate the growth of brain cells and the ability to normalize gastrointestinal
hypermotility (Aizpurua-Olaizola et al., 2016).
Least observed in the Cannabis plant is cannabigerolic acid (CBGA), the original
biogenetic phytocannabinoid which metabolically yields CBDA, CBCA and THCA via their
respective synthases (De Meijer & Hammond, 2005). Decarboxylation of the acid form (Wang et
al., 2016) yields CBG, which has been shown to have anti-inflammatory, antibiotic and
antifungal properties (Moreno-Sanz, 2016) and inhibits the growth of human oral epithelioid
carcinoma cells (Baek et al., 1998). CBG has also been shown to have promising potential for
the treatment of glaucoma, prostate carcinoma and inflammatory bowel disease (Aizpurua-
Olaizola et al., 2016).
The aforementioned phytocannabinoids have a pentyl side-chain, but traces of methyl
(Vree, Breimer, van Ginneken, & van Rossum, 1972) and minor amounts of propyl (De Meijer
& Hammond, 2005) homologues also occur. The propyl homologues of CBD and THC, named
cannabidivarin (CBDV) and -9-trans-tetrahydrocannabivarin (THCV) respectively, are present
in the plant at various ratios, depending on the specific Cannabis variety (Deiana et al., 2012).
These compounds have not yet been studied as extensively as the other phytocannabinoids, but
research shows that both THCV and CBDV may have therapeutic potential for reducing nausea
(Rock, Sticht, Duncan, Stott, & Parker, 2013). Additionally, CBDV may have potential for the
treatment of neuronal hyperexcitability, whereas THCV improves insulin sensitivity in obesity
mouse models (Iannotti et al., 2014; Wargent et al., 2013). As little is known about these
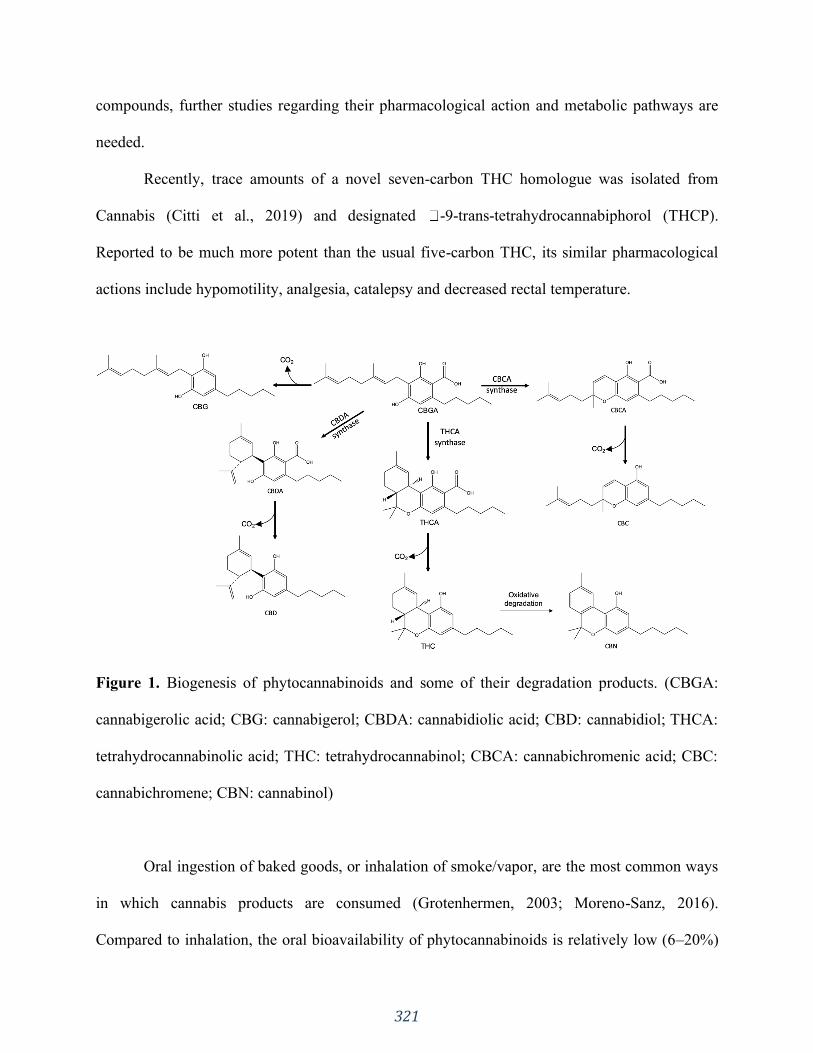
321
compounds, further studies regarding their pharmacological action and metabolic pathways are
needed.
Recently, trace amounts of a novel seven-carbon THC homologue was isolated from
Cannabis (Citti et al., 2019) and designated -9-trans-tetrahydrocannabiphorol (THCP).
Reported to be much more potent than the usual five-carbon THC, its similar pharmacological
actions include hypomotility, analgesia, catalepsy and decreased rectal temperature.
Figure 1. Biogenesis of phytocannabinoids and some of their degradation products. (CBGA:
cannabigerolic acid; CBG: cannabigerol; CBDA: cannabidiolic acid; CBD: cannabidiol; THCA:
tetrahydrocannabinolic acid; THC: tetrahydrocannabinol; CBCA: cannabichromenic acid; CBC:
cannabichromene; CBN: cannabinol)
Oral ingestion of baked goods, or inhalation of smoke/vapor, are the most common ways
in which cannabis products are consumed (Grotenhermen, 2003; Moreno-Sanz, 2016).
Compared to inhalation, the oral bioavailability of phytocannabinoids is relatively low (6–20%)

322
due to a high first-pass metabolism within the liver (Ohlsson et al., 1980; Wall, Sadler, Brine,
Taylor, & Perez-Reyes, 1983). Unlike inhaled phytocannabinoids, onset of psychoactive effects
via oral ingestion is slow and varies from 30 minutes to occasionally over 2 hours (Eichler et al.,
2012), with the duration of action being more prolonged. This is due to the usually larger dose
administered, slow gastro-intestinal absorption, and continued gut reabsorption (Eichler et al.,
2012; Garrett & Hunt, 1977; Hollister et al., 1981; Lemberger et al., 1972; Ohlsson et al., 1980).
As mainstream use of cannabis grows, it is increasingly important to understand
phytocannabinoid disposition within the human body, and especially its metabolic pathways. In a
generic sense, the metabolic pathways operate under two broad categories: Phase I and Phase II.
Phase I reactions include oxidation, reduction and hydrolysis, which increase the molecule’s
hydrophilicity. Phase II metabolism involves conjugation reactions with endogenous hydrophilic
compounds to either increase water solubility or inhibit pharmacological activity (Kirchmair et
al., 2015, 2013; Tyzack & Glen, 2014; Tyzack & Kirchmair, 2019). These reactions include
glucuronidation, sulfation, amino acid conjugation, acetylation, methylation and glutathione
conjugation. Even though the complex metabolism of phytocannabinoids poses many challenges,
a more thorough understanding generates many opportunities, especially with regard to the
investigation (Testa, Pedretti, & Vistoli, 2012) of possible drug-drug interactions (DDIs).
DDIs can lead to adverse drug reactions, with loss of, or increase in, efficacy due to
altered systemic exposure. Therefore, as variations in drug response of the co-administered drugs
can occur, it is important to evaluate potential drug interactions prior to market approval, as well
as during the post-approval marketing period (Izzo et al., 2012). Consideration of these factors,
combined with an increasing frequency of polypharmacy, has led regulatory agencies such as the
U.S. FDA and the European Medicines Agency (EMA) to issue guidelines for industry to
323
investigate the potential DDIs of new molecular entities. Guidance for studies of clinical drug
interactions, in vitro metabolism, and transporter-mediated DDIs, as well as in silico analyses of
DDIs, have been published (Prueksaritanont et al., 2013).
The application of in silico modelling and simulation within drug development is rapidly
increasing in the R&D sector of the pharmaceutical industry (Duque et al., 2018; Silva, Duque,
Davies, Löbenberg, & Ferraz, 2018). It has been suggested (Rostami-Hodjegan & Tucker, 2007)
that such an approach could potentially represent up to 15% of R&D expenditures in the next 5–
10 years. The in silico approach can be applied to all stages of the drug discovery and
development process, from predicting the molecular properties of lead compounds to simulating
clinical trials (Rostami-Hodjegan & Tucker, 2007). Within the context of metabolism prediction,
in silico tools are most commonly used for predicting substrates and inhibitors of metabolic
enzymes, sites of metabolism, and the structures of probable metabolites. These predictions can
assist optimizations during the drug discovery process, helping to identify metabolic stability
issues, in vivo half-lives and potentially toxic metabolites (Tyzack & Kirchmair, 2019).
Furthermore, understanding the individual cytochrome P450 (CYP) isoform specificities of a
given molecule can help to predict enzyme inhibitions and DDIs.
Phase I and Phase II enzymes are located in the endoplasmic reticulum of hepatocytes,
hence that is where metabolic reactions such as Phase I hydroxylation by CYPs and Phase II
glucuronidation occur (Elmes et al., 2019). Since phytocannabinoids are highly lipophilic
molecules, a mechanism to facilitate their cytoplasmic transport from the cell membrane to the
intracellular metabolic enzymes is needed (Morales, Hurst, & Reggio, 2017). It has been
postulated that such trafficking is accomplished through soluble carrier proteins that cross the
aqueous environments of the cytosol (Elmes et al., 2015, 2019; Huang et al., 2016).
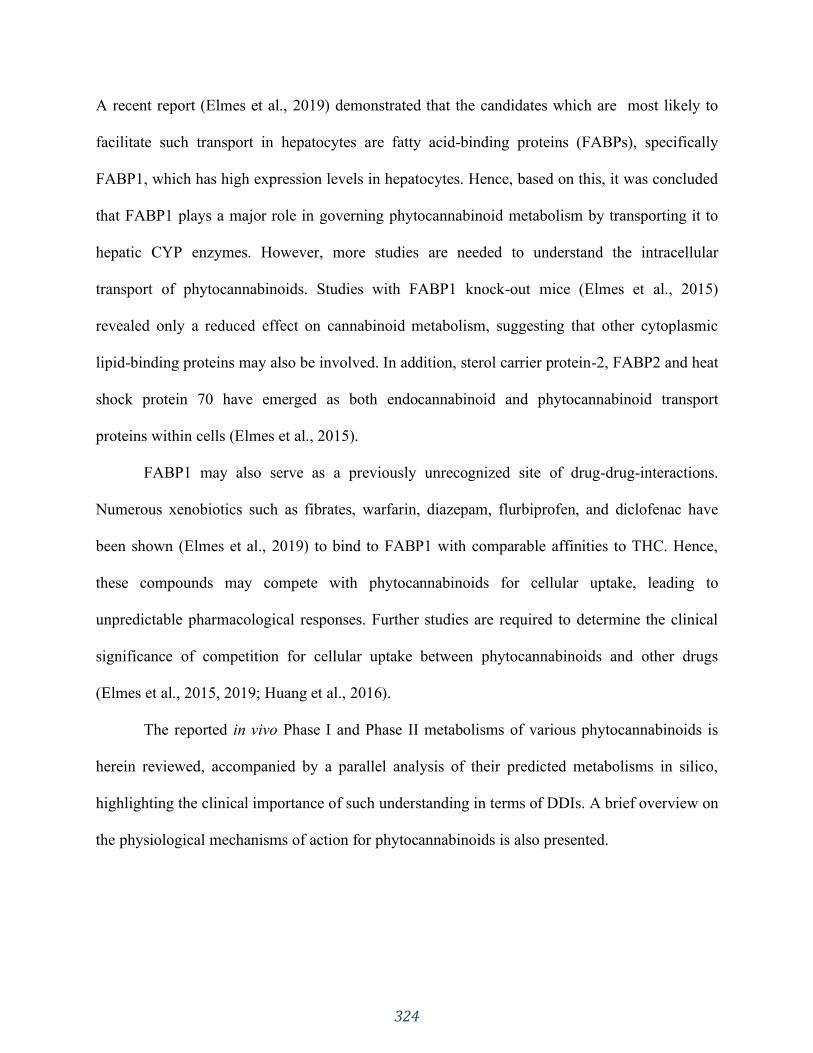
324
A recent report (Elmes et al., 2019) demonstrated that the candidates which are most likely to
facilitate such transport in hepatocytes are fatty acid-binding proteins (FABPs), specifically
FABP1, which has high expression levels in hepatocytes. Hence, based on this, it was concluded
that FABP1 plays a major role in governing phytocannabinoid metabolism by transporting it to
hepatic CYP enzymes. However, more studies are needed to understand the intracellular
transport of phytocannabinoids. Studies with FABP1 knock-out mice (Elmes et al., 2015)
revealed only a reduced effect on cannabinoid metabolism, suggesting that other cytoplasmic
lipid-binding proteins may also be involved. In addition, sterol carrier protein-2, FABP2 and heat
shock protein 70 have emerged as both endocannabinoid and phytocannabinoid transport
proteins within cells (Elmes et al., 2015).
FABP1 may also serve as a previously unrecognized site of drug-drug-interactions.
Numerous xenobiotics such as fibrates, warfarin, diazepam, flurbiprofen, and diclofenac have
been shown (Elmes et al., 2019) to bind to FABP1 with comparable affinities to THC. Hence,
these compounds may compete with phytocannabinoids for cellular uptake, leading to
unpredictable pharmacological responses. Further studies are required to determine the clinical
significance of competition for cellular uptake between phytocannabinoids and other drugs
(Elmes et al., 2015, 2019; Huang et al., 2016).
The reported in vivo Phase I and Phase II metabolisms of various phytocannabinoids is
herein reviewed, accompanied by a parallel analysis of their predicted metabolisms in silico,
highlighting the clinical importance of such understanding in terms of DDIs. A brief overview on
the physiological mechanisms of action for phytocannabinoids is also presented.
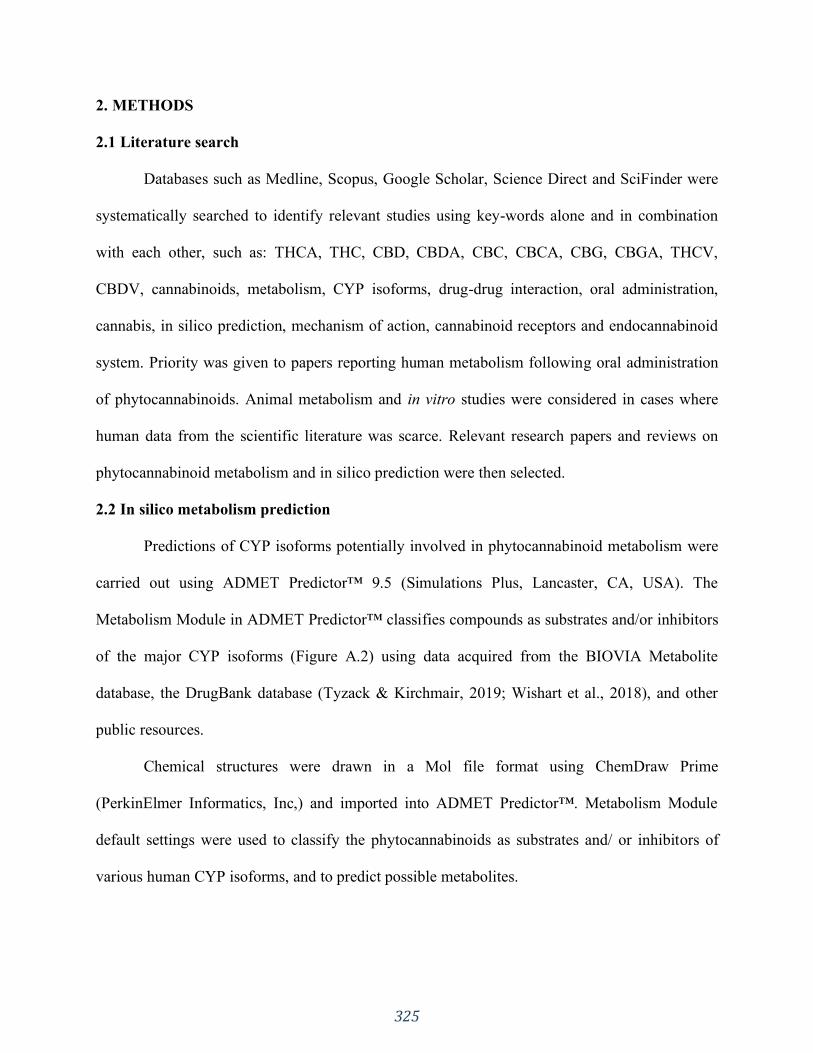
325
2. METHODS
2.1 Literature search
Databases such as Medline, Scopus, Google Scholar, Science Direct and SciFinder were
systematically searched to identify relevant studies using key-words alone and in combination
with each other, such as: THCA, THC, CBD, CBDA, CBC, CBCA, CBG, CBGA, THCV,
CBDV, cannabinoids, metabolism, CYP isoforms, drug-drug interaction, oral administration,
cannabis, in silico prediction, mechanism of action, cannabinoid receptors and endocannabinoid
system. Priority was given to papers reporting human metabolism following oral administration
of phytocannabinoids. Animal metabolism and in vitro studies were considered in cases where
human data from the scientific literature was scarce. Relevant research papers and reviews on
phytocannabinoid metabolism and in silico prediction were then selected.
2.2 In silico metabolism prediction
Predictions of CYP isoforms potentially involved in phytocannabinoid metabolism were
carried out using ADMET Predictor™ 9.5 (Simulations Plus, Lancaster, CA, USA). The
Metabolism Module in ADMET Predictor™ classifies compounds as substrates and/or inhibitors
of the major CYP isoforms (Figure A.2) using data acquired from the BIOVIA Metabolite
database, the DrugBank database (Tyzack & Kirchmair, 2019; Wishart et al., 2018), and other
public resources.
Chemical structures were drawn in a Mol file format using ChemDraw Prime
(PerkinElmer Informatics, Inc,) and imported into ADMET Predictor™. Metabolism Module
default settings were used to classify the phytocannabinoids as substrates and/ or inhibitors of
various human CYP isoforms, and to predict possible metabolites.

326
Figure 2. Simplified scheme of simulations using default settings in ADMET Predictor™
(Metabolism Module). OATP: Organic-anion-transporting polypeptides; OCT: Organic cation
transporter, P-gp: P-glycoprotein.
3. RESULTS & DISCUSSION
3.1 Mechanisms of action
The first breakthrough for understanding the THC mechanism of action was in the late
1980s, with the discovery of a cannabinoid receptor in rat brain (Devane, Dysarz, Johnson,
Melvin, & Howlett, 1988), now known as the cannabinoid receptor 1 (CB1). Receptors are
generally activated by endogenous molecules, hence, there was a strong motivation to identify
endogenous cannabinoids. The isolation and molecular structure determination of “anandamide”
(an endogenous natural ligand of cannabinoid receptors) was this second ground-breaking
discovery (Devane, Hanus, et al., 1992), followed by the description of SR141716A as the first
CB1-specific antagonist (Rinaldi-Carmona et al., 1994). Shortly thereafter, 2-arachidonoyl
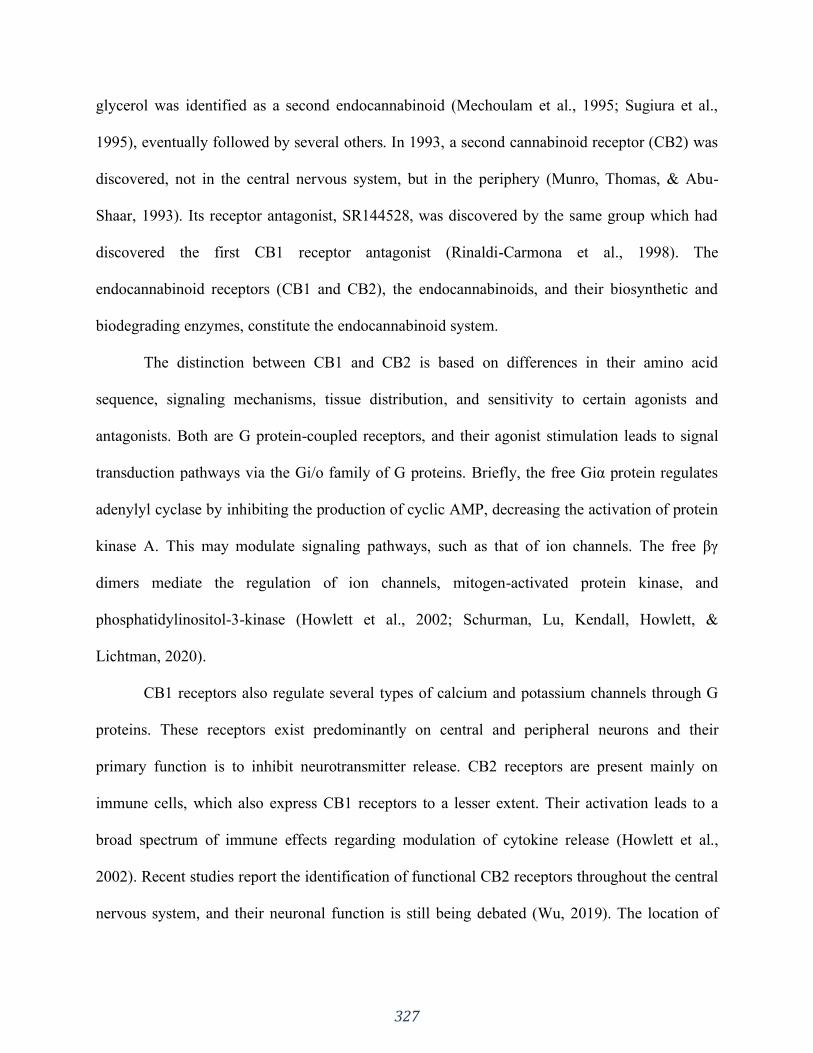
327
glycerol was identified as a second endocannabinoid (Mechoulam et al., 1995; Sugiura et al.,
1995), eventually followed by several others. In 1993, a second cannabinoid receptor (CB2) was
discovered, not in the central nervous system, but in the periphery (Munro, Thomas, & Abu-
Shaar, 1993). Its receptor antagonist, SR144528, was discovered by the same group which had
discovered the first CB1 receptor antagonist (Rinaldi-Carmona et al., 1998). The
endocannabinoid receptors (CB1 and CB2), the endocannabinoids, and their biosynthetic and
biodegrading enzymes, constitute the endocannabinoid system.
The distinction between CB1 and CB2 is based on differences in their amino acid
sequence, signaling mechanisms, tissue distribution, and sensitivity to certain agonists and
antagonists. Both are G protein-coupled receptors, and their agonist stimulation leads to signal
transduction pathways via the Gi/o family of G proteins. Briefly, the free Giα protein regulates
adenylyl cyclase by inhibiting the production of cyclic AMP, decreasing the activation of protein
kinase A. This may modulate signaling pathways, such as that of ion channels. The free βγ
dimers mediate the regulation of ion channels, mitogen-activated protein kinase, and
phosphatidylinositol-3-kinase (Howlett et al., 2002; Schurman, Lu, Kendall, Howlett, &
Lichtman, 2020).
CB1 receptors also regulate several types of calcium and potassium channels through G
proteins. These receptors exist predominantly on central and peripheral neurons and their
primary function is to inhibit neurotransmitter release. CB2 receptors are present mainly on
immune cells, which also express CB1 receptors to a lesser extent. Their activation leads to a
broad spectrum of immune effects regarding modulation of cytokine release (Howlett et al.,
2002). Recent studies report the identification of functional CB2 receptors throughout the central
nervous system, and their neuronal function is still being debated (Wu, 2019). The location of
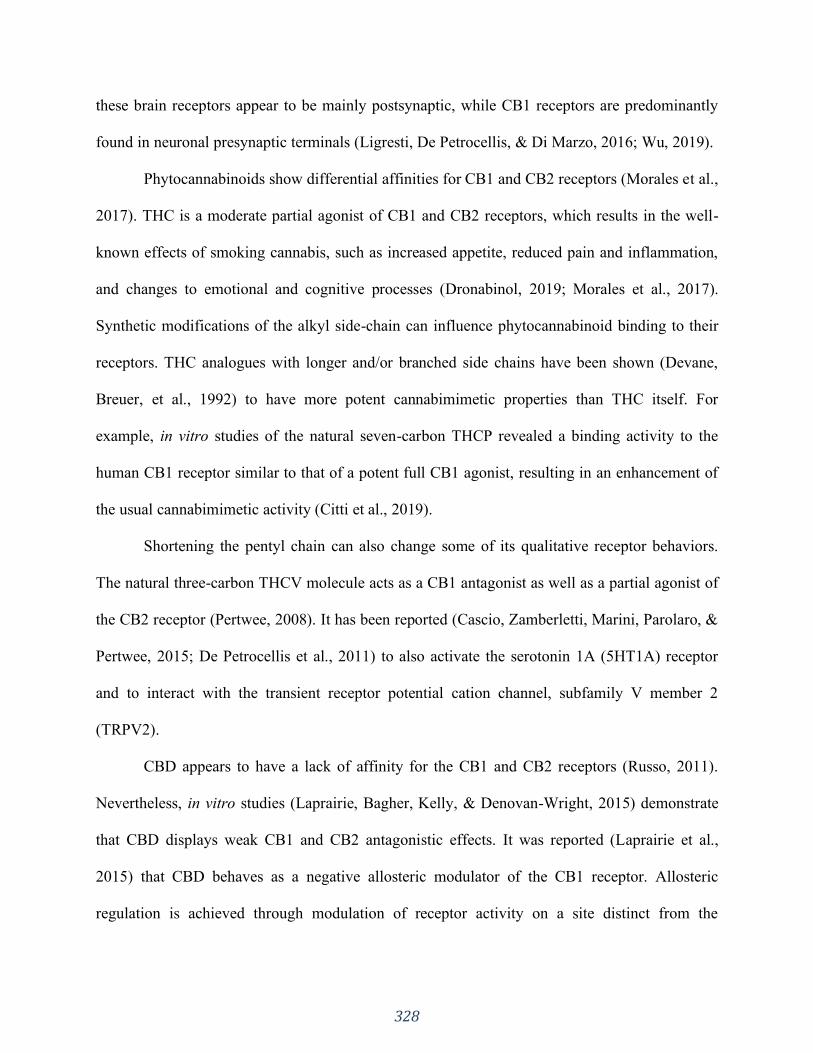
328
these brain receptors appear to be mainly postsynaptic, while CB1 receptors are predominantly
found in neuronal presynaptic terminals (Ligresti, De Petrocellis, & Di Marzo, 2016; Wu, 2019).
Phytocannabinoids show differential affinities for CB1 and CB2 receptors (Morales et al.,
2017). THC is a moderate partial agonist of CB1 and CB2 receptors, which results in the well-
known effects of smoking cannabis, such as increased appetite, reduced pain and inflammation,
and changes to emotional and cognitive processes (Dronabinol, 2019; Morales et al., 2017).
Synthetic modifications of the alkyl side-chain can influence phytocannabinoid binding to their
receptors. THC analogues with longer and/or branched side chains have been shown (Devane,
Breuer, et al., 1992) to have more potent cannabimimetic properties than THC itself. For
example, in vitro studies of the natural seven-carbon THCP revealed a binding activity to the
human CB1 receptor similar to that of a potent full CB1 agonist, resulting in an enhancement of
the usual cannabimimetic activity (Citti et al., 2019).
Shortening the pentyl chain can also change some of its qualitative receptor behaviors.
The natural three-carbon THCV molecule acts as a CB1 antagonist as well as a partial agonist of
the CB2 receptor (Pertwee, 2008). It has been reported (Cascio, Zamberletti, Marini, Parolaro, &
Pertwee, 2015; De Petrocellis et al., 2011) to also activate the serotonin 1A (5HT1A) receptor
and to interact with the transient receptor potential cation channel, subfamily V member 2
(TRPV2).
CBD appears to have a lack of affinity for the CB1 and CB2 receptors (Russo, 2011).
Nevertheless, in vitro studies (Laprairie, Bagher, Kelly, & Denovan-Wright, 2015) demonstrate
that CBD displays weak CB1 and CB2 antagonistic effects. It was reported (Laprairie et al.,
2015) that CBD behaves as a negative allosteric modulator of the CB1 receptor. Allosteric
regulation is achieved through modulation of receptor activity on a site distinct from the

329
agonist/antagonist binding site (Laprairie et al., 2015). Additionally, there is evidence that CBD
activates 5-HT1A and TRPV1–2 vanilloid receptors, antagonizes alpha-1 adrenergic and µ-
opioid receptors, and inhibits the uptake of various neurotransmitters (e.g., noradrenaline,
dopamine, and serotonin) at the synaptic cleft. CBD has also been shown (Zhornitsky & Potvin,
2012) to inhibit the cellular uptake of anandamide and to inhibit the activity of fatty acid amide
hydrolase, the anandamide degrading enzyme.
CBDV is thought to modulate TRPV1, conferring its anti-epileptic activity (Iannotti et
al., 2014). It has also been shown to inhibit the activity of diacylglycerol lipase-α, which is
involved in the synthesis of the endocannabinoid 2-arachidonoylglycerol (Amada, Yamasaki,
Williams, & Whalley, 2013; Bisogno et al., 2003). The clinical implications of these actions are
unclear. Other phytocannabinoids under current investigation for anticonvulsant action include
CBD, THCV and THCA. Their anti-epileptic activity appears to be at sites other than
endocannabinoid receptors, such as modulation of TRPV receptors.
Although the cannabis-related fields of study have greatly expanded since the initial
discovery of the endocannabinoid receptor system and its ligands, there remains a great need to
enhance our understanding of the biochemistry and pharmacology of phytocannabinoids,
particularly as relevant to clinical applications.
3.2 Metabolic routes
3.2.1 Tetrahydrocannabinolic acid and tetrahydrocannabinol
THCA has no psychoactive effects in humans and does not seem to be converted
substantially to THC in vivo (Jung et al., 2009). Both THC and THCA undergo similar major
metabolic pathways: first, the 11-hydroxyl intermediate is formed, which is then oxidized to the
11-carboxylic metabolite (Moreno-Sanz, 2016) via a transient aldehyde. The parent compound

330
and metabolites are further conjugated with glucuronic acid and excreted into feces (65%) and
urine (20%) (Eichler et al., 2012; Huestis & Cone, 1998; Lemberger, Axelrod, & Kopin, 1971;
Sharma et al., 2012; Wall et al., 1983).
The metabolism of THCA in rats after oral administration has been examined (Jung et al.,
2009). Hydroxylation in position 11 to 11-hydroxy-Δ-9-tetrahydrocannabinolic acid (11-OH-
THCA) was identified, which was further oxidized to 11-nor-9-carboxy-Δ-9-
tetrahydrocannabinolic acid (THCA-COOH). Glucuronic acid conjugation was observed with the
parent compound and both main metabolites. THCA also undergoes a hydroxylation at position 8
to yield 8α-OH-THCA and 8β-OH-THCA, followed by dehydration (Figure A.3a).
The metabolism of THCA within human liver microsomes and via isolated CYP
isoenzymes has been investigated in vitro (Wohlfarth, 2013). In that study, THCA was incubated
with pooled human liver microsomes and with CYP isozymes 1A2, 2A6, 2B6, 2C8, 2C9, 2C19,
2D6, 2E1, 3A4 and 3A5. Mono- and di-hydroxylated metabolites were identified. A total of five
out of the ten isozymes showed no catalytic activity, namely CYP 1A2, 2A6, 2B6, 2D6, and 2E1.
The main enzymes involved in the metabolism of THCA were CYP2C9 and 3A4, while
CYP2C8, 2C19 and 3A5 only played a minor role. It was reported that CYP2C8 generated 8β-
OH-THCA and 8α-OH-THCA metabolites; CYP2C19 generated 8α-OH-THCA; CYP3A5
generated 8β-OH-THCA; CYP2C9 generated 11-OH-THCA and 8α-OH-THCA metabolites and
CYP3A4 generated both mono- and di-hydroxylated metabolites. The mono-hydroxylated
metabolites included 8β-OH-THCA and 11-OH-THCA. The di-hydroxylated metabolites
included 9,10-bis-OH-HHCA (9,10-bis-hydroxy-hexahydrocannabinolic acid) and 8,x-bis-OH-
THCA (one hydroxylation was not identified). The metabolites detected when incubating THCA
with human liver microsomes were 8β-OH-THCA, 8α-OH-THCA and unknown metabolites.

331
Interestingly, no 11-OH-THCA was found using the human liver microsome approach. The
study speculated that this may be due to a difference in enzyme density of the media, which is
higher in the heterologous expressed microsomes.
The metabolism of THC also takes place in the liver and potentially in the gut wall
(Eichler et al., 2012) and involves liver enzymes of the CYP complex (Bland, Haining, Tracy, &
Callery, 2005; Bornheim, Lasker, & Raucy, 1992; Halldin, Widman, Bahr, Lindgren, & Martin,
1982; Jung et al., 2009; Maurer, Sauer, & Theobald, 2006; Wall & Perez-Reyes, 1981;
Watanabe, Matsunaga, Yamamoto, Funae, & Yoshimura, 1995). 11-hydroxy-Δ-9-
tetrahydrocannabinol (11-OH-THC) is formed primarily by the CYP isoenzyme CYP2C9, and
this metabolite is further oxidized via a transient aldehyde to 11-nor-9-carboxy-Δ-9-
tetrahydrocannabinol (THC-COOH). After enzymatic glucuronidation of the carboxy function,
the conjugate (THC-COOH glucuronide) is excreted (Jung et al., 2009; Williams & Moffat,
1980) in the urine (Figure A.3b). Approximately 80-90% of the phytocannabinoid is excreted
within 5 days as hydroxylated and carboxylated metabolites (Goulle, Saussereau, & Lacroix,
2008; Sharma et al., 2012). Several other metabolites have been reported, such as those having
hydroxylation at C’1 to C’5 of the side-chain, hydroxylation in position eight (followed by
dehydration), and formation of an epoxide at C9–10 followed by hydrolysis or glutathione
conjugation. The formation of 8-hydroxy metabolites and the C9-10 epoxide have been reported
to be catalyzed by CYP3A4 (Bornheim et al., 1992; Halldin et al., 1982; Jung et al., 2009)
(Figure A.3b).
Most of these metabolites are conjugated with glucuronic acid, increasing their water
solubility. Among the major metabolites, THC-COOH (which has no psychotropic effects in
humans) is the primary glucuronide conjugate in urine, whereas its metabolic precursor 11-OH-

332
THC (a very psychoactive metabolite) is the predominant form in feces (Eichler et al., 2012;
Moreno-Sanz, 2016; Sharma et al., 2012). Very low excretion of unchanged drug is found in the
urine due to the high lipophilicity of THC, resulting in its reabsorption by the kidney (Eichler et
al., 2012).
Because of its high lipophilicity, THC is preferentially taken up by fatty tissues, and peak
concentrations are reached in 4–5 days (Ashton, 2001; Eichler et al., 2012). Due to this
accumulation, terminal elimination half-life of THC can be as long as 7 days, and complete
elimination of a single dose can take up to 30 days (Eichler et al., 2012; Maykut, 1985).
Metabolites have a much shorter half-life and therefore might serve as biomarkers for current
exposure.
Another factor influencing phytocannabinoid pharmacokinetics is the route of
administration. After smoking, a maximum THC plasma concentration was observed (Sharma et
al., 2012) at approximately 8 minutes, whereas 11-OH-THC peaked at 15 minutes and THC-
COOH at 81 minutes. THC concentrations rapidly decreased within 3-4 hours, and a slow
redistribution occurred from the deep fat deposits back into the blood stream (Haggerty, Deskin,
Kurtz, Fentiman, & Leighty, 1986; Hollister et al., 1981; Huestis, 2005; Sharma et al., 2012). In
contrast to inhalation, THC systemic absorption after oral ingestion is fairly slow, with
maximum plasma concentration being reached within 1-2 hours, but in rare cases may be
delayed by a few hours (Hollister et al., 1981; Lemberger et al., 1971; Sharma et al., 2012). Even
though THC oral bioavailability is reduced compared to the pulmonary route, due to extensive
first-pass liver metabolism, a much higher concentration of the more psychoactive 11-OH-THC
is produced after oral ingestion than by inhalation (Owens, McBay, Reisner, & Perez-Reyes,
1981; Sharma et al., 2012).
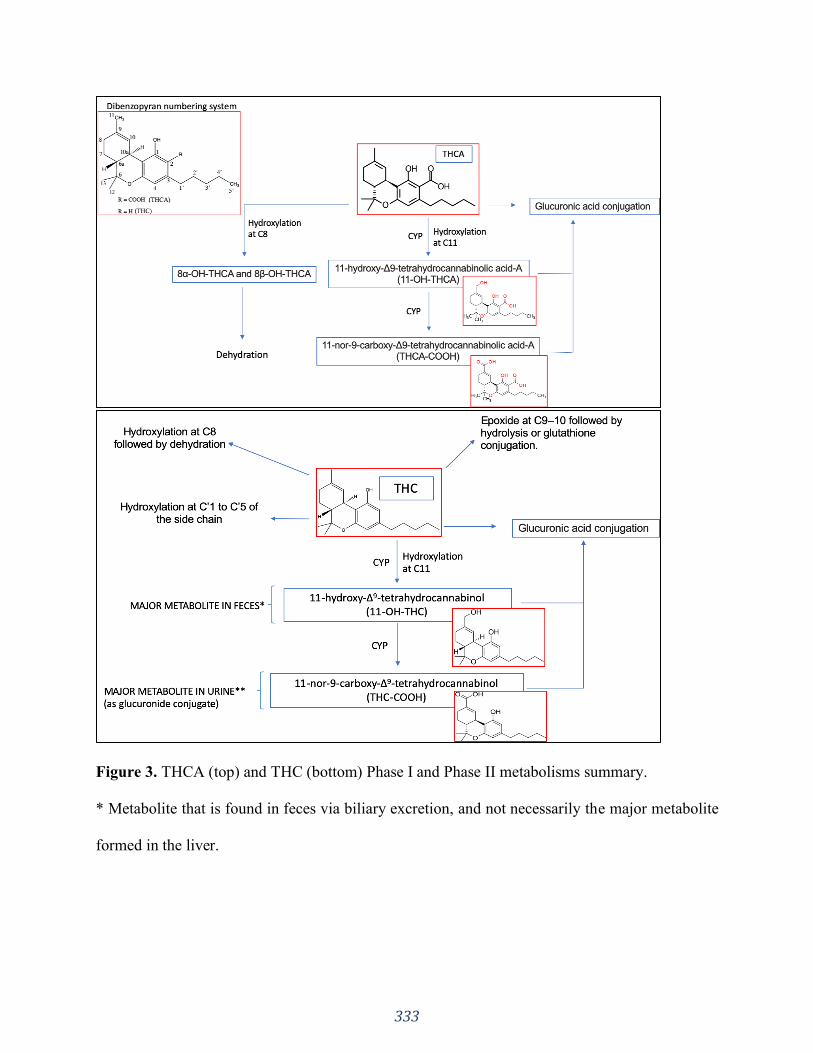
333
Figure 3. THCA (top) and THC (bottom) Phase I and Phase II metabolisms summary.
* Metabolite that is found in feces via biliary excretion, and not necessarily the major metabolite
formed in the liver.
334
** Urine metabolite excreted by the kidney, and not necessarily the major metabolite formed in
the liver. Glucuronides tend to make good substrates for excretion into the bile, but are often
broken down in the gut by glycosidases or, in the case of acyl glucuronides, spontaneously.
Data on animal or human THCV metabolism is very scarce. It has been suggested
(Elsohly, DeWit, Wachtel, Feng, & Murphy, 2001) that THCV would be metabolized in a
similar manner as THC, resulting in 11-carboxy-THCV. Nevertheless, it is controversial as to
whether or not its concentrations in urine would be enough to confirm cannabis consumption
(Elsohly et al. , 1999, 2001; Sedgwick, 2000).
3.2.2 Cannabidiol
Although CBD is not significantly psychoactive, a wide range of other pharmacological
effects have been reported for both the sole compound and for its combination with other drugs.
Similarly to THC, CBD is also the spontaneous degradation product of its biogenetic precursor
CBDA, which is decarboxylated upon heating (Ujvary & Hanuš, 2016) to form CBD (Figure
A.1).
CBD undergoes extensive Phase I metabolism, which results in low bioavailability across
species, and a complex pharmacokinetic disposition pattern. Studies in animals (i.e., rodents and
dog), indicate that a large portion of the administered CBD is excreted intact or as its
glucuronide (Harvey, 1991; Hawksworth & McArdle, 2004; Huestis, 2007; Huestis & Smith,
2014; Ujvary & Hanuš, 2016). Overall, the most abundant metabolites are hydroxylated 11-
COOH derivatives which are excreted either intact or as glucuronide conjugates (Ujváry &
Hanuš, 2016). As it is a good CYP substrate, CBD undergoes hydroxylation at multiple sites
followed by further oxidations, resulting in a complex metabolic pattern of multiple metabolites
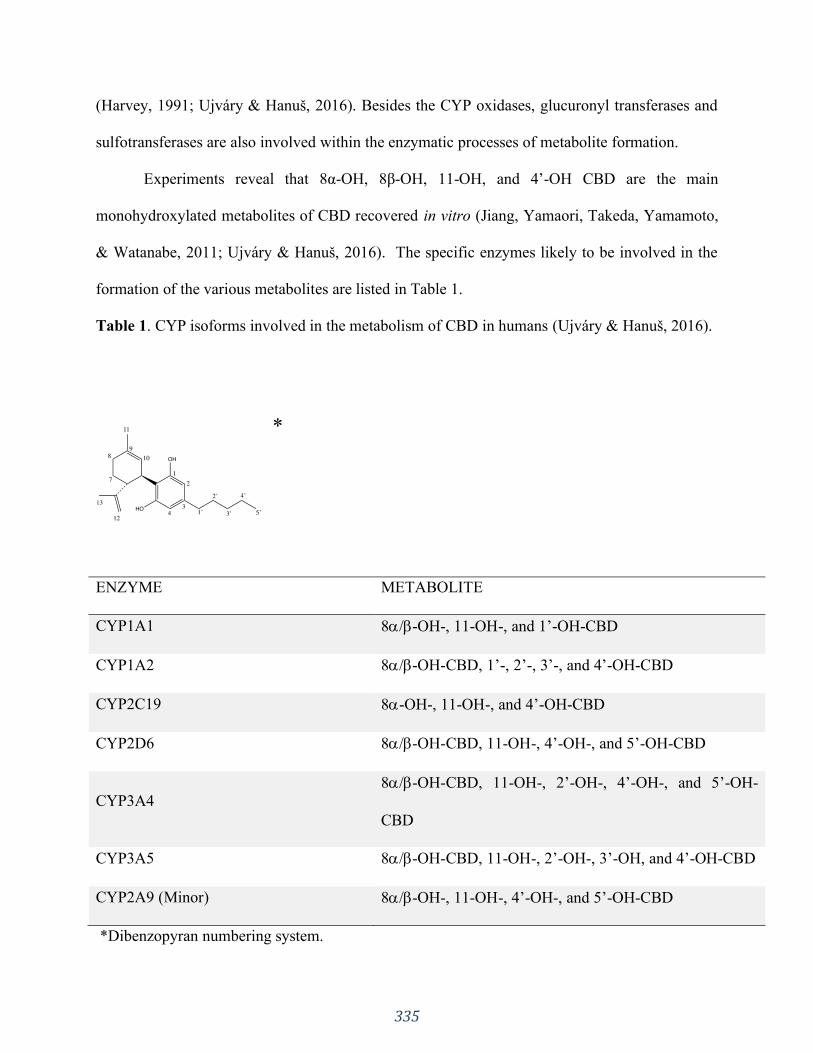
335
(Harvey, 1991; Ujvary & Hanuš, 2016). Besides the CYP oxidases, glucuronyl transferases and
sulfotransferases are also involved within the enzymatic processes of metabolite formation.
Experiments reveal that 8α-OH, 8β-OH, 11-OH, and 4’-OH CBD are the main
monohydroxylated metabolites of CBD recovered in vitro (Jiang, Yamaori, Takeda, Yamamoto,
& Watanabe, 2011; Ujvary & Hanuš, 2016). The specific enzymes likely to be involved in the
formation of the various metabolites are listed in Table 1.
Table 1. CYP isoforms involved in the metabolism of CBD in humans (Ujvary & Hanuš, 2016).
ENZYME METABOLITE
CYP1A1 8/-OH-, 11-OH-, and 1’-OH-CBD
CYP1A2 8/-OH-CBD, 1’-, 2’-, 3’-, and 4’-OH-CBD
CYP2C19 8-OH-, 11-OH-, and 4’-OH-CBD
CYP2D6 8/-OH-CBD, 11-OH-, 4’-OH-, and 5’-OH-CBD
CYP3A4
8/-OH-CBD, 11-OH-, 2’-OH-, 4’-OH-, and 5’-OH-
CBD
CYP3A5 8/-OH-CBD, 11-OH-, 2’-OH-, 3’-OH, and 4’-OH-CBD
CYP2A9 (Minor) 8/-OH-, 11-OH-, 4’-OH-, and 5’-OH-CBD
*Dibenzopyran numbering system.
*
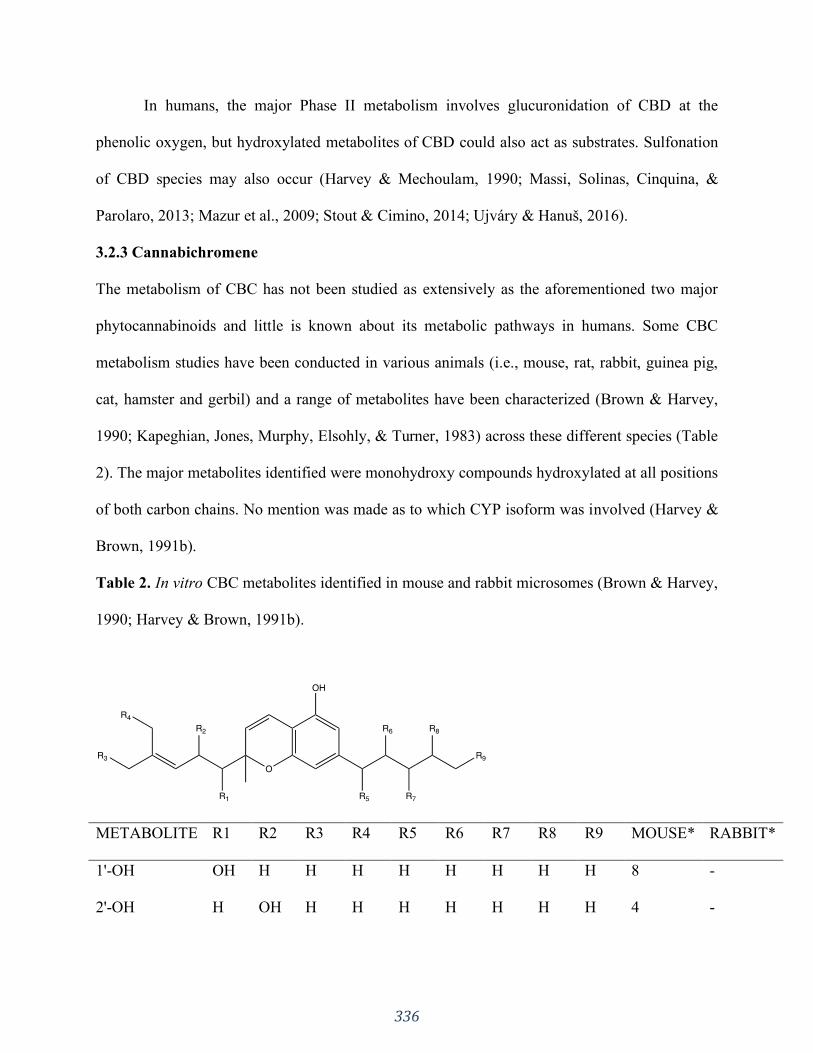
336
In humans, the major Phase II metabolism involves glucuronidation of CBD at the
phenolic oxygen, but hydroxylated metabolites of CBD could also act as substrates. Sulfonation
of CBD species may also occur (Harvey & Mechoulam, 1990; Massi, Solinas, Cinquina, &
Parolaro, 2013; Mazur et al., 2009; Stout & Cimino, 2014; Ujvary & Hanuš, 2016).
3.2.3 Cannabichromene
The metabolism of CBC has not been studied as extensively as the aforementioned two major
phytocannabinoids and little is known about its metabolic pathways in humans. Some CBC
metabolism studies have been conducted in various animals (i.e., mouse, rat, rabbit, guinea pig,
cat, hamster and gerbil) and a range of metabolites have been characterized (Brown & Harvey,
1990; Kapeghian, Jones, Murphy, Elsohly, & Turner, 1983) across these different species (Table
2). The major metabolites identified were monohydroxy compounds hydroxylated at all positions
of both carbon chains. No mention was made as to which CYP isoform was involved (Harvey &
Brown, 1991b).
Table 2. In vitro CBC metabolites identified in mouse and rabbit microsomes (Brown & Harvey,
1990; Harvey & Brown, 1991b).
METABOLITE R1 R2 R3 R4 R5 R6 R7 R8 R9 MOUSE* RABBIT*
1'-OH OH H H H H H H H H 8 -
2'-OH H OH H H H H H H H 4 -
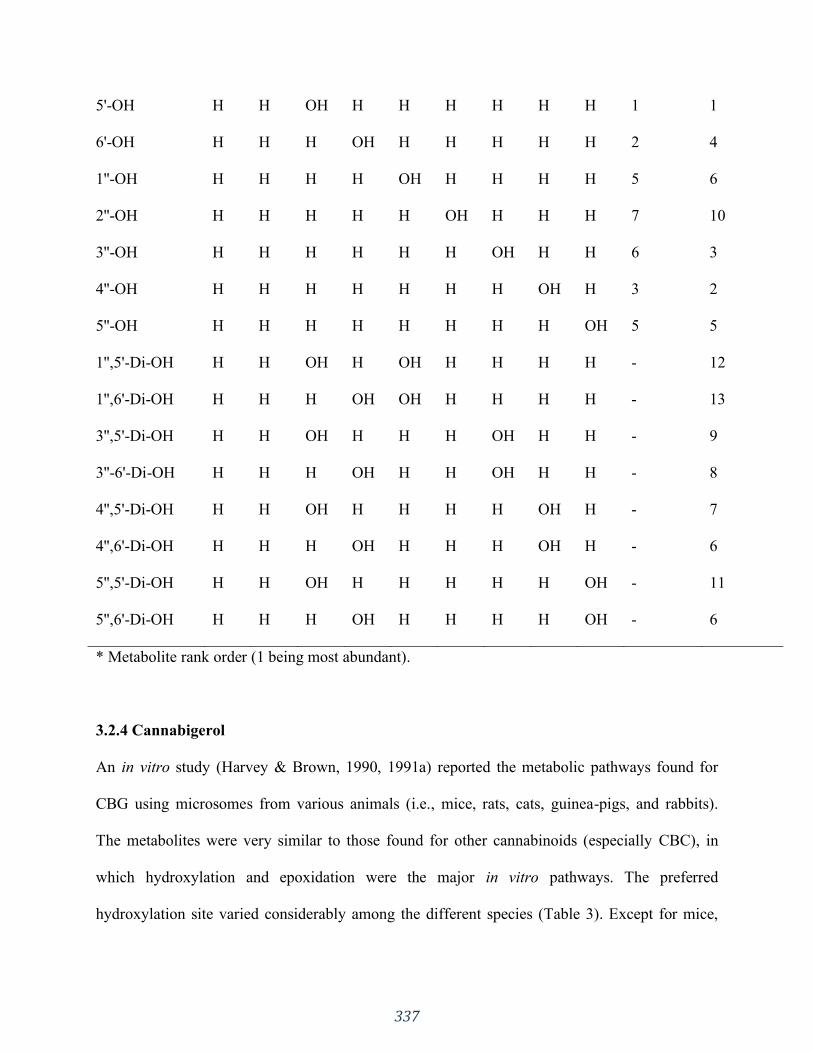
337
5'-OH H H OH H H H H H H 1 1
6'-OH H H H OH H H H H H 2 4
1''-OH H H H H OH H H H H 5 6
2''-OH H H H H H OH H H H 7 10
3''-OH H H H H H H OH H H 6 3
4''-OH H H H H H H H OH H 3 2
5''-OH H H H H H H H H OH 5 5
1'',5'-Di-OH H H OH H OH H H H H - 12
1'',6'-Di-OH H H H OH OH H H H H - 13
3'',5'-Di-OH H H OH H H H OH H H - 9
3''-6'-Di-OH H H H OH H H OH H H - 8
4'',5'-Di-OH H H OH H H H H OH H - 7
4'',6'-Di-OH H H H OH H H H OH H - 6
5'',5'-Di-OH H H OH H H H H H OH - 11
5'',6'-Di-OH H H H OH H H H H OH - 6
* Metabolite rank order (1 being most abundant).
3.2.4 Cannabigerol
An in vitro study (Harvey & Brown, 1990, 1991a) reported the metabolic pathways found for
CBG using microsomes from various animals (i.e., mice, rats, cats, guinea-pigs, and rabbits).
The metabolites were very similar to those found for other cannabinoids (especially CBC), in
which hydroxylation and epoxidation were the major in vitro pathways. The preferred
hydroxylation site varied considerably among the different species (Table 3). Except for mice,
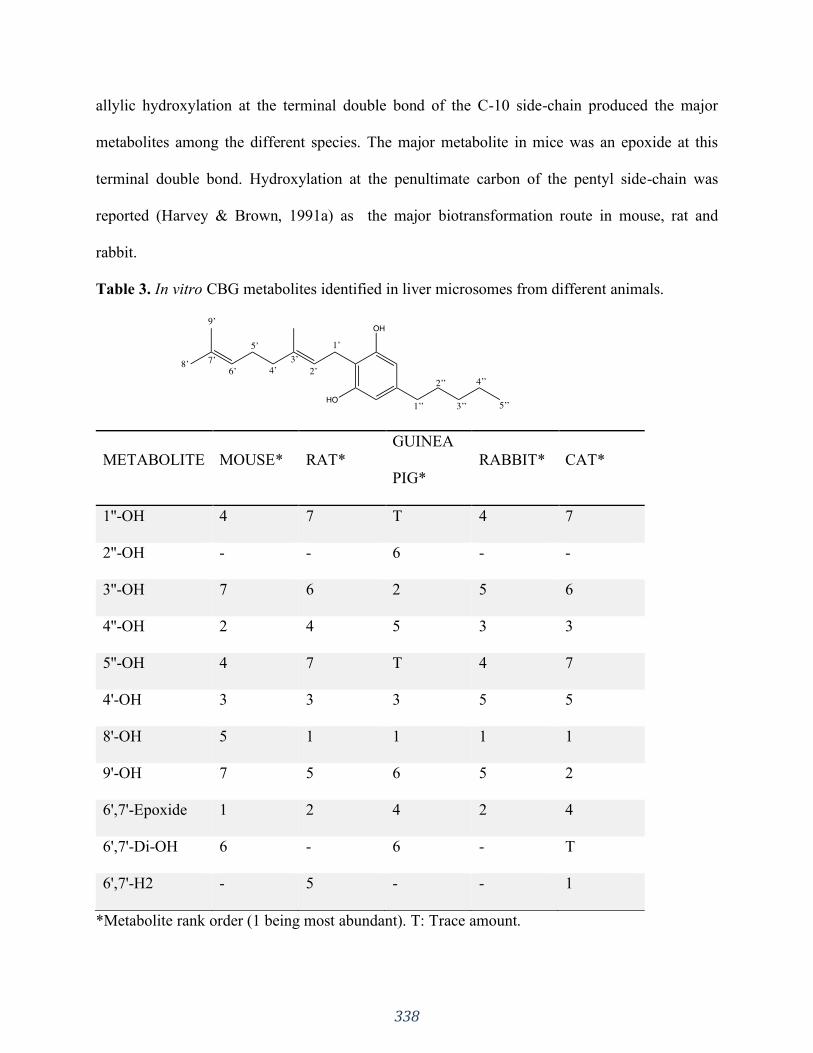
338
allylic hydroxylation at the terminal double bond of the C-10 side-chain produced the major
metabolites among the different species. The major metabolite in mice was an epoxide at this
terminal double bond. Hydroxylation at the penultimate carbon of the pentyl side-chain was
reported (Harvey & Brown, 1991a) as the major biotransformation route in mouse, rat and
rabbit.
Table 3. In vitro CBG metabolites identified in liver microsomes from different animals.
METABOLITE MOUSE* RAT*
GUINEA
PIG*
RABBIT* CAT*
1''-OH 4 7 T 4 7
2''-OH - - 6 - -
3''-OH 7 6 2 5 6
4''-OH 2 4 5 3 3
5''-OH 4 7 T 4 7
4'-OH 3 3 3 5 5
8'-OH 5 1 1 1 1
9'-OH 7 5 6 5 2
6',7'-Epoxide 1 2 4 2 4
6',7'-Di-OH 6 - 6 - T
6',7'-H2 - 5 - - 1
*Metabolite rank order (1 being most abundant). T: Trace amount.
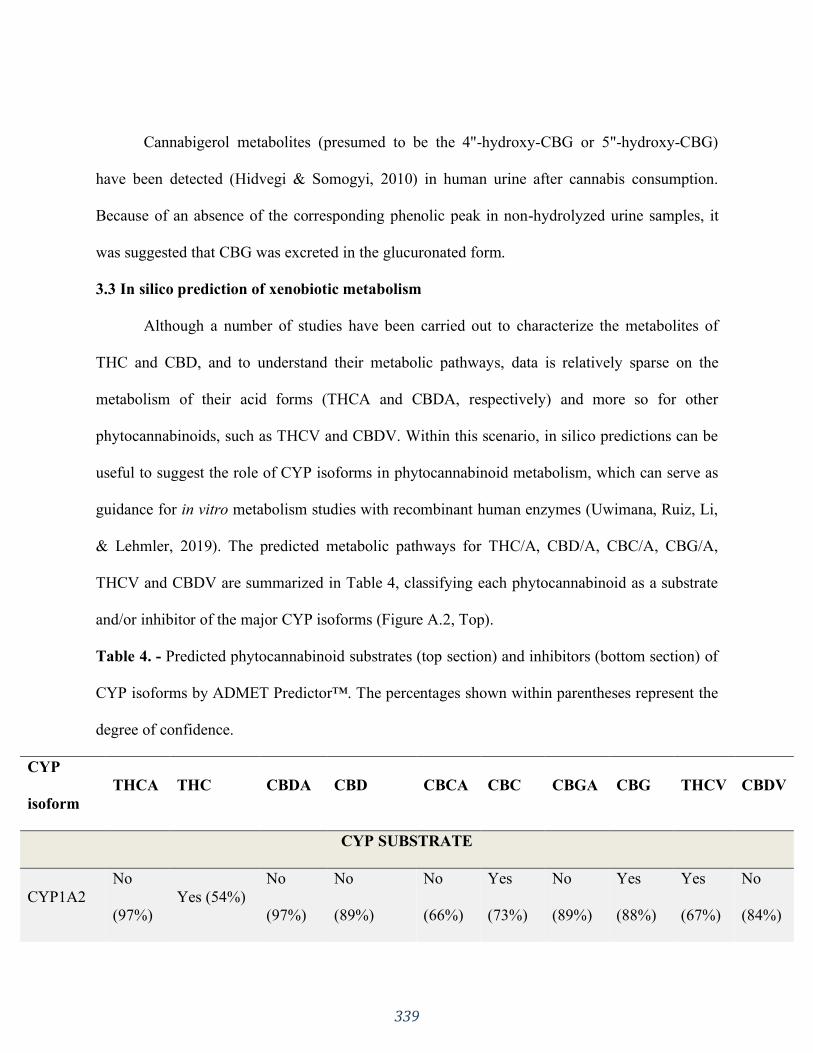
339
Cannabigerol metabolites (presumed to be the 4"-hydroxy-CBG or 5"-hydroxy-CBG)
have been detected (Hidvegi & Somogyi, 2010) in human urine after cannabis consumption.
Because of an absence of the corresponding phenolic peak in non-hydrolyzed urine samples, it
was suggested that CBG was excreted in the glucuronated form.
3.3 In silico prediction of xenobiotic metabolism
Although a number of studies have been carried out to characterize the metabolites of
THC and CBD, and to understand their metabolic pathways, data is relatively sparse on the
metabolism of their acid forms (THCA and CBDA, respectively) and more so for other
phytocannabinoids, such as THCV and CBDV. Within this scenario, in silico predictions can be
useful to suggest the role of CYP isoforms in phytocannabinoid metabolism, which can serve as
guidance for in vitro metabolism studies with recombinant human enzymes (Uwimana, Ruiz, Li,
& Lehmler, 2019). The predicted metabolic pathways for THC/A, CBD/A, CBC/A, CBG/A,
THCV and CBDV are summarized in Table 4, classifying each phytocannabinoid as a substrate
and/or inhibitor of the major CYP isoforms (Figure A.2, Top).
Table 4. - Predicted phytocannabinoid substrates (top section) and inhibitors (bottom section) of
CYP isoforms by ADMET Predictor™. The percentages shown within parentheses represent the
degree of confidence.
CYP
isoform
THCA THC CBDA CBD CBCA CBC CBGA CBG THCV CBDV
CYP SUBSTRATE
CYP1A2
No
(97%)
Yes (54%)
No
(97%)
No
(89%)
No
(66%)
Yes
(73%)
No
(89%)
Yes
(88%)
Yes
(67%)
No
(84%)
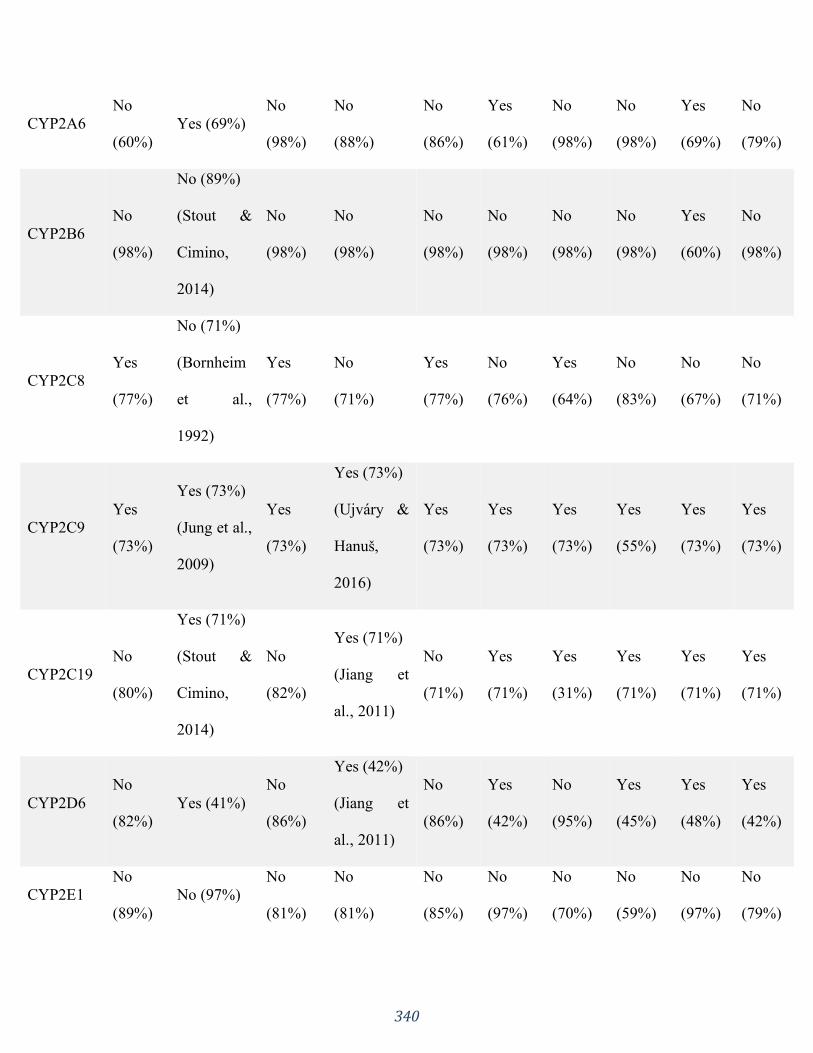
340
CYP2A6
No
(60%)
Yes (69%)
No
(98%)
No
(88%)
No
(86%)
Yes
(61%)
No
(98%)
No
(98%)
Yes
(69%)
No
(79%)
CYP2B6
No
(98%)
No (89%)
(Stout &
Cimino,
2014)
No
(98%)
No
(98%)
No
(98%)
No
(98%)
No
(98%)
No
(98%)
Yes
(60%)
No
(98%)
CYP2C8
Yes
(77%)
No (71%)
(Bornheim
et al.,
1992)
Yes
(77%)
No
(71%)
Yes
(77%)
No
(76%)
Yes
(64%)
No
(83%)
No
(67%)
No
(71%)
CYP2C9
Yes
(73%)
Yes (73%)
(Jung et al.,
2009)
Yes
(73%)
Yes (73%)
(Ujváry &
Hanuš,
2016)
Yes
(73%)
Yes
(73%)
Yes
(73%)
Yes
(55%)
Yes
(73%)
Yes
(73%)
CYP2C19
No
(80%)
Yes (71%)
(Stout &
Cimino,
2014)
No
(82%)
Yes (71%)
(Jiang et
al., 2011)
No
(71%)
Yes
(71%)
Yes
(31%)
Yes
(71%)
Yes
(71%)
Yes
(71%)
CYP2D6
No
(82%)
Yes (41%)
No
(86%)
Yes (42%)
(Jiang et
al., 2011)
No
(86%)
Yes
(42%)
No
(95%)
Yes
(45%)
Yes
(48%)
Yes
(42%)
CYP2E1
No
(89%)
No (97%)
No
(81%)
No
(81%)
No
(85%)
No
(97%)
No
(70%)
No
(59%)
No
(97%)
No
(79%)
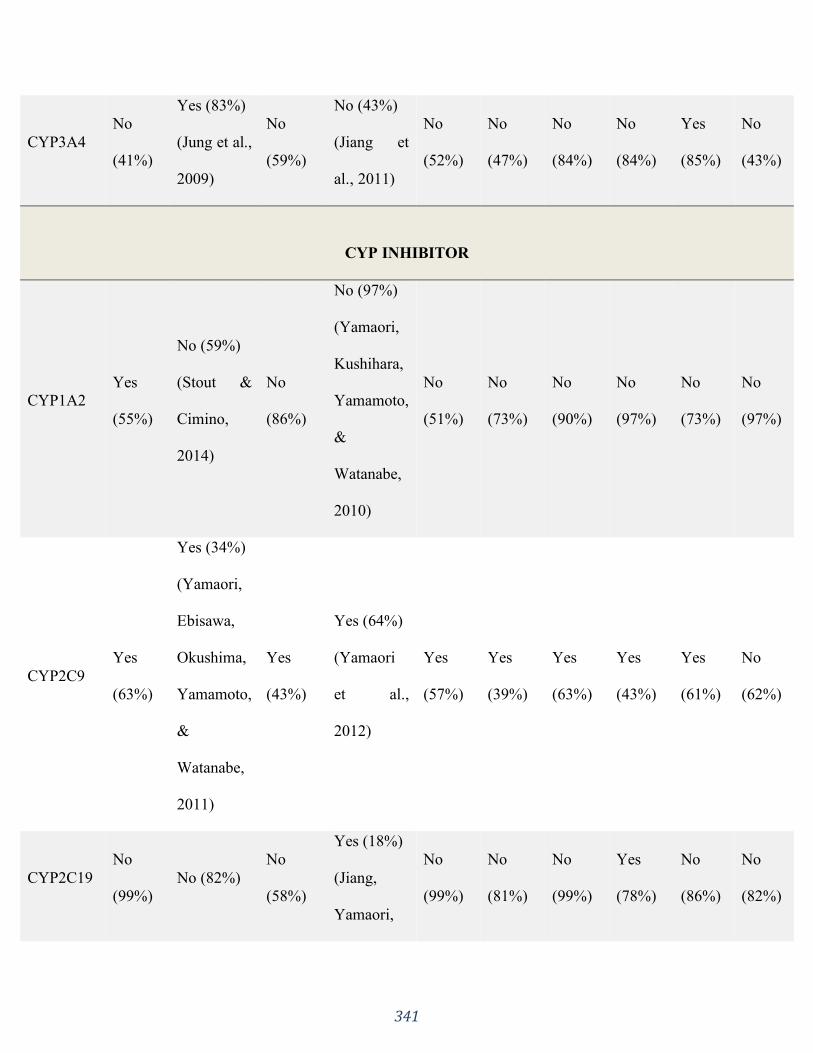
341
CYP3A4
No
(41%)
Yes (83%)
(Jung et al.,
2009)
No
(59%)
No (43%)
(Jiang et
al., 2011)
No
(52%)
No
(47%)
No
(84%)
No
(84%)
Yes
(85%)
No
(43%)
CYP INHIBITOR
CYP1A2
Yes
(55%)
No (59%)
(Stout &
Cimino,
2014)
No
(86%)
No (97%)
(Yamaori,
Kushihara,
Yamamoto,
&
Watanabe,
2010)
No
(51%)
No
(73%)
No
(90%)
No
(97%)
No
(73%)
No
(97%)
CYP2C9
Yes
(63%)
Yes (34%)
(Yamaori,
Ebisawa,
Okushima,
Yamamoto,
&
Watanabe,
2011)
Yes
(43%)
Yes (64%)
(Yamaori
et al.,
2012)
Yes
(57%)
Yes
(39%)
Yes
(63%)
Yes
(43%)
Yes
(61%)
No
(62%)
CYP2C19
No
(99%)
No (82%)
No
(58%)
Yes (18%)
(Jiang,
Yamaori,
No
(99%)
No
(81%)
No
(99%)
Yes
(78%)
No
(86%)
No
(82%)
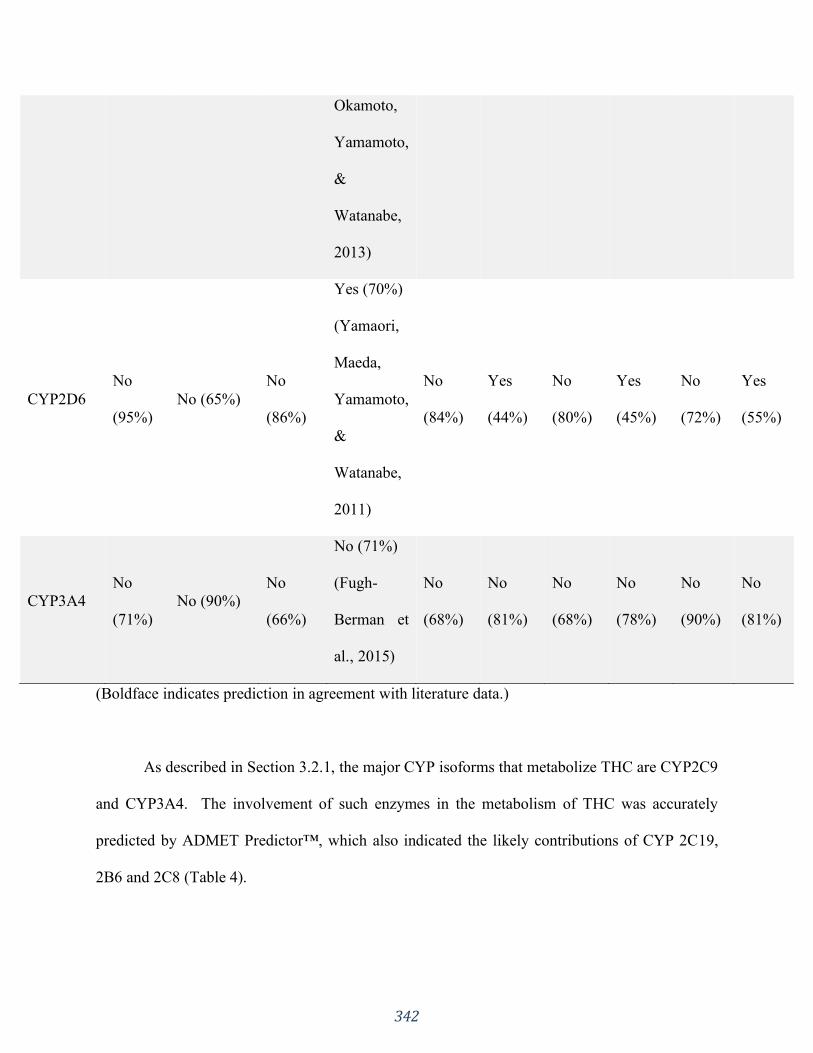
342
Okamoto,
Yamamoto,
&
Watanabe,
2013)
CYP2D6
No
(95%)
No (65%)
No
(86%)
Yes (70%)
(Yamaori,
Maeda,
Yamamoto,
&
Watanabe,
2011)
No
(84%)
Yes
(44%)
No
(80%)
Yes
(45%)
No
(72%)
Yes
(55%)
CYP3A4
No
(71%)
No (90%)
No
(66%)
No (71%)
(Fugh-
Berman et
al., 2015)
No
(68%)
No
(81%)
No
(68%)
No
(78%)
No
(90%)
No
(81%)
(Boldface indicates prediction in agreement with literature data.)
As described in Section 3.2.1, the major CYP isoforms that metabolize THC are CYP2C9
and CYP3A4. The involvement of such enzymes in the metabolism of THC was accurately
predicted by ADMET Predictor™, which also indicated the likely contributions of CYP 2C19,
2B6 and 2C8 (Table 4).
343
Many CYP isoforms have also been identified as CBD metabolizing enzymes. The
activity of CYP isoforms 2C9, 2C19 and 2D6 were predicted accurately (shown boldface in
Table 4), whereas CBD was mis-predicted as not being a substrate for CYP3A4 or CYP1A2.
Both represent false positives, but the low confidence for CYP3A4 (43%) makes this merely a
“soft” false positive (i.e., in a prospective application, this marginal result would indicate the
need for experimental investigation). The complex metabolic pattern exhibited by CBD makes
predictions of its metabolites challenging.
The inhibitory power of THC and CBD upon CYP enzymes has been more thoroughly
studied than other cannabinoids (Yamaori, Ebisawa, et al., 2011; Yamaori et al., 2012, 2010;
Yamaori, Maeda, et al., 2011; Yamaori, Okamoto, Yamamoto, & Watanabe, 2011). It was
reported (Yamaori et al., 2010) that THC, CBD and CBN inhibited the 7-ethoxyresorufin O-
deethylase catalytic activity of recombinant human CYP1A1, CYP1A2, and CYP1B1 in a
competitive manner. CBD most potently inhibited CYP1A1 activity, whereas CBN decreased the
activity of CYP1A2 and CYP1B1 more effectively than CYP1A1. THC inhibited CYP1 activity
less potently than CBD and CBN, and also exhibited a lower selectivity.
The inactivation of recombinant CYP1A1 by CBD was characterized (Yamaori et al.,
2010) as a potent mechanism-based inhibition. For human liver microsomes, this inhibition was
also indicated as competitive. Their inhibition by THC and CBN indicated a mixed action,
contrasting to isolated recombinant CYP1A2, which was competitively inhibited. It was
speculated that these cannabinoids may interact with certain CYPs other than CYP1A2 in human
liver microsomes, thus indicating various simultaneous mechanisms. CBD and CBN exhibited
CYP1 isoform-selective direct inhibition and among the phytocannabinoids examined, CBD had
the highest ability to inactivate human CYP1 enzymes.

344
CYP3A isoforms are potently inhibited by CBD in a competitive manner, especially
CYP3A4 and CYP3A5 (Yamaori, Ebisawa, et al., 2011). CYP2A6 was noncompetitively
inhibited by THC and CBD, whereas CYP2B6 was inhibited in a mixed fashion. THC and CBD
displayed differences in their inhibition of CYP2A6 and CYP2B6, but inhibition of the latter
enzyme by CBD was the most effective (Yamaori, Maeda, et al., 2011). Other studies (Yamaori,
Okamoto, et al., 2011) indicated that CBD also potently inhibited CYP2C19.
CYP2D6 is responsible for the metabolism of a wide variety of clinically used drugs,
such as dextromethorphan, debrisoquine, promethazine, and codeine. Specifically,
dextromethorphan, an over-the-counter cough suppressant agent, is metabolized to dextrorphan
by CYP2D6 through O-demethylation, which has been shown (Yamaori, Okamoto, et al., 2011)
to be competitively inhibited by CBD in a concentration dependent manner. The apparent CBD
Ki values for dextromethorphan O-demethylation in recombinant CYP2D6 were 2.69μM and
2.42μM for human liver microsomes. These results indicate that CBD is a potent inhibitor for
CYP2D6 which could conceivably have clinical implications, as the reported plasma levels of
CBD after smoking a placebo cannabis cigarette spiked with 20 mg of CBD was reported
(Yamaori, Okamoto, et al., 2011) to be 0.363 μM (114 ng/ml). However, a previous study
(Yamaori et al., 2010) had found that the Cmax for CBD after four buccal sprays of Sativex®
totalling 10 mg of CBD (and 10.8 mg of THC) was only 9.62 nM (3.02 ng/ml). Notably, these
plasma levels are below the Ki values, and thus, low oral doses of CBD are not anticipated to
exhibit in vivo inhibition of CYP2D6. Further investigations are needed to elucidate in vivo
CYP2D6-targeted drug interactions with increased doses of CBD via various routes of
administration.
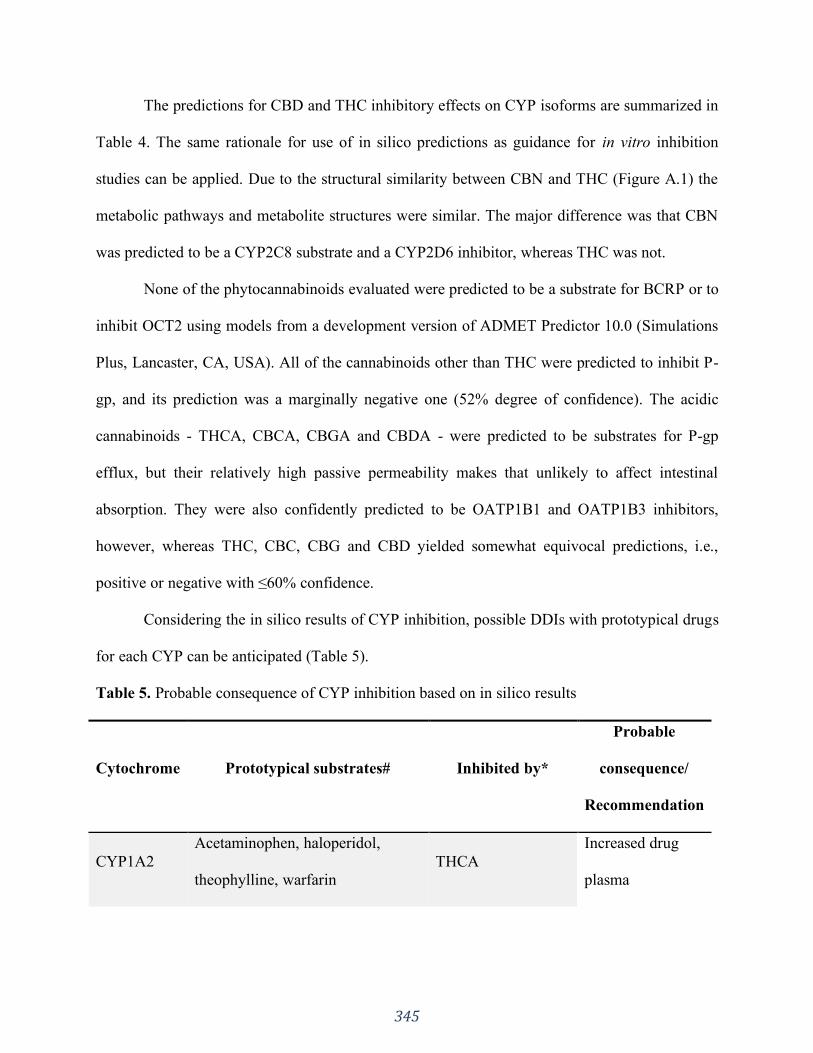
345
The predictions for CBD and THC inhibitory effects on CYP isoforms are summarized in
Table 4. The same rationale for use of in silico predictions as guidance for in vitro inhibition
studies can be applied. Due to the structural similarity between CBN and THC (Figure A.1) the
metabolic pathways and metabolite structures were similar. The major difference was that CBN
was predicted to be a CYP2C8 substrate and a CYP2D6 inhibitor, whereas THC was not.
None of the phytocannabinoids evaluated were predicted to be a substrate for BCRP or to
inhibit OCT2 using models from a development version of ADMET Predictor 10.0 (Simulations
Plus, Lancaster, CA, USA). All of the cannabinoids other than THC were predicted to inhibit P-
gp, and its prediction was a marginally negative one (52% degree of confidence). The acidic
cannabinoids - THCA, CBCA, CBGA and CBDA - were predicted to be substrates for P-gp
efflux, but their relatively high passive permeability makes that unlikely to affect intestinal
absorption. They were also confidently predicted to be OATP1B1 and OATP1B3 inhibitors,
however, whereas THC, CBC, CBG and CBD yielded somewhat equivocal predictions, i.e.,
positive or negative with ≤60% confidence.
Considering the in silico results of CYP inhibition, possible DDIs with prototypical drugs
for each CYP can be anticipated (Table 5).
Table 5. Probable consequence of CYP inhibition based on in silico results
Cytochrome Prototypical substrates# Inhibited by*
Probable
consequence/
Recommendation
CYP1A2
Acetaminophen, haloperidol,
theophylline, warfarin
THCA
Increased drug
plasma
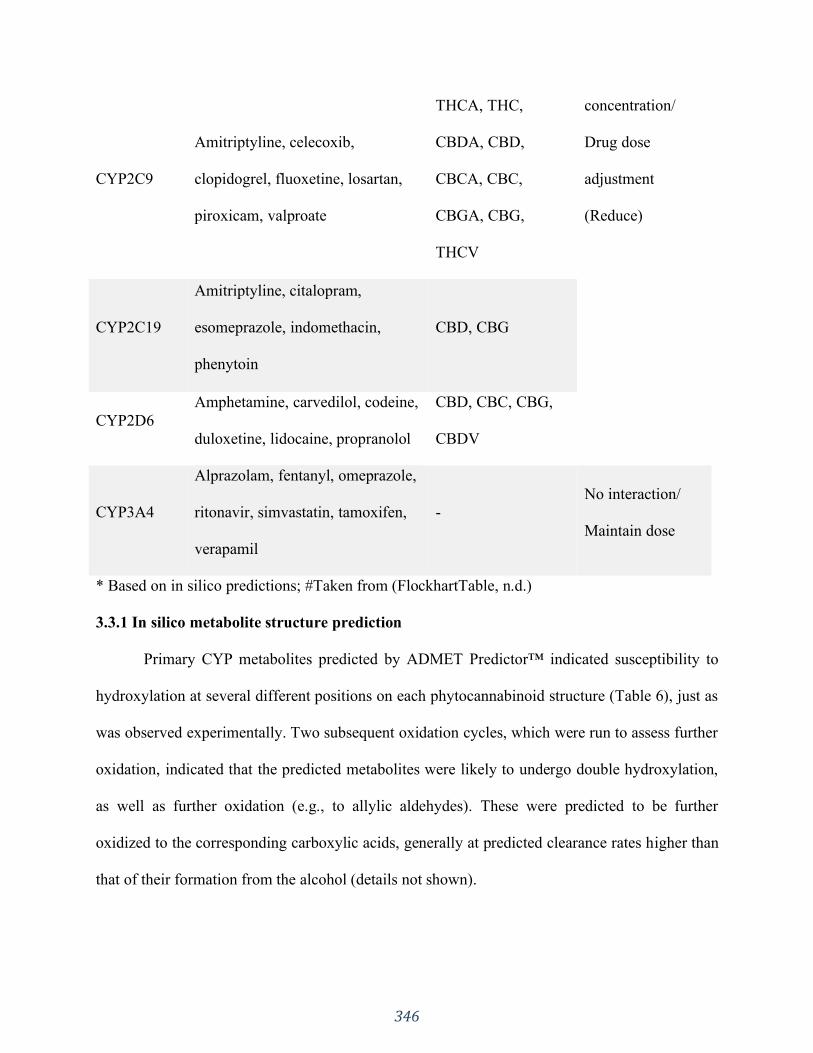
346
CYP2C9
Amitriptyline, celecoxib,
clopidogrel, fluoxetine, losartan,
piroxicam, valproate
THCA, THC,
CBDA, CBD,
CBCA, CBC,
CBGA, CBG,
THCV
concentration/
Drug dose
adjustment
(Reduce)
CYP2C19
Amitriptyline, citalopram,
esomeprazole, indomethacin,
phenytoin
CBD, CBG
CYP2D6
Amphetamine, carvedilol, codeine,
duloxetine, lidocaine, propranolol
CBD, CBC, CBG,
CBDV
CYP3A4
Alprazolam, fentanyl, omeprazole,
ritonavir, simvastatin, tamoxifen,
verapamil
-
No interaction/
Maintain dose
* Based on in silico predictions; #Taken from (FlockhartTable, n.d.)
3.3.1 In silico metabolite structure prediction
Primary CYP metabolites predicted by ADMET Predictor™ indicated susceptibility to
hydroxylation at several different positions on each phytocannabinoid structure (Table 6), just as
was observed experimentally. Two subsequent oxidation cycles, which were run to assess further
oxidation, indicated that the predicted metabolites were likely to undergo double hydroxylation,
as well as further oxidation (e.g., to allylic aldehydes). These were predicted to be further
oxidized to the corresponding carboxylic acids, generally at predicted clearance rates higher than
that of their formation from the alcohol (details not shown).
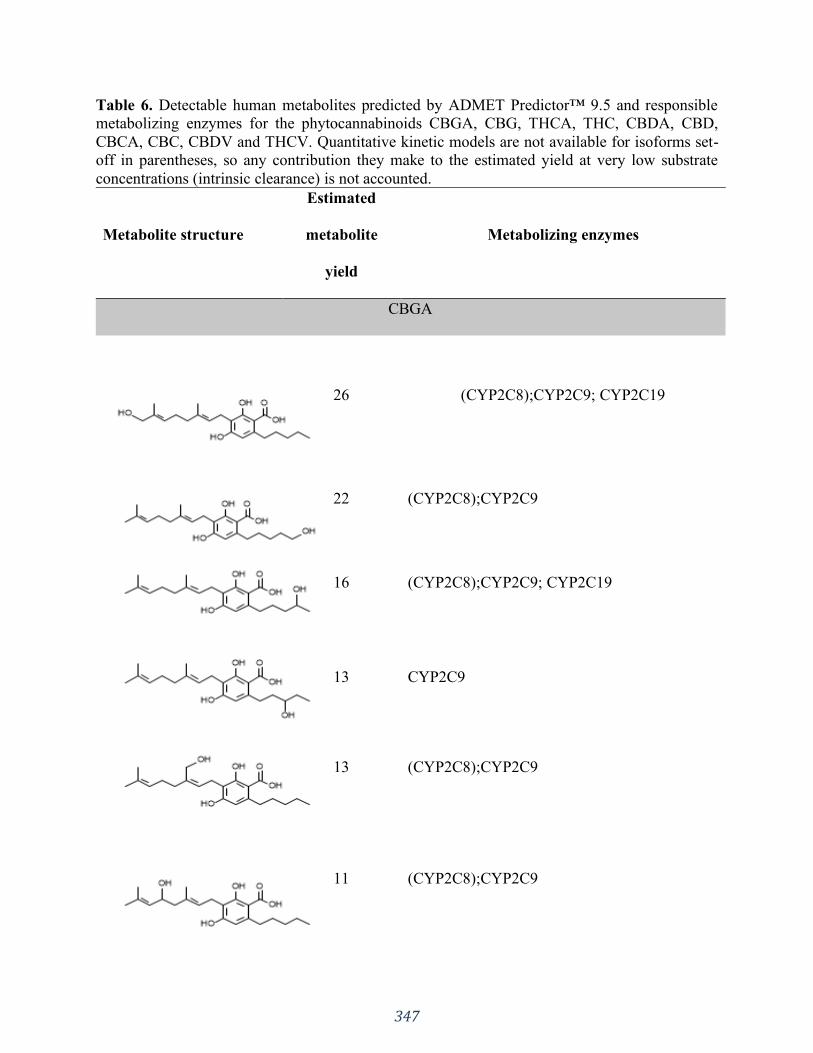
347
Table 6. Detectable human metabolites predicted by ADMET Predictor™ 9.5 and responsible
metabolizing enzymes for the phytocannabinoids CBGA, CBG, THCA, THC, CBDA, CBD,
CBCA, CBC, CBDV and THCV. Quantitative kinetic models are not available for isoforms set-
off in parentheses, so any contribution they make to the estimated yield at very low substrate
concentrations (intrinsic clearance) is not accounted.
Metabolite structure
Estimated
metabolite
yield
Metabolizing enzymes
CBGA
26 (CYP2C8);CYP2C9; CYP2C19
22 (CYP2C8);CYP2C9
16 (CYP2C8);CYP2C9; CYP2C19
13 CYP2C9
13 (CYP2C8);CYP2C9
11 (CYP2C8);CYP2C9
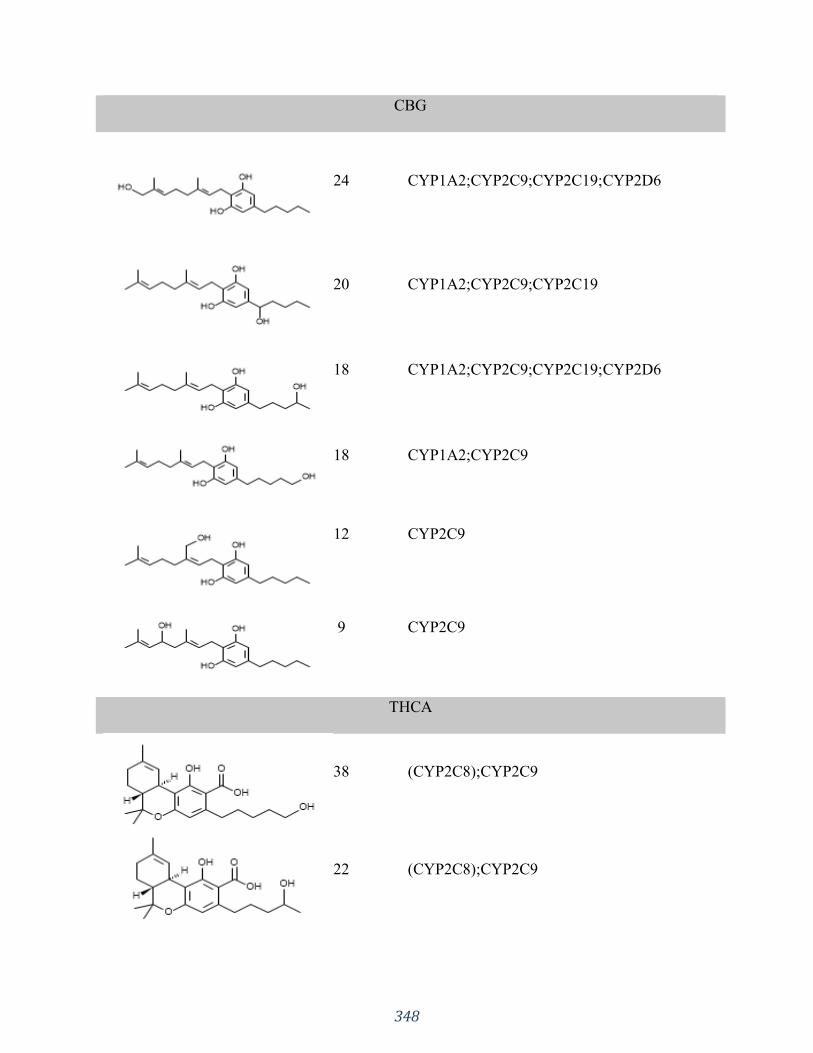
348
CBG
24 CYP1A2;CYP2C9;CYP2C19;CYP2D6
20 CYP1A2;CYP2C9;CYP2C19
18 CYP1A2;CYP2C9;CYP2C19;CYP2D6
18 CYP1A2;CYP2C9
12 CYP2C9
9 CYP2C9
THCA
38 (CYP2C8);CYP2C9
22 (CYP2C8);CYP2C9

349
21 (CYP2C8);CYP2C9
19* (CYP2C8);CYP2C9
--- (CYP2C8)
THC
25
CYP1A2;(CYP2A6);CYP2C9;CYP2C19;CYP2
D6;CYP3A4
21 CYP1A2;CYP2C9
20 CYP1A2;CYP2C9;CYP2D6
11 CYP1A2;(CYP2A6);CYP2C19;CYP3A4
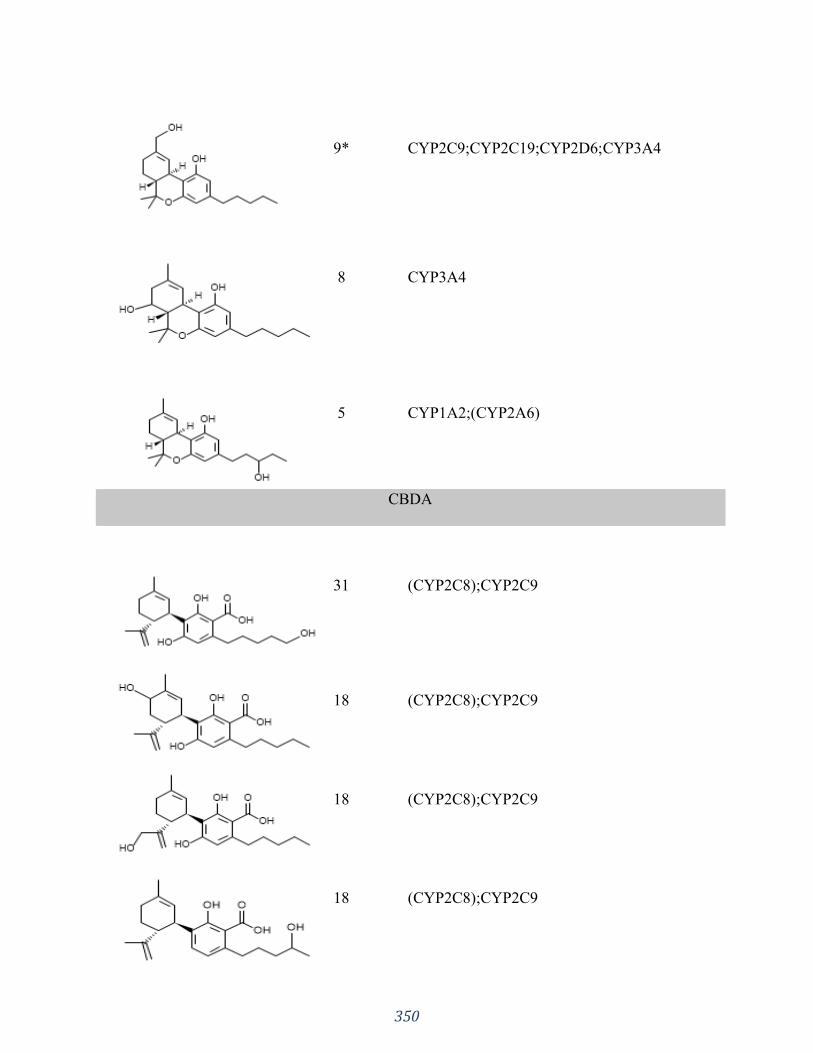
350
9* CYP2C9;CYP2C19;CYP2D6;CYP3A4
8 CYP3A4
5 CYP1A2;(CYP2A6)
CBDA
31 (CYP2C8);CYP2C9
18 (CYP2C8);CYP2C9
18 (CYP2C8);CYP2C9
18 (CYP2C8);CYP2C9
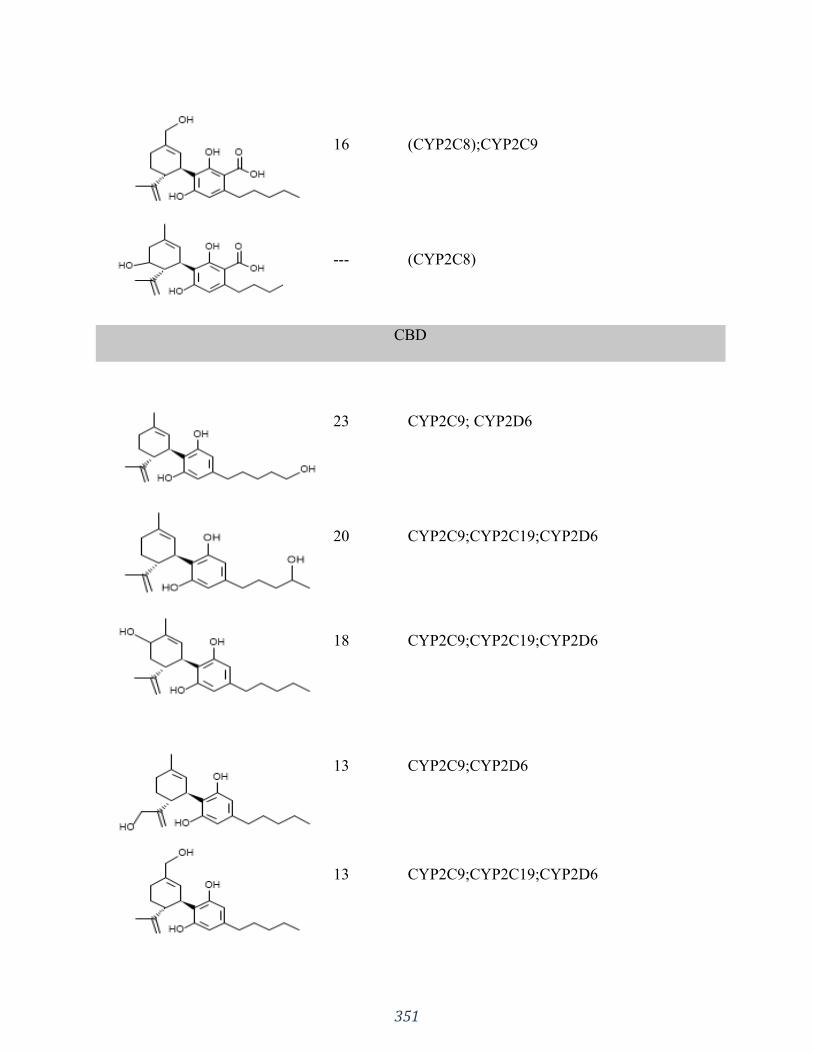
351
16 (CYP2C8);CYP2C9
--- (CYP2C8)
CBD
23 CYP2C9; CYP2D6
20 CYP2C9;CYP2C19;CYP2D6
18 CYP2C9;CYP2C19;CYP2D6
13 CYP2C9;CYP2D6
13 CYP2C9;CYP2C19;CYP2D6
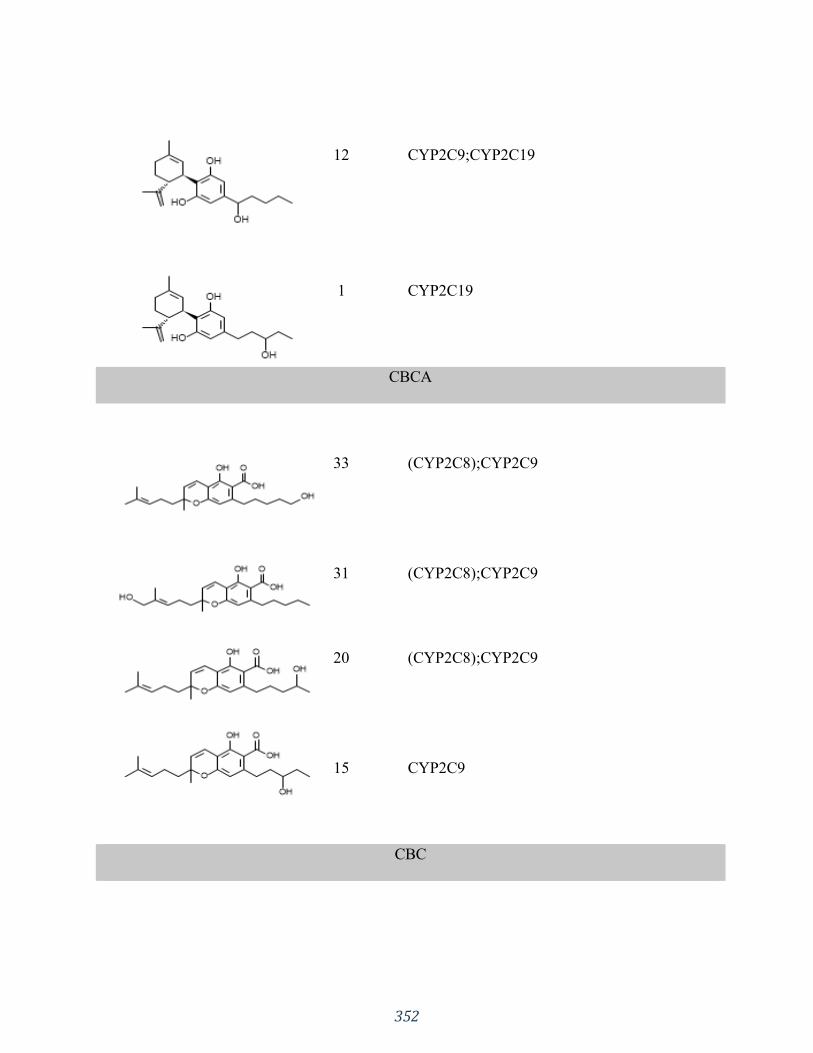
352
12 CYP2C9;CYP2C19
1 CYP2C19
CBCA
33 (CYP2C8);CYP2C9
31 (CYP2C8);CYP2C9
20 (CYP2C8);CYP2C9
15 CYP2C9
CBC
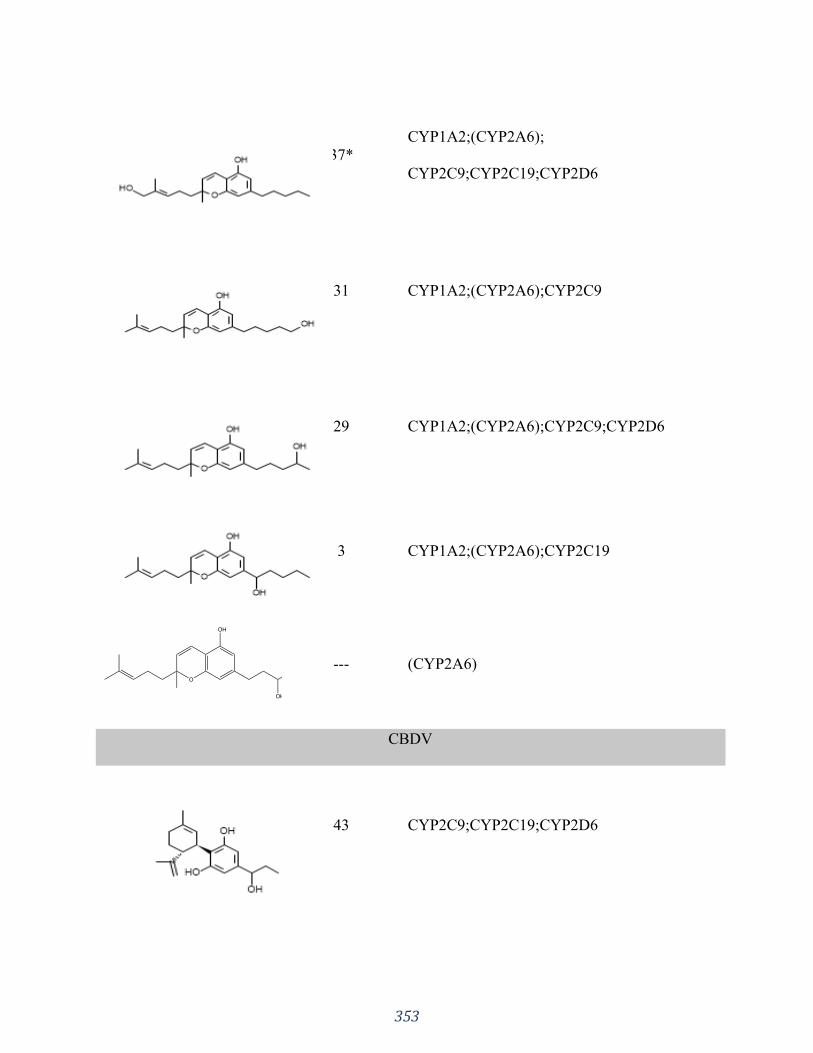
353
37*
CYP1A2;(CYP2A6);
CYP2C9;CYP2C19;CYP2D6
31 CYP1A2;(CYP2A6);CYP2C9
29 CYP1A2;(CYP2A6);CYP2C9;CYP2D6
3 CYP1A2;(CYP2A6);CYP2C19
--- (CYP2A6)
CBDV
43 CYP2C9;CYP2C19;CYP2D6

354
18 CYP2C9
16 CYP2C9;CYP2C19;CYP2D6
11 CYP2C9;CYP2D6
11 CYP2C9;CYP2C19;CYP2D6
1 CYP2D6
THCV
32
CYP1A2;(CYP2A6);CYP2B6;CYP2C9;CYP2C
19;CYP2D6;
CYP3A4
31
CYP1A2;(CYP2A6);CYP2B6;CYP2C9;CYP2C
19;CYP2D6;
CYP3A4

355
11 CYP2C9
10 CYP2C9;CYP2C19;CYP2D6;CYP3A4
8 CYP2B6;CYP3A4
8 CYP3A4
The software correctly predicted several of the many metabolites reported in the literature
for the main phytocannabinoids, i.e., THC, CBD and CBC (Tables 4 and 6). The estimated
uncertainty for the CYP clearance predictions ranged from 2.8-fold for CYP1A2 to 4.7-fold for
CYP3A4. This, taken together with the complexity of CYP kinetics and the potential for auto-
inhibition makes the estimated metabolite yields for ADMET Predictor™ semi-quantitative, at
best, for these compounds (Table 6). In particular, the yields predicted for the major primary
metabolites of THC and THCA hydroxylated at C11 (Huestis, Mazzoni, & Rabin, 2011; Jung et
al., 2009) are not significantly different from those predicted for other major metabolic products.
The same holds true with regard to the tertiary oxidation products THC-COOH (i.e., the main
THC metabolite found in human urine) and THCA-COOH.
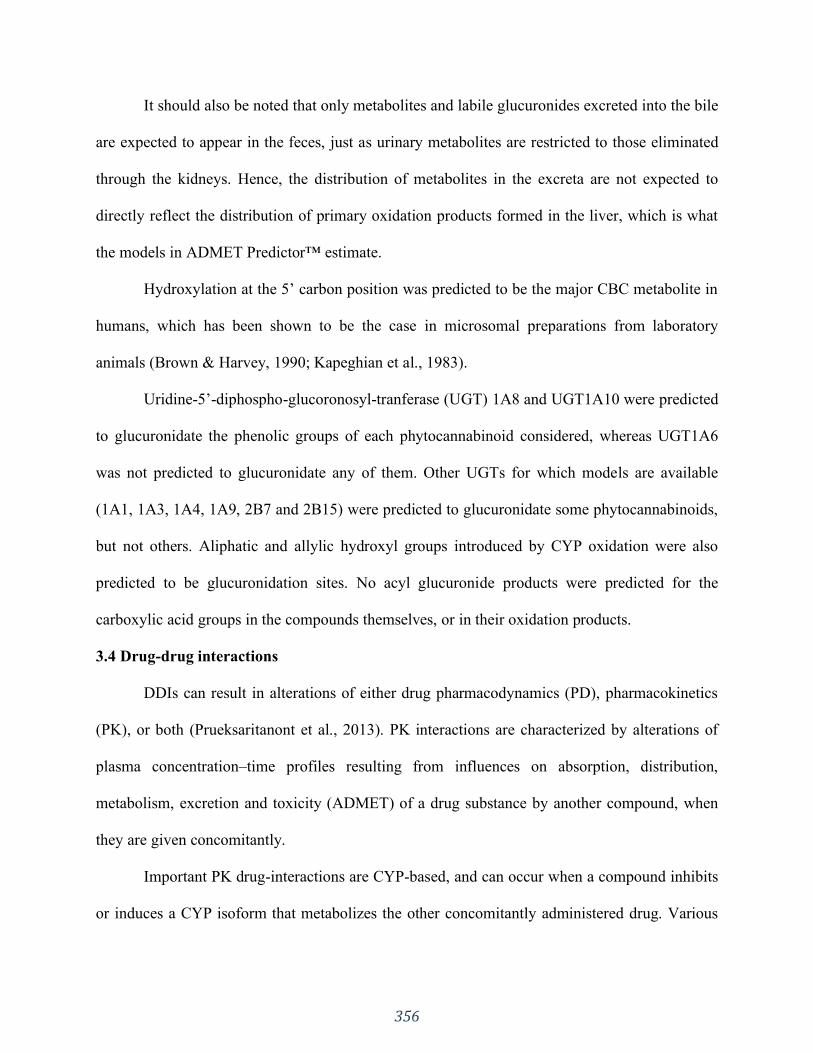
356
It should also be noted that only metabolites and labile glucuronides excreted into the bile
are expected to appear in the feces, just as urinary metabolites are restricted to those eliminated
through the kidneys. Hence, the distribution of metabolites in the excreta are not expected to
directly reflect the distribution of primary oxidation products formed in the liver, which is what
the models in ADMET Predictor™ estimate.
Hydroxylation at the 5’ carbon position was predicted to be the major CBC metabolite in
humans, which has been shown to be the case in microsomal preparations from laboratory
animals (Brown & Harvey, 1990; Kapeghian et al., 1983).
Uridine-5’-diphospho-glucoronosyl-tranferase (UGT) 1A8 and UGT1A10 were predicted
to glucuronidate the phenolic groups of each phytocannabinoid considered, whereas UGT1A6
was not predicted to glucuronidate any of them. Other UGTs for which models are available
(1A1, 1A3, 1A4, 1A9, 2B7 and 2B15) were predicted to glucuronidate some phytocannabinoids,
but not others. Aliphatic and allylic hydroxyl groups introduced by CYP oxidation were also
predicted to be glucuronidation sites. No acyl glucuronide products were predicted for the
carboxylic acid groups in the compounds themselves, or in their oxidation products.
3.4 Drug-drug interactions
DDIs can result in alterations of either drug pharmacodynamics (PD), pharmacokinetics
(PK), or both (Prueksaritanont et al., 2013). PK interactions are characterized by alterations of
plasma concentration–time profiles resulting from influences on absorption, distribution,
metabolism, excretion and toxicity (ADMET) of a drug substance by another compound, when
they are given concomitantly.
Important PK drug-interactions are CYP-based, and can occur when a compound inhibits
or induces a CYP isoform that metabolizes the other concomitantly administered drug. Various

357
studies have demonstrated that CBD is not only a substrate, but also an inhibitor of CYP
enzymes. Hence, it can interfere with the metabolism of other xenobiotics, such as THC and
other medicinal products (Hawksworth & McArdle, 2004; Jiang et al., 2013; Nadulski et al.,
2005; Pertwee, 2004; Stout & Cimino, 2014; Ujvary & Hanuš, 2016). For example, a large oral
CBD dose of 600 mg/day for 5 to 12 days inhibited hexobarbital metabolism in ten subjects
leading to a significant increase in its the bioavailability and prolonged elimination half-time
(Benowitz, Nguyen, Jones, Herning, & Bachman, 1980; Ujvary & Hanuš, 2016). Another study
(Geffrey, Pollack, Bruno, & Thiele, 2015) investigated the effect of CBD on clobazam
pharmacokinetics using a dose regimen of 5 mg/kg/day, titrating up by 5 mg/kg/day each week
to the goal of a very large 25 mg/kg/day. CBD increased clobazam (anticonvulsant) plasma level
by 60% ± 80% (mean ± SD), and the level of its active metabolite (norclobazam) increased by
500% ± 300% (mean ± SD). The authors concluded that there is a drug–drug interaction between
clobazam and CBD. However, reduction of the clobazam dose reduces consequential side-
effects, which should allow normal doses of CBD to be a safe and effective treatment of
refractory epilepsy in patients receiving clobazam treatment. The primary CYP isoforms
involved were CYP3A4 and CYP2C19 (Geffrey et al., 2015; Ujvary & Hanuš, 2016).
Indeed, it has been reported (Fugh-Berman et al., 2015) that CBD is a potent inhibitor of
not only CYP3A4, but also CYP2D6. As CYP3A4 metabolizes about a quarter of all drugs, CBD
may increase serum concentrations of macrolides, calcium channel blockers, benzodiazepines,
cyclosporine, sildenafil (and other PDE5 inhibitors), antihistamines, haloperidol, anti-retrovirals,
and some statins (e.g., atorvastatin and simvastatin), among many others. In addition, CYP2D6
metabolizes many antidepressants, which means that CBD could increase serum concentrations

358
of SSRIs, tricyclic antidepressants, antipsychotics, beta blockers, and opioids (including codeine
and oxycodone).
A case report (Stott, White, Wright, Wilbraham, & Guy, 2013) of a 44-year-old
Caucasian male taking pharmaceutical grade CBD (as Epidiolex®) and warfarin showed a
clinically significant interaction between these two drugs. The patient’s International Normalized
Ratio (INR) had been stable for at least 6 months before taking CBD concomitantly with
warfarin. He was placed on the starting dose of CBD at 5 mg/kg/day divided twice daily, which
was increased in 5 mg/kg/day increments every two weeks. With up-titration of CBD, a non-
linear increase in the INR was noted and warfarin dosage adjustments were made, and the patient
was followed clinically without bleeding complications. Warfarin is metabolized by CYP2C9
and CYP3A4, which are known to be inhibited by CBD in a competitive manner. This could
further impair the metabolism of warfarin leading to the observed INR increase (Grayson, Vines,
Nichol, & Szaflarski, 2018).
However, given that CBD is also metabolized by CYP450 isoforms, other CYP
inhibitors/inducers can also affect CBD pharmacokinetics. A Phase I study (Stott et al., 2013)
assessed the potential for drug-drug interactions between a THC/CBD oromucosal spray
(Sativex®) and a CYP450 inducer (rifampicin) or inhibitors (ketoconazole or omeprazole).
Rifampicin significantly reduced the peak plasma concentration of CBD, while the antifungal
ketoconazole almost doubled the peak plasma concentration of CBD, whereas omeprazole (a
moderate CYP2C19 inhibitor) did not seem to alter the pharmacokinetics of CBD (Stott et al.,
2013; Ujvary & Hanuš, 2016). The authors concluded that the THC/CBD spray was well
tolerated both alone and in combination with rifampicin, ketoconazole and omeprazole, but
potential effects should be taken into consideration when co-administering the THC/CBD spray
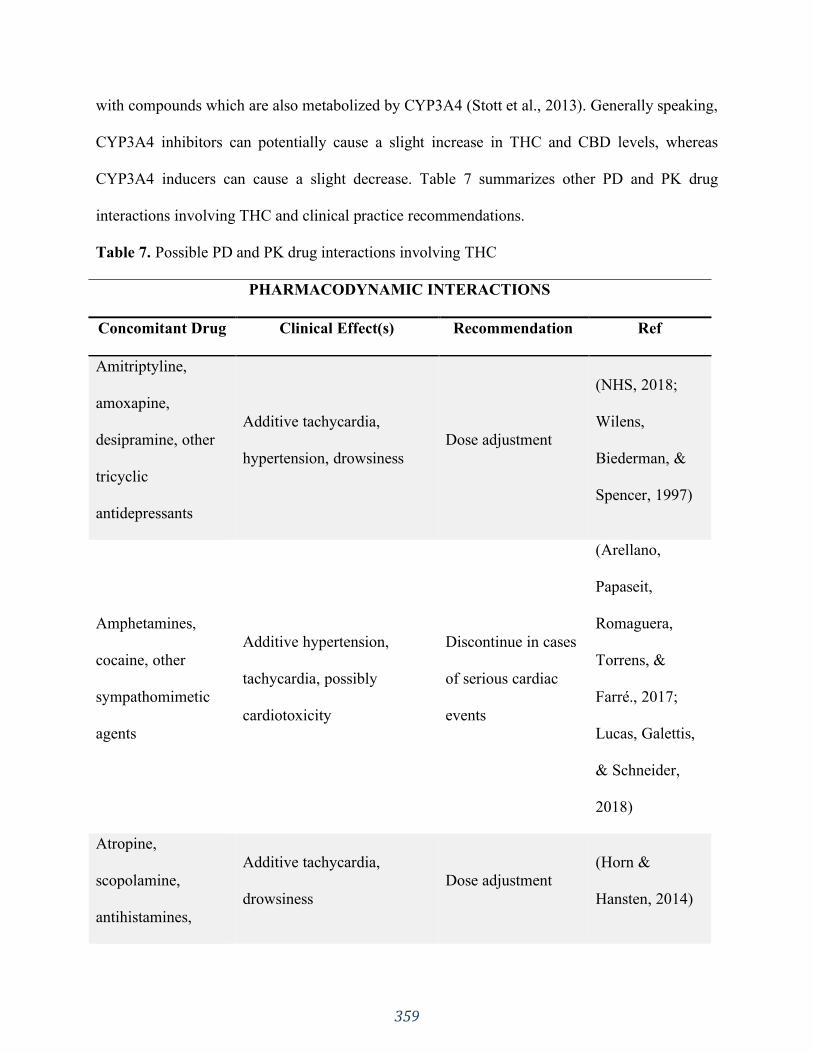
359
with compounds which are also metabolized by CYP3A4 (Stott et al., 2013). Generally speaking,
CYP3A4 inhibitors can potentially cause a slight increase in THC and CBD levels, whereas
CYP3A4 inducers can cause a slight decrease. Table 7 summarizes other PD and PK drug
interactions involving THC and clinical practice recommendations.
Table 7. Possible PD and PK drug interactions involving THC
PHARMACODYNAMIC INTERACTIONS
Concomitant Drug Clinical Effect(s) Recommendation Ref
Amitriptyline,
amoxapine,
desipramine, other
tricyclic
antidepressants
Additive tachycardia,
hypertension, drowsiness
Dose adjustment
(NHS, 2018;
Wilens,
Biederman, &
Spencer, 1997)
Amphetamines,
cocaine, other
sympathomimetic
agents
Additive hypertension,
tachycardia, possibly
cardiotoxicity
Discontinue in cases
of serious cardiac
events
(Arellano,
Papaseit,
Romaguera,
Torrens, &
Farré., 2017;
Lucas, Galettis,
& Schneider,
2018)
Atropine,
scopolamine,
antihistamines,
Additive tachycardia,
drowsiness
Dose adjustment
(Horn &
Hansten, 2014)

360
other
anticholinergic
agents
Disulfiram
A reversible hypomanic
reaction was reported after
smoking marijuana
Avoid smoking;
Dose adjustment
when taking
medicinal cannabis
(Unimed
Pharmaceuticals,
2006)
Fluoxetine
Hypomanic reaction after
smoking marijuana;
symptoms resolved after 4
days. Possible biochemical
mechanism: enhanced
inhibition of 5-
hydroxytryptamine reuptake
Avoid smoking;
Dose adjustment
when taking
medicinal cannabis
(Stoll, Cole, &
Lukas, 1991)
PHARMACOKINETIC INTERACTIONS
Concomitant Drug
(Metabolic Mechanism)
Clinical Effect(s)
Recommendation Ref
Antipyrine,
barbiturates
Decreased clearance of these
agents, presumably via
competitive inhibition of
metabolism.
Dose adjustment,
therapeutic drug
monitoring
(Benowitz &
Jones, 1977)

361
Theophylline
(CYP1A2)
Increased theophylline
metabolism reported with
smoking of marijuana; effect
similar to that following
smoking tobacco
Avoid smoking
(Jusko,
Schentag, Clark,
Gardner, &
Yurchak, 1978)
Valproate
(CYP2C9)
Can theoretically potentiate
the psychotropic effects of
THC by decreasing plasma
clearance.
Dose adjustment
(Gaston &
Friedman, 2017)
Phenytoin
(CYP2C9)
THC increased the in vitro
metabolism of phenytoin
Therapeutic drug
monitoring
(Gaston &
Friedman, 2017)
Ethanol
Gut motility
THC may delay alcohol
absorption
Avoid alcohol
consumption when
taking medicinal
cannabis
(Benowitz &
Jones, 1977)
Even though phytocannabinoids may present many potential DDIs, studies of THC and
CBD inhibition and/or induction of major human CYP isoforms generally present low clinical
risk, although more specific human data is needed (Stout & Cimino, 2014). Another important
factor to take into account is the dose at which phytocannabinoids are used in the clinic and their
inhibitory constants and/or half maximal inhibitory concentration values. Generally, THC and
362
CBD Ki and/or IC50 values for studied CYP isoforms are below the expected systemic
concentrations of these phytocannabinoids. Nevertheless, clinically significant inhibitory effects
cannot be ruled out entirely.
There is still much room for investigation of DDIs involving phytocannabinoids. Not
only must CYP-mediated DDIs be considered, but other aspects such as plasma protein binding
and gastrointestinal motility should be taken into account, as they may impact the absorption and
other ADMET properties of concomitantly administered drugs (Izzo et al., 2012; Schwilke et al.,
2009).
4. CONCLUSIONS
Understanding phytocannabinoid metabolism is developing into a key factor within the
drug development process, as a strategy to reduce the risk of costly late-stage project failure due
to adverse ADMET properties. DDI knowledge is also of growing practical importance in order
to avoid potential clinical complications arising from the increasingly widespread use of legal
marijuana, both medically and recreationally. Alternatively, possible beneficial effects, including
the opportunity to exploit multiple therapeutic mechanisms and the avoidance of deleterious
side-effects in concomitant drugs, may be delineated because of such interactions at a
pharmacokinetic or pharmacodynamic level. Hence, more investigational efforts are required in
this field. Many computer modeling methods of metabolic pathways have already been
developed, but they are not perfect. More metabolism data is needed, as well as more efficient
and reliable in silico methods. Those needs should motivate more studies along this line in the
near future.
363
References
Aizpurua-Olaizola, O., Soydaner, U., Öztürk, E., Schibano, D., Simsir, Y., Navarro, P., …
Usobiaga, A. (2016). Evolution of the cannabinoid and terpene content during the growth of
Cannabis sativa plants from different chemotypes. Journal of Natural Products, 79(2), 324–331.
https://doi.org/10.1021/acs.jnatprod.5b00949
Amada, N., Yamasaki, Y., Williams, C. M., & Whalley, B. J. (2013). Cannabidivarin (CBDV)
suppresses pentylenetetrazole (PTZ)-induced increases in epilepsy-related gene expression.
PeerJ, 1, e214–e214. https://doi.org/10.7717/peerj.214
Appendino, G., Chianese, G., & Taglialatela-Scafati, O. (2011). Cannabinoids: Occurrence and
medicinal chemistry. Current Medicinal Chemistry, 18(7), 1085–1099.
Arellano, A. L., Papaseit, E., Romaguera, A., Torrens, M., & Farré., M. (2017). Neuropsychiatric
and general interactions of natural and synthetic cannabinoids with drugs of abuse and
medicines. CNS & Neurological Disorders - Drug Targets, 16(5).
https://doi.org/10.2174/1871527316666170413104516
Ashton, C. (2001). Pharmacology and effects of cannabis: A brief review. British Journal of
Psychiatry, 178(Feb), 101–106.
Baek, S., Kim, Y., Kwag, J., Choi, K., Jung, W., & Han, D. (1998). Boron trifluoride etherate on
silica-A modified Lewis acid reagent (VII). Antitumor activity of cannabigerol against human
oral epitheloid carcinoma cells. Archives of Pharmacal Research, 21(3), 353–356.
https://doi.org/10.1007/BF02975301
Balabanova, S., Parsche, F., & Pirsig, W. (1992). First identification of drugs in Egyptian
mummies. Naturwissenschaften, 79(8), 358. https://doi.org/10.1007/bf01140178
364
Benowitz, N., & Jones, R. T. (1977). Effects of delta-9-tetrahydrocannabinol on drug distribution
and metabolism. Antipyrine, pentobarbital, and ethanol. Clinical Pharmacology and
Therapeutics, 22(3), 259–268. https://doi.org/10.1002/cpt1977223259
Benowitz, N., Nguyen, T., Jones, R., Herning, R., & Bachman, J. (1980). Metabolic and
psychophysiologic studies of cannabidiol-hexobarbital interaction. Clinical Pharmacology &
Therapeutics, 28(1), 115–120. https://doi.org/10.1038/clpt.1980.139
Bisogno, T., Howell, F., Williams, G., Minassi, A., Cascio, M. G., Ligresti, A., … Doherty, P.
(2003). Cloning of the first sn1-DAG lipases points to the spatial and temporal regulation of
endocannabinoid signaling in the brain. Journal of Cell Biology, 163(3), 463–468.
https://doi.org/10.1083/jcb.200305129
Bland, T., Haining, R., Tracy, T., & Callery, P. (2005). CYP2C-catalyzed delta(9)-
tetrahydrocannabinol metabolism: Kinetics, pharmacogenetics and interaction with phenytoin.
Biochemical Pharmacology, 70(7), 1096–1103.
Bornheim, L., Lasker, J., & Raucy, J. (1992). Human hepatic microsomal metabolism of delta-1-
tetrahydrocannabinol. Drug Metabolism and Disposition, 20(2), 241–246.
Brown, N. K., & Harvey, D. J. (1990). In vitro metabolism of cannabichromene in seven
common laboratory animals. Drug Metabolism and Disposition, 18(6), 1065–1070.
Cascio, M. G., Zamberletti, E., Marini, P., Parolaro, D., & Pertwee, R. G. (2015). The
phytocannabinoid, Δ9-tetrahydrocannabivarin, can act through 5-HT₁A receptors to produce
antipsychotic effects. British Journal of Pharmacology, 172(5), 1305–1318.
https://doi.org/10.1111/bph.13000
Citti, C., Linciano, P., Russo, F., Luongo, L., Iannotta, M., Maione, S., … Cannazza, G. (2019).
A novel phytocannabinoid isolated from Cannabis sativa L. with an in vivo cannabimimetic

365
activity higher than Δ9-tetrahydrocannabinol: Δ9-Tetrahydrocannabiphorol. Scientific Reports,
9(1), 20335. https://doi.org/10.1038/s41598-019-56785-1
Clark, A., Ware, M., Yazer, E., Murray, T., & Lynch, M. (2004). Patterns of cannabis use among
patients with multiple sclerosis. Neurology, 62(11), 2098–2100.
De Meijer, E. P. M., & Hammond, K. M. (2005). The inheritance of chemical phenotype in
Cannabis sativa L. (II): Cannabigerol predominant plants. Euphytica, 145(1–2), 189–198.
https://doi.org/10.1007/s10681-005-1164-8
De Petrocellis, L., Ligresti, A., Moriello, A. S., Allarà, M., Bisogno, T., Petrosino, S., … Di
Marzo, V. (2011). Effects of cannabinoids and cannabinoid-enriched Cannabis extracts on TRP
channels and endocannabinoid metabolic enzymes. British Journal of Pharmacology, 163(7),
1479–1494. https://doi.org/10.1111/j.1476-5381.2010.01166.x
Deiana, S., Watanabe, A., Yamasaki, Y., Amada, N., Arthur, M., Fleming, S., … Riedel, G.
(2012). Plasma and brain pharmacokinetic profile of cannabidiol (CBD), cannabidivarine
(CBDV), Δ9-tetrahydrocannabivarin (THCV) and cannabigerol (CBG) in rats and mice
following oral and intraperitoneal administration and CBD action on obsessive-compulsive
behavi. Psychopharmacology, 219(3), 859–873. https://doi.org/10.1007/s00213-011-2415-0
Devane, W. A., Breuer, A., Sheshkin, T., Jarbe, T. U. C., Eisen, M. S., & Mechoulam, R. (1992).
A novel probe for the cannabinoid receptor. Journal of Medicinal Chemistry, 35, 2065–2069.
Devane, W. A., Dysarz, F. A. 3rd, Johnson, M. R., Melvin, L. S., & Howlett, A. C. (1988).
Determination and characterization of a cannabinoid receptor in rat brain. Molecular
Pharmacology, 34, 605–613.
366
Devane, W. A., Hanus, L., Breuer, A., Pertwee, R. G., Stevenson, L. A., Griffin, G., …
Mechoulam, R. (1992). Isolation and structure of a brain constituent that binds to the
cannabinoid receptor. Science, 258, 1946–1949.
Dronabinol. (2019). Drugbank, Canada. Retrieved from
https://www.drugbank.ca/drugs/DB00470
Duque, M. D., Issa, M. G., Silva, D. A., Barbosa, E. J., Löbenberg, R., & Ferraz, H. G. (2018). In
silico simulation of dissolution profiles for development of extended-release doxazosin tablets.
Dissolution Technologies, 25(4), 14–21. https://doi.org/10.14227/dt250418p14
Dussy, F., Hamberg, C., Luginbühl, M., Schwerzmann, T., & Briellmann, T. (2005). Isolation of
delta9-THCA-A from hemp and analytical aspects concerning the determination of delta9-THC
in cannabis products. Forensic Science International, 149(1), 3–10.
Eichler, M., Spinedi, L., Unfer-Grauwiler, S., Bodmer, M., Surber, C., Luedi, M., & Drewe, J.
(2012). Heat exposure of Cannabis sativa extracts affects the pharmacokinetic and metabolic
profile in healthy male subjects. Planta Medica, 78(7), 686–691. https://doi.org/10.1055/s-0031-
1298334
Elmes, M. W., Kaczocha, M., Berger, W. T., Leung, K. N., Ralph, B. P., Wang, L., … Deutsch,
D. G. (2015). Fatty acid-binding proteins (FABPs) are intracellular carriers for Δ9-
tetrahydrocannabinol (THC) and cannabidiol (CBD). Journal of Biological Chemistry, 290(14),
8711–8721. https://doi.org/10.1074/jbc.M114.618447
Elmes, M. W., Prentis, L. E., McGoldrick, L. L., Giuliano, C. J., Sweeney, J. M., Joseph, O. M.,
… Kaczocha, M. (2019). FABP1 controls hepatic transport and biotransformation of Δ9-THC.
Scientific Reports, 9, 7588. https://doi.org/10.1038/s41598-019-44108-3
367
ElSohly, M. (2002). Chemical constituents of Cannabis. In F. Grotenhermen & E. Russo (Eds.),
Cannabis and Cannabinoids. Pharmacology, Toxicology, and Therapeutic Potential (pp. 27–36).
Binghamton, New York, USA: The Haworth Press, Inc.
Elsohly, M., DeWit, H., Wachtel, S., Feng, S., & Murphy, T. (2001). Δ9-Tetrahydrocannabivarin
as a marker for the ingestion of marijuana versus Marinol®: Results of a clinical study. Journal
of Analytical Toxicology, 25(7), 565–571. https://doi.org/10.1093/jat/25.7.565
Elsohly, M., Feng, S., Murphy, T., Ross, S., Nimrod, A., Mehmedic, Z., & Fortner, N. (1999).
Δ9-Tetrahydrocannabivarin (Δ9-THCV) as a marker for the ingestion of cannabis versus
Marinol®. Journal of Analytical Toxicology, 23(3), 222–224.
https://doi.org/10.1093/jat/23.3.222
ElSohly, M., & Slade, D. (2005). Chemical constituents of marijuana: The complex mixture of
natural cannabinoids. Life Sciences, 78(5), 539–548. https://doi.org/10.1016/j.lfs.2005.09.011
FDANewsRelease. (2018). FDA approves first drug comprised of an active ingredient derived
from marijuana to treat rare, severe forms of epilepsy. Retrieved from
https://www.fda.gov/news-events/press-announcements/fda-approves-first-drug-comprised-
active-ingredient-derived-marijuana-treat-rare-severe-forms
FlockhartTable. (n.d.). Available at: https://drug-interactions.medicine.iu.edu/MainTable.aspx.
Accessed on May 19, 2020.
Fugh-Berman, A., Wood, S., Kogan, M., Abrams, D., Mathre, M. L., Robie, A., … Kasimu-
Graham, J. (2015). Medical cannabis: Adverse effects & drug interactions. Retrieved from
https://dchealth.dc.gov/publication/medical-cannabis-adverse-effects-and-drug-interactions
368
Furler, M., Einarson, T., Millson, M., Walmsley, S., & Bendayan, R. (2004). Medicinal and
recreational marijuana use by patients infected with HIV. AIDS Patient Care and STDs, 18(4),
215–228.
Gaoni, Y., & Mechoulam, R. (1964). Isolation, structure and partial synthesis of an active
constituent of hashish. Journal of the American Chemical Society, 86, 1646–1647.
Garrett, E., & Hunt, C. (1977). Pharmacokinetics of delta9-tetrahydrocannabinol in dogs. Journal
of Pharmaceutical Sciences, 66(3), 395–407.
Gaston, T. E., & Friedman, D. (2017). Pharmacology of cannabinoids in the treatment of
epilepsy. Epilepsy and Behavior, 70, 313–318. https://doi.org/10.1016/j.yebeh.2016.11.016
Geffrey, A., Pollack, S., Bruno, P., & Thiele, E. (2015). Drug–drug interaction between
clobazepam and cannabidiol in children with refractory epilepsy. Epilepsia, 56(8), 1246–1251.
Goulle, J., Saussereau, E., & Lacroix, C. (2008). Delta-9-tetrahydrocannabinol
pharmacokinetics. Annales pharmaceutiques françaises, 66(4), 232–244.
Grayson, L., Vines, B., Nichol, K., & Szaflarski, J. P. (2018). An interaction between warfarin
and cannabidiol, a case report. Epilepsy & Behavior Case Reports Journal, 9, 10–11.
https://doi.org/10.1016/j.ebcr.2017.10.001
Grotenhermen, F. (2003). Pharmacokinetics and pharmacodynamics of cannabinoids. Clin
Pharmacokinet., 42(4), 327–360.
Grotenhermen, F. (2007). The toxicology of cannabis and cannabis prohibition. Chemistry and
Biodiversity, 4(8), 1744-1769. https://doi.org/doi:10.1002/cbdv.200790151.
Haggerty, G., Deskin, R., Kurtz, P., Fentiman, A., & Leighty, E. (1986). The pharmacological
activity of the fatty acid conjugate 11-palmitoyloxy-delta 9-tetrahydrocannabinol. Toxicol Appl
Pharmacol, 84(3), 599–606.
369
Halldin, M., Widman, M., Bahr, C., Lindgren, J., & Martin, B. (1982). Identification of in vitro
metabolites of delta1-tetrahydrocannabinol formed by human livers. Drug Metabolism and
Disposition, 10(4), 297–301.
Harvey, D. (1991). Metabolism and pharmacokinetics of the cannabinoids. In R.R. Watson
(Ed.), Biochemistry and physiology of substance abuse (pp. 279–365). Boca Raton, Florida,
USA: CRC Press.
Harvey, D., & Brown, N. (1990). In vitro metabolism of cannabigerol in several mammalian
species. Biomedical & Environmental Mass Spectrometry, 19(9), 545–553.
Harvey, D., & Brown, N. (1991a). Comparative in vitro metabolism of the cannabinoids.
Pharmacology, Biochemistry and Behavior, 40(3), 533–540. https://doi.org/10.1016/0091-
3057(91)90359-A
Harvey, D., & Brown, N. (1991b). Identification of cannabichromene metabolites by mass
spectrometry: Identification of eight new dihydroxy metabolites in the rabbit. Biological Mass
Spectrometry, 20, 275–285. https://doi.org/10.1002/bms.1200200507
Harvey, D., & Mechoulam, R. (1990). Metabolites of cannabidiol identified in human urine.
Xenobiotica, 20(3), 303–320.
Hatoum, N. S., Davis, W. M., Elsohly, M. A., & Turner, C. E. (1981). Cannabichromene and Δ9-
tetrahydrocannabinol: Interactions relative to lethality, hypothermia and hexobarbital hypnosis.
General Pharmacology, 12(5), 357–362. https://doi.org/10.1016/0306-3623(81)90090-2
Hawksworth, G., & McArdle, K. (2004). Metabolism and pharmacokinetics of cannabinoids. In
G.W. Guy, B.A. Whittle & P.J. Robson (Eds.), The Medicinal Uses of Cannabis and
Cannabinoids (pp. 205–228). London, England: Pharmaceutical Press.
370
Hazekamp, A., & Grotenhermen, F. (2010). Review on clinical studies with cannabis and
cannabinoids 2005-2009. Cannabinoids, 5(special issue), 1–21.
Hidvegi, E., & Somogyi, G. (2010). Detection of cannabigerol and its presumptive metabolite in
human urine after Cannabis consumption. Die Pharmazie, 65(6), 408–411.
Hollister, L., Gillespie, H., Ohlsson, A., Lindgren, J., Wahlen, A., & Agurell, S. (1981). Do
plasma concentrations of delta 9-tetrahydrocannabinol reflect the degree of intoxication? The
Journal of Clinical Pharmacology, 21(S1), 171S-177S.
Horn, J. R., & Hansten, P. D. (2014). Drug interactions with marijuana. Retrieved from
Pharmacy Times website:
https://www.pharmacytimes.com/publications/issue/2014/december2014/drug-interactions-with-
marijuana
Howlett, A. C., Barth, F., Bonner, T. I., Cabral, G., Casellas, P., Devane, W. A., … Pertwee, R.
G. (2002). International Union of Pharmacology. XXVII. Classification of cannabinoid
receptors. Pharmacological Reviews, 54(2), 161–202. https://doi.org/10.1124/pr.54.2.161
Huang, H., McIntosh, A. L., Martin, G. G., Landrock, D., Chung, S., Landrock, K. K., …
Schroeder, F. (2016). FABP1: A novel hepatic endocannabinoid and cannabinoid binding
protein. Biochemistry, 55(37), 5243–5255. https://doi.org/10.1021/acs.biochem.6b00446
Huestis, M. (2005). Pharmacokinetics and metabolism of the plant cannabinoids, delta9-
tetrahydrocannabinol, cannabidiol and cannabinol. Handbook of Experimental Pharmacology,
168, 657–690.
Huestis, M. (2007). Human cannabinoid pharmacokinetics. Chemistry and Biodiversity, 4(8),
1770–1804.
371
Huestis, M., & Cone, E. (1998). Urinary excretion half-life of 11-nor-9-carboxy-delta9-
tetrahydrocannabinol in humans. Therapeutic Drug Monitoring, 20(5), 570–576.
Huestis, M., Mazzoni, I., & Rabin, O. (2011). Cannabis in sport: Anti-doping perspective. Sports
Medicine, 41(11), 949–966. https://doi.org/10.2165/11591430-000000000-00000
Huestis, M., & Smith, M. L. (2014). Cannabinoid pharmacokinetics and disposition in alternative
matrices. In R.G. Pertwee (Ed.), Handbook of Cannabis (pp. 296–316). Oxford, England: Oxford
University Press.
Iannotti, F. A., Hill, C. L., Leo, A., Alhusaini, A., Soubrane, C., Mazzarella, E., … Stephens, G.
J. (2014). Nonpsychotropic plant cannabinoids, cannabidivarin (CBDV) and cannabidiol (CBD),
activate and desensitize transient receptor potential vanilloid 1 (TRPV1) channels in vitro:
Potential for the treatment of neuronal hyperexcitability. ACS Chemical Neuroscience, 5(11),
1131–1141. https://doi.org/10.1021/cn5000524
Izzo, A. A., Capasso, R., Aviello, G., Borrelli, F., Romano, B., Piscitelli, F., … Di Marzo, V.
(2012). Inhibitory effect of cannabichromene, a major non-psychotropic cannabinoid extracted
from Cannabis sativa, on inflammation-induced hypermotility in mice. British Journal of
Pharmacology, 166(4), 1444–1460. https://doi.org/10.1111/j.1476-5381.2012.01879.x
Jiang, R., Yamaori, S., Okamoto, Y., Yamamoto, I., & Watanabe, K. (2013). Cannabidiol is a
potent inhibitor of the catalytic acitivity of cytochrome P450 2C19. Drug Metabolism and
Pharmacokinetics, 28(4), 332–338.
Jiang, R., Yamaori, S., Takeda, S., Yamamoto, I., & Watanabe, K. (2011). Identification of
cytochrome P450 enzymes responsible for metabolism of cannabidiol by human liver
microsomes. Life Sciences, 89(5–6), 165–170.

372
Jung, J., Kempf, J., Mahler, H., & Weinmann, W. (2007). Detection of Delta9-
tetrahydrocannabinolic acid A in human urine and blood serum by LC-MS/MS. Journal of Mass
Spectrometry, 42(3), 354–360.
Jung, J., Meyer, M., Maurer, H., Neusüß, C., Weinmann, W., & Auwärter, V. (2009). Studies on
the metabolism of the Δ9-tetrahydrocannabinol precursor Δ9-tetrahydrocannabinolic acid A (Δ9-
THCA-A) in rat using LC-MS/MS, LC-QTOFMS and GC-MS techniques. Journal of Mass
Spectrometry, 44(10), 1423–1433. https://doi.org/10.1002/jms.1624
Jusko, W. J., Schentag, J. J., Clark, J. H., Gardner, M., & Yurchak, A. M. (1978). Enhanced
biotransformation of theophylline in marihuana and tobacco smokers. Clinical Pharmacology &
Therapeutics, 24, 405–410.
Kapeghian, J. C., Jones, A. B., Murphy, J. C., Elsohly, M. A., & Turner, C. E. (1983). Effect of
cannabichromene on hepatic microsonal enzyme activity in the mouse. General Pharmacology,
14(3), 361–363. https://doi.org/10.1016/0306-3623(83)90044-7
Kirchmair, J., Göller, A. H., Lang, D., Kunze, J., Testa, B., Wilson, I. D., … Schneider, G.
(2015). Predicting drug metabolism: Experiment and/or computation? Nature Reviews Drug
Discovery, 14(6), 387–404. https://doi.org/10.1038/nrd4581
Kirchmair, J., Howlett, A., Peironcely, J., Murrell, D., Williamson, M., Adams, S., … Glen, R.
(2013). How do metabolites differ from their parent molecules and how are they excreted?
Journal of Chemical Information and Modeling, 53(2), 354–367.
https://doi.org/10.1021/ci300487z
Koltai, H., Poulin, P., & Namdar, D. (2019). Promoting cannabis products to pharmaceutical
drugs. European Journal of Pharmaceutical Sciences, 132, 118–120.
https://doi.org/10.1016/j.ejps.2019.02.027

373
Laprairie, R. B., Bagher, A. M., Kelly, M. E. M., & Denovan-Wright, E. M. (2015). Cannabidiol
is a negative allosteric modulator of the cannabinoid CB1 receptor. British Journal of
Pharmacology, 172(20), 4790–4805. https://doi.org/10.1111/bph.13250
Lemberger, L., Axelrod, J., & Kopin, I. (1971). Metabolism and disposition of delta-9-
tetrahydrocannabinol in man. Pharmacological Reviews, 23(4), 371–380.
Lemberger, L., Weiss, J., Watanabe, A., Galanter, I., Wyatt, R., & Cardon, P. (1972). Delta-9-
tetrahydrocannabinol. Temporal correlation of the psychologic effects and blood levels after
various routes of administration. New England Journal of Medicine, 286(13), 685–688.
Ligresti, A., De Petrocellis, L., & Di Marzo, V. (2016). From phytocannabinoids to cannabinoid
receptors and endocannabinoids: Pleiotropic physiological and pathological roles through
complex pharmacology. Physiological Reviews, 96(4), 1593–1659.
https://doi.org/10.1152/physrev.00002.2016
Liskow, B. I. (1973). Licit and illicit drugs: The Consumers’ Union report on narcotics,
stimulants, depressants, inhalants, hallucinogens, and marijuana—Including caffeine, nicotine,
and alcohol. Journal of the American Medical Association, 224(8), 1192.
Lucas, C. J., Galettis, P., & Schneider, J. (2018). The pharmacokinetics and the
pharmacodynamics of cannabinoids. British Journal of Clinical Pharmacology, 84(11), 2477–
2482. https://doi.org/10.1111/bcp.13710
Massi, M., Solinas, M., Cinquina, V., & Parolaro, D. (2013). Cannabidiol as potential anticancer
drug. British Journal of Clinical Pharmacology, 75(2), 303–312.
Maurer, H., Sauer, C., & Theobald, D. (2006). Toxicokinetics of drugs of abuse: Current
knowledge of the isoenzymes involved in the human metabolism of tetrahydrocannabinol,
cocaine, heroin, morphine and codein. Therapeutic Drug Monitoring, 28(3), 447–453.

374
Maykut, M. (1985). Health consequences of acute and chronic marihuana use. Progress in
Neuro-Psychopharmacology & Biological Psychiatry, 9(3), 209–238.
Mazur, A., Lichti, C., Prather, P., Zielinska, A., Bratton, S., Gallus-Zawada, A., … Moran, J.
(2009). Characterization of human hepatic and extrahepatic UDP-glucuronosyltransferase
enzymes involved in the metabolism of classic cannabinoids. Drug Metabolism and Disposition,
37(7), 1496–1504.
McPartland, J. M., & Russo, E. B. (2001). Cannabis and cannabis extracts: Greater than the sum
of their parts? Journal of Cannabis Therapeutics, (3–4), 103–132.
https://doi.org/10.1300/J175v01n03
Mechoulam, R., Ben-Shabat, S., Hanus, L., Ligumsky, M., Kaminski, N. E., Schatz, A. R., …
Vogel, Z. (1995). Identification of an endogenous 2-monoglyceride, present in canine gut, that
binds to cannabinoid receptors. Biochemical Pharmacology, 50(1), 83–90.
https://doi.org/https://doi.org/10.1016/0006-2952(95)00109-D
Mechoulam, R., & Gaoni, Y. (1967). Recent advances in the chemistry of hashish. Progress in
the Chemistry of Organic Natural Products., 25, 175–213.
Mechoulam, R., Hanus, L., Pertwee, R. G., & Howlett, A. (2014). Early phytocannabinoid
chemistry to endocannabinoids and beyond. Nature Reviews Neuroscience, 15(11), 757‐764.
Mechoulam, R., & Shvo, Y. (1963). The structure of cannabidiol. Tetrahedron, 19, 2073–2078.
Medical Cannabis. (2019). Drugbank, Canada. Retrieved from
https://www.drugbank.ca/drugs/DB14009#reference-A32585
Moore, C., Rana, S., & Coulter, C. (2007). Simultaneous identification of 2-carboxy-
tetrahydrocannabinol, tetrahydrocannabinol, cannabinol and cannabidiol in oral fluid. Journal of

375
Chromatography B: Analytical Technologies in the Biomedical and Life Sciences, 852(1–2),
459–464.
Morales, P., Hurst, D. P., & Reggio, P. H. (2017). Molecular Targets of the Phytocannabinoids:
A complex picture. In A.D. Kinghorn, H. Falk, S. Gibbons, & J. Kobayashi (Eds.),
Phytocannabinoids: Unraveling the complex chemistry and pharmacology of Cannabis sativa
(pp. 103–131), Progress in the chemistry of organic natural products book series, Volume 103.
Cham, Switzerland: Springer International Publishing. https://doi.org/10.1007/978-3-319-45541-
9_4
Moreno-Sanz, G. (2016). Can you pass the acid test? Critical review and novel therapeutic
perspectives of Δ 9 -Tetrahydrocannabinolic acid A. Cannabis and Cannabinoid Research, 1(1),
124–130. https://doi.org/10.1089/can.2016.0008
Munro, S., Thomas, K. L., & Abu-Shaar, M. (1993). Molecular characterization of a peripheral
receptor for cannabinoids. Nature, 365, 61–65.
Nabilone. (2019). Drugbank, Canada. Retrieved from https://www.drugbank.ca/drugs/DB00486
Nabiximols. (2019). Drugbank, Canada. Retrieved from
https://www.drugbank.ca/drugs/DB14011
Nadulski, T., Pragst, F., Weinberg, G., Roser, P., Schnelle, M., Fronk, E., & Stadelmann, A.
(2005). Randomized, double-blind, placebo-controlled study about the effects of cannabidiol
(CBD) on the pharmacokinetics of D9-tetrahydrocannabinol (THC) after oral application of THC
verses standardized cannabis extract. Therapeutic Drug Monitoring, 27(6), 799–810.
https://doi.org/10.1097/01.ftd.0000177223.19294.5c
376
NHS. (2018). Does cannabis interact with antidepressants or lithium? Retrieved from
https://www.nhs.uk/common-health-questions/medicines/does-cannabis-interact-with-
antidepressants-or-lithium/#
Ohlsson, A., Lindgren, J., Wahlen, A., Agurell, S., Hollister, L., & Gillespi, H. (1980). Plasma
delta-9 tetrahydrocannabinol concentrations and clinical effects after oral and intravenous
administration and smoking. Clinical Pharmacology & Therapeutics, 28(3), 409–416.
Owens, S., McBay, A., Reisner, H., & Perez-Reyes, M. (1981). 125I radioimmunoassay of delta-
9-tetrahydrocannabinol in blood and plasma with a solid-phase second-antibody separation
method. Clinical Chemistry, 27(4), :619-624.
Pate, D. W. (1994). Chemical ecology of Cannabis. Journal of the International Hemp
Association, 1(2), 29, 32-37. http://www.internationalhempassociation.org/jiha/iha01201.html
Pate, D. W. (1999). Cannabinoid taxonomy. In J. Mönkkönen (Ed.), Anandamide structure-
activity relationships and mechanisms of action on intraocular pressure in the normotensive
rabbit model (pp.15-21). Pharmaceutical sciences dissertation 37. Kuopio, Finland: Kuopio
University Publications A. https://www.elibrary.ru/item.asp?id=5313464.
Pertwee, R. G. (2004). The pharmacology and therapeutic potential of cannabidiol. In V. Di
Marzo (Ed.), Cannabinoids (pp. 32-83). New York, New York, USA: Kluwer Academic /
Plenum Publishers.
Pertwee, R. G. (2008). The diverse CB1 and CB2 receptor pharmacology of three plant
cannabinoids: Delta9-tetrahydrocannabinol, cannabidiol and delta9-tetrahydrocannabivarin.
British Journal of Pharmacology, 153(2), 199–215. https://doi.org/10.1038/sj.bjp.0707442
Prueksaritanont, T., Chu, X., Gibson, C., Cui, D., Yee, K. L., Ballard, J., … Hochman, J. (2013).
Drug–drug interaction studies: Regulatory guidance and an industry perspective. The American

377
Association of Pharmaceutical Scientists Journal, 15(3), 629–645.
https://doi.org/10.1208/s12248-013-9470-x
Raharjo, T., & Verpoorte, R. (2004). Methods for the analysis of cannabinoids in biological
materials: A review. Phytochemical Analysis, 15(2), 79–94.
Rinaldi-Carmona, M., Barth, F., Héaulme, M., Shire, D., Calandra, B., Congy, C., … Caput, D.
(1994). SR141716A, a potent and selective antagonist of the brain cannabinoid receptor.
Federation of European Biochemical Societies Letters, 350(2–3), 240–244.
https://doi.org/10.1016/0014-5793(94)00773-x
Rinaldi-Carmona, M., Barth, F., Millan, J., Derocq, J. M., Casellas, P., Congy, C., … Le Fur, G.
L. (1998). SR 144528, the first potent and selective antagonist of the CB2 cannabinoid receptor.
Journal of Pharmacology and Experimental Therapeutics, 284(2), 644–650.
Rock, E. M., Sticht, M. A., Duncan, M., Stott, C., & Parker, L. A. (2013). Evaluation of the
potential of the phytocannabinoids, cannabidivarin (CBDV) and Δ9-tetrahydrocannabivarin
(THCV), to produce CB 1 receptor inverse agonism symptoms of nausea in rats. British Journal
of Pharmacology, 170, 671–678. https://doi.org/10.1111/bph.12322
Rong, C., Carmona, N. E., Lee, Y. L., Ragguett, R.-M., Pan, Z., Rosenblat, J. D., … McIntyre,
R. S. (2018). Drug-drug interactions as a result of co-administering Δ9 -THC and CBD with
other psychotropic agents. Expert Opinion on Drug Safety, 17(1), 51–54.
https://doi.org/10.1080/14740338.2017.1397128
Rostami-Hodjegan, A., & Tucker, G. T. (2007). Simulation and prediction of in vivo drug
metabolism in human populations from in vitro data. Nature Reviews Drug Discovery, 6(2),
140–148. https://doi.org/10.1038/nrd2173
378
Russo, E. (2001). Hemp for headache: An in-depth historical and scientific review of cannabis in
migraine treatment. Journal of Cannabis Therapeutics, 1(2), 21–92.
Russo, E. (2002). Cannabis treatments in obstetrics and gynecology: A historical review. Journal
of Cannabis Therapeutics, 2(3–4), 5–35.
Russo, E. (2011). Taming THC: Potential cannabis synergy and phytocannabinoid-terpenoid
entourage effects. British Journal of Pharmacology, 163(7), 1344–1364.
https://doi.org/10.1111/j.1476-5381.2011.01238.x
Schurman, L. D., Lu, D., Kendall, D. A., Howlett, A. C., & Lichtman, A. H. (2020). Molecular
mechanism and cannabinoid pharmacology. In M. A. Nader & Y. L. Hurd (Eds.), Substance Use
Disorders. Handbook of Experimental Pharmacology (pp. 323–353). Springer International
Publishing.
Schwilke, E. W., Karschner, E. L., Lowe, R. H., Gordon, A. M., Cadet, J. L., Herning, R. I., &
Huestis, M. A. (2009). Intra- and intersubject whole blood/plasma cannabinoid ratios determined
by 2-dimensional, electron impact GC-MS with cryofocusing. Clinical Chemistry, 55(6), 1188–
1195. https://doi.org/10.1371/journal.pone.0178059
Sedgwick, B. (2000). Δ9-Tetrahydrocannabivarin (THCV) as a marker of cannabis use: Is the
methodology forensically acceptable? Journal of Analytical Toxicology, 24(1), 73–74.
https://doi.org/10.1093/jat/24.1.74
Sharma, P., Murthy, P., & Bharath, M. M. S. (2012). Chemistry, metabolism, and toxicology of
cannabis: Clinical implications. Iranian Journal of Psychiatry, 7(4), 149–156.
Silva, D., Duque, M., Davies, N., Löbenberg, R., & Ferraz, H. (2018). Application of in silico
tools in clinical practice using ketoconazole as a model drug. Journal of Pharmacy and
Pharmaceutical Sciences, 21(1S), 242s-253s. https://doi.org/10.18433/jpps30227

379
Stoll, A. L., Cole, J. O., & Lukas, S. E. (1991). A case of mania as a result of fluoxetine
marijuana interaction. The Journal of Clinical Psychiatry, 52(6), 280–281.
Stott, C., White, L., Wright, S., Wilbraham, D., & Guy, G. (2013). A Phase I, open-label,
randomized, crossover study in three parallel groups to evaluate the effect of rifampicin,
ketoconazole, and omeprazole on the pharmacokinetics of THC/CBD oromucosal spray in
healthy volunteers. SpringerPlus, 2(1), 236. https://doi.org/10.1186/2193-1801-2-236
Stout, S., & Cimino, N. (2014). Exogenous cannabinoids as substrates, inhibitors, and inducers
of human drug metabolizing enzymes: A systematic review. Drug Metabolism Reviews, 46(1),
86–95.
Sugiura, T., Kondo, S., Sukagawa, A., Nakane, S., Shinoda, A., Itoh, K., … Waku, K. (1995). 2-
Arachidonoylgylcerol: A possible endogenous cannabinoid receptor ligand in brain. Biochemical
and Biophysical Research Communications, 215(1), 89–97.
https://doi.org/https://doi.org/10.1006/bbrc.1995.2437
Testa, B., Pedretti, A., & Vistoli, G. (2012). Reactions and enzymes in the metabolism of drugs
and other xenobiotics. Drug Discovery Today, 17(11–12), 549–560.
Tramer, M., Carroll, D., Campbell, F., Reynolds, D., Moore, R., & McQuay, H. (2001).
Cannabinoids for control of chemotherapy induced nausea and vomiting: Quantitative systematic
review. The British Medical Journal, 323(7303), 16-21.
Tyzack, J., & Glen, R. C. (2014). Investigating and predicting how biology changes molecules
and their properties. Molecular Informatics, 33((6–7)), 443–445.
Tyzack, J., & Kirchmair, J. (2019). Computational methods and tools to predict cytochrome
P450 metabolism for drug discovery. Chemical Biology and Drug Design, (93), 377–386.
https://doi.org/10.1111/cbdd.13445
380
Ujvary, I., & Hanuš, L. (2016). Human metabolites of cannabidiol: A review on their formation,
biological activity, and relevance in therapy. Cannabis and Cannabinoid Research, 1(1), 90–101.
https://doi.org/10.1089/can.2015.0012
Unimed Pharmaceuticals, I. (2006). MARINOL: Dronabinol. [Package insert]. Retrieved from
https://www.accessdata.fda.gov/drugsatfda_docs/label/2006/018651s025s026lbl.pdf
Uwimana, E., Ruiz, P., Li, X., & Lehmler, H. J. (2019). Human CYP2A6, CYP2B6, and
CYP2E1 atropselectively metabolize polychlorinated biphenyls to hydroxylated metabolites.
Environmental Science and Technology, 53, 2114–2123. https://doi.org/10.1021/acs.est.8b05250
Vree, T., Breimer, D., van Ginneken, C., & van Rossum, J. (1972). Identification in hashish of
tetrahydrocannabinol, cannabidiol and cannabinol analogs with methyl side-chain. Journal of
Pharmacy and Pharmacology, 24, 7–12.
Wall, M., & Perez-Reyes, M. (1981). The metabolism of delta9-tetrahydrocannabinol and related
cannabinoids in man. Journal of Clinical Pharmacology, 21(S1), 178S-189S.
Wall, M., Sadler, B., Brine, D., Taylor, H., & Perez-Reyes, M. (1983). Metabolism, disposition,
and kinetics of delta-9-tetrahydrocannabinol in men and women. Clinical Pharmacology &
Therapeutics, 34(3), 352–363.
Wang, M., Wang, Y. H., Avula, B., Radwan, M. M., Wanas, A. S., Van Antwerp, J., … Khan, I.
A. (2016). Decarboxylation study of acidic cannabinoids: A novel approach using ultra-high-
performance supercritical fluid chromatography/photodiode array-mass spectrometry. Cannabis
and Cannabinoid Research, 1(1), 262–271. https://doi.org/10.1089/can.2016.0020
Ware, M., Adams, H., & Guy, G. (2005). The medicinal use of cannabis in the UK: Results of a
nationwide survey. International Journal of Clinical Practice, 59(3), 291–295.
381
Wargent, E. T., Zaibi, M. S., Silvestri, C., Hislop, D. C., Stocker, C. J., Stott, C. G., …
Cawthorne, M. A. (2013). The cannabinoid Δ9-tetrahydrocannabivarin (THCV) ameliorates
insulin sensitivity in two mouse models of obesity. Nutrition and Diabetes, 3(e68), 1–10.
https://doi.org/10.1038/nutd.2013.9
Watanabe, K., Matsunaga, T., Yamamoto, I., Funae, Y., & Yoshimura, H. (1995). Involvement
of CYP2C in the metabolism of cannabinoids by human hepatic microsomes from an old
woman. Biological and Pharmaceutical Bulletin, 18(8), 1138–1141.
Wilens, T. E., Biederman, J., & Spencer, T. J. (1997). Case study: Adverse effects of smoking
marijuana while receiving tricyclic antidepressants. Journal of the American Academy of Child
and Adolescent Psychiatry, 36(1), 45–48. https://doi.org/10.1097/00004583-199701000-00016
Williams, P. L., & Moffat, A. C. (1980). Identification in human urine of delta9-
tetrahydrocannabinol-11-oic acid glucuronide: A tetrahydrocannabinol metabolite. Journal of
Pharmacy and Pharmacology, 32(7), 445-8.
Wishart, D. S., Feunang, Y. D., Guo, A. C., Lo, E. J., Marcu, A., Grant, J. R., … Wilson, M.
(2018). DrugBank 5.0: A major update to the DrugBank database for 2018. Nucleic Acids
Research, 46(D1), D1074–D1082.
Wohlfarth, A. (2013). Pharmakokinetik und metabolismus von Δ9-tetrahydrocannabinolsäure A
im menschen. Toxichem Krimtech 80(1), 60-65.
https://www.gtfch.org/cms/images/stories/media/tk/tk80_1/Wohlfarth.pdf
Wood, S. (2004). Evidence for using cannabis and cannabinoids to manage pain. Nursing Times,
100(49), 38–40.
382
Wu, J. (2019). Cannabis, cannabinoid receptors, and endocannabinoid system: Yesterday, today,
and tomorrow. Acta Pharmacologica Sinica, 40(3), 297–299. https://doi.org/10.1038/s41401-
019-0210-3
Yamaori, S., Ebisawa, J., Okushima, Y., Yamamoto, I., & Watanabe, K. (2011). Potent
inhibition of human cytochrome P450 3A isoforms by cannabidiol: Role of phenolic hydroxyl
groups in the resorcinol moiety. Life Sciences, 88, 730–736.
https://doi.org/10.1016/j.lfs.2011.02.017
Yamaori, S., Koeda, K., Kushihara, M., Hada, Y., Yamamoto, I., & Watanabe, K. (2012).
Comparison in the in vitro inhibitory effects of major phytocannabinoids and polycyclic aromatic
hydrocarbons contained in marijuana smoke on cytochrome P450 2C9 activity. Drug Metabolism
and Pharmacokinetics, 27(3), 294–300. https://doi.org/10.2133/dmpk.dmpk-11-rg-107
Yamaori, S., Kushihara, M., Yamamoto, I., & Watanabe, K. (2010). Characterization of major
phytocannabinoids, cannabidiol and cannabinol, as isoform-selective and potent inhibitors of
human CYP1 enzymes. Biochemical Pharmacology, 79(11), 1691–1698.
https://doi.org/10.1016/j.bcp.2010.01.028
Yamaori, S., Maeda, C., Yamamoto, I., & Watanabe, K. (2011). Differential inhibition of human
cytochrome P450 2A6 and 2B6 by major phytocannabinoids. Forensic Toxicology, 29(2), 117–
124. https://doi.org/10.1007/s11419-011-0112-7
Yamaori, S., Okamoto, Y., Yamamoto, I., & Watanabe, K. (2011). Cannabidiol, a major
phytocannabinoid, as a potent atypical inhibitor for CYP2D6. Drug Metabolism and Disposition,
39(11), 2049–2056. https://doi.org/10.1124/dmd.111.041384
Zhornitsky, S., & Potvin, S. (2012). Cannabidiol in humans — The quest for therapeutic targets.
Pharmaceuticals (Basel, Switzerland), 5(5), 529–552. https://doi.org/10.3390/ph5050529
383
Zou, S., & Kumar, U. (2018). Cannabinoid receptors and the endocannabinoid system: Signaling
and function in the central nervous system. International Journal of Molecular Sciences, 19(3),
pii:E833.