
K De Silva. - ERA
147
PROCESS DEVELOPMENTS IN ELECTROCHEMICAL ARC MACHINING K De Silva. Ph D University of Edinburgh 1988
-
Upload
khangminh22 -
Category
Documents
-
view
3 -
download
0
Transcript of K De Silva. - ERA
PROCESS DEVELOPMENTS
IN
ELECTROCHEMICAL ARC MACHINING
K De Silva.
Ph D
University of Edinburgh
1988

CONTENTS
Title Page .......................................................................................................................... (i)
Contents ............................................................................................................................ (ii)
Acknowledgements: ........................................................................................................... Ov)
Declaration ........................................................................................................................ (V)
Abstract ............................................................................................................................. (vi)
Abbreviations & Symbols ................................................................................................. (viii)
Chapter I INTRODUCTION .......................................................................................
1.1 Non-conventional Machining Processes ................................................................. I
1.1.1 Electrochemical Machining .............................................................................. 1
1.1.2 Electrodischarge Machining ............................................................................. 2
1.2 Electrochemical Arc Machining .............................................................................. 4
1.3 Review of Literature ............................................................................................... 5
1.4 Objectives of Thesis ............................................................................................... 8
1.5 Thesis Organisation ................................................................................................ 8
Chapter 2 ELECTROCHEMICAL ARC DRILLING OF ALLOYS ....................... 11
2.1 Introduction ............................................................................................................. 11
2.2 ECAM Drilling ....................................................................................................... 12 2.3 Experimental Apparatus ........................................................................................... 14
2.3.1 'Ille Main Machine Unit .................................................................................. 15 2.3.2 The Power Supply ........................................................................................... 17
2.3.3 The Electrolyte Supply System ........................................................................ 17
2.3A The Process Monitoring Instrumentation ......................................................... 17
2.4 Experimental Procedure .......................................................................................... 18
2.5 Results and Discussion ........................................................................................... 19
2.5.1 Feed Rate ......................................................................................................... 20
2.5.2 Electrolyte Pressure .......................................................................................... 20
2.5.3 Vibration Amplitude ........................................................................................ 21
2.5.4 Phase Angle between Vibration and Voltage Waveforms ............................... 22
2.5.5 Machining Voltage ........................................................................................... 25
2.6 Summary ................................................................................................................. 34
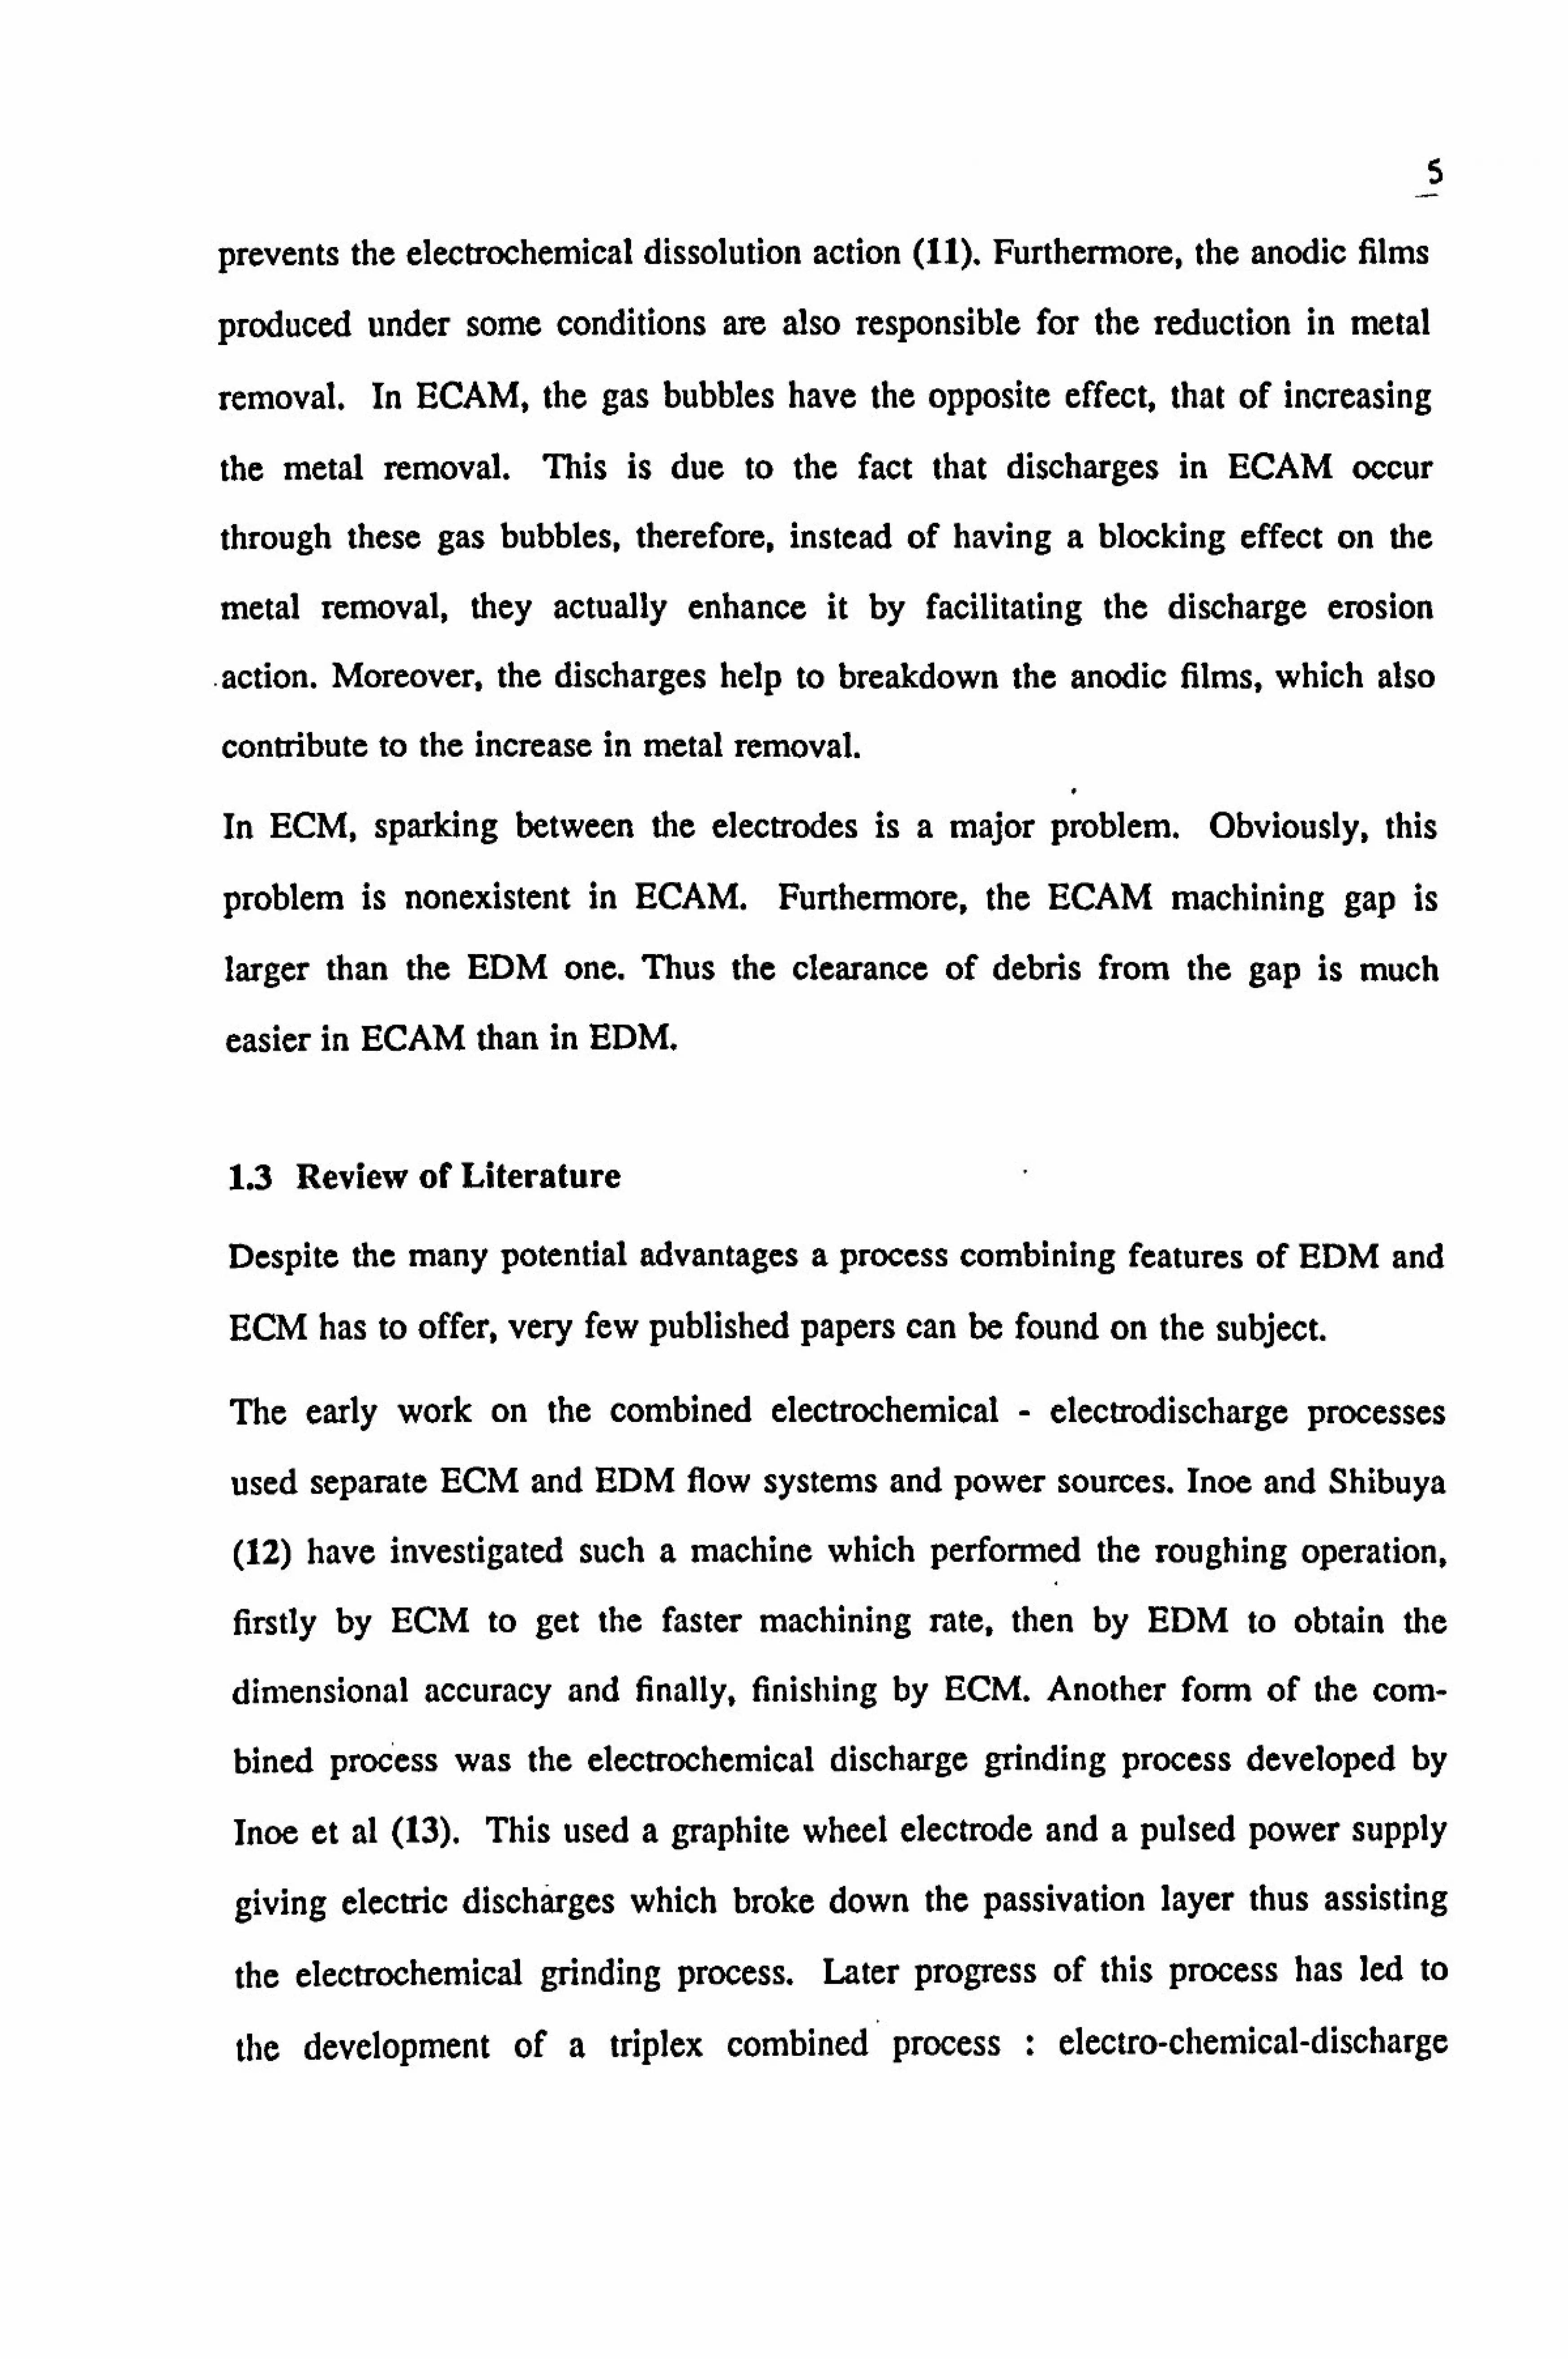
Chapter 3 SURFACE EFFECTS ON ALLOYS DRILLED BY ECAM .................. 36
3.1 Introduction ............................................................................................................. 36
3.2 EDM Surface Effects .............................................................................................. 37
3.3 ECM Surface Effects .............................................................................................. 38 3.4 Surface Effects of ECAM Drilling ......................................................................... 39
3.5 Evaluation of Surface Integrity ............................................................................... 40
3.6 Results and Discussion ........................................................................................... 41
3.6.1 Low Carbon Chrome Steel .............................................................................. 43
3.6.2 Cobalt Alloy Steel ........................................................................................... 47
3.6.3 Low Alloy Steel ............................................................................................... 50
3.6.4 Nickel Alloy .................................................................................................... 53
3.6.5 Titanium ........................................................................................................... 57
3.7 Summary ................................................................................................................. 60
Chapter 4 ANALYSIS OF GAP PHENOMENA IN ECAM .................................... 62
4.1 Introduction ............................................................................................................. 62 4.2 Electric Discharge Mechanism ............................................................................... 62
4.2.1 Breakdown Theory of Liquids ......................................................................... 63 4.2.2 Electric Discharges in Conductive Liquids ...................................................... 64
4.3 Gap Phenomena in ECAM ..................................................................................... 65
4.3.1 Types of Discharges and Their Classification ................................................. 67
4.3.2 RF Emission by Discharges ............................................................................. 69
4.4 Experimental Apparatus & Procedure .................................................................... 71 4.4.1 The Basic Apparatus ........................................................................................ 71 4.4.2 Adaptation of Agemaspark EDM Machine ...................................................... 73
4.4.3 Monitoring and Instrumentation ....................................................................... 75
4.4.4 RF Monitoring Considerations ......................................................................... 75
4.5 Results and Discussion ........................................................................................... 77
4.5.1 Tap Water ........................................................................................................ 78
4.5.2 Electrolyte ........................................................................................................ 81
4.5.3 Experiments with Gap Flushing ....................................................................... 88
4.6 Summary ................................................................................................................. 89
Chapter 5A THEORETICAL MODEL FOR THE RF EMISSION ....................... 91

5.1 Introduction ............................................................................................................. 91 5.2 Field and Particle Equations ................................................................................... 91
5.3 Electromagnetic Field due to Discharges ................................................................ 93
5.3.1 The Discharge Current ..................................................................................... 94
5.4 Detection of Electromagnetic Radiation ................................................................. 96 5.4.1 Emf Induced in a Loop Antenna ..................................................................... 96
5.5 Comparison with the Measured Values .................................................................. 99
5.5.1 Characteristic Frequencies of Radiation ........................................................... 99
5.5.2 Calculation of Emf ........................................................................................... 100
5.6 Summary ................................................................................................................. 101
Chapter 6 DEVELOPMENT OF THE PORTABLE ECAM DRILLER ................. 103
6.1 Introduction ............................................................................................................. 103
6.2 Apparatus Specification .......................................................................................... 104
6.3 Design and Construction of the Main Body ........................................................... 104
6.4 Tool Motion Control System ...................................................... .... ........................ 110
6.4.1 Feed Control Unit ............................................................................................ 110 6.4.2 Feed Rate Calibration ...................................................................................... 110
6.4.3 Vibration Control Unit ..................................................................................... III 6.4.4 Phase Angle Controller .................................................................................... 112
6.5 Power Supply System .................... o ............................ -00- ......... 0 ....... 00 .................. 113
6.6 Electrolyte Supply System .... oo ................................................. ... 0 ........................ 114
6.7 Testing of the Portable ECAD Apparatus ....... o .................... o ..... 0.0 ......... ........... 115
6.8 Results and Discussion . ........ 0.0 ............ 00 ..... 0.0. - ............... o. 0.0 ..... o ...... O.... o - ..... o.. 115
6.9 Summary .... oo- .......... o ...................... o.... 0 ................... oo .......... 0.0 ....... oo ...................... 116
Chapter 7 CONCLUSIONS AND RECOMMENDATIONS ..................................... 118
7.1 Conclusions ............................................................................................................. 118
7.2 Further Recommendations ...................................................................................... 120
BIBLIOGRAPHY ........................................................................................................... 123
APPENDIX I

iv
ACKNOWLEDGEMENTS
I wish to express my sincere thanks to Professor JA McGeough for his supervi-
sion and constant guidance throughout this project.
Many -thanks are due to my colleagues Drs M Barker, AB Khayry, the late Dr I
M Crichton, Messers C Spencer and A Wood for their advice in various parts of
this project.
The support given by the staff of the Mechanical Engineering Workshop is
greatly acknowledged. Special thanks are due to Messers D Anderson and R Gus-
tart for their help in the design and construction of the portable drilling apparatus.
I also wish to thank Mrs I Duncan, Miss M McLeod and Ms D McCluskey for
their assistance in typing this thesis.
.I wish to thank my husband Alan, for not only proof reading the thesis but also
for being a constant source of support and encouragement.
Finally, the financial support given by the South of Scotland Electricity Board is
greatly appreciated.
0

V
DECLARATION
I hereby declare that this thesis has been composed by myself, that it has not
been accepted in any previous application for a degree, that the work of which it
is a record has been carried out by myself, and that all sources of information
have been specifically acknowledged.
Anjali K De Silva

vi
ABSTRACT
Electrochemical arc machining (ECAM) utilises pulsed power across a cathode-
tool and an anode-workpiece, separated by a gap filled with electrolyte, in order
to achieve both electrochemical dissolution (ECD) and electrodischarge erosion
(EDE) of the workpiece. This thesis describes some further developments made
in the ECAM process.
The feasibility of using ECAM to drill holes in several alloys of industrial
interest, which are difficult to machine by conventional methods, was investi-
gated. The effects of the machining variables on the process parameters were
evaluated and the optimum machining conditions established for each of the five
materials drilled: chrome steel, cobalt alloy, nickel alloy, titanium and low alloy
steel. The surface effects on the alloys drilled by ECAM were analysed by
means of optical and scanning electron microscopy and microhardness testing.
These revealed that for most of the alloys, the heat induced damage due to EDE
phase can be eliminated by the ECD phase, leaving smooth, damage free sur-
faces. However, the last few millimeters of the hole exhibited EDE induced dam-
age due to lack of electrolyte at the exit, which prevented the ECD action. One
exception was titanium, which showed typical EDE damage consistently along
the hole. This is because of the oxide film which develops in water based, salt
electrolytes, inhibiting the the ECD action.
Occasionally, some localised areas were found to exhibit extensive surface dam-
age in the form of large craters, grain boundary cracking and microcracking.
This type of damage was attributed to abnormal discharges. These are the pro-
longed discharges which occur in the same location causing severe damage to
both the workpiece and the tool.

I vii
In order to prevent these undesirable abnormal discharges an analysis into the gap
phenomena in ECAM was undertaken. The radio frequency emission from the
gap was used to differentiate between the normal and the abnormal discharges,
since the RF level was found to be considerably higher for normal discharges
than for abnormal ones. The monitoring of the RF signal together with the
current or voltage can give a clear indication of the gap situation ; whether it is
electrochemical action, a normal discharge, an abnormal arc or a short circuit.
A theoretical model has been developed for the RF emission from the gap,
assuming the discharge to be a small Hertzian dipole antenna.
Finally, as an industrial application of the ECAM process, a portable ECAM dril-
ling apparatus was designed and built. This can be used successfully to drill
holes of high depth/diameter ratio. in large steel structures. One specific applica-
tion for the Electricity Generating Industry is the drilling of holes in boilers to
insert thennocouples.
viii
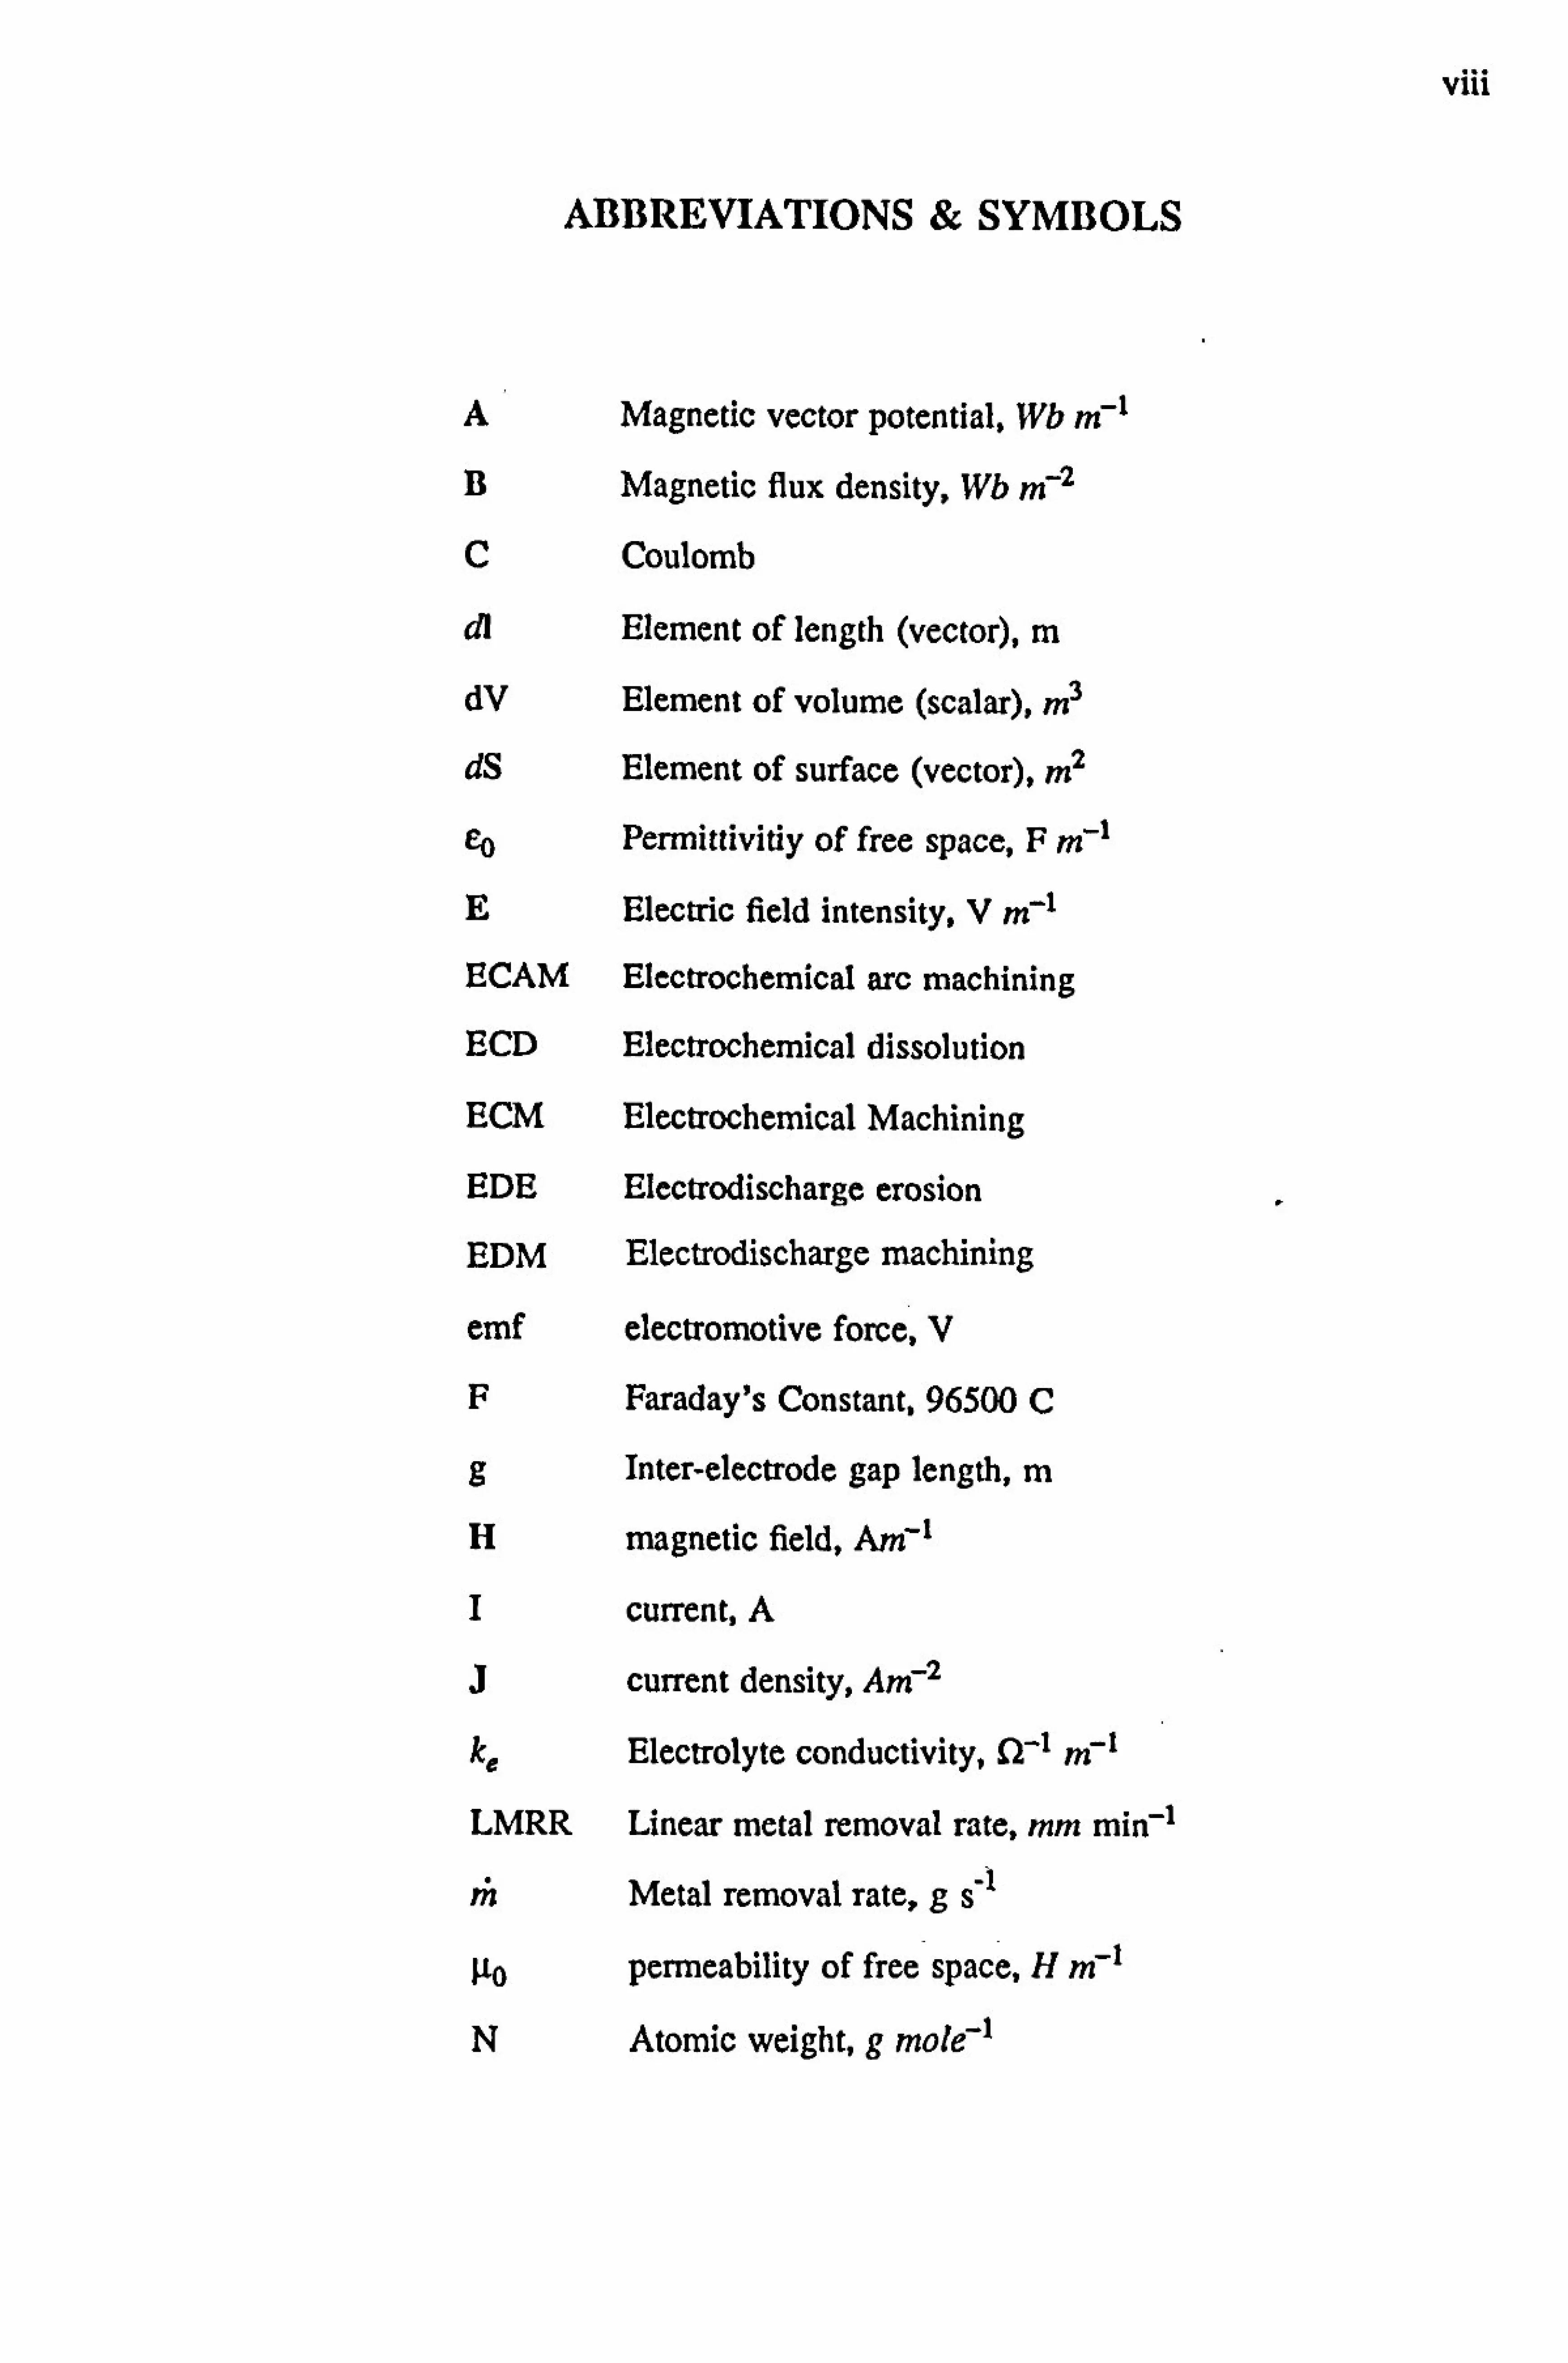
ABBREVIATIONS & SYMBOLS
A Magnetic vector potential, Wb trrl B Magnetic flux density, Wb m-2 C Coulomb
dl Element of length (vector), rn.
dV Element of volume (scalar), m3 dS Element of surface (vector), m2
CO Permittividy of free space, F m-1 E Electric field intensity, V m-1 ECAM Electrochemical arc machining ECD Electrochemical dissolution
ECM Electrochemical Machining
EDE Electrodischarge erosion EDM Electrodischarge machining
emf electromotive force, V
F Faraday's Constant, 96500 C
9 Inter-electrode gap length, m H magnetic field, Anrl
I current, A
current density, Ai? O
k, Electrolyte conductivity, n-1 i? rl
LMRR Linear metal removal rate, mm min-1
Metal removal rate, g s-1
go permeability of free space, H nF1
N Atomic weight, g motel

ix
n Valency
Current efficiency
frequency, rad r'
P charge density, C ni-3
RF Radio frequency
SMRR Specific metal removal rate, mm3 mih-1
V Scalar potential, V

I
I: INTRODUCTION
1.1 Nontraditional Machining Processes
The so-called "nontraditional machining processes" are the ones which emerged
after World War H in response to the changing machining requirements made by
industry. Electrochemical machining (ECM) and electrodischarge, machining (EDM) are two such processes which were developed primarily to
I a) machine hard, tough materials which are difficult to machine by conven-
tional methods.
b) produce intricate and complex geometries to close dimensional tolerances
which are beyond the capabilities of the traditional processes.
Both ECM and EDM, although different in their metal removal mechanisms, are
&ý widely used in similar applications such as die sinking and fine hole drilling,
especially in the aerospace industry.
1.1.1 Electrochemical Machining
Although the application of electrolytic dissolution as a metal removal tool is
relatively new, the basic principles are not. During the period 1818-1827, Michael
Faraday(l) showed that when two electrodes were immersed in an electrolyte
with a potential difference applied across them, the cathode would deposit metal
on to it and the anode would dissolve into the solution. The rate of metal
dissolution/deposition is a function of the electrochemical equivalent of the
material and the current passed.
In the electrochemical machining process, the anodic workpiece and the cathodic
tool is connected to a low voltage DC supply. The inter-electrode gap is flushed

2
with an electrolyte, which, as well as being the essential medium for the electro-
lytic process, carries the by-products away from the machining gap. In order to
maintain the gap at equilibrium, one of the electrodes is fed towards the other at
a speed determined by the metal removal rate.
The typical reaction at the cathode is the the evolution of hydrogen gas . At the
anode, the anode metal dissolves, atom by atom, into the electrolyte solution
releasing electrons. The theoretical rate of metal removal is given by Faraday's
Laws of Electrolysis. 7be actual rate at which metal is Temoved depends upon
the current density'and this, in turn, depends not only upon the conductance of
the electrolyte and the voltage applied across the electrodes but also upon the
shape of the electrodes and their distance apart. Typical current densities are in
the range 150 - 200 A mm-2 and the gap sizes vary from 0.025 -0.750 mm (2).
Modem developments in ECM machines such as adaptive control systems and
silicon controlled rectifier power sources enable ECM to be used in a wide
variety of industrial applications. It is mostly used to machine very hard metal
that would be less economical to work in other ways. Die sinking, fine and mul-
tiple hole drilling, trepanning, deburring and grinding are some of the many
applications of ECM (3).
The major advantages of the process are the absence of tool wear as well as any
thermal load on the workpiece. Furthermore, the surface finish can be smooth
and free from residual stresses. However, there are disadvantages such as the
poor dimensional accuracy and the inability to produce sharp contours.
1.1.2 Elect rodischarge Machining
The work done in the early 1940's by two separate groups of people with
different objectives led to the development of the EDM process. The studies

3
done by B. R. and N. I. Lazerenko (4) into the erosion of electrical contacts led to
the development of the basic method for shaping metals in 1943. They
developed the R-C generator for EDM. At about same time, the investigations by
another group of people (H. L. Stork, H. V. Harding and J. Beam) into removing broken taps and drills from hydraulic valve bodies, made them develop an electri-
cal circuit that produced a spark after the electrode had made physical contact
with the workpiece (5).
The EDM process is effectively a thermal one, which removes metal by the ero-
sive effects of discharges. The tool and the workpiece (which can be of either
polarity) is connected to a pulsed DC supply and the inter-electrode gap is
flushed with a dielectric. -The voltage across the gap is high enough to cause the
dielectric to breakdown resulting in electric discharges. These discharges occur
randomly over the machining area and the high temperatures of the discharges
cause tiny craters to be removed from both electrodes by melting and evapora-
tion. Erosion of the electrodes is asymmetric. By, choosing appropriate tool
material and controlling the discharge, varying its duration, intensity and polarity,
a significant asymmetry can be obtained : for instance, 99.5% of erosion of the
workpiece to 0.5% erosion of the tool (6). The metal removal rate is determined
by the frequency of the discharges and the energy available to them, which is
proportional to the product of the current and the pulse duration. Although the
higher energy discharges, yield faster machining rates, they also increase the sur-
face roughness and the overcut, due to the larger crater sizes produced.
EDM machining has evolved to be an accurate machining process due to the
advances made in transistorised power supplies, adaptive controf systems, elec-
trode materials and dielectric fluids. The orbiting technique and computer control
has further enhanced its capabilities in many modem machining applications

4
(7,8). Latest developments include computer aided process planning packages for
k EDM (9). Nevertheless, the principal disadvantage of EDM still remains, that it
is rather a slow process.
1.2 Electrochemical Arc Machining (ECAM)
Although ECM and EDM differ in their principles of metal removal, the many
similarities in their machine configuration (tool and workpiece separated by a
small gap containing a liquid medium) has led to the development of combined
processes. Electrochemical arc machining (ECAM) is such a process which com-
bines features of ECM and EDM, by having a cathodic tool and an anodic work-
piece, which are separated by a gap filled with electrolyte, and pulsed DC power
applied between them. 'Mis leads to discharges in electrolytes, thus achieving
both electrochemical dissolution and electrodischarge erosion of the workpiece.
One of the major advantages of ECAM, over ECM or EDM, is that the combined
metal removal mechanisms in ECAM, yield a much higher machining rate (10).
Furthermore, in EDM, discharge energies are limited to avoid poor surface finish.
In ECAM however, much higher energy discharges can be used because the
craters produced by the erosive nature of discharges are smoothed out by the
electrolytic dissolution process. In order to distinguish the high energy ECAM
discharges from the EDM ones, they are referred to as "arcs", hence the name
Electrochemical arc machining. It is obvious therefore, that the metal removal
rate of ECAM is much higher than EDM because the combination of high energy
discharges and the electrolytic dissolution, remove a far greater amount of
material from the workpiece.
The rate of metal removal is also higher than ECM. This is because that in ECM
the generation of hydrogen gas at the cathode causes a choking effect, which
-5 prevents the electrochemical dissolution action (11). Furthermore, the anodic films
produced under some conditions are also responsible for the reduction in metal
removal. In ECAM, the gas bubbles have the opposite effect, that of increasing
the metal removal. 'Mis is due to the fact that discharges in ECAM occur
through these gas bubbles, therefore, instead of having a blocking effect on the
metal removal, they actually enhance it by facilitating the discharge erosion
action. Moreover, the discharges help to breakdown the anodic films, which also
contribute to the increase in metal removal.
In ECM, sparking between the electrodes is a major problem. Obviously, this
problem is nonexistent in ECAM. Furthermore, the ECAM machining gap is
larger than the EDM one. Thus the clearance of debris from the gap is much
easier in ECAM than in EDM.
1.3 Review of Literature
Despite the many potential advantages a process combining features of EDM and
ECM has to offer, very few published papers can be found on the subject.
The early work on the combined electrochemical - electrodischarge processes
used separate ECM and EDM flow systems and power sources. Inoe and Shibuya
(12) have investigated such a machine which performed the roughing operation,
firstly by ECM to get the faster machining rate, then by EDM to obtain the
dimensional accuracy and finally, finishing by ECM. Another form of the com-
bined process was the electrochemical discharge grinding process developed by
Inoe et al (13). This used a graphite wheel electrode and a pulsed power supply
giving electric discharges which broke down the passivation layer thus assisting
the electrochemical grinding process. Later progress of this process has led to
the development of a triplex combined process : electro-chemical-discharge
6
mechanical grinding, as reported by Kubota (14). Kimoto (15), investigated
EDM in very dilute electrolytes and found that it increased the erosion rate and
decreased the wear ratio.
All the processes above are biased towards either EDM or ECM and therefore do
not contribute much to the understanding of a truly combined process. Dimen-
sional electrochemical machining, reported by Lazarenko (16) and also by
Glaskov (17) can be regarded as a truly combined process. They have reported
the occurrence of a significant discharge phase in electrochemical machining.
Kubota (18) has developed a combined process called Electrochemical discharge
machining (ECDM) for sinking holes. From his several publications on ECDM
(18,19,20) a significant amount of insight into the workings of a combined pro-
cess is gained. Zaytev and Polyanin (21) have also developed a spark- electro-
chemical machine for piercing small holes, which utilises an EDM type power
supply. Saushkin et al (22) have investigated a combined electrochemical- elec-
troerosion process (named EECP) for machining elongated surfaces. They
recorded that when large areas (18.5 cm 2) were present only electrochemical
machining occurred in certain zones, while in the other areas combination of
discharge erosion and anodic dissolution occurred. The areas where electric
discharges occurred were the downstream regions where the strongest concentra-
tion of gas bubbles were present.
The literature on the ECAM process includes some fundamental aspects of the
mechanisms involved and the feasibility studies of its various applications. Crich-
ton et al (23) have carried out a comparative analysis of the metal removal
mechanisms an the applications of ECM, EDM and the combined process ECAM.
The fundamental study of single discharges in electrolytes by Crichton (24) has
given some insight into the process, although conditions are much more compli-
7
cated in full scale ECAM.
Satisfactory results have been obtained by Drake (25) and also Khayry (26) into
hole drilling by ECAM. The ECAM. drilling differed from the previously
recorded ECDM hole sinking by Kubota, because it employed vibration of one
of the electrodes. This gave it an added controlling dimension. El Hofy (27) has
investigated the feasibility of wire cutting by ECAM. Munro (28) applied the
ECAM process to remove irregularities from machined components. All the
above feasibility studies have given valuable knowledge about the ECAM, pro-
cess. However, much more research is still required before ECAM can be esta-
blished as a machining process in the same level of EDM and ECM.
The success of EDM and ECM has been based. mainly on the ability to control
the process effectively. EDM and ECM both employ sophisticated "in-process"
evaluation systems in order to achieve process optimisation. Since the metal
removal mechanisms of both processes are well understood, and the gap situation
is correlated to either the machining current or the voltage, the usual feedback
signals are easily derived from the time averaged current or voltage. Ile problem
of stationary arcs in EDM has been overcome by monitoring various other sig-
nals such as the radio frequency emission from the gap. A survey of various
control techniques in EDM is given in Snoey (29).
The complex nature of ECAM requires further analysis of the gap situation in
order to employ some form of feedback control. The analysis of the ECAM gap
may be done by monitoring signals such as current, voltage and the radio fre-
quency emission.

8
1.4 Objectives of the thesis
The purpose of the present thesis is to investigate the ECAM process further in
order to gain more insight into the underlying mechanisms of the process and
also to help its establishment as an industrially viable machining technique.
Specifically, the study has the following objectives:
1. Investigate the electrochemical arc drilling of different alloys which are
difficult to machine by conventional methods.
2. Study the surface effects on the alloys produced as a result of ECAM dril-
ling.
3. Analyse the gap phenomena which occur in ECAM, with the practical moni-
toring of the gap using the radio frequency emission signal.
4. Develop a theoretical model for the discharges using the RF emission.
5. Design and develop a portable electrochemical arc drilling machine as an
industrial application of the process.
1.5 Thesis Organisation
Chapter 2: An experimental investigation into the electrochemical arc drilling of
five different alloys of industrial interest is presented. The analysis
shows how the machining variables such as gap voltage, vibration
amplitude and phase angle influence the metal removal mechanisms
of electrochemical dissolution and electrodischarge erosion. The
correlations between the process parameters (metal removal rate, tool
wear, overcut) and the machining variables are established together
with optimum machining conditions which yield the best hole for
each material.
9
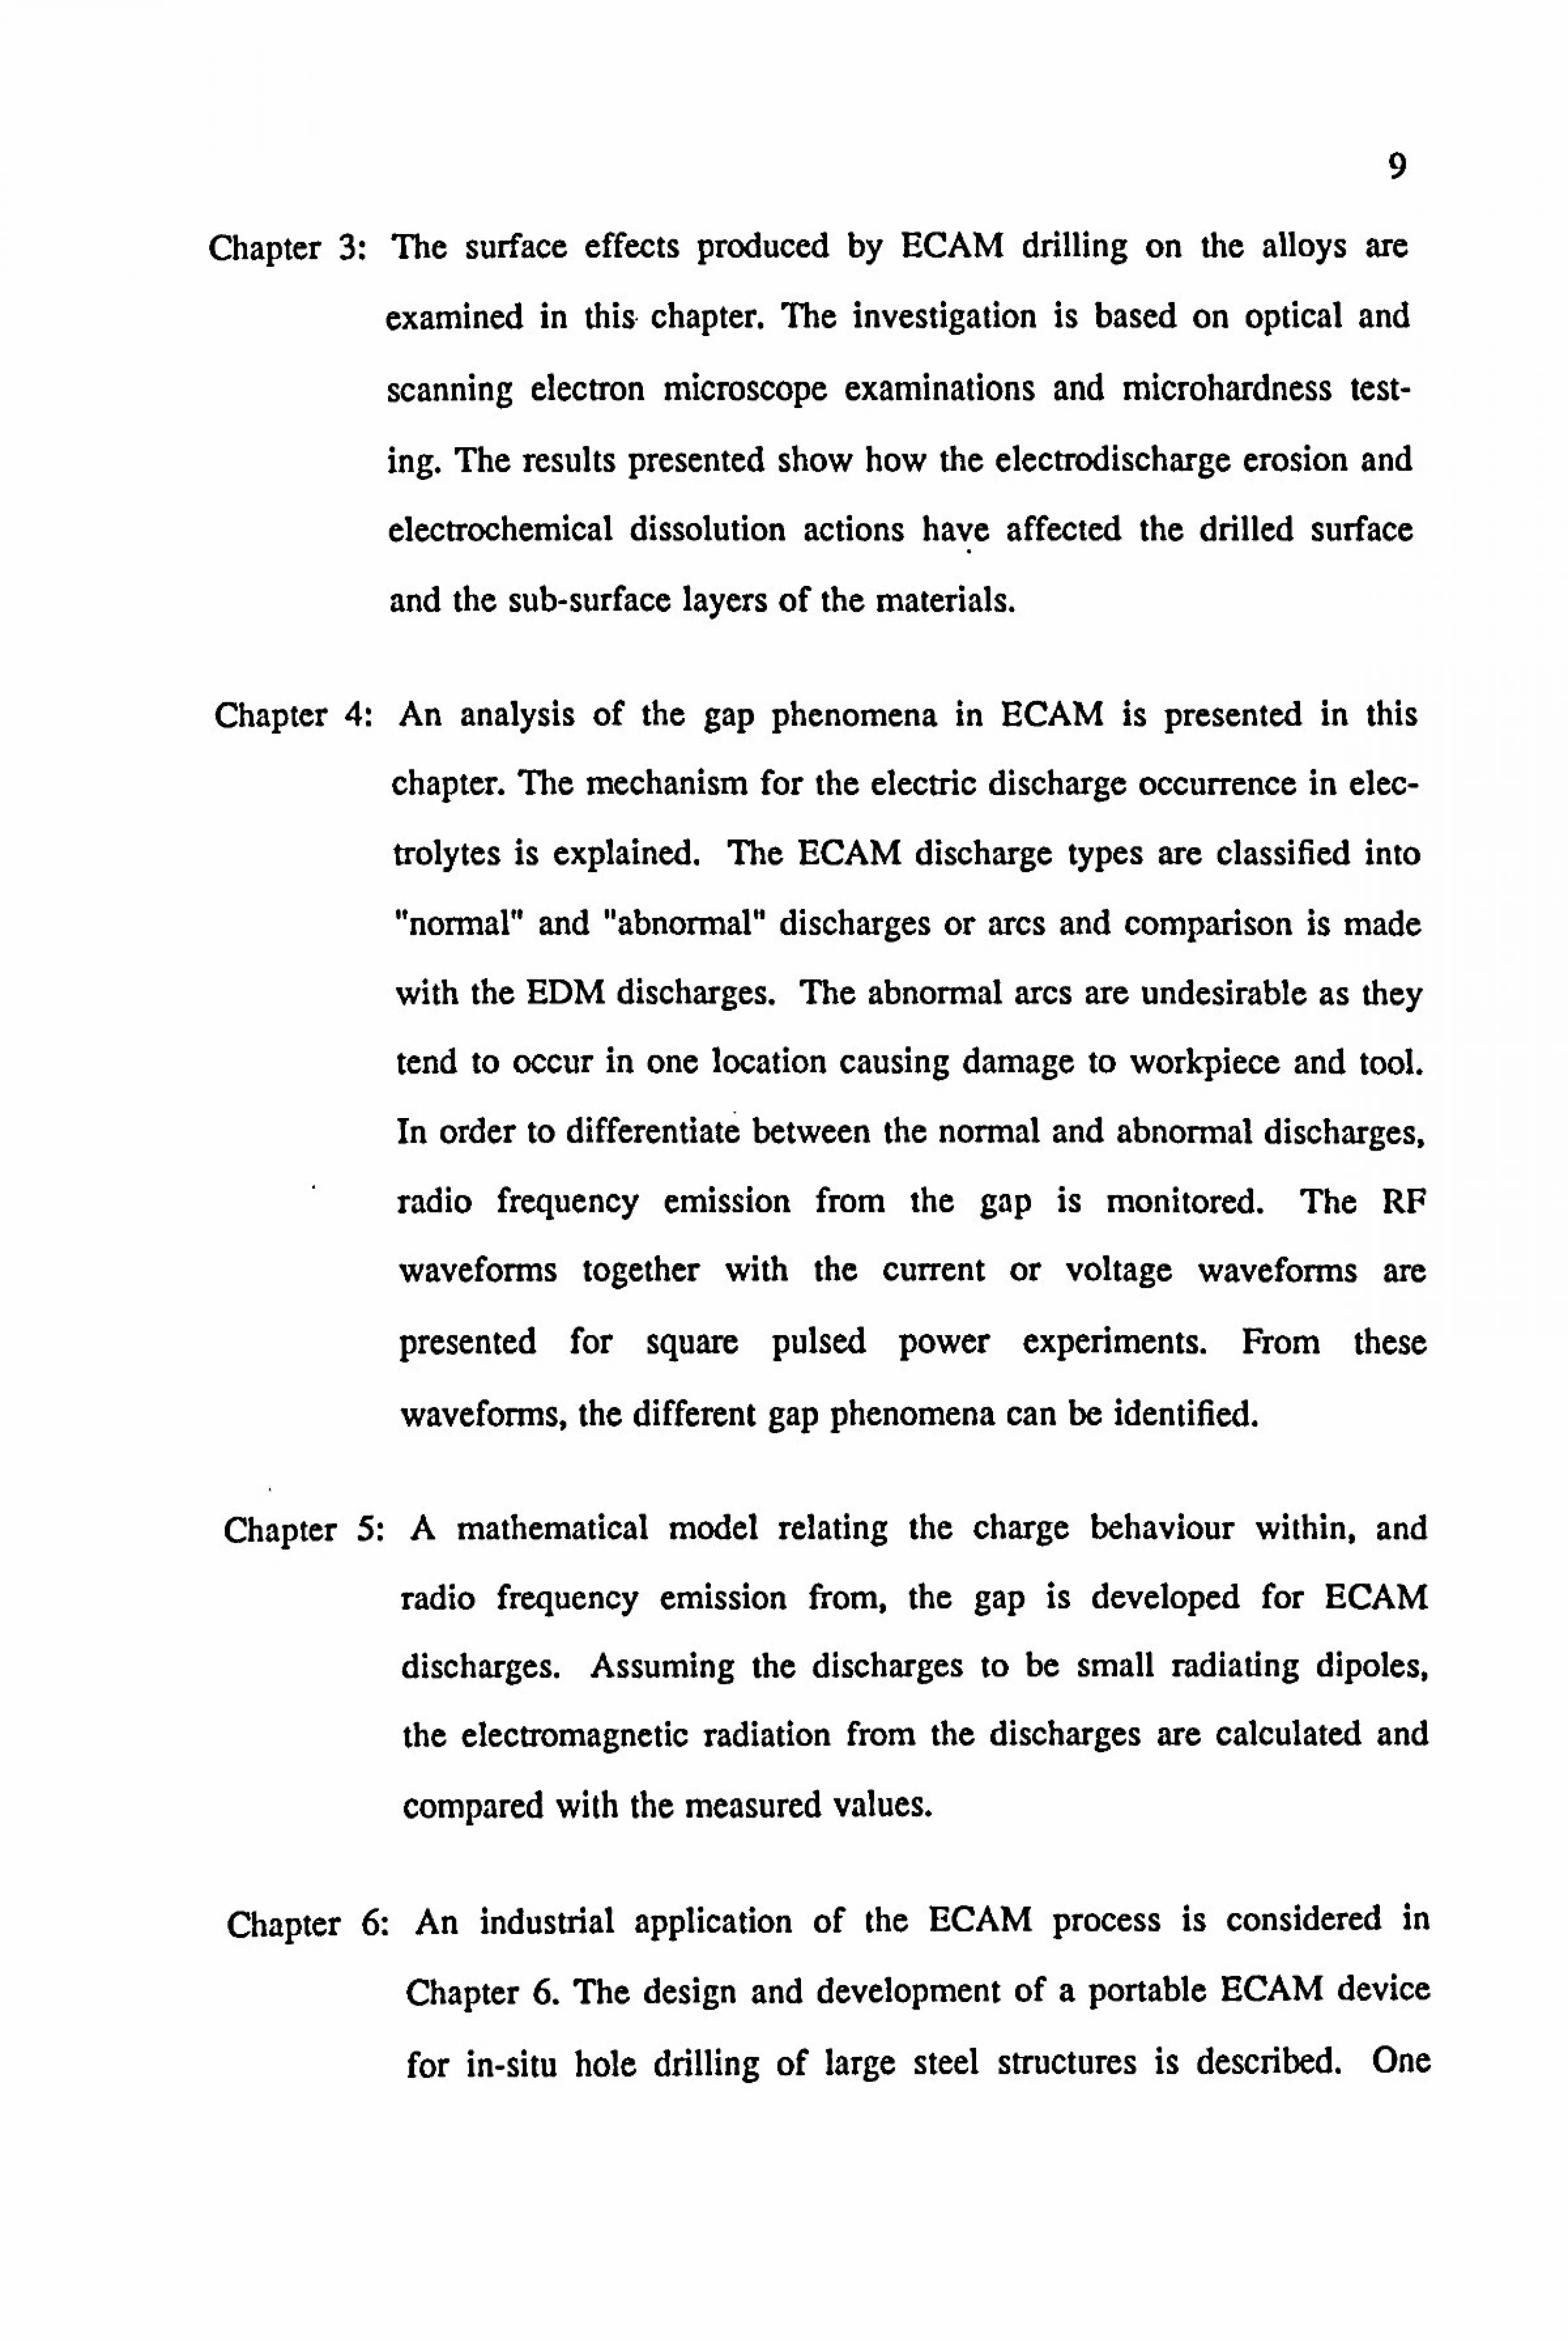
Chapter 3: The surface effects produced by ECAM drilling on the alloys are
examined in this. chapter. The investigation is based on optical and
scanning electron microscope examinations and microhardness test-
ing. The results presented show how the electrodischarge erosion and
electrochemical dissolution actions have affected the drilled surface
and the sub-surface layers of the materials.
Chapter 4: An analysis of the gap phenomena in ECAM is presented in this
chapter. The mechanism for the electric discharge occurrence in elec-
trolytes is explained. The ECAM discharge types are classified into
"normal" and "abnormal" discharges or arcs and comparison is made
with the EDM discharges. The abnormal arcs are undesirable as they
tend to occur in one location causing damage to workpiece and tool.
In order to differentiate between the normal and abnormal discharges,
radio frequency emission from the gap is monitored. The RF
waveforms together with the current or voltage waveforms are
presented for square pulsed power experiments. From these
waveforms, the different gap phenomena can be identified.
Chapter 5: A mathematical model relating the charge behaviour within, and
radio frequency emission from, the gap is developed for ECAM
discharges. Assuming the discharges to be small radiating dipoles,
the electromagnetic radiation from the discharges are calculated and
compared with the measured values.
Chapter 6: An industrial application of the ECAM process is considered in
Chapter 6. The design and development of a portable ECAM device
for in-situ hole drilling of large steel structures is described. One

10
possible use of it is to drill holes to insert thermocouples in large
steam boilers in the electricity generating industry.
Chapter 7: This chapter gives the conclusions with recommendations for further
developments.
The published material on the surface effects on alloys drilled by ECAM is given
in the Appendix.

11
2: ELECTROCHEMICAL ARC DRILLING OF ALLOYS
2.1 Introduction
Electrochemical arc machining is particularly useful in applications for which
conventional methods are not suitable. For instance, when tough, hard, heat and
corrosion resistant materials are encountered and also when holes of large depth
to diameter ratios ( 20: 1 or more ) are needed.
Previous research by Drake (25) and Khayry (26) into ECAM has proved that it
can be used successfully to drill holes at rates much faster than the comparable
processes of ECM and EDM. They have done extensive experimental work in
electrochemical arc drilling of mild steel material, relating the process parameters
with the machining variables. Although metal removal of ECAM is independent
of the mechanical properties of the workpiece material, the composition and the
material properties such as the thermal conductivity can affect the process param-
eters. Ilerefore, further experimental study is necessary to establish the relation-
ships between the machining variables (feed rate, gap voltage, amplitude and
phase of vibration, electrolyte pressure) and the process parameters Oinear metal
removal rate, specific metal removal rate, relative tool wear, overcut and taper)
for other different metals and alloys.
This chapter is concerned with an experimental investigation into the feasibility
of producing fast and accurate holes in five different alloys by ECAM. All the
alloys are of potential industrial interest, four of which are widely used in the
aerospace industry, and the fifth in the electricity generating industry. The alloys
investigated are low carbon chrome steel, cobalt alloy steel, nickel alloy, titanium
and low alloy steel.

12
2.2 ECAM Drilling
In the course of ECAM, electrochemical dissolution (ECD) and electrodischarge
erosion (EDE) can occur simultaneously in different regions of the gap, or in suc-
cession in the same area. In ECAM drilling, the inter-electrode machining gap
can be divided into two main zones: the frontal gap and the side gap (Figure 2.1).
In the frontal gap the main contribution to material removal comes from the EDE
action, whereas, in the side gap it is predominantly ECD which removes metal. In
the intermediate region where the two zones overlap, both ECD and EDE are
possible. The front gap tends to favour discharges because the rapid advance-
ment of the tool towards the workpiece keeps the gap relatively small. Further-
more, the accumulation of machining by-products such as gas bubbles and metal
particles encourage electric discharges.
Feed with superimposed IK
vibration II
1
. 41
Vibration
Vottage
0. (f
Etectrotyte out
Toot (Cathode)
Etectroty-te in
Workplece (anode)
Frontat gap
Side gap
FIGURE 2.1 Machining gap in electrochemical arc drilling
13
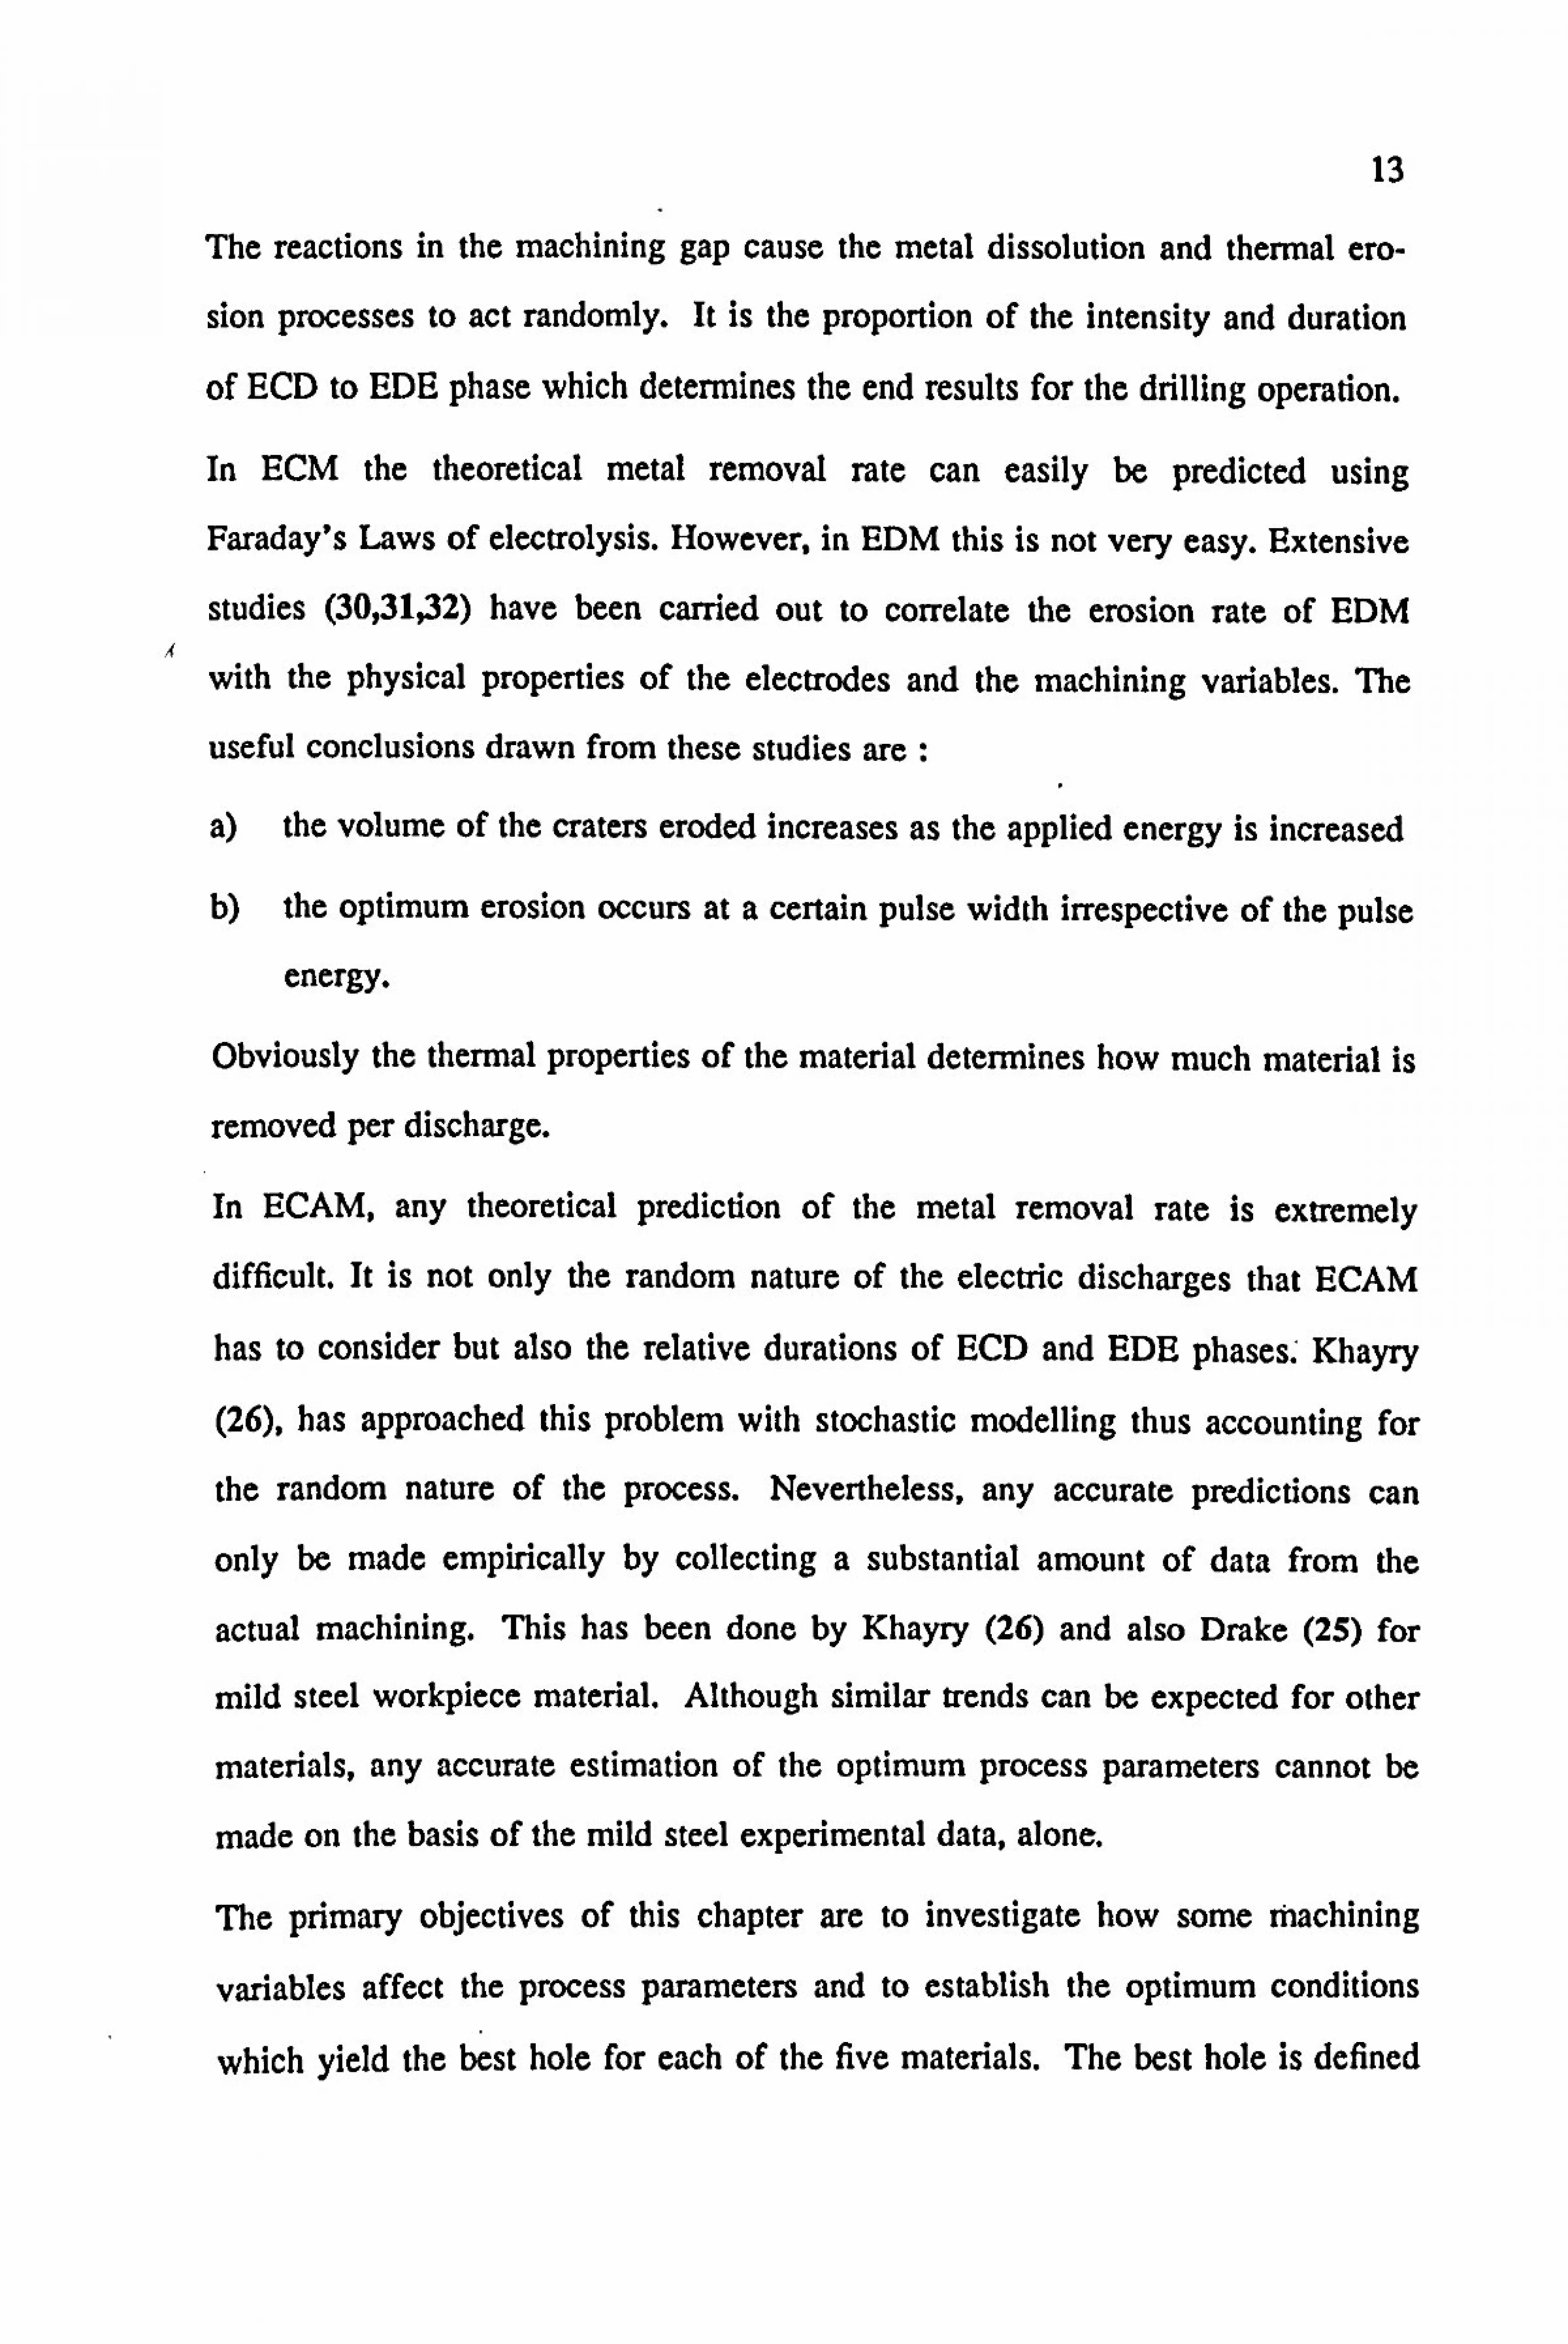
The reactions in the machining gap cause the metal dissolution and thermal ero-
sion processes to act randomly. It is the proportion of the intensity and duration
of ECD to EDE phase which determines the end results for the drilling operation.
In ECM the theoretical metal removal rate can easily be predicted using
Faraday's Laws of electrolysis. However, in EDM this is not very easy. Extensive
studies (30,31,32) have been carried out to correlate the erosion Tate of EDM
with the physical properties of the electrodes and the machining variables. The
useful conclusions drawn from these studies are
a) the volume of the craters eroded increases as the applied energy is increased
b) the optimum erosion occurs at a certain pulse width irrespective of the pulse
energy.
Obviously the thermal properties of the material determines how much material is
removed per discharge.
In ECAM, any theoretical prediction of the metal removal Tate is extremely
difficult. It is not only the random nature of the electric discharges that ECAM
has to consider but also the relative durations of ECD and EDE phases. ' Khayry
(26), has approached this problem with stochastic modelling thus accounting for
the random nature of the process. Nevertheless, any accurate predictions can
only be made empirically by collecting a substantial amount of data from the
actual machining. This has been done by Khayry (26) and also Drake (25) for
mild steel workpiece material. Although similar trends can be expected for other
materials, any accurate estimation of the optimum process parameters cannot be
made on the basis of the mild steel experimental data, alone.
The primary objectives of this chapter are to investigate how some machining
variables affect the process parameters and to establish the optimum conditions
which yield the best hole for each of the five materials. The best hole is defined

14
as the one that has the highest drilling rate, the least overcut and taper and the
minimum tool wear. The materials investigated and their composition are given
in Table 2.1.
TABLE 2.1 Composition of the alloys
Alloy Composifion per cent
Cr Ni Mo V Co Ti C Si Mn Cu Al Fe
Jethete 12.00 2.00 2.00 0.30
Rex535 10.00 0.08
Inco9OI 12.00 42.00 6.00
Low all- oy steel
1.08 0.14 Q51 0.02
Titanium
0.10 b&L
6.00 bAL
1.00 2.80 0.05 0.40 aso 0.20 b&L
0.10 0.29 0.44 0.02 0.15 baL
commemiaUy pure
23 Experimental Apparatus
The salient features of the prototype ECAM drilling apparatus are shown in the
schematic diagram in Figure 2.2. 'Me four main aspects of the apparatus are:
(1) the main machine unit which locates the tool and the workpiece and
provides the controlled movement of the workpiece.
(2) the power supply.
(3) the electrolyte supply system.
(4) the instrumentation for monitoring the process.

is
Hydraulic Servo Ram
Control Unit
Workpiece Control Fullwave Signals Rectified
Power Tool supply
Process Monitoring & Control
Instrumentation
Pump
Else Z I IV
FIGURE 2.2 Schematic diagram of the ECAM drilling apparatus
2.3.1 The Main Machine Unit
A general view of the prototype ECAM apparatus is shown in Figure 2.3(a).
The workpiece was located above the tool and was given a linear feed movement,
superimposed with a sinusoidal vibration. A hydraulic cylinder was used to pro-
vide both the feed and the vibration. The uniform feeding motion of the hydraulic
ram was obtained by using a ramp voltage generator. The signals from the ramp
voltage generator, fed via a differential amplifier to the servo unit, controlled the
q
feed motion.
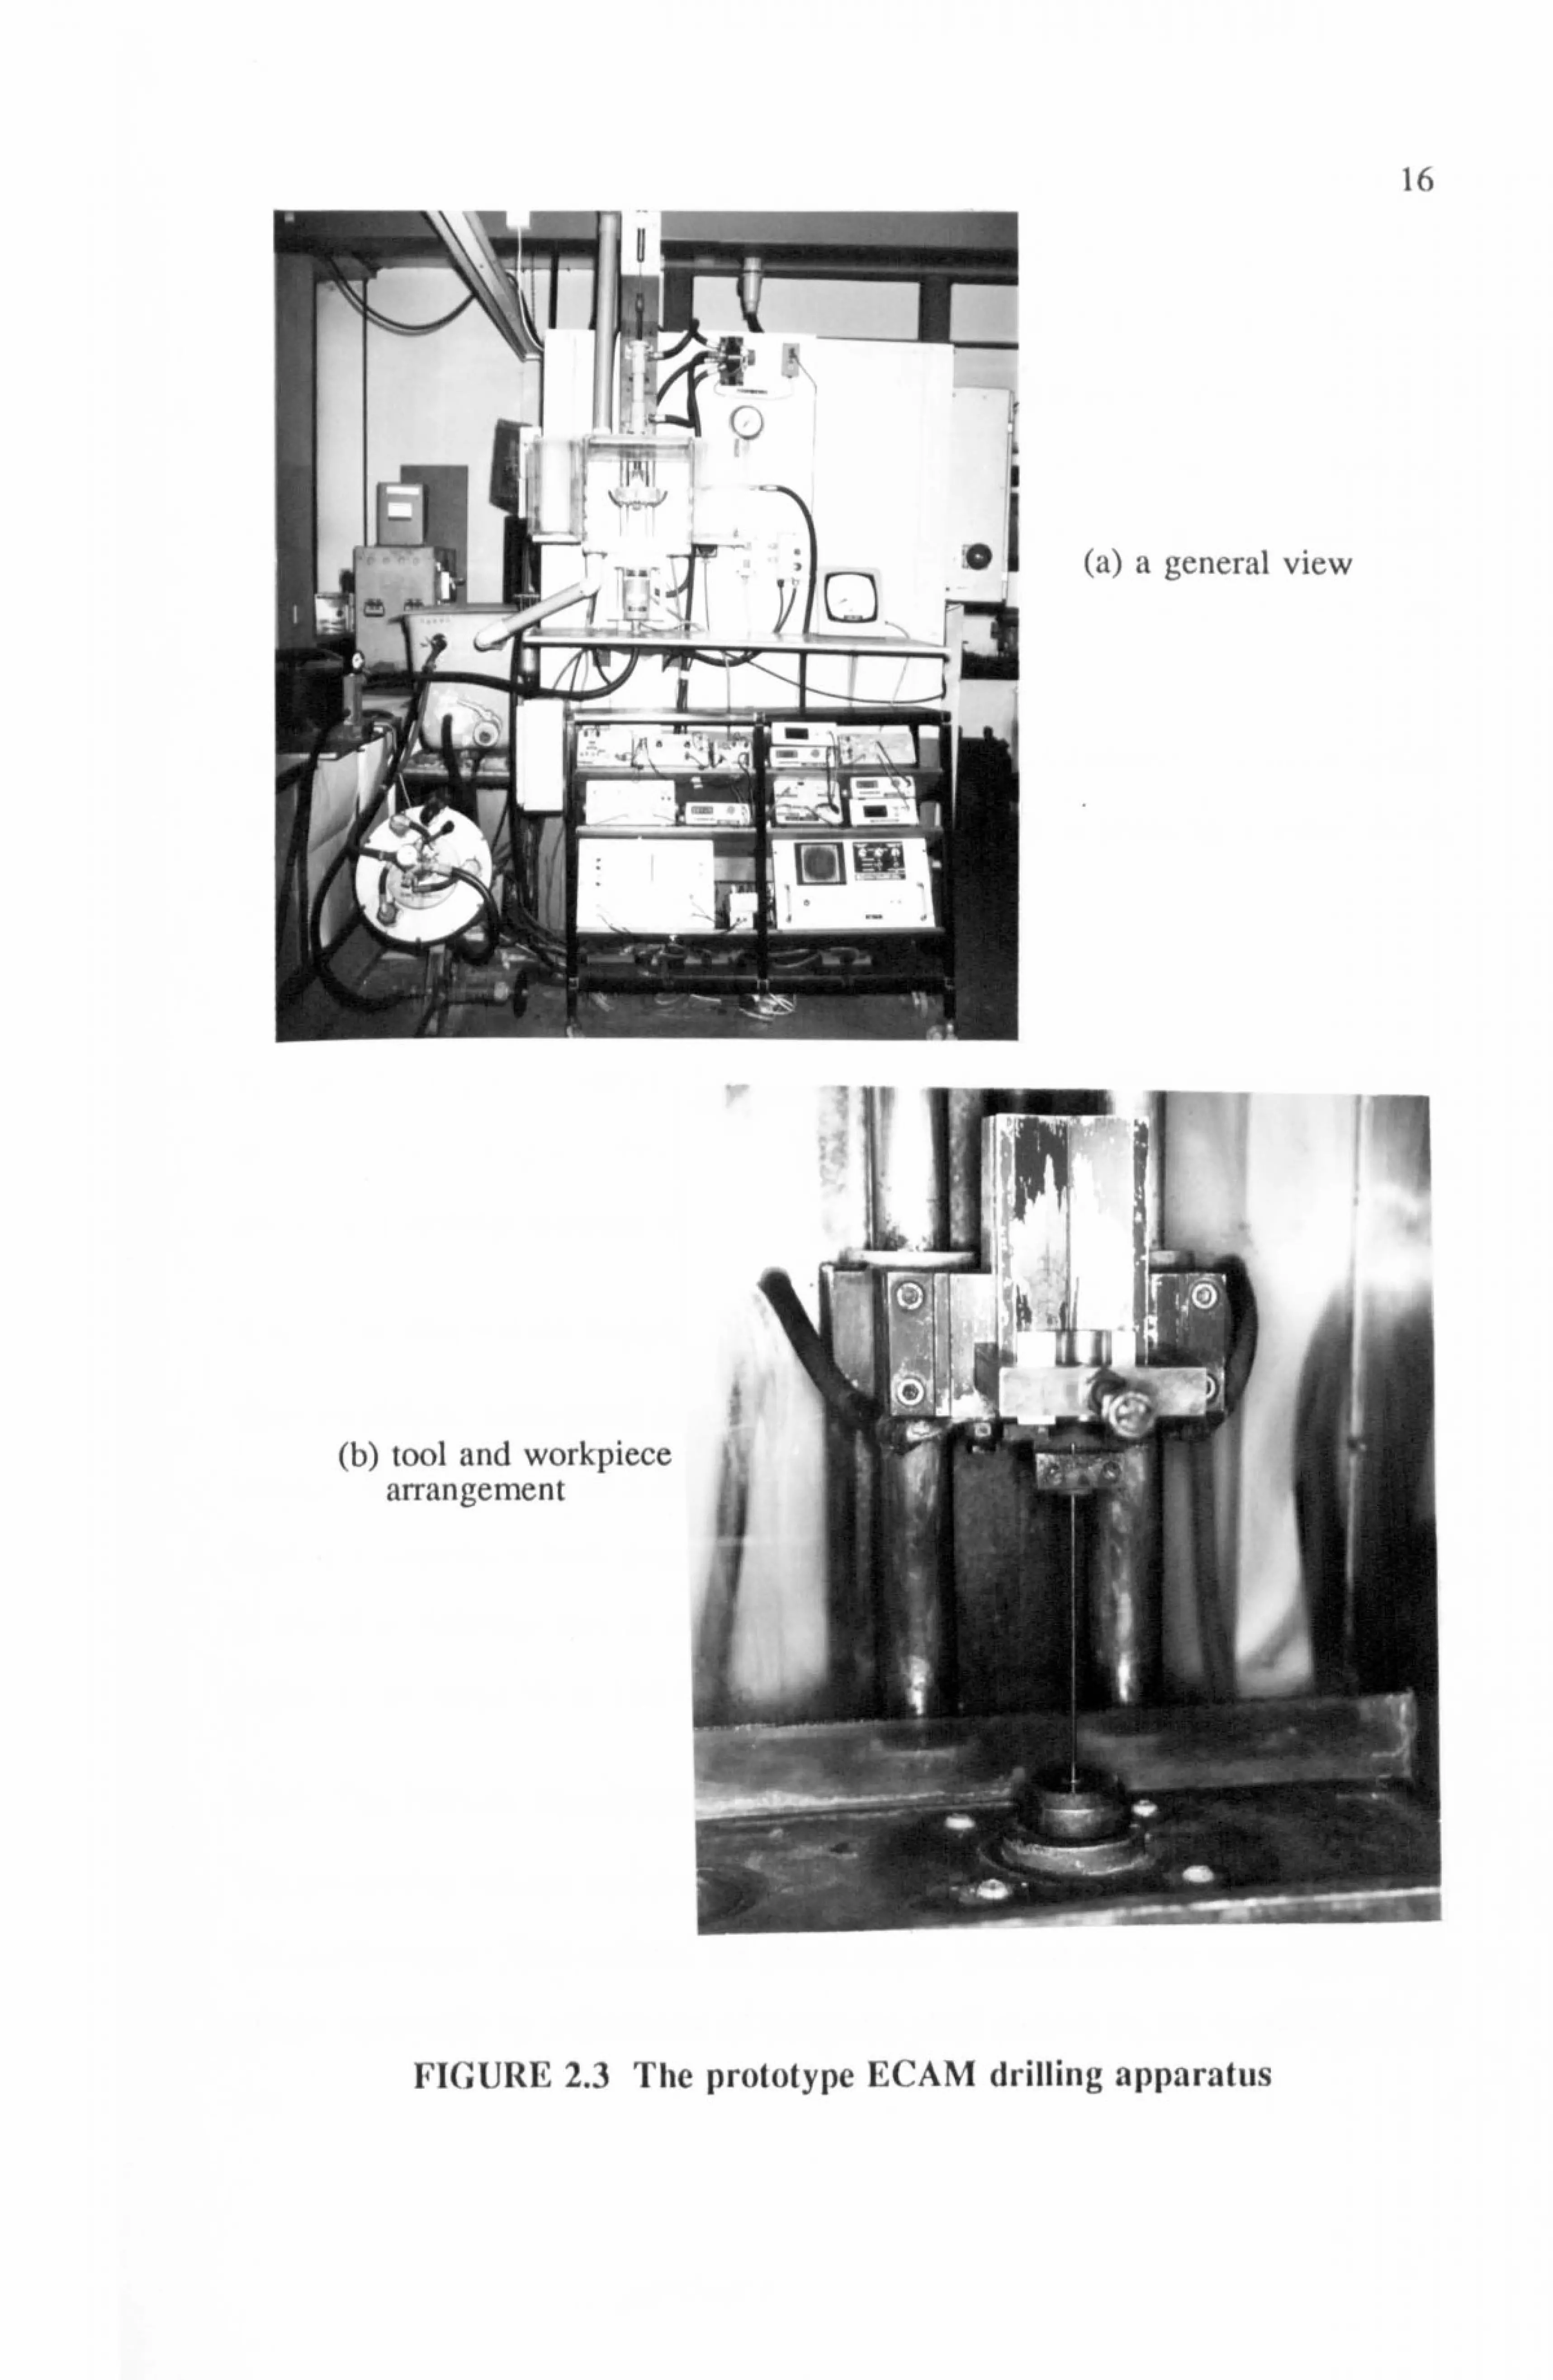
tool and workpiece arrangement
(a) a general view
16
FIGIURE 2.3 The prototype ECAM drilling apparatus

17
The amplitude and the frequency of the vibration were controlled by a sinusoidal
signal from a variable phase function generator to the differential amplifier unit.
The generator was triggered from a full-wave rectified mains signal, enabling the
output to be locked with the trigger input. In this way, the phase relationship
between the vibration and the machining voltage waveforms can be varied from
180' lag to 180* lead. A linear variable differential transformer provided the
feedback element.
The tool was kept stationary, except for the optional rotational movement which
was provided by a stepper motor. The tool was fixed in place by a collet chuck
arrangement as shown in Figure 2.3 (b).
2.3.2 The Power Supply
The power supply consisted of a variable transformer, a step-down transformer
and a rectifying bridge. 'Ibis provided a single phase, full-wave rectified voltage
which was variable between 0 to 50 volts.
2.3.3 The Electrolyte Supply System
The electrolyte, maintained at the room temperature, was drawn from a 250 litre
storage tank by means of a diaphragm pump capable of delivering 18. litres min-I
against a maximum back pressure of 127 bar. By means of a control valve fitted
in the flow delivery line to the tool electrode, the electrolyte pressure could be
preset in the range 13 to 120 bar.
2.3.4 The Process Monitoring Instrumentation
The machining voltage and the vibration waveforms were recorded in a two chan-
nel oscilloscope. This enabled the phase angle between the two waveforms to be
preset accurately by adjustment of the phase shift control on the function genera-
tor.

18
To measure the current a Coulomb counter was used. This measured the total
charge consumed within the machining period. By dividing the amount of charge
recorded by the total machining time, the average machining current could be
obtained. Similarly, the total electrical energy consumed was measured by a Joule
counter.
2.4 Experimental Procedure
After recording the workpiece and tool weights and lengths, they were mounted
in their respective positions in the ECAM apparatus. The initial inter-electrode
gap was set to about 5 mm, while the process variables, such as amplitude and
phase of vibration, voltage, feed rate and electrolyte pressure were set to their
required values. I'lie feed switch was now turned on to commence the machining.
Each experiment was continued until the drill broke through the workpiece. Occa-
sionally (about 1 in 25), the drilling process had to be abandoned due to severe
short circuiting of the tool and the workpiece.
After each test the weight loss from both the tool and the workpiece was meas-
ured. The reduction in tool length was also noted. The diameter of the hole at
drill entry and exit was measured using a microscope.
Experiments were performed for each of the materials using different combina-
tions of process variables, until the best hole was achieved. Experiments were
then repeated for the same conditions to ensure that these were the optimum pro-
cess variables for the given material.
The electrolyte used throughout was 20% weight/volume aqueous sodium nitrate.
Although it is appreciated that the electrolyte type can affect materials differently
(2), it was too vast an experimental programme within this project to find out
which electrolyte was the best for a given material. Sodium nitrate was chosen
because this was found to be the most satisfactory electrolyte for mild steel by

19
Drake(25) who investigated a variety of electrolytes in ECAM.
The tools used for all the tests were copper tubes of inner and outer diameters
0.864 and 1.890 mm respectively. The workpieces were of various lengths rang-
ing from 30 to 100 mm.
2.5 Results and Discussion
Different machining variables influence the process to different degrees. The
effect of some machining variables on the process parameters are independent of
the material properties. Therefore, in the optimisation of the process parameters
for different alloys, these variables will have common optimum values. However,
the effects of some variables are dependent on the material properties, thus giving
differing optimum values. Nevertheless, similar trends can be expected in the
relationships between the machining variables and the process parameters for all
the materials.
The machining variables investigated are : the machining gap voltage, the vibra-
tion amplitude and phase, the feed rate and the electrolyte pressure. The process
parameters are defined below.
1. Linear Metal Removal Rate (LMRR)
This is the actual drilling rate which is less than the feed rate. The value of
this was obtained by dividing the hole length by the machining time.
2. Specific Metal Removal Rate (SMRR)
This indicates the rate of metal removal per unit electric charge. The
volume (V) removed is obtained by dividing the workpiece weight loss by
its density. The average machining current (1) is calculated from the of
charge registered in the Coulomb counter. For a machining time T in
minutes :

20
bv 3A-1 * -1 SMRR =7, - mm min
Volumetric Tool Wear Ratio
This gives the volume of tool eroded as a percentage of the workpiece loss.
Taper and Overcut
Taper =[ hole diameter at drill entry - hole diameter at drill exit I+2
Maximum Over-cut hole diameter at drill entry - tool diameter +2
2.5.1 Feed Rate
In order to minimise the number of experiments required to establish the
optimum machining variables for each of the five materials, some variables were
kept constant. Since the fastest drill rate is a criterion for determining the
optimum performance, it was decided to carry out all the experiments at a feed
rate of 20 mm. min7l, as this was found to be the maximum feed rate achievable
without excessive short circuits,, by Khayry (26)and also Drake (25). They have
found that at low feed rates the metal removal rate was very low and was mainly
due to ECD, because the machining gap was too large for any discharges to
occur. Furthermore the ECD rate was well below the theoretical value due to low
current densities resulting from larger gaps. As the feed rate was increased, the
ECD rate increased. Consequently, more gas was generated in the gap. This
increase in the amount of gas combined with the decrease in the gap produced
electric discharges, thereby increasing the metal removal rate. Further increase in
the feed rate resulted in short circuits.
2.5.2 Electrolyte Pressure
The electrolyte in the gap performs two essential tasks. Firstly it is the medium
in which electrolysis occurs and secondly, it acts as a coolant and carries the
debris away from the gap. 7be flow of electrolyte is controlled by the pressure

21
reading in the gauge in the inlet line.
The variation in electrolyte pressure does not influence the process parameters
significantly (25). However, the pressure should be adequate to flush the debris
from the gap, in order to sustain efficient machining. Although the variation in
the flow pattern could affect the ECD phase, this is not critical for the overall
performance. Preliminary tests were done at 20,30 and 40 bar for one material
(Jethete). No significant change in the process parameters was observed. Hence
the rest of the experiments were performed at 30 bar pressure as this proved to be
the most stable and provided adequate flushing of the gap.
2.5.3 Vibration Amplitude
In ECAM, vibration of one of the electrodes is necessary for the following rea-
sons:
1) The vibration facilitates the removal of debris from the machining gap.
2) It allows the control of the amount of energy transmitted across the gap at
any instant by varying the phase angle between the gap and the voltage
waveforms.
From the preliminary experiments performed, it was found that the specific metal
removal rate decreased very slightly with increasing vibration amplitude.
Although larger vibration amplitudes mean better flushing of the machining debris
from the gap, they also give rise to increased lateral movement of the tool. This
causes more tool wear and less metal removal from the workpiece. However,
with the tool penetrating further into the workpiece, especially at higher vibration
amplitudes, machining along the side walls of the hole is increased. 'Mis is
accompanied by efficient expulsion of the machining products from the inter-
electrode gap by increase in turbulence of the convective flow. For such condi-
tions, the decrease in specific metal removal is expected to be smaller at greater

22
vibration amplitudes.
On the whole, varying the vibration amplitude *did not have a significant effect on
the process parameters, hence it did not warrant a detailed investigation. The
two limits for the vibration amplitude were that it should be large enough for the
debris to be flushed away and small enough for no lateral vibration which tended
to cause short circuits. This was found to be between 0.10 to 0.15 mm. peak-peak.
2.5.4 Phase Angle between Vibration and Voltage Waveforms
The phase angle between vibration and voltage waveforms determines the instan-
taneous - relationship between the inter-electrode gap width and the amount of
power transmitted across it. This, therefore can be used to control the relative
intensities and durations of electrochemical and electrodischarge phases in
ECAM.
Since the effect of the phase angle on the process parameters is independent of
the properties of the materials, the optimum value of the phase angle would be
the same for any material.
Previous researchers explorations in to phase angle influence on process parame-
ters is not fully clear. Khayry (26) has reported a slight increase in specific metal
removal rate (SMRR) with phase angle increase from 30" lag to 20" lead.
Whereas, Drake (25) observed a slight decrease in SMRR in the same range,
using the same conditions of machining.
From the experiments carried out the most stable machining was achieved when
the phase difference was 0". When the phase angle was 180* lead or lag, inter-
mittent periods of very intense sparking and quiet periods were noted. Table 2.2
gives the process parameters for three different phase angles (0*, 300,1800) for
one of the materials (Jethete - the chrome alloy). The values given in the table
were obtained by taking the average of three experimental data values.

23
TABLE 2.2 Process Parameters for Different Phase Angles
Phase LMRR SMRR Drill Wear -
Tapcr Angle Mm min" mm3 A71min*1 Ratio mm/100mm
oo 16.2 8.11 11% 0.32
30* 13.4 12.67 16.5% 1.56
18011 12.4 14.57 20% 3A2
From the table it is apparent that the optimum conditions were obtained when the
phase angle was 0*, i. e., the fastest drill rate, the least tool wear and the smallest
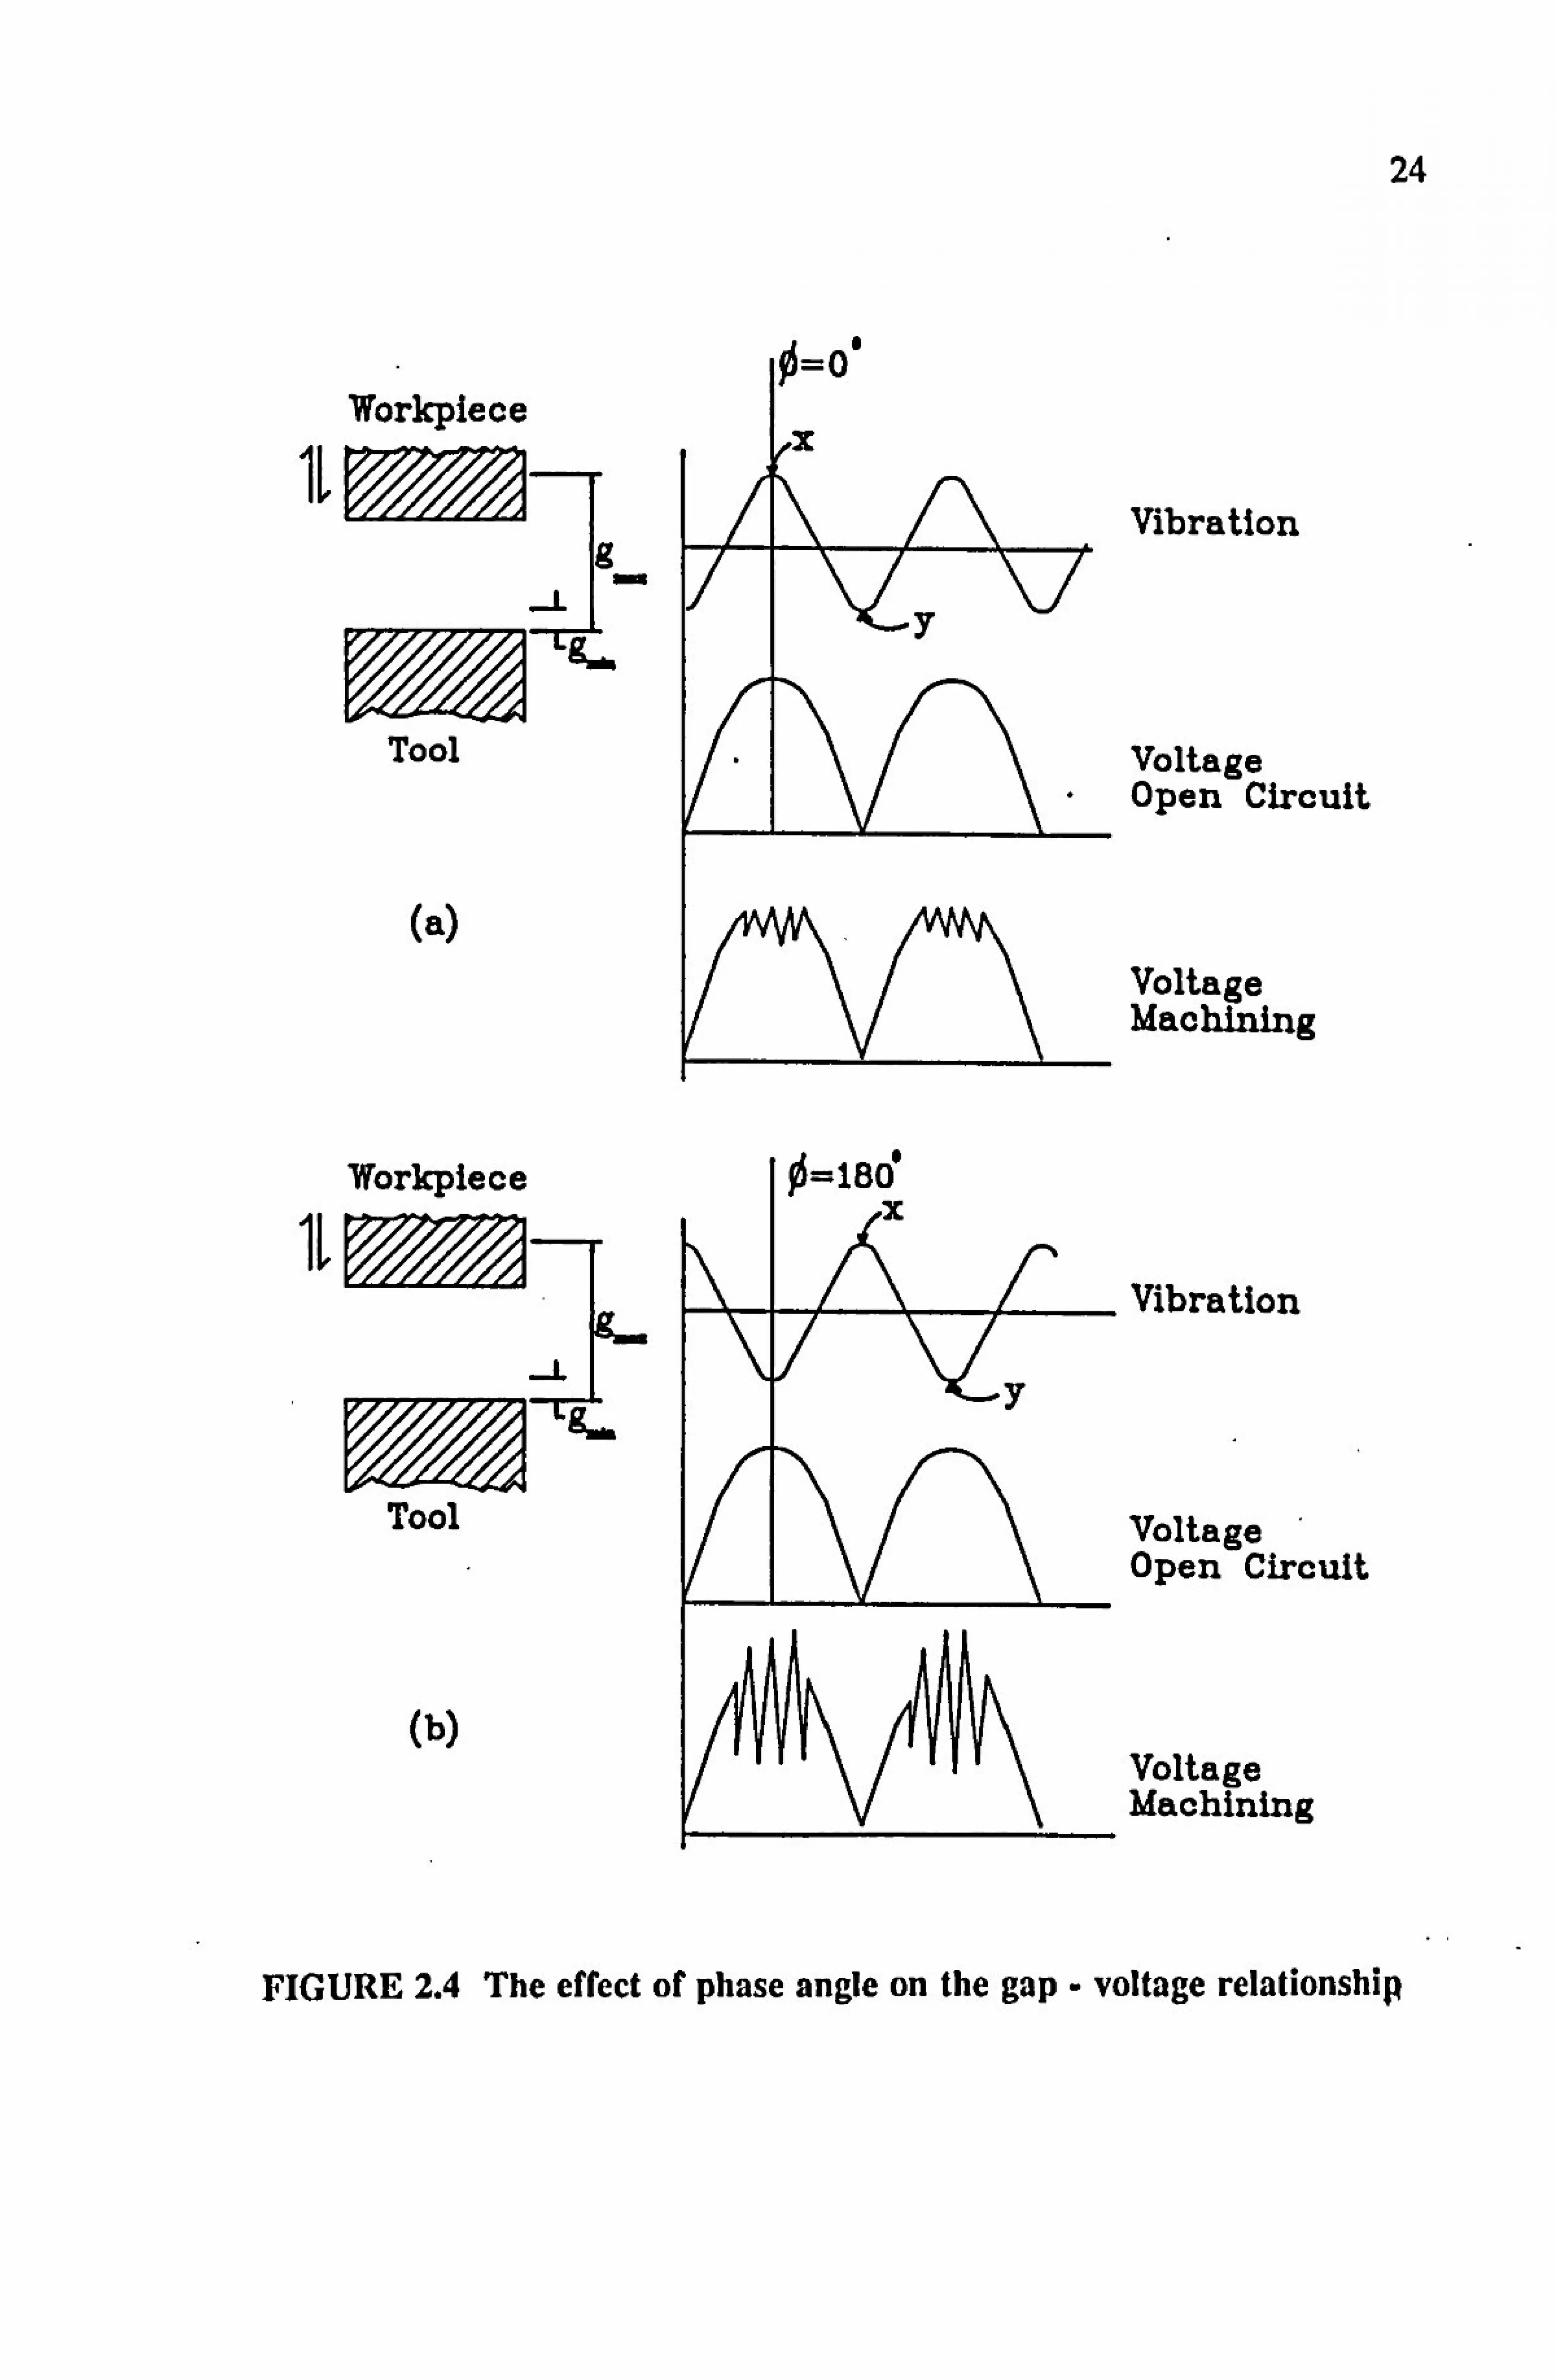
taper. 'Ibis can be explained with the aid of graphical illustrations in Figure 2.4.
Figure 2.4(a) shows the case when phase angle is 0*. This gives the condition,
that at instant x in time, the voltage is maximum when the gap is maximum. As
the gap decreases, so does the voltage, giving minimum voltage at minimum gap
at instant y. It can be assumed that at equilibrium gap (i. e. when the feed rate
equals to the sum of linear metal removal rate and the tool wear rate), the varia-
tion in electric field strength across the gap is minimal, giving very stable
machining conditions. As illustrated in Figure 2.4(a) the actual machining vol-
tage wavefonn shows ECD occurring at low values of the voltage giving rise to
low intensity EDE as the peak value of the voltage is reached.
In Fig. 2.4(b), the case is illustrated when the phase angle is 180*. 'Ibis gives
minimum voltage at maximum gap at instant x to maximum voltage at minimum
gap at instant y. When the gap is at equilibrium, the electric field strength would
vary from a minimum to a maximum, giving unstable machining. As depicted in
Figure 2.4(b), actual machining voltage had very spiky peaks indicating high a
intensity discharge phase. The severity of the discharge phase caused large
craters to be removed giving high SMRR but low LMRR.
24
,1 -0
Workplece
Tool
(
Workplece
Tool
(b)
Vibration
Voltage Open Circuit
Voltage Machining
Vibration
Voltage ' Open Circuit
Voltage Machining
FIGURE 2.4 The effect of phase angle on the gap - voltage relationship

25
The intermediate phase angle of 30*, gave gap conditions which were more stable
than 180* but not as stable as at 00. This is evident from table 2.2, as 01 has
higher LMRR than at 30*.
The conclusion reached was that at 0" phase difference, the proportion of EDE
action was balanced by the ECD giving optimum results of highest LMRR with
least tool wear and taper.
2.5.5 The Machining Voltage
The machining voltage proved to be the most crucial variable in determining the
optimum conditions for the five alloys. The effect of other variables on all pro-
cess parameters discussed in the previous sections were independent of the
material properties, thus giving the same optimum values for all the materials.
Although the trends in the relationship between the voltage and the process
parameters were similar for all the materials, the optimum values differed.
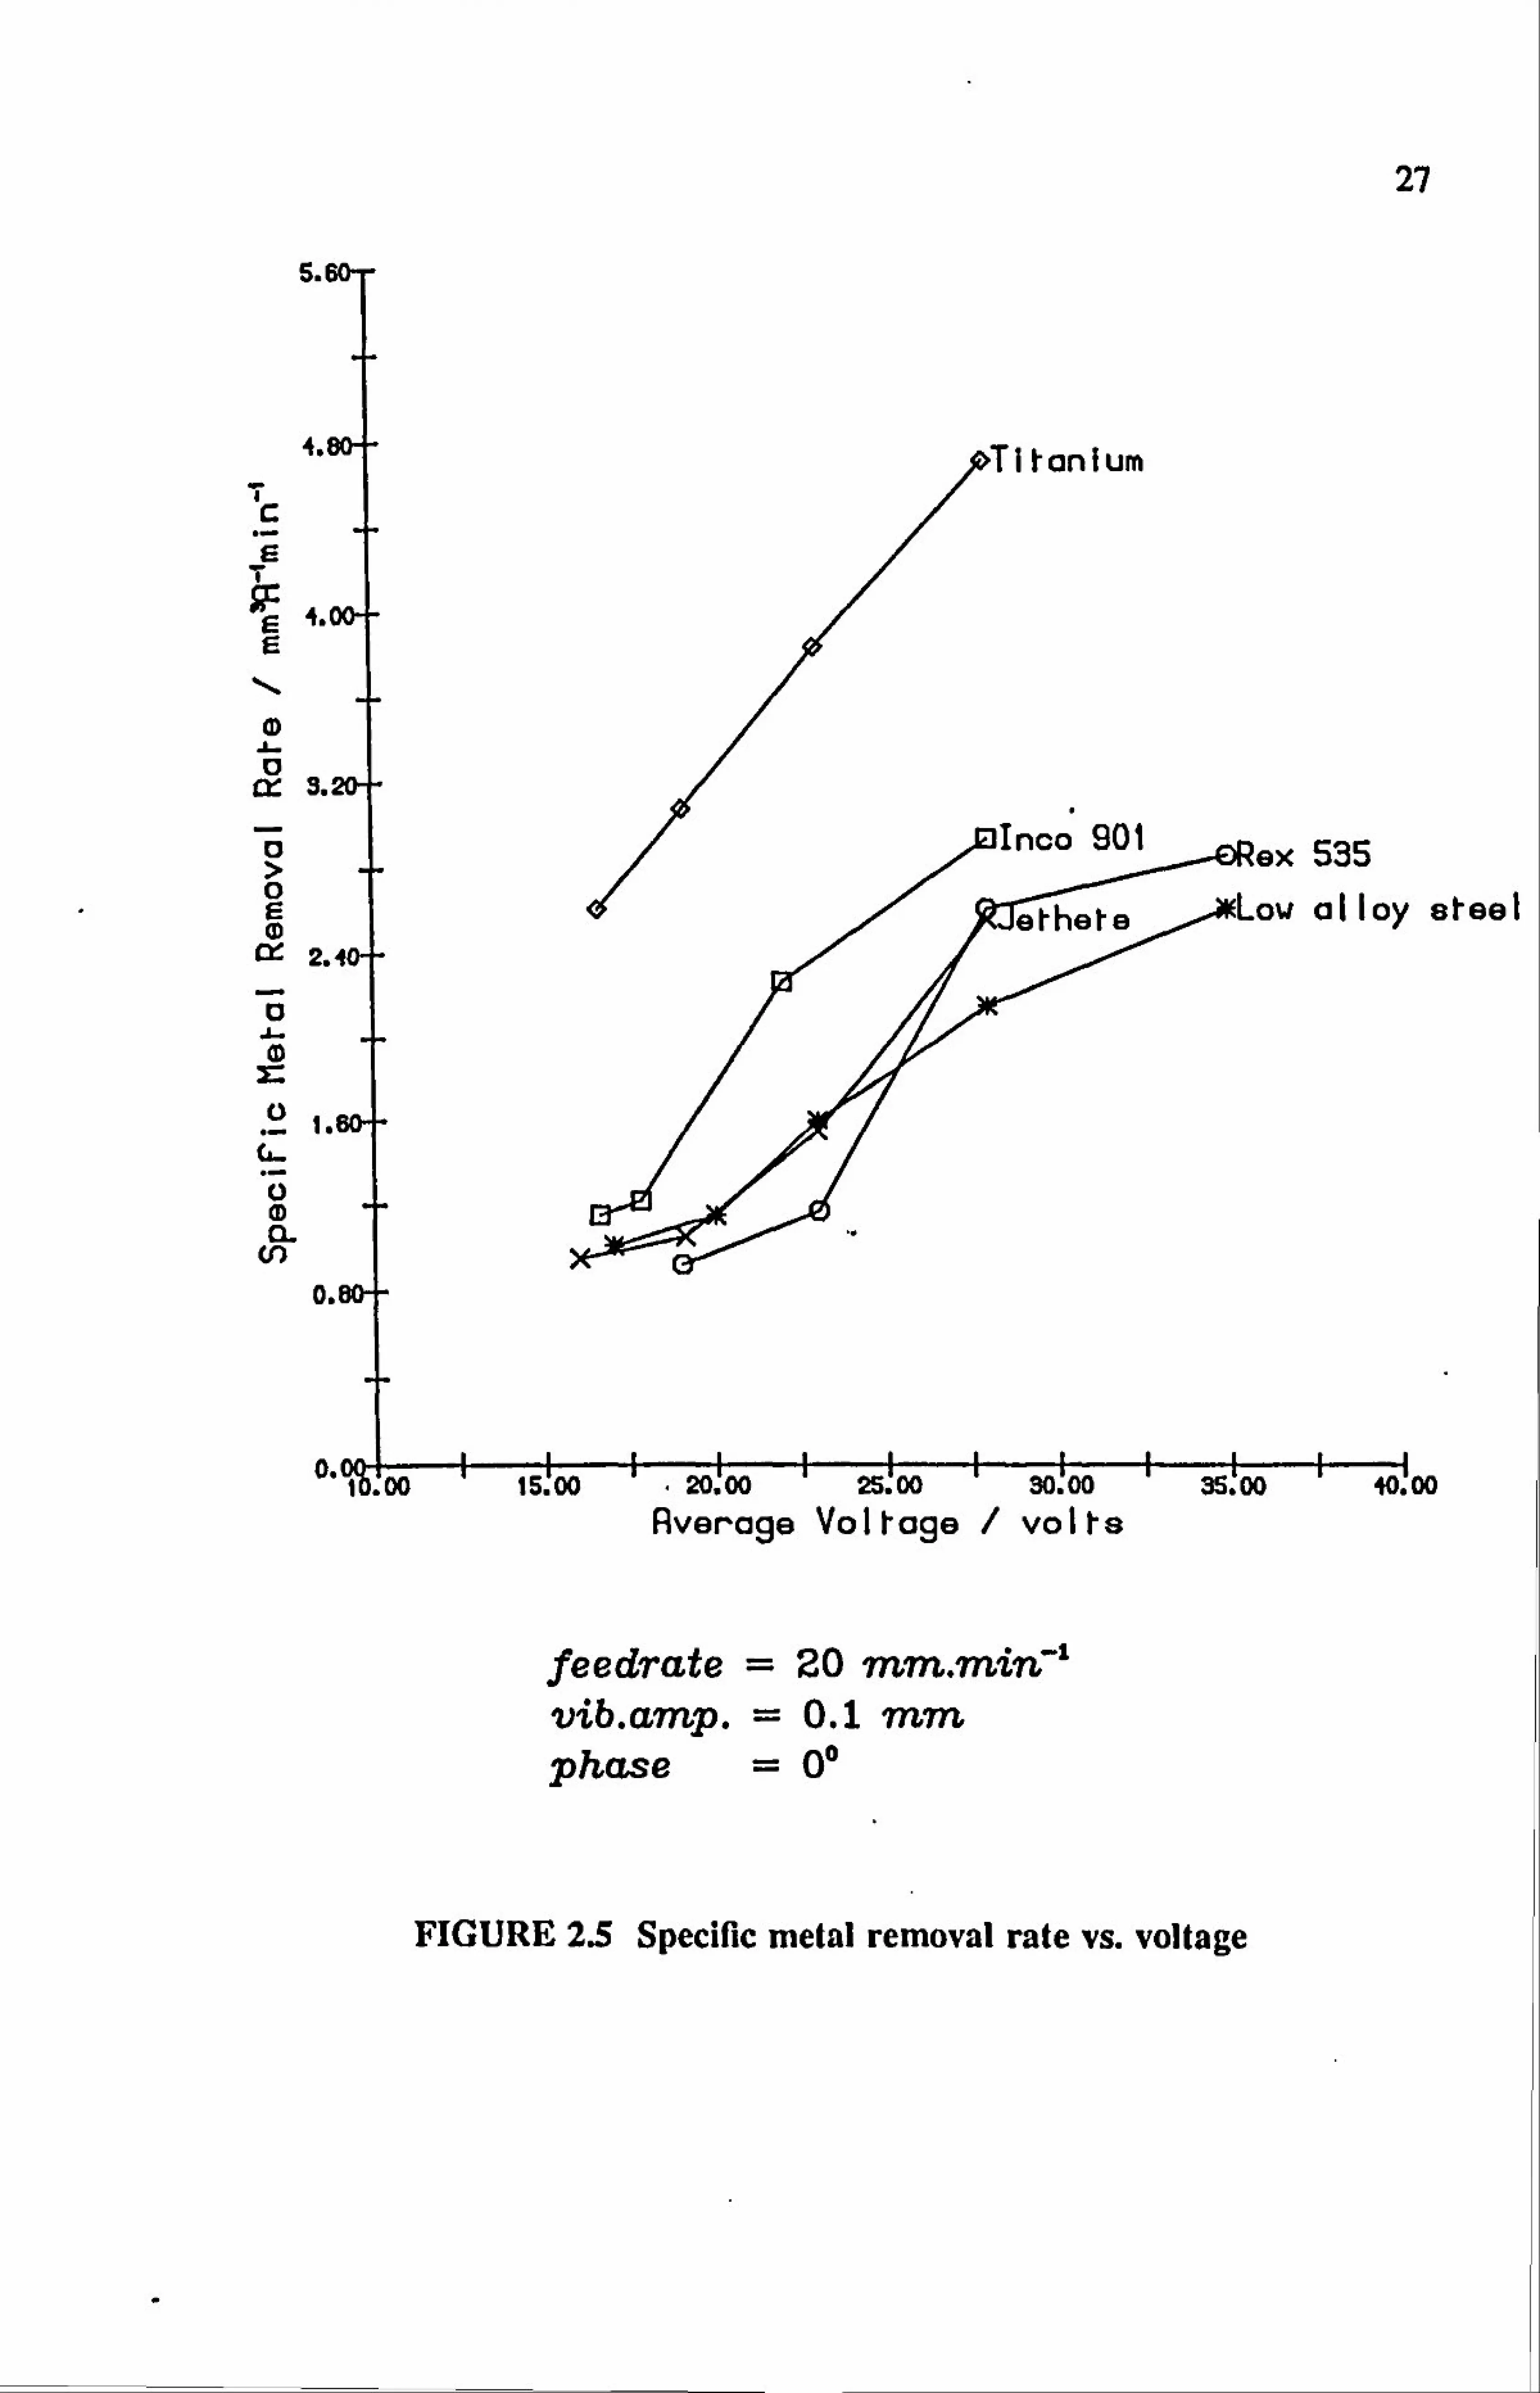
Figure 2.5 shows the variation in SMRR with voltage. It can be seen that the
SMRR increased with increasing voltage. The applied voltage determines the
electric field strength in the gap, which in turn governs the metal removal rates
by both the ECD and EDE phases. The relationship between the electrochemical
dissolution rate and the gap voltage is derived by the following formulae.
From Faraday's Laws of electrolysis,
-N "TF- XIx 11
where,
A is the metal removal rate (g4,1vun71)
N is the atomic weight (g moleý)
n is the valency

26
F is Faraday's Constant ( 96500 )
I is the cuffent
il is the cuffent efficiency
From Ohm's Law, the current I is related to the voltage V and the gap resistance
R by
v [2.21 R and for an electrolytic gap width g, current path area A and electrolyte conduc-
tivity k,
R=g [2.31 ke xA
the current density J is given by
therefore,
j k,,
[2.41 9
N VxAxk, [2.51 xg
From equation 2.5 above, it can be seen that the voltage is directly proportional
to the metal removal rate. At higher voltages, the enhanced ECD rate will pro-
duce more hydrogen gas, which will lead to more discharges. Furthermore, the
discharges have more energy at higher voltages owing to the increased ionisation
which occurs as a result of high field strengths. Consequently, the craters eroded
will have larger volumes resulting in higher metal removal rates.
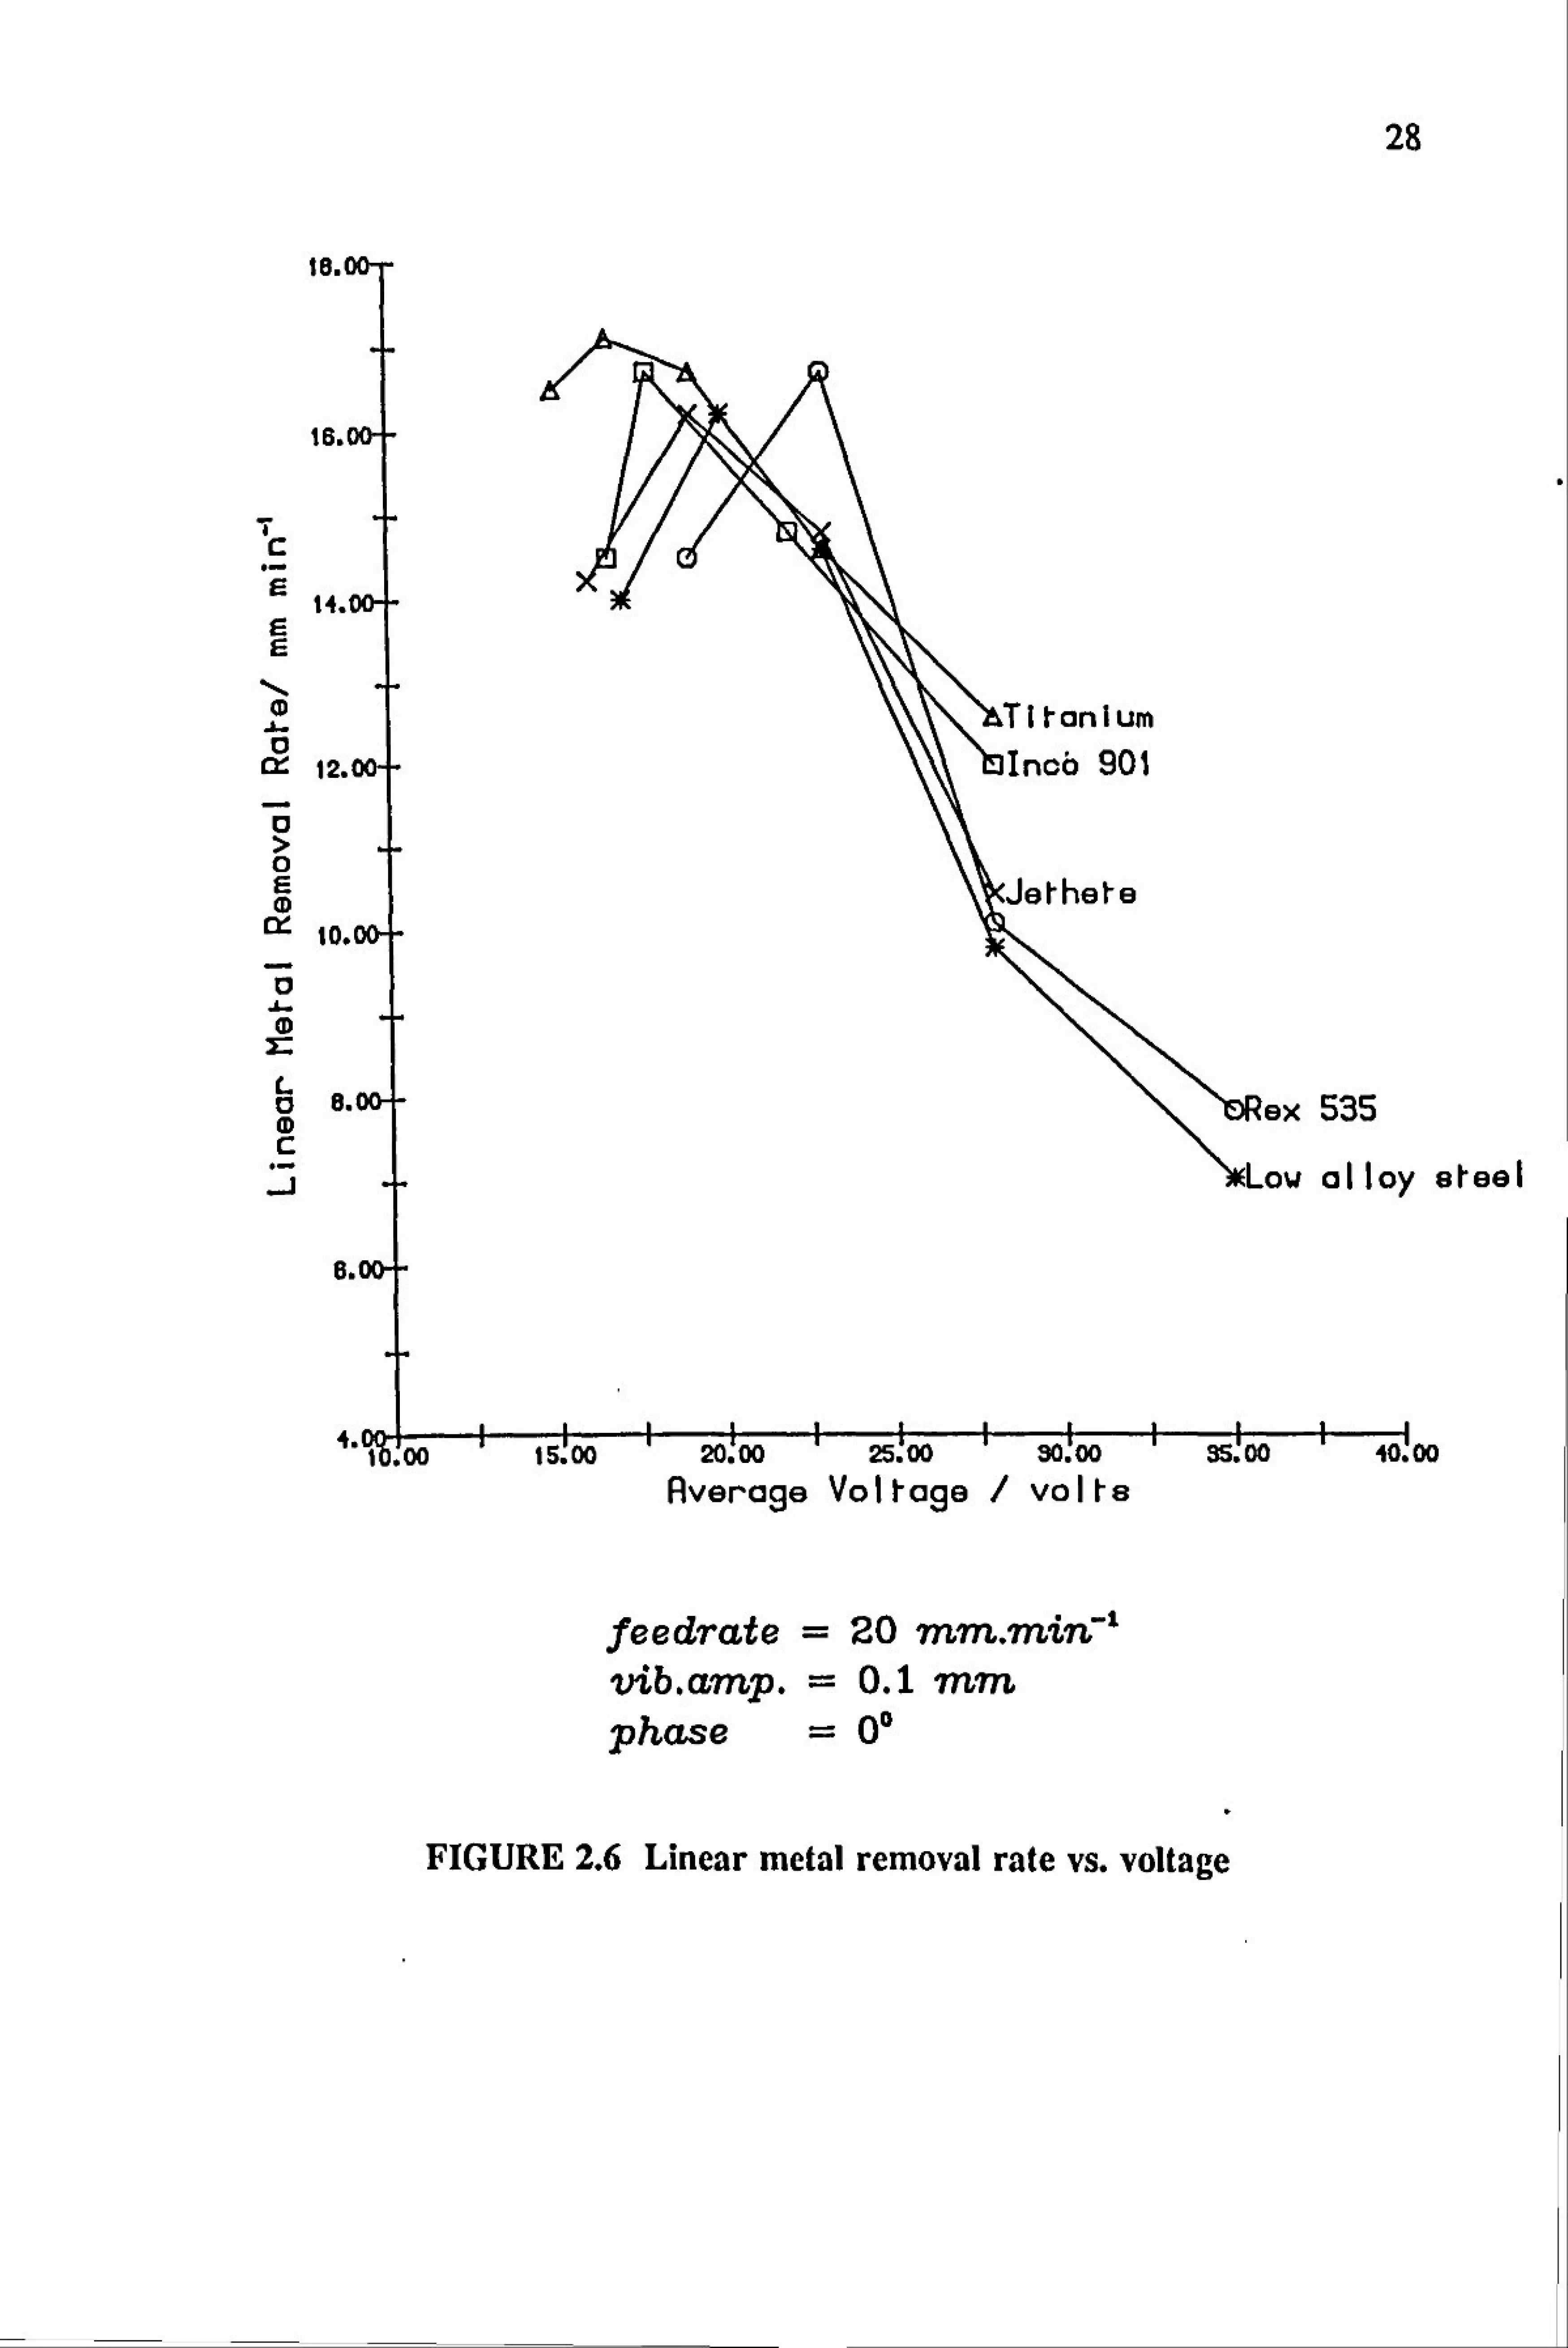
Although the SMRR increases with voltage the LMRR does not. This in fact can
be seen from Figure 2.6. In effect, what the voltage increase does is to remove
larger volumes of material at a given instant, resulting in increased SMRR and
large overcuts.
27
4. (
IC
E
E E
J-. a 0:: 5.
a > 0 E
o:: 2.
a as
.2i. 0
0 C, )
0.
WOO 15! 00 20! 00 25! 00 30! 00
0,0
Rverage Voltage volts
feedrate 20 mm. miTC' vib. amp. 0.1 mm phase 00
35.00
535
allay steel
40.
FIGURE 2.5 Speciflc metal removal rate vs. voltage
28
Is
Is
14.1
CD
Q-' 12.1
0 E (D
10.
. A- (D
2- L 0 8. (D c
I
8.
535
alloy steel
M: 00 ISSO 20! 00 2550 30! 00 SS! 00 00 I. u
Average Voltage volts
feedrate 20 mm. -mz'n-' vib. amp. 0.1 mm phase 00
FIGURE 2.6 Linear metal removal rate vs. voltage

29
35.
30.
25.1
20.
CD C3) 0 C 0 0 C.. 0
0.. 10.
5.00
535
alloy steel
1 ! oo 15.00
1 2200 2200 3200
Rvera! ge Volfage / volfe
feedrate 20 mmmiTC' vib. amp. 0.1 7n7n phase 00
FIGURE 2.7 Volumetric tool wear ratio vs. voltage
30
4.
L CD CL s E
L (D CL
1.
. '00 Is
535 alloy steel
40.
alloy steel 535
0 0. CD
10! 00 1
15! 00 1
20! 00 25! 00 1
30! 00 35! 00 1
00
Average Voltage / volts
feedrate 20 mm. m-t*n-' vib. amp. 0.1 mm phase 00
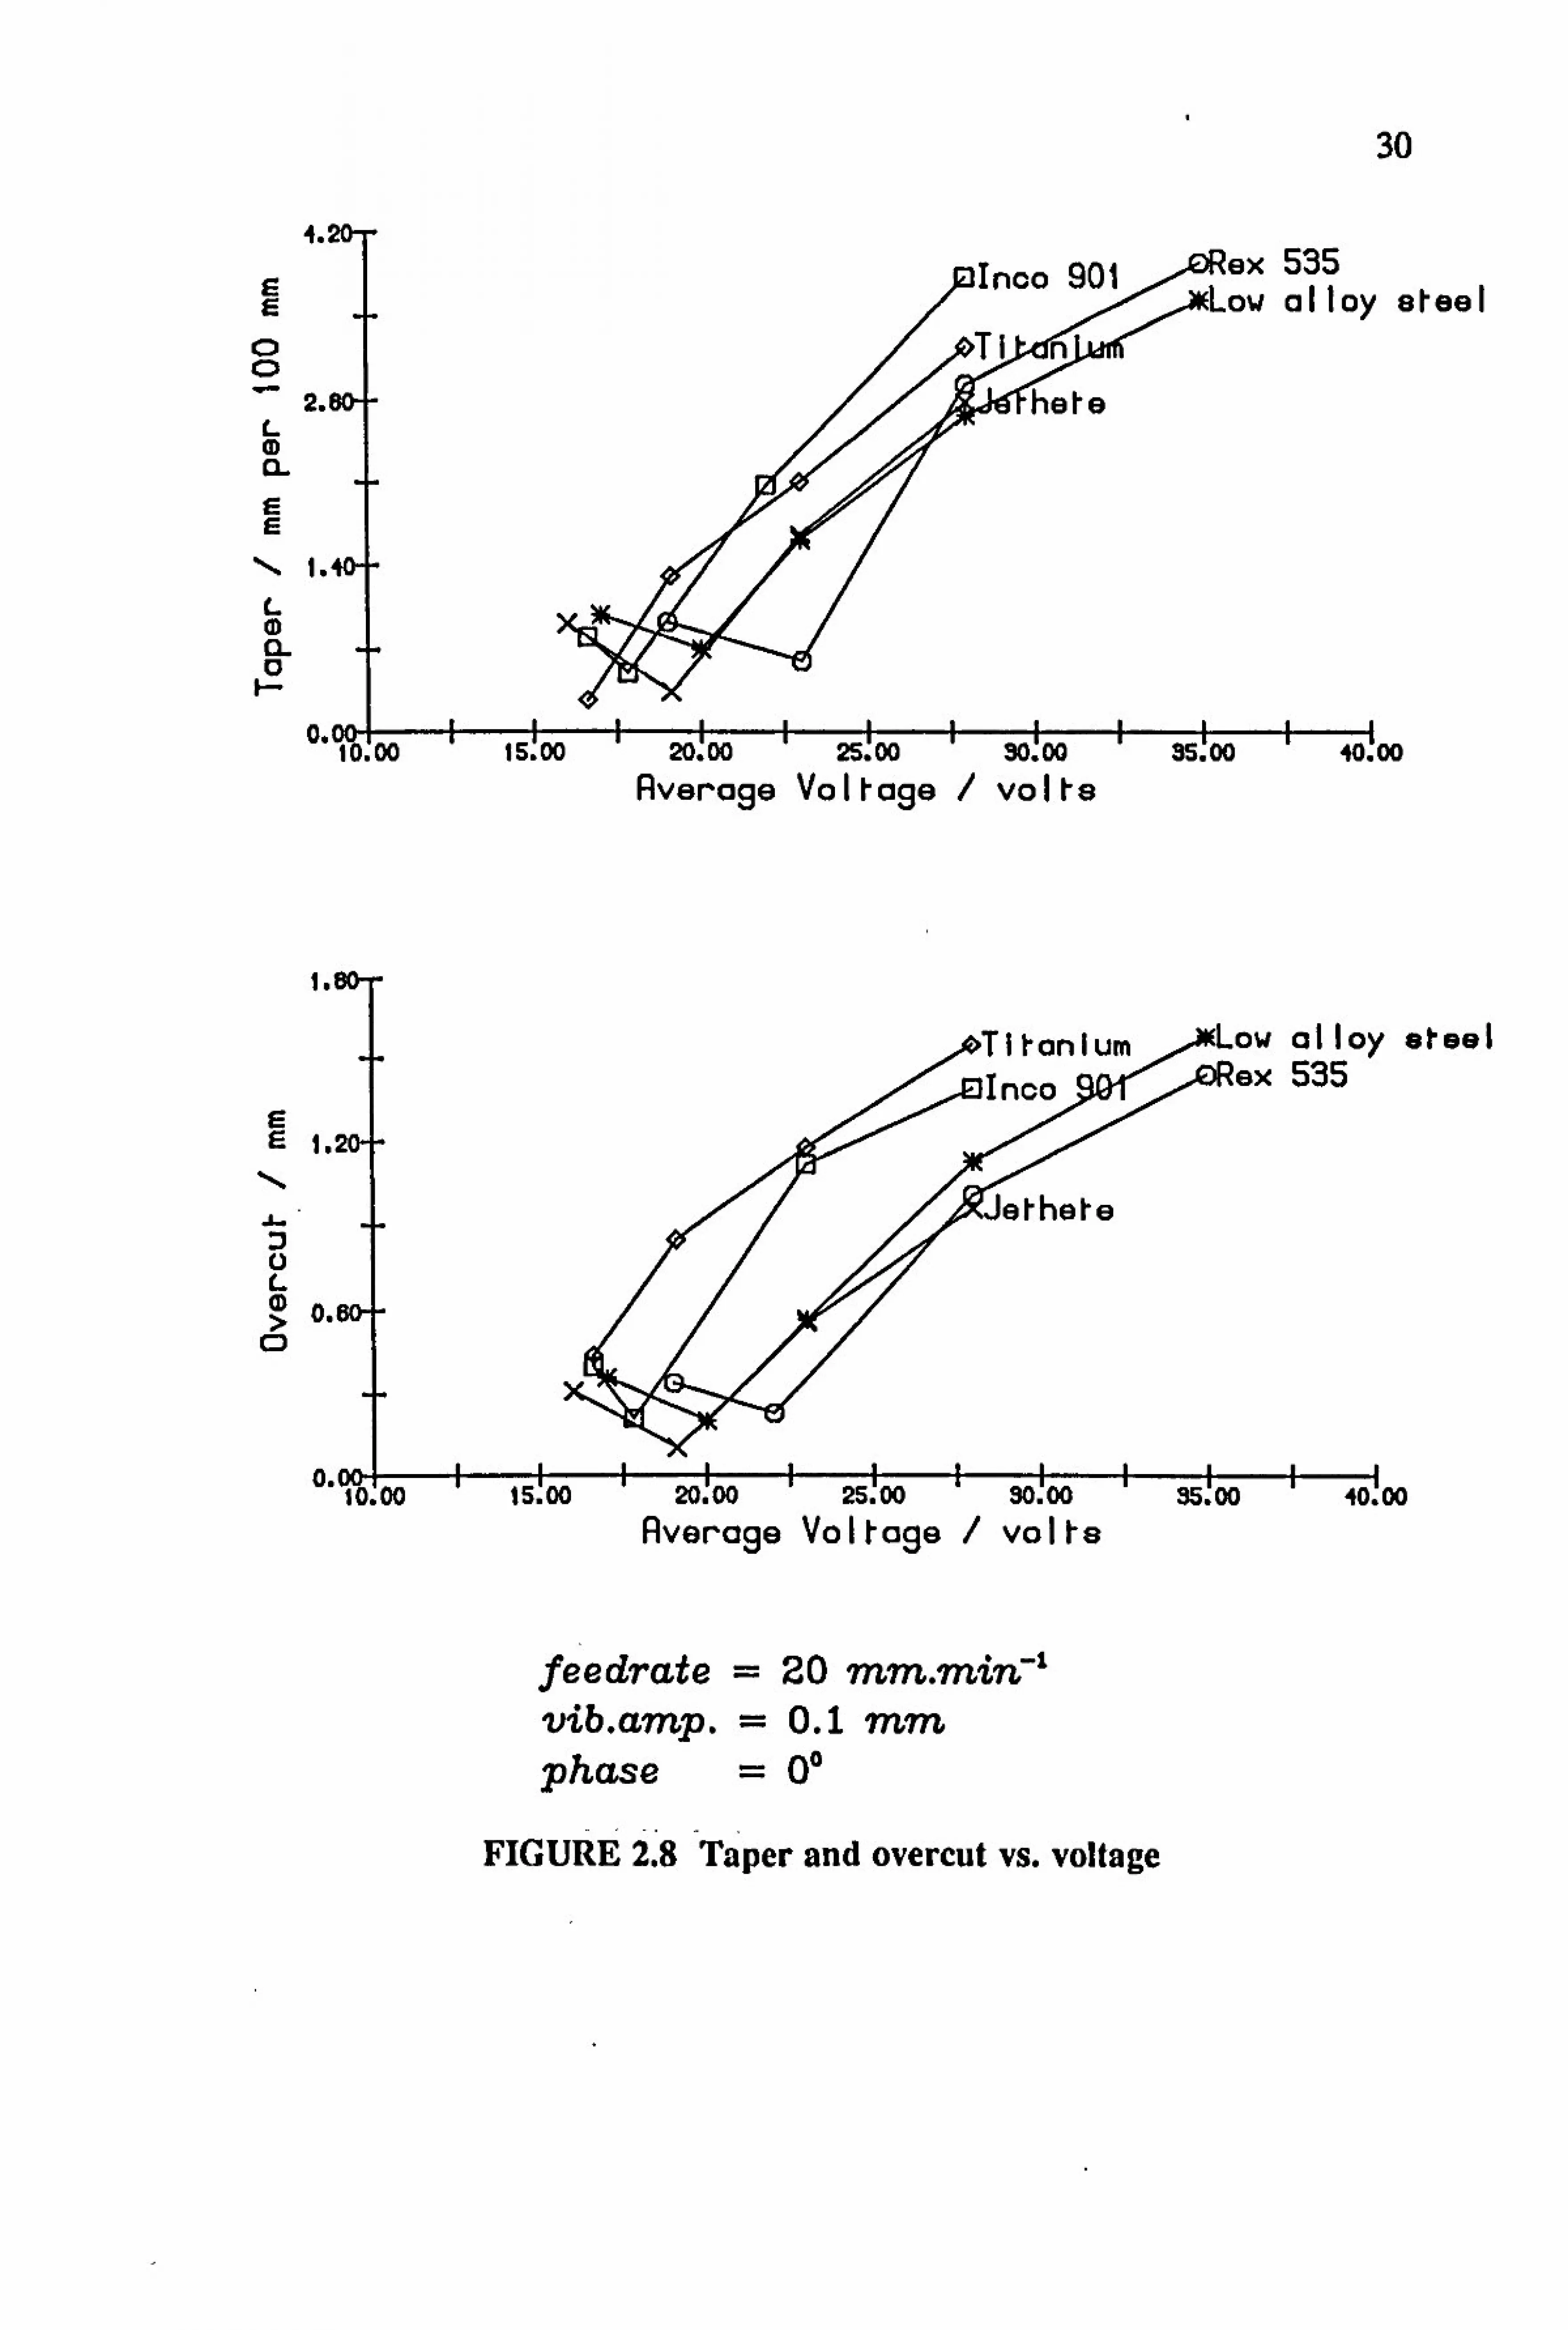
FIGURE 2.8 Taper and overcut vs. voltage
D 20.00 25.00 30.00 35.00
Rverage Voltage volts

31
There is a minimum voltage for a given feed rate below which no discharges
occurred. At these reduced voltages, the metal removal was due to ECD only, as
the voltage was too low for any discharge breakdown of the gap. Often the dril-
ling operation ended in a short circuit because the metal removal rate by ECD
was slower than the feed rate. As expected the volumetric tool wear decreased
with decreasing voltage (Figure 2.7).
It can be said that for each material there is an optimum gap voltage for a given
feed rate, which gives the fastest drill rate. It is apparent from Figure. 2.8 that
this voltage also gives the least taper. At this voltage, the balance between EDE
and ECD phases is achieved, giving high LMRR, low taper and overcut and low
tool wear. The voltage where that right balance of EDE to ECD occurs, differs
slightly for the different alloys as it is dependent on the material properties.
The ECD rate of any material is dependent on its chemical equivalent (atomic
weight/valency) as given by equation 2.5. For a material which has many consti-
tuents the electrochemical equivalent can be found by taking the percentage elec-
trochemical equivalent of each element. In McGeough (33) a detailed account of
how to estimate the chemical equivalent of alloys is found. Other factors which
influence the ECD rate of a material are the build up of surface anodic films and
anode and cathode over-potentials.
For the electrodischarge phase, the metal removal rate depends upon the volume
of metal removed by each discharge and the frequency of discharges. The
volume of metal removed per discharge is a function of the discharge energy. A
certain power density (heat flux) is necessary to sustain the boiling temperature at
the centre of the plasma channel. Clearly this heat flux will depend on the rate at
which heat is conducted into the electrodes from the surface heat source. Ibis
rate of heat flow will be dependent on the material properties such as thermal
32
conductivity, diffusivity and melting/boiling point. There are many theories
based on heat conduction models to correlate the crater volume removed per
discharge with the thermal properties of the material. Although it is very difficult
to establish a definite relationship between the thermal properties and the metal
removal rate, the following relationships established empirically by Berghausen
(34) give a good indication of how metal removal rate is determined by the melt-
ing point.
Rw = 2.43 M,; -1-23
and
V=1.36xlo-4M,; -1.43
where,
[2.61
[2.71
Rw is the average metal removal rate from workpiece (in3amp-IMiri-IX104)
V is the average volume per discharge (in3)
M,, melting point of workpiece ( *C )
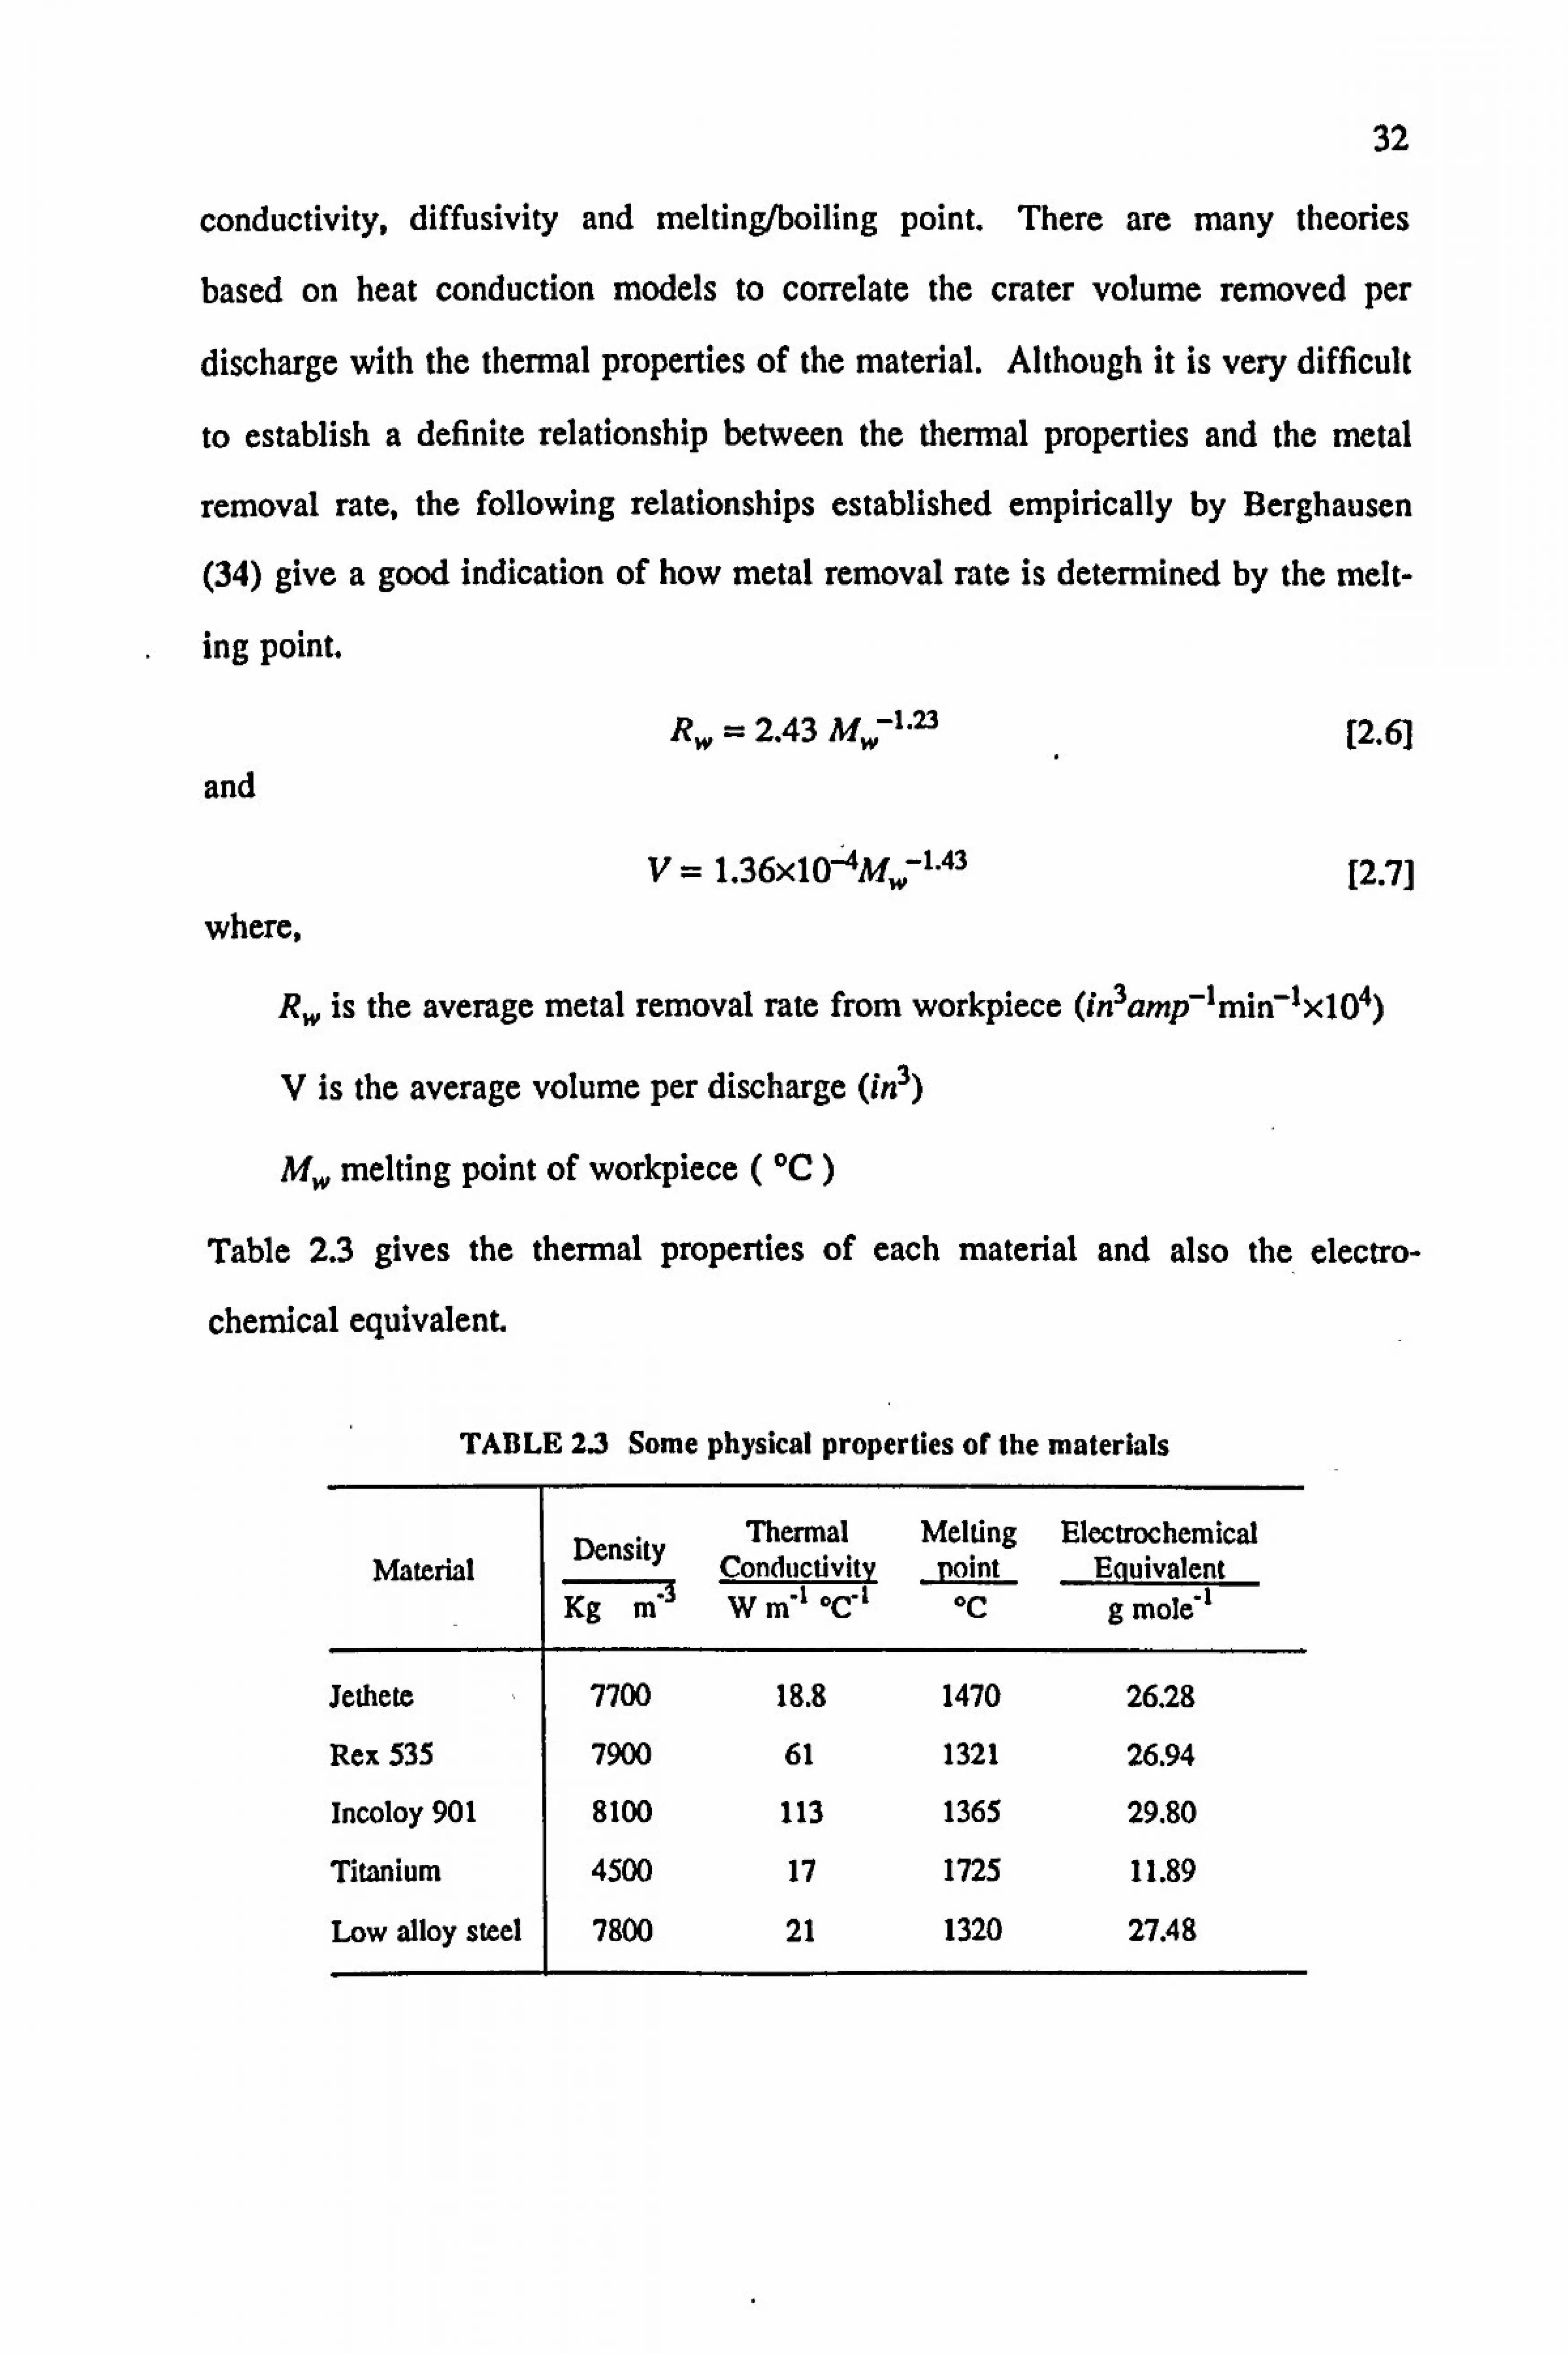
Table 2.3 gives the thermal properties of each material and also the electro-
chemical equivalent.
TABLE 23 Some physical properties of the materials
Material Density
Kg M"3
Themal Conductivity W m"I OC71
Melting
- point Oc
Elecumhemical
- Equivalent g mole7l
Jethete 7700 18.8 1470 26.28
Rex 535 7900 61 1321 26.94
Incoloy 901 8100 113 1365 29.80
Titanium 4500 17 1725 11.89
Low alloy steel 7800 21 1320 27.48

33
It can be seen from Figure 2.5 that SMRR for titanium was considerably higher
than for the other materials. This is attributed to the low average current drawn
while machining titanium in comparison to the others (table 2.4). This is also
evidence, that in titanium very little ECD occurred, therefore all the energy
applied was available to the EDE phase. Consequently, a larger volume of metal
was removed per discharge. Although titanium has a high melting point, its very
low thermal conductivity may have contributed to it undergoing thermal shock.
This may have caused the grains to be ripped away from their boundaries. The
LMRR for titanium was only slightly higher than for the other materials (Figure
2.6). The taper was found to be the least in titanium (Figure 2.7) again indicating
the absence of ECD phase. However, as can be seen from Figure 2.8, the overcut
endured by titanium was not any less than for the other materials. This supports
the argument that with titanium, the high intensity discharges have caused whole
grains to be eroded giving high rate of volumetric metal removal. For the other
four materials, the SMRR differed only slightly. Since it is very difficult to esti-
mate the relative intensities and durations of ECD and EDE phases, no analysis
can be made on how material properties have affected the process conditions.
From Figure 2.5 it can be seen that the nickel alloy (Inco 901) has slightly higher
SMRR than the other three alloys. This may be due to the greater ECD rate
resulting from the higher electrochemical equivalent.
What was achieved by varying machining conditions was the balanced ECD/EDE
which gave optimum results for the five materials. The optimum machining vari-
ables together with their resulting process parameters are given in Table 2.4.

34
__ TABLE'2.4 Optimum Machining Variables and Process Parameters
Average Average Volumetric Linear Volumetric Hole Geometry Voltage Current M. R. R. M. R. R. Toot Wear Material Diameter/mm Taper
volts amps mm3mm-1 mm min .1 Ratio entry exit Angle
Jethete 19.1 66 612 16.2 11% 2.31 2.12 0.1711
Rex535 22.0 61 63.6 16.7 8% 2A5 2.13 0.280
Incoloy901 17.8 63 76.2 16.7 qJ% 2.28 2.02 0.24*
Titanium 16.6 29 88.8 17.1 5.2% 2.20 2.08 0.101,
Low alloy steel 20.0 68 69.5 16.2 12% 2A6 2.11 0.3111
Process variables common to all the materials: Tool Feedrate - 20 mm min" Vib. Amplitude - 0.1 mm peak to peak
Phase Angle . 00 Elec. Pressure - 30 bar
The values shown in the table are the average values of three sets of experimental data.
2.6 Summary
ECAM has been used successfully to drill holes in the five alloys (chrome alloy,
cobalt alloy, nickel alloy, titanium and low alloy steel) investigated. The experi-
ments performed examined how the machining variables influenced the process
parameters and whether it was dependent on the material properties. For each of
the materials, a set of optimum machining variables was established, which
yielded the highest linear metal removal rate, the least taper and overcut and
lowest tool wear. For most materials, this optimum performance was achieved
when the EDE phase was balanced by the ECD phase. This meant that the energy
35
available to the discharges must have been such that it was directed at the frontal
gap, removing craters which were small enough for the ECD action to smooth
out completely. This way the highest drill rate was achieved with the least over-
cut and taper.
In the case of titanium, however, the ECD rate was much less, therefore the
optimum conditions were determined entirely by the energy available to the discharges.

36
3: SURFACE EFFECTS
ON ALLOYS DRILLED BY ECAM
3.1 Introduction
Electrochemical arc machining is a contactless machining process. Nevertheless
the thermal and the electrochemical metal removal mechanisms in ECAM can
affect the surface integrity of a machined component. The degree of alteration to
the surface integrity of any material is determined by the material properties such
as the thermal conductivity and the composition. It is of value therefore to inves-
tigate the effects of ECAM on different types of materials. The surface charac-
teristics of machined parts are of great interest for two reasons:
(1) Higher surface-volume ratios are encountered as strength-weight ratios are
increased.
(2) The extreme environments to which they may be subjected make them
inherently more sensitive to their surface conditions.
This chapter investigates the surface effects produced by ECAM drilling on the
five materials encountered in the previous chapter. The analysis of the surface
quality is based on optical and scanning electron microscopic examination and
microhardness testing.
Since the surface effects produced by ECAM are expected to have both EDM and
ECM surface characteristics, a brief account of the EDM and ECM characteristics
is given first.

37
3.2 EDM Surface Effects
Several publications can be found on surface characteristics of EDM components
(35,36,37). It is well known, that when a discharge occurs the material is
melted, or even evaporated, thus forming craters on the component surface. 'Me
heat of the discharge penetrates to the sub-surface layers inducing a heat affected
zone. The amount of heat damage is dependent on the thermal conductivity of
the material and the intensity of the discharge itself, which is governed by the
process variables and the gap conditions. The craters produced by EDM are
associated with fusion and plastic deformation due to Molten liquid solidifying
epitaxially when quenched by dielectric. Platanik et al (38) have reported that
this in turn causes slip, twinning, cleavage and microcracks in the surface
depending on the crystal structure, regardless of tlýe ductility of the material. A
review on the existing published work on the nature of electrodischarge machined
surfaces can be found in Crookall and Khor (35). Typical surface defects and
sub-surface layers which can be caused by EDM is shown in Figure 3.1.
Tool Al oying Gas porosity Micr cracks Ad ering globules
Fused- redeposited layer
Annealed layer
Main matrix ...........
FIGURE 3.1 Typical EDM surface effects
38
3.3 ECM Surface Effects
The microfinish of an electrochemically machined surface is governed mainly by
the type of electrolyte, the composition of the workpiece material and the
machining conditions such as the current density and the electrolyte flow rate.
The main factors resulting in poor surface finish in ECM are pitting, preferential
grain boundary attack, surface waviness and formation of oxide layers. These
effects are illustrated in Figure 3.2. Pitting tends to occur in regions of low
current density where the passivating layer would slow down dissolution of the
majority of the surface. Grain boundary attack is an example of local recession
and is very important because severe attack may reduce fatigue life by as much
as 50%.
De Barr and Oliver (2) describe how current density, electrode potential and type
of electrolyte can result in differential removal rates in inhomogeneous materials.
Bannard (39) has investigated the surface finish of fine hole drilling using ECM.
He has found that electrochemical drilling of multiphase alloys could present par-
ticular problems, where, if the coffect dissolution-controlling anodic film is not
generated, differential dissolution of the phases would. occur resulting in a rough
surface. However, Cole (40) claims that if the current density is sufficiently large
(100 A crif 2 ), bright surface finishes could be obtained on many metals and
alloys. Kashthejev (41) also reports that an increase in the working current den-
sity, as a rule, is accompanied by a decrease in surface roughness and by an
improvement in reflecting ability. This could be associated with the disappear-
ance of surface etching at high current densities.
ECM surfaces are free from residual stresses and also from any heat affected
zones or recast layers. Therefore smooth ECM surfaces are much preferable to
EDM surfaces.

39
Crystal imlodging itung Oxide layer tio Undula
7
ýýF -
FIGURE 3.2 Typical ECM surface effects
3.4 Surface Effects of ECAM Drilling
In ECAM drilling the main mechanism responsible for material removal at the
frontal gap is electrodischarge erosion (EDE) while at the side gap electrochemi-
cal dissolution (ECD) of the material occurs. The metallurgically damaged layers
caused by the discharge erosion phase are wholly or partially removed by the
electrochemical dissolution phase. 7berefore, the main factor which determines
the ECAM surface integrity is the proportion of EDE to ECD phase.
In McGeough et al (42) the factors which affect the surface quality produced by
the ECD phase are given as: fon-nation of anodic surface films, non-uniformity of
the electrolyte flow pattern, change in bulk conductivity and effects of cathode
and anode overpotentials. Likewise, the factors for the EDE phase are given as:
the type and duration of the machining voltage, the frequency and distribution of
discharges and the effect of electrolyte flow rate.

40
The proportion of EDE to ECD phase is determined mainly by the machining
variables and the gap conditions. Machining voltage is the most crucial process
variable where surface quality is concerned. At highervoltages, the intensities of
the discharges are greater, thus the craters formed are larger and also the depth of
the heat affected zone is greater. To remove all the damaged layers, prolonged
ECD action is required. This invariably means slow feed rates. Prolonged ECD
action will also cause larger tapers and overcuts, resulting in poor dimensional
accuracy. Another variable which can have a marked effect on the surface qual-
ity is the phase angle between vibration and voltage waveforms. As discussed in
Chapter 2, the instantaneous relationship between the machining gap and the
power transmitted across it is determined by the phase angle. By varying the
phase angle the relative intensity and duration of ECD and EDE phases can be
changed.
3. S Evaluation of Surface Integrity
Surface effects were analysed for the holes drilled using the optimum machining
variables for each of the five materials. Normal illumination optical microscopy
was used to examine the structures in the sub-surface layers of the specimens.
Specimens were prepared by taking longitudinal sections through the drilled hole
for each material. These were then polished and etched in the following etchants:
low carbon chrome steel (Jethete) -
cobalt alloy (Rex 535) -
nickel alloy (inco 901) - low alloy steel
titanium
5% ferric chloride/nitric acid
5% ferric chloride/nitric acid
5% ferric chloride/nitric acid
5% Nital
10% hydrofluoric acid/5% nitric Acid
41
The microstructure along the drilled hole was examined and photographed on a
"Zeiss" photomicroscope. Microhardness readings were taken using a "Leitz"
microhardness tester. Scanning electron microscopy was used to examine the
ECAM drilled surface. This technique allows the identification of any craters and
also gives some indication of the surface roughness due to its relatively high
depth of field (1 mm).
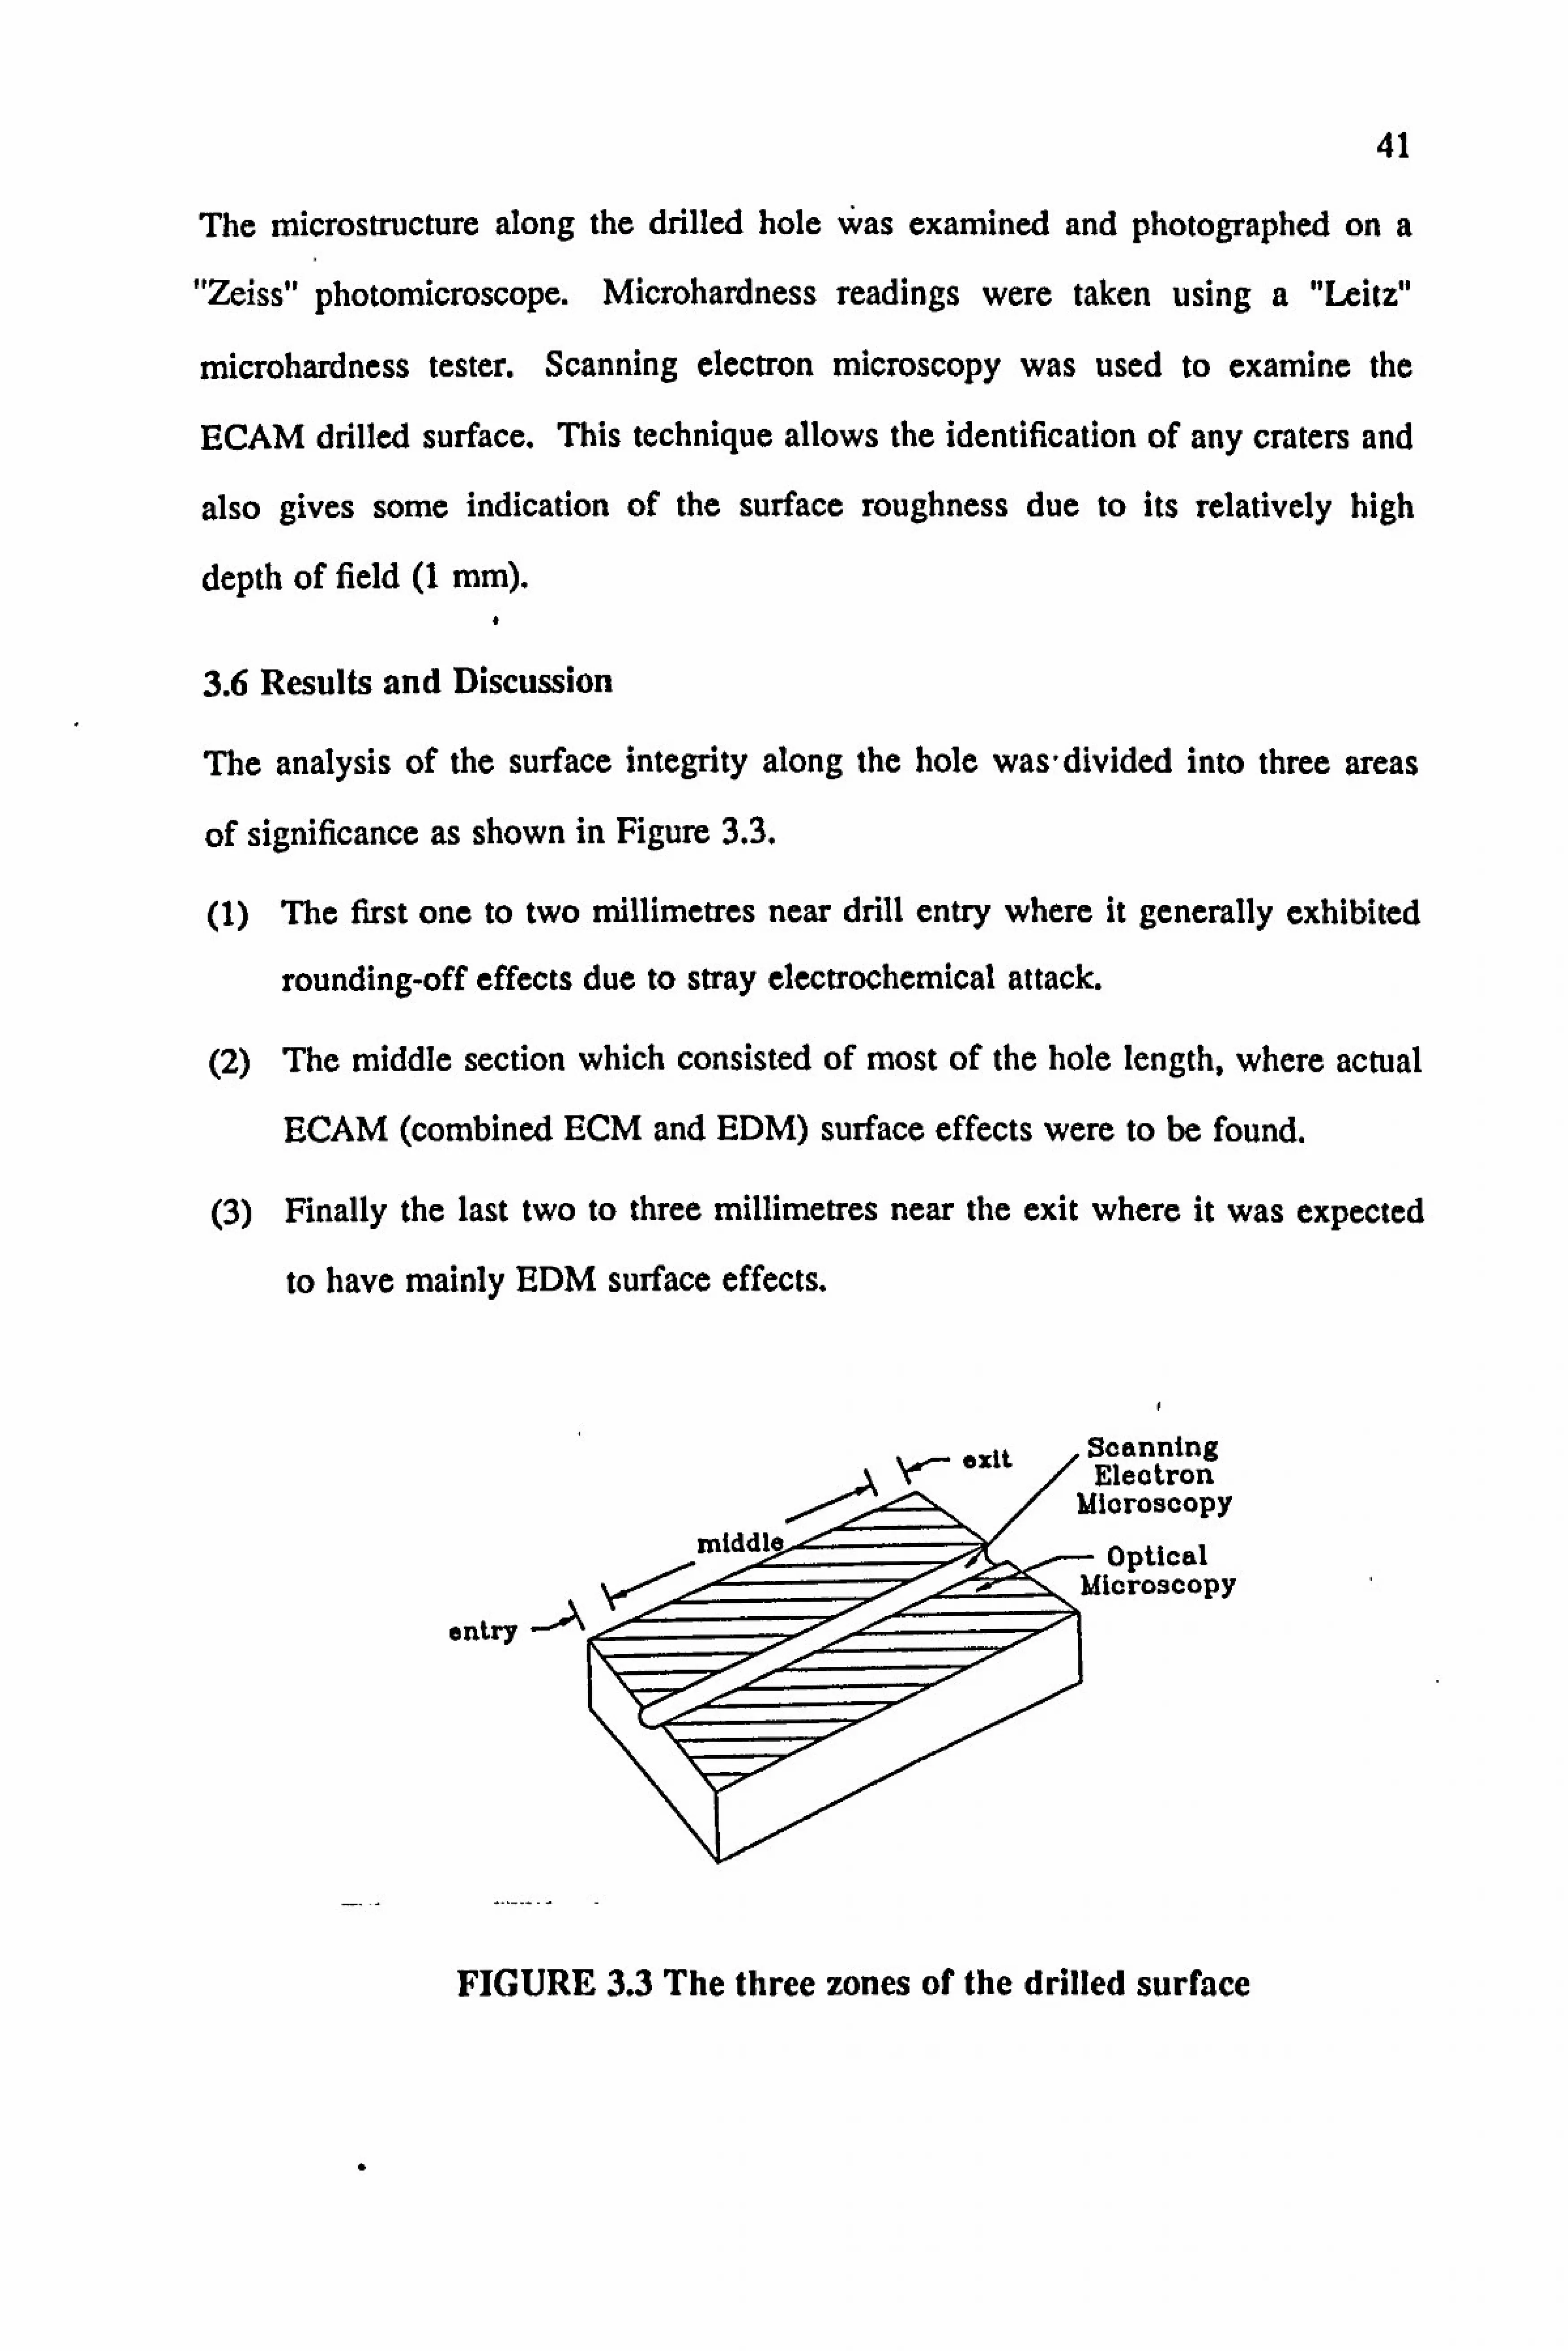
3.6 Results and Discussion
The analysis of the surface integrity along the hole was-divided into three areas
of significance as shown in Figure 3.3.
(1) The first one to two rnillimetres near drill entry where it generally exhibited
rounding-off effects due to stray electrochemical attack.
(2) The middle section which consisted of most of the hole length, where actual
ECAM (combined ECM and EDM) surface effects were to be found.
(3) Finally the last two to three millimetres near the exit where it was expected
to have mainly EDM surface effects.
I Scanning Electron
dicroscopy
- Optical fficroscopy
entry -, A
FIGURE 3.3 The three zones of the drilled surface

42
The microhardness readings in Table 3.1 were taken from the middle of the hole
as this is where the true ECAM effects are represented.
TABLE 3.1 Variation of microhardness with depth
Depth from the drilled surface
ttm
70
170
270
370
570
1000
Mierohardness
Kg MM»2
Jethete Rex535 Low alloy steel
Incoloy 901 Titanium
340 363 147 458 377
339 371 151 452 416
348 377 145 452 406
368 378 155 436 371
350 371 150 427 383
357 370 155 433 394

43
3.6.1 Low Carbon Chrome Steel (Jethete)
Figure 3.4 shows photomicrographs of longitudinal sections taken from drill
entry, middle and drill exit points of a typical ECAM specimen. Apart from
near the drill exit end, the martensi tic surface structure of the low carbon chrome
steel appears to be regular with no sub-surface layers or microstructural change.
At the exit, however, some damage is evident, a white layer of about 10 Rm
thickness can be seen (Figure 3.4(c)). This white layer extended to about 1.5 mm
from the exit end. Table 3.1 shows the microhardness readings taken at various
depths from the drilled surface. No significant variations in these readings can be
detected, which indicates that there are no hardened layers left on the surface.
Scanning electron microscope photographs of the drilled surface are presented in
Figure 3.5. Except for the exit end, the surface is smooth and crater-free. Some
surface etching is visible in the middle area, at higher magnification as can be
seen from Figure 3.6. This is because that the ECD phase was such that it left a
highly polished surface which was subsequently etched by the etching solution.
At the exit, a rough and irregular surface, similar to that of an EDM surface is
apparent, with signs of surface melting and resolidification.
The smooth profile and the absence of surface layers up until the last 1-2 mrn
from the exit end, is taken as evidence that all the damage induced by the elec-
trodischarge erosion action has been effectively removed by the following electro-
chemical dissolution action. At the drill exit end, electrolyte was lost in the
machining gap, as a result of the drill breaking through the workpiece. This
stops the electrochemical dissolution at the exit, leaving the damage caused by
the discharge erosion action.

44
(a)
(b)
(c)
FIGURE 3.4 Photornicrographs of polished and etched Jethete specimens showing the subsurface region along the hole. (a)near (trill entry x 640, (b) middle x 640, (c) near exit x 640

15
Id ýýw Mir,
4p- , to. A; K
jK
woe A-' 4;,,! At s je: ---.. 0 1-
44 4
#.... ___%.
(UI
.L
FIGURE, 3.5 Scanning electron micrographs of Jethete specimens showing the drilled surface along the hole. (a)near drill entry x 100, (b) middle x 100, (c) near exit x 500
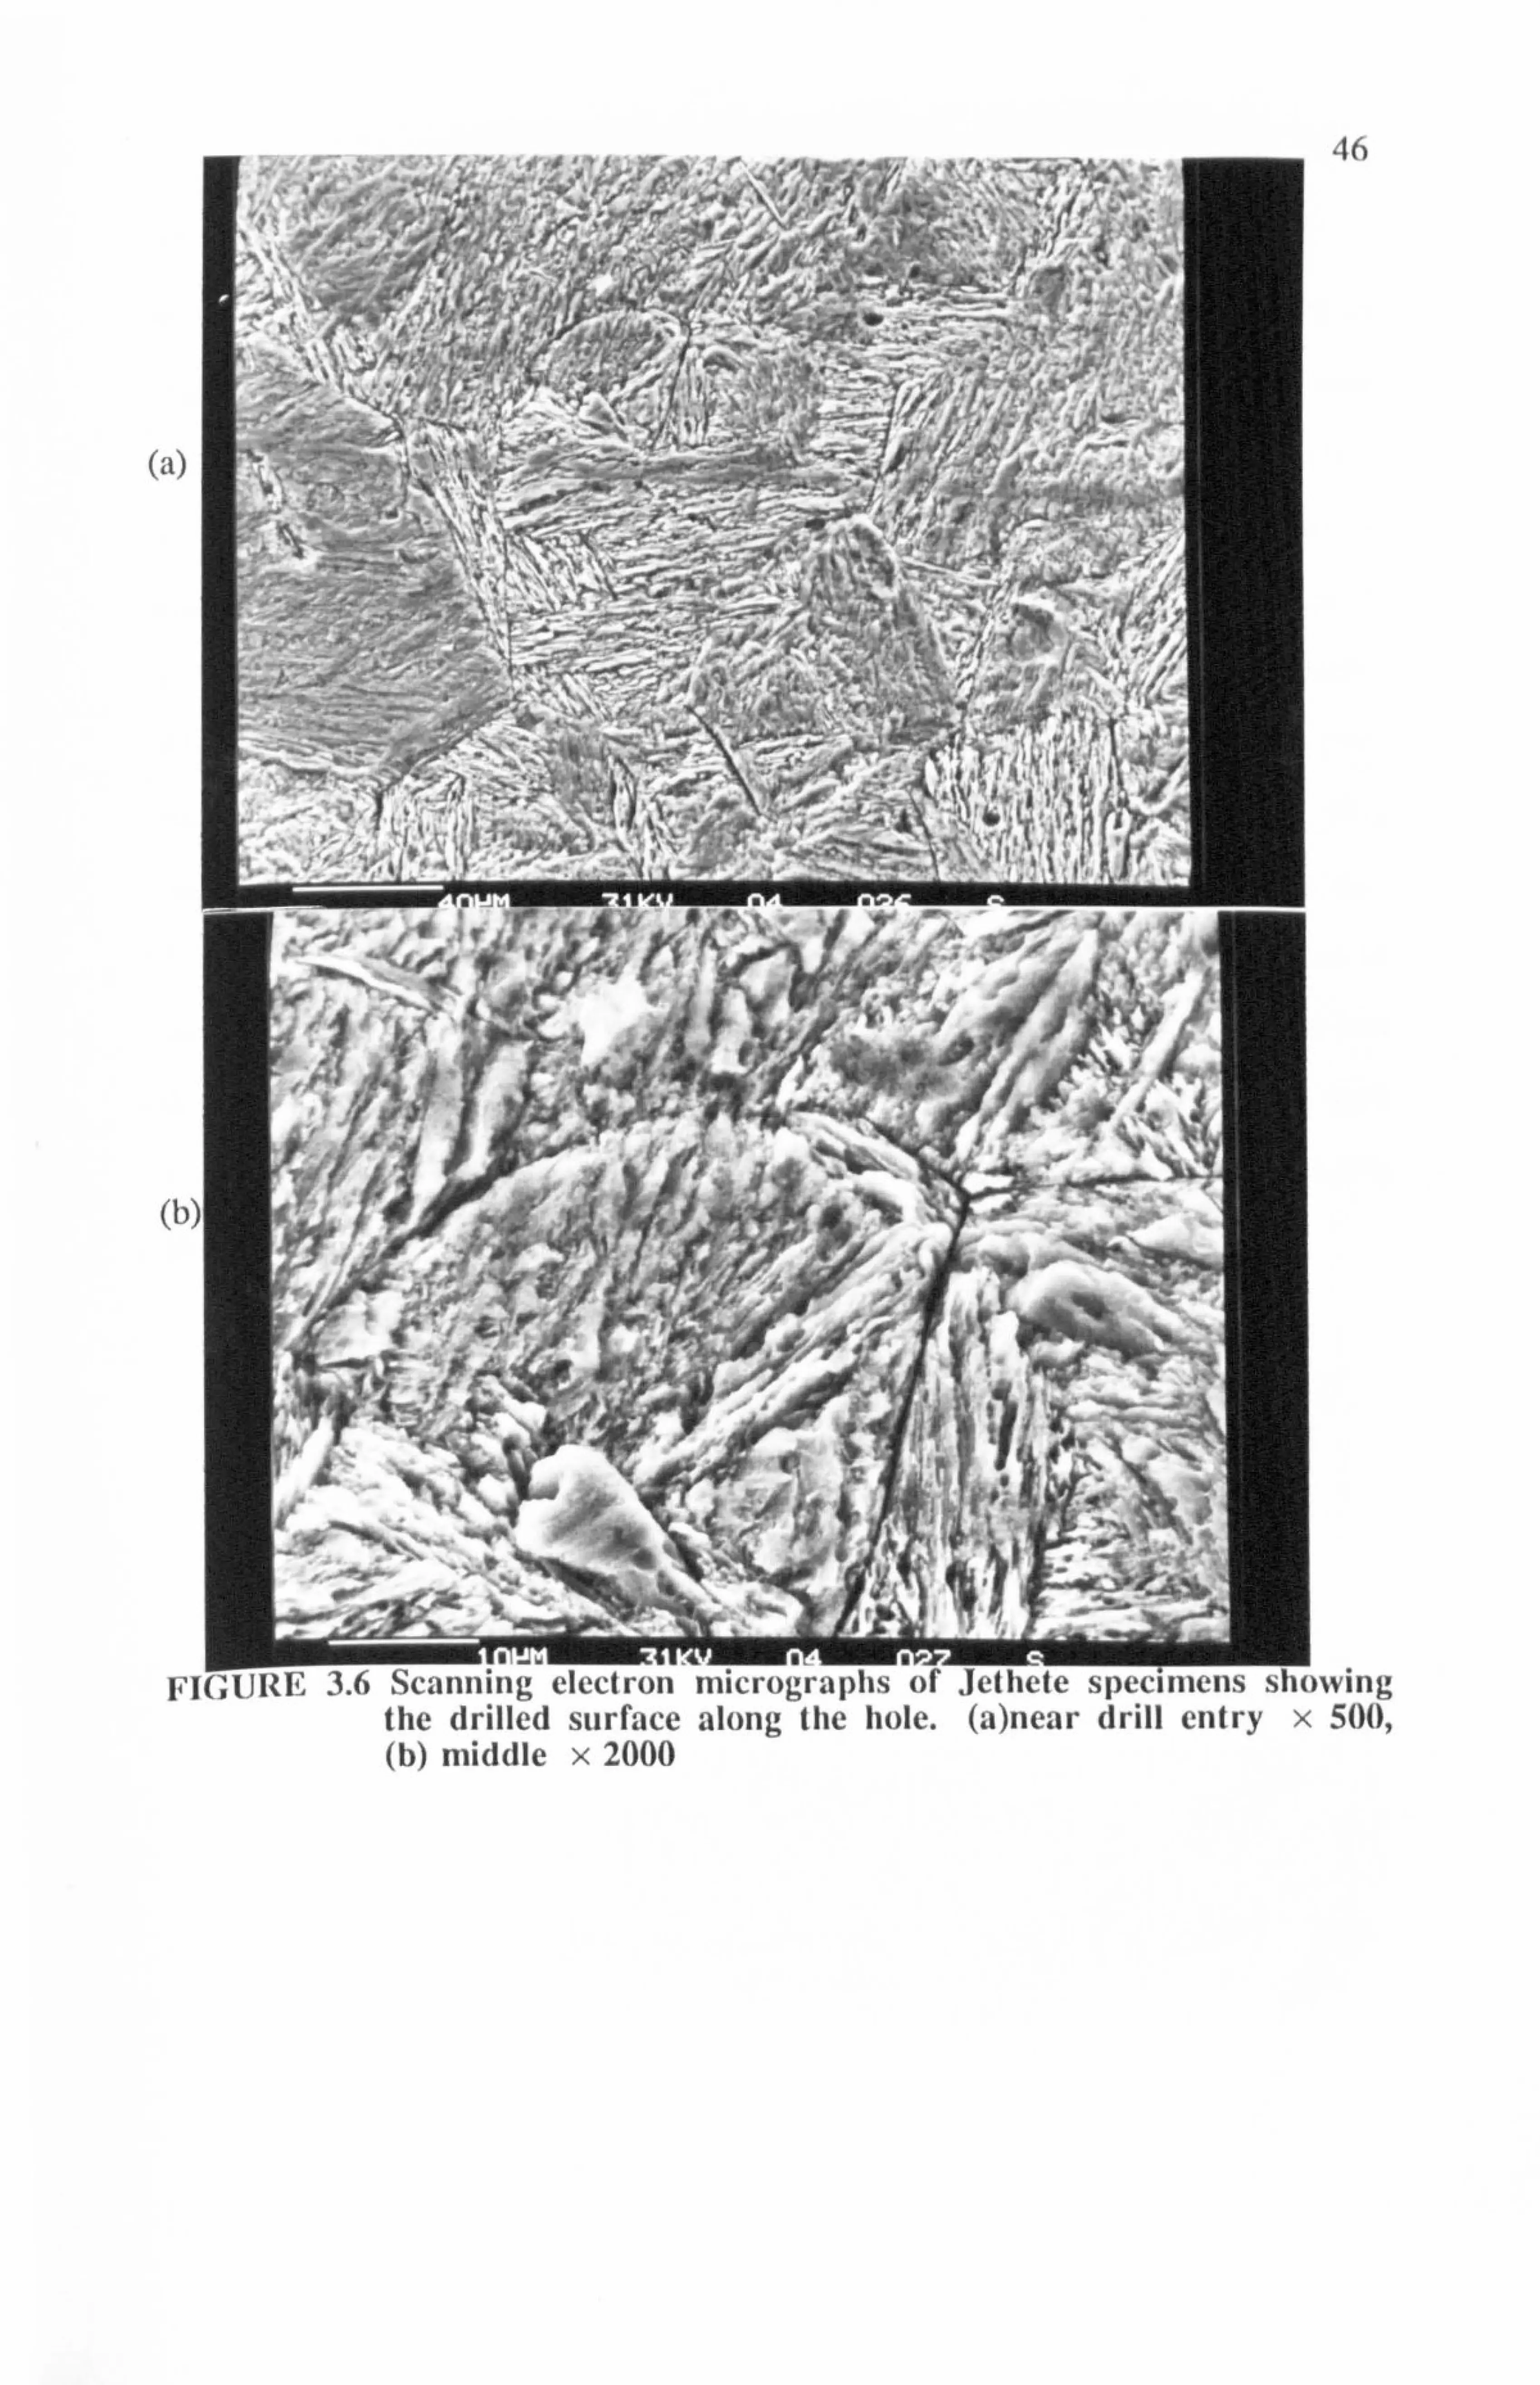
46
(a)
(1)
I" lowing x 500, the drilled surface along (lie hole. (a)near drill entry
(b) middle x 2000

0
47
3.6.2 Cobalt Alloy Steel (Rex 535)
As seen from the photomicrographs of Rex 535 in Figure 3.7, no significant or
measurable effects on the microstructure can be detected. Even at the exit end,
the sub-surface region appears to be unaffected. Nevertheless the scanning elec-
tron microscope (SE M) photograph of the exit end in Figure 3.8 shows signs of
splashing during the ejection and resolidification due to discharges. A few pock
marks, caused by the entrapped gas bubbles reaching the surface, are also visible.
This damage is limited to the final length (last mm) of the hole as the SEM pho-
tographs on entry and middle sections show a very smooth bright surface. This
indicates that ECD occurring along the side gap has effectively removed the sur-
face damage produced by the erosive effects of discharges. In the final mm of
length of the hole the damage remains because the electrochemical action is lost
due to lack of electrolyte. Microbardness readings in Table 3 do not vary
significantly with depth from the machined surface. This is further evidence that
there are no hardened layers left on the surface.

48
(Ii
(b)
(c)
lq(; tjRl, I 3.7 11hotornicrographs of polished and etched Rex 535 specimens showing the subsurface region along the hole. (a)near drill entry x 320, (b) middle x 320, (c) near exit x 320

49
(a)
(b)
(c)
FIGURE 3.8 Scanning c1cctron 111j, "'o9raphs ()I 53i specimens shoNving the drilled surface along the hole. (a)near drill entry x 5()(), (b) middle x 100, (c) near exit x 100

50
3.6.3 Low Alloy Steel
Surface effects revealed in optical micrographs of low alloy steel specimens in
Figure 3.9 show tendencies very similar to that of Jethete (low carbon chrome
steel) and Rex 535 (cobalt steel). The near-surface region along the hole exhibits
no detectable signs of damage whatsoever except for last few millimetres, where
typical EDM surface characteristics are apparent. The heat affected zone near the
exit ponsists of several sub-surface layers, totalling a depth of about 50 gm. The
substrate appears to have a much finer grain. structure than the matrix, which can
be attributed to melting and rapid resolidification. There is also evidence of a
dark etched band.
Scanning electron micrographs of the drilled surface in Figure 3.10 substantiate
the evidence that electrochemical dissolution occurring along the side gap has
effectively eliminated any damage due to electric discharges along the hole
except for the exit end. However, some preferential grain boundary attack was
noted in some areas. Once again, no hardened layers can be detected from the
microhardness values in Table 3.1.

51
(a)
4«
(h)
(c)
7' k
;: C''-; -\ ' \. 1--_
I- "'
FIGURE 3.9 Photomicrographs of polished and etched low alloy steel speci- mens showing the subsurface region along the hole. (a)near drill entry x 640, (b) middle x 640, (c) near exit x 640

52
(ýt1
(h)
(c)
Fl(, t Id, 3.10 Scanning clukilull 11 11 c" )grapfrs ()I low alloy SICCI ", I)CCilliens showing the drilled surface along the hole. (a)near drill entry x 100, (b) middle x 100, (c) near exit x 100
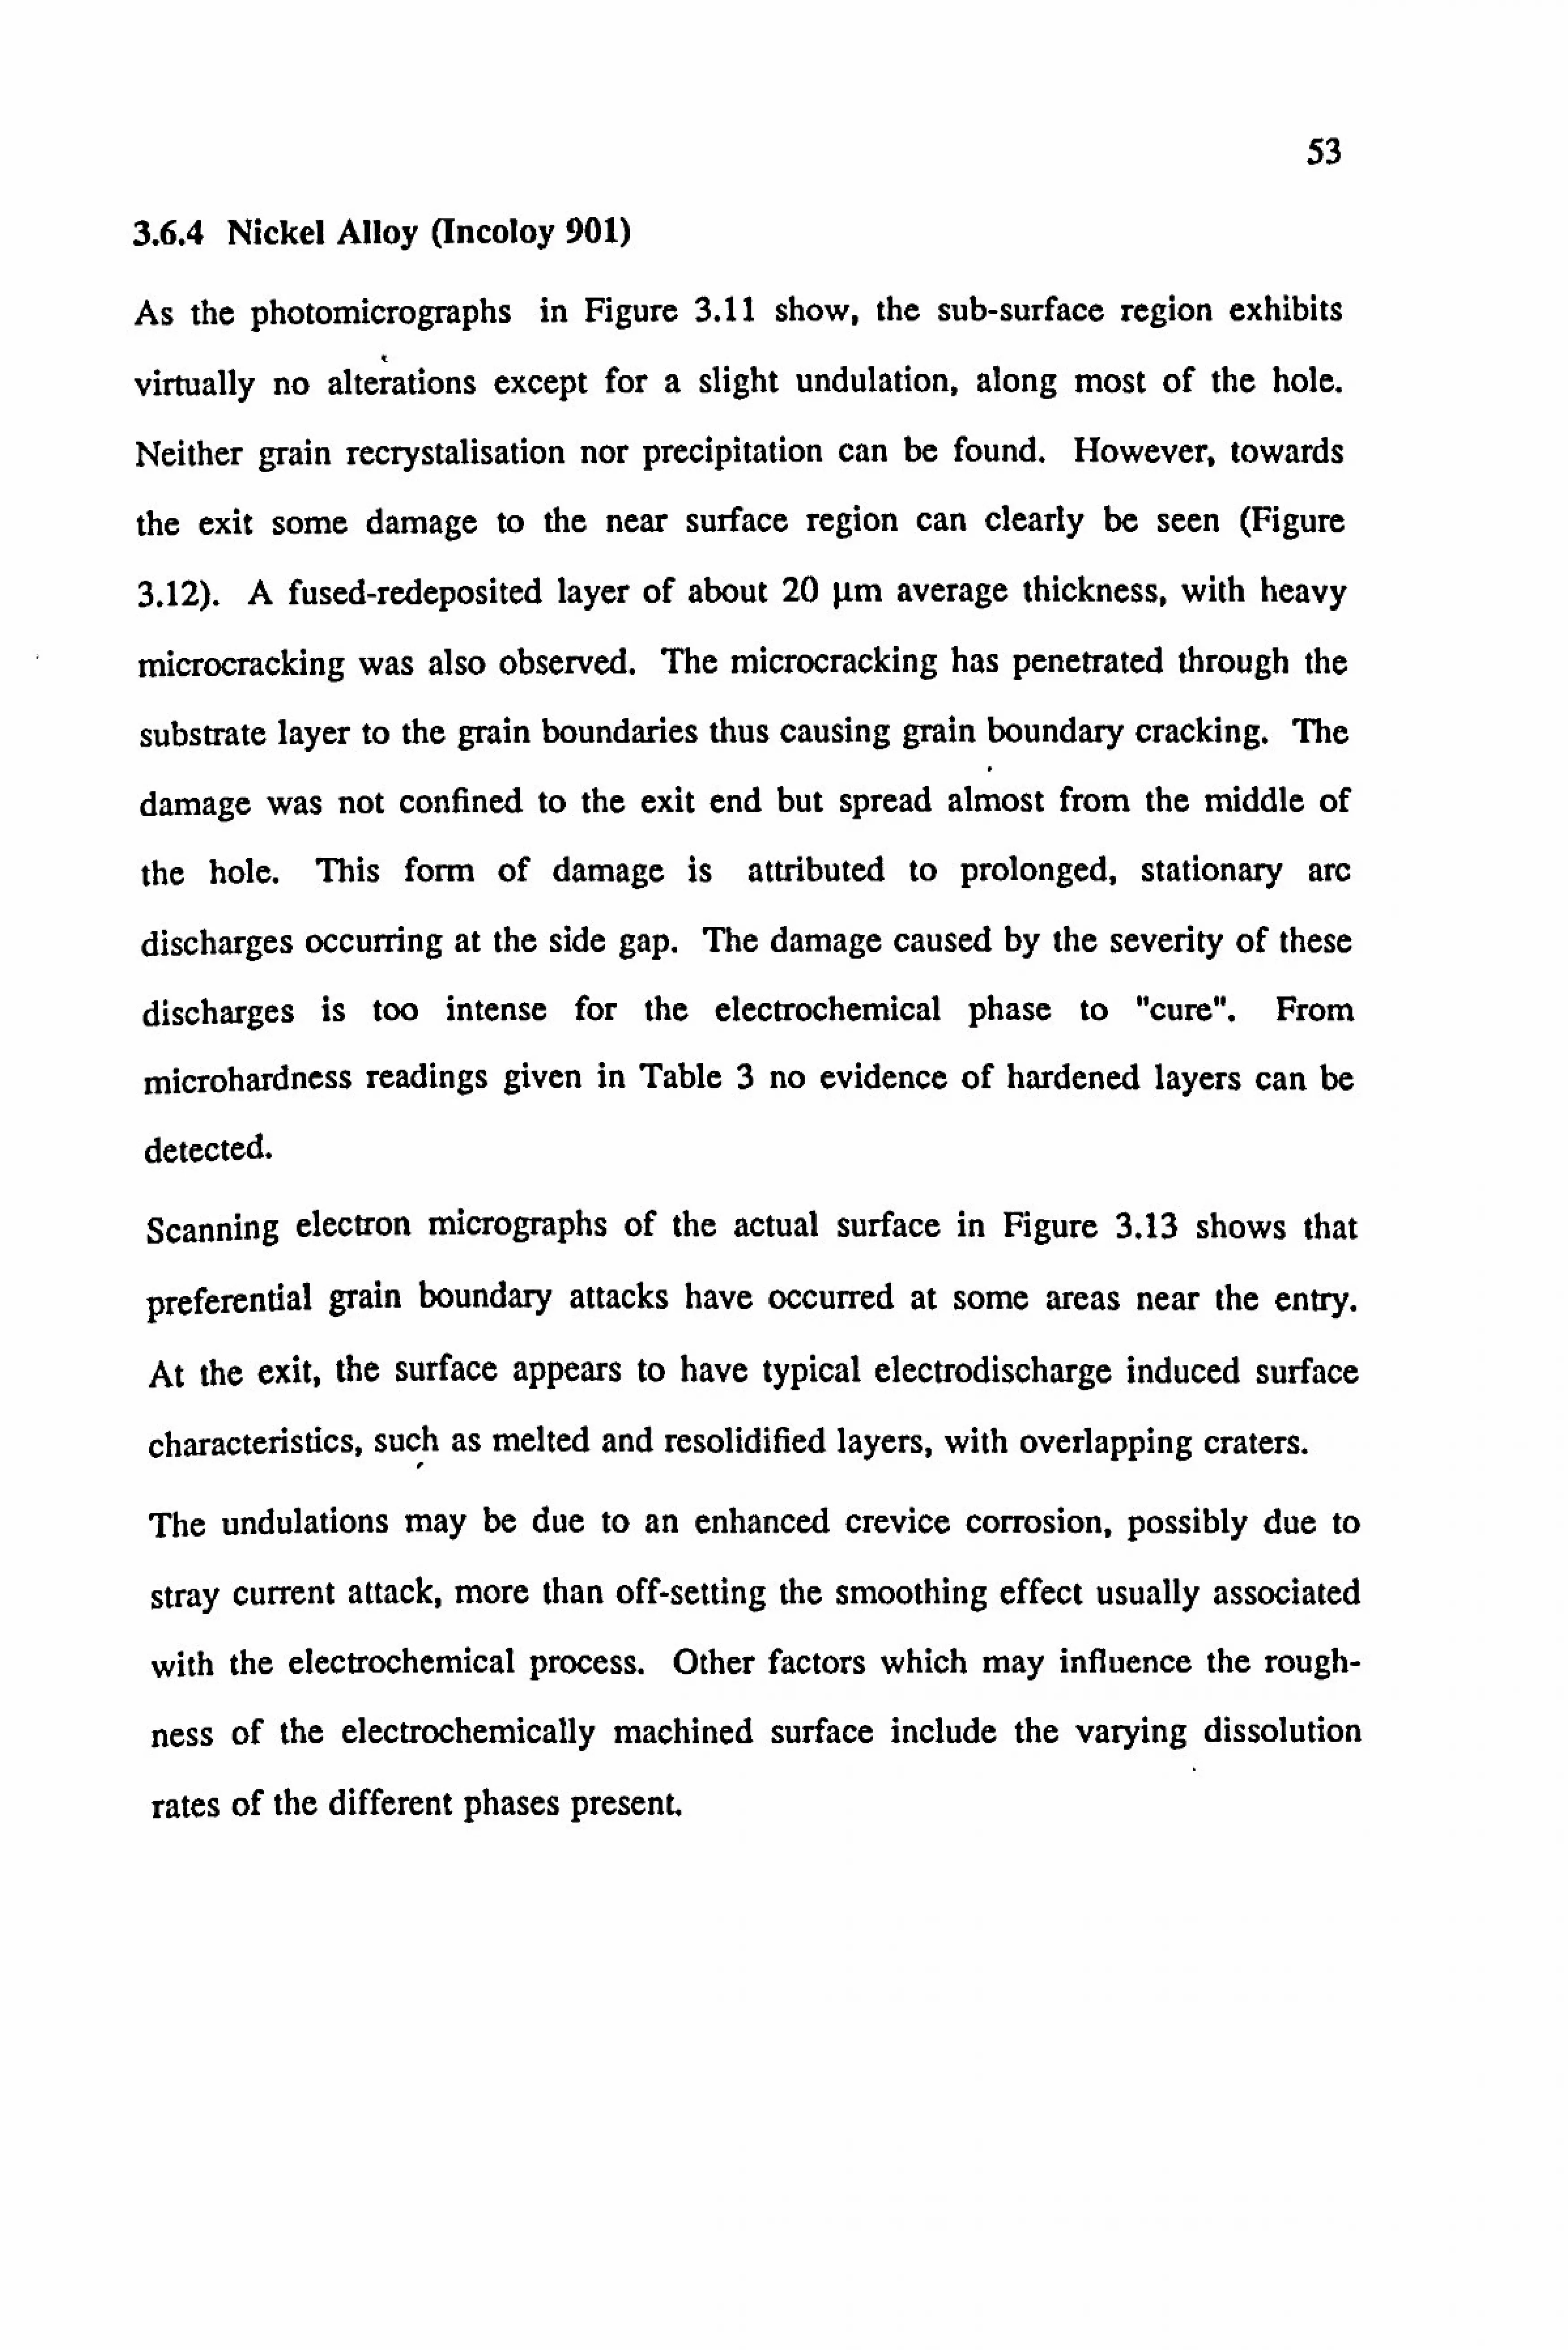
53
3.6.4 Nickel Alloy (Incoloy 901)
As the photomicrographs in Figure 3.11 show, the sub-surface region exhibits
virtually no alteiations except for a slight undulation, along most of the hole.
Neither grain recrystalisation nor precipitation can be found. However. towards
the exit some damage to the near surface region can clearly be seen (Figure
3.12). A fused-redeposited layer of about 20 gm average thickness, with heavy
microcracking was also observed. The microcracking has penetrated through the
substrate layer to the grain boundaries thus causing grain boundary cracking. The
damage was not confined to the exit end but spread almost from the middle of
the hole. This form of damage is attributed to prolonged, stationary arc
discharges occurring at the side gap. The damage caused by the severity of these
discharges is too intense for the electrochemical phase to "cure". From
microbardness readings given in Table 3 no evidence of hardened layers can be
detected.
Scanning electron micrographs of the actual surface in Figure 3.13 shows that
preferential grain boundary attacks have occurred at some areas near the entry.
At the exit, the surface appears to have typical electrodischarge induced surface
characteristics, such as melted and resolidified layers, with overlapping craters. 0
The undulations may be due to an enhanced crevice corrosion, possibly due to
stray current attack, more than off-setting the smoothing effect usually associated
with the electrochemical process. Other factors which may influence the rough-
ness of the electrochemically machined surface include the varying dissolution
rates of the different phases present.

54
(a)
(b) -.
- _) &2/ .
s-- '
\�.
J6-
-loo -
(C)
-, - \"
I ",
"0 ., --- \-.
- II\, 4*-
FIG,, URE 3.11 Photomicrographs of polished and etched Incoloy 901 speci- mens showing the subsurface region along the hole. (a)near drill entry x 320, (b) middle x 3210, (c) near exit x 320

55
(a)
(b)
F discharges in Incoloy 901. (a)optical micrograph subsurface region x320 (b) scanning electron showing the machined surface x 100
Showing tile micrograph
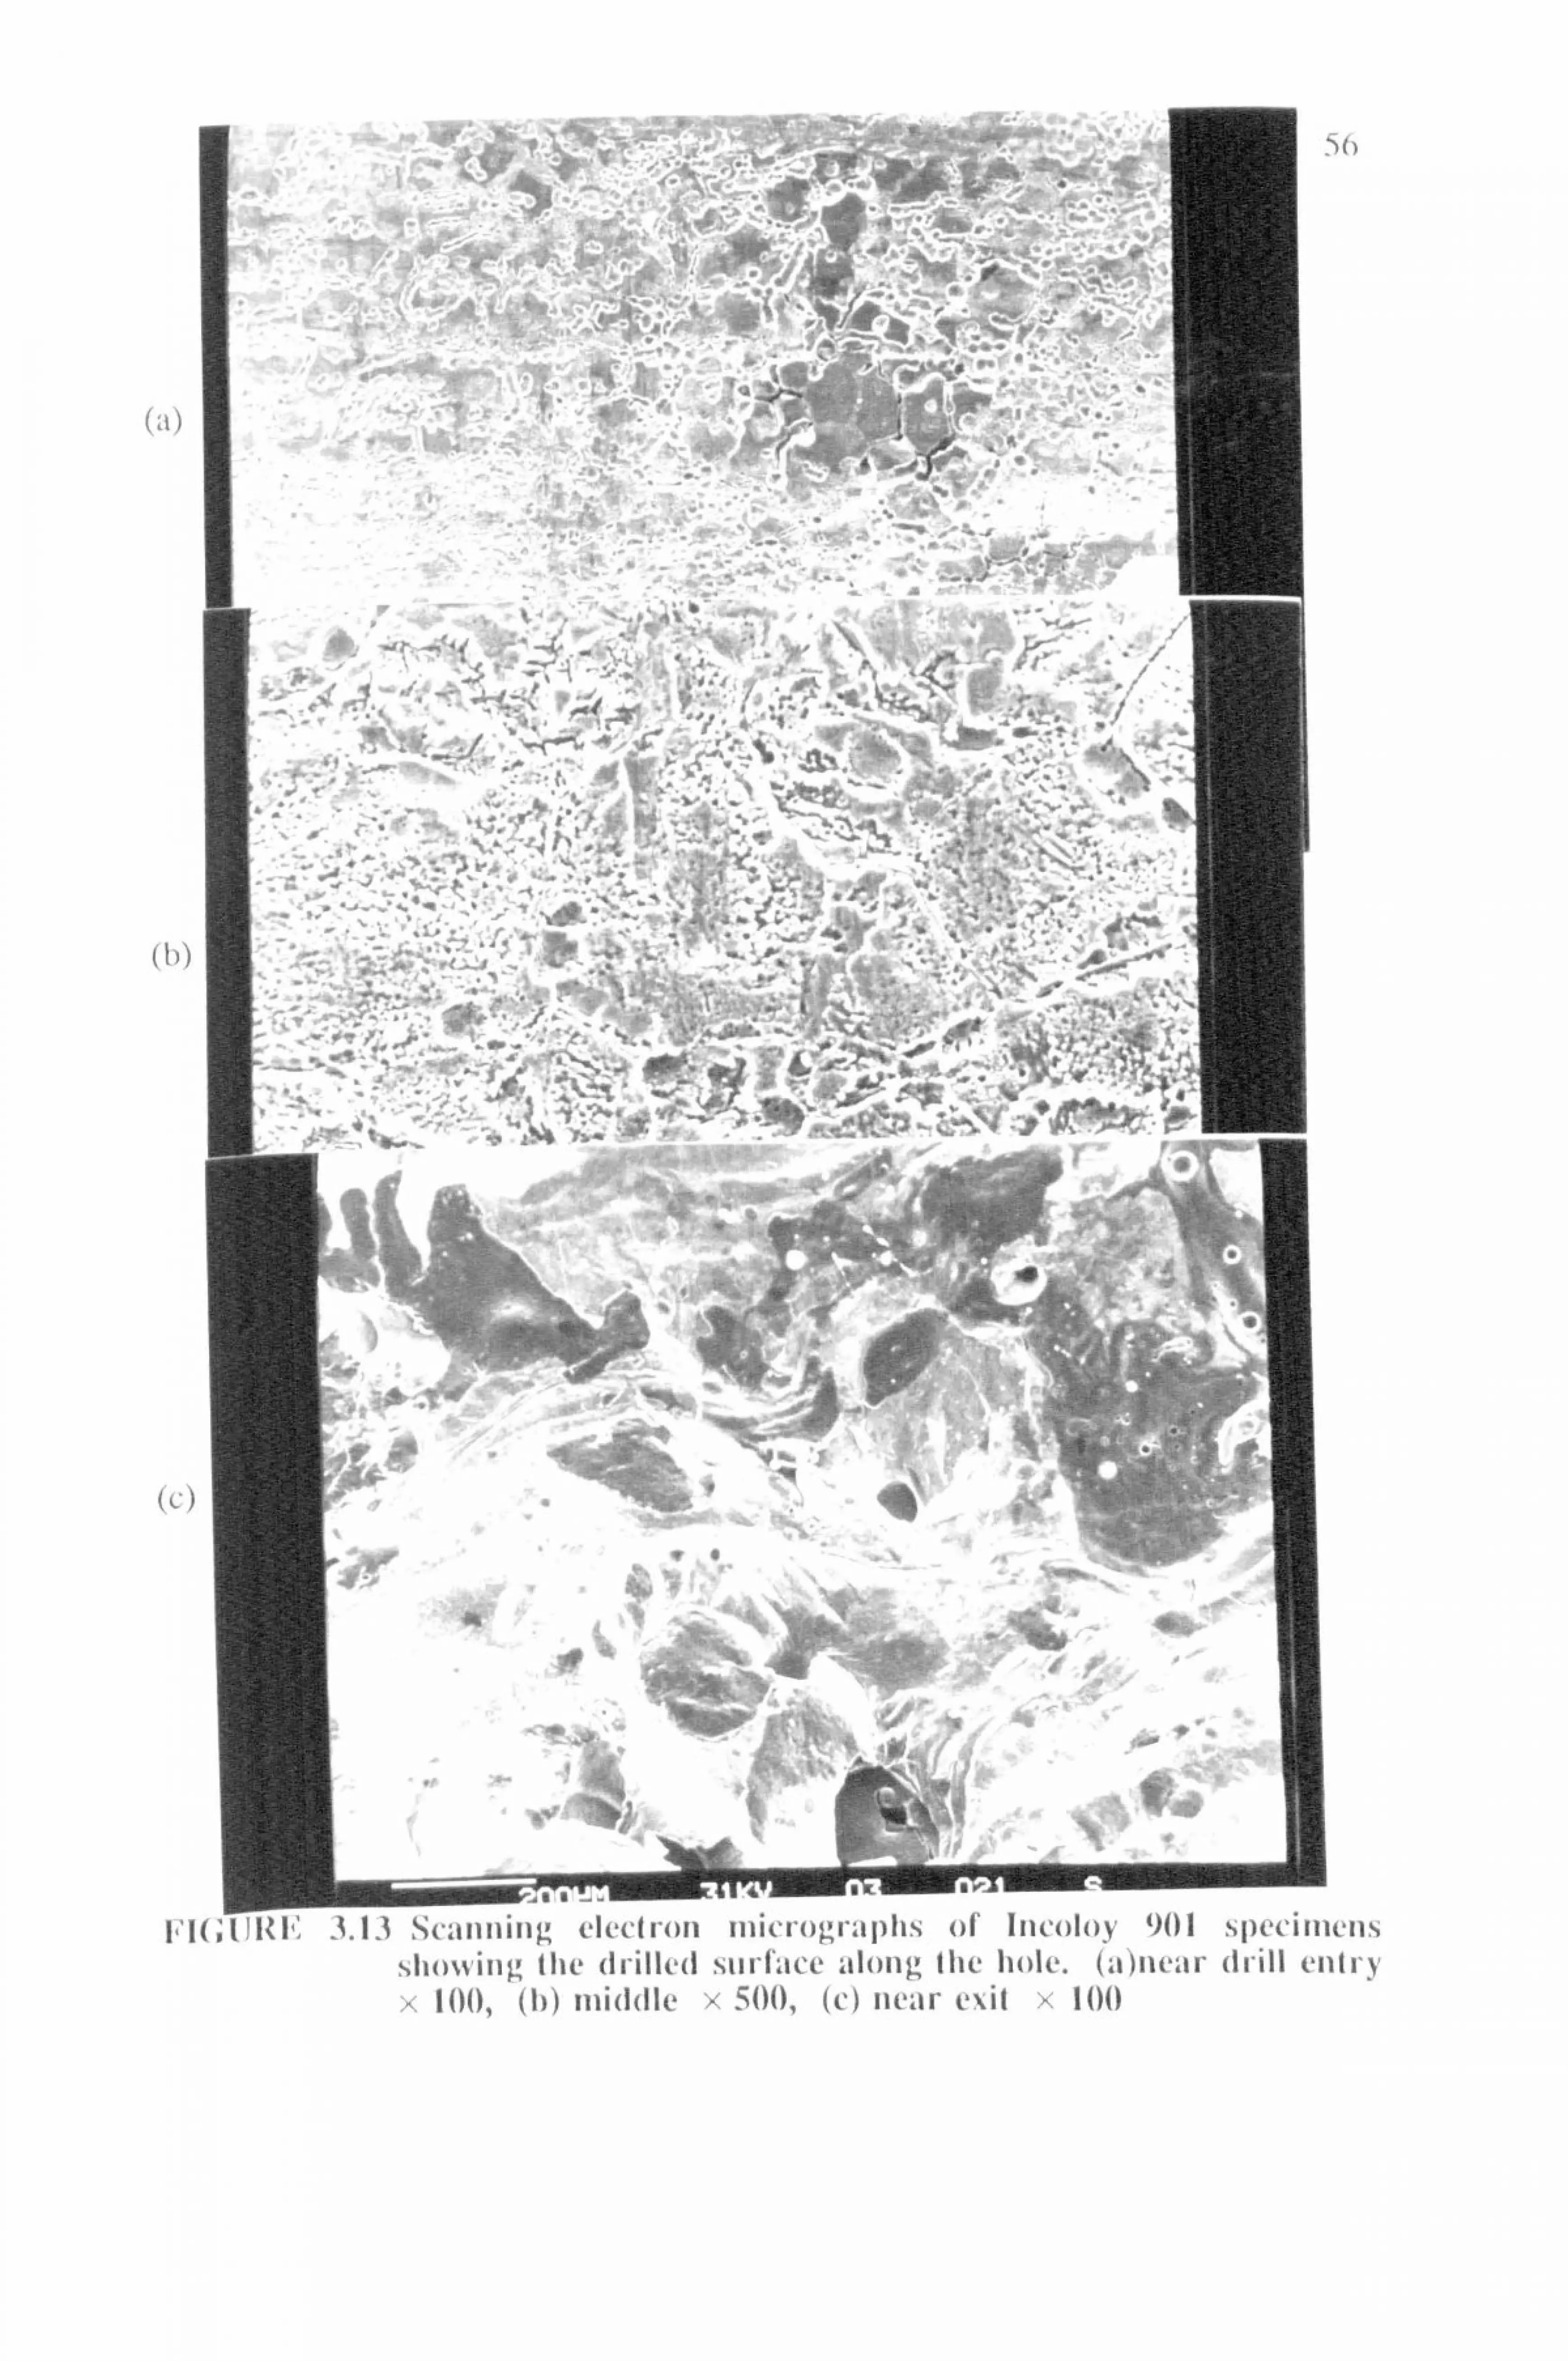
') h
(t)
(, i
1.13 Scanning c1cch-oll til Incolo) 901
Showing (lie drilled Surface along file hole. (11-111 entry x 100, (b) middle x 500, (C) lical, CO x 100

57
3.6.5 Titanium
Unlike the other four materials, micrographs of titanium in Figure 3.14 illustrate
considerable amount of damage to the surface. The-damage is consistent along
the entire length of the hole, whereas in the other materials it is confined only to
the exit end and to the occasional localised areas where severe, prolonged
discharges have occurred. An irregular spattered layer with heavy microcracking
can be seen. The surface profile along the hole was very uneven and rough.
Further evidence of irregularities can be seen in scanning electron micrographs of
the drilled surface (Figure 3.15). Grain boundary cracking, overlapping craters
and adhering globular particles are all apparent. It appears that the surface of
titanium has undergone a phase transformation from cc aligned to cc Wid- 1
manstatten, has occurred due to the rapid cooling. In effect, the surface
integrity of ECAM drilled titanium is very similar to that of EDM. A hardened
layer between 100 - 250 gm depth from the drilled surface is evident from
microhardness readings in Table 3.1.
All these surface effects in titanium can be attributed to the formation of a tena-
cious oxide layer in water based electrolytes, which inhibits the electrochemical
dissolution of the material. This lack of ECD phase is evident from the reduced
current observed. The damage caused by the erosive effect of the discharges thus
remains. Successful electrochemical machining of titanium has been achieved
using methanoic or formamide based solution of electrolyte by Bannard (44).
ECAM drilling of titanium using non-aqueous electrolytes may hence yield a
better surface finish by improving the ECD at the side gap which would remove
the discharge induced damage.
IA description of the fitanium structure and the phases can be found in Driver (43).

58
(it)
(h
S
3.14 Photomicrographs of polished and etched titanium specimens showing the subsurface region along the hole. (a)near drill entry x 320, (b) middle x 320, (c) near exit x 320

59
(a)
(I
(, 1
, electron micrographs of lifalliIIIII specillicils Showing FIGUREI 3.15 Scanning the drilled surface along the hole. (a)near drill entry x 100, (b) middle x 100, (c) near exit x 100

60
3.7 Summary
Microscopic and microhardness examinations were performed to evaluate the sur-
face integrity of electrochemical arc drilling (ECAD) on five different metal
alloys.
Optical and scanning electron microscopy revealed similar surface effects in all
but titanium. Jethete (Low carbon - high chrome steel), Rex 535 (Cobalt alloy
steel), Inco 901 (nimonic alloy) and low alloy steel (1/2% Mo, 1% Cr) exhibited
a smooth ECM surface finish along most of the hole. It can be said therefore,., that
for these four materials, the right balance of EDE to ECD had been achieved to
give a smooth, damage free surface finish. However, there were some undesirable
effects present at the exit end and also at occasional localised regions.
The damage at the exit, which was due to the lack of ECD there, could have
been eliminated completely if an additional metallic extension was used, which
would be discarded after the drilling operation. This would have prevented, the
electrolyte loss there, and enabled the occurrence of ECD.
The damage due to severe prolonged arc discharges appeared in the form of i large
localised craters, microcracks and recast layers in Incoloy 901. The ECD phase
was not sufficient to, remove these surface effects. If these localised damaged
zones were to be removed by increased ECD action, a reduction in feed rates
would be necessary. This in turn would cause large tapers and oVercuts giving
poor dimensional accuracy. On the other hand, by preventing the formation of
these abnormal discharges this type of damage could be avoided. To do this,
some form of monitoring and control of the discharges would be necessary.
The surface integrity of ECAD on titanium was very similar to that of EDM. A
rough and irregular surface with heavy microcracking, spattered material and
recast layers was observed. The surface quality of titanium could possibly be

61
improved by using non-aqueous electrolytes, thus avoiding the formation of the
tenacious oxide layer which prevents the electrochemical dissolution of the dam-
aged layers.

4: ANALYSIS OF GAP PHENOMENA IN ECAM
4.1 Introduction
62
This chapter deals with a qualitative analysis of the inter electrode gap
phenomena that occurs in ECAM. It explains briefly the fundamental physical
characteristics of electric discharges and how they occur in electrolytes. Then it
goes on to describe the different discharge types which are possible in ECAM
and how to differentiate between them by the radio frequency emission from the
gap. The experimental apparatus together with the instrumentation for monitoring
the gap situation is described next. Waveforms of voltage, current and the radio
frequency signal are presented, which identify the different gap phenomena that
occurred in ECAM.
4.2 Electric Discharge Mechanism
Full theoretical analysis of the discharge mechanism involves complicated
discharge and plasma physics which is beyond the scope of this thesis. Therefore
only a brief outline of the discharge mechanism is given here. The breakdown of
a gaseous gap by an electric field is, for moderate and high pressures, usually
associated with the appearance of an electric discharge. The essential characteris-
tic of a discharge breakdown is that of a fast, non-steady, irreversible transition
from a very low to a very high current state.
On application of an electric field to two metal electrodes separated by an insulat-
ing medium, the breakdown of the dielectric would occur if the applied field
exceeds the dielectric strength of the medium. It is well known that for a gase-
ous discharge the breakdown proceeds through the following stages(45):

63
(1) The production of free electrons in the gap, for example, the emission
of electrons by the cathode surface known as the cathode phenomena.
(2) The subsequent acceleration of the electrons by the electric field and
their retardation by inelastic collisions with atoms.
(3) The multiplication or accumulation of charged particles due to collision
ionisation by energetic electrons, resulting in the development of an
electron avalanche.
(4) The formation of the plasma channel.
(5) The transition to the visible discharge.
4.2.1 Breakdown Theory of Liquids
The theories dealing with the discharges in liquids are mainly concerned with the
dielectric liquids. Even these are still not fully comprehended due to the complex
nature of the liquid molecular structure. The theories so far put forward can be
divided into two main streams.
a) The firwassurnes that an avalanche process of ionisation takes place in the
liquid medium, as it is known to occur in gases'and solids.
b) The second claims that the presence or the creation of agents of another
phase -a gaseous one, is necessary for the breakdown to occur.
Both theories have their strong advocates. Watson and Sharbaugh (46) proposed
that the breakdown resulted from the formation of a vapour bubble, which was
extended until the gap was bridged with a vapour channel of low electric
strength, since no (x-ionisation (electron impact ionisation) process was evident
from pulse conduction experiments in hexane at fields up to 1.3 x 10⁸ V/m. The
formation of the bubble was considered by them to be due to Joule heating
caused by high current densities at the tips of asperities on the cathode. Since
64
energy densities may be as large as 10 13 watts/m 3, local vapourisation of the
liquid could occur in times as short as a few microseconds.
An alternative theory offered by Kao and Highman (47) for gas free liquids sug-
gests that the bubble is formed, not from the gases in solution or adsorbed on
the electrode surface, but as a result of the dissociation of the liquid molecules by
energetic electrons.
However, Frei et al(48) support the breakdown hypothesis based on the electron
multiplication process in the liquid phase since no simPle explanation of their
observed data can be given if breakdown was controlled by the presence of gase-
ous cavities. Nevertheless, this theory still has to allow for a transition from
liquid to gas phase at a given stage of the discharge, since an arc is eventually
formed.
Heuvelman et al(49) in a study of EDM have considered whether breakdown of a
dielectric can be described by a mechanism similar to that for a gaseous break-
down, i. e. by collisional ionisation of the molecules. They suggest that the mean
free path in liquids is such that electrons accelerated under the applied field can-
not gain sufficient kinetic energy to cause ionisation. The authors conclude that
local heating of the liquid causes the vapour bubble to expand rapidly and the
breakdown to spread across the whole gap. Furthermore, the pressure dependence
of the breakdown mechanism is taken as evidence that transition to a gaseous
phase occurs before ionisation begins.
4.2.2 Electric Discharges in Conductive Liquids
Most of the published research involving discharges in conductive fluids has been
concerned with avoiding them during ECM. The application of an electric field
to a pair of electrodes separated by a conductive fluid would merely result in a
65
steady flow of current through it. Since the solution is already ionic, no break-
down phenomena leading to electric discharges can be expected. If however,
some insulating substance is present in the gap, bridging it, then the formation of
electric discharges is possible. The findings of Louterel and Cook(50) and Lars-
son and Baxter(51) into discharges during ECM suggest that they occur through
the regions of localised gas or vapour produced. This theory is also supported by
Kubota(20) who investigated the formation of discharges in electrochemical
discharge machining (ECDM), a very similar process to ECAM. Further evi-
dence that discharges in electrolytes occur through locallSed regions of gas bub-
bles is put forward by Crichton(24) in his study of single discharges In ECAM.
Both Kubota(20) and Crichton(24) state that discharges are also possible between
the electrode and the electrolyte.
4.3 Gap Phenomena in ECAM
In ECAM, the inter-electrode gap is filled with a highly conductive electrolyte.
The gap phenomena which occurs is described below with the aid of illustrations
of the gap shown in Figure 4. L
Initially, a potential difference across the gap would cause an electrochemical cell
to be set up. The reaction at the anode would be for the metal to dissolve into the
solution as anions, releasing electrons. At the cathode, these electrons combine
with the hydroxide ions which exist in the aqueous solution to generate hydrogen
gas (Figure 4.1(a)). If the volume of gas generated is sufficient and is not flushed
away from the gap, then it can form an insulating bridge between the anode and
the cathode (Figure 4.1(b)). The Joule heating effect would cause the elongation
of this gas bridge.

66
00 ____
0 0o ° On° 00 00
..
(a)
0
0*0 0 00
W
(g)
(a)
T5 _ (e) (d)
H -+
(ii) 0)
(a) metal dissolution at anode and hydrogen evolution at cathode (b) gas bubbles bridging the gap (c) elongation of the gas bubble and the electron emission from the
cathode, leading to an electron avalanche (d) occurrence of a visible discharge (e) melting and evaporation of metal with explosive collapsing of the
the vapour channel (f) complete deionisation of the channel (g) plasma channel not fully deionised (h) Next current pulse flows along the same path. (i) Stationary, abnormal arc.
FIGURE 4.1 Gap phenomena in ECAM
og 0
67
If the applied electric field across this gas channel is large enough, the breakdown
process leading to an electric discharge would then occur. Firstly, the cathode
would emit electrons which start accelerating towards the anode. The electron
collisions would release further electrons and ions causing an avalanche effect
(Figure 4.1(c)). This would result in a plasma channel growth which culminates
in a visible discharge (Figure 4.1(d)).
When a voltage pulse is applied to the ECAM gap the following three
phenomena may occur (52):
a) electrochemical reaction only.
b) electrochemical reaction followed by electrodischarge action.
C) electrodischarge action only.
4.3.1 Types of Discharges and Their Classification
ECAM and EDM both prefer the unstable, finite duration discharges which occur
randomly over the machining area, giving an even erosion rate. Nevertheless the
definitions used to classify the discharge types differ in ECAM and EDM. In
EDM, the preferred discharges are normally referred to as "sparks". The energy
of the EDM sparks is limited by the considerations towards the surface integrity
because the surface roughness and the heat affected zone increase with increasing
discharge energy. However, in ECAM one can afford to use much higher energy
discharges (longer duration and higher current) than EDM. This is made feasible
by the electrochemical dissolution action which smoothes out the craters and
reduces the heat affected zone formed by the discharge erosion mechanism.
Since ECAM discharges are of much higher energy than EDM ones, they are
normally referred to as "arcs".

68
The characteristics of EDM sparks and ECAM arcs are similar nonetheless. One
essential characteristic being that of a fast, non-steady, irreversible transition
from a very low to a very high current state. The external circuit, i. e. the pulse
generator, does not usually allow this discharge to achieve its quasi-stable state.
Therefore the life of a discharge is curtailed after a certain period (determined by
the pulse on time).
When a discharge extinguishes, the conducting channel begins to deionise by
recombination of the charged particles until a complete insulating bridge is
formed (Figure 4.1(f)). This should be achieved before the start of the next vol-
tage pulse. Then the next pulse would cause a discharge at a different location. If
however, the channel is not fully deionised (Figure 4.1(g)), the current of the next
pulse would preferably flow along the same path. This leads to a stationary
discharge occurring in the same spot. These stationary discharges commonly
known in EDM as "arcs", are defined in ECAM as "abnormal arcs or
discharges". The characteristic of this stationary discharge is that it is a current
maintained plasma.
These abnormal arcs are clearly very undesirable since they occur in the same
spot causing severe damage to both tool and workpiece. This has already -'been
demonstrated to be the case in Chapter 3. In order to prevent the abnormal
discharges from occurring, they have to be distinguished from the normal ones.
The obvious choice would be to monitor the voltage or the current waveforms.
This has been done for EDM by several researchers (53,54). Snoey et al(53) have
developed a pulse discriminator on the basis of voltage level and pulse duration.
However,, the difference between a normal and an abnormal arc is not very easily
recognised by their voltage and current waveforms. This is because there are so
many forms of normal discharges, some of which are quite close to abnormal

69
arcs(29). In ECAM the identification is made even more difficult because of the
ECM element.
Bhattacharyya and El Me: nshawy (55) have found that the radio frequency noise
emitted by the gap was significantly different for arcs and sparks in EDM. Their
work revealed that when good machining was in progress, a very intense RF sig-
nal was recorded at about 30 MHz. However, when the process deteriorated due
to continuous arcing, the RF level dropped considerably. This has enabled them
to develop an adaptive control system for EDM machines which has been quite
successful in preventing process deterioration due to continuous arcing. Xi et al
(56) have used the RF emission from the EDM gap to monitor the performance
of several machines simultaneously by utilising different bandwidths of the radi-
ated spectrum. More recently, the RF monitoring technique has bee n used to
optimise an EDM texturing process(57).
The RF monitoring technique has been applied to ECAM in order to identify the
different discharge types by Wood(58). He demonstrated that the RF level was
higher for sparks than it is for arcs in single pulse experiments. However, his
findings cannot be extrapolated to multi pulse ECAM machining as the gap situa-
tion in multi-pulse machining is far more complicated than that of'a single pulse.
4.3.3 RF Emission by Discharges
The following section analyses why and how normal discharges tend to emit
much higher radio frequency noise levels than the abnormal, stationary
discharges.
When a normal discharge is formed, it implies the formation of a high density
plasma - which is the result of the ionisation of materials by blow-off electrons.
It is well known that this type of nonequilibrium plasma tends to equilibrate by
emitting electromagnetic radiation at the local plasma frequencies (59).
70
The collisions which occur in partially ionised gases involve relatively low den-
sities of charged particles and low particle energies. The forces exerted between
the colliding particles are short range forces. With increasing degree of ionisa-
tion, however, these short range forces are replaced by the long range electros-
tatic forces between ions and electrons. In these circumstances an electron may
be deviated from its original path and accelerated, releasing a pulse of elec-
tromagnetic radiation. For the electron the collision has resulted in transition
between two unquantised or free states and is known as a 6ee-free transition
being essentially an inelastic collision, the loss of energy appearing as loss of
radiation.
Since the electrons move at random, energy is radiated continuously and over a
wide band of frequencies and therefore is incoherent. In addition to this
"bremsstrahlung", radiative collisions may occur following capture of an electron
into a bound state.
In the case of an abnormal arc, very little ionisation results as the arc occurs
along the previous plasma channel which is not fully deionised. In this context,
abnormal discharge means steady current flow through a low impedance conduct-
ing path which has developed between the electrodes. Because the current path is
continuous, the phenomena which would accompany a normal discharge are
absent, and very little radiation is detected.
Abnormal discharges can be thought of as current maintained plasma, since they
are maintained in existence by the passage of a steady current through them. In
contrast to metallic or liquid conductors, such plasmas remain conducting solely
by virtue of the-current which is passed through them. If the current ceases for a
long enough period the conductivity falls to zero because of loss of charge car-
riers by diffusion or recombination.
71
4.4 Experimental Apparatus & Procedure
For the reasons given below, it was decided to use a modified EDM machine for
the purpose of monitoring and correlating the ECAM gap situation with RF emis-
sion.
1. The previous research in ECAM used a full wave rectified single phase
power source. Each voltage pulse is of fixed duration (0.01 sec) and within
it, several discharges may result. The duration of each individual discharge
is very difficult to estimate. Therefore, the correlation of each discharge with
either the voltage, the current or the RF emission is difficult. In square
pulse power, the pulse duration is relatively short and can be set to any
desired value 0-5 ms. Each pulse will result in one discharge only, mak-
ing it very easy to monitor the discharges and correlate with RF emission.
2. Another reason for using an EDM machine was that it was capable of using
a wide variety of workpiece and tool shapes. Since the abnormal arcing
becomes more of a problem when larger surface areas are encountered,
plane parallel electrodes of a relatively larger area were chosen for the
experiments.
4.4.1 The Basic Apparatus 0
An EDM machine, "AGEMASPARK 740" was suitably modified as described
below to carry out the experiments.
a) A tank made of perspex. was incorporated to contain the electrolyte, thereby
avoiding corrosion of the work table and the machine parts which was not
designed to withstand corrosive fluids.
b) The control system of the EDM machine was altered, in order to machine in
electrolyte.

72
C) At first, no gap-flushing was used. Later on a flushing system for the elec-
trolyte was incorporated.
Figure 4.2 shows the apparatus together with the monitoring set-up.
FIGURE 4.2 Experimental Apparatus and Monitoring Instruments

73
4.4.2 Adaptation of Agemaspark EDM Machine to Produce ECAM
The EDM machine is designed to work with non-conductive fluids such as
paraffin, light oil or deionised water. The machining gap width in EDM is pro-
portional to the gap voltage. In order to control the gap, the time averaged gap
voltage (V,,, ) is sensed and compared with a reference value (V"f)' the resultant
error signal (V,,,, ) is then applied to the controller, which is amplified and used to
drive the output in a direction to reduce the error to zero. Figure 4.3 shows a
schematic diagram of the control system. The operation of the servo control is
such that:
1. when V,,, > V,, f an open circuit is sensed which instructs the servo to
feed the tool electrode towards the workpiece.
2. when V,,., < V,. f a short circuit is sensed and the servo retracts the tool
head.
3. when V,, p = V,, .f
stable machining is indicated and the servo maintains
the gap.
VV AmpUfler Servo
ControUer put Out to Motor
VM
Feedback I Network
I
FIGURE 4.3 Schematic diagram of the EDM control system

74
When electrolyte is used, as soon as the tool touches the electrolyte an electro-
chemical current begins to flow reducing the gap voltage below the VO 'Ibis
indicates to the servo a short circuit, which then instructs the motor to retract the
tool.
In order to machine in electrolyte, the reference voltage to the servo system must
be changed. 71iis was achieved by adjusting some variable resistors and also
replacing some of the fixed resistors. The circuit diagram of the altered control
system is shown in Figure 4.4.7be reduction in the reference signal made it pos-
sible to achieve a gap width of 0.1 mm in electrolyte.
Some other EDM safety controls such as the limit switches for the dielectric level
and the dielectric pump control were also disabled.
+12V -12T
FIGURE 4.4 Circuit diagram of the modifled control sYstem

75
4.4.3 Monitoring & Instrumentation
The three variables monitored were, the gap voltage waveform, the gap current
waveform and the RF emission.
Gap Voltage
This was measured straight across the gap as shown in Figure 4.5 and
observed via a digital storage oscilloscope.
2. Gap Current
At the beginning, a non-inductive shunt similar to -the one used by Crich-
ton(24), was used to measure the current. However, this shunt proved in-
capable of handling high cuffents(50A) for lengthy machining periods.
Hence a Hall effect transducer (Heme 200) was used as the current measur-
ing device.
3. Radio Frequency emission
The RF emission was picked up by an antenna, which was then received by
a spectrum analyser (Hewlett Packard 1401141). The video output of the
spectrum analyser was fed to the digital storage oscilloscope (Nicolet 3690).
The monitoring set up is shown in Figure 4.5.
4.4.4 RF Monitoring Considerations
To pick up the RF emission, some form of transducer was necessary. El
Menshawy(54) used a small coil to pickup the radio signals. Both a coil and
dipole were tried in these experiments. The aim was to obtain as clear a signal
as possible without undue interference from background sources.

76
Antenna \[/ M Tool Power
Generator
IýF \N7, ., e
Ij Current Itage Workple
Spectrum Oscilloscope cope AnaLlyser.
FS 'e
Apnaly um H 0scillow
FIGURE 4.5 Gap monitoring set-up
The loop antenna gave better signals up to about 50 MHz. The dipole antenna
was used to monitor the signals in the 50 - 110 MHz range. The dipole antenna
was constructed using two telescopic radio aerials. This enabled the length of it
to be varied to form a half wave element at the monitoring frequency. This facil-
itated the impedance matching between the antenna and the receiver. The antenna
length ranged from 0.2 to 1.5 metres, giving a frequency range of 50 MHz and
upwards.
77
The antenna was directly connected to the spectrum analyser via a short length of
coaxial cable. The feeder length was kept short in order to minimise the losses
caused by ohmic resistance and dielectric conductance.
The spectrum analyser is a superheterodyne (swept-tuned) receiver which pro-
vides a visual display of amplitude versus frequency, displaying the absolute
value of Fourier components of a given waveform. The spectrum analyser can be
tuned to any frequency in the range 1- 110 MHz. Its scan rate, scan width, IF
bandwidth, gain, RF attenuation and other controls can be adjusted to describe
best the signals under observation.
The video output from the spectrum analyser was fed to one of the channels in
the digital storage oscilloscope thus enabling the RF amplitude to be viewed as a
function of the time. The other channel of the scope was connected to either the
current or the voltage probe. This allowed the correlation between the RF
waveform and either the current or the voltage waveforms.
Measurements showed that the field strength versus frequency varied depending
on the position of the antenna. The electric field at an antenna is a vector sum of
the direct field from the emitting source and the other fields which are reflected
from nearby objects. If the position of the receiving antenna is changed, these
fields arrive at the receiving antenna with phases changed, and the resulting vec-
tor is changed.
4.5. Results and Discussion
Initially experiments were conducted in stationary electrolyte (i. e. without gap
flushing) to establish the feasibility of ECAM over relatively large areas.
Different machining fluids from water to 10% sodium nitrate solution were used
to see how the conductivity of the machining fluid affected the metal removal

78
mechanism. The tools used were 25 mm, diameter brass rod and the workpieces
were mild steel.
The machining rates for different machining fluids from deionised water to 10%
sodium nitrate solution are given in Table 4.1.
TABLE 4.1 Machining rates in different electrolytes
Electrolyte Cuffent Pulse Time Metal Removal Tool Density On/Off Rate, Wear
Type A CM-2 PS mm 3 mirf I mm 3 mwl
tap water(Edinburgh) 6.00 250/200 60.92 15.61
2% sodium nitrate 6.00 250/160 23.21 1.56
5% sodium nitrate 6.00 250/160 24.50 1.93
10% sodium nitrate 6.00 250/160 30.25 1.96
4.5.1 Tap Water
Although gas bubbles were observed to be forming around the tool, very little
electrochemical dissolution of the anode occurred in tap water. Most of the
applied pulses resulted in normal discharges for the conditions given in Table
4.1, indicating optimum machining conditions. It can be said that water (conduc-
tivity 0.125ma-Icnrl) acts as a dielectric rather than an electrolyte. After pro-
longed periods of machining, deterioration of the process occurred. Since no
flushing was used this was mainly due to agglomeration of debris which lead to
abnormal arcs.
The RF emission at 40 MHz picked up by the loop antenna is shown in Figure

79
4.6 together with the voltage waveform, when normal discharges were occurring.
Figure 4.7 shows the RF level detected at 40 MHz and the voltage waveform
when abnormal discharges were occurring. From figures 4.6 and 4.7, it can be
seen that, although the voltage is not very different, the RF level detected is
significantly different for normal and abnormal discharges. Furthermore, it is
apparent from figure 4.8, that the RF level is very much less for a short circuit
than for a normal discharge.
In tap water, basically four pulse types occurred : normal discharges, abnormal
discharges, short circuits and open circuits.
From the waveforms presented in Figures 4.6 to 4.8, it can be seen that the RF
level was considerably higher for the normal discharges than for any other pulse
- type. 7berefore the RF signal can be used to differentiate between the pulse
types in tap water.
00.00
0 cr)
40.00
0
CL
0.00 0.00
80.00-
40.00-
0.00 0.00 ODO. 00 16M. 00 2400.00
TI me/psec
uuu. uu 4000.00
FIGURE 4.6 RF and voltage waveforms for normal discharges
000 . . 00 , IGW. 00 2400.00 3200.00 4000.00
TI me/lisoo

80
00.00 de
0) 0 40.00
0
CL 0
L2 0.00
ý
0.00
80.00
llý. fa
40.00
it 0.00 019111ar ----- r----n
0.00 WO. 00 1600.00 2400.00 3M. 00 4M. 00
TI me/peeo
FIGURE 4.7 RF and voltage waveforms for abnormal discharges
00.00
40.00
0
0 0.00
ý
0.00
00.00
io 0 40.00
Ez 0.00 -f-
0.00
FIGURE 4.8 RF and voltage waveforms for short circuits and normal discharges
OW. 00 1600.00 2400.00 3200.00 4000.00 TI me/psec
000.00 1600.00 2400.00 3200.00 4M. 00 TI me/poeo
800.00 1600.00 2400.00 3200.00 4000.00 TI melposo
81
4.5.2 Electrolyte
When the power was switched on, the tool descended towards the workpiece and
ECD action was observed. 7bis was evident because gas bubbles were generated
at the cathode and a brown sludge accumulated near the anode. However, no
discharges were observed.
As previously discussed the discharges in electrolytes occur mainly through the
gas bubbles that bridge the gap. When the tool and the workpiece were com-
pletely submerged in electrolyte, the gas bubbles evolved at the cathode, rose to
the surface due to the effects of surface tension acting upon them. Mius, very lit-
tle gas remained in the gap to cause discharges.
This problem was overcome by having the electrolyte level just above (no more
than 2mm) the workpiece surface. This made the bubbles remain in the gap,
which in turn, resulted in discharges.
When comparing the metal removal rates given in Table 4.1, it can be seen that
the metal removal rates for electrolytes were much less than for ordinary tap
water. This is in sharp contrast to what is expected of ECAM. In water the metal
removal was totally due to the discharge erosion action as almost all the input
pulses resulted in discharges. In electrolytes however, many of the applied pulses
resulted in electrochemical action only. Discharges only resulted when the inter
electrode gap was bridged either by gas bubbles or debris. The ECD pulses did
not yield very much metal removal since the maximum current obtainable with
the EDM generator was only 50 A. Therefore, the maximum current density
achievable, for the machining areas concerned (5 cm'), was 10 Acnr2, which was
inadequate for effective electrochemical dissolution of the anode. '
With increasing electrolyte concentration, the metal removal rate increased
slightly (Table 4.1). The higher conductivity resulted in higher current density,

82
thereby giving increased electrochemical dissolution of the anode. T'his also lead
to more discharges since more gas was generated as a result of the increased
ECD rate.
There was a considerable amount of stray electrochemical attack due to the high
applied voltage (95 volts). This voltage could not be lowered as the EDM gen-
erator had it at a fixed level. The high voltage also resulted in severe sparking
giving large craters. Obviously, the EDM power source is not suitable for ECAM.
However, it can still be used to observe the ECAM gap phenomena.
-The general observations of the ECAM pulse trains suggest that within each
applied pulse, any one of the following phenomena may occur:
a) electrochemical action only
b) electrochemical action followed by normal discharges
C) normal discharges
d) abnormal discharges
e) short circuits
Open circuits were absent as some electrochemical current flowed even with
larger gaps, although very little metal removal occurred.
At first, only ECD occurred. The waveforms of current and voltage when only
ECD was present in the gap are shown in figure 4.9. As the gas bubbles started
to accumulate in the gap, the voltage and current waveforms increased and
decreased respectively, indicating increased gap impedance. When the voltage
had risen sufficiently high, the breakdown of this high impedance gas channel
occurred giving normal discharges. Figures 4.10 and 4.11 show the current and
voltage waveforms illustrating the above gap condition. Several pulse types
(ECD, ECD with normal discharges and normal discharges) which occur in the

83
ECAM gap can be seen from these figures.
ug. vu
40.00-
0.001 0.00
40.00
cc A.
20.00
0.00 0.00
000.00 low. 00 2400. uu
TI mo/lisec
800.00 tem. 00 2wo. 00
TI me/pipec
aww. uu
32w. uu
4000.00
%%M. ULP
FIGURE 4.9 Voltage and current waveforms of ECD pulses

84
00.00
40.00
0 >
CL
0.00 0.00
40.00
20.00
0.00 -t- 0.00 eoo. oo 1600.00 2400.00 3200.00 4000.00
TI me/lieso
FIGURE 4.10 Voltage and current waveforms: for ECD and normal discharges
$0.00
0 40.00 A..
0
0.00 0.00
40.00
cr
c 20.00
0.00 -t- 0.00 wo. OO 1600.00 2400.00 3200.00 4000.00
Time/poeo
I
FIGURE 4.11 Voltage and current waveforms for ECD and normal discharges
OW. 00 1600.00 2400.00 32W. 00 4000.00 Time/peso
800.00 IOW. 00 2400.00 SM. 00 4000.00 TI melposo

85
After long periods (about 30 min) of machining, abnormal arcs occurred. The
waveforms of voltage and current for abnormal arcing are presented in Figures
4.12. It can be seen from the above figures, that the difference in current ampli-
tude between an arc and a spark is very small. However, the off-time is quite
clearly defined in a normal discharge, whereas, in the abnormal arc the current
does not approach the zero for any finite time. As shown in the figure the "off"
edge tends to trail off to the "on" edge of the next pulse. This is indicative of the
fact that the abnormal arcs are occurring in the same location due to the plasma
channel not being deionised fully between the pulses.
The RF level detected at 40 MHz is shown to drop considerably from normal to
abnormal discharges in figure 4.13. Figure 4.14 shows the RF level and the vol-
tage waveform observed for abnormal arcs leading to short circuits. Abnormal
arcs leading to ECD pulses, can be seen in Figure 4.15. Finally, figure 4.16 gives
the current and the RF levels for normal discharges and ECD pulses.
What can be said from the above observations of the current, voltage and RF
emission waveforms is that normal and abnormal discharges can be differentiated
by the RF emission from the gap. The RF level was also low for other pulse
types, such as short circuits and ECD pulses. Hence the RF level can be utilised
in a control system, purely to indicate the occurrence of normal discharges. The
other pulse types can easily be identified by the current and the voltage
waveforms.
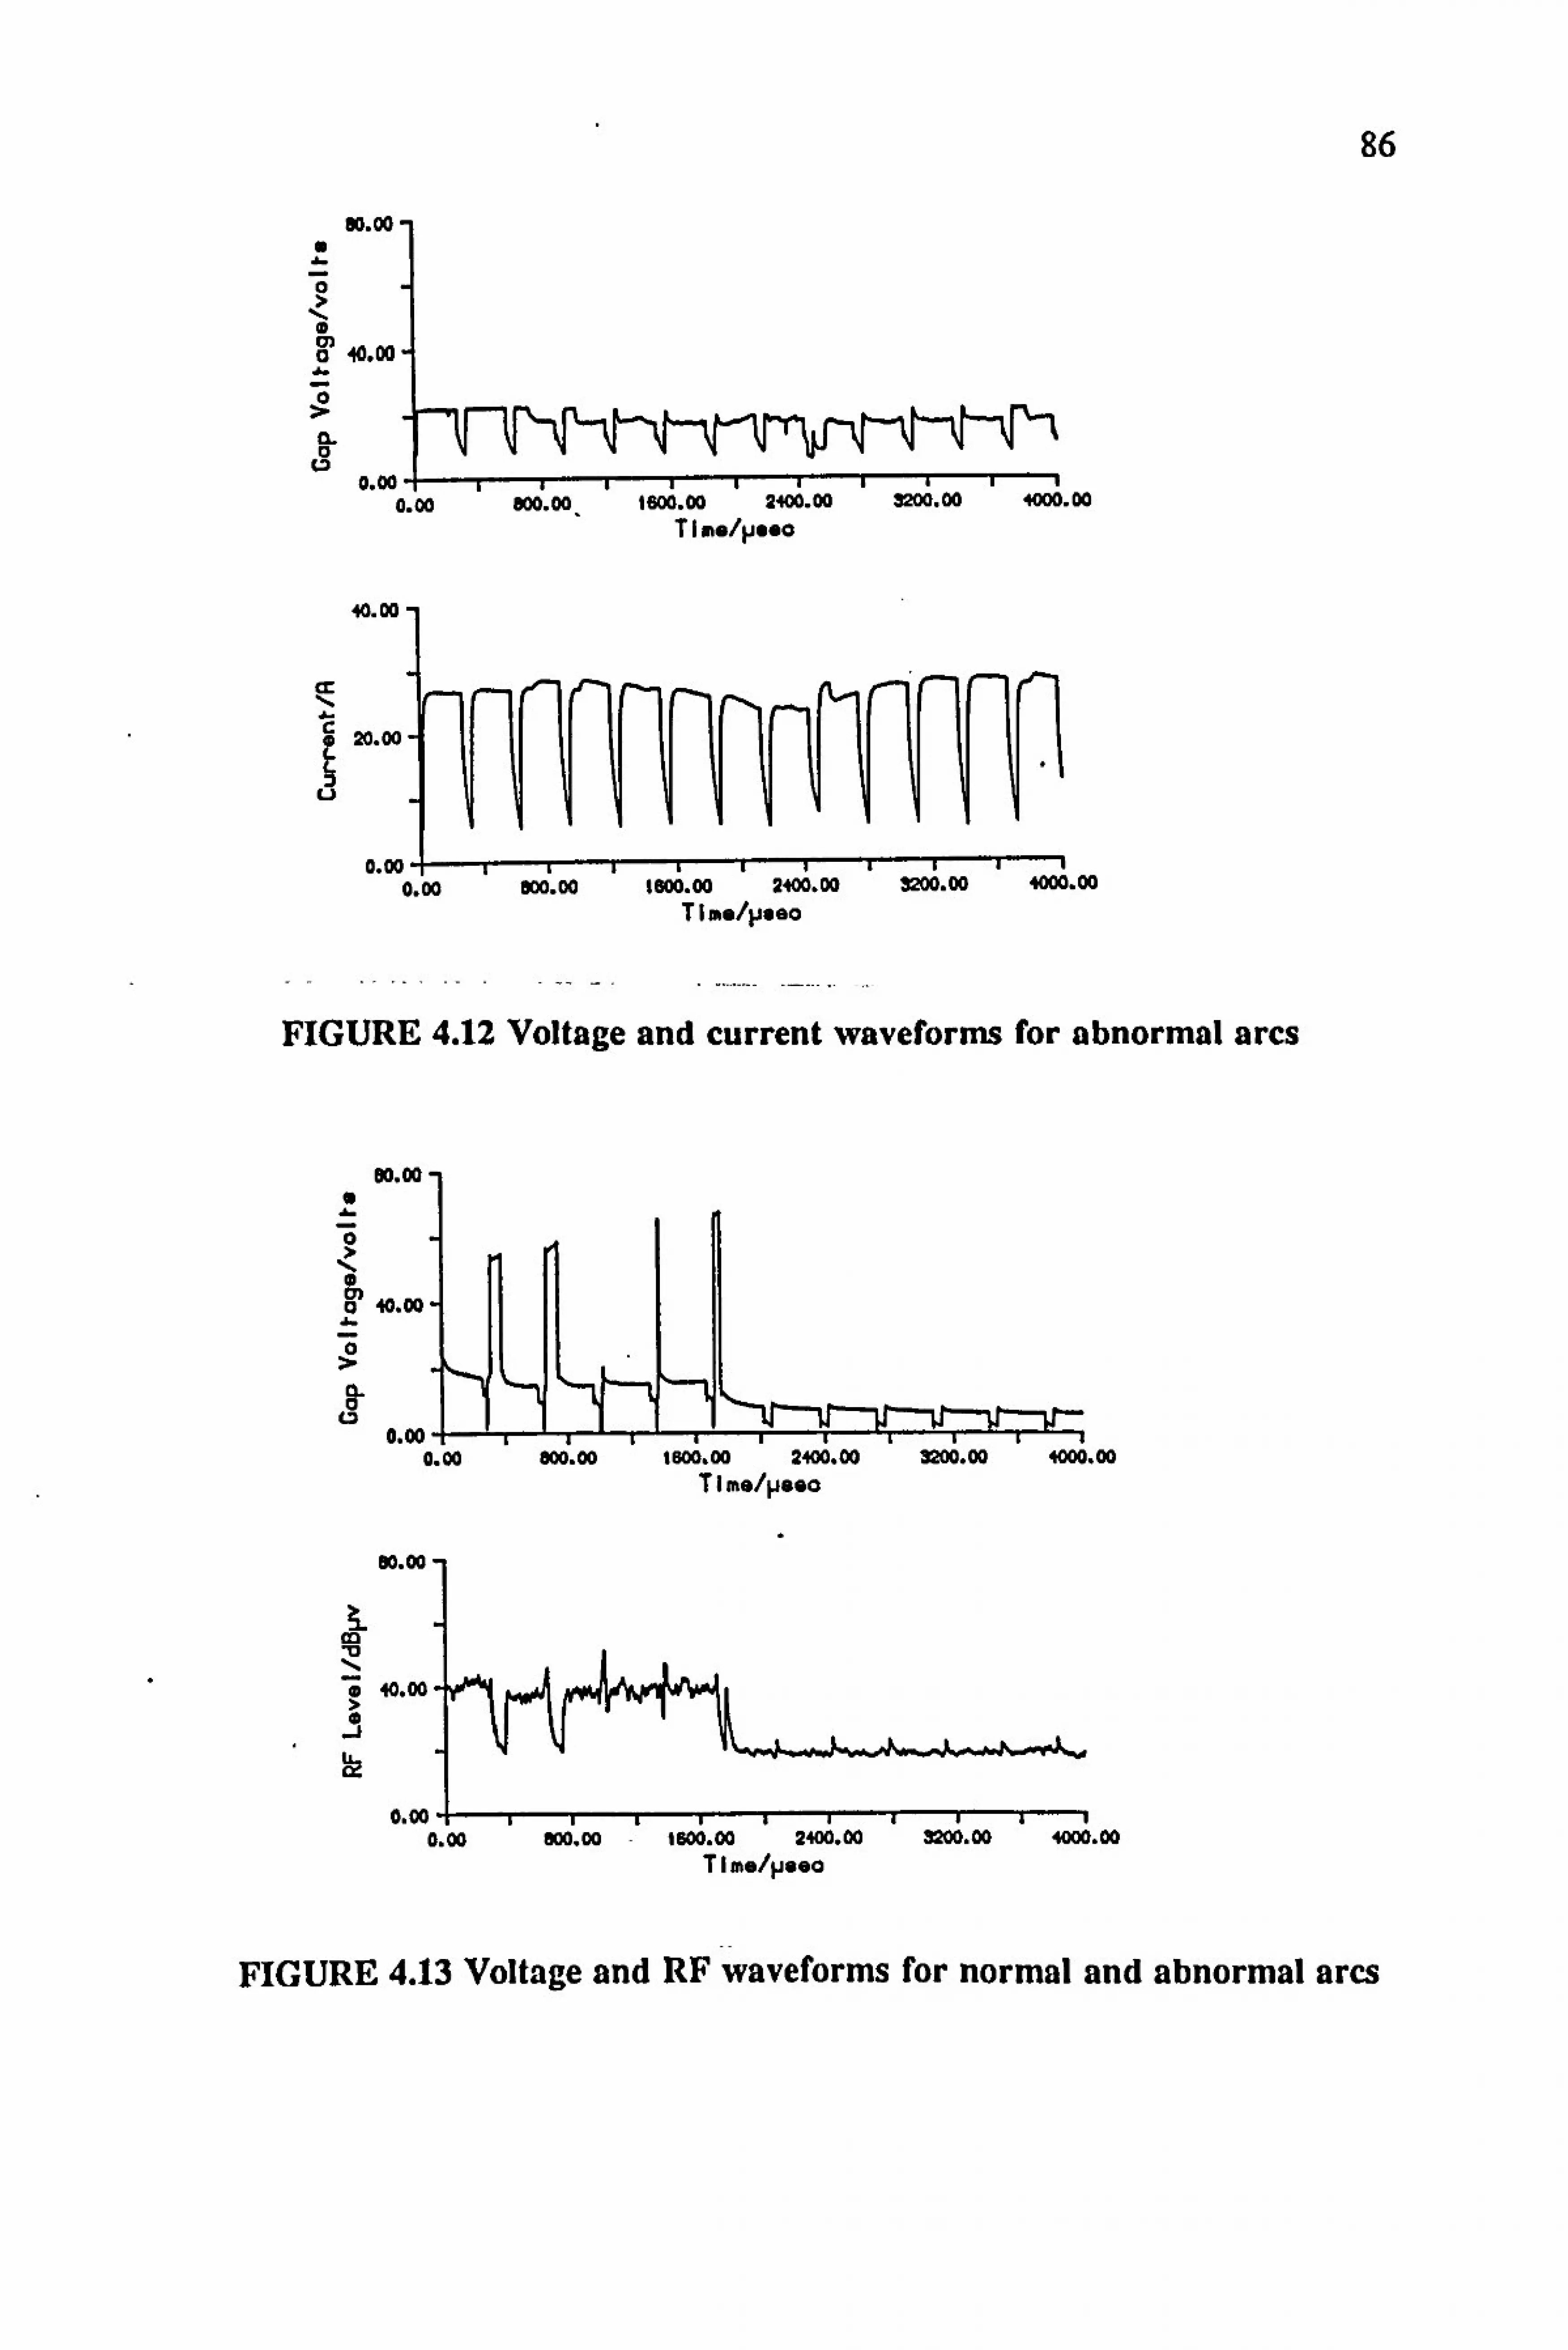
86
90.00-
0 z
10 cn o 40.00,
0
CL 0 0.00
0.00
40.00
cr
20.00
0.00 -ý- IIIiIIA r---T----l 0.00 000.00 16W. 00 2400.00 3M. 00 4000.00
TI me/pseo
FIGURE 4.12 Voltage and current waveforms for abnormal arcs
00.00-
o 40.00-
0.00 0.00
00.00
co M 0 40.00
0.00 -t- 0.00 000.00 ISM. 00 2400.00 3200.00 4000.00
TI me/poeo
FIGURE 4.13 Voltage and RF waveforms for normal and abnormal arcs
800.00 ISW. 00 2400.00 3200.00 4000.00 TI me/lisso
800.00 tGO0.00 2400.00 3200.00 4000.00 TI me/peso

87 eo. 00
0
40-00-
0
CL
0.00 0.00
90.00
40.00
0.00 -t- . 0.00 000.00 1600.00 2400.00
TI melpsoo 3200.00 4000.00
FIGURE 4.14 Voltage and RF waveforms for abnormal arcs and short circuits
$0.00
40.00
0
0.00 0.00
00.00
to 40.00
0.00 000.00 IOW. 00 2400.00 3200.00 4000.00
FIGURE 4.15 Voltage and RF waveforms for abnormal arcs and ECD pulses
000.00 t 600.00 2400.00 3200.00 40W. 00 TI me/peso
800.00 1600.00 2400.00 3M. 00 4M. 00 TI me/psec

88
40.00-
cc
c 2D. 00
0.00 -P 0.00
80.00-1
k 10 I.,
40.00
ýl 0.00 -t-
0.00
000.00 1600.00 2400.00 3200.00 4000.00 TI me/poeo
000.00 1800.00 2400.00 3200.00 4000.00 TI me/lisoo
FIGURE 4.19 Current and RF waveforms for normal discharges and ECD pulses
4.5.3 Experiments with Gap Flushing
Experiments in stagnant electrolyte is useful only to ascertain the gap phenomena
of ECAM with large machining areas. For ECAM to be a successful practical
machining process, some form of gap flushing is essential. To this aim, an air
driven pump (Madan Unicub B) was. incorporated into the electrolyte supply sys-
tem. The pump was capable of delivering pressures up to 69 bar at flow rate of
1.2 litres min". The pulsating effect of the pump was damped with an accumu-
lator.

89
Originally, the electrolyte was flushed through a center hole in the tube but this
proved unsatisfactory as only electrochemical action was present. Due to the
removal of gas bubbles from the gap by the flushing action, discharges failed to
occur. The tool was redesigned to have several small holes rather than one center hole
to achiýve turbulent flow in the gap. If the flow is turbulent, it may help to retain
the gas in the gap. However, this did not produce the desired effect - that of hav-
ing effective discharges.
Finally, it was decided to use pulsed flushing of the gap. A solenoid valve was
fitted to the system to achieve the pulsed flushing automatically at intervals rang-
ing from 5- 200 sec. This produced encouraging results. When the flushing was
on electrochemical dissolution of the anode-workplece occurred and when the
flushing was off, discharges occurred through the gas bubbles generated at the
cathode by the electrochemical reaction. By varying the flushing on and off
times the durations of the ECD to EDE phases can be changed. The pulsed flush-
ing has solved the problem of obtaining discharges in large area ECAM without
having to sacrifice the metal removal or the surface finish by having stagnant
electrolyte. ' Further detailed investigation of the pulsed flushing technique is
necessary to relate the flushing onloff times with ECD/EDE durations and the
metal removal rates. Due to lack of time this has not been done here.
Summary
A qualitative account of the discharge mechanism in large area ECAM was
given. 'Me possible gap phenomena in ECAM within a short duration square
pulse was found to be: ECD action, ECD and normal discharges, normal
discharges, abnormal discharges and short circuits. In order to differentiate
90
between the normal and abnormal discharges, the RF emission from the gap was
monitored. The RP level was found to be considerably higher for a normal
discharge than for any other type of gap phenomena above the 12 MlIz range.
The RF signal, together with the current or the voltage signal, was used to iden-
tify the exact gap phenomena in ECAM.
The pulsed flushing of the gap gave encouraging results into how ECAM can be
utilised in practical applications of large area machining.

91
5: A THEORETICAL MODEL
FOR THE RF EMISSION FROM DISCHARGES
5.1 Introduction
This chapter presents the development of a mathematical model relating the
charge behaviour within, and radio frequency emission from, ECAM discharges.
The existence of such a model, can allow the radio emission patterns already
recorded to be interpreted in terms of the high frequency charge behaviour within
the ECAM pulses. The mathematical model is based on the assumption that the
discharge can be regarded as a short dipole antenna -a Hertzian dipole. It is
called a Hertzian dipole as Heinrich Hertz was the first one to investigate the
radiation from a small dipole. In fact, Hertz used electric sparks to generate elec-
tromagnetic radiation in his experiments(60). The electromagnetic field due to
the discharges is calculated using Maxwell's equations. The induced electromo-
tive force (emf) on an antenna is then obtained. A comparison with the measured
values is made.
5.2 The Field and Particle Equations
The electric and magnetic field vectors E and HI are the basic quantities through
which the properties of the electromagnetic field are specified. In general, the two
vectors are functions of position r and time t. The electromagnetic field is gen-
erated by sources: the conduction current density J and the space charge density
p. These two quantities are used in introducing the discharge plasma into
Maxwell's equations,
I The symbols in bold denote vector quantities.
a

92
VxE =-go 3H at
V xH =eo iDE +j [5.21 at
V-E= P [5.31 CO
V-B=0 [5.41
where, co and go are permittivity and permeability of free space, respectively.
In order to develop a mathematical description of the field of antennae the fol-
lowing equations are used,
E=-VV-- DA at
and,
[5.51
H=-L Vx A [5.61 go
In order to calculate E and H, the magnetic vector potential A and the scalar
potential V must be calculated first.
The magnetic vector potential A at a point, is related to the source conduction
current density J by,
A= [L i dV [5.71 47c r
and the scalar vector potential V at a point, is related to the charge density p by,
-P- dv [5.81 4neo r
For a sinusoidal current, I= lo cos cot,
A= --ý- f Jo Cos Ot dv [5.91 41c v r'

93
Retarded current is used since the effect of the current is not felt at a point r
instantaneously, but only after a finite time -L, where c is the speed of light at c
which the wave propagates.
Hence,
I=IOCOSO)(t--L c
For simplicity in the expressions,
I= 10 Cos Coe where,
t f= t-r C
The retarded current density J and the retarded charge density p can be written
as,
A Cos cd and
P= PO COS Cd
Thus, the retarded vector potential can be written as,
N
A= go JO Cos Cd dv [5.111 4x
fr
v Similarly, the retarded scalar potential V can be written as,
V=1 PO COS (d
dv [5.121 4 7c co
fr
v
5.3 Electromagnetic Field Due To Discharges
The discharges are assumed to be short dipoles, in order to calculate the electric
and magnetic field strengths in the vicinity of it. The definition of a short dipole
is that, the length I is very short in comparison with the wavelength (I < X). The

94
two electrodes (tool and workpiece) can be regarded as plates at the end of the
discharge which provide capacitive loading. The short length and the presence of
these plates result in a uniform current I along the entire length I of the
discharge. This is illustrated in Figure 5.1.
Anode suriboe
Mthode awjbaa
FIGURE 5.1 The discharge current and charge configuration
5.3.1 The Discharge Current
it is very difficult to obtain an exact expression for the discharge current.
Nevertheless, the discharge current can be represented by the Fourier series
expansion,
I,, cos(n(ot) [5.131 n--O
Only cosine terms are considered, as the current function can be regarded as an
even function. For the initial calculation of the field components due to the I
discharge, however, it is assumed that,
I(t) = Io Cos cot [5.141
That is, only the fundamental component of the waveform is considered, other-
wise, the calculation of the field components becomes very difficult. The funda-
mental component should give a reasonable approximation as it is the dominant

95
component.
5.3.2 Calculation of the Field Components
Let the discharge (short dipole) be placed coincident with the z axis and its center
at the origin, as shown in Figure 5.2.
FIGURE S. 2 Relation of dipole antenna to coordinates
The magnetic vector potential has only the z component, A., which is given by,
Az -g 10 1 Cos cd
4xr
In polar coordinates,
A, =A, cos 0 Ao = -A, sin 0 Ao =0
[5.151
The expression for the scalar - potential is calculated to be (calculation is
not shown here but can be found in most electromagnetic theory text books, for
example, Kraus(61)),
V= 10 1 Cos co? Cos 01+
-S--. -L [5.161 4neoc
Irj
Co r2
I
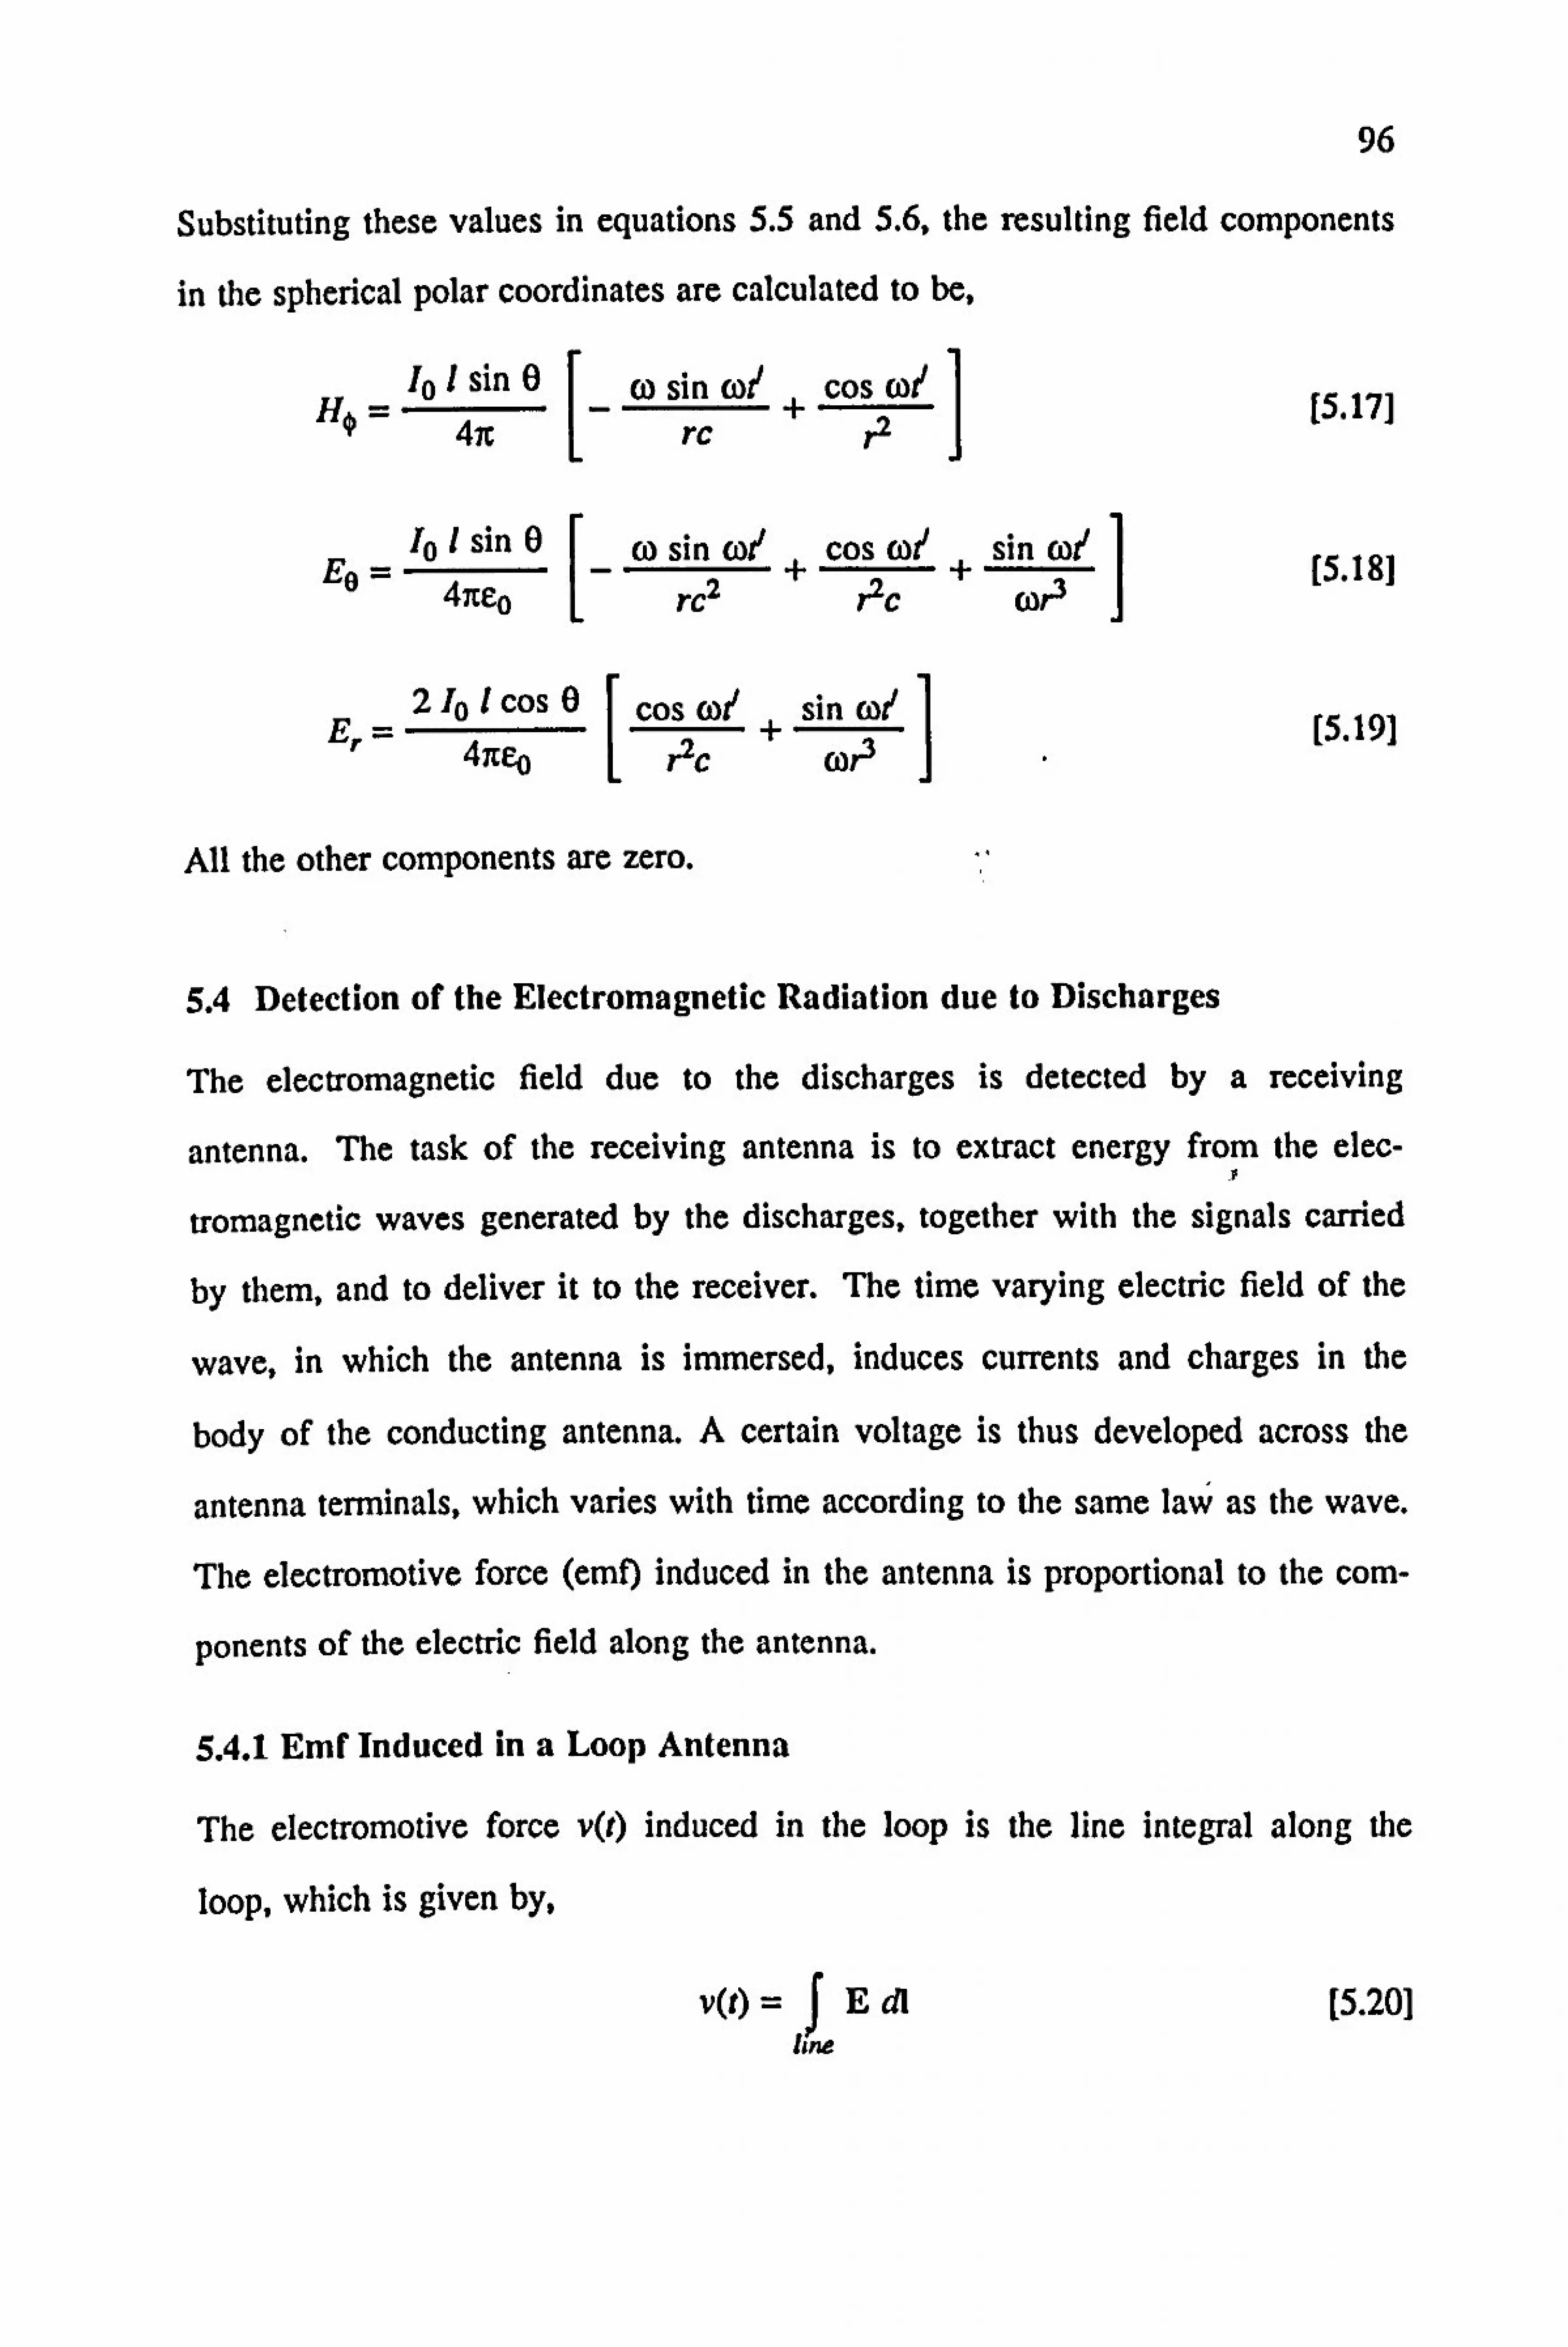
96
Substituting these values in equations 5.5 and 5.6, the resulting field components
in the spherical polar coordinates are calculated to be,
Io I sin 0+ [5.171
41r
I
rc r2
I
Eo - Io 1 sin 0 co sin wý ++ sin cd [5.18]
4neo
I
rC2 r2C coP
I
2 Io I cos 0 Cos cd + sin cd [5.191 4neo
I
r2C Wr3
I-
All the other components are zero.
5.4 Detection of the Electromagnetic Radiation due to Discharges
The electromagnetic field due to the discharges is detected by a Teceiving
antenna. The task of the receiving antenna is to extract energy from the elec- F
tromagnetic waves generated by the discharges, together with the signals carried
by them, and to deliver it to the receiver. The time varying electric field of the
wave, in which the antenna is immersed, induces currents and charges in the
body of the conducting antenna. A certain voltage is thus developed across the
antenna terminals, which varies with time according to the same law as the wave.
The electromotive force (emf) induced in the antenna is proportional to the com-
ponents of the electric field along the antenna.
5.4.1 Emf Induced in a Loop Antenna
The electromotive force v(t) induced in the loop is the line integral along the
loop, which is given by,
V(t) =iE dl [5.201 line

97
The orientation of the loop in the electromagnetic field is shown in Figure 5.3.
E
E*IH I
un
FIGURE 5.3 Orientation of loop in electromagnetic field
Instead of calculating the line integral, by using Stoke's Theorem and the curl DB
equation, VxE at , v(t) can be written as,
V(t) =fVxE- dS [5.211 surface
V(t) =-D .1B-
dS [5.221 at ce
Since the loop is assumed to be small, B is practically constant over its area S.
Hence v(t) can be expressed as,
DH V(t) [to S U" at [5.231
where un is the unit vector normal to the surface, as shown in Figure 5.3.
The emf is a maximum when the loop is perpendicular to the magnetic field H in
which case, its plane coincides with the direction of propagation of the wave.
The only component of H in the spherical polar . coordinates is HO which is given
by the equation 5.17.

98
Substituting this value of Hý in equation 5.23,
V(t) go S COSOC DHO
[5.241 at
where a is the angle between the magnetic field 11 and u.
This then gives,
V(t) go S Io I sin 0 cos a co sin col + [5.251 4xrc r2
I
5.5 Comparison with the Measured Values
The measured spectrum of the radio frequency emission during normal discharges
is shown in Figure 5.4. This was obtained using the loop antenna and displayed
on the spectrum analyser screen. From Figure 5.4, it is apparent that the RF
emission has a spectrum of frequencies.
60.00
m- 40.00 m
CD -i Lj_ 20.00 fr.
0.0() -t- 0.00
FIGURE 5.4 Measured RF spectrum during normal discharges
20.00 40.00 60.00 80.00 100.00 Frequency/MHz

99
5.5.1 Characteristic Frequencies of Radiation
According to Somerville(62) and also Bekefi(59), the frequencies at which radia-
tion is emitted from plasmas is characterised. by the "plasma frequency", (OP,
which is given by,
M, e]
I
cop=
[Ze2 2
where,
n is the electron density
e is the electron charge
m. is the electron mass
The plasma frequency is a kind of relax altio'n frequency at which the electrons (or
ions) oscillate when the equilibrium distribution has been perturbed(62).
If the thermal motion of the electrons is allowed for, instead of a single electron
oscillation frequency, a frequency spectrum is obtained. In this frequency spec-
trum, each frequency is associated with a wavelength of propagation, X, accord-
ing to the relationship,
CI)2 = (J) 2 p
1,
+ X2
co appears here as the limit of frequency when X-4-. P
Numerical values for the plasma frequencies cannot be obtained because the
charge density is difficult to estimate. From the observed spectrum, however, the
values for the characteristic frequencies can be estimated. The electromagnetic
radiation at these frequencies is then obtained and compared with the measured
spectrum.

100
5.5.2 Calculation of Emf
The amplitude of the electromagnetic radiation level corresponds to the emf
induced in the loop antenna. The value of the ernf is given by equation 5.25.
From this equation it can be seen that the ernf is a maximum when the plane of
the loop is perpendicular to the magnetic field (i. e. the angle cc = 0). Since the
loop was positioned to obtain the maximum intensity, it can be assumed that cc is
0. Furthermore, the angle 0 can also be assumed to be 0 as this is when the max-
imum intensity is achieved. The other values for the variables used for the calcu-
lation is shown in Table 5.1.
TABLE S. 1 Variable values used in the calculation
Variable Value
Current, 10 20 A
Length of dipole, 0.1 mm
Area of loop, S 1257 mm2
No. of loop turns I
Distance, r 030 m
Permeability, V() 4007c nH nC'
These values were substituted in equation 5.25,
VW go S Io I sin 0 cos a co sin cd + 4 7c
Irc
r2
to obtain the emf values at the characteristic frequencies of the discharge.
Table 5.2 gives the values of the measured and the calculated values of emf
received at the characteristic frequencies.

101
TABLE 5.2 Calculated and measured values of emf
Freguency Calculated emf Measured emf mv mv MHz
max min average
40 0.698 0.175 0.223
60 1.047 0.395 0.221
100 1.720 0.975 0.316
From the table, it can be seen that at 40 MHz, the measured signal is well within
the calculated range. However, the calculated values at higher frequencies exceed
the measured values by significant amounts. Ibis discrepancy at the higher fre-
quency values is due to the inefficiency of a loop antenna to pick up RF emission
above 50MHz.
The other factors which have contributed to the high values of the calculated emf
are:
a) Neglecting the effects of electrolyte medium, by the assumption that the
waves propagate in free space.
b) Not considering the harmonic components of the Fourier expansion of the
current wavefonn in the magnetic vector potential calculation.
C) Assuming the transmission lines to be loss-free.
5.6 Summary
Electromagnetic radiation emitted by electric discharges were mathematically
modelled by assuming the discharges to be small Hertzian dipoles. Ile frequen-
cies at which radiation levels peaked were related to the plasma frequencies of
the discharge. Ile measured values of emf induced in a loop antenna correlated
well with the calculated values within its frequency range (0 - 50MHz). 'Illis
mathematical model gave a reasonable understanding of the charge behaviour

102
within a discharge by relating it to the RF emission. T'his model can be regarded
as a starter. A more accurate model can be developed by considering all the har-
monics of the current waveform. By using a computer package to decompose the
current waveform, the mathematical complexity may be reduced.
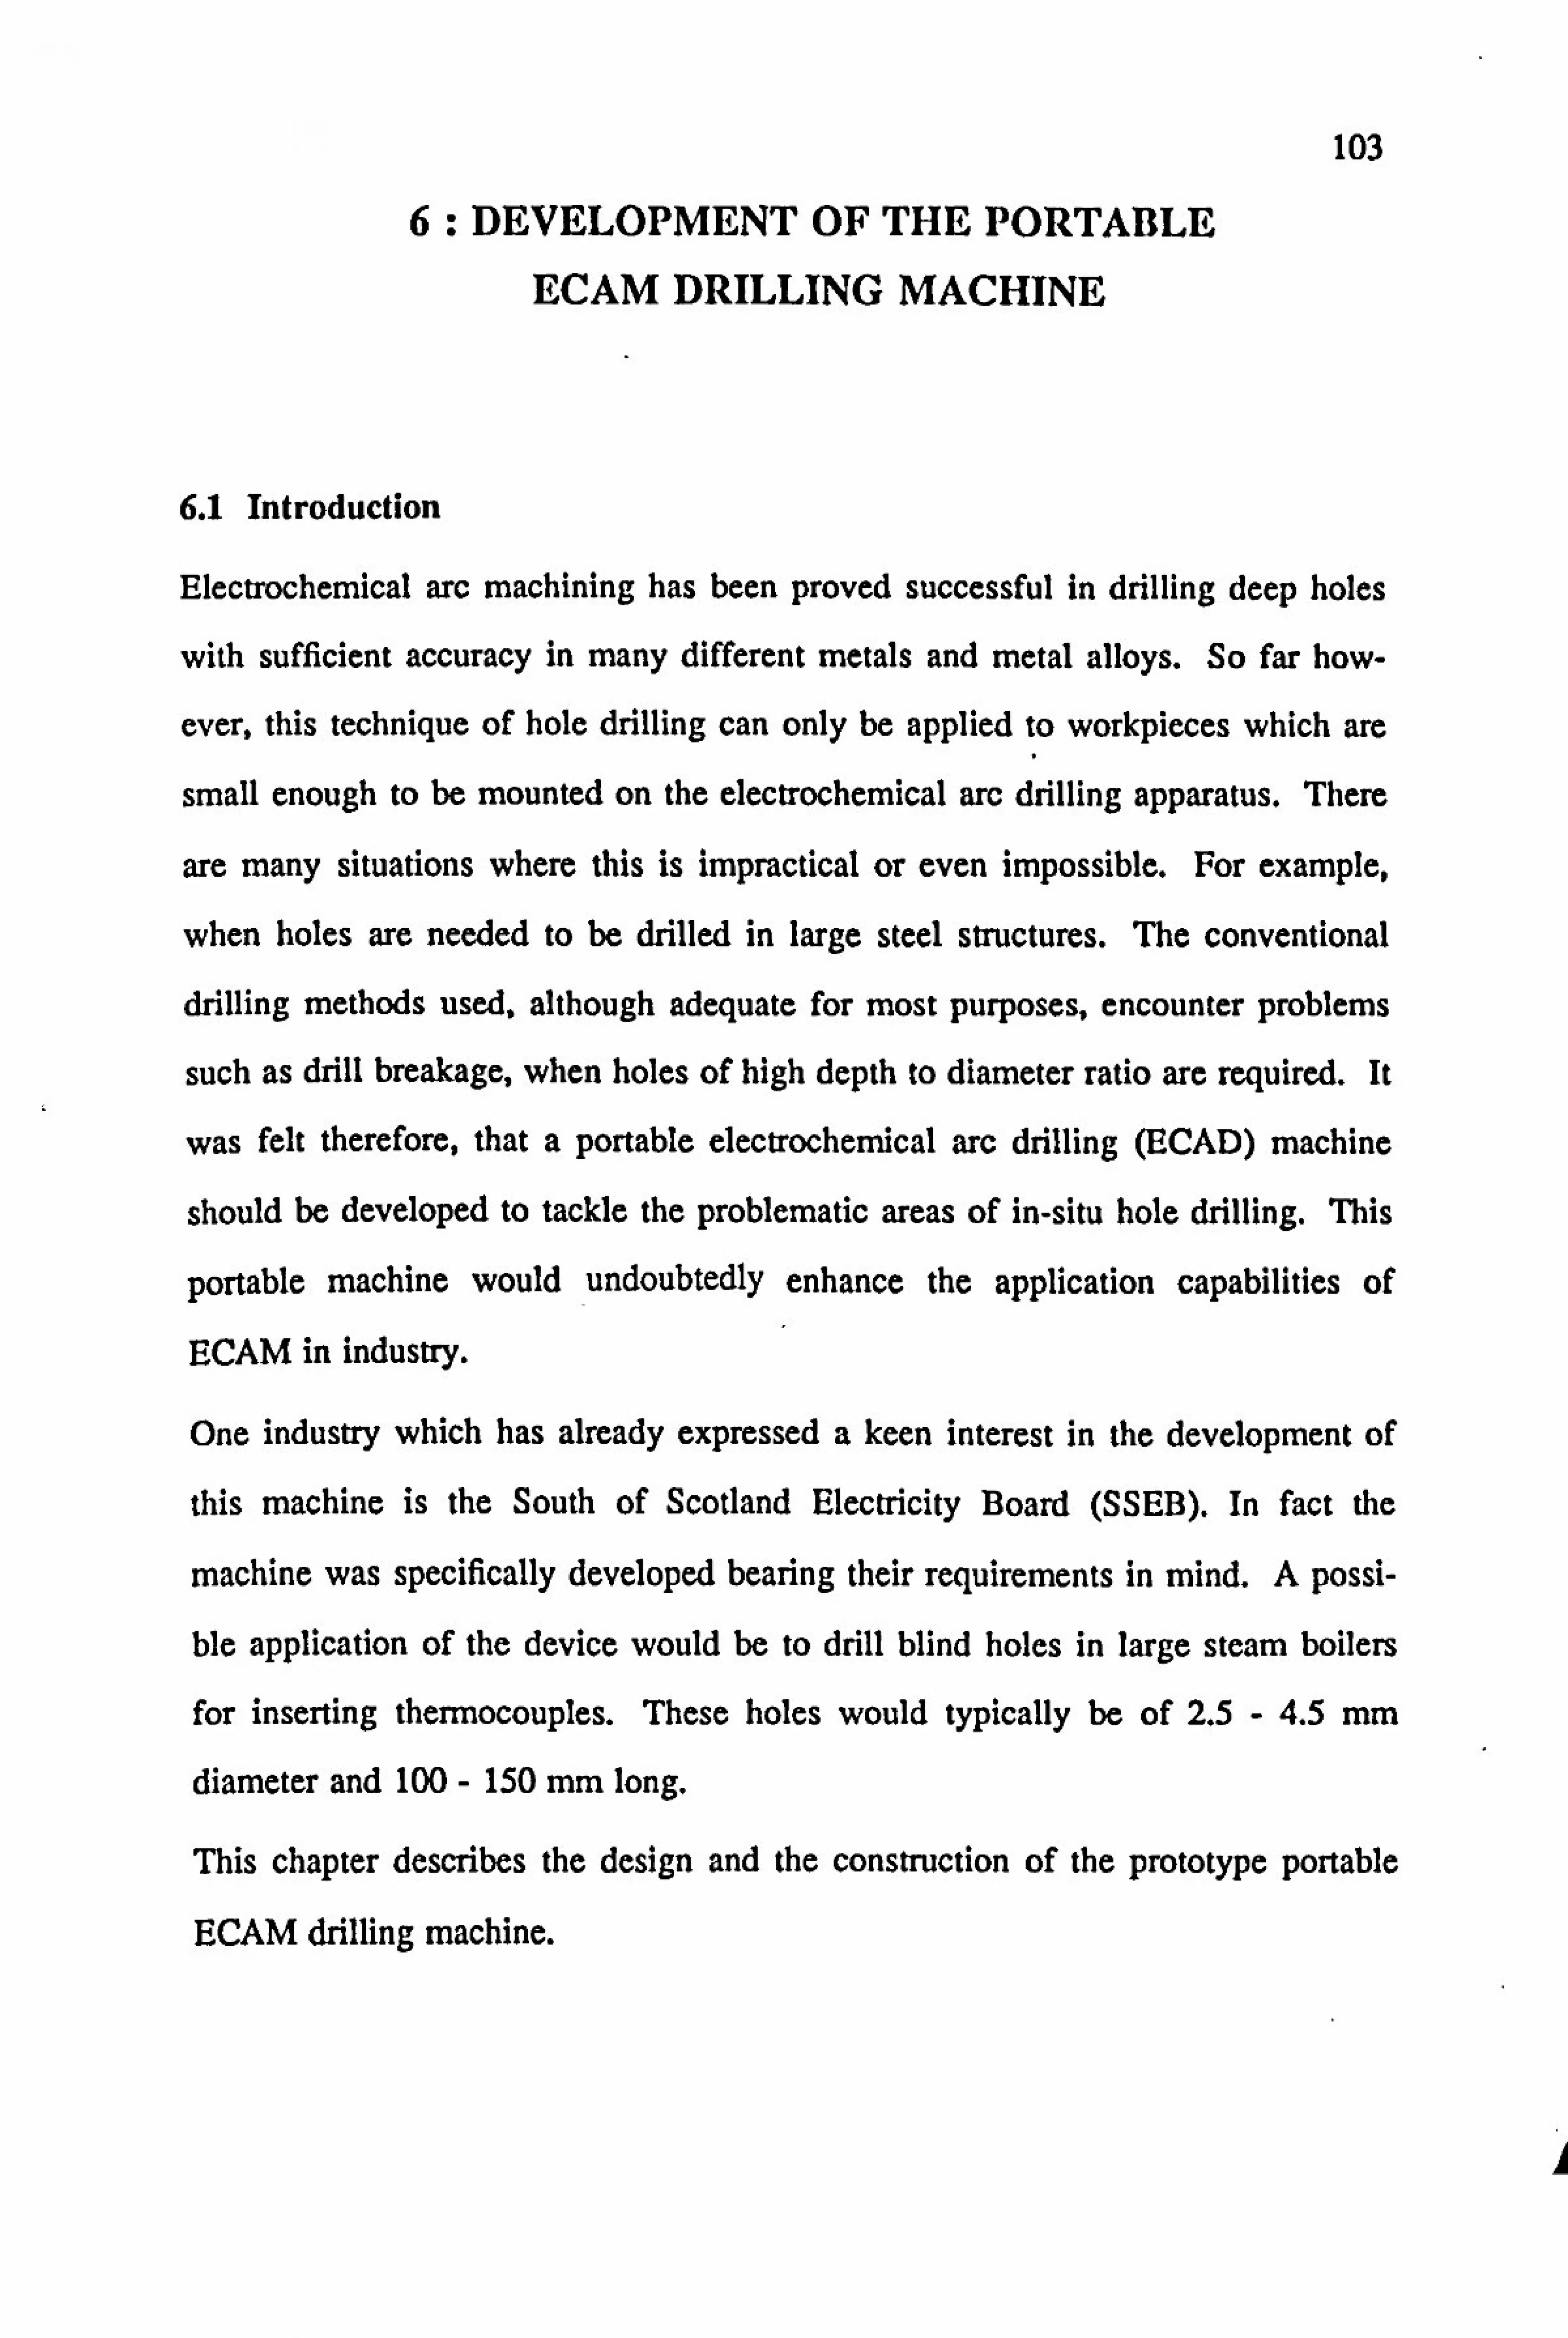
103
6: DEVELOPMENT OF THE PORTABLE
ECAM DRILLING MACHINE
6.1 Introduction
Electrochemical arc machining has been proved successful in drilling deep holes
with sufficient accuracy in many different metals and metal alloys. So far how-
ever, this technique of hole drilling can only be applied to workpieces which are
small enough to be mounted on the electrochemical arc drilling apparatus. There
are many situations where this is impractical or even impossible. For example,
when holes are needed to be drilled in large steel structures. The conventional
drilling methods used, although adequate for most purposes, encounter problems
such as drill breakage, when holes of high depth to diameter ratio are required. It
was felt therefore, that a portable electrochemical arc drilling (ECAD) machine
should be developed to tackle the problematic areas of in-situ hole drilling. Ibis
portable machine would undoubtedly enhance the application capabilities of
ECAM in industry.
One industry which has already expressed a keen interest in the development of
this machine is the South of Scotland Electricity Board (SSEB). In fact the
machine was specifically developed bearing their requirements in mind. A possi-
ble application of the device would be to drill blind holes in large steam boilers
for inserting thermocouples. These holes would typically be of 2.5 - 4.5 mm
diameter and 100 - 150 mm. long.
This chapter describes the design and the construction of the prototype portable
ECAM drilling machine.

.0
6.2 Apparatus Speciflcation.
104
1. The main body of the apparatus should contain the following:
(a) tool holder which also incorporates the means of supplying electrolyte
and power to the tool.
(b) tool feeding mechanism
(c) tool vibrator
(d) supporting structure which can be clamped to the work-surface
(e) provision for electrolyte output and the necessary sealing arrangement
to prevent electrolyte spillage.
2. A motion control system is needed to provide the tool feed and vibration.
3. The power supply should be capable of supplying a full-wave rectified
unsmoothed voltage which can be varied within the required range.
4. The electrolyte supply and clarifying system should provide fresh and clean
electrolyte to the machining gap at the required flow rate and pressure.
6.3 Design and Construction of the Main Body
This is the part which requires to be the most portable. Therefore considerable
effort was directed towards keeping the weight and the size of the machine to a
minimum. Design considerations were also given to the rigidity of the apparatus
and the stiffness of the moving parts in order to obtain consistent accuracy and
geometry of the drilled holes. Although no mechanical forces are encountered in
the drilling process, electromagnetic, hydrostatic and hydrodynamic forces are
induced as shock cycles. These can be attributed to the stochastic generation of
discharges, the variation in the flow pattern due to gap oscillations, the explosion
of gas bubbles and the unsteady pumping of electrolyte in the gap.
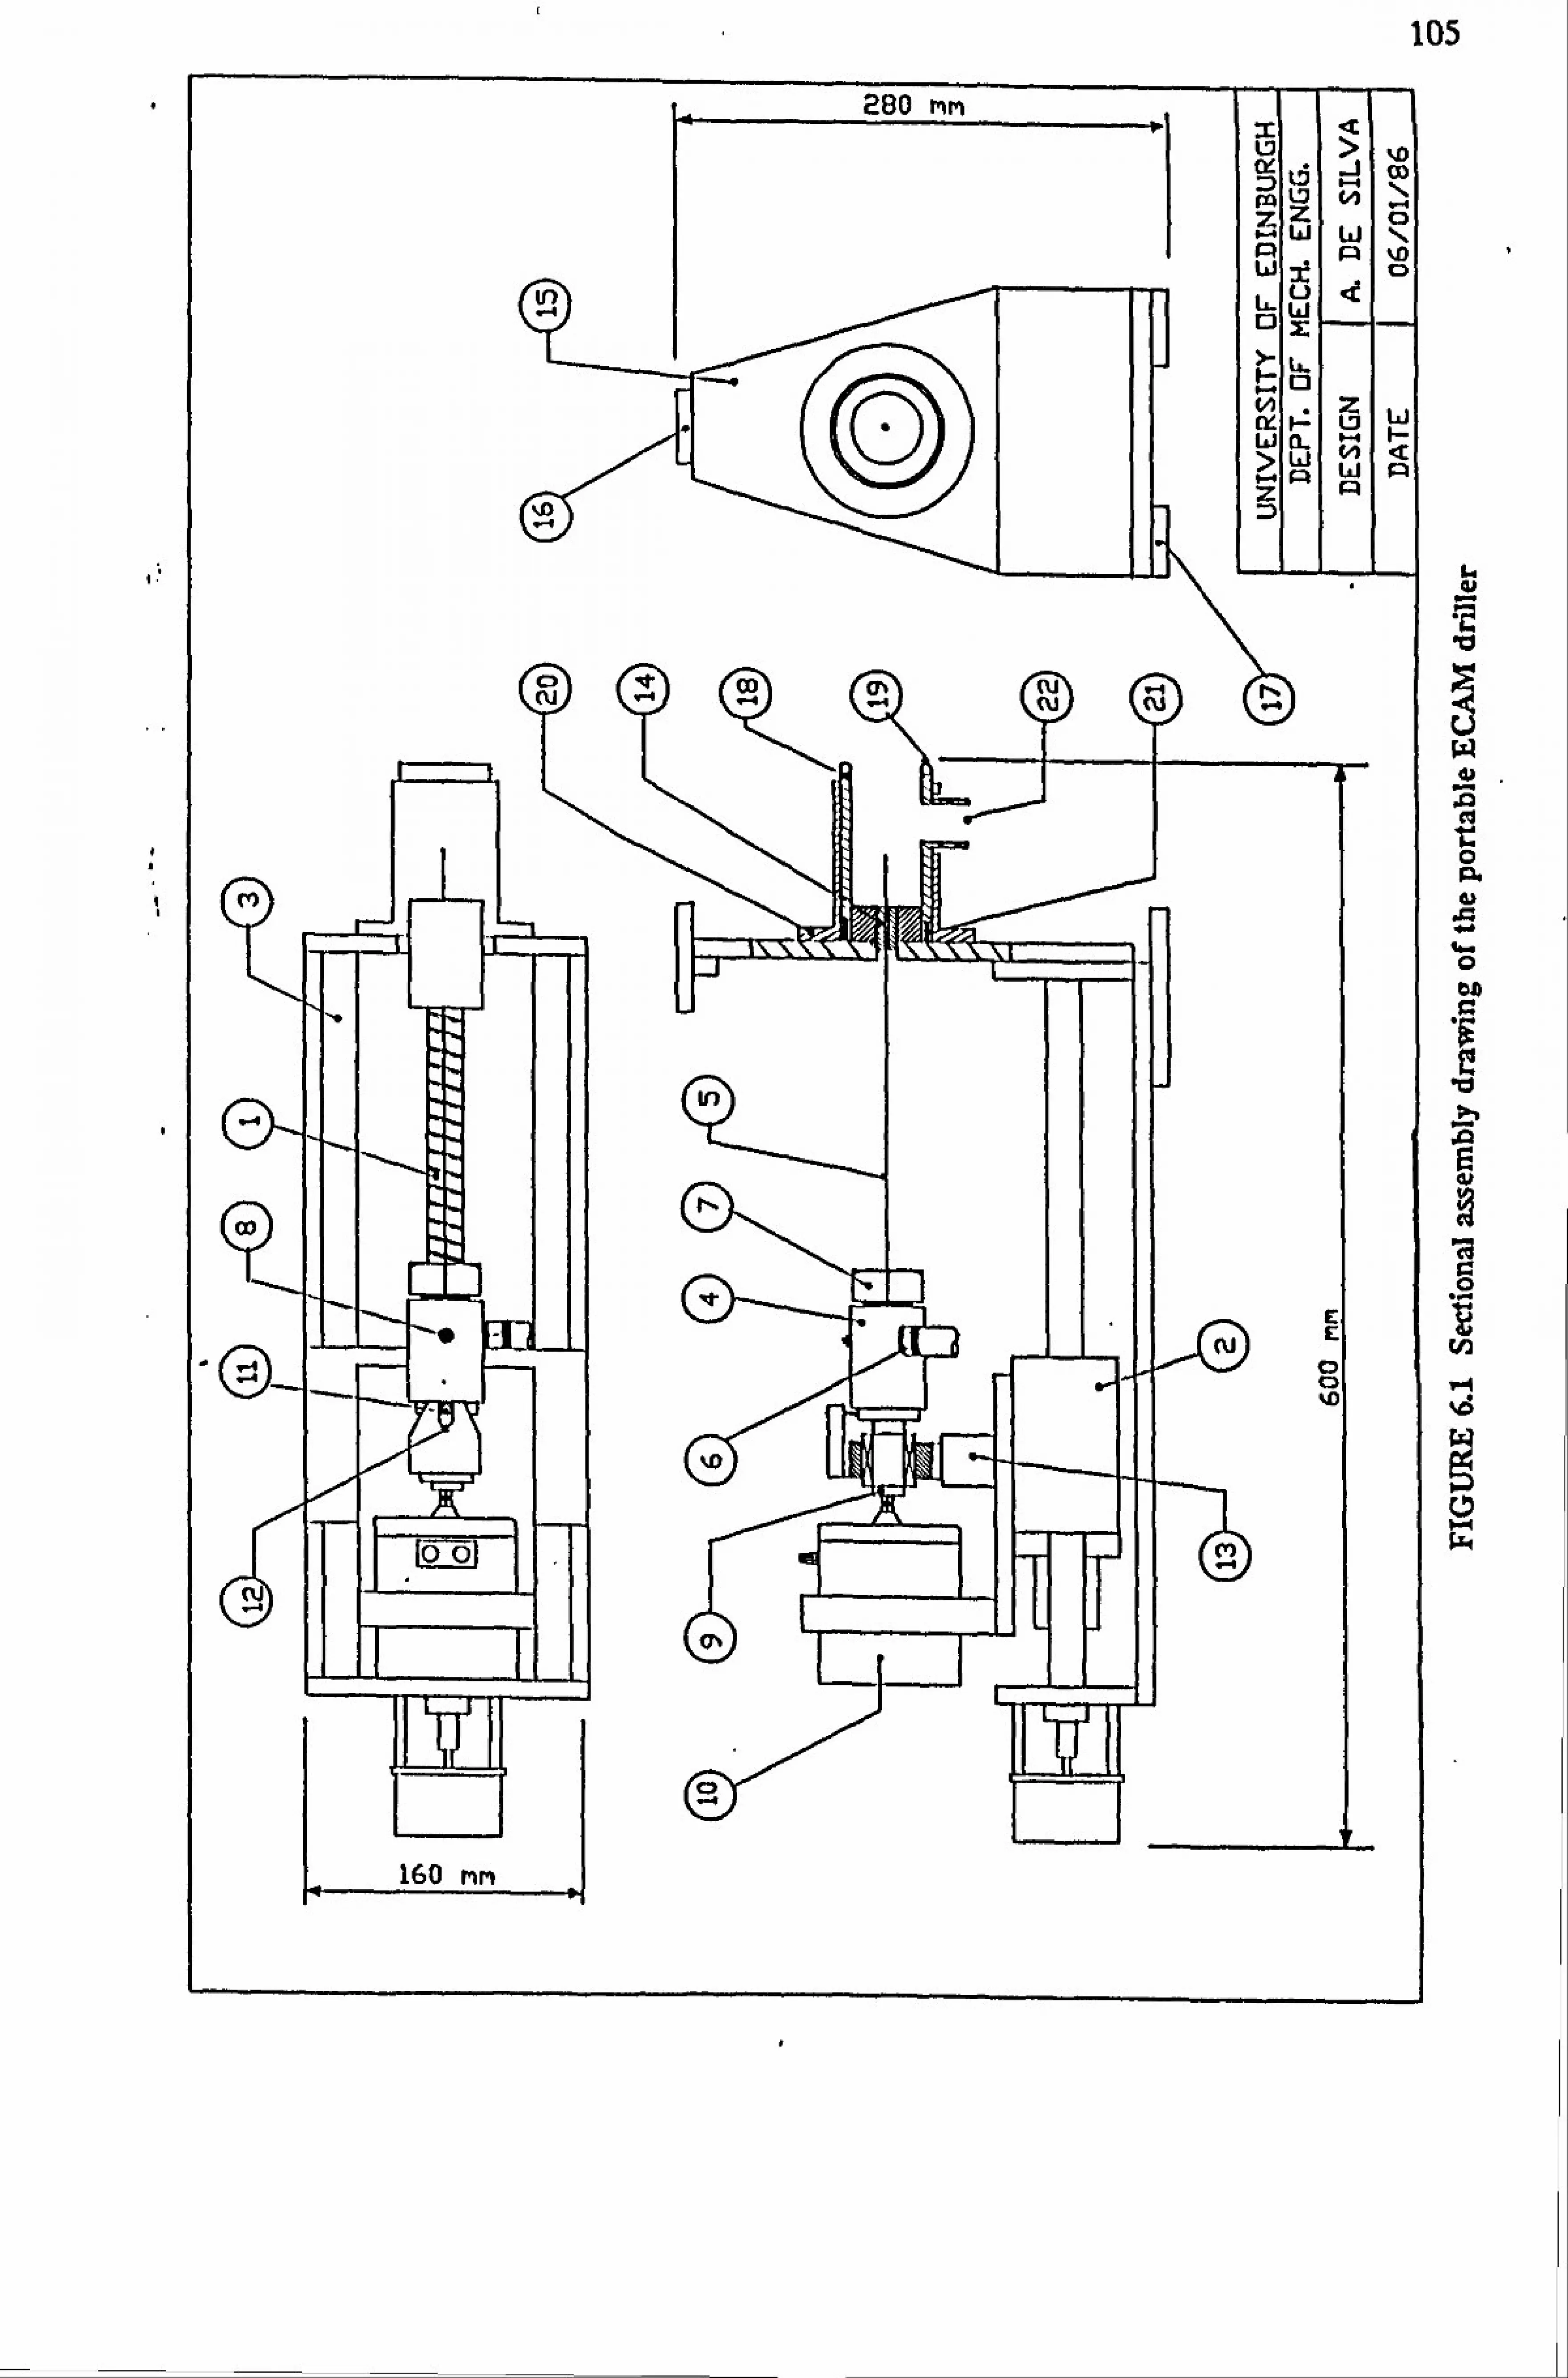
105
160 mm
pAn,.,

L- 106
Figure 6.1 shows a sectional assembly drawing of tile portable ECAD apparatus.
The feed system is based on a recirculating ball leadscrew and an antibacklash
double nut assembly (1). The nut is preloaded to eliminate axial play, thereby
increasing the positioning accuracy. The ballnut housing (2) which is made of
light aluminium alloy (duralumin) also serves as an anchorage for the tool holder
and the vibrator. The smooth and stick slip free movement of the housing is
achieved with the aid of two linear ball bearings travelling along two hardened
ground shafts (3) on either side of the leadscrew.
The electrode holder (4) is designed such that the hollow copper tube (5) can be
pushed into a chamber in the holder through a rubber seal, and the seal is ren-
dered more efficient by the action a spring and also by the pressure of the elec-
trolyte which forces the rubber into and around the circumference of the elec-
trode.
A tapping on the side of the electrolyte chamber (6) admits a pipe fitting to
which a flexible high pressure hose is connected via a quick release coupling to
supply the electrolyte. The electrode is held in position both axially and radially
by a collet and chuck arrangement, and this is tightened around the tube by
means of a large nut (7) which holds the chuck captive in the taper of the holder.
A tapping (8) on the holder is provided for the electrical connection. The tool
holder is constructed out of stainless steel.
To connect the vibrator to the tool holder, a hardened ground steel stub shaft (9)
is fitted into the back of the holder. The shaft is electrically insulated from the
holder by means of a tufhol bush. The stub then slides inside a linear race acting
as a bearing surface and a radial constraint. This allows the electrode holder to
move back and forth along the axial direction and also to rotate but does not
allow any radial play. The stub shaft is tapped at its free end and is attached to
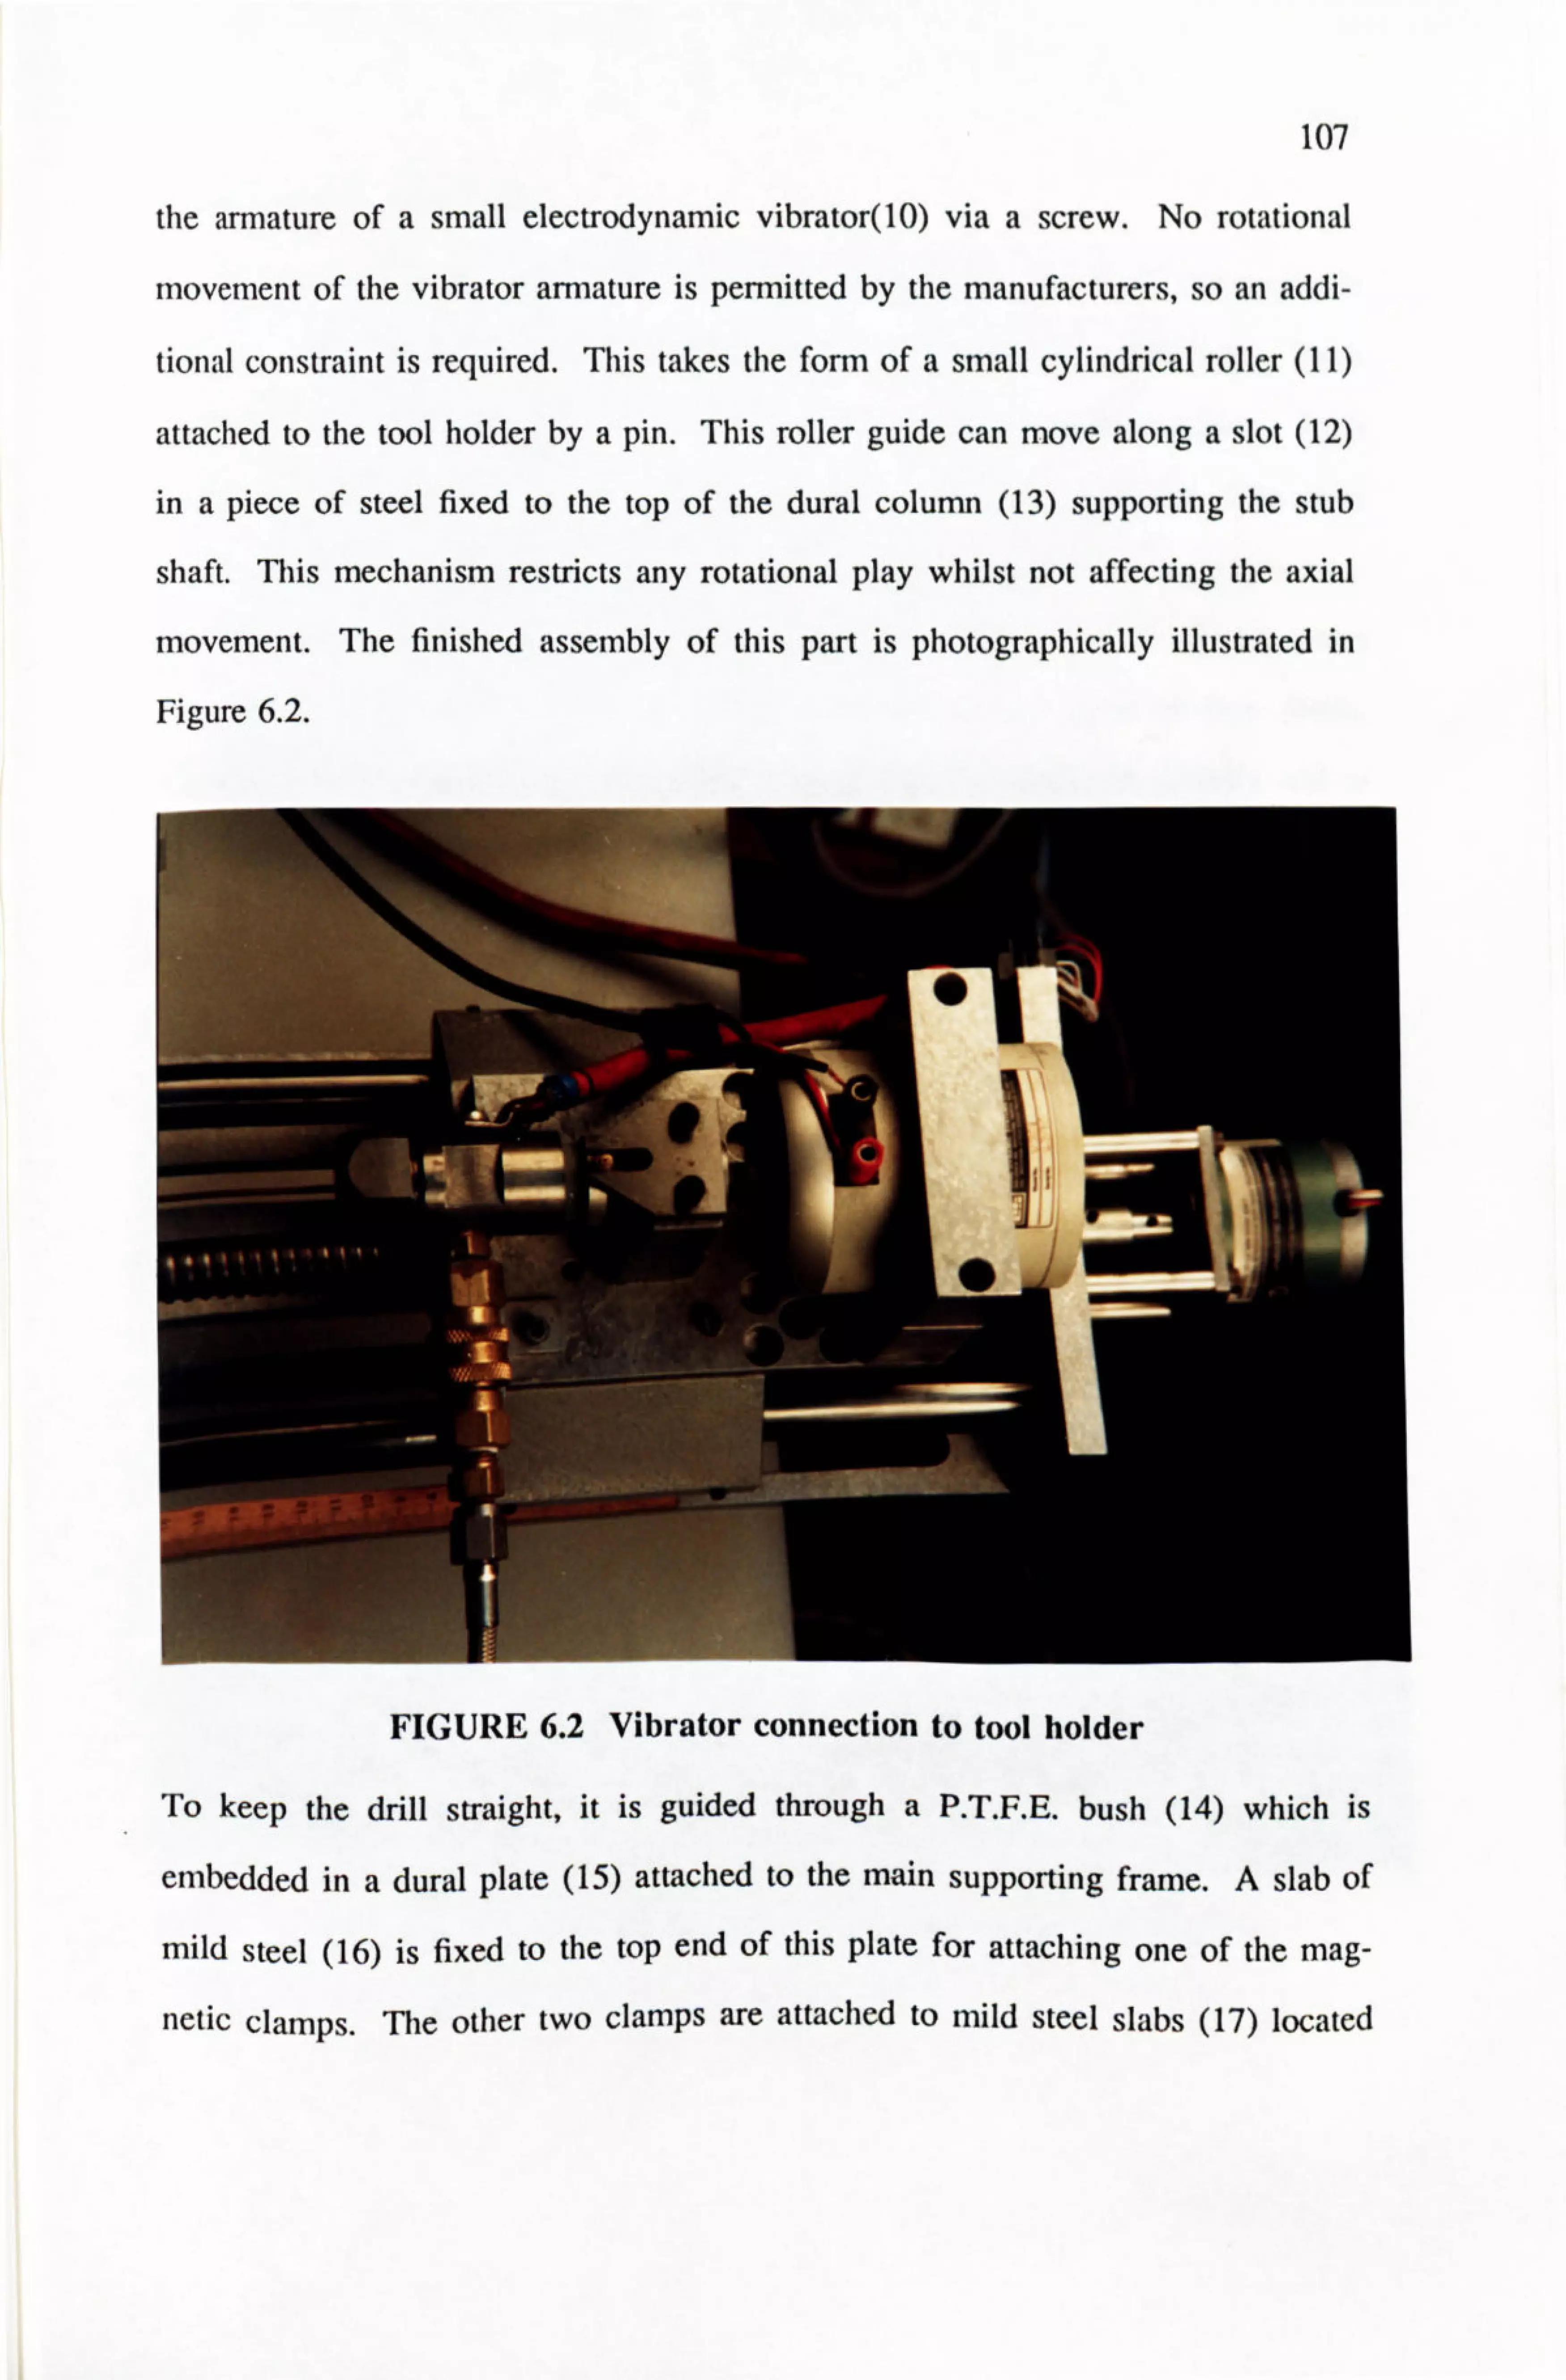
107
the armature of a small electrodynamic vibrator(10) via a screw. No rotational
movement of the vibrator armature is permitted by the manufacturers, so an addi-
tional constraint is required. This takes the form of a small cylindrical roller (11)
attached to the tool holder by a pin. This roller guide can move along a slot (12)
in a piece of steel fixed to the top of the dural column (13) supporting the stub
shaft. This mechanism restricts any rotational play whilst not affecting the axial
movement. The finished assembly of this part is photographically illustrated in
Figure 6.2.
FIGURE 6.2 Vibrator connection to tool holder
To keep the drill straight, it is guided through a P. T. F. E. bush (14) which is
embedded in a dural plate (15) attached to the main supporting frame. A slab of
mild steel (16) is fixed to the top end of this plate for attaching one of the mag-
netic clamps. The other two clamps are attached to mild steel slabs (17) located

109
underneath the base plate.
Figure 6.3 shows the completed apparatus attached to the work by magnetic
clamps. The magnetic clamps are Eclipse Model 922 magnetic positioners. Each
comprises of two switchable units which provide infinitely variable power. Each
unit has two magnetic faces and accepts either round or flat material. The units
are joined by non magnetic steel straps and are simply locked at any angle by a
central locking nut. Each magnetic face can exert a pull of about 100 Kg when
in contact with mild steel of an adequate thickness and good surface finish.
Although each magnetic clamp weighs about 3 Kg, this does not directly add to
the weight of the tool head because the magnetic clamps are not permanently
fixed to it.
FIGURE 6.3 Drilling apparatus clamped to the workpiece

109
The apparatus needs to be properly sealed to keep the spent electrolyte to a
minimum area. This takes the form of a perspex tube (18) with a rubber O-ring
seal (19) which can be pushed against the work-surface by a spring (20) located
in the other end of the tube. The tube and the spring are contained by a flanged
outer perspex tube (21) attached to the dural plate which houses the drill guide
bush. A tapping on the tube provides an outlet for the electrolyte (22). A closer
view of the sealing mechanism and the magnetic clamps can be seen in Figure
6.4.
FIGURL 0.4 Sealing arrangement and the magnetic clanips
110
6.4 Tool Motion Control System
6.4.1 Feed Control Unit
A stepper motor is chosen to drive the ballscrew since it provides a simple open
loop control, characterised by a direct input to motor output relationship and reli-
able motor response without need for a servo-feedback mechanism. Furthermore,
the compact size and the ability to provide sufficient torque at low speeds without
a reduction gear box make it more suitable than other type of motors. The
stepper motor used is Sigma series 20-22 D200.
The motor'spindle is connected to the ballscrew via a universal coupling. The
motor is held in position by four extension rods connected to the back plate of
the supporting frame.
The stepper motor control system is based on a Unimatic UDBO53-1 Digicard.
This powered by a 24V power pack generates the step pulses required to drive
the motor. The board has a built in wide range oscillator with separate control of
fast and slow speeds. This enable the fast control to be used when positioning
and retracting the tool and the slow control to be used when feeding the tool.
6.4.2 Feed Rate Calibration
The range of feed rates required is from 5.0 to 40.0 mm min7l. Since the
ballscrew has h pitch of 5.0 mm, each revolution produces 5.0 mm of linear
travel. Therefore the ballscrew should rotate at speeds from 1.0 r. p. m. to 8.0
r. p. m. to achieve the required feed rates. The stepper motor can operate either at
200 or 400 steps per revolution. At 200 steps per revolution, the range of step
rates required are from 3 to 30 steps per second. These rates are obtained by
adjusting resistor and capacitor values on the board. Thus the stepper motor con-
trol system is capable of providing feed rates from 2.5 to 40.0 mm min7l in its

III
slow mode. In the fast mode it can provide up to 500 mm mifi-1.
6.4.3 Vibration Control Unit
The vibration of the tool electrode has been proved to be an essential part of the
ECAD apparatus. This facilitates the clearance of debris from the machining gap
and hence prevents short circuits between tool and workpiece. The amplitude
and the phase of vibration are quite important process variables which influence
the machining parameters. By varying the phase angle between the vibration and
voltage waveforms the relative intensity and duration of electrochemical dissolu-
tion and electrodischarge erosion phases can be varied (Chapter 2).
A Ling Dynamic 201 electromagnetic vibrator was selected for its compact size
and its ability to provide adequate thrust. The vibrator depends for its operation
on the interaction between the steady magnetic field produced by the permanent
magnet, and an oscillating current flowing in the moving coil. The drive current
for the vibrator is derived from the amplified output from an oscillator (Ling
Dynamic TPO 25). The frequency of the movement of the moving coil is die
same as the frequency of the oscillator signal. Hence, the load mounted on the
armature can be vibrated at the required frequency pre-set on the oscillator.
The model TPO 25 is a compact combined oscillator/amplifier capable of a power
output of 25 watts r. m. s.. A feature of this unit is that it can also be driven from
an external signal source.
The amplitude calibration of the vibration was done using a piezo electric
accelerometer and a charge amplifier. For sinusoidal motion the amplitude can
be calculated from the measured acceleration using the formula given below.
0.002f +2d
where,

112
a is the acceleration in g
d is the displacement in mm (peak to peak)
f is the frequency in hertz
6.4.4 Phase Angle Controller
A phase shift controller was designed and built in order to give the required
phase angle between the vibration and the voltage waveforms. A schematic
diagram of the phase shift controller is shown in Figure 6.5. The basis of die
design is that an attenuated signal from the full-wave rectified power supply out-
put is passed through a band-pass filter. This band-pass filter has a centre fre-
quency of 100 Hz and a bandwidth of 10 Hz. The output from this filter has the
same frequency as the voltage waveform. This sine wave is then passed through a
R-C phase shift network which enabled the phase angle to be set to the required
value. This signal is then fed to the external input of the oscillator/amplifier unit
which drove the vibrator.
U
14G
Fullwave Brid " RoMfler
FIGURE 6.5 Schematic diagram or the phase shift controller
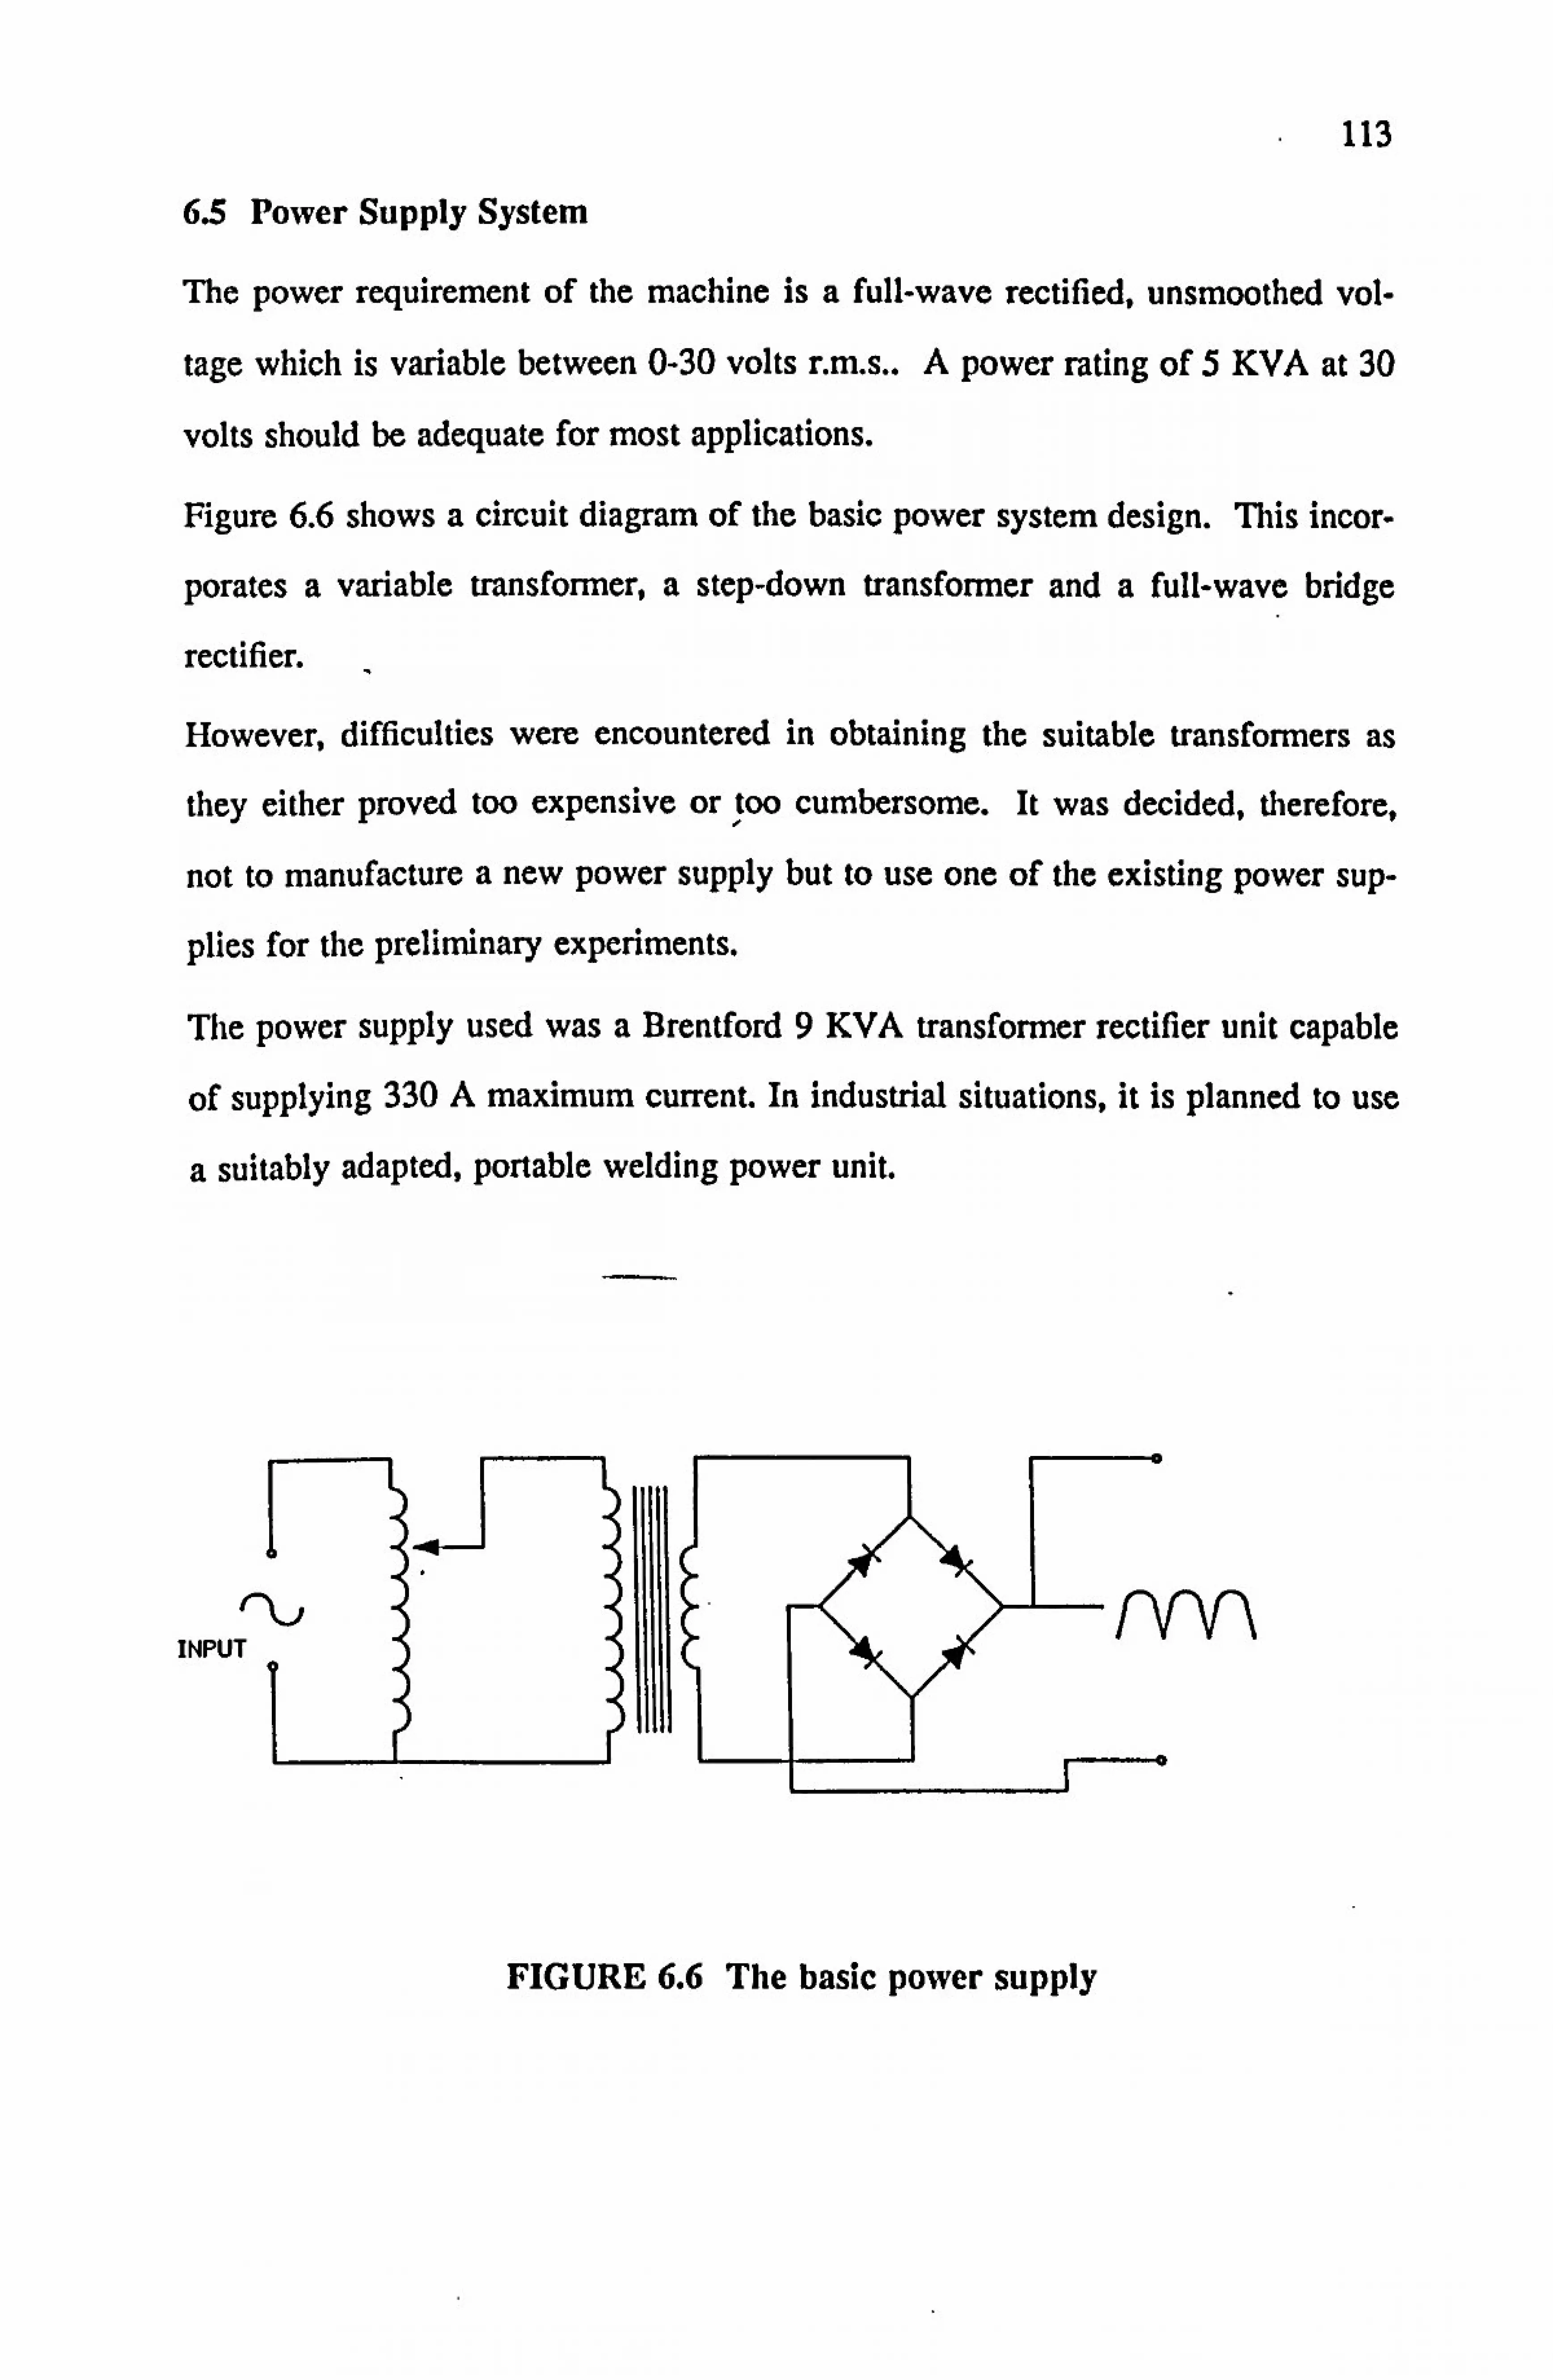
113
6.5 Power Supply System
The power requirement of the machine is a full-wave rectified, unsmoothed vol-
tage which is variable between 0-30 volts r. m. s.. A power rating of 5 KVA at 30
volts should be adequate for most applications.
Figure 6.6 shows a circuit diagram of the basic power system design. This incor-
porates a variable transformer, a step-down transfonner and a full-wave bridge
rectifier.
However, difficulties were encountered in obtaining the suitable transfort-ners as
they either proved too expensive or too cumbersome. It was decided, therefore, I
not to manufacture a new power supply but to use one of the existing power sup-
plies for the preliminary experiments.
The power supply used was a Brentford 9 KVA transformer rectifier unit capable
of supplying 330 A maximum current. In industrial situations, it is planned to use
a suitably adapted, portable welding power unit.
INPUT
FIGURE 6.6 The basic power supply
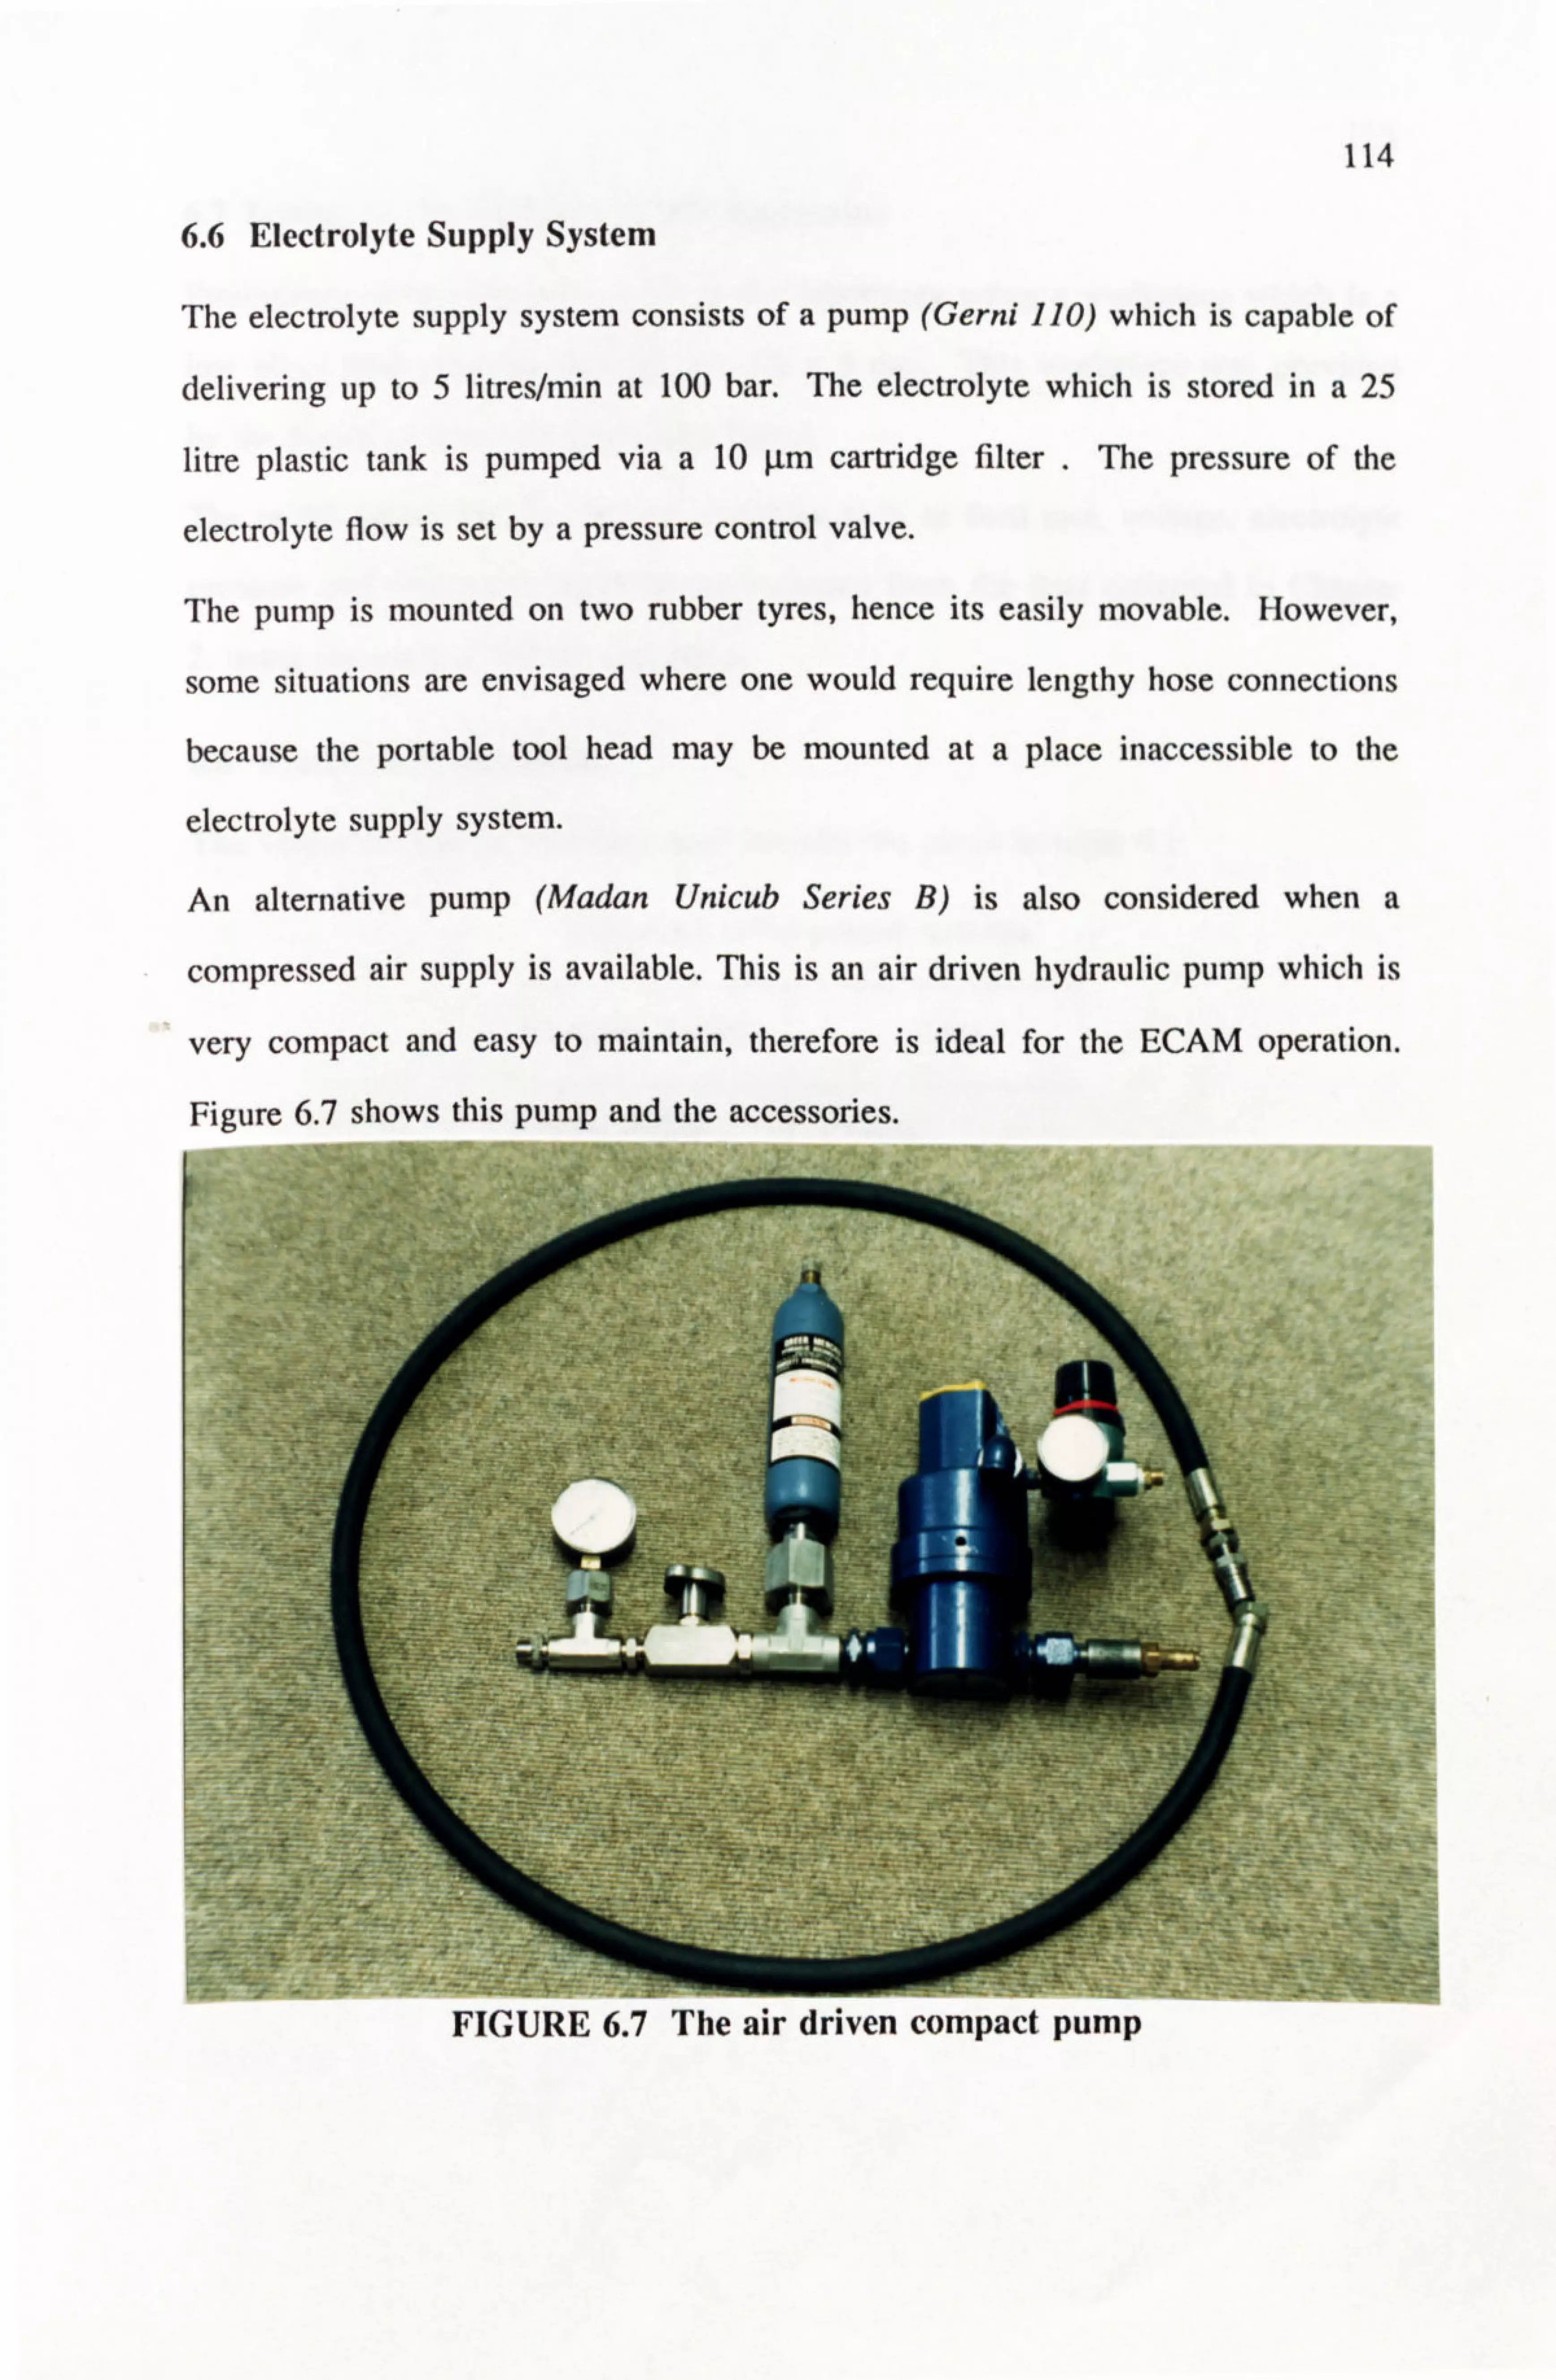
114
6.6 Electrolyte Supply System
The electrolyte supply system consists of a pump (Gerni 110) which is capable of
delivering up to 5 litres/min at 100 bar. The electrolyte which is stored in a 25
litre plastic tank is pumped via a 10 ýtm cartridge filter .
The pressure of the
electrolyte flow is set by a pressure control valve.
The pump is mounted on two rubber tyres, hence its easily movable. However,
some situations are envisaged where one would require lengthy hose connections
because the portable tool head may be mounted at a place inaccessible to the
electrolyte supply system.
An alternative pump (Madan Unicub Series B) is also considered when a
compressed air supply is available. This is an air driven hydraulic pump which is
very compact and easy to maintain, therefore is ideal for the ECAM operation.
Figure 6.7 shows this pump and the accessories.
: -: -. --.
or
FIGURE 6.7 The air driven compact pump

115
6.7 Testing of the Portable ECAD Apparatus
Preliminary tests were carried out in the laboratory using a workpiece which is a
low alloy steel plate measuring 50 x 50 x5 cm.. This workpiece was provided
by the South of Scotland Electricity Board.
The initial values for the process variables such as feed rate, voltage, electrolyte
pressure and vibration amplitude were chosen from the data collected in Chapter
2, using the vertical ECAD apparatus.
6.8 Results and Discussion
The values of process variables used initially are given in table 6.1.
TABLE 6.1 Initial process variables
Machining Variable I Value
average voltage
toot feed rate
electrolyte pressure
vibration amplitude
phase angle
. 20 volts
20 mnVmin
30 bar
0.1 mm peak to peak
00
Although these. values were based on the optimum process variables for the verti-
cal ECAM drilling apparatus, they did not prove to be the optimum values for the
portable driller. In fact they gave very poor results. Ile machining began with
severe arcing and ended in a short circuit after few minutes. 'Me process vari-
ables were gradually changed until successful drilling of holes was achieved.
These values are listed in Table 6.2.
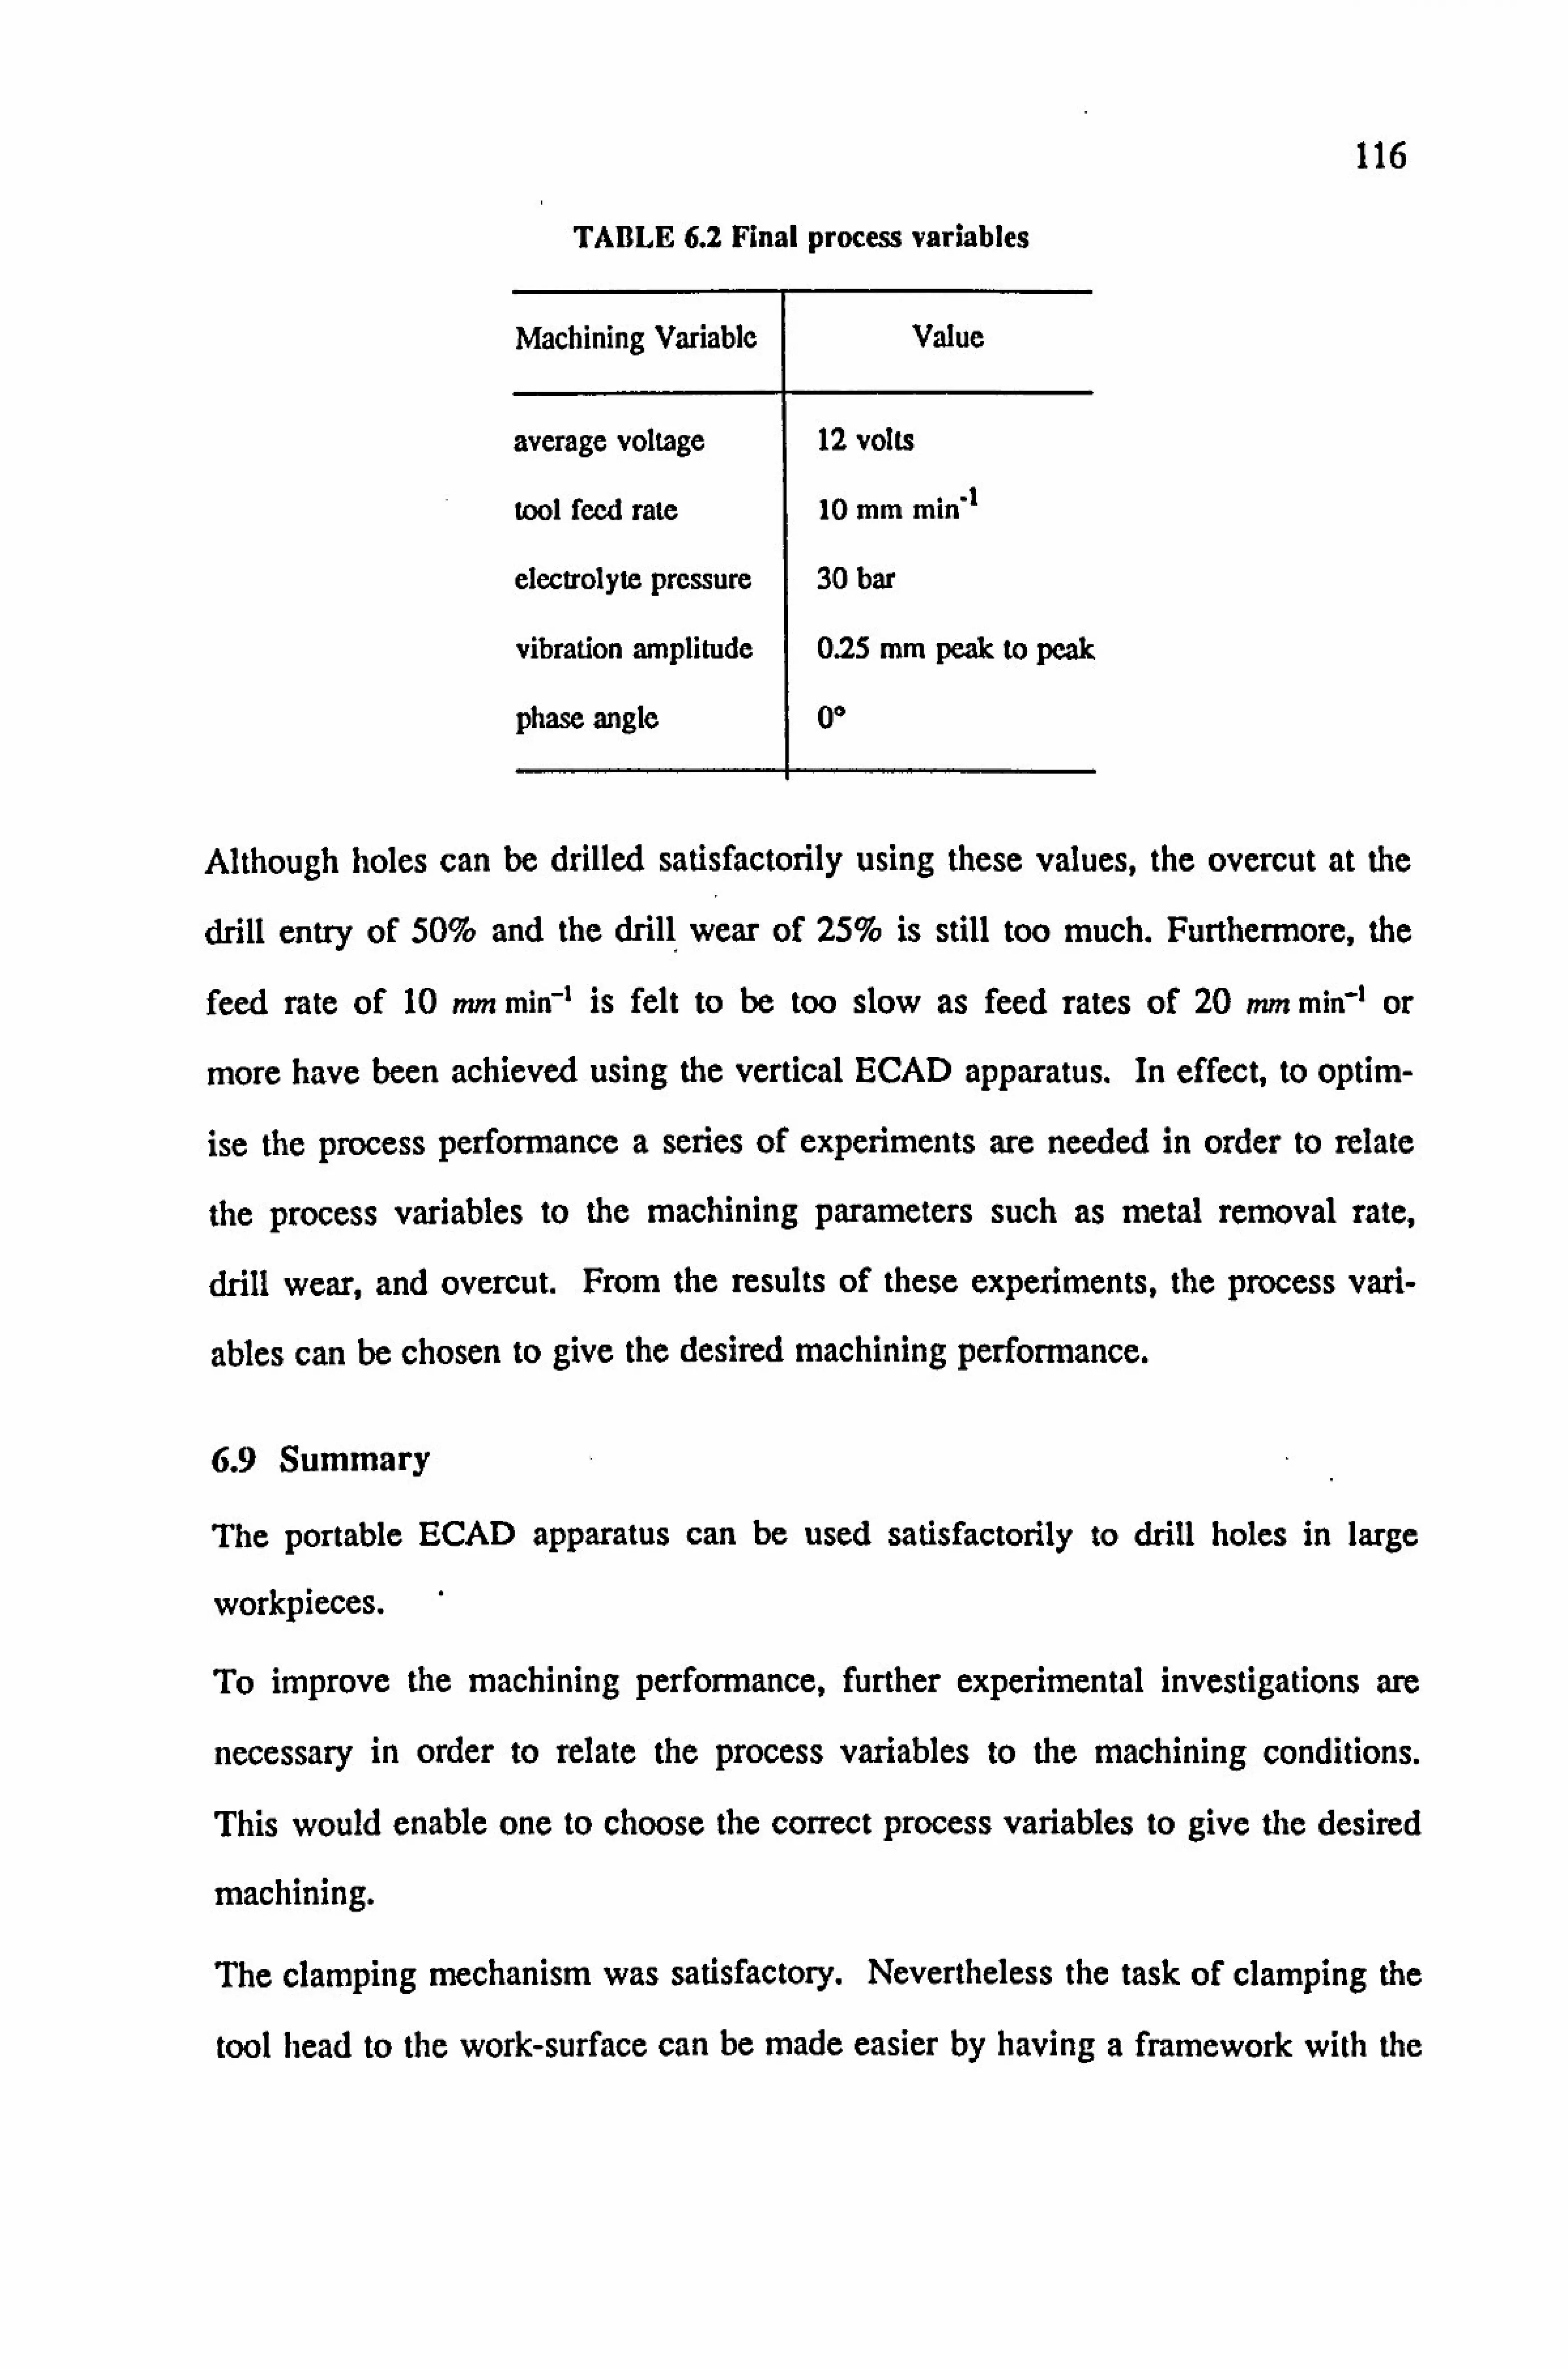
116
TABLE 6.2 Final process variables
Machining Variable I Value
average voltage
tool feed rate
electrolyte pressure
vibration amplitude
phase angle
12 volts
10 mrn min"'
30 bar
0.25 mm peak to peak
0 ()
Although holes can be drilled satisfactorily using these values, the overcut at the
drill entry of 50% and the drill. wear of 25% is still too much. Furthermore, the
feed rate of 10 mm min-' is felt to be too slow as feed rates of 20 MM min-' or
more have been achieved using the vertical ECAD apparatus. In effect, to optim-
ise the process performance a series of experiments are needed in order to relate
the process variables to the machining parameters such as metal removal rate,
drill wear, and overcut. From the results of these experiments, the process vari-
ables can be chosen to give the desired machining performance.
6.9 Summary
The portable ECAD apparatus can be used satisfactorily to drill holes in large
workpieces.
To improve the machining performance, further experimental investigations are
necessary in order to relate the process variables to the machining conditions.
This would enable one to choose the correct process variables to give the desired
machining.
The clamping mechanism was satisfactory. Nevertheless the task of clamping the
tool head to the work-surface can be made easier by having a framework with the

117
three magnetic clamps, which can be attached to the work-surface first. 7le tool
head can then be slotted into this framework.
The sealing affangement proved to be effective as long as the rubber O-ring seat
was flushed right against the workpiece. A softer rubber O-ring would enhance
this sealing capability by being more flexible.
118
7: CONCLUSIONS AND RECOMMENDATIONS
7.1 Conclusions
ECAM can be used successfully to drill holes in many metals and alloys.
For a given material, there exists a set of machining variables which
yield the optimum drilling conditions of fastest drill rate, lowest taper
and overcut, and lowest tool wear.
For most materials, the optimum conditions are obtained when the
energy available to the discharge phase is balanced by the energy avail-
able to the electrochemical phase. Since the complex nature of ECAM
makes any theoretical prediction of when this occurs difficult, these
correct permutations of the machining variables must be gained empiri-
cally.
The optimum machining conditions have been established for the five
alloys investigated : low carbon chrome steel, cobalt alloy, nickel alloy,
low alloy steel and titanium. These conditions can be used as the starting
point when drilling other similar materials by ECAM.
For most process variables, common optimum values prevailed for all the
materiils, indicating that their effect on the machining performance is
independent of the material properties. The machining voltage which was
the most crucial variable in determining the optimum conditions, differed
for each material.
7.1.2 The surface integrity of ECAM drilled alloys can exhibit both ECM and
EDM characteristics. The discharges which occur in the frontal gap leave
heat induced damage layers which are subsequently removed by the ECD

119
action occurring along the side gap.
For most of the alloys (iron and nickel based) a smooth damage free sur-
face can be obtained using aqueous sodium nitrate electrolyte. For
through holes, some typical electrodischarge induced damage can be
present at the exit end, due to the loss of electrolyte which prevents the
ECD there. This can be remedied by using a metallic extension piece
which can be discarded after the drilling operation.
The surface effects of ECAM on titanium are poor due to lack of electro-
chemical action. Ibis is a result of the tenacious oxide film which forms
on titanium in water based electrolytes, blocking the electrochemical
smoothing of the discharge induced damage.
In ECAM the problem of abnormal arcs is also present. These abnormal
arcs occur in the same location causing severe damage to both tool and
workpiece.
7.1.3 Analysis of the ECAM gap phenomena has given a deeper understanding
of the process mechanisms involved in ECAM. When using short dura-
tion square pulses instead of the full-wave rectified power, any one of
the following gap phenomena can be observed within one pulse:
a) Electrochemical action.
b) Electrochemical action followed by a normal discharge.
C) Normal discharge.
d) Abnormal discharge.
e) Short circuit.
The radio frequency emission from the gap can be used to differentiate
between the normal and the abnormal discharges. The RF level detected

120
during normal discharges is considerably higher than for the abnormal
discharges. By monitoring the RF signal together with the voltage or the
current clear indication of the ECAM gap situation can be obtained.
7.1.4 The incorporation of pulsed gap flushing has given ECAM the opportun-
ity to machine large flat areas. When flushing is on, only ECD occurs
and when the flushing stops EDE occurs. By varying the flushing on and
off times the duration of the ECD to EDE phases can be varied to suit
the machining requirements.
7.1.5 Further insight into the discharge behaviour can be obtained by theoreti-
cally analysing the RF emission from the gap. By making some basic
assumptions, the discharge current can be used to evaluate the level of
RF emission to a reasonable approximation.
7.1.6 An industrial application of ECAM which arose as a result of this project
is the development of a portable device to drill holes in large steel struc-
tures for the South of Scotland Electricity Board. The design and the
development has been successfully completed. One application of the
device is to drill holes in steam boilers to insert thermocouples.
7.2 Further Recommendations
7.2.1 Now that the process mechanisms in ECAM drilling have been further
understood, some form of automatic control system can be developed.
The gap monitoring signals such as the voltage and the current can be
used as the feedback signals. Such closed loop control should ensure a
reasonably constant gap. Using the RF emission as a feedback signal, it

121
should be possible to avoid the abnormal arcs, further enhancing the pro-
cess performance. Other signals which should be monitored are the elec-
trolyte flow rate /pressure, the vibration amplitude and phase. A micro-
computer can be implemented to achieve the autonomy.
7.2.2 Further research is needed in the large area ECAM, in order to establish
it as a die producing tool. The results obtained with pulsed flushing are
encouraging and should be further. investigated. The flushing on and off
duration should be correlated with: the EDE duration, the ECD duration,
the metal removal rate and the surface finish.
A hybrid ECAM/ECM machine for the production of full die shapes can
be developed. The roughing operation can be done using ECAM and the
finishing by ECM.
7.2.3 In ECAM discharges can only occur if there is a copious amount of gas
bubbles present in the machining gap. Therefore a study into experiments
involving gas injection into the machining gap would be useful.
7.2.4 The normal EDM-type power generator has proved to be totally inade-
quate in its present form when ECAM is to be applied over the large sur-
face areas of many typical dies. In particular, the current generated is not
sufficiently high to produce significant electrochemical dissolution. Also,
the voltage is too high, resulting in severe discharges and stray electro-
chemical attack. A new ECAM power supply, in the form of a square
pulsed, high current(600A), low voltage (variable between 0-60V) is
recommended. The square pulses will have variable on and off times
from 10 - 5000 psec.

122
The power supply can be constructed using power MOSFET transistors
as the switching elements. The latest developments in these MOSFETs
include devices with very low on resistance values, making them ideal
for switching high currents. MOSFETs also have several advantages
over bipolar transistors:
1) They are voltage controlled devices, enabling them to be driven directly
by CMOS or TTL integrated circuit logic, thus simplifying the electronic
design of switching circuitry.
2) MOSFETs have outstanding stability with temperature variation, enabling
them to be paralleled without danger of thermal runaway.
7.2.5 The theoretical model for the RF emission can be developed further by
using a computer subroutine package to give the spectral decomposition
of the current waveform. This way all the harmonics of the current
waveform can be included in the calculation to give a more accurate
model.

123
BIBLIOGRAPHY
1. Faraday, M, Experimental Researches in Electricity, I, H, In, Dover, New York, 1965.
2. DeBarr, AE and PA Oliver, Electrochemical Machining, MacDonald and G. Pub. Ltd., 1968.
3. Snoeys, R, F Staelens, and W Dekeyser, "Current Trends in Non Conventional Material Removal Processes, " Annals of the CIRP, vol. 35 part 2, pp. 467- 480,1986.
4. Uzarenko, BR and NI Lazarenko, Electrospark Processing of Current car. rying Materials, USSR Academy of Sciences, Moscow, 1958.
5. Weller, E J, Nontraditional Machining Processes, Society of Manufacturing Engineers, Dearbon, Michigan, 1984 0
6. Semon, G, A Practical Guide to EDM, Ateliers Des Charmilles S A, Geneva, 1975.
7. Hatschek, R L, "EDM Update '84, " American Machinist, vol. 128 part 3, pp. 113-124,1984.
8. Astrop, P, "Seminar reveals some new ideas, " Mach Prod Eng, vol. 141 p3629, pp. 21-22,1983.
9. Dobovsek, M. and F Roethel, "Contribution to Computer Aided Process Plan- ning of EDM, " Proc. Int. Conf. on Advanced Manufacturing Systems and Technology, Yugoslavia, October 1987.
10. Drake, T and JA McGeough, "Aspects of Drilling by Electrochemical Arc Machining, " Proc. Machine Tool Design Conference, pp. 362-369, MacMil- lan, 1981.
11. Petrow, J ý4, GH Zajdman, AW Rybalko, and GN Prin, "Pulse Current ECM of Metals, " Int. Symp. Electromachining, pp. 285-289, Poland, 1980.
12. Inoe, K and I Shibuya , "On the ECDM, " Jap Tool Engineer, vol. 17, p. 8, 1963.
13. Inoe, K and A Shin-Azu , "ECD Grinding Machine, " J. S. M. E., vol. 71, p. 890, 1968. no 594
14. Kubota, M, "Electrochemical-Discharge Mechanical Grinding with a Graphite Inserted Abrasive Wheel, " Proc of 7th Int Syrn on Elect romachinin g (CIRP), April 1983.
15. Kimoto, Y, K Tamiya, and K Hirata, "Study on Low Electrode-wear-ratio EDM in water and water solution, " Japan Society of Electrical Machining Engineers, vol. I no 2, p. 45,1968.

124
16. Lazarenko, BR and NI Lazarenko, "Mechanism of Passage of Electric Current Through Electrolyte, " Elektronnaya Obrabotka Materialov, 1977.
17. Glazkov, AV and BR Lazarenko, "Common Problems of Three Dimensional EDM and ECM, " Proc Int Symp for Electromachining (CIRP), pp. 7-9, 1977.
18. Kubota, M, "Metal Removal in ECDM, " Proc of ISEM-5, pp. 217-220, June 1977.
19. Kubota, M, "On the Technological Potentialites of ECDM, " Mechanique, vol. 303, pp. 15-18, March 1975.
20. Kubota, M, Y Tamura, H Takahashi, and T Sugaya, "Basic Study of ECDM- H. " Jap. Assoc. of Elect romachinery, vol. 26,1980.
21. Zaytsev, AN and VI Polyanin, "The frequency properties of the interelec- trodes gap in spark-electrochemical piercing of small holes, " Electrochemical Ind Proc & Biol, vol. 5, pp. 16-20,1978.
22. Saushkin, B P, I Mingazetdinov, VK Sidelnikov, EG Semonov, and VA Gushan, "Special Features of Combined Electrochemical and Electro-Erosion Machining of Elongate Machine Parts, " Electrochemical In Indust Proc & Biol, vol. 105 part 3, pp. 8-14,1982.
23. Crichton, I M, JA McGeough, W Munro, and C White, "Comparative Studies of ECM, EDM and ECAM, " Precision Engineering, 1981.
24. Crichton, I M, "A Computational and Experimental Study of Discharges in Electrolytes, " PhD Thesis, University of Aberdeen, 1982.
25. Drake, T H, "Aspects of Drilling by Electrochemical Arc Machining, " MSc Thesis, University of Aberdeen, 1980.
26. Khayry, A B, "Stochastic and Experimental Studies of Drilling by Electro- chemical Arc Machining, " PhD Thesis, University of Aberdeen, 1984.
27. El-Hofy, H, "Stochastic and Experimental Studies of Wire Cutting by Electro- chemical Arc Machining, " PhD Thesis, University of Aberdeen, 1985.
28. Munro, W, "Experimental and Theoretical Studies of the Surface Treatment of Dies and Moulds, " PhD Thesis, University of Aberdeen, 1983.
29. Snoey, R, DF Dawn, and JP Kruth, "Survey of Adaptive Control in Electro Discharge Maching, " J. of Man. Systems, vol. 2, No 2, pp. 147-164.
30. Jones, F L, "Electrode Erosion by Spark Discharges, " Brit. Journal of Ap- plied Physics, vol. 1, no 3, pp. 60-65, March 1950.
31. Van-Dijck, FS and WL Dutre, "Heat Conduction Model for the Calculation of the Volume of Molten Metal in Electric Discharges, " Applied Physics, vol. 7, pp. 899-910,1974.

125
32. Erden, A and B Kafatanoglu, "Heat Transfer Modelling of Electric Discharge Machining, " Proc 21st Int Mach Tool Design and Research Conf, pp. 351- 358.
33. McGeough, J A, Principles of Electrochemical Machining, Chapman & Hall, London, 1974.
34. Berghausen, P E, "Electro-Discharge Machining Program, " Final Report ASD-TDR-7-545, vol. AD 423-199, Defence Document Centre, Arlington Hall Station, Arlington Virginia, July 1963.
35. Crookall, JR and B Khor, "Electrodischarge Machined Surfaces, " Int. J. Mach. Tool Des. Res., pp. 373-384,1975.
36. - Bucklow, IA and M Cole, "Spark Machining, " Met. Reviews, vol. 3, no. 135
, pp. 103-113., June 1969 - 37. Lloyd, HK and RH Warren, "Metallurgy of Spark Machined Surfaces, "
journal of The Iron and Steel Institute,, pp. 238-247, March 1965 . 38. Platanik, LS and AA Levechenko, Kristral-lograflya , vol. 3, p. 613., 1958
39. Bannard, J, "Fine hole drilling using electrochemical machining, " Int. Machine Tool Des. Res. Conf., pp. 503-510, MacMillan Pub. , Manchester, 1978.
40. Cole, RR and Y Hopenfeld, ASME paper, no. 62-wa-71 , 1962.
41. Kashthejev, V D, "Processes which control surface microroughness during ECM, " Proc. Int. Symp. for Electromachining, Poland pp 271-274, June 17- 20,1980.
42. McGeough, J A, AB Khayry, and W Munro, "Theoretical and Experimental Investigation of the Relative Effects of Spark Erosion and Electrochemical Dis- solution in Electrochemical Arc Machining, " Annals of the CIRP vol. 32, no. 1, pp. 113-118., 1983
43. Driver, I;, "Developments in Aero Engine Materials, " Metals and Materials, pp. 345-354, June 1985.
44. Bannard, J E, JR Treble, and PA Brook, "The Electrochemical Machining of Titanium in Non- aqueous Electrolytes, " Int. Symp. for Electromachining, pp. 121-125., June 1977.
45. Meek, JM and JD Craggs, Electrical Breakdown of Gases, pp. 252-256, Clarendon Press, Oxford, 1953.
46. Watson, PK and AH Sharbaugh, Electrochemical Society, p. 107,516,1960.
47. Kao, K C, Applied Physics, vol. 12, p. 629,1961.
126
48. Fiei, C, E Perreard, and M Peter, "On the Breakdown Mechanism of Recurring Discharges in Liquid Dielectric, " Helvetica Physica, Acta, vol. 45,1972.
49. Heuvelman, C 1, HJA Horsten, and PC Veenstra, "An Introductory Investi- gation of Breakdown Mechanism in Electro-Discharge Machining, " Annals of CIRP, vol. 20, pp. 43-44.
50. Loutrel, SP and NH Coo4 "Ffigh Rate Electrochemical Machining, " Trans. ASNIIE, pp. 992-996, Nov 1973.
51. Larsson, CN and EM Baxter, "Tool Damage by Sparking in ECM, " Proc. 18th Int. Mach. Tool Des. Res. Conf, pp. 499-505, Sept 1977.
52. McGeough, JA and IM Crichton, "Studies of the Discharge Mechanisms in Electrochemical Arc. Machining, " Applied Electrochemistry, pp. 113-119, 1985.
53. Snoeys, R and H Cornelissen, "Correlation Between Electro-Discharge Machinery Dam and Machinery Settings., " Annals of the CIRP, vol. 24/1, 1975.
54. Snoeys, R, D Dauw, and M Jennes, "Survey of EDM Adaptive Con=ol and Detection Systems, " Annals of the CIRP, vol. 31/2, pp. 483-489,1982.
55. Bhahacharyya, SK and MF El-Menshawy, "Monitoring the EDM Process by Radio Signals, " Int. J. Prod. Res., vol. 16, pp. 353-363,1978.
56. Xi, S and L Liming, "Preliminary Investigation on the Radio Frequency Radia- tion in EDM (in Chinese), " Electromachinery, vol. 2,1984.
57. El-Menshavty, MF and MS Ahmed, "Monitoring and Control of the Electro- Discharge Texturing Process for Steel Cold MR Work Rolls, " Transfer Tec. nology Ltd, Birmingham, U. K., 1985.
58. .
Wood, A N, "Electrochemical Arc Machining - Characteristics, Process Moni- toring and Control., " MSc Thesis, University of Aberdeen, 1985.
59. Bekefi, G, Radiation Process in Plasmas, Wiley, New York, 1980.
60. Phillips, V J, Early Radio Wave Detectors, Peter Peregrinus Ltd in association with the Science Museum, London, 1980.
61. Kraus, J, Electromagentics, 3rd Edition, McGrawhill, 1984.
62. Somerville, J M, "Some Fundamental Properties of Plasmas, " Discharge and Plasma Physics, The University of New England, Australia, 1964.

APPENDIX
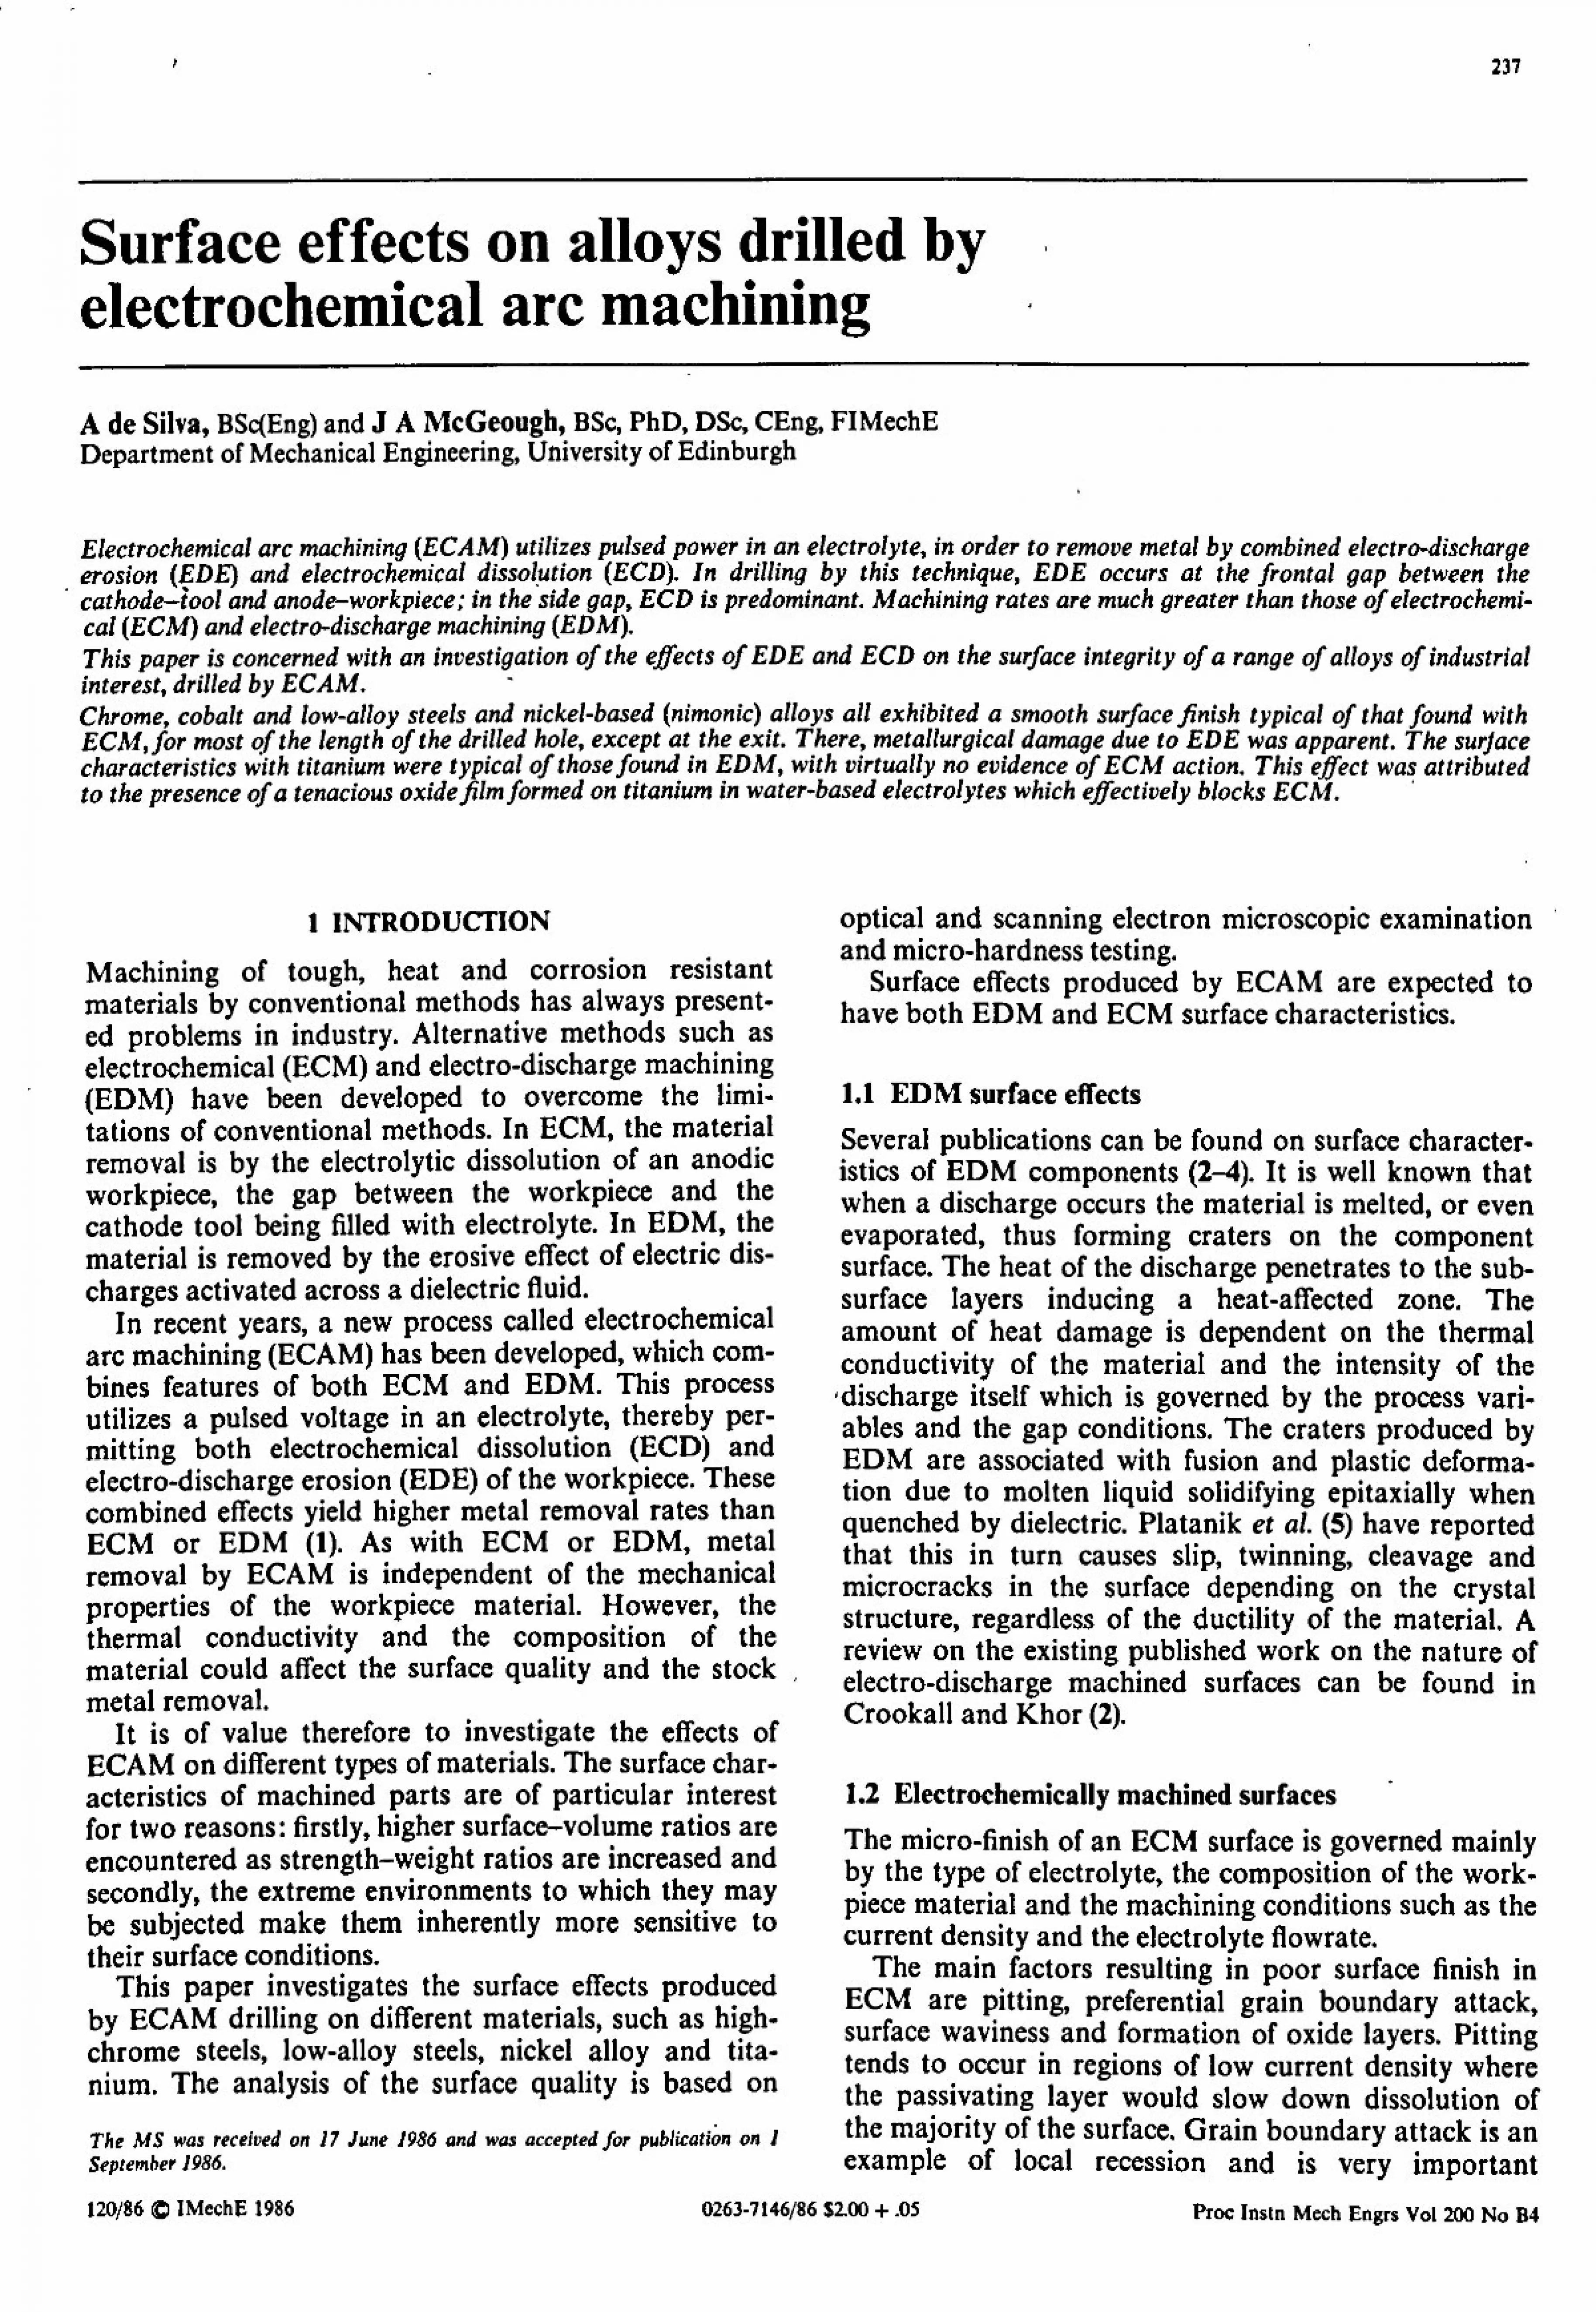
237
Surface effects on alloys drilled by electrochemical arc machining A de Silva, BSc(Eng) and JA McGeough, BSc, PhD, DSc, CEng, FlMechE Department of Mechanical Engineering, University of Edinburgh
Electrochemical arc machining (ECAM) utilizes pulsed power in an electrolyte, in order to remove metal by combined electro-discharge erosion (EDE) and electrochemical dissol
' ution (ECD). In drilling by this technique, EDE occurs at the frontal gap between the
cathode-iool and anode-workpiece; in the side gap, ECD is predominant. Machining rates are much greater than those of electrochemi- cal (ECM) and electro-discharge machining (EDM). This paper is concerned with an investigation of the effects of EDE and ECD on the surface integrity of a range of alloys of industrial interest, drilled by ECAM. Chrome, cobalt and low-alloy steels and nickel-based (nimonic) alloys all exhibited a smooth surface finish typical of that found with ECM, for most qf the length of the drilled hole, except at the exit. There, metallurgical damage due to EDE was apparent. The surface characteristics with titanium were typical of thosefound in EDM, with virtually no evidence of ECM action. This effect was attributed to the presence of a tenacious oxidefilm formed on titanium in water-based electrolytes which effectively blocks ECM.
1 INTRODUCTION
Machining of tough, hcat and corrosion resistant materials by conventional methods has always present- cd problems in industry. Alternative methods such as electrochemical (ECM) and elcctro-dischargc machining (EDM) have been developed to overcome the limi- tations of conventional methods. In ECM, the material removal is by the electrolytic dissolution of an anodic workpiece, the gap between the workpiece and the cathode tool being filled with electrolyte. In EDM, the material is removed by the erosive cffect of electric dis- charges activated across a dielectric fluid.
In recent years, a new process called electrochemical arc machining (ECAM) has been developed, which com- bines features of both ECM and EDM. This process utilizes a pulsed voltage in an electrolyte, thereby per- mitting both electrochemical dissolution (ECD) and clcctro-discharge erosion (EDE) of the workpiece. These combined effects yield higher metal removal rates than ECM or EDM (1). As with ECM or EDM, metal removal by ECAM is independent of the mechanical properties of the workpiece material. However, the thermal conductivity and the composition of the material could affect the surface quality and the stock metal removal.
It is of value therefore to investigate the effects of ECAM on different types of materials. The surface char- actcristics of machined parts arc of particular interest for two reasons: firstly, higher surface-volume ratios arc encountered as strcngth-wcight ratios are increased and secondly, the extreme environments to which they may be subjected make them inherently more sensitive to their surface conditions.
This paper investigates the surface cffects produced by ECAM drilling on different materials, such as high- chrome steels, low-alloy steels, nickel alloy and tita- nium. The analysis of the surface quality is based on The MS was received on 17 June 1986 and was accepted for publication on I September 1986.
optical and scanning electron microscopic examination and micro-hardness testing.
Surface effects produced by ECAM are expected to have both EDM and ECM surface characteristics.
1.1 EDM surface effects Several publications can be found on surface character- istics of EDM components (2-4). It is well known that when a discharge occurs the material is melted, or even evaporated, thus forming craters on the component surface. The heat of the discharge penetrates to the sub- surface layers inducing a heat-affected zone. The amount of heat damage is dependent on the thermal conductivity of the material and the intensity of the , discharge itself which is governed by the process vari- ables and the gap conditions. The craters produced by EDM are associated with fusion and plastic deforma- tion due to molten liquid solidifying epitaxially when quenched by dielectric. Platanik et al. (5) have reported that this in turn causes slip, twinning, cleavage and microcracks in the surface depending on the crystal structure, regardless of the ductility of the material. A review on the existing published work on the nature of electro-discharge machined surfaces can be found in Crookall and Khor (2).
1.2 Electrochemically machined surfaces The micro-finish of an ECM surface is governed mainly by the type of electrolyte, the composition of the work- piece material and the machining conditions such as the current density and the electrolyte flowrate.
The main factors resulting in poor surface finish in ECM are pitting, preferential grain boundary attack, surface waviness and formation of oxide layers. Pitting tends to occur in regions of low current density where the passivating layer would slow down dissolution of the majority of the surface. Grain boundary attack is an example of local recession and is very important
120/86 C lMcchE 1986 0263-7146/86 $100 +. 05 Proc Instn Mcch Engrs Vol 200 No B4
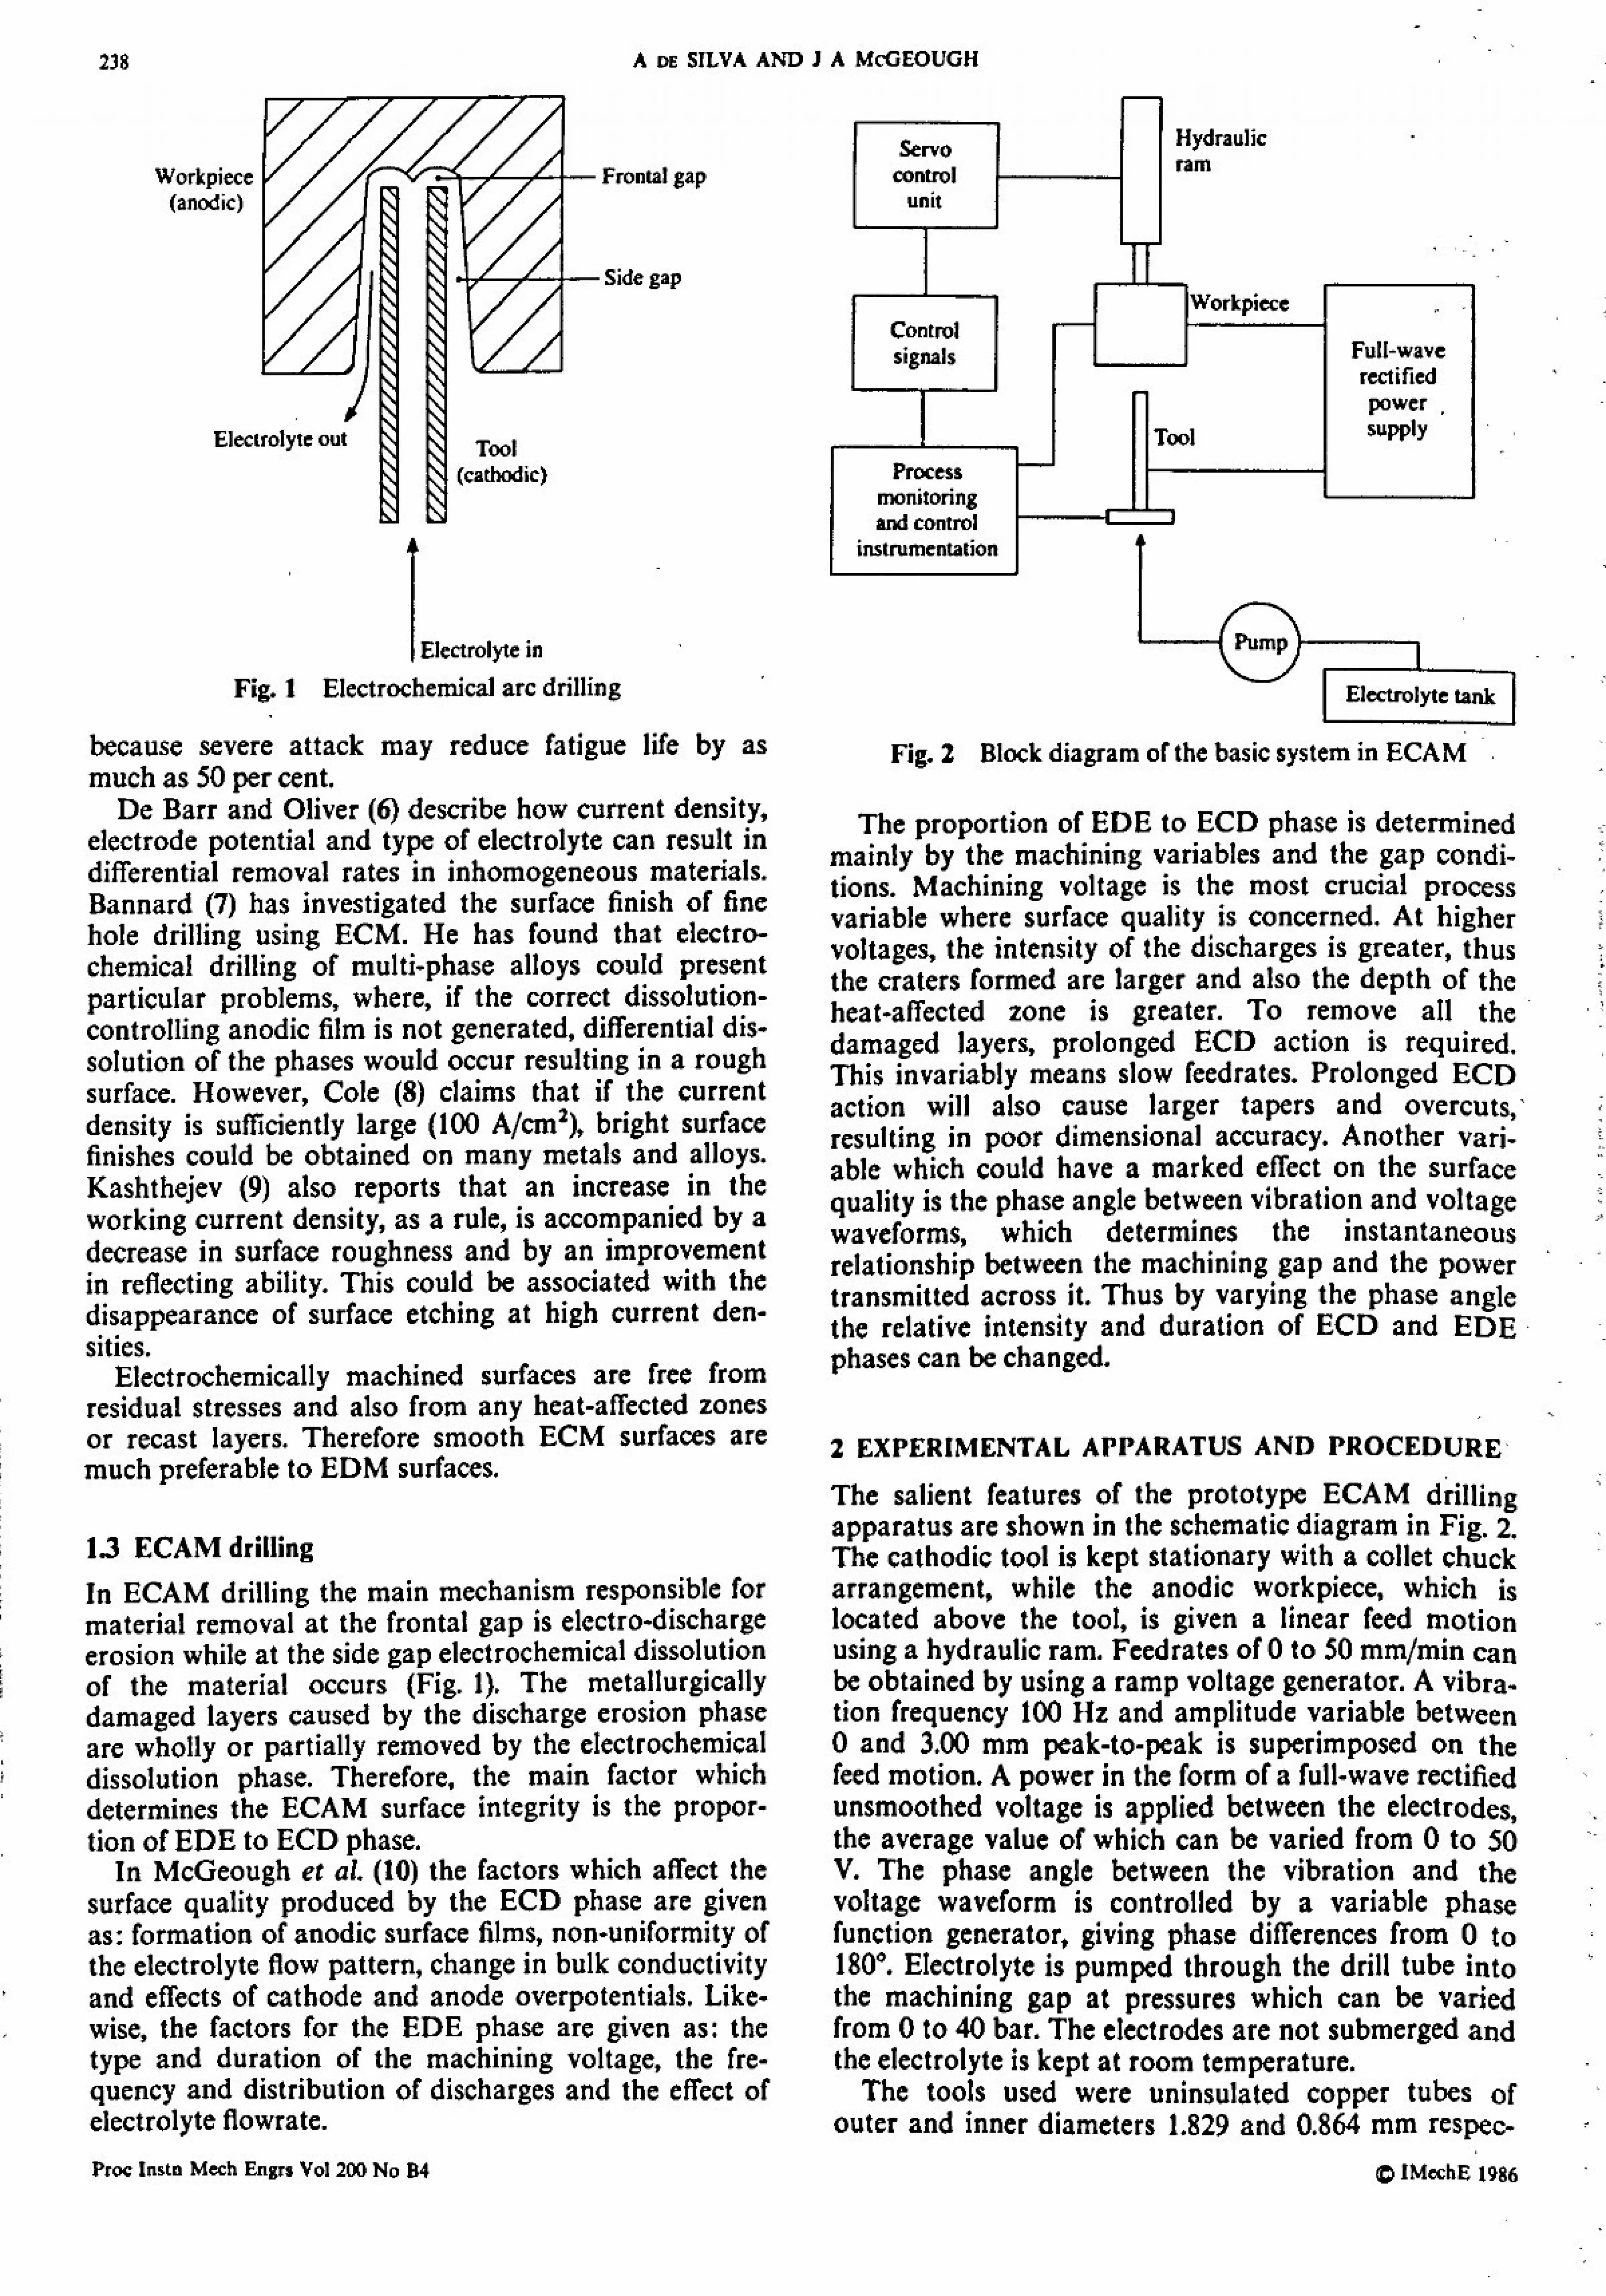
238
Workpiece (anodic)
Electrolyte out
A DE SILVA AND JA McGEOUGH
Frontal gap
Side gap
Tool (cathodic)
Electrolyte in
Fig. 1 Electrochemical arc drilling
because severe attack may reduce fatigue life by as much as 50 per cent.
De Barr and Oliver (6) describe how current density, electrode potential and type of electrolyte can result in differential removal rates in inhomogeneous materials. Bannard (7) has investigated the surface finish of fine hole drilling using ECM. He has found that electro- chemical drilling of multi-phase alloys could present particular problems, where, if the correct dissolution- controlling anodic film is not generated, differential dis- solution of the phases would occur resulting in a rough surface. However, Cole (8) claims that if the current density is sufficiently large (100 A/crn'), bright surface finishes could be obtained on many metals and alloys. Kashthejcv (9) also reports that an increase in the working current density, as a rule, is accompanied by a decrease in surface roughness and by an improvement in reflecting ability. This could be associated with the disappearance of surface etching at high current den- sities.
Electrochemically machined surfaces are free from residual stresses and also from any hcat-affected zones or recast layers. Therefore smooth ECM surfaces are much preferable to EDM surfaces.
13 ECAM drilling In ECAM drilling the main mechanism responsible for material removal at the frontal gap is electro-discharge erosion while at the side gap electrochemical dissolution of the material occurs (Fig. 1). The metallurgically damaged layers caused by the discharge erosion phase are wholly or partially removed by the electrochemical dissolution phase. Therefore, the main factor which determines the ECAM surface integrity is the propor- tion of EDE to ECD phase.
In McGeough et al. (10) the factors which affect the surface quality produced by the ECD phase are given as: formation of anodic surface films, non-uniformity of the electrolyte flow pattern, change in bulk conductivity and effects of cathode and anode overpotentials. Like- wise, the factors for the EDE phase are given as: the type and duration of the machining voltage, the fre- quency and distribution of discharges and the effect of electrolyte flowrate.
Servo Hydraulic
control ram unit
I
C si Full-wave
rectified power
Tool supply
Process monitoring and control
instrumentation
Pump
F "lectro tank E, ectrolyte t &]
Fig. 2 Block d iagram of the basic system in ECAM
The proportion of EDE to ECD phase is determined mainly by the machining variables and the gap condi- tions. Machining voltage is the most crucial process variable where surface quality is concerned. At higher voltages, the intensity of the discharges is greater, thus the craters formed are larger and also the depth of the heat-affected zone is greater. To remove all the damaged layers, prolonged ECD action is required. This invariably means slow feedrates. Prolonged ECD action will also cause larger tapers and overcuts, - resulting in poor dimensional accuracy. Another vari- able which could have a marked effect on the surface quality is the phase angle between vibration and voltage waveforms, which determines the instantaneous relationship between the machining gap and the power transmitted across it. Thus by varying the phase angle the relative intensity and duration of ECD and EDE, phases can be changed.
2 EXPERIMENTAL APPARATUS AND PROCEDURE-
The salient features of the prototype ECAM drilling apparatus arc shown in the schematic diagram in Fig. 2. The cathodic tool is kept stationary with a collet chuck arrangement, while the anodic workpiece, which is located above the tool, is given a linear feed motion using a hydraulic ram. Feedrates of 0 to 50 mm/min can be obtained by using a ramp voltage generator. A vibra- tion frequency 100 Ift and amplitude variable between 0 and 3.00 mm peak-to-pcak is superimposed on the feed motion. A power in the form of a full-wave rectified unsmoothed voltage is applied between the electrodes, the average value of which can be varied from 0 to 50 V. The phase angle between the vibration and the voltage waveform is controlled by a variable phase function generator, giving phase differences from 0 to 180*. Electrolyte is pumped through the drill tube into the machining gap at pressures which can be varied from 0 to 40 bar. The electrodes are not submerged and the electrolyte is kept at room temperature.
The tools used were uninsulated copper tubes of outer and inner diamcters 1.829 and 0.864 mm respec-
Proc Instn Mech Engrs Vol 200 No R4 Q IMechE 1986
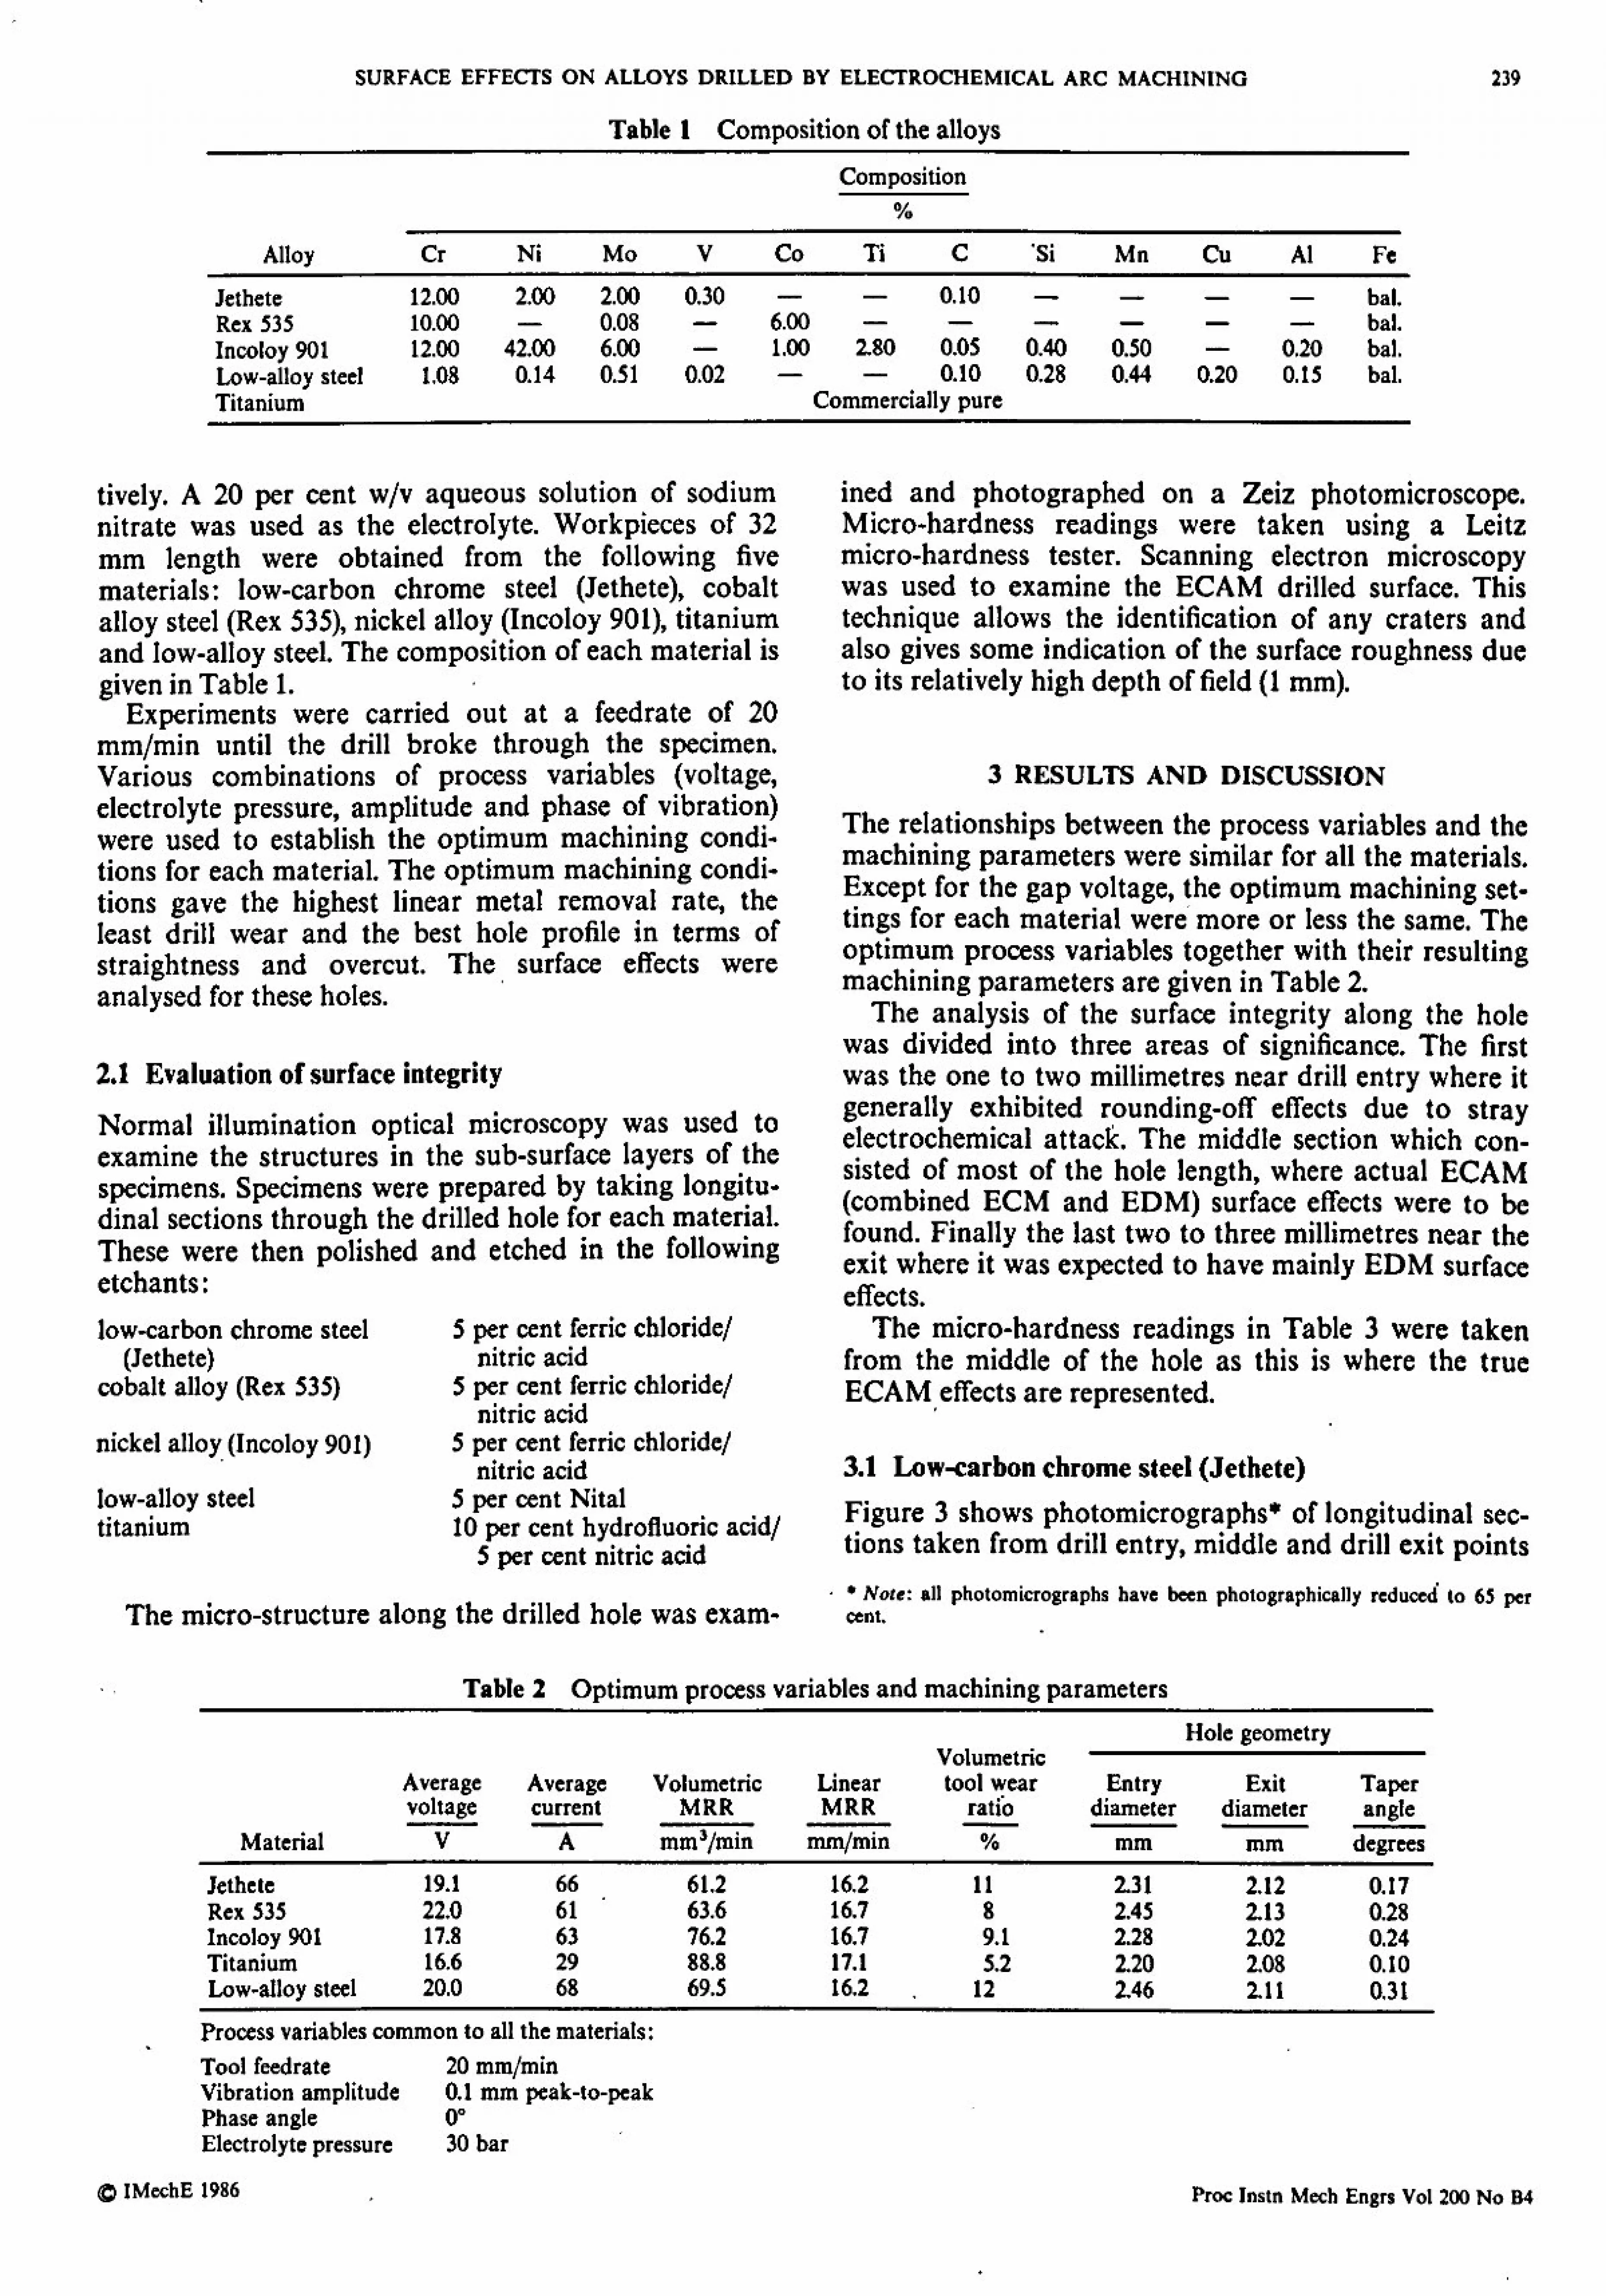
SURFACE EFFECTS ON ALLOYS DRILLED BY ELECTROCHEMICAL ARC MACHINING
Table I Composition of the alloys Composition
Alloy Cr Ni Mo v CO Ti C Mn Cu Al Fe
Jethete 12.00 2.00 2.00 0.30 --0.10 bal. Rex 535 10.00 - 0.08 - 6.00 -- bal. Incoloy 901 12.00 42.00 6.00 - 1.00 2.80 0.05 0.40 0.50 - 0.20 bal. Low-alloy steel 1.08 0.14 0.51 0.02 --0.10 0.28 0.44 0.20 0.15 bal. Titanium Commercially pure
tively. A 20 per cent w/v aqueous solution of sodium nitrate was used as the electrolyte. Workpieces of 32 mm length were obtained from the following five materials: low-carbon chrome steel (Jethete), cobalt alloy steel (Rex 535), nickel alloy (Incoloy 901), titanium and low-alloy steel. The composition of each material is given in Table 1.
Experiments were carried out at a feedrate of 20 mm/min until the drill broke through the specimen. Various combinations of process variables (voltage, electrolyte pressure, amplitude and phase of vibration) were used to establish the optimum machining condi- tions for each material. The optimum machining condi- tions gave the highest linear metal removal rate, the least drill wear and the best hole profile in terms of straightness and overcut. The surface effects were analysed for these holes.
2.1 Evaluation of surface integrity
Normal illumination optical microscopy was used to examine the structures in the sub-surface layers of the specimens. Specimens were prepared by taking longitu- dinal sections through the drilled hole for each material. These were then polished and etched in the following etchants: low-carbon chrome steel 5 per cent ferric chloride/
(Jethete) nitric acid cobalt alloy (Rex 535) 5 per cent ferric chloride/
nitric acid nickel alloy (Incoloy 901) 5 per cent ferric chloride/
nitric acid low-alloy steel 5 per cent Nital titanium 10 per cent hydrofluoric acid/
5 per cent nitric acid
The micro-structure along the drilled hole was exam-
239
ined and photographed on a Zeiz photomicroscope. Micro-hardness readings were taken using a Leitz micro-hardness tester. Scanning electron microscopy was used to examine the ECAM drilled surface. This technique allows the identification of any craters and also gives some indication of the surface roughness due to its relatively high depth of field (I mm).
3 RESULTS AND DISCUSSION
The relationships between the process variables and the machining parameters were similar for all the materials. Except for the gap voltage, the optimum machining set- tings for each material were'more or less the same. The optimum process variables together with their resulting machining parameters are given in Table 2.
The analysis of the surface integrity along the hole was divided into three areas of significance. The first was the one to two millimetres near drill entry where it generally exhibited rounding-off effects due to stray electrochemical attack. The middle section which con- sisted of most of the hole length, where actual ECAM (combined ECM and EDM) surface effects were to be found. Finally the last two to three millimetres near the exit where it was expected to have mainly EDM surface effects.
The micro-hardness readings in Table 3 were taken from the middle of the hole as this is where the true ECAM. effects are represented.
3.1 Low-carbon chrome steel (Jethete) Figure 3 shows photomicrographs* of longitudinal sec- tions taken from drill entry, middle and drill exit points 0 Note: all photornicrographs have been photographically reduced to 65 per cent.
Table 2 Optimum process variables and machining parameters Hole geometry
Volumetric Average Average Volumetric Linear tool wear Entry Exit Taper voltage current MRR MRR ratio diameter diameter angle
Material VA ; Wm; 7/min min/min % mm mirk degrees
Jethete 19.1 66 61.2 16.2 11 2-31 2.12 0.17 Rex 535 22.0 61 63.6 16.7 8 2.45 2.13 0.28 Incoloy 901 17.8 63 76.2 16.7 9.1 2.28 2.02 0.24 Titanium 16.6 29 88.8 17.1 5.2 2.20 2.08 0.10 Low-alloy steel 20.0 68 69.5 16.2 12 2.46 2.11 0.31
Process variables common to all the materials: Tool feedrate 20 mm/min Vibration amplitude 0.1 mm. peak-to-peak Phase angle 0. Electrolyte pressure 30 bar
lMechE 1986 Proc Instn Mcch Engrs Vol 200 No B4
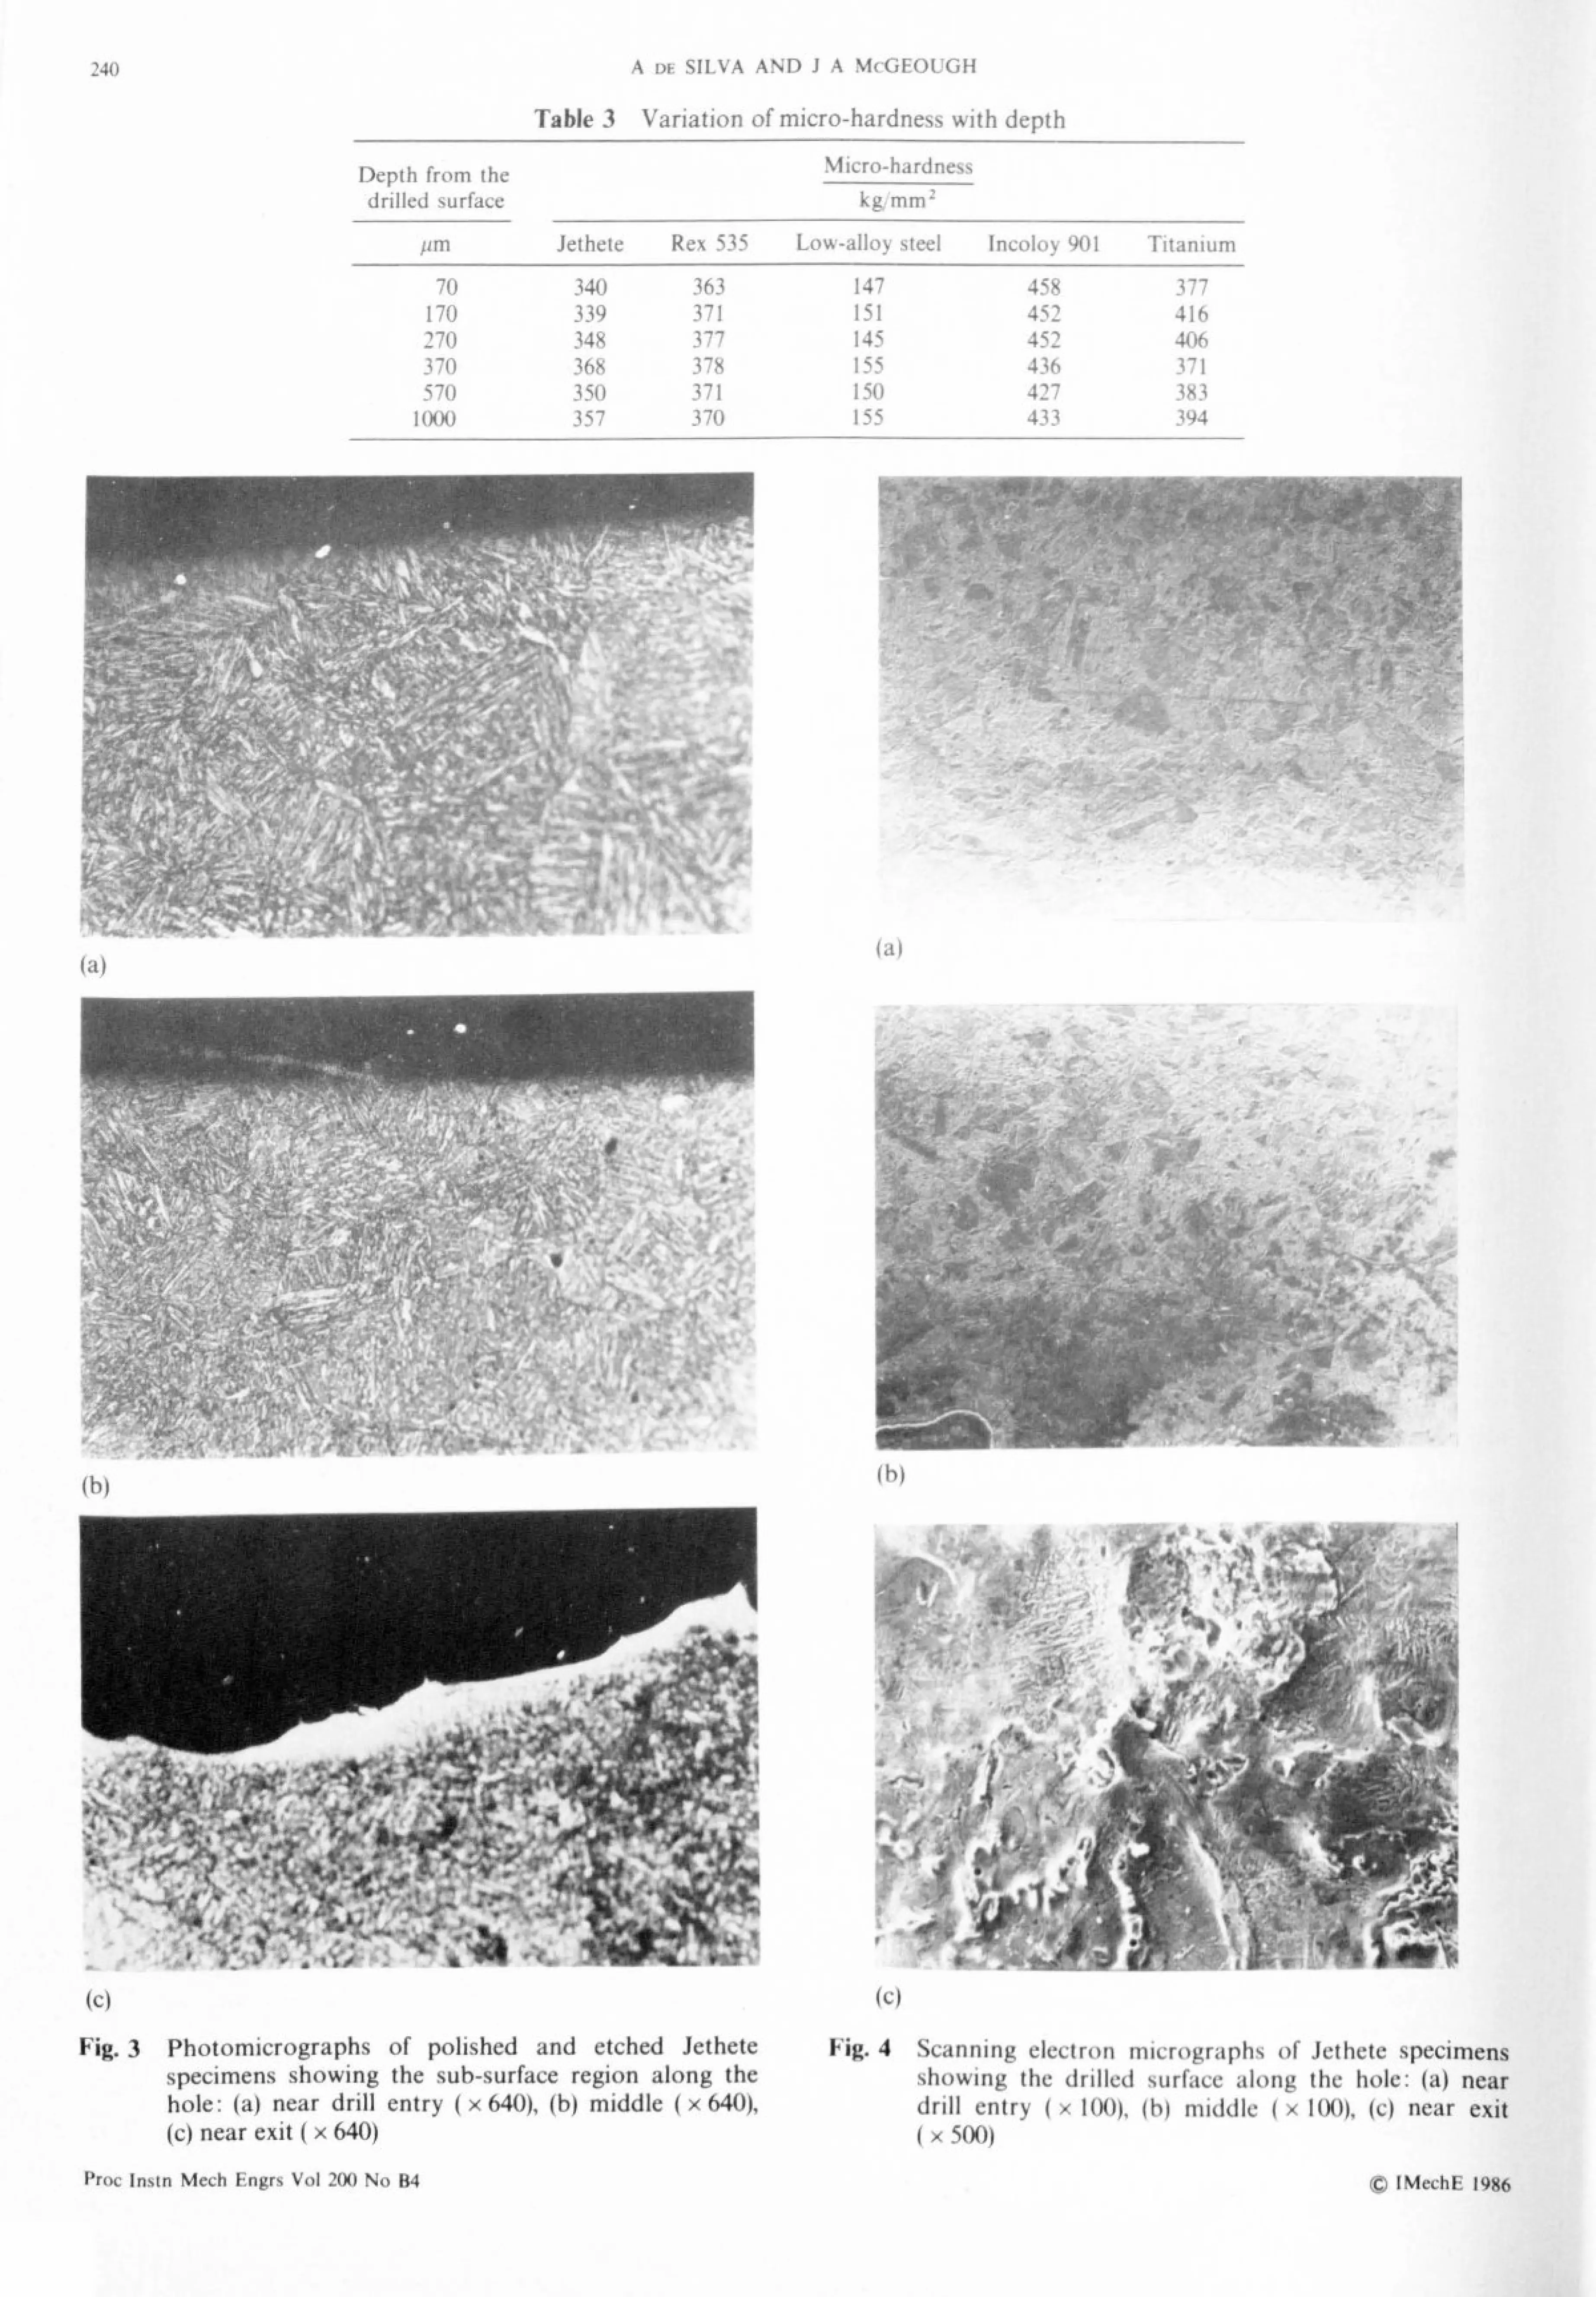
'4 0 \ý"ý; I ýý \%"I); \%I(ýI(, ý(, Ii
Table 3 Variation of micro-hardness with depth
Depth from the Micro-hardness drilled surface kg, mm'
Pm Jethete Rex 535 Low-alloy steel Incoloy 901 Titanium
70 340 363 147 458 377 170 339 371 151 452 416 '170 348 377 145 452 406 370 368 378 155 436 371 570 350 371 150 427 383
1000 357 370 155 433 394
(a)
ijý. 's,
SS--.. �-5------- -
S '*)S5-' -.
--
(h)
ý. 1w, A-
(c)
Fig. 3 Photomicrographs of polished and etched Jethete specimens showing the sub-surface region along the hole: (a) near drill entry (x 640), (b) middle (x 640), (c) near exit (x 640)
Proc Instn Mech Engrs Vol 200 No B4
-17i
(a
-AiL WJW
- a-i,. -
- jc. .;. - ;
I
" ".
_'-b"-" ". -'
(C)
Fig. 4 Scanning electron micrographs of Jethete specimens showing the drilled surface along the hole: (a) near drill entry (x 100), (b) middle (x IM), (c) near exit (x 500)
CO IMechE 1986
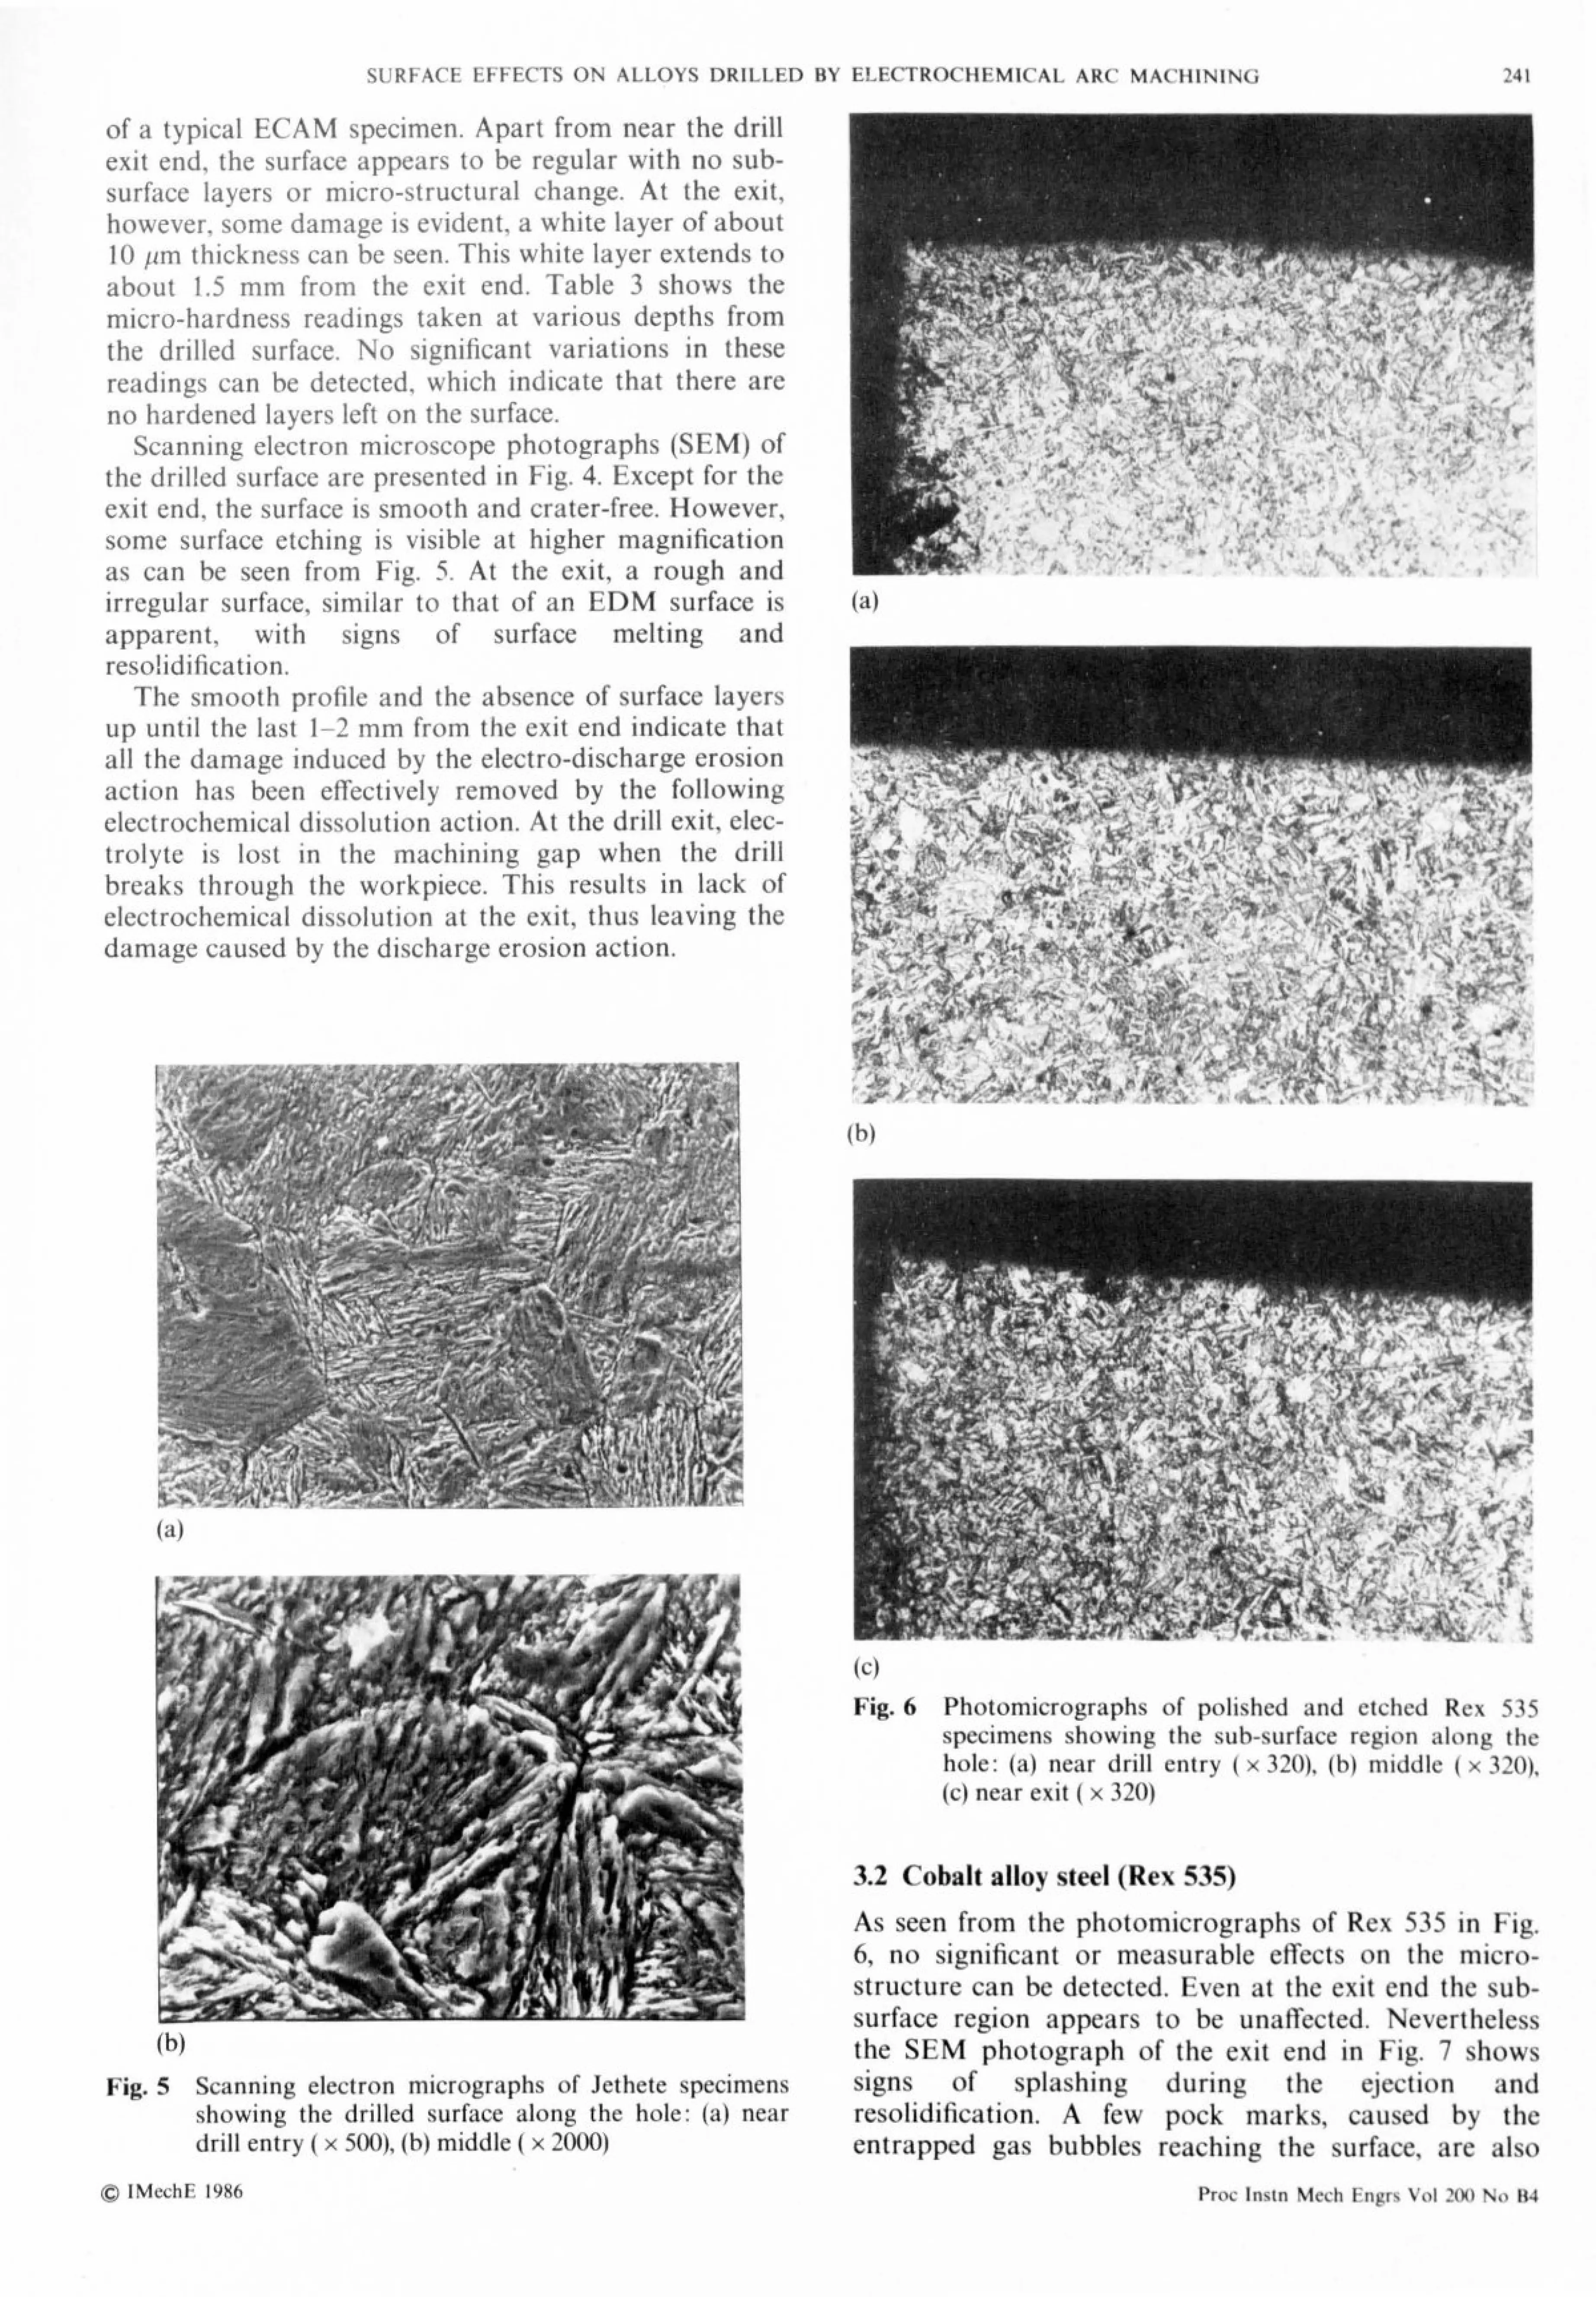
SURFACE EFFECTS ON ALLOYS DRILLED BY ELECTROCHEMICAL ARC MACIIINING
of a typical ECAM specimen. Apart from near the drill exit end, the surface appears to be regular with no sub- surface layers or micro-structural change. At the exit, however, some damage is evident, a white layer of about 10 jim thickness can be seen. This white layer extends to about 1.5 mm from the exit end. Table 3 shows the micro-hardness readings taken at various depths from the drilled surface. No significant variations in these readings can be detected, which indicate that there are no hardened layers left on the surface.
Scanning electron microscope photographs (SEM) of' the drilled surface are presented in Fig. 4. Except for the exit end, the surface is smooth and crater-free. However, some surface etching is visible at higher magnification as can be seen from Fig. 5. At the exit, a rough and irregular surface, similar to that of an EDM surface is apparent, with signs of surface melting and resofidification.
The smooth profile and the absence of surface layer, up until the last 1-2 mm from the exit end indicate that all the damage induced by the electro-discharge erosioii action has been effectively removed by the following electrochemical dissolution action. At the drill exit, elec- trolyte is lost in the machining gap when the drill breaks through the workpiece. This results in lack of electrochemical dissolution at the exit, thus leaving the damage caused by the discharge erosion action.
(a)
(b) Fig. 5 Scanning electron micrographs of Jethete specimens
showing the drilled surface along the hole: (a) near drill entry (x 5(X)), (b) middle (x 2000)
(a)
(b)
(c)
'41
Fig. 6 Photomicrographs of polished and etched Rex 535 specimens showing the sub-surface region along the hole: (a) near drill entry (x 320), (b) middle (x 320), (c) near exit (x 320)
3.2 Cobalt alloy steel (Rex 535)
As seen from the photomicrographs of Rex 535 in Fig. 6, no significant or measurable effects on the micro- structure can be detected. Fven at the exit end the sub- surface region appears to be unaffected. Nevertheless the SFM photograph of the exit end in Fig. 7 shows signs of splashing during the ejection and resolidification. A few pock marks, caused by the entrapped gas bubbles reaching the surface, are also
(C) IMechE 1986 Proc Insm Mech Engrs Vol 2M No 114
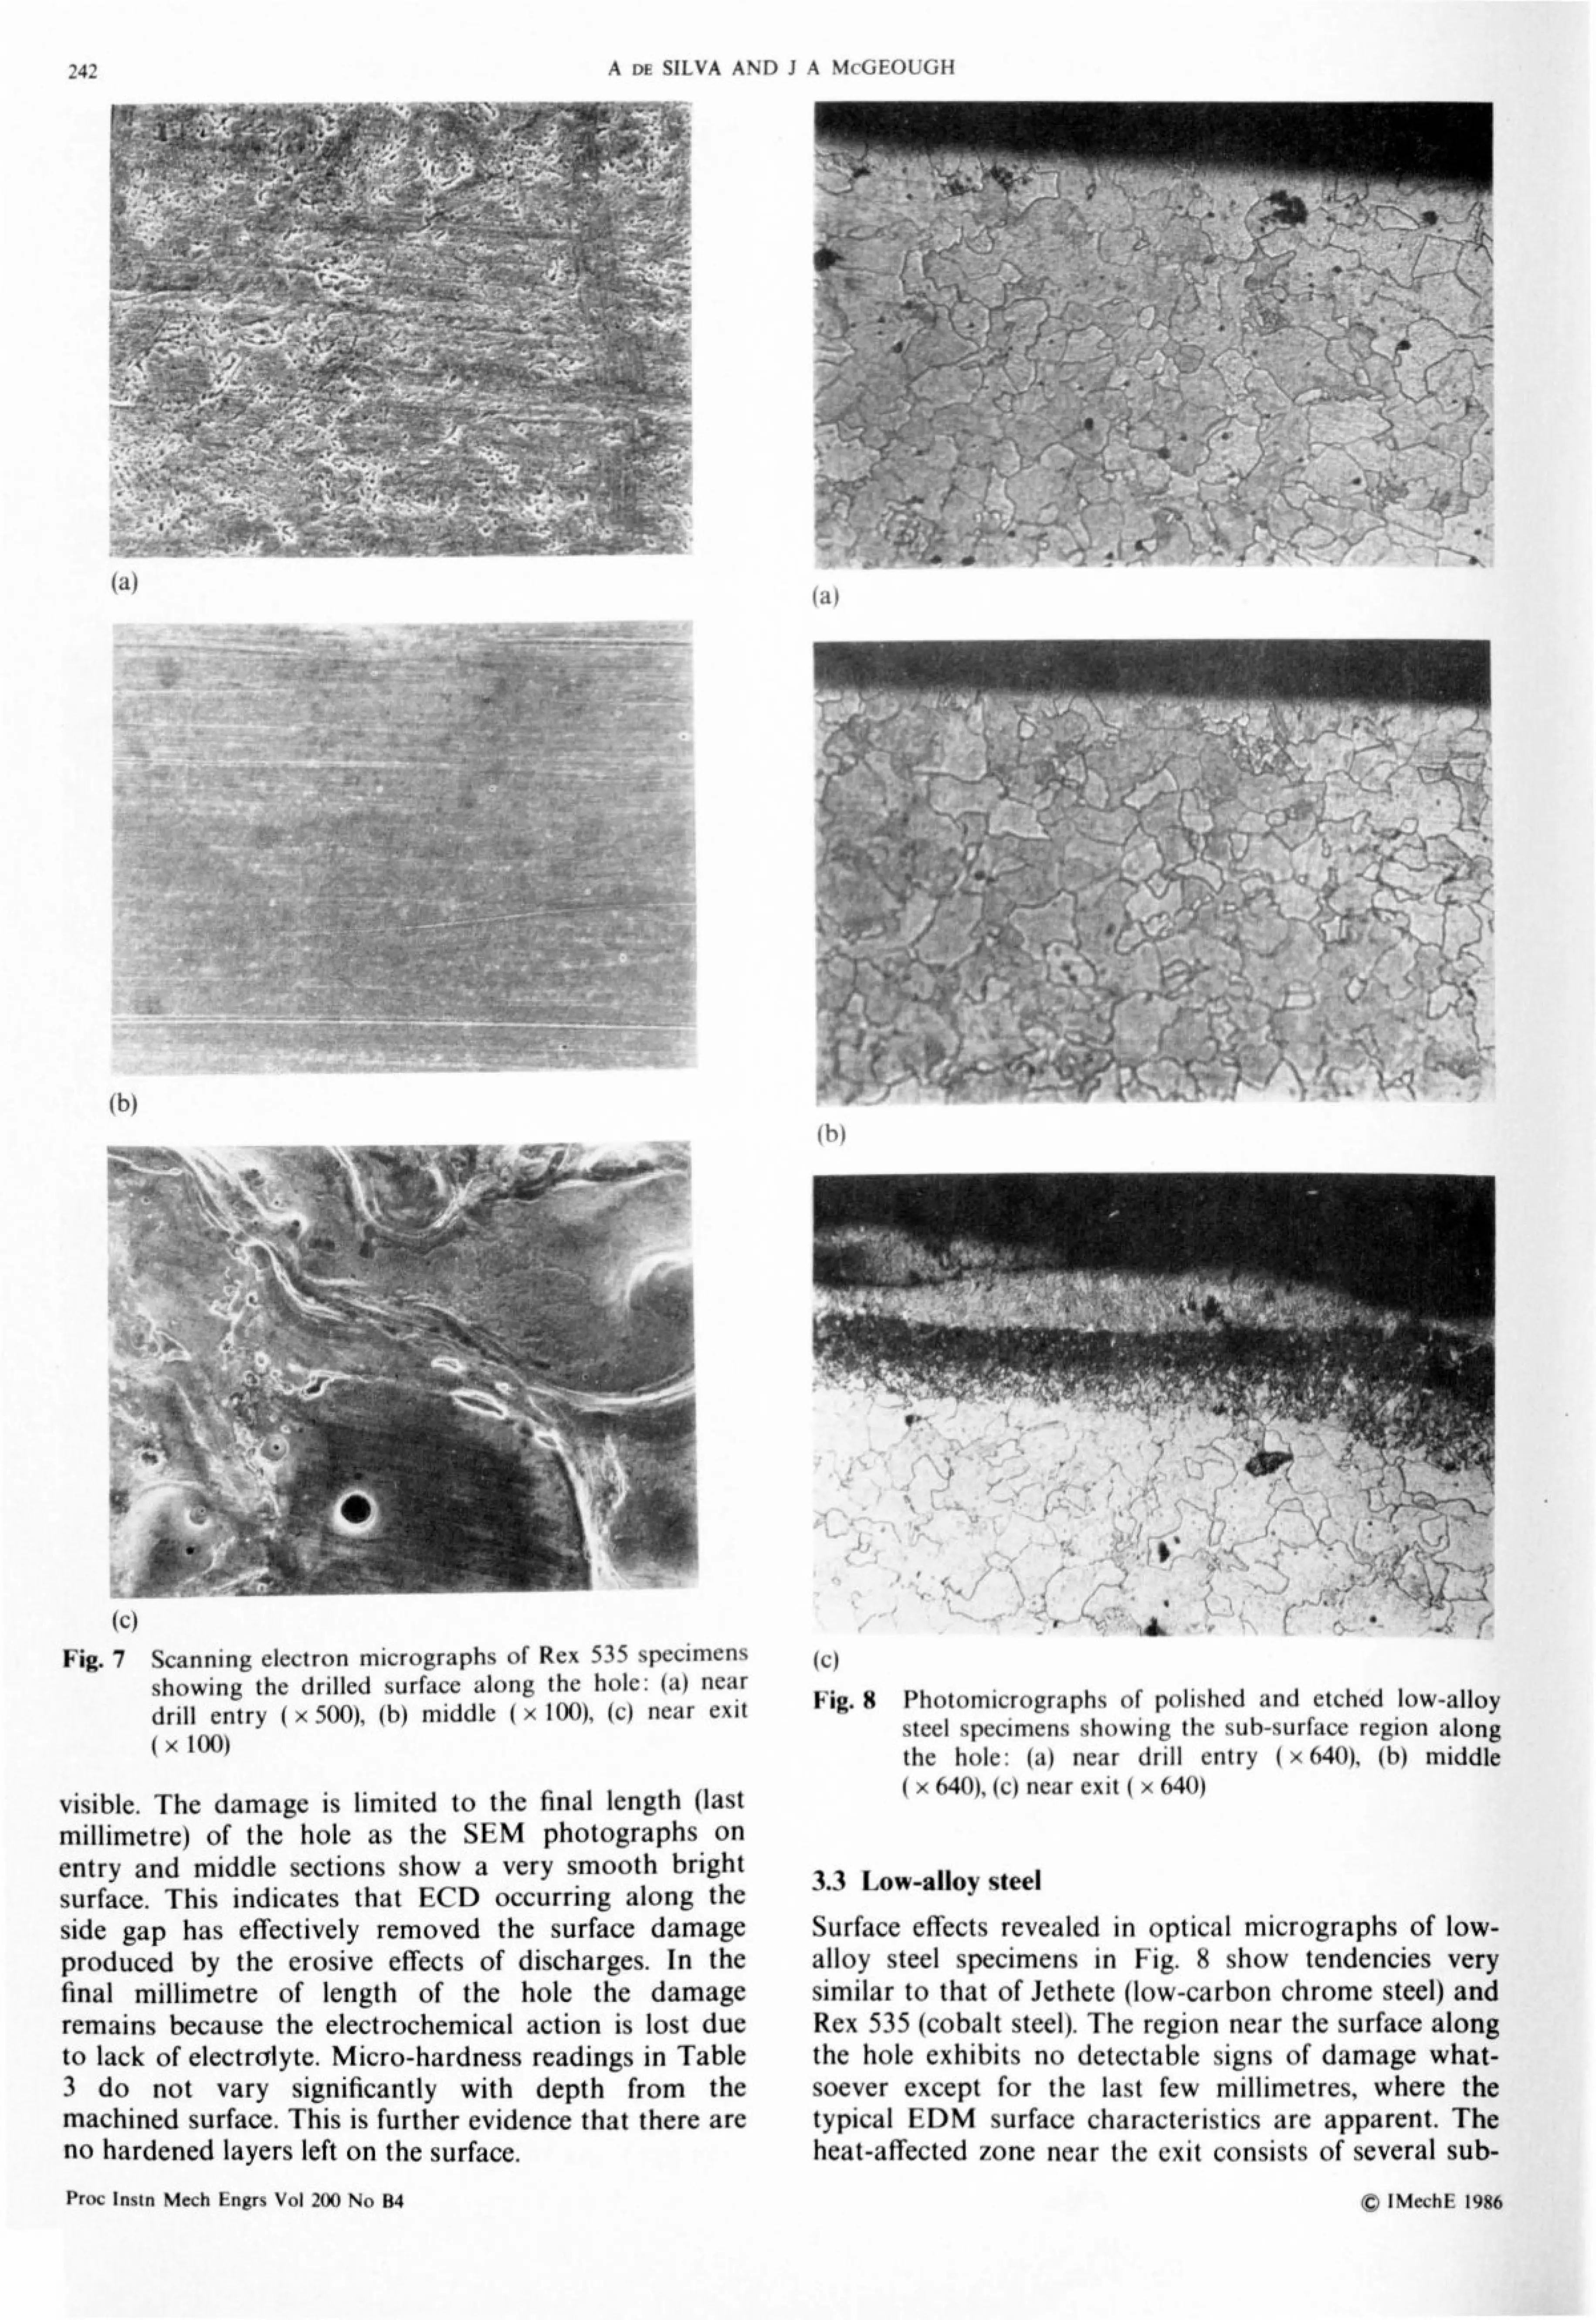
242 A Df. SILVA AND JA %1((jFOI (; If
. ZVI
4-1
(a)
1 7m
(b)
(it I
(h)
(c) Fig. 7 Scanning electron micrographs of Rex 535 specimens
showing the drilled surface along the hole: (a) near drill entry (x 500), (b) middle (x 100), (c) near exit
X 100)
visible. The damage is limited to the final length (last millimetre) of the hole as the SEM photographs on entry and middle sections show a very smooth bright surface. This indicates that ECD occurring along the side gap has effectively removed the surface damage produced by the erosive effects of discharges. In the final millimetre of length of the hole the damage remains because the electrochemical action is lost due to lack of electrolyte. Micro-hardness readings in Table 3 do not vary significantly with depth from the machined surface. This is further evidence that there are no hardened layers left on the surface. Proc Insm Mech Engrs Vol 200 No B4
ç) - L..
--- '-
(J. Jç % -.
(c)
Fig. 8 Photomicrographs of polished and etched low-alloy steel specimens showing the sub-surface region along the hole: (a) near drill entry (x 640), (b) middle (x 640), (c) near exit (x 640ý
3.3 Low-alloy steel Surface effects revealed in optical micrographs of low- alloy steel specimens in Fig. 8 show tendencies very similar to that of Jethete (low-carbon chrome steel) and Rex 535 (cobalt steel). The region near the surface along the hole exhibits no detectable signs of damage what- soever except for the last few millimetres, where the typical EDM surface characteristics are apparent. The heat-affected zone near the exit consists of several sub-
(C) IMechE 1986
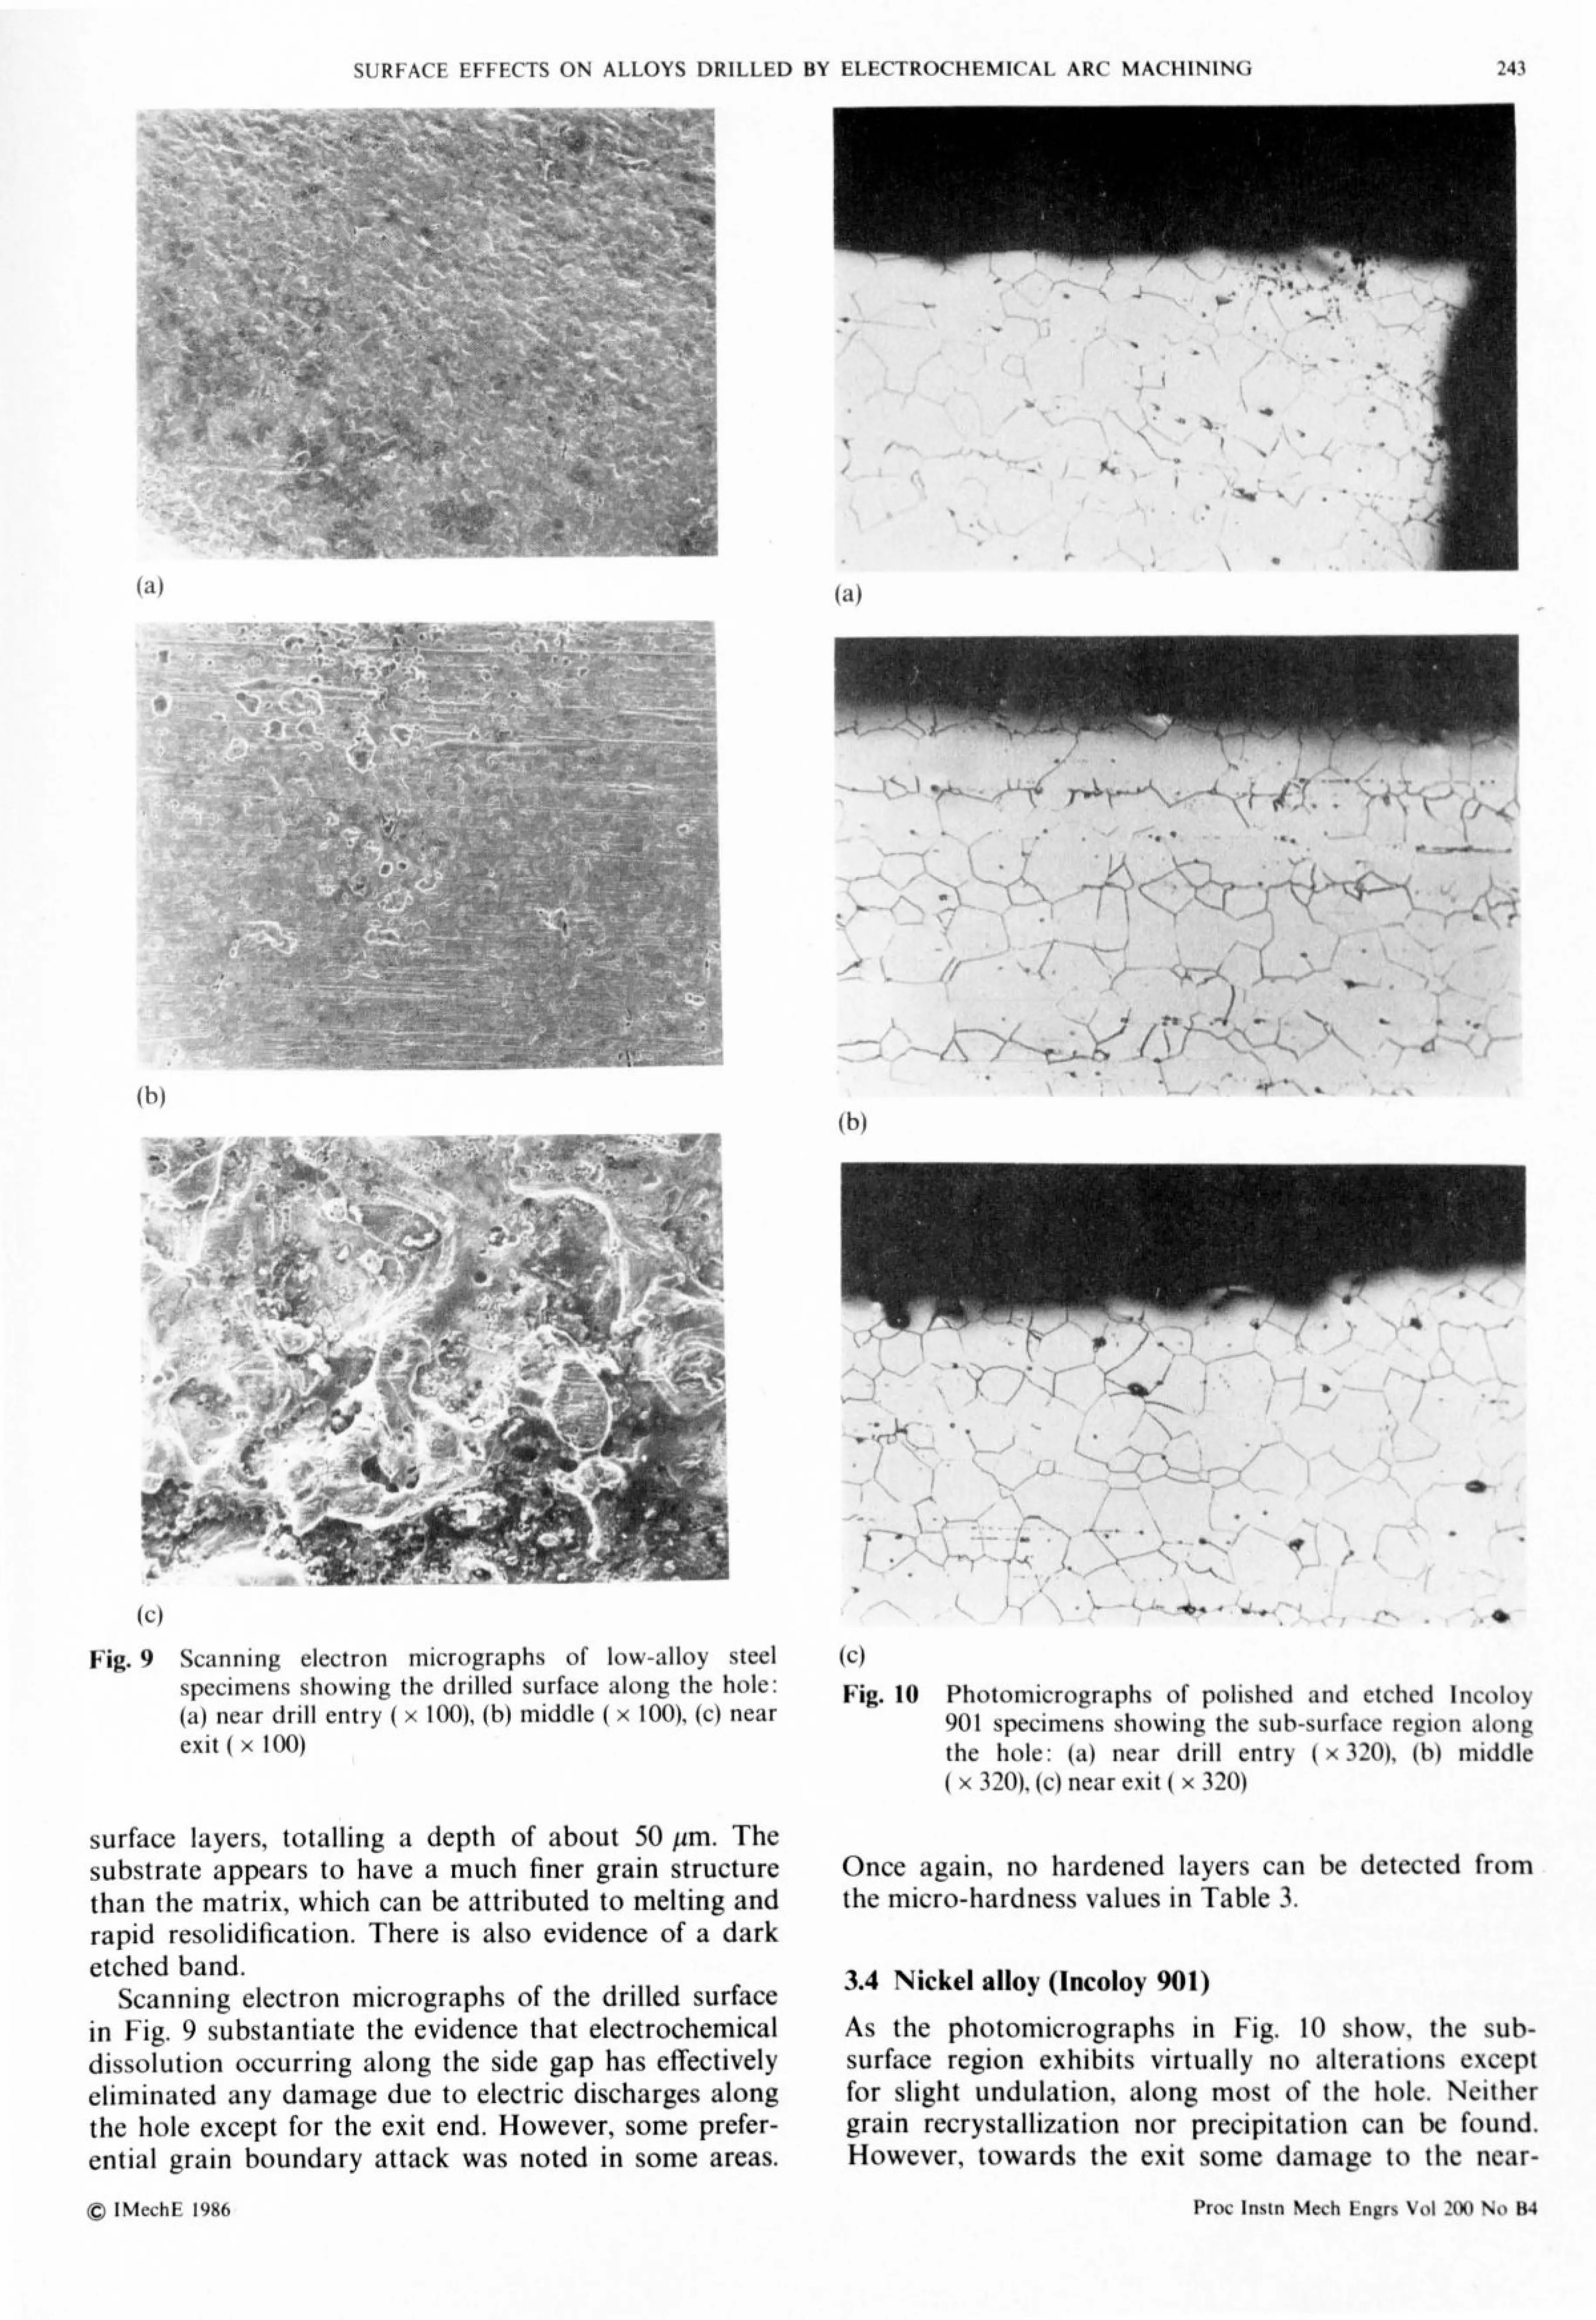
SURFACE EFFECTS ON ALLOYS DRILLED BY ELECTROCHEMICAL ARC MACHINING
(h)
p. 4.
4
(a)
241
x\ It ý. I/ o"
(c) 0
Fig. 9 Scanning electron micrographs of low-alloy steel (c) specimens showing the drilled surface along the hole: Fig. 10 Photomicrographs of polished and etched Incoloy (a) near drill entry (x 100), (b) middle (x 100), (c) near 901 specimens showing the sub-surface region along exit (X 100) the hole: (a) near drill entry (x 320), (b) middle
(x 320), (c) near exit (x 320)
surface layers, totalling a depth of about 50 pm. The substrate appears to have a much finer grain structure than the matrix, which can be attributed to melting and rapid resolidification. There is also evidence of a dark etched band.
Scanning electron micrographs of the drilled surface in Fig. 9 substantiate the evidence that electrochemical dissolution occurring along the side gap has effectively eliminated any damage due to electric discharges along the hole except for the exit end. However, some prefer- ential grain boundary attack was noted in some areas.
- '-\a- -
¶- -
-'
r- -- -
' '"
(a)
- .-» -- »
-p.
-I- -i--- - -- _»; -
-- »_t, " -.
»: : »; - »»-.
'- 4. ;---. ---'
-- . *»»»--
�. -. ---- . __4t.
Once again, no hardened layers can be detected from the micro-hardness values in Table 3.
3.4 Nickel alloy (Incoloy 901)
As the photornicrographs in Fig. 10 show, the sub- surface region exhibits virtually no alterations except for slight undulation. along most of the hole. Neither grain recrystallization nor precipitation can be fo und. However, towards the exit some damage to the near-
(C) lMechE 1996 Proc Insm Mech Engrs Vol 200 No B4
IT \_-..
: I-- 4. ' - i\ ---1- / ?.

244
ft
(a)
(bJ
A i)F SILVA AND JA %1( OFOt 01i
Fig. II Micrographs showing damage due to severe prol- onged arc discharges in Incoloy 901: (a) optical micrograph showing the sub-surface region (x 320), (b) scanning electron micrograph showing the machined surface (x 100)
surface region can clearly be seen (Fig. 11). A fused-
redeposited layer of about 20 jim average thickness with heavy micro-cracking was also observed. The micro- cracking has penetrated through the substrate layer to the grain boundaries thus causing grain boundarý
cracking. The damage was not confined to the exit end but spread almost from the middle of the hole. This form of damage can be attributed to prolonged, station- ary arc discharges occurring at the side gap. The damage caused by the severity of these discharges is too intense for the electrochemical phase to 'cure'. From
micro-hardness readings given in Table 3 no evidence of hardened layers can be detected.
Scanning electron micrographs of the actual surface in Fig. 12 show that preferential grain boundary
attacks have occurred at some areas near the entry. At the exit, the surface appears to have typical electro- discharge-induced surface characteristics, such as melted and resolidified layers, with overlapping craters.
The undulations may be due to an enhanced crevice corrosion, possibly due to stray current attack, more than offsetting the smoothing effect usually associated with the electrochemical process. Other factors which may influence the roughness of the electrochemically machined surface include the varying dissolution rates of the different phases present.
(a)
1h)
(c) Fig. 12 Scanning electron micrographs of Incoloy 901 speci-
mens showing the drilled surface along the hole: (a) near drill entry (x IN)), (b) middle (x 500), (c) near exit (x IM)
3.5 Titanium
Unlike the other four material,.,, micrographs of tita- mum in Fig. 13 illustrate a considerable amount of damage to the surface. The damage is consistent along the entire length of the hole, whereas in the other materials it is confined only to the exit end and to the occasional localized areas where severe, prolonged dis- charges have occurred. An irregular spattered layer with heavy micro-cracking can be seen. The surface profile along the hole was very uneven and rough. Further evidence of irregularities can be seen in SFMs of the
Proc Insm Mech Engrs Vol 200 No B4 C) IMechE 1986

SURFACE EFFECTS ON ALLOYS DRILLED BY ELECTROCHEMICAL ARC MACHINING
(a)
(b)
ýA
(c)
Fig. 13 Photomicrographs of polished and etched titanium specimens showing the sub-surface region along the hole: (a) near drill entry (x 320), (b) middle (x 320), (c) near exit (x 320)
drilled surface (Fig. 14). Grain boundary cracking, over- lapping craters and adhering globular particles are all apparent.
In effect, surface integrity of ECAM drilled titanium is very similar to that of EDM. A hardened layer between 100 and 250 jim depth from the drilled surface is evident from the micro-hardness readings in Table 3.
All these surface effects in titanium can be attributed to the formation of a tenacious oxide layer in water- based electrolytes, which inhibits the electrochemical
, l)
(h)
245
(c) Fig. 14 Scanning electron micrographs of titanium speci-
mens showing the drilled surface along the hole: (a) near drill entry (x 100), (b) middle x 100), (c) near exit (x 100)
dissolution of the material. This lack of ECD phase is evident from the reduced current observed. The damage caused by the erosive effect of the discharges thus remains. Successful electrochemical machining of tita- nium has been achieved using methanoic or formarrude- based solution of electrolyte by Bannard (11). ECAM drilling of titanium using non-aqueous electrolytes may hence yield a better surface finish by improving the ECD at the side gap to remove the discharge-induced damage.
C) IMechE 1986 Proc Insin Mech Engrs Vol 200 No B4

246
4 CONCLUSIONS
A DE SILVA AND JA McGEOUGH
Microscopic and micro-hardness examinations were performed to evaluate the surface integrity of electro- chemical arc drilling (ECAD) on five different metal alloys.
Optical and scanning electron microscopy revealed similar surface effects in all but titanium. Jethete Oow- carbon, high-chrome steel), Rex 535 (cobalt alloy steel), IncoloY 901 (nimonic alloy) and low-alloy steel (jMo--jCr) exhibited a smooth ECM surface finish along most of the hole. However, there were some unde- sirable effects present at the exit end and also at occasional localized regions. For these four materials, the right balance of EDE to ECD has been achieved to give a smooth, damage-free surface finish without sacri- ficing the metal removal rate.
The damage at the exit, which is due to the lack of ECD there, can be eliminated completely by utilizing an additional metallic extension which can be discarded after the drilling operation. This would prevent the elec- trolyte being lost there, thus enabling the occurrence of ECD.
The damage due to severe prolonged arc discharges appeared in the form of large localized craters, micro- cracks and recast layers in Incoloy 901. The ECD phase was not sufficient to remove these surface effects. If these localized damaged zones were to be removed by increased ECD action, a reduction in feedrates would be necessary. This in turn would cause large tapers and overcuts giving poor dimensional accuracy. On the other hand, by preventing the formation of these abnor- mal discharges this type of damage could be avoided. To do this, some form of monitoring and control of the discharges are necessary. At present, an investigation into radio-frequency emission from the discharges is being carried out in order to distinguish between the 'normal' (short duration, unstable) discharges and the 'abnormal' (severe, prolonged) discharges.
The surface integrity of ECAD on titanium was very
similar to that of EDM. A rough and irregular surface with heavy micro-cracking, spattered material and recast layer
's was observed. The surface quality of tita-
nium could possibly be improved by using non-aqueous electrolytes, thus avoiding the formation of the tena- cious oxide layer which prevents the electrochemical dissolution of the damaged layers.
Finally electrochemical arc drilling with sodium nitrate electrolyte can yield a smooth surface finish with reasonable dimensional accuracy and fast metal removal rates in most iron- and nickel-based alloys. Titanium, however, is likely to require non-aqueous electrolytes to give an acceptable surface finish.
REFERENCES
I Drake, T. and McGeough, J. A. Aspects of drilling by eIectro- chemical arc machining. Proc. Machine Tool Design Conf., 198.1, pp. 362-369 (MacMillan, London).
2 Crookall, J. R. and Khor, B. Electrodischarge machined surfaces. Int J. Mach. Tool Des. Res., 1975,373-384.
3 Bucklow, I. A. and Cole, M. Spark machining. Metall. Rev, June 1969,3(135), 103-113.
4 Lloyd, H. K. and Warren, R. H. Metallurgy of spark machined surfaces. J. Iron Steel Inst., March 1965,238-247.
5 Platanik, L. S. and Levechenko, A. A. Electro-spark machining. Kristral-lografiya, 1958,3,613.
6 De Barr, A. L and Oliver, P. A. Electrochemical machining, 1968 (MacDonald and Company, London).
7 Bannard, J. Fine hole drilling using electrochemical machining. Nineteenth Int. Machine Tool Design Research Conf, Manchester, 1978, pp. 503-510 (MacMillan, London, 1979).
8 Cole, R. R. and Hopenfeld, Y. Investigation of electrolytic jet pol- ishing at high current densities. ASME paper 62-WA-71,1962 9 Kashthejev, V. D. Processes which control surface microroughness
during ECM. Proc. Int. Symp. for- Electromachining, June 1980, Poland, pp. 271-274 (CIRP).
10 McGeough, J. A, Khayry, A. B. and Munro, W. Theoretical and experimental investigation of the relative effects of spark erosion and electrochemical dissolution in electrochemical arc machining. Ann. CIRP, 1983,32(l), 113-118.
11 Bannard, J. I, Treble, J. R. and Brook, P. A. The electrochemical machining of titanium in non-aqueous electrolytes. Proc. Int. Symp. for Electromachining, June 1977, pp. 121-125 (CIRP).
Proc Instn Mech Engrs Vol 200 No B4 C) IMechE 1986