TigarB causes mitochondrial dysfunction and neuronal loss in PINK1 deficiency

The FASEB Journal • Research Communication
Altered regulation of the PINK1 locus: a link betweentype 2 diabetes and neurodegeneration?
Camilla Scheele,*,1 Anders Rinnov Nielsen,†,§ Tomas B. Walden,‡,§ Dean A. Sewell,§
Christian P. Fischer,† Robert J. Brogan,* Natasa Petrovic,*,‡ Ola Larsson,*Per A. Tesch,� Kristian Wennmalm,* Dana S. Hutchinson,‡,¶ Barbara Cannon,‡,§
Claes Wahlestedt,*,# Bente K. Pedersen,† and James A. Timmons*,‡,§,1
*Center for Genomics and Bioinformatics, Karolinska Institutet, Stockholm, Sweden; †Centre ofInflammation and Metabolism, Rigshospitalet, University of Copenhagen, Copenhagen, Denmark;‡The Wenner-Gren Institute, The Arrhenius Laboratories, Stockholm University, Stockholm, Sweden;§School of Life Sciences, Heriot-Watt University, Edinburgh, Scotland, UK; �Department ofPhysiology and Pharmacology, Karolinska Institutet, Stockholm, Sweden; ¶Department ofPharmacology, Monash University, Clayton, Victoria, Australia; and #Department of Biochemistry,The Scripps Research Institute, Jupiter, Florida, USA
ABSTRACT Mutations in PINK1 cause the mitochon-drial-related neurodegenerative disease Parkinson’s. Herewe investigate whether obesity, type 2 diabetes, or inactiv-ity alters transcription from the PINK1 locus. We utilizeda cDNA-array and quantitative real-time PCR for geneexpression analysis of muscle from healthy volunteersfollowing physical inactivity, and muscle and adiposetissue from nonobese or obese subjects with normalglucose tolerance or type 2 diabetes. Functional studies ofPINK1 were performed utilizing RNA interference in cellculture models. Following inactivity, the PINK1 locus hadan opposing regulation pattern (PINK1 was down-regu-lated while natural antisense PINK1 was up-regulated). Intype 2 diabetes skeletal muscle, all transcripts from thePINK1 locus were suppressed and gene expression corre-lated with diabetes status. RNA interference of PINK1 inhuman neuronal cell lines impaired basal glucose uptake.In adipose tissue, mitochondrial gene expression corre-lated with PINK1 expression although remained unal-tered following siRNA knockdown of Pink1 in primarycultures of brown preadipocytes. In conclusion, regula-tion of the PINK1 locus, previously linked to neurodegen-erative disease, is altered in obesity, type 2 diabetes andinactivity, while the combination of RNAi experimentsand clinical data suggests a role for PINK1 in cell ener-getics rather than in mitochondrial biogenesis.—Scheele,C., Nielsen, A. R., Walden, T. B., Sewell, D. A., Fischer, C.P., Brogan, R. J., Petrovic, N., Larsson, O., Tesch, P. A.,Wennmalm, K., Hutchinson, D. S., Cannon, B., Wahlest-edt, C., Pedersen, B. K., Timmons, J. A. Altered regula-tion of the PINK1 locus: a link between Type 2 diabetesand neurodegeneration? FASEB J. 21, 3653–3665 (2007)
Key Words: metabolism � inactivity � mitochondria � alteredgene regulation
The interaction between physical inactivity, ge-netically determined aerobic capacity and the subse-quent role of mitochondrial “dysfunction” in precipi-
tating metabolic disease is extremely complex andtypically confounds the interpretation of disease phe-notypes. Some have found a relationship between mi-tochondrial capacity and insulin resistance (1), andgreat importance has been attached to recent observa-tions that PGC-1�, a transcriptional cofactor and amaster regulator of mitochondrial biogenesis, is down-regulated in the skeletal muscle of type 2 diabetespatients (2). PGC-1� is involved in several metabolicpathways (3, 4) making it a plausible “disease gene”.However, skeletal muscle gene expression changes incomplex diseases, such as type 2 diabetes, are difficultto interpret. For example, we have demonstrated thatshort term physical inactivity alone can induce similarchanges in human skeletal muscle PGC-1� expressionto those found in type 2 diabetes (5), such that theinteraction between diabetes per se and inactivity meritsfurther investigation. It is also plausible that othermitochondrially associated genes participate in provid-ing a link between mitochondrial function, physicalinactivity, obesity, and type 2 diabetes.
To identify novel candidate genes associated withone physical inactivity model (5) we utilized a smallcustom cDNA array platform that was enriched withdruggable (6) protein targets. We identified a modestnumber of candidate genes, partly reflecting the lim-ited performance of this particular custom array. Oneof the genes we identified was PTEN induced putativekinase 1 (PINK1). PINK1 is a putative serine-threoninekinase that has been linked to a recessive form offamilial parkinsonism (7–10). Although little is knownabout the etiology of diabetes in Parkinson’s disease, up
1 Correspondence: C.S., Center for Genomics and Bioinfor-matics, Karolinska Institutet, 171 77 Stockholm, Sweden.E-mail: [email protected]; J.A.T., School of LifeSciences, Heriot-Watt University, Edinburgh EH14 4AS, Scot-land, U.K.. E-mail: [email protected].
doi: 10.1096/fj.07-8520com
36530892-6638/07/0021-3653 © FASEB

to 80% of the patients are claimed to have impairedglucose tolerance (11), while several pieces of evidencepoint to a link between Parkinson’s disease and mito-chondrial dysfunction (12), an association commonwith diabetes. Over-expressed and endogenous PINK1localizes to the mitochondria (8, 10, 13) and veryrecently it has been demonstrated that PINK1 plays acritical role in Drosophila oxidative flight muscle (14–16) where mutated PINK1 resulted in loss of mitochon-drial architecture and muscle function and was associ-ated with increased ROS production. Indeed,antioxidant therapy could rescue neuronal cell deathinduced by knockdown of PINK1 in Drosophila (17),thus providing a link between the function of PINK1and a postulated role of ROS in the etiology of insulinresistance (18).
In addition to PINK1, there are a number of tran-scripts produced from the human PINK1 locus (Fig. 3),including Dolichyl-diphosphooligosaccharide-proteinglycosyltransferase (DDOST) and a natural antisensePINK1 molecule (19). Interestingly, DDOST translatesinto the AGE-R1 scavenger receptor, a counter regula-tory mechanism for advanced glycation end product(AGE)-induced oxidative stress (20–22). AGE forma-tion is enhanced by hyperglycemia (23), has beenlinked to diabetic complications (24–26) and shown toaccumulate in neurodegenerative disease (27). Partlyoverlapping with the 3�-end of DDOST and partlycomplementary to PINK1 is naPINK1, a cis-encodednatural antisense to PINK1 that we have recently func-tionally verified (19). Given the number of potentialinteractions between these genes and impaired metab-olism, we selected the PINK1 locus for investigation insubjects with type 2 diabetes (with and without obesity).We did this simultaneously in two insulin sensitiveorgans (muscle and adipose tissue) and related geneexpression to measures of metabolic and physical fit-ness. In addition, we profiled PGC-1� and two mito-chondrial genes (mtND4 and Citrate synthase) to allowfor direct comparison with previously published data(2, 28, 29), and evaluated the function of PINK1 usingRNA interference (RNAi) in cell based models. Geneexpression changes are presented from human modelsof physical activity (30) and inactivity (5, 19) to provideadditional context to the cause-effect interpretation ofthe clinical data.
MATERIALS AND METHODS
Human inactivity model and custom gene array analysis
We utilized a model of skeletal muscle disuse (31–33), toimpose five weeks of muscle inactivity in one leg of healthyvolunteers. Six healthy adult subjects, four men and twowomen, volunteered for this study. At the time of beingrecruited, the subjects did not participate in any regulartraining programs. A written consent was given after theprocedures and risks associated with participation in the studyhad been explained. The experimental protocol was ap-proved by the Institutional Review Board at the University and
the study was conducted in accordance with the Declarationof Helsinki as revised in 2000. The subjects were 30–56 y, witha body fat range of 9–25% (calculated from biceps, triceps,suprailiac, and front thigh skinfolds, using a Harpendencaliper). The subjects had a body mass range of 57–91 kg anda height range of 165–185 cm. The physiological results andglobal changes in muscle volume from this study have beenreported elsewhere (5, 34). Muscle biopsies were obtainedfrom the m Soleus before and after this intervention period,and RNA isolation, real-time quantitative PCR and calcula-tions were carried out as described previously (5).
For the custom microarray analysis, total RNA was pre-pared as described below. Data appear in supplementaryFile 1. All samples were labeled and hybridized as exten-sively described previously (35). The software used for theimage analysis of the arrays was SpotReader (http://www.nilesscientific.com). Data analysis was performed using theR environment and Bioconductor (36) unless otherwisestated. The images were digitalized using Quantarray andnormalized using nonprint-tip loess normalization (37) with-out background subtraction as this gives higher accuracy(38). Significantly differentially expressed genes were identi-fied using the Significance Analysis of Microarrays (SAM)algorithm using the paired test setting as previously discussed(39). The significant gene list is supplied as an Excel spread-sheet. However, due to the limitation of the arrays, this dataset should only be considered pilot data.
Obesity and type 2 diabetes cohort
Using a cross-sectional case-control design, participants forthis study were divided into 4 groups according to thepresence or absence of a diagnosis for type 2 diabetes andaccording to body mass index (BMI) � 27 or �35. All subjects(n�53) were recruited by advertising in a local newspaperand information of diagnosis of type 2 diabetes was based oninformation from each subject respectively. To verify correctdiagnosis, the World Health Organization (WHO) diagnosticcriteria for diabetes were employed. Exclusion criteria weretreatment with insulin, recent or ongoing infection, history ofmalignant disease or treatment with antiinflammatory drugs.Characteristics are given in Table 1 for the four main groups:1) normal glucose tolerant, nonobese (n�12); 2) normalglucose tolerant, obese (n�14); 3) type 2 diabetes, nonobese,(n�13); 4) type 2 diabetes, obese (n�14). Participants weregiven both oral and written information about the experi-mental procedures before giving their written informed con-sent. The study was approved by the Ethical Committee ofCopenhagen and Frederiksberg Communities, Denmark (j.nr(KF) 01–141/04), and performed according to the Declara-tion of Helsinki. The Universities of Copenhagen, KarolinskaInstitutet and Heriot-Watt provided additional ethics ap-proval for all molecular analysis.
Clinical evaluation protocol
Participants reported between 8:00 and 10:00 a.m. into thelaboratory after an overnight fast. Subjects did not take theirusual medication for 24 h preceding the examination, andsubjects with type 2 diabetes did not take hypoglycemicmedicine for one week preceding the examination day. Theabdominal and limb circumferences were measured, as werebody mass and height for BMI calculations. Sphygomanomet-ric measurement of the brachial arterial blood pressure wasperformed on the participants resting in supine position.Blood samples were drawn from an antecubital vein. On thesame day, biopsies were obtained from muscle and adiposetissue; the subjects performed an oral glucose tolerance test
3654 Vol. 21 November 2007 SCHEELE ET AL.The FASEB Journal

(OGTT), an aerobic capacity (fitness) test and were scannedusing a dual-energy X-ray absorptiometry (DEXA) wholebody scanner for determining body composition.
Muscle and adipose tissue biopsies
Muscle biopsies from the patient cohort were obtained fromthe m vastus lateralis of m quadriceps femoris using the percuta-neous needle method with suction (40). Prior to each biopsy,local anesthesia (lidocaine, 20 mg ml–1; SAD, Denmark) wasapplied to the skin and superficial fascia of the biopsy site.Adipose tissue biopsies were sampled from the abdominalsubcutaneous adipose tissue by the percutaneous needlebiopsy technique with suction, preceded by a subcutaneousinjection of lidocaine. Visible blood contamination was care-fully removed and all biopsies were frozen in liquid nitrogenand subsequently stored at –80°C until further analysis.
Aerobic capacity (fitness) test and body composition
Peak aerobic capacity was determined by the Åstrand-Ryhmingindirect test of maximal oxygen uptake (VO2max) (41). Totalbody and regional fat (kg) were assessed by dual-energy X-rayabsorptiometry (DEXA) GE Medical Systems lunar, ProdigyAdvance). The scanner was calibrated daily and a spinephantom was scanned weekly. Software version 8.8 was usedto estimate regional and total fat and lean soft tissue. Nosandbags or pillows were used. Landmarks were set to sepa-rate appendages (upper and lower limbs) from truncal re-gions: (1) the upper limb-region was separated from trunk bya line extended from the head of humerus and the glenoidfossa of the scapula; (2) The legs consisted of the tissueextended from the inferior border of the ischial tuborosity tothe distal tip of the toes. Lean soft tissue is directly correlatedto skeletal muscle mass and appendicular skeletal musclemass (ASM) is calculated as total muscle mass in upper- andlower-limbs, which is directly correlated to total body skeletalmuscle mass (42). Relative truncal fat is calculated as truncalfat divided by total body fat (43, 44) and used as an estimateof fat distribution, assumed to correlate to the amount ofvisceral adipose tissue (45). Self reported physical activity wasdetermined as previously discussed (46).
Blood analyses
Plasma was obtained by drawing blood samples into glasstubes containing EDTA, and serum was obtained by drawingblood into glass tubes containing a clot-inducing plug. Thetubes were immediately spun at 3500 g for 15 min at 4°C andthe supernatant was isolated and stored at –20°C until analy-ses were performed. Plasma insulin were analyzed by radio-immunoassay (Insulin RIA 100, Amersham Pharmacia Bio-tech, Uppsala, Sweden) and plasma glucose was determinedusing an automatic analyzer (Cobas Fara, Roche, France)both as described previously (47). All samples and standardswere run as duplicates, and the mean of duplicates was usedin the statistical analyses.
Oral glucose tolerance test (OGTT)
Blood samples were drawn before, and 1 and 2 h after,drinking 500 ml of water containing 75 g of dissolved glucose.The WHO diagnostic criteria were applied (48). Normalglucose tolerance (NGT) was defined as fasting venousplasma glucose � 6 mM and �7.8 mM 2 h after the oralglucose load, and type 2 diabetes as fasting venous plasmaglucose � 7.0 mM or venous plasma glucose � 11.1 mM 2 hafter the oral glucose load. HOMA2-IR was determinedaccording to current guidelines (49, 50).
Cell culture and transfection
All cell culture reagents were purchased from GIBCO (In-vitrogen, Carlsbad, CA, USA) unless otherwise stated. Theneuroblastoma cell line SK-N-MC was subcultured in minimalessential media (MEM) � Earle’s supplemented with 10%fetal bovine serum (FBS), 2 mM L-glutamine, 1 mM sodiumpyruvate, nonessential amino acids, 100 U/ml penicillin, and100 �g/ml streptomycin. The neuroblastoma cell line SH-SY5Y was subcultured in DMEM/F12 supplemented with 10%FBS, nonessential amino acids, 100 U/ml penicillin and 100�g/ml streptomycin. Cell cultures were maintained at 37°C in5% CO2. Transfection was performed using 0.25% Lipo-fectamine 2000 (Invitrogen) and 20 nM siRNA, according tothe manufacturer’s protocol. Following 48 h, cells were
TABLE 1. Demographic characteristics
NGT non-obese NGT obese DM2 non-obese DM2 obese
n 12 14 13 14Gender 7 F, 5 m 4 F, 10 m 6 F, 7 m 6 F, 8 mAge 53.5 � 4.1 47 � 2.1 53.9 � 2.3 53.1 � 2.5Current smoker (%) 41.7 14.3 30.8 21.4BMI, kg/m2 24.4 � 0.9 36.0 � 0.7***††† 25.8 � 0.5 37.0 � 1.6***†††Previously diagnosed diabetes (%) 0 0 100 71Physical activity score 3.4 � 0.4 2.8 � 0.6 2.6 � 0.6 1.6 � 0.4VO2max/kg 40.4 � 6.2 26.2 � 3.5*** 28.9 � 4.0** 22.5 � 4.9***VO2max/ffm 58.5 � 3.1 44.6 � 1.8* 42.8 � 1.8* 40.5 � 2.2**Fasting glucose (mm) 5.1 � 0.2 5.3 � 0.1 9.9 � 1.5***‡‡‡ 8.6 � 0.5*‡Two hour glucose (mm) 5.5 � 0.5 6.0 � 0.3 17.7 � 2.1***‡‡‡ 15.3 � 0.7***‡‡‡Fasting insulin (pmol/l) 33 � 5 72 � 12 51 � 8 161 � 25***†††‡‡‡Two hour insulin (pmol/l) 285 � 115 321 � 46 333 � 78 621 � 121HOMA2 IR 0.63 � 0.1 1.34 � 0.2 1.25 � 0.2 3.24 � 0.5***†††‡‡‡Hemoglobin A1c (%) 5.5 � 0.5 5.6 � 0.1 7.7 � 0.7**‡‡ 6.9 � 0.3Adiponectin (ng/ml) 7383 � 1437 6380 � 784 5221 � 889 4200 � 475
P values were relative to NGT non-obese (*; **; ***); DM non-obese (†; ††; †††) or NGT obese (‡; ‡‡; ‡‡‡) (P � 0.05; P � 0.01; P � 0.001).Values are mean (se) and one-way ANOVA and Tukey’s post-tests (providing the P values) were used.
3655THE PINK1 LOCUS IN OBESITY AND TYPE 2 DIABETES

harvested for RNA isolation or, following 72 h, used forglucose uptake. PINK1 was knocked down with either PINK1-siRNA-1 (n�9) or PINK1-siRNA-2 or-3 (n�9). The siRNAstargeting PINK1 (Table S1) were prevalidated or predesignedsiRNAs from Ambion (Austin, TX, USA; PINK1-siRNA-1: ID#1199; PINK1-siRNA-2: ID #1294 and PINK1-siRNA-3:ID#103456) and thus designed and chemically synthesized byAmbion. The control siRNA was predesigned by Ambion tonot target any gene in the genome (Silencer®Negative Con-trol#1, Ambion).
Primary brown preadipocyte cell culture and differentia-tion: Male NMRI mice (age 3–4 wk; B&K, Stockholm, Swe-den) were sacrificed by CO2, and brown adipose tissue (BAT)(from the interscapular, cervical and axillary depots) wasisolated as described previously (51). Briefly, minced tissueswere digested in a collagenase (type II, Sigma Aldrich,Stockholm, Sweden) containing buffer, for 30 min at 37°C.The cell suspension was filtered and kept on ice for 20 min.After discarding the top layer (mature adipocytes) the sus-pension was filtered and washed in Dulbecco’s modifiedEagle’s media (DMEM) and resuspended in 0.5 ml culturemedia per animal. Cells were cultured in 6-well plates (Falcon,BD Biosciences, Erembodegem, Belgium) in DMEM supple-mented with 10% (v/v) newborn calf serum (HyClone, Erem-bodegem, Belgium), 2.4 nM insulin, 25 �g/ml sodium ascor-bate, 10 mM HEPES, 4 mM glutamine, 100 U/ml penicillin, and100 �g/ml streptomycin. Culture media (1.8 ml) was added toeach well before 0.2 ml of cell suspension was added.
Following 24 h in culture, cells were transfected using 0.1%Lipofectamine 2000 (Invitrogen) and 20 nM short interferingRNA (siRNA) in 2.5 ml newborn calf serum-containing cellculture media (without penicillin/streptomycin) accordingto the manufacturer’s protocol and as described above.Following 48 h of transfection, media was changed and after72 h cells were harvested for RNA isolation using TRIzol(Invitrogen). The siRNA (PINK1-siRNA-1, Table S1) target-ing PINK1 was a prevalidated siRNA from Ambion (ID #1199)and thus designed and chemically synthesized by Ambion.The control siRNA was predesigned by Ambion to not targetany gene in the genome (Silencer®Negative Control#1, Am-bion).
Western blot analysis
Cells were washed twice in ice-cold PBS and harvested in alysis buffer containing 62.5 mM Tris-HCl (pH 6.8), 2% (w/v)SDS and 10% (v/v) glycerol. Protein concentration wasdetermined using the Lowry method, and 20 �g proteinswere separated on 12% polyacrylamide gels and transferredon to a PVDF membrane (Amersham Biosciences, Piscataway,NJ, USA) in 48 mM Tris/HCl, 39 mM glycine, 0.037% (w/v)SDS and 15% (v/v) methanol, using a semidry electro-phoretic transfer cell (Bio-Rad, Sundbyberg, Sweden). Themembrane was blocked in 5% milk for 1 h at room temper-ature and probed with indicated antibodies overnight at 4°C.The immunoblots were visualized with horseradish peroxi-dase-conjugated secondary antibodies and enhanced chemi-luminescence on Hyperfilm-ECL (Amersham Biosciences).Following immunoblotting, the membrane was stained withAmido Black and a highly abundant band of 45 kDa wasused for normalization. The band intensities were quantifiedusing ImageQuant software. Antibodies used were: COXI:Anti-OxPhos Complex IV subunit I, mouse IgG2a, monoclo-nal 1D6 (anticytochrome oxidase subunit I) (MolecularProbes, Eugene, OR, USA, Catalog#A-6403), dilution 1:1000;Parkin: Anti Parkin rabbit polyclonal antibody (Cell Signal-ing, Cat#4211), dilution 1:1000; TFAM: Rabbit polyclonal(52), kindly provided by Dr. Claes Gustafsson, KarolinskaInstitutet, Stockholm, Sweden (Dilution 1:1000).
Glucose uptake assay
Following 72 h of PINK1 siRNA transfection of neuroblas-toma cells, glucose uptake was measured. Cells were serum-starved for 2 h and then washed twice with PBS. 3H-2-deoxyglucose was added to glucose-free DMEM and appliedto the cells. Following 15 min of incubation, cells were washedtwice with cold PBS, subsequently lysed with 500 �l 0.2 MNaOH, and incubated for 30 min at 60°C. 400 �l were usedfor the scintillation vials and the rest (100 �l) was used fordetermine protein concentration using the Lowry method. Ineach experiment, each treatment was determined in triplicateand normalized to the protein concentration.
RNA isolation and quantitative real- time PCR (qRT-PCR)
Human tissue biopsies were homogenized in TRIzol (Invitro-gen) using a motor-driven homogenizer (Polytron, Kine-matica, Newark, NY, USA) and total RNA was isolated accord-ing to the manufacturer’s protocol. Total RNA was dissolvedin RNase-free water and quantified using a Spectrophotome-ter (Pharmacia Biotech, Piscataway, NJ, USA). For the cellsamples, total RNA was isolated using TRIzol (Invitrogen),according to the manufacturer’s protocol. Total RNA wasreverse-transcribed using reverse transcription reagents (Ap-plied Biosystems, Foster City, CA, USA) according to themanufacturer’s protocol. Random hexamers were used forfirst-strand cDNA synthesis. Detection of mRNA was per-formed using an ABI-PRISM® 7000 Sequence Detection sys-tem (Applied Biosystems). Primers and MGB probes (Table1) were designed using Primer Express software (AppliedBiosystems) or obtained using the Universal Probe Library(Roche Applied Science). A preoptimized primer and probeassay for 18S rRNA was used as an endogenous control(Applied Biosystems). Primers and probes were premixedwith TaqMan Universal Master Mix or SYBR®GREEN PCRMaster Mix (Applied Biosystems) and distributed into 96-wellMicroAmp Optical barcode plates (Applied Biosystems).cDNA aliquots of 4 �l were added in triplicates. The amplifi-cation of genomic DNA typically amounted to a maximumof �1% of the target gene when using the TRIzol protocol.Two-fold dilutions series were performed for all target genesand endogenous controls to determine the amplificationefficiency.
Calculations and statistical analysis
All data are presented as mean � se, unless otherwise stated.The Ct method (Applied Biosystems, User bulletin 2) wasused to calculate relative changes in mRNA abundance. Thethreshold cycle (CT) value for 18S was subtracted from theCT value for the target gene to adjust for any variations in thecDNA synthesis. For the metabolic cohort, a mean wascalculated from 18S adjusted CT-values of any target gene foreach of the four groups and the individual values in eachgroup were related to that mean. For the paired musclesamples, the preinactivity values reflect baseline gene expres-sion levels and were subtracted from the postinactivity sam-ple. For the siRNA experiments, 18S adjusted CT-values wererelated to the adjusted CT-value of the untreated sample ineach experiment, and then a mean from all experiments wascalculated. The results are presented as percentage mRNAabundance of untreated samples (mean�se). ANOVA wasutilized to analyze both the human gene expression responsesand the cell based responses. When a significant F ratio wasachieved, post hoc analysis (Tukey) was utilized to makeindividual comparisons and generate P-values that are stated
3656 Vol. 21 November 2007 SCHEELE ET AL.The FASEB Journal
in the figure legends. Sample size and significance level isshown in the figure legends for each graph.
RESULTS
Expression of PGC-1� and marker mitochondrialgenes in human muscle and adipose tissue
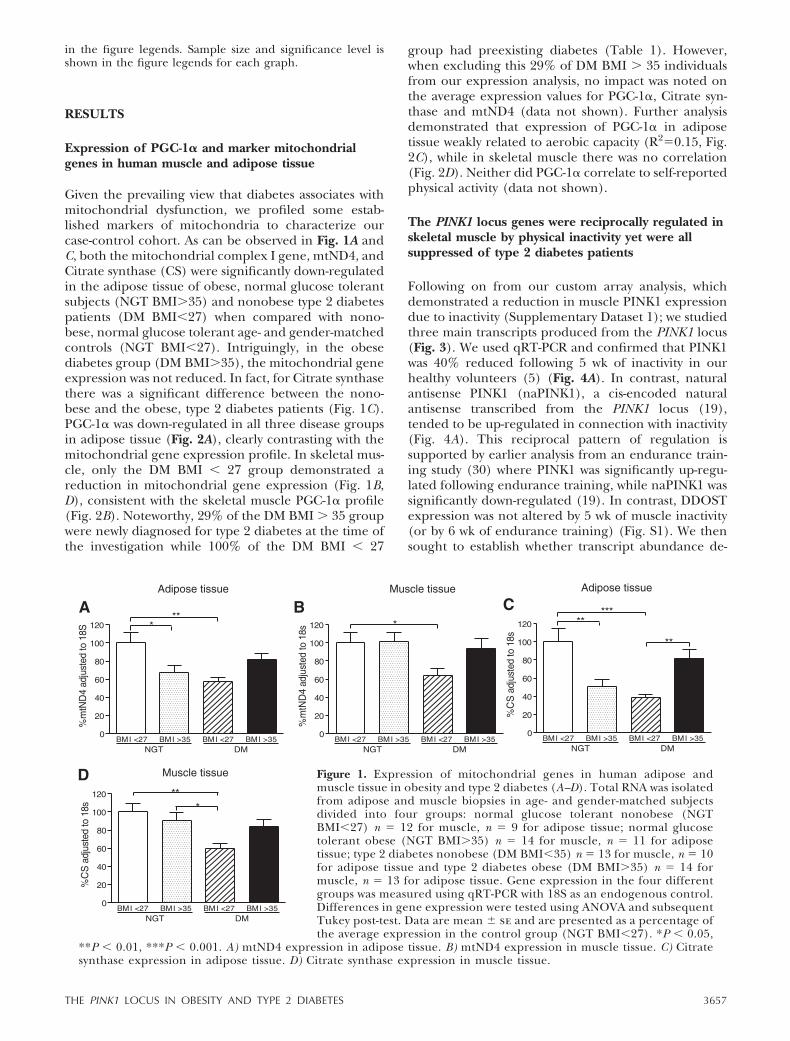
Given the prevailing view that diabetes associates withmitochondrial dysfunction, we profiled some estab-lished markers of mitochondria to characterize ourcase-control cohort. As can be observed in Fig. 1A andC, both the mitochondrial complex I gene, mtND4, andCitrate synthase (CS) were significantly down-regulatedin the adipose tissue of obese, normal glucose tolerantsubjects (NGT BMI�35) and nonobese type 2 diabetespatients (DM BMI�27) when compared with nono-bese, normal glucose tolerant age- and gender-matchedcontrols (NGT BMI�27). Intriguingly, in the obesediabetes group (DM BMI�35), the mitochondrial geneexpression was not reduced. In fact, for Citrate synthasethere was a significant difference between the nono-bese and the obese, type 2 diabetes patients (Fig. 1C).PGC-1� was down-regulated in all three disease groupsin adipose tissue (Fig. 2A), clearly contrasting with themitochondrial gene expression profile. In skeletal mus-cle, only the DM BMI � 27 group demonstrated areduction in mitochondrial gene expression (Fig. 1B,D), consistent with the skeletal muscle PGC-1� profile(Fig. 2B). Noteworthy, 29% of the DM BMI � 35 groupwere newly diagnosed for type 2 diabetes at the time ofthe investigation while 100% of the DM BMI � 27
group had preexisting diabetes (Table 1). However,when excluding this 29% of DM BMI � 35 individualsfrom our expression analysis, no impact was noted onthe average expression values for PGC-1�, Citrate syn-thase and mtND4 (data not shown). Further analysisdemonstrated that expression of PGC-1� in adiposetissue weakly related to aerobic capacity (R2�0.15, Fig.2C), while in skeletal muscle there was no correlation(Fig. 2D). Neither did PGC-1� correlate to self-reportedphysical activity (data not shown).
The PINK1 locus genes were reciprocally regulated inskeletal muscle by physical inactivity yet were allsuppressed of type 2 diabetes patients
Following on from our custom array analysis, whichdemonstrated a reduction in muscle PINK1 expressiondue to inactivity (Supplementary Dataset 1); we studiedthree main transcripts produced from the PINK1 locus(Fig. 3). We used qRT-PCR and confirmed that PINK1was 40% reduced following 5 wk of inactivity in ourhealthy volunteers (5) (Fig. 4A). In contrast, naturalantisense PINK1 (naPINK1), a cis-encoded naturalantisense transcribed from the PINK1 locus (19),tended to be up-regulated in connection with inactivity(Fig. 4A). This reciprocal pattern of regulation issupported by earlier analysis from an endurance train-ing study (30) where PINK1 was significantly up-regu-lated following endurance training, while naPINK1 wassignificantly down-regulated (19). In contrast, DDOSTexpression was not altered by 5 wk of muscle inactivity(or by 6 wk of endurance training) (Fig. S1). We thensought to establish whether transcript abundance de-
Figure 1. Expression of mitochondrial genes in human adipose andmuscle tissue in obesity and type 2 diabetes (A–D). Total RNA was isolatedfrom adipose and muscle biopsies in age- and gender-matched subjectsdivided into four groups: normal glucose tolerant nonobese (NGTBMI�27) n � 12 for muscle, n � 9 for adipose tissue; normal glucosetolerant obese (NGT BMI�35) n � 14 for muscle, n � 11 for adiposetissue; type 2 diabetes nonobese (DM BMI�35) n � 13 for muscle, n � 10for adipose tissue and type 2 diabetes obese (DM BMI�35) n � 14 formuscle, n � 13 for adipose tissue. Gene expression in the four differentgroups was measured using qRT-PCR with 18S as an endogenous control.Differences in gene expression were tested using ANOVA and subsequentTukey post-test. Data are mean � se and are presented as a percentage ofthe average expression in the control group (NGT BMI�27). *P � 0.05,
**P � 0.01, ***P � 0.001. A) mtND4 expression in adipose tissue. B) mtND4 expression in muscle tissue. C) Citratesynthase expression in adipose tissue. D) Citrate synthase expression in muscle tissue.
3657THE PINK1 LOCUS IN OBESITY AND TYPE 2 DIABETES

rived from the PINK1 locus related to metabolic fitness.In Fig. 4B–D, it can be observed that all three tran-scripts from the locus were down-regulated in diabetesskeletal muscle, providing a clear contrast to the re-
sponse of this genomic locus to altered physical activitylevels. In the NGT BMI � 37 group, PINK1 was notaltered while both naPINK1 and DDOST expressionwere significantly reduced.
Figure 2. The role of PGC-1� in obesity and type 2 diabetes (A–D). Adiposeand muscle samples described in Fig. 2 were utilized and PGC-1� geneexpression in the four different groups was measured using qRT-PCR with 18Sas an endogenous control. Differences in gene expression were tested usingANOVA and subsequent Tukey post-test. Data are mean � se and arepresented as a percentage of the average expression in the control group(NGT BMI�27). *P � 0.05, **P � 0.01, ***P � 0.001. A) PGC-1� mRNAexpression in adipose tissue. B) PGC-1� mRNA expression in muscle tissue.C–D) For the gene expression correlations, outliers were excluded (low 18Svalues) and the n numbers were: normal glucose tolerant nonobese (NGTBMI�27) n � 8 for adipose tissue, n � 12 for muscle; normal glucose tolerantobese (NGT BMI�35) n � 11 for adipose tissue, n � 13 for muscle; type 2diabetes nonobese (DM BMI�27) n � 10 for adipose tissue, n � 12 for muscle
and type 2 diabetes obese (DM BMI�35) n � 13 for adipose tissue, n � 14 for muscle. C) Linear regression of PGC-1�mRNA expression (values are percentage of the average expression in the control group) in adipose tissue vs. vO2max/kgof the subjects. D) Linear regression analysis of PGC-1� mRNA expression (values are percentage of the expression in thecontrol group) in muscle tissue vs. vO2max/kg of the subjects. NGT BMI � 27: white triangles; NGT BMI � 35: whitecircles; DM BMI � 27: black triangles; DM BMI � 35: black circles.
Figure 3. A scaled overview of the PINK1 locus,presented along with the location of quantita-tive real-time PCR (qRT-PCR) amplicons andshort interfering RNA (siRNA) target sites forthe different transcripts (primer and siRNAsequences in Table S1). The drawing is basedon the chromosomal coordinates for thePINK1 gene annotated in the Ensembl genebrowser (20,832,535–20,850,591, chromosome1). Arrows indicate direction of transcription(i.e., PINK1 is transcribed from left to rightwhile DDOST and naPINK1 are transcribed from right to left (A–E). A) PINK1 qRT-PCR amplicon. B) naPINK1 qRT-PCRamplicon (C) DDOST qRT-PCR amplicon (exon-spanning). D) PINK1 siRNA-1 (spanning exon 1 and 2). This sequenceis conserved and the siRNA was used for both human and murine cells. E) PINK1 siRNA-2 (partly overlapping PINK1siRNA-1). Note that both D and E span exons 1 and 2. F) PINK1 siRNA-3.
3658 Vol. 21 November 2007 SCHEELE ET AL.The FASEB Journal
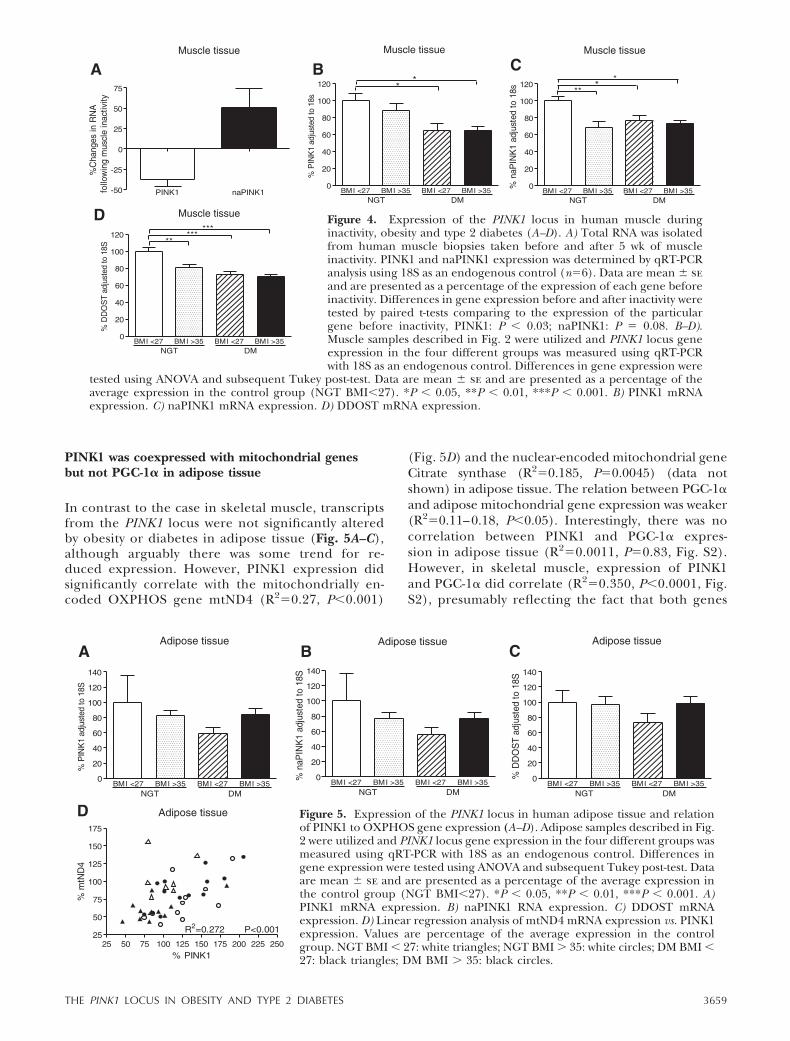
PINK1 was coexpressed with mitochondrial genesbut not PGC-1� in adipose tissue
In contrast to the case in skeletal muscle, transcriptsfrom the PINK1 locus were not significantly alteredby obesity or diabetes in adipose tissue (Fig. 5A–C),although arguably there was some trend for re-duced expression. However, PINK1 expression didsignificantly correlate with the mitochondrially en-coded OXPHOS gene mtND4 (R2�0.27, P�0.001)
(Fig. 5D) and the nuclear-encoded mitochondrial geneCitrate synthase (R2�0.185, P�0.0045) (data notshown) in adipose tissue. The relation between PGC-1�and adipose mitochondrial gene expression was weaker(R2�0.11–0.18, P�0.05). Interestingly, there was nocorrelation between PINK1 and PGC-1� expres-sion in adipose tissue (R2�0.0011, P�0.83, Fig. S2).However, in skeletal muscle, expression of PINK1and PGC-1� did correlate (R2�0.350, P�0.0001, Fig.S2), presumably reflecting the fact that both genes
Figure 4. Expression of the PINK1 locus in human muscle duringinactivity, obesity and type 2 diabetes (A–D). A) Total RNA was isolatedfrom human muscle biopsies taken before and after 5 wk of muscleinactivity. PINK1 and naPINK1 expression was determined by qRT-PCRanalysis using 18S as an endogenous control (n�6). Data are mean � seand are presented as a percentage of the expression of each gene beforeinactivity. Differences in gene expression before and after inactivity weretested by paired t-tests comparing to the expression of the particulargene before inactivity, PINK1: P � 0.03; naPINK1: P � 0.08. B–D).Muscle samples described in Fig. 2 were utilized and PINK1 locus geneexpression in the four different groups was measured using qRT-PCRwith 18S as an endogenous control. Differences in gene expression were
tested using ANOVA and subsequent Tukey post-test. Data are mean � se and are presented as a percentage of theaverage expression in the control group (NGT BMI�27). *P � 0.05, **P � 0.01, ***P � 0.001. B) PINK1 mRNAexpression. C) naPINK1 mRNA expression. D) DDOST mRNA expression.
Figure 5. Expression of the PINK1 locus in human adipose tissue and relationof PINK1 to OXPHOS gene expression (A–D). Adipose samples described in Fig.2 were utilized and PINK1 locus gene expression in the four different groups wasmeasured using qRT-PCR with 18S as an endogenous control. Differences ingene expression were tested using ANOVA and subsequent Tukey post-test. Dataare mean � se and are presented as a percentage of the average expression inthe control group (NGT BMI�27). *P � 0.05, **P � 0.01, ***P � 0.001. A)PINK1 mRNA expression. B) naPINK1 RNA expression. C) DDOST mRNAexpression. D) Linear regression analysis of mtND4 mRNA expression vs. PINK1expression. Values are percentage of the average expression in the controlgroup. NGT BMI � 27: white triangles; NGT BMI � 35: white circles; DM BMI �27: black triangles; DM BMI � 35: black circles.
3659THE PINK1 LOCUS IN OBESITY AND TYPE 2 DIABETES

are regulated by physical activity—a dominant factorfor regulating gene expression in skeletal muscle(30).
PINK1 was not essential for mitochondrial geneexpression in a murine brown adipocyte model
To further investigate the potential role of PINK1 inthe regulation of mitochondrial gene expression, weutilized a primary brown preadipocyte model (53),which demonstrates robust expression of mitochon-drial genes. After transfection of short interfering RNA(siRNA) on day 1 of culture, Pink1 was knocked downby 80% on cell harvesting for gene expression 3 dayslater (Fig. 5). In the present model, neither the mito-chondria-encoded mtNd5 nor the nuclear encodedCitrate synthase gene expression changed followingPink1 knockdown. At the protein level, we analyzed theexpression of the established mitochondrial markersTFAM and COXI, as well as Parkin (a gene suggested tobe part of a Pink1 mitochondrial biogenesis pathway inDrosophila). However, none of these proteins showedany alterations in abundance following Pink1 knock-down in our model (Fig. 6).
PINK1 expression related to diabetes status andinfluenced human cell glucose uptake
Altered expression from the PINK1 locus in skeletalmuscle related to a number of diabetes-related param-eters in our clinical samples. For example, there was anonlinear relationship between both HbA1c and fast-ing glucose levels and both PINK1 and DDOST mRNAlevels, where a low expression of either gene wasassociated with elevated blood glucose levels or HbA1c(Fig. 7A, B and Fig. S3). It may be noted that in eachcase a “threshold” type relationship existed, much likerecent analysis from the Kahn Laboratory (54), whereabove a certain level for the clinical parameter, geneexpression appears most dramatically altered. Surpris-ingly and in contrast to PINK1, PGC-1� only weaklyrelated to parameters reflecting glucose tolerance (R2
�0.1, Fig. S3). To examine whether the suppression ofPINK1 may directly contribute to altered glucose me-tabolism, we knocked down PINK1 by transfectingsiRNAs into human neuroblastoma cells and found that80% knockdown of PINK1 mRNA for 48 h caused asubsequent reduction of basal glucose uptake in neu-roblastoma cells (Fig. 7C–D).
Figure 6. Expression ofmitochondrial genes in pri-mary brown preadipocytesfollowing knockdown ofPink1 with siRNA (A–E). Pri-mary brown preadipocyteswere transfected with siRNAday 1 of culture and totalRNA and protein was iso-lated and gene (A–C) andprotein (D–E) expressionwere determined 72 h fol-lowing transfection by qRT-PCR analysis using 18S as anendogenous control (n�6)or by Western blot analysis
using Amido Black as loading control (n�7). Differences in gene or protein expression were tested using ANOVA andsubsequent Tukey post-test. Data are mean � se and are presented as a percentage of the expression in the untreated cells.*P � 0.05, **P � 0.01, ***P � 0.001. Bars are labeled: a: untreated cells, grown and harvested in parallel to transfectedcells; b: cells transfected with control#1siRNA (Ambion); c: cells transfected with PINK1-siRNA-1, targeting Pink1. A) PINK1mRNA expression. B) mtND5 mRNA expression. C) Citrate synthase (CS) mRNA expression. D) Western blot analysis ofParkin, TFAM and COXI protein expression. E) The band intensities from Western blots (n�7) were adjusted to AmidoBlack and related to the levels of untreated cells.
3660 Vol. 21 November 2007 SCHEELE ET AL.The FASEB Journal

DISCUSSION
In this study, we demonstrate that regulation of thePINK1 locus, previously linked to neurodegenerativedisease, is altered during inactivity, obesity and type 2diabetes. Our data further indicate that PINK1 mayhave a role in cell glucose metabolism, although it wasnot essential for mitochondrial gene expression in ourbrown preadipocyte model, arguing for a role in cellenergetics rather than in mitochondrial biogenesis.Finally, our data did not show a direct relationshipbetween PGC-1� and type 2 diabetes.
PGC-1� and mitochondrial genes were notconsistently reduced in skeletal muscleof type 2 diabetes
We have previously shown that PGC-1� is down-regu-lated in skeletal muscle following inactivity and thatseveral mitochondrial target genes correlated with thisdown-regulation (5). In diabetes patients, loss ofPGC-1� is claimed to modulate mitochondrial genes inskeletal muscle (2, 29). Mootha et al. 2003, describe adecrease in the expression of mitochondrial genes indiabetics and a subgroup of these to be regulated byPGC-1�. However, the control group in that study hada BMI of 23.6 � 3.4 (kg/m2), the type 2 diabetes grouphad a BMI of 27.3 � 4 (kg/m2) and thus nonobesenormal glucose tolerant controls were compared with ablend of nonobese and obese type 2 diabetes subjects.In our study, we distinguish between nonobese (BMI
25.8�1.6) type 2 diabetes subjects and demonstrate asignificant down-regulation of PGC-1� and two repre-sentative mitochondrial genes (Citrate synthase andmtND4) only in the DM BMI � 27 group. Further, if weexcluded the recently-diagnosed patients, this did notalter the mean expression value in the DM BMI � 35group, such that our observations may reflect theoccurrence of a BMI related mechanism that appears tomaintain mitochondrial function in type 2 diabetes.Preliminary analysis (Table 1) suggested this was notdue to altered adiponectin levels, which could havebeen one potential mechanism to explain our observa-tion (55), as adiponectin can positively modulate mito-chondrial gene expression. Alternatively, obese individ-uals may develop diabetes by a distinct mechanism,independent of any mitochondrial contribution, whilenonobese people with diabetes may develop diabetesfor reasons that include impaired mitochondrial func-tion. An attractive feature of this hypothesis is that theconfounding effects of inactivity (on molecular data)should have resulted in lower mitochondrial geneexpression regardless of the cause-effect debate. This isbecause it would be expected that obese people aregenerally less active (an assumption implied but notsignificantly confirmed by our physical activity ques-tionnaire). While our results are in line with otherstudies demonstrating a decrease in some but not allmitochondrial OXPHOS genes profiled in skeletalmuscle from diabetes (56–58), it partly challenges theidea proposed by Patti et al. that a decrease in PGC-1�is a specific and early alteration connected with insulin
Figure 7. Relation of PINK1 expression to diabetic status and effect on glucoseuptake in human cells following knockdown of PINK1 using siRNA (A–D). A–B)PINK1 expression levels from the muscle samples in Fig. 1 were utilized. Values arepercentage of the average expression in the control group. Various nonlinearregression models were applied to gene expression vs. fasting glucose levels orhemoglobin A1c to describe the relationship between gene expression anddiabetic parameters. R2-correlation coefficients are as stated in the figure. A)Nonlinear regression (power series) of hemoglobin A1c vs. PINK1 expression. B)Nonlinear regression (polynomial: second order) of fasting glucose levels vs.PINK1 mRNA expression. C–D) Neuroblastoma cells were transfected with twodifferent siRNAs targeting PINK1 and one control siRNA. Cells were harvested for
expression analysis and glucose uptake as described in Materials and Methods. Bars are labeled: a: untreated cells grownand harvested in parallel to transfected cells; b: cells transfected with control#1siRNA (Ambion); c: cells transfected withPINK1-siRNA-1; d: cells transfected with PINK1-siRNA-2 or PINK1-siRNA-3 Differences in gene expression or glucoseuptake were tested using ANOVA and subsequent Tukey post-test. *P � 0.05, **P � 0.01, ***P � 0.001 (C) Following 48 hof siRNA transfection, total RNA was isolated and gene expression was determined using qRT-PCR with 18S as anendogenous control. Data are mean � se and are presented as a percentage of the gene expression in the untreated cells(n�9). D) Following 72 h of siRNA transfection, cells were assessed for glucose uptake ability. Data are mean � se,normalized to protein concentration and presented as a percentage of glucose uptake in untreated cells (n�6).
3661THE PINK1 LOCUS IN OBESITY AND TYPE 2 DIABETES

resistance. The patients in that particular study werenot remotely age-matched (the control group was31.1�2.0 yr; insulin resistant, normal glucose tolerantgroup 40.3�3.0 yr; type 2 diabetes group 47.3�1.9 yr)such that we feel it is difficult to accept the validity oftheir study. Furthermore, the lack of association be-tween PGC-1� and aerobic capacity or diabetes param-eters in our data suggest that PGC-1� can not yetconfidently be classified as being an important gene forskeletal muscle dysfunction in diabetes, while geneticassociations perhaps reflect the role of PGC-1� in othercritical organs such as the liver and the pancreas (59).
Altered regulation of the PINK1 locus: a link betweentype 2 diabetes and neurodegenerative disease?
In line with recent findings of mitochondria and mus-cle deficient phenotypes in Drosophila Pink1 mutants(14–16), our data reveal that PINK1, similar to PGC-1�,is regulated by physical inactivity in humans. Inactivityis known to be a risk factor for developing severaldegenerative diseases (60, 61), and as PINK1 is down-regulated by physical inactivity, it may represent onestarting point for PINK1-related metabolic dysfunction.The relationship between PINK1 gene expression andfasting glucose levels in human muscle, together withthe impaired glucose uptake due to PINK1 knockdownin neuroblastoma cells, implies a potential role forPINK1 in glucose metabolism. We speculate thatchronic physical inactivity could in time result in aninactivation of the whole PINK1 locus and that this maysubsequently contribute to the development of type 2diabetes. This could occur via a connection betweenhyperglycaemia (caused by inactivity induced insulinresistance) and regulation of the PINK1 locus. Thedifferent regulation patterns of the PINK1 locus inskeletal muscle during physical inactivity compared todiabetes, indicates that the PINK1 locus may be lessavailable for transcriptional activation in people withdiabetes, perhaps due to epigenetic changes (62). Thiskind of genomic modulation has been suggested to playa role in complex diseases such as aging and cancer(63), however it is has not yet shown to occur in type 2diabetes, a research idea that deserves further atten-tion.
Given the linkage between PINK1 mutations andParkinson’s disease (7) and the suggestion that Parkin-son’s disease patients may have impaired glucose toler-ance (11), there is a possibility that a decrease in PINK1may represent a direct link between neurodegenera-tion and type 2 diabetes, albeit one operating viaphysical inactivity and skeletal muscle insulin resis-tance. DDOST, on the other hand, remained unalteredby physical activity. Thus, any altered DDOST expres-sion found in obesity or diabetes is unlikely to directlyreflect physical activity levels but rather the subsequenthyperglycemia. The accumulation of AGE in thesecomplex diseases is enhanced by hyperglycemia, andour data suggest that one of the molecular mechanismsthrough which this may occur could be via down-
regulation of DDOST (encoding the AGE-R1 scavengerreceptor thought to regulate the removal of AGEs).The previous linkage to Parkinson’s disease implied theassumption that PINK1 plays a causative role in mito-chondrial disease. We further extend this idea andsuggest that deregulation of the whole PINK1 locus maybe involved in the pathophysiology of both neurode-generative disease and type 2 diabetes.
Implications for a PGC-1� independent pathway forregulation of mitochondrial genes in adipose tissue
Although extensively explored in skeletal muscle (2, 29,56, 57), fewer studies have focused on the gene expres-sion in adipose tissue from people with diabetes. Careyet al, report a discordant regulation in skeletal muscleand adipose tissue of nonobese patients with type 2diabetes, demonstrating a three-fold up-regulation ofPGC-1� and other metabolic genes in adipose tissue,suggesting a potential transformation of white adiposetissue toward a brown adipocyte phenotype using UCP1gene expression as the sole marker (28). We did notobserve an induction of PGC-1�, rather our results arein line with two previous studies that demonstrated adecrease in PGC-1� expression in adipose tissue ofobese subjects and insulin resistant subjects respectively(64, 65) while reliance on UCP1 as the sole marker ofa brown adipocyte phenotype is not ideal (66). Surpris-ingly, in contrast to PGC-1�, Citrate synthase andmtND4 expression were not decreased in the DMBMI � 35 group. This was intriguing as PGC-1� isthought to be a master regulator of mitochondrialgenes (59), and suggests that a PGC-1� independentpathway operates in human white adipose tissue. Thisidea was further emphasized by the weak correlationbetween PGC-1� and the mitochondrial genes in adi-pose tissue.
Knockdown of Pink1 in murine brown preadipocytesargues against a role in mitochondrial biogenesis
For two reasons we measured the abundance of Parkinfollowing Pink1 knockdown: (1) Over-expression ofParkin could rescue Drosophila Pink1 loss-of-functionmitochondrial disease phenotypes (14–16) but not viceversa (16) and Pink1 knockdown in Drosophila resultedin a reduced expression of Parkin (14), suggesting thatParkin operates down-stream of PINK1 to regulatemitochondrial function (2). Parkin has recently beensuggested to enhance mitochondrial transcription inmammalian cells (67). Interestingly, the expressionprofile of PINK1 in human adipose tissue also variedclosely with mitochondrial gene expression. Our RNAiexperiments in murine brown preadipocytes did notalter the expression of mitochondrial proteins at a levelof knockdown that had functional consequences forglucose metabolism in neuroblastoma cells. This arguesagainst a role of PINK1 in mitochondrial biogenesis inmammalian adipocytes. More likely, PINK1 has a rolein cell energetics, where depletion would not compro-
3662 Vol. 21 November 2007 SCHEELE ET AL.The FASEB Journal

mise mitochondria in a catastrophic manner, but wouldrather have a cumulative effect over time, possiblyrelating to ROS related damage. This hypothesis is inline with a previous study in Drosophila (15), where themitochondria of the Pink1 mutant pupae were unaf-fected while a degenerative mitochondrial phenotypewas observed in the adult Pink1 mutant fly.
In conclusion, our data demonstrate that the PINK1locus is regulated by physical inactivity, obesity and type2 diabetes, appears to have a role in glucose metabo-lism (an observation that require further study inadipocytes and myocytes) but is not apparently essentialfor mitochondrial biogenesis in brown adipocytes.Thus, we provide one of the first potential molecularlinks between type 2 diabetes and Parkinson’s disease.We suggest that altered expression of PGC-1� is lesslikely to have a direct causative role in the skeletalmuscle defects observed in diabetes patients, while wedemonstrate that down-regulation of PGC-1� and mi-tochondrial genes in skeletal muscle occurs predomi-nantly in nonobese diabetics, possibly implying anobesity-dependent feedback mechanism for maintain-ing mitochondrial function or a unique disease path-way for obese subjects becoming diabetic. Future stud-ies should explore the role of PINK1 in glucosemetabolism as well as potential epigenetic mechanismsthat could explain the silencing of the PINK1 locus andhence the association between type 2 diabetes andneurodegeneration.
We thank Elsebrit Ljungstrom, Anders Lundmark andMargareta Faxen at the KI Chip core facility for their techni-cal help with the microarray component. The present studywas supported by the Swedish Diabetes Association and theDanish National Research Council (no 02–512-55), the Dan-ish Medical Research Council (no. 22–01-009) and by re-search support from Heriot-Watt University (L6004). We alsoacknowledge the funding support from the Swedish NationalSpace Board (SNSB) (P.A.T.) and the Centre for GenderRelated Medicine at Karolinska Institutet (J.A.T., P.A.T.).D.S.H. is a C. J. Martin Fellow of the National Health andMedical Research Council of Australia.
REFERENCES
1. Petersen, K. F., Dufour, S., Befroy, D., Garcia, R., and Shulman,G. I. (2004) Impaired mitochondrial activity in the insulin-resistant offspring of patients with type 2 diabetes. N. Engl.J. Med. 350, 664–671
2. Patti, M. E., Butte, A. J., Crunkhorn, S., Cusi, K., Berria, R.,Kashyap, S., Miyazaki, Y., Kohane, I., Costello, M., Saccone, R.,Landaker, E. J., Goldfine, A. B., Mun, E., DeFronzo, R., Finlay-son, J., Kahn, C. R., and Mandarino, L. J. (2003) Coordinatedreduction of genes of oxidative metabolism in humans withinsulin resistance and diabetes: Potential role of PGC1 andNRF1. Proc. Natl. Acad. Sci. U. S. A. 100, 8466–8471
3. Sandri, M., Lin, J., Handschin, C., Yang, W., Arany, Z. P., Lecker,S. H., Goldberg, A. L., and Spiegelman, B. M. (2006) PGC-1{alpha} protects skeletal muscle from atrophy by suppressingFoxO3 action and atrophy-specific gene transcription. Proc. Natl.Acad. Sci. U. S. A.
4. Handschin, C., and Spiegelman, B. M. (2006) PGC-1 coactiva-tors, energy homeostasis, and metabolism. Endocr. Rev. 27,728–735.
5. Timmons, J. A., Norrbom, J., Scheele, C., Thonberg, H., Wahl-estedt, C., and Tesch, P. (2006) Expression profiling followinglocal muscle inactivity in humans provides new perspective ondiabetes-related genes. Genomics 87, 165–172
6. Hopkins, A. L., and Groom, C. R. (2002) The druggablegenome. Nat. Rev. Drug. Discov. 1, 727–730
7. Valente, E. M., Abou-Sleiman, P. M., Caputo, V., Muqit, M. M.,Harvey, K., Gispert, S., Ali, Z., Del Turco, D., Bentivoglio, A. R.,Healy, D. G., Albanese, A., Nussbaum, R., Gonzalez-Maldonado,R., Deller, T., Salvi, S., Cortelli, P., Gilks, W. P., Latchman, D. S.,Harvey, R. J., Dallapiccola, B., Auburger, G., and Wood, N. W.(2004) Hereditary early-onset Parkinson’s disease caused bymutations in PINK1. Science 304, 1158–1160
8. Silvestri, L., Caputo, V., Bellacchio, E., Atorino, L., Dallapiccola,B., Valente, E. M., and Casari, G. (2005) Mitochondrial importand enzymatic activity of PINK1 mutants associated to recessiveparkinsonism. Hum. Mol. Genet. 14, 3477–3492
9. Petit, A., Kawarai, T., Paitel, E., Sanjo, N., Maj, M., Scheid, M.,Chen, F., Gu, Y., Hasegawa, H., Salehi-Rad, S., Wang, L.,Rogaeva, E., Fraser, P., Robinson, B., St George-Hyslop, P., andTandon, A. (2005) Wild-type PINK1 prevents basal and inducedneuronal apoptosis, a protective effect abrogated by Parkinsondisease-related mutations. J. Biol. Chem. 280, 34025–34032
10. Beilina, A., Van Der Brug, M., Ahmad, R., Kesavapany, S., Miller,D. W., Petsko, G. A., and Cookson, M. R. (2005) Mutations inPTEN-induced putative kinase 1 associated with recessive par-kinsonism have differential effects on protein stability. Proc.Natl. Acad. Sci. U. S. A. 102, 5703–5708
11. Ristow, M. (2004) Neurodegenerative disorders associated withdiabetes mellitus. J. Mol. Med. 82, 510–529
12. Abou-Sleiman, P. M., Muqit, M. M., and Wood, N. W. (2006)Expanding insights of mitochondrial dysfunction in Parkinson’sdisease. Nat. Rev. Neurosci. 7, 207–219
13. Gandhi, S., Muqit, M. M., Stanyer, L., Healy, D. G., Abou-Sleiman, P. M., Hargreaves, I., Heales, S., Ganguly, M., Parsons,L., Lees, A. J., Latchman, D. S., Holton, J. L., Wood, N. W., andRevesz, T. (2006) PINK1 protein in normal human brain andParkinson’s disease. Brain 129, 1720–1731
14. Yang, Y., Gehrke, S., Imai, Y., Huang, Z., Ouyang, Y., Wang,J. W., Yang, L., Beal, M. F., Vogel, H., and Lu, B. (2006)Mitochondrial pathology and muscle and dopaminergic neurondegeneration caused by inactivation of Drosophila Pink1 isrescued by Parkin. Proc. Natl. Acad. Sci. U. S. A. 103, 10793–10798
15. Clark, I. E., Dodson, M. W., Jiang, C., Cao, J. H., Huh, J. R., Seol,J. H., Yoo, S. J., Hay, B. A., and Guo, M. (2006) Drosophila pink1is required for mitochondrial function and interacts geneticallywith parkin. Nature 441, 1162–1166
16. Park, J., Lee, S. B., Lee, S., Kim, Y., Song, S., Kim, S., Bae, E.,Kim, J., Shong, M., Kim, J. M., and Chung, J. (2006) Mitochon-drial dysfunction in Drosophila PINK1 mutants is comple-mented by parkin. Nature 441, 1157–1161
17. Wang, D., Qian, L., Xiong, H., Liu, J., Neckameyer, W. S.,Oldham, S., Xia, K., Wang, J., Bodmer, R., and Zhang, Z.(2006) Antioxidants protect PINK1-dependent dopaminergicneurons in Drosophila. Proc. Natl. Acad. Sci. U. S. A. 103,13520 –13525
18. Houstis, N., Rosen, E. D., and Lander, E. S. (2006) Reactiveoxygen species have a causal role in multiple forms of insulinresistance. Nature 440, 944–948
19. Scheele, C., Petrovic, N., Faghihi, M. A., Lassmann, T., Fredriks-son, K., Rooyackers, O., Wahlestedt, C., Good, L., and Timmons,J. A. (2007) The human PINK1 locus is regulated in vivo by anon-coding natural antisense RNA during modulation of mito-chondrial function. BMC Genomics 8, 74.
20. Lu, C., He, J. C., Cai, W., Liu, H., Zhu, L., and Vlassara, H.(2004) Advanced glycation endproduct (AGE) receptor 1 is anegative regulator of the inflammatory response to AGE inmesangial cells. Proc. Natl. Acad. Sci. U. S. A. 101, 11767–11772
21. Stern, D. M., Yan, S. D., Yan, S. F., and Schmidt, A. M. (2002)Receptor for advanced glycation endproducts (RAGE) and thecomplications of diabetes. Ageing. Res. Rev. 1, 1–15
22. Bucciarelli, L. G., Wendt, T., Rong, L., Lalla, E., Hofmann,M. A., Goova, M. T., Taguchi, A., Yan, S. F., Yan, S. D., Stern,D. M., and Schmidt, A. M. (2002) RAGE is a multiligandreceptor of the immunoglobulin superfamily: implications for
3663THE PINK1 LOCUS IN OBESITY AND TYPE 2 DIABETES

homeostasis and chronic disease. Cell Mol. Life. Sci. 59, 1117–1128
23. Rolo, A. P., and Palmeira, C. M. (2006) Diabetes and mitochon-drial function: role of hyperglycemia and oxidative stress. Toxi-col. Appl. Pharmacol. 212, 167–178
24. Vlassara, H., and Palace, M. R. (2002) Diabetes and advancedglycation endproducts. J. Intern. Med. 251, 87–101
25. Brownlee, M. (2001) Biochemistry and molecular cell biology ofdiabetic complications. Nature 414, 813–820
26. Basta, G., Schmidt, A. M., and De Caterina, R. (2004) Advancedglycation end products and vascular inflammation: implicationsfor accelerated atherosclerosis in diabetes. Cardiovasc. Res. 63,582–592
27. Sasaki, N., Fukatsu, R., Tsuzuki, K., Hayashi, Y., Yoshida, T.,Fujii, N., Koike, T., Wakayama, I., Yanagihara, R., Garruto, R.,Amano, N., and Makita, Z. (1998) Advanced glycation endproducts in Alzheimer’s disease and other neurodegenerativediseases. Am. J. Pathol. 153, 1149–1155
28. Carey, A. L., Petersen, E. W., Bruce, C. R., Southgate, R. J.,Pilegaard, H., Hawley, J. A., Pedersen, B. K., and Febbraio, M. A.(2006) Discordant gene expression in skeletal muscle andadipose tissue of patients with type 2 diabetes: effect of inter-leukin-6 infusion. Diabetologia 49, 1000–1007.
29. Mootha, V. K., Lindgren, C. M., Eriksson, K. F., Subramanian,A., Sihag, S., Lehar, J., Puigserver, P., Carlsson, E., Ridderstrale,M., Laurila, E., Houstis, N., Daly, M. J., Patterson, N., Mesirov,J. P., Golub, T. R., Tamayo, P., Spiegelman, B., Lander, E. S.,Hirschhorn, J. N., Altshuler, D., and Groop, L. C. (2003)PGC-1alpha-responsive genes involved in oxidative phosphory-lation are coordinately downregulated in human diabetes. Nat.Genet. 34, 267–273
30. Timmons, J. A., Larsson, O., Jansson, E., Fischer, H., Gustafsson,T., Greenhaff, P. L., Ridden, J., Rachman, J., Peyrard-Janvid, M.,Wahlestedt, C., and Sundberg, C. J. (2005) Human muscle geneexpression responses to endurance training provide a novelperspective on Duchenne muscular dystrophy. FASEB J. 19,750–760
31. Berg, H. E., Dudley, G. A., Haggmark, T., Ohlsen, H., andTesch, P. A. (1991) Effects of lower limb unloading on skeletalmuscle mass and function in humans. J. Appl. Physiol. 70,1882–1885
32. Berg, H. E., Dudley, G. A., Hather, B., and Tesch, P. A. (1993)Work capacity and metabolic and morphologic characteristicsof the human quadriceps muscle in response to unloading. Clin.Physiol. 13, 337–347
33. Haddad, F., Baldwin, K. M., and Tesch, P. A. (2005) Pretrans-lational markers of contractile protein expression in humanskeletal muscle: effect of limb unloading plus resistance exer-cise. J. Appl. Physiol. 98, 46–52
34. Tesch, P. A., Trieschmann, J. T., and Ekberg, A. (2004) Hyper-trophy of chronically unloaded muscle subjected to resistanceexercise. J. Appl. Physiol. 96, 1451–1458
35. Kemmer, D. F., Hodges, M., Lim, E., Herzog, J., Ljungstr, E. om,Lundmark, E., Olsen, A. M. K. Podowski, Sonnhammer, R., ELL,Nilsson, Reimers, P., Lenhard, M., Roberds, B. S. L. Wahlestedt,C. Hoog, Agarwal, C., P., and Wasserman, W. W. (2004)Exploring the foundation of genomics: A northern blot refer-ence set for the comparative analysis of transcript profilingtechnologies. Comp. Funct. Genom. 5, 584–595
36. Gentleman, R. C., Carey, V. J., Bates, D. M., Bolstad, B., Dettling,M., Dudoit, S., Ellis, B., Gautier, L., Ge, Y., Gentry, J., Hornik, K.,Hothorn, T., Huber, W., Iacus, S., Irizarry, R., Leisch, F., Li, C.,Maechler, M., Rossini, A. J., Sawitzki, G., Smith, C., Smyth, G.,Tierney, L., Yang, J. Y., and Zhang, J. (2004) Bioconductor:open software development for computational biology andbioinformatics. Genome. Biol. 5, R80
37. Yang, Y. H., Dudoit, S., Luu, P., Lin, D. M., Peng, V., Ngai, J., andSpeed, T. P. (2002) Normalization for cDNA microarray data: arobust composite method addressing single and multiple slidesystematic variation. Nucleic Acids Res. 30, e15
38. Irizarry, R. A., Warren, D., Spencer, F., Kim, I. F., Biswal, S.,Frank, B. C., Gabrielson, E., Garcia, J. G., Geoghegan, J.,Germino, G., Griffin, C., Hilmer, S. C., Hoffman, E., Jedlicka,A. E., Kawasaki, E., Martinez-Murillo, F., Morsberger, L., Lee,H., Petersen, D., Quackenbush, J., Scott, A., Wilson, M., Yang, Y.,Ye, S. Q., and Yu, W. (2005) Multiple-laboratory comparison ofmicroarray platforms. Nat. Methods 2, 345–350
39. Larsson, O., Wahlestedt, C., and Timmons, J. A. (2005) Consid-erations when using the significance analysis of microarrays(SAM) algorithm. BMC. Bioinformatics 6, 129
40. Bergstrom, J., and Hultman, E. (1966) The effect of exercise onmuscle glycogen and electrolytes in normals. Scand. J. Clin. Lab.Invest. 18, 16–20
41. Astrand, P. a. R., K. (2003) Textbook of Work Physiology: Physiolog-ical Bases of Exercise, Human Kinetics, Champaign, IL
42. Gallagher, D., Visser, M., De Meersman, R. E., Sepulveda, D.,Baumgartner, R. N., Pierson, R. N., Harris, T., and Heymsfield,S. B. (1997) Appendicular skeletal muscle mass: effects of age,gender, and ethnicity. J. Appl. Physiol. 83, 229–239
43. Howell, S. J., Radford, J. A., Adams, J. E., and Shalet, S. M.(2000) The impact of mild Leydig cell dysfunction followingcytotoxic chemotherapy on bone mineral density (BMD) andbody composition. Clin. Endocrinol. (Oxf). 52, 609–616
44. Harris, T. B., Visser, M., Everhart, J., Cauley, J., Tylavsky, F.,Fuerst, T., Zamboni, M., Taaffe, D., Resnick, H. E., Scherzinger,A., and Nevitt, M. (2000) Waist circumference and sagittaldiameter reflect total body fat better than visceral fat in oldermen and women. The Health, Aging and Body CompositionStudy. Ann. N. Y. Acad. Sci. 904, 462–473
45. Pedersen, M., Bruunsgaard, H., Weis, N., Hendel, H. W.,Andreassen, B. U., Eldrup, E., Dela, F., and Pedersen, B. K. (2003)Circulating levels of TNF-alpha and IL-6-relation to truncal fat massand muscle mass in healthy elderly individuals and in patients withtype-2 diabetes. Mech. Ageing. Dev. 124, 495–502
46. Fischer, C. P., Berntsen, A., Perstrup, L. B., Eskildsen, P., andPedersen, B. K. (2006) Plasma levels of interleukin-6 andC-reactive protein are associated with physical inactivity inde-pendent of obesity. Scand. J. Med. Sci. Sports. doi: 10.1111/j.1600-0838.2006.00602.x
47. Steensberg, A., Fischer, C. P., Sacchetti, M., Keller, C., Osada, T.,Schjerling, P., van Hall, G., Febbraio, M. A., and Pedersen, B. K.(2003) Acute interleukin-6 administration does not impairmuscle glucose uptake or whole-body glucose disposal inhealthy humans. J. Physiol. 548, 631–638
48. WHO (1999) Definition, diagnosis and classification of diabetesmellitus and its complications: report of a WHO consultation.Part 1: diagnosis and classification of diabetes mellitus, pp1–100. World Health Organization, Geneva, Switzerland.
49. Levy, J. C., Matthews, D. R., and Hermans, M. P. (1998) Correcthomeostasis model assessment (HOMA) evaluation uses thecomputer program. Diabetes Care 21, 2191–2192
50. Wallace, T. M., Levy, J. C., and Matthews, D. R. (2004) Use andabuse of HOMA modeling. Diabetes Care 27, 1487–1495
51. Nechad, M., Nedergaard, J., and Cannon, B. (1987) Noradren-ergic stimulation of mitochondriogenesis in brown adipocytesdifferentiating in culture. Am. J. Physiol. 253, C889–894
52. Parisi, M. A., Xu, B., and Clayton, D. A. (1993) A humanmitochondrial transcriptional activator can functionally replacea yeast mitochondrial HMG-box protein both in vivo and invitro. Mol. Cell Biol. 13, 1951–1961
53. Cannon, B., and Nedergaard, J. (2004) Brown adipose tissue:function and physiological significance. Physiol. Rev. 84, 277–359
54. Gesta, S., Bluher, M., Yamamoto, Y., Norris, A. W., Berndt, J.,Kralisch, S., Boucher, J., Lewis, C., and Kahn, C. R. (2006)Evidence for a role of developmental genes in the origin ofobesity and body fat distribution. Proc. Natl. Acad. Sci. U. S. A.103, 6676–6681
55. Heilbronn, L. K., Smith, S. R., and Ravussin, E. (2003) Theinsulin-sensitizing role of the fat derived hormone adiponectin.Curr. Pharm. Des. 9, 1411–1418
56. Yechoor, V. K., Patti, M. E., Saccone, R., and Kahn, C. R. (2002)Coordinated patterns of gene expression for substrate andenergy metabolism in skeletal muscle of diabetic mice. Proc.Natl. Acad. Sci. U. S. A. 99, 10587–10592
57. Sreekumar, R., Halvatsiotis, P., Schimke, J. C., and Nair, K. S.(2002) Gene expression profile in skeletal muscle of type 2diabetes and the effect of insulin treatment. Diabetes 51, 1913–1920
58. Asmann, Y. W., Stump, C. S., Short, K. R., Coenen-Schimke,J. M., Guo, Z., Bigelow, M. L., and Nair, K. S. (2006) Skeletalmuscle mitochondrial functions, mitochondrial DNA copy num-bers, and gene transcript profiles in type 2 diabetic and nondi-abetic subjects at equal levels of low or high insulin andeuglycemia. Diabetes 55, 3309–3319
3664 Vol. 21 November 2007 SCHEELE ET AL.The FASEB Journal

59. Lin, J., Handschin, C., and Spiegelman, B. M. (2005) Metaboliccontrol through the PGC-1 family of transcription coactivators.Cell Metab. 1, 361–370
60. LaMonte, M. J., and Blair, S. N. (2006) Physical activity, cardio-respiratory fitness, and adiposity: contributions to disease risk.Curr. Opin. Clin. Nutr. Metab. Care. 9, 540–546
61. Gill, J. M., and Malkova, D. (2006) Physical activity, fitness andcardiovascular disease risk in adults: interactions with insulinresistance and obesity. Clin. Sci. (Lond). 110, 409–425
62. Wren, J. D., and Garner, H. R. (2005) Data-mining analysissuggests an epigenetic pathogenesis for type 2 diabetes.J. Biomed. Biotechnol. 2005, 104–112
63. Lu, Q., Qiu, X., Hu, N., Wen, H., Su, Y., and Richardson, B. C.(2006) Epigenetics, disease, and therapeutic interventions. Age-ing. Res. Rev. 5, 449–467
64. Semple, R. K., Crowley, V. C., Sewter, C. P., Laudes, M.,Christodoulides, C., Considine, R. V., Vidal-Puig, A., andO’Rahilly, S. (2004) Expression of the thermogenic nuclearhormone receptor coactivator PGC-1alpha is reduced in the
adipose tissue of morbidly obese subjects. Int. J. Obes. Relat.Metab. Disord. 28, 176–179
65. Hammarstedt, A., Jansson, P. A., Wesslau, C., Yang, X., andSmith, U. (2003) Reduced expression of PGC-1 and insulin-signaling molecules in adipose tissue is associated with insulinresistance. Biochem. Biophys. Res. Commun. 301, 578–582
66. Timmons, J. A., Wennmalm, K., Larsson, O., Walden, T. B.,Lassmann, T., Petrovic, N., Hamilton, D. L., Gimeno, R. E.,Wahlestedt, C., Baar, K., Nedergaard, J., and Cannon, B. (2007)Myogenic gene expression signature establishes that brown andwhite adipocytes originate from distinct cell lineages. Proc. Natl.Acad. Sci. U. S. A. 104, 4401–4406
67. Kuroda, Y., Mitsui, T., Kunishige, M., Shono, M., Akaike, M.,Azuma, H., and Matsumoto, T. (2006) Parkin enhances mito-chondrial biogenesis in proliferating cells. Hum. Mol. Genet. 15,883–895
Received for publication March 13, 2007.Accepted for publication May 3, 2007.
3665THE PINK1 LOCUS IN OBESITY AND TYPE 2 DIABETES
Copyright © 2022 FDOKUMEN