Altered energy flow pathways in a lake ecosystem following manipulation of fish community structure
11
RESEARCH ARTICLE Altered energy flow pathways in a lake ecosystem following manipulation of fish community structure Jari Syva ¨ranta • Pia Ho ¨gmander • Tapio Keskinen • Juha Karjalainen • Roger I. Jones Received: 8 April 2010 / Accepted: 16 August 2010 / Published online: 28 August 2010 Ó Springer Basel AG 2010 Abstract We used carbon and nitrogen stable isotope analyses to assess the relative contributions from pelagic and littoral energy sources to higher trophic levels in a lake ecosystem before and after a major food web perturbation. The food web structure of the lake was altered when the population sizes of the most abundant fish species (small perch, roach and bream) were reduced during an attempt to improve water quality by biomanipulation. Fish removal was followed by dense year classes of young fish, which subsequently increased the utilisation of pelagic resources. This was reflected as a decrease in relative energy contri- bution from littoral sources and also led to more distinct pelagic and littoral food chains after fish removal. Com- munity metrics calculated from stable isotope data indicated increased trophic diversity and occupied niche area, and reduced trophic redundancy in the food web. However, only minor changes were observed in fish trophic positions, although roach and pike occupied slightly lower trophic positions after fish removal. Despite the Jyva ¨sja ¨rvi ecosystem becoming more dependent on pelagic energy after fish removals, the littoral energy contribution was still substantial, particularly to certain fish species. Hence, our results support recent arguments for the importance of benthic production in lake ecosystems. More generally, our results illustrate how large-scale perturbations of food web structure can alter energy flow patterns through an entire ecosystem. Keywords Fish removal Food web Littoral Pelagic Stable isotopes Trophic cascades Introduction Studies of lake ecosystems have traditionally emphasised the importance of pelagic primary production over benthic production. However, some studies have argued greater importance of littoral (benthic) production in supporting higher trophic levels in lakes (Hecky and Hesslein 1995; Vander Zanden and Rasmussen 1999; Vander Zanden and Vadeboncoeur 2002). The contribution of benthic produc- tion to a whole lake ecosystem depends on many lake- specific factors such as lake area and morphometry, but also on lake trophic state, with benthic production becoming less important with increasing eutrophy and decreasing water clarity (Vadeboncoeur et al. 2001; Vadeboncoeur et al. 2003). The relative contributions from benthic and pelagic primary production to higher trophic levels are also likely to depend on the species composition and size structure of the fish community, which can generate both interspecific and intraspecific competition for available food resources. In many North European lakes, perch (Perca fluviatilis L.) and roach (Rutilus rutilus L.) are common species that compete for food resources (Persson 1986; Persson et al. 1999). Roach is generally considered a superior competitor for pelagic zooplankton (Persson 1987), whereas perch has the competitive advantage in the more structured littoral zone (Persson 1991; Winfield 1986). Moreover, these species undergo marked ontogenetic shifts in diet from J. Syva ¨ranta (&) P. Ho ¨gmander T. Keskinen J. Karjalainen R. I. Jones Department of Biological and Environmental Science, University of Jyva ¨skyla ¨, PO Box 35, 40014 Jyva ¨skyla ¨, Finland e-mail: jari.syvaranta@jyu.fi J. Syva ¨ranta Department of Biology and Ecology of Fishes, Leibniz-Institute of Freshwater Ecology and Inland Fisheries, Mu ¨ggelseedamm 310, 12561 Berlin, Germany Aquat Sci (2011) 73:79–89 DOI 10.1007/s00027-010-0161-8 Aquatic Sciences
Transcript of Altered energy flow pathways in a lake ecosystem following manipulation of fish community structure
RESEARCH ARTICLE
Altered energy flow pathways in a lake ecosystem followingmanipulation of fish community structure
Jari Syvaranta • Pia Hogmander • Tapio Keskinen •
Juha Karjalainen • Roger I. Jones
Received: 8 April 2010 / Accepted: 16 August 2010 / Published online: 28 August 2010
� Springer Basel AG 2010
Abstract We used carbon and nitrogen stable isotope
analyses to assess the relative contributions from pelagic
and littoral energy sources to higher trophic levels in a lake
ecosystem before and after a major food web perturbation.
The food web structure of the lake was altered when the
population sizes of the most abundant fish species (small
perch, roach and bream) were reduced during an attempt to
improve water quality by biomanipulation. Fish removal
was followed by dense year classes of young fish, which
subsequently increased the utilisation of pelagic resources.
This was reflected as a decrease in relative energy contri-
bution from littoral sources and also led to more distinct
pelagic and littoral food chains after fish removal. Com-
munity metrics calculated from stable isotope data
indicated increased trophic diversity and occupied niche
area, and reduced trophic redundancy in the food web.
However, only minor changes were observed in fish trophic
positions, although roach and pike occupied slightly lower
trophic positions after fish removal. Despite the Jyvasjarvi
ecosystem becoming more dependent on pelagic energy
after fish removals, the littoral energy contribution was still
substantial, particularly to certain fish species. Hence, our
results support recent arguments for the importance of
benthic production in lake ecosystems. More generally, our
results illustrate how large-scale perturbations of food web
structure can alter energy flow patterns through an entire
ecosystem.
Keywords Fish removal � Food web � Littoral �Pelagic � Stable isotopes � Trophic cascades
Introduction
Studies of lake ecosystems have traditionally emphasised
the importance of pelagic primary production over benthic
production. However, some studies have argued greater
importance of littoral (benthic) production in supporting
higher trophic levels in lakes (Hecky and Hesslein 1995;
Vander Zanden and Rasmussen 1999; Vander Zanden and
Vadeboncoeur 2002). The contribution of benthic produc-
tion to a whole lake ecosystem depends on many lake-
specific factors such as lake area and morphometry, but also
on lake trophic state, with benthic production becoming less
important with increasing eutrophy and decreasing water
clarity (Vadeboncoeur et al. 2001; Vadeboncoeur et al.
2003).
The relative contributions from benthic and pelagic
primary production to higher trophic levels are also likely
to depend on the species composition and size structure of
the fish community, which can generate both interspecific
and intraspecific competition for available food resources.
In many North European lakes, perch (Perca fluviatilis L.)
and roach (Rutilus rutilus L.) are common species that
compete for food resources (Persson 1986; Persson et al.
1999). Roach is generally considered a superior competitor
for pelagic zooplankton (Persson 1987), whereas perch has
the competitive advantage in the more structured littoral
zone (Persson 1991; Winfield 1986). Moreover, these
species undergo marked ontogenetic shifts in diet from
J. Syvaranta (&) � P. Hogmander � T. Keskinen �J. Karjalainen � R. I. Jones
Department of Biological and Environmental Science,
University of Jyvaskyla, PO Box 35, 40014 Jyvaskyla, Finland
e-mail: [email protected]
J. Syvaranta
Department of Biology and Ecology of Fishes, Leibniz-Institute
of Freshwater Ecology and Inland Fisheries,
Muggelseedamm 310, 12561 Berlin, Germany
Aquat Sci (2011) 73:79–89
DOI 10.1007/s00027-010-0161-8 Aquatic Sciences

early dependence on zooplankton to progressively greater
diet diversification with increasing size. Perch is a rather
strict carnivore that switches to feeding on littoral macro-
invertebrates and at still larger sizes can switch to
piscivory, while roach is considered more of a generalist
feeder, utilising both plant and animal food (Persson 1983).
Typically the fish community of these lakes may also
contain more specialist benthivores such as bream (Abr-
amis brama L.), specialist planktivores such as smelt
(Osmerus eperlanus L.), as well as littoral piscivores such
as pike (Esox lucius L.) and more open water piscivores
such as zander (Sander lucioperca L.). However, strick
classification to a certain feeding behaviour is not always
desirable and, for example, bream can sometimesalso be
well adapted to planktivory (Van den Berg et al. 1994).
The implications of large-scale food web perturbations
for energy flow patterns and trophic structures in entire
lake ecosystems have not been thoroughly investigated,
probably because of the amount of work needed to cate-
gorise ecosystem properties and processes by conventional
methods. Stable isotope analysis (SIA) potentially provides
more economical and integrative measures of ecosystem
properties, and has proved particularly useful for assessing
the relative importance of littoral and pelagic production in
lake ecosystems. Changes in the ratios of heavy to light
isotopes (13C/12C and 15N/14N, expressed relative to a
standard as d13C% or d15N%) can occur at each trophic
step because of fractionation of isotopes between animals
and their diet during assimilation or excretion (Peterson
and Fry 1987). Carbon fractionates less between trophic
steps and has proven particularly useful for distinguishing
the contributions of different food sources, whereas nitro-
gen fractionates to a greater extent and has been widely
used to define trophic positions of organisms (DeNiro and
Epstein 1978; Minagawa and Wada 1984; Peterson and Fry
1987). Boundary layer effects on inorganic carbon avail-
ability produce differences between phytoplankton and
periphyton photosynthesis in carbon isotope fractionation
(Hecky and Hesslein 1995). Hence pelagic and littoral
energy sources in lakes typically have distinct isotope
signatures (France 1995; Vander Zanden and Rasmussen
1999; Post 2002; Vander Zanden and Vadeboncoeur 2002),
so that the isotope ratios in consumers can be used to assess
the relative contributions from these different energy
sources to higher trophic levels.
Lakes are good model systems to test effects of food
web perturbations, since lake ecosystems have rather
clearly defined boundaries and their food web structure is
relatively easy to alter. Indeed, attempts at lake restoration
by biomanipulation are excellent examples of major eco-
system food web perturbations (Carpenter and Kitchell
1993) and as such they can offer valuable general insights
into ecosystem responses to food web perturbations (Pace
et al. 1999). We used carbon and nitrogen stable isotope
analyses to evaluate changes in lake ecosystem structure
during mass fish removal under a biomanipulation pro-
gramme in Lake Jyvasjarvi, central Finland, and especially
the effect of this food web perturbation on the relative
contributions of production from different sources to higher
levels in the food chain. The removal of fish during bi-
omanipulation can be expected to alter the population
structure of many fish species toward greater abundance
of younger individuals, thereby promoting predation on
zooplankton and reliance on pelagic energy sources. Fur-
thermore, substantial removal of generalist feeders, such as
roach, can also be expected to reduce the linkage between
pelagic and littoral energy flow, leading to more distinct
energy pathways and trophic structures. We tested these
expectations using stable isotope mixing models (SIAR),
and by using community-wide metrics calculated from
stable isotope data to characterise possible changes in the
food web structure of the lake.
Materials and methods
Jyvasjarvi (62�140N, 25�460E) is an urban lake in central
Finland, surrounded by the city of Jyvaskyla with some
80,000 inhabitants. The lake has an area of 337 ha, a
maximum depth of 27 m and a mean depth of 7.2 m, and is
thermally stratified in summer. Jyvasjarvi had become
heavily polluted by the late 1960s, but the condition of the
lake since has been progressively improving (Merilainen
et al. 2003; Salonen et al. 2005). Paleolimnological studies
from chironomid remains indicated mesotrophic conditions
in the lake even before the high anthropogenic pollution
(Merilainen et al. 2003). Nevertheless, the lake is still
somewhat eutrophic and the concentration of total phos-
phorus is typically around 35–40 lg l-1 and of total
nitrogen 850 lg l-1 (Salonen et al. 2005). Hence, an
attempt at further restoration, by biomanipulation involving
mass removals of cyprinid and small percid fish species,
was started by the local authorities in the spring of 2004.
Large traps (30–40 m in length and 10–15 m in width,
mesh size 8 mm) were set around the lake close to shore-
lines at depths less than 5 m. After the first removals of
over 50,000 kg of fish, the catches dropped sharply indi-
cating that there had been an efficient reduction in the fish
stock. A further 50,000 kg of fish were removed during
2005 and 2006, resulting in a total removal of 101,100 kg
(*300 kg ha-1) of fish from Jyvasjarvi during the
biomanipulation.
Zooplankton samples for SIA were collected in 2004
and 2006 bimonthly from May to September–October by
hauling zooplankton nets (mesh size 48 and 100 lm) ver-
tically through the entire water column. Zooplankton
80 J. Syvaranta et al.

samples were then taken to the laboratory and left over-
night in clean water to allow gut evacuation. The next day
these samples were identified and sorted into cladocerans,
and cyclopoid and calanoid copepods. All predatory
zooplankters [such as Leptodora kindtii (Focke) and Cha-
oborus flavicans (Meigen)] were removed from these
samples and, if sufficient, analysed separately. Samples
were then filtered onto glass-fibre filters and dried at 60�C.
Dried zooplankton samples were stored in a dessicator in
petri dishes for later stable isotope analysis. Other zoo-
plankton samples were collected in 2001–2006 from five
sampling sites using a 7.1 l Limnos water sampler. Sam-
ples were taken from 0 to 5 m depth and each was a
composite of 10 hauls, so that a sample from each location
was 71 l. Sampled water was then sieved through a 50-lm
net and preserved using ethanol in 250-ml containers. Five
subsamples (5–10 ml) were taken with a pipette (mouth
4 mm) from each composite sample for later species
identification and enumeration in a sedimentation cuvette
using an inverted microscope. The effect of the subsam-
pling on the precision is described in Karjalainen et al.
(1996). Zooplankton densities were converted into carbon
biomass (lg C) using the average carbon values for the size
classes of each taxon (Rahkola et al. 1998).
Macroinvertebrate samples for SIA were collected in
2004 and 2006 on several occasions from 4 to 5 littoral
sites. Samples were collected by sweep netting (mesh size
500 lm) at depths less than 1 m, and deeper samples
(mussels from down to 6 meters) were obtained with an
Ekman grab. All macroinvertebrate samples were then
taken to the laboratory and individuals were transferred
into clean water to allow them to void their guts. The
following day macroinvertebrates were sorted either into
small glass vials (2 ml) if a sample was a mixture of sev-
eral individuals of the same taxon, or on glass fibre filters if
samples were analysed individually. Only the foot tissue of
mussels was dissected for SIA. After drying at 60�C, the
samples were ground and weighed (0.6 mg) into small tin
cups.
Fish samples for SIA were collected from summer 2003
to autumn 2006 during open water periods from the large
traps used for biomanipulation and with multipanel gill
nets set around the lake. Gill nets were also used to monitor
the fish community structure and habitat use in Jyvasjarvi
in 2001–2006. The gill nets were 30 m 9 1.5 m with 9
mesh sizes (10, 12, 15, 20, 25, 30, 35, 45 and 55 mm from
knot to knot). The nets were used to sample pelagic, pro-
fundal and littoral habitats by setting nets at the surface in
pelagic areas where the water depth exceeded 3 m, at the
bottom in profundal areas where the water depth exceeded
6 m, and at the bottom in littoral areas where the water
depth was less than 3 m. Each habitat had 7–10 gill nets
and catch-per-unit-effort (CPUE) results were calculated
from these catches for each area in 2001–2006. The large
biomanipulation traps (30–40 m in length and 10–15 m in
width, mesh size 8 mm) were set close to shorelines at
depths less than 5 m. Fish sampled for SIA were divided
into those caught before the biomanipulation (fish caught in
2003 and spring 2004) and those caught after (a few
individual predatory fish from late autumn 2005, but
mostly 2006). Sampled fish included mainly perch, roach,
bream, smelt, zander, pike and burbot (Lota lota L.). Perch
were divided according to their size into planktivorous/
benthivorous (\15 cm) or primarily piscivorous ([15 cm)
(Persson et al. 1991; Horppila et al. 2000). Length and
weight were recorded for all fish and a small piece of dorsal
muscle tissue was dissected. Muscle samples were dried at
60�C, ground to a fine powder using a mortar and pestle,
and a small subsample (0.6 mg) was weighed into a tin cup
for SIA.
Stable isotope analyses were done at the Institute for
Environmental Research, University of Jyvaskyla, using a
FlashEA 1112 elemental analyzer coupled to a Thermo
Finnigan DELTAplus Advantage mass spectrometer
(Thermo Electron Corporation, Waltham, MA, USA).
Pulverised pike muscle tissue was used as a laboratory
working standard and replicate standards were run repeat-
edly in every analysis to ensure accurate analysis and to
allow any required correction for linearity and drift. Stable
isotope ratios are expressed as parts per thousand (%) delta
values (d13C or d15N) referring to the international stan-
dards for carbon (PeeDee Belemnite) and nitrogen
(atmospheric nitrogen) (Peterson and Fry 1987). Internal
precision for standards was always better than 0.2% for
both C and N in each run. Lipids are 13C-depleted,
resulting in low d13C values in tissues rich in lipids (Parker
1964) and, as Post et al. (2007) recently showed, the error
in isotope mixing models resulting from overlooked lipid
variability can be considerable. Seasonally collected zoo-
plankton samples may reflect considerable variation in
their lipid content, particularly in colder climates when
they store energy as lipids to survive the winter, which may
translate into biased d13C values in lipid rich zooplankton
(Smyntek et al. 2007; Syvaranta and Rautio 2010). The
zooplankton samples collected from Jyvasjarvi showed
increased lipid content and higher C:N ratios (up to 6.4) in
late autumn with a corresponding decrease in d13C values.
Therefore, we used an empirical lipid normalisation model
(Syvaranta and Rautio 2010) modified from Smyntek et al.
(2007) to normalise the d13C values in our zooplankton
samples based on a non-linear relationship between zoo-
plankton tissue C:N ratios and the difference in d13C values
of bulk and lipid free tissues. In contrast, all our fish
samples had C:N ratios \3.5 (i.e. low lipid content) and
according to Post et al. (2007) normalising these would
have minimal effect on the d13C values.
Altered energy flow pathways in a lake ecosystem 81
We used the SIAR (Stable Isotope Analysis in R)
package (Parnell et al. 2010) in R 2.9.2 (R Development
Core Team 2009) to calculate relative contributions from
pelagic and littoral production in fish species before and
after the fish removals. The SIAR isotope mixing model
uses Bayesian inference to estimate source contribution and
allows the input of uncertainties, such as variation around
the isotope values of source end member values and fraction
factors, into the final model (Jackson et al. 2008). The
contribution (possible range from 0 to 1) of littoral carbon
was also used to estimate trophic positions (TP) of fish with
a simple two-source model following Karlsson and Bystrom
(2005): TP = k ? ([d15Nc – d15Np – (d13Cl – d13Cp) 9
BS 9 LC]/DN), where k is the trophic position of the
organism used to calculate end member values (primary
consumers = 2), BS is the slope of the linear relationship
between littoral and pelagic source end members, LC is the
littoral contribution (0–1), DN is the fractionation factor for
d15N and c, p and l correspond to the consumer, pelagic and
littoral end members. We used fractionation factors of
0.5 ± 0.2% for d13C and 3.0 ± 0.5% for d15N, which fall
within the range for most often reported and used factors
(Peterson and Fry 1987; Vander Zanden and Rasmussen
1999; Post 2002). Both values (with uncertainties) were
used in SIAR model and values for nitrogen in the model to
estimate trophic positions.
End points for pelagic d13C values were calculated as a
mean value extracted from the zooplankton (cladocera and
copepods) summer mean and the mean for unionid mussels
collected in 2004 (‘‘before’’ end point) and 2006 (‘‘after’’
end point). Similarly, littoral d13C end points were calcu-
lated from mean values of snails and the most abundant
littoral macroinvertebrates, such as water slater (Asellus
aquaticus L.) and species of mayfly, caddis fly and chir-
onomids. The d15N end points were calculated similarly to
represent secondary consumer d15N values in the pelagic
and littoral, excluding all potentially predatory species. The
d15N values in the pelagic consumers are substantially
higher than in littoral consumers in Jyvasjarvi (Syvaranta
et al. 2006), which highlights the need of a two source
mixing model to be used when assessing trophic positions
accurately.
We also calculated community-wide metrics from stable
isotope data to assess possible changes in food web
structure (Layman et al. 2007). These metrics were calcu-
lated from a mean value d13C–d15N biplot of all analysed
species of the food web (similar to Fig. 4 but only mean
values for each species). The metrics and their application
in SIA studies have been reviewed in detail by Layman
et al. (2007) and the metrics we included were total area
(TA), a convex hull area covering the whole food web as
indicated by species’ mean values in d13C–d15N isotope
space; mean distance to centroid (CD), which is the mean
distance of each species mean value to the d13C–d15N
centroid (mean of all species) indicating the average degree
of trophic diversity within a food web; mean nearest
neighbour distance (NND), the mean of the distances
between all species and their closest neighbouring species
in d13C–d15N space whose values indicate trophic redun-
dancy (smaller NND values ? increased redundancy); and
standard deviation of nearest neighbour distances
(SDNND), the standard deviation of NND which is a
measure of evenness of the distribution of species’ mean
values (i.e. trophic niches).
Statistical analyses included t tests, analysis of variance
(ANOVA) with Levene’s test for homoscedasticity and
Tukey’s multiple comparisons tests when appropriate, and
Kruskall-Wallis test with Mann–Whitney U tests when
assumptions for parametric tests were not met to analyse
differences in littoral contribution and trophic positions
between species and sampling times (before and after fish
removal). Burbot was not included in the ‘before’ analyses
due to low sample size (n = 2). All statistical analyses
were performed using R 2.9.2 (R Development Core Team
2009) and SPSS for Windows v. 14.0.1 software package
(SPSS Inc., Chicago, IL, USA).
Results
Fish catches
After fish removals started in 2004, gill net catches in the
pelagic habitat declined for perch and roach from an
average CPUE of 769 g net-1 (54 ind. net-1) and
747 g net-1 (15 ind. net-1) in 2001–2003 to 232 g net-1
(18 ind. net-1) and 293 g net-1 (13 ind. net-1) in 2005
(Fig. 1). However, in 2006 catches from the pelagic habitat
increased considerably to 2,827 g net-1 (197 ind. net-1)
for perch, while the increase was 962 g net-1 for roach and
the mean size of these roach had increased notably,
equating to an average catch of 17 ind. net-1. Very few
fish were caught from the profundal habitat and the sam-
pled fish are unlikely to efficiently exploit these depths
with very low oxygen concentrations in Jyvasjarvi. The
only exception, shown by Ravinet et al. (2010), is the ruffe
which is partly supported by methane-dervied carbon after
specialising in feeding on profundal chironomids. The ruffe
were therefore excluded from this data set due to their use
of a unique trophic pathway in Jyvasjarvi. The impact of
fish removals on perch and roach catches from the littoral
habitat were minor until 2006, when catches especially for
perch rapidly increased. The removals had an impact on the
size structure of the fish community, making particularly
smaller perch (\15 cm) more abundant in 2006 than before
the removals in 2001–2003 (Fig. 2). The percentage
82 J. Syvaranta et al.

distribution of species in the biomanipualtion trap catches
were estimated from random subsamples but only calcu-
lated for small perch, roach and bream, since other species
were either too rare or released back into the lake as pre-
dators. Perch made up 31%, roach 25% and bream 43% of
the total catches (by weight) in 2004–2006.
Zooplankton and macroinvertebrates
There was only a small indication of zooplankton biomass
response to these fish removals, against a background of
wide interannual fluctuations in biomasses during the per-
iod 2000–2006 with particularly high zooplankton biomass
in 2001 (Fig. 3). After the first fish removals in 2004,
cladoceran biomass increased by 49%, but decreased again
in 2005. The copepod biomass similarly increased (54%) at
first before quickly returning to pre-biomanipulation levels.
There was a slight but statistically insignificant increase in
proportion of larger bodied individuals in both cladoceran
and copepod populations (Fig. 3). These rather minor
changes in zooplankton community had no appreciable
affect on either chlorophyll a concentrations or water
clarity (mean secchi disk depth 2001–2003 was 1.6 m and
2004–2006 1.5 m).
Zooplankton (Ntot = 127) and littoral macroinverte-
brates (Ntot = 141) had distinct d13C and d15N values
consistent with their assumed energy sources (Fig. 4).
Fig. 1 Gill net catches of perch and roach from different habitats in
Jyvasjarvi during summers 2001–2006. Bars represent mean (±SE)
catch per unit effort (CPUE, n) catches of fish from pelagic, profundal
and littoral areas (each with ten replicate nets). Dashed line indicates
the beginning of fish removals
Fig. 2 Size distribution of perch and roach individuals in gill net
catches from Jyvasjarvi before the fish removals (means ± SE of
2001–2003 catches) and after the last removals in 2006. Values on
x-axis denote the upper size limit for each size class, and median and
percentile size values are given for each panel separately
Altered energy flow pathways in a lake ecosystem 83

The zooplankton samples were then used together with
macroinvertebrate samples to calculate end member values
for mixing models to estimate littoral contribution and
trophic positions. The end member values calculated from
these samples did not differ significantly from each other
between years [all P [ 0.05) and were (±SD): (before)
pelagic C = -34.8 ± 1.3% N = 13.7 ± 2.7%, littoral
C = -27.9 ± 1.3% N = 9.3 ± 1.0% (after) pelagic
C = -34.8 ± 0.8% N = 14.1 ± 1.7%, littoral C =
-27.6 ± 3.5% N = 10.2 ± 1.4%]. Although the samples
used to calculate the before end member values were col-
lected during the first fish removals, it is highly unlikely
that there had already been any significant impacts on
stable isotope values due to fish removals, since no impacts
were identified even after 3 years of removals. Also, this
would have been too short of a time period for any major
changes to occur in zooplankton or macroinvertebrate
community structure.
Littoral energy contribution to fish
Taking all fish (Ntot = 543) analysed for stable isotopes
together by species, the fraction of littoral carbon in higher
trophic levels was 0.65 (65%) before and 0.40 (40%) after
fish removals, as estimated using the SIAR model. Both
planktivorous/benthivorous (small perch, roach, bream and
smelt) and piscivorous (larger perch, pike, zander and
burbot) fish showed greater reliance on pelagic production
after fish removals (Table 1). The mean decrease in littoral
contribution was 33% (23% units) for non-piscivores and
44% (27% units) for piscivores, calculated as the mean
from species’ mean values. There were also clear species-
specific differences within these changes (Table 1 and
Fig. 5). For example, there was no change in the littoral
contribution for bream, but 47% change for smaller perch
and 74% change for smelt. Before fish removals, small
perch and smelt did not differ from each other in littoral
contribution, but both differed from roach and bream
(Kruskall-Wallis v2 = 127.14, df = 3, P \ 0.001), which
also differed from each other (Mann–Whitney U = 1019,
P = 0.003). After fish removals, all these planktivorous/
benthivorous fish differed significantly from each other in
littoral contribution (Kruskall-Wallis v2 = 166.07, df = 3,
P \ 0.001). Piscivorous fish did not differ from each other
Fig. 3 Cladocera and copepod zooplankton biomass and population
size structure in Jyvasjarvi during 2001–2006. Data shown are from
samples collected in August from 0 to 5 m depth. Dashed lineindicates the beginning of fish removals
Fig. 4 Isotope biplots illustrating the food web relationships in
Jyvasjarvi before (upper panel) and after (lower panel) the fish
removals. Mean values (±SE) are given for different zooplankton,
macroinvertebrates and piscivorous fish samples. Individual values
are shown for smelt (black filled circles), small perch (grey filledcircles), roach (open diamonds) and bream (open squares). Eu,
Eudiaptomus sp.; Cyc, cyclopoida; Cla cladocera; Pred, predatory
zooplankton (mainly Leptodora kindtii, Chaoborus sp.); Tr, Trichop-
tera, Lp, Leptophlebiidae (Ephemeroptera); Ch, Caenis horaria(Ephemeroptera); Aa, Asellus aquaticus (Isopoda); C, Chironomidae;
P, pike; Z, zander; LP, large perch; B, burbot
84 J. Syvaranta et al.
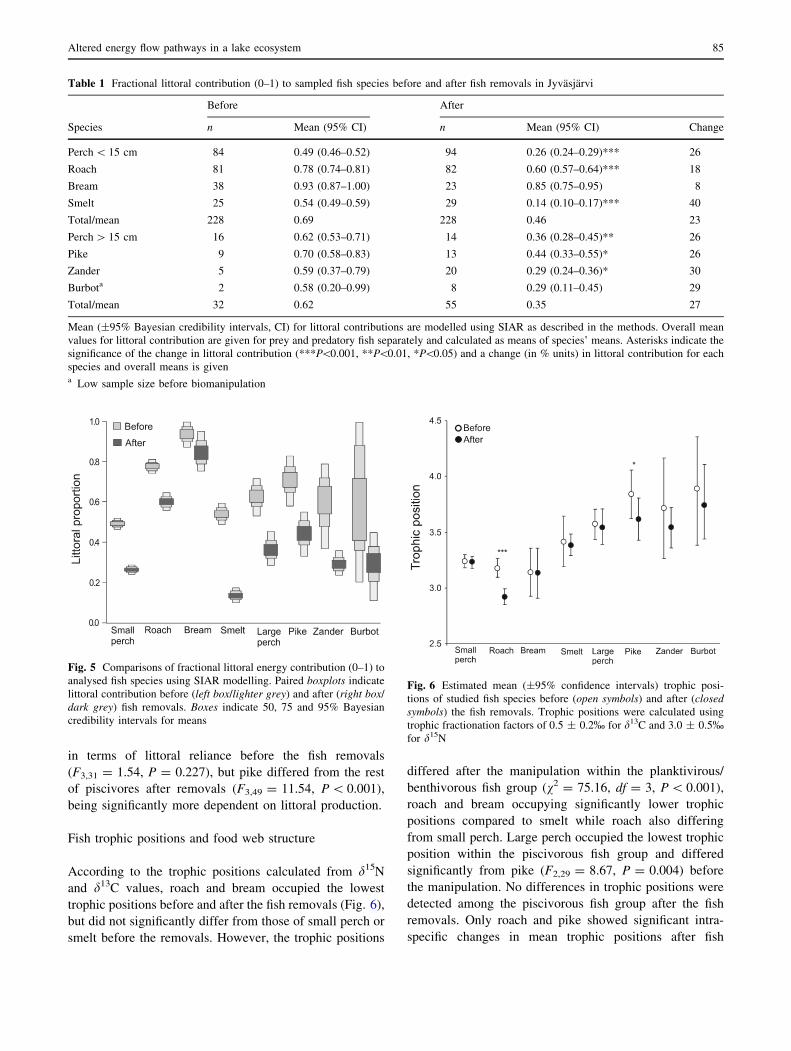
in terms of littoral reliance before the fish removals
(F3,31 = 1.54, P = 0.227), but pike differed from the rest
of piscivores after removals (F3,49 = 11.54, P \ 0.001),
being significantly more dependent on littoral production.
Fish trophic positions and food web structure
According to the trophic positions calculated from d15N
and d13C values, roach and bream occupied the lowest
trophic positions before and after the fish removals (Fig. 6),
but did not significantly differ from those of small perch or
smelt before the removals. However, the trophic positions
differed after the manipulation within the planktivirous/
benthivorous fish group (v2 = 75.16, df = 3, P \ 0.001),
roach and bream occupying significantly lower trophic
positions compared to smelt while roach also differing
from small perch. Large perch occupied the lowest trophic
position within the piscivorous fish group and differed
significantly from pike (F2,29 = 8.67, P = 0.004) before
the manipulation. No differences in trophic positions were
detected among the piscivorous fish group after the fish
removals. Only roach and pike showed significant intra-
specific changes in mean trophic positions after fish
Table 1 Fractional littoral contribution (0–1) to sampled fish species before and after fish removals in Jyvasjarvi
Before After
Species n Mean (95% CI) n Mean (95% CI) Change
Perch \ 15 cm 84 0.49 (0.46–0.52) 94 0.26 (0.24–0.29)*** 26
Roach 81 0.78 (0.74–0.81) 82 0.60 (0.57–0.64)*** 18
Bream 38 0.93 (0.87–1.00) 23 0.85 (0.75–0.95) 8
Smelt 25 0.54 (0.49–0.59) 29 0.14 (0.10–0.17)*** 40
Total/mean 228 0.69 228 0.46 23
Perch [ 15 cm 16 0.62 (0.53–0.71) 14 0.36 (0.28–0.45)** 26
Pike 9 0.70 (0.58–0.83) 13 0.44 (0.33–0.55)* 26
Zander 5 0.59 (0.37–0.79) 20 0.29 (0.24–0.36)* 30
Burbota 2 0.58 (0.20–0.99) 8 0.29 (0.11–0.45) 29
Total/mean 32 0.62 55 0.35 27
Mean (±95% Bayesian credibility intervals, CI) for littoral contributions are modelled using SIAR as described in the methods. Overall mean
values for littoral contribution are given for prey and predatory fish separately and calculated as means of species’ means. Asterisks indicate the
significance of the change in littoral contribution (***P\0.001, **P\0.01, *P\0.05) and a change (in % units) in littoral contribution for each
species and overall means is givena Low sample size before biomanipulation
Fig. 5 Comparisons of fractional littoral energy contribution (0–1) to
analysed fish species using SIAR modelling. Paired boxplots indicate
littoral contribution before (left box/lighter grey) and after (right box/
dark grey) fish removals. Boxes indicate 50, 75 and 95% Bayesian
credibility intervals for means
Fig. 6 Estimated mean (±95% confidence intervals) trophic posi-
tions of studied fish species before (open symbols) and after (closedsymbols) the fish removals. Trophic positions were calculated using
trophic fractionation factors of 0.5 ± 0.2% for d13C and 3.0 ± 0.5%for d15N
Altered energy flow pathways in a lake ecosystem 85

removals; the mean trophic position for roach decreased
from 3.1 to 2.9 (t161 = 5.33, P \ 0.001) and that for pike
from 3.9 to 3.6 (t20 = 2.41, P = 0.026) during biomanip-
ulation (Fig. 6).
The community-wide isotope metrics also revealed
changes in the food web structure after the fish removals.
Almost all metrics calculated for the whole food web
showed increased values after manipulation; mean distance
to centroid (CD) increased by 41% (from 17 to 24), total
area (TA) by 11% (54–60), and mean nearest neighbour
distance (NND) by 50% (1.6–2.4). However, the standard
deviation of nearest neighbour distances (SDNND)
decreased by 17% (1.8–1.5). The greatest changes in NND
were observed for roach (from 2.2 to 4.5), smelt (0.4–1.9)
and pike (0.4–1.1). After fish removals, NND for bream
was actually calculated against snails since these had
become the nearest neighbour to bream in the isotope
biplot, and the change was only from 2.2 to 2.9. However,
if NND for bream was calculated against the nearest fish
neighbour (roach), the change for bream was from 2.2 to
8.6. When TA and CD were calculated just for the fish part
of the food web, the increases were 72 and 120%,
respectively.
Discussion
The fish removals in 2004–2006 had an impact on the fish
community structure in the lake, particularly on the perch
population. Gill net catches of perch decreased consider-
ably in the pelagic habitat in 2005, while there was no
impact in the littoral zone (Fig. 1). The impact was less
clear on the roach population, although the catches of roach
were also lower in the pelagic habitat in 2004 and 2005 but
little different in the littoral habitat. The catches of perch
dramatically increased in 2006, both in the pelagic and
littoral habitats. This increase was due to a dense juvenile
perch year class in 2005 seen as a peak in the 90–110 mm
size class of perch in 2006 (Fig. 2), which has been typical
in many restoration attempts after some years of fish
removals (e.g. Hansson et al. 1998; Karjalainen et al.
1999). The size distributions of perch and roach before fish
removals were heavily influenced by a long and warm
summer in 2002 that produced exceptionally abundant
juvenile year classes. This was evident as a 15-fold gill net
catch of 100 mm size class roach in 2003 compared to
years 2001 and 2002, and is seen as a considerable peak in
the catch of these small roach size classes before fish
removals (Fig. 2).
The zooplankton community shifted from dominance by
the small-bodied cladocerans Daphnia cucullata (Sars) and
D. cristata (Sars) towards a greater proportion of the lar-
ger-bodied cladoceran D. galeata (Sars), as would be
expected during the first years after major fish removals
under reduced predation pressure (Hansson et al. 1998).
However, appreciable longer-term interannual fluctuations
in zooplankton biomass obscure any impacts of fish rem-
ovals on zooplankton biomass. Cladoceran and copepod
biomasses increased slightly immediately after the first fish
removals in 2004 but were again lower in 2005. This could
partly be due to a strong juvenile fish year class in 2005
feeding efficiently on zooplankton. There also seemed to be
less impact on the proportion of large copepods and
predatory zooplankton, even though these groups clearly
became more abundant in the SIA samples collected with a
zooplankton net. However, if these larger and more quickly
moving zooplankters effectively evade capture by the
Limnos water sampler used for quantitative zooplankton
sampling, their biomasses would have been underesti-
mated. The data available here for zooplankton biomass
and community composition were from samples collected
in August each year and all larger-bodied copepods were
almost absent from these samples. A few preliminary
samples analysed from June and July indicate that Het-
erocope sp. and Eurytemora sp. biomass increased from
less than 2 lg C l-1 in 2003 to 8–10 lg C l-1 in 2006.
Nevertheless, any cascading effects on chlorophyll-a con-
centrations or water clarity in Jyvasjarvi seem to have been
rather limited.
After fish removal, almost all studied fish species
showed significantly increased energy contributions from
pelagic sources (Table 1; Fig. 5); the only exception was
bream, and also burbot, for which statistical testing was
prevented by low sample size before the fish removals.
Bream is a specialised and efficient benthivore and,
although the bream population was also considerably
reduced (to &30% of stock prior to fish removals based on
a virtual population analysis, T. Keskinen, unpublished
data), there seemed to be little effect on bream feeding
pattern. Smelt and small perch showed the strongest
dependence on pelagic food sources, especially after the
fish removals. Because the smelt population in Jyvasjarvi is
rather small, small perch is likely the primary planktivore
in Jyvasjarvi, particularly after fish removals when abun-
dant year classes of young-of-the-year (YOY) perch
increased the planktivory in Jyvasjarvi. Similar responses
to biomanipulation attempts by fish removals have been
reported before. For example, Karjalainen et al. (1999)
reported decreased predation pressure on benthic inverte-
brates but increased predation on zooplankton after fish
removals due to very dense perch year classes. The fish
removals in Jyvasjarvi had significant impacts on the
feeding niche widths of perch and roach, and many larger
perch specialised in feeding on the abundant fish juveniles
in 2006 (Syvaranta and Jones 2008). Since juvenile fish are
efficient zooplanktivores, predation on juveniles by larger
86 J. Syvaranta et al.
fish promotes the flow of energy from pelagic sources to
higher trophic levels in the food web.
We observed only minor changes in trophic positions of
fish after fish removals. Only roach and pike showed sig-
nificantly decreased trophic positions after biomanipulation
and these changes are likely to be linked. Of the piscivores
in Jyvasjarvi, pike showed the highest littoral contribution
and is therefore likely to feed more on roach than the other
piscivores. Any change in roach trophic position would
then affect the trophic position of pike. According to iso-
tope values, other piscivores in Jyvasjarvi seemed to prey
more on smaller perch, which became more abundant after
the mass removal of larger perch and roach, and were
frequently observed in stomachs of larger perch, burbot and
especially zander. The relatively high temporal variability
in pelagic d15N values observed in Jyvasjarvi (see
Syvaranta et al. 2008) may introduce some bias into our
trophic position calculations. Zooplankton d15N values in
Jyvasjarvi have an increasing trend during summer, with a
peak in autumn. However, the mean cladoceran d15N value
was equivalent to that calculated for mussels, and using a
time series of cladoceran d15N values (Matthews and
Mazumder 2003) together with mussel d15N values as
baseline provides a reasonably good integrated end point
(or baseline) for most longer-lived fish. But some smaller
and more rapidly growing individuals (such as YOY fish)
feeding on zooplankton, may temporarily reflect d15N
values inconsistent with averaged baseline values.
The community-wide measures indicated increased total
occupied niche area and trophic diversity after fish remo-
vals. Greater variability in isotope values associated with
lower trophic levels in a food chain can influence these
metrics, when the whole food web is considered (Layman
et al. 2007). However, these changes were equivalent when
only the fish part of the food web was considered. Roach
and bream (when only fish were considered) showed par-
ticularly pronounced increases in NND values (indicating
decreased trophic redundancy), which suggests that these
species show rather distinct feeding ecologies and are
probably less affected by competition from other fish
species. After fish removals, these species were also less
affected by competition from each other as well as by
intraspecific competition, since the abundance of these
species was substantially reduced. Increases in TA and
especially in CD indicate that the two primary energy
pathways in Jyvasjarvi, one originating from pelagic pri-
mary production and the other from littoral production,
were more distinct after biomanipulation. Fish species
primarily using zooplankton prey (such as smelt and small
perch) were more clearly associated at the top of the zoo-
plankton food chain, whereas benthivorous species (roach
and bream) were closer to the macroinvertebrate food chain
in the d13C–d15N biplot (Fig. 4).
Although smelt is not abundant in Jyvasjarvi, it was
originally included in this study to represent a true plank-
tivorous feeder. However, in practice, it may not have been
a representative planktivore. Before the fish removals, the
smelt population in Jyvasjarvi was divided by their isotope
values into two groups, both having similar d13C but one
with notably higher d15N values (Fig. 4). After fish remo-
vals, the isotope values of smelt were considerably more
homogenous (Fig. 4). Total lengths of smelt individuals in
our samples were 90–140 mm and, according to Vinni
et al. (2004), cannibalism is common for smelt of this size,
so those individuals with higher d15N values before fish
removal may have been largely cannibalistic. Smelt typi-
cally feeds on large-bodied predatory zooplankters, but
these were very scarce in Jyvasjarvi before fish removals,
whereas individuals of both predatory zooplankters and a
large bodied calanoid copepod, Heterocope sp., became
sufficiently abundant after the removals to be included in
SIA. Hence cannibalism amongst smelt was probably more
frequent when the smelt population was larger and valuable
zooplankton prey was limiting, but became rare as both the
availability of more profitable large bodied zooplankton
prey increased and the abundance of smelt had decreased.
A change to feeding primarily on predatory zooplankton
also decreased the variation in smelt trophic position
(Fig. 6).
The results reported in this paper illustrate how the lake
food web in Jyvasjarvi became more dependent on pelagic
production after the fish removals, which appears to be the
result of altering the fish community structure by efficient
removal of older fish followed by increases in younger fish
size classes, in particular those of perch. As the fish com-
munity structure changed towards younger and more
planktivorous individuals, it is not surprising that the whole
Jyvasjarvi food web became less supported by benthic
primary production. In another Finnish lake zooplankton
similarly became more important and benthic macroin-
vertebrates less important prey for fish due to changed
population structure after biomanipulation (Karjalainen
et al. 1999). In Jyvasjarvi, although littoral energy contri-
bution was still considerable after fish removal, the more
important response proved to be the rapid production of
strong year classes of planktivorous juvenile fish that
increased exploitation of and reliance on pelagic energy
sources. These abundant small juvenile fish are profitable
and effectively exploited prey for larger piscivorous fish,
which thereby also became ultimately more dependent on
pelagic primary production (Fig. 5). Hence our first
expectation of increasing contribution of pelagic primary
production to the Jyvasjarvi food web after fish removals
seems valid.
The second original expectation of more discrete pelagic
and littoral energy pathways was supported by the isotope
Altered energy flow pathways in a lake ecosystem 87

data before and after fish removal, where the variation
associated with values for individual fish was considerably
reduced. Also, species that mostly use either pelagic or
benthic consumers (such as smelt and bream) became
clearly separated by their isotope values, and the commu-
nity-wide metrics indicated decreased trophic redundancy
and more even distribution of trophic niches.
In conclusion, our results support recent arguments that
littoral/benthic production in lakes is more important to the
whole lake energy budget than is often acknowledged (e.g.
Vander Zanden and Vadeboncoeur 2002), even in rela-
tively deep lakes. The pelagic primary production in
Jyvasjarvi contributed more to the whole ecosystem after
the fish removal; this is an expected, but probably tempo-
rary, outcome of the change in age and size structure of the
fish populations following selective removal of larger fish
and the subsequent stimulation to recruitment of small
planktivorous perch and roach, and of larger fish feeding on
these. Thus, our results show that lakes undergoing an
attempted biomanipulation may experience considerable
ecosystem changes even if the primary targets (decreased
phytoplankton biomass and increased water clarity, etc.)
are being largely unaffected. More generally, these results
illustrate how alterations of the consumer population
structure can exert a change in energy flow patterns
through an entire ecosystem, a finding probably applicable
not only in lake ecosystems but also in other more diverse
ecosystems (Pace et al.1999).
Acknowledgments Pekka Majuri, Antti Eloranta, Sami Vesala, Sari
Oksanen, Katie Aoki and Joanne Kitchen gave valuable assistance in
the field and laboratory. Tuula Sinisalo, Virve Kustula and Tony
Pirkola helped with operating the SIA instrument in Jyvaskyla. All
personnel working in the Jyvasjarvi Project and biomanipulation
fishing are thanked for their help. Two anonymous reviewers pro-
vided useful comments on an earlier version of this paper. This work
was funded by the Maj and Tor Nessling Foundation (research pro-
jects 2004074, 2005020, 2006026 to RIJ and 2007051 to JS) and by
grants from the Finnish Cultural Foundation and the Kone Foundation
to JS.
References
Carpenter SR, Kitchell JF (1993) The trophic cascade in lake
ecosystems. Cambridge University Press, London
DeNiro MJ, Epstein S (1978) Influence of diet on the distribution of
carbon isotopes in animals. Geochim Cosmochim Ac 42:495–506
Development Core Team R (2009) R: a language and environment for
statistical computing. R Foundation for Statistical Computing,
Vienna
France RL (1995) Differentiation between littoral and pelagic food
webs in lakes using stable carbon isotopes. Limnol Oceanogr
40:1310–1313
Hansson L, Annadotter H, Bergman E et al (1998) Biomanipulation
as an application of food-chain theory: constraints, synthesis, and
recommendations for temperate lakes. Ecosystems 1:558–574
Hecky RE, Hesslein RH (1995) Contributions of benthic algae to lake
food webs as revealed by stable isotope analysis. J N Am
Benthol Soc 14:631–653
Horppila J, Ruuhijarvi J, Rask M, Karppinen C, Nyberg K, Olin M
(2000) Seasonal changes in the diets and relative abundances of
perch and roach in the littoral and pelagic zones of a large lake.
J Fish Biol 56:51–72
Jackson AL, Inger R, Bearhop S, Parnell A (2008) Erroneous
behaviour of MixSIR, a recently published Bayesian isotope
mixing model: a discussion of Moore and Semmens. Ecol Lett
12:E1–E5
Karjalainen J, Rahkola M, Viljanen M, Andronikova I, Avinsky V
(1996) Comparison of methods used in zooplankton sampling
and counting in joint Russian–Finnish evaluation of Lake
Ladoga trophic state. Hydrobiologia 322:249–253
Karjalainen J, Leppa M, Rahkola M, Tolonen K (1999) The role of
benthivorous and planktivorous fish in a mesotrophic lake
ecosystem. Hydrobiologia 408(409):73–84
Karlsson J, Bystrom P (2005) Littoral energy mobilization dominates
energy supply for top consumers in subarctic lakes. Limnol
Oceanogr 50:538–543
Layman CA, Arrington DA, Montana CG, Post DM (2007) Can stable
isotope ratios provide for community-wide measures of trophic
structure? Ecology 88:42–48
Matthews B, Mazumder A (2003) Compositional and interlake
variability of zooplankton affect baseline stable isotope signa-
tures. Limnol Oceanogr 48:1977–1987
Merilainen JJ, Hynynen J, Palomaki A, Mantykoski K, Witick A
(2003) Environmental history of an urban lake: a palaeolimno-
logical study of Lake Jyvasjarvi, Finland. J Paleolimnol
30:387–406
Minagawa M, Wada E (1984) Stepwise enrichment of 15N along food
chains: Further evidence and the relation between d15N and
animal age. Geochim Cosmochim Ac 48:1135–1140
Pace ML, Cole JJ, Carpenter SR, Kitchell JF (1999) Trophic cascades
revealed in diverse ecosystems. Trends Ecol Evol 14:483–488
Parker PL (1964) The biogeochemistry of the stable isotopes of
carbon in a marine bay. Geochim Cosmochim Ac 28:1155–1164
Parnell AC, Inger R, Bearhop S, Jackson AL (2010) Source
partioning using stable isotopes: coping with too much variation.
PLoS ONE 5:e9672
Persson L (1983) Food consumption and competition between age
classes in a perch Perca fluviatilis population in a shallow
eutrophic lake. Oikos 40:197–207
Persson L (1986) Effects of reduced interspecific competition on
resource utilization in perch (Perca fluviatilis). Ecology
67:355–364
Persson L (1987) Effects of habitat and season on competitive
interactions between roach (Rutilus rutilus) and perch (Percafluviatilis). Oecologia 73:170–177
Persson L (1991) Behavioural response to predators reverses the
outcome of competition between prey species. Behav Ecol
Sociobiol 28:101–105
Persson L, Diehl S, Johansson L, Andersson G, Hamrin SF (1991)
Shifts in fish communities along the productivity gradient of
temperate lakes—patterns and the importance of size-structured
interactions. J Fish Biol 38:281–293
Persson L, Bystrom P, Wahlstrom E, Andersson J, Hjelm J (1999)
Interactions among size-structured populations in a whole-lake
experiment: size- and scale-dependent processes. Oikos
87:139–156
Peterson BJ, Fry B (1987) Stable isotopes in ecosystem studies. Annu
Rev Ecol Syst 18:293–320
Post DM (2002) Using stable isotopes to estimate trophic position:
models, methods and assumptions. Ecology 83:703–718
88 J. Syvaranta et al.
Post DM, Layman CA, Arrington DA, Takimoto G, Quattrochi J,
Montana CG (2007) Getting to the fat of the matter: models,
methods and assumptions for dealing with lipids in stable isotope
analyses. Oecologia 152:179–189
Rahkola M, Karjalainen J, Avinsky V (1998) Individual weight
estimates of zooplankton based on length-weight regressions in
Lake Ladoga and Saimaa lake system. Nordic J Freshw Res
74:100–111
Ravinet M, Syvaranta J, Jones RI, Grey J (2010) A trophic pathway
from biogenic methane supports fish biomass in a temperate lake
ecosystem. Oikos 119:409–416
Salonen K, Karjalainen J, Hogmander P, Keskinen T, Huttula T,
Palomaki A (2005) Recovery of Lake Jyvasjarvi after pollution
by municipal and industrial waste waters. Verh Internat Verein
Limnol 29:619–622
Smyntek PM, Teece MA, Schultz KL, Thackeray SJ (2007) A
standard protocol for stable isotope analysis of zooplankton in
aquatic food web research using mass balance correction models.
Limnol Oceanogr 52:2135–2146
Syvaranta J, Jones RI (2008) Changes in feeding niche widths of
perch and roach following biomanipulation, revealed by stable
isotope analysis. Freshw Biol 53:425–434
Syvaranta J, Rautio M (2010) Zooplankton, lipids and stable isotopes:
importance of seasonal, latitudinal and taxonomic differences.
Can J Fish Aquat Sci (in press)
Syvaranta J, Hamalainen H, Jones RI (2006) Within-lake variability
in carbon and nitrogen stable isotope signatures. Freshw Biol
51:1090–1102
Syvaranta J, Tiirola M, Jones RI (2008) Seasonality in lake pelagic
d15N values: patterns, possible explanations, and implications for
food web studies. Fundam Appl Limnol 172:255–262
Vadeboncoeur Y, Lodge DM, Carpenter SR (2001) Whole-lake
fertilization effects on distribution of primary production
between benthic and pelagic habitats. Ecology 82:1065–1077
Vadeboncoeur Y, Jeppesen E, Vander Zanden MJ, Schierup H,
Christofersen K, Lodge DM (2003) From Greenland to green
lakes: cultural eutrophication and the loss of benthic pathways in
lakes. Limnol Oceanogr 48:1408–1418
Van den Berg C, Van den Boogaart JGM, Sibbing FA, Osse JWM
(1994) Zooplankton feeding in common bream (Abramisbrama), white bream (Blicca bjoerkna) and roach (Rutilusrutilus): experiments, models and energy intake. Neth J Zool
44:15–42
Vander Zanden MJ, Rasmussen JB (1999) Primary consumer d13C
and d15N and the trophic position of aquatic consumers. Ecology
80:1395–1404
Vander Zanden MJ, Vadeboncoeur Y (2002) Fishes as integrators of
benthic and pelagic food webs in lakes. Ecology 83:2152–2161
Vinni M, Lappalainen J, Malinen T, Peltonen H (2004) Seasonal
bottlenecks in diet shifts and growth of smelt in a large eutrophic
lake. J Fish Biol 64:567–579
Winfield IJ (1986) The influence of simulated aquatic macrophytes on
the zooplankton consumption rate of juvenile roach, Rutilusrutilus, rudd, Scardinus erythrophtalmus, and perch, Percafluviatilis. J Fish Biol 29:37–48
Altered energy flow pathways in a lake ecosystem 89