Fatty acid changes help to better understand regression of nonalcoholic fatty liver disease
Upload
khangminh22Category
view
1download
0
Alrehaili, Amaal Faraj (2020) Fatty acid metabolism and adipocyte function
in healthy and gestational diabetes mellitus pregnancy. PhD thesis.
http://theses.gla.ac.uk/81776/
Copyright and moral rights for this work are retained by the author
A copy can be downloaded for personal non-commercial research or study,
without prior permission or charge
This work cannot be reproduced or quoted extensively from without first
obtaining permission in writing from the author
The content must not be changed in any way or sold commercially in any
format or medium without the formal permission of the author
When referring to this work, full bibliographic details including the author,
title, awarding institution and date of the thesis must be given
Enlighten: Theses
https://theses.gla.ac.uk/
Fatty acid metabolism and adipocyte function in healthy and gestational diabetes mellitus
pregnancy
Amaal Faraj Alrehaili
MBBS MSc
Submitted in fulfilment of the requirement for the degree of Doctor of Philosophy
Institute of Cardiovascular & Medical Sciences College of Medical, Veterinary & Life Sciences
University of Glasgow
March 2020
ii
Abstract
Gestational diabetes mellitus (GDM) is defined as a glucose intolerance of varying
severity with first recognition during pregnancy. The prevalence of GDM is
increasing worldwide, largely attributable to the dramatic rise in maternal obesity,
resulting in several maternal and fetal complications. The maternal metabolic
adaptation during pregnancy is challenged by maternal obesity, resulting in β cell
dysfunction and exaggerated insulin resistance in women with GDM. However, the
exact cellular mechanisms involved in the development of GDM are not yet
completely understood. Increasing evidence from clinical and experimental studies
has suggested that adipose tissue dysfunction could be one of the underlying
mechanisms for the metabolic abnormalities observed in women with GDM.
However, most of the published literature on this topic has been focused on plasma
measures of adipocyte-derived adipokines and how they are linked to insulin
resistance. Functional measures of adipocytes, such as adipocyte size, lipolysis,
insulin sensitivity and direct measurement of adipocyte secretory function, have not
been widely studied in GDM. Failure to efficiently increase the adipocyte cell number
(hyperplasia) rather than increase size (hypertrophy) in order to store excess free
fatty acids (FFA), and the subsequent failure to suppress adipocyte lipolysis when
FFA demands are low, is believed to be a key mechanism in the development of
type 2 diabetes in the non-pregnant. Similarly, this could be a major candidate
pathway for pregnancy complicated by GDM, leading to the observed higher plasma
FFA and higher plasma pro-inflammatory cytokine concentrations, which may result
from exaggerated adipocyte insulin resistance and inflammation. Therefore, the
hypothesis tested in this thesis was that GDM results from defective expansion of
SAT adipocytes, resulting in adipocyte hypertrophy. Subsequently, there is
increased adipocyte lipolysis and inflammatory adipokine secretion.
The aim of this thesis was, firstly, to explore the epidemiological evidence for the
role of maternal obesity in the development of GDM and other maternal and fetal
complications, specifically in the highly diverse local Greater Glasgow and Clyde
population. Data from the Scottish Morbidity Record 2 (SMR02) and the Scottish
Care Information – Diabetes Mellitus (SCI-diabetes) databases for pregnant women
between 2010 and 2015 was combined, and the prevalence of maternal obesity and
GDM established among 38,178 births. The associated risks for several adverse
pregnancy outcomes among women with maternal obesity and GDM in the Greater
iii
Glasgow and Clyde population were calculated. It was found that in the local
population maternal obesity and GDM were at higher prevalence (22.3% and 2.2%,
respectively) compared to recent historical studies, and are associated with an
increase in the incidence of a range of adverse pregnancy outcomes. Furthermore,
the resulting adverse maternal and fetal complications of both first trimester
maternal obesity and GDM were likely to be a considerable burden on clinical
resources. Assessment of the long-term implications of maternal and fetal
complications secondary to GDM and maternal obesity was not included, and a
prospective follow-up analysis of this cohort is recommended.
The second aim of this thesis was to determine the evidence for the role of failure
of adipocyte expansion in the development of underlying metabolic abnormalities in
women with GDM. Several functional measures of adipocyte expansion were
assessed, including adipocyte size, lipolytic function, adipokine secretion, and the
expression of genes involved in adipocyte physiology and biochemistry.
Subcutaneous adipose tissue (SAT) and visceral adipose tissue (VAT) biopsies
from non-labouring women with GDM (n=22) and healthy (n=22) BMI-matched
controls, undergoing elective caesarean section, were collected. Maternal blood
was collected prior to delivery and maternal phenotyping was carried out by the
assessment of plasma glucose, insulin, plasma lipids (triglyceride, cholesterol,
glycerol and non-esterified fatty acids), pregnancy hormones (estradiol and
progesterone), liver enzymes (gamma-glutamyl transferase, alanine
aminotransferase and aspartate aminotransferase), plasma inflammatory cytokines
and oxidised low-density lipoprotein (oxLDL), a biomarker of lipotoxicity. Maternal
BMI at booking was recorded from the patient notes, along with other demographic
information. Fetal weight and sex were recorded after the baby was delivered.
Adipocyte isolation and sizing were carried out. The ex vivo lipolytic activity (basal
and β adrenergic- stimulated lipolysis, and insulin suppression of lipolysis) and
adipokine production (basal and lipopolysaccharide stimulated conditions) were
assessed in isolated adipocytes. The adipocyte expression of genes involved in
adipocyte differentiation, lipid storage, lipid and glucose metabolism and
angiogenesis were also performed by RT-qPCR.
In GDM, VAT adipocytes had higher mean adipocyte diameter ((control) 62.9[3.8]
vs (GDM) 75.5[11.6] µm, p=0.004) and volume ((control) 0.00007[0.00000002] vs
(GDM) 0.00012[0.0000005] mm3, p=0.003) compared to controls. VAT adipocytes
iv
from women with GDM had higher basal lipolysis compared to controls (0.02[0.02]
vs 0.07[0.07] glycerol mmol/hr/ug of DNA, p=0.001). The fat cell insulin sensitivity
index (FCISI), a measure of adipocyte insulin suppression of lipolysis, was six times
lower in the VAT adipocytes of women with GDM, but failed to reach statistical
significance ((control) 62[204] vs (GDM) 35[52] FCISI, p=0.61). In contrast, there
were no differences observed in SAT adipocytes with regard to adipocyte size,
lipolysis and FCISI between the two groups. Hypertrophic expansion of VAT
adipocytes may be one of the contributors to the increased basal lipolysis rate seen
in this depot. This will favour portal release of fatty acids, and could be an important
factor in triggering metabolic abnormalities associated with liver fat accumulation in
obese pregnant women. Thus, dysfunctional VAT adipocytes may represent an
important event contributing to the emergence of metabolic dysfunction in women
with GDM.
The study of isolated VAT adipocyte adipokine secretion in basal or activated (LPS-
stimulated) conditions in a subset of healthy and GDM women did not show any
differences in VAT adipocyte adipokine release in GDM compared to controls.
However, these results should be interpreted with caution, because of the small
sample size. Therefore, further tissue collection is recommended in order to
increase the power of the study. Further investigation of macrophage and other
immune cell contribution to adipose tissue inflammation in women with GDM is
warranted. Isolated adipocyte gene expression analysis in both SAT and VAT
showed that women with GDM had significantly higher insulin receptor (INSR)
expression in both SAT (9.0(3.1) vs 11.7(3.7) INSR percentage expression relative
to PPIA, p= 0.031) and VAT (10.8(3.6) vs 15.8(5.6) INSR percentage expression
relative to PPIA, p= 0.022) compared to controls. There were no differences in the
expression of other genes involved in adipocyte differentiation, lipid storage, lipid
and glucose metabolism and angiogenesis in isolated SAT and VAT adipocytes for
women with GDM compared to controls.
The final aim was to assess the role, in early pregnancy, of very low-density
lipoprotein (VLDL) as a potential maternal plasma carrier of the extremely important
long chain polyunsaturated fatty acid (LC-PUFA) docosahexaenoic acid (DHA),
required by the fetus for neuronal development. During pregnancy, there is a three-
fold increase in VLDL synthesis by the liver. The liver is the primary site for de novo
LC-PUFA synthesis, which is shown to be increased in early pregnancy; therefore,
v
VLDL could be the carrier of DHA at early pregnancy. Infants born to mothers with
GDM had lower DHA levels, and were shown to have lower cognitive performance,
partly attributed to lower placental transfer of DHA in GDM. However, the underlying
mechanism for defective DHA metabolism and transport in GDM pregnancy is not
fully understood. Using an archival plasma collection of women undergoing frozen
embryo transfer (FET), fasting blood samples were collected at approximately day
10 following the last menstrual period (LMP) (pre-luteinizing hormone (LH) surge),
and on days 18, 29 and 45 post-LH surge from women who were successful in
getting pregnant (n= 27). VLDL FA composition was assessed by gas
chromatography in women who were successful in getting pregnant and women
who were not. There was no evidence for VLDL being the main carrier of DHA at
the critical time of neuronal tube closure, as DHA concentration in VLDL and VLDL
DHA enrichment was unchanged over time. A reduction in VLDL particle number
(measured by apo-B concentration) by 18 days post-LH surge was observed
(p<0.001), which was then recovered to pre-LH surge level by 45 days post-LH
surge. It is likely that DHA is carried by other lipoproteins such as HDL, as is
observed in the non-pregnant population. Further investigation of the main
lipoprotein carrier for DHA during pregnancy, and the study of its metabolism and
transport in GDM pregnancy, is needed.
In conclusion, GDM and maternal obesity are associated with increased risk of
adverse pregnancy outcomes. Effective intervention strategies are required for
weight control prior to pregnancy. The data presented in this thesis provides
evidence that in GDM, VAT adipocytes expand in a hypertrophic manner, and have
increased basal lipolysis. Hypertrophic expansion of VAT adipocytes may be linked
to systemic insulin resistance. Thus, defective VAT adipocyte expansion might have
a role in the underlying pathophysiology of GDM. Further studies on the role of
adipocyte differentiation and ectopic fat storage in normal and complicated human
pregnancy are warranted. DHA is not transported by VLDL in early pregnancy.
Further investigation of the main carrier of DHA during pregnancy, and the study of
DHA metabolism in pregnancies complicated by GDM, is needed.
vi
Table of Contents
Abstract ......................................................................................... ii
List of Tables .................................................................................. xi
List of Figures ................................................................................ xii
List of publications......................................................................... xvii
List of presentations ...................................................................... xviii
Acknowledgement............................................................................ xx
Author’s Declaration ....................................................................... xxii
List of Abbreviations ...................................................................... xxiii
Chapter 1 Introduction and Literature Review ........................................ 1
1.1 Maternal obesity .................................................................... 1
1.2 Gestational diabetes – the clinical problem .................................... 3
1.3 Maternal metabolic adaptation to pregnancy in healthy, obese and GDM pregnancy .................................................................................... 8
1.3.1 Healthy pregnancy ............................................................. 8
1.3.2 Obese pregnancy ............................................................. 12
1.3.3 GDM pregnancy ............................................................... 15
1.4 Docosahexaenoic acid (DHA) .................................................... 17
1.5 Non-pregnant adipose tissue .................................................... 20
1.5.1 Adipose tissue lipid storage ................................................ 20
1.5.2 Adipocyte differentiation (adipogenesis) ................................ 21
1.5.3 Adipocyte hypertrophy vs hyperplasia ................................... 22
1.5.4 Depot differences in adipocyte expansion .............................. 23
1.5.5 Adipose tissue lipolytic function .......................................... 23
1.5.6 Adipose tissue secretory function ......................................... 25
1.5.7 The adipose tissue expandability hypothesis (the overspill hypothesis) .............................................................................. 26
1.5.8 Ectopic fat .................................................................... 27
1.5.9 Non-pregnant adipose tissue in obesity .................................. 29
1.5.10 Other processes involved in adipose tissue dysfunction in obesity-related metabolic disorders ......................................................... 30
1.6 Adipose tissue in pregnancy ..................................................... 32
1.6.1 Adipose tissue adaptation to healthy pregnancy ....................... 32
1.6.2 Adipose tissue in obese pregnancy........................................ 33
1.6.3 Adipose tissue and GDM pregnancy ....................................... 34
1.7 Adipose tissue inflammation in healthy, obese and GDM pregnancy .... 36
1.8 Project hypothesis ................................................................ 38
1.8.1 Study aims and objectives.................................................. 38
Chapter 2 Materials and methods ...................................................... 40
vii
2.1 Study participants ................................................................ 40
2.1.1 Recruitment................................................................... 40
2.1.2 Tissue collection ............................................................. 41
2.1.3 Power calculation ............................................................ 41
2.2 Adipocyte preparation ........................................................... 42
2.2.1 Buffers ......................................................................... 42
2.2.2 Collagenase digestion of adipose tissue and isolation of adipocytes 43
2.2.3 Adipocyte DNA extraction .................................................. 44
2.2.4 Normalising NEFA, glycerol and inflammatory cytokines to total DNA content 45
2.3 Adipocyte sizing ................................................................... 45
2.4 Lipolysis assay ..................................................................... 46
2.4.1 Lipolysis assay conditions................................................... 46
2.4.2 Timeline and dose response determination for lipolysis assay
reagents ................................................................................. 47
2.4.3 Assaying NEFA and glycerol as indicators of adipocyte net and total lipolysis respectively .................................................................. 47
2.4.4 Calculation of percent inhibition, percent stimulation and fat cell insulin sensitivity index (FCISI) ...................................................... 49
2.4.5 Buffer stability ............................................................... 49
2.5 Quantitative real-time PCR ..................................................... 50
2.5.1 Gene selection using Ingenuity Pathway Analysis (IPA) ............... 50
2.5.2 Isolation of total RNA ....................................................... 52
2.5.3 DNase treatment of isolated RNA ......................................... 52
2.5.4 cDNA synthesis ............................................................... 53
2.5.5 Preamplification of cDNA and Test of Uniformity ...................... 53
2.5.6 Insulin receptors isoforms A (IRA) and B (IRB) probes ................. 57
2.5.7 TaqMan RT-PCR .............................................................. 57
2.6 Adipocyte inflammation ......................................................... 58
2.6.1 LPS .............................................................................. 58
2.6.2 Multiplex bead arrays ....................................................... 58
2.7 Maternal blood phenotyping .................................................... 66
2.7.1 Insulin resistance estimated by the homeostasis model assessment-estimated insulin resistance (HOMA-IR) ........................................... 67
2.8 Early pregnancy study ............................................................ 67
2.8.1 Subjects ....................................................................... 67
2.8.2 Study design .................................................................. 68
2.8.3 Fatty acid extraction ........................................................ 69
2.8.4 Gas Chromatography (GC) .................................................. 70
2.9 Statistical analysis ................................................................ 70
viii
Chapter 3 Pregnancy outcomes in women with underweight, overweight and obese BMI and gestational diabetes in Greater Glasgow and Clyde, 2010 to 2015: a retrospective cohort using linked national datasets ................................ 71
3.1 Introduction ........................................................................ 71
3.2 Aims ................................................................................. 72
3.3 Specific research questions ..................................................... 73
3.4 Materials and methods ........................................................... 74
3.4.1 Data source ................................................................... 74
3.4.2 Demographic information and clinical outcomes ...................... 75
3.4.3 Definitions ..................................................................... 79
3.4.4 Data linkage................................................................... 79
3.4.5 Statistical analysis ........................................................... 82
3.5 Results .............................................................................. 82
3.5.1 Final dataset for analysis ................................................... 82
3.5.2 Maternal BMI and clinical outcomes ...................................... 83
3.5.3 GDM and clinical outcomes................................................. 93
3.6 Discussion........................................................................... 94
Chapter 4 Adipocyte lipolytic function in pregnancies complicated with gestational diabetes mellitus compared to healthy pregnancy .................... 101
4.1 Introduction ....................................................................... 101
4.2 Aim ................................................................................. 105
4.2.1 Hypotheses ................................................................... 105
4.2.2 Specific research questions ............................................... 105
4.3 Methods ............................................................................ 106
4.3.1 Adipocyte isolation and sizing ............................................ 106
4.3.2 Adipocyte lipolysis assay................................................... 106
4.3.3 Hepatic steatosis index (HSI) ............................................. 106
4.3.4 Statistical analysis .......................................................... 107
4.4 Results ............................................................................. 107
4.4.1 Study participants .......................................................... 107
4.4.2 Maternal plasma glucose, lipids, insulin sensitivity and markers of liver function .......................................................................... 108
4.4.3 Hepatic steatosis index (HSI) ............................................. 109
4.4.4 Adipocyte cell size and volume in GDM and healthy pregnancy .... 111
4.4.5 In vitro adipocyte lipolysis in GDM and in healthy pregnancy ...... 115
4.4.6 Depot specific differences in adipocyte size and lipolysis in the healthy control group ................................................................ 125
4.4.7 Depot specific differences in adipocyte size and lipolysis in the GDM
group 125
4.4.8 Relationships between SAT and VAT adipocyte cell size and adipocyte characteristics in control and GDM pregnancies ................... 126
ix
4.4.9 Relationships between SAT and VAT adipocyte lipolytic function and maternal characteristics in control and GDM pregnancies .................... 130
4.5 Discussion.......................................................................... 139
Chapter 5 Adipose tissue inflammation in gestational diabetes mellitus ...... 147
5.1 Introduction ....................................................................... 147
5.2 Aim ................................................................................. 154
5.2.1 Hypotheses ................................................................... 154
5.2.2 Specific research questions ............................................... 154
5.3 Methods ............................................................................ 155
5.4 Results ............................................................................. 157
5.4.1 Study participants included for adipocyte adipokine secretion experiments ........................................................................... 157
5.4.2 Adipokine release from VAT adipocytes in women with GDM compared to controls ................................................................ 159
5.4.3 Relationship between VAT adipocyte adipokine release and VAT adipocyte morphological and lipolytic characteristics ......................... 170
5.4.4 Relationship between VAT adipocyte adipokine release and maternal BMI and HOMA-IR ..................................................................... 171
5.4.5 Relationship between VAT adipocyte adipokine release and pregnancy hormones ................................................................. 172
5.4.6 Study participants included for adipocyte gene expression analysis 173
5.4.7 Gene expression of inflammatory genes in SAT and VAT adipocytes
from women with GDM compared to controls ................................... 174
5.4.8 Gene exprssion of genes involved in adipocyte lipolysis genes in SAT and VAT adipocytes from women with GDM compared to controls .......... 176
5.4.9 Gene expression of genes involved in insulin signaling in SAT and VAT adipocytes from women with GDM compared to controls ..................... 181
5.4.10 Gene expression of glucose metabolism genes in SAT and VAT adipocytes from women with GDM compared to controls ..................... 183
5.4.11 Gene expression of adipocyte differentiation genes in SAT and VAT adipocytes from women with GDM compared to controls ..................... 185
5.4.12 Gene expression of lipid storage genes in SAT and VAT adipocytes from women with GDM compared to controls ................................... 188
5.4.13 Gene expression of angiogenesis genes in SAT and VAT adipocytes from women with GDM compared to controls ................................... 190
5.4.14 Gene expression of apoptosis genes in SAT and VAT adipocytes from women with GDM compared to controls ................................... 192
5.5 Discussion.......................................................................... 193
Chapter 6 Maternal VLDL lipid and fatty acid composition in early pregnancy 200
6.1 Introduction ....................................................................... 200
6.2 Aim ................................................................................. 202
x
6.2.1 Hypothesis .................................................................... 202
6.2.2 Specific research questions ............................................... 202
6.3 Methods ............................................................................ 203
6.4 Results ............................................................................. 204
6.4.1 Study participants .......................................................... 204
6.4.2 Maternal pregnancy hormones, plasma lipids, insulin and HOMA-IR 206
6.4.3 Plasma VLDL composition in pregnant and non-pregnant women .. 208
6.5 Discussion.......................................................................... 216
Chapter 7 Discussion .................................................................... 220
Appendices .................................................................................. 231
List of References .......................................................................... 238
Accompanying Material ................................................................... 292
xi
List of Tables
Table 1-1 Different international guidelines for gestational diabetes screening and diagnosis ................................................................................... 5
Table 2-1 Power calculation .............................................................. 42
Table 2-2 NEFA release in response to different experimental conditions using buffer prepared the day before collection (DB) and buffer prepared on the same day of collection (SD) (n=3) ............................................................... 50
Table 2-3 TaqMan gene expression assays .............................................. 56
Table 2-4 Analytes measured for VAT adipocytes cytokine release in basal and LPS stimulated condition .................................................................. 60
Table 2-5 Standard concentration of MILLIPEX Map Human Cytokine/Chemokine Magnetic Bead Panel ....................................................................... 61
Table 2-6 Standard Concentration for MILLIPEX Map Human Cardiovascular Disease (CVD) Magnetic Bead Panel 1 (for PlGF measurement)................... 62
Table 2-7 Antibody-Immobilized Magnetic Beads Region for MILLIPLEX map kits ................................................................................................. 65
Table 2-8 The Quality Control ranges for MILLIPLEX® map kits .................... 65
Table 3-1 Diabetes recording in SMR02 in comparison to SCI-Diabetes. .......... 77
Table 3-2 BMI coverage over the study period after data merge (n= 64,700) ... 81
Table 3-3 Maternal characteristics and obstetric outcomes over the study period (2010–2015)................................................................................... 85
Table 3-4 Fetal outcomes over the study period (2010–2015) ...................... 86
Table 3-5 Unadjusted odds ratios for the relationship of maternal BMI category and several maternal and fetal outcomes .............................................. 88
Table 4-1 Characteristics of GDM women and BMI matched controls ............. 108
Table 4-2 Maternal plasma lipids, markers of insulin resistance and liver function test for GDM and control groups at third trimester .................................. 109
Table 4-3 Lipolysis rates in SAT and VAT adipocytes from healthy pregnancy .. 125
Table 4-4 Lipolysis rates in SAT and VAT adipocytes from GDM pregnancy ...... 126
Table 5-1 Genes included in gene expression analysis .............................. 153
Table 5-2 Demographic characteristics of GDM pregnancies and BMI matched controls for adipocyte adipokine secretion experiments ........................... 158
Table 5-3 Maternal lipids, plasma markers of insulin resistance and plasma cytokines for GDM and control group ................................................... 159
Table 5-4: Demographic characteristics and plasma markers of GDM pregnancies and BMI matched controls for SAT adipocytes gene expression experiment .... 173
Table 5-5: Demographic characteristics and plasma markers of GDM pregnancies and BMI matched controls for VAT adipocytes gene expression experiment .... 174
Table 6-1 Demographic characteristics of the study participants ................. 206
Table 6-2 Maternal pregnancy hormones, plasma lipids, insulin and HOMA, mean (SD) across the study period (from pre-LH surge to 45 days post-LH surge). .... 207
Table 6-3 Correlations between pregnancy hormones (estrogen, progesterone and HCG), VLDL composition (VLDL apo-B, VLDL TAG and VLDL TC) and plasma
lipids (TAG and TC) at all time points. ................................................. 211
Table 6-4 VLDL FA concentrations from pre-LH surge to 45 days post-LH surge in pregnant women (P, n=27) and women who were unsuccessful in getting pregnant (NP, n=35) ....................................................................... 213
xii
List of Figures
Figure 1-1 Maternal adipose tissue response to metabolic changes during early and late pregnancy. ........................................................................ 10
Figure 1-2: Changes in lipoprotein metabolism during obese pregnancy leads to development of metabolic syndrome features. ....................................... 14
Figure 1-3: Maternal adipose tissue metabolism during early and late pregnancy in GDM......................................................................................... 16
Figure 1-4 PUFA synthesis pathway. ..................................................... 18
Figure 1-5 Hormonal regulation of adipocyte lipolysis ............................... 24
Figure 1-6 The consequences of adipose tissue limited expandability according to the overspill hypothesis. ................................................................... 27
Figure 2-1 : Example of a digital image captured of an isolated adipocyte suspension .................................................................................... 46
Figure 2-2 Venn diagram to identify common genes expressed in relation to Insulin, Metformin and progesterone pathways in adipose tissue using Ingenuity Pathway Analysis (QIAGEN). ............................................................... 51
Figure 2-3 Preamplification test of uniformity results ............................... 55
Figure 2-4 Example of plate layout for multiplex bead arrays ...................... 63
Figure 3-1 Ethnic group categorization in the current study based on SMR02 codes of ethnicity. .......................................................................... 76
Figure 3-2 Flow diagram for data cleaning and linkage. ............................. 80
Figure 3-3 Flow diagram for the study exclusions. .................................... 83
Figure 3-4 Multiple logistic regression analysis evaluating the risk of elective caesarean section. .......................................................................... 89
Figure 3-5 Multiple logistic regression analysis evaluating the risk of emergency caesarean section. .......................................................................... 90
Figure 3-6 Multiple logistic regression analysis evaluating the risk of large for gestational age (LGA). ..................................................................... 90
Figure 3-7 Multiple logistic regression analysis evaluating the risk of preterm
delivery. ...................................................................................... 91
Figure 3-8 Multiple logistic regression analysis evaluating the risk of APGAR <7. 91
Figure 3-9 Multiple logistic regression analysis evaluating the risk of stillbirth . 92
Figure 3-10 Multiple logistic regression analysis evaluating the risk of perinatal mortality ...................................................................................... 92
Figure 3-11 Multiple logistic regression analysis evaluating the risk of GDM during pregnancy. ................................................................................... 94
Figure 4-1 The relationship maternal BMI and HSI in GDM and control groups .. 110
Figure 4-2 The relationship maternal insulin level and HSI in GDM and control group ......................................................................................... 110
Figure 4-3 The relationship maternal HOMA-IR and HSI in GDM and control group ................................................................................................ 111
Figure 4-4 The relationship maternal glucose level and HSI in GDM and control group ......................................................................................... 111
Figure 4-5 Subcutaneous adipocyte size distribution in GDM and controls ...... 112
Figure 4-6 Subcutaneous adipocyte volume distribution in GDM and controls .. 113
Figure 4-7 Visceral adipocyte size distribution in GDM and controls.............. 114
Figure 4-8 Visceral adipocyte volume distribution in GDM and controls ......... 114
Figure 4-9 Total basal lipolysis and isoprotenerol-stimulated total lipolysis in SAT adipocytes from GDM and control groups. ............................................. 115
Figure 4-10 Net basal and net isoprotenerol-stimulated lipolysis in SAT adipocytes from GDM and control groups. ............................................. 116
xiii
Figure 4-11 Basal total lipolysis, total lipolysis rate in presence of 200nM isoprotenerol, total lipolysis rate in the presence of 10nM insulin and total lipolysis rate in the presence of of 200nM isoprotenerol and 10nM insulin conditions in SAT adipocytes from GDM and control groups. ....................... 117
Figure 4-12 Basal net lipolysis, net lipolysis rate in presence of 200nM isoprotenerol, net lipolysis rate in presence of 10nM insulin and net lipolysis rate in presence of 200nM isoprotenerol and 10nM insulin conditions measured by NEFA release in SAT adipocytes from GDM and control group. ................... 117
Figure 4-13 Percentage stimulation of lipolysis by 200nM isoprotenerol expressed as A) total lipolysis and B) net lipolysis in SAT adipocytes from GDM and controls ................................................................................................ 118
Figure 4-14 Percentage suppression of SAT adipocyte lipolysis by 10nM insulin expressed as A) total lipolysis and B) net lipolysis in SAT adipocytes from GDM and controls ................................................................................. 119
Figure 4-15 SAT adipocyte FCISI expressed as A) total lipolysis and B) net lipolysis in GDM and controls ....................................................................... 119
Figure 4-16 Total basal lipolysis and total lipolysis rate in presence of 200nM isoprotenerol in VAT adipocytes from GDM and control groups. .................. 120
Figure 4-17 Net basal lipolysis and net lipolysis rate in presence of 200nM isoprotenerol in VAT adipocytes from GDM and control group. .................... 121
Figure 4-18 Total basal lipolysis, total lipolysis in presence of 200nM isoprotenerol, total lipolysis in presence of 10nM insulin and total lipolysis in presence of 200nM isoprotenerol and 10nM insulin conditions in VAT adipocytes from GDM and control group. ............................................................ 122
Figure 4-19 Net basal lipolysis, net lipolysis in presence of 200nM isoprotenerol, net lipolysis in presence of 10nM insulin and net lipolysis rate in presence of 200nM isoprotenerol and 10nM insulin conditions in VAT adipocytes from GDM and control group. ......................................................................... 122
Figure 4-20 Percentage stimulation of lipolysis by 200nM isoproterenol expressed as A) total lipolysis and B) net lipolysis in VAT adipocytes from GDM and controls ................................................................................................ 123
Figure 4-21 The percentage suppression of lipolysis by 10nM insulin expressed as
A) total lipolysis and B) net lipolysis in VAT adipocytes from GDM and controls 124
Figure 4-22 VAT adipocytes FCISI expressed as A) total lipolysis and B) net lipolysis in GDM and controls ............................................................. 124
Figure 4-23 The relationship between BMI and SAT adipocyte diameter in GDM and control groups ......................................................................... 127
Figure 4-24 The relationship between BMI and VAT adipocyte diameter in GDM and control groups ......................................................................... 127
Figure 4-25 The relationship between VAT adipocytes diameter and maternal insulin level in GDM and control group ................................................. 128
Figure 4-26 The relationship between VAT adipocytes diameter and maternal HOMA-IR in GDM and control group ..................................................... 128
Figure 4-27 The relationship between SAT adipocytes diameter and maternal HSI in GDM and control group ................................................................. 129
Figure 4-28 The relationship between VAT adipocytes diameter and maternal HSI in GDM and control group ................................................................. 130
Figure 4-29 The relationship between maternal HOMA-IR and SAT percentage stimulation of lipolysis by isoprotenerol expressed as NEFA release in GDM and control group................................................................................ 131
Figure 4-30 The relationship between maternal insulin level and SAT percentage stimulation of lipolysis by isoprotenerol expressed as NEFA release in GDM and control group................................................................................ 131
xiv
Figure 4-31 The relationship between maternal glucose level and SAT percentage stimulation of lipolysis by isoprotenerol expressed as NEFA release in GDM and control group................................................................................ 132
Figure 4-32 The relationship between maternal plasma glycerol level and SAT basal release of glycerol in GDM and control group ................................. 133
Figure 4-33 The relationship between maternal plasma glycerol level and SAT glycerol release in presence of isoproterenol in GDM and control group ........ 133
Figure 4-34 The relationship between maternal plasma glycerol level and SAT glycerol release in presence of isoproterenol and insulin in GDM and control group ......................................................................................... 134
Figure 4-35 The relationship between maternal HSI and SAT adipocytes total basal lipolysis in GDM and control group ............................................... 135
Figure 4-36 The relationship between maternal HSI and SAT adipocytes net basal lipolysis in GDM and control group ...................................................... 135
Figure 4-37 The relationship between maternal HSI and SAT adipocytes total lipolysis in presence of 200nM isoproterenol in GDM and control group ......... 136
Figure 4-38 The relationship between maternal HSI and SAT adipocytes net lipolysis in presence of 200nM isoproterenol in GDM and control group ......... 136
Figure 4-39 The relationship between maternal HSI and SAT adipocytes total lipolysis in presence of 10nM insulin in GDM and control group .................. 137
Figure 4-40 The relationship between maternal HSI and SAT adipocytes net lipolysis in presence of insulin in GDM and control group .......................... 137
Figure 4-41 The relationship between maternal HSI and SAT adipocytes total lipolysis in presence of 200nM isoproterenol and 10nM insulin in GDM and control group ......................................................................................... 138
Figure 4-42 The relationship between maternal HSI and SAT adipocytes net lipolysis in presence of 200nM isoproterenol and 10nM insulin in GDM and control group ......................................................................................... 138
Figure 4-43 The relationship between maternal progesterone level and VAT adipocytes net lipolysis FCISI expressed as NEFA release in GDM and control group ......................................................................................... 139
Figure 4-44 Regional differences in adipose tissue expansion in GDM ............ 146
Figure 5-1 Flowchart for the sample number at lipolysis, adipokine secretions and gene expression experiment ........................................................ 156
Figure 5-2: Net basal and net lipolysis rate in presence of LPS expressed as NEFA release in SAT adipocytes from GDM and control groups. .......................... 160
Figure 5-3: Net basal and net lipolysis rate in presence of LPS expressed as NEFA release in VAT adipocytes from GDM and control groups. .......................... 160
Figure 5-4 Comparison of basal and LPS stimulated release of TNF- in VAT adipocytes ................................................................................... 161
Figure 5-5 Comparison of basal and LPS stimulated release of IL-6 in VAT adipocytes ................................................................................... 162
Figure 5-6 Comparison of basal and LPS stimulated release of IL-1 in VAT
adipocytes ................................................................................... 163
Figure 5-7 Comparison of basal and LPS stimulated release of IFN-gamma in VAT adipocytes ................................................................................... 164
Figure 5-8 Comparison of basal and LPS stimulated release of MCP-1 in VAT adipocytes ................................................................................... 165
Figure 5-9 Comparison of basal and LPS stimulated release of adiponectin in VAT adipocytes ................................................................................... 166
Figure 5-10 Comparison of basal and LPS stimulated release of IL-8 in VAT adipocytes ................................................................................... 167
xv
Figure 5-11 Comparison of basal and LPS stimulated release of IL-10 in VAT adipocytes ................................................................................... 168
Figure 5-12 Comparison of basal and LPS stimulated release of VEGF in VAT adipocytes ................................................................................... 169
Figure 5-13 Comparison of basal and LPS stimulated release of PIGF in VAT adipocytes ................................................................................... 170
Figure 5-14 The relationship between VAT LPS stimulated TNF- release and FCISI in GDM and control group .......................................................... 171
Figure 5-15 VAT adipocyte basal adipokine release and maternal BMI and HOMA-
IR relationship .............................................................................. 171
Figure 5-16 VAT adipocyte LPS adipokine release and maternal BMI and HOMA-IR relationship ................................................................................. 172
Figure 5-17 VAT adipocyte basal adipokine release and pregnancy hormones relationship ................................................................................. 172
Figure 5-18 VAT adipocyte LPS adipokine release and pregnancy hormones relationship ................................................................................. 173
Figure 5-19 Gene expression of inflammatory genes in SAT adipocytes in controls and GDM group ............................................................................. 175
Figure 5-20 Gene expression of inflammatory genes in VAT adipocytes in controls and GDM group ............................................................................. 176
Figure 5-21 Gene expression of lipolytic enzymes genes in SAT adipocytes in controls and GDM group ................................................................... 178
Figure 5-22 Gene expression of lipolytic enzymes genes in VAT adipocytes in controls and GDM group ................................................................... 179
Figure 5-23 Gene expression of adrenoreceptors genes in SAT adipocytes in controls and GDM group ................................................................... 180
Figure 5-24 Gene expression of adrenoreceptors genes in VAT adipocytes in controls and GDM group ................................................................... 180
Figure 5-25 Gene expression of insulin signaling genes in SAT adipocytes from controls and GDM group ................................................................... 182
Figure 5-26 Gene expression of insulin signaling genes in VAT adipocytes from controls and GDM group ................................................................... 183
Figure 5-27 Gene expression of glucose metabolism genes in SAT adipocytes from controls and GDM group ................................................................... 184
Figure 5-28 Gene expression of glucose metabolism genes in VAT adipocytes from controls and GDM group ................................................................... 184
Figure 5-29 Gene expression of adipocytes differentiation genes in SAT adipocytes from controls and GDM group .............................................. 187
Figure 5-30 Gene expression of adipocytes differentiation genes in VAT adipocytes from controls and GDM group .............................................. 187
Figure 5-31 Gene expression of lipid storage genes in SAT adipocytes from controls and GDM group ................................................................... 189
Figure 5-32 Gene expression of lipid storage genes in VAT adipocytes from controls and GDM group ................................................................... 190
Figure 5-33 Gene expression of angiogenesis genes in SAT adipocytes from controls and GDM group ................................................................... 191
Figure 5-34 Gene expression of angiogenesis genes in VAT adipocytes from controls and GDM group ................................................................... 192
Figure 5-35 Gene expression of angiogenesis genes in SAT adipocytes from controls and GDM group ................................................................... 193
Figure 5-36 Gene expression of apoptosis genes in VAT adipocytes from controls and GDM group ............................................................................. 193
Figure 6-1 Consort diagram of the study ............................................... 205

xvi
Figure 6-2 VLDL apo-B concentration ................................................... 208
Figure 6-3 VLDL TC concentration ...................................................... 209
Figure 6-4 VLDL TAG concentration ..................................................... 209
Figure 6-5 TAG/ apo-B ratio .............................................................. 210
Figure 6-6 CE/apo-B ratio ................................................................ 210
Figure 6-7 DHA per apo-B ................................................................. 214
Figure 6-8 Rates of change of maternal FA concentration in VLDL:16:0, 18:0 and 24:0 ........................................................................................... 215
Figure 6-9 iAUC of maternal FA concentration in VLDL lignoceric acid (24:0) .. 215
Figure 7-1 Revised hypothesis of adipocyte expansion during pregnancy in GDM, healthy obese and normal-weight pregnancy. ........................................ 223
xvii
List of publications
Published abstracts
Alrehaili, A., Freeman, D., Lindsay, R., Increased risk of gestational diabetes,
caesarean delivery and large for gestational age infants among overweight and
obese women in Greater Glasgow and Clyde “Presentation Abstracts”, International
Journal of Obesity 8 (2018):14-60.
Alrehaili, A., Anderson, M., Hagan, M., Lindsay, R., and Freeman, D., In gestational
diabetes mellitus, maternal third trimester visceral adipocytes are hypertrophic with
enhanced basal lipolysis and isoproterenol stimulation of lipolysis “Obesity Facts”,
The European Journal of Obesity (2019), vol. 12, suppl. 1.
Manuscript in process
Nicola Zamai, Colin H. Cortie, Eleanor M. Jarvie, Christopher C. Onyiaodike, Amaal
Alrehaili, Monique Francois, Dilys J. Freeman and Barbara J. Meyer. In pregnancy,
maternal high density lipoprotein is enriched in docosahexaenoic acid, but not
arachidonic acid, and carries the largest fraction of these fatty acids in plasma
xviii
List of presentations
Oral presentations
In gestational diabetes mellitus, maternal third trimester visceral adipocytes are
hypertrophic with enhanced basal lipolysis and isoproterenol stimulation of lipolysis.
26th European congress on obesity, Glasgow, May 2019
Increased adipocyte diameter and upregulated CIDEC expression in visceral
adipocytes from mothers with gestational diabetes mellitus. Adipose tissue
discussion group, Edinburgh, December 2018.
Adipose tissue function in gestational diabetes. 2nd Glasgow Pregnancy Research
Symposium. Glasgow, February 2017.
Poster presentations
Increased risk of gestational diabetes, caesarean delivery and large for gestational
age infants among overweight and obese women in Greater Glasgow and Clyde.
5th UK congress on obesity (UKCO), Newcastle, September 2018
Maternal VLDL composition in early pregnancy and its relationship to estradiol and
progesterone. World Obesity federation, Belgium, Leuven, November 2017

xix
This thesis is dedicated to the soul of my father, Mr. Faraj Abdullah Alrehaili, who
sadly passed away one year before our dream comes true, from him I learned how
to turn my pain into drive and made it to submission of this thesis.
To my father,
With gratitude for his inspiration, love and support.

xx
Acknowledgement
It is with the upmost gratitude that I would like to acknowledge my supervisor
Dr.Dilys Freeman and Dr.Robert Lindsay, for offering the exceptional guidance and
support needed to compete this body of work. Without their invaluable advice, I
would not have completed my thesis.
I would like to thank Prof. Barbra Myer and her team from Wollongong University in
Australia for their assistance and support to conduct our collaborative research. I
would like to thank Dr.Martin McBride for his help and guidance to carry the
Ingenuity Pathway analysis. Dr.Lesely Graham generosity and assistance has been
essential to carry out the multiplex analysis. Additionally, I would like to thank Mrs.
Fiona Jordan for help and guidance to conduct several lab techniques and her
unwavering support whenever needed. I would like to thank our research group
members, including Fiona Jordan, Wan Noraini, Xuan Gao andOom Patamat, we
have worked together for past few years and I have learned so much from each one
of you.
I would like to present my sincere appreciation to the midwifes in recovery unit at
QEUH for their cooperation and support when needed to carry out the patient
recruitment of this study. Special thanks to pathology lab personnel at QEUH who
supported me in using their lab facility to process and store the blood samples. Many
thanks are deservedly due to all the study participants who made the project worth
doing. Special thanks go to Maria Hagan, Melisa Anderson, Kirsten Mitchell, Fiona
Currie and Scott McCoull, the lovely student participated in several parts of my
project.
I would like to thank Taibah University and Saudi Arabian Ministry of Education, who
funded this project.
Special thanks to my husband, Abdulmajeed Albalawi, who has taught me the
importance of working and living passionately through example. His unwavering
support has allowed us to share our successes and affords me the ability to fully
devote myself to my scientific research. Thank you to my mother, sisters and
brothers, who are never hesitant to listen and offer help and encouragement. My
mother’s fortitude, dedication, and ingrained compassion inspire me to strive for the

xxi
incredible; for this I am most grateful. I would also like to thank my mother- and
father- and sisters- in-law for their love and support, welcoming me into their family,
and teaching me the true meaning of success. Lastly, I would like to express my
gratitude to my lovely beautiful kids Battal, Bassam and the little one who did not
show appearance yet, you are my biggest supporters and advocates to live this life
truly with love and passion.
xxii
Author’s Declaration
The contents of this thesis have not been submitted elsewhere for any other degree,
diploma or professional qualification.
This thesis has been written by me, and unless otherwise acknowledged I have
been responsible for epidemiological data analysis, patient recruitment and consent,
adipose tissue and blood samples collection and processing, adipocyte function
studies including adipocyte sizing, lipolysis, adipokine secretion using multiplex
technique and adipocyte DNA extraction, plasma ELISA technique and VLDL
isolation for FA metabolism in early pregnancy study.
I would therefore like to acknowledge the contributors below for their assistance in
the laboratory techniques used. Plasma cholesterol, triglycerides, glucose, insulin,
C-Reactive Protein, non-esterified fatty acids, Alanine Aminotransferase, Aspartate
aminotransferase and Glutamyl transferase for plasma samples of adipocyte
function in GDM participants and the analysis of VLDL lipoprotein fraction
triglycerides, phospholipid, total cholesterol, free cholesterol, cholesteryl ester and
apo-B for FA metabolism in early pregnancy study were performed by Josephine
Cooney from the University of Glasgow.
Maria Hagan, Melisa Anderson, Fiona Currie, Scott McCoull contributed to the
overall study of gene expression analysis for adipocyte function in GDM study.
Kirsten Mitchell conducted the phenformin and metformin dose response curve (this
data is not presented in this thesis).
Fiona Jordan from institute of cardiovascular and medical sciences University of
Glasgow carried out the fatty acid extraction for VLDL samples of FA metabolism in
early pregnancy study.
Nicola Zamai form Wollongong University, Australia carried out gas chromatography
for VLDL samples of FA metabolism in early pregnancy study.
Amaal Faraj Alrehaili, March 2020
xxiii
List of Abbreviations
AC Adenyl cyclase
ACS acyl-CoA synthase
ADMSC Adipose tissue mesenchymal stem cells
AMPK AMP-protein kinase
ATGL Adipose triglyceride lipase
BMI Body mass index
cDNA Complementary deoxyribonucleic acid
CETP Cholesteryl ester transfer protein
CRP C- reactive protein
DAG Diacylglycerides
DBP Diastolic blood pressure
DHA Docosahexaenoic acid
DNA Deoxyribonucleic acid
ER Endoplasmic reticulum
FA Fatty acid
FABP Fatty acid binding protein
FATP Fatty acid transport protein
FCISI Fat cell insulin sensitivity index
FFA Free fatty acid
GDM Gestational diabetes mellitus
GLUT4 Glucose transporter 4
HDL High density lipoprotein
xxiv
HSL Hormone sensitive lipase
HTN Hypertension
IADPSG International Association of Diabetes and Pregnancy Study Groups
LC-PUFA Long chain polyunsaturated fatty acid
LD Lipid droplet
LDAP Lipid droplet-associated proteins
LGA Large for gestational age
LPL Lipoprotein lipase
LPS Lipopolysaccharide
MAG Monoacylglyceride
NEFA Non-esterified fatty acid
NICU Neonatal intensive care unit
oxLDL oxidised low density lipoprotein
PE Pre-eclampsia
PKA Protein kinase A
PLIN1 Perilipin 1
RNA Ribonucleic acid
ROS Reactive oxidative stress
RT-qPCR Quantitative reverse transcription polymerase chain reaction
SAT Subcutaneous adipose tissue
SBP Systolic blood pressure
sdLDL Small dense low density lipoprotein
SVF Stromal vascular fraction
xxv
T2DM Type 2 diabetes mellitus
TAG Triacylglycerides
TLR-4 Toll-like receptors 4
TNF-α Tumour necrosis factor alpha
UPR Unfolded protein response
VAT Visceral adipose tissue
VEGF Vascular endothelial growth factor
VLDL Very low density lipoprotein
WAT White adipose tissue
WHO World health organization
1
Chapter 1 Introduction and Literature Review
1.1 Maternal obesity
Rapidly increasing rates of obesity worldwide represent a major health concern.
Maternal obesity is a well-established risk factor for adverse pregnancy outcomes
such as gestational diabetes (GDM), preeclampsia (PE), miscarriage and
Caesarean section. Obesity can be classified by BMI into three classes, according
to World Health Organization (WHO) criteria: obese class 1 (30–34.99 kg/m²), obese
class 2 (35–39.99kg/m²) and obese class 3 (≥ 40 kg/m²) (World Health Organization,
2000). In the United Kingdom, there are no population-wide data that directly
estimates maternal BMI just before pregnancy. In Scotland, a study examining
maternal obesity using a national dataset from 1981 to 2012 reported a 21.1%
prevalence of maternal obesity (Collier et al., 2017). Another observational study of
the Scottish population for all singleton pregnancies between 2003 and 2010
reported a 19.6% prevalence of maternal obesity (Denison et al., 2014). In England
in 2010, the incidence of first-trimester maternal obesity has doubled over the last
19 years since 2010 from 7.6% to 15.6% (Heslehurst et al., 2010a). Another study
examined the trends of obesity among the Glasgow population in 1990 compared
to 2002-2004 and found there was a significant increase in the proportion of women
who were obese (BMI> 30 kg/m2) at booking, from 9.4% to 18.9%. This trend of
increasing maternal obesity is a warning sign, and this issue needs to be addressed
in order to avoid serious implications for obstetric care.
Maternal obesity has adverse outcomes for both mother and baby, and it can lead
to a repeated cycle of metabolic risk between generations (O'Reilly and Reynolds,
2013). Obese mothers are at higher risk of type 2 diabetes mellitus (T2DM)
development later in life (Kim et al., 2002). The offspring of obese mothers are at
higher risk of childhood obesity via programming effects, as reviewed by Freeman
(2010). The increased prevalence of maternal obesity is associated with an
observed increase of pre-existing conditions among mothers, such as T2DM and
chronic hypertension (HTN), which could potentially increase fetal and maternal
adverse outcomes. Pre-existing T2DM increases the risk of congenital
malformation, pregnancy loss, fetal macrosomia (Inkster et al., 2006) and poor
maternal outcomes, such as PE, caesarean delivery and retinopathy progression
(Morrison et al., 2016a, Morrison et al., 2016b). Pre-existing chronic HTN increases
Chapter 1 2
the risk of preeclampsia, caesarean section and preterm delivery (Chappell et al.,
2008).
Pre-pregnancy, obese women are more likely to suffer from infertility than normal-
weight women (Gesink Law et al., 2006). This can be related to ovulatory
dysfunction due to increased insulin resistance (Chavarro et al., 2007). In early
pregnancy, obese mothers had a 30% increased chance of having a miscarriage
(Marchi et al., 2015). Maternal obesity is associated with increased risk of congenital
malformations, such as neural tube defects and cardiovascular, orofacial and limb
anomalies (Marchi et al., 2015).
From mid-pregnancy onwards, obese women are more likely to develop
complications such as GDM and PE. Obese mothers have four- to nine-fold
increased risk of developing GDM during pregnancy (Poston et al., 2016), and this
risk is linearly related to obesity class (Kim et al., 2016). Both maternal obesity and
GDM are associated with maternal and fetal adverse outcomes, such as large for
gestational age babies (LGA), macrosomia, shoulder dystocia, caesarean delivery
and NICU admission. In a study assessing pregnancy outcomes in GDM mothers
by obesity class, mode of treatment and glycaemic control, pregnancy outcomes
were found to be compromised, independent of all other factors (Yogev and Langer,
2008). Several studies highlighted the importance of gestational weight gain over
pre-pregnancy BMI regarding the risk of LGA babies in GDM obese mothers (Santos
et al., 2016b, Santos et al., 2016a).
PE is a hypertensive disorder during pregnancy. It is considered to be the leading
cause of maternal and fetal morbidity and mortality, occurring in approximately 1–
8% of pregnancies. Obesity is a risk factor for PE. An obese mother has 3–10 times
increased risk of developing PE compared to normal pregnant women (Marchi et
al., 2015). PE presents risk of convulsion, kidney failure, liver failure and death for
the mother, and premature delivery and intra-uterine growth restriction (IUGR) for
the baby. An increase in pre-pregnancy BMI is associated with a higher risk of
developing PE. Compared with women with a BMI of 21, the risk of preeclampsia
doubles at a BMI of 26 (OR 2.1), triples at a BMI of 30 (OR 2.9), and increases
further with severe obesity (OR 3.5) (Bodnar et al., 2005). Furthermore, women with
higher BMI were found to be at risk of developing severe PE (Stone, 1994).
Chapter 1 3
1.2 Gestational diabetes – the clinical problem
GDM was defined by the WHO as ‘glucose intolerance resulting in hyperglycaemia
of variable severity with first onset during pregnancy’. This definition applies even if
this condition continues after pregnancy and does not exclude the possibility that
glucose intolerance could be undiagnosed at the start of pregnancy. By contrast,
the American Diabetes Association (ADA) recently redefined GDM as ‘diabetes
diagnosed in the second or third trimester of pregnancy that is not clearly overt
diabetes’ (American Diabetes Association, 2015). Therefore, women with glucose
intolerance in the first trimester are classified as T2DM. The global prevalence of
diabetes mellitus is increasing rapidly worldwide, affecting people at different stages
in life. In 2010, an estimated 285 million people in the world had T2DM (Shaw et al.,
2010). This number is expected to rise in 2030 to reach 439 million, making T2DM
one of the most critical public health challenges, and a major burden on health care
systems worldwide. GDM risk factors include family history of T2DM, ethnicity,
maternal age, obesity, and past history of GDM and macrosomia. Gestational
diabetes is a heterogeneous disorder and has adverse maternal and fetal
consequences. The majority of β-cell dysfunction observed in GDM is due to a
pathophysiology similar to that observed in T2DM. GDM prevalence figures are
affected by the geographic population, GDM screening intensity, and the employed
diagnostic criteria. A recent review of global estimates of GDM suggested that the
Middle East and North Africa had the highest prevalence, with median estimates of
12.9%, whereas Europe had the lowest estimates of 5.8% (Zhu and Zhang, 2016).
Recent analysis showed that the prevalence of GDM among the Scottish population
was only 1.9%.
There are two common screening approaches in use: universal screening or
selective screening at mid-pregnancy (24–28 weeks of gestation). Early screening
is recommended for high-risk individuals in order to rule out pre-existing diabetes
and prevent possible fetal and maternal complications. The Hyperglycaemia and
Adverse Pregnancy Outcomes (HAPO) study was conducted in response to the
need for internationally agreed diagnostic criteria for GDM, based upon their
predictive value for adverse pregnancy outcomes. Based on this observational
study, the International Association of Diabetes and Pregnancy Study Groups
(IADPSG) (Metzger et al., 2010) proposed a universal screening method using a
75g glucose load test at 24–28 weeks of gestation. Increases in each of the three
Chapter 1 4
values (fasting blood glucose ≥ 5.1, 1 hour ≥ 10.0, 2 hours ≥ 8.5 mmol/L) on the
75g, 2-hour oral glucose tolerance test were associated with graded increases in
the likelihood of pregnancy outcomes, such as LGA, caesarean section, high fetal
insulin levels and increased neonatal fat content. A diagnosis of GDM can be made
if one result of blood glucose levels reaches one or more of the previously mentioned
values. These new criteria resulted in an 18% increase in GDM prevalence. The
widespread use of the IADSPG criteria would result in nearly 1 in 5 pregnant women
being classified as GDM (Metzger et al., 2010). However, the implementation of
these new criteria to diagnose GDM has not yet been proven to be effective in terms
of cost-effectiveness. Recent studies (Welch, 2011, Chen et al., 2009) suggested
that the use of a two-step approach (first a non-fasting 50g glucose challenge test,
to be followed, if positive (7.8 mmol/L), by a fasting 100g oral glucose tolerance test
(OGTT)) is more cost-effective. Another study (Werner et al., 2012) suggested that
IADPSG criteria could be more effective if post-partum care and monitoring were
included in the cost-effectiveness analysis. The IADPSG criteria were adopted by
the WHO, the American Diabetes Association (ADA) (2011), and the International
Federation of Gynaecology and Obstetrics (FIGO), but not by the American College
of Obstetricians and Gynecologists (ACOG) (2013), or the National Institute for
Health and Care Excellence (NICE) (Bilous, 2015) (Table 1-1). In the UK, NICE
proposed another criterion based on health economic analysis, using a wide range
of glucose thresholds, and published new clinical guidelines in 2015. The NICE
analysis did not support the cost-effectiveness of IADPSG criteria (Bilous, 2015). In
the NICE guidelines, GDM is diagnosed if: fasting blood glucose (FBG) ≥ 5.6
mmol/L, or 2-hour glucose after a 75g OGTT ≥ 7.8 mmol/L. The Scottish
Intercollegiate Guidelines Network (SIGN), in their 2010 recommendations, advised
screening with clinical risk factors for GDM at booking, with HBA1c or fasting
glucose (The Scottish Intercollegiate Guidelines network, 2010). At 24–28 weeks of
gestation, all high-risk women should undergo a 75-g OGTT with the IADPSG
criteria used for diagnosis, and all low-risk women should undergo the fasting
plasma glucose testing.
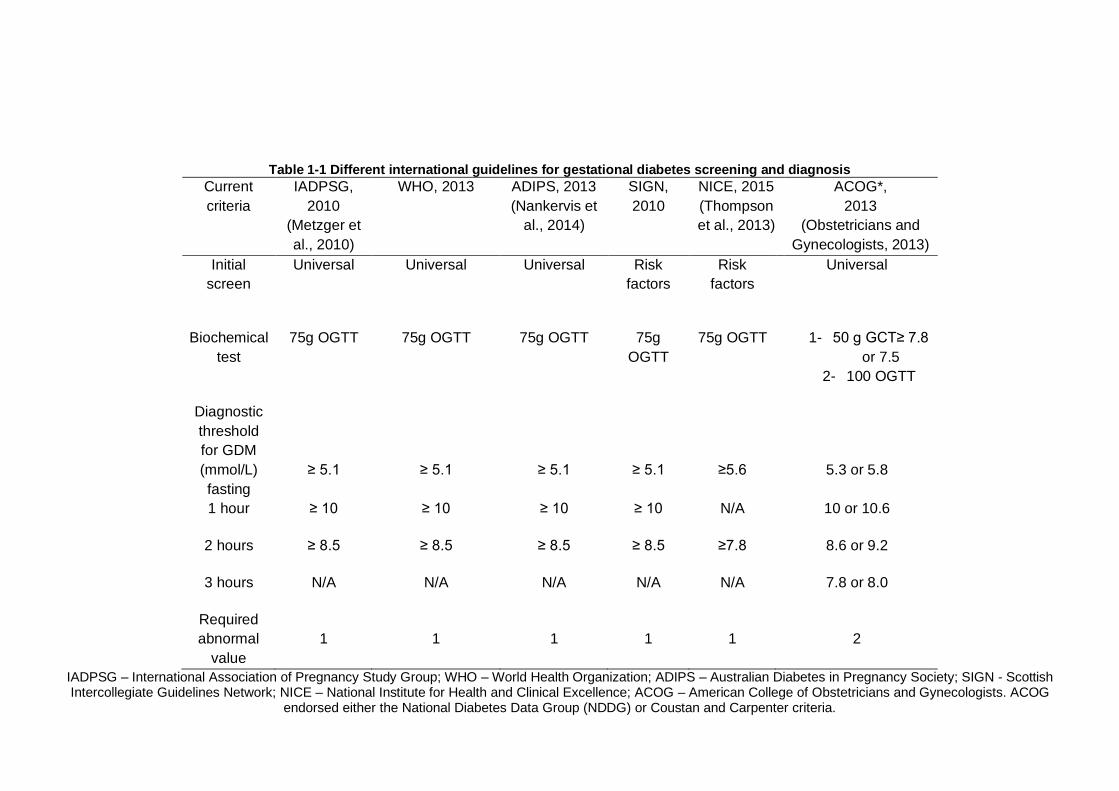
Table 1-1 Different international guidelines for gestational diabetes screening and diagnosis
Current
criteria
IADPSG,
2010
(Metzger et
al., 2010)
WHO, 2013 ADIPS, 2013
(Nankervis et
al., 2014)
SIGN,
2010
NICE, 2015
(Thompson
et al., 2013)
ACOG*,
2013
(Obstetricians and
Gynecologists, 2013)
Initial
screen
Universal Universal Universal Risk
factors
Risk
factors
Universal
Biochemical
test
75g OGTT 75g OGTT 75g OGTT 75g
OGTT
75g OGTT 1- 50 g GCT≥ 7.8
or 7.5
2- 100 OGTT
Diagnostic
threshold
for GDM
(mmol/L)
fasting
≥ 5.1
≥ 5.1
≥ 5.1
≥ 5.1
≥5.6
5.3 or 5.8
1 hour ≥ 10 ≥ 10 ≥ 10 ≥ 10 N/A 10 or 10.6
2 hours ≥ 8.5 ≥ 8.5 ≥ 8.5 ≥ 8.5 ≥7.8 8.6 or 9.2
3 hours N/A N/A N/A N/A N/A 7.8 or 8.0
Required
abnormal
value
1
1
1
1
1
2
IADPSG – International Association of Pregnancy Study Group; WHO – World Health Organization; ADIPS – Australian Diabetes in Pregnancy Society; SIGN - Scottish Intercollegiate Guidelines Network; NICE – National Institute for Health and Clinical Excellence; ACOG – American College of Obstetricians and Gynecologists. ACOG
endorsed either the National Diabetes Data Group (NDDG) or Coustan and Carpenter criteria.
Chapter 1 6
There are several adverse outcomes associated with GDM. The many differences
in the reported associations of GDM with adverse outcomes are due to the lack of
universal agreement on GDM screening, diagnostic criteria, and the best
methodology to screen or diagnose GDM. In GDM, there are increased risks of
perinatal mortality, macrosomia, birth trauma, shoulder dystocia, and metabolic and
cardiovascular complications in untreated GDM. A retrospective study suggested
that unrecognised GDM is an independent risk factor for perinatal morbidity after
controlling for confounders, and that dietary control of GDM decreases perinatal
morbidity (Adams et al., 1998). A recent meta-analysis (Horvath et al., 2010),
including two of the most important randomised controlled trials – the Australian
Carbohydrate Intolerance Study in Pregnant Women (ACHOIS) (Crowther et al.,
2005) and the Maternal Fetal Medicine Unit Network (MFMU) (Landon et al., 2009)
– showed that the pregnancy outcomes improved by treating GDM are a reduction
in macrosomia (OR 0.38), large for gestational age infants (LGA) (OR 0.48) and
shoulder dystocia (OR 0.40).
The adverse consequences of GDM for mothers are mainly the development of
T2DM post-pregnancy, preeclampsia and caesarean delivery. Studies have
suggested that up to 50% of GDM mothers developed overt T2DM, with the highest
occurrence rate in the first five years following delivery (Bellamy et al., 2009). Other
factors such as glycaemic status during pregnancy, gestational weight gain, and
obstetric complications such as PE are known to influence the future risk of diabetes
(Kwak et al., 2013). A recent systematic review and meta-analysis of 95,750 women
showed that the future risk of diabetes is mainly influenced by gestational glycaemic
status, and that both hypertensive disorders in pregnancy and preterm delivery in
GDM pregnancies were associated with future onset of T2DM (Rayanagoudar et
al., 2016a, Rayanagoudar et al., 2016b). Therefore, postnatal counselling of women
with GDM regarding the risk of future diabetes should be individualised. Catalano et
al. (1991) suggested that 50% of GDM mothers remained insulin-resistant following
delivery. This suggests that GDM diagnosis is a good opportunity for intervention
and prevention of T2DM, and slowing its epidemic progress.
Fetal outcomes are improved after treating GDM. Adequate glycaemic control
enhances perinatal outcomes in GDM (Crowther et al., 2005). This can be achieved
by the use of oral hypoglycaemic drugs such as metformin, and/or by the use of
insulin to manage maternal blood glucose levels. Metformin is a second-generation
Chapter 1 7
biguanide that has been shown to be effective in T2DM. Metformin was found to
provide adequate glycaemic control in GDM mothers, resulting in reduced weight
gain and lower frequency of neonatal hypoglycaemia. In a large randomised
controlled trial (RCT) (Rowan et al., 2008), there was no difference between
metformin and insulin in the level of glycaemic control and pregnancy outcomes.
The degree of glycaemic control has a key role regarding the degree to which
pregnancy outcomes in GDM are improved (Langer et al., 1994).
The matter of which criteria are the most clinically useful and cost-effective remains
controversial. Some studies have attempted to examine pregnancy complications in
women fulfilling different criteria in order to address this. However, there are few
studies that have assessed the differences between IADPSG and NICE criteria in
the same population. It is important to note that the populations of these studies are
usually populations treated under one or other criteria, making interpretation more
challenging. For example, a retrospective study (Meek et al., 2015) assessed the
neonatal and obstetric outcomes in 25,543 live singleton births from a single centre
in Cambridge, using IADPSG and NICE 2015 criteria for GDM diagnosis; GDM
prevalence was 4.13% (NICE) and 4.62% (IADPSG). This study showed that 167
women tested negative using NICE criteria, but positive using IADPSG criteria.
These women had a higher risk of LGA OR 3.12 (95% CI 2.44–3.98), caesarean
delivery OR 1.44 (95% CI 1.15–1.81) and polyhydramnios OR 6.90 (95% CI 3.94–
12.08) compared to healthy pregnant women. This study concluded that the
IADPSG criteria identify women at higher risk of GDM complications, and the
number of cases needed to treat one case of LGA is 5.8. A similar study conducted
at a centre in Croatia included 4,646 women (Djelmis et al., 2016); GDM prevalence
was 23.1% (IADPSG) and 17.8% (NICE). Women with FBG (5.1–5.5 m.mol/l) had
higher risk of LGA OR 3.7 (95% CI 2.0–4.6) and caesarean delivery OR 1.8 (95%
CI 1.3–2.3) compared to the control group. These women were at greater risk of
maternal and neonatal adverse outcomes, and were not diagnosed by NICE criteria.
One issue must be addressed when comparing the results of the previous two
studies. In the Cambridge study, NICE criteria were used to diagnose GDM, which
means that the IADPSG-positive women were untreated. The Croatia study was
analysed in the time period when IADPSG criteria were used to diagnose GDM,
which means that IADPSG-positive women were treated. This could possibly
account for the high caesarean section rates in the Cambridge study. However, it is
Chapter 1 8
difficult to reach conclusions with regard to use of the IADPSG and NICE criteria
when each study used different selection criteria.
Ethnicity has long been recognized as a risk factor for GDM development. Several
ethnicities were recognized to have a higher risk for GDM such as Hispanic, African,
Native American, South and East Asian (Berkowitz et al., 1992). It is recommended
that women from high risk group get screened for GDM as soon as feasible and to
repeat at 24-28 weeks of gestation (International Association of Diabetes and
Pregnancy Study Groups, 2010). Therefore, the regional prevalence of GDM varies
from 10.4% in Africa to 24.2% in South Asia (Ogurtsova et al., 2017). Furthermore,
the prevalence of GDM among various ethnic group varies considerably. Sanchalika
and Teresa (2015) showed in a large retrospective study that among South Asian
women living in New Jersey, Bangladeshi women had highest rate of GDM followed
by Indians, Sri Lankans and Pakistanis. There are also differences in GDM
pregnancy outcomes between different ethnicities. It was reported previously that
South Asian women had lower preterm birth and LGA rates than white women, but
higher small for gestational age infants (Sanchalika and Teresa, 2015).
1.3 Maternal metabolic adaptation to pregnancy in healthy, obese and GDM pregnancy
1.3.1 Healthy pregnancy
In early pregnancy, there is an increase in maternal lipogenesis and fat
accumulation, which was found to account for most of the conceptus-free weight
gain (Herrera, 2002b). This was suggested to result from the development of
hyperphagia and a relative increase in lipoprotein lipase in early pregnancy, which
increases fat storage. There is increased insulin sensitivity in early pregnancy due
to high estrogen levels. Insulin strongly inhibits lipolysis at adipose tissue with the
suppression of hormone-sensitive lipase. The acquired adipose tissue is a source
of fatty acid supply during late gestation, which is required to support rapid fetal
growth (Herrera, 2002b). In a previous study, where maternal body composition was
assessed by hydrodensitometry, there was a significant increase in fat mass in lean
women with normal glucose tolerance during pregnancy (Catalano et al., 1998). This
relationship was significant only for the period before conception up to early
gestation, and not late pregnancy (Catalano et al., 1998). The mechanism
underlying this observed relationship between insulin sensitivity and weight gain in
Chapter 1 9
early pregnancy remains unknown. Healthy normal-weight women gain around
3.8 kg of fat during pregnancy, but there is high inter-individual variability.
At mid-gestation, a time of increasing fetal demand, the maternal body switches
from anabolic lipogenesis to a catabolic lipolytic, insulin-resistant state (Figure 1-1).
This is a physiological response to preserve glucose, as the primary fuel for fetal
metabolism, by reducing maternal carbohydrate utilisation. Due to increased total
energy expenditure at late gestation (Catalano et al., 1998), any reduction in
maternal carbohydrate utilisation is substituted by fat utilisation, as an alternative
source of energy. Consequently, lipid metabolism is markedly altered. The
increased insulin resistance at late gestation increases lipolysis, which enhances
the availability of free fatty acids (FFA) and glycerol (the main substrate for
gluconeogenesis) for both maternal and fetal use (Huda et al., 2009). During healthy
pregnancy there is an increase in plasma cholesterol and triglyceride (TAG)
concentration by 20–25% and 200–400%, respectively (Huda et al., 2009). This
increase in TAG was found to be due to a three-fold increase in very low-density
lipoprotein (VLDL) synthesis from 14 weeks of gestation to the end of pregnancy.
This increase in TAG incorporation into VLDL by the liver is augmented by the effect
of estrogen. Insulin resistance decreases lipoprotein lipase activity, the enzyme
responsible for VLDL clearance from the plasma and TAG uptake from VLDL by
peripheral tissues. As a result, VLDL remains longer in the plasma, which increases
LDL accumulation. This potentially can lead to the appearance of small dense low-
density lipoproteins (sdLDL). Plasma LDL concentration increases during late
pregnancy by 70%. At 28 weeks of gestation, HDL is also increased by 40%
compared to 14-week gestation levels (Fahraeus et al., 1985). This is attributed to
the effect of estrogen, which promotes ApoA-I production by the liver, thereby
increasing HDL formation. Furthermore, accelerated transfer of TAG to lipoproteins
of higher density is attributed to the long exposure to cholesteryl ester transfer
protein (CETP). The increase in HDL is suggested to be a protective mechanism to
counteract any detrimental effects of pregnancy hyperlipidaemia (Huda et al., 2009).
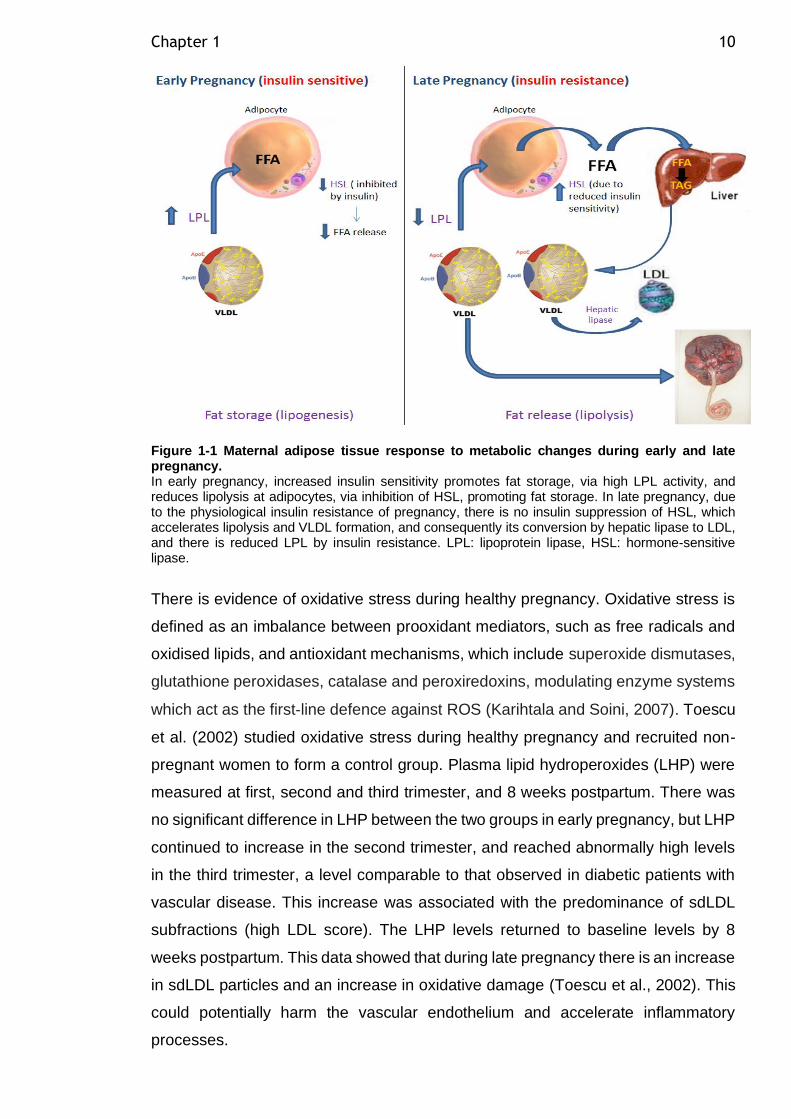
Chapter 1 10
Figure 1-1 Maternal adipose tissue response to metabolic changes during early and late pregnancy. In early pregnancy, increased insulin sensitivity promotes fat storage, via high LPL activity, and reduces lipolysis at adipocytes, via inhibition of HSL, promoting fat storage. In late pregnancy, due to the physiological insulin resistance of pregnancy, there is no insulin suppression of HSL, which accelerates lipolysis and VLDL formation, and consequently its conversion by hepatic lipase to LDL, and there is reduced LPL by insulin resistance. LPL: lipoprotein lipase, HSL: hormone-sensitive lipase.
There is evidence of oxidative stress during healthy pregnancy. Oxidative stress is
defined as an imbalance between prooxidant mediators, such as free radicals and
oxidised lipids, and antioxidant mechanisms, which include superoxide dismutases,
glutathione peroxidases, catalase and peroxiredoxins, modulating enzyme systems
which act as the first‐line defence against ROS (Karihtala and Soini, 2007). Toescu
et al. (2002) studied oxidative stress during healthy pregnancy and recruited non-
pregnant women to form a control group. Plasma lipid hydroperoxides (LHP) were
measured at first, second and third trimester, and 8 weeks postpartum. There was
no significant difference in LHP between the two groups in early pregnancy, but LHP
continued to increase in the second trimester, and reached abnormally high levels
in the third trimester, a level comparable to that observed in diabetic patients with
vascular disease. This increase was associated with the predominance of sdLDL
subfractions (high LDL score). The LHP levels returned to baseline levels by 8
weeks postpartum. This data showed that during late pregnancy there is an increase
in sdLDL particles and an increase in oxidative damage (Toescu et al., 2002). This
could potentially harm the vascular endothelium and accelerate inflammatory
processes.
Chapter 1 11
Pregnancy is characterised by physiological systemic inflammation. During
pregnancy, the balance between cell-mediated immunity (Th1) and humoral
immunity (Th2) is strongly shifted towards the predominance of Th2 cytokines (IL-
5, IL-10 and IL-13), which have a potentially protective role in pregnancy (Challis et
al., 2009). Inflammatory processes towards late pregnancy alter this balance and
lead to a progressive shift back towards Th1 cytokines (IL-2, IFN-gamma and
lymphotoxin), which initiates and intensifies the inflammatory cytokine production
involved in adverse pregnancy outcomes (Challis et al., 2009). In pregnancy there
are increased levels of inflammatory markers, particularly in the third trimester, such
as TNF-α, which may be major mediators for pregnancy-induced insulin resistance.
TNF-α promotes IR by suppressing tyrosine phosphorylation of the insulin receptor
and its substrate-insulin receptor substrate-1 (IRS-1) via inhibition of tyrosine kinase
(Hotamisligil et al., 1994). Furthermore, it diminishes the expression of glucose
transporter type 4 (GLUT 4) in adipose tissue and skeletal muscle. The pro-
inflammatory activity of TNF-α in beta cells of the pancreas plays a key role in their
apoptosis, contributing to T2DM development (Akash et al., 2018).
Healthy pregnancy is associated with enhanced vascular function. The vascular
endothelium has a major role in maintaining vascular function despite the metabolic
and inflammatory changes during pregnancy. The vascular endothelium is involved
in the control of various functions such as inflammation, vascular tone, permeability,
thrombosis, platelet and leukocyte adhesion and aggregation. Disturbances in
endothelium function have been associated with pregnancy complications such as
preeclampsia. Vascular function can be determined by both endothelial cell
production of vasoactive substances and smooth muscle responsiveness – termed
endothelium-dependent and endothelium-independent function, respectively – and
they can be assessed ex vivo by the use of endothelium-dependent agonists
(acetylcholine and bradykinin) and endothelium-independent agonists (sodium
nitroprusside and nitro-glycerine). These vascular responses are often tested in
different vascular beds, which makes it difficult to compare endothelial function
assessed in different studies.
Enhanced endothelial function during healthy pregnancy was apparent from 10
weeks of gestation (Savvidou et al., 2000). There was an increase in endothelium-
dependent function in lean pregnant mothers, which remained improved up to 4
months postpartum (Stewart et al., 2007b). This has been demonstrated in several
Chapter 1 12
studies using flow-mediated dilatation (FMD). FMD is an in vivo assessment method
used to assess macrovascular function, in which the brachial (most commonly),
femoral or radial artery diameter changes in response to increased flow (shear
stress) are measured using high resolution ultrasound. This is a non-invasive
method dependent on nitric oxide (NO) release from endothelial cells to assess
endothelium-dependent vascular function. Lack of standardisation and intra-
observer variability are the major limitations of this technique. After 30 weeks of
gestation, a fall in FMD was observed and negatively correlated with an increase in
brachial artery resting diameter at this time point (Savvidou et al., 2000). A positive
correlation between maternal plasma TAG and FMD suggested that enhanced
vascular function in pregnancy is dependent on the hyperlipidaemia status
(Saarelainen et al., 2006). Laser Doppler imaging/flowmetry (LDF) is a non-invasive
in vivo method used to assess microvascular function by the measurement of
cutaneous perfusion accompanied by iontophoresis of acetylcholine and sodium
nitroprusside. The assessment of microvascular function during pregnancy using
laser Doppler imaging shows improved endothelium-dependent and endothelium-
independent vascular function (Stewart et al., 2007b). Microvascular function in
isolated arteries can be assessed in vitro by wire myography. This method was
found to have a strong correlation with other studies using brachial artery FMD, and
is suggested to be more sensitive (Endemann and Schiffrin, 2004). Wire myography
studies on pregnant women confirmed the improved FMD in small resistance
arteries isolated from pregnant women compared to non-pregnant women (Cockell
and Poston, 1997).
1.3.2 Obese pregnancy
Metabolic adaptation during pregnancy is exaggerated in obese mothers. There is
a significant increase in fat mass in obese mothers during pregnancy, but
interestingly this is to a lesser extent than that observed in lean mothers. This is
most likely related to lower insulin sensitivity in early pregnancy in obese mothers
(Okereke et al., 2004). Fat mass accretion is variable among obese women, ranging
from 2 to 13.1 kg (Okereke et al., 2004). The progressive decline in insulin sensitivity
during healthy pregnancy is magnified in obese mothers. Both central and peripheral
insulin sensitivity are reduced in obese pregnant women (Catalano et al., 1992).
Peripheral insulin sensitivity is 40% lower in obese mothers, leading to an increase
Chapter 1 13
in pregnancy hyperinsulinemia in this population that could potentially lead to
increased vascular inflammation and oxidative stress.
Due to reduced insulin suppression of HSL in late gestation and lower levels of LPL,
the release of FFA from adipocytes increases, which leads to VLDL enrichment with
TAG (Alvarez et al., 1996). Interestingly, this causes TAG enrichment in HDL and
LDL particles that have low TAG content under non-pregnant conditions. CETP
transfers TAG from VLDL particles to lipoproteins of higher density (LDL and HDL),
and the transfer of cholesteryl esters (CE) from HDL to apolipoprotein B (apoB)-
containing particles (VLDL and LDL) (Knopp et al., 1998). In the liver, hepatic lipase
hydrolyses HDL-associated TAG, and also phospholipids, inducing the formation of
smaller HDL particles that can be easily cleared by the kidney (Alvarez et al., 1996).
Higher plasma LDL enriched in TAG can lead to the production of easily oxidised
sdLDL particles, which leads to the production of oxidised LDL (oxLDL) particles
(Griffin et al., 1994). OxLDL is highly atherogenic because of its reduced affinity for
the native LDL receptor. OxLDL can be taken up by macrophages promoting the
formation of foam cells and development of early atherosclerotic lesions (Clausen
et al., 2001). This can initiate endothelial dysfunction and, ultimately, vascular
occlusion. These pathways explain the development of metabolic syndrome
features in obese pregnancy characterised by elevated plasma concentrations of
TAG and VLDL and decreased plasma HDL concentration (Figure 1-2).
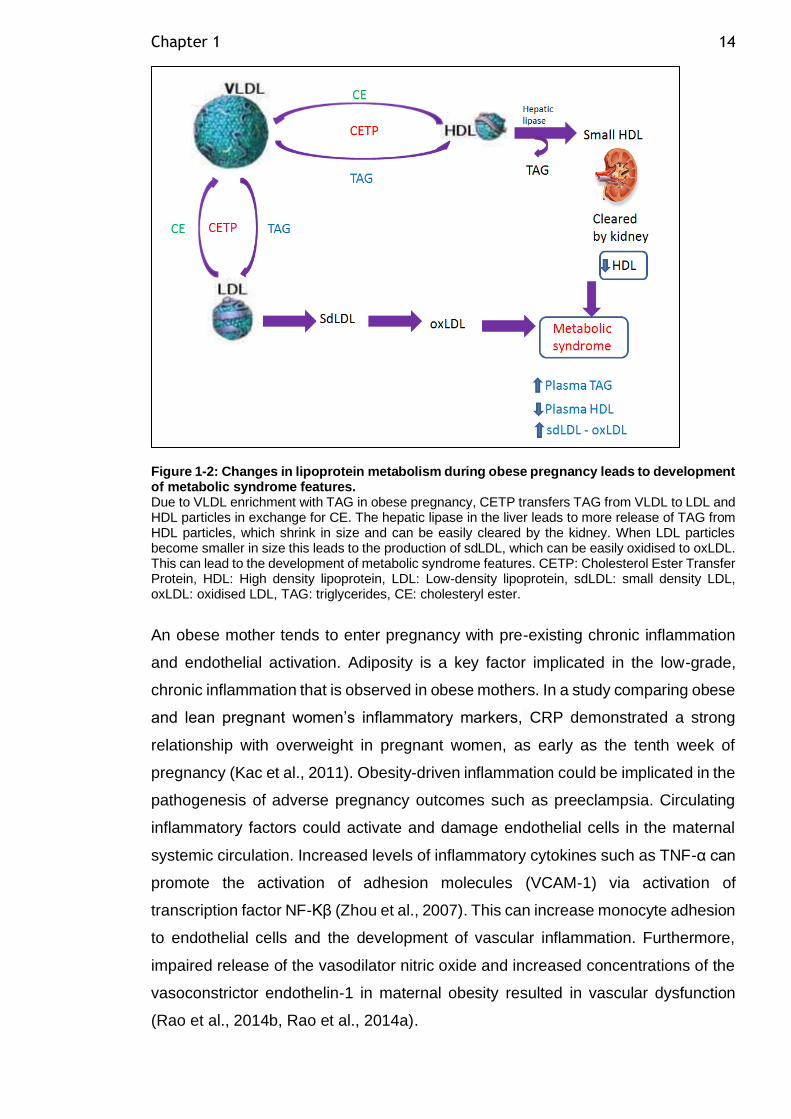
Chapter 1 14
Figure 1-2: Changes in lipoprotein metabolism during obese pregnancy leads to development of metabolic syndrome features. Due to VLDL enrichment with TAG in obese pregnancy, CETP transfers TAG from VLDL to LDL and HDL particles in exchange for CE. The hepatic lipase in the liver leads to more release of TAG from HDL particles, which shrink in size and can be easily cleared by the kidney. When LDL particles become smaller in size this leads to the production of sdLDL, which can be easily oxidised to oxLDL. This can lead to the development of metabolic syndrome features. CETP: Cholesterol Ester Transfer Protein, HDL: High density lipoprotein, LDL: Low-density lipoprotein, sdLDL: small density LDL, oxLDL: oxidised LDL, TAG: triglycerides, CE: cholesteryl ester.
An obese mother tends to enter pregnancy with pre-existing chronic inflammation
and endothelial activation. Adiposity is a key factor implicated in the low-grade,
chronic inflammation that is observed in obese mothers. In a study comparing obese
and lean pregnant women’s inflammatory markers, CRP demonstrated a strong
relationship with overweight in pregnant women, as early as the tenth week of
pregnancy (Kac et al., 2011). Obesity-driven inflammation could be implicated in the
pathogenesis of adverse pregnancy outcomes such as preeclampsia. Circulating
inflammatory factors could activate and damage endothelial cells in the maternal
systemic circulation. Increased levels of inflammatory cytokines such as TNF-α can
promote the activation of adhesion molecules (VCAM-1) via activation of
transcription factor NF-Kβ (Zhou et al., 2007). This can increase monocyte adhesion
to endothelial cells and the development of vascular inflammation. Furthermore,
impaired release of the vasodilator nitric oxide and increased concentrations of the
vasoconstrictor endothelin-1 in maternal obesity resulted in vascular dysfunction
(Rao et al., 2014b, Rao et al., 2014a).
Chapter 1 15
Laser Doppler imaging was used in a longitudinal study to assess microvascular
vascular function in lean and obese women, and revealed that although there was
a similar pattern of improvement in vascular function during pregnancy, obese
mothers had significantly lower endothelium-dependent and -independent vascular
function than lean women (Stewart et al., 2007b). In the postpartum period,
endothelium-dependent function in obese mothers declined to first-trimester levels
and failed to maintain the gestational improvement, whereas in lean women it
remained at an enhanced level (Stewart et al., 2007b). In another study, myometrial
arteries isolated from obese mothers (BMI>36kg/m²) showed reduced relaxation in
response to bradykinin compared to vessels obtained from pregnant non-obese
women (BMI<30 kg/m²) (Myers et al., 2006).
1.3.3 GDM pregnancy
Increased insulin resistance during late gestation in healthy women is accompanied
by increased insulin production from β-cells to maintain euglycemia; if this does not
occur then GDM can develop. GDM is a pregnancy metabolic complication resulting
from increased insulin resistance during pregnancy. Glucose homeostasis is
impaired in GDM. Inadequate β-cell compensation for insulin resistance has been
found in women with GDM, suggesting that β-cell dysfunction is a common feature
of GDM (Buchanan, 2001). Mechanisms that lead to β-cell failure in women with
GDM are yet to be identified. The frequent occurrence of chronic insulin resistance
in women who have or had GDM suggests that the propensity for β-cells to fail in
the presence of insulin resistance may be a common feature of the disease (Prentki
and Nolan, 2006). The same mechanism may be involved in the progression from
GDM to T2DM and in the pathogenesis of T2DM in general. Other factors such as
maternal and placental hormones, genetic predisposition, and suboptimal lifestyle
might contribute to the development of GDM (Prentki and Nolan, 2006).
In a longitudinal study comparing body composition in lean, normal glucose tolerant
(NGT) mothers and lean GDM mothers, there was a significant increase in weight
in both groups over time, but no significant difference between the two groups
(Catalano et al., 1998). However, GDM mothers had significantly smaller increases
in body fat (1.3 kg, P=0.04) and percentage of fat (1.6%, P=0.02) than lean NGT
mothers (2 kg and 3.6%, respectively) (Catalano et al., 1998). Total weight gain was
2.5 kg less than that of NGT women. This could be related to the decreased pre-

Chapter 1 16
gravid insulin sensitivity in GDM women, which limited their ability to conserve
energy expenditure and increase body fat (Okereke et al., 2004).
GDM mothers had higher concentrations of VLDL particles and a lower number of
large HDL particles compared to healthy pregnant women controls (Mokkala et al.,
2019). Interestingly, the study of Mokkala et al. (2019) found that the most predictive
biomarker for GDM at early pregnancy was higher concentrations of small HDL
particles. Other studies have reported that small HDL particles are associated with
type 1 diabetes (Gourgari et al., 2018), inflammation (Phillips et al., 2018), and
dyslipidaemias, probably due to impaired capacity to esterify cholesterol (Hernáez
Camba et al., 2019). In healthy pregnancies, maternal glycemia before delivery
correlates with neonatal weight and fat mass (Metzger et al., 2008). However, in
women with well-controlled GDM, both maternal plasma TAG and NEFA, rather than
maternal glucose, are positively correlated with neonatal weight and fat mass
(Schaefer‐Graf et al., 2011, Schaefer-Graf et al., 2008). This indicates that maternal
dyslipidaemia in GDM may enhance the maternal fatty acid transfer to the fetus
contributing to increased fetal adipose tissue mass and the consequent risk of
developing macrosomia (Figure 1-3).
Figure 1-3: Maternal adipose tissue metabolism during early and late pregnancy in GDM. In GDM, women start pregnancy with some degree of insulin resistance due to pre-pregnancy obesity. At late gestation, there is a pronounced increase in insulin resistance due to failure of β-cell compensation with an increased insulin requirement during pregnancy leading to hyperglycaemia. There is pronounced production of VLDL carrying more TAG more than normal pregnancy (explained in figure 1-1), which probably contributes to fetal macrosomia via delivery of fatty acids to the placenta. In GDM, TAG-rich VLDL exchanges TAG and CE with HDL and leads to production of sdLDL, which is more easily oxidised and leads to the production of atherogenic oxLDL.
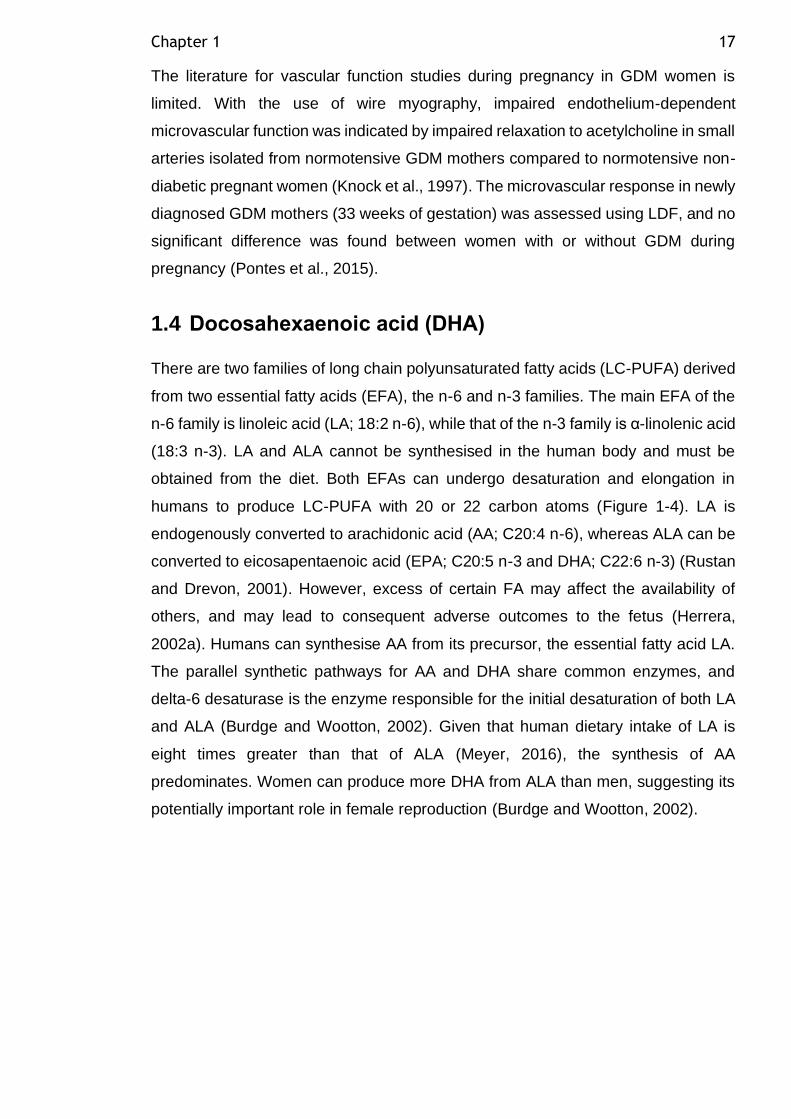
Chapter 1 17
The literature for vascular function studies during pregnancy in GDM women is
limited. With the use of wire myography, impaired endothelium-dependent
microvascular function was indicated by impaired relaxation to acetylcholine in small
arteries isolated from normotensive GDM mothers compared to normotensive non-
diabetic pregnant women (Knock et al., 1997). The microvascular response in newly
diagnosed GDM mothers (33 weeks of gestation) was assessed using LDF, and no
significant difference was found between women with or without GDM during
pregnancy (Pontes et al., 2015).
1.4 Docosahexaenoic acid (DHA)
There are two families of long chain polyunsaturated fatty acids (LC-PUFA) derived
from two essential fatty acids (EFA), the n-6 and n-3 families. The main EFA of the
n-6 family is linoleic acid (LA; 18:2 n-6), while that of the n-3 family is α-linolenic acid
(18:3 n-3). LA and ALA cannot be synthesised in the human body and must be
obtained from the diet. Both EFAs can undergo desaturation and elongation in
humans to produce LC-PUFA with 20 or 22 carbon atoms (Figure 1-4). LA is
endogenously converted to arachidonic acid (AA; C20:4 n-6), whereas ALA can be
converted to eicosapentaenoic acid (EPA; C20:5 n-3 and DHA; C22:6 n-3) (Rustan
and Drevon, 2001). However, excess of certain FA may affect the availability of
others, and may lead to consequent adverse outcomes to the fetus (Herrera,
2002a). Humans can synthesise AA from its precursor, the essential fatty acid LA.
The parallel synthetic pathways for AA and DHA share common enzymes, and
delta-6 desaturase is the enzyme responsible for the initial desaturation of both LA
and ALA (Burdge and Wootton, 2002). Given that human dietary intake of LA is
eight times greater than that of ALA (Meyer, 2016), the synthesis of AA
predominates. Women can produce more DHA from ALA than men, suggesting its
potentially important role in female reproduction (Burdge and Wootton, 2002).
Chapter 1 18
Figure 1-4 PUFA synthesis pathway. Adapted from (Meyer and Freeman, 2017), journal permission is pending.
Fatty acids are needed by the fetus to control the fluidity and permeability of cell
membranes, as a source of energy, and as precursors of bioactive compounds such
as eicosanoids. Although all fatty acids can be used as energy sources, the LC-
PUFAs are predominantly used for structural and metabolic functions (Herrera and
Ortega-Senovilla, 2018). The LC-PUFAs, AA and DHA are important structural fatty
acids in neural tissue. During pregnancy, there is increased accretion of maternal,
placental and fetal tissues, and consequently the LC-PUFA requirements of
pregnant women and their developing fetuses are high. The fetal requirements for
AA and DHA are especially high during the third trimester, due to the rapid synthesis
of brain tissue (Martinez, 1992). As the fetus may have a limited capacity to
synthesise DHA, and requires essential FA to do it, the fetus depends primarily on
placental transfer, and thus on the maternal supply of DHA (Innis, 1991).
Chapter 1 19
DHA is the predominant LC-PUFA in phospholipids in the neural membranes of the
cerebral cortex and in the photoreceptors of the retina (Guesnet and Alessandri,
2011). Both retinal function and learning ability become permanently impaired if the
accumulation of DHA during intrauterine life is insufficient (Innis, 1991), indicating
that the supply of DHA during pregnancy is critical for these functions. Of particular
importance for fetal growth and development is AA, which is alone among the
plasma fatty acids of premature infants in showing a significant linear positive
correlation with birth weight (Koletzko and Braun, 1991). This growth-promoting
effect of AA could be related to its function as a precursor of prostaglandins and
other eicosanoids, or to its structural roles in membrane phospholipids.
It was previously demonstrated that maternal NEFA can cross the placenta by
passive diffusion without prior modification or protein-mediated transport (Herrera,
2002a). Several studies have demonstrated placental selectivity of FA transfer and
a strong preference of the placental plasma membrane binding sites for LC-PUFA
was observed (Campbell et al., 1996). LC-PUFA storage in fetal adipose tissue
provides an important source of LC-PUFA during the critical first months of postnatal
life. The placenta has a pivotal role for the selective transport of DHA from maternal
diet and body stores to the fetus. Several studies have associated various fatty acid
transport and binding proteins (FATP) with the preferential DHA transfer, but the
importance of the different lipolytic enzymes has also been shown. However, the
exact mechanisms and the interaction of these factors remains elusive (Hanebutt et
al., 2008).
As discussed previously, maternal obesity is characterised by greater FA flux from
adipose tissue stores. The maternal FA flux affects the placental lipid uptake, but
the role of placental tissue in moderating this transfer is yet to be clarified. In GDM
compared to normoglycemic pregnancies, there was a higher accumulation of lipid
droplets in placental tissue (Tewari et al., 2011). In addition, there was reduced
mitochondrial FA oxidation by 20% in placentas from women with GDM compared
to healthy controls, contributing to enhanced triglyceride content within the placenta.
It is also important to consider that the functionality of the placenta may affect the
fetal levels of key FA such as LC-PUFA. It was found that LPL activity is increased
in placentas from GDM pregnancies, and positively correlated to TAG and NEFA in
the offspring of mothers with GDM (Dubé et al., 2013). These changes could
adversely affect the fetal metabolism and predispose the fetus to future metabolic
Chapter 1 20
diseases. Thus, it is important to control dyslipidemia in pregnant women to avoid
increased neonatal fat accretion and disturbed LC-PUFA transport to the fetus,
which could have implications for the fetal neurodevelopment and the later risk of
obesity.
1.5 Non-pregnant adipose tissue
Adipose tissue is a critical organ in maintaining energy homeostasis under
conditions of excess nutritional intake by storing it in the form of TAG in the fed state
(lipogenesis). In prolonged starvation, adipose tissue releases FFA to meet the body
energy demands (lipolysis). These processes are controlled by insulin and
epinephrine, which regulate lipogenic and lipolytic enzymes. There are two major
types of adipose tissue in humans: white adipose tissue (WAT) and brown adipose
tissue (BAT). WAT comprises two major depots according to their anatomical
distribution: subcutaneous adipose tissue (SAT) localised beneath the skin, and
visceral adipose tissue (VAT) distributed in the abdominal cavity. The gluteofemoral
depot is the predominant subcutaneous depot in humans, while the predominant
visceral depot is the omental depot. Important differences in depot function exist
between these categories, as discussed below in 1.5.3 and 1.5.4. Adipose tissue is
a heterogeneous tissue containing several cell types in addition to adipocytes and
preadipocytes, collectively called the stromal vascular fraction (SVF). The SVF
includes endothelial cells, fibroblasts, histiocytes, adipose tissue-derived
mesenchymal stem cells (ADMSC), immune cells and adipose tissue macrophages
(ATM). The discovery that adipose tissue is capable of secreting various hormones
and cytokines, named collectively as adipokines, changed our understanding of
adipose tissue (Kershaw and Flier, 2004).
1.5.1 Adipose tissue lipid storage
Adipose tissue stores FA in the form of TAG in the lipid droplet. TAG is formed from
three FA molecules esterified on the backbone of a glycerol molecule. FA stored in
TAG can be released by lipase enzymes (as discussed in section 1.5.5) to oxidative
organs according to energy demand (Braun and Severson, 1992). The FA stored in
adipocyte lipid droplets originate from the diet and from de novo lipogenesis
(synthesis of FA from glucose) in adipocytes or in the liver. In the post-prandial state,
TAG from the diet is absorbed by enterocytes and delivered as chylomicrons in the
Chapter 1 21
lymphatic ducts, which later enter the bloodstream. The synthesised TAG by the
liver is transported in the blood by VLDL. Chylomicrons and VLDL are TAG-rich
lipoproteins that are too large to cross the endothelium of the blood vasculature
surrounding the adipocytes. LPL is an enzyme synthesised by adipocytes that is
exported to the luminal surface of adipocytes to hydrolyse TAG in TAG-rich
lipoproteins into FA (Braun and Severson, 1992). Once the FA is liberated from
TAG-rich lipoproteins, it enters the adipocytes by several protein-mediated uptake
mechanisms, including fatty acid transport protein (FATPpm), the human scavenger
receptor CD36, and the plasma membrane fatty acid binding protein (FABP) (Hajri
and Abumrad, 2002). Intracellularly, another family of FATPs transport the FA from
the cytoplasm to various compartments (Hajri and Abumrad, 2002). FA must be
activated into acyl-CoA to be esterified and stored in adipocyte lipid droplets, a
process catalysed by acyl-CoA synthase (ACS) (Ellis et al., 2010). Once activated,
FA can be stored in the form of TAG in adipocyte lipid droplets through the glycerol-
3-phosphate pathway. This pathway starts with esterification of the first acyl-CoA on
glycerol-3-phosphate molecule to form lysophosphatidic acid (Takeuchi and Reue,
2009). Then, the second acyl-CoA is esterified to form phosphatidic acid. The
phosphatidic acid is then dephosphorylated to form diacylglycerol (DAG), and then
the third acyl-CoA is added to synthesise one molecule of TAG (Takeuchi and Reue,
2009).
1.5.2 Adipocyte differentiation (adipogenesis)
Adipogenesis is the process whereby ADMSC restrict their fate to the adipogenic
lineage and become triglyceride-filled mature adipocytes. There are two phases of
adipogenesis. The determination phase involves commitment of ADMSC to the
adipocyte lineage. This results in the conversion of the stem cell to a pre-adipocyte
that exhibits no morphological changes, but has lost the potential to differentiate into
other cell types. This commitment is then followed by the differentiation phase,
where the pre-adipocyte develops the characteristics of a mature adipocyte, and
acquires the machinery necessary for lipid transport and synthesis, insulin
sensitivity, and the secretion of adipokines.
The nuclear hormone receptor PPARγ is characterised as the master regulator of
adipogenesis. The expression of PPARγ is sufficient to induce adipocyte
differentiation in fibroblasts (Tontonoz et al., 1994). No factor has been discovered
Chapter 1 22
that promotes adipogenesis in the absence of PPARγ. These findings are consistent
with the observation that most pro-adipogenic factors seem to function at least in
part by activating PPARγ expression or activity. Adipogenesis promotes healthy
adipose tissue expansion while limiting hypoxia, chronic inflammation and fibrosis
(Kusminski et al., 2012). Evidence from mouse models suggests that improved
metabolic health in animals can be induced by promoting the healthy expansion of
fat mass by adipogenesis (Combs et al., 2004). These findings imply that obesity-
associated metabolic disturbances are not due to adiposity per se, but probably are
a result of an insufficient capacity of adipose tissue to expand by adipogensis.
1.5.3 Adipocyte hypertrophy vs hyperplasia
There are two modes of adipocyte expansion: adipocyte hyperplasia and adipocyte
hypertrophy. An increased requirement to store fat stimulates the expansion of
adipocyte numbers by increasing pre-adipocyte differentiation into mature
adipocytes (adipogenesis) capable of storing excess TAG efficiently (Hoffstedt et
al., 2010). This adipocyte hyperplastic expansion is associated with greater insulin
sensitivity and normal glucose and lipid profile (Veilleux et al., 2011). Adipocyte
hypertrophy is an alternative form of adipocyte expansion, where adipocytes are
increased in size to contain the larger lipid droplet rather than increasing the number
of adipocytes. Hypertrophic expansion of adipocytes is less metabolically
favourable. Hypertrophic adipocytes have impaired cellular functions, restricting
their ability to store TAG. Hypertrophic adipocytes are insulin-resistant, and any
stored TAG is increasingly broken down and released as FA (Tchoukalova et al.,
2010b). Adipocyte hypertrophy generates areas of tissue hypoxia, thus adipocytes
become hypoxic and show necrotic changes, which leads to macrophage infiltration,
inducing inflammatory cytokine production (Skurk et al., 2007). Dysfunctional
hypertrophic adipocytes result in higher circulating plasma FA turnover and
accumulation in ectopic sites and lipotoxicity, which has a deleterious effect on
metabolic health. Adipocyte hypertrophic expansion has been associated with
dyslipidaemia and insulin resistance (Kim et al., 2015). The exact cellular
mechanisms involved in the metabolic disturbances demonstrated by larger
adipocytes are not well understood.
Chapter 1 23
1.5.4 Depot differences in adipocyte expansion
Considering that the main function of WAT is the storage of excess energy, SAT is
considered to be the main storage site for TAG and a safer depot to store fat than
VAT. In the SAT depot, fat mass increases predominantly through adipocyte
hyperplasia, whereas hypertrophy is predominantly observed in VAT (Joe et al.,
2009). The lower differentiation potential of VAT progenitors relative to SAT could
potentially explain the preferential adipocyte hypertrophy expansion in the VAT
depot. Increased adipocyte hyperplasia in SAT is thought to be a result of the greater
number and activity of precursor cells (Tchoukalova et al., 2010a). Moreover, if there
is a reduction in precursor cell division in SAT, i.e. SAT dysfunction, it compromises
SAT expansion, leading to systemic insulin resistance and metabolic disturbance
(Kim et al., 2014). Arner et al. (2013) provided evidence that in obese human
subjects an increase in VAT mass involves an increase in VAT adipocyte number,
as well as adipocyte size. Similarly, in mice, Jeffery et al. (2015) observed increased
adipocyte number in VAT after 8 weeks of a high-fed diet. Taken together, these
results suggest that there is increased SAT proliferative capacity under physiological
conditions, whereas in obesity, VAT adipogenesis may occur in the context of SAT
dysfunctional ability to expand.
1.5.5 Adipose tissue lipolytic function
During lipolysis, TAG is hydrolysed into diacylglyceride (DAG), monoacylglyceride
(MAG) and glycerol, releasing one FA molecule at each step. Three lipases are
involved in TAG hydrolysis: HSL, adipose tissue triglyceride lipase (ATGL) and
monoacylglycerol lipase (MGL), respectively(Ribet et al., 2010). The hydrolysis
process is followed by the transport of NEFA and glycerol to the bloodstream, and
then on to other tissues. Glycerol is mainly transported to the liver for
gluconeogenesis, while NEFA is transported to skeletal muscle, the heart, the liver,
or re-esterified by adipocytes into TAG (Ribet et al., 2010).
The catecholamines are the primary mediators of adrenergic signalling in adipose
tissue. The catecholamines can both stimulate and inhibit lipolysis depending on
their relative affinity for different adrenergic receptor subtypes. Thus, stimulation of
lipolysis requires the activation of β-adrenergic receptors on the surface of the
adipocyte, while anti-lipolytic signals are transmitted by the α2-adrenergic receptors.
Both α2- and β-adrenergic receptors belong to the G-protein-coupled receptor
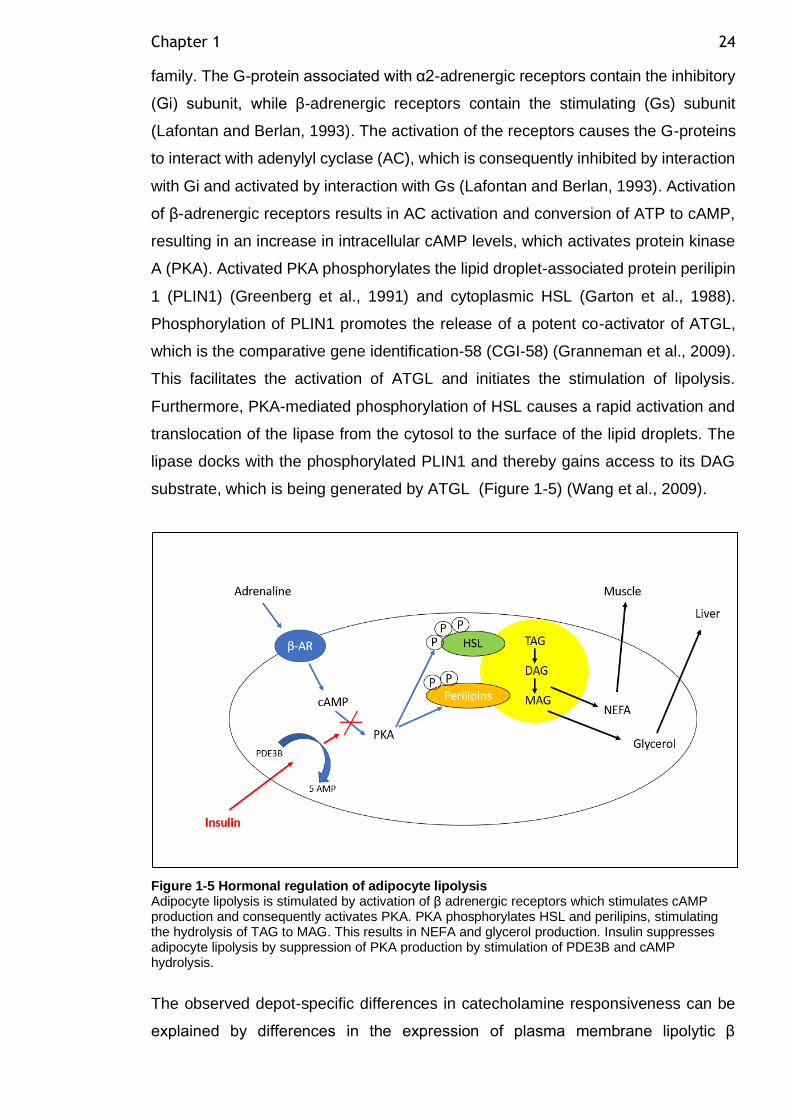
Chapter 1 24
family. The G-protein associated with α2-adrenergic receptors contain the inhibitory
(Gi) subunit, while β-adrenergic receptors contain the stimulating (Gs) subunit
(Lafontan and Berlan, 1993). The activation of the receptors causes the G-proteins
to interact with adenylyl cyclase (AC), which is consequently inhibited by interaction
with Gi and activated by interaction with Gs (Lafontan and Berlan, 1993). Activation
of β-adrenergic receptors results in AC activation and conversion of ATP to cAMP,
resulting in an increase in intracellular cAMP levels, which activates protein kinase
A (PKA). Activated PKA phosphorylates the lipid droplet-associated protein perilipin
1 (PLIN1) (Greenberg et al., 1991) and cytoplasmic HSL (Garton et al., 1988).
Phosphorylation of PLIN1 promotes the release of a potent co-activator of ATGL,
which is the comparative gene identification-58 (CGI-58) (Granneman et al., 2009).
This facilitates the activation of ATGL and initiates the stimulation of lipolysis.
Furthermore, PKA-mediated phosphorylation of HSL causes a rapid activation and
translocation of the lipase from the cytosol to the surface of the lipid droplets. The
lipase docks with the phosphorylated PLIN1 and thereby gains access to its DAG
substrate, which is being generated by ATGL (Figure 1-5) (Wang et al., 2009).
Figure 1-5 Hormonal regulation of adipocyte lipolysis Adipocyte lipolysis is stimulated by activation of β adrenergic receptors which stimulates cAMP production and consequently activates PKA. PKA phosphorylates HSL and perilipins, stimulating the hydrolysis of TAG to MAG. This results in NEFA and glycerol production. Insulin suppresses adipocyte lipolysis by suppression of PKA production by stimulation of PDE3B and cAMP hydrolysis.
The observed depot-specific differences in catecholamine responsiveness can be
explained by differences in the expression of plasma membrane lipolytic β
Chapter 1 25
adrenergic receptors (β1 and β2) and α2-adrenergic anti-lipolytic receptors in
adipocytes from different adipose tissue depots (Mauriege et al., 1987). It is
understood that omental adipocytes have higher lipolytic activity compared to SAT
adipocytes, due to reduced insulin action and lower availability of the anti-lipolytic
alpha 2-adrenoreceotor in VAT adipocytes (Goldrick and McLoughlin, 1970). The
converse is true for SAT, which shows less response to catecholamine-induced
lipolysis, due to higher availability of the anti-lipolytic alpha 2-adrenoreceptors
compared to VAT (Wahrenberg et al., 1989). Insulin has a major role in the inhibition
of lipolysis in adipocytes (as explained above). In the SAT depot, there is increased
adipocyte sensitivity to the insulin suppression of lipolysis (Jensen, 2008). VAT
adipocyte lipolysis was shown to be more resistant to insulin suppression than SAT
adipocytes in humans (Mauriege et al., 1987).
It is well established that increased adipocyte size contributes to higher basal
lipolysis rate (Goldrick and McLoughlin, 1970). In a study that used cell fractionation
by a flotation technique to separate large and small adipocytes from the same
healthy individual, lipolytic activity of larger adipocytes was shown to be higher in
unstimulated (basal), hormone-stimulated (adrenergic) and hormone-inhibited
(insulin) conditions. Furthermore, there was higher protein expression of HSL, ATGL
and perilipin in larger adipocytes compared to small adipocytes, independent of the
donor characteristics (Laurencikiene et al., 2011). Therefore, enhanced lipolytic
activity might provide the link between adipocyte hypertrophy and the associated
metabolic disturbances, such as systemic insulin resistance.
1.5.6 Adipose tissue secretory function
Adipocytes, SVF and immune cells resident in adipose tissue are capable of
producing several adipokines, contributing to the regulation of energy expenditure,
insulin sensitivity, appetite control, adipogenesis, adipocyte function, and immune
cell migration to adipose tissue (Schling and Löffler, 2018). These adipokines act
via autocrine and paracrine signalling pathways. Changes in adipose tissue function
and adipocyte size could promote changes in the secretory function, and
subsequent secondary changes in the target organs of these adipokines (White and
Ravussin, 2019). Adipose tissue expresses a variety of adipokines: pro-
inflammatory adipokines (such as TNF-α, CRP, IL-1, IL-6 and IL-8) and adipose
Chapter 1 26
tissue-specific adipokines (such as leptin, adiponectin, resistin and visfatin)
(Fantuzzi, 2005).
Leptin is secreted from adipocytes during the fed state and acts on the
hypothalamus to regulate energy balance and appetite control (Matarese et al.,
2005). The plasma leptin levels correlate positively with the body fat mass and more
leptin is released from hypertrophic adipocytes compared to smaller adipocytes
(Lönnqvist et al., 1997). Adiponectin is the only adipokine considered to have
insulin-sensitising ability. Adiponectin functions to promote peripheral insulin
sensitivity, therefore, its reduction is associated with insulin resistance and
hyperinsulinemia (Kubota et al., 2002). Adiponectin plasma level is reduced with
increasing adiposity (Guenther et al., 2014). Furthermore, adiponectin is reported to
elicit systemic anti-inflammatory effects (Ouchi and Walsh, 2007).The release of
these adipokines (except adiponectin) by adipocytes, or the macrophages that
infiltrate adipose tissue, leads to a chronic inflammatory state (Pessin and Kwon,
2013). With the development of adipose tissue inflammation, the pattern of
adipokine secretion is significantly altered towards a pro-inflammatory and
atherogenic profile.
The VAT depot has a higher secretory capacity than the SAT depot (Hocking et al.,
2010). This difference is an intrinsic feature, due to VAT different cellular
components compared to SAT. Differences in the secretory function of adipocyte
depot is addressed in more detail in Chapter 5. Several components of human
adipose tissue secretory function remain unknown, or their actions remain poorly
understood due to the complexity of paracrine interactions between several cellular
types in adipose tissue. The human adipose tissue secretory function is an area of
research that has expanded rapidly.
1.5.7 The adipose tissue expandability hypothesis (the overspill hypothesis)
Adipose tissue dysfunction in terms of adipocyte size, number and lipolytic function
may underlie obesity-associated metabolic abnormalities (Gustafson et al., 2009).
In individuals with impaired SAT expandability, the so-called overspill hypothesis
suggests that impaired SAT expandability initiates fat accumulation in VAT, primarily
as an alternative site for fat storage to minimise the deleterious effect of systemic
FA. This then contributes to later development of hepatic and peripheral insulin
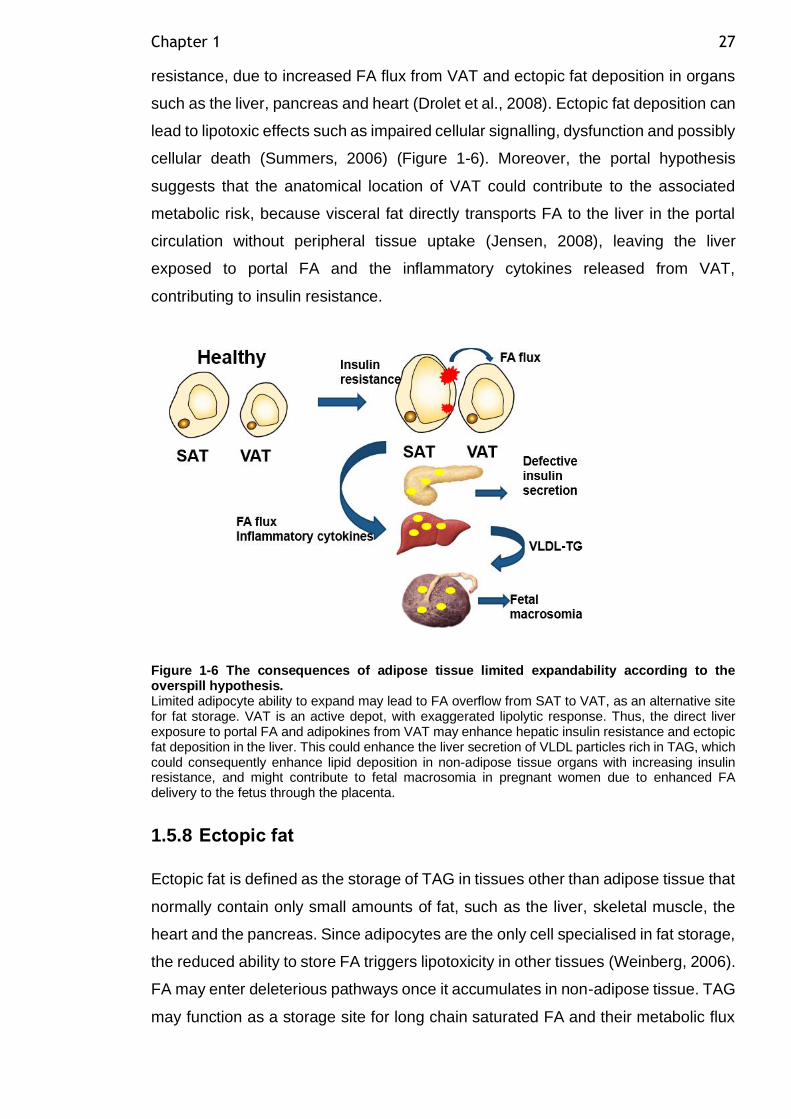
Chapter 1 27
resistance, due to increased FA flux from VAT and ectopic fat deposition in organs
such as the liver, pancreas and heart (Drolet et al., 2008). Ectopic fat deposition can
lead to lipotoxic effects such as impaired cellular signalling, dysfunction and possibly
cellular death (Summers, 2006) (Figure 1-6). Moreover, the portal hypothesis
suggests that the anatomical location of VAT could contribute to the associated
metabolic risk, because visceral fat directly transports FA to the liver in the portal
circulation without peripheral tissue uptake (Jensen, 2008), leaving the liver
exposed to portal FA and the inflammatory cytokines released from VAT,
contributing to insulin resistance.
Figure 1-6 The consequences of adipose tissue limited expandability according to the overspill hypothesis. Limited adipocyte ability to expand may lead to FA overflow from SAT to VAT, as an alternative site for fat storage. VAT is an active depot, with exaggerated lipolytic response. Thus, the direct liver exposure to portal FA and adipokines from VAT may enhance hepatic insulin resistance and ectopic fat deposition in the liver. This could enhance the liver secretion of VLDL particles rich in TAG, which could consequently enhance lipid deposition in non-adipose tissue organs with increasing insulin resistance, and might contribute to fetal macrosomia in pregnant women due to enhanced FA delivery to the fetus through the placenta.
1.5.8 Ectopic fat
Ectopic fat is defined as the storage of TAG in tissues other than adipose tissue that
normally contain only small amounts of fat, such as the liver, skeletal muscle, the
heart and the pancreas. Since adipocytes are the only cell specialised in fat storage,
the reduced ability to store FA triggers lipotoxicity in other tissues (Weinberg, 2006).
FA may enter deleterious pathways once it accumulates in non-adipose tissue. TAG
may function as a storage site for long chain saturated FA and their metabolic flux
Chapter 1 28
may favour the synthesis of complex lipids such as ceramides, DAG and CEs
(Summers, 2006). The accumulation of complex lipids results in endoplasmic
reticulum stress and insulin resistance, which affect organ function (Summers,
2006).
Lipid ‘spillover’ to non-adipose tissues may occur in response to over-accumulation
of FA in adipocytes, exceeding the adipocyte hypertrophy and hyperplasia
necessary to accommodate the increased influx of FA (Kusminski et al., 2009).
While some non-adipose tissues have the compensatory capability to enhance FA
oxidation in response to modest FA surplus, such as the liver (Mason, 1998) and
skeletal muscle, other tissues such as pancreatic β-cells (Shimabukuro et al., 1998)
and the myocardium (Szczepaniak et al., 2007) have limited FA oxidation
capabilities. Ectopic fat accumulation in oxidative organs such as the liver and
skeletal muscles results in enhanced systemic insulin resistance. Stefan et al.
(2008) assessed total body fat, SAT and VAT with magnetic resonance tomography,
and ectopic fat deposition in the liver and skeletal muscles with proton magnetic
resonance spectroscopy in insulin-sensitive and insulin-resistant obese individuals.
Although VAT mass did not differ across obese individuals, obese insulin-sensitive
individuals had 54% less fat accumulation in the liver than the equally obese insulin-
resistant group. These findings indicated the predominant role of fatty liver in the
regulation of glucose and lipid metabolism, and the development of insulin
resistance as a consequence for ectopic fat deposition in the liver. Furthermore, the
lack of liver fat can be used as a key determinant of metabolically benign obesity
and maintained insulin sensitivity in obese individuals.
Ectopic fat deposition in other non-adipose organs can be illustrated by the intrinsic
differences between lipid droplet (LD) composition in adipocytes or other ectopic
tissues. The lipid droplet-associated proteins (LDAP) are present only in adipocytes,
not in ectopic sites of lipid accumulation (Brasaemle, 2007). These proteins, such
as perilipin1, FSP27 (CIDEC) and caveolin-1, are abundantly present in adipocyte
LD and function, primarily as regulators of lipid metabolism, by protecting the LD
from degradation by cytosolic lipases (Brasaemle et al., 2000). Indeed, the absence
of perilipin expression in animal models greatly increases basal FA release,
suggesting its role in the control of lipase access to LD, in a manner that is
responsive to the metabolic status of adipocytes (Tansey et al., 2001). Perilipin null
mice are lean, and resistant to diet-induced obesity, due to accelerated adipose
Chapter 1 29
tissue lipolysis (Tansey et al., 2001). Interestingly, perilipin null mice had glucose
intolerance and peripheral insulin resistance, highlighting that lipid mobilisation from
adipose tissue is critical in the control of glucose homeostasis (Tansey et al., 2004).
1.5.9 Non-pregnant adipose tissue in obesity
Adult human obesity is associated with an increase in hypertrophic adipocytes,
which trigger metabolic disorders such as insulin resistance, metabolic syndrome
and T2DM. There is a remarkable increase of fat mass in both SAT and VAT depots
in obese women. Adipocyte hypertrophy due to excess TAG accumulation results
in an imbalance between adipogenesis and lipolysis in adipocytes. The adipogenic
capacity in human obesity remains a debatable subject (as discussed in section
1.5.4); however, adipose tissue lipolysis is an important process in determining
circulating FA levels. The adipose tissue of obese individuals with enlarged
adipocytes is less responsive to insulin, which reduces anti-lipolytic action in these
cells (Salans et al., 1968). The reason for this diminished responsiveness to insulin
is presently unknown. A reduction of insulin receptors (number, affinity and coupling)
due to cell enlargement is one of the suggested reasons (Salans et al., 1968).
Another explanation could be that the reduction in insulin responsiveness is a
protective mechanism to control further cell enlargement, cell rupture and death.
Adipocyte lipolytic activity also depends on the level of expression of adipocyte
lipases. There is reduced ATGL activity and expression level in SAT for obese
individuals. Moreover, the mRNA and protein levels of ATGL and HSL in SAT for
insulin-resistant individuals are reduced compared to insulin-sensitive healthy
individuals (Jocken et al., 2007). Variation in perilipin1 levels relative to adipocyte
size may contribute to differences between basal lipolysis rate between fat depots
(Sohn et al., 2018). Downregulated perilipin1 gene expression was observed in both
the SAT and VAT samples of obese women compared to normal-weight women
(Wang et al., 2003).
A plethora of deleterious reactive lipids accumulate in non-adipose tissues in holding
ectopic fat in obesity, and these contribute to the pathophysiology of insulin
resistance, liver steatosis, impaired myocardial function and β-cell failure (van der
Zijl et al., 2011, Shulman, 2014). Ectopic fat is extremely toxic to tissues, because
it will favour the synthesis of complex metabolites such as ceramides, diacylglycerol
(DAG) and cholesteryl esters (Shulman, 2014). These metabolites antagonise
Chapter 1 30
insulin-signalling pathways and lead to insulin resistance and disturbed glucose
metabolism within the tissue (Shulman, 2014). Furthermore, this may contribute to
chronic inflammation, oxidative stress, disturbed mitochondrial function and
programmed cell death.
1.5.10 Other processes involved in adipose tissue dysfunction in obesity-related metabolic disorders
1.5.10.1 Adipose tissue inflammation
Dysregulated adipokine secretion is another feature of adipose tissue dysfunction
which results in disturbed WAT homeostasis and dysregulated whole-body
metabolism, such as in obesity (Divella et al., 2016). Adipocytes and SVF cells are
capable of secreting pro-inflammatory factors. In obesity, there is altered adipose
tissue cellularity (AT remodelling), secondary to adipocyte hypertrophy, cellular
dysfunction and inflammation (Trayhurn, 2013). Farley et al. (2009) showed that
maternal obesity is associated with macrophage infiltration in adipose tissue in
response to hypertrophic necrotic adipocytes in a ‘crown-like structure’. The
accumulation of CD 68(+) macrophages was documented in subcutaneous
abdominal tissue in obese insulin-resistant women (Basu et al., 2011).
The pro-inflammatory classical macrophages are named M1, while M2 have the
anti-inflammatory phenotype (Zeyda and Stulnig, 2007). In obesity there is a shift
towards the pro-inflammatory phenotype M1, which is considered to be the major
contributor to the development of adipose tissue inflammation (Weisberg et al.,
2003). In contrast, M2 improves insulin sensitivity and suppresses the M1
macrophage function. Adipose tissue responds to inflammatory signals such as FA
and lipopolysaccharide (LPS) with induction of the inflammatory response through
the activation of TLR-4 and the associated intracellular signalling pathway NF-ĸB.
Similarly, macrophages respond to adipose tissue hypoxia with the production of
cytokines and inflammatory mediators which can lead to upregulation of TLR-4, thus
participating in a paracrine loop between the two cell types. The activation of these
receptors in adipocytes alters mediators in the insulin-signalling cascade and
glucose uptake, which leads to insulin resistance (Song et al., 2006). In situations
of induced adipose tissue hypoxia (to mimic obesity), there is decreased production
of the glucose transporter (GLUT4), which reduces the insulin-stimulated glucose
uptake (Trayhurn, 2013).
Chapter 1 31
Adipokines may provide the link between the changes in adipose tissue function
and the development of systemic insulin resistance, dyslipidaemia and T2DM
(Blüher, 2013). The production of adipokines in obese women could induce systemic
insulin resistance with the decreased production of adiponectin, or increased
production of cytokines such as IL-6 (Engeli et al., 2003). Increased inflammatory
adipokine production in obesity can activate various signalling pathways that
interfere with insulin signalling in adipocytes. Adipocyte insulin resistance
contributes to adipose tissue dysfunction and systemic insulin resistance, observed
during obesity and T2DM.
1.5.10.2 ROS and endoplasmic reticulum (ER) stress
Adipose tissue inflammation is not the only pathophysiological mechanism involved
in obesity-related adipose tissue dysfunction. With increasing insulin resistance in
obese pregnancy, there are increased stressors for adipose tissue, such as ROS,
endoplasmic reticulum stress and adipose tissue hypoxia, which induce local
inflammation in adipose tissue (Trayhurn, 2013). During obesity, the cellular
antioxidant mechanisms in adipocytes were reported to have reduced ability to
restore protein oxidative damage. Oxidised proteins are toxic to the cells.
Proteasomal dysfunction results in protein oxidation and the unfolded protein
response (UPR), which are major mechanisms in the development of insulin
resistance (Diaz-Ruiz et al., 2015). Proteasomal dysfunction leads to obesity-
induced ER stress and insulin resistance in adipocytes through the activation of the
c-Jun N-terminal Kinase (JNK) pathway (Otoda et al., 2013). ER stress is a condition
characterised by the accumulation of misfolded proteins in the ER lumen, resulting
from inflammation. ER stress is a well-known feature of insulin resistance and
obesity (Yang et al., 2015).
1.5.10.3 Hypoxia and angiogenesis
Hypoxia is a well-known condition that increases the production of angiogenic
factors. Adipocyte hypertrophic expansion resulting in cells of more than 100m
exceeds the maximum cellular oxygen diffusion distance and creates an area of
hypoxia. This could lead to adipocyte necrosis, and probably adipose tissue
infiltration by immune cells such as macrophages and disturbed adipokine secretion
(Goossens, 2008). Indeed, diet-induced weight loss following diet-induced obesity
Chapter 1 32
is associated with reduced inflammation and improved oxygenation of adipose
tissue in mice (Ye et al., 2007).
Healthy adipose tissue expansion requires angiogenesis (Bouloumié et al., 2002).
Adipose tissue plasticity requires constant growth and remodelling of adipose tissue
blood vessels. The adipose tissue vasculature is important for adipose tissue
metabolic and secretory function, as it facilitates interactions between the blood
compartment and adipocytes. Adipose tissue angiogenesis is a complex process
requiring balanced production of the extracellular matrix, endothelial cell
proliferation and migration. Several angiogenic factors are produced by adipocytes
and the SVF, such as vascular endothelial growth factor (VEGF) and fibroblast
growth factor (FGF). VEGF gene expression is upregulated in adipocytes cultured
in 1% oxygen (hypoxic condition) (Wang et al., 2007). Overweight and obese
subjects have 44% lower capillary density and 58% lower VEGF compared to lean
subjects. This might be due to lower PPARγ and higher collagen VI mRNA
expression, which correlates with the lower adipose tissue oxygen partial pressure
(Pasarica et al., 2009). Rupnick et al. (2002) showed that in conditions of impaired
angiogenesis, there was inhibited adipose tissue accumulation. Gealekman et al.
(2011) found a higher capillary density per adipocyte and higher angiogenic growth
capacity in SAT compared to VAT. This supports the biological and metabolic
variability between the two different WAT depots.
1.6 Adipose tissue in pregnancy
1.6.1 Adipose tissue adaptation to healthy pregnancy
Changes in adipose tissue metabolic and endocrine function are central to maintain
whole-body energy homeostasis during pregnancy. In response to the metabolic
changes during pregnancy (previously described in section 1.3.1), adipose tissue
undergoes dynamic remodelling. This includes changes in AT mass, AT expansion
and adipokine secretion.
During pregnancy, maternal body fat distribution moves from the lower body towards
upper and central compartments, which are relatively resistant to insulin
suppression of lipolysis (Stevens-Simon et al., 2001). Kinoshita and Itoh (2006)
observed an increase in fat accumulation in VAT measured by ultrasound (US) in
Chapter 1 33
lean healthy pregnant women towards the end of pregnancy. This observation is
consistent with the observed hyperlipidaemic status during late pregnancy.
In a cohort of healthy non-obese women, recruited pre-gravid and followed in early
(8–12 weeks of gestation) and late (36–38 weeks of gestation) pregnancy, gluteal
fat samples were obtained, and Resi et al. (2012) observed that gluteal adipose
tissue mass, adipocyte size and cell number significantly increased in late
pregnancy compared with the pre-gravid measurements, but remained unchanged
in early pregnancy. These results are consistent with a previous observation by
Rebuffe-Scrive et al. (1985), who found higher LPL activity in the femoral region
than in the abdominal region in pregnant women. This pattern favours triglyceride
accumulation in the femoral adipocytes in pregnant women at early pregnancy. In
contrast, lipolysis was considerably higher in the abdominal than in the femoral SAT
adipocytes. Thus, it is possible that femoral adipose tissue may serve a specialised
function in women, as an important source of energy supply during lactation. This is
supported by the observation that women usually have a larger gluteal fat depot
than men (Sjöström et al., 1972). Vesco et al. (2018b) assessed healthy pregnant
women for ectopic fat deposition (intra-hepatic, intra-myocellular and extra-
myocellular) in early and late pregnancy with magnetic resonance spectroscopy,
and found no evidence of ectopic fat deposition. Moreover, whole-body insulin
sensitivity was measured by insulin clamp, and was not related to ectopic fat or fat
mass measured by BODPOD. Thus, Vesco et al. (2018b) suggested that non-body
composition factors appear to be the primary determinant of gestation-related insulin
resistance. In a second study, Vesco et al. (2018a) showed that gestational weight
gain in healthy pregnant women is not related to ectopic fat deposition during
pregnancy.
1.6.2 Adipose tissue in obese pregnancy
Maternal obesity has been the driver for the interest in adipose tissue biology in
pregnancy. Pre-gestational obesity has been shown to have a significant influence
on adipose tissue distribution during pregnancy (Ehrenberg et al., 2003). There was
an increase in VAT accumulation measured by ultrasound in overweight/obese
pregnant women compared to lean pregnant controls (Straughen et al., 2013). This
finding suggests the possibility that the observed differences in VAT deposition
across pregnancy are related to the different metabolic adaptations to pregnancy
Chapter 1 34
seen in overweight and obese women compared with lean women (as discussed in
section 1.3.2).
Adipocyte size and number in abdominal SAT was examined in a cohort of obese
pregnant women, compared to normal pregnant women, during the first and third
trimesters of pregnancy. The mean adipocyte size and the proportion of large
adipocytes was higher in normal-weight women than obese women, and was
accompanied by reduced adiponectin release (Svensson et al., 2016). In contrast,
obese women had a higher proportion of small cells and lower proportion of large
cells in the third trimester, suggestive of adipocyte recruitment, and maintained
adiponectin levels. This study suggested that changes in adipose tissue cellularity
during pregnancy in obese women help to protect against even more severe insulin
resistance. Adipocyte lipolysis was increased in the third trimester compared to first-
trimester levels in both the lean and obese groups (Svensson et al., 2016). The
increase in lipolysis levels from first trimester to third trimester was slightly higher in
the obese group, but did not reach statistical significance. Although VAT fat mass
was reported to be increased in obese pregnant women during pregnancy, VAT
lipolysis has not been examined to the best of our knowledge. Increased VAT FA
flux could potentially provide the link to the metabolic disturbances observed in
obese women during pregnancy, as suggested by the overspill hypothesis
discussed in 1.5.7.
1.6.3 Adipose tissue and GDM pregnancy
In a cohort of women with GDM (lean and obese) and healthy pregnant (lean and
obese) controls, body composition was measured longitudinally at preconception,
first trimester and third trimester by hydrodensitometry and serial skin fold
measurement. Healthy lean women were noted to have significantly more peripheral
fat, whereas healthy obese women accumulated adipose tissue more centrally
(Ehrenberg et al., 2003). This pattern of adipose tissue accumulation over the
course of pregnancy may contribute to the insulin-resistant state of obesity. In
contrast, there were no significant differences in the pre-gravid body composition
measures between GDM and control subjects in either the lean group or obese
group. This suggests that pre-gravid obesity is more influential in body fat
distribution than glucose tolerance status. Women with a previous history of GDM,
followed for five years after the index pregnancy, had a higher VAT content
Chapter 1 35
compared to non-GDM women (Lekva et al., 2015). There was a strong association
of higher VAT content, with low β-cell function, indicating that the VAT compartment
may contribute to the metabolic disturbances in women with a history of GDM in the
long-term (Lekva et al., 2015).
Rojas-Rodriguez et al. (2015) studied adipocyte size and capillary density in a small
cohort of women with GDM (n=11), compared to healthy pregnant controls (n=3). In
GDM, VAT adipocyte hypertrophy and reduced capillary density compared to
controls was observed. This study suggested that VAT adipocyte hypertrophy is
probably due to diminished hyperplastic potential in this depot. ADMSC were
strongly associated with the AT capillary network, and a reduction in capillary
density may underlie the diminished hyperplastic growth with subsequent VAT
adipocyte hypertrophy (Rojas-Rodriguez et al., 2015). Functional studies of adipose
tissue during GDM pregnancy are very limited, and to the best of our knowledge,
adipocyte lipolysis in women with GDM has not been studied previously.
1.6.3.1 Ectopic fat in GDM
There is emerging evidence to suggest that ectopic fat deposition in the liver,
skeletal muscle and pancreas could be one of the factors that causes IR in women
with GDM. Non-alcoholic fatty liver disease (NAFLD) is characterised by the
presence of fat within the liver in a person who does not drink significant amounts
of alcohol (Angulo, 2002). A recent study examined the relationship between first-
trimester NAFLD (measured by ultrasound) and subsequent development of GDM,
and revealed that NAFLD is an independent risk factor for GDM development (Lee
et al., 2019). However, the molecular mechanisms linking hepatic fat accumulation
and GDM development remained elusive. It could be that maternal hyperinsulinemia
in women with GDM derives hepatic de novo lipogenesis and inhibits VLDL-TAG
secretion from the liver, leading to hepatic steatosis. Additionally, obese mothers
with GDM may experience greater portal NEFA flux from VAT stores, which has
been found to preferentially increase fat accumulation in women with GDM (as
discussed in 1.6.3). These mechanisms are speculative and require further
investigation. Liver fat accumulation during pregnancy is probably the link between
GDM and future risk of T2DM. Bozkurt et al. (2012) found that fatty liver is
associated with subclinical inflammation in women with a previous history of GDM
(3–6 months), and demonstrated that the fatty liver index (FLI) is predictive of
Chapter 1 36
T2DM. Recently, Mehmood et al. (2018) demonstrated that there is a higher
prevalence of liver fat in women with a previous history of GDM, and it is associated
with an increased risk of pre-diabetes/diabetes among them.
Vesco et al. (2019) assessed liver and muscle fat content in GDM using magnetic
resonance spectroscopy (MRI). There was no increase in intra-hepatic, intra-
myocellular or extra-myocellar lipid content in women with GDM compared to
healthy pregnant controls. However, this cohort of women had not demonstrated an
increase in VAT accumulation during pregnancy. In contrast, women with a previous
history of GDM were found to have higher intra-myocellular fat content compared to
women with normal glucose tolerance (Kautzky-Willer et al., 2003). Kautzky-Willer
et al. (2003) suggested that intra-myocellular fat content could serve as an additional
parameter of increased diabetes risk, because it identified women with a previous
history of GDM, and those women who were diagnosed earlier in pregnancy with
GDM. It was suggested that a reduction in the compensatory insulin release from
pancreatic β cells in obese women during pregnancy could be related to ectopic fat
deposition in β cells (Giacca et al., 2011). However, there are no primary studies to
confirm this yet. A decrease in β cell function was found to be associated with VAT
mass in women with a history of GDM five years after the index pregnancy (Lekva
et al., 2015). This may suggest that FA flux from VAT stores is the underlying
mechanism for ectopic fat in the pancreas in women with GDM.
1.7 Adipose tissue inflammation in healthy, obese and GDM pregnancy
Compared to non-pregnant women, healthy pregnancy is characterised by mild
elevations in both serum pro-and anti-inflammatory cytokine levels (Curry et al.,
2008). Christian and Porter (2014) examined the longitudinal changes in several
plasma inflammatory markers during and after pregnancy; pregnancy was
associated with higher levels of plasma IL-6 and TNF-α, but decreased CRP level,
whereas obese women had higher CRP levels, and obesity predicted their plasma
IL-6 levels. Serial gluteal fat samples were obtained from healthy non-obese
women, sampled pre-gravid and in early (8–12 weeks of gestation) and late (36–38
weeks of gestation) pregnancy. Adipose tissue transcriptomic analysis revealed
early pregnancy molecular changes in the TLR4/NF-ĸB signalling pathway with
respect to inflammatory adipokine genes (Resi et al., 2012). Furthermore, increased
Chapter 1 37
expression of macrophage markers such as CD68 and CD14 emphasised the
recruitment of the immune network in both early and late pregnancy. This biphasic
pattern suggests that there could be an early enhancement of immune pathways as
an initial step in pregnancy, proceeding the development of insulin resistance, which
peaked in late pregnancy. This hypothesis would suggest that the activation of
inflammatory pathways could be necessary to induce gestational insulin resistance
towards the third trimester. Adipose tissue cytokines were suggested to contribute
to the low-grade inflammation status at the third trimester of pregnancy.
Maternal obesity is considered to be the primary driver of inflammation during
pregnancy due to increased fat mass. An increase in TNF-α mRNA levels in the
maternal SVF cells of obese women has been observed (Basu et al., 2011).
Recently, the VAT depot in overweight and obese pregnant women was shown to
be strongly associated with adipocyte hypertrophy and increased macrophage
infiltration compared to SAT (Bravo-Flores et al., 2018). Macrophages recruited to
adipose tissue might be a noticeable source of inflammatory cytokines in obese
pregnancy (Challier et al., 2008). The activation of inflammatory pathways in
adipocytes impairs triglyceride storage and increases the release of FFAs, an
excess of which is known to induce insulin resistance in skeletal muscle and the
liver in the non-pregnant population (Guilherme et al., 2008). Thus, adipose tissue
inflammation appears to be a clinically important change that may occur in the
adipose tissue of obese pregnant women who are metabolically challenged by
pregnancy. Previous observations provide evidence for defective insulin signalling
in the adipose tissue of obese pregnant NGT mothers, and adipose tissue
inflammation is one of the suggested underlying mechanisms (Colomiere et al.,
2009). TNF-α induction of IRS-1 serine phosphorylation links inflammation to
disturbed insulin action. One leading hypothesis for the role of cytokines such as
TNF-α, adiponectin and resistin is that they link inflammation to metabolic changes
by modifying insulin sensitivity (Matarese and La Cava, 2004). The sequence of
events that leads to adipose inflammation, and how those events are regulated, is
still poorly understood.
Enhanced insulin resistance and inflammation are the main hallmarks of GDM. The
macrophages infiltrating adipose tissue are laid out in a crown-like structure
surrounding adipocytes in GDM (Cinti et al., 2005). It was previously identified that
GDM is associated with increased macrophage infiltration in omental fat, rather than
Chapter 1 38
SAT, compared to normal pregnancy (Harlev et al., 2014). In the same study,
omental fat macrophages correlated positively with HOMA-IR, suggesting that low-
grade inflammation could contribute to the development of insulin resistance in
GDM. Several pro-inflammatory adipokines were found to be increased in adipose
tissue samples of women with GDM compared to controls. An increase in IL-6
mRNA in the SAT of women with GDM has been reported previously (Kleiblova et
al., 2010). Nucleotide-binding oligomerisation domain (NOD) is an intracellular
molecule that recognises danger signals by initiating inflammation and the activation
of NF-KB signalling. Lappas (2014b) observed increased NOD1 expression in the
omental and subcutaneous fat of women with GDM compared to NGT women,
suggesting its importance in the development of inflammation and IR in GDM. The
pro-inflammatory cytokine IL-1β is cytokine that impairs insulin signalling in
adipocytes. The inflammasome is a large protein complex that processes IL-1β to
its active secreted form. Caspase-1 is a key factor in the inflammasome, activated
under conditions of cellular stress, which leads to the maturation of IL-1β. A previous
study confirmed that there is increased expression of caspase-1 and IL-1β in the
adipose tissue of GDM women (Lappas, 2014a). This study highlighted the
importance of caspase-1/IL-1β signalling in the development of insulin resistance in
GDM by decreasing AMP-activated protein kinase (AMPK) activity in the adipose
tissue of pregnant women.
1.8 Project hypothesis
The hypothesis tested in this thesis is that in women with GDM, SAT adipocytes
have defective adipocyte expansion, resulting in adipocyte hypertrophy.
Subsequently, there is increased lipolysis and inflammatory adipokine secretion.
1.8.1 Study aims and objectives
This thesis aimed to explore the epidemiological evidence for the role of maternal
obesity in the development of GDM and other maternal and fetal complications,
specifically in the highly diverse local Greater Glasgow and Clyde population.
Additionally, this thesis aimed to compare SAT and VAT adipocyte size, adipocyte
lipolytic function and adipokine secretion between GDM and healthy (BMI-matched)
pregnant women. A final aim was to assess the role in early pregnancy of VLDL as
a potential maternal plasma carrier of the extremely important long chain
Chapter 1 39
polyunsaturated fatty acid docosahexaenoic acid (DHA), required by the fetus for
neuronal development.
Objective 1 (Chapter 3)
To explore the epidemiological evidence that women with maternal obesity are at
greater risk of GDM and maternal and fetal adverse outcomes in the Greater
Glasgow and Clyde population, and to understand the clinical characteristics of the
background population of the overall study.
Objective 2 (Chapter 4)
To compare adipocyte function in isolated SAT and VAT adipocytes of healthy and
BMI-matched GDM women in the third trimester. The aspects of adipocyte function
assessed were adipocyte size, adipocyte lipolytic function (basal and β adrenergic-
stimulated lipolysis, and insulin suppression of lipolysis) and fat cell insulin
sensitivity index (FCISI). To explore the relationship between maternal BMI, markers
of maternal systemic insulin sensitivity and maternal plasma pregnancy hormone
concentrations with SAT and VAT adipocyte size and lipolytic function.
Objective 3 (Chapter 5)
To compare adipocyte inflammation in basal or activated (LPS stimulated)
conditions in isolated SAT and VAT adipocytes from healthy and BMI-matched GDM
women in the third trimester. To assess plasma cytokine concentrations in both
groups.
Objective 4 (Chapter 6)
To explore plasma lipoprotein VLDL fatty acid composition in healthy pregnant
women prior to pregnancy and throughout early gestation.
40
Chapter 2 Materials and methods
2.1 Study participants
Ethical approval for adipose function in GDM study was obtained from the West of
Scotland Research Ethics Committee and Research and Development, NHS
Greater Glasgow and Clyde reference number 11/AL/0017 . All participants were
fully informed of the study objectives and participation requirements by means of
verbal communication and a written information sheet. Written consent was
obtained from all participants.
2.1.1 Recruitment
Adipose tissue and blood samples were obtained from non-labouring healthy
pregnant women at term (n=24) and non-labouring women with GDM (n=23)
undergoing Caesarean section at the Queen Elizabeth University Hospital in
Glasgow. The International Association of Diabetes and Pregnancy Study Groups
(IADPSG) criteria were utilized locally at Queen Elizabeth University Hospital
(QEUH) to establish the diagnosis of GDM (Metzger et al., 2010). According to
IADPSG criteria, a diagnosis of GDM can be made if one result of blood glucose
levels reaches one or more of the following values (fasting blood glucose ≥ 5.1, 1
hour≥ 10.0, 2 hours≥8.5 mmol/L) using a 75g glucose load test at 24-28 weeks of
gestation. Treatment (diet, insulin, metformin or both insulin and metformin) was
recorded for women with GDM. Women undergoing elective Caesarean section
between 37+0 weeks to 39+6 weeks were eligible for this study. Women of all ages
and ethnic groups were eligible while multiple pregnancies were excluded. Women
were categorized according to the World Health Organization categorization of
obesity to: normal weight (BMI=20-24.9 kg/m2), overweight (BMI=25-29.9 kg/m2)
and obese (BMI ≥30kg/m2) (Nuttall, 2015) using booking BMI. Participants were
excluded if they had any history of medical conditions such as cardiovascular or
metabolic disease and other adverse pregnancy outcomes such as preeclampsia or
intrauterine growth restriction. The study participants were not on regular medication
such as antiemetic drugs, aspirin, low molecular weight heparin, thyroxine or blood
pressure medications.
The subject’s demographic characteristics and delivery information were recorded
from the patient’s medical record. SAT samples were obtained by the obstetric
Chapter 2 41
surgeon from the fat layer beneath the skin while VAT samples were obtained from
greater omentum. The fresh adipose tissue was placed in warm buffer and quickly
transported to the laboratory for adipocyte preparation.
2.1.2 Tissue collection
Maternal blood was collected prior to the Caesarean section by the anaesthetist in
charge in a 20 ml syringe and handed in to the researcher. The blood then added
to a selection of blood tubes with various additives including K2 EDTA, clot activator,
sodium citrate, lithium heparin and potassium oxalate/sodium fluoride. The blood
tubes were transferred immediately to the pathology lab at QEUH for immediate
centrifugation within approximately 20 minutes of blood collection. The blood tubes
were centrifuged at 3000rpm for 15 minutes then the resultant plasma or serum
were aliquoted into colour coded (to the appropriate additive) microtubes and stored
at -80°C. The plasma obtained from the sodium citrate tube was transferred into
Eppendorf tubes and were further centrifuged using microcentrifuge at 13000 rpm
for 4 minutes to remove platelets. Then the supernatant was transferred in to
microtubes with color-coded lids. The surgeon was briefed to collect subcutaneous
adipose tissue (SAT) sample from the fat layer beneath the skin on entry of the
abdominal cavity about the size of 50 pence coin (approximately 4-6 gm) and this
was placed in a previously labelled collection tube containing warm collection buffer.
After delivery of the baby and placenta, a sample of visceral adipose tissue (VAT)
about the size of 50 pence coin was collected from greater omentum and placed
immediately in a previously labelled collection tube with warm collection buffer. The
adipose tissue was transported immediately to the laboratory by the researcher and
processing was commenced immediately on arrival.
2.1.3 Power calculation
Power calculation for this study was carried out before commencing tissue
collection. The primary outcome was adipocyte diameter (physical measure) while
secondary outcomes were insulin suppression of lipolysis (functional measure),
adipokine production by adipocytes (consequences of the previous changes).
Adipocyte diameter has been studied recently in GDM (Rojas-Rodriguez et al.,
2015), but all other outcomes have not been assessed in the population of women
with GDM. A formal power calculation for the adipocyte diameter requires up to n=
7 per group for 80% power. We have no information about the effect size of the
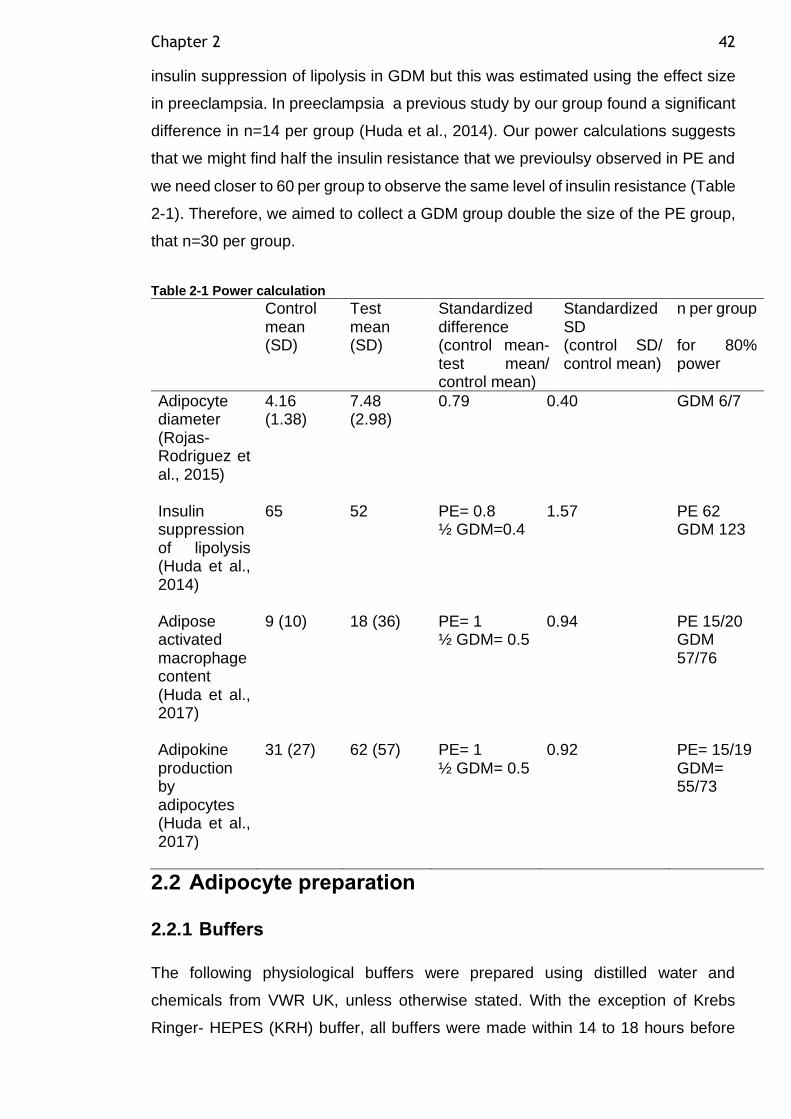
Chapter 2 42
insulin suppression of lipolysis in GDM but this was estimated using the effect size
in preeclampsia. In preeclampsia a previous study by our group found a significant
difference in n=14 per group (Huda et al., 2014). Our power calculations suggests
that we might find half the insulin resistance that we previoulsy observed in PE and
we need closer to 60 per group to observe the same level of insulin resistance (Table
2-1). Therefore, we aimed to collect a GDM group double the size of the PE group,
that n=30 per group.
Table 2-1 Power calculation
Control mean (SD)
Test mean (SD)
Standardized difference (control mean- test mean/ control mean)
Standardized SD (control SD/ control mean)
n per group for 80% power
Adipocyte diameter (Rojas-Rodriguez et al., 2015)
4.16 (1.38)
7.48 (2.98)
0.79 0.40 GDM 6/7
Insulin suppression of lipolysis (Huda et al., 2014)
65 52 PE= 0.8 ½ GDM=0.4
1.57 PE 62 GDM 123
Adipose activated macrophage content (Huda et al., 2017)
9 (10) 18 (36) PE= 1 ½ GDM= 0.5
0.94 PE 15/20 GDM 57/76
Adipokine production by adipocytes (Huda et al., 2017)
31 (27) 62 (57) PE= 1 ½ GDM= 0.5
0.92 PE= 15/19 GDM= 55/73
2.2 Adipocyte preparation
2.2.1 Buffers
The following physiological buffers were prepared using distilled water and
chemicals from VWR UK, unless otherwise stated. With the exception of Krebs
Ringer- HEPES (KRH) buffer, all buffers were made within 14 to 18 hours before

Chapter 2 43
sample collection and kept at 4⁰C overnight before collection, then warmed to 37°C
on collection day. To confirm buffer stability using this approach, an experiment was
conducted to compare buffer made fresh on the collection day and buffer made
approximately 14 to 18 hours before sample collection using the same
subcutaneous adipose tissue sample of healthy individuals (n=3). The experiment
is detailed in section 2.4.5.
2.2.1.1 Krebs Ringer - HEPES (KRH) Buffer
KRH buffer consisted of 118mM NaCl (Merck, UK), 5mM NaHCO3, 4.7mM KCl,
1.2mM KH2PO4, 1.2mM MgSO4.7H2O (Sigma, UK) and 25mM HEPES (Sigma, UK).
The buffer was adjusted to pH 7.4, autoclaved and stored at 4°C.
2.2.1.2 Wash buffer
Wash buffer was KRH buffer containing 2.5mM CaCl2 and 151μM BSA, essentially
FA free (Sigma-Aldrich, UK, cat.no. A6003).
2.2.1.3 Collection buffer
Collection buffer was wash buffer containing D-glucose 3mM (Fisher Scientific,
UK).
2.2.1.4 Digestion buffer
Digestion buffer consisted of 4ml collection buffer per 1g of adipose tissue plus
2mg/ml collagenase (Type 1, Worthington biomedical corporation, UK, cat. no.
L5004197)
2.2.2 Collagenase digestion of adipose tissue and isolation of adipocytes
If the adipose tissue samples were more than 6-8 g, a small piece of adipose tissue
was flash frozen in liquid nitrogen and stored at -80°C until further use. The
remaining unfrozen adipose tissue sample was placed in a petri dish with warm
collection buffer. Scissors and forceps were used to remove any skin, visible blood
vessels and fibrous tissue. The sample was dried quickly on filter paper and
weighed. The weight of the tissue was used to determine the required volume of
digestion buffer containing collagenase at 2mg/ml. The sample was then placed into
Chapter 2 44
a 50ml centrifuge tube containing the digestion buffer and minced finely with
scissors. Collagenase digestion occurred for 30mins at 37°C in a shaking water bath
at 100 cycle per minute.
After collagenase digestion the adipose-buffer mixture was filtered first through a
plastic tea strainer (600μm pore) to remove any large pieces of undigested tissue.
The digestate was then passed through a 400μm pore mesh. The adipocytes were
allowed to float to the top and the buffer underneath was aspirated away using a
20ml syringe and 18-gauge needle and replaced with fresh warm wash buffer of a
similar volume. This process was repeated up to a maximum of four times, or until
the buffer under the adipocytes was clear. The buffer was finally aspirated away as
much as possible such that the adipocytes were suspended at approximately 90%
cytocrit.
The experimental tubes (15ml centrifuge tubes) were prepared to contain 900μl
warm (37°C) wash buffer. The adipocyte cell suspension (100μl) was added to the
experimental tubes followed by all other reagents. All experimental conditions were
carried out in duplicate. The tubes were placed in a shaking water bath at 37°C with
gentle agitation of 91 cycles per minute for 2 hours. Remaining adipocytes were
frozen in aliquots at -80°C for subsequent DNA quantification and RNA isolation.
2.2.3 Adipocyte DNA extraction
DNA was isolated from a known volume of adipocyte cellular suspension from each
preparation that had been flash frozen in liquid nitrogen and then transferred to a -
80°C freezer immediately after adipocyte isolation was carried out. Two aliquots of
100µl adipocytes were thawed at room temperature and DNA was extracted using
a Nucleospin DNA Lipid Tissue kit (Machery-Nagel, Germany) which utilizes
Silica-membrane technology. Lipid-rich tissues can cause difficulties in DNA
isolation by influencing the tissue disruption or changing the chemistry of the DNA
isolation buffer. The Nucleospin DNA Lipid Tissue kit combined enzymatic lysis
and mechanical disruption of lipid-rich tissues with the Nucleospin Bead Tubes
which were used to obtain high DNA yields from adipocytes. Following the
manufacturer’s protocol, 200µl of thawed adipocyte suspension was transferred to
bead tube D (3mm steel balls) and 100µl of elution buffer BE was added to prepare
the sample for lysis. Cell lysis was achieved by adding 40µl of lysis buffer LT, 10 µl
Chapter 2 45
of liquid proteinase K and agitating the tubes in the bead tube holder (Vortex mixer,
VV3, VWR) for 20minutes at full speed. The tube was spun afterward to clear the
lid at 13000rpm for 30 seconds in a bench microcentrifuge. To adjust DNA binding
conditions, 600µl of lysis buffer LT was added, vortexed and centrifuged as above.
DNA binding was achieved by transferring the clear liquid supernatant
(approximately 500-600µl) to a spin column placed inside a collection tube and then
centrifuged as above. The silica membrane was washed twice, by adding 500µl of
wash buffer BW and then 500µl of wash buffer B5 followed by centrifugation with
discard of the flow through at each wash. Further centrifugation took place to dry
the silica membrane and remove the residual wash buffer. DNA elution was
completed by placing the spin column in an autoclaved Eppendorf tube and 100µl
of warm elution buffer BE at 70°C was added to the column followed by incubation
at room temperature for one minute and the tube was then centrifuged as above.
The resultant eluate was then reused in another elution step to improve DNA yields.
The DNA was then transferred to a new autoclaved Eppendorf tube and left
incubating overnight in the fridge. DNA quantification by Nanodrop was carried out
the following day after resuspension. A 260/280 ratio of ~1.8 is generally accepted
as “pure” for DNA.
2.2.4 Normalising NEFA, glycerol and inflammatory cytokines to total DNA content
Lipolysis rates as measured by NEFA and glycerol are influenced by adipocyte
cellular density in each experimental condition. Therefore, DNA was extracted and
quantified from a known volume of adipocytes cellular suspension. The adipocytes
cell number is directly proportional to DNA content within the same volume. Lipolysis
rates are expressed as per ug of DNA.
2.3 Adipocyte sizing
Equal volumes of unfixed fresh adipocyte cellular suspension (5μl) and KRH buffer
(5μl) were mixed on a glass slide. The slide was placed under an Olympus BX50
microscope connected to a 3-CCD colour camera (JVC) and 7-9 digital images of
the adipocytes were captured on different fields at x10 magnification (Figure 2-1).
Computer visualisation of images was carried out using Image-Pro Plus 4.0 and the
images were analysed with Adobe Photoshop version 7.0. The internal diameters
of 100 adipocytes were measured manually using a graticule that was calibrated
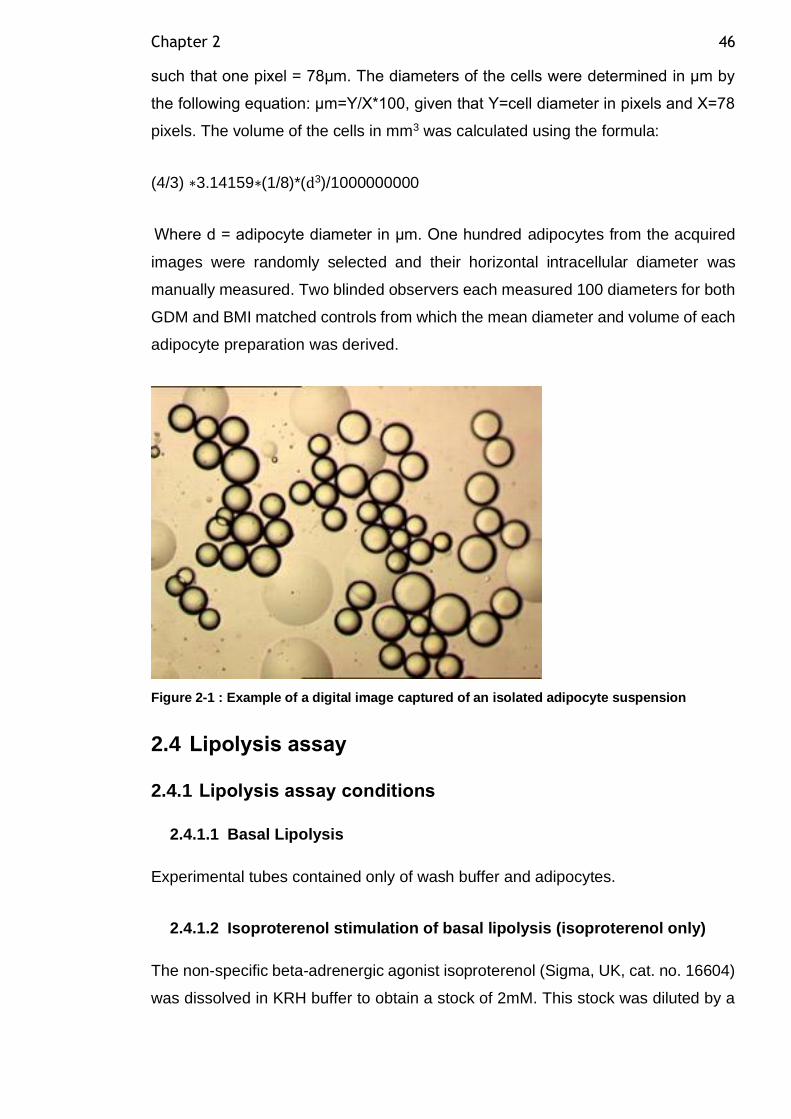
Chapter 2 46
such that one pixel = 78μm. The diameters of the cells were determined in μm by
the following equation: μm=Y/X*100, given that Y=cell diameter in pixels and X=78
pixels. The volume of the cells in mm3 was calculated using the formula:
(4/3) ∗3.14159∗(1/8)*(d3)/1000000000
Where d = adipocyte diameter in μm. One hundred adipocytes from the acquired
images were randomly selected and their horizontal intracellular diameter was
manually measured. Two blinded observers each measured 100 diameters for both
GDM and BMI matched controls from which the mean diameter and volume of each
adipocyte preparation was derived.
Figure 2-1 : Example of a digital image captured of an isolated adipocyte suspension
2.4 Lipolysis assay
2.4.1 Lipolysis assay conditions
2.4.1.1 Basal Lipolysis
Experimental tubes contained only of wash buffer and adipocytes.
2.4.1.2 Isoproterenol stimulation of basal lipolysis (isoproterenol only)
The non-specific beta-adrenergic agonist isoproterenol (Sigma, UK, cat. no. 16604)
was dissolved in KRH buffer to obtain a stock of 2mM. This stock was diluted by a
Chapter 2 47
factor of 100 to give 0.02mM. Isoproterenol (10μl of 0.02mM) was added to the
experimental tubes to give a final isoproterenol concentration of 200nM.
2.4.1.3 Insulin inhibition of basal lipolysis (insulin only)
Insulin solution human (Sigma-Aldrich, UK, 19278 – 300 Units/ml) (1.76μl) was
added to 3ml of KRH buffer to produce insulin stock (1000nM). Insulin stock solution
(10μL of 1000nM) was added to the adipocyte cellular suspension (total volume of
1ml) to produce a final concentration of 10nM.
2.4.1.4 Insulin inhibition of stimulated lipolysis (isoproterenol + insulin)
Isoproterenol and insulin were prepared as above and 10μl of each were added to
adipocyte cellular suspension. The final concentration was 200nM for isoproterenol
and 10nM for insulin.
2.4.1.5 Lipopolysaccharide (LPS)
Sterile balanced salt solution (1ml of autoclaved KRH buffer) was added to 1mg
lipopolysaccharide from Escherichia coli O55:B5 (Sigma Aldrich, UK, L6529)
powder to produce LPS stock (1mg/ml) frozen in 25µl aliquots and kept at -80 until
needed. On the day of experiment, 10µl of 1mg/ml LPS stock were added to culture
vial contains 900µl of wash buffer and 100µl of adipocyte cellular suspension to
obtain final concentration of 10μg/ml.
2.4.2 Timeline and dose response determination for lipolysis assay reagents
Time course of lipolysis experiment and dose response curve of isoproterenol,
insulin and lipopolysaccharide (LPS) was determined previously (unpublished
Shahzya Huda).
2.4.3 Assaying NEFA and glycerol as indicators of adipocyte net and total lipolysis respectively
Both NEFA and glycerol concentrations in the medium below the adipocytes were
assayed as indicators of lipolysis. Once released from the adipocytes, NEFA can be
taken up by the adipocytes and re-esterified to triglyceride a process referred to as
recycling. Hence assaying NEFA gives a measure of net lipolysis. Glycerol,
Chapter 2 48
however, once released from the adipocytes cannot be reutilised by the adipocytes
due to the minimal expression of glycerol kinase. As such, assaying glycerol gives
a measure of total lipolysis.
The medium below the adipocyte suspension was sampled at 2 hours for
determination of NEFA and glycerol concentrations. Aliquots (5μl for NEFA and 10μl
for glycerol) of the medium were added to individual wells of a 96 well plate. Each
experimental condition was assayed for NEFA and glycerol in duplicate.
2.4.3.1 Measuring NEFA concentrations
NEFA concentrations were estimated using an enzymatic colorimetric NEFA assay
kit (Wako, Alpha Laboratories, UK) using a protocol adapted for 96 well plate
analysis. The kit provides substrates (coenzyme A and ATP) and enzymes (acyl-
CoA synthetase) that convert NEFA in the medium to acyl-CoA. The Acyl-CoA is
oxidised to produce hydrogen peroxide, which in the presence of peroxidase yields
a violet pigment. NEFA concentration was obtained by measuring the absorbance
of the pigment on a spectrophotometer (Multiscan EX, Thermo Electron
Corporation) at 550nm. The values are compared to a NEFA standard curve. The
standard curve was obtained by making serial dilutions of a NEFA standard (Wako,
Alpha Laboratories, UK) to achieve a concentration curve ranging from 0.1-
1mmol/L.
2.4.3.2 Measuring glycerol concentrations
Glycerol concentrations were determined by means of a colorimetric kit (Randox).
The kit utilises a quinoneimine chromogen system whereby in the presence of
glycerol kinase, peroxidase and glycerol phosphate oxidase, glycerol in the medium
is converted to the product n-(4-antipyryl)-3-chloro-5-sulphonate-p-
benzoquinoneimine (ACSB). Production of ACSB yields an orange pigment.
Glycerol concentration was obtained by measuring the absorbance of the pigment
on a spectrophotometer (Multiscan EX, Thermo Electron Corporation) at 520nm.
The values are compared to a glycerol standard curve. The standard curve was
obtained by making serial dilutions of a glycerol standard (Sigma, UK, G7793) to
achieve a concentration curve ranging from 10-400µmol/L.
Chapter 2 49
2.4.4 Calculation of percent inhibition, percent stimulation and fat cell insulin sensitivity index (FCISI)
The degree of lipolysis stimulation by isoproterenol was calculated as the
percentage of release of NEFA or glycerol in the presence of isoprotenerol relative
to basal lipolysis i.e. Percentage stimulation= ((lipolysis rate in presence of
isoproterenol – basal lipolysis) / basal lipolysis)*100.
The degree of lipolysis suppression by insulin was calculated as the percentage of
release of NEFA or glycerol in the presence of insulin relative to basal release i.e.
((basal lipolysis – lipolysis rate in the presence of insulin) / basal lipolysis)*100.
FCISI is a direct measure of adipocyte insulin sensitivity. It can be calculated as
the percentage suppression of isoproterenol stimulated lipolysis by insulin
measured either as NEFA or glycerol release i.e. FCISI= ((lipolysis rate in
presence of isoproterenol – lipolysis rate in presence of isoproterenol and insulin)
/ (lipolysis rate in presence of isoproterenol – basal lipolysis))*100.
2.4.5 Buffer stability
For logistical reasons, preparation of buffer 14-18 hours in advance was
advantageous due to the distance between the laboratory and QEUH hospital, while
our standard protocol stated same day preparation. To ensure buffer stability when
made the day before, an experiment was conducted to compare buffer made fresh
on the day of sample collection and buffer made approximately 14 to 18 hours before
sample collection using the same subcutaneous adipose tissue sample from healthy
pregnant women. Subcutaneous adipose tissue samples (n=3) were cut into 2
pieces immediately after collection at the hospital in a petri dish using surgical
scissors. One piece was placed in warm buffer made on the day of collection and
the other one was placed in warm buffer made 14-18 hours before collection. The
samples were then transferred immediately to the laboratory and adipocytes were
isolated as described previously in section 2.2.2. Isoproterenol and insulin were
prepared as above and added to adipocyte cellular suspension. Basal, isoproterenol
stimulation of basal lipolysis, insulin inhibition of basal lipolysis and insulin inhibition
of isoproterenol stimulated lipolysis conditions were carried out for each sample
using buffer made on the day of collection or 14-18 hours before. After 2 hours
incubation, the buffer below adipocytes were sampled for NEFA analysis to test if
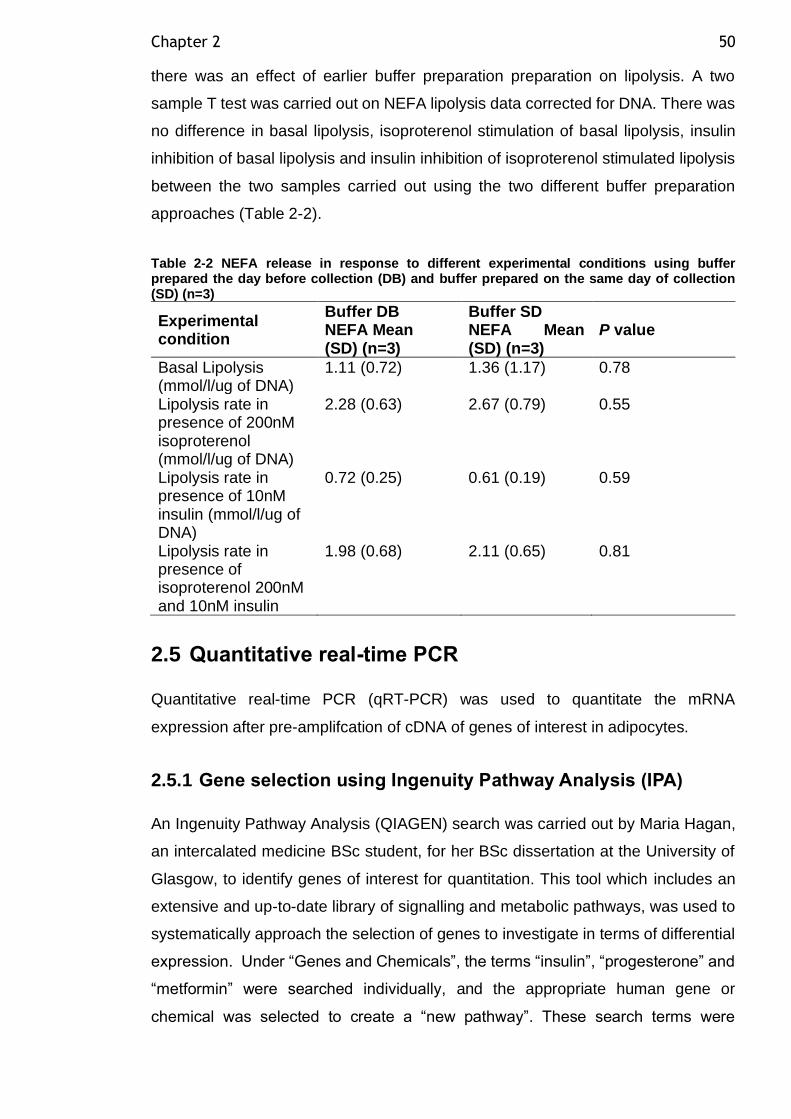
Chapter 2 50
there was an effect of earlier buffer preparation preparation on lipolysis. A two
sample T test was carried out on NEFA lipolysis data corrected for DNA. There was
no difference in basal lipolysis, isoproterenol stimulation of basal lipolysis, insulin
inhibition of basal lipolysis and insulin inhibition of isoproterenol stimulated lipolysis
between the two samples carried out using the two different buffer preparation
approaches (Table 2-2).
Table 2-2 NEFA release in response to different experimental conditions using buffer prepared the day before collection (DB) and buffer prepared on the same day of collection (SD) (n=3)
Experimental condition
Buffer DB NEFA Mean (SD) (n=3)
Buffer SD NEFA Mean (SD) (n=3)
P value
Basal Lipolysis (mmol/l/ug of DNA)
1.11 (0.72) 1.36 (1.17) 0.78
Lipolysis rate in presence of 200nM isoproterenol (mmol/l/ug of DNA)
2.28 (0.63) 2.67 (0.79) 0.55
Lipolysis rate in presence of 10nM insulin (mmol/l/ug of DNA)
0.72 (0.25) 0.61 (0.19) 0.59
Lipolysis rate in presence of isoproterenol 200nM and 10nM insulin
1.98 (0.68) 2.11 (0.65) 0.81
2.5 Quantitative real-time PCR
Quantitative real-time PCR (qRT-PCR) was used to quantitate the mRNA
expression after pre-amplifcation of cDNA of genes of interest in adipocytes.
2.5.1 Gene selection using Ingenuity Pathway Analysis (IPA)
An Ingenuity Pathway Analysis (QIAGEN) search was carried out by Maria Hagan,
an intercalated medicine BSc student, for her BSc dissertation at the University of
Glasgow, to identify genes of interest for quantitation. This tool which includes an
extensive and up-to-date library of signalling and metabolic pathways, was used to
systematically approach the selection of genes to investigate in terms of differential
expression. Under “Genes and Chemicals”, the terms “insulin”, “progesterone” and
“metformin” were searched individually, and the appropriate human gene or
chemical was selected to create a “new pathway”. These search terms were
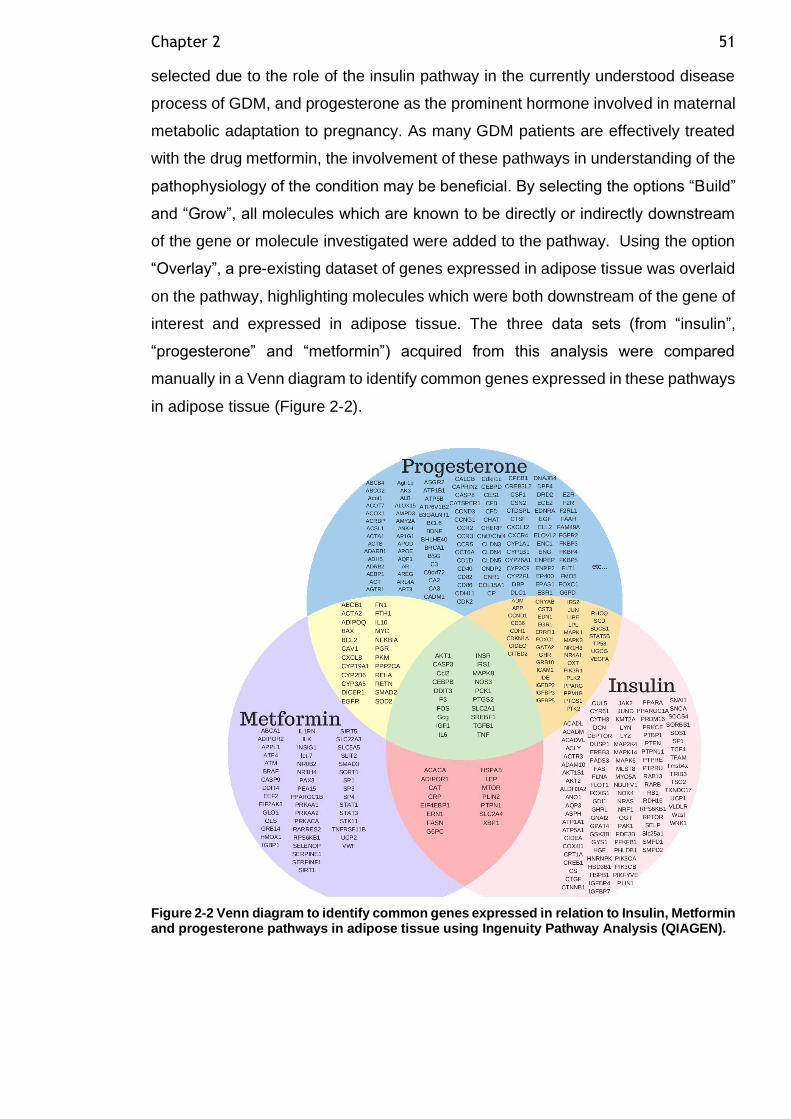
Chapter 2 51
selected due to the role of the insulin pathway in the currently understood disease
process of GDM, and progesterone as the prominent hormone involved in maternal
metabolic adaptation to pregnancy. As many GDM patients are effectively treated
with the drug metformin, the involvement of these pathways in understanding of the
pathophysiology of the condition may be beneficial. By selecting the options “Build”
and “Grow”, all molecules which are known to be directly or indirectly downstream
of the gene or molecule investigated were added to the pathway. Using the option
“Overlay”, a pre-existing dataset of genes expressed in adipose tissue was overlaid
on the pathway, highlighting molecules which were both downstream of the gene of
interest and expressed in adipose tissue. The three data sets (from “insulin”,
“progesterone” and “metformin”) acquired from this analysis were compared
manually in a Venn diagram to identify common genes expressed in these pathways
in adipose tissue (Figure 2-2).
Figure 2-2 Venn diagram to identify common genes expressed in relation to Insulin, Metformin and progesterone pathways in adipose tissue using Ingenuity Pathway Analysis (QIAGEN).
Chapter 2 52
2.5.2 Isolation of total RNA
The RNeasy Lipid Tissue Mini Kit (Qiagen) was used to isolate total RNA from frozen
stored adipocytes, as per the manufacturer’s instructions. Briefly, 100μl of isolated
adipocytes were homogenised in 1ml Qiazol lysis reagent using a hand-held
homogeniser (Omni UH Motor Battery Pack & Charger, Camlab). The homogenate
was transferred to a 1.5ml centrifuge tube and incubated at room temperature for 5
minutes. Chloroform (200μl) was added to the homogenate and shaken vigorously
for 15 seconds followed by incubation at room temperature for a further 3 minutes.
The samples were subsequently centrifuged at 13000rpm for 15 minutes at 4°C
using Beckman Coulter™ Microfuge 22R centrifuge. The upper aqueous phase
(approximately 400μl) was transferred to a clean 1.5ml centrifuge tube, to which the
same volume of 75% ethanol was added, and the sample was vortexed. The mixture
was then transferred to RNeasy spin columns in batches and centrifuged for 15
seconds at 10,000rpm in the microcentrifuge. The flow-through was discarded and
this step repeated until the entire sample was processed. The column was then
washed twice with RPE buffer (500μl) (QIAGEN) and centrifuged at 10,000rpm for
15 seconds and two minutes respectively. The column membrane was dried by
centrifugation at 10,000rpm for 1min. RNase-free water (30μl) was then added to
the sample column prior to centrifugation at 10,000rpm for one minute. The
concentration and quality of the eluted RNA was determined using a Nanodrop ND-
1000 spectrophotometer (Thermo Fisher Scientific). This produced a 260/280nm
absorbance ratio and concentrations in ng/μl. A 260/280 ratio of ~2.0 is generally
accepted as “pure” for RNA. The RNA was stored at -80°C until required.
2.5.3 DNase treatment of isolated RNA
A DNA-free kit (Ambion, cat. no.AM1906) was used to remove contaminating
genomic DNA from the extracted RNA samples. Nuclease free water (6.5μl) was
added to 15μl of RNA sample to make a final volume of 21.5μl. 10X DNase 1 buffer
(2.5μl) was then added to the mixture and centrifuged at 13000rpm for 6 seconds at
4°C using Beckman Coulter™ Microfuge 22R centrifuge. The mixture was then
incubated for 30 minutes at 37°C in an OMN-E thermalcycler. Following this, DNase
Inactivation Reagent was vortexed before adding 3ml and the aliquots were mixed.
They were incubated for a further 2 minutes at room temperature. The samples were
mixed again to re- suspend the DNase Inactivation Reagent. It was then removed
Chapter 2 53
by centrifuging the samples at 13,000rpm for 1 minute using the microcentrifuge.
The transparent supernatant layer containing RNA was transferred to a new tube,
leaving the DNase Inactivation Reagent at the bottom. DNA-free RNA was stored
at -80°C.
2.5.4 cDNA synthesis
To make complementary DNA (cDNA), RNA was reverse transcribed using a High
Capacity cDNA Reverse Transcription Kit (Applied Biosystems, cat. no. 4368813)
in the presence of ThermoFisher SUPERase:In (cat. no. 2696) RNase. DNase-
treated RNA samples and reagents were thawed and kept on ice for the duration of
this procedure. The following volumes were added into a new Eppendorf tube to
make 2x RT mastermix: 34μl of 10X RT buffer, 13.6μl of 25X dNTPs, 34μl of 10X
random primers, 17μl of multiscribe reverse transcriptase (mRT), 17μl of
SUPERase:In and 54.4μl of nuclease free water. An additional control “No RT
mastermix” was also prepared using the same volumes of reagents but without
mRT. These were mixed by vortexing. 2X RT mastermix (5μl) was added to 5μl of
each sample. They were then briefly centrifuged followed by incubation at 25°C for
10 minutes. This was followed by incubation at 37°C for 120 minutes then 85°C for
5 seconds using the ThermoFisher Hybaid PCR Express Thermal Cycler. The
samples were stored at -20°C.
2.5.5 Preamplification of cDNA and Test of Uniformity
Due to the very small quantity of RNA which can be isolated from adipocytes, a very
small quantity of cDNA is obtained from reverse transcription. The TaqMan PreAmp
Master Mix Kit (Applied Biosystems, cat. no. 4384266) was used to increase the
quantity of the cDNA targets for gene expression analysis. The preamplification
product was used for TaqMan Real-Time PCR. A pooled assay mix was prepared
according to the manufacturer instructions containing the appropriate volume of
Tris-EDTA (TE) PH 8 buffer (Ambion, cat. no. AM9849), primer probes of the genes
to be investigated including Cyclin-dependant Kinase Inhibitor 1B (CDKN1B) the
recommended endogenous uniformity reference gene and PPIA the endogenous
control gene to be used in relative quantitation Real-Time PCR analysis. Pooled
assay mix, TaqMan PreAmp Master Mix (2X), nuclease free water and the samples
cDNA was added to a 96 well plate. The plate was centrifuged briefly in Jouan
CR412 centrifuge, loaded into a thermocycler (StepOnePlus Real-Time PCR
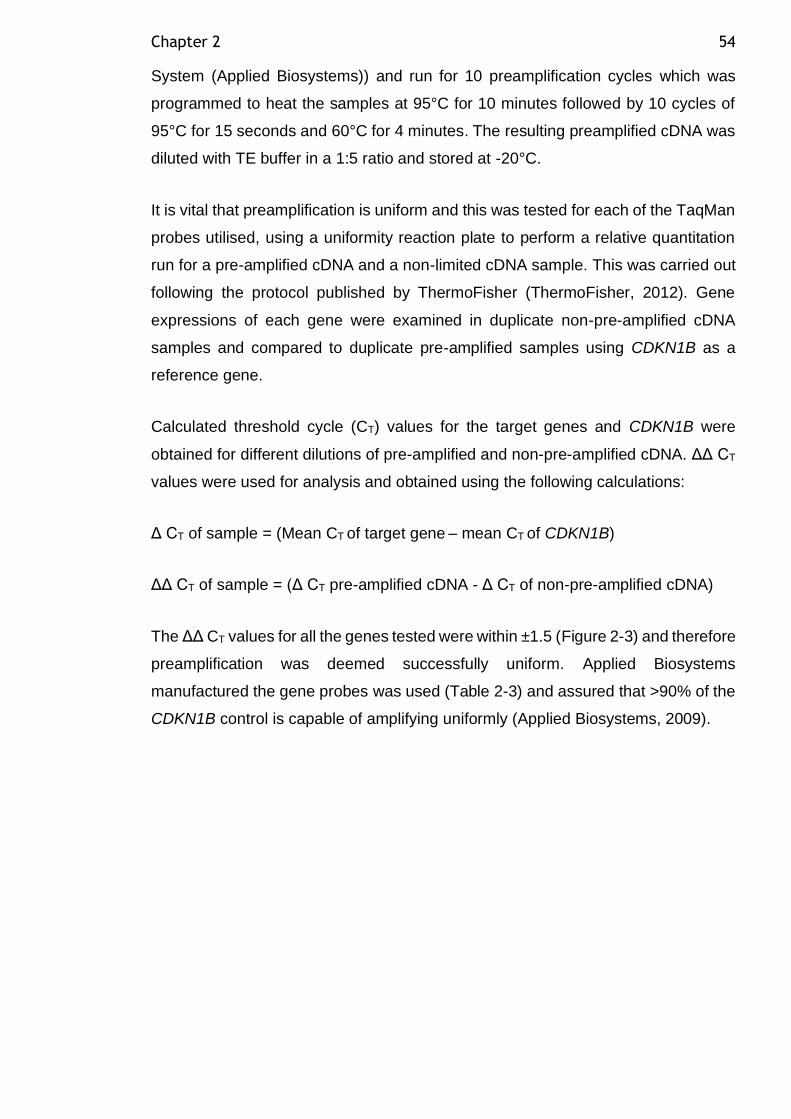
Chapter 2 54
System (Applied Biosystems)) and run for 10 preamplification cycles which was
programmed to heat the samples at 95°C for 10 minutes followed by 10 cycles of
95°C for 15 seconds and 60°C for 4 minutes. The resulting preamplified cDNA was
diluted with TE buffer in a 1:5 ratio and stored at -20°C.
It is vital that preamplification is uniform and this was tested for each of the TaqMan
probes utilised, using a uniformity reaction plate to perform a relative quantitation
run for a pre-amplified cDNA and a non-limited cDNA sample. This was carried out
following the protocol published by ThermoFisher (ThermoFisher, 2012). Gene
expressions of each gene were examined in duplicate non-pre-amplified cDNA
samples and compared to duplicate pre-amplified samples using CDKN1B as a
reference gene.
Calculated threshold cycle (CT) values for the target genes and CDKN1B were
obtained for different dilutions of pre-amplified and non-pre-amplified cDNA. ΔΔ CT
values were used for analysis and obtained using the following calculations:
Δ CT of sample = (Mean CT of target gene – mean CT of CDKN1B)
ΔΔ CT of sample = (Δ CT pre-amplified cDNA - Δ CT of non-pre-amplified cDNA)
The ΔΔ CT values for all the genes tested were within ±1.5 (Figure 2-3) and therefore
preamplification was deemed successfully uniform. Applied Biosystems
manufactured the gene probes was used (Table 2-3) and assured that >90% of the
CDKN1B control is capable of amplifying uniformly (Applied Biosystems, 2009).
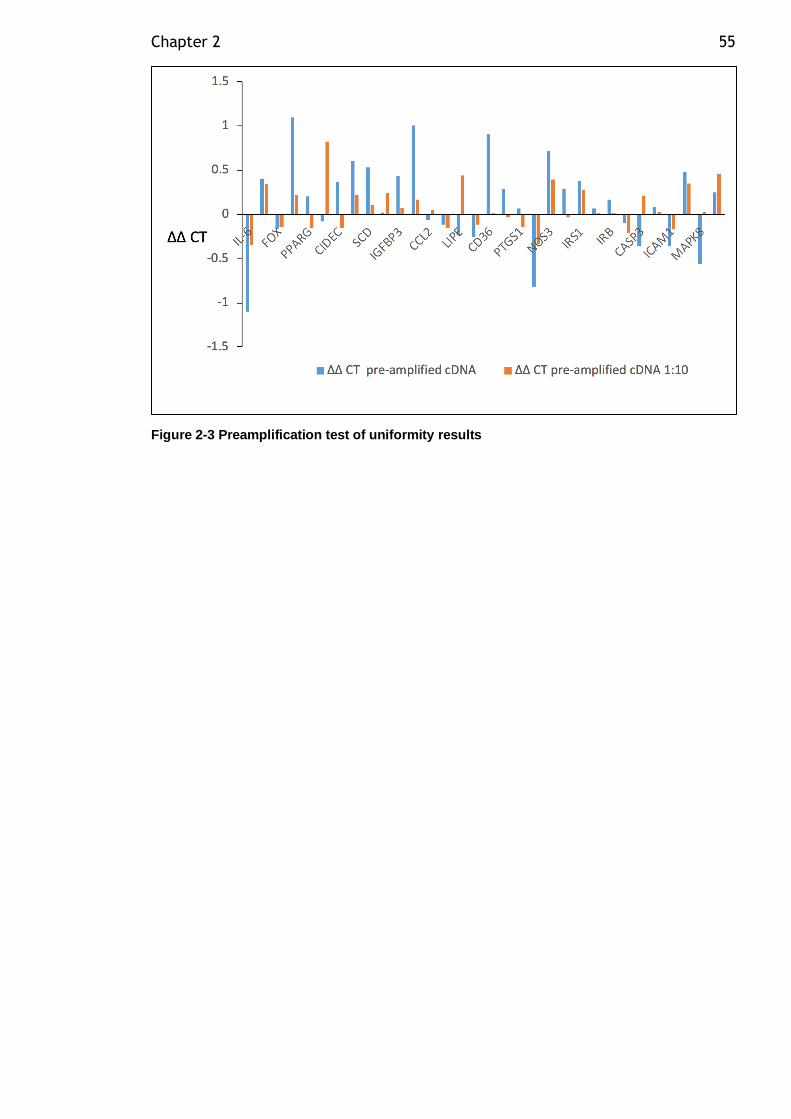
Chapter 2 55
Figure 2-3 Preamplification test of uniformity results
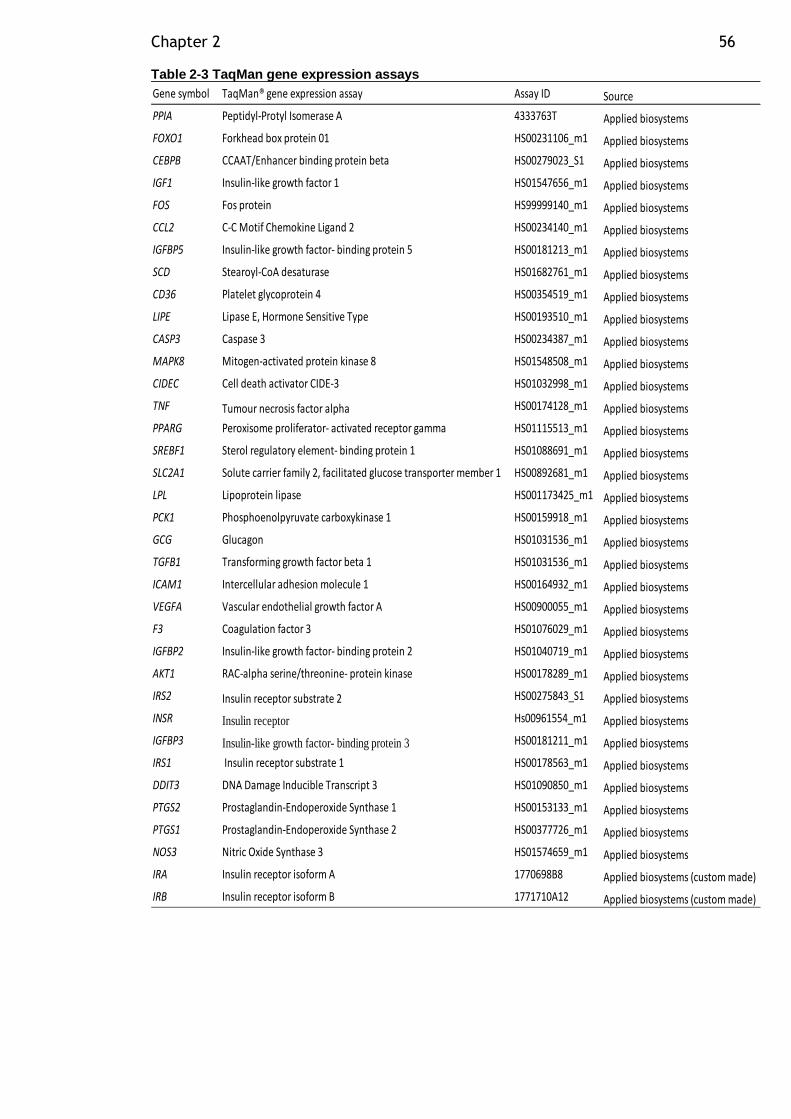
Chapter 2 56
Table 2-3 TaqMan gene expression assays
Gene symbol TaqMan® gene expression assay Assay ID Source
PPIA Peptidyl-Protyl Isomerase A 4333763T Applied biosystems
FOXO1 Forkhead box protein 01 HS00231106_m1 Applied biosystems
CEBPB CCAAT/Enhancer binding protein beta HS00279023_S1 Applied biosystems
IGF1 Insulin-like growth factor 1 HS01547656_m1 Applied biosystems
FOS Fos protein HS99999140_m1 Applied biosystems
CCL2 C-C Motif Chemokine Ligand 2 HS00234140_m1 Applied biosystems
IGFBP5 Insulin-like growth factor- binding protein 5 HS00181213_m1 Applied biosystems
SCD Stearoyl-CoA desaturase HS01682761_m1 Applied biosystems
CD36 Platelet glycoprotein 4 HS00354519_m1 Applied biosystems
LIPE Lipase E, Hormone Sensitive Type HS00193510_m1 Applied biosystems
CASP3 Caspase 3 HS00234387_m1 Applied biosystems
MAPK8 Mitogen-activated protein kinase 8 HS01548508_m1 Applied biosystems
CIDEC Cell death activator CIDE-3 HS01032998_m1 Applied biosystems
TNF Tumour necrosis factor alpha HS00174128_m1 Applied biosystems
PPARG Peroxisome proliferator- activated receptor gamma HS01115513_m1 Applied biosystems
SREBF1 Sterol regulatory element- binding protein 1 HS01088691_m1 Applied biosystems
SLC2A1 Solute carrier family 2, facilitated glucose transporter member 1 HS00892681_m1 Applied biosystems
LPL Lipoprotein lipase HS001173425_m1 Applied biosystems
PCK1 Phosphoenolpyruvate carboxykinase 1 HS00159918_m1 Applied biosystems
GCG Glucagon HS01031536_m1 Applied biosystems
TGFB1 Transforming growth factor beta 1 HS01031536_m1 Applied biosystems
ICAM1 Intercellular adhesion molecule 1 HS00164932_m1 Applied biosystems
VEGFA Vascular endothelial growth factor A HS00900055_m1 Applied biosystems
F3 Coagulation factor 3 HS01076029_m1 Applied biosystems
IGFBP2 Insulin-like growth factor- binding protein 2 HS01040719_m1 Applied biosystems
AKT1 RAC-alpha serine/threonine- protein kinase HS00178289_m1 Applied biosystems
IRS2 Insulin receptor substrate 2 HS00275843_S1 Applied biosystems
INSR Insulin receptor Hs00961554_m1 Applied biosystems
IGFBP3 Insulin-like growth factor- binding protein 3 HS00181211_m1 Applied biosystems
IRS1 Insulin receptor substrate 1 HS00178563_m1 Applied biosystems
DDIT3 DNA Damage Inducible Transcript 3 HS01090850_m1 Applied biosystems
PTGS2 Prostaglandin-Endoperoxide Synthase 1 HS00153133_m1 Applied biosystems
PTGS1 Prostaglandin-Endoperoxide Synthase 2 HS00377726_m1 Applied biosystems
NOS3 Nitric Oxide Synthase 3 HS01574659_m1 Applied biosystems
IRA Insulin receptor isoform A 1770698B8 Applied biosystems (custom made)
IRB Insulin receptor isoform B 1771710A12 Applied biosystems (custom made)
Chapter 2 57
2.5.6 Insulin receptors isoforms A (IRA) and B (IRB) probes
The mature human insulin receptor has two isoforms, IRA and IRB. They result from
alternative splicing of the same primary transcript. IRA differs from IRB by exclusion
of exon 11. A recent method to specifically measure IRA and IRB expression has
been described by Huang and colleges (Huang et al., 2011). This method was
based on TaqMan qRT-PCR. They designed qRT-PCR primer and probes for IRA
and IRB. For the IRA assay, Haung and colleagues targeted the exon 10/12 junction
region for the gene specific probe; the exon 10 coding region for the forward primer
pairs; and the exon 12 coding regions for the reverse primer pairs. For IRB assay,
they targeted the exon 11 interior coding region for the gene specific probe; exon
11/12 junction for the forward primer pairs; and exon 12 for the reverse primer pairs.
All probes were designed to incorporate a minor groove binding moiety (MGB) and
were labelled with a fluorescent dye (FAM) for detection and a non-fluorescent
quencher. We used the sequences for IRA and IRB primer/probe published by
Huang et al. (2011), and primer/probes were custom ordered from Applied
Biosystems (Table 2-3).
The sequences for primers and probes were as follows:
for IRA, probe sequence is 5’-TCCCCAGGCCATCT-3’; forward primer sequence is
5’-TGAGGATTACCTGCACAACG-3’; reverse primer sequence is 5’-
ACCGTCACATTCCCAACATC -3’.
For IRB: probe sequence is 5’-CCGAGGACCCTAGGC-3’; forward primer sequence
is 5’-CGTCCCCAGAAAAACCTCTTC-3’; reverse primer sequence is 5’-
GGACCTGCGTTTCCGAGAT-3’.
This assay was proven to be more sensitive and specific for IRA and IRB isoforms
compared to the commercially available Applied Biosystems assays which had a
strong cross reaction and could not measure insulin receptors isoforms accurately
(Huang et al., 2011).
2.5.7 TaqMan RT-PCR
Target gene expression was quantified relative to an endogenous control gene,
PPIA (Neville et al., 2011), using TaqMan probes. A PCR reaction mixture was
Chapter 2 58
prepared for each target gene (12.5µl of TaqMan Universal PCR Mastermix, 1.25µl
target assay probe mixture and 5 µl of nuclease-free water) and 18.75µl of this was
added to 6.25µl of diluted pre-amplified cDNA sample for a final reaction volume of
25µl per well of a 96 well plate. PPIA endogenous controls and no-RT controls
(using 6.25μl of water instead of cDNA) were carried out for all samples. Target
gene expression of the pre-amplified cDNA samples were carried out in duplicate
on 96-well plate and appropriate negative controls used. The plate was centrifuged
briefly using Jouan CR412 centrifuge, loaded into a StepOnePlus Real-Time PCR
System (Applied Biosystems) which completed a standard RT-PCR cycle i.e. 40
cycles of 50º°C for 2 minutes, 95°C for 10 minutes and 40 cycles of 95°C for 15
seconds alternated with 60°C for 1 minute. This produced an amplification plot.
Average Ct values between the duplicate samples were obtained using SDS
Software version 2.3. Expression of target genes was normalized to the endogenous
control gene PPIA – previously shown to be a stable control gene for adipose tissue
(Neville et al., 2011).These were converted to percentage expression relative to
PPIA using the ΔCT method (CT value of target assay – CT value of PPIA).The
calculation 2-ΔCT was used to determine the fold difference in expression relative to
control, and the expression of the target assay was then expressed as a percentage
relative to PPIA. Percent gene expression relative to control has an inter-assay CV
<13% in adipocytes for a wide variety of target genes when carried out using a
commercial primer process from Applied Biosystems (unpublished data from our
lab).
2.6 Adipocyte inflammation
2.6.1 LPS
Isolated adipocytes were incubated with LPS for 2 hours as outlined in section
2.4.1.5. The medium underneath the adipocytes were aliquoted into two 300µl and
frozen at -20°C for later analysis of adipokines.
2.6.2 Multiplex bead arrays
2.6.2.1 Assay principle
For the quantification of cytokines and chemokines in biological samples, multiplex
bead arrays are an efficient alternative to the traditional enzyme-linked
Chapter 2 59
immunosorbent assays (ELISA). In a traditional ELISA only one cytokine at a time
is studied. The total number of possible analytes studied can be limited by sample
volume when using ELISA. Multiplex bead arrays allow simultaneous quantification
of several analytes (up to 100) in the same sample, and generally no more than 50µl
of sample is required for the entire panel.
The principle of the multiplex bead assays is similar to that of ELISA based methods
except that capture antibodies are covalently coupled to the surface of beads
instead of the bottom of a 96-well plate. The bead conjugates are distinguished from
one another by the fluorescent intensity ratio of two different fluorescent dyes
embedded on each bead. Sample incubation is similar to ELISA, as well as the
detection steps, which uses biotinylated detection antibodies and a streptavidin-
phycoerythrin (PE) conjugate reporter. Sample acquisition is performed using a
specialised flow cytometer which performs a series of analyses similar to flow
cytometric analysis of cell targets. Individual beads are first gated for the correct
size, then the bead type is determined based on ratio of the two internal fluorescent
dyes, and lastly the fluorescent intensity of the reporter is determined for each
individual analyte. It correlates with the concentration of a given analyte in solution.
A standard curve is generated to calculate the final analyte concentration.
In the current study, kits utilizing magnetic bead technology were used. This
technology is compatible with the MAGPIX® xPONENT 4.2 system, which uses a
magnetic plate to capture all of the beads simultaneously in a monolayer, while two
spectrally distinct light-emitting diodes (LEDs) illuminate the beads. One LED
identifies the analyte that is being detected and, the second LED determines the
magnitude of the PE-derived signal. Each well is imaged with a CCD camera system
to capture a digital image and determine the fluorescence intensity of each bead.
Analytes measured for VAT adipocytes are detailed in Table 2-4.
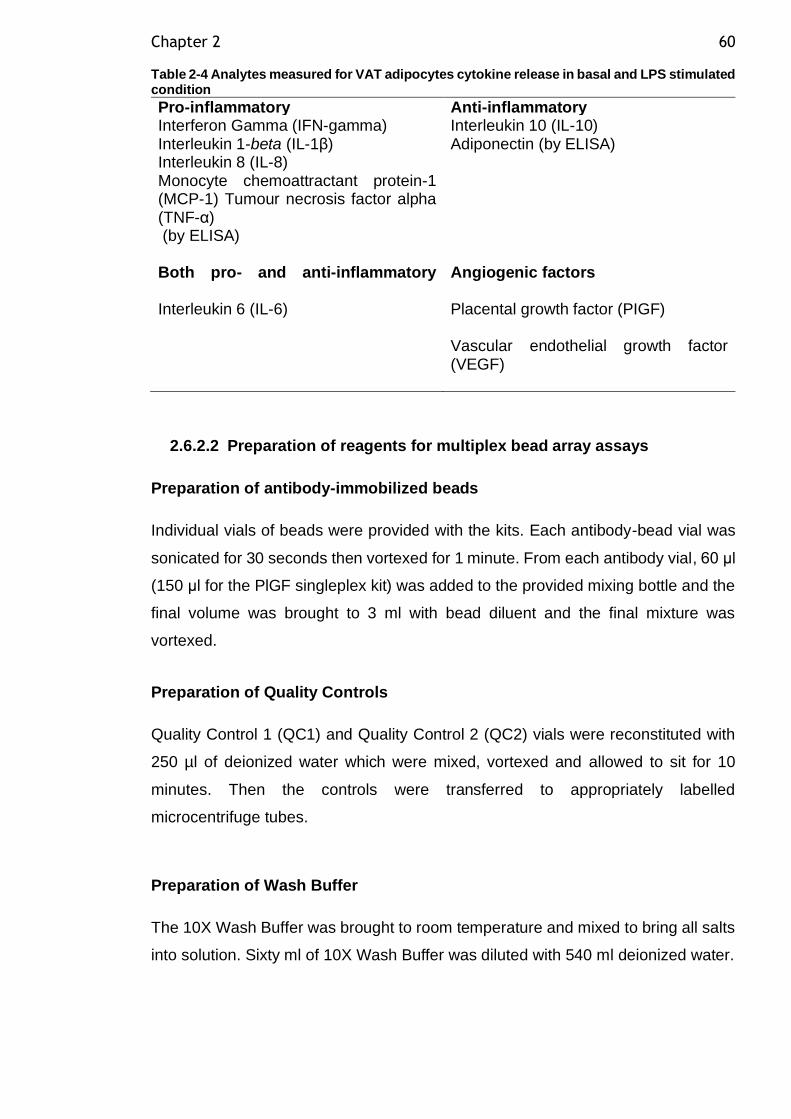
Chapter 2 60
Table 2-4 Analytes measured for VAT adipocytes cytokine release in basal and LPS stimulated condition
Pro-inflammatory Anti-inflammatory Interferon Gamma (IFN-gamma) Interleukin 1-beta (IL-1β) Interleukin 8 (IL-8) Monocyte chemoattractant protein-1 (MCP-1) Tumour necrosis factor alpha (TNF-α) (by ELISA)
Interleukin 10 (IL-10) Adiponectin (by ELISA)
Both pro- and anti-inflammatory
Angiogenic factors
Interleukin 6 (IL-6) Placental growth factor (PIGF) Vascular endothelial growth factor (VEGF)
2.6.2.2 Preparation of reagents for multiplex bead array assays
Preparation of antibody-immobilized beads
Individual vials of beads were provided with the kits. Each antibody-bead vial was
sonicated for 30 seconds then vortexed for 1 minute. From each antibody vial, 60 μl
(150 μl for the PlGF singleplex kit) was added to the provided mixing bottle and the
final volume was brought to 3 ml with bead diluent and the final mixture was
vortexed.
Preparation of Quality Controls
Quality Control 1 (QC1) and Quality Control 2 (QC2) vials were reconstituted with
250 µl of deionized water which were mixed, vortexed and allowed to sit for 10
minutes. Then the controls were transferred to appropriately labelled
microcentrifuge tubes.
Preparation of Wash Buffer
The 10X Wash Buffer was brought to room temperature and mixed to bring all salts
into solution. Sixty ml of 10X Wash Buffer was diluted with 540 ml deionized water.

Chapter 2 61
Preparation of Human Cytokine Standard
The Human Cytokine Standard was reconstituted with 250 μl deionized water to
give 10,000 pg/ml concentration of standard for all analytes. The vial was mixed and
vortexed several times and allowed to sit for 10 minutes for complete reconstitution.
This was used as the 10,000 pg/ml standard (standard 6).
Preparation of Human Cytokine Working Standards
Fife polypropylene microfuge tubes were labelled Standard 5, Standard 4, Standard
3, Standard 2 and Standard 1. Two hundred μL of Assay Buffer was added to each
of the fife tubes. Serial 1:5 dilutions were performed by adding 50μL of the Standard
6 to the Standard 5 tube, mixed well and transferred 50μL of the Standard 5 to the
Standard 4 tube, mixed well and transferred 50 μL of the Standard 4 tube to the
Standard 3 tube, mixed well and transferred 50 μL of the Standard 3 tube to the
Standard 2 tube, mixed well and transferred 50 μl of the Standard 2 tube to the
Standard 1 tube, mixed well. The 0 pg/ml standard (Background) was Assay Buffer.
Standard concentrations for each cytokine are shown in Table 2-5.
Table 2-5 Standard concentration of MILLIPEX Map Human Cytokine/Chemokine Magnetic Bead Panel
Standard concentration (pg/ml)
Volume to add Volume of standard to add
(Standard 6) 10,000 250 μl of deionized water 0 (Standard 5) 2000 200 μl of Assay Buffer 50 μl of 10,000 pg/ml (Standard 4) 400 200 μl of Assay Buffer 50 μl of 2000 pg/ml (Standard 3) 80 200 μl of Assay Buffer 50 μl of 400 pg/ml (Standard 2) 16 200 μl of Assay Buffer 50 μl of 80 pg/ml (Standard 1) 3.2 200 μl of Assay Buffer 50 μl of 16 pg/ml
Preparation of Human CVD panel 1 standard for PlGF measurement
The Human CVD panel 1 Standard was reconstituted with 250 μl deionized water
to give 2000 pg/ml concentration of standard for all analytes. The vial was mixed
and vortexed several times and allowed to sit for 10 minutes for complete
reconstitution. This was used as the 2000 pg/ml standard (standard 7).

Chapter 2 62
Preparation of Human CVD panel 1 working standard for PIGF measurement
Six polypropylene microfuge tubes were labelled as Standard 6, Standard 5,
Standard 4, Standard 3, Standard 2 and Standard 1. Two hundred and fifty μL of
Assay Buffer was added to each of the six tubes. Serial 1:3 dilutions were performed
by adding 125 μL of the Stock Standard to the Standard 6 tube, mixed well and
transferred 125 μL of the Standard 6 to the Standard 5 tube, mixed well and
transferred 125 μL of the Standard 5 tube to the Standard 4 tube, mixed well and
transferred 125 μL of the Standard 4 tube to the Standard 3 tube, mixed well and
transferred 125 μL of the Standard 3 tube to the Standard 2 tube, mixed well and
transfer 125 μL of the Standard 2 tube to the Standard 1 tube, mixed well. The 0
pg/mL standard (Background) was Assay Buffer. Standard concentrations for PlGF
are shown in Table 2-6.
Table 2-6 Standard Concentration for MILLIPEX Map Human Cardiovascular Disease (CVD) Magnetic Bead Panel 1 (for PlGF measurement)
Standard concentration (pg/ml)
Volume to add Volume of standard to add
(Standard 7) 2000 250 μl of deionized water 0 (Standard 6) 666.7 250 μl of Assay Buffer 125 μl of 2000 pg/ml (Standard 5) 222.2 250 μl of Assay Buffer 125 μl of 666.7 pg/ml (Standard 4) 74.1 250 μl of Assay Buffer 125 μl of 222.2 pg/ml (Standard 3) 24.7 250 μl of Assay Buffer 125 μl of 74.1 pg/ml (Standard 2) 8.2 250 μl of Assay Buffer 125 μl of 24.7 pg/ml (Standard 1) 2.7 250 μl of Assay Buffer 125 μl of 8.2 pg/ml
2.6.2.3 Multiplex bead array assay procedure
The multiplex bead array assay procedure was carried out according to the
manufacturer’s protocol and was similar for both multiplex and singleplex assay
used apart from some volume differences which are highlighted below.
Plate layout
The following plate layout was used for all assays (Figure 2-4). Each
standard/quality control was run in duplicate. Samples were run in singlecate due to
limited resources.
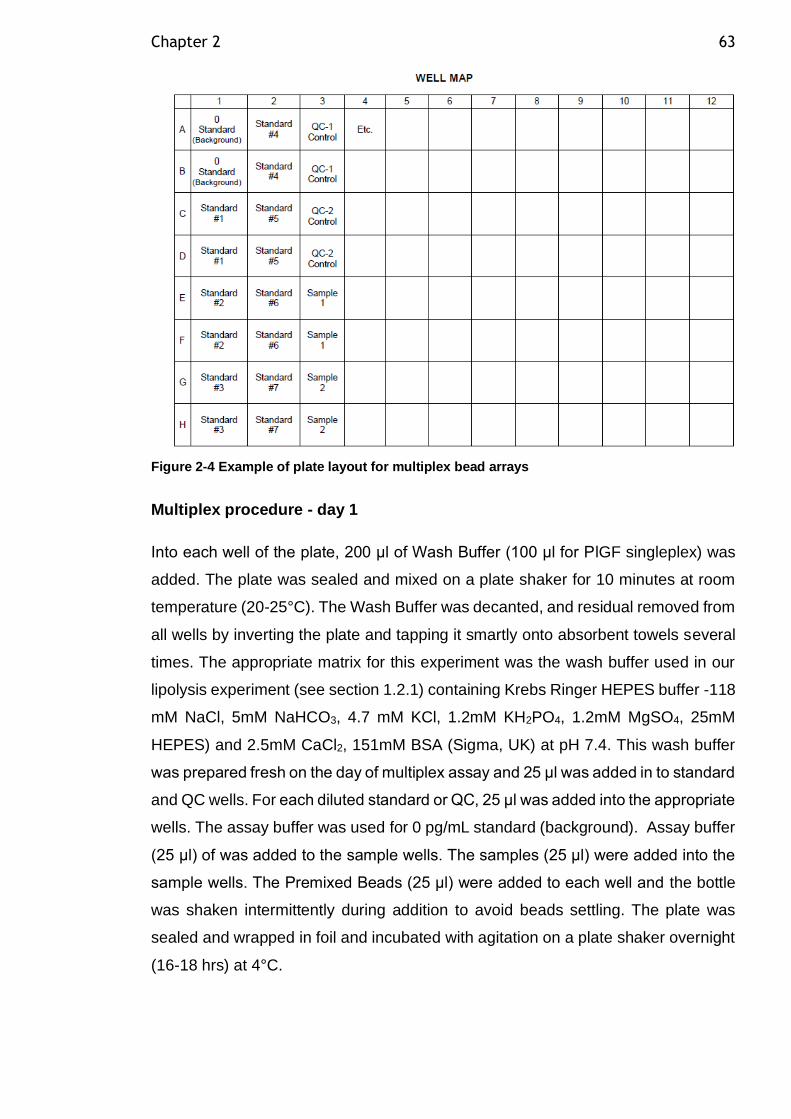
Chapter 2 63
Figure 2-4 Example of plate layout for multiplex bead arrays
Multiplex procedure - day 1
Into each well of the plate, 200 μl of Wash Buffer (100 μl for PlGF singleplex) was
added. The plate was sealed and mixed on a plate shaker for 10 minutes at room
temperature (20-25°C). The Wash Buffer was decanted, and residual removed from
all wells by inverting the plate and tapping it smartly onto absorbent towels several
times. The appropriate matrix for this experiment was the wash buffer used in our
lipolysis experiment (see section 1.2.1) containing Krebs Ringer HEPES buffer -118
mM NaCl, 5mM NaHCO3, 4.7 mM KCl, 1.2mM KH2PO4, 1.2mM MgSO4, 25mM
HEPES) and 2.5mM CaCl2, 151mM BSA (Sigma, UK) at pH 7.4. This wash buffer
was prepared fresh on the day of multiplex assay and 25 μl was added in to standard
and QC wells. For each diluted standard or QC, 25 μl was added into the appropriate
wells. The assay buffer was used for 0 pg/mL standard (background). Assay buffer
(25 μl) of was added to the sample wells. The samples (25 μl) were added into the
sample wells. The Premixed Beads (25 μl) were added to each well and the bottle
was shaken intermittently during addition to avoid beads settling. The plate was
sealed and wrapped in foil and incubated with agitation on a plate shaker overnight
(16-18 hrs) at 4°C.
Chapter 2 64
Multiplex procedure - day 2
The plate was placed on a handheld magnet (EMD Millipore Cat. no. 40-285) for 60
seconds to allow complete settling of magnetic beads. The well contents were
removed by gently decanting the plate into an appropriate waste beaker and gently
tapping on absorbent pads to remove residual liquid. The plate was washed 2 times
with 200 μL of Wash Buffer (3 times for PlGF singleplex) by removing the plate from
magnet, adding wash buffer, shaking for 30 seconds, reattaching to magnet, letting
beads settle for 60 seconds and removing well contents as previously described
after each wash. Detection Antibodies (25 μl) was added per well (50 μl for PlGF
singleplex). The plate was sealed, covered with foil and incubated with agitation on
a plate shaker for 1 hour at room temperature (20-25°C). By keeping the well content
during this step, 25 μl of Streptavidin-Phycoerythrin (50 μl for PIGF singleplex) was
added to each well containing the 25 μl of Detection Antibodies (50 μl for PIGF
singleplex). The plate was sealed, covered with foil and incubated with agitation on
a plate shaker for 30 minutes at room temperature (20-25°C). The well contents
were gently removed, and the plate was washed 2 times as above (3 times for PlGF
singleplex). Drive fluid (150 μl) was added to all wells and the beads were
resuspended on a plate shaker for 5 minutes (100 μl for PIGF singleplex). The plate
was run on MAGPIX® with xPONENT® software. The Median Fluorescent Intensity
(MFI) data was analysed using a 5-parameter logistic method (standard curve) and
used to calculate analyte concentrations in samples and controls.
2.6.2.4 Multiplex assay run
The Luminex® MAGPIX® instrument was calibrated with the MAGPIX® Calibration
Kit (EMD Millipore, cat. no. 40-049) and performance verified with the MAGPIX®
Performance Verification Kit (EMD Millipore, cat. no. 40-050). The start-up, daily
maintenance and probe height adjustment procedures were performed on the day
of running the assays on the MAGPIX® machine.
2.6.2.5 Generation of protocol using luminex xPONENT software
Each type of kit has its own optimal settings (e.g. number of beads to be acquired,
bead size, sample volume etc). To generate a protocol all the information required
is contained in the Milliplex kit. The information needed to generate a protocol
included the Milliplex Protocol booklet, QC sample Certificate of Analysis, Kit Lot
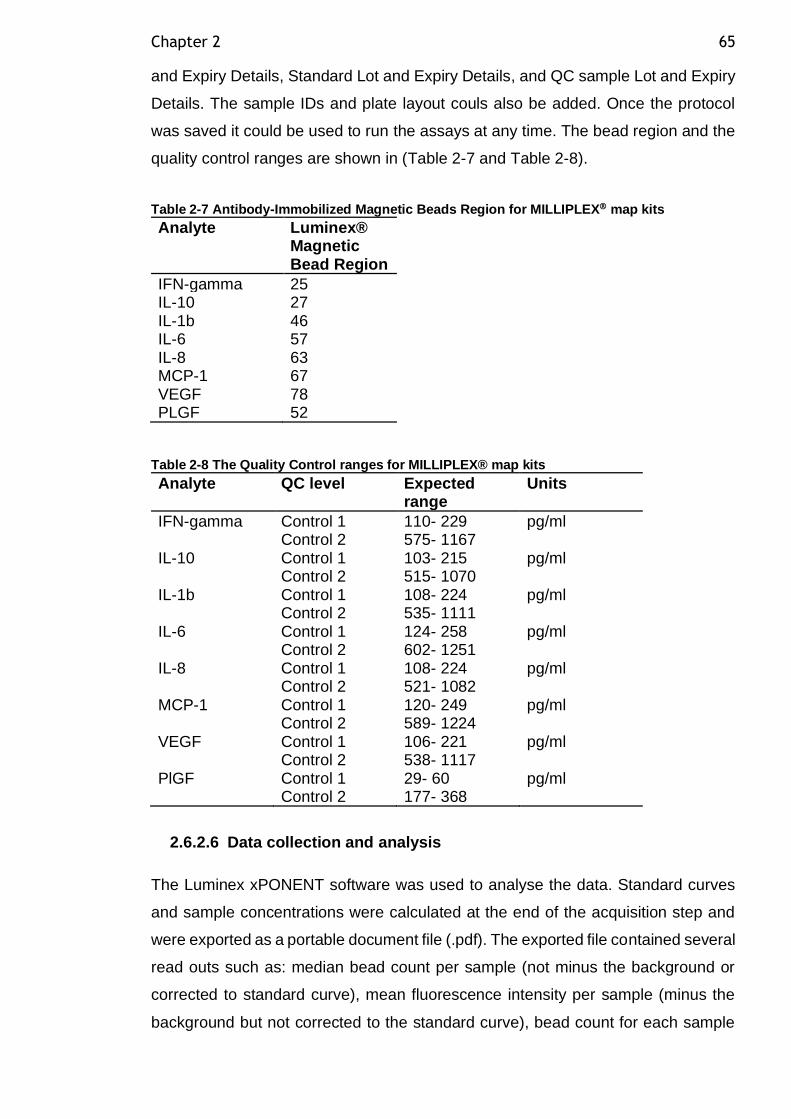
Chapter 2 65
and Expiry Details, Standard Lot and Expiry Details, and QC sample Lot and Expiry
Details. The sample IDs and plate layout couls also be added. Once the protocol
was saved it could be used to run the assays at any time. The bead region and the
quality control ranges are shown in (Table 2-7 and Table 2-8).
Table 2-7 Antibody-Immobilized Magnetic Beads Region for MILLIPLEX map kits
Analyte Luminex® Magnetic Bead Region
IFN-gamma 25 IL-10 27 IL-1b 46 IL-6 57 IL-8 63 MCP-1 67 VEGF 78 PLGF 52
Table 2-8 The Quality Control ranges for MILLIPLEX® map kits
Analyte QC level Expected range
Units
IFN-gamma Control 1 Control 2
110- 229 575- 1167
pg/ml
IL-10 Control 1 Control 2
103- 215 515- 1070
pg/ml
IL-1b Control 1 Control 2
108- 224 535- 1111
pg/ml
IL-6 Control 1 Control 2
124- 258 602- 1251
pg/ml
IL-8 Control 1 Control 2
108- 224 521- 1082
pg/ml
MCP-1 Control 1 Control 2
120- 249 589- 1224
pg/ml
VEGF Control 1 Control 2
106- 221 538- 1117
pg/ml
PlGF Control 1 Control 2
29- 60 177- 368
pg/ml
2.6.2.6 Data collection and analysis
The Luminex xPONENT software was used to analyse the data. Standard curves
and sample concentrations were calculated at the end of the acquisition step and
were exported as a portable document file (.pdf). The exported file contained several
read outs such as: median bead count per sample (not minus the background or
corrected to standard curve), mean fluorescence intensity per sample (minus the
background but not corrected to the standard curve), bead count for each sample
Chapter 2 66
(minus the background), result pg/ml (normalised to standard curve and minus the
background) and average MFI (normalised to standard curve and minus the
background). Here “result” was used for analysis purposes. This is the result per
sample minus the background and corrected to the standard curve. Following advice
from Merck, bead counts ≤50 would be considered low and beads counts ≤35 would
be considered void. Any samples with bead counts ≤35 were excluded.
The standard curves for each analyte were generally sigmoidal and each had their
own formula for best fit line depending on the binding behaviour of each antibody
type (best fit is determined by the software). Samples were checked for their location
on the standard curve and most samples fell within the linear range of the curve, but
some fell out with the lower plateau. Bead count for these samples were assessed
and if ≤35, were discounted. All our analytes QCs fell within the range provided by
the manufacturer. Intra-assay precision was generated by the manufacturer from
the mean of the %CV from 16 reportable results across two different concentrations
of cytokines in single assay as follows: IL-6 2%, IL-8 1.9%, IL-10 1.6%, 1L-1β 2.3%,
MCP-1 1.5%, IFN-gamma 1.6%, VEGF 3.7% and PIGF <10%. Inter-assay precision
was generated by the manufacturer from the mean of the %CV’s from four
reportable results across two different concentrations of cytokines across six
different experiments as follows: IL-6 18.3%, IL-8 3.5%, IL-10 16.8%, 1L-1β 6.7%,
MCP-1 7.9%, IFN-gamma 12%, VEGF 10.4% and PIGF <20%.
2.7 Maternal blood phenotyping
All analysis was carried out using plasma collected in the fasted state. Cholesterol
and triglycerides were determined by enzymatic colorimetric assay on a Roche
Cobas C311 analyser (Roche/Hitachi Cobas c systems, United Kingdom). Glucose
was measured by Glucose hexokinase/ Glucose 6 phosphate dehydrogenase assay
on a Roche Cobas C311 analyser (Roche/Hitachi Cobas c systems, United
Kingdom). Insulin was measured by sandwich electrochemiluminescence
immunoassay “ECLIA” using a Roche 411 Immunology analyser (cat. no.
12017547122, Roche/Hitachi Cobas c systems, United Kingdom). CRP was
measured by the immunoturbidimetric assay Cardiac C-Reactive Protein (Latex)
High Sensitivity kit (Roche/Hitachi Cobas c systems, United Kingdom). Alanine
Aminotransferase (ALT), Aspartate aminotransferase (AST), Glutamyl transferase
(GGT) was measured using a Roche Cobas C311 analyser. NEFA in plasma was
Chapter 2 67
measured by autoanalyzer. All tests listed above were carried out by Mrs. Josephine
Cooney, in the Department of Metabolic Medicine, University of Glasgow.
Glycerol in plasma was measured by enzymatic colorimetric assay using a glycerol
assay (cat. no. GY105, Randox, UK), glycerol standard (cat. no. G7793, Sigma) and
glycerol control (cat. no. GY1369, Randox, UK) the plate was read on a microplate
spectrophotometer at 520 nm. IL-6 (HS600C), TNF-α (HSTA00E) and adiponectin
(DRP300) were measured by quantative sandwich ELISA assay (R&D laboratories,
UK). Oxidized LDL (oxLDL) was measured by sandwich ELISA (cat. no. 10114301,
Mercodia, Sweden).
2.7.1 Insulin resistance estimated by the homeostasis model assessment-estimated insulin resistance (HOMA-IR)
The HOMA-IR was developed by Matthews et al. (1985). HOMA-IR has been widely
used for the estimation of insulin resistance. HOMA-IR has been the most frequently
employed technique both in clinical practice and in epidemiological studies, due to
the simplicity of its determination and calculation. HOMA-IR was calculated using
the following formula (fasting plasma insulin in mU/l X fasting plasma glucose in
mmol/l)/22.5 (Wallace et al., 2004). Low HOMA-IR values indicate high insulin
sensitivity, whereas high HOMA-IR values indicate low insulin sensitivity (insulin
resistance) (Matthews et al., 1985).
2.8 Early pregnancy study
2.8.1 Subjects
This study utilized plasma samples from an archival collection of women undergoing
frozen embryo transfer (Meyer et al., 2016). This was a prospective, observational
study conducted at Glasgow Royal Infirmary and was approved by the Local
Research Ethics Committee (07/S0704/49). Plasma samples were collected from
women undergoing frozen embryo transfer (FET) treatment for infertility and were
recruited from the Assisted Conception Unit between October 2007 and April 2010
(Meyer et al., 2016). Samples were stored at -80ºC.
Chapter 2 68
2.8.2 Study design
Women were eligible for the study if they had a regular menstrual cycle. Patients
who had ovulation stimulation or induction were excluded. No progesterone
supplementation or other hormonal supplements were given. All women were
recommended to take 400 mg per day of folic acid in line with World Health
Organization guidelines. Women were informed of the study when notifying the clinic
nurse of their last menstrual period (LMP) date with a view to booking FET
treatment. At day 10 after LMP, the women attended the Assisted Conception Unit
to commence daily hormonal sampling to detect the luteinizing hormone (LH) surge
in order to time embryo replacement. At this point women provided written informed
consent and a basal blood sample. Embryo transfer was performed on day 3 post-
LH surge. Information on patient demographics and fertility history was collected
from patient notes. Patient height and weight data were collected at the pre-LH
surge visit. Body mass index (BMI) was calculated as weight in kg divided by height
in meters squared. Fasting blood samples were collected at day 10 after LMP (pre-
LH surge) and on days 18, 29, and 45 post-LH surge. Plasma was collected by low-
speed centrifugation and frozen at -80°C within 2 hours.
2.8.2.1 Preparation of density solution
1.006 g/ml density solution was prepared by adding 11.4g NaCl, 0.1g EDTA, 1000ml
distilled water (dH2O) and 1ml N NaOH. The solution density was checked using a
PAAR DMA 35 Density meter (cat. no. 84138, Paar Scientific Ltd).
2.8.2.2 Isolation of VLDL by sequential density ultracentrifugation
EDTA plasma (500 μL) was overlaid with 500 μl density solution (density (d) <1.006
g/mL) in 11*34mm Thick wall Polycarbonate Optima Ultracentrifuge tubes (cat. no.
343778, Beckman Instruments Inc., UK). The samples were then transferred to a
TLA 120.2 rotor and the lid secured. Using a Optima TLX Table-Top Ultracentrifuge
the samples were centrifuged at 100,000 rpm (224000g) at 23 oC for 2.5 hours with
4 deceleration.
Using a drawn-out glass pipette, the top 500 µL fraction was removed from each
tube by placing the pipette on the edge of the meniscus to ensure removing the very
top fraction. The isolated VLDL (500 μL) was removed and divided into two tubes;
Chapter 2 69
both were stored at -20oC. One was sent for lipoprotein composition analysis, and
the other was used for FA extraction and later gas chromatography (GC) analysis.
2.8.2.3 Lipoprotein composition analysis
VLDL lipoprotein fraction triglycerides (TG), phospholipid (PL), total cholesterol
(TC), free cholesterol (FC), cholesteryl ester (CE), were analysed by autoanalyzer
and this was carried out by Mrs. Josephine Cooney, in department of Metabolic
Medicine, University of Glasgow.
2.8.3 Fatty acid extraction
2.8.3.1 Preparation of reagents
Methanol: toluene (4:1), with containing C21 fatty acid internal standard and
butylated hydroxytoluene (BHT) was prepared via the following steps. First, 0.02 g
of Heneicosanoic acid (H-5149, Sigma) was measured and transferred to a glass
bottle. Second, in the fume hood, 100 ml of toluene (BDH, 102846G) was measured
and added to the bottle. Third, 400 ml of methanol (BDH, 101586B) were added and
mixed with amagnetic stirrer. Finally, 0.05g of butylated hydroxy toluene (BHT)
(B1378, Sigma) were added and mixed with the previous solution under the fume
hood. Potassium carbonate (K2CO3) 10% w/v solution (101964H, BDH) was
prepared by mixing 100g of K2CO3 with 1L of distilled water.
2.8.3.2 Procedure
Fatty acids were extracted as described previously (Lepage and Roy, 1986). In a
fume hood, 2 mL of methanol: toluene 4:1 (w/v) + 0.01% BHT and 0.2 mL of 0.2
mg/mL 21:0 internal standard (Sigma-Aldrich, St. Louis, MO, USA) was added to
200 μL of VLDL in a Pyrex glass culture tube with a Teflon lined screw cap (Bibby
Sterilin, Staffordshire). Then 200 μL of acetyl chloride (100055V, BDH) was added
slowly while vortexing and sealed with Teflon tape (Z-104388, Sigma). The tubes
were heated on a heating block (DB.3D, TECHNE DRI-block) for 1 hour at 100oC in
the fume hood. The tubes were then cooled in a water bath in a metal rack for 15
minutes, after which 3 mL of 10% K2CO3 w/v solution was added and the tubes
vortexed. Then,100μl toluene were added and mixed. Tubes were centrifuged for
8min, at 3000 rpm at 5C using Jouan CR412 refrigerated centrifuge. The upper
Chapter 2 70
toluene phase was transferred to a GC vial (Supelco) using a glass Pasteur pipette.
Tubes were stored at - 20C until required for injection or transport.
After VLDL isolation and FA extraction was carried out by the researcher, samples
were shipped to our collaborator at Wollongong University in Australia and Gas
Chromatography analysis was carried out by Nicola Zamai.
2.8.4 Gas Chromatography (GC)
The VLDL fatty acids were analysed by flame-ionization gas chromatography
(model GC-17A; Shimadzu, Rydalmere, NSW, Australia). A 50 m x 0.25 mm internal
diameter capillary column was used. Oven temperature was initially set at 150oC
and rose to 170oC at a rate of 10
oC/min, then to 200
oC at a rate of 2
oC/min, and
finally to 211oC at a rate of 1.3
oC/min. A 1 μL of sample was injected into the column,
and individual fatty acids were identified by comparison with known fatty acid
standards (Nu-Chek and Sigma, Sydney, NSW, Australia) and quantified by
comparison with the 21:0 internal standard using Shimadzu analysis software
(Class-VP 7.2.1 SP1).
2.9 Statistical analysis
Data distribution was assessed by Ryan Joiner test and was log or square root
transformed where appropriate to achieve a normal distribution. Two sample T test
was used for comparisons between groups (Control Vs GDM). Paired t test was
used for comparison of SAT vs VAT. Data were expressed as mean and standard
deviation. For non-parametric data, Mann-Whitney U test was used, and data were
expressed as median and inter quartile range. To assess association between
variables, Pearson’s correlation coefficient was used, and results were expressed
as r value and P value. A P value of <0.05 was considered significant. Multiple
testing was carried out using post hoc Tukey-Kramer honest significant difference
(HSD) test. More specific detailed statistical analysis is provided within the relevant
chapters. Minitab version 18 was used for experimental data analysis.
71
Chapter 3 Pregnancy outcomes in women with underweight, overweight and obese BMI and gestational diabetes in Greater Glasgow and Clyde, 2010 to 2015: a retrospective cohort using linked national datasets
3.1 Introduction
The worldwide prevalence of obesity has increased markedly over the past few
decades posing serious threat to public health. Obesity among women who are
pregnant is of particular concern as it carries additional risk for the baby. Obesity
during pregnancy is defined as body mass index (BMI) >30 kg/m2. It affects
between16 and 18% of the antenatal population as reported in two observational
studies conducted between 2002 and 2004 in maternity units in Glasgow and north
England, respectively (Kanagalingam et al., 2005, Heslehurst et al., 2010b).
Maternal obesity has been recognised to affect maternal, fetal and neonatal
outcomes. These include: preeclampsia (PE) (O’brien et al., 2003), gestational
diabetes mellitus (GDM), operative delivery (Sebire et al., 2001b), fetal macrosomia,
birth injury (Cedergren, 2004), stillbirth (Nohr et al., 2005) and neonatal intensive
care unit (NICU) admission (Heslehurst et al., 2008). In addition to maternal obesity,
being an overweight mother was also shown to increase the risk of several
pregnancy complications such as GDM, caesarean delivery, fetal macrosomia
(Abrams and Parker, 1988) and birth asphyxia related complications (Persson et al.,
2014). At the other end of the spectrum, being underweight has long been
recognised as presenting increased risk of low fetal birth weight and preterm
delivery (Sebire et al., 2001a).
The incidence of gestational diabetes mellitus (GDM) is increasing worldwide,
secondary to the epidemic rise in maternal obesity. GDM is a heterogeneous
disorder with adverse maternal and fetal consequences. As discussed in the general
introduction, metabolic complications during pregnancy such as maternal obesity,
GDM and pre-eclampsia seems to be an early marker of disturbances in insulin
sensitivity, lipid metabolism and endothelial function later in life. The development
of pregnancy metabolic complication such as GDM and PE could predict the future
risk of T2DM and CVD in the mother (Bilhartz et al., 2011). Research into the
developmental origins of disease have suggested that intrauterine environment may
Chapter 3 72
have significant influence on fetal growth and the later development of disease in
the offspring (Barker, 1998). Childhood obesity poses a substantial risk of a future
epidemic of CVD in early adulthood (Logue and Sattar, 2011). Thus, the higher
prevalence of maternal obesity and GDM among women of reproductive age from
high risk ethnicities or in socially deprived areas may have major health
consequences across generations.
Given the fact that many factors associated with increased maternal and fetal
morbidity and mortality are not amenable to intervention, evidence has suggested
that maternal weight control before pregnancy might offer an opportunity for
reduction of gestational adverse outcomes. Therefore, the purpose of the analysis
in this chapter was to assess the impact of first-trimester high (and low) BMI on the
subsequent development of clinical complications later in pregnancy, in a
retrospectively evaluated cohort of women representing a real-world sample of the
general population in Greater Glasgow and Clyde. Using the Scottish Morbidity
Record 2 (SMR02), maternal and fetal information was obtained about obstetric
events. To derive a more robust diabetes status diagnosis, the data from SMR02
was then merged with data from the Scottish Care Information – Diabetes Mellitus
(SCI-diabetes) database using the patient ID held by the NHS Greater Glasgow &
Clyde Safe Haven. This merge resulted in dataset containing no patient identifiable
information and was provided to the researcher through a secure access portal. The
study period was chosen from 2010- 2015 due to improved BMI recording compared
to the period before and to avoid selective recording of women with higher BMI.
Maternal BMI was examined as a categorical variable to provide better information
about women at the extreme ends of the spectrum because BMI is not linearly
associated with obstetric complications which tends to affect women with higher BMI
(El-Chaar et al., 2013). The study subjects were mothers with different levels of
socio-economic status, including women who lived in areas that were socially
deprived.
3.2 Aims
1. To describe the characteristics of pregnant women with or without obesity
and/or gestational diabetes.
Chapter 3 73
2. To estimate the prevalence of obesity and gestational diabetes in pregnant
women recorded within a single health board in the SMR02 and SCI-diabetes
databases.
3. To examine the outcomes of pregnancy in women who are underweight,
overweight or obese compared to normal weight women.
4. To examine the outcomes of pregnancy in women who develop GDM.
3.3 Specific research questions
1. What are the pregnancy outcomes and their frequency for women with
gestational diabetes and those who are overweight or obese?
2. How do obesity and gestational diabetes affect the following key outcomes
from SMR02: mode of delivery, outcome of pregnancy (live, stillbirth), birth
weight adjusted for sex, gestational age at delivery and parity (z score for
birth weight), maternal smoking, parity, APGAR score at 5 minutes, feeding
intention at discharge.
3. How do outcomes compare depending on ethnicity, social deprivation
(quintiles of the Scottish Index of Multiple Deprivation (SIMD)) and age?
Chapter 3 74
3.4 Materials and methods
3.4.1 Data source
Approval for this study was obtained from NHS Greater Glasgow & Clyde Safe
Haven GSH/16/DI/005. Anonymised data was retrieved retrospectively on all
singleton deliveries in Greater Glasgow and Clyde, between 1 January 2010 and 1
January 2016, from the SMR02 held at the Information Services Division (ISD) of
NHS Scotland. An SMR02 dataset collects episode-level data of discharge
information every time a mother had an obstetric event, and includes information on
mother and baby characteristics, such as maternal age, maternal weight and height,
baby birth weight, gestational age, mode of delivery, and outcome of pregnancy.
The SMR02 covers all obstetric events in Scotland. This dataset has been shown
to include 98.5% of births in comparison with the number of births registered by
National Records of Scotland. The register is subject to regular data quality
assessment, the most recent quality assurance showed that all data items were 90%
or more complete in comparison with the medical record/Scottish Women Held
Maternity Record (SWHMR), therefore, the register is considered robust
(Information Services Division Scotland, 2010).
Data on diabetes diagnoses was obtained from the SCI-diabetes dataset (McKnight
et al., 2008). This dynamic clinical register was established in 2000, and currently
collates demographic and clinical data for people with a diagnosis of diabetes in
Scotland. From 2004 onwards, the coverage of the register was estimated to be
99.5% for people diagnosed with diabetes in Scotland (Anwar et al., 2011). Diabetes
type was defined in this register using an algorithm which utilises age at diagnosis,
prescriptions data, and clinically assigned type of diabetes (Anwar et al., 2011).
Information from SMR02 was linked with the national diabetes register SCI-diabetes
network using the community health index number (CHI) to allow the identification
of pregnancies in mothers with diabetes and subsequent perinatal outcomes. GDM
diagnosis was coded in both clinical records of SCI-DM and SMR02. Data was
extracted from the SCI-diabetes dataset in March 2017, which was then linked to
the SMR02 hospital episode dataset by NHS Greater Glasgow and Clyde Safe
Haven. This linkage produced a dataset with no patient-identifiable information and
was provided to the researcher through secure Safe haven access.
Chapter 3 75
3.4.2 Demographic information and clinical outcomes
The following demographic information was extracted from SMR02 for every
pregnant woman: maternal age, parity, height, weight, ethnicity, smoking status
during pregnancy and deprivation category, at booking visit (~14 weeks pregnant).
Maternal age was 100% complete in our cohort while there was only 0.2% missing
information regarding parity. Maternal smoking information during pregnancy was
81% complete in SMR02 and coded as current smoker, current non-smoker and
unknown (Information Services Division Scotland, 2010).
Maternal BMI was calculated from the mother’s height and weight (weight
(kilograms)/ height2 (meter2), which were measured at the booking visit by a trained
midwife. Within SMR02, height and weight were 72-79% complete (Information
Services Division Scotland, 2010). This is due to some hospitals incorrectly mis-
assigned data for weight and duration of labour which lead to miss recorded BMI
within the dataset. Furthermore, height was an optional data item which contributed
to the missing BMI data. In our study height values were deemed valid within the
range 100–250 cm, and weight was considered valid within the range 30–250 kg.
Women were grouped into six BMI categories based on the WHO classification:
underweight (UW<18.5 kg/m2), normal weight (NW=18.5–24.9 kg/m2), overweight
(OW=25–29.9 kg/m2), obese class 1 (OB1=30–34.9 kg/m2), obese class 2
(OB2=35–39.9 kg/m2) and obese class 3 (OB3≥40 kg/m2) (World Health
Organization, 2000). The reference group for all analysis were women with normal
weight. We also used BMI as a continuous variable to investigate associations over
the entire range of body weight.
Maternal deprivation was categorized using a tool for measurement of social
deprivation, the SIMD 2009 deciles corrected version 2 (SIMD 2009v2), with 1 being
the most deprived and 10 being the least deprived. The SIMD dataset identifies
small areas where there are concentrations of multiple deprivations. It combines
many indicators in several domains as a measure of multiple deprivation such as
income, employment, education, housing, health, crime, and geographical access.
Each data zone was ranked according to the overall score from a range of indicators
which together creates the index. Ranks were grouped in categories such as deciles
and quantiles. The SIMD 2009v2 used 2001 Data Zones which were introduced in
2004 to replace post code as the key small area geography in Scotland (Information
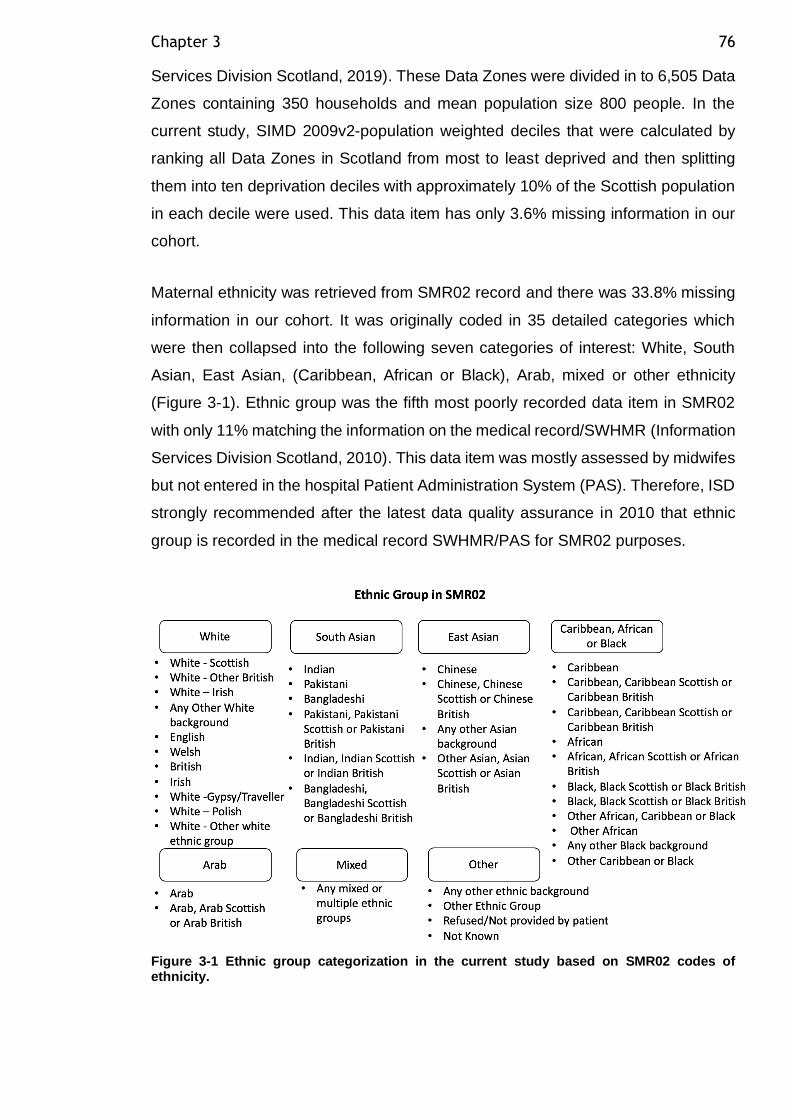
Chapter 3 76
Services Division Scotland, 2019). These Data Zones were divided in to 6,505 Data
Zones containing 350 households and mean population size 800 people. In the
current study, SIMD 2009v2-population weighted deciles that were calculated by
ranking all Data Zones in Scotland from most to least deprived and then splitting
them into ten deprivation deciles with approximately 10% of the Scottish population
in each decile were used. This data item has only 3.6% missing information in our
cohort.
Maternal ethnicity was retrieved from SMR02 record and there was 33.8% missing
information in our cohort. It was originally coded in 35 detailed categories which
were then collapsed into the following seven categories of interest: White, South
Asian, East Asian, (Caribbean, African or Black), Arab, mixed or other ethnicity
(Figure 3-1). Ethnic group was the fifth most poorly recorded data item in SMR02
with only 11% matching the information on the medical record/SWHMR (Information
Services Division Scotland, 2010). This data item was mostly assessed by midwifes
but not entered in the hospital Patient Administration System (PAS). Therefore, ISD
strongly recommended after the latest data quality assurance in 2010 that ethnic
group is recorded in the medical record SWHMR/PAS for SMR02 purposes.
Figure 3-1 Ethnic group categorization in the current study based on SMR02 codes of ethnicity.
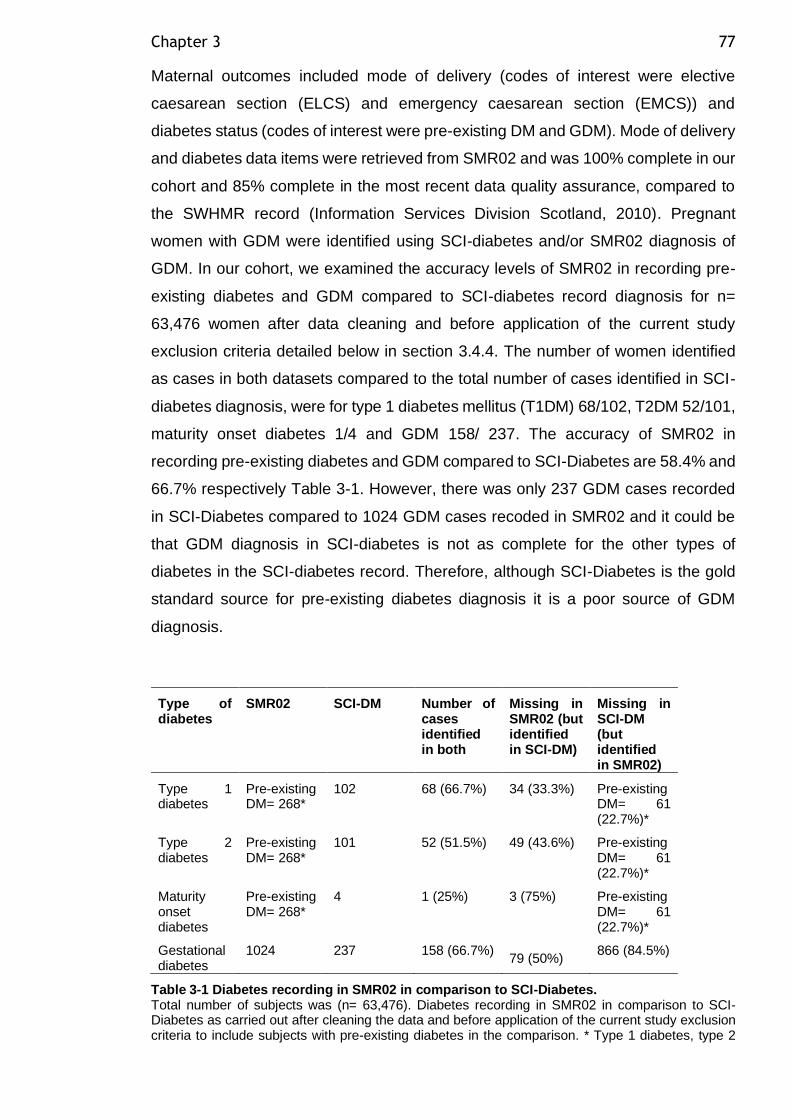
Chapter 3 77
Maternal outcomes included mode of delivery (codes of interest were elective
caesarean section (ELCS) and emergency caesarean section (EMCS)) and
diabetes status (codes of interest were pre-existing DM and GDM). Mode of delivery
and diabetes data items were retrieved from SMR02 and was 100% complete in our
cohort and 85% complete in the most recent data quality assurance, compared to
the SWHMR record (Information Services Division Scotland, 2010). Pregnant
women with GDM were identified using SCI-diabetes and/or SMR02 diagnosis of
GDM. In our cohort, we examined the accuracy levels of SMR02 in recording pre-
existing diabetes and GDM compared to SCI-diabetes record diagnosis for n=
63,476 women after data cleaning and before application of the current study
exclusion criteria detailed below in section 3.4.4. The number of women identified
as cases in both datasets compared to the total number of cases identified in SCI-
diabetes diagnosis, were for type 1 diabetes mellitus (T1DM) 68/102, T2DM 52/101,
maturity onset diabetes 1/4 and GDM 158/ 237. The accuracy of SMR02 in
recording pre-existing diabetes and GDM compared to SCI-Diabetes are 58.4% and
66.7% respectively Table 3-1. However, there was only 237 GDM cases recorded
in SCI-Diabetes compared to 1024 GDM cases recoded in SMR02 and it could be
that GDM diagnosis in SCI-diabetes is not as complete for the other types of
diabetes in the SCI-diabetes record. Therefore, although SCI-Diabetes is the gold
standard source for pre-existing diabetes diagnosis it is a poor source of GDM
diagnosis.
Type of diabetes
SMR02 SCI-DM Number of cases identified in both
Missing in SMR02 (but identified in SCI-DM)
Missing in SCI-DM (but identified in SMR02)
Type 1 diabetes
Pre-existing DM= 268*
102 68 (66.7%) 34 (33.3%) Pre-existing DM= 61 (22.7%)*
Type 2 diabetes
Pre-existing DM= 268*
101 52 (51.5%) 49 (43.6%) Pre-existing DM= 61 (22.7%)*
Maturity onset diabetes
Pre-existing DM= 268*
4 1 (25%) 3 (75%) Pre-existing DM= 61 (22.7%)*
Gestational diabetes
1024 237 158 (66.7%) 79 (50%)
866 (84.5%)
Table 3-1 Diabetes recording in SMR02 in comparison to SCI-Diabetes. Total number of subjects was (n= 63,476). Diabetes recording in SMR02 in comparison to SCI-Diabetes as carried out after cleaning the data and before application of the current study exclusion criteria to include subjects with pre-existing diabetes in the comparison. * Type 1 diabetes, type 2
Chapter 3 78
diabetes and maturity onset diabetes was recorded in one category in SMR02 as pre-existing diabetes.
Offspring outcomes were extracted from the SMR02 record and included
gestational age, birthweight, birth outcome (codes of interest were live birth, stillbirth
and perinatal death), feeding intention at discharge (coded as breast, formula, mixed
breast and formula or unknown) and APGAR score at 5 minutes (coded as score
from 1 to 10), all were more than 99% complete in the cohort. Gestational age at
birth was reported in completed weeks as estimated by the clinicians based on
ultrasound dating scan at early pregnancy and last menstrual period date.
Gestational age confirmation by ultrasound in early pregnancy is the usual practice
in the UK and it has been more than 95% complete for pregnant women since the
early 1990s (Campbell and Soothill, 1993). Gestational age at delivery was deemed
valid if it was 43 and 22 weeks of gestation, 22 weeks is the lowest gestational
age for infant’s survival after the recent advances in neonatal intensive care. Infant
APGAR score was used as an index to evaluate the neonate’s overall health status
and response to resuscitation. The resulting scores ranged from zero to 10 and were
evaluated at 5 minutes after birth. Low infant APGAR score at 5 minutes is
associated with an increased risk of neonatal and infant death (Zhu et al., 2015).
Birth weight z score was calculated and adjusted for gestational age, sex and parity
using a set of standard LMS-tables derived from Scottish data on 100,133 singleton
births from the years 1998–2003 (Bonellie et al., 2008). Birthweight centiles are
used to monitor the birthweight of an individual offspring in the context of the mean
population birthweight when plotted against gestational age. These centiles were
calculated using the LMS method which uses the Box-Cox power transformation to
obtain normally distributed data within each group (Cole, 1988). This involves
estimating three sets of values for each gestational age group, (L) the power
transformation used to achieve normality, (M) the median birthweight and (S) the
coefficient of variation of the data. The L, M and S values are estimated for each
gestational age and then smoothed curves are fitted using cubic splines to give L(t),
M(t) and S(t) where t is the gestational age (Bonellie et al., 2008). There were 227
(0.6%) missing birthweight z scores due to missing information on birthweight,
gestational age, baby sex and/or parity.
The selection of covariates was based on the published literature, and bi-variable
logistic regression analysis was performed to identify potentially confounding
Chapter 3 79
factors. We considered the following factors to be potential confounders: continuous
factors (maternal age at delivery, parity and z score of birth weight) and categorical
variables (smoking during pregnancy, ethnicity, SIMD and APGAR score).
3.4.3 Definitions
Stillbirth was defined as a child born after 24 weeks of gestation, who did not breathe
or show signs of life.
Perinatal death was considered as a combination of stillbirth and death in the first
week of life.
Large for gestational age (LGA) infants were those weighing above the 90th centile
at birth, corrected for gestational age, sex and parity.
Delivery was considered preterm if gestation was less than 37 weeks and
considered very preterm if gestation was less than 32 weeks.
The APGAR score used as an index to evaluate the neonate’s overall health and
response to resuscitation and is evaluated at 1, 5 and 10 minutes after birth.
3.4.4 Data linkage
The original dataset for analysis included 144,167 pregnancies. After exclusion of
non-delivery admission (identified with missing delivery date), 65,054 pregnancies
were identified in SMR02 between 1 January 2009 and 1 January 2016 (Figure 3-2).
We excluded 354 pregnancies, as the maternal weight and height were mis-
recorded and out of the height (100–250 cm) and weight ranges (30–250 kg) we
considered. Data for 64,700 pregnancies were merged with the SCI-diabetes
database using patient ID. A further 968 pregnancies were removed due to twin
pregnancy. Gestational age was either less than 22 weeks or more than 43 weeks
for 192 pregnancies, which were removed. We included only the first pregnancy for
each woman; therefore, 13,615 pregnancies, for women who had an additional
pregnancy over the study period were not included. Due to the low number of
pregnancies recorded in SMR02 in 2009 and 2016, those two calendar years were
excluded from our analysis (Table 3-2).
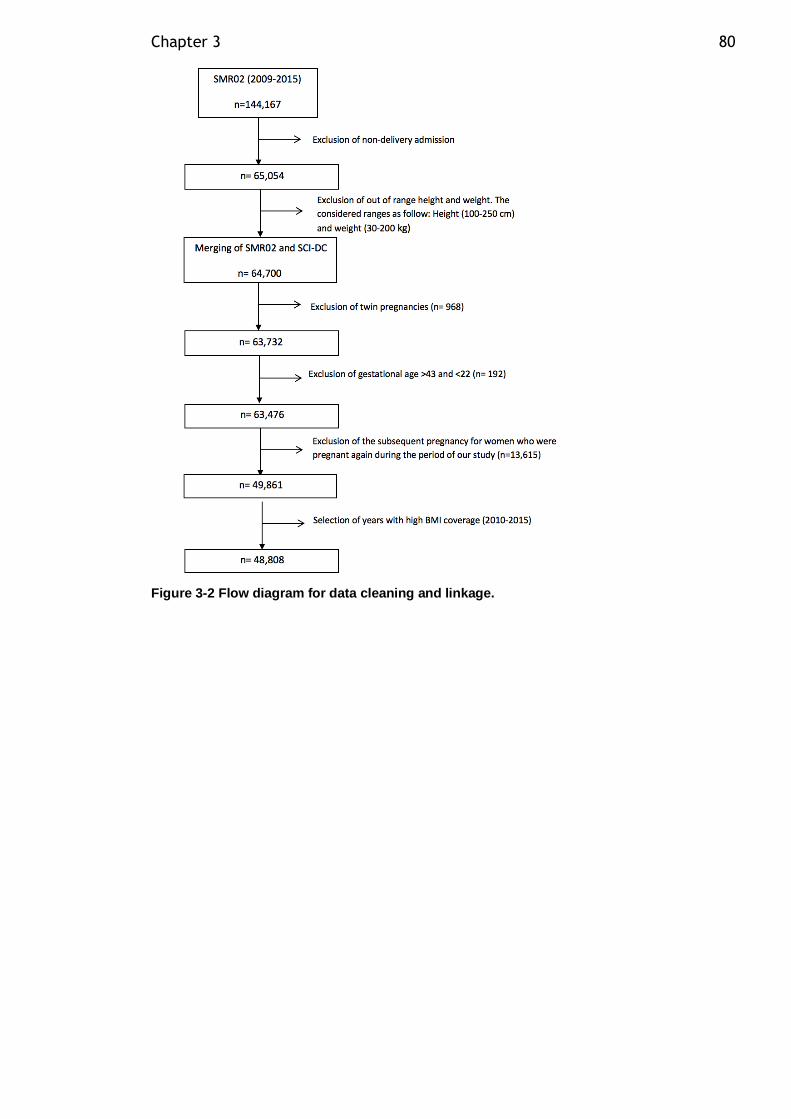
Chapter 3 80
Figure 3-2 Flow diagram for data cleaning and linkage.
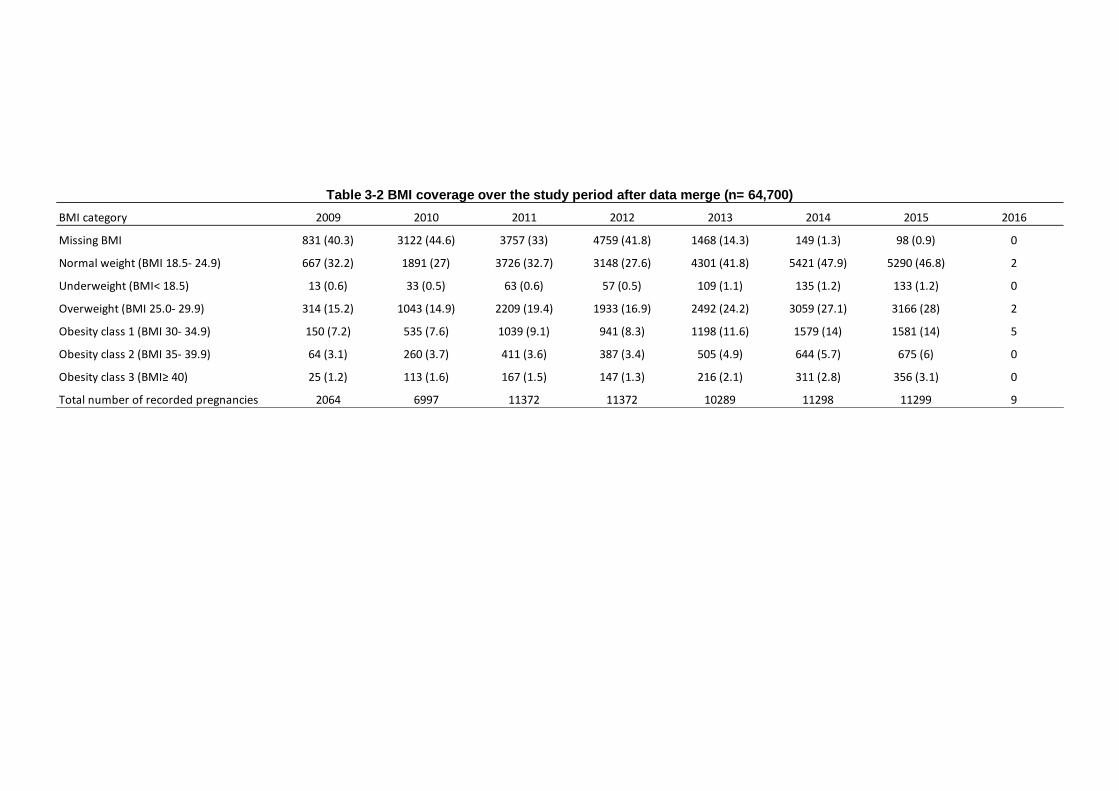
Table 3-2 BMI coverage over the study period after data merge (n= 64,700)
BMI category 2009 2010 2011 2012 2013 2014 2015 2016
Missing BMI 831 (40.3) 3122 (44.6) 3757 (33) 4759 (41.8) 1468 (14.3) 149 (1.3) 98 (0.9) 0
Normal weight (BMI 18.5- 24.9) 667 (32.2) 1891 (27) 3726 (32.7) 3148 (27.6) 4301 (41.8) 5421 (47.9) 5290 (46.8) 2
Underweight (BMI< 18.5) 13 (0.6) 33 (0.5) 63 (0.6) 57 (0.5) 109 (1.1) 135 (1.2) 133 (1.2) 0
Overweight (BMI 25.0- 29.9) 314 (15.2) 1043 (14.9) 2209 (19.4) 1933 (16.9) 2492 (24.2) 3059 (27.1) 3166 (28) 2
Obesity class 1 (BMI 30- 34.9) 150 (7.2) 535 (7.6) 1039 (9.1) 941 (8.3) 1198 (11.6) 1579 (14) 1581 (14) 5
Obesity class 2 (BMI 35- 39.9) 64 (3.1) 260 (3.7) 411 (3.6) 387 (3.4) 505 (4.9) 644 (5.7) 675 (6) 0
Obesity class 3 (BMI≥ 40) 25 (1.2) 113 (1.6) 167 (1.5) 147 (1.3) 216 (2.1) 311 (2.8) 356 (3.1) 0
Total number of recorded pregnancies 2064 6997 11372 11372 10289 11298 11299 9
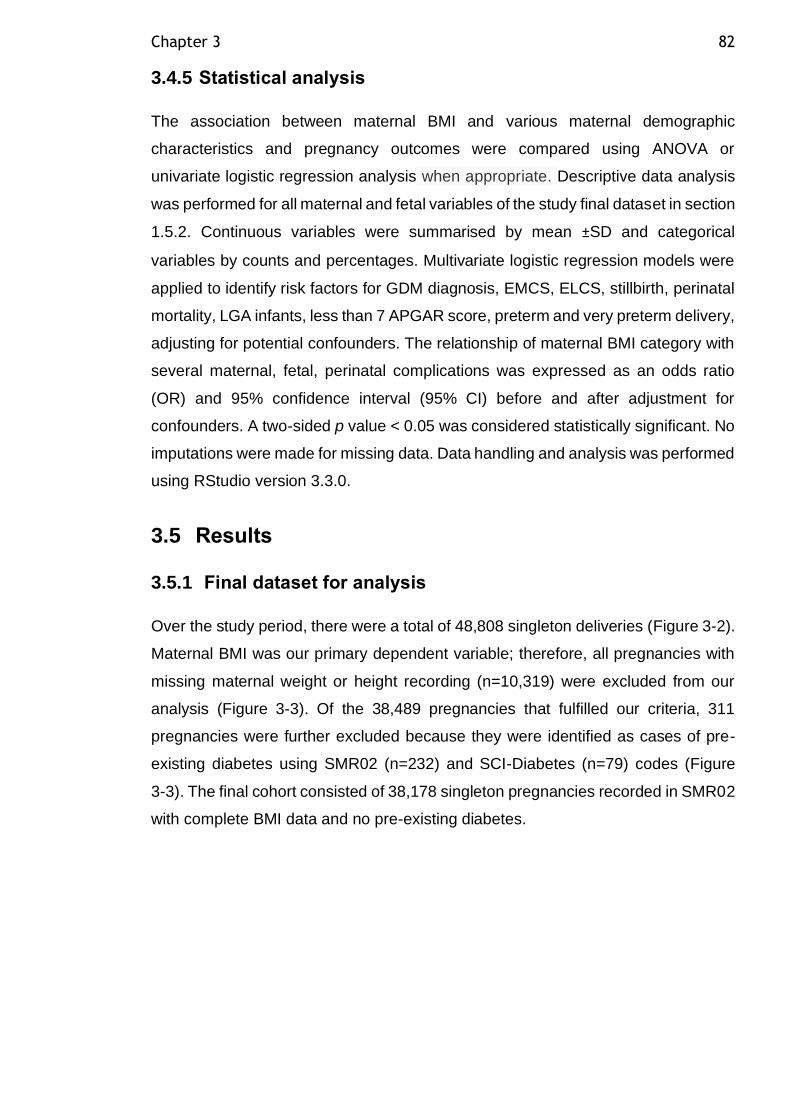
Chapter 3 82
3.4.5 Statistical analysis
The association between maternal BMI and various maternal demographic
characteristics and pregnancy outcomes were compared using ANOVA or
univariate logistic regression analysis when appropriate. Descriptive data analysis
was performed for all maternal and fetal variables of the study final dataset in section
1.5.2. Continuous variables were summarised by mean ±SD and categorical
variables by counts and percentages. Multivariate logistic regression models were
applied to identify risk factors for GDM diagnosis, EMCS, ELCS, stillbirth, perinatal
mortality, LGA infants, less than 7 APGAR score, preterm and very preterm delivery,
adjusting for potential confounders. The relationship of maternal BMI category with
several maternal, fetal, perinatal complications was expressed as an odds ratio
(OR) and 95% confidence interval (95% CI) before and after adjustment for
confounders. A two-sided p value < 0.05 was considered statistically significant. No
imputations were made for missing data. Data handling and analysis was performed
using RStudio version 3.3.0.
3.5 Results
3.5.1 Final dataset for analysis
Over the study period, there were a total of 48,808 singleton deliveries (Figure 3-2).
Maternal BMI was our primary dependent variable; therefore, all pregnancies with
missing maternal weight or height recording (n=10,319) were excluded from our
analysis (Figure 3-3). Of the 38,489 pregnancies that fulfilled our criteria, 311
pregnancies were further excluded because they were identified as cases of pre-
existing diabetes using SMR02 (n=232) and SCI-Diabetes (n=79) codes (Figure
3-3). The final cohort consisted of 38,178 singleton pregnancies recorded in SMR02
with complete BMI data and no pre-existing diabetes.
Chapter 3 83
Figure 3-3 Flow diagram for the study exclusions.
3.5.2 Maternal BMI and clinical outcomes
The maternal characteristics and the prevalence of maternal, delivery and neonatal
outcomes are summarised in (Table 3-3). Fifty percent of pregnancies were
classified as overweight or obese from the total cohort: 28.2% were overweight,
13.8% were obese class 1, 5.9% were obese class 2, and 2.7% were obese class
3. Pregnant women with overweight and obesity were older and more multiparous
compared with normal-weight women. Furthermore, underweight, overweight and
obese women formed a higher proportion of women in the most deprived SIMD and
formed a lower proportion of women in the least deprived SIMD, compared with
women of normal weight (P< 0.001). Mothers of African ethnic background was
more likely to be overweight or obese, while, mothers of South Asian ethnicity were
more likely to be underweight or overweight, but not obese. The proportion of
maternal smoking during pregnancy appeared higher among underweight women
but did not reach statistical significance.
There were marked differences in pregnancy outcomes between overweight and
obese mothers versus normal-weight mothers. Severely obese or underweight
women delivered earlier than normal-weight women. Among them, the proportion of
preterm delivery significantly increased, but not the proportion of very preterm
delivery. Overweight and obese mothers formed a much greater proportion of those
who had undergone ELCS and EMCS. Despite earlier delivery, mean birth weight
was higher for the offspring of overweight and obese mothers (OW, 109g; OB1,
132g; OB2, 157g; OB3, 148g higher compared to normal-weight mothers’ offspring
mean birth weight). The same pattern was observed for birthweight adjusted for
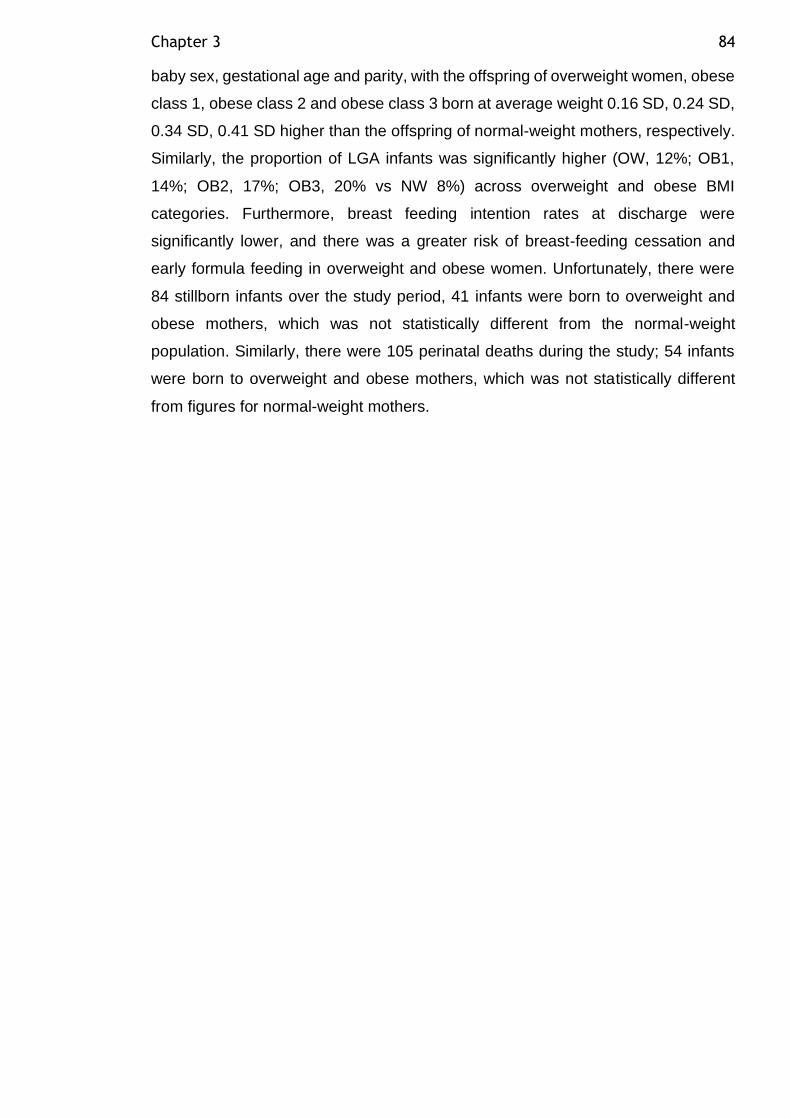
Chapter 3 84
baby sex, gestational age and parity, with the offspring of overweight women, obese
class 1, obese class 2 and obese class 3 born at average weight 0.16 SD, 0.24 SD,
0.34 SD, 0.41 SD higher than the offspring of normal-weight mothers, respectively.
Similarly, the proportion of LGA infants was significantly higher (OW, 12%; OB1,
14%; OB2, 17%; OB3, 20% vs NW 8%) across overweight and obese BMI
categories. Furthermore, breast feeding intention rates at discharge were
significantly lower, and there was a greater risk of breast-feeding cessation and
early formula feeding in overweight and obese women. Unfortunately, there were
84 stillborn infants over the study period, 41 infants were born to overweight and
obese mothers, which was not statistically different from the normal-weight
population. Similarly, there were 105 perinatal deaths during the study; 54 infants
were born to overweight and obese mothers, which was not statistically different
from figures for normal-weight mothers.
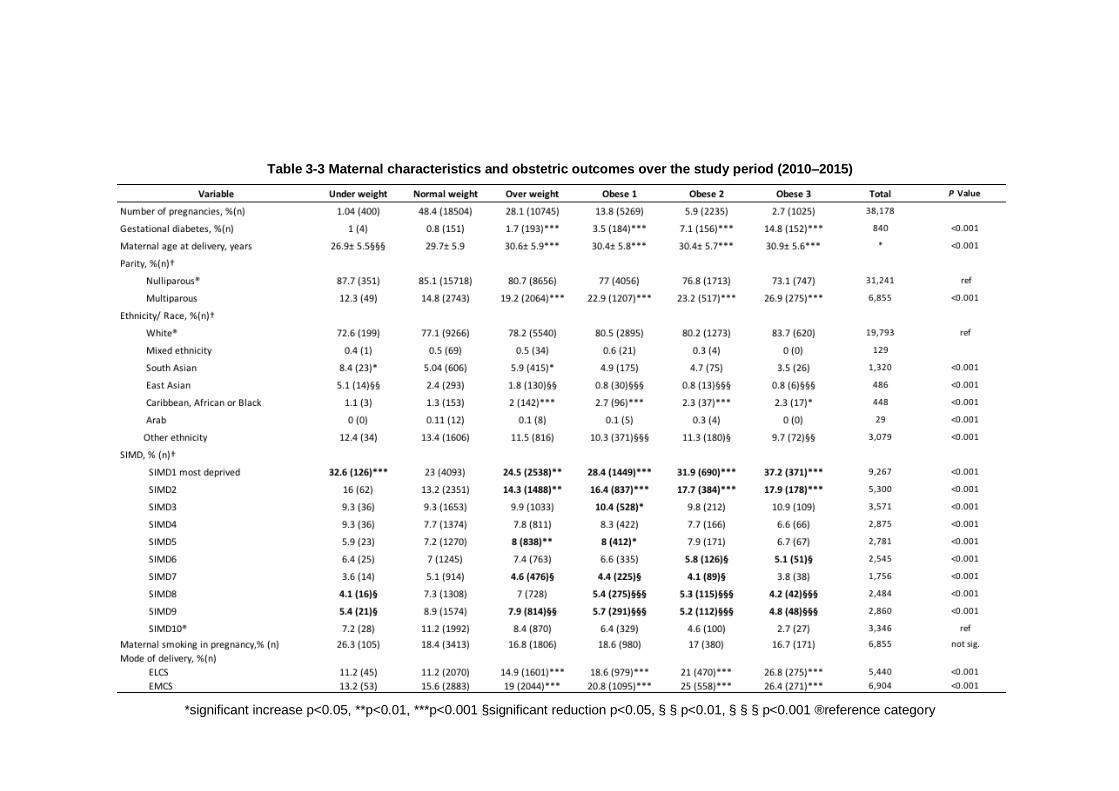
Table 3-3 Maternal characteristics and obstetric outcomes over the study period (2010–2015)
*significant increase p<0.05, **p<0.01, ***p<0.001 §significant reduction p<0.05, § § p<0.01, § § § p<0.001 ®reference category
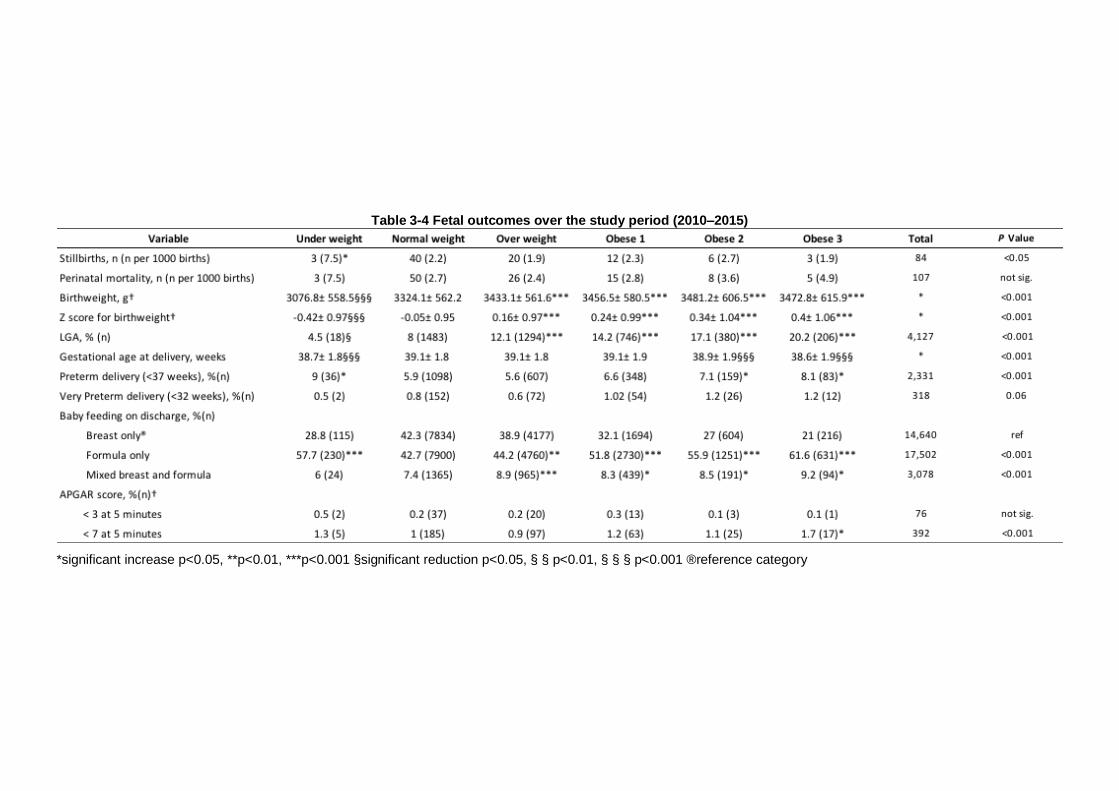
Table 3-4 Fetal outcomes over the study period (2010–2015)
*significant increase p<0.05, **p<0.01, ***p<0.001 §significant reduction p<0.05, § § p<0.01, § § § p<0.001 ®reference category

Chapter 3 87
Unadjusted odds ratios for the association between maternal BMI and several
obstetric outcomes are shown in Table 3-5. Maternal overweight and obesity was
strongly associated with risk of ELCS, EMCS and LGA. Mothers with morbid obesity
are at greater risk of having an infant with APGAR score below 7, but this
relationship disappeared after adjustment for confounders. Underweight women
had a greater risk for stillbirth, which disappeared after adjustment for confounders.
Table 3-5 Unadjusted odds ratios for the relationship of maternal BMI category and several maternal and fetal outcomes
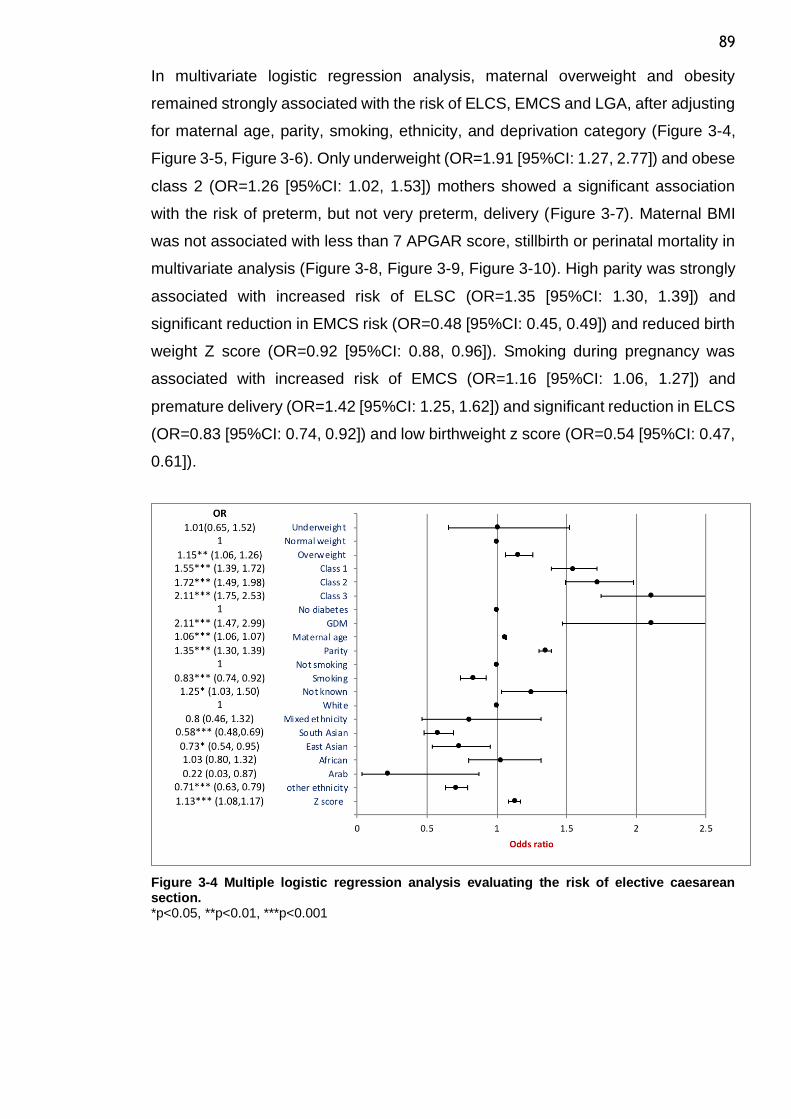
89
In multivariate logistic regression analysis, maternal overweight and obesity
remained strongly associated with the risk of ELCS, EMCS and LGA, after adjusting
for maternal age, parity, smoking, ethnicity, and deprivation category (Figure 3-4,
Figure 3-5, Figure 3-6). Only underweight (OR=1.91 [95%CI: 1.27, 2.77]) and obese
class 2 (OR=1.26 [95%CI: 1.02, 1.53]) mothers showed a significant association
with the risk of preterm, but not very preterm, delivery (Figure 3-7). Maternal BMI
was not associated with less than 7 APGAR score, stillbirth or perinatal mortality in
multivariate analysis (Figure 3-8, Figure 3-9, Figure 3-10). High parity was strongly
associated with increased risk of ELSC (OR=1.35 [95%CI: 1.30, 1.39]) and
significant reduction in EMCS risk (OR=0.48 [95%CI: 0.45, 0.49]) and reduced birth
weight Z score (OR=0.92 [95%CI: 0.88, 0.96]). Smoking during pregnancy was
associated with increased risk of EMCS (OR=1.16 [95%CI: 1.06, 1.27]) and
premature delivery (OR=1.42 [95%CI: 1.25, 1.62]) and significant reduction in ELCS
(OR=0.83 [95%CI: 0.74, 0.92]) and low birthweight z score (OR=0.54 [95%CI: 0.47,
0.61]).
Figure 3-4 Multiple logistic regression analysis evaluating the risk of elective caesarean section. *p<0.05, **p<0.01, ***p<0.001
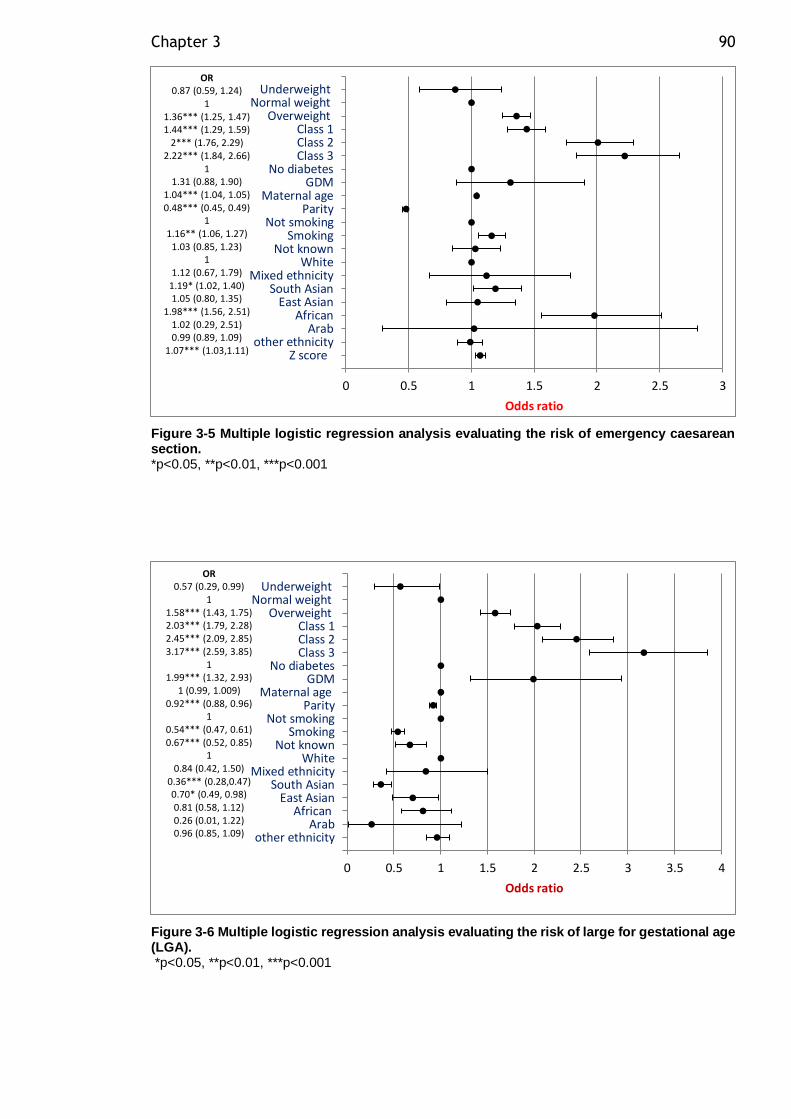
Chapter 3 90
Figure 3-5 Multiple logistic regression analysis evaluating the risk of emergency caesarean section. *p<0.05, **p<0.01, ***p<0.001
Figure 3-6 Multiple logistic regression analysis evaluating the risk of large for gestational age (LGA). *p<0.05, **p<0.01, ***p<0.001
0 0.5 1 1.5 2 2.5 3
Underweight Normal weight
Overweight Class 1 Class 2 Class 3
No diabetes GDM
Maternal ageParity
Not smoking Smoking
Not known White
Mixed ethnicity South Asian
East AsianAfrican Arab
other ethnicityZ score
Odds ratio
OR0.87 (0.59, 1.24)
11.36*** (1.25, 1.47)1.44*** (1.29, 1.59)
2*** (1.76, 2.29)2.22*** (1.84, 2.66)
11.31 (0.88, 1.90)
1.04*** (1.04, 1.05)0.48*** (0.45, 0.49)
11.16** (1.06, 1.27)
1.03 (0.85, 1.23)1
1.12 (0.67, 1.79)1.19* (1.02, 1.40)1.05 (0.80, 1.35)
1.98*** (1.56, 2.51)1.02 (0.29, 2.51)0.99 (0.89, 1.09)
1.07*** (1.03,1.11)
0 0.5 1 1.5 2 2.5 3 3.5 4
Underweight Normal weight
Overweight Class 1 Class 2 Class 3
No diabetes GDM
Maternal ageParity
Not smoking Smoking
Not known White
Mixed ethnicity South Asian
East AsianAfrican
Arabother ethnicity
Odds ratio
OR0.57 (0.29, 0.99)
11.58*** (1.43, 1.75)2.03*** (1.79, 2.28)2.45*** (2.09, 2.85)3.17*** (2.59, 3.85)
11.99*** (1.32, 2.93)
1 (0.99, 1.009)0.92*** (0.88, 0.96)
10.54*** (0.47, 0.61)0.67*** (0.52, 0.85)
10.84 (0.42, 1.50)
0.36*** (0.28,0.47)0.70* (0.49, 0.98)0.81 (0.58, 1.12)0.26 (0.01, 1.22)0.96 (0.85, 1.09)
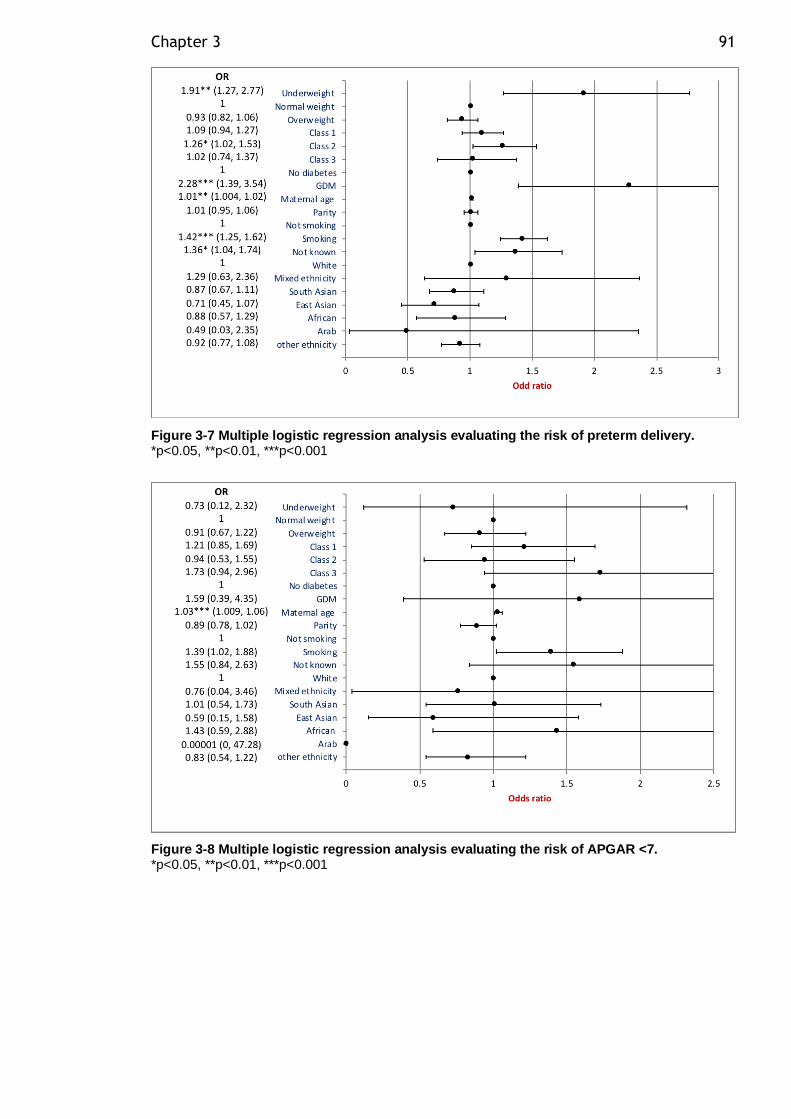
Chapter 3 91
Figure 3-7 Multiple logistic regression analysis evaluating the risk of preterm delivery. *p<0.05, **p<0.01, ***p<0.001
Figure 3-8 Multiple logistic regression analysis evaluating the risk of APGAR <7. *p<0.05, **p<0.01, ***p<0.001
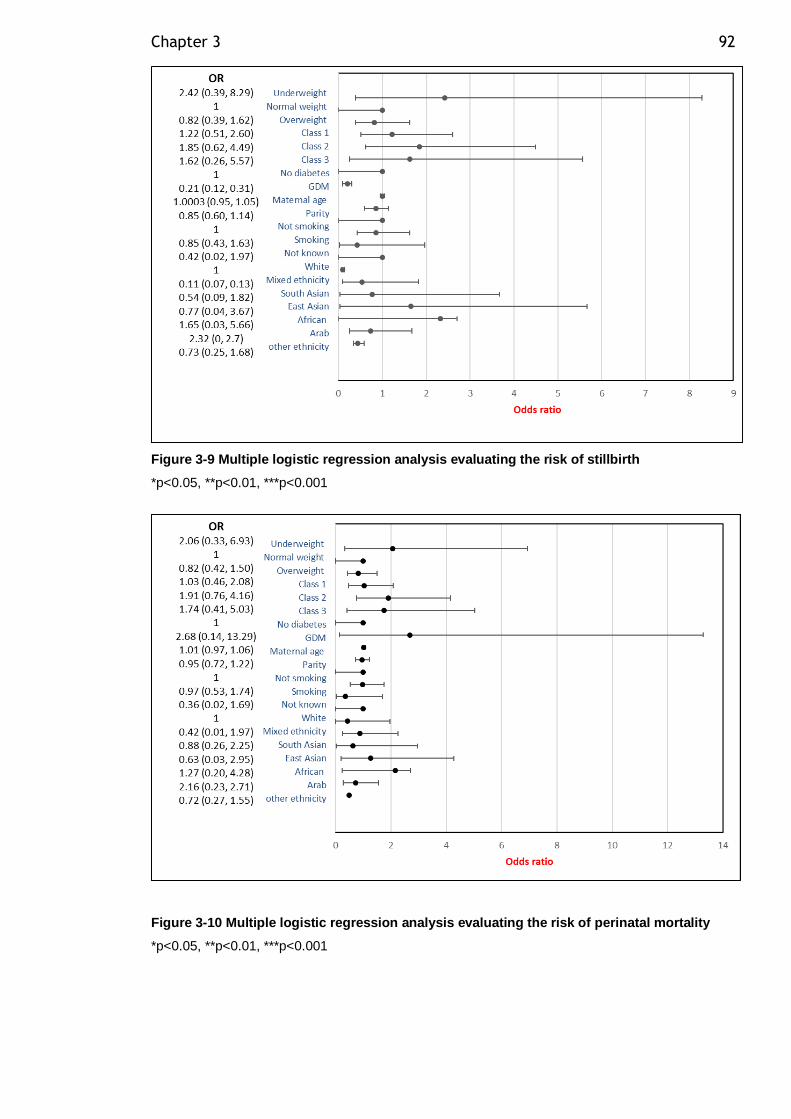
Chapter 3 92
Figure 3-9 Multiple logistic regression analysis evaluating the risk of stillbirth
*p<0.05, **p<0.01, ***p<0.001
Figure 3-10 Multiple logistic regression analysis evaluating the risk of perinatal mortality
*p<0.05, **p<0.01, ***p<0.001
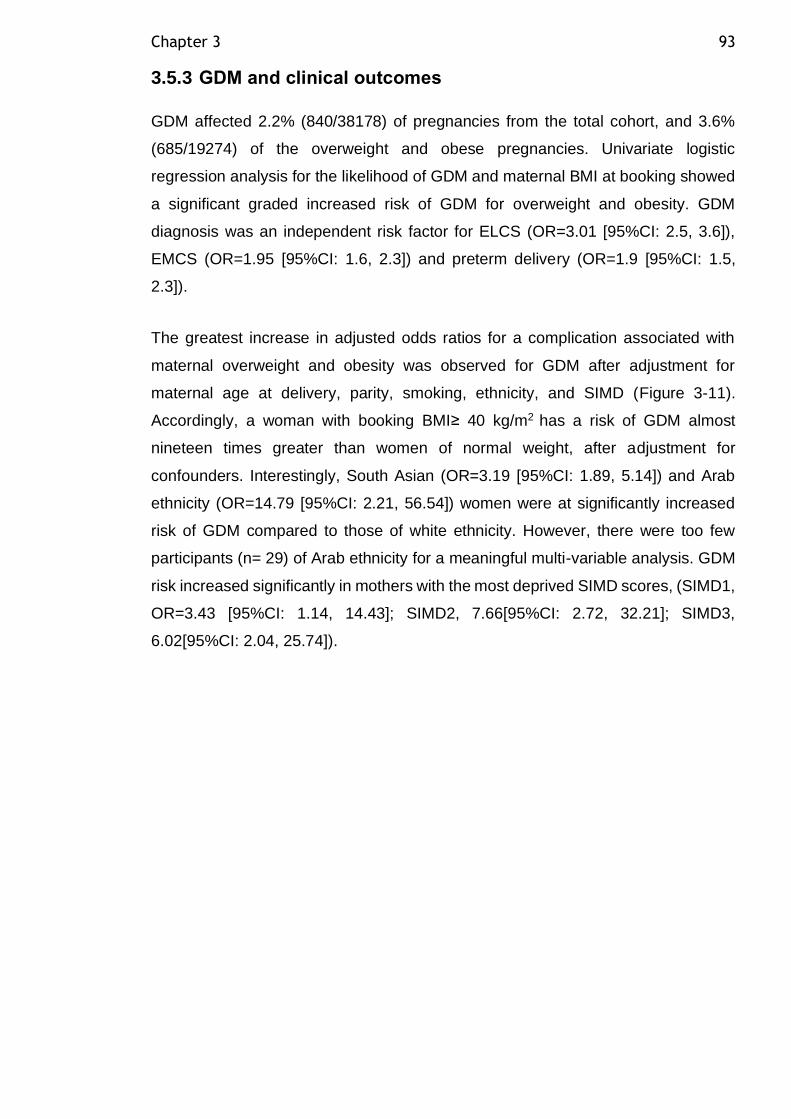
Chapter 3 93
3.5.3 GDM and clinical outcomes
GDM affected 2.2% (840/38178) of pregnancies from the total cohort, and 3.6%
(685/19274) of the overweight and obese pregnancies. Univariate logistic
regression analysis for the likelihood of GDM and maternal BMI at booking showed
a significant graded increased risk of GDM for overweight and obesity. GDM
diagnosis was an independent risk factor for ELCS (OR=3.01 [95%CI: 2.5, 3.6]),
EMCS (OR=1.95 [95%CI: 1.6, 2.3]) and preterm delivery (OR=1.9 [95%CI: 1.5,
2.3]).
The greatest increase in adjusted odds ratios for a complication associated with
maternal overweight and obesity was observed for GDM after adjustment for
maternal age at delivery, parity, smoking, ethnicity, and SIMD (Figure 3-11).
Accordingly, a woman with booking BMI≥ 40 kg/m2 has a risk of GDM almost
nineteen times greater than women of normal weight, after adjustment for
confounders. Interestingly, South Asian (OR=3.19 [95%CI: 1.89, 5.14]) and Arab
ethnicity (OR=14.79 [95%CI: 2.21, 56.54]) women were at significantly increased
risk of GDM compared to those of white ethnicity. However, there were too few
participants (n= 29) of Arab ethnicity for a meaningful multi-variable analysis. GDM
risk increased significantly in mothers with the most deprived SIMD scores, (SIMD1,
OR=3.43 [95%CI: 1.14, 14.43]; SIMD2, 7.66[95%CI: 2.72, 32.21]; SIMD3,
6.02[95%CI: 2.04, 25.74]).
Chapter 3 94
Figure 3-11 Multiple logistic regression analysis evaluating the risk of GDM during pregnancy. *p<0.05, **p<0.01, ***p<0.001
3.6 Discussion
The current study demonstrates that both high and low BMI are associated with
increased odds of pregnancy adverse outcomes. The prevalence of maternal
obesity was 22.3% which has increased compared to the previous analysis
conducted in the Glasgow population in 2005 (Kanagalingam et al., 2005). Higher
maternal BMI was strongly associated with several risks such as GDM, EMCS,
ELCS and LGA babies. The prevalence of GDM was 2.2% in our cohort, however,
although this is a low GDM prevalence but it has slightly increased by 0.3%
compared to the Scottish prevalence since 2012 (Collier et al., 2017). However,
GDM rate is very dependent on the screening pattern used and the rates of the
current study could be an underestimate compared to populations implying the
universal screening. The ATLANTIC Diabetes in Pregnancy (DIP) program
identified 12.4% prevalence of GDM within a cohort of Irish women in which
universal screening was applied using the IADPSG criteria. In the current study
pregnant women with GDM had increased risk of ELCS, EMCS, LGA baby and
preterm delivery in our cohort. The present study confirmed the association of GDM
with maternal BMI, maternal age, social deprivation and ethnicity. The cohort for this
study was taken from a national dataset with regular proven data quality assessment
which enabled us to obtain a large number of patients’ representative of the general
Chapter 3 95
population. In particular, the results of this study were not confounded by other forms
of pre-existing diabetes and twin pregnancy. Furthermore, each woman accounts
for one pregnancy only and the effect of consecutive pregnancies during the study
period was accounted for.
The results of this study showed that 50.4% of the maternity population living in
Greater Glasgow and Clyde were overweight or obese at the first trimester of their
pregnancy, of which 28.1% were overweight and 22.3% were obese. From 2002 to
2004, a previous observational study reported maternal obesity prevalence rate of
18% in the Princess Royal Maternity Unit (PRMU) at Glasgow Royal Infirmary
(Kanagalingam et al., 2005). However, the previous study cohort was randomly
selected by medical record staff from one hospital in Glasgow. The current rates of
maternal obesity confirm that the maternal obesity prevalence rate in the Glasgow
population continues to be on a slow increasing trend over the last 15 years.
Maternal obesity in the first trimester has significant implications for clinical practice.
It results in a higher demand for high dependency care, and the complications that
can arise for mother or child need to be managed. The NICE guideline recommends
that pregnant women whose BMI is greater than 30 kg/m2 should be placed under
the care of a consultant rather than a midwife, which places a huge burden on
resources in maternity units (National Collaborating Centre for Women's and
Children's Health, 2008). In our cohort, overweight and obese women are at higher
risk of operative delivery (both ELCS and EMCS) and LGA infants. This possibly
could lead to further complications such as shoulder dystocia and instrumental
delivery due to LGA infants and wound infection following operative delivery. Only
obese class 2 women showed a slight increase in risk of preterm delivery. However,
different types of preterm birth (i.e. after spontaneous preterm labour, preterm
premature rupture of membranes, or indicated labour) were not distinguished in our
study. Secondary analysis of the Maternal–Fetal Medicine Units Network (MFMUN)
study showed that pre-pregnancy obesity was associated with a lower rate of
spontaneous preterm birth (Hendler et al., 2005). Therefore, the higher preterm
delivery risk observed in the current study among obese women class 2 could be
secondary to other obstetric complications such as GDM and PE. In our cohort, first-
trimester obesity was not associated with stillbirth, perinatal mortality or APGAR
score <7. Contrary to our results, a meta-analysis concluded that even modest
increases in maternal BMI were associated with risk of stillbirth and perinatal
Chapter 3 96
mortality suggesting that our study could be underpowered to observe this
association (Aune et al., 2014).
Maternal underweight, overweight and increasing levels of obesity show a striking
positive relationship with social deprivation. The reverse was also true, higher SIMD
levels were associated with a significant reduction in the risk of being underweight,
overweight or obese. This highlights the inequalities in health that have been
reported widely in previous research. A similar association was observed in a
retrospective cohort of women living in Scotland from 2003–2010 (Denison et al.,
2014). Therefore, the mothers at higher clinical risk (severely obese) are those
facing a higher level of health inequality. In our study, the most deprived women are
at increased risk of GDM, EMCS and preterm delivery, and reduced risk of ELCS
and LGA infants. Moreover, the association between deprivation and preterm
delivery in our cohort was striking. We observed increasing risk of preterm delivery
with increasing deprivation status. Although social deprivation, underweight and
smoking were individually associated with preterm delivery, the risk between
deprivation status and preterm delivery could be mediated via underweight and
smoking. However, underweight and smoking, both modifiable risk factors, could be
an important determinant of preterm delivery in the most deprived population.
Although association does not infer causation, possible interventions to reduce
maternal underweight and promote smoking cessation among the deprived
population may be highly beneficial in adverse obstetric outcome reduction. The
recent research of Mehra et al. (2019) observed a similar association, and
suggested that hypertension and infection moderately determine this association.
However, other factors related to area-level conditions, such as inadequate housing,
transportation and violence, may influence pregnancy through psychological stress
(Messer et al., 2013). In line with our results, a meta-analysis of seven studies on
neighbourhood deprivation found that the risk for preterm birth was significantly
increased in the most deprived neighbourhood quantiles, compared to the least
(OR=1.23 [95%CI: 1.18, 1.25]) (Vos et al., 2014). The higher risk for EMCS among
the socially deprived population could be related to the observed higher incidence
of metabolic complications such as maternal obesity and GDM in this group.
Ethnic minorities in Europe have been shown to have higher susceptibility to T2DM
(Meeks et al., 2016) and CVD (Tran et al., 2011). Pregnancy can be considered to
be a stress test to unmask the mother’s metabolic dysfunction and predict future
Chapter 3 97
morbidity patterns that will affect both maternal and offspring health. There was a
positive relationship between obesity and African ethnicity, which is representative
of the black ethnicity relationship with obesity in the general population, where Black
African and Black Caribbean women show the highest prevalence of obesity
(Sproston and Mindell, 2006). While African mothers are very likely to be overweight
or obese, GDM risk in the current study population disappeared after adjustment for
confounders. Contrary to our results, a larger study in London, including 76,158
pregnancies, found that women of Afro-Caribbean origin had increased risk of GDM
in multivariate analysis (OR=1.44 [95%CI: 1.25, 1.65] (Khalil et al., 2013). The same
study observed three-fold increased risk of PE in women of Afro-Caribbean origin.
Although we did not have data on PE, but this could possibly explain the observed
higher EMCS rate among African population in our study.
Interestingly, our study showed a positive relationship between South Asian
ethnicity and being underweight or overweight, but not obese pregnant women.
There was an increased relationship between obesity and women of Asian ethnicity
in the general population (Sproston and Mindell, 2006). In our study, although South
Asian mothers tended to have lower BMI compared to the white population, they
had significantly increased risk of GDM and EMCS probably reflecting increased
testing for this population, and reduced risk of LGA infants and ELCS. On the other
hand. Heslehurst et al. (2010b) observed a significantly reduced risk of being
overweight or obese for pregnant Asian women in England. However, Heslehurst et
al. (2010b) study involved a larger sample size, and this might have contributed to
this inverse relationship which we did not observe. In addition, their study did not
observe South Asian ethnicity as a separate group from other Asian backgrounds.
Unfortunately, we did not possess data on PE, but it would be interesting to examine
whether it is related to the increased risk of EMCS in South Asian and black mothers.
At the other end of the spectrum, underweight women represented the only BMI
category at significantly increased risk of stillbirth in our cohort, which remained
consistent after adjustment for confounders. Underweight women are at greater risk
of preterm delivery and reduced z score for their infant’s birthweight. These findings
were consistent with other meta-analysis studies for different populations, including
low- and middle-income countries (Rahman et al., 2015). However, these results
should be interpreted with caution, due to the low number of events (3 stillbirth and
9 preterm birth) among underweight women.
Chapter 3 98
The results of this analysis have shown that the prevalence of GDM was 2.2% in
our cohort. The Scottish prevalence of GDM was 1.9% on 2012 (Collier et al., 2017).
This confirms that the reporting of GDM is low in the Glasgow population in similar
rates to the national data although it is not clear whether this is probably due to lower
reporting or testing or not. In our cohort, GDM diagnosis was associated with
maternal BMI, maternal age, social deprivation and ethnicity. A study by Collier et
al. (2017) showed similar associations although ethnicity was not studied in their
analysis. They showed that maternal macrosomia was not associated with GDM.
However, in our cohort, women with GDM had increased risk for a LGA baby. This
is probably because we have used adjusted birthweight for gestational age, sex and
parity rather than birth weight only for offspring of GDM mothers who tend to deliver
earlier than healthy mothers. In this situation the birthweight alone may not be
reflecting the real impact. Furthermore, we have used both SMR02 and SCI-
diabetes dataset diagnosis of GDM and excluded mothers with pre-existing diabetes
from our analysis which could improve our GDM diagnosis accuracy.
Overweight and obese women start pregnancy with greater insulin resistance than
normal weight women (Catalano, 2010), and become highly insulin-resistant around
mid- to late-gestation, which then can lead to metabolic complications such as GDM
and PE. In the current cohort, the association between first-trimester BMI and GDM
was strongly significant, with increasing levels of risk among higher BMI categories,
and remained consistent after adjustment for confounders. South Asian women had
a three-fold increased risk of GDM despite being at lower BMI. This observation was
in line with the finding of Khalil et al. (2013), which also pointed to women of South
Asian origin developing GDM at a younger age compared to those from Caucasian
ethnic backgrounds. This suggests that lower BMI cut-off for obesity diagnosis in
women of South Asian origin might not be sufficient to identify women at higher risk.
The observed difference in body fat distribution between South Asian and
Caucasian ethnicity could probably explain the previous results in which South
Asians were found to accumulate fat more centrally rather mostly in subcutaneous
fat such as Caucasians. Therefore, lower BMI cut off points were recommended to
be used in South Asian population due to their high risk to develop T2DM at lower
BMI compared to Caucasians. Another relevant aspect for ethnic differences is that
a two- to three-fold higher prevalence of GDM is reported when applying IADPSG
criteria, rather than WHO criteria, due to a lower fasting glucose cut-off in the former
(Jenum et al., 2012). Previous evidence has shown that women of South Asian
Chapter 3 99
origin have more abnormal fasting plasma glucose levels (Agarwal et al., 2010).
Therefore, the application of IADPSG criteria to our cohort could be responsible for
the observed association. In addition to adiposity and ethnicity, low socio-economic
status in our cohort was strongly associated with GDM diagnosis. It could be that
there are area level factors that we did not measure, such as the density of retail
outlets for alcohol, tobacco, and unhealthy and healthy foods, which might explain
this association.
A GDM pregnancy implies a substantial risk of T2DM development later in life.
Neonates of women of South Asian origin are of lower birth weight compared to the
general population. When exposed to the current obesogenic environment, those
neonates could be at higher risk of later obesity, T2DM and CVD. This study draws
awareness to the notion that pregnancy can be considered as a natural stress test
to reveal the maternal risk for future T2DM and CVD development. The increasing
trend for maternal obesity and GDM prevalence among ethnic minority and socially
deprived groups is of great concern.
There are several limitations in our study. First, this study used routinely collected
data, which relied on reliable coding, and did not include a laboratory measure of
GDM diagnosis. Second, our analysis was adjusted for several maternal
demographic confounders but not for maternal pre-existing conditions other than
diabetes, such as operative delivery, which could probably amplify the effect of
obesity in those individuals. Third, we used BMI as a measure of obesity. Emerging
evidence has suggested that measures of abdominal obesity may be more
important as an indicator of risk for metabolic disease than general adiposity.
Several alternative anthropometric measures such as waist circumference,
waist/hip ratio and skin fold thickness could have been used but these can be
unreliable in pregnant women and difficult to record at a population level. Therefore,
although BMI has limitations, it remains the practical option for large epidemiological
studies. Finally, this study might not be representative of other settings, or
generalizable to other populations but it does confirm the work of multiple previous
investigations.
A particular strength of our study is that it provides detailed demographic and
obstetrics outcomes analysis among the greatly diverse Greater Glasgow and Clyde
population, and highlights subgroups at higher risk of facing health inequalities.
Chapter 3 100
Furthermore, we examined the associations between maternal obesity and a wide
range of adverse pregnancy outcomes among ethnic minorities, an area which is
still sparsely documented. Our analysis included social economic status and the
effect of race on various obstetric outcomes which are not usually accounted for in
previous research. We merged SMR02 and SCI-diabetes to obtain accurate data
on diabetes status to diagnose GDM and accurately exclude woman with pre-
existing diabetes from confounding our findings.
In conclusion, our study showed that in a single health board of Scotland’s
population, there was a notable risk of maternal obesity and GDM, which
predisposes mothers to several obstetric complications and adverse outcomes.
Mothers with obesity and GDM receive higher obstetric interventions, including
operative and earlier delivery. Average birthweight for the offspring of overweight
and obese mothers is significantly increased, despite the increased rate of medical
interventions among this group. Among ethnic minority groups and the most
deprived areas, there was a significant risk of both adverse maternal and fetal
outcomes. To reduce the risk of these adverse outcomes, it is important to identify
the modifiable risk factors that can potentially be targeted for interventions.
Behavioural interventions to control maternal weight during pregnancy have been
shown to be significantly reduce the maternal weight gain during pregnancy but did
not reduce the adverse pregnancy outcomes (Poston et al., 2015), therefore,
effective intervention strategies are needed for weight control prior to pregnancy.
Targeted intervention approaches towards the low-income population and ethnic
minorities at higher metabolic risk could be highly effective in improving pregnancy
outcomes. Wider analysis of maternal obesity rates and obstetric outcomes at
national level could be beneficial in informing our clinical practice in the
management of maternal obesity during pregnancy. Future research is required to
address the economic costs associated with obesity and GDM during pregnancy
including maternal hospitals costs for the mother and her neonate.
101
Chapter 4 Adipocyte lipolytic function in pregnancies complicated with gestational diabetes mellitus compared to healthy pregnancy
4.1 Introduction
Pregnancy requires substantial maternal metabolic adaptation to accommodate the
demands of the growing fetus. Late pregnancy is characterized by physiological
insulin resistance to adapt with increasing fetal demand to preserve glucose as the
primary fuel for the fetus. Insulin resistance is a condition of reduced responsiveness
to insulin in several tissues such liver, muscle and adipose tissue. As a result, insulin
production from β-cells increases to maintain normal blood glucose levels. Insulin
resistance is present in several conditions including T2DM and obesity. For obese
women with subclinical decreased insulin sensitivity, pregnancy represents a
metabolic stress test which may lead to development of pregnancy complications
such as GDM and PE due to exaggerated insulin resistance. The decrease in insulin
sensitivity with advancing gestation is not limited only to disturbed glucose
metabolism but is also is observed in relation to lipid metabolism (Catalano et al.,
2002). There is a two to threefold increase in basal triglyceride and cholesterol
concentrations with advancing gestation. The increases are more pronounced in
women with GDM as compared with healthy pregnant women (Catalano et al.,
2002). The increase in plasma FFA concentration is related to the decreased ability
of insulin to suppress lipolysis in late gestation.
During pregnancy, there is an increased need to expand adipose tissue
(lipogenesis) in early pregnancy and increase FA availability (lipolysis) in late
pregnancy. These physiological changes are of great interest to study, in particular
how adipocytes respond to these changes. The size of the adipocytes can change
throughout life, depending on the amount of lipid stored. From in vitro experiments
in non-pregnant individuals, it is well established that larger adipocytes are less
sensitive to insulin action (Salans and Dougherty, 1971). Abdominal SAT adipocytes
size was shown to be predictive of T2DM in non-pregnant women (Lonn et al.,
2010). In severely obese non-pregnant individuals both SAT and VAT adipocytes
size was correlated with fatty liver (O'Connell et al., 2010). Despite the great impact
of maternal obesity on gestational insulin resistance and the development of
Chapter 4 102
subsequent metabolic complications among the mother and her fetus, there are few
studies of human adipose tissue morphology and function during healthy and
complicated pregnancy. Longitudinal studies of gluteal adipose tissue biopsies
show that there was larger gluteal adipocytes with increased numbers of adipocytes
during late gestation compared to early and pre-pregnancy samples (Resi et al.,
2012). Inherent defective adipocyte expansion in the face of pre-pregnancy obesity
may be unmasked during pregnancy leading to pregnancy metabolic complications
such as GDM. The functional measures of adipocytes were rarely studied in women
with GDM such as adipocyte size and lipolytic function. Rojas-Rodriguez et al.
(2015) found that women with GDM had omental (visceral) adipocyte hypertrophy
and decreased capillary density compared to pregnant women with normal glucose
tolerance.
Insulin suppression of lipolysis is a direct measure of adipocyte insulin sensitivity,
which was shown to be a major contributor to whole body insulin sensitivity. There
was increased adipocytes sensitivity to insulin in adipocytes from non-pregnant
females compared to males (Macotela et al., 2009). The adipocytes insulin
sensitivity in females may account for their lower level of insulin resistance and
diabetes risk despite similar or higher fat content than in males (Macotela et al.,
2009). Adipose tissue of obese non-pregnant subjects showed reduced response
to insulin (Salans et al., 1968). After weight loss and reduction in adipose cell size,
insulin sensitivity of the adipose tissue of obese patients was restored to normal.
Adipose tissue insulin sensitivity was impaired in non-pregnant T2DM subjects
(Kotronen et al., 2008). In the third trimester of pregnancy, there is enhanced insulin
resistance. Pregnant normal weight women in the third trimester were shown to
have increased SAT adipocytes lipolysis measured by tracer catheterization
(Diderholm et al., 2005) compared to the non-pregnant data (Kalhan et al., 2001).
In overweight and obese pregnant women, it was demonstrated that there is
resistance to insulin suppression of lipolysis and fat oxidation during euglycemic-
hyperinsulinemic clamping in third trimester compared to second trimester and
postpartum (Sivan et al., 1999). Therefore, defective insulin suppression of lipolysis
is suggested in pregnancies complicated with GDM. Moreover, the maternal
dyslipidemia observed in GDM may result from enhanced subcutaneous adipocyte
lipolysis in obese mothers. however, there are no previous studies on adipocyte
lipolysis in women with GDM. Thus, we hypothesized that there is adipocyte
Chapter 4 103
hypertrophy, adipocyte insulin resistance and increased adipocyte lipolysis in GDM
over and above the effects of obesity.
It has been suggested that SAT adipocyte storage capacity is diminished due to
SAT adipocyte dysfunction in terms of hypertrophy and increased lipolysis, which
lead to ectopic fat deposition in other organs. VAT can be regarded as an ectopic
fat depot which acts as a source of excessive FA release and inflammatory
cytokines to the liver through the portal circulation leading to hepatic fat
accumulation. This in turn affect glucose and lipoprotein metabolism and contributes
to the development of metabolic diseases. Fatty liver was independently associated
with impaired glucose tolerance and T2DM, an association that was increased by
adipose tissue insulin resistance (Jorge-Galarza et al., 2016). Recently hepatic
steatosis index (HSI) was studied in women at early pregnancy and the results were
consistent with non-alcoholic fatty liver disease (NAFLD) diagnosis by ultrasound.
Women with higher HSI score had significantly increased risk of developing GDM
later in pregnancy (Lee et al., 2019). More interestingly, this study demonstrated
that abnormal hepatic steatosis indices correlated positively with GDM risk when the
analysis was confined to those women with normal liver ultrasound (Lee et al.,
2019). The mechanism linking the development of GDM and hepatic steatosis
during pregnancy is not known yet. However, it is likely that these are two metabolic
diseases that share a metabolic dysfunction such as insulin resistance.
Overweight and obesity increases the risk for GDM substantially and also
independently affects adipocyte function. To account for this, the GDM and the
control groups in this study were BMI-matched. I collected adipose tissue biopsies
at Caesarean section in order to obtain larger adipose tissue biopsies than could be
obtained by needle biopsy and to allow collection of both SAT and VAT biopsies to
address the regional differences in adipocyte size and in vitro lipolytic function of
isolated adipocytes. Since dysfunctional adipocyte lipolysis is key to my central
hypothesis, I aimed to study isolated adipocytes and their basal and beta
adrenergic-stimulated lipolysis and the inhibitory effects of insulin. To isolate
adipocytes, I selected to use the collagenase digestion method, a standard method
carried out by the landmark original studies into lipolytic function (Rodbell, 1964)
and the more recent study of adipocyte function in pre-eclampsia carried out in my
laboratory (Huda et al., 2014). I was also able to measure adipocyte size. Glycerol
and NEFA are the end products of TAG hydrolysis such that their release from
Chapter 4 104
adipocytes can be used as an index of adipocyte lipolysis. There is no consensus
in the literature on the presentation of lipolysis data in terms of correcting for cell
number/ or tissue weight and most lipolysis data are corrected for different factors
such as tissue weight, cell number, lipid weight or DNA content in different studies.
In this study, DNA content was used as an index of the tissue cellularity which
enabled us to directly compare metabolic effects independently of fat cell size i.e.
on a per adipocyte basis. It could be argued that lipolysis rates measured in isolated
adipocytes in cellular preparations are not similar to lipolysis in adipose tissue
pieces ex vivo due to presence of other SVF cells which could contribute to the
lipolytic response. However, it was reported previously that there is strong
correlation between basal lipolysis rate of isolated adipocyte and ex vivo adipose
tissue samples (Rydén and Arner, 2017). Furthermore, my hypothesis focusses on
the adipocyte in the key initiator of adipose tissue dysfunction. While adipocytes are
capable of NEFA re-uptake and re-esterification, this is not the case for glycerol due
to the limited availability of the glycerol kinase enzyme in adipocytes. Thus, glycerol
is suggested to be a better measure of total lipolysis (Rydén et al., 2019) while NEFA
measures net lipolysis. NEFA/ glycerol ratio is a measure of FA reuptake where a
lower ratio indicates re-uptake of NEFA and the maximum value of 3.0 indicates full
breakdown of the triglyceride molecule. Whether depot differences in insulin action
on lipolysis and NEFA re-esterification occur in adipocytes from different depot
remains to be established (Zierath et al., 1998).
To explore the relationship between adipocyte cell size, lipolytic function and fat
deposition in the liver during pregnancy, a relationship not explored before to our
knowledge, hepatic steatosis index (HSI) was used. This is a simple non-invasive
screening tool for non-alcoholic fatty liver disease (NAFLD) previously used in
pregnancy (Lee et al., 2019). Moreover, it was suggested that HSI could have more
predictive value in women with mild or moderate NAFLD (Lee et al., 2019) than
ultrasound assessment since ultrasound is only able to detect positive results when
the liver fat content exceeds 30% (McCullough, 2004). Plasma lipids, insulin,
glucose, and liver function enzymes were measured and their relationship to
adipocyte function was explored.
Integrating these structural and functional elements of adipocyte function, along with
a biomarker of liver fat accumulation, this study was performed to determine the
Chapter 4 105
relative contribution of adipocyte function to the underlying pathophysiology of GDM
compared to a healthy BMI-matched control group.
4.2 Aim
The aim of this chapter was to compare subcutaneous (SAT) and visceral (VAT)
adipocyte diameter and lipolytic function and a biomarker of liver fat accumulation
(HIS) in pregnant women with and without GDM
4.2.1 Hypotheses
• That women with GDM have larger subcutaneous adipocytes than healthy
BMI-matched controls
• That SAT adipocytes from GDM women have higher basal lipolysis than
those from healthy BMI matched controls
• That adipocytes from women with GDM have higher NEFA release in
response to catecholamine stimulation of lipolysis than those from healthy
BMI matched controls
• That adipocytes from women with GDM have lower insulin suppression of
lipolysis those from healthy BMI matched controls i.e. are more insulin
resistant.
• That women with GDM have higher HSI compared healthy controls, i.e. have
higher liver fat.
4.2.2 Specific research questions
• How are adipocyte diameter and volume affected by GDM?
• Which adipose tissue depot is more dysfunctional in women with GDM?
• Do adipocytes from women with GDM have increased insulin resistance
resulting in increased lipolysis compared to BMI matched controls?
• What are the depot differences in lipolytic function?
Chapter 4 106
• How are plasma lipids and liver function affected if there is enhanced
adipocyte lipolysis in GDM?
4.3 Methods
4.3.1 Adipocyte isolation and sizing
The study participants were recruited as outlined in the Methods Chapter section
2.1.1. Subcutaneous and visceral adipose tissue samples were processed as
outlined in section 2.2. After two hours incubation, two 300µl aliquots of the medium
below the adipocyte suspensions were collected and stored at -20°C for later
analysis of NEFA and glycerol concentration as outlined in section 2.4.3. Glycerol
and NEFA concentrations were corrected for cell number by dividing by DNA
concentration of a known volume of adipocytes as outlined in method section 2.2.3.
The values were then expressed in mmol/hr/ug of DNA. Adipocyte sizing was
carried out as detailed in section 2.3. Maternal lipids, markers of insulin sensitivity
and liver function enzymes were measured as outlined in section 2.7.
4.3.2 Adipocyte lipolysis assay
Adipocyte lipolysis assay was carried out as outlined in 2.4.The degree of lipolysis
stimulation by isoproterenol was calculated as the percentage of release of NEFA
or glycerol in the presence of isoprotenerol relative to basal lipolysis i.e. Percentage
stimulation= ((lipolysis rate in presence of isoproterenol – basal lipolysis) / basal
lipolysis)*100. The degree of lipolysis suppression by insulin was calculated as the
percentage of release of NEFA or glycerol in the presence of insulin relative to basal
release i.e. ((basal lipolysis – lipolysis rate in the presence of insulin) / basal
lipolysis)*100. FCISI is a direct measure of adipocyte insulin sensitivity. It can be
calculated as the percentage suppression of isoproterenol stimulated lipolysis by
insulin measured either as NEFA or glycerol release i.e. FCISI= ((lipolysis rate in
presence of isoproterenol – lipolysis rate in presence of isoproterenol and insulin) /
(lipolysis rate in presence of isoproterenol – basal lipolysis))*100.
4.3.3 Hepatic steatosis index (HSI)
HSI was calculated using the following equation (Lee et al., 2010):
Chapter 4 107
HSI= 8*ALT (IU/l) / AST (IU/l) + BMI (kg/m2) + 2 (if T2DM) + 2 (if female)
Where ALT is alanine aminotransferase, AST is aspartate aminotransferase and
T2DM is type 2 diabetes. Taking the conservative approach, GDM women in our
study were not considered as T2DM in the above equation. The participants were
classified into three groups according to the HSI: low risk of steatosis (HSI <30);
intermediate risk (30≤ HSI ≤36) and high risk (HSI >36).
4.3.4 Statistical analysis
The statistical analysis was carried out as outlined in section 2.9. The following
variables were log transformed: fasting glucose level at OGTT, plasma insulin,
HOMA-IR, GGT, HSI, SAT basal lipolysis (SAT-basal), SAT lipolysis rate in
presence of isoprotenerol (SAT-ISO), SAT lipolysis rate in presence of insulin and
isoprotenerol (SAT-ISO+INS), VAT basal lipolysis (VAT-basal), VAT lipolysis rate in
presence of isoprotenerol (VAT-ISO) and VAT lipolysis rate in presence of insulin
and isoprotenerol (VAT-ISO+INS). The following variables were square root
transformed: SAT total volume and VAT total volume. The following variables were
not normally distributed and analyzed non-parametrically: plasma glucose, plasma
glycerol, ALT, AST, SAT lipolysis rate in presence of insulin (SAT-INS), VAT
lipolysis rate in presence of insulin (VAT-INS), percentage stimulation of lipolysis by
isoprotenerol, percentage suppression of lipolysis by insulin and fat cell insulin
sensitivity index (FCISI).
4.4 Results
4.4.1 Study participants
The study participants in GDM (n=22) and control group (n=22) had similar BMI and
age reflecting the study design (table 1-1). Ethnicity, parity, smoking history, blood
pressure, birthweight and fetal sex did not differ between control and GDM
pregnancy. GDM mothers delivered six days earlier than controls (p=0.001).
Diagnostic OGTT tests were carried out in the second trimester and as expected,
women in the GDM group had higher fasting OGTT blood glucose (p= 0.0001).
However, there was only 4 women in the control group who were screened for GDM
due to having an obese BMI and a family history of T2DM.
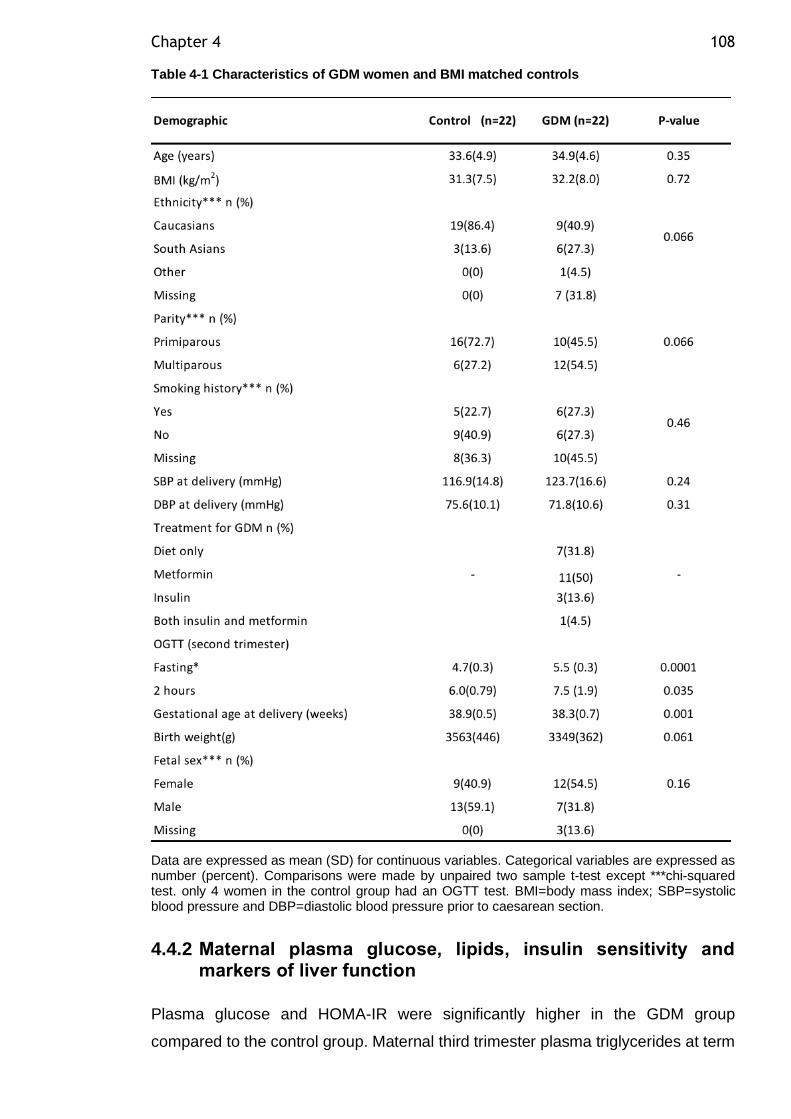
Chapter 4 108
Table 4-1 Characteristics of GDM women and BMI matched controls
Data are expressed as mean (SD) for continuous variables. Categorical variables are expressed as number (percent). Comparisons were made by unpaired two sample t-test except ***chi-squared test. only 4 women in the control group had an OGTT test. BMI=body mass index; SBP=systolic blood pressure and DBP=diastolic blood pressure prior to caesarean section.
4.4.2 Maternal plasma glucose, lipids, insulin sensitivity and markers of liver function
Plasma glucose and HOMA-IR were significantly higher in the GDM group
compared to the control group. Maternal third trimester plasma triglycerides at term
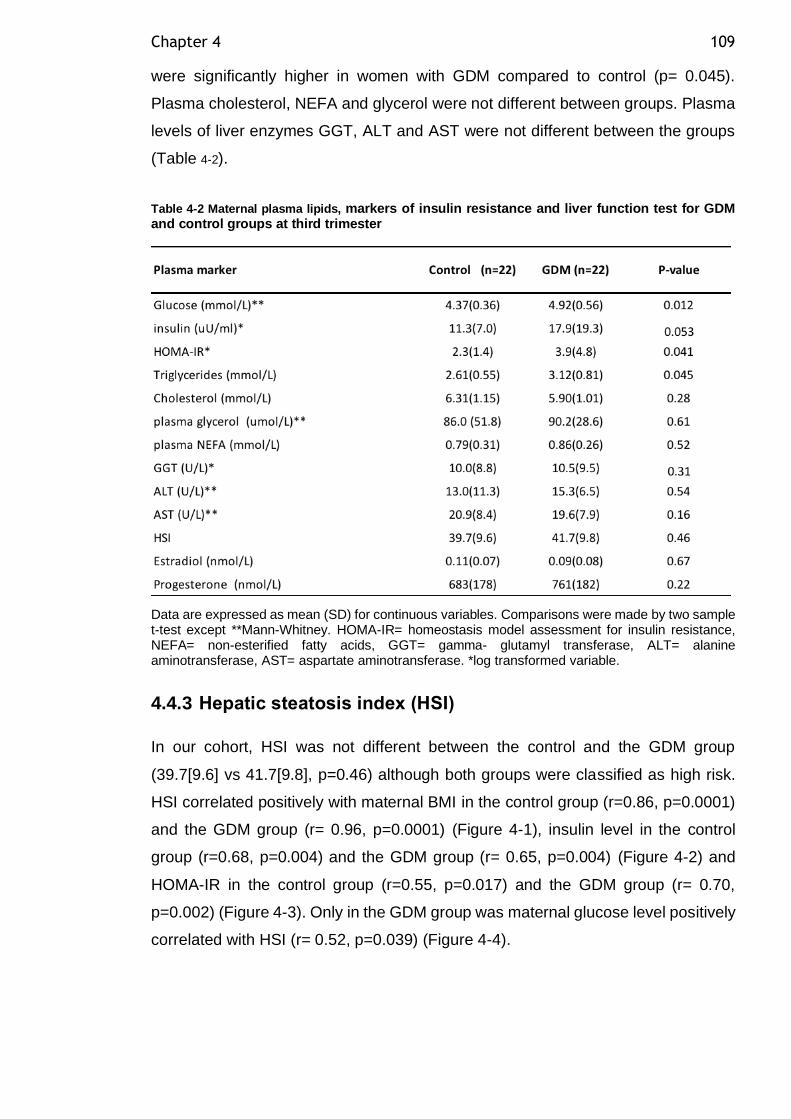
Chapter 4 109
were significantly higher in women with GDM compared to control (p= 0.045).
Plasma cholesterol, NEFA and glycerol were not different between groups. Plasma
levels of liver enzymes GGT, ALT and AST were not different between the groups
(Table 4-2).
Table 4-2 Maternal plasma lipids, markers of insulin resistance and liver function test for GDM and control groups at third trimester
Data are expressed as mean (SD) for continuous variables. Comparisons were made by two sample t-test except **Mann-Whitney. HOMA-IR= homeostasis model assessment for insulin resistance, NEFA= non-esterified fatty acids, GGT= gamma- glutamyl transferase, ALT= alanine aminotransferase, AST= aspartate aminotransferase. *log transformed variable.
4.4.3 Hepatic steatosis index (HSI)
In our cohort, HSI was not different between the control and the GDM group
(39.7[9.6] vs 41.7[9.8], p=0.46) although both groups were classified as high risk.
HSI correlated positively with maternal BMI in the control group (r=0.86, p=0.0001)
and the GDM group (r= 0.96, p=0.0001) (Figure 4-1), insulin level in the control
group (r=0.68, p=0.004) and the GDM group (r= 0.65, p=0.004) (Figure 4-2) and
HOMA-IR in the control group (r=0.55, p=0.017) and the GDM group (r= 0.70,
p=0.002) (Figure 4-3). Only in the GDM group was maternal glucose level positively
correlated with HSI (r= 0.52, p=0.039) (Figure 4-4).
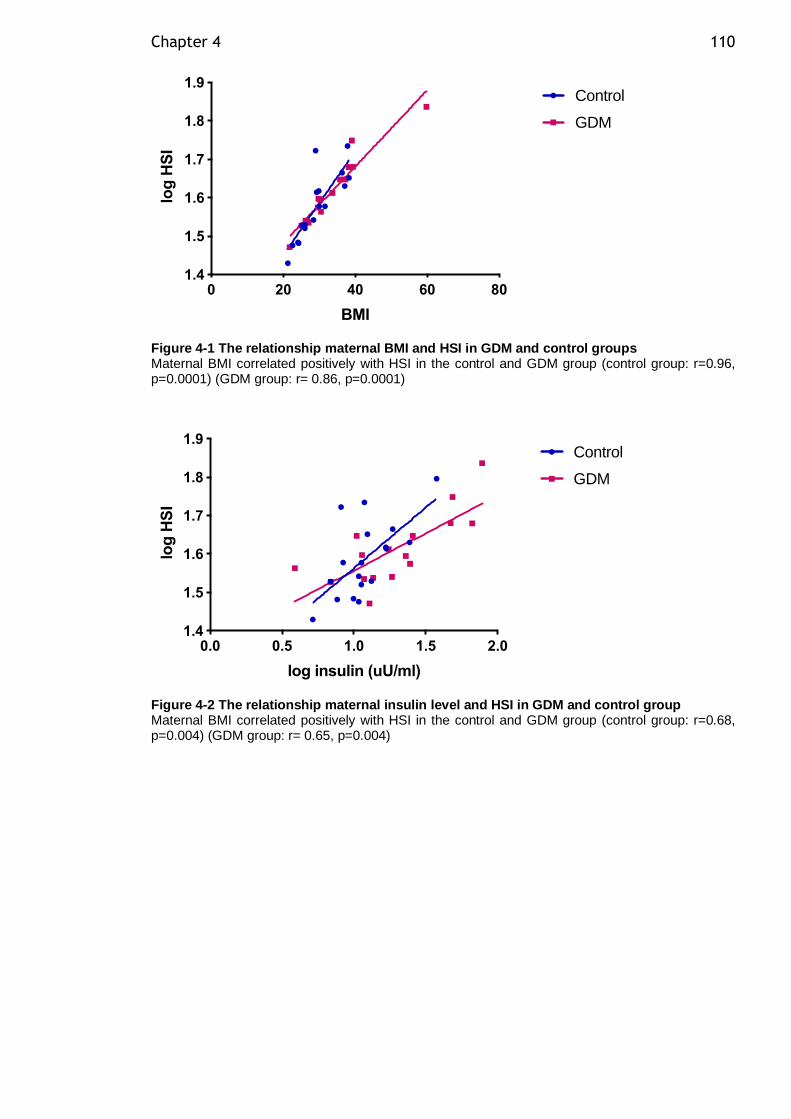
Chapter 4 110
Figure 4-1 The relationship maternal BMI and HSI in GDM and control groups Maternal BMI correlated positively with HSI in the control and GDM group (control group: r=0.96, p=0.0001) (GDM group: r= 0.86, p=0.0001)
Figure 4-2 The relationship maternal insulin level and HSI in GDM and control group Maternal BMI correlated positively with HSI in the control and GDM group (control group: r=0.68, p=0.004) (GDM group: r= 0.65, p=0.004)
0 20 40 60 801.4
1.5
1.6
1.7
1.8
1.9
BMI
lo
g H
SI
Control
GDM
0.0 0.5 1.0 1.5 2.01.4
1.5
1.6
1.7
1.8
1.9
log insulin (uU/ml)
lo
g H
SI
Control
GDM
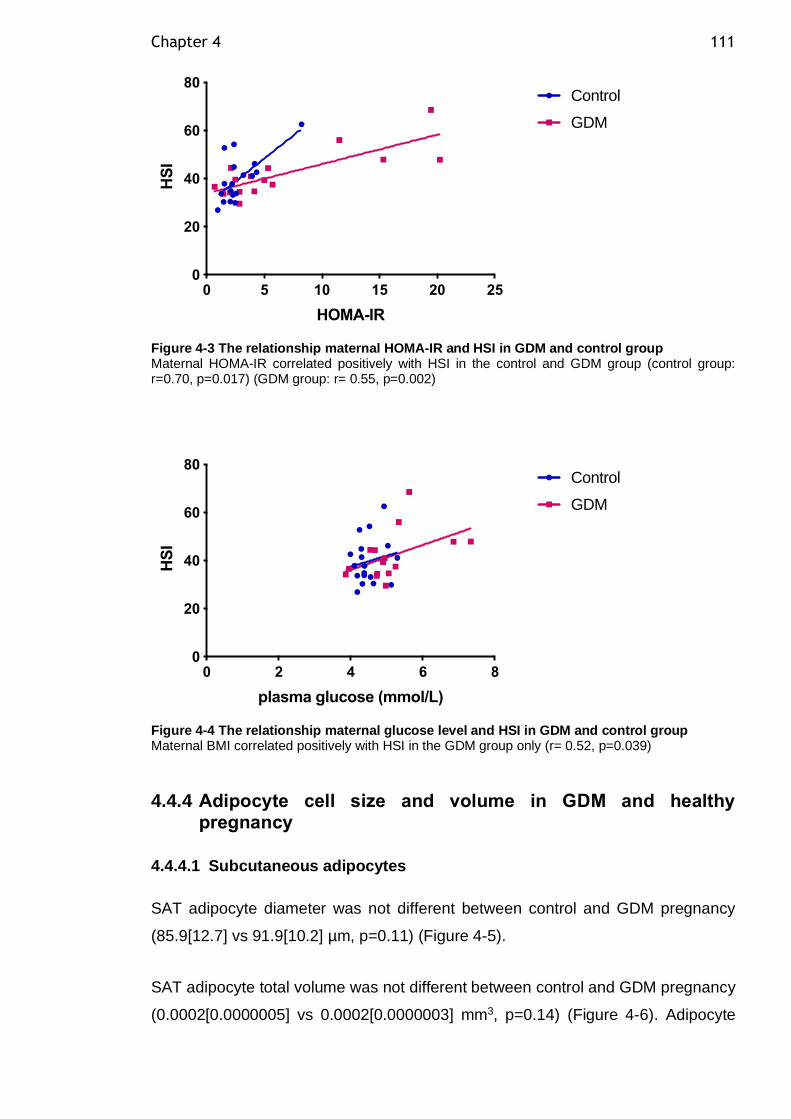
Chapter 4 111
Figure 4-3 The relationship maternal HOMA-IR and HSI in GDM and control group Maternal HOMA-IR correlated positively with HSI in the control and GDM group (control group: r=0.70, p=0.017) (GDM group: r= 0.55, p=0.002)
Figure 4-4 The relationship maternal glucose level and HSI in GDM and control group Maternal BMI correlated positively with HSI in the GDM group only (r= 0.52, p=0.039)
4.4.4 Adipocyte cell size and volume in GDM and healthy pregnancy
4.4.4.1 Subcutaneous adipocytes
SAT adipocyte diameter was not different between control and GDM pregnancy
(85.9[12.7] vs 91.9[10.2] µm, p=0.11) (Figure 4-5).
SAT adipocyte total volume was not different between control and GDM pregnancy
(0.0002[0.0000005] vs 0.0002[0.0000003] mm3, p=0.14) (Figure 4-6). Adipocyte
0 5 10 15 20 250
20
40
60
80
HOMA-IR
HS
I
Control
GDM
0 2 4 6 80
20
40
60
80
plasma glucose (mmol/L)
HS
I
Control
GDM
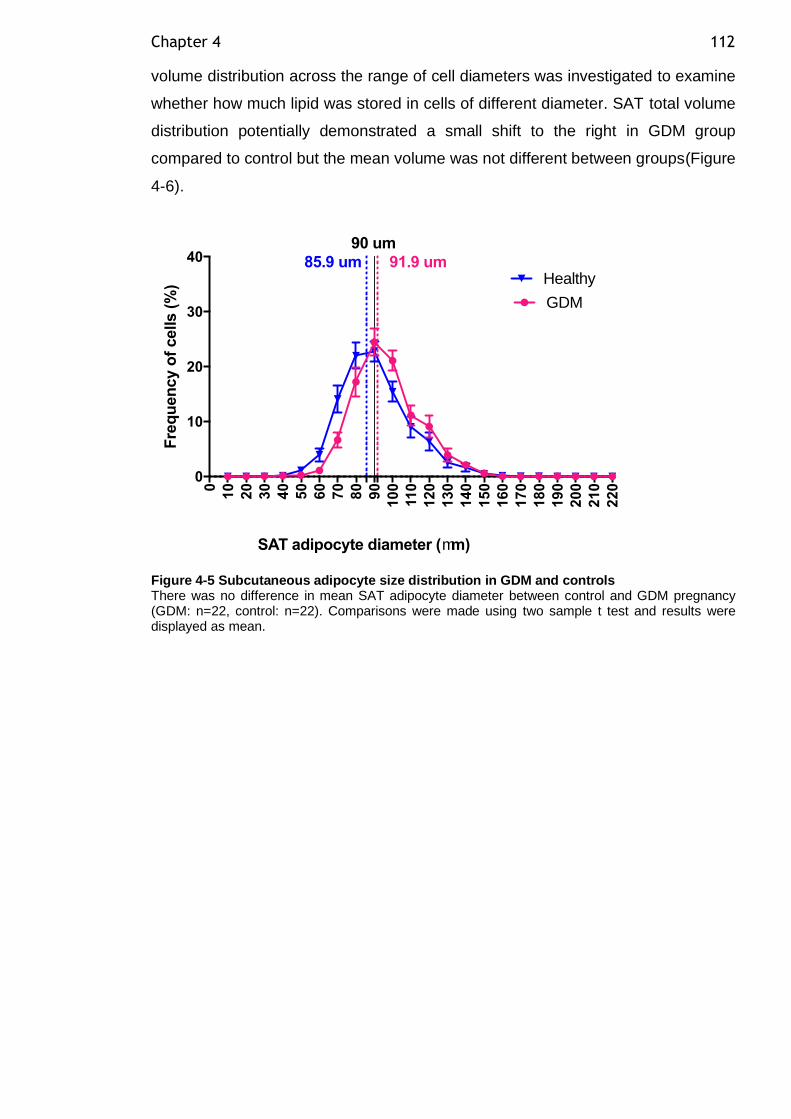
Chapter 4 112
volume distribution across the range of cell diameters was investigated to examine
whether how much lipid was stored in cells of different diameter. SAT total volume
distribution potentially demonstrated a small shift to the right in GDM group
compared to control but the mean volume was not different between groups(Figure
4-6).
Figure 4-5 Subcutaneous adipocyte size distribution in GDM and controls There was no difference in mean SAT adipocyte diameter between control and GDM pregnancy (GDM: n=22, control: n=22). Comparisons were made using two sample t test and results were displayed as mean.
0
10
20
30
40
50
60
70
80
90
10
0
11
0
12
0
13
0
14
0
15
0
16
0
17
0
18
0
19
0
20
0
21
0
22
0
0
10
20
30
40
Fre
qu
en
cy o
f cells (
%)
SAT adipocyte diameter (mm)
85.9 um 91.9 um
GDM
Healthy
90 um
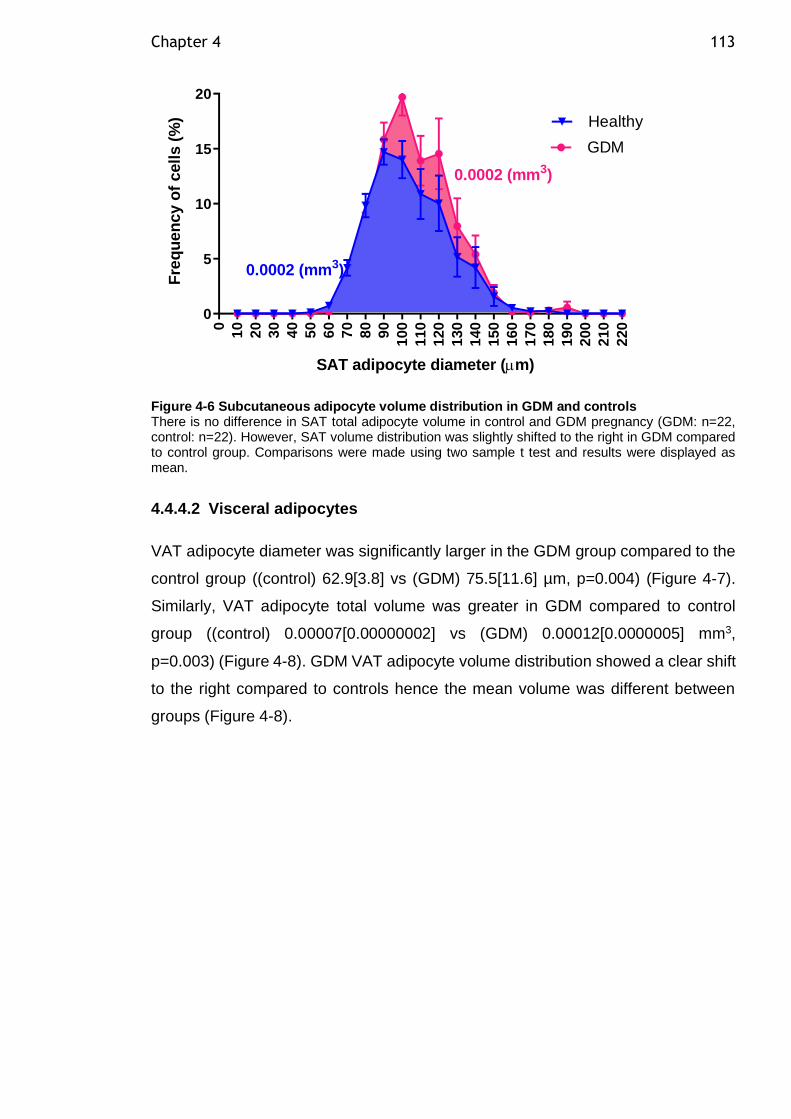
Chapter 4 113
0
10
20
30
40
50
60
70
80
90
100
110
120
130
140
150
160
170
180
190
200
210
220
0
5
10
15
20
SAT adipocyte diameter (m)
Fre
qu
en
cy o
f cells (
%) Healthy
GDM
0.0002 (mm3)
0.0002 (mm3)
Figure 4-6 Subcutaneous adipocyte volume distribution in GDM and controls There is no difference in SAT total adipocyte volume in control and GDM pregnancy (GDM: n=22, control: n=22). However, SAT volume distribution was slightly shifted to the right in GDM compared to control group. Comparisons were made using two sample t test and results were displayed as mean.
4.4.4.2 Visceral adipocytes
VAT adipocyte diameter was significantly larger in the GDM group compared to the
control group ((control) 62.9[3.8] vs (GDM) 75.5[11.6] µm, p=0.004) (Figure 4-7).
Similarly, VAT adipocyte total volume was greater in GDM compared to control
group ((control) 0.00007[0.00000002] vs (GDM) 0.00012[0.0000005] mm3,
p=0.003) (Figure 4-8). GDM VAT adipocyte volume distribution showed a clear shift
to the right compared to controls hence the mean volume was different between
groups (Figure 4-8).
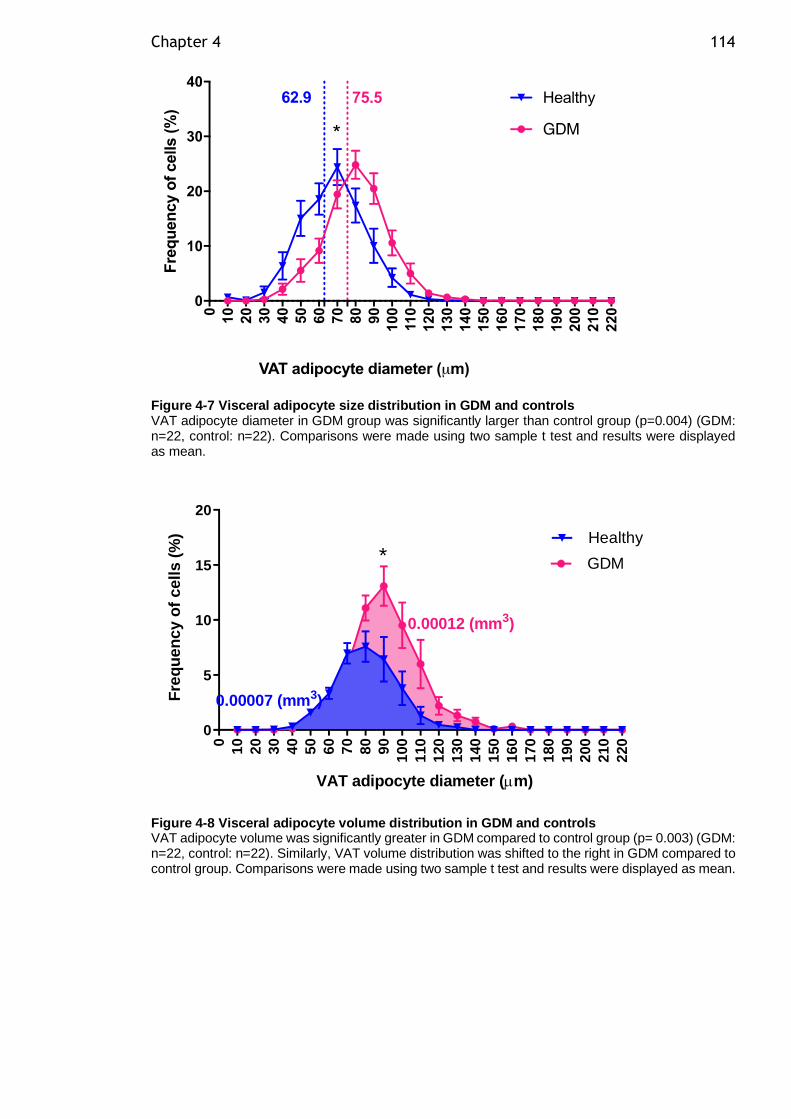
Chapter 4 114
Figure 4-7 Visceral adipocyte size distribution in GDM and controls VAT adipocyte diameter in GDM group was significantly larger than control group (p=0.004) (GDM: n=22, control: n=22). Comparisons were made using two sample t test and results were displayed as mean.
0
10
20
30
40
50
60
70
80
90
100
110
120
130
140
150
160
170
180
190
200
210
220
0
5
10
15
20
VAT adipocyte diameter (m)
Fre
qu
en
cy o
f cells (
%) Healthy
GDM
0.00007 (mm3)
0.00012 (mm3)
*
Figure 4-8 Visceral adipocyte volume distribution in GDM and controls VAT adipocyte volume was significantly greater in GDM compared to control group (p= 0.003) (GDM: n=22, control: n=22). Similarly, VAT volume distribution was shifted to the right in GDM compared to control group. Comparisons were made using two sample t test and results were displayed as mean.
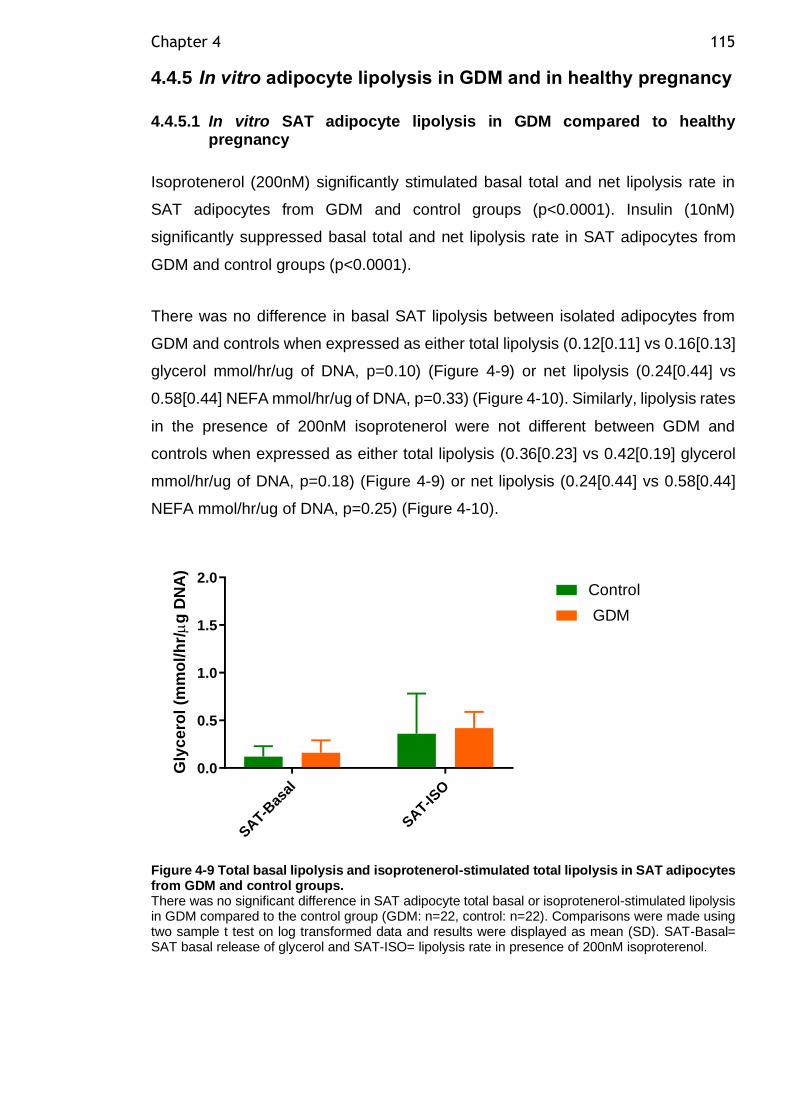
Chapter 4 115
4.4.5 In vitro adipocyte lipolysis in GDM and in healthy pregnancy
4.4.5.1 In vitro SAT adipocyte lipolysis in GDM compared to healthy pregnancy
Isoprotenerol (200nM) significantly stimulated basal total and net lipolysis rate in
SAT adipocytes from GDM and control groups (p<0.0001). Insulin (10nM)
significantly suppressed basal total and net lipolysis rate in SAT adipocytes from
GDM and control groups (p<0.0001).
There was no difference in basal SAT lipolysis between isolated adipocytes from
GDM and controls when expressed as either total lipolysis (0.12[0.11] vs 0.16[0.13]
glycerol mmol/hr/ug of DNA, p=0.10) (Figure 4-9) or net lipolysis (0.24[0.44] vs
0.58[0.44] NEFA mmol/hr/ug of DNA, p=0.33) (Figure 4-10). Similarly, lipolysis rates
in the presence of 200nM isoprotenerol were not different between GDM and
controls when expressed as either total lipolysis (0.36[0.23] vs 0.42[0.19] glycerol
mmol/hr/ug of DNA, p=0.18) (Figure 4-9) or net lipolysis (0.24[0.44] vs 0.58[0.44]
NEFA mmol/hr/ug of DNA, p=0.25) (Figure 4-10).
SAT-B
asal
SAT-IS
O
0.0
0.5
1.0
1.5
2.0
Gly
ce
rol
(mm
ol/
hr/
g D
NA
)
Control
GDM
Figure 4-9 Total basal lipolysis and isoprotenerol-stimulated total lipolysis in SAT adipocytes from GDM and control groups. There was no significant difference in SAT adipocyte total basal or isoprotenerol-stimulated lipolysis in GDM compared to the control group (GDM: n=22, control: n=22). Comparisons were made using two sample t test on log transformed data and results were displayed as mean (SD). SAT-Basal= SAT basal release of glycerol and SAT-ISO= lipolysis rate in presence of 200nM isoproterenol.
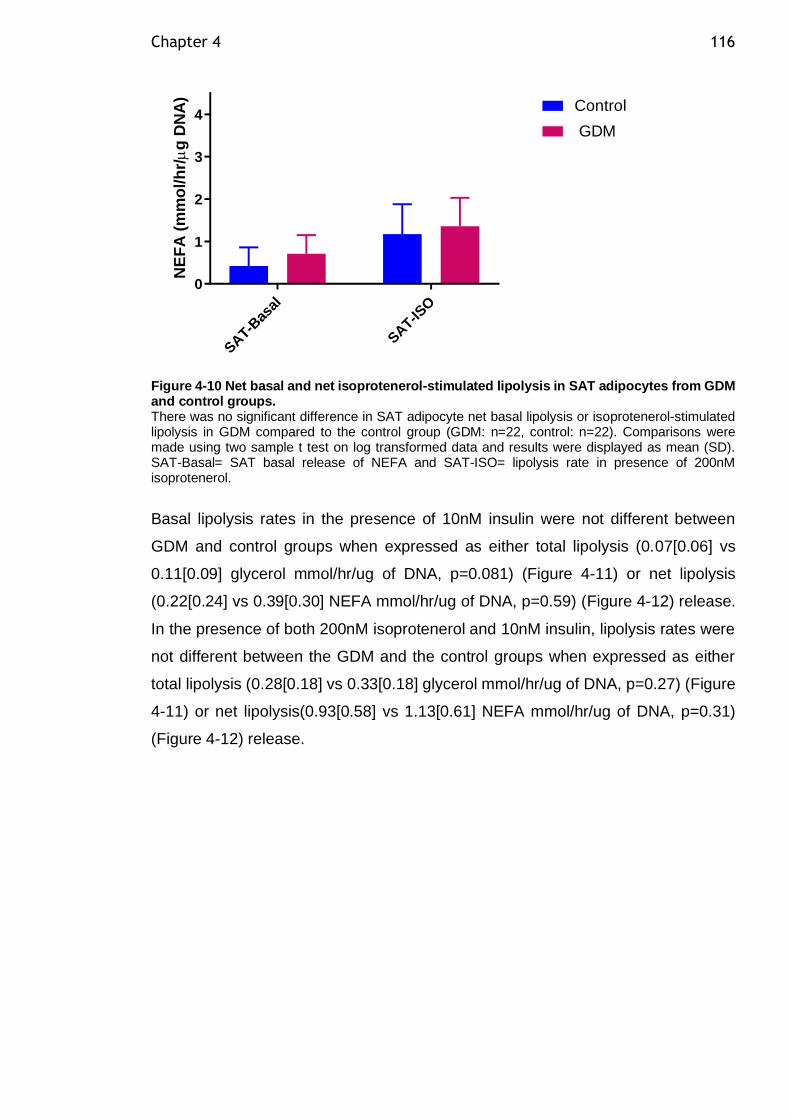
Chapter 4 116
SAT-B
asal
SAT-IS
O
0
1
2
3
4
NE
FA
(m
mo
l/h
r/
g D
NA
)
Control
GDM
Figure 4-10 Net basal and net isoprotenerol-stimulated lipolysis in SAT adipocytes from GDM and control groups. There was no significant difference in SAT adipocyte net basal lipolysis or isoprotenerol-stimulated lipolysis in GDM compared to the control group (GDM: n=22, control: n=22). Comparisons were made using two sample t test on log transformed data and results were displayed as mean (SD). SAT-Basal= SAT basal release of NEFA and SAT-ISO= lipolysis rate in presence of 200nM isoprotenerol.
Basal lipolysis rates in the presence of 10nM insulin were not different between
GDM and control groups when expressed as either total lipolysis (0.07[0.06] vs
0.11[0.09] glycerol mmol/hr/ug of DNA, p=0.081) (Figure 4-11) or net lipolysis
(0.22[0.24] vs 0.39[0.30] NEFA mmol/hr/ug of DNA, p=0.59) (Figure 4-12) release.
In the presence of both 200nM isoprotenerol and 10nM insulin, lipolysis rates were
not different between the GDM and the control groups when expressed as either
total lipolysis (0.28[0.18] vs 0.33[0.18] glycerol mmol/hr/ug of DNA, p=0.27) (Figure
4-11) or net lipolysis(0.93[0.58] vs 1.13[0.61] NEFA mmol/hr/ug of DNA, p=0.31)
(Figure 4-12) release.
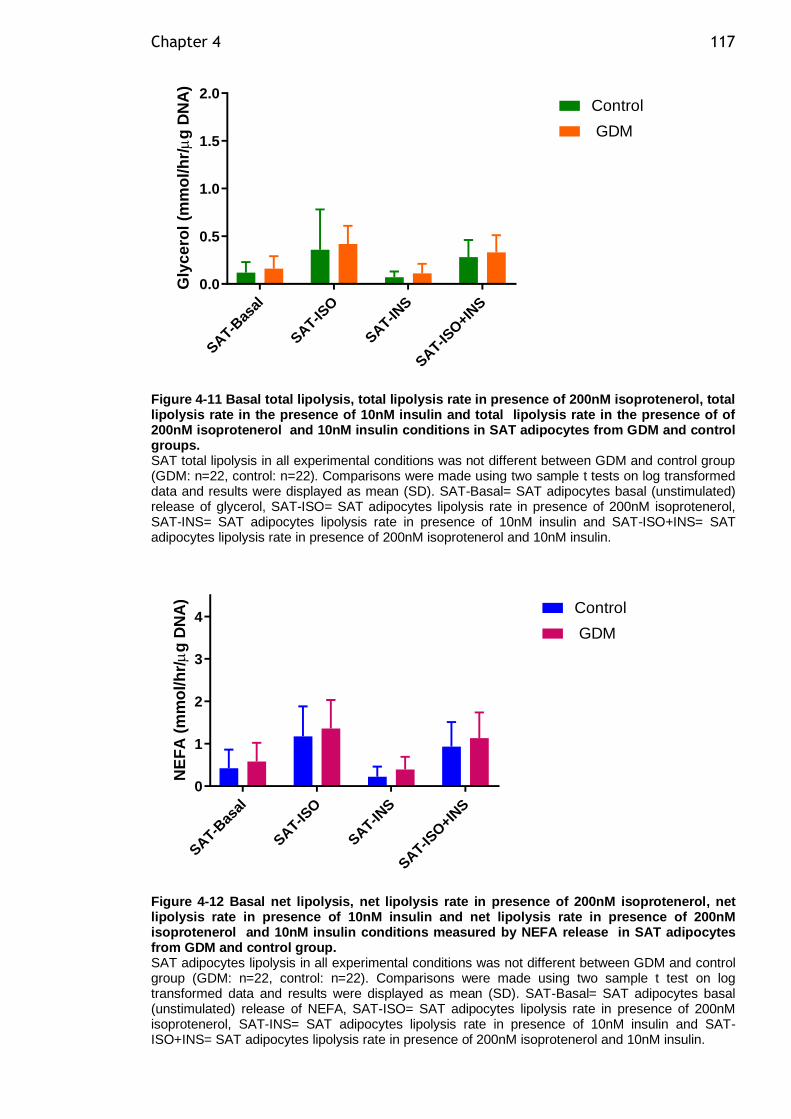
Chapter 4 117
SAT-B
asal
SAT-IS
O
SAT-IN
S
SAT-IS
O+IN
S
0.0
0.5
1.0
1.5
2.0
Gly
ce
rol
(mm
ol/
hr/
g D
NA
)
Control
GDM
Figure 4-11 Basal total lipolysis, total lipolysis rate in presence of 200nM isoprotenerol, total lipolysis rate in the presence of 10nM insulin and total lipolysis rate in the presence of of 200nM isoprotenerol and 10nM insulin conditions in SAT adipocytes from GDM and control groups. SAT total lipolysis in all experimental conditions was not different between GDM and control group (GDM: n=22, control: n=22). Comparisons were made using two sample t tests on log transformed data and results were displayed as mean (SD). SAT-Basal= SAT adipocytes basal (unstimulated) release of glycerol, SAT-ISO= SAT adipocytes lipolysis rate in presence of 200nM isoprotenerol, SAT-INS= SAT adipocytes lipolysis rate in presence of 10nM insulin and SAT-ISO+INS= SAT adipocytes lipolysis rate in presence of 200nM isoprotenerol and 10nM insulin.
SAT-B
asal
SAT-IS
O
SAT-IN
S
SAT-IS
O+IN
S
0
1
2
3
4
NE
FA
(m
mo
l/h
r/
g D
NA
)
Control
GDM
Figure 4-12 Basal net lipolysis, net lipolysis rate in presence of 200nM isoprotenerol, net lipolysis rate in presence of 10nM insulin and net lipolysis rate in presence of 200nM isoprotenerol and 10nM insulin conditions measured by NEFA release in SAT adipocytes from GDM and control group. SAT adipocytes lipolysis in all experimental conditions was not different between GDM and control group (GDM: n=22, control: n=22). Comparisons were made using two sample t test on log transformed data and results were displayed as mean (SD). SAT-Basal= SAT adipocytes basal (unstimulated) release of NEFA, SAT-ISO= SAT adipocytes lipolysis rate in presence of 200nM isoprotenerol, SAT-INS= SAT adipocytes lipolysis rate in presence of 10nM insulin and SAT-ISO+INS= SAT adipocytes lipolysis rate in presence of 200nM isoprotenerol and 10nM insulin.
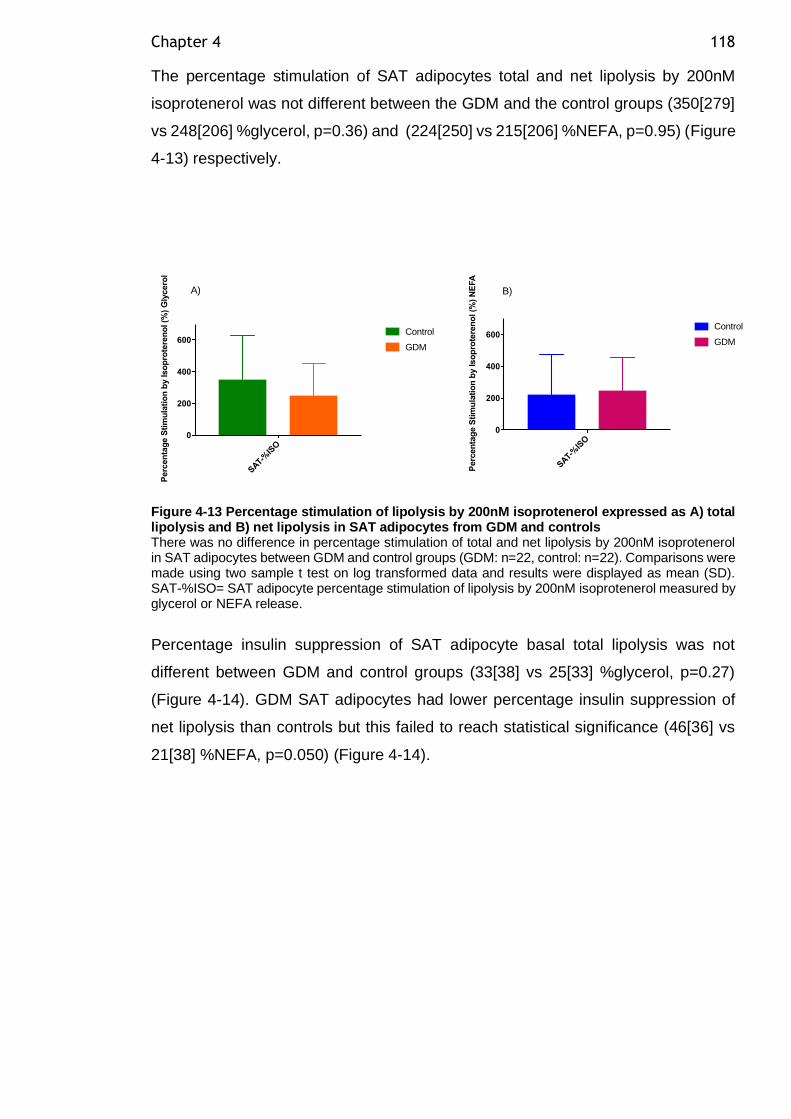
Chapter 4 118
The percentage stimulation of SAT adipocytes total and net lipolysis by 200nM
isoprotenerol was not different between the GDM and the control groups (350[279]
vs 248[206] %glycerol, p=0.36) and (224[250] vs 215[206] %NEFA, p=0.95) (Figure
4-13) respectively.
Figure 4-13 Percentage stimulation of lipolysis by 200nM isoprotenerol expressed as A) total lipolysis and B) net lipolysis in SAT adipocytes from GDM and controls There was no difference in percentage stimulation of total and net lipolysis by 200nM isoprotenerol in SAT adipocytes between GDM and control groups (GDM: n=22, control: n=22). Comparisons were made using two sample t test on log transformed data and results were displayed as mean (SD). SAT-%ISO= SAT adipocyte percentage stimulation of lipolysis by 200nM isoprotenerol measured by glycerol or NEFA release.
Percentage insulin suppression of SAT adipocyte basal total lipolysis was not
different between GDM and control groups (33[38] vs 25[33] %glycerol, p=0.27)
(Figure 4-14). GDM SAT adipocytes had lower percentage insulin suppression of
net lipolysis than controls but this failed to reach statistical significance (46[36] vs
21[38] %NEFA, p=0.050) (Figure 4-14).
SAT-
%IS
O
0
200
400
600
Perc
en
tag
e S
tim
ula
tio
n b
y Iso
pro
tere
no
l (%
) G
lycero
l
Control
GDM
SAT-
%IS
O
0
200
400
600
Perc
en
tag
e S
tim
ula
tio
n b
y Iso
pro
tere
no
l (%
) N
EFA
Control
GDM
A) B)
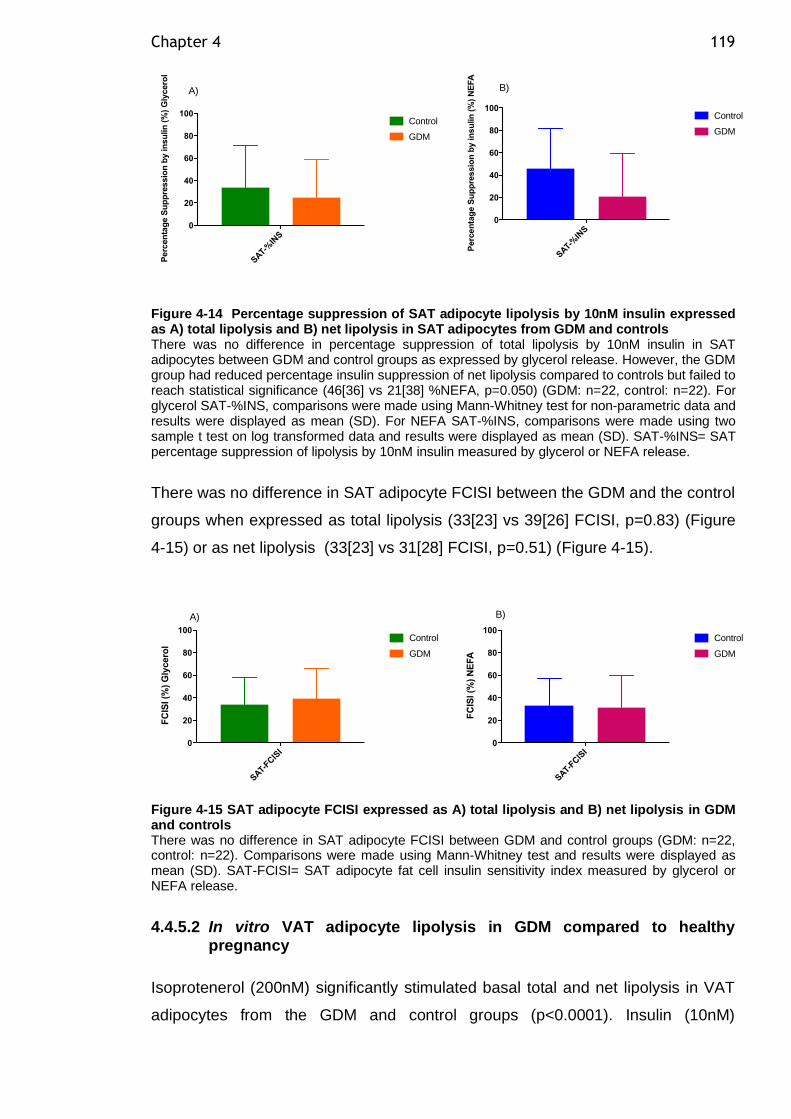
Chapter 4 119
Figure 4-14 Percentage suppression of SAT adipocyte lipolysis by 10nM insulin expressed as A) total lipolysis and B) net lipolysis in SAT adipocytes from GDM and controls There was no difference in percentage suppression of total lipolysis by 10nM insulin in SAT adipocytes between GDM and control groups as expressed by glycerol release. However, the GDM group had reduced percentage insulin suppression of net lipolysis compared to controls but failed to reach statistical significance (46[36] vs 21[38] %NEFA, p=0.050) (GDM: n=22, control: n=22). For glycerol SAT-%INS, comparisons were made using Mann-Whitney test for non-parametric data and results were displayed as mean (SD). For NEFA SAT-%INS, comparisons were made using two sample t test on log transformed data and results were displayed as mean (SD). SAT-%INS= SAT percentage suppression of lipolysis by 10nM insulin measured by glycerol or NEFA release.
There was no difference in SAT adipocyte FCISI between the GDM and the control
groups when expressed as total lipolysis (33[23] vs 39[26] FCISI, p=0.83) (Figure
4-15) or as net lipolysis (33[23] vs 31[28] FCISI, p=0.51) (Figure 4-15).
Figure 4-15 SAT adipocyte FCISI expressed as A) total lipolysis and B) net lipolysis in GDM and controls There was no difference in SAT adipocyte FCISI between GDM and control groups (GDM: n=22, control: n=22). Comparisons were made using Mann-Whitney test and results were displayed as mean (SD). SAT-FCISI= SAT adipocyte fat cell insulin sensitivity index measured by glycerol or NEFA release.
4.4.5.2 In vitro VAT adipocyte lipolysis in GDM compared to healthy pregnancy
Isoprotenerol (200nM) significantly stimulated basal total and net lipolysis in VAT
adipocytes from the GDM and control groups (p<0.0001). Insulin (10nM)
SAT-
%IN
S
0
20
40
60
80
100
Perc
en
tag
e S
up
pre
ssio
n b
y in
su
lin
(%
) G
lycero
l
Control
GDM
SAT-
%IN
S
0
20
40
60
80
100
Perc
en
tag
e S
up
pre
ssio
n b
y in
su
lin
(%
) N
EFA
Control
GDM
A) B)
SAT-
FCIS
I0
20
40
60
80
100
FC
ISI (%
) G
lycero
l
Control
GDM
SAT-
FCIS
I0
20
40
60
80
100
FC
ISI (%
) N
EFA
Control
GDM
A) B)
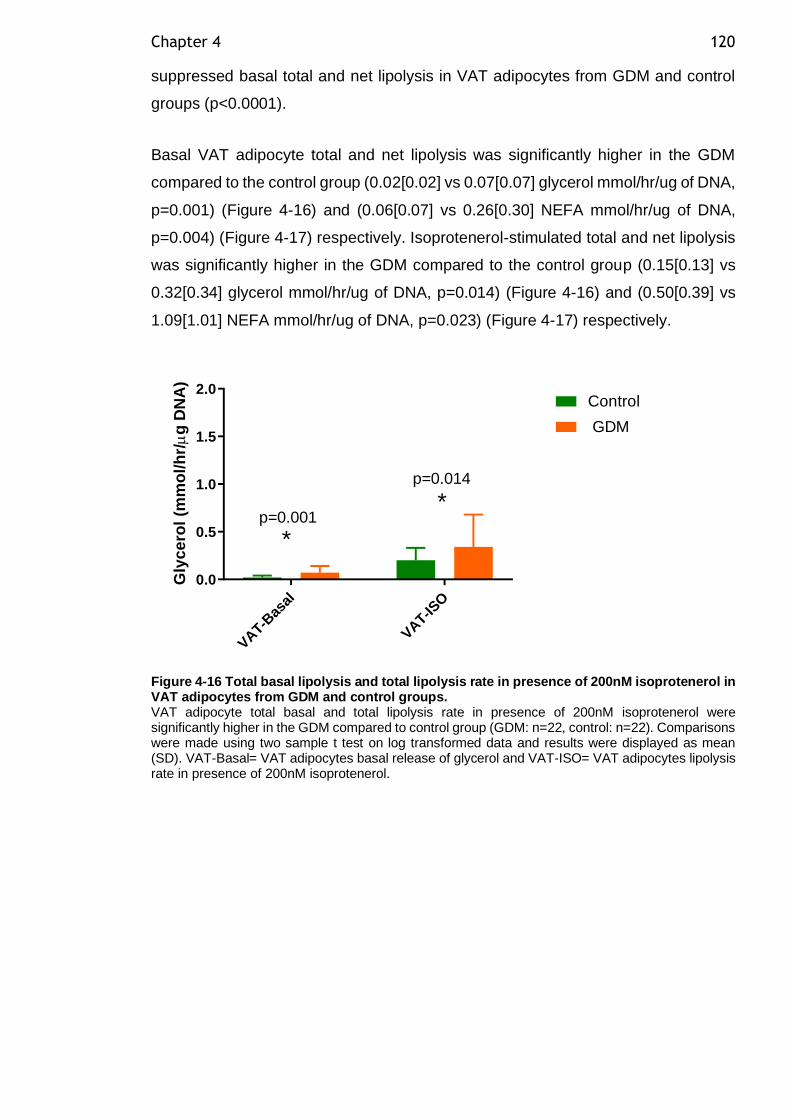
Chapter 4 120
suppressed basal total and net lipolysis in VAT adipocytes from GDM and control
groups (p<0.0001).
Basal VAT adipocyte total and net lipolysis was significantly higher in the GDM
compared to the control group (0.02[0.02] vs 0.07[0.07] glycerol mmol/hr/ug of DNA,
p=0.001) (Figure 4-16) and (0.06[0.07] vs 0.26[0.30] NEFA mmol/hr/ug of DNA,
p=0.004) (Figure 4-17) respectively. Isoprotenerol-stimulated total and net lipolysis
was significantly higher in the GDM compared to the control group (0.15[0.13] vs
0.32[0.34] glycerol mmol/hr/ug of DNA, p=0.014) (Figure 4-16) and (0.50[0.39] vs
1.09[1.01] NEFA mmol/hr/ug of DNA, p=0.023) (Figure 4-17) respectively.
VAT-B
asal
VAT-IS
O
0.0
0.5
1.0
1.5
2.0
Gly
ce
rol
(mm
ol/
hr/
g D
NA
)
Control
GDM
*
*p=0.001
p=0.014
Figure 4-16 Total basal lipolysis and total lipolysis rate in presence of 200nM isoprotenerol in VAT adipocytes from GDM and control groups. VAT adipocyte total basal and total lipolysis rate in presence of 200nM isoprotenerol were significantly higher in the GDM compared to control group (GDM: n=22, control: n=22). Comparisons were made using two sample t test on log transformed data and results were displayed as mean (SD). VAT-Basal= VAT adipocytes basal release of glycerol and VAT-ISO= VAT adipocytes lipolysis rate in presence of 200nM isoprotenerol.
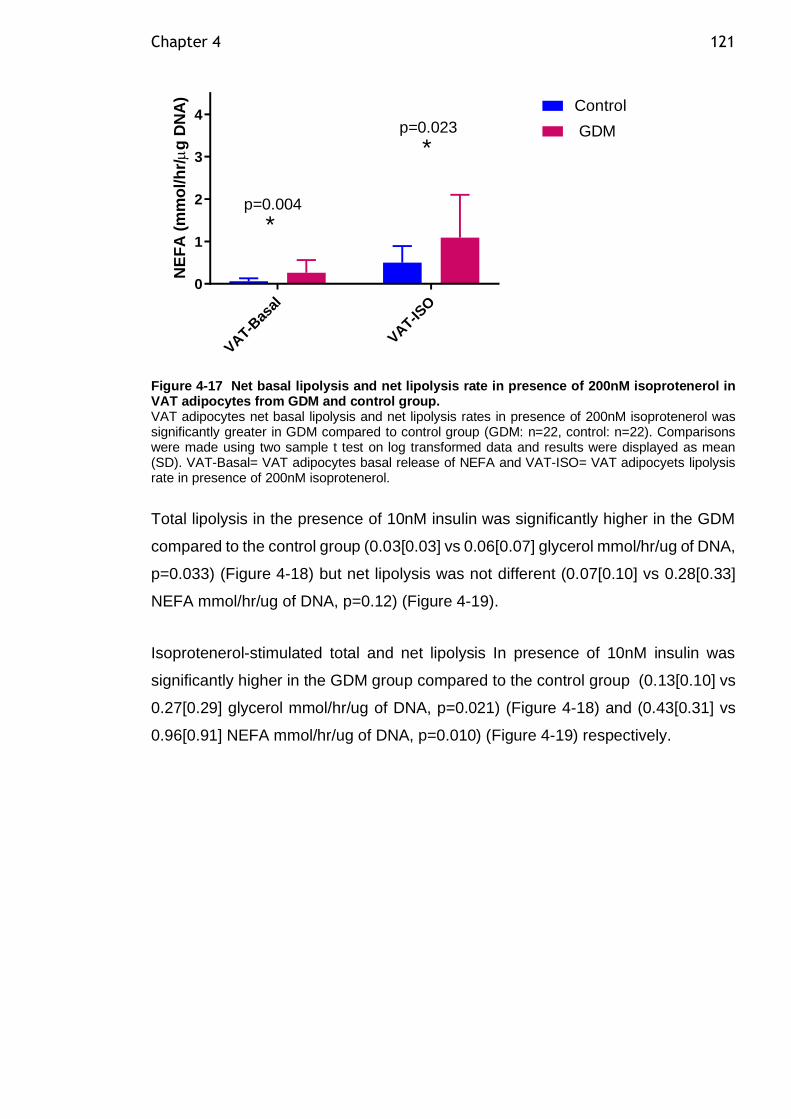
Chapter 4 121
VAT-B
asal
VAT-IS
O
0
1
2
3
4
NE
FA
(m
mo
l/h
r/
g D
NA
)
Control
GDM
*
*
p=0.004
p=0.023
Figure 4-17 Net basal lipolysis and net lipolysis rate in presence of 200nM isoprotenerol in VAT adipocytes from GDM and control group. VAT adipocytes net basal lipolysis and net lipolysis rates in presence of 200nM isoprotenerol was significantly greater in GDM compared to control group (GDM: n=22, control: n=22). Comparisons were made using two sample t test on log transformed data and results were displayed as mean (SD). VAT-Basal= VAT adipocytes basal release of NEFA and VAT-ISO= VAT adipocyets lipolysis rate in presence of 200nM isoprotenerol.
Total lipolysis in the presence of 10nM insulin was significantly higher in the GDM
compared to the control group (0.03[0.03] vs 0.06[0.07] glycerol mmol/hr/ug of DNA,
p=0.033) (Figure 4-18) but net lipolysis was not different (0.07[0.10] vs 0.28[0.33]
NEFA mmol/hr/ug of DNA, p=0.12) (Figure 4-19).
Isoprotenerol-stimulated total and net lipolysis In presence of 10nM insulin was
significantly higher in the GDM group compared to the control group (0.13[0.10] vs
0.27[0.29] glycerol mmol/hr/ug of DNA, p=0.021) (Figure 4-18) and (0.43[0.31] vs
0.96[0.91] NEFA mmol/hr/ug of DNA, p=0.010) (Figure 4-19) respectively.
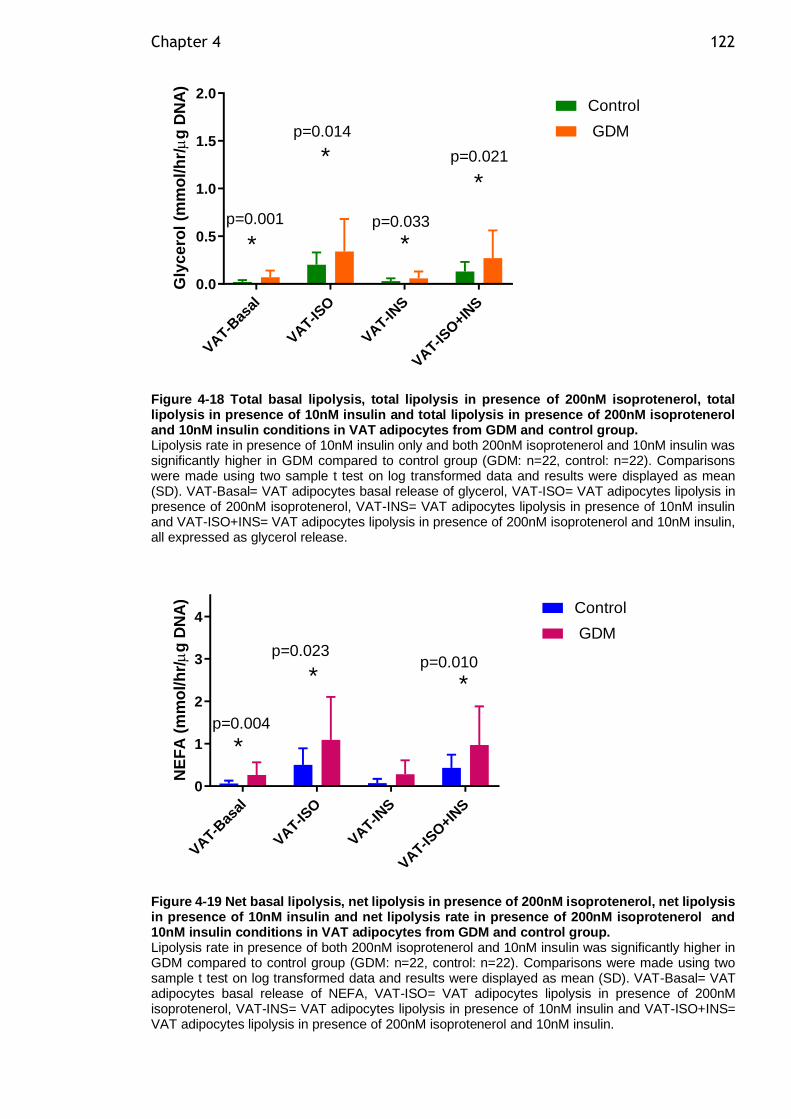
Chapter 4 122
VAT-B
asal
VAT-IS
O
VAT-IN
S
VAT-IS
O+IN
S
0.0
0.5
1.0
1.5
2.0
Gly
ce
rol
(mm
ol/
hr/
g D
NA
)
Control
GDM
*
*
*
*p=0.033
p=0.021
p=0.001
p=0.014
Figure 4-18 Total basal lipolysis, total lipolysis in presence of 200nM isoprotenerol, total lipolysis in presence of 10nM insulin and total lipolysis in presence of 200nM isoprotenerol and 10nM insulin conditions in VAT adipocytes from GDM and control group. Lipolysis rate in presence of 10nM insulin only and both 200nM isoprotenerol and 10nM insulin was significantly higher in GDM compared to control group (GDM: n=22, control: n=22). Comparisons were made using two sample t test on log transformed data and results were displayed as mean (SD). VAT-Basal= VAT adipocytes basal release of glycerol, VAT-ISO= VAT adipocytes lipolysis in presence of 200nM isoprotenerol, VAT-INS= VAT adipocytes lipolysis in presence of 10nM insulin and VAT-ISO+INS= VAT adipocytes lipolysis in presence of 200nM isoprotenerol and 10nM insulin, all expressed as glycerol release.
VAT-B
asal
VAT-IS
O
VAT-IN
S
VAT-IS
O+IN
S
0
1
2
3
4
NE
FA
(m
mo
l/h
r/
g D
NA
)
Control
GDM
*
**p=0.010
p=0.004
p=0.023
Figure 4-19 Net basal lipolysis, net lipolysis in presence of 200nM isoprotenerol, net lipolysis in presence of 10nM insulin and net lipolysis rate in presence of 200nM isoprotenerol and 10nM insulin conditions in VAT adipocytes from GDM and control group. Lipolysis rate in presence of both 200nM isoprotenerol and 10nM insulin was significantly higher in GDM compared to control group (GDM: n=22, control: n=22). Comparisons were made using two sample t test on log transformed data and results were displayed as mean (SD). VAT-Basal= VAT adipocytes basal release of NEFA, VAT-ISO= VAT adipocytes lipolysis in presence of 200nM isoprotenerol, VAT-INS= VAT adipocytes lipolysis in presence of 10nM insulin and VAT-ISO+INS= VAT adipocytes lipolysis in presence of 200nM isoprotenerol and 10nM insulin.
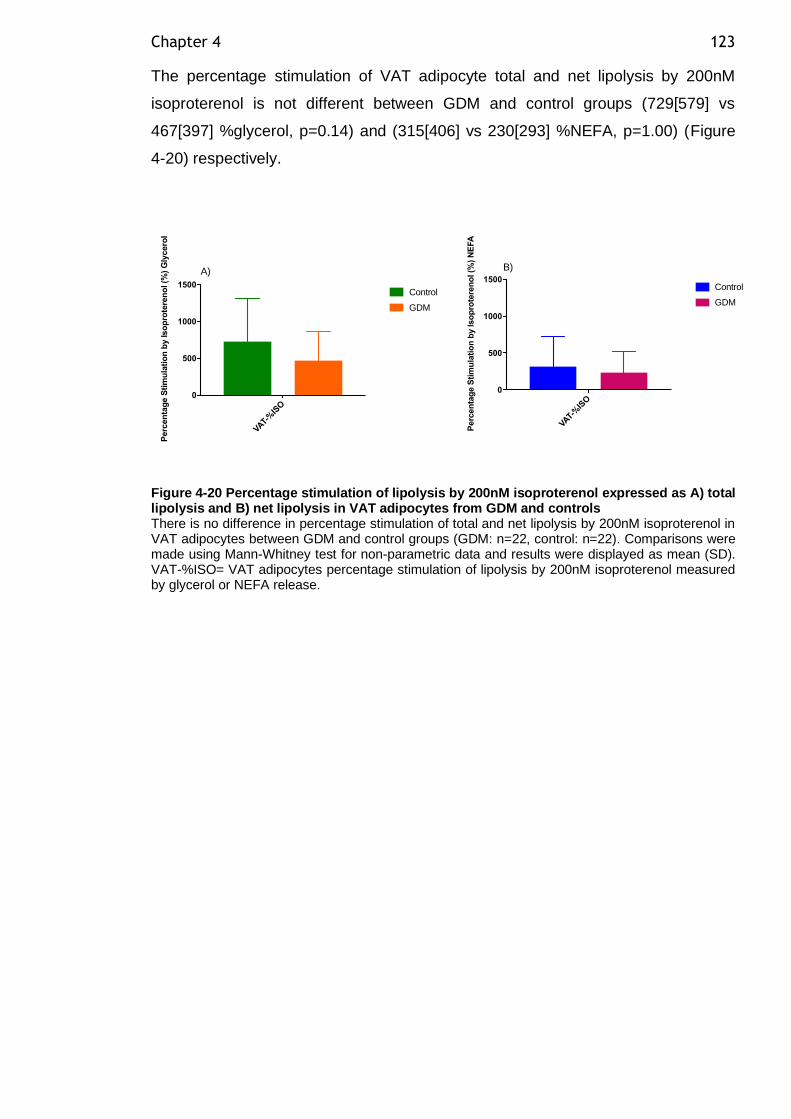
Chapter 4 123
The percentage stimulation of VAT adipocyte total and net lipolysis by 200nM
isoproterenol is not different between GDM and control groups (729[579] vs
467[397] %glycerol, p=0.14) and (315[406] vs 230[293] %NEFA, p=1.00) (Figure
4-20) respectively.
Figure 4-20 Percentage stimulation of lipolysis by 200nM isoproterenol expressed as A) total lipolysis and B) net lipolysis in VAT adipocytes from GDM and controls There is no difference in percentage stimulation of total and net lipolysis by 200nM isoproterenol in VAT adipocytes between GDM and control groups (GDM: n=22, control: n=22). Comparisons were made using Mann-Whitney test for non-parametric data and results were displayed as mean (SD). VAT-%ISO= VAT adipocytes percentage stimulation of lipolysis by 200nM isoproterenol measured by glycerol or NEFA release.
VAT-%
ISO
0
500
1000
1500
Perc
en
tag
e S
tim
ula
tio
n b
y Iso
pro
tere
no
l (%
) G
lycero
l
Control
GDM
VAT-%
ISO
0
500
1000
1500
Perc
en
tag
e S
tim
ula
tio
n b
y Iso
pro
tere
no
l (%
) N
EFA
Control
GDM
A) B)
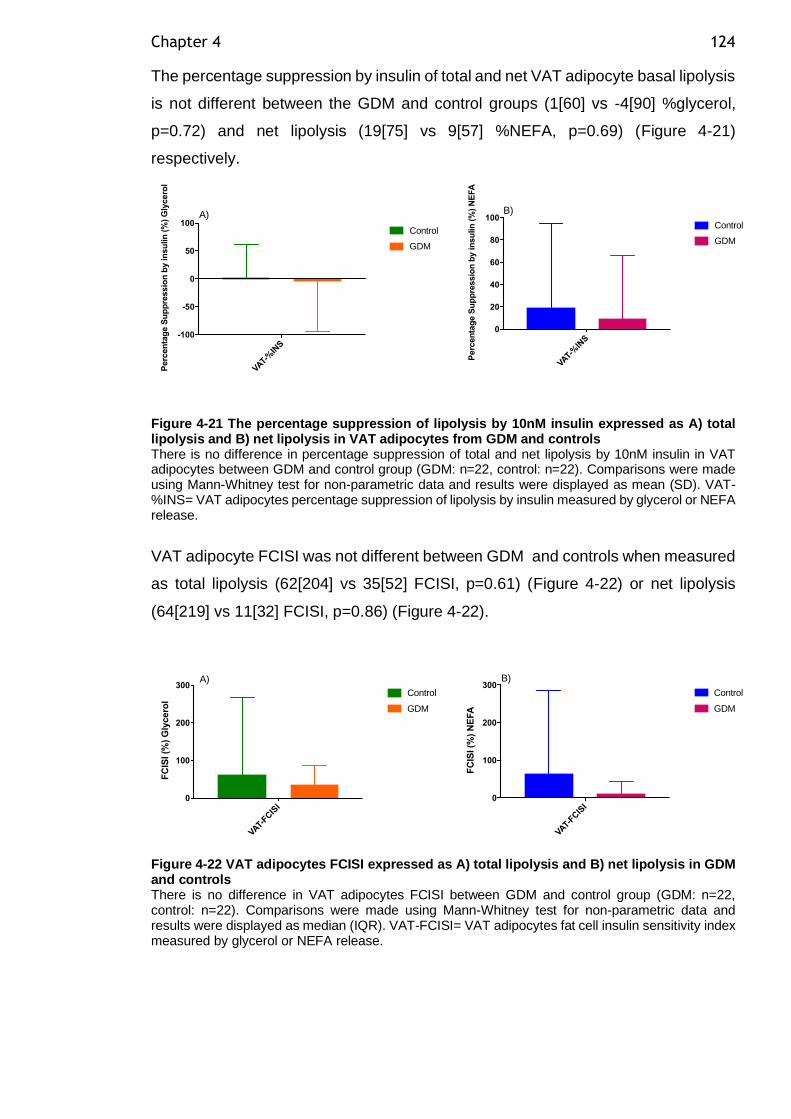
Chapter 4 124
The percentage suppression by insulin of total and net VAT adipocyte basal lipolysis
is not different between the GDM and control groups (1[60] vs -4[90] %glycerol,
p=0.72) and net lipolysis (19[75] vs 9[57] %NEFA, p=0.69) (Figure 4-21)
respectively.
Figure 4-21 The percentage suppression of lipolysis by 10nM insulin expressed as A) total lipolysis and B) net lipolysis in VAT adipocytes from GDM and controls There is no difference in percentage suppression of total and net lipolysis by 10nM insulin in VAT adipocytes between GDM and control group (GDM: n=22, control: n=22). Comparisons were made using Mann-Whitney test for non-parametric data and results were displayed as mean (SD). VAT-%INS= VAT adipocytes percentage suppression of lipolysis by insulin measured by glycerol or NEFA release.
VAT adipocyte FCISI was not different between GDM and controls when measured
as total lipolysis (62[204] vs 35[52] FCISI, p=0.61) (Figure 4-22) or net lipolysis
(64[219] vs 11[32] FCISI, p=0.86) (Figure 4-22).
Figure 4-22 VAT adipocytes FCISI expressed as A) total lipolysis and B) net lipolysis in GDM and controls There is no difference in VAT adipocytes FCISI between GDM and control group (GDM: n=22, control: n=22). Comparisons were made using Mann-Whitney test for non-parametric data and results were displayed as median (IQR). VAT-FCISI= VAT adipocytes fat cell insulin sensitivity index measured by glycerol or NEFA release.
VAT-%
INS
-100
-50
0
50
100
Perc
en
tag
e S
up
pre
ssio
n b
y in
su
lin
(%
) G
lycero
l
Control
GDM
VAT-%
INS
0
20
40
60
80
100
Perc
en
tag
e S
up
pre
ssio
n b
y in
su
lin
(%
) N
EFA
Control
GDM
A) B)
VAT-FC
ISI
0
100
200
300
FC
ISI (%
) G
lycero
l
Control
GDM
VAT-FC
ISI
0
100
200
300
FC
ISI (%
) N
EFA
Control
GDM
A) B)
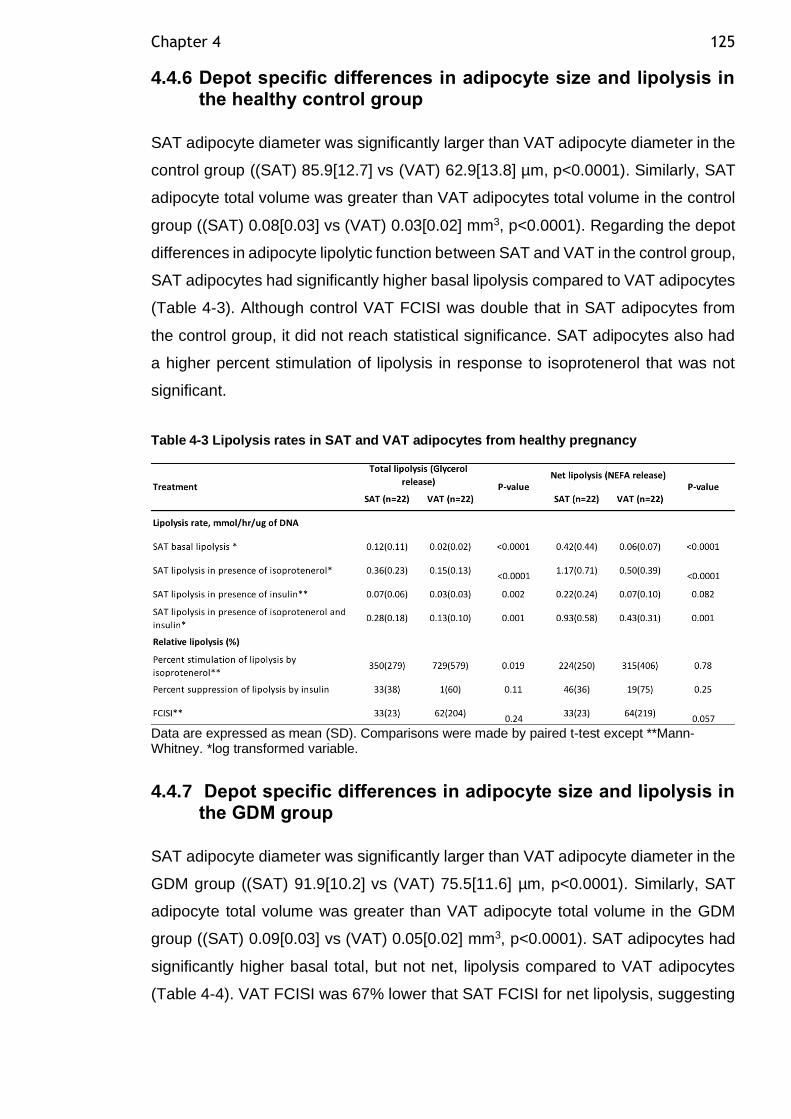
Chapter 4 125
4.4.6 Depot specific differences in adipocyte size and lipolysis in the healthy control group
SAT adipocyte diameter was significantly larger than VAT adipocyte diameter in the
control group ((SAT) 85.9[12.7] vs (VAT) 62.9[13.8] µm, p<0.0001). Similarly, SAT
adipocyte total volume was greater than VAT adipocytes total volume in the control
group ((SAT) 0.08[0.03] vs (VAT) 0.03[0.02] mm3, p<0.0001). Regarding the depot
differences in adipocyte lipolytic function between SAT and VAT in the control group,
SAT adipocytes had significantly higher basal lipolysis compared to VAT adipocytes
(Table 4-3). Although control VAT FCISI was double that in SAT adipocytes from
the control group, it did not reach statistical significance. SAT adipocytes also had
a higher percent stimulation of lipolysis in response to isoprotenerol that was not
significant.
Table 4-3 Lipolysis rates in SAT and VAT adipocytes from healthy pregnancy
Data are expressed as mean (SD). Comparisons were made by paired t-test except **Mann-Whitney. *log transformed variable.
4.4.7 Depot specific differences in adipocyte size and lipolysis in the GDM group
SAT adipocyte diameter was significantly larger than VAT adipocyte diameter in the
GDM group ((SAT) 91.9[10.2] vs (VAT) 75.5[11.6] µm, p<0.0001). Similarly, SAT
adipocyte total volume was greater than VAT adipocyte total volume in the GDM
group ((SAT) 0.09[0.03] vs (VAT) 0.05[0.02] mm3, p<0.0001). SAT adipocytes had
significantly higher basal total, but not net, lipolysis compared to VAT adipocytes
(Table 4-4). VAT FCISI was 67% lower that SAT FCISI for net lipolysis, suggesting
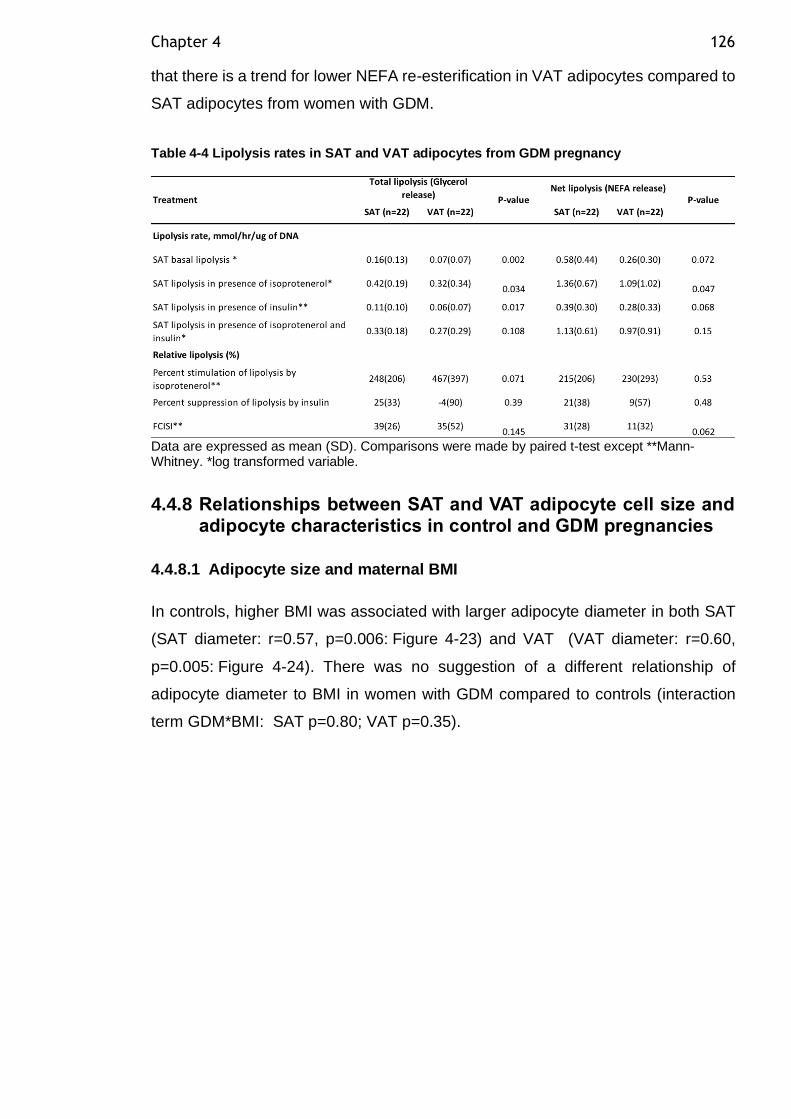
Chapter 4 126
that there is a trend for lower NEFA re-esterification in VAT adipocytes compared to
SAT adipocytes from women with GDM.
Table 4-4 Lipolysis rates in SAT and VAT adipocytes from GDM pregnancy
Data are expressed as mean (SD). Comparisons were made by paired t-test except **Mann-Whitney. *log transformed variable.
4.4.8 Relationships between SAT and VAT adipocyte cell size and adipocyte characteristics in control and GDM pregnancies
4.4.8.1 Adipocyte size and maternal BMI
In controls, higher BMI was associated with larger adipocyte diameter in both SAT
(SAT diameter: r=0.57, p=0.006: Figure 4-23) and VAT (VAT diameter: r=0.60,
p=0.005: Figure 4-24). There was no suggestion of a different relationship of
adipocyte diameter to BMI in women with GDM compared to controls (interaction
term GDM*BMI: SAT p=0.80; VAT p=0.35).
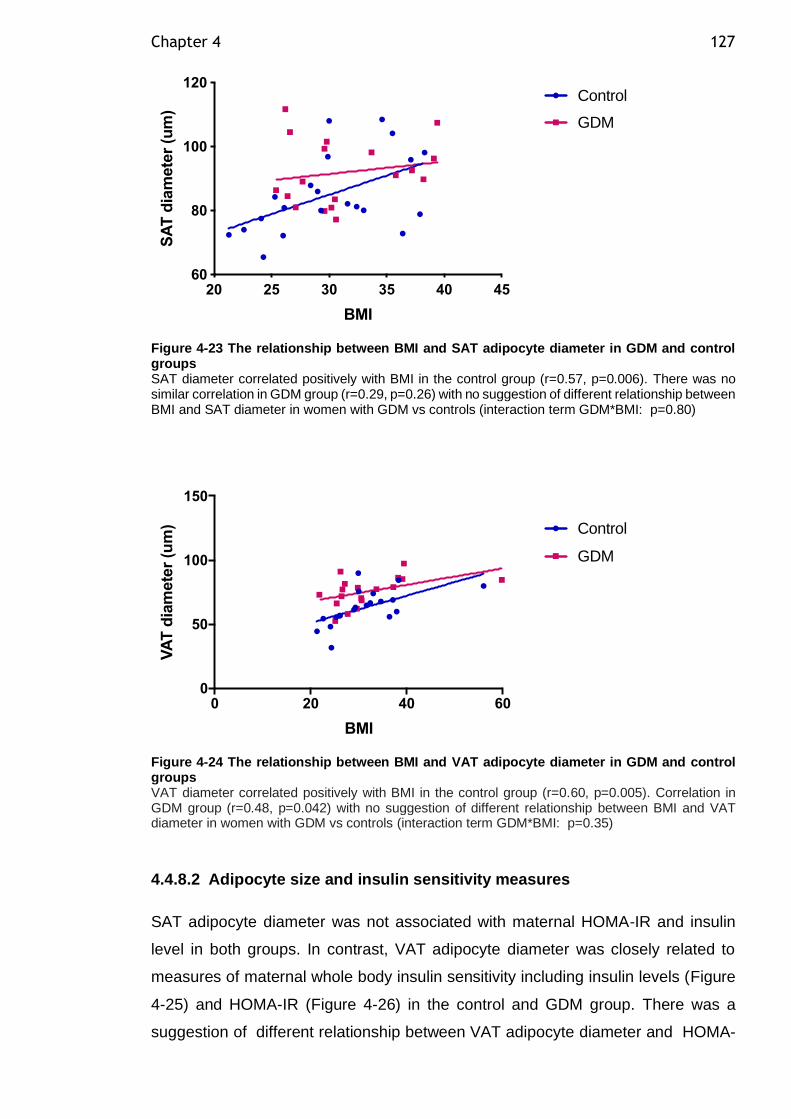
Chapter 4 127
Figure 4-23 The relationship between BMI and SAT adipocyte diameter in GDM and control groups SAT diameter correlated positively with BMI in the control group (r=0.57, p=0.006). There was no similar correlation in GDM group (r=0.29, p=0.26) with no suggestion of different relationship between BMI and SAT diameter in women with GDM vs controls (interaction term GDM*BMI: p=0.80)
Figure 4-24 The relationship between BMI and VAT adipocyte diameter in GDM and control groups VAT diameter correlated positively with BMI in the control group (r=0.60, p=0.005). Correlation in GDM group (r=0.48, p=0.042) with no suggestion of different relationship between BMI and VAT diameter in women with GDM vs controls (interaction term GDM*BMI: p=0.35)
4.4.8.2 Adipocyte size and insulin sensitivity measures
SAT adipocyte diameter was not associated with maternal HOMA-IR and insulin
level in both groups. In contrast, VAT adipocyte diameter was closely related to
measures of maternal whole body insulin sensitivity including insulin levels (Figure
4-25) and HOMA-IR (Figure 4-26) in the control and GDM group. There was a
suggestion of different relationship between VAT adipocyte diameter and HOMA-
20 25 30 35 40 4560
80
100
120
BMI
SA
T d
iam
ete
r (u
m)
Control
GDM
0 20 40 600
50
100
150
BMI
VA
T d
iam
ete
r (u
m) Control
GDM
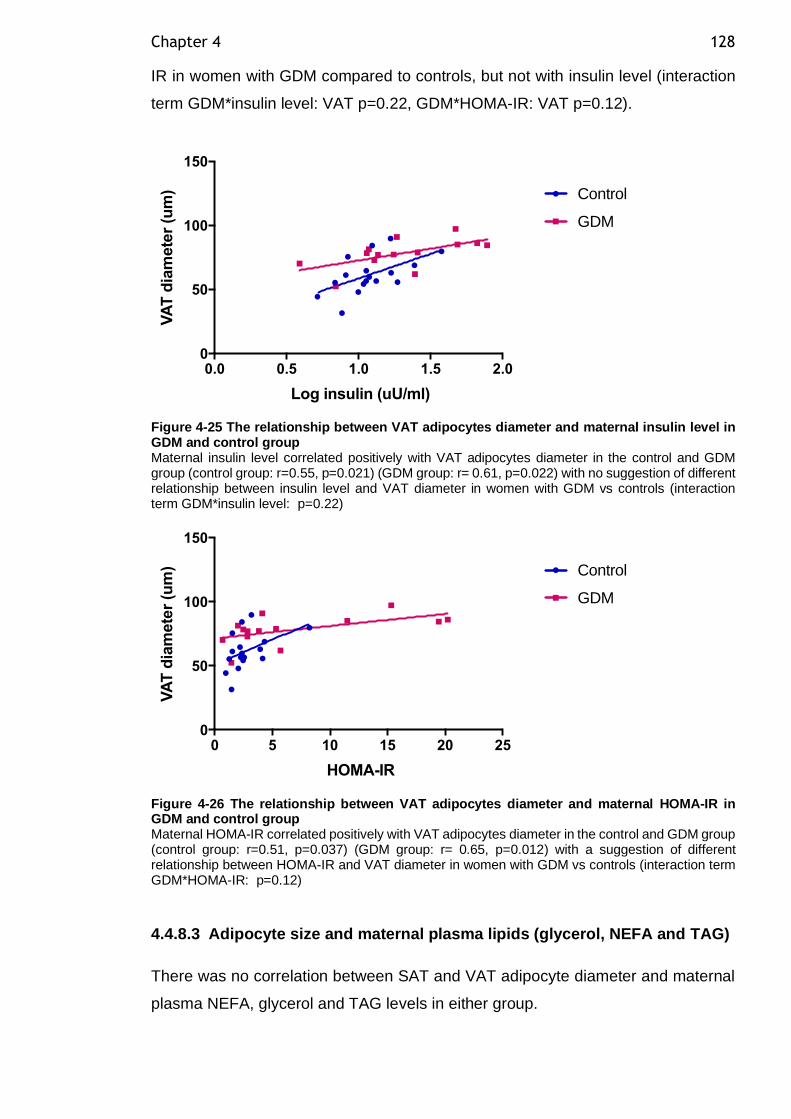
Chapter 4 128
IR in women with GDM compared to controls, but not with insulin level (interaction
term GDM*insulin level: VAT p=0.22, GDM*HOMA-IR: VAT p=0.12).
Figure 4-25 The relationship between VAT adipocytes diameter and maternal insulin level in GDM and control group Maternal insulin level correlated positively with VAT adipocytes diameter in the control and GDM group (control group: r=0.55, p=0.021) (GDM group: r= 0.61, p=0.022) with no suggestion of different relationship between insulin level and VAT diameter in women with GDM vs controls (interaction term GDM*insulin level: p=0.22)
Figure 4-26 The relationship between VAT adipocytes diameter and maternal HOMA-IR in GDM and control group Maternal HOMA-IR correlated positively with VAT adipocytes diameter in the control and GDM group (control group: r=0.51, p=0.037) (GDM group: r= 0.65, p=0.012) with a suggestion of different relationship between HOMA-IR and VAT diameter in women with GDM vs controls (interaction term GDM*HOMA-IR: p=0.12)
4.4.8.3 Adipocyte size and maternal plasma lipids (glycerol, NEFA and TAG)
There was no correlation between SAT and VAT adipocyte diameter and maternal
plasma NEFA, glycerol and TAG levels in either group.
0.0 0.5 1.0 1.5 2.00
50
100
150
Log insulin (uU/ml)
VA
T d
iam
ete
r (u
m) Control
GDM
0 5 10 15 20 250
50
100
150
HOMA-IR
VA
T d
iam
ete
r (u
m) Control
GDM
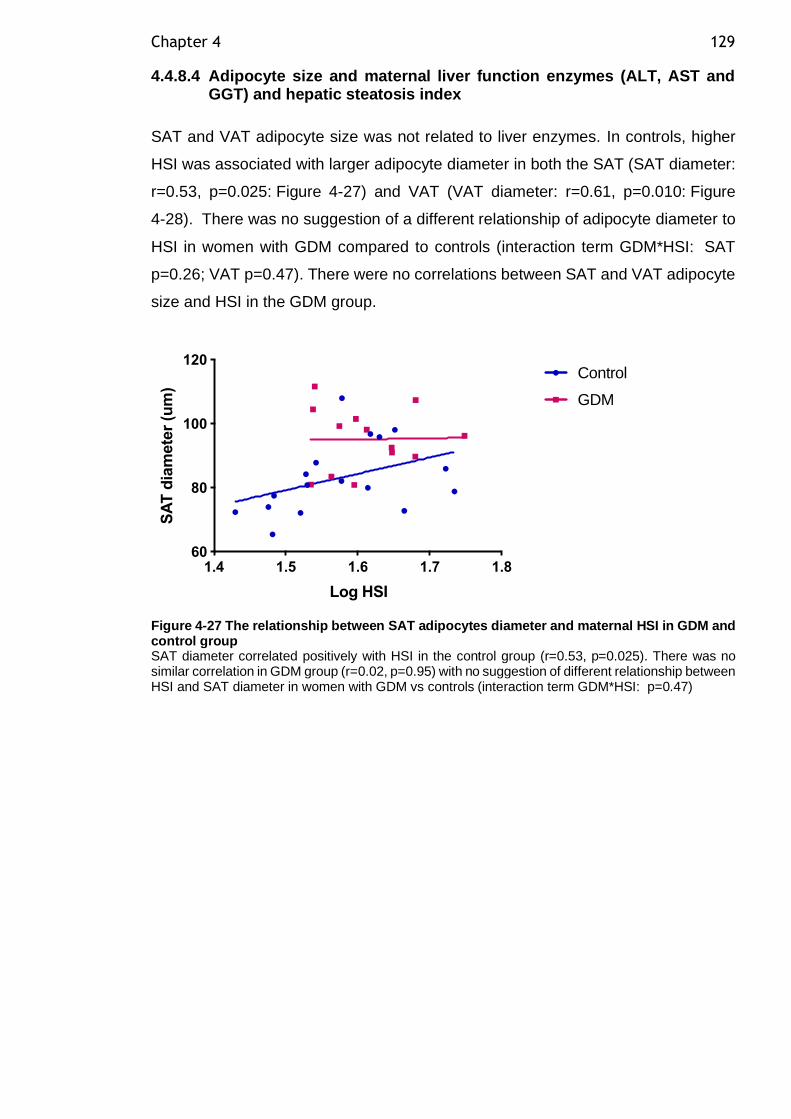
Chapter 4 129
4.4.8.4 Adipocyte size and maternal liver function enzymes (ALT, AST and GGT) and hepatic steatosis index
SAT and VAT adipocyte size was not related to liver enzymes. In controls, higher
HSI was associated with larger adipocyte diameter in both the SAT (SAT diameter:
r=0.53, p=0.025: Figure 4-27) and VAT (VAT diameter: r=0.61, p=0.010: Figure
4-28). There was no suggestion of a different relationship of adipocyte diameter to
HSI in women with GDM compared to controls (interaction term GDM*HSI: SAT
p=0.26; VAT p=0.47). There were no correlations between SAT and VAT adipocyte
size and HSI in the GDM group.
Figure 4-27 The relationship between SAT adipocytes diameter and maternal HSI in GDM and control group SAT diameter correlated positively with HSI in the control group (r=0.53, p=0.025). There was no similar correlation in GDM group (r=0.02, p=0.95) with no suggestion of different relationship between HSI and SAT diameter in women with GDM vs controls (interaction term GDM*HSI: p=0.47)
1.4 1.5 1.6 1.7 1.860
80
100
120
Log HSI
SA
T d
iam
ete
r (u
m)
Control
GDM
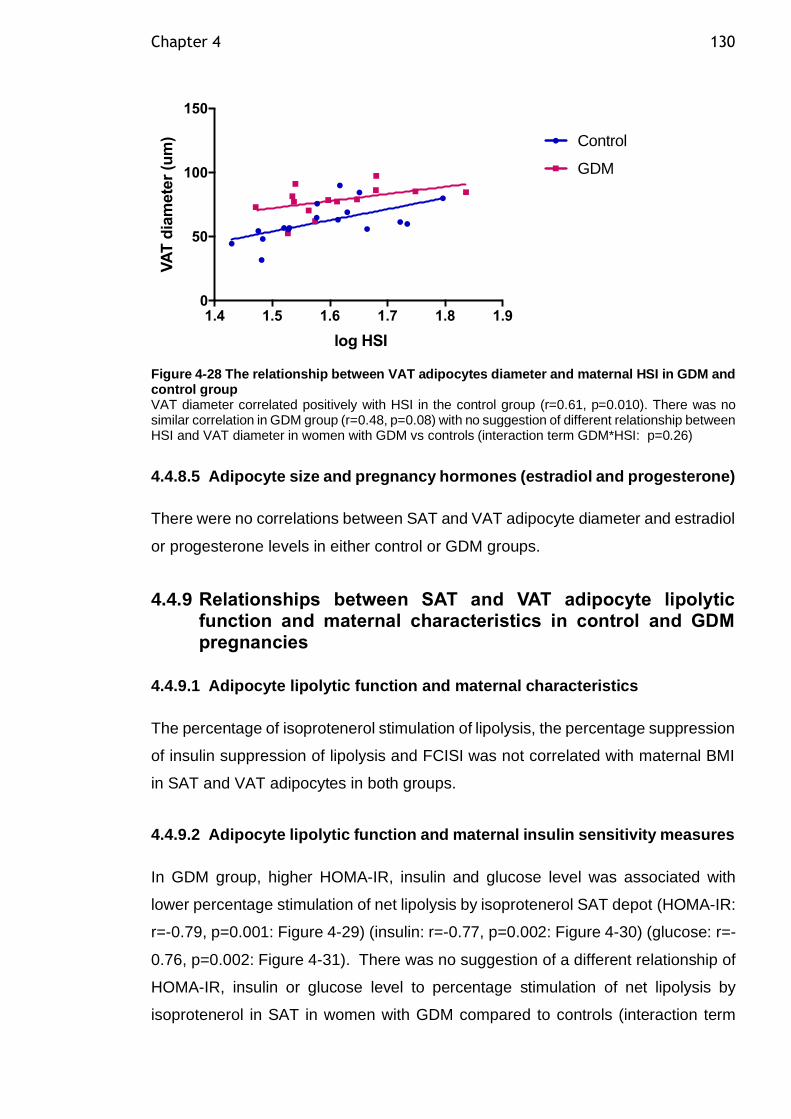
Chapter 4 130
Figure 4-28 The relationship between VAT adipocytes diameter and maternal HSI in GDM and control group VAT diameter correlated positively with HSI in the control group (r=0.61, p=0.010). There was no similar correlation in GDM group (r=0.48, p=0.08) with no suggestion of different relationship between HSI and VAT diameter in women with GDM vs controls (interaction term GDM*HSI: p=0.26)
4.4.8.5 Adipocyte size and pregnancy hormones (estradiol and progesterone)
There were no correlations between SAT and VAT adipocyte diameter and estradiol
or progesterone levels in either control or GDM groups.
4.4.9 Relationships between SAT and VAT adipocyte lipolytic function and maternal characteristics in control and GDM pregnancies
4.4.9.1 Adipocyte lipolytic function and maternal characteristics
The percentage of isoprotenerol stimulation of lipolysis, the percentage suppression
of insulin suppression of lipolysis and FCISI was not correlated with maternal BMI
in SAT and VAT adipocytes in both groups.
4.4.9.2 Adipocyte lipolytic function and maternal insulin sensitivity measures
In GDM group, higher HOMA-IR, insulin and glucose level was associated with
lower percentage stimulation of net lipolysis by isoprotenerol SAT depot (HOMA-IR:
r=-0.79, p=0.001: Figure 4-29) (insulin: r=-0.77, p=0.002: Figure 4-30) (glucose: r=-
0.76, p=0.002: Figure 4-31). There was no suggestion of a different relationship of
HOMA-IR, insulin or glucose level to percentage stimulation of net lipolysis by
isoprotenerol in SAT in women with GDM compared to controls (interaction term
1.4 1.5 1.6 1.7 1.8 1.90
50
100
150
log HSI
VA
T d
iam
ete
r (u
m) Control
GDM
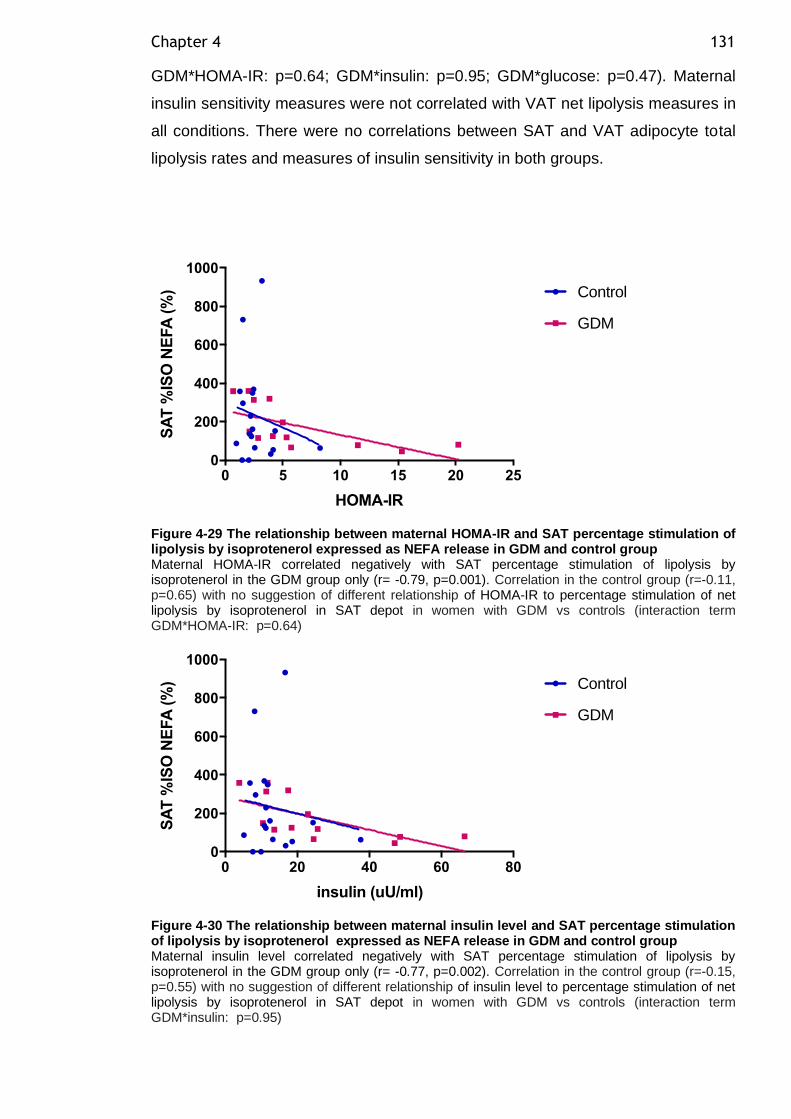
Chapter 4 131
GDM*HOMA-IR: p=0.64; GDM*insulin: p=0.95; GDM*glucose: p=0.47). Maternal
insulin sensitivity measures were not correlated with VAT net lipolysis measures in
all conditions. There were no correlations between SAT and VAT adipocyte total
lipolysis rates and measures of insulin sensitivity in both groups.
Figure 4-29 The relationship between maternal HOMA-IR and SAT percentage stimulation of lipolysis by isoprotenerol expressed as NEFA release in GDM and control group Maternal HOMA-IR correlated negatively with SAT percentage stimulation of lipolysis by isoprotenerol in the GDM group only (r= -0.79, p=0.001). Correlation in the control group (r=-0.11, p=0.65) with no suggestion of different relationship of HOMA-IR to percentage stimulation of net lipolysis by isoprotenerol in SAT depot in women with GDM vs controls (interaction term GDM*HOMA-IR: p=0.64)
Figure 4-30 The relationship between maternal insulin level and SAT percentage stimulation of lipolysis by isoprotenerol expressed as NEFA release in GDM and control group Maternal insulin level correlated negatively with SAT percentage stimulation of lipolysis by isoprotenerol in the GDM group only (r= -0.77, p=0.002). Correlation in the control group (r=-0.15, p=0.55) with no suggestion of different relationship of insulin level to percentage stimulation of net lipolysis by isoprotenerol in SAT depot in women with GDM vs controls (interaction term GDM*insulin: p=0.95)
0 5 10 15 20 250
200
400
600
800
1000
HOMA-IR
SA
T %
ISO
NE
FA
(%
) Control
GDM
0 20 40 60 800
200
400
600
800
1000
insulin (uU/ml)
SA
T %
ISO
NE
FA
(%
) Control
GDM
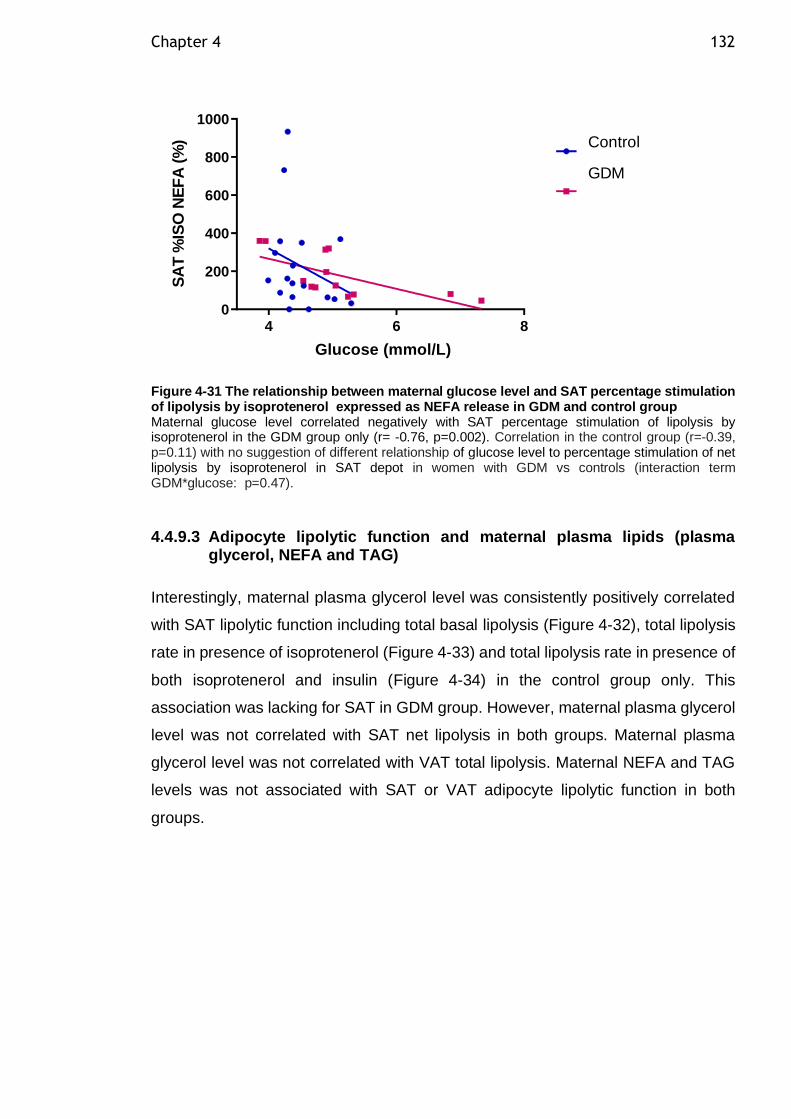
Chapter 4 132
4 6 80
200
400
600
800
1000
Glucose (mmol/L)
SA
T %
ISO
NE
FA
(%
) Control
GDM
Figure 4-31 The relationship between maternal glucose level and SAT percentage stimulation of lipolysis by isoprotenerol expressed as NEFA release in GDM and control group Maternal glucose level correlated negatively with SAT percentage stimulation of lipolysis by isoprotenerol in the GDM group only (r= -0.76, p=0.002). Correlation in the control group (r=-0.39, p=0.11) with no suggestion of different relationship of glucose level to percentage stimulation of net lipolysis by isoprotenerol in SAT depot in women with GDM vs controls (interaction term GDM*glucose: p=0.47).
4.4.9.3 Adipocyte lipolytic function and maternal plasma lipids (plasma glycerol, NEFA and TAG)
Interestingly, maternal plasma glycerol level was consistently positively correlated
with SAT lipolytic function including total basal lipolysis (Figure 4-32), total lipolysis
rate in presence of isoprotenerol (Figure 4-33) and total lipolysis rate in presence of
both isoprotenerol and insulin (Figure 4-34) in the control group only. This
association was lacking for SAT in GDM group. However, maternal plasma glycerol
level was not correlated with SAT net lipolysis in both groups. Maternal plasma
glycerol level was not correlated with VAT total lipolysis. Maternal NEFA and TAG
levels was not associated with SAT or VAT adipocyte lipolytic function in both
groups.
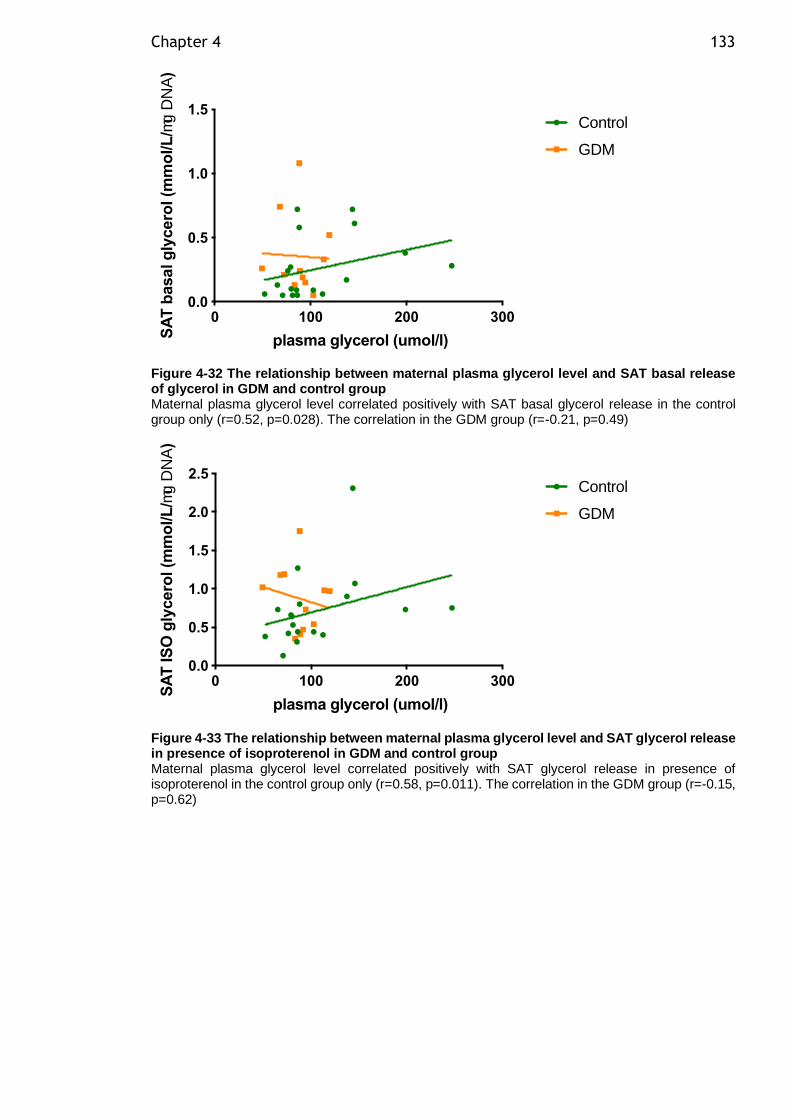
Chapter 4 133
Figure 4-32 The relationship between maternal plasma glycerol level and SAT basal release of glycerol in GDM and control group Maternal plasma glycerol level correlated positively with SAT basal glycerol release in the control group only (r=0.52, p=0.028). The correlation in the GDM group (r=-0.21, p=0.49)
Figure 4-33 The relationship between maternal plasma glycerol level and SAT glycerol release in presence of isoproterenol in GDM and control group Maternal plasma glycerol level correlated positively with SAT glycerol release in presence of isoproterenol in the control group only (r=0.58, p=0.011). The correlation in the GDM group (r=-0.15, p=0.62)
0 100 200 3000.0
0.5
1.0
1.5
plasma glycerol (umol/l)SA
T b
asal g
lycero
l (m
mo
l/L
/mg D
NA
)
Control
GDM
0 100 200 3000.0
0.5
1.0
1.5
2.0
2.5
plasma glycerol (umol/l)
SA
T IS
O g
lycero
l (m
mo
l/L
/mg D
NA
)
Control
GDM
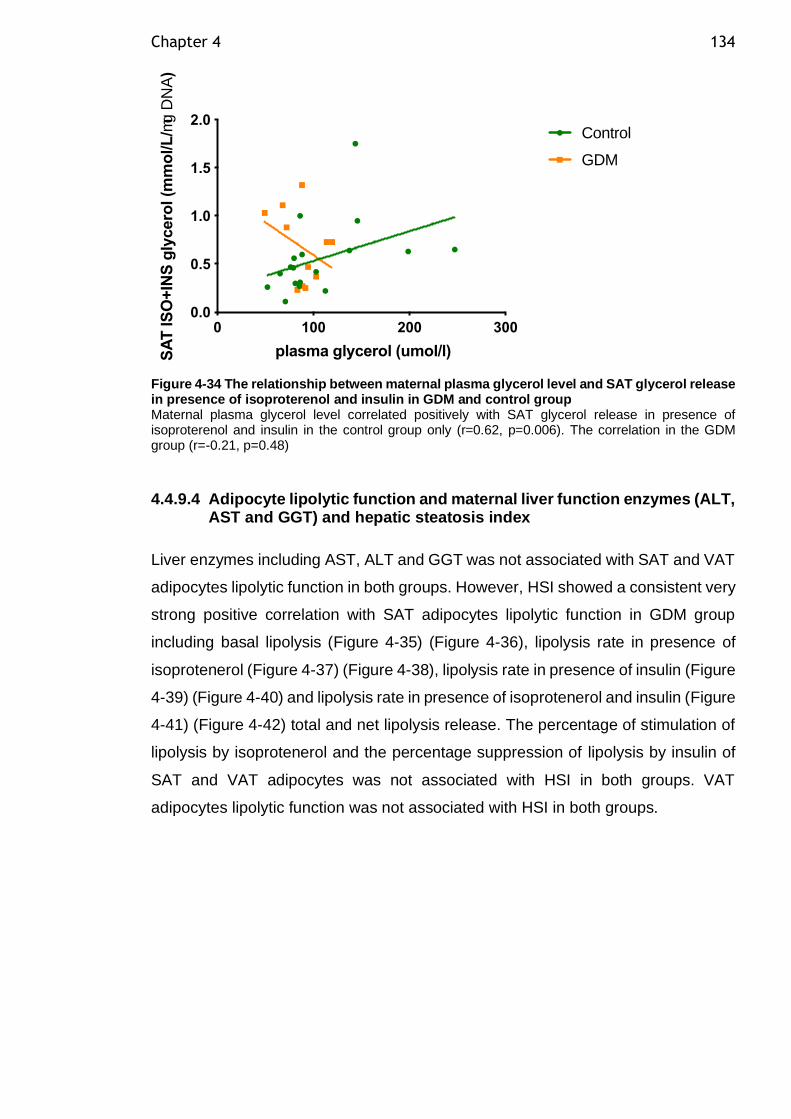
Chapter 4 134
Figure 4-34 The relationship between maternal plasma glycerol level and SAT glycerol release in presence of isoproterenol and insulin in GDM and control group Maternal plasma glycerol level correlated positively with SAT glycerol release in presence of isoproterenol and insulin in the control group only (r=0.62, p=0.006). The correlation in the GDM group (r=-0.21, p=0.48)
4.4.9.4 Adipocyte lipolytic function and maternal liver function enzymes (ALT, AST and GGT) and hepatic steatosis index
Liver enzymes including AST, ALT and GGT was not associated with SAT and VAT
adipocytes lipolytic function in both groups. However, HSI showed a consistent very
strong positive correlation with SAT adipocytes lipolytic function in GDM group
including basal lipolysis (Figure 4-35) (Figure 4-36), lipolysis rate in presence of
isoprotenerol (Figure 4-37) (Figure 4-38), lipolysis rate in presence of insulin (Figure
4-39) (Figure 4-40) and lipolysis rate in presence of isoprotenerol and insulin (Figure
4-41) (Figure 4-42) total and net lipolysis release. The percentage of stimulation of
lipolysis by isoprotenerol and the percentage suppression of lipolysis by insulin of
SAT and VAT adipocytes was not associated with HSI in both groups. VAT
adipocytes lipolytic function was not associated with HSI in both groups.
0 100 200 3000.0
0.5
1.0
1.5
2.0
plasma glycerol (umol/l)SA
T IS
O+
INS
gly
cero
l (m
mo
l/L
/mg D
NA
)
Control
GDM
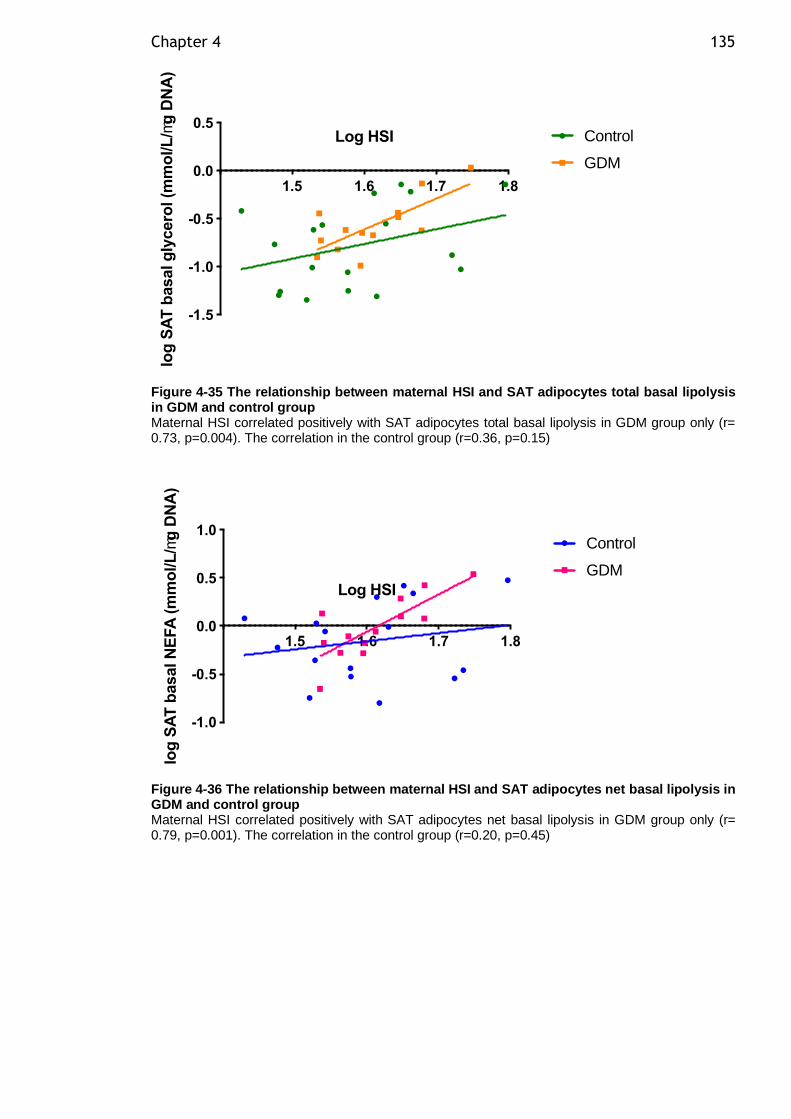
Chapter 4 135
Figure 4-35 The relationship between maternal HSI and SAT adipocytes total basal lipolysis in GDM and control group Maternal HSI correlated positively with SAT adipocytes total basal lipolysis in GDM group only (r= 0.73, p=0.004). The correlation in the control group (r=0.36, p=0.15)
Figure 4-36 The relationship between maternal HSI and SAT adipocytes net basal lipolysis in GDM and control group Maternal HSI correlated positively with SAT adipocytes net basal lipolysis in GDM group only (r= 0.79, p=0.001). The correlation in the control group (r=0.20, p=0.45)
1.5 1.6 1.7 1.8
-1.5
-1.0
-0.5
0.0
0.5Log HSI
log
SA
T b
asal g
lycero
l (m
mo
l/L
/mg
DN
A)
Control
GDM
1.5 1.6 1.7 1.8
-1.0
-0.5
0.0
0.5
1.0
Log HSI
log
SA
T b
asal N
EFA
(m
mo
l/L
/mg
DN
A)
Control
GDM
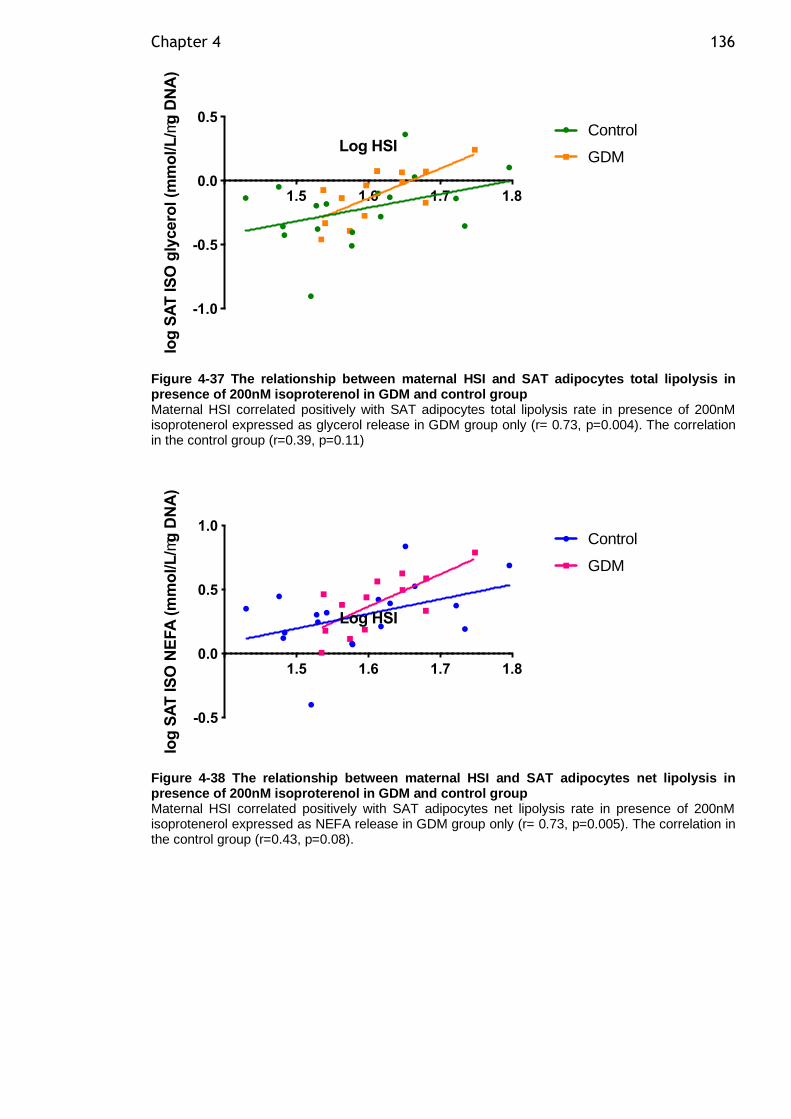
Chapter 4 136
Figure 4-37 The relationship between maternal HSI and SAT adipocytes total lipolysis in presence of 200nM isoproterenol in GDM and control group Maternal HSI correlated positively with SAT adipocytes total lipolysis rate in presence of 200nM isoprotenerol expressed as glycerol release in GDM group only (r= 0.73, p=0.004). The correlation in the control group (r=0.39, p=0.11)
Figure 4-38 The relationship between maternal HSI and SAT adipocytes net lipolysis in presence of 200nM isoproterenol in GDM and control group Maternal HSI correlated positively with SAT adipocytes net lipolysis rate in presence of 200nM isoprotenerol expressed as NEFA release in GDM group only (r= 0.73, p=0.005). The correlation in the control group (r=0.43, p=0.08).
1.5 1.6 1.7 1.8
-1.0
-0.5
0.0
0.5
Log HSI
log
SA
T IS
O g
lycero
l (m
mo
l/L
/mg
DN
A)
Control
GDM
1.5 1.6 1.7 1.8
-0.5
0.0
0.5
1.0
Log HSI
log
SA
T IS
O N
EFA
(m
mo
l/L
/mg
DN
A)
Control
GDM
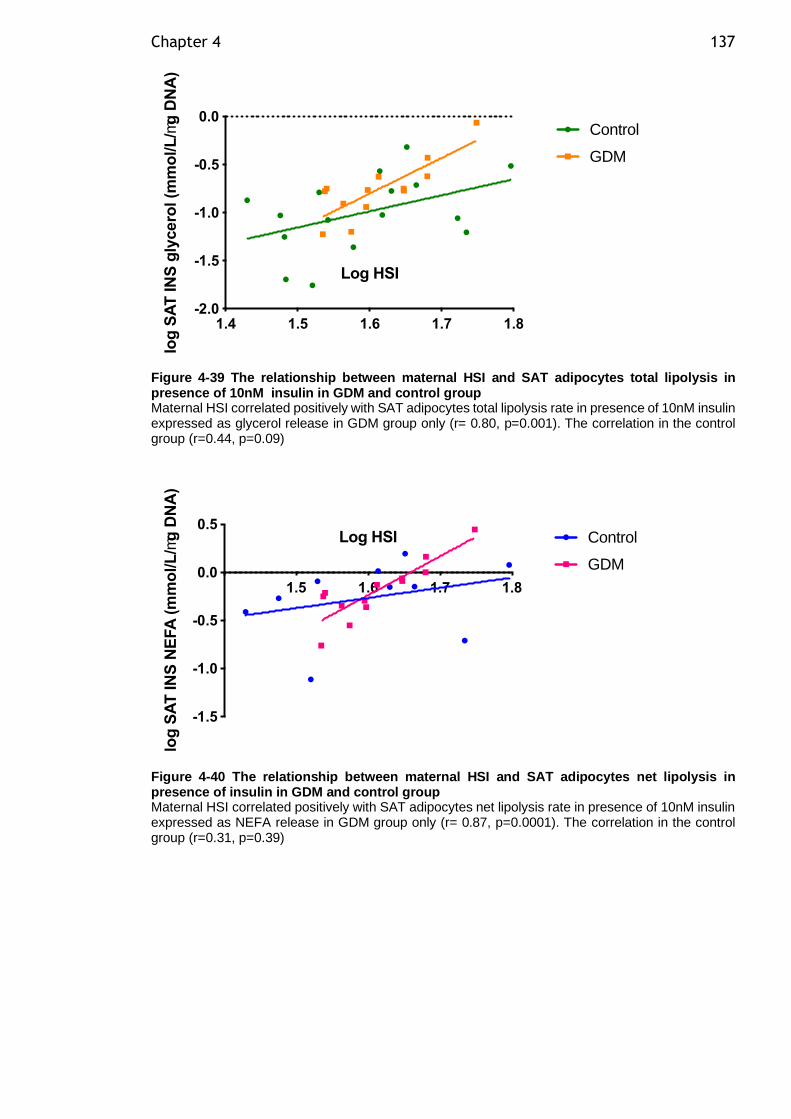
Chapter 4 137
Figure 4-39 The relationship between maternal HSI and SAT adipocytes total lipolysis in presence of 10nM insulin in GDM and control group Maternal HSI correlated positively with SAT adipocytes total lipolysis rate in presence of 10nM insulin expressed as glycerol release in GDM group only (r= 0.80, p=0.001). The correlation in the control group (r=0.44, p=0.09)
Figure 4-40 The relationship between maternal HSI and SAT adipocytes net lipolysis in presence of insulin in GDM and control group Maternal HSI correlated positively with SAT adipocytes net lipolysis rate in presence of 10nM insulin expressed as NEFA release in GDM group only (r= 0.87, p=0.0001). The correlation in the control group (r=0.31, p=0.39)
1.4 1.5 1.6 1.7 1.8-2.0
-1.5
-1.0
-0.5
0.0
Log HSI
log
SA
T IN
S g
lycero
l (m
mo
l/L
/mg
DN
A)
Control
GDM
1.5 1.6 1.7 1.8
-1.5
-1.0
-0.5
0.0
0.5Log HSI
log
SA
T IN
S N
EFA
(m
mo
l/L
/mg
DN
A)
Control
GDM
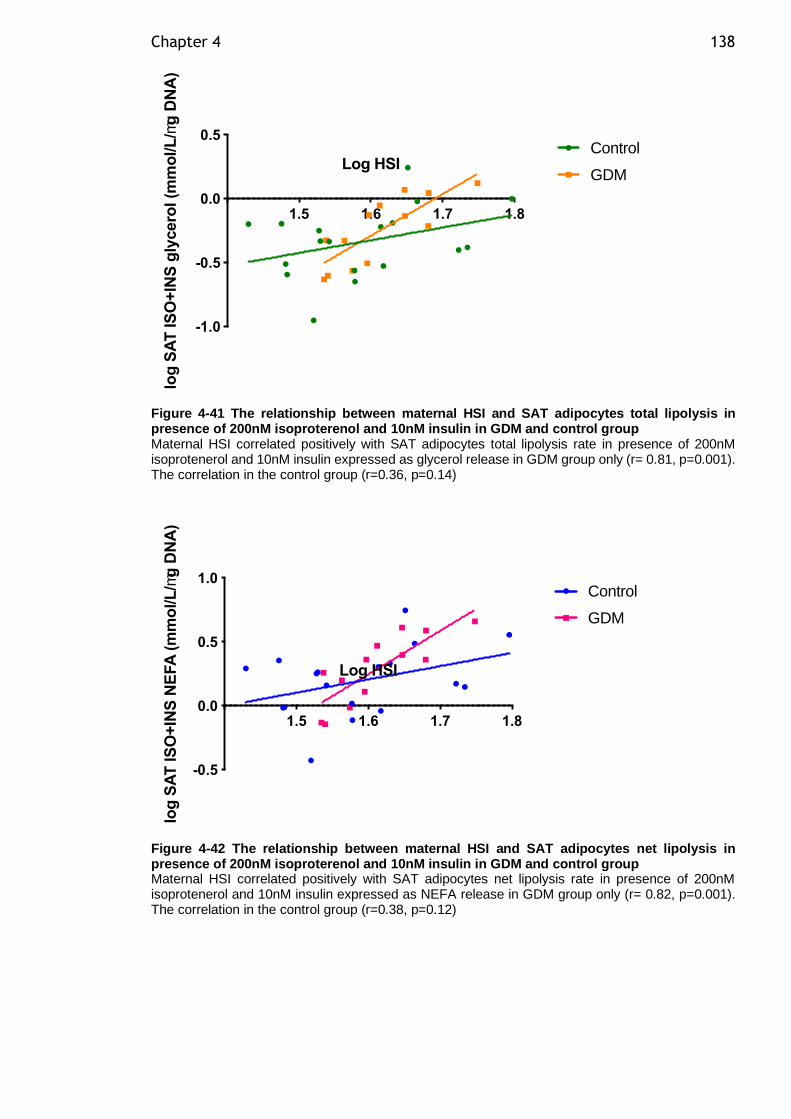
Chapter 4 138
Figure 4-41 The relationship between maternal HSI and SAT adipocytes total lipolysis in presence of 200nM isoproterenol and 10nM insulin in GDM and control group Maternal HSI correlated positively with SAT adipocytes total lipolysis rate in presence of 200nM isoprotenerol and 10nM insulin expressed as glycerol release in GDM group only (r= 0.81, p=0.001). The correlation in the control group (r=0.36, p=0.14)
Figure 4-42 The relationship between maternal HSI and SAT adipocytes net lipolysis in presence of 200nM isoproterenol and 10nM insulin in GDM and control group Maternal HSI correlated positively with SAT adipocytes net lipolysis rate in presence of 200nM isoprotenerol and 10nM insulin expressed as NEFA release in GDM group only (r= 0.82, p=0.001). The correlation in the control group (r=0.38, p=0.12)
1.5 1.6 1.7 1.8
-1.0
-0.5
0.0
0.5
Log HSIlo
g S
AT
IS
O+
INS
gly
cero
l (m
mo
l/L
/mg
DN
A)
Control
GDM
1.5 1.6 1.7 1.8
-0.5
0.0
0.5
1.0
Log HSI
log
SA
T IS
O+
INS
NE
FA
(m
mo
l/L
/mg
DN
A)
Control
GDM
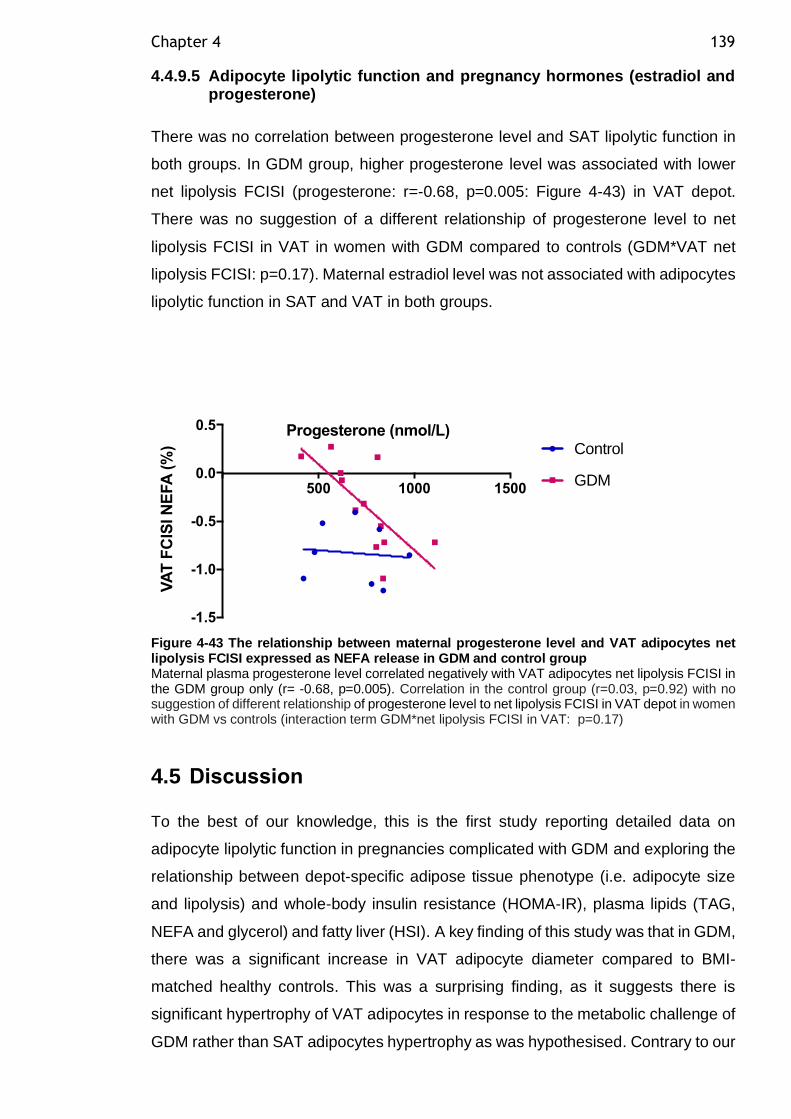
Chapter 4 139
4.4.9.5 Adipocyte lipolytic function and pregnancy hormones (estradiol and progesterone)
There was no correlation between progesterone level and SAT lipolytic function in
both groups. In GDM group, higher progesterone level was associated with lower
net lipolysis FCISI (progesterone: r=-0.68, p=0.005: Figure 4-43) in VAT depot.
There was no suggestion of a different relationship of progesterone level to net
lipolysis FCISI in VAT in women with GDM compared to controls (GDM*VAT net
lipolysis FCISI: p=0.17). Maternal estradiol level was not associated with adipocytes
lipolytic function in SAT and VAT in both groups.
Figure 4-43 The relationship between maternal progesterone level and VAT adipocytes net lipolysis FCISI expressed as NEFA release in GDM and control group Maternal plasma progesterone level correlated negatively with VAT adipocytes net lipolysis FCISI in the GDM group only (r= -0.68, p=0.005). Correlation in the control group (r=0.03, p=0.92) with no suggestion of different relationship of progesterone level to net lipolysis FCISI in VAT depot in women with GDM vs controls (interaction term GDM*net lipolysis FCISI in VAT: p=0.17)
4.5 Discussion
To the best of our knowledge, this is the first study reporting detailed data on
adipocyte lipolytic function in pregnancies complicated with GDM and exploring the
relationship between depot-specific adipose tissue phenotype (i.e. adipocyte size
and lipolysis) and whole-body insulin resistance (HOMA-IR), plasma lipids (TAG,
NEFA and glycerol) and fatty liver (HSI). A key finding of this study was that in GDM,
there was a significant increase in VAT adipocyte diameter compared to BMI-
matched healthy controls. This was a surprising finding, as it suggests there is
significant hypertrophy of VAT adipocytes in response to the metabolic challenge of
GDM rather than SAT adipocytes hypertrophy as was hypothesised. Contrary to our
500 1000 1500
-1.5
-1.0
-0.5
0.0
0.5 Progesterone (nmol/L)
VA
T F
CIS
I N
EFA
(%
) Control
GDM
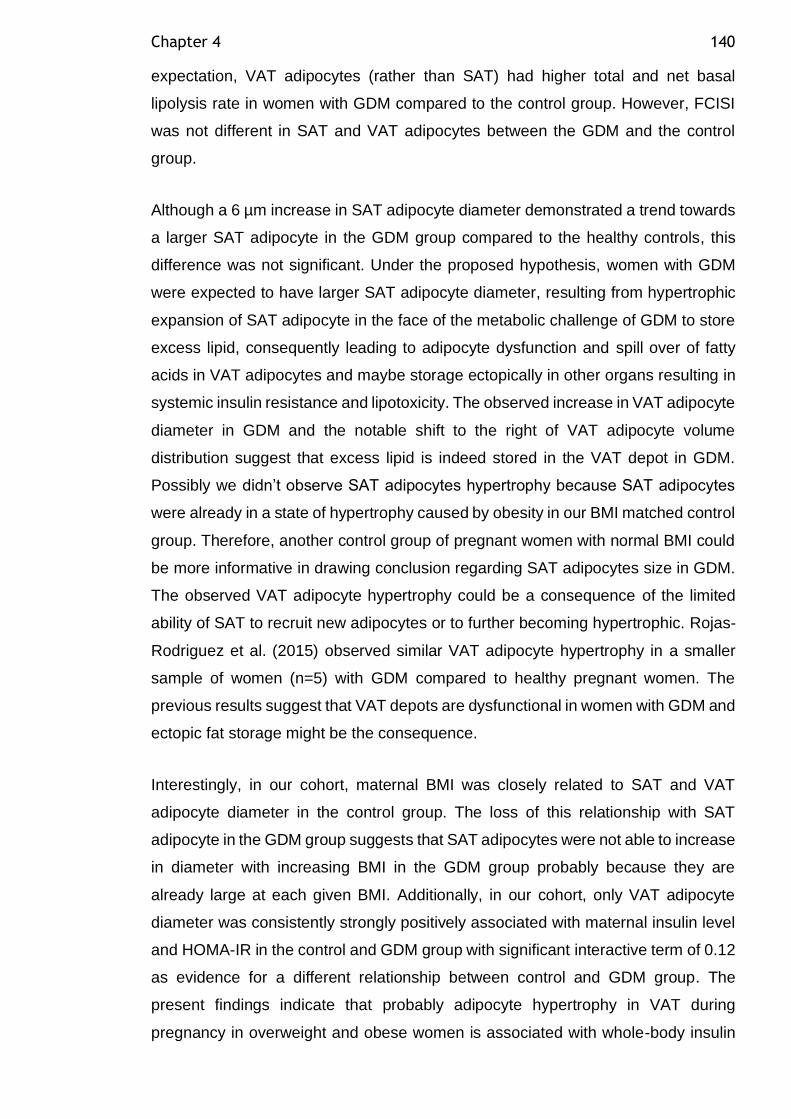
Chapter 4 140
expectation, VAT adipocytes (rather than SAT) had higher total and net basal
lipolysis rate in women with GDM compared to the control group. However, FCISI
was not different in SAT and VAT adipocytes between the GDM and the control
group.
Although a 6 µm increase in SAT adipocyte diameter demonstrated a trend towards
a larger SAT adipocyte in the GDM group compared to the healthy controls, this
difference was not significant. Under the proposed hypothesis, women with GDM
were expected to have larger SAT adipocyte diameter, resulting from hypertrophic
expansion of SAT adipocyte in the face of the metabolic challenge of GDM to store
excess lipid, consequently leading to adipocyte dysfunction and spill over of fatty
acids in VAT adipocytes and maybe storage ectopically in other organs resulting in
systemic insulin resistance and lipotoxicity. The observed increase in VAT adipocyte
diameter in GDM and the notable shift to the right of VAT adipocyte volume
distribution suggest that excess lipid is indeed stored in the VAT depot in GDM.
Possibly we didn’t observe SAT adipocytes hypertrophy because SAT adipocytes
were already in a state of hypertrophy caused by obesity in our BMI matched control
group. Therefore, another control group of pregnant women with normal BMI could
be more informative in drawing conclusion regarding SAT adipocytes size in GDM.
The observed VAT adipocyte hypertrophy could be a consequence of the limited
ability of SAT to recruit new adipocytes or to further becoming hypertrophic. Rojas-
Rodriguez et al. (2015) observed similar VAT adipocyte hypertrophy in a smaller
sample of women (n=5) with GDM compared to healthy pregnant women. The
previous results suggest that VAT depots are dysfunctional in women with GDM and
ectopic fat storage might be the consequence.
Interestingly, in our cohort, maternal BMI was closely related to SAT and VAT
adipocyte diameter in the control group. The loss of this relationship with SAT
adipocyte in the GDM group suggests that SAT adipocytes were not able to increase
in diameter with increasing BMI in the GDM group probably because they are
already large at each given BMI. Additionally, in our cohort, only VAT adipocyte
diameter was consistently strongly positively associated with maternal insulin level
and HOMA-IR in the control and GDM group with significant interactive term of 0.12
as evidence for a different relationship between control and GDM group. The
present findings indicate that probably adipocyte hypertrophy in VAT during
pregnancy in overweight and obese women is associated with whole-body insulin
Chapter 4 141
resistance. however, the direction of the association cannot be inferred. A similar
association between VAT hypertrophy and adverse metabolic health was observed
previously in obese individuals (O'Connell et al., 2010). Moreover, VAT cell size
increases the total amount of the VAT depot. Although we haven’t measured the
total size of VAT depot, it was previously shown that VAT thickness measured by
ultrasound is associated with insulin resistance in early pregnancy (De Souza et al.,
2014) and impaired glucose homeostasis in mid-pregnancy (De Souza et al., 2016)
(D'Ambrosi et al., 2018) independent of BMI and other risk factors for GDM.
This study sheds light on the possible aetiological role of defective VAT adipocyte
expansion in the development of GDM. In this study, several lipolysis measures
were examined (basal, catecholamine stimulation and insulin suppression of
lipolysis). Although all measures of lipolysis and SAT FCISI were not different in
SAT adipocytes in the GDM compared to the control group, both groups had one
fold lower SAT FCISI net lipolysis when our results were compared with the lean
control group of a previous similar study conducted by our group on women with PE
(Huda et al., 2014). The possible explanation for not observing a difference in SAT
lipolysis between this study groups might be explained by the similar degree of SAT
adipocytes insulin resistance in both groups due to BMI matching. This is suggesting
there could be no GDM effect above the obesity effect in SAT adipocytes insulin
resistance and hypertrophy. Similar to this finding but in non-pregnant T2DM,
Verboven et al. (2018) observed a similar degree of SAT adipocytes hypertrophy in
obese men with and without diabetes but this was significantly larger than the mean
SAT adipocyte diameter of the lean control group in their study. VAT adipocytes in
GDM were 6 times more insulin resistant compared to control group but failed to
reach statistical significance probably due to low numbers. This finding was different
from what our group found previously in PE, in PE there was significant insulin
resistance in SAT adipocytes compared to healthy women (Huda et al., 2014). PE
is a metabolic pregnancy complication that shares accelerated insulin resistance
and poor lipid metabolism handling with GDM. Although PE and GDM are the most
common metabolic pregnancy complications, it is likely that are both share an
underlying SAT adipocytes dysfunction but may be at different steps in the
subsequent pathway. PE is a pregnancy complication with more systemic
involvement than GDM and SAT adipocytes insulin suppression of lipolysis was
shown to be defective (Huda et al., 2014). However, GDM is a metabolic
complication of a milder form than PE with hepatic insulin resistance affecting
Chapter 4 142
glucose tolerance. Therefore, the observed VAT adipocyte dysfunction in women
with GDM in our study could be the missing link between SAT adipocytes and the
underlying pathophysiology.
The observed higher basal lipolysis rate in VAT adipocytes in the GDM compared
to the control group suggests that dysregulation of VAT adipocyte basal lipolysis
may be an important secondary event to SAT adipocyte hypertrophy contributing to
the emergence of metabolic dysfunction in women with GDM. Regarding the
association between lipolytic function and plasma lipid level, only maternal glycerol
level was associated with SAT basal lipolysis, lipolysis rate in presence of
isoprotenerol and lipolysis rate in presence of both isoprotenerol and insulin in the
control group suggesting that SAT adipocytes glycerol release is an important
determinant of plasma glycerol level in pregnancy. The maternal plasma NEFA and
glycerol level was not elevated in the GDM group and did not correlate with HOMA-
IR suggesting that it could be there is a compensatory increase in FA clearance
from plasma as protective mechanism to reduce the deleterious effects of circulating
NEFA.
The adipocyte size and lipolysis results when interpreted together suggest that in
GDM, in order to store excess lipids which were unable to be stored in SAT
adipocytes probably due to defective expansion, VAT adipocytes are responding by
hypertrophy resulting in higher basal lipolysis rates compared to the control group.
VAT is considered as an alternative depot for fat storage to minimize the deleterious
effect of circulating NEFA. However, the data does not distinguish whether
adipocyte dysfunction precedes the insulin resistance in GDM or the opposite. A
major determinant of metabolic health is SAT’s ability to expand and store excess
fat safely rather than its accumulation in ectopic sites. Ectopic fat accumulation in
insulin sensitive organs lead to insulin resistance and T2DM (Ravussin and Smith,
2002). Thus, it is important to recognize that SAT has a “fat buffering” property,
which is key to preserving normal level of insulin sensitivity and appropriate
metabolic responses.
Data from the current study suggest that expansion of VAT, probably due to
underlying SAT defective expansion, might lead to consequent ectopic fat
deposition in other organs (Figure 4-44). Hepatic fat measured by HSI and its
relationship with adipocyte size during normal or complicated pregnancy was not
Chapter 4 143
assessed before in women with GDM. Although HSI was not different between the
groups, both groups demonstrated high HSI score which could be driven by their
BMI as we have shown the strong relationship between HSI and BMI. In our cohort,
HSI is closely related to maternal adiposity and measures of insulin sensitivity in
normal pregnancy and GDM. Furthermore, SAT and VAT adipocyte diameter was
closely positively associated with HSI in the control group highlighting the
importance of adipocyte size as a determinant of metabolic health possibly by
affecting subsequent lipid deposition in the liver during obese pregnancy following
adipocytes defective expansion. The strong consistent relationship between HSI
and SAT lipolytic function in GDM supports the importance of lipid release from SAT
adipocytes in determining the lipid deposition in the liver and this could be the
underlying pathophysiology for the previously observed liver insulin resistance in
GDM pregnancy in several studies (Retnakaran et al., 2011) (Tiikkainen et al.,
2002). A study by Armstrong et al. (2014) represents the first in vivo evidence of
abdominal SAT dysfunction in the inflammatory form of NAFLD, non-alcoholic
steatohepatitis (NASH). It was previously reported that the majority of lipid
accumulation in NASH was attributed to adipose tissue derived NEFA (59%) rather
than de novo lipogenesis in the liver (26%) (Donnelly et al., 2005). Subcutaneous
adipose tissue is 10 fold larger than VAT, therefore, it was suggested that there is
an important SAT mass effect and its lipolytic action compared to VAT. Serum NEFA
was shown to be strongly related to SAT basal lipolysis in a large cohort of 1066
subjects (Rydén and Arner, 2017). The previous findings suggest that SAT
adipocytes may not have a direct impact on metabolic dysfunction, but they still may
play a key role as the initiating factor in the process of the hypothesized fat overflow
to ectopic sites.
VAT adipocyte hypertrophy would be expected to lead to detrimental metabolic
effects such as fatty liver, possibly due to the drainage of VAT into the portal
circulation. VAT adipocytes hypertrophy and disturbed adipokine secretion which
could be transported to the liver through portal circulation may be the link between
NAFLD and metabolic diseases such as GDM. It was shown in a large population
study (n=1115) that GDM is strongly associated with non-alcoholic fatty liver
(NAFLD) disease, and GDM diagnosis could represent an opportunity to prevent the
development of NAFLD later in life (Ajmera et al., 2016). It was shown that fatty liver
precedes T2DM in non-pregnant population (Lim et al., 2011). However, similar to
other parameters of metabolic health, not all women with history of GDM develop
Chapter 4 144
NAFLD or T2DM. Other potential sites of ectopic fat deposition such as pancreas,
heart and placenta are beyond the scope of this study and require further
investigation. However, this pathway could be anticipated by the observed maternal
hypertriglyceridemia in the GDM group in our cohort.
A limitation of the present study was the cross-sectional design as it will not provide
information about adipose tissue changes during pregnancy. However, a
longitudinal design was difficult to perform in pregnant women, especially for VAT
samples because a repeated intra-abdominal biopsy would be needed to get access
to adipose tissue, a procedure unlikely to be tolerated by pregnant women. The
collagenase digestion method was used to obtain mature adipocytes for this study,
however, it was reported previously that collagenase could lead to small cells
disruption (Taylor, 1987). Therefore, the same batch of collagenase was used for
this experiment. Isolated adipocyte lipolytic function may not exactly represent in
vivo adipose tissue lipolysis because it excludes the extracellular matrix and SVF
effect. However, in vivo measurement of adipose tissue lipolysis involves
cumbersome methods such as tracer catheterization which require continuous
infusion of glucose and glycerol and frequent venous blood sampling which could
challenging to consent for large sample of pregnant women. Furthermore, this
technique assesses whole body adipose tissue lipolysis and is not depot specific.
Another in vivo lipolysis assay is microdialysis, which requires probe insertion in the
abdomen for minimum of one-centimeter depth and frequent sampling is required
which can be time consuming and uncomfortable for pregnant women. Furthermore,
microdialysis allows investigation of SAT only and it is difficult to evaluate VAT
lipolysis using this technique (Frayn et al., 1997). However, several studies have
found similar results when SAT lipolysis was compared in vivo (Kolehmainen et al.,
2000) and in vitro (Agustsson et al., 2007). This study involved a small cohort of
women and there were not enough numbers to look at the effect of GDM treatment
and glycemic control on adipose tissue lipolysis. The original study was powered for
30 participants per group but I only managed to collect 22 participants per group,
which could affect achieving significance level in some of the parameters such as
FCISI. HSI was used to assess for fatty liver however, liver biopsy is the most
sensitive measure to assess for fatty liver, but it can be more challenging to perform.
In this study, it is not possible to exclude the GDM treatment effect on adipose tissue
function but it was not possible to look at this effect due to relatively small sample
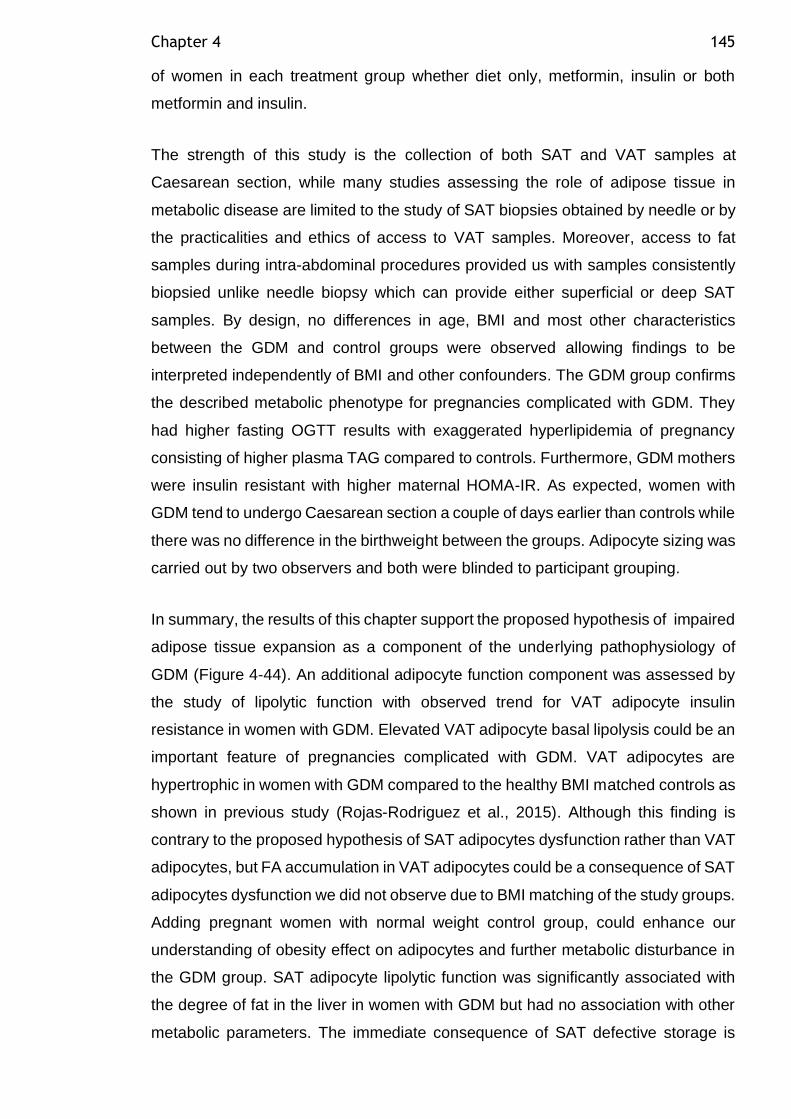
Chapter 4 145
of women in each treatment group whether diet only, metformin, insulin or both
metformin and insulin.
The strength of this study is the collection of both SAT and VAT samples at
Caesarean section, while many studies assessing the role of adipose tissue in
metabolic disease are limited to the study of SAT biopsies obtained by needle or by
the practicalities and ethics of access to VAT samples. Moreover, access to fat
samples during intra-abdominal procedures provided us with samples consistently
biopsied unlike needle biopsy which can provide either superficial or deep SAT
samples. By design, no differences in age, BMI and most other characteristics
between the GDM and control groups were observed allowing findings to be
interpreted independently of BMI and other confounders. The GDM group confirms
the described metabolic phenotype for pregnancies complicated with GDM. They
had higher fasting OGTT results with exaggerated hyperlipidemia of pregnancy
consisting of higher plasma TAG compared to controls. Furthermore, GDM mothers
were insulin resistant with higher maternal HOMA-IR. As expected, women with
GDM tend to undergo Caesarean section a couple of days earlier than controls while
there was no difference in the birthweight between the groups. Adipocyte sizing was
carried out by two observers and both were blinded to participant grouping.
In summary, the results of this chapter support the proposed hypothesis of impaired
adipose tissue expansion as a component of the underlying pathophysiology of
GDM (Figure 4-44). An additional adipocyte function component was assessed by
the study of lipolytic function with observed trend for VAT adipocyte insulin
resistance in women with GDM. Elevated VAT adipocyte basal lipolysis could be an
important feature of pregnancies complicated with GDM. VAT adipocytes are
hypertrophic in women with GDM compared to the healthy BMI matched controls as
shown in previous study (Rojas-Rodriguez et al., 2015). Although this finding is
contrary to the proposed hypothesis of SAT adipocytes dysfunction rather than VAT
adipocytes, but FA accumulation in VAT adipocytes could be a consequence of SAT
adipocytes dysfunction we did not observe due to BMI matching of the study groups.
Adding pregnant women with normal weight control group, could enhance our
understanding of obesity effect on adipocytes and further metabolic disturbance in
the GDM group. SAT adipocyte lipolytic function was significantly associated with
the degree of fat in the liver in women with GDM but had no association with other
metabolic parameters. The immediate consequence of SAT defective storage is
Chapter 4 146
outflow of FA to expand the VAT depot or it gets stored in non-adipose tissue organs
such as the liver. Therefore, longitudinal studies to look at adipose tissue function
throughout pregnancy are needed, combined with liver ultrasound assessment for
fatty liver and liver and placenta biopsy at term to assess the evidence for ectopic
fat deposition in GDM. Studies of a larger cohort of women with GDM would make
it possible to look at adipose tissue response to GDM treatment. Although placentas
from GDM pregnancies have been shown to have altered fatty acid composition and
lipid transporter expression (Segura et al., 2017), an investigation to quantify
placental lipid storage in GDM compared to controls would be valuable to provide
evidence for the remaining component of the hypothesised pathway; ectopic fat
accumulation and any pathological effects it may have on the placenta of women
with GDM.
Figure 4-44 Regional differences in adipose tissue expansion in GDM SAT limited expandability leads to overflow of FA in VAT and other organs such as liver. This possibly could lead to rise in plasma lipid level in women with GDM. Adipocytes in VAT depot responded by adipocyte hypertrophy and higher basal lipolysis. Increased FA flow in portal circulation could lead to fatty liver and increased production of VLDL. Reduced clearance of VLDL particles plasma can lead to production of oxLDL.
147
Chapter 5 Adipose tissue inflammation in gestational diabetes mellitus
5.1 Introduction
Disturbed adipocyte function in the form of adipocyte hypertrophy and enhanced
basal lipolysis in VAT adipocytes in women with GDM compared to healthy controls
was observed in the previous chapter. I hypothesised that dysregulated adipokine
secretion from hypertrophic VAT adipocytes would occur and aimed to examine it in
this chapter. There is emerging evidence suggesting a role for plasma adipokines
in the development of insulin resistance and the subclinical inflammation observed
in women with GDM as discussed in the Introduction Chapter section 1.7. Plasma
levels of several adipokines such as TNF-α and IL-6 were found to be elevated in
women with GDM (Christian and Porter, 2014). Adipose tissue has been suggested
as a source of higher plasma inflammatory cytokine levels in women with GDM.
While most of the published literature has been about the dysregulated inflammatory
cytokines markers, direct measurement of adipocytes cytokine secretion was not
studied before in GDM. Moreover, the underlying mechanism for the increased
inflammatory cytokine release in women with GDM is not completely understood but
infiltration of immune cells such as macrophages infiltration in adipose tissue was
one of the suggested mechanisms.
It was previously identified that GDM is associated with increased macrophage
infiltration in omental fat (VAT) rather than SAT compared to healthy control
pregnancy (Harlev et al., 2014). In the same study, omental fat macrophages
correlated positively with HOMA-IR suggesting that low grade inflammation
contributes to the development of insulin resistance in GDM. A similar observation
in non-pregnant centrally obese individuals suggests that, in GDM, there is a similar
inflammatory stress in the VAT depot. During pregnancy, macrophage phenotype
shifts from resident M2 anti-inflammatory phenotype to M1 pro-inflammatory
phenotype which secretes several pro-inflammatory cytokines as discussed in the
general introduction through activation of the TLR4/NF-ĸB pathway (Shi et al.,
2006). In adipose tissue, hypertrophic adipocytes release FA, which in turn stimulate
the TLR4/NF-ĸβ pathway in the macrophages, thus, participating in a deleterious
paracrine loop between adipocytes and macrophages (Suganami et al., 2009).
Chapter 5 148
Proinflammatory stimuli such as LPS and the proinflammatory cytokines such as IL-
6 and TNFα cause phosphorylation of inhibitor NF-ĸB (IĸB) and subsequent
translocation of the nuclear transcription factor NF-ĸB to the nucleus. Intra-nuclear
NFKB induces transcription of proinflammatory cytokines such as TNF-α, IL-6, IL-
1β, adhesion molecules such as ICAM-1 and VCAM-1, chemokines such as MCP-
1. However, the adipocyte’s contribution to the previously observed higher plasma
levels of adipokines (independent of the paracrine effect of SVF and macrophages)
has not been studied previously in GDM. In women with PE, where isolated SAT
and VAT adipocyte secretory function was studied in basal and in stimulated
conditions (in response to 10µM LPS) there was higher VAT adipocyte release of
TNF-α and IL-6 in response to LPS stimulation (Huda et al., 2017). In the same
cohort, a negative correlation was noted between TNF-α secretion from VAT
adipocytes in response to LPS and VAT adipocyte insulin sensitivity suggesting a
role of adipocyte inflammation, lipolysis and insulin resistance in the development
of PE (Huda et al., 2017). TNF-α is known to be an important mediator of insulin
resistance during pregnancy and in women with GDM (Long et al., 2009).
Furthermore, TNF-α has a potent lipolytic activity possibly through down-regulation
of perilipin expression (Souza et al., 2003). Therefore, in addition to the previously
observed higher VAT basal lipolysis in GDM (chapter 4), it is plausible that there
could be upregulation of adipokine secretion in VAT adipocytes associated with the
development of GDM, a condition with accelerated maternal insulin resistance and
higher plasma level of inflammatory markers.
Adipocyte size is an important determinant of the expression and secretion of
adipokines from isolated adipocytes (Skurk et al., 2007). In particular, Skurk et al.
(2007) have suggested that the secretion of pro-inflammatory adipokines such as
leptin, IL-6, IL-8, TNF-α, MCP-1, IL-1ra, and adiponectin was significantly elevated
in larger adipocytes compared to small adipocytes and was positively correlated
with cell size. In addition, there was a decrease of anti-inflammatory IL-10 secretion
with increasing cell size. Therefore, the observed VAT adipocytes hypertrophy in
women with GDM could be hypothesised to regulate the expression level of these
adipokines in isolated VAT adipocytes.
In adipocytes, exogenous signals such as fatty acids or LPS induce an inflammatory
response through activation of TLR4 and the associated intracellular pathway NF-
ĸB (Song et al., 2006). Therefore, in the current study LPS was used to mimic
Chapter 5 149
inflammation in isolated adipocytes as previously used in Huda et al. (2017). I
measured the secretion by adipocytes of several proinflammatory cytokines known
to be induced in response to NF-ĸB activation such as TNFα, IL-6, IL-1β, MCP-1
and IFN-gamma. Other anti-inflammatory cytokines such as IL-8 and IL-10 and
growth factors such as VEGF and PIGF were assessed. Adipokine secretion from
adipocytes treated with or without LPS was measured using the multiplex array
technology which allowed detection of numerous analytes in small volume of
sample, while possible analytes to study can be limited by sample volume when
using traditional ELISA. Limited by the cost of multiplex technology, adipokine
secretion was studied in VAT adipocytes only due to the previously observed
adipocyte dysfunction in the previous chapter, otherwise SAT adipokine secretory
profile will be of great interest. Furthermore, our group’s previous study in GDM
showed that the inflammatory dysfunction was found primarily in VAT adipocytes
(Huda et al., 2014). However, due to the late instigation of LPS stimulated
experiment conditions throughout our fat biopsy collection, a smaller subset from
the original cohort used in the lipolysis study (GDM n=22 and control n=22) was
available for the analysis of adipokine secretion experiment (GDM n=15 and control
n=12) as detailed in the methods section below.
In the non-pregnant population different adipose tissue depots are known to
differentially regulate the expression of inflammatory markers, adipokines, and
several other genes involved in adipocyte differentiation, lipid storage and insulin
signalling. There are some data available in GDM. The mRNA expression of the
anti-inflammatory insulin sensitizing agent, adiponectin is reduced in whole adipose
tissue from both SAT and VAT in pregnancies complicated with GDM (Lappas et
al., 2005). In GDM VAT samples, there was increased expression of leptin and the
proinflammatory cytokines IL-6 and IL-8 (Kleiblova et al., 2010). However, the
contribution of isolated adipocytes rather than whole adipose tissue to the observed
disturbed adipokine release and subsequent insulin resistance in women with GDM
has not been studied previously to the best of our knowledge. Whole adipose tissue
sample inflammatory mediator production is confounded by the presence of immune
cells, particularly macrophages in the SVF.
Adipose tissue expands in the face of a requirement to store additional energy by
increasing lipid storage in existing adipocytes leading to adipocyte hypertrophy or
by increasing adipocyte differentiation and recruitment of new adipocytes. PPARγ
Chapter 5 150
mRNA expression in abdominal SAT tissue samples has been shown to be reduced
by 38% in pregnant women and 48% in women with GDM compared to non-
pregnant control women group suggesting a reduced SAT adipocyte differentiation
ability in the face of the metabolic challenge and insulin resistance of pregnancy and
GDM (Catalano et al., 2002). Furthermore, this was suggested to be part of the
molecular mechanisms to accelerate fat catabolism to meet the fetal nutritional
demands.
In adipocytes, the insulin receptors are essential to transmit insulin effects on
glucose and lipid metabolism. There are two isoforms of insulin receptor; insulin
receptor A (IR-A) and insulin receptor B (IR-B) based on alternative splicing of exon
11. IR-A promotes cell growth while IR-B is the more active isoform in insulin
signalling and glucose homeostasis (Belfiore et al., 2009). Insulin receptor
dysfunction has been implicated in cellular insulin resistance and disturbed
metabolic function. Few studies have investigated the role of insulin receptor
different isoforms and its downstream effects on insulin sensitive tissues such as
muscle and SAT. In women with GDM, there was reduced mRNA expression levels
of IRB in both SAT and VAT whole tissue samples compared to healthy pregnant
women. However, this was more pronounced in VAT and the reduction of IRB was
independent of maternal BMI (Ott et al., 2018). The depot specific regional variation
of adipocytes insulin receptors isoform expression in women with GDM was not
studied before to the best of our knowledge.
Various metabolic pathways are involved in the development of metabolic
disturbances in women with GDM. The adipocytes intracellular mechanisms
responsible for insulin suppression of lipolysis are initiated when insulin bind to its
receptor resulting in tyrosine phosphorylation of insulin receptor substrate 1 (IRS1)
by insulin receptor tyrosine kinase. Tyrosine phosphorylated IRS1 activates
phosphoinositide 3-kinase (PI3K) (Czech and Corvera, 1999). Insulin activates PI3K
activity and mediates the activation of protein kinase Akt which subsequently
phosphorylates and activates cAMP-phosphodiesterase (PDE3B)(Okada et al.,
1994). This kinase is activated by insulin through binding to insulin receptors
(PDE3B is the substrate) thus, initiating the antilipolytic effect of insulin. The
PI3K/AKT pathway further stimulates the translocation of GLUT4 vesicles to the
plasma membrane and allows the uptake of glucose into the adipose cells. In GDM,
defective post receptor insulin signalling was suggested in several studies. Studies
Chapter 5 151
on adipose and muscle tissue from pregnant GDM women revealed that there was
defective post-receptor insulin signalling demonstrated as reduced IRS1 activity
(Friedman et al., 1999). The protein expression of IRS1 was 43% lower in abdominal
SAT whole tissue from women with GDM compared to healthy pregnant controls
(Catalano et al., 2002). In addition, reduced GLUT4 translocation to plasma
membrane was demonstrated in women with GDM (Garvey et al., 1993).
The changes in lipid and glucose metabolism during GDM pregnancy is consistent
with increased maternal insulin resistance leading to increased FA and TAG
availability for the fetus (Colomiere et al., 2010). Offspring of GDM mothers were
shown to have greater risk of obesity and insulin resistance later in life (Catalano et
al., 2003). Therefore, further understanding adipose tissue lipid metabolism and
function has become increasingly important in the light of rising obesity and GDM
incidence. Furthermore, the differential expression of genes involved in other
adipose tissue functions such as adipose tissue angiogenesis and adipocyte
apoptosis was of interest to the current study.
Microarray analysis of genes was a potential method for assessing differences in
gene expression between healthy control and GDM adipocytes, but this was not
accessible due to the particularly expensive cost for adipocytes due to the need for
pre-amplification step and limited fund availability. Alternatively, to avoid selection
only of genes already reported previously to be differentially expressed in GDM in
the literature and to explore new pathways, a number of genes was selected by
Ingenuity pathway analysis (QIAGEN) (discussed in the Methods Chapter section
1.5.1) involved in several pathways. To quantitate the mRNA expression of target
genes Taqman qRT PCR was used. Messenger RNA was extracted from isolated
adipocytes from SAT and VAT rather than whole adipose tissue samples to avoid
the confounding effects of SVF cells including macrophages. Preamplification of
cDNA targets for gene expression analysis was required due to the very small
quantity of RNA that can be isolated from adipocytes. The uniformity of
preamplification of genes of interest was controlled for by A ΔΔ CT method, using
CDKN1B (the recommended endogenous uniformity reference gene). Calculated
CT values for the target genes and CDKN1B were obtained for different dilutions of
pre-amplified and non-pre-amplified cDNA. ΔΔ CT value close to zero indicates
preamplification uniformity, with values within ±1.5 being acceptable. The cohort
used for SAT (GDM n=15 and control n=18) and VAT (GDM n=14 and control n=11)

Chapter 5 152
gene expression analysis utilizes samples available from the original cohort of
lipolysis experiments (GDM n=22 and control n=22). There were some samples not
available for SAT and VAT gene expression analysis from the original cohort and
this was limited by smaller fat biopsies provided to the researcher which limited the
number of adipocytes that could be isolated. Priority was given to lipolysis assays.
Another frequent reason for missing samples especially in VAT depot, was wound
closure by the surgeon before remembering to take the VAT sample.
This study explored the expression of several genes involved in different adipocyte
functions as shown in Table 5-1.

Chapter 5 153
Table 5-1 Genes included in gene expression analysis
Chapter 5 154
5.2 Aim
• The aim was to compare visceral adipocyte (VAT) basal and LPS-stimulated
adipokine release in pregnant women with and without GDM.
• To compare SAT and VAT adipocyte gene expression of thirty-five genes
involved in adipose tissue inflammation, adipocyte differentiation, lipid
storage, insulin signaling, glucose metabolism, angiogenesis, and apoptosis
in pregnant women with and without GDM.
5.2.1 Hypotheses
• Women with GDM have higher levels of VAT adipocyte pro-inflammatory and
lower anti-inflammatory adipokine release under basal and LPS stimulated
conditions compared to BMI-matched controls
• There is enhanced expression of genes involved in inflammation, lipid
storage and apoptosis in VAT adipocytes in women with GDM compared to
a BMI-matched control group and gene expression are related to adipocyte
hypertrophy as assessed by adipocyte diameter.
• Adipocytes in GDM have lower expression of genes involved in adipocyte
differentiation, angiogenesis and insulin signaling compared to BMI-matched
controls.
5.2.2 Specific research questions
• Is the release of IL-6, IL-8, IL-10, IL-1,TNF- and adiponectin from VAT
adipocytes altered in women with GDM compared to control? In basal or LPS
stimulated conditions?
• Is basal or LPS stimulated release of MCP-1, VEGF, PlGF and INF-gamma
from VAT adipocytes altered in women with GDM?
• How does basal or stimulated VAT adipocyte adipokine release relate to
adipocyte size and lipolytic function?
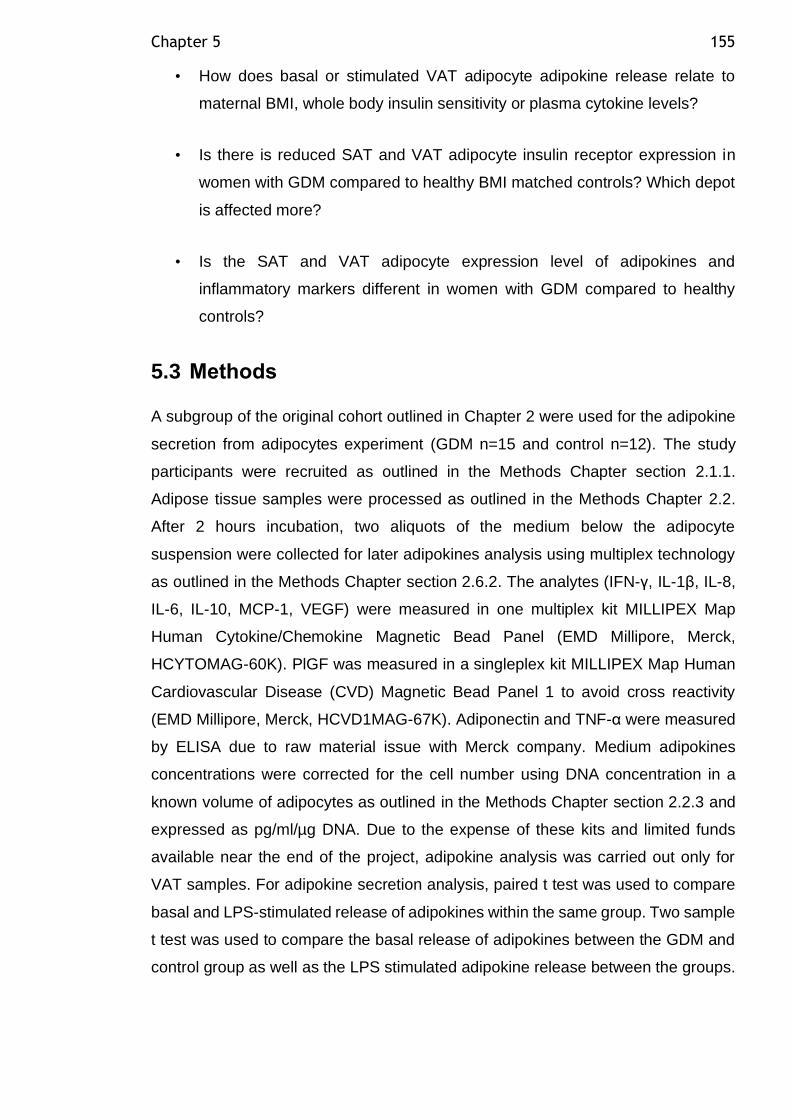
Chapter 5 155
• How does basal or stimulated VAT adipocyte adipokine release relate to
maternal BMI, whole body insulin sensitivity or plasma cytokine levels?
• Is there is reduced SAT and VAT adipocyte insulin receptor expression in
women with GDM compared to healthy BMI matched controls? Which depot
is affected more?
• Is the SAT and VAT adipocyte expression level of adipokines and
inflammatory markers different in women with GDM compared to healthy
controls?
5.3 Methods
A subgroup of the original cohort outlined in Chapter 2 were used for the adipokine
secretion from adipocytes experiment (GDM n=15 and control n=12). The study
participants were recruited as outlined in the Methods Chapter section 2.1.1.
Adipose tissue samples were processed as outlined in the Methods Chapter 2.2.
After 2 hours incubation, two aliquots of the medium below the adipocyte
suspension were collected for later adipokines analysis using multiplex technology
as outlined in the Methods Chapter section 2.6.2. The analytes (IFN-γ, IL-1β, IL-8,
IL-6, IL-10, MCP-1, VEGF) were measured in one multiplex kit MILLIPEX Map
Human Cytokine/Chemokine Magnetic Bead Panel (EMD Millipore, Merck,
HCYTOMAG-60K). PlGF was measured in a singleplex kit MILLIPEX Map Human
Cardiovascular Disease (CVD) Magnetic Bead Panel 1 to avoid cross reactivity
(EMD Millipore, Merck, HCVD1MAG-67K). Adiponectin and TNF-α were measured
by ELISA due to raw material issue with Merck company. Medium adipokines
concentrations were corrected for the cell number using DNA concentration in a
known volume of adipocytes as outlined in the Methods Chapter section 2.2.3 and
expressed as pg/ml/µg DNA. Due to the expense of these kits and limited funds
available near the end of the project, adipokine analysis was carried out only for
VAT samples. For adipokine secretion analysis, paired t test was used to compare
basal and LPS-stimulated release of adipokines within the same group. Two sample
t test was used to compare the basal release of adipokines between the GDM and
control group as well as the LPS stimulated adipokine release between the groups.
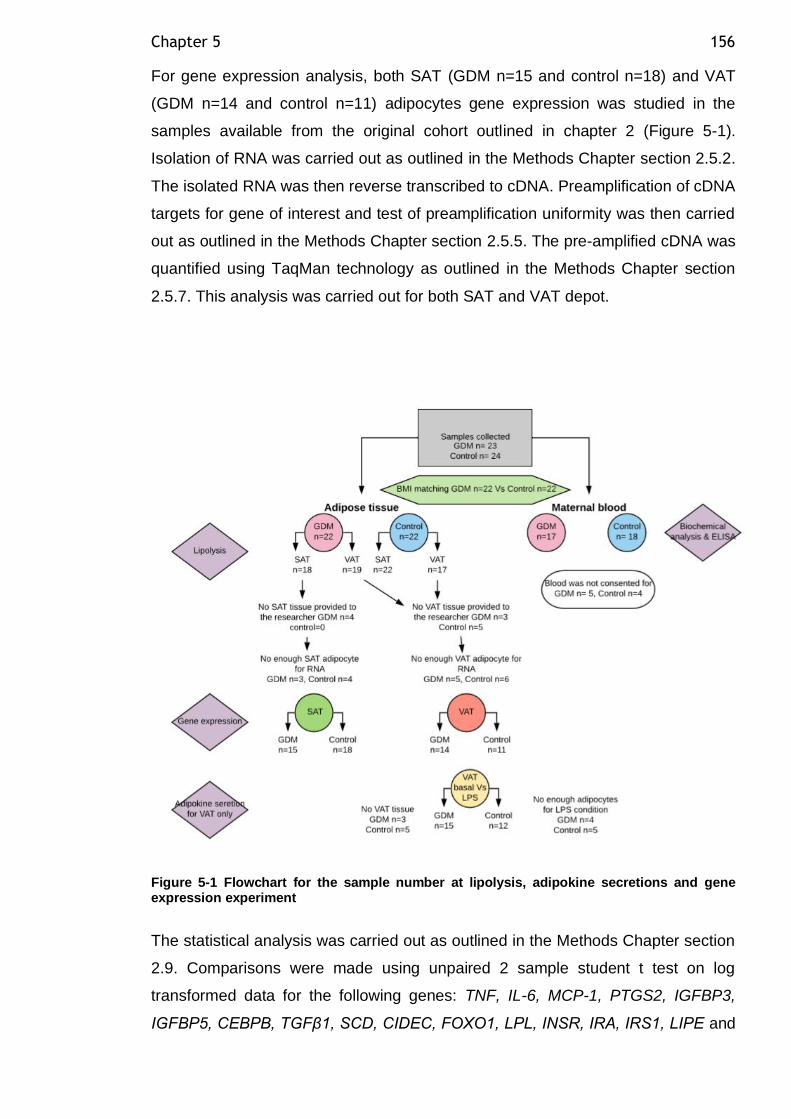
Chapter 5 156
For gene expression analysis, both SAT (GDM n=15 and control n=18) and VAT
(GDM n=14 and control n=11) adipocytes gene expression was studied in the
samples available from the original cohort outlined in chapter 2 (Figure 5-1).
Isolation of RNA was carried out as outlined in the Methods Chapter section 2.5.2.
The isolated RNA was then reverse transcribed to cDNA. Preamplification of cDNA
targets for gene of interest and test of preamplification uniformity was then carried
out as outlined in the Methods Chapter section 2.5.5. The pre-amplified cDNA was
quantified using TaqMan technology as outlined in the Methods Chapter section
2.5.7. This analysis was carried out for both SAT and VAT depot.
Figure 5-1 Flowchart for the sample number at lipolysis, adipokine secretions and gene expression experiment
The statistical analysis was carried out as outlined in the Methods Chapter section
2.9. Comparisons were made using unpaired 2 sample student t test on log
transformed data for the following genes: TNF, IL-6, MCP-1, PTGS2, IGFBP3,
IGFBP5, CEBPB, TGFβ1, SCD, CIDEC, FOXO1, LPL, INSR, IRA, IRS1, LIPE and
Chapter 5 157
ICAM1. Two 2 sample student t test on square root transformed data was used for
IRB and VEGF genes. Unpaired 2 sample student t test on raw normally distributed
data for the following genes: IGF-1, PPARG, MAPK8, CD36 and IRS1. Mann-
Whitney test for non-parametric data for the following genes: Akt1, FOS, IGFBP2,
SREBF1, SLC2A1, PCK1, NOS3, PTGS1, F3, DDIT3 and CASP3 at significance
level of p value of <0.05. A targeted research question approach was used when
examining the correlation analysis in adipokine secretions from VAT adipocytes
experiment. Correlation were considered significant if the p value was <0.010 to
avoid random associations.
5.4 Results
5.4.1 Study participants included for adipocyte adipokine secretion experiments
The study participants had similar BMI and age (Table 5-2). Blood pressure did not
differ between control and GDM pregnancy. GDM mothers delivered six days earlier
than controls (p= 0.0009). Women diagnosed with GDM in our cohort undergo
diagnostic OGTT test in the second trimester of their pregnancy. However, only four
women in the control group was screened for GDM and the results were negative
and the test was indicated due to high maternal BMI or family history of diabetes.
Diagnostic OGTT test results as expected, women in the GDM group had higher
fasting blood glucose (p= 0.0001) and higher 2 hours OGTT blood glucose
(p=0.035). Women with GDM had babies of lower birthweight compared to controls
(p=0.006). This subgroup demographic characteristics were similar to the original
cohort apart from the tendency of women with GDM to have babies of lower birth
weight compared to controls.
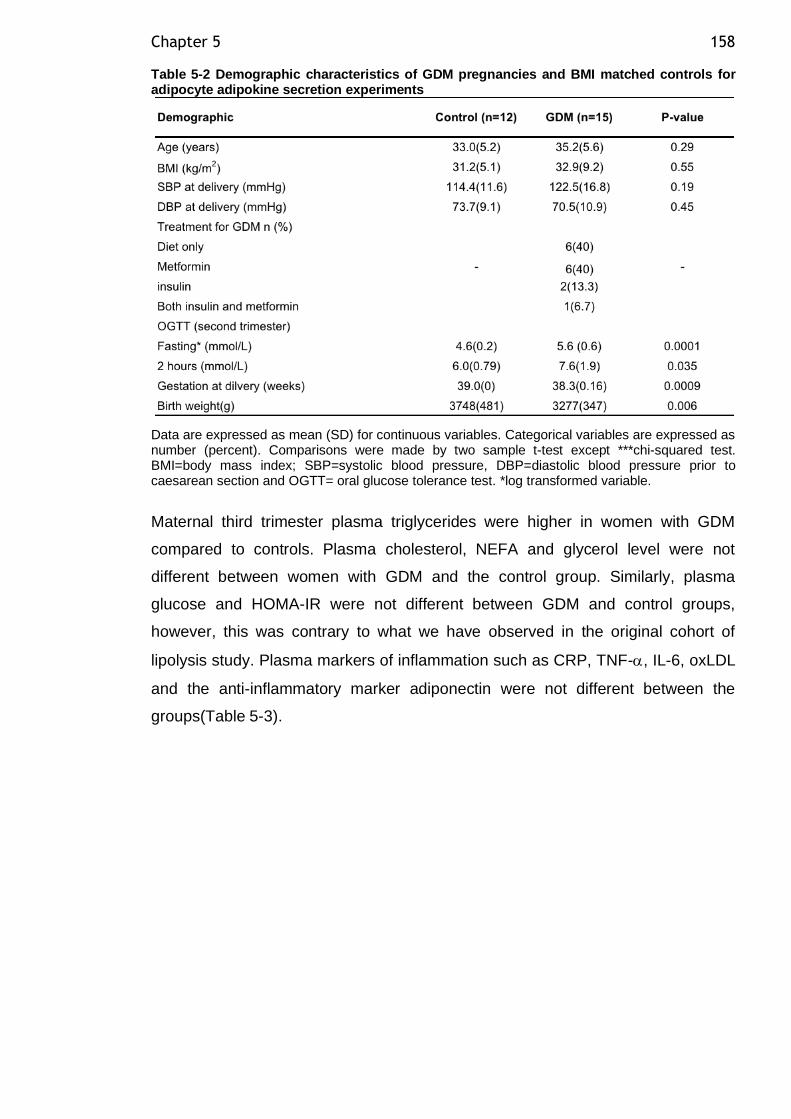
Chapter 5 158
Table 5-2 Demographic characteristics of GDM pregnancies and BMI matched controls for adipocyte adipokine secretion experiments
Data are expressed as mean (SD) for continuous variables. Categorical variables are expressed as number (percent). Comparisons were made by two sample t-test except ***chi-squared test. BMI=body mass index; SBP=systolic blood pressure, DBP=diastolic blood pressure prior to caesarean section and OGTT= oral glucose tolerance test. *log transformed variable.
Maternal third trimester plasma triglycerides were higher in women with GDM
compared to controls. Plasma cholesterol, NEFA and glycerol level were not
different between women with GDM and the control group. Similarly, plasma
glucose and HOMA-IR were not different between GDM and control groups,
however, this was contrary to what we have observed in the original cohort of
lipolysis study. Plasma markers of inflammation such as CRP, TNF-, IL-6, oxLDL
and the anti-inflammatory marker adiponectin were not different between the
groups(Table 5-3).
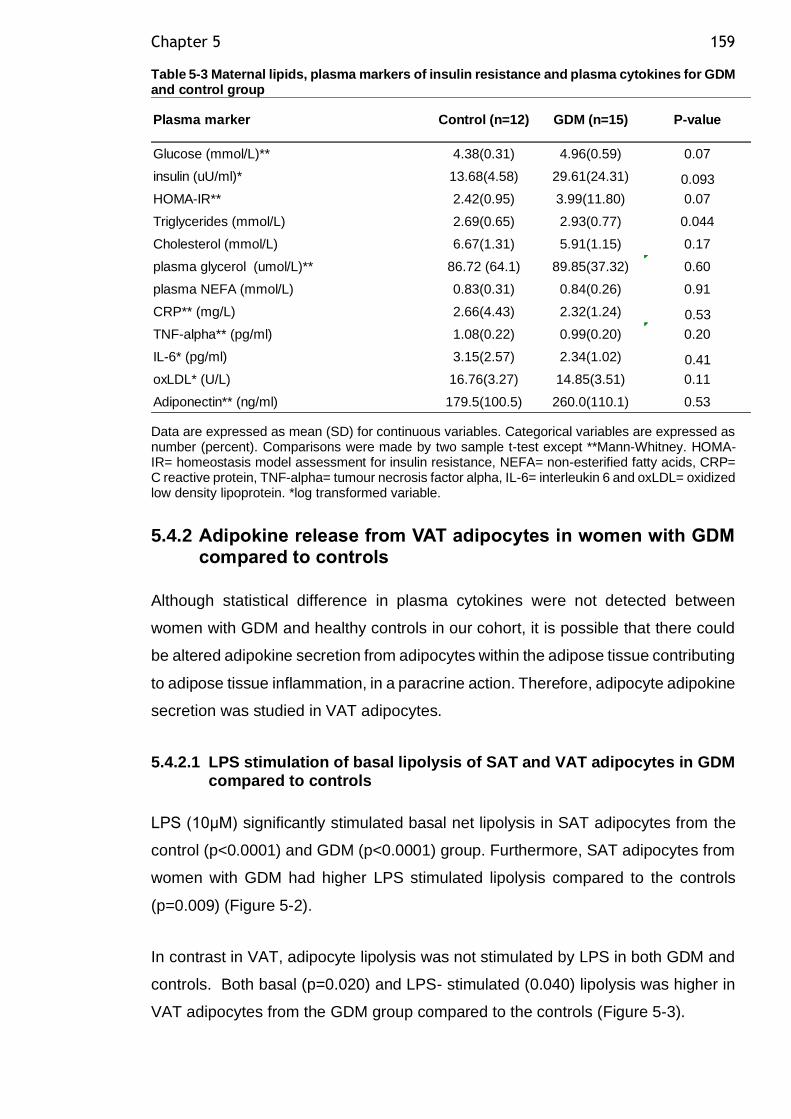
Chapter 5 159
Table 5-3 Maternal lipids, plasma markers of insulin resistance and plasma cytokines for GDM and control group
Data are expressed as mean (SD) for continuous variables. Categorical variables are expressed as number (percent). Comparisons were made by two sample t-test except **Mann-Whitney. HOMA-IR= homeostasis model assessment for insulin resistance, NEFA= non-esterified fatty acids, CRP= C reactive protein, TNF-alpha= tumour necrosis factor alpha, IL-6= interleukin 6 and oxLDL= oxidized low density lipoprotein. *log transformed variable.
5.4.2 Adipokine release from VAT adipocytes in women with GDM compared to controls
Although statistical difference in plasma cytokines were not detected between
women with GDM and healthy controls in our cohort, it is possible that there could
be altered adipokine secretion from adipocytes within the adipose tissue contributing
to adipose tissue inflammation, in a paracrine action. Therefore, adipocyte adipokine
secretion was studied in VAT adipocytes.
5.4.2.1 LPS stimulation of basal lipolysis of SAT and VAT adipocytes in GDM compared to controls
LPS (10μM) significantly stimulated basal net lipolysis in SAT adipocytes from the
control (p<0.0001) and GDM (p<0.0001) group. Furthermore, SAT adipocytes from
women with GDM had higher LPS stimulated lipolysis compared to the controls
(p=0.009) (Figure 5-2).
In contrast in VAT, adipocyte lipolysis was not stimulated by LPS in both GDM and
controls. Both basal (p=0.020) and LPS- stimulated (0.040) lipolysis was higher in
VAT adipocytes from the GDM group compared to the controls (Figure 5-3).
Glucose (mmol/L)** 4.38(0.31) 4.96(0.59) 0.07
insulin (uU/ml)* 13.68(4.58) 29.61(24.31) 0.093
HOMA-IR** 2.42(0.95) 3.99(11.80) 0.07
Triglycerides (mmol/L) 2.69(0.65) 2.93(0.77) 0.044
Cholesterol (mmol/L) 6.67(1.31) 5.91(1.15) 0.17
plasma glycerol (umol/L)** 86.72 (64.1) 89.85(37.32) 0.60
plasma NEFA (mmol/L) 0.83(0.31) 0.84(0.26) 0.91
CRP** (mg/L) 2.66(4.43) 2.32(1.24) 0.53
TNF-alpha** (pg/ml) 1.08(0.22) 0.99(0.20) 0.20
IL-6* (pg/ml) 3.15(2.57) 2.34(1.02) 0.41
oxLDL* (U/L) 16.76(3.27) 14.85(3.51) 0.11
Adiponectin** (ng/ml) 179.5(100.5) 260.0(110.1) 0.53
Plasma marker Control (n=12) GDM (n=15) P-value
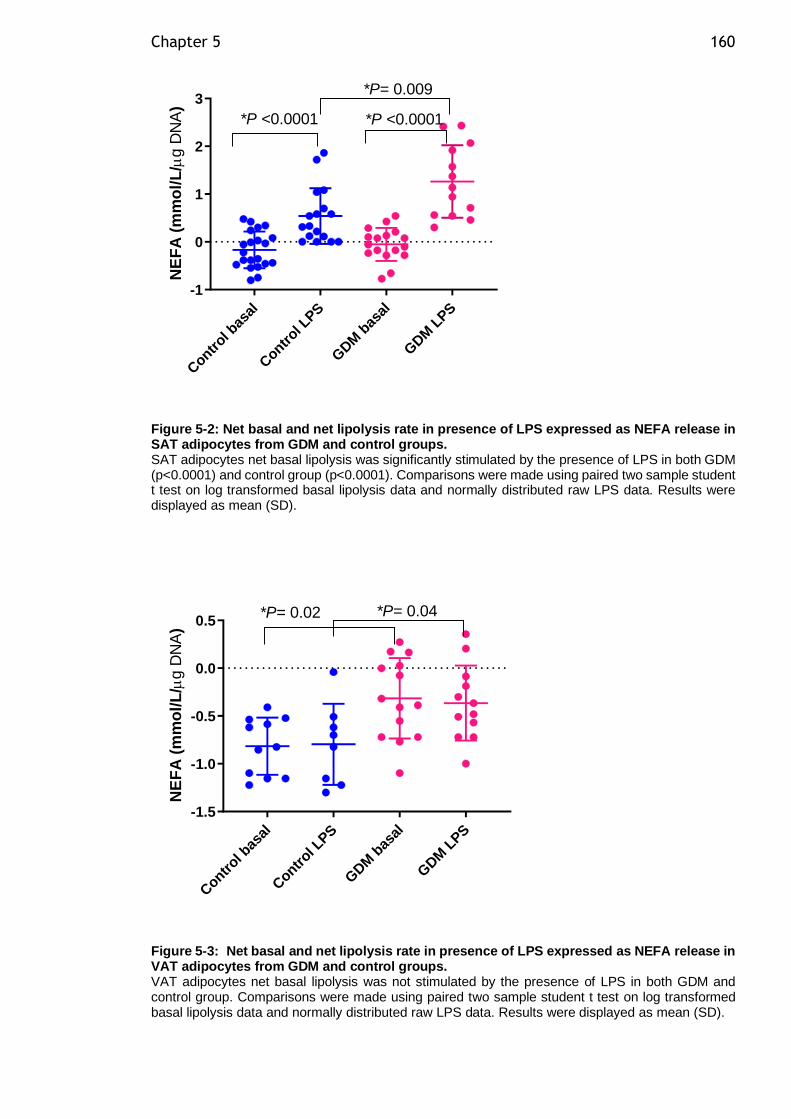
Chapter 5 160
Contr
ol bas
al
Contr
ol LPS
GDM
bas
al
GDM
LPS
-1
0
1
2
3
NE
FA
(m
mo
l/L
/g D
NA
)
*P= 0.009
*P <0.0001 *P <0.0001
Figure 5-2: Net basal and net lipolysis rate in presence of LPS expressed as NEFA release in SAT adipocytes from GDM and control groups. SAT adipocytes net basal lipolysis was significantly stimulated by the presence of LPS in both GDM (p<0.0001) and control group (p<0.0001). Comparisons were made using paired two sample student t test on log transformed basal lipolysis data and normally distributed raw LPS data. Results were displayed as mean (SD).
Contr
ol bas
al
Contr
ol LPS
GDM
bas
al
GDM
LPS
-1.5
-1.0
-0.5
0.0
0.5
NE
FA
(m
mo
l/L
/g D
NA
)
*P= 0.04*P= 0.02
Figure 5-3: Net basal and net lipolysis rate in presence of LPS expressed as NEFA release in VAT adipocytes from GDM and control groups. VAT adipocytes net basal lipolysis was not stimulated by the presence of LPS in both GDM and control group. Comparisons were made using paired two sample student t test on log transformed basal lipolysis data and normally distributed raw LPS data. Results were displayed as mean (SD).
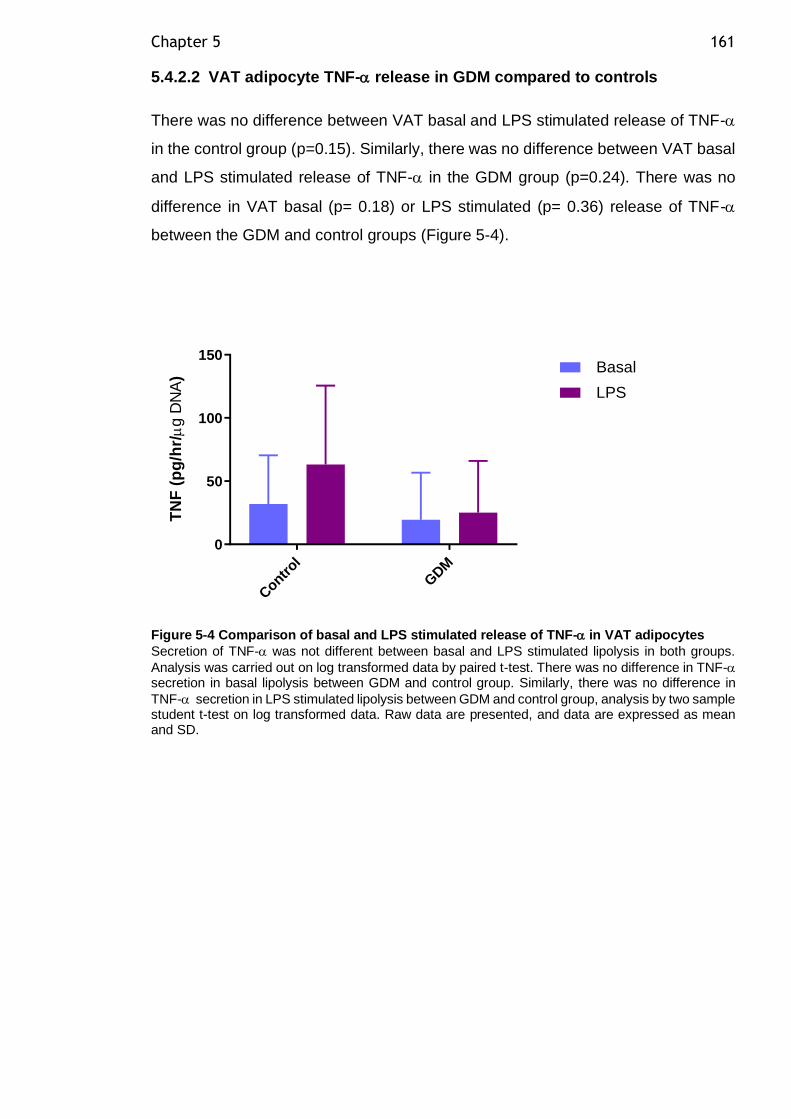
Chapter 5 161
5.4.2.2 VAT adipocyte TNF- release in GDM compared to controls
There was no difference between VAT basal and LPS stimulated release of TNF-
in the control group (p=0.15). Similarly, there was no difference between VAT basal
and LPS stimulated release of TNF- in the GDM group (p=0.24). There was no
difference in VAT basal (p= 0.18) or LPS stimulated (p= 0.36) release of TNF-
between the GDM and control groups (Figure 5-4).
Contr
ol
GDM
0
50
100
150
TN
F (
pg
/hr/
g D
NA
)
Basal
LPS
Figure 5-4 Comparison of basal and LPS stimulated release of TNF- in VAT adipocytes
Secretion of TNF- was not different between basal and LPS stimulated lipolysis in both groups.
Analysis was carried out on log transformed data by paired t-test. There was no difference in TNF- secretion in basal lipolysis between GDM and control group. Similarly, there was no difference in
TNF- secretion in LPS stimulated lipolysis between GDM and control group, analysis by two sample student t-test on log transformed data. Raw data are presented, and data are expressed as mean and SD.
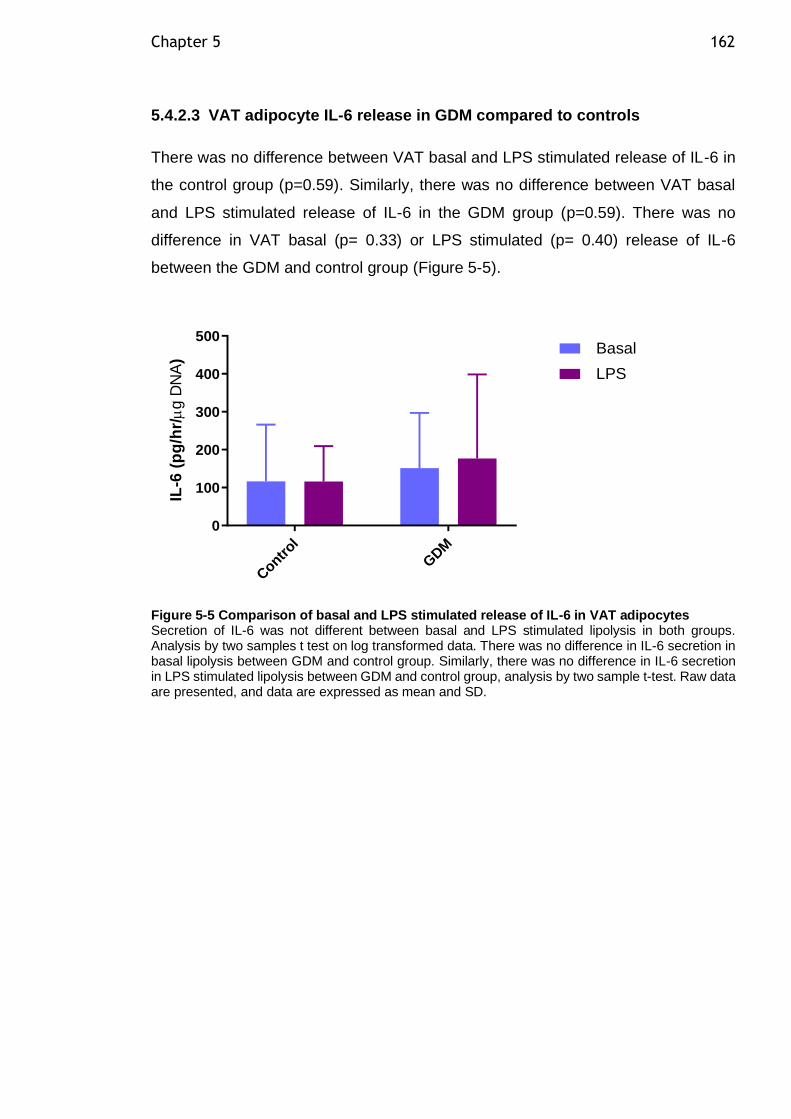
Chapter 5 162
5.4.2.3 VAT adipocyte IL-6 release in GDM compared to controls
There was no difference between VAT basal and LPS stimulated release of IL-6 in
the control group (p=0.59). Similarly, there was no difference between VAT basal
and LPS stimulated release of IL-6 in the GDM group (p=0.59). There was no
difference in VAT basal (p= 0.33) or LPS stimulated (p= 0.40) release of IL-6
between the GDM and control group (Figure 5-5).
Contr
ol
GDM
0
100
200
300
400
500
IL-6
(p
g/h
r/
g D
NA
)
Basal
LPS
Figure 5-5 Comparison of basal and LPS stimulated release of IL-6 in VAT adipocytes Secretion of IL-6 was not different between basal and LPS stimulated lipolysis in both groups. Analysis by two samples t test on log transformed data. There was no difference in IL-6 secretion in basal lipolysis between GDM and control group. Similarly, there was no difference in IL-6 secretion in LPS stimulated lipolysis between GDM and control group, analysis by two sample t-test. Raw data are presented, and data are expressed as mean and SD.
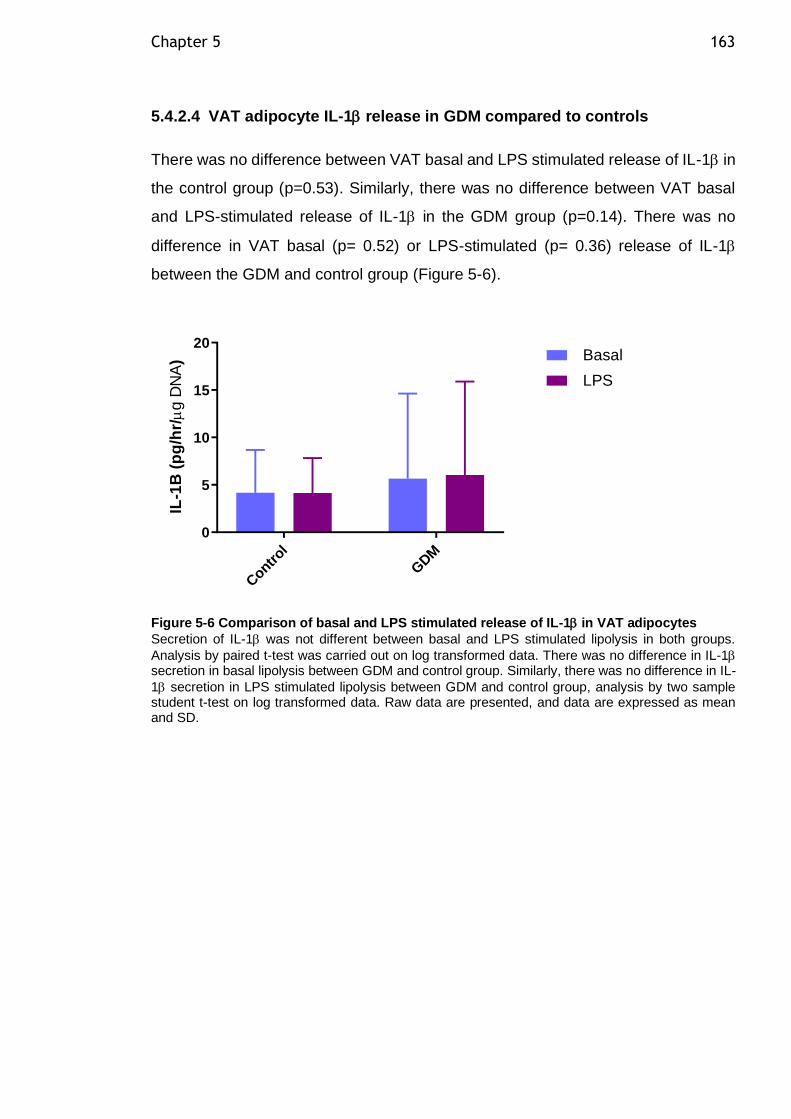
Chapter 5 163
5.4.2.4 VAT adipocyte IL-1 release in GDM compared to controls
There was no difference between VAT basal and LPS stimulated release of IL-1 in
the control group (p=0.53). Similarly, there was no difference between VAT basal
and LPS-stimulated release of IL-1 in the GDM group (p=0.14). There was no
difference in VAT basal (p= 0.52) or LPS-stimulated (p= 0.36) release of IL-1
between the GDM and control group (Figure 5-6).
Contr
ol
GDM
0
5
10
15
20
IL-1
B (
pg
/hr/
g D
NA
) Basal
LPS
Figure 5-6 Comparison of basal and LPS stimulated release of IL-1 in VAT adipocytes
Secretion of IL-1 was not different between basal and LPS stimulated lipolysis in both groups.
Analysis by paired t-test was carried out on log transformed data. There was no difference in IL-1 secretion in basal lipolysis between GDM and control group. Similarly, there was no difference in IL-
1 secretion in LPS stimulated lipolysis between GDM and control group, analysis by two sample student t-test on log transformed data. Raw data are presented, and data are expressed as mean and SD.
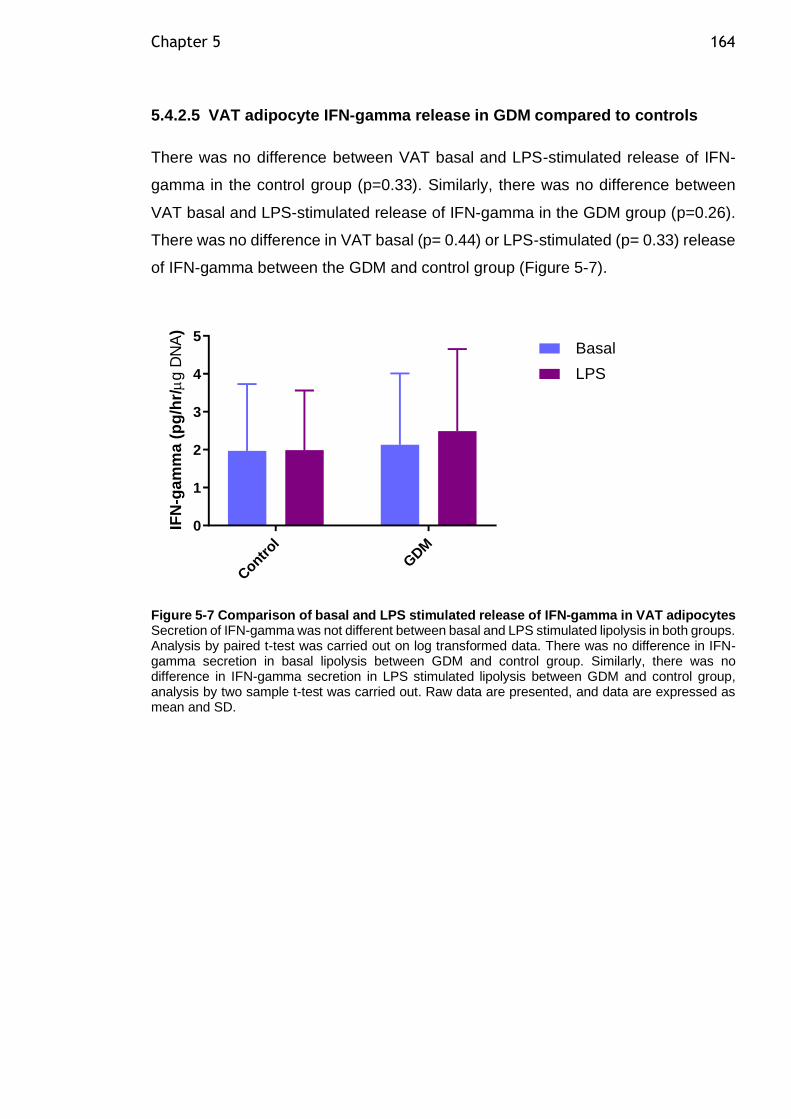
Chapter 5 164
5.4.2.5 VAT adipocyte IFN-gamma release in GDM compared to controls
There was no difference between VAT basal and LPS-stimulated release of IFN-
gamma in the control group (p=0.33). Similarly, there was no difference between
VAT basal and LPS-stimulated release of IFN-gamma in the GDM group (p=0.26).
There was no difference in VAT basal (p= 0.44) or LPS-stimulated (p= 0.33) release
of IFN-gamma between the GDM and control group (Figure 5-7).
Contr
ol
GDM
0
1
2
3
4
5
IFN
-ga
mm
a (
pg
/hr/
g D
NA
)
Basal
LPS
Figure 5-7 Comparison of basal and LPS stimulated release of IFN-gamma in VAT adipocytes Secretion of IFN-gamma was not different between basal and LPS stimulated lipolysis in both groups. Analysis by paired t-test was carried out on log transformed data. There was no difference in IFN-gamma secretion in basal lipolysis between GDM and control group. Similarly, there was no difference in IFN-gamma secretion in LPS stimulated lipolysis between GDM and control group, analysis by two sample t-test was carried out. Raw data are presented, and data are expressed as mean and SD.
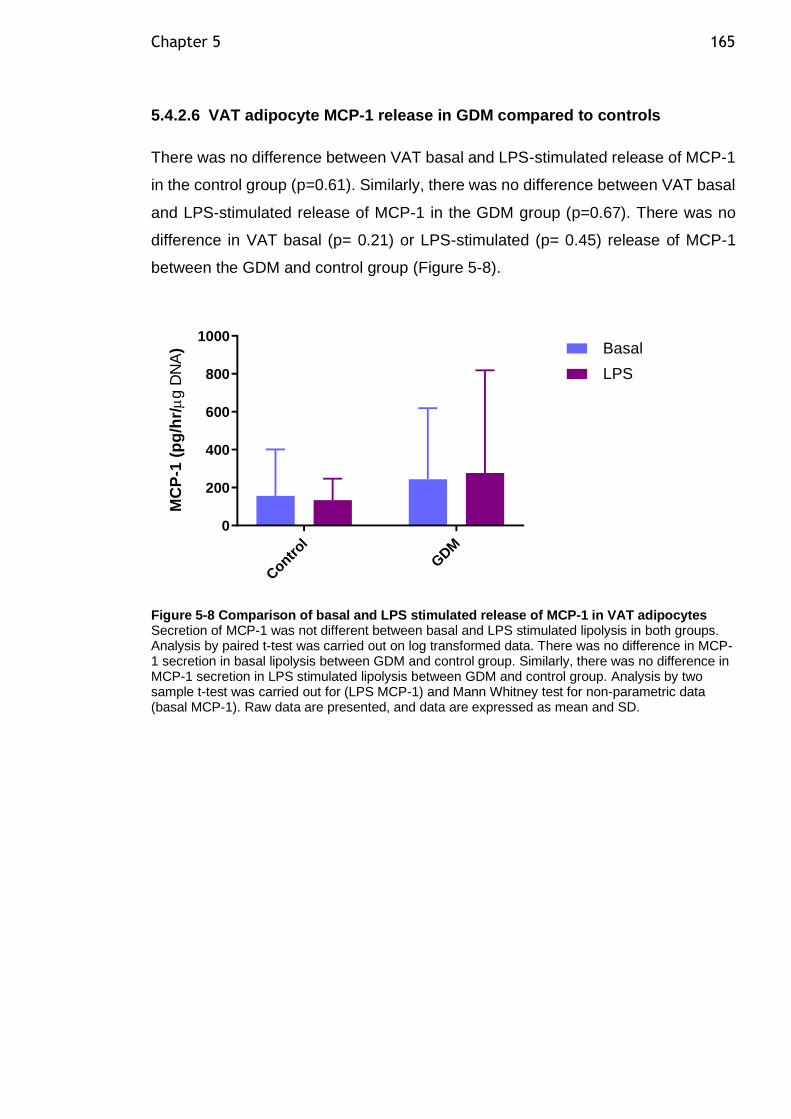
Chapter 5 165
5.4.2.6 VAT adipocyte MCP-1 release in GDM compared to controls
There was no difference between VAT basal and LPS-stimulated release of MCP-1
in the control group (p=0.61). Similarly, there was no difference between VAT basal
and LPS-stimulated release of MCP-1 in the GDM group (p=0.67). There was no
difference in VAT basal (p= 0.21) or LPS-stimulated (p= 0.45) release of MCP-1
between the GDM and control group (Figure 5-8).
Contr
ol
GDM
0
200
400
600
800
1000
MC
P-1
(p
g/h
r/
g D
NA
) Basal
LPS
Figure 5-8 Comparison of basal and LPS stimulated release of MCP-1 in VAT adipocytes Secretion of MCP-1 was not different between basal and LPS stimulated lipolysis in both groups. Analysis by paired t-test was carried out on log transformed data. There was no difference in MCP-1 secretion in basal lipolysis between GDM and control group. Similarly, there was no difference in MCP-1 secretion in LPS stimulated lipolysis between GDM and control group. Analysis by two sample t-test was carried out for (LPS MCP-1) and Mann Whitney test for non-parametric data (basal MCP-1). Raw data are presented, and data are expressed as mean and SD.
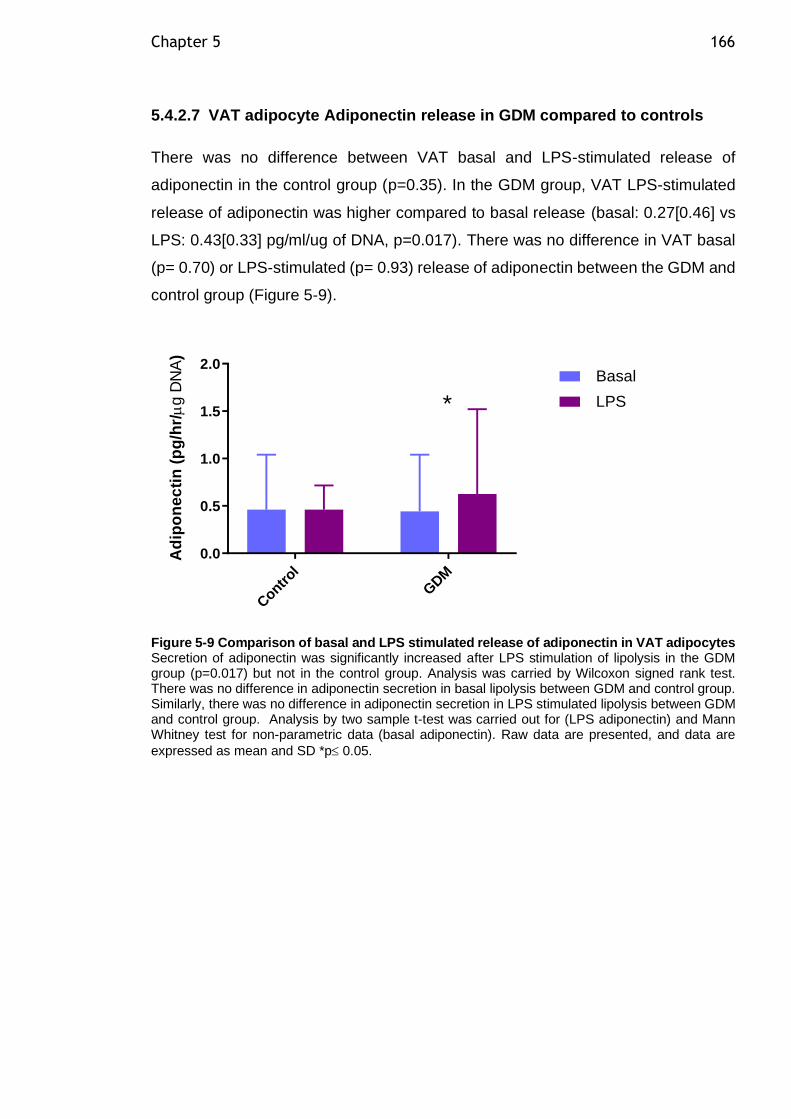
Chapter 5 166
5.4.2.7 VAT adipocyte Adiponectin release in GDM compared to controls
There was no difference between VAT basal and LPS-stimulated release of
adiponectin in the control group (p=0.35). In the GDM group, VAT LPS-stimulated
release of adiponectin was higher compared to basal release (basal: 0.27[0.46] vs
LPS: 0.43[0.33] pg/ml/ug of DNA, p=0.017). There was no difference in VAT basal
(p= 0.70) or LPS-stimulated (p= 0.93) release of adiponectin between the GDM and
control group (Figure 5-9).
Contr
ol
GDM
0.0
0.5
1.0
1.5
2.0
Ad
ipo
ne
cti
n (
pg
/hr/
g D
NA
)
Basal
LPS*
Figure 5-9 Comparison of basal and LPS stimulated release of adiponectin in VAT adipocytes Secretion of adiponectin was significantly increased after LPS stimulation of lipolysis in the GDM group (p=0.017) but not in the control group. Analysis was carried by Wilcoxon signed rank test. There was no difference in adiponectin secretion in basal lipolysis between GDM and control group. Similarly, there was no difference in adiponectin secretion in LPS stimulated lipolysis between GDM and control group. Analysis by two sample t-test was carried out for (LPS adiponectin) and Mann Whitney test for non-parametric data (basal adiponectin). Raw data are presented, and data are
expressed as mean and SD *p 0.05.
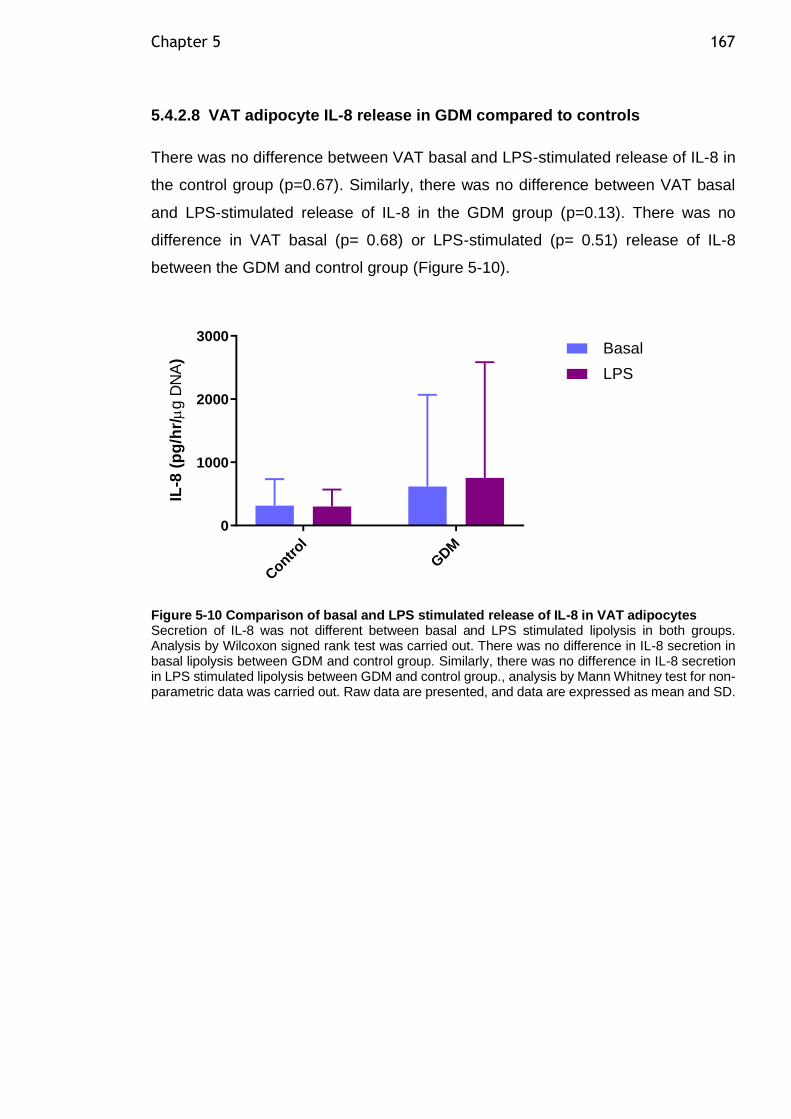
Chapter 5 167
5.4.2.8 VAT adipocyte IL-8 release in GDM compared to controls
There was no difference between VAT basal and LPS-stimulated release of IL-8 in
the control group (p=0.67). Similarly, there was no difference between VAT basal
and LPS-stimulated release of IL-8 in the GDM group (p=0.13). There was no
difference in VAT basal (p= 0.68) or LPS-stimulated (p= 0.51) release of IL-8
between the GDM and control group (Figure 5-10).
Contr
ol
GDM
0
1000
2000
3000
IL-8
(p
g/h
r/
g D
NA
)
Basal
LPS
Figure 5-10 Comparison of basal and LPS stimulated release of IL-8 in VAT adipocytes Secretion of IL-8 was not different between basal and LPS stimulated lipolysis in both groups. Analysis by Wilcoxon signed rank test was carried out. There was no difference in IL-8 secretion in basal lipolysis between GDM and control group. Similarly, there was no difference in IL-8 secretion in LPS stimulated lipolysis between GDM and control group., analysis by Mann Whitney test for non-parametric data was carried out. Raw data are presented, and data are expressed as mean and SD.
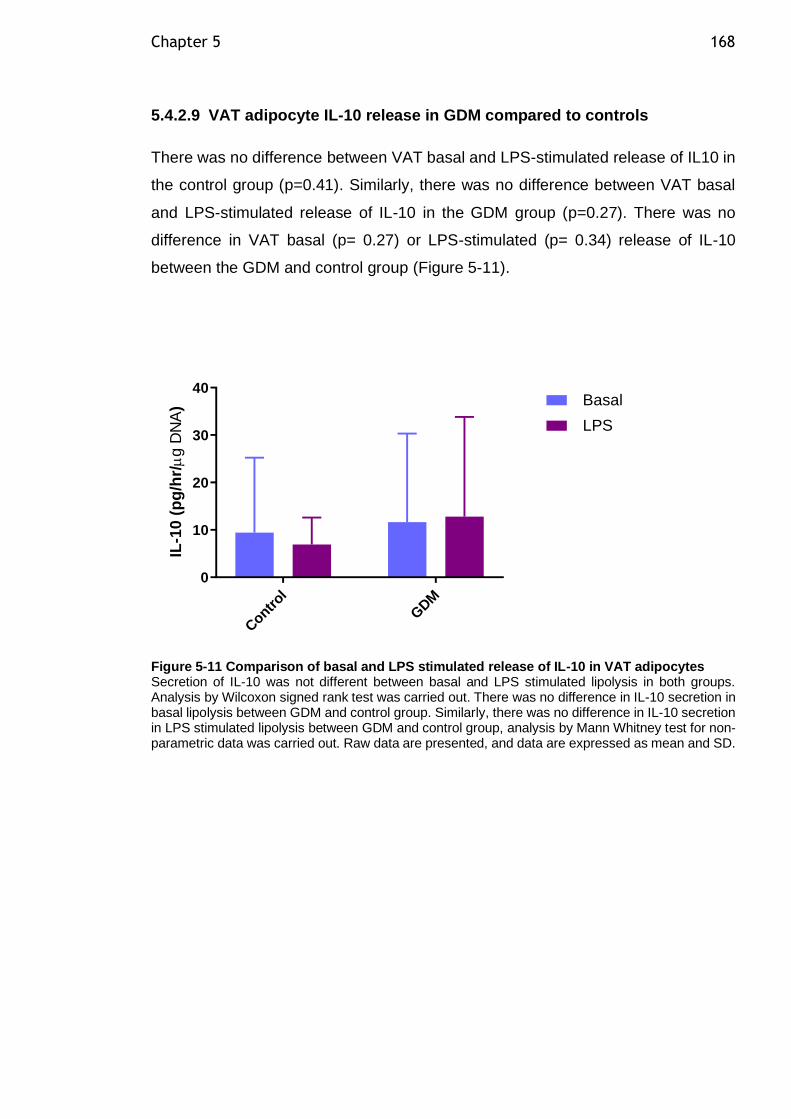
Chapter 5 168
5.4.2.9 VAT adipocyte IL-10 release in GDM compared to controls
There was no difference between VAT basal and LPS-stimulated release of IL10 in
the control group (p=0.41). Similarly, there was no difference between VAT basal
and LPS-stimulated release of IL-10 in the GDM group (p=0.27). There was no
difference in VAT basal (p= 0.27) or LPS-stimulated (p= 0.34) release of IL-10
between the GDM and control group (Figure 5-11).
Contr
ol
GDM
0
10
20
30
40
IL-1
0 (
pg
/hr/
g D
NA
) Basal
LPS
Figure 5-11 Comparison of basal and LPS stimulated release of IL-10 in VAT adipocytes Secretion of IL-10 was not different between basal and LPS stimulated lipolysis in both groups. Analysis by Wilcoxon signed rank test was carried out. There was no difference in IL-10 secretion in basal lipolysis between GDM and control group. Similarly, there was no difference in IL-10 secretion in LPS stimulated lipolysis between GDM and control group, analysis by Mann Whitney test for non-parametric data was carried out. Raw data are presented, and data are expressed as mean and SD.
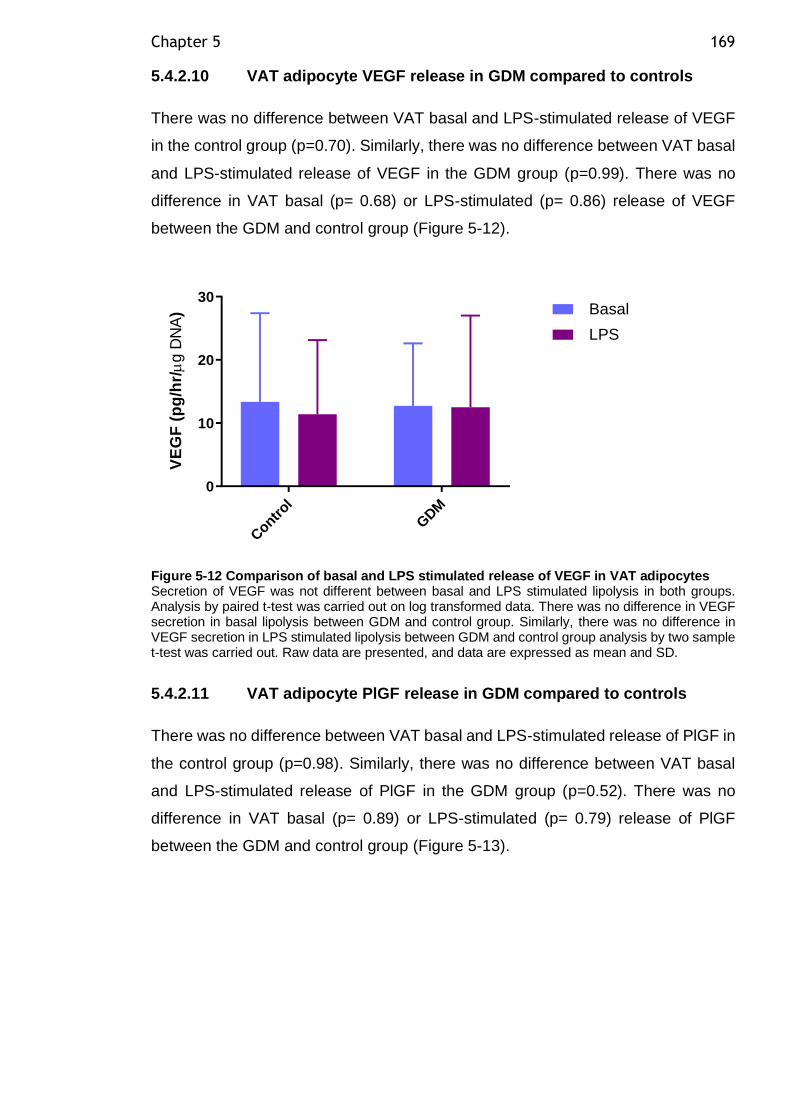
Chapter 5 169
5.4.2.10 VAT adipocyte VEGF release in GDM compared to controls
There was no difference between VAT basal and LPS-stimulated release of VEGF
in the control group (p=0.70). Similarly, there was no difference between VAT basal
and LPS-stimulated release of VEGF in the GDM group (p=0.99). There was no
difference in VAT basal (p= 0.68) or LPS-stimulated (p= 0.86) release of VEGF
between the GDM and control group (Figure 5-12).
Contr
ol
GDM
0
10
20
30
VE
GF
(p
g/h
r/
g D
NA
) Basal
LPS
Figure 5-12 Comparison of basal and LPS stimulated release of VEGF in VAT adipocytes Secretion of VEGF was not different between basal and LPS stimulated lipolysis in both groups. Analysis by paired t-test was carried out on log transformed data. There was no difference in VEGF secretion in basal lipolysis between GDM and control group. Similarly, there was no difference in VEGF secretion in LPS stimulated lipolysis between GDM and control group analysis by two sample t-test was carried out. Raw data are presented, and data are expressed as mean and SD.
5.4.2.11 VAT adipocyte PlGF release in GDM compared to controls
There was no difference between VAT basal and LPS-stimulated release of PlGF in
the control group (p=0.98). Similarly, there was no difference between VAT basal
and LPS-stimulated release of PlGF in the GDM group (p=0.52). There was no
difference in VAT basal (p= 0.89) or LPS-stimulated (p= 0.79) release of PlGF
between the GDM and control group (Figure 5-13).
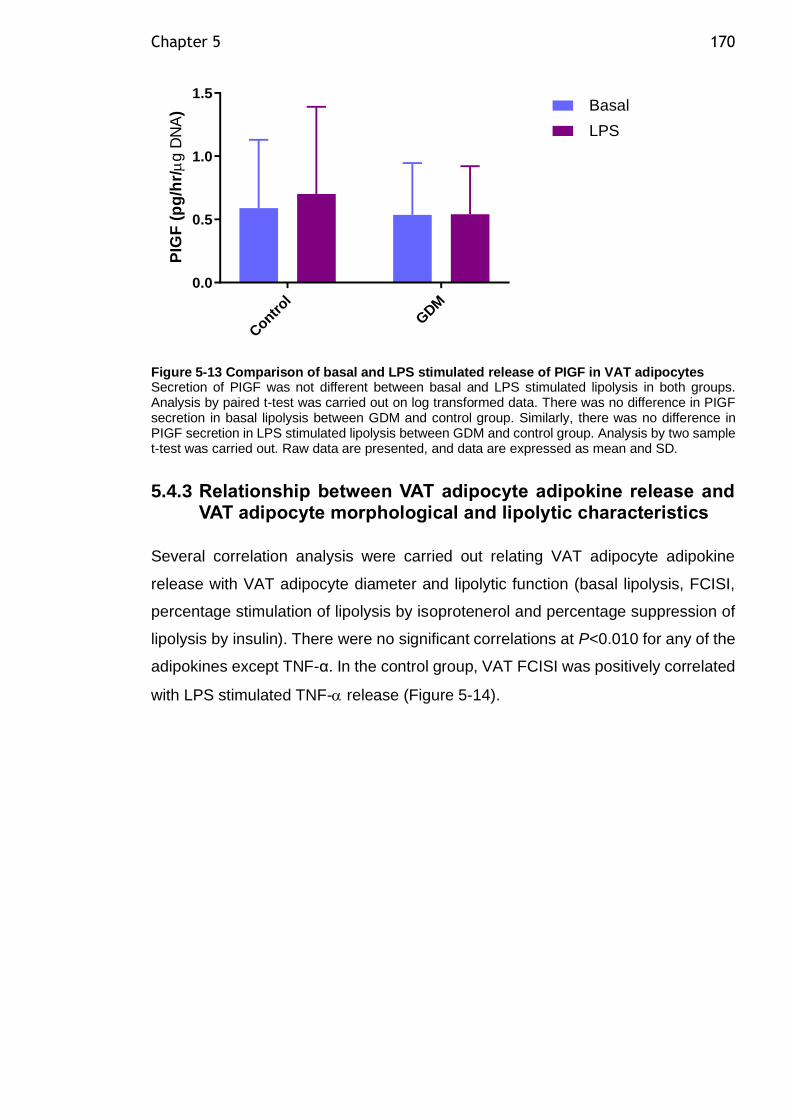
Chapter 5 170
Contr
ol
GDM
0.0
0.5
1.0
1.5
PIG
F (
pg
/hr/
g D
NA
) Basal
LPS
Figure 5-13 Comparison of basal and LPS stimulated release of PIGF in VAT adipocytes Secretion of PIGF was not different between basal and LPS stimulated lipolysis in both groups. Analysis by paired t-test was carried out on log transformed data. There was no difference in PIGF secretion in basal lipolysis between GDM and control group. Similarly, there was no difference in PIGF secretion in LPS stimulated lipolysis between GDM and control group. Analysis by two sample t-test was carried out. Raw data are presented, and data are expressed as mean and SD.
5.4.3 Relationship between VAT adipocyte adipokine release and VAT adipocyte morphological and lipolytic characteristics
Several correlation analysis were carried out relating VAT adipocyte adipokine
release with VAT adipocyte diameter and lipolytic function (basal lipolysis, FCISI,
percentage stimulation of lipolysis by isoprotenerol and percentage suppression of
lipolysis by insulin). There were no significant correlations at P<0.010 for any of the
adipokines except TNF-α. In the control group, VAT FCISI was positively correlated
with LPS stimulated TNF- release (Figure 5-14).
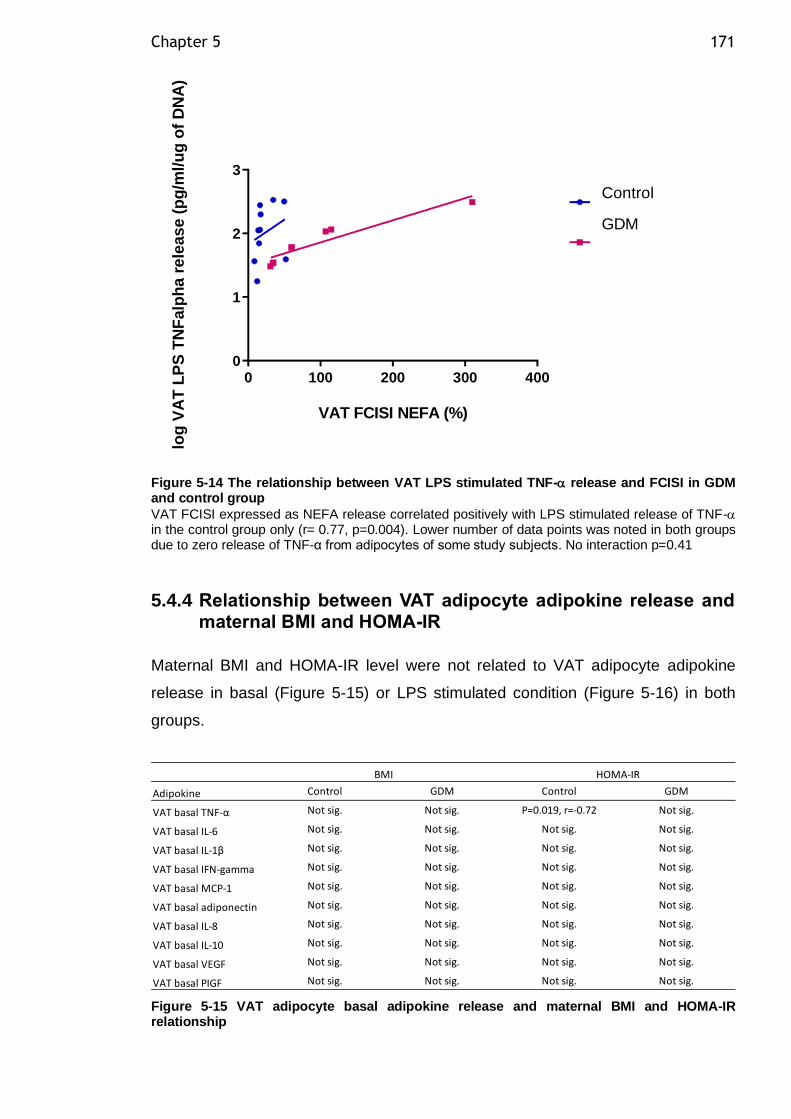
Chapter 5 171
0 100 200 300 4000
1
2
3
VAT FCISI NEFA (%)
log
VA
T L
PS
TN
Falp
ha
re
leas
e (
pg
/ml/
ug
of
DN
A)
Control
GDM
Figure 5-14 The relationship between VAT LPS stimulated TNF- release and FCISI in GDM and control group
VAT FCISI expressed as NEFA release correlated positively with LPS stimulated release of TNF- in the control group only (r= 0.77, p=0.004). Lower number of data points was noted in both groups due to zero release of TNF-α from adipocytes of some study subjects. No interaction p=0.41
5.4.4 Relationship between VAT adipocyte adipokine release and maternal BMI and HOMA-IR
Maternal BMI and HOMA-IR level were not related to VAT adipocyte adipokine
release in basal (Figure 5-15) or LPS stimulated condition (Figure 5-16) in both
groups.
Figure 5-15 VAT adipocyte basal adipokine release and maternal BMI and HOMA-IR relationship
Adipokine Control GDM Control GDM
VAT basal TNF-α Not sig. Not sig. P=0.019, r=-0.72 Not sig.
VAT basal IL-6 Not sig. Not sig. Not sig. Not sig.
VAT basal IL-1β Not sig. Not sig. Not sig. Not sig.
VAT basal IFN-gamma Not sig. Not sig. Not sig. Not sig.
VAT basal MCP-1 Not sig. Not sig. Not sig. Not sig.
VAT basal adiponectin Not sig. Not sig. Not sig. Not sig.
VAT basal IL-8 Not sig. Not sig. Not sig. Not sig.
VAT basal IL-10 Not sig. Not sig. Not sig. Not sig.
VAT basal VEGF Not sig. Not sig. Not sig. Not sig.
VAT basal PIGF Not sig. Not sig. Not sig. Not sig.
BMI HOMA-IR
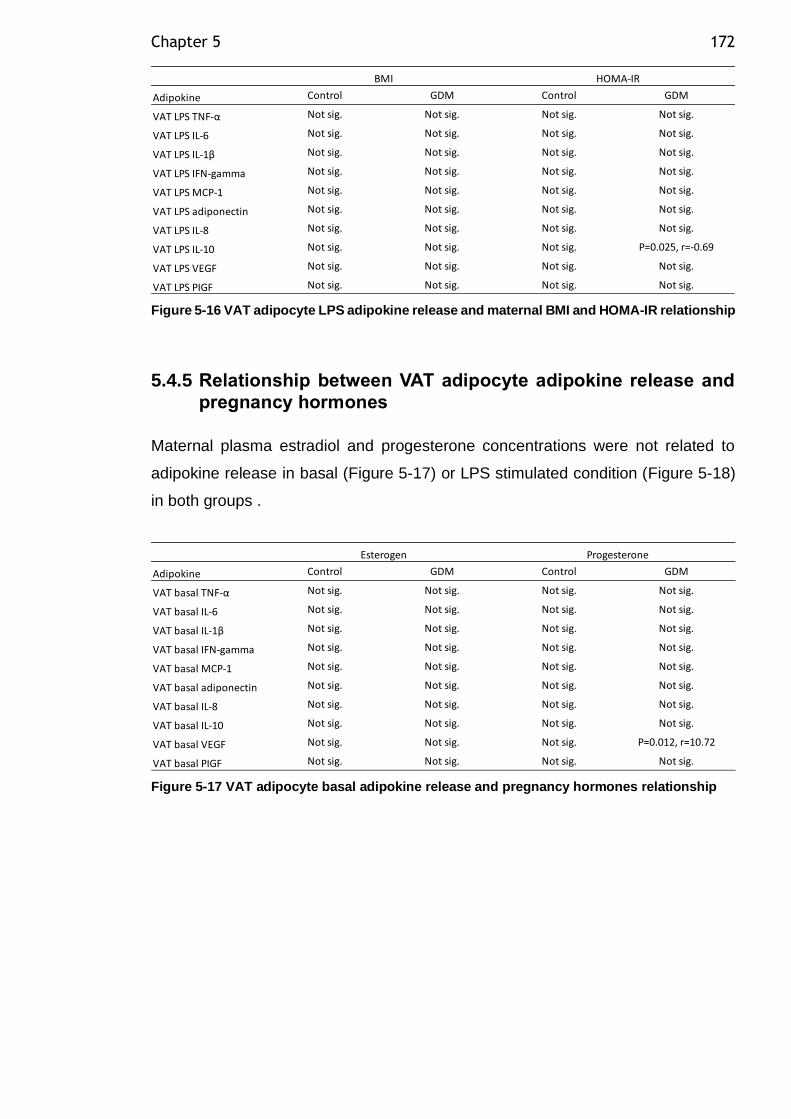
Chapter 5 172
Figure 5-16 VAT adipocyte LPS adipokine release and maternal BMI and HOMA-IR relationship
5.4.5 Relationship between VAT adipocyte adipokine release and pregnancy hormones
Maternal plasma estradiol and progesterone concentrations were not related to
adipokine release in basal (Figure 5-17) or LPS stimulated condition (Figure 5-18)
in both groups .
Figure 5-17 VAT adipocyte basal adipokine release and pregnancy hormones relationship
Adipokine Control GDM Control GDM
VAT LPS TNF-α Not sig. Not sig. Not sig. Not sig.
VAT LPS IL-6 Not sig. Not sig. Not sig. Not sig.
VAT LPS IL-1β Not sig. Not sig. Not sig. Not sig.
VAT LPS IFN-gamma Not sig. Not sig. Not sig. Not sig.
VAT LPS MCP-1 Not sig. Not sig. Not sig. Not sig.
VAT LPS adiponectin Not sig. Not sig. Not sig. Not sig.
VAT LPS IL-8 Not sig. Not sig. Not sig. Not sig.
VAT LPS IL-10 Not sig. Not sig. Not sig. P=0.025, r=-0.69
VAT LPS VEGF Not sig. Not sig. Not sig. Not sig.
VAT LPS PIGF Not sig. Not sig. Not sig. Not sig.
BMI HOMA-IR
Adipokine Control GDM Control GDM
VAT basal TNF-α Not sig. Not sig. Not sig. Not sig.
VAT basal IL-6 Not sig. Not sig. Not sig. Not sig.
VAT basal IL-1β Not sig. Not sig. Not sig. Not sig.
VAT basal IFN-gamma Not sig. Not sig. Not sig. Not sig.
VAT basal MCP-1 Not sig. Not sig. Not sig. Not sig.
VAT basal adiponectin Not sig. Not sig. Not sig. Not sig.
VAT basal IL-8 Not sig. Not sig. Not sig. Not sig.
VAT basal IL-10 Not sig. Not sig. Not sig. Not sig.
VAT basal VEGF Not sig. Not sig. Not sig. P=0.012, r=10.72
VAT basal PIGF Not sig. Not sig. Not sig. Not sig.
Esterogen Progesterone
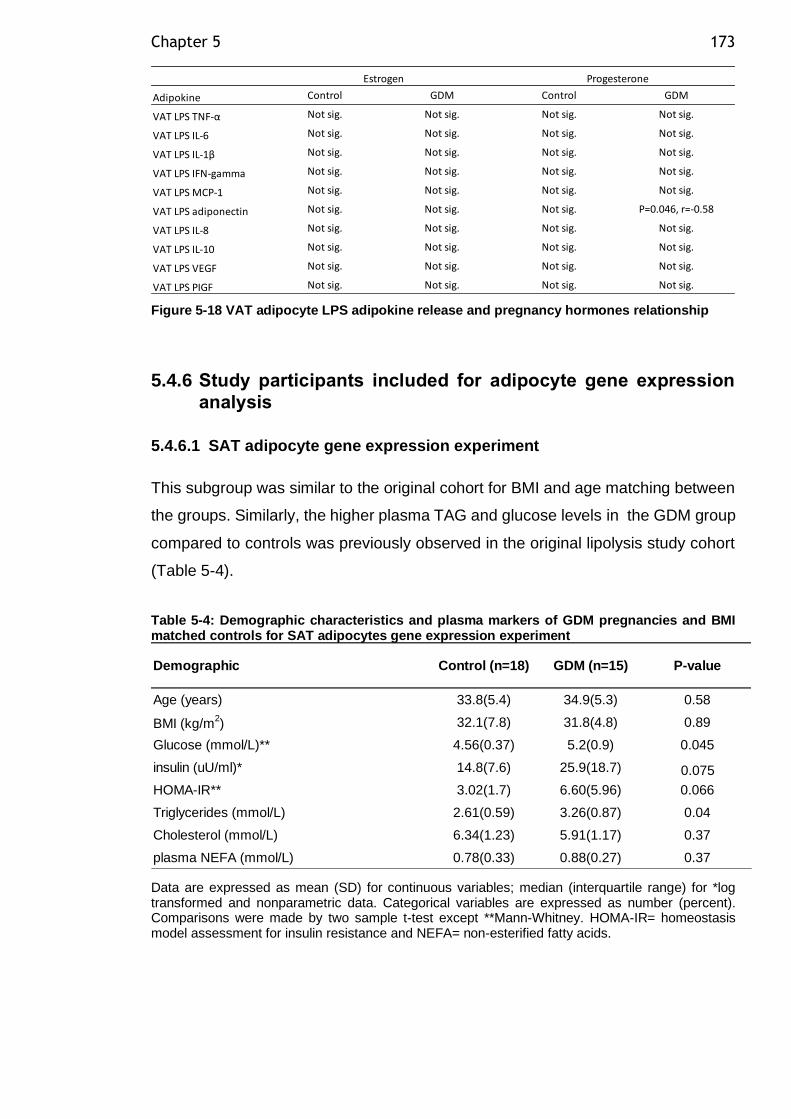
Chapter 5 173
Figure 5-18 VAT adipocyte LPS adipokine release and pregnancy hormones relationship
5.4.6 Study participants included for adipocyte gene expression analysis
5.4.6.1 SAT adipocyte gene expression experiment
This subgroup was similar to the original cohort for BMI and age matching between
the groups. Similarly, the higher plasma TAG and glucose levels in the GDM group
compared to controls was previously observed in the original lipolysis study cohort
(Table 5-4).
Table 5-4: Demographic characteristics and plasma markers of GDM pregnancies and BMI matched controls for SAT adipocytes gene expression experiment
Data are expressed as mean (SD) for continuous variables; median (interquartile range) for *log transformed and nonparametric data. Categorical variables are expressed as number (percent). Comparisons were made by two sample t-test except **Mann-Whitney. HOMA-IR= homeostasis model assessment for insulin resistance and NEFA= non-esterified fatty acids.
Adipokine Control GDM Control GDM
VAT LPS TNF-α Not sig. Not sig. Not sig. Not sig.
VAT LPS IL-6 Not sig. Not sig. Not sig. Not sig.
VAT LPS IL-1β Not sig. Not sig. Not sig. Not sig.
VAT LPS IFN-gamma Not sig. Not sig. Not sig. Not sig.
VAT LPS MCP-1 Not sig. Not sig. Not sig. Not sig.
VAT LPS adiponectin Not sig. Not sig. Not sig. P=0.046, r=-0.58
VAT LPS IL-8 Not sig. Not sig. Not sig. Not sig.
VAT LPS IL-10 Not sig. Not sig. Not sig. Not sig.
VAT LPS VEGF Not sig. Not sig. Not sig. Not sig.
VAT LPS PIGF Not sig. Not sig. Not sig. Not sig.
Estrogen Progesterone
Age (years) 33.8(5.4) 34.9(5.3) 0.58
BMI (kg/m2) 32.1(7.8) 31.8(4.8) 0.89
Glucose (mmol/L)** 4.56(0.37) 5.2(0.9) 0.045
insulin (uU/ml)* 14.8(7.6) 25.9(18.7) 0.075
HOMA-IR** 3.02(1.7) 6.60(5.96) 0.066
Triglycerides (mmol/L) 2.61(0.59) 3.26(0.87) 0.04
Cholesterol (mmol/L) 6.34(1.23) 5.91(1.17) 0.37
plasma NEFA (mmol/L) 0.78(0.33) 0.88(0.27) 0.37
Demographic Control (n=18) GDM (n=15) P-value
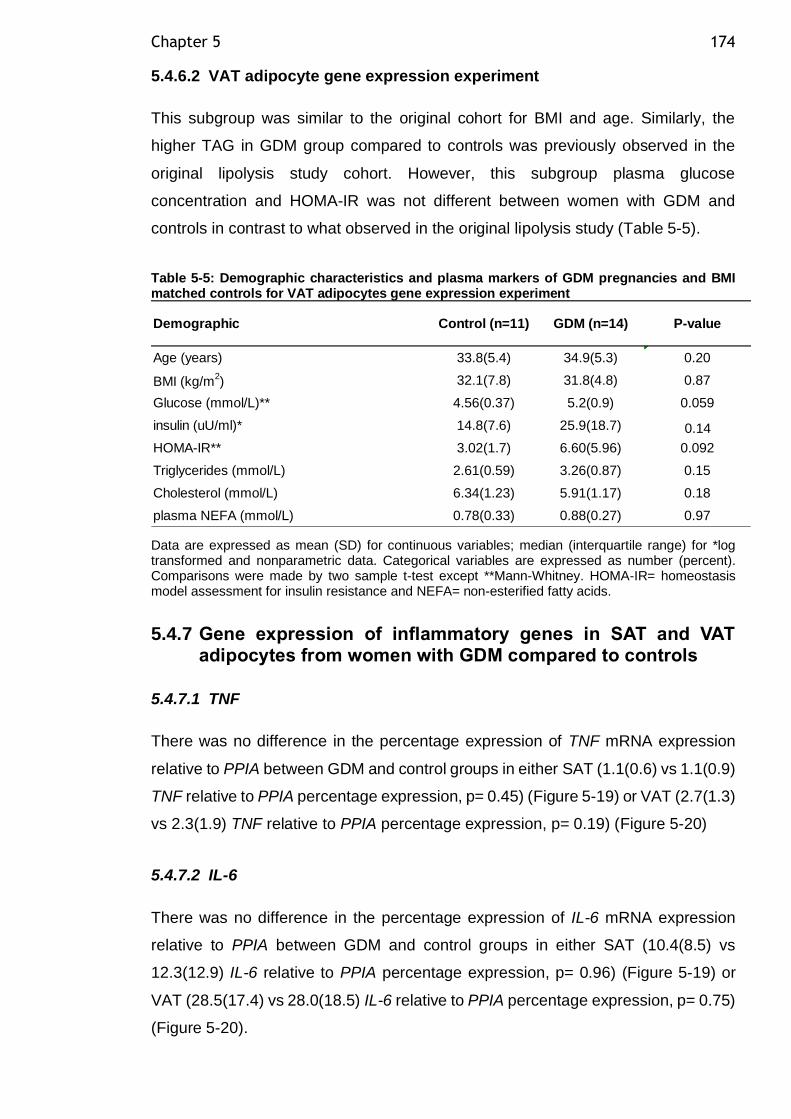
Chapter 5 174
5.4.6.2 VAT adipocyte gene expression experiment
This subgroup was similar to the original cohort for BMI and age. Similarly, the
higher TAG in GDM group compared to controls was previously observed in the
original lipolysis study cohort. However, this subgroup plasma glucose
concentration and HOMA-IR was not different between women with GDM and
controls in contrast to what observed in the original lipolysis study (Table 5-5).
Table 5-5: Demographic characteristics and plasma markers of GDM pregnancies and BMI matched controls for VAT adipocytes gene expression experiment
Data are expressed as mean (SD) for continuous variables; median (interquartile range) for *log transformed and nonparametric data. Categorical variables are expressed as number (percent). Comparisons were made by two sample t-test except **Mann-Whitney. HOMA-IR= homeostasis model assessment for insulin resistance and NEFA= non-esterified fatty acids.
5.4.7 Gene expression of inflammatory genes in SAT and VAT adipocytes from women with GDM compared to controls
5.4.7.1 TNF
There was no difference in the percentage expression of TNF mRNA expression
relative to PPIA between GDM and control groups in either SAT (1.1(0.6) vs 1.1(0.9)
TNF relative to PPIA percentage expression, p= 0.45) (Figure 5-19) or VAT (2.7(1.3)
vs 2.3(1.9) TNF relative to PPIA percentage expression, p= 0.19) (Figure 5-20)
5.4.7.2 IL-6
There was no difference in the percentage expression of IL-6 mRNA expression
relative to PPIA between GDM and control groups in either SAT (10.4(8.5) vs
12.3(12.9) IL-6 relative to PPIA percentage expression, p= 0.96) (Figure 5-19) or
VAT (28.5(17.4) vs 28.0(18.5) IL-6 relative to PPIA percentage expression, p= 0.75)
(Figure 5-20).
Age (years) 33.8(5.4) 34.9(5.3) 0.20
BMI (kg/m2) 32.1(7.8) 31.8(4.8) 0.87
Glucose (mmol/L)** 4.56(0.37) 5.2(0.9) 0.059
insulin (uU/ml)* 14.8(7.6) 25.9(18.7) 0.14
HOMA-IR** 3.02(1.7) 6.60(5.96) 0.092
Triglycerides (mmol/L) 2.61(0.59) 3.26(0.87) 0.15
Cholesterol (mmol/L) 6.34(1.23) 5.91(1.17) 0.18
plasma NEFA (mmol/L) 0.78(0.33) 0.88(0.27) 0.97
Demographic Control (n=11) GDM (n=14) P-value
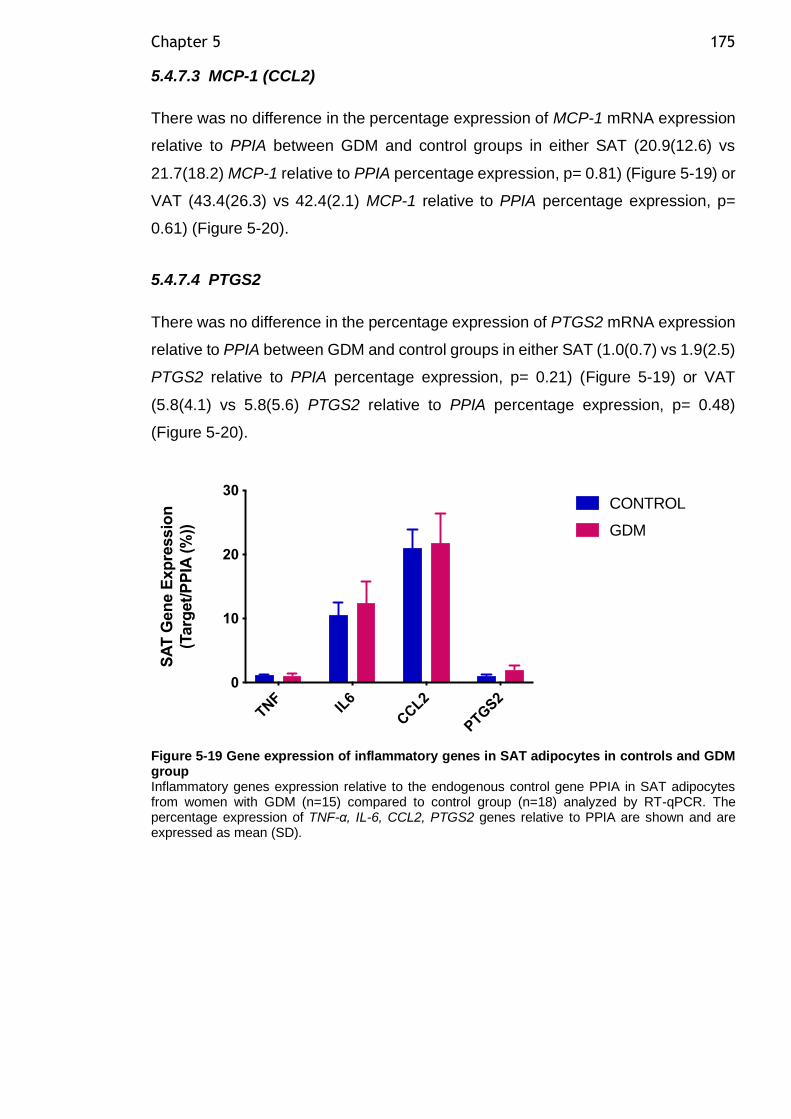
Chapter 5 175
5.4.7.3 MCP-1 (CCL2)
There was no difference in the percentage expression of MCP-1 mRNA expression
relative to PPIA between GDM and control groups in either SAT (20.9(12.6) vs
21.7(18.2) MCP-1 relative to PPIA percentage expression, p= 0.81) (Figure 5-19) or
VAT (43.4(26.3) vs 42.4(2.1) MCP-1 relative to PPIA percentage expression, p=
0.61) (Figure 5-20).
5.4.7.4 PTGS2
There was no difference in the percentage expression of PTGS2 mRNA expression
relative to PPIA between GDM and control groups in either SAT (1.0(0.7) vs 1.9(2.5)
PTGS2 relative to PPIA percentage expression, p= 0.21) (Figure 5-19) or VAT
(5.8(4.1) vs 5.8(5.6) PTGS2 relative to PPIA percentage expression, p= 0.48)
(Figure 5-20).
Figure 5-19 Gene expression of inflammatory genes in SAT adipocytes in controls and GDM group Inflammatory genes expression relative to the endogenous control gene PPIA in SAT adipocytes from women with GDM (n=15) compared to control group (n=18) analyzed by RT-qPCR. The percentage expression of TNF-α, IL-6, CCL2, PTGS2 genes relative to PPIA are shown and are expressed as mean (SD).
TNF
IL6
CCL2
PTG
S2
0
10
20
30
SA
T G
en
e E
xp
ressio
n
(Targ
et/
PP
IA (
%))
CONTROL
GDM
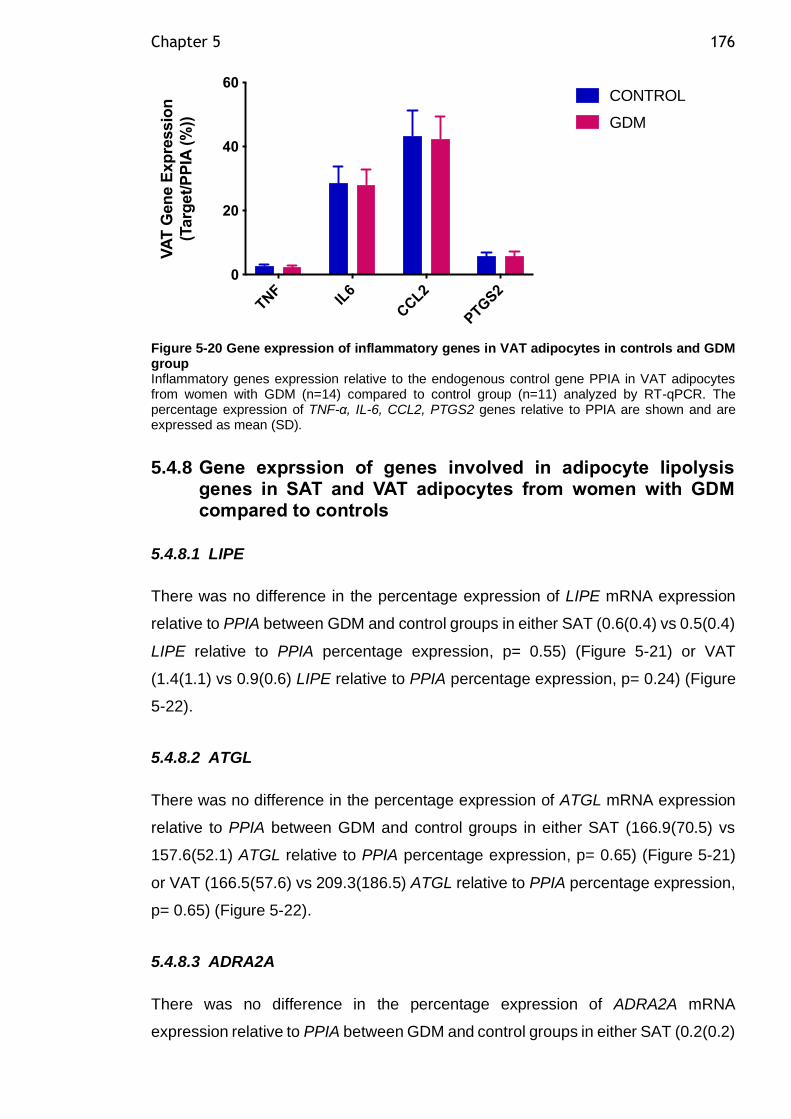
Chapter 5 176
Figure 5-20 Gene expression of inflammatory genes in VAT adipocytes in controls and GDM group Inflammatory genes expression relative to the endogenous control gene PPIA in VAT adipocytes from women with GDM (n=14) compared to control group (n=11) analyzed by RT-qPCR. The percentage expression of TNF-α, IL-6, CCL2, PTGS2 genes relative to PPIA are shown and are expressed as mean (SD).
5.4.8 Gene exprssion of genes involved in adipocyte lipolysis genes in SAT and VAT adipocytes from women with GDM compared to controls
5.4.8.1 LIPE
There was no difference in the percentage expression of LIPE mRNA expression
relative to PPIA between GDM and control groups in either SAT (0.6(0.4) vs 0.5(0.4)
LIPE relative to PPIA percentage expression, p= 0.55) (Figure 5-21) or VAT
(1.4(1.1) vs 0.9(0.6) LIPE relative to PPIA percentage expression, p= 0.24) (Figure
5-22).
5.4.8.2 ATGL
There was no difference in the percentage expression of ATGL mRNA expression
relative to PPIA between GDM and control groups in either SAT (166.9(70.5) vs
157.6(52.1) ATGL relative to PPIA percentage expression, p= 0.65) (Figure 5-21)
or VAT (166.5(57.6) vs 209.3(186.5) ATGL relative to PPIA percentage expression,
p= 0.65) (Figure 5-22).
5.4.8.3 ADRA2A
There was no difference in the percentage expression of ADRA2A mRNA
expression relative to PPIA between GDM and control groups in either SAT (0.2(0.2)
TNF
IL6
CCL2
PTG
S2
0
20
40
60
VA
T G
en
e E
xp
ressio
n
(Targ
et/
PP
IA (
%))
CONTROL
GDM
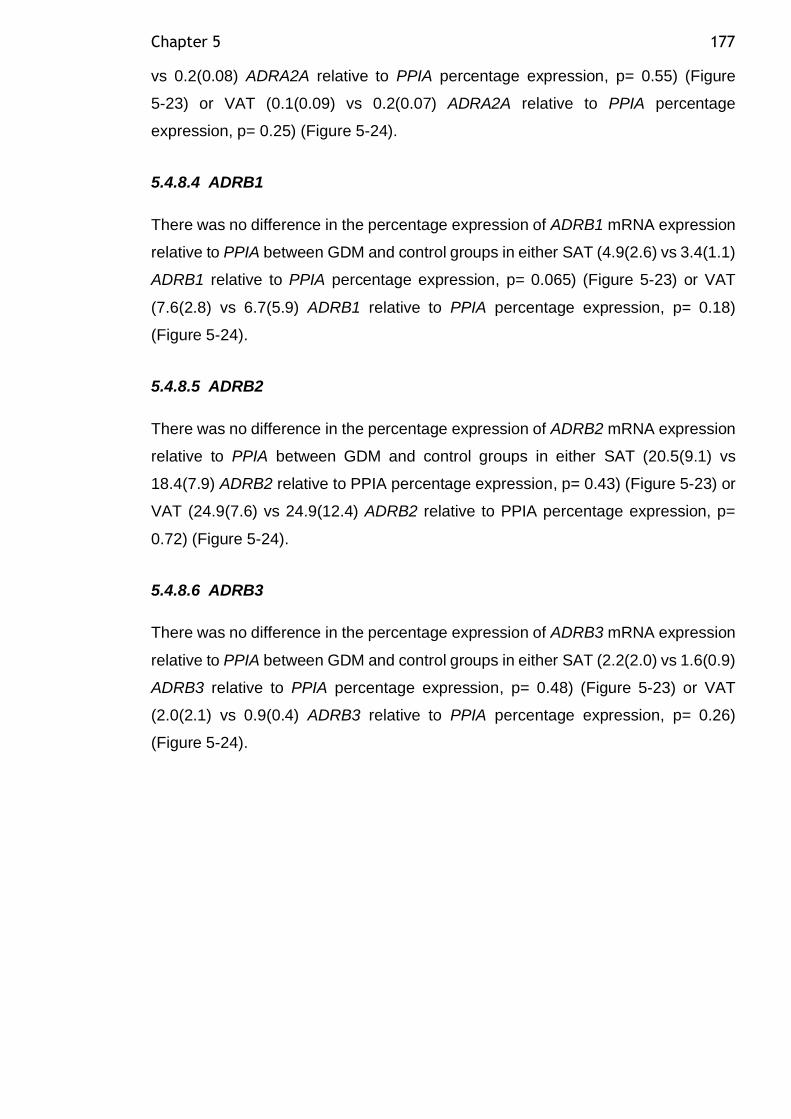
Chapter 5 177
vs 0.2(0.08) ADRA2A relative to PPIA percentage expression, p= 0.55) (Figure
5-23) or VAT (0.1(0.09) vs 0.2(0.07) ADRA2A relative to PPIA percentage
expression, p= 0.25) (Figure 5-24).
5.4.8.4 ADRB1
There was no difference in the percentage expression of ADRB1 mRNA expression
relative to PPIA between GDM and control groups in either SAT (4.9(2.6) vs 3.4(1.1)
ADRB1 relative to PPIA percentage expression, p= 0.065) (Figure 5-23) or VAT
(7.6(2.8) vs 6.7(5.9) ADRB1 relative to PPIA percentage expression, p= 0.18)
(Figure 5-24).
5.4.8.5 ADRB2
There was no difference in the percentage expression of ADRB2 mRNA expression
relative to PPIA between GDM and control groups in either SAT (20.5(9.1) vs
18.4(7.9) ADRB2 relative to PPIA percentage expression, p= 0.43) (Figure 5-23) or
VAT (24.9(7.6) vs 24.9(12.4) ADRB2 relative to PPIA percentage expression, p=
0.72) (Figure 5-24).
5.4.8.6 ADRB3
There was no difference in the percentage expression of ADRB3 mRNA expression
relative to PPIA between GDM and control groups in either SAT (2.2(2.0) vs 1.6(0.9)
ADRB3 relative to PPIA percentage expression, p= 0.48) (Figure 5-23) or VAT
(2.0(2.1) vs 0.9(0.4) ADRB3 relative to PPIA percentage expression, p= 0.26)
(Figure 5-24).
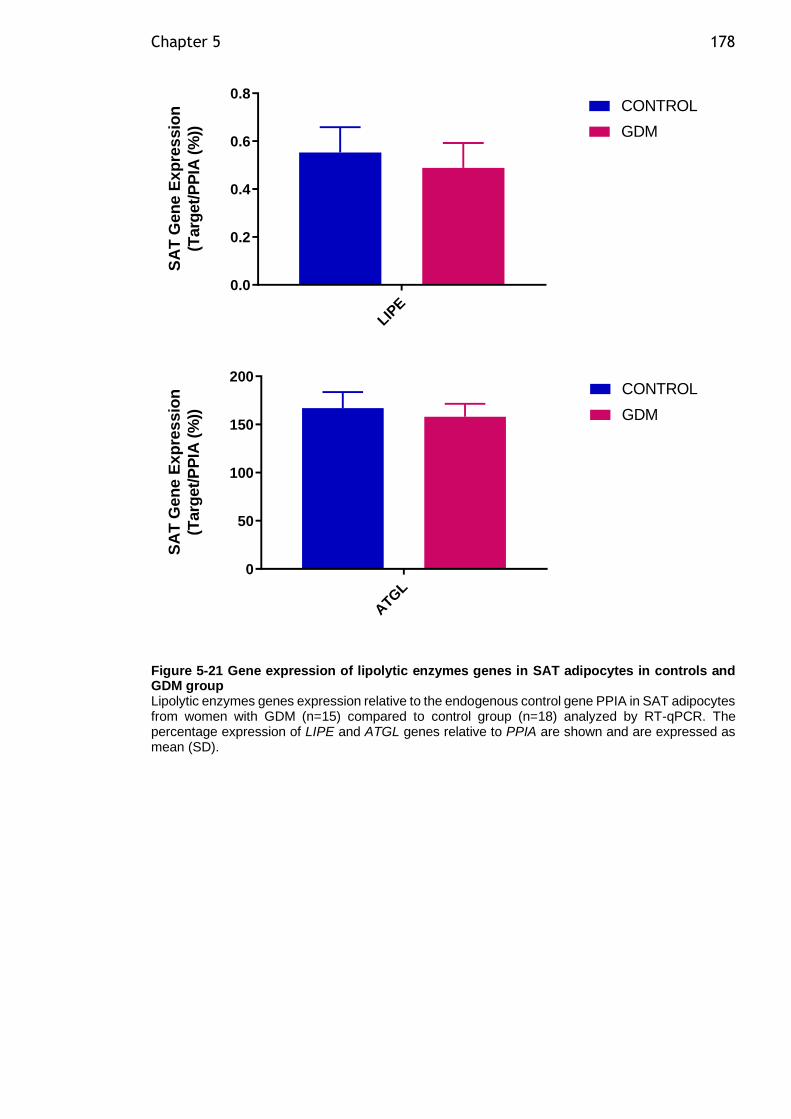
Chapter 5 178
LIPE
0.0
0.2
0.4
0.6
0.8
SA
T G
en
e E
xp
res
sio
n
(Targ
et/
PP
IA (
%))
CONTROL
GDM
ATG
L
0
50
100
150
200
SA
T G
en
e E
xp
res
sio
n
(Targ
et/
PP
IA (
%))
CONTROL
GDM
Figure 5-21 Gene expression of lipolytic enzymes genes in SAT adipocytes in controls and GDM group Lipolytic enzymes genes expression relative to the endogenous control gene PPIA in SAT adipocytes from women with GDM (n=15) compared to control group (n=18) analyzed by RT-qPCR. The percentage expression of LIPE and ATGL genes relative to PPIA are shown and are expressed as mean (SD).
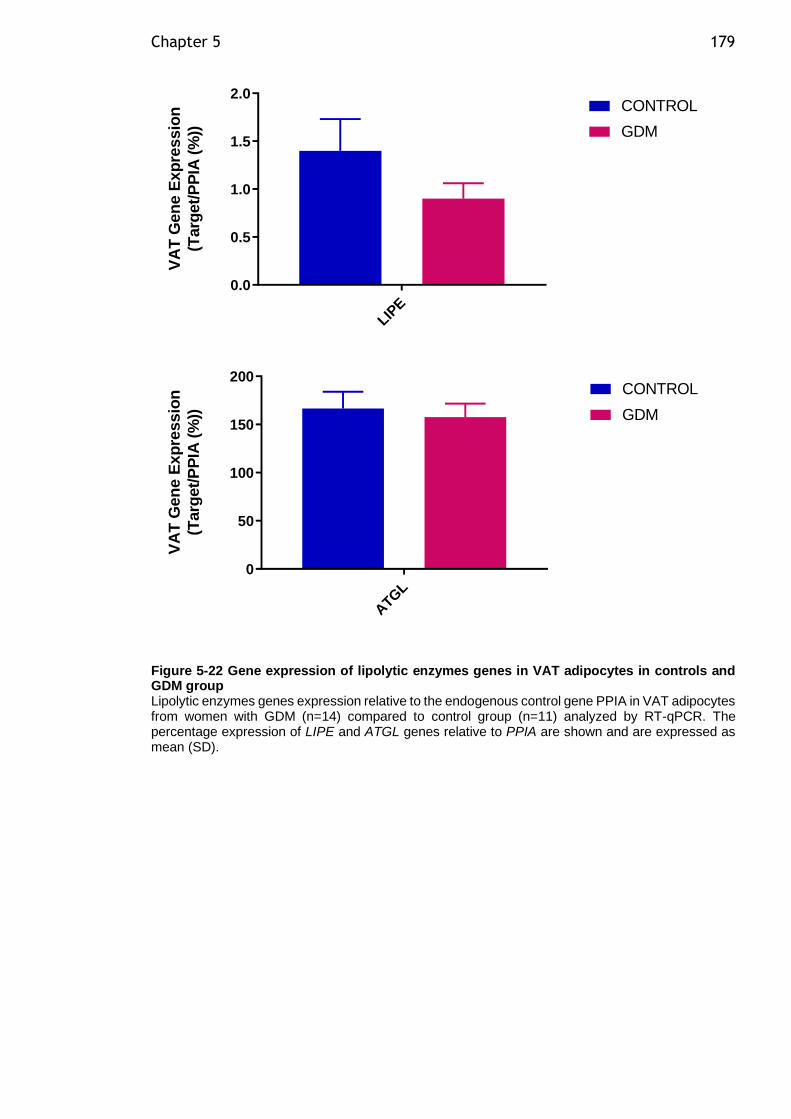
Chapter 5 179
LIPE
0.0
0.5
1.0
1.5
2.0
VA
T G
en
e E
xp
ressio
n
(Targ
et/
PP
IA (
%))
CONTROL
GDM
ATG
L
0
50
100
150
200
VA
T G
en
e E
xp
ressio
n
(Targ
et/
PP
IA (
%))
CONTROL
GDM
Figure 5-22 Gene expression of lipolytic enzymes genes in VAT adipocytes in controls and GDM group Lipolytic enzymes genes expression relative to the endogenous control gene PPIA in VAT adipocytes from women with GDM (n=14) compared to control group (n=11) analyzed by RT-qPCR. The percentage expression of LIPE and ATGL genes relative to PPIA are shown and are expressed as mean (SD).
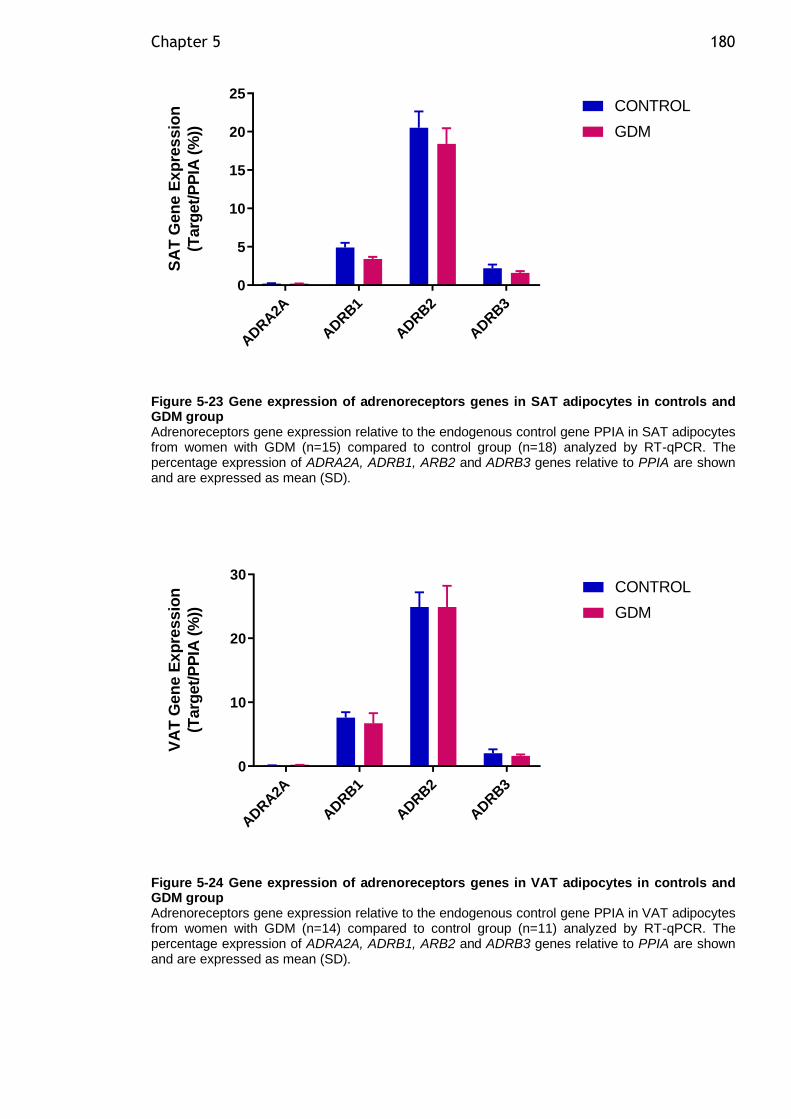
Chapter 5 180
ADRA2A
ADRB1
ADRB2
ADRB3
0
5
10
15
20
25
SA
T G
en
e E
xp
res
sio
n
(Targ
et/
PP
IA (
%))
CONTROL
GDM
Figure 5-23 Gene expression of adrenoreceptors genes in SAT adipocytes in controls and GDM group Adrenoreceptors gene expression relative to the endogenous control gene PPIA in SAT adipocytes from women with GDM (n=15) compared to control group (n=18) analyzed by RT-qPCR. The percentage expression of ADRA2A, ADRB1, ARB2 and ADRB3 genes relative to PPIA are shown and are expressed as mean (SD).
ADRA2A
ADRB1
ADRB2
ADRB3
0
10
20
30
VA
T G
en
e E
xp
ressio
n
(Targ
et/
PP
IA (
%))
CONTROL
GDM
Figure 5-24 Gene expression of adrenoreceptors genes in VAT adipocytes in controls and GDM group Adrenoreceptors gene expression relative to the endogenous control gene PPIA in VAT adipocytes from women with GDM (n=14) compared to control group (n=11) analyzed by RT-qPCR. The percentage expression of ADRA2A, ADRB1, ARB2 and ADRB3 genes relative to PPIA are shown and are expressed as mean (SD).
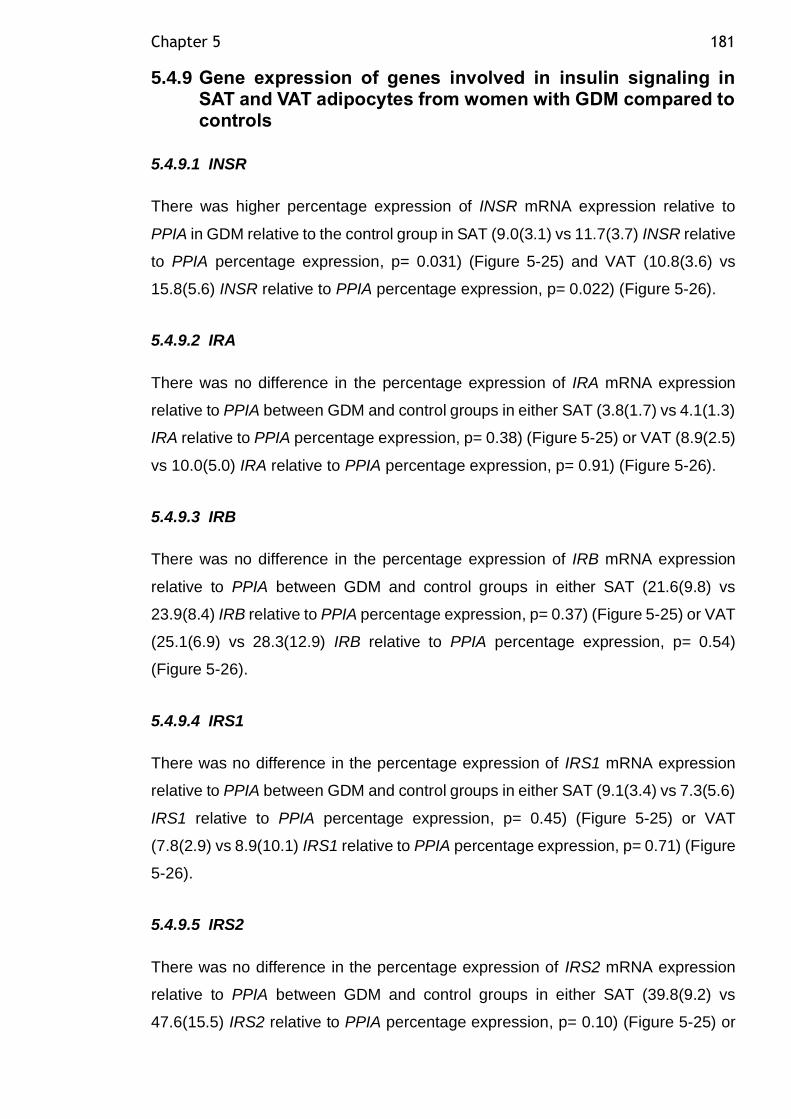
Chapter 5 181
5.4.9 Gene expression of genes involved in insulin signaling in SAT and VAT adipocytes from women with GDM compared to controls
5.4.9.1 INSR
There was higher percentage expression of INSR mRNA expression relative to
PPIA in GDM relative to the control group in SAT (9.0(3.1) vs 11.7(3.7) INSR relative
to PPIA percentage expression, p= 0.031) (Figure 5-25) and VAT (10.8(3.6) vs
15.8(5.6) INSR relative to PPIA percentage expression, p= 0.022) (Figure 5-26).
5.4.9.2 IRA
There was no difference in the percentage expression of IRA mRNA expression
relative to PPIA between GDM and control groups in either SAT (3.8(1.7) vs 4.1(1.3)
IRA relative to PPIA percentage expression, p= 0.38) (Figure 5-25) or VAT (8.9(2.5)
vs 10.0(5.0) IRA relative to PPIA percentage expression, p= 0.91) (Figure 5-26).
5.4.9.3 IRB
There was no difference in the percentage expression of IRB mRNA expression
relative to PPIA between GDM and control groups in either SAT (21.6(9.8) vs
23.9(8.4) IRB relative to PPIA percentage expression, p= 0.37) (Figure 5-25) or VAT
(25.1(6.9) vs 28.3(12.9) IRB relative to PPIA percentage expression, p= 0.54)
(Figure 5-26).
5.4.9.4 IRS1
There was no difference in the percentage expression of IRS1 mRNA expression
relative to PPIA between GDM and control groups in either SAT (9.1(3.4) vs 7.3(5.6)
IRS1 relative to PPIA percentage expression, p= 0.45) (Figure 5-25) or VAT
(7.8(2.9) vs 8.9(10.1) IRS1 relative to PPIA percentage expression, p= 0.71) (Figure
5-26).
5.4.9.5 IRS2
There was no difference in the percentage expression of IRS2 mRNA expression
relative to PPIA between GDM and control groups in either SAT (39.8(9.2) vs
47.6(15.5) IRS2 relative to PPIA percentage expression, p= 0.10) (Figure 5-25) or
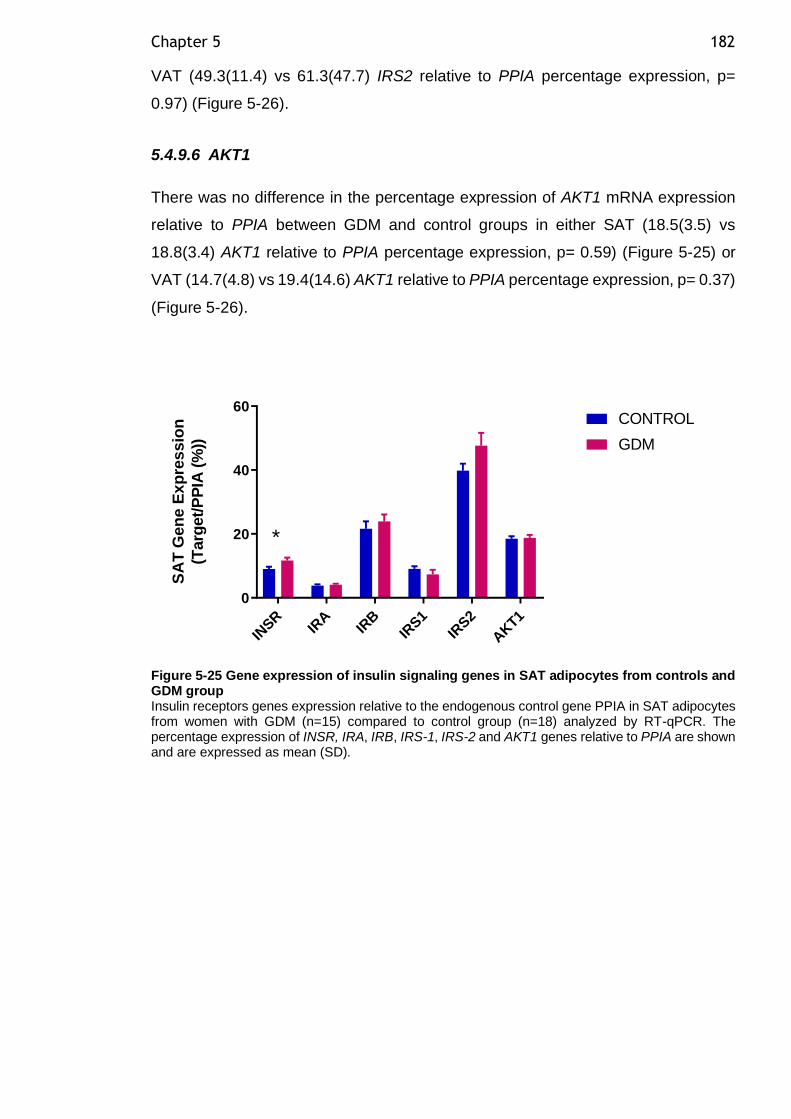
Chapter 5 182
VAT (49.3(11.4) vs 61.3(47.7) IRS2 relative to PPIA percentage expression, p=
0.97) (Figure 5-26).
5.4.9.6 AKT1
There was no difference in the percentage expression of AKT1 mRNA expression
relative to PPIA between GDM and control groups in either SAT (18.5(3.5) vs
18.8(3.4) AKT1 relative to PPIA percentage expression, p= 0.59) (Figure 5-25) or
VAT (14.7(4.8) vs 19.4(14.6) AKT1 relative to PPIA percentage expression, p= 0.37)
(Figure 5-26).
IN
SRIR
AIR
BIR
S1
IRS2
AKT1
0
20
40
60
SA
T G
en
e E
xp
res
sio
n
(Targ
et/
PP
IA (
%))
CONTROL
GDM
*
Figure 5-25 Gene expression of insulin signaling genes in SAT adipocytes from controls and GDM group Insulin receptors genes expression relative to the endogenous control gene PPIA in SAT adipocytes from women with GDM (n=15) compared to control group (n=18) analyzed by RT-qPCR. The percentage expression of INSR, IRA, IRB, IRS-1, IRS-2 and AKT1 genes relative to PPIA are shown and are expressed as mean (SD).
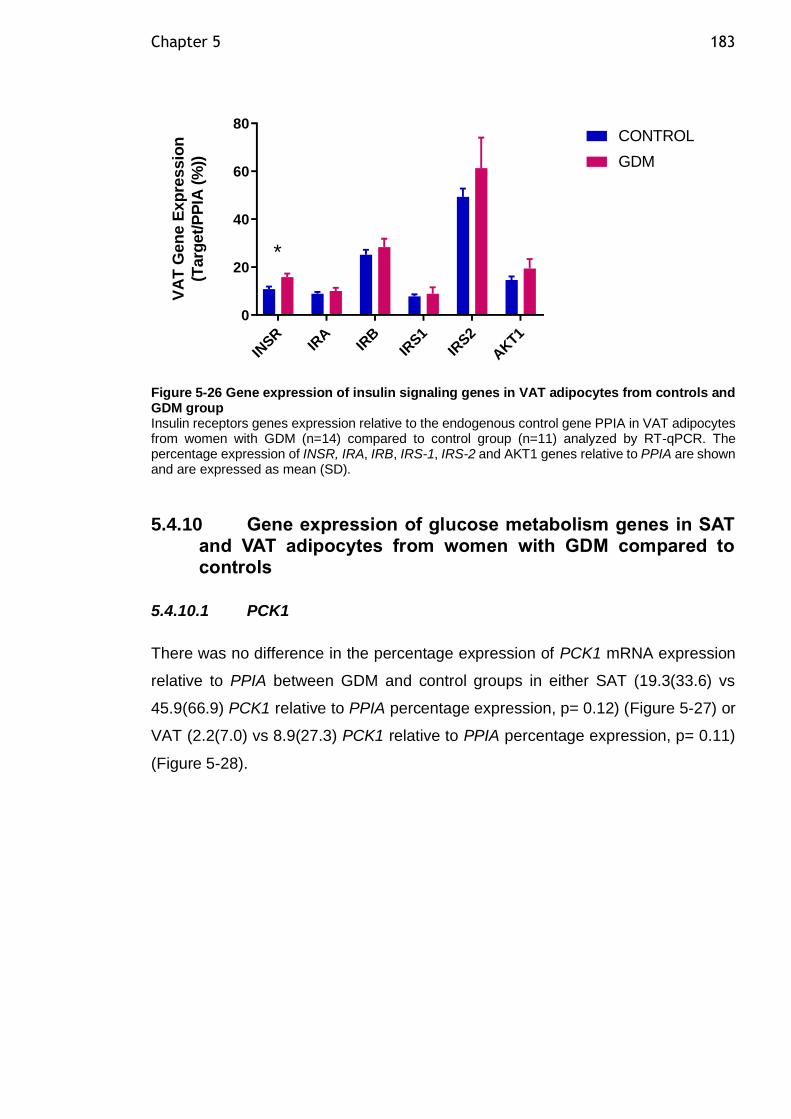
Chapter 5 183
IN
SRIR
AIR
BIR
S1
IRS2
AKT1
0
20
40
60
80
VA
T G
en
e E
xp
ressio
n
(Targ
et/
PP
IA (
%))
CONTROL
GDM
*
Figure 5-26 Gene expression of insulin signaling genes in VAT adipocytes from controls and GDM group Insulin receptors genes expression relative to the endogenous control gene PPIA in VAT adipocytes from women with GDM (n=14) compared to control group (n=11) analyzed by RT-qPCR. The percentage expression of INSR, IRA, IRB, IRS-1, IRS-2 and AKT1 genes relative to PPIA are shown and are expressed as mean (SD).
5.4.10 Gene expression of glucose metabolism genes in SAT and VAT adipocytes from women with GDM compared to controls
5.4.10.1 PCK1
There was no difference in the percentage expression of PCK1 mRNA expression
relative to PPIA between GDM and control groups in either SAT (19.3(33.6) vs
45.9(66.9) PCK1 relative to PPIA percentage expression, p= 0.12) (Figure 5-27) or
VAT (2.2(7.0) vs 8.9(27.3) PCK1 relative to PPIA percentage expression, p= 0.11)
(Figure 5-28).
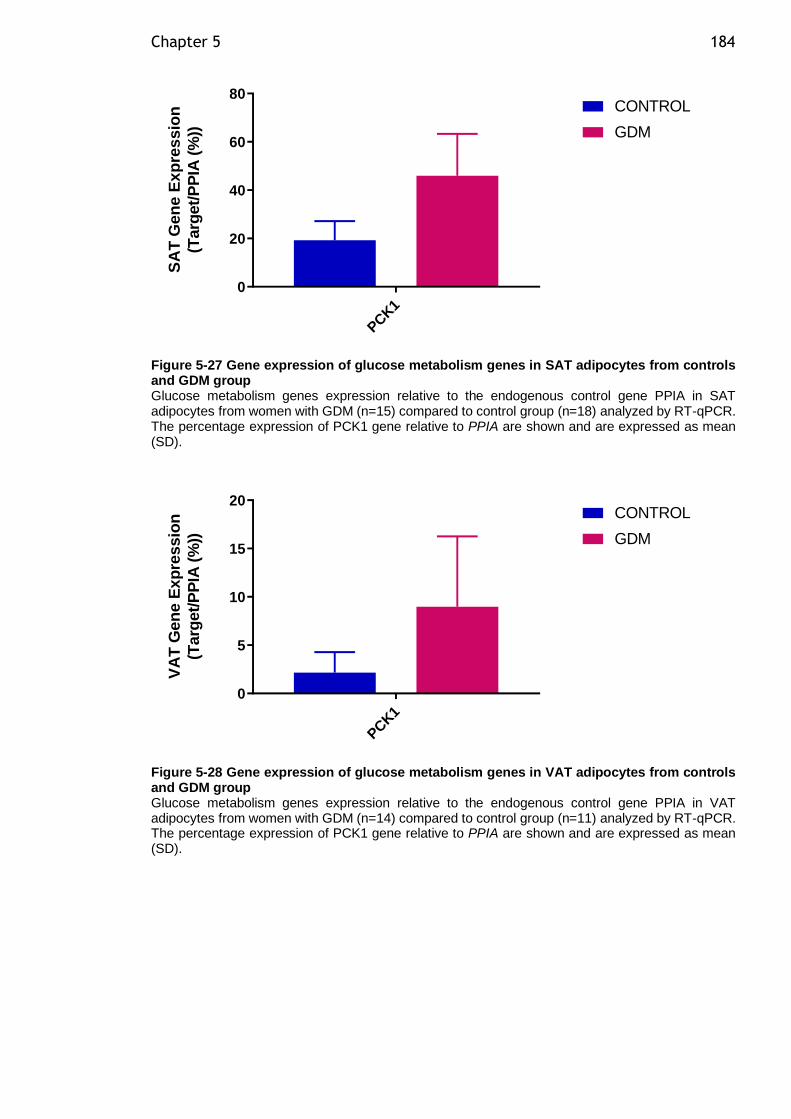
Chapter 5 184
PCK1
0
20
40
60
80
SA
T G
en
e E
xp
res
sio
n
(Targ
et/
PP
IA (
%))
CONTROL
GDM
Figure 5-27 Gene expression of glucose metabolism genes in SAT adipocytes from controls and GDM group Glucose metabolism genes expression relative to the endogenous control gene PPIA in SAT adipocytes from women with GDM (n=15) compared to control group (n=18) analyzed by RT-qPCR. The percentage expression of PCK1 gene relative to PPIA are shown and are expressed as mean (SD).
PCK1
0
5
10
15
20
VA
T G
en
e E
xp
ressio
n
(Targ
et/
PP
IA (
%))
CONTROL
GDM
Figure 5-28 Gene expression of glucose metabolism genes in VAT adipocytes from controls and GDM group Glucose metabolism genes expression relative to the endogenous control gene PPIA in VAT adipocytes from women with GDM (n=14) compared to control group (n=11) analyzed by RT-qPCR. The percentage expression of PCK1 gene relative to PPIA are shown and are expressed as mean (SD).
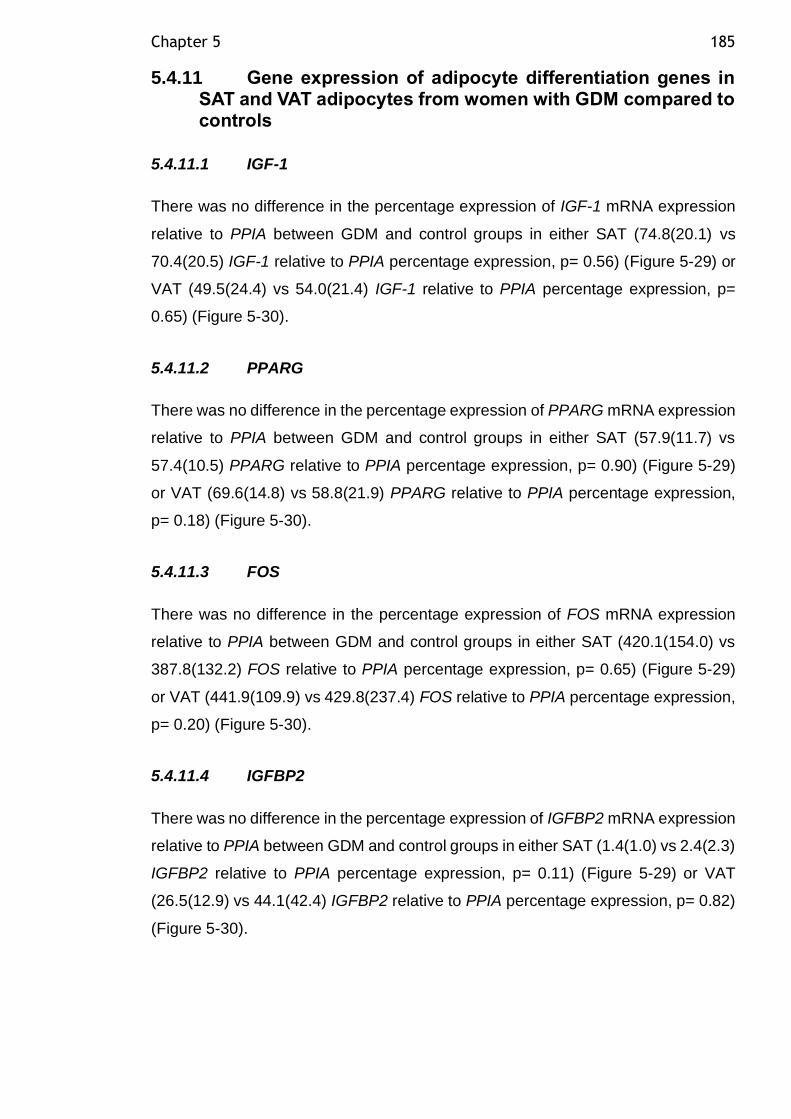
Chapter 5 185
5.4.11 Gene expression of adipocyte differentiation genes in SAT and VAT adipocytes from women with GDM compared to controls
5.4.11.1 IGF-1
There was no difference in the percentage expression of IGF-1 mRNA expression
relative to PPIA between GDM and control groups in either SAT (74.8(20.1) vs
70.4(20.5) IGF-1 relative to PPIA percentage expression, p= 0.56) (Figure 5-29) or
VAT (49.5(24.4) vs 54.0(21.4) IGF-1 relative to PPIA percentage expression, p=
0.65) (Figure 5-30).
5.4.11.2 PPARG
There was no difference in the percentage expression of PPARG mRNA expression
relative to PPIA between GDM and control groups in either SAT (57.9(11.7) vs
57.4(10.5) PPARG relative to PPIA percentage expression, p= 0.90) (Figure 5-29)
or VAT (69.6(14.8) vs 58.8(21.9) PPARG relative to PPIA percentage expression,
p= 0.18) (Figure 5-30).
5.4.11.3 FOS
There was no difference in the percentage expression of FOS mRNA expression
relative to PPIA between GDM and control groups in either SAT (420.1(154.0) vs
387.8(132.2) FOS relative to PPIA percentage expression, p= 0.65) (Figure 5-29)
or VAT (441.9(109.9) vs 429.8(237.4) FOS relative to PPIA percentage expression,
p= 0.20) (Figure 5-30).
5.4.11.4 IGFBP2
There was no difference in the percentage expression of IGFBP2 mRNA expression
relative to PPIA between GDM and control groups in either SAT (1.4(1.0) vs 2.4(2.3)
IGFBP2 relative to PPIA percentage expression, p= 0.11) (Figure 5-29) or VAT
(26.5(12.9) vs 44.1(42.4) IGFBP2 relative to PPIA percentage expression, p= 0.82)
(Figure 5-30).
Chapter 5 186
5.4.11.5 IGFBP3
There was no difference in the percentage expression of IGFBP3 mRNA expression
relative to PPIA between GDM and control groups in either SAT (20.5(14.1) vs
38.8(38.2) IGFBP3 relative to PPIA percentage expression, p= 0.051) (Figure 5-29)
or VAT (56.4(34.8) vs 90.3(84.3) IGFBP3 relative to PPIA percentage expression,
p= 0.31) (Figure 5-30).
5.4.11.6 IGFBP5
There was no difference in the percentage expression of IGFBP5 mRNA expression
relative to PPIA between GDM and control groups in either SAT (86.4(50.5) vs
87.7(47.4) IGFBP5 relative to PPIA percentage expression, p= 0.91) (Figure 5-29)
or VAT (96.5(32.3) vs 123.1(77.1) IGFBP5 relative to PPIA percentage expression,
p= 0.55) (Figure 5-30).
5.4.11.7 CEBPB
There was no difference in the percentage expression of CEBPB mRNA expression
relative to PPIA between GDM and control groups in either SAT (60.1(30.1) vs
70.6(27.9) CEBPB relative to PPIA percentage expression, p= 0.17) (Figure 5-29)
or VAT (63.7(35.4) vs 104.9(86.7) CEBPB relative to PPIA percentage expression,
p= 0.24) (Figure 5-30).
5.4.11.8 MAPK8
There was no difference in the percentage expression of MAPK8 mRNA expression
relative to PPIA between GDM and control groups in either SAT (1.9(0.4) vs 1.9(0.5)
MAPK8 relative to PPIA percentage expression, p= 0.89) (Figure 5-29) or VAT
(2.4(0.5) vs 2.3(0.7) MAPK8 relative to PPIA percentage expression, p= 0.61)
(Figure 5-30).
5.4.11.9 TGFβ1
There was no difference in the percentage expression of TGFβ1 mRNA expression
relative to PPIA between GDM and control groups in either SAT (1.4(0.7) vs 1.6(0.7)
TGFβ1 relative to PPIA percentage expression, p= 0.45) (Figure 5-29) or VAT
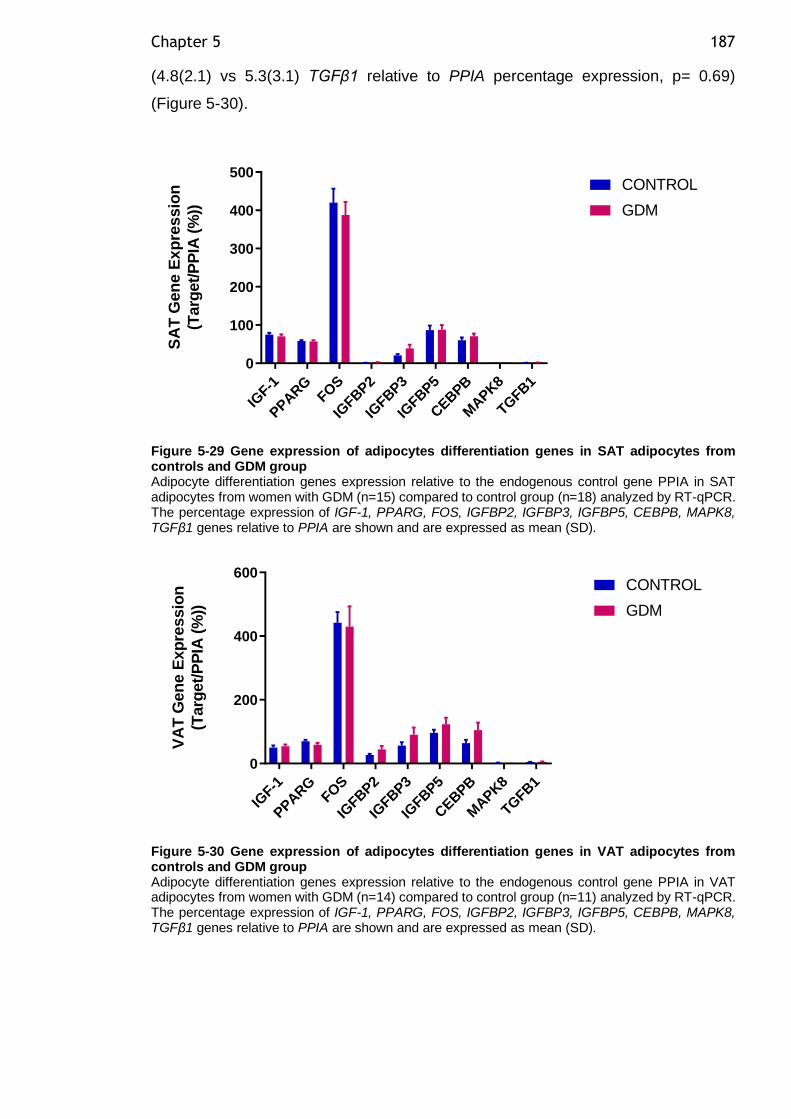
Chapter 5 187
(4.8(2.1) vs 5.3(3.1) TGFβ1 relative to PPIA percentage expression, p= 0.69)
(Figure 5-30).
IGF-1
PPARG
FOS
IGFB
P2
IGFB
P3
IGFB
P5
CEBPB
MAPK8
TGFB
1
0
100
200
300
400
500S
AT
Gen
e E
xp
res
sio
n
(Targ
et/
PP
IA (
%))
CONTROL
GDM
Figure 5-29 Gene expression of adipocytes differentiation genes in SAT adipocytes from controls and GDM group Adipocyte differentiation genes expression relative to the endogenous control gene PPIA in SAT adipocytes from women with GDM (n=15) compared to control group (n=18) analyzed by RT-qPCR. The percentage expression of IGF-1, PPARG, FOS, IGFBP2, IGFBP3, IGFBP5, CEBPB, MAPK8, TGFβ1 genes relative to PPIA are shown and are expressed as mean (SD).
IGF-1
PPARG
FOS
IGFB
P2
IGFB
P3
IGFB
P5
CEBPB
MAPK8
TGFB
1
0
200
400
600
VA
T G
en
e E
xp
ressio
n
(Targ
et/
PP
IA (
%))
CONTROL
GDM
Figure 5-30 Gene expression of adipocytes differentiation genes in VAT adipocytes from controls and GDM group Adipocyte differentiation genes expression relative to the endogenous control gene PPIA in VAT adipocytes from women with GDM (n=14) compared to control group (n=11) analyzed by RT-qPCR. The percentage expression of IGF-1, PPARG, FOS, IGFBP2, IGFBP3, IGFBP5, CEBPB, MAPK8, TGFβ1 genes relative to PPIA are shown and are expressed as mean (SD).
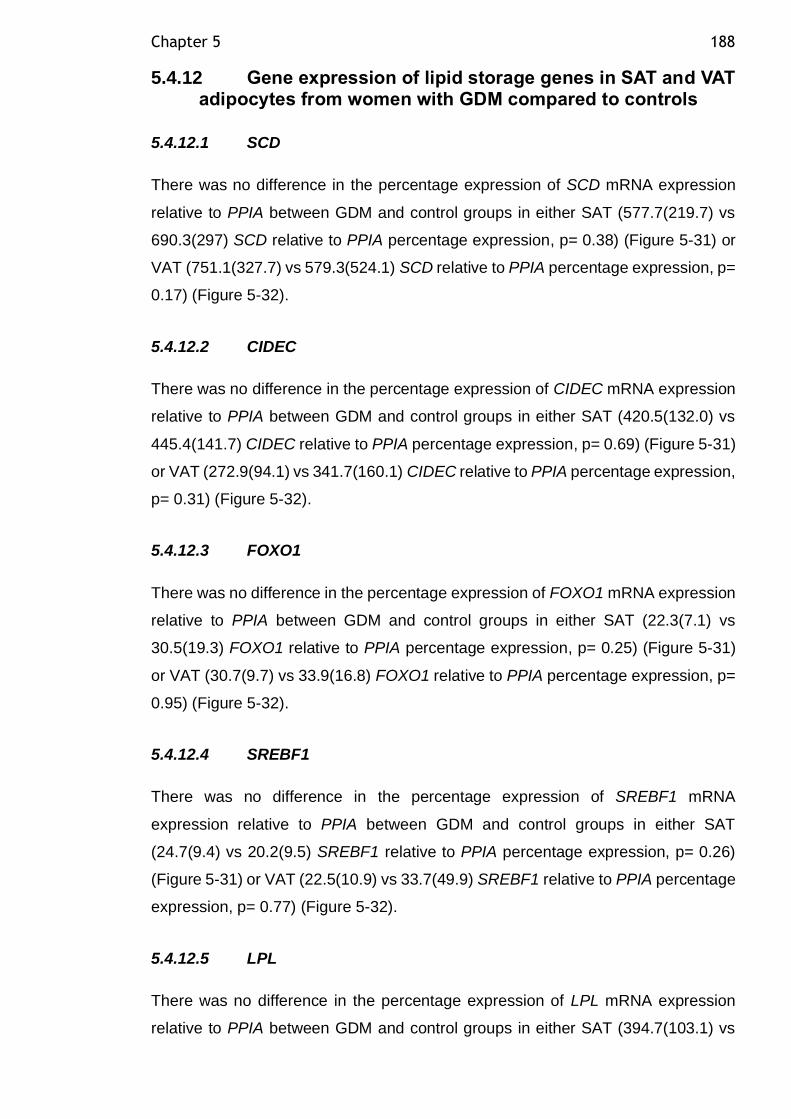
Chapter 5 188
5.4.12 Gene expression of lipid storage genes in SAT and VAT adipocytes from women with GDM compared to controls
5.4.12.1 SCD
There was no difference in the percentage expression of SCD mRNA expression
relative to PPIA between GDM and control groups in either SAT (577.7(219.7) vs
690.3(297) SCD relative to PPIA percentage expression, p= 0.38) (Figure 5-31) or
VAT (751.1(327.7) vs 579.3(524.1) SCD relative to PPIA percentage expression, p=
0.17) (Figure 5-32).
5.4.12.2 CIDEC
There was no difference in the percentage expression of CIDEC mRNA expression
relative to PPIA between GDM and control groups in either SAT (420.5(132.0) vs
445.4(141.7) CIDEC relative to PPIA percentage expression, p= 0.69) (Figure 5-31)
or VAT (272.9(94.1) vs 341.7(160.1) CIDEC relative to PPIA percentage expression,
p= 0.31) (Figure 5-32).
5.4.12.3 FOXO1
There was no difference in the percentage expression of FOXO1 mRNA expression
relative to PPIA between GDM and control groups in either SAT (22.3(7.1) vs
30.5(19.3) FOXO1 relative to PPIA percentage expression, p= 0.25) (Figure 5-31)
or VAT (30.7(9.7) vs 33.9(16.8) FOXO1 relative to PPIA percentage expression, p=
0.95) (Figure 5-32).
5.4.12.4 SREBF1
There was no difference in the percentage expression of SREBF1 mRNA
expression relative to PPIA between GDM and control groups in either SAT
(24.7(9.4) vs 20.2(9.5) SREBF1 relative to PPIA percentage expression, p= 0.26)
(Figure 5-31) or VAT (22.5(10.9) vs 33.7(49.9) SREBF1 relative to PPIA percentage
expression, p= 0.77) (Figure 5-32).
5.4.12.5 LPL
There was no difference in the percentage expression of LPL mRNA expression
relative to PPIA between GDM and control groups in either SAT (394.7(103.1) vs
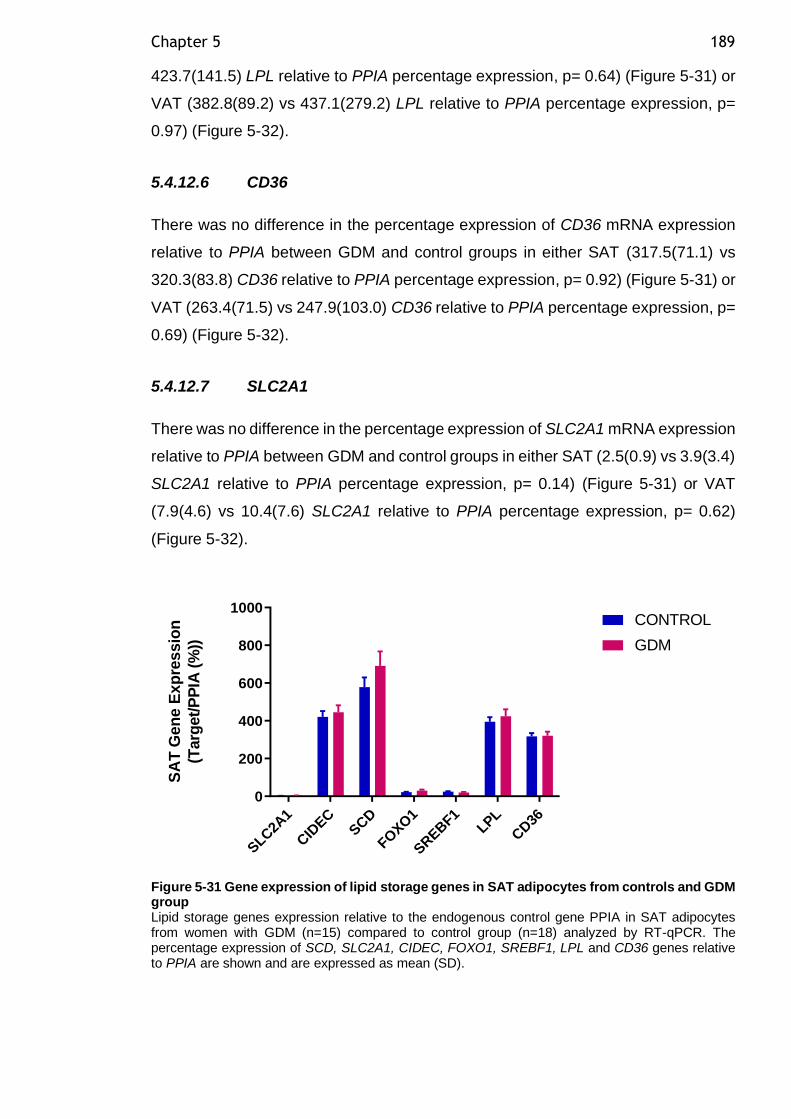
Chapter 5 189
423.7(141.5) LPL relative to PPIA percentage expression, p= 0.64) (Figure 5-31) or
VAT (382.8(89.2) vs 437.1(279.2) LPL relative to PPIA percentage expression, p=
0.97) (Figure 5-32).
5.4.12.6 CD36
There was no difference in the percentage expression of CD36 mRNA expression
relative to PPIA between GDM and control groups in either SAT (317.5(71.1) vs
320.3(83.8) CD36 relative to PPIA percentage expression, p= 0.92) (Figure 5-31) or
VAT (263.4(71.5) vs 247.9(103.0) CD36 relative to PPIA percentage expression, p=
0.69) (Figure 5-32).
5.4.12.7 SLC2A1
There was no difference in the percentage expression of SLC2A1 mRNA expression
relative to PPIA between GDM and control groups in either SAT (2.5(0.9) vs 3.9(3.4)
SLC2A1 relative to PPIA percentage expression, p= 0.14) (Figure 5-31) or VAT
(7.9(4.6) vs 10.4(7.6) SLC2A1 relative to PPIA percentage expression, p= 0.62)
(Figure 5-32).
SLC
2A1
CID
ECSCD
FOXO
1
SREBF1
LPL
CD36
0
200
400
600
800
1000
SA
T G
en
e E
xp
res
sio
n
(Targ
et/
PP
IA (
%)) GDM
CONTROL
Figure 5-31 Gene expression of lipid storage genes in SAT adipocytes from controls and GDM group Lipid storage genes expression relative to the endogenous control gene PPIA in SAT adipocytes from women with GDM (n=15) compared to control group (n=18) analyzed by RT-qPCR. The percentage expression of SCD, SLC2A1, CIDEC, FOXO1, SREBF1, LPL and CD36 genes relative to PPIA are shown and are expressed as mean (SD).
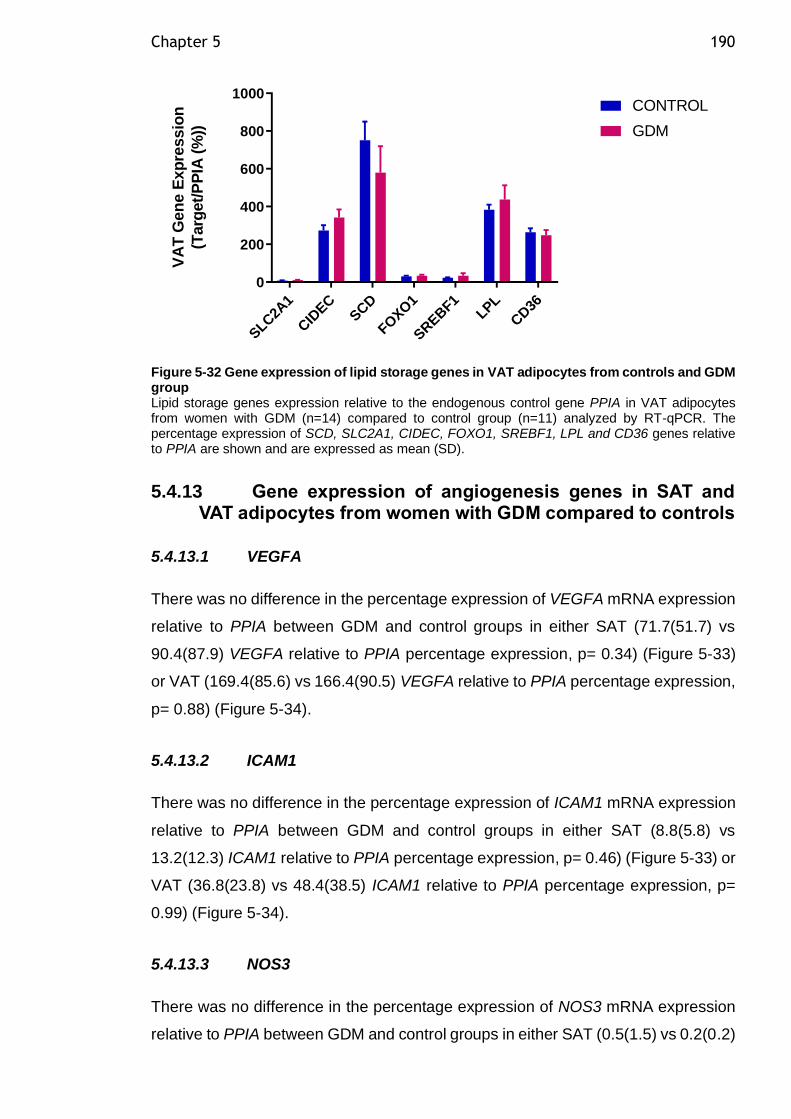
Chapter 5 190
SLC
2A1
CID
ECSCD
FOXO
1
SREBF1
LPL
CD36
0
200
400
600
800
1000
VA
T G
en
e E
xp
ressio
n
(Targ
et/
PP
IA (
%))
CONTROL
GDM
Figure 5-32 Gene expression of lipid storage genes in VAT adipocytes from controls and GDM group Lipid storage genes expression relative to the endogenous control gene PPIA in VAT adipocytes from women with GDM (n=14) compared to control group (n=11) analyzed by RT-qPCR. The percentage expression of SCD, SLC2A1, CIDEC, FOXO1, SREBF1, LPL and CD36 genes relative to PPIA are shown and are expressed as mean (SD).
5.4.13 Gene expression of angiogenesis genes in SAT and VAT adipocytes from women with GDM compared to controls
5.4.13.1 VEGFA
There was no difference in the percentage expression of VEGFA mRNA expression
relative to PPIA between GDM and control groups in either SAT (71.7(51.7) vs
90.4(87.9) VEGFA relative to PPIA percentage expression, p= 0.34) (Figure 5-33)
or VAT (169.4(85.6) vs 166.4(90.5) VEGFA relative to PPIA percentage expression,
p= 0.88) (Figure 5-34).
5.4.13.2 ICAM1
There was no difference in the percentage expression of ICAM1 mRNA expression
relative to PPIA between GDM and control groups in either SAT (8.8(5.8) vs
13.2(12.3) ICAM1 relative to PPIA percentage expression, p= 0.46) (Figure 5-33) or
VAT (36.8(23.8) vs 48.4(38.5) ICAM1 relative to PPIA percentage expression, p=
0.99) (Figure 5-34).
5.4.13.3 NOS3
There was no difference in the percentage expression of NOS3 mRNA expression
relative to PPIA between GDM and control groups in either SAT (0.5(1.5) vs 0.2(0.2)
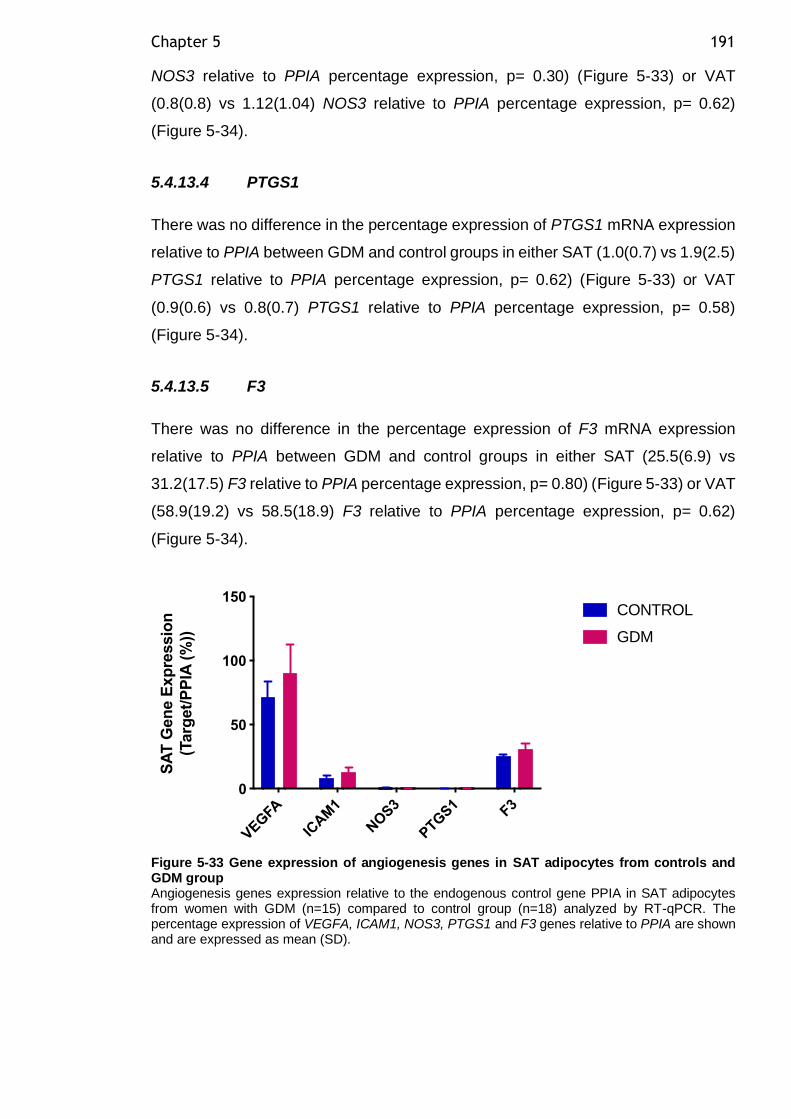
Chapter 5 191
NOS3 relative to PPIA percentage expression, p= 0.30) (Figure 5-33) or VAT
(0.8(0.8) vs 1.12(1.04) NOS3 relative to PPIA percentage expression, p= 0.62)
(Figure 5-34).
5.4.13.4 PTGS1
There was no difference in the percentage expression of PTGS1 mRNA expression
relative to PPIA between GDM and control groups in either SAT (1.0(0.7) vs 1.9(2.5)
PTGS1 relative to PPIA percentage expression, p= 0.62) (Figure 5-33) or VAT
(0.9(0.6) vs 0.8(0.7) PTGS1 relative to PPIA percentage expression, p= 0.58)
(Figure 5-34).
5.4.13.5 F3
There was no difference in the percentage expression of F3 mRNA expression
relative to PPIA between GDM and control groups in either SAT (25.5(6.9) vs
31.2(17.5) F3 relative to PPIA percentage expression, p= 0.80) (Figure 5-33) or VAT
(58.9(19.2) vs 58.5(18.9) F3 relative to PPIA percentage expression, p= 0.62)
(Figure 5-34).
Figure 5-33 Gene expression of angiogenesis genes in SAT adipocytes from controls and GDM group Angiogenesis genes expression relative to the endogenous control gene PPIA in SAT adipocytes from women with GDM (n=15) compared to control group (n=18) analyzed by RT-qPCR. The percentage expression of VEGFA, ICAM1, NOS3, PTGS1 and F3 genes relative to PPIA are shown and are expressed as mean (SD).
VEGFA
ICAM
1
NOS3
PTG
S1 F3
0
50
100
150
SA
T G
en
e E
xp
ressio
n
(Targ
et/
PP
IA (
%))
CONTROL
GDM
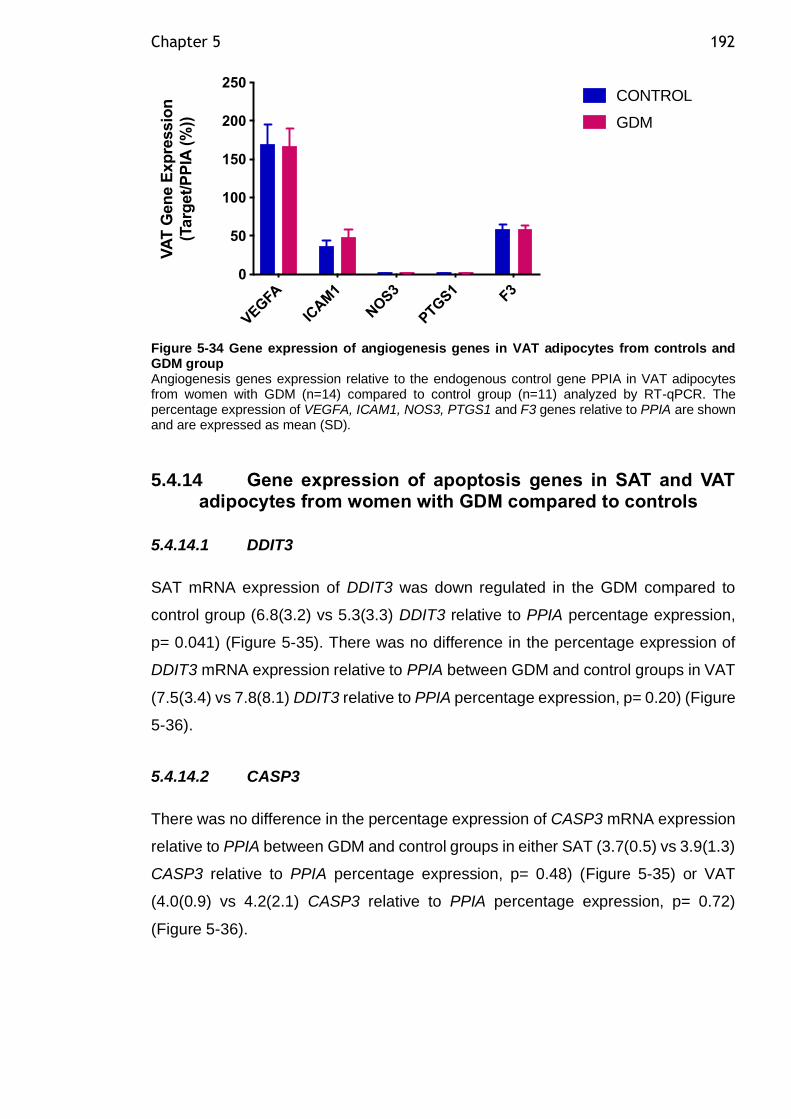
Chapter 5 192
Figure 5-34 Gene expression of angiogenesis genes in VAT adipocytes from controls and GDM group Angiogenesis genes expression relative to the endogenous control gene PPIA in VAT adipocytes from women with GDM (n=14) compared to control group (n=11) analyzed by RT-qPCR. The percentage expression of VEGFA, ICAM1, NOS3, PTGS1 and F3 genes relative to PPIA are shown and are expressed as mean (SD).
5.4.14 Gene expression of apoptosis genes in SAT and VAT adipocytes from women with GDM compared to controls
5.4.14.1 DDIT3
SAT mRNA expression of DDIT3 was down regulated in the GDM compared to
control group (6.8(3.2) vs 5.3(3.3) DDIT3 relative to PPIA percentage expression,
p= 0.041) (Figure 5-35). There was no difference in the percentage expression of
DDIT3 mRNA expression relative to PPIA between GDM and control groups in VAT
(7.5(3.4) vs 7.8(8.1) DDIT3 relative to PPIA percentage expression, p= 0.20) (Figure
5-36).
5.4.14.2 CASP3
There was no difference in the percentage expression of CASP3 mRNA expression
relative to PPIA between GDM and control groups in either SAT (3.7(0.5) vs 3.9(1.3)
CASP3 relative to PPIA percentage expression, p= 0.48) (Figure 5-35) or VAT
(4.0(0.9) vs 4.2(2.1) CASP3 relative to PPIA percentage expression, p= 0.72)
(Figure 5-36).
VEGFA
ICAM
1
NOS3
PTG
S1 F3
0
50
100
150
200
250
VA
T G
en
e E
xp
ressio
n
(Targ
et/
PP
IA (
%))
CONTROL
GDM
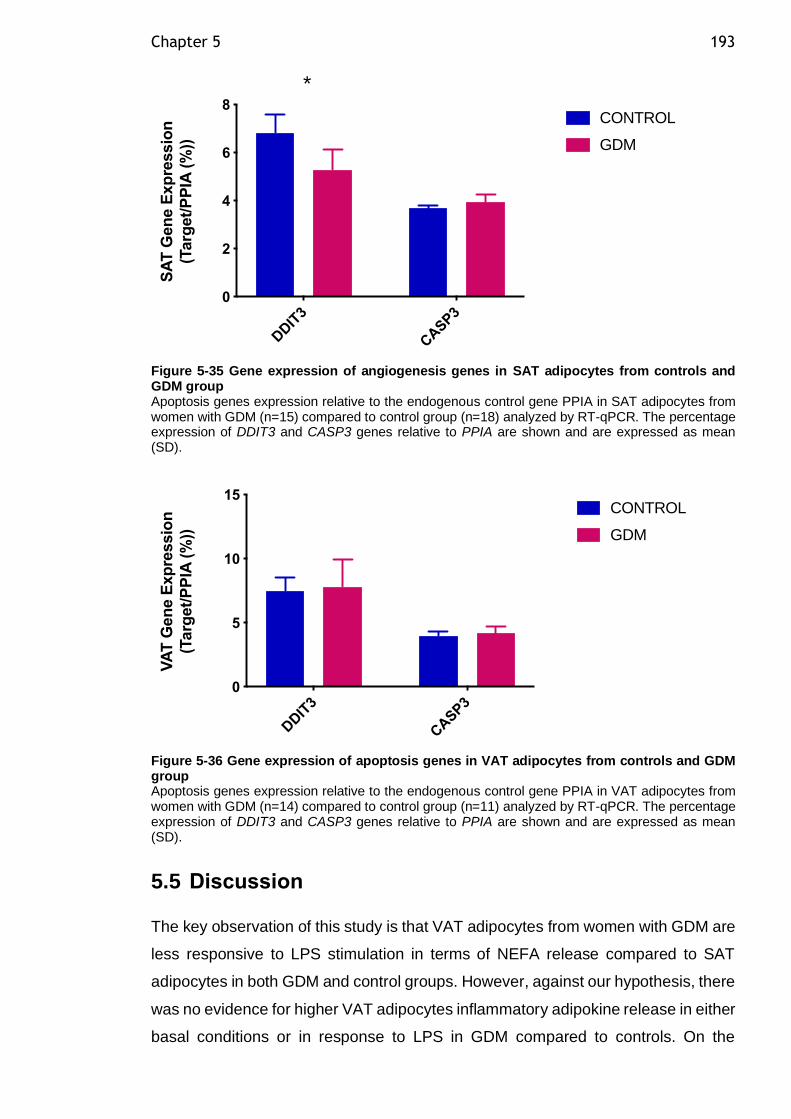
Chapter 5 193
Figure 5-35 Gene expression of angiogenesis genes in SAT adipocytes from controls and GDM group Apoptosis genes expression relative to the endogenous control gene PPIA in SAT adipocytes from women with GDM (n=15) compared to control group (n=18) analyzed by RT-qPCR. The percentage expression of DDIT3 and CASP3 genes relative to PPIA are shown and are expressed as mean (SD).
Figure 5-36 Gene expression of apoptosis genes in VAT adipocytes from controls and GDM group Apoptosis genes expression relative to the endogenous control gene PPIA in VAT adipocytes from women with GDM (n=14) compared to control group (n=11) analyzed by RT-qPCR. The percentage expression of DDIT3 and CASP3 genes relative to PPIA are shown and are expressed as mean (SD).
5.5 Discussion
The key observation of this study is that VAT adipocytes from women with GDM are
less responsive to LPS stimulation in terms of NEFA release compared to SAT
adipocytes in both GDM and control groups. However, against our hypothesis, there
was no evidence for higher VAT adipocytes inflammatory adipokine release in either
basal conditions or in response to LPS in GDM compared to controls. On the
DDIT
3
CASP3
0
2
4
6
8
SA
T G
en
e E
xp
ressio
n
(Targ
et/
PP
IA (
%))
CONTROL
GDM
*
DDIT
3
CASP3
0
5
10
15
VA
T G
en
e E
xp
ressio
n
(Targ
et/
PP
IA (
%))
CONTROL
GDM
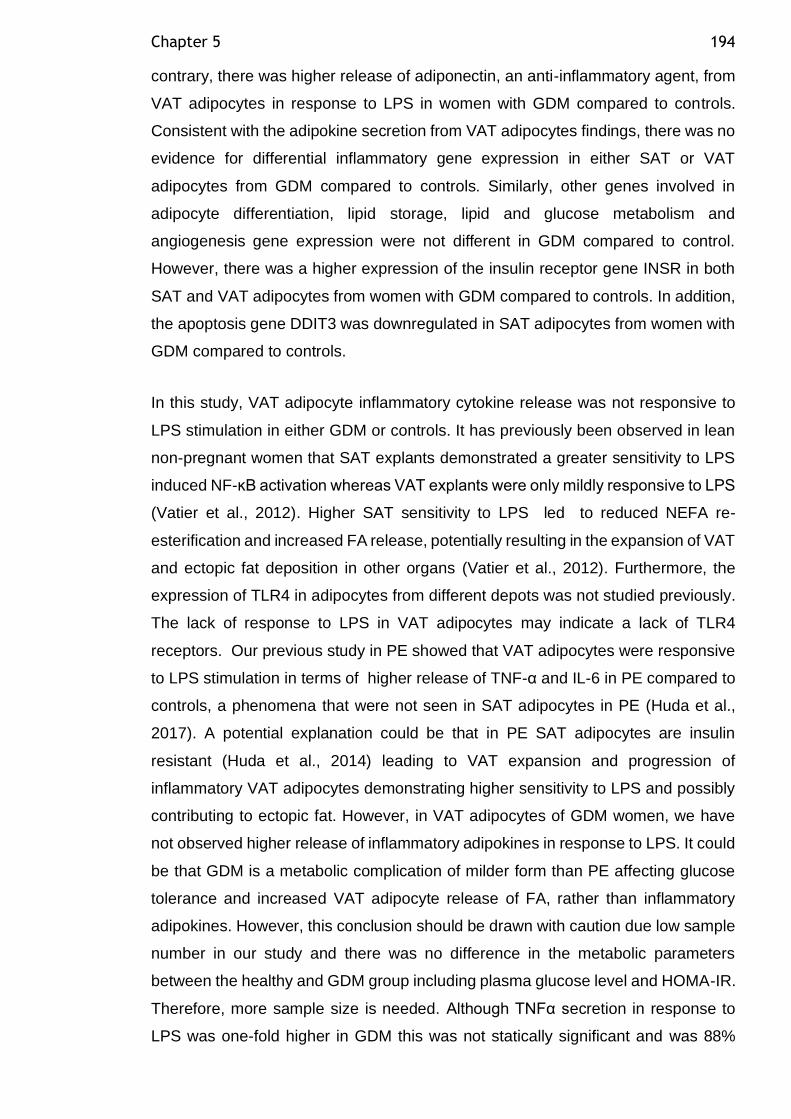
Chapter 5 194
contrary, there was higher release of adiponectin, an anti-inflammatory agent, from
VAT adipocytes in response to LPS in women with GDM compared to controls.
Consistent with the adipokine secretion from VAT adipocytes findings, there was no
evidence for differential inflammatory gene expression in either SAT or VAT
adipocytes from GDM compared to controls. Similarly, other genes involved in
adipocyte differentiation, lipid storage, lipid and glucose metabolism and
angiogenesis gene expression were not different in GDM compared to control.
However, there was a higher expression of the insulin receptor gene INSR in both
SAT and VAT adipocytes from women with GDM compared to controls. In addition,
the apoptosis gene DDIT3 was downregulated in SAT adipocytes from women with
GDM compared to controls.
In this study, VAT adipocyte inflammatory cytokine release was not responsive to
LPS stimulation in either GDM or controls. It has previously been observed in lean
non-pregnant women that SAT explants demonstrated a greater sensitivity to LPS
induced NF-ĸB activation whereas VAT explants were only mildly responsive to LPS
(Vatier et al., 2012). Higher SAT sensitivity to LPS led to reduced NEFA re-
esterification and increased FA release, potentially resulting in the expansion of VAT
and ectopic fat deposition in other organs (Vatier et al., 2012). Furthermore, the
expression of TLR4 in adipocytes from different depots was not studied previously.
The lack of response to LPS in VAT adipocytes may indicate a lack of TLR4
receptors. Our previous study in PE showed that VAT adipocytes were responsive
to LPS stimulation in terms of higher release of TNF-α and IL-6 in PE compared to
controls, a phenomena that were not seen in SAT adipocytes in PE (Huda et al.,
2017). A potential explanation could be that in PE SAT adipocytes are insulin
resistant (Huda et al., 2014) leading to VAT expansion and progression of
inflammatory VAT adipocytes demonstrating higher sensitivity to LPS and possibly
contributing to ectopic fat. However, in VAT adipocytes of GDM women, we have
not observed higher release of inflammatory adipokines in response to LPS. It could
be that GDM is a metabolic complication of milder form than PE affecting glucose
tolerance and increased VAT adipocyte release of FA, rather than inflammatory
adipokines. However, this conclusion should be drawn with caution due low sample
number in our study and there was no difference in the metabolic parameters
between the healthy and GDM group including plasma glucose level and HOMA-IR.
Therefore, more sample size is needed. Although TNFα secretion in response to
LPS was one-fold higher in GDM this was not statically significant and was 88%
Chapter 5 195
powered. However, there was higher release of adiponectin in response to LPS in
GDM compared to controls. This release was not correlated with adipocyte diameter
and does not suggest its related to hypertrophied VAT adipocytes. Probably, the
higher adiponectin release from VAT adipocytes in our cohort can be related to the
treatment of GDM with metformin or insulin. Metformin has anti-inflammatory
properties which are found to be exerted irrespective of the diabetes status
(Cameron et al., 2016). Furthermore, insulin, another GDM treatment, was found to
antagonize IL-6 signaling and it has anti-inflammatory effect on 3T3-L1 adipocytes
(Andersson et al., 2007). Adipokine release from VAT adipocytes was not correlated
with maternal BMI, HOMA-IR, adipocyte size and lipolytic function.
The lack of any differences in gene expression of inflammatory genes is consistent
with our observation of lack of differences in VAT adipocytes adipokine release of
women with GDM compared to controls. There was no difference in SAT and VAT
adipocytes inflammatory gene expression including TNF between GDM and
controls . Dong et al. (2018) have observed increased macrophage infiltration and
gene expression of TNFα from VAT explants in women with GDM compared to
pregnant healthy controls. Similarly, Rancourt et al. (2020) recently have shown
increased gene expression of the inflammatory markers TNFα and suppressor of
cytokine signaling (SOCS3) in VAT tissue from women with GDM compared to
healthy pregnant controls. However, the previous studies used whole adipose tissue
samples rather than isolated adipocytes which are confounded by the demonstrated
increased VAT macrophage infiltration in GDM. Contrary to our results, increased
gene expression of IL-6 was demonstrated previously in SAT tissue samples in
women with GDM compared to controls (Kleiblova et al., 2010).
Lipolytic activity in vitro and in vivo depends on the functional efficiency of lipolytic
and antilipolytic regulators of lipolysis such as lipases and adrenoreceptors.
Expression of the lipolysis enzymes ATGL and LIPE were not different between
GDM and controls in both SAT and VAT adipocytes. Similarly, gene expression of
lipolytic adrenoreceptors (ADRB1 and ADRB2) and the antilipolytic adrenoreceptor
(ADRA2A) were not different between GDM and controls in both SAT and VAT
adipocytes. However, although the gene expression of ADRB3 was one-fold lower
in VAT adipocytes in GDM compared to controls, this was not statically significant
with 78% power. These results did not explain the observed higher VAT adipocytes
basal lipolysis in GDM compared to controls (Chapter 4), however, other changes
Chapter 5 196
at protein or receptor activity level cannot be ruled out. Furthermore, other
underlying mechanisms such as the role perilipin1 and other lipid droplet associated
proteins have not explored in this project. Gene expression of perilipin1 was not
measured in this study and would be of interest to find out if its expression is related
to higher VAT adipocyte lipolysis in GDM compared to controls.
In the insulin signalling pathway, there was higher expression of the insulin receptor
gene INSR in SAT and VAT adipocytes in GDM compared to controls. Then, using
the method described by Huang et al. (2011) I designed probes to measure the two
insulin receptor isoforms IRA and IRB gene expression in order to have a better
understanding of whether there is a role for a specific isoform in the observed
increase in INSR expression in SAT and VAT adipocytes in GDM. There was no
difference in IRA and IRB gene expression in GDM compared to controls in both
SAT and VAT adipocytes. This is suggesting there is total increase in insulin
receptors in SAT and VAT adipocytes from women with GDM compared to controls
without specific increase in one of the insulin receptors isoforms. The higher
expression of insulin receptors in both SAT and VAT adipocytes in women with GDM
could be an adaptive mechanism to the accelerated insulin resistance especially for
IR-B. Furthermore, this possibly could explain why we did not find evidence for VAT
adipocytes insulin resistance (FCISI) in our cohort in the previous chapter. We also
cannot rule out the effect of GDM treatment among our treated cohort. The insulin
sensitizing effects of both metformin (Cameron et al., 2016) and insulin (Das, 2001)
could contribute to improvement of adipocyte insulin sensitivity and availability of
insulin receptors. Alterations in INSR splicing are associated with insulin resistance
and T2DM (Sesti et al., 1991). However, other studies did not show any significant
alterations in the IRA and IRB expression in various conditions of insulin resistance
(Moller et al., 1989). The role of the distinct insulin receptors isoforms in the function
of human adipose tissue is not yet fully understood. Gene expression of insulin
receptors substrates IRS1 and IRS2 was not different in either SAT or VAT
adipocytes in GDM compared to control group. However, we did not measure the
protein level of IRS1 which has been reported previously to be 43% lower in
abdominal SAT tissue from women with GDM compared to healthy pregnant
controls (Catalano et al., 2002).This reduction in IRS1 expression was suggested to
be responsible for the failure of insulin to suppress lipolysis as well as reduced
insulin-stimulated glucose transport in GDM in adipose tissue. Similarly, in isolated
SAT adipocytes from T2DM patients, IRS-1 protein expression is markedly reduced
Chapter 5 197
in SAT adipocytes, resulting in decreased IRS-1-associated PI3-kinase activity
(Rondinone et al., 1997).
Previous studies have shown that the roles of PCK1 in white adipose tissue in
glyceroneogenesis and re-esterification of FFA to generate TAG are vital for the
prevention of T2DM (Millward et al., 2010). Glyceroneogenesis is the de novo
synthesis of glycerol-3-phosphate from gluconeogenic precursors such as pyruvate,
alanine and lactate. Glyceroneogenesis is considered to be a shorter version of
gluconeogenesis that is induced by fasting in both liver and adipose tissue. Each
glycerol-3-phosphate product is used to esterify three fatty acyl-CoAs to form a
molecule of TAG as explained in the introduction Chapter. The function of adipose
tissue glyceroneogenesis is to regulate the release of FAs via a TAG/FA cycle within
the adipocyte. In the current study, PCK1 gene expression demonstrated a trend for
higher expression in SAT and VAT adipocytes from GDM compared to controls but
this was not a statically significant difference in both SAT and VAT. PCK1 encodes
an essential enzyme involved in the NEFA re-esterification (glyceroneogensis).
Increased expression of PCK1 decrease serum FA while increasing stored TAG and
promote obesity. In T2DM, regions near the PCK1 locus on chromosome 20 have
also been implicated in obesity. Furthermore, mice that overexpress PCK1 in
adipocytes have reduced circulating FFA levels and normal insulin sensitivity, which
has been associated with increased fat depots due to enhanced FA re-esterification
(Franckhauser et al., 2002). The gene expression of the PCK1 was found to be
reduced in SAT and VAT explants from lean women in response to LPS induced
inflammation consequently, the FA release during lipolysis was higher, SAT was far
more sensitive than VAT (Vatier et al., 2012).
Although the results from the expression analysis of genes involved in adipocyte
differentiation present no statistically significant difference to support our hypothesis
of failure of adipocytes differentiation in GDM, it should be considered that by
investigating mature adipocytes which are terminally differentiated, as we did in our
experiment, we may be investigating the wrong stage of the cell. Deficiencies in
potential for differentiation could be detected in preadipocytes which are present in
the stromal vascular fraction of the adipose tissue explants. Decreased
preadipocyte differentiation capacity has been demonstrated in in T2DM (van
Tienen et al., 2011). To evaluate whether the adipocyte differentiation process is
impaired in GDM and limiting the hyperplastic expansion of the adipose tissue, it will
Chapter 5 198
be more valuable to assess preadipocyte gene expression analysis and in vitro
differentiation capacity in future studies.
Gene expression of adipogenic and angiogenic genes was not different in both SAT
and VAT adipocytes in GDM compared to controls. Apoptosis gene expression
DDIT3 was lower in SAT adipocytes from women with GDM compared to controls.
Several autophagic genes were found to be down regulated during obesity in non-
pregnant population including Atg7, Atg5 and Ulk1. AMPK positively regulate
autophagy to decrease the accumulation of mitochondrial ROS by increased
clearance of dysfunctional mitochondria (Egan et al., 2011). Saturated FA decrease
AMPK activity leading to defective autophagy response and increased ROS in
adipocytes (Wen et al., 2011). Thus, the measurement of ROS in the current study
isolated adipocytes will be an interesting follow on study.
This study main limitation was the small sample size especially for subgroup
analysis when we had less than 50% of the proposed n=30 per group. There was
an inherent difficulties in VAT tissue collection such as the closure of wound by the
surgeon before remembering to take the VAT samples in the way out. Furthermore,
this study was limited by the measurement of adipokine release from one depot
(VAT adipocytes) rather than both depots (SAT and VAT adipocytes). This was due
to limited resources. SAT adipocytes adipokine release would be of a great interest
to reflect if there is underlying SAT adipocyte inflammation. Furthermore, we used
a GDM treated population therefore, our adipokine release and gene expression
results could be confounded by this. However, the number of GDM women at each
treatment category (diet only, metformin only, insulin only and both metformin and
insulin) were too small to look at statically meaningful analysis for treatment effect.
Alternatively, we could have used women treated with diet only, but this would have
lengthen the time period for tissue collection. With regards to gene expression
analysis, microarray analysis would be of great interest to this project, but we were
again limited by resource because of the requirement form pre-amplification of
cDNA. therefore, Ingenuity Pathway Analysis to look for novel genes was chosen
as an alternative approach. Collection of placenta and cord blood samples would
have enhanced our results to look at other potential source of inflammation in GDM
other than adipose tissue but this was not accessible during this project due to
limited personnel available to handle fresh samples.
Chapter 5 199
A particular strength of the present study that to the best of our knowledge this is
the first study that examined isolated VAT adipocytes adipokine release in both
basal and LPS stimulated conditions. Furthermore, I used isolated VAT adipocytes
rather than whole adipose tissue samples to examine adipocyte per se contribution
to the hypothesized adipose tissue inflammation in women with GDM. The multiplex
technique was used to look at several adipokines using small volume rather than
using ELISA to look at different adipokine release which requires larger volume
which might limit the adipokines we are able to investigate. The differential
expression of insulin receptors isoforms IRA and IRB has not previously been
studied in adipocytes from women with GDM.
In conclusion, although our data present no evidence for VAT adipocytes
inflammation in women with GDM, however, we had a small sample size in this
subgroup analysis which might limit our ability to detect significant differences. SAT
adipocytes adipokines secretion was not studied yet, but gene expression analysis
did not show that there could be SAT adipocytes contribution to inflammation in
GDM. Other potential mechanism than inflammation could be underlying adipose
tissue dysfunction in women with GDM. However, other potential sites such as
placenta could be contributing to the observed higher inflammatory markers in GDM
(Feng et al., 2016).
200
Chapter 6 Maternal VLDL lipid and fatty acid composition in early pregnancy
6.1 Introduction
The long chain polyunsaturated fatty acids (LC-PUFA), particularly
docosahexaenoic acid (DHA, 22:6n-3) and arachidonic acid (AA, 20:4n-6) are of
particular importance in fetal neurological development (Sattar et al., 1998). AA is
particularly important for the synthesis of eicosanoids, which are involved in the
development of the fetal nervous, visual, and immune systems (Duttaroy, 2009).
DHA is a key membrane component of nervous tissue (Parletta et al., 2013). DHA
is highly concentrated in the fetal brain and retina and is essential for the
development of the fetal nervous and visual system (Duttaroy, 2009). The
importance of maternal DHA mobilisation at latter stages of pregnancy are well
established as demonstrated by the link between premature birth and
neurodevelopmental disorders (Johnson et al., 2015).
During pregnancy, maternal transport of DHA to the rapidly growing fetus via the
placenta is not very well understood (Freeman and Meyer, 2017). Knowing that the
first primitive fetal brain cells are formed around 15 days of gestation and that neural
tube closure occurs at 28 days of gestation, early DHA availability for the growing
fetus appears to be very critical. The maternal-fetal circulation is established around
9-13 weeks of gestation to allow transport of nutrients to the growing fetus. The
placenta has been shown to preferentially transport DHA from the maternal plasma
to the fetus, suggesting an important role for DHA in fetal development (Al et al.,
1995). However, the precursors of LC-PUFA, linoleic acid (LA, 18:2n6) and alpha-
linolenic acid (ALA, 18:3n-3) are at best minimally transferred to the fetus from
maternal plasma (De Groot et al., 2004).
Essential fatty acids derived from maternal diet are transported as TAG in TAG-rich
lipoproteins in maternal plasma. There is no direct placental transfer of maternal
lipoproteins and essential FA need to be made available to the fetus (Herrera et al.,
2006). The presence of the scavenger-receptors for VLDL, LDL and HDL allows
these lipoproteins to be taken up by the placenta. In addition, placental tissue
expresses LPL activity which may release FA from maternal plasma lipoproteins
(Haggarty, 2002). Subsequently, the constituent FA of maternal TAG in plasma
Chapter 6 201
lipoproteins are re-esterified to synthesize glycerolipids in the fetal circulation
(Coleman and Haynes, 1987). Subsequent hydrolysis of glycerolipids releases FA
into fetal plasma, where they bind to the α-fetoprotein and are transported to the
fetal liver. Although LC-PUFAs may be taken up by the syncytiotrophoblast via
passive diffusion, the placental plasma membrane fatty acid binding protein
(pFABPpm), which has a preferential affinity for AA and DHA is also implicated in
this transport (Araújo et al., 2013). Moreover, intracellular fatty acid binding proteins
(FABPs) are responsible for guiding FA to their specific intracellular locations
(Duttaroy, 2009). The exact mechanisms by which these protein carriers facilitate
the transcellular transport of LC-PUFAs remain not well understood.
Luteinizing hormone (LH) is hormone secreted by the gonadotropic cells in the
anterior pituitary gland. LH acute rise (LH surge) in females trigger ovulation. The
LH surge biologically indicates day zero of pregnancy whereas the clinical day zero
of pregnancy is taken as the day of the last menstrual period, approximately 14 days
prior to the LH surge. It was previously shown that the plasma concertation of DHA
was uniquely increased, compared to other LC-PUFA, prior to 28 day of gestation
(between 18 and 29 days post-LH surge, in women who had a successful pregnancy
after frozen embryo transfer (FET) (Meyer et al., 2016). This higher DHA
concentration coincides with the time of neural tube closure at early pregnancy.
Maternal erythrocyte DHA content, an indicator of maternal DHA plasma
concentration over the previous three months, was found to be increased by 17%
at the end of the first trimester (Stewart et al., 2007a). Thus, maternal DHA
concentrations in plasma and erythrocytes are increased by the end of the first
trimester and are available for placental transport to the fetus. This could potentially
be very important for early fetal neurological development.
The early increase in maternal plasma DHA concentration could be achieved either
through increased DHA release from maternal stores, increased DHA de novo
synthesis in the liver or from increased dietary consumption. There are several
observations from the Meyer et al. (2016) study that suggest there is an increased
synthesis of DHA from its precursors (ALA) at the critical time of neural tube closure.
Firstly, the increase in DHA concentration between 18 and 29 days post-LH surge
was correlated positively with an index of delta-6 desaturase activity (20:3n6/ 18:2n6
ratio) during this time point only. Secondly, there was a significant 10% reduction in
plasma LA, the precursor for the n-6 series of LC-PUFA, in those women who
Chapter 6 202
became pregnant after FET but not in those who did not, from pre-pregnancy to 18
days post-LH surge. Together these findings suggest an increased ability to convert
ALA to DHA in very early pregnancy.
The main plasma carrier that delivers LC-PUFA in the maternal circulation to the
placenta is not yet known. DHA is primarily transported on HDL particles in the non-
pregnant population (Augustine et al., 2014). However, during pregnancy, there is
a three-fold increase in VLDL synthesis by the liver (Huda et al., 2009). Moreover,
the liver is the primary site for de novo LC-PUFA synthesis which is suggested to
be increased in early pregnancy (Meyer et al., 2016). Thus, VLDL may be an
important transporter of plasma LC-PUFA during pregnancy. I hypothesised that in
pregnancy, as compared to the non-pregnant state, DHA is carried in higher
concentration than other FA in the VLDL lipoprotein fraction. The assessment of
maternal FA changes from pre-pregnancy to the first weeks of gestation is difficult
in a free-living population. Therefore, these changes were assessed in a population
of women undergoing natural cycle-frozen embryo transfer as a means of achieving
accurately timed periconceptual sampling.
6.2 Aim
The aim of this study was to determine the distribution of fatty acids, particularly
DHA, in the VLDL plasma fraction prior to pregnancy and throughout early gestation.
6.2.1 Hypothesis
1. That pregnant women have higher VLDL particle number compared to non-
pregnant controls.
2. That pregnant women have VLDL enriched with TAG compared to non-
pregnant controls.
3. That maternal VLDL is enriched in DHA relative to other FA.
6.2.2 Specific research questions
• Is there is an early pregnancy increase in VLDL particle number and/or TAG
enrichment?
Chapter 6 203
• How is VLDL composition related to plasma pregnancy hormone
concentrations?
• How does VLDL FA composition change in early pregnancy?
• Is there DHA enrichment of VLDL in early pregnancy?
6.3 Methods
This study utilized plasma samples from an archival collection of women undergoing
frozen embryo transfer (FET) (Meyer et al., 2016) as discussed in the Methods
Chapter sections 2.8.1 and 2.8.2. Fasting blood samples were collected
approximately day 10 after last menstrual period (LMP) (pre-LH surge) and on days
18, 29, and 45 post-LH surge. Plasma was collected by low-speed centrifugation
and frozen at -80°C within 2 hours. At day 18 post-LH surge the women who were
not successful in getting pregnant tended to not come for more study visits and
withdrew from the study. Therefore, there were no blood samples for non-pregnant
women at days 29 and 45 post-LH surge. VLDL isolation was carried out by
sequential density ultracentrifugation as outlined in the Methods Chapter section
2.8.2.2. VLDL lipoprotein fraction triglyceride (TAG), phospholipid (PL), total
cholesterol (TC), free cholesterol (FC), apo-B and cholesteryl ester (CE), were
analysed by autoanalyzer as outlined in Methods Chapter section 2.8.2.3. Apo-B is
an indicator of VLDL particle number because each VLDL particle contains a single
molecule of apo-B. VLDL TAG/Apo-B ratio and VLDL CE/Apo-B ratio (VLDL TAG
and CE concentrations divided by VLDL Apo-B concentration respectively) were
calculated to express TAG and CE content by VLDL particle number. FA extraction
was carried out as outlined in the Methods Chapter section 2.8.3. VLDL FA
composition was analysed by flame-ionization gas chromatography as outlined in
the Methods Chapter section 2.8.4.
Data were tested for normal distribution using a Ryan Joiner test and log or square
root transformed when necessary. Values for continuous variables are given as
mean (SD) or number (%) for categorical variables. Differences in VLDL apo-B
concentration, VLDL TG/Apo-B ratio and VLDL CE/Apo-B ratio over time were
assessed by one-way ANOVA for repeated measures, with between group
comparison using post hoc Tukey-Kramer honest significant difference (HSD) test.
Chapter 6 204
The rate of change of fatty acids between time points was calculated as the
difference between the fatty acid concentration at the second time point and at the
first time point divided by the difference in time (days) between the two time points.
The results are expressed as nmol/mL plasma per day. Incremental area under the
concentration (pre-LH surge to 45 d post-LH surge) x time curve (iAUC) were
calculated using the trapezium method for FA change in concentration (Matthews
et al., 1990). The results are expressed as nmol/mL x day. Differences in
concentrations of fatty acids over time were assessed by one-way ANOVA for
repeated measures, with between-group comparison using post-hoc Tukey-Kramer
HSD. Statistical analysis was performed using Minitab version 18.
6.4 Results
6.4.1 Study participants
A total of 196 FET cycles were started in the original study cohort (Meyer et al.,
2016), of which 161 were completed, from which there were 38 pregnancies: two
were excluded as being a repeat attempt at FET treatment within the study and nine
were excluded as they did not have complete data for all visits; therefore, 27
pregnant women were included. Of the 161 FET cycles completed, there were 123
failed pregnancies, of which 35 had full fatty-acid data (Figure 6-1). Frozen plasma
aliquots were available from these n=27 pregnant women and n=35 non-pregnant
women and were used for the current analysis.
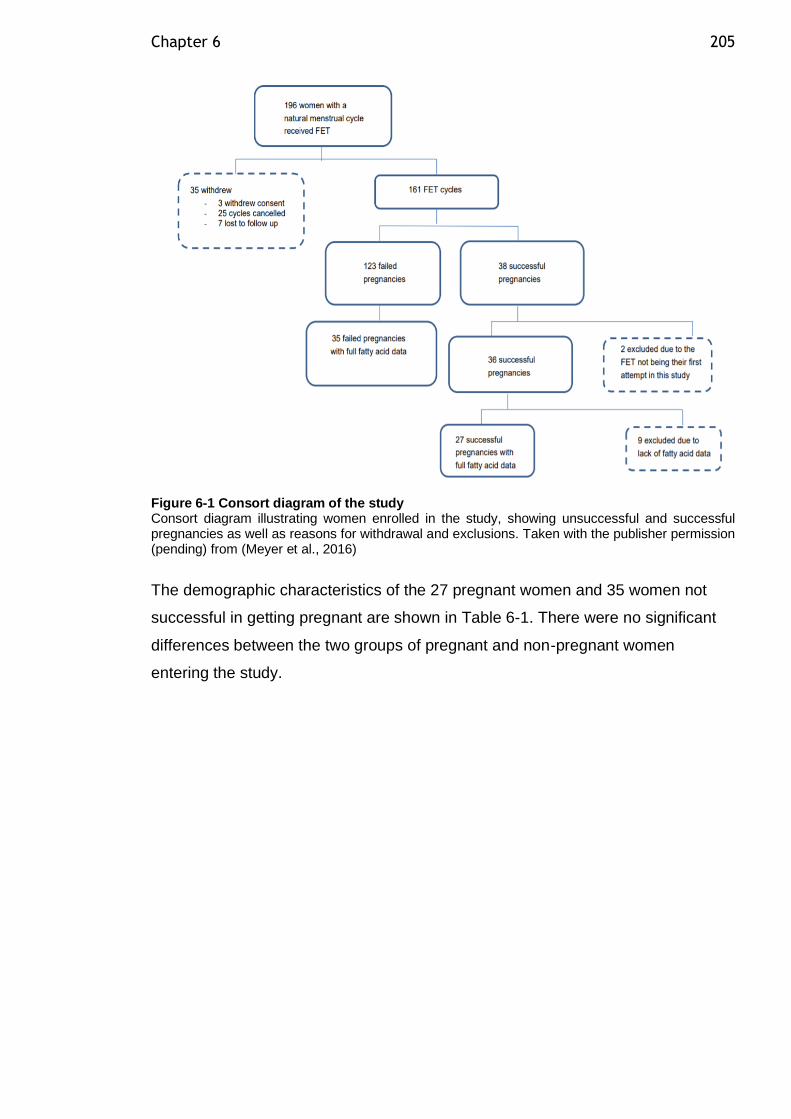
Chapter 6 205
Figure 6-1 Consort diagram of the study Consort diagram illustrating women enrolled in the study, showing unsuccessful and successful pregnancies as well as reasons for withdrawal and exclusions. Taken with the publisher permission (pending) from (Meyer et al., 2016)
The demographic characteristics of the 27 pregnant women and 35 women not
successful in getting pregnant are shown in Table 6-1. There were no significant
differences between the two groups of pregnant and non-pregnant women
entering the study.
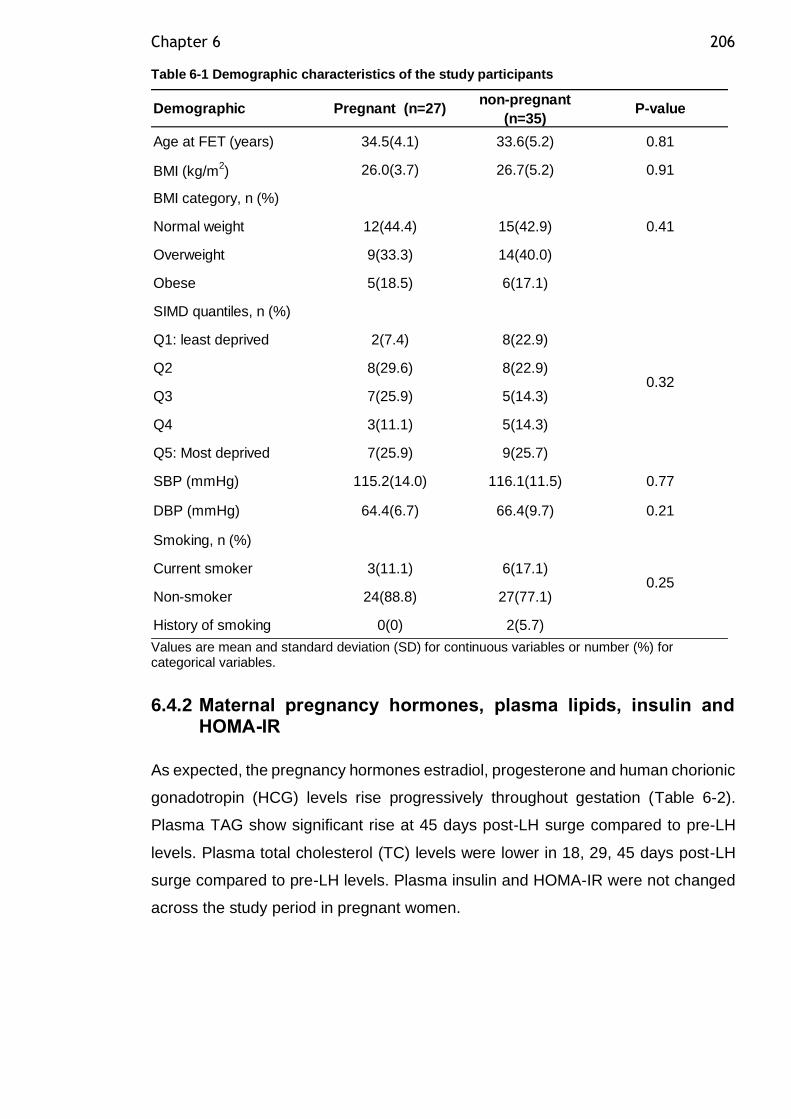
Chapter 6 206
Table 6-1 Demographic characteristics of the study participants
Values are mean and standard deviation (SD) for continuous variables or number (%) for categorical variables.
6.4.2 Maternal pregnancy hormones, plasma lipids, insulin and HOMA-IR
As expected, the pregnancy hormones estradiol, progesterone and human chorionic
gonadotropin (HCG) levels rise progressively throughout gestation (Table 6-2).
Plasma TAG show significant rise at 45 days post-LH surge compared to pre-LH
levels. Plasma total cholesterol (TC) levels were lower in 18, 29, 45 days post-LH
surge compared to pre-LH levels. Plasma insulin and HOMA-IR were not changed
across the study period in pregnant women.
Age at FET (years) 34.5(4.1) 33.6(5.2) 0.81
BMI (kg/m2) 26.0(3.7) 26.7(5.2) 0.91
BMI category, n (%)
Normal weight 12(44.4) 15(42.9)
Overweight 9(33.3) 14(40.0)
Obese 5(18.5) 6(17.1)
SIMD quantiles, n (%)
Q1: least deprived 2(7.4) 8(22.9)
Q2 8(29.6) 8(22.9)
Q3 7(25.9) 5(14.3)
Q4 3(11.1) 5(14.3)
Q5: Most deprived 7(25.9) 9(25.7)
SBP (mmHg) 115.2(14.0) 116.1(11.5) 0.77
DBP (mmHg) 64.4(6.7) 66.4(9.7) 0.21
Smoking, n (%)
Current smoker 3(11.1) 6(17.1)
Non-smoker 24(88.8) 27(77.1)
History of smoking 0(0) 2(5.7)
0.25
0.41
Demographic Pregnant (n=27)non-pregnant
(n=35)P-value
0.32
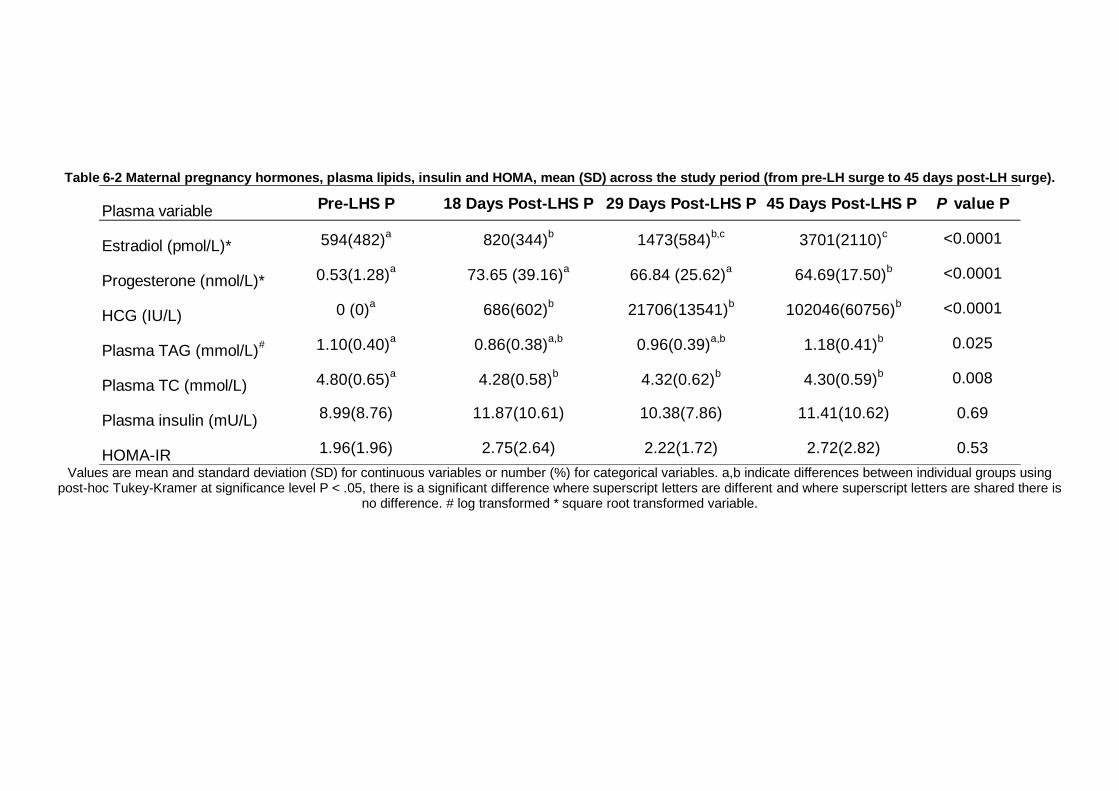
Table 6-2 Maternal pregnancy hormones, plasma lipids, insulin and HOMA, mean (SD) across the study period (from pre-LH surge to 45 days post-LH surge).
Values are mean and standard deviation (SD) for continuous variables or number (%) for categorical variables. a,b indicate differences between individual groups using
post-hoc Tukey-Kramer at significance level P < .05, there is a significant difference where superscript letters are different and where superscript letters are shared there is no difference. # log transformed * square root transformed variable.
Plasma variable Pre-LHS P 18 Days Post-LHS P 29 Days Post-LHS P 45 Days Post-LHS P P value P
Estradiol (pmol/L)* 594(482)a
820(344)b
1473(584)b,c
3701(2110)c <0.0001
Progesterone (nmol/L)* 0.53(1.28)a
73.65 (39.16)a
66.84 (25.62)a
64.69(17.50)b <0.0001
HCG (IU/L) 0 (0)a
686(602)b
21706(13541)b
102046(60756)b <0.0001
Plasma TAG (mmol/L)# 1.10(0.40)
a0.86(0.38)
a,b0.96(0.39)
a,b1.18(0.41)
b 0.025
Plasma TC (mmol/L) 4.80(0.65)a
4.28(0.58)b
4.32(0.62)b
4.30(0.59)b 0.008
Plasma insulin (mU/L)8.99(8.76) 11.87(10.61) 10.38(7.86) 11.41(10.62) 0.69
HOMA-IR 1.96(1.96) 2.75(2.64) 2.22(1.72) 2.72(2.82) 0.53
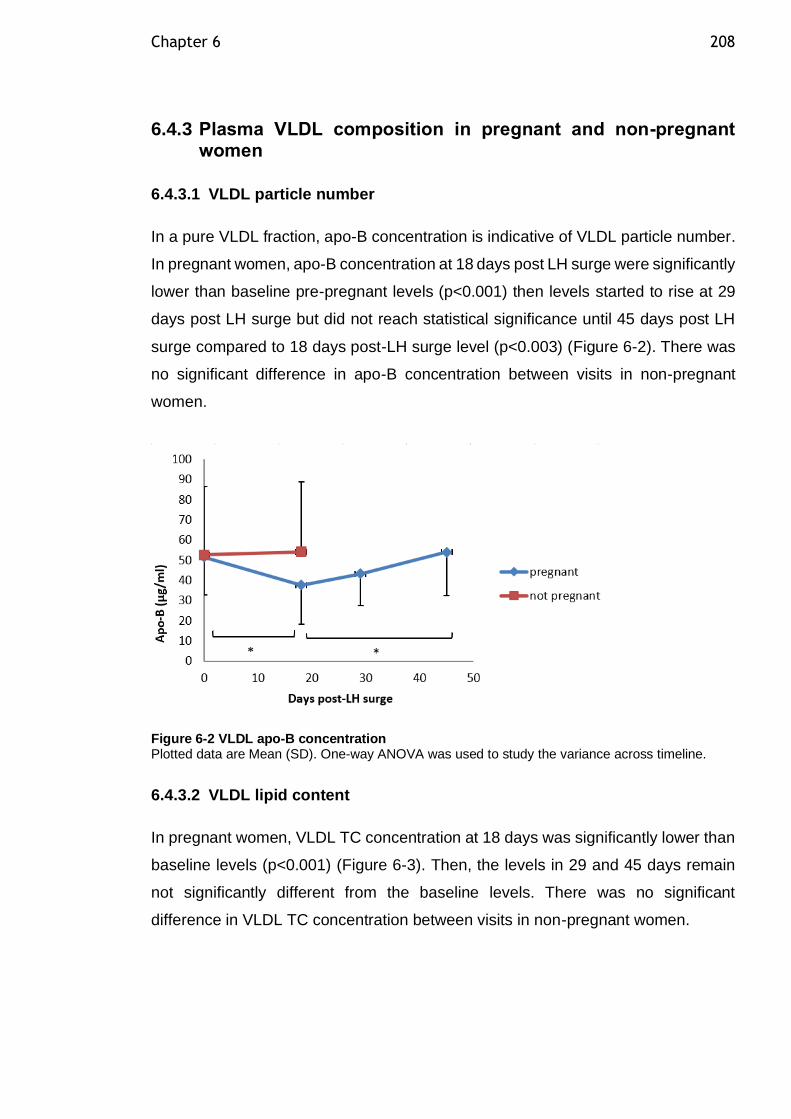
Chapter 6 208
6.4.3 Plasma VLDL composition in pregnant and non-pregnant women
6.4.3.1 VLDL particle number
In a pure VLDL fraction, apo-B concentration is indicative of VLDL particle number.
In pregnant women, apo-B concentration at 18 days post LH surge were significantly
lower than baseline pre-pregnant levels (p<0.001) then levels started to rise at 29
days post LH surge but did not reach statistical significance until 45 days post LH
surge compared to 18 days post-LH surge level (p<0.003) (Figure 6-2). There was
no significant difference in apo-B concentration between visits in non-pregnant
women.
Figure 6-2 VLDL apo-B concentration Plotted data are Mean (SD). One-way ANOVA was used to study the variance across timeline.
6.4.3.2 VLDL lipid content
In pregnant women, VLDL TC concentration at 18 days was significantly lower than
baseline levels (p<0.001) (Figure 6-3). Then, the levels in 29 and 45 days remain
not significantly different from the baseline levels. There was no significant
difference in VLDL TC concentration between visits in non-pregnant women.
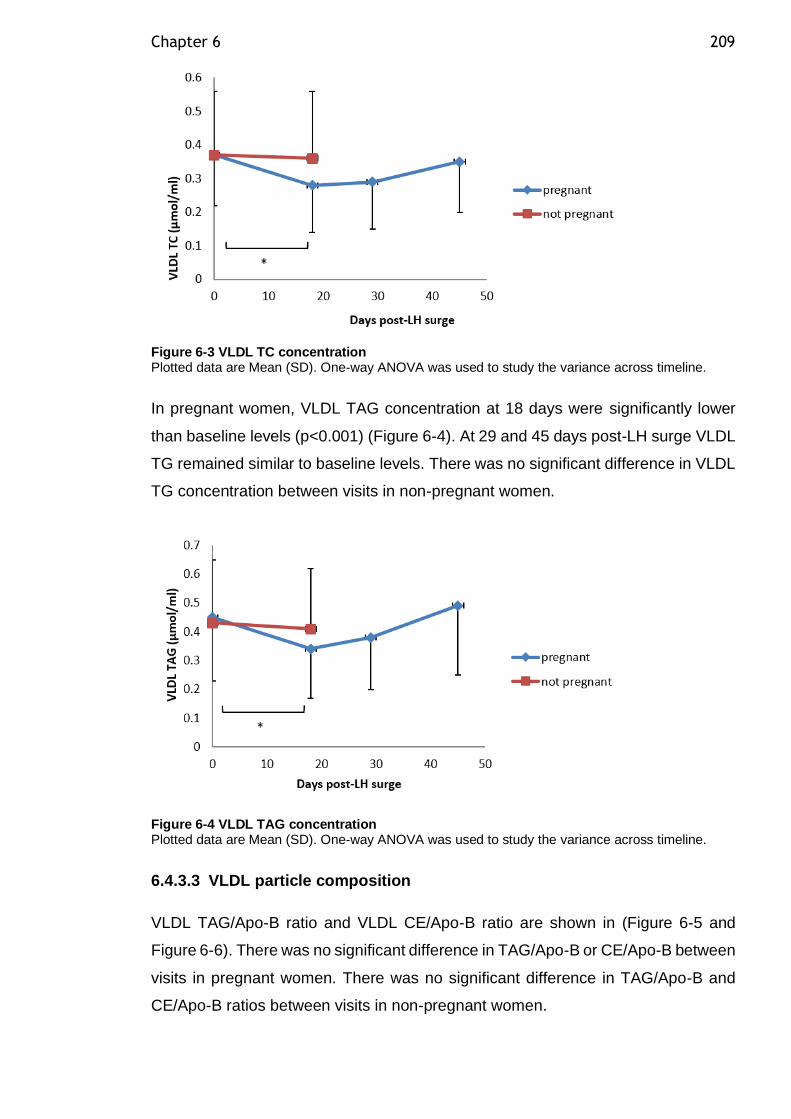
Chapter 6 209
Figure 6-3 VLDL TC concentration Plotted data are Mean (SD). One-way ANOVA was used to study the variance across timeline.
In pregnant women, VLDL TAG concentration at 18 days were significantly lower
than baseline levels (p<0.001) (Figure 6-4). At 29 and 45 days post-LH surge VLDL
TG remained similar to baseline levels. There was no significant difference in VLDL
TG concentration between visits in non-pregnant women.
Figure 6-4 VLDL TAG concentration Plotted data are Mean (SD). One-way ANOVA was used to study the variance across timeline.
6.4.3.3 VLDL particle composition
VLDL TAG/Apo-B ratio and VLDL CE/Apo-B ratio are shown in (Figure 6-5 and
Figure 6-6). There was no significant difference in TAG/Apo-B or CE/Apo-B between
visits in pregnant women. There was no significant difference in TAG/Apo-B and
CE/Apo-B ratios between visits in non-pregnant women.
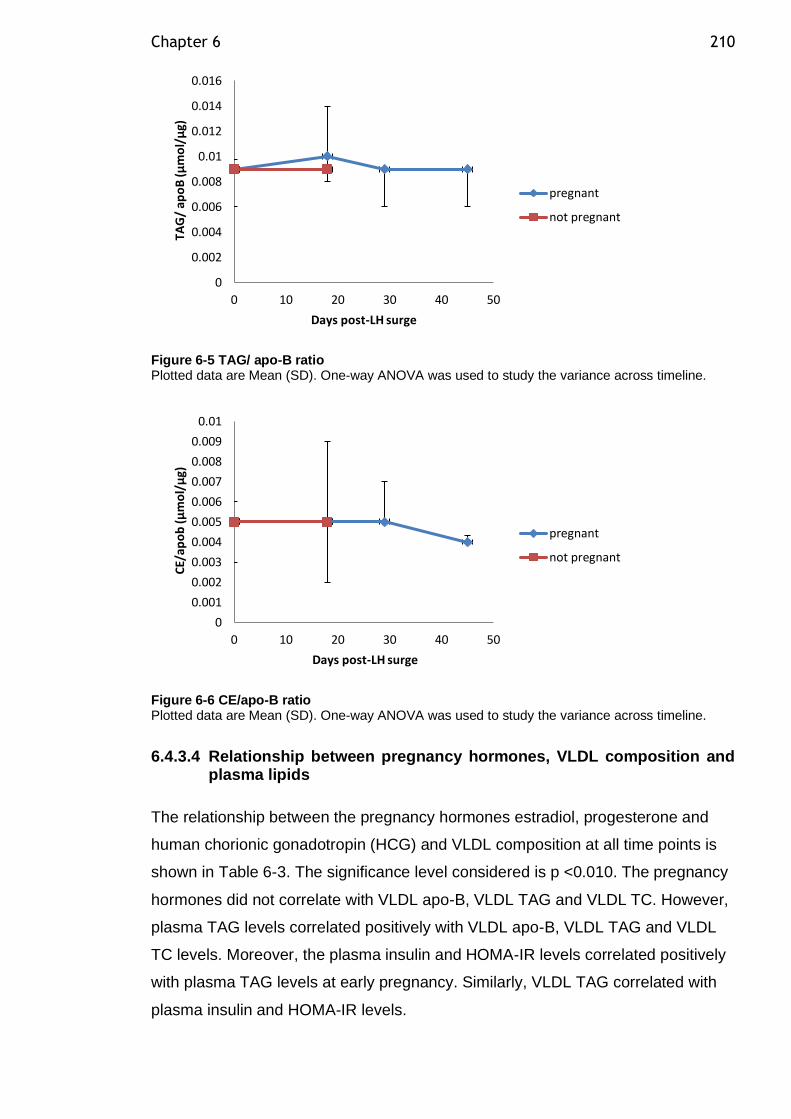
Chapter 6 210
Figure 6-5 TAG/ apo-B ratio Plotted data are Mean (SD). One-way ANOVA was used to study the variance across timeline.
Figure 6-6 CE/apo-B ratio Plotted data are Mean (SD). One-way ANOVA was used to study the variance across timeline.
6.4.3.4 Relationship between pregnancy hormones, VLDL composition and plasma lipids
The relationship between the pregnancy hormones estradiol, progesterone and
human chorionic gonadotropin (HCG) and VLDL composition at all time points is
shown in Table 6-3. The significance level considered is p <0.010. The pregnancy
hormones did not correlate with VLDL apo-B, VLDL TAG and VLDL TC. However,
plasma TAG levels correlated positively with VLDL apo-B, VLDL TAG and VLDL
TC levels. Moreover, the plasma insulin and HOMA-IR levels correlated positively
with plasma TAG levels at early pregnancy. Similarly, VLDL TAG correlated with
plasma insulin and HOMA-IR levels.
0
0.002
0.004
0.006
0.008
0.01
0.012
0.014
0.016
0 10 20 30 40 50
TAG
/ ap
oB
(µm
ol/
µg)
Days post-LH surge
pregnant
not pregnant
0
0.001
0.002
0.003
0.004
0.005
0.006
0.007
0.008
0.009
0.01
0 10 20 30 40 50
CE/
apo
b (
µm
ol/
µg)
Days post-LH surge
pregnant
not pregnant
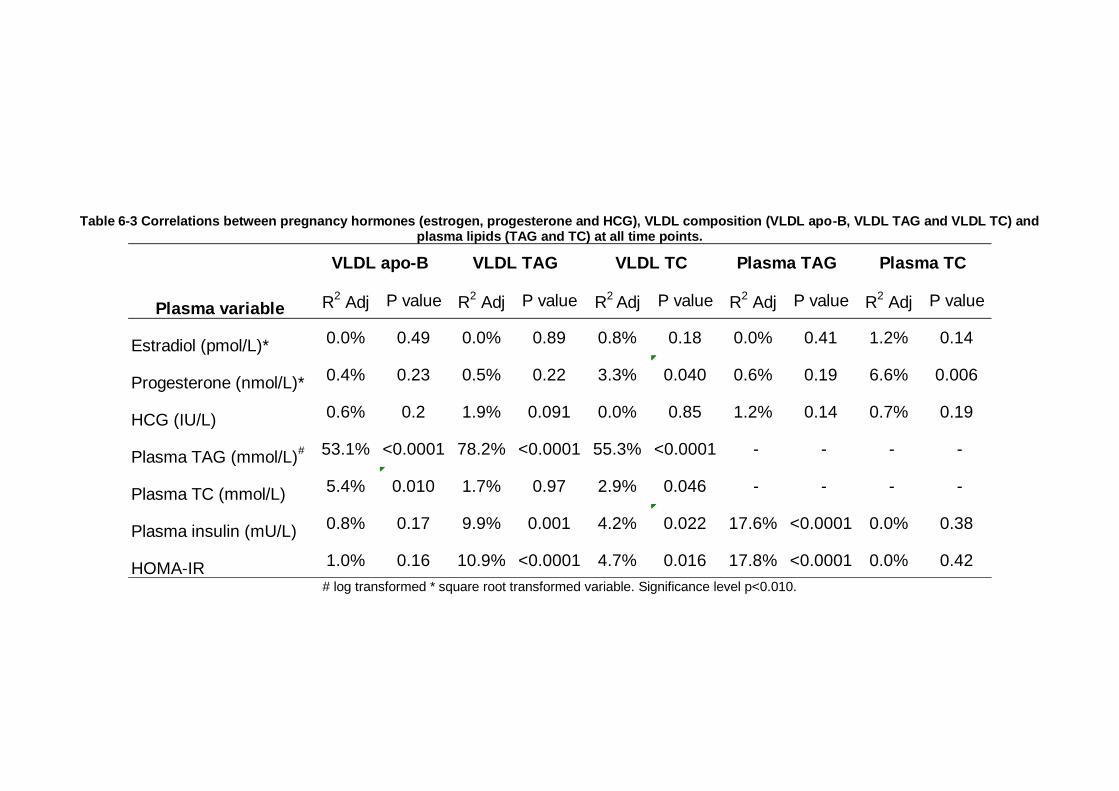
Table 6-3 Correlations between pregnancy hormones (estrogen, progesterone and HCG), VLDL composition (VLDL apo-B, VLDL TAG and VLDL TC) and plasma lipids (TAG and TC) at all time points.
# log transformed * square root transformed variable. Significance level p<0.010.
R2 Adj P value R
2 Adj P value R
2 Adj P value R
2 Adj P value R
2 Adj P value
Estradiol (pmol/L)* 0.0% 0.49 0.0% 0.89 0.8% 0.18 0.0% 0.41 1.2% 0.14
Progesterone (nmol/L)*0.4% 0.23 0.5% 0.22 3.3% 0.040 0.6% 0.19 6.6% 0.006
HCG (IU/L)0.6% 0.2 1.9% 0.091 0.0% 0.85 1.2% 0.14 0.7% 0.19
Plasma TAG (mmol/L)# 53.1% <0.0001 78.2% <0.0001 55.3% <0.0001 - - - -
Plasma TC (mmol/L) 5.4% 0.010 1.7% 0.97 2.9% 0.046 - - - -
Plasma insulin (mU/L) 0.8% 0.17 9.9% 0.001 4.2% 0.022 17.6% <0.0001 0.0% 0.38
HOMA-IR 1.0% 0.16 10.9% <0.0001 4.7% 0.016 17.8% <0.0001 0.0% 0.42
VLDL apo-B VLDL TAG VLDL TC Plasma TAG Plasma TC
Plasma variable

Chapter 6 212
6.4.3.5 VLDL FA concentrations over the first 45 days post-LH surge
VLDL FA concentrations over time for women who were successful in getting
pregnant and non-pregnant women are shown in Table 6-4..
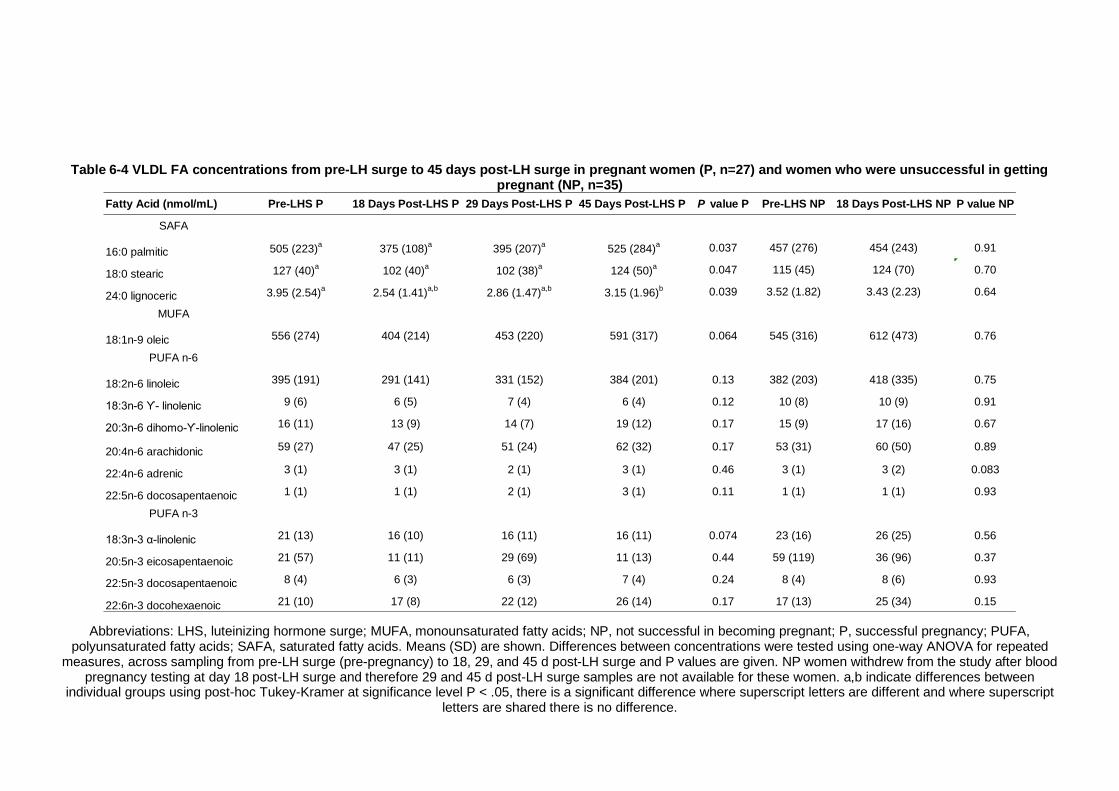
Table 6-4 VLDL FA concentrations from pre-LH surge to 45 days post-LH surge in pregnant women (P, n=27) and women who were unsuccessful in getting pregnant (NP, n=35)
Abbreviations: LHS, luteinizing hormone surge; MUFA, monounsaturated fatty acids; NP, not successful in becoming pregnant; P, successful pregnancy; PUFA, polyunsaturated fatty acids; SAFA, saturated fatty acids. Means (SD) are shown. Differences between concentrations were tested using one-way ANOVA for repeated
measures, across sampling from pre-LH surge (pre-pregnancy) to 18, 29, and 45 d post-LH surge and P values are given. NP women withdrew from the study after blood pregnancy testing at day 18 post-LH surge and therefore 29 and 45 d post-LH surge samples are not available for these women. a,b indicate differences between
individual groups using post-hoc Tukey-Kramer at significance level P < .05, there is a significant difference where superscript letters are different and where superscript letters are shared there is no difference.
Fatty Acid (nmol/mL) Pre-LHS P 18 Days Post-LHS P 29 Days Post-LHS P 45 Days Post-LHS P P value P Pre-LHS NP 18 Days Post-LHS NP P value NP
SAFA
16:0 palmitic 505 (223)a
375 (108)a
395 (207)a
525 (284)a 0.037 457 (276) 454 (243) 0.91
18:0 stearic 127 (40)a
102 (40)a
102 (38)a
124 (50)a 0.047 115 (45) 124 (70) 0.70
24:0 lignoceric 3.95 (2.54)a
2.54 (1.41)a,b
2.86 (1.47)a,b
3.15 (1.96)b 0.039 3.52 (1.82) 3.43 (2.23) 0.64
MUFA
18:1n-9 oleic 556 (274) 404 (214) 453 (220) 591 (317) 0.064 545 (316) 612 (473) 0.76
PUFA n-6
18:2n-6 linoleic 395 (191) 291 (141) 331 (152) 384 (201) 0.13 382 (203) 418 (335) 0.75
18:3n-6 ϒ- linolenic 9 (6) 6 (5) 7 (4) 6 (4) 0.12 10 (8) 10 (9) 0.91
20:3n-6 dihomo-ϒ-linolenic 16 (11) 13 (9) 14 (7) 19 (12) 0.17 15 (9) 17 (16) 0.67
20:4n-6 arachidonic 59 (27) 47 (25) 51 (24) 62 (32) 0.17 53 (31) 60 (50) 0.89
22:4n-6 adrenic 3 (1) 3 (1) 2 (1) 3 (1) 0.46 3 (1) 3 (2) 0.083
22:5n-6 docosapentaenoic 1 (1) 1 (1) 2 (1) 3 (1) 0.11 1 (1) 1 (1) 0.93
PUFA n-3
18:3n-3 α-linolenic 21 (13) 16 (10) 16 (11) 16 (11) 0.074 23 (16) 26 (25) 0.56
20:5n-3 eicosapentaenoic 21 (57) 11 (11) 29 (69) 11 (13) 0.44 59 (119) 36 (96) 0.37
22:5n-3 docosapentaenoic 8 (4) 6 (3) 6 (3) 7 (4) 0.24 8 (4) 8 (6) 0.93
22:6n-3 docohexaenoic 21 (10) 17 (8) 22 (12) 26 (14) 0.17 17 (13) 25 (34) 0.15
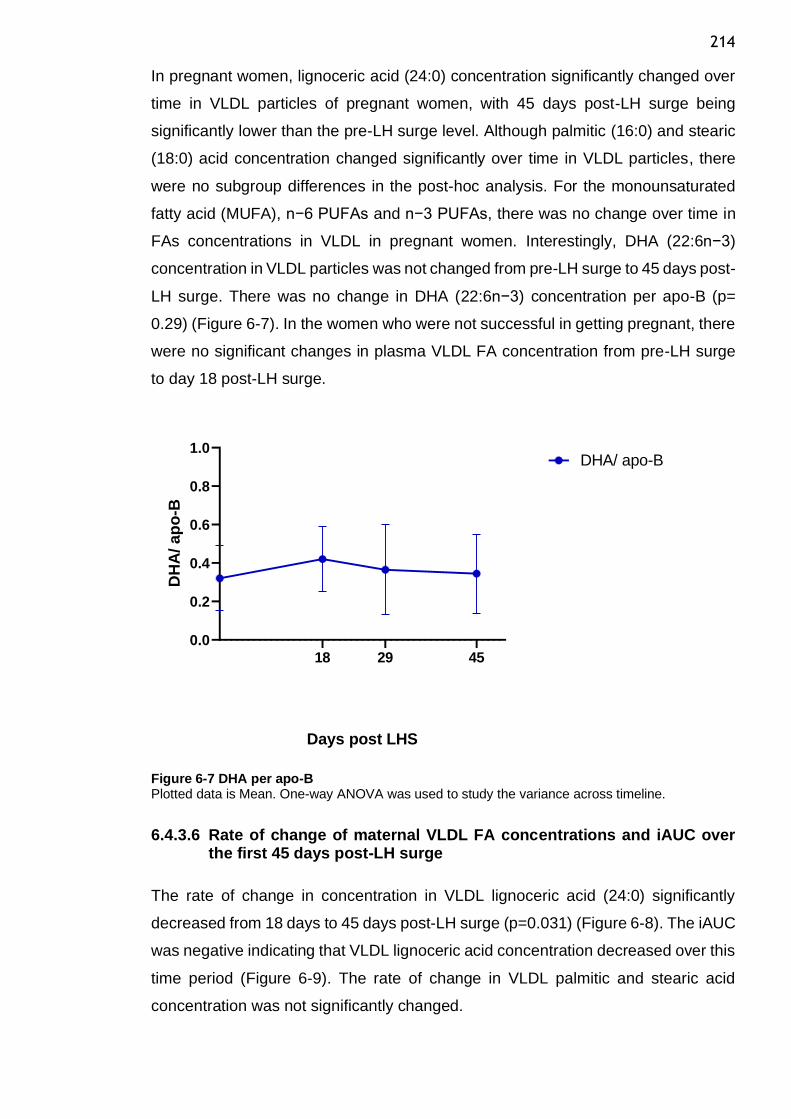
214
In pregnant women, lignoceric acid (24:0) concentration significantly changed over
time in VLDL particles of pregnant women, with 45 days post-LH surge being
significantly lower than the pre-LH surge level. Although palmitic (16:0) and stearic
(18:0) acid concentration changed significantly over time in VLDL particles, there
were no subgroup differences in the post-hoc analysis. For the monounsaturated
fatty acid (MUFA), n−6 PUFAs and n−3 PUFAs, there was no change over time in
FAs concentrations in VLDL in pregnant women. Interestingly, DHA (22:6n−3)
concentration in VLDL particles was not changed from pre-LH surge to 45 days post-
LH surge. There was no change in DHA (22:6n−3) concentration per apo-B (p=
0.29) (Figure 6-7). In the women who were not successful in getting pregnant, there
were no significant changes in plasma VLDL FA concentration from pre-LH surge
to day 18 post-LH surge.
0.0
0.2
0.4
0.6
0.8
1.0
Days post LHS
DH
A/ ap
o-B
18 29 45
DHA/ apo-B
Figure 6-7 DHA per apo-B Plotted data is Mean. One-way ANOVA was used to study the variance across timeline.
6.4.3.6 Rate of change of maternal VLDL FA concentrations and iAUC over the first 45 days post-LH surge
The rate of change in concentration in VLDL lignoceric acid (24:0) significantly
decreased from 18 days to 45 days post-LH surge (p=0.031) (Figure 6-8). The iAUC
was negative indicating that VLDL lignoceric acid concentration decreased over this
time period (Figure 6-9). The rate of change in VLDL palmitic and stearic acid
concentration was not significantly changed.
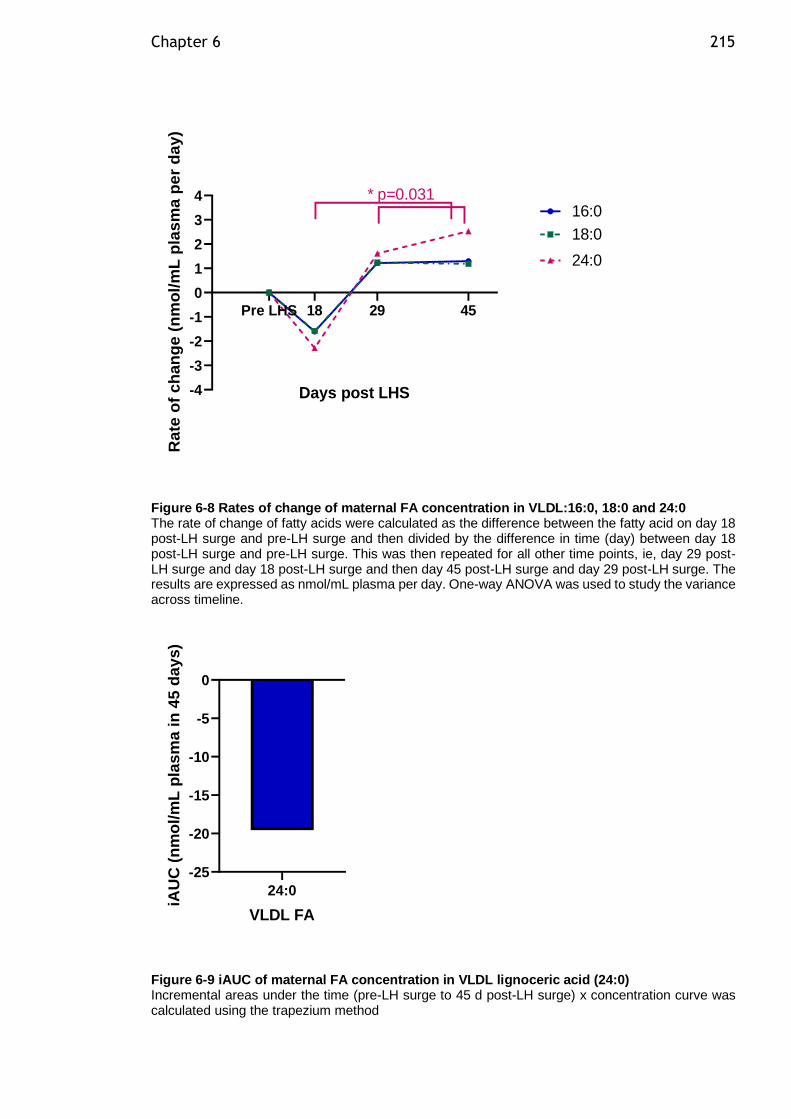
Chapter 6 215
-4
-3
-2
-1
0
1
2
3
4
Days post LHS
Ra
te o
f c
han
ge
(n
mo
l/m
L p
las
ma
pe
r d
ay)
18:0
24:0
Pre LHS 18 29 45
* p=0.03116:0
Figure 6-8 Rates of change of maternal FA concentration in VLDL:16:0, 18:0 and 24:0 The rate of change of fatty acids were calculated as the difference between the fatty acid on day 18 post-LH surge and pre-LH surge and then divided by the difference in time (day) between day 18 post-LH surge and pre-LH surge. This was then repeated for all other time points, ie, day 29 post-LH surge and day 18 post-LH surge and then day 45 post-LH surge and day 29 post-LH surge. The results are expressed as nmol/mL plasma per day. One-way ANOVA was used to study the variance across timeline.
24:0
-25
-20
-15
-10
-5
0
VLDL FA
iAU
C (
nm
ol/
mL
pla
sm
a i
n 4
5 d
ay
s)
Figure 6-9 iAUC of maternal FA concentration in VLDL lignoceric acid (24:0) Incremental areas under the time (pre-LH surge to 45 d post-LH surge) x concentration curve was calculated using the trapezium method
Chapter 6 216
6.5 Discussion
Our main finding is that there was no change in VLDL DHA concentration or VLDL
DHA enrichment from pre-LH surge to 45 days post-LH surge. However, there was
reduced VLDL particle number by 18 days post-LH surge in pregnant women only.
These findings suggest that VLDL is not the main lipoprotein carrier for DHA which
was contrary to our hypothesis. Other lipoproteins such as HDL could be an
important carrier of DHA similar to the non-pregnant population. Therefore, isolation
of other lipoprotein fractions throughout gestation and the subsequent study of their
FA composition would be of interest to identify the primary carrier of DHA in maternal
plasma.
The reduction in VLDL particle number by 18 days post-LH surge was an
unexpected finding. VLDL assembly and secretion is a process highly regulated by
TAG availability in the liver (Fisher and Ginsberg, 2002). The TAG sources for the
liver include circulating FA bound to albumin, VLDL and chylomicron remnants and
de novo hepatic synthesis of TAG. TAG entry into the pool for VLDL secretion is
regulated by insulin and microsomal triglyceride transfer protein (MTTP) (Pan and
Hussain, 2007). In the presence of lipids, nascent apo-B is lipidated by MTTP to
increase VLDL secretion by the liver (Fisher et al., 2001). In contrast, the absence
of lipids leads to a reduction in MTTP activity, subsequent apo-B degradation and
reduced VLDL secretion (Fisher et al., 2001). In early pregnancy, there is a
physiological increase in insulin sensitivity which leads to increased LPL activity and
increased FA storage. Furthermore, the enhanced insulin sensitivity in early
pregnancy inhibits adipocyte lipolysis by inhibition of HSL. Interestingly, plasma
TAG levels were reduced by 18- and 29-days post-LH surge. However, the
underlying mechanism for this early reduction in plasma TAG is not clear but it could
be used as an energy source for the rapidly growing fetus. The reduction in plasma
TAG was partially mediated by HOMA-IR and plasma insulin level in early
pregnancy. Moreover, the reduction in TAG availability to the liver in early pregnancy
might contributed to the observed reduction in VLDL particle number by subsequent
apo-B degradation and reduced VLDL secretion. This relationship was suggested
by the observed correlation between VLDL particle number and plasma TAG. Thus,
we hypothesise that the early pregnancy changes in insulin sensitivity and the
subsequent reduction in TAG availability to the liver could probably explain the
current study observation of reduced VLDL particle number at 18 days post-LH
Chapter 6 217
surge, an effect probably mediated through reduced MTTP activity and subsequent
apo-B degradation.
Other lipoprotein fractions were not studied by the researcher. However, this has
since been carried out in collaboration with Wollongong University. The current
study cohort was analysed along with other study cohort plasma samples collected
longitudinally throughout gestation at 16, 25, 35 weeks of gestation and 13 weeks
postnatal to examine the lipoprotein fractions VLDL, IDL, LDL, HDL and LPDP FA
composition prior to pregnancy, throughout gestation and in the post-partum period.
The results revealed that DHA is carried primarily in HDL throughout gestation and
the HDL particles are enriched in DHA similar to the non-pregnant population
(Augustine et al., 2014). This was observed as a consistently increasing
concentration of DHA carried by HDL peaking at 25 weeks of gestation, a higher
proportion of DHA carried in the HDL fraction than any other lipoprotein fraction and
the progressive enrichment of HDL in DHA peaking at 25 weeks of gestation
(Samani et al unpublished data). In contrast, DHA concentrations in the other
lipoprotein fractions do not change throughout pregnancy. HDL is an ideal vehicle
to carry the additional DHA required for transfer to the fetus because of its very well-
known anti-oxidant and anti-inflammatory properties which are increased during
pregnancy as a protective mechanism against the pregnancy associated oxidative
stress (Sulaiman et al., 2016). The observed peak concentration of DHA carried by
HDL at 25 weeks of gestation coincides with the previously observed higher CETP
activity in the second trimester which then declines in third trimester (Iglesias et al.,
1994). Therefore, it is possible that the maternal DHA packaged into VLDL is
incorporated into HDL by the transfer from other lipoproteins via CETP.
Furthermore, the observed increased concentration of DHA carried by HDL peaking
at 25 weeks of gestation (Samani et al unpublished data), coincides with a second
peak of increased head circumference growth velocity which peaks twice during
gestation, (14 weeks and 19-21 weeks of gestation) (Grantz et al., 2018). This
evidence supports the importance of HDL in delivering the DHA required for fetal
neurological development.
The concentration of DHA in neonates of mothers with GDM have been found to be
low compared to healthy women (Thomas et al., 2005). Several studies have related
reduced DHA concentration to reduced placental transfer to the fetus (Wijendran et
al., 2000). GDM pregnancy is characterized by greater FA flux from adipose tissue
Chapter 6 218
stores as we have shown in Chapter 4. The maternal FA flux affects the placental
lipid uptake. In GDM, there was a higher accumulation of lipid droplets in placental
tissue (Tewari et al., 2011) and reduced mitochondrial FA oxidation by 20% in
placenta, contributing to enhanced TAG content within the placenta. This might
affect the placental function and may affect the fetal levels of important FA such as
DHA. These changes could adversely affect the fetal metabolism and predispose
the fetus to future metabolic diseases and other adverse implications on the fetal
neurodevelopment. However, another study has attributed the reduced DHA
concentration in neonates of mothers with GDM to increased fetal utilization
(Ortega-Senovilla et al., 2009). Additionally, the previous study proposed that
augmented utilization of LC-PUFA could contribute to increase in the fetus body fat
mass and subsequent tendency to develop macrosomia (Ortega-Senovilla et al.,
2009). The study of HDL FA composition, the main carrier of DHA in pregnancy, to
determine the GDM effect on DHA concentration compared to healthy pregnancy
was not carried out before.
A particular strength of the current study was the prospective design and repeated
within individual sampling up to 45 days post-LH surge. This early time period is
rarely studied in early pregnancy because it is difficult to assess in a free-living
population and is very critical for embryo neuronal development. Additionally, the
comprehensive analysis of VLDL FA measuring absolute concentrations allowed
me to draw conclusions regarding different subtypes of FAs. The main limitation of
the current study was that the women participants were undergoing in vitro
fertilization, and this might not be considered a “normal” pregnancy population.
However, the women had a natural menstrual cycle, meaning there was no
interference of exogenous hormones used in cycle reconstruction on their metabolic
adaptation to pregnancy. Indeed, the study of this population provided us with
accurately timed periconceptual and early pregnancy blood samples that would be
extremely difficult to achieve from a free-living population. Unfortunately, there was
no dietary intake data, no direct measure of δ6-desaturase activity and no
assessment of embryonal accrual of FA. Inferences on changes in VLDL FA
metabolism were made using serial steady state plasma VLDL FA concentrations.
Although I could observe increases and decreases in plasma VLDL FA
concentration, it does not fully establish whether these changes in concentration
were due to changes in rates of entry into or removal from plasma compartments as
Chapter 6 219
would be described by kinetic tracer studies, which are clearly extremely difficult to
perform in pregnant women.
In conclusion, my results have shown that contrary to our hypothesis, VLDL is not
the carrier for DHA in the first 45 days post-LH surge as evidenced by unchanged
DHA concentration in VLDL, unchanged DHA enrichment per VLDL particle and
reduced VLDL particle number. Subsequent analysis of the study cohort by our
collaborator has shown that HDL, and not VLDL, is the preferred lipoprotein in terms
of DHA transport across the pregnancy timeline possibly because of HDL important
antioxidant and anti-inflammatory properties that may protect DHA from oxidation.
220
Chapter 7 Discussion
Given the increased obesity rates among the general population, it is unsurprising
that maternal obesity rates are on an increasing trend. In Scotland, the proportion
of women who were obese at their booking visit rose from 9.4% to 18.9% between
1990 and 2002–2004 (Kanagalingam et al., 2005). Similar trends were also
observed in England (Heslehurst et al., 2010b). Given the association between
maternal obesity and maternal and fetal adverse outcomes, this rising trend is a
major concern. The increase in adiposity has been linked to several cardiometabolic
complications, including insulin resistance and impaired glucose and lipid
metabolism. The main and unique function of adipocytes is the storage of FFA under
conditions of positive energy supply, and their release during conditions of negative
energy balance. However, the concept of a primary mechanistic role for adipose
tissue in the development of metabolic abnormalities has emerged over the last
decade, which involves adipose tissue expandability, fat distribution (specifically the
role of VAT), ectopic fat deposition, lipotoxicity and low-grade inflammation. The
work presented in this thesis firstly aimed to examine the current trends in maternal
obesity and GDM rates at the population level among pregnant women in Greater
Glasgow and Clyde. The recent advances in robust recording of maternal BMI and
its associated adverse events make this a timely analysis. Secondly, the thesis
aimed to test the hypothesis that in women with GDM, SAT adipocytes show
adipocyte hypertrophy and increased lipolysis, which would provide evidence for the
failure of adipocyte expansion in GDM, consistent with that observed in T2DM.
Thirdly, the work presented in this thesis aimed to assess the role of VLDL in early
pregnancy as a potential maternal plasma carrier of the extremely important long
chain polyunsaturated fatty acid docosahexaenoic acid (DHA), required by the fetus
for neuronal development. Infants born to mothers with GDM had lower DHA levels,
and were shown to have lower cognitive performance, partly attributed to lower
placental transfer of DHA in GDM. However, the underlying mechanism for defective
DHA metabolism and transport in GDM pregnancy is not fully understood.
The first objective of this thesis was to explore the epidemiological evidence that
among the population of the overall study, women with maternal obesity are at
greater risk of GDM and adverse maternal and fetal outcomes. This analysis
provided robust background information on the clinical characteristics of the
population in which the adipocyte function and DHA transportation studies were
Chapter 7 221
undertaken. The prevalence of maternal obesity in the current study was 22.3%,
suggesting that maternal obesity is on an increasing trend in the Glasgow population
when compared to earlier studies (Kanagalingam et al., 2005). Although the
prevalence of GDM (2.2%) remains low in the Glasgow population compared to the
worldwide prevalence of GDM (from 0.5 to 15%), the associated risks observed
represent a great burden on NHS resources. The current study showed that mothers
with obesity and GDM receive a higher number of obstetric interventions, including
operative and earlier delivery. Moreover, despite the higher rate of medical
interventions among obese and GDM mothers, the average birthweight for offspring
is significantly higher for GDM mothers. Further analysis of this data to address the
economic costs associated with obesity and GDM diagnosis during pregnancy,
including maternal hospital costs for the mother and her neonate, will provide
insights to inform clinical practice decision-making and national pregnancy care
planning. Wider analysis of maternal obesity rates at a national level could be
beneficial in informing clinical practice for the management of maternal obesity
during pregnancy. Moreover, a national analysis of maternal obesity rates and
subsequent outcomes will provide an evaluation of the current therapeutic
strategies, and might provide firm evidence regarding the optimal
treatment/management for maternal obesity during pregnancy and better direction
of NHS resources. Prospective follow-up analysis of the current study cohort might
provide more insight about the long-term complications in the mother and her fetus
in this population. Future experimental studies are required to provide better
understanding of the underlying pathophysiology linking high maternal BMI and the
associated adverse pregnancy outcomes.
The second objective of this thesis was to ascertain whether adipocyte size and
adipocyte lipolytic function (basal and β-adrenergic-stimulated lipolysis, and insulin
suppression of lipolysis) in SAT and VAT adipocytes were different between women
with GDM and healthy BMI-matched controls. In this study, contrary to our
hypothesis that adipocyte hypertrophy would be observed in SAT adipocytes,
significantly higher adipocyte diameter and basal lipolysis were observed in VAT
adipocytes in GDM women than in BMI-matched healthy controls. This suggests
that failure of adipocyte expansion occurs in the VAT depot in women with GDM.
Due to the study design (cross-sectional in the third trimester), pre-gestation or early
gestation hypertrophic changes in SAT adipocytes caused by overweight and
obesity, which might have proceeded VAT adipocyte hypertrophy, would not be
Chapter 7 222
observed. Thus, our revised hypothesis is that VAT adipocyte hypertrophy in the
third trimester of pregnancy could be a consequence of failed SAT expandability,
which occurs earlier and represents SAT adipocyte overspill stored “ectopically” in
VAT adipocytes. Studying another control group of healthy pregnant women with
normal BMI would help in drawing conclusions regarding hypertrophy in SAT
adipocytes. One could hypothesise that in healthy-weight women in pregnancy, SAT
hypertrophy may occur in response to gestational weight gain, at least in a subset
of women, but may never reach the stage of fatty acid overspill. In such healthy
women with low pre-pregnancy BMI or limited gestational weight gain, either they
have full potential for adipocyte differentiation to occur, or, even in a situation of
limited adipocyte differentiation capacity, hypertrophy of SAT is sufficient to buffer
excessive gestational fatty acid flux without VAT hypertrophy. In healthy pregnant
women with normal BMI, SAT hypertrophy could be reversed after delivery (Figure
7-1). The failure of adipocyte expansion results from a reduced ability to recruit new
adipocytes. Adipocyte differentiation was not measured in the current study, and
assessment of this in pre-adipocytes collected pre-pregnancy, in early gestation and
in late gestation, would be very informative. This would be a valuable, but difficult to
execute, next study.
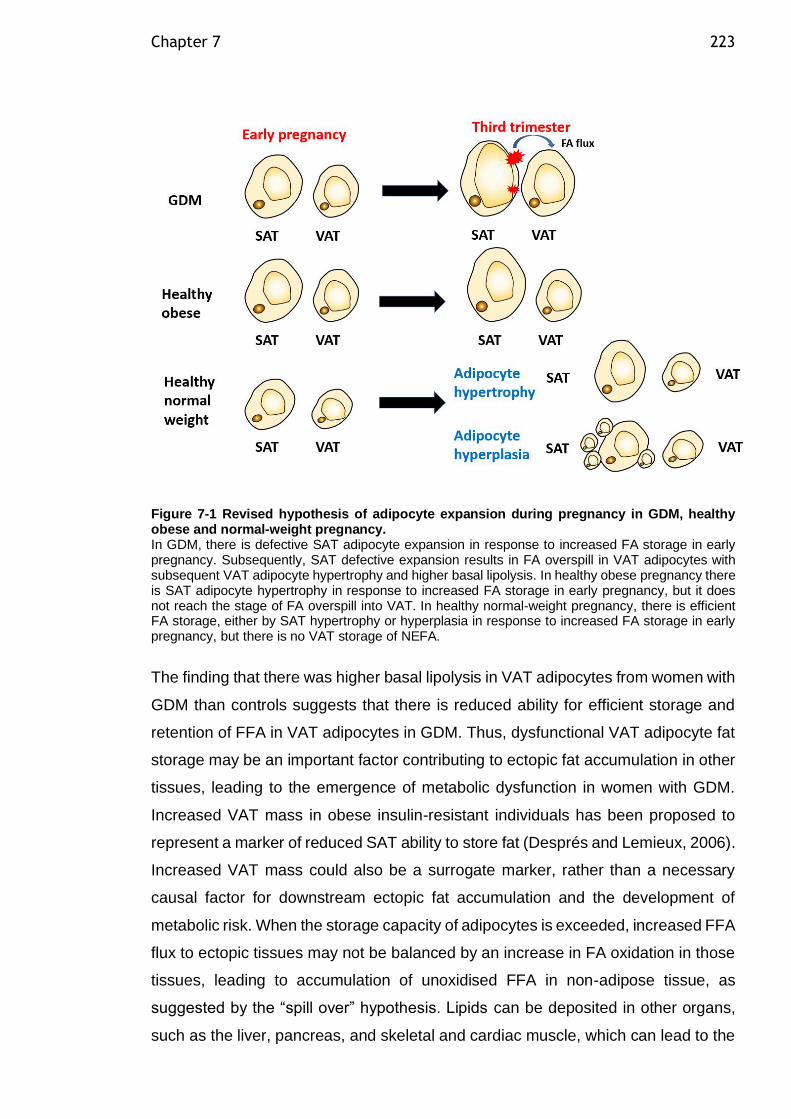
Chapter 7 223
Figure 7-1 Revised hypothesis of adipocyte expansion during pregnancy in GDM, healthy obese and normal-weight pregnancy. In GDM, there is defective SAT adipocyte expansion in response to increased FA storage in early pregnancy. Subsequently, SAT defective expansion results in FA overspill in VAT adipocytes with subsequent VAT adipocyte hypertrophy and higher basal lipolysis. In healthy obese pregnancy there is SAT adipocyte hypertrophy in response to increased FA storage in early pregnancy, but it does not reach the stage of FA overspill into VAT. In healthy normal-weight pregnancy, there is efficient FA storage, either by SAT hypertrophy or hyperplasia in response to increased FA storage in early pregnancy, but there is no VAT storage of NEFA.
The finding that there was higher basal lipolysis in VAT adipocytes from women with
GDM than controls suggests that there is reduced ability for efficient storage and
retention of FFA in VAT adipocytes in GDM. Thus, dysfunctional VAT adipocyte fat
storage may be an important factor contributing to ectopic fat accumulation in other
tissues, leading to the emergence of metabolic dysfunction in women with GDM.
Increased VAT mass in obese insulin-resistant individuals has been proposed to
represent a marker of reduced SAT ability to store fat (Després and Lemieux, 2006).
Increased VAT mass could also be a surrogate marker, rather than a necessary
causal factor for downstream ectopic fat accumulation and the development of
metabolic risk. When the storage capacity of adipocytes is exceeded, increased FFA
flux to ectopic tissues may not be balanced by an increase in FA oxidation in those
tissues, leading to accumulation of unoxidised FFA in non-adipose tissue, as
suggested by the “spill over” hypothesis. Lipids can be deposited in other organs,
such as the liver, pancreas, and skeletal and cardiac muscle, which can lead to the
Chapter 7 224
development of metabolic syndrome features. According to the portal hypothesis,
the anatomical location of the VAT depot exposes the liver to increased flux of FFA
and adipokines via the portal vein. Higher VAT adipocyte FFA release potentially
contributes to ectopic fat deposition in the liver, and to hepatic insulin resistance
(Boden, 2008). This is consistent with the current study, finding that both women
with GDM and overweight/obese control groups had high HSI scores. In our cohort,
HSI was closely related to maternal adiposity and measures of insulin sensitivity in
normal pregnancy and GDM. There was a strong, consistent relationship between
SAT adipocyte lipolysis and HSI score in women with GDM, probably suggesting
the importance of SAT adipocyte expansion ability as an initiating factor for the
subsequent increase in VAT mass and ectopic fat deposition in the liver. Therefore,
the measurement of liver fat during routine antenatal ultrasound for pregnant women
at risk of pregnancy metabolic complications may be of clinical utility. Further studies
that examine maternal liver fat deposition longitudinally throughout gestation in
women with GDM, in comparison to a healthy pregnant control group using
magnetic resonance spectroscopy, are needed to assess the evidence for ectopic
fat deposition in the liver in women with GDM.
This thesis provided support for the theory that adipose tissue distribution during
pregnancy is associated with maternal metabolic health. The importance of visceral
obesity as either a marker of or facilitator in developing subsequent maternal and
fetal complications should be recognised among clinicians. Visceral distribution of
fat pre-pregnancy, or accumulation of visceral fat during pregnancy, may identify
women most at risk of an adverse outcome. If so, there is a need to revise the clinical
approach towards obesity categorisation and treatment during pregnancy.
Measuring VAT could be a novel strategy that would assist in more effectively
directing medical resources to those women at greater risk. Screening for visceral
adiposity in pregnant populations is not an easy task. BMI does not account for
differences in body fat distribution among different populations. BMI is not a precise
measure of body composition, and cannot distinguish lean or fat tissue or the
location of fat. Abdominal waist circumference has been used as a measure of
central obesity and a marker of visceral fat in large-scale epidemiological studies.
Sattar et al. (2001) assessed abdominal waist circumference at 16 weeks’ gestation,
and found that larger waist circumferences (>80cm) were associated with an
increased risk of pregnancy-induced hypertension and pre-eclampsia. At 20–24
weeks of gestation, waist circumference values in the range of 86–88 cm were
Chapter 7 225
shown to represent a predictor of GDM in the population of Brazilian women
(Bolognani et al., 2014). Sattar et al. (2001) suggested that waist circumference is
a simple measure which could form the basis for health promotion among women
who are planning to get pregnant, indicating a need for weight reduction. Further
epidemiological studies are warranted to determine whether abdominal waist
circumference is as sensitive as BMI for predictions of pregnancy complications
associated with maternal obesity and GDM. Newer techniques to measure visceral
fat, which are convenient and quick to perform in busy antenatal clinics, include the
use of bioimpedance assessment (Khalil et al., 2014). Bioimpedance analysis can
be used to identify the visceral fat compartment, which highly correlates with VAT
measurements obtained by computed tomography (Yamakage et al., 2014). A new
screening tool – used to define the obesity-associated risk of adverse pregnancy
outcomes using a composite phenotype measure, taking into account maternal BMI,
plasma TAG as a surrogate marker for effective fat storage in adipocytes, adipose
tissue distribution, adipose tissue inflammation status, and ectopic fat – would
represent a novel strategy and could be highly beneficial.
Adipose tissue is an active endocrine organ, secreting many adipokines shown to
be linked to obesity, insulin resistance and T2DM in the non-pregnant population.
This thesis explored isolated VAT adipocyte adipokine secretion in basal or
activated (LPS-stimulated) conditions in healthy and BMI-matched GDM women. In
this study, there was no evidence for higher VAT adipocyte inflammatory adipokine
release in either basal or stimulated conditions in GDM compared to controls.
However, this conclusion can only be drawn with caution, as there was insufficient
recruitment for the study to be sufficiently representative to identify significant
differences. If similar results were confirmed with larger sample size, this data might
suggest that adipokine release is related to obesity, and due to BMI-matching of our
groups we did not observe differences between GDM and control groups.
Alternatively, adipokine release could have been altered in SAT, which was not
assessed in this study. Furthermore, pregnancy is considered to be a state of low-
grade inflammation, especially in the third trimester, and it is not clear whether there
is a difference in adipokine levels from adipocytes in response to obesity in
pregnancy. In the current study, consistent with the adipokine secretion from VAT
adipocyte findings, there were no significant differences in inflammatory gene
expression in either SAT or VAT adipocytes from GDM compared to controls.
Similarly, other genes involved in adipocyte differentiation, lipid storage, lipid and
Chapter 7 226
glucose metabolism, and angiogenesis gene expression were not different in GDM
compared to controls.
The data collected on adipocyte inflammation is limited by the incomplete analysis
of all tissues, and low sample size. At present, the data provides no evidence for the
role of VAT inflammation in GDM. This could suggest that adipocytes are not the
main contributing factor per se to the low-grade inflammation observed in obese and
GDM pregnancy. This is probably because infiltrating inflammatory cells may be of
more importance than adipocyte cytokine production. Other studies have focused
more on the role of inflammatory cells that infiltrate adipose tissue. Gene profile
analysis of isolated SAT adipocytes and SVF from obese non-pregnant individuals,
after following a very low-calorie diet for 28 days, revealed that only 13% of
differentially expressed genes related to inflammation were expressed in adipocytes
in obese individuals compared to lean controls (Clément et al., 2004). The
inflammation-related genes are mainly expressed in cells of the SVF of adipose
tissue, which include the macrophages (Clément et al., 2004). However, it would be
useful to discount the adipocyte’s role in inflammatory cytokine production if the
results presented here could be confirmed by a larger sample size. Further studies
of inflammatory gene expression on the isolated SVF fraction or whole adipose
tissue explants could provide insight into adipose tissue inflammation in GDM.
Adipocytes could be viewed as the primary initiating factor for macrophage
activation and recruitment when adipose tissue becomes dysfunctional, which
subsequently leads to adipose tissue inflammation through enhanced macrophage
and immune cell recruitment. Therefore, the determination of adipose tissue cell
densities of activated (cfms+) and total (CD68+) macrophages could be an
interesting analysis to perform on the current study samples. Furthermore, a wide
range of protein factors, including various chemokines, which are known to be
secreted from adipose tissue to attract immune cells, could be studied further, such
as MCP-1 and Stromal cell-derived factor 1 (SDF1). SDF1 is a novel chemotactic
factor secreted from adipose tissue, mainly by cells of SVF, and might be involved
in the recruitment of lymphocytes.
The placenta is another potential site of inflammation during pregnancy. The
placenta is able to produce inflammatory cytokines, and has the capability to
respond to a variety of inflammatory stimuli. It was found that the secretory function
of the placenta contributes to local and systemic cytokine levels. The placenta
Chapter 7 227
secretes cytokines similar to those derived from adipose tissue. Under the
hypothesis suggesting that the activation of inflammatory pathways is necessary to
induce gestational insulin resistance towards the third trimester, placental cytokines
could contribute to low-grade inflammation at the third trimester of pregnancy.
Alternatively, placental hormones could enhance the pre-pregnancy inflammatory
status of adipose tissue in pregnancies complicated by maternal obesity and GDM.
However, the relative contribution of the placenta to low-grade inflammation in
obese and GDM pregnancy is yet to be determined. Under the proposed overspill
hypothesis, ectopic fat in the placenta could enhance the inflammatory status. FFA
deposition in the placenta could potentially contribute to macrophage accumulation
in the placenta. Thus, the study of the placental contribution to low-grade
inflammation in women with GDM might provide insight into the potential
mechanisms for communicating the metabolic disease to the fetus. Unfortunately,
in the current study, we could not collect placenta samples due to having limited lab
personnel able to assist with its collection.
The final objective of this thesis was to test whether VLDL could be the main carrier
for DHA at the critical time of neural tube closure. Given that the liver is the primary
site for de novo LC-PUFA synthesis, and there was a three-fold increase in VLDL
synthesis by the liver during pregnancy, we hypothesised that DHA is carried out by
VLDL in early pregnancy. However, our analysis showed that, contrary to our
hypothesis, DHA was not carried out by VLDL in early pregnancy. Subsequent
analysis of these samples by our collaborator showed that HDL is the primary carrier
of DHA throughout gestation, similar to the non-pregnant population. HDL is an ideal
carrier for DHA at the very important time of neuronal development, as its
antioxidant and anti-inflammatory properties could protect DHA from oxidation.
Considering the important role played by LC-PUFAs in fetal visual, behavioural and
cognitive development, the study of DHA metabolism in pregnancies complicated
by GDM is of interest. Thomas et al. (2005) showed that offspring of mothers with
GDM have lower plasma DHA level than neonates of healthy mothers. Infants born
to mothers with GDM demonstrate lower cognitive performance (Hod et al., 1999),
attention span, and face more than twice the risk of language impairment than
infants born to mothers without diabetes (Dionne et al., 2008). This was attributed
to reduced placental transfer of DHA in GDM (Wijendran et al., 2000). However, the
underlying mechanisms for reduced placental DHA transfer to the fetus of GDM
mothers are not known yet. It is not known whether placental inflammation interferes
Chapter 7 228
with lipid metabolism pathways, affecting the transfer of DHA in women with GDM.
Thus, further investigation of the influence of placental inflammation on the
regulation of maternal–fetal DHA transport is warranted. Furthermore, the study of
HDL composition in GDM pregnancy to determine the DHA concentration compared
to healthy pregnancy has not yet been researched. DHA supplementation of 600 mg
DHA was found to enhance maternal but not fetal DHA status in pregnancy
complicated by GDM (Min et al., 2016). This suggests that the transfer of DHA
across the placenta is impaired in GDM. Further investigation of the clinical
implications of reduced DHA level in offspring of mothers with GDM, and the optimal
clinical management to reduce the neurodevelopmental impact on GDM neonates,
is warranted.
There were significant strengths to this study. The epidemiology study provided
detailed demographic and obstetric outcomes analysis among the greatly diverse
Greater Glasgow and Clyde population, using data linkage analysis of two robust
datasets. The associations between maternal obesity and a wide range of adverse
pregnancy outcomes were examined, and the effect of race and social economic
status on various obstetric outcomes was accounted for – factors which were not
usually studied in previous research. The study of SAT and VAT adipocytes in
women with GDM compared to BMI-matched controls provided, for the first time,
extensive adipocyte functional measures in women with GDM, including adipocyte
size, and lipolytic and secretory function. We have studied isolated adipocytes rather
than whole adipose tissue samples to clearly identify the role of the adipocyte in the
development of insulin resistance during GDM pregnancy. Thus, our results were
not confounded by immune and other cells in the adipose tissue. This is an area
where the current available literature is very limited, especially in the context of
pregnancy and GDM. The VLDL FA composition study provided samples from the
early pregnancy period, which is rarely studied in pregnancy, because it is difficult
to assess in a free-living population, a very critical for embryo neuronal
development. The strengths of the methodologies employed in this study were
discussed in detail in the relevant chapters.
The limitations of the current study should also be considered. In the epidemiology
study, BMI was used as a measure of obesity. However, alternative measures of
abdominal obesity such as waist circumference, waist/hip ratio and skin-fold
thickness could have been used, but were not available in the dataset I used, are
Chapter 7 229
difficult to record at a population level, and can be unreliable in pregnant women.
Moreover, this study might not be representative of other settings, or generalisable
to other populations, but it does confirm the work of multiple previous investigations.
The study of adipocyte function in GDM was limited by the cross-sectional design,
which does not provide any information about the adipose tissue changes during
pregnancy. However, a longitudinal study design would be difficult to conduct with
pregnant women, because the required repeated intra-abdominal procedure during
pregnancy would be difficult for pregnant women to tolerate. Another limitation
involved adipose tissue inflammation only being assessed in adipocytes, which may
not be the main cell contributing to adipokine secretion in adipose tissue. The main
limitation of the VLDL FA composition in the early pregnancy study was that the
women participants were undergoing in vitro fertilisation, and this might not be
considered a “normal” pregnancy population. However, the women had a natural
menstrual cycle, meaning there was no interference of exogenous hormones used
in cycle reconstruction on their metabolic adaptation to pregnancy. The study of this
population provided us with accurately timed periconceptual and early pregnancy
blood samples that would be extremely difficult to obtain from a free-living
population.
In this thesis, much useful data was collected, which has a bearing on current
ongoing research in maternal obesity, GDM and clinical practice. Although the
epidemiology study provided evidence that GDM prevalence remains low in the
Greater Glasgow and Clyde population, maternal obesity and its associated risks
still represent a great burden on clinical resources. The study of adipocyte function
in GDM adds evidence to the existing literature, showing that adipocyte dysfunction
in GDM could be one of the underlying pathophysiological mechanisms for GDM
and adverse pregnancy complications among obese mothers. The early pregnancy
study provides evidence that VLDL is not the carrier of DHA in early pregnancy.
In conclusion, in a single health board of Scotland’s population, there was a notable
risk of maternal obesity and GDM, which predisposes mothers to several obstetric
complications and adverse outcomes. Furthermore, this study provides evidence
that VAT adipocytes are dysfunctional in GDM pregnancy compared to healthy BMI-
matched controls. Our data did not provide evidence of adipocyte inflammation in
GDM pregnancy. However, the effects of SVF and macrophages were not studied;
therefore, their possible contribution to adipose tissue inflammation cannot be
Chapter 7 230
disregarded. Further collection of samples is recommended to improve the power
of the current study in order to reach conclusions regarding VAT FCISI and
adipocyte inflammation, as the current study was underpowered with regard to
detecting significant differences. Finally, the data presented in this thesis has shown
that HDL, and not VLDL, is the preferred lipoprotein in terms of DHA transport across
the pregnancy timeline, possibly because of HDL’s important antioxidant and anti-
inflammatory properties that may protect DHA from oxidation. Therefore, the study
of HDL metabolism in GDM pregnancy could be of particular importance to provide
insight into the neurodevelopmental impacts of reduced DHA levels in the neonates
of mothers with GDM.
231
Appendices
PATIENT INFORMATION LEAFLET Adipose Tissue, Blood Vessel and Placental Function in Pregnancy (Pregnant Participants) Researchers: Dr Amaal Alrehaili Postgraduate Researcher Dr Sharon Mackin Postgraduate Researcher Dr Patamat Patapirunhakit Postgraduate Researcher Dr Kirsten Mitchell Postgraduate Researcher Mrs Fiona Jordan Senior Research Technician
Institute of Cardiovascular and Medical Sciences Level 5, Gardiner Lab (Lab 535), Wolfson Link Building University of Glasgow, G12 8QQ, Glasgow
Tel: 0141 330 2821
Dr Dilys Freeman BSc (Hons), PhD Senior Lecturer, Principal Investigator Institute of Cardiovascular and Medical Sciences Room 534, Wolfson Link Building University of Glasgow, G12 8QQ, Glasgow Tel: 0141 330 2299
We would like to invite you to take part in a research study. Before you decide you need to understand why the research is being done and what it would involve for you. Please take time to read the following information carefully. Talk to others about the study if you wish. Part 1 tells you the purpose of this study and what will happen to you if you take part.
Part 2 gives you more detailed information about the conduct of the study. Part 3 provides information on the General Data Protection Regulations (GDPR) Ask us if there is anything that is not clear, or, if you would like more information. Take time to decide whether or not you wish to take part. PART 1 1. What is the purpose of the study? We are interested in how blood, fat tissue and the afterbirth (placenta) function in pregnancy and how these tissues can influence blood vessel function in the mother and the baby. This is important as blood, fat tissue and blood vessel function may play a prominent role in achieving a successful outcome i.e. a healthy mother and baby. In some instances, we are interested in obtaining fat tissue from different body
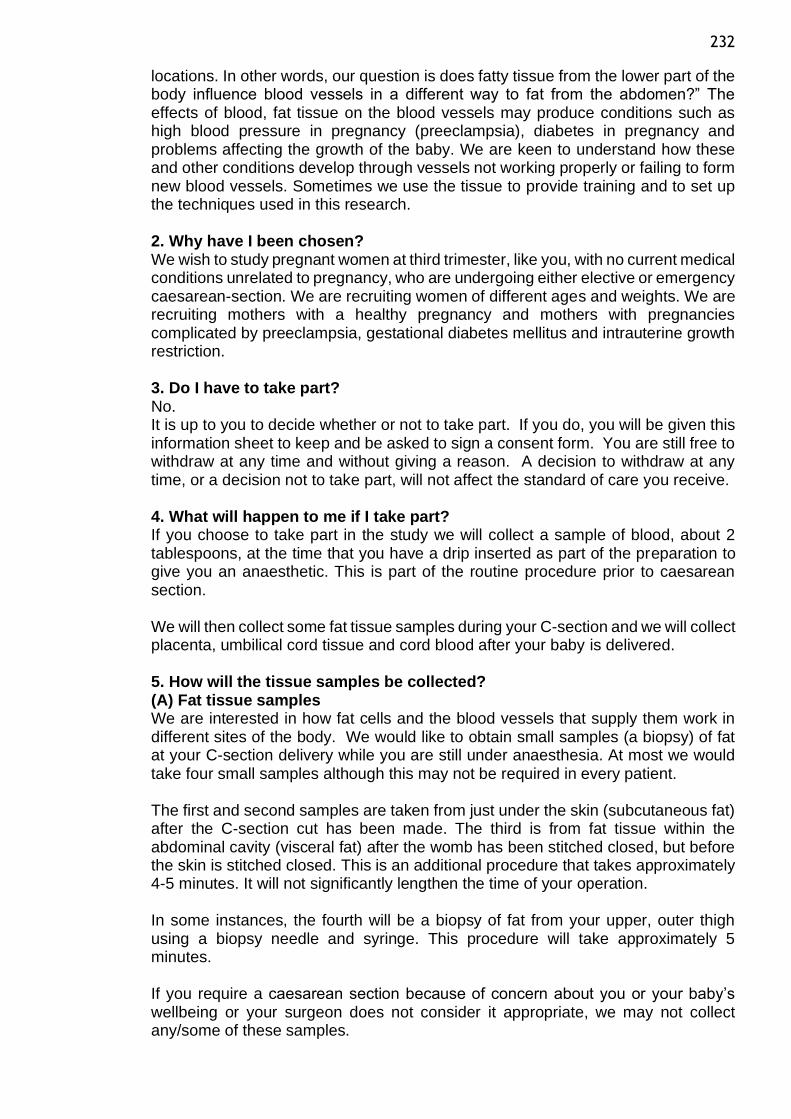
232
locations. In other words, our question is does fatty tissue from the lower part of the body influence blood vessels in a different way to fat from the abdomen?” The effects of blood, fat tissue on the blood vessels may produce conditions such as high blood pressure in pregnancy (preeclampsia), diabetes in pregnancy and problems affecting the growth of the baby. We are keen to understand how these and other conditions develop through vessels not working properly or failing to form new blood vessels. Sometimes we use the tissue to provide training and to set up the techniques used in this research. 2. Why have I been chosen? We wish to study pregnant women at third trimester, like you, with no current medical conditions unrelated to pregnancy, who are undergoing either elective or emergency caesarean-section. We are recruiting women of different ages and weights. We are recruiting mothers with a healthy pregnancy and mothers with pregnancies complicated by preeclampsia, gestational diabetes mellitus and intrauterine growth restriction. 3. Do I have to take part? No. It is up to you to decide whether or not to take part. If you do, you will be given this information sheet to keep and be asked to sign a consent form. You are still free to withdraw at any time and without giving a reason. A decision to withdraw at any time, or a decision not to take part, will not affect the standard of care you receive. 4. What will happen to me if I take part? If you choose to take part in the study we will collect a sample of blood, about 2 tablespoons, at the time that you have a drip inserted as part of the preparation to give you an anaesthetic. This is part of the routine procedure prior to caesarean section. We will then collect some fat tissue samples during your C-section and we will collect placenta, umbilical cord tissue and cord blood after your baby is delivered. 5. How will the tissue samples be collected? (A) Fat tissue samples We are interested in how fat cells and the blood vessels that supply them work in different sites of the body. We would like to obtain small samples (a biopsy) of fat at your C-section delivery while you are still under anaesthesia. At most we would take four small samples although this may not be required in every patient. The first and second samples are taken from just under the skin (subcutaneous fat) after the C-section cut has been made. The third is from fat tissue within the abdominal cavity (visceral fat) after the womb has been stitched closed, but before the skin is stitched closed. This is an additional procedure that takes approximately 4-5 minutes. It will not significantly lengthen the time of your operation. In some instances, the fourth will be a biopsy of fat from your upper, outer thigh using a biopsy needle and syringe. This procedure will take approximately 5 minutes. If you require a caesarean section because of concern about you or your baby’s wellbeing or your surgeon does not consider it appropriate, we may not collect any/some of these samples.

233
(B)Samples from the placenta (afterbirth) We would like to gain information about how the placenta (afterbirth) functions during pregnancy and we would like to use umbilical cord cells to understand how blood vessels function. Normally the placenta and its attached umbilical cord are delivered after the baby and it is discarded because it has completed its function. In our study, instead of the afterbirth being discarded, the blood retained in the cord will be collected and the placental and umbilical cord tissue will be passed onto the laboratory where it will be studied. 6. What do I have to do? Your participation in the study will end once the aforementioned samples have been collected. 7. What are the possible disadvantages and risks of taking part? There are no disadvantages to your baby by taking part in this study. There is a minimal extra risk to you of abdominal bleeding from small vessels in the fat layers over and above that associated with a Caesarean section when the fat samples are collected. As noted above it may also extend your operation by a few minutes. There is a very small risk of bruising associated with the needle biopsy from your upper thigh should this sample be collected; however this is no greater than what would be expected following a blood sample taken from the arm. 8. What are the possible benefits of taking part? There is no direct benefit for you in taking part in this study. We hope that the information we get from this study will help improve the care of women who develop problems in pregnancy. 10. What if there is a problem? The samples will be collected at the discretion of the surgeon responsible for your care. If at any point the surgeon feels it is not appropriate to take samples then they will not be taken. If you have a concern about any aspect of this study, you should ask to speak with the researchers who will do their best to answer your questions. The contact numbers are provided on this form. If you remain unhappy and wish to complain formally, you can do so through the NHS complaints procedure. Details can be obtained from the hospital. 11. Will my taking part in the study be kept confidential? Yes. All the information which we collect will remain completely confidential.
If the information in Part 1 has interested you and you are considering participation, please read the additional information in Part 2 and Part 3 before making any decision.

234
PART 2 12. What if relevant new information becomes available? Since your participation in the study involves a one-off collection of tissue future new information will not affect the tissue collection. New information may suggest modifications and improvement to our laboratory analysis which will not directly affect you. 13. What will happen if I don’t want to carry on with the study? If you withdraw from the study, we will retain the data that has been collected up to your withdrawal. However, should you wish for samples and data to be destroyed we will comply with this request. 14. What if there is a problem? If you have a concern about any aspect of this study, you should ask to speak with the researchers who will do their best to answer your questions. The contact numbers are provided on this form. If you remain unhappy and wish to complain formally, you can do so through the NHS complaints procedure. Details can be obtained from the hospital. In the event that something does go wrong and you are harmed during the research study, there are no special compensation arrangements. If you are harmed and this is due to someone’s negligence, then you may have grounds for a legal action for compensation against NHS Greater Glasgow and Clyde, but you may have to pay your legal costs. The normal National Health Service complaints mechanisms will still be available to you. 15. Will my taking part in this study be kept confidential? Yes. All the information which we collect will remain completely confidential. Any information about you which leaves the hospital will have your name and address removed so you cannot be identified from it. If you join the study, some of the data collected for the study may be looked at by authorised persons from the University of Glasgow. They may also be looked at by people or representatives of regulatory authorities and by authorised people to check that the study is being carried out correctly. 16. What will happen to any tissue samples or data that I give? Data and tissue samples collected from the study are retained by the University of Glasgow. Sometimes new research indicates further tests that would expand the knowledge coming from the study and we can use the archived material to carry out additional tests. This allows us to maximise the amount of information on pregnancy complications that we can get from the study. Anonymised data and samples may be shared with collaborators in other institutions who may be able to offer specialised techniques that we do not have in Glasgow. 17. What will happen to the results of the research study? New information that we gain from the study will be published in scientific journals. No specific individual from whom we have collected tissue will be identified in these publications. These publications are available for all to read. 18. Who is organising and funding the research?

235
This research will be funded by grants from the Saudi Arabian Cultural Bureau, the Siriraj hospital, Mahidol University, Thailand and the Glasgow Children’s Hospital Charity to the University of Glasgow. This work is supervised by Dr Dilys Freeman from Institute of Cardiovascular and Medical Sciences, University of Glasgow. 19. Who has reviewed the study? All research in the NHS is looked at by an independent group of people, called a Research Ethics Committee to protect your safety, rights, wellbeing and dignity. This study has been reviewed and given favourable opinion by the West of Scotland Research Ethics Committee 4. 20. Further Information Further information about this study may be obtained from Dr Amaal Alrehaili, Dr Sharon Mackin, Dr Patamat Panatapirunhakit, Dr Kirsten Mitchell or Dr Dilys Freeman Should you require independent advice regarding this study you can contact
Professor Mary Ann Lumsden Level 2, Reproductive & Maternal Medicine, Glasgow Royal Infirmary, New Lister Building Tel: 0141 201 8616

236
PART 3 General Data Protection Regulation (GDPR) Information
NHS Greater Glasgow & Clyde is the sponsor for this study based in Scotland. We will be using information from your medical records in order to undertake this study and will act as the data controller for this study. This means that we are responsible for looking after your information and using it properly. NHS Greater Glasgow and Clyde will keep identifiable information about you for 10 years after the study has
finished.
Your rights to access, change or move your information are limited, as we need to manage your information in specific ways in order for the research to be reliable and accurate. If you withdraw from the study, we will keep the information about you that we have already obtained. To safeguard your rights, we will use the minimum personally-identifiable information possible.
You can find out more about how we use your information by contacting Dr Dilys
Freeman
NHS Greater Glasgow and Clyde will collect information about you for the Adipose Tissue, Blood Vessel and Placental Function in Pregnancy from your maternity medical notes. This information will include your name, NHS number, postcode and date of birth and health information, which is regarded as a special category of information. We will use this information to relate our study findings to maternal characteristics (e.g. how does maternal age affect the research findings?) and to delivery characteristics (e.g. how are the research finding’s related to baby birth
weight?).
When you agree to take part in a research study, the information about your health and care may be provided to researchers running other research studies in this organisation and in other organisations. These organisations may be universities, NHS organisations or companies involved in health and care research in this country or abroad. Your information will only be used by organisations and researchers to conduct research in accordance with the UK Policy Framework for Health and Social
Care Research.
This information will not identify you and will not be combined with other information in a way that could identify you. The information will only be used for the purpose of health and care research, and cannot be used to contact you or to affect your care. It will not be used to make decisions about future services available to you, such as
insurance.
237
Adipose Tissue, Blood Vessel and Placental Function in Pregnancy
(Pregnant Participants)
Your Consent Please initial box
I confirm that I have read and understand the patient information sheet
dated 18th September 2018 (Pregnant Participants, Version 7) for the
above study. I have had the opportunity to consider the information,
ask questions and have had these answered satisfactorily.
I understand that my participation is voluntary and that I am free to withdraw without giving any reason, without my medical care or legal rights being affected.
I understand that relevant sections of my medical notes and data
collected during the study may be looked at by individuals from the
University of Glasgow, from regulatory authorities or from the NHS
Trust, where it is relevant to my taking part in this research. I give
permission for these individuals to have access to my records.
I understand that data and samples used in this study may be used in
relevant future research. I give my consent for this.
I consent to the collection of a blood sample before delivery and tissue
samples at delivery. These samples will be retained by the Institute of
Cardiovascular and Medical Sciences (ICAMS) at the University of
Glasgow.
I consent to the collection, processing, reporting and transfer within and outside Europe of my anonymised data for healthcare and/or medical research purposes.
I agree to take part in the above study
_______________ ________________ _________________ Name of Patient
Date Signature
_______________ ________________ __________________
Name of Person Date Signature
obtaining consent
When completed, 1 for patient; 1 for researcher site file; 1 (original) to be kept in medical notes
STUDY IDENTIFICATION NUMBER______________
238
List of References
ABRAMS, B. & PARKER, J. 1988. Overweight and pregnancy complications. International journal of obesity, 12, 293-303.
ADAMS, K. M., LI, H., NELSON, R. L., OGBURN, P. L. & DANILENKO-DIXON, D. R. 1998. Sequelae of unrecognized gestational diabetes. American journal of obstetrics and gynecology, 178, 1321-1332.
AGARWAL, M. M., DHATT, G. S. & SHAH, S. M. 2010. Gestational diabetes mellitus: simplifying the international association of diabetes and pregnancy diagnostic algorithm using fasting plasma glucose. Diabetes care, 33, 2018-2020.
AGUSTSSON, T., RYDÉN, M., HOFFSTEDT, J., VAN HARMELEN, V., DICKER, A., LAURENCIKIENE, J., ISAKSSON, B., PERMERT, J. & ARNER, P. 2007. Mechanism of increased lipolysis in cancer cachexia. Cancer research, 67, 5531-5537.
AJMERA, V. H., GUNDERSON, E. P., VANWAGNER, L. B., LEWIS, C. E., CARR, J. J. & TERRAULT, N. A. 2016. Gestational Diabetes Mellitus Is Strongly Associated With Non-Alcoholic Fatty Liver Disease. American Journal of Gastroenterology, 111, 658-664.
AKASH, M. S. H., REHMAN, K. & LIAQAT, A. 2018. Tumor Necrosis Factor-Alpha: Role in Development of Insulin Resistance and Pathogenesis of Type 2 Diabetes Mellitus. Journal of Cellular Biochemistry, 119, 105-110.
AL, M. D., VAN HOUWELINGEN, A. C., KESTER, A. D., HASAART, T. H., DE JONG, A. E. & HORNSTRA, G. 1995. Maternal essential fatty acid patterns during normal pregnancy and their
239
relationship to the neonatal essential fatty acid status. British Journal of Nutrition, 74, 55-68.
ALVAREZ, J., MONTELONGO, A., IGLESIAS, A., LASUNCION, M. & HERRERA, E. 1996. Longitudinal study on lipoprotein profile, high density lipoprotein subclass, and postheparin lipases during gestation in women. Journal of lipid research, 37, 299-308.
AMERICAN DIABETES ASSOCIATION 2015. Classification and diagnosis of diabetes. Diabetes Care, 38, S8-S16.
ANDERSSON, C. X., SOPASAKIS, V. R., WALLERSTEDT, E. & SMITH, U. 2007. Insulin antagonizes interleukin-6 signaling and is anti-inflammatory in 3T3-L1 adipocytes. Journal of Biological Chemistry, 282, 9430-9435.
ANGULO, P. 2002. Nonalcoholic fatty liver disease. New England Journal of Medicine, 346, 1221-1231.
ANWAR, H., FISCHBACHER, C., LEESE, G., LINDSAY, R., MCKNIGHT, J. & WILD, S. 2011. Assessment of the under‐reporting of diabetes in hospital admission data: a study from the Scottish Diabetes Research Network Epidemiology Group. Diabetic Medicine, 28, 1514-1519.
ARAÚJO, J. R., CORREIA-BRANCO, A., RAMALHO, C., KEATING, E. & MARTEL, F. 2013. Gestational diabetes mellitus decreases placental uptake of long-chain polyunsaturated fatty acids: involvement of long-chain acyl-CoA synthetase. The Journal of Nutritional Biochemistry, 24, 1741-1750.
ARMSTRONG, M., HAZLEHURST, J., HULL, D., GUO, K., BORROWS, S., YU, J., GOUGH, S., NEWSOME, P. & TOMLINSON, J. 2014.
240
Abdominal subcutaneous adipose tissue insulin resistance and lipolysis in patients with non‐alcoholic steatohepatitis. Diabetes, Obesity and Metabolism, 16, 651-660.
ARNER, P., ANDERSSON, D. P., THÖRNE, A., WIRÉN, M., HOFFSTEDT, J., NÄSLUND, E., THORELL, A. & RYDÉN, M. 2013. Variations in the size of the major omentum are primarily determined by fat cell number. The Journal of Clinical Endocrinology & Metabolism, 98, E897-E901.
AUGUSTINE, A. H., LOWENSTEIN, L. M., HARRIS, W. S., SHEARER, G. C. & BLOCK, R. C. 2014. Treatment with omega-3 fatty acid ethyl-ester alters fatty acid composition of lipoproteins in overweight or obese adults with insulin resistance. Prostaglandins, Leukotrienes and Essential Fatty Acids, 90, 69-75.
AUNE, D., SAUGSTAD, O. D., HENRIKSEN, T. & TONSTAD, S. 2014. Maternal body mass index and the risk of fetal death, stillbirth, and infant death: a systematic review and meta-analysis. Jama, 311, 1536-1546.
BARKER, D. J. 1998. In utero programming of chronic disease. Clinical science, 95, 115-128.
BASU, S., HAGHIAC, M., SURACE, P., CHALLIER, J.
C., GUERRE‐MILLO, M., SINGH, K., WATERS, T., MINIUM, J., PRESLEY, L. & CATALANO, P. M. 2011. Pregravid obesity associates with increased maternal endotoxemia and metabolic inflammation. Obesity, 19, 476-482.
BELFIORE, A., FRASCA, F., PANDINI, G., SCIACCA, L. & VIGNERI, R. 2009. Insulin receptor isoforms and insulin receptor/insulin-like growth factor
241
receptor hybrids in physiology and disease. Endocrine reviews, 30, 586-623.
BELLAMY, L., CASAS, J.-P., HINGORANI, A. D. & WILLIAMS, D. 2009. Type 2 diabetes mellitus after gestational diabetes: a systematic review and meta-analysis. The Lancet, 373, 1773-1779.
BERKOWITZ, G. S., LAPINSKI, R. H., WEIN, R. & LEE, D. 1992. Race/Ethnicity and Other Risk Factors for Gestational Diabetes. American Journal of Epidemiology, 135, 965-973.
BILHARTZ, T. D., BILHARTZ, P. A., BILHARTZ, T. N. & BILHARTZ, R. D. 2011. Making use of a natural stress test: pregnancy and cardiovascular risk. Journal of Women's Health, 20, 695-701.
BILOUS, R. 2015. Diagnosis of gestational diabetes, defining the net, refining the catch. Diabetologia, 58, 1965-1968.
BLÜHER, M. 2013. Adipose tissue dysfunction contributes to obesity related metabolic diseases. Best practice & research Clinical endocrinology & metabolism, 27, 163-177.
BODEN, G. 2008. Obesity and Free Fatty Acids. Endocrinology and Metabolism Clinics of North America, 37, 635-646.
BODNAR, L. M., NESS, R. B., MARKOVIC, N. & ROBERTS, J. M. 2005. The risk of preeclampsia rises with increasing prepregnancy body mass index. Annals of epidemiology, 15, 475-482.
BOLOGNANI, C. V., DE SOUSA MOREIRA REIS, L. B., DE SOUZA, S. S., DIAS, A., RUDGE, M. V. C. & DE MATTOS PARANHOS CALDERON, I. 2014. Waist circumference in predicting gestational diabetes mellitus. The Journal of Maternal-Fetal & Neonatal Medicine, 27, 943-948.
242
BONELLIE, S., CHALMERS, J., GRAY, R., GREER, I., JARVIS, S. & WILLIAMS, C. 2008. Centile charts for birthweight for gestational age for Scottish singleton births. BMC Pregnancy and Childbirth, 8, 5.
BOULOUMIÉ, A., LOLMEDE, K., SENGENES, C., GALITZKY, J. & LAFONTAN, M. Angiogenesis in adipose tissue. Annales d'endocrinologie, 2002. 91.
BOZKURT, L., GÖBL, C. S., TURA, A., CHMELIK, M., PRIKOSZOVICH, T., KOSI, L., WAGNER, O., RODEN, M., PACINI, G. & GASTALDELLI, A. 2012. Fatty liver index predicts further metabolic deteriorations in women with previous gestational diabetes. PloS one, 7.
BRASAEMLE, D. L. 2007. Thematic review series: adipocyte biology. The perilipin family of structural lipid droplet proteins: stabilization of lipid droplets and control of lipolysis. Journal of lipid research, 48, 2547-2559.
BRASAEMLE, D. L., RUBIN, B., HARTEN, I. A., GRUIA-GRAY, J., KIMMEL, A. R. & LONDOS, C. 2000. Perilipin A increases triacylglycerol storage by decreasing the rate of triacylglycerol hydrolysis. Journal of Biological Chemistry, 275, 38486-38493.
BRAUN, J. E. & SEVERSON, D. L. 1992. Regulation of the synthesis, processing and translocation of lipoprotein lipase. Biochemical Journal, 287, 337-347.
BRAVO-FLORES, E., MANCILLA-HERRERA, I., ESPINO Y SOSA, S., ORTIZ-RAMIREZ, M., FLORES-RUEDA, V., IBARGÜENGOITIA-OCHOA, F., IBAÑEZ, C., ZAMBRANO, E., SOLIS-PAREDES, M. & PERICHART-PERERA, O. 2018.
243
Macrophage Populations in Visceral Adipose Tissue from Pregnant Women: Potential Role of Obesity in Maternal Inflammation. International journal of molecular sciences, 19, 1074.
BUCHANAN, T. A. 2001. Pancreatic B-cell defects in gestational diabetes: Implications for the pathogenesis and prevention of type 2 diabetes. Journal of Clinical Endocrinology and Metabolism, 86, 989-993.
BURDGE, G. C. & WOOTTON, S. A. 2002. Conversion of α-linolenic acid to eicosapentaenoic, docosapentaenoic and docosahexaenoic acids in young women. British Journal of Nutrition, 88, 411-420.
CAMERON, A. R., MORRISON, V. L., LEVIN, D., MOHAN, M., FORTEATH, C., BEALL, C., MCNEILLY, A. D., BALFOUR, D. J., SAVINKO, T. & WONG, A. K. 2016. Anti-inflammatory effects of metformin irrespective of diabetes status. Circulation research, 119, 652-665.
CAMPBELL, F. M., GORDON, M. J. & DUTTA-ROY, A. K. 1996. Preferential uptake of long chain polyunsaturated fatty acids by isolated human placental membranes. Molecular and Cellular Biochemistry, 155, 77-83.
CAMPBELL, S. & SOOTHILL, P. 1993. Detection and management of intrauterine growth retardation: a British approach. Ultrasound in obstetrics and gynaecology, 2, 1432-5.
CATALANO, P. M. 2010. Obesity, insulin resistance, and pregnancy outcome. Reproduction, 140, 365-371.
CATALANO, P. M., KIRWAN, J. P., HAUGEL-DE MOUZON, S. & KING, J. 2003. Gestational Diabetes and Insulin Resistance: Role in Short-
244
and Long-Term Implications for Mother and Fetus. The Journal of Nutrition, 133, 1674S-1683S.
CATALANO, P. M., NIZIELSKI, S. E., SHAO, J., PRESTON, L., QIAO, L. & FRIEDMAN, J. E. 2002. Downregulated IRS-1 and PPARγ in obese women with gestational diabetes: relationship to FFA during pregnancy. American Journal of Physiology-Endocrinology and Metabolism, 282, E522-E533.
CATALANO, P. M., ROMAN-DRAGO, N. M., AMINI, S. B. & SIMS, E. A. 1998. Longitudinal changes in body composition and energy balance in lean women with normal and abnormal glucose tolerance during pregnancy. American journal of obstetrics and gynecology, 179, 156-165.
CATALANO, P. M., TYZBIR, E. D., WOLFE, R. R., ROMAN, N. M., AMINI, S. B. & SIMS, E. A. 1992. Longitudinal changes in basal hepatic glucose production and suppression during insulin infusion in normal pregnant women. American journal of obstetrics and gynecology, 167, 913-919.
CEDERGREN, M. I. 2004. Maternal morbid obesity and the risk of adverse pregnancy outcome. Obstetrics & Gynecology, 103, 219-224.
CHALLIER, J., BASU, S., BINTEIN, T., MINIUM, J., HOTMIRE, K., CATALANO, P. & HAUGUEL-DE MOUZON, S. 2008. Obesity in pregnancy stimulates macrophage accumulation and inflammation in the placenta. Placenta, 29, 274-281.
CHALLIS, J. R., LOCKWOOD, C. J., MYATT, L., NORMAN, J. E., STRAUSS, J. F. & PETRAGLIA, F. 2009. Inflammation and pregnancy. Reproductive Sciences, 16, 206-215.
245
CHAPPELL, L. C., ENYE, S., SEED, P., BRILEY, A. L., POSTON, L. & SHENNAN, A. H. 2008. Adverse perinatal outcomes and risk factors for preeclampsia in women with chronic hypertension: a prospective study. Hypertension, 51, 1002-1009.
CHAVARRO, J. E., RICH-EDWARDS, J. W., ROSNER, B. A. & WILLETT, W. C. 2007. Diet and lifestyle in the prevention of ovulatory disorder infertility. Obstetrics and Gynecology, 110, 1050-1058.
CHEN, Y., QUICK, W. W., YANG, W., ZHANG, Y., BALDWIN, A., MORAN, J., MOORE, V., SAHAI, N. & DALL, T. M. 2009. Cost of gestational diabetes mellitus in the United States in 2007. Population health management, 12, 165-174.
CHRISTIAN, L. M. & PORTER, K. 2014. Longitudinal changes in serum proinflammatory markers across pregnancy and postpartum: effects of maternal body mass index. Cytokine, 70, 134-140.
CINTI, S., MITCHELL, G., BARBATELLI, G., MURANO, I., CERESI, E., FALOIA, E., WANG, S., FORTIER, M., GREENBERG, A. S. & OBIN, M. S. 2005. Adipocyte death defines macrophage localization and function in adipose tissue of obese mice and humans. Journal of lipid research, 46, 2347-2355.
CLAUSEN, T., DJUROVIC, S. & HENRIKSEN, T. 2001. Dyslipidemia in early second trimester is mainly a feature of women with early onset pre-eclampsia. British Journal of Obstetrics and gynaecology, 108, 1081-1087.
CLÉMENT, K., VIGUERIE, N., POITOU, C., CARETTE, C., PELLOUX, V., CURAT, C. A., SICARD, A., ROME, S., BENIS, A., ZUCKER, J. D., VIDAL, H., LAVILLE, M., BARSH, G. S.,
246
BASDEVANT, A., STICH, V., CANCELLO, R. & LANGIN, D. 2004. Weight loss regulates inflammation-related genes in white adipose tissue of obese subjects. FASEB Journal, 18, 1657-1669.
COCKELL, A. P. & POSTON, L. 1997. Flow-mediated vasodilatation is enhanced in normal pregnancy but reduced in preeclampsia. Hypertension, 30, 247-251.
COLE, T. 1988. Fitting smoothed centile curves to reference data. Journal of the Royal Statistical Society: Series A (Statistics in Society), 151, 385-406.
COLEMAN, R. A. & HAYNES, E. B. 1987. Synthesis and release of fatty acids by human trophoblast cells in culture. Journal of lipid research, 28, 1335-1341.
COLLIER, A., ABRAHAM, E. C., ARMSTRONG, J., GODWIN, J., MONTEATH, K. & LINDSAY, R. 2017. Reported prevalence of gestational diabetes in Scotland: The relationship with obesity, age, socioeconomic status, smoking and macrosomia, and how many are we missing? Journal of diabetes investigation, 8, 161-167.
COLOMIERE, M., PERMEZEL, M. & LAPPAS, M. 2010. Diabetes and obesity during pregnancy alter insulin signalling and glucose transporter expression in maternal skeletal muscle and subcutaneous adipose tissue. J Mol Endocrinol, 44, 213-223.
COLOMIERE, M., PERMEZEL, M., RILEY, C., DESOYE, G. & LAPPAS, M. 2009. Defective insulin signaling in placenta from pregnancies complicated by gestational diabetes mellitus. European Journal of Endocrinology, 160, 567-578.
247
COMBS, T. P., PAJVANI, U. B., BERG, A. H., LIN, Y., JELICKS, L. A., LAPLANTE, M., NAWROCKI, A. R., RAJALA, M. W., PARLOW, A. F. & CHEESEBORO, L. 2004. A transgenic mouse with a deletion in the collagenous domain of adiponectin displays elevated circulating adiponectin and improved insulin sensitivity. Endocrinology, 145, 367-383.
CROWTHER, C. A., HILLER, J. E., MOSS, J. R., MCPHEE, A. J., JEFFRIES, W. S. & ROBINSON, J. S. 2005. Effect of treatment of gestational diabetes mellitus on pregnancy outcomes. New England Journal of Medicine, 352, 2477-2486.
CURRY, A., VOGEL, I., SKOGSTRAND, K., DREWS, C., SCHENDEL, D., FLANDERS, W., HOUGAARD, D. M. & THORSEN, P. 2008. Maternal plasma cytokines in early-and mid-gestation of normal human pregnancy and their association with maternal factors. Journal of reproductive immunology, 77, 152-160.
CZECH, M. P. & CORVERA, S. 1999. Signaling mechanisms that regulate glucose transport. Journal of Biological Chemistry, 274, 1865-1868.
D'AMBROSI, F., CROVETTO, F., COLOSI, E., FABIETTI, I., CARBONE, F., TASSIS, B., MOTTA, S., BULFONI, A., FEDELE, L., ROSSI, G. & PERSICO, N. 2018. Maternal Subcutaneous and Visceral Adipose Ultrasound Thickness in Women with Gestational Diabetes Mellitus at 24-28 Weeks' Gestation. Fetal Diagnosis and Therapy, 43, 143-147.
DAS, U. N. 2001. Is insulin an antiinflammatory molecule? Nutrition, 17, 409-413.
DE GROOT, R. H., HORNSTRA, G., VAN HOUWELINGEN, A. C. & ROUMEN, F. 2004.
248
Effect of α-linolenic acid supplementation during pregnancy on maternal and neonatal polyunsaturated fatty acid status and pregnancy outcome. The American journal of clinical nutrition, 79, 251-260.
DE SOUZA, L. R., BERGER, H., RETNAKARAN, R., MAGUIRE, J. L., NATHENS, A. B., CONNELLY, P. W. & RAY, J. G. 2016. First-trimester maternal abdominal adiposity predicts dysglycemia and gestational diabetes mellitus in midpregnancy. Diabetes Care, 39, 61-64.
DE SOUZA, L. R., KOGAN, E., BERGER, H., ALVES, J. G., LEBOVIC, G., RETNAKARAN, R., MAGUIRE, J. L. & RAY, J. G. 2014. Abdominal adiposity and insulin resistance in early pregnancy. Journal of Obstetrics and Gynaecology Canada, 36, 969-975.
DENISON, F., NORWOOD, P., BHATTACHARYA, S., DUFFY, A., MAHMOOD, T., MORRIS, C., RAJA, E., NORMAN, J., LEE, A. & SCOTLAND, G. 2014. Association between maternal body mass index during pregnancy, short‐term morbidity, and
increased health service costs: a population‐based study. BJOG: An International Journal of Obstetrics & Gynaecology, 121, 72-82.
DESPRÉS, J.-P. & LEMIEUX, I. 2006. Abdominal obesity and metabolic syndrome. Nature, 444, 881-887.
DIAZ-RUIZ, A., GUZMAN-RUIZ, R., MORENO, N. R., GARCIA-RIOS, A., DELGADO-CASADO, N., MEMBRIVES, A., TÚNEZ, I., EL BEKAY, R., FERNÁNDEZ-REAL, J. M. & TOVAR, S. 2015. Proteasome dysfunction associated to oxidative stress and proteotoxicity in adipocytes
249
compromises insulin sensitivity in human obesity. Antioxidants & redox signaling, 23, 597-612.
DIDERHOLM, B., STRIDSBERG, M., EWALD, U., LINDEBERG‐NORDÉN, S. & GUSTAFSSON, J.
2005. Increased lipolysis in non‐obese pregnant women studied in the third trimester. BJOG: An International Journal of Obstetrics & Gynaecology, 112, 713-718.
DIONNE, G., BOIVIN, M., SÉGUIN, J. R., PÉRUSSE, D. & TREMBLAY, R. E. 2008. Gestational diabetes hinders language development in offspring. Pediatrics, 122, e1073-e1079.
DIVELLA, R., DE LUCA, R., ABBATE, I., NAGLIERI, E. & DANIELE, A. 2016. Obesity and cancer: the role of adipose tissue and adipo-cytokines-induced chronic inflammation. Journal of Cancer, 7, 2346.
DJELMIS, J., PAVIĆ, M., MULLIQI KOTORI, V., PAVLIĆ RENAR, I., IVANISEVIC, M. & ORESKOVIC, S. 2016. Prevalence of gestational diabetes mellitus according to IADPSG and NICE criteria. International Journal of Gynecology & Obstetrics, 135, 250-254.
DONG, Y., CHAUHAN, M., BETANCOURT, A., BELFORT, M. & YALLAMPALLI, C. 2018. Adipose tissue inflammation and adrenomedullin overexpression contribute to lipid dysregulation in diabetic pregnancies. The Journal of Clinical Endocrinology & Metabolism, 103, 3810-3818.
DONNELLY, K. L., SMITH, C. I., SCHWARZENBERG, S. J., JESSURUN, J., BOLDT, M. D. & PARKS, E. J. 2005. Sources of fatty acids stored in liver and secreted via lipoproteins in patients with nonalcoholic fatty liver disease. The Journal of clinical investigation, 115, 1343-1351.
250
DROLET, R., RICHARD, C., SNIDERMAN, A., MAILLOUX, J., FORTIER, M., HUOT, C., RHEAUME, C. & TCHERNOF, A. 2008. Hypertrophy and hyperplasia of abdominal adipose tissues in women. International journal of obesity, 32, 283-291.
DUBÉ, E., ETHIER-CHIASSON, M. & LAFOND, J. 2013. Modulation of cholesterol transport by insulin-treated gestational diabetes mellitus in human full-term placenta. Biology of reproduction, 88, 16, 1-10.
DUTTAROY, A. K. 2009. Transport of fatty acids across the human placenta: A review. Progress in Lipid Research, 48, 52-61.
EGAN, D. F., SHACKELFORD, D. B., MIHAYLOVA, M. M., GELINO, S., KOHNZ, R. A., MAIR, W., VASQUEZ, D. S., JOSHI, A., GWINN, D. M. & TAYLOR, R. 2011. Phosphorylation of ULK1 (hATG1) by AMP-activated protein kinase connects energy sensing to mitophagy. Science, 331, 456-461.
EHRENBERG, H. M., HUSTON-PRESLEY, L. & CATALANO, P. M. 2003. The influence of obesity and gestational diabetes mellitus on accretion and the distribution of adipose tissue in pregnancy. American journal of obstetrics and gynecology, 189, 944-948.
EL-CHAAR, D., FINKELSTEIN, S. A., TU, X., FELL, D. B., GAUDET, L., SYLVAIN, J., TAWAGI, G., WEN, S. W. & WALKER, M. 2013. The impact of increasing obesity class on obstetrical outcomes. Journal of Obstetrics and Gynaecology Canada, 35, 224-233.
ELLIS, J. M., FRAHM, J. L., LI, L. O. & COLEMAN, R. A. 2010. Acyl-coenzyme A synthetases in
251
metabolic control. Current opinion in lipidology, 21, 212.
ENDEMANN, D. H. & SCHIFFRIN, E. L. 2004. Endothelial dysfunction. Journal of the American Society of Nephrology, 15, 1983-1992.
ENGELI, S., FELDPAUSCH, M., GORZELNIAK, K., HARTWIG, F., HEINTZE, U., JANKE, J., MÖHLIG, M., PFEIFFER, A. F., LUFT, F. C. & SHARMA, A. M. 2003. Association between adiponectin and mediators of inflammation in obese women. Diabetes, 52, 942-947.
FAHRAEUS, L., LARSSON-COHN, U. & WALLENTIN, L. 1985. Plasma lipoproteins including high density lipoprotein subfractions during normal pregnancy. Obstetrics and gynecology, 66, 468-472.
FANTUZZI, G. 2005. Adipose tissue, adipokines, and inflammation. Journal of Allergy and Clinical Immunology, 115, 911-919.
FARLEY, D., TEJERO, M. E., COMUZZIE, A. G., HIGGINS, P. B., COX, L., WERNER, S. L., JENKINS, S. L., LI, C., CHOI, J. & DICK, E. 2009. Feto-placental adaptations to maternal obesity in the baboon. Placenta, 30, 752-760.
FENG, H., SU, R., SONG, Y., WANG, C., LIN, L., MA, J. & YANG, H. 2016. Positive correlation between enhanced expression of TLR4/MyD88/NF-κB with insulin resistance in placentae of gestational diabetes mellitus. PloS one, 11.
FISHER, E. A. & GINSBERG, H. N. 2002. Complexity in the secretory pathway: the assembly and secretion of apolipoprotein B-containing lipoproteins. Journal of Biological Chemistry, 277, 17377-17380.
252
FISHER, E. A., PAN, M., CHEN, X., WU, X., WANG, H., JAMIL, H., SPARKS, J. D. & WILLIAMS, K. J. 2001. The triple threat to nascent apolipoprotein B Evidence for multiple, distinct degradative pathways. Journal of Biological Chemistry, 276, 27855-27863.
FRANCKHAUSER, S., MUÑOZ, S., PUJOL, A., CASELLAS, A., RIU, E., OTAEGUI, P., SU, B. & BOSCH, F. 2002. Increased fatty acid re-esterification by PEPCK overexpression in adipose tissue leads to obesity without insulin resistance. Diabetes, 51, 624-630.
FRAYN, K., FIELDING, B. & SUMMERS, L. 1997. Obesity and the adipocyte. Investigation of human adipose tissue metabolism in vivo. Journal of Endocrinology, 155, 187-189.
FREEMAN, D. J. 2010. Effects of maternal obesity on fetal growth and body composition: implications for programming and future health. Seminars in Fetal and Neonatal Medicine, 15, 113-118.
FREEMAN, D. J. & MEYER, B. J. 2017. Brain food for babies. The Biochemist, 39, 26-29.
FRIEDMAN, J. E., ISHIZUKA, T., SHAO, J., HUSTON, L., HIGHMAN, T. & CATALANO, P. 1999. Impaired glucose transport and insulin receptor tyrosine phosphorylation in skeletal muscle from obese women with gestational diabetes. Diabetes, 48, 1807-1814.
GARTON, A. J., CAMPBELL, D. G., COHEN, P. & YEAMAN, S. J. 1988. Primary structure of the site on bovine hormone‐sensitive lipase
phosphorylated by cyclic AMP‐dependent protein kinase. FEBS letters, 229, 68-72.
GARVEY, W. T., MAIANU, L., ZHU, J.-H., HANCOCK, J. A. & GOLICHOWSKI, A. M. 1993. Multiple
253
defects in the adipocyte glucose transport system cause cellular insulin resistance in gestational diabetes: heterogeneity in the number and a novel abnormality in subcellular localization of GLUT4 glucose transporters. Diabetes, 42, 1773-1785.
GEALEKMAN, O., GUSEVA, N., HARTIGAN, C., APOTHEKER, S., GORGOGLIONE, M., GURAV, K., TRAN, K.-V., STRAUBHAAR, J., NICOLORO, S. & CZECH, M. P. 2011. Depot-specific differences and insufficient subcutaneous adipose tissue angiogenesis in human obesity. Circulation, 123, 186-194.
GESINK LAW, D., MACLEHOSE, R. F. & LONGNECKER, M. P. 2006. Obesity and time to pregnancy. Human Reproduction, 22, 414-420.
GIACCA, A., XIAO, C., OPRESCU, A. I., CARPENTIER, A. C. & LEWIS, G. F. 2011. Lipid-induced pancreatic β-cell dysfunction: focus on in vivo studies. American Journal of Physiology-Endocrinology And Metabolism, 300, E255-E262.
GOLDRICK, R. & MCLOUGHLIN, G. 1970. Lipolysis and lipogenesis from glucose in human fat cells of different sizes: Effects of insulin, epinephrine, and theophylline. The Journal of clinical investigation, 49, 1213-1223.
GOOSSENS, G. H. 2008. The role of adipose tissue dysfunction in the pathogenesis of obesity-related insulin resistance. Physiology & behavior, 94, 206-218.
GOURGARI, E., PLAYFORD, M. P., CAMPIA, U., DEY, A. K., COGEN, F., GUBB-WEISER, S., METE, M., DESALE, S., SAMPSON, M. & TAYLOR, A. 2018. Low cholesterol efflux capacity and abnormal lipoprotein particles in youth with
254
type 1 diabetes: a case control study. Cardiovascular diabetology, 17, 158.
GRANNEMAN, J. G., MOORE, H.-P. H., KRISHNAMOORTHY, R. & RATHOD, M. 2009. Perilipin controls lipolysis by regulating the interactions of AB-hydrolase containing 5 (Abhd5) and adipose triglyceride lipase (Atgl). Journal of Biological Chemistry, 284, 34538-34544.
GRANTZ, K. L., KIM, S., GROBMAN, W. A., NEWMAN, R., OWEN, J., SKUPSKI, D., GREWAL, J., CHIEN, E. K., WING, D. A. & WAPNER, R. J. 2018. Fetal growth velocity: the NICHD fetal growth studies. American journal of obstetrics and gynecology, 219, 285. e1-285. e36.
GREENBERG, A. S., EGAN, J. J., WEK, S. A., GARTY, N. B., BLANCHETTE-MACKIE, E. J. & LONDOS, C. 1991. Perilipin, a major hormonally regulated adipocyte-specific phosphoprotein associated with the periphery of lipid storage droplets. Journal of Biological Chemistry, 266, 11341-11346.
GRIFFIN, B. A., FREEMAN, D. J., TAIT, G. W., THOMSON, J., CASLAKE, M. J., PACKARD, C. J. & SHEPHERD, J. 1994. Role of plasma triglyceride in the regulation of plasma low density lipoprotein (LDL) subfractions: relative contribution of small, dense LDL to coronary heart disease risk. Atherosclerosis, 106, 241-253.
GUENTHER, M., JAMES, R., MARKS, J., ZHAO, S., SZABO, A. & KIDAMBI, S. 2014. Adiposity distribution influences circulating adiponectin levels. Translational Research, 164, 270-277.
GUESNET, P. & ALESSANDRI, J.-M. 2011. Docosahexaenoic acid (DHA) and the developing
255
central nervous system (CNS)–implications for dietary recommendations. Biochimie, 93, 7-12.
GUILHERME, A., VIRBASIUS, J. V., PURI, V. & CZECH, M. P. 2008. Adipocyte dysfunctions linking obesity to insulin resistance and type 2 diabetes. Nature reviews Molecular cell biology, 9, 367-377.
GUSTAFSON, B., GOGG, S., HEDJAZIFAR, S., JENNDAHL, L., HAMMARSTEDT, A. & SMITH, U. 2009. Inflammation and impaired adipogenesis in hypertrophic obesity in man. American Journal of Physiology-Endocrinology and Metabolism, 297, E999-E1003.
HAGGARTY, P. 2002. Placental regulation of fatty acid delivery and its effect on fetal growth—a review. Placenta, 23, S28-S38.
HAJRI, T. & ABUMRAD, N. A. 2002. Fatty acid transport across membranes: relevance to nutrition and metabolic pathology. Annual review of nutrition, 22, 383-415.
HANEBUTT, F. L., DEMMELMAIR, H., SCHIESSL, B., LARQUÉ, E. & KOLETZKO, B. 2008. Long-chain polyunsaturated fatty acid (LC-PUFA) transfer across the placenta. Clinical Nutrition, 27, 685-693.
HARLEV, A., ARICHA-TAMIR, B., SHACO-LEVY, R., TARNOVSCKI, T., BASHAN, N., RUDICH, A., SHEINER, E., PRESS, F. & WIZNITZER, A. 2014. Macrophage infiltration and stress-signaling in omental and subcutaneous adipose tissue in diabetic pregnancies. The Journal of Maternal-Fetal & Neonatal Medicine, 27, 1189-1194.
HENDLER, I., GOLDENBERG, R. L., MERCER, B. M., IAMS, J. D., MEIS, P. J., MOAWAD, A. H., MACPHERSON, C. A., CARITIS, S. N.,
256
MIODOVNIK, M. & MENARD, K. M. 2005. The Preterm Prediction Study: association between maternal body mass index and spontaneous and indicated preterm birth. American journal of obstetrics and gynecology, 192, 882-886.
HERNÁEZ CAMBA, Á., SORIA FLORIDO, M. T., SCHRÖDER, H., ROS RAHOLA, E., PINTÓ SALA, X., ESTRUCH RIBA, R., SALAS SALVADÓ, J., CORELLA PIQUER, D., ARÓS, F. & SERRA MAJEM, L. 2019. Role of HDL function and LDL atherogenicity on cardiovascular risk: a comprehensive examination. PLoS One, 2019, vol. 14, núm. 6: e0218533.
HERRERA, E. 2002a. Implications of Dietary Fatty Acids During Pregnancy on Placental, Fetal and Postnatal Development—A Review. Placenta, 23, S9-S19.
HERRERA, E. 2002b. Lipid metabolism in pregnancy and its consequences in the fetus and newborn. Endocrine, 19, 43-55.
HERRERA, E., AMUSQUIVAR, E., LÓPEZ-SOLDADO, I. & ORTEGA, H. 2006. Maternal Lipid Metabolism and Placental Lipid Transfer. Hormone Research in Paediatrics, 65(suppl 3), 59-64.
HERRERA, E. & ORTEGA-SENOVILLA, H. 2018. Implications of lipids in neonatal body weight and fat mass in gestational diabetic mothers and non-diabetic controls. Current diabetes reports, 18, 7.
HESLEHURST, N., RANKIN, J., WILKINSON, J. & SUMMERBELL, C. 2010a. A nationally representative study of maternal obesity in England, UK: trends in incidence and demographic inequalities in 619 323 births, 1989–
257
2007. International Journal of Obesity, 34, 420-428.
HESLEHURST, N., RANKIN, J., WILKINSON, J. & SUMMERBELL, C. 2010b. A nationally representative study of maternal obesity in England, UK: trends in incidence and demographic inequalities in 619 323 births, 1989–2007. International journal of obesity, 34, 420.
HESLEHURST, N., SIMPSON, H., ELLS, L. J., RANKIN, J., WILKINSON, J., LANG, R., BROWN, T. J. & SUMMERBELL, C. D. 2008. The impact of maternal BMI status on pregnancy outcomes with
immediate short‐term obstetric resource implications: a meta‐analysis. Obesity reviews, 9, 635-683.
HOCKING, S. L., WU, L. E., GUILHAUS, M., CHISHOLM, D. J. & JAMES, D. E. 2010. Intrinsic depot-specific differences in the secretome of adipose tissue, preadipocytes, and adipose tissue–derived microvascular endothelial cells. Diabetes, 59, 3008-3016.
HOD, M., LEVY-SHIFF, R., LERMAN, M., SCHINDEL, B., BEN-RAFAEL, Ζ. & BAR, J. 1999. Developmental outcome of offspring of pregestational diabetic mothers. Journal of Pediatric Endocrinology and Metabolism, 12, 867-872.
HOFFSTEDT, J., ARNER, E., WAHRENBERG, H., ANDERSSON, D., QVISTH, V., LÖFGREN, P., RYDEN, M., THÖRNE, A., WIREN, M. & PALMER, M. 2010. Regional impact of adipose tissue morphology on the metabolic profile in morbid obesity. Diabetologia, 53, 2496-2503.
HORVATH, K., KOCH, K., JEITLER, K., MATYAS, E., BENDER, R., BASTIAN, H., LANGE, S. &
258
SIEBENHOFER, A. 2010. Effects of treatment in women with gestational diabetes mellitus: systematic review and meta-analysis. Bmj, 340, c1395.
HOTAMISLIGIL, G. S., BUDAVARI, A., MURRAY, D. & SPIEGELMAN, B. M. 1994. Reduced tyrosine kinase activity of the insulin receptor in obesity-diabetes. Central role of tumor necrosis factor-alpha. The Journal of Clinical Investigation, 94, 1543-1549.
HUANG, J., MOREHOUSE, C., STREICHER, K., HIGGS, B. W., GAO, J., CZAPIGA, M., BOUTRIN, A., ZHU, W., BROHAWN, P. & CHANG, Y. 2011. Altered expression of insulin receptor isoforms in breast cancer. PloS one, 6, e26177.
HUDA, S. S., FORREST, R., PATERSON, N., JORDAN, F., SATTAR, N. & FREEMAN, D. J. 2014. In preeclampsia, maternal third trimester subcutaneous adipocyte lipolysis is more resistant to suppression by insulin than in healthy pregnancy. Hypertension, 63, 1094-1101.
HUDA, SHAHZYA S., JORDAN, F., BRAY, J., LOVE, G., PAYNE, R., SATTAR, N. & FREEMAN, DILYS J. 2017. Visceral adipose tissue activated macrophage content and inflammatory adipokine secretion is higher in pre-eclampsia than in healthy pregnancys. Clinical Science, 131, 1529-1540.
HUDA, S. S., SATTAR, N. & FREEMAN, D. J. 2009. Lipoprotein metabolism and vascular complications in pregnancy. Clinical Lipidology, 4, 91-102.
IGLESIAS, A., MONTELONGO, A., HERRERA, E. & LASUNCIÓN, M. A. 1994. Changes in cholesteryl ester transfer protein activity during normal
259
gestation and postpartum. Clinical biochemistry, 27, 63-68.
INFORMATION SERVICES DIVISION SCOTLAND. 2010. Data Quality Assurance Assessment of Maternity Data (SMR02) 2008-2009 [Online]. Available: https://www.isdscotland.org/data_quality_assurance/DQA-Assessment-of-Maternity-Data-SMR02-2008-to-2009.pdf [Accessed 21-05-2019].
INFORMATION SERVICES DIVISION SCOTLAND. 2019. DEPRIVATION GUIDANCE FOR ANALYSTS [Online]. Available: https://www.isdscotland.org/Products-and-Services/GPD-Support/Deprivation/_docs/PHI-Deprivation-Guidance-version-3-2.pdf [Accessed 21-05-2019].
INKSTER, M. E., FAHEY, T. P., DONNAN, P. T., LEESE, G. P., MIRES, G. J. & MURPHY, D. J. 2006. Poor glycated haemoglobin control and adverse pregnancy outcomes in type 1 and type 2 diabetes mellitus: systematic review of observational studies. BMC Pregnancy and Childbirth, 6, 1.
INNIS, S. M. 1991. Essential fatty acids in growth and development. Progress in lipid research, 30, 39-103.
INTERNATIONAL ASSOCIATION OF DIABETES AND PREGNANCY STUDY GROUPS 2010. International association of diabetes and pregnancy study groups recommendations on the diagnosis and classification of hyperglycemia in pregnancy. Diabetes care, 33, 676-682.
JEFFERY, E., CHURCH, C. D., HOLTRUP, B., COLMAN, L. & RODEHEFFER, M. S. 2015. Rapid depot-specific activation of adipocyte precursor
260
cells at the onset of obesity. Nature cell biology, 17, 376-385.
JENSEN, M. D. 2008. Role of body fat distribution and the metabolic complications of obesity. The Journal of Clinical Endocrinology & Metabolism, 93, s57-s63.
JENUM, A. K., MØRKRID, K., SLETNER, L., VANGE, S., TORPER, J. L., NAKSTAD, B., VOLDNER, N., ROGNERUD-JENSEN, O. H., BERNTSEN, S. & MOSDØL, A. 2012. Impact of ethnicity on gestational diabetes identified with the WHO and the modified International Association of Diabetes and Pregnancy Study Groups criteria: a population-based cohort study. European journal of endocrinology, 166, 317-324.
JOCKEN, J. W., LANGIN, D., SMIT, E., SARIS, W. H., VALLE, C., HUL, G. B., HOLM, C., ARNER, P. & BLAAK, E. E. 2007. Adipose triglyceride lipase and hormone-sensitive lipase protein expression is decreased in the obese insulin-resistant state. The journal of clinical endocrinology & metabolism, 92, 2292-2299.
JOE, A. W., YI, L., EVEN, Y., VOGL, A. W. & ROSSI, F. M. 2009. Depot‐specific differences in adipogenic progenitor abundance and proliferative response to high‐fat diet. Stem cells, 27, 2563-2570.
JOHNSON, S., EVANS, T. A., DRAPER, E. S., FIELD, D. J., MANKTELOW, B. N., MARLOW, N., MATTHEWS, R., PETROU, S., SEATON, S. E. & SMITH, L. K. 2015. Neurodevelopmental outcomes following late and moderate prematurity: a population-based cohort study. Archives of Disease in Childhood-Fetal and Neonatal Edition, 100, F301-F308.
261
JORGE-GALARZA, E., MEDINA-URRUTIA, A., POSADAS-SÁNCHEZ, R., POSADAS-ROMERO, C., CARDOSO-SALDAÑA, G., VARGAS-ALARCÓN, G., CARACAS-PORTILLA, N., GONZÁLEZ-SALAZAR, C., TORRES-TAMAYO, M. & JUÁREZ-ROJAS, J. G. 2016. Adipose tissue dysfunction increases fatty liver association with pre diabetes and newly diagnosed type 2 diabetes mellitus. Diabetology & metabolic syndrome, 8, 73.
KAC, G., DOS SANTOS VAZ, J., SCHLÜSSEL, M. M. & MOURA, A. S. 2011. C-reactive protein and hormones but not IL-6 are associated to body mass index in first trimester of pregnancy. Archives of gynecology and obstetrics, 284, 567-573.
KALHAN, S. C., MAHAJAN, S., BURKETT, E., RESHEF, L. & HANSON, R. W. 2001. Glyceroneogenesis and the source of glycerol for hepatic triacylglycerol synthesis in humans. Journal of Biological Chemistry, 276, 12928-12931.
KANAGALINGAM, M. G., FOROUHI, N. G., GREER, I. A. & SATTAR, N. 2005. Changes in booking body mass index over a decade: retrospective analysis from a Glasgow Maternity Hospital. BJOG: An International Journal of Obstetrics & Gynaecology, 112, 1431-1433.
KARIHTALA, P. & SOINI, Y. 2007. Reactive oxygen species and antioxidant mechanisms in human tissues and their relation to malignancies. Apmis, 115, 81-103.
KAUTZKY-WILLER, A., KRSSAK, M., WINZER, C., PACINI, G., TURA, A., FARHAN, S., WAGNER, O., BRABANT, G., HORN, R. & STINGL, H. 2003.
262
Increased intramyocellular lipid concentration identifies impaired glucose metabolism in women with previous gestational diabetes. Diabetes, 52, 244-251.
KERSHAW, E. E. & FLIER, J. S. 2004. Adipose tissue as an endocrine organ. The Journal of Clinical Endocrinology & Metabolism, 89, 2548-2556.
KHALIL, A., REZENDE, J., AKOLEKAR, R., SYNGELAKI, A. & NICOLAIDES, K. 2013. Maternal racial origin and adverse pregnancy outcome: a cohort study. Ultrasound in Obstetrics & Gynecology, 41, 278-285.
KHALIL, S. F., MOHKTAR, M. S. & IBRAHIM, F. 2014. The theory and fundamentals of bioimpedance analysis in clinical status monitoring and diagnosis of diseases. Sensors, 14, 10895-10928.
KIM, C., NEWTON, K. M. & KNOPP, R. H. 2002. Gestational Diabetes and the Incidence of Type 2 Diabetes A systematic review. Diabetes care, 25, 1862-1868.
KIM, J. I., HUH, J. Y., SOHN, J. H., CHOE, S. S., LEE, Y. S., LIM, C. Y., JO, A., PARK, S. B., HAN, W. & KIM, J. B. 2015. Lipid-overloaded enlarged adipocytes provoke insulin resistance independent of inflammation. Molecular and cellular biology, 35, 1686-1699.
KIM, S. M., LUN, M., WANG, M., SENYO, S. E., GUILLERMIER, C., PATWARI, P. & STEINHAUSER, M. L. 2014. Loss of white adipose hyperplastic potential is associated with enhanced susceptibility to insulin resistance. Cell metabolism, 20, 1049-1058.
KIM, S. S., ZHU, Y., GRANTZ, K. L., HINKLE, S. N., CHEN, Z., WALLACE, M. E., SMARR, M. M., EPPS, N. M. & MENDOLA, P. 2016. Obstetric and
263
Neonatal Risks Among Obese Women Without Chronic Disease. Obstetrics and gynecology.
KINOSHITA, T. & ITOH, M. 2006. Longitudinal variance of fat mass deposition during pregnancy evaluated by ultrasonography: the ratio of visceral fat to subcutaneous fat in the abdomen. Gynecologic and obstetric investigation, 61, 115-118.
KLEIBLOVA, P., DOSTALOVA, I., BARTLOVA, M., LACINOVA, Z., TICHA, I., KREJCI, V., SPRINGER, D., KLEIBL, Z. & HALUZIK, M. 2010. Expression of adipokines and estrogen receptors in adipose tissue and placenta of patients with gestational diabetes mellitus. Molecular and cellular endocrinology, 314, 150-156.
KNOCK, G. A., MCCARTHY, A. L., LOWY, C. & POSTON, L. 1997. Association of gestational diabetes with abnormal maternal vascular endothelial function. BJOG: An International Journal of Obstetrics & Gynaecology, 104, 229-234.
KNOPP, R. H., BONET, B. & ZHU, X. 1998. Lipid metabolism in pregnancy. Principles of Perinatal—Neonatal Metabolism. Springer.
KOLEHMAINEN, M., OHISALO, J., KAARTINEN, J., TUONONEN, V., PÄÄKKÖNEN, M., POIKOLAINEN, E., ALHAVA, E. & UUSITUPA, M. 2000. Concordance of in vivo microdialysis and in vitro techniques in the studies of adipose tissue metabolism. International journal of obesity, 24, 1426.
KOLETZKO, B. & BRAUN, M. 1991. Arachidonic acid and early human growth: is there a relation? Annals of nutrition and metabolism, 35, 128-131.
264
KOTRONEN, A., JUURINEN, L., TIIKKAINEN, M., VEHKAVAARA, S. & YKI–JÄRVINEN, H. 2008. Increased liver fat, impaired insulin clearance, and hepatic and adipose tissue insulin resistance in type 2 diabetes. Gastroenterology, 135, 122-130.
KUBOTA, N., TERAUCHI, Y., YAMAUCHI, T., KUBOTA, T., MOROI, M., MATSUI, J., ETO, K., YAMASHITA, T., KAMON, J. & SATOH, H. 2002. Disruption of adiponectin causes insulin resistance and neointimal formation. Journal of Biological Chemistry, 277, 25863-25866.
KUSMINSKI, C. M., HOLLAND, W. L., SUN, K., PARK, J., SPURGIN, S. B., LIN, Y., ASKEW, G. R., SIMCOX, J. A., MCCLAIN, D. A. & LI, C. 2012. MitoNEET-driven alterations in adipocyte mitochondrial activity reveal a crucial adaptive process that preserves insulin sensitivity in obesity. Nature medicine, 18, 1539.
KUSMINSKI, C. M., SHETTY, S., ORCI, L., UNGER, R. H. & SCHERER, P. E. 2009. Diabetes and apoptosis: lipotoxicity. Apoptosis, 14, 1484-1495.
KWAK, S. H., CHOI, S. H., JUNG, H. S., CHO, Y. M., LIM, S., CHO, N. H., KIM, S. Y., PARK, K. S. & JANG, H. C. 2013. Clinical and genetic risk factors for type 2 diabetes at early or late post partum after gestational diabetes mellitus. The Journal of Clinical Endocrinology & Metabolism, 98, E744-E752.
LAFONTAN, M. & BERLAN, M. 1993. Fat cell adrenergic receptors and the control of white and brown fat cell function. Journal of lipid research, 34, 1057-1091.
LANDON, M. B., SPONG, C. Y., THOM, E., CARPENTER, M. W., RAMIN, S. M., CASEY, B., WAPNER, R. J., VARNER, M. W., ROUSE, D. J.
265
& THORP JR, J. M. 2009. A multicenter, randomized trial of treatment for mild gestational diabetes. New England Journal of Medicine, 361, 1339-1348.
LANGER, O., RODRIGUEZ, D. A., XENAKIS, E. M., MCFARLAND, M. B., BERKUS, M. D. & ARREDONDO, F. 1994. Intensified versus conventional management of gestational diabetes. American journal of obstetrics and gynecology, 170, 1036-1047.
LAPPAS, M. 2014a. Activation of inflammasomes in adipose tissue of women with gestational diabetes. Molecular and cellular endocrinology, 382, 74-83.
LAPPAS, M. 2014b. NOD1 expression is increased in the adipose tissue of women with gestational diabetes. Journal of endocrinology, 222, 99-112.
LAPPAS, M., YEE, K., PERMEZEL, M. & RICE, G. E. 2005. Release and regulation of leptin, resistin and adiponectin from human placenta, fetal membranes, and maternal adipose tissue and skeletal muscle from normal and gestational diabetes mellitus-complicated pregnancies. Journal of endocrinology, 186, 457-465.
LAURENCIKIENE, J., SKURK, T., KULYTÉ, A., HEDÉN, P., ÅSTRÖM, G., SJÖLIN, E., RYDÉN, M., HAUNER, H. & ARNER, P. 2011. Regulation of Lipolysis in Small and Large Fat Cells of the Same Subject. The Journal of Clinical Endocrinology & Metabolism, 96, E2045-E2049.
LEE, J.-H., KIM, D., KIM, H. J., LEE, C.-H., YANG, J. I., KIM, W., KIM, Y. J., YOON, J.-H., CHO, S.-H., SUNG, M.-W. & LEE, H.-S. 2010. Hepatic steatosis index: A simple screening tool reflecting
266
nonalcoholic fatty liver disease. Digestive and Liver Disease, 42, 503-508.
LEE, S. M., KWAK, S. H., KOO, J. N., OH, I. H., KWON, J. E., KIM, B. J., KIM, S. M., KIM, S. Y., KIM, G. M. & JOO, S. K. 2019. Non-alcoholic fatty liver disease in the first trimester and subsequent development of gestational diabetes mellitus. Diabetologia, 62, 238-248.
LEKVA, T., BOLLERSLEV, J., GODANG, K., CECILIE, M., ROLAND, P. & FRIIS, C. 2015. B-cell dysfunction in women with previous gestational diabetes is associated with visceral adipose tissue distribution. Eur J Endocrinol, 173, 63-70.
LEPAGE, G. & ROY, C. C. 1986. Direct transesterification of all classes of lipids in a one-step reaction. Journal of lipid research, 27, 114-120.
LIM, E. L., HOLLINGSWORTH, K. G., ARIBISALA, B. S., CHEN, M. J., MATHERS, J. C. & TAYLOR, R. 2011. Reversal of type 2 diabetes: normalisation of beta cell function in association with decreased pancreas and liver triacylglycerol. Diabetologia, 54, 2506-2514.
LOGUE, J. & SATTAR, N. 2011. Childhood obesity: a ticking time bomb for cardiovascular disease? Clinical Pharmacology & Therapeutics, 90, 174-178.
LONG, Y., SU, K., ZHOU, Y., LU, Y., LIN, F., YU, J. & PENG, Y. 2009. Relationship between the adiponectin and TNF-α with insulin resistance in patients with gestational diabetes mellitus. Shandong Medical Journal, 49, 26-28.
LONN, M., MEHLIG, K., BENGTSSON, C. & LISSNER, L. 2010. Adipocyte size predicts
267
incidence of type 2 diabetes in women. The FASEB journal, 24, 326-331.
LÖNNQVIST, F., NORDFORS, L., JANSSON, M., THÖRNE, A., SCHALLING, M. & ARNER, P. 1997. Leptin secretion from adipose tissue in women. Relationship to plasma levels and gene expression. The Journal of clinical investigation, 99, 2398-2404.
MACOTELA, Y., BOUCHER, J., TRAN, T. T. & KAHN, C. R. 2009. Sex and depot differences in adipocyte insulin sensitivity and glucose metabolism. Diabetes, 58, 803-812.
MARCHI, J., BERG, M., DENCKER, A., OLANDER, E. & BEGLEY, C. 2015. Risks associated with obesity in pregnancy, for the mother and baby: a systematic review of reviews. Obesity Reviews, 16, 621-638.
MARTINEZ, M. 1992. Tissue levels of polyunsaturated fatty acids during early human development. The Journal of pediatrics, 120, S129-S138.
MASON, T. M. 1998. The Role of Factors that Regulate the Synthesis and Secretion of Very-Low-Density Lipoprotein by Hepatocytes. Critical Reviews in Clinical Laboratory Sciences, 35, 461-487.
MATARESE, G. & LA CAVA, A. 2004. The intricate interface between immune system and metabolism. Trends in Immunology, 25, 193-200.
MATARESE, G., MOSCHOS, S. & MANTZOROS, C. S. 2005. Leptin in immunology. The Journal of Immunology, 174, 3137-3142.
MATTHEWS, D., HOSKER, J., RUDENSKI, A., NAYLOR, B., TREACHER, D. & TURNER, R. 1985. Homeostasis model assessment: insulin resistance and β-cell function from fasting plasma
268
glucose and insulin concentrations in man. Diabetologia, 28, 412-419.
MATTHEWS, J., ALTMAN, D. G., CAMPBELL, M. & ROYSTON, P. 1990. Analysis of serial measurements in medical research. Bmj, 300, 230-235.
MAURIEGE, P., GALITZKY, J., BERLAN, M. & LAFONTAN, M. 1987. Heterogeneous distribution
of beta and alpha‐2 adrenoceptor binding sites in human fat cells from various fat deposits: functional consequences. European journal of clinical investigation, 17, 156-165.
MCCULLOUGH, A. J. 2004. The clinical features, diagnosis and natural history of nonalcoholic fatty liver disease. Clinics in liver disease, 8, 521-533.
MCKNIGHT, J., MORRIS, A., CLINE, D., PEDEN, N., FISCHBACHER, C. & WILD, S. 2008. Implementing a national quality assurance system for diabetes care: the Scottish Diabetes Survey 2001–2006. Diabetic Medicine, 25, 743-746.
MEEK, C. L., LEWIS, H. B., PATIENT, C., MURPHY, H. R. & SIMMONS, D. 2015. Diagnosis of gestational diabetes mellitus: falling through the net. Diabetologia, 58, 2003-2012.
MEEKS, K. A., FREITAS-DA-SILVA, D., ADEYEMO, A., BEUNE, E. J., MODESTI, P. A., STRONKS, K., ZAFARMAND, M. H. & AGYEMANG, C. 2016. Disparities in type 2 diabetes prevalence among ethnic minority groups resident in Europe: a systematic review and meta-analysis. Internal and emergency medicine, 11, 327-340.
MEHMOOD, S., MARGOLIS, M., YE, C., MAPLE-BROWN, L., HANLEY, A. J., CONNELLY, P. W., SERMER, M., ZINMAN, B. & RETNAKARAN, R. 2018. Hepatic fat and glucose tolerance in women
269
with recent gestational diabetes. BMJ Open Diabetes Research and Care, 6.
MEHRA, R., SHEBL, F. M., CUNNINGHAM, S. D., MAGRIPLES, U., BARRETTE, E., HERRERA, C., KOZHIMANNIL, K. B. & ICKOVICS, J. R. 2019. Area-level deprivation and preterm birth: results from a national, commercially-insured population. BMC Public Health, 19, 236.
MESSER, L. C., MAXSON, P. & MIRANDA, M. L. 2013. The Urban Built Environment and Associations with Women’s Psychosocial Health. Journal of Urban Health, 90, 857-871.
METZGER, B., GABBE, S., PERSSON, B., BUCHANAN, T., CATALANO, P., DAMM, P., DYER, A., LEIVA, A., HOD, M. & KITZMILER, J. 2010. International Association of Diabetes and Pregnancy Study Groups Consensus Panel. International association of diabetes and pregnancy study groups recommendations on the diagnosis and classification of hyperglycemia in pregnancy. Diabetes Care, 33, 676-682.
METZGER, B. E., LOWE, L. P., DYER, A. R., TRIMBLE, E. R., SHERIDAN, B., HOD, M., CHEN, R., YOGEV, Y., COUSTAN, D. R. & CATALANO, P. M. 2008. Hyperglycemia and Adverse Pregnancy Outcome (HAPO) Study: associations with neonatal anthropometrics. Diabetes, 14 Nov.
MEYER, B. J. 2016. Australians are not meeting the recommended intakes for omega-3 long chain polyunsaturated fatty acids: results of an analysis from the 2011–2012 national nutrition and physical activity survey. Nutrients, 8, 111.
MEYER, B. J. & FREEMAN, D. J. 2017. Maternal plasma docosahexaenoic acid (DHA)
270
concentrations increase at the critical time of neural tube closure. Fats of Life.
MEYER, B. J., ONYIAODIKE, C. C., BROWN, E. A., JORDAN, F., MURRAY, H., NIBBS, R. J., SATTAR, N., LYALL, H., NELSON, S. M. & FREEMAN, D. J. 2016. Maternal plasma DHA levels increase prior to 29 days post-LH surge in women undergoing frozen embryo transfer: a prospective, observational study of human pregnancy. The Journal of Clinical Endocrinology & Metabolism, 101, 1745-1753.
MILLWARD, C. A., DESANTIS, D., HSIEH, C.-W., HEANEY, J. D., PISANO, S., OLSWANG, Y., RESHEF, L., BEIDELSCHIES, M., PUCHOWICZ, M. & CRONIGER, C. M. 2010. Phosphoenolpyruvate carboxykinase (Pck1) helps regulate the triglyceride/fatty acid cycle and development of insulin resistance in mice. Journal of lipid research, 51, 1452-1463.
MIN, Y., DJAHANBAKHCH, O., HUTCHINSON, J., ERAM, S., BHULLAR, A. S., NAMUGERE, I. & GHEBREMESKEL, K. 2016. Efficacy of docosahexaenoic acid-enriched formula to enhance maternal and fetal blood docosahexaenoic acid levels: Randomized double-blinded placebo-controlled trial of pregnant women with gestational diabetes mellitus. Clinical Nutrition, 35, 608-614.
MOKKALA, K., VAHLBERG, T., PELLONPERÄ, O., HOUTTU, N., KOIVUNIEMI, E. & LAITINEN, K. 2019. Distinct Metabolic Profile in Early Pregnancy of Overweight and Obese Women Developing Gestational Diabetes. The Journal of Nutrition, 150, 31-37.
271
MOLLER, D. E., YOKOTA, A., CARO, J. F. & FLIER, J. S. 1989. Tissue-Specific Expression of Two Alternatively Spliced Insulin Receptor mRNAs in Man. Molecular Endocrinology, 3, 1263-1269.
MORRISON, J. L., HODGSON, L. A., LIM, L. L. & AL‐QURESHI, S. 2016a. Diabetic retinopathy in pregnancy: a review. Clinical & experimental ophthalmology, 44, 321-334.
MORRISON, J. L., HODGSON, L. A., LIM, L. L. & AL‐QURESHI, S. 2016b. Diabetic retinopathy in pregnancy: a review. Clinical & experimental ophthalmology.
MYERS, J., HALL, C., WAREING, M., GILLHAM, J. & BAKER, P. 2006. The effect of maternal characteristics on endothelial-dependent relaxation of myometrial arteries. European Journal of Obstetrics & Gynecology and Reproductive Biology, 124, 158-163.
NANKERVIS, A., MCINTYRE, H., MOSES, R., ROSS, G., CALLAWAY, L., PORTER, C. & JEFFRIES, W. 2014. ADIPS consensus guidelines for the testing and diagnosis of gestational diabetes mellitus in Australia. Australas Diabetes Pregnancy Soc, , 1-8 . Modified June.
NATIONAL COLLABORATING CENTRE FOR WOMEN'S AND CHILDREN'S HEALTH 2008. Antenatal Care: Routine Care for the Healthy Pregnant Woman. RCOG Press, London.
NEVILLE, M. J., COLLINS, J. M., GLOYN, A. L., MCCARTHY, M. I. & KARPE, F. 2011. Comprehensive human adipose tissue mRNA and microRNA endogenous control selection for quantitative real‐time‐PCR normalization. Obesity, 19, 888-892.
272
NOHR, E. A., BECH, B. H., DAVIES, M. J., FRYDENBERG, M., HENRIKSEN, T. B. & OLSEN, J. 2005. Prepregnancy obesity and fetal death: a study within the Danish National Birth Cohort. Obstetrics & Gynecology, 106, 250-259.
NUTTALL, F. Q. 2015. Body mass index: obesity, BMI, and health: a critical review. Nutrition today, 50, 117.
O'CONNELL, J., LYNCH, L., CAWOOD, T. J., KWASNIK, A., NOLAN, N., GEOGHEGAN, J., MCCORMICK, A., O'FARRELLY, C. & O'SHEA, D. 2010. The relationship of omental and subcutaneous adipocyte size to metabolic disease in severe obesity. PloS one, 5, e9997.
O'REILLY, J. R. & REYNOLDS, R. M. 2013. The risk of maternal obesity to the long‐term health of the offspring. Clinical endocrinology, 78, 9-16.
O’BRIEN, T. E., RAY, J. G. & CHAN, W.-S. 2003. Maternal body mass index and the risk of preeclampsia: a systematic overview. Epidemiology, 14, 368-374.
OBSTETRICIANS, A. C. O. & GYNECOLOGISTS 2013. Practice bulletin no. 137: gestational diabetes mellitus. Obstet Gynecol, 122, 406-416.
OGURTSOVA, K., DA ROCHA FERNANDES, J., HUANG, Y., LINNENKAMP, U., GUARIGUATA, L., CHO, N. H., CAVAN, D., SHAW, J. & MAKAROFF, L. 2017. IDF Diabetes Atlas: Global estimates for the prevalence of diabetes for 2015 and 2040. Diabetes research and clinical practice, 128, 40-50.
OKADA, T., KAWANO, Y., SAKAKIBARA, T., HAZEKI, O. & UI, M. 1994. Essential role of phosphatidylinositol 3-kinase in insulin-induced glucose transport and antilipolysis in rat
273
adipocytes. Studies with a selective inhibitor wortmannin. Journal of Biological Chemistry, 269, 3568-3573.
OKEREKE, N. C., HUSTON-PRESLEY, L., AMINI, S. B., KALHAN, S. & CATALANO, P. M. 2004. Longitudinal changes in energy expenditure and body composition in obese women with normal and impaired glucose tolerance. American Journal of Physiology-Endocrinology and Metabolism, 287, E472-E479.
ORTEGA-SENOVILLA, H., ALVINO, G., TARICCO, E., CETIN, I. & HERRERA, E. 2009. Gestational diabetes mellitus upsets the proportion of fatty acids in umbilical arterial but not venous plasma. Diabetes Care, 32, 120-122.
OTODA, T., TAKAMURA, T., MISU, H., OTA, T., MURATA, S., HAYASHI, H., TAKAYAMA, H., KIKUCHI, A., KANAMORI, T. & SHIMA, K. R. 2013. Proteasome dysfunction mediates obesity-induced endoplasmic reticulum stress and insulin resistance in the liver. Diabetes, 62, 811-824.
OTT, R., MELCHIOR, K., STUPIN, J. H., ZISKA, T., SCHELLONG, K., HENRICH, W., RANCOURT, R. C. & PLAGEMANN, A. 2018. Reduced insulin receptor expression and altered DNA methylation in fat tissues and blood of women with GDM and offspring. The Journal of Clinical Endocrinology & Metabolism, 104, 137-149.
OUCHI, N. & WALSH, K. 2007. Adiponectin as an anti-inflammatory factor. Clinica chimica acta, 380, 24-30.
PAN, X. & HUSSAIN, M. M. 2007. Diurnal regulation of microsomal triglyceride transfer protein and plasma lipid levels. Journal of Biological Chemistry, 282, 24707-24719.
274
PARLETTA, N., MILTE, C. M. & MEYER, B. J. 2013. Nutritional modulation of cognitive function and mental health. The Journal of nutritional biochemistry, 24, 725-743.
PASARICA, M., SEREDA, O. R., REDMAN, L. M., ALBARADO, D. C., HYMEL, D. T., ROAN, L. E., ROOD, J. C., BURK, D. H. & SMITH, S. R. 2009. Reduced Adipose Tissue Oxygenation in Human Obesity. Evidence for Rarefaction, Macrophage Chemotaxis, and Inflammation Without an Angiogenic Response, 58, 718-725.
PERSSON, M., JOHANSSON, S., VILLAMOR, E. & CNATTINGIUS, S. 2014. Maternal overweight and obesity and risks of severe birth-asphyxia-related complications in term infants: a population-based cohort study in Sweden. PLoS medicine, 11, e1001648.
PESSIN, J. E. & KWON, H. 2013. Adipokines mediate inflammation and insulin resistance. Frontiers in endocrinology, 4, 71.
PHILLIPS, C. M., SHIVAPPA, N., HÉBERT, J. R. & PERRY, I. J. 2018. Dietary inflammatory index and biomarkers of lipoprotein metabolism, inflammation and glucose homeostasis in adults. Nutrients, 10, 1033.
PONTES, I. E., AFRA, K. F., SILVA JR, J. R., BORGES, P. S., CLOUGH, G. F. & ALVES, J. G. 2015. Microvascular reactivity in women with gestational diabetes mellitus studied during pregnancy. Diabetology & metabolic syndrome, 7, 27.
POSTON, L., BELL, R., CROKER, H., FLYNN, A. C., GODFREY, K. M., GOFF, L., HAYES, L., KHAZAEZADEH, N., NELSON, S. M. & OTENG-NTIM, E. 2015. Effect of a behavioural intervention
275
in obese pregnant women (the UPBEAT study): a multicentre, randomised controlled trial. The lancet Diabetes & endocrinology, 3, 767-777.
POSTON, L., CALEYACHETTY, R., CNATTINGIUS, S., CORVALÁN, C., UAUY, R., HERRING, S. & GILLMAN, M. W. 2016. Preconceptional and maternal obesity: epidemiology and health consequences. The Lancet Diabetes & Endocrinology, 4, 1025-1036.
PRENTKI, M. & NOLAN, C. J. 2006. Islet β cell failure in type 2 diabetes. Journal of Clinical Investigation, 116, 1802-1812.
RAHMAN, M., ABE, S., KANDA, M., NARITA, S., RAHMAN, M., BILANO, V., OTA, E., GILMOUR, S. & SHIBUYA, K. 2015. Maternal body mass index and risk of birth and maternal health
outcomes in low‐and middle‐income countries: a systematic review and meta‐analysis. Obesity reviews, 16, 758-770.
RANCOURT, R. C., OTT, R., ZISKA, T., SCHELLONG, K., MELCHIOR, K., HENRICH, W. & PLAGEMANN, A. 2020. Visceral Adipose Tissue Inflammatory Factors (TNF-Alpha, SOCS3) in Gestational Diabetes (GDM): Epigenetics as a Clue in GDM Pathophysiology. International Journal of Molecular Sciences, 21, 479.
RAO, R., SEN, S., HAN, B., RAMADOSS, S. & CHAUDHURI, G. 2014a. Gestational diabetes, preeclampsia and cytokine release: similarities and differences in endothelial cell function. Advances in Fetal and Neonatal Physiology. Springer.
RAO, R., SEN, S., HAN, B., RAMADOSS, S. & CHAUDHURI, G. 2014b. Gestational diabetes, preeclampsia and cytokine release: similarities
276
and differences in endothelial cell function. Advances in Fetal and Neonatal Physiology. Springer, New York, NY.
RAVUSSIN, E. & SMITH, S. R. 2002. Increased fat intake, impaired fat oxidation, and failure of fat cell proliferation result in ectopic fat storage, insulin resistance, and type 2 diabetes mellitus. Annals of the New York Academy of Sciences, 967, 363-378.
RAYANAGOUDAR, G., HASHI, A. A., ZAMORA, J., KHAN, K. S., HITMAN, G. A. & THANGARATINAM, S. 2016a. Quantification of the type 2 diabetes risk in women with gestational diabetes: a systematic review and meta-analysis of 95,750 women. Diabetologia 59, 1403–1411(2016).
RAYANAGOUDAR, G., HASHI, A. A., ZAMORA, J., KHAN, K. S., HITMAN, G. A. & THANGARATINAM, S. 2016b. Quantification of the type 2 diabetes risk in women with gestational diabetes: a systematic review and meta-analysis of 95,750 women. Springer.
REBUFFE-SCRIVE, M., ENK, L., CRONA, N., LÖNNROTH, P., ABRAHAMSSON, L., SMITH, U. & BJÖRNTORP, P. 1985. Fat cell metabolism in different regions in women. Effect of menstrual cycle, pregnancy, and lactation. The Journal of clinical investigation, 75, 1973-1976.
RESI, V., BASU, S., HAGHIAC, M., PRESLEY, L., MINIUM, J., KAUFMAN, B., BERNARD, S., CATALANO, P. & HAUGUEL-DE MOUZON, S. 2012. Molecular inflammation and adipose tissue matrix remodeling precede physiological adaptations to pregnancy. American Journal of
277
Physiology-Endocrinology and Metabolism, 303, E832-E840.
RETNAKARAN, R., QI, Y., YE, C., HANLEY, A. J., CONNELLY, P. W., SERMER, M. & ZINMAN, B. 2011. Hepatic insulin resistance is an early determinant of declining β-cell function in the first year postpartum after glucose intolerance in pregnancy. Diabetes Care, 34, 2431-2434.
RIBET, C., MONTASTIER, E., VALLE, C., BEZAIRE, V., MAZZUCOTELLI, A., MAIRAL, A., VIGUERIE, N. & LANGIN, D. 2010. Peroxisome proliferator-activated receptor-α control of lipid and glucose metabolism in human white adipocytes. Endocrinology, 151, 123-133.
RODBELL, M. 1964. METABOLISM OF ISOLATED FAT CELLS. I. EFFECTS OF HORMONES ON GLUCOSE METABOLISM AND LIPOLYSIS. The Journal of biological chemistry, 239, 375.
ROJAS-RODRIGUEZ, R., LIFSHITZ, L. M., BELLVE, K. D., MIN, S. Y., PIRES, J., LEUNG, K., BOERAS, C., SERT, A., DRAPER, J. T. & CORVERA, S. 2015. Human adipose tissue expansion in pregnancy is impaired in gestational diabetes mellitus. Diabetologia, 58, 2106-2114.
RONDINONE, C. M., WANG, L.-M., LONNROTH, P., WESSLAU, C., PIERCE, J. H. & SMITH, U. 1997. Insulin receptor substrate (IRS) 1 is reduced and IRS-2 is the main docking protein for phosphatidylinositol 3-kinase in adipocytes from subjects with non-insulin-dependent diabetes mellitus. Proceedings of the National Academy of Sciences, 94, 4171-4175.
ROWAN, J. A., HAGUE, W. M., GAO, W., BATTIN, M. R. & MOORE, M. P. 2008. Metformin versus insulin for the treatment of gestational diabetes.
278
New England Journal of Medicine, 358, 2003-2015.
RUPNICK, M. A., PANIGRAHY, D., ZHANG, C.-Y., DALLABRIDA, S. M., LOWELL, B. B., LANGER, R. & FOLKMAN, M. J. 2002. Adipose tissue mass can be regulated through the vasculature. Proceedings of the National Academy of Sciences, 99, 10730-10735.
RUSTAN, A. C. & DREVON, C. A. 2001. Fatty acids: structures and properties. Nature Publishing, London, 30
RYDÉN, M. & ARNER, P. 2017. Subcutaneous adipocyte lipolysis contributes to circulating lipid levels. Arteriosclerosis, thrombosis, and vascular biology, 37, 1782-1787.
RYDÉN, M., PETRUS, P., ANDERSSON, D. P.,
MEDINA‐GÓMEZ, G., ESCASANY, E., CORRALES CORDÓN, P., DAHLMAN, I., KULYTÉ, A. & ARNER, P. 2019. Insulin action is severely impaired in adipocytes of apparently healthy overweight and obese subjects. Journal of internal medicine, 285, 578-588.
SAARELAINEN, H., LAITINEN, T., RAITAKARI, O. T., JUONALA, M., HEISKANEN, N., LYYRA-LAITINEN, T., VIIKARI, J. S., VANNINEN, E. & HEINONEN, S. 2006. Pregnancy-related hyperlipidemia and endothelial function in healthy women. Circulation Journal, 70, 768-772.
SALANS, L. B. & DOUGHERTY, J. W. 1971. The effect of insulin upon glucose metabolism by adipose cells of different size: influence of cell lipid and protein content, age, and nutritional state. The Journal of clinical investigation, 50, 1399-1410.
SALANS, L. B., KNITTLE, J. L. & HIRSCH, J. 1968. The role of adipose cell size and adipose tissue
279
insulin sensitivity in the carbohydrate intolerance of human obesity. The Journal of Clinical Investigation, 47, 153-165.
SANCHALIKA, A. & TERESA, J. 2015. Risk of gestational diabetes among South Asian immigrants living in New Jersey—a retrospective data review. Journal of racial and ethnic health disparities, 2, 510-516.
SANTOS, M., FERNANDES, V., MARQUES, O. & PEREIRA, M. 2016a. Effect of maternal body mass index and weight gain in women with gestational diabetes on the incidence of large-for-gestational-age infants. Diabetes & Metabolism.
SANTOS, M., FERNANDES, V., MARQUES, O. & PEREIRA, M. 2016b. Effect of maternal body mass index and weight gain in women with gestational diabetes on the incidence of large-for-gestational-age infants.
SATTAR, N., BERRY, C. & GREER, I. A. 1998. Essential fatty acids in relation to pregnancy complications and fetal development. BJOG: An International Journal of Obstetrics & Gynaecology, 105, 1248-1255.
SATTAR, N., CLARK, P., HOLMES, A., LEAN, M. E., WALKER, I. & GREER, I. A. 2001. Antenatal waist circumference and hypertension risk. Obstetrics & Gynecology, 97, 268-271.
SAVVIDOU, M., KAMETAS, N., DONALD, A. & NICOLAIDES, K. 2000. Non‐invasive assessment of endothelial function in normal pregnancy. Ultrasound in obstetrics & gynecology, 15, 502-507.
SCHAEFER-GRAF, U. M., GRAF, K., KULBACKA, I., KJOS, S. L., DUDENHAUSEN, J., VETTER, K. & HERRERA, E. 2008. Maternal lipids as strong
280
determinants of fetal environment and growth in pregnancies with gestational diabetes mellitus. Diabetes care, 31, 1858-1863.
SCHAEFER‐GRAF, U., MEITZNER, K., ORTEGA‐SENOVILLA, H., GRAF, K., VETTER, K., ABOU‐DAKN, M. & HERRERA, E. 2011. Differences in the implications of maternal lipids on fetal metabolism and growth between gestational diabetes mellitus and control pregnancies. Diabetic medicine, 28, 1053-1059.
SCHLING, P. & LÖFFLER, G. 2018. Cross talk between adipose tissue cells: impact on pathophysiology. Physiology.
SEBIRE, N., JOLLY, M., HARRIS, J., REGAN, L. & ROBINSON, S. 2001a. Is maternal underweight really a risk factor for adverse pregnancy outcome? A population‐based study in London. BJOG: an international journal of obstetrics & gynaecology, 108, 61-66.
SEBIRE, N. J., JOLLY, M., HARRIS, J., WADSWORTH, J., JOFFE, M., BEARD, R., REGAN, L. & ROBINSON, S. 2001b. Maternal obesity and pregnancy outcome: a study of 287 213 pregnancies in London. International journal of obesity, 25, 1175.
SEGURA, M. T., DEMMELMAIR, H., KRAUSS-ETSCHMANN, S., NATHAN, P., DEHMEL, S., PADILLA, M. C., RUEDA, R., KOLETZKO, B. & CAMPOY, C. 2017. Maternal BMI and gestational diabetes alter placental lipid transporters and fatty acid composition. Placenta, 57, 144-151.
SESTI, G., MARINI, M. A., TULLIO, A. N., MONTEMURRO, A., BORBONI, P., FUSCO, A., ACCILI, D. & LAURO, R. 1991. Altered expression of the two naturally occurring human insulin
281
receptor variants in isolated adipocytes of non-insulin-dependent diabetes mellitus patients. Biochemical and Biophysical Research Communications, 181, 1419-1424.
SHAW, J. E., SICREE, R. A. & ZIMMET, P. Z. 2010. Global estimates of the prevalence of diabetes for 2010 and 2030. Diabetes research and clinical practice, 87, 4-14.
SHI, H., KOKOEVA, M. V., INOUYE, K., TZAMELI, I., YIN, H. & FLIER, J. S. 2006. TLR4 links innate immunity and fatty acid–induced insulin resistance. The Journal of clinical investigation, 116, 3015-3025.
SHIMABUKURO, M., ZHOU, Y.-T., LEVI, M. & UNGER, R. H. 1998. Fatty acid-induced β cell apoptosis: A link between obesity and diabetes. Proceedings of the National Academy of Sciences, 95, 2498-2502.
SHULMAN, G. I. 2014. Ectopic fat in insulin resistance, dyslipidemia, and cardiometabolic disease. New England Journal of Medicine, 371, 1131-1141.
SIVAN, E., HOMKO, C. J., CHEN, X., REECE, E. A. & BODEN, G. 1999. Effect of insulin on fat metabolism during and after normal pregnancy. Diabetes, 48, 834-838.
SJÖSTRÖM, L., SMITH, U., KROTKIEWSKI, M. & BJÖRNTORP, P. 1972. Cellularity in different regions of adipose tissue in young men and women. Metabolism, 21, 1143-1153.
SKURK, T., ALBERTI-HUBER, C., HERDER, C. & HAUNER, H. 2007. Relationship between adipocyte size and adipokine expression and secretion. The Journal of Clinical Endocrinology & Metabolism, 92, 1023-1033.
282
SOHN, J. H., LEE, Y. K., HAN, J. S., JEON, Y. G., KIM, J. I., CHOE, S. S., KIM, S. J., YOO, H. J. & KIM, J. B. 2018. Perilipin 1 (Plin1) deficiency promotes inflammatory responses in lean adipose tissue through lipid dysregulation. Journal of Biological Chemistry, 293, 13974-13988.
SONG, M. J., KIM, K. H., YOON, J. M. & KIM, J. B. 2006. Activation of Toll-like receptor 4 is associated with insulin resistance in adipocytes. Biochemical and biophysical research communications, 346, 739-745.
SOUZA, S. C., PALMER, H. J., KANG, Y. H., YAMAMOTO, M. T., MULIRO, K. V., ERIC PAULSON, K. & GREENBERG, A. S. 2003. TNF‐α induction of lipolysis is mediated through activation of the extracellular signal related kinase pathway in 3T3‐L1 adipocytes. Journal of cellular biochemistry, 89, 1077-1086.
SPROSTON, K. & MINDELL, J. 2006. Health Survey for England 2004. The health of minority ethnic groups.
STEFAN, N., KANTARTZIS, K., MACHANN, J., SCHICK, F., THAMER, C., RITTIG, K., BALLETSHOFER, B., MACHICAO, F., FRITSCHE, A. & HÄRING, H.-U. 2008. Identification and characterization of metabolically benign obesity in humans. Archives of internal medicine, 168, 1609-1616.
STEVENS-SIMON, C., THUREEN, P., BARRETT, J. & STAMM, E. 2001. Skinfold caliper and ultrasound assessments of change in the distribution of subcutaneous fat during adolescent pregnancy. International journal of obesity, 25, 1340-1345.
STEWART, F., RODIE, V. A., RAMSAY, J. E., GREER, I. A., FREEMAN, D. J. & MEYER, B. J.
283
2007a. Longitudinal assessment of erythrocyte fatty acid composition throughout pregnancy and post partum. Lipids, 42, 335-344.
STEWART, F. M., FREEMAN, D. J., RAMSAY, J. E., GREER, I. A., CASLAKE, M. & FERRELL, W. R. 2007b. Longitudinal assessment of maternal endothelial function and markers of inflammation and placental function throughout pregnancy in lean and obese mothers. The Journal of Clinical Endocrinology & Metabolism, 92, 969-975.
STONE, J. 1994. Risk factors for severe preeclampsia. Obstet. Gynecol, 83, 357-61.
STRAUGHEN, J., TRUDEAU, S. & MISRA, V. 2013. Changes in adipose tissue distribution during pregnancy in overweight and obese compared with normal weight women. Nutrition & diabetes, 3, e84-e84.
SUGANAMI, T., YUAN, X., SHIMODA, Y., UCHIO-YAMADA, K., NAKAGAWA, N., SHIRAKAWA, I., USAMI, T., TSUKAHARA, T., NAKAYAMA, K. & MIYAMOTO, Y. 2009. Activating transcription factor 3 constitutes a negative feedback mechanism that attenuates saturated Fatty acid/toll-like receptor 4 signaling and macrophage activation in obese adipose tissue. Circulation research, 105, 25-32.
SULAIMAN, W. N. W., CASLAKE, M. J., DELLES, C., KARLSSON, H., MULDER, M. T., GRAHAM, D. & FREEMAN, D. J. 2016. Does high-density lipoprotein protect vascular function in healthy pregnancy? Clinical Science, 130, 491-497.
SUMMERS, S. A. 2006. Ceramides in insulin resistance and lipotoxicity. Progress in lipid research, 45, 42-72.
284
SVENSSON, H., WETTERLING, L., BOSAEUS, M., ODÉN, B., ODÉN, A., JENNISCHE, E., EDÉN, S., HOLMÄNG, A. & LÖNN, M. 2016. Body fat mass and the proportion of very large adipocytes in pregnant women are associated with gestational insulin resistance. International journal of obesity, 40, 646.
SZCZEPANIAK, L. S., VICTOR, R. G., ORCI, L. & UNGER, R. H. 2007. Forgotten but Not Gone. Circulation Research, 101, 759-767.
TAKEUCHI, K. & REUE, K. 2009. Biochemistry, physiology, and genetics of GPAT, AGPAT, and lipin enzymes in triglyceride synthesis. American Journal of Physiology-Endocrinology And Metabolism, 296, E1195-E1209.
TANSEY, J., SZTALRYD, C., GRUIA-GRAY, J., ROUSH, D., ZEE, J., GAVRILOVA, O., REITMAN, M., DENG, C.-X., LI, C. & KIMMEL, A. 2001. Perilipin ablation results in a lean mouse with aberrant adipocyte lipolysis, enhanced leptin production, and resistance to diet-induced obesity. Proceedings of the National Academy of Sciences, 98, 6494-6499.
TANSEY, J., SZTALRYD, C., HLAVIN, E., KIMMEL, A. & LONDOS, C. 2004. The central role of perilipin a in lipid metabolism and adipocyte lipolysis. IUBMB life, 56, 379-385.
TAYLOR, R. 1987. 11 Use of adipose tissue for metabolic studies. Bailliere's clinical endocrinology and metabolism, 1, 1023-1035.
TCHOUKALOVA, Y. D., KOUTSARI, C., VOTRUBA, S. B., TCHKONIA, T., GIORGADZE, N., THOMOU, T., KIRKLAND, J. L. & JENSEN, M. D.
2010a. Sex‐and depot‐dependent differences in
285
adipogenesis in normal‐weight humans. Obesity, 18, 1875-1880.
TCHOUKALOVA, Y. D., VOTRUBA, S. B., TCHKONIA, T., GIORGADZE, N., KIRKLAND, J. L. & JENSEN, M. D. 2010b. Regional differences in cellular mechanisms of adipose tissue gain with overfeeding. Proceedings of the National Academy of Sciences, 107, 18226-18231.
TEWARI, V., TEWARI, A. & BHARDWAJ, N. 2011. Histological and histochemical changes in placenta of diabetic pregnant females and its comparision with normal placenta. Asian Pacific Journal of Tropical Disease, 1, 1-4.
THE SCOTTISH INTERCOLLEGIATE GUIDELINES NETWORK 2010. Management of diabetes, a national clinical guideline.
THOMAS, B. A., GHEBREMESKEL, K., LOWY, C., OFFLEY-SHORE, B. & CRAWFORD, M. A. 2005. Plasma fatty acids of neonates born to mothers with and without gestational diabetes. Prostaglandins, Leukotrienes and Essential Fatty Acids, 72, 335-341.
THOMPSON, D., BERGER, H., FEIG, D., GAGNON, R., KADER, T., KEELY, E., KOZAK, S., RYAN, E., SERMER, M. & VINOKUROFF, C. 2013. Diabetes and Pregnancy. Canadian Journal of Diabetes, 37, Supplement 1, S168-S183.
TIIKKAINEN, M., TAMMINEN, M., HÄKKINEN, A. M., BERGHOLM, R., VEHKAVAARA, S., HALAVAARA, J., TERAMO, K., RISSANEN, A. &
YKI‐JÄRVINEN, H. 2002. Liver‐fat accumulation and insulin resistance in obese women with previous gestational diabetes. Obesity research, 10, 859-867.
286
TOESCU, V., NUTTALL, S., MARTIN, U., KENDALL, M. & DUNNE, F. 2002. Oxidative stress and normal pregnancy. Clinical endocrinology, 57, 609-613.
TONTONOZ, P., HU, E. & SPIEGELMAN, B. M. 1994. Stimulation of adipogenesis in fibroblasts by PPARγ2, a lipid-activated transcription factor. Cell, 79, 1147-1156.
TRAN, A. T., STRAAND, J., DIEP, L. M., MEYER, H. E., BIRKELAND, K. I. & JENUM, A. K. 2011. Cardiovascular disease by diabetes status in five ethnic minority groups compared to ethnic Norwegians. BMC public health, 11, 554.
TRAYHURN, P. 2013. Hypoxia and adipose tissue function and dysfunction in obesity. Physiological reviews, 93, 1-21.
VAN DER ZIJL, N. J., GOOSSENS, G. H., MOORS, C. C., VAN RAALTE, D. H., MUSKIET, M. H., POUWELS, P. J., BLAAK, E. E. & DIAMANT, M. 2011. Ectopic fat storage in the pancreas, liver, and abdominal fat depots: impact on β-cell function in individuals with impaired glucose metabolism. The Journal of Clinical Endocrinology & Metabolism, 96, 459-467.
VAN TIENEN, F. H., VAN DER KALLEN, C. J., LINDSEY, P. J., WANDERS, R. J., VAN GREEVENBROEK, M. M. & SMEETS, H. J. 2011. Preadipocytes of type 2 diabetes subjects display an intrinsic gene expression profile of decreased differentiation capacity. International Journal of Obesity, 35, 1154-64.
VATIER, C., KADIRI, S., MUSCAT, A., CHAPRON, C., CAPEAU, J. & ANTOINE, B. 2012. Visceral and subcutaneous adipose tissue from lean women respond differently to lipopolysaccharide-induced
287
alteration of inflammation and glyceroneogenesis. Nutrition & diabetes, 2, e51-e51.
VEILLEUX, A., CARON-JOBIN, M., NOËL, S., LABERGE, P. Y. & TCHERNOF, A. 2011. Visceral adipocyte hypertrophy is associated with dyslipidemia independent of body composition and fat distribution in women. Diabetes, 60, 1504-1511.
VERBOVEN, K., WOUTERS, K., GAENS, K., HANSEN, D., BIJNEN, M., WETZELS, S., STEHOUWER, C., GOOSSENS, G., SCHALKWIJK, C. & BLAAK, E. 2018. Abdominal subcutaneous and visceral adipocyte size, lipolysis and inflammation relate to insulin resistance in male obese humans. Scientific reports, 8, 4677.
VESCO, K., LEO, M., FRANCISCO, M., MARCHALL, N. & RONNEY, W. 2019. 1386-P: A Comparison of Ectopic Fat Stores and Insulin Sensitivity among Women With and Without Gestational Diabetes. (2019): 1386-P.
VESCO, K., LEO, M. C., FRANCISCO, M., BAETSCHER, E., ROONEY, W., MARSHALL, N. E. & PURNELL, J. Q. 2018a. Is Gestational Weight Gain Associated with Change in Ectopic Lipid Stores? American Diabetes Association (2018): 1407-P.
VESCO, K., MARSHALL, N. E., ROONEY, W., LEO, M. C., BAETSCHER, E., FRANCISCO, M. & PURNELL, J. Q. 2018b. Are Changes in Whole-Body Insulin Sensitivity during Pregnancy Related to Changes in Ectopic Fat Stores? American Diabetes Association (2018): 1408-P.
VOS, A. A., POSTHUMUS, A. G., BONSEL, G. J., STEEGERS, E. A. & DENKTAŞ, S. 2014.
288
Deprived neighborhoods and adverse perinatal outcome: a systematic review and meta‐analysis. Acta obstetricia et gynecologica Scandinavica, 93, 727-740.
WAHRENBERG, H., LÖNNQVIST, F. & ARNER, P. 1989. Mechanisms underlying regional differences in lipolysis in human adipose tissue. The Journal of clinical investigation, 84, 458-467.
WALLACE, T. M., LEVY, J. C. & MATTHEWS, D. R. 2004. Use and abuse of HOMA modeling. Diabetes care, 27, 1487-1495.
WANG, B., WOOD, I. S. & TRAYHURN, P. 2007. Dysregulation of the expression and secretion of inflammation-related adipokines by hypoxia in human adipocytes. Pflügers Archiv-European Journal of Physiology, 455, 479-492.
WANG, H., HU, L., DALEN, K., DORWARD, H., MARCINKIEWICZ, A., RUSSELL, D., GONG, D., LONDOS, C., YAMAGUCHI, T. & HOLM, C. 2009. Activation of hormone-sensitive lipase requires two steps, protein phosphorylation and binding to the PAT-1 domain of lipid droplet coat proteins. Journal of Biological Chemistry, 284, 32116-32125.
WANG, Y., SULLIVAN, S., TRUJILLO, M., LEE, M. J., SCHNEIDER, S. H., BROLIN, R. E., KANG, Y. H., WERBER, Y., GREENBERG, A. S. & FRIED, S. K. 2003. Perilipin expression in human adipose tissues: effects of severe obesity, gender, and depot. Obesity research, 11, 930-936.
WEINBERG, J. 2006. Lipotoxicity. Kidney international, 70, 1560-1566.
WEISBERG, S. P., MCCANN, D., DESAI, M., ROSENBAUM, M., LEIBEL, R. L. & FERRANTE, A. W. 2003. Obesity is associated with
289
macrophage accumulation in adipose tissue. The Journal of clinical investigation, 112, 1796-1808.
WELCH, H. G. 2011. Overdiagnosed: making people sick in the pursuit of health, Boston, Mass. , Beacon Press.
WEN, H., GRIS, D., LEI, Y., JHA, S., ZHANG, L., HUANG, M. T.-H., BRICKEY, W. J. & TING, J. P. 2011. Fatty acid–induced NLRP3-ASC inflammasome activation interferes with insulin signaling. Nature immunology, 12, 408.
WERNER, E. F., PETTKER, C. M., ZUCKERWISE, L., REEL, M., FUNAI, E. F., HENDERSON, J. & THUNG, S. F. 2012. Screening for gestational diabetes mellitus: are the criteria proposed by the International Association of the Diabetes and Pregnancy Study Groups cost-effective? Diabetes care, 35, 529-535.
WHITE, U. & RAVUSSIN, E. 2019. Dynamics of adipose tissue turnover in human metabolic health and disease. Diabetologia, 62, 17-23.
WIJENDRAN, V., BENDEL, R. B., COUCH, S. C., PHILIPSON, E. H., CHERUKU, S. & LAMMI‐KEEFE, C. J. 2000. Fetal erythrocyte phospholipid polyunsaturated fatty acids are altered in pregnancy complicated with gestational diabetes mellitus. Lipids, 35, 927-931.
WORLD HEALTH ORGANIZATION 2000. OBESITY: PREVENTING AND MANAGING THE GLOBAL EPIDEMIC. Report of a WHO Consultation, WHO Technical Report Series 894, Geneva.
WORLD HEALTH ORGANIZATION. 2013. Diagnostic criteria and classification of hyperglycaemia first detected in pregnancy [Online]. Available: https://www.who.int/diabetes/publications/Hypergl
290
ycaemia_In_Pregnancy/en/ [Accessed October 11 2019].
YAMAKAGE, H., ITO, R., TOCHIYA, M., MURANAKA, K., TANAKA, M., MATSUO, Y., ODORI, S., KONO, S., SHIMATSU, A. & SATOH-ASAHARA, N. 2014. The utility of dual bioelectrical impedance analysis in detecting intra-abdominal fat area in obese patients during weight reduction therapy in comparison with waist circumference and abdominal CT. Endocrine journal, EJ14-0092.
YANG, L., CALAY, E. S., FAN, J., ARDUINI, A., KUNZ, R. C., GYGI, S. P., YALCIN, A., FU, S. & HOTAMISLIGIL, G. S. 2015. S-Nitrosylation links obesity-associated inflammation to endoplasmic reticulum dysfunction. Science, 349, 500-506.
YE, J., GAO, Z., YIN, J. & HE, Q. 2007. Hypoxia is a potential risk factor for chronic inflammation and adiponectin reduction in adipose tissue of ob/ob and dietary obese mice. American Journal of Physiology-Endocrinology and Metabolism, 293, E1118-E1128.
YOGEV, Y. & LANGER, O. 2008. Pregnancy outcome in obese and morbidly obese gestational diabetic women. European Journal of Obstetrics & Gynecology and Reproductive Biology, 137, 21-26.
ZEYDA, M. & STULNIG, T. M. 2007. Adipose tissue macrophages. Immunology letters, 112, 61-67.
ZHOU, Z., CONNELL, M. C. & MACEWAN, D. J. 2007. TNFR1-induced NF-κB, but not ERK, p38MAPK or JNK activation, mediates TNF-induced ICAM-1 and VCAM-1 expression on endothelial cells. Cellular signalling, 19, 1238-1248.
ZHU, T., TANG, J., ZHAO, F., QU, Y. & MU, D. 2015. Association between maternal obesity and
291
offspring Apgar score or cord pH: a systematic review and meta-analysis. Scientific reports, 5, 18386.
ZHU, Y. & ZHANG, C. 2016. Prevalence of Gestational Diabetes and Risk of Progression to Type 2 Diabetes: a Global Perspective. Current diabetes reports, 16, 1-11.
ZIERATH, J., LIVINGSTON, J., THÖRNE, A., BOLINDER, J., REYNISDOTTIR, S., LÖNNQVIST, F. & ARNER, P. 1998. Regional difference in insulin inhibition of non-esterified fatty acid release from human adipocytes: relation to insulin receptor phosphorylation and intracellular signalling through the insulin receptor substrate-1 pathway. Diabetologia, 41, 1343-1354.
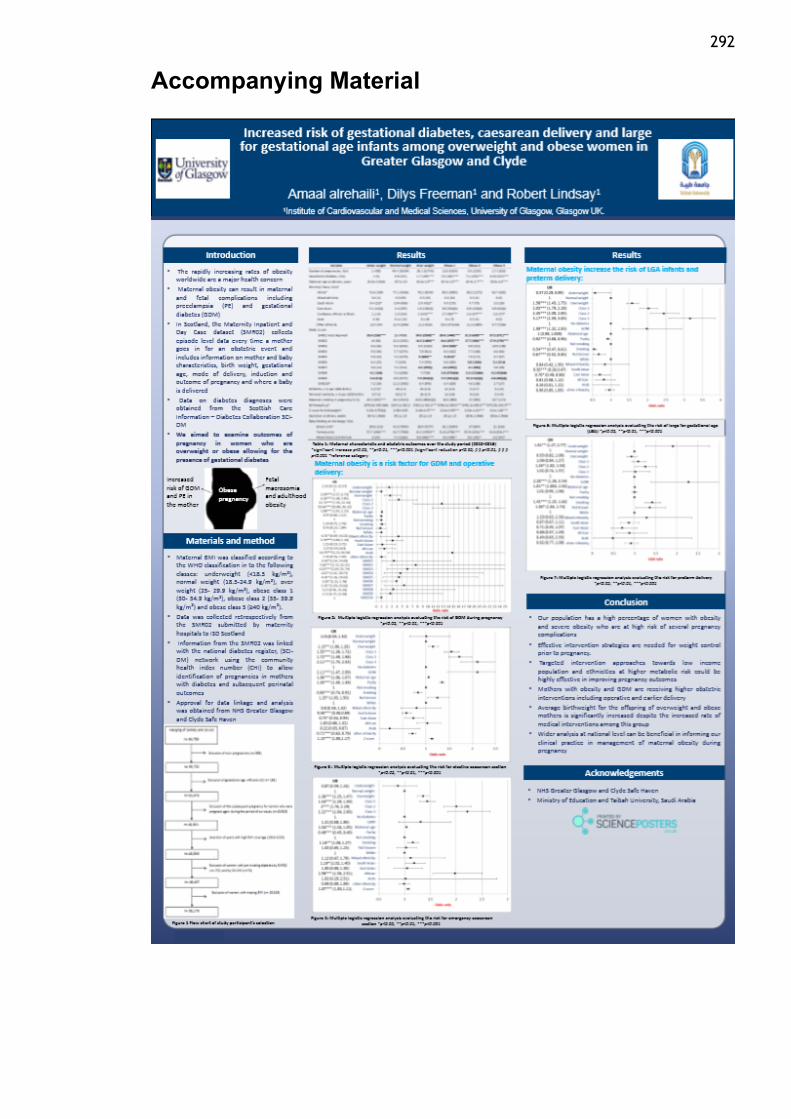
292
Accompanying Material
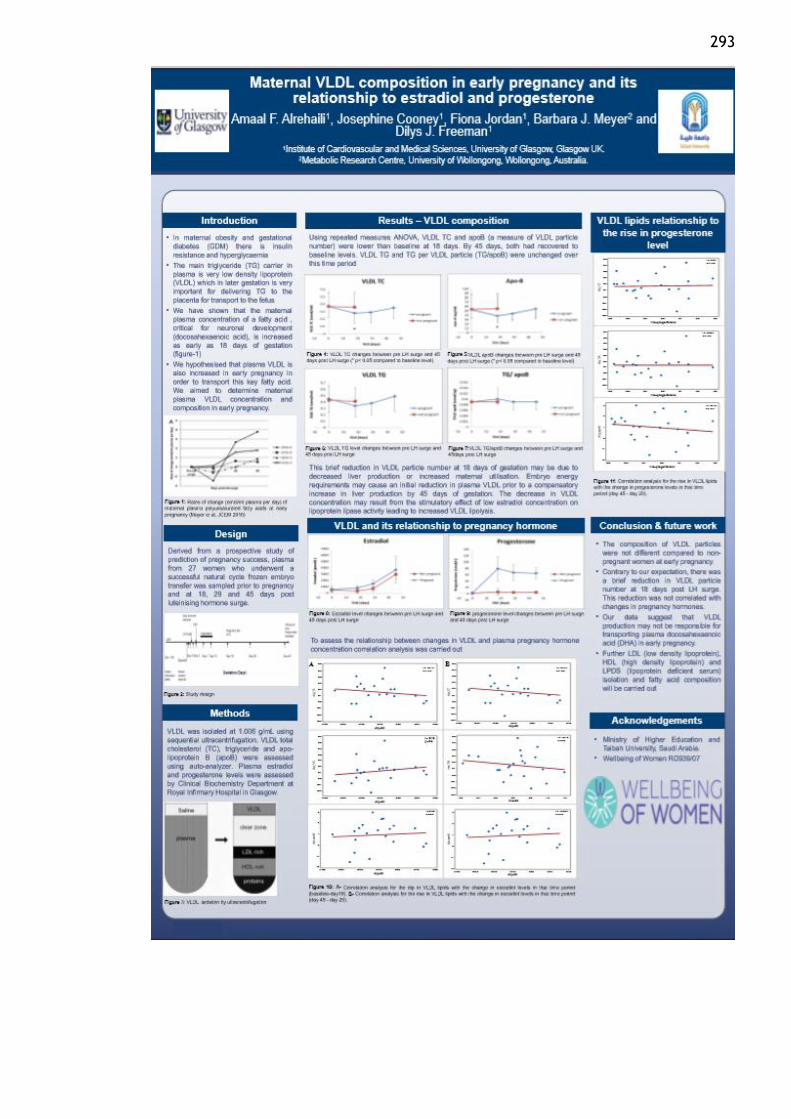
293
Copyright © 2022 FDOKUMEN