Airport noise in South Africa - Stellenbosch University
260
Airport noise in South Africa – Prediction models and their effect on land-use planning PAUL GOLDSCHAGG Dissertation presented in fulfilment of the requirements for the degree of Doctor of Philosophy at the University of Stellenbosch. Prof HL Zietsman December 2007
-
Upload
khangminh22 -
Category
Documents
-
view
4 -
download
0
Transcript of Airport noise in South Africa - Stellenbosch University

Airport noise in South Africa – Prediction models and their
effect on land-use planning
PAUL GOLDSCHAGG
Dissertation presented in fulfilment of the requirements for the degree of Doctor of
Philosophy at the University of Stellenbosch.
Prof HL Zietsman
December 2007

ii
AUTHOR’S DECLARATION
I, the undersigned, hereby declare that the work contained in this dissertation is my
own original work and that I have not previously in its entirety or in part submitted it
at any university for a degree.
Signature: _________________________
Date: _________________________
Copyright © 2007 Stellenbosch University
All rights reserved
iii
ABSTRACT The use of average energy aircraft noise contours as the sole means for guiding
aircraft noise-based planning around airports is being questioned increasingly. A
growing proportion of residents who live in neighbourhoods adjacent to airports are
dissatisfied with the averaging procedure that is employed. In their experience of
exposure to aircraft noise, particularly in the evening and at night when they are at
home, the average energy aircraft noise descriptors are misleading. In order to
effectively analyse the socio-spatial interaction of annoyance at and interference by
aircraft noise, an alternative approach has been suggested – a supplemental noise
perspective. Conventional approaches to aircraft noise land use planning based on
average energy noise descriptors run the risk of being ineffectual, or even
counterproductive, because they do not consider the central aspects of disturbance,
namely the loudness of an event and the number of times events are heard.
Consequently, an alternative measure to ameliorate the limitations of average energy
noise contours is needed by which airport neighbours, the aviation industry and town
planners can better understand the nature of the problem.
Although supplemental noise analysis is not new, this study applies it to a South
African international airport (OR Tambo) for the first time. The airport’s operations
are typical of many busy airports close to large urban areas, serving domestic,
regional and international routes. Reportedly, there have been few complaints about
noise emanating from the airport, but when they are made they are usually about
evening and night-time aircraft noise events. In the context of South Africa as a
developing society in transition, where growth of urban settlements continues apace,
average energy aircraft noise information must be enhanced by providing
supplemental noise information.
This study investigated the broad issue of land use planning around airports by
employing two aircraft noise prediction models, namely the Integrated Noise Model
and the Transparent Noise Information Package, to establish the various potential
effects and consequences of night-time aircraft noise in noise zones demarcated
according to supplemental aircraft noise information. The effects and consequences
examined include annoyance, disturbance of sleep, telephone conversations, watching
iv
television and work or study, and the likelihood that people will move away to escape
night-time aircraft noise. The perceptions of residents living in neighbourhoods
around the airport were surveyed and the responses analysed according to noise zones
classified as supplemental noise information.
The results show that the airport’s neighbours are annoyed by aircraft noise and that
aircraft noise interferes with normal household activities. This annoyance and
interference decreases with increasing distance from the airport. Furthermore,
reported annoyance and interference is greater in those areas where higher numbers of
noise events are encountered, even at relatively low noise levels of 60 LAmax –
something not evident from average energy noise contours.
This finding strengthens the argument that it is insufficient to provide only average
energy aircraft noise information when studying the impact of aircraft noise. To
understand the situation more fully, supplemental noise information is essential. The
study concludes with a framework constructed to apply supplemental aircraft noise
information to the abatement and mitigation measures normally used to deal with
aircraft noise.
KEYWORDS and KEY PHRASES
Airport noise, aircraft noise, aircraft noise annoyance/interference, aircraft noise
descriptors, average energy noise contours, Integrated Noise Model, Johannesburg
International Airport, land use planning, noise abatement/mitigation, noise zones, OR
Tambo International Airport, supplemental noise information, Transparent Noise
Information Package.

v
OPSOMMING
Die gebruik van gemiddelde energie geraaskontoere as die enigste manier om
vliegtuiggeraas-gebaseerde beplanning rondom lughawens te rig, word in toenemende
mate bevraagteken. Al hoe meer inwoners in die omstreke van lughawens is ontevrede
met die aweryprosedure wat gevolg word. Hulle ervaring van blootstelling aan
vliegtuiggeraas – veral in die aand en nag – getuig daarvan dat die gemiddelde energie
geraasbeskrywers misleidend is. Om die sosiaal-ruimtelike interaksie van ergenis met en
steuring deur vliegtuiggeraas effektief te ontleed, is ‘n alternatiewe benadering al
voorgestel, naamlik ‘n aanvullende geraasperspektief. Konvensionele benaderings tot
grondgebruikbeplanning wat vliegtuiggeraas oorweeg, loop die gevaar om
ondoeltreffend, selfs teenproduktief, te wees omdat hulle nie die sentrale aspekte van
steuring, naamlik die luidheid van ‘n gebeurtenis en die aantal kere wat dit gehoor word,
in ag neem nie. Gevolglik word ‘n ander maatstaf benodig om die beperkings van die
gemiddelde energie geraaskontoere te verbeter sodat die lughawe se bure, die
lugvaartindustrie en stadsbeplanners die aard van die probleem beter kan verstaan.
Ofskoon aanvullende geraasanalise nie nuut is nie, word dit in hierdie studie vir die eerste
maal op ‘n Suid-Afrikaanse internasionale lughawe (OR Tambo) toegepas. Die lughawe
se werksaamhede is soortgelyk aan baie ander bedrywige lughawens naby groot stedelike
gebiede wat binnelandse, streeks- en internasionale roetes bedien. Volgens berig, word
min klagtes oor geraas afkomstig van die lughawe ingedien, maar wanneer dit wel
gebeur, handel dit meesal oor vliegtuiggeraas saans en snags. In die konteks van Suid-
Afrika as ‘n ontwikkelende en transformerende gemeenskap met stedelike gebiede wat
aanhou snel groei, moet gemiddelde energie vliegtuiggeraasinligting deur aanvullende
geraasinligting versterk word.
Hierdie studie het die breë kwessie van grondgebruik rondom lughawens ondersoek deur
twee modelle vir vliegtuiggeraasvoorspelling, naamlik die Geïntegreerde Geraasmodel en
die Deursigtige Geraasinligtingspakket, in te span om die verskeie potensiële effekte en
gevolge van nagtelike vliegtuiggeraas in geraassones afgebaken volgens aanvullende

vi
vliegtuiggeraasinligting, vas te stel. Die effekte en gevolge wat ondersoek is, sluit
verergdheid, die versteuring van slaap, telefoongesprekke, televisiekyk en werk- of
studiebedrywighede in, asook die waarskynlikheid dat mense sal wegtrek om nagtelike
vlietuiggeraas te ontvlug. ‘n Opname oor die persepsies van inwoners in die buurte
rondom die lughawe is uitgevoer en die response is volgens geraassones geklassifiseer as
aanvullende geraasinligting.
Die resultate toon dat die lughawe se bure versteur is deur vliegtuiglawaai en dat die
geraas by normale huishoudelike aktiwiteite inmeng. Hierdie ergenis en steuring neem af
met toenemende afstand vanaf die lughawe. Verder is vasgestel dat die vermelde
versteuring en inmenging groter is in dié gebiede waar meer geraasvoorvalle plaasvind,
selfs teen relatief lae geraasvlakke van 60 LAmax – iets wat nie blyk uit gemiddelde
energie geraaskontoere nie.
Hierdie bevinding ondersteun die argument dat dit ontoereikend is om slegs gemiddelde
energie vliegtuiggeraasinligting by die bestudering van die effekte van vliegtuiggeraas te
gebruik. Aanvullende geraasinligting is noodsaaklik vir beter begrip van geraastoestande.
Die studie sluit met ‘n raamwerk waarmee aanvullende vliegtuiggeraasinligting
aangewend kan word by die geraasverminderings- en verligtingsmaatreëls wat
normaalweg ingespan word om met vliegtuiglawaai te handel.
SLEUTELWOORDE EN -FRASES
Aanvullende geraasinligting, Deursigte Geraasinligtingspakket, ergenis met/steuring deur
vliegtuiggeraas, Geïntegreerde Geraasmodel, gemiddelde energie geraaskontoere,
geraassones, geraasvermindering, geraasversagting, grondgebruikbeplanning,
Johannesburg Internasionale Lughawe, lughawegeraas, OR Tambo Internasionale
Lughawe, vliegtuiggeraas, vliegtuiggeraasbeskrywers

vii
ACKNOWLEDGEMENTS
I should like to thank the following people:
My supervisor, Prof HL Zietsman, for his advice, guidance and patience, particularly
for continuing to work with me after taking retirement.
Dr P De Necker for his patient editing.
Air Traffic and Navigation Services (ATNS) for providing the air traffic movement
data.
Ekhuruleni Metro for providing the GIS land-use data and other valuable insights.
The staff at the Department of Geography and Environmental Studies, Stellenbosch
University, for their assistance.
My colleagues, Kobus Reynecke, Andre Bruton and Allen van der Linde for their
technical support.
My family, parents Eddie and Barbara; wife Jane; and children David, Sarah, Danielle
and Michael for all their understanding and encouragement.

viii
CONTENTS
1 ...........................1 CHAPTER 1: AIRCRAFT NOISE: AN ENVIRONMENTAL PROBLEM
1.1 ............................................. 1 BACKGROUND AND RATIONALE FOR THE STUDY.
1.2 .........................................................................................................................................6
RESEARCH PROBLEM: LINKING AIRCRAFT NOISE AND LAND-USE
PLANNING
1.3 ........................................................................... 7 RESEARCH AIM AND OBJECTIVES
1.4 ..............................................................................8
THEORETICAL FRAMEWORK: PHILOSOPHY OF GEOGRAPHY AND THE
URBAN PLANNING-AIRCRAFT NOISE LINK
1.4.1 ........................................................... 9 Aircraft noise studies in the context of geography
1.4.2 ....................... 15 Using Geographical information systems (GIS) in aircraft noise studies
1.4.3 . 15 The Aarhus Convention: access to aircraft noise information and public participation
1.4.4 ................................................................................................................... 16 Airport noise
1.4.5 ..................................................................... 17 Noise as an urban environmental problem
1.4.6 ............................................... 18 Techniques used to minimize the aircraft noise problem
1.5 ....................................................................................................... 18 NOISE EXPLORED
1.5.1 ................................................................................................................ 18 What is noise?
1.5.2 .................................................................................................... 19 What is aircraft noise?
1.5.3 ....................................................................................... 20 Airport noise or aircraft noise?
1.5.4 ............................................................................................ 21 Land-use and aircraft noise
1.6 .................................................................................23
AIRCRAFT NOISE AND LAND-USE CONTROLS IN SOUTH AFRICA: THE
REGULATORY FRAMEWORK FOR NOISE
1.6.1 ............................................................................................. 23 Noise and the Constitution
1.6.2 ................................................................................................ 23 Noise control regulations
1.6.3 ........................................................................ 24 Aircraft noise and environmental policy
1.6.4 ............. 25 Noise standards: SABS 0117-1974, SANS 10117:2003 & SANS 10103:2003
1.7 ..............................................................................................................................25
RESEARCH METHODOLOGY USED FOR INVESTIGATING AIRCRAFT NOISE
DISTURBANCE
1.8 .
........................................................................................................................................27 DEMARCATION OF STUDY AREA AND TARGET RESPONDENT POPULATION
1.8.1 .................................................................................................... 27 Air traffic flight routes
1.8.2 ............................................................................... 28 Previously produced noise contours
1.8.3 ................................................................................................................ 28 Land-use maps
1.9 .................................................................. 30 REPORT STRUCTURE AND SEQUENCE
2 ......................................................................................................................................32
CHAPTER 2: AIRCRAFT NOISE AND LAND-USE PLANNING: THE LINK WITH
GEOGRAPHY
2.1 ..................... 32 INTRODUCTION: DEMARCATING THE LITERATURE COVERED

ix
2.2 ..........................................................................................................................32
SPATIAL DATA ANALYSIS – PLACE OF THE RESEARCH IN THE REALM OF
GEOGRAPHY
2.2.1 ......................................................................................... 34 Location as place and context
2.2.2 .................................................................................. 35 Location and spatial relationships
2.2.3 ............................................................................................................. 36 Spatial processes
2.2.4 ...................................................................................... 36 Defining spatial sub-disciplines
2.3 ............................................. 38 NOISE: KEY CONCEPTS AND NEGATIVE EFFECTS
2.3.1 ................................................................................................................ 38 Noise concepts2.3.1.1 .................................................................................................................................. 38 Sound
2.3.1.2 ................................................................................................................................... 39 Noise
2.3.1.3 ......................................................................................................... 39 Measurement of noise
2.3.1.4 ............................................................................................................ 40 Assessment of noise
2.3.2 ................................................................................................ 44 Negative effects of noise2.3.2.1 ........................................................................................................... 44 Physiological effects
2.3.2.2 ........................................................................................ 44 Interference with communication
2.3.2.3 .................................................................................................... 45 Psychological annoyance
2.4 ............................................................................. 45 AIRPORT NOISE DISTURBANCE.
2.5 ....................................................................................... 47 ENVIRONMENTAL ETHICS
2.6 ..............................................................................................47
JOHANNESBURG: WORLD CITY AND OR TAMBO INTERNATIONAL AIRPORT
AS A GLOBAL TRANSPORT NODE
2.7 .................................................. 50 HOW AIRPORTS DEAL WITH NOISE PROBLEMS
2.8 ........... 51 DEALING WITH AIRCRAFT NOISE: SOUTH AFRICAN FRAMEWORKS
2.8.1 ...................................................................................... 51 The South African Constitution
2.8.2 53 The National Environmental Management Act and the Environment Conservation Act
2.8.3 ........................................................................................... 54 Provincial noise regulations
2.8.4 .................................................... 55 The national government’s position on aircraft noise
2.9 ........... 58 DEALING WITH AIRCRAFT NOISE: INTERNATIONAL FRAMEWORKS
2.9.1 ...................................................................................................................... 58 Agenda 21
2.9.2 ............................................................................................. 59 World Health Organisation
2.9.3 ............... 59 International Civil Aviation Organisation Annex 16, and Balanced approach
2.9.4 ............................................................................ 60 Airports Council International (ACI).
2.9.5 ............................... 60 Examples of National Standards in the United Kingdom and USA
2.10 61
URBAN SPATIAL AND LAND-USE PLANNING IN THE VICINITY OF AIRPORTS
2.11 ............................................................... 63 URBAN PLANNING UNDER APARTHEID
2.12 ........................................... 64 SUPPLEMENTAL AIRCRAFT NOISE INFORMATION
2.12.1 .................................................................................................... 64 Single events contours
2.12.2 ............................................................................................. 66 Number of events contours2.12.2.1 .......................................................................... 67 Advantages of number of events contours
2.12.2.2 ...................................................................... 69 Disadvantages of number of events contours
3 ............................................71 CHAPTER 3: RESEARCH DESIGN AND METHODOLOGY

x
3.1 ...................................................... 71 TYPES OF AVERAGE ENERGY DESCRIPTORS
3.1.1 .......................................................................................................... 77 L noise contourAeq
3.1.2 .......................................................................................................... 77 L noise contourRdn
3.1.3 ......................................................................................................... 77 DNL noise contour
3.1.4 .............................................................................................................. 77 Noisiness Index
3.1.5 .................................................................... 78 Comparison of noise metrics’ areal extent.
3.2 .......................................................................................78
O.R. TAMBO INTERNATIONAL AIRPORT AND SURROUNDING
NEIGHBOURHOODS AS STUDY AREA
3.3 ...........................................................................................................................81
SURVEY OF CITIZENS’ PERCEPTIONS OF EVENING AND NIGHT-TIME
AIRCRAFT NOISE
3.3.1 .......................................................................................... 83 Survey design and execution
3.3.2 .................................................................................. 85 Questionnaire survey data capture
3.3.3 ..................................................................................................... 86 Land-use information
3.4 .................................................................................... 86 SURVEY SAMPLING FRAME
3.4.1 ..................................................................................... 86 Runway layout and flight tracks
3.4.2 ........................................................................................................... 87 The sample frame3.4.2.1 .............................................................................................................. 88 Age of respondents
3.4.2.2 ......................................................................... 88 Linking with Ekhuruleni’s future planning
3.4.3 ........................................................................................... 90 Selection of the respondents3.4.3.1 ........................................................................................................... 93 The selected suburbs
3.4.3.2 ............................................................................................................... 93 Tembisa township
3.4.3.3 ................................................................................................................ 94 The control group
3.4.4 ............................................................................................... 94 Time-frame of the survey
3.4.5 .................................................................................................................. 94 Survey ethics
3.4.6 ....................................................................................... 95 Improving the survey response
3.5 ............................................................. 95 AIRCRAFT FLIGHT OPERATIONAL DATA
3.5.1 .......................................................................................... 96 24-hour flight operation data
3.5.2 ............................................................. 96 12-hour evening and night flight operation data
3.6 ....................................................................................... 96 METEOROLOGICAL DATA
3.7 ............................................................... 96 DATA CAPTURING AND DATA EDITING
3.8 ........................................................................................ 97 AIRCRAFT OPERATIONS DATA.
3.8.1 .................................................. 98 Average energy contours: the Integrated Noise Model
3.8.2 ..................... 98 Number of events contours: the Transparent Noise Information Package
3.9 ........................................................................................................ 99 DATA ANALYSIS
3.9.1 ............................................................................................................ 99 Cross tabulations
3.10 ....................................................... 100 SHORTCOMINGS AND SOURCES OF ERROR
4 .................................................................................................102
CHAPTER 4: SURVEY RESULTS: INTERPRETED ACCORDING TO AVERAGE-
ENERGY NOISE INFORMATION
4.1 ....................................................................... 102 SPATIAL ANALYSIS OF THE DATA
4.2 ............................................................................. 104 ASSESSMENT OF THE SURVEY

xi
4.2.1 .................................................................................. 104 Selection of valid questionnaires
4.2.2 ....................................................................... 105 Questionnaires distributed and returned
4.2.3 .......................................................................................................................... 107 Gender
4.3 ........................................................................ 108 REPORTED ANNOYANCE LEVELS
4.4 ......................................................................................................................................110 OVERALL ANNOYANCE BY THE CONTROL, SUBURB AND TOWNSHIP SUB-
GROUPS.
4.5 .......................................... 114 OVERALL ANNOYANCE ACCORDING TO GENDER
4.6 ............. 115 AIRCRAFT NOISE INTERFERENCE WITH HOUSEHOLD ACTIVITIES
4.7 ..................................... 118 AIRCRAFT NOISE AS A MOTIVE FOR MOVING AWAY
4.8
1.
INTERPRETING SURVEY RESULTS BY AVERAGE ENERGY L NOISE
ZONESRDN
120 4.8.1 ................................ 120 Interpreting the township response by L noise contour zonesRdn
4.8.2 .................................... 122 Interpreting the suburb response by L noise contour zonesRdn
4.9 ..................................................... 123 SUMMARY OF AVERAGE ENERGY RESULTS
5 .................................................................................125
CHAPTER 5: SURVEY RESULTS: INTERPRETED ACCORDING TO
SUPPLEMENTAL NOISE INFORMATION
5.1 ......................................................................................126
EVALUATION OF SURVEY RESPONSES ACCORDING TO THE 12-HOUR L
EVENING & NIGHT NOISE CONTOURAEQ
5.1.1 ....................................... 130 Comparison between suburb 24 hour L and 12 hour LRdn Aeq
5.1.2 ............. 131 Noise interference with household activities: Sleep, Phone, TV, Work/study5.1.2.1 .............................................................................................................. 131 Sleep disturbance
5.1.2.2 ................................................................................. 132 Telephone conversation disturbance
5.1.2.3 ......................................................................................... 133 Television viewing disturbance
5.1.2.4 ................................................................................................ 134 Work or study disturbance
5. 3 135
Comparison of responses by L noise zones and by household activities interfered
withAeq
5.1.3.1 ............................................................. 135
Comparison by noise zone of respondents reporting being disturbed very often: sleep,
telephone conversations, television viewing and work or study
5.1.3.2 .................................................. 136
Comparison by activity disturbed of respondents reporting being disturbed very often:
sleep, telephone conversations, television viewing and work or study
5.2 ..............................................................137
EVALUATION OF SURVEY RESPONSES ACCORDING TO THE THREE
‘NUMBER OF EVENTS’ CONTOURS (N60, N70, N80)
5.2.1 ............................. 138 General discussion of the shape of the number of events contours.5.2.1.1 ........................................................................ 139 Number of events above 60L contourAmax
5.2.1.2 ........................................................................ 139 Number of events above 70L contourAmax
5.2.1.3 ........................................................................ 140 Number of events above 80L contourAmax
5.2.2 ...................................... 144 ANNOYANCE ACCORDING TO NUMBER OF EVENTS
5.2.3 . 145 SLEEP DISTURBANCE REPORTED ACCORDING TO NUMBER OF EVENTS
5.2.4 .....................................................................................................................................145
TV VIEWING DISTURBANCE REPORTED ACCORDING TO NUMBER OF
EVENTS

xii
5.2.5 .............................................................................................................146
TELEPHONE CONVERSATION DISTURBANCE REPORTED ACCORDING TO
NUMBER OF EVENTS
5.2.6 ............................................................................................................................147 WORK OR STUDY DISTURBANCE REPORTED ACCORDING TO NUMBER OF
EVENTS
5.2.7 .....................................................................................................................................148
WOULD CONSIDER MOVING REPORTED ACCORDING TO NUMBER OF
EVENTS
6 ...........151 CHAPTER 6: AN INCLUSIVE AIRPORT NOISE PLANNING FRAMEWORK
6.1 ..
...................................................................................................................................... 152 GROWTH PROSPECTS FOR RURAL AND URBAN GREATER JOHANNESBURG
6.1.1 .................................................................................................................... 152 Rural areas
6.1.2 ..................................................................................................... 153 Urban Johannesburg
6.2 .................................... 154 GROWTH PROSPECTS FOR THE AVIATION INDUSTRY
6.3 ................................................................................................... 156 URBAN PLANNING
6.3.1 ............................................................................... 156 The need for a guiding framework
6.3.2 .................................................................................................................. 157 Localisation
6.3.3 .............................................................................................. 159 Tensions in land demand
6.3.4 ..................................................................... 160 Environmental Justice and Social Justice
6.4 .................................................................. 164 STATE OF THE ENVIRONMENT (SOE)
6.5 .......................... 168 INTEGRATED DEVELOPMENT PLANNING IN EKURHULENI
6.6 ............. 171 GUIDING PRINCIPLES FOR SUSTAINABLE URBAN DEVELOPMENT
6.6.1 ....................................................................................... 171 Prevention is better than cure
6.6.2 .................................................................................................... 172 Nothing stands alone
6.6.3 .................... 172 Identify and respect local, regional and global environmental tolerances
6.6.4 ............................................. 173 Enhance environmental understanding through research
6.7 ...................................................................... 173
PRINCIPLES FOR REDUCING AIRCRAFT NOISE SUCH THAT A SUSTAINABLE
URBAN NOISE ENVIRONMENT IS PROMOTED
6.7.1 ............................................................. 173 Appropriate technology, materials and design
6.7.2 ............................................................ 174 New indicators for noise environmental health
6.7.3 ............................................................ 174 New indicators for environmental productivity
6.7.4 ......................................... 174 Acceptable minimum standards through regulatory control
6.7.5 ........................................................... 174 Internalise environmental costs into the market
6.7.6 ............................................................. 175 Social acceptability of environmental policies
6.7.7 ................................................................................... 175 Widespread public participation
6.7.8 ................................................................................................................... 175 Subsidiarity
6.7.9 .................................. 175 Flexibility in devising and implementing environmental policy
6.7.10 ............................ 176 Long-term strategies are necessary for environmental management
6.7.11 ....................................... 176 Improved co-ordination across environment-related policies
6.7.12 ............................................................. 177 Non-discrimination and equal right of hearing
6.7.13 ............. 177 Need for better availability and understanding of environmental information

xiii
6.8 ................................................................................178
POLICY INSTRUMENTS FOR IMPROVING THE AIRCRAFT NOISE
ENVIRONMENT IN AN URBAN SETTING
6.8.1 ..................................................................................................... 179
Environmental impact assessment and integrated environment management mechanisms
for airport noise management
6.8.2 ....................................................................................... 179 Economic policy instruments6.8.2.1 .................................................. 179 Potential of economic policy instrument to reduce noise
6.8.2.2 ............................................................................. 180 Limits of economic policy instruments
6.9 181
AIRCRAFT NOISE PREDICTION MODELS AND NOISE CONTROL STRATEGIES
6.9.1 ........................................................................................... 182 Noise preferential runways
6.9.2 ............................................................................................... 182 Minimum noise routings
6.9.3 .............................................................................. 182 Noise insulation and land purchase
6.10 .............................................................183
PROVIDING AIRCRAFT NOISE PREDICTION: AVERAGE ENERGY AND
SUPPLEMENTAL AIRCRAFT NOISE INFORMATION
6.11 ......................................................183
THE AIRPORT MASTER PLANNING FRAMEWORK AND SUPPLEMENTAL
NOISE INFORMATION – A COLLABORATIVE PROCESS
6.12 ............................................................................................................ 184 CONCLUSION
7 ........................................185 CHAPTER 7: CONCLUSIONS AND RECOMMENDATIONS.
7.1 ..................................... 185 SUSTAINABLE DEVELOPMENT AND URBAN POLICY
7.1.1 ....................................................................................................... 189 Summary of results
7.1.2 .................................................................... 192 Noise control in developing communities
7.2 .............................. 193
ALIGNING THE PLANNING HORIZONS OF THE TIME SCALES OF AIR TRAFFIC
FLIGHT ROUTE PLANNING AND TOWN AND REGIONAL PLANNING
7.3 ............................................................................................. 194 RECOMMENDATIONS
7.3.1 ............................................................... 194 Recommendations for a planning framework
7.3.2 .................................................................. 195 Aircraft noise problems: political solutions
7.3.3 ................. 197 Incorporating an airport noise planning framework into Ekurhuleni’s IDP
7.3.4 .............................................................. 198 Aircraft noise reduction technology at source
7.3.5 .................................................................................. 199 More effective tools and metrics
7.4 ......................................................................................... 199 PESSIMISTIC REALITIES
7.5 .....................................................................................................................200
FUTURE FRAMEWORK DIRECTION: A PROGRAMME FOR ACTION AND
NEGOTIATION
7.6 ............................................................................202
AIRPORT NOISE AND ENVIRONMENTALLY SUSTAINABLE URBAN
DEVELOPMENT: CONCLUDING REMARKS
REFERENCES ...................................................................................................................................205
APPENDICES ....................................................................................................................................230

xiv
TABLES Table 1.1: Analytical value of different theoretical perspectives in urban geography applied to aircraft noise ....... 14 Table 2.1: Spatial extent of single event noise contours of old and new technology aircraft .................................. 66 Table 2.2: Spatial extent of 24-hour 65 L contour: 50 versus 100 movements.Aeq .................................................. 69 Table 4.1: Final response summary of the questionnaire survey of aircraft noise disturbance around OR Tambo
International Airport. ............................................................................................................................................. 105 Table 4.2: Gender summary................................................................................................................................... 108 Table 4.3: Degrees of aircraft noise annoyance experienced by men and women respondents. ............................ 114 Table 6.1: DPSIR framework component definitions ............................................................................................ 165 Table B 1: Figure 4.4 Number of surveys distributed and returned: ...................................................................... 234 Table B 2: Figure 4.5 Percentage of responses returned per sub group, and the total percentage returned:........... 234 Table B 3: Figure 4.6 Control group and experiment group percentages reporting being highly annoyed due to
aircraft noise between 6pm and 6am:..................................................................................................................... 234 Table B 4: Figure 4.7 Annoyance reported vs. frequency of hearing aircraft noise. .............................................. 235 Table B 5: Figure 4.8 Percentage of control group and experiment group split into suburb and township groups
reporting being highly annoyed due to aircraft noise between 6pm and 6am ........................................................ 235 Table B 6: Figure 4.10 100% bar graph illustrating the distribution within each sub-group including control group,
and experiment group split into suburb and township groups reporting being highly annoyed due to aircraft noise
between 6pm and 6am ........................................................................................................................................... 235 Table B 7: Figure 4.13 Percentage Sleep, TV, Phone and Work, very often interfered with, by sub-group. ......... 236 Table B 8: Figure 4.16 Percentage of residents who would consider moving vs. how often aircraft noise is heard.
............................................................................................................................................................................... 236 Table B 9: Figure 4.17 Percentage of township respondents reporting being highly annoyed by L noise zone.Rdn
............................................................................................................................................................................... 236 Table B 10: Figure 4.18 Percentage of suburb respondents reporting being highly annoyed by L noise zone:Rdn 237 Table B 11: Figure 5.2 Reported annoyance of the suburb group by 12 hour L noise zone
Table B 12: Figure 5.4 Comparison between suburb group response when classified according to 12 hour L Aeq .............................. 237
9
0
able B 22: Figure 5.19 12 hour N60, N70, N80: Would consider moving because of aircraft noise. .................. 241
Aeq
noise contour and 24 hour L contour.Rdn ............................................................................................................... 238 Table B 13: Figure 5.5 Suburb group. Sleep disturbance 12 hour night LAeq ........................................................ 238 Table B 14: Figure 5.6 Suburb group. Phone disturbance 12 hour night LAeq ....................................................... 239 Table B 15: Figure 5.7 Suburb group. TV disturbance 12 hour night LAeq ............................................................ 239 Table B 16: Figure 5.8 Suburb group. Work / study disturbance 12 hour night L
Table B 17: Figure 5.14 12 hour N60, N70, N80 suburb group reporting being considerably annoyed and highly Aeq ............................................ 23
annoyed.................................................................................................................................................................. 240 Table B 18: Figure 5.15 12 hour N60, N70, N80 Sleep reported as being often and very often disturbed ............ 240 Table B 19: Figure 5.16 12 hour N60, N70, N80 TV viewing reported as being often and very often disturbed
Table B 20: Figure 5.17 12 hour N60, N70, N80 Telephone conversations reported as being often and very often
.. 24
disturbed ................................................................................................................................................................ 241 Table B 21: Figure 5.18 12 hour N60, N70, N80 Work or study reported as being very often disturbed .............. 241 T

xv
FIGURES Figure 1.1: Location of ORTIA and its surrounding land-uses ................................................................................ 29 Figure 1.2: Research design and process ................................................................................................................. 31 Figure 2.1: Relationship between distance and noise level for an aircraft on departure with three different thrust
settings. .................................................................................................................................................................... 41 Figure 2.2: Noise contour of a departing aircraft. ................................................................................................... 42 Figure 2.3: Noise contour of an arriving aircraft.................................................................................................... 43 Figure 2.4: Single event noise contour – departure of a Chapter 2 Boeing 737-200. .............................................. 65 Figure 2.5: Single event noise contour – departure of a Chapter 2 Boeing 737-500. .............................................. 65 Figure 2.6: 65 L contour for 50 takeoff movements over a 24-hour periodAeq ....................................................... 68 Figure 2.7: 65 L contour for 100 takeoff movements over a 24 hour period.Aeq ..................................................... 68 Figure 3.1: L noise contour for ORTIAAeq ............................................................................................................ 73 Figure 3.2: L noise contour for ORTIARdn ............................................................................................................ 74 Figure 3.3: DNL noise contour for ORTIA............................................................................................................ 75 Figure 3.4: Noisiness Index for ORTIA.................................................................................................................. 76 Figure 3.5: Comparison of the spatial extent of NI, L , DNL and L noise metricsRdn Aeq ......................................... 78 Figure 3.6: Delimitation of the study area: flight tracks and survey respondent locations...................................... 89 Figure 3.7 Residences in the control group area, Benoni ........................................................................................ 90 Figure 3.8: Residences in the experiment group area, Kempton Park. Note the Boeing 777 visible above the
houses ...................................................................................................................................................................... 91 Figure 3.9 Houses in the township experiment area, Tembisa ................................................................................ 92 Figure 4.1: Number of questionnaires distributed and returned ............................................................................ 106 Figure 4.2 Percentage of questionnaires returned per sub-group, and the total percentage returned..................... 107 Figure 4.3: Control group and experiment group reporting being highly annoyed due to aircraft noise between
18:00 and 06:00. .................................................................................................................................................... 108 Figure 4.4: Degrees of annoyance reported according to frequency of hearing aircraft noise (all respondents) ... 110 Figure 4.5: Sub-groups reporting being highly annoyed due to aircraft noise between 18:00 and 06:00.............. 111 Figure 4.6: Houses in Tembisa with little acoustic attenuation............................................................................. 112 Figure 4.7: Degree of annoyance caused by aircraft noise between 18:00 and 06:00 according to respondents in
the three sub-groups............................................................................................................................................... 113 Figure 4.8: Female and male distribution of noise annoyance .............................................................................. 115 Figure 4.9: Percentage of responses about home activities being interfered with very often by aircraft noise. .... 116 Figure 4.10: A typical street scene in a suburb group ........................................................................................... 117 Figure 4.11 A typical street in Tembisa ................................................................................................................ 118 Figure 4.12: Frequency of hearing aircraft noise and desire to move away .......................................................... 119 Figure 4.13: L contour for the week of the surveyRdn ........................................................................................... 121 Figure 4.14: Level of annoyance experienced by township residents according to L noise zones.Rdn .................. 122 Figure 4.15: Level of annoyance experienced by suburb residents according to L noise zonesRdn ....................... 123 Figure 5.1: 12-hour night L noise contours at ORTIAAeq ..................................................................................... 128 Figure 5.2: Level of reported annoyance experienced by suburb residents according to 12-hour L noise zonesAeq
............................................................................................................................................................................... 129 Figure 5.3: Specific noise complaints (per 1000 movements) for each hour of the day at Manchester Airport.... 130 Figure 5.4: Level of annoyance experienced by suburb residents according to 12-hour LAeq and 24 hour LRdn
noise zones............................................................................................................................................................. 131

xvi
Figure 5.5: Frequency of sleep disturbance in the suburb group per 12-hour night L noise zoneAeq .................... 132 Figure 5.6: Frequency of interference with telephone conversations among the suburb group per 12-hour night
L noise zoneAeq ...................................................................................................................................................... 133 Figure 5.7: Frequency of interference with television viewing among the suburb group per 12-hour night L
noise zoneAeq
.............................................................................................................................................................. 133 Figure 5.8: Frequency of interference with work or study among the suburb group per 12-hour night L noise
zoneAeq
........................................................................................................................................................................ 134 Figure 5.9: Disturbance of household activities by aircraft noise according to L noise zoneAeq ........................... 136 Figure 5.10: Noise zone disturbance according to household activities................................................................ 137 Figure 5.11: 12 hour 18:00-05:59 N60 contour .................................................................................................... 141 Figure 5.12: 12 hour 18:00-05:59 N70 contour .................................................................................................... 142 Figure 5.13: 12 hour 18:00-05:59 N80 contour .................................................................................................... 143 Figure 5.14: 12-hour N60, N70, N80 suburb group reporting being considerably or highly annoyed.................. 144 Figure 5.15: 12 hour N60, N70, N80 Sleep reported as being often and very often disturbed.............................. 145 Figure 5.16: 12 hour N60, N70, N80 TV viewing reported as being often and very often disturbed.................... 146 Figure 5.17: 12 hour N60, N70, N80 Telephone conversations reported as being often and very often disturbed147 Figure 5.18: 12 hour N60, N70, N80 Work or study reported as being very often disturbed................................ 148 Figure 5.19: 12-hour N60, N70, N80 Would consider moving because of aircraft noise ..................................... 149 Figure 6.1: Example of the DPSIR framework in terms of aircraft noise management ........................................ 167 Figure 7.1: The decline in numbers of noisy aircraft ............................................................................................ 198 Figure C1: Full spatial extent of N60 contour........................................................................................................ 242 Figure C2: Full spatial extent of N70 contour........................................................................................................ 243

xvii
ACRONYMS
EIA Environmental Impact Assessment
FAA Federal Aviation Administration
GPG Gauteng Provincial Government
IDZ Industrial Development Zone
IEM Integrated Environmental Management
INM Integrated Noise Model
LAeq A-weighted Equivalent Level
LRdn Day Night Rating Level
SABS South African Bureau of Standards
SANS South African National Standard
SAST South African Standard Time
SDF Spatial Development Framework
TNIP Transparent Noise Information Package
UDB Urban Development Boundary
UT Universal Time

1 CHAPTER 1: AIRCRAFT NOISE: AN ENVIRONMENTAL
PROBLEM
1.1 BACKGROUND AND RATIONALE FOR THE STUDY.
The last one hundred years have been the urban century, in that the phenomenon of
growth of cities and urban areas has been one of the most remarkable geographical
social and economic features (Badcock 2002; Miller 2005 & Nagle 2000). High urban
population densities have led to the problem of what to do about the environmental
impacts of cities on their residents, surrounding countrysides and even their larger
global footprint. Environmental management in First World cities is currently geared
to waste reduction and recycling, and eventually dumping whatever is left over. In
developing countries, less emphasis is placed on waste reduction and recycling – most
solid waste is just dumped. However, environmental management goes far beyond
simple waste management. Badcock (2002) maintains that citizens in more developed
countries are demanding that cities as living environments meet higher expectations
with respect to quality of life. Urban managers are having to confront more planning
issues to satisfy citizens that the planning and design of cities are environmentally
sustainable.
Spatial configurations of cities produce effects which may affect social behaviour and
interaction (Massey 1999). The adverse effects of pollution and waste creating
activities are not the only negatives that residents have to suffer. Residents also have
to contend with noise from road traffic, trains, rowdy neighbours, pets and aircraft.
Whilst other environmental hazards, such as the supply and removal of water and
sewage, the production and disposal of solid waste and air pollution are more
pervasive, the generation of harmful noise also has a negative impact on the health
and wellbeing of city dwellers. In more and more of the world’s cities, people are
becoming increasingly aware of the nuisance of intrusive and even harmful noise.
These changes in public perception of noise have not occurred as isolated social
phenomena. For example, opposition to nuclear power began to grow in the 1970’s
and there are mounting concerns about global climate change and its consequences
(Stallen & Compagne 2006).

2
Excessive noise levels can lead to hearing damage, but other unpleasant effects occur,
for example sleep disturbance and interference with work and recreation, sometimes
leading to a desire to move away from the area to escape the disturbance. Badcock
(2002) identifies four main sources of noise pollution in urban environments namely
industrial equipment, construction work, road traffic and aircraft. Many of the world’s
international airports are situated in densely populated urban areas. People living in
neighbourhoods in London, New York, Los Angeles and Mexico City, close to airport
approach and departure flight paths have to put up with the continuous noise of
aircraft landing and taking off (Hardoy, Mitlin & Satterthwaite 2001).
The transport of goods and people has been vital for the growth of cities (Nagle 2000)
since transport matches the supply of goods, materials and services with the demand
for them. Transport modes like air, pipelines, rail, road and water all have a variety of
impacts on the environment. The major environmental impacts of air transport are
engine emissions and aircraft noise, and since the introduction in the late 1950’s of the
first commercial jet aircraft – the British Comet, the American Boeing 707 and
McDonnell-Douglas DC-8 - there have been dramatic changes in the nature and
magnitude of the airport noise problem (Ashford & Wright 1979; Brennan, Orth,
Conner & Schwartz 1991). Significantly, noise is by far the most frequently
mentioned disamenity in the home (Organisation for Economic Co-operation and
Development 1986).
The major atmospheric pollutants are carbon, sulphur and nitrogen oxides, volatile
organic compounds and suspended particulate matter. Although not often regarded as
a major atmospheric pollutant, noise can be regarded as an atmospheric pollutant
since noise depends on the ability of air to transmit sound waves (Haughton & Hunter
1994).
Communities living in the vicinity of airport flight paths have a long-standing interest
in the noise emitted from aircraft as they land or takeoff and authorities around the
world have attempted to manage the negative impact of noise from these aircraft
operations. The Organisation for Economic Co-operation and Development (1986)
has reported that there are many ways of combating the disamenity of aircraft noise.
These can be classified into three categories: firstly, noise can be reduced at source,

3
i.e. make aircraft engines quieter; secondly, the impact of noise can be averted by
preventing it from reaching the receiving environment, i.e. keeping airports and
residential land-uses far apart; and thirdly, it is possible to increase the protection
provided by the receiving environment e.g. double-glaze windows in exposed
housing. Perhaps the most co-ordinated attempts have been the efforts of the
International Civil Aviation Organisation (ICAO) – a division of the United Nations
(UN). In 2001, the General Assembly of ICAO endorsed the concept of a balanced
approach to aircraft noise management. This consists of four principal elements,
namely:
• reduction of noise at the source (engines and airframe improvements),
• land-use planning and management,
• noise abatement operational procedures,
• operating restrictions (International Civil Aviation Organisation 2004).
Of these methods, the one with the greatest relevance to geographers is land-use
planning and management. The problem of airport noise is a function of the location
and size of an airport, and the built-up areas under the flight paths. Land-use controls
informed by accurate delimitation of noise exposure zones is one way of resolving the
problem (Pacione 2001).
For land-use planning purposes worldwide, ‘average energy noise contours’ are
produced to represent aircraft noise around airports. The contours are based either on
actual measurements of noise made by landing and departing aircraft, or on computer
modelling of aircraft noise, and are known as ‘average energy contours’ since the total
amount of aircraft noise is distributed over a defined time period, usually 24 hours.
The ‘average energy noise’ contours have been linked by sociological surveys to the
annoyance levels that residents and other land-users around airports display so that
aircraft noise contours can be used in the town planning and land management
process. Examples of average energy noise descriptor terms in use around the world
are Noise Exposure Forecast (NEF, Canada), Day-Night Average Sound Level (DNL,
USA), Community Noise Equivalent Level (CNEL, California), Psophic Index (IP,
France), Noise and Number Index (NNI, Ireland), Weighted Equivalent Continuous
Perceived Noise Level (WECPNL, Japan), Leq (United Kingdom) and Day Night
Rating Level (LRdn, South Africa). These terms refer to noise levels measured or

4
computed over a long period of time (usually a year). They are sometimes called
‘cumulative noise’ or ‘noise exposure’ because they can either be viewed as sums or
as averages over time (Timmermann 2005). They are based on total (average)
numbers of flights at average wind and weather conditions on allocated (average)
runway use conditions. Because they represent all the varied conditions, they are
useful in planning and in regulation. The major criticism of average energy contours
is that there is rarely a real day which is average in all those ways.
Noise contours are superimposed onto land-use planning maps, and the boundaries of
the contours used to determine and delineate the spatial extent of the spread of aircraft
noise. The noise calculation methods are accompanied by a table describing the types
of land-uses permitted in or to be excluded from the noise zones. For example, in the
USA, the compatible land-use table is contained in the Federal Aviation
Administration’s FAR Part 150 (United States General Accounting Office 2000). In
South Africa, the Standards South Africa document SANS 10103 The measurement
and rating of environmental noise with respect to land use, health, annoyance and to
speech communication (Standards South Africa 2004) gives guidance on noise and
land-use.
For over three decades the South African Bureau of Standards and more recently the
restructured Standards South Africa – a division of the South African Bureau of
Standards have compiled codes and standards (see South African Bureau of Standards
1974; Standards South Africa 2003 and 2004) used to calculate and delineate where,
and what type of development can take place around airports. The recently revised
Standards South Africa system (SANS 10117) continues to provide guidance in this
role (Standards South Africa 2003). Updates of SANS 10117 include the requirement
that the Integrated Noise Model (INM) aircraft noise modelling computer program be
used to calculate noise contours around airports, and includes reference to new land-
use planning guidelines contained in the SANS 10103.
The INM is developed by (and available from) the United States’ Federal Aviation
Administration Office of Environment and Energy. It is widely used by the civil
aviation community for evaluating aircraft noise impacts in the vicinity of airports and
the author set up and used this model to further the aims of the study.

5
Until 2002, the SABS 0117 standard, and since 2003 the SANS 10117 and SANS
10103 standards, have been used in three key ways. They have been used to delineate
where, and what type of development can take place around airports; for technical
assessments of airport operating options in environmental impact assessments; and as
tools for providing information to the public on noise exposure patterns around
airports. For example, SANS 10103 recommends an LRdn level of 45 should not be
exceeded in rural areas, 50 in suburban districts, and 55 in urban districts.
These standards have been useful in land-use planning, and the SANS 10117 and
10103 systems will continue to play an important part in guiding land-use planning.
However, there are significant limitations in using the SANS 10117 system to
describe aircraft noise to the non-technical person. Many noise complaints are now
coming from people who live outside the 55 LRdn contour. Traditionally, these
residents have been given little or no information on aircraft noise. Most people living
outside the 55 LRdn contour have an expectation of being subjected to little or no
aircraft noise – those seeking the peace and quiet of a rural environment find the
levels of aircraft noise experienced to be unacceptable.
Van Heerden (2000) reported that residents in Pretoria’s eastern suburbs were
complaining about contending with high noise levels caused by commercial air traffic
departing OR Tambo International Airport1 (ORTIA) for long-haul destinations in the 1 The city of Johannesburg is at the core of South Africa’s major metropolis. Two
points of clarification are required. First, a distinction must be made between the city
of Johannesburg per se, and its growing metropolitan region, itself composed of
several autonomous but interconnected municipal authorities, one of which is
Ekhuruleni, in which the Johannesburg International Airport is located. Johannesburg,
and all of its surrounding municipal authorities will be collectively referred to as
Metropolitan Johannesburg, or “Johannesburg” after Beavon (1998) and Rakodi
(1998). Second, during the latter stages of authoring, Johannesburg International
Airport (JIA) was renamed to OR Tambo International Airport (Pressley 2006), and
so these names may be used interchangeably.

6
northern hemisphere. Even though these residents lived some distance outside ORTIA
noise contours, they were annoyed by aircraft noise. This issue is not unique to South
Africa. In Australia, the Australian Noise Exposure Forecast (ANEF) of 20 is the
value below which areas are acceptable for housing (Airservices Australia 1996). In
1998, the Australian Department of Transport and Regional Services reported that at
Sydney Airport over 90 per cent of the complaints came from residents in areas
outside the 20 ANEF contour (Commonwealth Department of Transport and Regional
Services 2000).
Since 1996 the author has been a member of the Airport Environment Committee
(AEC) at ORTIA. There have been two constant complaints tackled at the committee
meetings over the years, namely from those residents who complain about night-time
aircraft noise, and those from people who live to the north of the airport and outside
the land-use planning contour being disturbed by aircraft noise. The fact that people
who live outside the noise contours are being disturbed by aircraft noise has led, in
recent years, to suspicion about and mistrust of the validity of the contours.
This leads to a pertinent question regarding the South African context, namely the role
‘average energy’ aircraft noise contours (calculated according to the SANS 10107
standard) have in land-use spatial planning for neighbourhoods in the vicinity of
airports. It would appear that SANS 10107 needs to be enhanced to provide a basis for
the provision of better information to address the issues of aircraft noise that arise at
South African airports.
1.2 RESEARCH PROBLEM: LINKING AIRCRAFT NOISE AND LAND-
USE PLANNING
It has been established that aircraft noise disturbs communities around airports. To
counter the problem, noise contours are produced by acoustic experts, consultants and
airport authorities for use by town planners with the intention that the planners will
use the contours to keep noise sensitive land-uses and airport noise impacted areas
apart. Average energy noise descriptors, usually used in association with land-use
planning guidelines, are designed as a system or methodology to provide a consistent,
7
repeatable way of producing aircraft noise contours. Average energy aircraft noise
descriptors were initially intended for use by the authorities (for example town
planners) as an input into the land-use planning process. With time, the use of the
contours has evolved. Contours now also tend to be used by authorities to “prove” to
people who complain about aircraft noise that they do not have a problem
(Commonwealth Department of Transport and Regional Services 2000).
While the merits of average energy noise descriptors, which have been stated above,
help bureaucratic decision-makers establish guidelines for land-use planning, reducing
noise exposure to a single value of LRdn does not convey to the public the extent of the
aircraft noise impact because LRdn masks the number of events, and the peaks in noise
level experienced. People hear individual aircraft noise events – they do not hear an
average, and it is the individual peak noise levels which cause complaints.
From the foregoing introduction, it can be postulated that supplemental2 information
about aircraft noise has a role to play in the planning framework that town planners
use and in keeping residents who live around airports informed about aircraft noise.
1.3 RESEARCH AIM AND OBJECTIVES
The aim of this study is to investigate the broad issue of land-use planning around
airports by employing two aircraft noise prediction models, namely the Integrated
Noise Model and the Transparent Noise Information Package to establish the various
potential effects and consequences of night-time aircraft noise, in noise zones
demarcated according to supplemental aircraft noise information. The effects and
consequences include disturbance of sleep, telephone conversations, television
viewing and work or study and the likelihood that people will move away to escape
night-time aircraft noise.
2 Stein (1971: 1429) defines supplemental as ‘… added to furnish what is lacking or
missing.’ A ‘supplemental noise descriptor’ in this study refers to additional
information about aircraft noise.

8
Specific objectives are to
• Examine aircraft noise and land-use planning literature and practise, and
determine the conceptual links between the two fields (Chapter 2:
Literature review/theoretical framework).
• Expose the confusion that different average energy noise contour
calculation methodologies can create (LAeq, DNL, NI and LRdn) (Chapter
3: Research design and methodology).
• Establish that communities experience annoyance from aircraft noise even
when they are located outside 55 LRdn aircraft noise contours (Chapter 4:
‘Average energy results).
• Calculate a 12-hour night-time ‘average energy’ contour for a South
African airport (Chapter 4: ‘Average energy’ results).
• Calculate supplemental aircraft noise information in the form of ‘number
of events’ above specified thresholds (Chapter 5: Supplemental noise
information)
• Devise an inclusive airport noise and land-use planning framework to be
used around new or existing airports. The present study will propose the
possibility, as a new social practice, of making digital aircraft noise spatial
data available in a format easily understood by the layperson to
communities around airports. (Chapter 6: An inclusive airport noise and
land-use planning framework).
• Draw salient conclusions and make relevant recommendations (Chapter 7:
Conclusions and recommendations).
Geography as a field of study can be very broad. The following section draws links
between geography, urban planning and aviation noise.
1.4 THEORETICAL FRAMEWORK: PHILOSOPHY OF GEOGRAPHY
AND THE URBAN PLANNING-AIRCRAFT NOISE LINK
The introduction made clear how noise, specifically aircraft noise, is a problem in the
vicinity of airports. It was pointed out that informed land-use planning in the vicinity
of airports is one way of reducing aircraft noise disturbances. The question that arises

9
is where the domains of aircraft noise and land-use planning lie in the theoretical
framework of geography, the discipline in which this research is to be conducted?
The debate about pollution in an urban context is very relevant to geographers.
Human geography focuses on the social (human) landscape but is open to a cross-
disciplinary focus (Haggett 1990; Massey 1999) in which practical geography is
simultaneously spatial, natural and social (Smith 2004).
In the following sections the links between geography and noise, and aircraft noise as
environmental problems are explored.
1.4.1 Aircraft noise studies in the context of geography
The field of geography covers a vast range of topics and interactions and conflicts
between topics. Indeed, Heffernan (2003) states that geography has always been in a
state of uncertainty and flux, but argues that the absence of conceptual conformity has
been one of the discipline’s strengths. All disciplines are prone to shifts in focus and
methodology, and geography is no exception (Barnard 2001). A study of the literature
about the discipline of geography yields a multitude of viewpoints, and it is quickly
apparent that there is no single umbrella definition. Over the years, geography has
evolved from the classical geography of Eratosthenes’ gê (earth) and grapheïn (to
draw or write) to environmental determinism, through modernism, to postmodernist
contemporary geography through the renewal of the discipline after the 1950s to
humanism and on to a specialist phase where geographers were specialists in one or
other branch of the subject and research competence and output were the criteria on
which they assessed themselves (Barnard 2001).
Haggett (1990) writes that geographers are concerned with finding the pattern,
structure and meaning that lies in the world’s regional diversity at all scales.
Cresswell (2004) in turn argues that being informed by place involves more than
simply writing about a place. It involves thinking about the implications of the idea of
place for whatever it is being researched. Place can have a double meaning (Harvey
1996). It can be the position of a location on a map, or an entity. Soja (1999)
encourages a different way of thinking about space as rather an open-ended set of
defining moments. He describes an ontological shift from temporal and social

10
characteristics to the ontology of human existence. The spatiality of being and
becoming is beginning to be recognized more than before, injecting an assertive term
of spatiality-sociality-historicality into the ontology of human existence. Stated
differently, the social production of spatiality or the making of geographies is
becoming fundamental to understanding our life worlds (Soja 1999).
It can be argued that the study of aircraft noise and land-use around airports
constitutes an endeavour to find Haggett’s pattern and structure. The present study
acknowledges Soja’s way of thinking about space in the search for supplemental
aircraft noise information in the space around airports.
“Urban geography is an established branch of geography … to aid our understanding
of the city” (Pacione 2001: 26). From the 1970s, the scope of urban geography has
expanded rapidly. Some writers believe that the increased diversity is a source of
weakness whilst others believe the breadth of the perspective strengthens urban
geography’s position as an integrative focus for research on the city (Pacione 2001).
Hence, urban geographers have approached the study of cities from a number of
philosophical perspectives. Pacione, (2001) lists some of the main epistemological
developments of urban geography, namely environmentalism, positivism,
behaviouralism, humanism, structuralism, managerialism, postmodernism and moral
philosophy. He also rejects the view of those who “… insist on the need to make a
unitary choice of theoretical framework due to the perceived superiority of a
particular theory of knowledge.” and instead favours a combination of approaches in
different ways which “… incorporates a search for a middle ground between the
generalization of positivism and the exceptionalism of postmodern theory.” (Pacione
2001: 26)
The importance of employing a combined multi-layered ‘realist’ perspective (Pacione
2001) that encompasses the global and local scales, social structure and human
agency, and theory and empirical investigation in seeking to interpret the city will
inform this research.
To study urban geography is to study the living environments of more than half the
world’s population. Although there are exceptions, living conditions in urban areas in

11
the First World are generally better than in the developing world, one of the reasons
being good planning. South Africa is striving to attain the characteristics of a modern
developed country. The greater Johannesburg urban agglomeration is one of the core
urban areas at the forefront of this striving, and faces its share of common problems,
particularly pollution. Noise, defined as unwanted sound, is one of the most
ubiquitous urban pollutants and most urban dwellers are subjected to noise pollution
(Miller 2005). Possible adverse effects of noise include annoyance, sleep disturbance,
health problems, disruption of television viewing and other entertainment, effects on
job performance, and property value reductions. Serious noise nuisance can be created
between multi-occupancy buildings such as flats and offices. Outdoor sources of noise
include construction and industry, but the most persistent is transportation noise
which includes road, rail and noise from aircraft landing and taking off. Resolution of
the aircraft noise problem requires a combination of technical improvements to
aircraft airframes and engines, insulation of dwelling units near flight paths, and land-
use planning informed by accurate delimitation of aircraft noise exposure zones.
Geographical research is ideally positioned to integrate all of these requirements, and
then determine optimal planning and flight route solutions which limit noise exposure.
‘Place’ is a term frequently used to describe some aspect of geographical study. The
vision of place could, for example, be cultural, ecological or economic. The present
study will treat place as areas to be emphasised – those areas around an airport, near
the flight paths of aircraft where residents have to endure aircraft noise which makes
their place less nice to live (Cresswell 2004). The research methodology followed in
this approach is postmodernist to an extent where the viewpoints of diverse
individuals are considered, and follows the epistemology of a combination of
environmentalism and positivism.
A research agenda is an inventory of problems which justifies the research –
dysfunctions in urban society in which the researcher happens to have an interest. The
current problems of a particular society at a particular time will attract research
interest. In the present study there are overlaps with other disciplines, for example
socio-psychoacoustics is one and aeronautical engineering another, but this study is
viewed as a human-environment one, the environment in this instance being the
pollution of the soundscape to which at the local neighbourhood level of analysis

12
residents are exposed. If noise can be regarded as a hazard, then residential location
within a noise zone around an airport could be regarded as being in a hazardous zone.
Living in or developing residential dwellings in noise zones are then to be avoided.
Pacione (2001) mentions the epistemologies of behaviouralism and managerialism.
Behaviourism comes into the present study when the key question of how people
respond to an environmental pollutant, in this case noise from aircraft is addressed. A
survey to gauge annoyance and interference from aircraft noise will be administered.
Managerialism, in turn comes into play when it will be examined how bureaucratic
gatekeepers – those who are responsible for the laws and standards, and administering
them (national government, Standards South Africa, local authorities) – control how
land resources are used.
A number of philosophical approaches have been mentioned earlier. No single
approach in the present study will provide an explanation of the aircraft noise
pollution phenomena under investigation. The question is whether a convenient
accommodation is possible among the different approaches. The researcher accepts a
pluralist stance – that there is no single way to gain knowledge (Pacione 2001: 31).
The route which incorporates a search for a middle ground between behaviouralism,
positivism and managerialism is the approach favoured here.
Barnard (2001) and Unwin (1992) are of the view that the trend toward the division of
geography into distinct physical and human parts will eventually fall away. Unwin
(1992) foresees specific social science and earth science departments with an
increasing interdisciplinary context, while Barnard (2001) sees a holistic, flexible and
applied environmental geography, and a diffuse holistic geography. Unwin (1992)
expresses the concern that the human utilization of the environment, and particularly
pollution control, require a cross-disciplinary knowledge of physical processes and
social practice. An understanding of them can only be partial if approached purely
from either the physical or the social sciences. Geography has a long tradition of
research about the human occupation of the Earth and a tackling of the issues facing
contemporary society. This study will attempt to interpret the coming together of the
objective and subjective worlds of reality. Place has become a focus for understanding
the interaction of the human world of experience and the physical world of existence.

13
Space is the fundamental stuff of human geography – it divides and connects things
into different kinds of collectives which are slowly provided with the means which
render them durable and sustainable (Thrift 2003). In this study the ‘things’ he refers
to are: (i) the aeronautical engineers working on technical solutions to reduce noise
from aircraft whilst at the same time balancing the requirements for safe flight,
reducing fuel consumption and emissions; (ii) the pilots flying the aircraft and
attempting to do so safely and as quietly as possible; (iii) the noise from aircraft; (iv)
residents on the ground living in the vicinity of flights paths around an airport whose
television viewing, telephone conversations, sleep and work are disturbed by aircraft
flying overhead; (v) land-use planners attempting to accommodate the demand for
more land in a rapidly growing urban context. All of these result in the collective of
an aircraft noise problem which needs to be provided with solutions that are durable
and sustainable.
The analytical value of employing the different theoretical perspectives raised so far is
illustrated in Table 1.1 with reference to the question of urban land-use in the vicinity
of flight paths around airports, and the resulting aircraft noise pollution. The
importance of employing a combined ‘realist’ perspective that encompasses the local
scale of urban studies informs the organization and content of this study.

14
Table 1.1: Analytical value of different theoretical perspectives in urban geography
applied to aircraft noise
Theoretical
perspective
Interpretive insight
Environmentalism The influence of environmental factors on residential location
can be seen in the problems of aircraft noise in
neighbourhoods around airports.
Positivism Uses statistical analysis of subjective responses to aircraft
noise to reveal areas around airports with aircraft noise
characteristics which affect residential developments.
Behaviouralism Addresses the key question of how people are disturbed by
aircraft noise and what their response may be.
Humanism Explains how different social groups interact with noise from
aircraft. In the present study, survey responses of two groups
will be considered: suburb and township.
Managerialism Illustrates how urban residential structure is affected by the
ability of local planning authorities to control development
which is inappropriate for the relevant aircraft noise levels.
Postmodernism Explores the place of population groups of different
socioeconomic status in the community. Generally township
residents are less wealthy than suburb residents. How does this
affect their perceptions of aircraft noise and their priorities for
local development.
Moral philosophy Critically evaluates the ethical underpinnings of issues such as
locating less wealthy communities in areas around airports
which are affected by aircraft noise.
Source: Adapted from an idea by Pacione (2001: 32).

15
1.4.2 Using Geographical information systems (GIS) in aircraft noise studies
GIS can best be described as a computer information system capable of entering,
manipulating, analysing and displaying geographically referenced data. GIS is well
suited to analyse data of a spatial as well as a non-spatial nature (Zietsman 1991). The
location of the loudness of an aircraft taking off or landing at a point on the ground is,
for example, spatial in nature while the type of aircraft, type of operation and time of
the flight are the non-spatial features of the flight. GIS also allows the researcher to
transfer data from other software packages or extract data for the purpose of analysis.
Being an applied and environmentally focused approach, the output of airport noise
contouring software may be regarded as a simple type of GIS, well suited to
cartographic presentation in a more comprehensive GIS. Aircraft noise information by
itself is almost useless. Once it has been overlaid onto a land-use map it becomes
much more relevant. From here it is easy to take the next step to making the noise
information available and transparent. Making transparent aircraft noise information
available has a democratising potential within informatics. Informed open discussion
is mobilised through providing more information and access to information and
provide tools for sustaining and enlarging opportunities for ‘voice’ and ‘access’ in an
arena of reasoned, open, un-coerced discourse (Pickles 2004).
1.4.3 The Aarhus Convention: access to aircraft noise information and public
participation
The Aarhus Convention (adopted by the United Nations Economic Commission for
Europe in the Danish city of Aarhus in 1998) developed out of Agenda 21, and
concentrates on linking environmental rights and human rights (United Nations
Economic Commission for Europe 2006). Access to information about the
environment by the public is a particular aspect which is stressed in the convention,
and which will be discussed later in this dissertation where the possibility, as a new
social practice, of making digital aircraft noise spatial data available in a format easily
understood by the layperson to communities around airports will be explored.
16
1.4.4 Airport noise
For Barnard (2001:5), geography is a discipline which “… represents a specialized
way of looking at the earth’s surface, collecting facts, transforming them into
concepts and addressing problems.” If airport noise is regarded as a problem, then the
question may be posed: How may geography be used to process the information and
address the problem?
To illustrate the way the SABS and SANS standards have been used as an information
tool, it is useful to examine the type of information usually given to people who are
interested in learning about aircraft noise perhaps because they are town planners or
developers, or perhaps because they are disturbed by the noise from aircraft
operations. They are generally shown a land-use planning map with the aircraft noise
contours superimposed on the map. They then find the location of the property or area
in which they are interested, and the corresponding aircraft noise level (for argument’s
sake say below 55 LRdn). If any further advice by an aviation or local authority official
is given, it usually relates to the objectivity of the assessment of the noise in the area
according to national standards. The advice is not very enlightening – the advice has
merely told the enquirer that a national standard has determined that they would not
be disturbed by noise should they move into those houses in question. It may even be
interpreted that there is no aircraft noise at those properties. It is therefore possible,
and likely that people form the opinion that aircraft noise would only be a problem for
properties inside the contours.
Recent experience, however, has demonstrated that the aircraft noise problem is not
confined to areas inside the contours (Commonwealth Department of Transport and
Regional Services 2000; Fidell 1999). People hear individual aircraft – they do not
hear an average, and individual aircraft are heard for some distance outside the spatial
extent of average energy noise contours.
Some land-use planning which has been done around airports was based on the spatial
extent of the boundaries of noise contours produced by the SABS over the years. The
SABS Noisiness Index (NI) system was developed in the early 1970s. Since then the
NI contours, as an aircraft noise information and land-use planning system, grew to

17
the point that the contours excluded all other ways of reporting aircraft noise
exposure. In recent years there has been public dissatisfaction with average energy
contours. Other average energy noise descriptors, notably the DNL in America and
the ANEF in Australia have also come under criticism (Commonwealth Department
of Transport and Regional Services 2000; Federal Interagency Committee on Aviation
Noise 2002).
The shortcomings of the way the average energy noise contours have been used to
provide aircraft noise information for communities and for land-use planning, and the
strategies to address these, are the foci of this dissertation.
1.4.5 Noise as an urban environmental problem
The World Health Organisation defines ‘community noise’ (also called
‘environmental noise’, ‘residential noise’ or ‘domestic noise’) as noise emitted from
all sources except noise at the industrial workplace, the main sources including road,
rail and air traffic, and the neighborhood (Berglund, Lindvall & Schwela, 1999).
According to Berglund, Lindvall & Schwela (1999), noise has always been an
important environmental problem for human beings. As far back as ancient Rome and
Medieval Europe rules existed to limit the noise from ironed wheels of wagons and
horse-carriages during night-time to ensure a peaceful sleep for inhabitants.
Negative effects of noise include interference with communications; noise-induced
hearing loss; sleep disturbance effects; cardiovascular and psycho-physiological
effects; performance reduction effects; annoyance responses; effects on social
behaviour; reduction in property values and noise induced ghettos (Berglund, Lindvall
& Schwela, 1999). The nature of activities in urban areas means that more noise is
created, and more people are affected because of the high density of people living in
these areas.
Aircraft noise is the focus of this study and in the next section, techniques which are
in use to minimise aircraft noise will be discussed.

18
1.4.6 Techniques used to minimize the aircraft noise problem
Four techniques are commonly used to counter the problem of aircraft noise, namely
• use of technology to design and manufacture quieter aircraft (including quieter
engines and improved airframe design)
• noise abatement (meaning that pilots take measures to operate the aircraft as
quietly as is safely and operationally possible)
• noise mitigation (meaning reducing noise at the recipient, such as acoustic
insulation of buildings)
• land-use zoning.
Local authorities are able to control development of various parcels of land around
airports through noise zoning, the goal being to keep development, which is
incompatible with aircraft noise away from the airport. It is in this area that geography
has a promising contribution to make in dealing with the aircraft noise problem
(Morgan 1999, Vowles 2006).
1.5 NOISE EXPLORED
1.5.1 What is noise?
It is necessary to explain what is understood by the term noise before investigating the
impact of aircraft noise. The Encarta world English dictionary defines noise as
“Unpleasant sound, a loud, surprising, irritating or unwanted sound” (Rooney,
Carney, Soukhanov, Jellis, Clarke & Yates 1999: 1285). Other authors describe noise
as: “… one of the environmental problems festering in the cities… ” (Bragdon,
1973:15); “… a source of great annoyance, interrupting sleep, interfering with
conversation, and depriving people from full enjoyment of many recreational
activities …” (Ashford & Wright 1979: 410) “… the intrusion of unwanted,
uncontrollable, and unpredictable sounds.” (Bronzaft 2004: 66); “… excessive or
unwanted sound that is unwanted because it annoys people, and one of the most
common forms of pollution … noise can be defined as unwanted sound waves that
were not present in the pre-modern electromagnetic spectrum.” (Duckworth & Frost
2004: 2783). The general message is that noise is something which is irritating and
annoying and to be avoided.

19
Noise is measured in units known as decibels, abbreviated to dB. Noise can range
from 1dB (which is near silence) to 140dB which could be made by military jet
aircraft. A sound level meter is the instrument used to measure noise levels in
decibels.
1.5.2 What is aircraft noise?
In 1911, when aviation was in its infancy, noise from aircraft was already receiving
attention. “Taking everything into consideration, there is little to be lost by silencing
and a great deal to be gained…. we may rest assured that the tremendous racket that is
at present associated with the aeroplane, plays a considerable part in prejudicing the
public against these machines.” (The Aero 1911: 1).
Large technological advances have been made since the 1960s in reducing the noise
made by transport aircraft. Aircraft and engine manufacturers continue with research
to increase the noise reductions, even as aircraft become larger. These include an
ultra-quiet blended wing-body airliner so quiet it can only be heard within the airport
boundary (Coppinger 2005); aircraft engine manufacturer CFM International
acknowledging that “… there is huge pressure on noise … .” and that “… a
breakthrough is needed in terms of technology …” (Norris 2005a: 60); and Boeing
recommending the use of engine chevrons that help mix fan and core exhaust streams
with bypass flow thereby reducing shear and noise (Norris 2005b: 26). These efforts
will bring about improvements in reducing the noise impact but they cannot be
expected to replace land-use planning and zoning controls.
Speaking at a conference on aviation and the environment, Geoff Maynard, chairman
of the UK’s Royal Aeronautical Society operational sub-group believes that airspace
reform is crucial if noise-reduction techniques more advanced than continuous
descent approaches are to work (Wastnage 2005). The group is also studying other
noise reduction methods including crosswind/tailwind landings, non-precision
approaches to runways that avoid residential areas, noise abatement take-offs, noise
preferential routeings, steeper approaches and displaced threshold landings (Wastnage
2005).

20
Recent increases in aircraft fuel prices have led to renewed airline interest in
turboprop aircraft (Kingsley-Jones 2005a). Turboprop aircraft use less fuel than jet
aircraft with a similar seating capacity, and on short routes the speed advantage of jets
over turboprops is minor (Kingsley-Jones 2005b). The benefit of an increased
proportion of turboprops is that they are quieter than jets, and this advantage is passed
on to the airport’s neighbours. However this benefit is relatively minor since jets are
still preferred by airlines and passengers over medium distance to long flights due to
their speed advantage so it is unlikely that jets will be replaced by turboprops on noise
grounds alone.
Noise is made by aircraft engine run-ups and taxiing on the ground, during take-off
and landing, and en-route between destinations. Take-off and landing operations when
aircraft are being operated at high power settings and are close to the ground create
the most noise problems. Bronzaft, Ahern, McGinn, O’Conner & Savino (1998) found
that nearly 70% of residents who live within flight corridors reported themselves as
being bothered by aircraft noise. Not all aircraft are noisy. Older jet aircraft,
particularly those dating back to the 1970s are extremely noisy whilst new jets and
turboprop aircraft are much quieter.
Noise from aircraft is very complex and comprises engine noise and airframe noise.
Engine noise is the sum of noise produced by several engine components: fan,
compressor, combustor, turbine and jet exhaust (Brennan et al. 1991). Airframe noise
originates from the airframe itself as well as the undercarriage and undercarriage
doors, wing flaps and slats when these are deployed on take-off and landing. The first
jet engines were known as turbojets and were the noisiest engines. These were
followed by low bypass ratio, and later high bypass ratio turbofan engines which are
the quietest even though they produce much more thrust than early turbojet and low
bypass ratio engines.
1.5.3 Airport noise or aircraft noise?
The terms airport noise and aircraft noise are often used interchangeably, leading to
some confusion. The airport may be a source of noise nuisance when aircraft are on
the ground maneuveuring or when engine testing takes place. However, the problem
21
of aircraft noise extends much further into surrounding communities. In this study, the
aircraft noise problem is assumed to affect neighbourhoods surrounding airports,
where noise from aircraft in the air causes problems. The present study will therefore
refer to aircraft noise.
1.5.4 Land-use and aircraft noise
The implementation of almost any transportation project brings with it a series of
impacts or consequences that may be negative in nature, and in need of impact
analysis and abatement considerations. Cohn & Harris (1987) assign the responsibility
of dealing with the negative impact to environmental planners (also referred to as
environmental engineers, analysts or specialists). Whilst environmental planners have
a role to play, it is also up to legislators to enact comprehensive laws which
environmental planners and town planners use to do their planning.
A land-use plan for property surrounding an airport boundary is an integral part of a
comprehensive urban planning system and must be co-ordinated with the planning
policies of the area in which the airport is located. Incompatibilities of an airport with
its neighbours can include road traffic congestion, aircraft engine emissions, toxic
chemicals and industrial waste, but the objections of the airport’s neighbours to
aircraft noise is the primary problem (Horonjeff & McKelvey 1983). Land-use
planning must therefore take into account the projected extent of aircraft noise that
will be generated by airport operations in the future. Where the land-use around the
airport is underdeveloped, the projected aircraft noise contours must form the basis for
establishing comprehensive land-use zones. Land-use zoning is not an effective
method of controlling land-use in areas which are already built-up because such
zoning is not retroactive. In those areas which are already built-up, citizens could be
made aware of the noise impact in a process of providing transparent noise
information.
Even though aircraft noise contours are available, municipal planning authorities
having zoning powers may also not take effective action, thus rendering zoning
ineffective (Horonjeff & McKelvey 1983). Height and hazard zoning is used to
protect airport approaches from obstructions, and these zones may offer some
protection against noise too, but they are limited to close proximity to the airport and

22
it must be remembered that their primary intention is to provide space for safe flight
operations.
The average energy noise contour calculation process is the traditional approach to
noise planning and analysis around airports. The Federal Interagency Commission on
Aviation Noise (2002) recommend the use of supplemental aircraft noise information
(or supplemental metrics) to best determine noise impacts at specific noise-sensitive
locations. Albee & Burn (2004) describe average energy contours as an exclusive
process that defines some people who are located within a contour as having a
significant noise problem whilst others located as close as next door, but who live
outside the contour, are relegated to not having a problem. In the USA, a level of
DNL 65dB is defined as the threshold of significant impact. Land-use planning zones
are defined by aircraft noise pollution, and affected residents may qualify for funding
to insulate their homes, or may even be bought out. Of the residents who live outside
the zone, those that are the most sensitive to noise comprise the vocal opposition to
these noise contours and noise zones.
Albee & Burn (2004) are of the opinion that given that most noise complaints come
from persons residing outside the contour, it is clear that the general approach to
conducting analyses of aircraft noise, and consequent planning, viz. average energy
noise contours, needs improvement. This is similar to the view of the Australian
Department of Transport who also consider average energy noise information
inadequate (Commonwealth Department of Transport and Regional Services 2000).
Two phrases commonly used to describe the aircraft noise information which is
additional to average energy noise metrics are ‘supplemental aircraft noise
information’ and ‘transparent noise information’. Essentially the two describe the
same intention, viz. the provision of additional information to that which is
traditionally presented about aircraft noise. The use of the word ‘transparent’ implies
that all types of noise information are made available in a transparent process. The use
of the word ‘supplemental’ does convey that more information is made available, but
when compared with the word ‘transparent’ it does not carry quite the same
convincing message of openness. It is the intention of this study to encourage the use

23
of both supplemental and transparent information, so the two terms will be used
interchangeably.
1.6 AIRCRAFT NOISE AND LAND-USE CONTROLS IN SOUTH AFRICA:
THE REGULATORY FRAMEWORK FOR NOISE
A regulatory framework which deals with broad environmental issues per se, and
which proceeds down to the specific level of noise and aircraft noise, has been
constructed in South Africa. This framework is discussed in this section.
1.6.1 Noise and the Constitution
The right to health and well-being is provided for in the Bill of Rights contained in
Chapter 2 of the Constitution of South Africa (South Africa 1996). The right to an
environment that is conducive to well-being is apt in the context of noise pollution
(Glazewski 2000). Schedule 4, Part A of the Constitution includes the ‘environment’
as a functional area of concurrent national and provincial legislative competence
while Schedule 5 Part B specifically includes noise pollution as a provincial function
provided that the local authority has the capacity to carry out this function (South
Africa 1996).
The Constitution contributes to the mitigation of noise by recognising that noise is a
problem. In broad terms, it provides for a regulatory structure to deal with noise, but
does not go into specific details. This is left up to national, provincial and local
regulations which will be discussed in the next section.
1.6.2 Noise control regulations
The wide definition of the ‘environment’ in the Environment Conservation Act and
the National Environmental Management Act means that “… noise pollution is also
included under the purview of both of these acts” (Glazewski 2000: 748). It is clear
from the paragraph above that noise pollution control is primarily a provincial
responsibility. Three provinces which have passed their own noise control regulations
are the Free State, Gauteng and the Western Cape (Glazewski 2000). Although these

24
are provincial laws, they are “… to be applied by local authorities…” (Glazewski
2000: 752).
In Gauteng, the Department of Agriculture, Conservation and Environment has
published a service delivery charter in which sustainable development in Gauteng is
to be facilitated by “… ensuring sustainable land-uses … and land-use patterns”
(Gauteng Department of Agriculture, Conservation and Environment. s.d. no page).
The service delivery charter includes reference to noise control regulations. These
regulations are published in order to “… provide a uniform minimum standard for
noise regulation” and “create new mechanisms for effective enforcement in
neighbourhoods” (Gauteng Department of Agriculture, Conservation and
Environment 1999 no page). However, only brief mention is made of aircraft noise in
that a local authority may designate a controlled area where “… air traffic noise in the
vicinity of an airfield … exceeds 65dBA” (Gauteng Department of Agriculture,
Conservation and Environment 1999: 1). The regulations refer to the previous code of
practice for aircraft noise calculation (SABS 0117-1974) in which it is stated that for
residential areas “… the total noisiness index … should not exceed 65 for residential
areas” (South African Bureau of Standards 1974: 5). In 2003 a new standard was
introduced (not referred to as a code of practice any more), but the Gauteng noise
control regulations have not yet been updated to reflect this. This has led to confusion
in the province where airport developers and town planners have, in some instances,
used old regulations to justify their developments, whilst in others new standards are
referred to.
1.6.3 Aircraft noise and environmental policy
An aircraft noise and environment policy has been in a process of development since
1999. The most recent release (16 March 2005) is a third draft of the white paper on
national civil aviation policy which contains (in Chapter 6), draft policy on aircraft
operations and the environment (National Department of Transport 2005). Section
6.9.1 of the white paper recognizes the importance of noise contours for the long-term
planning of land-uses around airports. The proposed policy specifies that the
calculation of noise contours for an airport must be in accordance with SANS 10117-
2003.

25
1.6.4 Noise standards: SABS 0117-1974, SANS 10117:2003 & SANS 10103:2003
The SABS standard SABS 0117-1974, published in 1974, covered the calculation of
noise contours for an airport for the purpose of zoning of land to prevent disturbance
in future residential areas around the airport. This code of practice was replaced in
2003 by the SANS 10103:2003 standard (dealing amongst others with land-use) and
by SANS 10117:2003 which specifies the calculation method for predicting aircraft
noise around airports. Importantly, none of the policies, standards or regulations refer
to supplemental or transparent noise information. In each instance, the noise
calculations refer to average energy aircraft noise representations.
1.7 RESEARCH METHODOLOGY USED FOR INVESTIGATING
AIRCRAFT NOISE DISTURBANCE
Disturbance from aircraft noise is well documented, the seminal work by Theodore
Schultz in which he devised a dose-response relationship based on a number of other
surveys being an oft-quoted example (Schultz 1978). Noise from aircraft can
adversely affect people living near airports in many ways and concern that night-time
noise is detrimental to public welfare is understandable. The evening and night-time is
when people are usually at home, relaxing, watching television or listening to music,
sleeping, studying and so on. Using the World Health Organisation (1946: 2)
definition of health, namely ‘… a state of complete physical, mental and social well-
being and not merely the absence of disease or infirmity’, it is clear that night-time
environmental noise including aircraft noise adversely affects health by causing
chronic subjective reactions (Porter, Kershaw & Ollerhead 2000).
In South Africa aircraft noise has received some attention although not very much.
Whilst van der Linde (2003) found no noise related papers published by geographers
in the period 1996-2001, Goldschagg (2002) traces the development of aircraft noise
agreements and their consequences for those living near airports. Van der Merwe &
Von Holdt (2005) and Van der Merwe & Von Holdt (2006) have found that while
aircraft noise is often deemed to be of little importance, steadily increasing air traffic
requires the demarcation of noise-controlled areas around airports to manage the

26
environmental nuisance. In the present study the goal will be to help fill this gap by
obtaining the opinions about airport noise that people living in the vicinity of the
airport have at those times when they are most likely to be disturbed, i.e. in the
evening and at night when they are at home. A survey was designed to investigate
people’s perception of aircraft noise when they are most likely to be at home in the
evening and at night. It was important for people to be at home so that their
geographical location could be established. A time period of 18:00 to 06:00 was
selected. The survey questions were selected to investigate the nature of the
disturbance from aircraft noise. These included whether people felt annoyed, and if
interference occurred with activities including sleep, television viewing, talking on the
telephone and working or studying. Furthermore, it probed whether people would
consider moving away because of aircraft noise. A questionnaire survey was
undertaken and participants were asked to respond to questions about aircraft noise
during the week of 16-22 October 2004 (Appendix A). At the end of the week,
respondents were required to return the questionnaire in a pre-addressed, stamped
envelope.
At the end of the survey week the air traffic control flight logsheets for that week
were obtained. From the flight information on the logsheets, five sets of noise
contours were calculated:
• A 24-hour average energy contour (according to the SANS 10117 method)
• A 12-hour (from 18:00 to 06:00) night-time LAeq average energy aircraft
noise contour;
• A 12-hour (from 18:00 to 06:00) number of events above 60dBA (N60)
contour;
• A 12-hour (from 18:00 to 06:00) number of events above 70dBA (N70)
contour;
• A 12-hour (from 18:00 to 06:00) number of events above 80dBA (N80)
contour.
The noise contours of the first two types represent lines of equal noise exposure. The
outermost (quietest) contour that was mapped is 55dBA, and the contours increase
with increasing noise level in increments of 5dBA closer to the airport.

27
The latter three noise contours are representations of the number of aircraft noise
events exceeding 60-, 70- and 80dBA for the specified time period of 18:00 to 06:00.
The outermost contour that was mapped represents less than 10 events of the specified
level, and the number of events increases with increasing noise level closer to the
airport to 10-20 events, 21-50 events, and more than 50 events to form four ‘Number
of Events’ noise zones.
The geographical locations of the survey respondents were captured into a GIS, and
the five noise contour sets overlaid. The responses of the respondents within each of
the five sets of noise zones respectively were analysed. The survey responses were
correlated with noise disturbance using standard descriptive statistics.
1.8 DEMARCATION OF STUDY AREA AND TARGET RESPONDENT
POPULATION
Ekurhuleni Metropolitan Municipality recognise the importance of dealing with
airport noise “JIA (now ORTIA) is causing noise pollution in the surrounding
residential areas especially Kempton Park… ” (Ekurhuleni Metropolitan Municipality
2003a: 41). This quote provided some insight on the area of study. Aircraft noise
disturbance is limited to the vicinity of flight corridors near airports. To demarcate the
study area and target population, air traffic flight routes, previously produced noise
contours, and land-use maps were consulted.
1.8.1 Air traffic flight routes
The air traffic control authorities produce standard arrival and departure routes for
busy airports primarily to ensure safe operation of aircraft. These are known as
Standard Instrument Departures (SIDs) and Standard Terminal Arrival Routes
(STARs). All pilots are expected to be familiar with these routes and comply with
them unless otherwise instructed. The actual routes flown can vary for a number of
reasons; viz. weather, aircraft type, pilot technique and air traffic control are common.
The SIDs and STARs were carefully studied. A visit to the Air Traffic Control Centre
of the airport was undertaken to familiarise the researcher with air traffic control

28
routes at ORTIA. Flight paths of arriving and departing aircraft were studied on the
radar screens in order to determine where the aircraft operate, and advice sought from
the air traffic controllers who control flights into and out of the airport on a daily
basis.
1.8.2 Previously produced noise contours
In 2001, during the review of the SABS standard for aircraft noise calculations, three
sets of aircraft noise contours using an identical set of aircraft operational data but
applying different night-time periods and associated weightings were produced
(Goldschagg 2001). The three contours produced for this review of the SABS
standards in 2001 were overlaid onto a land-use map of the neighbourhoods around
the airport. The shape and spatial extent of the contours was studied in order to gain
further understanding of the extent of the noise.
From the flight routes, radar screens, and noise contours for 2001, it was possible to
determine which areas were most likely to be overflown by aircraft, and consequently
affected by noise from these aircraft.
1.8.3 Land-use maps
The 1:50 000 scale topographical series maps (2527DD, 2528CC, 2528CD, 2628AA,
2628AB and 2628AC), and electronic maps sourced from the local authority were
scrutinised to determine where people around the airport live. Kempton Park and
Tembisa to the north of the airport contain many residential dwellings (Figure 1.1)
and these municipal districts formed the study area.

29
Source: compiled by author
Figure 1.1: Location of ORTIA and its surrounding land-uses

30
1.9 REPORT STRUCTURE AND SEQUENCE
The structure of the research is outlined in Figure 1.2.
Chapter 2 is a review of the literature. This will include average energy aircraft noise
metrics, land-use planning and supplemental aircraft noise information. Chapter 3
documents the design and methodology followed during the collection of aircraft
operational data and calculation of the aircraft noise contours, and the design and
administration of the survey. The survey results according to the average energy noise
descriptor are displayed and interpreted in Chapter 4. In Chapter 5, the survey results
are interpreted according to the supplemental aircraft noise information descriptors,
these being the 12-hour evening and night LAeq, and number of events above 60, 70
and 80dB. Chapter 6 develops the results from Chapters 4 and 5 by proposing an
inclusive aircraft noise planning framework. Chapter 7 contains conclusions and
recommendations of this study.

31
Chapter 3
• Research design
• Average energy aircraft noise
descriptors
• Supplemental aircraft noise
descriptors
• A survey of citizen’s
perceptions of aircraft noise
Chapter 6
An inclusive airport noise
planning framework
Chapter 7
Conclusions and
recommendations
Aircraft noise: an environmental
problem
Chapter 1
• Rationale for the study
• Research aim and objectives
• Research methodology
Chapter 2
• Philosophy of Geography
and urban planning – the
aircraft noise link
Chapter 4
Average energy noise
results
Chapter 5
Supplemental noise results
Figure 1.2: Research design and process

32
2 CHAPTER 2: AIRCRAFT NOISE AND LAND-USE
PLANNING: THE LINK WITH GEOGRAPHY
In Chapter 1, the problem of noise and aircraft noise and consequently the need to
conduct suitable land-use planning was discussed. ‘Traditional’ noise contours were
discussed. Providing supplemental aircraft noise information is proposed as an
approach that can foster and reinforce town planning. The possibility of this being
realised is a fundamental focus of this study. Chapter 1 also pointed out that the
research methodology draws strongly on realism and pragmatism. These approaches
necessitate four fields of research namely: land-use planning, socio-psychoacoustics,
air traffic control and the aviation sphere of activity. In this chapter, the links between
the foregoing and geography are explored.
2.1 INTRODUCTION: DEMARCATING THE LITERATURE COVERED
The literature review in this chapter is organised around the following key constructs:
• Spatial data analysis
• Noise – physical effects; physiological effects; effects on communication and
productivity; psychological effects
• Airport noise disturbance
• Land use regulatory framework
• Land-use planning in the vicinity of airports based on LRdn noise contours
• Supplemental aircraft noise information.
2.2 SPATIAL DATA ANALYSIS – PLACE OF THE RESEARCH IN THE
REALM OF GEOGRAPHY
A hundred years ago, the geographer’s job was the ‘grand survey’ – mapping the
landscape from a balloon or a hilltop to guide subsequent travellers through it (Holt-
Jensen 1999). Buttimer (1993: 63) reports on the Victorian image of the geographer as
“… master teacher capable of integrating insights from a great variety of other
disciplines…”. There is some truth in the ‘integrating insights’ phrase in this
statement in the present study where acoustics, aviation, town planning and socio-
psychoacoustics are integrated. Geography pays great attention to the environment

33
(Porteous 1977) which in the present study requires an interface between the
subdisciplines of acoustics, town planning and aviation.
Buttimer (1993) speaks of the recovery of the human subject – the recognition of
human agency as an integral part of the lived world. Human agency is communicated
as the inner thought and feelings of people. The negative impact of aircraft noise on
people is difficult to quantify since responses are subjective. People who are
negatively affected by the noise from aircraft have feelings which should be
acknowledged and attended to. The subjectivity is difficult to quantify scientifically
on an individual basis yet when individual responses are aggregated to a community
level, some common response patterns emerge.
Scientifically based knowledge can be described as the result of a search for new
insight and understanding. Description of phenomena, prediction, causality and
explanation are all closely linked (Smit 1995) and geography is ideally suited to
consider these four aspects. Firstly, the phenomena to be studied are aircraft flights,
town planning, air traffic control, socio-psychoacoustics; secondly, the noise impact
from aircraft flights can be predicted through scientific calculations; thirdly the causal
link between aircraft noise and community response can be established; and fourthly,
explanation can be made regarding two aspects of aircraft noise – in the short-term the
choices residents make to live in a noise affected area and in the longer term,
decisions land-use planners have to make about planning. Essentially, the aircraft
noise problem can be studied from a spatial data analysis viewpoint. In a geographical
spatial data analysis context, all events have space and time co-ordinates attached to
them (Haining 2003). In the present study, the impact of aircraft noise ‘taking’ space
in a time-frame which people find disruptive (evening and night) will be examined. In
many areas of experimental science, the exact spatial co-ordinates do not usually need
to enter the database as such information is not of any material importance in
analysing the outcomes. However, spatial co-ordinates are important in the present
study, and will therefore be included. This is because the location of the respondents
and their responses is important in analysing their response to noise according to noise
zone.

34
The present research lies within the social and environmental sciences which are
largely observational and not experimental, so the results are taken as found (Hainig
2003). The researcher is not able to experiment with the levels of the explanatory
variables namely aircraft noise levels. Spatial data analysis has a role to play in
supporting the search for scientific explanation (aircraft noise annoyance and
interference with activities), and more general problem solving (land-use planning)
(Haining 2003).
In the rest of this section, generic issues of place, context and space in scientific
explanation will be explored to reinforce the links with geography.
2.2.1 Location as place and context
Location enters into scientific explanation when geographically defined areas are
conceptualised as collections of a particular mix of attribute values. Airport noise
analysis is the study of spatially aggregated data where the object of study is an
individual member of a household as the spatial unit. This study will focus on
individual-level characteristics. Area-level characteristics in the form of the township
response and suburb response which were also observed to have an impact will also
be analysed.
Explaining spatial variation needs to disentangle ‘compositional’ and ‘contextual’
influences. Geographical variations in response to aircraft noise may be due to
differences between areas in the resident population in terms of say distance from the
airport and types of aircraft operating (the compositional effect). Variation may also
be due to differences between areas in terms of exposure to the noise factor that may
have a direct or indirect effect on causing annoyance and interference (the contextual
effect) (Haining 2003).
In this study, the contextual properties of the geographical areas are important. The
variation of noise zones across the study area may be explained in terms of the
numbers of aircraft movements, aircraft types, times of flights, flight paths used,
meteorological conditions and type of noise descriptor (the compositional effect).
The contextual effect may operate at several scales or levels, for example
neighbourhood quality. Neighbourhoods influence behaviour, attitudes, values and

35
opportunities (Brooks-Gunn, Duncan, Klebanov & Sealand 1993). For this reason, the
analysis will separate the respondents into a township group and a suburb group.
The introduction of ‘place’ raises the problem of how to handle scale effects. ‘Place’
can refer to objects of varying sizes. In this study, ‘place’ is regarded as the house
where the respondent lives.
2.2.2 Location and spatial relationships
The second way location enters into scientific explanation is through the ‘space’ view
(Haining 2003). This emphasises how objects are positioned with respect to one
another and how this relative positioning may enter into explaining variability, for
example, where the residential areas are positioned in relation to the airport and, more
importantly, the flight routes around the airport.
Distance becomes part of a scientific explanation when attribute variability
(annoyance and disturbance) across a set of areas is shown to be a consequence of
how far areas are from a particular region that possesses what may be a critical level
of some causal factor. For example, how close are houses to the airport and flight
paths? The closer they are, the greater the noise level that can be expected, especially
if they are in the flight paths.
A gradient is a local property of space, for example how similar or how different two
neighbouring areas are in terms of variable characteristics, in this case aircraft noise.
Aircraft noise level at a location depends on how many aircraft fly over, the type of
aircraft, their height above, or distance from the location, and the engine power
setting. The further from the airport and the flight path, the less the noise from
aircraft, and the lower the expected annoyance and interference will be. The research
will investigate whether a noise annoyance and disturbance gradient exists.

36
2.2.3 Spatial processes
Certain spatial processes operate in geographic space. Haining (2003) discusses four
generic types: diffusion, interaction, exchange and transfer, and dispersal processes.
The first two and last are fitting, and given more attention here.
A diffusion process is interpreted here to mean where some attribute – in this case
diffusion of aircraft noise – is taken up by a population, and at any point in time it is
possible to say which areas have the attribute, and how much of it, and which do not.
The mechanism by which the attribute affects the population depends on the flight
characteristics (aircraft type, frequency, height), and the noise descriptor. The noise
descriptor will be revisited later.
An interaction process is one in which outcomes at one location influence, and are
influenced by, outcomes at other locations. For example, the ICAO phase-out of noisy
aircraft in Europe and the USA, led to the purchase of many of these aircraft in South
Africa. Consequently flight frequencies increased, and noise levels increased at
locations near flight paths around the airport. A growing economy leads to an
increased demand for business travel. A change in government in South Africa to a
democracy in 1994 led to a lifting of sanctions and an increase in the number of
foreign airlines operating to South Africa as a result of increased passenger demand.
In a diffusion process, the attribute spreads through the population. The final type of
process is a dispersal process, where two types of dispersal may be considered.
Firstly, the population who are most annoyed by aircraft noise may move away to be
replaced by others who are not aware of the noise problem or who are not as annoyed.
Secondly, the flights may be dispersed in such a way that the noise is less intense but
is diffused over a larger area.
2.2.4 Defining spatial sub-disciplines
Cloke, Cook, Crang, Goodwin, Painter & Philo (2004) argue that using statistics to
perform descriptive functions is regarded as the foundation level of analysis to be
built on by strategies of hypothesis testing so as to infer either difference or

37
association. This argument will be followed in this research where it will be attempted
to establish that noise is a problem (descriptive) and there is a difference in the survey
responses according to aircraft noise zones.
Heuristic research is often linked to psychotherapy, but it is also a process of
continual questioning and checking to ensure explication of one’s experiences
(Moustakas 1990). The survey conducted in this research lends itself partially to this
process. Respondents were expected to communicate their own experiences (of
aircraft noise) which required them to examine their feelings. Heightened awareness
of aircraft noise may occur at night when respondents have an expectation for relative
quiet when they want to watch TV undisturbed, or ‘absolute quiet’ when they sleep.
The quality of the environment in a given urban place will influence the quality of life
for its residents. Goodall (2000) contends that three factors have a particular bearing
on environmental quality: (i) public health; (ii) provision of an efficient urban
structure; and (iii) creation of an environment which maximises people’s comfort and
enjoyment of living. Airport noise is at least dealt with by (i) and (iii) for residents
living near airports, whilst the airport itself may be regarded as contributing to
efficient urban structure.
Present land-use planning around an airport is a legacy of past and present phases of
land-use development. Quality of the urban environment is reflected in the
juxtaposition of land-uses (Goodall 2000) so that past and present built forms are not
always good neighbours. This is reflected in the relative location of residential areas
located under or close to airport flight paths. Residents are heard to say that they have
lived in the area long before the airport became so busy. Airport owners in turn
respond that people should not buy houses which are close to the airport.
Aircraft noise pollution arises from the provision of transport services. Urban areas
are concentrated centres where aircraft arrive and depart, and where there are dense
concentrations of population. Many current urban activities date back to times when
urban environmental quality was accorded a lower priority than today. Technical
capability to reduce aircraft noise, measure it, and predict it was limited, and the

38
legislative framework did not exist. Whilst advances have been made in the technical
aspects of noise reduction, legislation has not kept up, or is out of date or confusing.
Planning implies that future developments and proposed activities are
environmentally friendly by requiring appropriate environmental impact assessments
to be done before granting permission to succeed. However, in the case of an airport,
activities continue. Usually, planners have an opportunity to bring polluters into the
net when they seek in some way to redevelop or increase the use intensity of their
sites.
Goodall (2000) stresses the need for an environmental database to be produced, to
identify the features of the problem and allow the environmental performance of
individual polluters to be determined. The Airports Council International (ACI) has
proposed an aircraft noise rating index (Airports Council International 2005).
Recognising that airport noise is the single major cause of community opposition to
airport capacity development to meet future traffic growth, the ACI developed this
tool to assist airports with rating all aircraft which operate into an airport, on the basis
of the certificated noise levels relative to Chapter 3 standards. The index gives
information about the status of an aircraft relative to the state of the art in noise
reduction technology.
2.3 NOISE: KEY CONCEPTS AND NEGATIVE EFFECTS
Acoustics, sound and noise comprise a vast field of study. Some basics are imparted
in the following sections drawn from Fuggle & Rabie (1999) and Bristow, Wardman,
Heaver, Murphy, Hulme, Dimitriu, Plachinski, Hullah & Eliff (2003).
2.3.1 Noise concepts
2.3.1.1 Sound
Sound may be loosely described as that which we can hear. Fluctuations in the static
air pressure that surrounds us are perceived by our ears as sound. Loudness is related
to the amplitude of these fluctuations. In general, the loudness of the sound decreases
as the distance from the sound source increases. In an outdoors environment under

39
certain atmospheric conditions (eg a temperature inversion) loudness can temporarily
increase with distance.
2.3.1.2 Noise
Noise is a particular category of sound which is undesirable. The factors which cause
a sound to be undesirable are physical, physiological, or psychological in nature or
those that effect communication and productivity.
Physical damage to the ear caused by aircraft noise is rare and will not be treated
further here. The most important physiological effect is loss of hearing acuity caused
by repeated exposure to high noise levels, primarily in the workplace. This is an
occupational hazard, not an environmental concern and will not be discussed further
here.
Even at levels below those which cause hearing damage, aircraft noise can be
annoying, and cause interference with communication such as television viewing,
radio listening and telephone conversations. Noise at the lower end of the severity
scale is the most significant from an environmental point of view. Noise causes
interference with activities and annoyance which leads to negative community
reactions (Johnston 1992). Aircraft noise can propagate over considerable distances
and consequently affect a large population. A single noisy aeroplane can awaken an
entire suburb in the early hours of the morning.
2.3.1.3 Measurement of noise
The intensity of sound is usually expressed in decibels (dB). The range of intensities
encountered is very great, so the intensity level is expressed as 20 times the logarithm
of the ratio of the sound pressure of a particular sound (P) to a standard reference
pressure (P0). By using decibels as a unit of measure, the large range of sound
intensities can be compressed into a range from 0 to 150 decibels. A jet aircraft can
generate a noise level of over 100 dB. The average noise level in a residential area
varies from 55 to 65 dB.

40
The human ear is not equally sensitive to all audible frequencies. It is most sensitive
at medium frequencies of about 3-4kHz. Noise measuring instruments are adapted at
different frequencies so that they react in a similar fashion to the human ear. This
adaptation is known as frequency weighting, and is referred to as the A-weighting.
The term commonly used to denote sound measurements employing the A-weighting
is dBA (Horonjeff & McKelvey 1983).
Most noises (including aircraft noise) vary in loudness over time. It is therefore
essential that noise measurements and calculations perform some averaging function
over a period of time. To this end, the LAeq descriptor has achieved widespread usage.
LAeq is a long-term average taken over the entire measurement period which may for
example be a 12 hour night period, a day, or even year. Because of the possible
variations of the time that LAeq can be measured over, it is vital that the user articulate
this in any usage.
2.3.1.4 Assessment of noise
Aircraft noise is a necessary by-product of the operation of this type of transport
vehicle. Aircraft produce noise from their engines, and from the flow of air over their
wings, fuselage and undercarriage. Consequently, noise around airports is a
troublesome problem for the aircraft operators, airport operator, local authorities, and
residents (Ashford, Martin Stanton & Moore 1984).
Noise has been defined as unwanted sound and there is a strong element of
subjectivity in its measurement. Intensity of sound alone is not a suitable measure.
The time the sound is heard is another factor that strongly affects the reactions of
people. This creates difficulties when attempting to assess the impact of a given noise,
and when setting limits (Horonjeff & McKelvey 1983).
Another important factor in the evaluation of sound is the frequency, described as the
vibration of a sound source expressed in cycles per second. An object which vibrates
fast has a high number of cycles per second and a high frequency, measured in hertz.
The human ear can detect sounds over a wide frequency range, from about 16 hertz to
about 16 kilohertz.
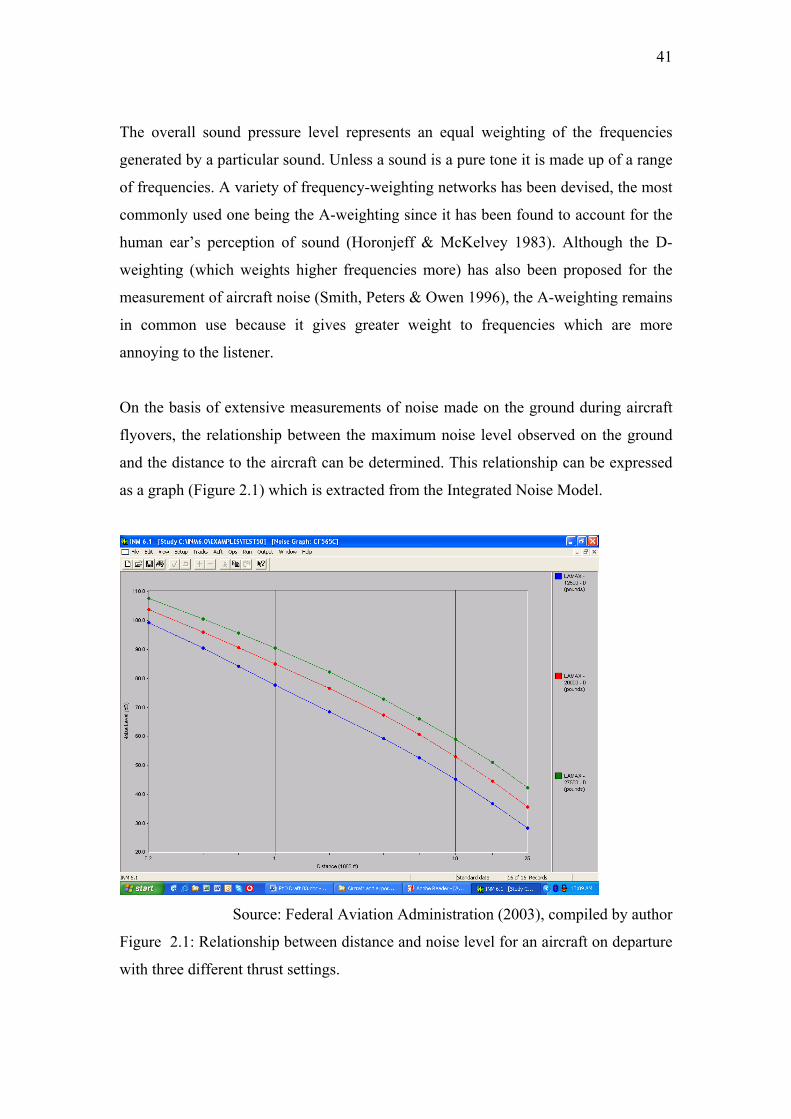
41
The overall sound pressure level represents an equal weighting of the frequencies
generated by a particular sound. Unless a sound is a pure tone it is made up of a range
of frequencies. A variety of frequency-weighting networks has been devised, the most
commonly used one being the A-weighting since it has been found to account for the
human ear’s perception of sound (Horonjeff & McKelvey 1983). Although the D-
weighting (which weights higher frequencies more) has also been proposed for the
measurement of aircraft noise (Smith, Peters & Owen 1996), the A-weighting remains
in common use because it gives greater weight to frequencies which are more
annoying to the listener.
On the basis of extensive measurements of noise made on the ground during aircraft
flyovers, the relationship between the maximum noise level observed on the ground
and the distance to the aircraft can be determined. This relationship can be expressed
as a graph (Figure 2.1) which is extracted from the Integrated Noise Model.
Source: Federal Aviation Administration (2003), compiled by author
Figure 2.1: Relationship between distance and noise level for an aircraft on departure
with three different thrust settings.

42
Clearly, as the distance between aircraft and observer increases, the noise level on the
ground decreases. By using this graph, the noise level of an aircraft taking off can be
determined at any distance from the aircraft. The same may be done for landings. A
set of noise contours representing the maximum noise levels on the ground can also
be constructed (see Figures 2.2 and 2.3).
Source: Federal Aviation Administration (2003), compiled by author
Figure 2.2: Noise contour of a departing aircraft.
Note that the noise contours in Figures 2.2 and 2.3 represent the sound levels
generated by a single departure and arrival respectively of one type of aircraft.

43
Source: Federal Aviation Administration (2003), compiled by author
Figure 2.3: Noise contour of an arriving aircraft
In order to determine the response of the community to aircraft noise, the cumulative
effects of the noise created by the arrivals and departures of many aircraft must be
considered.
Investigations of aircraft noise disturbance have shown that the impact on
neighbourhoods is not only caused by single events, but also by the duration and
number of events occurring during the day and night (Horonjeff & McKelvey 1983;
Fujii, Soeta & Ando 2001). A number of methods of combining the noise levels from
single events into measures of cumulative noise exposure, or average energy have
been developed. In South Africa, the day night rating level (LRdn) is prescribed by
Standards South Africa (2003). The LRdn, although differing in technical detail from
other well-known methods, for example the DNL (USA), NNI and Leq (UK) and
TNL (Total noise load, Holland) is conceptually very similar. Noise can also be
described as the number of events, either all the events or the events that exceed a

44
certain level, and the noise value of these events, for example the maximum value
(Rylander & Björkman 1997).
Awareness has grown that hearing damage is a limited aspect of the harmfulness of
noise and that continual noise (average, peak, number of events) is likely to bring
about psychological discomfort and somatic disorders. Background noise in urban
areas is rising, increasing annoyance and so creating wide-ranging urban areas which,
although not intensely noisy, are placed where the stock of silence is being eroded
(Burns 1968; Ashford, Stanton & Moore 1984; Organisation for Economic Co-
operation and Development 1986; Nero & Black 2000).
2.3.2 Negative effects of noise
2.3.2.1 Physiological effects
When people are exposed to sounds, an impulse is registered in the ear, and the
subsequent signal in the auditory nerve is interpreted in the central nervous system.
The neurophysiological reaction mechanism is such that the sounds most noticed are
those which exceed the background level. Sounds which are excessively loud, which
have a tone, and tend to increase and decrease suddenly, and so on, are often referred
to as noise. Noise studies usually consider a number of events over a given time
period, and are traditionally expressed as an average value. If a sound is loud enough,
or if the recipient is exposed to it for long enough, permanent hearing damage may
occur. Noise may also cause cardiovascular and digestive diseases (Organisation for
Economic Co-operation and Development 1986; Quehl & Basner 2006).
2.3.2.2 Interference with communication
Speech, whether direct, or by telephone, can be interfered with by noise. Researchers
have shown that noise is an inconvenience and can disrupt work or leisure activities.
With noise at low intensities it is possible for people to talk louder or move closer in
order to be heard. As noise increases, it gradually masks conversation until even
shouted speech cannot be discerned (Smith, Peters & Owen 1996).

45
Experimental psychologists have for many years been conducting research on the
effect of noise in the workplace. Some noise may be helpful, for example the noise a
machine makes may be helpful to an operator, but annoying to somebody else. Music
at a party may be enjoyable, but not when a researcher is trying to write a report. The
point is that the way a sound is perceived depends on more than just its intensity or
frequency (Burns 1968; Smith, Peters & Owen 1996; Zaporozhets & Tokarev 1998).
2.3.2.3 Psychological annoyance
This term is given to the annoyance that is the subjective expression that people have
about noise. The use of the annoyance concept encounters a number of difficulties of
correlating acoustical indices with the level of human response owing to the
subjectivity of responses. Despite this, surveys show a high degree of consistency in
expressing annoyance due to noise, with an increasingly high percentage of
individuals who express annoyance as noise increases.
2.4 AIRPORT NOISE DISTURBANCE.
By definition, noise is unwanted sound. In tracing the development of thinking on
airport noise, it is important to recognise that efforts to predict the annoyance of noise
exposure on individuals and communities began as early as the 1930s, in the United
States (Fidell 1990). More recently, Connor (1968) conducted research for the
National Aeronautical and Space Administration (NASA) to investigate aircraft noise
exposure. In a study funded by NASA at four airports, Hazard (1971) examined the
relationship between public annoyance with aircraft noise and various noise exposure
variables. That study’s aim was to investigate the relationship between public
annoyance with aircraft noise, objective measures of the noise itself, and social or
psychological conditions which affect the noise-annoyance relationship, Three key
findings which are important for the present study, namely noise from aircraft does
create annoyance; psychological adjustment ‘possibly’ occurs in individuals living
immediately adjacent to or under flight paths at the ends of runways; and persons
living in relatively quiet neighbourhoods several kilometres from an airport
experience annoyance reactions to aircraft noise. These findings, made over three

46
decades ago, point to the fact that aircraft noise disturbance occurs some distance
from an airport.
Theodore Schultz’s seminal paper (1978) compared the conclusions of 18 social
surveys on annoyance due to noise. He concluded that the results of 11 of the surveys
show a remarkable consistency and proposed that the average of these curves “… is
the best currently available relationship for predicting community annoyance due to
transportation noise of all kinds” (Schultz 1978: 377). Known as the Schultz curve, it
has been widely used to determine annoyance responses, despite criticism about the
generalisations in the methods employed (Kryter 1982; Hall 1984).
Hall (1984) reported that various studies of aircraft noise annoyance and interference
at the same location (Heathrow) have produced differing results but they agree that
the aircraft annoyance function is greater than that for road traffic.
Burns (1968) reports that there is a wide range of individual responses to noise from
aircraft operations in the vicinity of airports. Noise levels that are extremely annoying
and disturbing to some individuals cause little disturbance to others. The reasons for
the differences are complex and difficult to extract. Research has indicated that unlike
individual responses, the response of the community is more predictable because of
the large number of individuals involved. Below exposure levels of 55DNL (similar to
55 LRdn in South Africa), the percentage of affected individuals who are highly
annoyed by aircraft noise is low. Above 80DNL, over half the community is
annoyed.
Downing (2004) discusses simulation based modelling as opposed to average energy
modelling. Since computational capabilities have increased, it is now possible to
simulate noise exposure on a personal computer. Such simulation modelling can be
linked to supplemental noise.
The principal concerns of geographers with respect to annoyance from aircraft noise,
involves research on land-use planning in the vicinity of airports which, in turn, is
based on the sociological domain of testing people’s reactions to aircraft noise.
Researching the expectations of an airport’s neighbours and how they perceive

47
aircraft noise, will allow the development of supplemental noise information, and will
also cater for the need of airport neighbours to visualise the noise they are likely to be
exposed to, and will decide whether the noise levels will be acceptable to them. Great
disappointment, leading to annoyance, can be experienced by residents when their
expectations of a quiet neighbourhood, a peaceful night’s sleep, and uninterrupted TV
viewing and telephone conversations are not met.
2.5 ENVIRONMENTAL ETHICS
A recognised field of study within philosophy is environmental ethics – usually
referring to the threats to nature posed by humans. Threats by humans to humans are
also included in environmental ethics (Attfield 2003, Light & Rolston 2003). Public
goods (in this case airports) create accountability problems because their disrupters
(aircraft) are not the victims of the disruption they cause (Scherer 2003). Aircraft
noise, for example creates annoyance and interferes with the activities of communities
on the ground. However, the airport itself does not create very much noise for its
neighbours, if any at all. It is the clients of the airport who are mostly responsible for
the problem.
2.6 JOHANNESBURG: WORLD CITY AND OR TAMBO
INTERNATIONAL AIRPORT AS A GLOBAL TRANSPORT NODE
Cities provide a variety of services including government, transportation,
communication, education, trade, manufacturing, wholesaling, business services,
retailing, and entertainment. The hinterland surrounding a city also benefits from
these services. A primate city is one which concentrates a high degree of the entire
national population or of national political, intellectual or economic life. Greater
Johannesburg, can be regarded as the primate city of South Africa with its influence
spreading even further into southern Africa.
South Africa is widely regarded as a developing country, and as economic
development takes place so urbanisation is set to continue, and Johannesburg will be
part of this growth. The discovery of gold resources led to the sustained growth of
48
Johannesburg in the past. Whilst the importance of gold to Johannesburg has declined,
the manufacturing industry and tertiary services such as the financial sector have
become more important. Abundant energy supplies at comparatively low cost have
also enhanced growth so that Johannesburg is of primary importance to South
Africa’s economy.
Structure and location are fundamental to geographers in explaining a region’s
prosperity. Structure and location are enhanced by access in the form of
communication in this case, transportation. The economic importance of
Johannesburg has been enhanced by, and has enhanced good air transport access
which has played its part in Johannesburg’s growth.
Airports form an important component of the transportation network. ORTIA is South
Africa’s busiest airport in terms of aircraft movements, passengers and freight
handled. The airport operator is responsible for providing a world-class service to the
aviation industry and as such is determined that ORTIA be able to accommodate
passenger growth and continue to act as an economic force in the South African and
local economy. In the 2005/6 financial year, the airport handled 9.0 million domestic
passengers, and 7.04 million international passengers (Airports Company South
Africa 2006). With this volume of traffic, the airport, similar to airport developments
globally, acts like a magnet to a range of industrial and commercial activities and
related service industries which serve the airport and its workers (Nagle 2000).
ORTIA’s development as South Africa’s most important airport is related to a number
of factors. Johannesburg has important financial and trading links with much of the
world. For example, at the time of writing, there were 38 flights a week to London
and 19 flights a week to the United States. Although Johannesburg is not a national
capital (it is the provincial capital of Gauteng province), most international flights and
therefore people travelling on holiday, business or on diplomatic service fly
internationally via ORTIA. As a hub airport, Johannesburg has an advantageous
geographic location, a multi-million catchment population and a large number of air
carriers and destinations.

49
These positive benefits of the airport are important – however, there are a number of
disadvantages to airport development – chief amongst these being air pollution, road
traffic congestion and aircraft noise. Airports and their use can have a major
environmental impact on surrounding areas. Aircraft noise is probably the worst
environmental impact caused by airports and emerged as a problem as far back as
1952 in the United States when the Doolittle Commission prepared a report for
President Truman identifying conflict between airport noise and community land-use
as a future national problem (Bragdon, 1973). Horonjoff & McKelvey (1983)
consider aircraft noise to be the most severe environmental problem in the
development of airports, and Ashford, Stanton & Moore (1984) state that aircraft
noise is a worldwide problem which can constrain the operation of existing airports.
Bryant (in De Roo & Bartelds 2000) states that the resolution of land-use
compatibility conflicts between noise sensitive land-uses and the acoustically
intrusive activities associated with the operation of an urban airport, requires a three-
pronged approach. Firstly, noise abatement programmes relate directly to noise
reduction at the source such as aircraft and engine types, flight procedures and flight
tracks. Secondly, noise mitigation programmes reduce the effects of noise on the
community through building insulation and property acquisition. The third prong is
compatible land-use planning and involves cooperation with those who control land-
use. Noise contours based on aircraft operations are produced for airports. These
contours are linked to social surveys which give average levels of irritation expected
from the community as aircraft noise levels increase. For example, in the United
States, 65DNL is regarded as the limit above which certain land-use types,
particularly residential, should not be permitted in the vicinity of airports. Typically,
the noise contours are then used to guide the land-use planning process so as to keep
noise sensitive land-uses away from the aircraft noise.
In South Africa, Standards South Africa prescribe the standards whereby aircraft
noise should be calculated for land-use planning purposes. These standards were
updated in 2004 after extensive consultation. This author was a member of the
working group tasked by the then SABS to revise these standards. The relevant old
standards were referred to as SABS 0113 and SABS 0117, and the new standards as

50
SANS 10113 and SANS 10117. These new standards link to World Health
Organisation (WHO) documents as their starting point.
It has become evident, however that more and more complaints about aircraft noise
originate from areas outside of the published noise contours (Commonwealth
Department of Transport and Regional Services 2000) and that complaints depend in
part not only on the noise level but also the time of day that the noise occurred, and
the number of noise events heard (Hume, Gregg, Thomas & Terranova 2003). Wijnen
& Visser (2003) and Quehl & Basner (2006) found that noise levels which are
tolerated during the day may be found to be unacceptable at night with great efforts
being put into reducing the problem. Ohrstrom, Hadzibajramovic, Holmes &
Svensson (2006) reported that placing a transparent plastic pane over a window
reduced noise level by 11dBA.
Further compounding the problem of understanding aircraft noise are differences in
individual responses to noise. Job (1993) cited evidence that a large proportion of the
variation in reaction to environmental noise is accounted for by psychosocial factors.
Hume et al. (2003) report that a complex relationship exists between annoyance and
stress, in noise affected residents living near airports. An individual who is already
stressed may find aircraft noise more annoying. The causality can be reversed as
stress can lead to annoyance reactions (Kryter 1985).
Whilst SANS 10113 and 10117 follow international best practice in calculating
cumulative noise exposure, and in recommending suitable land-use planning, it will
be shown that these standards may not always suffice as evidenced by people who are
still disturbed by aircraft noise even though they reside outside noise contours.
2.7 HOW AIRPORTS DEAL WITH NOISE PROBLEMS
Many large, busy airports around the world have noise and track monitoring systems,
and information about aircraft flight tracks and noise is made available to the public.
Sometimes this information is published by airports in a regularly produced report,
whilst other airports have linked their noise data to a website where flight track and
noise information is available, usually with a short delay due to security concerns.
51
These airports usually have a community relations department which deals with
complaints by surface mail, e-mail, dedicated phone line during office hours and an
answer phone at other times (Hume et al. 2003). The information is used to refine or
restrict operations in order to minimize disturbance.
This advanced type of noise and track monitoring technology is not used in South
Africa, although most of the major airports have, to some extent, formulated a
mechanism to log and respond to complaints about aircraft noise. A further use for
aircraft noise and track monitoring systems is to provide information which may be
used to guide land-use planning in the vicinity of airports where residents are likely to
be exposed to disturbing noise from aircraft.
2.8 DEALING WITH AIRCRAFT NOISE: SOUTH AFRICAN
FRAMEWORKS
There are many national bodies and organisations which have some responsibility for
addressing quality of life in urban environments. Since noise, particularly aircraft
noise, may be regarded as a quality of life issue it is useful to explore the
responsibility and accountability of dealing with aircraft noise.
In 1976, the United Nations held its first conference on human settlements, also
known as Habitat 1. In 1992 the United Nations Conference on Human Development
was held in Rio de Janeiro out of which the well-known Agenda 21 arose – a
document detailing how countries may work towards global sustainable development.
In 1996, Habitat II was held in Turkey, and in 2002 the UN Habitat agency’s mandate
was strengthened and its status elevated to that of a fully fledged programme of the
UN system (United Nations 2003). In the discourse of urban sustainability, these
organisations make recommendations, designed to improve living conditions within
urban areas but don’t really have the teeth to enforce these.
2.8.1 The South African Constitution
The constitution of a country contains the most important rules of law concerning the
political system of a country (Rautenbach & Malherbe 2004). Government in South

52
Africa consists of the national, provincial and local levels, which are distinctive, but
also interdependent and interrelated. Government may intervene at any of the three
levels to protect its citizens from negative environmental impacts. The South African
Bill of Rights in Chapter 2 of the Constitution includes not only an environmental
clause but a number of other clauses which have made, or have the potential to make
significant contributions to environmental justice in the country (Glazewski 2002). In
particular, subsections 24(a) of the environmental clause of the bill of Rights in
Chapter 2 of the Constitution provides that “Everyone has the right … to an
environment that is not harmful to their health or well-being” (South Africa 1996: 8)
and 24(b) “Everyone has the right … to have the environment protected … through
reasonable legislative and other measures that … prevent pollution and ecological
degradation” (South Africa 1996: 8). The constitution may thus be interpreted to offer
some protection for those who are disturbed by aircraft noise if it is accepted that
noise is harmful to their health or well-being.
If the Constitution is interpreted to offer some protection, then the question may be
asked: Under which jurisdiction does aircraft noise pollution lie? Is it national,
provincial or local government? And which departments’ skills and expertise are
required to deal with it? Is it a matter for environmental affairs, town and regional
planning, transport, health? The following have some bearing on answering this:
• Section 125(2)(b) of the Constitution states that provinces are responsible for
“… implementing all national legislation within the functional areas listed in
Schedule 4 or 5 except where the Constitution or an Act of Parliament
provides otherwise” (South Africa 1996, 53).
• Section 155(6)(a and b) of the Constitution states that provincial governments
must establish municipalities. Section 156(1)(a) explains that municipalities
have the executive authority to administer the local government matters listed
in Part B of Schedule 4 and Part B of Schedule 5 (South Africa 1996).
• Schedule 4 of the Constitution stipulates that a provincial executive is
responsible for implementing all national legislation in the schedule. Of

53
possible relevance to dealing with the issue of airport noise in the schedule in
Part A are:
o Airports other than international and international airports
o Environment
o Pollution control
o Regional planning and development
o Urban and rural development
and
Part B refers to:
• Municipal airports
• Municipal planning
• Municipal health services (South Africa 1996).
It is evident that whilst the constitution provides some guidance, one must look
elsewhere for more detailed direction. This is provided in the National Environmental
Management Act and the Environment Conservation Act.
2.8.2 The National Environmental Management Act and the Environment
Conservation Act
The National Environmental Management Act 107 of 1998 sets out environmental
management principles that provide the basis for environmental management (South
Africa 1998). Noise is a form of pollution as defined by the act but other than this
brief definition, the act is silent on noise. This is in contrast to international examples
where the basis of the regulatory approach is some form of licensing, planning, zoning
or monitoring, aimed at creating a socially optimal level of environmental quality. (De
Roo & Bartelds 1996; Eckdish Knack & Schwab 1986; Goodall 2000; Pacione 2001;
Thomas 1996). Regulatory instruments therefore should have a direct influence on
noise pollution since compliance is mandatory. However, the approach is often
designed to be flexible and the rules are tailored to individual circumstances which
means they may not be as effective. Goodall (2000) adds to the regulatory framework
economic instruments and voluntary instruments to bring about compliance.
54
The Environment Conservation Act 73 of 1989 has a broad definition of
‘environment’ which means that noise pollution is included in its purview (Glazewski
2000). Section 25 of the Act states that the minister may make regulations with regard
to the control of noise, vibration and shock (South Africa 1989). Acting in accordance
with this empowering provision, the environmental ministers of two provinces – the
Western Cape and Gauteng - have made noise control regulations which these
provinces have adopted (Province of the Western Cape 1998; Province of Gauteng
1999). They are detailed in the next section.
2.8.3 Provincial noise regulations
Gauteng’s regulations are pertinent to this research as the study area is in this
province. The regulations adopt a number of technical terms and standards. Section
1(b) of the Gauteng Noise Control Regulations includes reference to the South
African Bureau of Standards’ publications SABS 0103-1997 The measurement and
rating of environmental noise with respect to annoyance and speech communication
and SABS 0117-1974 Code of practice for the determination and limitation of
disturbance around an aerodrome due to the noise from aeroplane, both as amended
from time to time, or their corresponding replacements. Both standards were amended
in 2003.
Section 11(1)(a) of Gauteng’s GN5479 gives local authorities the authority to
designate a controlled area in its area of jurisdiction. A controlled area in the case of
an airfield is taken to mean a piece of land where the calculated noisiness index,
projected for a period of 15 years following the date on which the local authority
made such designation, exceeds 65dBA. Section 11(2)(a) states that no educational,
residential, flat, hospital, church or office buildings may be erected within a controlled
area for which a zone sound level has been designated. Section 11(2)(b) states that no
educational, residential, hospital or church erven may be situated within a controlled
area for which a zone sound level has been designated (Province of Gauteng 1999).
In the Western Cape (Section 2(c)) (Province of the Western Cape 1998) and in
Gauteng (Section 14(b)) (Province of Gauteng 1999) if, in the opinion of the local
authority, a noise is a disturbing noise, or noise nuisance, the local authority may

55
instruct the person responsible for causing the noise to either discontinue the noise or
lower the level to conform with requirements of regulations. It is important to note
that in respect of noise caused by air traffic, the provision shall not apply. This is a
critical observation since in the law it is evidently difficult for the provincial
authorities to take action. Whilst land-use planning can have a role to play in dealing
with aircraft noise, local authorities have no jurisdiction over noise from air traffic.
The statutes mentioned above all involve or imply that land owners have limitations
placed upon their rights. These limitations or controls imply a restriction upon the
freedom of owners to use and exploit their property according to their discretion. The
question that must be asked is whether land owners in the vicinity of airports are able
to use their land at their discretion if noise from aircraft interferes with their activities.
Municipalities impose restrictions on the use of land, but other restrictions like noise
may come into play. The next question which arises is whether land owners are
entitled to some sort of redress for the effect of noise upon their rights to use of their
land. Let us assume that aircraft have to use land to make noise. If the land is not
available to them for this purpose, then they cannot fly. What compensation measures
are available to land owners if the extent of the use of their land is inhibited by aircraft
making noise? Claassen & Milton (1992) mention that expropriation, injurious
affectation and tax relief are provided for in the ordinances. However, many prevalent
forms of disturbance are excluded, rendering compensation largely ineffective.
Clearly, the law in South Africa presently does not provide for any compensation due
to noise.
2.8.4 The national government’s position on aircraft noise
In 1999, the then Minister of Transport announced that the Department of Transport
had developed a draft policy document on aircraft noise and engine emissions
following the International Civil Aviation Organisation’s (ICAO) resolutions to have
a policy framework in place regarding environmental issues, and the worldwide trend
relating to minimising the impact of aircraft noise and engine emissions on the
environment (Omar 1999). It was also conveyed in the announcement that the draft
policy had the broad support of stakeholders and would be finalised shortly. Since

56
then though, there appears to be a reversal, or at least a reconsideration, of this stated
position.
Three quotes are relevant.
Firstly, at the Ninth Aviation and Allied Business Leadership Conference, the then
Minister Dullah Omar stated that:
“The area of aircraft noise and engine emissions requires a balance to be
established between the interests of airport operators and the public affected
by aircraft noise and engine emissions. We need to find mechanisms to ensure
that noise abatement procedures are developed and adhered to. One difficult
area is the phasing out of chapter 2 aircraft and the non-addition of these
aircraft on to fleets of both domestic and international operators. This is
largely a safety issue as most of these aircraft will be around 30 years old by
the end of the 7-year period” (Omar 2003).
Secondly, at the 17th Plenary Session of African Civil Aviation Commission, Mr
Omar’s successor, Mr J Radebe, addressed the issue of aircraft noise. He spoke about
the
“… need to come up with appropriate yet realistic timeframes for the
implementation of suitable regulations governing aviation environmental
protection. The most obvious one in this regard is noise. The extent to which
developed world concepts such as acceptable level of noise pollution in an
urban setting can be carried into other parts of the world is a debate I do not
want to entertain here, but the fact remains that we should examine whether
the ‘one size fits all’ approach will address the issue adequately” (Radebe
2004a, no page number).
At the Airlines Association of Southern Africa Annual General Meeting and
Conference he stated that
“I would understand that all our airlines at one point or another have faced
significant fines at European and North American airports, so there is another
commercial angle to the issue as well. Nevertheless, ICAO has moved forward

57
with an accommodation of some of Africa's concerns on this score and we
need to develop an approach to see implementation in as practical a manner as
possible. Naturally, sooner or later the question of reducing and controlling
engine emissions and other aviation pollutants must also be dealt with. But
once again, these are issues that are related in part to the question of aging air-
fleets, and the application of often-costly new technologies, and of adequate
maintenance facilities” (Radebe 2004a).
Thirdly, at the Airlines Association of Southern Africa Annual General Meeting &
Conference held on 15 October 2004, Minister Radebe spoke as follows:
“…ICAO made some progress concerning the thorny issue of the
environment, particularly emissions and noise pollution. Whilst everyone is
concerned about emissions and noise, it is quite clear that for many states,
particularly those in the developing world, these issues do not rank in the
immediate priority list of social needs. ICAO has committed itself to getting
some resolution on the matter by 2007, and in the meantime has indicated that
no unilateral penalty system can be imposed on states until that time” (Radebe
2004b).
While recognising that the issue of noise remains a problem, the position taken is one
of questioning the current approach taken by the international community in the light
of penalising the aviation industry in developing countries for infringing noise limits.
The consequences of delaying a decision on an aviation environmental policy could
however be severe. The Organisation for Economic Co-operation and Development
(1986) recognised that problems can result from ‘no-change’ policies. In their report
on the state of the noise environment, they highlight the problem of ‘grey areas’
where the “… number of people who, while not in a wholly unacceptable situation,
cannot be said to enjoy ‘acoustic comfort’, will increase substantially.” (Organisation
for Economic Co-operation and Development 1986: 25). As more residential
development takes place close to airports, residents are exposed to more noise, firstly
because they are closer, and secondly as more flights take to the skies. Eventually, as
has been the case in other parts of the world, authorities have been forced to take
action which often has expensive or inconvenient consequences. Noise insulation of
houses, and financial compensation are expensive options – inconvenience may for

58
example take place when airports operating hours are restricted to those times when
noise is judged to be most disruptive.
2.9 DEALING WITH AIRCRAFT NOISE: INTERNATIONAL
FRAMEWORKS
There are a wide range of international organisations who provide guidance on urban
environmental sustainability and dealing with noise in general, and aircraft noise in
particular. In this section they are discussed.
2.9.1 Agenda 21
Agenda 21 – essentially an agency for the environment for the 21st century – was
conceived at the Rio conference in 1992. The United Nations’ Agenda 21 supports a
number of environmental management principles on which government policies,
including noise management policies, can be based.
These include:
The precautionary principle. In all cases, noise should be reduced to the lowest level
achievable in a particular situation. Where there is a reasonable possibility that
public health will be damaged, action should be taken to protect public health
without awaiting full scientific proof.
The polluter pays principle. The full costs associated with noise pollution (including
monitoring, management, lowering levels and supervision) should be met by
those responsible for the source of noise.
The prevention principle. Action should be taken where possible to reduce noise at the
source. Land-use planning should be guided by an environmental health impact
assessment that considers noise as well as other pollutants.
Local authorities worldwide have devised their own locally negotiated proposals for
an environmentally sustainable environment. Known as LA21s, one of the key aims is
to encourage participation and involvement of all members of society in a process
through which they can identify their needs and bring these needs into decision-
making arenas (Evans & Percy 1999).

59
The recommendation that land-use planning be guided by an environmental health
impact assessment that considers noise as well as other pollutants is an important one
which will be revisited in Chapter 6.
2.9.2 World Health Organisation
The World Health Organisation has published guidelines to be considered when
dealing with noise (World Health Organization Regional Office for Europe 2001).
Environmental noise, specifically noise from aircraft is acknowledged as a problem to
be dealt with. The stated goal of noise management is to maintain low noise
exposures, such that human health and well-being are protected. The specific
objectives of noise management are to develop criteria for the maximum safe noise
exposure levels, and to promote noise assessment and control as part of
environmental health programmes. A sufficient distance between the airport and
residential areas will make noise minimal, although this is not always achievable
(World Health Organization Regional Office for Europe 2001).
The WHO also expects substantial growth in air transport in the future. Large
international airports may have to accommodate an increase in passenger movement
numbers and general aviation noise at regional airports is also expected to increase.
Although jet aircraft have become less noisy due to regulation of noise emissions, the
number of passengers and therefore flights is expected to increase. In Germany,
increased air traffic movement between 1980 and 1990 is considered to be the main
reason for the average 22% increase in the number of people exposed to noise above
67 dB LAeq at German airports (Berglund, Lindvall & Schwela 1999).
2.9.3 International Civil Aviation Organisation Annex 16, and Balanced
approach
The International Civil Aviation Organisation has published standards for noise
certification which aircraft manufacturers must comply with. These standards have
had a significant effect on reducing noise emissions from aircraft. Aircraft certified
according to Annex 16, Chapter 4 (which was implemented in 2006) comply with the
most stringent requirements (Bottcher 2004). However, the way the aircraft are

60
operated and maintained by operators will have a bearing on attainment of ICAO
standards. The ‘Balanced Approach to aircraft noise management’ was endorsed by
ICAO in 2001 (International Civil Aviation Organisation 2004). Part of this approach
is the need to implement suitable land-use planning and management.
2.9.4 Airports Council International (ACI).
Whilst supporting the balanced approach favoured by ICAO, the ACI has devised its
own aircraft noise rating index. The index provides airports with a common tool to
rate all aircraft which operate into the airport on the basis of the certificated noise
levels relative to ICAO Chapter 3. Although not a computerized model, it can
nevertheless be regarded as an aircraft noise prediction model which is used to
provide aircraft noise information. The index was selected because it gives
information about the status of an aircraft relative to the state of the art in aircraft
noise reduction technology. The index can be used to encourage airlines to use quieter
aircraft and, as an incentive to manufacturers, to develop and market the quietest
aircraft possible. It can also be used to communicate with neighbouring communities,
local authorities, and regulators.
2.9.5 Examples of National Standards in the United Kingdom and USA
Economic instruments imply the polluter pays principle. The cost incurred by the
polluter ensures that the polluter attempts to change its behaviour to reduce this cost,
and which eventually reduces the pollution to an acceptable level. In the United
Kingdom at Heathrow, Gatwick and Stansted airports, fines are levied on airlines
which do not comply with noise limits (Department for Transport 2005). Economic
instruments, although provided for in the South African White Paper on Aircraft
Noise and Engine Emissions have not yet been implemented in South Africa.
Voluntary instruments imply an integration of environmental quality into the total
quality management of a company. Companies, instead of being reactive, switch to
anticipatory modes of behaviour without waiting for government action. This has
happened in the aviation industry to some extent, where airlines are operating quieter

61
aircraft now than a decade ago. The primary reason is that newer aircraft are far more
fuel efficient than older types. The added benefit is that these aircraft are also quieter.
In the United Kingdom, when assessing residential developments near a source of
noise, including airports, local planning authorities are required to heed the advice of
four Noise Exposure Categories (Department for Communities and Local Government
2006). However, the wording is couched in words such as ‘advice’,
‘recommendations’ and ‘guidelines’ creating plenty of flexibility for local planning
authorities to interpret things as they please. British Airways recognises the
importance of planning but criticises the statement in the document that there is a “…
balance to be made between noise and the pressure for housing development, which
severely compromises the effectiveness of this document” (British Airways 2006).
The airline is concerned that if planning for housing does not keep residences away
from an airport, in time the airport’s activities will be curtailed by complaints, which
in turn will affect the airlines.
Planning is limited in its ability to bring about improvements in the noise around
airports for existing land-use activities. Any conditions or standards which are
imposed at the time planning permission is granted become outdated as aircraft types
change, movements increase, and society’s environmental aspirations increase
(Goodall 2000).
The Federal Aviation Administration in the United States has developed an extensive
noise modelling and land use planning tool. Colloquially known as Federal Aviation
Regulations (FAR) Part 150, this statutory requirement is prescribed for airport noise
compatibility planning (Federal Aviation Administration 2003).
2.10 URBAN SPATIAL AND LAND-USE PLANNING IN THE VICINITY OF
AIRPORTS
The term planning is derived from the noun plan, which can be defined as ‘a method
of doing something that is worked out in some detail before it is begun; a drawing or
diagram showing the layout, arrangement or structure of something’ (Rooney et al.
1999). In the case of town and regional planning, the goal to be achieved by planning

62
is to improve the quality of life and wellbeing of the community concerned (Claassen
& Milton 1992; Singh 2000; Wagner 2000). One of the means to achieving this goal
is land-use planning. Claassen & Milton (1992) divide town and regional planning
into two interdependent functions. One deals with the ideal arrangement of land-uses
based on theories. However, because of the subjective nature of what people believe
to be ideal, and resultant conflicting expectations, an ideal is unachievable. The
second function which Claassen & Milton (1992) discuss is that town and regional
planning should provide a fair, just and efficient process for deciding on land-uses.
One important function of town and regional planning is to prevent unhealthy living
conditions in cities, one such condition being airport noise. Other functions are to
limit diminution in residential property market values experienced internationally
around airports as a result of airport noise (Bell 2001) and to limit conflict between
land developers and airport management (May & Hill 2006).
How effective is planning in this role? Todes (2006) holds the view that in the early
post-apartheid period, there were severe constraints on planning policy with a weak
and fragmented local government system, the emphasis being on making cities safe
for capital. This led to an expansion in development in urban areas with little or no
thought for future consequences.
Zoning land for a particular use does not initiate development. Other factors such as
the intentions of the land owner and market forces carry more weight. This is a
weakness of town planning. With large numbers of people migrating from rural
hinterlands to urban areas, land-use planning has been reactive and not pro-active.
Reactive planning reacts to problems that occur whilst pro-active planning anticipates
and prevents problems. Claassen & Milton (1992) state that planning is often seen as a
Western concept which can be an obstruction to development. This would indicate
that reactive planning is used to deal with problems so that pro-active planning does
not get in the way of socio-economic development.
The concept of sustainable development i.e. development that “… meets the needs of
the present without compromising the ability of future generations to meet their own
needs …” (Mayhew 2004: 480) has also been taken into town and regional planning,
so indicating that both development and conservation are imperative to the process.

63
Gilbert, Stevenson, Girardet & Stren (1996) maintain that the role of local
governments in ensuring well-functioning cities is important in making progress
towards sustainable development goals and programmes. Issues related to cities are
addressed throughout Agenda 21; for example Chapter 7 deals with protecting and
promoting human health, where noise is recognised as having a severe impact on the
urban environment (United Nations 2005). Claassen & Milton (1992) contend that
town planning is becoming more process orientated than blueprint orientated. This
means that it is striving to become a people orientated system, to be used by the whole
community and to which a wide range of professions contributes. It is essential that
the system by which decisions are taken is fair and democratic so that the will of the
majority prevails. Claassen & Milton (1992) show that the local level of town
planning goes a long way to provide such a system. Claassen & Milton (1992) state
that town and regional planning operates at three levels: local, regional and national.
Local planning is well developed, the emphasis being on physical planning and
control, and various town-planning ordinances are in place at a local level too.
Environmental problems cover a wide range of topics and are to be found at various
scales (Claassen & Milton 1992). Many of these problems fall outside of the town and
regional planning organisational framework. Certain environmental aspects can be
addressed through town planning, and one of these is noise.
Claassen & Milton (1992) are critical of town planning schemes, stating that instead
of these being policy documents for future development, they were development
control mechanisms. The Ekurhuleni Integrated Development Plan published in 2003
(as required in Section 25(1) of the Municipal Systems Act) seems to recognise
previous shortcomings and addresses them in a strategic planning instrument
(Ekurhuleni Metropolitan Municipality 2003b), something envisaged earlier by
Claassen & Milton (1992).
2.11 URBAN PLANNING UNDER APARTHEID
No writing on urban planning in South Africa can be complete without reference to
urban planning under apartheid. Apartheid-style urban divides are not unique to South
Africa, but in many cases communities were relocated under Group Areas removals to
places with poor access to urban services and facilities (Todes 2006) and areas which

64
had other unpleasant characteristics – for example near Cape Town and East London
airports where noise was set to become a problem. In South Africa today, particularly
around Cape Town International airport, residents are vulnerable to aircraft noise as
the airport’s traffic is predicted to grow (Van der Merwe & Von Holdt 2005).
Up until this point in this study, discussion has centred around land-use planning
based on average energy aircraft noise contours. In the following section,
supplemental aircraft noise information will be discussed.
2.12 SUPPLEMENTAL AIRCRAFT NOISE INFORMATION
It is an important argument in this dissertation that average energy aircraft noise
contours do not provide enough information to lay-persons about the noise they are
likely to be exposed to around airports. Average energy contours do not show the user
how many flights the contours represent, or what the noise levels of these flights are.
The terms supplemental noise information and transparent noise information have
been employed to describe the efforts made to expand on the average energy
information. Members of the public are interested in being provided with aircraft
noise information in a form to which they can readily relate.
2.12.1 Single events contours
When supplemental aircraft noise information is made available, interest initially
focuses on providing information on the maximum dBA level of single aircraft
movements as this is the most basic, and easily understood way to report noise
(Commonwealth Department of Transport and Regional Services 2000). An interested
person would typically be shown single event maximum noise contours of aircraft
which operate from the airport in question. Figures 2.4 and 2.5 illustrate examples of
two single event departures. Figure 2.4 represents an older generation Boeing 737-200
with a takeoff weight of 56 246kg and static engine thrust of 7 257kg. Figure 2.5 is for
a newer generation 737-500 with a takeoff weight of 62 823kg and a static thrust of
9 072kg. Both are produced from data in the Integrated Noise Model. (Although the
Integrated Noise Model does not provide a scale representation in these figures, the
same scale setup was used as evidenced by the tick marks.)

65
Source: Federal Aviation Administration (2003).
Figure 2.4: Single event noise contour – departure of a Chapter 2 Boeing 737-200.
Source: Federal Aviation Administration (2003).
Figure 2.5: Single event noise contour – departure of a Chapter 2 Boeing 737-500.
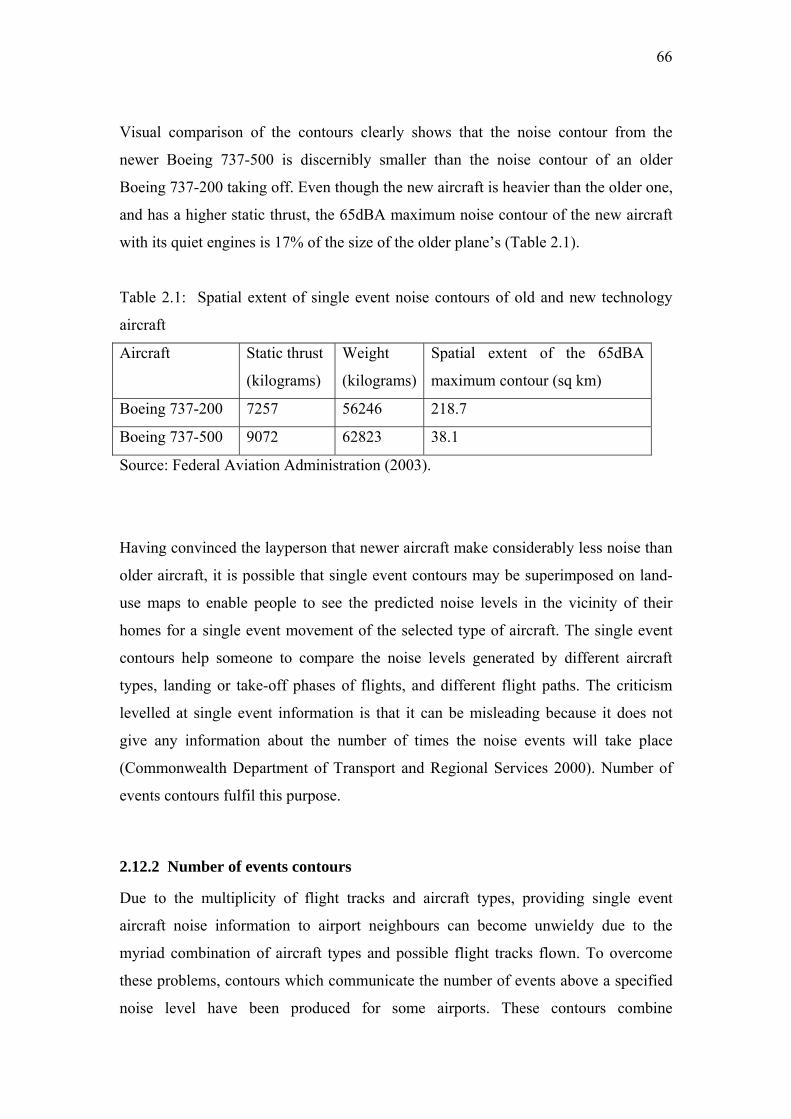
66
Visual comparison of the contours clearly shows that the noise contour from the
newer Boeing 737-500 is discernibly smaller than the noise contour of an older
Boeing 737-200 taking off. Even though the new aircraft is heavier than the older one,
and has a higher static thrust, the 65dBA maximum noise contour of the new aircraft
with its quiet engines is 17% of the size of the older plane’s (Table 2.1).
Table 2.1: Spatial extent of single event noise contours of old and new technology
aircraft
Aircraft Static thrust
(kilograms)
Weight
(kilograms)
Spatial extent of the 65dBA
maximum contour (sq km)
Boeing 737-200 7257 56246 218.7
Boeing 737-500 9072 62823 38.1
Source: Federal Aviation Administration (2003).
Having convinced the layperson that newer aircraft make considerably less noise than
older aircraft, it is possible that single event contours may be superimposed on land-
use maps to enable people to see the predicted noise levels in the vicinity of their
homes for a single event movement of the selected type of aircraft. The single event
contours help someone to compare the noise levels generated by different aircraft
types, landing or take-off phases of flights, and different flight paths. The criticism
levelled at single event information is that it can be misleading because it does not
give any information about the number of times the noise events will take place
(Commonwealth Department of Transport and Regional Services 2000). Number of
events contours fulfil this purpose.
2.12.2 Number of events contours
Due to the multiplicity of flight tracks and aircraft types, providing single event
aircraft noise information to airport neighbours can become unwieldy due to the
myriad combination of aircraft types and possible flight tracks flown. To overcome
these problems, contours which communicate the number of events above a specified
noise level have been produced for some airports. These contours combine

67
information on aircraft movement numbers with their single event noise levels.
Important here is the selection of the noise level to represent, and the numbers of
events to show on the contours. Contours showing the number of events louder than
70dBA have been adopted because this is regarded as being equivalent to a level of
60dBA inside a normal house with open windows (Commonwealth Department of
Transport and Regional Services 2000). A normal house is regarded to be constructed
from brick and mortar, with conventional roofing materials – tiles or corrugated iron.
In South Africa many residential dwellings are not constructed from these materials,
so do not provide much protection against noise. Consequently, in this study, it is
necessary to set a noise level of 60dBA to account for dwellings which acoustically
do not provide much protection. A level of 60dBA is also convenient to represent
night-time exposure patterns because an external single event noise level equates to
the sleep disturbance level of 50dBA (Commonwealth Department of Transport and
Regional Services 2000). Extending noise contours to lower levels raises questions
about the accuracy of aircraft noise information, particularly because of interfering
noises from other sources, for example road traffic. Number of events contours have
advantages and disadvantages and these will be set out in the following section.
2.12.2.1 Advantages of number of events contours
The Integrated Noise Model (INM) is prescribed by SANS 10117 to be used to
calculate average energy noise contours. The INM can also be used to compute a grid
file which is used as an input into noise modelling software which calculates number
of events. This means that the same data used to produce average energy noise
contours is used to produce the number of events contours. In turn this means that an
understanding of average energy contours can be clarified and expanded upon by
using number of events.
The number of events contour is attractive to laypersons in that it is an arithmetic
indicator. For example, if the number of events at an airport doubles then, all other
things being equal, the number of events contour will double. This is a different
outcome to the LAeq noise metric which is logarithmic and relatively insensitive to
change. The difference between the two can be shown graphically.

68
Source: Federal Aviation Administration (2003), compiled by author
Figure 2.6: 65 LAeq contour for 50 takeoff movements over a 24-hour period
Source: Federal Aviation Administration (2003), compiled by author
Figure 2.7: 65 LAeq contour for 100 takeoff movements over a 24 hour period.

69
Using the INM, the average noise impact (65LAeq) over 24 hours of 50 and 100
departures of a Boeing 737-500 are illustrated in Figures 2.6 and 2.7 respectively3.
Although the 24-hour average noise contour of the 100 movements is larger than that
of 50 movements, it is not twice the size. The spatial extent of the two contours differs
by a factor of 1.8 (see Table 2.2). The importance of this difference is that residents
around this airport are exposed to twice as many aircraft noise events.
Table 2.2: Spatial extent of 24-hour 65 LAeq contour: 50 versus 100 movements.
Number of
movements
Area of 24-hour
65LAeq contour
(sq km)
50 0.540
100 0.973
Source: Federal Aviation Administration (2003).
If an airport has a sophisticated noise monitoring system installed, use of the number
of events enables summaries to be made for any given period. If there is no noise
monitoring system noise information can be produced by computer modelling. By
combining the loudness of events with the number of events, a useful addition can be
made to the process of making information transparent. But number of events
contours also have drawbacks of which one must be aware.
2.12.2.2 Disadvantages of number of events contours
Members of the public living near an airport often want to be given a comparison
between an aircraft noise level and the noise made by a common everyday event. This
is especially so when a new airport or runway or flight path is being planned. People
living in urban areas are generally exposed to a high number of events louder than say
70dBA on a daily basis – cars, domestic appliances, music etc. However, a statement
that the sound pressure level of an aircraft will sound like a car passing down the road
3 The 65 LAeq contours shown in Figures 2.6 and 2.7 are the outermost contour lines. The 70 LAeq and
75LAeq contour are also shown for comparison. These contours are smaller and closer to the airport.

70
is misleading. The sound pressure levels may indeed be the same, but the perception
of the two events is likely to be different. If people show a strong interest in the noise
levels, then the best approach is to let them form their own views by directing them to
a place near an existing airport with similar aircraft types operating as the proposed
development, where they can compare the levels with the readings on a sound-level
meter and with other common noise sources such as road traffic.
Another weakness is that once a noise level is selected for portrayal, for example
70dBA, then noise events greater than 70dBA, for example 80dBA are also registered.
There are arguments that this is not important since the N70 is based on the concept
that once this noise level is reached the annoyance or activity interference is such that
the noise event becomes intrusive anyway. The issue can be addressed by producing a
series of number of events contours for other noise levels, e.g. N80. The production of
a range of these contours works well when a detailed examination of noise exposure
and response is being carried out.
One of the strengths of geography is to integrate subject matter from different fields
of study. The purpose of this chapter was to describe the links between geography,
town planning and the aircraft noise problem and how people understand and interpret
the spatial aspects of the aircraft noise dilemma. It has been shown how mapping
average energy aircraft noise contours leads to a better understanding of the problem,
and the initiation of finding solutions to noise problems. However, average energy
aircraft noise contours remain highly idealised representations of the reality of aircraft
noise to which people are exposed. The total noise energy from aircraft operations is
averaged out over a 24 hour period typically resulting in averages which are up to 30
dB lower then the maximum noise levels which people actually hear. In Chapter 3, the
research methodology which was followed to draw attention to the value of
supplemental aircraft noise information in the form of maximum noise levels, is
explained.

71
3 CHAPTER 3: RESEARCH DESIGN AND METHODOLOGY
Scientific research is defined by Smit (1995) as a critical and purposeful action to
collect data and new facts, and provide the correct and lasting interpretation of data
and facts. The two main components of scientific research are observation and
argumentation and this chapter outlines how the observation component of this
dissertation was conducted. The purpose of the spatial sampling was to make
inferences about a population where each respondent has a geographical reference or
geocoding (Haining 2003).
3.1 TYPES OF AVERAGE ENERGY DESCRIPTORS
In 2002 ICAO published an updated version of its airport planning manual, in which it
surveyed the noise metrics and land-use planning guidelines for 15 of its member
states (International Civil Aviation Organisation 2002). A wide variety of noise
metrics and land-use planning guidelines were discussed, for example the American
DNL, British LAeq, the French Index Phosphique and German Korsten units. Most
average energy noise metrics use some form of weighting to account for the noise
created by aircraft at night. Debates still continue as to what time-span the weightings
are applied to, and what the value of a weighting should be.
The LAeq 24 descriptor is the equivalent noise level in dB(A) and is probably the least
complicated average energy noise metric to understand, as it averages aircraft noise
over a 24-hour period with no weighting and therefore no time period to be weighted.
Since weightings, their values, and the period of time applied to them are and will
continue to be up for scrutiny, a simple average energy descriptor has received some
acceptance.
Some aircraft noise descriptors have weightings applied to the noise from aircraft
flights which take place at night-time when communities are regarded to be most
susceptible to noise. The DNL as used in the USA, has a 10dBA weighting for flights
which take place between 22:00 and 07:00. In South Africa, the NI descriptor (which
was in use until 2003) had a weighting of 5dBA applied to flights between 18:00 and

72
midnight, and 10dBA to flights between midnight and 06:00. Flights taking place
between midday on Saturday and midnight on Sunday had a weighting of 5dBA
applied to them (South African Bureau of Standards 1974). The LRdn (in use in South
Africa since 2003) is conceptually similar to the DNL, adding 10dBA to flights
between 22:00 and 06:00 (Standards South Africa 2003).
As part of the SABS review of the noise modelling methodology in 2001, the
researcher produced noise contours representing four noise metrics (Goldschagg
2001). The same flight operation records were used to calculate the spatial extent of
the contours. The only variable that changed was the respective metric’s weighting.
The flight operations for each metric were grouped according to the time of operation
since this affects the weighting which in turn influences the calculated noise level and
in turn the spatial extent of the contour.
The differences in spatial extent of noise descriptors is illustrated by the size and
shape of contours produced according to these descriptor methodologies in Figures
3.1 to 3.5. For example, consider the 55dB contour (Figures 3.1 to 3.4), the spatial
extent of which varies from just over 100 square km for the LAeq to nearly 200 square
km for the NI (Figure 3.5). The area of this contour almost doubles from one
calculation method (LAeq) to another (NI). The variation is due to the weightings used.
It is easy to see how the layperson may become confused by the size and shape of the
contours if the rather complicated underlying assumptions are not clearly understood,
particularly as the same aircraft movement data is used to calculate the four contour
sets. It is also clear that from the proximity of houses to the airport, and that no
matter which noise metric is used, little attention was given to aircraft noise or that
aircraft noise becomes more of a problem because of airport growth. Town planners
would need to take care to apply the correct land-use planning guidelines based on the
appropriate noise contour. Each of the four contour metrics is described in turn.

73
Source: Compiled by author
Figure 3.1: LAeq noise contour for ORTIA

74
Source: Compiled by author
Figure 3.2: LRdn noise contour for ORTIA

75
Source: Compiled by author
Figure 3.3: DNL noise contour for ORTIA

76
Source: Compiled by author
Figure 3.4: Noisiness Index for ORTIA

77
3.1.1 LAeq noise contour
Of the four contours examined here, the LAeq contour (Figure 3.1) has the smallest
spatial extent. There are no weightings or time periods applied to the calculation of
this contour. Without weightings to consider, it is the simplest contour to understand
of the four discussed here.
3.1.2 LRdn noise contour
The LRdn noise contour (Figure 3.2) represents the aircraft noise impact currently
prescribed by South African National Standards. A weighting of 10dB is applied to
flights occurring between 22:00 and 06:00. This implies that flights between these
times must be identified, and classified as such, so that the noise modelling software
will perform the calculations based on the appropriate time and weighting. The spatial
extent of the LRdn contour is third largest of those discussed here.
3.1.3 DNL noise contour
The DNL contour (Figure 3.3) represents one of the metrics more frequently used to
illustrate noise impact. A weighting of 10dB is applied to aircraft movements taking
place between 22:00 and 07:00. The metric is prescribed by the Federal Aviation
Administration in the United States and is in common use in that country. The DNL
metric is frequently quoted in noise studies, probably for no other reason than airports
wish to compare themselves with other airports, and the United States is the most
prolific producer of noise contours as it has the greatest number of aircraft movements
worldwide. The DNL contour has the second largest spatial extent of those shown
here.
3.1.4 Noisiness Index
The Noisiness Index (NI) contour (Figure 3.4) represents the noise from aircraft as
calculated according to the prescribed South African standard prior to the introduction
of the new standard in 2003. A weighting of 5dB was added to flights operating
between 22:00 and 24:00, and 10dB to flights between 24:00 and 06:00. This contour
has the largest spatial extent which is attributable to the additional weightings over the
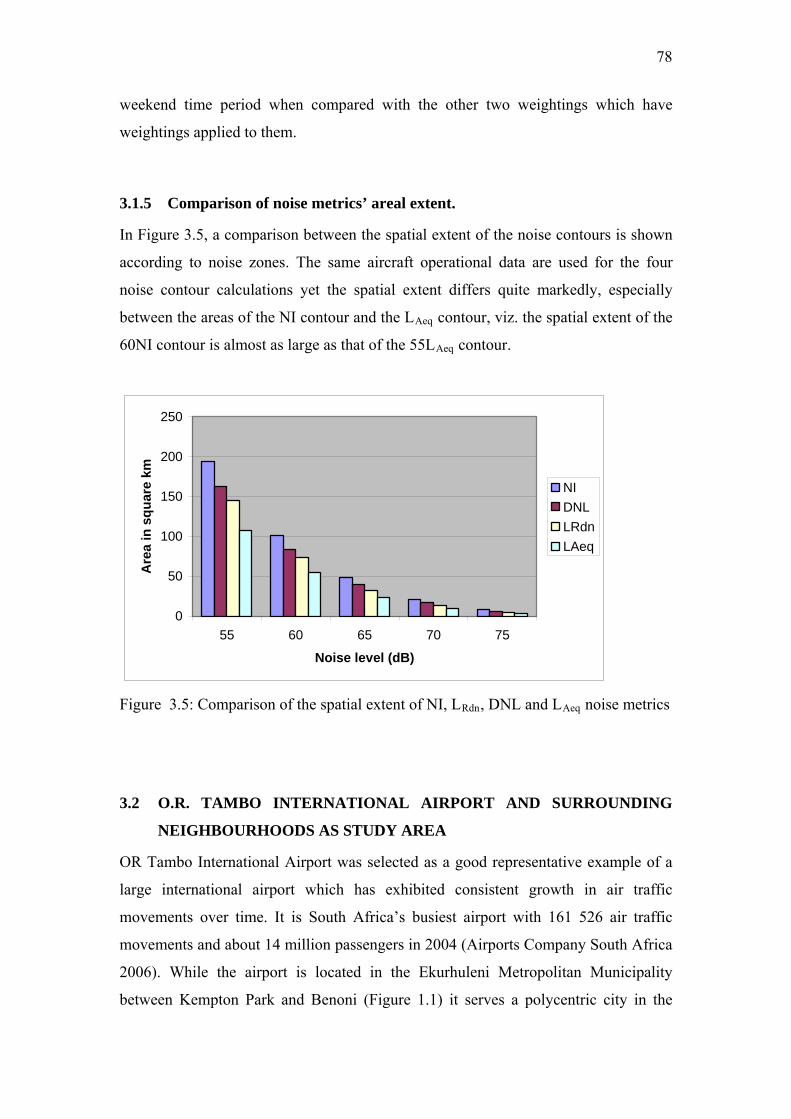
78
weekend time period when compared with the other two weightings which have
weightings applied to them.
3.1.5 Comparison of noise metrics’ areal extent.
In Figure 3.5, a comparison between the spatial extent of the noise contours is shown
according to noise zones. The same aircraft operational data are used for the four
noise contour calculations yet the spatial extent differs quite markedly, especially
between the areas of the NI contour and the LAeq contour, viz. the spatial extent of the
60NI contour is almost as large as that of the 55LAeq contour.
250
0
50
100in s
q
150
200
Are
a ua
re k
m
NIDNLLRdnLAeq
55 60 65 70 75
Noise level (dB)
Figure 3.5: Comparison of the spatial extent of NI, LRdn, DNL and LAeq noise metrics
3.2 O.R. TAMBO INTERNATIONAL AIRPORT AND SURROUNDING
NEIGHBOURHOODS AS STUDY AREA
od representative example of a
wth in air traffic
irport with 161 526 air traffic
(Airports Company South Africa
i Metropolitan Municipality
serves a polycentric city in the
OR Tambo International Airport was selected as a go
large international airport which has exhibited consistent gro
movements over time. It is South Africa’s busiest a
movements and about 14 million passengers in 2004
2006). While the airport is located in the Ekurhulen
between Kempton Park and Benoni (Figure 1.1) it

79
central Witwatersrand made up of Ekurhuleni, Emfuleni, Johannesburg, Midvaal,
with, and facilitate increases in air traffic
ovements are being considered (Geldenhuys 2006). The airport is also central to the
ore aircraft movements
ill be accommodated. In the absence of as yet undeveloped new technology which
ill reduce aircraft noise, it is probable that more noise from aircraft will be
xperienced in the surrounding neighbourhoods in the future.
Mogale City, and Tshwane4 which together have a combined population of over 8
million (Pillay, Tomlinson & du Toit 2006).
The airport infrastructure itself has undergone considerable growth, particularly since
South Africa’s transition to a democracy in 1994, and this growth is set to continue.
Between 1996 and 2001 the population of the surrounding urban areas also grew fast:
Ekurhuleni by 22.4%, Johannesburg by 22.2%, and Tshwane by 18.0% (Pillay,
Tomlinson & du Toit 2006). ORTIA operates international and domestic terminals
and has a dedicated freight area. As of 2007, the Airport is undergoing an R11-billion
upgrade to accommodate the new Airbus A380 aircraft, a station for the Gautrain, a
new hotel, an additional parkade for 5 000 cars, and a new central terminal to link the
domestic and international terminals. In the long term, a new terminal complex is
planned to be built in the midfield between the two runways (Smillie, 2006) and new
runway developments designed to cope
m
Gauteng provincial government’s plans to develop the province into a city-province
(Gauteng Provincial Government 2006).
All of this means that as the airport infrastructure grows, m
w
w
e
changes to place names:
New name
sburg International Airport O.R. Tambo International Airport
d Ekurhuleni
4 List of
Old Name
Johanne
East Ran
Vaal Emfuleni
Vaal Triangle Midvaal
West Rand Mogale City
Pretoria Tshwane

80
The airport’s owner, ACSA, recognizes the impact of aviation on the environment:
“As a responsible corporate citizen, ACSA has over the last three or so years
intensified its research efforts and participated in various environmental
studies and subsequent policy frameworks. Through these interactions, the
company found that there was substantial interest around the issue of noise
pollution.” (Makgale 2006: no page number).
easures. As yet the airport has not
stalled an automated, computer-based aircraft noise and track information system as
operators.
here are no restrictions placed on times of operation (curfews), number of
ovements or aircraft types. Neither are there fines or penalties applied to aircraft
isa. In the next section the capture and
anipulation of the survey data and aircraft operational data are dealt with.
The airport has taken the initiative in advance to establish an Airport Environmental
Committee as envisaged in the Department of Transport’s White paper on national
civil aviation policy (South Africa 2005). This committee meets regularly and is the
vehicle to take the initiative for considering and implementing possible noise
abatement procedures and noise mitigation m
in
has been done at many of the world’s large international airports. However, the airport
has a help desk which logs noise complaints and forwards them to the relevant
personnel to investigate the grievance and suggest mitigation measures.
The airport recommends that noise abatement procedures (as published in the South
African Aeronautical Information Publication) are adhered to by aircraft
T
m
exceeding limits as there are no limits in place.
With the inevitable increase in noise as a result of the expected air traffic growth, the
question which arises is what residents living near the airport think about the noise
impact. The noise contours described in Sections 3.1.1 to 3.1.4 were principally used
to identify the noise impacted neighbourhoods and the study area around the airport
namely Benoni, Kempton Park and Temb
m

81
3.3 SURVEY OF CITIZENS’ PERCEPTIONS OF EVENING AND NIGHT-
TIME AIRCRAFT NOISE
The rationale for a survey usually originates when there is a need for information
because existing data are insufficient. No information could be found on the
perception people in South Africa have of evening and night-time aircraft noise and so
a survey was undertaken. A sample was used rather than undertaking a complete
ensus for reasons of practicality and cost.
f people
aircraft noise is so varied (van Kampen 2005). It is important to keep in mind that
resent research, one of the primary weaknesses of surveys (at one level) – the
ommunicative competence of the informant – is recognised, but the potential of the
rimary data are collected by a researcher to meet the specific objectives of a project
c
The survey was intended to evaluate the reaction of people who live in the vicinity of
the airport, to aircraft noise. The main benefit of this survey for the researcher is the
identification of broad trends in people’s responses to noise from aircraft. Hoggart,
Lees & Davies (2002) are of the opinion that a survey is a trawling exercise, designed
to establish general trends, but lack the capability to reveal meaning and significance.
This is a valid point, particularly in the present research since the response o
to
any statistical results can only be applied with limited success in practice, as human
behaviour – in this case response to aircraft noise – cannot be fully explained or
predicted by statistical models.
In the p
c
survey instrument to highlight incidences and trends is powerful. To do this meant
establishing what data would be needed before undertaking the survey. It would be
inefficient to conduct a survey if suitable data from other sources already existed –
however, it was soon established that although many surveys of people’s response to
aircraft noise have been done overseas, this was not the case in South Africa.
P
(Sheskin 1985; Haining 2003). In the present study, the required primary data
originated from the sample survey, namely resident’s annoyance with evening and
night-time aircraft noise, and interference with certain key activities carried out in the
home.

82
The data recorded came from a set of fixed locations, the attributes measured being
categorical. Such categorical data may be divided into parcels or blocks (Haining
2003). Instead of being called blocks, the land around the airport was divided into
zones and the noise value recorded for each of these. The survey respondents, once
ographically referenced, are points in geographic space. Each individual respondent
o elicit information about noise disturbance from aircraft operations, a questionnaire
was designed to explore the perceptions that communities around ORTIA have of
ersion of the mail out/mail back procedure
which combine any of these may also be used. The
ecision which then had to be taken was to select the method most likely to serve the
ge
was first assigned to a geographic location, and then to a noise zone.
Residential areas are places people normally return to in the evening and at night.
Because aircraft noise is most disruptive to people when they are at home in the
evening or at night, watching television, talking on the telephone, trying to work,
study, or sleep, the key variables assessed in the survey were: annoyance (what
people’s general feelings about airport noise are); interference (sleep disturbance,
telephone conversations, TV viewing, work or study); whether people would consider
moving from the neighbourhood because of night-time aircraft noise; and what
people’s general feelings about aircraft noise are (after Blitch 1976; Brooker,
Critchley, Monkman & Richmond 1985; Berglund, Lindvall & Nordim 1990; Fastl &
Widman 1990; Staples, Cornelius & Gibbs 1999; Aasvang & Engdahl 2001).
T
aircraft noise. This is a modified v
discussed by Sheskin (1985) and the American Statistical Association (1997). Sheskin
(1985) and Hoggart, Lees & Davies (2002) outline a number of procedures which
may be used to collect data. These include the personal interview survey, the intercept
survey, mail surveys, telephone surveys and the most recent type of survey, the online
survey. Dual survey mechanisms
d
purpose of the study. Two methods were chosen. Firstly, a drop-off and mail-back self
administered survey was selected as being the best option for obtaining the required
information in Kempton Park and Benoni. In Tembisa the intercept survey method
was selected. The methods are discussed in detail in Section 3.6.1.

83
3.3.1 Survey design and execution
Two types of time critical data were collected, which referenced a specific time period
of one week – an aircraft noise perception survey based on one week of aircraft
movements, and the actual aircraft movements during the week of the survey. In this
section the survey design and execution is discussed. Aircraft flight operational data is
rther discussed in Section 3.8.
ure how individuals
el or think about aircraft noise. Neuman (2006) refers to these feelings or thoughts
1996).
fu
A number of aircraft noise surveys were studied to determine what questions should
be asked (Brooker et al 1985, Heinonen-Guzejev et al 2000, Health Canada 2001,
Hiramatsu et.al. 2002, Miyakita et al 2002, Hume et.al 2003, Schipper, Rietveld &
Nijkamp 2003). In these surveys, the researchers wanted to meas
fe
as the potency of feelings. In the present survey, annoyance and interference were the
two key concepts being measured along with querying whether the respondent would
consider moving away. The questions which were decided upon were determined by
important aspects of people’s lives affected by aircraft noise. The survey was softened
to reduce bias – titled a neighborhood quality survey so as not to alert respondents
immediately that aircraft noise disturbance information was being sought (Staples,
Cornelius & Gibbs 1999; Utts 1996).
The survey was designed as an investigation to establish whether there is a functional
relationship between aircraft noise and annoyance and activity disturbance in the time
period between 18:00 and 06:00 i.e. evening and night (after Torgerson 1970). The
survey was designed with closed-response questions, the data reflecting the
researcher’s prior structuring of the ‘universe’ (after Swift
In planning the survey, individual residents and other community members (former
school principal, university students, chairman of a residents association), were
approached with the aim of finding out if, and what aircraft noise concerns they had.
A trial survey was then undertaken in the week of September 20th to 26th 2004 to
check the credibility of the survey. Hoggart, Lees & Davies (1998) suggest that to get
a feel for the problem investigated, the pilot group of respondents could vary from 5
to 50 respondents while Fink & Kosecoff (1998) suggest that the pilot survey may be

84
stopped once it no longer yields any more useful information that helps improve the
study. Questionnaires were dropped off at 30 residential addresses which lay directly
under or very close to flight tracks observed in the field by the author to have regular
aircraft movements. Respondents were invited to complete the questionnaire and
return it by post in the pre-addressed and stamped envelope. The questionnaire was
anonymous in order to encourage frank and honest views.
Once the pilot survey responses were returned, the proposed instrument was
challenged so that it could be adjusted for better effect (Fink & Kosecoff 1998). The
questions which were included in the pilot survey were included to focus on their
clarity and see if they were understood. Six responses were received giving a response
te of 20%. These responses were examined to investigate whether the survey
nts completing these
ctions. Question 1, 6, 8 and 9 were retained. Question 4 was adjusted for better
0 and 11 could be omitted. Firstly,
ey comprised questions which were not essential for the goals of this study; namely
to investigating interference and annoyance caused by aircraft noise. Secondly, if the
survey could be shortened, the response
y worthwhile, and the open-response questions were dropped.
Alt
English
promot
e final improved survey materials used, viz. letter of introduction, questionnaire,
and m
ra
instrument could be improved. The closed-response questions (1 to 11) where
respondents had to make a choice, for example between a range of phrases from ‘very
often’ to ‘never’, were well answered with most responde
se
effect, to give respondents more choice than a simple ‘yes’ or ‘no’ answer. For two
reasons it was decided that questions 2, 3, 5, 7, 1
th
time required by respondents to complete the
rate could be improved. The three open-response items were very poorly answered,
the responses not being of any value. It was evident to the researcher that the
respondents were willing to participate in a survey with closed-response questions and
that open-response questions were to be avoided. This aspect of the pilot survey was
particularl
hough not directly evident from the pilot survey, the author decided to use both the
and Afrikaans language in the final survey. This decision was taken to
e a feeling of inclusivity and improve the response rate.
Th
re inder letter are appended in Appendix A.

85
3.3.2
The da and
oise, and respondents’ biographical information. Eight questions probed
resp d
(see A
analysi
• a place to live)
required respondents to make a choice between Very good, Fairly good,
• Question two requested respondents to indicate which noises they experienced
indicate whether ‘Sleep’, ‘Telephone
conversations’, ‘Television viewing’, ‘Work or study’ and ‘Other’ activities
se of
aircraft noise. These answers were coded as 1 & 2 respectively.
• Question five required the respondents to describe their general feelings about
ting whether they felt ‘Highly annoyed’,
Questionnaire survey data capture
ta capture of survey responses was separated into neighbourhood quality
n
on ent’s perceptions of their neighbourhood and the occurrence of aircraft noise
ppendix A). The coded answers were captured into a spreadsheet for later
s.
Question one (concerning rating the neighbourhood overall as
Average, Fairly bad and Very bad. These answers were coded as 1 – 5
respectively.
in the neighbourhood. The choice of responses available to respondents for
this question ranged from ‘Very often’ through ‘Often’, ‘Sometimes’,
‘Seldom’ to ‘Never’. These answers were also coded as 1 – 5 respectively.
• Question three requested respondents to
were disturbed. The choice of responses available to respondents for these
questions ranged from ‘Very often’ through ‘Often’, ‘Sometimes’, ‘Seldom’ to
‘Never’. These answers were also coded as 1 – 5 respectively.
• Question four required respondents to answer ‘Yes’ or ‘No’ to the question on
whether they would consider moving from this neighbourhood becau
night-time aircraft noise by indica
‘Considerably annoyed’, ‘Moderately annoyed’, ‘Slightly annoyed’ or ‘Not at
all annoyed’. This question was also coded from 1 – 5.

86
3.3.3 Land-use information
Land-use information to be used as a backdrop for the noise contours and to orientate
the reader was required. For better clarity, a combination of georeferenced 1:50 000
pographical maps and ESRI shape files were selected. This data was used to create
ientated at about 15 degrees east of true
. The western runway has a length of
0 to
the compass heading, but the last digit is
nways are spaced about 2.5km apart. Due to the busy nature
rture and arrival flight tracks have been
are known as Standard Instrument Departures (SIDs) and
routed. The standard route for flights departing from the airport is to remain on the
to
maps to provide a backdrop against which the position of the noise contours and the
locations of the survey respondents could be visualized. This information was also
essential to visualise and assist with selecting the sample frame.
3.4 SURVEY SAMPLING FRAME
3.4.1 Runway layout and flight tracks
In order to make decisions on the survey frame, it is necessary to understand the
layout of ORTIA’s runways and associated aircraft flight tracks (Figure 3.6). The
airport has two parallel runways which are or
north and run to 195 degrees east of true north
4 418m and the eastern runway is 3 400m long. To improve air traffic flow, and
owing to its additional length, the western runway is generally used for departures and
the eastern runway for landings.
To avoid confusion, and for safety reasons, runways are named after the magnetic
compass heading they point towards. Compass headings can be any number from
359 degrees, so runways are referred to by
dropped. For example, at ORTIA, the runways are referred to as 03 left, 03 right, 21
left and 21 right. The ru
of the airport, prescribed procedural depa
designed. The flight tracks
Standard Terminal Arrival Routes (STARs). Aircraft flight crews are required to
adhere to these procedures although exceptions may be made, visibility and other
traffic permitting.
The SIDs and STARs for the airport were overlaid onto the appropriate 1:50 000
topographical maps and examined to obtain a broad visualization of where aircraft are

87
runway heading until the first navigation point is reached. At this point the aircraft
may commence with their initial turn to their intended destination. Arriving aircraft
re stabilised on their approach at about 18km from their touchdown point.
rior to selecting the sample, it is necessary to define the population to which
the sample frame can imply a
cer
phenom
investig noise is, before its
population and a control population were required. The
affected at the time these noise contours were produced.
a
It then follows that the sample frame would be located in the vicinity of these flight
tracks.
3.4.2 The sample frame
P
inference will be made (Sheskin 1985). Selecting
tain ambiguity (Smit 1995) and this research reflected Smit’s writing. The
enon of airport noise in a defined time period of one week was being
ated. It was therefore a prerequisite to know where the
impact could be determined. However, the survey was limited to a specific time
period of one week during which noise from aircraft would have been made.
Therefore another way had to be found to determine the survey frame.
The sampling frame is best described as a modified probability sample after Hazard
(1971). An experimental
experimental population had to be located in the vicinity of the airport’s flight paths
where there was a likelihood that they would be exposed to noise from aircraft
operations. The control population were required to be located a similar distance from
the airport but not directly under the flight paths.
The following were used to locate the sample frame:
• Firstly, the noise contour examples (Figures 3.1 to 3.4) overlaid onto a 1:50
000 scale topographical land-use map were examined to see which areas were
• Secondly, the published SID and STAR flight procedures were studied to
understand where aircraft were expected to fly. Generally, for departures
aircraft follow the extended runway centerline for about 9.4km from the start
of the takeoff roll before turning on track. Arriving aircraft are usually

88
stabilized and on their landing flight track within about 18km from the runway
touchdown point.
• Thirdly, field observations were made of aircraft flying into and out of the
airport, to verify the SIDs and STARs. The writer drove into the suburbs and
spent time observing the aircraft as they took off and landed. The general
positions of the flight tracks were recorded on a map.
• Fourthly, the air traffic control centre was visited, and radar plots of aircraft
ined. A computer linked to the radar network
and an associated software distance measuring tool, was used to assess where
y tracks’ in the sky. Rather, the flight
aths could be described as corridors in the sky within which pilots are expected to fly
d, a cluster sample method was
dged
against the results - control group against the suburb group, (p value >.0001) and
male/female respondent proportions (as judged against population census data) and
deemed acceptable.
3.4.2.1 Age of respondents
Any adult over the age of 18 years in the household could be selected. Persons over
18 years should have had no difficulty in understanding the language and
requirements of the survey which were designed to be comprehensible to anybody
who has completed a primary school education.
3.4.2.2 Linking with Ekhuruleni’s future planning
Because of the researcher’s interest in Ekhuruleni’s Northern Spatial Development
Region (NSDR), and because of planned and potential development in this region, it
was decided to concentrate on the land covered by this region. In Figure 3.6 the
flight tracks observed and exam
aircraft were being operated and to validate the SIDs and STARs.
Although there are published flight routes, it was obvious from observation of flights
and radar data that aircraft do not follow ‘railwa
p
their aircraft. Once the flight paths were establishe
selected because a sample frame listing population elements was not available
(Schofield 1996). There was the risk that the clusters would fall by chance on streets
that were unrepresentative, either totally or to some extent. This risk was ju

89
Source: compiled by author
Figure 3.6: Delimitation of the study area: flight tracks and survey respondent
locations.

90
Spatial Development Boundary region (shown in blue) to the west and south of the
airport partially defines the study area. The Urban Development Boundary (UDB) to
the north east defines the rest of the study area. The UDB (represented by a pink line)
is the area beyond which no further urban development is to be permitted – in this
instance to the east of the UDB as portrayed in Figure 3.6.
3.4.3 Selection of the respondents
Foster (1996) and Newman & Benz (1998) state that if a researcher’s conclusion is
supported by data from other sources, then they can be more confident of its validity.
Phrased another way, was there a shared reality? Triangulation is a concept which
expresses the idea that data should be collected in as many different ways and from as
many sources as possible, the hope being that the data from different sources tells a
similar story (Riley 1990, Foster 1996, Newman & Benz 1998). In the present study,
the results will be compared with international results, whilst within the study, two
survey areas will be assessed namely residential suburbs, and a township.
An experiment group (subdivided into two groups) and a control group were selected.
Figure 3.7 Residences in the control group area, Benoni

91
The requirements for the control group were (i) to consist of houses of similar
construction, type and materials (Figure 3.7) to the experiment group (Figure 3.8 and
Figure 3.9), and (ii) to be located at similar distances from the airport, but the control
group not lying directly under flight paths.
Figure 3.8: Residences in the experiment group area, Kempton Park. Note the Boeing
777 visible above the houses
The control group’s function is to evaluate whether in fact there is a difference
between the experiment group in response to aircraft noise. The experiment group was
divided into township respondents and suburb respondents. The construction of the
type of dwellings in the suburb experiment group (Figure 3.8) differs from the type of
dwellings in the township experiment group (Figure 3.9).

92
Figure 3.9 Houses in the township experiment area, Tembisa
The control group is located to the east of the airport. The houses in this group closely
resemble the houses in the suburb group. No similar control group could however be
identified to compare with the township group at a similar distance from the airport.
This presented two choices – either omit the results from the township group or
include them with an indication that no comparison was made, but that results could
be obtained which may inform later research.
There are more residential areas to the north of the airport than to the south which is
mostly mining land and industry. To the northeast and east of the airport, land is
generally agricultural smallholdings, or plots with a low population density (see
Figure 3.6, to the east of the pink UDB line). A field visit established that it would be
very time-consuming and expensive to obtain information from residents in the
smallholdings. None of the smallholdings had mailboxes which meant that delivering
the survey was impractical, and the low density of residential properties would have
made the survey cost-ineffective.

93
The survey frame was therefore identified in the north to be the Kempton Park
suburbs and Tembisa township, and Boksburg suburb in the south. Both the suburb
and township populations were selected on the cluster sample principle.
3.4.3.1 The selected suburbs
The first level of cluster selection was suburbs likely to be affected; the second level
of cluster selected was alternative streets in an affected suburb; and the third level was
every second house on the evenly numbered side of the street. This was seen to be a
form of cluster sampling with the advantage of having a realistic element of
randomness and reduced costs, but with the disadvantage of increased sampling error
(Federer 1973; Foster 1996). These groups were located between 4.4km and 11.6km
from the centre of the airport property, and roughly in line with the extended
centerline of the runway system or within about 6km of the extended centerline. For
the questionnaire delivery, a drop-off and post back method was followed in these
suburbs.
3.4.3.2 Tembisa township
The township of Tembisa (northwest of ORTIA) was identified to be on the boundary
of the noise contours. It was important to obtain the views of the township population
for the purposes of triangulation of the results.
For the Tembisa survey the interview method was selected and interviewers used the
intercept interview method of contacting respondents. The interviewers approached
residents and asked them the questions from the questionnaire. Because language and
literacy were barriers, interviewers were trained to administer the questions in a
neutral manner and to obtain respondents’ responses only.
Seventy interview surveys were conducted in Tembisa. The same questionnaire was
used for Tembisa residents as for the suburbs. Two researchers were trained to
administer the survey. Part of this training included the firm requirement that the
researchers take great care not to introduce any bias into the answers. They were
instructed to ask the questions and record a respondent’s response as given.

94
3.4.3.3 The control group
The control frame was selected on the same criteria as the experiment groups with the
exception that this group was not near the flight paths. The flight path criteria was
replaced by selecting the control population in suburbs to the east of the airport at
approximately the same range of distances of between 5km and 11.5km east of the
centre of the airport property, but off to the east, in Benoni. This population’s
residences are not overflown by arriving or departing aircraft.
3.4.4 Time-frame of the survey
There were two time-related aspects to the survey. Firstly, the time period selected
was the evening and night from 18:00 to 06:00 when respondents were most likely to
be at home and their geographical location could be fairly accurately established.
Secondly, the duration of the survey was selected to be one week. This was done to
improve the chances of accurate recollection of noise events by respondents. This
meant that participants would be responding to aircraft noise events when they were at
home in the evening and at night for seven days.
3.4.5 Survey ethics
Questionnaires were answered anonymously. No information was requested which
could be used to directly identify the respondents. Respondents were encouraged to
feel free to express their opinions honestly and not fear being associated with an
opinion. Residents were invited to participate and the covering letter made it clear that
participation was voluntary.
IsiZulu, Afrikaans, English, Sepedi and Sesotho are the local languages mostly
spoken in the study area (Ekurhuleni Metropolitan Municipality 2003a). A covering
letter written in English and Afrikaans explaining the aims of the survey and what was
required of the respondents accompanied each questionnaire. Tembisa residents who
did not speak English or Afrikaans had the survey explained to them by the
interviewer in one of the indigenous African languages.
95
3.4.6 Improving the survey response
A number of measures were implemented to improve the survey response rate. Firstly,
a covering letter (in English and Afrikaans) introducing the researcher and explaining
that a neighbourhood quality survey was being conducted was included (copy in
Appendix A). English and Afrikaans language instructions were provided (see
Appendix A). The name, institutional affiliation and contact details of the researcher
were included so that respondents could contact the researcher if necessary. Secondly,
an addressed, stamped envelope was included with each survey pack for easy return.
Thirdly, a reminder letter (see Appendix A) was dropped off at every address at the
end of the survey week to encourage participants to complete and post the
questionnaire form back. Fourthly, the survey wording was kept simple and concise to
encourage participation. The time required to complete the survey was stated to be no
more than ten minutes, thereby indicating to participants that they would not waste
their time.
3.5 AIRCRAFT FLIGHT OPERATIONAL DATA
For the success of the study it was essential to gather accurate aircraft flight
information for the time period of the survey. The air traffic control authorities collect
and store detailed information about the movement of aircraft, and their co-operation
was sought in this regard. Much of the information which is gathered by air traffic
control was not relevant to nor required for the present study, for example airline
name and aircraft registration. The relevant information was extracted and supplied,
namely the aircraft type, flight origin or destination and routing used, runway used,
and time of flight.
The flight information was next prepared for capture into the Integrated Noise Model
computerised noise modelling software. This entailed grouping the flight operations
by aircraft type, operation type (arrival or departure), flight profile (used to estimate
aircraft weight based on fuel uploaded for the distance of the flight), runway, flight
track and time of operation. Because the flight operations had to be classified
according to two time periods for survey analysis, namely an average 24-hour day

96
(according to the requirements of South African National Standard 10117), and a 12-
hour evening and night (18:00 to 06:00) period (required as part of the supplemental
noise analysis), the flight grouping will be discussed next.
3.5.1 24-hour flight operation data
Aircraft movement data was captured into a spreadsheet and sorted as described
above. Air traffic control records store the time of the flight according to Universal
Time (UT) which is two hours behind South African Standard Time (SAST). SANS
10117 prescribes a weighting of 10dBA for flights between 22:00 and 06:00 SAST
which is 20:00 and 04:00 UT. Care had to be taken to group all flights according to
the correct SAST they operated to ensure that the correct noise weighting would be
applied to the flight.
3.5.2 12-hour evening and night flight operation data
No weightings were applied to the flights operated in the evening and night period of
18:00 to 06:00 SAST. Nevertheless, similar to the 24-hour aircraft movement data, the
aircraft movement spreadsheet was carefully sorted to enable accurate selection of
those flights which took place between the required times of 18:00 and 06:00 SAST
(16:00 and 04:00 UT) which corresponded to the times on the survey form for which
respondents were required to provide information.
3.6 METEOROLOGICAL DATA
The INM requires average meteorological data to improve computational accuracy.
They are temperature, humidity, pressure and wind speed. The average meteorological
data for the study week were obtained from the airport’s meteorological office.
3.7 DATA CAPTURING AND DATA EDITING
Two separate data flows had to be collected. Firstly the survey was administered for
one week, and this data collected. Secondly, aircraft operational information for the
same week of the survey was collected, and noise contours for these flight operations
produced. A 24-hour LRdn contour representing flight operations of the survey week

97
was produced. This contour represents the SANS 10117 methodology. Further, the
following supplemental noise information was produced: a 12-hour contour
representing operations from 18:00 to 06:00, and N60, N70 and N80 contours.
The survey data was prepared following the example of Swift (1996). As the survey
contained closed questions, the respondents were forced to choose from one of a set of
options designed to measure the intensity or potency of a variable (Neuman 2006).
Numbers (codes) were assigned to the various answers on the questionnaire. Each
returned questionnaire form was numbered and filed. The numbering was important
for later location of the respondent’s residence. The 5-point (Likert-type) scale
questions were coded as were the questions where there was a simple yes/no answer.
Biographical information was also coded. The data was captured onto a spreadsheet
according to the codings.
In order to preserve the anonymity of the respondents, no information was requested
which could be used to directly identify the respondents. However, the respondents
were asked to indicate their street name, and nearest intersecting street. The numbered
questionnaires were used to match the location of the respondent on a GIS as
accurately as confidentiality would allow. The respondents’ survey form were used to
identify their suburb, street and nearest intersecting street in the GIS. An xy co-
ordinate point was created with the respondent’s survey attribute information
attached.
3.8 Aircraft operations data.
The flight records discussed in Section 3.5 were used by the writer to set up the INM
aircraft modelling computer software. Version 6.1 of the software was used and two
types of noise contour were produced. The INM was used to generate a 24-hour LRdn
contour and a 12-hour night LAeq contour. A grid file which was further input into the
TNIP software was used to generate 12-hour N60, N70 and N80 contours. The INM
noise contours and the TNIP contours were imported into the GIS.

98
3.8.1 Average energy contours: the Integrated Noise Model
Data was captured by the writer into the INM in a sequence which was grouped
according to aircraft type, then runway, followed by operation type (arrival or
departure), stage length (for departures, the distance of the flight), flight track, and
finally number of day and night flights.
Two noise contours were required representing two noise descriptors namely a 24-
hour LRdn and a 12-hour LAeq. In the INM, the menu item ‘setup metrics’ option was
used to create these metrics. The LRdn option was set up with a ‘day’ period and a
‘night’ period with a weighting of 10. The evening and night LAeq was set up as an
unweighted 12-hour LAeq metric.
The menu item ‘run’ was selected to instruct the software to calculate the noise
contours from the input data. Once the calculations had been performed, the menu
item ‘output graphics’ was selected and the required ESRI shape files generated.
3.8.2 Number of events contours: the Transparent Noise Information Package
The Transparent Noise Information Package (TNIP) is a computer application
developed by the Australian Department of Transport and Regional Services
(DOTARS). Its primary use is to enable the generation of aircraft noise information
descriptors such as flight path movements, number of events above a specified level,
and aircraft noise contours. It can also be used as a tool to ‘see inside’ noise
contouring studies, and it is this capability which is applied in the present study.
In order for TNIP to run, a grid file which is generated by INM from the input data
used to create the average energy contours must first be created. The grid file is then
processed in TNIP to produce the number of events contour files. These contour files
are then imported into the GIS for further analysis. To fulfil the aims of the study, the
writer produced a set of three number-of-events contours, based on the aircraft
operations data used to calculate the 12-hour evening and night LAeq contour. The
three sets of number-of-events were:
• Number of events above 60dBA
• Number of events above 70dBA

99
• Number of events above 80dBA.
3.9 DATA ANALYSIS
An electronic map depicting the roads and suburbs of the study area was imported
into a GIS. The address on each numbered survey form was located on the electronic
GIS map, and a point created with the survey number as the attribute. This was
followed by draping the five noise contours onto the map with the survey points.
Noise zones were created and the survey points in each noise zone identified and
classified. The GIS was queried and the survey locations falling into each of the noise
zones of the five scenarios identified. The following noise zones in each of the five
scenarios were used, namely
• For the average energy analysis
24-hour <55, 56 – 60, 61 – 65, 66 – 70 and 71 – 75 LRdn noise zones
• For the supplemental noise analysis:
12-hour night LAeq: <55, 56 – 60, 61 – 65, >66 LAeq noise zones
12-hour night N60: <10 events, 10 – 20 events, 21 – 50 events, >50 events
12-hour night N70: <10 events, 10 – 20 events, 21 – 50 events, >50 events
12-hour night N80: <10 events, 10 – 20 events, 21 – 50 events, >50 events
Using a commercial statistical computer programme (SAS), the data were transformed
to standard two-way tables for analysis.
3.9.1 Cross tabulations
Bivariate frequency distributions, or cross-tabulations, expressed in percentages rather
than response frequencies form the main vehicle for the graphs used in Chapters 4 and
5 for presenting and examining the relationship between noise zones and the survey
variables. The dependent variables are the survey responses being explained by the
author, and the independent variables are the noise zones used to explain the survey
responses. Two way tables were selected because they lend themselves to analysis of
the relationship between the numbers inside the table and the row and column labels.
Apart from these relationships, the numbers inside the table may exhibit an internal
structure which is a matter of fundamental interest (Mandel 1995).

100
The chi-square test was used to test whether there is a difference between two samples
of data expressed in frequency form. The control group and the suburb group were
treated as a random cross-section of the population at large and also as two random
samples for the purpose of the chi-square test. A large value of chi-square indicates
that there is a large amount of difference between the observed and the expected
frequencies (Ebdon 1977). The null hypothesis is that there is no difference between
the control group and the suburb group in terms of annoyance and interference (with
sleep, television viewing, telephone conversations and work or study) due to aircraft
noise. A significance level of 0.0001 was chosen.
Amalgamation of categories can be used to overcome the problem of low expected
frequencies (Ebdon 1977). In the case of the 12 hour average energy LAeq contour, the
noise zones above 66 LAeq were combined because of the small size of the area
delimited by the contours, and the low number of respondents in these zones.
3.10 SHORTCOMINGS AND SOURCES OF ERROR
To preserve the anonymity of the respondents, and therefore encourage frank
responses, their physical addresses were not requested. Respondents were asked to
indicate their street name and that of the nearest intersecting street. Since no suburban
block runs for more than about 220metres without an intersection, the accuracy of
respondent location is at this level. This means that respondents living close to a noise
zone line may or may not be included.
It was left up to the household members to decide who would complete the survey
form. Many factors could come into play in motivating respondents to participate, for
example assertiveness or taking on a positive mental attitude after balancing the noise
disturbance with the positive aspect of the airport being nearby (Hume et al. 2003) or
older members of the household being more inclined to answer than the younger
members.

101
Records of detailed radar flight tracks were not available. While aircraft are expected
to follow the published flight routes, there may be instances where they do not, which
consequently has an effect on the size and shape of the noise contours.
To conclude, this chapter has outlined how the observation component of this
dissertation was conducted. Although the criticism can be made that the data are only
a snapshot representing one week’s worth of airport operations, it is pointed out that
limiting the time frame facilitates better recall of noise events by respondents and
from which more reliable conclusions may be drawn. In the next chapter, the average
energy results are discussed.
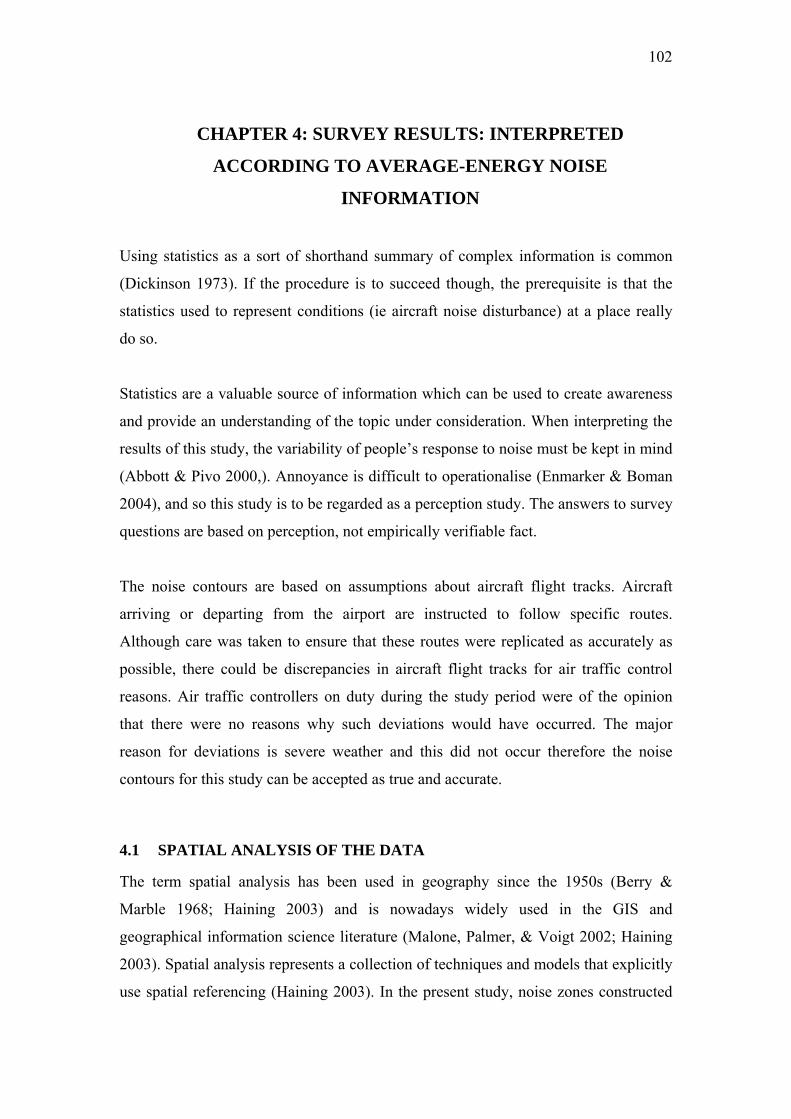
102
4 CHAPTER 4: SURVEY RESULTS: INTERPRETED
ACCORDING TO AVERAGE-ENERGY NOISE
INFORMATION
Using statistics as a sort of shorthand summary of complex information is common
(Dickinson 1973). If the procedure is to succeed though, the prerequisite is that the
statistics used to represent conditions (ie aircraft noise disturbance) at a place really
do so.
Statistics are a valuable source of information which can be used to create awareness
and provide an understanding of the topic under consideration. When interpreting the
results of this study, the variability of people’s response to noise must be kept in mind
(Abbott & Pivo 2000,). Annoyance is difficult to operationalise (Enmarker & Boman
2004), and so this study is to be regarded as a perception study. The answers to survey
questions are based on perception, not empirically verifiable fact.
The noise contours are based on assumptions about aircraft flight tracks. Aircraft
arriving or departing from the airport are instructed to follow specific routes.
Although care was taken to ensure that these routes were replicated as accurately as
possible, there could be discrepancies in aircraft flight tracks for air traffic control
reasons. Air traffic controllers on duty during the study period were of the opinion
that there were no reasons why such deviations would have occurred. The major
reason for deviations is severe weather and this did not occur therefore the noise
contours for this study can be accepted as true and accurate.
4.1 SPATIAL ANALYSIS OF THE DATA
The term spatial analysis has been used in geography since the 1950s (Berry &
Marble 1968; Haining 2003) and is nowadays widely used in the GIS and
geographical information science literature (Malone, Palmer, & Voigt 2002; Haining
2003). Spatial analysis represents a collection of techniques and models that explicitly
use spatial referencing (Haining 2003). In the present study, noise zones constructed

103
from individual noise points are associated with each survey point specified within the
system under study.
The purpose of the analysis initially is to describe the spatial variation in attribute
values across the study area. The next step is to explain the spatial pattern of variation
in terms of the attributes. Interesting features in the data are identified, including
detecting clusters or concentrations of high values, and the final step is to try and
explain why there are concentrations of high values (Haining 2003).
In describing and explaining the variation in perceptions of airport noise across the
noise zones the locations of respondents are treated as fixed. The survey responses are
regarded as one dataset. The urban area around the airport is partitioned into five
noise scenarios, each of which is subdivided into noise zones that have been defined
independently of the distribution of the survey response sites. These five noise
scenarios are regarded as five further datasets. The location of the five noise scenarios
are regarded as fixed, according to the calculation methodology. In actual fact, aircraft
noise exposure around the airport changes constantly as determined by aircraft
movements. The noise contours are therefore a snapshot representing the period in
time that they are based on.
Spatial data analysis can be considered a sub-field of the more general field of data
analysis. Haining (2003) believes that spatial data analysis has three main elements
which are used here. Firstly, it includes cartographic modelling. Each data set is
represented as a map, and map-based operations generate new maps. Overlaying
includes the generic logical operation .AND. which was used to identify areas on a
map which simultaneously satisfy a set of conditions on two or more variables. For
example the .AND. function was used to locate which of the respective noise zones
the respondents lived in.
Secondly, spatial analysis includes forms of mathematical modelling where model
outcomes are dependent on the form of spatial interaction between objects in the
model, or spatial relationships or the geographical positioning of objects within the
model. In this study, the land surface around the airport is divided into a grid. At each

104
point on the grid, the noise is calculated for each aircraft operation. Each answer is
added to a total, and the average noise level for each grid point is calculated.
Thirdly, spatial analysis includes the application of statistical techniques for the
analysis of spatial data and which make use of spatial referencing in the data.
Statistical graphics are a powerful system of visual communication of arrays of
figures. They have two primary functions: presentation and analysis. Whether
statistical charts are used for analysis or presentation, they serve as essential media for
communication (Schmid 1983). For this reason the correct choice of graphic form
should be selected. In judging the acceptability of a particular type of chart,
consideration should be given to the nature of the data the chart is to represent. In this
study, solid and subdivided column graphs are used.
The analysis of the results is broken down into a number of steps, proceeding from
overall impressions, to groups and then noise zones. The analysis of the survey results
will take place as follows:
• Firstly, the survey results will be interpreted overall in the first section of
Chapter 4
• Secondly the survey average noise levels will be dealt with in the second
section of Chapter 4.
• In Chapter 5, the survey results will be interpreted according to the
supplemental noise information. (evening and night average energy noise
contours, and number of events contours).
4.2 ASSESSMENT OF THE SURVEY
In this section an assessment of the survey data is presented.
4.2.1 Selection of valid questionnaires
Valid questionnaires were selected according to two criteria, namely
i) that the answer contained the name of the street where the respondent
resides and the nearest intersecting street, so as to be able to identify the LRdn
noise exposure zone, 12-hour evening and night LAeq noise exposure zone and
N60, N70 and N80 number of events zones that the respondent resides in. This

105
allowed geo-referencing of each respondent to be as precise as confidentiality
would allow (Haining 2003), and
ii) that the respondent’s age was 18 years or older, thus ensuring that
youngsters who may not treat the survey responsibly had not participated. No
questionnaires were rejected based on this criterion.
Table 4.1: provides a summary of the questionnaires sent out and responses received.
The only reason not to use a survey response form was if the address was bad. A total
of 880 survey forms were distributed and 329 valid responses returned meaning that
just over one third of survey forms which were distributed were eventually used.
Table 4.1: Final response summary of the questionnaire survey of aircraft noise
disturbance around OR Tambo International Airport.
Number Percentage
No usable response
obtained by
reason of bad address
14 1.6
No answer 537 61.02
Valid responses 329 37.4
Total 880 100.0
4.2.2 Questionnaires distributed and returned
Figure 4.1 illustrates the number of survey forms distributed and usable
questionnaires received from each of the three groups. The highest number of returns
came from the suburb group followed by the township group then the control group.

106
800
0
100
200
300
400
500
Control Suburb Township
Group
Num
ber o
f que
stio
nnai
res 600
700
DistributedReturned
Figure 4.1: Number of questionnaires distributed and returned
ber of questionnaires and percentage of questionnaires returned
spectively are compared. The control group returned 62% of the survey forms, the
type of survey was conducted. The completion of the questionnaires was
ssisted by interviewers who communicated with respondents in their home
lan g
and po e usually low unless
In Figure 4.2 the num
re
suburb group 30.9%, and the township group 82.5%. The overall response rate of
37.4% was considered good. The township response is exceptionally high because
another
a
gua es. Sheskin (1985) and Schofield (1996) report that the response rates of drop
st-back surveys as used in the control and suburb groups ar
the respondent’s interests are engaged and/or or the investigation is perceived to be of
value to the respondent.

107
0
10
20
30% re
t
40urns
50
90
Control Suburb Township Total
Group
by
g
60
70
80ro
up
urned per sub-group, and the total
materials were bilingual (English and Afrikaans) thereby giving
elope was included for returning the
questionnaire, thereby reducing cost and inconvenience to a respondent,
which will be discussed later, so the gender
Figure 4.2 Percentage of questionnaires ret
percentage returned.
The acceptably high response rates of the suburb and control group subjects can be
ascribed to the following suggestions adopted from Jenkins (1999) and Thomas
(1999):
• All the survey
the respondents a choice of language in which to respond,
• An addressed and stamped env
• A reminder in English and Afrikaans was dropped off at each sampled house
at the end of the survey week,
• The time taken to complete the survey was quite short and an overload of
information was not requested.
4.2.3 Gender
Respondent gender is not a condition for questionnaire acceptability. However,
gender is an explanatory variable

108
breakdown is given in Table 4.2. There were 13 responses without gender indicated.
nsus
The gender proportion of respondents to census data is well correlated.
Table 4.2: Gender summary
Gender Survey Ce
Number Percentage Percentage
Male 161 50.9 50.7
Female 155 49.1 49.3
Total 316 100 100
4.3 REPORTED ANNOYANCE LEVELS
high levels of annoyance to aircraft noise during the week of
al group reported a much greater level of annoyance (32.8%)
aircraft noise than the control group (3.2%). This result creates an initial impression
that evening and night-time aircraft noise is a problem.
Respondents reporting
16 to 22 October 2004 between 18:00 and 06:00 are shown in Figure 4.3 where it is
clear that the experiment
to
30
35
25
ed
0
5
10
15
20
Control Experiment
Sub-group
% h
ighl
y an
noy
Figure 4.3: Control group and experiment group reporting being highly annoyed due
t
the people who never hear
o aircraft noise between 18:00 and 06:00.
It is important to also evaluate how often people hear aircraft noise as opposed to their
degree of annoyance with noise. If the results had shown

109
aircraft noise were highly annoyed, they would have been suspect. However, this was
not the case. Figure 4.4 illustrates a clear link between the frequency aircraft noise is
heard, and the degree of annoyance. Of respondents who heard aircraft noise very
often, 58.6% reported being highly annoyed. Expectedly, 71.4% of residents who
never hear aircraft noise reported not being annoyed and the remainder were only
slightly or moderately annoyed. More than 90% of the respondents who seldom hear
the aircraft are not annoyed at all.
As the frequency with which aircraft noise is heard increases, so the degree of
annoyance increases. Considerable and high annoyance only occurs when noise is
heard very often. Interestingly, respondents who seldom hear aircraft noise report
being less annoyed than respondents who never hear aircraft noise.
This overall picture of noise frequency and respondent annoyance calls for
disaggregation by sub-group, namely control, suburb and township in order to expose
any inherent differences and similarities.
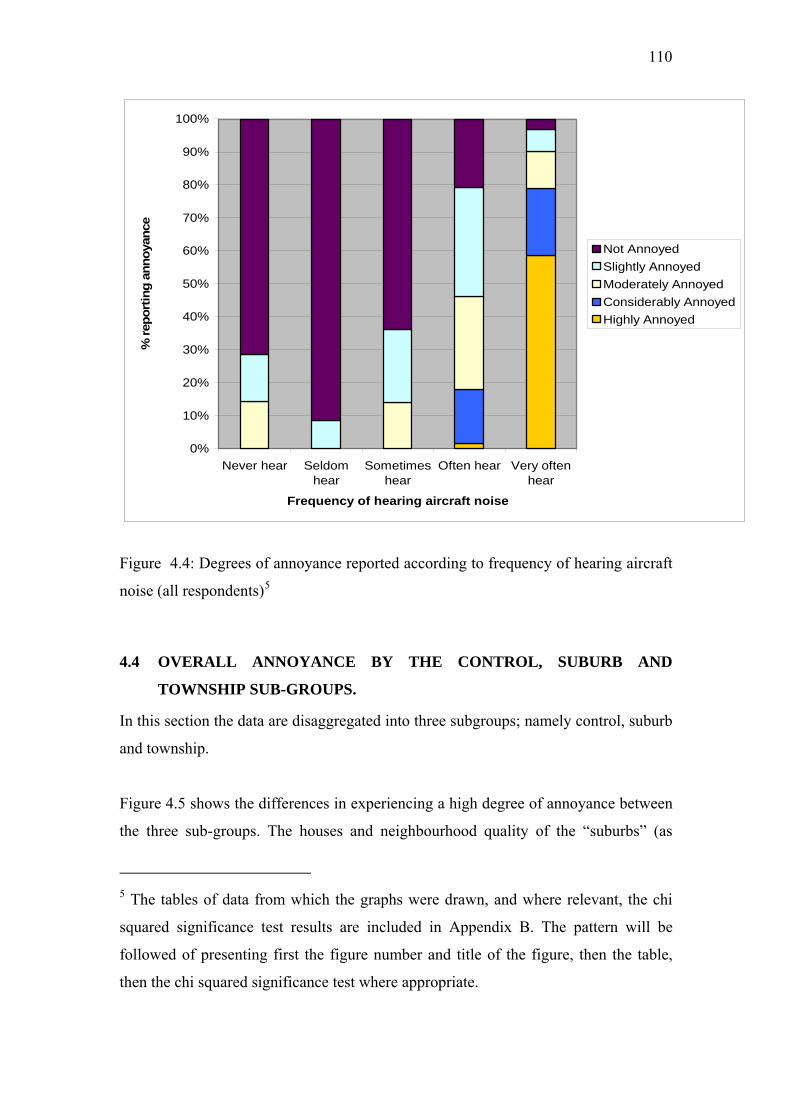
110
0%
10%
20%
30%
40%
50%
60%
70%
80%
90%
100%
Never hear Seldomhear hear
Sometimes Often hear Very oftenhear
Frequency of hearing aircraft noise
% re
port
ing
anno
yanc
e
Not AnnoyedSlightly Annoyed Moderately AnnoyedConsiderably AnnoyedHighly Annoyed
Figure 4.4: Degrees of annoyance reported according to frequency of hearing aircraft
noise (all respondents)5
4.4 OVERALL ANNOYANCE BY THE CONTROL, SUBURB AND
TOWNSHIP SUB-GROUPS.
In this section the data are disaggregated into three subgroups; namely control, suburb
and township.
Figure 4.5 shows the differences in experiencing a high degree of annoyance between
the three sub-groups. The houses and neighbourhood quality of the “suburbs” (as
ropriate.
5 The tables of data from which the graphs were drawn, and where relevant, the chi
squared significance test results are included in Appendix B. The pattern will be
followed of presenting first the figure number and title of the figure, then the table,
then the chi squared significance test where app
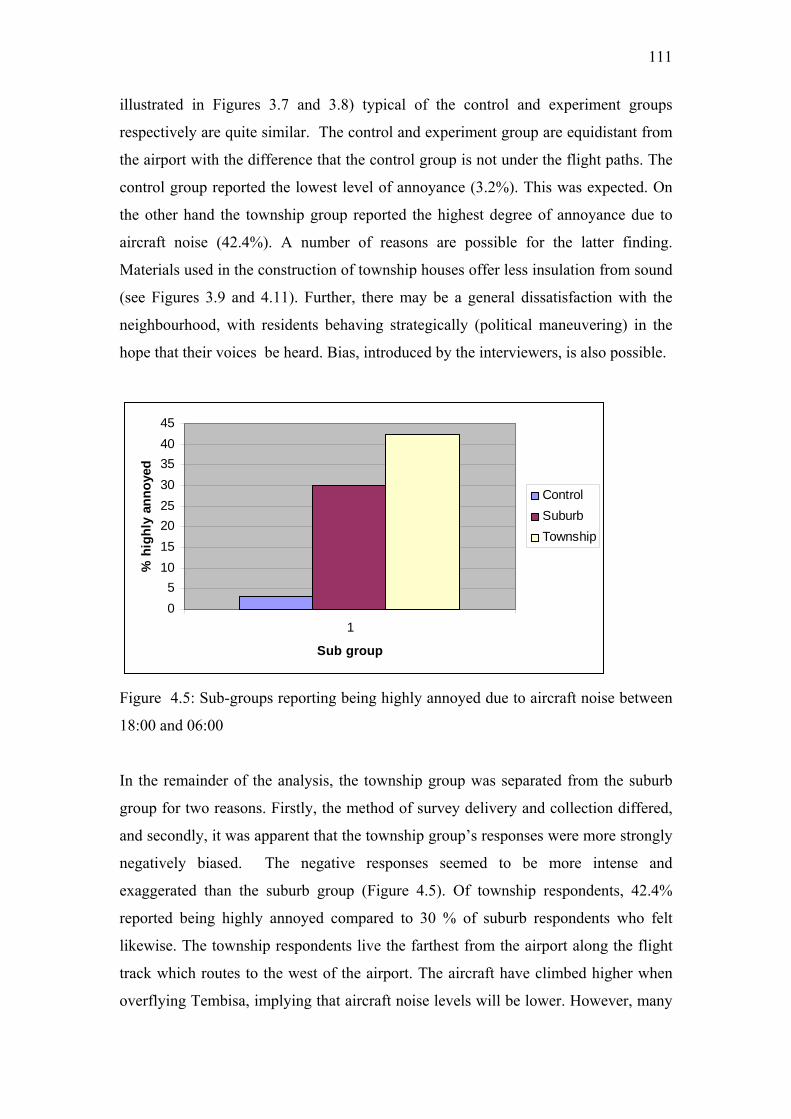
111
illustrated in Figures 3.7 and 3.8) typical of the control and experiment groups
respectively are quite similar. The control and experiment group are equidistant from
the airport with the difference that the control group is not under the flight paths. The
control group reported the lowest level of annoyance (3.2%). This was expected. On
the other hand the township group reported the highest degree of annoyance due to
ircraft noise (42.4%). A number of reasons are possible for the latter finding.
). Further, there may be a general dissatisfaction with the
residents behaving strategically (political maneuvering) in the
a
Materials used in the construction of township houses offer less insulation from sound
(see Figures 3.9 and 4.11
neighbourhood, with
hope that their voices be heard. Bias, introduced by the interviewers, is also possible.
05
1015202530354045
% h
ighl
y an
noye
d
ControlSuburbTownship
1
Sub group
Figure 4.5: Sub-groups reporting being highly annoyed due to aircraft noise between
18:00 and 06:00
In the remainder of the analysis, the township group was separated from the suburb
group for two reasons. Firstly, the method of survey delivery and collection differed,
nd secondly, it was apparent that the township group’s responses were more strongly
%
airport. The aircraft have climbed higher when
verflying Tembisa, implying that aircraft noise levels will be lower. However, many
a
negatively biased. The negative responses seemed to be more intense and
exaggerated than the suburb group (Figure 4.5). Of township respondents, 42.4
reported being highly annoyed compared to 30 % of suburb respondents who felt
likewise. The township respondents live the farthest from the airport along the flight
track which routes to the west of the
o

112
of the houses are also constructed of materials which do not provide much acoustic
insulation against noise as is clearly evident in Figure 4.6.
igure 4.6: Houses in Tembisa with little acoustic attenuation
preventing noise from penetrating inside. It is assumed that residents would have been
ced by the survey collectors. The method of collection of
urvey data in the township group differed from the method of delivery of the suburb
roup. Although the assistants were instructed to be careful about injecting their own
– they subsequently gave assurances that they adhered to this
he township group’s responses are important as Tembisa lies outside the noise
contour usually considered as the limit for residential land-use planning (55LRdn).
F
Houses in the suburbs tend to be constructed from brick and mortar which are better at
inside their houses when the survey was completed – four of the activities investigated
reporting interference (sleep, television viewing, telephone conversations and work or
study) would take place indoors. Some township houses are brick and mortar whilst
others are made from whatever convenient materials are available. This may explain
why township residents report more annoyance from noise. It is also possible that a
bias may have been introdu
s
g
opinions into answers
requirement – it is not possible to establish whether the responses are unbiased.
T
113
Consequently the responses of the township group will be included in the following
discussions, but will be considered separately.
The variation in response between the township group and the suburb group is
difficult to account for. Several studies have investigated the relationship between
level of impact and degree of annoyance, but they have not been able to establish a
close relationship between them on an individual level (Voogd 2000). This difference
in response could be the subject of a future investigation.
The degree of annoyance experienced by the three sub-groups is graphically
illustrated in Figure 4.7.
0%
10%
20%
30%
40%
50%
60%
70%
80%
90%
100%
Control Suburb Township
Sub-group
% re
port
ing
anno
yanc
e
Not annoyedSlightly annoyedModerately annoyedConsiderably annoyedHighly annoyed
Figure 4.7: Degree of annoyance caused by aircraft noise between 18:00 and 06:00
according to respondents in the three sub-groups.
Of the control group, 83.9% reported not being annoyed at all – a result that was
expected. It is, however, noteworthy that only 6.1% of township respondents reported
no annoyance at all. This is an unexpected result because these residents lie outside of
the 55LRdn contour which is presented in the recommendation for land-use planning in
Table 2 of the Standards South Africa document SANS 10103: 2003. Significantly,

114
27.8% of the suburb residents – they live under the flight paths – reported not being
annoyed at all.
In the case of the control group who are located near the airport, but not directly under
any of the flight paths, a few (3.2%) reported being highly annoyed by aircraft noise.
The aircraft noise these residents hear is probably caused by aircraft engines being
tested late at night after maintenance. Less than one third of the suburb group which
was located in the vicinity of flight paths, reported being highly annoyed by aircraft
noise. The township group reported that 42% of the respondents were highly annoyed
by aircraft noise.
If the township group is compared to the control group, then it may be considered odd
that they report such high levels of annoyance whilst they are outside of the 55LRdn
contour. On the other hand, the flight paths do lie in the vicinity of the township
residents and it is probably the noise from the single events of flights using these
tracks which causes the disturbance.
.5 OVERALL ANNOYANCE ACCORDING TO GENDER
males and 25.5% of males reported no annoyance.
Table 4.3: Degrees of aircraft noise annoyance experienced by men and women
respondents.
Highly
annoyed
Considerably
annoyed
Moderately
annoyed
Slightly
annoyed
Not
annoyed
4
It was not expected that there would be a difference in annoyance levels between
males and females. In Table 4.3 and Figure 4.8, the gender based reply to respondents
being asked to describe their feelings about aircraft noise is given. Slightly more
males (32.3%) than females (27.1%) reported being highly annoyed. Conversely,
32.9% of fe
Female 27.1 12.3 14.8 12.9 32.9
Male 32.3 14.9 11.8 15.5 25.5
Total 59.4 27.2 26.6 28.4 58.4

115
0%
10%
20%
30%
40%
50%
60%
70%
80%
90%
100%
Female Male
Gender
% re
port
ing
anno
yanc
e
Not annoyedSlightly annoyedModerately annoyedConsiderbly annoyedHighly annoyed
Figure 4.8: Female and male distribution of noise annoyance
.6 AIRCRAFT NOISE INTERFERENCE WITH HOUSEHOLD
ACTIVITIES
of mind, four
4
In addition to the analysis of annoyance, which is a general state
activities which take place at home were identified for analysis to see whether aircraft
noise interferes with them. They were sleep, television viewing, telephone
conversations, and work or study (the latter two were combined in the survey form).
This section reports on the interference of aircraft noise on these activities as reported
by the survey respondents.

116
0
10
20
30
40
50
60%
repo
rtin
g in
terf
eren
ce o
ccur
ring
very
of
ten
Sleep TV Phone Work
Activity interfered with
ControlSuburbTownship
Figure 4.9: Percentage of responses about home activities being interfered with very
the township, whilst suburb residents reported
levision viewing as being the most interfered with.
s difficult
often by aircraft noise.
About 6% of the control group reported that aircraft noise interferes with sleep
(Figure 4.9) whereas no control group respondents reported that there was
interference with their television watching, telephone conversations or work/study
activities very often. Township residents reported the highest percentages of
interference with sleep, television watching, telephone conversations and work/study.
This is a significant finding as the township residents live outside the land-use
planning contour where interference levels would be expected to be low. Telephone
conversations were most interfered in
te
These findings confirm that the level of annoyance according to noise only i
to explain. Wagner (2000) reports that two thirds of the individual variance in the
reaction to noise is dependent on individual traits and the surrounding environment.
He gives an example of how in visually attractive streets residents feel less annoyed
than in visually unpleasant streets with the same level of noise. Wallenius (2004)

117
reports that physiological effects and health complaints are more closely related to
subjective reactions to noise than to the noise itself.
Figure 4.10: A typical street scene in a suburb group
A typical street in the suburb group is illustrated in Figure 4.10 and a township street
in Figure 4.11. Wagner’s (2000) assertion that the visual attractiveness of the
surrounding environment can have a bearing on aircraft noise perception can be
understood when these two streets are compared. The peace and tranquillity suggested
by the green leafy suburb is in stark contrast to the bleak barrenness of the township.

118
Figure 4.11 A typical street in Tembisa
4.7 AIRCRAFT NOISE AS A MOTIVE FOR MOVING AWAY
If the frequency of aircraft noise heard by residents is perceived to be too often, and
annoyance by the noise becomes unbearable and/or their activities at home are
interfered with too much by noise, one option for residents to consider is to move
away from the area. Residents were asked to respond whether they would consider
moving away because of such disturbances. The results are shown in Figure 4.12.

119
0%
10%
20%
30%
40%
50%
Never
Seldom
Someti
mesOfte
n
Very of
ten
How often aircraft noise is heard
% w
ho w
oul
60%d
70%
80%
d co
nsi
er m
o90%
100%
ving
NoYes
Figure 4.12: Frequency of hearing aircraft noise and desire to move away
s expected, the residents who responded that they never heard aircraft noise would
ot move while those residents who heard aircraft noise very often (55.4%) indicated
er moving away (Figure 4.12). This could have implications for
ts would have to sell their properties in order to raise capital to purchase
new property away from the noise, then more houses would come onto the market.
greater than
at of houses in lower-value neighbourhoods. In another study McMillen (2004)
und that home values within a 65dB noise contour band around Chicago’s O’Hare
airport were valued about 9% lower than similar homes outside this contour. The
values of houses around
A
n
that they would consid
property values. If residents who are owners choose to move away, and assuming that
these residen
a
An increase in housing supply may result in a reduction of house prices in the area.
This was demonstrated by the FAA in a study conducted to assess the reduction in
property values of houses near airports (Federal Aviation Administration 1994). The
study concluded that aircraft noise reduced property values, and also pointed out that
the noise impact on prices of houses in higher-value neighbourhoods is
th
fo
results of these two studies would indicate that property
ORTIA would probably indicate a similar trend.

120
4.8 INTERPRETING SURVEY RESULTS BY AVERAGE ENERGY LRdn
NOISE ZONES
In this section, the survey results are interpreted according to LRdn noise contours. The
calculation method used to produce the LRdn noise contour (Figure 4.13) was done as
prescribed in the SANS 10117 document. LRdn contours are usually calculated for a
timespan which may be as long as one year. In this study a period of one week was
used because the survey investigated respondents’ annoyance and irritation over a
hort period during which they would still have an accurate recall of the noise from
Interpreting the township response by LRdn noise contour zones
e of the township group will be dealt with first, followed by the suburb
Rdn
s
aircraft. The survey therefore had a time-critical element to it, as the responses to the
noise had to be linked to the flights at that time. The resulting noise contours must
therefore be regarded as surrogates of LRdn noise contours which average noise over a
longer period, for example one year.
4.8.1
The respons
group. This section considers the degree of reported annoyance to aircraft noise as it
varies according to LRdn zone. Borrowing a concept from GIS, this section may be
seen as an attempt to ‘ground-truth’ the survey results at a local level (Brown 1999)
by checking them against international experience. With the exception of two
respondents in the township group, all of the Tembisa residents live outside the
55LRdn contour (Figure 4.13). Of the township respondents living outside the 55LRdn
zone, 42.2% reported being highly annoyed while only 4.7% reported not being
annoyed (Figure 4.14). The results of the 55-60 L are meaningless as there were
only 2 respondents (Figure 4.14).

121
Source: Compiled by author
Figure 4.13: LRdn contour for the week of the survey

122
0%10%20%30%
<55 55-60
LRdn noise zone
% re
p
40%50%g
a
60%70%
ortin
nnoy
an
80%90%
100%ce
Not annoyedSlightly annoyedModerately annoyedConsiderably annoyedHighly annoyed
Figure 4.14: Level of annoyance experienced by township residents according to LRdn
noise zones.
4.8.2 Interpreting the suburb response by LRdn noise contour zones
The suburb residents’ responses show a link between increasing annoyance, and LRdn
noise zones zone (Figure 4.15). The ‘less than 55LRdn noise zone’ has the lowest
percentage (9.8%) of residents reporting being highly annoyed and the highest
percentage (65.6%) reporting being not annoyed. The ‘70-75LRdn noise zone’ has the
highest percentage (77.8%) of residents reporting being highly annoyed while there
ere no residents (0%) reporting being not annoyed. It is interesting to note that the w
‘highly annoyed’ response does not increase consistently in the 66-70LRdn noise zone.
This may be because of the relatively low response in this zone (25 respondents). If
the ‘considerably annoyed’ and ‘highly annoyed’ responses are read together, then the
increase in annoyance is consistent with an increase in noise zone.

123
100%
0%
20%
40%
60%
80%
<55
% re
port
ing
anno
yanc
e
Not annoyedSlightly annoyedModerately annoyedConsiderably annoyedHighly annoyed
55-60 61-65 66-70 70-75
LRdn noise zone
Figure 4.15: Level of annoyance experienced by suburb residents according to LRdn
noise zones
When comparing the results of the township and suburb ‘less than 55 LRdn’ noise zone
ting being ‘highly annoyed’ equate to
42.2% while the suburb result is just 9.8%. Only 4.7% of township residents reported
no annoyance compared with 65.6% of the suburb residents. In general, the township
respondents appear to be more disturbed by noise than suburb residents.
4.9 SUMMARY OF AVERAGE ENERGY RESULTS
Aircraft noise is a problem for neighbourhoods around the airport. The data presented
in Figure 4.3 confirms this by clearly indicating that within the experiment group,
33% of respondents who live under or near a flight path are highly annoyed by aircraft
responses, the township respondents repor

124
noise when compared with the control group where 3% of respondents who live a
similar distance from the airport but not near a flight path are highly annoyed. When
the experiment group is further separated into the suburb and township groups, a
difference in people reporting being highly annoyed emerges. Of the township group
42% were highly annoyed whilst 30% of the suburb group reported being highly
annoyed. This is an important finding since the township group are located further
from the airport where noise levels are lower (Figure 4.13) and their response was
expected to be less annoyed.
In analysing the interference with normal household activities (Figure 4.9) including
sleep, television viewing, telephone conversations and work (with the exception of the
suburb group reporting on work interference), all of these activities were reported as
being interfered with very often by over 22% of respondents. The township group
once again reported greater interference with each of these activities than the suburb
group.
Average energy noise levels (LRdn )are prescribed by South African national standards
for use in land use planning around airports with the aim of separating residential
areas from areas exposed to aircraft noise. Quite clearly, from Figure 4.13 this has not
been achieved. Residential areas are located in aircraft noise zones up to 20 dB higher
than they should be and the consequence is that citizens living in the vicinity of the
airport flight paths have a problem with noise. It is also clear that as the average noise
levels increase within the noise zones, there is a general trend in increasing annoyance
(Figure 4.15) where in the 70-75 LRdn zone almost 80% of respondents are highly
annoyed.
The foregoing discussion confirms the specific objective (3rd bullet) namely:
• Establish that communities experience annoyance from aircraft noise even
when they are located outside 55 LRdn aircraft noise contours.
dtruthing, the next chapter
onsiders the results in terms of supplemental aircraft noise information.
These results are illuminating, and in line with groun
c

125
5 CHAPTER 5: SURVEY RESULTS: INTERPRETED
ACCORDING TO SUPPLEMENTAL NOISE INFORMATION
any studies have been done to assess the annoyance and disturbance caused by
ur periods,
hereas the present survey required respondents to answer questions about noise
experienced over a 12-hour period between 18:00 and 06:00.
At a first glance, when compared with Schultz’s findings, the survey responses in this
study seem to be more acute. In other words, the average response in the ORTIA
study seems to reflect that residents living around the airport are more sensitive to
noise, however, the survey did cover a time period when respondents are more likely
to be disturbed.
The problem of sleep disturbance by aircraft in Holland led to an investigation by
Wijnen & Visser (2003) designed to optimise flight trajectories to minimise sleep
disturbance. The goal of their research was to integrate the Integrated Noise Model
and a GIS to develop flight paths which would deviate laterally from the reference
flight track if this lessened the noise impact by reducing the population numbers
affected by aircraft noise. A further noise mitigation step would be to incorporate
supplemental noise information into that which town planners and residents have
available and to assist them with making decisions about locating near airports.
urvey results are interpreted according to the required
ental aircraft noise descriptors.
M
aircraft noise when the noise is averaged over a 24-hour period. The most seminal
work is that of Schultz (1978) in which he synthesised the results of 11 ‘clustering
surveys’, conducted to assess the magnitude of transportation noise problems. Schultz
found that a relationship could be established between increasing noise levels and
annoyance.
The survey respondents in this study generally reported more annoyance than found
by Schultz. However, the surveys reviewed by Schultz all covered 24-ho
w
In this chapter the s
supplem

126
More recently, Hume et.al (2003) have shown that when analysed over a 24 hour
period, night flights caused an average of 5 times more complaints than the rest of the
day, with the time of greatest propensity to complain being 01h00 and 02h00. This
will be shown in the following graphs and the reason why explained.
5.1 EVALUATION OF SURVEY RESPONSES ACCORDING TO THE 12-
HOUR LAeq EVENING & NIGHT NOISE CONTOUR
R average noise
the LRdn contours
annot be used, since they are 24-hour average contours. The purpose of this section
ople’s responses are based on the 12-hour LAeq noise contour
is expected that most residents are at home in the 12-hour evening and night period
om 18:00 to 06:00. Supplemental noise information was therefore calculated, and
example of supplem ation to be analysed is the average aircraft noise
level to which residents are exposed when they are at home. For the purpose of this
ords for the study period were accessed, and all aircraft
The L dn noise contours discussed in the previous chapter modelled the
exposure over a 24 hour period. This is unrealistic because residents are not at home
for a large proportion of the 24 hour period. For example work commitments and
education require many people to leave home in the morning and return much later in
the day. It seems more meaningful to match residents’ feelings about aircraft noise to
those times when they are likely to be at home. This means that
c
is to analyse what pe
zone which they live in.
It
fr
used to provide noise information about the times when people are at home. The first
ental noise inform
study, it was assumed that residents are at home between 18:00 and 06:00.
The aircraft movement rec
operations at the airport between 18:00 and 06:00 extracted. These movements were
then pre-processed as described previously, and then captured into the INM. A 12-
hour LAeq noise simulation run was conducted and a series of noise contours at 5dB
intervals from 55LAeq to 65LAeq produced. A 70LAeq noise contour was also produced,
but this contour was almost entirely on the airport property and therefore discarded as
it did not impact on residential areas. The noise contours were exported as shape files,
then imported into the GIS. The spatial extent of the 12 hour LAeq noise contour was

127
such that it did not extend as far as Tembisa. The analysis in this section will therefore
focus on the suburb respondents.
Four LAeq noise zones were produced: <55, 55-60, 61-65 and >65. The residents’
sponses according to the 12-hour night LAeq contour were statistically extracted
e zone they were located in. It is emphasised that the survey
ccording to a 12-hour evening and night average that changes. In Figure
.1 the 12 hour night LAeq noise contours are plotted. During the 12-hour evening and
ents as
opposed to an average of 497 daily movements in the 24 hour period. Although the
ith increasing noise level zone, except in
were only 21 respondents in this zone. If the
o highest levels of annoyance are combined, the direct relationship is more
consistent. Two thirds of the respondents in both the 55-60LAeq noise zone and in the
r highly annoyed.
re
according to the nois
responses remain the same. It is just the noise zone that the residents live in,
calculated a
5
night period from 18:00 to 06:00, there were an average of 124 aircraft movem
evening and night noise was averaged over a 12-hour period, the reduced number of
aircraft movements (373 fewer movements) and the fact that no weighting was
applied to the 12-hour evening and night LAeq contour calculation, the spatial extent of
the evening and night noise contour (Figure 5.1) is smaller than the 24 hour LRdn
contour (Figure 4.13).
The degree of annoyance increases directly w
the 61-65 LAeq noise zone where there is a decrease in the highly annoyed responses
(Figure 5.2). This could be because there
tw
61-65LAeq noise zone were considerably o

128
Source: Compiled by author
.1: 12-hour night LFigure 5 Aeq noise contours at ORTIA

129
0%
20%
40%
60%
80%
100%%
repo
rtin
g an
noya
nce
<55 55-60 61-65 >65
12-hour LAeq noise zone
Not annoyedSlightly annoyedModerately annoyedConsiderably annoyedHighly annoyed
Figure 5.2: Level of reported annoyance experienced by suburb residents according
Aeq noise zones
oderately annoyed responses are added to the considerably and highly
nnoyed responses, the annoyance response correlates highly with the increasing
Aeq noise zone, the combined moderately to highly
all the respondents in this zone were annoyed by
hich noise complaints for each hour of the day were matched with aircraft
ovements (Figure 5.3). It is evident that the most complaints per 1000 movements
were received between 23:00 and 05:59 which are normal sleeping hours.
to 12-hour L
If the m
a
noise zone level. In the >65L
annoyed responses indicate that
aircraft noise at night. This result can be viewed against the findings of Hume et al.
(2003) in w
m

130
Source: Hume et al. 2003:158
Figure 5.3: Specific noise complaints (per 1000 movements) for each hour of the day
t Manchester Airport
5.1.1
a
Because complaints are actions which arise out of annoyance, this casts further light
on the results in Figure 5.2. Annoyance finds expression in complaints particularly at
night in the early stages of sleep when there is a predominance of slow-wave sleep
with the highest sleep arousal threshold. Residents whose sleep is disturbed
experience greater levels of distress which contributes to increased annoyance leading
to a greater level of complaints (Hume et al 2003).
Comparison between suburb 24 hour LRdn and 12 hour LAeq
In Figure 5.4 the annoyance level responses are displayed according to the LRdn and
LAeq noise contours. The combined considerably and highly annoyed responses reveal
a trend for annoyance to increasing with noise level. Also evident is that, with the
exception of the 61-65LAeq noise zone, the annoyance responses for the 12-hour LAeq
noise contours are more intense than the 24-hour LRdn noise zones.

131
20%
40%
60%
80%
100%%
repo
rtin
g an
noya
nce
Not annoyedSlightly annoyedModerately annoyedConsiderably annoyedHighly annoyed
0%
LRdn <55
LAeq <55
LRdn 55-60
LAeq 55-60
LRdn 61-65
LAeq 61-65
LRdn 66-70
LAeq 66-70
LRdn 70-75
LAeq 70-75
Noise zone LRdn / LAeq
Figure 5.4: Level of annoyance experienced by suburb residents according to 12-hour
leep disturbance is an important consequence of night-time aircraft noise (Figure
5.5). The percentage of respondents reporting their sleep never being disturbed by
aircraft noise is highest in the <55LAeq noise zone, whereas at the level of >65LAeq, no
respondents reported never being disturbed. This confirms the expectation that as
noise increases, so residents will experi
m the
LAeq and 24 hour LRdn noise zones
5.1.2 Noise interference with household activities: Sleep, Phone, TV,
Work/study
In this section aircraft noise interference with four household activities; namely sleep,
telephone conversations, television viewing and work or study is discussed.
5.1.2.1 Sleep disturbance
S
ence more sleep disturbance. The proportion
of residents reporting their sleep being disturbed very often, increases fro

132
<55LAeq noise zone (12%) to the >65LAeq noise zone (50%) with the exception of the
61-65LAeq noise zone (25%). Approximately 35% of the respondents in the 55-
60LAeq noise zone report having their sleep disturbed very often. This is a significant
finding. If this supplemental aircraft noise information were to be made available to
residents, those individuals who believe that their sleep may be disturbed may elect
not to live in the noise zones where sleep disturbance has been reported.
40banc
e 50
60
Never
0
10
20
30
<55 55-60 61-65 >65
LAeq noise zone
% re
port
ing
dist
ur
SeldomSometimesOftenVery often
igure 5.5: Frequency of sleep disturbance in the suburb group per 12-hour night
LAeq noise zone
about 63%
f respondents still experience some disturbance of telephone conversations in the
F
5.1.2.2 Telephone conversation disturbance
Frequency of interference with telephone conversations is illustrated in Figure 5.6.
More than 60% of respondents in the >65LAeq noise zone report being disturbed very
often. On the other hand about 37% of respondents in the <55LAeq noise zone report
that their conversations are never disturbed. However, this also means that
o
latter zone where the noise level is the lowest.

133
0
10
20
30
40
50
60
70
<55 55-60 61-65 >66
Noise zone
% v
ery
ofte
n di
stur
bed Never
SeldomSometimesOftenVery often
Figure 5.6: Frequency of interference with telephone conversations among the suburb
group per 12-hour night LAeq noise zone
.1.2.3 Television viewing disturbance
Approximately 30% of residents in the <55LAeq noise zone reported that television
viewing is never disturbed by aircraft noise (Figure 5.7) while 70% did report some
disturbance. In each of the noisier zones more than half of the respondents reported
their television viewing being disturbed very often. No respondents in the 61-65LAeq
and >65LAeq noise zones reported that they are never, or even seldom disturbed.
5
0
10
20
30
40
50
60
70
80
<55 55-60 61-65 >66
Noise zone
% v
ery
ofte
n di
stur
bed
NeverSeldomSometimesOftenVery often
Figure 5.7: Frequency of interference with television viewing among the suburb
group per 12-hour night LAeq noise zone

134
5.1.2.4 Work or study disturbance
The work or study variable shows a clear relationship between increasing noise level
and reported disturbance (Figure 5.8). As the noise zone increases, the percentage of
respondents reporting that they are never disturbed decreases from 45% in the <55
LAeq noise zone, to less than 10% in the >66 LAeq noise zone.
There is also a clear increase in the percentage of respondents reporting being
disturbed very often. Approximately 5% of respondents are disturbed very often in the
<55 LAeq noise zone and 50% are disturbed very often in the >66 LAeq noise zone.
0
10
20
30
40
50
60
<55 55-60 61-65 >66
Noise zone
% v
ery
ofte
n di
stur
bed
NeverSeldomSometimesOftenVery often
Figure 5.8: Frequency of interference with work or study among the suburb group per
12-hour night LAeq noise zone
It was stated in the research objectives that it would be established that communities
living outside the 55 LRdn aircraft noise contour line experience annoyance from
aircraft noise. From the preceding graphs it is apparent that up to 20% of respondents
living outside of this noise zone are often or very often disturbed thus confirming this
particular stated research objective.

135
5.1.3 Comparison of responses by LAeq noise zones and by household activities
interfered with
Following Riley’s (1990) example of progressive focusing where data are examined
in different ways, the data were redrawn to illustrate and compare the activity
disturbance between the LAeq noise zones with one another (Figure 5.9) and the LAeq
noise zones with the activities (Figure 5.10).
5.1.3.1 Comparison by noise zone of respondents reporting being disturbed very
often: sleep, telephone conversations, television viewing and work or study
In Figure 5.9, each of the four activities investigated are grouped by noise zone
according to the ‘very often’ response. Below 55LAeq, reported disturbance across the
four activities varies between five and 13 percent. The noise level is not very loud
here and this result is expected. As the noise zone level increases, there is an increase
in the frequency of reported disturbance of the activities. Television viewing
disturbance shows the greatest increase as the noise levels increase across the noise
zones. Reported television viewing disturbance is also the highest in each noise zone
when compared with sleep, telephone conversations and work or study. With the
exception of the <55 LAeq noise zone, telephone conversations are reported to have
the second highest level of disturbance. Sleep disturbance does not follow a consistent
pattern of increase with increasing noise zone. There is a decrease in reported
disturbance in the 61-65LAeq noise zone and an increase in the >65LAeq noise zone
again.

136
0
10
20
30
40
50
60
70
80
<55LAeq 55-60LAeq
61-65LAeq
>65LAeq
LAeq noise zone
% d
istu
rbed
ver
y of
ten
Sleep disturbed
Telephoneconversations disturbedTelevision viewingdisturbedWork or study disturbed
Figure 5.9: Disturbance of household activities by aircraft noise according to LAeq
noise zone
5.1.3.2 Comparison by activity disturbed of respondents reporting being disturbed
very often: sleep, telephone conversations, television viewing and work or
study
In Figure 5.10, responses are grouped by activity to permit a comparison across noise
zones. The activities generally show an increase in disturbance across noise zones
with two exceptions. In the sleep disturbance grouping the 61-65LAeq noise zone
breaks the pattern with a decrease, and in the television viewing grouping the >65LAeq
noise zone disturbance is slightly lower than the 61-65LAeq noise zone. Television
viewing is clearly reported as being the most disturbed.

137
0102030405060
Sleep disturbed Telephoneconversations
disturbed
Televisionviewing
disturbed
Work or studydisturbed
Activity
% d
istu
rbed
ver
y of
70ten
80
<55LAeq55-60LAeq61-65LAeq>65LAeq
Figure 5.10: Noise zone disturbance according to household activities
5.2 EVALUATION OF SURVEY RESPONSES ACCORDING TO THE
BER OF EVENTS’ CONTOURS (N60, N70, N80)
ve specified threshold noise levels are portrayed on land-use maps.
hree 12-hour ‘number of events’ contours were produced; namely the number of
Figures 5.11 to 5.136.
THREE ‘NUM
‘Number of events’ is a concept developed in TNIP whereby the number of aircraft
noise events abo
T
events above 60, 70 and 80dBA. The spatial extent of these contours is displayed in
6 The mapped area of the N60 contour in Figure 5.11 and the N70 contour in Figure 5.12 only includes
the contour where it intersects the study area because both the N60 and the N70 contours extend
beyond the study area boundaries. A portion of each of the N60 and N70 contours were therefore
excluded. To include the whole contour would have meant altering the maps to a smaller scale which
ould result in the points which represent the survey locations merging into one another and obscuring
detail. For consistency, it was necessary to keep the N60, N70 and N80 contours the same scale so the
non-essential portions of the contours were trimmed and the scale detail of the study area retained. For
the full spatial extent of the N60 and N70 contours, please consult Figures C1 and C2 in Appendix C.
w

138
5.2.1 General discussion of the shape of the number of events contours.
ctors affect the size and shape of an individual aircraft’s noise signature.
enerally aircraft make more noise on departure than they do when landing because
restrict a short-haul flight can gain altitude quickly, and so
the aircraft is lined up with the runway, and follows the
ent landing system between 15 and 20 km from touchdown and descends at a
ees. The engines on an arriving aircraft are throttled
ake minor adjustments to the power levels to maintain
is therefore quite long, but narrow compared to a departing aircraft.
hese differences in power settings are evident in the size and shape of the noise
contours shown in Figures 5.11 – 5.13.
In the erational data and the survey
the western
nway, known as Runway 03 Left 7.
ing, the general size and shape of the ‘Number of Events’
Several fa
G
the engines are operated at, or close to, full power. If there are no air traffic control
ions, a departing aircraft on
its noise footprint will decrease quickly. However, a heavily loaded widebody jet
departing on an intercontinental flight will climb slowly so that its noise footprint for
departure is greater. The noise contour of a departing aircraft is typically quite long
and wide while an arriving jet’s noise contour is narrow and short by comparison.
In the case of landing aircraft, pilots are required to fly what is known as a stabilised
approach. This means
instrum
controlled angle of three degr
back, but pilots often have to m
the three degree steady descent to the runway. The resulting noise contour of a
landing aircraft
T
week of the study during which aircraft op
responses were elicited, the air traffic flow was predominantly from the south to the
north. This means that whichever airport the aircraft was arriving from, or departing
to, arriving aircraft would have approached the airport from the south, and departed to
the north. Of the arriving aircraft, most landed on the eastern runway, known as
runway 03 Right. In the case of departing aircraft, most took off from
ru
With this understand
contours can be explained.
rport runways are named after the magnetic compass heading they point towards, rounded off to the
nearest 10, then the 0 at the end of the heading is removed. For example a runway pointing to a
direction of 150 degrees would be called Runway 15 and in the opposite direction, Runway 33.
7 Ai

139
5.2.1.1 Number of events above 60L contour
om the airport increases.
ntour to the north. The relative narrowness is due to the aircraft following
e stabilised approach to the runway. Regarding the approach to runway 03 Right,
the eastern portion of the contour in Boksburg has a steep gradient where the number
500m. contour has a gentler gradient. This is due to the
.2.1.2 Number of events above 70LAmax contour
l extent of the N70LAmax contour (in Figure 5.12) differs quite significantly
ontour. Firstly, the 10 events noise lobe to the west (between
embisa and Kempton Park) has disappeared. This means that there are no events
e narrower and shorter. Whilst the spatial extent of the N70LAmax contour is
maller, the intensity of the noise is greater. Residents living in these areas will be
Amax
The spatial extent of the N60 LAmax contour illustrated in Figure 5.11 is larger than
that of the N70LAmax and N80LAmax contours (Figures 5.12 and 5.13). As departing
aircraft climb away from the airport, the noise energy transmitted to the ground
decreases. This means that fewer noise events above 60LAmax are heard as distance
fr
In Figure 5.11, the N60LAmax contour to the south of the airport is narrower compared
with the co
th
of events decreases sharply from 50 events to less than10 events in a distance of about
The western edge of the
relatively fewer numbers of arrivals onto runway 03 Left. To the north of the airport,
the noise contour is wider and the noise impact greater. This is due to the high power
setting used by departing aircraft, and the fact that the aircraft are turning onto a
heading commensurate with their intended destination.
5
The spatia
from the N60LAmax c
T
exceeding 70LAmax over these areas. The noise lobes to the south and north have also
becom
s
exposed to noise within the N60LAmax contour, as well as the N70LAmax contour.

140
5.2.1.3 Number of events above 80LAmax contour
The N80LAmax contours are the smallest in spatial extent of all the number of events
contours. However, the noise intensity is also the highest, with residents being
exposed (in addition to noise above 60LAmax and 70LAmax) to noise above 80 LAmax in
these areas. The large lobe which extends to the north is caused by widebody jets
departing for European destinations. These aircraft carry a heavy fuel load for the
ight and climb slowly thereby causing greater noise closer to the ground.
wealth Department of Transport and Regional
ervices so that future comparisons may be made. It is not improbable that future
research will also follow this example, making this research forward compatible for
the future.
fl
To continue exploring the research objectives and the reported problems with airport
noise, the following analysis of Number of Events is presented.
Firstly, reported annoyance according to the number of events will be discussed.
Thereafter, sleep, TV, telephone, work/study will be discussed, and then whether
residents will consider moving. There is any amount of flexibility in deciding what
the number of events should be, and what the levels of the events should be. In the
present study, the number of events were classified according to the Commonwealth
Department of Transport and Regional Services (2000) i.e. <10 events above, 10-20
events, 21-50 events and > 50 events at specified levels of 60dBA, 70 dBA and 80
dB(A). Any choice of number of events and/or noise level of the events is possible.
The number of events is a relatively new concept, and it was decided to follow the
divisions selected by the Common
S

141
Source: compiled by author
Figure 5.11: 12 hour 18:00-05:59 N60 contour

142
Source: compiled by author
Figure 5.12: 12 hour 18:00-05:59 N70 contour

143
Source: compiled by author
Figure 5.13: 12 hour 18:00-05:59 N80 contour

144
5.2.2 ANNOYANCE ACCORDING TO NUMBER OF EVENTS
A trend exists in Figure 5.14 that as the number of events increases, so does the
reported annoyance. Similarly, noise level and annoyance are directly related. The
exception is at the >50 events level, where the N80LAmax is slightly less than
N70LAmax. There were only nine respondents in this N80LAmax >50 events category.
The results suggest that at greater than 50 events, whether noise level is fairly low, at
N60LAmax or higher, at N80LAmax reported annoyance levels off between 85 and 94%
respondents reporting considerable to high annoyance. Generally, annoyance
increases with number of events and the noise level of these events. It is quite clear
that the number of events plays a larger role in creating annoyance when the
occurrence of <10 events and >50 events are compared. In the case of the occurrence
of 10-20 events, the noise level plays an important role. At busy airports, these
number of events contours should be used for land use planning rather than noise
level contours.
010203040
% c
onsi
de an
50
<10 10-20 21-50 >50
rabl
no
60708090
100
y or
hig
hly
yed N60LAmax
N70LAmaxN80LAmax
Number of events
Figure 5.14: 12-hour N60, N70, N80 suburb group reporting being considerably or
highly annoyed

145
5.2.3 SLEEP DISTURBANCE REPORTED ACCORDING TO NUMBER OF
EVENTS
Some sleep disturbance is reported at less than ten events and noise levels of
l
vel.
N60LAmax and N70LAmax (Figure 5.15). At less than 10 events, a level of N80LAmax
disturbs about 30 percent of the respondents. Thereafter, as the number of events
increases, there is a fairly consistent increase in disturbance with increasing noise
level. At the >50 events level, the N60LAmax, N70LAmax and N80LAmax are all over
80% indicating that the number of events is more important to people than the actua
le
0102030405060708090
100
<10 10-20 21-50 >50
Nu
% re
port
ing
slee
p di
stur
bed
ofte
n or
ver
y of
ten
mber of events
N60LAmaxN70LAmaxN80LAmax
Figure 5.15: 12 hour N60, N70, N80 Sleep reported as being often and very often
disturbed
5.2.4 TV VIEWING DISTURBANCE REPORTED ACCORDING TO
NUMBER OF EVENTS
A general increase in reporting disturbance of television viewing is evident across the
number of events and the noise level of the events in Figure 5.16. An anomaly exists
at the number of events above 80LAmax in the 10-20 events noise zone where over
90% of respondents reported being disturbed often or very often. It is clear though
that people find aircraft noise disturbing to their television viewing since, with the

146
exception of one noise zone (ie. 10 – 20 events), all other responses are over 35% and
six are more than 80%.
01020
port
ur
30405060
80
ing
tele
ibe
d of
tey
of 90100
ewin
g te
n
70
visi
on v
n or
ver
N60LAmaxN70LAmaxN80LAmax
<10 10-20 21-50 >50
Number of events
% re dist
Figure 5.16: 12 hour N60, N70, N80 TV viewing reported as being often and very
often disturbed
TELEPHONE CONVERSATION DISTURBANCE REPORTED
5.2.5
ACCORDING TO NUMBER OF EVENTS
Figure 5.17 illustrates the disturbance made by aircraft noise to telephone
conversations according to number of events. Events over 80LAmax show a large
increase in the 10-20 events zone and remains fairly constant in the 21-50 and >50
zones. The responses in N60 contour and the N70 contours are not as pronounced as
the N80, but it is clear that people in these zones also report disturbance.

147
0102030405060708090
100
<10 10-20 21-50 >50
Number of events
% re
port
ing
tele
phon
e co
nver
satio
ns d
istu
rbed
ofte
n or
ver
y of
ten
N60LAmaxN70LAmaxN80LAmax
Figure 5.17: 12 hour N60, N70, N80 Telephone conversations reported as being often
and very often disturbed
5.2.6 WORK OR STUDY DISTURBANCE REPORTED ACCORDING TO
NUMBER OF EVENTS
In Figure 5.18, the pattern of increased interference with increasing number of events
and increasing noise level is continued. The N80 response again shows a
disproportionately large percentage of people reporting disturbance in the 10 - 20
events category. It remains clear though that an increasing number of events even at
the relatively low noise level of N60 is responsible for more disturbance.

148
0102030
% re
por
dist
urbe
40
ting
wor
d of
te
5060708090
k or
stu
dy
n or
ver
y of
ten
N60LAmaxN70LAmaxN80LAmax
<10 10-20 21-50 >50
Number of events
Figure 5.18: 12 hour N60, N70, N80 Work or study reported as being very often
disturbed
5.2.7 WOULD CONSIDER MOVING REPORTED ACCORDING TO
NUMBER OF EVENTS
The
aircraft noise are shown in Figure 5.19 where it is evident that as noise level and
e N80LAmax case in the 10-20 events zone when compared with
in the case of the N60LAmax and N70LAmax contours.
responses to the question whether residents would consider moving because of
number of events increases, the tendency to consider moving also increases. There is
an affirmation with th
the other results where almost 60% of the respondents reported considering moving as
opposed to less than 20%

149
010203040506070
<10 10-20 21-50 >50
Number of event
% w
ho w
ould
con
side
r8090
s
mo
100vi
ng
N60LAmaxN70LAmaxN80LAmax
hold activities from aircraft noise. The ‘highly
nnoyed’ and ‘often and very often interfered with’ occurrence of number of events
is consistently above 50% which is to be
is also an important finding that at the
n
ousehold activities and the inclination of residents to move away from areas of
Figure 5.19: 12-hour N60, N70, N80 Would consider moving because of aircraft
noise
In this chapter, it has been shown that supplemental noise information both in the
form of a more tightly defined average energy noise time period (summarised in
Figures 5.9 and 5.10), and number of events information (summarised in Figures 5.14
to 5.19) provide an important insight into the reported annoyance caused by aircraft
noise, and interference of normal house
a
above 80 at the level greater than 10 events
expected given the loudness of this level. It
greater than 20 events level for N60, N70 and N80, (with the exception of work or
study [Figure 5.18] and people who would consider moving [Figure 5.19]) over 50%
of respondents are ‘highly annoyed’ and experience interference ‘often and very
often’.
In Chapter 6 an airport noise planning framework will be proposed. In devising such a
framework, it is important that consideration be given to different factors which are
important to residents. In Chapters 4 and 5, annoyance, interference with commo
h

150
aircraft noise disturbance were the factors which were discussed. The choice of these
factors does not eliminate or diminish the importance of others. Based on the work of
Blitch 1976; Brooker, Critchley, Monkman & Richmond 1985; Berglund, Lindvall &
Nordim 1990; Fastl & Widman 1990; Staples, Cornelius & Gibbs 1999 and Aasvang
& Engdahl 2001 these factors were selected. There is no universally recognised gold
standard of measurement of aircraft noise, but there is consensus among people who
live close to an airport’s flight tracks that noise is an important aspect which has the
potential to affect their well-being. The concept of this disturbance is not formally
defined but any aircraft noise mitigation framework must take those factors which are
portant to residents into account. im

151
6 CHAPTER 6: AN INCLUSIVE AIRPORT NOISE PLANNING
FRAMEWORK
During the last two decades, the global environment has developed into the third
major issue in world politics, the others being international security and the
international economy (Elander & Lidskog 2000). The development of ideas and
frameworks for environmental planning and development using noise as a focus is an
volutionary, historical and experiential course since the effect of the built e
environment on the quality of life on its residents is of growing interest (Dunstan et al.
2005). This has been the case in the United Nations Centre for Human Settlements, in
the Habitat Agenda, and in information emanating from the Sustainable Cities
Programme (Dahiya & Pugh 2000).
Airports which are located in undeveloped environments such as farming land,
indigenous vegetation or arid land present no real noise problems. This is not to say
that noise is not a problem for the relatively few people living in these environments
and that aircraft noise should not be researched in these places. It should still be a
priority to determine whether the impact of aircraft noise on humans and animals can
be reduced and under what circumstances. Rather, it is the interaction of aircraft noise
and land used intensively for commercial, industrial and residential purposes in urban
areas that creates undesirable noise impacts for the greatest numbers of people. This
has been clearly demonstrated in Chapters 4 and 5. In addition to being places where
aircraft land and take off, airports are also work environments, terminal points for
nodes of transport systems, and freight centres. In the absence of planning
supervision, they will inevitably generate urban development in their vicinity.
Development is most likely in the form of residential areas for employees working at
the airport and commercial and industrial projects located near the airport. Land-uses
associated with the airport are likely to generate secondary growth in the form of
schools, shops and other functions associated with urban activity. Without land-use
controls an airport will soon find that it indirectly spawns developments in its vicinity
that are incompatible with its own function. Todes (2006) casts doubts on the
existence of a strong urban spatial policy in South Africa, stating that policy has
remained marginal and ineffective. It is also conceivable that if policy is strengthened,

152
and land-use planning guidelines around airports are enforced, an airport’s future
growth will be constrained because of incompatible land-uses in its vicinity.
It is in this instance that the possibility of setting aside land for farming and
ircumstances in
hich most of the living conditions have completely changed inside the cities…”
preserving indigenous vegetation be considered. Farming already takes place to the
north of the airport, within the noise contours. However, Breuste (2004) expresses a
word of caution against the belief that establishment of indigenous vegetation is a
simple matter: “…indigenous vegetation cannot be secured under c
w
(Breuste 2004: 442).
This research has established that airport noise is a problem for residents living in
areas surrounding ORTIA, particularly in areas close to the flight tracks. This chapter
begins by looking at the growth prospects of Johannesburg as an urban area, as well
as those of O.R. Tambo International Airport. Next, the necessity to plan for this
growth in the context of aircraft noise will be examined at length. Finally, the role of
aircraft noise prediction models in relation to land use planning and resident’s feelings
will be discussed.
6.1 GROWTH PROSPECTS FOR RURAL AND URBAN GREATER
JOHANNESBURG
The question in this section is posed: What are the growth prospects for rural and
urban areas in greater Johannesburg? Since there is not much rural land in greater
Johannesburg, rural areas will be dealt with briefly. Greater Johannesburg’s urban
areas which comprise higher densities of residential land will be discussed in greater
detail.
6.1.1 Rural areas
Rural areas often provide only limited economic opportunities for their inhabitants. A
deterioration in infrastructure, service provision and employment opportunities in
rural areas and the chance of a better life in cities however remote continues to attract
migrants from rural to urban areas.

153
6.1.2 Urban Johannesburg
, Johannesburg offers its citizens (who can afford it),
onsumption patterns drawn from nearly every geographical and cultural context. The
o urban areas.
eby making the area attractive to prospective
sidents and a likely choice for the location of transnational and domestic companies
op,
ctivities should be free to locate away from central locations offering savings in
Johannesburg is at the core of the major metropolis of southern Africa. The ending of
apartheid, and the re-integration of the South African economy into the world
economy have led to increased business activity and to the physical growth of the city.
Indeed, this urban area is experiencing growth in one generation that occurred in cities
in some developed countries over several generations (Gleeson & Low 2000).
Johannesburg’s inaccessibility caused by artificial apartheid barriers to movement has
been removed. As a key node for ever-expanding flows of traded goods, money and
services in southern Africa
c
range and variety of available goods results from a proliferation of tastes and because
of this variety in lifestyle, Johannesburg lends itself to attracting more and more
people. Growth prospects for Johannesburg are also determined, inter alia, by pull
factors like water provision, services provision, economic growth, availability of job
opportunities, and push factors like unpleasant living conditions in rural areas.
Johannesburg also has a significant urban formal business sector providing wage
employment, and this will continue to attract people t
The rate of natural population increase in Africa’s cities remains high despite the
spread of AIDS (Rakodi 1998). Johannesburg is no exception. While growth figures
for greater Johannesburg are not readily available, Gauteng, of which Johannesburg is
a major part grew from 7.3 million to 8.8 million people (i.e. 20.3%) between 1996
and 2001 (Lehohla 2004). Johannesburg is an economic, communication and transport
hub, and houses the seat of Gauteng’s provincial government. Politicians, senior civil
servants and business leaders live there causing public expenditure to be directed
towards the metropolitan area, ther
re
(Todes 2006).
It has been argued by Hall (1998) that electronic communication works, and will
continue to work as an agent of dispersal. As the costs of telecommunications dr
a
property rents and/or purchases, and salaries. However, Hall (1998) also recognises

154
that telecommunications are not costless and that linguistic and cultural boundaries
and objections to technology create barriers to telecommunications services. Studies
ave shown that in metropolitan areas, the diffusion of information technology is
erations out of ORTIA since
004; namely 1time in 2004 (Rondganger 2004), Mango Airlines (Adams 2006) and
th is set to continue, then the activities associated with the city
ught to continue to grow too, one of which is air transport. The next section
considers the growth prospects for the aviation industry.
h
more rapid than elsewhere, and that large cities will retain their key role as centres of
economies. Gleeson & Low (2000) also refer to the role of new communication
technologies. It is often claimed that new communication technologies slow the rate
of entropy by reducing the need for air travel and transport of goods. However, this is
disputed, given the power of these new technologies to reshape cultural horizons and
encourage greater mobility by those who can now afford to travel. This is evidenced
by three low-cost passenger carriers commencing op
2
Victoria International Airways (linking Johannesburg and Kampala) (D’Angelo 2006)
and the Airports Company of South Africa having to double in capacity every nine
years to handle the increasing demand from airlines (Bough 2006). This means
communications technology alone cannot be relied upon to reduce air traffic
movements.
Urban housing infrastructure is expensive to set up, and in a developing city like
Johannesburg, spending on urban infrastructure will remain high. It is therefore of
critical importance to ensure that the right residential planning is in place around
airports to avoid planning mistakes which are almost impossible to fix in the future.
If Johannesburg’s grow
o
6.2 GROWTH PROSPECTS FOR THE AVIATION INDUSTRY
The reason for the existence of an airport is primarily to move passengers and high
value, low weight/volume freight over large distances by the fastest mode of
transport, aviation. Air traffic in South Africa has grown at almost eight percent per
year over the past five years (Bough 2006), and this growth is expected to continue.
Land-use planning must take this growth into account since although aircraft are

155
becoming quieter, aircraft noise levels will continue to increase with increasing
chnological improvements result
uction ential
development. T
example, the y
international f
Johannesburg a
destinations. Th h currently do not have noise
problems may develop them in the future. It also means that the noise problem is
m on
which presently
using airport no hich take future
aircraft moveme ts into account.
Johannesburg, a world city in the making (Lo & Yeung 1998), is adopting more
functions in the world-city system. Beavon (1998) believes that as South African
Beavo
grips with glob ent will
be required. The importance of airport noise models as a predictive tool for use by
anag
three critical is
approach to ur
initiatives needed to secure sustainability. The aircraft noise issues around airports
would have to be linked to the decision-making authority of planning authorities so
these issues.
aircraft movements.
Geldenhuys (2006) has recently reported on runway extensions and new runways. If
the proposed developments go ahead, then the requirement for aligning town planning
with those aspects of airport development which affect aircraft flight routes, namely
runway position, length and orientation is highlighted. An important way for this to
happen is to use the output from airport noise models to determine the noise impact.
Planners are faced with a number of paradoxes. If te
in a red in aircraft noise, too much land may be restricted from resid
echnological improvements in aircraft range and efficiency (for
et-to-fly Boeing 787 and Airbus A350) could mean that long-haul
lights go directly to other destinations instead of routing to
s a hub from which smaller aircraft take passengers to their final
is means that South African airports whic
shifted fro e place to another. Local authorities located near to smaller airports
do not have noise problems would be wise to conduct noise analyses
ise modelling tools, and to prepare land-use plans w
n
cities (in n’s case, Johannesburg, but also applicable to Ekhuruleni) come to
alisation from their abnormal apartheid base, strong managem
planning m ers to plan for the future is highlighted. Gilbert et al. (1996) identify
sues for the world’s cities as to what is necessary for a concerted
ban sustainability namely governance, capacity, and actions and
that the airport noise problem is considered in the light of

156
In the present context of globalisation, cities are growth machines, and aviation will
, a fuel spillage at an airport is on birds, animals and plants, it nevertheless
an be regarded in the same way.
cribes the need for a spatial planning framework to plan for this
rowth.
6.3 URB
The ter
to be w ity of airports, planners need to look
d Health Organisation’s (WHO)
most widely accepted. This holistic
efinition of health requires some interrogation of which physical factors influence
quired. Concerning noise, what is needed are
rocedural and operational aims and programmes related to the goal of achieving a
continue to grow to service this growth. Aviation is linked to the global capitalist
economy, and its entropic logic of accumulation of wealth. Gleeson & Low (2000)
argue that this growth is anti-ecological. Although noise is not as anti-ecological as,
for example
c
The next section des
g
AN PLANNING
m ‘urban planning’ implies that some provision is made for future urban form
ell designed and functional. In the vicin
beyond the basics of land allotment, so that those areas with the particular problem of
aircraft noise can be pinpointed and dealt with. In the next section, the importance of a
guiding framework is elaborated upon.
6.3.1 The need for a guiding framework
Harpham & Allison (2000) contend that the Worl
definition of health – a state of physical, mental and social well-being, and not merely
the absence of disease or infirmity is the
d
health. An individual’s health and well-being is a result of the physical and social
environments impacting on the person. If the WHO definition of health is to be
achieved, then a guiding framework is re
p
healthy acoustic environment which conforms with the goals of sustainability. This
means that authorities, acting within broad-based community participation, set, and
adhere to legal, institutional, organisational and action orientated directions for
environmental enhancement and protection (Dahiya & Pugh 2000).

157
The process of governance requires an environmental framework which is relevant to
e context of where the intervention occurs because the state does not operate in a
. It operates where people and organisations associate for some objectives and
ng with the aircraft noise issue can be viewed in this context.
irlines and the airport wish to maximise their business in oviding a
pid and safe transport service. Many citizens benefit from
thers suffer from negative externalities of noise, manifested
as shown in Chap
society ance – in this case a reasonable expectation
f a healthy acoustic environment around an airport – there ement
n what is considered healthy. This will bring into focus that which must be done by
ociety to a e. An ensemble of ideas i citizen’s
pertoire (in this case aircraft noise abatement and miti e
rough which society relates to its structure of authority (Ha
n compared with many other African cities,
services infrastructure is ered to
there are aspects of planning and management which are weak and need
ent that takes place outside a guiding framework leads
a deterioration in the quality of residential space and services. Rakodi (1998)
xamples of deterioration as
udan and Nigeria. In settlements in
evelopment took place without any reference to a guiding framework. Resources that
ould have been used to ensure basic environmental standards for urban residents
ere not used to best effect. While aircraft noise is not generally regarded as a serious
ealth threat, it may nevertheless still be regarded as an industrial residual which
6.3.2 Localisation
Localisation – the need for cities to find solutions to their own environmental
problems – is inherent in urban and environmental programmes. A clear assignment
of responsibilities among levels of government is required. To this end, the United
Nations Council for Human Settlements (UNCHS) launched the Sustainable Cities
th
vacuum
compete for others. Deali
A vestment by pr
ra this service, but many
o as expressed annoyance
ters 4 and 5. In pursuing and interference with household activities
what has agreed to be good govern
o must be some agre
o
s chieve the objectiv ncluded in the
re gation) includes a cod
th rpham & Allison 2000).
Rakodi (1998) reports that whe
Johannesburg’s administration and
be good, but
generally consid
remediation. Urban developm
to
reports on e a consequence of lack of planning in Zaire,
these countries, a large proportion of land S
d
c
w
h
threatens the urban soundscape (Hardoy, Mitlin & Satterthwaite 2001).

158
Programme (SCP) in 1990 (United Nations Sustainable Cities Programme 2006). The
ir
guided by a number of principles and
vie o e (United Nations
e manner;
s cut across traditional administrative and
t be addressed with new types of political
nd
nmental problems requires the active
community.
an effective environmental planning and management strategy, the
CP helps cities to:
ues;
•
•
• e actions taken.
The o
establis
diverse
readily
inform
SCP focuses on sustainable development issues. While these are usually related to a
and water pollution, ‘dirty’ production techniques, resource depletion, overwhelming
urban growth and resultant inadequate infrastructure, aircraft noise is clearly an issue
that has been shown in Chapters 4 and 5 that cannot be ignored.
To address these problems, the SCP is
wp ints which can also be seen from an aircraft noise perspectiv
Sustainable Cities Programme 2006):
• The environment is a resource to be managed in a sustainabl
• Environmental problem
organisational boundaries and mus
and managerial action; a
• A successful response to urban enviro
participation of all sectors of the
In establishing
S
• Identify and understand local environmental issues and establish priorities
among such iss
• Work out procedures and mechanisms for building consensus and developing
co-operation;
Develop up-to-date strategies and action plans that command widespread
support;
Implement strategies and convert action plans into projects and programmes;
and
Monitor and follow up th
f regoing examples from the SCP range from principles and viewpoints to
hing an effective planning and management strategy. Localisation leads to
understandings and feasibility in sustainability. Having public access to
understandable aircraft noise information in the form of evening and night
ation and number of events noise information facilitates understanding and

159
sustain
on identifying the underlying reasons for the options chosen.
is more likely when the rules of
air travel go beyond safety and security to include dealing with noise through, for
s information.
nvironmentalism brings with it economic-organisational dilemmas, including
d-use planning between the land demanded by
demanded by prospective city residents, and developers. In
LRdn contour clearly covers many residential
Rdn contour is viewed as unachievable as a
extent, authorities may tend to ignore it,
In areas which are already built-up, the
Rdn l development is not achievable anyway.
nsions requires good governance and development of capacity.
ability. Research agendas can focus on comparative evaluations with emphasis
A country’s progress is dependent on creating and developing institutional and social
capital. The air travel industry augments development patterns, and enhances the
prospects of economic success. However, the aviation industry has a negative impact
in the noise effects, as has been shown. This means that important social capital must
be encouraged with a view to minimising the aircraft noise impact. Associational
experiences of airport neighbours must be enhanced otherwise the disapproving
reaction of the airport’s neighbours can have a negative impact on air travel and the
positive benefits air travel has on development.
Productive cohesion between aviation and residents
example contracts or agreements setting out responsibilities, assignment of costs,
monitoring, enforcement of the rules and incentives for co-operation. Supplemental
noise information lends itself well to these aspects as it democratise
E
corruption, apathy, the power of vested interests and administrative incapacity
(Dahiya & Pugh 2000). If left unchecked, environmental concerns are trodden
underfoot by the economic imperative.
6.3.3 Tensions in land demand
In a sense there is a tension in lan
SANS 10103, and land
Figure 4.13, the spatial extent of the 55
areas and undeveloped land. If the 55L
land-use planning goal because of its spatial
meaning that another limit must be sought.
55L contour as a limit for residentia
Dealing with these te

160
Governance embraces inclusiveness – the more inclusive the planning the more likely
the outcome will be broadly accepted and appropriate than when affected people are
excluded from decision-making. However, poorly managed moves to promote more
inclusiveness can result in interminable discussion. Municipal leaders need to lead
their local authorities by setting clear goals, in this case for land-use planning, and
sticking to them. Capacity – the capability of local authorities to act in a town-
planning role – is almost meaningless unless they have the facility to act effectively.
A local authority must have the management, technical and fiscal capacity to act
effectively in land-use planning when dealing with airports.
ith the overall system of settlements is a goal to be
chieved (Dahiya & Pugh 2000).
al justice’ encompasses the widest definition of what is considered
nvironmental, and the present paper places people at the centre of the complex web
Meeting the challenges of sustainability in an urban context as suggested by Agenda
21 will require effective leadership by the elected local authority. Integrated
transportation and land-use planning and local environmental assessments and audits
should be carried out and action taken based on the recommendations. Harmonizing
the development of urban areas w
a
6.3.4 Environmental Justice and Social Justice
Environmental justice is about incorporating environmental issues (including the less
frequently considered issue of noise) into the broader intellectual and institutional
framework of human rights and democratic accountability (McDonald 2002). The
term ‘environment
e
of social, economic, political and environmental relationships (McDonald 2002).
Environmental justice “…concerns itself primarily with the environmental injustices
of these relationships and the ways and means of rectifying these wrongs and/or
avoiding them in the future” (McDonald 2002). Locating a toxic waste site or an
airport next to a poor community simply because it is poor is an environmental
injustice that violates basic human rights.
In South Africa, the environmental justice movement has been able to attract a
substantial following because of undemocratic decisions made in the past. The idea of
social justice grew out of the close juxtaposition of great wealth and poverty in the

161
early industrial city, and continues in the city being the site of constant struggles
between conflicting groups (Gleeson & Low 2000). However, most environmental
stice issues relate to forced removals, toxic waste and atmospheric pollutants. Social
ed assumptions and capabilities
hich enable the adherents to assemble bits of information that come their way into
coherent wholes. They are a set of shared understandings. Discourses shape
planning in the vicinity of airports. Within the social justice and environmental
n as evidenced by the lack of documented noise
alues in urban areas. Countering the problem of airport noise thrown up by
t airlines is increasingly being recognised by
and judicial procedure (McDonald 2002). Whatever the reason, town planning around
ju
justice struggles were in large part, over the environment, and its qualities. Noise and
noise from airports does not feature highly in the debates, but they do form a
discourse which co-ordinates social action as argued by Habermas (1995) and Dryzek
(1997).
It is worth pointing out that discourses are a set of shar
w
institutional arrangements – in this case governmental bodies responsible for land-use
movements, it must be questioned whether the airport noise discourse in South Africa
(to which Goldschagg 2002; Van der Merwe & Von Holdt 2005; and Van der Merwe
& Von Holdt 2006; have contributed), has reached a level so that action is now taken.
Chanda (2000) points out that noise pollution is the least documented environmental
quality problem in the SADC regio
v
compe itive entrepreneurialism between
government to require national interventions. Airport noise is a contested concept and
problematic in implementation, but the discourse has the potential to guide
development in a benign direction. However, airport noise planning appears to be
playing a supporting and apologetic role in urban planning which is increasingly
dominated by a discourse of market co-ordinated competitive growth (Chanda 2000).
This could be because airports in South Africa are not very busy yet – or certainly not
as busy as airports overseas. Not one of South Africa’s airports ranks in the top 30
busiest airports as measured by number of aircraft movements or passengers handled
(Airports Council International 2006). It could also be because there are many other
issues of pressing health urgency – HIV/AIDS, malaria and drug resistant TB and
social needs (housing, water, sanitation) which beg attention. It could also be because
the debate for reform in a market economy is split between protecting local business
interests or protecting the environment, or because of the efficacy of the legislative

162
airports must still be approached with caution so that the mistakes which have been
made overseas are not repeated in South Africa and then have to be repaired in a
costly manner afterwards.
The results of this study are an indication that airport noise constitutes an
nvironmental threat and that there is some degree of consensus about the disturbance
r countries, despite the use of average energy noise metrics,
erception of noise as a threat to overall quality of life remains strong. The local
impacts of a new or modified source of noise pollution from aircraft can frequently
conflict (Moore 2000). What is lacking though is the
of number of events contours
elps to reduce what is unknown. Comprehension of the problem, especially from a
r
understood by the layperson.
e
caused by aircraft noise in the evening and at night. This is a contrast to Chanda’s
(2000) view that the problem with noise is its general insignificance.
These concerns have translated into regulations dealing with noise. In the USA,
Europe and othe
p
lead to considerable debate and
legal requirement for data collecting and reporting. In the absence of strong
regulations, totally supported introduction of new improved aircraft with quiet
engines, comprehensive databases and evaluation and analysis of the impacts,
communities feel annoyance at and experience interference with the impacts of these
airport activities.
Moore (2000) offers two reasons why communities feel the way they do. First, the
geographic context of the problem has been minimised, often to make the problem
more approachable from the standpoint of bureaucratic control. This fragments the
presentation of information about what is known and unknown. An average energy
aircraft noise contour can appear to be quite small and be criticised for understating
the problem. The use of supplemental noise in the form
h
layperson’s perspective, is difficult with average energy contours but made easie
with number of events. People relate to the world around them, based on their
knowledge, observations and perceptions integrated over the whole experience of life
and not on environmental rules, regulations, procedures, policy analysis, and science
designed under a conceptual framework. Supplemental aircraft noise information
makes aircraft noise information available in a transparent way that is more easily

163
Secondly, the human dimension, as an essential element of the solution or at least
mitigation of noise, has been minimised. Noise problems are often perceived by
scientists, academics and regulators to be environmental and scientific in nature,
quiring improved models, more environmental data, and better statistical methods in
order to produce better decisions. These issues have consumed the energy of the
gmented approaches to risk management should be re-evaluated, and
quitable solutions found that are community based.
Archi atrix;
ailable land resources can be determined.
atrix are to estimate the availability or supply, and social
demand for physical resources; and to evaluate the overall social costs and benefits of
iction models to inform this
me satisfy several demands and be in demand for several uses (Archibugi 2000).
The LURM constitutes an instrument for evaluating the opportunity cost of the use of
a resource in terms of the advantage lost for alternative uses and provides a means of
re
process of studying airport noise and associated land-use planning while the ideas,
values, positions, interests and beliefs of the affected public are far removed from the
proceedings (Moore 2000).
To respond to these concerns, this dissertation presents a possible paradigm for local
aircraft noise management which uses GIS-based technology to support land-use
planning in which the community is involved. The approach conceives of the spatial
and temporal challenges of achieving environmental equity as a regional planning
problem. The argument is made that if environmental equity is a widely held regional
goal, then fra
e
bugi (2000) proposes a methodology consisting of a land-use resources m
identification of the appropriate territorial unit of evaluation; and the definition of
indicators and for the various territorial units. A land-use resources matrix (LURM)
can be constructed, on the basis of which av
The purposes of the m
the consumption of land. The use of aircraft noise pred
process is presented in Section 6.11.
In the urban environment, environmental disturbance in the form of aircraft noise
pollution is between the demand for the use by urban activities and the supply of
environmental resources. Problems arise when the same land unit may at the same
ti

164
presenting decision makers with tradeoffs between costs and benefits for reaching
tory
quested on the other side. The balance between territory requested and territory
supplied is realised by means of the territory balance.
ects namely decision making,
anagement, monitoring and reporting. The LRdn contour is prescribed by Standards
mplex in that
there is no contentious time-weighted period and provides information related to when
.4 STATE OF THE ENVIRONMENT (SOE)
e right to an environment
that is not harmful to their health or wellbeing, and the right to have the environment
ent and consequently started a state
f the environment reporting initiative in the 1990s. These reports have been produced
at different scales of analysis, namely national, provincial, metropolitan and local, as
well as for different sectors, i.e. coasts, air, rivers, estuaries and catchments.
justifiable planning decisions.
Archibugi’s matrix rests on two conceptual entities: the supply of and the demand for
limited space. This can be translated into land space around the airport. Examining the
map will reveal certain open spaces, but these are covered by airport noise contours,
where there is a demonstrably impact from noise. Should this land be developed? The
LURM places the data on available territory on one side, and data relative to terri
re
How can supplemental airport noise contours be useful in the urban planning process?
Airport noise contours are an index, and like other indexes, they focus and condense
information about complex issues for four asp
m
South Africa but is complex. A night LAeq contour is slightly less co
people are at home and disturbed by aircraft noise as has been shown in Chapter 5.
Number of events above specified threshold contours provide supplemental
information useful in decision making by residents, management by aviation
authorities, and monitoring and reporting by airports. These different types of airport
noise contours are part of an aggregation process of knowledge production to assist
with decision making.
6
In terms of the South African constitution, everyone has th
protected for the benefit of present and future generations (South Africa 1996). The
Department of Environment Affairs and Tourism recognised the difficulty in
accessing information on the state of the environm
o

165
Ekurhuleni local authorities have compiled their SOE report (Ekurhuleni Metropolitan
Municipality 2004) according to the Department of Environment Affairs and
Tourism’s national state of the environment reporting guidelines which follow the
format of drivers, pressures, state, impacts and responses (DPSIR). Issues and
descriptions have been presented according to environmental media, namely air,
ater, land and soils, and ecosystems and biodiversity. The definitions of the
components of this framework are given in Table 6.1. The airport noise problem can
the corresponding changes in lifestyles,
overall levels of consumption and production patterns (e.g. population
ining, and industry).
w
Table 6.1: DPSIR framework component definitions
Drivers The human influences and activities that, when combined with
environmental conditions, underpin environmental change. Indicators
for driving forces describe the social, demographic and economic
developments in societies and
growth, poverty, m
Pressures The pressures acting on the environment which result from human
activities, (e.g. pollution of air, soil and water from industry,
depletion of firewood through human consumption).
State The condition of the environment including recent trends (e.g. level of
air pollution)
Impacts The consequences of the pressures on the environment (e.g. loss of
biodiversity and ecosystem functioning, poor human health).
Responses The societal responses to reduce or prevent negative impacts, correct
environmental damage, or conserve natural resources, including
legislation and policy, management strategies and programmes and
initiatives
Source: Ekurhuleni Metropolitan Municipality (2004: 6)

166
be usefully interpreted and investigated with this framework, and by incorporating the
supplemental number of events aircraft noise information. An example of the DPSIR
framework in terms of aircraft noise pollution is developed in Table 6.1 and
Figure 6.1.
In the Ekurhuleni report, the issue of aircraft noise pollution is raised on five
occasions, namely:
• “JIA is causing noise pollution in the surrounding residential areas especially
Kempton Park – proposed residential developments here”; and possible
solutions are mooted, i.e. “[c]hange flight paths, conduct thorough planning
exercises considering relevant environmental legislation” (Ekurhuleni
Metropolitan Municipality 2003a: 41).
Chapter 5 makes reference to the detrimental levels of aircraft noise which
Metropolitan Municipality 2003a: 130)
players as set out in Figure 6.1.
•
residents of Greater Boksburg and Kempton Park are exposed to (Ekurhuleni
Metropolitan Municipality 2003a: 122).
• Chapter 5 also includes a map of 24-hour cumulative aircraft noise contours
which were produced in 2001(Ekurhuleni Metropolitan Municipality 2003a:
124) (No reference is made to explaining the nature of the noise or presenting
alternative supplemental noise information.)
• Noise is highlighted as a critical area for monitoring and action (Ekurhuleni
In its conclusion the report is very brief in its treatment of aircraft noise, stating that
“[n]oise issues related to air traffic need to be addressed in planning” (Ekurhuleni
Metropolitan Municipality 2003a: 307).
Once the state of the environment is clearly understood, goals are set to deal with
identified problems, so that the planning which is done can take these goals into
account. The structure in which this is done is referred to as integrated development
planning which takes place in a number of defined phases involving various role

167
Agents Phases
Phase 1: Planning overview Airport operators
Produce masterplan for the futurNoise related elements extracted namely aircraft types, frequencies, Flight origin or destination
e.
Air traffic control
Designs flight routes
Noise modelling
Figure 6.1: Example of the DPSIR framework in terms of aircraft noise management
Phase 3: Evaluation
Phase 2: Implementation Town planners use LRdn to plan for land not yet built on; Prospective residents use supplemental aircraft noise information (SANI) to assist with purchasing decisions; Existing residents use SANI to verify that runway and flight track use is as agreed to
Town
planners Aircraft operators
Aircraft types
Flight origin and destinations
INMproduLRdn c
c
used to e
ontour
Supplemental information INM used to produce L contour TNIP used to produce number of
Aeq
events above threshold
Weather office Wind direction Barometric pressure Temperature Humidity
Residents/community
Airport environment committee (AEC) Role-players namely airport operator, ATC, aircrafoperators, town planners, community agree on airporrunway and flight track usage.
t t

168
6.5 INTEGRATED DEVELOPMENT PLANNING IN EKURHULENI
In terms of Section 25(1) of South Africa’s Municipal Systems Act, municipalities
must prepare and adopt their own integrated development plan (IDP) which outlines
e future planning direction of the municipality, and embraces the needs of the
ight. The airport attracts significant secondary activities to the area,
such as manufacturing and warehousing” (Ekurhuleni Metropolitan
• “The triangular area around ORTIA represents a core focus area for
th
community (Ekurhuleni Metropolitan Municipality 2003b). The IDP must contain the
following core components:
• A vision for the long-term development of the municipality;
• An assessment of the existing level of development in the municipality;
• Development priorities and objectives for the elected term;
• Development strategies;
• A spatial development framework;
• Operational strategies;
• Applicable disaster management plans;
• Financial plan and budgets; and
• A performance management system with key performance indicators and
targets.
The IDP recognizes the importance of ORTIA as bourne out in the following two
quotes from the IDP:
• “JIA, Africa’s largest airport, is the entry point for most foreign visitors to
Southern Africa. During the 1999/2000 financial year, R475 million was spent
on expanding its facilities. Approximately 450 flights daily, or one every three
minutes, carry an annual total of 6,2 million departing passengers and 350 000
tons of fre
Municipality 2003b: 7).
Ekurhuleni. Large portions of land to the south and east of the airport offer
potential for future development or re-development. These developments
could be used to establish and promote the identity of Ekurhuleni in future.
The agricultural holdings of Boksburg directly to the south of ORTIA, in

169
particular, have the potential to be developed in such a way” (Ekurhuleni
Metropolitan Municipality 2003b: 19).
The airport is also part of the Gauteng Provincial Government’s (GPG) Blue IQ
roject, the economic infrastructure development programme of the GPG. It is
investing an initial R3,5 billion of provincial government funds in creating or
driven int private sector,
IDZ site”
kurhuleni Metropolitan Municipality 2003b: 19).
kurhuleni has adopted a Spatial Development Framework (SDF) as part of their IDP.
opment strategy should be
200
• Infill development priority areas;
• Service upgrading priority areas;
p
upgrading strategic economic infrastructure to kick-start 11 major projects to be
by Public Private Partnerships. “This project is the first, jo
government-led IDZ and involves upgrading the airport and further developing
manufacturing and exports. Government wants to encourage the private sector to
invest in the projects, which will include an industrial development zone for light
manufacturing and high-technology production; and infrastructure for the
(E
What all this portends is that air traffic to and from the airport will continue to grow
and as a consequence, noise from aircraft will continue to increase. The importance of
taking aircraft noise into account in planning is therefore emphasised.
E
The SDF proposals deal with how the future land devel
structured by addressing the following (Ekurhuleni Metropolitan Municipality
3b):
• Implementation of an urban development boundary (UDB) ;
• Peripheral land-uses;
• Extensive agriculture;
• Activity nodes;
• Strategic development areas;
• Regional open-space system;
• Mining; and
• Transportation.

170
The SDF recognises the creation of an urban development boundary (UDB) declared
by the GPG (see Figure 3.6). The UDB limits the type and extent of development
outside of this boundary in the future. The boundary is designed to limit urban sprawl
and protect agricultural land. This poses the question should land be sterilised for
development near the airport, would this have consequences for land outside the
airport boundaries? Within the UDB, land-use must be consistent with existing plans,
legislation and normal procedures. The SDF makes the point that development rights
within the UDB will not be automatically guaranteed in the future, and that outside
the UDB, rural land-use is more desirable.
ORTIA is part of one of four main core areas, known as activity nodes. The triangular
rea around the airport is a core focus area for Ekurhuleni. Large portions of land to
there is potential for aircraft noise disruption. It is important that these
reas receive particularly careful consideration of the aircraft noise impact, and that
consideration be given to using supplemental aircraft noise information in the
a
the south of the airport offer the potential for future redevelopment. The agricultural
holdings in Boksburg to the south of the airport are singled out as having the potential
for possible future development.
Eight major precincts have been identified in the SDF for future residential expansion.
Of these, the Esselenpark/Kaalfontein area which forms part of the Tembisa-ORTIA
corridor, Pomona/Benoni North (area northeast of ORTIA); and Boksburg South lie in
areas where
a
planning process.
The responsibility for ensuring that the Ekurhuleni region develops according to the
guidelines in the SDF lies with the municipality’s development planning department.
They are required to manage conflicting aspects of spatial development. Land-use
management and spatial planning are key performance areas for this department. Air
quality monitoring and the rehabilitation of damaged environmental areas are
mentioned, but noise and specifically aircraft noise are conspicuously absent.
Under the transport theme, the SDF places emphasis on improving the services
provided by the taxi industry and bus companies but the airport is only discussed in
the context of how Ekurhuleni can exploit its spatial proximity. The impact of the

171
growth of the airport is not mentioned, nor the probable future aircraft noise impact
resulting from this growth.
The health and social development sections of the SDF are also silent on the issue of
noise. Primary health care rightfully receives priority, particularly given the
challenges of TB, HIV/AIDS and maternal health, but in an area where a large airport
already exists, and which is going to get bigger and noisier, some mention of dealing
with the noise impact would be prudent. This leads to the subject of applying
sustainable development principles to the noise issue.
.6.1 Prevention is better than cure
ch to urban
ent; environmental impact assessments must be conducted on all major
the en cts of their activities, they should refrain from activities which
interrelationships of activities that need to be assessed. Aircraft noise
ay be a disturbance and the current means of assessment – a 24-hour average – may
not describe the night-time disturbance adequately. One is to prevent activities from
commencing in the form originally envisaged. Aircraft noise carries a personal risk to
health rather than an environmental risk. Risk-taking is a necessary part of human
6.6 GUIDING PRINCIPLES FOR SUSTAINABLE URBAN
DEVELOPMENT
Many guiding principles for sustainable development which are already in use and
have gained widespread acceptance have also increasingly found their way into
legislation and instruments of policy. Four of these principles gleaned from Haughton
& Hunter (1994) are put forward here as starting points for a debate on the necessity
or not of aircraft noise information.
6
This principle stresses the importance of a precautionary approa
developm
development projects. The principle advocates that unless people clearly understand
vironmental impa
may potentially damage the environment. The difficult challenge is to prove that an
activity is not environmentally damaging. The answer to this is that some form of
rigorous investigation needs to be done of the likely environmental implications of a
particular activity prior to its commencement. This, however, is not adequate in itself,
as it is also the
m

172
existence, but it is an activity which requires continual questioning of the degree of
ent probably have a higher level. It is unlikely that
will be beneficial that development decisions are left solely to the wishes of any
single grouping.
climate modification. The key point is that airports can exert profound
irect and indirect impacts on the surrounding environments, and it is important that
policy-makers attempt to understand these consequences in order to minimise the
contours have the ability to inform city
capacity to accept
nd adjust to environmental disturbances. For example, in a developing country like
South Africa, in order to promote economic development and reduce unemployment,
acceptable risk. Providing citizens with aircraft information in the form of number of
events at different levels will enable them to evaluate the extent of the problem. It will
enable air traffic control to evaluate the consequences of routing aircraft one way or
another, and airlines to understand the noise consequences of their flight decisions.
The related question arises as to who decides on the acceptability of noise? Affected
residents probably have a lower threshold for acceptability – airlines in their attempt
to maximise use of capital equipm
it
6.6.2 Nothing stands alone
Account should be taken of the local, regional and global implications of urban
activities and urban environmental policies. Individual pollutants may combine in the
environment to produce more severe effects than their individual effects may suggest:
the synergy (cumulative effects) problem. While it is important to consider aircraft
noise around an airport, the question may be raised about other noise sources like road
traffic. Road vehicles and aircraft give off noxious gases which have immediate health
consequences for people exposed to them, as well as longer term consequences in the
form of global
d
creation of undesirable impacts. Aircraft noise
managers and local authorities about these problems.
6.6.3 Identify and respect local, regional and global environmental tolerances
This principle ensures that urban development is sensitised to its capacity to interact
with and alter capacities to cope with environmental disturbances. It is related to the
‘nothing stands alone’ axiom. There exists local variability in the
a

173
it may be necessary to accept higher noise levels if it means creating jobs.
emental aircraft noise information contours can then be used to studySuppl where the
o
ental and social consequences of aircraft movements. The
requirement is to create new indicators for environmental protection. Dissemination of
behav
gover
problem is at its worst, and attempt to minimise its impact. At the urban level, aircraft
may be routed via areas best able to cope with noise pollution.
6.6.4 Enhance environmental understanding through research
This precept ensures that complex environmental and economic interdependencies are
better understood as a basis for informed decision-making. Ranging across all of the
principles discussed in this section is the need to understand environmental processes
better. Night-time noise contours, and number of events contours will help people t
understand the environm
this improved knowledge is an important element in refining the decision-making
iour of individuals, aviation related companies and local, provincial and national
nment.
6.7 PRINCIPLES FOR REDUCING AIRCRAFT NOISE SUCH THAT A
SUSTAINABLE URBAN NOISE ENVIRONMENT IS PROMOTED
Once the areas which are, or could be affected by aircraft noise have been established,
a number of principles for reducing aircraft noise can be implemented. These are
discussed in this section.
6.7.1 Appropriate technology, materials and design
Technological solutions to aircraft noise can be expensive and create problems which
ordinary people cannot understand or implement themselves. It is very difficult and
expensive to insulate an existing house from aircraft noise and the dwellings in
Tembisa (Figures 4.6 and 4.11) would be almost impossible to insulate. A simple yet
effective remedy is to locate houses far away from airport flight routes.

174
6.7.2 New indicators for noise environmental health
There is a need to broaden the way people measure their acoustic well-being. The
well-being of people should also take into account the noise they are exposed to.
ove into an area affected by aircraft
ay to providing
e noise levels are
.7.4 Acceptable minimum standards through regulatory control
ulatory controls creates the problem of diminishing returns. It
ircraft to airline fleets.
6.7.5 Internalise environmental costs into the market
The essence of this principle is the ‘user pays’. The market needs to be made to work
for the environment by moving away from the situation where polluters can abuse the
‘free goods’ of the natural environment.
Improved knowledge of the aircraft noise environment can be valuable to residents in
decision-making, for example should they m
noise? Supplemental aircraft noise information would go a long w
information which laypersons could use to decide whether th
acceptable to them and whether they want to choose to live in that place or move.
6.7.3 New indicators for environmental productivity
A whole life-cycle audit of the aviation industry can highlight where unnecessary
noise generation occurs and assess the potential to reduce these. The number of events
above a threshold contour is a good example of this.
6
The extensive use of reg
is argued that countries reach a point in their direct use of regulation where the
efficacy of these regulations declines. It cannot be said that this has happened in South
Africa yet. Legislation, or national standards, are merely pieces of paper. To
successfully transform the aircraft noise environment in neighbourhoods around
airports requires community will and support, and an effective programme of
implementation. Countries which are signatories to ICAO have been phasing out old
noisy aircraft and banning the addition of these a

175
6.7.6 Social acceptability of environmental policies
It is difficult to ensure that all parties agree on what constitutes an acceptable aircraft
noise environmental management policy. This survey has confirmed that those people
st disturbed by
nformation and thereby improve
articipation, decision making and planning.
key issue though is how effectively government at
e lowest level can function. The level of policy formulation may be at national
ent, there is a
t too much reliance will be placed on one particular means of representing
who live closest to the flight tracks followed by aircraft are the mo
aircraft noise. The use of supplemental aircraft noise information will at least help
people to understand the problem.
6.7.7 Widespread public participation
The Australian experience has shown that average energy contours do not provide
enough information, and because of their complexity they are often misunderstood
and mistrusted. Supplemental aircraft noise information will assist in providing the
public at large with more easily understandable i
p
6.7.8 Subsidiarity
The responsibility for the implementation and management of urban environmental
programmes must rest at the appropriate level of government. Subsidiarity implies the
decentralisation of power and responsibility to the lowest level of government
possible – to the level where people who are more affected by noise can appeal to
have something done about it. A
th
government level, but the realisation of the policy will be at local level. Because
aircraft move rapidly over long distances, and the same aircraft may appear at airports
within the jurisdictions of several local authorities in one day, control of that aircraft’s
noise by local authorities is not feasible. National government is therefore most suited
for this and not subsidiarity. The principle of subsidiarity may, however be applied to
the land-use management around those airports where the aeroplane flies.
6.7.9 Flexibility in devising and implementing environmental policy
In the search for appropriate policies to enhance the noise environm
danger tha

176
aircraft noise. This could be said of SANS 10103 and 10117. Given the wide range of
the urban aircraft noise problem, and the dynamic nature of urban areas, a flexible
approach to representing aircraft noise is required. Average-energy aircraft noise
contours are complex to understand especially given the tendency to obscure
particularly noisy events at noise sensitive times. Therefore, rather than try to use one
instrument derived from a particular principle, it is more likely to be fruitful to
consider using the number of events noise descriptor as well when responding to a set
of interacting and changing aircraft noise problems. Flexibility also encourages
experimentation and innovation to emerge and guide the next generation of policies.
Sensitivity to the peculiarity of place is also encouraged by innovation. The need for
continuing research into finding the most efficient combination of aircraft noise
contours and information is emphasised.
6.7.10 Long-term strategies are necessary for environmental management
Aircraft noise contours and urban land-use planning can promote a long-term
intergenerational equity meaning that future generations do not have to suffer the
consequences of bad planning of the present. Average energy noise contours are
useful to assist with considering the long-term development of urban areas and the
wider region. A strategic long-term vision for cities should be to enhance the quality
of life for present and future residents. To do this around airports, mitigating and
managing the environmental impact of aircraft noise should be prioritised.
6.7.11 Improved co-ordination across environment-related policies
There are many aspects to the quality of life of urban areas. These need to be brought
together under the principle of improved co-ordination of environmental policies. A
well-defined, clearly identifiable authority should have responsibility for overseeing
the formulation and implementation of such a vision. At national level, policy should
be formulated, and at local level it should be implemented. Identification of the
appropriate level of responsibility is critical. This means that the work of traditionally
separate departments within local government needs to be brought together more
consistently. Strategies should maximise co-operation between departments to use

177
local knowledge and initiatives and integrate the policies of different departments and
maximise the existing and potential complementarities.
Land-use planning decisions around airports should be based on a local development
plan agreed to by local government departments responsible for that area, as well as
the local community and local business interests. Airlines should also be kept
informed and consulted since they are the ones responsible for creating the noise.
Private companies in urban areas may have much to offer local authorities. For
example, around an airport freight forwarding and courier companies may be
encouraged to move into areas considered unsuitable for residential development due
to noise.
6.7.12 Non-discrimination and equal right of hearing
Although more commonly referred to in issues of transboundary pollution (eg. climate
change), this would ensure that aircraft noise pollution issues could be resolved by all
those affected on a basis of equal rights. Previously, in South Africa, during the
apartheid era, land-use planning was racially based. Although these policies are no
longer in force, their land-use planning consequences are still very much in evidence
and will be for many decades to come. The equal right of hearing provides citizens
with the basic right to be heard, no matter what their race or their location. The survey
sults from the township group clearly indicated an awareness of aircraft noise and re
resultant annoyance and interference. Local urban development proposals which will
have adverse impacts, including new airports, or changes to runways which will
change the noise patterns around airports, should be subject to consideration on an
equal basis by all those who may be affected.
6.7.13 Need for better availability and understanding of environmental
information
The awareness of aircraft noise issues needs to be continually heightened amongst the
community around an airport, government agencies, and the aviation industry to
achieve the most from urban environmental management and to encourage a more
responsible attitude to acoustic environmental quality. This heightened awareness

178
requires a right to freedom of information on the impact of aircraft noise on
developments, and education and advice for noise producers, and those who are
affected. Number of events aircraft noise information provides a means of raising
aircraft noise awareness.
In order for the marketplace to work effectively to reduce aircraft noise environment
consumers (passengers and freight forwarders) need freely available information on
the noise environment friendliness of aircraft. This is something which airlines will
start to take seriously in recognition of the search for the ‘acoustically green’
onsumer, and in the face of increasingly tight governmental environmental
nd the prioritisation of action plans and policies. National governments
hould monitor the compliance of airports and local planning authorities with quality
ples for sustainable urban development into
ractice requires a complex inter-weaving of different approaches and different urban
requirements. Haughton & Hunter (1994) condense these into six categories; namely
legislative, technological, economic, planning, local enablement, and education and
c
regulation. In South Africa, governmental regulation of aircraft noise is still very lax.
However, some aircraft operators have taken steps to renew their fleets with quieter
aircraft. Admittedly, major factors are the high fuel and maintenance costs of noisier
old generation aircraft, but if airlines are forced to consider phasing-out noisy aircraft
and are not permitted to add these to their fleets after agreed-upon dates, then this
would help to bring South Africa into line with ICAO guidelines which have been
enforced in Europe and America.
The continual monitoring, evaluation and synthesis of aircraft noise information at
local and national level is an important environmental management tool. Average
energy and number of events aircraft noise audits can aid the identification of aircraft
problems a
s
standards and allocate resources effectively to neighbourhoods with pressing aircraft
noise problems.
6.8 POLICY INSTRUMENTS FOR IMPROVING THE AIRCRAFT NOISE
ENVIRONMENT IN AN URBAN SETTING
The previous sections concentrated on principles for sustainability in the aircraft noise
and urban environment. Putting the princi
p

179
information. The approach in this dissertation favours the technological, planning, and
ese approaches usually brings about more rapid and
ffective change than used in isolation.
s planned for an existing airport (new
.8.2 Economic policy instruments
education and information categories, while recognising that the others also have their
role to play. A combination of th
e
6.8.1 Environmental impact assessment and integrated environment
management mechanisms for airport noise management
Environmental impact assessment (EIA) provides a framework for assessing the
potential impacts of developments so that adverse environmental effects can be
eliminated or minimised. An EIA may also cover the noise from aircraft, and noise
contours are the mechanism to represent, visualise and study the problem.
Airport noise contours may be used in three key ways. Firstly, when a new airport is
being planned, secondly if there are change
runway, lengthened runway, new aircraft types), and thirdly to evaluate the impact of
an existing airport’s operation. The first two would be incorporated into an EIA
study, while the third would be part of integrated environmental management (IEM).
Most forms of EIA attempt to do three fundamental tasks:
• Identify the nature of the induced activities which are likely to be generated by the
project;
• Identify the elements of the environment which will be significantly affected; and
• Evaluate the initial and subsequent impacts.
An IEM plan should be concerned with the management of the beneficial and adverse
impacts which are generated by aircraft noise.
6
6.8.2.1 Potential of economic policy instrument to reduce noise
The potential of economic instruments to foster improvements in the airport noise
environment has been increasingly recognised. The economic instruments are
informed by the noise contours produced either from calculated noise contours, or by

180
measured noise contours. Use of aircraft noise contours enables state decision-makers
to take account of positive and negative environmental externalities. For example,
onstructing an airport may raise nearby property values for some land-uses (for
to ensure
at the market takes account of all environmental costs, risks and benefits. For
c
example warehousing) but decrease them for residential users. Aircraft noise contours
can provide an indication of the cost incurred when making noise, and allow
producers and consumers rather than regulators to decide how to alter their behaviour
to meet environmental needs. This has a number of beneficial consequences: freedom
of choice is not constrained; those who find it cheaper to make less noise will make
the biggest reductions; there will be an incentive to develop quieter flight procedures
or take into service quieter aircraft; and there is a continuing incentive not to misuse
the environment.
There is intrinsic value to looking at applying economic instruments to dealing with
aircraft noise in an urban context since many of the aircraft noise problems in cities
are what economists call non-costed environmental impacts. For example if a
residential dwelling’s value is reduced because of aircraft noise, does the noise maker
pay compensation to the dwelling’s owner? The instrument must be capable of
attaining its environmental objectives in a reliable and consistent fashion. It therefore
needs a way of assessing the objective, and aircraft noise contours are one way of
doing this.
6.8.2.2 Limits of economic policy instruments
In attempting to make the market work for the environment, a concern is
th
example, reducing noise often leads to an increase in emissions which pose a more
immediate risk to the environment, climate and health. Another problem is that the
information base for producers and consumers is never likely to be sufficiently
reliable or widely available. There is still incomplete scientific understanding of
aircraft noise – its propagation, transmission, and the annoyance and interference it
causes. Aircraft noise contours are time-consuming and costly to calculate and
disseminate, and can only provide a snapshot of the noise around an airport for the
time period they represent. Although it is an inexact science in the ways reported
above, it is argued by the author that to approximate and move towards improving

181
using aircraft noise models as a tool for introducing economic tools, society is at least
attempting to move forward rather than ignore the problem.
Key aspects of adopting an economic policy are a noise tax, a limit on the types of
ircraft flown, a phase-out or a non-addition rule. A noise tax may be socially
runways, minimum noise routings and noise insulation and land purchase
re discussed.
a
regressive in South Africa since older, noisier aircraft which are cheaper to buy, can
be used to transport passengers who previously could not afford to fly. The tax would
hinder the stimulation of business and the economy is therefore hindered (Haughton
& Hunter 1994).
Policies make a marked difference to rates of economic growth, and to the
environmental conditions and quality of life in cities. Sustainable development then
becomes a debate about urban policies and how to shape and implement these policies
for the abatement of environmental (noise) degradation. Development policies that
achieve growth and social development improve incomes and expand social
opportunities. However, these improved incomes and social opportunities also place a
burden on society. The airline market creates better transport opportunities, but high-
quality public administration must be created which serves the general public interest,
in this case understanding and dealing with noise impacts.
In the next section the role of noise prediction models will be discussed.
6.9 AIRCRAFT NOISE PREDICTION MODELS AND NOISE CONTROL
STRATEGIES
Apart from land-use planning, the INM and TNIP aircraft noise prediction models can
be used to study operations on and in the vicinity of an airport, and to modify these to
control noise and decrease its impact on airport neighbours. In this section, noise
preferential
a

182
6.9.1 Noise preferential runways
ponent.
onsequently, landing and take-off operations can be carried out on a less than
ally o educe the noise nuisance to the
community. This is known as a noise preferential runway. Noise prediction models
educing noise nuisance may be adopted where
uildings in the immediate vicinity of the airport may be purchased by the authorities
Conventionally, aircraft are operated into the wind on landing and take-off so that the
crosswind and tailwind component is minimised and operations made safer. Modern
aircraft are not particularly sensitive to the crosswind and tailwind com
C
optim rientated runway, if that facility will r
can help planners to visualise the impact and assess whether there are gains to be
made for the community at large.
6.9.2 Minimum noise routings
Related to the noise preferential runway concept is that of minimum noise routings
which are designed to direct arriving and departing aircraft to follow routes over areas
of low population density. The size of the impact of the noise footprint is not altered,
but the impact in terms of the size of the disturbed population is lower. The place of
noise prediction models in this instance is to model different options and implement
those with the lowest population impact. Town planners must ensure that the
identified low densities are kept that way, and air traffic control must retain those
routes for which land-use planning has been done. The work of Von Holdt (2003);
Van der Merwe & Von Holdt (2005); and Van der Merwe & Von Holdt (2006) have
potential here.
6.9.3 Noise insulation and land purchase
Sound insulation can provide some relief from aircraft noise albeit an expensive
option. In some countries, residents affected by defined levels of aircraft noise
nuisance are eligible for grants which must be used for sound insulation procedures.
Noise prediction models can be used to initially identify which buildings may qualify.
An even more expensive option of r
b
and their use converted to something more compatible with noise.

183
6.10 PROVIDING AIRCRAFT NOISE PREDICTION: AVERAGE ENERGY
AND SUPPLEMENTAL AIRCRAFT NOISE INFORMATION
has been raised elsewhere in this study that average energy aircraft noise
inform
minim mmendation of this study that supplemental
information be provided to these residents. For example, consider a residential
n to provide a framework for future development. The master plan assists
anagement in making short and medium term decisions without compromising the
y for communities to
et involved in the process and participate in the discourse at a level at which they can
It
information, while useful for land-use planning does not provide sufficient
ation for residents affected by noise seeking to understand the problem and
ise their exposure. It is a key reco
property where the occupier has a problem with noise. The amount of aircraft noise
that location will be exposed to according to the LRdn, night LAeq, and number of
events above specified threshold values can be determined. Authorities may agree that
there is a problem and attempt to deal with the problem (e.g. through noise sharing).
6.11 THE AIRPORT MASTER PLANNING FRAMEWORK AND
SUPPLEMENTAL NOISE INFORMATION – A COLLABORATIVE
PROCESS
Although not a requirement in South Africa yet, airport owners usually create a
master pla
m
options for future long term development. Master planning should incorporate
collaborative planning – as has been successfully used by the United States
Department of Transport (Morgan 1999) - by including all the role players (including
airport neighbours) so that trust is enhanced and relationships and networks are
forged. Rapid urbanisation can be expected to continue in South Africa resulting in
land use planning conflicts. One such conflict which will create ongoing problems is
the encroachment by residential land in airport locations creating ongoing problems
with noise from aircraft in residential neighbourhoods. Providing supplemental noise
information in the planning framework will present an opportunit
g
freely engage. Moote, McClaren & Chickering (1997) divulge that if the full range of
the public’s needs and concerns are not addressed, and in terms they understand, the
consequences are that the general public feel they have no alternative but to resort to
appeals and lawsuits to block implementation of land use planning.

184
Doyle (1998) and Morgan & Mitchell (1998) add that an airport can be made
compatible with its neighbours if management has the following characteristics:
• A belief that a problem exists and can be resolved.
is unlikely that there will ever be unanimous agreement for the airport operation
supplemental aircraft noise information available in
the airport master planning framework through a collaborative approach will
. It has been demonstrated that using supplemental aircraft noise
formation within a collaborative approach framework is essential for the layperson
d that for transparency, the
• A belief that occupants of the environs are constituents of management on an
equal footing with users of the airport.
• An approach to the situation that is open, fair, and objective.
• A willingness to consider any and all possible alternatives.
• The ability to compromise towards a consensus solution if necessary.
It
options chosen, however making
demonstrate that management are sensitive to the concerns of the community and the
community will respond by being more sympathetic to the airport’s needs (European
Transport Forum 1995).
6.12 CONCLUSION
This chapter has identified a wide range of guiding principles for aircraft noise which
when used together may help urban residents, the aviation industry and government to
contribute positively to providing attractive urban environments and intergenerational
urban sustainability
in
to grasp the issues around reporting aircraft noise an
information supplied should be comprehensive.

185
7 CHAPTER 7: CONCLUSIONS AND RECOMMENDATIONS.
7.1 SUSTAINABLE DEVELOPMENT AND URBAN POLICY
waste with the
alling outside of
e mainstream of concerns about the environment.
cept of
ustainable development makes society think about the environmental implications of
human activity – in this case, the waste product being noise generated by aircraft, but
airports at distances which are
djust for the cost of people
eing woken. Revenue generated in this way is used to fund noise insulation
The concept of sustainable development is a useful one because it creates links
between different sectors, and highlights potential synergies and conflicts between
different goals (Hardoy, Mitlin & Satterthwaite 2001). Sustainable development at its
core is about reconciling the use of resources and the generation of
capacity of the environment to absorb and break down wastes and render them
harmless. This idea is more commonly applied to air and water pollution, so the
dilemma with aircraft noise is that it may not be seen in this context and the problem
is not regarded as being so severe. Aircraft noise can be regarded as f
th
However, there is evidence from the survey in this research and research done
elsewhere that aircraft noise is a problem which can, and has generated conflict in
localities where airports and citizens are in close proximity. For example, 33% of
respondents reported being highly annoyed with aircraft noise. The con
s
it could also be the decision to build houses and
inappropriately close together.
A quiet soundscape is a natural resource which is difficult to protect within a market
economy because economic transactions allocate little or no value to quietness. For
instance, every time a noisy Chapter 2 freight aircraft takes off over a residential
neighbourhood at 03:00, noise is generated which disturbs sleep. But no ‘price’ is paid
towards the cost of awakening people although some governments have been
considering, even implementing, noise-based pricing to a
b
programmes at some airports in America and Europe. Detailed understanding of the
adverse effects of aircraft noise disturbance is still being sought.

186
The environmental debate has changed from the specific preservation of natural areas
to environmental planning for sustainability. However, because much of the
discussion on sustainable development has concentrated on ecological sustainability
(e.g. forests and fisheries), town planners and others involved in dealing with aircraft
noise have not fully explored the possibilities that the sustainable development ethos
has to offer. Indeed, greenhouse gas emissions and the depletion of the stratospheric
ozone layer have taken on much of the discussion. The discourse has more recently
started to focus on the unmet needs for water, sanitation, health and nutrition
requirements of millions of urban and rural dwellers. These are pressing problems
which require urgent successful solutions. But what of the areas where gains are being
made? What problems presently regarded as minor are going to become the major
problems of tomorrow, and how should we be looking ahead to avoid having to undo
ostly mistakes?
a reduction in the number of flights, or can it
e achieved through removing the noisy aircraft? Should draconian measures be taken
-developed countries which were not required by their governments to
omply with these regulations. So while urban noise environment sustainability in the
was being
ought.
c
The threats to the natural soundscape beg the question: What limits should be set, and
what criteria apply? In Chapter 2 it was clearly shown that four sets of noise contours
with very different spatial characteristics could be produced from one set of aircraft
movement data. If there was more time available an even greater number of contours
could have been produced, with different noise sensitive time and associated noise
weightings. Does sustainability require
b
to remove residents who are most exposed to aircraft noise? The answer to these
questions is that it is possible to implement these, but at a cost to business and other
air travel which in turn would have severe consequences for the economy.
Global aircraft noise problems were, to a great extent, dealt with in the First World by
phasing out noisy aircraft in 2002. In fact, in accomplishing the phase-out many
airlines headquartered in developed countries sold off their offending aircraft to
airlines in less
c
First World was enhanced, on a global scale, the noise just went elsewhere. It is
unclear from ICAO phase-out guidelines at which scale sustainability
s
187
To tackle such issues, adequate policy measures at different levels and sectors of state
and society must be sought. Strong national policies must be developed and local
overnment must take responsibility as co-ordinator, facilitator, and enabler of
daily lives (concerning consumption and transportation, for
xample) and is “… becoming a main arena for the implementation of green policies”
may not reflect the
ality of the extended time frame required for development and adoption of advanced
er diligence on the part of urban planners.
g
environmental policies and strategies. Central to these roles are the development of
strategies ‘… which bring together actors and agencies at local, national and
international levels, across public, private and voluntary sectors” (Haughton & Hunter
1994: 300). Aircraft noise is not the immense environmental problem like climate
change or ozone depletion, but, like these problems, it is linked to the value-systems
of people in their
e
(Elander & Lidskog 2000: 44). Therefore, with regard to the question of aircraft noise,
the remedies are also located in the streets and suburbs where people spend their lives.
The urgency of the aircraft noise problem posed in the introduction has in no way
diminished. Indeed, more recent research argues that the noise problem continues to
worsen (Eagan 2006; Morimoto & Hope 2005). Eagan (2006: 6) contends that
“[c]ommunity expectations of continued decreases in noise levels
re
technology for the next generation of quieter aircraft” and Morimoto & Hope (2005:
165) report that “[t]here is increasing concern about aircraft noise as a result of the
rising demand for air transport”.
Sustainable city development at present has become commonplace in the policy goals
set by politicians. National government provides the leadership, but decentralises the
implementation to the local authorities by diversifying responsibilities. Hardoy, Mitlin
& Satterthwaite (2001) query the ambiguity in the term sustainable development. For
a town planner, sustainable development is reflected in the need to design livable
urban areas. For an airline and an airport however, it may refer to the need to sustain
profits and returns on investments. One of the ways in which the progress of capitalist
expansion can be read is by the rise in air traffic. Consequent aircraft noise disruptions
threaten urban areas close to airports. The dynamic of social deprivation in rural areas
(relative and absolute) can be expected to catalyse further migrations to wealthy
heartlands, requiring even great

188
The result of the phase-out of Chapter 2 aircraft in Europe and North America has
he question on which this dissertation is intended to throw light:
ow far has the discourse of urban sustainability, promoted at the Rio ‘Earth Summit’
of 1992 and at subsequent international fora, penetrated the world’s national airport
equently the South African
a of the world, and the commitment
isplayed by the role players. Those communities who are most affected by noise tend
and wealthy communities may complain even if the noise levels
are relatively low. Poor communities m
imity to the airport supports
ic endeavours and if they were to move, they would face more economic
generally meant a shift to, and an increase of these aircraft types, and consequently
noise, in the developing world. It is necessary today “… to act to change the global
context of local action” (Elander & Lidskog 2000: 45).
Urban environmental sustainability cannot be perceived without social equity and
economic sustainability when environmentally sustainable development is being
defined more as a process and not as an endpoint. Supplemental noise analysis
democratizes knowledge by operationalising the notion of sustainable development.
The author raises t
h
noise and urban planning policy systems, and subs
situation? What has the scope of the discourse on urban airport noise planning
revealed? The answer is it depends on the are
d
to be most vociferous
ay not complain because they are occupied
with other more pressing concerns, or because their prox
their econom
hardship.
The term airport noise can be understood in different ways. For example, residents,
aircraft operators, airports, planners all have their perspective. Cohen (2001) discusses
features of the urbanisation experience that fragment, divide and polarise metropolitan
areas. He does not mention airport noise, but it may be regarded as one such divisive
force. If municipal leaders can communicate that the diverse members of the aviation
community and surrounding residential community have a shared future, then there
are possibilities for shared interests. If not, then the tendencies for polarisation and
conflict over noise will continue to grow.

189
7.1.1 Summary of results
The results of the research are presented according to the problems which also guide
the progression of the chapters.
The literature study and survey results in Chapters 2, 4 & 5 show that airport noise
creates annoyance and interferes with activities of people who live in the vicinity of
flight paths used by aircraft arriving at or departing from ORTIA. Two approaches to
dealing with these problems which are of interest to human geographers are to make
use of comprehensive land-use planning to keep noise sensitive land-uses away from
airports and adapt aircraft flight tracks to avoid overflying noise sensitive areas. The
conceptualisation of these approaches reveals that they have many aspects in common
when dealing with aircraft noise around the world, such as modelling, measuring and
monitoring aircraft noise, then using the results to reduce the total population affected
by noise, to prevent noise ghettos from developing by improved planning.
In Chapters 4 and 5, the results of the survey which investigates annoyance at and
terference with household tasks by aircraft noise were presented. From the analysis
two findings are made. Firstly, it was found that night time aircraft noise is a problem
people who live outside of the noise
ven more so with
creasing frequency of flights. This addresses the third problem.
in
around ORTIA. Secondly, it was found that
contours (calculated according to national standards) still report being annoyed by
aircraft noise and that some of their household activities are interfered with. Chapter 5
investigates a different type of aircraft noise metric produced from the same data
using another aircraft noise modelling program, the number of events, and associates
the results with the survey responses. This information differs from an average in that
the number of events above specified levels were examined. The intensity of the
annoyance was found to increase with increasing noise level, and e
in
In answering the first two problems set out in the study, the primary aim has been
achieved. The importance and relevance of aircraft noise calculation models in airport
noise studies has been established. In Chapter 5, survey results are interpreted
according to supplemental aircraft noise modelling techniques, and the usefulness of
supplemental aircraft noise information is recognized. A modelling process

190
incorporating night-time average energy airport noise modelling, and number of
events is recommended for distribution to residents.
Observation of the planning processes in the vicinity of airports enables the researcher
the following paragraphs,
ading to the reassessment of the SANS standards to produce recommendations for
effective land-use planning and optimisation of flight tracks in the vicinity of airports
l noise information in the form of the
umber of events occurring allows residents to understand the requirements of airport
od reason for this in that
eople’s response to noise is very subjective and even varies in the same person
to determine to what extent the principles deduced from the literature study were
applied. The result of this process is that the principles postulated for planning for
airport noise could be assessed on whether or not, and how, they can be applied in
practice and what the results are. The results are given in
le
(see section 7.3.2).
One of the first consequences of not involving the surrounding community in the
discovery stage of the selection / design of runways and flight tracks is that the broad
acceptance of the flight tracks at a later stage in the planning phase is affected. The
lack of involvement and continuity from one stage to the next could result in continual
and confusing changes having to be made to flight tracks. Flight track parameters that
emerged from aircraft departing from ORTIA at night are that residents who live
some distance to the north of the airport, and outside the LRdn planning contours were
bothered by noise from long-haul aircraft departing for Europe. Collaborative
planning which includes the use of supplementa
n
master planning with the necessity that all parties, in this instance, including the air
traffic control authorities and the airlines be willing to reach a compromise.
It also transpires from this research that there is no evaluation scale for supplemental
aircraft noise information readily in place. There is a go
p
depending on time of day and type of noise. However by interpretation of the results,
it can be seen that as the number of events increases above 20, then even the lower
levels become annoying for a large percentage of people (see Figure 5.14). This
indicates a real problem. If the parameter strives not to be subjective, it will have to
involve all the agents, including residents, air traffic controllers, pilots, aircraft
operators and town planners in establishing it. The lack of such an evaluation scale

191
can initiate new research opportunities. For example, number of events contours can
be calculated at regular, predetermined intervals - for instance every five years. The
number of events and the LAmax of these events can be compared between time
periods and the effectiveness of noise abatement and mitigation measures assessed.
This study reveals that the flight track planning process and what happens in the land
se planning process must be carried over to future planning phases. The lack of agent
d by specialist experts. Remarks by the community
uch as that aircraft fly too low, there are too many aircraft, and can’t they fly
rom their aircraft is of less interest to them. The efforts of
tow
are thw fic controllers change their routes so that noise affects areas
es, thus enhancing participation. Use
f number of noise events above specified threshold values descriptors will make
The analysis of the needs of the economy, community and aviation as stakeholders is
an integral principle to the framework. An understanding of the strengths and
weaknesses of airport noise models will assist with realistic needs being articulated
and met.
u
involvement and long term planning foresight in the early planning phase can result in
flight tracks being modified later in a manner which is inappropriate to the land use
planning. Different agents participating in the flight track planning process have
different concepts of the flight track planning and of noise dispersion. These
differences need to be addresse
s
somewhere else have been common at ORTIA’s AEC. Aircraft operators would like
their aircraft to fly as directly as possible between airports to reduce fuel and
maintenance costs. Noise f
n planners who are on a long-term planning horizon, possibly of 50 years or more,
arted when air traf
which had an expectation of reasonable quiet have these expectations dashed.
Community involvement is crucial to the success of land-use planning around
airports. Community participation ensures that relevant issues will be looked at and
that the community will identify with these issu
o
understanding aircraft noise more accessible to the community. Maximising the early
and long-term participation of local people helps to determine the kind of land-use
and flight track planning that should occur, or at least informs communities and
planners why certain decisions to facilitate safe and efficient operation of aircraft are
necessary.

192
A is important to Ekurhuleni’s economy and for job creationORTI , but – little of its
o register its response, one wonders what will be done.
7.1.2
South Africa is a diverse country
developed (for exam
developing (for exam
and criteria commonly in use are based on the experience of the developed world, the
needs of the developing sector (in this study characterised by the residents of
concluded that a community will remain relatively insensitive to noise as long as more
dial actions
e survey responses from the developing community in Tembisa may have been
rol over these flight routes, but should be
impact and what will be done to minimise this is covered in the IDP or the SDF. Until
the community starts t
Noise control in developing communities
with communities that may be regarded as
ple, those living in the suburbs) and those who are regarded as
ple those living in townships). While the noise control measures
Tembisa) should not be ignored (Johnston 1992). In the late 1980s Johnston (1992),
basic needs such as food, shelter, security and employment are not met. Johnston
believes that in this case, time and money should not be spent on reme
against noise in developing communities. Financial resources should be applied to
meeting basic needs. However, the present study would suggest otherwise. Although
th
exaggerated due to the survey delivery mechanism, the results (of annoyance and
interference with household tasks) should be taken into consideration. It is not
suggested that any form of compensation be considered. Rather, resources should go
into suitable planning, to serve the basic needs.
If the goals of the South African government, that the basic needs for housing, water,
sanitation, food, employment and security will be satisfied, and it can be assumed that
they eventually will be, at that stage a more vigorous response to noise can be
expected (Johnston 1992). Those communities which currently are considered to be
developing, and which are now affected by aircraft noise, may not be willing to
tolerate excessive noise in the future.
Local authorities have no control over airport developments. Runways which are
lengthened, realigned or even newly constructed will have flight routes designed for
their use. The local authorities have no cont

193
provided with the opportunity to comment on them so that other options can be
t may be routed over houses which they did not fly over before which
ose residents would find unacceptable. Using aircraft noise models to assess the
ithin the noise zones as established by the SANS standards, annoyance from noise
ty is interpreted through
conceptual systems and filters as it is transformed into perception. Planners can use
information from aircraft noise models when laying out new land in the vicinity of
existing airports, or when new developments at airports are planned. Airports which
considered and unsuitable ones ruled out.
7.2 ALIGNING THE PLANNING HORIZONS OF THE TIME SCALES OF
AIR TRAFFIC FLIGHT ROUTE PLANNING AND TOWN AND
REGIONAL PLANNING
Average energy noise contours and supplemental noise information can be used by
town planners and air traffic control authorities alike to better understand the impacts
of their planning. Air traffic flight route planning and town and regional planning
need coordination so that their time scales and planning horizons are aligned and
system wide conflict is minimised (Rachami 2006). Planning for aircraft noise cannot
be retrospective. Once there are houses under flight paths near an airport, noise
mitigation measures need to be considered. Alternatively, if airspace is redesigned
then aircraf
th
impacts of these changes before they are implemented can assist with finding the best
solution.
It has been shown in Chapters 4 & 5 that taking the impact of aircraft noise into
account in land-use planning in the vicinity of airports is important. The survey has
shown that aircraft noise is a stress factor which reduces the amenity people get out of
their places of residence. Similarly, annoyance and interference with household
activities from aircraft noise is experienced outside of the noise zones, and that even
w
and interference from noise is a factor to be considered by town planners. Aircraft
noise models and noise descriptors other than average energy metrics can add to the
understanding people have of noise in the vicinity of the airport.
ORTIA is unique in its constraints. Every planner and developer encounters different
variables and conditions in space and time, and the reali

194
were in remote areas often attract new developments. People who work there want to
ve close to work. People who travel often want to live close to the airport.
The pla
present um. It is also
n attempt to bring together acoustic experts responsible for calculating noise
from d
need to
significance and centrality as a transport node
ORTIA itself also has a social space functi
travellers, or simply to identify with
Hundreds of people turned up just to see th
attracts visitors like no other m
in the first chapter about the necessity for aircraft noise planning are raised in
agenda for cities.
7.3.1 mendations for a planning framework
our planning framework recommendations (after Abbott & Pivo 2000) are made for
lanning
amework, namely:
volve the cooperation of
the airport owners as well as the municipal authorities. Ekurhuleni
uleni.
li
nning framework as proposed is aimed at alleviating past mistakes, preventing
mistakes from spreading and reducing future errors to the minim
a
contours, town planners, residents and the aviation industry because though they come
ifferent backgrounds with different expertise and have their own goals, they
be brought together for planning purposes.
7.3 RECOMMENDATIONS
ORTIA is at the forefront of the sub-Saharan air network maintaining a position of
to the movement of humans. However,
on (after McNeill 2004) where people go to
greet and fetch, or drop-off and say goodbye to
aviation. Take for example the Airbus A380’s visit to ORTIA in November 2006.
is huge new aircraft whilst the airport
ode of transport just to look at aeroplanes. The points
raised
the section below with regard to recommendations for an aircraft noise environmental
Recom
F
improving the effectiveness of SANS standards as planning tools within a p
fr
• The presence of a strong comprehensive plan is a leading variable associated
with the effectiveness of planning. This plan would in
Metropolitan Municipality’s IDP is a start but is inadequate in its dealings
with the aircraft noise impact at Ekurh

195
• Improve documentation of tools used and effectiveness, and promote the
sharing of information. The limitations of LRdn should not be concealed –
rather the usefulness of supplemental noise information should be
• hly effective tools. For example TNIP
and supplemental aircraft noise information in the form of number of
• vents above a specified
threshold noise descriptor is a good example of the implementation of this
ic and research responsibilities to update the software.
implem nvolve considered application of readily available
chniques and software. This is not to ignore the fourth. Users of the software and
cientific and research organisations to help them design more suitable tools.
eferring to aircraft noise as a pressing environmental problem can be misleading
visible pollution, e.g. air pollution. Rarely does the noise from aircraft threaten
earing. Because of this, the aircraft noise problem is not regarded politically as a
noise c
aviatio fic growth or to allocate
uitable sites for residential development, or flight routes.
There are shortages of suitable land in Ekurhuleni, but even here authorities should do
uch more to support the search for and provision of suitable land where aircraft
Satterth ailure of government can be said to
underscored.
Improve the use of seldom used but hig
occurrences of events can be taken into wider use. The helpfulness of
frequently used but less effective tools can also be improved.
Continue to develop new tools. The number of e
recommendation. This is largely up to organisations (such as the FAA) with
scientif
The first three bulleted points of the framework mentioned above are the most readily
entable since they i
te
framework have a responsibility to provide feedback (as done by the writer) to
s
7.3.2 Aircraft noise problems: political solutions
R
since it does not involve shortage of some resource, e.g. land or water, or obvious
h
matter for urgent attention. The many households living in areas affected by aircraft
hoose such sites possibly out of ignorance, but also because town planning and
n authorities fail to plan for urban growth and air traf
s
m
noise model contours are an essential tool in the allocation of land. Hardoy, Mitlin &
waite (2001) are of the opinion that a f

196
underlie environmental problems. This belief can be transferred to the problems of
allowed ise contours intrude on residential areas
hich were previously not in affected zones. Residents are not protected and local
raft
oise contours based on predicted air traffic growth over defined periods, perhaps up
problem uture they are, the less
ccurate they are likely to be due to the changes in the multiple variables needed to
contou
present.
The concept above is not meant to imply that government agencies should be
sponsible for all the planning tasks. Their role should also be to provide the
public
delayed South African aircraft noise and engine emissions policy would go a long
ay to guiding the aviation industry and preventing failures in planning leading to
rowing pressure for action on aircraft noise environmental problems in developed
environ
Frankfurt, London Heathrow, Los Angeles, New York, San Francisco, Sydney and
urich. Yet only a small percentage of the population lives in large cities. A large
these a
long w
uilding on the basis for aircraft noise environmental management through the use of
residential areas being planned too close to airports, and air traffic movements being
to grow to the extent that aircraft no
w
authorities need to plan in advance to ensure that sufficient land is available. Airc
n
to 50 years, need to be used by authorities to guide their decision-making. The
with these predictions is that the further into the f
a
perform the prediction calculations. The resultant predictions are used to derive the
rs which will also be less accurate the further into the future the contours
re
re
framework within which the aviation industry can operate, or take measures to ensure
accountability by the aviation industry for their noise emissions. The long
w
land-use incompatibility in the future.
G
countries must continue in all urban areas. Most of the literature on aircraft noise
ment problems centres on a handful of airports in the largest cities, typically
Z
proportion of people affected by aircraft noise live in smaller urban areas, and some of
re in developing countries where plans to phase out and ban noisy aircraft are a
ay off.
B
noise contours should focus on the aspect which follows in Section 7.3.3.

197
7.3.3 Incorporating an airport noise planning framework into Ekurhuleni’s
The pr
contrib g of urban areas in such a way that it will add to
e protection of residents living under flight paths and not lead to restrictions on
framew nsions of
uman geography.
The ID
and im ws will address new challenges that arise from its
plementation, as well as the changing needs and aspirations of Ekurhuleni’s
ensurin
all futu that it
ecomes proactive rather than reactive”. (Ekurhuleni 2003a: 48).
In sea
inform all
reas. This would require an acknowledgement that annoyance and disturbance in
ns of residents be effectively
ealt with. The other is to use noise load sharing where aircraft fly on tracks, which
choices end on the land use patterns around individual airports. For
xample, if an even population density is present, noise load sharing may be better. If
the noi tracks accordingly. These
umber of events contours have proved to be a more popular information type.
average
officials should provide accessible information from early on to influence and guide
e land development process.
IDP
oposed collaborative airport noise planning framework in Section 7.3.1 should
ute to the multipurpose plannin
th
sustainable economic benefits and growth for the country. The airport noise planning
ork combines into one framework the environmental and urban dime
h
P is a constantly evolving document that will be continually developed, refined
proved. Annual IDP revie
im
communities. “The IDP will always be responsive to the external environment,
g that the Ekurhuleni Metropolitan Municipality is flexible enough to address
re challenges. Our aim, in fact, is to develop our IDP to such an extent
b
rching for ways to describe aircraft noise, supplemental aircraft noise
ation can be extended into two strategies. One is to concentrate noise in sm
a
these areas would be high and that the resultant concer
d
over a period of time would result in reasonably equally shared noise exposure. The
so made will dep
e
the land use pattern is uneven, then N60, N70 and N80 contours can be used to focus
se where it least affects people by modifying flight
n
Planners and other administrative officials have to recognise that technical, scientific
energy noise information is regarded as less important by people. These
th

198
r way of interpreting the survey resuAnothe lts is that “quiet” is valued by the
opulation. Noise exposed areas ought to be protected against urban expansion by
plannin
some “ ent white paper (South Africa 2005)
rovides an opportunity for land use planning, but quality targets must be set and used
could b is also reduced over time. To
o this, the white paper should explicitly address the issue of supplemental aircraft
Aircraft noise reduction technology at source
about 2
p
planning and development practice against consumption for urban expansion so that
g targets can be realised and embedded in general planning ideas and that
quiet” can be experienced. The governm
p
as strategic tools. For example the reduction of the size of the N70 noise contour
e a goal achieved so that the population exposed
d
noise information.
7.3.4
Between 1999 and 2003 the worldwide Chapter 2 aircraft fleet reduced in size from
400 aircraft to about 1600 (Figure 7.1).
0
500
1000
1500
2000e irlin
2500
1999 2000 2001 2002 2003
Nm
ber o
f Cha
ptr 2
airc
raf
he w
orld
ae
fleet
3000t
Boeing 707
Boeing 727
Fokker F28
McDonnellDouglas DC-8
u in t
McDonnellDouglas DC-9Chapter 2aircraft totalYears
Source: Aerospace Industries Association (2006)
Figure 7.1: The decline in numbers of noisy aircraft

199
This re
aircraft
Technology Programs have resulted in the incorporation of such noise-reduction
technologies as nozzle chevrons, spliceless inlet linings, extended lining locations,
on existing and future airplanes (Herkes 2006).
radical ince town and regional
planning are best based on present knowledge a conservative approach to town
lanning should be adopted until such time as it is evident that substantially quieter
7.3.5
their report to the United States Congress, Waitz et al (2004) recommend that more
communicate aviation’s environmental effects, should be developed. The relevance of
is recommendation to South Africa is clear. The United States has the busiest airline
traffic in the world – in the first six months of 2006, nine out of ten of the worlds
States (Airports Council Inte has an average energy airport noise
aitz et al’s (2004) recommendation is made in the
information to airport neighbours. If this
where average energy n tours have been a requirement for some time and
ental aircraft noise information is now being
, and make a difference in understanding and dealing with the problem, a
It is ea
surrounding neighbourhoods. Aircraft noise does not directly cause serious health
problems, like poor air quality can; rather the effects are measured in terms of
presents a significant reduction in noise simply through removal of noisy
. But what other potential does noise reduction technology have? The Quiet
and redesigned wing anti-icing system
No doubt these will have their place, but given current technology and knowledge no
ly quieter aircraft are envisaged for the near future. S
p
aircraft are in the offing.
More effective tools and metrics
In
effective metrics and tools, including supplemental metrics to assess and
th
busiest airports as measured according to aircraft movements were in the United
rnational 2006) – and
policy (FAR Part 150) in place. W
light of dissatisfaction with average energy metrics and the need to provide better
has been recognised in the United States
oise con
where the provision of supplem
encouraged, then in South Africa supplemental noise information can be applied to
the problem
lot sooner.
7.4 PESSIMISTIC REALITIES
sy to find pessimism in a context of discussions on aircraft noise impact on

200
annoya
urban l re not prohibited from adding noisy aircraft to
eir fleets nor is there a planned phase-out of noisy aircraft in place, meaning that
Curfew
also n ted and neither are financial restrictions. Economists have
eveloped principles and techniques for the total economic valuation of
easures both the
irect and indirect effects of investment in environmental, social and economic assets.
very disturbing could be regarded as more expensive than similar movements during
e day when people are less likely to be disturbed. These movements may be priced
funds t m of compensation to affected residents.
lawmak e a difference
deficient and the noise issue is likely to become a more serious problem as aircraft
A
he difficulties encountered in scaling up actions for aviation-noise sustainability and
views
urbanisation and growth in air travel. The views of the SABS, local municipal
uthorities and airport neighbours play a leading role in the conflict. The SABS have
technic in the form of bylaws to
nforce the standards, and airport neighbours don’t trust the noise contours, believing
that they under report noise and are misleading.
nce and interference with activities, resulting in a negative impact on quality of
ife. In South Africa airlines a
th
these aircraft can be expected to operate into the foreseeable future.
s on aircraft operations at times when people are likely to be most sensitive are
ot implemen
d
environmental and related investment. Total economic valuation m
d
This includes non-market valuation aircraft noise. Aircraft noise at night when it is
th
accordingly, either to discourage night operations with noisy aircraft, and to raise
o pay some for
Whilst there remains a perception that aircraft noise is not a health problem,
ers are not inclined to make it a priority. The motivation to mak
is
flights increase and the demand for urban space continues.
7.5 FUTURE FRAMEWORK DIRECTION: A PROGRAMME FOR
CTION AND NEGOTIATION
T
increasing the effectiveness of their impact are threefold. The first lies in conflicting
on how to implement average energy noise contours given the rapid pace of
a
issued standards which in their view are sufficient. Local authorities recognise the
al authority of the SABS but don’t have the teeth
e

201
The second difficulty relates to the political processes required to translate principles
aft noise management into meaningful practice. The CAA have a draft white of aircr
paper on aviation and the environment which is yet to be finalised and implemented
y the Department of Transport. Lastly are the structural obstacles that are found at
Three d
on the o take. The question remains to what extent
ave the standards been translated into courses of action by local authorities and what
sustain s documented
ere, the role of the aviation industry, town planners and airport neighbours in South
recogn
blinker planning in the vicinity of airports as
videnced by the quantity of inappropriate housing developments near airport flight
noise.
depth u
to devi
noise b
democratisation of knowledge.
aken on three
omplementary paths to advance the process of consolidating action for aviation-noise
• tional supplemental
noise information
policy, including reference to supplemental noise analysis
b
different levels of the policy and decision making process.
ecades after the SABS first issued the standards, there are growing misgivings
most effective course of action t
h
future potential will the CAA’s white paper policy realise to make aviation more
able? Despite the usefulness of supplemental aircraft noise idea
h
Africa in sustainable development is under-represented. Aviation is increasingly
ised as part of the noise problem and rarely as part of the solution and a
ed approach is frequently encountered in
e
paths. A major reason for this lack of uptake is the poor understanding of planning for
This dissertation argues that one answer to dealing with aircraft noise requires an in-
nderstanding of the noise problem at a different level so as to empower people
se strategies that have a positive impact. Implementing supplemental aircraft
ased collaborative planning will empower citizens’ participation through this
To progress airport-noise sustainability, action should be t
c
sustainability. These are:
Updating SABS standards to encourage provision of addi
• Completing the CAA white paper on aviation and the environment and
implementing it as

202
• Harmonising the planning horizons of town planners and air traffic controllers,
n
planning and airspace design proposals.
The lim to guide land use planning
round airports contribute to a lack of motivation to even bother with using them.
occurrences, provided in a format which is readily understood by the layperson will
lay an important role in public involvement and decision making processes.
.6 AIRPORT NOISE AND ENVIRONMENTALLY SUSTAINABLE
An ass
at least
•
06:00. The
at home and when the survey in
this study has revealed that household activities are disrupted is not
• Secondly, three years since the inception of these standards is too short for
• Thirdly, there is no simple yardstick of measurement. Land-use planning is on
• ere is the problem of considering what would have been
the case if the standards had never been implemented.
A few y,
ANS 10103 and 10107 represent a moral commitment which provides a yardstick
dly, to
plement the standards, local authorities will have to build capacity and develop
their potential to become vehicles for development towards social justice and
then using supplemental noise analysis to expose the consequences of tow
ited trust in and reliability of the SABS standards
a
Supplemental aircraft noise information and particularly the number of event
p
7
URBAN DEVELOPMENT: CONCLUDING REMARKS
essment of outcomes of SANS 10103 and SANS 10117 is difficult to make for
four reasons.
Firstly, the scope is broad. Land-use planning is based on a 24 - hour period.
Noise-sensitive night periods are only catered for from 22:00 to
18:00 to 22:00 time period when people are
incorporated. The number of events is not included. It is impossible to see
whether the balance between success on one front is outweighed by failures in
other areas.
making a conclusive assessment of the standards.
a long timeframe which cannot be evaluated in a few short years.
In the final instance, th
general conclusions can still be drawn with these reservations in mind. Firstl
S
for critique although efficient action will only materialise slowly. Secon
im

203
economic development. Thirdly, although the standards are implemented as a top-
roject, participation by local authorities and other stakeholders is encoudown p raged.
ourthly, the standards embody a positive strategy for modernisation which tackles
oppone
addend equiring the provision of supplemental noise information,
articularly in the form of number of event occurrences would go a long way towards
improv nd embodying a positive strategy for
odernisation.
A num
scientific intent and real actions taken thus far is tenuous. Money to implement the
change
which environments, such as aircraft
oise, are not given priority. For example, reducing aircraft emissions will have a
advanc lem: the trick is to avoid some of the
roblems which technology seems to bring with it (Haughton & Hunter 1994). Thus
fectiveness of
ircraft noise regulation writes that “… limitation of noise levels to certain values of
substan o problems of community reaction to aircraft noise” (Fidell
999: 17).
Althou has a negative flavour, there
re positive examples in a national context. At the larger airports in South Africa, and
and lan
and con hich will continue to grow. Sustainable development is “…
t once economic, social, political and environmental. It is not limited to what rates of
develop economic impacts.” (Pugh 2000: 206).
F
the polarised approaches of ‘business as usual’ and the ‘fundamentalisms’ of
nts to airport development. Because these standards are already in place, an
um to the standards r
p
strengthening the moral commitment of SANS, implementing the standards,
ing local authority participation a
m
ber of items can also be listed on the negative side. The relationship between
standards must be made available. Town planners, business and industry are slow to
their behaviour in an acoustically environmentally friendly direction. Issues
are crucial for acoustically sustainable urban
n
negative impact on noise as more fuel has to be carried (Waitz 2006). Technological
es bring some solutions to the noise prob
p
it is not surprising that Sandford Fidell in his assessment of the ef
a
favoured noise metrics may therefore provide the appearance, rather than the
ce, of a solution t
1
gh the overall assessment of the national standards
a
slightly farther afield in Botswana, at least seven major airports are involved in noise
d-use master planning studies. Some attention is being given to participation
sensus building, w
a
economic growth are environmentally tolerable. Rather, it is more about patterns of
ment and their environment, social and

204
The measures at the disposal of the interested community can be summarised as a
of international agreements, government policies in waiting, efficient use of
resources a
mixture
private nd initiatives by grassroots organisations and local governments.
ore simply, the community needs to think and act, globally and locally.
t with those in
uthority being seen to be making the best effort, more will.
M
Notwithstanding the best efforts, not everyone will be satisfied, bu
a

205
REFE
asvang GM & Engdahl B 2001. Noise questionnaire database. [online] Bochum,
RENCES
A
Germany: Ruhr University. Available from http://eco.psy.ruhr-uni-
bochum.de/nqd/details.php?282 [Accessed 17 September 2004].
De Roo G (eds) Resolving urban environmental and spatial
conflicts, pp 135-152. Groningen: Geo Press.
Adams S 2006. Mango hits the skies – a little late. Pretoria News 16 November: 2.
acts_figures0405.cfm
Abbott NA & Pivo G 2000. Use and effectiveness of local government planning tools.
In Miller D &
Aerospace Industries Association 2006. Aerospace facts and figures [online]
Aerospace Industries Association: Arlington, VA. Available from:
http://www.iccaia.org/stats/facts_figures/ff_04_05/f
ports.co.za/home.asp?pid=1124
Airports Company South Africa 2006. Traffic stats. [online] Bedfordview: Airports
Company South Africa. Available from
http://www.air [Accessed 15 May 2006]
ports.org/aci/aci/file/ACIANRI(1).pdf
Airports Council International 2005. Aircraft noise rating index. [online] Geneva:
Airports Council International. Available from
http://www.air [Accessed 19 May
2006].
Airport
irservices Australia 1996. The long-term operating plan for Sydney airport and
Albee copy.
Washington DC: Wyle Laboratories.
s Council International 2006. Air traffic data. Airport World 11(5): 69.
A
associated airspace. Canberra: Airservices Australia.
W 2002. Why we must supplement DNL noise analysis. Duplicated
206
Albee W & Burn M 2004. An “inclusive” approach to noise planning and analysis.
Americ
merican Statistical Association.
ronmental and
spatial conflicts, pp 187-197. Groningen: Geo Press.
Arlingh
shford N & Wright PH 1979. Airport engineering. New York: John Wiley and Sons.
Attfield ambridge: Blackwell Publishing.
al
base. In Lo F & Yeung Y (eds) Globalisation and the world of large cities,
ell R 2001. The impact of airport noise on residential real estate. The Appraisal
erglund B, Lindvall T & Nordin S 1990. Adverse effects of aircraft noise.
Environment International 16: 315-338.
Duplicated copy. Washington DC: Wyle Laboratories.
an Statistical Association 1997. ASA Series What is a survey?. Alexandria,
VA: A
Archibugi F 2000. An instrument for environmental planning: the land-use resource
matrix. In Miller D & De Roo G (eds) Resolving urban envi
aus SL (ed) 1995. Practical handbook of spatial statistics. New York: CRC
Press.
Ashford N, Martin Stanton HP & Moore CA 1984. Airport operations. New York:
John Wiley and Sons.
A
R 2003. Environmental ethics. C
Badcock B 2002. Making sense of cities. London: Arnold.
Barnard WS 2001. Conceptions of geography. Stellenbosch: Centre for Geographical
Analysis.
Beavon K 1998. Johannesburg: coming to grips with globalization from an abnorm
pp352-388. Tokyo: United Nations University Press.
B
Journal July: 312-321.
B

207
Berglund B, Lindvall T & Schwela DH (eds) 1999. Guidelines for community noise.
Geneva: World Health Organisation.
erry BJL & Marble DF 1968. Spatial analysis. Engelwood Cliffs: Prentice Hall.
Blitch rgovernmental conflict: a case study in land-use
ottcher J 2004. Aircraft noise certification Annex 16, volume I and equivalent
ough G 2006. First-time travellers bring boom to airports. Cape Times 23 October:
ment Division 99: 15-
23.
Brennan P, Orth K, Conner L & Schwartz T 1991. Airport community noise
regulations – their impact on our industry. Airliner Oct-Dec: 6-12.
Breuste on of
indigenous vegetation within urban development. Landscape and Urban
ristow A, Wardman M, Heaver C, Murphy P, Hulme K, Dimitriu D, Plachinski E,
Eurocontrol Experimental Centre.
oise/public/en_gb
B
SG 1976. Airport noise and inte
parochialism. Ecology Law Quarterly 5(4): 669-705.
B
procedures. Paper (delivered) at the Noise Certification Workshop, Montreal.
B
5.
Bragdon CR 1973. Noise control in urban planning. American Society of Civil
Engineers Journal of the Urban Planning and Develop
JH 2004. Decision making, planning and design for the conservati
Planning 68: 439 – 452.
B
Hullah P & Eliff T 2003. Attitudes towards and values of aircraft annoyance
and noise nuisance. (Report No. EEC/SEE/2003/002). Bretigny Sur Orge,
France:
British Airways 2006. Land use planning. [online] London: British Airways.
Available from http://www.britishairways.com/travel/crn
[Accessed 20 May 2006].

208
Bronzaft AL 2004. Noise pollution. In Stapleton RM (ed) Pollution A to Z [online]
=22&docNum=CX340810018
New York: Macmillan Reference USA. Available from
http://galenet.galegroup.com/servlet/eBooks?ste
0> [Accessed 14 June 2004].
Bronza
rooker P, Critchley JB, Monkman DJ & Richmond C 1985. United Kingdom aircraft
rooks-Gunn J, Duncan GJ, Klebanov PK & Sealand N 1993. Do neighbourhoods
rown VA 1999. Ground-truthing ecologically sustainable development. In
Routledge.
uttimer A 1993. Geography and the human spirit. Baltimore: The Johns Hopkins
handa R 2000.Towards contextualizing environmental quality in the SADC region.
laassen PE & Milton JRL 1992. Land-use planning. In Fuggle RF & Rabie MA
. Cape Town:
Juta & Co.
ft AL, Ahern KD, McGinn R, O’Conner J & Savino B 1998. Aircraft noise: A
potential health hazard. Environment and Behaviour 30(1): 101-112.
B
noise index study: main report. (Office report No. DR Report 8402). London:
Civil Aviation Authority.
B
influence child and adolescent development? In Haining R. Spatial data
analysis: theory and practice. Cambridge: Cambridge University Press.
B
Buckingham-Hatfield S & Percy S (eds) Constructing local environmental
agendas. People, places and participation, pp140-155. London:
Burns W. 1968. Noise and man. London: John Murray.
B
University Press.
C
South African Geographical Journal 82,2: 122-129.
C
(eds) Environmental management in South Africa, pp715-738

209
Cloke P, Cook I, Crang P, Goodwin M, Painter J, & Philo C 2004. Practising human
Cohen
of urban government: policies and practises. pp5-17.
Washington DC: World Bank Institute.
Cohn L n Urban Transportation. Journal
of Transportation Engineering 113,3: 229-247.
Comm
ssess airport noise. Discussion Paper. Canberra:
Commonwealth Department of Transport and Regional Services.
Connor ffice report No NASA
SP-189). Sine loco: National Aeronautics and Space Administration.
oppinger R 2005. Stowable powerplant under study in silent aircraft project. Flight
com/sscalc.htm
geography. London: Sage Publications.
M 2001. The impact of the global economy on cities. In Freire ME & Stren RE
(eds) The challenge
& Harris R 1987. Environmental Planning i
onwealth Department of Transport and Regional Services 2000. Expanding
ways to describe and a
WK 1968. Community reactions to aircraft noise. (O
C
International 1-7 February: 25.
Creative Research Systems 2004. The survey system [online]. Petaluma, California:
Creative Research Systems. Available from
http://www.surveysystem. [Accessed 5 June 2006].
Dahiya C & Pugh C 2000. The localization of Agenda 21 and the sustainable cities
programme. In Pugh C (ed) Sustainable cities in developing countries, pp152-
D’Ang
Depart Communities and Local Government 2006. Planning policy guidance
24: planning and noise [online]. London: Office of the Deputy Prime Minister.
Cresswell T 2004. Place: a short introduction. Malden: Blackwell Publishing.
184. London: Earthscan Publications.
elo A 2006. Myburgh chairs Ugandan airline. The Star 21 November: 7.
ment for

210
Available from: .
http://www.odpm.gov.uk/index.asp?id=1144100#P32_2161 [Accessed 20
May 2006].
Department for Transport 2005. Night flying restrictions at Heathrow, Gatwick and
l version1.0. Canberra: Department of
Transport and Regional Services.
e Roo G & Bartelds H 1996. Quiet areas: a noble failure!? Town Planning Review
ickinson GC 1973. Statistical mapping and the presentation of statistics. 2nd ed.
Downi
on Noise Control
Engineering, Prague.
Doyle omas Telford.
cyclopedia of science 3rd ed. [online] Detroit: Gale. Available
from
Stansted Airports. London: Department for Transport.
Department of Transport and Regional Services 2005. TNIP-Expert. Transparent
noise information package. Setup manua
D
67(1): 87-95.
D
London: Edward Arnold.
ng JM 2004. Noise simulation modelling for airport noise analysis. Paper
delivered at the 33rd International Congress and Exposition
RH 1998. Airports for people. London: Th
Dryzek J 1997. The politics of the Earth: environmental discourses. Oxford:
Blackwell.
Duckworth C & Frost R 2004. Noise pollution. In Lerner KL & Wilmoth Lerner B
(eds) Gale en

211
http://galenet.galegroup.com/servlet/eBooks?ste=22&docNum=CX341850157
8 > [Accessed 14 June 2004].
unstan F, Weaver N, Araya R, Bell T, Lannon S, Lewis G, Patterson J, Thomas H,
Eagan ME 2006. Noise. Transportation Research Circular January
Eckdis
5.
kurhuleni Metropolitan Municipality 2003b Integrated Development Plan 2003 -
Ekurhu 004 State of the environment report: 2004.
Germiston: Ekurhuleni Metropolitan Municipality.
Elander I & Lidskog R 2000. The Rio declaration and subsequent global initiatives. In
Low N, Gleeson B, Elander I & Lidskog R (eds) Consuming cities, pp30-53.
nmarker I & Boman E 2004. Noise responses of middle school pupils and teachers.
D
Jones P & Palmer S 2005. An observational tool to assist with the assessment
of urban residential environments. Journal of Environmental Psychology
25:293-305.
Ebdon D 1977. Statistics in geography. a practical approach. Oxford: Basin
Blackwell.
h Knack R & Schwab J 1986. Learning to live with airports. Planning Practice
52: 11-1
Ekurhuleni Metropolitan Municipality 2003a First year state of the environment
report 2003. Germiston: Ekurhuleni Metropolitan Municipality.
E
2007. Germiston: Ekurhuleni Metropolitan Municipality.
leni Metropolitan Municipality 2
London: Routledge.
E
Journal of Environmental Psychology 24: 527-536.

212
European Transport Forum 1995. JNE Twigg: Manchester airport runway 2 –
& Percy S (eds)
Constructing local environmental agendas. People, places and participation,
astl H & Widman U 1990. Technical note: subjective and physical evaluation of
ederal Aviation Administration 1994. The effect of airport noise on housing values:
Washington
D.C.: Federal Aviation Administration.
Federa ise Model Release 6.1.
Washington D.C: Federal Aviation Administration.
Federal Interagency Committee on Aviation Noise 2002. The use of supplemental
noise metrics in aircraft noise analysis. [Online] Burlington: Federal
/supplemetal_metrics.pdf
planning and public inquiry: does anyone want a runway? 23rd European
Transport Forum, sine loco.
Evans B & Percy S 1999. The opportunities and challenges for local environmental
policy and action in the UK. In Buckingham-Hatfield S
pp172-185. London: Routledge.
F
aircraft noise. Noise Control Engineering Journal 35(2): 61-63.
F
a summary report. (Office report No. DTFA-01-93-C-00065).
l Aviation Administration 2003. Integrated No
Interagency Committee on Aviation Noise. Available from
http://www.fican.org/pdf [Accessed 11 November
2006].
Federe
idell S 1990. An historical perspective on predicting the annoyance of noise
Fink A & Kosecoff J 1998. How to conduct surveys. 2nd ed. Beverley Hills, CA: Sage.
r WT 1973. Statistics and society. New York: Marcel Dekker.
F
exposure. Paper delivered at Noise-Con 90, Austin Texas.
Fidell S 1999. Assessment of the effectiveness of aircraft noise regulation. Noise
Health 1,3: 17-26.

213
International 2005. The wrong stuff. Flight InternationalFlight 15-21 February: 3.
ujii K, Soeta Y & Ando Y 2001. Acoustical properties of aircraft noise measured by
Gauten
dards of the Gauteng Department of Agriculture
conservation and Environment [Online] Johannesburg: Gauteng Department
.gov.za/html/PDF/FeatureIIStandards20-09-
Foster P 1996. Observational Research. In Sapsford R & Jupp V (eds) Data collection
and analysis, pp57-93. London: Sage Publications.
Fuggle RF & Rabie MA 1999. Environmental management in South Africa. Cape
Town: Juta.
F
temporal and spatial factors. Journal of Sound and Vibration 241(1): 69-78.
g Department of Agriculture, Conservation and Environment s.d. Service
delivery charter and stan
of Agriculture Conservation and Environment. Available from
http://www.gdace.gpg
05%20(2).pdf [Accessed 13 February 2006].
Gauten 999. GN.5479:
Noise control regulations – Gauteng. Johannesburg: Gauteng Department of
auteng Provincial Government 2006. Gauteng City Region. Gauteng News July: 3.
Gelden
lazewski J 2000. Environmental law in South Africa. Durban: Butterworths.
g Department of Agriculture Conservation and Environment 1
Agriculture Conservation and Environment.
G
huys H 2006. New runway may spell disaster for suburb. Sunday Times Metro.
10 September 2006:1.
Gilbert R, Stevenson D, Girardet H & Stren R 1996. Making cities work. The role of
local authorities in the urban environment. London: Earthscan Publications.
G

214
Glazewski J 2002. The rule of law. In McDonald DA (ed) Environmental justice in
South Africa, pp171-198. Cape Town: University of Cape Town Press.
leeson B & Low N 2000. Cities as consumers of the world’s environment. In Low
oldschagg PL 2001. SABS 0117 review. (Report SABS 0117 Review) Pretoria:
Goldsc
ional Research in Geographical and Environmental Education. 11,2:
72-75.
abermas J 1995. Between facts and norms: contributions to a discourse theory of
Haggett P 1990. The geographer’s art. Oxford: Basil Blackwell Ltd.
al of the
Acoustical Society of America. 76,4: 1161-1168.
Hall P ung Y (eds)
Globalisation and the world of large cities, pp17-36. Tokyo: United Nations
Hardoy
urbanizing world. London: Earthscan.
G
N, Gleeson B, Elander I & Lidskog R (eds) Consuming cities, pp1-29.
London: Routledge.
G
South African Bureau of Standards.
hagg PL 2002. Airport noise and environmental justice in South Africa.
Internat
Goodall B 2000. Planning and pollution abatement: a role for environmental auditing.
In Miller D & De Roo G (eds) Resolving urban environmental and spatial
conflicts, pp 153-171. Groningen: Geo Press.
H
law and democracy. Cambridge: Polity.
Haining R 2003. Spatial data analysis: theory and practice. Cambridge: Cambridge
University Press.
Hall FH 1984. Community response to noise: Is all noise the same? Journ
1998. Globalization and the world cities. In Lo F & Ye
University Press.
JE, Mitlin D & Satterthwaite D 2001. Environmental problems in an

215
m T & Allison M 2000. Health, governance and the environment. In Pugh C
(ed) Sustainable cities in deve
Harpha
loping countries, pp115-134. London:
Earthscan.
Harvey ation in geography. London: Edward Arnold.
aughton G & Hunter C 1994. Sustainable cities. London: Jessica Kingsley.
Hazard
ealth Canada 2001. Noise from civilian aircraft in the vicinity of airports -
Heffernan M 2003. Histories of geography. In Holloway SL, Rice SP & Valentine G
(eds) Key concepts in geography, 3-19. London: Sage Publications.
Heinon aa H
& Koskenvuo M 2000. Self-report of transportation noise exposure,
erkes B. 2006. The quiet technology demonstrator 2 flight test. Paper delivered at
Hirama i T, Miyakita T, Ito A, Tokuyama T, Osada Y & Yamamoto T
2002. Population-based questionnaire survey on health effects of aircraft noise
D 1969. Explan
Harvey D 1996. Justice, nature and the geography of difference. Cambridge, MA:
Blackwell Publishers.
H
WR 1971. Predictions of noise disturbance near large airports. Journal of
Sound and Vibration 15(4): 425-445.
H
implications for human health. Ottawa: Minister of Health.
en-Guzejev M, Vuorinens HS, Kaprio J, Heikkilag, K Mussalo-Rauham
annoyance and noise sensitivity in relation to noise map information. Journal
of Sound and Vibration 234,2: 191-206.
H
the University of California Technology Transfer Program Conference, Palm
Springs.
tsu K, Matsu
on residents living around U.S. airfields in the Ryukus – Part II: an analysis of

216
the discriminant score and the factor score. Journal of Sound and Vibration.
250(1): 139-144.
oggart K, Lees L & Davies A 2002. Researching human geography. London:
Holt-Je ory and concepts. (3rd ed) London: Sage
Publications.
Horonj
-Hill.
t
operations: an assessment of annoyance by noise level and time of day.
ine] Geneva: International Civil Aviation Organisation. Available
from www.icao.int/icao/en/env/noise.htm
H
Arnold.
nsen A 1999. Geography hist
eff R & McKelvey F 1983. Planning and design of airports. New York:
McGraw
Hume K, Gregg M , Thomas C & Terranova D 2003. Complaints caused by aircraf
Journal of Air Transport Management 9: 153-160.
International Civil Aviation Organisation 1985. Airport planning manual Part 2 land
use and environmental control. 2 ed. Montreal: International Civil Aviation
Organisation.
nd
International Civil Aviation Organisation 1988. Recommended method for computing
airport noise contours around airports. Montreal: International Civil Aviation
Organisation.
International Civil Aviation Organisation 2002. Airport planning manual Part 2 land
use and environmental control. 3 ed. Montreal: International Civil Aviation
Organisation.
rd
International Civil Aviation Organisation 2004. Assembly resolutions in force. Doc
9848 [onl
[Accessed 1 February 2006].
Jenkins ouncil for
Educational Research.
P 1999. Surveys and questionnaires. Wellington: New Zealand C

217
Job RFS 1993. Psychological factors of community reaction to noise. In Staples SL,
Cornelius RR & Gibbs M. Noise disturbance from a developing airport.
ohnston CJ 1992. Noise. In Fuggle RF & Rabie MA (eds) Environmental
ingsley-Jones M 2005b. Turning a circle. Flight International 11-17 February: 38.
Kryter sources.
Journal of the Acoustical Society of America 72(4): 1222-1242.
Kryter fects of noise on man. Orlando: Academic Press.
Perceived risk or general annoyance? Environment and Behaviour 31(5): 692-
710.
J
management in South Africa, 569-589. Cape Town: Juta & Co.
Johnson K & Button K 1997. Benefit transfers: are they a satisfactory input to benefit
cost analysis? An airport noise nuisance case study. Transportation Research
D 2,45: 223-231.
Johnston R 2003. Geography and the social science tradition. In Holloway SL, Rice
SP & Valentine G (eds) Key concepts in geography, pp3-19. London: Sage
Publications.
Kingsley-Jones M 2005a. ATR confident as orders for turboprops recover. Flight
International 8-14 February: 18.
K
KD 1982. Community annoyance from aircraft and ground noise
KD 1985. The ef
Lehohla P 2004. Stats in brief, 2004. Ten years of democratic governance. Pretoria:
Statistics South Africa.
Light A & Rolston H 2003. (eds) Environmental ethics. An anthology. Oxford:
Blackwell Publishers.

218
Lo F & Yeung Y 1998. Globalization and the world of large cities. Tokyo: United
Nations University Press.
Madej E 2001. Cartographic design using ArcView GIS. Albany, NY: OnWord Press.
akgale S 2006. Tackling noise pollution [online] Bedfordview: Airports Company M
South Africa. Available from
http://www.airports.co.za/home.asp?PID=456&ToolID=2&ItemID=503
[Accessed 26 May 2006].
Malone L, Palmer AM & Voigt CL 2002. Mapping our world. GIS lessons for
educators. Redlands: ESRI Press.
Mandel J 1995. Analysis of two way layouts, New York: Chapman and Hall.
Massey D 1999. On space and the city. In Massey D, Allen J & Pile S (eds)
Understanding cities. City worlds. London: Routledge.
Massey D, Allen J & Sarre P (eds) 1999. Human geography today, Cambridge: Polity
Press.
May M & Hill SB 2006. Questioning airport expansion – a case study of Canberra
International Airport. Journal of Transport Geography. 14(6): 437-450.
Mayhew S 2004. Oxford dictionary of geography. 3rd ed. Oxford: Oxford University
Press.
McDonald DA 2002. What is environmental justice? In McDonald DA (ed)
Environmental Justice in South Africa. Cape Town: University of Cape Town
Press.
McMillen DC 2004. Airport expansions and property values: the case of Chicago
O’Hare Airport. Journal of Urban Economics 55: 627-640.

219
McNeill D 2004. New Europe: imagined spaces. London: Arnold.
oks/Cole.
iyakita T, Matsui T, Ito A, Tokuyama T, Hiramatsu K, Osada Y & Yamamoto T
2002. Population-based questionnaire survey on health effects of aircraft noise
on residents living around U.S. airfields in the Ryukyus - part I: an analysis of
12 scale scores. Journal of Sound and Vibration 250,1: 129-137.
Moore TJ 2000. Environmental equity and air toxics: a model for GIS-based risk
management. In Miller D & De Roo G (eds) Resolving urban environmental
and spatial conflicts, 199-222. Groningen: Geo Press.
Moote MA, McClaran MP & Chickering DK 1997. Theory in practice: applying
participatory democracy theory to public land planning. Environmental
Management 21, 6: 877-889.
Morgan S & Mitchell B 1998. Effective management of conflict and change in noise
pollution. Duplicated copy. Waterloo: University of Waterloo.
Morgan S 1999. Airport Noise Geographical Information System. Seniors Honours
Essay. Waterloo: University of Waterloo, Faculty of Environmental Studies.
Morimoto R & Hope C 2005. Making the case for developing a silent aircraft.
Transport Policy 12: 165-174.
Moustakas CE 1990. Heuristic research: design, methodology, and applications.
Newbury Park: Sage Publications.
Nagle G 2000. Advanced geography. Oxford: Oxford University Press.
National Department of Transport 2005. White paper on national civil aviation policy.
Duplicated copy. Pretoria: National Department of Transport.
Miller G 2005. Living in the environment. Principles, connection and solutions. 14
ed. Pacific Grove, CA: Thomson Bro
th
M

220
Nero G & Black JA 2000. A critical examination of an airport noise mitigation
scheme and an aircraft noise charge: the case of capacity expansion and
externalities at Sydney (Kingsford Smith) airport. Transportation Research
Part D 5: 433-461.
Neuman WL 2006. Social research methods. Qualitative and quantitative
approaches. [sixth edition] Boston: Pearson.
Newman I & Benz CR 1998. Qualitative-quantitative research methodology:
exploring the interactive continuum. Carbondale and Edwardsville: Southern
Illinois University Press.
Newton RR & Rudestam KE 1999. Your statistical consultant: answers to your data
analysis questions. Thousand Oaks: Sage Publications.
Norris G 2005a. Not if…but when. Flight International 7-13 June: 60.
Norris G 2005b. Wearing chevrons. Flight International 22-28 November: 26.
Ohrstrom E, Hadzibajramovic E, Holmes M & Svensson H 2006. Effects of road
traffic noise on sleep: studies on children and adults. Journal of Environmental
Psychology 26: 116-126.
Omar AM 1999. Aircraft noise and engine emissions [online]. Pretoria: Minister of
Transport. Available from: http://www.polity.org.za/pol/search/ [Accessed 25
May 2005]
Omar AM 2003. The ninth aviation and allied business leadership conference. Paper
(delivered) at the Ninth aviation and allied business leadership conference
[online] available from
http://www.polity.org.za/pol/search/content/?show=39844 [Accessed 25 May
2006].
221
Organisation for Economic Co-operation and Development 1986. Fighting noise.
Strengthening noise abatement policies. Paris: Organisation for Economic Co-
operation and Development.
Pacione M 2001. Urban geography: a global perspective. London: Routledge.
Pickles J 2004. Computing geographical futures. In Cloke P, Crang P & Goodwin M
(eds) Envisioning human geographies, pp172-194. London: Arnold.
Pillay U, Tomlinson R & Du Toit J 2006. Democracy and delivery: urban policy in
South Africa. Cape Town: HSRC Press.
Porter ND, Kershaw AD & Ollerhead JB 2000. Adverse effects of night-time aircraft
noise. (Report no 9964). London: Civil Aviation Authority.
Porteous JD 1977. Environment and behaviour: planning and everyday urban life.
Reading, Massachusets: Addison-Wesley.
Pressley D 2006. Goodbye, Jo’burg International Airport. Mail & Guardian [online]
Available from
http://www.mg.co.za/articlePage.aspx?articleid=282698&area=/breaking_new
s/breaking_news__national/ [Accessed 21 September 2006]
Province of Gauteng 1999. Noise control regulations – Gauteng GN 5479. Provincial
Gazette of Gauteng (5479), 20.08.1999.
Province of the Western Cape 1998. Noise control regulations – Western Cape 5309.
Provincial Gazette of the Western Cape (5309), 20.11.1998.
Pugh C 2000. Sustainable cities in developing countries. London: Earthscan
Publications.

222
Quehl J & Basner M 2006. Annoyance from nocturnal aircraft noise exposure:
laboratory and field-specific dose-response curves. Journal of Environmental
Psychology 26: 127-140.
Radebe J 2004a. 17th Plenary Session of African Civil Aviation Commission. Paper
(delivered) at the 17th Plenary Session of the African Civil Aviation
Commission [online] available from
http://www.polity.org.za/pol/search/content/?show=50786 [Accessed 25 May
2006].
Radebe J 2004b. Airlines Association of Southern Africa Annual General Meeting &
Conference. Paper (delivered) at the Airlines Association of Southern Africa
Annual General Meeting & Conference [online] available from
http://www.polity.org.za/pol/search/content/?show=58510 [Accessed 25 May
2006].
Rachami J 2006. Integrating airspace redesign and airport planning:
a vital step towards sustainability. Paper delivered at the University of
California Technology Transfer Program Conference, Palm Springs.
Rakodi C 1998. Globalization trends and sub-Saharan African cities. In Lo F &
Yeung Y (eds) Globalisation and the world of large cities, pp314-351. Tokyo:
United Nations University Press.
Rautenbach IM & Malherbe EFJ 2004. What does the constitution say? Pretoria: Van
Schaik.
Riley J 1990. Getting the most from your data. A handbook of practical ideas on how
to analyse qualitative data. Bristol: Technical and Educational Services Ltd.
Rondganger L 2004. New zero-frill airline begins price war. The Star 22 January: 3.
Rooney K, Carney F, Soukhanov AH, Jellis J, Clarke P & Yates S (eds) 1999.
Encarta world English dictionary:1285, London: Bloomsbury Publishing.

223
Rylander R & Björkman M 1997. Annoyance by aircraft noise around small airports.
apsford R & Jupp V 1996. Validating evidence. In Sapsford R & Jupp V (eds) Data
anthology. Oxford: Blackwell Publishers.
d external costs: a
elf . tation Research Part B 37: 699-718.
S 3. Statistical graphics. New York: John Wiley and Sons.
p25-55. London: Sage Publications.
Schultz TJ 1978. Synthesis of social surveys on noise annoyance. Journal of the
u Society of America 64(2): 377-405.
Survey research for geographers. Washington DC: Association of
Singh RB 2000. Urbanization in India’s metropolis Delhi: problems and perspectives.
il de Roo G (eds) Resolving urban environmental and spatial
oningen: GeoPress.
Smillie S 2006. R11bn facelift for Joburg International. The Star 24 May: 2.
Smit GJ 1995. Research guidelines for planning and documentation. Halfway House:
Southern Book Publishers.
Journal of Sound and Vibration 205(4): 533-537.
S
collection and analysis, pp1-24. London: Sage Publications.
Scherer D 2003. The ethics of sustainable resources. In Light A & Rolston H 2003.
(eds) Environmental ethics. An
Schipper Y, Rietveld P & Nijkamp P 2003. Airline deregulation an
w are analysis Transpor
chmid CF 198
Schofield W 1996. Survey Sampling. In Sapsford R & Jupp V (eds) Data collection
and analysis, p
Aco stical
Sheskin IM 1985.
American Geographers.
In M ler D &
conflicts, pp27-37. Gr
224
Smith B, Peters RJ & Owen S 1996. Acoustics and noise control 2nd ed. Essex:
S 4. S ce and stance in ge y. In Cloke P, Crang P & Goodwin M
n ioning h an geograp es, pp11-28. London: Arnold.
S 99. space anding the scope of the geographical imagination. In
arre P ( uman raph ay, pp 260-277.
ss.
Addison Wesley Longman Limited
mith N 200 pa sub ograph
(eds) E vis um hi
oja EW 19 Third : exp
Massey en D, All J & S eds) H geog y tod
Cambridge: Polity Pre
South Africa 1989. Environment Conservation Act, Act 73 of 1989. [online]
Available from http://gw.capetown.gov.za/wcms/eDocuments/Act_-
_Environmental_Conservation_-_73_of_1989__75200519579_257.pdf
[Accessed 25 May 2006].
South Africa 1996. The Constitution of the Republic of South Africa 1996. Pretoria:
South Africa 2005. l ci tion Pretoria:
ep nt of Transport.
Standards 1974. SABS 0117-1974 Code of practice for the
mination and limitation of disturbance around an aerodrome due to noise
eroplanes. Pretoria: Council of the South African Bureau of Standards.
au of Standards 1997. SABS 0103-1997 The measurement and
rating of environmental noise with respect to annoyance and speech
communication. Pretoria: Council of the South African Bureau of Standards.
Government Printer.
South Africa 1998. National Environmental Management Act, Act 107 of 1998.
Government Gazette of South Africa 401 (19519) 27.11.1998.
White paper on nationa vil avia policy.
D artme
South African Bureau of
deter
from a
South African Bure

225
Stallen P J M & Compagne H 2006. Residential preferences in noise annoyance
nces
Standards So r 0 S : 2003 South African national standard:
cu a e raft noise around airports for land use
tandards South Africa 2004. SANS 10103: 2004 South African national standard:
The measurement and rating of environmental noise with respect to land use,
S B , Lopez-Barrio I, Fischer P, Öhrström E, Haines M
mp I & Berry B F 2005. Aircraft and road traffic
an ildren gnition and health: a cross-national study. The Lancet
365: 1942-1949.
RR, & Gibbs MS 1999. Noise disturbance from a developing
airport: perceived risk or general annoyance. Environment and Behaviour
1971. The Random House dictionary of the English language. New York:
ho
tfo A. 1974. rports and th nvironment ondon: M Millan Press.
Swift B 1996. Preparing numerical data. In Sapsford R & Jupp V (eds). Data
collection and analysis, pp154-183. London: Sage Publications.
The Aero 1911. On the fitting of silencers. As quoted by Wyle Aviation News Issues
Digest ([email protected]
reduction: history of exposure matters much. Leiden: University Department
of Social Scie
uth Af ica 20 3. SAN 10117
Cal lation nd pr diction of airc
purposes. Pretoria: Standards South Africa.
S
health, annoyance and to speech communication. Pretoria: Standards South
Africa.
tansfeld S A, erglund B, Clark C
M, Head J, Hygge S, van Ka
noise d ch ’s co
Staples S, Cornelius
31:5.
Stein
Random use.
Stra rd Ai e e . L ac
) 2006 Re: aviation-noise-
issues digest. E-mail to P Goldschagg ([email protected]) (11 January).

226
Thomas C 1996. Noise related to airport operations – community impacts. In Tunstall
mas Telford.
T Des s that w by step housa
Corwin Press.
Thrift N 2003. Space: the fundamental stuff of human geography. In Holloway SL,
Rice SP & Valentine G (eds) Key concepts in geography, pp95-107. London:
Sage Publications.
. Airport noise complaints: talking the same language. [online]
Vancouver: Acoustical Society of America. Available from
Pedoe N, Raper D & Holden J (eds) Environmental management at airports,
pp 8-34. London: Tho
homas SJ 1999. igning survey ork! A step guide. T nd Oaks:
Timmerman N 2005
http://www.acoustics.org/press/149th/timmerman.html [Accessed 31 January
2006].
T Urban y. In P mlinson R & du Toit J (eds)
Democracy and delivery: urban p South Afri -74. Cap n:
HSRC Press.
T rso 1970 hophysical s methods. In Chalupnik JD (ed)
, pp165-173. Seattle: University of London Press.
United Nations 2003. United Nations Human Settlements Programme. [online]
Geneva: United Nations. Available from:
http://www.unchs.org/about/history.asp
odes A 2006. spatial polic illay U, To
olicy in ca, 50 e Tow
orge n WS . Psyc caling
Transportation noises
[Accessed 21 June 2006].
United Nations 2005. United Nations Conference on Environment and Development.
Agenda 21 [online]. Geneva: United Nations. Available from:
http://www.un.org/esa/sustdev/documents/agenda21/index.htm [Accessed 20
June 2006].
United Nations Economic Commission for Europe 2006. Aarhus Convention on
Access to Information, Public Participation in Decision-making and Access to

227
Justice in Environmental Matters [online]. Geneva: United Nations. Available
from: http://www.unece.org/env/pp/welcome.html [Accessed 18 August
2006].
U Nati staina gramm elter online] Geneva:
http://www.unhabitat
nited ons Su ble Cities Pro e 2006. Sh for all. [
.org/categorietid=369United Nations. Available from
[Acc 27 Sep r 2006].
United States General A ffice 20 iation and ironme A
le jor airport noise programs. ashington D.C.: General Accounting
U T 19 e place graphy. Harlow: Longman Sc ic and Te al
U 99 ing thr tatistics. Bel adsworth Publishing.
Van der Linde M 2003. Environmental study/management/science orientated papers,
rican geograph s during the pe d 1996-200 ast
dissertation. Johannesburg: Rand Afrikaans University, Faculty of Arts.
m
controlled-area demarcation in South Africa: its application at Cape Town
International airport. South African Journal of Science. 10
V r M JH on Ho 2006 oot f aircraft noise
ex e at e Tow rnatio por h A Geographical
Van Heerden M 2000. Civil aviation to lend an ear to noise levels Pretoria Rekord 17
March: 1.
Van Kampen 2005. Annoyance from air traffic noise. Possible trends in exposure-
response relationships. (Report No. 01/2005 MGO EvK Reference
essed tembe
ccounting O 00. Av the env nt: FA ’s
ro in ma W
Office.
nwin 92. Th of geo ientif chnic .
tts JM 1 6. See ough s mont: W
published by South Af er rio 1. M ers
Van der Merwe JH & Von Holdt DS 2005. Aircraft noise manage ent through
1: 1–9.
an de erwe & V ldt DS . Environmental f print o
posur Cap n Inte nal air t. Sout frican
Journal 88,2:177-193.

228
00265/2005). Bilthoven: Dutch Ministry of Housing and Environmental and
Voogd H 2000. Urban environm pe n a sation. In
Miller D & de Roo G (eds) Resolving urban environmental and spatial
co 91- ronin eoPre
perspectives of air transportation. The Professional
vironmental
spillovers in urban areas. In Miller D & de Roo G (eds) Resolving urban
environmental and spatial conflicts pp 39-62. Groningen: GeoPress.
IA wns , Cutc rshen Gr E & Kerrebrock J 2004.
A n a the env ent. A al v stat framework for
ded actions. (Report No. 03-C-NE-MIT). Cambridge,
husetts Institute of Technology.
aitz IA 2006. Benefit-cost analysis of aviation and environmental impacts. Paper
(delivered) at the 2006 Aviation Noise and Air Quality Symposium, Palm
Wallenius MA 2004. The interaction of noise stre d pe ect stress on
s v h. J of Envi tal olog 67-177.
W ag 20 efo ucial’ i se b e. Flight International 8-14
Wijnen RAA & Visser HG 2003. Optimal departure trajectories with respect to sleep
disturbance. Aerospace Science and Technology 7: 81–91.
World Health Organisation 1946. Constitution of the world health organization. New
York: World Health Organisation.
Spatial Planning.
ental pollution: rceptio nd compen
nflict: 102. G gen: G ss.
Vowles TV 2006. GeographicGeographer 58(1): 12–19.
Wagner D 2000. German planning principles preventing and reducing en
Waitz , To end J her-Ge feld J, eitzer
viatio nd ironm nation ision ement,
goals and recommen
MA.: Massac
W
Springs.
ss an rsonal proj
ubjecti e healt ournal ronmen Psych y 24: 1
astn e J 05. R rm ‘cr n noi attl
November: 13.

229
World Health Organisation Regional Office for Europe 2001. WHO technical meeting
on aircraft noise and health. Bonn: World Health Organisation.
Zaporozhets OI & Tokarev VI 1998. Aircraft noise modelling for environmental
asse t ar irp plied Acoustics 55(2): 99-127.
p information systems and their applicability to
ional authorities: the Western Cape Regional Council.
23, Stellenbosch: Institute for Cartographic Analysis,
lenbosch.
ssmen ound a orts. Ap
Zietsman HL 1991. Geogra hical
metropolitan reg
Publication no.
University of Stel

230
APPENDICES Appendix A: Examples of the English and Afrikaans versions of the covering
letter, questionnaire, and reminder letter

231

232

233

234
Appendix B: Tables upon which graphs are based, and Chi squared tests of
significance.
In this appendix, the tables of data from which the graphs were drawn are included,
and where relevant, the chi squared significance test results. The pattern will be
followed of presenting first the figure number and title of the figure, then the table,
then the chi squared significance test.
Table B 1: Figure 4.4 Number of surveys distributed and returned:
Group Distributed ReturnedControl 50 31 Suburb 750 232 Township 80 66 Total 880 329
Table B 2: Figure 4.5 Percentage of responses returned per sub group, and the total
percentage returned:
Group % returned Control 62 Suburb 30.93 Township 82.5 Total 37.38
Table B 3: Figure 4.6 Control group and experiment group percentages reporting
being highly annoyed due to aircraft noise between 6pm and 6am:
Group % highly annoyed Control 3.23 Experiment 32.77
Number of respondents: 316

235
Table B 4: Figure 4.7 Annoyance reported vs. frequency of hearing aircraft noise.
Highly Annoyed
Considerably Annoyed
Moderately Annoyed
Slightly Annoyed
Not Annoyed
Never hear 0 0 14.29 14.29 71.43 Seldom hear 0 0 0 8.7 91.3 Sometimes hear 0 0 13.89 22.22 63.89 Often hear 1.49 16.42 28.36 32.84 20.9 Very often hear 58.64 20.37 11.11 6.79 3.09
Number of respondents: 327
Chi squared: 137.30
Table B 5: Figure 4.8 Percentage of control group and experiment group split into
suburb and township groups reporting being highly annoyed due to aircraft noise
between 6pm and 6am
Group % highly annoyed Control 3.23 Suburb 30 Township 42.42
Number of respondents: 327
Table B 6: Figure 4.10 100% bar graph illustrating the distribution within each sub-
group including control group, and experiment group split into suburb and township
groups reporting being highly annoyed due to aircraft noise between 6pm and 6am
Group Highly annoyed
Considerably annoyed
Moderately annoyed
Slightly annoyed
Not at all annoyed
Control 3.23 3.23 3.23 6.45 83.87 Suburb 30 14.78 13.04 14.35 27.83 Township 42.42 15.15 19.7 16.67 6.06
Number of respondents:
Control: 31
Suburb: 230
Township: 66
Chi-squared: 39.73

236
Table B 7: Figure 4.13 Percentage Sleep, TV, Phone and Work, very often interfered
with, by sub-group.
Group Sleep TV Phone Work/study Control 6.45 0 0 0 Suburb 22.84 34.4 27.06 18.69 Township 36.36 44.62 53.85 25.81
Number of respondents : Sleep 329, TV 311, Phone 311, Work/study 288.
Chi squared: Sleep 38.24, TV 65.25, Phone 66.77, Work/study 25.33.
Table B 8: Figure 4.16 Percentage of residents who would consider moving vs. how
often aircraft noise is heard.
How often aircraft noise is heard
Would consider moving
Would not consider moving
Never 0 100 Seldom 8.7 91.3 Sometimes 0 100 Often 14.71 85.29 Very often 55.41 44.59
Number of respondents: 319
Chi-squared: 49.07
Table B 9: Figure 4.17 Percentage of township respondents reporting being highly
annoyed by LRRdnR noise zone.
LRRdnR noise zone
Highly annoyed
Considerably annoyed
Moderately annoyed
Slightly annoyed
Not annoyed
<55 42.19 15.63 20.31 17.19 4.69 55-60 1 0 0 0 1 Number of respondents: 66.

237
Table B 10: Figure 4.18 Percentage of suburb respondents reporting being highly
annoyed by LRRdnR noise zone:
LRRdnR noise zone
Highly annoyed
Considerably annoyed
Moderately annoyed
Slightly annoyed
Not annoyed
<55 9.84 4.92 13.11 6.56 65.57 55-60 14.75 14.75 13.11 31.15 26.23 61-65 46.15 20 7.69 13.85 12.31 66-70 40 28 28 4 0 70-75 77.78 11.11 11.11 0 0
Number of respondents: 230
Chi-squared: 71.84
Table B 11: Figure 5.2 Reported annoyance of the suburb group by 12 hour LRAeqR
noise zone
LRAeqR noise zone
Highly annoyed
Considerably annoyed
Moderately annoyed
Slightly annoyed
Not annoyed
<55 11.02 10.17 12.71 19.49 46.61 55-60 48.44 17.19 9.38 14.06 10.94 61-65 33.33 33.33 19.05 4.76 9.52 >66 65.38 15.38 19.23 0 0
Number of respondents: 230
Chi-squared: 68.87

238
Table B 12: Figure 5.4 Comparison between suburb group response when classified
according to 12 hour LRAeqR noise contour and 24 hour LRRdnR contour. Average energy noise zone
Highly annoyed
Considerably annoyed
Moderately annoyed
Slightly annoyed Not annoyed
LRDN <55 9.84 4.92 13.11 6.56 65.57 100 LRAeq <55 11.02 10.17 12.71 19.49 46.61 100 LRDN 55-60 14.75 14.75 13.11 31.15 26.23 99.99 LRAeqR 55-60 48.44 17.19 9.38 14.06 10.94 100.01 LRDN 61-65 46.15 20 7.69 13.85 12.31 100 LRAeqR 61-65 33.33 33.33 19.05 4.76 9.52 99.99 LRDN 66-70 40 28 28 4 0 100 LRAeqR 66-70 65.38 15.38 19.23 0 0 99.99 LRDN 70-75 77.78 11.11 11.11 0 0 100 LRAeqR 70-75 100 0 0 0 0 100
Number of respondents: 230
Table B 13: Figure 5.5 Suburb group. Sleep disturbance 12 hour night LRAeq
LRAeq
noise
zoneR Never Seldom Sometimes Often Very often
Often/very often
<55 40.54 18.92 18.02 9.91 12.61 22.52 55-60 11.29 9.68 12.9 30.65 35.48 66.13 61-65 9.52 4.76 33.33 28.57 23.81 52.38 >66 0 4.17 29.17 16.67 50 66.67
Number of respondents: 219
Chi-squared 53.30, P<.0001

239
Table B 14: Figure 5.6 Suburb group. Phone disturbance 12 hour night LRAeq
LRAeq
noise
zoneR Never Seldom Sometimes Often Very often
Often/very often
<55 36.04 18.02 18.02 18.92 9.01 27.93 55-60 6.56 13.11 16.39 27.87 36.07 63.94 61-65 4.76 0 14.29 23.81 57.14 80.95 >66 4.17 0 8.33 25 62.5 87.5
Number of respondents: 218
Chi-squared: 51.24
Table B 15: Figure 5.7 Suburb group. TV disturbance 12 hour night LRAeq
LRAeq
noise
zoneR Never Seldom Sometimes Often Very often
Often/very often
<55 29.2 15.93 20.35 21.24 13.27 34.51 55-60 6.78 5.08 11.86 25.42 50.85 76.27 61-65 4.76 0 9.52 19.05 66.67 85.72 >66 8 0 4 24 64 88 Number of respondents: 218
Chi-squared: 51.06
Table B 16: Figure 5.8 Suburb group. Work / study disturbance 12 hour night LRAeq
LRAeq
noise
zoneR Never Seldom Sometimes Often Very often
Often/very often
<55 44.76 22.86 12.38 14.92 5.71 20.63 55-60 23.53 11.76 15.69 23.53 25.49 49.02 61-65 10.53 15.79 10.53 26.32 36.84 63.16 >66 9.09 4.55 18.18 18.18 50 68.18
Number of respondents: 198
Chi-squared: 35.27

240
Table B 17: Figure 5.14 12 hour N60, N70, N80 suburb group reporting being
considerably annoyed and highly annoyed. Number of events N60 N70 N80 <10 22.64 19.8 28.83 10-20 13.95 29.41 68.42 21-50 57.28 70.83 89.74 >50 83.87 95.65 88.89
Number of respondents: 228
Chi-squared N60: 76.88
Chi-squared N70: 89.82
Chi-squared N80: 71.79
Table B 18: Figure 5.15 12 hour N60, N70, N80 Sleep reported as being often and
very often disturbed Number of events N60 N70 N80 <10 19.61 20.21 29.87 10-20 15.38 33.33 57.9 21-50 52.52 60.87 75.68 >50 83.33 91.3 88.89 Number of respondents: 219
Chi-squared N60: 61.38
Chi-squared N70: 66.78
Chi-squared N80: 49.76
Table B 19: Figure 5.16 12 hour N60, N70, N80 TV viewing reported as being often
and very often disturbed Number of events
N60 Suburb
N70 suburb
N80 suburb
<10 37.26 34.38 41.83 10-20 20 38.71 94.74 21-50 71.14 83.82 89.19 >50 93.33 95.65 100
Number of respondents: 218
Chi-squared N60: 66.60
Chi-squared N70: 62.95
Chi-squared N80: 48.08

241
Table B 20: Figure 5.17 12 hour N60, N70, N80 Telephone conversations reported as
being often and very often disturbed Number of events N60 Suburb N70 suburb N80 suburb <10 26 24.47 33.33 10-20 12.82 38.71 89.47 21-50 65.65 74.28 86.49 >50 83.33 91.3 88.89
Number of respondents: 218
Chi-squared N60: 70.30
Chi-squared N70: 64.45
Chi-squared N80: 55.74
Table B 21: Figure 5.18 12 hour N60, N70, N80 Work or study reported as being very
often disturbed Number of events
N60 Suburb
N70 suburb
N80 suburb
<10 22.45 18.89 21.43 10-20 5.71 17.86 68.75 21-50 46.59 56.67 74.29 >50 73.07 85 85.71
Number of respondents: 198
Chi-squared N60: 45.15
Chi-squared N70: 50.17
Chi-squared N80: 53.55
Table B 22: Figure 5.19 12 hour N60, N70, N80: Would consider moving because of
aircraft noise. Number of events N60 N70 N80 <10 16.67 13.73 16.46 10-20 13.33 14.71 57.89 21-50 42.72 55.56 76.92 >50 64.51 78.26 100
Number of respondents: 231
Chi-squared N60: 43.23
Chi-squared N70: 59.84
Chi-squared N80: 77.50

242
Appendix C: Full spatial extent of N60 and N70 contours
Source: Compiled by author
Figure C1: Full spatial extent of N60 contour.

243
Source: Compiled by author
Figure C2: Full spatial extent of N70 contour.