Chrysomya chloropyga larvae meal ... - Stellenbosch University
103
Chrysomya chloropyga larvae meal as a protein source for broiler nutrition by Bertus van der Merwe Thesis presented in fulfilment of the requirements for the degree of Master of Science in the Faculty of AgriScience at Stellenbosch University Supervisor: Dr. E Pieterse Co-supervisor: Prof LC Hoffman December 2018
-
Upload
khangminh22 -
Category
Documents
-
view
0 -
download
0
Transcript of Chrysomya chloropyga larvae meal ... - Stellenbosch University

Chrysomya chloropyga larvae meal as a
protein source for broiler nutrition
by
Bertus van der Merwe
Thesis presented in fulfilment of the requirements for the degree of Master of Science in the
Faculty of AgriScience at Stellenbosch University
Supervisor: Dr. E Pieterse
Co-supervisor: Prof LC Hoffman
December 2018

ii
Declaration
By submitting this thesis electronically, I declare that the entirety of the work contained
therein is my own, original work, that I am the sole author thereof (save to the extent explicitly
otherwise stated), that reproduction and publication thereof by Stellenbosch University will
not infringe any third party rights and that I have not previously in its entirety or in part
submitted it for obtaining any qualification.
Signature:
Date: December 2018
Copyright © 2018 Stellenbosch University
All rights reserved
Stellenbosch University https://scholar.sun.ac.za

iii
Summary
This study investigated the possibility of using Chrysomya chloropyga (copper bottom blow
fly) larvae meal as a protein source in broiler nutrition. At first the chemical composition of
the larvae meal was determined before three balanced diets were formulated containing 5%,
10% and 15% larvae meal, along with a maize-soya based control diet. The four diets were fed
to 320 day-old Cobb 500 broiler chickens. A three phase feeding system were used i.e. starter
(900g per bird), grower (1200g per bird) and finisher (1200g per bird). Each treatment was
replicated eight times.
The effect of the copper bottom blow fly larvae on the production parameters of broilers were
determined. Treatment had no effect on average intake per bird, feed conversion ratio (FCR),
European production efficiency factor (EPEF) or livability. Broilers that were fed the 10%
inclusion had a slightly higher live weight at slaughter and average daily gain (ADG) than the
other three treatments.
The chemical, physical, carcass and sensory characteristics were then evaluated. Treatment
had no effect on cold carcass weight, dressing percentage, thigh-, drumstick- wing and back
yields. The 10% inclusion had a higher breast portion yield than the other treatments. No
differences were observed regarding the yields of skin plus fat, muscle or bone percentages.
Treatment did not affect meat colour. No differences were observed regarding the initial pH
(pHi) of the breast and thigh meat, or the ultimate pH (pHu) of the breast. The pHu of the thigh
of the 5% and 15% inclusion were lower than that of the Control and 10% inclusion.
The control meat had a higher moisture content and a lower ash content than the three
treatment diets. Protein and fat did not differ. No differences regarding the amino acid
composition and the mineral composition in the broiler meat were observed.
Few differences were observed for sensory attributes of the broiler meat. The 5% inclusion
had the highest chicken aroma, the control had the lowest chicken aroma and the 10% and
15% were intermediate. The control had the highest initial juiciness, while the 10% and 15%
had significant lower values for initial juiciness.
Stellenbosch University https://scholar.sun.ac.za

iv
Lastly the organ, gut and tibia bone parameters were evaluated. Treatment had no effect on
gizzard erosion and all gizzard scores were normal. Treatment had no effect on gizzard, liver,
heart, bursa or spleen weights or the weight of these organs relative to live weight. Treatment
had no effect on tibia bone breaking force and tibia bone breaking strength. Treatment had
little effect on tibia bone mineral composition, with only a difference in the potassium (K)
content; the control had a lower K content than the three larvae fed diets.
Overall the study concluded that copper bottom blow fly larvae meal can be used in broiler
diets at inclusions levels of up to 15% without any negative effect while 10% inclusion yielded
positive results in some instances.
Stellenbosch University https://scholar.sun.ac.za

v
Opsomming
Die doel van die studie was om die moontlikheid van die gebruik van Chrysomya chloropyga
(CC) larwe meel in braaikuiken voeding te ondersoek. Die chemiese samestelling van die larwe
meel was bepaal, en daarna is drie gebalanseerde diëte geformuleer wat 5%, 10% en 15%
larwe meel bevat het. ʼn Kontrole dieet is ook geformuleer. Die vier diëte is gevoer aan 320
dag-oud Cobb 500 braaikuikens. ʼn Drie fase voersisteem is gevolg nl. aanvangs (900g per
kuiken), groei rantsoen (1200g per kuiken) en afrond rantsoen (1200g per kuiken). Elke
behandeling is ag keer herhaal.
Die effek van CC larwe meel op die produksie parameters van braaikuikens is bepaal.
Behandeling het geen effek op voer inname, voeromsetverhouding, Europese produksie
effektiwiteitsfaktor en kuiken oorlewing gehad nie. Die 10% insluiting het ‘n effe beter
lewendige eindgewig en gemiddelde daaglikse toename (GDT) as die ander drie behandelings
gehad.
Die chemiese, fisiese, karkas en sensoriese eienskappe was bepaal. Behandeling het geen
effek op koue karkasgewig, uitslag persentasie, dy-, boud-, vlerk- en rugopbrengs gehad nie.
Die 10% insluiting het ʼn hoër borsopbrengs gehad as die ander behandelings. Geen verskille
in terme van weefsel opbrengste was gevind nie.
Behandeling het geen effek op vleis kleur gehad nie. Geen verskille was gesien in die
aanvanklike pH van die bors en dy asook die finale pH van die bors nie. Die finale pH van die
dy van die 5% en 15% insluitings was effens laer as die van die kontrole en die 10% insluiting.
Die kontrole vleis het ‘n hoër vog inhoud gehad as die ander drie behandelings, asook ‘n laer
as inhoud. Proteïene en vet het nie verskil nie. Geen verskille rakende aminosuur samestelling
en die minerale samestelling van die vleis was aangemeld nie.
Min verskille wat sensoriese parameters betref is gesien. Die 5% insluiting het die hoogste
hoender geur gehad, die kontrole het die laagste met die 10% en 15% intermediêr. Die
kontrole het die hoogste aanvanklike sappigheid gehad, terwyl die 10% en 15% laer waardes
vir aanvanklike sappigheid gehad het.
Stellenbosch University https://scholar.sun.ac.za

vi
Laastens is die orgaan, maelmaag en tibia been parameters evalueer. Behandeling het geen
effek op maelmaagerosie gehad nie, en die maelmaggies was geklassifiseer as normaal.
Behandeling het geen effek op maelmaag, lewer, hart, bursa of milt gewigte, asook hulle
verhoudings tot slagmassa gehad nie. Behandeling het geen effek op tibia been breekkrag of
tibia been breeksterkte gehad nie. Behandeling het min effek op tibia been
mineraalsamestelling gehad, met net verskille in kaliumvlakke (K). Die kontrole het ʼn
beduidende laer K-waarde gehad as die drie larwe behandelings.
Die gevolgtrekking kan gemaak word dat CC larwe meel in braaikuiken diëte gebruik kan word
tot en met ʼn insluiting van 15% sonder enige nadelige effek, die 10% insluiting het op ʼn paar
plekke die beter resultate gelewer.
Stellenbosch University https://scholar.sun.ac.za

vii
Acknowledgements
I would like to thank a few people who made this very difficult situation a bit more bearable.
First Dr. Elsje Pieterse, my supervisor, for her patience with me, especially during the writing
period. Without her I would not have been able to complete this study.
AgriProtein who financed my studies and their support during the on farm trails.
Ms. Beverley Ellis and Mr. Danie Bekker for listening to my complaints during the laboratory
work phase.
Frederick Albertyn for assisting me during the whole period.
To my wife, Helanje, for her patience, love and understanding.
To all my family and friends for their encouragement.
I would like to thank the Lord for the opportunity and the ability that he gave me.
Lastly, my Jack Russel, Buks, who waited for hours outside the laboratory door every day for
me to finish this impossible task.
Stellenbosch University https://scholar.sun.ac.za

viii
Notes
The language and style used in this thesis are in accordance with the requirements of the
South African Journal of Animal Science. This thesis represents a compilation of manuscripts
where each chapter is an individual entity and some repetition between chapters is therefore
unavoidable
Stellenbosch University https://scholar.sun.ac.za

ix
Table of Contents
Declaration ii
Summary iii
Opsomming v
Acknowledgements ...................................................................................................................vii
Notes viii
Table of Contents .......................................................................................................................ix
List of Tables xiii
List of Abbreviations ................................................................................................................. xvi
General introduction ............................................................................................ 1
1.1 References ................................................................................................................... 2
Literature Review ................................................................................................. 4
2.1 Introduction ................................................................................................................. 4
2.2 Organic waste products ............................................................................................... 4
2.3 Insects, waste treatment and protein recovery .......................................................... 6
2.4 The use of insect meal in animal nutrition .................................................................. 6
2.4.1 Chemical composition of insects .......................................................................... 7
2.4.2 Production parameters, growth performance and feed intake ........................ 18
2.4.3 Carcass characteristics and meat quality ........................................................... 19
2.4.4 Organ, gut and bone parameters ....................................................................... 19
2.5 Conclusion ................................................................................................................. 21
2.6 References ................................................................................................................. 22
Stellenbosch University https://scholar.sun.ac.za
x
Comparison of the Production Parameters of broilers grown on a diet containing
either Chrysomya chloropyga or soya as the main protein source ......................................... 30
3.1 Abstract...................................................................................................................... 30
3.2 Introduction ............................................................................................................... 30
3.3 Materials and Methods ............................................................................................. 32
3.3.1 Larvae production and treatment ...................................................................... 32
3.3.2 Animals and housing .......................................................................................... 32
3.3.3 Experimental diets.............................................................................................. 33
3.3.4 Data collection and analysis ............................................................................... 36
3.3.5 Analytical and mathematical methodologies .................................................... 37
3.3.6 Statistical analysis ............................................................................................... 38
3.4 Results and Discussion ............................................................................................... 38
3.5 Conclusion ................................................................................................................. 46
3.6 References ................................................................................................................. 47
The effect of copper bottom blow fly (Chrysomya chloropyga) larvae meal on
chemical, physical, sensory and carcass characteristics of broiler chicken meat .................... 53
4.1 Abstract...................................................................................................................... 53
4.2 Introduction ............................................................................................................... 53
4.3 Materials and methods ............................................................................................. 54
4.3.1 Experimental layout, handling and management .............................................. 54
4.3.2 Slaughtering procedure ...................................................................................... 55
Stellenbosch University https://scholar.sun.ac.za
xi
4.3.3 Carcass characteristics ....................................................................................... 55
4.3.4 Physical measurements ...................................................................................... 56
4.3.4.1 pH ................................................................................................................ 56
4.3.4.2 Colour .......................................................................................................... 56
4.3.5 Chemical analysis ............................................................................................... 56
4.3.5.1 Sample preparation .................................................................................... 56
4.3.5.2 Proximate analysis ...................................................................................... 57
4.3.6 Sensory analysis ................................................................................................. 58
4.3.6.1 Sample preparation .................................................................................... 58
4.3.6.2 Descriptive sensory analysis ....................................................................... 58
4.3.7 Statistical analysis ............................................................................................... 60
4.4 Results and Discussion ............................................................................................... 61
4.4.1 Carcass characteristics ....................................................................................... 61
4.4.2 Physical measurements ...................................................................................... 62
4.4.3 Chemical analysis ............................................................................................... 65
4.4.4 Descriptive sensory analysis ............................................................................... 68
4.5 Conclusion ................................................................................................................. 69
4.6 References ................................................................................................................. 69
The effect of copper bottom blow fly (Chrysomya chloropyga) (CC) larvae meal
on organ, gut and tibia bone parameters of broiler chickens ................................................. 72
5.1 Abstract...................................................................................................................... 72
5.2 Introduction ............................................................................................................... 72
5.3 Materials and methods ............................................................................................. 74
Stellenbosch University https://scholar.sun.ac.za

xii
5.3.1 Organ Sample ..................................................................................................... 74
5.3.2 Intestinal Samples .............................................................................................. 75
5.3.3 Tibia bone samples ............................................................................................. 75
5.3.4 Tibia bone strength and bone mineral content ................................................. 75
5.3.5 Statistical analysis ............................................................................................... 76
5.4 Results and discussion ............................................................................................... 77
5.4.1 Gizzard erosion and organ weight ..................................................................... 77
5.4.2 Intestinal pH ....................................................................................................... 78
5.4.3 Tibia bone parameters ....................................................................................... 79
5.5 Conclusion ................................................................................................................. 80
5.6 References ................................................................................................................. 80
General Conclusion ............................................................................................ 83
Stellenbosch University https://scholar.sun.ac.za
xiii
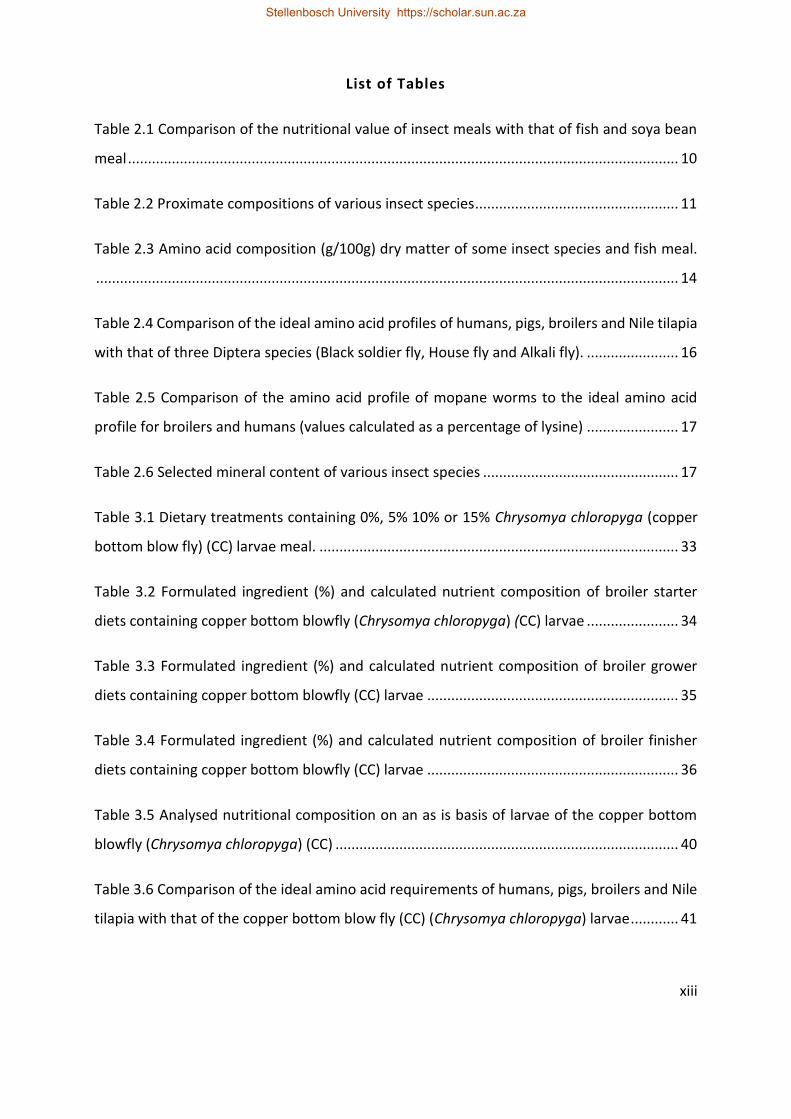
List of Tables
Table 2.1 Comparison of the nutritional value of insect meals with that of fish and soya bean
meal .......................................................................................................................................... 10
Table 2.2 Proximate compositions of various insect species ................................................... 11
Table 2.3 Amino acid composition (g/100g) dry matter of some insect species and fish meal.
.................................................................................................................................................. 14
Table 2.4 Comparison of the ideal amino acid profiles of humans, pigs, broilers and Nile tilapia
with that of three Diptera species (Black soldier fly, House fly and Alkali fly). ....................... 16
Table 2.5 Comparison of the amino acid profile of mopane worms to the ideal amino acid
profile for broilers and humans (values calculated as a percentage of lysine) ....................... 17
Table 2.6 Selected mineral content of various insect species ................................................. 17
Table 3.1 Dietary treatments containing 0%, 5% 10% or 15% Chrysomya chloropyga (copper
bottom blow fly) (CC) larvae meal. .......................................................................................... 33
Table 3.2 Formulated ingredient (%) and calculated nutrient composition of broiler starter
diets containing copper bottom blowfly (Chrysomya chloropyga) (CC) larvae ....................... 34
Table 3.3 Formulated ingredient (%) and calculated nutrient composition of broiler grower
diets containing copper bottom blowfly (CC) larvae ............................................................... 35
Table 3.4 Formulated ingredient (%) and calculated nutrient composition of broiler finisher
diets containing copper bottom blowfly (CC) larvae ............................................................... 36
Table 3.5 Analysed nutritional composition on an as is basis of larvae of the copper bottom
blowfly (Chrysomya chloropyga) (CC) ...................................................................................... 40
Table 3.6 Comparison of the ideal amino acid requirements of humans, pigs, broilers and Nile
tilapia with that of the copper bottom blow fly (CC) (Chrysomya chloropyga) larvae ............ 41
Stellenbosch University https://scholar.sun.ac.za

xiv
Table 3.7 Comparison of the nutritional value of insect meals with that of fish and soya bean
meal .......................................................................................................................................... 41
Table 3.8 Means and standard deviations (SD) of production parameters of broilers grown for
32 days receiving varying amounts of Chrysomya chloropyga larvae meal in comparison with
a maize soya based diet ........................................................................................................... 45
Table 4.1 Definition and scale of each attribute used for the descriptive sensory analysis on
breast portion ........................................................................................................................... 60
Table 4.2 The means (± standard error) of live slaughter weight, cold carcass weight, dressing
percentage, carcass portion yields (g) and skin, muscle and bone percentages of broilers as
influenced by inclusion of Chrysomya chloropyga meal (CC) in their diets ............................. 62
Table 4.3 The means (± standard error) of physical measurements of broiler carcasses as
influenced by the inclusion of Chrysomya chloropyga meal (CC) in their diets ...................... 65
Table 4.4 The means (± standard error) of the proximate analysis (g/100g; meat) of broiler
cooked breast meat as influenced by the inclusion of Chrysomya chloropyga meal (CC) in their
diets .......................................................................................................................................... 66
Table 4.5 The means (± standard error) of the amino acid composition (g/100g) of cooked
breast meat as influenced by inclusion of Chrysomya chloropyga meal (CC) in broiler chickens
diets .......................................................................................................................................... 67
Table 4.6 The means (± standard error) of mineral composition of cooked breast meat as
influenced by inclusion of Chrysomya chloropyga meal (CC) in broiler chickens diets ........... 68
Table 4.7 The means (± standard error) of sensory attributes as influenced by inclusion of
Chrysomya chloropyga meal (CC) in broiler chickens diets ..................................................... 69
Table 5.1 Gizzard erosion scoring description (Johnson & Pinedo, 1971) ............................... 75
Table 5.2 Gizzard erosion scores as influenced by inclusion of Chrysomya chloropyga larvae
meal (CC) in broiler chicken diets ............................................................................................. 78
Stellenbosch University https://scholar.sun.ac.za

xv
Table 5.3 Mean (± standard deviation) of organ weight and organ weight relative to body
weight as influenced by inclusion of Chrysomya chloropyga meal (CC) in broiler chicken diets
.................................................................................................................................................. 78
Table 5.4 Mean (± standard deviation) of small intestine pH as influenced by inclusion of
Chrysomya chloropyga meal (CC) in broiler chicken diets ....................................................... 79
Table 5.5 Mean (± standard error) of tibia breaking force and strength of broiler chickens fed
different levels of copper bottom blow fly larvae meal (CC) in their diets ............................. 79
Table 5.6 Mean (± standard error) of tibia bone ash percentage and mineral content of broiler
chickens fed different levels of copper bottom blow fly larvae meal (CC) in their diets ........ 80
Stellenbosch University https://scholar.sun.ac.za

xvi
List of Abbreviations
a* Red-green
AA Amino acid ADF Acid detergent fibre ADG Average daily gain Al Aluminium Ala Alanine ANOVA Analysis of variance Arg Arginine Asp Aspartic acid ATP Adenosine triphosphate b* Blue-yellow
B Boron BSF Black solder fly BSM Black soldier fly pre-pupae meal Ca Calcium CC Chrysomya chloropyga CF Crude fibre cm Centi-meter CP Crude protein Cu Copper Cys Cysteine DAFF Department of Agriculture, forestry and fisheries DSA Descriptive sensory analysis EE Ether extract EPEF European production efficiency factor FC Field cricket meal FCR Feed conversion ratio Fe Iron FM Fish meal g grams GH Grasshopper meal Glu Glutamic acid Gly Glycine h Hour HFP Housefly pupae mal HFM Housefly maggot His Histidine IAAP Ideal amino acid profile Ile Iso leucine K Potassium kg Kilogram L* Lightness
Leu Leucine Lys Lysine
Stellenbosch University https://scholar.sun.ac.za
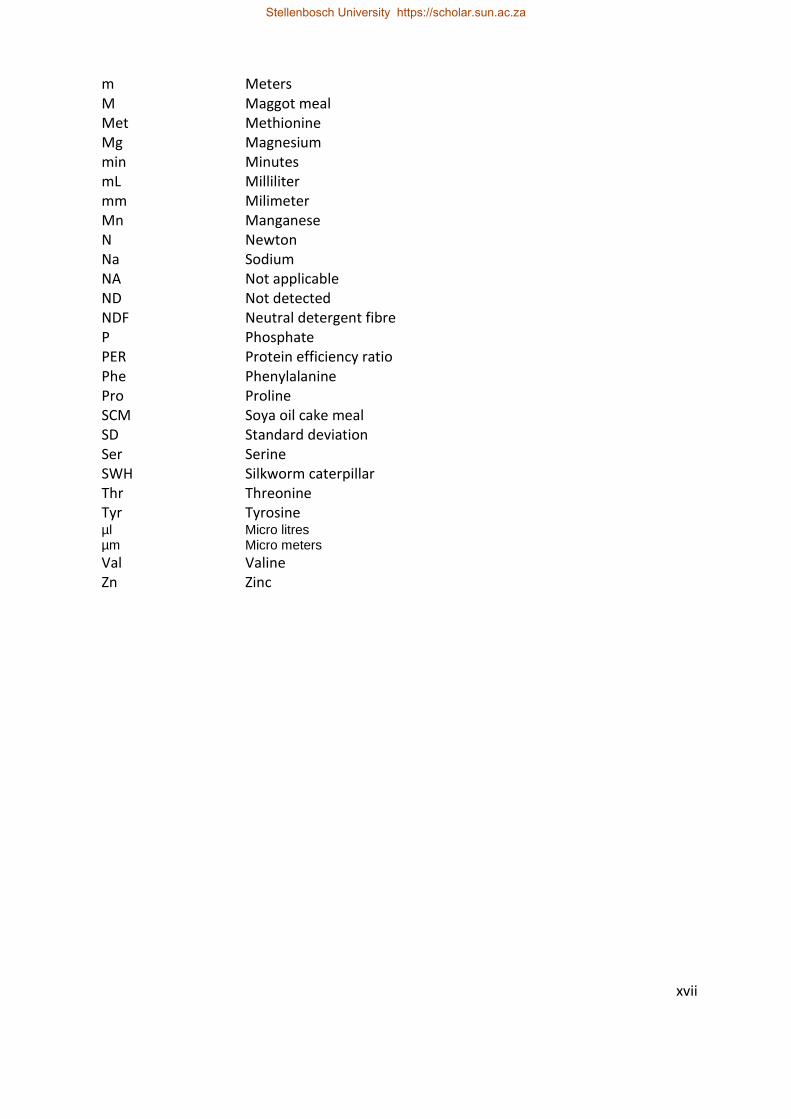
xvii
m Meters M Maggot meal Met Methionine Mg Magnesium min Minutes mL Milliliter mm Milimeter Mn Manganese N Newton Na Sodium NA Not applicable ND Not detected NDF Neutral detergent fibre P Phosphate PER Protein efficiency ratio Phe Phenylalanine Pro Proline SCM Soya oil cake meal SD Standard deviation Ser Serine SWH Silkworm caterpillar Thr Threonine Tyr Tyrosine µl Micro litres µm Micro meters
Val Valine Zn Zinc
Stellenbosch University https://scholar.sun.ac.za

1
General introduction
The world human population is increasing rapidly and in 2050 there will be an estimated 9.7
billion people on earth (http://www.un.org/en/development/desa/news/population/2015-
report.html). The need for more protein for human consumption is inevitable, and humans
and animals are competing for the same protein sources. This has started a demand for
alternative protein sources in animal nutrition. Capture fisheries have already reached
maximum sustainable production and fishmeal will likely soon be diverted to direct human
nutrition (Lim et al., 2008)
It is important that these alternative protein sources are sustainable and beneficial to the
environment, as most organic waste pose a health risk if not managed correctly (Roberts & de
Jager, 2004).
Most insects are rich in fat and protein, and are part of wild and free range birds’ diets (Miao
et al., 2005). The fact that insects form part of a large portion of wild birds’ diets initiated this
study.
The disposal of abattoir waste can pollute the environment (Mittal, 2006). Nutrients can
possibly be recycled from abattoir waste by Chrysomya chloropyga (CC) and in this manner
the risk to the environment can be reduced. South Africa produces approximately 19.5 million
broilers per week (Astral, 2013). Broilers typically lose 30 % of their live weight of 1.9 kg as
waste (Haitook, 2006). That means 19.5 million broilers will produce 11 115 tons of waste per
week. Given the production potential of CC this can be converted to 500 000 tons of protein
per annum while reducing the waste to feed in approximately three days.
Blood from slaughtered cattle in South Africa contains 20 000 tons of protein annually
(Arvanitoyannis & Ladas, 2008) for which a new method of recycling needs to be investigated.
C. chloropyga (CC) is a carnivorous fly species and is of forensic importance (Richards et al,.
2011). The larvae of CC grow from a starting weight of 0.5 milligrams (mg) to a final weight of
Stellenbosch University https://scholar.sun.ac.za

2
61.5mg in 63 hours (De Souza et al., 1982). This make CC the ideal species to break down
abattoir waste.
No research on the possible use of CC in broiler nutrition have been done to date. Therefore,
a study was conducted to investigate the use of CC larvae meal fed on pork abattoir waste in
broiler nutrition. The study included the evaluation of the chemical composition of CC larvae,
production parameters, carcass characteristics, sensory attributes and organ, gut and tibia
bone parameters of broilers fed CC larvae meal in diets at inclusions of 0%, 5%, 10% and 15%.
1.1 References
ASTRAL. Poultry integration & brand positioning. Presentation to Market Commentators 23 July
2013
Arvanitoyannis, I. S. & Ladas, D., 2008. Meat waste treatment methods and potential uses. Int. J.
Food Sci. Tech. 43(3): 543-559.
Haitook, T., 2006., Study on chicken meat production for small-farmers in Northwest Thailand.
Kassel University Press.
Lim, C.E., Webster, C.D., Lee, C.S., 2008. Alternative Protein Sources in Aquaculture Diets. New
York:Haworth Press. 571 p.
Miao, Z., Glatz, P. & Ru, Y., 2005. Free-range poultry production-A review. Asian-Aust. J. Anim.
Sci. 18(1): 113-132.
Mittal, G. S., 2006. Treatment of wastewater from abattoirs before land application—a review.
Bioresour. Technol. 97(9): 1119-1135.
Richards, C.S. & Campobasso, CP., 2011. Forensic Entomology: Applications and Limitations.
Forensic Sci. Med. Pathol., 7: 379–392.
Roberts, H. & De Jager, L., 2004. Current meat-related waste disposal practices of Free State red-
meat abattoirs, South Africa. International conference on waste management and the
environment.
Stellenbosch University https://scholar.sun.ac.za

3
http://www.un.org/en/development/desa/news/population/2015-report.html. Accessed 15
December 2016
Stellenbosch University https://scholar.sun.ac.za

4
Literature Review
2.1 Introduction
With a fast-growing world human population, and limited protein sources which are becoming
more expensive, it is important to find alternative protein sources for animal nutrition. The
world human population grew exponentially from 1.5 to 6.1 billion between the years 1900
and 2000 (Ortiz-Ospina & Roser, 2016). The world population then grew further to more than
7.5 billion in 2016 (Ortiz-Ospina & Roser, 2016) and is expected to reach 9.7 billion in 2050
(http://www.un.org/en/development/desa/news/population/2015-report.html). Humans
will soon compete with animals for the same protein sources, and a demand for alternative
protein sources in animal nutrition will follow.
On the other hand, it is also important that the production of these alternative protein sources
should be sustainable / renewable and beneficial to the environment. Most of the organic
waste produced in South Africa can pose a health risk if not managed correctly (Roberts & de
Jager, 2004). Organic waste streams such as abattoir waste, can possibly be used by insects,
like the copper bottom blowfly (Chrysomya chloropyga) (CC), to produce an alternative
protein source for animal nutrition. At the same time this can reduce the organic waste.
2.2 Organic waste products
Most of the organic waste produced come from the agricultural industry (El Boushy, 1991)
and the nutrients in the waste products can be recycled using insects (El Boushy, 1991; Li et
al., 2011). Agricultural waste include waste from farms, food retailers, the fermentation
industry and abattoirs (El Boushy, 1991).
Abattoir waste can be buried in the ground to decompose, run off into fields, or the local
authorities can dispose of it (Roberts & De Jager, 2004). This can pollute the environment with
pathogens and contaminate ground water (Mittal, 2006). Nutrients can possibly be recycled
from abattoir waste by CC and the risk to the environment can be reduced. In 2003 South
Stellenbosch University https://scholar.sun.ac.za

5
Africa produced approximately 19.5 million broilers per week (Astral, 2013). Broilers typically
lose 30% of their live weight of 1.9kg as waste (Haitook, 2006). That means 19.5 million broiler
will produce 11 115 tons of waste per week.
Abattoir waste include fat, feathers, rejected carcasses, dead on arrivals, hides, hooves, feet,
heads, trimmings, intestines and blood (Roberts & De Jager, 2004). Intestines, hooves and
heads can be sold as oval (Christoe, 2003) while feather meal is a protein source in animal
nutrition (Dalev, 1994). Blood meal and carcass meal can serve as a great source of protein in
animal nutrition, but are banned in most countries due to health risks (Act No 36 of 1947).
Intestinal waste, blood and rejected carcasses have the biggest volume of waste products
(Christoe, 2003). The blood from abattoir waste contains protein for which a new method of
recycling needs to be investigated (Arvanitoyannis & Ladas, 2008). C. chloropyga (CC) is a
carnivorous fly species and is of forensic importance (Richrads et al., 2011). The larvae of CC
grow from a starting weight of 0.5 milligrams (mg) to a final weight of 61.5mg in 63 hours (De
Souza et al., 1982). This make CC the ideal species to break down abattoir waste. Large scale
abattoir waste break down and protein recovery means that CC must be mass reared. These
insects mass rearing facilities should not experience high fly mortalities or low fertility and
fecundity. Different fly species respond in different ways to mass rearing (Robinson, 2005).
Increased stress due to overstocked or understocked cages can cause physical injury or
reduced longevity as well as changes in interaction between sexes, leading to changes in
fertility and fecundity (Rull et al,. 2011). Increased density can decrease male reproduction
success due to decreased territoriality, changes in mating behavior and interrupted mating
(Diaz-Fleischer et al., 2009; Gaskin et al., 2015). High densities was shown to lead to fewer
territoriality and therefore fewer male interaction in Drosophila melanogaster (Hoffmann &
Cacoyianni, 1990). C. chloropyga can produce a high number of eggs at a time and is a large
mammal carcass specialist (Richards et al., 2009). Although the longevity of CC is lower as fly
density increases, Parry (2014) found no clear trend in survival as an effect of increasing
density. In a study on the mass rearing of four blow fly species, CC were the first to reach peak
production and also produced the most eggs at day of peak production (Parry, 2014). At low
density, CC had a low fertility rate, while at high density CC had a higher fertility rate than
Stellenbosch University https://scholar.sun.ac.za

6
three other blow fly species in the study (Parry, 2014). C. chloropyga congregates in large
numbers on big carcasses and it may well be that there are too few interactions between the
different sexes when the flies are present at low densities to stimulate mating (Rhainds, 2010).
Ridley (1988) concluded that female CC will lay their eggs sooner and in higher quantities at
higher densities as there are more opportunities to mate. This makes CC a good insect species
to mass rear and to recycle protein from abattoir waste.
2.3 Insects, waste treatment and protein recovery
As early as 1919 the first reports of recovering protein from waste was described. Linder
(1919) reared Musca domestica larvae on sewage and fed the dried larvae to rats. The next
authors that used insects for waste treatment and protein recovery was Calbert & Martin
(1969). Also, using M. domestica they used chicken manure as a substrate to grow the larvae
in, and dried pupae were fed to chickens. Calbert & Martin (1969) concluded that dried house
fly pupae provided sufficient protein for normal growth and development for broilers for the
first two weeks of life.
2.4 The use of insect meal in animal nutrition
The increase in the price of especially protein sources made it important to produce
alternative protein sources for animal nutrition all over the world. The use of house fly larvae
meal was in most studies compared with conventional protein sources and the aim was to
replace the conventional protein sources with larvae meal (Newton et al., 1977; Awoniyi et
al., 2003; Ogunji et al., 2006; Adeniji, 2007; Agunbiade et al., 2007). All these researchers
concluded that house fly larvae meal has the right nutritional values to replace conventional
protein sources such as fishmeal. Studies on the value of insect meal in animal nutrition were
performed on many occasions. Among these insects are Musca domestica (House fly) (Zuidhof
et al., 2003; Aniebo et al., 2008; Pretorius, 2011; Pieterse & Pretorius, 2013), Hermetia illucens
(Black Soldier fly) (Hale, 1973; Newton et al., 1977; Bondari & Sheppard, 1987; Kroeckel et al.,
2012, Uushona, 2016), Tenebrio molitor (Mealworm) (Klasing et al., 2000; Ng et al., 2001;
Ramos-Elorduy et al., 2002, Hopley, 2016), Zophobas morio (Giant Mealworm) (Barker et al.,
Stellenbosch University https://scholar.sun.ac.za

7
1998; Jabir et al., 2012; Finke, 2013), Acrida cinerea (Grasshopper) (Wang et al., 2007), Cirina
forda (Pallid Emperor Moth) (Oyegoke et al., 2006) and Anaphe infracta (Silkworm) (Ijaiya &
Eko, 2009).
Some of this studies include the comparison of fish meal (Téguia et al., 2002; Awoniyi et al.,
2003; Ogunji et al., 2006; Agunbiade et al., 2007; Pretorius, 2011), groundnut meal (Adeniji,
2007) and soya bean oil cake meal (Hwangbo et al., 2009) with common house fly (M.
domestica) larvae meal.
2.4.1 Chemical composition of insects
The comparison of the nutritional values of insect meals with that of fish meal and soya oil
cake meal (Animals have specific amino acid requirements (Teles et al., 2011). Therefore
amino acid composition of a protein source is important (Conconi et al., 1984). Table 2.3
compare the amino acid composition of various insect species with that of fish meal. Fish
meal has a higher lysine value than all the insect species in this study. The ideal amino acid
profile (IAAP) is a concept where the pattern of amino acids (defined as a percentage of
lysine) maximizes growth in animals (Baker, 1996). When the amino acids provided in the
ration are out of balance, the excess of the least limiting amino acids will be de-aminated
and used as energy. This de-amination will also result in higher nitrogenous excretions
(http://www.puyallup.wsu.edu). The oversupply of protein causes more Nitrogen excretion
via uric acid; a significant amount of energy is required for this process (Macleod, 1997). An
estimated six molecules of adenosine triphosphate (ATP) are used to excrete one gram of
Nitrogen (Macleod, 1997).
The amino acid composition of black soldier fly larvae (BSF), house fly and alkali fly meet and
in some instances, exceed the amino acid profiles of humans, pigs, broilers and Nile tilapia (
Stellenbosch University https://scholar.sun.ac.za
8
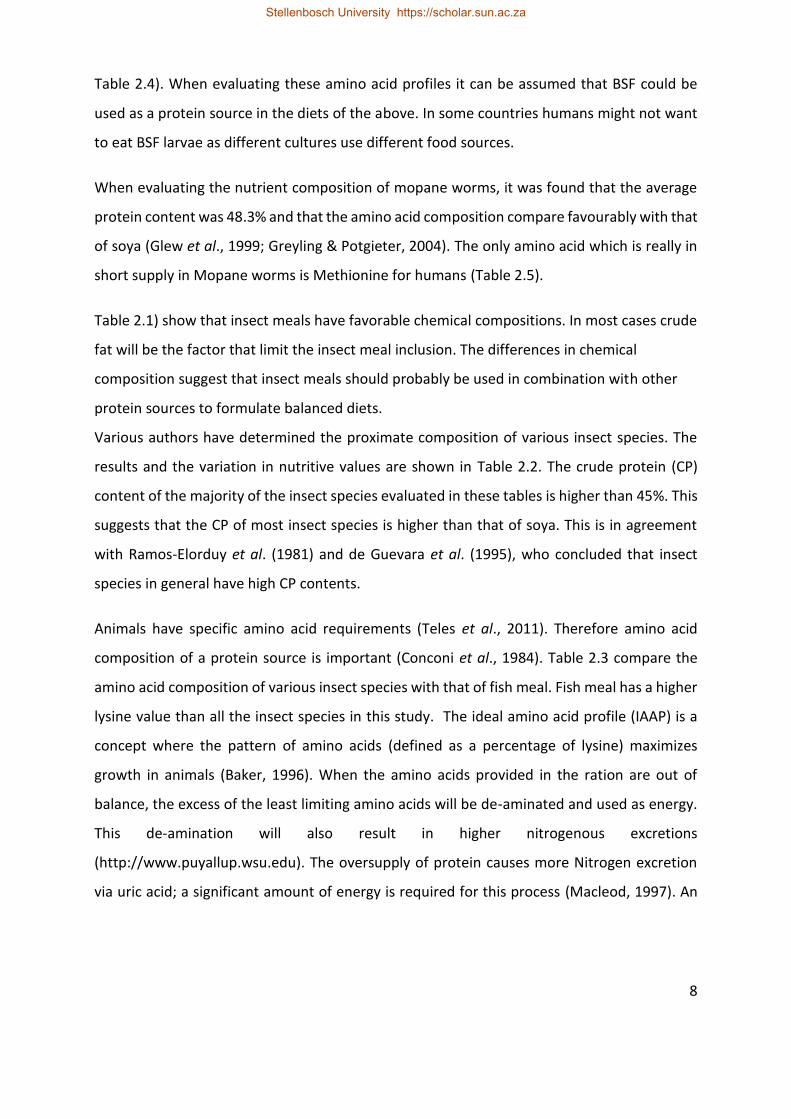
Table 2.4). When evaluating these amino acid profiles it can be assumed that BSF could be
used as a protein source in the diets of the above. In some countries humans might not want
to eat BSF larvae as different cultures use different food sources.
When evaluating the nutrient composition of mopane worms, it was found that the average
protein content was 48.3% and that the amino acid composition compare favourably with that
of soya (Glew et al., 1999; Greyling & Potgieter, 2004). The only amino acid which is really in
short supply in Mopane worms is Methionine for humans (Table 2.5).
Table 2.1) show that insect meals have favorable chemical compositions. In most cases crude
fat will be the factor that limit the insect meal inclusion. The differences in chemical
composition suggest that insect meals should probably be used in combination with other
protein sources to formulate balanced diets.
Various authors have determined the proximate composition of various insect species. The
results and the variation in nutritive values are shown in Table 2.2. The crude protein (CP)
content of the majority of the insect species evaluated in these tables is higher than 45%. This
suggests that the CP of most insect species is higher than that of soya. This is in agreement
with Ramos-Elorduy et al. (1981) and de Guevara et al. (1995), who concluded that insect
species in general have high CP contents.
Animals have specific amino acid requirements (Teles et al., 2011). Therefore amino acid
composition of a protein source is important (Conconi et al., 1984). Table 2.3 compare the
amino acid composition of various insect species with that of fish meal. Fish meal has a higher
lysine value than all the insect species in this study. The ideal amino acid profile (IAAP) is a
concept where the pattern of amino acids (defined as a percentage of lysine) maximizes
growth in animals (Baker, 1996). When the amino acids provided in the ration are out of
balance, the excess of the least limiting amino acids will be de-aminated and used as energy.
This de-amination will also result in higher nitrogenous excretions
(http://www.puyallup.wsu.edu). The oversupply of protein causes more Nitrogen excretion
via uric acid; a significant amount of energy is required for this process (Macleod, 1997). An
Stellenbosch University https://scholar.sun.ac.za

9
estimated six molecules of adenosine triphosphate (ATP) are used to excrete one gram of
Nitrogen (Macleod, 1997).
The amino acid composition of black soldier fly larvae (BSF), house fly and alkali fly meet and
in some instances, exceed the amino acid profiles of humans, pigs, broilers and Nile tilapia (
Stellenbosch University https://scholar.sun.ac.za

10
Table 2.4). When evaluating these amino acid profiles it can be assumed that BSF could be
used as a protein source in the diets of the above. In some countries humans might not want
to eat BSF larvae as different cultures use different food sources.
When evaluating the nutrient composition of mopane worms, it was found that the average
protein content was 48.3% and that the amino acid composition compare favourably with that
of soya (Glew et al., 1999; Greyling & Potgieter, 2004). The only amino acid which is really in
short supply in Mopane worms is Methionine for humans (Table 2.5).
Table 2.1 Comparison of the nutritional value of insect meals with that of fish and soya bean meal
Parameters HFM1,a M2,b FC3,c GH4,d SWC5,e FM6,f SCM7,f HFP8,g BSM9,h
Proximate analysis (%)
Crude protein 47.60 55.10 58.30 53.58 50.30 69.13 49.44 76.23 43.20
Crude fat 25.30 20.70 10.30 26.52 16.43 10.11 0.90 14.39 28.00
Crude fibre 7.50 6.30 8.70 9.21 10.90 0.54 7.87 15.71 -
Ash 6.25 10.40 2.96 4.31 12.03 - 5.90 7.73 16.60
Amino acids (%)
Lysine 6.04 2.92 4.79 - 5.02 3.57 3.05 4.92 2.21
Methionine 2.28 - 1.93 - 3.02 1.09 0.70 1.37 0.83
Threonine 2.03 - 2.75 - 4.50 1.47 1.95 2.31 1.41
Mineral content
(%)
Ca - - - - 1.05 1.34 0.33 0.52 5.36
P - - - - 2.77 1.77 0.73 1.72 0.88 a Aniebo et al. (2009) 1 HFM (Housefly maggot, blood & wheat meal) b Awoniyi et al. (2003) 2 M (Maggot meal) c Wang et al. (2005) 3 FC (Field cricket meal) d Hassan et al. (2009) 4 GH (Grasshopper meal) e Ijaiya & Eko (2009) 5 SWC (Silkworm caterpillar) f NRC (2004) 6 FM (Fish meal dehydrated) g Pieterse & Pretorius (2014) 7 SCM (Soya oil cake meal) h Newton et al. (2005a) 8 HFP (Housefly pupae meal dried)
9 BSM (Black soldier fly pre-pupae meal dried)
Stellenbosch University https://scholar.sun.ac.za

11
Stellenbosch University http://scholar.sun.ac.za
Table 2.2 Proximate compositions of various insect species
Crude Protein
(%) Crude Fat (%)
Crude Fibre (%)
Neutral Detergent Fibre (%)
Acid Detergent Fibre (%)
Ash (%) References
Lepidoptera Achroia grisella (L) 33.97 60.00 NA 19.50 8.19 1.40 Finke, 2002
Bombyx mori (L) 53.75 8.09 NA 6.36 6.36 6.36 Finke, 2002; Frye & Calvert, 1989
Chilecomadia moorei (L) 38.94 73.86 NA 6.53 3.52 2.01 Finke, 2012 Hyalophora cecropia (L) 54.70 10.20 14.70 NA NA 5.90 Landry et al., 1986 Collosamia promethean (L)
49.40 10.00 10.80 NA NA 6.90 Landry et al., 1986
Manduca sexta (L) 58.10 20.70 9.40 NA NA 7.40 Landry et al., 1986 Spodoptera frugiperda (L)
57.80 20.20 6.70 NA NA 5.60 Landry et al., 1986
Pseudaletia unipuncta (L)
54.40 14.90 5.00 NA NA 6.90 Landry et al., 1986
Spodoptera eridania (L) 54.70 13.90 7.10 NA NA 9.80 Landry et al., 1986 Samia ricinii (PP) 54.20 26.20 3.26 NA NA 3.80 Longvah et al., 2011 Samia racinii (P) 54.60 26.20 3.45 NA NA 3.80 Longvah et al., 2011 Cirina forda 20.00 12.50 8.70 NA NA NA Osasona & Olaofe, 2010 Antherea pernyi 71.90 20.10 NA NA NA 4.00 Zhou & Han, 2006
Coleoptera
Z. morio (A) 68.05 14.25 NA 50.14 32.06 6.16 Oonincx & Dierenfeld, 2012
Z. morio 46.79 42.04 NA 9.26 6.41 2.38 Finke, 2002 T. molitor 49.08 35.17 NA 14.96 6.56 2.36 Finke, 2002
Stellenbosch University https://scholar.sun.ac.za

12
Stellenbosch University http://scholar.sun.ac.za
Crude Protein
(%) Crude Fat (%)
Crude Fibre (%)
Neutral Detergent Fibre (%)
Acid Detergent Fibre (%)
Ash (%) References
Cotinis ntida 51.75 5.41 19.3 NA NA 12.34 Rakashantong et al., 2010
Hymenoptera Oecophylla smaragdina 53.46 13.46 15.38 NA NA 6.55 Rakashantong et al., 2010
Orthoptera
Acheta domesticus 66.56 22.08 NA 22.08 10.39 3.57 Finke, 2002; Bernard et al., 1997
Microcentrum rhombifolium (A)
77.80 9.00 NA 41.14 19.39 9.10 Oonincx & Dierenfeld, 2012
Anurogryllus arboreus 48.69 20.60 11.61 NA NA 9.36 Rakashantong et al., 2010
Diptera H. illucens 45.10 36.08 NA 9.79 7.73 9.02 Finke, 2012 Musca domestica (L) 78.17 7.50 NA 14.29 11.51 6.75 Finke, 2012
D. melanogaster (A) 68.00 19.00 NA 17.66 10.14 7.20 Oonincx & Dierenfeld, 2012; Barker et al., 1998
Blattodea Blatta Lateralis 61.50 32.40 NA 9.06 7.12 3.90 Finke, 2012
B. lateralis (S) 76.05 14.45 NA 11.41 10.87 7.88 Oonincx & Dierenfeld, 2012
B. Lateralis (M) 62.85 26.50 NA 12.76 12.75 6.89 Oonincx & Dierenfeld, 2012
Stellenbosch University https://scholar.sun.ac.za

13
Stellenbosch University http://scholar.sun.ac.za
Crude Protein
(%) Crude Fat (%)
Crude Fibre (%)
Neutral Detergent Fibre (%)
Acid Detergent Fibre (%)
Ash (%) References
Eublaberus distanti 52.10 43.10 NA NA NA 2.98 Oonincx & Dierenfeld, 2012
Gromphadorhina portentosa
63.35 20.30 NA 36.54 13.12 8.49 Oonincx & Dierenfeld, 2012
Periplaneta americana 53.90 28.40 NA NA 9.40 3.30 Bernard et al., 1997 A – Adullt, M – medium, S- small, L- larvae, P- pupae, PP- pre-pupae, NA- not applica
Stellenbosch University https://scholar.sun.ac.za

14
Stellenbosch University http://scholar.sun.ac.za
Table 2.3 Amino acid composition (g/100g) dry matter of some insect species and fish meal.
Arg His Ile Leu Lys Met Phe Thr Trp Val Asp Cys Glu Gly Pro Ser Tyr Ala Reference
Lepidoptera
Samia ricinii 4.40 2.7 1.4 6.6 6.5 2.3 5.2 4.8 NA 5.4 9.9 0.50 13.0 4.9 6.5 5.3 6.4 6.1 Longvah et al.
(2011)
Bombyx mori 6.80 2.5 5.7 8.3 6.5 4.6 5.1 5.4 0.9 5.6 11.0 1.40 15.0 4.6 4.0 4.7 5.4 5.5 Rao (1994)
Cossus
redtenbachi 6.00 1.6 5.1 7.9 4.9 2.1 9.3 4.7 0.6 6.1 11.0 1.30 17.0 5.5 5.5 5.9 6.2 6.5
Ramos-Elorduy
et al. (1982)
Coleoptera
Scyphophorous
acupunctatus 4.40 1.5 4.8 7.8 5.5 2.0 4.6 4.0 0.8 6.2 9.1 2.20 16.0 6.1 5.4 6.6 6.4 6.5
Ramos-Elorduy
et al. (1997)
Zophobos morio 2.30 1.4 2.2 4.5 2.4 0.5 1.6 1.9 0.4 2.4 3.8 0.35 5.7 2.3 2.6 2.2 3.3 3.4 Finke (2002)
Tenebrio molitor 2.70 1.5 2.5 5.2 2.7 0.6 1.7 2.0 0.4 2.9 4.0 0.40 5.5 2.7 3.4 2.5 3.6 4.0
Hymenoptera
Vespa basalis 1.70 1.1 2.6 3.5 1.9 0.9 1.9 1.8 NA 2.6 3.4 ND 7.5 3.6 3.7 1.9 2.5 3.4 Ying et al.
(2010) Polistes
sagittarius 1.60 1.1 2.0 2.8 1.6 0.5 1.8 1.5 NA 2.4 3.0 ND 6.2 2.5 3.2 1.6 1.8 2.6
Orthoptera
Boopedon
flaviventris 4.30 2.4 4.7 8.8 5.5 1.8 4.1 4.4 0.6 5.7 8.8 2.0 15.0 7.5 6.8 4.3 7.4 5.9
Ramos-Elorduy
et al. (1997)
Gryllus testaceus 3.70 1.9 3.1 5.5 4.8 1.9 2.9 2.8 NA 4.4 6.3 1.0 9.1 3.6 4.5 3.7 3.9 5.6 Wang et al.
(2005)
Sphenarium
histrio 6.60 1.1 5.3 8.7 5.7 2.0 12.0 4.0 0.6 5.1 9.3 1.3 4.3 5.3 7.2 5.1 7.3 7.7
Ramos-Elorduy
& Pino (1982)
Stellenbosch University https://scholar.sun.ac.za

15
Stellenbosch University http://scholar.sun.ac.za
Arg His Ile Leu Lys Met Phe Thr Trp Val Asp Cys Glu Gly Pro Ser Tyr Ala Reference
Callipogon
barbatum 5.90 2.2 5.8 10.0 5.7 2.0 4.7 4.0 0.7 7.0 9.1 2.0 10.0 9.2 6.2 3.7 4.2 8.0
Ramos-Elorduy
et al. (2006)
Diptera
Musca
domestica 5.2. 2.90 4.4 7.8 7.3 4.60 13.0 4.4 0.60 5.1 11.1 2.40 13.0 5.8 4.8 3.7 7.0 6.5 Ramos-Elorduy
& Pino (1982) Ephydra hians 2.7. 1.00 5.0 8.0 5.8 3.80 10.0 4.6 0.40 5.6 11.0 2.20 16.0 4.9 6.5 3.8 5.1 12.0
Hermetia
illucens 3.17 1.52 2.0 3.1 3.1 0.87 2.0 1.8 0.77 3.3 4.3 0.25 5.1 2.3 2.6 1.8 3.1 3.1 Finke (2012)
Blattodea
Blatta lateralis 4.5. 1.80 2.5 3.9 4.2 1.10 2.5 2.5 0.55 3.9 4.9 0.45 7.4 3.9 3.6 2.7 4.5 5.5 Finke (2012)
Fishmeal 6.14 3.60 4.8 7.8 7.9 2.50 4.1 4.4 1.00 5.2 9.0 1.00 13.0 6.2 4.5 4.0 3.2 6.3
Lall &
Anderson
(2005)
NA- not applicable, ND- not detected
Stellenbosch University https://scholar.sun.ac.za

16
Stellenbosch University http://scholar.sun.ac.za
Table 2.4 Comparison of the ideal amino acid profiles of humans, pigs, broilers and Nile tilapia with that of three Diptera species (Black soldier fly, House fly and Alkali fly).
IAAP humans (FAO/WHO/UNU 2007, 1)
IAAP pigs (NRC 1998)
IAAP broilers (NRC 1994)
IAAP Nile Tilapia (NRC
1993)
Black soldier fly larvae
(Newton et al., 2005)
House fly Ramos-
Elorduy & Pino (1982)
Alkali fly Pino (1982)
Lysine 100 100 100 100 100 100 100
Methionine 33 27 38 52 36 63 66
Threonine 50 64 74 73 64 60 79
Leucine 130 100 109 66 118 107 138
Isoleucine 67 54 73 61 68 60 86
Valine 87 68 82 101 70 97
Histidine 33 32 32 34 43 40 17
Arginine 38 110 82 80 71 47
Stellenbosch University https://scholar.sun.ac.za

17
Table 2.5 Comparison of the amino acid profile of mopane worms to the ideal amino acid profile for broilers and humans (values calculated as a percentage of lysine)
Threonine (%) Valine (%) Isoleucine (%) Methionine (%)
Mopane worm1
65 80 70 38
Ideal amino acid profile for broilers2 98 87 64 32
Ideal amino acid profile for humans3 50 87 67 50 (1) Ohiokpehai et al. (1996), (2) Schutte & de Jong (2004), (3) World Health Organization (2007)
The mineral content of some insect species are shown in Error! Not a valid bookmark self-
reference.. While some insect species are low in calcium (Ca), insects are good sources of
Copper (Cu), Iron (Fe) and Zinc (Zn) (Oliveira et al,. 1976). Glew et al. (1999) also concluded
that mopane worms contain minerals such as magnesium, calcium, zinc and manganese. No
literature regarding the minerals of CC in animal nutrition was found.
Table 2.6 Selected mineral content of various insect species
Ca
(g/kg)
Mg
(g/kg)
P
(g/kg)
Cu
(mg/kg)
Fe
(mg/kg)
Mn
(mg/kg)
Zn
(mg/kg) Reference
Lepidoptera
Galleria mellonella 0.6 0.9 12.0 3.06 77.27 3.28 77.78 Barker et al.
(1998)
Bombyx mori 1.0 3.0 14.0 20.81 95.38 24.86 177.46 Finke (2002)
Chilecomadia
moorei 0.3 0.7 5.7 7.40 35.18 1.78 89.70 Finke (2012)
Coleoptera
Tenebrio molitor 1.2 2.8 14.2 17.77 39.70 6.79 131.02 Barker et al.
(1998) Zophobas morio 1.2 1.8 8.3 13.94 50.34 1.54 87.50
Rhynchophorous
phoenicis 2.1 1.3 6.9 16.00 158.00 35.00 158.00
Rumpold &
Schlüter (2013)
Orthoptera
Acheta domestica 2.1 0.8 7.8 8.50 112.33 29.65 186.36 Barker et al.
(1998)
Diptera
Hermetia illucens 24.0 4.5 9.2 10.39 171.65 159.28 144.85 Finke (2012)
Drosophila
melanogaster 1.7 1.7 13.2 16.00 400.50 16.50 223.00
Oonincx &
Dierenfeld (2011)
Blattodea
Blatta Lateralis 1.2 0.8 5.7 25.66 47.89 8.54 105.83 Finke (2012)
Gromphadorhina
portentosa 2.5 2.4 9.3 22.50 153.50 10.00 202.00
Oonincx &
Dierenfeld (2011)
Eublaberus distanti 0.8 0.8 4.6 12.00 55.00 5.00 124.00 Oonincx &
Dierenfeld (2011)
Stellenbosch University https://scholar.sun.ac.za
18
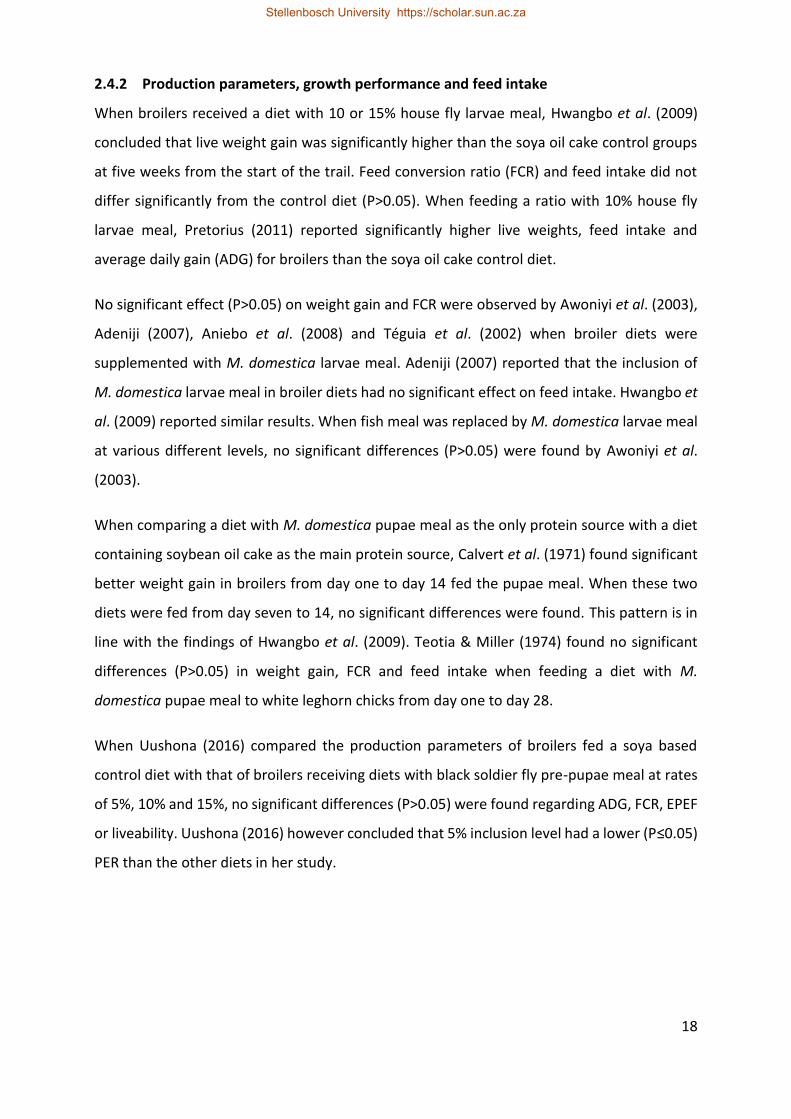
2.4.2 Production parameters, growth performance and feed intake
When broilers received a diet with 10 or 15% house fly larvae meal, Hwangbo et al. (2009)
concluded that live weight gain was significantly higher than the soya oil cake control groups
at five weeks from the start of the trail. Feed conversion ratio (FCR) and feed intake did not
differ significantly from the control diet (P>0.05). When feeding a ratio with 10% house fly
larvae meal, Pretorius (2011) reported significantly higher live weights, feed intake and
average daily gain (ADG) for broilers than the soya oil cake control diet.
No significant effect (P>0.05) on weight gain and FCR were observed by Awoniyi et al. (2003),
Adeniji (2007), Aniebo et al. (2008) and Téguia et al. (2002) when broiler diets were
supplemented with M. domestica larvae meal. Adeniji (2007) reported that the inclusion of
M. domestica larvae meal in broiler diets had no significant effect on feed intake. Hwangbo et
al. (2009) reported similar results. When fish meal was replaced by M. domestica larvae meal
at various different levels, no significant differences (P>0.05) were found by Awoniyi et al.
(2003).
When comparing a diet with M. domestica pupae meal as the only protein source with a diet
containing soybean oil cake as the main protein source, Calvert et al. (1971) found significant
better weight gain in broilers from day one to day 14 fed the pupae meal. When these two
diets were fed from day seven to 14, no significant differences were found. This pattern is in
line with the findings of Hwangbo et al. (2009). Teotia & Miller (1974) found no significant
differences (P>0.05) in weight gain, FCR and feed intake when feeding a diet with M.
domestica pupae meal to white leghorn chicks from day one to day 28.
When Uushona (2016) compared the production parameters of broilers fed a soya based
control diet with that of broilers receiving diets with black soldier fly pre-pupae meal at rates
of 5%, 10% and 15%, no significant differences (P>0.05) were found regarding ADG, FCR, EPEF
or liveability. Uushona (2016) however concluded that 5% inclusion level had a lower (P≤0.05)
PER than the other diets in her study.
Stellenbosch University https://scholar.sun.ac.za

19
2.4.3 Carcass characteristics and meat quality
Hwangbo et al. (2009) reported significantly better (P≤0.05) carcass characteristics when M.
domestica larvae meal were included in broiler diets. Dressing Percentage, thigh muscle
weight and breast muscle weight as a percentage of carcass weight were significantly higher.
This is in contrast with Awoniyi et al. (2003) and Téguia et al. (2002) who found no significant
influence of M. domestica larvae meal on breast muscle weight and dressing percentage. The
differences can possibly be attributed to the fact that Téguia et al. (2002) and Awoniyi et al.
(2003) had four and six replicates per treatment respectively, while Hwangbo et al. (2009) had
30 replicates per treatment. No significant differences in abdominal fat were observed by
Téguia et al. (2002) when broilers that received the different ratios were evaluated.
When Uushona (2016) compared the carcass characteristics of broilers that received diets
with black soldier fly pre-pupae meal at rates of 0%, 5%, 10%, and 15%, no differences were
observed regarding live slaughter weight, cold carcass weight, dressing percentage or carcass
portion yields (breast, thigh, drumstick, wing and back). Uushona (2016) also did not observe
significant differences in the initial and ultimate pH of the breast or thigh or in the colour of
the meat (L*, a*, b*).
Hwangbo et al. (2009) reported no significant differences in meat colour when comparing a
soya bean meal control diet with treatment diets containing 5%, 10%, 15% and 20% house fly
larvae meal.
2.4.4 Organ, gut and bone parameters
For the poultry industry all over the world, gizzard erosion is a huge problem (Johnson, 1971).
High mortalities, low feed intake and listlessness characterizes this phenomenon (Itakura et
al., 1981). Gizzard erosion can by diagnosed post mortem by the presence of a black watery
content in the crop, proventriculus and gizzard, with the lining of the gizzard eroded and ulcers
on the gizzard muscles (Johnson, 1971). Gizzard erosion can be caused by a number of dietary
factors which include minerals such as copper (Fisher et al,. 1973; Ross, 1979), form of the
diet (pellet vs. mash)( Ross, 1979), presence of certain bacteria ( Ferencik, 1970), toxins like
gizzerozine ( Okazaki et al., 1983), the presence of mycotoxins (Hoerr et al., 1982; Dorner et
al., 1983; Diaz & Sugahara, 1995) or stress (Grabarevic et al., 1993; Dzaja et al., 1996).
Stellenbosch University https://scholar.sun.ac.za

20
Although copper sulphate is used in broiler diets as a growth promoter, Fisher et al. (1973)
concluded that gizzard erosion was related to the copper concentration in the diet. Chicks fed
pelleted feed had more gizzard erosion than those fed mash feed (Ross, 1979). The author
believed the method of pelleting induced gizzard erosion. Bacteria that occur naturally on fish
meal cause the formation of histamine by the decarboxylation of histidine in fish meal
(Ferencik, 1970). Gizzerosine is formed when histamine or histidine reacts with lysine during
overheating of fish meal in the processing of fish meal (Okazaki et al., 1983). Excessive
secretions of hydrochloric acid and pepsin are secreted in the stomach when gizzerosine is
present, causing gizzard erosion (Masumura et al., 1985). The presence of mycotoxins in
broiler diets also causes gizzard erosion (Hoerr et al., 1982; Dorner et al., 1983; Diaz &
Sugahara, 1995). When broiler chicks are exposed to stressful environments, more gizzard
erosion occur (Grabarevic et al., 1993; Dzaja et al., 1996). The levels of aspartate
aminotransferase and creatine kinase in the proventriculus are increased by stress in broilers
chicks (Dzaja et al., 1996). This lead to lower pH in the stomach and gizzard erosion.
There is limited literature available regarding toxic effects of insect meals in broiler nutrition.
Teguia et al. (2002) found no significant differences (P≤0.05) in the weights of the liver, gizzard
and hearts of broilers when replacing 50% and 100% of the fish meal in the diet with house fly
larvae meal. Pretorius (2011) reported no significant differences (P≤0.05) in the weights of the
liver, gizzard and heart relative to chick weight even when 50% of the diet was house fly larvae
meal. Uushona (2016) reported no significant differences (P≤0.05) in the weights of gizzard,
liver, heart, bursa, and spleen when supplementing a soya based diet with black soldier fly
pre-pupae at rates of 5%, 10% and 15%.
Pretorius (2011) concluded that neither house fly larvae meal nor pupae meal caused gizzard
erosion when dried at 45°C, 65°C and 85°C. When Uushona (2016) included black soldier fly
pre-pupae in broiler diets at rates of 0%, 5%, 10% and 15%, no differences (P>0.05) were
observed. Uushona (2016) concluded that gizzard erosion scores of the broilers fed the BSF
pre-pupae did not exceed two and can be classified as acceptable gizzard erosion scores.
This result is similar to results of studies where house fly larvae meal (Teguia et al., 2002) were
used in broiler diets. In contrast, Okah & Onwujiariri (2012) reported lower heart weights and
higher gizzard weights in broilers fed house fly larvae meal, while treatment did not affect
Stellenbosch University https://scholar.sun.ac.za

21
liver weights. The broilers used in the study by Okah & Onwujiariri (2012) were older than 35
days, and this might have influenced their results.
When BSF pre-pupae was included in broiler diets at rates of 0%, 5%, 10% and 15%, no
differences (P>0.05) were found regarding the pH of the duodenum, jejunum or ileum
(Uushona, 2016). The normal gut pH range in healthy poultry are 5.5-6.2 in the duodenum,
5.8-6.9 in the jejunum and 6.3-8.0 in the ileum (Van der Klis & Jansman, 2002).
When Uushona (2016) evaluated the mineral content of the tibia bones of broilers fed BSF
pre-pupae meal at rates of 0%, 5%, 10% and 15% she observed that the 15% inclusion had a
higher calcium (Ca) content than the 5% inclusion, while the control and the 10% inclusion
were intermediate. Black soldier fly pre-pupae contains high P and Ca contents (Newton et al.,
2005), but the diets in Uushona’s (2016) study were formulated for similar Ca levels. The
higher Ca content in the tibia bones of the 15% BSM pre-pupae inclusion may indicate higher
bioavailability of Ca in it (Uushona, 2016).
2.5 Conclusion
The fast-growing world human population requires an increase of protein for human
consumption (meat). Broiler meat could fulfill that need because of its high growth rate and
good feed conversion ratio. The need for more broiler meet pose another problem for the
farmers; more nutrients will be needed to produce more broiler meat. Fish meal and soya
meal are the most used protein sources in broiler nutrition. With the growing demand for
these products it has become very expensive.
The production of fish meal is not sustainable, and this could leave the biodiversity of the
ocean out of balance. The demand for more soya could also impact nature negatively, as more
land would be needed for soya production.
In many studies insect meals proved to be suitable protein sources for animal nutrition. The
production of CC larvae meal could be another sustainable insect protein source for animal
production. At the same time abattoir waste could be reduced by CC, making it both
sustainable and beneficial to the environment.
Stellenbosch University https://scholar.sun.ac.za

22
Because no literature on CC larvae meal in animal nutrition was available, a study was
conducted to evaluate the possibility of using CC larvae meal as a protein source in broiler
nutrition.
2.6 References
Adeniji, A., 2007. Effect of replacing groundnut cake with maggot meal in the diet of broilers. Int.J.Poult.Sci. 6(11): 822-825.
Allen, C., Fletcher, D., Northcutt, J. & Russell, S., 1998. The relationship of broiler breast color to meat quality and shelf-life. Poult. Sci. 77(2): 361-366.
Aniebo, A., Erondu, E., and Owen, O., 2008. Proximate composition of housefly larvae (Musca domestica) meal generated from mixture of cattle blood and wheat bran. Livestock Res. Rural Dev. 20(12): 1-5.
Arvanitoyannis, I. S. & Ladas, D., 2008. Meat waste treatment methods and potential uses. Int. J. Food Sci. Tech. 43(3): 543-559.
ASTRAL. Poultry integration & brand positioning. Presentation to Market Commentators 23 July 2013.
Awoniyi, T., Aletor, V. & Aina, J., 2003. Performance of broiler-chickens fed on maggot meal in place of fishmeal. International Journal of Poultry Science. 2(4): 271-274.
Baker, D.H., 1996. Advances in amio acid nutrition and metabolism of swine and poultry. Pg. 41-53 in: Nutrient Management of Food Animals to enhance and protect the environment. E.T. Kornegay, edit., Lewis Publishers, New York, NY.
Barbut, S., 1997. Problem of pale soft exudative meat in broiler chickens. Br. Poult. Sci. 38(4): 355-358.
Barker, D., Fitzpatrick, M. P. & Dierenfeld, E. S., 1998. Nutrient composition of selected whole invertebrates. Zoo Biol. 17(2): 123-134.
Bernard, J. B., Allen, M. E. & Ullrey, D. E., 1997. Feeding captive insectivorous animals: Nutritional aspects of insects as food. Nutrition Advisory Group Handbook, Fact Sheet. 3: 1-7.
Bondari, K. & Sheppard D., 1987. Soldier fly, Hermetia illucens L., larvae as feed for channel catfish, Ictalurus punctatus (rafinesque), and blue tilapia, Oreochromis aureus (steindachner). Aquacult. Res. 18(3): 209-220.
Calvert, C.C., Morgan, N.O. & Eby, H.J., 1971. Biodegraded hen manure and adult houseflies: Their nutritional value to the growing chick. Livestock Waste Management and Pollution Abatement, Proceedings International Symposium on Livestock Wastes, Ohio State University. 319-320.
Stellenbosch University https://scholar.sun.ac.za

23
Christoe, J., 2003. Waste not, want not: Managing livestock waste for income and the environment. THE LIVESTOCK REVOLUTION A Pathway from Poverty?. : 54.
Conconi, J. R. E., Moreno, J. M. P., Mayaudon, C. M., Valdez, F. R., Perez, M. A., Prado, E. S., Rodriguez, H. & Moreno, B., 1984. Protein content of some edible insects in Mexico. Ethnobiol. 4(1): 61-72.
Dalev, P. G., 1994. Utilisation of waste feathers from poultry slaughter for production of a protein concentrate. Bioresour. Technol. 48(3): 265-267.
Diaz, G.J. & Sugahara, M., 1995. Individual and combined effects of aflatoxin and gizzerosine in broiler chickens. British Poultry Science. 36(5): 729-736.
Díaz-fleischer, F., Arredondo, J., & Aluja, M., 2009. Enriching early adult environment affects the
copulation behaviour of a tephritid fly. Journal of Experimental Biology, 212: 2120-2127.
De Guevara, O. L., Padilla, P., García, L., Pino, J. M. & Ramos-Elorduy, J., 1995. Amino acid determination in some edible Mexican insects. Amino Acids. 9(2): 161-173.
Department of Agriculture, Forestry & Fisheries (DAFF)., 2012. Abstract of Agricultural statistics. Republic of South Africa.
Dorner, J. W., Cole, R. J., Lomax, L. G., Gosser, H. S. & Diener U. L., 1983. Cyclopiazonic acid production by aspergillus flavus and its effects on broiler chickens. Application of Environment and Microbiolology. 46(3): 698.
Džaja, P., Grabazrević, Ž., Perić, J., Mazija, H., Prukner-Radovčić, E., Bratulić, M., Žubčič, D. & Ragland, W.L., 1996. Effects of histamine application and water-immersion stress on gizzard erosion and fattening of broiler chicks. Avian Pathology. 25(2): 359-367.
El Boushy, A., 1991. House-fly pupae as poultry manure converters for animal feed: A review. Bioresour. Technol. 38(1): 45-49.
Ferencik, M., 1970. Formation of histamine during bacterial decarboxylation of histidine in the flesh of some marine fishes. Journal of Hygienic Epidemiology, Microbiology and Immunology. 14(1): 52-60.
Finke, M.D., 2002. Complete nutrient composition of commercially raised invertebrates used as food for insectivores. Zoo Biol. 21(3): 269-285.
Finke, M.D., 2012. Complete nutrient content of four species of feeder insects. Zoo Biol. 00:1-15.
Finke, M. D., 2013. Complete nutrient content of four species of feeder insects. Zoo Biol. 32(1): 27-36.
Fisher, G., Laursen-Jones, A.P., Hill, K.J. & Hardy, W.S., 1973. The effect of copper sulfate on performance and the structure of the gizzard in broilers. British Poultry Science. 14(1): 55-68.
Fletcher, D., 1999. Broiler breast meat color variation, pH, and texture. Poult. Sci. 78(9): 1323-1327.
Stellenbosch University https://scholar.sun.ac.za

24
Frye, F.L. & Calvert, C.C., 1989. Preliminary information on the nutritional content of mulberry silk moth (Bombyx mori) larvae. J Zoo Wildl Med. 20: 73-75.
Gaskin, T., Futerman, P. & Chapman, T., 2002. Increased density and male–male interactions
reduce male longevity in the medfly, Ceratitis capitata. Animal Behaviour, 63: 121-129.
Garcia, A. F. Q. M., Murakami, A. E., Duarte, C. R. D. A., Rojas, I. C. O., Picoli, K. P. & Puzotti, M. M., 2013. Use of vitamin d3 and its metabolites in broiler chicken feed on performance, bone parameters and meat quality. Asian-Aust. J. Anim. Sci. 26(3): 408.
Glew, R. H., Jackson, D., Sena, L., Vanderjagt, D. J., Pastuszyn, A. & Millson, M., 1999. Gonimbrasia belina (Lepidoptera: Saturniidae): A nutritional food source rich in protein, fatty acids, and minerals. Am. Entomol. 45(4): 250-253.
Grabarević, Ž., Tišljar, M., Džaja, P., Artuković, B., Seiwerth, S. & Sikirić, P., 1993. Stress induced gizzard erosion in chicks. Journal of Veterinary Medicine Series A. 40(1-10): 265-270.
Greyling, M. & Potgieter, M., 2004. Mopane worms as a key woodland resource: The use, trade and conservation of Imbrasia belina. Indigenous Forests and Woodlands in South Africa: Policy, People and Practice. 575-589.
Haitook, T., 2006. Study on chicken meat production for small-farmers in Northwest Thailand. Kassel University Press.
Hale, O., 1973. Dried Hermetia illucens larvae (diptera: Stratiomyidae) as a feed additive for poultry. Ga Entomol Soc J.
Hassan, A., Sani, I., Maiangwa, M. & Rahman, S., 2009. The effect of replacing graded levels of fishmeal with grasshopper meal in broiler starter diet. PAT. 5(1): 30-38.
Hocking, P., Sandercock, D., Wilson, S. & Fleming R., 2009. Quantifying genetic (co) variation and effects of genetic selection on tibial bone morphology and quality in 37 lines of broiler, layer and traditional chickens. Br. Poult. Sci. 50(4): 443-450
Hoerr, F.J., Carlton, W.W., Tuite, J., Vesonder, R.F., Rohwedder, W.K. & Szigeti, G., 1982. Experimental trichothecene mycotoxicosis produced in broiler chickens by Fusarium sporotrichiella var. sporotrichioides. Avian Pathology. 11(3): 385-405.
Hoffmann, A. A. & Cacoyianni, Z., 1990. Territoriality in Drosophila melanogaster as a
conditional strategy. Animal Behaviour, 40: 526–537.
Hoffman, L. & Cawthorn, D., 2012. Consumer preferences in meat. International seminar on animal industry. Jakarta, 5-6 July 2012. 9-22.
Hopley, D., 2016. The evaluation of the potential of Tenebrio molitor, Zophobas morio,
Naophoeta cinerea, Blaptica dubia, Gromphardhina portentosa, Oeriplaneta americana,
Blatta lateralis, Oxyhalao duesta and Hermetia illucens for use in poultry feeds.
Stellenbosch University https://scholar.sun.ac.za

25
Hwangbo, J., Hong, E., Jang, A., Kang, H., Oh, J., Kim, B. & Park B., 2009. Utilization of house fly-maggots, a feed supplement in the production of broiler chickens. J. Environ. Biol. 30(4)
Ijaiya, A. & Eko E. 2009. Effect of replacing dietary fish meal with silkworm (Anaphe infracta) caterpillar meal on performance, carcass characteristics and haematological parameters of finishing broiler chicken. Pakistan J.Nutr. 8: 850-855.
Itakura, C., Hakotani, Y., Goto, M., Saito, T. & Ishii, K., 1981. Histopathology of gizzard erosion in young broiler chickens due to fish meal in the diets. Japanese Journal of Veterinary Science. 43: 677-687.
Jabir, M., Razak, S. & Vikineswary, S., 2012. Nutritive potential and utilization of super worm (zophobas morio) meal in the diet of nile tilapia (Oreochromis niloticus) juvenile. African Journal of Biotechnology. 11(24): 6592-6598.
Johnson, D. & Pinedo, D. C., 1971. Case report: Gizzard erosion and ulceration in Peru broilers. Avian Dis. 15(4): 835-837.
Klasing, K. C., Thacker P., Lopez M. A. & Calvert C. C., 2000. Increasing the calcium content of mealworms (Tenebrio molitor) to improve their nutritional value for bone mineralization of growing chicks. Journal of Zoo and Wildlife Medicine. 31(4): 512-517.
Kroeckel, S., Harjes, A., Roth, I., Katz, H., Wuertz, S., Susenbeth, A. & Schulz C., 2012. When a turbot catches a fly: Evaluation of a pre-pupae meal of the black soldier fly (Hermetia illucens) as fish meal substitute—Growth performance and chitin degradation in juvenile turbot (Psetta maxima). Aquaculture. 364: 345-352.
Lall, S. P. & Anderson, S., 2005. Amino acid nutrition of salmonids: Dietary requirements and bioavailability. Cahiers Options Méditerranéennes. 63: 73-90.
Landry, S.V., DeFoliart, G.R. & Sunde, M.L., 1986. Larval protein quality of six species of Lepidoptera (Saturniidae, Sphingidae, Noctuidae). J Econ Entomol. 79:600-604.
Li, Q., Zheng, L., Qiu, N., Cai, H., Tomberlin, J. K. & Yu, Z., 2011. Bioconversion of dairy manure by black soldier fly (diptera: Stratiomyidae) for biodiesel and sugar production. Waste Manage. 31(6): 1316-1320.
Longvah, T., Mangthya, K. & Ramulu, P., 2011. Nutrient composition and protein quality evaluation of eri silkworm (Samia ricinii) prepupae and pupae. Food Chem. 128(2): 400-403.
Masumura, T., Sugahara, M., Noguchi, T., Mori, K. & Naito, H., 1985. The effect of gizzerosine, a recently discovered compound in overheated fish meal, on the gastric acid secretion in chicken. Poultry Science. 64(2): 356-361.
Macleod, M., 1997.Effects of amino acid balance and energy: protein ratio on energy and
nitrogen metabolism in male broiler chickens. Brit. Poult. Sci. 38(4): 405-411.
Stellenbosch University https://scholar.sun.ac.za

26
Mittal, G. S., 2006. Treatment of wastewater from abattoirs before land application—a review. Bioresour. Technol. 97(9): 1119-1135.
Mottram, D. S., 1998. Flavour formation in meat and meat products: A review. Food Chem. 62(4): 415-424.
National Research Council (US). Committee on Animal Nutrition., 1993. Nutrient requirements of fish. Course Technology.
National Research Council., 1994. Nutrient requirements of poultry. Ninth Revised ed. National Academy Press. Washington, DC.
NCR., 1998. Nutrient requirements of swine.
Newton, G., Booram, C., Barker, R. & Hale, O. 1977. Dried Hermetia illucens larvae meal as a supplement for swine. J. Anim. Sci. 44(3): 395-400.
Newton, G., Sheppard, D., Watson, D., Burtle, G., Dove, C. & Tomberlin, J., 2005. The black soldier fly, Hermetia illucens, as a manure management/resource recovery tool. Symposium on the state of the science of animal manure and waste management. San Antonio, Texas, January 5-7, 2005.
Ng, W., Liew, F., Ang, L. & Wong K., 2001. Potential of mealworm (tenebrio molitor) as an alternative protein source in practical diets for african catfish, clarias gariepinus. Aquacult. Res. 32(s1): 273-280.
Ogunji, J. O., Kloas, W., Wirth, M., Schulz, C. & Rennert, B., 2006. Housefly maggot meal (magmeal): An emerging substitute of fishmeal in tilapia diets. Conference on international agricultural research for development, deutscher tropentag,
Ohiokpehai, O., Bulawayo, B., Mpotokwane, S., Sekwati, B. & Bertinuson, A., 1996. Expanding the use of mopane, a nutritionally rich local food. Proc. Multidisciplinary symposium. Mopane. University of Botswana and Kalahari conservation society. Gaborone, Botswana,
Okah, U. & Onwujiariri, E., 2012. Performance of finisher broiler chickens fed maggot meal as a replacement for fish meal. Int. J. Agric. Technol. 8(2): 471-477.
Okazaki, T., Noguchi, T., Igarashi, K., Sakagami, Y., Seto, H., Mori, K., Naito, H., Masumura, T. and Sugahara, M., 1983. Gizzerosine, a new toxic substance in fish meal, causes severe gizzard erosion in chicks. Agricultural Biology and Chemistry. 47(12): 2949-2952.
Oliveira, J. F. S., de Carvalho, J. P., De Sousa, R. F. X. B. & Simao, M. M., 1976. The nutritional value of four species of insects consumed in Angola. Ecol. Food Nutr. 5(2): 91-97.
Oonincx, D. G. A. B. & Dierenfeld E. S., 2012. An investigation into the chemical composition of alternative invertebrate prey. Zoo Biol. 31(1): 40-54.
Ortiz-Ospina, E & Roser, M.,2016. ‘World Population Growth’. Published online at
OurWorldInData.org. Retrieved from: https://ourworldindata.org/world-population-
growth/ [Online Resource]
Stellenbosch University https://scholar.sun.ac.za

27
Osasona, A.I. & Olaofe, O., 2010. Nutritional and functional properties of Cirina forda larva from Ado-Ekiti, Nigeria. Afr. J. Food Sci. 12(4): 775-777.
Oyegoke, O., Akintola, A. & Fasoranti, J., 2006. Dietary potentials of the edible larvae of cirina forda (westwood) as a poultry feed. African Journal of Biotechnology. 5(19)
Pieterse, E. & Pretorius Q., 2013. Nutritional evaluation of dried larvae and pupae meal of the housefly (Musca domestica) using chemical-and broiler-based biological assays. Prod. Sci. 54(3); 347-355
Pretorius, Q., 2011. The Evaluation of Larvae of Musca domestica (Common House Fly) as Protein Source for Broiler Production. MSc Thesis. University of Stellenbosch.
Qiao, M., Fletcher D., Northcutt J. & Smith D., 2002. The relationship between raw broiler breast meat color and composition. Poult. Sci. 81(3): 422-427.
Raksakantong, P., Meeso, N., Kubola, J. & Siriamornpun, S., 2010. Fatty acids and proximate composition of eight thai edible terricolous insects. Food Res. Int. 43(1): 350-355.Ramos-Elorduy, J., 2009. Anthropo‐entomophagy: Cultures, evolution and sustainability. Entomological Research. 39(5): 271-288.
Ramos-Elorduy, J. & Pino, J., 1982. Valor nutritivo y calidad de la proteína de algunos insectos comestibles de México. Folia Entomológica Mexicana. 53: 111-118.
Ramos-Elorduy, J., Moreno, J. M. P., Prado, E. E., Perez, M. A., Otero, J. L. & de Guevara, O. L., 1997. Nutritional value of edible insects from the state of Oaxaca, Mexico. Journal of Food Composition and Analysis. 10(2): 142-157.
Ramos-Elorduy, J., González, E. A., Hernández, A. R. & Pino J. M. 2002. Use of Tenebrio molitor (coleoptera: Tenebrionidae) to recycle organic wastes and as feed for broiler chickens. J. Econ. Entomol. 95(1): 214-220.
Ramos-Elorduy, J., Neto, E. M. C., dos Santos, J. F., Moreno, J. M. & Torres, I. L., 2006. Estudio comparativo del valor nutritivo de varios coleoptera comestibles de méxico y pachymerus nucleorum de brasil. Interciencia: Revista De Ciencia y Tecnología De América. 31(7): 512-516.
Rao, P. U., 1994. Chemical composition and nutritional evaluation of spent silk worm pupae. J. Agric. Food Chem. 42(10): 2201-2203.
Rath, N., Huff, G., Huff, W. & Balog, J., 2000. Factors regulating bone maturity and strength in poultry. Poult. Sci. 79(7): 1024-1032.
Reddy, C.V., 1992. Aflatoxins in feed: An enemy to poultry producers in the tropics. World Poultry, Doetichen, Netherland. 8: 19-20.
Rhainds, M.,2010. Female mating failures in insects. Entomologia Experimentalis et Applicata,
136(3), 211-226.
Stellenbosch University https://scholar.sun.ac.za

28
Richards, C.S., 2011. Forensic Entomology: Applications and Limitations. Forensic Sci. Med. Pathol., 7: 379–392.
Risvik, E., 1994. Sensory properties and preferences. Meat Sci. 36(1): 67-77.
Robinson, A. S., 2005. Genetic basis of the sterile insect technique. In Dyck et al. (Ed.), Sterile
Insect Technique (pp. 96 – 110). Austria, IAEA.
Roberts, H. & De Jager, L., 2004. Current meat-related waste disposal practices of free state red-meat abattoirs, south africa. International conference on waste management and the environment.
Ross, E., 1979. Effect of pelleted feed on the incidence of gizzard erosion and black vomit in broilers. Avian Diseases. 23(4): 1051-1054.
Rumpold, B. A. & Schlüter, O. K., 2013. Potential and challenges of insects as an innovative source for food and feed production. Innovative Food Science & Emerging Technologies. 17: 1-11.
Schutte, J.B. & de Jong, J., 2004. Ideal amino acid profile of poultry. Nutrition and Food Research
Institute. Department of Animal Nutrition and Physiology. Wageningen, Netherlands.
Téguia, A., Mpoame, M., and Mba, J. O., 2002. The production performance of broiler birds as affected by the replacement of fish meal by maggot meal in the starter and finisher diets. Tropicultura. 20(4): 187-192.
Teotia, J. & Miller B., 1974. Nutritive content of house fly pupae and manure residue 1. Br. Poult. Sci. 15(2): 177-182.
Uushona, T., 2016. Black soldier fly (Hermetia illucens) pre-pupae as a protein source for broiler production. MSc Thesis. University of Stellenbosch.
Van der Klis, J. & Jansman, A., 2002. Optimising nutrient digestion, absorption and gut barrier function in monogastrics: Reality or illusion. Wageningen Academic Publishers, Wagenin.
Wang, D., Zhai, S. W., Zhang, C. X., Bai, Y. Y., An, S. H. & Xu, Y. N., 2005. Evaluation on nutritional value of field crickets as a poultry feedstuff. Asian-Australasian Journal of Animal Sciences. 18(5): 667-670.
Wang, D., Zhai, S., Zhang, C., Zhang, Q. & Chen H., 2007. Nutrition value of the chinese grasshopper (Acrida cinerea)(thunberg) for broilers. Anim. Feed Sci. Technol. 135(1): 66-74.
World Health Organization, 2007. Protein and amino acid requirements in human nutrition.
Ying, F., Xiaoming, C., Long S. & Zhiyong, C., 2010. Common edible wasps in Yunnan province, China and their nutritional value. In: Forest Insects as Food: Humans Bite Back. : 93.
Stellenbosch University https://scholar.sun.ac.za

29
Zhou, J. & Han, D., 2006. Proximate, amino acid and mineral composition of pupae of the silkworm Antheraea pernyi in China. Journal of Food Composition and Analysis. 19:850-853.
Zuidhof, M., Molnar, C., Morley, F., Wray, T., Robinson, F., Khan, B., Al-Ani, L. & Goonewardene L., 2003. Nutritive value of house fly (Musca domestica) larvae as a feed supplement for turkey poults. Anim. Feed Sci. Technol. 105(1): 225-230.
http://www.puyallup.wsu.edu/dairy/nutrient-management/default.asp. Accessed 21 December
2016
http://www.un.org/en/development/desa/news/population/2015-report.html. Accessed 15
December 2016
Stellenbosch University https://scholar.sun.ac.za

30
Comparison of the Production Parameters of broilers grown
on a diet containing either Chrysomya chloropyga or soya as the
main protein source
3.1 Abstract
This study evaluated the possibility of using larvae of the copper bottom blow fly (Chrysomya
chloropyga) (CC) as a protein source in broiler nutrition. Proximate and amino acid analyses
of the larvae were used for formulation of iso-nitrogenous and iso-energetic diets with 0%,
5%, 10% and 15% CC larvae meal. The effects of the larvae meal in the ratios were tested on
three hundred and twenty broiler chickens. A three phase feeding system were used i.e.
starter (900g per bird), grower (1200g per bird) and finisher (1200g per bird). Each treatment
was replicated eight times. Results of the proximate and amino acid analyses showed that
copper bottom blow fly larvae are suitable to use as a protein source in broiler nutrition. The
10% inclusion rate increased rate of gain, live weight and European production efficiency
factor when compared to the soya based control diet. No differences (P>0.05) were found
between the four treatment diets for cumulative weekly intake per bird, average weekly
intake per bird, average weekly gain per bird, feed conversion efficiency or acceptability. It is
thus concluded that the larvae of the copper bottom blow fly is a viable protein source for
broiler production.
Keywords- Larvae meal, copper bottom blow fly, broiler, poultry
3.2 Introduction
Protein and the quality of protein is very important in broiler nutrition. The amino acid
composition of protein sources can have a great influence on broiler performance.
Conventional protein sources such as fish meal and soya meal are expensive (Agunbiade et
al., 2007) and not always sustainable. Overfishing and deforestation (to clear land for planting
of soya) have negative impacts on the environment. Over the years agriculture has had a
negative impact on the world’s ecosystems. Agriculture is also damaging the earth’s
biodiversity, causing certain insect species to multiply and others to be eliminated
Stellenbosch University https://scholar.sun.ac.za

31
(Premalatha et al., 2011). Deforestation also cause floods to occur more frequently; Bradshaw
et al., (2007) found a positive correlation between flood occurrence and non-natural forest
cover. However, flood occurrences decrease when natural forest cover is present.
Alternative protein sources therefore need to be investigated to supplement conventional
protein sources in a world where there is not enough sustainable protein sources to feed a
growing human population. Such sustainable protein sources for animal nutrition can possibly
be supplied by the mass rearing of insects, and in this case C. chloropyga (copper bottom blow
fly). Although no studies have been reported on using CC meal in broiler rations, studies on
the complete or partial replacement of conventional protein sources in broiler diets with
insect meals or larvae meal have been reported. Insects that have been evaluated include
Musca domestica (House fly) (Zuidhof et al., 2003; Aniebo et al., 2008; Pretorius, 2011;
Pieterse & Pretorius, 2013), Hermetia illucens (Black Soldier fly) (Hale, 1973; Newton et al.,
1977; Bondari & Sheppard, 1987; Kroeckel et al., 2012), Tenebrio molitor (Mealworm) (Klasing
et al., 2000; Ng et al., 2001; Ramos-Elorduy et al., 2002; Hopley, 2016), Zophobas morio (Giant
Mealworm) (Barker et al., 1998; Jabir et al., 2012; Finke, 2013), Acrida cinerea (Grasshopper)
(Wang et al., 2007), Cirina forda (Pallid Emperor Moth) (Oyegoke et al., 2006) and Bombyx
mori (Silkworm) (Ijaiya & Eko, 2009).
Some of this studies include the replacement of fish meal (Téguia et al., 2002; Awoniyi et al.,
2003; Ogunji et al., 2006; Agunbiade et al., 2007; Pretorius, 2011), groundnut meal (Adeniji,
2007) and soya bean oil cake meal (Hwangbo et al., 2009; Pretorius, 2011) with common
house fly (M. domestica) larvae meal.
The mass production of CC can possibly have a positive effect on commercial broiler
production, either by lowering the cost to rear a broiler, or by enhancing the productivity on
such farms. The supplementation of other protein sources with CC larvae meal can also have
a positive impact on the environment, as CC production is sustainable and can utilize abattoir
waste to produce protein for animal feed.
By supplementing conventional protein sources with CC larvae meal, less pressure is put on
soya production and fishing while decreasing the negative effect of food production waste.
Stellenbosch University https://scholar.sun.ac.za

32
This study was conducted to investigate the value of CC larvae meal as a protein source in
broiler feeds.
3.3 Materials and Methods
3.3.1 Larvae production and treatment
Larvae used in this study were produced and treated on the Mariendahl Experimental farm of
the University of Stellenbosch. Abattoir waste were transported in a sealed container from
Winelands pork, a commercial pig abattoir in Cape Town to Mariendahl, before being fed to
the larvae.
The copper bottom blow fly (C. chloropyga) (CC) eggs were collected from the breeding colony
(maintained on the experimental farm) daily, and placed on abattoir waste prior to hatching.
The eggs hatched within three hours. Larvae were allowed to grow until crawl off which was
around the sixth day. After crawling off, the larvae were collected and killed by freezing at -
20°C prior to drying in an oven at 60°C for 24h. After drying the larvae were milled and stored
in the freezer at -20°C until the feed was mixed.
3.3.2 Animals and housing
Three hundred and twenty day-old Cobb 500 chicks were used in this study. The broilers were
housed at Stellenbosch University, Mariendahl experimental farm, Stellenbosch. The unit at
the poultry section is temperature controlled and equipped with 120 wire cages. The cages
measure 0.9m x 0.6m, and each cage has two nipple drinkers and a tube feeder. Broilers were
stocked 10 chicks per cage, with a density of 18.5 chicks/m2. Thirty two cages were used in
this study. From day one till day four the broiler chicks were fed a commercial starter diet to
allow adaptation to the new environment. At four days of age, broilers were placed in the
cages and remained there until day 35 when they were slaughtered. A randomized block
design was used. Lighting and temperature were set according to the Cobb 500 management
guide (Cobb-Vantress, 2012). Ventilation were set to provide a minimum of six air changes per
minute. The broilers had ad libitum access to water and feed.
Ethical clearance was obtained from Stellenbosch University, with ethical clearance number
SU-ACUM13-00026.
Stellenbosch University https://scholar.sun.ac.za

33
3.3.3 Experimental diets
Four different ratios of CC were fed to the broilers. The control contained 0% CC larvae meal,
with soya as the main protein source. The three treatment diets contained 5%, 10% and 15%
CC larvae meal respectively.Table 3.1, Table 3.3 and Table 3.4 show the four diets fed to the
chickens. The treatments were formulated to meet the minimum requirement of the Cobb
500 broiler chick (Cobb-Vanress, 2012). Amino acid composition were formulated according
to the ideal amino acid requirements for broilers (NRC, 1944).
Table 3.1 Dietary treatments containing 0%, 5% 10% or 15% Chrysomya chloropyga (copper bottom blow fly) (CC) larvae meal.
Diet Inclusion level Description
Control 0% Standard maize soya based diet
CC larvae 5% Standard maize soya based diet with 5%(CC)
CC larvae 10% Standard maize soya based diet with 10% CC
CC larvae 15% Standard maize soya based diet with 15% CC
Stellenbosch University https://scholar.sun.ac.za

34
Table 3.2 Formulated ingredient (%) and calculated nutrient composition of broiler starter diets containing copper bottom blowfly (Chrysomya chloropyga) (CC) larvae
Control 5% CC 10% CC 15% CC
Formulated ingredient composition
CC % 5.000 10.000 15.000 Fine Yellow maize % 50.091 50.330 49.642 56.936 Full fat soya bean meal % 15.392 15.130 15.865 11.240 Soya oilcake meal (50% CP) % 30.138 25.396 20.068 12.026 L-lysine HCl % 0.136 0.177 0.214 0.471 DL methionine % 0.125 0.107 0.090 0.123 Vitamin and mineral premix % 0.150 0.150 0.150 0.150 Limestone % 1.660 1.660 1.657 1.702 Salt % 0.129 0.219 0.114 0.064 Monocalcium phosphate % 1.639 1.639 1.639 1.649 Sodium bicarbonate % 0.540 0.193 0.561 0.640 Sunflower oil %
Calculated ingredient composition
AMEn_chick MJ/kg 11.900 11.921 11.900 11.900 Crude protein % 20.691 20.247 19.882 16.425 Lysine % 1.525 1.521 1.519 1.497 Methionine % 0.496 0.498 0.499 0.518 Cysteine % 0.419 0.420 0.420 0.390 Methionine+cysteine % 0.915 0.917 0.919 0.909 Threonine % 0.968 0.968 0.968 0.861 Tryptophan % 0.303 0.303 0.304 0.266 Arginine % 1.728 1.728 1.731 1.518 Isoleucine % 1.161 1.118 1.076 0.895 Leucine % 2.162 2.086 2.006 1.758 Crude fibre % 3.003 3.084 3.178 3.058 Crude fat % 5.203 6.000 6.937 7.146 Calcium % 1.000 1.000 1.000 1.000 Available phosphorous % 0.500 0.500 0.500 0.500 Sodium % 0.220 0.160 0.220 0.220 Chloride % 0.160 0.220 0.160 0.160
AMEn – Apparent metabolisable energy, CP – Crude protein
Stellenbosch University https://scholar.sun.ac.za

35
Table 3.3 Formulated ingredient (%) and calculated nutrient composition of broiler grower diets containing copper bottom blowfly (CC) larvae
Control 5%CC 10%CC 15%CC
Formulated ingredient composition
CC % 5.000 10.000 15.000 Fine Yellow maize % 45.682 47.108 48.533 49.959 Full fat soya bean meal % 44.172 39.086 34.000 28.914 Soya oilcake meal (50% CP) % 6.147 4.764 3.380 1.996 L-lysine HCl % 0.045 0.095 0.145 0.195 DL methionine % 0.145 0.123 0.101 0.079 Vitamin and mineral premix % 0.150 0.150 0.150 0.150 Limestone % 1.632 1.641 1.649 1.658 Salt % 0.275 0.260 0.246 0.231 Monocalcium phosphate % 1.632 1.634 1.636 1.638 Sodium bicarbonate % 0.118 0.139 0.160 0.180
Calculated nutrient composition
AMEn_chick MJ/kg 12.901 12.745 12.590 12.434 Crude protein % 19.533 18.953 18.372 17.792 Lysine % 1.394 1.389 1.383 1.378 Methionine % 0.492 0.489 0.487 0.484 Cysteine % 0.396 0.397 0.398 0.400 Methionine+cysteine % 0.888 0.887 0.885 0.884 Threonine % 0.915 0.912 0.909 0.907 Tryptophan % 0.280 0.280 0.281 0.281 Arginine % 1.627 1.622 1.616 1.611 Isoleucine % 1.078 1.034 0.991 0.947 Leucine % 2.019 1.947 1.875 1.802 Crude fibre % 3.650 3.608 3.567 3.526 Crude fat % 10.000 10.000 10.000 10.000 Calcium % 1.000 1.000 1.000 1.000 Phosphorous % 0.832 0.831 0.829 0.828 Available phosphorous % 0.500 0.500 0.500 0.500 Sodium % 0.160 0.160 0.160 0.160 Chloride % 0.220 0.220 0.220 0.220
AMEn – Apparent metabolisable energy, CP – Crude protein
Stellenbosch University https://scholar.sun.ac.za
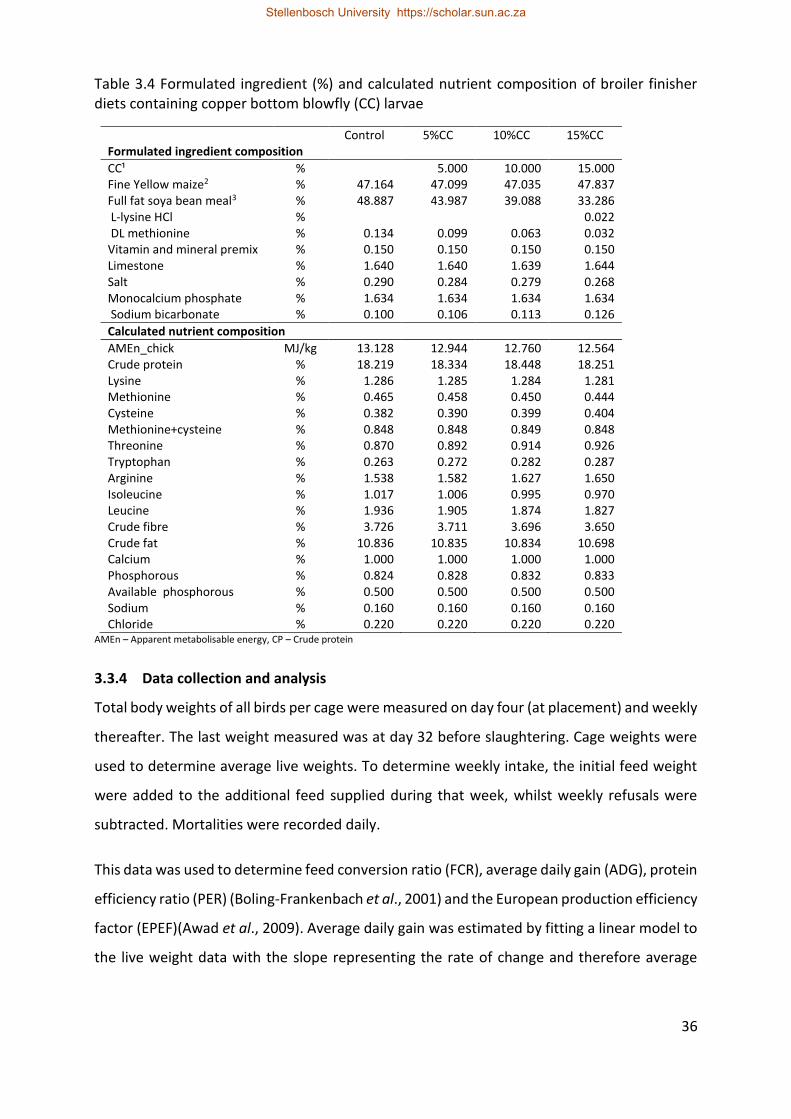
36
Table 3.4 Formulated ingredient (%) and calculated nutrient composition of broiler finisher diets containing copper bottom blowfly (CC) larvae
Control 5%CC 10%CC 15%CC Formulated ingredient composition
CC¹ % 5.000 10.000 15.000 Fine Yellow maize2 % 47.164 47.099 47.035 47.837 Full fat soya bean meal3 % 48.887 43.987 39.088 33.286 L-lysine HCl % 0.022 DL methionine % 0.134 0.099 0.063 0.032 Vitamin and mineral premix % 0.150 0.150 0.150 0.150 Limestone % 1.640 1.640 1.639 1.644 Salt % 0.290 0.284 0.279 0.268 Monocalcium phosphate % 1.634 1.634 1.634 1.634 Sodium bicarbonate % 0.100 0.106 0.113 0.126
Calculated nutrient composition
AMEn_chick MJ/kg 13.128 12.944 12.760 12.564 Crude protein % 18.219 18.334 18.448 18.251 Lysine % 1.286 1.285 1.284 1.281 Methionine % 0.465 0.458 0.450 0.444 Cysteine % 0.382 0.390 0.399 0.404 Methionine+cysteine % 0.848 0.848 0.849 0.848 Threonine % 0.870 0.892 0.914 0.926 Tryptophan % 0.263 0.272 0.282 0.287 Arginine % 1.538 1.582 1.627 1.650 Isoleucine % 1.017 1.006 0.995 0.970 Leucine % 1.936 1.905 1.874 1.827 Crude fibre % 3.726 3.711 3.696 3.650 Crude fat % 10.836 10.835 10.834 10.698 Calcium % 1.000 1.000 1.000 1.000 Phosphorous % 0.824 0.828 0.832 0.833 Available phosphorous % 0.500 0.500 0.500 0.500 Sodium % 0.160 0.160 0.160 0.160 Chloride % 0.220 0.220 0.220 0.220
AMEn – Apparent metabolisable energy, CP – Crude protein
3.3.4 Data collection and analysis
Total body weights of all birds per cage were measured on day four (at placement) and weekly
thereafter. The last weight measured was at day 32 before slaughtering. Cage weights were
used to determine average live weights. To determine weekly intake, the initial feed weight
were added to the additional feed supplied during that week, whilst weekly refusals were
subtracted. Mortalities were recorded daily.
This data was used to determine feed conversion ratio (FCR), average daily gain (ADG), protein
efficiency ratio (PER) (Boling-Frankenbach et al., 2001) and the European production efficiency
factor (EPEF)(Awad et al., 2009). Average daily gain was estimated by fitting a linear model to
the live weight data with the slope representing the rate of change and therefore average
Stellenbosch University https://scholar.sun.ac.za

37
daily gain (ADG). The formulae used to calculate these production parameters are showed in
Equation 1, Equation 2and Equation 3.
Equation 1
Feed Conversion Ratio =Cumulative Feed Intake (g)
Average Live Weight per Chick (g)
Equation 2
Protein Efficiency Ratio =Weight Gain (g)
(Weekly Feed Intake (g) × Protein % of Diet) 100⁄
Equation 3
European Production Efficiency Factor =Liveability % × Live Weight (g)
Age (days) × FCR×
100
1
On day 32, two birds per pen of the middle weight group were randomly selected and their
weight recorded. Thereafter these birds were slaughtered using standard commercial
practices; electrical stunning followed by exsanguination.
3.3.5 Analytical and mathematical methodologies
Larvae were submitted for chemical analyses before the trial began. Larvae were grown over
a period of seven days for the trial. Each batch was sampled and these samples were mixed
and pooled before a subsample was taken for analysis. Dry matter (DM) of the larvae was
determined according to the Official Method 934.01 of the AOAC (Feldsine et al., 2002). The
subsamples used to determine DM were thereafter used to determine the ash content of
larvae meal (Official Method 942.05, Feldsine et al., 2002). Crude fibre (CF) was determined
using Official Method 962.09 (Feldsine et al., 2002). Ether extract (EE) was determined using
the Foss Tecator Soxtec HT 1043 Extraction Unit (Höganäs, Sweden) while total fat was
determined using an acid hydrolysis (method 954.02 AOAC International 2000). Crude protein
(CP) were determined by measuring the total nitrogen content of the larvae meal, according
to Official Method 4.2.07 (Feldsine et al., 2002) in a LECO FP 528 Protein / Nitrogen
Determinator and multiplying the nitrogen value by 6.25. Amino acids (excluding tryptophan
and cysteine) were determined using the method described by Cunico et al., (1986). The
Stellenbosch University https://scholar.sun.ac.za

38
samples were prepared through hydrolysis and then the total amino acid profile was
determined through pre-column derivatisation of the amino acids, which were then separated
using high performance liquid chromatography. This procedure was completed by the
detection of the amino acids using a fluorescence detector. Mineral composition was
determined using the combustion method as described by Method no. 6.1.1 for feeds and
plants of the Agriculture Laboratory Association of Southern Africa (AgriLASA) (2007). The
concentrations of P, K, Ca, Mg, Na, Cu, Fe, Al, Zn and B were determined.
3.3.6 Statistical analysis
The study consisted of a randomised design with four treatments; larvae meal inclusion levels
of 0%, 5%, 10% and 15%. Data was subjected to an analysis of variance (ANOVA) utilising SAS
Statistical software (Version 9.2) (SAS, 2009). The Shapiro-Wilk test was performed to test for
normality (Shapiro; Wilk, 1965). All of the outliers were identified and removed before final
analysis of the ANOVA’s. Differences were deemed to be significant at P≤0.05.
3.4 Results and Discussion
The nutritional composition of dried, ground CC larvae is depicted in
Stellenbosch University https://scholar.sun.ac.za

39
Table 3.5. When the amino acid (AA) composition is compared with the ideal amino acid requirements of pigs, broilers, Nile tilapia and humans (
Stellenbosch University https://scholar.sun.ac.za

40
Table 3.6), it can be seen that it meets or exceeds the amino acid requirements of broilers
(NRC. 1994), Nile tilapia (National Research Council (US). Committee on Animal Nutrition,
1993), and pigs (NCR, 1998). Except for leucine, it also meets the amino acid requirements of
humans (Joint WHO/FAO/UNU Expert Consultation, 2007).
A comparison of the proximate analysis between insect meals and that of fish and soya bean
meal (Table 3.7) indicates that CC has a much higher crude fat content than fish meal and soya
oil cake meal, but is lower in crude protein. This is because fish meal and soya oil cake meal
are byproducts and the most of the crude fat content were removed, leaving a product with
lower crude fat and higher crude protein to use in animal nutrition. The partial removal of
crude fat of CC will also increase the crude protein content of CC, making it more comparable
with fish meal and soya oil cake meal. The partial removal of crude fat in CC will also allow
easier and longer storage before the product goes rancid.
The proximate analysis of the different species of insects differ possibly due to species, diets
of the insects and stage of harvesting.
Stellenbosch University https://scholar.sun.ac.za

41
Table 3.5 Analysed nutritional composition on an as is basis of larvae of the copper bottom blowfly (Chrysomya chloropyga) (CC)
CC larvae
Proximate composition (%)
Moisture 63.81 As is DM
Ash 11.65 32.20 Crude protein (CP) 13.21 48.01 Crude fibre (CF) 2.23 6.16 Crude fat (EE) 6.90 19.07
Amino acid composition (g/kg CP)
Arginine 3.60 Serine 1.92 Aspartic acid 0.99 Glutamic acid 1.96 Glycine 2.08 Threonine 1.90 Alanine 1.69 Tyrosine 1.96 Proline 1.89 HO-Proline 0.02 Methionine 1.04 Valine 1.95 Phenylalanine 2.80 Isoleucine 1.55 Leucine 2.21 Histidine 1.43 Lysine 2.32
Stellenbosch University https://scholar.sun.ac.za

42
Table 3.6 Comparison of the ideal amino acid requirements of humans, pigs, broilers and Nile tilapia with that of the copper bottom blow fly (CC) (Chrysomya chloropyga) larvae
IAAP1 humans
(FAO/WHO/UNU. 2007)
IAAP pigs (NCR. 1998)
IAAP broilers (NRC. 1994)
IAAP Nile Tilapia (NRC.
1993)
CC larvae meal
Lysine 100 100 100 100 100
Methionine 33 27 38 52 45
Threonine 50 64 74 73 82
Leucine 130 100 109 66 95
Isoleucine 67 54 73 61 67
Valine 87 68 82 84
Histidine 33 32 32 34 62
Arginine 38 110 82 155
IAAP – Ideal amino acid profile
Table 3.7 Comparison of the nutritional value of insect meals with that of fish and soya bean meal
Parameters HFM1,a BSM2,b FC3,c GH4,d SWC5,e FM6,f SCM7,f HFP8,g CC9
Proximate
analysis (%)
Crude protein 47.60 43.20 58.30 53.58 50.30 69.13 49.44 76.23 48.01
Crude fat 25.30 28.00 10.30 26.52 16.43 10.11 0.90 14.39 19.07
Crude fibre 7.50 - 8.70 9.21 10.90 0.54 7.87 15.71 6.16
Ash 6.25 16.60 2.96 4.31 12.03 - 5.90 7.73 32.20
Amino acids (%)
Lysine 6.04 2.21 4.79 - 5.02 3.57 3.05 4.92 2.32
Methionine 2.28 0.83 1.93 - 3.02 1.09 0.70 1.37 1.04
Threonine 2.03 -1.41 2.75 - 4.50 1.47 1.95 2.31 1.90
Mineral content
(%)
Ca - 5.36 - - 1.05 1.34 0.33 0.52 -
P - 0.88 - - 2.77 1.77 0.73 1.72 - a Aniebo et al. (2009) 1 HFM (Housefly maggot, blood & wheat meal) b Newton et al. (2005) 2 BSM (Black soldier fly pre-pupae meal dried) c Wang et al. (2005) 3 FC (Field cricket meal) d Hassan et al. (2009) 4 GH (Grasshopper meal) e Ijaiya & Eko (2009) 5 SWC (Silkworm caterpillar) f NRC (2004) 6 FM (Fish meal dehydrated) g Pieterse & Pretorius (2014)7 SCM (Soya oil cake meal)
8 HFP (Housefly pupae meal dried)
9 CC (Copper bottom blow fly larvae meal dried)
As pertaining to the broiler production data (Table 3.8), the live weights of the chicks at the
start of the trail (day 4 of age) did not differ (P=0.24). It is therefore accepted that any
Stellenbosch University https://scholar.sun.ac.za

43
differences in live weights later in the trial are due to the dietary treatments. After one week,
the live weights did not differ (P>0.05), but from 18 days of age until slaughter at day 35 the
live weights (P≤0.05) differed. Live weighs at 18 days of age of the birds that were fed the 10%
inclusion level were higher than that of the birds fed the control diet. The 5% inclusion level
showed statistically similar live weights to the 10% inclusion, while the 15% inclusion level
showed results similar to the control diet. At 25 days of age, the 10% inclusion level had higher
live weights (P≤0.05) than the 15% and control diets. The 15% grower and finisher diets had
slightly lower energy levels due to the fact that it was difficult to formulate a ration with 15%
of full fat CC larvae meal. This could explain the lower growth rate in comparison with the 5%
and 10% diets. The 5% inclusion level was intermediate and did not differ (P>0.05) from any
of the other diets. On 35 days of age the 10% inclusion level still had the highest live weights,
but did not differ (P>0.05) from the 5% and 15% inclusion levels. Although the control diet had
the lowest live weights on these ages, it did not differ (P>0.05) from the 5% and 15%
inclusions, but did differ from the 10% inclusion level (P≤0.05). Hwangbo et al., (2009) also
measured higher live weights in broilers fed a 5% and 10% house fly larvae meal diet compared
to a soya oil cake based control diet at five weeks into the trail, while Pretorius (2011) also
reported higher live weights in broilers fed a 10% house fly larvae meal compared to a soya
oil cake control diet. However no significant differences in live weights were observed by
Uushona (2016) when black soldier fly pre-pupae were included in broiler diets at 5%, 10%
and 15% compared to a soya based control diet.
The replacement (Teguia et al., 2002; Awoniyi et al., 2003) and partial replacement (Pretorius,
2011) of fishmeal with house fly larvae meal had no significant differences on live weight in
broilers. Pretorius (2011) also noted higher mortalities in broilers fed high levels of fish meal.
Although growth rates were low, Pretorius (2011) did not observe any mortalities in broilers
fed a 50% house fly larvae meal inclusion diet. The low growth rate could be attributed to the
oversupply of protein in the diet. Such high inclusion levels of protein leads to a high cost of
deamination to the birds and subsequent energy shortage. The oversupply of protein also
causes more nitrogen excretion via uric acid; a significant amount of energy is required for this
process (Macleod, 1997). An estimated six molecules of adenosine triphosphate (ATP) are
used to excrete one gram of Nitrogen (Macleod, 1997). Undigested proteins reaching the
caeca also cause an inflammatory response, and this can reduce feed efficiency further (Collet,
Stellenbosch University https://scholar.sun.ac.za

44
2005). An imbalanced amino acid profile of the diet could also have attributed to the low
growth rate reported by Pretorius (2011).
When a sorghum-soybean meal based diet was replaced by T. molitor at rates of 0%, 5% and
10% in broiler starter diets, Ramos-Elorduy et al., (2002) did not find significant differences in
weight gain. Hopley (2016) also observed no significant differences in average live weight
when a soya based control diet was compared to a 10% inclusion level op T. molitor in layer
hens.
During the first two weeks of the trail there were no differences (P>0.05) in average feed
intake per bird. During the third week the 10% inclusion level had a higher (P≤0.05) intake per
bird than the 15% inclusion. Although the 5% inclusion level and the control had slightly lower
intakes per bird than the 10%, and slightly higher intakes than the 15% inclusion level, no
differences were found (P>0.05). During the last week, there were no differences (P>0.05) in
average weekly intake per bird between the four treatments. Hwangbo et al. (2009) also
reported no differences in feed intake when a 5% and 10% inclusion level of house fly larvae
meal was compared to a soya based control diet, while Pretorius (2011) reported higher feed
intakes in broilers fed the 10% inclusion of house fly larvae meal in comparison with a soya
based control diet. When comparing black solder fly pre-pupae meal at inclusion levels of 5%,
10% or 15% with a soya based broiler diet, Uushona (2016) reported no differences for feed
intake. The replacement of fishmeal with house fly larvae meal had no effect on feed intake
(Awoniyi et al., 2003; Teguia et al., 2002).
When a sorghum-soybean meal based diet was replaced by T. molitor at rates of 0%, 5% and
10% in broiler starter diets, Ramos-Elorduy et al. (2002) did not find significant differences in
feed intake. Hopley (2016) also observed no significant differences in weekly feed intake or
cumulative feed intake when a soya based control diet was compared to a 10% inclusion level
op T. molitor in layer hens. Ijaiya & Eko (2009) reported no significant differences in feed intake
when fish meal was replaced by A. infracta at ratios of 0%, 25%, 50%, 75% and 100% in broiler
diets containing 20% crude protein. At the end of the first week of the trail, the 5% inclusion
level had a higher (P≤0.05) feed conversion ratio (FCR) than the control and 10% inclusion
diets. There were no differences (P>0.05) between the 15% inclusion and the other diets
regarding FCR in the first week of the trail. At the end of week two, the 10% inclusion lever
Stellenbosch University https://scholar.sun.ac.za

45
had a higher (P≤0.05) FCR than the control diet, but did not differ (P>0.05) from the 5% and
15% inclusion levels. The total FCR of the control, 5% and 15% inclusions did not differ (P>0.05)
at the end of week two. At the end of week three, the 5% inclusion level had a significantly
higher total FCR than the control diet, but did not differ significantly from the 5% and 15%
diets. At the end of week four there were no differences (P>0.05) between the FCR’s of the
four diets. This was expected, as there were also no differences in FCR in the partial (Hwangbo
et al., 2009) or complete (Pretorius, 2011) replacement of soya oil cake based diets with house
fly larvae meal in broiler diets. Uushona (2016) also reported no differences in FCR when a
soya based control diet was replaced by black soldier fly pre-pupae meal at 5%, 10% and 15%
inclusion levels.
As pertaining to the growth rates, at the end of the second week the 10% inclusion level had
a higher (P≤0.05) average weekly gain than the control and the 15% inclusion level, but did
not differ (P>0.05) from the 5% inclusion diet. During week three the 10% inclusion diet had a
higher (P≤0.05) average weekly gain than the 15% ratio, but did not differ (P>0.05) from the
control and 5% diets. No differences (P>0.05) were observed between the control, 5% and
15% inclusion levels during this period. The 10% inclusion level had a higher (P≤0.05) average
daily gain (ADG) than the control and 15% inclusion diets over the duration of the trail. The
ADG did not differ (P>0.05) between the 10% and 5% inclusion diets. The ADG of the control,
5% and 15% inclusion levels also did not differ (P>0.05). When comparing a soya oil cake
control diet with a 10% house fly larvae meal inclusion diet, Pretorius (2011) reported
significant higher ADG in broilers fed the trail diet, while Uushona (2016) reported no
differences in ADG when a 10% black soldier fly pre-pupae meal diet was compared to a soya
based control diet.
No significant differences (P>0.05) were found between the liveability of the broilers fed any
of the four ratio’s. Liveability was constantly high (>96%). Uushona (2016) also found no
differences in liveability when a soya oil cake based control diet was compared to black soldier
fly diets at inclusions of 5%, 10% and 15%.
Stellenbosch University https://scholar.sun.ac.za

46
Stellenbosch University http://scholar.sun.ac.za
Table 3.8 Means and standard deviations (SD) of production parameters of broilers grown for 32 days receiving varying amounts of Chrysomya chloropyga larvae meal in comparison with a maize soya based diet
Day Parameter Control 5% 10% 15%
P Value Mean SD Mean SD Mean SD Mean SD
4 Live weight (g) 106.03 3.41 109.00 3.43 109.41 3.20 108.64 4.12 0.2424
11 Live weight (g) 271.02 7.03 268.48 12.67 278.63 4.80 266.69 13.55 0.1197
Average weekly intake per bird (g) 224.51 5.60 231.61 10.71 230.63 9.56 220.70 12.19 0.1084
Average cumulative intake per bird (g) 224.51 5.60 231.61 10.71 230.63 9.56 220.70 12.19 0.1084
FCR for total period 1.34a 0.04 1.41b 0.08 1.32a 0.03 1.36ab 0.07 0.0272
Average weekly gain per bird (g/week) 165.00 6.07 159.48 10.49 169.21 4.28 158.05 10.36 0.0422
18 Live weight (g) 612.11a 16.38 624.63 32.71 656.50 22.21 603.50a 39.23 0.0060
Average weekly intake per bird (g) 497.75 21.50 490.50ab 24.09 508.25b 24.18 476.25 27.82 0.0883
Average cumulative intake per bird (g) 722.26 23.51 722.11 31.54 738.88 32.33 696.95 37.19 0.0883
FCR for total period 1.42a 0.03 1.39ab 0.04 1.34b 0.02 1.40ab 0.08 0.0128
Average weekly gain per bird (g/week) 341.09a 13.69 356.15ab 28.60 377.88b 20.11 336.81a 29.41 0.0077
25 Live weight (g) 1122.39a 26.07 1152.50ab 56.19 1206.00b 52.12 1101.25a 74.10 0.0043
Average weekly intake per bird (g) 764.24ab 28.61 774.75ab 32.58 803.00a 30.65 733.25b 53.73 0.0092
Average cumulative intake per bird (g) 1486.50ab 44.90 1496.86ab 62.55 1541.88a 55.57 1430.20b 88.38 0.0172
FCR1 for total period 1.46a 0.02 1.43b 0.04 1.40ab 0.04 1.44ab 0.05 0.0349
Average weekly gain per bird (g/week) 510.28ab 18.42 527.88ab 24.73 549.50a 34.83 497.75b 36.17 0.0092
32 Live weight (g) 1758.33a 46.37 1829.97ab 50.11 1880.00b 98.83 1790.42ab 78.01 0.0130
Average weekly intake per bird (g) 1033.68 49.17 1100.78 81.15 1068.75 44.58 1098.19 102.42 0.2456
Average cumulative intake per bird (g) 2520.18 70.71 2597.64 77.57 2610.63 73.22 2528.39 64.45 0.0323
FCR for total period 1.52 0.02 1.51 0.03 1.47 0.07 1.50 0.05 0.2537
Average weekly gain per bird (g/week) 635.94 28.20 677.47 60.76 674.00 58.53 689.17 75.52 0.3104
35 Live weight (g) 2033.42a 67.31 2110.14ab 56.78 2165.50b 121.39 2077.19ab 93.97 0.0398
Average weekly intake per bird (g) 480.33 28.45 469.17 40.57 473.75 25.31 454.14 107.56 0.8464
Average cumulative intake per bird (g) 3000.51 93.59 3066.81 73.26 3084.38 72.69 2982.53 92.70 0.0575
FCR for total period 1.56 0.02 1.53 0.04 1.50 0.08 1.51 0.08 0.3195
Average weekly gain per bird (g/week) 275.08 30.38 280.17 24.09 285.50 34.05 286.78 22.89 0.8333
EPEF2 411.07a 20.46 439.74ab 21.02 468.09b 50.53 426.95ab 36.72 0.0190
Liveability 97.50 4.63 98.75 3.54 100.00 0.00 96.25 5.18 0.2720
ADG3 64.22a 1.94 66.89ab 1.90 68.76b 4.02 65.47a 3.09 0.0050
Stellenbosch University https://scholar.sun.ac.za

47
The 10% inclusion level had a higher (P≤0.05) European Production Efficiency Factor (EPEF)
than the control diet, but did not differ (P>0.05) from the 5% and 15% inclusion levels. No
significant differences in EPEF were observed between the control, 5% and 15% inclusion
levels. Pretorius (2011) observed no differences in EPEF when a 10% inclusion of house fly
larvae meal diet was compared to a 10% fish meal diet, nor did Pretorius (2011) reported
differences in EPEF when House fly larvae meal and fish meal diets were compared both at
25% inclusion levels. When comparing black soldier fly pre-pupae diets at inclusions of 5%,
10% and 15% with a soya oil cake control diets, Uushona (2016) observed no differences in
EPEF.
3.5 Conclusion
The study revealed that commercially produced larvae meal from C. chloropyga (CC) raised on
abattoir waste was superior compared with that of standard maize soya based diets for
commercial broiler production regarding live weight, EPEF and ADG. The proximate
composition as well as the amino acid composition of CC compared favorably to that of the
ideal amino acid requirements of humans, broilers, pigs and tilapia. The use of these larval
meals in broiler diets when fed on an iso-nutritional basis resulted in production parameters
similar to, or exceeding that, of a standard maize soya based broiler diet. All production
parameters were superior with the 10% inclusion level resulting in the highest live weight at
slaughter, the highest ADG and the best EPEF. It can thus be concluded that the use of these
products will have a positive effect on productivity of broiler farms. The results of the current
study warrant further research into the use of different species of larval meals as well as the
use of larvae meals in the nutrition of other high producing farm species. Further processing,
and especially defatting of the larvae meal could add value to the products since the high fat
content (19.07%) is the single most limiting factor when formulating diets for monogastric
animals. Also it is recommended that this research be expanded into the field of ruminant
nutrient with the evaluation of the meal as a potential bypass protein for high producing
ruminants.
Stellenbosch University https://scholar.sun.ac.za

48
3.6 References
Adeniji, A., 2007. Effect of replacing groundnut cake with maggot meal in the diet of broilers.
Int. J .Poult. Sci. 6(11): 822-825.
Agunbiade, J. A., Adeyemi, O. A., Ashiru, O. M., Awojobi, H. A., Taiwo, A. A., Oke D. B. &
Adekunmisi, A. A., 2007. Replacement of fish meal with maggot meal in cassava-based
layers' diets. J. Poult. Sci. 2007
Aniebo, A., Erondu, E. & Owen, O., 2008. Proximate composition of housefly larvae (Musca
domestica) meal generated from mixture of cattle blood and wheat bran. Livestock Res.
Rural Dev. 20(12): 1-5.
Aniebo, A. O., Erondu, E. S. & Owen, O. J., 2009. Replacement of fish meal with maggot meal
in African catfish (Clarias gariepinus) diets sustitución de harina de pescado con harina
de larvas en dietas para el bagre africano (clarias gariepinus). Revista Científica UDO
Agrícola. 9(3): 666-671.
Awad, W. A., Ghareeb, K., Abdel-Raheem, S. & Bohm J., 2009. Effects of dietary inclusion of
probiotic and synbiotic on growth performance, organ weights, and intestinal
histomorphology of broiler chickens. Poult. Sci. 88(1): 49-56.
Awoniyi, T., Aletor V. & Aina J., 2003. Performance of broiler-chickens fed on maggot meal in
place of fishmeal. Int. J .Poult. Sci. 2(4): 271-274.
Barker, D., Fitzpatrick, M. P. & Dierenfeld, E. S., 1998. Nutrient composition of selected
whole invertebrates. Zoo Biol. 17(2): 123-134.
Boling-Frankenbach, S. D., Peter, C. M., Douglas, M. W., Snow, J. L., Parsons, C. M. & Baker,
D. H., 2001. Efficacy of phytase for increasing protein efficiency ratio values of feed
ingredients. Poult. Sci. 80(11): 1578-1584.
Stellenbosch University https://scholar.sun.ac.za

49
Bondari, K. & Sheppard D., 1987. Soldier fly, Hermetia illucens L., larvae as feed for channel
catfish, Ictalurus punctatus (rafinesque), and blue tilapia, Oreochromis aureus
(steindachner). Aquacult. Res. 18(3): 209-220.
Bradshaw, C. J., Sodhi, N. S., PEH, K. S. & Brook, B. W., 2007. Global evidence that
deforestation amplifies flood risk and severity in the developing world. Global Change
Biol. 13(11): 2379-2395.
Cobb-Vantress, Inc. (Cobb)., 2012. Cobb broiler management guide. http://www.cobb-
vantress.com/products/guide-library/general/broiler-management/pdf-downloads-
languages.
Collet, S., 2005. Strategies for improving gut health in commercial operations. Poultry
Beyond. 2010: 3rd.
Cunico, R., Mayer, A., Wehr, C. & Sheehan T., 1986. High sensitivity amino acid analysis using
a novel automated precolumn derivatization system. Biochromatography. 1: 6-14.
Ellinger, G. M., 1958. The importance of protein quality in animal feeding. Proc. Nutr. Soc.
17(01): 100-106.
Feldsine, P., Abeyta, C. & Andrews W. H., 2002. AOAC international methods committee
guidelines for validation of qualitative and quantitative food microbiological official
methods of analysis. J. AOAC Int. 85(5): 1187-1200.
Finke, M. D., 2013. Complete nutrient content of four species of feeder insects. Zoo Biol.
32(1): 27-36.
Hale, O., 1973. Dried Hermetia illucens larvae (diptera: Stratiomyidae) as a feed additive for
poultry. Ga Entomol Soc J.
Hassan, A., Sani, I., Maiangwa, M. & Rahman, S., 2009. The effect of replacing graded levels of
fishmeal with grasshopper meal in broiler starter diet. PAT. 5(1): 30-38.
Stellenbosch University https://scholar.sun.ac.za

50
Hopley, D., 2016. The evaluation of the potential of Tenebrio molitor, Zophobas morio,
Naophoeta cinerea, Blaptica dubia, Gromphardhina portentosa, Oeriplaneta americana,
Blatta lateralis, Oxyhalao duesta and Hermetia illucens for use in poultry feeds. MSC
thesis. University of Stellenbosch
Hwangbo, J., Hong, E., Jang, A., Kang, H., Oh, J., Kim, B. & Park, B., 2009. Utilization of house
fly-maggots, a feed supplement in the production of broiler chickens. J. Environ. Biol.
30(4)
Ijaiya, A. & Eko E., 2009. Effect of replacing dietary fish meal with silkworm (Anaphe infracta)
caterpillar meal on performance, carcass characteristics and haematological parameters
of finishing broiler chicken. Pakistan J.Nutr. 8: 850-855.
Jabir, M., Razak, S. & Vikineswary S., 2012. Nutritive potential and utilization of super worm
(Zophobas morio) meal in the diet of nile tilapia (Oreochromis niloticus) juvenile. African
J. Biotechn. 11(24): 6592-6598.
Joint WHO/FAO/UNU Expert Consultation., 2007. Protein and amino acid requirements in
human nutrition. World Health. Organ. Tech. Rep. Ser. (935)(935): 1-265, back cover.
Klasing, K. C., Thacker, P., Lopez, M. A. & Calvert C. C., 2000. Increasing the calcium content
of mealworms (Tenebrio molitor) to improve their nutritional value for bone
mineralization of growing chicks. J. Zoo & Wildl. Med. 31(4): 512-517.
Kroeckel, S., Harjes, A., Roth, I., Katz, H., Wuertz, S., Susenbeth, A. & Schulz C., 2012. When a
turbot catches a fly: Evaluation of a pre-pupae meal of the black soldier fly (Hermetia
illucens) as fish meal substitute—Growth performance and chitin degradation in
juvenile turbot (Psetta maxima). Aquaculture. 364: 345-352.
Macleod, M., 1997.Effects of amino acid balance and energy: protein ratio on energy and
nitrogen metabolism in male broiler chickens. Brit. Poult. Sci. 38(4): 405-411.
Stellenbosch University https://scholar.sun.ac.za

51
National Research Council (US). Committee on Animal Nutrition., 1993. Nutrient
requirements of fish. Course Technology.
Newton, G., Booram, C., Barker, R. & Hale O., 1977. Dried Hermetia illucens larvae meal as a
supplement for swine. J. Anim. Sci. 44(3): 395-400.
Newton, G., Sheppard, D., Watson, D., Burtle, G., Dove, C. & Tomberlin, J., 2005. The black
soldier fly, Hermetia illucens, as a manure management/resource recovery tool.
Symposium on the state of the science of animal manure and waste management. San
Antonio, Texas, January 5-7, 2005.
Ng, W., Liew, F., Ang, L. & Wong K., 2001. Potential of mealworm (Tenebrio molitor) as an
alternative protein source in practical diets for african catfish (Clarias gariepinus).
Aquacult. Res. 32(s1): 273-280.
NRC., 1994. Nutrient requirements of poultry.
NCR., 1998. Nutrient requirements of swine.
Ogunji, J. O., Kloas, W., Wirth, M., Schulz, C. & Rennert, B., 2006. Housefly maggot meal
(magmeal): An emerging substitute of fishmeal in tilapia diets. Conference on
international agricultural research for development, Deutscher Tropentag,
Oyegoke, O., Akintola, A. & Fasoranti J., 2006. Dietary potentials of the edible larvae of Cirina
forda (westwood) as a poultry feed. African Journal of Biotechnology. 5(19)
Pieterse, E. & Pretorius Q. 2013. Nutritional evaluation of dried larvae and pupae meal of the
housefly (Musca domestica) using chemical-and broiler-based biological assays. Anim.
Prod. Sci. 54(3); 347-355
Pieterse, E., Pretorius, Q., Hoffman, L. & Drew, D., 2014. The carcass quality, meat quality
and sensory characteristics of broilers raised on diets containing either Musca
domestica larvae meal, fish meal or soya bean meal as the main protein source. Anim.
Prod. Sci. 54(5): 622-628.
Stellenbosch University https://scholar.sun.ac.za
52
Premalatha, M., Abbasi, T., Abbasi, T. & Abbasi, S., 2011. Energy-efficient food production to
reduce global warming and ecodegradation: The use of edible insects. Renewable and
Sustainable Energy Reviews. 15(9): 4357-4360.
Pretorius, Q., 2011. The Evaluation of Larvae of Musca domestica (Common House Fly) as
Protein Source for Boiler Production. MSc thesis, University of Stellenbosch.
Ramos-Elorduy, J., González, E. A., Hernández, A. R. & Pino J. M., 2002. Use of Tenebrio
molitor (coleoptera: Tenebrionidae) to recycle organic wastes and as feed for broiler
chickens. J. Econ. Entomol. 95(1): 214-220.
Sarà, G., 2007. A meta-analysis on the ecological effects of aquaculture on the water column:
Dissolved nutrients. Mar. Environ. Res. 63(4): 390-408.
SAS., 2009. Version 9.3. SAS Institute Inc. Cary, North Carolina, USA
Shapiro, S. S. & Wilk M. B., 1965. An analysis of variance test for normality (complete
samples). Biometrika. : 591-611.
Téguia, A., Mpoame, M. & Mba, J. O., 2002. The production performance of broiler birds as
affected by the replacement of fish meal by maggot meal in the starter and finisher
diets. Tropicultura. 20(4): 187-192.
Uushona, T., 2016. Black soldier fly (Hermetia illucens) pre-pupae as n protein source for
broiler production. MSc Thesis, university of Stellenbosch.
Wang, D., Zhai, S. W., Zhang, C. X., Bai, Y. Y., An, S. H. & Xu, Y. N., 2005. Evaluation on
nutritional value of field crickets as a poultry feedstuff. Asian-Aust. J. Anim. Sci. 18: 667-
670.
Wang, D., Zhai, S., Zhang, C., Zhang, Q. & Chen, H., 2007. Nutrition value of the chinese
grasshopper Acrida cinerea(thunberg) for broilers. Anim. Feed Sci. Technol. 135(1): 66-
74.
Stellenbosch University https://scholar.sun.ac.za

53
World Health Organization., 2007. Protein and amino acid requirements in human nutrition.
Zuidhof, M., Molnar, C., Morley, F., Wray, T., Robinson, F., Khan, B., Al-Ani, L. &
Goonewardene, L., 2003. Nutritive value of house fly (Musca domestica) larvae as a feed
supplement for turkey poults. Anim. Feed Sci. Technol. 105(1): 225-230.
Stellenbosch University https://scholar.sun.ac.za

54
The effect of copper bottom blow fly (Chrysomya chloropyga)
larvae meal on chemical, physical, sensory and carcass
characteristics of broiler chicken meat
4.1 Abstract
The effects of copper bottom blow fly (CC) larvae meal when used as a protein source in broiler
diets on the sensory, chemical, physical and carcass characteristics of broilers were
investigated. Four formulated diets consisting of 0%, 5%, 10% and 15% larvae meal were used.
Three hundred and twenty day-old chicks were randomly allocated to the diets and
slaughtered on day 35. Diet had no significant effect on live slaughter weight, cold carcass
weight or dressing percentage. Of the carcass portion yields, diet had an effect only on breast
portion yield and no effect on the thigh, drumstick, wing or back portion yields. Also, diet did
not influence skin plus fat, muscle or bone yields. Diet influenced the ultimate pH of the thigh,
but had no influence on the initial pH of the breast nor thigh, nor on muscle colour. Diet also
had no effect on the protein, fat and ash content of the meat, but differences in moisture
contents were observed; the control had a higher moisture content than the CC treatment
diets. No differences in amino acids and mineral contents of the meat were observed. When
comparing the sensory attributes, the 5% inclusion level had the most intense chicken aroma.
The control had the least intense chicken aroma, while the 10% and 15% were intermediate.
The cooked breast meat of the control birds had the highest initial juiciness, while the 10%
inclusion level had the lowest.
Keywords – larvae meal, tenderness, yield, flavor
4.2 Introduction
The use of Chrysomya chloropyga (copper bottom blow fly) (CC) larvae meal in broiler diets
can possibly impact on the carcass, chemical, physical and sensory characteristics of their
meat. In response to these changes the consumer could be influenced in his choice to
Stellenbosch University https://scholar.sun.ac.za

55
purchase, or not to purchase, meat. The consumer’s initial selection is influenced by the
appearance of the product (Fletcher 2002; Huff-Lonergan and Lonergan, 2005) while the
repurchase decision is based on sensory attributes (Fletcher, 2002).
No literature regarding the use of CC larvae meal in broiler nutrition is available. However,
many studies were conducted using other insect species in broiler nutrition. When Pieterse et
al. (2014) used house fly larvae meal in broiler diets, the treatments had a positive influences
on slaughter weight and cold carcass weight, but had no influence on dressing percentage.
Teguia et al. (2002) and Awoniyi et al. (2003) reported similar results on dressing percentage,
while Hwangbo et al. (2009) found an increase in dressing percentage. Uushona (2016) used
black soldier fly pre-pupae in her trails and did not report any differences in live slaughter
weight, cold carcass weight or dressing percentage.
The use of house fly larvae meal (Pieterse et al., 2014) and black soldier fly pre-pupae
(Uushona, 2016) had no influence on the colour of broiler breast meat, and in both studies
the colour was classified as normal. Sealy et al. (2011) found high levels of moisture and fat in
trout when black soldier fly larvae was used in the diets. Uushona (2016) reported no
differences in the mineral content of broiler meat when black soldier fly pre-pupae were used
in the diets. House fly larvae meal (Pieterse et al., 2014) and black soldier fly pre-pupae meal
(Uushona, 2016) had no influence on the sensory attributes of broiler meat.
Although studies on using insect meal as a protein source in broiler nutrition did differ in some
occasions regarding chemical, physical, sensory and carcass characteristics of broiler chicken
meat, the influence were in no occasion negative. Therefore the use of CC larvae meal can
possibly be used as an alternative protein source in broiler nutrition.
4.3 Materials and methods
4.3.1 Experimental layout, handling and management
This section is described in detail in Chapter 3 (Section 3.3.1).
Stellenbosch University https://scholar.sun.ac.za

56
4.3.2 Slaughtering procedure
At 35 days of age, the birds were weighed individually to determine the average live weight
of all the birds in each cage. One broiler with a live weight closest to this average weight was
then selected for slaughter.
The broilers were slaughtered at the Mariendahl experimental farm abattoir according to
acceptable slaughtering standard methods used for commercial chickens (Department of
Agriculture, Forestry & Fisheries [DAFF], 2006). At slaughter the birds were rendered
unconscious by electrical stunning (50-70 volts; 3-5 s), exsanguinated and allowed to bleed
out for ~2 min. Thereafter, the birds were soaked in a rotating 60 °C water bath for 5 min, de-
feathered and then eviscerated.
4.3.3 Carcass characteristics
After slaughter, the carcasses were refrigerated (~4 °C) overnight where after the cold carcass
weight was determined. The dressing percentage was calculated as the percentage of cold
carcass weight to the live slaughter weight. The carcasses were cut into commercial portions
(thigh, wing, drumstick and breast) using a portion cutter. The cutting procedure was as
follows: firstly, the whole carcass was halved. Then, the leg was removed by cutting above the
thigh towards the acetabulum just behind the pubic bone. The leg was further cut
perpendicular to the joints where the tibia, fibula and femur bones are attached together to
obtain the drumstick and thigh portions. Then the wing was removed by cutting through the
joint between the scapula and coracoid and the breast portion was separated from the wing.
The breast, wing, drumstick and thigh portions were then weighed in pairs using a Mettler PC
400 scale (Mettler-Toledo, Switzerland) and recorded. The right breast portion was skinned
and deboned. The skin, muscle and bone of each breast portion were weighed separately for
the determination of the bone, meat and skin (and subcutaneous fat) percentage. Percentage
component yields were calculated by expressing these weights as n percentage of cold carcass
weight. The left breast samples were vacuum-packed with their skins and bones attached, and
frozen at -18°C for sensory analyses.
Stellenbosch University https://scholar.sun.ac.za

57
4.3.4 Physical measurements
4.3.4.1 pH
Subsequently, 15min after slaughter the carcass initial pH (pHi) was measured from the right
breast and thigh, where after the carcass was chilled at ~4 °C for 24 h. The ultimate pH (pHu)
of the right breast and thigh was measured 24 h after chilling. The pH was measured by means
of a small incision in the centre of both the breast and the thigh muscle with a Crison pH 25
handheld portable pH meter (Lasec (Pty) Ltd, South Africa) with an automatic temperature
adjuster. The Crison pH 25 was calibrated before pH measurements were taken with the
standard buffers (pH 4.0 and pH 7.0) as provided by the manufacturer. After chilling the
carcasses were transported (15 mins transport time) to the meat laboratory at Stellenbosch
University for further processing.
4.3.4.2 Colour
Breast meat colour was measured 24 h post-mortem. The skin and subcutaneous fat on the
thigh and breast was removed, and the exposed thigh and breast muscle were placed on a flat
surface. Colour was measured at three randomly selected positions on the meat muscle
surface after a 20 min blooming period. The colour was recorded using a Colour guide 45°/0°
colorimeter (Catelogue no: 6805; BYK-Gardner, USA) to determine the L*, a* and b* values.
The L* indicating lightness, a* red-green range and b* blue-yellow range of the meat muscle
surface. The a* and b* values were used to calculated the hue angle (ℎ𝑎𝑏) (°) and chroma
value (𝐶∗) as outlined in Honkel (1998).
4.3.5 Chemical analysis
4.3.5.1 Sample preparation
Six replicates (birds) per treatment were used for sensory and also chemical analysis. After the
breast sub-samples for descriptive sensory analysis (DSA) were removed, the remainder were
used for chemical analysis. These cuts were homogenised and vacuum packed separately and
frozen at -18°C until analysed. Before analysis the samples were removed from the -18°C
freezer and defrosted in a refrigerator at 4°C for approximately 12h before being
homogenised.
Stellenbosch University https://scholar.sun.ac.za

58
4.3.5.2 Proximate analysis
For proximate analysis the homogenised cooked breast meat samples were analysed using
the methods described by the Association of Analytical Chemists International (AOAC) (2002).
Official method 934.01 was used to determine dry matter (DM). Samples were dried for 24 h
at 100 ̊C. Crude protein was determined by using the LECO FP528 machine to measure the
total nitrogen content. Method 992.15 was used to determine the nitrogen content, which
was then multiplied by 6.25 to determine crude protein. Retained samples from the dry
matter determination were used for further analysis to determine the ash content of the
homogenised cooked breast meat samples. Official method 942.05 was used; combustion of
the samples occurred at 500°C for 6 h.
The amino acid composition was determined using official method 994.12. Six mm of 6N
hydrochloric acid containing 15% phenol solution was added to the cooked breast meat
samples and then sealed under nitrogen and left in an 110 ̊C oven. After 24 h, the samples
were removed, left to cool down and then frozen in Eppendorf tubes at -18°C until further
analysis. Amino acid analysis was done using a Water API Quattro Micro instrument with the
sample being subjected to the Water AccQ Tag Ultra derivitization kit for cleaning. The amino
acid standard used was purchased from Waters (P/N: WAT088122) and prepared by adding
40 µl of standard, 760 µl of Water and 200 µl Internal standard. To prepare the samples, 20 µl
AccQ Tag reagent and 70 µl Borate buffer were added to a 10 µl sample. After the sample was
vortexed, it was allowed to stand for 1 min at room temperature and then placed in a heating
block for 10 min at 55°C. To determine the amino acid composition, 1 µl was then injected in
the apparatus.
The mineral composition of the cooked breast meat samples were determined at the institute
of Animal Production, Western Cape Department at Elsenburg by using the combustion
method No. 6.1.1 as described by Agriculture Laboratory Association of South Africa
(AgriLASAS) (2007).
To determine the crude fat content, 5 g of cooked breast meat were homogenised with 50 mL
chloroform/methanol (1:2 vol/vol) where after the solution was filtered into a separation
funnel through Whatman® No 1. Thereafter, 20 mL of 0.5% sodium chloride was added and
Stellenbosch University https://scholar.sun.ac.za

59
the solution was allowed to separate. Then 5 mL of the lower extract was placed into a fat
glass beaker and dried on a sand bath (~85°C) to allow the chloroform/methanol to evaporate.
A 16.7 mL factor were used to correct the results as total percentage of fat (Lee et al., 1996).
4.3.6 Sensory analysis
4.3.6.1 Sample preparation
The left breasts of the birds were used for sensory analysis. Prior to conducting sensory
analyses the samples were defrosted for ±12 h at 4°C and then blot-dried and weighed. The
blot-dried samples were deboned, skin plus fat removed and weighed. Subsequently, the
muscle was placed inside a marked oven bag (Glad®). No salt (sodium chloride) nor seasoning
additives nor preservatives were added to the breast meat used for the sensory analysis. Meat
samples in the oven bags were placed on stainless steel grids fitted in oven roasting pans.
Thermocouple probes attached to a hand operated digital temperature monitor (Hanna
Instruments, South Africa) were placed in the centre of each of the meat samples and sealed
in the oven bag to keep the probe in place.
The prepared samples were placed in a conventional oven (Defy, Model 835) connected to a
computerized monitoring system responsible for regulation of the temperature. The ovens
were pre-heated to 160 °C (American Meat Science Association [AMSA],1995). The meat
samples were removed from the oven when a core temperature of 75°C was reached for each
sample (AMSA, 1995). The samples were cooled for 15 min allowing them to equilibrate to
ambient temperature, blot dried and weighed. The cooked samples were each cut into 32
sample cubes of 1 cm x 1 cm x 1 cm. The cubes were then individually wrapped in aluminium
foil (with the shiny side to the food) and placed into glass ramekins coded with a randomized
three-digit code. The 32 sample cubes were given to eight judges; each with four test samples
per treatment. The coded ramekins, each containing four wrapped meat cubes were placed
in a preheated industrial oven (Hobart, France) at 70°C for 7 min and placed in a water bath
preheated to 70°C for the duration of the testing session.
4.3.6.2 Descriptive sensory analysis
Descriptive sensory analysis (DSA) was performed on four meat cubes per treatment with six
consecutive replications, thus the experimental design: 4 treatments x 6 replications = 24
Stellenbosch University https://scholar.sun.ac.za

60
breasts (experimental units). A panel of eight judges, with previous experience with sensory
analysis of meat, were used. The panellists were trained according to the guidelines for
sensory analysis of meat (AMSA, 1995) and the generic descriptive sensory analysis technique
as described by Lawless & Heymann (2010) before the actual test analysis.
The panel undertook five training sessions and during each of these training sessions the
panellists received four 1 cm x 1 cm x 1 cm cubes of meat from the four treatments. During
the training sessions the panel decided on the following sensory attributes: chicken flavour,
metallic flavour, chicken aroma, metallic aroma, initial and sustained juiciness, and tenderness
(evaluated on first bite). The definitions for each of the attributes are described in Table 4.1.
The re-test method was used for DSA, where the panellists received four 1 cm x 1 cm x 1 cm
cubes of each of the four treatment samples in a completely randomized order. The panellist
carried out DSA on the treatment samples while seated in individual tasting booths having
computers fitted with the Compusense® five (Compusense, Guelph, Canada) software
programme. On Compusense® five the samples were analysed for the respective sensory
attributes using an unstructured line scale with zero indicating “low intensity” and 100 “high
intensity”. The sensory analysis sessions took place inside a temperature controlled room at
21°C with artificial daylight in accordance to guidelines set by AMSA (1995). The panellists
were availed with distilled water (21 C), apple pieces and water biscuits in order to cleanse
and refresh their palates between testing of samples. The DSA of the test samples was done
over six sessions on three different consecutive days, with two testing sessions per day.
Stellenbosch University https://scholar.sun.ac.za

61
Table 4.1 Definition and scale of each attribute used for the descriptive sensory analysis on breast portion
Sensory attribute Description Scale
Chicken aroma Aroma associated with the chicken meat, as
soon as the aluminium foil is removed
0 = None
100 = Prominent
Chicken flavour Flavour associated with chicken prior to
swallowing while chewing
0 = None
100 = Prominent
Metallic aroma Aroma associated with raw meat and/or blood-
like, as soon as the aluminium foil is removed
0 = None
100 = Prominent
Metallic flavour Taste associated with raw meat and/or blood-
like taste prior to swallowing while chewing
0 = None
100 = Prominent
Initial juiciness
Amount of fluid extruded on surface of meat
sample when pressed between the thumb and
forefinger (pressed perpendicular to fibres)
0 = Dry
100 = Extremely juicy
Sustained juiciness
Amount of moisture perceived during
mastication, after the first 5 chews using the
molar teeth
0 = Dry
100 = Extremely juicy
Tenderness The impression of tenderness perceived after
the first 5 chews using the molar teeth
0 = Tough
100 = Extremely tender
4.3.7 Statistical analysis
The following hypothesis was proposed:
H1: There is no statistical difference amongst the analysed meat quality attributes and carcass
characteristics of broiler carcass as influenced by CC
H0: There is a statistical difference amongst the analysed meat quality attributes and carcass
characteristics of broiler carcasses as influence by CC
Statistical analysis of carcass, chemical and physical data were analysed using the general
linear models (GLM) procedure of SAS (2009). The Shapiro-Wilk test for normality of data and
homoscedasticity test was performed before proceeding with further analyses. The tests were
considered significant at P>0.05. A one-way analysis of variance (ANOVA) with Bonferroni’s
post hoc test was used for statistical analysis. Sensory analysis data was analysed by
multivariate analyses using XLStat software (Version 2012, Addinsoft, New York, USA). In the
event of significant non-normality values (P<0.05) in the sensory data, outliers were identified
and residuals greater than three were removed. The correlations coefficients for the sensory,
physical and chemical data was analysed using the Pearson’s correlation coefficient (r). The
Stellenbosch University https://scholar.sun.ac.za

62
relationship between the sensory, physical and chemical data was indicated by performing a
principal component analysis (PCA) with correlation matrix, combined with discriminant
analysis (DA).
The 5% significance level was used for the statistical tests and treatment differences were
declared at P≤0.05.
The statistical model for the ANOVA test is indicated by, Yіϳ = µі + αj + ԑіϳ where the terms in
the model are defined as; the treatment effect response (Yіϳ), the overall mean (µі), treatment
effect (αj) and the unexplained error (ԑіϳ).
4.4 Results and Discussion
4.4.1 Carcass characteristics
Table 4.2 indicates that the inclusion of C. chloropyga (CC) larvae meal in broiler diets at rates
of 0%, 5%, 10% and 15% had no influence (P>0.05) on live weight, cold carcass weight and
dressing percentage. Pieterse et al. (2014) reported higher (P≤0.05) live slaughter weights and
cold carcass weights in broilers fed a 10% inclusion of house fly larvae meal compared to a
soya based control diet, but did not report any differences in dressing percentage. Téguia et
al. (2002) and Awoniyi et al. (2003) reported similar results for dressing percentage when
using house fly larvae meal, but Hwangbo et al. (2009) noted that the use of larvae meal
increased dressing percentage (P≤0.05). When comparing slaughter weight, cold carcass
weight and dressing percentages in broilers fed on diets containing a soya based control diet,
and treatment diets containing 5%, 10% and 15% black soldier fly pre-pupae meal, Uushona
(2016) also reported no differences (P>0.05).
It can be noted that CC larvae meal had little influence on carcass portion yields. No
differences (P>0.05) were found in thigh, drumstick, wing and back weights. However, the
inclusion of CC larvae meal at a 10% level had higher (P≤0.05) right breast weight than the
control diet. The 5% and 15% inclusion levels were intermediate. Pieterse et al. (2014) noted
differences (P≤0.05) in the carcass portion yield of broilers fed on a 10% house fly larvae meal
based diet compared to the soya based control diet. Pieterse et al. (2014) found higher
(P≤0.05) yields of breast and thigh muscle as a percentage of carcass weight of the broilers
Stellenbosch University https://scholar.sun.ac.za

63
that were fed the treatment diets when compared to the control-diet broilers. However, the
leg and wing weights did not differ (P>0.05) in the carcasses of the 10% house fly larvae meal
and the soya based control (Pieterse et al., 2014). Uushona (2016) reported no differences
(P>0.05) in breast, thigh, drumstick, wing or back yields when broiler diets containing 5%, 10%
and 15% black soldier fly pre-pupae meal were compared to a soya based control diet. Table
4.2 shows no differences (P>0.05) regarding breast skin plus fat percentage, breast muscle
percentage and breast bone percentage. This differs from Uushona (2016) who reported
higher (P≤0.05) skin plus fat yields from broilers fed 15% black soldier fly pre-pupae diets
compared to the soya based control diets, while the 5% and 10% inclusion levels were
intermediate. No differences (P≤0.05) were observed by Uushona, (2016) regarding bone
percentages of broilers as influenced by feeding black soldier fly pre-pupae meal.
Table 4.2 The means (± standard error) of live slaughter weight, cold carcass weight, dressing percentage, carcass portion yields (g) and skin, muscle and bone percentages of broilers as influenced by inclusion of Chrysomya chloropyga meal (CC) in their diets
Parameters Treatments diets
P-value Control 5% CC 10% CC 15% CC
Live slaughter
weight (g) 2067.5 ±10.65 2047.5 ± 0.04 2172.5 ± 0.04 2095.0 ± 0.04 0.052
Cold carcass
weight (g) 1364.5 ±11.32 1388.73 ±30.99 1472.27 ±38.55 1399.5 ±25.36 0.067
Dressing
percentage (%) 66.0 ± 0.50 67.86 ± 0.01 67.78 ± 0.01 66.83 ± 0.01 0.525
Right Breast 267.58b± 8.12 277.45ab± 5.18 299.35a± 9.33 270.91ab± 7.68 0.031
Thigh 352.65 ± 5.27 348.93 ±11.63 373.36 ±10.44 365.10 ± 10.72 0.290
Drumstick 195.04 ± 4.82 209.65 ± 6.52 213.20 ± 9.76 205.55 ± 5.38 0.293
Wing 172.60 ± 9.41 178.15 ± 7.96 178.73 ± 5.62 179.19 ± 5.78 0.091
Back 93.29 ± 3.37 94.61 ± 2.78 99.61 ± 4.76 98.00 ± 5.56 0.704
Skin plus fat 5.73 ± 0.38 6.93 ± 0.55 6.28 ± 0.35 6.87 ± 0.48 0.212
Muscle 74.25 ± 0.91 74.21 ± 1.39 72.79 ± 1.56 71.33 ± 1.35 0.366
Bone 18.54± 0.77 17.55 ± 1.02 20.00 ± 1.61 20.72 ± 0.87 0.205 (a,b) Means with different superscripts within the same row differ significantly (P≤0.05)
4.4.2 Physical measurements
Stellenbosch University https://scholar.sun.ac.za

64
Table 4.3 indicates that the inclusion of CC larvae did not have an influence (P>0.05) on the
initial pH of the breast or thigh, nor on the ultimate pH of the breast. However, there were
differences in the ultimate pH of the thigh with that of the control being higher (P≤0.05) than
the 5% and 15% CC larvae inclusion levels. The 10% CC larvae inclusion level was intermediate.
Similarly, no differences (P>0.05) were observed in the pH of breast and thigh meat of broilers
fed a 10% house fly larvae meal and the soya based control diet (Pieterse et al., 2014). Nor
were any differences (P>0.05) reported regarding initial and ultimate pH of both breast and
thigh meat of broilers that received diets with 5%, 10% or 15% black soldier fly pre-pupae
meal, compared to a soya based control diet (Uushona, 2016). No differences (P>0.05) were
observed regarding the L*, a*, b*, hue and chroma measurements of the colour of the breast
(
Stellenbosch University https://scholar.sun.ac.za

65
Table 4.3) and the ordinate values are very similar to that reported in other investigations
where insect larvae were fed to broilers. For example, when 10% house fly larvae meal were
fed to broilers, the lightness of both the breast meat of the experimental broilers and that of
the soya based control diet were classified as normal, and did not differ (P>0.05) from each
other (Pieterse et al., 2014). However, in the same study, Pieterse et al. (2014) concluded that
the breast meat of the soya based control broilers were redder (P≤0.05) than the breast meat
of the 10% house fly larvae meal treatment. Pieterse et al. (2014) noted no difference in the
yellowness of the breast meat of the 10% house fly larvae meal treatment compared to that
of the soya based control broilers. In the thigh, no differences (P>0.05) were observed in the
colour (L*, a* and b*) between the 10% house fly larvae meal treatment broilers and the soya
based control broilers (Pieterse et al., 2014). Similar to this investigation, when diets
containing 5%, 10% and 15% black soldier fly pre-pupae meal were compared to a soya based
control diet, Uushona (2016) observed no significant differences (P>0.05) regarding L*, a*, b*,
Hue and Chroma of the breast or thigh.
Stellenbosch University https://scholar.sun.ac.za

66
Table 4.3 The means (± standard error) of physical measurements of broiler carcasses as influenced by the inclusion of Chrysomya chloropyga meal (CC) in their diets
Parameters Treatment diets
P-value Control 5% CC 10% CC 15% CC
pHi breast 6.38 ± 0.044 6.35 ± 0.059 6.38 ± 0.056 6.41 ± 0.034 0.890
pHµ breast 6.13 ± 0.043 6.06 ± 0.037 6.13 ± 0.032 6.06 ± 0.020 0.261
pHi thigh 6.65 ± 0.056 6.57 ± 0.061 6.58 ± 0.042 6.52 ± 0.044 0.302
pHµ thigh 6.65a ± 0.043 6.46b ± 0.025 6.52ab ± 0.043 6.47b ± 0.039 0.006
L* 54.35 ± 0.705 53.35 ± 1.261 53.94 ± 1.223 54.03 ± 0.873 0.922
a* 0.74 ± 0.304 -0.35 ± 0.227 0.22 ± 0.318 0.14 ± 0.331 0.105
b* 12.31 ± 0.259 9.97 ± 0.706 10.54 ± 0.760 12.15 ± 1.037 0.085
Hue 86.70 ± 1.251 92.88 ± 2.075 89.33 ± 1.443 90.36 ± 1.774 0.093
Chroma 12.35 ± 0.283 10.01 ± 0.680 10.57 ± 0.774 12.18 ± 1.032 0.083 (a,b) Means with different superscripts within the same row differ significantly (P≤0.05)
4.4.3 Chemical analysis
The moisture content of cooked broiler breast meat of the control was higher (P=0.002) than
the three treatments (Table 4.4). There were no significant differences between the four
treatments for protein and fat, but the 15% CC had a higher ash content (P=0.054) than the
control, while the 5% and 10% were intermediate (Table 4.4). When Sealey et al. (2011)
partially replaced fishmeal with black soldier fly larvae meal at rates of 25% and 50% of the
protein content of the diets of rainbow trout, they found a higher (P≤0.05) moisture content
in the muscles of both treatment groups. Sealey et al. (2011) also found lower (P≤0.05) fat
levels in the muscles of both treatment groups, while the protein and ash content did not
differ (P>0.05). When a soya based control diet was compared to diets containing black soldier
fly pre-pupae meal at inclusion levels of 5%, 10% and 15%, Uushona (2016) observed no
differences (P>0.05) regarding moisture, protein, fat and ash of the cooked breast meat of
broilers receiving different levels of black soldier fly pre-pupae meal.
Table 4.4 The means (± standard error) of the proximate analysis (g/100g; meat) of broiler cooked breast meat as influenced by the inclusion of Chrysomya chloropyga meal (CC) in their diets
Parameters Treatment diets
P-value Control 5% BSM 10% BSM 15% BSM
Moisture 68.9 ± 0.58a 66.1 ± 0.50b 66.2 ± 0.50b 66.0 ± 0.50b 0.002
Protein 28.4 ± 0.57 28.9 ± 0.50 29.3 ± 0.50 29.4 ± 0.50 0.568
Fat 2.1 ± 0.24 2.8 ± 0.21 2.8 ± 0.21 2.7 ± 0.21 0.090
Ash 1.1 ± 0.09b 1.2 ± 0.08ab 1.2 ± 0.08ab 1.4 ± 0.08a 0.054
Stellenbosch University https://scholar.sun.ac.za

67
(a,b) Means with different superscripts within the same row differ significantly (P≤0.05)
Stellenbosch University https://scholar.sun.ac.za

68
Table 4.5 The means (± standard error) of the amino acid composition (g/100g) of cooked breast meat as influenced by inclusion of Chrysomya chloropyga meal (CC) in broiler chickens diets
Amino acids Treatment diets
P-value Control 5% BSM 10% BSM 15% BSM
Histidine* 2.5 ± 0.09 2.5 ± 0.08 2.5 ± 0.09 2.5 ± 0.08 0.995
Serine 3.0 ± 0.08 3.0 ± 0.07 3.1 ± 0.08 3.0 ± 0.07 0.860
Arginine* 5.2 ± 0.12 5.3 ± 0.11 5.3 ± 0.11 5.4 ± 0.10 0.883
Glycine 3.3 ± 0.07 3.5 ± 0.06 3.3 ± 0.07 3.4 ± 0.06 0.266
Aspartic acid 7.2 ± 0.18 7.0 ± 0.15 7.2 ± 0.16 7.2 ± 0.14 0.916
Glutamic acid 11.3 ± 0.24 11.1 ± 0.21 11.3 ± 0.23 11.4 ± 0.20 0.865
Threonine* 3.6 ± 0.09 3.5 ± 0.08 3.5 ± 0.08 3.5 ± 0.07 0.945
Alanine 4.2 ± 0.08 4.3 ± 0.07 4.2 ± 0.07 4.2 ± 0.07 0.782
Proline 2.8 ± 0.06 2.8 ± 0.05 2.7 ± 0.05 2.8 ± 0.05 0.542
Cysteine 0.4 ± 0.02 0.4 ± 0.02 0.4 ± 0.02 0.4 ± 0.02 0.683
Lysine* 7.5 ± 0.55 7.6 ± 0.48 7.5 ± 0.51 6.7 ± 0.45 0.543
Tyrosine 3.1 ± 0.11 3.0 ± 0.10 3.1 ± 0.11 3.1 ± 0.09 0.723
Methionine* 2.0 ± 0.10 2.3 ± 0.08 2.3 ± 0.09 2.3 ± 0.08 0.086
Valine* 4.2 ± 0.09 4.2 ± 0.07 4.1 ± 0.08 4.1 ± 0.07 0.466
Isoleucine* 3.7 ± 0.08 3.8 ± 0.07 3.7 ± 0.07 3.7 ± 0.06 0.758
Leucine* 6.4 ± 0.13 6.3 ± 0.12 6.3 ± 0.12 6.3 ± 0.11 0.946
Phenylalanine* 3.5 ± 0.12 3.4 ± 0.10 3.5 ± 0.11 3.4 ± 0.10 0.717
* Essential amino acids
There were no treatment differences (P>0.05) regarding the amino acid composition in the cooked broiler breast meat (
Stellenbosch University https://scholar.sun.ac.za

69
Table 4.5). Uushona (2016) also reported no significant differences in the amino acid
composition of cooked breast meat of broilers fed a soya based control diet and 5%, 10% and
15% black soldier fly pre-pupae meal, respectively. Sealey et al. (2011) also found no
significant differences (P≤0.05) in the amino acid compositions when a fish meal based diet
was compared to diets containing 25% and 50% of black soldier fly larvae meal as a percentage
of total protein in the diet of rainbow trout.
Table 4.6 shows no differences (P>0.05) in the mineral composition between the four
treatments of cooked broiler breast meat. Uushona (2016) also found no differences (P>0.05)
in the mineral composition of cooked breast meat of broilers receiving either a soya based
control diet or a treatment diet containing black soldier fly pre-pupae meal at inclusions of
5%, 10% or 15%.
Table 4.6 The means (± standard error) of mineral composition of cooked breast meat as influenced by inclusion of Chrysomya chloropyga meal (CC) in broiler chickens diets
Parameters Units Treatment diets
Control 5% BSM 10% BSM 15% BSM P-value
Phosphorous % 0.69 ± 0.022 0.67 ± 0.019 0.64 ± 0.019 0.68 ± 0.019 0.428
Potassium % 0.73 ± 0.030 0.71 ± 0.026 0.68 ± 0.026 0.70 ± 0.026 0.606
Calcium % 0.03 ± 0.005 0.03 ± 0.004 0.03 ± 0.004 0.03 ± 0.004 0.930
Magnesium % 0.12 ± 0.004 0.11 ± 0.004 0.11 ± 0.004 0.12 ± 0.004 0.373
Iron mg/kg 28.11 ± 3.037 25.64 ± 1.871 27.85 ± 2.146 25.99 ± 2.180 0.841
Copper mg/kg 0.46 ± 0.023 0.69 ± 0.085 0.48 ± 0.060 0.52 ± 0.068 0.106
Zinc mg/kg 29.15 ± 1.940 29.76 ± 1.515 26.75 ± 0.803 26.21 ± 1.241 0.249
Manganese mg/kg 0.83 ± 0.065 0.72 ± 0.030 0.92 ± 0.055 0.93 ± 0.059 0.069
Boron mg/kg 0.71 ± 0.049 0.70 ± 0.046 0.63 ± 0.062 0.71 ± 0.078 0.739
Sodium mg/kg 717.33 ± 33.503 593.88 ± 29.014 602.25 ± 29.014 613.88 ± 29.014 0.041
4.4.4 Descriptive sensory analysis
The results of the sensory analysis are shown in Table 4.7. No differences were observed for
chicken flavour, metallic aroma, metallic flavour, sustained juiciness and tenderness in the
cooked chicken breast meat. However, the 5% inclusion level of CC had a higher chicken aroma
(P=0.008) than the control, while the 10% and 15% were intermediate. The control had the
highest initial juiciness, but did not differ (P>0.05) from the 5% inclusion level. The 15%
inclusion of CC had an initial juiciness similar to the 5% CC, but significantly lower than that of
the control. The 10% inclusion level had the lowest initial juiciness of the four treatment diets
which differed from that of the control and 5% CC. When Pieterse et al. (2014) compared the
Stellenbosch University https://scholar.sun.ac.za
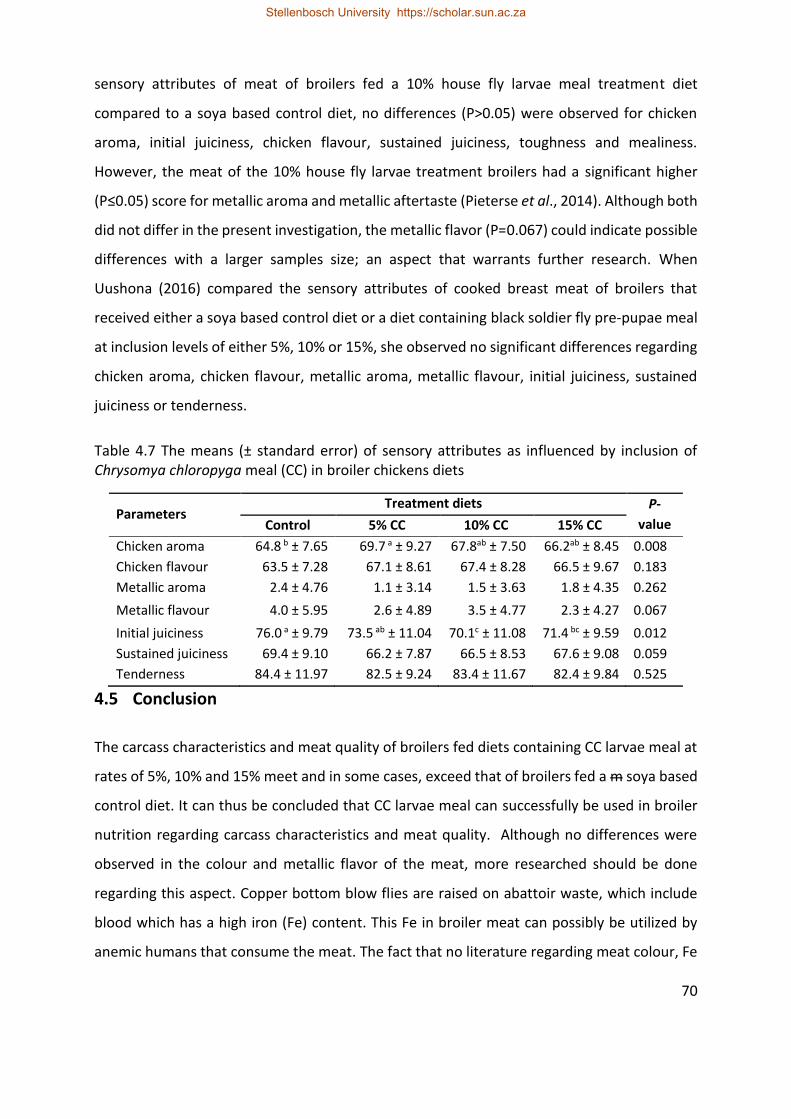
70
sensory attributes of meat of broilers fed a 10% house fly larvae meal treatment diet
compared to a soya based control diet, no differences (P>0.05) were observed for chicken
aroma, initial juiciness, chicken flavour, sustained juiciness, toughness and mealiness.
However, the meat of the 10% house fly larvae treatment broilers had a significant higher
(P≤0.05) score for metallic aroma and metallic aftertaste (Pieterse et al., 2014). Although both
did not differ in the present investigation, the metallic flavor (P=0.067) could indicate possible
differences with a larger samples size; an aspect that warrants further research. When
Uushona (2016) compared the sensory attributes of cooked breast meat of broilers that
received either a soya based control diet or a diet containing black soldier fly pre-pupae meal
at inclusion levels of either 5%, 10% or 15%, she observed no significant differences regarding
chicken aroma, chicken flavour, metallic aroma, metallic flavour, initial juiciness, sustained
juiciness or tenderness.
Table 4.7 The means (± standard error) of sensory attributes as influenced by inclusion of Chrysomya chloropyga meal (CC) in broiler chickens diets
Parameters Treatment diets P-
value Control 5% CC 10% CC 15% CC
Chicken aroma 64.8 b ± 7.65 69.7 a ± 9.27 67.8ab ± 7.50 66.2ab ± 8.45 0.008
Chicken flavour 63.5 ± 7.28 67.1 ± 8.61 67.4 ± 8.28 66.5 ± 9.67 0.183
Metallic aroma 2.4 ± 4.76 1.1 ± 3.14 1.5 ± 3.63 1.8 ± 4.35 0.262
Metallic flavour 4.0 ± 5.95 2.6 ± 4.89 3.5 ± 4.77 2.3 ± 4.27 0.067
Initial juiciness 76.0 a ± 9.79 73.5 ab ± 11.04 70.1c ± 11.08 71.4 bc ± 9.59 0.012
Sustained juiciness 69.4 ± 9.10 66.2 ± 7.87 66.5 ± 8.53 67.6 ± 9.08 0.059
Tenderness 84.4 ± 11.97 82.5 ± 9.24 83.4 ± 11.67 82.4 ± 9.84 0.525
4.5 Conclusion
The carcass characteristics and meat quality of broilers fed diets containing CC larvae meal at
rates of 5%, 10% and 15% meet and in some cases, exceed that of broilers fed a m soya based
control diet. It can thus be concluded that CC larvae meal can successfully be used in broiler
nutrition regarding carcass characteristics and meat quality. Although no differences were
observed in the colour and metallic flavor of the meat, more researched should be done
regarding this aspect. Copper bottom blow flies are raised on abattoir waste, which include
blood which has a high iron (Fe) content. This Fe in broiler meat can possibly be utilized by
anemic humans that consume the meat. The fact that no literature regarding meat colour, Fe
Stellenbosch University https://scholar.sun.ac.za

71
content of meat or metallic flavour of meat of broilers raised on a diets containing CC larvae
meal to compare the results of this study with make it impossible to make a recommendation
regarding Fe in the meat. Further studies need to be conducted regarding Fe availability from
the blood feed to the broilers. Before broiler meat produces from CC diets can be sold to the
consumer, a survey should be done to make sure the consumer will buy broiler meat from
such unconventional protein source.
4.6 References
American Meat Science Association (AMSA)., 1995. Research guidelines for cookery, sensory
evaluation and instrumental tenderness measurements of fresh meat. Chicago, USA:
National Livestock and Meat Board.
Awoniyi, T.A.M., Aletor, V.A. & Aina, J.M., 2003. Performance of broiler-chickens fed on
maggot meal in place of fishmeal. International Journal of Poultry Science 2, 271-274.
Doi:10.3923/ijps.2003.271.274
Department of Agriculture, Forestry & Fisheries (DAFF)., 2006. Meat Safety Act (Act no. 20 of
2000, R153/2006). South African Government Gazette. 28520: 20-22.
Fletcher, D.L., 2002. Poultry meat quality. Wld’s Poult. Sci. J. 58: 131-145. Doi:
10.1079/WPS20020013
Honikel, K. O., 1998. Reference methods for the assessment of physical characteristics of
meat. Meat Sci. 49(4): 447-457.
Huff-Lonergan, E. & Lonergan, S.M., 2005. Mechanisms of water-holding capacity of meat:
the role of postmortem biochemical and structural changes. Meat Sci. 71: 194-204. Doi:
10:16/j.meatsci.2005.04.022
Hwangbo, J., Hong, E., Jang, A., Kang, H., Oh, J., Kim, B. & Park B., 2009. Utilization of house
fly-maggots, a feed supplement in the production of broiler chickens. J. Environ. Biol.
30(4): 609-614.
Stellenbosch University https://scholar.sun.ac.za

72
Lawless, H. T. & Heymann, H., 2010. Sensory evaluation of food: principles and practices. 2nd
ed. New York, USA: Springer.
Lee, C. M., Trevino, B. & Chaiyawat, M., 1996. A simple and rapid solvent extraction method
for determining total lipids in fish tissue. J. AOAC Int. 79(2): 487-492.
Pieterse, E., Pretorius, Q., Hoffman, L. & Drew, D., 2014. The carcass quality, meat quality
and sensory characteristics of broilers raised on diets containing either Musca
domestica larvae meal, fish meal or soya bean meal as the main protein source. Anim.
Prod. Sci. 54(5): 622-628.
SAS., 2009. Version 9.3. SAS Institute Inc. Cary, North Carolina, USA.
Sealey, W.M., Gaylord, T.G., Barrows, F.T., Tomberlin, J.K., McGuire, M.A., Ross, C., St-Hilaire,
S., 2011. Sensory analysis of rainbow trout, Oncorhynchus mykiss, fed enriched black
soldier fly prepupae, Hermetia illucens. Journal of the world aquaculture society. Vol.42,
No. 1
Teguia, A., Mpoame, M. & Mba, J.A.O., 2002. The production performance of broiler birds as
affected by the replacement of fish meal by maggot meal in the starter and finisher
diets. Tropicultura 20, 187-192.
Uushona, T., 2016. Black soldier fly (Hermetia illucens) pre-pupae as a protein source for
broiler production. MSc Thesis. University of Stellenbosch.
Stellenbosch University https://scholar.sun.ac.za

73
The effect of copper bottom blow fly (Chrysomya chloropyga)
(CC) larvae meal on organ, gut and tibia bone parameters of broiler
chickens
5.1 Abstract
This study investigated the effect of Chrysomya chloropyga larvae meal as a protein source in
broiler diets. The effect on gizzard erosion and organ weights, intestinal pH and tibia bone
parameters were evaluated. Treatment had no effect on gizzard erosion score, and the gizzard
erosion scores of all the treatments were described as normal. Treatment also did not
influence organ weights and organ weights relative to live weights. The pH of the duodenum
of the control diets were significant lower than that of the 5%, 10% and 15% inclusion of CC
larvae meal. Treatment did not influence jejunum pH. The pH of the ileum of the control diets
were significant lower than that of the 5%, 10% and 15% inclusion of CC larvae meal.
Treatment had no effect on tibia bone breaking force (N) and tibia bone breaking strength
(N/mm2). Treatment did not influence tibia bone minerals, except for potassium (K). The
control diet had a lower K level than the treatment diets. It can be concluded that the inclusion
of CC in broiler diets has no negative effect on any of the parameters evaluated.
Keywords: tibia, bone breaking strength, minerals,
5.2 Introduction
For the poultry industry all over the world, gizzard erosion has always been a huge problem
(Johnson, 1971). Gizzard erosion are normally characterized by a rough inner lining of the
gizzard, and by erosions in the inner muscle layer of the gizzard (Wessles & Post, 1989). High
mortalities, low feed intake and listlessness characterizes this disease (Itakura et al., 1981).
Gizzard erosion can by diagnosed post mortem by the presence of a black watery content in
the crop, proventriculus and gizzard, with the lining of the gizzard eroded and ulcers forming
on the gizzard muscles (Johnson, 1971).
Stellenbosch University https://scholar.sun.ac.za

74
Gizzard erosion can be induced by the minerals in the diet, or the diets itself (Fisher et al,.
1973; Ross, 1979). Chicks fed pelleted fed have more gizzard erosion than those fed mash feed
(Ross, 1979). The authors believed the method of pelleting induced gizzard erosion. Although
copper sulphate is used in broiler diets as a growth promoter, Fisher et al. (1973) concluded
that gizzard erosion was related to the copper concentration in the diet.
When broiler chicks are exposed to stressful environments, more gizzard erosion occur
(Grabarevic et al., 1993; Dzaja et al., 1996). The levels of aspartate aminotransferase and
creatine kinase in the proventriculus are increased by stress in broilers chicks (Dzaja et al.,
1996). This lead to a lower pH in the stomach and gizzard erosion.
Bacteria that occur naturally on fish meal cause the formation of histamine by the
decarboxylation of histidine in fish meal (Ferencik, 1970). Gizzerosine is formed when
histamine or histidine reacts with lysine during overheating of fish meal in the processing of
fish meal (Okazaki et al., 1983). Excessive secretions of hydrochloric acid and pepsin are
secreted in the stomach when gizzerosine is present, causing gizzard erosion (Masumura et
al., 1985).
The presence of mycotoxins in broiler diets also causes gizzard erosion (Hoerr et al., 1982;
Dorner et al., 1983; Diaz & Sugahara, 1995). Raw materials from a hot and humid environment
may contain mycotoxins (Reddy, 1992).
There are limited literature available regarding toxic effects of insect meals in broiler nutrition.
Teguia et al. (2002) found no significant differences (P≤0.05) in the masses of the liver, gizzard
and hearts of broilers when replacing 50% and 100% of the fish meal in the diet with house fly
larvae meal. Pretorius (2011) reported no significant differences (P≤0.05) in the masses of the
liver, gizzard and heart relative to chick weight even when 50% of the diet were house fly
larvae meal. Uushona (2016) reported no significant differences (P≤0.05) in the masses of
gizzard, liver, heart, bursa, and spleen when supplementing a soya based diet with black
soldier fly pre-pupae at rates of 5%, 10% and 15%.
Weight gain in modern broilers occur faster than bone development, and as a result the bones
are too weak to support the weight of the bird (Hocking et al., 2009; Garcia et al., 2013). During
Stellenbosch University https://scholar.sun.ac.za

75
the slaughtering procedure these porous bones can fracture and bleed, causing the
discoloration of meat close to the bone as well as welfare concerns (Rath et al., 2000; Brenes
et al., 2003; Garcia et al., 2013). The development of avian skeletal structure mainly depend
on calcium (Ca), phosphorus (P) and dietary vitamin D (Rath et al., 2000). Although no
literature is available on the effect of CC on broiler tibia bone parameters, it might have an
effect.
This study was conducted to investigate the possible influence of copper bottom blow fly (C.
chloropyga) (CC) larvae meal could have on gizzard erosion, organ stress and tibia bone
parameters.
5.3 Materials and methods
The materials and methods used for the treatments, layout, housing, bird handling and
management as well as the diets are described in Chapter 3 under materials and methods. In
summary, eight replicas of four treatment diets were fed to 320 Cobb 500 day-old chicks until
35 days of age. Four different inclusion levels of CC larvae meal defined the feeds. One bird of
average weight per cage were selected at day 35 to slaughter. Slaughtering methods used in
commercial abattoirs were used as described by the Department of Agriculture, Forestry &
Fisheries [DAFF], 2006. At slaughter the birds were rendered unconscious by electrical
stunning (50-70 volts; 3-5 s), exsanguinated and allowed to bleed out for about 2 min.
Thereafter, the birds were soaked in a rotating 60 °C water bath for 5 min, de-feathered and
then eviscerated.
5.3.1 Organ Sample
Immediately after exsanguinations and de-feathering, the organs were removed from the
carcasses. Organs used in this study were the spleen, heart, gizzard, liver and the bursa of
fabricius. After the gizzard was cut open and rinsed, it was evaluated for gizzard erosion using
an ordinal scale as described by Johnson & Pinedo (1971). The gizzard erosion scoring
description are shown in Table 5.1. Immediately after removal, the organs were weighed using
a PC Mettler laboratory scale (Mettler-Toledo, Switzerland).
Stellenbosch University https://scholar.sun.ac.za

76
Table 5.1 Gizzard erosion scoring description (Johnson & Pinedo, 1971) Score Description
0 No erosion
1 Light erosion (minimal roughness of the epithelia)
2 Modest erosion (roughness and minimal gaps of the epithelia)
3 Severe erosion (roughness, gaps and ulcers on wall showing slight
haemorrhaging)
4 Extreme erosion (roughness, gaps and haemorrhagic ulcers on stomach wall
and visible separation of epithelia from stomach wall)
5.3.2 Intestinal Samples
Gut samples were retained from the duodenum, jejunum and ileum within 15 minutes after
slaughter. The duodenum was removed at the start of the pancreas on the gizzard side of the
duodenum. Jejunum sample were retained from the center of the jejunum. Ileum samples
were taken 5mm from the Meckel’s diverticulum to the ileocecal junction. The pH of this three
intestinal samples were measured using a Crison pH 25 meter. The pH electrode was placed
into the center of the intestinal sample to be measured. Between each reading the probe was
rinsed with distilled water.
5.3.3 Tibia bone samples
After the organs and intestines were removed, the tibia bones were removed from the rest of
the carcass. While the skin and muscles were still attached to the tibia bone, it was stored at
-18°C until analysis. Before analysis the samples were thawed at 4°C for approximately 12 h.
The right tibia was then cleaned of all visible tissue. The length of the tibia was then measured
with a Vernier caliper. The tibia was weighed and bone breaking strength was measured with
an Instron (Fleming et al., 1998).
5.3.4 Tibia bone strength and bone mineral content
An Instron tensile/compression machine with a 50kg load cell was used to determine bone
strength. Bones was set into the machine one at a time, with their mid-diaphyseal diameter
in the middle of the probe. The bending force of the bone was measured using a 10mm probe
that moved at a constant speed of 30mm/s. the Instron is controlled by a computer and this
system recorded the force in Newton. This methodology was used as described by Fleming et
al. (1998). Bone strength was measured in Newton force per square millimeter (N/mm2) and
this strength indicates the rigidity of the bone (Rath et al., 1999; Baird et al., 2008).
Stellenbosch University https://scholar.sun.ac.za

77
The remains after bone breaking was weighed, dried at 100°C for 48 h and weighed again to
determine dry matter. After that the dried bone were placed in a furnace at 600°C for 24 h
and weighed gain to determine the ash content of the bones. The ash content was sent to the
Institute of Animal Production, Western Cape Department of Agriculture at Elsenburg for
mineral analysis. The minerals were analysed according to the Combustion Method No. 6.1.1
as described by Agriculture Laboratory Association of Southern Africa (AgriLASA) (2007).
Briefly, 5 mL of 6 M hydrochloric acid was added to 0.5 g sample. The samples were then
placed in a 50 °C oven for 30 minutes. After removal of samples, 35 mL of distilled water was
added and filtered into a 50 mL bottle topped with distilled water to fill to the 50 mL mark.
The minerals were measured on an iCAP 6000 Series Inductive Coupled Plasma (ICP)
Spectrophotometer (Thermo Electron Corporation, Strada Rivoltana, 20090 Rodana, Milan,
Italy) fitted with a vertical quartz torch and Cetac ASX-520 autosampler. The iTEVA Analyst
software was used to calculate for the mineral concentrations. The wavelengths at which Ca
and P were eluted are 317.933 and 177.495 nm, respectively.
5.3.5 Statistical analysis
The hypotheses for this chapter is as follows:
H0: There are no statistical differences between organ, gut and tibia bone parameters
investigated in broilers fed four different levels of CC.
H1: There are statistical differences between organ, gut and tibia bone parameters
investigated in broilers fed four different levels of CC.
Statistical analysis were analysed using the general linear models (GLM) procedure of SAS
(2009). The analysis of variance (ANOVA) assumptions for normality and homoscedasticity
were investigated before further analyses were done. The tests were considered significant at
P≤0.05. Treatment effects of all parameters except for gizzard erosion score were analysed
using one-way ANOVA with Bonferroni’s post hoc (least square means) test. In cases where
the homoscedasticity assumption for the data was not satisfied, a Welch’s ANOVA for unequal
variances was used. The gizzard erosion scores were analysed using the Chi-squared test of
Stellenbosch University https://scholar.sun.ac.za

78
SAS (2009). The significance level of 5% of all tests was used and significant treatment
differences were declared at P≤0.05.
5.4 Results and discussion
5.4.1 Gizzard erosion and organ weight
The inclusion of CC at the rates of 0%, 5%, 10% and 15% in broiler diets did not affect the gizzard erosion score (
Stellenbosch University https://scholar.sun.ac.za

79
Table 5.2). A gizzard erosion score of two and below is acceptable (Johnson & Pinedo, 1971).
In this study there were no gizzard erosion scores of more than two in the treatment diets. It
can therefore be concluded that no gizzerosine formation occurred (caused by histidine-lysine
interaction at high temperatures) as a result of drying temperatures used in this study (Okazaki
et al., 1983). It can also be concluded that no harmful minerals such as high levels of copper
(Fisher et al., 1973; Ross, 1979), no harmful bacteria (Ferencik, 1970) and no mycotoxins
(Hoerr et al., 1982; Dorner et al., 1983; Diaz & Sugahara, 1995) were present in the treatment
diets.
When CC was included in broiler diets at rates of 0%, 5%, 10% and 15%, no differences (P>0.05)
were found in the weights of their gizzard, liver, heart, bursa, spleen or spleen:bursa (Table
5.3). This result is similar to results of studies where house fly larvae meal (Teguia et al., 2002)
and black soldier fly pre-pupae meal (Uushona, 2016) were used in broiler diets. In contrast,
Okah & Onwujiariri (2012) reported lower heart weights and higher gizzard weights in broilers
fed house fly larvae meal, while treatment did not affect liver weights. The broilers used in the
study by Okah & Onwujiariri (2012) were older than 35 days, and this might affect their results.
Stellenbosch University https://scholar.sun.ac.za

80
Table 5.2 Gizzard erosion scores as influenced by inclusion of Chrysomya chloropyga larvae meal (CC) in broiler chicken diets
Treatment diets Gizzard erosion score
0 1 2 3
0% (Control) 0 2 5 1
5% CC 4 0 3 0
10% CC 2 3 3 0
15% CC 4 2 2 0
Chi-Square P-value 0.362
Table 5.3 Mean (± standard deviation) of organ weight and organ weight relative to body weight as influenced by inclusion of Chrysomya chloropyga meal (CC) in broiler chicken diets
Parameters Treatment diets
P-value Control 5% CC 10% CC 15% CC
Organ weight (g)
Gizzard 32.7 ± 3.66 35.0 ± 2.46 34.0 ± 3.70 35.6 ± 5.17 0.480
Liver 35.5 ± 4.82 36.5 ± 5.06 36.1 ± 3.43 37.6 ± 6.02 0.855
Heart 10.6 ± 1.26 10.8 ± 1.59 11.2 ± 1.37 10.7± 1.04 0.801
Bursa 3.5 ± 1.64 4.3 ± 0.71 3.8 ± 1.78 3.9 ± 0.80 0.693
Spleen 2.6 ± 0.60 2.7 ± 0.73 2.6 ± 0.57 2.6 ± 0.88 0.978
Spleen:
Bursa 0.9 ± 0.57 0.7 ± 0.25 0.9 ± 0.57 0.7 ± 0.24 0.554
Organ weight relative to body weight (%)
Gizzard 1.6 ± 0.07 1.7 ± 0.07 1.6 ± 0.07 1.7 ± 0.04 0.326
Liver 1.7 ± 0.07 1.8 ± 0.07 1.7 ± 0.07 1.8 ± 0.07 0.553
Heart 0.5 ± 0.02 0.5 ± 0.02 0.5 ± 0.02 0.5 ± 0.02 0.932
Spleen 0.1 ± 0.01 0.1 ± 0.01 0.1 ± 0.01 0.1 ± 0.01 0.890
Bursa 0.2 ± 0.02 0.2 ± 0.02 0.2 ± 0.02 0.2 ± 0.02 0.572
Bursa:
spleen 0.04 ± 0.01 0.03 ± 0.01 0.04 ± 0.01 0.03 ± 0.01 0.573
Treatment also did not influence (P>0.05) organ weight relative to body weight. It is important
to evaluate the bursa weight relative to live weight. An increase in bursa weight relative to
live weight indicates the possibility of increased immunosuppression of the bird’s immune
system (Pope, 1991).
5.4.2 Intestinal pH
The inclusion of CC larvae meal in broiler diets did influence (P≤0.05) intestinal pH. The pH of
the duodenum of birds of the 5%, 10% and 15% CC inclusion diets was higher (P<0.0001) than
Stellenbosch University https://scholar.sun.ac.za

81
the control (Table 5.4). Treatment did not affect the pH of the jejunum. The ileum of the
control birds had a higher (P<0.0001) pH than the treatment diets. In this study, the pH of the
duodenum of the 5%, 10% and 15% birds were higher than the normal duodenum pH (5.5-
6.2) of broilers, while the control birds had duodenums with normal pH. The pH of the jejunum
and ileum of all the birds in this study were within the normal pH range. Normal pH ranges for
broiler jejunum and ileum are 5.8-6.9 and 6.3-8.0, respectively (Van der Klis & Jansen, 2002).
Table 5.4 Mean (± standard deviation) of small intestine pH as influenced by inclusion of Chrysomya chloropyga meal (CC) in broiler chicken diets
Parameters Treatment diets
P-value Control 5% CC 10% CC 15% CC
Duodenum 6.0b ± 0.62 6.9a ± 0.23 6.9a ± 0.19 6.8a ± 0.35 0.000
Jejunum 6.3 ± 0.14 6.5 ± 0.37 6.5 ± 0.14 6.4 ± 0.19 0.178
Ileum 6.8a ± 0.25 6.1b ± 0.35 6.0b ± 0.31 6.3b ± 0.11 <.0001 (a,b) Means with different superscripts within the same row differ significantly (P≤0.05)
5.4.3 Tibia bone parameters
The results of the tibia bone breaking force and breaking strength are shown in Table 5.5.
Treatment die not affect bone breaking force (N) or bone breaking strength (N/mm2). This is
in line with Uushona (2016) who compared black soldier flies pre-pupae with a maize-soya
control diets.
Table 5.5 Mean (± standard error) of tibia breaking force and strength of broiler chickens fed different levels of copper bottom blow fly larvae meal (CC) in their diets
Parameters Units Treatments
P-value Control 5% BSM 10% BSM 15% BSM
Breaking force N 357.8 ± 29.09 375.1 ± 29.09 359.9 ± 25.20 391.2 ± 26.95 0.805
Breaking strength N/mm2 75.4 ± 5.40 68.9 ± 5.40 66.1 ± 4.68 71.9 ± 5.00 0.615
The inclusion of CC in broiler diets had no effect (P>0.05) on the calcium (Ca), phosphate (P),
Magnesium (Mg) sodium (Na), copper (Cu), zinc (Zn) and Iron (Fe) content of broiler tibia
bones (Table 5.6). The tibia bone of the control diet had higher (P<0.0001) Potassium (K) levels
than the treatment diets. This similar tibia bone mineral composition was expected because
all the diets were formulated to have the same specifications.
Stellenbosch University https://scholar.sun.ac.za

82
Table 5.6 Mean (± standard error) of tibia bone ash percentage and mineral content of broiler chickens fed different levels of copper bottom blow fly larvae meal (CC) in their diets
Parameters Units Treatment diets
P-value Control 5% BSM 10% BSM 15% BSM
Calcium % 41.0 ± 1.14 38.6 ± 1.14 37.4 ± 1.00 38.1 ± 1.05 0.126
Phosphate % 19.6 ± 0.44 19.3 ± 0.44 18.1 ± 0.38 18.8 ± 0.40 0.083
Potassium % 1.0b ± 0.04 1.6a ± 0.04 1.5a ± 0.04 1.4a ± 0.04 <0.0001
Magnesium % 0.7 ± 0.01 0.7 ± 0.01 0.7 ± 0.01 0.7 ± 0.01 0.080
Sodium mg/kg 12.8 ± 0.78 28.3 ± 0.78 14.8 ± 0.68 13.7 ± 0.72 0.890
Copper mg/kg 1.9 ± 1.53 1.7 ± 1.53 2.8 ± 1.33 4.2 ± 1.42 0.618
Zinc mg/kg 303.1 ± 10.21 325.1 ± 10.21 322.8 ± 8.85 306.0 ± 9.46 0.287
Iron mg/kg 234.0 ± 14.17 288.5 ± 14.17 263.6 ± 12.28 239.9 ± 13.12 0.043 a,b Means with different superscripts within the same row differ significantly (P≤0.05)
5.5 Conclusion
The results in this study show that the larvae of the copper bottom blow fly (CC) had no
influence on organ weights and gizzard erosion. The CC larvae also did not influence tibia bone
parameters. To investigate the repeatability of the intestinal pH measurements, more studies
should be done. It can therefore be concluded that CC larvae meal can be included in broiler
diets without influencing their immune system or the intestinal organ development.
5.6 References
Brenes, A., Viveros, A., Arija, I., Centeno, C., Pizarro, M. & Bravo, C., 2003. The effect of citric
acid and microbial phytase on mineral utilization in broiler chicks. Anim. Feed Sci.
Technol. 110(1): 201-219.
Department of Agriculture, Forestry & Fisheries (DAFF)., 2006. Meat Safety Act (Act no. 20 of
2000, R153/2006). South African Government Gazette. 28520: 20-22.
Diaz, G.J. & Sugahara, M., 1995. Individual and combined effects of aflatoxin and gizzerosine
in broiler chickens. Brit. Poult. Sci. 36(5): 729-736.
Dorner, J. W., Cole, R. J., Lomax, L. G., Gosser, H. S. & Diener, U. L., 1983. Cyclopiazonic acid
production by aspergillus flavus and its effects on broiler chickens. Appl. Environ.
Microbiol. 46(3): 698.
Stellenbosch University https://scholar.sun.ac.za
83
Džaja, P., Grabazrević, Ž., Perić, J., Mazija, H., Prukner-Radovčić, E., Bratulić, M., Žubčič, D. &
Ragland, W.L., 1996. Effects of histamine application and water-immersion stress on
gizzard erosion and fattening of broiler chicks. Avian Pathol. 25(2): 359-367.
Ferencik, M., 1970. Formation of histamine during bacterial decarboxylation of histidine in
the flesh of some marine fishes. J. Hyg. Epidem., Microbiol. Immunol. 14(1): 52-60.
Fisher, G., Laursen-Jones, A.P., Hill, K.J. & Hardy, W.S., 1973. The effect of copper sulfate on
performance and the structure of the gizzard in broilers. Brit. Poult. Sci. 14(1): 55-68.
Fleming, R., McCormack, H. & Whitehead, C., 1998. Bone structure and strength at different
ages in laying hens and effects of dietary particulate limestone, Vitamin K and
ascorbic acid. Br. Poult. Sci. 39(3): 434-440.
Garcia, A. F. Q. M., Murakami, A. E., Duarte, C. R. d. A., Rojas, I. C. O., Picoli, K. P. & Puzotti,
M. M., 2013. Use of vitamin D3 and its metabolites in broiler chicken feed on
performance, bone parameters and meat quality. Asian-Aust. J. Anim. Sci. 26(3): 408.
Grabarević, Ž., Tišljar, M., Džaja, P., Artuković, B., Seiwerth, S. & Sikirić, P., 1993. Stress
induced gizzard erosion in chicks. J. Vet. Med. Series A. 40(1-10): 265-270.
Hibbeler, R. C., 2005. Mechanics of materials. Pearson/Ptentice Hall, Jurong, Singapore
Hocking, P., Sandercock, D., Wilson, S. & Fleming R., 2009. Quantifying genetic (co) variation
and effects of genetic selection on tibial bone morphology and quality in 37 lines of
broiler, layer and traditional chickens. Br. Poult. Sci. 50(4): 443-450.
Hoerr, F.J., Carlton, W.W., Tuite, J., Vesonder, R.F., Rohwedder, W.K. & Szigeti, G., 1982.
Experimental trichothecene mycotoxicosis produced in broiler chickens by Fusarium
sporotrichiella var. sporotrichioides. Avian Pathology. 11(3): 385-405.
Itakura, C., Hakotani, Y., Goto, M., Saito, T. & Ishii, K., 1981. Histopathology of gizzard
erosion in young broiler chickens due to fish meal in the diets. Jap. J. Vet. Sci. 43:
677-687.
Johnson, D. & Pinedo, D. C., 1971. Case report: Gizzard erosion and ulceration in Peru
broilers. Avian Dis. 15(4): 835-837.
Masumura, T., Sugahara, M., Noguchi, T., Mori, K. & Naito, H., 1985. The effect of
gizzerosine, a recently discovered compound in overheated fish meal, on the gastric
acid secretion in chicken. Poult. Sci. 64(2): 356-361.
Stellenbosch University https://scholar.sun.ac.za
84
Okah, U. & Onwujiariri, E., 2012. Performance of finisher broiler chickens fed maggot meal as
a replacement for fish meal. Int. J. Agric. Technol. 8(2): 471-477.
Okazaki, T., Noguchi, T., Igarashi, K., Sakagami, Y., Seto, H., Mori, K., Naito, H., Masumura, T.
& Sugahara, M., 1983. Gizzerosine, a new toxic substance in fish meal, causes severe
gizzard erosion in chicks. Agricult. Biol. Chem. 47(12): 2949-2952.
Pope, C. R.,1991. Pathology of lymphoid organs with emphasis on immunosuppression. Vet.
Immunol. Immunopathol. 30(1): 31-44
Pretorius, Q., 2011. The Evaluation of Larvae of Musca domestica (Common House Fly) as
Protein Source for Broiler Production. MSc Thesis, University of Stellenbosch.
Rath, N., Huff, G., Huff, W. & Balog, J., 2000. Factors regulating bone maturity and strength
in poultry. Poult. Sci. 79(7): 1024-1032.
Reddy, C.V., 1992. Aflatoxins in feed: An enemy to poultry producers in the tropics. World
Poultry, Doetichen, Netherland. 8: 19-20.
Ross, E., 1979. Effect of pelleted feed on the incidence of gizzard erosion and black vomit in
broilers. Avian Dis. 23(4): 1051-1054.
Téguia, A., Mpoame, M. & Mba, J.A.O., 2002. The production performance of broiler birds as
affected by the replacement of fish meal by maggot meal in the starter and finisher
diets. Tropicultura. 20(4): 187-192.
Uushona, T., 2016. Black soldier fly(Hermetia illucens) pre-pupae as n protein source for
broiler production. MSc Thesis, University of Stellenbosch.
Van der Klis, J. & Jansman, A., 2002. Optimising nutrient digestion, absorption and gut barrier
function in monogastrics: Reality or illusion. Wageningen Academic Publishers, Wagenin
Wessels, J. P. H. & Post, B. J., 1989. Effect of heat treatment of fish meals, fines and the
addition of lysine as related to gizzard erosion in chickens. J. Sci. Food Agric. 46(4):
393-406.
Stellenbosch University https://scholar.sun.ac.za

85
General Conclusion
This study was conducted to investigate the possibility of using Chrysomya chloropyga (copper
bottom blow fly) larvae meal as a protein source in broiler nutrition.
Treatment had no effect on intake per bird, feed conversion ratio (FCR), European production
efficiency factor (EPEF) or liveability. Broilers that were fed the 10% inclusion had a slightly
higher slaughter weight and average daily gain (ADG) than the other three treatments.
Treatment had no effect on cold carcass weight, dressing percentage, thigh-, drumstick- wing
and back yields. The 10% inclusion had a higher right breast portion yield than the other
treatments. No differences were observed regarding the yields of skin plus fat, muscle or bone
percentage.
Treatment did not affect meat colour. No differences were observed regarding the initial pH
(pHi) of the breast and thigh meat, or the ultimate pH (pHu) of the breast. The phu of the thigh
of the 5% and 15% inclusion were lower than that of the Control and 10% inclusion.
The control meat had a higher moisture content and a lower ash content than three treatment
diets. Protein end fat did not differ. No differences regarding the amino acid composition and
the mineral composition in the broiler meat were observed.
Few differences were observed for sensory attributes of the broiler meat. The 5% inclusion
had the highest chicken aroma, the control had the lowest chicken aroma and the 10% and
15% were intermediate. The control had the highest initial juiciness, while the 10% and 15%
had significant lower values for initial juiciness.
Treatment had no effect on gizzard erosion and the gizzard scores were classified as normal.
Treatment had no effect on gizzard, liver, heart, bursa or spleen weights or the weight of these
organs relative to live weight. Treatment had no effect on tibia bone breaking force and tibia
bone breaking strength. Treatment had little effect on tibia bone mineral, with only n
difference in the potassium (K) value. The control had n lower K composition than the three
treatment diets.
Stellenbosch University https://scholar.sun.ac.za

86
Overall the study concluded that copper bottom blow fly larvae meal can be used in broiler
diets, with the 10% inclusion getting slightly better results than the rest on a few occasions
such as live slaughter weight and ADG.
More research needs to be considered regarding this study to investigate the repeatability of
these parameters evaluated. Especially the pH of the intestines were expected not to differ.
Research should be done on the histology of the broiler intestines and organs fed CC larvae
meal. Differences in histology of the intestines may declare the pH differences observed in the
intestine in this study.
The four treatments in this study were formulated to have identical specifications regarding
nutrients. This may explain the few differences in parameters observed in this study. However,
the fatty acid composition of the larvae was not determined prior to the study. This may have
led to some differences observed. Research should be conducted to investigate the fatty acid
composition of both the larvae and the broiler meat to make a better conclusion regarding
the suitability of CC in broiler nutrition.
To complete the research, the digestibility of CC larvae meal should be researched.
Digestibility results may explain the differences in live slaughter weight and ADG in this study.
The objective of this study was not to prove that CC larvae meal is superior to soya in broiler
diets, but rather that it can be used as an additional protein source in the broiler industry. It
can be concluded that CC larvae meal is a suitable protein source for broiler nutrition.
Research regarding CC larvae meal in animal nutrition is very limited. Studies to investigate
the suitability of CC larvae meal in other animal nutrition (pigs, layers, fish and ruminants)
should be considered.
Stellenbosch University https://scholar.sun.ac.za