Airborne particulate metals in the New York City subway: A pilot study to assess the potential for...
26
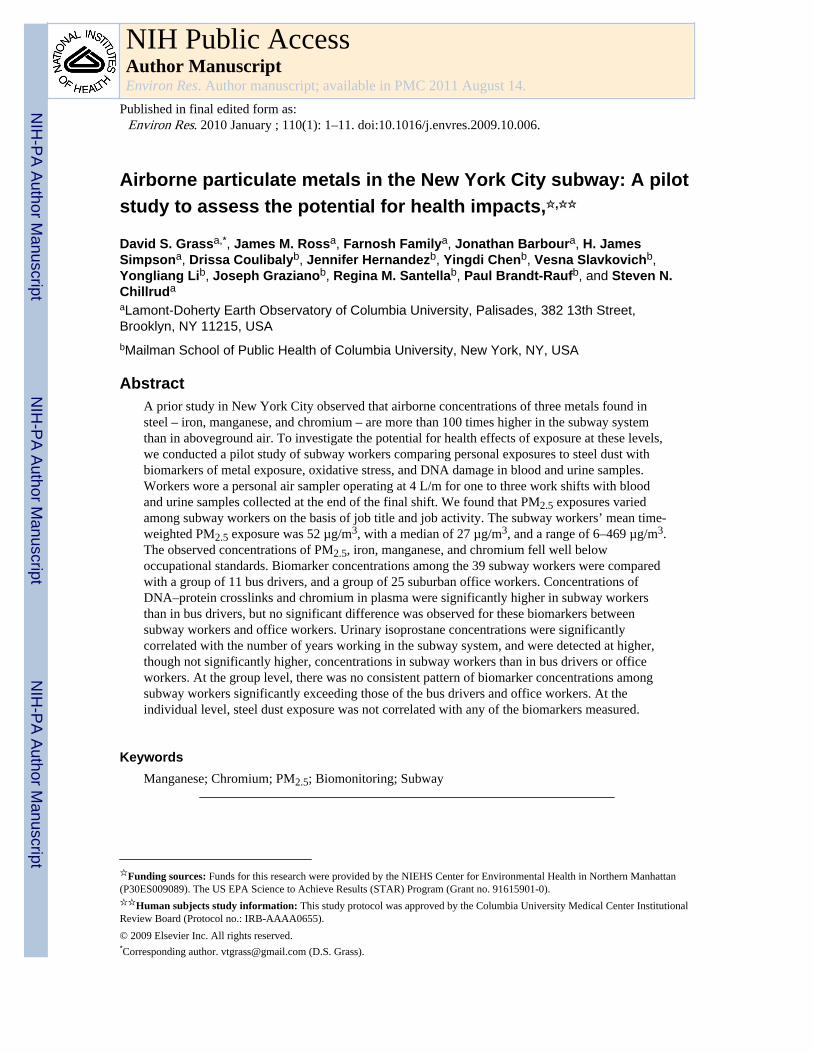
Airborne particulate metals in the New York City subway: A pilot study to assess the potential for health impacts, ✩,✩✩ David S. Grass a,* , James M. Ross a , Farnosh Family a , Jonathan Barbour a , H. James Simpson a , Drissa Coulibaly b , Jennifer Hernandez b , Yingdi Chen b , Vesna Slavkovich b , Yongliang Li b , Joseph Graziano b , Regina M. Santella b , Paul Brandt-Rauf b , and Steven N. Chillrud a a Lamont-Doherty Earth Observatory of Columbia University, Palisades, 382 13th Street, Brooklyn, NY 11215, USA b Mailman School of Public Health of Columbia University, New York, NY, USA Abstract A prior study in New York City observed that airborne concentrations of three metals found in steel – iron, manganese, and chromium – are more than 100 times higher in the subway system than in aboveground air. To investigate the potential for health effects of exposure at these levels, we conducted a pilot study of subway workers comparing personal exposures to steel dust with biomarkers of metal exposure, oxidative stress, and DNA damage in blood and urine samples. Workers wore a personal air sampler operating at 4 L/m for one to three work shifts with blood and urine samples collected at the end of the final shift. We found that PM 2.5 exposures varied among subway workers on the basis of job title and job activity. The subway workers’ mean time- weighted PM 2.5 exposure was 52 μg/m 3 , with a median of 27 μg/m 3 , and a range of 6–469 μg/m 3 . The observed concentrations of PM 2.5 , iron, manganese, and chromium fell well below occupational standards. Biomarker concentrations among the 39 subway workers were compared with a group of 11 bus drivers, and a group of 25 suburban office workers. Concentrations of DNA–protein crosslinks and chromium in plasma were significantly higher in subway workers than in bus drivers, but no significant difference was observed for these biomarkers between subway workers and office workers. Urinary isoprostane concentrations were significantly correlated with the number of years working in the subway system, and were detected at higher, though not significantly higher, concentrations in subway workers than in bus drivers or office workers. At the group level, there was no consistent pattern of biomarker concentrations among subway workers significantly exceeding those of the bus drivers and office workers. At the individual level, steel dust exposure was not correlated with any of the biomarkers measured. Keywords Manganese; Chromium; PM 2.5 ; Biomonitoring; Subway ✩ Funding sources: Funds for this research were provided by the NIEHS Center for Environmental Health in Northern Manhattan (P30ES009089). The US EPA Science to Achieve Results (STAR) Program (Grant no. 91615901-0). ✩✩ Human subjects study information: This study protocol was approved by the Columbia University Medical Center Institutional Review Board (Protocol no.: IRB-AAAA0655). © 2009 Elsevier Inc. All rights reserved. * Corresponding author. [email protected] (D.S. Grass). NIH Public Access Author Manuscript Environ Res. Author manuscript; available in PMC 2011 August 14. Published in final edited form as: Environ Res. 2010 January ; 110(1): 1–11. doi:10.1016/j.envres.2009.10.006. NIH-PA Author Manuscript NIH-PA Author Manuscript NIH-PA Author Manuscript
-
Upload
independent -
Category
Documents
-
view
3 -
download
0
Transcript of Airborne particulate metals in the New York City subway: A pilot study to assess the potential for...
Airborne particulate metals in the New York City subway: A pilotstudy to assess the potential for health impacts,✩,✩✩
David S. Grassa,*, James M. Rossa, Farnosh Familya, Jonathan Barboura, H. JamesSimpsona, Drissa Coulibalyb, Jennifer Hernandezb, Yingdi Chenb, Vesna Slavkovichb,Yongliang Lib, Joseph Grazianob, Regina M. Santellab, Paul Brandt-Raufb, and Steven N.Chillruda
aLamont-Doherty Earth Observatory of Columbia University, Palisades, 382 13th Street,Brooklyn, NY 11215, USAbMailman School of Public Health of Columbia University, New York, NY, USA
AbstractA prior study in New York City observed that airborne concentrations of three metals found insteel – iron, manganese, and chromium – are more than 100 times higher in the subway systemthan in aboveground air. To investigate the potential for health effects of exposure at these levels,we conducted a pilot study of subway workers comparing personal exposures to steel dust withbiomarkers of metal exposure, oxidative stress, and DNA damage in blood and urine samples.Workers wore a personal air sampler operating at 4 L/m for one to three work shifts with bloodand urine samples collected at the end of the final shift. We found that PM2.5 exposures variedamong subway workers on the basis of job title and job activity. The subway workers’ mean time-weighted PM2.5 exposure was 52 µg/m3, with a median of 27 µg/m3, and a range of 6–469 µg/m3.The observed concentrations of PM2.5, iron, manganese, and chromium fell well belowoccupational standards. Biomarker concentrations among the 39 subway workers were comparedwith a group of 11 bus drivers, and a group of 25 suburban office workers. Concentrations ofDNA–protein crosslinks and chromium in plasma were significantly higher in subway workersthan in bus drivers, but no significant difference was observed for these biomarkers betweensubway workers and office workers. Urinary isoprostane concentrations were significantlycorrelated with the number of years working in the subway system, and were detected at higher,though not significantly higher, concentrations in subway workers than in bus drivers or officeworkers. At the group level, there was no consistent pattern of biomarker concentrations amongsubway workers significantly exceeding those of the bus drivers and office workers. At theindividual level, steel dust exposure was not correlated with any of the biomarkers measured.
KeywordsManganese; Chromium; PM2.5; Biomonitoring; Subway
✩Funding sources: Funds for this research were provided by the NIEHS Center for Environmental Health in Northern Manhattan(P30ES009089). The US EPA Science to Achieve Results (STAR) Program (Grant no. 91615901-0).✩✩Human subjects study information: This study protocol was approved by the Columbia University Medical Center InstitutionalReview Board (Protocol no.: IRB-AAAA0655).© 2009 Elsevier Inc. All rights reserved.*Corresponding author. [email protected] (D.S. Grass).
NIH Public AccessAuthor ManuscriptEnviron Res. Author manuscript; available in PMC 2011 August 14.
Published in final edited form as:Environ Res. 2010 January ; 110(1): 1–11. doi:10.1016/j.envres.2009.10.006.
NIH
-PA Author Manuscript
NIH
-PA Author Manuscript
NIH
-PA Author Manuscript
1. IntroductionThe subway is increasingly recognized as a unique and important microenvironment for airpollution research (Nieuwenhuijsen et al., 2007). Suspended particulate matter in subwaysystems differs from street-level particulate matter with respect to particulate morphology,size distribution, concentration, and chemical composition. Relative to street-level particles,subway particles are generally more angular in shape, larger in diameter, more abundant bymass, and contain higher levels of the metals found in steel (Seaton et al., 2005; Sitzmann etal., 1999). In New York City for example, the concentrations of iron (Fe), manganese (Mn),and chromium (Cr) in suspended particulate matter were found to be more than 100 timeshigher in the subway system than aboveground (Chillrud et al., 2004). Subway particles alsohave greater capacity than outdoor (street-level) particles to induce DNA damage andoxidative stress in cultured lung cells (Karlsson et al., 2005; Seaton et al., 2005). Given theelevated concentration of suspended particulate matter in the subway, the greater in vitroreactivity of subway particles, the large number of people exposed (millions per day), andthe long-term nature of the exposure, it seems appropriate to assess whether exposure tosuspended particulate matter in the subway could potentially pose a risk to human health.Because of the fundamental differences between subway particles and street-level particles,we cannot infer the potential health effects of exposure to suspended particulate matter inthe subway based on the health effects known to be associated with exposure to ambientparticulate matter (Seaton et al., 2005). In this pilot study, we focus our attention on thepotential health effects of those metals that are most enriched in the New York City subwayenvironment relative to street-level particulate matter: iron, manganese, and chromium(Chillrud et al., 2004).
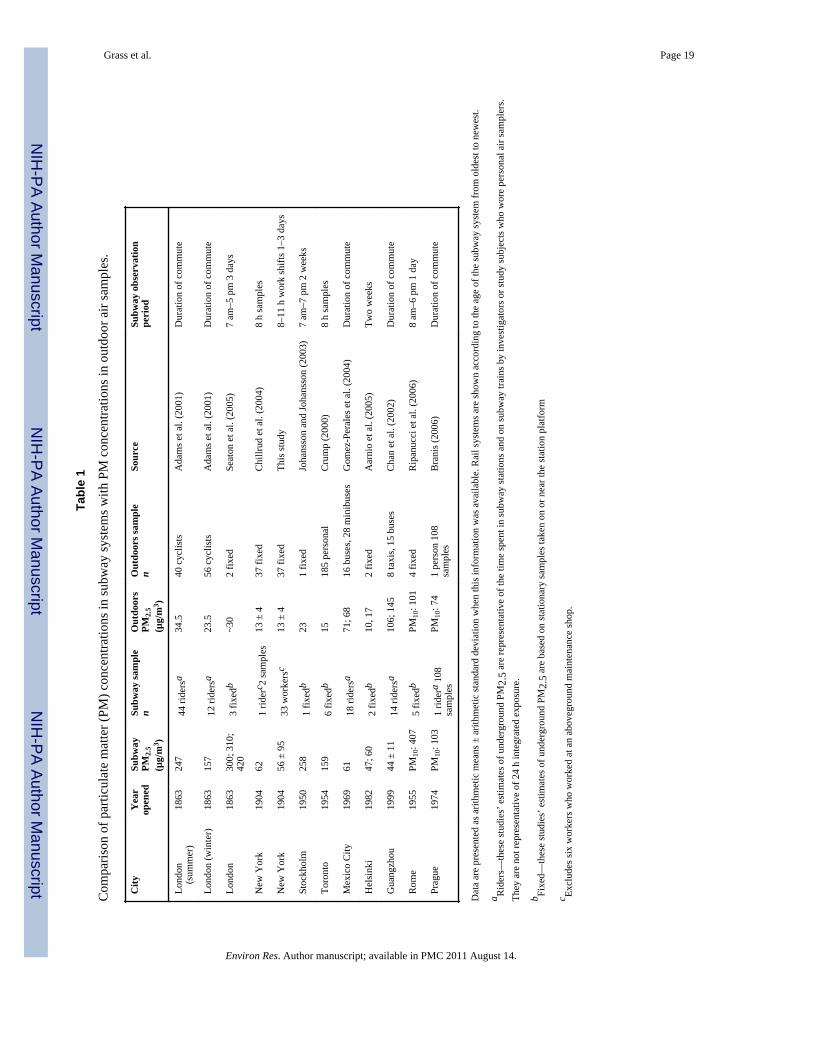
Prior studies in several cities have shown that concentrations of suspended particulate matter(PM) in the subway are generally elevated above street-level concentrations (Table 1).Subway particulate matter concentrations vary widely as does the ratio of subway to street-level particulate matter concentrations. Factors thought to influence subway PMconcentrations include station depth, date of construction, ventilation rate, proportion offrictional to regenerative braking, train frequency, wheel type (rubber versus steel), and thepresence or absence of platformedge doors and/or air-conditioning in subway cars andstations. The New York City subway system currently uses steel wheels, ceramic compositebrake shoes, and regenerative breaking (Cudahy, 2003). Subway cars have on-board airfiltration/ conditioning and underground station depths for much of the system are shallowas compared with London or Washington, DC. In London, Toronto, and Stockholm,concentrations of particulate matter with an aerodynamic diameter ≤2.5 µm (PM2.5) are onthe order of 10 times higher in the subway than aboveground, whereas in Guangzhou,subway PM2.5 concentrations are four times lower than the relatively high levels of outdoorPM2.5 (Chan et al., 2002; Crump, 2000; Johansson and Johansson, 2003; Seaton et al.,2005). While the difference between subway and street-level particulate matterconcentrations will strongly influence how subway air quality is perceived by the public, itis only one of many parameters that determine the health risks associated with air pollutionexposure in underground rail systems. Among other factors to consider are the number ofparticles per volume of air (number density), the particles’ chemical composition,toxicological properties, and size distribution.
While choosing the subway as a mode of transport may have a relatively small effect on acommuter’s total daily PM2.5 exposure, the effect on their total daily particulate metalexposure will be more pronounced. Studies in Toronto and London designed to detect theeffects of the introduction of the gasoline additive methylcyclopentadienyl manganesetricarbonyl (MMT) on automobile drivers’ manganese exposures inadvertently detected theeffects of the manganese-enriched subway environment on subway commuters. The Toronto
Grass et al. Page 2
Environ Res. Author manuscript; available in PMC 2011 August 14.
NIH
-PA Author Manuscript
NIH
-PA Author Manuscript
NIH
-PA Author Manuscript
study found that the best predictor of manganese in personal air samples was time spent inthe subway (Crump, 2000). The London study found that office workers, roughly half ofwhom commuted by subway, had blood manganese levels significantly higher than those oftaxi drivers (Pfeifer et al., 1999). In New York, a study whose primary goal was tounderstand the personal exposure pathways of air toxics for high school students, found thatsubway steel dust was the dominant source of exposure to airborne iron, chromium, andmanganese for the students enrolled in the study who used the subway (Chillrud et al.,2004).
The deleterious effects of particulate metal exposure at high concentrations have beendocumented in toxicological, animal, and epidemiological studies. When compared toaboveground PM, subway PM sampled in Stockholm was found to be eight times morelikely to induce DNA damage and four times more likely to cause oxidative stress incultured lung cells (Karlsson et al., 2005). Particles sampled from three London subwaystations were found to have greater inflammatory potential and greater capacity to induceDNA damage in cultured human epithelial cells than aboveground particulate matter (Seatonet al., 2005). Karlsson et al. (2008) found that the genotoxicity of subway particles may bedue to their ability to form intracellular reactive oxygen species (ROS). Karlsson et al.(2008) also found that subway dust was more genotoxic than Fe3O4, Fe2O3, CuO, or Cu/Znparticles, suggesting that the genotoxicity of subway dust could not be solely attributable tothese constituent particles. Numerous epidemiological studies of welders have documentedsignificant associations between exposure to welding fumes and disease endpoints(Antonini, 2003), such as pneumonia (Palmer et al., 2003), siderosis (Doherty et al., 2004),and neurological disorders such as Parkinsonism (Aschner et al., 1999). Welding fumes andsubway particulates are both enriched in Fe, Mn, and Cr, though welding fumes have a finersize distribution and exposures typically occur at much higher concentrations than those thathave been observed in subway environments.
The pro-inflammatory effects of soluble transition metals have been demonstrated in vitro(McNeilly et al., 2004), and animal models suggest that soluble transition metals, with ironthe most prevalent species, may be the primary determinant of acute inflammatory responseto ambient particulate matter (Costa and Dreher, 1997). In humans, instillation of metal-richambient PM2.5 in the lungs of healthy human volunteers was found to be associated withgreater airway inflammation than instillation of ambient PM2.5 with lower concentrations oftransition metals (Schaumann et al., 2004). If the transition metal content of particulatematter is a primary determinant of the severity of inflammatory response in vitro, and incontrolled animal and human experiments, then the subway provides a suitable environmentto determine whether an inflammatory response can also be induced by long-term exposureto particulate metals at lower concentrations than those used in the laboratory studies citedabove.
While there are no known health effects of airborne particulate metal exposure at the levelsobserved in the study of New York City high school students (Chillrud et al., 2004),investigation of potential health effects from steel dust exposure among adult subwayworkers seems prudent, given that they spend a greater amount of time in the subway systemand that their work-related activities should result in greater per-unit-time exposure levelsthan those of the public. If there are biological effects of exposure, they may be easier todetect among the subway worker population than among the subway-riding public.
While there have been numerous efforts to monitor air quality in subway systems (see Table1) the present study is one of the first to couple personal air monitoring with biologicalmonitoring of study participants. A similar study in Stockholm (Bigert, 2007) found thatsubway workers with greater exposure to subway particulate matter (platform workers), had
Grass et al. Page 3
Environ Res. Author manuscript; available in PMC 2011 August 14.
NIH
-PA Author Manuscript
NIH
-PA Author Manuscript
NIH
-PA Author Manuscript
significantly higher plasma concentrations of PAI-1, a biomarker of inflammatory response,than subway workers with lower exposures (ticket sellers).
In the present study, we characterize the particulate metal exposure of a cross-section ofsubway workers, and evaluate whether their exposure is associated with biological changesthat can result in greater susceptibility to disease. We examine: (a) whether there is a dose–response relationship between exposure to subway particulate metals and levels of variousbiomarkers in the blood and urine of study participants, and (b) whether concentrations ofbiomarkers of metal exposure, oxidative stress, and DNA damage are significantly higheramong subway workers than among office workers or bus drivers, and (c) whetherassociations between biomarker concentrations are indicative of potential biologicalmechanisms of damage.
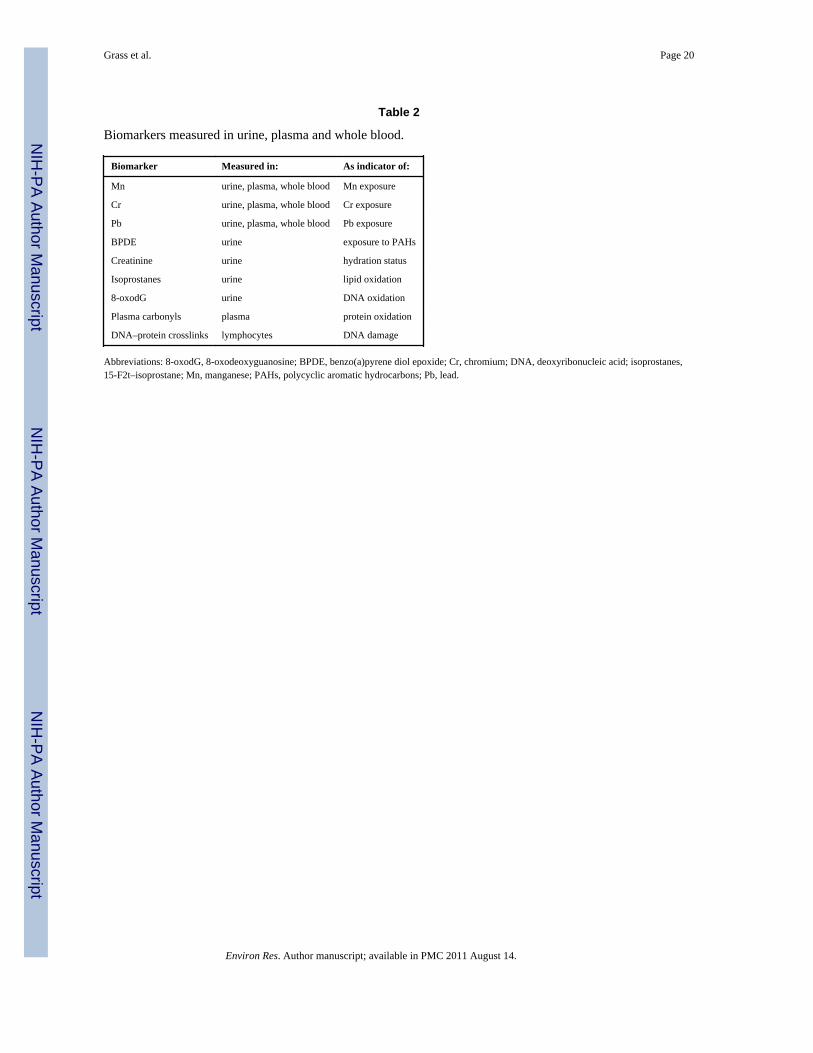
2. Materials and methodsIn this pilot study, the potential for biological effects due to steel dust exposure was assessedat the individual level by comparing the concentration of biomarkers in the subway workers’blood and urine samples to the concentration of particulate metals in air sampled by theirpersonal air monitors during one to three (8–11 h) work shifts. The potential for biologicalmodification at the population level was evaluated by comparing biomarker concentrationsin blood and urine samples from 39 subway workers with those from 11 bus drivers and 25suburban office workers. No environmental monitoring data were collected for the controlgroups who were assumed to be minimally exposed to particulate iron, manganese, andchromium, based on questionnaire data, and prior ambient air sampling in the New Yorkmetropolitan area (Urban outdoor samples) and at the place of work of the office workers(Suburban outdoor samples). The biomarkers used in this study are listed in Table 2.
Inclusion criteria for all subjects: we selected males, 18 years or older, who had workedcontinuously in the same job title for at least the past 2 years. Preference was given to non-smokers who did not wear personal protective equipment such as face masks or respirators.Women were excluded because their endogenous iron stores are generally lower than thosein men, and since our small study size precluded us from adequately controlling for genderdifferences. Control subjects who rode the subway more than twice a month were excluded.The study protocol was approved by the Columbia University Medical Center InstitutionalReview Board.
2.1. Personal air monitoring and biological sample collectionWe enrolled 39 New York City subway workers from a cross-section of job titles with awide range of anticipated exposure levels. The typical duties of the various job titles aredescribed below. The subway lines where the workers were monitored are given inparentheses. Workers recruited for the study included track construction crews who removeballast, lay new track, and perform maintenance tasks (A,C,E,6,D,N,R). Track maintenancecrews replace rails, change plates, put up conduit, and perform other tasks (4,6,S,N,7,2,3,F,J). Station cleaners hose down the subway platform, clean the tile wall opposite theplatform while standing on the tracks, and flag oncoming trains (1,9,F,D,3,4,N,R,L). Each ofthe overhaul shop workers monitored worked aboveground and performed distinct tasks indistinct locations in this aboveground facility. Train operators drive the train from the leadcar while train conductors operate the car doors from the middle of the train (1,9).Construction flaggers work in tunnels and on platforms signaling approaching trains to slowdown and warning workers of oncoming trains (D,1,9,6). Refuse train workers spendapproximately 3 h a day loading and unloading dumpsters at underground and abovegroundstations (D,M,F,G,E). Most of their time is spent on the refuse train. The refuse train does
Grass et al. Page 4
Environ Res. Author manuscript; available in PMC 2011 August 14.
NIH
-PA Author Manuscript
NIH
-PA Author Manuscript
NIH
-PA Author Manuscript
not have an air-conditioning system and particulate matter levels on-board are higher thanlevels measured on trains with air conditioning and air filtration (Chillrud et al., 2004).
The personal air-monitoring campaign began in November 2004 and ended in February2005. Station cleaners (n=6), overhaul shop workers (n=6), construction flaggers (n=6),track maintenance workers (n=6), and track construction workers (n=6) were monitored forthree work shifts, while refuse train workers (n=3) were monitored for two shifts and trainoperators and conductors (n=6) for one shift. The monitoring period was shorter for thoseworkers thought to have consistent exposures from one shift to the next. Track workers weremonitored using a new filter for each work shift because their exposures were expected to behigh and to vary appreciably depending on work location and activity. A composite multi-day filter was collected for construction flaggers, station cleaners, overhaul shop workersand refuse train workers, who were expected to have exposures that potentially could be toolow to capture accurately in one work shift. All exposures were normalized for total volumeof air sampled. At the end of each shift, workers returned the personal air-monitoringequipment and described the location and duration of their job activities.
Workers were outfitted with personal air monitors custom-built with a low profile and wornunder the arm beneath work jackets to minimize the risk of injury from entanglement withpassing trains. An air intake tube clipped to the outside of the worker’s lapel was attached toa size-selective cyclone with a 2.5 mm aerodynamic-diameter cut point (model KTL, BGIInc.) when operated at 4 L/min ± 10%. Particulates were collected onto 37 mm Teflonmembrane filters (Gelman Inc.) in plastic cassettes. The personal air monitor consisted of aThomas rotary air pump (G12/04 EB) housed with a cooling fan in an acrylic tube held inthe holster of a DeSantis Patriot shoulder harness. A rechargeable lithium ion battery array(Battery Specialties, 186502S-2P, 7.2V-4.0Ah), regulated to +12 v DC ± − 2% by anLM340 solid-state regulator, and a custom-designed circuit board fabricated to provideswitched, fuse-protected power, were housed in the pouch under the opposite arm. The fixedvoltage supply powered the timer and the air pump. Filters were weighed pre- and post-sampling on a microbalance after being conditioned in a temperature/humidity controlledenvironment for at least 24 h (by opening the petrislide filter container) and staticallydischarged via a polonium source. Filters were analyzed inside a class-100 flow bench forreflectance. Following reflectance measurements, filters were prepared for multi-elementanalysis by magnetic sector high-resolution inductively-coupled-plasma mass-spectrometry(HR-ICP-MS). Aliquots of Standard Reference Material (SRM) 1648 (Urban ParticulateMatter) were weighed on a microbalance and digested several times during the course of thesample analyses. The SRM aliquots were digested using the same quantities of acids andmicrowave program. Recoveries for iron, manganese, and chromium were 93%, 86%, and92%, respectively, of their reported values. Recoveries for all other measured analytes werewithin 25% of reported values and most were within 12% of reported values.
To compare particle size distribution in the subway to aboveground conditions, a light-scattering particle counter (Met-One 237b, Grants Pass, OR) was installed on a refusecollection train for 2 days in February, 2005. The air inlet tube of the particle counter waspositioned outside the window of an empty conductor’s cabin. Particle counts wereintegrated every 30 s. Mean particle counts for the size fractions were compared during aperiod of approximately 1 h during which the subway train’s trajectory was eithercontinuously underground or continuously aboveground.
At the conclusion of the final shift, each worker filled out a study questionnaire andprovided a blood sample and a urine sample. The study questionnaire asked workers abouttheir typical job activities, commuting habits, other potential exposures to particulate metals,diet, and use of vitamins and medications. To better understand potential determinants of
Grass et al. Page 5
Environ Res. Author manuscript; available in PMC 2011 August 14.
NIH
-PA Author Manuscript
NIH
-PA Author Manuscript
NIH
-PA Author Manuscript
exposure, questionnaire data for continuous variables (e.g. number of hours spent on track)were compared to average (filter-based) metal exposures. Binary variables (e.g. spends timescraping debris from track) were used to categorize subway workers into two groups thatcould then be compared for significant differences in exposure levels or biomarkerconcentrations (see section “Statistical methods” below for more details).
A total of 28 mL of blood was collected into four 7 mL vacutainers by a physician orcertified phlebotomist in a mobile blood donation vehicle parked near the worksite.Vacutainers were inverted 10 times to mix the anticoagulant (EDTA or sodium heparin) intothe blood sample. Urine was collected into 50 mL acid-washed polypropylene tubes. Duringsample collection, urine and blood samples were stored in a cooler for no more than 3 h,then transferred to a laboratory refrigerator and prepared for analysis.
2.2. Biomarker selectionIron, manganese, and chromium can have toxic biological effects by generating reactiveoxygen species through Fenton or Fenton-like chemistry, inducing oxidative stress (Ali etal., 1995; Costa and Dreher, 1997; Shi et al., 1993). The increase in reactive oxygen speciesdisrupts biochemical homeostasis, which can result in lipid peroxidation, DNA damage, anddepletion of the antioxidants that mediate inflammatory response in epithelial cells(McNeilly et al., 2004; Stohs and Bagchi, 1995). We used 15-F2t-isoprostane (isoprostane),protein carbonyls, and 8-oxodeoxyguanosine (8-oxodG) as measures of lipid, protein, andDNA oxidation, respectively.
Blood, plasma, and urine manganese concentrations were measured as biomarkers of Mnexposure. However, Mn absorption and excretion are strongly regulated, maintaining stabletissue levels (Aschner et al., 2005). Since much of the variability in blood and urine Mnconcentrations is unrelated to inhalation exposure, urinary and blood Mn may be useful asindicators of exposure on a group basis, but are not considered suitable for use as abiomarker of individual exposure (Apostoli et al., 2000).
DNA-protein crosslinks (DPC) in lymphocytes were quantified as a measure of DNAdamage potentially resulting from inhalation exposure to chromium. Exposure to Cr(VI) hasbeen shown to produce DPC in vitro and in vivo (Zhitkovich, 2002). At low and moderateexposures the dose-response curve has shown good sensitivity, and DPC are not affected byage, race, bodyweight, or gender (Zhitkovich, 2002). Intracellular reduction of Cr(VI) toCr(III) results in the formation of Cr(III) adducts with DNA and proteins (Zhitkovich, 2002).These ternary Cr(III) DNA complexes have been found to be mutagenic in human cells(Voitkun et al., 1998). It is important to note that DPC can also be caused by exposure tonickel, arsenic, formaldehyde, radiation, and other factors (Barker et al., 2005) and that theassay used here is not specific to Cr-induced DNA lesions.
Urinary polycyclic aromatic hydrocarbon (PAH) metabolites, were measured as a marker ofexposure to combustion generated aerosols, with the expectation that concentrations wouldbe higher for bus drivers than for subway workers. In prior sampling, it was found that whencompared to aboveground concentrations, the NYC subway did not have elevated airbornePb concentrations on a per mass basis (e.g. ng Pb per mg PM2.5) (Chillrud et al., 2005).However, at the request of subway workers who collaborated in the planning of this study,we tested personal air samples and biological samples for lead content.
2.3. Analyses of biological samplesICP-MS-DRC methods for measuring metals in whole blood, plasma and urine weredeveloped according to published procedures (Pruszkowski et al., 1998; Stroh, 1993), withmodifications for blood sample preparation as suggested by the Laboratory for ICP-MS
Grass et al. Page 6
Environ Res. Author manuscript; available in PMC 2011 August 14.
NIH
-PA Author Manuscript
NIH
-PA Author Manuscript
NIH
-PA Author Manuscript
Comparison Program, Institut National de Sante Publique du Quebec. Methods for plasmaand urine sample preparation were developed in the Trace Metal Core Laboratory at theMailman School of Public Health at Columbia University. DNA–protein crosslinks weremeasured in lymphocytes isolated from whole blood using a modified method described byZhitkovich and Costa (1992), Kuykendall et al. (1996) and Quievryn and Zhitkovich (2000).Methods for the isoprostane and 8-oxodG assays are described in Rossner et al. (2006).Protocols for the measurement of PAH metabolites are described in Santella et al. (1994).The levels of protein carbonyl groups were assessed using a noncompetitive ELISA, asdescribed in Buss et al. (1997), with some modifications following Marangon et al. (1999).
2.4. Statistical methodsBecause of the small sample size and because many of the variables were not normallydistributed, non-parametric statistical tests were used. These tests do not assume a normaldistribution and are based on rank rather than the actual value of the quantity measured. Allgroup-level comparisons discussed below are the results of Wilcoxon’s rank sum test forequality of medians (Mathworks Inc, 2002). Since multiple comparisons were made, weperformed a Bonferroni adjustment of the critical level (p=0.05), dividing by the number ofcomparisons that were made (three) to obtain an adjusted critical level of p=0.016 (Feise,2002). All individual level tests of association discussed below were performed usingSpearman’s coefficient of rank correlation (rs).
2.5. Creatinine adjustment for urinary analytesUrinary creatinine was measured as an indicator of hydration status and was used tonormalize the concentrations of urinary biomarkers. Urinary analytes were adjusted forcreatinine by dividing the analyte concentration (nmol/L or µg/L) by the creatinineconcentration (mg/dL) to obtain a creatinine-adjusted analyte concentration (reported asnmol/mmol or ng/mg). However, urinary creatinine concentrations have also been found tobe dependent on age, muscle mass, race, red meat intake, and other factors (Barr et al.,2005). At the individual level, partial correlation was used to control for the effects ofcreatinine and BMI on associations between urinary biomarkers and exposure metrics, assuggested by Barr et al. (2005). For group-level comparisons, results are shown with andwithout creatinine normalization.
3. Results and discussion3.1. Personal air-monitoring results
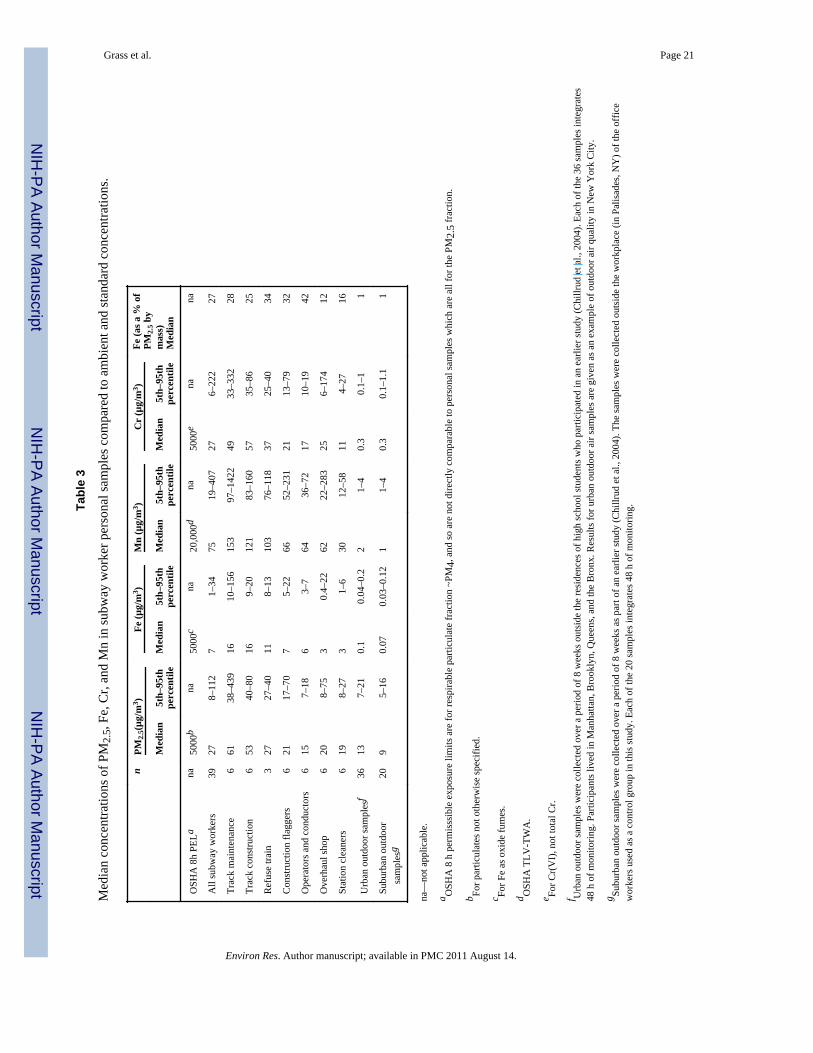
Subway worker PM2.5 concentrations varied on the basis of job activity and job title (Table3). The mean subway worker time-weighted PM2.5 exposure was 52 µg/m3, with a medianof 27 µg/m3, and a range of 6–469 µg/m3. Generally, train operators, train conductors andstation cleaners were exposed to the lowest PM2.5 and steel dust concentrations (in µg/m3).Construction flaggers, refuse train workers and overhaul shop workers were exposed tointermediate concentrations of PM2.5 and steel dust. Track construction and trackmaintenance workers were exposed to the highest concentrations of steel dust. Trackmaintainers were exposed to a mean PM2.5 concentration of 171 µg/m3. Exposures for thesame individuals varied substantially from one night to the next, depending on job activityand job location. For example, scraping dry impacted material from the tracks was thedirtiest activity monitored, but when the impacted material was wet, exposures were reducedby a factor of eight.
As a point of reference, the 24 h EPA National Ambient Air Quality Standard for PM2.5 is35 µg/m3 (EPA, 2008), while the 24 h WHO Air Quality Guideline for PM2.5 is 25 µg/m3
(WHO, 2006). However, these air quality standards are not ideal benchmarks for evaluating
Grass et al. Page 7
Environ Res. Author manuscript; available in PMC 2011 August 14.
NIH
-PA Author Manuscript
NIH
-PA Author Manuscript
NIH
-PA Author Manuscript
health risks in this case because they are intended to be compared with stationary samplesfrom outdoor environments averaged over 24 h, rather than personal air samples fromenclosed spaces averaged over 8 h work shifts. Differences between subway andaboveground particle morphology, composition and size distribution further limit the valueof comparisons to outdoor PM2.5 guidelines. Additionally, results from personal andstationary air samples are not always well correlated; stationary air-sampling methods canunderestimate personal air pollution exposures (Violante et al., 2006).
As expected, Fe, Mn, and Cr in subway worker personal PM2.5 samples fell well belowOSHA guidelines for respirable PM (~PM4, see Table 3). The median subway workermanganese concentration was 75 ng/m3, with a range of 11–1582 ng/m3. The median Pbparticulate concentration for subway workers was 16 ng/m3 (5th–95th percentile: 5–83 ng/m3). This exceeded median Pb concentrations of urban outdoor samples (6 ng/m3, 5th-95thpercentile: 3–13 ng/m3) collected outside residences in an earlier study (Chillrud et al.,2004), but was well below the EPA NAAQS (150 ng/m3, rolling 3-month average) andOSHA PEL (50,000 ng/m3). Furthermore, the difference was largely due to higherparticulate matter concentrations in the subway. On a per mass basis (pg of Pb per µg ofPM2.5), the median Pb concentration for subway workers (573 ppm, 5th–95th percentile:367– 1478 ppm) approximated the median urban outdoor Pb concentration (538 ppm, 5th–95th percentile: 317–937 ppm).
Since a quantitative characterization of exposure levels for the various job titles was lackingat the outset of this study, it was necessary to collect this information by enrolling subwayworkers from a cross-section of job titles with a wide range of exposure levels. This allowedus to explore dose–response relationships at the individual level. However, the wide range ofexposure levels also weakened our ability to detect biological differences between theexposed and control groups at the group level. The exposure levels for various job titlesdetermined in this study may provide a useful basis for developing enrollment criteria infuture studies of subway workers.
3.2. Determinants of exposureSelf-reported information about work location and work activity provided some detailsregarding potential determinants of exposure. Workers who spent time on the subway tracks,spent time scraping, or were exposed to second-hand smoke on the job were exposed toPM2.5, Fe, Mn, and Cr (ng/m3) concentrations 2–6 times higher than those who did not. Thesix workers who spent any time scraping had fewer years of experience, on average,working in the subway system (4.7 years) than those who did not (11.3 years). Thisobservation raises the possibility that individual exposures may decrease over time asworkers self-select out of job activities with higher exposures.
The percentage of iron in the particulate matter to which subway workers were exposedvaried widely, from 14% for overhaul shop workers to 43% for train operators andconductors. Track workers who often actively disturb sedimented debris and were exposedto mean PM2.5 concentrations of 113 µg/m3, consisting of 27% iron by mass. In contrast,train operators and conductors are exposed to particulate matter that is already suspended orthat has been re-suspended by the train. On average the train operator’s and conductor’sexposure to PM2.5 was 13 µg/ m3, consisting of 43% iron by mass. This relatively highpercentage of iron is consistent with the high levels of particulate metals detected inparticulate matter vacuumed from 13 air-conditioning filters, which act as bulk samplers ofsuspended particulates in the subway system. Filters from eight different subway linescontained an average of 43 ± 3.7% iron, 0.35 ± 0.04% manganese, and 0.16 ± 0.04%chromium (mean ± one standard deviation).
Grass et al. Page 8
Environ Res. Author manuscript; available in PMC 2011 August 14.
NIH
-PA Author Manuscript
NIH
-PA Author Manuscript
NIH
-PA Author Manuscript
3.3. Chemical composition and size distribution of subway particulate matterFe/Mn ratios for subway worker personal air samples were consistent with personal samplesof subway-riding high school students collected in an earlier study (Chillrud et al., 2004).The subway worker personal samples had Fe/Mn ratios of 103±10 and Cr/Mn ratios of0.36±0.16 (7one standard deviation). The subway-riding student personal samples had Fe/Mn ratios of 104 and Cr/Mn ratios of 0.33 (Chillrud et al., 2004). These Fe/Mn and Cr/Mnratios suggest that Fe and Mn found in the subway is not derived from soil blown in fromaboveground. Typical crustal ratios are 55 for Fe/Mn and 0.11 for Cr/Mn (Turekian andWedepohl, 1961).
Observations from a light-scattering particle counter drawing air from outside an operatingrefuse train indicated that particles collected when the train was underground were greater innumber in every size fraction, and had a coarser size distribution than particles collectedwhen the train was aboveground. In the 0.3–0.5 mm, 0.5– 0.7 µm, 0.7–1.0 µm, 1.0–2.5 µm,2.5–5.0 µm, and >5.0 µm size fractions, the ratios of subway particle counts to abovegroundparticle counts were 2.4, 6.1, 7.4, 7.7, 7.3, and 10.7, respectively.
Particle count observations were also made on the 42nd Street Shuttle platform in the 42ndStreet/Times Square station over a period of 3 weeks in May 2005. These data werecompared to aboveground observations collected over 6 weeks during the summer of 1999outside a residential building in Harlem. The ratios of subway particle counts toaboveground particle counts in the same size fractions listed above were 0.7, 1.6, 2.5, 5.2,11.1, and 22.5, respectively. These observations support the claim that larger diameter steeldust particles derived from frictional abrasion are an important component of subway PMwhile smaller-diameter combustion-derived particles represent a more important componentof aboveground PM (Karlsson et al., 2005; Sitzmann et al., 1999). Fig. 1 shows a scanningelectron micrograph (SEM) of particulate matter collected from a high-volume samplerdeployed at the 42nd Street/ Times Square station.
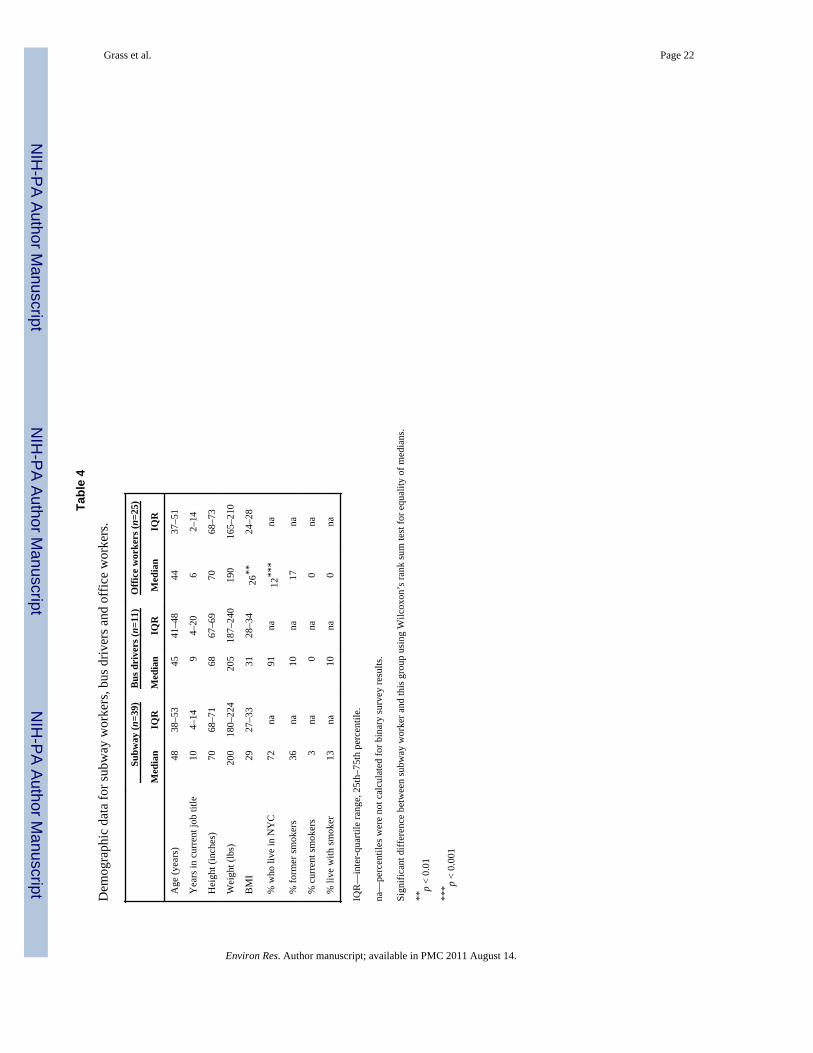
3.4. Demographic characteristics of study subjectsA summary of the demographic characteristics of the control and exposed groups is given inTable 4. Results are reported here for both bus drivers and office workers, however, neitherof these groups is drawn from an ideal control population. The bus driver group is small(n=11) and is subject to stresses and air pollution exposures that are distinct from thoseexperienced by subway workers. The office workers recruited lived mostly outside of NewYork City (88% compared to 28% of subway workers) and had a significantly lower bodymass index on average than subway workers. While information about participant’s race wasnot collected as part of the study, we estimated that 26 of the 39 subway workers wereAfrican-American, while 21 of the 25 office workers were non-hispanic whites. Given thesesubstantive differences between control and exposed populations, observed differences inbiomarker concentrations cannot be attributed with certainty to differences in particulatemetal exposure.
3.5. Biological monitoring: overviewStrong evidence for steel dust-related biological effects would consist of a significantdifference between the biomarker concentrations of the control and exposed groups for abiomarker that also shows a significant association at the individual level with steel dustexposure measured in personal air monitoring samples. No such evidence was found.Urinary isoprostanes, Cr in plasma, and DPC were detected at higher levels in subwayworkers than in the bus drivers control group (Table 5), but these biomarkers were not foundto be associated with steel dust exposures. At the individual level, none of the biomarkersmeasured were significantly associated with the airborne Fe, Mn, or Cr concentrations (in
Grass et al. Page 9
Environ Res. Author manuscript; available in PMC 2011 August 14.
NIH
-PA Author Manuscript
NIH
-PA Author Manuscript
NIH
-PA Author Manuscript
ng/m3) measured on PM2.5 filters; in other words, no dose–response relationship wasapparent (Table 6). It is possible that the biomarkers of oxidative stress selected for thisstudy (protein carbonyls, urine 8oxo-dG, and isoprostanes) were too specific, and thereforedid not adequately capture general oxidative response.
3.6. Urinary creatinine, manganese, and 8-oxodGAmong all study subjects, creatinine was significantly correlated with BMI (rs=0.30,p=0.008, n=74), but not with age or red meat consumption. There were differences increatinine status between the relatively sedentary office workers, the bus drivers, and themore active subway workers. Creatinine-normalized urinary manganese and 8-oxodGconcentrations were significantly higher in the office worker control group samples than insubway worker samples, but the differences was driven entirely by differences in creatinine,i.e. there was no significant difference in the raw urinary manganese and 8-oxodGconcentrations.
3.7. PAH metabolitesAs expected, concentrations of PAH metabolites were higher for bus drivers than forsubway workers or office workers. While personal inhalation exposure to PAH was notmeasured, the difference in PAH metabolite concentrations suggests that occupational airpollution exposures and the risk conveyed by those exposures are different for subwayworkers and bus drivers as a result of their distinct workplace environments. Consumptionof meat cooked at high-temperatures can also be an important source of PAH exposure(Sinha et al., 2005). The self-reported weekly rate of consumption of red meat for busdrivers (mean: 1.7 times per week) was not greater than that of subway workers (mean: 2.4times per week) or office workers (mean: 2.2 times per week). No information regardingcooking method was collected.
3.8. Protein carbonylsSubway workers had significantly higher concentrations of protein carbonyls than officeworkers (p=0.01, see Table 5). The bus drivers control group also had elevated levels ofprotein carbonyls relative to the office workers (p=0.03). This suggests that the differencebetween subway worker and office worker protein carbonyl concentrations may not havebeen due to differences steel dust exposures. Protein carbonyls were significantly correlatedwith blood Mn for subway workers (rs=0.38, p=0.024, n=36), but not for the office workers(rs= 0.18, p=0.40, n=25) or bus drivers (rs=0.23, p=0.50, n=11).
3.9. LeadMedian subway worker Pb levels in blood, plasma, and urine approximated or were lowerthan the median control group Pb levels. Mean Pb blood levels among all subway workers(1.92 µg/dL), bus drivers (1.88 µg/dL), and office workers (2.23 µg/dL) approximated themean Pb blood levels for adult males (n=762) living in New York City reported in the NYCHealth and Nutrition Examination Survey (NYCHANES) (2.1 µg/dL) (McKelvey et al.,2007). One subway worker, no office workers, and no bus drivers exceeded theNYCHANES 95th percentile (5.87 µg/dL) for adult males (McKelvey et al., 2007). Thesubway worker Pb blood level that exceeded the NYCHANES 95th percentile of 5.87 µg/deciliter (dL) did not exceed the CDC’s blood lead action level for children (10 µg/dL).
3.10. Urinary isoprostanesUrinary isoprostane concentrations were higher in subway workers than in office workers(p=0.026) or in bus drivers (p=0.092). When isoprostane concentrations were normalized forcreatinine, concentrations remained higher among subway workers than office workers or
Grass et al. Page 10
Environ Res. Author manuscript; available in PMC 2011 August 14.
NIH
-PA Author Manuscript
NIH
-PA Author Manuscript
NIH
-PA Author Manuscript
bus drivers, though these differences were not statistically significant, see Table 5. Totalyears of subway work was significantly correlated with isoprostane concentrations bothbefore (rs=0.42, p=0.008) and after controlling for the effect of creatinine concentrations(rs=0.53, p=0.0005, see Fig. 2). This relationship remains significant when BMI (rs=0.52,p=0.012) and age (rs=0.43, p=0.024) are added to the regression model. Of the 39 subwayworkers, four held jobs before they began working for the Transit Authority that hadpotential for high exposures to particulate metals. When these four workers are excluded, thestrength of the adjusted isoprostane—years of subway work relationship remainsapproximately the same (rs=0.54, p=0.001).
We are not aware of any prior study that has found a relationship between isoprostaneconcentrations and cumulative exposure to transition metals. The possibility that isoprostanelevels respond to steel dust exposure is consistent with earlier studies that found thatasymptomatic shipyard welders in South Korea had serum isoprostane concentrations 2.4times higher than an unexposed office worker control group (Han et al., 2005), and thatMnCl2 exposure induces changes in isoprostane concentrations in the nematode C. Elegans(Aschner, 2006).
3.11. DNA–protein crosslinks and chromium in plasmaSubway workers (n=36) had significantly higher concentrations of chromium in plasma(p=0.005) and DNA–protein crosslinks (DPC) in lymphocytes (p=0.005) than the bus drivercontrol group (n=11). There was no significant difference between subway workers’ andoffice workers’ plasma Cr and DPC concentrations. Among all study subjects, the percent ofDPC was significantly correlated with the concentrations of chromium in plasma (rs=0.34,p=0.003, n=71, Fig. 3). Among the subway workers, the strength of the association was thesame (rs=0.48, p=0.003, n=36), while for the office workers (rs=0.02, p=0.94, n=25) and busdrivers (rs=0.36, p=0.31, n=10), the relationship between DPC and Cr in plasma was notsignificant. It is also worth noting that plasma Cr concentrations were significantly elevated(p=0.017) for the 12 subway workers who reported working in areas where metal was beingcut (0.37 µg/L) versus the 24 workers who did not (0.27 µg/L). Several studies have shownthat DPC are responsive to chromium exposure. For example, Medeiros et al. (2003) foundthat both Cr(VI) and Cr(III) exposed workers had elevated levels of plasma Cr and DPC ascompared to controls, and an in vitro study by Zhitkovich et al. (1996) showed thaterythrocyte chromium levels were correlated with lymphocyte DPC.
3.12. Intra-individual versus inter-individual biomarker variabilityWhile screening studies have found that urinary isoprostanes, 8-oxodG, and plasma proteincarbonyl content demonstrate suggestive or consistent responses to iron exposure(Schumann et al., 2005), their suitability as indicators of a biological response to inhalationtransition metal exposure is also dependent on intra- and inter-individual variability.Measurement of urinary isoprostane concentrations has proved to be a reliable means toassess oxidative stress in vivo (Montuschi et al., 2004). While most studies have found nosignificant intra-individual daily variability and limited day-to-day variability in urinaryisoprostane concentrations (Montuschi et al., 2004), at least one study (Helmersson andBasu, 2001) found significant diurnal variation in healthy adults. Between subject variabilityof blood 8-oxodG has also been found to be consistently greater than within subjectvariability suggesting that it is appropriate to use single measurements of this biomarker asan indicator of oxidative DNA damage in healthy individuals (Kato et al., 2006). However,Kanabrocki et al. (2002) found significant diurnal variation in 8-oxodG (potentially as aresult of diurnal variation in oxidative stress), which would suggest that the results of spotsamples such as those used in this study should be interpreted with caution.
Grass et al. Page 11
Environ Res. Author manuscript; available in PMC 2011 August 14.
NIH
-PA Author Manuscript
NIH
-PA Author Manuscript
NIH
-PA Author Manuscript
3.13. Evaluating the potential for health risksThe concentrations of particulate metals at which health risks have been established farexceed the concentrations observed in this study. For example, cases of manganism ormanganese-induced Parkinsonism are typically associated with chronic exposure to airbornemanganese concentrations in excess of 1000–5000 µg/m3 (Aschner et al., 2005). Symptomsof neurofunc-tional changes and elevated manganese levels in blood and urine have beenreported with exposure to levels as low as 70 µg/m3 (Lucchini et al., 1999). By contrast, thehighest time-weighted concentrations of manganese found in this study were in the range of1–2 µg/m3, with a median value of 0.075 µg/m3. We found no dose–response relationshipbetween particulate metal concentrations measured from PM2.5 filters and the biologicalmarkers measured in blood and urine samples.
In no instance were subway worker biomarker concentrations significantly elevated aboveboth the office worker and the bus driver control group concentrations. Given these results,and because the levels of steel dust observed in this study fell well below levels with knownhealth risks, we conclude that the potential for health impacts in the worker populationstudied, at the levels observed, appears to be low. It is not clear whether the lack of aconsistent pattern of positive associations between pollutant dose and biomarker response isdue to poor biomarker selection, limited statistical power, or levels of particulate metals thatare so low that they genuinely do not present a health risk. Therefore further investigationmay be warranted, especially for those groups with the highest subway dust exposures (trackmaintenance and track construction workers). Given the small size of this study, andpotential differences between the workers studied and the general public, the results of thisstudy should not be interpreted to apply to the general subway ridership, which includessusceptible subgroups such as children, the elderly, and people with pre-existing respiratoryconditions.
AcknowledgmentsWe thank the members of Local 100 of the Transit Workers Union and the MTA Office of System Safety. We aregrateful for technical expertise provided by Dee Breger, Manuel Gonzalez, Dr. Marc Grodman, Robert Ortiz,Slavenka Sedlar, and Galina Zimberg. The EPA has not officially endorsed this publication and the views expressedherein may not reflect the views of the EPA. This is LDEO contribution no. 7264.
ReferencesAarnio P, Yli-Tuomi T, Kousa A, Makela T, Hirsikko A, Hameri K, Raisanen M, Hillamo R,
Koskentalo T, Jantunen M. The concentrations and composition of and exposure to fine particles(PM2.5) in the Helsinki subway system. Atmospheric Environment. 2005; 39:5059–5066.
Adams HS, Nieuwenhuijsen MJ, Colvile RN, McMullen MAS, Khandelwal P. Fine particle (PM2.5)personal exposure levels in transport microenvironments, London, UK. Science of the TotalEnvironment. 2001; 279:29–44. [PubMed: 11712603]
Ali SF, Duhart HM, Newport GD, Lipe GW, Slikker W. Manganeseinduced reactive oxygen secies—comparison between Mn+2 and Mn+3. Neurodegeneration. 1995; 4:329–334. [PubMed: 8581566]
Antonini JM. Health effects of welding. Critical Reviews in Toxicology. 2003; 33:61–103. [PubMed:12585507]
Apostoli P, Lucchini R, Alessio L. Are current biomarkers suitable for the assessment of manganeseexposure in individual workers? American Journal of Industrial Medicine. 2000; 37:283–290.[PubMed: 10642418]
Aschner, M. Personal Communication. Nashville, TN: Department of Pediatrics Vanderbilt UniversitySchool of Medicine; 2006.
Aschner M, Erikson KM, Dorman DC. Manganese dosimetry: species differences and implications forneurotoxicity. Critical Reviews in Toxicology. 2005; 35:1–32. [PubMed: 15742901]
Grass et al. Page 12
Environ Res. Author manuscript; available in PMC 2011 August 14.
NIH
-PA Author Manuscript
NIH
-PA Author Manuscript
NIH
-PA Author Manuscript
Aschner M, Vrana KE, Zheng W. Manganese uptake and distribution in the central nervous system(CNS). Neurotoxicology. 1999; 20:173–180. [PubMed: 10385881]
Barker S, Weinfeld M, Murray D. DNA-protein crosslinks: their induction, repair, and biologicalconsequences. Mutation Research—Reviews in Mutation Research. 2005; 589:111–135. [PubMed:15795165]
Barr DB, Wilder LC, Caudill SP, Gonzalez AJ, Needham LL, Pirkle JL. Urinary creatinineconcentrations in the US population: implications for urinary biologic monitoring measurements.Environmental Health Perspectives. 2005; 113:192–200. [PubMed: 15687057]
Bigert, C. Cardiovascular Disease among Professional Drivers and Subway Staff in Stockholm.Stockholm: Department of Public Health Sciences, Karolinska Institutet; 2007. p. 44Ph.D. Thesis
Branis M. The contribution of ambient sources to particulate pollution in spaces and trains of thePrague underground transport system. Atmospheric Environment. 2006; 40:348–356.
Buss H, Chan TP, Sluis KB, Domigan NM, Winterbourn CC. Protein carbonyl measurement by asensitive ELISA method. Free Radical Biology and Medicine. 1997; 23:361–366. [PubMed:9214571]
Chan LY, Lau WL, Zou SC, Cao ZX, Lai SC. Exposure level of carbon monoxide and respirablesuspended particulate in public transportation modes while commuting in urban area ofGuangzhou, China. Atmospheric Environment. 2002; 36:5831–5840.
Chillrud SN, Epstein D, Ross JM, Sax SN, Pederson D, Spengler JD, Kinney PL. Elevated airborneexposures of teenagers to manganese, chromium, and iron from steel dust and New York City’ssubway system. Environmental Science & Technology. 2004; 38:732–737. [PubMed: 14968857]
Chillrud SN, Grass D, Ross JM, Coulibaly D, Slavkovich V, Epstein D, Sax SN, Pederson D, JohnsonD, Spengler JD, Kinney PL, Simpson HJ, Brandt-Rauf P. Steel dust in the New York City subwaysystem as a source of manganese, chromium, and iron exposures for transit workers. Journal ofUrban Health—Bulletin of the New York Academy of Medicine. 2005; 82:33–42. [PubMed:15738337]
Costa DL, Dreher KL. Bioavailable transition metals in particulate matter mediate cardiopulmonaryinjury in healthy and compromised animal models. Environmental Health Perspectives. 1997;105:1053–1060. [PubMed: 9400700]
Crump KS. Manganese exposures in Toronto during use of the gasoline additive,methylcyclopentadienyl manganese tricarbonyl. Journal of Exposure Analysis and EnvironmentalEpidemiology. 2000; 10:227–239. [PubMed: 10910116]
Cudahy, B. A Century of Subways: Celebration 100 Years of New York’s Underground Railways.New York: Fordham University Press; 2003.
Doherty MJ, Healy M, Richardson SG, Fisher NC. Total body iron overload in welder’s siderosis.Occupational and Environmental Medicine. 2004; 61:82–85. [PubMed: 14691279]
EPA, U.S. Integrated Science Assessment for Particulate Matter (External Review Draft). Washington,DC: US Environmental Protection Agency; 2008.
Feise RJ. Do multiple outcome measures require p-value adjustment? BMC Medical ResearchMethodology. 2002; 2:8–11. [PubMed: 12069695]
Gomez-Perales JE, Colvile RN, Nieuwenhuijsen MJ, Fernandez-Bremauntz A, Gutierrez-Avedoy VJ,Paramo-Figueroa VH, Blanco-Jimenez S, Bueno-Lopez E, Mandujano F, Bernabe-Cabanillas R,Ortiz-Segovia E. Commuters’ exposure to PM2.5, CO, and benzene in public transport in themetropolitan area of Mexico City. Atmospheric Environment. 2004; 38:1219–1229.
Han SG, Kim Y, Kashon ML, Pack DL, Castranova V, Vallyathan V. Correlates of oxidative stressand free-radical activity in serum from asymptomatic shipyard welders. American Journal ofRespiratory and Critical Care Medicine. 2005; 172:1541–1548. [PubMed: 16166614]
Helmersson J, Basu S. F-2-isoprostane and prostaglandin F-2 alpha metabolite excretion rate and dayto day variation in healthy humans. Prostaglandins Leukotrienes and Essential Fatty Acids. 2001;65:99–102.
Johansson C, Johansson PA. Particulate matter in the underground of Stockholm. AtmosphericEnvironment. 2003; 37:3–9.
Grass et al. Page 13
Environ Res. Author manuscript; available in PMC 2011 August 14.
NIH
-PA Author Manuscript
NIH
-PA Author Manuscript
NIH
-PA Author Manuscript
Kanabrocki EL, Murray D, Hermida RC, Scott GS, Bremner WF, Ryan MD, Ayala DE, Third J,Shirazi P, Nemchausky BA, Hooper DC. Circadian variation in oxidative stress markers in healthyand type II diabetic men. Chronobiology International. 2002; 19:423–439. [PubMed: 12025934]
Karlsson HL, Holgersson A, Moller L. Mechanisms related to the genotoxicity of particles in thesubway and from other sources. Chemical Research in Toxicology. 2008; 21:726–731. [PubMed:18260651]
Karlsson HL, Nilsson L, Moller L. Subway particles are more genotoxic than street particles andinduce oxidative stress in cultured human lung cells. Chemical Research in Toxicology. 2005;18:19–23. [PubMed: 15651844]
Kato I, Ren J, Heilbrun LK, Djuric Z. Intra- and inter-individual variability in measurements ofbiomarkers for oxidative damage in vivo: nutrition and Breast Health Study. Biomarkers. 2006;11:143–152. [PubMed: 16766390]
Kuykendall JR, Kerger BD, Jarvi EJ, Corbett GE, Paustenbach DJ. Measurement of DNA-proteincross-links in human leukocytes following acute ingestion of chromium in drinking water.Carcinogenesis. 1996; 17:1971–1977. [PubMed: 8824522]
Lucchini R, Apostoli P, Perrone C, Placidi D, Albini E, Migliorati P, Mergler D, Sassine MP, Palmi S,Alessio L. Long term exposure to “low levels” of manganese oxides and neurofunctional changesin ferroalloy workers. Neurotoxicology. 1999; 20:287–297. [PubMed: 10385891]
Marangon K, Devaraj S, Jialal I. Measurement of protein carbonyls in plasma of smokers and inoxidized LDL by an ELISA. Clinical Chemistry. 1999; 45:577–578. [PubMed: 10102923]
Mathworks Inc. Statistical Toolbox User’s Guide: Version 4. Natick, MA: Mathworks Inc; 2002.McKelvey W, Gwynn RC, Jeffery N, Kass D, Thorpe LE, Garg RK, Palmer CD, Parsons PJ. A
biomonitoring study of lead, cadmium, and mercury in the blood of New York city adults.Environmental Health Perspectives. 2007; 115:1435–1441. [PubMed: 17938732]
McNeilly JD, Heal MR, Beverland IJ, Howe A, Gibson MD, Hibbs LR, MacNee W, Donaldson K.Soluble transition metals cause the pro-inflammatory effects of welding fumes in vitro.Toxicology and Applied Pharmacology. 2004; 196:95–107. [PubMed: 15050411]
Medeiros MG, Rodrigues AS, Batoreu MC, Laires A, Rueff J, Zhitkovich A. Elevated levels of DNA-protein crosslinks and micronuclei in peripheral lymphocytes of tannery workers exposed totrivalent chromium. Mutagenesis. 2003; 18:19–24. [PubMed: 12473731]
Montuschi P, Barnes PJ, Roberts LJ. Isoprostanes: markers and mediators of oxidative stress. FasebJournal. 2004; 18:1791–1800. [PubMed: 15576482]
Nieuwenhuijsen MJ, Gomez-Perales JE, Colvile RN. Levels of particulate air pollution, its elementalcomposition, determinants and health effects in metro systems. Atmospheric Environment. 2007;41:7995–8006.
Palmer KT, Poole J, Ayres JG, Mann J, Burge PS, Coggon D. Exposure to metal fume and infectiouspneumonia. American Journal of Epidemiology. 2003; 157:227–233. [PubMed: 12543622]
Pfeifer GD, Harrison RM, Lynam DR. Personal exposures to airborne metals in London taxi driversand office workers in 1995 and 1996. Science of the Total Environment. 1999; 235:253–260.[PubMed: 10535124]
Pruszkowski E, Neubauer K, Thomas R. An overview of clinical applications by inductively coupledplasma mass spectrometry. Atomic Spectroscopy. 1998; 19:111–115.
Quievryn G, Zhitkovich A. Loss of DNA-protein crosslinks from formaldehyde-exposed cells occursthrough spontaneous hydrolysis and an active repair process linked to proteosome function.Carcinogenesis. 2000; 21:1573–1580. [PubMed: 10910961]
Ripanucci G, Grana M, Vicentini L, Magrini A, Bergamaschi A. Dust in the underground railwaytunnels of an Italian town. Journal of Occupational and Environmental Hygiene. 2006; 3:16–25.[PubMed: 16482974]
Rossner P, Gammon MD, Terry MB, Agrawal M, Zhang FF, Teitelbaum SL, Eng SM, Gaudet MM,Neugut AI, Santella RM. Relationship between urinary 15-F-2t isoprostane and 8-oxodeoxyguanosine levels and breast cancer risk. Cancer Epidemiology Biomarkers & Prevention.2006; 15:639–644.
Santella RM, Nunes MG, Blaskovic R, Perera FP, Tang DL, Beachman A, Lin JH, Deleo VA.Quantitation of polycyclic aromatic-hydrocarbons, 1-hydroxypyrene, and mutagenicity in urine of
Grass et al. Page 14
Environ Res. Author manuscript; available in PMC 2011 August 14.
NIH
-PA Author Manuscript
NIH
-PA Author Manuscript
NIH
-PA Author Manuscript
coal-tar-treated psoriasis patients and untreated volunteers. Cancer Epidemiology Biomarkers &Prevention. 1994; 3:137–140.
Schaumann F, Borm PJA, Herbrich A, Knoch J, Pitz M, Schins RPF, Luettig B, Hohlfeld JM, HeinrichJ, Krug N. Metal-rich ambient particles (particulate matter(2.5)) cause airway inflammation inhealthy subjects. American Journal of Respiratory and Critical Care Medicine. 2004; 170:898–903. [PubMed: 15229099]
Schumann K, Kroll S, Weiss G, Frank J, Biesalski HK, Daniel H, Friel J, Solomons NW. Monitoringof hematological, inflammatory and oxidative reactions to acute oral iron exposure in humanvolunteers: preliminary screening for selection of potentially-responsive biomarkers. Toxicology.2005; 212:10–23. [PubMed: 15963385]
Seaton A, Cherrie J, Dennekamp M, Donaldson K, Hurley JF, Tran CL. The London underground:dust and hazards to health. Occupational and Environmental Medicine. 2005; 62:355–362.[PubMed: 15901881]
Shi XL, Dalal NS, Kasprzak KS. Generation of free-radicals from hydrogen-peroxide and lipidhydroperoxides in the presence of Cr(III). Archives of Biochemistry and Biophysics. 1993;302:294–299. [PubMed: 8385901]
Sinha R, Peters U, Cross AJ, Kulldorff M, Weissfeld JL, Pinsky PF, Rothman N, Hayes RB. Meat,meat cooking methods and preservation, and risk for colorectal adenoma. Cancer Research. 2005;65:8034–8041. [PubMed: 16140978]
Sitzmann B, Kendall M, Watt J, Williams I. Characterisation of airborne particles in London bycomputer-controlled scanning electron microscopy. Science of the Total Environment. 1999;241:63–73.
Stohs SJ, Bagchi D. Oxidative mechanisms in the toxicity of metal-ions. Free Radical Biology andMedicine. 1995; 18:321–336. [PubMed: 7744317]
Stroh A. Determination of Pb and Cd in whole-blood using isotope-dilution ICP-MS. AtomicSpectroscopy. 1993; 14:141–143.
Turekian KK, Wedepohl KH. Distribution of the elements in some major units of the Earth’s crust.Geological Society of America Bulletin. 1961; 72:175–191.
Violante FS, Barbieri A, Curti S, Sanguinetti G, Graziosi F, Mattioli S. Urban atmospheric pollution:personal exposure versus fixed monitoring station measurements. Chemosphere. 2006; 64:1722–1729. [PubMed: 16481025]
Voitkun V, Zhitkovich A, Costa M. Cr(III)-mediated crosslinks of glutathione or amino acids to theDNA phosphate backbone are mutagenic in human cells. Nucleic Acids Research. 1998; 26:2024–2030. [PubMed: 9518499]
WHO. Air Quality Guidelines: Global Update 2005. Germany: World Health Organization; 2006.Zhitkovich, A. Chromium: exposure, toxicity, and biomonitoring approaches. In: Wilson, SH.; Suk,
WA., editors. Biomarkers of Environmentally Associated Disease: Technologies, Concepts, andPerspectives. Boca Raton: Lewis Publishers; 2002. p. 582([8] of plates ill. (some col.) 24 cm)
Zhitkovich A, Costa M. A simple, sensitive assay to detect DNA-protein cross-links in intact-cells andin vivo. Carcinogenesis. 1992; 13:1485–1489. [PubMed: 1499101]
Zhitkovich A, Lukanova A, Popov T, Taioli E, Cohen H, Costa M, Toniolo P. DNA-protein crosslinksin peripheral lymphocytes of individuals exposed to hexavalent chromium compounds.Biomarkers. 1996; 1:86–93.
Grass et al. Page 15
Environ Res. Author manuscript; available in PMC 2011 August 14.
NIH
-PA Author Manuscript
NIH
-PA Author Manuscript
NIH
-PA Author Manuscript
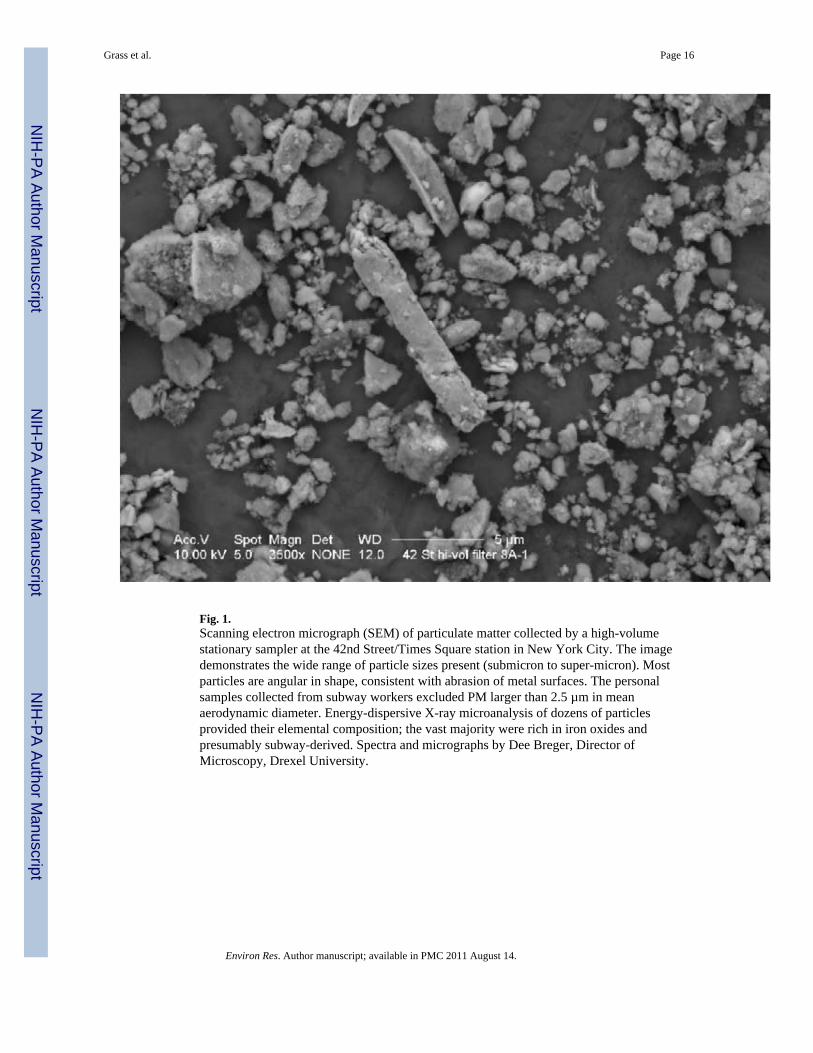
Fig. 1.Scanning electron micrograph (SEM) of particulate matter collected by a high-volumestationary sampler at the 42nd Street/Times Square station in New York City. The imagedemonstrates the wide range of particle sizes present (submicron to super-micron). Mostparticles are angular in shape, consistent with abrasion of metal surfaces. The personalsamples collected from subway workers excluded PM larger than 2.5 µm in meanaerodynamic diameter. Energy-dispersive X-ray microanalysis of dozens of particlesprovided their elemental composition; the vast majority were rich in iron oxides andpresumably subway-derived. Spectra and micrographs by Dee Breger, Director ofMicroscopy, Drexel University.
Grass et al. Page 16
Environ Res. Author manuscript; available in PMC 2011 August 14.
NIH
-PA Author Manuscript
NIH
-PA Author Manuscript
NIH
-PA Author Manuscript
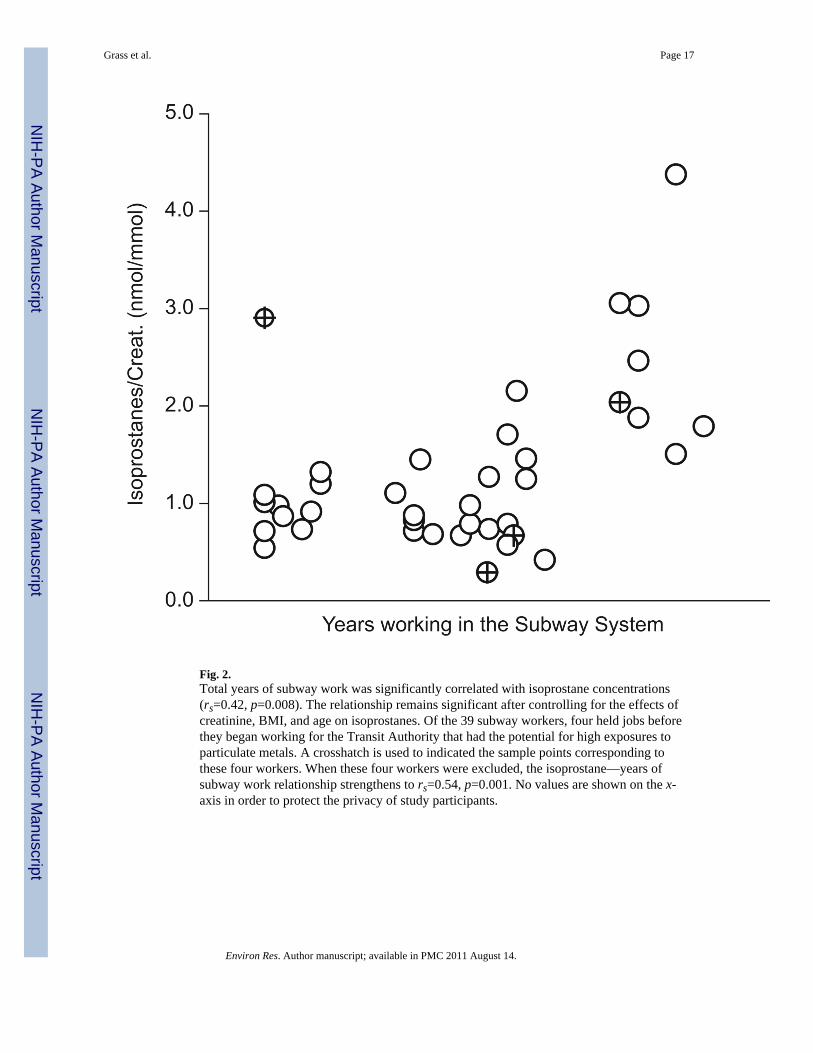
Fig. 2.Total years of subway work was significantly correlated with isoprostane concentrations(rs=0.42, p=0.008). The relationship remains significant after controlling for the effects ofcreatinine, BMI, and age on isoprostanes. Of the 39 subway workers, four held jobs beforethey began working for the Transit Authority that had the potential for high exposures toparticulate metals. A crosshatch is used to indicated the sample points corresponding tothese four workers. When these four workers were excluded, the isoprostane—years ofsubway work relationship strengthens to rs=0.54, p=0.001. No values are shown on the x-axis in order to protect the privacy of study participants.
Grass et al. Page 17
Environ Res. Author manuscript; available in PMC 2011 August 14.
NIH
-PA Author Manuscript
NIH
-PA Author Manuscript
NIH
-PA Author Manuscript
Fig. 3.The correlation between DNA–protein crosslinks and chromium in plasma is significant forall study subjects (rs=0.34, p=0.003). Since Spearman’s coefficient of rank correlation, rs, isnot based on observed values but on rank, the subway worker outlier does not have adisproportionate effect on the significance of the correlation. The DPC–plasma Crrelationship remains significant when the point is removed (rs=0.32, p=0.007).
Grass et al. Page 18
Environ Res. Author manuscript; available in PMC 2011 August 14.
NIH
-PA Author Manuscript
NIH
-PA Author Manuscript
NIH
-PA Author Manuscript
NIH
-PA Author Manuscript
NIH
-PA Author Manuscript
NIH
-PA Author Manuscript
Grass et al. Page 19
Tabl
e 1
Com
paris
on o
f par
ticul
ate
mat
ter (
PM) c
once
ntra
tions
in su
bway
syst
ems w
ith P
M c
once
ntra
tions
in o
utdo
or a
ir sa
mpl
es.
City
Yea
rop
ened
Subw
ayPM
2.5
(µg/
m3 )
Subw
ay sa
mpl
en
Out
door
sPM
2.5
(µg/
m3 )
Out
door
s sam
ple
nSo
urce
Subw
ay o
bser
vatio
npe
riod
Lond
on
(sum
mer
)18
6324
744
ride
rsa
34.5
40 c
yclis
tsA
dam
s et a
l. (2
001)
Dur
atio
n of
com
mut
e
Lond
on (w
inte
r)18
6315
712
ride
rsa
23.5
56 c
yclis
tsA
dam
s et a
l. (2
001)
Dur
atio
n of
com
mut
e
Lond
on18
6330
0; 3
10;
420
3 fix
edb
~30
2 fix
edSe
aton
et a
l. (2
005)
7 am
–5 p
m 3
day
s
New
Yor
k19
0462
1 rid
erc 2
sam
ples
13 ±
437
fixe
dC
hillr
ud e
t al.
(200
4)8
h sa
mpl
es
New
Yor
k19
0456
± 9
533
wor
kers
c13
± 4
37 fi
xed
This
stud
y8–
11 h
wor
k sh
ifts 1
–3 d
ays
Stoc
khol
m19
5025
81
fixed
b23
1 fix
edJo
hans
son
and
Joha
nsso
n (2
003)
7 am
–7 p
m 2
wee
ks
Toro
nto
1954
159
6 fix
edb
1518
5 pe
rson
alC
rum
p (2
000)
8 h
sam
ples
Mex
ico
City
1969
6118
ride
rsa
71; 6
816
bus
es, 2
8 m
inib
uses
Gom
ez-P
eral
es e
t al.
(200
4)D
urat
ion
of c
omm
ute
Hel
sink
i19
8247
; 60
2 fix
edb
10, 1
72
fixed
Aar
nio
et a
l. (2
005)
Two
wee
ks
Gua
ngzh
ou19
9944
± 1
114
ride
rsa
106;
145
8 ta
xis,
15 b
uses
Cha
n et
al.
(200
2)D
urat
ion
of c
omm
ute
Rom
e19
55PM
10: 4
075
fixed
bPM
10: 1
014
fixed
Rip
anuc
ci e
t al.
(200
6)8
am–6
pm
1 d
ay
Prag
ue19
74PM
10: 1
031
rider
a 10
8sa
mpl
esPM
10: 7
41
pers
on 1
08sa
mpl
esB
rani
s (20
06)
Dur
atio
n of
com
mut
e
Dat
a ar
e pr
esen
ted
as a
rithm
etic
mea
ns ±
arit
hmet
ic st
anda
rd d
evia
tion
whe
n th
is in
form
atio
n w
as a
vaila
ble.
Rai
l sys
tem
s are
show
n ac
cord
ing
to th
e ag
e of
the
subw
ay sy
stem
from
old
est t
o ne
wes
t.
a Rid
ers—
thes
e st
udie
s’ e
stim
ates
of u
nder
grou
nd P
M2.
5 ar
e re
pres
enta
tive
of th
e tim
e sp
ent i
n su
bway
stat
ions
and
on
subw
ay tr
ains
by
inve
stig
ator
s or s
tudy
subj
ects
who
wor
e pe
rson
al a
ir sa
mpl
ers.
They
are
not
repr
esen
tativ
e of
24
h in
tegr
ated
exp
osur
e.
b Fixe
d—th
ese
stud
ies’
est
imat
es o
f und
ergr
ound
PM
2.5
are
base
d on
stat
iona
ry sa
mpl
es ta
ken
on o
r nea
r the
stat
ion
plat
form
c Excl
udes
six
wor
kers
who
wor
ked
at a
n ab
oveg
roun
d m
aint
enan
ce sh
op.
Environ Res. Author manuscript; available in PMC 2011 August 14.
NIH
-PA Author Manuscript
NIH
-PA Author Manuscript
NIH
-PA Author Manuscript
Grass et al. Page 20
Table 2
Biomarkers measured in urine, plasma and whole blood.
Biomarker Measured in: As indicator of:
Mn urine, plasma, whole blood Mn exposure
Cr urine, plasma, whole blood Cr exposure
Pb urine, plasma, whole blood Pb exposure
BPDE urine exposure to PAHs
Creatinine urine hydration status
Isoprostanes urine lipid oxidation
8-oxodG urine DNA oxidation
Plasma carbonyls plasma protein oxidation
DNA–protein crosslinks lymphocytes DNA damage
Abbreviations: 8-oxodG, 8-oxodeoxyguanosine; BPDE, benzo(a)pyrene diol epoxide; Cr, chromium; DNA, deoxyribonucleic acid; isoprostanes,15-F2t–isoprostane; Mn, manganese; PAHs, polycyclic aromatic hydrocarbons; Pb, lead.
Environ Res. Author manuscript; available in PMC 2011 August 14.
NIH
-PA Author Manuscript
NIH
-PA Author Manuscript
NIH
-PA Author Manuscript
Grass et al. Page 21
Tabl
e 3
Med
ian
conc
entra
tions
of P
M2.
5, Fe
, Cr,
and
Mn
in su
bway
wor
ker p
erso
nal s
ampl
es c
ompa
red
to a
mbi
ent a
nd st
anda
rd c
once
ntra
tions
.
nPM
2.5(
µg/m
3 )Fe
(µg/
m3 )
Mn
(µg/
m3 )
Cr
(µg/
m3 )
Fe (a
s a %
of
PM2.
5 by
mas
s)M
edia
nM
edia
n5t
h–95
thpe
rcen
tile
Med
ian
5th–
95th
perc
entil
eM
edia
n5t
h–95
thpe
rcen
tile
Med
ian
5th–
95th
perc
entil
e
OSH
A 8
h PE
Lana
5000
bna
5000
cna
20,0
00d
na50
00e
nana
All
subw
ay w
orke
rs39
278–
112
71–
3475
19–4
0727
6–22
227
Trac
k m
aint
enan
ce6
6138
–439
1610
–156
153
97–1
422
4933
–332
28
Trac
k co
nstru
ctio
n6
5340
–80
169–
2012
183
–160
5735
–86
25
Ref
use
train
327
27–4
011
8–13
103
76–1
1837
25–4
034
Con
stru
ctio
n fla
gger
s6
2117
–70
75–
2266
52–2
3121
13–7
932
Ope
rato
rs a
nd c
ondu
ctor
s6
157–
186
3–7
6436
–72
1710
–19
42
Ove
rhau
l sho
p6
208–
753
0.4–
2262
22–2
8325
6–17
412
Stat
ion
clea
ners
619
8–27
31–
630
12–5
811
4–27
16
Urb
an o
utdo
or sa
mpl
esf
3613
7–21
0.1
0.04
–0.2
21–
40.
30.
1–1
1
Subu
rban
out
door
sa
mpl
esg
209
5–16
0.07
0.03
–0.1
21
1–4
0.3
0.1–
1.1
1
na—
not a
pplic
able
.
a OSH
A 8
h p
erm
isss
ible
exp
osur
e lim
its a
re fo
r res
pira
ble
parti
cula
te fr
actio
n ~P
M4,
and
so a
re n
ot d
irect
ly c
ompa
rabl
e to
per
sona
l sam
ples
whi
ch a
re a
ll fo
r the
PM
2.5
frac
tion.
b For p
artic
ulat
es n
ot o
ther
wis
e sp
ecifi
ed.
c For F
e as
oxi
de fu
mes
.
d OSH
A T
LV-T
WA
.
e For C
r(V
I), n
ot to
tal C
r.
f Urb
an o
utdo
or sa
mpl
es w
ere
colle
cted
ove
r a p
erio
d of
8 w
eeks
out
side
the
resi
denc
es o
f hig
h sc
hool
stud
ents
who
par
ticip
ated
in a
n ea
rlier
stud
y (C
hillr
ud e
t al.,
200
4). E
ach
of th
e 36
sam
ples
inte
grat
es48
h o
f mon
itorin
g. P
artic
ipan
ts li
ved
in M
anha
ttan,
Bro
okly
n, Q
ueen
s, an
d th
e B
ronx
. Res
ults
for u
rban
out
door
air
sam
ples
are
giv
en a
s an
exam
ple
of o
utdo
or a
ir qu
ality
in N
ew Y
ork
City
.
g Subu
rban
out
door
sam
ples
wer
e co
llect
ed o
ver a
per
iod
of 8
wee
ks a
s par
t of a
n ea
rlier
stud
y (C
hillr
ud e
t al.,
200
4). T
he sa
mpl
es w
ere
colle
cted
out
side
the
wor
kpla
ce (i
n Pa
lisad
es, N
Y) o
f the
off
ice
wor
kers
use
d as
a c
ontro
l gro
up in
this
stud
y. E
ach
of th
e 20
sam
ples
inte
grat
es 4
8 h
of m
onito
ring.
Environ Res. Author manuscript; available in PMC 2011 August 14.
NIH
-PA Author Manuscript
NIH
-PA Author Manuscript
NIH
-PA Author Manuscript
Grass et al. Page 22
Tabl
e 4
Dem
ogra
phic
dat
a fo
r sub
way
wor
kers
, bus
driv
ers a
nd o
ffic
e w
orke
rs.
Subw
ay (n
=39)
Bus
dri
vers
(n=1
1)O
ffice
wor
kers
(n=2
5)
Med
ian
IQR
Med
ian
IQR
Med
ian
IQR
Age
(yea
rs)
4838
–53
4541
–48
4437
–51
Yea
rs in
cur
rent
job
title
104–
149
4–20
62–
14
Hei
ght (
inch
es)
7068
–71
6867
–69
7068
–73
Wei
ght (
lbs)
200
180–
224
205
187–
240
190
165–
210
BM
I29
27–3
331
28–3
426
**24
–28
% w
ho li
ve in
NY
C72
na91
na12
***
na
% fo
rmer
smok
ers
36na
10na
17na
% c
urre
nt sm
oker
s3
na0
na0
na
% li
ve w
ith sm
oker
13na
10na
0na
IQR
—in
ter-
quar
tile
rang
e, 2
5th–
75th
per
cent
ile.
na—
perc
entil
es w
ere
not c
alcu
late
d fo
r bin
ary
surv
ey re
sults
.
Sign
ifica
nt d
iffer
ence
bet
wee
n su
bway
wor
ker a
nd th
is g
roup
usi
ng W
ilcox
on’s
rank
sum
test
for e
qual
ity o
f med
ians
.
**p
< 0.
01
*** p
< 0.
001
Environ Res. Author manuscript; available in PMC 2011 August 14.
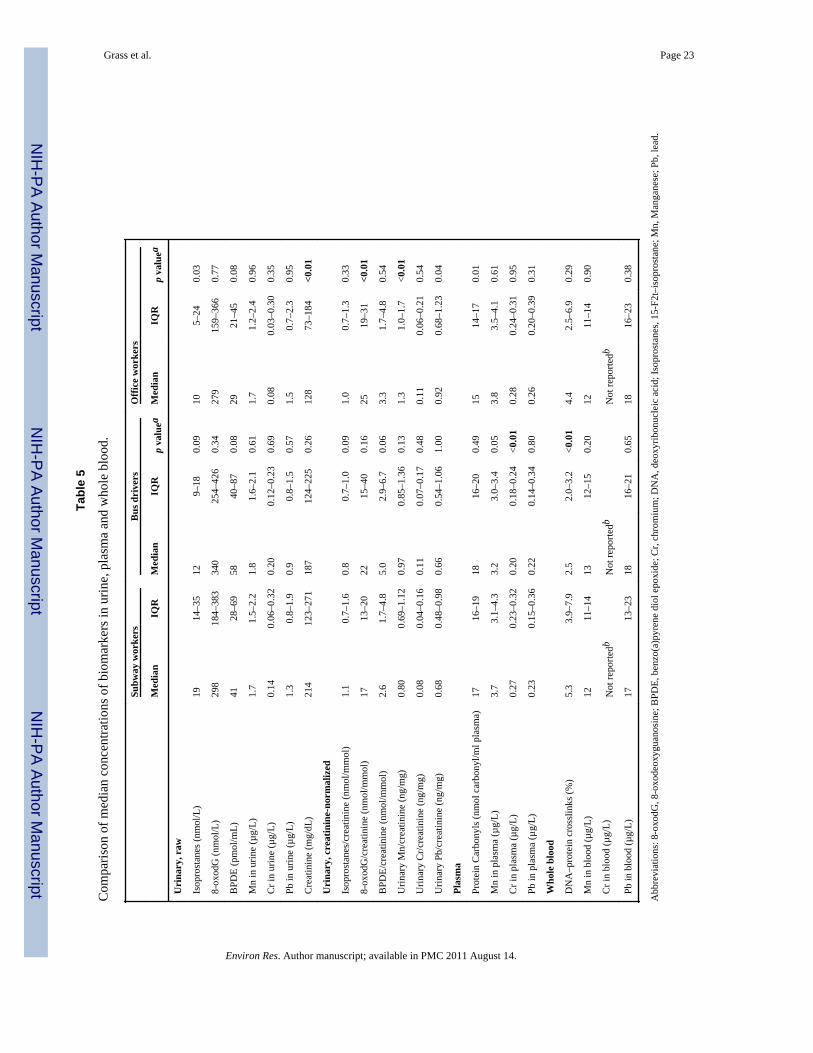
NIH
-PA Author Manuscript
NIH
-PA Author Manuscript
NIH
-PA Author Manuscript
Grass et al. Page 23
Tabl
e 5
Com
paris
on o
f med
ian
conc
entra
tions
of b
iom
arke
rs in
urin
e, p
lasm
a an
d w
hole
blo
od.
Subw
ay w
orke
rsB
us d
rive
rsO
ffice
wor
kers
Med
ian
IQR
Med
ian
IQR
p va
luea
Med
ian
IQR
p va
luea
Uri
nary
, raw
Isop
rost
anes
(nm
ol/L
)19
14–3
512
9–18
0.09
105–
240.
03
8-ox
odG
(nm
ol/L
)29
818
4–38
334
025
4–42
60.
3427
915
9–36
60.
77
BPD
E (p
mol
/mL)
4128
–69
5840
–87
0.08
2921
–45
0.08
Mn
in u
rine
(µg/
L)1.
71.
5–2.
21.
81.
6–2.
10.
611.
71.
2–2.
40.
96
Cr i
n ur
ine
(µg/
L)0.
140.
06–0
.32
0.20
0.12
–0.2
30.
690.
080.
03–0
.30
0.35
Pb in
urin
e (µ
g/L)
1.3
0.8–
1.9
0.9
0.8–
1.5
0.57
1.5
0.7–
2.3
0.95
Cre
atin
ine
(mg/
dL)
214
123–
271
187
124–
225
0.26
128
73–1
84<0
.01
Uri
nary
, cre
atin
ine-
norm
aliz
ed
Isop
rost
anes
/cre
atin
ine
(nm
ol/m
mol
)1.
10.
7–1.
60.
80.
7–1.
00.
091.
00.
7–1.
30.
33
8-ox
odG
/cre
atin
ine
(nm
ol/m
mol
)17
13–2
022
15–4
00.
1625
19–3
1<0
.01
BPD
E/cr
eatin
ine
(nm
ol/m
mol
)2.
61.
7–4.
85.
02.
9–6.
70.
063.
31.
7–4.
80.
54
Urin
ary
Mn/
crea
tinin
e (n
g/m
g)0.
800.
69–1
.12
0.97
0.85
–1.3
60.
131.
31.
0–1.
7<0
.01
Urin
ary
Cr/c
reat
inin
e (n
g/m
g)0.
080.
04–0
.16
0.11
0.07
–0.1
70.
480.
110.
06–0
.21
0.54
Urin
ary
Pb/c
reat
inin
e (n
g/m
g)0.
680.
48–0
.98
0.66
0.54
–1.0
61.
000.
920.
68–1
.23
0.04
Plas
ma
Prot
ein
Car
bony
ls (n
mol
car
bony
l/ml p
lasm
a)17
16–1
918
16–2
00.
4915
14–1
70.
01
Mn
in p
lasm
a (µ
g/L)
3.7
3.1–
4.3
3.2
3.0–
3.4
0.05
3.8
3.5–
4.1
0.61
Cr i
n pl
asm
a (µ
g/L)
0.27
0.23
–0.3
20.
200.
18–0
.24
<0.0
10.
280.
24–0
.31
0.95
Pb in
pla
sma
(µg/
L)0.
230.
15–0
.36
0.22
0.14
–0.3
40.
800.
260.
20–0
.39
0.31
Who
le b
lood
DN
A–p
rote
in c
ross
links
(%)
5.3
3.9–
7.9
2.5
2.0–
3.2
<0.0
14.
42.
5–6.
90.
29
Mn
in b
lood
(µg/
L)12
11–1
413
12–1
50.
2012
11–1
40.
90
Cr i
n bl
ood
(µg/
L)N
ot re
porte
dbN
ot re
porte
dbN
ot re
porte
db
Pb in
blo
od (µ
g/L)
1713
–23
1816
–21
0.65
1816
–23
0.38
Abb
revi
atio
ns: 8
-oxo
dG, 8
-oxo
deox
ygua
nosi
ne; B
PDE,
ben
zo(a
)pyr
ene
diol
epo
xide
; Cr,
chro
miu
m; D
NA
, deo
xyrib
onuc
leic
aci
d; Is
opro
stan
es, 1
5-F2
t–is
opro
stan
e; M
n, M
anga
nese
; Pb,
lead
.
Environ Res. Author manuscript; available in PMC 2011 August 14.
NIH
-PA Author Manuscript
NIH
-PA Author Manuscript
NIH
-PA Author Manuscript
Grass et al. Page 24a p
valu
es—
sign
ifica
nce
leve
ls a
re b
ased
on
com
paris
ons b
etw
een
the
cont
rol g
roup
(eith
er b
us d
river
s or o
ffic
e w
orke
rs) a
nd th
e ex
pose
d gr
oup
(sub
way
wor
kers
). Si
gnifi
canc
e le
vels
are
cal
cula
ted
base
don
Wilc
oxon
’s ra
nk su
m te
st fo
r equ
ality
of m
eans
and
are
indi
cate
d as
follo
ws.
Res
ults
for b
iom
arke
rs w
ith a
sign
ifica
nt d
iffer
ence
bet
wee
n su
bway
wor
kers
and
the
bus d
river
gro
up o
r sub
way
wor
kers
and
the
offic
e w
orke
r gro
up, a
re sh
own
in b
old.
b Not
repo
rted—
chro
miu
m in
blo
od re
sults
are
not
repo
rted
beca
use
conc
entra
tions
wer
e fo
und
to b
e in
vers
ely
prop
ortio
nal t
o sa
mpl
e vo
lum
e in
dica
ting
that
the
sodi
um h
epar
in a
ntic
oagu
lant
may
hav
eco
ntam
inat
ed th
e sa
mpl
es w
ith d
etec
tabl
e am
ount
s of c
hrom
ium
.
Environ Res. Author manuscript; available in PMC 2011 August 14.
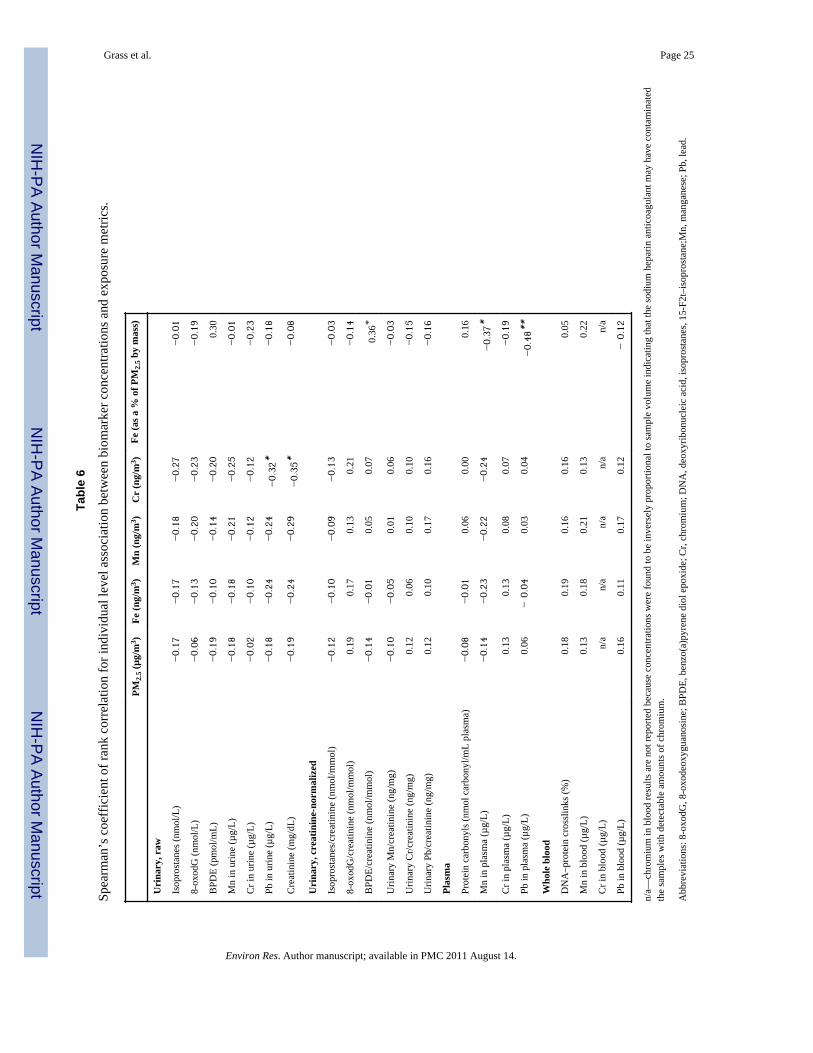
NIH
-PA Author Manuscript
NIH
-PA Author Manuscript
NIH
-PA Author Manuscript
Grass et al. Page 25
Tabl
e 6
Spea
rman
’s c
oeff
icie
nt o
f ran
k co
rrel
atio
n fo
r ind
ivid
ual l
evel
ass
ocia
tion
betw
een
biom
arke
r con
cent
ratio
ns a
nd e
xpos
ure
met
rics.
PM2.
5 (µg
/m3 )
Fe (n
g/m
3 )M
n (n
g/m
3 )C
r (n
g/m
3 )Fe
(as a
% o
f PM
2.5 b
y m
ass)
Uri
nary
, raw
Isop
rost
anes
(nm
ol/L
)−0.
17−0.
17−0.
18−0.
27−0.
01
8-ox
odG
(nm
ol/L
)−0.
06−0.
13−0.
20−0.
23−0.
19
BPD
E (p
mol
/mL)
−0.
19−0.
10−0.
14−0.
200.
30
Mn
in u
rine
(µg/
L)−0.
18−0.
18−0.
21−0.
25−0.
01
Cr i
n ur
ine
(µg/
L)−0.
02−0.
10−0.
12−0.
12−0.
23
Pb in
urin
e (µ
g/L)
−0.
18−0.
24−0.
24−0.
32*
−0.
18
Cre
atin
ine
(mg/
dL)
−0.
19−0.
24−0.
29−0.
35*
−0.
08
Uri
nary
, cre
atin
ine-
norm
aliz
ed
Isop
rost
anes
/cre
atin
ine
(nm
ol/m
mol
)−0.
12−0.
10−0.
09−0.
13−0.
03
8-ox
odG
/cre
atin
ine
(nm
ol/m
mol
)0.
190.
170.
130.
21−0.
14
BPD
E/cr
eatin
ine
(nm
ol/m
mol
)−0.
14−0.
010.
050.
070.
36*
Urin
ary
Mn/
crea
tinin
e (n
g/m
g)−0.
10−0.
050.
010.
06−0.
03
Urin
ary
Cr/c
reat
inin
e (n
g/m
g)0.
120.
060.
100.
10−0.
15
Urin
ary
Pb/c
reat
inin
e (n
g/m
g)0.
120.
100.
170.
16−0.
16
Plas
ma
Prot
ein
carb
onyl
s (nm
ol c
arbo
nyl/m
L pl
asm
a)−0.
08−0.
010.
060.
000.
16
Mn
in p
lasm
a (µ
g/L)
−0.
14−0.
23−0.
22−0.
24−0.
37*
Cr i
n pl
asm
a (µ
g/L)
0.13
0.13
0.08
0.07
−0.
19
Pb in
pla
sma
(µg/
L)0.
06− 0
.04
0.03
0.04
−0.
48**
Who
le b
lood
DN
A–p
rote
in c
ross
links
(%)
0.18
0.19
0.16
0.16
0.05
Mn
in b
lood
(µg/
L)0.
130.
180.
210.
130.
22
Cr i
n bl
ood
(µg/
L)n/
an/
an/
an/
an/
a
Pb in
blo
od (µ
g/L)
0.16
0.11
0.17
0.12
− 0
.12
n/a—
chro
miu
m in
blo
od re
sults
are
not
repo
rted
beca
use
conc
entra
tions
wer
e fo
und
to b
e in
vers
ely
prop
ortio
nal t
o sa
mpl
e vo
lum
e in
dica
ting
that
the
sodi
um h
epar
in a
ntic
oagu
lant
may
hav
e co
ntam
inat
edth
e sa
mpl
es w
ith d
etec
tabl
e am
ount
s of c
hrom
ium
.
Abb
revi
atio
ns: 8
-oxo
dG, 8
-oxo
deox
ygua
nosi
ne; B
PDE,
ben
zo(a
)pyr
ene
diol
epo
xide
; Cr,
chro
miu
m; D
NA
, deo
xyrib
onuc
leic
aci
d, is
opro
stan
es, 1
5-F2
t–is
opro
stan
e;M
n, m
anga
nese
; Pb,
lead
.
Environ Res. Author manuscript; available in PMC 2011 August 14.
NIH
-PA Author Manuscript
NIH
-PA Author Manuscript
NIH
-PA Author Manuscript
Grass et al. Page 26Si
gnifi
cant
cor
rela
tions
bet
wee
n bi
omar
kers
and
exp
osur
e m
etric
s are
indi
cate
d as
follo
ws.
* p <
0.05
**p
< 0.
01
Environ Res. Author manuscript; available in PMC 2011 August 14.