Natural Ventilation for the Prevention of Airborne Contagion
9
Natural Ventilation for the Prevention of Airborne Contagion A. Roderick Escombe 1,2,3* , Clarissa C. Oeser 3 , Robert H. Gilman 3,4 , Marcos Navincopa 5 , Eduardo Ticona 5 , William Pan 4 , Carlos Martı ´nez 5 , Jesus Chacaltana 6 , Richard Rodrı ´guez 7 , David A. J. Moore 1,2,3 , Jon S. Friedland 1,2 , Carlton A. Evans 1,2,3,4 1 Department of Infectious Diseases & Immunity, Imperial College London, London, United Kingdom, 2 Wellcome Trust Centre for Clinical Tropical Medicine, Imperial College London, London, United Kingdom, 3 Asociacio ´n Bene ´fica PRISMA, Lima, Peru ´, 4 Department of International Health, Johns Hopkins Bloomberg School of Public Health, Baltimore, Maryland, United States of America, 5 Hospital Nacional Dos de Mayo, Lima, Peru ´, 6 Hospital Nacional Daniel Carrio ´ n, Lima, Peru ´, 7 Hospital de Apoyo Maria Auxiliadora, Lima, Peru ´ Funding: ARE was initially funded by the Sir Halley Stewart Trust, United Kingdom. ARE, DAJM, CAE, JSF, and RHG are funded by the Wellcome Trust, UK; and ARE, DAJM, and CAE have Wellcome Trust Clinical Tropical Medicine Research Fellowships. RHG is supported by USAID award #HRN-5986-A-00-6006- 00, GHS-A-00-03-00019–00, and Global Research Activity Cooperative Agreement, National Institutes of Health/National Institute of Allergy and Infectious Diseases (T35A107646). These funding agencies had no involvement in the conduct or publication of this research. The funders had no role in study design, data collection and analysis, decision to publish, or preparation of the manuscript. Competing Interests: The authors have declared that no competing interests exist. Academic Editor: Peter Wilson, University College London, United Kingdom Citation: Escombe AR, Oeser CC, Gilman RH, Navincopa M, Ticona E, et al. (2007) Natural ventilation for the prevention of airborne contagion. PLoS Med 4(2): e68. doi:10.1371/journal.pmed.0040068 Received: May 17, 2006 Accepted: January 4, 2007 Published: February 27, 2007 Copyright: Ó 2007 Escombe et al. This is an open-access article distributed under the terms of the Creative Commons Attribution License, which permits unrestricted use, distribution, and reproduction in any medium, provided the original author and source are credited. Abbreviations: ACH, air changes per hour; TB, tuberculosis * To whom correspondence should be addressed. E-mail: rod.escombe@ imperial.ac.uk ABSTRACT Background Institutional transmission of airborne infections such as tuberculosis (TB) is an important public health problem, especially in resource-limited settings where protective measures such as negative-pressure isolation rooms are difficult to implement. Natural ventilation may offer a low-cost alternative. Our objective was to investigate the rates, determinants, and effects of natural ventilation in health care settings. Methods and Findings The study was carried out in eight hospitals in Lima, Peru; five were hospitals of ‘‘old- fashioned’’ design built pre-1950, and three of ‘‘modern’’ design, built 1970–1990. In these hospitals 70 naturally ventilated clinical rooms where infectious patients are likely to be encountered were studied. These included respiratory isolation rooms, TB wards, respiratory wards, general medical wards, outpatient consulting rooms, waiting rooms, and emergency departments. These rooms were compared with 12 mechanically ventilated negative-pressure respiratory isolation rooms built post-2000. Ventilation was measured using a carbon dioxide tracer gas technique in 368 experiments. Architectural and environmental variables were measured. For each experiment, infection risk was estimated for TB exposure using the Wells- Riley model of airborne infection. We found that opening windows and doors provided median ventilation of 28 air changes/hour (ACH), more than double that of mechanically ventilated negative-pressure rooms ventilated at the 12 ACH recommended for high-risk areas, and 18 times that with windows and doors closed (p , 0.001). Facilities built more than 50 years ago, characterised by large windows and high ceilings, had greater ventilation than modern naturally ventilated rooms (40 versus 17 ACH; p , 0.001). Even within the lowest quartile of wind speeds, natural ventilation exceeded mechanical (p , 0.001). The Wells-Riley airborne infection model predicted that in mechanically ventilated rooms 39% of susceptible individuals would become infected following 24 h of exposure to untreated TB patients of infectiousness characterised in a well-documented outbreak. This infection rate compared with 33% in modern and 11% in pre-1950 naturally ventilated facilities with windows and doors open. Conclusions Opening windows and doors maximises natural ventilation so that the risk of airborne contagion is much lower than with costly, maintenance-requiring mechanical ventilation systems. Old-fashioned clinical areas with high ceilings and large windows provide greatest protection. Natural ventilation costs little and is maintenance free, and is particularly suited to limited-resource settings and tropical climates, where the burden of TB and institutional TB transmission is highest. In settings where respiratory isolation is difficult and climate permits, windows and doors should be opened to reduce the risk of airborne contagion. The Editors’ Summary of this article follows the references. PLoS Medicine | www.plosmedicine.org February 2007 | Volume 4 | Issue 2 | e68 0309 P L o S MEDICINE
Transcript of Natural Ventilation for the Prevention of Airborne Contagion

Natural Ventilation for the Prevention ofAirborne ContagionA. Roderick Escombe
1,2,3*, Clarissa C. Oeser
3, Robert H. Gilman
3,4, Marcos Navincopa
5, Eduardo Ticona
5, William Pan
4,
Carlos Martınez5
, Jesus Chacaltana6
, Richard Rodrıguez7
, David A. J. Moore1,2,3
, Jon S. Friedland1,2
,
Carlton A. Evans1,2,3,4
1 Department of Infectious Diseases & Immunity, Imperial College London, London, United Kingdom, 2 Wellcome Trust Centre for Clinical Tropical Medicine, Imperial College
London, London, United Kingdom, 3 Asociacion Benefica PRISMA, Lima, Peru, 4 Department of International Health, Johns Hopkins Bloomberg School of Public Health,
Baltimore, Maryland, United States of America, 5 Hospital Nacional Dos de Mayo, Lima, Peru, 6 Hospital Nacional Daniel Carrion, Lima, Peru, 7 Hospital de Apoyo Maria
Auxiliadora, Lima, Peru
Funding: ARE was initially funded bythe Sir Halley Stewart Trust, UnitedKingdom. ARE, DAJM, CAE, JSF, andRHG are funded by the WellcomeTrust, UK; and ARE, DAJM, and CAEhave Wellcome Trust ClinicalTropical Medicine ResearchFellowships. RHG is supported byUSAID award #HRN-5986-A-00-6006-00, GHS-A-00-03-00019–00, andGlobal Research Activity CooperativeAgreement, National Institutes ofHealth/National Institute of Allergyand Infectious Diseases(T35A107646). These fundingagencies had no involvement in theconduct or publication of thisresearch. The funders had no role instudy design, data collection andanalysis, decision to publish, orpreparation of the manuscript.
Competing Interests: The authorshave declared that no competinginterests exist.
Academic Editor: Peter Wilson,University College London, UnitedKingdom
Citation: Escombe AR, Oeser CC,Gilman RH, Navincopa M, Ticona E,et al. (2007) Natural ventilation forthe prevention of airbornecontagion. PLoS Med 4(2): e68.doi:10.1371/journal.pmed.0040068
Received: May 17, 2006Accepted: January 4, 2007Published: February 27, 2007
Copyright: � 2007 Escombe et al.This is an open-access articledistributed under the terms of theCreative Commons AttributionLicense, which permits unrestricteduse, distribution, and reproductionin any medium, provided theoriginal author and source arecredited.
Abbreviations: ACH, air changesper hour; TB, tuberculosis
* To whom correspondence shouldbe addressed. E-mail: [email protected]
A B S T R A C T
Background
Institutional transmission of airborne infections such as tuberculosis (TB) is an importantpublic health problem, especially in resource-limited settings where protective measures suchas negative-pressure isolation rooms are difficult to implement. Natural ventilation may offer alow-cost alternative. Our objective was to investigate the rates, determinants, and effects ofnatural ventilation in health care settings.
Methods and Findings
The study was carried out in eight hospitals in Lima, Peru; five were hospitals of ‘‘old-fashioned’’ design built pre-1950, and three of ‘‘modern’’ design, built 1970–1990. In thesehospitals 70 naturally ventilated clinical rooms where infectious patients are likely to beencountered were studied. These included respiratory isolation rooms, TB wards, respiratorywards, general medical wards, outpatient consulting rooms, waiting rooms, and emergencydepartments. These rooms were compared with 12 mechanically ventilated negative-pressurerespiratory isolation rooms built post-2000. Ventilation was measured using a carbon dioxidetracer gas technique in 368 experiments. Architectural and environmental variables weremeasured. For each experiment, infection risk was estimated for TB exposure using the Wells-Riley model of airborne infection. We found that opening windows and doors provided medianventilation of 28 air changes/hour (ACH), more than double that of mechanically ventilatednegative-pressure rooms ventilated at the 12 ACH recommended for high-risk areas, and 18times that with windows and doors closed (p , 0.001). Facilities built more than 50 years ago,characterised by large windows and high ceilings, had greater ventilation than modernnaturally ventilated rooms (40 versus 17 ACH; p , 0.001). Even within the lowest quartile ofwind speeds, natural ventilation exceeded mechanical (p , 0.001). The Wells-Riley airborneinfection model predicted that in mechanically ventilated rooms 39% of susceptible individualswould become infected following 24 h of exposure to untreated TB patients of infectiousnesscharacterised in a well-documented outbreak. This infection rate compared with 33% inmodern and 11% in pre-1950 naturally ventilated facilities with windows and doors open.
Conclusions
Opening windows and doors maximises natural ventilation so that the risk of airbornecontagion is much lower than with costly, maintenance-requiring mechanical ventilationsystems. Old-fashioned clinical areas with high ceilings and large windows provide greatestprotection. Natural ventilation costs little and is maintenance free, and is particularly suited tolimited-resource settings and tropical climates, where the burden of TB and institutional TBtransmission is highest. In settings where respiratory isolation is difficult and climate permits,windows and doors should be opened to reduce the risk of airborne contagion.
The Editors’ Summary of this article follows the references.
PLoS Medicine | www.plosmedicine.org February 2007 | Volume 4 | Issue 2 | e680309
PLoSMEDICINE

Introduction
Infections transmitted by the airborne route are leadingcauses of morbidity and mortality worldwide, with tuber-culosis (TB) alone causing 1.8 million deaths each year [1].Outbreaks occur in prisons [2,3], homeless shelters [4,5], andschools [6], but it is health care facilities that may pose thegreatest risk from airborne contagion by congregatinginfectious and susceptible individuals, resulting in frequentairborne nosocomial transmission [7–11]. This public healthproblem is exacerbated by HIV infection, which increasesboth susceptibility and hospitalisation.
In industrialised nations, optimal care for patients at riskof transmitting airborne infections includes isolation inmechanically ventilated negative-pressure rooms. Staff andvisitors wear particulate respirators, and dilutional ventila-tion with uncontaminated air provides additional protectionfrom disease transmission when patients generate infectiousaerosols by coughing. Ventilation is usually measured in airchanges per hour (ACH), with guidelines recommending 6–12ACH for the control of TB transmission in high-risk healthcare settings [12]. ACH are calculated by dividing absoluteroom ventilation (m3/h) by room volume (m3). However,focusing on ACH alone may be misleading [13], because theabsolute ventilation of a room per occupant is a majordeterminant of contagion in models of airborne infection,such as the Wells-Riley equation [14]. Protection against thetransmission of airborne infection is increased by maximisingabsolute ventilation per occupant, which may be achieved byincreasing the number of ACH or by increasing the roomvolume per occupant for a given rate of air exchange.
Dilutional ventilation with fresh air becomes critical forairborne infection control whenever infectious and suscep-tible people share air space without the use of particulaterespirators, such as in waiting rooms, outpatient clinics,emergency departments, shared wards, and investigationsuites. These spaces are often ventilated at levels well belowthose recommended for the control of TB transmission.Furthermore, most airborne infections such as TB occur inthe developing world where isolation facilities are sparse,effective mechanical ventilation is often too costly to installor maintain, respirator use is infrequent, and wards andwaiting areas are frequently overcrowded. Consequently,transmission of airborne infections to staff, relatives, andother patients is even more common in the developing world,where health care facilities may disseminate the veryinfections they are attempting to control.
In resource-limited settings lacking negative-pressurerespiratory isolation, natural ventilation by opening windowsis recommended for the control of nosocomial TB [15], butthe rates and determinants of natural ventilation in healthcare facilities have not been defined. We therefore measuredventilation in a variety of hospital wards and clinics whereinfectious patients are likely to be encountered. We inves-tigated the determinants of natural ventilation, and usedmathematical modelling to evaluate the effect of naturalventilation on airborne TB transmission.
Methods
SettingVentilation was measured in 368 experiments in 70
naturally ventilated rooms in eight hospitals in Lima, Peru.These included respiratory isolation rooms (n¼13); wards forTB (n ¼ 13), respiratory (n ¼ 9), general medical (n ¼ 8), andHIV/infectious diseases (n ¼ 4) patients; emergency depart-ments (n¼ 8); out-patient consulting rooms (n¼ 6); TB clinics(n ¼ 5); nebuliser rooms (n ¼ 2); one autopsy room; and onerespiratory outpatient waiting room. Five hospitals were builtpre-1950 (‘‘old-fashioned’’) and three were constructed 1970–1990 (‘‘modern,’’ naturally ventilated). Lima’s first mechan-ically ventilated negative-pressure isolation rooms for TB,built in 2000, were also studied (n ¼ 12). The followingarchitectural features and environmental variables wererecorded: area of windows and doors open; presence of openwindows or doors on opposite walls to facilitate the through-flow of air; ceiling height; floor area; elevation of the roomabove ground level; temperature; relative humidity; and windspeed measured at the window using a thermal anemometer(TA35 Airflow Technical Products, http://www.airflow.com).Direction of airflow was assessed using smoke tubes. Ethicalapproval was obtained from Asociacion Benefica PRISMA,Peru.
Measurement of VentilationACH were measured using a tracer gas concentration-
decay technique [16]. With all windows and doors closed,carbon dioxide (CO2) was released and mixed well with roomair using large fans to create a spatially uniform CO2
concentration in the room. Fans were then switched off soas not to interfere with natural ventilation air currents.Depending on room size, after 5–15 min, windows and doorswere opened, either simultaneously or sequentially. CO2
concentrations were measured throughout at 1-min intervalsusing a centrally located infrared gas analyser (Gas-Data Ltd,http://www.gasdata.co.uk).
Calculation of Air Changes per HourACH were calculated for each experiment for each
configuration studied: all windows/doors closed; some butnot all windows/doors open; all windows/doors fully open.ACH were calculated as the gradient of the straight linethrough the natural logarithm of CO2 concentration plottedagainst time in hours [16]. Measurements were consideredfrom peak concentrations after mixing (3,000–10,000 parts/million depending on room size) until concentration fell towithin 200 parts/million of baseline, to allow for CO2
production by room occupants.
Estimated Risk of Airborne InfectionThe risk of airborne TB infection (percent of susceptible
persons infected) was estimated for each ventilation experi-ment using a standard model of airborne infection, the Wells-Riley equation [14]: C ¼ S(1 � e�Iqpt/Q), where: C ¼ number ofnew cases; S¼ number of susceptible individuals exposed; e¼base of natural logarithms; I ¼ number of infectors; q ¼number of infectious ‘‘quanta’’ produced per hour byinfectors; p ¼ pulmonary ventilation rate of susceptibleindividuals (0.6 m3/h [17]); t ¼ exposure time (hours); and Q¼ absolute room ventilation (m3/h). A ‘‘quantum’’ is used todescribe the ‘‘infectious dose’’ for TB, defined as the numberof infectious particles required to cause infection in (1� e�1)of a susceptible population when each susceptible personbreathed, on the average, one quantum of infectious particles
PLoS Medicine | www.plosmedicine.org February 2007 | Volume 4 | Issue 2 | e680310
Natural Ventilation

[18]. Exposure duration was 24 h, and susceptible individualswere assumed to be unprotected by particulate respirators.To allow comparison between isolation and shared rooms, allpatients in each room were assumed to have TB and produce13 infectious quanta per hour (q ¼ 13), the rate determinedfor an untreated TB case in a well-documented outbreak [17].For external validity comparing natural and mechanicalventilation, all mechanically ventilated rooms were assumedto deliver the recommended 12 ACH [12], and absoluteventilation (m3/h) was therefore calculated by multiplyingroom volume (m3) by ACH [12].
Statistical AnalysisAll statistical analyses were performed with Stata v. 8.0
(Statacorp, http://www.stata.com) or SPSS v. 10 (http://www.spss.com). Determinants of ventilation and infection riskwere first assessed by univariate regression. Three separatedependent variables were evaluated. Two were measures ofventilation. These were ACH and absolute ventilation (m3/h;derived by multiplying ACH by room volume). The thirddependent variable was an estimate of TB transmission riskfor exposure to patients producing 13 infectious quanta perhour as detailed in the preceding paragraph. The followingcontinuous independent variables were examined: area ofwindows and/or doors open (m2); ceiling height (m); floor area(m2); wind speed (km/h); elevation of room above the ground(m); temperature (8C); and relative humidity (%). Onecategorical variable was examined: presence or absence ofopen windows and/or doors on opposite walls of a room.Associations with p , 0.15 were included in a multiple linear
regression model [19]. For all regressions dependent variableswere normalised by log10-transformation, and a generalisedestimating equation [20] was used to fit clustering ofobservations within rooms. Modified ‘‘marginal R-square’’values were calculated for these models [21]. The textpresents median values, and graphs are ‘‘box-and-whiskerplots’’ [22].
Results
Effect of Opening Windows and DoorsChanges in CO2 concentration were measured in each
room. A characteristic pattern was observed of slow CO2
concentration-decay with windows and doors closed, whichmarkedly increased on opening windows and doors. Figure 1shows a typical concentration-decay curve, demonstrating therapid increase in carbon dioxide removal by ventilation whenwindows and doors were opened. Such data was obtained forall rooms measured. For all naturally ventilated facilities,opening windows and doors provided median absoluteventilation of 2,477 m3/h, more than six times the 402 m3/hcalculated for mechanically ventilated rooms at 12 ACH, andtwenty times the 121 m3/h with windows/doors closed (all p ,
0.001). The corresponding ACH were 28 versus 12 versus 1.5,respectively, and absolute ventilation per person was 1,053m3/h versus 374 m3/h versus 55 m3/h, respectively (all p ,
0.001).Opening increasing numbers of windows and doors
increased ventilation. This is demonstrated in Figure 2 andTable 1 where absolute ventilation is shown for naturally
Figure 1. Measurement of Ventilation
Illustrative carbon dioxide (CO2) concentration-decay experiment dem-onstrating a rapid rise in CO2 concentration during initial release to apeak of 6,000 parts/million (ppm) followed by slow decay calculated as0.5 ACH until the windows and doors were opened. After windows anddoors were opened, CO2 concentrations fell rapidly, indicating acalculated ventilation rate of 12 ACH. Repeated experiments of thistype defined the effect of architectural and environmental variables onnatural ventilation.doi:10.1371/journal.pmed.0040068.g001
Figure 2. Effect of Window Opening and Wind Speed on Absolute
Ventilation
The effect of partial and complete window opening and wind speed onnatural ventilation is shown, compared with mechanically ventilatednegative-pressure respiratory isolation rooms. The triplet of bars on theleft of the graph represents absolute ventilation measured in naturallyventilated clinical rooms on days when wind speed was within thelowest quartile (i.e., �2 km/h), with windows and doors closed (n¼ 102),partially open (n¼ 167), or fully open (n¼ 86). The triplet of bars in thecentre of the graph represents absolute ventilation at wind speeds in theupper three quartiles combined (i.e., .2 km/h) with windows and doorsclosed (n¼ 266), partially open (n¼ 74) or fully open (n¼ 240). ‘‘Partiallyopen’’ was defined as at least one window and/or door open, but not all.The single bar on the right of the graph represents absolute ventilationin mechanically ventilated negative-pressure respiratory isolation wardsat 12 ACH. The corresponding median ACH for the seven bars from leftto right are: 1.0; 7.6; 20; 1.8; 17; 34; and 12.doi:10.1371/journal.pmed.0040068.g002
PLoS Medicine | www.plosmedicine.org February 2007 | Volume 4 | Issue 2 | e680311
Natural Ventilation
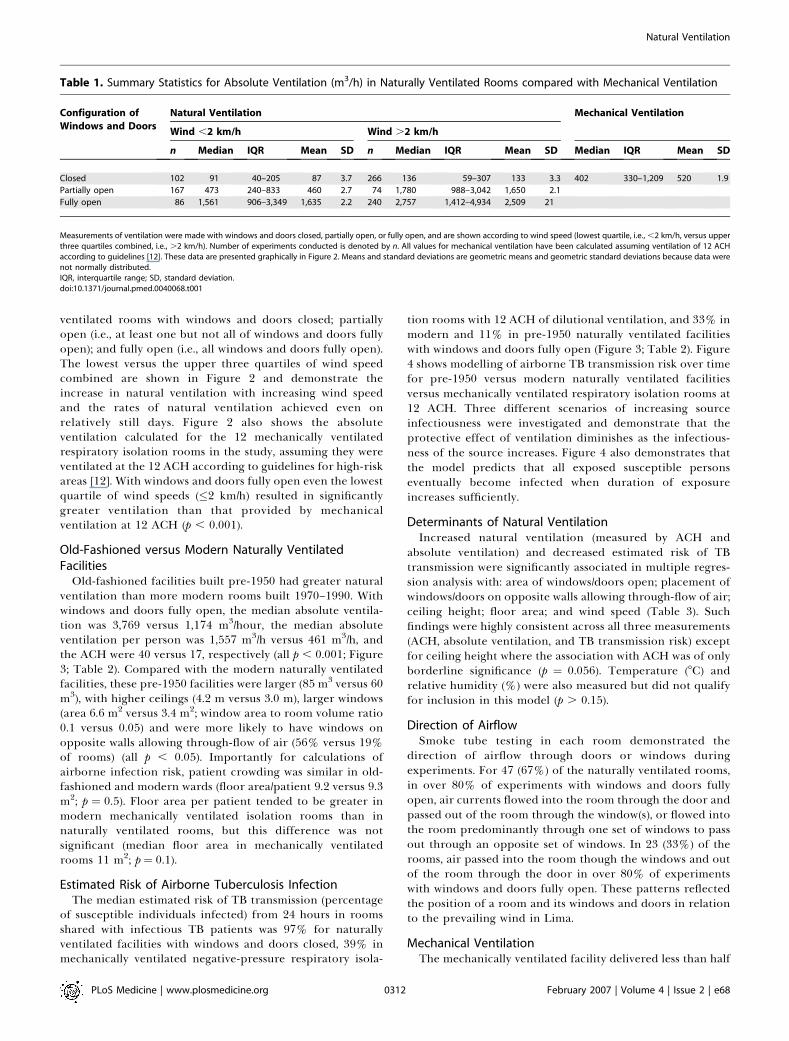
ventilated rooms with windows and doors closed; partiallyopen (i.e., at least one but not all of windows and doors fullyopen); and fully open (i.e., all windows and doors fully open).The lowest versus the upper three quartiles of wind speedcombined are shown in Figure 2 and demonstrate theincrease in natural ventilation with increasing wind speedand the rates of natural ventilation achieved even onrelatively still days. Figure 2 also shows the absoluteventilation calculated for the 12 mechanically ventilatedrespiratory isolation rooms in the study, assuming they wereventilated at the 12 ACH according to guidelines for high-riskareas [12]. With windows and doors fully open even the lowestquartile of wind speeds (�2 km/h) resulted in significantlygreater ventilation than that provided by mechanicalventilation at 12 ACH (p , 0.001).
Old-Fashioned versus Modern Naturally VentilatedFacilities
Old-fashioned facilities built pre-1950 had greater naturalventilation than more modern rooms built 1970–1990. Withwindows and doors fully open, the median absolute ventila-tion was 3,769 versus 1,174 m3/hour, the median absoluteventilation per person was 1,557 m3/h versus 461 m3/h, andthe ACH were 40 versus 17, respectively (all p , 0.001; Figure3; Table 2). Compared with the modern naturally ventilatedfacilities, these pre-1950 facilities were larger (85 m3 versus 60m3), with higher ceilings (4.2 m versus 3.0 m), larger windows(area 6.6 m2 versus 3.4 m2; window area to room volume ratio0.1 versus 0.05) and were more likely to have windows onopposite walls allowing through-flow of air (56% versus 19%of rooms) (all p , 0.05). Importantly for calculations ofairborne infection risk, patient crowding was similar in old-fashioned and modern wards (floor area/patient 9.2 versus 9.3m2; p ¼ 0.5). Floor area per patient tended to be greater inmodern mechanically ventilated isolation rooms than innaturally ventilated rooms, but this difference was notsignificant (median floor area in mechanically ventilatedrooms 11 m2; p ¼ 0.1).
Estimated Risk of Airborne Tuberculosis InfectionThe median estimated risk of TB transmission (percentage
of susceptible individuals infected) from 24 hours in roomsshared with infectious TB patients was 97% for naturallyventilated facilities with windows and doors closed, 39% inmechanically ventilated negative-pressure respiratory isola-
tion rooms with 12 ACH of dilutional ventilation, and 33% inmodern and 11% in pre-1950 naturally ventilated facilitieswith windows and doors fully open (Figure 3; Table 2). Figure4 shows modelling of airborne TB transmission risk over timefor pre-1950 versus modern naturally ventilated facilitiesversus mechanically ventilated respiratory isolation rooms at12 ACH. Three different scenarios of increasing sourceinfectiousness were investigated and demonstrate that theprotective effect of ventilation diminishes as the infectious-ness of the source increases. Figure 4 also demonstrates thatthe model predicts that all exposed susceptible personseventually become infected when duration of exposureincreases sufficiently.
Determinants of Natural VentilationIncreased natural ventilation (measured by ACH and
absolute ventilation) and decreased estimated risk of TBtransmission were significantly associated in multiple regres-sion analysis with: area of windows/doors open; placement ofwindows/doors on opposite walls allowing through-flow of air;ceiling height; floor area; and wind speed (Table 3). Suchfindings were highly consistent across all three measurements(ACH, absolute ventilation, and TB transmission risk) exceptfor ceiling height where the association with ACH was of onlyborderline significance (p ¼ 0.056). Temperature (8C) andrelative humidity (%) were also measured but did not qualifyfor inclusion in this model (p . 0.15).
Direction of AirflowSmoke tube testing in each room demonstrated the
direction of airflow through doors or windows duringexperiments. For 47 (67%) of the naturally ventilated rooms,in over 80% of experiments with windows and doors fullyopen, air currents flowed into the room through the door andpassed out of the room through the window(s), or flowed intothe room predominantly through one set of windows to passout through an opposite set of windows. In 23 (33%) of therooms, air passed into the room though the windows and outof the room through the door in over 80% of experimentswith windows and doors fully open. These patterns reflectedthe position of a room and its windows and doors in relationto the prevailing wind in Lima.
Mechanical VentilationThe mechanically ventilated facility delivered less than half
Table 1. Summary Statistics for Absolute Ventilation (m3/h) in Naturally Ventilated Rooms compared with Mechanical Ventilation
Configuration of
Windows and Doors
Natural Ventilation Mechanical Ventilation
Wind ,2 km/h Wind .2 km/h
n Median IQR Mean SD n Median IQR Mean SD Median IQR Mean SD
Closed 102 91 40–205 87 3.7 266 136 59–307 133 3.3 402 330–1,209 520 1.9
Partially open 167 473 240–833 460 2.7 74 1,780 988–3,042 1,650 2.1
Fully open 86 1,561 906–3,349 1,635 2.2 240 2,757 1,412–4,934 2,509 21
Measurements of ventilation were made with windows and doors closed, partially open, or fully open, and are shown according to wind speed (lowest quartile, i.e., ,2 km/h, versus upperthree quartiles combined, i.e., .2 km/h). Number of experiments conducted is denoted by n. All values for mechanical ventilation have been calculated assuming ventilation of 12 ACHaccording to guidelines [12]. These data are presented graphically in Figure 2. Means and standard deviations are geometric means and geometric standard deviations because data werenot normally distributed.IQR, interquartile range; SD, standard deviation.doi:10.1371/journal.pmed.0040068.t001
PLoS Medicine | www.plosmedicine.org February 2007 | Volume 4 | Issue 2 | e680312
Natural Ventilation

the number of ACH recommended when measured (unpub-lished data). On inspection, air extraction and supply fanswere unprotected by filters, motors were poorly maintained,and fan blades were corroded and clogged with deposits.Therefore, to improve external validity, values of 12 ACH andcorresponding calculated values for absolute ventilation weresubstituted for all comparisons between mechanical andnatural ventilation.
Discussion
We found that natural ventilation created by openingwindows and doors provided high rates of air exchange,absolute ventilation, and theoretical protection against air-borne TB infection. These factors were greatest in facilitiesbuilt more than 50 years ago, even on days with little wind. Incontrast, modern mechanically ventilated rooms had poor
absolute ventilation even at recommended air exchange ratesfor high-risk areas, and consequently had higher estimatedrisks of airborne contagion.Mechanical ventilation is expensive to install and maintain.
Even in the developed world, respiratory isolation roomsoften do not deliver the recommended number of ACH [23],and many fail to maintain negative pressure and may even beunder positive pressure [23–25]. Such failings have beenimplicated in numerous TB outbreaks [7,10,26–28]. It istherefore not surprising that we found the new mechanicallyventilated facility in Lima to be poorly ventilated and in needof refurbishment to achieve negative pressure and the 12ACH recommended for the control of TB transmission inhigh-risk areas [12]. However, even at the recommendedventilation rate, the calculated risk of airborne contagion wasgreater in these mechanically ventilated rooms than innaturally ventilated rooms with open windows and doors.
Figure 3. Ventilation and Protection against Airborne TB Transmission in Old-Fashioned Compared with Modern Rooms
Ventilation and protection against airborne infection is shown for pre-1950 versus modern (1970–1990) naturally ventilated facilities versus mechanicallyventilated negative-pressure respiratory isolation rooms. The triplet of bars on the left represents ACH in old-fashioned, high-ceilinged, pre-1950naturally ventilated clinical areas (n¼ 22; 201 experiments), versus modern naturally ventilated facilities (n¼ 42; 125 experiments), versus mechanicallyventilated negative-pressure facilities (n¼ 12). The left-centre triplet of bars represents the same comparison for absolute ventilation (m3/h/100); theright-centre triplet of bars represents that for absolute ventilation per person (m3/h/100); and the triplet of bars on the right that for the estimated risk ofairborne TB transmission (percentage of susceptible persons infected), for 24-h exposure to infectious TB patients [17]. Data are shown for 64 naturallyventilated rooms with windows and doors fully open (the remaining six naturally ventilated rooms had windows that could not be fully opened).doi:10.1371/journal.pmed.0040068.g003
Table 2. Summary Statistics for Measures of Ventilation and Calculated TB Transmission Risk
Type of Ventilation ACH (Hour�1) Absolute Ventilation (m3/h) Absolute Ventilation
per Person (m3/h)
Calculated Risk of
TB Transmission (%)
Median IQR Mean SD Median IQR Mean SD Median IQR Mean SD Median IQR Mean SD
All natural ventilation 28 18–46 28 4.7 2,477 1,162–4,345 2,241 5.4 1,053 516–1,749 942 4.8 16 10–30 17 2.8
Natural ventilation
built pre-1950
40 26–52 38 5.0 3,769 2,477–5,104 3,401 6.1 1,557 1,063–2,283 1,508 5.3 11 7.9–16 12 3.2
Natural ventilation
built 1970–1990
17 12–23 17 4.1 1,174 812–1,627 1,146 4.3 461 296–697 442 4.2 33 24–47 33 2.0
Mechanical ventilation 12 — 12 — 402 330–1,209 520 1.8 374 324–404 356 1.2 39 37–44 41 1.1
All values for natural ventilation reflect measurements with windows and doors fully open. All values for mechanical ventilation have been calculated assuming ventilation of 12 ACHaccording to guidelines [12]. TB transmission risk was calculated using the Wells-Riley model for exposure to TB patients generating 13 infectious quanta per hour (see text) [14,17]. Thesedata are presented graphically in Figure 3. Means and standard deviations are geometric means and geometric standard deviations because data were not normally distributed.IQR, interquartile range; SD, standard deviation.doi:10.1371/journal.pmed.0040068.t002
PLoS Medicine | www.plosmedicine.org February 2007 | Volume 4 | Issue 2 | e680313
Natural Ventilation

Airborne infections may be prevented by screeningindividuals for infectiousness and isolating contagious pa-tients in individual negative-pressure rooms in which care-givers and visitors wear particulate respirators. Respiratorefficacy, however, depends on a good facial seal, which maynot be easily achieved [29]. Their expense limits widespreaduse in resource-limited settings, and adherence to guidelinesfor their use is often poor, even in high-risk areas [30,31].More importantly, respirators are rarely used when patientinfectiousness is unrecognised, such as in waiting rooms andemergency departments [30], and it is these undiagnosed,untreated patients who are likely to be the most infectious[32,33]. Such patients represent an important source of
nosocomial TB transmission to health care workers [23], andemergency departments may be heavily utilized by TBpatients prior to diagnosis [34]. Negative-pressure isolationand dilutional mechanical ventilation are inevitably limitedto selected areas that are designated high risk, such asrespiratory isolation rooms. In clinical areas that are notdesignated high risk, including the majority of wards,emergency departments, and waiting areas, mechanicalventilation rates are usually much lower than 12 ACH, andairborne infection risks will be correspondingly higher. In themodel of airborne infection with the infectious source q¼ 13(the untreated office worker), 39% of susceptible individualswere predicted to become infected in mechanically ventilatedrooms at 12 ACH, compared with 33% in modern and 11% inpre-1950 naturally ventilated facilities. If all these modernnaturally ventilated hospital rooms in the study wereconsidered instead to be mechanically ventilated at 6 ACH(a relatively high rate of ventilation for non-high-risk areas inhealth care settings), the model predicted that 70% ofsusceptible individuals would become infected. Risks oftransmission would increase further were the mechanicalventilation systems to be poorly maintained. High airexchange mechanical ventilation must be reserved becauseof its great expense for high-risk areas. In contrast, naturalventilation is applicable across a wide variety of hospitalsettings, including waiting rooms, outpatient departments,and emergency departments. Indeed, it is in these areaswhere infectious patients are likely to be found, especiallyprior to diagnosis when they are untreated and thereforelikely to be most infectious. Natural ventilation is alsoapplicable in nonclinical environments such as prisons andhomeless shelters, where rates of institutional TB trans-mission are high.The risk of airborne contagion was significantly lower in
older, spacious facilities with high ceilings and large windowson more than one wall. In contrast, modern wards with lowceilings and small windows were associated with higher risk,and mechanically ventilated rooms with sealed windows hadeven greater risk, despite being ventilated optimally accord-ing to guidelines. The highest risk was found in naturallyventilated rooms with all windows and doors closed,
Figure 4. Estimated TB Transmission Risk over Time for Three Sources of
Increasing Infectiousness in Naturally versus Mechanically Ventilated
Facilities
The estimated risk of TB infection over time for exposure to three TBsource cases of different infectiousness is shown for pre-1950 naturallyventilated facilities (dotted lines) versus modern 1970–1990 naturallyventilated facilities (dashed lines) versus mechanically ventilated neg-ative-pressure isolation facilities at 12 ACH (continuous lines). The threeinfectious sources are: q ¼ 1.3 standard ward TB patients who infectedguinea pigs studied by Riley [32] (lowest three lines); q¼ 13 an untreatedTB case who infected 27 coworkers in an office over 4 wk [17] (middlethree lines); and q¼249 for an outbreak associated with bronchoscopy ofa TB patient [14] (uppermost three lines). Median values for all measuresof absolute ventilation for each category of naturally ventilated roomwith all windows and doors open have been used in the model.doi:10.1371/journal.pmed.0040068.g004
Table 3. Determinants of Ventilation and Protection against Airborne TB Transmission
Determinant of
Ventilation
ACH (log10) Absolute Ventilation (m3/h) (log10) Estimated Risk of TB Transmission (log10)
Coefficient (95% CI) p-Value Coefficient (95% CI) p-Value Coefficient (95% CI) p-Value
Area windows and
doors open (m2)
0.027 (0.022 to 0.032) ,0.001 0.026 (0.022 to 0.031) ,0.001 –0.024 (�0.027 to �0.020) ,0.001
Presence of open windows/
doors on opposite walls
0.337 (0.228 to 0.447) ,0.001 0.347 (0.235 to 0.460) ,0.001 –0.216 (�0.290 to �0.142) ,0.001
Ceiling height (m) 0.064 (�0.002 to 0.130) 0.056 0.108 (0.017 to 0.200) 0.02 –0.14 (�0.20 to �0.076) ,0.001
Floor area (m2) –0.005 (�0.006 to �0.004) ,0.001 0.005 (0.002 to 0.008) ,0.001 0.006 (0.004 to 0.007) ,0.001
Wind speed (km/h) 0.034 (0.019 to 0.049) ,0.001 0.032 (0.017 to 0.048) ,0.001 –0.028 (�0.040 to �0.016) ,0.001
Room elevation (m) 0.004 (�0.003 to 0.010) 0.2 0.006 (�0.000 to 0.013) 0.06 0.002 (�0.007 to �0.003) 0.4
Constant 0.599 (0.364 to 0.835) ,0.001 2.032 (1.747 to 2.317) ,0.001 2.172 (1.935 to 2.410) ,0.001
Marginal R-square [21] 0.635 — 0.675 — 0.663 —
Environmental and architectural variables that approached statistically significant associations with measures of natural ventilation and calculated estimates of TB transmission risk in 70rooms with windows and doors partially or fully open (p , 0.15) were included in multiple regression analysis that is shown above. Data were logarithmically transformed to allow linearregression analysis.CI, confidence interval.doi:10.1371/journal.pmed.0040068.t003
PLoS Medicine | www.plosmedicine.org February 2007 | Volume 4 | Issue 2 | e680314
Natural Ventilation

preventing almost all ventilation. Several factors may leadmodern ward design to increase the risk of airborneinfection. Guidelines for infection control focus on mechan-ical ACH rather than absolute ventilation per person.However, for a given air change rate there will be greaterabsolute ventilation in a larger room. For example, a 12 m2
isolation room with ceiling 3 m high ventilated at 12 ACH hasabsolute ventilation of 432 m3/h. The same room but with theceiling increased to 4 m high ventilated at the same 12 ACHhas absolute ventilation 576 m3/h and offers substantiallygreater protection against airborne infection according toairborne infection models. This additional protection mayeven be underestimated because of modelling assumptions ofsteady state conditions, which in reality may rarely be thecase.
To prevent TB transmission, mechanical ventilation ofhigh-risk clinical areas at a rate of 6–12 ACH is recommended[12], in part because higher rates are prohibitively expensive,noisy, and difficult to maintain. Simply opening windows anddoors achieves far greater ventilation and correspondingtheoretical protection against airborne infection. Probablythe major reason that modern building trends increasepatient risk is financial: smaller rooms (which more easilybecome stuffy and overcrowded) are cheaper to build andheat.
A disadvantage of natural ventilation is the difficulty incontrolling direction of airflow due to the absence of negativepressure. Contamination of corridors and adjacent rooms istherefore a risk, particularly on completely still days.However, it is possible to locate a TB ward, for example, onthe uppermost floor of a building and downwind of otherrooms or the nursing station. Furthermore, corridors that areopen at both ends may allow the passage of large volumes offresh air that may compensate for the absence of negativepressure. The smoke pattern testing of airflow directiondemonstrated consistent patterns of airflow into or out ofrooms depending on the configuration of open windows anddoors and location with respect to prevailing winds. In Limaprevailing winds come from the Pacific Ocean, but wind maybe less predictable in other locations. The enormous dilutionresulting from release of contaminated air into the outsideatmosphere prevents natural ventilation from contaminatingthe immediate environment significantly. Whilst exhaust airfrom TB isolation rooms may be filtered, air from generalclinical spaces is usually pumped unfiltered into theatmosphere. Consequently, opening the windows releasesthe same number of infectious particles into the atmosphereas mechanical ventilation without causing significant risk tothose outside, but does so with greater protection for peopleinside the rooms.
In contrast to mechanical ventilation, natural ventilationoffers high rates of air exchange for little or no cost, and isrelatively free of maintenance. Whilst weather conditionsplay an obvious role, this study has shown that high levels ofprotective ventilation are readily achievable even at low windspeeds. Natural ventilation may increase building heat loss,but this may be less important in tropical climates where alarge part of the burden of TB is found. Other factors such ascultural traditions or security may result in windows beingtightly closed at night, but this research has demonstratedthat protective rates of ventilation are achievable withwindows only partially open. Furthermore, wards are less
crowded during night hours, and it may also be possible touse supplementary environmental controls such as upperroom ultraviolet light. Although not suited to cold regions, intemperate or tropical climates with a high prevalence of TB,it may be safer for patients, visitors, and staff to wear extraclothing in open-windowed, naturally ventilated wards andwaiting rooms than to be warm in stuffy, low-ceilinged roomswith increased risk of nosocomial airborne disease trans-mission. Whilst this research has focused on TB transmission,natural ventilation also has implications for other infectionstransmitted by the respiratory route, including influenza,although it should be noted that the protective effect ofventilation diminishes as infectiousness increases [17].There are several limitations to this study. The number of
mechanically ventilated rooms included in this study (n¼ 12)was small compared with the number of naturally ventilatedrooms studied (n¼70), which may have given an unjustly poorevaluation of mechanical ventilation in general. This possi-bility is mitigated by several factors. First, nine of these roomswere individual respiratory isolation rooms, and with anaverage volume of 31 m3 were typical in size. The highproportion of individual rooms in the mechanically venti-lated category resulted in floor area per patient in mechan-ically ventilated rooms actually tending to be greater thanthat in naturally ventilated rooms (11 versus 9.3 m2 perpatient), although this difference was not statistically signifi-cant. This would favour increased values for calculatedabsolute ventilation, and hence decreased values for trans-mission risk. Furthermore, mechanical ventilation wasassumed to have optimal ventilation according to guidelines,12 ACH, and it is well documented that many real-worldmechanically ventilated facilities function below these rec-ommended levels. Another limitation of the study is theinherent limitations of the Wells-Riley airborne infectionmodel, which makes a number of assumptions such asconditions being in steady state and infection being a ‘‘one-hit’’ process, and does not take into account other factorssuch as the fact that a susceptible person located closer to aninfectious source is more likely to become infected than onewho is further away. The model also does not account for thedeposition fraction of bacilli in the alveoli, or for the removalof viable particles from the air by processes such as settling.However, the TB transmission risk values presented are notintended as absolute estimates of risk, but rather as relativemeasures, to allow comparison of the protection afforded bynatural ventilation in old-fashioned and modern facilities,compared with mechanical ventilation.In summary, natural ventilation has advantages over
mechanical ventilation in the fight against the institutionaltransmission of airborne infections, especially in resource–limited settings. When designing medical facilities there arelessons to be learnt from the past and it may be better toreplace overcrowding and poor ventilation by the saferdesign principles of our predecessors. Well-maintainednegative-pressure isolation facilities are the optimal standardof care for infectious respiratory patients. However, they aretoo costly for many limited-resource settings, and arerestricted to small high-risk areas of health care settings,neglecting many important areas of potential transmissionsuch as emergency departments and waiting rooms. Wheninfectious and susceptible individuals must share rooms andrespirators and negative-pressure isolation are impractical,
PLoS Medicine | www.plosmedicine.org February 2007 | Volume 4 | Issue 2 | e680315
Natural Ventilation
crowding should be reduced and windows and doors openedto maximise natural ventilation and reduce the risk ofairborne contagion.
Acknowledgments
The authors would like to thank the staff of the followingparticipating Lima hospitals for their invaluable support in makingthis research possible: Hospital Nacional Dos de Mayo; HospitalNacional Daniel Alcides Carrion, Lima; Hospital de Apoyo MariaAuxiliadora; Instituto de Medicina Tropical Alexander von Hum-boldt; Hospital Nacional Hipolito Unanue; Instituto de Salud delNino; Hospital Arzobispo Loayza; and Hospital Sergio Bernales,Collique. We also thank Edward Nardell for reviewing an earlier draftof this manuscript.
Author contributions. All authors contributed to the design or dataanalysis of the study, the writing of the article, and approval of thefinal version to be published. ARE had full access to all the data in thestudy and had final responsibility for the decision to submit forpublication and is the guarantor.
Supporting Information
Alternative Language Abstract S1. Translation of the Abstract intoFrench by Gaeton Favre.
Found at doi:10.1371/journal.pmed.0040068.sd001 (28 KB DOC)
Alternative Language Abstract S2. Translation of the Abstract intoGerman by Clarissa C. Oeser.
Found at doi:10.1371/journal.pmed.0040068.sd002 (36 KB DOC)
Alternative Language Abstract S3. Translation of the Abstract intoJapanese by Mayuko Saito.
Found at doi:10.1371/journal.pmed.0040068.sd003 (28 KB DOC)
Alternative Language Abstract S4. Translation of the Abstract intoRussian by Erna Crane.
Found at doi:10.1371/journal.pmed.0040068.sd004 (36 KB DOC)
Alternative Language Text S1. Translation of the Article into Spanishby A. Roderick Escombe and Marcos Navincopa.
Found at doi:10.1371/journal.pmed.0040068.sd005 (344 KB DOC)
References1. Corbett EL, Watt CJ, Walker N, Maher D, Williams BG, et al. (2003) The
growing burden of tuberculosis: Global trends and interactions with theHIV epidemic. Arch Intern Med 163: 1009–1021.
2. Valway SE, Greifinger RB, Papania M, Kilburn JO, Woodley C, et al. (1994)Multidrug-resistant tuberculosis in the New York State prison system,1990–1991. J Infect Dis 170: 151–156.
3. Mohle-Boetani JC, Miguelino V, Dewsnup DH, Desmond E, Horowitz E, etal. (2002) Tuberculosis outbreak in a housing unit for human immunode-ficiency virus-infected patients in a correctional facility: Transmission riskfactors and effective outbreak control. Clin Infect Dis 34: 668–676.
4. Dwyer B, Jackson K, Raios K, Sievers A, Wilshire E, et al. (1993) DNArestriction fragment analysis to define an extended cluster of tuberculosisin homeless men and their associates. J Infect Dis 167: 490–494.
5. Curtis AB, Ridzon R, Novick LF, Driscoll J, Blair D, et al. (2000) Analysis ofMycobacterium tuberculosis transmission patterns in a homeless shelteroutbreak. Int J Tuberc Lung Dis 4: 308–313.
6. Danis K, Fitzgerald M, Connell J, Conlon M, Murphy PG (2004) Lessonsfrom a pre-season influenza outbreak in a day school. Commun Dis PublicHealth 7: 179–183.
7. Ehrenkranz NJ, Kicklighter JL (1972) Tuberculosis outbreak in a generalhospital: Evidence for airborne spread of infection. Ann Intern Med 77:377–382.
8. Petrosillo N, Nicastri E, Viale P (2005) Nosocomial pulmonary infections inHIV-positive patients. Curr Opin Pulm Med 11: 231–235.
9. Edlin BR, Tokars JI, Grieco MH, Crawford JT, Williams J, et al. (1992) An
outbreak of multidrug-resistant tuberculosis among hospitalized patientswith the acquired immunodeficiency syndrome. N Engl J Med 326: 1514–1521.
10. Ikeda RM, Birkhead GS, DiFerdinando GT Jr, Bornstein DL, Dooley SW, etal. (1995) Nosocomial tuberculosis: An outbreak of a strain resistant toseven drugs. Infect Control Hosp Epidemiol 16: 152–159.
11. Jiamjarasrangsi W, Hirunsuthikul N, Kamolratanakul P (2005) Tuberculosisamong health care workers at King Chulalongkorn Memorial Hospital,1988–2002. Int J Tuberc Lung Dis 9: 1253–1258.
12. Jensen PA, Lambert LA, Iademarco MF, Ridzon R (2005) Guidelines forpreventing the transmission of Mycobacterium tuberculosis in health-caresettings, 2005. MMWR Recomm Rep 54: 1–141.
13. Beggs CB, Noakes CJ, Sleigh PA, Fletcher LA, Siddiqi K (2003) Thetransmission of tuberculosis in confined spaces: an analytical review ofalternative epidemiological models. Int J Tuberc Lung Dis 7: 1015–1026.
14. Riley RL, Nardell EA (1989) Clearing the air. The theory and application ofultraviolet air disinfection. Am Rev Respir Dis 139: 1286–1294.
15. Granich R, Binkin NJ, Jarvis WR, Simone PM (1999) Guidelines for theprevention of tuberculosis in health care facilities in resource-limitedsettings. WHO/CDS/TB99.269 ed. Geneva: World Health Organization.
16. Menzies R, Schwartzman K, Loo V, Pasztor J (1995) Measuring ventilation ofpatient care areas in hospitals. Description of a new protocol. Am J RespirCrit Care Med 152: 1992–1999.
17. Nardell EA, Keegan J, Cheney SA, Etkind SC (1991) Airborne infection.Theoretical limits of protection achievable by building ventilation. Am RevRespir Dis 144: 302–306.
18. Wells WF (1955) Airborne contagion and air hygiene: An ecological studyof droplet infection. Cambridge (Massachusetts): Harvard University Press.
19. Kennedy WJ, Bancroft TA (1971) Model-building for prediction inregression based on repeated significance tests. Ann Math Stat 42: 1273–1284.
20. Zeger SL, Liang KY, Albert PS (1988) Models for longitudinal data: Ageneralized estimating equation approach. Biometrics 44: 1049–1060.
21. Zheng B (2000) Summarizing the goodness of fit of generalized linearmodels for longitudinal data. Stat Med 19: 1265–1275.
22. SPSS (1999) SPSS User Manual Version 10.0. Chicago: SPSS.23. Menzies D, Fanning A, Yuan L, FitzGerald JM (2000) Hospital ventilation
and risk for tuberculous infection in canadian health care workers.Canadian Collaborative Group in Nosocomial Transmission of TB. AnnIntern Med 133: 779–789.
24. Fraser VJ, Johnson K, Primack J, Jones M, Medoff G, et al. (1993) Evaluationof rooms with negative pressure ventilation used for respiratory isolationin seven midwestern hospitals. Infect Control Hosp Epidemiol 14: 623–628.
25. Pavelchak N, DePersis RP, London M, Stricof R, Oxtoby M, et al. (2000)Identification of factors that disrupt negative air pressurization ofrespiratory isolation rooms. Infect Control Hosp Epidemiol 21: 191–195.
26. Catanzaro A (1982) Nosocomial tuberculosis. Am Rev Respir Dis 125: 559–562.
27. Pearson ML, Jereb JA, Frieden TR, Crawford JT, Davis BJ, et al. (1992)Nosocomial transmission of multidrug-resistant Mycobacterium tuberculosis. Arisk to patients and health care workers. Ann Intern Med 117: 191–196.
28. Beck-Sague C, Dooley SW, Hutton MD, Otten J, Breeden A, et al. (1992)Hospital outbreak of multidrug-resistant Mycobacterium tuberculosis infec-tions. Factors in transmission to staff and HIV-infected patients. JAMA 268:1280–1286.
29. Coffey CC, Lawrence RB, Campbell DL, Zhuang Z, Calvert CA, et al. (2004)Fitting characteristics of eighteen N95 filtering-facepiece respirators. JOccup Environ Hyg 1: 262–271.
30. Biscotto CR, Pedroso ER, Starling CE, Roth VR (2005) Evaluation of N95respirator use as a tuberculosis control measure in a resource-limitedsetting. Int J Tuberc Lung Dis 9: 545–549.
31. Bonifacio N, Saito M, Gilman RH, Leung F, Cordova Chavez N, et al. (2002)High risk for tuberculosis in hospital physicians, Peru. Emerg Infect Dis 8:747–748.
32. Riley RL, Mills CC, O’Grady F, Sultan LU, Wittstadt F, et al. (1962)Infectiousness of air from a tuberculosis ward. Ultraviolet irradiation ofinfected air: comparative infectiousness of different patients. Am RevRespir Dis 85: 511–525.
33. Menzies D (1997) Effect of treatment on contagiousness of patients withactive pulmonary tuberculosis. Infect Control Hosp Epidemiol 18: 582–586.
34. Long R, Zielinski M, Kunimoto D, Manfreda J (2002) The emergencydepartment is a determinant point of contact of tuberculosis patients priorto diagnosis. Int J Tuberc Lung Dis 6: 332–339.
PLoS Medicine | www.plosmedicine.org February 2007 | Volume 4 | Issue 2 | e680316
Natural Ventilation

Editors’ Summary
Background. Tuberculosis (TB) is a major cause of ill health and deathworldwide, with around one-third of the world’s population infectedwith the bacterium that causes it (Mycobacterium tuberculosis). Oneperson with active tuberculosis can go on to infect many others; thebacterium is passed in tiny liquid droplets that are produced whensomeone with active disease coughs, sneezes, spits, or speaks. The risk oftuberculosis being transmitted in hospital settings is particularly high,because people with tuberculosis are often in close contact with verymany other people. Currently, most guidelines recommend that the riskof transmission be controlled in certain areas where TB is more likely bymaking sure that the air in rooms is changed with fresh air between sixand 12 times an hour. Air changes can be achieved with simple measuressuch as opening windows and doors, or by installing mechanicalequipment that forces air changes and also keeps the air pressure in anisolation room lower than that outside it. Such ‘‘negative pressure,’’mechanically ventilated systems are often used on tuberculosis wards toprevent air flowing from isolation rooms to other rooms outside, and soto prevent people on the tuberculosis ward from infecting others.
Why Was This Study Done? In many parts of the world, hospitals do nothave equipment even for simple air conditioning, let alone the specialequipment needed for forcing high air changes in isolation rooms andwards. Instead they rely on opening windows and doors in order toreduce the transmission of TB, and this is called natural ventilation.However, it is not clear whether these sorts of measures are adequate forcontrolling TB transmission. It is important to find out what sorts ofsystems work best at controlling TB in the real world, so that hospitalsand wards can be designed appropriately, within available resources.
What Did the Researchers Do and Find? This study was based in Lima,Peru’s capital city. The researchers studied a variety of rooms, includingtuberculosis wards and respiratory isolation rooms, in the city’s hospitals.Rooms which had only natural measures for encouraging airflow werecompared with mechanically ventilated, negative pressure rooms, whichwere built much more recently. A comparison was also done betweenrooms in old hospitals that were naturally ventilated with rooms innewer hospitals that were also naturally ventilated. The researchers useda particular method to measure the number of air changes per hourwithin each room, and based on this they estimated the risk of a personwith TB infecting others using a method called the Wells-Riley equation.The results showed that natural ventilation provided surprisingly highrates of air exchange, with an average of 28 air changes per hour.Hospitals over 50 years old, which generally had large windows and highceilings, had the highest ventilation, with an average of 40 air changes
per hour. This rate compared with 17 air changes per hour in naturallyventilated rooms in modern hospitals, which tended to have lowerceilings and smaller windows. The rooms with modern mechanicalventilation were supposed to have 12 air changes per hour but in realitythis was not achieved, as the systems were not maintained properly. TheWells-Riley equation predicted that if an untreated person withtuberculosis was exposed to other people, within 24 hours this personwould infect 39% of the people in the mechanically ventilated room,33% of people in the naturally ventilated new hospital rooms, and only11% of the people in the naturally ventilated old hospital rooms.
What Do These Findings Mean? These findings suggest that naturalmethods of encouraging airflow (e.g., opening doors and windows) workwell and in theory could reduce the likelihood of TB being carried fromone person to another. Some aspects of the design of wards in oldhospitals (such as large windows and high ceilings) are also likely toachieve better airflow and reduce the risk of infection. In poor countries,where mechanical ventilation systems might be too expensive to installand maintain properly, rooms that are designed to naturally achievegood airflow might be the best choice. Another advantage of naturalventilation is that it is not restricted by cost to just high-risk areas, andcan therefore be used in many different parts of the hospital, includingemergency departments, outpatient departments, and waiting rooms,and it is here that many infectious patients are to be found.
Additional Information. Please access these Web sites via the onlineversion of this summary at http://dx.doi.org/10.1371/journal.pmed.0040068.
� Information from the World Health Organization on tuberculosis,detailing global efforts to prevent the spread of TB� The World Health Organization publishes guidelines for the prevention
of TB in health care facilities in resource-limited settings� Tuberculosis infection control in the era of expanding HIV care and
treatment is discussed in an addendum to the above booklet� The Centers for Disease Control have published guidelines for
preventing the transmission of mycobacterium tuberculosis in healthcare settings� Wikipedia has an entry on nosocomial infections (diseases that are
spread in hospital). Wikipedia is an internet encyclopedia anyone canedit� A PLoS Medicine Perspective by Peter Wilson, ‘‘Is Natural Ventilation a
Useful Tool to Prevent the Airborne Spread of TB?’’ discusses theimplications of this study
PLoS Medicine | www.plosmedicine.org February 2007 | Volume 4 | Issue 2 | e680317
Natural Ventilation