Room ventilation and the risk of airborne infection transmission in 3 health care settings within a...
20
This is the author’s version of a work that was submitted/accepted for pub- lication in the following source: Knibbs, Luke D., Morawska, Lidia, Bell, Scott C., & Grzybowski, Piotr (2011) Room ventilation and the risk of airborne infection transmission in three health care settings within a large teaching hospital. American Journal of Infection Control, 39 (10), pp. 866-872. This file was downloaded from: c Copyright 2011 Elsevier This is the author’s version of a work that was accepted for publication in <American Journal of Infection Control>. Changes resulting from the publishing process, such as peer review, editing, corrections, structural formatting, and other quality control mechanisms may not be reflected in this document. Changes may have been made to this work since it was submitted for publication. A definitive version was subsequently published in American Journal of Infection Control, [in press (2011)]. Notice: Changes introduced as a result of publishing processes such as copy-editing and formatting may not be reflected in this document. For a definitive version of this work, please refer to the published source: http://dx.doi.org/10.1016/j.ajic.2011.02.014
-
Upload
independent -
Category
Documents
-
view
4 -
download
0
Transcript of Room ventilation and the risk of airborne infection transmission in 3 health care settings within a...
This is the author’s version of a work that was submitted/accepted for pub-lication in the following source:
Knibbs, Luke D., Morawska, Lidia, Bell, Scott C., & Grzybowski, Piotr(2011) Room ventilation and the risk of airborne infection transmissionin three health care settings within a large teaching hospital. AmericanJournal of Infection Control, 39(10), pp. 866-872.
This file was downloaded from: http://eprints.qut.edu.au/47040/
c© Copyright 2011 Elsevier
This is the author’s version of a work that was accepted for publicationin <American Journal of Infection Control>. Changes resulting from thepublishing process, such as peer review, editing, corrections, structuralformatting, and other quality control mechanisms may not be reflected inthis document. Changes may have been made to this work since it wassubmitted for publication. A definitive version was subsequently publishedin American Journal of Infection Control, [in press (2011)].
Notice: Changes introduced as a result of publishing processes such ascopy-editing and formatting may not be reflected in this document. For adefinitive version of this work, please refer to the published source:
http://dx.doi.org/10.1016/j.ajic.2011.02.014
1
Room ventilation and the risk of airborne infection transmission in three health care
settings within a large teaching hospital
Abstract
Background: Room ventilation is a key determinant of airborne disease transmission.
Despite this, ventilation guidelines in hospitals are not founded on robust scientific evidence
related to prevention of airborne transmission.
Methods: We sought to assess the effect of ventilation rates on influenza, tuberculosis (TB)
and rhinovirus infection risk within three distinct rooms in a major urban hospital; a Lung
Function Laboratory, Emergency Department (ED) Negative-pressure Isolation Room and an
Outpatient Consultation Room were investigated. Air exchange rate measurements were
performed in each room using CO2 as a tracer. Gammaitoni and Nucci’s model was
employed to estimate infection risk.
Results: Current outdoor air exchange rates in the Lung Function Laboratory and ED
Isolation Room limited infection risks to between 0.1 and 3.6%. Influenza risk for
individuals entering an Outpatient Consultation Room after an infectious individual departed
ranged from 3.6 to 20.7%, depending on the duration for which each person occupied the
room.
Conclusions: Given the absence of definitive ventilation guidelines for hospitals, air
exchange measurements combined with modelling afford a useful means of assessing, on a
case-by-case basis, the suitability of room ventilation at preventing airborne disease
transmission.
2
Introduction
Room ventilation acts to dilute and remove infectious airborne droplet nuclei (aerosols), and
several epidemiologic investigations have underscored its significant role in determining
airborne transmission of tuberculosis (TB), influenza, measles, rhinovirus and severe acute
respiratory syndrome (SARS) in various indoor settings.1-8 An extensive multi-disciplinary
review conducted in the wake of the 2003 SARS epidemic9 concluded that the relationship
between ventilation and airborne transmission of diseases indoors was supported by strong
and sufficient evidence. Despite this, the potential for transmission in hospitals has received
little attention, and there is insufficient data to prescribe minimum ventilation rates.9 Existing
ventilation guidelines, of which there are several (summarised by Beggs et al.10), are
therefore not founded on robust scientific evidence related to prevention of airborne
transmission.
While some respiratory infections may be communicated by fomites or over short distances
(less than a few metres) by large droplets (> approximately 20 µm) that subsequently result in
direct contact with the respiratory tract , airborne transmission is likely to contribute to
person-to-person spread over relatively long distances due the ability of small droplet nuclei
(< 5µm) to remain suspended in air for extended periods.11 In addition to clear evidence that
the airborne route is a mode of spread for tuberculosis and measles, there is mounting
evidence for its role in influenza and rhinovirus transmission.7, 12-16
Given that the significance of knowledge gaps outlined above was amplified by the 2009
H1N1 pandemic, we sought to determine the effect of ventilation on the risk of airborne
infection posed by three common pathogens in a major teaching hospital. We aimed to
3
provide general information for use in evaluation of hospital design and infection control
strategies and also to inform in-house patient management guidelines.
Methods
Setting
The Prince Charles Hospital (TPCH) is a major tertiary referral and university hospital
located in south eastern Queensland, Australia. TPCH has 588 beds, including a large
Pulmonology unit with 54 inpatient beds. The hospital had ~77,000 outpatient consultations
and ~17,000 lung function tests in 2009/10, and a large Emergency Department delivered
43,000 occasions of service. Clinical services at TPCH were built in recent years, and the
Outpatient Department and Lung Function Laboratory, both commissioned in 1999,
underwent redevelopment in 2007. The Emergency Department was completed and
commissioned in 2007. In 2009, there were 286 confirmed cases of H1N1 influenza
diagnosed and managed at the hospital. An average of 7 cases of Mycobacterium tuberculosis
are managed at TPCH each year within the Pulmonology Unit.
Our study targeted rooms within TPCH that encompassed a range of uses and were potential
airborne transmission locations: (1) the Respiratory Investigation (Lung Function) Laboratory
(169 m3); (2) a Negative-pressure Isolation Room within the Emergency Department (ED)
(24 m3), and; (3) two separate but proximate Outpatient Consulting Rooms (Room A and
Room B: 32 and 36 m3, respectively). All rooms were mechanically ventilated. The Lung
Function Laboratory and Outpatient Consulting Rooms were served by Air Handling Units
(AHUs), with the latter sharing a common AHU. The ED Isolation Room was ventilated
entirely by outdoor air drawn in by an exhaust fan.
Air exchange rate measurements
4
Air exchange rate measurements in the Lung Function Laboratory and ED Isolation Room
were performed with the doors in their typical position; fully open and fully closed,
respectively, whilst those in the two outpatient consulting rooms were conducted under both
closed and open door conditions, representing a typical functioning outpatient clinic session.
All measurements were performed when the rooms were unoccupied. Background
concentrations of CO2 were monitored by a Sable Systems CA-10 CO2 analyser for at least
20 minutes. High purity (99.9%) CO2 was then released and vigorously mixed with room air
by two fans until concentrations stabilised. Approximate homogeneity of concentration was
confirmed by measurements at a minimum of three points throughout each room prior to
cessation of CO2 release. A single sampling point was then sited at a central location. The
decay of CO2 was recorded every second until background concentrations were reached.
Three repeat measurements were conducted in each room, and in the case of consulting
rooms, for each door position. Eighteen air exchange measurements were performed.
The gradient of the line-of-best-fit through the natural logarithm of the background-corrected
decay was recorded as the number of air changes per hour (ACH). The standard error of the
line-fitting procedure was calculated.
For all rooms except the ED Isolation Room, the proportion of outdoor air in the total air
volume supplied by their respective AHUs (i.e. the combination of outdoor and recirculated
air) was determined by mass-balance of CO2 concentrations measured in return, supply and
outdoor air.17 The precision of calculated values was estimated using the method described
by Persily.17
Infection risk modelling
5
We employed Gammaitoni and Nucci’s18 (G-N) model to estimate airborne transmission risk.
The G-N model is a variation of the traditional steady-state Wells-Riley1 (W-R) model. Both
models assume that an infectious person constantly generates a number of infectious quanta
through time, with a quantum defined as the dose of airborne droplet nuclei required to cause
infection in 1 , or 63% of susceptible persons. Unlike the W-R model, however, the G-
N model is capable of incorporating non-steady-state quanta concentrations. Detailed
discussions of each model’s merits and underlying assumptions are provided by Beggs et al.19
and Sze To and Chao.20
W-R model:
1 / (1)
Where: I is the number of infectious source cases, q is the number of infectious quanta
produced per source case (quanta/h), p is the average respiratory ventilation rate of
susceptible persons (m3/h), t is the duration of exposure (h) and Q is the volume of infection-
free (i.e. outdoor) air supplied to the room (m3/h).
G-N model (when initial quanta concentration is non-zero)19:
1
–
(2)
Where: V is the volume of the room (m3), N is the air change rate (i.e. Q/V) and n0 is the total
number of quanta in the room at t = 0.
6
We modelled three diseases spread by the airborne route that spanned a range of
infectiousness and frequency of presentation at the study site; influenza, tuberculosis and
rhinovirus. Quanta generation rates were 67, 12.7 and 5 quanta/hour, respectively, with these
values chosen to represent relatively typical cases.5,21 Although we did not explicitly model
H1N1, the influenza quanta generation rate we used is within its suspected range.22 We
assumed that all susceptible individuals had a standard adult respiratory rate of 0.6 m3/h.5,19
The modelling approach and additional equations used are described in the appendix.
Based on typical patient occupancy times and patterns, two general scenarios were modelled
for each airborne pathogen: (1) risk of infection for susceptible individuals occupying the
Lung Function Laboratory with an infectious patient (exposure times ranging from 15 to 45
min), and; (2) risk of infection for susceptible individuals occupying the ED Isolation Room
for between 30 min and 8 h immediately following the departure of an infectious individual
who spent 30 min or more in the room. A third, more complex, situation was also modelled;
(3) risk of infection for a susceptible individual occupying an Outpatient Consulting Room
for up to 120 min after prior occupation by an infectious individual for each of 15, 60 and
120 min; which span the range of consultation times for a brief through to complex multi-
disciplinary consultation. To mimic typical practice, a period of 5 minutes during which the
door was open was incorporated into each scenario (i.e. between the departure of the
infectious person and arrival of the susceptible individual). To best assess the capability of
its ventilation system at preventing airborne transmission, the most infectious pathogen of
those we investigated (influenza) was modelled in the outpatient consulting room.
Ethical Approval
7
The study was approved by the Human Research Ethics Committees of TPCH
(HREC/09/QPCH/163) and Queensland University of Technology (0900001290). Individual
patient consent was not required for this study, though signage explaining the purpose of the
measurements was displayed to staff, patients and visitors.
Results
Table 1 summarises the results of air exchange and outdoor air proportion measurements.
The proportion of outdoor air supplied to the Lung Function Laboratory by its AHU was
approximately twice that of the Outpatient Consulting Rooms; the cause of which was traced
to modification of the outdoor air intake dampers by technicians two years prior to our
investigation. All outdoor air proportions were fixed and did not vary with season, reflecting
the small seasonal temperature variation at the study location.
A significant finding was the effect of door position on air exchange rates in Outpatient
Consulting Rooms A and B, which was most marked in the former and resulted in a near-
doubling of air exchange compared to the closed door situation. We ascribe this to the
presence of a large air return air vent in the corridor immediately adjacent to room A that
promoted air movement out of the room, and that this effect was enhanced under open door
conditions.
Lung Function Laboratory
Figures 1a and b show the effect of outdoor air exchange rate on the infection risk of
susceptible individuals occupying the Lung Function Laboratory for 15 and 45 mins,
respectively. For all scenarios, risk decreased rapidly with increasing air exchange. The
current outdoor air exchange rate in the Lung Function Laboratory (4.9 ACH; shown as the
8
vertical dotted line in figures 1a and b) is relatively high and resulted in risks ranging from
0.1% (following 15 min exposure to rhinovirus) to 3.6% (following 45 min exposure to
influenza).
Emergency Department (ED) Isolation Room
The high air exchange rate in the ED Isolation Room (23.8 ACH) resulted in steady-state
quanta concentrations being achieved after approximately 15 mins, and these were
consequently low; 0.12, 0.02 and 0.009 quanta/m3 for influenza, TB and rhinovirus,
respectively. The estimated time required to achieve a 99.9% reduction in quanta
concentrations following the departure of an infectious individual is 18 min. The risk posed
to an individual entering the room immediately after the departure of an infectious influenza
case (i.e. worst-case scenario) and remaining there for 30 min or 8 h was 0.3%. The
additional 7.5 hours of occupancy time in the latter case did not have a significant effect on
risk, as no new sources of influenza quanta were present.
Outpatient (OPD) Consulting Rooms
Figure 2a shows the modelled influenza quanta concentration in Outpatient Consulting Room
A during a consultation with an infectious individual for up to 120 min. Also shown are the
decays in quanta concentration following departure of the individual after 15, 60 and 120
min, including an initial 5 min period with the door to the room open. Figure 2b shows the
estimated risk of infection for a susceptible individual entering the room after each of these
periods.
During a 15 min consultation with an infectious individual, there is insufficient time for the
quanta concentration to reach its steady-state value (1.08 quanta/m3). An initially sharp
9
decrease in quanta when the door is opened and the infectious individual departs is curtailed
as the air exchange rate is lowered once the susceptible individual enters and the door is
closed. As Figure 2b shows, the subsequent risk of infection to the susceptible individual
ranges from 3.6 to 8.8% for 15 and 120 min consultations, respectively.
A similar pattern, albeit of greater magnitude, is repeated in the case of 60 and 120 min
consultations with an infectious individual. In these scenarios, quanta concentrations
approach their steady-state values at the conclusion of the consultation. When the room has
previously been occupied for 60 min by an infectious person, the susceptible individual’s
estimated infection risk ranges from 8.1 to 18.5% for 15 and 120 min consultations,
respectively. The equivalent range assuming prior occupation by an infectious individual for
120 min is 8.8 to 20.7%.
Discussion
The scarcity of scientific evidence available to underpin ventilation guidelines in hospitals
makes modelling studies an attractive means of developing customised airborne infection
control policies. In our study, we have focussed on producing conservative risk estimates
that reflect the real-world activities of individuals (staff, patients and visitors) at the study
location. It is important to consider that our risk estimates are expressed as percentages, and
whilst this is a convenient and intuitive metric, it may not translate to a significant absolute
number of infections in a room with low occupancy.19,23
Examining the points at which the existing air exchange rate in the Lung Function Laboratory
intersects the curves shown in Figures 1a and b, it is clear that increasing air exchange further
would provide a negligible reduction in an already very low infection risk. The attendant
10
increase in energy consumption required would be difficult to justify when the size of the
room and its typical occupancy of up to 10 persons are considered.24 A similar situation exists
in the ED Isolation Room, where occupancy is low and outdoor air exchange is very high;
even in the ‘worst-case’ scenario, a very low risk of 0.3% was estimated. The ventilation rate
in the ED isolation room afforded substantial protection from the three pathogens modelled,
and was approximately twice what is recommended by the Centers for Disease Control and
Prevention for airborne infection isolation rooms. 25 Although the real-world bases of
prescribed ventilation guidelines are limited, in these two scenarios modelling demonstrated
that measured air exchange limited infection risk to relatively low levels. For both clinical
rooms, in the case of a highly contagious airborne infection and/or highly susceptible group,
modelling could be useful when conducted on a case-by-case basis to assess the benefit of
increasing air exchange on infection risk.
Infections arising from airborne transmission during time spent in a physician’s waiting or
consulting room after the departure of an infectious individual have been documented
previously.3,4 However, these instances resulted from a combination of a paediatric source
case and highly infectious airborne pathogen (measles), which were compounded by low
outdoor air ventilation rates. Airborne transmission is widely acknowledged as the
mechanism of spread of tuberculosis, although its role in influenza and rhinovirus
transmission is less well-established.16 There is, however, evidence to support increased
airborne transmission of the latter two diseases under conditions where outdoor air exchange
is low.7,15 Our results suggest that the risk of influenza infection for susceptible individuals
entering an Outpatient Consulting Room, whilst relatively low, are not negligible despite the
total and outdoor air change rates meeting guidelines recommended for patient rooms and
general wards.10 This further emphasises the need to develop a rigorous scientific basis for
11
prescribing minimum ventilation rates within a diverse range of hospital environments.9 It is
also worthwhile to note that natural ventilation can reduce airborne infection risk and energy
consumption compared to mechanical ventilation,26,27 although this requires a climate
amenable to this practice and appropriate planning of the hospital environment.
While ventilation rates increased in Outpatient Consulting Rooms A and B when doors were
opened compared to closed, the increase was approximately 50% greater in Room A.
Although not modelled, the risks to a susceptible individual entering Room B are therefore
greater than those shown in Figure 2b, and such room-specific idiosyncrasies highlight the
potential pitfalls of generalising results, even between two proximate and similar rooms.
Notwithstanding this, infection risks in both rooms could be further reduced by allowing their
doors to remain open for greater periods following occupation by a potentially infectious
individual. However, reducing risk in one room occupied by a handful of individuals at the
expense of increased risk in more densely occupied adjacent areas (e.g. waiting room) would
represent a clearly false economy. The infectiousness of the pathogen, air volume into which
it would be mixed and number of susceptible persons located nearby would need to be
carefully considered and balanced against existing risks before opening doors could be
recommended as a general control strategy. Further research addressing this issue is
required.
Certain locations within hospitals are likely to be airborne infection ‘hotspots’, especially
those where large numbers of untriaged individuals assemble. Beggs et al.23 estimated risks
of airborne transmission of TB, influenza and measles in a hypothetical hospital waiting area
containing a single infectious individual. They found respective mean risks of infection for
susceptible persons of 0.3, 2.6 and 13.5% for a 30 minute wait, and 0.8 and 6.6 and 30.9% for
12
a 60 minute wait. Despite differences in methodology, our work and that of Beggs et al.23
highlight the approximate relative risks posed to individuals during the time spent waiting for
and during medical consultations. The risk of an individual acquiring influenza appears more
likely to occur during the actual consultation than the period spent in a waiting room based on
the limited scenarios modelled in the two studies.
Infection risk modelling using the W-R or G-N models has several limitations that reflect the
varying degrees to which its assumptions represent real-world conditions, and these are
discussed in detail elsewhere.19,20,23,24 The primary limitation is the reliance on quanta
generation rates that have been calculated by a handful of prior epidemiologic investigations,
although recent work suggests that this can be ameliorated somewhat by adopting a stochastic
approach.23 We have sought to minimise this limitation by using values approximately
representative of median cases reported by the literature.5,21 Nonetheless, it is prudent to
view the output of infection risk models from a relative perspective.23-24,26 Also, we did not
assess risks posed to health care workers6,28 which are undoubtedly higher than those
presented here given their longer exposure times.
In locations with suitably accurate ventilation control systems, it may be possible to infer
outdoor air exchange for some rooms from known total air flow rates and outdoor air intake
percentages, thus enabling real-time infection risk estimates to be calculated when combined
with occupancy at a given time. However, such an approach would need to be capable of
representing air exchange rates at the room, rather than AHU, scale, and would only be
appropriate for locations where air exchange due to non-mechanical means (e.g. infiltration)
is small relative to that delivered mechanically. For greatest accuracy, a measurement-
13
oriented approach should be employed, even if only to validate the utility of the above
method.
This study has built upon previous work by estimating airborne infection risk posed to
individuals both simultaneous and subsequent to the presence of an infectious person.
Infection risk was found to vary considerably in the different locations assessed. A simple
model provided useful information regarding relative infection risks, and the role of room
ventilation as a determinant of these. The influenza infection risk of susceptible individuals
entering an outpatient consultation room after the departure of an infectious person was
related to the occupancy time of both parties and the outdoor air exchange rate. Allowing the
door to remain open for longer periods between consultations in the room we investigated
could reduce transmission risk by significantly increasing air exchange rate. However, such a
basic infection control strategy cannot be recommended without an appropriately detailed
assessment of its effects on infection risks in proximate areas.
We have highlighted the utility of a customised approach that accounts for typical occupancy
patterns of individuals at our study site. Ventilation measurements and modelling can be
used to produce location-specific risk estimates that err on the side of caution and inform
airborne infection control and patient management practices. Such an approach may
increasingly find applications in the wake of the 2009 H1N1 pandemic, and in locations
dealing with particularly susceptible individuals.
Acknowledgements
Financial support: NMHRC Project Grant 455919. Queensland University of Technology
IHBI Human Health and Wellbeing Collaborative Research Development Grant. PG was
14
supported financially by the Center for Advanced Studies at Warsaw University of
Technology. Conflict of interest: Nil. We thank the Hospital Executive and staff in the
Emergency Department, Lung Function Laboratory and Outpatients Department at the study
site, all of whom generously accommodated the research team and their equipment. We are
grateful to the Engineering Department staff at TPCH for their expert advice regarding the
ventilation systems with the hospital.
References
1. Riley EC, Murphy, G, Riley RL. Airborne spread of measles in a suburban elementary
school. Am J Epidemiol 1978;107:421-32.
2. Moser MR, Bender TR, Margolis HS, Noble GR, Kendal AP, Ritter DG. An outbreak of
influenza aboard a commercial airliner. Am J Epidemiol 1979;110:1-6.
3. Bloch AB, Orenstein WA, Ewing WM, Spain WH, Mallison GF, Herrmann KL, Hinman
AR. Measles outbreak in a pediatric practice: airborne transmission in an office setting.
Pediatrics 1985;75:676-83.
4. Remington PL, Hall WN, Davis IH, Herald A, Gunn RA. Airborne transmission of
measles in a physician’s office. JAMA 1985;253:1574-77.
5. Nardell EA, Keegan J, Cheney SA, Etkind SC. Airborne infection: theoretical limits of
protection achievable by building ventilation. Am Rev Respir Dis 1991;144:302-06.
6. Menzies D, Fanning A, Yuan L, Fitzgerald M. Hospital ventilation and risk for
tuberculosis in Canadian health care workers. Ann Intern Med 2000;133:779-89.
7. Myatt TA, Johnston SL, Zuo Z, Wand M, Kebadze T, Rudnick S, Milton DK. Detection
of airborne rhinovirus and its relation to outdoor air supply in office environments. Am J
Respir Crit Care Med 2004;169:1187-90.
15
8. Li Y, Huang X, Yu ITS, Wong TW, Qian H. Role of air distribution in SARS
transmission during the largest nosocomial outbreak in Hong Kong. Indoor Air
2004;15:83-95.
9. Li, Y, Leung GM, Tang JW, Yang X, Chao CYH, Lin JZ, Lu JW, et al. Role of
ventilation in airborne transmission of infectious agents in the built environment – a
multidisciplinary systematic review. Indoor Air 2007;17:2-18.
10. Beggs CB, Kerr KG, Noakes CJ, Hathaway EA, Sleigh PA. The ventilation of multiple-
bed hospital wards: review and analysis. Am J Infect Control 2008;36:250-9.
11. Stilianakis NI, Drossinos Y. Dynamics of infectious disease transmission by inhalable
respiratory droplets. J R Soc Interface 2010;7:1355-66.
12. Dick EC, Jennings LC, Mink KA, Wartgow CD, Inhorn SL. Aerosol transmission of
rhinovirus colds. J Infect Dis 1987;156:442-48.
13. Roy CJ, Milton DK. Airborne transmission of communicable infection – the elusive
pathway. NEJM 2004;350:1710-12.
14. Tellier R. Aerosol transmission of influenza A: a review of new studies. J R Soc
Interface 2009;6:S783-90.
15. Tellier R. Review of aerosol transmission of influenza A virus. Emerg Infect Dis
2006;12:1657-62.
16. Tang JW, Li Y, Eames I, Chan PKS, Ridgway GL. Factors involved in the aerosol
transmission of infection and control of ventilation in healthcare premises. J Hosp Infect
2006;64:100-14.
17. Persily AK. Evaluating building IAQ and ventilation with indoor carbon dioxide.
ASHRAE Tran 1997;103:1-12.
18. Gammaitoni L, Nucci MC. Using a mathematical model to evaluate the efficacy of TB
control measures. Emerg Infect Dis 1997;3:335-42.
16
19. Beggs CB, Noakes CJ, Sleigh PA, Fletcher LA, Siddiqi K. The transmission of
tuberculosis in confined spaces: an analytical review of alternative epidemiological
models. Int J Tuberc Lung Dis 2003;7:1015-26.
20. Sze To GN, Chao CYH. Review and comparison between the Wells-Riley and dose-
response approaches to risk assessment of infectious respiratory diseases. Indoor Air
2010;20:2-16.
21. Myatt TA, Minegishi T, Allen JG, MacIntosh DL. Control of asthma triggers in indoor
air with air cleaners: a modeling analysis. Environ Health 2008;7:43.
22. Wagner BG, Coburn BJ, Blower S. Calculating the potential for within-flight
transmission of influenza A (H1N1). BMC Med 2009;7:81.
23. Beggs CB, Shepherd SJ, Kerr KG. Potential for airborne transmission of infection in the
waiting areas of healthcare premises: stochastic analysis using a Monte Carlo model.
BMC Infect Dis 2010;10:247.
24. Nardell EA. The role of ventilation in preventing nosocomial transmission of
tuberculosis. Int J Tuberc Lung Dis 1998;2:S110-17.
25. Centers for Disease Control and Prevention. Guidelines for preventing the transmission
of Mycobacterium tuberculosis in health-care settings. MMWR 2005;54:1-142.
26. Escombe AR, Oeser CC, Gilman RH, Navincopa M, Ticona, E, Pan W, et al. Natural
ventilation for the prevention of airborne contagion. PLoS Medicine 2007;4:309-17.
27. Qian H, Li Y, Seto WH, Ching P, Ching WH, Sun HQ. Natural ventilation for reducing
airborne infection in hospitals. Build Environ 2010;45:559-65.
28. Fennelly KP, Nardell EA. The relative efficacy of respirators and room ventilation in
preventing occupational tuberculosis. Infect Cont Hosp Ep 1998;19:754-759.
17
Figure captions (Figure 1a to be stacked on top of figure 1b. Same for 2a and 2b)
Figure 1. Part (a) shows modelled influenza, TB and rhinovirus infection risk as a function of
outdoor air exchange rate for individuals occupying the Lung Function Laboratory for 15
minutes in the presence of an infectious person. The current outdoor air exchange rate is
indicated by the vertical dotted line. Part (b) shows equivalent risks for 45 minutes of
exposure.
Figure 2. Part (a) shows modelled influenza quanta concentration in Outpatient Consulting
Room A for consultations with an infectious individual for up to 120 minutes. The decay in
quanta concentration following the departure of the infectious person after 15, 60 and 120
minute consultations , including an initial 5 minute period with the door open, is shown. Part
(b) shows the corresponding infection risks for a susceptible person entering the room after
the 5 minute open door period and remaining there for up to 120 minutes.
18
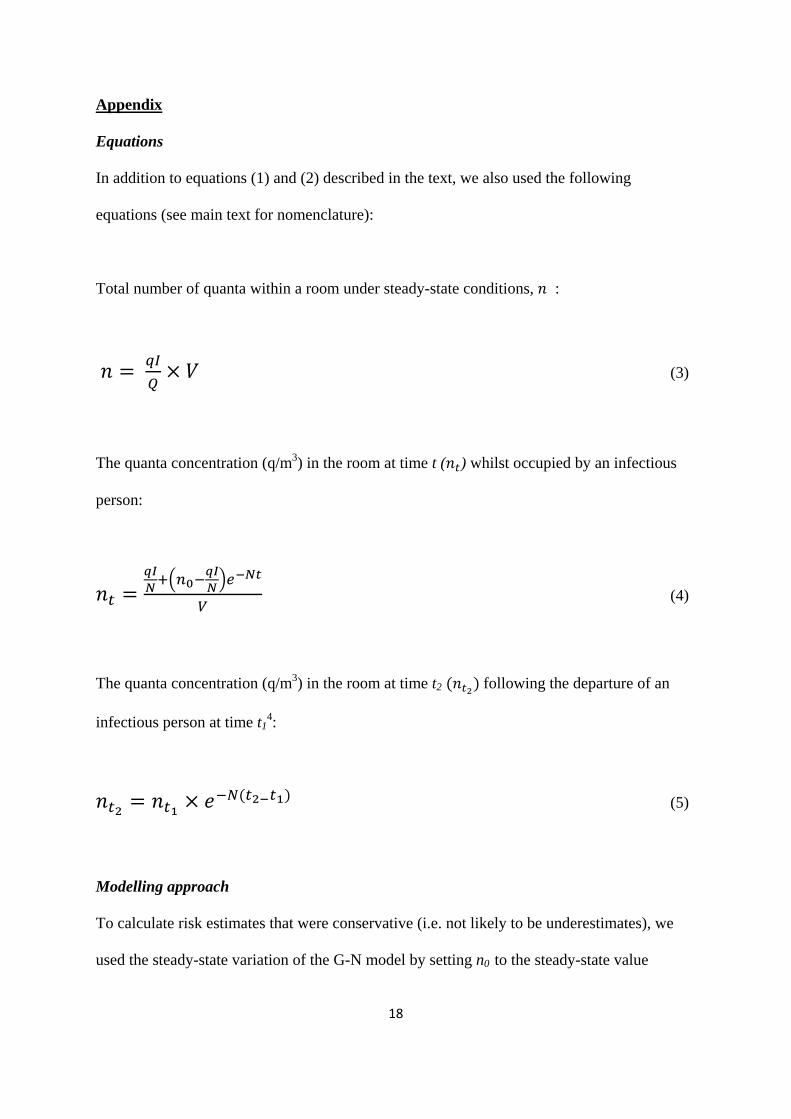
Appendix
Equations
In addition to equations (1) and (2) described in the text, we also used the following
equations (see main text for nomenclature):
Total number of quanta within a room under steady-state conditions, :
(3)
The quanta concentration (q/m3) in the room at time t ( ) whilst occupied by an infectious
person:
(4)
The quanta concentration (q/m3) in the room at time t2 following the departure of an
infectious person at time t14:
(5)
Modelling approach
To calculate risk estimates that were conservative (i.e. not likely to be underestimates), we
used the steady-state variation of the G-N model by setting n0 to the steady-state value
19
(equation 3) for situations where the initial quanta concentration was lower than its steady-
state value.19 Under these conditions, G-N and W-R model outputs are the same. When
modelling risk to an individual entering a room after the departure of infectious individual,
steady-state, initial and decaying quanta concentrations were calculated using equations 3, 4
and 5, and the G-N model shown as equation 2 was used.