Application of K Chart in Supporting Axial Force Analysis of Subway Deep Foundation Pit
17
Application of K Chart in Supporting Axial Force Analysis of Subway Deep Foundation Pit Guoqiang Zhao 1 and Wei Qi 2,3 1 Construction Engineering, Jilin University; No.6, West Minzhu Street, Changchun 130026; TEL: 15943077401;Email: [email protected] 2 Construction Engineering, Jilin University; No.6, West Minzhu Street, Changchun 130026; TEL: 13843160203 3 The City College of Jilin Architectural and Civil Engineering Institute; No.1666, Yingbin Street, Changchun; ABSTRACT Previous researchers processed monitoring data through some math means mainly, which make the result reflect better the character of building monitoring data. But data expression is single. However you process the data
-
Upload
grenoble-inp -
Category
Documents
-
view
3 -
download
0
Transcript of Application of K Chart in Supporting Axial Force Analysis of Subway Deep Foundation Pit
Application of K Chart in Supporting Axial Force Analysis
of Subway Deep Foundation Pit
Guoqiang Zhao1 and Wei Qi2,3
1 Construction Engineering, Jilin University; No.6, West
Minzhu Street, Changchun 130026; TEL: 15943077401;Email:
2 Construction Engineering, Jilin University; No.6, West
Minzhu Street, Changchun 130026; TEL: 13843160203
3 The City College of Jilin Architectural and Civil
Engineering Institute; No.1666, Yingbin Street,
Changchun;
ABSTRACT
Previous researchers processed monitoring data through
some math means mainly, which make the result reflect
better the character of building monitoring data. But
data expression is single. However you process the data
in various methods, the result is a line chart or a
smooth curve fitting. It is necessary to develop more
data expression and processing methods. It will help us
find the character of monitoring objects that is
difficult to find in a single line chart. This paper
introduces the K chart which is used in the stock market
commonly. And the author did some trials in this new
method to analyze axial force of deep silt foundation pit
supporting.
KEYWORDS
K chart; foundation pit monitoring; deep silt; axialforce
INTRODUCTION
With the exploiting of cities, the numbers of deep
foundation pits are increasing. Due to the big individual
differences between foundation pit projects, it usually
contains some uncertain factors for engineers to make the
plan of design and construction only according to
geological exploration information and indoor experiment
data. For this reason, engineers pay great attention to
the monitoring of foundation pit. And predecessors had
done a lot of study(An & Gao, 2005 and Liu et al., 2007).
However, at present, there are some common defects that
are lack of processing monitoring data and utilization
rate of monitoring data is low. Sometimes, the data
processing is too complex to use it in engineering
project(Zhao & Yuan, 2008 and Liu et al., 2010). The
value of the monitoring data is difficult to play a role,
which is a block in the way of improving design and
construction level. This paper focuses on the process of
monitoring data and makes use of K chart developing a new
method to process monitoring data. It is expected to work
on deep foundation engineering even civil engineering.
BRIEF INTRODUCTION OF K CHART
K chart is also called candlestick chart, which can be
traced back to the rice market trade in Tokugawa Bakufu
in the eighteenth century. Originally it is used to
calculate daily fluctuation of rice prices. Because this
method is convenient, comprehensive, intuitive and
unique, people use it to analyze the stock price trend.
After over 300 years of development, it is widely used in
securities market, such as stock, futures and etc. From
the current international and domestic literature, this
is the first time that K line is used in processing the
monitoring data of deep foundation pit.
APPLICATION OF K LINE CHART IN ENGINEERING
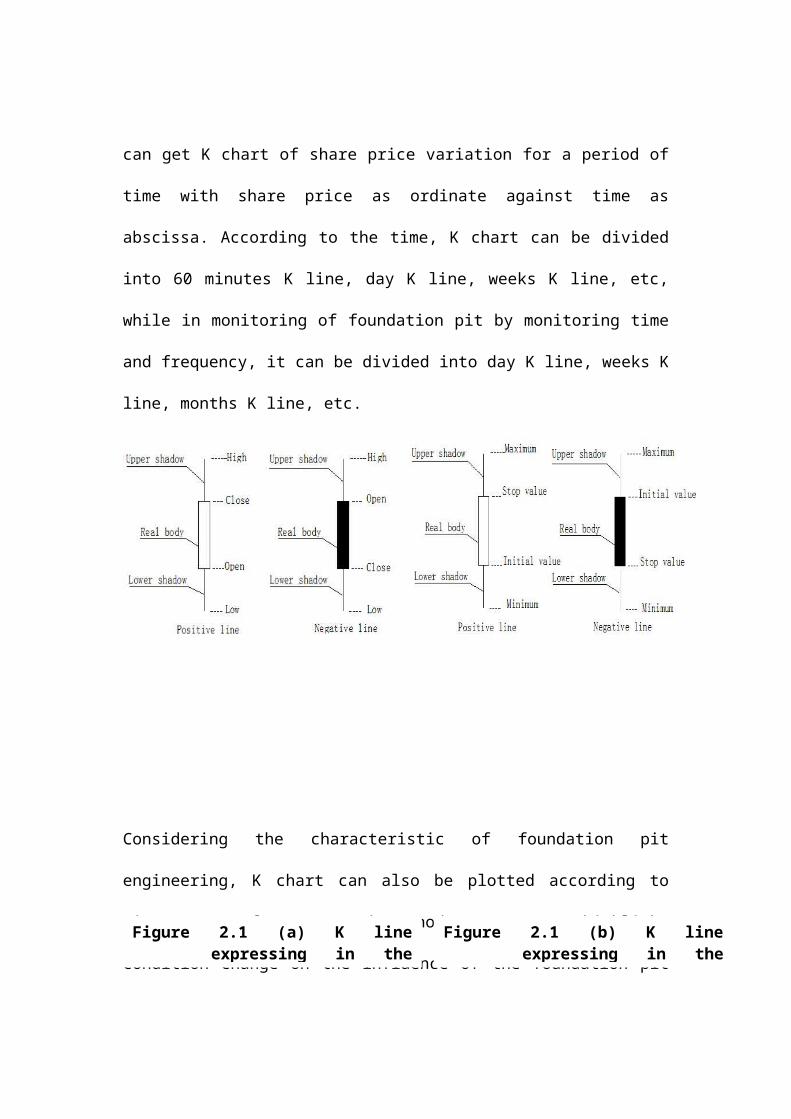
From the form, K line chart is divided into negative
(black) line, positive (red/white) line and the
equivalent price line. Each line is composed of three
parts, namely, the upper shadow, the lower shadow and the
real body. As shown in Figure 2.1, Figure 2.1 (a) is the
K line expressing in the stock market, and Figure 2.1 (b)
is the data expressing that this paper introduced to the
foundation pit monitoring. In the stock market, taking a
period of time's share price to draw on a coordinate
paper as negative and positive line in figure 2-1 (a),
can get K chart of share price variation for a period of
time with share price as ordinate against time as
abscissa. According to the time, K chart can be divided
into 60 minutes K line, day K line, weeks K line, etc,
while in monitoring of foundation pit by monitoring time
and frequency, it can be divided into day K line, weeks K
line, months K line, etc.
Considering the characteristic of foundation pit
engineering, K chart can also be plotted according to
time span of construction nodes. It can highlight
condition change on the influence of the foundation pitFigure 2.1 (b) K line
expressing in theFigure 2.1 (a) K line
expressing in the
supporting. This paper mainly with weeks K line as an
example introduces the application of K chart to process
monitoring data of axial force of foundation pit. As
shown in figure 2.1 (b), in weeks K line, the initial
value and stop value of positive line indicate
respectively the measured data value on the first day and
the last day in a week. The highest and lowest values
indicate respectively the maximum and minimum values of
axial force change in this week.
APPLICATION OF ENGINEERING PRACTICE
General situation of the engineering. The project issubway station for leaving and arriving in Ningbo. Thestarting point is R5K0+800 and terminal point isR5K1+152. Its total length is 352m, and width is 17m to22.2m. The construction method is open excavation andcut-bottom up. Floor buried depth is about 0m to 13m.
Geological and hydrological conditions. According to thedesign scheme, open excavation section is related to thelayers as 1-2 ① plain fill, 2 grayish yellow clay, 3① ①gray silt clay, 2-1 silt, 2-2 gray silt clay. Among② ②them, 1-2 plain fill structure is loose. Table 3.1①shows parameters of main layers.Phreatic water mainly exists in the shallow cohesivesoil, silty soil. And on the basis of regional geologicalinformation, a change of ground water level is little,generally in the range of 0.5m ~ 1.0m. In accordance withthe survey information, the confined water level in the
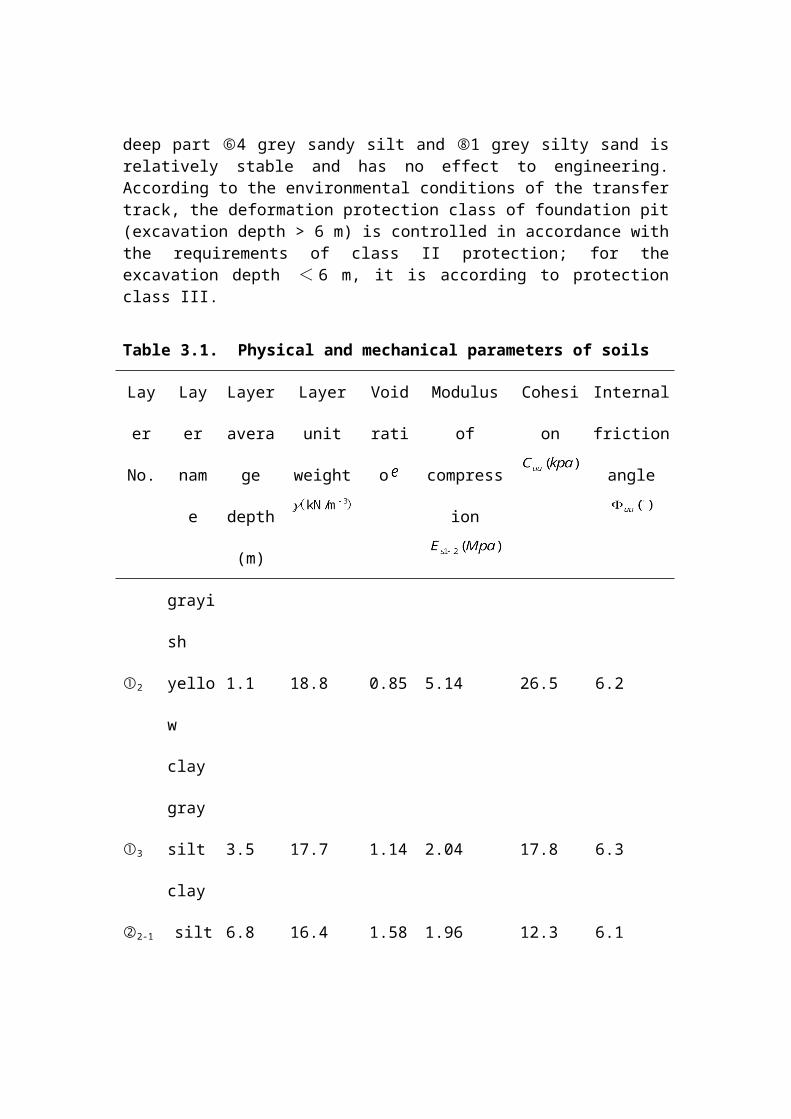
deep part ⑥4 grey sandy silt and ⑧1 grey silty sand isrelatively stable and has no effect to engineering.According to the environmental conditions of the transfertrack, the deformation protection class of foundation pit(excavation depth > 6 m) is controlled in accordance withthe requirements of class II protection; for theexcavation depth < 6 m, it is according to protectionclass III.
Table 3.1. Physical and mechanical parameters of soils
Lay
er
No.
Lay
er
nam
e
Layer
avera
ge
depth
(m)
Layer
unit
weight
Void
rati
o
Modulus
of
compress
ion
Cohesi
on
Internal
friction
angle
①2
grayi
sh
yello
w
clay
1.1 18.8 0.85 5.14 26.5 6.2
①3
gray
silt
clay
3.5 17.7 1.14 2.04 17.8 6.3
②2-1 silt 6.8 16.4 1.58 1.96 12.3 6.1
②2-2
gray
silt
clay
2.7 16.9 1.42 2.15 14.0 6.5
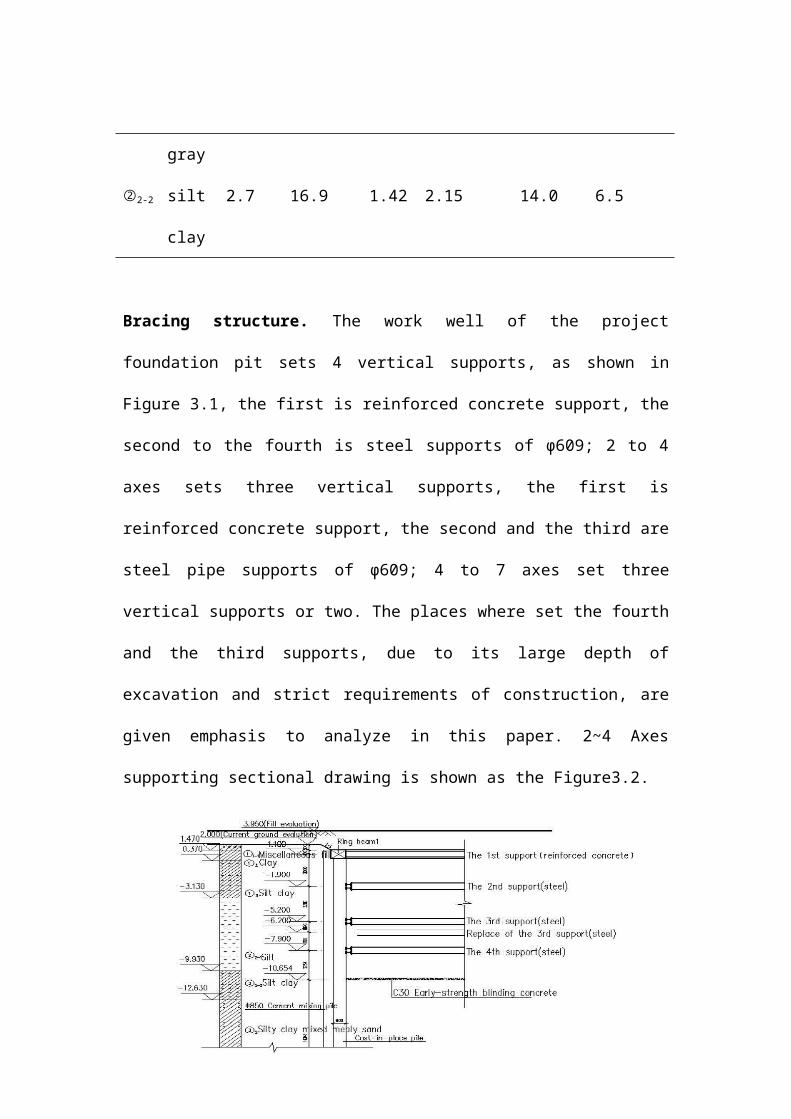
Bracing structure. The work well of the project
foundation pit sets 4 vertical supports, as shown in
Figure 3.1, the first is reinforced concrete support, the
second to the fourth is steel supports of φ609; 2 to 4
axes sets three vertical supports, the first is
reinforced concrete support, the second and the third are
steel pipe supports of φ609; 4 to 7 axes set three
vertical supports or two. The places where set the fourth
and the third supports, due to its large depth of
excavation and strict requirements of construction, are
given emphasis to analyze in this paper. 2~4 Axes
supporting sectional drawing is shown as the Figure3.2.
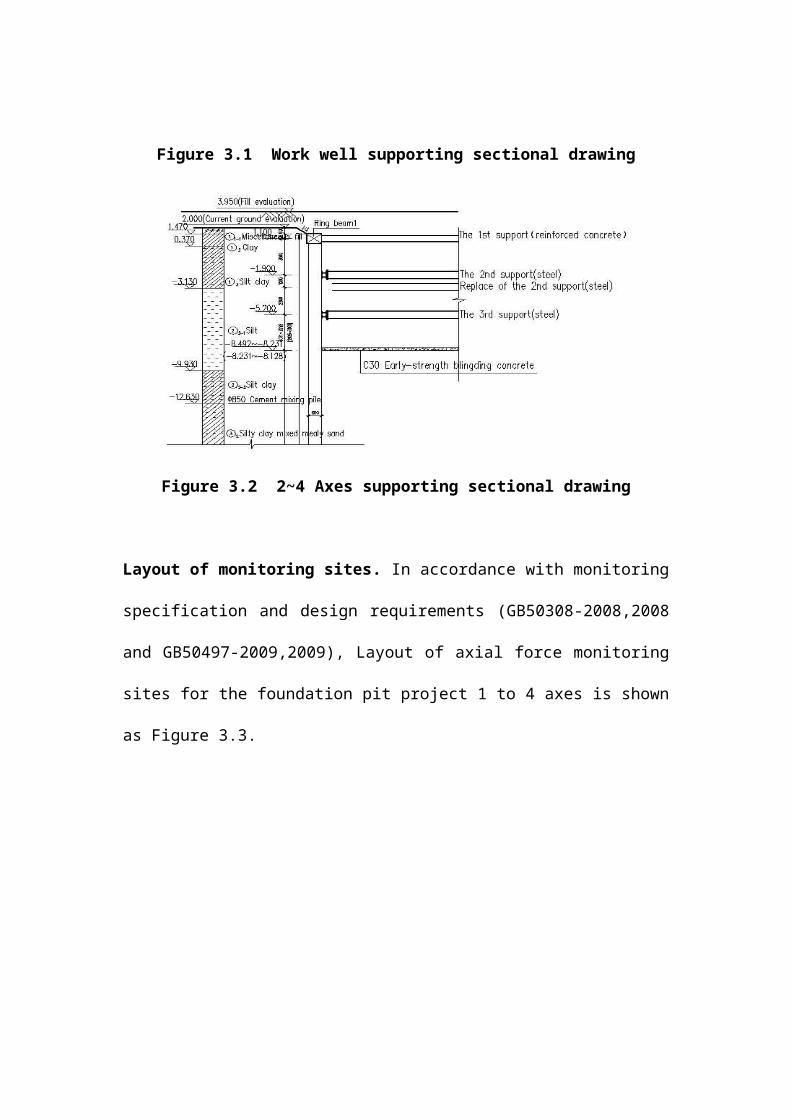
Figure 3.1 Work well supporting sectional drawing
Figure 3.2 2~4 Axes supporting sectional drawing
Layout of monitoring sites. In accordance with monitoring
specification and design requirements (GB50308-2008,2008
and GB50497-2009,2009), Layout of axial force monitoring
sites for the foundation pit project 1 to 4 axes is shown
as Figure 3.3.
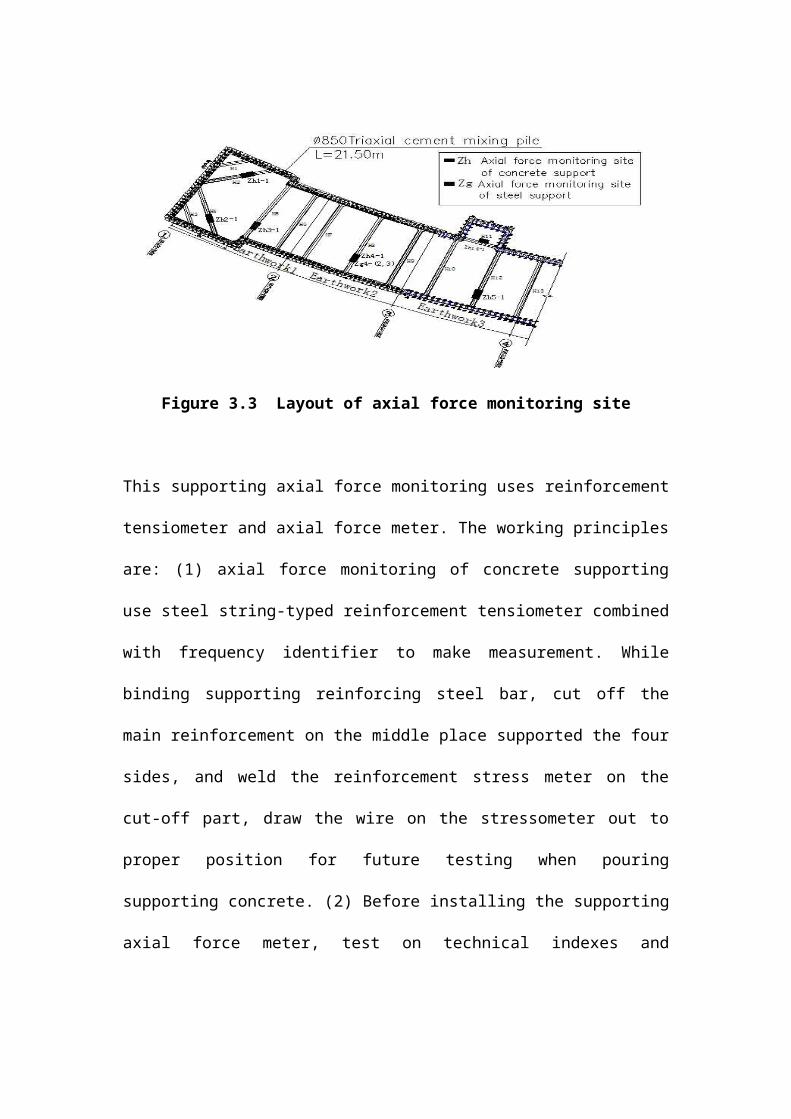
Figure 3.3 Layout of axial force monitoring site
This supporting axial force monitoring uses reinforcement
tensiometer and axial force meter. The working principles
are: (1) axial force monitoring of concrete supporting
use steel string-typed reinforcement tensiometer combined
with frequency identifier to make measurement. While
binding supporting reinforcing steel bar, cut off the
main reinforcement on the middle place supported the four
sides, and weld the reinforcement stress meter on the
cut-off part, draw the wire on the stressometer out to
proper position for future testing when pouring
supporting concrete. (2) Before installing the supporting
axial force meter, test on technical indexes and
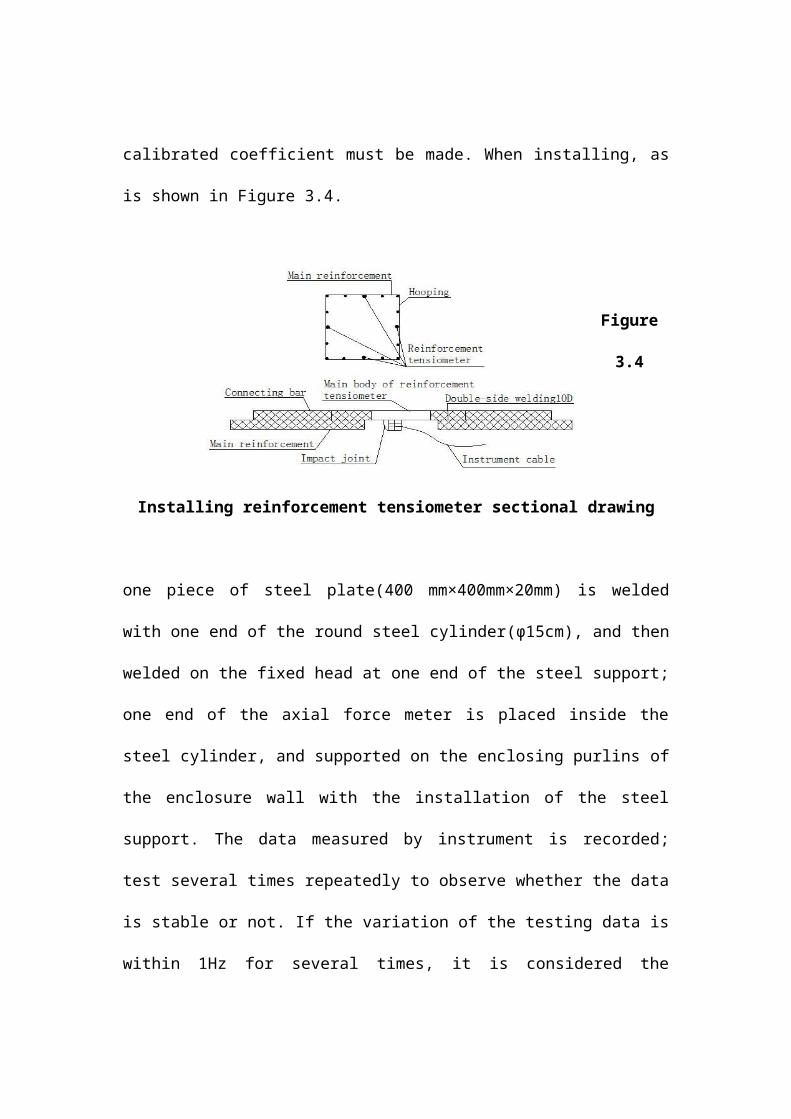
calibrated coefficient must be made. When installing, as
is shown in Figure 3.4.
Figure
3.4
Installing reinforcement tensiometer sectional drawing
one piece of steel plate(400 mm×400mm×20mm) is welded
with one end of the round steel cylinder(φ15cm), and then
welded on the fixed head at one end of the steel support;
one end of the axial force meter is placed inside the
steel cylinder, and supported on the enclosing purlins of
the enclosure wall with the installation of the steel
support. The data measured by instrument is recorded;
test several times repeatedly to observe whether the data
is stable or not. If the variation of the testing data is
within 1Hz for several times, it is considered the
testing data is stable, and make its average value as the
testing value.
Because the axial force monitoring is greatly affected by
the temperature, to get stable monitoring data, the
monitoring times are all in the same time period.
Monitoring analysis. In accordance with the supporting
load conditions of foundation pit, the paper selects the
supporting axial force as the object of discussion, which
can reflect the characteristic of the deformation of
foundation pit and also the key monitoring parts for the
construction. According to the K line expressing in the
foundation pit monitoring, draw the K line chart of the
selected monitoring sites. It is required to excavate on
the principles of layering, blocking and balancing, when
reaching 0.5 m below the specified supporting elevation,
set up supports in time.
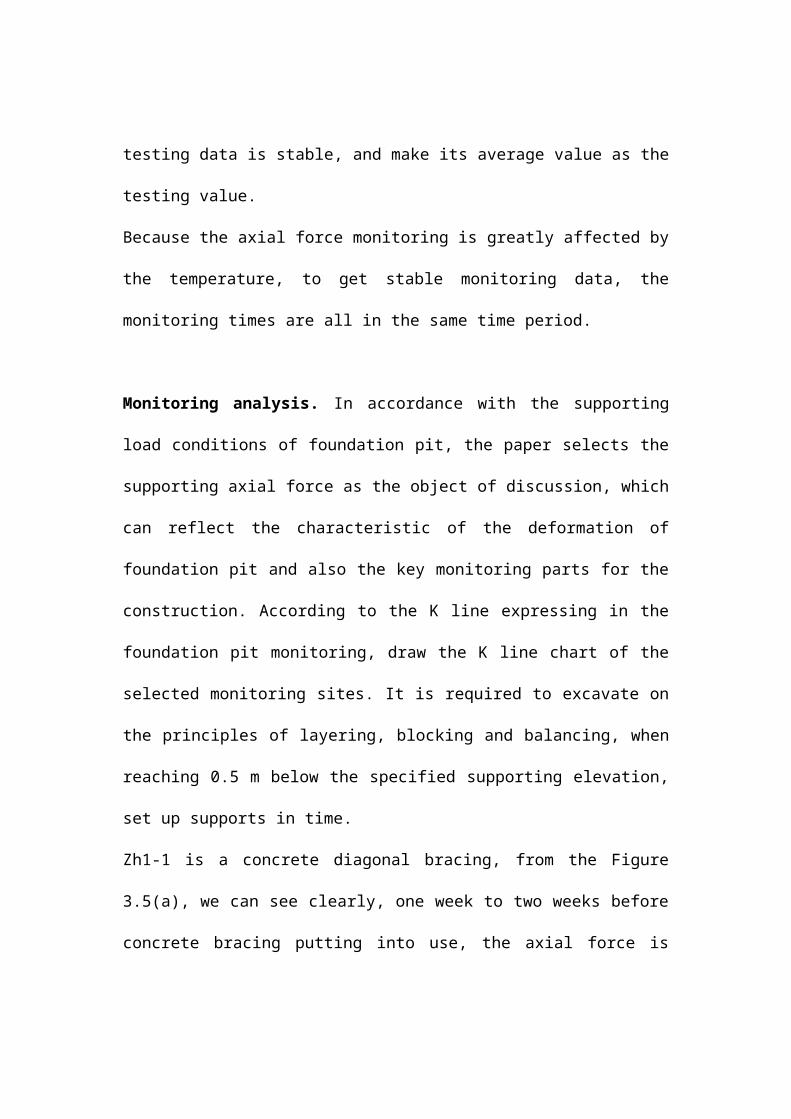
Zh1-1 is a concrete diagonal bracing, from the Figure
3.5(a), we can see clearly, one week to two weeks before
concrete bracing putting into use, the axial force is
increasing continuously, later the variation scope of it
is decreasing gradually and tends to a stable state. The
jump of the upper and lower shadow and real body shows
the abrupt change of axial force within a certain time
scope. The upper shadow in the first week is due to the
soil body excavating around it and the lower part, stress
releases, making the axial force increase, within 24 h
after excavating in place, the lower support erected,
Zh1-1 axial force is recovered. The K line chart reflects
visually the increasing and recovery of the supporting
axial force, as well as the change reduces gradually and
tends to a stable state.
Zh1-1
0100200300400500600700800900
1 2 3 4 5 6 7 8 9 10 11Weeks
KN
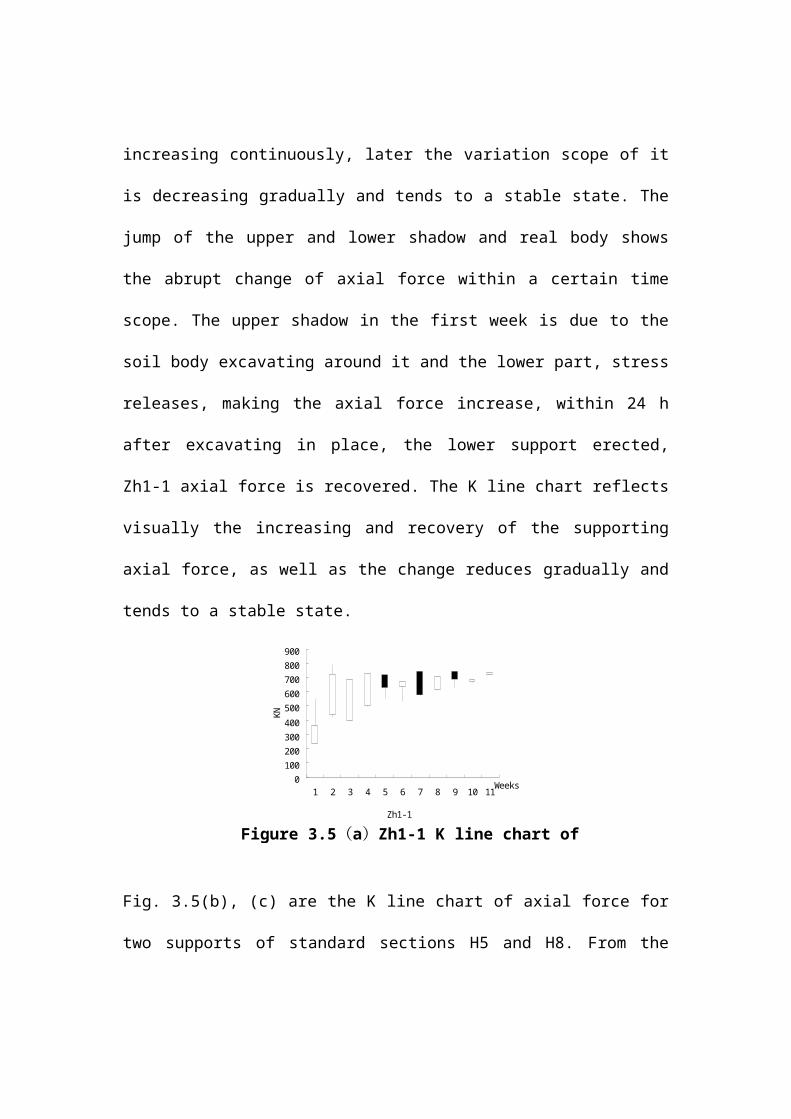
Fig. 3.5(b), (c) are the K line chart of axial force for
two supports of standard sections H5 and H8. From the
Figure 3.5(a)Zh1-1 K line chart of
Figure, we can see, except the one or two weeks before
the supports starting to work, the change of axial force
is severe, in other time periods, the variation
amplitudes are relatively small. Analyzing from the point
of layer, this place is silt soft soil, with high
sensitivity; its bearing capacity is reducing obviously
after being disturbed. When excavating, the axial force
change greatly. The method to avoid this case is that the
working procedure of the construction shall be compactly
arranged to reduce the non-supporting exposure time, the
feedback from the construction site proved this method is
effective. From the above two Figures, we can also find
that, no matter how great the variation of upper and
lower shadow is, the axial force is always oriented to
the variation of the value of the middle part of the real
body, and this value can be compared with the calculation
value as the reference value for the follow-up project
design.
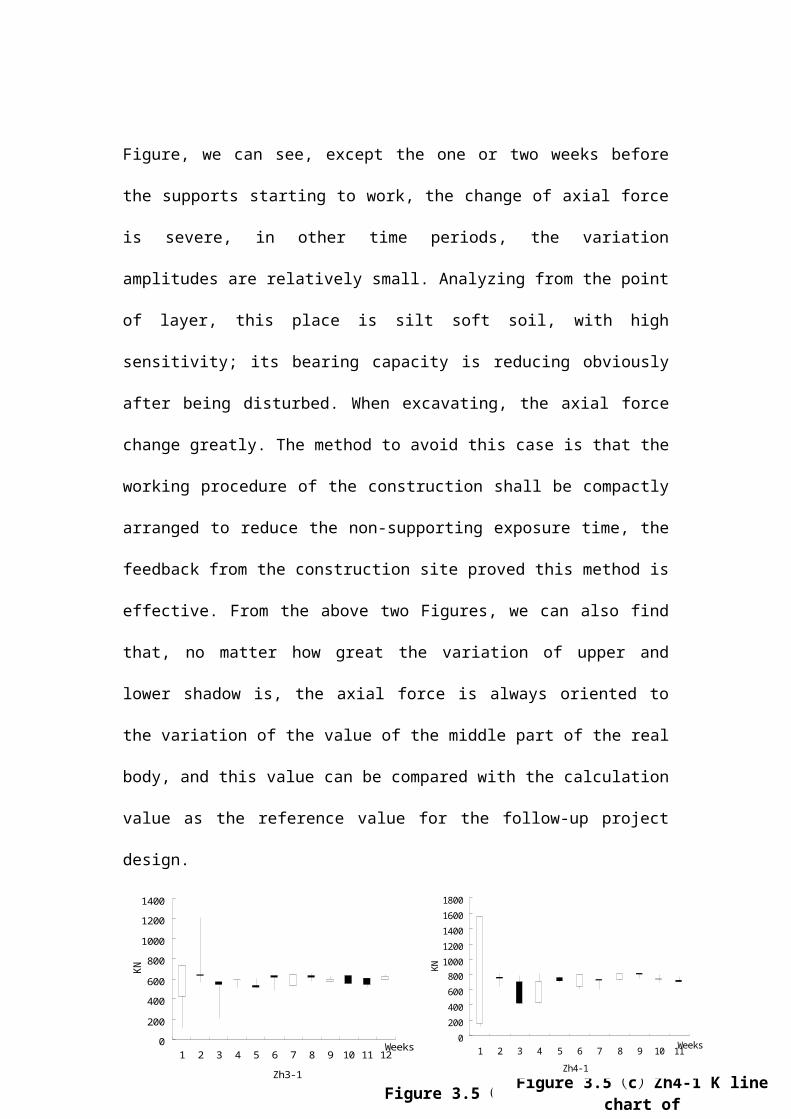
Zh3-1
0200
400600
8001000
12001400
1 2 3 4 5 6 7 8 9 10 11 12Weeks
KN
Figure 3.5(b)Zh3-1 K line chart ofaxial force
Figure 3.5(c)Zh4-1 K linechart of
Zh4-1
020040060080010001200140016001800
1 2 3 4 5 6 7 8 9 10 11Weeks
KN
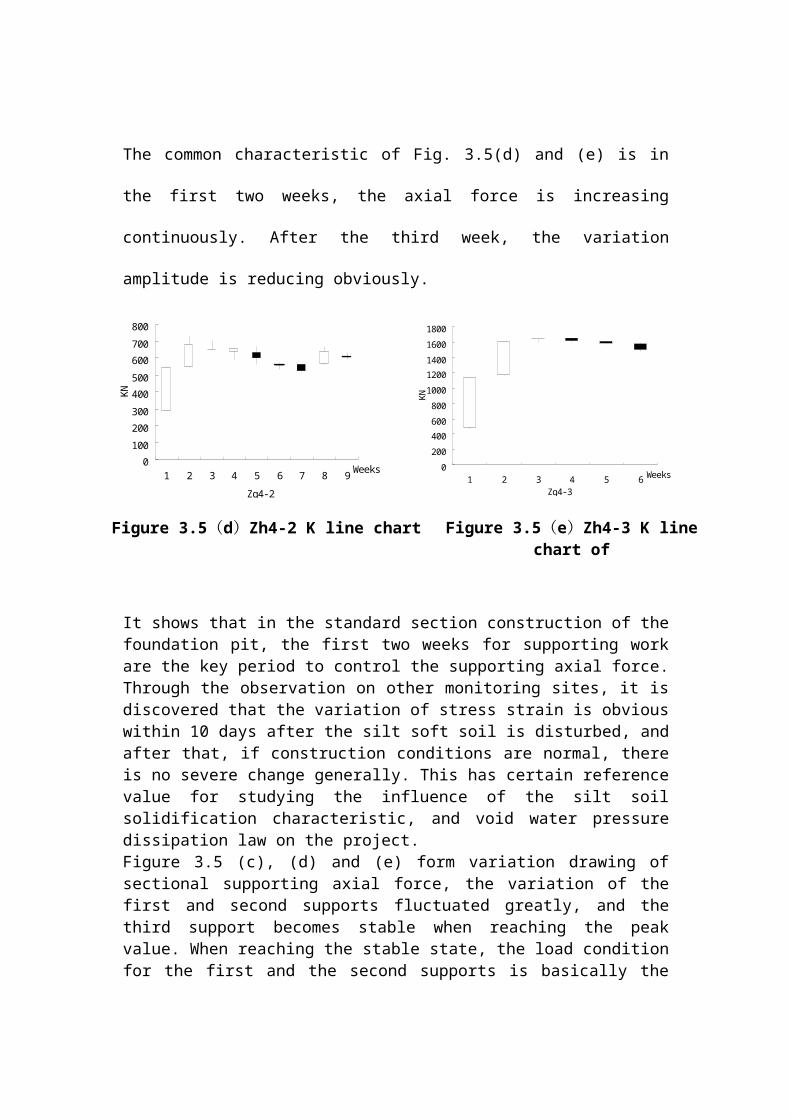
The common characteristic of Fig. 3.5(d) and (e) is in
the first two weeks, the axial force is increasing
continuously. After the third week, the variation
amplitude is reducing obviously.
It shows that in the standard section construction of thefoundation pit, the first two weeks for supporting workare the key period to control the supporting axial force.Through the observation on other monitoring sites, it isdiscovered that the variation of stress strain is obviouswithin 10 days after the silt soft soil is disturbed, andafter that, if construction conditions are normal, thereis no severe change generally. This has certain referencevalue for studying the influence of the silt soilsolidification characteristic, and void water pressuredissipation law on the project.Figure 3.5 (c), (d) and (e) form variation drawing ofsectional supporting axial force, the variation of thefirst and second supports fluctuated greatly, and thethird support becomes stable when reaching the peakvalue. When reaching the stable state, the load conditionfor the first and the second supports is basically the
Zg4-2
0100200300400500600700800
1 2 3 4 5 6 7 8 9 Weeks
KN
Zg4-3
020040060080010001200140016001800
1 2 3 4 5 6 Weeks
KN
Figure 3.5(d)Zh4-2 K line chartof axial force
Figure 3.5(e)Zh4-3 K linechart of
same, the third support’s load condition is about the sumof the above two supports. This is not fully inconformity with the result calculated according to thesoil pressure, which deserves the designers to take itinto consideration, and increase the designing value ofthe first and the third supports properly.
CONCLUSIONS
Through analyzing the above K line chart, it shows that
the chart can reflect the variation law on another aspect
when excavating the foundation pit, and visually reflects
the variation amplitude of the foundation pit in a
certain time period, as well as the relationship between
the stable value and variation value, with the updating
of the monitoring equipments, it is possible to get the
real time data of monitoring sites, or soil pressure,
water level and other monitoring values can also be added
on the lower part of the figure to make comprehensive
analysis. This will give full play of K line chart.
REFERENCES
An G.F and Gao J.Y. (2005). “Analysis of Deep Excavation Retaining
Design and Its Construction Monitoring for the Wushan Metro
Station ”J. Industrial Construction, 35(12): 61-65.
GB50308-2008: Code for urban rail transit engineering
survey [S], Beijing. China Architecture & Building Press,
2008.
GB50497-2009: Technical code for monitoring of building
excavation engineering [S], Beijing. China Architecture
& Building Press, 2009.
Liu G.B., Liu D.P, Liu L.X and Diao W.Y. (2007).
“Monitoring Analysis of the Deformation of Enclosure Wall on the
Stage of Foundation Fit Base”J. Journal of Rock Mechanics
and Geotechnical Engineering, 26 ( Supplementary
2): 4386~4394.
Liu N., Ma L.J., Xia H.M and Hua R.P. (2010). “Dynamic Back-
Analysis and Displacement Prediction for Retaining Structures” J.
Building Science,26(9): 79~82
Zhao Y.R and Yuan B.Y. (2008). “A method based on time series
improvement method of wavelet applied to deep foundation pit
monitoring” J. Rock and Soil Mechanics, 29( 12):
3381~3386.