AGENT BASED SIMULATION AND AN EXAMPLE IN ANYLOGIC
36
YILDIZ TECHNICAL UNIVERSITY MECHANICAL FACULTY INDUSTRIAL ENGINEERING DEPARTMENT AGENT-BASED SIMULATION AND AN EXAMPLE IN ANYLOGIC GİZEM GÜNEŞ 11061007 ADVISOR Assoc. Prof. Ali Fuat GÜNERİ ISTANBUL, 2014
Transcript of AGENT BASED SIMULATION AND AN EXAMPLE IN ANYLOGIC

YILDIZ TECHNICAL UNIVERSITY MECHANICAL FACULTY
INDUSTRIAL ENGINEERING DEPARTMENT
AGENT-BASED SIMULATION
AND AN EXAMPLE IN ANYLOGIC
GİZEM GÜNEŞ 11061007
ADVISOR
Assoc. Prof. Ali Fuat GÜNERİ
ISTANBUL, 2014
1
AGENT-BASED SIMULATION
AND AN EXAMPLE IN ANYLOGIC
GİZEM GÜNEŞ
ADVISOR
Assoc. Prof. Ali Fuat GÜNERİ
Abstract
A simulation model is a copy of a real world system on computer and can be used to see
results of different scenarios. But, simulation modeling typically requires some training and
learning, in a conclusion it’s harder than mathematical models. There are three simulation
methods: Discrete Event Simulation (DE), Agent-Based Simulation (AB) and System Dynamics
(SD). The example is a scenario in healthcare sector. Finally, results of the example will be
shown with graphical methods.
Yıldız Technical University, Industrial Engineering Department, Istanbul, 2014
2
CONTENTS
1. Introduction …………………………………………………………………………………………………………………… 3
2. Agent – Based Simulation ……………………………………………………………………………………………….. 4
2.1. Comparison of AB, DE and SD ……………………………………………………………………………………………………… 5
2.2. When Do We Use AB? …………………………………………………………………………………………………………………. 7
2.3. Working Principle of AB ………………………………………………………………………………………………………………. 7
2.4. Steps of AB Simulation ………………………………………………………………………………………………………………… 8
3. AnyLogic Simulation Software …………………………………………………………………………………………. 9
3.1. AnyLogic and AB Simulation ………………………………………………………………………………………………………… 9
3.1.1. Agents …………………………………………………………………........................................................................ 10
3.1.1.1. Agent Type – Properties ……………………………………………………………………………………………………………. 10
4. Epidemic Example in AnyLogic ………………………………………………………………………………………. 15
4.1. Creating Model of The Epidemic Example …………………………………………………….…………………………… 16
Step 1. To Create a New Model ………………………………………………………………………………………………………….. 16
Step 2. To Create a Population of Agents ……………………………………………………………………………………………. 17
Step 3. To Create Statechart of The Agent ………………………………………………………………………………………….. 20
Step 4. To Create Variables of The Agent ……………………………………………………………………………………………. 25
Step 5. To Edit State Entity and Exit Actions ……………………………………………………………………………………….. 27
Step 6. To Add Statistics for Time Stack Chart …………………………………………………………………………………….. 29
Step 7. To Add Time Stack Chart …………………………………………………………………………………………………………. 30
Step 8. To Determine Experiment Conditions ……………………………………………………………………………………… 31
4.2. Results of The Epidemic Example ………………………………………………………………………………………………. 32
5. Conclusions …………………………………………………………………………………………………………………… 34
6. References ……………………………………………………………………………………………………………………. 35
3
1. Introduction
Globalization improves day by day so the companies face with much more complex
problem in these days. In the past, there was less variability and uncertainty than nowadays.
In a result, traditional methods couldn’t be enough for solving problems. Its reason is that
traditional methods prepared for determined conditions so they can’t succeed about being
adapted different conditions. Nowadays, the companies have to use simulation methods for
modeling different conditions.
A simulation model is a copy of a real world system on computer and can be used to see
results of different scenarios without nothing changes in the real world. But we have to not
forget that models aren’t represent to real system exactly. Because real systems are more
complex than the models. So simulation modeling typically requires some training and
learning, in a conclusion it’s harder than mathematical models.
There are three simulation methods: Discrete Event Simulation (DE), Agent-Based
Simulation (AB) and System Dynamics (SD). DE is used to model systems that change
stochastically and dynamically and based on processes. SD is one of the most useable
method for continuous systems and based on changing results of equations
instantaneously. The most important part of SD is feedback. AB is a newer and more detailed
method than DE and SD. It based on organizing and communication. In this study, AB will be
explained comprehensively.
Simulation modeling is done with software programmes (such as Arena, AnyLogic, Simul8,
AutoMod, etc.) and these programmes have various computer languages; some of them are
general computer languages (such as Java, C++, etc.) and some of them were created to use
in just simulation programmes (such as GPSS, SLAM, SIMAN, etc.). In this study, AnyLogic will
be used to simulation modeling and it uses Java programming language. In addition, some
Java codes will be explained and it will be used in the example.
Another useful property of simulation modeling is that software tools can show results
with visual and textual. So it’s really effective and helpful method to understand conditions,
their effects and results.
4
2. Agent-Based Simulation
AB modeling is newer than other methods of simulation modeling. Until the early 2000s,
AB is only academic study. However, AB gets popular day by day because AB can be used in a
system flexibly and effectively. Because AB is more useable for complex and dynamic
systems. Many disciplines(anthropology, consumer behavior analysis, economics,
manufacturing, military, physical sciences, sociology, etc.) use AB simulation model in their
research.
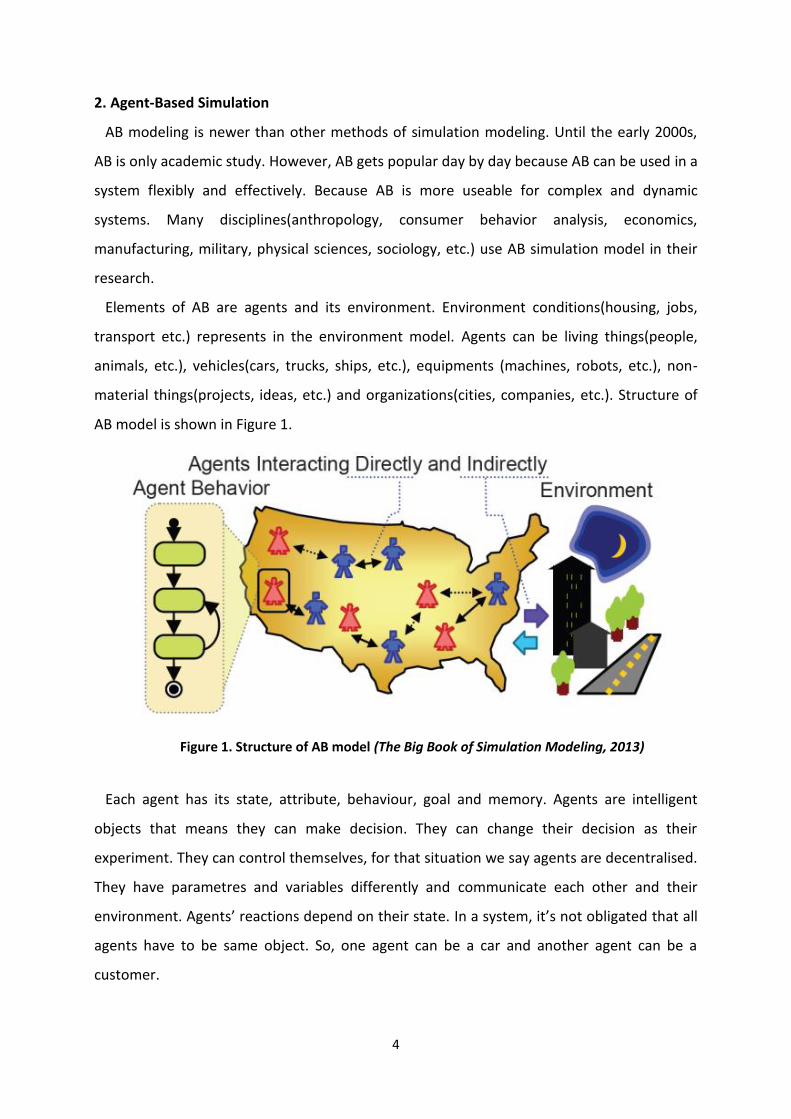
Elements of AB are agents and its environment. Environment conditions(housing, jobs,
transport etc.) represents in the environment model. Agents can be living things(people,
animals, etc.), vehicles(cars, trucks, ships, etc.), equipments (machines, robots, etc.), non-
material things(projects, ideas, etc.) and organizations(cities, companies, etc.). Structure of
AB model is shown in Figure 1.
Each agent has its state, attribute, behaviour, goal and memory. Agents are intelligent
objects that means they can make decision. They can change their decision as their
experiment. They can control themselves, for that situation we say agents are decentralised.
They have parametres and variables differently and communicate each other and their
environment. Agents’ reactions depend on their state. In a system, it’s not obligated that all
agents have to be same object. So, one agent can be a car and another agent can be a
customer.
Figure 1. Structure of AB model (The Big Book of Simulation Modeling, 2013)

5
AB demolished the traditional top-down modeling. We can determine interaction,
behavior and communication systems of agents so top-down study can’t help solving
complex problems. In a result, AB has buttom-up modeling.
2.1. Comparison of AB, DE and SD :
Firstly AB, DE and SD simulation methods are shown with visually in Figure 2.
Some Differences:
o The most important change between AB and DE is that DE based on queue though
AB doesn’t have queue.
o DE is used for decrete systems, but AB and SD are used for continuous systems.
o DE based on processes; AB based on agents; SD based on changing results of
equations instantaneously.
o The most important part of SD is feedback. However, AB doesn’t have it.
o DE generally respresents with flowcharts, but AB generally represents with
statecharts.
Figure 2. Describing AB, DE and SD visually (The Big Book of Simulation Modeling, 2013)
If we do a list of agents’ properties, these are:
1. Agents aren’t centralised.
2. Agents contact with their environment and with other agents.
3. Agents have goals, the ability to learn and adapt, resource attributes.
4. Agents are various and may be heterogeneous. (people, companies, projects,
assets, vehicles, cities, animals, ships, products, etc.)
6
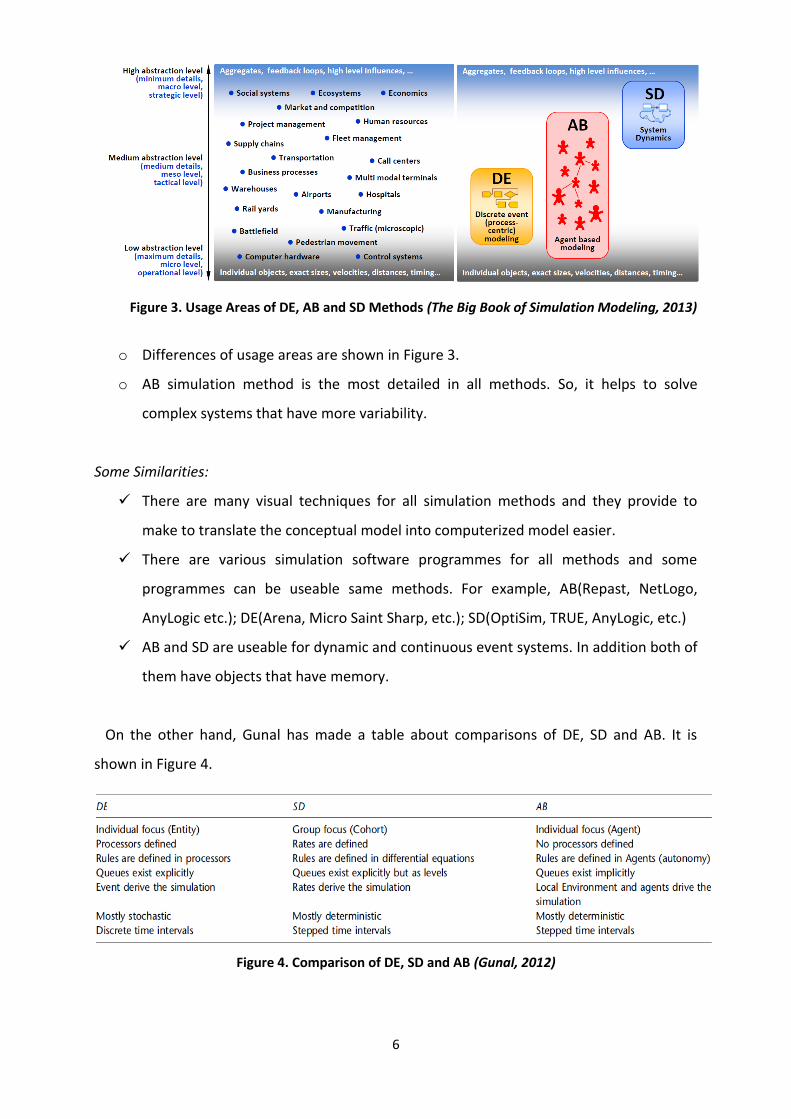
o Differences of usage areas are shown in Figure 3.
o AB simulation method is the most detailed in all methods. So, it helps to solve
complex systems that have more variability.
Some Similarities:
There are many visual techniques for all simulation methods and they provide to
make to translate the conceptual model into computerized model easier.
There are various simulation software programmes for all methods and some
programmes can be useable same methods. For example, AB(Repast, NetLogo,
AnyLogic etc.); DE(Arena, Micro Saint Sharp, etc.); SD(OptiSim, TRUE, AnyLogic, etc.)
AB and SD are useable for dynamic and continuous event systems. In addition both of
them have objects that have memory.
On the other hand, Gunal has made a table about comparisons of DE, SD and AB. It is
shown in Figure 4.
Figure 4. Comparison of DE, SD and AB (Gunal, 2012)
Figure 3. Usage Areas of DE, AB and SD Methods (The Big Book of Simulation Modeling, 2013)
7
2.2. When do we use AB?
List of features for a problem to have that make it a good candidate for an application of
AB, such as: (Siebers, Macal, Garnett, Buxton and Pidd, 2010)
when the problem has a natural representation as agents
when the goal is modeling the behaviours of individuals in a diverse population;
when agents have relationships with other agents, especially dynamic relationships—
agent relationships form and dissipate, for example, structured contact, social
networks;
when it is important that individual agents have spatial or geo-spatial aspects to their
behaviours (eg, agents move over a landscape);
when it is important that agents learn or adapt, or populations adapt;
when agents engage in strategic behaviour, and anticipate other agents’ reactions
when making their decisions;
when it is important to model agents that cooperate, collude, or form organisations;
when the past is not a predictor of the future (eg, new markets that do not currently
exist);
when scale-up to arbitrary levels is important, that is, extensibility;
when process structural change needs to be a result of the model, rather than an
input to the model (eg, agents decide what process to go to next).
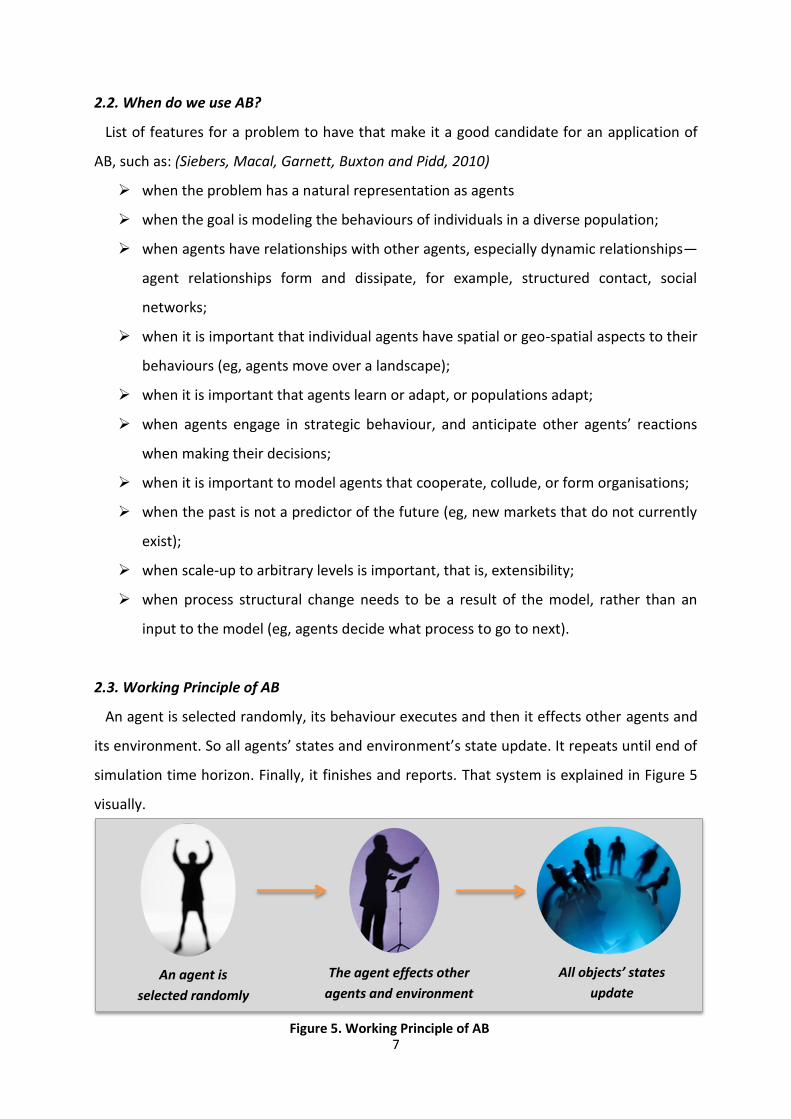
2.3. Working Principle of AB
An agent is selected randomly, its behaviour executes and then it effects other agents and
its environment. So all agents’ states and environment’s state update. It repeats until end of
simulation time horizon. Finally, it finishes and reports. That system is explained in Figure 5
visually.
The agent effects other
agents and environment
All objects’ states
update An agent is
selected randomly
Figure 5. Working Principle of AB
8
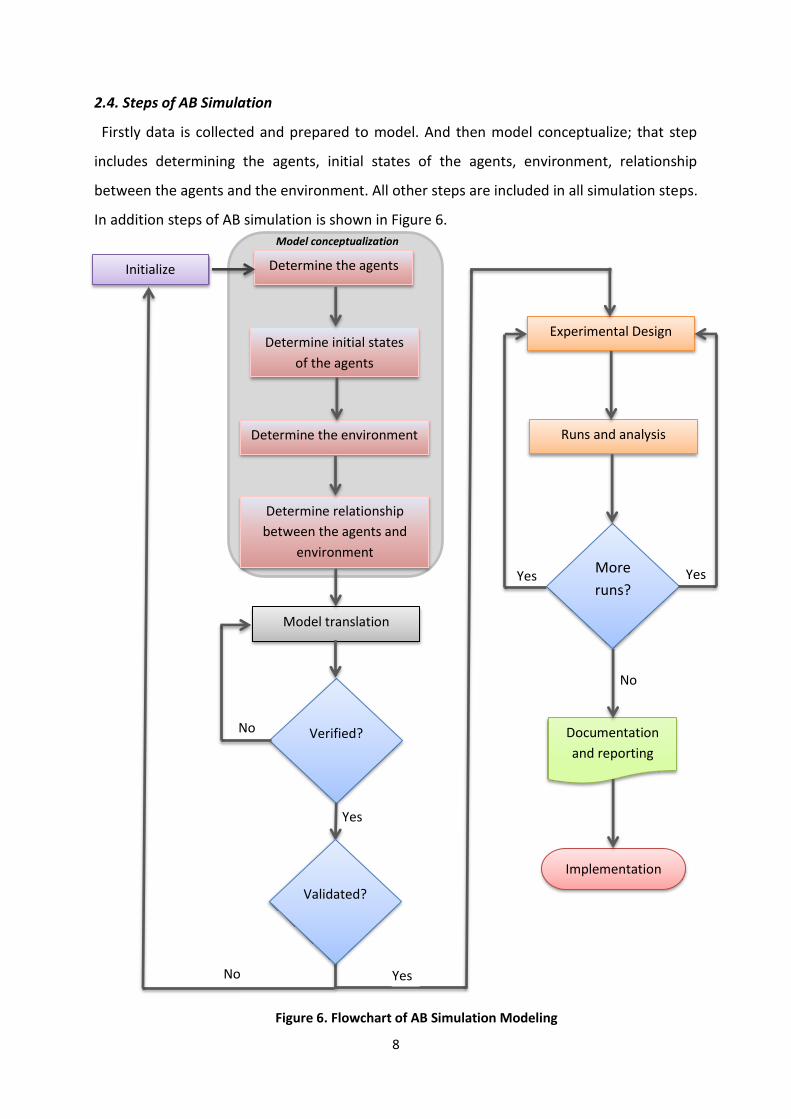
2.4. Steps of AB Simulation
Firstly data is collected and prepared to model. And then model conceptualize; that step
includes determining the agents, initial states of the agents, environment, relationship
between the agents and the environment. All other steps are included in all simulation steps.
In addition steps of AB simulation is shown in Figure 6.
Initialize Determine the agents
Determine initial states
of the agents
Determine the environment
Determine relationship
between the agents and
environment
Model translation
Verified?
Experimental Design
Runs and analysis
More
runs?
Documentation
and reporting
Implementation
Validated?
No
No
No
Yes Yes
Yes
Yes
Model conceptualization
Figure 6. Flowchart of AB Simulation Modeling
9
3. AnyLogic Simulation Software
Firstly, it was named AnyLogic because it can be used with all of simulation approaches
(Agent-Based Simulation, Descrete Event Simulation, System Dynamics) very well. AnyLogic
provides to model a complex system easily. Because it can communicate between different
simulation methods each other. On the other hand, in that study, only AB modeling will be
explained with an example in the software.
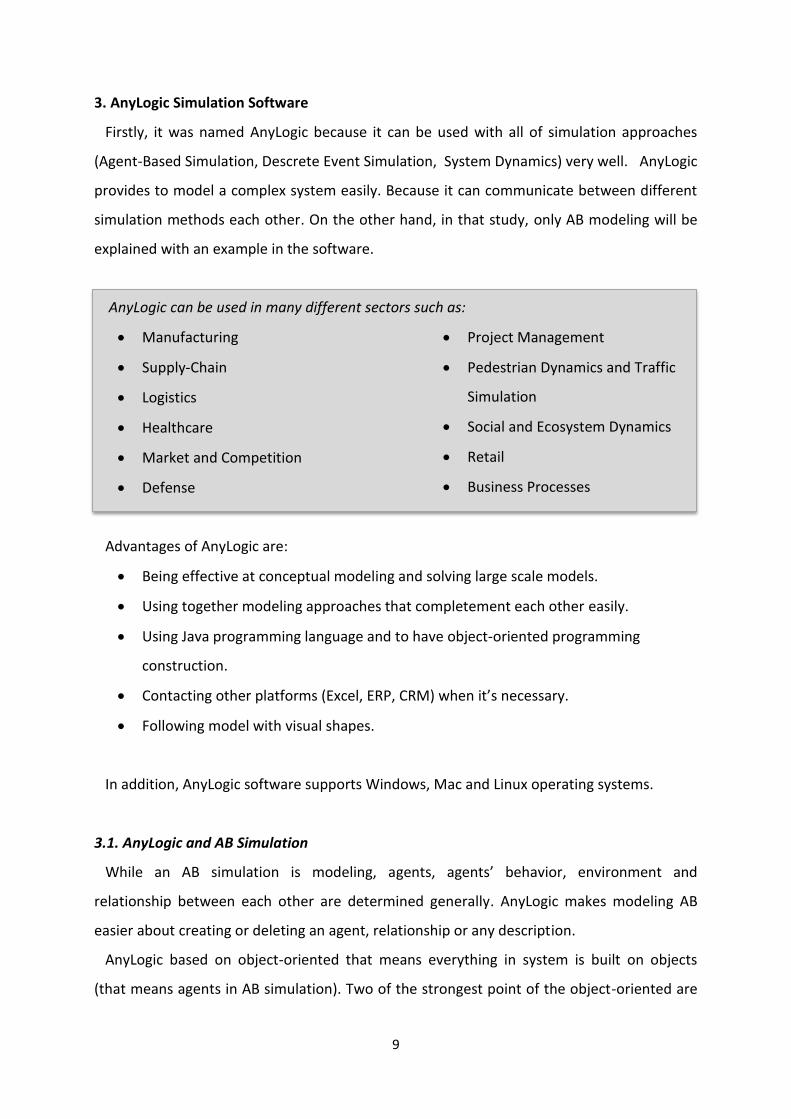
AnyLogic can be used in many different sectors such as:
Manufacturing
Supply-Chain
Logistics
Healthcare
Market and Competition
Defense
Project Management
Pedestrian Dynamics and Traffic
Simulation
Social and Ecosystem Dynamics
Retail
Business Processes
Advantages of AnyLogic are:
Being effective at conceptual modeling and solving large scale models.
Using together modeling approaches that completement each other easily.
Using Java programming language and to have object-oriented programming
construction.
Contacting other platforms (Excel, ERP, CRM) when it’s necessary.
Following model with visual shapes.
In addition, AnyLogic software supports Windows, Mac and Linux operating systems.
3.1. AnyLogic and AB Simulation
While an AB simulation is modeling, agents, agents’ behavior, environment and
relationship between each other are determined generally. AnyLogic makes modeling AB
easier about creating or deleting an agent, relationship or any description.
AnyLogic based on object-oriented that means everything in system is built on objects
(that means agents in AB simulation). Two of the strongest point of the object-oriented are
10
expressing reality (that means a real system is abstracted as you modeled) and managing
change. In addition, AnyLogic simulation software uses Java programming language. So, it
helps to understand how we can model easily.
3.1.1. Agents
Agents are the most important element in AB Simulation. It is explained in “2. Agent-Based
Simulation” longly. In this part, how you can create an agent in AnyLogic Simulation Software
is explained.
3.1.1.1. Agent Type – Properties
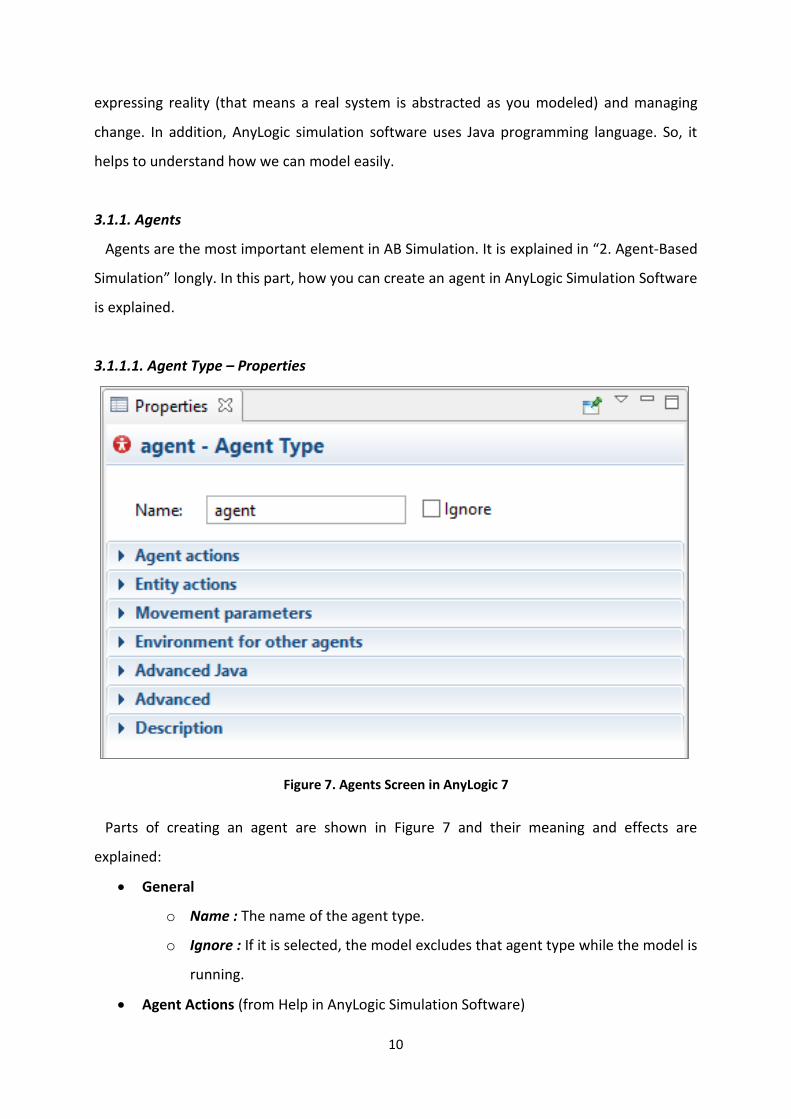
Parts of creating an agent are shown in Figure 7 and their meaning and effects are
explained:
General
o Name : The name of the agent type.
o Ignore : If it is selected, the model excludes that agent type while the model is
running.
Agent Actions (from Help in AnyLogic Simulation Software)
Figure 7. Agents Screen in AnyLogic 7
11
o On Startup : Code to be executed after all agents throughout the whole
model are constructed, connected and initialized, and before anything else is
done.
o On Destroy : Code to be executed on destroying agent of this type.
o On Arrival to Target Location : Code to be executed when the agent arrives at
the destination.
o On Before Step : Code to be executed for this agent before a step is taken in
agent based model with synchronization.
o On Step : Code to be executed for this agent on taking a step in agent based
model with synchronization.
Entity Actions
o Use in Flowcharts As : Select the role of the agent in the flowcharts.
o On Enter Flowchart Block : You can write the code to be executed when the
agent enters the flowchart in there.
o On Exit Flowchart Block : You can write the code to be executed when the
agent exits the flowchart in there.
o On Seize Resource : You can write the code to be executed when the agent
seizes the resource while being in the flowchart in there.
o On Release Resource : You can write the code to be executed when this agent
releases the resource while being in the flowchart in there.
Movement Parameters
o Initial Speed : (It can seem if Space Type is Continuous or GIS.) That means the
speed of the agent.
o Rotate Animation Towards Movement : (It can seem if Space Type is
Continuous or GIS.) That means the route of the agent.
o Rotate Vertically as well (along Z-axis) : If it is selected, the agent shape will
be headed towards the purpose throughout the agent movement.
Environment for Other Agents
o Select the Agents You Want to Place in the Environment : You can select
agents with checkboxes which you want to live in the environment.
o Space Type : It can express continuous (space), discrete (space) or GIS (space).
12
o GIS Map : (It can seem if GIS Space Type is chosen.) That means Geospatial
Space fort he environment.
o Width : (It can seem if Continuous or Discrete Space Type is chosen.) The
horizontal dimension of the visualizing space.
o Height : (It can seem if Continuous or Discrete Space Type is chosen.) The
vertical dimension of the visualizing space.
o Columns : (It can seem if Discrete Space Type is chosen.) The number of
columns in discrete space.
o Rows : (It can seem if Discrete Space Type is chosen.) The number of rows in
discrete space.
o Neighbourhood Type : (It can seem if Discrete Space Type is chosen.) It can be
Moore or Euclidean.
Moore : The neighbours are counted in all 8 cells.
Euclidean : The neighbours are counted in 4 cells.
o Layout Type : (It can seem if Discrete or Continuous Space Type is chosen.)
Layout Type can be User-Defined, Random, Arranged, Ring or Spring Mass. If
you want your agents to be placed according to you chose which layout when
the model starts, you should check the Apply on Startup checkbox.
User-Defined : You decide which agent is placed in where.
Random : An agent location is chosen randomly and uniformly.
Arranged : The agents are arranged within the space dimensions.
Ring : The agents uniformly distributed on a ring whose diameter is
smaller than the smallest space dimension.
Spring Mass : The agents are located as a spring mass system where
agents are masses and their connections are springs.
o Network Type : (It can seem if Discrete or Continuous Space Type is chosen.) It
provides to define how agents connect each other. It can be user-defined,
random, distance-based, ring lattice, small world or scale-free. If you want
this network to be constructed when the model starts, you should check the
Apply on Startup checkbox.
User-Defined : You decide which agent how connects to other agents.
Random : Agents are connected each other randomly.
13
Distance-Based : An agent connect the other one agent if the distance
between of them is less than given maximum number of distance.
Ring Lattice : Agent connections form a ring where an agent is
connected to a given number of closest agents.
Small World : It can be considered as ring lattice where some links
have been “re-wired” to long-distance agents.
Scale Free : Some agents are “hubs” with a lot of connections and
some are “hermits” with few connections.
o Connections per Agent : (It can seem if Random, Small World or Ring is
chosen as Network Type.) It means the number of connections per agent.
o Connection Range : (It can seem if Distance Based is chosen as Network
Type.) It provides to define the radius of the connection area for agents
connect each other.
o Neighbour Link Fraction : (It can seem if Small World is chosen as Network
Type.) It is a parameter for Small World network type.
o M : (It can seem if Scale Free is chosen as Network Type.) It is a parameter for
Scale Free network type.
o Enable Steps : If it is selected, AB modeling is synchronous. You can define the
step duration with Step Duration.
Step Duration (in model time units) : (It can seem if Enable Steps is
selected.) It provides to custom step duration in the case of
synchronous modeling.
Advanced Java
o Imports Section : Import statements are needed for correct of the class code.
When Java code is generated, these statements are inserted before definition
of the Java class.
o Implements (comma-seperated list of interfaces) : It is implemented by the
class.
o Additional Class Code : Arbitrary member variables, nested classes, constants
and functions are defined here. You can access these class data members
anywhere within this agent.
14
o Parameterized Type : If it is selected, you can define generic parameters for
this agent type in the Type Parameters part.
Advanced
o Extend Other Agent : This feature gives you an ability to expose the
functionality common for agents of different types into one place, "base
agent type".
o Create View Area in Origin : If it is selected, a view area in the axis origin is
created automatically.
o Create Dataset for Dynamic Variables : If it is selected, AnyLogic creates
datasets for all dynamic variables (stock, flow and dynamic variables),
contained in this agent type and collects the well-defined number (specified
in the Keep up to ... latest samples property) of latest samples of these
variables in these datasets. Samples collection is performed with the specified
Recurrence time. If this option is not set, the user needs to create dataset for
each dynamic variable by himself.
Recurrence Time : (It can seem if Create Datasets for Dynamic
Variables is set.) It defines the recurrence time for collecting samples
of dynamic variables.
Limit the Number of Array Elements Up to the First … Items : (It can
seem if Create Datasets for Dynamic Variables is set.) It defines the
nmber of samples in each dataset automatically created by AnyLogic
for dynamic variable.
15
4. Epidemic Example in AnyLogic
This problem is adapted from The Big Book of Simulation Modeling. The problem
statements are :
Consider a population of 10,000 people. They live in an area measuring 10 by 10
kilometers, and are evenly spread throughout the area.
A person in the area knows everybody who lives within 1 kilometer of him, and does
not know anybody else.
10 random people are initially infected, and everybody else is susceptible (none are
immune).
If an infectious person contacts a susceptible person, the latter gets infected with
probability 0.1.
Having been infected, a person does not immediately become infectious. There is a
latent phase that lasts from 3 to 6 days. We will call people in the latent phase
exposed.
The illness duration after the latent phase (i.e. the duration of the infectious phase) is
uniformly distributed between 7 and 15 days.
During the infectious phase, a person on average contacts 5 people he knows per
day.
When the person recovers, he becomes immune to the disease, but not forever.
Immunity lasts from 30 to 70 days.
We are to find out the epidemic dynamics -- namely, the number of exposed and infectious
people over time.
The terminology and the overall structure of the problem is taken from the compartmental
models in epidemiology -- namely, from the SEIR (Susceptible Exposed Infectious Recovered)
model. The SEIR problem was originally solved using differential equations; the approach is
similar to system dynamics. We, however, are adding details that are not well captured by
compartmental (aggregated) models: space, communication dependent on space, and
uniformly distributed phase durations. The rationale behind using the agent based approach
is its naturalness: we may not know how to derive global equations for a particular disease,
but we know the course of the disease and can model this easily and in a straightforward
manner at the individual level.
16
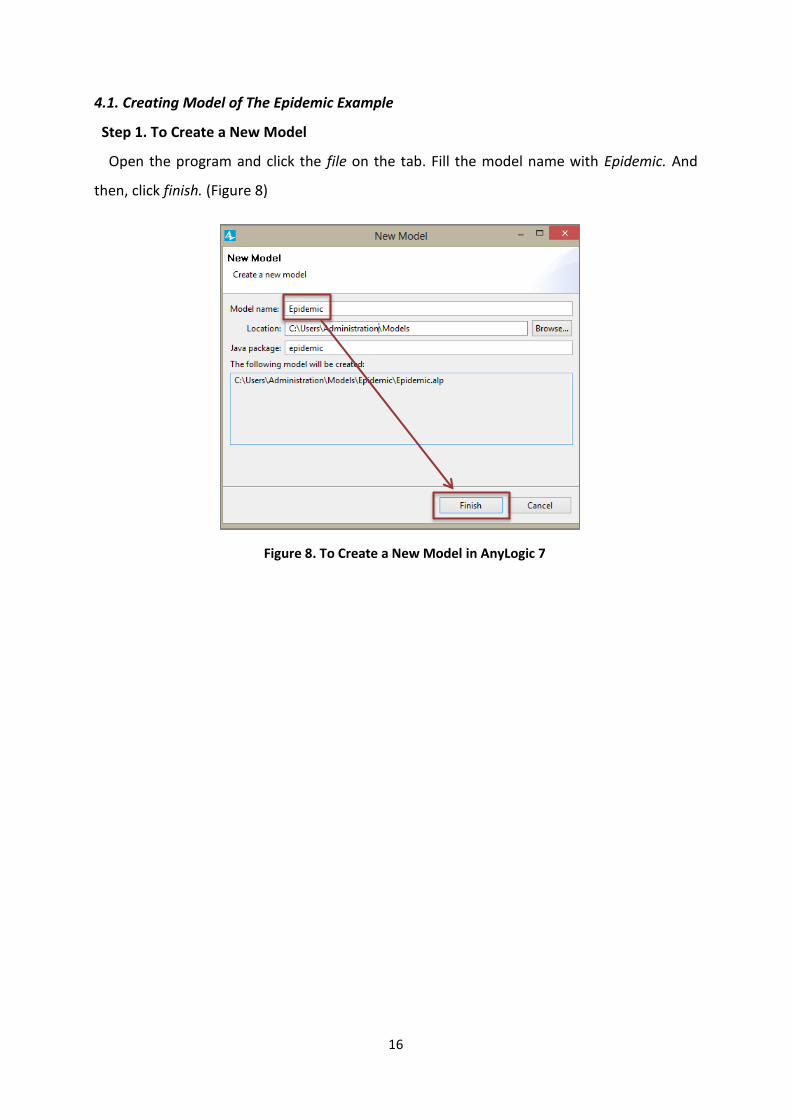
4.1. Creating Model of The Epidemic Example
Step 1. To Create a New Model
Open the program and click the file on the tab. Fill the model name with Epidemic. And
then, click finish. (Figure 8)
Figure 8. To Create a New Model in AnyLogic 7
17
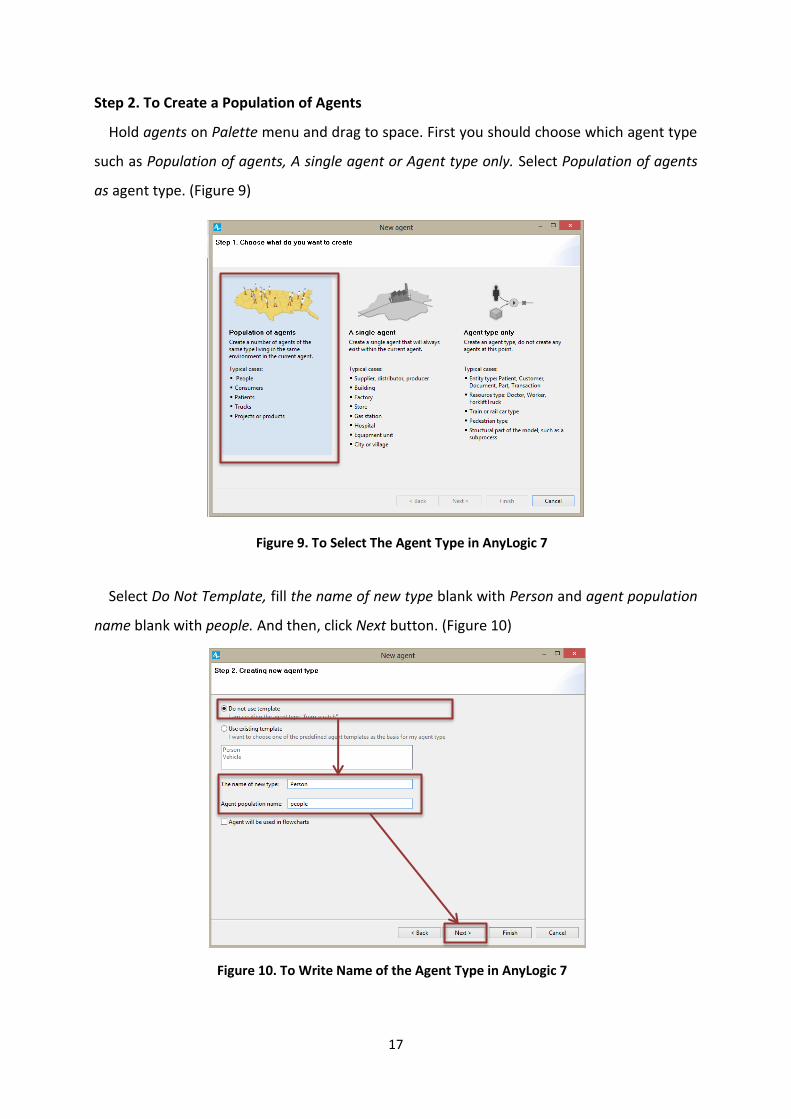
Step 2. To Create a Population of Agents
Hold agents on Palette menu and drag to space. First you should choose which agent type
such as Population of agents, A single agent or Agent type only. Select Population of agents
as agent type. (Figure 9)
Select Do Not Template, fill the name of new type blank with Person and agent population
name blank with people. And then, click Next button. (Figure 10)
Figure 9. To Select The Agent Type in AnyLogic 7
Figure 10. To Write Name of the Agent Type in AnyLogic 7
18
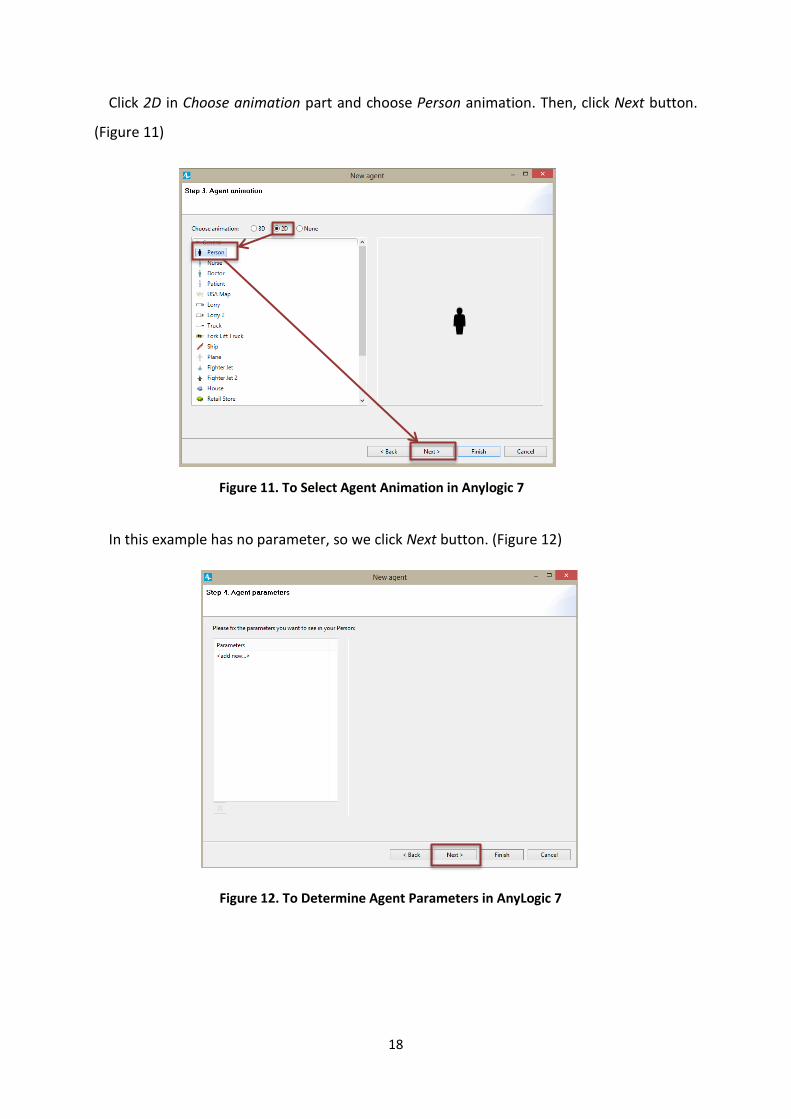
Click 2D in Choose animation part and choose Person animation. Then, click Next button.
(Figure 11)
In this example has no parameter, so we click Next button. (Figure 12)
Figure 11. To Select Agent Animation in Anylogic 7
Figure 12. To Determine Agent Parameters in AnyLogic 7
19
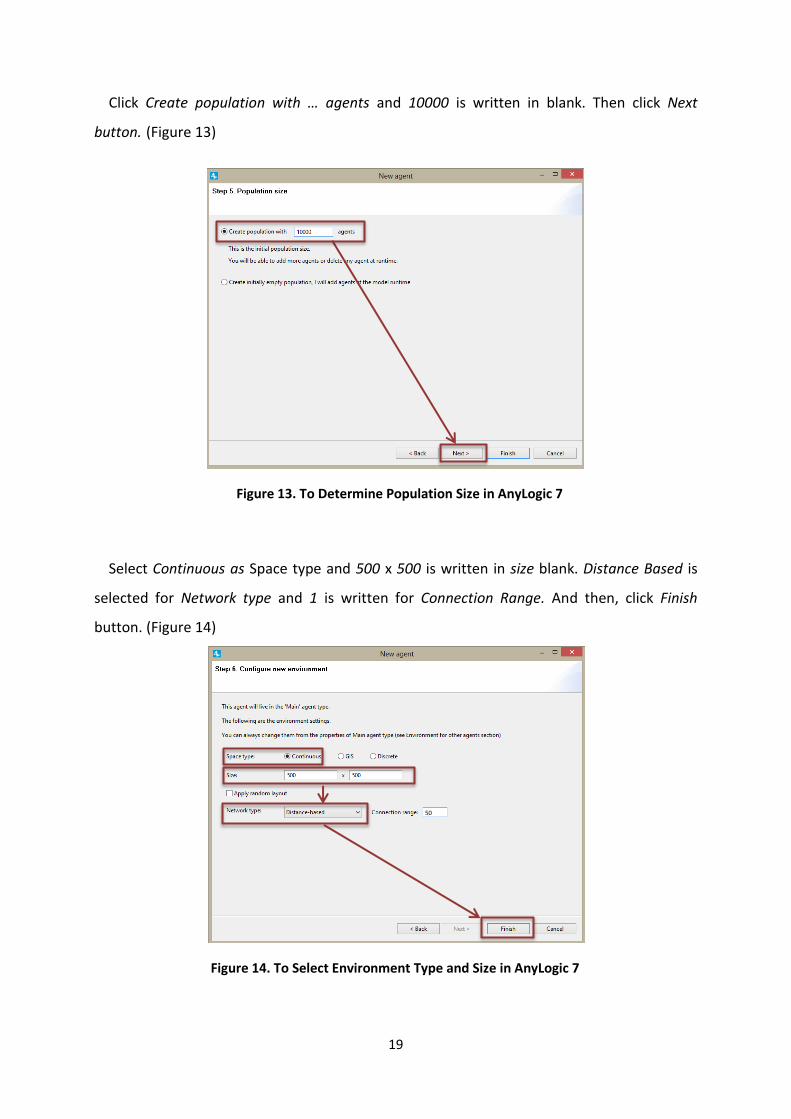
Click Create population with … agents and 10000 is written in blank. Then click Next
button. (Figure 13)
Select Continuous as Space type and 500 x 500 is written in size blank. Distance Based is
selected for Network type and 1 is written for Connection Range. And then, click Finish
button. (Figure 14)
Figure 13. To Determine Population Size in AnyLogic 7
Figure 14. To Select Environment Type and Size in AnyLogic 7
50
20
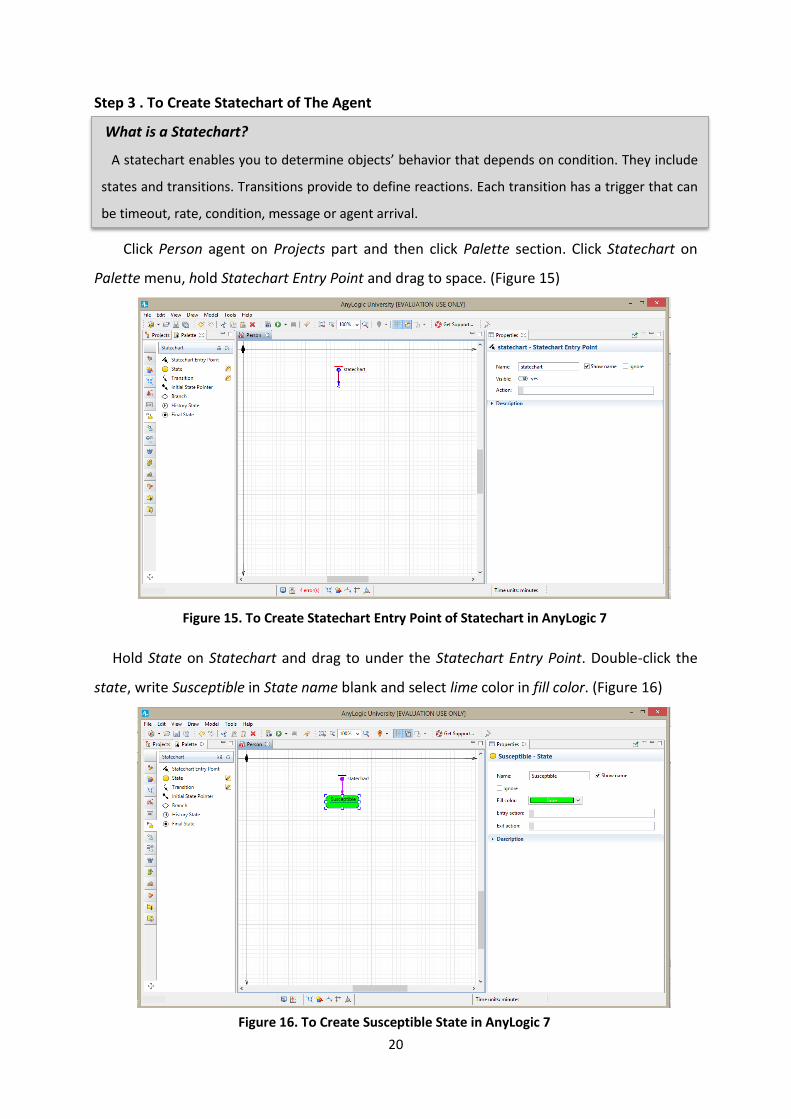
Step 3 . To Create Statechart of The Agent
Click Person agent on Projects part and then click Palette section. Click Statechart on
Palette menu, hold Statechart Entry Point and drag to space. (Figure 15)
Hold State on Statechart and drag to under the Statechart Entry Point. Double-click the
state, write Susceptible in State name blank and select lime color in fill color. (Figure 16)
Figure 15. To Create Statechart Entry Point of Statechart in AnyLogic 7
Figure 16. To Create Susceptible State in AnyLogic 7
What is a Statechart?
A statechart enables you to determine objects’ behavior that depends on condition. They include
states and transitions. Transitions provide to define reactions. Each transition has a trigger that can
be timeout, rate, condition, message or agent arrival.
21
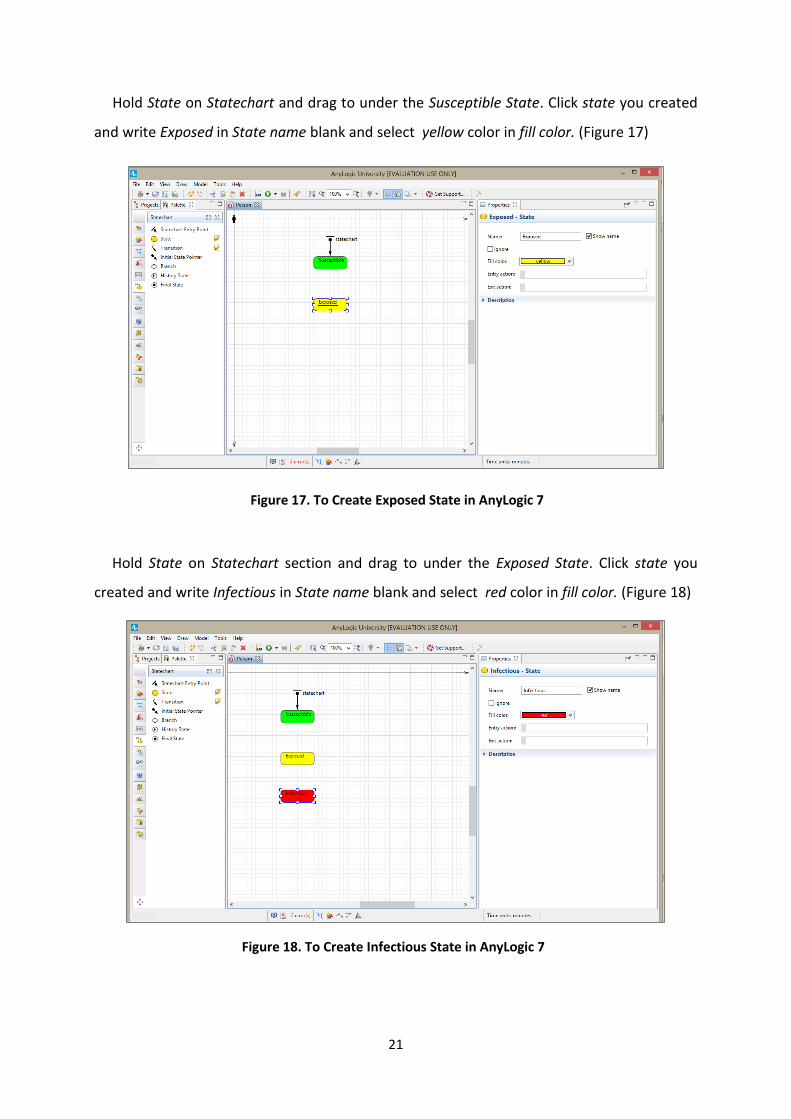
Hold State on Statechart and drag to under the Susceptible State. Click state you created
and write Exposed in State name blank and select yellow color in fill color. (Figure 17)
Hold State on Statechart section and drag to under the Exposed State. Click state you
created and write Infectious in State name blank and select red color in fill color. (Figure 18)
Figure 17. To Create Exposed State in AnyLogic 7
Figure 18. To Create Infectious State in AnyLogic 7
22
Hold State on Statechart section and drag to under the Infectious State. Click state you
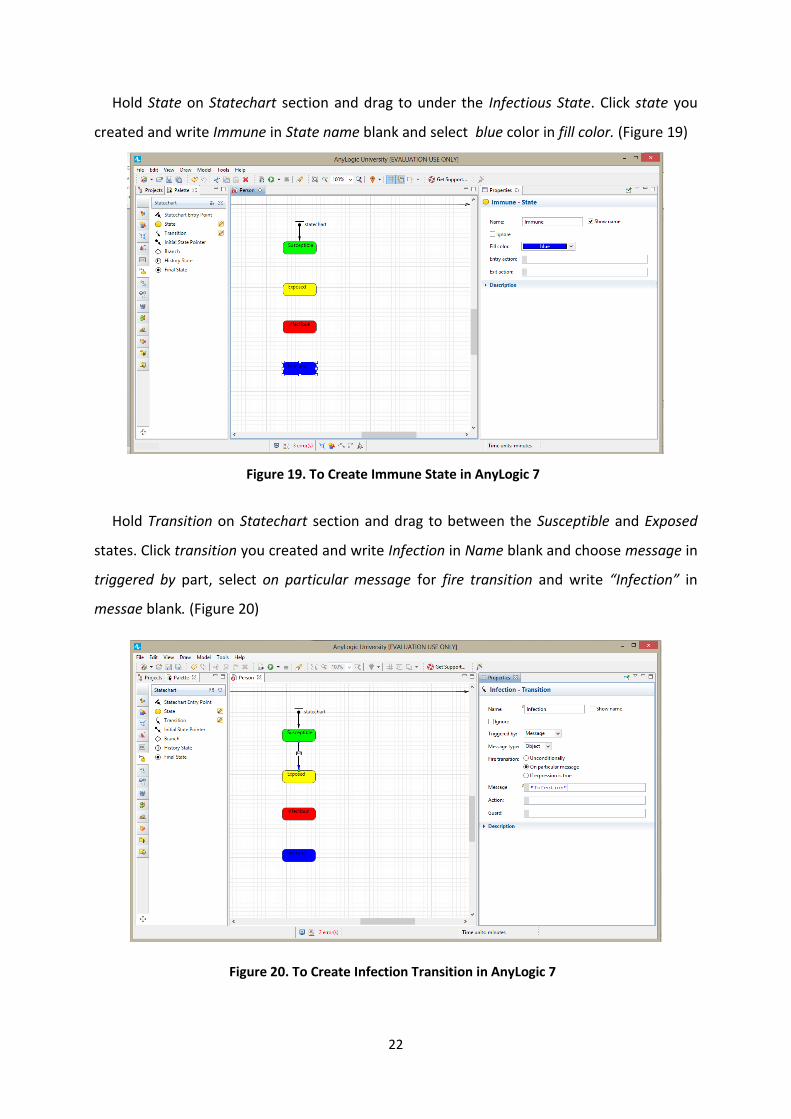
created and write Immune in State name blank and select blue color in fill color. (Figure 19)
Hold Transition on Statechart section and drag to between the Susceptible and Exposed
states. Click transition you created and write Infection in Name blank and choose message in
triggered by part, select on particular message for fire transition and write “Infection” in
messae blank. (Figure 20)
Figure 19. To Create Immune State in AnyLogic 7
Figure 20. To Create Infection Transition in AnyLogic 7
23
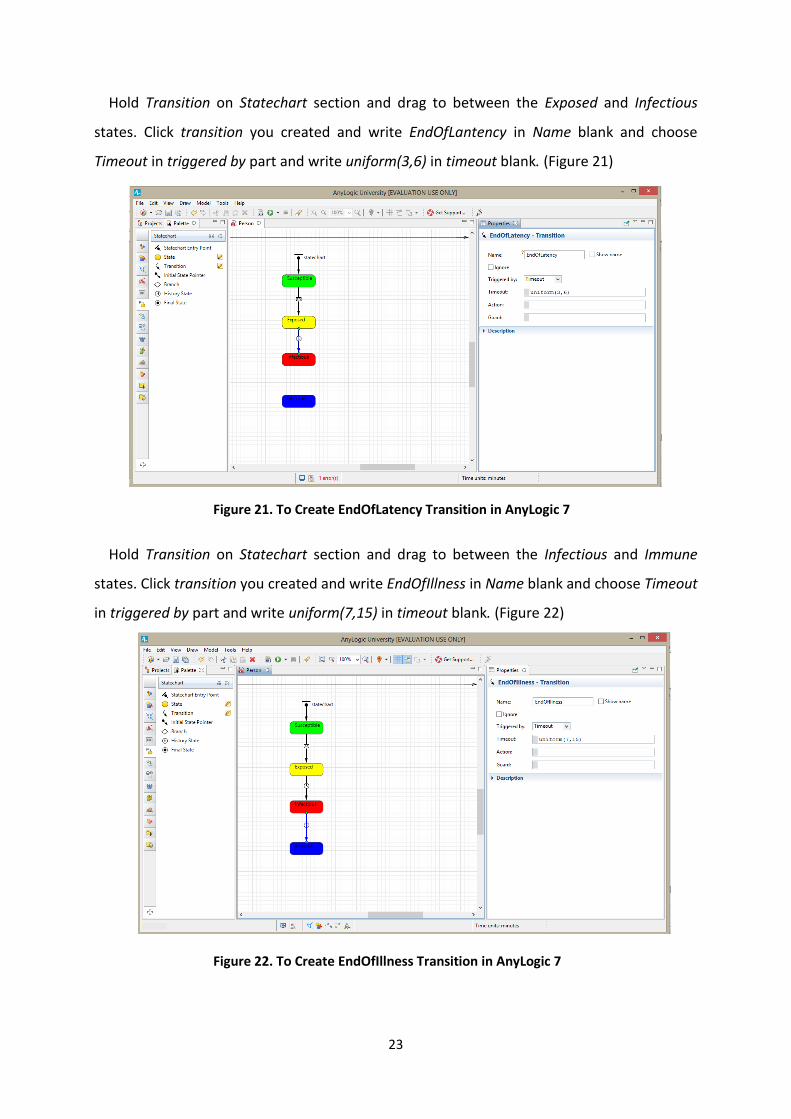
Hold Transition on Statechart section and drag to between the Exposed and Infectious
states. Click transition you created and write EndOfLantency in Name blank and choose
Timeout in triggered by part and write uniform(3,6) in timeout blank. (Figure 21)
Hold Transition on Statechart section and drag to between the Infectious and Immune
states. Click transition you created and write EndOfIllness in Name blank and choose Timeout
in triggered by part and write uniform(7,15) in timeout blank. (Figure 22)
Figure 21. To Create EndOfLatency Transition in AnyLogic 7
Figure 22. To Create EndOfIllness Transition in AnyLogic 7
24
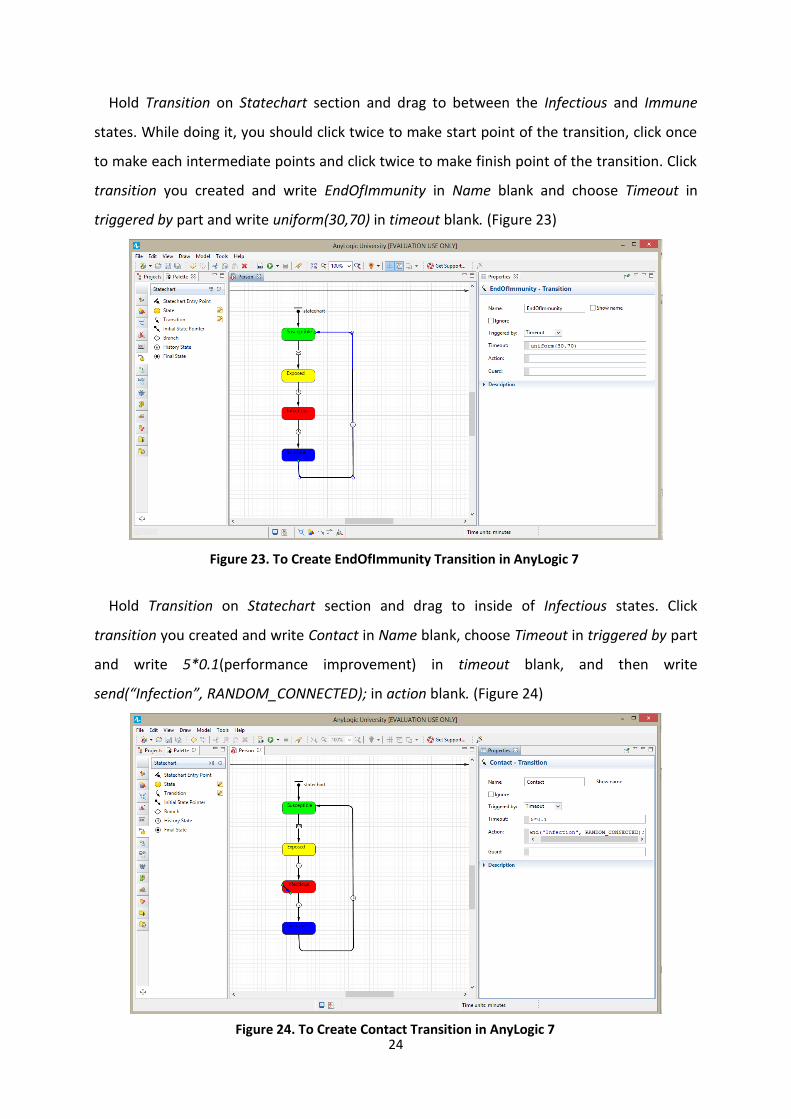
Hold Transition on Statechart section and drag to between the Infectious and Immune
states. While doing it, you should click twice to make start point of the transition, click once
to make each intermediate points and click twice to make finish point of the transition. Click
transition you created and write EndOfImmunity in Name blank and choose Timeout in
triggered by part and write uniform(30,70) in timeout blank. (Figure 23)
Hold Transition on Statechart section and drag to inside of Infectious states. Click
transition you created and write Contact in Name blank, choose Timeout in triggered by part
and write 5*0.1(performance improvement) in timeout blank, and then write
send(“Infection”, RANDOM_CONNECTED); in action blank. (Figure 24)
Figure 23. To Create EndOfImmunity Transition in AnyLogic 7
Figure 24. To Create Contact Transition in AnyLogic 7
25
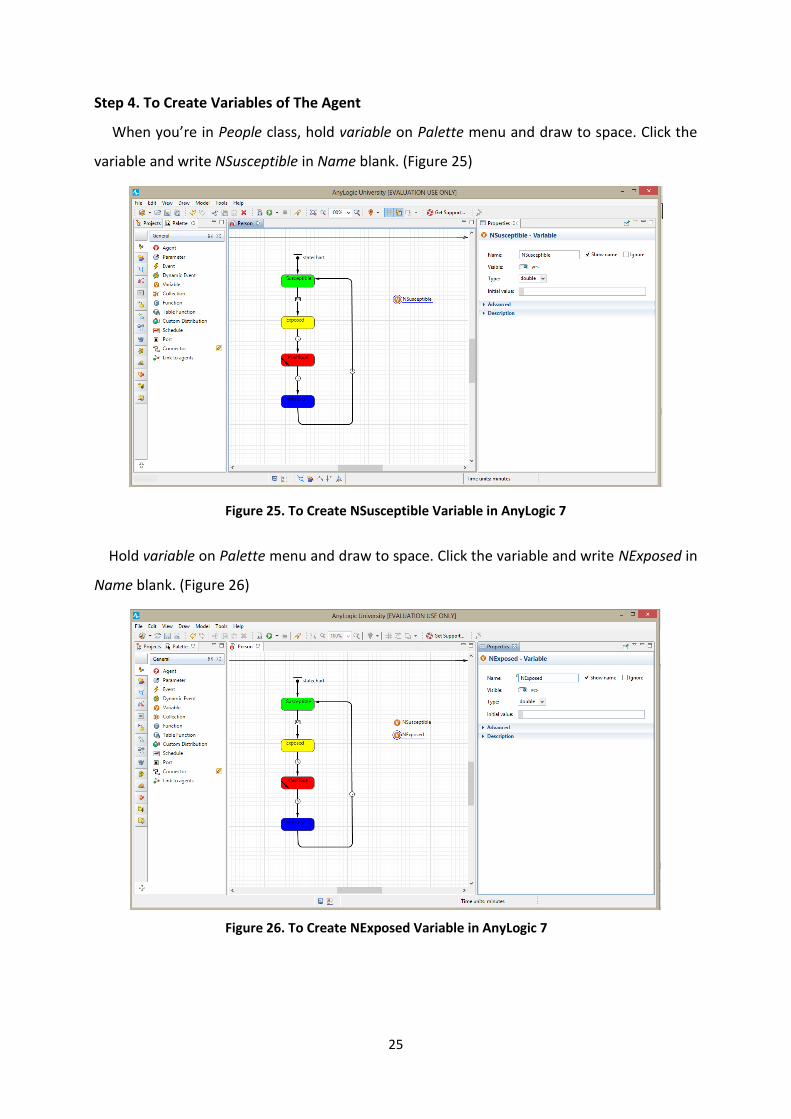
Step 4. To Create Variables of The Agent
When you’re in People class, hold variable on Palette menu and draw to space. Click the
variable and write NSusceptible in Name blank. (Figure 25)
Hold variable on Palette menu and draw to space. Click the variable and write NExposed in
Name blank. (Figure 26)
Figure 24. To Create Contact Transition in AnyLogic 7
Figure 25. To Create NSusceptible Variable in AnyLogic 7
Figure 26. To Create NExposed Variable in AnyLogic 7

26
Hold variable on Palette menu and draw to space. Click the variable and write NInfectious
in Name blank. (Figure 27)
Hold variable on Palette menu and draw to space. Click the variable and write NImmune in
Name blank. (Figure 28)
Figure 27. To Create NInfectious Variable in AnyLogic 7
Figure 28. To Create NImmune Variable in AnyLogic 7
27
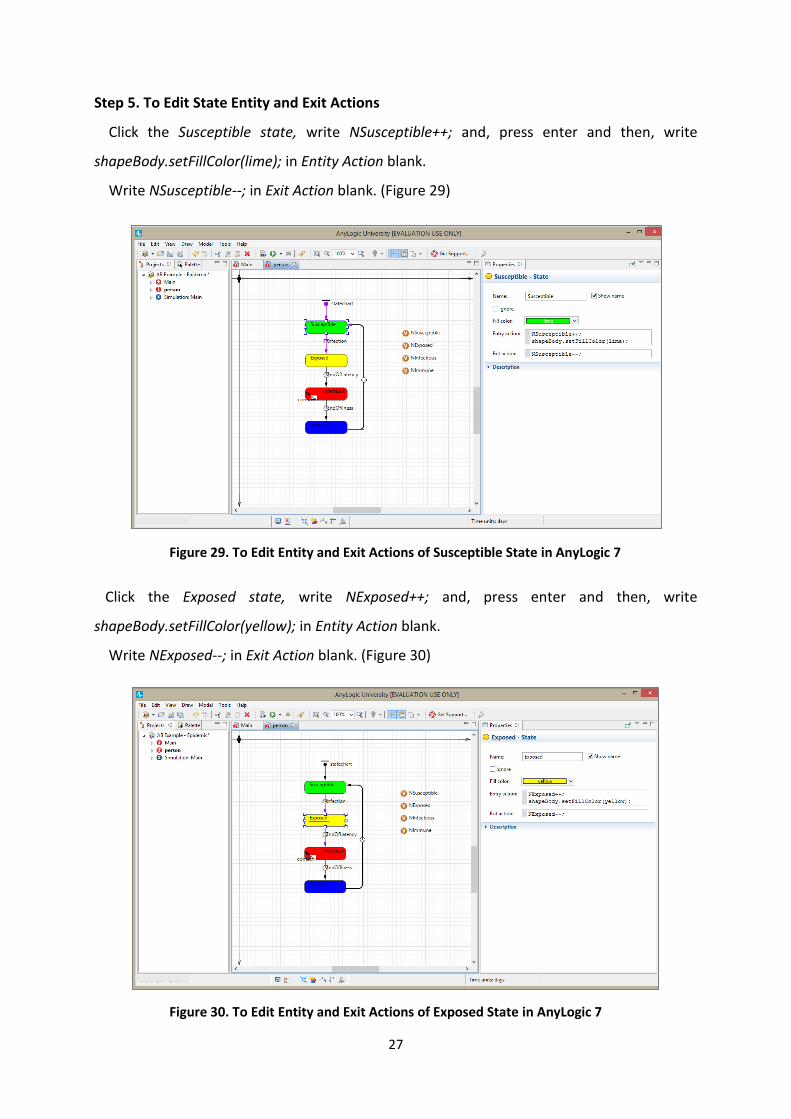
Step 5. To Edit State Entity and Exit Actions
Click the Susceptible state, write NSusceptible++; and, press enter and then, write
shapeBody.setFillColor(lime); in Entity Action blank.
Write NSusceptible--; in Exit Action blank. (Figure 29)
Click the Exposed state, write NExposed++; and, press enter and then, write
shapeBody.setFillColor(yellow); in Entity Action blank.
Write NExposed--; in Exit Action blank. (Figure 30)
Figure 29. To Edit Entity and Exit Actions of Susceptible State in AnyLogic 7
Figure 30. To Edit Entity and Exit Actions of Exposed State in AnyLogic 7
28
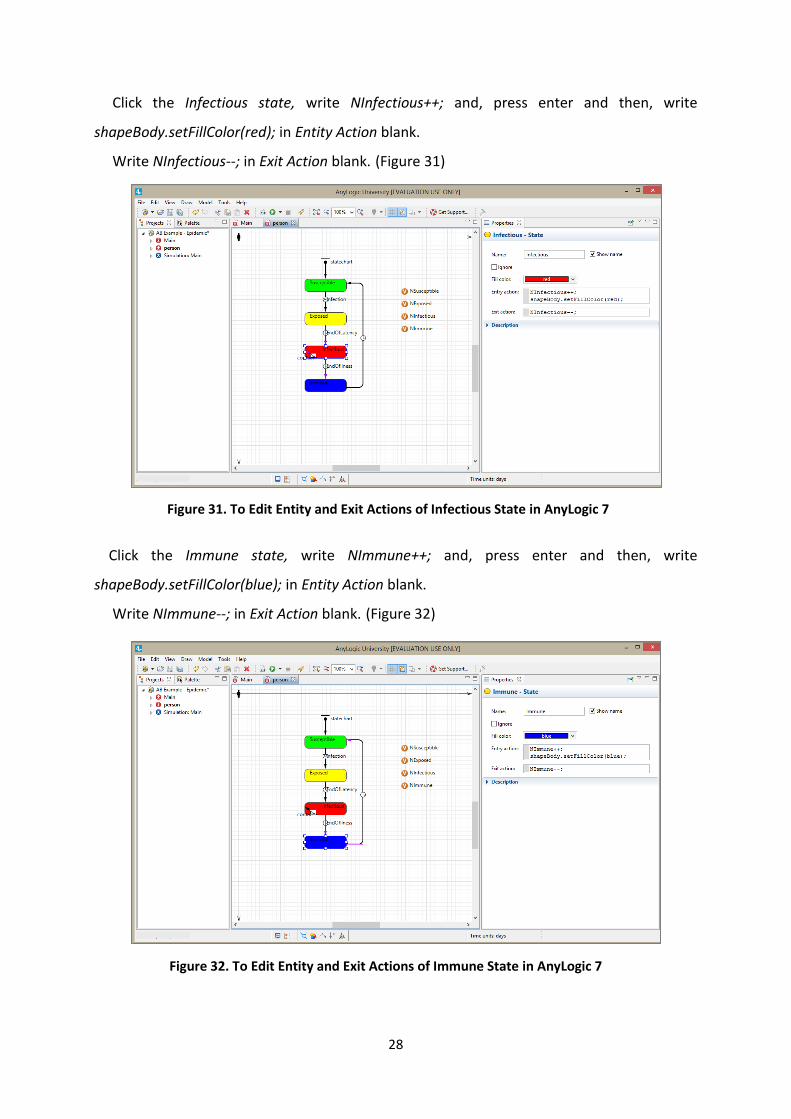
Click the Infectious state, write NInfectious++; and, press enter and then, write
shapeBody.setFillColor(red); in Entity Action blank.
Write NInfectious--; in Exit Action blank. (Figure 31)
Click the Immune state, write NImmune++; and, press enter and then, write
shapeBody.setFillColor(blue); in Entity Action blank.
Write NImmune--; in Exit Action blank. (Figure 32)
Figure 31. To Edit Entity and Exit Actions of Infectious State in AnyLogic 7
Figure 32. To Edit Entity and Exit Actions of Immune State in AnyLogic 7
29
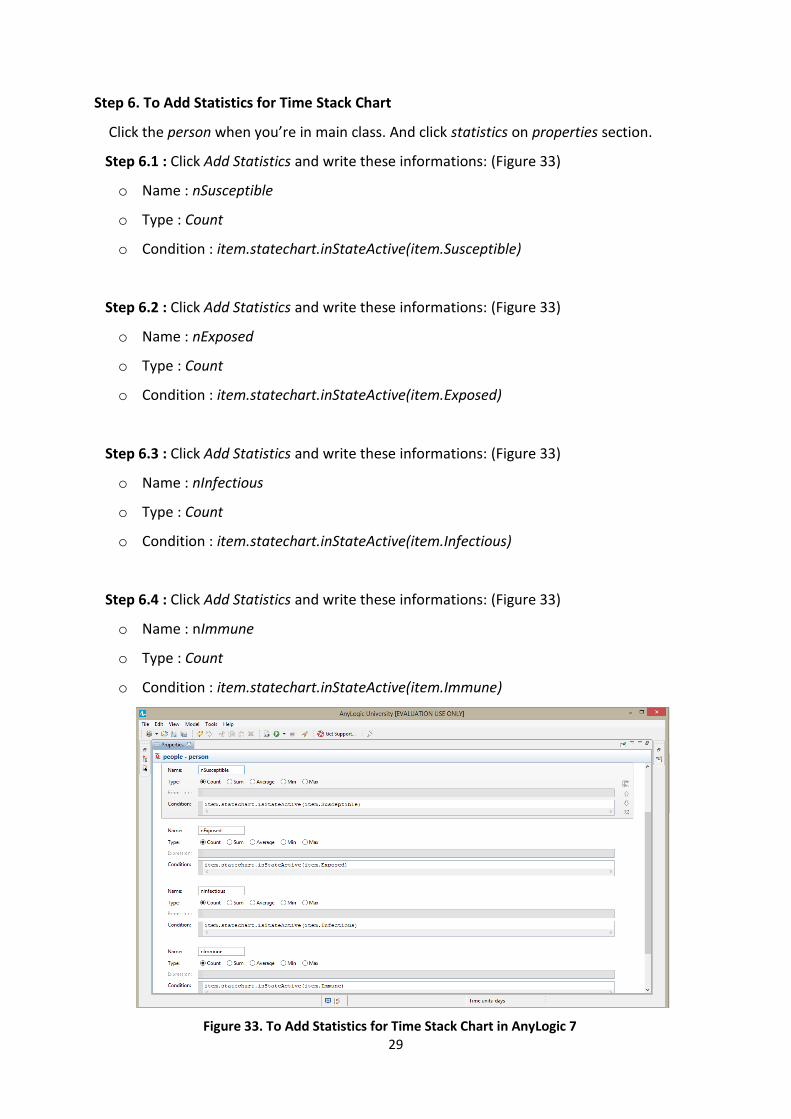
Step 6. To Add Statistics for Time Stack Chart
Click the person when you’re in main class. And click statistics on properties section.
Step 6.1 : Click Add Statistics and write these informations: (Figure 33)
o Name : nSusceptible
o Type : Count
o Condition : item.statechart.inStateActive(item.Susceptible)
Step 6.2 : Click Add Statistics and write these informations: (Figure 33)
o Name : nExposed
o Type : Count
o Condition : item.statechart.inStateActive(item.Exposed)
Step 6.3 : Click Add Statistics and write these informations: (Figure 33)
o Name : nInfectious
o Type : Count
o Condition : item.statechart.inStateActive(item.Infectious)
Step 6.4 : Click Add Statistics and write these informations: (Figure 33)
o Name : nImmune
o Type : Count
o Condition : item.statechart.inStateActive(item.Immune)
Figure 33. To Add Statistics for Time Stack Chart in AnyLogic 7
30
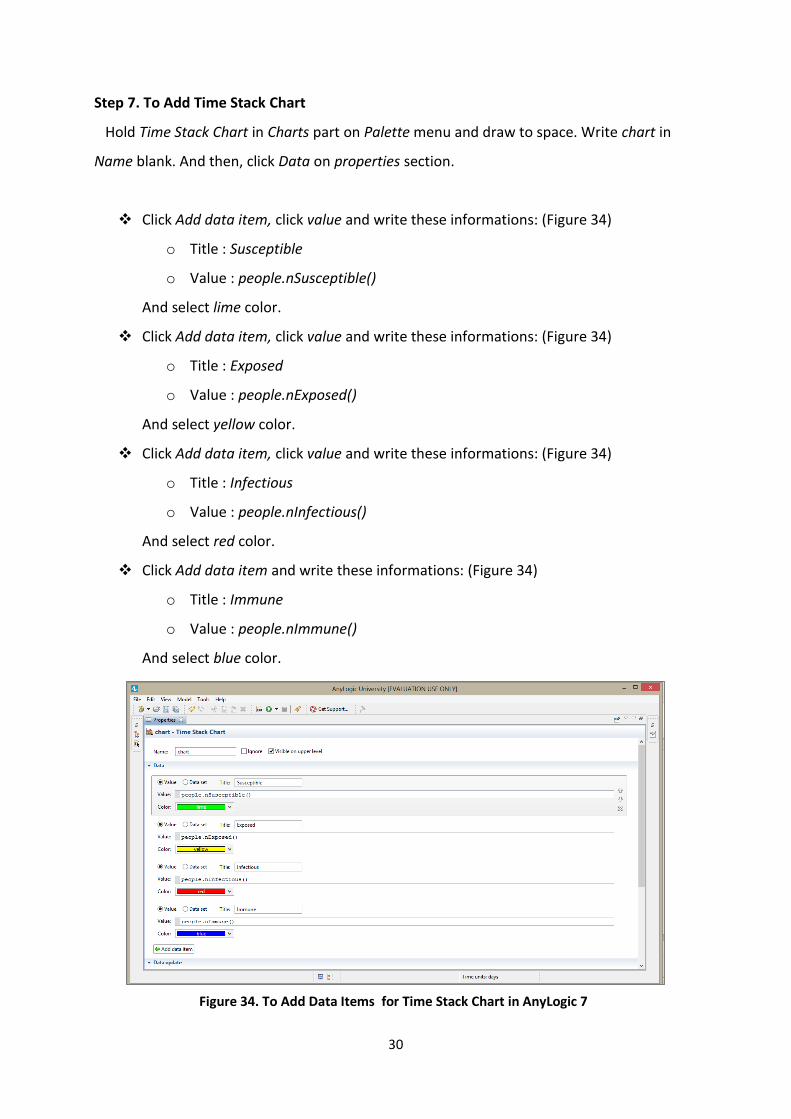
Step 7. To Add Time Stack Chart
Hold Time Stack Chart in Charts part on Palette menu and draw to space. Write chart in
Name blank. And then, click Data on properties section.
Click Add data item, click value and write these informations: (Figure 34)
o Title : Susceptible
o Value : people.nSusceptible()
And select lime color.
Click Add data item, click value and write these informations: (Figure 34)
o Title : Exposed
o Value : people.nExposed()
And select yellow color.
Click Add data item, click value and write these informations: (Figure 34)
o Title : Infectious
o Value : people.nInfectious()
And select red color.
Click Add data item and write these informations: (Figure 34)
o Title : Immune
o Value : people.nImmune()
And select blue color.
Figure 34. To Add Data Items for Time Stack Chart in AnyLogic 7
31
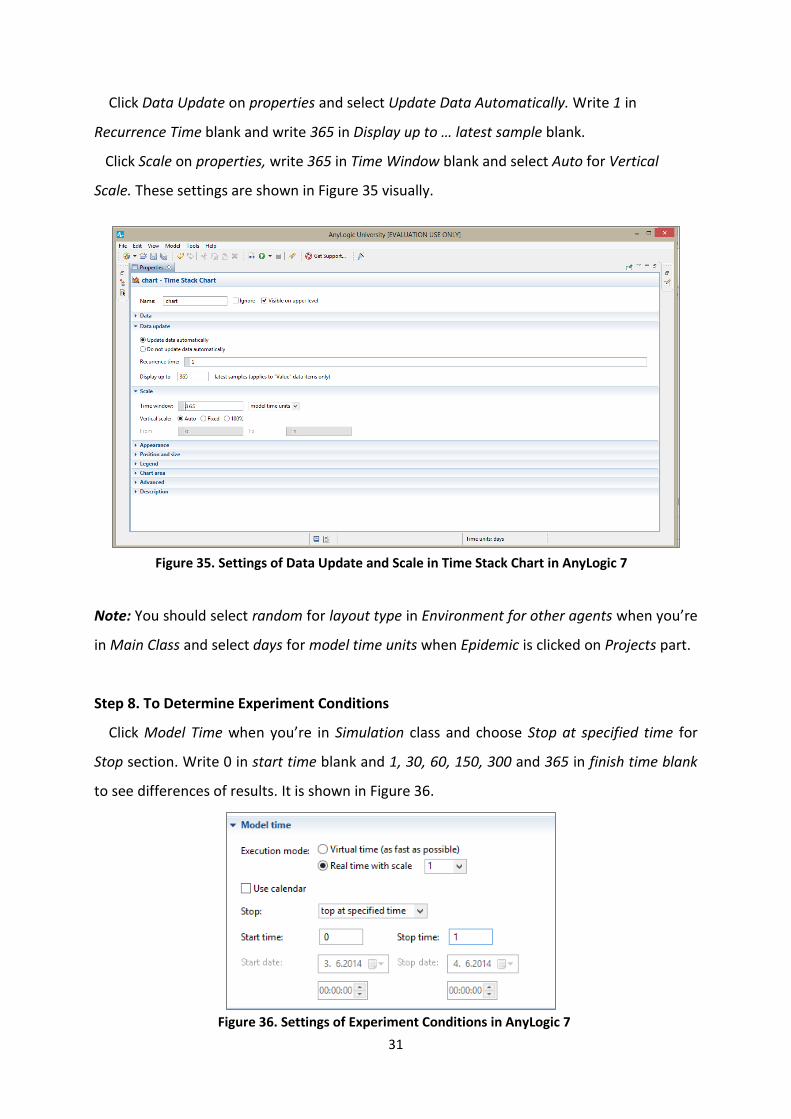
Click Data Update on properties and select Update Data Automatically. Write 1 in
Recurrence Time blank and write 365 in Display up to … latest sample blank.
Click Scale on properties, write 365 in Time Window blank and select Auto for Vertical
Scale. These settings are shown in Figure 35 visually.
Note: You should select random for layout type in Environment for other agents when you’re
in Main Class and select days for model time units when Epidemic is clicked on Projects part.
Step 8. To Determine Experiment Conditions
Click Model Time when you’re in Simulation class and choose Stop at specified time for
Stop section. Write 0 in start time blank and 1, 30, 60, 150, 300 and 365 in finish time blank
to see differences of results. It is shown in Figure 36.
Figure 35. Settings of Data Update and Scale in Time Stack Chart in AnyLogic 7
Figure 36. Settings of Experiment Conditions in AnyLogic 7

32
4.2. Results of The Epidemic Example
The experiment runs with different durations these are: 1, 30, 60, 150, 300 and 365. Their
outputs are shown in Figure 37, 38, 39, 40, 41 and 42.
Figure 37. Finish Time = 1
Figure 38. Finish Time = 30
Figure 39. Finish Time = 60

33
Figure 40. Finish Time = 150
Figure 41. Finish Time = 300
Figure 42. Finish Time = 365
34
5. Conclusions
AB approach provides to model much more detailed agent behavior than is possible in any
equation based or static model. History, learning, adapting and attribute are examples of
such behavior. Agents are intelligent objects that means they can make decision. They can
change their decision as their experiment and agents’ reactions depend on their state. These
details allows higher quality predictions in specific simulation models.
AB demolished the traditional top-down modeling. We can determine interaction,
behavior and communication systems of agents so top-down study can’t help solving
complex problems. In a result, AB has buttom-up modeling.
AnyLogic makes modeling AB easier about creating or deleting an agent, relationship or
any description. In addition, AnyLogic based on object-oriented that means everything in
system is built on objects (that means agents in AB simulation). Two of the strongest point of
the object-oriented are expressing reality (that means a real system is abstracted as you
modeled) and managing change. In a conclusion, AnyLogic simulation software uses Java
programming language. So, it helps to understand how we can model easily.
The most important point of AnyLogic is that it is used for multimethod modeling easily.
Simulation modeling is limitless with AnyLogic because of Java programming language.

35
6. References
[1] Borshchev A and Filippov A, “From System Dynamics and Discrete Event to Practical
Agent Based Modeling: Reasons, Techniques, Tools”, The 22nd International Conference of
the System Dynamics Society, 2004
[2] Borshchev A , The Big Book of Simulation Modeling: Multimethod Modeling with
AnyLogic 6, 2013
[3] Garifullin M, Borshchev A and Popkov T, “Using AnyLogic and Agent-Based Approach to
Model Customer Market”, XJ Technologies Company
[4] Macali CM and North MJ, “Tutorial on Agent-Based Modelling and Simulation”, The
University of Chicago, 2010
[5] Dong F, Liu H and Lu B, “Agent-based Simulation Model of Single Point Inventory
System”, North China Electric Power University, 2011
[6] Siebers PO, Macal CM, Garnetta J, Buxtons D and Pidd M, “Discrete-Event Simulation is
Dead, Long Live Agent-Based Simulation”, Operational Research Society, 2010
[7] Çelik F, “Discrete Event Agent-Based Simulation”, Turkish Naval Academy, 2013
[8] www.runthemodel.com
[9] www.anylogic.com