
Insecticide resistance in Aedes aegypti populations from Ceará, Brazil

lable at ScienceDirect
Environmental Modelling & Software 25 (2010) 1490e1507
Contents lists avai
Environmental Modelling & Software
journal homepage: www.elsevier .com/locate/envsoft
Review
Multi-agent modeling and simulation of an Aedes aegypti mosquito population
Sandro Jerônimo de Almeida a,*, Ricardo Poley Martins Ferreira b, Álvaro E. Eiras c, Robin P. Obermayr d,Martin Geier d
a Pontifical Catholic University of Minas Gerais, Informatics Institute, Anel Rodoviário Km 23,5 e Rua Walter Ianni, 255, São Gabriel, Belo Horizonte, Brazilb Federal University of Minas Gerais, Department of Mechanical Engineering, Belo Horizonte, Brazilc Federal University of Minas Gerais, Department of Parasitology, Belo Horizonte, BrazildUniversity of Regensburg, Zoological Department, Regensburg, Germany
a r t i c l e i n f o
Article history:Received 26 November 2009Received in revised form22 April 2010Accepted 27 April 2010Available online 26 June 2010
Keywords:Individual-based modelAgent-based modelEcological modelAedes aegypti mosquitoMulti-agent simulationBG-Sentinel
* Corresponding author. Tel.: þ55 31 3439 5217.E-mail address: [email protected] (S.J. de Alm
1364-8152/$ e see front matter � 2010 Elsevier Ltd.doi:10.1016/j.envsoft.2010.04.021
a b s t r a c t
The present work deals with the simulation of a mosquito Aedes aegypti population. The mosquitopopulation was modeled using an individual-based approach. The model consists of agents representingA. aegypti mosquitoes, human beings, some mammals and objects found in urban environments such aswalls and water containers. We describe the model which was implemented by multi-agent systems inthe Repast framework. Simulations were performed and the results were compared with those obtainedin a biological experiment, and data obtained from a local Zoonozes control center. Comparisonsbetween real and simulated data showed high correlation indices. We simulated cases to study whetheror not an artificial trap can be effectively used as an active based population control measure. We studiedhow the number of traps and their localization can affect the population dynamics.
� 2010 Elsevier Ltd. All rights reserved.
1. Introduction
Dengue virus, an arthropod-borne viral agent causes two typesof diseases, classic dengue fever and dengue hemorrhagic fever.Regarded as a major public health concern, the disease is trans-mitted by infected female mosquitoes of the genus Aedes whileblood feeding. Dengue is endemic in several countries worldwide,and public expenses to cover treatment have risen significantly.Global warming will certainly affect the abundance and distribu-tion of the disease vector. The mosquito population has expandedinto new geographical areas and increasingly higher latitudes(Houghton et al., 1997; Peterson, 1998).
Currently, dengue can only be reduced by mosquito control asno antiviral drugs and vaccines are available. Themain insect vectorcontrol measure consists of eliminating open water storagecontainers to prevent adult insects from reproducing (World HealthOrganization, 2002). The problemwith eliminatingwater storage inan urban environment is that it is dependent upon populationengagement and education. Since the main problem regardingcontrol measures of mosquito-borne diseases is related to insect
eida).
All rights reserved.
infestation control, some of the main questions raised are ‘what isthe size of a mosquito population in a particular area?’ ‘what is thespatial and temporal dynamics of such population?’ which leads to‘what can be done to control such a population?’ The answers tothese questions are determining factors in the decision-makingprocesses for designing efficient control measures.
Nowadays, estimates of a mosquito population size may becalculated by the number of mosquito larvae found in a particularsurveyed area. However, the larval survey is not accurate and itdoes not provide a reliable estimate of the population, or tips aboutits dynamics. Methods to estimate themosquito population size arebased on the direct counting of individuals in an area, using adulttraps, backpack aspirators, or human landing counts.
Computational simulation has been employed to support decision-making processes. A computer-based simulation works as a virtuallaboratory where a what-if statement is raised and answered and isused in order to increase the overall knowledge and understanding ofa specific subject (Chung, 2003). Computational simulation mayprovide answers to difficult questions limited by economical, envi-ronmental, ethical, technological and scientific matters (Peck, 2004).
Population dynamics models found in literature can be analyt-ical models (Dye, 1984), models based on systems of differentialequations (Dye, 1984; Williams et al., 2008) or individual-based

Fig. 1. Elements of the simulation model.
S.J. de Almeida et al. / Environmental Modelling & Software 25 (2010) 1490e1507 1491
models (Ferguson et al., 2003). Some of the principal differencesamong thesemodel types are based on questions about aggregationassumptions. They can be represented by closed mathematicalexpressions, systems of differential equations, or by individualcomputational descriptions (Rahmandad and Sterman, 2008; Fahseet al., 1998; Parunak et al., 1998). These models are not incompat-ible but complementary and each has strengths and weaknesses.Differential equation based models assume homogeneity andmixing compartments (Rahmandad and Sterman, 2008). Agent-based models can represent the agent heterogeneity and the agentinterrelationships network.
Investigations have been undertaken to assess populationdynamics of mosquitoes (Focks et al., 1993a, b; Yang et al., 2002;Ferreira and Yang, 2003; Yang, 2003), as well as dengue trans-mission dynamics (Derouich et al., 2003; Leonel and Yoneyama,2000; Focks et al., 1995; Williams et al., 2008).
The simulation models of mosquito populations reported inliterature are not aimed at simulating the behavior of individuals orsmall groups of mosquitoes. Nevertheless, the control of mosquitopopulations is actually carried out from house-to-house, street-to-street, always based on small areas, whose infestation is affected byboth geographical and social characteristics (Grand Challenges inGlobal Health, 2009).
An A. aegypti population simulator was proposed by Focks et al.(1993b) for which CIMSiM, a site-specific model, was used. It isa dynamic life table simulation entomological model whichproduces mean-value estimates of various parameters for allcohorts of a single species of Aedes mosquito within a representa-tive area of one hectare. This dynamic life table simulation ento-mological model maintains information about a mosquito groupthroughout its environment, such as temperature and humidity.
Computational monolitical mathematical models fail to simu-late environmental features and mathematical equation represen-tations of qualitative characteristics, such as preferences andbehaviors, may differ between individuals of the same species(Parunak et al., 1998). To overcome limitations of classical mathe-matical models, several investigations have used the individual-based modeling (IBM) approach. Grimm (1999) defines IBM asa computational model for simulating the actions and interactionsof autonomous individuals in a network, and the characteristics ofeach individual are tracked through time. Individual-based modelsare also known as entity or agent-based models, and as individual/entity/agent-based simulations. Each individual is seen as a singleentity with attributes such as age, weight and social status. Asa result, these models typically consist of an environment orframework in which the interactions occur and individuals aredefined by their emerging behaviors. These are not pre-pro-grammed behaviors, but they emerge from local interactions(Grimm and Railsback, 2005). An important example of how anindividual-basedmodel can be used to leadwith complex problemsis described in (Barrett et al., 2005). There are many other recentworks (Athanasiadis et al., 2009; Bithell and Brasington, 2009;Bomblies et al., 2008; Perez and Dragicevic, 2009; Rao et al., 2008;).
This paper provides a model and a computational tool forsimulating the dynamics of A. aegypti population, SimPopMosq. Ouraim is to simulate mosquito population, which present in smallgeographical area such as: a single home, a group of houses, or a cityblock. The simulator uses amulti-agent system(MAS), inwhich eachindividual is modeled and the model is carried out by a computa-tional agent capable of interacting with the environment and withother agents using sensors andactors (Sandholm,1999;Wooldridge,2002; Vlassis, 2003). The developed simulator can, for example,simulate a house and its inhabitants, objects and mosquitoes flyingwithin its limits. It is possible to simulate the dynamics of an A.aegyptimosquito population in a controlled environment in order to
observe the group dynamics of mosquitoes under particularconstraints, such as lack of water or blood for feeding. The degree ofdetail in the simulated environment can be increased. For example,it is possible to model and simulate a house, a city block, ora neighborhood. One objective of the proposed model is to explorehow the mosquito population can be affected by small-scaledistributed actions: how can people in their living environmentchange themosquito population dynamics? The SimPopMosqmodelcan provide spatial, temporal, and state details of each agent in thesimulation. The model can also specify special behaviors for eachagent.Wewant touse themodel to study how these behaviors couldaffect the mosquito population (Anholt, 1997). An agent-basedmodel can define specifications for each agent, group of agents, andobjects without modeling overhead (the environment can be spec-ified in detail: position of walls, windows, doors, and when they areopened or closed and the spatial and temporal distribution of agentsand objects in the environment). People living in infestation areasimplement simple practices such as keepingwindows closed duringtheday, and the keeping the lights off at night canhelp to keephomeinfestations to a minimum. The proposed model can be used toevaluate the effectiveness of this kind of popular knowledge. Thiskind of bottom-up simulation modeling is not very suitable forequation based models, unless you do not have problems withsolving rather large differential equation systems with deeplydetailed boundary conditions (Parunak et al., 1998).
We manually calibrated the parameters of the proposed modeland performed several oriented simulations. Two real experimentaldatabases were used to calibrate and validate the model. The firstdata base was obtained with an experiment conducted in a green-house, which was used as controlled environment. The second databasewas obtained from the Zoonoses department of BeloHorizonte,Brazil. This second data base was developed using real infestationdata gathered while using in-practice techniques to control themosquito population. The simulation model was used to test theeffectiveness of a trap applied (BG-Sentinel trap) (Kröckel et al.,2006) for active mosquito population control. Some “what-if”simulation cases were tested to verify how the localization and/orthe number of traps affect amosquito populationwithin a city block.
We consider that the structured definition of a decision-makingmodel for A. aegypti as being a significant contribution of thesimulation model proposed. We did not find a similar model inliterature.Adecision-makingmodel is useful for understandinghowthe behavior of themosquito can affect its population development.
The following sections are organized as follows: in section two,the simulator conceptual model, the proposed simulator and itscomponents are described in technical terms and in terms ofimplementation; section three presents the results of the computerexperiments and relates them to the construction and validationprocesses of the proposed models. Comments and conclusions arepresented in section four.

Fig. 2. UML class diagram of the agents, objects and the environment that composes the model.
S.J.deAlm
eidaet
al./Environm
entalModelling
&Softw
are25
(2010)1490
e1507
1492

S.J. de Almeida et al. / Environmental Modelling & Software 25 (2010) 1490e1507 1493
2. Conceptual model
The simulation model proposed, SimPopMosq, is described usingthe ODD protocol (Overview, Design concepts and Details)proposed by Grimm et al. (2006). The ODD protocol was proposedto describe individual-based modeling (IBM). It consists of threemain blocks e overview, design concepts and details.
The simulator was developed using Recursive Porous AgentSimulation Toolkit (Repast), version 3.0 (North et al., 2006). Severalfactors have contributed to this choice, including the structure ofobject orientation offered by this framework. The programminglanguage used for developing the simulator was Java. Therefore, itcan run in any operational system equipped with a Java virtualmachine.
The simulation model is divided into layers, Fig. 1 illustrates theset elements which comprise the simulation model.
If we observe the levels presented in Fig. 1 in an ascending way,we notice the definitions of some basic properties of the system,such as: timescale, definition of the space, definition of shifts andspeeds. The “environment” layer contains elements that can beinserted into simulation settings, such as: diffusion trace, weathervariables (rain, solar radiation, wind, etc.) and the geo-referencedspace where other elements such as agents and objects can beinserted. And above the other levels objects and agents, whichdepend on lower layers to function, which may be used incomputer simulations. Next, the layers presented in Fig. 1 aredescribed along with their elements and properties.
2.1. Overview
2.1.1. PurposeAn understanding of the population dynamics of A. aegypti
populations is necessary for adopting policies to implement effi-cient control measures. In order to access estimates of the pop-ulation dynamics, a simulationmodel for A. aegypti populations hasbeen proposed. The aim of the computational model is to allowanalysis of the population dynamics of A. aegypti in order to esti-mate the population size under different environmental conditions.This analysis was made by considering the mosquito populationduring the egg and adult life stages, availability of water-holdingcontainers and food in environments in which size may range fromtens to hundreds of square meters. To date, there are few strategiesfor directly estimating the population of A. aegypti mosquitoes ina given region. For example, it is possible by using BG-Sentinel traps(Kröckel et al., 2006) for host-seeking females and MosquiTRAP(Maciel-de-Freitas et al., 2008) for gravid females.
2.1.2. State variables and scalesThe SimPopMosqmodel comprises agents (mosquitoes, humans,
dogs, and cats), objects (vegetation, water containers, traps, ceilingsand walls) and their physical environment. Fig. 2 presents the UMLclass diagram of the agents, objects and the environment thatcomposes the model.
The spatial reference of agents and objects indicates theirlocation at a particular time in the setting for the simulation(world). Location is given by combining three coordinate points, x, yand z (length, width and height). Length and width are discrete,whereas the z dimension is continuous. It was established that onediscrete unit of simulated space would correspond with 50 centi-meters in the real world. One or more elements (agents and/orobjects) can occupy the same cell. Each cell has a linked list ofelements which stores the elements sequentially.
Time is modeled by discrete execution units called ticks, whichconstituteoneunitof artificial timeadoptedby the frameworkRepast,corresponding to 1-second. The notion of time is converted to
standard units of date and time. The standardized units of time, spaceand speed are seconds (s), meters (m) and meters/second (m/s).
Traces are left byagentsandobjects, suchas:A. aegypti,mammals,trapswith human odor, water and vegetation. Such traces are used formodeling the visualfield and thedispersionfields of chemicals. Eachelement has parameters pointing out the lowest and the highesttrace levels that can be emitted. The trace intensity emitted by anelement is definedbyproducing a randomnumberdefined betweenthese parameters. The diffusion model for estimating traces wasinspired by the model available in the multi-agent frameworkSwarm (Swarm Development Group, 2004; Minar et al., 1996).
The main computational agents of the simulation tool are the A.aegypti mosquitoes. The purpose of the system is related to A.aegypti mosquitoes. Male and female mosquitoes have some vari-ables in common and some gender related traits. Each mosquitohas the following state variables:
(i) Energy level (seconds) e energy level will affect decisionmaking by the agent. This is a variable property and its valuesrange from 0 to 259,200 s. The mosquito maximum energy iscalculated considering the number of days that a mosquito cansurvive without feeding 3 days¼ 259,200 s (Costero et al.,1999), so the energy level measures the number of secondsthat a mosquito may stay alive without feeding.
(ii) Stage e the stages, which the A. aegypti agent may undergo:egg, larva, pupa, adult and dead. The stage defines themosquito’s behavior. This variable can assume four possiblevalues, programmed as enumerable types.
(iii) Behavior/current statusemosquitoes behave in different ways.Their behaviors are defined by variables which can assumesome different values (enumerable types). They may, forinstance, display the following behaviors:(a) Common e flying randomly, looking for a resting place,
looking for a sap-based meal, feeding, mating,(b) Male e looking for a female,(c) Female e looking for an oviposition place, looking for
blood feeding, ovipositing, copulated, trying to bitea mammal normal, trying to bite a mammal fast;
(iv) Other female mosquitoes variables are:(a) number of eggs in the ovary (integer),(b) Trace intensity e every mosquito owns a trace intensity
that can be perceived by other agents. This is a variableproperty and its values range randomly between 3000 and10,000 trace units,
(c) Energy level related with blood feeding e female mosquitoesneed a “specific” sort of energy to mature their eggs. Thisenergy is provided byblood feeding. The higher the amountof blood consumed, the more likely are the eggs to hatch;
The mammals agents: human, dogs and cats present in thesimulation will be the blood source for the A. aegypti females. Theyhave common state variables:
(a) ongoing behavior ewhich can affect the agent’s speed (movingor stopped) e Boolean variable;
(b) trace intensityewhichcanaffect attractionof themosquito female
The human agents have a task schedule thatmay beprogrammed.If the task is not informed they follow randommovements.
The objects present in the model are: vegetation, water-holdingcontainers, ovitrap, humanodor trap (BG-Sentinel trap) (Kröckel et al.,2006), ceilings andwalls.Water-holding containers and object ovitrap(a trap for capturing eggs) are liquid containers which have thefollowing state variables, percentage of liquid, volatility of liquid andpercentage of exposure. The difference between water-holdingcontainer and ovitrap is the intensity of the trace emitted.

Fig. 3. UML class diagram of the schedules classes.
S.J. de Almeida et al. / Environmental Modelling & Software 25 (2010) 1490e15071494
Furthermore, eggs laid onto the ovitrap are eliminated. The secondtype of trap called “human odor trap” emits traces similar to those ofmammalagents andattracts adult femalemosquito.Uponentering thetrap, the mosquitoes are captured and eliminated.
Each vegetation object has its own trace, capable of attractingmosquitoes searching for sap-based feeding or for a place to rest.They have position state variables and trace intensity.
The objects representing ceilings and walls are used for definingthe geographic scenery to be simulated (houses, walls and plots ofland). Access to restricted spaces can also be represented in thesimulation sceneries. The forms of access that can be representedare doors and windows. The state variables for such objects arelocation, dimensions and whether they are open or closed.
2.1.2.1. Environment. The environment layer of the computationaltool comprises elements that canbe incorporated into simulations thatmay interact with agents and objects from upper layers. Some statevariables set up the environment conditions: daylight period, andweather variables. Weather conditions of the simulated environmentare definedbyglobal variables. The effects causedby such variables areused to calculate the water evaporation and rain which control thewater level in the water containers. The weather variables used are:accumulated rainfall (mm), air temperature (C), air relative humidity (%).
2.1.3. Process overview and schedulingAgent-related processes are performed based on the decisions
made by each agent (decision-making process). Agents are auton-omous and manage their own activities. In asynchronous updating,agent and object processes are performed at time intervals previ-ously defined in the parameters of the simulation model. Theasynchronous method randomly takes agents, objects and theenvironment processes one after another and updates all theirindividual schedules (North et al., 2006). Fig. 3 presents the UMLclass diagram of the schedules classes related to the agents, objectsand environment that compose the model. The schedulers manage
the sequence of actions in the simulation. Actions are individualevents that occur in a simulation, and they are dependent on agentand object behaviors. Agent behavior causes actions to occur byregistering them with a scheduler. The scheduler implemented ispreemptive.
2.2. Design concepts
2.2.1. Emerging phenomenaThe dynamics related to the A. aegypti population size may be
seen as an emerging property of the simulation model.
2.2.2. AdaptabilityThe only agents whose behavior may be adapted according to
their internal conditions or to those of their surrounding environ-ment are female and male mosquitoes.
Female A. aegypti mosquitoes are able to adapt their behavioraccording to the following conditions:
1. Daylight period e behavior of female mosquitoes at night isdifferent during day night. Females usually lay eggs at night; ifit is not the oviposition period of a female, it will rest at night.
2. Energy level e daylight behavior of females depends on theircurrentenergy level. Chancesare that if the femalehasa low(0 s)ormedium(129,600 s) energy level, itwill look formore food for theirown nourishment. Fertilized females will look for blood meals.
Although the male is less complex than the female, its adapta-tion behaviors include:
1. Daylight period e male mosquitoes behave differently duringdaylight and at night. They usually rest at night.
2. Energy level e daylight behavior of males depends on theircurrent energy level. If the male has a low or medium energylevel, it will look for plant-basedmeals for its ownnourishment.

Fig. 4. Life cycle of mosquito agent Aedes aegypti.
S.J. de Almeida et al. / Environmental Modelling & Software 25 (2010) 1490e1507 1495
3. Female closeness level e as the male mosquito notices thepresence of a female, it changes to mating behavior.
2.2.3. FitnessGrimm et al. (2006) define Fitness as the outcome of a certain
behavior and fitness-seeking as a phenomenon searching for betterbehavior options, to improve the agent’s conditions of survival.
The fitness-seeking process of modeled computational agents isimplicit in the current work. Although agents are not capable offinding out how a decision can bemore effective than another: theyimplicitly choose the behaviors that better fit their conditions (e.g.lack of water and blood feeding, etc.). They obey pre-definedbehaviors pre-programmed in decision diagrams. They decidewhatto do based on their state and in the environment variables (seeSubsection 2.3.2.3).
During oviposition periods, female lay their eggs randomly:different numbers and different times. This nonuniform distribu-tion strategy minimizes the effects of a possible destruction ofoviposition sites. The distribution adopted was based on the modelproposed by Gomes et al. (2006).
A. aegyptimosquitoes adopt strategies taking advantage of theircurrent situation. For instance, if a male notices a femaleapproaching, the mating behavior is favored. Occasionally, if thefemale has eggs in its ovary and notices the presence of mammalsaround, it will take advantage of the situation by blood feeding,even if its energy level is plenty. The behavioral choices are basedon rules codified as IFeTHEN statements.
2.2.4. SensingThe best way by which agents can detect the presence of
a certain agent or object is by noticing the trace emitted by theexplored element.
2.2.5. InteractionAgents, objects, and environments interact in the simulated
world since they are georeferred in this world and fulfill somephysical space. Major interactions include:
1. Objects and environment e objects existing in the simulatedworld may interact with the environment as they emit traces.Water-holding containers leave humidity traces in thesurrounding environment and vegetation emit sap traces.Water-holding containers can also collect water from rain falls.
2. Agents and environment e agents interact with the environ-ment by emitting traces, as well as objects.
3. Agents and objects e agents interact with objects. This inter-action takes place by physical contact among them. A. aegyptimosquitoes interact with vegetation as they land on it for eitherfeeding or resting; as they do with water-holding containersduring oviposition and larval development, as well as withobjects such as walls, ceilings, doors and windows. In theexperiments, only Human agents have access to some partic-ular spaces. For example, a human agent can arrive at the frontdoor of his house, open the door, enter the house, close thedoor. He or she can keep the windows and the doors closed donot allowing mosquitoes to enter his or her house.
4. Male and female A. aegypti e male and female mosquitoesinteract by mating. When the male detects a female’s trace, itgets closer and tries tomate. If the female is willing tomate, theagents remain together until the mating process is over.
5. Female A. aegypti and mammals e the female needs blood toprovide enough nourishment for its eggs. It is guided by themammal’s trace (which emits an odor trace) and tries to bite it.If the attempt is successful, the mosquito will remain feedingfor some time.
2.2.6. Stochastic modelThe simulation model proposed in this work presents
a stochastic behavior due to the several probabilistic transitionsdefined and configured based on pseudo-random numbers that aregenerated. The following elements are randomly produced:
1. Trace intensity of elements e trace are emitted at differentintensities. This intensity is randomly chosen within a rangedetermined for each element (agent, object).
2. Random displacement e A. aegypti and mammal agents canmove randomly. Mosquitoes can also move along the z-axis.
3. Life cycle of A. aegypti e as the mosquitoes undergo changes atdifferent stages, probabilities that can increase or decrease thelength of each stage are associated.
4. Aedes femalee there is an element of randomness for female A.aegypti regarding: reproduction (the number of eggs to benourished); oviposition (the gender of born-to-be mosquitoes)and; blood feeding (successfulness of a blood feeding and deathprobability in a failed bite attempt).
2.2.7. ObservationsOne of the main issues raised and intended to be answered by
the present simulation model is How large is the mosquito pop-ulation at a certain moment? Population sizes of mosquitoes atdifferent stages are recorded, as well as other variables that maycontribute to analyzes of mosquito population dynamics. The mainvariables that can be observed and recorded in the model proposedare the number of A. aegypti mosquitoes at the stages: egg, larva,pupae and adult; the number of female and male; the number of A.aegypti at the stage egg and adult born in the last 24 h; biting rate;ovitrap positivity index; ovitrap density index; and positivity indexof larvae and pupae inside ovitrap containers.
2.3. Details
2.3.1. Simulation control: initialization and inputStarting the simulation model needs formal specification of data
and information such as:
1. Simulation setting e it includes configuring agents and objectsto be added to the environment and the simulation sceneries

S.J. de Almeida et al. / Environmental Modelling & Software 25 (2010) 1490e15071496
must be defined. Simulation sceneries can be defined andstored into a repository. The following operations should bedefined to build the simulation scenery:(a) Space definition e width, length and height of the virtual
world are defined. Height values for the z dimension arecontinuous and, if this dimension is not defined, it can haveany value.
(b) Time definition e defining time in the simulation scenerymeans associating virtual time and date to the simulation.The main dates/times in the virtual world are: beginning ofsimulation, end of simulation and the current date and time.
(c) Object creation e configuring object installation in thesimulation scenery is an important aspect. The positions ofobjects in the virtual world as well as their particularproperties are defined.
(d) Agent creation e the agents participating in the simulationhave to be defined, such as mosquitoes, mammals. For thehuman agents, the path and dynamics of displacementmustbe previously defined.
2. Meteorological data e environment variables are updated bydata imported fromweather databases and adapted to a previ-ously defined pattern. The meteorological data used in thesimulations follow the same data pattern from CPTEC-INPE(2009). Although extensive data are available in the simulationscenery, the current models for objects and agents do not makefull useof them. Themaindataused in thepresentmodel are: airtemperature, accumulated rainfall, and air relative humidity.
3. Expected output e the user can follow the evolution of eachvariable throughout the simulation. It is possible to point outthe variable to be observed by a formal specification (XML file).Model parameters e the simulation model proposed isprovided with a set of control parameters. The main parame-ters of the simulation model are shown in Subsection 2.3.2.
2.3.2. SubmodelsThe simulation model SimPopMosq comprises several
submodels.
2.3.2.1. Diffusion model for estimating traces. Traces are left byagents and objects, such as: A. aegypti, mammals, traps with humanodor, water and vegetation. Such traces are used for modeling thevisual field and the dispersion fields of chemicals.
Trace emitting elements (agents and objects) have a propertyindicating the intensityof emitted traces. Eachelementhasparametersindicating the lowest and the highest trace levels that can be emitted.The trace intensity emitted by an element is defined by generatinga random number defined between these limits. The diffusion modelfor estimating traces was inspired in the model Cellular Automatamodel available in the multi-agent simulating framework Swarm(SwarmDevelopmentGroup,2004).Theadoptedequation foreachcellis in¼ te� (iaþ cd� (mv� ia)) where in is the new trace intensity, ia isthe actual cell trace intensity, te is a evaporation constant, cd is a diffu-sion constant, mv is the average of the eight neighborhood cells traceintensity. We adopted cd¼ 1 and te¼ 0.99 as in Minar et al. (1996).
When we use these Diffusion model for modeling the visualfield or dispersion fields of chemicals. The intensity values calcu-lated represent points into a potential field (Hagelbäck andJohansson, 2008). The major intensity implies that the cell islocalized nearest the element (which has emitted the trace).
2.3.2.2. Water level variation in water-holding containers. Thewater-holding containers in the simulation model show varyingliquid levels because of weather changes, such as increased volumedue to rainfall or decreased volume due to evaporation.
Liquid volume increase comprises a value increase of the liquidpercentage variable in the container, according to the weathervariable related to accumulated rainfall.
Liquid volume drop because of evaporation in the containers isa more complex process than that of rain. The evaporation modelpresented by Focks et al. (1993a) was adopted.
2.3.2.3. Agents. The processes related to the computer agentsrepresenting A. aegypti are basically the following:
1. Birth e initializing process of the agent and its basiccharacteristics.
2. Metamorphosis e process responsible for the agent stagetransition. The agent’s life cycle is shown in Fig. 4.
3. Deathe this process finishes any other processes performed bythe agent and removes it from the simulation scenery.
One of the main contributions of this work is to providecomputational models for decision-making processes and behaviorof A. aegypti. The female agent is more complex than its malecounterpart, since it takes blood meals for egg maturation duringgestation, and then searches for oviposition sites to ensure eggssurvival. Every mosquito agent can decide through a process thatevaluates a series of predetermined statuses and decisions. Thisprocess is performed at previously defined time intervals. Thefollowing processes can take place according to the female’sdecisions:
(a) Flying randomly e allows the agent to fly randomly, respectingthe space occupied by other elements.
(b) Looking for a resting place e this process is usually performedwhen the daylight period is over.
(c) Looking for blood meals e the female needs blood feeding foregg maturation.
(d) Looking for plant phloem sap e this feeding will be favored ifthe female is not fertilized or if it needs urgent feeding.
(e) Feeding e after finding food, the mosquito starts to feed.(f) Mating e mating process takes place if a male mosquito finds
a female.(g) Looking for an oviposition site. The female model differs from
themalemodel regarding gestation. Therefore it is necessary todefine a process by which the female looks for an ovipositionsite.
(h) Ovipositing e after finding a site, the female starts it.
The conditions under which such processes occur, as well as theorder in which they take place are defined by the decision-makingprocess of the agents. Fig. 5 depicts the decision-making process forfemale.
One of the major differences between male and femalemosquitoes is the oviposition-linked response behavior. If thefemale is laying eggs and has not finished the process, it mustremain performing this action. In continuing oviposition standing,the female will look for a new oviposition site. When oviposition isconcluded, the mosquito is free for adopting new behaviors.
If themosquito is not performing any of the activities mentionedabove (feeding, mating, and oviposition) and is not dead, answersconcerning the following itemsmust be answered: current daylightperiod, mating state, oviposition starting point, checking oviposi-tionmoment/time, current energy level, and presence of humans orvegetation in the surrounding area. Depending on how thesequestions are answered, the following states of behavior may beselected: looking for a resting place, looking for an oviposition loca-tion, flying randomly, dying, looking for sap-based meals, looking fora mammal for blood feeding, trying to bite a mammal.

Fig. 5. Female Aedes aegypti’s decision diagram of behavior model.
S.J. de Almeida et al. / Environmental Modelling & Software 25 (2010) 1490e1507 1497

Fig. 6. Female A. aegypti making decisions in a controlled environment.
Table 1Computer simulations.
Experiment Evaluated data Results
Greenhouse pre-trapObjective: calibration
Accumulated production of eggs Fig. 8Fortnightly productionof eggs e sliding window
Fig. 9
Accumulated adultsmosquito production
Fig. 10
Fortnightly adults mosquito production(sliding window)
Fig. 11
Greenhouse pos-trapObjective: calibrationand whateif cases
Accumulated adults mosquito production Fig. 12Fortnightly adults mosquito production(sliding window)
Fig. 13
2004e2005 City blockObjective: validation
Ovitrap captured eggs versussimulation results
Fig. 14
2004e2005 City blockObjective: whateifcases (effect of traps)
Number of traps influence Fig. 15Effect of Trap location: closerwater containersversus distributed randomly
Fig. 16
Effect of trap location: houseinside versus outside
Fig. 17
S.J. de Almeida et al. / Environmental Modelling & Software 25 (2010) 1490e15071498
An important instant is present in the decision diagram, the FirstQuestion. It is associated with the decision-making stage of themodel (grey box). At this moment, a question is asked about thecurrent behavior of the mosquito. Depending on the answer,further questions are asked (lozenge).
Once such questions have been answered, a behavior status isdefined (grey ellipse). The mosquito then performs actions accord-ing to the selected status. The decision-making process is iterative(re-starts at the initial question). Such iterations are performed atpre-defined time intervals. In the case of the A. aegypti agent, thisdecision-making interval was defined as 10 s (or 10 ticks).
Five possible answers are associated with the initial questionconcerning the following behaviors: feeding, mating, death,oviposition and remaining states. If the mosquitoes are ongoingfeeding or mating, they must keep performing these activities. Onthe other hand, if feeding or mating is concluded, the mosquito isfree to make new choices. One of the questions concerns the deathof a mosquito agent, based on which, the decision-making processis terminated.
Fig. 6 illustrates how the decision diagram is used by a mosquitofemale. In the first sequence the female was searching by a sap-based meal, but at the instant t¼ 292 s, she is founded by a male

Fig. 7. Simulated cases.
Table 2Correlation analysis in the pre-trap period.
ID. Compared data Correlationcoefficient
EP Correlation of egg productionEP.1 Daily production of egg 0.20EP.2 Daily production of egg e irregular sampling 0.37EP.3 Accumulated daily production of eggs 0.97EP.4 Accumulated daily production
of eggs e irregular sampling0.98
EP.5 Weekly production of eggs e fixed window 0.65EP.6 Weekly production of eggs e sliding window 0.63EP.7 Fortnightly production of eggs e fixed window 0.74EP.8 Fortnightly production of eggs e sliding window 0.80
AP Correlation of adults mosquito productionAP.1 Daily adults mosquito production 0.51AP.2 Daily adults mosquito
production e irregular sampling0.51
AP.3 Accumulated daily adults mosquito production 0.98AP.4 Accumulated daily adults
mosquito production e total data0.97
AP.5 Weekly adults mosquitoproduction e fixed window
0.60
AP.6 Weekly adults mosquitoproduction e sliding window
0.56
AP.7 Fortnightly adults mosquitoproduction e fixed window
0.54
AP.8 Fortnightly adults mosquitoproduction e sliding window
0.70
BR Correlation of biting rateBR.1 Biting rate 0.31BR.2 Biting rate (10 days before setup of trap) 0.77
S.J. de Almeida et al. / Environmental Modelling & Software 25 (2010) 1490e1507 1499
and copulated. After this moment she changed her behavior andbegan to search a blood meal. Finally, she has started feeding at theinstant t¼ 873 s.
This experiment showed in Fig. 6 was presented to biologistspecialists. The biologists validated the mosquito behaviors. Theyjudge that the behavior of mosquito in the experiment and thedecision model presented in Fig. 5 are coherent with the reality.This opinion was very important to help us validate the modelSimPopMosq. In Section 3, we complement the process of validationof the SimPopMosq.
Fig. 8. Accumulated production of eggs in pre-trap period.

Fig. 9. Fortnightly production of eggs in pre-trap period e sliding widow. Fig. 11. Fortnightly adults production in pre-trap period e sliding window.
S.J. de Almeida et al. / Environmental Modelling & Software 25 (2010) 1490e15071500
Various mosquito parameters affect its behavior and its vari-ables, defining its status. Next, we show the main parameters:
(i) Duration of stages e each stage has an average duration,therefore, every agent has a different life span. The duration ofeach stage is calculated based on equations, parameters andrandom numbers. Biological parameters were definedaccounting to Consoli and Oliveira (1994) and Eiras (2000).(a) Duration of the egg stage: fo¼ loþ (loþ RandomNormalDist
(m, s)) (days).Parameter lo corresponds to the average duration value of
the egg stage according to literature. Duration of the eggstage is calculated by adding lo to a random numberobtained from the normal distribution set by the average m
and by the standard deviation s. The values adopted for lo, mand s were 3, 0 and 10 days.
(b) Duration of the larva stage: fl¼ llþ (ll� RandomUniformDist(min, max)) (days).The parameter ll corresponds to the average duration
value of the larva stage according to literature data; min andmax are the limit values (lowest and highest) for generatingthe number based on the uniform distribution. The valuesadopted for ll, min and max were 15, �0.2 and 0.2 days.
(c) Duration of the pupa stage: fp¼ lpþ (lp� RandomUni-formDist(min, max)).The pupa stage is calculated in an identical way as the
larval stage. The values adopted for lp, min and max were 3,�0.1 and 0.1 days, respectively.
Fig. 10. Accumulated production of adults in pre-trap period.
(d) Duration of the adult stage: fa¼ RandomNormalDist(m, s).If RandomNormalDist (m, s) has a negative value, the
equation used is:fa¼ la� RandomNormalDist(m, s)The parameter la corresponds to the average duration
value of the adult stage according to literature data. Thestage duration is calculated using a random numberobtained from the normal distribution set by the average mand by the standard deviation s. The values adopted for la, mand s min and max were 15, 15 and 15 days, respectively.
(ii) Risk of death during stage transition e a mosquito may diewhile undergoing different stages. The model developedadopts survival odds in each stage transition. The parametersadopted are risk of death during eggelarva transition 30%, risk ofdeath during larvaepupa transition 30%, risk of death duringpupaeadult transition 30%, risk of death after reaching the end ofthe adult age 90%. These parameters were calibrated based onliterature references (Bellows et al., 1992; Hawkins et al., 1997;Mwangi and Rembold, 1988; Peters and Barbosa, 1977) andsubmitted to expert judgment.
(iii) Power consumption e power consumption is determined bythe amount of energy the agent needs to undertake a certaintask. Each sort of activity has a power consumption value asa parameter. The average value adopted for this parameter was0.75 energy units (seconds) per second. For example,
Fig. 12. Accumulated adults production in period with trap.

Fig. 13. Fortnightly adults production in period with trap e sliding window.
Fig. 14. Variation of initial number of gravid mosquito females into the greenhouse.
S.J. de Almeida et al. / Environmental Modelling & Software 25 (2010) 1490e1507 1501
a mosquito flying at 1 m/s uses 20W/kg in our model 1.00energy units (seconds) per second (Templin, 2000).
(iv) Standard flying height e the standard flying height parameteris defined as onemeter. This value is related to the thickness ofthe boundary layer of a flow caused by a moderate wind(Templin, 2000).
(v) Perception of vegetation proximitye it is important for an agentto notice the proximity of vegetation. The parameters high,medium and low vegetation trace intensity were defined, sothat the agents can verify if the trace intensity at their locationis high, medium or low. According to that specification, themosquito will choose the behavior to perform. The valuesadopted for high and medium vegetation trace intensity were6000 and 8000 trace units, respectively.
(vi) Feeding time e the parameter adopted for the mosquitofeeding time to was 1200 s.
(vii) Displacement speed e the average value adopted for thisparameter was 0.6 m/s (Consoli and Oliveira, 1994).
(viii)Vertical displacement speed e this parameter has a value of0.8 m/s. We estimate this value considering that the mosquitoclimbing speed is equal to the displacement speed is 0.6 m/s,but we consider its diving speed as 1.0 m/s, the verticaldisplacement speed is the average.
Female A. aegypti mosquitoes, when compared to the males,have several differences in terms of species reproduction. Activitiessuch as blood feeding, fertilization and oviposition are performedonly by female individuals. The variables that complement thecomputational model of the female defining its status are thefollowing:
(i) Energy level related with blood feeding e female mosquitoesneed a “specific” sort of energy to mature their eggs. Thisenergy is provided by blood feeding. The higher the amount ofblood consumed, the more likely are the eggs to hatch.
(ii) Number of eggs in the ovary e the number of eggs laid variesaccording to each gestational event. This variable can assumevalues ranging from 80 to 120 eggs (Consoli and Oliveira,1994;Eiras, 2000). However, the number of hatching eggs will pro-portionally depend on the variable Energy level as a function ofblood consumed.
(iii) Mating time e its ranges between 300 and 600 s (expertdefined).
(iv) Successful biting e this variable is calculated by dividing thenumber of bites by the total number of bite attempts, forwhich the value of 80% was adopted. This probabilistic
parameter is used to calculate how many attempts of thefemale to bite will be successful to feed blood.
(v) Risk of death due to bite attempte the probability of a mosquitobeing killed when trying to bite is 2% (calibrated).
(vi) Blood feeding length e the blood feeding is undertaken within900 s (calibrated).
(vii) Maximum amount of blood intake per bite e percentagedetermining the maximum amount of blood that can beingested per bite. The value adopted was 90% (calibrated).
(viii)Perception level for approaching mammals e female individualsnotice the closeness of mammals trace intensity adopted were8000 and 6000 trace units, respectively.
(ix) Oviposition speed e oviposition speed indicates the number ofeggs laid per time unit. A value of 0.02 eggs/s was adopted(calibrated).
(x) Spatial oviposition pattern e the eggs deposited on eachsubstrate is an important factor for the survival of mosquitospecies. According to the distribution pattern adopted,a female tends to lay its eggs randomly in environment atdifferent times and amounts. The distribution adopted isbased on the model proposed by Gomes et al. (2006).
2.3.3. Male Aedes aegypti agentThe decision-making model of the male mosquito is a simplified
version of the female. The computational model for the malemosquito contains parameters allowing perception of the traceintensity level of female mosquitoes. Such parameters are the highand low trace intensities with a goal similar to that related toperception of vegetation: the mosquito chooses what kind ofbehavior to adopt when a female individual gets closer. The valuesadopted for a high and medium female trace intensity were 8000and 6000 trace units, respectively.
2.3.4. Mammal agentsThe mammals e dogs and cats e available in the simulation
model SimPopMosq are agents capable of moving randomly,according to the physical conditions imposed by the environment,when inserted into particular simulation scenery. The only processassociated with mammal agents is that of movement. Such agentsmove without invading previously occupied locations.
2.3.5. The human agentBesides their random movement behavior, the human agent
also poses a schedule in this model that can determine activities tobe performed by them. The human agent follows tasks in its

Fig. 15. Ovitrap captured eggs versus simulation results.
S.J. de Almeida et al. / Environmental Modelling & Software 25 (2010) 1490e15071502
schedule. The human agent schedule defines where it should be orwhere it should be going at each moment..
A shift submodel based on the graph theory and shortest-pathalgorithms is adopted in the simulationmodel proposed. It allows thehuman agent to move between two points using the shortest way.
2.3.6. Transposition modelA transposition model has been developed to be used in the
simulation model proposed. By means of a centralized matrixe thetransposition matrix determines which elements may be trans-posed. When an agent attempts to move in a certain direction,verification is performed to check if the agent may occupy theexpected space. This also includes analyzing the transpositionpossibility of elements that might be occupying the expected space.In case the agent is not able to move into the expected space, itssurrounding cells must be analyzed until a possibility of positionshift is found (Millington, 2006; Ericson, 2004).
3. Experiments
Trials were aimed at adjusting parameters, validating thesimulation model and to answer “whateif” questions. They werebased on situations obtained from an actual biological experimentundertaken in a greenhouse at the University of Regensburg,Germany, in a partnership with the Institute for Biological Sciences(ICB) of the Federal University of Minas Gerais (UFMG) and on dataobtained with the Center for Zoonoses Control of the Municipalityof Belo Horizonte, Minas Gerais, Brazil. “Whateif” case experimentswere carried out to study how the localization and the number oftraps can affect a mosquito population in a city block. Table 1summarizes all computer simulations done.
We calibrated by hand the parameters of the proposed modelundertaken several oriented simulations. Two real experimentaldatabases were used to calibrate and validate the model. The firstbase was obtained with an experiment made in a greenhousecontrolled environment. The second base was obtained with theZoonoses Control center of Belo Horizonte, Brazil, and is real infes-tation data used to control in practice the mosquito population. Thesimulationmodelwas used to test the effectiveness of a trap appliedfor active mosquito population control. Some “whateif” simulationcaseswere tested toverifyhowthe localization andor thenumberoftraps affect amosquitopopulation in a city block. The result obtainedwas based on the mean from five different simulations.
1 The mosquitoes were reared from a laboratory colony free of any viruses, whichcould be potentially transferred by Aedes aegypti.
2 In this experiment, the biting rate corresponds to the number of bites takenwithin 1 min.
3.1. Practical experimental data description
Fig. 7 presents two graphs which represents the environmentsthat were simulated: the greenhouse experiment (left), and the city
block experiment (right). In the next subsections the cases arebetter explained and the results got are presented.
3.1.1. Greenhouse practical experimentThe greenhouse experiment was undertaken within a period of
159 days, from December 15, 2005 to May 22, 2006, in a plantgreenhouse, including water-holding containers and A. aegyptimosquitoes. The greenhouse was configured to reproduce thecharacteristics of a tropical environment. The greenhouse used inthe experiment was 11 m long and 3.8 m wide. The height in thegreenhouse ranged from 2.8 m to 3.8 m. Temperature rangedbetween 22 �C and 30 �C, and air relative humidity from 58% to 79%.About five water-holding containers were installed in the green-house. Several plants were installed inside the greenhouse.
The experimenter volunteered to blood feed female A. aegypti,by allowing them to bite him throughout the experiment.1 Duringthe experiment period, data were collected concerning the devel-opment of the mosquito population as well as the effectiveness ofa BG-Sentinel trap (Biogents AG, Germany, www.bg-sentinel.com)for controlling it. One trap was placed in the middle of the green-house after the biting rate was higher than 50 bites per min forthree consecutive days. The pre-trap period of the experimentbegan on December 15, 2005, and continued to April 5, 2006,totaling 112 days. The post-trap period began when a trap wasinstalled, on April 6, 2006, until the end of the experiment, on May22, 2006, in 47 days.
Initially, 50 female A. aegyptiwere released into the greenhouse.The mosquitoes were 5 days old and seeking a blood meal. Theexperimenter visited the greenhouse almost daily:
1. Between 9 and 11 a.m., the experimenter offered the females tofeed on his exposed arm. The rest of his body was covered withprotective clothes. He stayed in the greenhouse from 5 to30 min, depending on the number of bites he could stand eachtime. A maximum of 15 mosquitoes fed on his arm per day.
2. Between 3 and 7 p.m., the experimenter entered the green-house to measure the biting rate2 for a period from 5 to 30 min.The females that landed onto the human arm were immedi-ately collected (before biting him) and afterwards they werereleased into the greenhouse again. In this way, it was possibleto calculate the biting rate from the landing rate with no needfor new bites. After such values had been calculated, the water-holding containers (oviposition sites) were analyzed and the
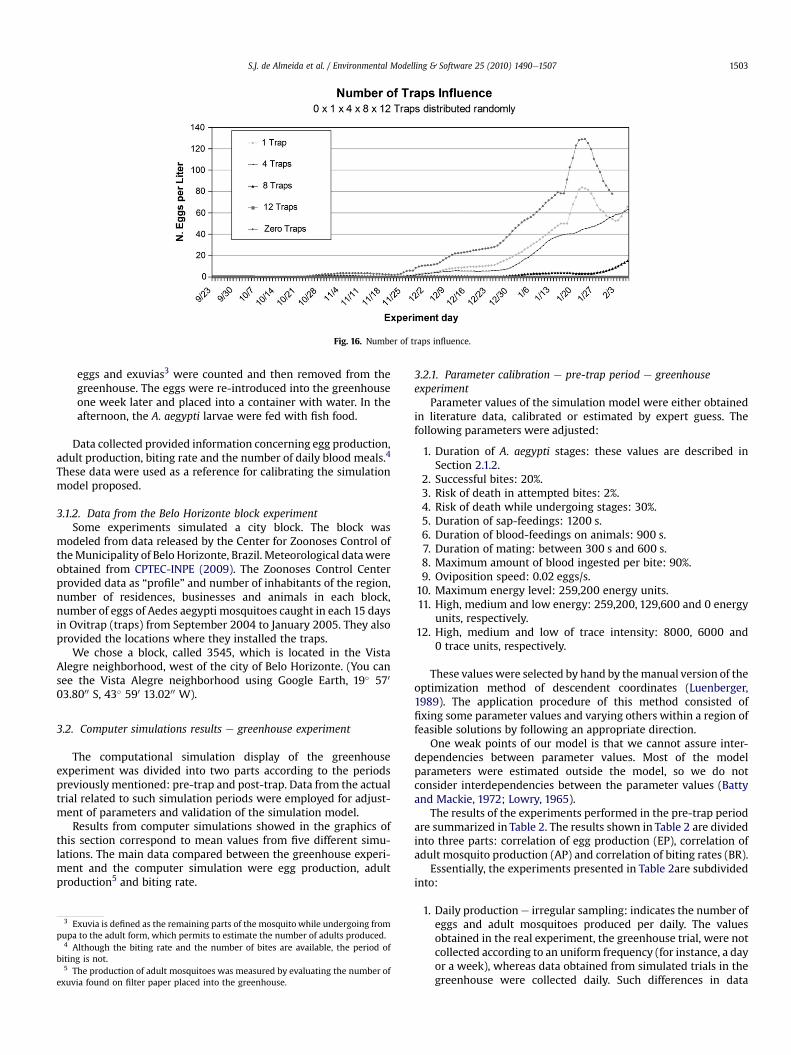
Fig. 16. Number of traps influence.
S.J. de Almeida et al. / Environmental Modelling & Software 25 (2010) 1490e1507 1503
eggs and exuvias3 were counted and then removed from thegreenhouse. The eggs were re-introduced into the greenhouseone week later and placed into a container with water. In theafternoon, the A. aegypti larvae were fed with fish food.
Data collected provided information concerning egg production,adult production, biting rate and the number of daily blood meals.4
These data were used as a reference for calibrating the simulationmodel proposed.
3.1.2. Data from the Belo Horizonte block experimentSome experiments simulated a city block. The block was
modeled from data released by the Center for Zoonoses Control oftheMunicipality of Belo Horizonte, Brazil. Meteorological datawereobtained from CPTEC-INPE (2009). The Zoonoses Control Centerprovided data as “profile” and number of inhabitants of the region,number of residences, businesses and animals in each block,number of eggs of Aedes aegypti mosquitoes caught in each 15 daysin Ovitrap (traps) from September 2004 to January 2005. They alsoprovided the locations where they installed the traps.
We chose a block, called 3545, which is located in the VistaAlegre neighborhood, west of the city of Belo Horizonte. (You cansee the Vista Alegre neighborhood using Google Earth, 19� 570
03.8000 S, 43� 590 13.0200 W).
3.2. Computer simulations results e greenhouse experiment
The computational simulation display of the greenhouseexperiment was divided into two parts according to the periodspreviously mentioned: pre-trap and post-trap. Data from the actualtrial related to such simulation periods were employed for adjust-ment of parameters and validation of the simulation model.
Results from computer simulations showed in the graphics ofthis section correspond to mean values from five different simu-lations. The main data compared between the greenhouse experi-ment and the computer simulation were egg production, adultproduction5 and biting rate.
3 Exuvia is defined as the remaining parts of the mosquito while undergoing frompupa to the adult form, which permits to estimate the number of adults produced.
4 Although the biting rate and the number of bites are available, the period ofbiting is not.
5 The production of adult mosquitoes was measured by evaluating the number ofexuvia found on filter paper placed into the greenhouse.
3.2.1. Parameter calibration e pre-trap period e greenhouseexperiment
Parameter values of the simulation model were either obtainedin literature data, calibrated or estimated by expert guess. Thefollowing parameters were adjusted:
1. Duration of A. aegypti stages: these values are described inSection 2.1.2.
2. Successful bites: 20%.3. Risk of death in attempted bites: 2%.4. Risk of death while undergoing stages: 30%.5. Duration of sap-feedings: 1200 s.6. Duration of blood-feedings on animals: 900 s.7. Duration of mating: between 300 s and 600 s.8. Maximum amount of blood ingested per bite: 90%.9. Oviposition speed: 0.02 eggs/s.
10. Maximum energy level: 259,200 energy units.11. High, medium and low energy: 259,200, 129,600 and 0 energy
units, respectively.12. High, medium and low of trace intensity: 8000, 6000 and
0 trace units, respectively.
These values were selected by hand by themanual version of theoptimization method of descendent coordinates (Luenberger,1989). The application procedure of this method consisted offixing some parameter values and varying others within a region offeasible solutions by following an appropriate direction.
One weak points of our model is that we cannot assure inter-dependencies between parameter values. Most of the modelparameters were estimated outside the model, so we do notconsider interdependencies between the parameter values (Battyand Mackie, 1972; Lowry, 1965).
The results of the experiments performed in the pre-trap periodare summarized in Table 2. The results shown in Table 2 are dividedinto three parts: correlation of egg production (EP), correlation ofadult mosquito production (AP) and correlation of biting rates (BR).
Essentially, the experiments presented in Table 2are subdividedinto:
1. Daily productione irregular sampling: indicates the number ofeggs and adult mosquitoes produced per daily. The valuesobtained in the real experiment, the greenhouse trial, were notcollected according to an uniform frequency (for instance, a dayor a week), whereas data obtained from simulated trials in thegreenhouse were collected daily. Such differences in data

Fig. 17. Effect of trap location: closer water containers versus distributed randomly.
S.J. de Almeida et al. / Environmental Modelling & Software 25 (2010) 1490e15071504
collection lead to behavior variations in comparative analysis.One of the approaches to dealing with such differences is tosum up the number of eggs produced in the computationalsimulation according to the days the human agent entered thegreenhouse to collect eggs.
2. Production with sliding window e the concept of slidingwindow in this work is associated with the sum of the valuesgot in the experiments in n days, where n is the size of thewanted window. For each day of experiment, the window“slides a position” and sums up the previous elements. Thecomparisons were made using 7- and 15-day sliding window.
3. Biting ratee the biting rate is the number of mosquitoes landedper min on the experimenter’s arm trying to suck his blood.
Table 2 presents the accumulated and daily egg and adultproduction. The correlation coefficients of the daily egg produc-tions suggests that simulation results are not similar to real dataunder this perspective. The highest correlation coefficient for thisanalysis was about 37%(EP.2). However, the accumulated datasuggests that the simulation results are close to the real data foundin real experiment. This analysis resulted in a 97% similarity (EP.4).Another result that should be considered is that of the comparisonbetween egg productions from a fortnightly perspective withsliding window (identification comparison EP.8). This comparisonresulted in a similarity higher than 80%.
The correlation coefficient of the daily egg production by adultmosquitoes (AP.2) shows that the simulation results are quitesimilar to the real data under this perspective. The simulation
Fig. 18. Effect of trap location: h
coefficient for this analysis was about 51%. However, in an accu-mulated perspective (AP.4), the simulation results are close to theresults of the real experiment. This analysis resulted in a similarityindex higher than 97%. The productions of adult mosquitoes ina fortnightly period, with sliding window (AP.8) resulted ina similarity higher than 70%.
The biting rates got from the real experiment and from thecomputer simulations did not behave in the same way during thepre-trap period. The correlation coefficient is approximately 31%(BR.1). However, the correlation coefficient between real andsimulation data in the period between the beginning of the exper-iments and 10 days before the trap was placed into the greenhousereveals a significant raise (identification comparison BR.2). If weconsider this comparison, the correlation coefficient is about 77%.
Figs. 8e11 show how the experiments evolved. Fig. shows thecurves concerning the number of eggs produced throughout theexperiment and the simulation time. Fig. 6 shows a graphic withfortnightly egg production. The graphic shown in Fig. 8 is presentsthe collection of exuvias accumulated throughout time and theaccumulated adult production in the computer experiment, ina similar way to what was presented previously concerning ancumulative evaluation of the egg production in the experiments. Tocomplement the analysis of adult/exuvias production, Fig. 11 showsa graphic with fortnightly totalizations of the adult/exuviasproductions.
Figs. 9 and 11 reveal a difference between the curve based on thereal experiment and the one based on the simulation, between the45th and the 65th day of experiment. We believe that this difference
ouse inside versus outside.

S.J. de Almeida et al. / Environmental Modelling & Software 25 (2010) 1490e1507 1505
couldbeduetoreasonsrelated todetailsof therealexperiment thatarenot considered by the simulation model proposed. Our hypothesis isassociatedwith the time-distributionmodel adopted for the eggs, thatis, the model adopted is more simple and deterministic than the realegg-distribution model of A. aegypti mosquitoes. Other possiblehypothesis is related to the fact that on one hand the egg productionincreased but on the other hand the exuvia production decreased.Weargue ifmaybepossible thatmosquitoesareproducingnonviableeggs.Even though there are differences between the curves, they behave insimilar way. The curves in the graphic presented by Fig. 8 are similar.
3.2.2. Post-trap period e general evaluation greenhouse experimentWe made two simulations on the post-trap period. An experi-
ment was carried out considering a trap placed in the middle of thegreenhouse, andwe simulated considering what could happen if detrap was not used. We do not calibrate any parameter in thisexperiment, so it is an evaluation experiment.
The trapmimics a human host. The female mosquito is attractedand captured. After the trap had been placed into the greenhouse,the student entered the place as often as in the pre-trap period, buthe was less often attacked by themosquitoes due to the presence ofthe trap. The simulations were made considering that human agentwas bitten up to 15 times everyday.
The results obtained from these experiments illustrate themosquito-population dynamics in the simulated scenery, inresponse to feeding and the presence of a trap. Figs. 12 and 13 showhow the experiments evolved.
The trap was placed into the greenhouse on the 112th day ofexperiment. The graphic presented in Fig. 13 shows that, after the112th day of experiment, the mosquito population keeps growingand starts to decrease a few days later. This occurs in the realexperiment, as well as in the computer simulations, except for thesimulation without trap.
3.2.3. Stability of modelWe cannot assure a theoretical stability (Goh, 1977; Lyapunov,
1992; May, 1974).Chli et al. (2003) consider the multi-agent system as a discrete
time Markov chain with a potentially unknown transitional prob-ability distribution. Markov processes are memoryless. So, only thecurrent state is required to describe its next state. They considera system stable when its state has converged to an equilibriumdistribution. SimPopMosq is a Markov process, and we made somesensitivity analysis experiments by adjusting up and down by(w10%) for each calibrated adopted parameter. Some of theseexperiments had an unstable or chaotic result.
Fig. 14 shows an experiment where we changed the initialnumber of gravid mosquito females into the greenhouse. Twosituations were performed and results were compared with basicgreenhouse experiment (50 females initially). The first considers 45females initial (�10%) and the second considers 55 females (þ10%).
We can see in Fig. 14 that the accumulative production of eggs isinversely proportional to the number of females initially introducedinitially into the greenhouse. This happened because the food intothe greenhouse was maintained constant, and, consequently, moremosquitoes competed for the food. The success of outbreak (born) ofeggs depends on the quantity of blood ingested by the females.
3.3. Belo Horizonte block experiment 2004e2005
Fig. 15 presents a comparison between real data and simulationresults. TheZoonozesControlCenter tries tocontrol theentirecity, acitywithmore thanatwo-million inhabitants. So, thedataaboutonespecialblock was not detailed. We do not have information about where theOvitrap was placed in the block. But, some preliminaries simulations
showed that the placement can affect results obtained. We decided tocompare real data (the number of eggs collected in the Ovitrap) withaverageof eggsper liter of allwater-holding containers in the simulatedscenario. We can say that the simulation was able to capture themomentwhen themosquitopopulationbegan to increase. ThePearsoncorrelation coefficient between field and predicted data is 0.97.
3.3.1. Cases study e city blockWe made a series of experiments to evaluate if a human odor
trap (BG-Sentinel trap) could be able to control to mosquito pop-ulation in a small area of a city block. The experiments were madewith the objective to verify where to locate these traps, and howmany traps were necessary for an efficient population control. Theresults got are presented in Figs. 16e18.
What can we imply from experiments? We found that thenumber of traps to extinguish the population has an optimumbetween 8 and 12 traps in the studied area (66 m� 66 m) e Fig. 16.But even if there are not enough traps to extinguish the resultsshown that they are able to slow the increase in population. Thisnumber is important if wewant to think that the active control as anofficial tactics to control the mosquito population, because of theinvolved costs. We also noticed that the trap location affects theresults. The simulation showed that is better to put the traps outsidethe house (Fig. 18), and if possible, closer of the possible mosquitonurseries (Fig. 17). Instead of put the trap at the head of the bed.
4. Comments and conclusions
With the developed model we can assess various situations thatother models are unable to address. These situations may lead touseful practices for controlling the mosquito population. Futuresimulations may help to answer some of the following questions:Are insect repellents effective in protecting the human population,or in controlling the insect population? Do mosquito nets work?Does architecture (doors, windows, swimming pool) have aninfluence on the mosquito population?
Experiments were performed to assess how the placement andnumber of traps could affect an active control policy. However,several other issues can be researched. For example, how coulda control policy based on the encouragement of people to useindividual protection, such as repellents, help control the mosquitopopulation? If people stay-at-home with the doors and windowsclosed, could this affect the mosquito population? What is better:setting traps, or using poison? Where, when and how to place thetraps? What kind of trap to use? Is it best to use traps or poison forhost seeking or gravid female mosquitoes? We could researchwhether or not it is better for people to remain indoors whilemosquitoes are most active. The simulation could show howhuman behavior has an effect on the number of bites and themosquito population. With the proposed model, various controlpolicies proposed in the literature could be tested.
In view of the problems associated with estimating a mosquitopopulation and the limitations of current models and tools, thepresent work introduces a computer simulation that provides newresults concerning the experiments performed.
The simulator consists of a population simulation model for theA. aegypti mosquito called SimPopMosq. This simulator has beendescribed in terms of concept and implementation. Results ofsimulations made with the simulator in question were analyzedand compared to real experimental data. The implementationcharacteristics of the model allow it to be improved. Each of thedetails, agents, objects, laws or rules can bemodified and improved.
For the conceptual modeling of the population simulator,models of agents, objects and the environment were proposed. Onecontribution of this work is a structured definition of a decision-

S.J. de Almeida et al. / Environmental Modelling & Software 25 (2010) 1490e15071506
makingmodel for the male and female A. aegyptimosquito. To date,no similar decision-making model for this particular mosquito canbe found in literature. The proposed simulation model can give theuser insights about how to control an insect population in an urbanenvironment. The proposed model provides quantitative informa-tion although we cannot say yet that we have definitive results.
The scenery and the initial conditions simulated are similar tothose of the real experiment conducted in the greenhouse. Manysimulations were performed in order to calibrate and validate theSimPopMosq simulation model. The results obtained from the simu-lations were compared to those obtained from the greenhouseexperiment. The correlation between these results proved satisfac-toryand reacheda similarity level higher than98% for somevariables.
A case study to evaluate the post-trap period revealed that theBG-Sentinel trap is effective in controlling the mosquito populationin a closed environment. The case study also indicated that makingit more difficult for females to consume blood leads to eggproduction control and consequently to population control. Theseresults indicate that the BG-Sentinel trap might also have an effectin the field to reduce a local population of A. aegypti. We found thatif we have a sufficient number of traps it will be possible to controlthe mosquito population.
One of the difficulties found in the present work is related to theparameter adjustment. Many of the parameters comprised by thesimulation model have not been found in literature. Due to thislimitation, some of the parameters were estimated and others weredetermined by a series of oriented experiments through an opti-mization method called descendent coordinates. One of thedisadvantages of the agent-based model compared to analyticalmodels is the demand for intensive computer resources. Uponrunning, the simulation requires intensive computing as it isa natural candidate for using computer grid resources.
In biology there are a strong study interest in mosquito ecologyand control. Biology hasworked to understand themosquito biology.
“Social and behavioral responses can help control vector-bornedisease” (Campbell-Lendrum and Molyneux, 2005). The simulationmodel proposed can be used to study what could be the impact ofthese responses.
We can also use the same developed framework to study othervectors. The application of the proposed model is straightforwardwithothervectors.Weneedonly to change themosquito agentmodelto the new kind of agent. Another vector-borne disease problem thatour city is suffering is Leishmaniasis. Leishmaniasis is caused byparasites of the genus Leishmania and it is transmitted by sandflies(subfamily Phlebotominae) (Berman, 2005). The death number fromleishmaniasis inMinasGerais state (Brazil) grew72.7%between2008ewhen35peoplehas diede and2009ewhen35peoplehas died. Inthe city of Belo Horizonte, 10,227 dogs were sacrificed, 161 humanbeingswere infected and 18 died from Leishmaniasis. These numberscan motivate researchers to investigate the use of computer simula-tion models on Leishmaniasis disease.
Acknowledgment
The authors thank to CNPQ, FAPEMIG and CAPES.
References
Anholt, B.R., 1997. How should we test for the role of behaviour in populationdynamics? Evolutionary Ecology 11, 633e640.
Athanasiadis, I.N., Milis, M., Mitkas, P.A., Michaelides, S.C., 2009. A multi-agentsystem for meteorological radar data management and decision support.Environmental Modelling & Software 24 (11), 1264e1273.
Barrett, C.L., Eubank, S.G., Smith, J.P., 2005. IF SMALLPOX STRIKES PORTLAND.EPISIMS unleashes virtual plagues in real cities to see how social networksspread disease. That knowledge might help stop epidemics. Scientific American292 (3), 42e49.
Batty, M., Mackie, S., 1972. The calibration of gravity, entropy and related models ofspatial interaction. Environment and Planning 4, 205e233.
Bellows Jr., T.S., Van Driesche, R.G., Elkinton, J.S., 1992. Life-table construction andanalysis in the evaluation of natural enemies. Annual Review of Entomology 37,587e614.
Berman, J., 2005. Recent developments in leishmaniasis: epidemiology, diagnosis,and treatment. Curr Infect Dis Resp 7, 33e38.
Bithell, M., Brasington, J., 2009. Coupling agent-based models of subsistencefarming with individual-based forest models and dynamic models of waterdistribution. Environmental Modelling & Software 24 (2), 173e190.
Bomblies, A., Duchemin, J.-A., Eltahir, E.A.B., 2008. Hydrology of malaria: modeldevelopment and application to a Sahelian village. Water Resources Research44:26 (12).
Campbell-Lendrum, D., Molyneux, D., 2005. Ecosystems and vector-borne diseasecontrol. In: Epstein, P., Githeko, A., Rabinovich, J., Weinstein, P. (Eds.), Ecosys-tems and Human Well-being: Policy Responses, vol. 2. Island Press, Wash-ington, DC, pp. 353e372.
Chli, M., De Wilde, P., Goossenaerts, J., Abramov, V., Szirbik, N., Correia, L., Mariano,P., Ribeiro, R., 2003. Stability of Multi-Agent Systems. In: Proceedings of the2003 IEEE International Conference on Systems, Man, and Cybernetics, pp.551e556.
Chung, C.A., 2003. Simulation Modeling Handbook: A Practical Approach. CRC Press.Consoli, R.A.G.B., Oliveira, R.L., 1994. Principais Mosquitos de Importância Sanitária
no Brasil. Editora Fiocruz, Rio de Janeiro.Costero, A., Edman, J.D., Clark, G.G., Kittayapong, P., Scott, T.W., May 1999. Survival
of starved Aedes aegypti (Diptera: Culicidae) in Puerto Rico and Thailand.Journal of Medical Entomology 36 (3), 272e276.
CPTEC-INPE, 2009. Centro de previsão de tempo e estudos climáticos. Availablefrom: http://www.cptec.inpe.br/ (accessed 4 April 2010).
Derouich, M., Boutayeb, A., Twizell, E., 2003. A model of dengue fever. BioMedicalEngineering OnLine.
Dye, C., 1984. Models for the population dynamics of the yellow fever mosquito,Aedes aegypti. Journal of Animal Ecology 53 (1), 247e268.
Eiras, A.E., 2000. Chapter 40: Culicidae. In: Neves, D.P., et al. (Eds.), ParasitologiaHumana. Atheneu.
Ericson, C., 2004. Real-Time Collision Detection. Morgan Kaufmann.Fahse, L., Wissel, C., Grimm, V., 1998. Reconciling classical and individual-based
approaches in theoretical population ecology: a protocol for extracting pop-ulation parameters from individual-based models. The American Naturalist 152(6), 838e852.
Ferguson, N.M., Keeling, M.J., Edmunds, J.W., Gani, R., Grenfell, B.T., Anderson, R.M.,Leach, S., 2003. Planning for smallpox outbreaks. Nature 425, 681e685.
Ferreira, C.P., Yang, H.M., 2003. Estudo dinâmico da população de mosquitos Aedesaegypti. CNMAC - Congresso Nacional de Matemática Aplicada e Computacio-nal, pp. 187e196.
Focks, D.A., Haile, D.G., Daniels, E., Mount, G.A., 1993a. Dynamic life table for Aedesaegypti (Diptera: Culicidae): analysis of the literature and model development.Journal of Medical Entomology, 1003e1017.
Focks, D.A., Haile, D.G., Daniels, E., Mount, G.A., 1993b. Dynamic life table for Aedesaegypti (Diptera: Culicidae): simulation results and validation. Journal ofMedical Entomology, 1018e1028.
Focks, D.A., Daniels, E., Haile, D.G., Keesling, J.E., 1995. A simulation model of theepidemiology of urban dengue fever: literature analysis, model development,preliminary validation, and samples of simulation results. American Journal ofTropical Medicine and Hygiene, 489e506.
Goh, B.S., 1977. Global stability in many-species systems. American Naturalist 111,135e143.
Gomes, A.S., Sciavico, C.J.S., Eiras, A.E., 2006. Periodicidade de oviposição de fêmeasde Aedes aegypti (Linnaeus, 1762) (Diptera: Culicidae) em laboratório e campo.Journal of Brazilian Society of Tropical Medicine, 327e332.
Grand Challenges in Global Health, 2009. Available from: http://www.grandchallenges.org/ControlInsect/Pages/default.aspx (accessed 4 April 2010).
Grimm, V., 1999. Ten years of individual-based modelling in ecology: what have welearned, and what could we learn in the future. Ecological Modelling, 129e148.
Grimm, V., Railsback, S.F., 2005. Individual-based Modeling and Ecology, NewJersey.
Grimm, V., et al., 2006. A standard protocol for describing individual-based andagent-based models. Ecological Modelling, 115e126.
Houghton, J.T., Meira Filho, L.G., Griggs, D.J., Maskell, K., 1997. Stabilization ofatmospheric greenhouse gases: physical, biological and socio-economic impli-cations. IPCC Technical Paper III. IPCC, pp. 51.
Hagelbäck, J., Johansson, S.J., 2008. Using multi-agent potential fields in real-timestrategy games. In: Proceedings of International Conference on AutonomousAgents and Multi-agent Systems (AAMAS).
Hawkins, B.A., Cornell, H.V., Hochberg, M.E., 1997. Predators, parasitoids, andpathogens as mortality agents in phytophagous insect populations. Ecology 78,2145e2152.
Kröckel, U., Rose, A., Eiras, A.E., Geier, M., 2006. New tools for surveillance of adultyellow fever mosquitoes: comparison of trap catches with human landing ratesin an urban environment. Journal of the American Mosquito Control Association22, 229e238.
Leonel, M.A., Yoneyama, T., 2000. Optimal and sub-optimal control in Dengueepidemics. Optimal Control Applications and Methods.
Lowry, I.S., 1965. A short course in hodel design. Journal of the American Institute ofPlanners 31, 158e165.

S.J. de Almeida et al. / Environmental Modelling & Software 25 (2010) 1490e1507 1507
Luenberger, D.G., 1989. Linear and Nonlinear Programming. Addison-WesleyPublishing Co.
Lyapunov, A.M., 1992. The General Problem of the Stability of Motion. Taylor &Francis, London. Reprint.
Maciel-de-Freitas, R., Eiras, A.E., Lourenço-de-Oliveira, R., 2008. Calculating thesurvival rate and estimated population density of gravid Aedes aegypti (Diptera:Culicidae) in Rio de Janeiro, Brazil. Memórias of Instituto Oswaldo Cruz 24, 1e8.
May, R., 1974. In: Stability and Complexity in Model Ecosystems, second ed.Princeton University Press, Princeton, NJ.
Millington, I., 2006. Artificial Intelligence for Games. Morgan Kaufmann.Minar, N., Burkhart, R., Langton, C., Askenazi, M., 1996. The Swarm Simulation
System, A Toolkit for Building Multi-Agent Simulations.Mwangi, R.W., Rembold, H., 1988. Growth-inhibiting and larvicidal effects of Melia
volkensii extracts on Aedes aegypti larvae. Entomol. Exp. Appl. 46, 103e108.North, M.J., Collier, N.T., Vos, J.R., 2006. Experiences creating three implementations
of the repast agent modeling toolkit. ACM Trans. Model. Comput. Simul. 16 (1),1e25.
Parunak, H.V.D., Savit, R., Riolo, R.L., 1998. Agent-Based Modeling vs. Equation-Based Modeling: A Case Study and Users Guide. In: Multi-agent Systems andAgent-based Simulation (MABS’98), vol. 1534. Springer-Verlag.
Peck, S.L., 2004. Simulation as experiment: a philosophical reassessment for bio-logical modeling. Trends in Ecology and Evolution.
Perez, L., Dragicevic, A., 2009. Modeling mountain pine beetle infestation with anagent-based approach at two spatial scales. Modelling & Software 25 (2),223e236.
Peters, T.M., Barbosa, P., 1977. Influence of population density on size, fecundity, anddevelopmental rate of insects in culture. Annual Review of Entomology 22,431e450.
Peterson, J., 1998. Global Warming Would Foster Spread of Dengue Fever into SomeTemperate Regions.
Rahmandad, H., Sterman, J., 2008. Heterogeneity and network structure in thedynamics of diffusion: comparing agent-based and differential equationmodels. Management Science 54 (5), 998e1014.
Rao, D.M., Chernyakhovsky, A., Rao, V., 2008. Modeling and analysis of globalepidemiology of avian influenza. Environmental Modelling & Software 24 (1),124e134.
Sandholm, T., 1999. Multi-agent Systems: A Modern Introduction to DistributedArtificial Intelligence. MIT Press.
Swarm Development Group: Swarm 2.2, 2004. Swarm Development Group. http://wiki.swarm.org (accessed 4 April 2010).
Templin, R.J., 2000. The spectrum of animal flight: insects to pterosaurs. Progress inAerospace Sciences, 393e436.
Vlassis, N., 2003. A Concise Introduction to Multiagent Systems and Distributed AI.Informatics Institute, University of Amsterdam.
Williams, C.R., Johnson, P.H., Long, S.A., Rapley, L.P., Ritchie, S.A., 2008. Rapid esti-mation of aedes aegypti population size using simulation modeling, witha novel approach to calibration and field validation. Journal of Medical Ento-mology, 1173e1179.
Wooldridge, M., 2002. An Introduction to MultiAgent Systems. Wiley, Chichester.Dengue and Dengue Haemorrhagic Fever, 2002. World Health Organization. http://
www.who.int/mediacentre/factsheets/fs117/en/ (accessed 4 April 2010).Yang, H.M., 2003. Epidemiologia da Transmissão da Dengue. CNMAC e Congresso
Nacional de Matemática Aplicada e Computacional, pp. 387e396.Yang, H.M., Ternes, S., Ferreira, C.P., 2002. Dinâmica populacional do vetor trans-
missor da dengue. CNMAC e Congresso Nacional de Matemática Aplicada eComputacional, p. 478.
Copyright © 2022 FDOKUMEN