Rhythms and synchronization patterns in gene expression in the Aedes aegypti mosquito
16
RESEARCH ARTICLE Open Access Rhythms and synchronization patterns in gene expression in the Aedes aegypti mosquito Andrey A Ptitsyn 1 , Guadalupe Reyes-Solis 2 , Karla Saavedra-Rodriguez 2 , Jonathan Betz 2 , Erica L Suchman 2 , Jonathan O Carlson 2 and William C Black IV 2* Abstract Background: Aedes aegypti is arguably the most studied of all mosquito species in the laboratory and is the primary vector of both Dengue and Yellow Fever flaviviruses in the field. A large number of transcriptional studies have been made in the species and these usually report transcript quantities observed at a certain age or stage of development. However, circadian oscillation is an important characteristic of gene expression in many animals and plants, modulating both their physiology and behavior. Circadian gene expression in mosquito species has been previously reported but for only a few genes directly involved in the function of the molecular clock. Results: Herein we analyze the transcription profiles of 21,494 messenger RNAs using an Ae. aegypti Agilent ® microarray. Transcripts were quantified in adult female heads at 24 hours and then again at 72 hours and eight subsequent time points spaced four hours apart. We document circadian rhythms in multiple molecular pathways essential for growth, development, immune response, detoxification/pesticide resistance. Circadian rhythms were also noted in ribosomal protein genes used for normalization in reverse transcribed PCR (RT-PCR) to determine transcript abundance. We report pervasive oscillations and intricate synchronization patterns relevant to all known biological pathways. Conclusion: These results argue strongly that transcriptional analyses either need to be made over time periods rather than confining analyses to a single time point or development stage or exceptional care needs to be made to synchronize all mosquitoes to be analyzed and compared among treatment groups. Background Mosquito species exhibit a wide range of distinct daily activity patterns and are, in fact, frequently character- ized as to whether their feeding and mating behaviors are diurnal, crepuscular, or nocturnal (reviewed in [1] chapter 33). Activity and blood-feeding rhythms appear to be controlled by a circadian (i.e. approximately daily) clock [1]. Observations of circadian rhythms in the phy- siology and behavior of the culicine mosquito species Aedes aegypti (L) have been previously reported in the field (biting patterns [2], biting and flight patterns [3]) and in laboratory studies (oviposition [4]; sugar-feeding [5]). Both oviposition and sugar-feeding patterns have been explained by an inherited endogenous circadian rhythm [1]. Entraining of flight pattern caused by the change from light to dark as a time-cue was experimen- tally studied by Taylor and Jones[6]. Subsequent publi- cations in the culicine mosquito Culiseta incidens reported differences in behavior in constant darkness and constant light after light/dark 12 h:12 h entraining. The authors proposed the existence of two dependent oscillators which could be temporarily or permanently uncoupled to explain lengthening and shortening of activity periods [7,8]. Connection between metabolism, feeding pattern and circadian regulation of gene expres- sion has been explored by Das and Dimopoulos [9]. This study taking advantage of custom designed micro- arrays has reported that genes controlling feeding beha- vior are under circadian control. Long and short light pulses can alter circadian feeding behavior through unknown molecular mechanisms, possibly involving chemosensory system [9]. * Correspondence: [email protected] 2 Department of Microbiology, Immunology and Pathology, College of Veterinary and Biomedical Sciences, Colorado State University, Fort Collins, CO 80525, USA Full list of author information is available at the end of the article Ptitsyn et al. BMC Genomics 2011, 12:153 http://www.biomedcentral.com/1471-2164/12/153 © 2011 Ptitsyn et al; licensee BioMed Central Ltd. This is an Open Access article distributed under the terms of the Creative Commons Attribution License (http://creativecommons.org/licenses/by/2.0), which permits unrestricted use, distribution, and reproduction in any medium, provided the original work is properly cited.
Transcript of Rhythms and synchronization patterns in gene expression in the Aedes aegypti mosquito

RESEARCH ARTICLE Open Access
Rhythms and synchronization patterns in geneexpression in the Aedes aegypti mosquitoAndrey A Ptitsyn1, Guadalupe Reyes-Solis2, Karla Saavedra-Rodriguez2, Jonathan Betz2, Erica L Suchman2,Jonathan O Carlson2 and William C Black IV2*
Abstract
Background: Aedes aegypti is arguably the most studied of all mosquito species in the laboratory and is theprimary vector of both Dengue and Yellow Fever flaviviruses in the field. A large number of transcriptional studieshave been made in the species and these usually report transcript quantities observed at a certain age or stage ofdevelopment. However, circadian oscillation is an important characteristic of gene expression in many animals andplants, modulating both their physiology and behavior. Circadian gene expression in mosquito species has beenpreviously reported but for only a few genes directly involved in the function of the molecular clock.
Results: Herein we analyze the transcription profiles of 21,494 messenger RNAs using an Ae. aegypti Agilent®
microarray. Transcripts were quantified in adult female heads at 24 hours and then again at 72 hours and eightsubsequent time points spaced four hours apart. We document circadian rhythms in multiple molecular pathwaysessential for growth, development, immune response, detoxification/pesticide resistance. Circadian rhythms werealso noted in ribosomal protein genes used for normalization in reverse transcribed PCR (RT-PCR) to determinetranscript abundance. We report pervasive oscillations and intricate synchronization patterns relevant to all knownbiological pathways.
Conclusion: These results argue strongly that transcriptional analyses either need to be made over time periodsrather than confining analyses to a single time point or development stage or exceptional care needs to be madeto synchronize all mosquitoes to be analyzed and compared among treatment groups.
BackgroundMosquito species exhibit a wide range of distinct dailyactivity patterns and are, in fact, frequently character-ized as to whether their feeding and mating behaviorsare diurnal, crepuscular, or nocturnal (reviewed in [1]chapter 33). Activity and blood-feeding rhythms appearto be controlled by a circadian (i.e. approximately daily)clock [1]. Observations of circadian rhythms in the phy-siology and behavior of the culicine mosquito speciesAedes aegypti (L) have been previously reported in thefield (biting patterns [2], biting and flight patterns [3])and in laboratory studies (oviposition [4]; sugar-feeding[5]). Both oviposition and sugar-feeding patterns havebeen explained by an inherited endogenous circadian
rhythm [1]. Entraining of flight pattern caused by thechange from light to dark as a time-cue was experimen-tally studied by Taylor and Jones[6]. Subsequent publi-cations in the culicine mosquito Culiseta incidensreported differences in behavior in constant darknessand constant light after light/dark 12 h:12 h entraining.The authors proposed the existence of two dependentoscillators which could be temporarily or permanentlyuncoupled to explain lengthening and shortening ofactivity periods [7,8]. Connection between metabolism,feeding pattern and circadian regulation of gene expres-sion has been explored by Das and Dimopoulos [9].This study taking advantage of custom designed micro-arrays has reported that genes controlling feeding beha-vior are under circadian control. Long and short lightpulses can alter circadian feeding behavior throughunknown molecular mechanisms, possibly involvingchemosensory system [9].
* Correspondence: [email protected] of Microbiology, Immunology and Pathology, College ofVeterinary and Biomedical Sciences, Colorado State University, Fort Collins,CO 80525, USAFull list of author information is available at the end of the article
Ptitsyn et al. BMC Genomics 2011, 12:153http://www.biomedcentral.com/1471-2164/12/153
© 2011 Ptitsyn et al; licensee BioMed Central Ltd. This is an Open Access article distributed under the terms of the Creative CommonsAttribution License (http://creativecommons.org/licenses/by/2.0), which permits unrestricted use, distribution, and reproduction inany medium, provided the original work is properly cited.
In no other insect species have the genes that controlcircadian rhythms been as well characterized as in Dro-sophila melanogaster. A number of genes have beenimplicated in the control of circadian rhythms in thisspecies. Transcriptional analyses of these suggest amechanism whereby transcriptional negative feedbackloops control cyclic expression [10]. The two main regu-latory loops of the circadian clock involve the genes per-iod (per), timeless (tim), Clock (Clk), cycle (cyc), vrille(vri), and Par-domain-protein-1 (Pdp1) [11-13]. Regula-tory loops control the circadian expression of genes inthe clock and determine the abundance of a large num-ber of fluctuating transcripts. These transcripts in turnare thought to be indicators of a pacemaker that con-trols various aspects of physiology and behavior [14].Orthologues of Drosophila circadian genes have been
cloned or identified in the mosquitoes Anopheles gam-biae [15] and Ae. aegypti [16]. Gentile et al [17] clonedand analyzed expression of tim in Ae. aegypti. In Droso-phila, tim controls a central pacemaker and a resettingmechanism that allows the clock to synchronize withenvironmental light-dark cycles. Predicted proteinsequence encoded by timeless in Ae. aegypti and D. mel-anogaster were highly similar in domains of knownfunction, suggesting functional conservation. Analysis ofthe daily expression of timeless indicated a peak inmRNA abundance around the daily light-dark transition.Gentile et al [18] compared the circadian expression ofclock genes in Ae. aegypti and Cx. quinquefasciatus.Both species diverged > 22 MYA but exhibit conservedcircadian expression patterns for all major cycling clockgenes (with the exception of cryptochrome 2). However,beyond these few core circadian genes, little is knownabout circadian oscillations in gene expression in mos-quitoes. Understanding these oscillations is essential forlearning the relationship between the circadian clockand the observed periodicity in mosquito physiology andbehavior.Due to the ease with which it can be collected in the
field and maintained in the laboratory, Ae. aegypti is themost studied of all mosquito species. Much of what weknow about the genetic, biochemical, physiological, andbehavior of mosquitoes has come from this species. Forexample, A.N. Clements’ (1992) encyclopedia on mos-quito physiology contains 800 references and 400 ofthese involve Ae. Aegypti [1]. As importantly the speciesis the principal vector of the dengue and yellow feverflaviviruses and a host of other important arbovirusesthroughout all tropical and subtropical regions of theworld. Many transcriptional studies of genes involved indevelopment [19,20], competence for pathogen propaga-tion and transmission [21,22], insecticide resistance[23,24], blood-feeding [25] and blood meal digestion[26] have been conducted in Ae. aegypti. More recently,
the species has also been the subject of a number oflarge scale transcriptional analyses using microarrays toscan for genes involved in insecticide resistance [27,28],development [29], vector competence [30-34], andbloodfeeding [35]. In no case did these studies (includ-ing those in which the senior author was directlyinvolved) consider the possibility of circadian oscillationsin expression of genes under study.Herein we present a study in which we tested for cir-
cadian oscillations in expression of genes in a large partof the transcriptome using the Agilent® Aedes aegyptimicroarray [15,33] and an experimental design that hasbeen successfully used to demonstrate circadian cyclesof gene transcription in model eukaryotic organisms(mouse, yeast) and humans. Transcripts were collectedfrom the heads of females that were 72, 76, 80, 84, 88,92, 96, 100 and 104 hours old. Transcripts were onlycollected from the heads of females for three reasons.First, whole bodies were not used because various stu-dies have demonstrated asynchronous oscillations intranscript abundance among different organs and tis-sues. Analysis of whole carcasses could therefore masktissue- or organ-specific oscillations in transcript abun-dance. Second, the head is a discrete structure that canbe easily and rapidly dissected from the body withoutlarge amounts of contamination by transcripts fromother tissues. We are of course assuming uniformity intranscript abundance among different organs and tissuesin the head; an assumption that is almost certainly false.Third, we wished to avoid gender differences in tran-script abundance. We demonstrate that a large numberof transcripts in the female head exhibit circadianfluctuations.
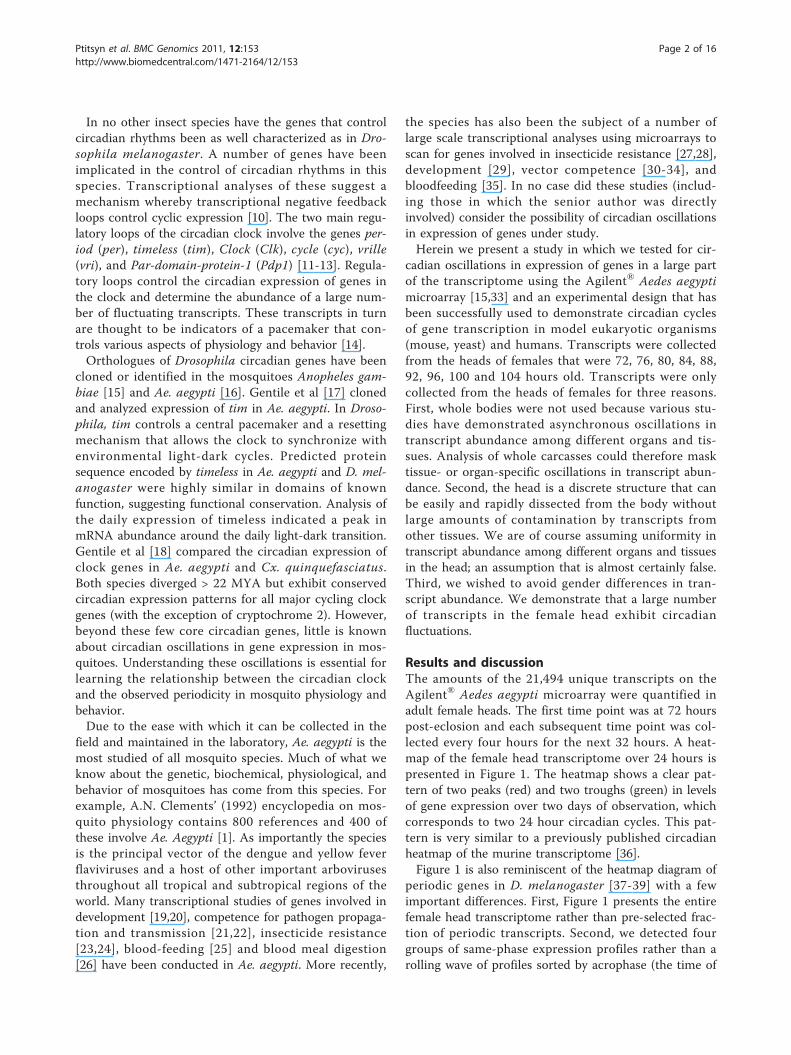
Results and discussionThe amounts of the 21,494 unique transcripts on theAgilent® Aedes aegypti microarray were quantified inadult female heads. The first time point was at 72 hourspost-eclosion and each subsequent time point was col-lected every four hours for the next 32 hours. A heat-map of the female head transcriptome over 24 hours ispresented in Figure 1. The heatmap shows a clear pat-tern of two peaks (red) and two troughs (green) in levelsof gene expression over two days of observation, whichcorresponds to two 24 hour circadian cycles. This pat-tern is very similar to a previously published circadianheatmap of the murine transcriptome [36].Figure 1 is also reminiscent of the heatmap diagram of
periodic genes in D. melanogaster [37-39] with a fewimportant differences. First, Figure 1 presents the entirefemale head transcriptome rather than pre-selected frac-tion of periodic transcripts. Second, we detected fourgroups of same-phase expression profiles rather than arolling wave of profiles sorted by acrophase (the time of
Ptitsyn et al. BMC Genomics 2011, 12:153http://www.biomedcentral.com/1471-2164/12/153
Page 2 of 16
highest expression level). We assigned expression pro-files to a phase group by fitting discrete expression pro-files with low sampling rate (12 time points per series)to a discrete cosine curve generated with the same sam-pling rate. Hence, discrete presentation of four possiblephases is the correct way to present the results.The majority of transcripts in Figure 1 exhibit two
cycles of oscillations over two days. This observation isconsistent with the hypothesis that there is a gradualreduction of signal to noise ratio without an actual lossof periodicity [36]. Tests for periodicity applied in astraightforward way and testing each expression profileindependently report considerable numbers of periodictranscripts (Table 1). The difference in estimated num-bers of transcripts passing the standard cutoff of p =0.05 is caused by the different set of assumptions under-lying each of the tests. Application of statistical tests in
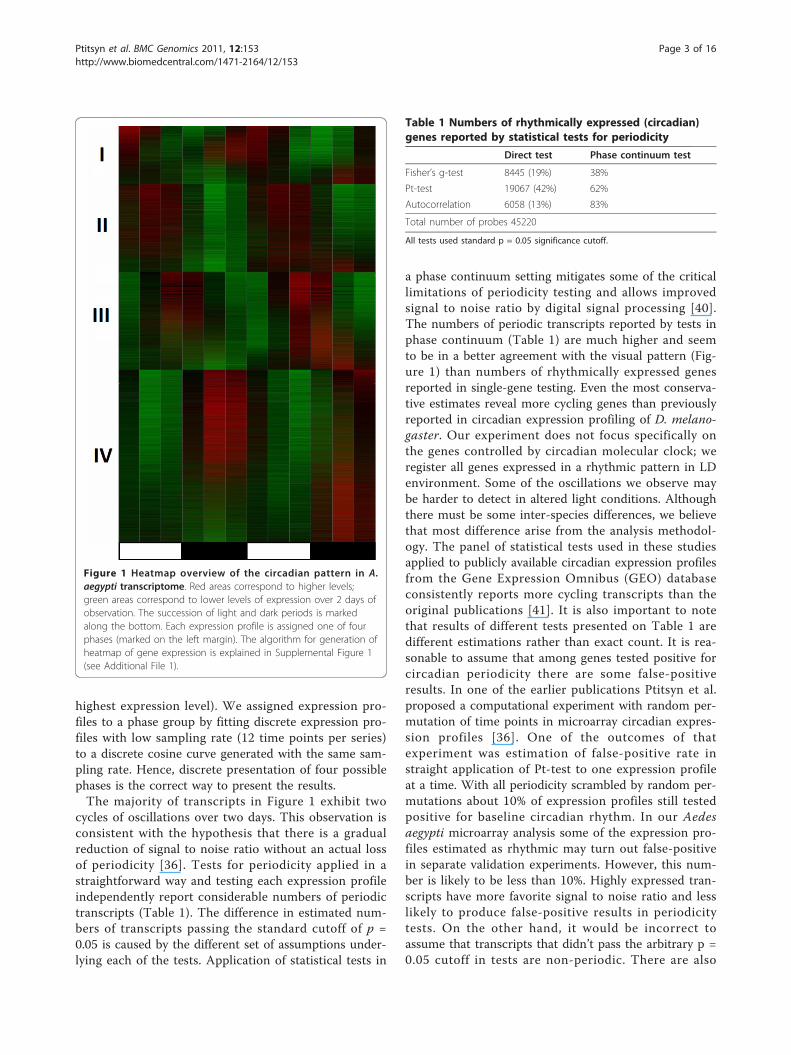
a phase continuum setting mitigates some of the criticallimitations of periodicity testing and allows improvedsignal to noise ratio by digital signal processing [40].The numbers of periodic transcripts reported by tests inphase continuum (Table 1) are much higher and seemto be in a better agreement with the visual pattern (Fig-ure 1) than numbers of rhythmically expressed genesreported in single-gene testing. Even the most conserva-tive estimates reveal more cycling genes than previouslyreported in circadian expression profiling of D. melano-gaster. Our experiment does not focus specifically onthe genes controlled by circadian molecular clock; weregister all genes expressed in a rhythmic pattern in LDenvironment. Some of the oscillations we observe maybe harder to detect in altered light conditions. Althoughthere must be some inter-species differences, we believethat most difference arise from the analysis methodol-ogy. The panel of statistical tests used in these studiesapplied to publicly available circadian expression profilesfrom the Gene Expression Omnibus (GEO) databaseconsistently reports more cycling transcripts than theoriginal publications [41]. It is also important to notethat results of different tests presented on Table 1 aredifferent estimations rather than exact count. It is rea-sonable to assume that among genes tested positive forcircadian periodicity there are some false-positiveresults. In one of the earlier publications Ptitsyn et al.proposed a computational experiment with random per-mutation of time points in microarray circadian expres-sion profiles [36]. One of the outcomes of thatexperiment was estimation of false-positive rate instraight application of Pt-test to one expression profileat a time. With all periodicity scrambled by random per-mutations about 10% of expression profiles still testedpositive for baseline circadian rhythm. In our Aedesaegypti microarray analysis some of the expression pro-files estimated as rhythmic may turn out false-positivein separate validation experiments. However, this num-ber is likely to be less than 10%. Highly expressed tran-scripts have more favorite signal to noise ratio and lesslikely to produce false-positive results in periodicitytests. On the other hand, it would be incorrect toassume that transcripts that didn’t pass the arbitrary p =0.05 cutoff in tests are non-periodic. There are also
Figure 1 Heatmap overview of the circadian pattern in A.aegypti transcriptome. Red areas correspond to higher levels;green areas correspond to lower levels of expression over 2 days ofobservation. The succession of light and dark periods is markedalong the bottom. Each expression profile is assigned one of fourphases (marked on the left margin). The algorithm for generation ofheatmap of gene expression is explained in Supplemental Figure 1(see Additional File 1).
Table 1 Numbers of rhythmically expressed (circadian)genes reported by statistical tests for periodicity
Direct test Phase continuum test
Fisher’s g-test 8445 (19%) 38%
Pt-test 19067 (42%) 62%
Autocorrelation 6058 (13%) 83%
Total number of probes 45220
All tests used standard p = 0.05 significance cutoff.
Ptitsyn et al. BMC Genomics 2011, 12:153http://www.biomedcentral.com/1471-2164/12/153
Page 3 of 16

false-negative rhythmically expressed transcripts, parti-cularly among low-expressed genes, for which test arenot sufficiently powerful. Reproducing the experimentwith more time points (and thus higher sampling rate)can improve both testing for periodicity and determin-ing the phase of oscillation. However, there are ways toimprove the validity of existing data. First, selectedmicroarray expression profiles can be validated usingalternative RT-PCR technique for estimation of tran-script abundance. Second, validity of gene expressionpatterns in time can be considered in the context oftheir interaction, i.e. within corresponding biologicalpathways.Selected expression profiles were validated using RT-
PCR (Figure 2). Overall the RT-PCR profiles are in agood agreement with the microarray profiles (panel A).Panel B shows agreement between intensity signal frommicroarray probes (two probes) and RT-PCR estimationof gene expression. For compatibility, raw RT-PCRvalues have been subtracted from the maximum. On the
other hand, one of the microarray probes selected forRT-PCR validation demonstrated a clear circadian oscil-lating profile, but in a counter-phase to microarrayexpression profile (panel C). In turn, microarray probesare not in complete agreement with each other. Thefirst probe (blue line) shows a mixed profile, whichcould be resulting from competing cross-hybridizationbetween different transcripts. In previous publications ithas been reported that alternatively polyadenylated tran-scripts of the same gene can oscillate in counter-phaseto one another [42]. We hypothesize that RT-PCRexpression values show behavior of only one of thealternative transcripts (green line), while microarrayprobes target the alternative transcript (probe b, redline) and both transcripts (blue line).Genes encoding the 40S ribosomal protein S7 and the
60S ribosomal proteins L8, L44, and P1 are commonlyused as “standards” for adjusting transcript abundanceduring RT-PCR. Figure 3a demonstrates clear andreproducible oscillations in 40S ribosomal S7 transcript
Figure 2 Validation of microarray expression by RT-PCR. A. Correlation between microarray significant ratios (log2) and average RTPCR ratiovalues. B. Timeline for microarray (two probes) and RTPCR expression values for AMP-dependent ligase. C. Timeline expression values for thehypothetic protein probe 16179 microarray (two probes) and RTPCR expression values.
Ptitsyn et al. BMC Genomics 2011, 12:153http://www.biomedcentral.com/1471-2164/12/153
Page 4 of 16
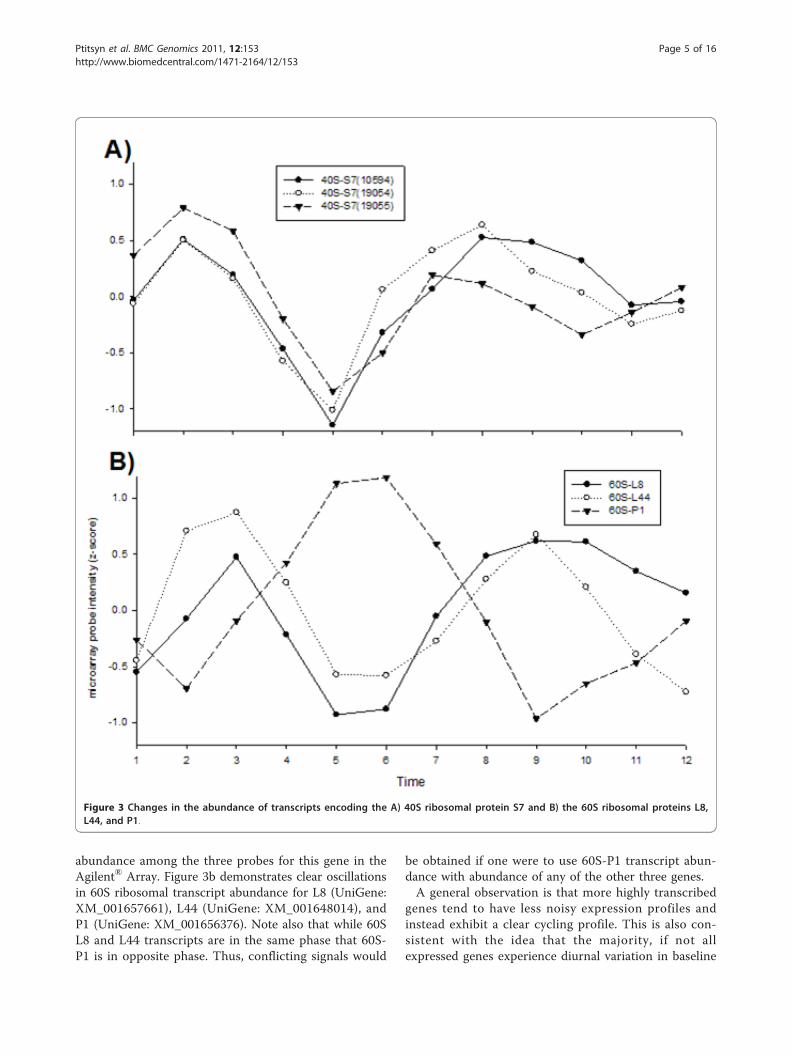
abundance among the three probes for this gene in theAgilent® Array. Figure 3b demonstrates clear oscillationsin 60S ribosomal transcript abundance for L8 (UniGene:XM_001657661), L44 (UniGene: XM_001648014), andP1 (UniGene: XM_001656376). Note also that while 60SL8 and L44 transcripts are in the same phase that 60S-P1 is in opposite phase. Thus, conflicting signals would
be obtained if one were to use 60S-P1 transcript abun-dance with abundance of any of the other three genes.A general observation is that more highly transcribed
genes tend to have less noisy expression profiles andinstead exhibit a clear cycling profile. This is also con-sistent with the idea that the majority, if not allexpressed genes experience diurnal variation in baseline
Figure 3 Changes in the abundance of transcripts encoding the A) 40S ribosomal protein S7 and B) the 60S ribosomal proteins L8,L44, and P1.
Ptitsyn et al. BMC Genomics 2011, 12:153http://www.biomedcentral.com/1471-2164/12/153
Page 5 of 16

expression. Thus we should account for such diurnaloscillation when considering gene function in the con-text of biological pathways. Coordinated non-randomtiming of peak and troughs of gene expression activitywithin a functionally related group can also serve as evi-dence of rhythmic expression.The first example of coordinated rhythmic pattern in a
biological pathway is presented in Figure 4. Here we pre-sent the components of the basic circadian clock identifiedin the mosquito genome form a circuit of the same designas the D. melanogaster molecular clock. The timelineexpression profiles reported in Drosophila [43] are similarfor the genes forming circadian molecular clock. In ourexperiment all components of the pathway are found to beoscillating and have expected differences in differentphases of the oscillation. This observation confirms theprevious report of circadian oscillation in A. aegypti
mosquito [9]. In contrast to that study we did not attemptto alter the pattern of gene expression by alternation inlight condition. Instead we used the same type of microar-rays to probe longer time spans with regular sampling.This design allowed identification of oscillation and phaseshift with more precision in much larger number ofexpressed genes. The fact that the majority of expressedgenes experience circadian oscillation also means thatoscillation affects the majority of biological pathways.Some of the pathways implicated in oscillatory expressionare discussed in Das and Dimopoulos report [9]. We con-firm the original report and extrapolate the oscillatory pat-tern to all other pathways. Evidence of coordinated timingof gene expression is seen in Figure 5, showing the expres-sion profile of the mosquito basal promoter complex. Allelements show some evidence of periodicity, but transcrip-tion factors TFIIA [UniGene: XM_001652453] and TFIIH
Figure 4 Expression profiles of the components of circadian molecular clock of A. aegypti. The schema is adopted from KEGG database.Each pane shows expression profile of genes (marked by gene symbols) over two complete circadian periods. Light and dark periods aremarked on the horizontal axis; vertical axis corresponds to relative abundance of transcripts (see Methods). Green arrows mark positiveregulation, red arrows mark negative regulation of gene expression. P+ marks activation by phosphorylation, tr+ and tr- mark positive andnegative regulation of transcription.
Ptitsyn et al. BMC Genomics 2011, 12:153http://www.biomedcentral.com/1471-2164/12/153
Page 6 of 16

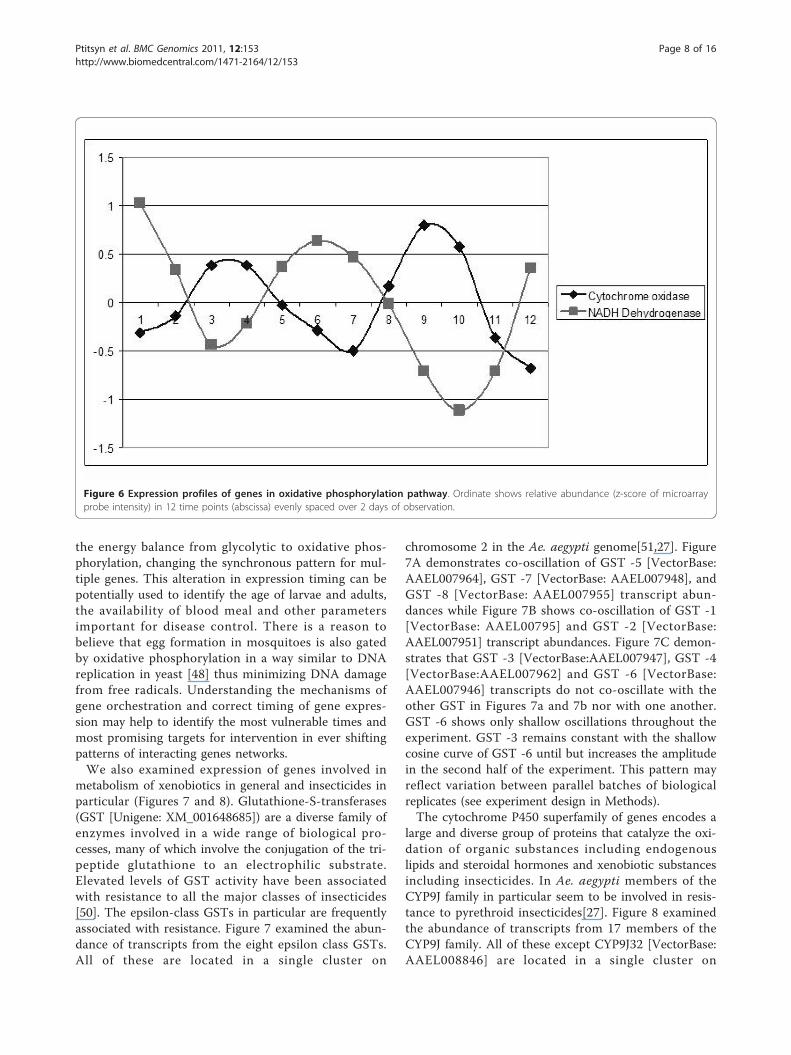
[UniGene:XM_001651873] are expressed clearly in coun-ter-phase to transcription factors TFIIF [UniGene:XM_001648018] and TFIID [Unigene: XM_001657785].Previously reported differences in oscillation patterns ofbasal transcription factors in murine bone [44] has beenattributed to differential modulation of gene expression bydifferent signaling systems, creating complex orchestrationof transcription for different genes. In A. aegypti the pat-tern might be less complicated or the analysis might haveomitted minor details due to technical noise. Overall,parts of the basal transcription complex and transcriptionfactors in particular, follow the pattern set by the elementsof the basic molecular clock, such as TFIID-F expressed inthe same phase as Pdp and TFIIA in the same phase withdCLK [UniGene: XM_001654547] (opposite to Pdp, [Uni-Gene: XM_001650542]). Timeless (Tim, [UniGene:XM_001657734]) and Period (Per, [Unigene:XM_001658926]) oscillate in the same phase with TFIIHslightly ahead of dCLK and Cycle (Cyc, [XM_001654547]).Among all pathways composed of oscillating genes basicenergy metabolism is particularly significant.The expression profiles of the major components of oxi-
dative phosphorylation are presented in Figure 6. Remark-ably, all genes involved in oxidative phosphorylation areamong the most prominently oscillating genes. Phase shiftin production rates for the oxidative phosphorylationgenes is in agreement with expectations from the general
model of the process: components of the oxidative phaseare expressed in counter-phase to the components of thereductive phase. Previous studies have pointed to the oxi-dative phosphorylation pathways as the intrinsic oscillator[45] modulating expression of many genes [46,47] and gat-ing DNA replication [48]. Other studies outline the regula-tory connection between basic metabolism and circadianclock [49]. Even though these studies used different modelorganisms it is reasonable to assume a connection betweencircadian clock and oxidative phosphorylation in mosqui-toes as well. We hypothesize that circadian clock and oxi-dative phosphorylation are two main intrinsic oscillatorsmodulating physiology and behavior of A. aegypti mosqui-toes. These oscillators are linked and work in synchrony,but can be temporarily or permanently uncoupled bychanging environmental conditions or due to mutationsthat lead to the creation of the behavioral patternsreported in previous publications [7].Understanding circadian oscillation rhythms and gene
synchronization patterns is essential to understandingmosquito molecular biology. Pesticide resistance is clo-sely related to detoxification pathways which in turn areinterlinked with oxidative phosphorylation. The oscillat-ing pattern of oxidative phosphorylation gene expressionmay modulate the mosquito’s ability to withstand insec-ticide exposure. On the other hand a mosquito’s meta-bolism is also modified by a blood meal, which changes
Figure 5 Expression profiles of the basal transcription factors in A. aegypti. Elements of basal transcription complex show various degreeof rhythmicity and different phase shifts modulating gene expression patterns. Each pane shows expression profile of genes (marked by genesymbols) over two complete circadian periods. Light and dark periods are marked on the horizontal axis; vertical axis corresponds to relativeabundance of transcripts (see Methods).
Ptitsyn et al. BMC Genomics 2011, 12:153http://www.biomedcentral.com/1471-2164/12/153
Page 7 of 16
the energy balance from glycolytic to oxidative phos-phorylation, changing the synchronous pattern for mul-tiple genes. This alteration in expression timing can bepotentially used to identify the age of larvae and adults,the availability of blood meal and other parametersimportant for disease control. There is a reason tobelieve that egg formation in mosquitoes is also gatedby oxidative phosphorylation in a way similar to DNAreplication in yeast [48] thus minimizing DNA damagefrom free radicals. Understanding the mechanisms ofgene orchestration and correct timing of gene expres-sion may help to identify the most vulnerable times andmost promising targets for intervention in ever shiftingpatterns of interacting genes networks.We also examined expression of genes involved in
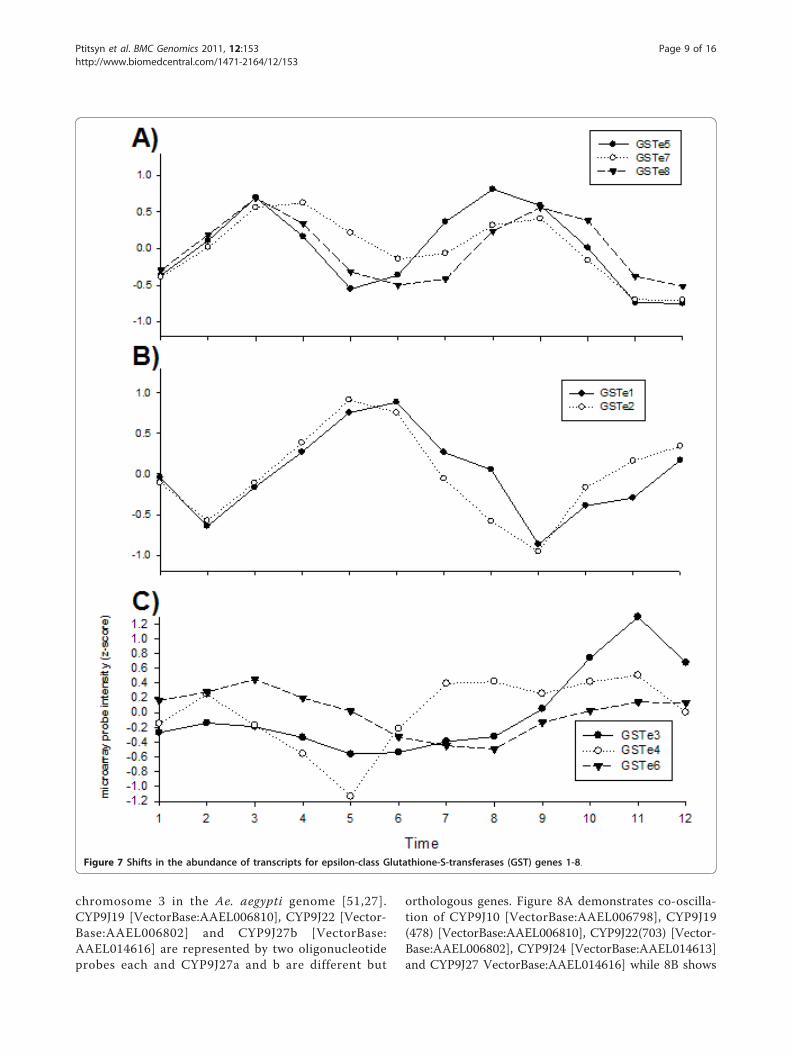
metabolism of xenobiotics in general and insecticides inparticular (Figures 7 and 8). Glutathione-S-transferases(GST [Unigene: XM_001648685]) are a diverse family ofenzymes involved in a wide range of biological pro-cesses, many of which involve the conjugation of the tri-peptide glutathione to an electrophilic substrate.Elevated levels of GST activity have been associatedwith resistance to all the major classes of insecticides[50]. The epsilon-class GSTs in particular are frequentlyassociated with resistance. Figure 7 examined the abun-dance of transcripts from the eight epsilon class GSTs.All of these are located in a single cluster on
chromosome 2 in the Ae. aegypti genome[51,27]. Figure7A demonstrates co-oscillation of GST -5 [VectorBase:AAEL007964], GST -7 [VectorBase: AAEL007948], andGST -8 [VectorBase: AAEL007955] transcript abun-dances while Figure 7B shows co-oscillation of GST -1[VectorBase: AAEL00795] and GST -2 [VectorBase:AAEL007951] transcript abundances. Figure 7C demon-strates that GST -3 [VectorBase:AAEL007947], GST -4[VectorBase:AAEL007962] and GST -6 [VectorBase:AAEL007946] transcripts do not co-oscillate with theother GST in Figures 7a and 7b nor with one another.GST -6 shows only shallow oscillations throughout theexperiment. GST -3 remains constant with the shallowcosine curve of GST -6 until but increases the amplitudein the second half of the experiment. This pattern mayreflect variation between parallel batches of biologicalreplicates (see experiment design in Methods).The cytochrome P450 superfamily of genes encodes a
large and diverse group of proteins that catalyze the oxi-dation of organic substances including endogenouslipids and steroidal hormones and xenobiotic substancesincluding insecticides. In Ae. aegypti members of theCYP9J family in particular seem to be involved in resis-tance to pyrethroid insecticides[27]. Figure 8 examinedthe abundance of transcripts from 17 members of theCYP9J family. All of these except CYP9J32 [VectorBase:AAEL008846] are located in a single cluster on
Figure 6 Expression profiles of genes in oxidative phosphorylation pathway. Ordinate shows relative abundance (z-score of microarrayprobe intensity) in 12 time points (abscissa) evenly spaced over 2 days of observation.
Ptitsyn et al. BMC Genomics 2011, 12:153http://www.biomedcentral.com/1471-2164/12/153
Page 8 of 16
chromosome 3 in the Ae. aegypti genome [51,27].CYP9J19 [VectorBase:AAEL006810], CYP9J22 [Vector-Base:AAEL006802] and CYP9J27b [VectorBase:AAEL014616] are represented by two oligonucleotideprobes each and CYP9J27a and b are different but
orthologous genes. Figure 8A demonstrates co-oscilla-tion of CYP9J10 [VectorBase:AAEL006798], CYP9J19(478) [VectorBase:AAEL006810], CYP9J22(703) [Vector-Base:AAEL006802], CYP9J24 [VectorBase:AAEL014613]and CYP9J27 VectorBase:AAEL014616] while 8B shows
Figure 7 Shifts in the abundance of transcripts for epsilon-class Glutathione-S-transferases (GST) genes 1-8.
Ptitsyn et al. BMC Genomics 2011, 12:153http://www.biomedcentral.com/1471-2164/12/153
Page 9 of 16
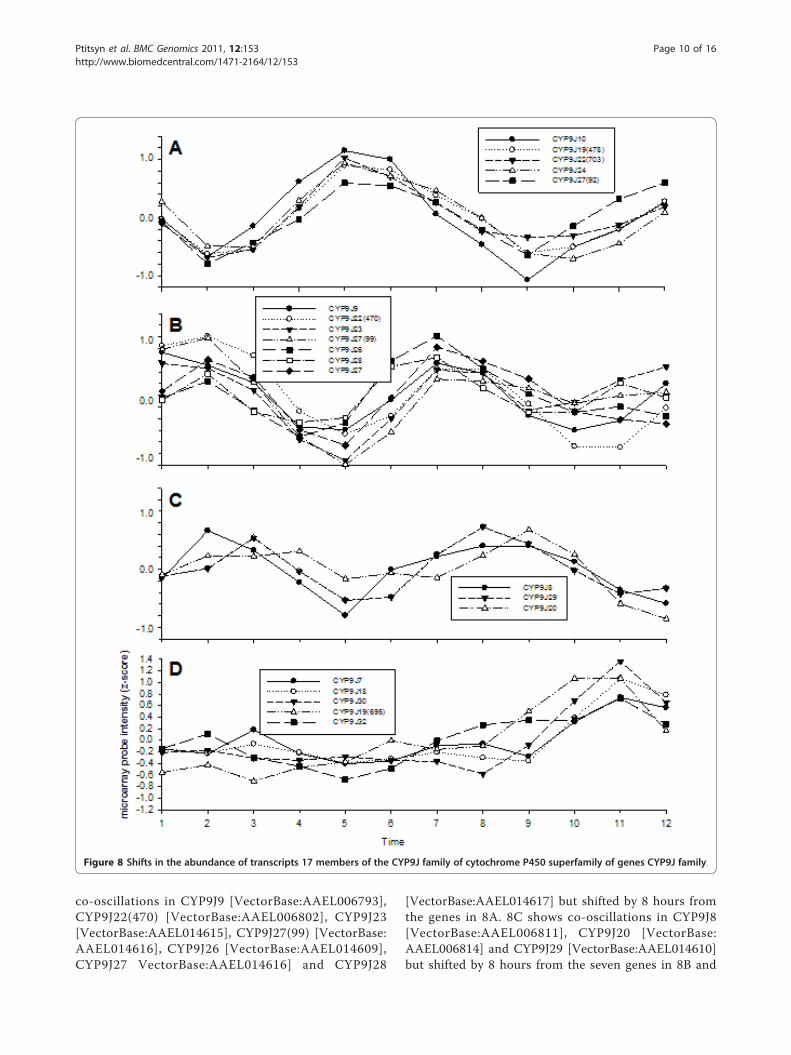
co-oscillations in CYP9J9 [VectorBase:AAEL006793],CYP9J22(470) [VectorBase:AAEL006802], CYP9J23[VectorBase:AAEL014615], CYP9J27(99) [VectorBase:AAEL014616], CYP9J26 [VectorBase:AAEL014609],CYP9J27 VectorBase:AAEL014616] and CYP9J28
[VectorBase:AAEL014617] but shifted by 8 hours fromthe genes in 8A. 8C shows co-oscillations in CYP9J8[VectorBase:AAEL006811], CYP9J20 [VectorBase:AAEL006814] and CYP9J29 [VectorBase:AAEL014610]but shifted by 8 hours from the seven genes in 8B and
Figure 8 Shifts in the abundance of transcripts 17 members of the CYP9J family of cytochrome P450 superfamily of genes CYP9J family.
Ptitsyn et al. BMC Genomics 2011, 12:153http://www.biomedcentral.com/1471-2164/12/153
Page 10 of 16

16 hours from the genes in 8A. 8D shows that CYP9J7[VectorBase:AAEL014606], CYP9J18 [VectorBase:AAEL006804], CYP9J19(695) [VectorBase:AAEL006810],CYP9J30 [VectorBase:AAEL014603] and CYP9J32 [Vec-torBase:AAEL008846] do not have an obvious oscillatingpattern. However, the increase and decline pattern inone of two concatenated profiles might be indicative ofa weak oscillation obscured by stochastic noise. We areuncertain as to how these oscillations affect insecticideresistance. Metabolic resistance is closely related todetoxification pathways which in turn are interlinkedwith oxidative phosphorylation. The oscillating pattern ofoxidative phosphorylation gene expression may modulatethe mosquito’s ability to withstand insecticide exposureand suggests the interesting possibility that susceptibilityto insecticides may show diurnal fluctuations.The purpose of these experiments was to document
that diurnal fluctuations occur in the heads of femalemosquitoes. Having demonstrated these diurnal pat-terns; a whole series of additional questions arise. Arethere diurnal fluctuations in gene expression in otheradult tissues and organs? Are diurnal fluctuations seenin the developing embryo? Do they occur in larvae?How do the oscillations relate to chitin deposition andsclerotization in the cuticle? How does moulting affectoscillations? Is moulting coordinated by oscillations indifferent tissues? Are oscillations coordinated amongdifferent tissues? How do these oscillations respond tomajor perturbations in the mosquitoes environment?Specifically, how do diurnal fluctuations respond to ablood meal in the female? Are there oscillations in theproduction of vitellogenins (egg yolk precursor glycoli-poproteins) that arise following a bloodmeal? Similarly,how are these perturbations influenced by oviposition?Are diurnal fluctuations in cytochrome P450s and Glu-tathione-S-Transferases perturbed by exposure to xeno-biotics? If so, how soon after exposure? Are innateimmunity pathways affected by the ingestion or expo-sure to pathogens? How does mating affect diurnal fluc-tuations? How are oscillations affected by lengthening orshortening the photoperiod away from the current 12:12pattern? Due to the limitations of our incubator, a cre-puscular period prior to and following the scotophasecould not be included. Are the observed oscillationsaffected by the lack of a crepuscular period? These ques-tions all require very specific experimental designs thatare far beyond the scope or intention of the currentstudy.In this study we have made a first attempt to identify
the baseline rhythms and co-oscillation patterns ingenes in the female head beyond the basic circadianmolecular clock. Due to the noisy nature of high-throughput microarray expression analysis we cannotobserve a baseline rhythm in abundance of every
detected transcript. However, we do observe baselineoscillation in majority of genes and thus it can be rea-sonably extrapolated that rhythmicity permeates everybiological pathway in mosquitoes. We hypothesize thatthis is orchestrating changes in both mosquito physiol-ogy and behavior. Apart from the technical challengesof microarray analysis this study is limited in resolutionability by the low sampling rate of circadian time series.We could only distinguish as many as four discretephases. The sampling rate determines the precision withwhich one can identify the phase of oscillation andsuperimpose the timing of expression of inter-dependentgenes in biological pathways. We hope to intensify sam-pling rates in future studies.
ConclusionsThe utility of understanding the timeline of gene expres-sion throughout the entire transcriptome is not an aca-demic exercise limited to understanding circadianbehavior. Most transcriptional experimental designsinvolve comparisons of strains or of individuals from astrain that exhibit different phenotypes. Implicit in thesecomparisons is the assumption that transcript abun-dance is constant within strains and individuals. If thisassumption is invalid these experimental designs mayhave a low power to detect true differences in geneabundance. Furthermore, considered in the broader con-text of gene interaction networks, timeline expressioncan help the reverse-engineering of biological pathways,identify alternative transcripts and potential drug targets.These results are the first step towards understandingthe structure and orchestration of molecular processesand gene functions in Ae. aegypti in relation to thedimension of time.
MethodsMosquito processingEggs were hatched from each of 11 field collectionsmade in 2006 from the state of Chiapas in Mexico.Cities sampled were Ciudad Hidalgo, Motozintla, RioFlorido, Puerto Chiapas, Mazatán, Huehuetán, Huixtla,Escuintla, Mapastepec, Pijijiapan, and Mixtla. The F5generation of each colony was used and 600 first instarlarvae from each collection were hatched in water thathad been autoclaved and cooled in sealed bottles atroom temperature to promote uniform hatching time.Equal numbers of larvae from the 11 collections weremixed and reared at a density of 200 mosquitoes in 2liters of water in Pyrex® 4 liter autoclaved baking dishes(33 containers total). The larvae were maintained at aconstant 28°C and a 12:12 photoperiod. Liver powdersuspension (1 mL of a 10% (w/v) solution) was providedin the morning on each day and water was added backto maintain a constant volume.
Ptitsyn et al. BMC Genomics 2011, 12:153http://www.biomedcentral.com/1471-2164/12/153
Page 11 of 16

Pupae first appeared four days after being countedinto the Pyrex® dishes. However, no pupae were col-lected for transcriptional analyses until day 8 when alarge number of female pupae became available. Weremoved and counted all pupae into two plastic 500 mLbeakers. Each beaker was placed into one of two 2’ × 2’× 2’ cages that were treated as biological replicates. Inthis context “biological replicate” means replicatedextraction of biological material from separate batchesof mosquitoes, but not necessarily hatched from a sepa-rate batch of eggs at a different time. Assuming an evensex ratio and allowing for daily mortality, 1,170 mosqui-toes were introduced as pupae into each cage to obtain~585 adult females.Adult mosquitoes were maintained at a constant 28°C
with 80% relative humidity, and a 12:12 photoperiod.The light safe incubator was locked during the 12 hourscotophase. Exactly 24 hours after placing the adultsinto the cage, 30 females were aspirated from replicatecage #1 into a small 500 mL cardboard carton andrapidly killed in a -80°C freezer. The heads of mosqui-toes were individually removed with a scalpel and trans-ferred with forceps into a 1.5 mL Diethylpyrocarbonate(DEPC) treated microcentrifuge tube labeled “24.1” and100 μL of RNA later® were added. These heads wereimmediately homogenized with a DEPC treated 500 μLKontes Pellet Pestle® and the volume was brought up to500 μL with RNA later®. Contents were further homo-genized until no large pieces of tissue were visible. Thetube was then returned to a -80°C freezer. All stepswere repeated for the second replicate cage, except thatthe tube was labeled “24.2” This entire process wasrepeated at 72, 76, 80, 84, 88, 92, 96, 100 and 104 hoursafter placing the adults into the cage. At the end of theexperiment two replicate pools of female heads hadbeen collected at each of 10 time points.
RNA isolation, cRNA synthesis, amplification and labelingThe RNeasy Midi-kit (QIAGEN Inc. Valencia, CA) wasused to isolate total RNA according to manufacturer’sinstructions. RNA was eluted in 150 μL DEPC–ddH2Ointo a 1.5 mL DEPC-treated tube. RNA concentrationwas read on a Nanodrop® spectrophotometer and thetube was maintained at -80°C. The Agilent RNA Spike-In® kit provided two-colored standards in all experi-ments. RNA (500 ng) was placed in a 200 uL tube alongwith two uL of either Diluted Spike A or B and 1.2 uLof T7 Promoter Primer Mix. RNA from 24 hour oldheads was labeled with Cyanine 5-CTP while RNA fromall heads collected at later time points were labeled withCyanine 3-CTP using the Agilent Technologies® lowinput linear amplification RNA labeling kit according tothe manufacturer’s instructions. The RNeasy Mini-kit
(QIAGEN Inc.) was used to purify the labeled/amplifiedcRNA. The purified cRNA was eluted in 30 μL RNase-free water and quantified in pmol/μL using a Nano-drop® spectrophotometer. We did not proceed to thehybridization steps if the total yield was < 825 ng or ifthe specific activity was < 8.0 pmol Cy3 or Cy5 per μgcRNA.
HybridizationThe Agilent® Aedes aegypti microarray described in Xiet al [33] and Nene et al [16] was used. Each array con-tained 45,220 features, 43,803 of which correspond to21,494 unique Ae. aegypti oligonucleotides replicatedtwice (20,692), thrice (793) or four times (10). Theremaining features hybridized to oligonucleotides con-tained in the Agilent RNA Spike-In® kit for quality con-trol. Hybridizations were conducted with the AgilentTechnologies® In Situ Hybridization kit at 60°C accord-ing to the manufacturer’s instructions. Hybridizationintensities were determined with an Axon GenePix4100AL scanner at 635 nm for Cy-5 and at 532 nm forCy3, and images were analyzed with Gene Pix Pro 6.0software. The quality of the hybridization was assessedwith Gene Pix software for control, feature and replicatequality control software packages. Two of the 26 arraysthat were processed failed to pass the quality controlscreens. Both were repeated from the original RNA andpassed on the second attempt.
Data pre-processingValues from all 1,417 spots that hybridize to the probesin the Agilent® RNA Spike-In kit were removed. Medianbackground values at 635 nm were subtracted frommedian spot values and the same was repeated for back-ground and spot values at 532 nm. Background cor-rected values were then transformed to relativeintensities using the formula:
M = log2(Cy5/Cy3)
so that all Cy3 values from 72 - 104 hours were stan-dardized against the same pool of Cy5 labelled RNAfrom the 24 hr timepoint. This experiment layout hasbeen chosen to standardise the impact of technical var-iation on different time points. The chosen referencepoint is the same for all microarrays and placed farahead of the starting point for the time series to allowsufficient numbers of genes differentially expressed incomparison to the Cy5 control at any point of the timeseries. Thus estimates of RNA quantities for eachof the 21,494 Ae. aegypti gene features was estima-ted from 2-4 technical replicates and two biologicalreplicates.
Ptitsyn et al. BMC Genomics 2011, 12:153http://www.biomedcentral.com/1471-2164/12/153
Page 12 of 16
Analysis of periodicityWe composed 48 h gene expression profiles out of a ser-ies of observation covering continuous 32 h period with2 independent replicates for each time point sampledevery 4 h. The technical replicates were processed asseparate entities, rather than averaged. The two biologicalreplicates we considered as two independent timelines.The first six time points of each were concatenated toconstruct a continuous 48 hour time line used in analysisof periodicity. This experimental design reconstructingtwo consecutive periods from two simultaneously pro-cessed independent timelines has been approbated inprevious studies [36]. The reconstructed time series startswith the first time point at 9 am. The experiment designwith numbers of replicates and time of sample collectionis given in Supplemental Table 1 (see Additional File 1).Expression profiles were smoothed using a 3rd degree
polynomial procedure and median-subtracted using theseven-point Savitzky-Golay algorithm [52]. To take advan-tage of all points in the time series a single-pass smoothingwas applied in a circular manner, with the last points con-tributing to smoothing of the starting points. The samesmoothing and median subtraction procedure was appliedto all data sets. The results of application of periodicitytests to individual gene expression profiles are given inSupplemental Table 2 (see inside Additional File 1).
Spectral AnalysisFor purposes of spectral analysis, consider a series ofmicroarray expression values for gene x with N samplesof the form:
Y = x0, x1, x2, ...xN−1
This series can be converted from time-domain, whereeach variable represents a measurement in time to a fre-quency domain using a Discrete Fourier Transform(DFT) algorithm. Frequency domain representation ofthe series of experiments is also known as a periodo-gram, which can be denoted by I(ω):
I(ω) =1N
∣∣∣∣∣N−1∑t=0
xte(−iωt)
∣∣∣∣∣2
, ω ∈ [0, π ]
If a time series has a significant sinusoidal componentwith frequency ω Î [0, π], then the periodogram exhibitsa peak at that frequency with a high probability. Conver-sely, if the time series is a purely random process (a.k.a“white noise”), then the plot of the periodogram againstthe Fourier frequencies approaches a straight line [53].
Fisher’s g-testThe significance of the observed periodicity can be esti-mated by Fisher’s g-statistic, as recently recommended
[54]. Fisher derived an exact test of the maximumperiodogram coordinate by introducing the g-statistic:
g =maxkI (ωk)∑N/2
k=1 I (ωk),
where I(ωk) is a k-th peak of the periodogram. Largevalues of g indicate a non-random periodicity. We cal-culate the p-value of the test under the null hypothesiswith the exact distribution of g using the followingformula:where n = [N/2] and p is the largest integer less than 1/x.
P(g > x
)=
1/x∑p=1
[(−1)p n
p(n − p
) (1 − px
)n−1
],
This algorithm closely follows the guidelines recom-mended for analysis of periodicities in time-seriesmicroarray data [54] except that we applied C++ code(written by and available from AP) instead of R scripts.Fisher’s g-test has low power on short time series under50 samples [55]. Attaining such series using contempor-ary technology would be prohibitively expensive. How-ever, the problem can be mitigated by application of theg-test in a phase continuum setting (see below).
AutocorrelationFor a given a discrete time series Y = x0, x1, x2, ...xN-1
the autocorrelation is simply the correlation of theexpression profile against itself with a frame shift of kdata points (where 0 ≤ k ≤ N-1, often referred as thelag). For the time shift f, defined as f = i + k if i + k <Nand f = i + k - N otherwise:
R(f ) =
∑N−10 (xi − x̄)
(xf − x̄
)∑N−1
0 (xi − x̄)2
For each time series we calculated the maximum posi-tive R( f) among all possible phase shifts f and use tabulated0.05 significance cut off values for correlation coefficient.Time series that shows significant autocorrelation R( f)with the lag f corresponding to one day (6 time points ×4 hours) are considered circadially expressed.
Pt-testConsider a time series Y = x0, x1, x2, ...xN-1 in whichtechnical variation approaches or even exceeds theamplitude of periodic expression. In a very short timeseries stochastic noise often obscures periodicity. How-ever, the periodic change of the base expression levelcan still be identified in spite of the high noise level. Ifthe periodogram of the original time series IY(ω) con-tains a significant peak corresponding to a particular
Ptitsyn et al. BMC Genomics 2011, 12:153http://www.biomedcentral.com/1471-2164/12/153
Page 13 of 16
frequency (e.g. circadian) this peak results from observa-tion in the Y. A random permutation would preservethe same noise level, but not the periodicity. Let YR bea random permutation of Y with a corresponding peri-odogram is IR(ω). After applying the DFT, a periodo-gram IR(ω) would represent only the peaks occurring bychance. However it would miss the true periodic fre-quencies unless permutations happen to preserve theperiod. This could occur if, for example the rank ofeach point x in a permutated series YR is XY ± npwhere n is a natural number and p is a period corre-sponding to a significant peak in IY(ω). To avoid ran-dom re-institution of periodicity a C++ program waswritten to generate YR by multiple shuffling of randomlyselected time points xn ⇔ xm, where |n - m| ≠ p. Foreach shuffle the program swaps time points from a dif-ferent phase. Comparing permutations with deliberatelywiped out periodicity to the original time series, we esti-mated whether the original order of observations mini-mized the overall noise. For each gene expressionprofile we generated two series of min (n!,100) randompermutations. Each permutated series YR was trans-formed to the frequency domain and a single peak ofthe periodogram IR(ω) was stored. The p-value for thenull-hypothesis of random nature of a particular peak ofperiodogram can be estimated by comparing the storedIR(ω) values to the observed I(ω):
p =NIR(ω)≥IY(ω)
min (n, 100)
High p-values that exceeded the threshold, for exam-ple 0.05, indicate that at least 5 out of 100 random per-mutations of the time series produced a periodogramwith the same or a higher peak, corresponding to agiven periodicity. Low p-values indicate a significant dif-ference between periodogram IR(ω) preserving circadianperiodicity and randomly permutated periodogram IY(ω)with the same level of technical variation. This differ-ence leads to rejection of the null-hypothesis of purelyrandom nature of variation in the original time series Y.
Phase continuumWe start with phase classification, assigning each gene aphase based on maximal correlation to an ideal cosinecurve. This method is superior to assigning a phase byposition of peaks only because it takes into account moredata. Each profile is subjected to z-score transformationequalizing the variation between time points. Autocorrela-tion with circadian lag (Rc) was calculated for each profileand all profiles were sorted first by phase then by descend-ing order of Rc. Concatenating all profiles of the samephase with an equalized range of variation (amplitude) wegenerate a continuous stream Cph of measurements
containing a clear signal on one end and stochastic noiseon the other. This continuum was treated with a low-passfrequency filter and polynomial smoothing [52]. As dis-cussed in the original publication of the method, somedigital filters can artificially modulate the expression pro-file [40]. For this reason we have limited the choice of fil-ters to a few least likely to propagate the oscillation alongthe phase continuum. We analyzed each phase fractionseparately to detect the point at which circadian signaldeteriorates beyond a p = 0.05 cutoff. A window W mov-ing along the stream is tested for periodicity using one ofthe previously described tests. Once the point at which Iwdoes not differ significantly from a random periodogramIwr, we counted all original gene expression profiles thathad circadian signal above the established cutoff [40].Here we applied the frame length 5 (testing 5 genes or 60timepoints at a time, the recommended minimal lengthfor g-test power) for Fisher’s g-test and frame length 3 forPermutation and Autocorrelation tests.
False Discovery Rate analysisThis methodology is often applied to reduce the numberof false-positive results. It is based in the assumption ofindependent or mildly dependent [56] hypothesis test-ing. However, in the case of testing timeline expressionprofiles for periodicity, independence cannot beassumed. First, the pattern of circadian oscillation isobvious in the great majority of expression profiles (seeFigure 1, for example). Second, an analysis of correla-tions with phase shift (also used to identify phasegroups) confirms high correlation of nearly all profilesto common cosine curves. Third, living cells are knownto have more than one oscillator, but these oscillatorsare normally synchronized to the rhythm of the circa-dian molecular clock, active in peripheral tissues. Whentesting individual expression profiles for periodicity weare looking for manifestation of the same factor, hencenot an independent hypothesis. For these reasons FDRcorrection was not applied to reduce the number ofdetected oscillating genes. In earlier publications explor-ing this methodology independent validation of expres-sion profiles confirmed oscillation pattern for multiplegenes that did not pass the periodicity test, with orwithout FDR adjustment [36].
Biological Pathway analysisFunctional annotation of A. aegypti transcripts targeted bymicroarray followed the annotation of nearest orthology inthe D. melanogaster genome. Information on gene interac-tion and charts for biological pathways specific to A.aegypti has been extracted from the Kyoto Encyclopedia ofGenes and Genomes (KEGG). Correspondence betweenKEGG genes and A. aegypti probe sequences has been ver-ified by the rapid BLAT [57] search.
Ptitsyn et al. BMC Genomics 2011, 12:153http://www.biomedcentral.com/1471-2164/12/153
Page 14 of 16
Real Time PCR analysisMicroarray results were tested for selected genes usingreal time PCR amplification of 2 ul of cDNA, and 10μm of each primer with SYBR green detection in a Bio-Rad iCYCLER using the IQ SYBR Green Supermix (Bio-Rad, Hercules, CA 94547). The cycling conditions wereStep 1: 50.0°C for 2 min Step 2: 95.0°C for 10 min; Step3: 95.0°C for 10 seconds Step 4: 60.0°C for 20 seconds,Step 5: 72.0°C for 10 seconds. Repeat steps 3-5, 40times. This was followed by a melting curve analysiswith 55 points collected between 68.0°C and 95.0°C.
Heatmap visualizationA heatmap was constructed to represent gene expressionprofiles in 72 hour-104 old female mosquito headswherein all twelve timepoints are represented as columnsalong the abscissa. Each line on the ordinate correspondsto the M-values for a particular gene feature and appearas shades of red to black to green. Bright red indicateslarge positive M-values (M24 > Mt, where t = 1,2,....,12),while black values indicate M24 ≃ Mt. and bright greenindicates large negative M-values (M24 < Mt).Each column is further vertically subdivided into four
“same-phase” groups. Each gene feature was assigned to agroup that contained gene features with the same-phase asexplained above. Within each group, gene expression pro-files were sorted and stacked on top of each other so thatmost clearly oscillating (i.e. highest signal to noise ratio)profiles are on top and the least periodic profiles are at thebottom of each group. All expression profiles were testedfor periodicity by autocorrelation test and sorted in orderof decreasing correlation between an early time and a sec-ond time 24 hours later. Additional explanation of thealgorithm for generating gene expression heatmap is givenin Supplemental Figure 1 (see inside Additional File 1).
Additional material
Additional file 1: Supplementary Information. This is a zip archive filethat contains Supplemental Table 1 (MS Excel file), Supplemental Table 2 (MSExcel file) and Supplemental Figure 1 (Adobe PDF file). Supplemental Table 1reports the experiment design for sample collection with date, time, poolingand replication information. Supplemental Table 2 reports the results ofstraight application of periodicity tests to reconstructed 48 h expressionprofiles (see Methods). Supplemental Figure 1 illustrates the process ofgeneration of circadian expression heat map (presented in Figure 1).
AcknowledgementsThis work was partially supported by a grant to the Regents of theUniversity of California from the Foundation for the National Institutes ofHealth through the Grand Challenges in Global Health initiative (JC andWCB4) and by the Innovative Vector Control Consortium (WCB4).
Author details1Center for Bioinformatics, Colorado State University, Fort Collins, CO 80525,USA. 2Department of Microbiology, Immunology and Pathology, College of
Veterinary and Biomedical Sciences, Colorado State University, Fort Collins,CO 80525, USA.
Authors’ contributionsAP analyzed the data, wrote the paper; GR performed experiments; KSperformed the experiments; JB performed the experiments; ES designed thestudy, wrote the paper; JC designed the study, wrote the paper; WBdesigned the study, wrote the paper. All authors read and approved thefinal manuscript.
Received: 3 August 2010 Accepted: 17 March 2011Published: 17 March 2011
References1. Clements AN: The Biology of Mosquitoes: Sensory reception and
Behaviour. Oxon, UK: CAB International; 19992.2. Boorman JPT: Observations on the habits of mosquitos of Plateau
Province, Northern Nigeria, with special reference to Aedes vittatus. Bullent Res 1961, 52:709-725.
3. McClelland GAH: Observations on the mosquito, Aedes aegypti, in EastAfrica. I - the biting cycle in an outdoor population at Entebbe, Uganda.Bull ent Res 1960, 50:227-235.
4. Haddow AJGJD: Observations on the oviposition-cycle of Aedes(Stegomyia) aegypti (Linnaeus). Ann trop Med Parasit 1957, 51:159-169.
5. Gillett JD, Haddow AJ, Corbet PS: The sugar-feeding cycle in a cage-population of mosquitoes. Entomologia exp appl 1962, 5:223-232.
6. Taylor B, Jones MDR: The circadian rhythm of flight activity in themosquito Aedes aegypti (L.): the phase-setting effects of light-on andlight-off. J Exp Biol 1969, 51:59-70.
7. Clopton JR: Mosquito circadian and circa-bi-dian flight rhythms: a two-oscillator model. J Comp Physiol A 1984, 155:1-12.
8. Clopton JR: Mosquito circadian flight rhythms: differential effects ofconstant light. Am J Physiol Regulatory Integrative Comp Physiol 1984,247:960-967.
9. Das S, Dimopoulos G: Molecular analysis of photic inhibition of blood-feeding in Anopheles gambiae. BMC Physiol 2008, 8:23.
10. Hall JC: Genetics and molecular biology of rhythms in Drosophila andother insects. Advances in Genetics 2003, 48:1-280.
11. Hardin PE: The circadian timekeeping system of Drosophila. Curr Biol2005, 15(17):R714-722.
12. Zheng X, Sehgal A: Probing the relative importance of molecularoscillations in the circadian clock. Genetics 2008, 178(3):1147-1155.
13. Zheng X, Koh K, Sowcik M, Smith CJ, Chen D, Wu MN, Sehgal A: Anisoform-specific mutant reveals a role of PDP1 epsilon in the circadianoscillator. J Neurosci 2009, 29(35):10920-10927.
14. Keegan KP, Pradhan S, Wang JP, Allada R: Meta-analysis of Drosophilacircadian microarray studies identifies a novel set of rhythmicallyexpressed genes. Plos Comput Biol 2007, 3(11):2087-2110.
15. Holt RA, Subramanian GM, Halpern A, Sutton GG, Charlab R, Nusskern DR,Wincker P, Clark AG, Ribeiro JMC, Wides R, et al: The genome sequence ofthe malaria mosquito Anopheles gambiae. Science 2002, 298(5591):129-+.
16. Nene V, Wortman JR, Lawson D, Haas B, Kodira C, Tu ZJ, Loftus B, Xi Z,Megy K, Grabherr M, et al: Genome sequence of Aedes aegypti, a majorarbovirus vector. Science 2007, 316(5832):1718-1723.
17. Gentile C, Meireles-Filho AC, Britto C, Lima JB, Valle D, Peixoto AA: Cloningand daily expression of the timeless gene in Aedes aegypti (Diptera:Culicidae). Insect Biochem Mol Biol 2006, 36(11):878-884.
18. Gentile C, Rivas GB, Meireles-Filho AC, Lima JB, Peixoto AA: Circadianexpression of clock genes in two mosquito disease vectors: cry2 isdifferent. J Biol Rhythms 2009, 24(6):444-451.
19. Raikhel AS, Kokoza VA, Zhu J, Martin D, Wang SF, Li C, Sun G, Ahmed A,Dittmer N, Attardo G: Molecular biology of mosquito vitellogenesis: frombasic studies to genetic engineering of antipathogen immunity. InsectBiochem Mol Biol 2002, 32(10):1275-1286.
20. Kim SR, Yao R, Han Q, Christensen BM, Li J: Identification and molecularcharacterization of a prophenoloxidase involved in Aedes aegyptichorion melanization. Insect Mol Biol 2005, 14(2):185-194.
21. Mayhew GF, Bartholomay LC, Fuchs JF, Rocheleau TA, Chen CC,Christensen BM: Approaches for discovering innate immune responseelements in Aedes aegypti based on microarray data. Am J Trop Med Hyg2006, 75(5):67-67.
Ptitsyn et al. BMC Genomics 2011, 12:153http://www.biomedcentral.com/1471-2164/12/153
Page 15 of 16
22. Shin SW, Bian GW, Raikhel AS: A toll receptor and a cytokine, Toll5A andSpz1C, are involved in toll antifungal immune signaling in the mosquitoAedes aegypti. J Biol Chem 2006, 281(51):39388-39395.
23. Lumjuan N, McCarroll L, Prapanthadara LA, Hemingway J, Ranson H:Elevated activity of an Epsilon class glutathione transferase confers DDTresistance in the dengue vector, Aedes aegypti. Insect Biochem Molec2005, 35(8):861-871.
24. Enayati AA, Ranson H, Hemingway J: Insect glutathione transferases andinsecticide resistance. Insect Mol Biol 2005, 14(1):3-8.
25. Ribeiro JMC, Valenzuela JG: The salivary purine nucleosidase of themosquito, Aedes aegypti. Insect Biochem Molec 2003, 33(1):13-22.
26. Noriega FG, Wells MA: A molecular view of trypsin synthesis in themidgut of Aedes aegypti. J Insect Physiol 1999, 45(7):613-620.
27. Saavedra-Rodriguez K, Strode C, Flores Suarez A, Fernandez Salas I,Ranson H, Hemingway J, Black WCt: Quantitative trait loci mapping ofgenome regions controlling permethrin resistance in the mosquitoAedes aegypti. Genetics 2008, 180(2):1137-1152.
28. Marcombe S, Poupardin R, Darriet F, Reynaud S, Bonnet J, Strode C,Brengues C, Yebakima A, Ranson H, Corbel V, et al: Exploring themolecular basis of insecticide resistance in the dengue vector Aedesaegypti: a case study in Martinique Island (French West Indies). BmcGenomics 2009, 10.
29. Zhu J, Busche JM, Zhang X: Identification of juvenile hormone targetgenes in the adult female mosquitoes. Insect Biochem Mol Biol 40(1):23-29.
30. Aliota MT, Fuchs JF, Rocheleau TA, Clark AK, Hillyer JF, Chen CC,Christensen BM: Mosquito Transcriptome Profiles and Filarial WormSusceptibility in Armigeres subalbatus. Plos Neglect Trop D 2010, 4(4).
31. Souza-Neto JA, Sim S, Dimopoulos G: An evolutionary conserved functionof the JAK-STAT pathway in anti-dengue defense. P Natl Acad Sci USA2009, 106(42):17841-17846.
32. Erickson SM, Xi ZY, Ramirez JL, Aliota MT, Mayhew GF, Christensen BM,Dimopoulos G: Changes in the Aedes Aegypti Transcriptome inResponse to Brugia Malayi Development. Am J Trop Med Hyg 2008,79(6):127-127.
33. Xi Z, Ramirez JL, Dimopoulos G: The Aedes aegypti toll pathway controlsdengue virus infection. PLoS Pathog 2008, 4(7):e1000098.
34. Waterhouse RM, Kriventseva EV, Meister S, Xi ZY, Alvarez KS,Bartholomay LC, Barillas-Mury C, Bian GW, Blandin S, Christensen BM, et al:Evolutionary dynamics of immune-related genes and pathways indisease-vector mosquitoes. Science 2007, 316(5832):1738-1743.
35. Sanders HR, Evans AM, Ross LS, Gill SS: Blood meal induces globalchanges in midgut gene expression in the disease vector, Aedesaegypti. Insect Biochem Mol Biol 2003, 33(11):1105-1122.
36. Ptitsyn AA, Zvonic S, Conrad SA, Scott LK, Mynatt RL, Gimble JM: Circadianclocks are resounding in peripheral tissues. Plos Comput Biol 2006, 2(3):e16.
37. Ueda HR, Chen W, Adachi A, Wakamatsu H, Hayashi S, Takasugi T,Nagano M, Nakahama K, Suzuki Y, Sugano S, et al: A transcription factorresponse element for gene expression during circadian night. Nature2002, 418(6897):534-539.
38. Boothroyd CE, Wijnen H, Naef F, Saez L, Young MW: Integration of lightand temperature in the regulation of circadian gene expression inDrosophila. PLoS Genet 2007, 3(4):e54.
39. Lin Y, Han M, Shimada B, Wang L, Gibler TM, Amarakone A, Awad TA,Stormo GD, Van Gelder RN, Taghert PH: Influence of the period-dependent circadian clock on diurnal, circadian, and aperiodic geneexpression in Drosophila melanogaster. Proc Natl Acad Sci USA 2002,99(14):9562-9567.
40. Ptitsyn AA, Zvonic S, Gimble JM: Digital Signal Processing RevealsCircadian Baseline Oscillation in Majority of Mammalian Genes. PlosComput Biol 2007, 3(6):e120.
41. Ptitsyn AA, Gimble JM: True or false: All genes are rhythmic. Ann Med43(1):1-12.
42. Ptitsyn AA, Gimble JM: Analysis of circadian pattern reveals tissue-specificalternative transcription in leptin signaling pathway. BMC Bioinformatics2007, 8(Suppl 7):S15.
43. McDonald MJ, Rosbash M: Microarray analysis and organization ofcircadian gene expression in Drosophila. Cell 2001, 107(5):567-578.
44. Zvonic S, Ptitsyn AA, Kilroy G, Wu X, Conrad SA, Scott LK, Guilak F, Pelled G,Gazit D, Gimble JM: Circadian oscillation of gene expression in murinecalvarial bone. J Bone Miner Res 2007, 22(3):357-365.
45. Selkov E: Stabilization of Energy Charge, Generation of Oscillation andMultiple Steady States in Energy Metabolism as a Result of PurelyStoichiometric Regulation. European Journal of Biochemistry 1975,59(1):151-157.
46. Tu BP, Kudlicki A, Rowicka M, McKnight SL: Logic of the yeast metaboliccycle: temporal compartmentalization of cellular processes. Science 2005,310(5751):1152-1158.
47. Klevecz RR, Bolen J, Forrest G, Murray DB: A genomewide oscillation intranscription gates DNA replication and cell cycle. Proc Natl Acad Sci USA2004, 101(5):1200-1205.
48. Chen Z, Odstrcil EA, Tu BP, McKnight SL: Restriction of DNA replication tothe reductive phase of the metabolic cycle protects genome integrity.Science 2007, 316(5833):1916-1919.
49. Panda S, Antoch MP, Miller BH, Su AI, Schook AB, Straume M, Schultz PG,Kay SA, Takahashi JS, Hogenesch JB: Coordinated transcription of keypathways in the mouse by the circadian clock. Cell 2002, 109(3):307-320.
50. Ranson H, Hemingway J: Mosquito glutathione transferases. MethodsEnzymol 2005, 401:226-241.
51. Lawson D, Arensburger P, Atkinson P, Besansky NJ, Bruggner RV, Butler R,Campbell KS, Christophides GK, Christley S, Dialynas E, et al: VectorBase: adata resource for invertebrate vector genomics. Nucleic Acids Res 2009, ,37 Database: D583-587.
52. Savitzky A, Golay M: Smoothing and differentiation of data by simplifiedleast squares procedures. Analytical Chemistry 1964, 36:1627-1639.
53. Priestley MB: Spectral Analysis and Time Series. Alcohol Clin Exp ResAcademic Press, London; 1981, vol., edn.
54. Wichert S, Fokianos K, Strimmer K: Identifying periodically expressedtranscripts in microarray time series data. Bioinformatics 2004, 20(1):5-20.
55. Liew AWC, Law NF, Cao XQ, Yan H: Statistical power of Fisher test for thedetection of short periodic gene expression profiles. Pattern Recognition2009, 42:549-556.
56. Storey JD, Tibshirani R: Statistical significance for genomewide studies.Proc Natl Acad Sci USA 2003, 100(16):9440-9445.
57. Kent WJ: BLAT–the BLAST-like alignment tool. Genome Res 2002,12(4):656-664.
doi:10.1186/1471-2164-12-153Cite this article as: Ptitsyn et al.: Rhythms and synchronization patternsin gene expression in the Aedes aegypti mosquito. BMC Genomics 201112:153.
Submit your next manuscript to BioMed Centraland take full advantage of:
• Convenient online submission
• Thorough peer review
• No space constraints or color figure charges
• Immediate publication on acceptance
• Inclusion in PubMed, CAS, Scopus and Google Scholar
• Research which is freely available for redistribution
Submit your manuscript at www.biomedcentral.com/submit
Ptitsyn et al. BMC Genomics 2011, 12:153http://www.biomedcentral.com/1471-2164/12/153
Page 16 of 16