Agenda - City of Penticton
78
Agenda Special Council Meeting to be held at City of Penticton Council Chambers 171 Main Street, Penticton, B.C. Wednesday, December 16, 2015 at 10:00 a.m. 1. Call Special Council Meeting to Order 2. Adoption of Agenda 3. Fees and Charges Amendment Bylaw No. 2015-60 Pages 1-15 Adopt Re: 2016-2020 Utility Rates 4. Public Comment (15 minutes) 5. 2016 Operating Budget Section Topic Page # Summary General Government Services 17 Corporate Administration 19 Mayor and Council 21 Municipal Grants/Partnerships 23 Communications 24 Finance – Accounting 25 Finance – General 27 Logistics 29 Revenue & Collections 31 General Government 33 Facilities 34 Operations Human Resources 36 Information Technology 37 Protective Services 39 Animal Control 40 Building and Licence 42 Fire Services 43 RCMP 45 Transportation Services 46 Fleet 47 General 48 Roads and Maintenance 49 Street Lighting 51 Traffic Control 53 Bylaw Enforcement 55 Transit 56
-
Upload
khangminh22 -
Category
Documents
-
view
0 -
download
0
Transcript of Agenda - City of Penticton

Agenda
Special Council Meeting
to be held at City of Penticton Council Chambers
171 Main Street, Penticton, B.C.
Wednesday, December 16, 2015 at 10:00 a.m.
1. Call Special Council Meeting to Order
2. Adoption of Agenda
3. Fees and Charges Amendment Bylaw No. 2015-60 Pages 1-15 Adopt Re: 2016-2020 Utility Rates
4. Public Comment (15 minutes)
5. 2016 Operating Budget
Section Topic Page # Summary General Government Services 17 Corporate Administration 19 Mayor and Council 21 Municipal Grants/Partnerships 23 Communications 24 Finance – Accounting 25 Finance – General 27 Logistics 29 Revenue & Collections 31 General Government 33 Facilities 34 Operations Human Resources 36 Information Technology 37 Protective Services 39 Animal Control 40 Building and Licence 42 Fire Services 43 RCMP 45 Transportation Services 46 Fleet 47 General 48 Roads and Maintenance 49 Street Lighting 51 Traffic Control 53 Bylaw Enforcement 55 Transit 56

Section Topic Page # Environmental Development Services
58
Planning 59 Development Services 60 Land Management 61 Engineering 62 Economic Development & Tourism 63 Recreation & Culture 64 Recreation 65 Facilities Parks 67 Library – see Municipal
Grants/Partnerships
Museum and Archives 68 Public Works – Cemetery 69 Solid Waste 70 Electric Utility 71 Sanitary Sewer 73 Water 75
6. Media and Public Question Period 7. Adjourn to In-Camera
Adjourn to a closed meeting of Council pursuant to the provisions of the Community Charter section 90 (1) as follows:
(e) the acquisition, disposition or expropriation of land or improvements, if the Council considers that
disclosure could reasonably be expected to harm the interests of the municipality; (g) litigation or potential litigation affecting the municipality; (i) the receipt of advice that is subject to solicitor-client privilege, including communications
necessary for that purpose;
2(b) the consideration of information received and held in confidence relating to negotiations between the municipality and a provincial government or the federal government or both, or between a provincial government or the federal government or both and a third party.

Fees and Charges Amendment Bylaw No. 2015-60 Page 1 of 1
The Corporation of the City of Penticton
Bylaw No. 2015-60
A bylaw to amend the Fees and Charges Bylaw No. 2014-07
WHEREAS the Council of the City of Penticton has adopted a Fees and Charges Bylaw pursuant to the Community Charter; AND WHEREAS the Council of the City of Penticton wishes to amend the “Fees and Charges Bylaw No. 2014-07”; NOW THEREFORE BE IT RESOLVED that the Council of the City of Penticton in open meeting assembled, hereby ENACTS AS FOLLOWS: 1. Title:
This Bylaw may be cited as “Fees and Charges Amendment Bylaw No. 2015-60”. 2. Amendment:
i. Amend “Fees and Charges Bylaw No. 2014-07” by deleting and replacing the following appendices in their entirety:
- Appendix 7 – Electric - Appendix 25 – Sewer Connection Charges - Appendix 29 – Water
ii. Appendices 7, 25, 29 attached hereto forms part of this bylaw. READ A FIRST time this 7 day of December, 2015
READ A SECOND time this 7 day of December, 2015
READ A THIRD time this 7 day of December, 2015
ADOPTED this day of , 2015
Andrew Jakubeit, Mayor Dana Schmidt, Corporate Officer
-1-

ELECTRICEffective February
1,2015
Bylaw No. 2015-32 Effective July 1, 2015
- 1.83% increase2016 2017 2018 2019 2020
Utility Administration Rates
Utility credit references (current or recent account) $15.75 $16.00
Archived account $26.25 $27.00
Utility account history $15.75 $16.00
Interest rate on delinquent utility accounts 10% per annum 10% per annum
Special electric meter reading $34.00 $34.50
Special electric meter inspection fee $34.00 $34.50
Postage/Printing Fee (per invoice) $1.00 $1.00
AMR OPT OUT
AMR Opt Out manual electric meter reading for an individual meter $11.00 per meter read $12.00 per meter read
AMR Opt Out manual combined electric and water meter reading for an individual for anindividual meter read
$13.00 per combined meter read
$14.00 per combined meter read
AMR Opt Out manual electric meter reading for a meter bank installation
$11.00 for the first meter and $1.00 per read for each
additional meter in the meter bank per meter read. The total cost for the electric meter bank read is to be equally split between all
customers serviced by the bank meter
$12.00 for the first meter and $1.00 per read for each
additional meter in the meter bank per meter read.
The total cost for the electric meter bank read is to be equally split between all
customers serviced by the bank meter
`
AMR Opt Out combined electric and water meter reading for a combined electric and watermeter bank installation
$13.00 for the first meter and $1.00 per read for each
additional meter in the meter bank per meter read. The
total cost for the combined electric and water meter bank
read is to be equally split between all customers served
by the meter bank.
$14.00 for the first meter and $1.00 per read for each
additional meter in the meter bank per meter read.
The total cost for the combined electric and water
meter bank read is to be equally split between all customers served by the
meter bank.
Utility application fee – next day service $40.00 $40.50
Utility application fee – same day service (accounts with combined electric and water) $90.00 $93.00
Utility application fee (electric only) same day service (accounts that only have electricservices)
$52.00 $53.00
Non-Payment: Electric disconnect and re-connect(during City Hall hours only) $68.00 $71.00
Non-Payment: Site visit without a disconnect (during City Hall hours only) $34.00 $35.00
Electrical disconnect or re-connect or site visit (cost per visit after hours with call-out) $405.00 $413.00
Electrical disconnect or reconnect or site visit (cost per visit during City Hall hours) $34.00 $35.50
Electrical disconnect or reconnect or site visit (cost per visit after hours without call-out) $68.00 $69.50
Appendix 7
Fees and Charges Bylaw No. 2014-07Appendix 7 - Page 1 of 5
-2-

ELECTRICEffective February
1,2015
Bylaw No. 2015-32 Effective July 1, 2015
- 1.83% increase2016 2017 2018 2019 2020
Appendix 7
Illegal reconnection administration charge $255.00 $265.00
Utility fee - Leave on Authorized $10.20 $11.00
Electrical Disconnect and reconnect from pole $348.00 $355.00
Special Administration charge per service $25.50 $26.50
Electric Rates
Rate Code 10 - Residential
Basic Charge $16.88 per billing plus $17.19 per billing plus $17.58 per billing plus $18.14 per billing plus $18.72 per billing plus $19.32 per billing plus $19.94 per billing plus
Energy Charge$0.1160 per kwh for all
consumption during the billing period
$0.1181 per kwh for all consumption during the
billing period
$0.1233 per kwh for all consumption during the
billing period
$0.1284 per kwh for all consumption during the
billing period
$0.1337 per kwh for all consumption during the
billing period
$0.1392 per kwh for all consumption during the
billing period
$0.1435 per kwh for all consumption during the
billing period
Rate Code 15 - Residential/Special Service
Basic Charge $16.88 per billing plus $17.19 per billing plus $17.58 per billing plus $18.14 per billing plus $18.72 per billing plus $19.32 per billing plus $19.94 per billing plus
Energy Charge$0.1334 per kwh for all
consumption during the billing period
$0.1358 per kwh for all consumption during the
billing period
$0.1416 per kwh for all consumption during the
billing period
$0.1474 per kwh for all consumption during the
billing period
$0.1534 per kwh for all consumption during the
billing period
$0.1597 per kwh for all consumption during the
billing period
$0.1647 per kwh for all consumption during the
billing period
Rate Code 20 - General - Secondary metered and City owned Transformation
Basic Charge $16.88 per billing plus $17.19 per billing plus $17.58 per billing plus $18.14 per billing plus $18.72 per billing plus $19.32 per billing plus $19.94 per billing plus
Energy Charge: First 10,000 kwh per billing $0.1362 per kwh $0.1387 per kwh $0.1409 per kwh $0.1429 per kwh $0.1449 per kwh $0.1469 per kwh $0.1515 per kwh
Next 90,000 kwh per billing $0.1072 per kwh $0.1092 per kwh $0.1110 per kwh $0.1126 per kwh $0.1143 per kwh $0.1159 per kwh $0.1196 per kwh
Additional kwh per billing $0.0751 per kwh $0.0765 per kwh $0.0778 per kwh $0.0789 per kwh $0.0801 per kwh $0.0812 per kwh $0.0838 per kwh
Demand Charge
$9.60 per KVA of billing demand which is the greater
of a) the maximum KVA demand in excess of 45 KVA for the current billing or b) 75% of the maximum KVA
demand in excess of 45 KVA recorded during the previous
eleven months
$9.78 per KVA of billing demand which is the greater
of a) the maximum KVA demand in ecess of 45 KVA for the current billing or b) 75% of the maximum KVA
demand in excess of 45 KVA recorded during the
previous eleven months
$9.94 per KVA of billing demand which is the greater
of a) the maximum KVA demand in ecess of 45 KVA for the current billing or b) 75% of the maximum KVA
demand in excess of 45 KVA recorded during the
previous eleven months
$10.09 per KVA of billing demand which is the greater
of a) the maximum KVA demand in ecess of 45 KVA for the current billing or b) 75% of the maximum KVA
demand in excess of 45 KVA recorded during the
previous eleven months
$10.23 per KVA of billing demand which is the greater
of a) the maximum KVA demand in ecess of 45 KVA for the current billing or b) 75% of the maximum KVA
demand in excess of 45 KVA recorded during the
previous eleven months
$10.38 per KVA of billing demand which is the greater
of a) the maximum KVA demand in ecess of 45 KVA for the current billing or b) 75% of the maximum KVA
demand in excess of 45 KVA recorded during the
previous eleven months
$10.71 per KVA of billing demand which is the greater
of a) the maximum KVA demand in ecess of 45 KVA for the current billing or b) 75% of the maximum KVA
demand in excess of 45 KVA recorded during the
previous eleven months
Rate Code - 25, 30 and 35
Primary Metering
1.5% discount on consumption and demand charges. Customer-owned
transformation - 9.0% discount on demand charges
only
1.5% discount on consumption and demand charges. Customer-owned
transformation - 9.0% discount on demand
charges only
1.5% discount on consumption and demand charges. Customer-owned
transformation - 9.0% discount on demand
charges only
1.5% discount on consumption and demand charges. Customer-owned
transformation - 9.0% discount on demand
charges only
1.5% discount on consumption and demand charges. Customer-owned
transformation - 9.0% discount on demand
charges only
1.5% discount on consumption and demand charges. Customer-owned
transformation - 9.0% discount on demand
charges only
1.5% discount on consumption and demand charges. Customer-owned
transformation - 9.0% discount on demand
charges only
Rate Code 25 - General - Primary metered and City owned Transformation
Basic Charge $16.88 per billing plus $17.19 per billing plus $17.58 per billing plus $18.14 per billing plus $18.72 per billing plus $19.32 per billing plus $19.94 per billing plus
Are subject to the same base rates for consumption and demand as set out in Rate Code 20 with the following discounts:
Fees and Charges Bylaw No. 2014-07Appendix 7 - Page 2 of 5
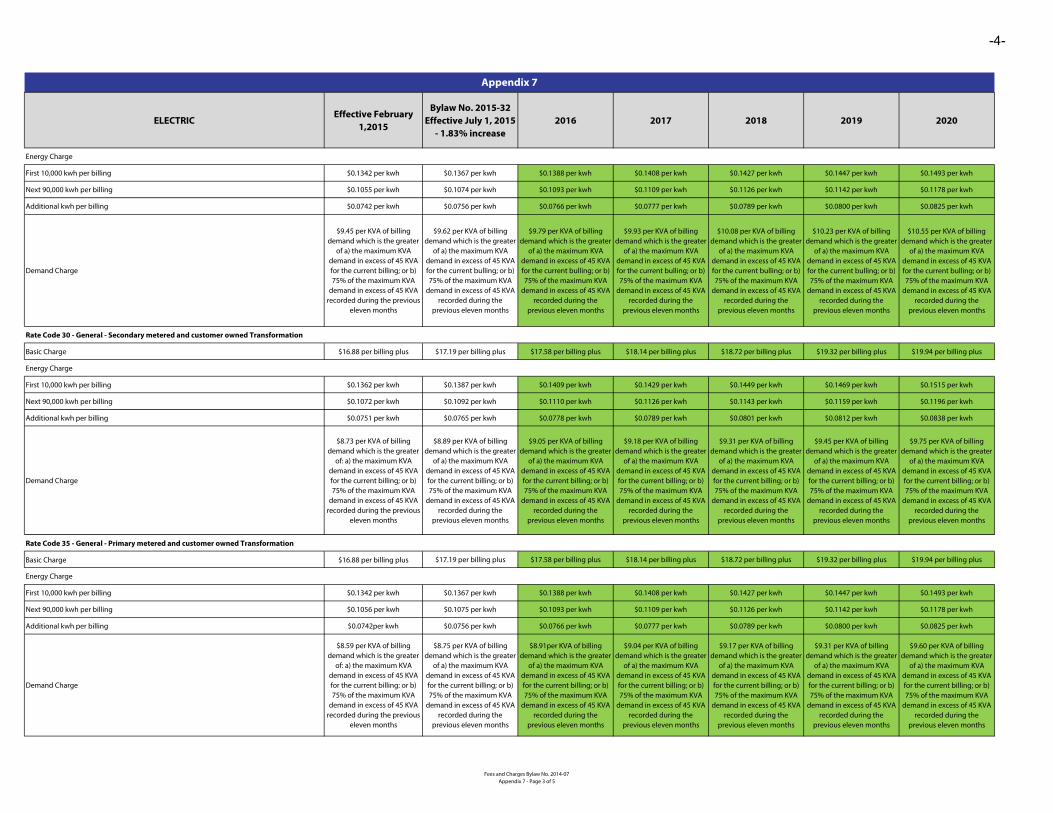
-3-
ELECTRICEffective February
1,2015
Bylaw No. 2015-32 Effective July 1, 2015
- 1.83% increase2016 2017 2018 2019 2020
Appendix 7
Energy Charge
First 10,000 kwh per billing $0.1342 per kwh $0.1367 per kwh $0.1388 per kwh $0.1408 per kwh $0.1427 per kwh $0.1447 per kwh $0.1493 per kwh
Next 90,000 kwh per billing $0.1055 per kwh $0.1074 per kwh $0.1093 per kwh $0.1109 per kwh $0.1126 per kwh $0.1142 per kwh $0.1178 per kwh
Additional kwh per billing $0.0742 per kwh $0.0756 per kwh $0.0766 per kwh $0.0777 per kwh $0.0789 per kwh $0.0800 per kwh $0.0825 per kwh
Demand Charge
$9.45 per KVA of billing demand which is the greater
of a) the maximum KVA demand in excess of 45 KVA for the current billing; or b) 75% of the maximum KVA
demand in excess of 45 KVA recorded during the previous
eleven months
$9.62 per KVA of billing demand which is the greater
of a) the maximum KVA demand in excess of 45 KVA for the current bulling; or b) 75% of the maximum KVA
demand in excess of 45 KVA recorded during the
previous eleven months
$9.79 per KVA of billing demand which is the greater
of a) the maximum KVA demand in excess of 45 KVA for the current bulling; or b) 75% of the maximum KVA
demand in excess of 45 KVA recorded during the
previous eleven months
$9.93 per KVA of billing demand which is the greater
of a) the maximum KVA demand in excess of 45 KVA for the current bulling; or b) 75% of the maximum KVA
demand in excess of 45 KVA recorded during the
previous eleven months
$10.08 per KVA of billing demand which is the greater
of a) the maximum KVA demand in excess of 45 KVA for the current bulling; or b) 75% of the maximum KVA
demand in excess of 45 KVA recorded during the
previous eleven months
$10.23 per KVA of billing demand which is the greater
of a) the maximum KVA demand in excess of 45 KVA for the current bulling; or b) 75% of the maximum KVA
demand in excess of 45 KVA recorded during the
previous eleven months
$10.55 per KVA of billing demand which is the greater
of a) the maximum KVA demand in excess of 45 KVA for the current bulling; or b) 75% of the maximum KVA
demand in excess of 45 KVA recorded during the
previous eleven months
Rate Code 30 - General - Secondary metered and customer owned Transformation
Basic Charge $16.88 per billing plus $17.19 per billing plus $17.58 per billing plus $18.14 per billing plus $18.72 per billing plus $19.32 per billing plus $19.94 per billing plus
Energy Charge
First 10,000 kwh per billing $0.1362 per kwh $0.1387 per kwh $0.1409 per kwh $0.1429 per kwh $0.1449 per kwh $0.1469 per kwh $0.1515 per kwh
Next 90,000 kwh per billing $0.1072 per kwh $0.1092 per kwh $0.1110 per kwh $0.1126 per kwh $0.1143 per kwh $0.1159 per kwh $0.1196 per kwh
Additional kwh per billing $0.0751 per kwh $0.0765 per kwh $0.0778 per kwh $0.0789 per kwh $0.0801 per kwh $0.0812 per kwh $0.0838 per kwh
Demand Charge
$8.73 per KVA of billing demand which is the greater
of: a) the maximum KVA demand in excess of 45 KVA for the current billing; or b) 75% of the maximum KVA
demand in excess of 45 KVA recorded during the previous
eleven months
$8.89 per KVA of billing demand which is the greater
of a) the maximum KVA demand in excess of 45 KVA for the current billing; or b) 75% of the maximum KVA
demand in excess of 45 KVA recorded during the
previous eleven months
$9.05 per KVA of billing demand which is the greater
of a) the maximum KVA demand in excess of 45 KVA for the current billing; or b) 75% of the maximum KVA
demand in excess of 45 KVA recorded during the
previous eleven months
$9.18 per KVA of billing demand which is the greater
of a) the maximum KVA demand in excess of 45 KVA for the current billing; or b) 75% of the maximum KVA
demand in excess of 45 KVA recorded during the
previous eleven months
$9.31 per KVA of billing demand which is the greater
of a) the maximum KVA demand in excess of 45 KVA for the current billing; or b) 75% of the maximum KVA
demand in excess of 45 KVA recorded during the
previous eleven months
$9.45 per KVA of billing demand which is the greater
of a) the maximum KVA demand in excess of 45 KVA for the current billing; or b) 75% of the maximum KVA
demand in excess of 45 KVA recorded during the
previous eleven months
$9.75 per KVA of billing demand which is the greater
of a) the maximum KVA demand in excess of 45 KVA for the current billing; or b) 75% of the maximum KVA
demand in excess of 45 KVA recorded during the
previous eleven months
Rate Code 35 - General - Primary metered and customer owned Transformation
Basic Charge $16.88 per billing plus $17.19 per billing plus $17.58 per billing plus $18.14 per billing plus $18.72 per billing plus $19.32 per billing plus $19.94 per billing plus
Energy Charge
First 10,000 kwh per billing $0.1342 per kwh $0.1367 per kwh $0.1388 per kwh $0.1408 per kwh $0.1427 per kwh $0.1447 per kwh $0.1493 per kwh
Next 90,000 kwh per billing $0.1056 per kwh $0.1075 per kwh $0.1093 per kwh $0.1109 per kwh $0.1126 per kwh $0.1142 per kwh $0.1178 per kwh
Additional kwh per billing $0.0742per kwh $0.0756 per kwh $0.0766 per kwh $0.0777 per kwh $0.0789 per kwh $0.0800 per kwh $0.0825 per kwh
Demand Charge
$8.59 per KVA of billing demand which is the greater
of: a) the maximum KVA demand in excess of 45 KVA for the current billing: or b) 75% of the maximum KVA
demand in excess of 45 KVA recorded during the previous
eleven months
$8.75 per KVA of billing demand which is the greater
of a) the maximum KVA demand in excess of 45 KVA for the current billing; or b) 75% of the maximum KVA
demand in excess of 45 KVA recorded during the
previous eleven months
$8.91per KVA of billing demand which is the greater
of a) the maximum KVA demand in excess of 45 KVA for the current billing; or b) 75% of the maximum KVA
demand in excess of 45 KVA recorded during the
previous eleven months
$9.04 per KVA of billing demand which is the greater
of a) the maximum KVA demand in excess of 45 KVA for the current billing; or b) 75% of the maximum KVA
demand in excess of 45 KVA recorded during the
previous eleven months
$9.17 per KVA of billing demand which is the greater
of a) the maximum KVA demand in excess of 45 KVA for the current billing; or b) 75% of the maximum KVA
demand in excess of 45 KVA recorded during the
previous eleven months
$9.31 per KVA of billing demand which is the greater
of a) the maximum KVA demand in excess of 45 KVA for the current billing; or b) 75% of the maximum KVA
demand in excess of 45 KVA recorded during the
previous eleven months
$9.60 per KVA of billing demand which is the greater
of a) the maximum KVA demand in excess of 45 KVA for the current billing; or b) 75% of the maximum KVA
demand in excess of 45 KVA recorded during the
previous eleven months
Fees and Charges Bylaw No. 2014-07Appendix 7 - Page 3 of 5
-4-

ELECTRICEffective February
1,2015
Bylaw No. 2015-32 Effective July 1, 2015
- 1.83% increase2016 2017 2018 2019 2020
Appendix 7
Rate Code 45 - General - City Accounts
Energy Charge$0.0792 per kwh for all
consumption$0.0806 per kwh for all
consumption$0.0873 per kwh for all
consumption$0.0953 per kwh for all
consumption$0.1041 per kwh for all
consumption$0.1137 per kwh for all
consumption$0.1173 per kwh for all
consumption
Rate Code 55 - Street Lighting, Traffic Lights & Other Un-metered Loads
Per fixture watt or volt ampere per billing subject to Section 3.b of Bylaw 2000-36 (Electrical Regulations)
$0.0883 per fixture watt or volt ampere per billing
$0.0899 per fixture watt or volt ampere per billing
$0.0977 per fixture watt or volt ampere per billing
$0.1071 per fixture watt or volt ampere per billing
$0.1174 per fixture watt or volt ampere per billing
$0.1287 per fixture watt or volt ampere per billing
$0.1411 per fixture watt or volt ampere per billing
Per watt or volt ampere per billing based on equipment name plate data or customer information, or where data is insufficient, the City will determine by appropriate measurement and calculation what equipment watt or volt ampere loading shall be used for billing purposes.
$0.1668 per watt $0.1699 per watt $0.1846 per watt $0.2024 per watt $0.2219 per watt $0.2432 per watt $0.2667 per watt
Monthly minimum charge per fixture or service connection $16.88 per billing plus $16.88 per billing plus $17.58 per billing plus $18.14 per billing plus $18.72 per billing plus $19.32 per billing plus $19.94 per billing plus
Net Metering
Electrical Service Calls
Service Call – 1 stop (1 hr. max) $205.00 $209.10
Service Call – 2 stops (1.5 hr. max) $305.00 $311.10
Electrical Service Connections
Temporary Service Connection
1 Phase up to 200 amps $205.00 $209.00
all except 1 phase up to 200 amps Actual Cost Actual Cost
Service Relocate
1 phase up to 200 amps $340.00 $347.00
Service Upgrade
1 phase over 200 amps Actual Cost Actual Cost
3 phase overhead (all) Actual Cost Actual Cost
Service Connection
1 phase per unit (200 amps max -includes 1 meter) overhead and underground $380.00 $388.00
Additional meters Actual Cost Actual Cost
1 phase overhead over 200 amps Actual Cost Actual Cost
3 phase overhead (all) Actual Cost Actual Cost
1 phase underground over 200 amps Actual Cost Actual Cost
3 phase underground (all) Actual Cost Actual Cost
Electrical Utility Ext. Agreement Actual Cost Actual Cost
Primary Underground Cable Actual Cost Actual Cost
Terminate and Energize underground - Per lot Actual Cost Actual Cost
Energy Credit – The City will apply a credit for the purchase of power from all City customers generating and transmitting power into the City electrical grid at the appropriate rate code that the City charges for power for the class of the said customer. Furthermore no additional City Fees related to electrical will be applied for participating in the Net Metering program. Customers will be responsible for all on-site costs of their Distribution Generation system including, but not limited to, design, permits, installation, repairs and maintenance.
Fees and Charges Bylaw No. 2014-07Appendix 7 - Page 4 of 5
-5-
ELECTRICEffective February
1,2015
Bylaw No. 2015-32 Effective July 1, 2015
- 1.83% increase2016 2017 2018 2019 2020
Appendix 7
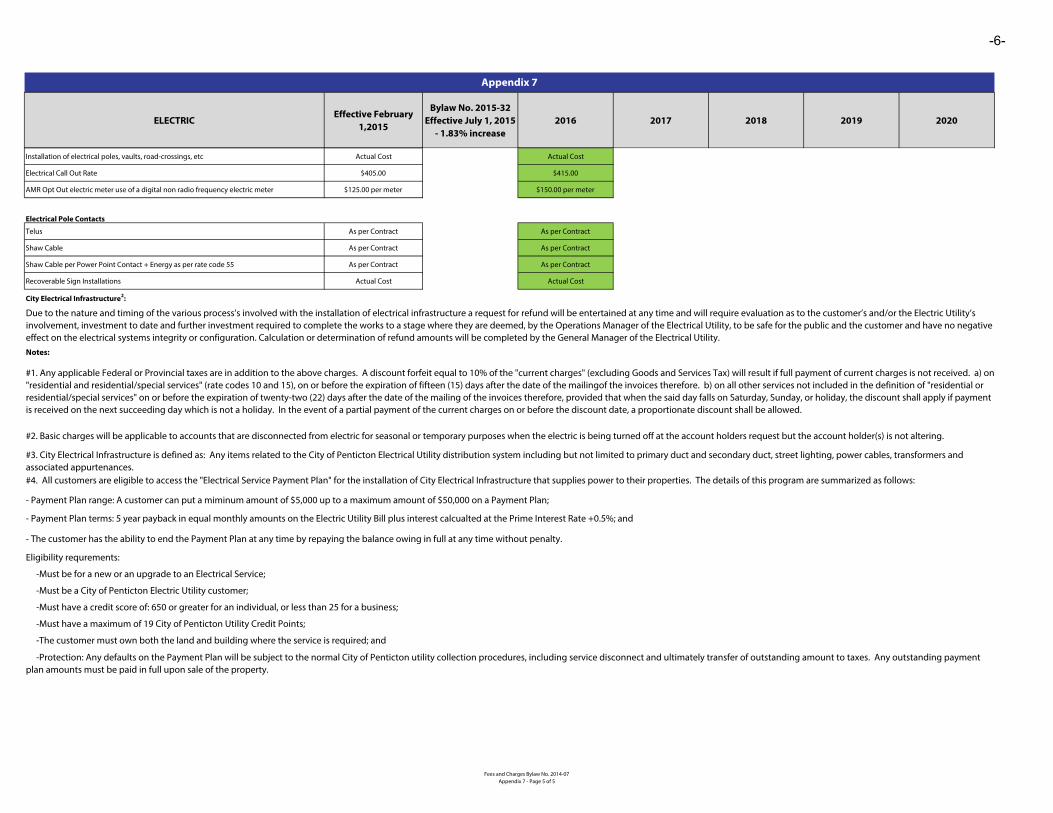
Installation of electrical poles, vaults, road-crossings, etc Actual Cost Actual Cost
Electrical Call Out Rate $405.00 $415.00
AMR Opt Out electric meter use of a digital non radio frequency electric meter $125.00 per meter $150.00 per meter
Electrical Pole Contacts
Telus As per Contract As per Contract
Shaw Cable As per Contract As per Contract
Shaw Cable per Power Point Contact + Energy as per rate code 55 As per Contract As per Contract
Recoverable Sign Installations Actual Cost Actual Cost
City Electrical Infrastructure2:
Notes:
-Must be a City of Penticton Electric Utility customer;
-Must have a credit score of: 650 or greater for an individual, or less than 25 for a business;
-The customer must own both the land and building where the service is required; and
-Protection: Any defaults on the Payment Plan will be subject to the normal City of Penticton utility collection procedures, including service disconnect and ultimately transfer of outstanding amount to taxes. Any outstanding payment plan amounts must be paid in full upon sale of the property.
-Must have a maximum of 19 City of Penticton Utility Credit Points;
#2. Basic charges will be applicable to accounts that are disconnected from electric for seasonal or temporary purposes when the electric is being turned off at the account holders request but the account holder(s) is not altering.
#3. City Electrical Infrastructure is defined as: Any items related to the City of Penticton Electrical Utility distribution system including but not limited to primary duct and secondary duct, street lighting, power cables, transformers and associated appurtenances.#4. All customers are eligible to access the "Electrical Service Payment Plan" for the installation of City Electrical Infrastructure that supplies power to their properties. The details of this program are summarized as follows:
Eligibility requrements:
-Must be for a new or an upgrade to an Electrical Service;
- Payment Plan range: A customer can put a miminum amount of $5,000 up to a maximum amount of $50,000 on a Payment Plan;
- Payment Plan terms: 5 year payback in equal monthly amounts on the Electric Utility Bill plus interest calcualted at the Prime Interest Rate +0.5%; and
- The customer has the ability to end the Payment Plan at any time by repaying the balance owing in full at any time without penalty.
Due to the nature and timing of the various process’s involved with the installation of electrical infrastructure a request for refund will be entertained at any time and will require evaluation as to the customer’s and/or the Electric Utility’s involvement, investment to date and further investment required to complete the works to a stage where they are deemed, by the Operations Manager of the Electrical Utility, to be safe for the public and the customer and have no negative effect on the electrical systems integrity or configuration. Calculation or determination of refund amounts will be completed by the General Manager of the Electrical Utility.
#1. Any applicable Federal or Provincial taxes are in addition to the above charges. A discount forfeit equal to 10% of the "current charges" (excluding Goods and Services Tax) will result if full payment of current charges is not received. a) on "residential and residential/special services" (rate codes 10 and 15), on or before the expiration of fifteen (15) days after the date of the mailingof the invoices therefore. b) on all other services not included in the definition of "residential or residential/special services" on or before the expiration of twenty-two (22) days after the date of the mailing of the invoices therefore, provided that when the said day falls on Saturday, Sunday, or holiday, the discount shall apply if payment is received on the next succeeding day which is not a holiday. In the event of a partial payment of the current charges on or before the discount date, a proportionate discount shall be allowed.
Fees and Charges Bylaw No. 2014-07Appendix 7 - Page 5 of 5
-6-

2015 2016 2017 2018 2019 2020
Sanitary Sewer Fixture Charges
A minimum annual charge which includes plumbing fixtures not exceeding six (6) in number
$141.00 $153.38
Each plumbing fixture exceeding six (6) in number $25.70 $27.96
First Unit $15.00 $16.00
Each additional Unit in the same complex $5.00 $6.00
Sanitary Sewer Charges based on Treated Water Use
Monthly Fixed Sanitary Sewer Rates Based on Water Meter Size
13mm / 16mm / 19mm (1/2 inch, 5/8 inch and 3/4 inch /month) $15.41 $16.76 $19.91 $21.66
25mm (1 inch) / month $25.69 $27.94 $33.19 $36.10
38 mm (1 1/2 inches) / month $51.37 $55.88 $66.38 $72.20
50 mm (2 inches) / month $82.19 $89.41 $106.20 $115.53
75 mm (3 inches) / month $179.80 $195.59 $232.32 $252.71
100 mm (4 inches) / month $323.64 $352.05 $418.17 $454.88
Variable Consumption Charge / 2.83 cubic meters (100 cubic feet) $2.23 $2.45 $2.52 $2.77
For Summer (April to September) for Residential Properties use 50% of the water use times the Variable Consumption Charge
For Non Residential Properties use 100% of the water use times the Variable Consumption Charge
For Winter (October to March) for Residential Properties use 100% of the water use times the Variable Consumption Charge
Sanitary sewer charges no water meter or no water service (per month)
Non Residential Customers may approach the City for a reduction in the % of water use to account for business practices that create a large discrpency between water use and sewage generation.
Appendix 25
Such charges to be effective immediately upon the expiration of 180 days (60 days in the case of a renovated building) from the date of validation of the building permit, provided however, that this amount may be pro-rated from the effective date to December 31 of the year in which the building is built or renovated.
An extension to the 180 day period will be considered providing the builder applies in writing to Building & Licence Division prior to the expiration of the 180 day period. Should a request come from a builder after the expiration of the 180 day period, an extension may still be granted upon payment of an administration fee:
PLUS Variable Sanitary Sewer Generation Charge based on Water Use for all Meter Sizes
Extensions are only to be granted in multiples of 30 days, ie 30, 60, 90 days.
Fees and Charges Bylaw No. 2014-07Appendix 25 - Page 1 of 3
-7-
2015 2016 2017 2018 2019 2020
Appendix 25
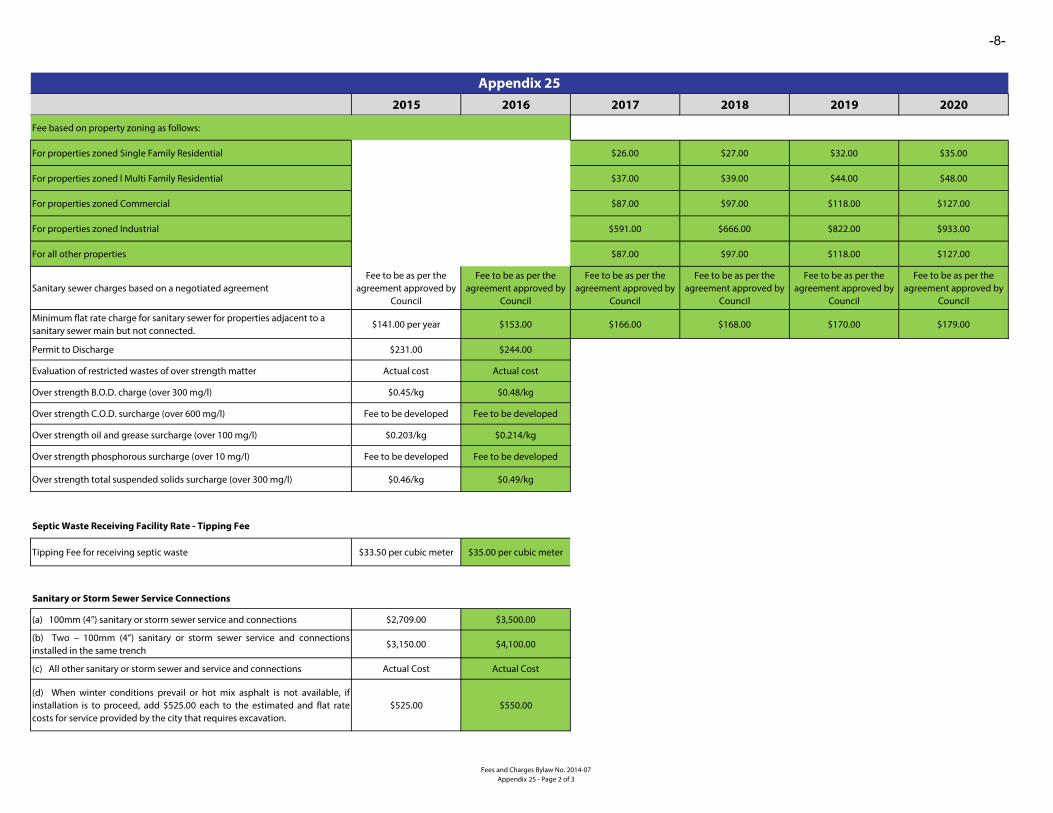
Fee based on property zoning as follows:
For properties zoned Single Family Residential $26.00 $27.00 $32.00 $35.00
For properties zoned l Multi Family Residential $37.00 $39.00 $44.00 $48.00
For properties zoned Commercial $87.00 $97.00 $118.00 $127.00
For properties zoned Industrial $591.00 $666.00 $822.00 $933.00
For all other properties $87.00 $97.00 $118.00 $127.00
Sanitary sewer charges based on a negotiated agreementFee to be as per the
agreement approved by Council
Fee to be as per the agreement approved by
Council
Fee to be as per the agreement approved by
Council
Fee to be as per the agreement approved by
Council
Fee to be as per the agreement approved by
Council
Fee to be as per the agreement approved by
Council
Minimum flat rate charge for sanitary sewer for properties adjacent to a sanitary sewer main but not connected.
$141.00 per year $153.00 $166.00 $168.00 $170.00 $179.00
Permit to Discharge $231.00 $244.00
Evaluation of restricted wastes of over strength matter Actual cost Actual cost
Over strength B.O.D. charge (over 300 mg/l) $0.45/kg $0.48/kg
Over strength C.O.D. surcharge (over 600 mg/l) Fee to be developed Fee to be developed
Over strength oil and grease surcharge (over 100 mg/l) $0.203/kg $0.214/kg
Over strength phosphorous surcharge (over 10 mg/l) Fee to be developed Fee to be developed
Over strength total suspended solids surcharge (over 300 mg/l) $0.46/kg $0.49/kg
Septic Waste Receiving Facility Rate - Tipping Fee
Tipping Fee for receiving septic waste $33.50 per cubic meter $35.00 per cubic meter
Sanitary or Storm Sewer Service Connections
(a) 100mm (4”) sanitary or storm sewer service and connections $2,709.00 $3,500.00
(b) Two – 100mm (4”) sanitary or storm sewer service and connectionsinstalled in the same trench
$3,150.00 $4,100.00
(c) All other sanitary or storm sewer and service and connections Actual Cost Actual Cost
(d) When winter conditions prevail or hot mix asphalt is not available, ifinstallation is to proceed, add $525.00 each to the estimated and flat ratecosts for service provided by the city that requires excavation.
$525.00 $550.00
Fees and Charges Bylaw No. 2014-07Appendix 25 - Page 2 of 3
-8-

2015 2016 2017 2018 2019 2020
Appendix 25
(e) Repair of service failure or interruption Actual Cost Actual Cost
(f) Winter Trench Repair maintenance $441.00 $450.00
(g) Reconnecting to a capped sewer service - No work by City -Reconnection Fee Only
$210.00 $220.00
(h) Sanitary or Storm Sewer Service Video Inspection $171.00 $174.50
Other:
(a) Service inspection of an irrigation water service, treated water service,sanitary sewer service and storm sewer service.
$163.00 $166.00
(b) Termination of an irrigation water service, treated water service, sanitarysewer service and storm sewer service
$1,575.00 $1,675.00
(c) Service calls regarding water service, treated water service, sanitarysewer service and storm sewer service
Actual Cost Actual Cost
In the event problem is determined to be caused by the City or the responsibility of the City all associated costs shall be applied to the City.
Fees and Charges Bylaw No. 2014-07Appendix 25 - Page 3 of 3
-9-

2015 2016 2017 2018 2019 2020
Utility Administration Rates
Utility credit references (current or recent account) $15.75 $17.00
Archived account $26.25 $27.75
Utility account history $15.75 $17.00
Interest rate on delinquent utility accounts 10% per annum 10% per annum
Special water meter reading $27.25 $29.00
Special water meter inspection fee $27.25 $29.00
AMR OPT OUT
AMR Opt Out manual water meter reading for an individual meter $11.00 per meter read $12.00 per meter read
AMR Opt Out manual combined electric and water meter reading for an individual for anindividual meter read
$13.00 per combined meter read
$14.00 per combined meter read
AMR Opt Out manual water meter reading for a meter bank installation
$11.00 for the first meter and $1.00 for each additional
meter in the meter bank per meter read. The total cost for the water meter bank read is
to be equally split between all customers served by the
meter bank.
$12.00 for the first meter and $1.00 for each additional
meter in the meter bank per meter read. The total cost for the water meter bank read is
to be equally split between all customers served by the
meter bank.
AMR Opt Out combined electric and water meter reading for a combined electric andwater meter bank installation
$13.00 for the first meter and $1.00 per read for each
additional meter in the meter bank per meter read. The total cost for the combined electric and water meter bank read is to be equally split between all
customers served by the meter bank.
$14.00 for the first meter and $1.00 per read for each
additional meter in the meter bank per meter read. The total cost for the combined electric and water meter bank read is to be equally split between all
customers served by the meter bank.
Applications / Connect / Disconnect / Reconnect
City padlocks $20.00 $22.00
City lock boxes (installed by City) $63.00 $67.00
City lock boxes (installed by customer) $47.25 $50.00
Utility application fee – next day service $30.00 $32.00
Utility application fee – same day service (accounts with combined electric and water) $90.00 $96.00
Utility application fee (water only) same day service (accounts that only have waterservices)
$59.75 $64.00
Water disconnect / re-connect fee (for non payment during regular City hall hours) $58.00 $62.00
Water disconnect / re-connect fee (for non payment after hours without call-out) $83.85 $89.00
Water disconnect / re-connect fee (for non payment after hours with call-out) $196.65 $208.00
Water disconnect (customer / agent request during City hall hours) $29.00 $31.00
Water disconnect (customer / agent request after hours without call-out) $42.50 $45.00
Appendix 29
Fees and Charges Bylaw No. 2014-07Appendix 29 - Page 1 of 6
-10-

2015 2016 2017 2018 2019 2020
Appendix 29
Water disconnect (customer / agent request after hours with call-out) $196.65 $208.00
Water re-connect (customer / agent request during City hall hours) $29.00 $31.00
Water re-connect (customer / agent request after hours without call-out) $42.50 $45.00
Water re-connect (customer / agent request after hours with call-out) $196.65 $208.00
Illegal reconnection administration charge $264.00 $279.00
Utility fee - Leave on Authorized $10.20 $11.00
Water Disconnection (for non-payment) $211.00 $223.00
Special Administration charge per service $25.50 $27.00
Non Treated Irrigation Water Charges
No Meter
Non-treated irrigation water per acre per year $145.60 $152.15
Minimum charge for non-treated irrigation water / year $145.60 $152.15
Household use from a connection to the untreated irrigation water system, unlessmetered, in which case metered rates then apply. (per annum per residence)
$340.08 $355.38
Monthly Fixed Non Treated Irrigation Water Meter Rates based on Meter Size
13mm / 16mm / 19mm (1/2 inch, 5/8 inch and 3/4 inch /month) $9.42 $9.85
25mm (1 inch) / month $20.20 $21.11
38 mm (1 1/2 inches) / month $59.51 $62.19
50 mm (2 inches) / month $131.04 $136.94
75 mm (3 inches) / month $376.19 $393.12
100 mm (4 inches) / month $827.19 $864.41
150 mm (6 inches) / month $2,321.59 $2,426.06
PLUS Variable Consumption Charge for all Meter Sizes
Variable Consumption Charge / 2.83 cubic meters (100 cubic feet) $0.23 $0.24
Reclaimed Treated Effluent for Irrigation Charges
Monthly Fixed Reclaimed Treated Effluent Meter Rates Based on Meter Size
13mm / 16mm / 19mm (1/2 inch, 5/8 inch and 3/4 inch /month) $9.42 $9.85
25mm (1 inch) / month $20.20 $21.11
38 mm (1 1/2 inches) / month $59.51 $62.19
50 mm (2 inches) / month $131.04 $136.94
75 mm (3 inches) / month $376.19 $393.12
100 mm (4 inches) / month $827.19 $864.41
150 mm (6 inches) / month $2,321.59 $2,426.06
PLUS Variable Consumption Charge for all Meter Sizes
Variable Consumption Charge / 2.83 cubic meters (100 cubic feet) $0.69 $0.72
Fees and Charges Bylaw No. 2014-07Appendix 29 - Page 2 of 6
-11-

2015 2016 2017 2018 2019 2020
Appendix 29
Treated Water Rates
Monthly Fixed Treated Water Meter Rates Based on Meter Size
13mm / 16mm / 19mm (1/2 inch, 5/8 inch and 3/4 inch /month) $19.77 $23.19 $26.92 $28.80 $30.60 $32.39
25mm (1 inch) / month $42.37 $56.42 $75.13 $92.58 $114.97 $121.71
38 mm (1 1/2 inches) / month $125.03 $133.36 $142.25 $141.12 $139.70 $147.89
50 mm (2 inches) / month $275.18 $298.64 $324.11 $324.92 $329.27 $348.58
75 mm (3 inches) / month $790.06 $784.02 $778.04 $750.32 $721.39 $691.17
100 mm (4 inches) / month $1,736.28 $1,684.84 $1,634.92 $1,580.05 $1,522.74 $1,462.90
150 mm (6 inches) / month $4,875.78
200 mm (8 inches) / month $10,854.48
250 mm (10 inches) / month $21,241.58
300 mm (12 inches) / month $38,310.64
PLUS Variable Consumption Charge for all Meter Sizes
Variable Consumption Charge / 2.83 cubic meters (100 cubic feet) $1.67 $1.86 $2.08 $2.17 $2.26 $2.36
Monthly Fixed Non Metered Treated Water Rates Based on Service Size
13mm / 16mm / 19mm (1/2 inch, 5/8 inch and 3/4 inch /month) $33.25 $38.22 $43.68 $46.30 $48.87 $51.48
25mm (1 inch) / month $68.80 $85.89 $107.99 $126.90 $150.80 $159.13
38 mm (1 1/2 inches) / month $204.20 $221.64 $240.68 $243.91 $247.04 $259.98
50 mm (2 inches) / month $442.26 $484.94 $531.83 $541.84 $555.80 $585.13
75 mm (3 inches) / month $1,300.57 $1,353.24 $1,412.71 $1,413.11 $1,413.52 $1,413.95
100 mm (4 inches) / month $2,820.64 $2,893.90 $2,983.03 $2,987.85 $2,992.88 $2,998.14
150 mm (6 inches) / month $7,944.30
200 mm (8 inches) / month $17,608.50
250 mm (10 inches) / month $34,298.63
300 mm (12 inches) / month $61,571.33
Treated water charges based on a negotiated agreementFee to be as per the
agreement approved by Council
Fee to be as per the agreement approved by
Council
Fee to be as per the agreement approved by
Council
Fee to be as per the agreement approved by
Council
Fee to be as per the agreement approved by
Council
Fee to be as per the agreement approved by
Council
Minimum charge for treated water for domestic purposes
Fee to be minimum monthly Basic Charge based on the meter size or the minimum
monthly charge based on the size of service
Fee to be minimum monthly Basic Charge based on the meter size or the minimum
monthly charge based on the size of service
Fee to be minimum monthly Basic Charge based on the meter size or the minimum
monthly charge based on the size of service
Fee to be minimum monthly Basic Charge based on the meter size or the minimum
monthly charge based on the size of service
Fee to be minimum monthly Basic Charge based on the meter size or the minimum
monthly charge based on the size of service
Fee to be minimum monthly Basic Charge based on the meter size or the minimum
monthly charge based on the size of service
Notwithstanding the above basic charges, should a 150 mm (6") meter be provided in conjunction with a 150 mm (6") line for the purpose of providing the dual requirements of domestic water and fire protection, the basic charge will be based on the size of meter that would be required to service the domestic water needs of the complex as determined by the Public Works Supervisor. This charge is to commence at the time of the installation of the meter. Prior to the installation of the meter, the service is to be billed at a 25 mm (1") unmetered rate.
Fees and Charges Bylaw No. 2014-07Appendix 29 - Page 3 of 6
-12-
2015 2016 2017 2018 2019 2020
Appendix 29
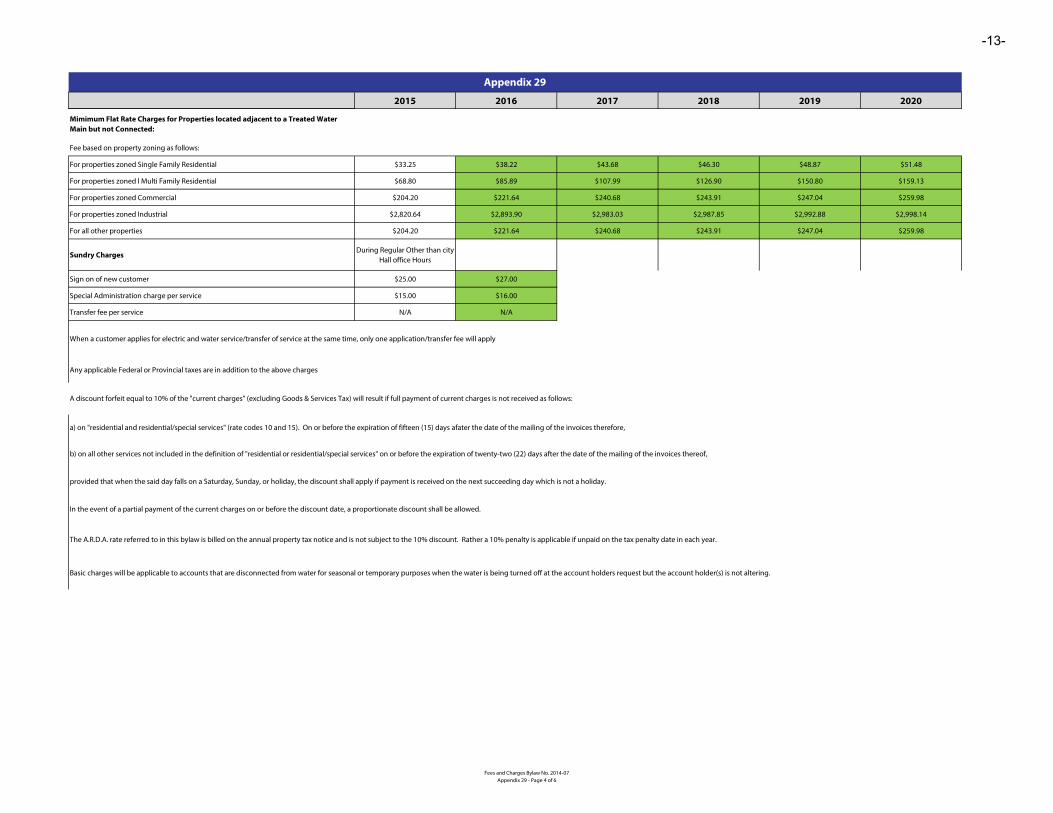
Fee based on property zoning as follows:
For properties zoned Single Family Residential $33.25 $38.22 $43.68 $46.30 $48.87 $51.48
For properties zoned l Multi Family Residential $68.80 $85.89 $107.99 $126.90 $150.80 $159.13
For properties zoned Commercial $204.20 $221.64 $240.68 $243.91 $247.04 $259.98
For properties zoned Industrial $2,820.64 $2,893.90 $2,983.03 $2,987.85 $2,992.88 $2,998.14
For all other properties $204.20 $221.64 $240.68 $243.91 $247.04 $259.98
Sundry ChargesDuring Regular Other than city
Hall office Hours
Sign on of new customer $25.00 $27.00
Special Administration charge per service $15.00 $16.00
Transfer fee per service N/A N/A
Mimimum Flat Rate Charges for Properties located adjacent to a Treated Water Main but not Connected:
When a customer applies for electric and water service/transfer of service at the same time, only one application/transfer fee will apply
Any applicable Federal or Provincial taxes are in addition to the above charges
A discount forfeit equal to 10% of the "current charges" (excluding Goods & Services Tax) will result if full payment of current charges is not received as follows:
a) on "residential and residential/special services" (rate codes 10 and 15). On or before the expiration of fifteen (15) days afater the date of the mailing of the invoices therefore,
b) on all other services not included in the definition of "residential or residential/special services" on or before the expiration of twenty-two (22) days after the date of the mailing of the invoices thereof,
provided that when the said day falls on a Saturday, Sunday, or holiday, the discount shall apply if payment is received on the next succeeding day which is not a holiday.
In the event of a partial payment of the current charges on or before the discount date, a proportionate discount shall be allowed.
The A.R.D.A. rate referred to in this bylaw is billed on the annual property tax notice and is not subject to the 10% discount. Rather a 10% penalty is applicable if unpaid on the tax penalty date in each year.
Basic charges will be applicable to accounts that are disconnected from water for seasonal or temporary purposes when the water is being turned off at the account holders request but the account holder(s) is not altering.
Fees and Charges Bylaw No. 2014-07Appendix 29 - Page 4 of 6
-13-

2015 2016 2017 2018 2019 2020
Appendix 29
Treated and Irrigation Services and Metering
AMR Opt Out treated or irrigation water meter, old style meter, use of a digital non radio frequency electric meter
$190.00 per meter $201.00 per meter
AMR Opt Out treated or irrigation water meter, new style meter, use of a digital non radio frequency electric meter
$40.00 per meter $42.25 per meter
19mm ( ¾”) water service $2,541.00 $2,641.00
25 mm (1”) water service $3,024.00 $3,124.00
All other water services Actual Cost Actual Cost
19mm ( ¾”) water meter $441.00 $450.00
25 mm (1”) water meter $567.00 $578.00
38 mm (1 ½”) water meter with register and Radio Fequency $882.00 $899.00
50 mm (2”) compound water meter with register and Radio Frequency $2,709.00 $2,763.00
(c) All other water meters with register and Radio Frequency Actual Cost Actual Cost
(d) Water meter chamber up to 25 mm (1”) supply and installation (in conjunction withservice install)
$840.00 $840.00
(e) Water meter chamber up to 25 mm (1") supply and installation (not installed withservice)
$1,840.00 $1,840.00
(f) Provision of temporary water Actual Cost Actual Cost
(g) All other water meter chambers supply and installation Actual Cost Actual Cost
(h) Water meter register and Radio Frequency - Supply and install $250.00 $250.00
(i) Water meter testing or repair if replacement is required and deemed the fault of theowner additional charges may be applied.
$87.00 $89.00
Customer request to relocate (or alter due to construction) meter or appurtences Actual Cost Actual Cost
Water Connection Charges
(a) Service inspection of an irrigation water service, treated water service, sanitary sewerservice and storm sewer service.
$163.00 $166.00
(b) Termination of an irrigation water service, treated water service, sanitary sewerservice and storm sewer service
$1,575.00 $1,675.00
(c) Service calls regarding water service, treated water service, sanitary sewer serviceand storm sewer service
Actual Cost Actual Cost
(a) Treated and Irrigation water service supply and installation, not including meter or meter chamber. Fee to be as follows:
(b) Treated and Irrigation water meter supply and installation, not including meter chamber. Fee to be as follows:
Note: if the meter is found to be accurate within 98.5% - 101.5%, the party disputing the accuracy of the meter shall bear the cost. If the meter is found not be accurate within the above limlits the City shall bear the costs.
Fees and Charges Bylaw No. 2014-07Appendix 29 - Page 5 of 6
-14-

2015 2016 2017 2018 2019 2020
Appendix 29
Fire Hydrants (both City and private hydrants)
(a) Fire hydrant supply and installation not requiring curb, gutter and asphalt work $5,600.00 $5,900.00
(b) Fire hydrant supply and installation requiring curb, gutter and asphalt work $7,800.00 $8,100.00
(c) Fire Hydrant rental (includes hook-up and water usage) Note: if total # of days is notknown (amount to be billed)
$110.00 first day and $21.00 each day thereafter
$112.00 first day and $22.00 each day thereafter
(d) Portable water meter rental $15.75 per day (plus cost of
water used at the current metered rate)
$16.75 per day (plus cost of water used at the current
metered rate)
(e) Fire Hydrant Implementation $163.00 $166.00
Other:
(a) Service inspection of an irrigation water service, treated water service, sanitary sewerservice and storm sewer service.
$163.00 $166.00
(b) Termination of an irrigation water service, treated water service, sanitary sewerservice and storm sewer service
$1,575.00 $1,675.00
(c) Service calls regarding water service, treated water service, sanitary sewer serviceand storm sewer service
Actual Cost Actual Cost
Fees and Charges Bylaw No. 2014-07Appendix 29 - Page 6 of 6
-15-

City of Penticton
2016 Operating Budget
Proposal to Council
Date: Wednesday December 16, 2015
An overview of the operating budget proposals for fiscal year of Jan. 1, 2016 to Dec. 31, 2016
City of Penticton Finance
171 Main St., Penticton, B.C.
-16-

General Revenue Fund2016 2017 2018 2019 2020
Budget Budget Budget Budget BudgetRevenue
Taxation 27,296,272 28,481,614 28,481,614 28,481,614 28,481,614Grants in Lieu 254,541 254,541 254,541 254,541 254,541Collections for other Governments 20,562,109 20,595,725 20,629,629 20,663,823 20,698,311Hotel Room Tax (MRDT) 450,000 450,000 450,000 450,000 450,000Sale of Services 9,676,698 9,371,558 9,401,194 9,426,597 9,452,782Fiscal Services 7,920,878 7,927,487 7,934,157 7,940,890 7,947,684Rentals/Leases 1,172,100 1,060,100 1,085,889 1,091,736 1,097,373Grants 1,782,701 1,782,701 1,782,701 1,782,701 1,782,701Gaming Funds 4,537,029 1,600,000 1,600,000 1,600,000 1,600,000Development Cost Charges 175,768 175,768 175,768 175,768 175,768
73,828,096 71,699,494 71,795,492 71,867,670 71,940,774
ExpenseGeneral Government Services 39,987,191 39,874,764 38,033,364 36,635,691 37,679,460 Protective Services 14,898,842 15,009,004 15,207,177 15,588,186 15,808,321 Transportation Services 5,768,721 5,836,133 5,946,858 6,059,166 6,164,679 Environmental Health Services 1,465,876 1,465,956 1,466,038 1,466,120 1,466,204 Public Health and Safety 192,533 192,879 192,977 193,076 193,177 Environmental Development Services 2,776,630 2,609,944 2,626,090 2,635,412 2,660,604 Recreation and Cultural Services 5,918,903 5,964,642 6,036,230 6,109,112 6,167,138
71,008,697 70,953,323 69,508,734 68,686,763 70,139,583
Surplus (Deficit) 2,819,399 746,171 2,286,758 3,180,907 1,801,191
Transfer from surplus/reserve - - - - - Transfer to surplus/reserve 4,716,198 5,641,670 5,641,670 5,641,670 5,641,670
Surplus (Deficit) (1,896,799) (4,895,499) (3,354,912) (2,460,763) (3,840,480)
-17-

General Government Services
2015 2016 2017 2018 2019 2020Budget Budget Budget Budget Budget Budget
Corporate Administration 673,960 703,262 705,680 708,133 710,622 713,146 Mayor and Council 273,450 274,250 274,605 274,964 275,325 275,690 Municipal Grants/Partnerships 1,802,613 1,788,163 1,574,613 1,574,613 1,574,613 2,599,552 Communications 197,000 215,819 215,879 215,889 215,899 214,159 Finance - Accounting 2,082,943 1,769,955 1,775,687 1,782,026 1,788,474 1,795,032 Finance - General 7,247,072 5,996,110 5,994,381 4,020,244 2,516,852 2,484,383 Logistics 369,089 411,950 418,700 422,750 425,750 427,950 Revenue & Collections 935,085 944,269 958,364 973,726 989,361 995,273 General Government 20,713,400 21,491,109 21,524,725 21,558,629 21,592,823 21,627,311 Facilities 3,938,290 4,135,414 4,168,691 4,195,323 4,199,962 4,204,675 Operations 2,950 56,670 56,670 56,670 56,670 53,720 Human Resources 670,885 722,677 718,931 749,332 779,901 771,814 Information Technology 1,440,506 1,477,542 1,487,837 1,501,066 1,509,440 1,516,755
40,347,243 39,987,191 39,874,764 38,033,364 36,635,691 37,679,460
-18-

Corporate Services - Operating Budget
2015 Year end 2015 2016 2017 2018 2019 2020Projection Budget Budget Budget Budget Budget Budget
Goods and Services 89,535 76,710 74,962 75,510 76,063 76,621 77,183 Legal 60,000 90,000 81,500 81,500 81,500 81,500 81,500 Salaries and Benefits 440,224 507,250 546,800 548,670 550,570 552,501 554,463 Net Operating Expense 589,758 673,960 703,262 705,680 708,133 710,622 713,146
5 FTECorporate Services are responsible for the Statutory duties as outlined in the Community CharterOur purpose is to serve Elected Officials and support other City departmentsThe primary responsibilities are: agendas, bylaws, elections, records management, FOIPPA requests and policy
Goods and Services 11%
Legal 11%
Salaries and Benefits 78%
Corporate Services - 2016 Operating Budget
-19-

Corporate Services - Operating Budget by Project
2015 Year end 2015 2016 2017 2018 2019 2020Projection Budget Budget Budget Budget Budget Budget
Advisory Committee 6,250 6,250 6,250 6,304 6,358 6,412 6,467 Council Catering 11,000 10,000 10,000 10,086 10,172 10,259 10,347 Legal 61,649 92,600 84,100 84,122 84,145 84,167 84,190 Municipal Elections 24,203 24,000 24,000 24,000 24,000 24,000 24,000 Safety (City Hall) 15,000 10,000 8,552 8,625 8,699 8,774 8,849 Salary and Benefits 440,224 507,250 533,800 535,670 537,570 539,501 541,463 Supplies 22,797 18,060 26,760 26,989 27,221 27,454 27,689 Travel and Training 8,635 5,800 9,800 9,884 9,969 10,054 10,140
589,758 673,960 703,262 705,680 708,133 710,622 713,146
Advisory Committee, 6,250
Council Catering, 10,000
Legal, 84,100 Municipal Elections,
24,000
Safety (City Hall), 8,552
Salary and Benefits, 533,800
Supplies, 26,760
Travel and Training, 9,800
-20-

Mayor and Council - Operating Budget
2015 Year end 2015 2016 2017 2018 2019 2020Projection Budget Budget Budget Budget Budget Budget
Goods and Services 55,389 67,250 63,250 63,605 63,964 64,325 64,690 Fleet 11,000 11,000 11,000 11,000 11,000 11,000 11,000 Salaries and Benefits 195,200 195,200 200,000 200,000 200,000 200,000 200,000 Net Operating Expense 261,589 273,450 274,250 274,605 274,964 275,325 275,690
Goods and Services, 63,250
Fleet, 11,000
Salaries and Benefits, 200,000
Mayor and Council 2016 Operating Budget
-21-

Mayor and Council - Operating Budget by Project
2015 Year end 2015 2016 2017 2018 2019 2020Projection Budget Budget Budget Budget Budget Budget
Fleet 11,000 11,000 11,000 11,000 11,000 11,000 11,000 Supplies 27,189 13,500 34,300 34,407 34,515 34,624 34,734 Travel and Conferences 28,200 53,750 28,950 29,198 29,448 29,701 29,955 Salary and Benefits 195,200 195,200 200,000 200,000 200,000 200,000 200,000 Net Operating Expense 261,589 273,450 274,250 274,605 274,964 275,325 275,690
Fleet, 11,000 Supplies, 34,300
Travel and Conferences, 28,950
Salary and Benefits, 200,000
-22-

Civic Grants - Operating Budget
2015 2016 2017 2018 2019 2020Budget Budget Budget Budget Budget Budget
Municipal Grants 699,674 598,913 499,674 499,674 499,674 1,524,613 Rogers Hometown Hockey - 23,550 - - - - BC Winter Games - 90,000 - - - - Public Art - 50,000 50,000 50,000 50,000 50,000 Civic Partnerships 1,102,939.00 1,025,700 1,024,939 1,024,939 1,024,939 1,024,939
1,802,613 1,788,163 1,574,613 1,574,613 1,574,613 2,599,552
Boston Pizza Jr. Triathlon 800.00Canadian Mental Health Association 2,000.00Challenge Penticton - All Services 110,000.00Community Arts Council 12,312.00Community Foundation of the South Okanagan Similkameen 25,000.00D.A.R.E. BC Society 2,000.00DPA - BC Family Day 1,500.00DPA - Canada Day Celebration 7,000.00DPA - Canada Day Fireworks 255.00DPA - Music in the Park 19,000.00DPA - New Year´s Eve Fireworks 255.00Grand Fondo 42,000.00Henning Emergency Clinic of Kindness 12,800.00Miss Penticton Royalty 9,150.00OK Similkameen Comm Fndtn - Neighbourhood Small Grants 5,000.00Okanagan fruit Tree Project Society 10,000.00Okanagan Motorcycle Association 500.00Okanagan Similkameen Healthy Living Fair Society 8,400.00Okanagan Simlkameen Conservation Alliance 5,000.00Okanagan Symphony 9,000.00Okanagan Trestle Tours 1,000.00Other 52,000.00Peach City Junior Triathlon 407.00Peach Festival Society 40,000.00Penticton & Area Access Society 4,300.00Penticton Art Gallery Society 95,000.00Penticton Cycling Association 2,500.00Penticton Dragonboat Festival Society 12,210.00Penticton Historic Automobile Assn 7,000.00Penticton Jazz Festival 13,000.00Penticton Kiwanis Music Festival 5,250.00Penticton Minor Hockey 4,000.00Penticton Scottish Festival Society 6,500.00Penticton Search & Rescue 12,435.00Red Cross HELP Depot 2,500.00Rotary Club of Penticton 25,000.00Royal Cdn Legion - Facility Rent 7,200.00Salvation Army 6,000.00School District reciprocal agreement 14,000.00Shatford Building - OSA 15,000.00South Okanagan Seniors Wellness Society 15,000.00South Okanagan Trail Alliance 1,000.00SS Sicamous - Operating 45,000.00SS Sicamous - Utilities 20,000.00United Way Emergency Transportation Assistance Program 7,200.00Upperdeck Vees Hockey 4,200.00Civic partnerships - Library 1,024,939.00Civic partnerships - Penmar Partnership 78,000.00
-23-

Communications - Operating Budget
2015 Year end 2015 2016 2017 2018 2019 2020Projection Budget Budget Budget Budget Budget Budget
Goods and Services 104,794 107,625 123,325 123,385 123,395 123,405 121,665 Salaries and Benefits 88,492 89,375 92,494 92,494 92,494 92,494 92,494 Net Operating Expense 193,286 197,000 215,819 215,879 215,889 215,899 214,159
1 FTE
o Of those goods and services, over 41% supports newspaper advertising required under legislation to meet requirements for public notice
Using an audience-centered model, Communications aims to support major city projects and provide accurate and timely information to citizens and staff through research, brand standards, media relations, crisis communications, development and maintenance of print and electronic communications channels (including penticton.ca and social media platforms), corporate advertising and public engagement.
There are the things that the public sees from Communications. Examples include: Council Highlights, website, monthly newsletter, earned media, events, social media and advertising.
It’s valuable to remember that Communications is a small investment in the overall budget of the City of Penticton. Only 0.2% of the City’s budget supports Communications, and this can be broken down into 2 key areas:
• 43% of Communications budget is allocated on personnel• 57% of Communications budget is allocated to goods and services.
Goods and Services 57%
Salaries and Benefits 43%
Communications 2016 Operating Budget
-24-

Finance Accounting- Operating Budget
2015 Year end 2015 2016 2017 2018 2019 2020Projection Budget Budget Budget Budget Budget Budget
Goods and Services 415,841 992,860 607,256 606,756 606,756 606,756 606,756 Insurance 789,000 533,000 589,000 589,000 589,000 589,000 589,000 Salaries and Benefits 555,058 557,083 573,699 579,931 586,270 592,718 599,276 Net Operating Expense 1,759,899 2,082,943 1,769,955 1,775,687 1,782,026 1,788,474 1,795,032
8 FTEAccounting/Finance provides transactional services and acurate and relevant reporting information to our internaland external customers and provides controls to safeguard the City's financial resources
Goods and Services, 607,256
Insurance, 589,000
Salaries and Benefits, 573,699
Finance Accounting 2016 Operating Budget
-25-

Finance Accounting- Operating Budget by Project
2015 Year end 2015 2016 2017 2018 2019 2020Projection Budget Budget Budget Budget Budget Budget
Audit 66,785 60,000 66,000 66,000 66,000 66,000 66,000 Equipment Repairs and Maintenance 2,200 6,500 6,500 6,500 6,500 6,500 6,500 Insurance Claims 367,500 30,000 80,000 80,000 80,000 80,000 80,000 Property Insurance 355,194 350,000 356,000 356,000 356,000 356,000 356,000 Liability Insurance 150,034 153,000 153,000 153,000 153,000 153,000 153,000 Operating Provision 250,000 900,596 512,242 512,242 512,242 512,242 512,242 Salary and Benefits 555,000 557,083 573,699 579,931 586,270 592,718 599,276 Supplies 3,837 6,614 4,614 4,114 4,114 4,114 4,114 Training/Conferences 10,361 19,150 17,900 17,900 17,900 17,900 17,900
1,760,911 2,082,943 1,769,955 1,775,687 1,782,026 1,788,474 1,795,032
Audit, 66,000 Repairs and Maintenance, 6,500
Insurance Claims, 80,000
Property Insurance, 356,000
Liability Insurance, 153,000
Operating Provision, 512,242
Salary and Benefits, 573,699
Supplies, 4,614
Training/Conferences, 17,900
-26-

Finance General - Operating Budget
2015 Year end 2015 2016 2017 2018 2019 2020Projection Budget Budget Budget Budget Budget Budget
Goods and Services 14,351 3,000 4,300 4,300 4,300 4,300 4,300 Debt principal repayments 3,223,575 3,802,975 3,231,189 3,232,875 1,985,241 1,059,152 1,041,702 Debt Interest 2,549,760 3,300,097 2,483,671 2,480,256 1,753,753 1,176,450 1,161,431 Bank Charges and Interest - 15,000 18,700 18,700 18,700 18,700 18,700 Loss on Exchange - 1,000 10,000 10,000 10,000 10,000 10,000 Salaries and Benefits 112,534 125,000 248,250 248,250 248,250 248,250 248,250 Total Expenses 5,900,220 7,247,072 5,996,110 5,994,381 4,020,244 2,516,852 2,484,383 HFAA Gaming Funds 417,875- 1,700,000- 1,600,000- 1,600,000- 1,600,000- 1,600,000- 1,600,000- Provincial Grant (CARIP) 46,458- - - - - - - DAC Gaming Funds 1,904,645- 4,000,000- 2,937,029- - - - - Revenue Sharing-Traffic Fines 458,557- 630,000- 412,701- 412,701- 412,701- 412,701- 412,701- Net Operating Expense 3,072,685 917,072 1,046,380 3,981,680 2,007,543 504,151 471,682
Starting in 2016 the City wide car allowance is included with the salaries and benefits in this cost centre
Goods and Services, 4,300
Debt principal repayments, 3,231,189
Debt Interest, 2,483,671
Bank Charges and Interest, 18,700
Loss on Exchange, 10,000 Salaries and
Benefits, 248,250
Finance General - 2016 Operating Budget
-27-

Finance General - Operating Budget by Project
2015 Year end 2015 2016 2017 2018 2019 2020Projection Budget Budget Budget Budget Budget Budget
Bank Charges and Interest 11,698 19,000 33,000 33,000 33,000 33,000 33,000 Debt - interest - RCMP building 99,750 99,750 84,000 84,000 84,000 84,000 84,000 Debt - interest - Public Works 183,187 183,137 174,478 174,478 174,478 115,768 104,433 Debt - interest - Facilities 480,000 480,000 455,612 453,542 451,419 449,242 447,009 Debt - interest - integrated waterfront 105,213 96,150 87,971 86,626 85,246 83,830 82,379 Debt - interest - parkland acquisition 33,600 33,600 33,600 33,600 33,600 33,600 33,600 Debt - interest - Cemetery 128,750 128,750 128,750 128,750 128,750 128,750 128,750 Debt - interest - sports fields 141,760 141,760 141,760 141,760 141,760 141,760 141,760 Debt - interest - SOEC project 1,377,500 1,377,500 1,377,500 1,377,500 654,500 139,500 139,500 Debt - principal - RCMP building 132,000 132,000 132,597 132,597 132,597 132,597 132,597 Debt - principal - Public Works 203,000 203,000 203,435 203,435 203,435 108,483 89,214 Debt - principal - Facilities 358,000 358,000 360,319 361,341 362,389 363,464 364,566 Debt - principal - integrated waterfront 105,213 105,213 109,594 110,258 110,940 111,638 112,355 Debt - principal - parkland acquisition 51,000 51,000 50,808 50,808 50,808 50,808 50,808 Debt - principal - Cemetery 83,900 83,900 83,955 83,955 83,955 83,955 83,955 Debt - principal - sports fields 107,462 107,462 107,462 107,462 107,462 107,462 107,462 Debt - principal - SOEC project 2,183,000 2,183,000 2,183,019 2,183,019 933,655 100,745 100,745 Labour Load 10,435 - 92,000 92,000 92,000 92,000 92,000 Salaries and Benefits 80,571 125,000 156,250 156,250 156,250 156,250 156,250
5,876,039 5,908,222 5,996,110 5,994,381 4,020,244 2,516,852 2,484,383
Bank Charges and Interest
Debt interest RCMP building
Debt interest Public Works
Debt interest Facilities
Debt interest integrated waterfront
Debt interest parkland acquisition
Debt interest Cemetery Debt interest sports
fields
Debt interest SOEC project
Debt principal RCMP building
Debt principal Public Works Debt principal
Facilities
Debt principal integrated waterfront
Debt principal parkland acquisition
Debt principal Cemetery
Debt principal sports fields
Debt principal SOEC project
Labour Load
Salaries and Benefits
-28-

Logistics - Operating Budget
2015 Year end 2015 2016 2017 2018 2019 2020Projection Budget Budget Budget Budget Budget Budget
Goods and Services 22,976 36,300 73,450 75,950 74,950 73,950 71,950 Forklift Amortization 2,000.0 3,250 3,250 3,250 3,250 3,250 Salaries and benefits 312,361 330,789 335,250 339,500 344,550 348,550 352,750 Net Operating Expense 335,336 369,089 411,950 418,700 422,750 425,750 427,950
Logistics provides central purhasing services for the City, oversight for the disposition of surplus and obsolete equipment and prepares quotes, requests for proposals, tenders and contracts for services
Goods and Services 18%
Salaries and benefits 82%
Logistics 2016 Operating Budget
-29-

Logistics - Operating Budget by Project
2015 Year end 2015 2016 2017 2018 2019 2020Projection Budget Budget Budget Budget Budget Budget
Fleet - 750 4,250 4,250 4,250 4,250 4,250 Freight 15,000 4,000 36,000 37,000 38,000 39,000 40,000 Inventory 6,239- 4,000 4,000 4,000 4,000 4,000 4,000 Legal - 1,500 1,000 1,000 1,000 1,000 1,000 Salaries and Benefits 311,431 326,789 331,250 335,500 340,550 344,550 348,750 Supplies 8,270 20,150 17,200 20,700 20,700 20,700 20,700 Training\Conferences 6,874 9,900 15,000 13,000 11,000 9,000 6,000
335,336 367,089 408,700 415,450 419,500 422,500 424,700
Fleet, 4,250
Freight, 36,000
Inventory, 4,000
Legal, 1,000
Salaries and Benefits, 331,250
Supplies, 17,200
Training\Conferences, 15,000
-30-
Revenue & Collections - Operating Budget
2015 Year end 2015 2016 2017 2018 2019 2020Projections Budget Budget Budget Budget Budget Budget
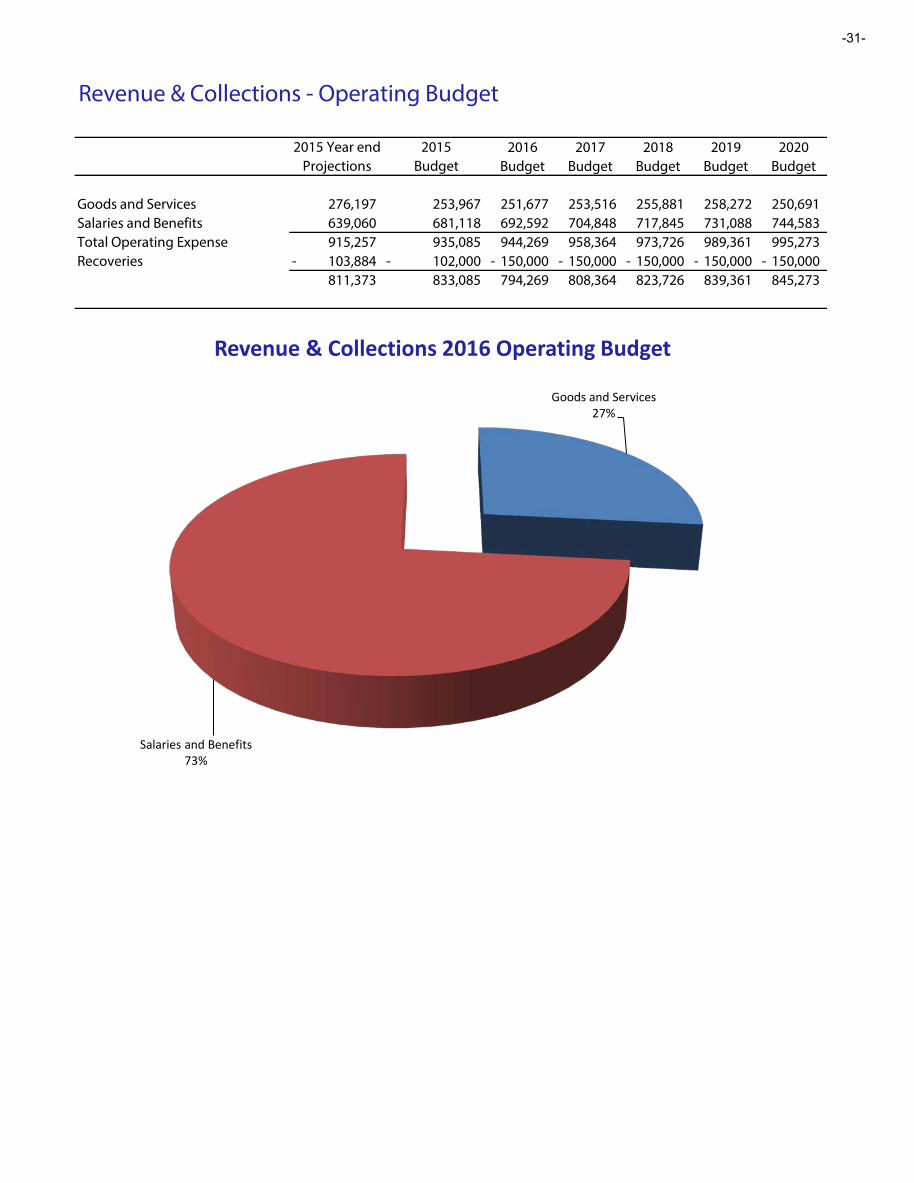
Goods and Services 276,197 253,967 251,677 253,516 255,881 258,272 250,691 Salaries and Benefits 639,060 681,118 692,592 704,848 717,845 731,088 744,583 Total Operating Expense 915,257 935,085 944,269 958,364 973,726 989,361 995,273 Recoveries 103,884- 102,000- 150,000- 150,000- 150,000- 150,000- 150,000-
811,373 833,085 794,269 808,364 823,726 839,361 845,273
Goods and Services 27%
Salaries and Benefits 73%
Revenue & Collections 2016 Operating Budget
-31-

Revenue & Collections - Operating Budget by Project
2015 Year end 2015 2016 2017 2018 2019 2020Projections Budget Budget Budget Budget Budget Budget
Allowance for Bad Debt 9,950 9,600 10,000 10,000 10,000 10,000 10,000 Collection Costs 500 1,400 1,900 1,400 1,400 1,400 - Commissions 2,000 8,600 4,100 8,600 8,600 8,600 - Postage 228,700 185,000 184,650 186,708 188,788 190,892 193,019 Salaries and Benefits 638,831 681,118 692,092 704,848 717,845 731,088 744,583 Supplies 33,093 38,267 43,527 38,808 39,093 39,381 39,672 Training/Conferences 1,954 11,100 8,000 8,000 8,000 8,000 8,000
915,028 935,085 944,269 958,364 973,726 989,361 995,273
Allowance for Bad Debt, 10,000 Collection Costs,
1,900
Commissions , 4,100
Postage, 184,650
Salaries and Benefits, 692,092
Supplies, 43,527
Training/Conferences, 8,000
-32-

General Government - Operating Budget
2015 Year end 2015 2016 2017 2018 2019 2020Revenue Projection Budget Budget Budget Budget Budget Budget
Taxation 26,355,465- 26,355,465- 26,933,422- 28,118,764- 28,118,764- 28,118,764- 28,118,764- Local Improvement Levy 183,850- 183,850- 183,850- 183,850- 183,850- 183,850- 183,850- BIA Levy 170,000- 170,000- 179,000- 179,000- 179,000- 179,000- 179,000- MRDT (Hotel Room Tax) 400,000- 400,000- 450,000- 450,000- 450,000- 450,000- 450,000- Grants in Lieu - - 254,541- 254,541- 254,541- 254,541- 254,541- Rentals/Leases 509,846- 806,316- 631,100- 615,226- 637,084- 638,943- 640,534- Sale of Services 606,384- 982,700- 611,400- 611,400- 611,400- 611,400- 611,400- Fiscal Services 5,117,600- 5,117,600- 5,035,639- 5,035,081- 5,034,523- 5,033,965- 5,033,407- Grants 3,821,333- 3,821,333- 1,370,000- 1,370,000- 1,370,000- 1,370,000- 1,370,000- Development Cost Charges 175,768- 175,768- 175,768- 175,768- 175,768- 175,768- 175,768- Collections for other Governments 20,523,100- 20,143,400- 20,562,109- 20,595,725- 20,629,629- 20,663,823- 20,698,311-
57,863,346- 58,156,433- 56,386,829- 57,589,355- 57,644,559- 57,680,055- 57,715,575-
ExpenseAsset Sustainability - - 300,000 300,000 300,000 300,000 300,000 BIA 170,000 170,000 179,000 179,000 179,000 179,000 179,000 MRDT (Hotel Room Tax) 400,000 400,000 450,000 450,000 450,000 450,000 450,000 Payments to other Governments 20,143,400 20,143,400 20,562,109 20,595,725 20,629,629 20,663,823 20,698,311
20,713,400 20,713,400 21,491,109 21,524,725 21,558,629 21,592,823 21,627,311
Net Revenue over Expense 37,149,946- 37,443,033- 34,895,720- 36,064,630- 36,085,930- 36,087,231- 36,088,264-
Transfer from reserve/surplusElectric capital - 137,400- - - - - - Operating Surplus - 10,000- - - - - - Amenity Bonusing Reserve - 78,000- - - - - -
- 225,400- - - - - -
Transfer to reserve\surplusLocal Improvement Levy 183,850 183,850 183,850 183,850 183,850 183,850 183,850 Marina Reserve - - 61,580 61,580 61,580 61,580 61,580 Gaming Reserve - - 4,537,059 - - - - Investment Income 500,000 500,000 500,000 500,000 500,000 500,000 500,000 Cemetery Perpetual Care Fund 20,000 20,000 20,000 20,000 20,000 20,000 20,000 MMBC 466,740 466,740 466,740 466,740 466,740 466,740 466,740 Community Works (Gas Tax) Reserve 1,370,000 1,370,000 1,370,000 1,370,000 1,370,000 1,370,000 1,370,000 General Capital Reserve 57,000 57,000 - - - - - Capital Reserve, Grant Revenue - 2,451,333 - - - - - SOEC Reserve 2,139,500 2,139,500 3,323,031- 2,139,500 2,139,500 2,139,500 2,139,500 Depreciation 665,205 665,205 900,000 900,000 900,000 900,000 900,000
5,402,295 7,853,628 4,716,198 5,641,670 5,641,670 5,641,670 5,641,670
11,034,251- 8,876,004- 30,179,522- 30,422,960- 30,444,260- 30,445,561- 30,446,594-
-33-

Facilities - Operating Budget
2015 Year end 2015 2016 2017 2018 2019 2020Projection Budget Budget Budget Budget Budget Budget
Goods and Services 2,832,482 2,931,990 3,073,789 3,089,370 3,095,423 3,079,071 3,062,376 Fleet 40,405 11,000 50,400 50,400 50,400 50,400 50,400 Salaries and Benefits 996,208 995,300 1,011,225 1,028,921 1,049,500 1,070,490 1,091,899 Net Operating Expense 3,869,094 3,938,290 4,135,414 4,168,691 4,195,323 4,199,962 4,204,675
The Facilities department maintains all City owned buildings and includes all maintenance and repairs
Goods and Services, 3,073,789
Fleet, 50,400
Salaries and Benefits, 1,011,225
Facilities 2016 Operating Budget
-34-

Facilities - Operating Budget by Project2015 Year end 2015 2016 2017 2018 2019 2020
Projection Budget Budget Budget Budget Budget Budget
General Facilities 186,375 132,966 402,579 404,085 405,765 405,820 405,820 City Hall 179,086 191,111 201,111 202,390 203,876 203,876 203,876 Rental Houses 6,996 9,058 9,058 9,112 9,173 9,173 9,173 Dog Pound 779 555 - - - - - Emergency Measures 1,091 - - - - - - Fire Hall # 1 43,176 48,370 47,650 48,023 48,421 48,721 49,031 Fire Hall # 2 24,816 34,755 31,755 31,871 32,003 32,003 32,003 Misc. Sites 135,454 299,010 145,510 149,656 151,906 153,596 155,317 RCMP Building 193,272 194,750 201,950 202,386 203,303 203,665 204,040 Yards & Warehouse 135,820 155,630 147,630 148,045 148,525 148,525 148,525 500 Edmonton Ave 1,110 - - - - - - Bathhouse 198,471 216,985 214,173 214,668 214,991 214,991 214,991 Community Centre 942,620 819,362 830,790 839,440 849,363 850,488 851,652 Curling Club 3,386 3,200 3,200 3,200 3,200 3,200 3,200 Edmonton Ave Centre 4,136 4,100 5,700 5,709 6,619 6,619 6,619 Gyro Bandshell 6,169 2,190 4,190 4,199 4,209 4,209 4,209 Indoor Soccer Facility 42,929 10,000 37,000 41,420 42,155 42,605 43,070 Jubilee Pavilion 8,226 3,120 14,420 14,604 14,806 14,937 15,073 Lawn Bowling Club 194 - - - - - - Library/Museum Complex 144,671 181,150 181,150 183,849 184,660 184,660 184,660 Marina - Okanagan 1,570 - 1,500 1,526 1,556 1,556 1,556 Marina - Skaha 5,160 4,500 4,500 4,500 4,500 4,500 4,500 McLaren Arena 351,629 394,220 368,320 375,876 381,143 381,406 381,677 Mobile Concession/Washroom 20,166 7,740 22,740 22,995 23,291 23,291 23,291 Nanaimo Hall 3,098 3,180 7,550 7,608 7,675 7,675 7,675 New Wine/visitor Info Centre 33,221 29,000 46,400 46,687 47,004 47,135 47,271 Sicamous Boathouse 1,453 1,200 1,200 1,200 1,200 1,200 1,200 Storage Facilities 525 - - - - - - Walking Pier 1,153 7,640 7,640 7,773 7,928 7,928 7,928 Westminster Centre 12,712 3,550 18,250 18,421 18,603 18,734 18,870 SOEC/Memorial/PTCC 1,179,631 1,179,448 1,179,448 1,179,448 1,179,448 1,179,448 1,179,448
3,869,094 3,936,790 4,135,414 4,168,691 4,195,323 4,199,962 4,204,675
General Facilities, 402,579
City Hall, 201,111
Rental Houses, 9,058
Fire Hall # 1, 47,650
Fire Hall # 2, 31,755
Misc. Sites, 145,510
RCMP Building, 201,950
Yards & Warehouse, 147,630
Bathhouse, 214,173
Community Centre, 830,790
Curling Club , 3,200
Edmonton Ave Centre, 5,700
Gyro Bandshell, 4,190
Indoor Soccer Facility, 37,000
Jubilee Pavilion, 14,420
Library/Museum Complex, 181,150
Marina - Okanagan, 1,500
Marina - Skaha, 4,500
McLaren Arena, 368,320
Mobile Concession/Washroom,
22,740
Nanaimo Hall, 7,550
Visitor Info Centre, 46,400
Sicamous Boathouse,
1,200
Walking Pier,
7,640
Westminster Centre, 18,250
SOEC/Memorial/PTCC , 1,179,448
-35-

Human Resources - Operating Budget
2015 Year end 2015 2016 2017 2018 2019 2020Projection Budget Budget Budget Budget Budget Budget
Emergency Preparedness 12,050 12,600 15,600 15,734 15,869 16,005 16,142 Employee Engagement 33,830 66,000 54,500 40,316 40,840 61,372 61,912 Fleet 5,500 5,500 5,500 5,500 5,500 5,500 5,500 Goods and Services 4,957 6,514 7,594 7,650 7,706 7,762 7,819 Recruitment, Claims and Legal 215,721 160,000 115,000 117,007 138,333 139,678 122,472 Safety 20,000 25,000 25,000 25,503 25,758 26,015 26,015 Salaries and Benefits 379,984 361,271 467,483 475,065 482,778 490,624 498,605 Training\Employee Development 13,948 34,000 32,000 32,158 32,549 32,945 33,348 Net Operating Expense 685,991 670,885 722,677 718,931 749,332 779,901 771,814
4 FTE
Human resource management is a function within an organization which is designed to maximize employee’s performance in achieving the employer’s strategic objectives. The Human Resources department is responsible for Recruitment & Retention, Training & Development, Benefits & Disability Management, Labour Relations, Performance Management, Compensation Management, Industrial Relations, Corporate Safety, Emergency Preparedness, Wellness & Employee Engagement, and Payroll Administration.
Emergency Preparedness, 15,600
Employee Engagement, 54,500
Fleet, 5,500 Goods and Services,
7,594
Recruitment, Claims and Legal, 115,000
Safety, 25,000
Salaries and Benefits, 467,483
Training\Employee Development, 32,000
Human Resources 2016 Operating Budget
-36-

Information Technology - Operating Budget
2015 Year end 2015 2016 2017 2018 2019 2020Projection Budget Budget Budget Budget Budget Budget
Goods and Services 533,400 530,710 557,466 570,071 577,909 580,841 582,663 Equipment Amortization 213,855 213,855 213,855 213,855 213,855 213,855 213,855 Fleet 5,500 5,500 5,500 5,500 5,500 5,500 5,500 Salaries and benefits 689,446 690,441 700,721 698,410 703,802 709,244 714,737 Total Operating Expense 1,442,200 1,440,506 1,477,542 1,487,837 1,501,066 1,509,440 1,516,755 Recoveries 45,536- 48,256- 45,506- 45,520- 45,534- 45,547- 45,561- Net Operating Expense 1,396,664 1,392,250 1,432,036 1,442,317 1,455,532 1,463,893 1,471,194
8 FTEThe Information Technology team brings an enterprise focus to the delivery of IT services and IT-based business solutions to enable the efficiency and effectiveness of City resources. The Department promotes a culture of customer service, and provides responsive and value-added delivery of IT services to our customers and partners. The Department engages the expertise, best practices, and innovation of our employees and outside contractors in the delivery of its services. The Department also ensures the protection and privacy of citizen, business, and government information by implementing IT security solutions of uncompromised quality.
Goods and Services, 557,466
Equipment Amortization, 213,855
Fleet, 5,500
Salaries and benefits, 700,721
Information Technology 2016 Operating Budget
- 37 -

Information Technology - Operating Budget by Project
2015 Year end 2015 2016 2017 2018 2019 2020Projection Budget Budget Budget Budget Budget Budget
Print 1,110 1,150 1,150 1,150 1,150 1,150 1,150 Fleet 5,500 - 5,500 5,500 5,500 5,500 5,500 Equipment maintenance and rentals 310,426 309,155 310,441 309,155 314,155 314,155 314,155 Software maintenance 231,129 225,510 233,860 252,871 255,709 258,641 260,463 Contract services 19,923 18,500 17,600 18,500 18,500 18,500 18,500 Telephone and fax 164,610 162,780 168,800 162,780 162,780 162,780 162,780 Salaries & Benefits 689,441 723,411 699,721 697,410 702,802 708,244 713,737 Supplies 410 - 2,490 2,490 2,490 2,490 2,490 Training\Conferences 19,652 - 38,300 38,300 38,300 38,300 38,300 Total Expenses 1,442,200 1,440,506 1,477,862 1,488,157 1,501,386 1,509,760 1,517,075 Telephone and fax 37,706- 40,456- 37,706- 37,716- 37,727- 37,737- 37,748- Fiber optic system 7,800- 7,800- 7,800- 7,803- 7,807- 7,810- 7,813-
1,396,694 1,392,250 1,432,356 1,442,637 1,455,852 1,464,213 1,471,514
Print, 1,150
Fleet, 5,500 Equipment maintenance
and rentals, 310,441
Software maintenance, 233,860
Contract services, 17,600
Telephone and fax, 168,800
Salaries & Benefits, 699,721
Supplies, 2,490
Training\Conferences, 38,300
- 38 -

Protective Services
2015 2016 2017 2018 2019 2020Budget Budget Budget Budget Budget Budget
Animal control 104,150 110,100 111,500 113,100 114,100 115,600 Building and License 576,489 703,683 624,231 617,493 625,878 634,386 Fire Services 4,739,249 5,217,689 4,985,363 4,985,668 4,987,994 4,985,436 RCMP 8,480,085 8,867,370 9,287,910 9,490,917 9,860,215 10,072,899
13,899,973 14,898,842 15,009,004 15,207,177 15,588,186 15,808,321
-39-

Animal Control - Operating Budget
2015 Year end 2015 2016 2017 2018 2019 2020Projection Budget Budget Budget Budget Budget Budget
Goods and Services 99,995 102,150 107,600 109,000 110,600 111,600 113,100 Salaries and Benefits 1,269 2,000 2,500 2,500 2,500 2,500 2,500 Total Operating Expense 101,265 104,150 110,100 111,500 113,100 114,100 115,600 Recoveries 63,706- - 67,400- 67,400- 67,400- 67,400- 67,400- Net Operating Expense 37,559 104,150 42,700 44,100 45,700 46,700 48,200
Goods and Services, 107,600
Salaries and Benefits, 2,500
Animal Control - 2016 Operating Budget
-40-

Animal Control - Operating Budget by Project
2015 Year End 2015 2016 2017 2018 2019 2020Projection Budget Budget Budget Budget Budget Budget
House Rental 12,000 12,000 14,400 14,400 15,000 15,000 15,500 Tags and Supplies - 850 1,500 1,600 1,600 1,600 1,600 Brochures - 600 500 500 500 500 500 Commission to SPCA for tag sales 384 700 800 800 800 800 800 Poundkeepeer contract 86,500 86,500 88,000 89,000 90,000 91,000 92,000 Uniforms and ID Badges 639 1,000 1,200 1,200 1,200 1,200 1,200 Seminars 472 - 1,000 1,000 1,000 1,000 1,000 Office Supplies - 500 200 500 500 500 500 Logistics 1,269 2,000 2,500 2,500 2,500 2,500 2,500 Total Expenses 101,265 104,150 110,100 111,500 113,100 114,100 115,600 Dog Licences 53,306- 55,000- 57,000- 57,000- 57,000- 57,000- 57,000- Dog Kennels 10,400- 10,000- 10,400- 10,400- 10,400- 10,400- 10,400- Net Operating Expenses 37,559 39,150 42,700 44,100 45,700 46,700 48,200
House Rental, 14,400
Tags and Supplies, 1,500
Brochures, 500
BCSPCA Commission , 800
Poundkeepeer contract, 88,000
Uniforms and ID Badges, 1,200
Seminars, 1,000
Office Supplies, 200
Logistics, 2,500
-41-

Building and License - Operating Budget
2015 Year End 2015 2016 2017 2018 2019 2020Projection Budget Budget Budget Budget Budget Budget
Goods and Services 29,291 33,750 54,500 53,219 38,439 38,661 38,886 Fleet 11,100 11,100 16,500 16,500 16,500 16,500 16,500 Conference\Training 13,288 25,005 18,415 18,415 18,415 18,415 18,415 Salaries and Benefits 510,149 506,634 614,268 536,098 544,139 552,301 560,586 Total Expenses 563,828 576,489 703,683 624,231 617,493 625,878 634,386 Revenues 1,003,000- 927,000- 1,392,500- 1,050,500- 1,050,500- 1,050,500- 1,050,500- Net Operating Surplus 439,172- 350,511- 688,817- 426,269- 433,007- 424,622- 416,114-
6 FTE
Enforcement of the City's building, land and other associated regulatory bylaws and cross connection control
The Building department regulates construction to safeguard and ensure the health and safety of the public and long term sustainability of the building stock in the CityThe department is responsible for: building, plumbing, mechanical, demolition and vacant buildings property use inspections for business licences
Goods and Services, 54,500
Fleet, 16,500
Conference\Training, 18,415
Salaries and Benefits, 614,268
Building and License 2016 Operating Budget
-42-
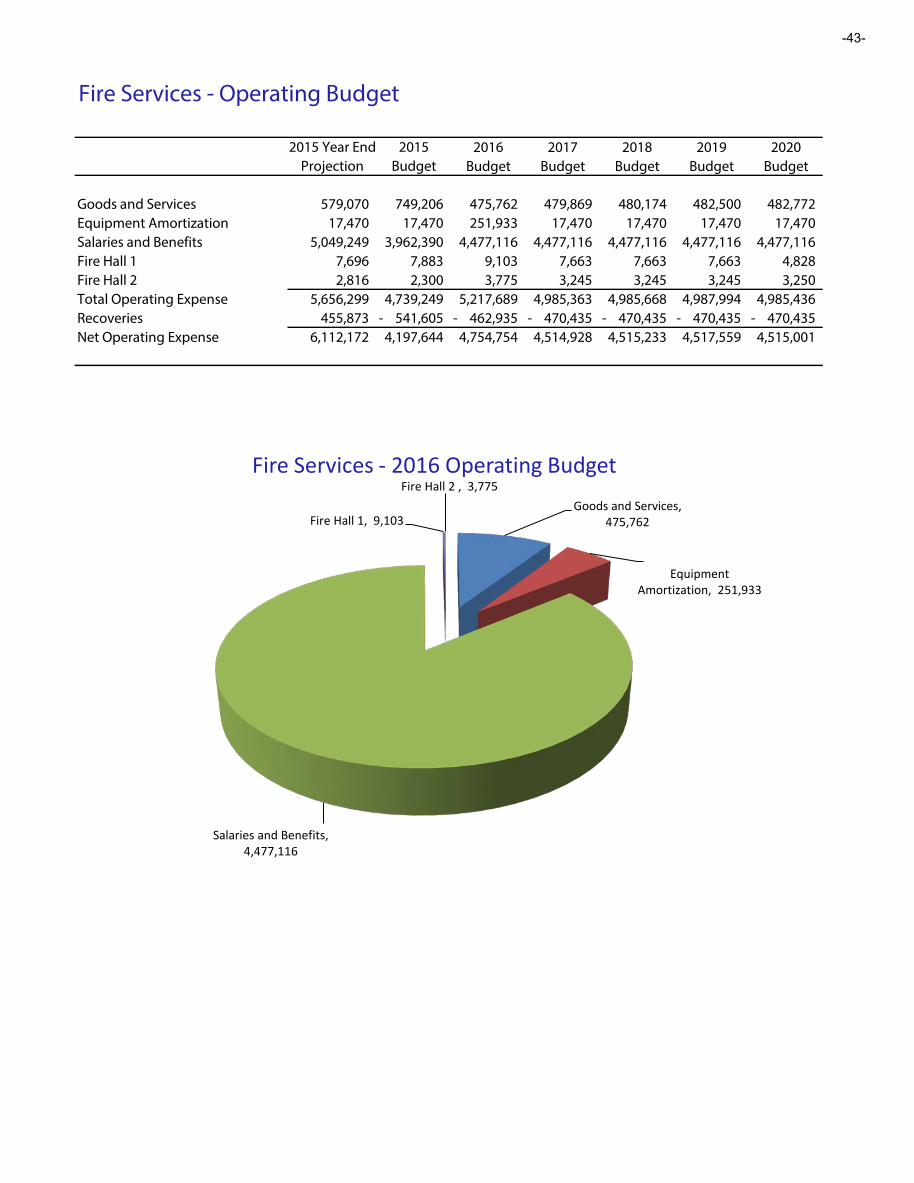
Fire Services - Operating Budget
2015 Year End 2015 2016 2017 2018 2019 2020Projection Budget Budget Budget Budget Budget Budget
Goods and Services 579,070 749,206 475,762 479,869 480,174 482,500 482,772 Equipment Amortization 17,470 17,470 251,933 17,470 17,470 17,470 17,470 Salaries and Benefits 5,049,249 3,962,390 4,477,116 4,477,116 4,477,116 4,477,116 4,477,116 Fire Hall 1 7,696 7,883 9,103 7,663 7,663 7,663 4,828 Fire Hall 2 2,816 2,300 3,775 3,245 3,245 3,245 3,250 Total Operating Expense 5,656,299 4,739,249 5,217,689 4,985,363 4,985,668 4,987,994 4,985,436 Recoveries 455,873 541,605- 462,935- 470,435- 470,435- 470,435- 470,435- Net Operating Expense 6,112,172 4,197,644 4,754,754 4,514,928 4,515,233 4,517,559 4,515,001
Goods and Services, 475,762
Equipment Amortization, 251,933
Salaries and Benefits, 4,477,116
Fire Hall 1, 9,103
Fire Hall 2 , 3,775 Fire Services - 2016 Operating Budget
-43-

Fire Services - Operating Budget by Project
2015 Year End 2015 2016 2017 2018 2019 2020Projection Budget Budget Budget Budget Budget Budget
Communications 14,946 16,200 16,735 16,952 17,172 17,396 17,624 Depreciation 17,470 17,470 251,933 17,470 17,470 17,470 17,470 Emergency Training Centre 18,489 73,420 21,250 21,432 21,616 21,801 21,988 Incidental Fire Expenses 3,034 4,500 2,625 2,716 2,814 2,921 3,037 Fleet 390,841 390,841 260,000 260,000 260,000 260,000 260,000 PEP Building 4,500 4,500 4,000 4,500 4,500 4,500 4,500 Prevention 9,973 12,650 10,645 10,664 10,684 10,703 10,723 Programs 43,203 58,400 57,750 58,197 58,648 59,103 59,561 Salary and Benefits 5,049,497 4,007,285 4,520,268 4,520,697 4,520,853 4,521,011 4,521,093 Uniform & Safety Equipment 76,726 69,700 64,105 66,328 65,503 66,681 65,862
5,628,678 4,654,966 5,209,311 4,978,955 4,979,260 4,981,586 4,981,858 Recoveries 24,352 468,505- 467,935- 475,435- 475,435- 475,435- 475,435-
5,653,029 4,186,461 4,741,376 4,503,520 4,503,825 4,506,151 4,506,423
Communications, 16,735 Depreciation, 251,933
Emergency Training Centre, 21,250 Incidental Fire Expenses,
2,625
Fleet, 260,000
PEP Building, 4,000 Prevention, 10,645
Programs, 57,750
Salary and Benefits, 4,520,268
Uniform & Safety Equipment, 64,105
-44-

RCMP - Operating Budget
2015 Year End 2015 2016 2017 2018 2019 2020Projection Budget Budget Budget Budget Budget Budget
Goods and Services 108,601 79,937 82,367 99,206 99,718 100,263 103,153 Fleet 11,000 11,000 11,000 11,000 11,000 11,000 11,000 Policing Agreement 6,813,748 6,809,444 7,153,363 7,536,234 7,717,630 8,065,014 8,253,164 Salaries and Benefits 1,510,797 1,579,704 1,620,640 1,641,470 1,662,569 1,683,938 1,705,582 Total Operating Expense 8,444,146 8,480,085 8,867,370 9,287,910 9,490,917 9,860,215 10,072,899 Recoveries 521,204- 464,883- 470,978- 472,171- 473,374- 474,587- 475,811- Net Operating Expense 7,922,942 8,015,202 8,396,392 8,815,739 9,017,543 9,385,628 9,597,089
The COP Detachment consists of:· 45 Police Officers – MUN funded· 9 Police Officers – PROV funded· 2 Police Officers – PROV/FED funded. (FNCP)· 22 Municipal Civilian Support Staff· 2 PROV Public Servants Support Staff· 6 Reserve Constables· 6 Auxiliary Constables· 35 Volunteers
Goods and Services, 82,367
Fleet, 11,000
Policing Agreement, 7,153,363
Salaries and Benefits, 1,620,640
RCMP - 2016 Operating Budget
-45-

Transportation Services 2015 2016 2017 2018 2019 2020Budget Budget Budget Budget Budget Budget
Fleet 1,406,755 1,839,106 1,852,819 1,866,198 1,879,743 1,886,658 General 62,381 61,116 60,941 61,106 61,273 61,273 Roads and Maintenance 1,546,743 1,615,097 1,631,196 1,648,019 1,665,069 1,682,348 Street Lighting 198,682 141,000 145,230 149,587 154,075 158,697 Traffic Control 2,933 72,000 74,160 76,386 78,676 81,037 Bylaw Enforcement 389,756 385,212 388,668 392,179 395,746 399,371 Transit 1,662,478 1,655,190 1,683,119 1,753,384 1,824,584 1,895,294
5,269,728 5,768,721 5,836,133 5,946,858 6,059,166 6,164,679
-46-
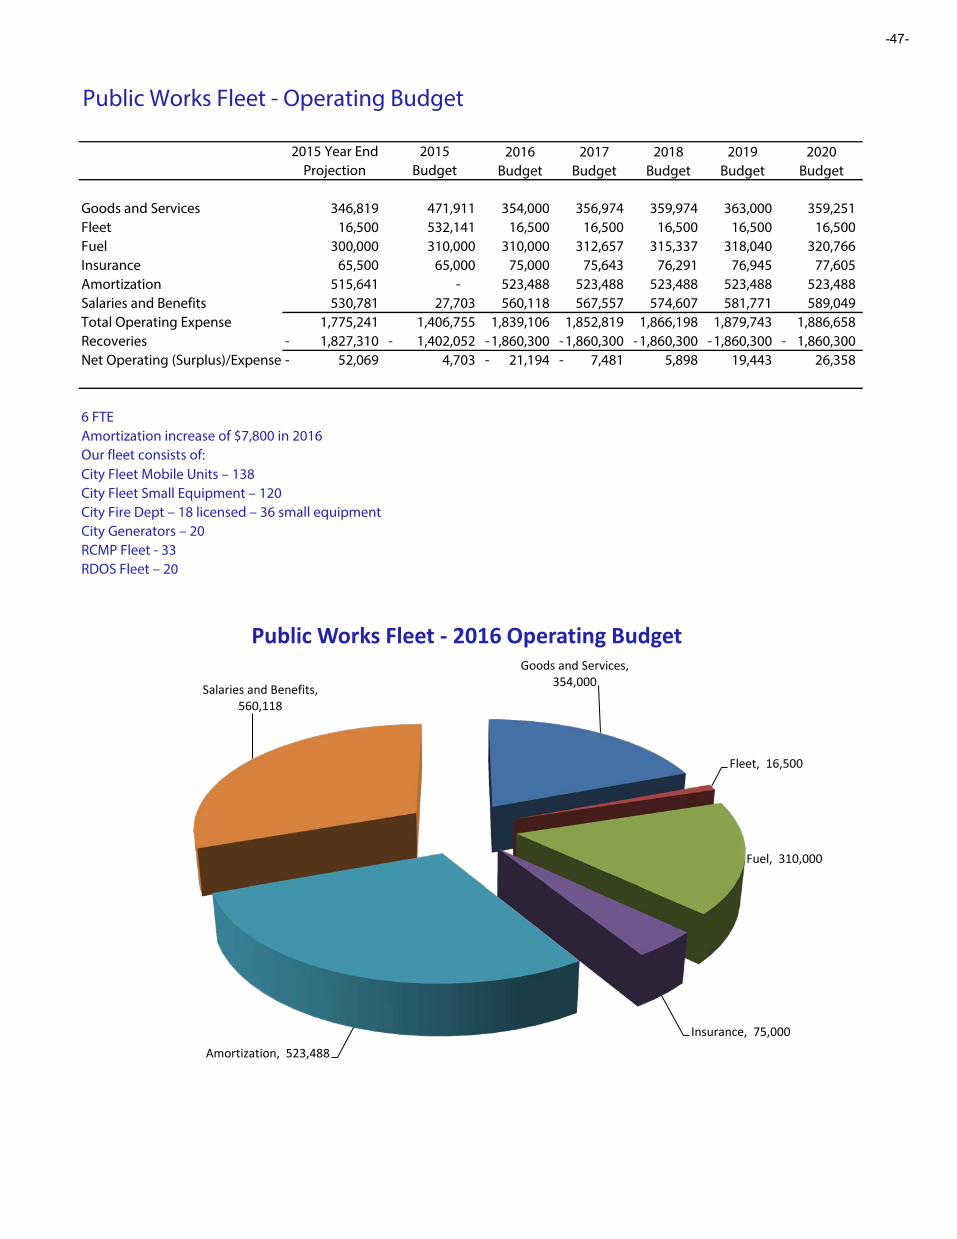
Public Works Fleet - Operating Budget
2015 Year End 2015 2016 2017 2018 2019 2020Projection Budget Budget Budget Budget Budget Budget
Goods and Services 346,819 471,911 354,000 356,974 359,974 363,000 359,251 Fleet 16,500 532,141 16,500 16,500 16,500 16,500 16,500 Fuel 300,000 310,000 310,000 312,657 315,337 318,040 320,766 Insurance 65,500 65,000 75,000 75,643 76,291 76,945 77,605 Amortization 515,641 - 523,488 523,488 523,488 523,488 523,488 Salaries and Benefits 530,781 27,703 560,118 567,557 574,607 581,771 589,049 Total Operating Expense 1,775,241 1,406,755 1,839,106 1,852,819 1,866,198 1,879,743 1,886,658 Recoveries 1,827,310- 1,402,052- 1,860,300- 1,860,300- 1,860,300- 1,860,300- 1,860,300- Net Operating (Surplus)/Expense 52,069- 4,703 21,194- 7,481- 5,898 19,443 26,358
6 FTEAmortization increase of $7,800 in 2016Our fleet consists of:City Fleet Mobile Units – 138City Fleet Small Equipment – 120 City Fire Dept – 18 licensed – 36 small equipment City Generators – 20RCMP Fleet - 33RDOS Fleet – 20
Goods and Services, 354,000
Fleet, 16,500
Fuel, 310,000
Insurance, 75,000
Amortization, 523,488
Salaries and Benefits, 560,118
Public Works Fleet - 2016 Operating Budget
-47-

Public Works General - Operating Budget
2015 Year End 2015 2016 2017 2018 2019 2020Projection Budget Budget Budget Budget Budget Budget
Goods and Services 23,898 29,381 22,116 22,441 22,606 22,773 22,773 Fleet 33,169 33,000 38,500 38,500 38,500 38,500 38,500 Salaries and Benefits 70,215 - 500 - - - - Net Operating Expense 127,282 62,381 61,116 60,941 61,106 61,273 61,273
Goods and Services, 22,116
Fleet, 38,500
Salaries and Benefits, 500
Public Works General - 2016 Operating Budget
-48-

Roads and Sidewalks - Operating Budget
2015 Year End 2015 2016 2017 2018 2019 2020Projection Budget Budget Budget Budget Budget Budget
Goods and Services 1,334,698 1,381,575 669,487 675,169 680,900 686,679 692,509 Fleet 2,200 - 263,507 263,507 263,507 263,507 263,507 Salaries and Benefits 179,935 165,168 682,103 692,520 703,612 714,882 726,333 Total Operating Expense 1,516,833 1,546,743 1,615,097 1,631,196 1,648,019 1,665,069 1,682,348 Recoveries 7,500- 7,500- 8,500- 8,500- 8,500- 8,500- 8,500- Net Operating Expense 1,509,333 1,539,243 1,606,597 1,622,696 1,639,519 1,656,569 1,673,848
26 FTEThere are 241 KM of roads and lanes and 144 KM of sidewalks
Goods and Services, 669,487
Fleet, 263,507
Salaries and Benefits, 682,103
Public Works Roads and Sidewalks - 2016 Operating Budget
-49-

Roads and Maintenance - Operating Budget by Project
2015 Year End 2015 2016 2017 2018 2019 2020Projection Budget Budget Budget Budget Budget Budget
Public Works - Roads and Maintenance - General 149,712 149,742 150,599 153,013 155,465 157,957 160,489 Standby after hrs. call 22,000 11,000 12,000 12,192 12,388 12,586 12,788 Tools & Supplies 12,500 13,000 13,000 13,111 13,224 13,337 13,451 Two-Way Radios 10,082 11,800 11,400 11,499 11,600 11,701 11,804 Yards Grounds 4,746 1,000 1,000 1,012 1,024 1,037 1,049 Lanes 60,500 63,000 63,000 63,587 64,180 64,779 65,385 Streets 444,600 495,000 503,000 507,363 511,779 516,249 520,774 Sidewalks 200,000 175,000 183,900 186,217 188,569 190,955 193,376 Walkways 18,800 16,000 17,500 17,730 17,964 18,201 18,442 Drainage Storm Sewer 89,600 108,500 103,000 104,008 105,031 106,069 107,123 Bridges 6,550 6,500 26,500 26,754 27,011 27,271 27,534 Parking Lots 16,200 18,000 18,500 18,778 19,060 19,347 19,638 Street scape 27,200 28,000 28,000 28,292 28,589 28,890 29,196 Street and sidewalk cleaning 189,350 182,550 183,464 184,967 186,491 188,036 189,603 Traffic control 204,500 209,000 240,000 242,342 244,710 247,104 249,525 Sign and barricade construction 5,000 4,500 4,500 4,540 4,581 4,622 4,664 Vandalism 20,000 20,000 20,000 20,262 20,528 20,798 21,072 Emergency support 1,200 500 500 506 513 520 526 Subdivision and capital works callback 6,800 5,000 5,000 5,045 5,092 5,138 5,185 Operations - general 13,083 12,426 12,704 12,908 13,115 13,325 13,538 Public Works - Roads and Maintenance 6,161 8,725 9,030 8,568 8,606 8,645 8,684
1,508,583 1,539,243 1,606,597 1,622,696 1,639,519 1,656,569 1,673,848
Roads and Maintenance
9%
Standby after hrs. call 1%
Tools & Supplies 1%
Two-Way Radios 1%
Yards Grounds 0%
Lanes 4%
Streets 31% Sidewalks
11%
Walkways 1%
Drainage Storm Sewer 6%
Bridges 2%
Parking Lots 1%
Street scape 2%
Street and sidewalk cleaning 11% Traffic control
15%
Sign and barricade construction
0% Vandalism 1%
Emergency support 0%
Subdivision and capital works callback
0% Operations - general
1% Roads and
Maintenance 1%
-50-

Street Lighting - Operating Budget
2015 Year End 2015 2016 2017 2018 2019 2020Projection Budget Budget Budget Budget Budget Budget
Goods and Services 204,270 165,212 140,158 144,715 149,057 153,529 158,134 Fleet - 6,377 201 - - - - Salaries and benefits - 27,093 641 515 530 546 563 Net Operating Expense 204,270 198,682 141,000 145,230 149,587 154,075 158,697
3,204 street lights1,465 on steel standards1,739 mounted on power poles
Goods and Services, 140,158
Fleet, 201
Salaries and benefits, 641
Street Lighting - 2016 Operating Budget
-51-

Street Lighting - Operating Budget by Project
2015 Year End 2015 2016 2017 2018 2019 2020Projection Budget Budget Budget Budget Budget Budget
Vandalism 3,364 719 3,500 3,605 3,713 3,825 3,939 City Parking Lots - 978 500 515 530 546 563 Light Standard Condition Assessmen 15,000 15,000 15,000 15,450 15,914 16,391 16,883 Repairs 45,906 5,985 22,000 22,660 23,340 24,040 24,761 Electricity 140,000 140,000 100,000 103,000 106,090 109,273 112,551 Total Expenses 204,270 162,682 141,000 145,230 149,587 154,075 158,697
Vandalism, 3,500 City Parking Lots , 500 Light Standard
Condition Assessment, 15,000
Repairs, 22,000
Electricity, 100,000
-52-

Traffic Control - Operating Budget
2015 Year End 2015 2016 2017 2018 2019 2020Projection Budget Budget Budget Budget Budget Budget
Goods and Services 52,687 128 59,551 29,767 30,661 31,580 32,528 Fleet - 287 2,065 - - - - Salaries and benefits 11,840 2,518 10,383 44,393 45,725 47,096 48,509 Net Operating Expense 64,527 2,933 72,000 74,160 76,386 78,676 81,037
36 full traffic signals4 pedestrain activated half-signals3 pedestrian crossing signals
Goods and Services, 59,551
Fleet, 2,065
Salaries and Benefits, 10,383
Traffic Control 2016 Operating Budget
-53-

Traffic Control - Operating Budget by Project
2015 Year End 2015 2016 2017 2018 2019 2020Projection Budget Budget Budget Budget Budget Budget
City Signals - Mtce/Inspection Prog 17,400 17,400 17,400 17,922 18,460 19,013 19,584 Provincial Cost Sharing 6,048 6,048 6,500 6,695 6,896 7,103 7,316 Vandalism/Hit & Run Damage 2,317 1,257 2,000 2,060 2,122 2,185 2,251 Traffic controls Electricity 5,000 4,000 5,000 5,150 5,305 5,464 5,628 Maintenance Program 33,762 35,985 41,100 42,333 43,603 44,911 46,258 Total Expenses 64,527 64,691 72,000 74,160 76,386 78,676 81,037
City Signals - Mtce/Inspection Prog,
17,400
Provincial Cost Sharing, 6,500
Vandalism/Hit & Run Damage, 2,000
Traffic controls Electricity, 5,000
Maintenance Program, 41,100
-54-
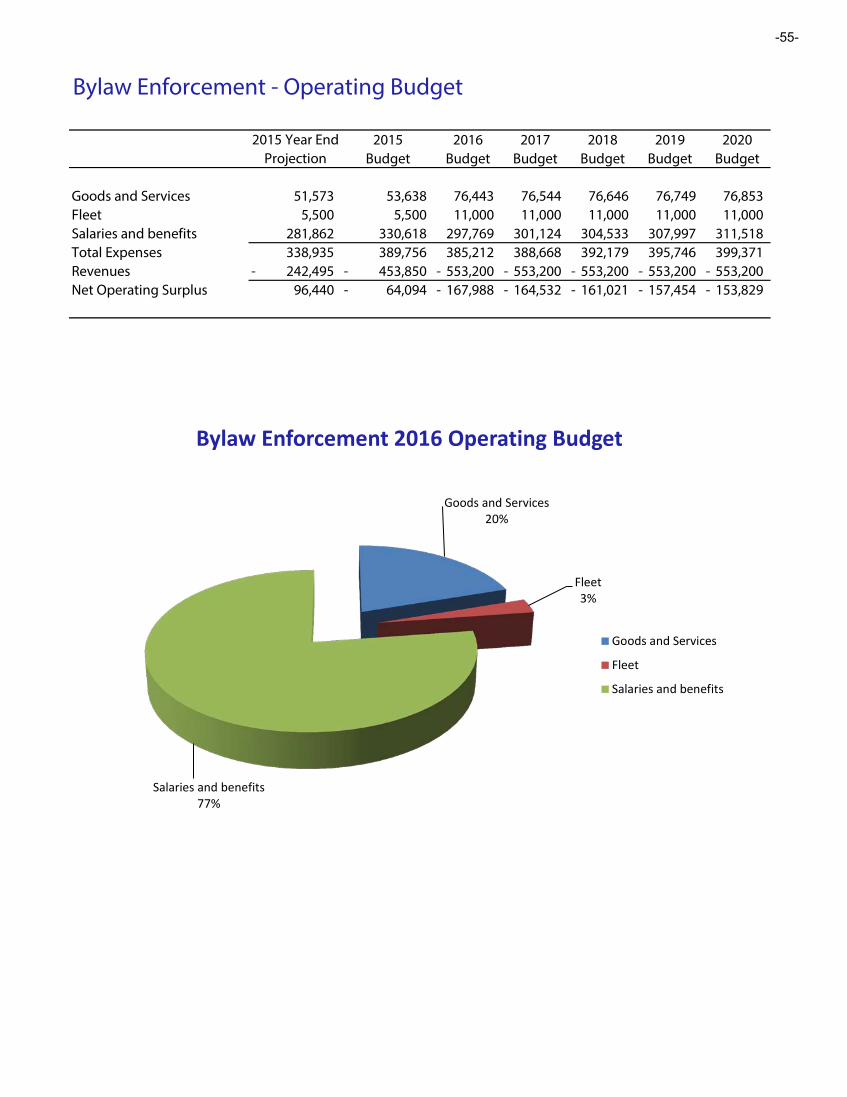
Bylaw Enforcement - Operating Budget
2015 Year End 2015 2016 2017 2018 2019 2020Projection Budget Budget Budget Budget Budget Budget
Goods and Services 51,573 53,638 76,443 76,544 76,646 76,749 76,853 Fleet 5,500 5,500 11,000 11,000 11,000 11,000 11,000 Salaries and benefits 281,862 330,618 297,769 301,124 304,533 307,997 311,518 Total Expenses 338,935 389,756 385,212 388,668 392,179 395,746 399,371 Revenues 242,495- 453,850- 553,200- 553,200- 553,200- 553,200- 553,200- Net Operating Surplus 96,440 64,094- 167,988- 164,532- 161,021- 157,454- 153,829-
Goods and Services 20%
Fleet 3%
Salaries and benefits 77%
Bylaw Enforcement 2016 Operating Budget
Goods and Services
Fleet
Salaries and benefits
-55-

Transit - Operating Budget
2015 Year End 2015 2016 2017 2018 2019 2020Projection Budget Budget Budget Budget Budget Budget
Goods and Services 1,564,457 1,644,864 1,628,435 1,656,244 1,726,264 1,797,334 1,867,804 Fleet 1,762 - 1,565 1,565 1,680 1,680 1,700 Salaries and benefits 26,387 17,614 25,190 25,310 25,440 25,570 25,790 Total Operating Expense 1,592,606 1,662,478 1,655,190 1,683,119 1,753,384 1,824,584 1,895,294 Recoveries 595,578- 612,006- 609,520- 613,520- 614,520- 615,020- 616,020- Net Operating Expense 997,028 1,050,472 1,045,670 1,069,599 1,138,864 1,209,564 1,279,274
Conventional Transit Custom Transit8 buses in service Door to door service for people with disabilities22,832 hours of service 3 buses in service420,614 rides 3,984 hours of service
23,212 rides
Goods and Services, 1,628,435
Fleet, 1,565 Salaries and benefits,
25,190
Transit - 2016 Operating Budget
-56-

Transit - Operating Budget by Project
2015 Year End 2015 2016 2017 2018 2019 2020Projection Budget Budget Budget Budget Budget Budget
Electricity 2,857 2,730 3,000 3,200 3,300 3,500 3,600 Maintainence Bus Shelters & Benches 48,549.09 44,614.09 51,305.00 51,725.00 52,720.00 53,650.00 54,090.00 Municipal Expense 1,538,036 1,606,634 1,597,285 1,624,494 1,693,564 1,763,634 1,833,704 Taxi Supplements 100 5,000 500 500 500 500 500 Coin Processing 3,064 3,500 3,100 3,200 3,300 3,300 3,400 Total Expenses 1,592,606 1,662,478 1,655,190 1,683,119 1,753,384 1,824,584 1,895,294 Recoveries 623,578- 612,006- 609,520- 613,520- 614,520- 615,020- 616,020- Net Operating Expenses 969,028 1,050,472 1,045,670 1,069,599 1,138,864 1,209,564 1,279,274
Electricity, 3,000 Maintainence Bus Shelters
& Benches, 51,305
Municipal Expense, 1,597,285
Taxi Supplements, 500
Coin Processing, 3,100
-57-

Environmental Development Services
2015 2016 2017 2018 2019 2020Budget Budget Budget Budget Budget Budget
Planning 602,623 715,347 578,996 578,996 578,996 596,147 Land Management 141,065 345,023 213,301 214,671 216,067 217,492 Development Services 449,813 442,569 444,600 446,664 448,762 449,394 Engineering 152,356 191,592 292,597 302,724 313,051 321,336 Economic Development & Tourism 1,160,805 1,082,100 1,080,450 1,083,035 1,078,535 1,076,235
2,506,662 2,776,630 2,609,944 2,626,090 2,635,412 2,660,604
-58-

Planning - Operating Budget
2015 Year End 2015 2016 2017 2018 2019 2020Projection Budget Budget Budget Budget Budget Budget
Goods and Services 16,777 68,548 224,100 86,749 86,749 86,749 105,900 Afordable Housing 50,000 - 50,000 50,000 50,000 50,000 50,000 Salaries and benefits 377,844 514,075 429,247 430,247 430,247 430,247 428,247 Urban Forestry Plan 12,000 20,000 12,000 12,000 12,000 12,000 12,000 Total Operating Expense 456,621 602,623 715,347 578,996 578,996 578,996 596,147 Recoveries 71,007- 85,000- 97,000- 97,000- 97,000- 97,000- 97,000- Net Operating Expense 385,614 517,623 618,347 481,996 481,996 481,996 499,147
In 2016 there is a one time fee for appraisal and survey of $145,000
Goods and Services, 224,100
Afordable Housing, 50,000
Salaries and benefits, 429,247
Urban Forestry Plan, 12,000
Planning - 2016 Operating Budget
-59-

Development Services - Operating Budget
2015 Year End 2015 2016 2017 2018 2019 2020Projection Budget Budget Budget Budget Budget Budget
Goods and Services 14,937 123,560 80,290 80,290 80,290 80,290 78,789 Legal 59,703 - 70,000 70,000 70,000 70,000 70,000 Carmi Landfill Monitoring 5,000 5,000 5,000 5,000 5,000 5,000 5,000 Salaries and benefits 208,340 321,253 287,279 289,310 291,375 293,473 295,605 Total Operating Expense 287,980 449,813 442,569 444,600 446,664 448,762 449,394 Recoveries 45,191- 61,000- 60,000- 61,000- 65,000- 65,000- 65,000- Net Operating Expense 242,789 388,813 382,569 383,600 381,664 383,762 384,394
Goods and Services, 80,290
Legal, 70,000
Carmi Landfill Monitoring, 5,000
Salaries and benefits, 287,279
Development Services 2016 Operating Budget
-60-

Land Management - Operating Budget
2015 Year End 2015 2016 2017 2018 2019 2020Projection Budget Budget Budget Budget Budget Budget
Goods and Services 135,668 111,065 203,376 87,994 88,695 89,413 90,150 Salaries and benefits 122,326 30,000 141,647 125,307 125,976 126,654 127,342 Total Operating Expense 257,994 141,065 345,023 213,301 214,671 216,067 217,492 Recoveries 489,000- 279,065- 541,000- 444,874- 448,805- 452,793- 456,839- Net Operating Expense 231,006- 138,000- 195,977- 231,573- 234,134- 236,725- 239,347-
Goods and Services
59%
Salaries and benefits
41%
Land Management 2016 Operating Budget
-61-

Engineering - Operating Budget
2015 Year End 2015 2016 2017 2018 2019 2020Projection Budget Budget Budget Budget Budget Budget
Goods and Services 42,864 75,850 50,700 50,500 50,500 50,500 48,250 Legal 20,000 - 25,000 25,000 25,000 25,000 25,000 Fleet 16,500 16,500 16,500 16,500 16,500 16,500 16,500 Salaries and Benefits 90,754 60,006 99,392 200,597 210,724 221,051 231,586 Net Operating Expense 170,118 152,356 191,592 292,597 302,724 313,051 321,336
8 FTEThe salaries and benfits are charged to capital and operations in each year based on what projectsrequire engineering staff
Goods and Services, 50,700
Legal, 25,000
Fleet, 16,500
Salaries and Benefits, 99,392
Engineering 2016 Operating Budget
-62-

Economic Development & Tourism - Operating Budget
2015 Year End 2015 2016 2017 2018 2019 2020Projection Budget Budget Budget Budget Budget Budget
Projects 474,380 458,305 295,100 365,500 364,000 359,500 357,200 Eastern Air Service 100,000 175,000 100,000 15,000 15,000 15,000 15,000 Small Business Development - 30,000 75,000 75,000 75,000 75,000 75,000 Tourism Funding 354,000 354,000 354,000 354,000 354,000 354,000 354,000 Salaries and benefits 229,861 143,500 258,000 270,950 275,035 275,035 275,035 Net Operating Expense 1,158,241 1,160,805 1,082,100 1,080,450 1,083,035 1,078,535 1,076,235
Economic Development comprises of 2 FTE contract staff who serve the role of ambassadors for the business community, focused on retention and growth of existing enterprises as well as attracting new business to Penticton and region.
Budget analysis shows that the largest percentage of Economic Development’s budget goes to organizations and initiatives related to tourism (45.7%). Economic development projects makes up 32% of the proposed budget; focusing on strategic initiatives such as resident recruitment, business retention and business attraction.
Tourism initiatives is proposed to see a decrease in 2016, as the investment in GoMedia was a one-time initiative for 2015 and the air service agreement enters its final year of municipal funding. Sport tourism remains as a strategic focus for the coming year.
Projects , 295,100
Eastern Air Service, 100,000
Small Business Development, 75,000
Tourism Funding, 354,000
Salaries and benefits, 258,000
Economic Development & Tourism - 2016 Operating Budget
-63-

Recreation and Culture 2015 2016 2017 2018 2019 2020Budget Budget Budget Budget Budget Budget
Recreation 2,088,661 2,254,181 2,272,131 2,305,016 2,338,518 2,363,619 Facilities 152,000 11,000 11,000 11,000 11,000 11,000 Parks 1,898,843 2,083,421 2,095,498 2,117,125 2,139,097 2,154,277 Library 1,284,100 1,323,100 1,338,700 1,354,600 1,370,808 1,387,329 Museum and Archives 286,106 247,201 247,313 248,489 249,689 250,913
5,709,710 5,918,903 5,964,642 6,036,230 6,109,112 6,167,138
-64-

Recreation - Operating Budget
2015 Year end 2015 2016 2017 2018 2019 2020Projections Budget Budget Budget Budget Budget Budget
Goods and Services 306,205 328,261 348,111 339,056 340,906 342,772 344,542 Salaries and benefits 1,832,062 1,760,400 1,906,070 1,933,075 1,964,110 1,995,746 2,019,077 Total Operating Expense 2,138,266 2,088,661 2,254,181 2,272,131 2,305,016 2,338,518 2,363,619 Recoveries 1,918,500- 1,882,800- 2,010,500- 2,029,425- 2,048,543- 2,067,845- 2,087,342- Net Operating Expense 219,766 205,861 243,681 242,706 256,473 270,673 276,277
64 staff2 Management (down from 3) – Manager of Recreation & Culture; Recreation Business Supervisor3 FT Recreation Coordinators5 FT Aquatics staff (1 exempt Supervisor and 4 Head Guards), 26 PT Lifeguard/Instructors3 FT Reception staff; 7 PT19 seasonal staff (McLaren Arena public skate attendants, Youth Park Ambassadors, Summer Daycamp staff) =~28 FTE100 Contractors and 80 Volunteers
Goods and Services, 348,111
Salaries and benefits, 1,906,070
Recreation - 2016 Operating Budget
-65-

Recreation - Operating Budget by Project
2015 Year end 2015 2016 2017 2018 2019 2020Projections Budget Budget Budget Budget Budget Budget
Administration 56,211 53,400 63,400 53,536 53,673 53,812 53,952 Marketing 35,000 35,000 35,000 36,000 37,000 38,000 39,000 Program Supplies 292,400 293,400 314,400 317,266 320,184 323,142 326,140 Conference\Training 10,056 16,950 18,600 17,600 17,600 17,600 17,600 Safety 8,000 10,311 10,311 10,518 10,623 10,730 10,730 Salaries and Benefits 1,380,400 1,323,200 1,438,870 1,460,889 1,486,862 1,513,372 1,531,513
1,782,066 1,732,261 1,880,581 1,895,809 1,925,942 1,956,656 1,978,935
Administration, 63,400 Marketing, 35,000
Program Supplies, 314,400
Conference\Training, 18,600
Safety, 10,311
Salaries and Benefits, 1,438,870
-66-

Public Works Parks - Operating Budget
2015 Year End 2015 2016 2017 2018 2019 2020Projection Budget Budget Budget Budget Budget Budget
Goods and Services 1,517,093 561,632 349,078 339,961 340,054 340,147 333,097 Fleet 16,512 16,500 388,865 388,865 388,865 388,865 388,865 Salaries and Benefits 284,250 1,320,711 1,345,478 1,366,672 1,388,206 1,410,085 1,432,315 Total Operating Expense 1,817,855 1,898,843 2,083,421 2,095,498 2,117,125 2,139,097 2,154,277 Recoveries 13,400- 13,400- 20,430- 20,430- 20,430- 20,430- 20,430- Net Operating Expense 1,804,455 1,885,443 2,062,991 2,075,068 2,096,695 2,118,667 2,133,847
19 FTE
365 Acres Open Space75 Acres of Turf100 + Irrigation Systems 70 + Pet Stands16 Sports Fields 6 Beaches (sand, buoys, rafts) 500 + Pieces of Furniture2 Skate & 2 Water Parks 25,000 m2 Landscape9 Play Grounds 25 Km of Trails/Walkways
5,000 Inventoried Trees200 + Litter Receptacles
6 Off-Leash Dog Areas
140 Hanging Baskets
The Parks department maintains:
Goods and Services, 349,078
Fleet, 388,865
Salaries and Benefits, 1,345,478
Public Works Parks 2016 Operating Budget
-67-

Museum and Archives - Operating Budget
2015 Year End 2015 2016 2017 2018 2019 2020Projection Budget Budget Budget Budget Budget Budget
Goods and Services 84,605 129,900 61,865 76,465 76,465 76,465 76,465 Salaries and benefits 180,989 156,206 185,336 170,848 172,024 173,224 174,448 Total Operating Expense 265,594 286,106 247,201 247,313 248,489 249,689 250,913 Recoveries 93,431- 96,000- 48,000- 48,000- 48,000- 48,000- 48,000- Net Operating Expense 172,163 190,106 199,201 199,313 200,489 201,689 202,913
Goods and Services, 61,865
Salaries and benefits, 185,336
Museum and Archives - 2016 Operating Budget
-68-

Public Works Cemetery - Operating Budget
2015 Year End 2015 2016 2017 2018 2019 2020Projection Budget Budget Budget Budget Budget Budget
Goods and Services 177,300 156,800 165,620 165,620 165,620 165,620 165,620 Fleet 2,425 3,500 3,500 3,500 3,500 3,500 3,500 Salaries and benefits 16,640 15,948 23,413 23,759 23,857 23,956 24,057 Total Operating Expense 196,365 176,248 192,533 192,879 192,977 193,076 193,177 Recoveries 106,700- 250,000- 330,952- 335,180- 339,481- 343,856- 348,306- Net Operating Surplus 89,665 73,753- 138,419- 142,301- 146,505- 150,780- 155,129-
Lakeview Cemetery is 14.7 acres and has 7,500 plots, 1,500 cremation plots, 1,525 niches in the columbarium an45 in the mausoleum
Goods and Services, 165,620
Fleet, 3,500
Salaries and benefits, 23,413
Public Works Cemetery - 2016 Operating Budget
-69-

Solid Waste - Operating Budget
2015 Year End 2015 2016 2017 2018 2019 2020Projection Budget Budget Budget Budget Budget Budget
Goods and Services 1,387,507 1,392,920 1,417,050 1,417,050 1,417,050 1,417,050 1,417,050 Fleet - - 1,750 1,750 1,750 1,750 1,750 Salaries and Benefits 43,427 43,017 47,076 47,156 47,238 47,320 47,404 Total Operating Expense 1,430,933 1,435,937 1,465,876 1,465,956 1,466,038 1,466,120 1,466,204 Recoveries 2,457,258- 2,453,965- 2,470,915- 2,470,915- 2,470,915- 2,470,915- 2,470,915- Net Operating Expense 1,026,325- 1,018,028- 1,005,039- 1,004,959- 1,004,877- 1,004,795- 1,004,711-
Contract increased by 2%Tippings fees increased ($10,000)Annually, Penticton residents generate approximately 4,050 metric tonnes of waste, 1,100 metric tonnes of recyclables and 1,400 metric tonnes of yard waste
Goods and Services, 1,417,050
Fleet, 1,750
Salaries and Benefits, 47,076
Solid Waste - 2016 Operating Budget
-70-

Electric Utility - Operating Budget
2015 Year End 2015 2016 2017 2018 2019 2020Projection Budget Budget Budget Budget Budget Budget
Goods and Services 29,522,597 31,098,570 31,315,445 32,969,667 34,678,248 36,505,213 38,433,223 Fleet 84,656 73,767 107,494 44,000 44,000 44,000 44,000 Salaries and Benefits 1,542,647 1,465,501 1,517,142 1,543,584 1,587,925 1,633,596 1,675,116 Total Operating Expense 31,149,900 32,637,838 32,940,081 34,557,251 36,310,173 38,182,809 40,152,339 Recoveries 38,791,554- 37,734,240- 40,967,152- 42,440,972- 43,981,017- 45,590,820- 47,245,179- Balance 7,641,654- 5,096,402- 8,027,071- 7,883,721- 7,670,844- 7,408,011- 7,092,840-
15 FTE
industrial customers This department is responsible for providing safe, efficient and reliable electrical service to our residential, commercial an
There are 4 substations feeding 17 distribution circuits, 272 km of overhead power lines, 86 km of underground cables3,999 power poles (3,061 wood, 938 steel), 2,719 distribution transformers and 17,373 active customer accounts
Goods and Services, 31,315,445
Fleet, 107,494
Salaries and Benefits, 1,517,142
Electric 2016 Operating Budget
-71-

Electric Utility - Operating Budget by Project
2015 Year End 2015 2016 2017 2018 2019 2020Projection Budget Budget Budget Budget Budget Budget
Administration Charges 2,246,197 2,238,703 2,060,080 1,881,457 1,702,834 1,524,211 1,345,588 Bulk Energy Purchases 26,662,040 27,746,505 28,278,733 30,050,474 31,933,224 33,933,938 36,060,007 Customer Billing and Collections 29,511 40,450 32,918 33,905 34,922 35,969 37,048 Meter Testing and Maintenance 65,837 99,500 98,000 100,940 103,967 107,088 110,300 Power Distribution 196,204 377,100 357,700 368,431 379,486 390,868 402,595 Substations 18,209 34,000 34,000 35,020 36,072 37,152 38,268 Turn-Ons and Cut-Offs 77,960 111,700 92,131 94,894 97,741 100,673 103,693 Salaries and Benefits (unallocated) 1,207,697 1,414,690 1,476,019 1,481,128 1,510,511 1,541,070 1,548,085
30,503,655 32,062,648 32,429,581 34,046,249 35,798,757 37,670,969 39,645,584
Administration Charges, 2,060,080
Bulk Energy Purchases, 28,278,733
Customer Billing and Collections, 32,918
Meter Testing and Maintenance,
98,000
Power Distribution, 357,700
Substations, 34,000 Turn-Ons and Cut-Offs, 92,131 Salaries and Benefits
(unallocated), 1,476,019
-72-

Sanitary Sewer - Operating Budget 2015 Year end 2015 2016 2017 2018 2019 2020
Projections Budget Budget Budget Budget Budget Budget
Administration 465,587 414,760 465,587 557,594 649,601 741,608 833,615Goods and Services 1,721,988 2,160,593 1,752,196 1,762,054 1,777,544 1,770,083 1,771,870 Debt Interest - 773,830 773,830 773,830 773,830 755,290 751,710 Debt Principal Repayments 584,381 584,381 584,381 575,057 575,057 545,072 538,987 Fleet 11,750 11,000 220,550 220,550 220,550 220,550 220,550 Salaries and Benefits 1,028,805 1,075,743 1,594,504 1,619,278 1,644,440 1,669,937 1,695,667 Total Operating Expense 3,346,925 4,605,547 4,925,461 4,950,769 4,991,421 4,960,932 4,978,784 Recoveries 6,203,384- 5,788,726- 6,150,983- 6,567,696- 7,101,655- 7,644,221- 8,249,034- Net Operating Expense 2,856,459- 1,183,179- 1,225,522- 1,616,927- 2,110,233- 2,683,289- 3,270,250-
11 FTE
bio-solids for compost production, processing 745 loads which equals 8,940 cubic metres of material
This department is responsible for maintenance of the treatment plant, lift stations, the collection system andtreatment of waste water to required standards. Generation of treated effluent for irrigation and generation of
Operations are maintained 24 hours a day
There is 171 KM of sanitary sewer pipe with 8,550 service connections, 5.4 KM of sewer effluent irrigation pipe and 88 KM of storm sewer pipe with 280 service connections
Administration, 465,587
Goods and Services, 1,752,196
Debt Interest, 773,830 Debt Principal
Repayments, 584,381
Fleet, 220,550
Salaries and Benefits, 1,594,504
Sanitary Sewer - 2016 Operating Budget
-73-

Sanitary Sewer - Operating Budget by Project
2015 Year end 2015 2016 2017 2018 2019 2020Projections Budget Budget Budget Budget Budget Budget
AWWTP 1,459,458 1,886,398 2,108,153 2,223,844 2,344,629 2,464,628 2,585,825 Pumps, Stations, and Sewers 118,800 94,030 109,027 110,559 114,169 115,716 118,663 Septage 38,100 30,050 33,738 34,068 35,724 36,036 37,704 Waste Water 50,387 57,092 162,332 166,814 168,739 170,699 163,143 Collection system 163,900 192,300 177,800 179,316 180,855 182,420 184,009 Swr Service Repairs 100,000 60,000 84,000 84,561 85,131 85,710 86,299 San Swr Main Repairs 2,500 10,500 10,500 10,564 10,629 10,695 10,763 Sewer Main Blockages 2,000 2,000 2,000 2,022 2,045 2,068 2,092 Video Inspection 61,000 61,500 61,500 61,548 61,597 61,647 61,697 Manholes 7,120 3,000 3,000 3,019 3,039 3,059 3,079 Vandalism - 1,000 1,000 1,008 1,016 1,024 1,033 Compost facility 263,690 282,000 283,000 284,984 287,006 289,068 291,168 Sewer - tools 8,000 10,500 10,500 10,500 10,500 10,500 10,500 Consulting - 10,000 10,000 10,000 10,000 10,000 10,000 Standby 11,000 11,000 11,000 11,176 11,355 11,537 11,722 Effluent collection system 750 2,000 2,000 2,024 2,048 2,073 2,099 Sewer system 16,410 7,800 14,800 14,980 15,164 15,350 15,539 Fleet 65,000 - - - - - - General Maintenance 179,953 176,420 174,657 174,657 174,657 174,657 174,657
2,548,068 2,897,590 3,259,007 3,385,646 3,518,305 3,646,888 3,769,992 Sewer Levy 1,376,731- 1,348,200- 1,348,200- 1,348,200- 1,348,200- 1,348,200- 1,348,200- Sewer User Fees 4,382,108- 4,221,526- 4,587,283- 5,003,996- 5,537,955- 6,087,963- 6,694,323- DCC 225,544- Grants 219,000- 219,000- 215,500- 215,500- 215,500- 208,058- 206,511-
3,655,316- 2,891,136- 2,891,976- 3,182,050- 3,583,349- 3,997,333- 4,479,042-
AWWTP, 2,108,153
Pumps, Stations, and Sewers, 109,027
Septage, 33,738
Waste Water, 162,332
Collection system, 177,800
Swr Service Repairs, 84,000
San Swr Main Repairs, 10,500
Sewer Main Blockages, 2,000
Video Inspection,
61,500
Manholes, 3,000
Vandalism, 1,000
Compost facility, 283,000
Sewer - tools, 10,500 Consulting, 10,000
Standby, 11,000
Effluent collection system, 2,000
Sewer system, 14,800
General Maintenance, 174,657
-74-

Water - Operating Budget
2015 Year end 2015 2016 2017 2018 2019 2020Projections Budget Budget Budget Budget Budget Budget
Administration 543,372 502,537 543,372 629,430 715,488 801,546 887,604 Goods and Services 815,112 1,825,694 915,850 935,502 957,495 980,998 241,381 Debt Interest 759,450 - 591,951 75 573,951 573,951 573,951 Debt Principal Repayment 467,738 - 467,738 422,123 422,123 422,123 422,123 Fleet 21,378 160,650 160,650 160,650 160,650 160,650 160,650 Salaries and Benefits 871,754 933,260 1,601,490 1,547,119 1,567,910 1,590,620 1,462,200 Total Operating Expense 3,478,805 3,422,141 4,281,051 3,694,899 4,397,617 4,529,888 3,747,909 Recoveries 6,355,065- 6,390,569- 7,165,766- 8,042,257- 8,474,400- 8,929,898- 9,410,016- Net Operating Expense 2,876,260- 2,968,428- 2,884,715- 4,347,358- 4,076,783- 4,400,010- 5,662,107-
7.5 FTE This department maintains the water treatment plant, reservoirs, pump stations, dams, and the distribution systemThere is 192 KM of domestic water pipe, 985 fire hydrants, 8,653 water meters, 33 KM of agricultural irrigation water main with 350 connections and 10 dam structures
Administration, 543,372
Goods and Services, 915,850
Debt Interest, 591,951
Debt Principal Repayment, 467,738
Fleet, 160,650
Salaries and Benefits, 1,601,490
Water Utility 2016 Operating Budget
-75-

Water - Operating Budget by Project2015 Year end 2015 2016 2017 2018 2019 2020
Projections Budget Budget Budget Budget Budget BudgetCross Connection 50,700 62,067 56,583 56,344 57,190 58,174 51,178 Pump Stations 274,936 281,471 271,783 299,669 315,184 331,675 32,243 Small Reservoirs 29,682 31,975 39,835 32,799 33,337 33,944 21,763 Warren Ave Well 2,700 5,623 5,644 5,854 5,991 6,140 2,720 Water Conservation 25,777 40,671 40,948 33,195 33,470 33,789 16,615 Water Treatment Plant 867,111 902,373 937,432 952,319 967,896 985,503 562,304 Water 43,133 65,428 183,532 114,253 114,478 114,707 82,440 PW Roads and Maintenance 130,452 130,452 132,705 132,705 132,705 132,705 132,705 Transmission and distribution 77,000 108,100 81,600 82,530 83,474 84,434 85,409 Hydrant Maintenance 68,000 70,000 70,000 70,841 71,696 72,565 73,448 Valve Maintenance 24,500 43,500 41,500 41,821 42,146 42,477 42,813 PRV Maintenance 9,500 18,000 15,000 15,160 15,323 15,489 15,657 Water Main Repairs 120,000 70,000 88,000 88,577 89,163 89,759 90,364 Water Service Repairs 86,000 100,000 92,000 92,721 93,454 94,199 94,955 Renew Fire Hydrants 8,700 9,500 9,500 9,564 9,629 9,695 9,763 Hydrant Connection Boxes 3,200 5,000 5,000 5,048 5,097 5,147 5,197 Meters / Customer Billing and Collections 123,700 150,500 137,200 138,843 140,512 142,208 143,931 Meter Pit Installations and maint 23,100 15,000 15,000 15,080 15,162 15,244 15,328 Water - tools 9,500 12,500 12,500 12,500 12,500 12,500 12,500 Water damage vandalism 1,000 3,000 1,000 1,008 1,016 1,024 1,033 Dams 61,865 89,750 80,350 81,290 82,245 83,216 84,202 Irrigation 70,000 63,500 70,500 71,325 72,164 73,016 73,882
2,110,557 2,278,410 2,387,612 2,353,447 2,393,834 2,437,611 1,650,451 Water User Fees 6,060,649- 5,982,080- 6,736,453- 7,585,956- 8,000,787- 8,438,304- 8,899,746- Recoveries 307,444- 405,489- 428,313- 455,301- 472,613- 490,594- 509,270-
4,257,535- 4,109,159- 4,777,154- 5,687,809- 6,079,566- 6,491,287- 7,758,565-
Cross Connection, 56,583
Pump Stations, 271,783
Small Reservoirs, 39,835
Warren Ave Well, 5,644 Conservation, 40,948
Treatment Plant, 937,432
Water, 183,532
PW Roads and Maintenance, 132,705
Transmission and distribution, 81,600
Hydrant Maintenance, 70,000
Valve Maintenance, 41,500
PRV Maintenance, 15,000
Main Repairs, 88,000
Service Repairs, 92,000
Renew Fire Hydrants, 9,500
Hydrant Connection
Boxes, 5,000
Meters , 137,200
Meter Pit Installations and maint, 15,000
Tools, 12,500
Vandalism, 1,000
Dams, 80,350
Irrigation, 70,500
-76-