Agenda Finance Committee - City of Richmond
81
FIN – 1 Agenda Finance Committee Anderson Room, City Hall 6911 No. 3 Road Wednesday, January 9, 2019 Immediately following the open General Purposes Committee meeting Pg. # ITEM MINUTES FIN-4 Motion to adopt the minutes of the meeting of the Finance Committee held on October 1, 2018. FINANCE AND CORPORATE SERVICES DIVISION 1. FINANCIAL INFORMATION – 3 RD QUARTER SEPTEMBER 30, 2018 (File Ref. No. 03-0970-09-01) (REDMS No. 5999628 v. 5) FIN-7 See Page FIN-7 for full report Designated Speaker: Cindy Gilfillan STAFF RECOMMENDATION That the staff report titled, “Financial Information – 3 rd Quarter September 30, 2018”, dated November 30, 2018 from the Director, Finance be received for information.
-
Upload
khangminh22 -
Category
Documents
-
view
0 -
download
0
Transcript of Agenda Finance Committee - City of Richmond
FIN – 1
Agenda
Finance Committee
Anderson Room, City Hall 6911 No. 3 Road
Wednesday, January 9, 2019 Immediately following the open General Purposes Committee meeting
Pg. # ITEM
MINUTES FIN-4 Motion to adopt the minutes of the meeting of the Finance Committee held
on October 1, 2018.
FINANCE AND CORPORATE SERVICES DIVISION 1. FINANCIAL INFORMATION – 3RD QUARTER SEPTEMBER 30, 2018
(File Ref. No. 03-0970-09-01) (REDMS No. 5999628 v. 5)
FIN-7 See Page FIN-7 for full report
Designated Speaker: Cindy Gilfillan
STAFF RECOMMENDATION
That the staff report titled, “Financial Information – 3rd Quarter September 30, 2018”, dated November 30, 2018 from the Director, Finance be received for information.
Finance Committee Agenda – Wednesday, January 9, 2019 Pg. # ITEM
FIN – 2 6058258
2. ACTIVE CAPITAL PROJECTS INFORMATION – 3RD QUARTER SEPTEMBER 30, 2018 (File Ref. No. 03-1200-05) (REDMS No. 6011060 v. 6)
FIN-34 See Page FIN-34 for full report
Designated Speaker: Melissa Shiau
STAFF RECOMMENDATION
That the staff report titled, “Active Capital Projects Information – 3rd Quarter September 30, 2018”, dated December 10, 2018 from the Director, Finance be received for information.
RICHMOND OLYMPIC OVAL CORPORATION 3. RICHMOND OLYMPIC OVAL – 3RD QUARTER FINANCIAL
INFORMATION (File Ref. No.) (REDMS No. 6034579)
FIN-52 See Page FIN-52 for full report
Designated Speaker: Rick Dusanj
STAFF RECOMMENDATION
That the report on Financial Information for the Richmond Olympic Oval Corporation for the third quarter ended September 30, 2018 from the Controller of the Richmond Olympic Oval Corporation be received for information.
LULU ISLAND ENERGY COMPANY 4. LULU ISLAND ENERGY COMPANY – 3RD QUARTER FINANCIAL
INFORMATION (File Ref. No. 10-6600-10-01) (REDMS No. 6040158 v. 4)
FIN-58 See Page FIN-58 for full report
Designated Speakers: Jerry Chong and John Irving
Finance Committee Agenda – Wednesday, January 9, 2019 Pg. # ITEM
FIN – 3 6058258
STAFF RECOMMENDATION
That the Lulu Island Energy Company report titled “Lulu Island Energy Company – 3rd Quarter Financial Information” dated November 28, 2018 from the Chief Executive Officer and Chief Financial Officer, Lulu Island Energy Company be received for information.
5. 2019 OPERATING BUDGET FOR THE LULU ISLAND ENERGY
COMPANY (File Ref. No. 10-6600-10-01) (REDMS No. 6011863 v. 10)
FIN-67 See Page FIN-67 for full report
Designated Speakers: Jerry Chong and John Irving
STAFF RECOMMENDATION
That the Lulu Island Energy Company report titled “2019 Operating Budget for the Lulu Island Energy Company” dated October 26, 2018 from the Chief Executive Officer and Chief Financial Officer, Lulu Island Energy Company be received for information.
ADJOURNMENT
Date:
Place:
Present:
City of Richmond
Finance Committee
Monday, October 1, 2018
Anderson Room Richmond City Hall
Mayor Malcolm D. Brodie, Chair Councillor Chak Au Councillor Derek Dang
Councillor Carol Day Councillor Ken Johnston
Councillor Alexa Loo Councillor Bill McNulty Councillor Linda McPhail Councillor Harold Steves
Minutes
Call to Order: The Chair called the meeting to order at 4:03p.m.
MINUTES
It was moved and seconded
That the minutes of the meeting of the Finance Committee held on
September 4, 2018, be adopted as circulated.
CARRIED
FINANCE AND CORPORATE SERVICES DIVISION
1. AMENDMENTS TO THE CONSOLIDATED 5 YEAR FINANCIAL
PLAN (2018-2022) BYLAW NO. 9800 (File Ref. No. 03-0985-01) (REDMS No. 59725333 v. 10; 5972984)
It was moved and seconded
That the Consolidated 5 Year Financial Plan (2018-2022) Bylaw No. 9800,
Amendment Bylaw No. 9904, which incorporates and puts into effect the
changes as outlined in the staff report titled "Amendments to the
Consolidated 5 Year Financial Plan (2018-2022) Bylaw No. 9800" dated
September 25, 2018 from the GM, Finance and Corporate Services, be
introduced and given first, second and third readings.
CARRIED
1. FIN - 4
5989783
Finance Committee Monday, October 1, 2018
2. PERMISSIVE EXEMPTION (2019) BYLAW NO. 9893 RTC (File Ref. No. 03-0925-02-01) (REDMS No. 5869998 v. 3; 5870025)
It was moved and seconded
That Permissive Exemption (2019) Bylaw No. 9893 be introduced and given first, second and third readings.
CARRIED
3. CONSOLIDATED FEES BYLAW NO. 8636, AMENDMENT BYLAW
NO. 9897 (File Ref. No. 03-1240-01) (REDMS No. 5950136; 5929485)
It was moved and seconded That Consolidated Fees Bylaw No. 8636, Amendment Bylaw No. 9897 be
introduced and given first, second and third readings.
ENGINEERING AND PUBLIC WORKS DIVISION
4. 2019 UTILITY BUDGETS AND RATES (File Ref. No. 03-0970-01) (REDMS No. 5920625 v. 7)
CARRIED
Committee reviewed each of the options for water utility, sewer utility, and drainage and diking utility outlined in the staff report. In response to queries from Committee regarding those options, Lloyd Bie, Manager, Engineering Planning, noted that option 2 for flood protection would increase rates by 8%
for medium and larger commercial and institutional (ICI) properties, 2% for single-family and smaller ICI and farms, and 0% for multi-family properties to create a more equitable distribution of rates.
It was moved and seconded That the 2019 Utility Budgets, as outlined under Option] for Water, Option
1 for Sewer, Option 2 for Drainage and Diking, and Option 3 for Solid Waste and Recycling, as contained in the staff report dated September 11,
2018 from the General Manager of Finance & Corporate Services and the
Deputy CAO and General Manager of Engineering & Public Works, be
approved as the basis for establishing the 2019 Utility Rates and preparing
the 5 Year Financial Plan (2019-2023) Bylaw.
The question on the motion was not called as, in response to further questions from Committee, Jatinder Johal, Manager, Public Works Administration,
noted that (i) Option 3 for solid waste and recycling includes an expansion of the materials accepted at the Recycling Depot which would include propane
tanks, butane cylinders, electronics, and upholstered furniture, and (ii) staff expect higher rates of volume from extending the Recycling Depot hours to be open 6 days a week.
The question on the motion was then called and it was CARRIED.
2.
FIN - 5
Finance Committee Monday, October 1, 2018
ADJOURNMENT
It was moved and seconded
That the meeting adjourn (4:10p.m.).
CARRIED
Certified a true and correct copy of the Minutes of the meeting of the Finance Committee of the Council of the City of Richmond held on Monday, October 1,
2018.
Mayor Malcolm D. Brodie Chair
Amanda Welby Legislative Services Coordinator
3.
5989783 FIN - 6
To:
City of Richmond
Finance Committee
. Report to Committee
Date: November 30, 2018
From: Jerry Chong File: 03-0970-09-01/2018-Director, Finance Vol 01
Re: Financial Information - 3rd Quarter September 30, 2018
Staff Recommendation
That the staff report titled, "Financial Information- 3rd Quarter September 30, 2018", dated November 30, 2018 from the Director, Finance be received for information.
~ JetTy Chong Director, Finance ( 604-2 7 6-4064)
Att: 5
ROUTED To: Arts, Culture & Heritage Building Approvals Community Bylaws Community Social Development Development Applications Economic Development Engineering Fire Rescue Parks Services Public Works RCMP Recreation Services Transportation Library Services
REVIEWED BY STAFF REPORT I AGENDA REVIEW SUBCOMMITTEE
5999628
REPORT CONCURRENCE
CONCURRENCE lit � !;r � !;ll � � liZf li2l' li2l I;J lil'f UlJ liZf
INITIALS:
CONCURRENCE OF GENERAL MANAGER
FIN - 7
November 30, 2018 - 2 -
Origin
Pre-audited financial information for the 3rd quarter ended September 30, 2018 is being provided to the Finance Committee for review. The repoti provides details on the economic environment, financial results and other key indicator information. The financial infmmation provides Council with an overview of the City's financial results throughout the year and before the annual audited financial statements are presented.
This report suppotis Council's 2014-2018 Term Goal #7 Strong Financial Stewardship:
Maintain the City's strong financial position through effective budget processes, the efficient and effective use of financial resources, and the prudent leveraging of economic and financial opportunities to increase current and long-term financial sustainability.
7.1. Relevant and effective budget processes and polices.
7. 2 Well-informed and sustainable financial decision-making.
7. 3 Transparent financial decisions that are appropriately communicated to the public.
Analysis
Macroeconomic Indicators & Forecast
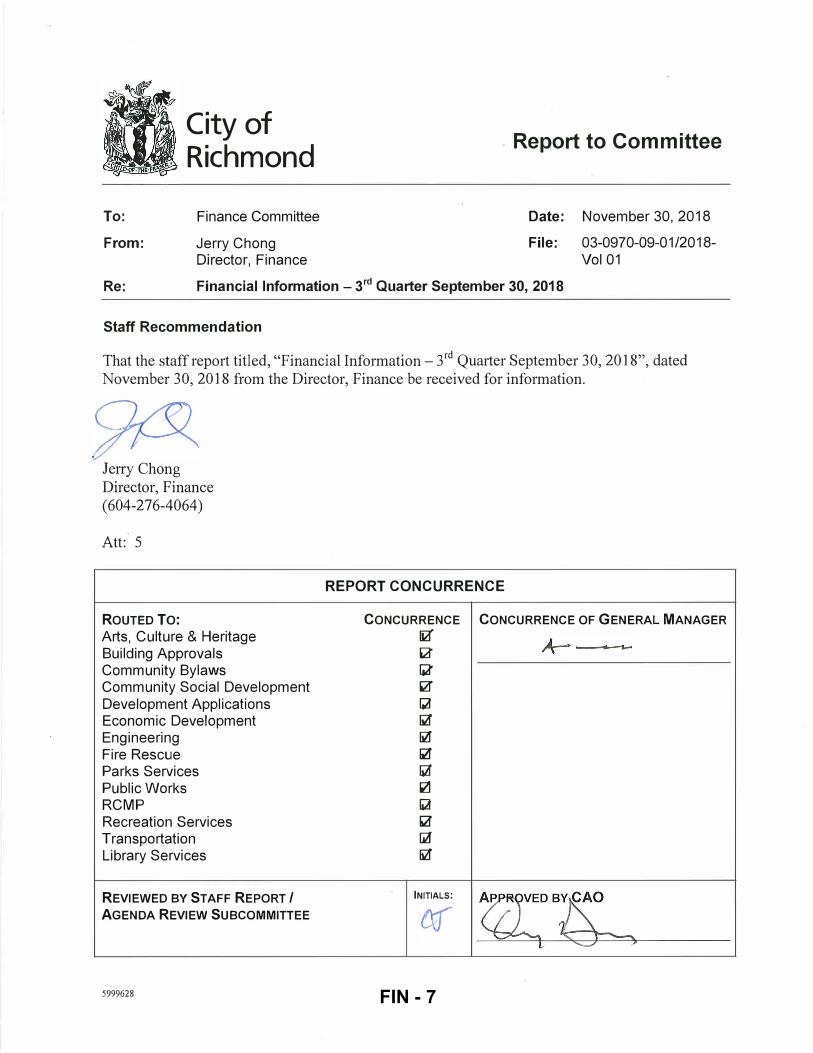
1) Global Growth- Real Gross Domestic Product (GDP)% Change'
12.0
10.0
8.0
6.0
4.0
2.0
0.0
-2.0
-4.0
2009 2010 2011 2012 2013 2014 2015 2016 2017 201Bf 2019f
-Canada - United States -China - Wor1d
1 International Monetmy Fund, World Economic Outlook (October 2018)
5999628
• Global growth for 2018-19 is projected to remain steady at its 2017 level of 3. 7%.
• Canada's GDP growth projections held steady at 2.1% in 2018 and 2.0% in 2019, credited to the United States-MexicoCanada Agreement (USMCA) agreed to on September 30, 2018.
• The growth forecast for the U.S. has been revised down to 2.9% in 2018 and 2.5% in 2019 due to recently announced trade measures including tariffs imposed on imports from China. China's economy is expected to grow by 6.6% in 2018 and 6.2% in 2019.
FIN - 8
November 30,2018 - 3-
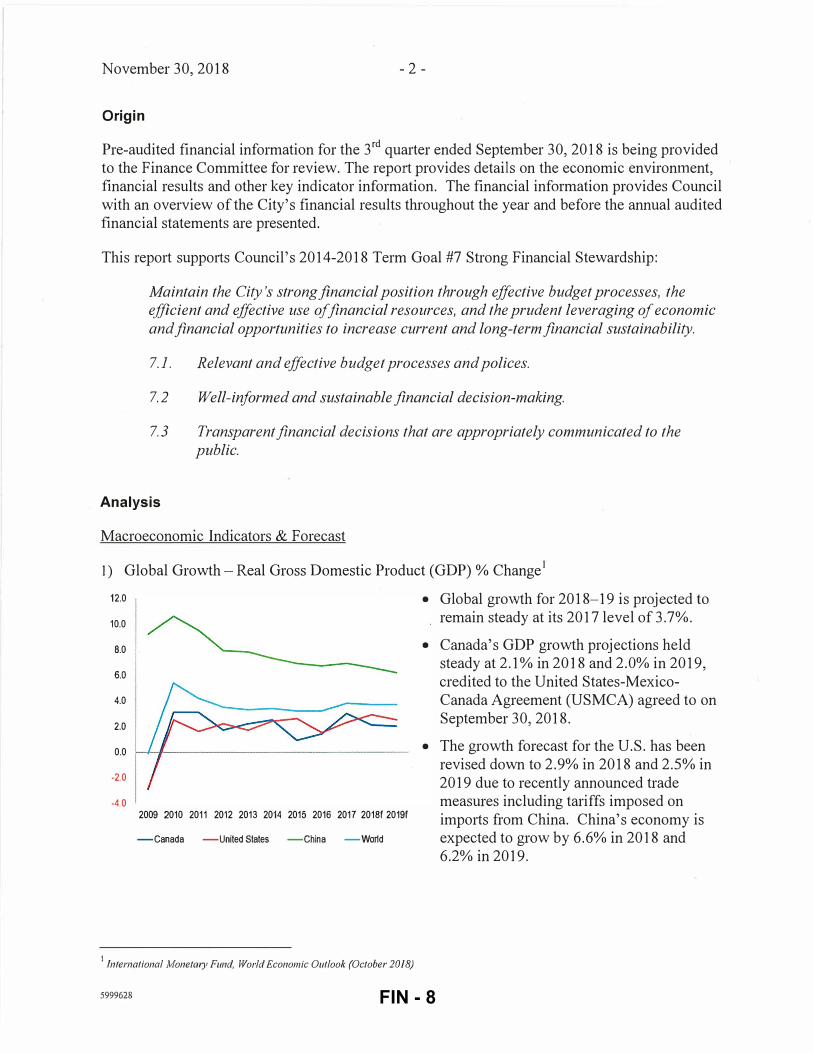
2) Interest Rates- US and Canadian Overnight Central Bank Rate% at Year-End2
4.00
3.50
3.00
2.50
2.00
1.50
1.00
• The U.S. Federal Reserve continues to retract policy supp01i via interest rate increases. The rate is expected to climb to 3.5% by the end of 2019 from 2.25% at the end ofQ3 2018.
o.5o L�============:::::=:_:_ ___ _ 0.00
• Consumer and business confidence remains high in Canada, and as a result the Bank of Canada (BoC) policy rate is expected to continue to climb, to 2.25% by the end of 2019. Although the new USMCA removed a key risk for the economy, challenges such as high household debt remain.
2009 2010 2011 2012 2013 2014 2015 2016 2017 20181 20191
-us FED -canada soc
3) Exchange Rates- CADIUSD at Year-End3
1.45
1.35
1.25
1.15
1.05
0.95
0.85
0.75
• Strong gains in real GDP and policy stimulus in the US caused the country's cun·ency to continue to strengthen in Q3 2018.
• The Canadian dollar held steady against the US currency throughout the third quatier and ended Q3 2018 at $1.29 CAD per $1 USD.
2010 2011 2012 2013 2014 2015 2016 2011 201Bf 2019f • Good economic conditions in Canada, a -CADper$1 uso new USMCA, and ongoing tightening by
the BoC, balanced declines in oil prices leaving the USD/CAD exchange rate forecast for 2019 at $1.28 CAD per $1 USD.
• Downside risks to the CAD include threats to global trade, lowered commodity prices and risk aversion from foreign investors.
2 US Federal Reserve, Bank of Canada and Royal Bank Research
3 Bank of Canada, Monetmy Policy Report (October 2018)
5999628 FIN - 9
November 30,2018 - 4-
Regional & Local Economic Activity Indicators
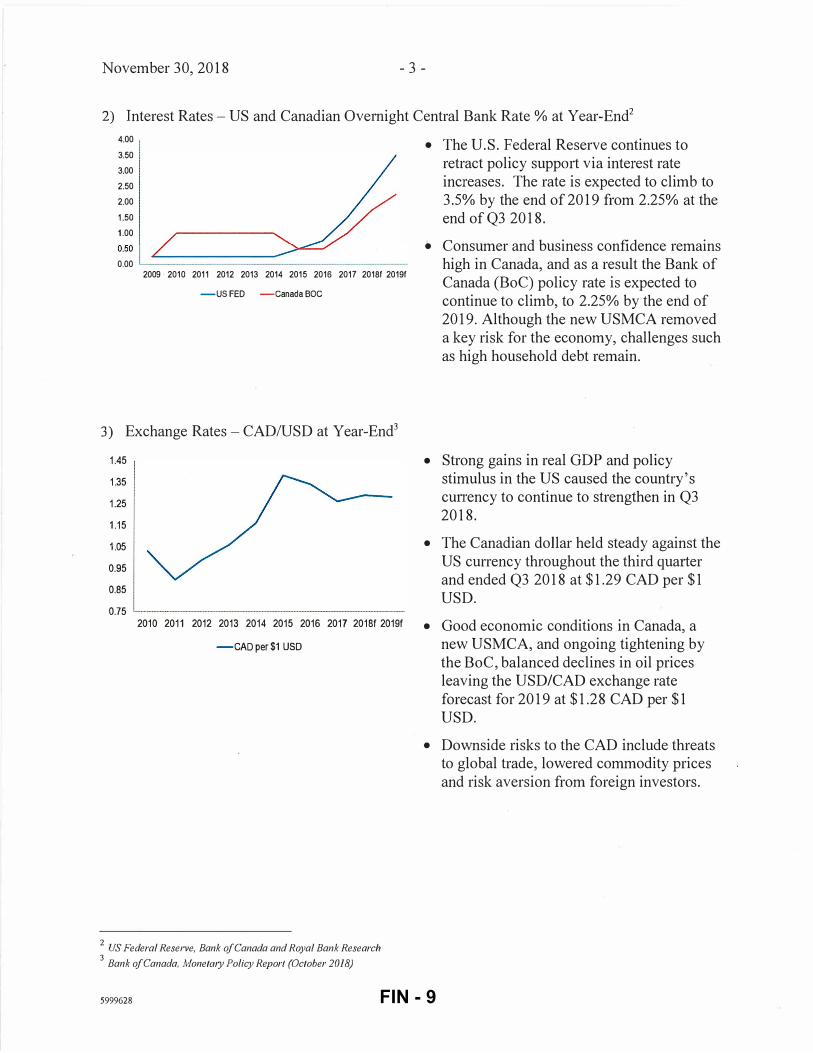
4) Unemployment4
7.5
6.5
5.5
4.5
3.5 '------------------
• National and regional economies continue to operate at close to full employment levels throughout the first three quarters of 2018. The unemployment rate in Canada decreased by 4.8% in Q3 2018 over Q3 2017.
• Unemployment rates ended the quarter at a low 5.9%, 4.2%, and 4.5% for Canada,
01-16 03-18 B.C. and Metro Vancouver respectively. - Canada -BC - Metro Vancouver
5) Consumer Price Index (CPI- 2002=100)5
136 134 132 130 128 126 124 122 120 118 116 114 '-----------------
01-16
-canada -BC -Metro Vancouver
4 Statistics Canada
5 Statistics Canada
5999628
03-18
• The unemployment rate in B.C. dropped by 14% over the same period last year and remains the lowest in the country.
• This prolonged period of strong employment growth is expected to put upward pressure on wages as companies compete for skilled employees.
• The country's annual pace of inflation, as measured by consumer price index (CPI) slowed in September as increases in the price of gasoline continued to ease.
• At the end ofQ3 2018, the CPI climbed by 2.2% in Canada, 2.5% in British Columbia and 2. 7% in Metro Vancouver compared to the same period last year.
• The BoC continues to monitor inflation closely, and increases to its policy interest rate are intended to maintain the CPI rate of increase at the midpoint between 1 and 3 percent.
FIN - 10
November 30, 2018 - 5 -
6) Housing Starts6
HoUIIngSiar11 '----------,-----,------'==-==::.=_---,-------� • Motro V:�n
J!l '2
BK
7K
6K
SK
:::l 4K
3K
2K
lK
OK
6 Canada Mortgage and Housing Corporation
5999628
.Richmond
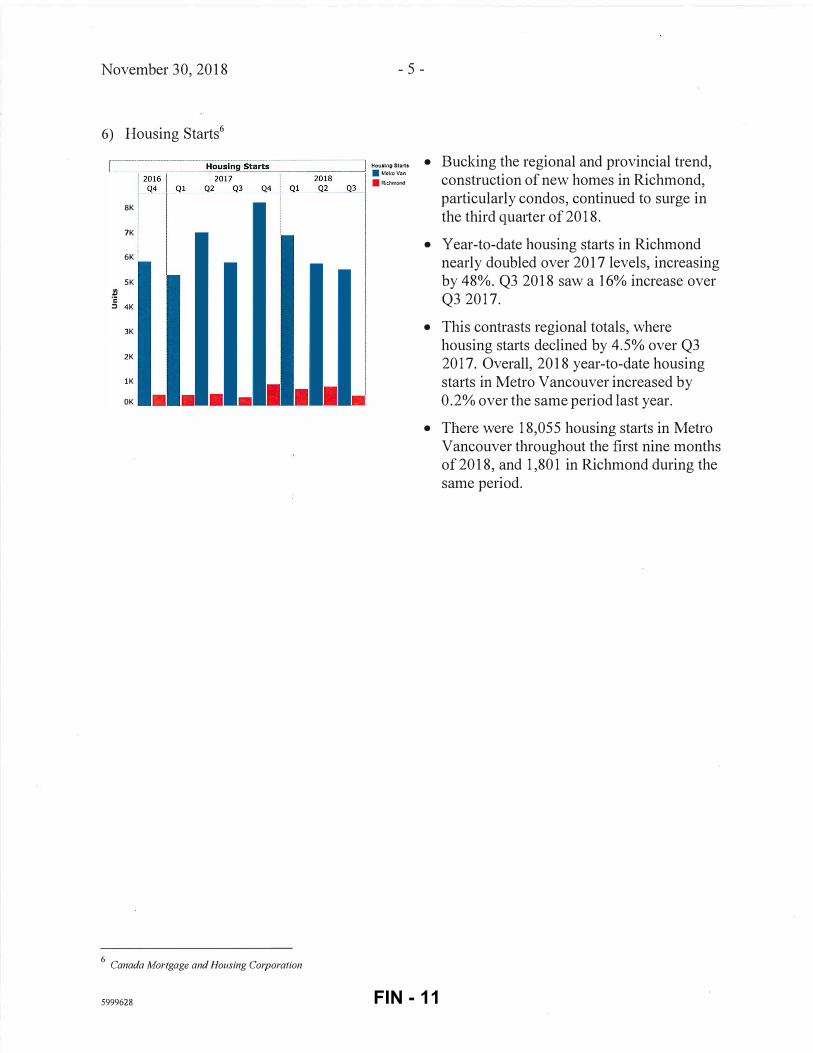
• Bucking the regional and provincial trend, construction of new homes in Richmond, particularly condos, continued to surge in the third qumier of2018.
• Year-to-date housing starts in Richmond nearly doubled over 2017 levels, increasing by 48%. Q3 2018 saw a 16% increase over Q3 2017.
• This contrasts regional totals, where housing starts declined by 4.5% over Q3 2017. Overall, 2018 year-to-date housing starts in Metro Vancouver increased by 0.2% over the same period last year.
• There were 18,055 housing starts in Metro Vancouver throughout the first nine months of2018, and 1,801 in Richmond during the same period.
FIN - 11
November 30,2018
7) Building Permits - Richmond7
Richmond Building Permits Issued 2017
Q4 Ql Q2 Q3 Q4 Ql Q2 Q3
- 6-
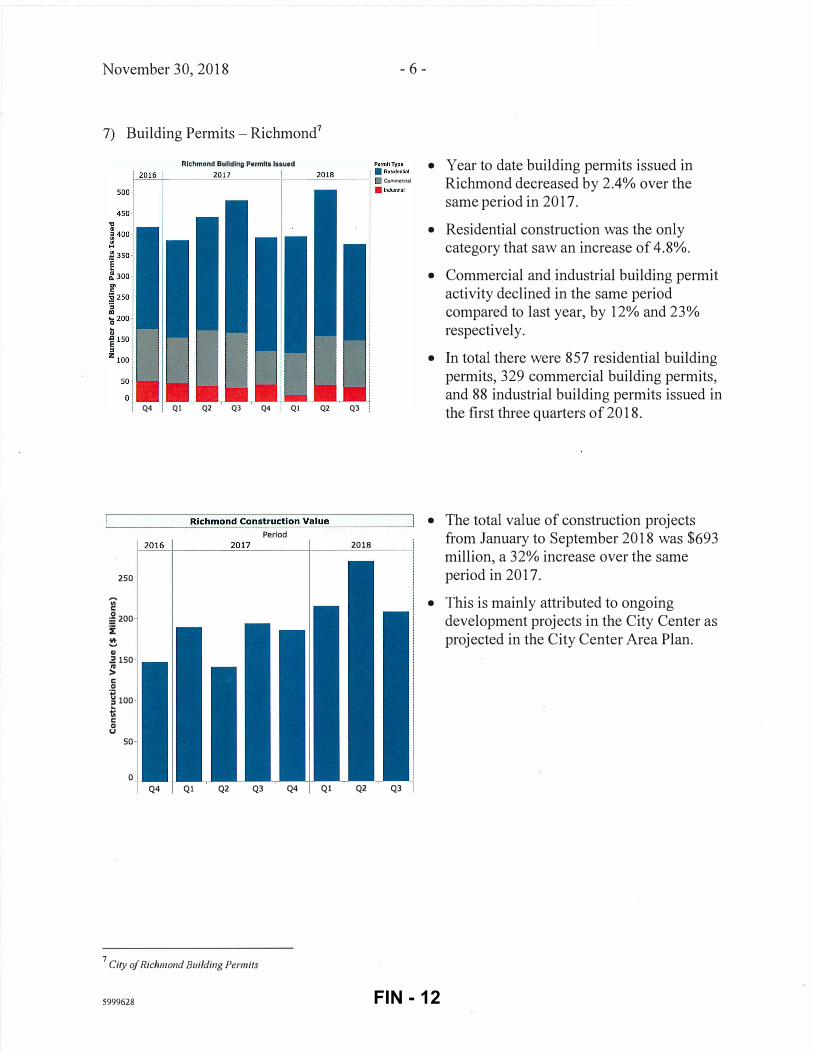
Commercial • Year to date building permits issued in
Richmond decreased by 2.4% over the same period in 2017.
• Residential construction was the only category that saw an increase of 4.8%.
• Commercial and.industrial building permit activity declined in the same period compared to last year, by 12% and 23% respectively.
• In total there were 857 residential building permits, 329 commercial building permits, and 88 industrial building permits issued in the first three quarters of 2018.
'------ �==--=.::.::===-=.:.:=-------_ji • The total value of construction projects Richmond Construction Value
250
� �200 i � 41 ..:! 150 .. > c 0
� 100 ... 'til c 0 u
50
0 Q4 Q1 Q2 Q3
7 City of Richmond Building Permits
5999628
Period 2016
Q4 Q1 Q2 Q3
from January to September 2018 was $693 million, a 32% increase over the same period in 2017.
• This is mainly attributed to ongoing development projects in the City Center as projected in the City Center Area Plan.
FIN - 12
November 30, 2018 - 7 -
8) Commercial Space8
a) Industrial Space
Industrial Space lnv•ntory ('000 SF) • Metro vancouver --t-=-t----==-----j�-----'==--===1 • Riehmond
I
Industrial Space Vacancy(%)
3.5
� � 2.5
2.0
1.5
Q4-16 Q1-17 02-17 03-17 Q4-17 Q1-18 02-18 03-18
Source: Cushman t Wekef�ld
b) Office Space
Office Space Inventory ('000 SF)
Office Space Vacancy(%) 10 ------------------------------------------·----------·------------·---·-;
c 6
� 0.. 4-
i
i � --. �--. --��--�- �·
Q4-16 Q1-17 02-17 Q3-17 Q4-17 Q1-18 02·18 Q3-18
8 Cushman & Wakefield Office and Industrial Market Beat Reports
5999628
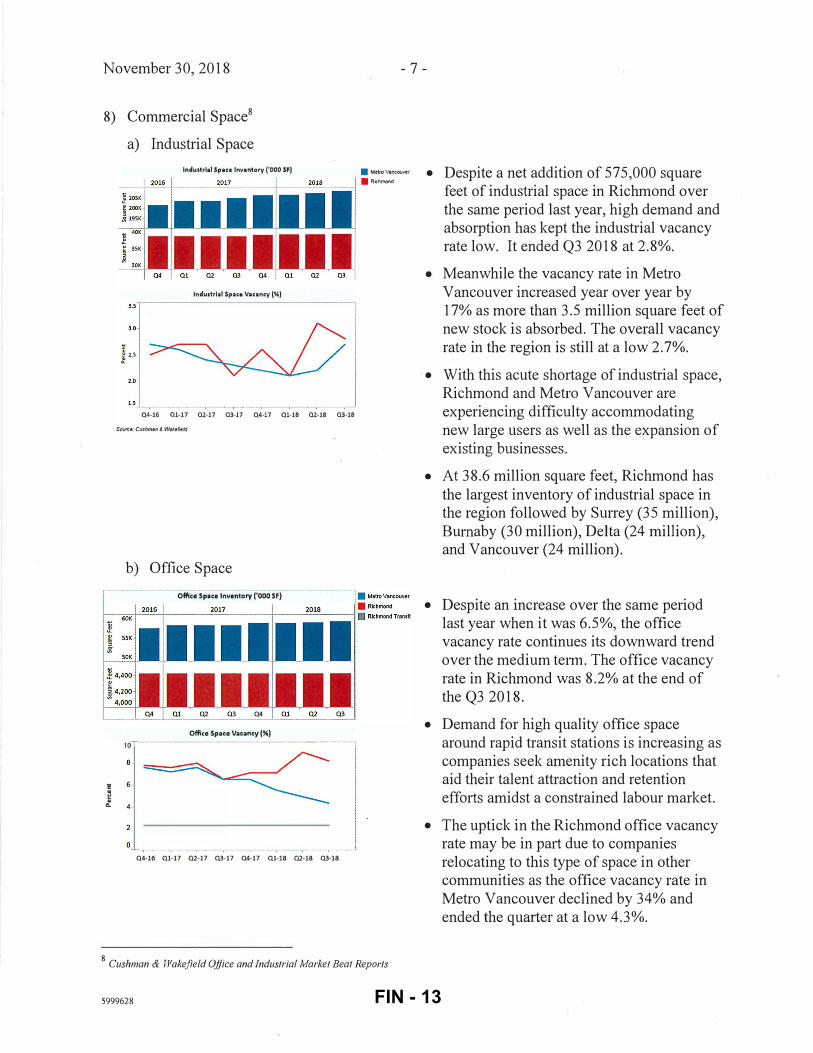
• Despite a net addition of 575,000 square feet of industrial space in Richmond over the same period last year, high demand and absorption has kept the industrial vacancy rate low. It ended Q3 2018 at 2.8%.
• Meanwhile the vacancy rate in Metro Vancouver increased year over year by 17% as more than 3.5 million square feet of new stock is absorbed. The overall vacancy rate in the region is still at a low 2.7%.
· • With this acute shortage of industrial space, Richmond and Metro Vancouver are experiencing difficulty accommodating new large users as well as the expansion of existing businesses.
• At 38.6 million square feet, Richmond has the largest inventory of industrial space in the region followed by Surrey (35 million), Burnaby (30 million), Delta (24 million), and Vancouver (24 million).
• Despite an increase over the same period last year when it was 6.5%, the office vacancy rate continues its downward trend over the medium te1m. The office vacancy rate in Richmond was 8.2% at the end of the Q3 2018.
• Demand for high quality office space around rapid transit stations is increasing as companies seek amenity rich locations that aid their talent attraction and retention eff01is amidst a constrained labour market.
• The uptick in the Richmond office vacancy rate may be in pati due to companies relocating to this type of space in other communities as the office vacancy rate in Metro Vancouver declined by 34% and ended the qumier at a low 4.3%.
FIN - 13
November 30,2018
9) Business Growth - Richmond
a) New Business Licences
Richmond New Business Licences .. Number 8r. Employees
Q4 Ql Q2 Q3 Q4 Ql Q2
- 8 -
Q3
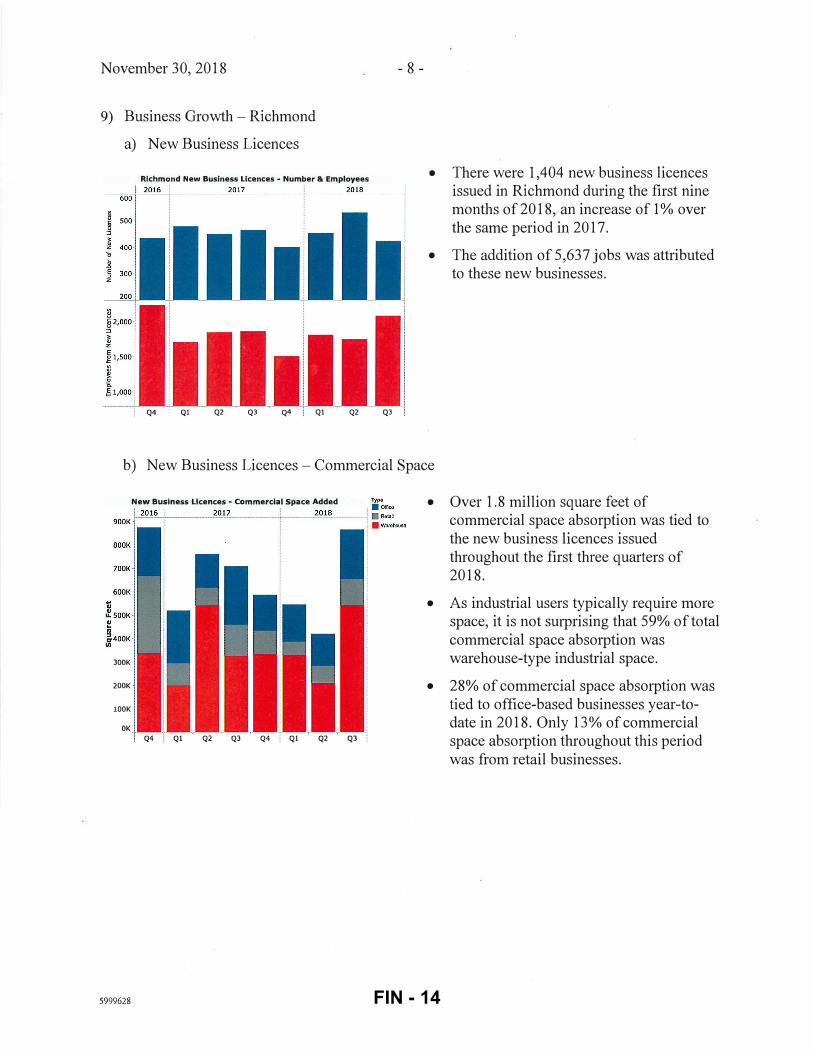
• There were 1,404 new business licences issued in Richmond during the first nine months of2018, an increase of 1% over the same period in 2017.
• The addition of 5,637 jobs was attributed to these new businesses.
b) New Business Licences- Commercial Space
JOOK
200K
lOOK
OK
5999628
New Business Licences - Commercial Space Added
I
Q4 ' Ql Q2 Q3 Q4 ' Ql Q2 Q3
• Over 1.8 million square feet of commercial space absorption was tied to
the new business licences issued throughout the first three quarters of
2018.
• As industrial users typically require more space, it is not surprising that 59% of total
commercial space absorption was warehouse-type industrial space.
• 28% of commercial space absorption was tied to office-based businesses year-todate in 2018. Only 13% of commercial space absorption throughout this period
was from retail businesses.
FIN - 14
November 30, 2018 - 9 -
1 0) Goods and People Movement
a) Regional Cargo Movemene
Regional Cargo Movement Cargo Movomont
l2016 2017 2018 • Air Corgo (Tonncs)
I Q4 Q1 Q2 -� � Ql Q2 Q3 900K:
• Port Containers (TEU)
i 600Ki
300K J I
�- - � . . . . .
�
Vl c:
� :§. X "'
0..
b) Airport Passengers 10
2016
Airport Passengers
..... 0'
2017
M 0'
M 0'
c) Richmond Hotel Room Revenue''
�
Vl c:
� 60 i: -111-
�40 ::J m > Q)
a: 20 E 0
il. 0
Richmond Hotel Room Revenue
2016 2017 2018
..... q
9 Pori of Vancouver Monthly Cmgo Stalislics 10 YVR Monthly Statistics
M 0'
11 City of Richmond Additional Hotel Room Tax Ledger; Destination BC
5999628
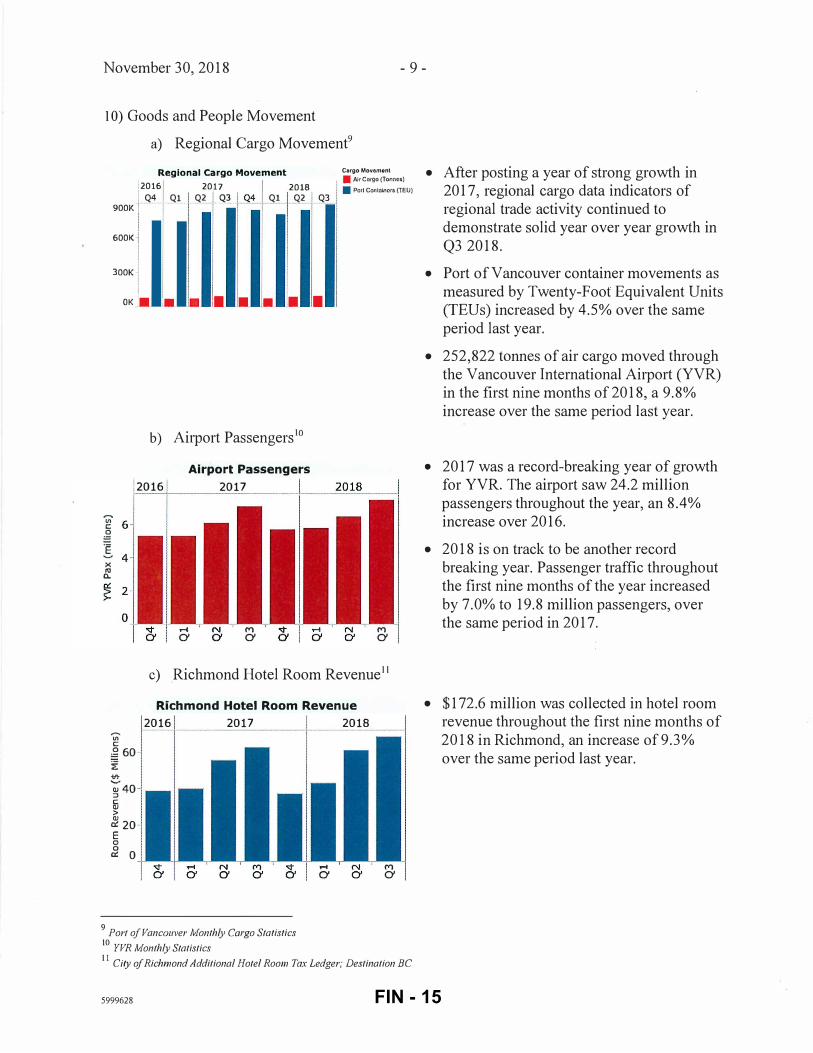
• After posting a year of strong growth in 201 7, regional cargo data indicators of regional trade activity continued to demonstrate solid year over year growth in Q3 2018.
• Port of Vancouver container movements as measured by Twenty-Foot Equivalent Units (TEUs) increased by 4.5% over the same period last year.
• 252,822 tonnes of air cargo moved through the Vancouver International Airport (YVR) in the first nine months of 2018, a 9.8% increase over the same period last year.
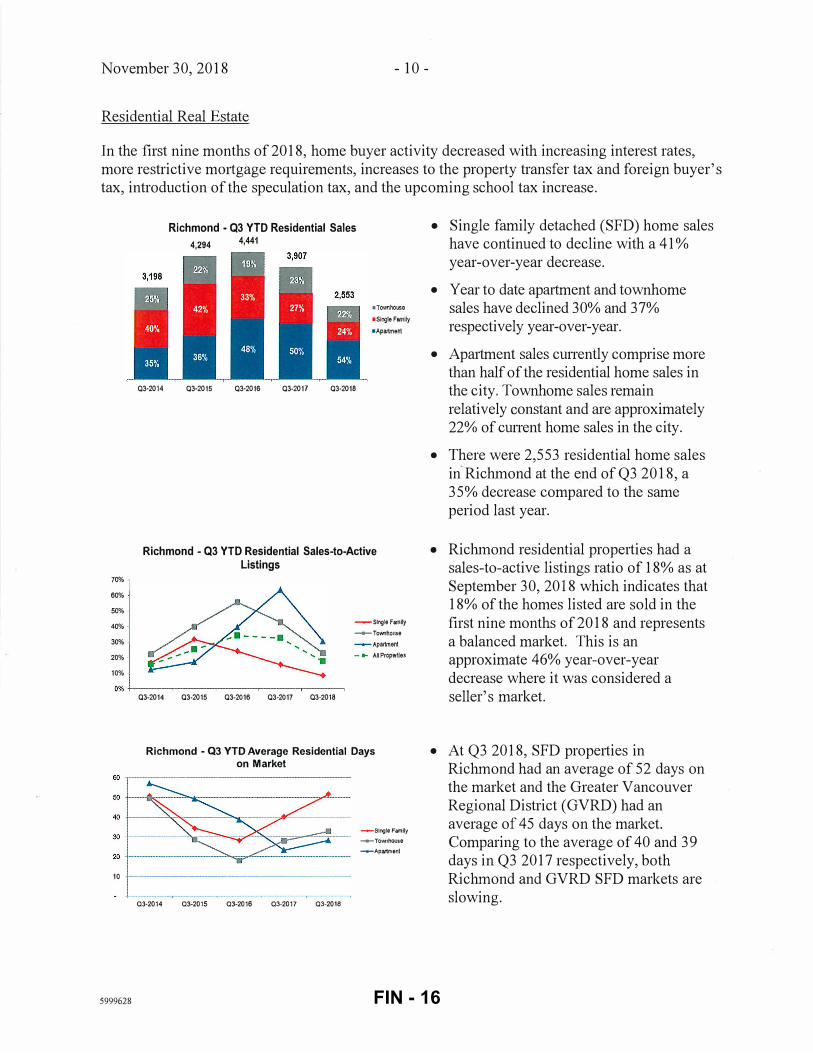
• 2017 was a record-breaking year of growth for YVR. The airport saw 24.2 million passengers throughout the year, an 8.4% increase over 2016.
• 2018 is on track to be another record breaking year. Passenger traffic throughout the first nine months of the year increased by 7.0% to 19.8 million passengers, over the same period in 2017.
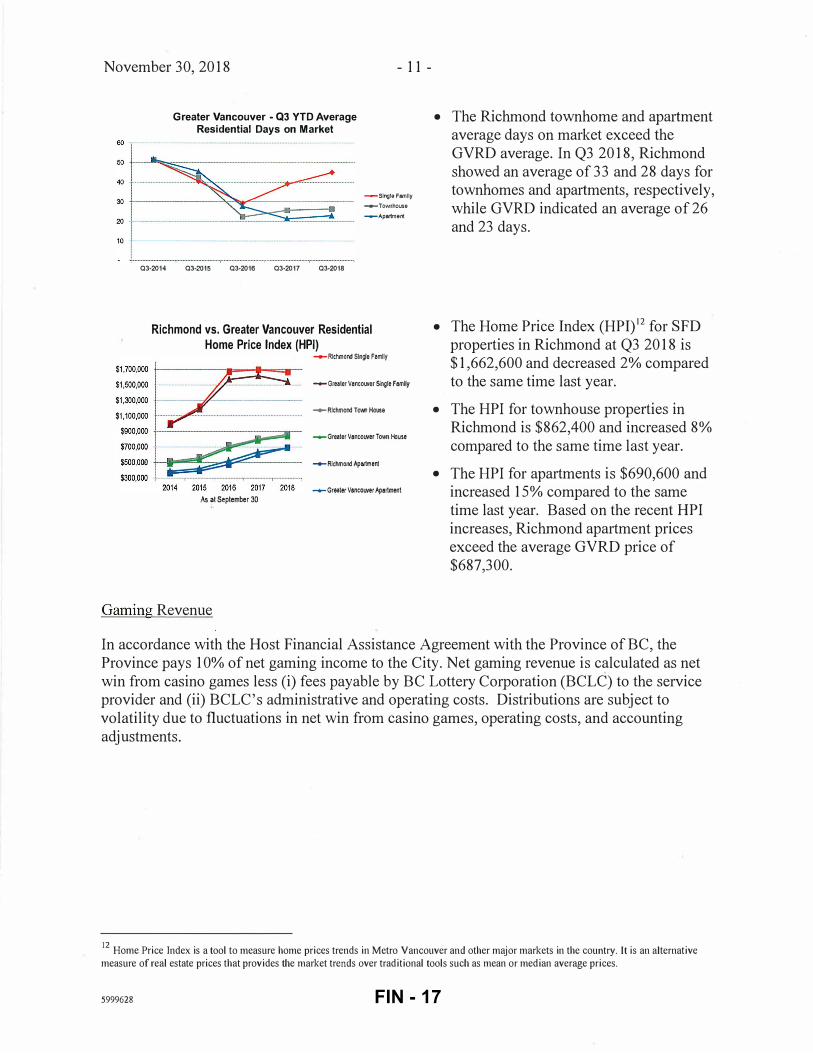
• $172.6 million was collected in hotel room revenue throughout the first nine months of 2018 in Richmond, an increase of 9.3% over the same period last year.
FIN - 15
November 30,2018 - 10 -
Residential Real Estate
In the first nine months of 2018, home buyer activity decreased with increasing interest rates,
more restrictive mmigage requirements, increases to the propetiy transfer tax and foreign buyer's tax, introduction of the speculation tax, and the upcoming school tax increase.
70% 1 60%
50%
40%.
30%
20% ·J
Richmond • Q3 YTD Residential Sales
4,294 4,441
•Tooohouse
•Single Family
•Apartment
03·2014 03·2015 03·2016 03-2017 03-2018
Richmond - Q3 YTD Residential Sales-to-Active Listings
-slngleFemlly
-+-Townhouse
-+-Apartment
- ... All Properties
10%
I 0% �--�----�----�--�----�
03-2014 03-2015 03-2016 03-2017 03-2018
Richmond - Q3 YTD Average Residential Days on Market
-single Family
-ro'Mlholl!e
-Ap81'1ment
10 �--------------------------
03-2014 03-2015 03-2016 03-2017 03-2018
5999628
• Single family detached (SFD) home sales have continued to decline with a 41%
year-over-year decrease.
• Year to date apmiment and townhome sales have declined 30% and 37% respectively year-over-year.
• Apartment sales cunently comprise more than half of the residential home sales in the city. Townhome sales remain
relatively constant and are approximately 22% of cunent home sales in the city.
• There were 2,553 residential home sales
in Richmond at the end ofQ3 2018, a
35% decrease compared to the same
period last year.
• Richmond residential properties had a sales-to-active listings ratio of 18% as at
September 30,2018 which indicates that 18% of the homes listed are sold in the
first nine months of 2018 and represents
a balanced market. This is an approximate 46% year-over-year
decrease where it was considered a
seller's market.
• At Q3 2018, SFD properties in Richmond had an average of 52 days on the market and the Greater Vancouver
Regional District (GVRD) had an average of 45 days on the market.
Comparing to the average of 40 and 39 days in Q3 2017 respectively, both
Richmond and GVRD SFD markets are
slowing.
FIN - 16
November 30, 2018 - 11 -
Greater Vancouver • Q3 YTD Average Residential Days on Market
-single Family -tt-To'Mlhouse
-Apartment
03-2014 03-2015 03-2016 03-2017 03-2018
Richmond vs. Greater Vancouver Residential Home Price Index (HPI)
-Ricllmord Sln�e Femlly
...,... Greater Vancower Single Family
....... Richmond Tooo House
_.,.....Greater Vancower Town House
-RichmordApertment
-+-Greater Vencower Apartment
As al September 30
Gaming Revenue
• The Richmond townhome and apatiment average days on market exceed the GVRD average. In Q3 2018, Richmond showed an average of 33 and 28 days for townhomes and apatiments, respectively, while GVRD indicated an average of 26 and 23 days.
• The Home Price Index (HPI)12 for SFD properties in Richmond at Q3 2018 is $1,662,600 and decreased 2% compared to the same time last year.
• The HPI for townhouse propetiies in Richmond is $862,400 and increased 8% compared to the same time last year.
• The HPI for apartments is $690,600 and increased 15% compared to the same time last year. Based on the recent HPI increases, Richmond apartment prices exceed the average GVRD price of $687,300.
In accordance with the Host Financial Assistance Agreement with the Province of BC, the Province pays 10% of net gaming income to the City. Net gaming revenue is calculated as net win from casino games less (i) fees payable by BC Lottery Corporation (BCLC) to the service provider and (ii) BCLC's administrative and operating costs. Distributions are subject to volatility due to fluctuations in net win from casino games, operating costs, and accounting adjustments.
12 Home Price Index is a tool to measure home prices trends in Metro Vancouver and other major markets in the country. It is an alternative
measure of real estate prices that provides the market trends over traditional tools such as mean or median average prices.
5999628 FIN - 17

November 30,2018
Gaming Revenue by Quarter
01 02 03 04
- 12-
• Gaming revenue for Q3 2018 decreased by 5.6% to $4.10M compared to $4.34M in Q3 2017.
• Q3 2018 decreased by 6.7% compared to the previous quarter from $4.39M to $4.10M.
River Rock continues to see a decrease in Tables Drop13 revenue as a result of the new BCLC source of funds procedures14 enacted earlier in the year. The decline continues to be offset by increased Slot Coin-In15 revenue, attributable to the renovations completed in the first quarter.
Effective June 3, 2018, Great Canadian Gaming Corporation (GCGC) signed new Operational Services Agreements (OSA) which replaced the existing casino operating and services agreements with BCLC for all gaming facilities in BC. The new OSAs will increase GCGC's accountability to BCLC through annual business planning requirements, compliance, and standards, while also creating strategic oppmiunities for greater alignment between BCLC and the GCGC.
On June 27, 2018, the BC provincial government released a report on the review of anti-money laundering (AML) policies and practices in Lower Mainland casinos. GCGC has stated that they are continuing to work in collaboration with regulators and Crown corporations to enhance the AML system and that the report's recommendations are not expected to have a material impact on GCLC's business.
At the December 11, 2017 Council meeting, the 2018 Budget was approved which included the gaming revenue allocation for 2018. The distribution of these funds is detailed in Table 1 with any surplus revenue transferred to the major capital community facility program (Capital Building Infrastructure Reserve). The distribution is consistent with the 2017 gaming revenue allocation.
Table 1: Distribution of the 2018 gaming revenue allocation
Capital Reserves Grants Council Community Initiatives Account Debt Servicing Operating (RCMP) Capital Building Infrastructure Reserve
Distribution 2018 Budget 30% $5.0M 15% 2.5M
2% 0.3M Fixed 5.0M
Four Officers 0.7M Remainder 3.0M
Total $16.5M
13 Table drop means the collective amount of money customers deposit to purchase casino chips to wager on table games.
14 Source of funds procedures requires all BC casinos to obtain a bank receipt for any buy-ins of$10,000 or more over a 24-hour period. The original receipt must be from the same day of the transaction and it must display the financial institution, branch, and account number.
15 Coin in/ coin out refer to the number of credits or units both played and paid out. Coin in are the number of units played and coin out are the number of units won.
5999628 FIN - 18
November 30,2018 - 13-
At end ofQ3 2018, the City received $12.83M or 77.7% of the annual budgeted amount.
Operating Activity
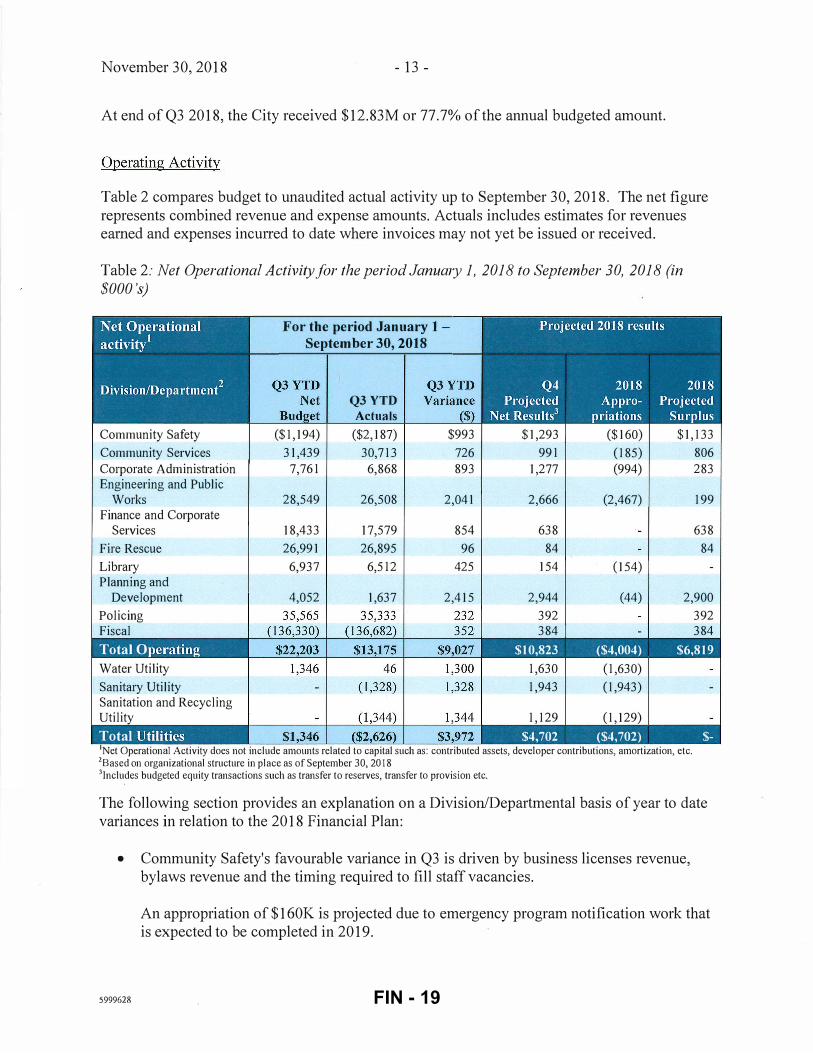
Table 2 compares budget to unaudited actual activity up to September 30,2018. The net figure represents combined revenue and expense amounts. Actuals includes estimates for revenues eamed and expenses incuned to date where invoices may not yet be issued or received.
Table 2: Net Operational Activity for the period January 1, 2018 to September 30, 2018 (in $000's)
Community Safety
Community Services
Corporate Administration Engineering and Public
Works Finance and Corporate
Services
Fire Rescue
Library Planning and
Development
Policing Fiscal
Total 0 eratin
Water Utility
Sanitary Utility Sanitation and Recycling Utility
Total Utilities
For the period January 1 -September 30, 2018
Q3YTD Actuals
($1,194) ($2,187) $993
31,439 30,713 726
7,761 6,868 893
28,549 26,508 2,041
18,433 17,579 854
26,991 26,895 96
6,937 6,512 425
4,052 1,637 2,415
$1,293 ($160) $1,133
991 (185) 806
1,277 (994) 283
2,666 (2,467) 199
638 638
84 84
154 (154)
2,944 (44) 2,900
392 392
384 384
$10,823 ($4,004) $6,819
1,630
1,943
1,129
(1,630)
(1,943)
(1,129)
$4,702 ($4,702) $-1Net Operational Activity does not include amounts related to capital such as: contributed assets, developer contributions, amortization, etc. 2Based on organizational structure in place as of September 30, 2018 3lncludes budgeted equity transactions such as transfer to reserves, transfer to provision etc.
The following section provides an explanation on a Division/Departmental basis of year to date variances in relation to the 2018 Financial Plan:
• Community Safety's favourable variance in Q3 is driven by business licenses revenue, bylaws revenue and the timing required to fill staff vacancies.
5999628
An appropriation of $160K is projected due to emergency program notification work that is expected to be completed in 2019.
FIN - 19
November 30, 2018 - 14-
• Community Services' favorable Q3 variance is mainly due to lower parks operations costs and recreation services. Parks has a number of vacant positions in the process of being filled and has experienced lower than expected public works materials and equipment costs. Recreation revenue exceeds estimates for aquatics and arenas, which is offset by higher labour costs. Recreation also has a projected surplus due to the Minoru Centre for Active Living Operating Budget Impact being phased in whereas the facility is not yet in operation. This budget has been committed to purchase equipment for the new facility and the remaining projected year end surplus of$125K is appropriated for the facility grand opening program and marketing in 2019. In Addition, $60K is appropriated to complete spending of the Community Action Initiative and Dementia Friendly grants.
• Corporate Administration's favourable variance is due to vacant positions in the process of being filled and corporate programs which are in the planning stage.
An appropriation of $994K is projected to continue these corporate initiatives and training programs in 2019.
• Engineering and Public Works' favourable net operating variance in Q3 is mainly due to lower consulting and contract expenses in Engineering, lower ditch canal maintenance costs and timing related to snow and ice control spending.
Appropriations at year end include the following: The fleet surplus estimated to be $165,000 and will be transfened to the Equipment Reserve in accordance with Policy 2020; $150,000 for wet materials from ditching for Sidaway projects, $1.2M for project development projects expected to be completed in 2019 and; $952,000 for service fees relating to Lulu Island Energy Company.
• Finance and Corporate Services surplus is mainly due to vacancies in various departments filled throughout the year and timing of IT maintenance contracts.
• Fire Rescue's favourable variance is from higher revenue from bylaw fines, false alarms and inspection fees.
• The Library's Q3 favourable variance is due to timing required to fill vacant positions during the year and lower IT operating costs incurred to date. The projected surplus is mainly from vacant positions throughout the year and will be appropriated for future use within library operations.
• Planning and Development favourable revenue variance is primarily from building permit revenue from building pe1mit fees received mostly for multi residential buildings.
5999628
Appropriation at year end includes $44K to purchase traffic operational products such as data traffic collection devices and speed radar boards.
FIN - 20
November 30,2018 - 15 -
• Policing's favourable variance is due to the time required to staff municipal vacancies and an increase in criminal record check revenues. The officer vacancies in the RCMP contract result in savings that reduce the required funding from the Rate Stabilization Account and the actuals include an accrual in relation to the anticipated settlement of the officers' retroactive salary adjustment.
• Fiscal is on budget.
• The Water Utility's favorable variance is mainly due to unbudgeted revenue received from developers for water consumption charges during construction of new residential developments, offset by higher water purchases year to date and material and equipment expenses related to water residential meters. Any surplus at year end will be transferred to the Water Levy Stabilization Provision.
• Sanitary Sewer Utility's favourable variance is mainly due to unbudgeted revenues received from developers for sanitary sewer user fees during construction of residential developments. Any surplus at year end will be transfened to the Sewer Stabilization Provision.
• Sanitation and Recycling has a favourable variance due to higher than budgeted revenue from Multi-Material BC and Garbage Utility revenues, and lower garbage and recycling processing fees. Any surplus at year end will be transferred to the General Solid Waste and Recycling Provision.
The presentation of the figures for the Financial Statement, Statement of Operations is different than the Net Budget presentation above. The above presentation combines revenues and expenses and presents the net amount inclusive of transfers. The Statement of Operations presents the revenues and expenses separately and prior to any surplus appropriations and transfer to reserves. The Statement of Operations for the Nine Month Period Ended September 30, 2018, with comparative figures for 2017 is included in Attachment 3.
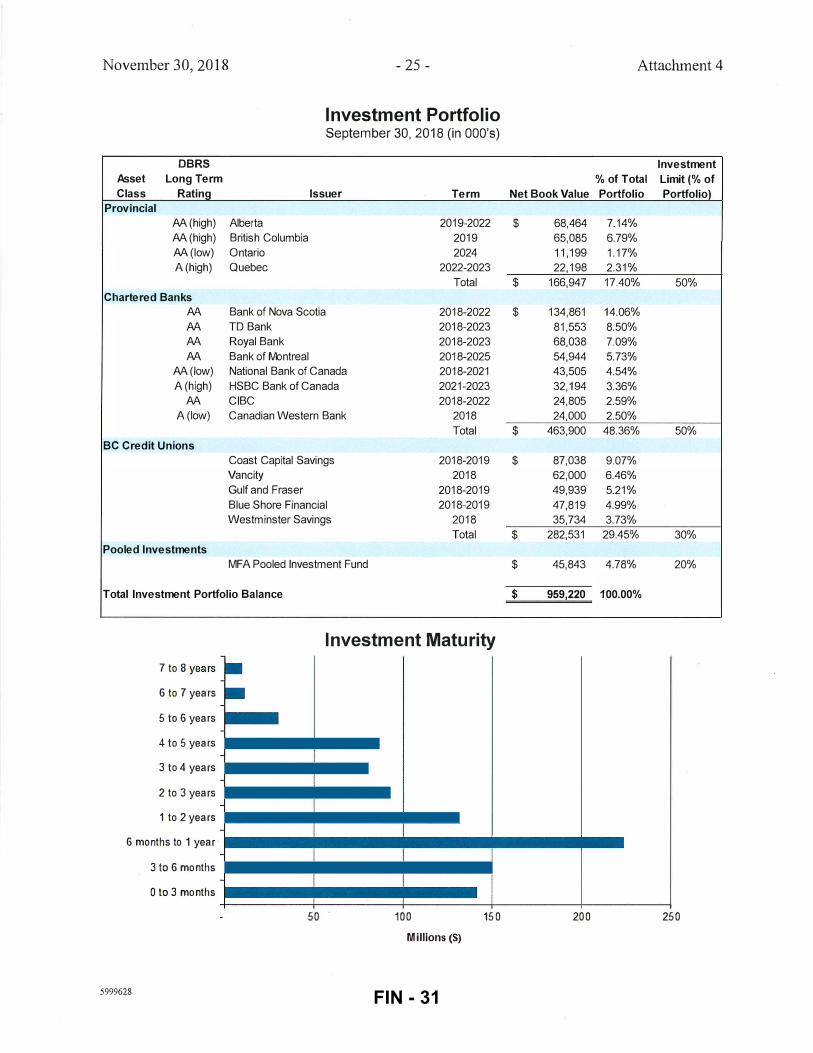
Investment Portfolio
The City's investment portfolio at September 30, 2018 was $959.2 million, with an average yield on investment of 2.34%. The interest rate environment and the City's cash flow projections have influenced the terms and types of investments that the City holds (Attachment 4).
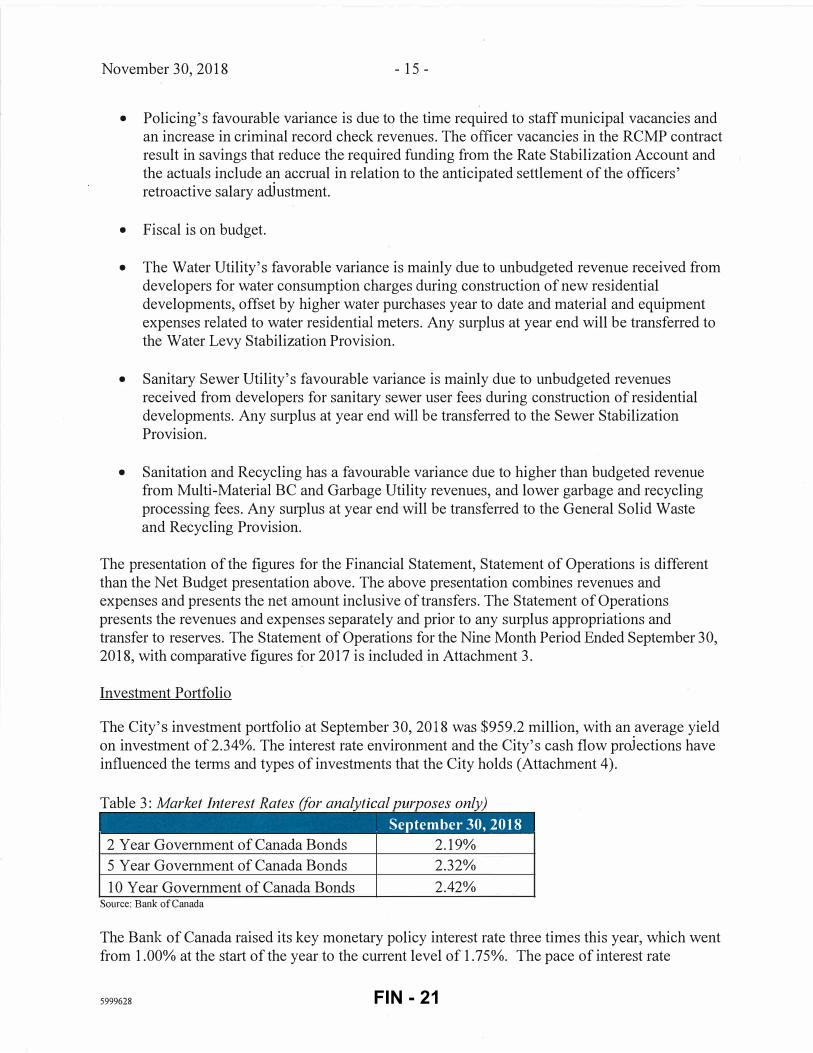
Table 3: Market Interest Rates (for analytical purposes only)
September 30, 2018
2 Year Govemment of Canada Bonds 2.19%
5 Year Govemment of Canada Bonds 2.32%
10 Year Government of Canada Bonds 2.42% Source: Bank of Canada
The Banlc of Canada raised its key monetary policy interest rate three times this year, which went from 1.00% at the start of the year to the current level of 1.75%. The pace of interest rate
5999628 FIN - 21
November 30, 2018 - 16-
increase is in line with market and economists' expectations attributed to the solid economic data and also relief in the trade uncertainty facing Canadian businesses.
The global economic outlook remains steady and the US economy is expected to moderate over the projection horizon. The new USMCA will reduce trade policy uncetiainty in North America, which has been an important curb on business confidence and investment. However, trade conflict, particularly between the United States and China, is weighing on global growth and commodity prices. Financial market volatility has resurfaced and some emerging markets are under stress. Overall, global financial conditions remain accommodative.
Household spending is expected to continue to grow at a healthy pace, supported by solid employment income growth. Households are adjusting their spending as expected in response to higher interest rates and housing market policies. In this context, household credit growth continues to moderate and housing activity across Canada is stabilizing.
The improved interest rate conditions allow the City to reinvest funds at the more attractive market rates, thereby boosting the City's average yield to 2.34%. If this trend continues as maturities take place throughout the year, the City may reinvest its funds in the higher yielding products.
The cunent yield enhancement strategies continue to play a key role in the City's investment pmifolio. Duration of the City's holding continues to remain in the shmi to mid-term range to achieve liquidity (for capital requirements) and to allow flexibility for reinvestment as we enter into a rising interest rate environment.
The City continues to comply with its Investment Policy (3703) by carrying a diversified investment portfolio with strong credit quality, meeting the objectives of managing its investment activities in a manner that seeks to preserve capital and to realize a reasonable rate of return.
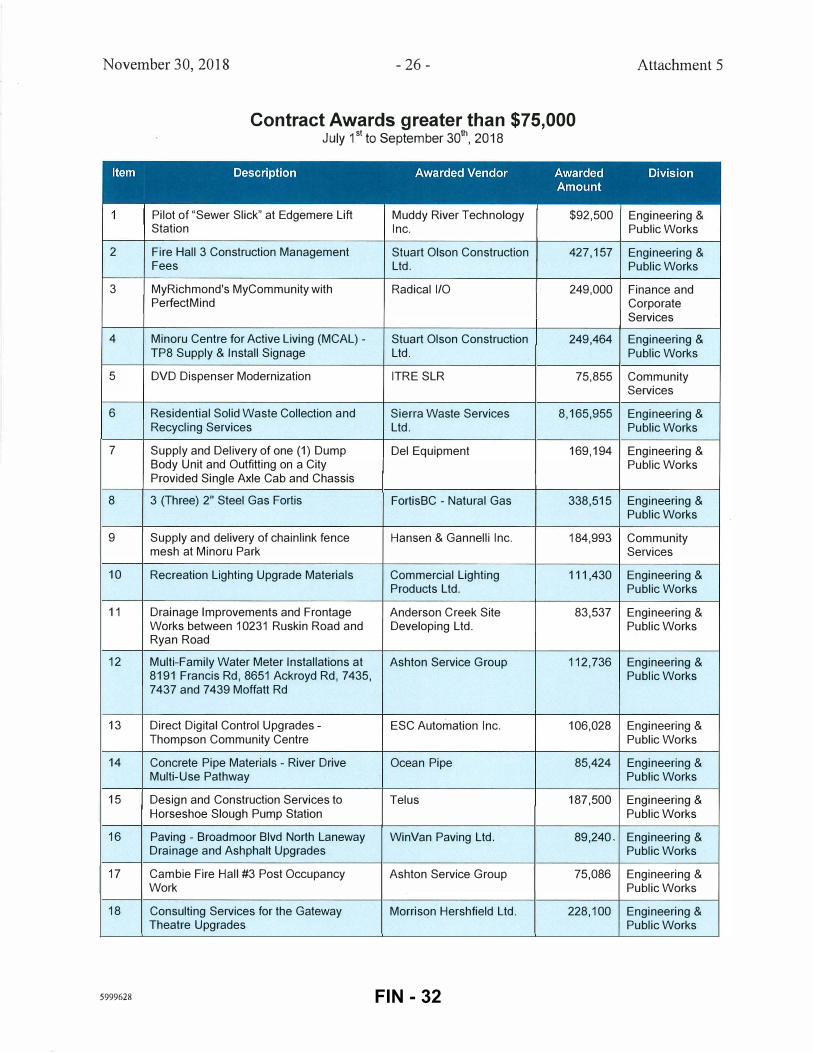
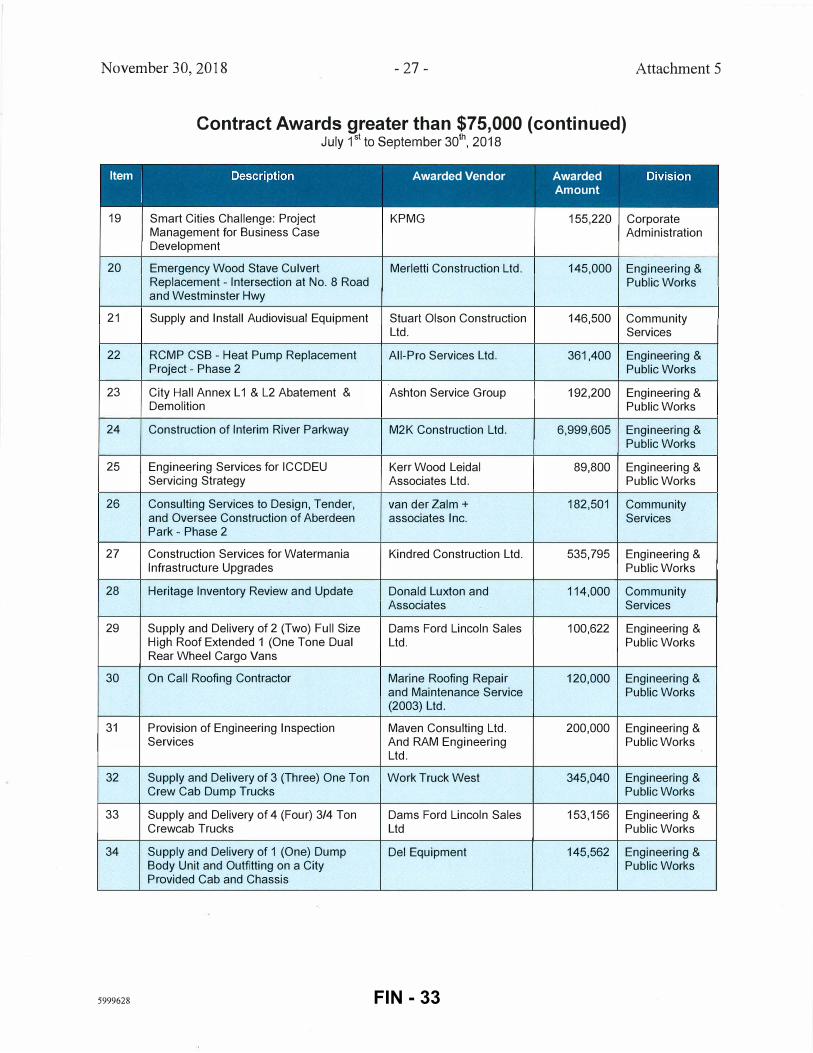
Contract Awards
This report provides information on the formal contracts awarded by the City during the third qumier. In accordance with Policy 3104, 34 contracts greater than $75,000 were awarded totalling over $21.0 million (Attachment 5).
Financial Impact
None.
5999628 FIN - 22
November 30, 2018 - 17 -
Conclusion
The City ofRichmond has maintained its strong financial position through the third quarter of2018. Building construction and development activity is exceeding budget and revenue collection and business activity remains steady. It is expected that these positive trends will continue through the last three months of the year. The forecast surplus at the end of the third quarter is $6.8M and following the year-end audit, the finalized surplus will be placed in the Rate Stabilization Account for future tax rate stabilization or one time expenditures as authorised by Council.
Cin�PA,CMA Manager, Financial Reporting (604) 276-4077
Att. 1: Att. 2: Att. 3: Att. 4: Att. 5:
5999628
Economic Indicators Financial and Key Indicators Unaudited Statement of Operations Investment Portfolio Contract Awards greater than $75,000
FIN - 23
November 30,2018 - 18- Attachment 1
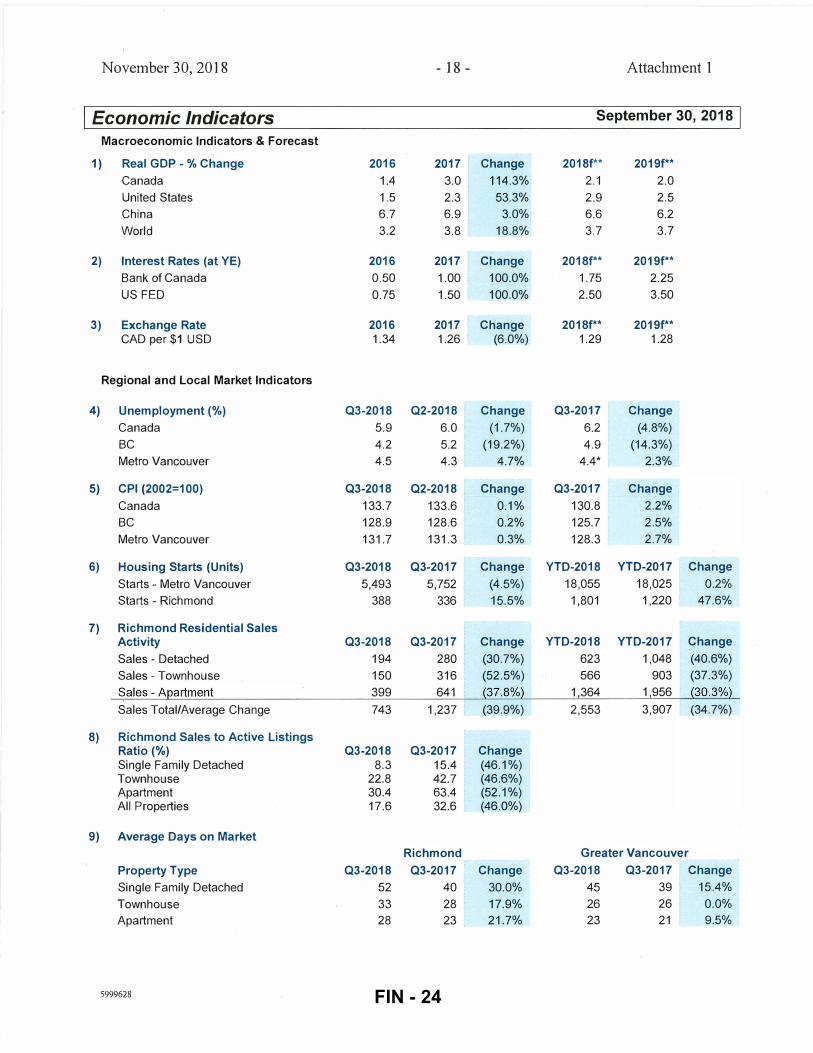
I Economic Indicators September 30, 2018 I Macroeconomic Indicators & Forecast
1) Real GOP-% Change 2016 2017 Change 2018f** 2019f**
Canada 1.4 3.0 114.3% 2.1 2.0 United States 1.5 2.3 53.3% 2.9 2.5 China 6.7 6.9 3.0% 6.6 6.2 World 3.2 3.8 18.8% 3.7 3.7
2) Interest Rates (at YE) 2016 2017 Change 2018f** 2019f**
Bank of Canada 0.50 1.00 100.0% 1.75 2.25 US FED 0.75 1.50 100.0% 2.50 3.50
3) Exchange Rate 2016 2017 Change 2018f** 2019f** CAD per $1 USD 1.34 1.26 (6.0%) 1.29 1.28
Regional and Local Market Indicators
4) Unemployment(%) Q3-2018 Q2-2018 Change Q3-2017 Change
Canada 5.9 6.0 (1.7%) 6.2 (4.8%) BC 4.2 5.2 (19.2%) 4.9 (14.3%) Metro Vancouver 4.5 4.3 4.7% 4.4* 2.3%
5) CPI (2002=1 00) Q3-2018 Q2-2018 Change Q3-2017 Change
Canada 133.7 133.6 0.1% 130.8 2.2% BC 128.9 128.6 0.2% 125.7 2.5% Metro Vancouver 131.7 131.3 0.3% 128.3 2.7%
6) Housing Starts (Units) Q3-2018 Q3-2017 Change YTD-2018 YTD-2017 Change
Starts - Metro Vancouver 5,493 5,752 (4.5%) 18,055 18,025 0.2% Starts - Richmond 388 336 15.5% 1,801 1,220 47.6%
7) Richmond Residential Sales Activity Q3-2018 Q3-2017 Change YTD-2018 YTD-2017 Change
Sales - Detached 194 280 (30.7%) 623 1,048 (40.6%) Sales - Townhouse 150 316 (52.5%) 566 903 (37.3%) �ales - A�artment 399 641 (37.8%} 1,364 1,956 {30.3%} Sales Total/Average Change 743 1,237 (39.9%) 2,553 3,907 (34.7%)
8) Richmond Sales to Active Listings Ratio(%) Q3-2018 Q3-2017 Change Single Family Detached 8.3 15.4 (46.1%) Townhouse 22.8 42.7 (46.6%) Apartment 30.4 63.4 (52.1%) All Properties 17.6 32.6 (46.0%)
9) Average Days on Market
Richmond Greater Vancouver
Property Type Q3-2018 Q3-2017 Change Q3-2018 Q3-2017 Change
Single Family Detached 52 40 30.0% 45 39 15.4% Townhouse 33 28 17.9% 26 26 0.0% Apartment 28 23 21.7% 23 21 9.5%
5999628 FIN - 24
November 30,2018 - 19- Attachment 1
I Economic Indicators September 30, 2018 I
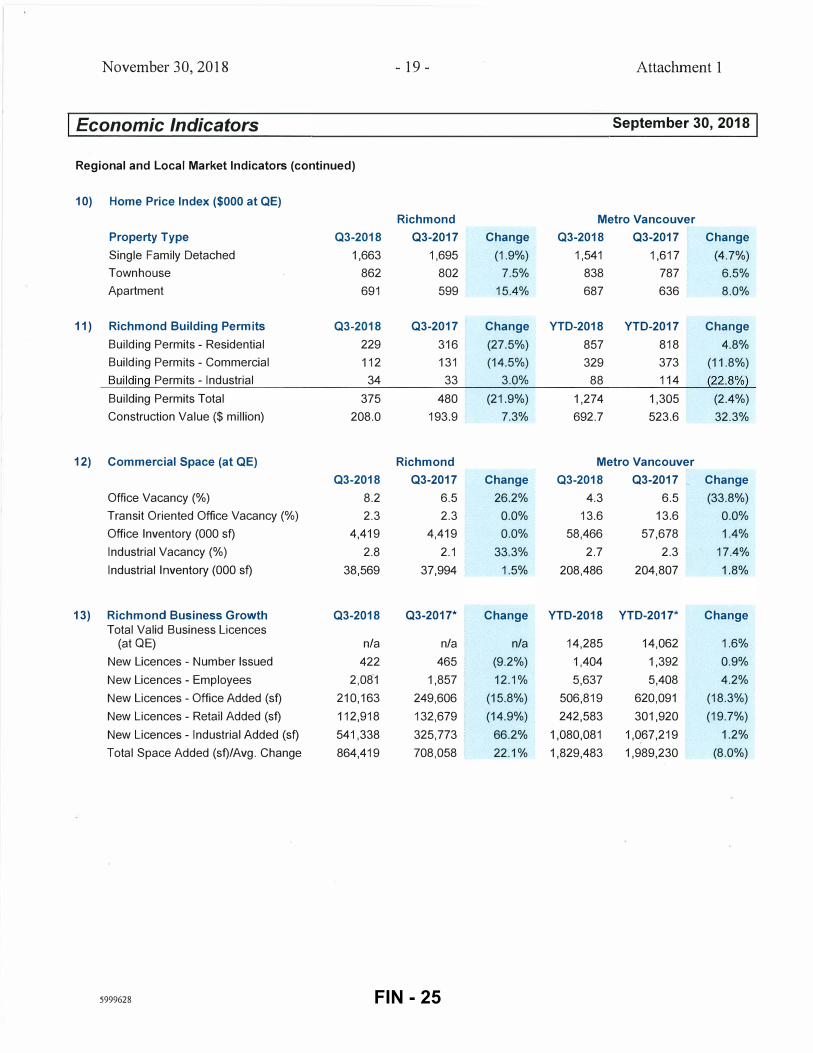
Regional and Local Market Indicators (continued)
10) Home Price Index ($000 at QE)
Richmond Metro Vancouver
Property Type Q3-2018 Q3-2017 Change Q3-2018 Q3-2017 Change
Single Family Detached 1,663 1,695 (1.9%) 1,541 1,617 (4.7%) Townhouse 862 802 7.5% 838 787 6.5% Apartment 691 599 15.4% 687 636 8.0%
11) Richmond Building Permits Q3-2018 Q3-2017 Change YTD-2018 YTD-2017 Change
Building Permits - Residential 229 316 (27.5%) 857 818 4.8% Building Permits - Commercial 112 131 (14.5%) 329 373 (11.8%) Building Permits - Industrial 34 33 3.0% 88 114 (22.8%}
Building Permits Total 375 480 (21.9%) 1,274 1,305 (2.4%) Construction Value ($ million) 208.0 193.9 7.3% 692.7 523.6 32.3%
12) Commercial Space (at QE) Richmond Metro Vancouver
Q3-2018 Q3-2017 Change Q3-2018 Q3-2017 Change
Office Vacancy (%) 8.2 6.5 26.2% 4.3 6.5 (33.8%) Transit Oriented Office Vacancy (%) 2.3 2.3 0.0% 13.6 13.6 0.0% Office Inventory (000 sf) 4,419 4,419 0.0% 58,466 57,678 1.4%
Industrial Vacancy (%) 2.8 2.1 33.3% 2.7 2.3 17.4%
Industrial Inventory (000 sf) 38,569 37,994 1.5% 208,486 204,807 1.8%
13) Richmond Business Growth Q3-2018 Q3-2017* Change YTD-2018 YTD-2017* Change Total Valid Business Licences
(at QE) n/a n/a n/a 14,285 14,062 1.6%
New Licences - Number Issued 422 465 (9.2%) 1,404 1,392 0.9%
New Licences - Employees 2,081 1,857 12.1% 5,637 5,408 4.2%
New Licences - Office Added (sf) 210,163 249,606 (15.8%) 506,819 620,091 (18.3%)
New Licences - Retail Added (sf) 112,918 132,679 (14.9%) 242,583 301,920 (19.7%)
New Licences- Industrial Added (sf) 541,338 325,773 66.2% 1,080,081 1,067,219 1.2%
Total Space Added (sf)/Avg. Change 864,419 708,058 22.1% 1,829,483 1,989,230 (8.0%)
5999628 FIN - 25
November 30,2018
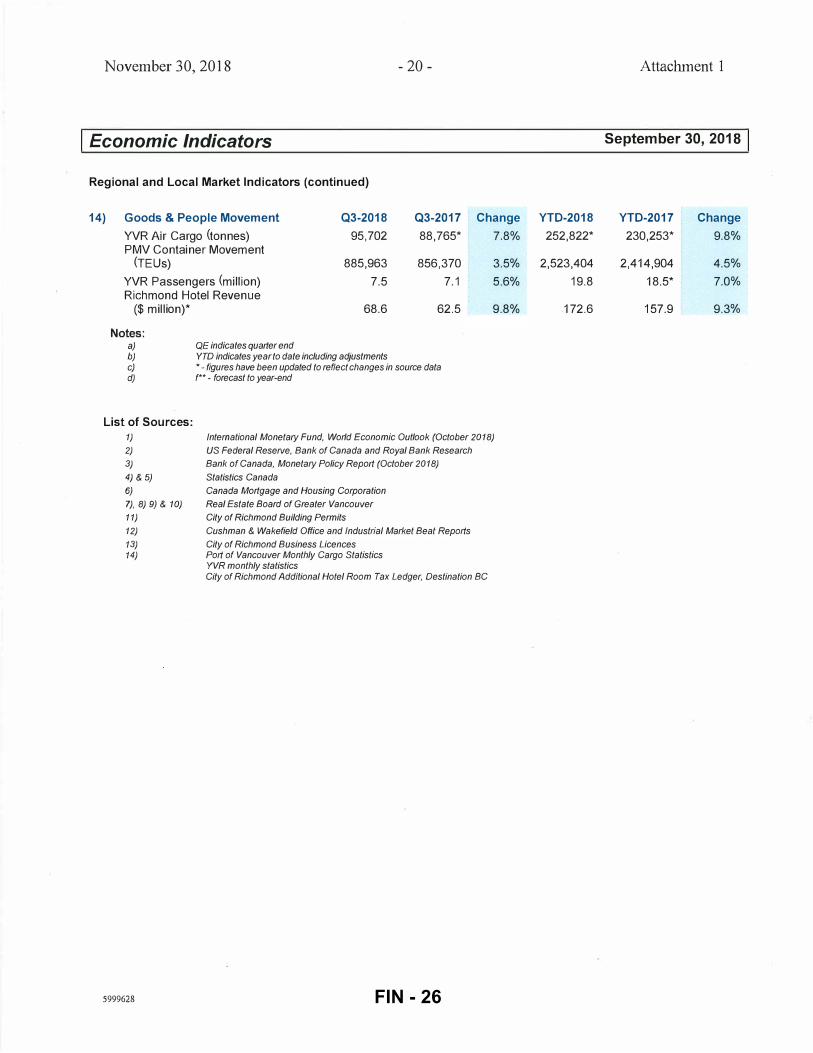
Economic Indicators
Regional and Local Market Indicators (continued)
14) Goods & People Movement Q3-2018
YVR Air Cargo (tonnes) 95,702 PMV Container Movement
(TEUs) 885,963
YVR Passengers (million) 7.5 Richmond Hotel Revenue
($ million)* 68.6
QE indicates quarter end
Notes: a) b) YTD indicates year to date including adjustments
-20-
Q3-2017
88,765*
856,370
7.1
62.5
c) d)
•- figures have been updated to reflect changes in source data f **- forecast to year-end
Change
7.8%
3.5%
5.6%
9.8%
List of Sources: 1)
2)
3)
International Monetary Fund, World Economic Outlook (October 2018)
US Federal Reserve, Bank of Canada and Royal Bank Research
Bank of Canada, Monetary Policy Report (October 2018)
4) & 5)
6)
7), 8) 9) & 10)
11)
12)
13) 14)
5999628
Statistics Canada
Canada Mortgage and Housing Corporation
Real Estate Board of Greater Vancouver
City of Richmond Building Permits
Cushman & Wakefield Office and Industrial Market Beat Reports
City of Richmond Business Licences Port of Vancouver Monthly Cargo Statistics YVR monthly statistics City of Richmond Additional Hotel Room Tax Ledger, Destination BC
Attachment 1
September 30, 2018
YTD-2018 YTD-2017 Change
252,822* 230,253* 9.8%
2,523,404 2,414,904 4.5%
19.8 18.5* 7.0%
172.6 157.9 9.3%
FIN - 26
November 30,2018 -21 - Attachment 2
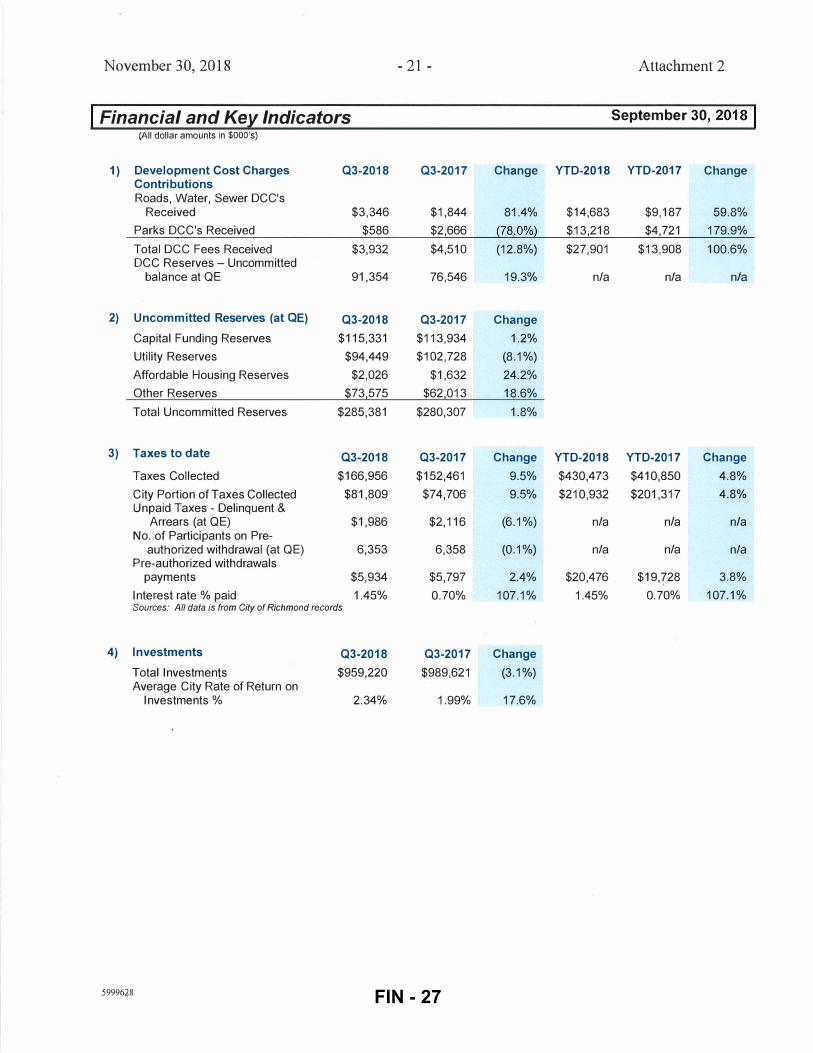
I Financial and Key Indicators September 30, 2018 1 (All dollar amounts in $DOD's)
1) Development Cost Charges 03-2018 03-2017 Change YTD-2018 YTD-2017 Change Contributions Roads, Water, Sewer DCC's
Received $3,346 $1,844 81.4% $14,683 $9,187 59.8%
Parks DCC's Received $586 $2,666 (78.0%} $13,218 $4,721 179.9%
Total DCC Fees Received $3,932 $4,510 (12.8%) $27,901 $13,908 100.6% DCC Reserves - Uncommitted
balance at QE 91,354 76,546 19.3% n/a n/a n/a
2) Uncommitted Reserves (at OE) 03-2018 03-2017 Change
Capital Funding Reserves $115,331 $113,934 1.2%
Utility Reserves $94,449 $102,728 (8.1%)
Affordable Housing Reserves $2,026 $1,632 24.2%
Other Reserves $73,575 $62,013 18.6%
Total Uncommitted Reserves $285,381 $280,307 1.8%
3) Taxes to date 03-2018 03-2017 Change YTD-2018 YTD-2017 Change
Taxes Collected $166,956 $152,461 9.5% $430,473 $410,850 4.8%
City Portion of Taxes Collected $81,809 $74,706 9.5% $210,932 $201,317 4.8% Unpaid Taxes - Delinquent &
Arrears (at QE) $1,986 $2,116 (6.1%) n/a n/a n/a No. of Participants on Pre-
authorized withdrawal (at QE) 6,353 6,358 (0.1%) n/a n/a n/a Pre-authorized withdrawals
payments $5,934 $5,797 2.4% $20,476 $19,728 3.8%
Interest rate % paid 1.45% 0.70% 107.1% 1.45% 0.70% 107.1% Sources: All data is from City of Richmond records
4) Investments 03-2018 03-2017 Change
Total Investments $959,220 $989,621 (3.1 %) Average City Rate of Return on
Investments % 2.34% 1.99% 17.6%
5999628 FIN - 27
November 30, 2018 -22-
I Financial and Key Indicators (All dollar amounts in $DOD's)
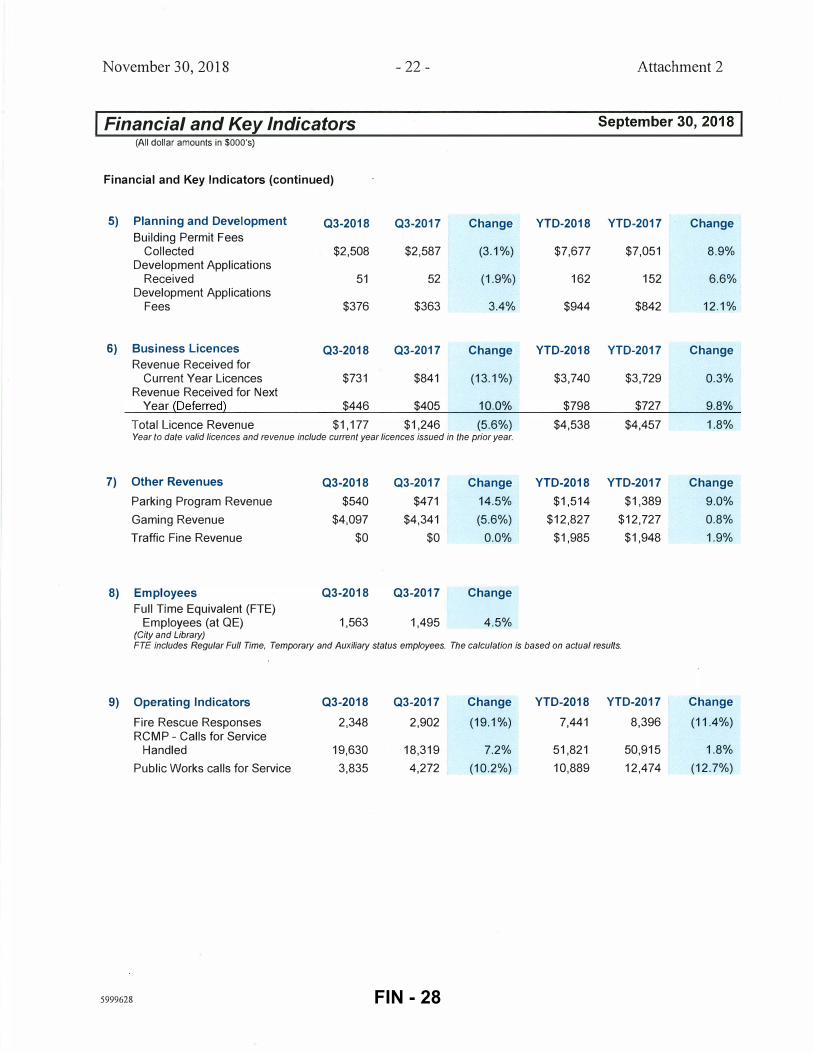
Financial and Key Indicators (continued)
5) Planning and Development Q3-2018 Q3-2017 Change Building Permit Fees
Collected $2,508 $2,587 (3.1%) Development Applications
Received 51 52 (1.9%) Development Applications
Fees $376 $363 3.4%
6) Business Licences Q3-2018 Q3-2017 Change Revenue Received for
Current Year Licences $731 $841 (13.1%) Revenue Received for Next
Year (Deferred} $446 $405 10.0%
Total Licence Revenue $1,177 $1,246 (5.6%) Year to date valid licences and revenue include current year licences issued in the prior year.
7) Other Revenues Q3-2018 Q3-2017 Change
Parking Program Revenue $540 $471 14.5%
Gaming Revenue $4,097 $4,341 (5.6%)
Traffic Fine Revenue $0 $0 0.0%
8) Employees Q3-2018 Q3-2017 Change
Full Time Equivalent (FTE) Employees (at QE) 1 ,563 1 ,495 4.5%
(City and Library)
Attachment 2
September 30, 2018 1
YTD-2018 YTD-2017 Change
$7,677 $7,051 8.9%
162 152 6.6%
$944 $842 12.1%
YTD-2018 YTD-2017 Change
$3,740 $3,729 0.3%
$798 $727 9.8%
$4,538 $4,457 1.8%
YTD-2018 YTD-2017 Change
$1,514 $1,389 9.0%
$12,827 $12,727 0.8%
$1,985 $1,948 1.9%
FTE includes Regular Full Time, Temporary and Auxiliary status employees. The calculation is based on actual results.
9) Operating Indicators Q3-2018 Q3-2017 Change YTD-2018 YTD-2017 Change
Fire Rescue Responses 2,348 2,902 (19.1%) 7,441 8,396 (11.4%) RCMP- Calls for Service
Handled 19,630 18,319 7.2% 51,821 50,915 1.8%
Public Works calls for Service 3,835 4,272 (10.2%) 10,889 12,474 (12.7%)
5999628 FIN - 28
November 30,2018 - 23-
I Financial and Key Indicators {All dollar amounts in $000's)
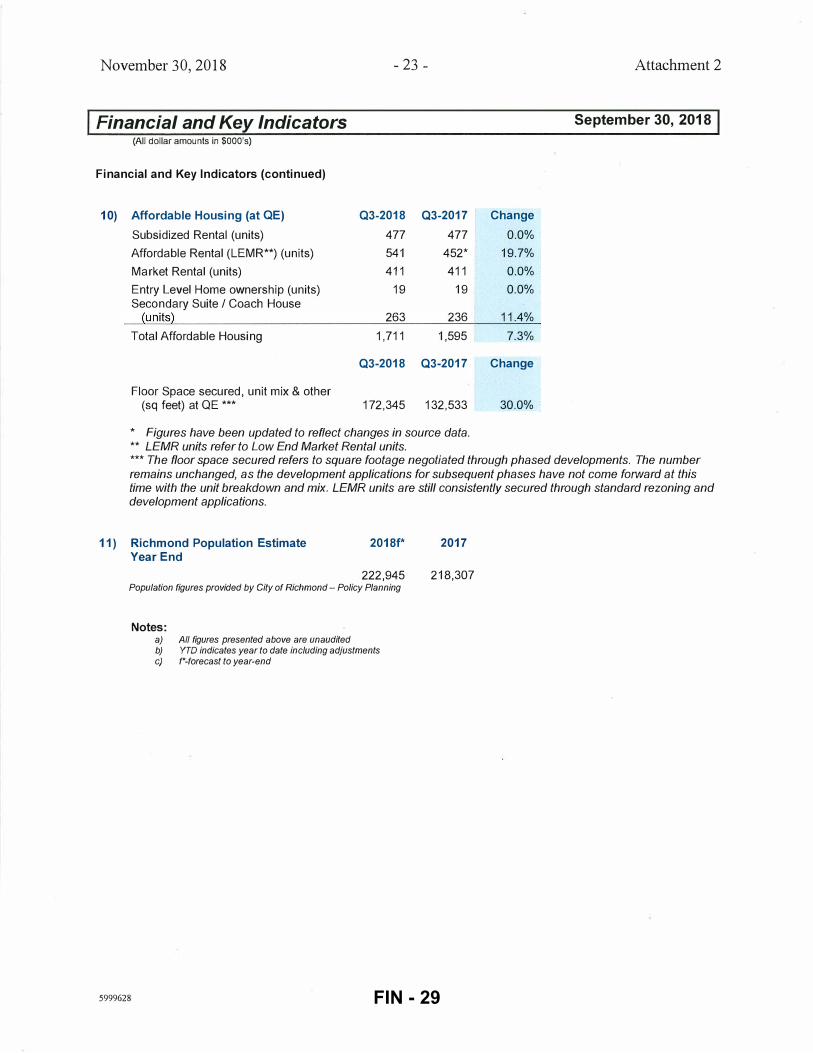
Financial and Key Indicators (continued)
10) Affordable Housing (at OE) 03-2018 03-2017
Subsidized Rental (units) 477 477
Affordable Rental (LEMR**) (units) 541 452*
Market Rental (units) 411 411
Entry Level Home ownership (units) 19 19
Secondary Suite I Coach House (units} 263 236
Total Affordable Housing 1,711 1,595
03-2018 03-2017
Floor Space secured, unit mix & other (sq feet) at QE *** 172,345 132,533
* Figures have been updated to reflect changes in source data. ** LEMR units refer to Low End Market Rental units.
Attachment 2
September 30, 2018 I
Change
0.0%
19.7%
0.0%
0.0%
11.4%
7.3%
Change
30.0%
*** The floor space secured refers to square footage negotiated through phased developments. The number remains unchanged, as the development applications for subsequent phases have not come forward at this time with the unit breakdown and mix. LEMR units are still consistently secured through standard rezoning and development applications.
11) Richmond Population Estimate Year End
2018f*
222,945 Population figures provided by City of Richmond- Policy Planning
5999628
Notes: a) b) c)
All figures presented above are unaudited YTD indicates year to date including adjustments f*-forecast to year-end
2017
218,307
FIN - 29
November 30, 2018 -24- Attachment 3
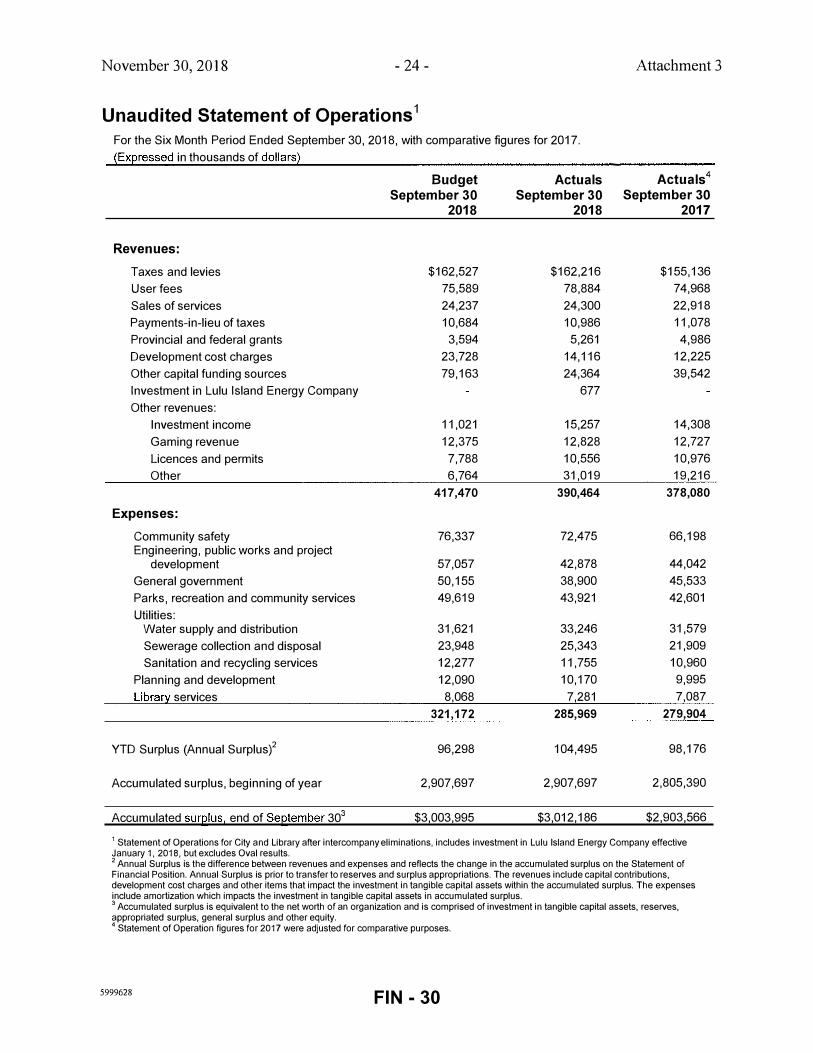
Unaudited Statement of Operations 1
For the Six Month Period Ended September 30, 2018, with comparative figures for 2017. �Exeressed in thousands of dollars�
Budget Actuals Actuals4
September 30 September 30 September 30 2018 2018 2017
Revenues:
Taxes and levies $162,527 $162,216 $155,136 User fees 75,589 78,884 74,968 Sales of services 24,237 24,300 22,918 Payments-in-lieu of taxes 10,684 10,986 11,078 Provincial and federal grants 3,594 5,261 4,986 Development cost charges 23,728 14,116 12,225 Other capital funding sources 79,163 24,364 39,542 Investment in Lulu Island Energy Company 677 Other revenues:
Investment income 11,021 15,257 14,308 Gaming revenue 12,375 12,828 12,727 Licences and permits 7,788 10,556 10,976 Other 6,764 31,019 19,216
417,470 390,464 378,080
Expenses:
Community safety 76,337 72,475 66,198 Engineering, public works and project
development 57,057 42,878 44,042 General government 50,155 38,900 45,533 Parks, recreation and community services 49,619 43,921 42,601 Utilities:
Water supply and distribution 31,621 33,246 31,579 Sewerage collection and disposal 23,948 25,343 21,909 Sanitation and recycling services 12,277 11,755 10,960
Planning and development 12,090 10,170 9,995 Librar:y services 8,068 7,281 7,087
321,172 285,969 279,904
YTD Surplus (Annual Surplus)2 96,298 104,495 98,176
Accumulated surplus, beginning of year 2,907,697 2,907,697 2,805,390
Accumulated surelus, end of Seetember 303 $3,003,995 $3,012,186 $2,903,566
1 Statement of Operations for City and Library after intercompany eliminations, includes investment in Lulu Island Energy Company effective January 1, 2018, but excludes Oval results. 2 Annual Surplus is the difference between revenues and expenses and reflects the change in the accumulated surplus on the Statement of Financial Position. Annual Surplus is prior to transfer to reserves and surplus appropriations. The revenues include capital contributions, development cost charges and other items that impact the investment in tangible capital assets within the accumulated surplus. The expenses include amortization which impacts the investment in tangible capital assets in accumulated surplus. 3 Accumulated surplus is equivalent to the net worth of an organization and is comprised of investment in tangible capital assets, reserves, appropriated surplus, general surplus and other equity. 4 Statement of Operation figures for 2017 were adjusted for comparative purposes.
5999628 FIN - 30
November 30,2018 - 25-
Investment Portfolio September 30, 2018 (in GOO's)
DBRS
Asset Long Term
Class Rating Issuer Term
Provincial
AA(high) Alberta 2019-2022
AA(high) British Columbia 2019
AA(Iow) Ontario 2024
A(high) Quebec 2022-2023
Total
Chartered Banks
AA Bank of Nova Scotia 2018-2022
AA TO Bank 2018-2023
AA Royal Bank 2018-2023
AA Bank of Montreal 2018-2025
AA(Iow) National Bank of Canada 2018-2021
A(high) HSBC Bank of Canada 2021-2023
AA CIBC 2018-2022
A(low) Canadian Western Bank 2018
Total
BC Credit Unions
Coast Capital Savings 2018-2019
Vancity 2018
Gulf and Fraser 2018-2019
Blue Shore Financial 2018-2019
Westminster Savings 2018
Total
Pooled Investments
MFA Pooled Investment Fund
Total Investment Portfolio Balance
Investment Maturity
7to 8 years � 6to7years � 5 to 6 years
4 to 5 years
3 to 4 years
2 to 3 years
1 to 2 years
Attachment 4
Investment
% of Total Limit(% of
Net Book Value Portfolio Portfolio)
$ 68,464 7.14%
65,085 6.79%
11 '199 1.17%
22,198 2.31%
$ 166,947 17.40% 50%
$ 134,861 14.06%
81,553 8.50%
68,038 7.09%
54,944 5.73%
43,505 4.54%
32,194 3.36%
24,805 2.59%
24,000 2.50%
$ 463,900 48.36% 50%
$ 87,038 9.07%
62,000 6.46%
49,939 5.21%
47,819 4.99%
35,734 3.73%
$ 282,531 29.45% 30%
$ 45,843 4.78% 20%
$ 959,220 100.00%
6 months to 1 year •••••••••••••••••••••••••• 3 to 6 months
0 to 3 months !����������������j _____ J _____ J 50 100 150 200 250
Millions (S)
5999628 FIN - 31
November 30, 2018 -26-
2
3
4
5
6
7
8
9
10
11
12
13
14
15
16
17
18
5999628
Contract Awards greater than $75,000 July 1st to September 301h, 2018
Pilot of "Sewer Slick" at Edgemere Lift Muddy River Technology $92,500 Station Inc.
Fire Hall 3 Construction Management Stuart Olson Construction 427,157 Fees Ltd.
MyRichmond's MyCommunity with Radical I/O 249,000 PerfectMind
Minoru Centre for Active Living (MCAL) - Stuart Olson Construction 249,464 TP8 Supply & Install Signage Ltd.
DVD Dispenser Modernization ITRE SLR 75,855
Residential Solid Waste Collection and Sierra Waste Services 8,165,955 Recycling Services Ltd.
Supply and Delivery of one (1) Dump Del Equipment 169,194 Body Unit and Outfitting on a City Provided Single Axle Cab and Chassis
3 (Three) 2" Steel Gas Fortis FortisBC - Natural Gas 338,515
Supply and delivery of chain link fence Hansen & Gannelli Inc. 184,993 mesh at Minoru Park
Recreation Lighting Upgrade Materials Commercial Lighting 111,430 Products Ltd.
Drainage Improvements and Frontage Anderson Creek Site 83,537 Works between 10231 Ruskin Road and Developing Ltd. Ryan Road
Multi-Family Water Meter Installations at Ashton Service Group 112,736 8191 Francis Rd, 8651 Ackroyd Rd, 7435, 7437 and 7439 Moffatt Rd
Direct Digital Control Upgrades - ESC Automation Inc. 106,028 Thompson Community Centre
Concrete Pipe Materials - River Drive Ocean Pipe 85,424 Multi-Use Pathway
Design and Construction Services to Tel us 187,500 Horseshoe Slough Pump Station
Paving - Broadmoor Blvd North Laneway WinVan Paving Ltd. 89,240. Drainage and Ashphalt Upgrades
Cambie Fire Hall #3 Post Occupancy Ashton Service Group 75,086 Work
Consulting Services for the Gateway Morrison Hershfield Ltd. 228,100 Theatre Upgrades
Attachment 5
Engineering &
Public Works
Engineering &
Public Works
Finance and Corporate Services
Engineering &
Public Works
Community Services
Engineering &
Public Works
Engineering &
Public Works
Engineering &
Public Works
Community Services
Engineering &
Public Works
Engineering &
Public Works
Engineering &
Public Works
Engineering &
Public Works
Engineering &
Public Works
Engineering &
Public Works
Engineering &
Public Works
Engineering &
Public Works
Engineering &
Public Works
FIN - 32
November 30,2018 -27- Attaclunent 5
Item j I
19
20
21
22
23
24
25
26
27
28
29
30
31
32
33
34
5999628
Contract Awards greater than $75,000 (continued) July 1st to September 30th, 2018
Descri ption Awarded Vendor Awarded Division Amount
Smart Cities Challenge: Project KPMG 155,220 Corporate Management for Business Case Administration Development
Emergency Wood Stave Culvert Merletti Construction Ltd. 145,000 Engineering & Replacement- Intersection at No. 8 Road Public Works and Westminster Hwy
Supply and Install Audiovisual Equipment Stuart Olson Construction 146,500 Community Ltd. Services
RCMP CSB - Heat Pump Replacement All-Pro Services Ltd. 361,400 Engineering & Project- Phase 2 Public Works
City Hall Annex L 1 & L2 Abatement & Ashton Service Group 192,200 Engineering & Demolition Public Works
Construction of Interim River Parkway M2K Construction Ltd. 6,999,605 Engineering & Public Works
Engineering Services for ICCDEU Kerr Wood Leidal 89,800 Engineering & Servicing Strategy Associates Ltd. Public Works
Consulting Services to Design, Tender, van der Zalm + 182,501 Community and Oversee Construction of Aberdeen associates Inc. Services Park - Phase 2
Construction Services for Watermania Kindred Construction Ltd. 535,795 Engineering & Infrastructure Upgrades Public Works
Heritage Inventory Review and Update Donald Luxton and 114,000 Community Associates Services
Supply and Delivery of 2 (Two) Full Size Dams Ford Lincoln Sales 100,622 Engineering & High Roof Extended 1 (One Tone Dual Ltd. Public Works Rear Wheel Cargo Vans
On Call Roofing Contractor Marine Roofing Repair 120,000 Engineering & and Maintenance Service Public Works (2003) Ltd.
Provision of Engineering Inspection Maven Consulting Ltd. 200,000 Engineering & Services And RAM Engineering Public Works
Ltd.
Supply and Delivery of 3 (Three) One Ton Work Truck West 345,040 Engineering & Crew Cab Dump Trucks Public Works
Supply and Delivery of 4 (Four) 3/4 Ton Dams Ford Lincoln Sales 153,156 Engineering & Crewcab Trucks Ltd Public Works
Supply and Delivery of 1 (One) Dump Del Equipment 145,562 Engineering & Body Unit and Outfitting on a City Public Works Provided Cab and Chassis
FIN - 33
To:
City of Richmond
Finance Committee
Report to Committee
Date: December 10, 2018
From: Jerry Chong, CPA, CA File: 03-1200-05/2018-Vol Director, Finance 01
Re: Active Capital Projects Information - 3rd Quarter September 30, 2018
Staff Recommendation
That the staff repmi titled, "Active Capital Projects Information- 3rd Quarter September 30,
2018", dated December 10,2018 from the Director, Finance be received for information.
�� J eny Chong, CPA, CA Director, Finance ( 604-2 7 6-4064)
Att. 2
REPORT CONCURRENCE
ROUTED To: CONCURRENCE CONCURRENCE OF GENERAL MANAGER
� -�
Arts, Culture & Heritage [};( Parks Services lid"" Engineering � Project Development [B"' Roads & Construction [B" Sustainability [kJ' Transportation �
REVIEWED BY STAFF REPORT I INITIALS:
�"2;.-AGENDA REVIEW SUBCOMMITTEE
0f "
6011060
FIN - 34
December 10, 2018 - 2-
Staff Report
Origin
Active Capital Project Information for the 3rd quarter (ended September 30, 2018) is being provided to the Finance Committee for information.
This report supports Council's 2014-2018 Term Goal #7 Strong Financial Stewardship:
Maintain the City's strong financial position through effective budget processes, the efficient and effective use of financial resources, and the prudent leveraging of economic and financial opportunities to increase current and long-term financial sustainability.
7.1. Relevant and effective budget processes and polices.
7.2 Well-informed and sustainable financial decision-making.
7. 3 Transparent financial decisions that are appropriately communicated to the public.
Analysis
Active Capital Projects Summary
Active Capital projects represent capital projects previously approved by Council. Projects include construction projects that are in various stages of completion, which may include:
Planning and Design- includes projects that were approved in the 2018 budget and other previously approved projects that are undergoing design specifications, design approvals, or public consultation.
Contract Award- this includes preparing to issue a request for proposal, evaluating the proposals received, and finalizing contract award agreements.
Construction- includes build out of the approved design either by City forces or under the executed agreements.
Functional Completion- certain projects are completed in phases that allow for portions of the project to be functionally complete while the next phase is initiated.
Project Completion -may include fully functional assets that are in their final inspection and acceptance stage, which may still require minor deficiencies to be addressed, as-built drawings to be received, collection of grant funding and fulfillment of audit requirements, where applicable.
Final Completion- All aspects of the project are complete including the one year deficiency period which leads to the project removal from the active capital project list and return of any unspent funds to its original funding sources.
6011060 FIN - 35
December 10,2018 - 3 -
A Capital Project is considered active for the purposes of this report if the project is in any of the above stages (except Final Completion). Generally, projects are completed within three years; however due to complexities at each stage it is not unusual for a project to take longer than three years to see through to Final Completion.
Projects also include amounts set aside for Land acquisition, Public Ali, Child Care and Affordable Housing which are dependent upon extemal factors such as market conditions, availability and extemal pminers. Therefore, these projects m·e presented to Council prior to final project approval.
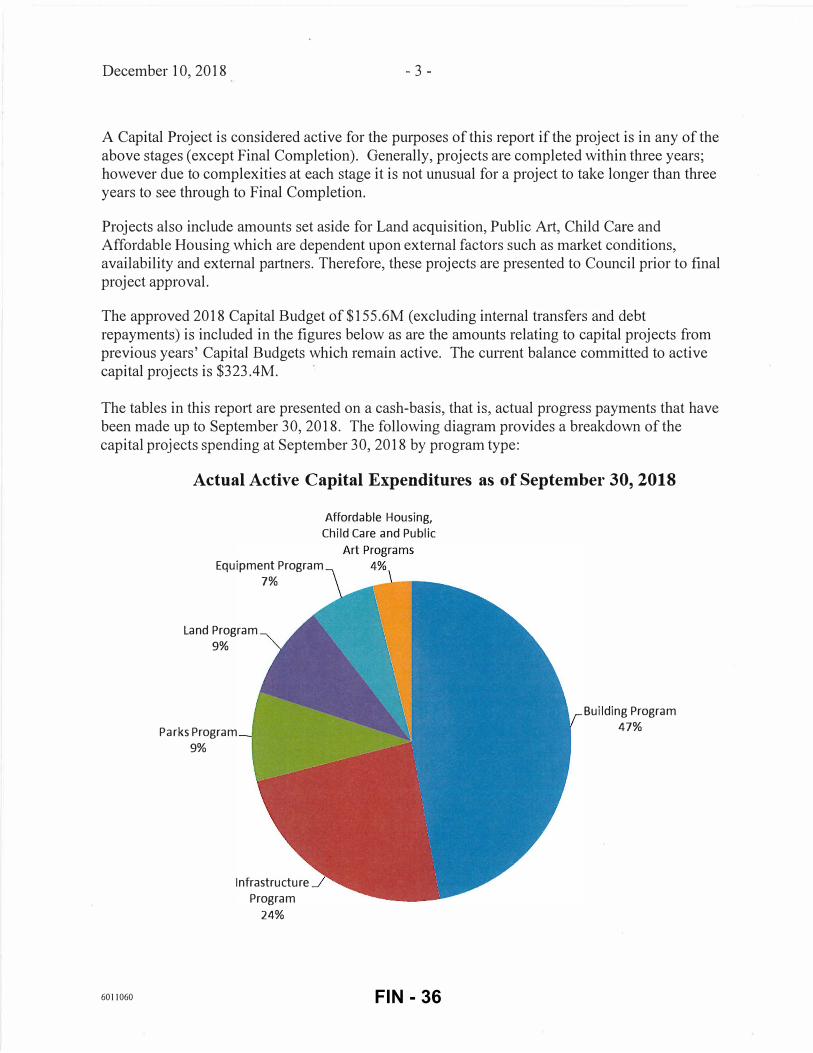
The approved 2018 Capital Budget of$155.6M (excluding intemal transfers and debt repayments) is included in the figures below as are the amounts relating to capital projects from previous years' Capital Budgets which remain active. The cunent balance committed to active capital projects is $323.4M.
The tables in this repmi are presented on a cash-basis, that is, actual progress payments that have been made up to September 30,2018. The following diagram provides a breakdown of the capital projects spending at September 30, 2018 by program type:
6011060
Actual Active Capital Expenditures as of September 30, 2018
Affordable Housing,
Child Care and Public
Equipment Program
7%
Land Program
9%
Parks Program
9%
Infrastructure
Program
24%
Building Program
47%
FIN - 36
December 10,2018 - 4-
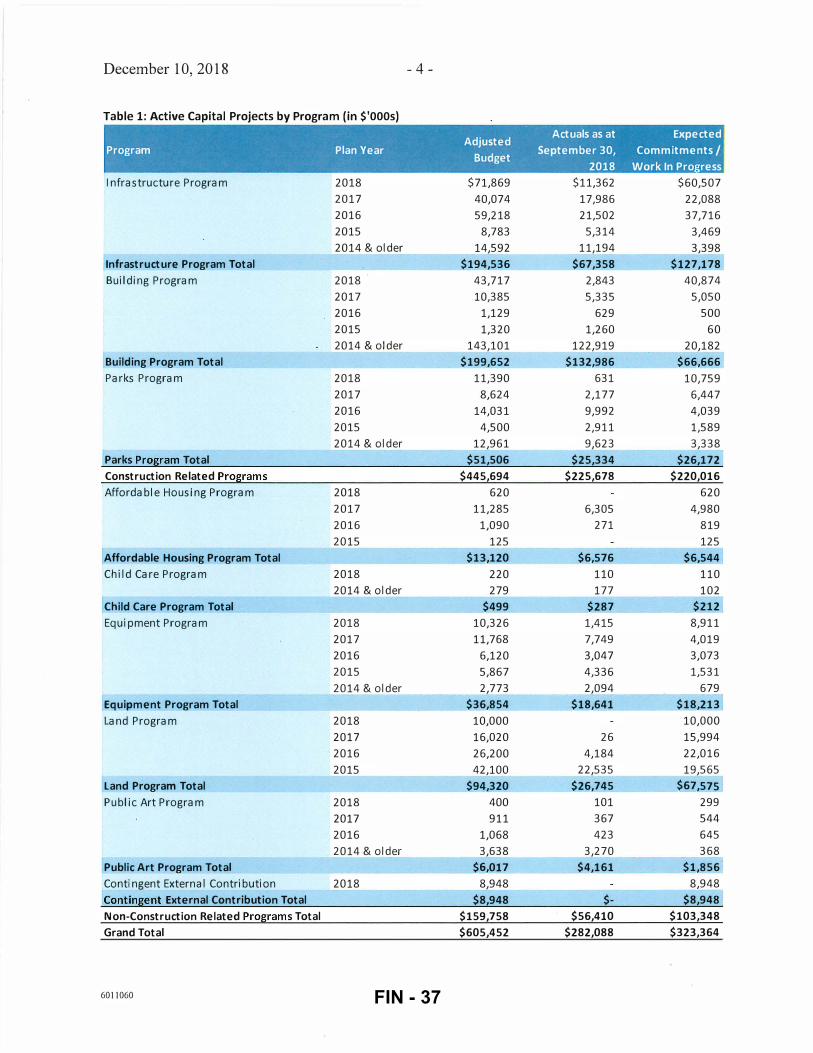
Table 1: Active Capital Projects by Program (in $'000s)
Ad. d Actuals as at Expected
JUSte Program Plan Year
8 d September 30, Commitments I
u get
Infrastructure Program 2018 $71,869 2017 40,074 2016 59,218 2015 8,783 2014 & older 14,592
Infrastructure Program Total $194,536
Building Program 2018 43,717 2017 10,385 2016 1,129 2015 1,320 2014 & older 143,101
Building Program Total $199,652
Parks Program 2018 11,390 2017 8,624 2016 14,031 2015 4,500 2014 & older 12,961
Parks Program Total $51,506
Construction Related Programs $445,694
Affordable Housing Program 2018 620 2017 11,285 2016 1,090 2015 125
Affordable Housing Program Total $13,120
Child Care Program 2018 220 2014 & older 279
Child Care Program Total $499
Equipment Program 2018 10,326 2017 11,768 2016 6,120 2015 5,867 2014 & older 2,773
Equipment Program Total $36,854
Land Program 2018 10,000 2017 16,020 2016 26,200 2015 42,100
Land Program Total $94,320
Public Art Program 2018 400 2017 911 2016 1,068 2014 & older 3,638
Public Art Program Total $�017
Contingent Extern a I Contribution 2018 8,948 Contingent External Contribution Total $8,948
Non-Construction Related Programs Total $159,758
Grand Total $605,452
6011060
2018 Work In Pro ress
$11,362 $60,507 17,986 22,088 21,502 37,716
5,314 3,469 11,194 3,398
$67,358 $127,178
2,843 40,874 5,335 5,050
629 500 1,260 60
122,919 20,182 $132,986 $66,666
631 10,759 2,177 6,447 9,992 4,039 2,911 1,589 9,623 3,338
$25,334 $26,172
$225,678 $220,016
620 6,305 4,980
271 819 125
$6,576 $6,544
110 110 177 102
$287 $212
1,415 8,911 7,749 4,019 3,047 3,073 4,336 1,531 2,094 679
$18,641 $18,213
10,000 26 15,994
4,184 22,016 22,535 19,565
$26,745 $67,575
101 299 367 544 423 645
3,270 368 $4,161 $1,856
8,948 $- $8,948
$56,410 $103,348
$282,088 $323,364
FIN - 37
December 10,2018 - 5 -
Included in the 2018 Capital Plan (20 18-2022 Financial Plan Bylaw) is an estimate of $1OM for external grants or contributions that may be received throughout the year. As external funding is confirmed, funding is transferred to the approved applicable projects.
Highlights of Key Construction Related Capital Projects
Information on key capital projects includes the project budget, inclusive of transfers from other projects and budget amendments, actuals on a cash-basis, and the remaining commitments as at September 30,2018.
INFRASTRUCTURE
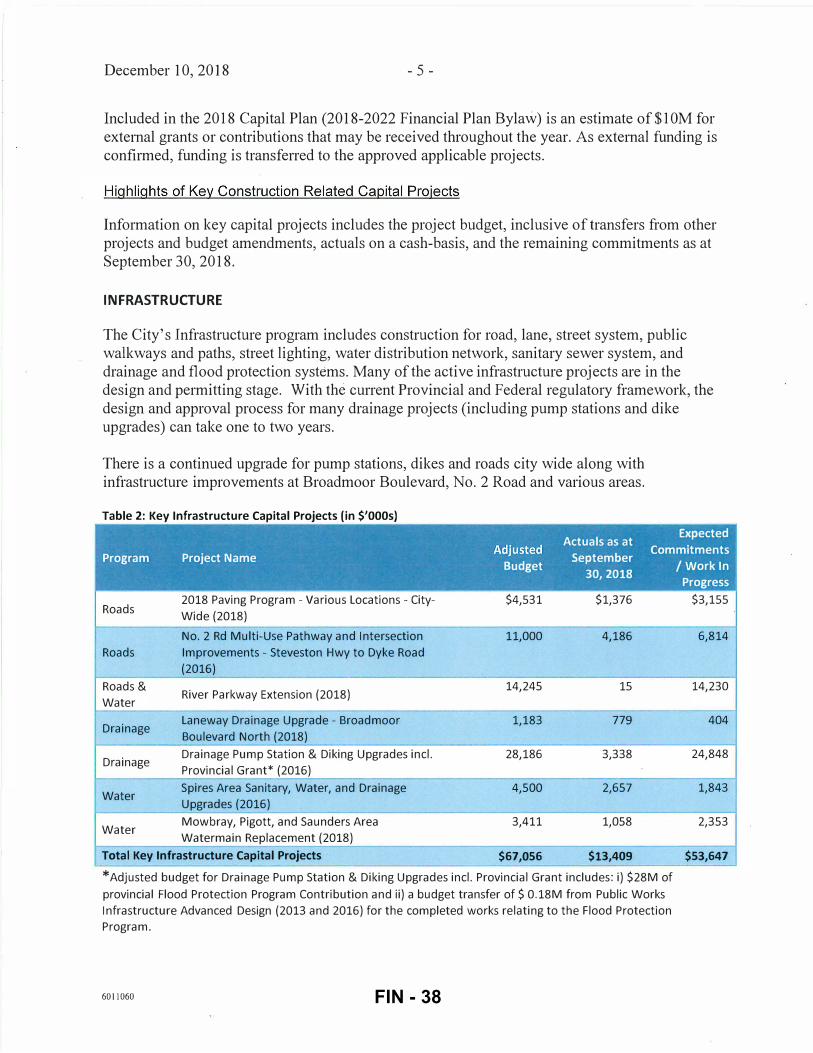
The City's Infrastructure program includes construction for road, lane, street system, public walkways and paths, street lighting, water distribution network, sanitary sewer system, and drainage and flood protection systems. Many of the active infrastructure projects are in the design and permitting stage. With the current Provincial and Federal regulatory framework, the design and approval process for many drainage projects (including pump stations and dike upgrades) can take one to two years.
There is a continued upgrade for pump stations, dikes and roads city wide along with infrastructure improvements at Broadmoor Boulevard, No.2 Road and various areas.
Table 2: Key Infrastructure Capital Projects (in $'000s)
Expected Actuals as at
Program Project Name Adjusted
September Commitments
Budget 30,2018
Roads 2018 Paving Program -Various Locations- City- $4,531 $1,376
Wide (2018)
No. 2 Rd Multi-Use Pathway and Intersection 11,000 4,186
Roads Improvements- Steveston Hwy to Dyke Road
(2016)
Roads & River Parkway Extension (2018)
14,245 15
Water
Drainage Laneway Drainage Upgrade- Broadmoor 1,183 779
Boulevard North (2018)
Drainage Drainage Pump Station & Diking Upgrades incl. 28,186 3,338
Provincial Grant* (2016)
Water Spires Area Sanitary, Water, and Drainage 4,500 2,657
Upgrades (2016)
Water Mowbray, Pigott, and Saunders Area 3,411 1,058
Watermain Replacement (2018)
Total Key Infrastructure Capital Projects $67,056 $13,409
*Adjusted budget for Drainage Pump Station & Diking Upgrades incl. Provincial Grant includes: i) $28M of
provincial Flood Protection Program Contribution and ii) a budget transfer of$ 0.18M from Public Works
Infrastructure Advanced Design (2013 and 2016) for the completed works relating to the Flood Protection
Program.
6011060
I Work In
Progress
$3,155
6,814
14,230
404
24,848
1,843
2,353
$53,647
FIN - 38
December 10, 2018 - 6 -
Please see Attachment 1 for Q3 2018 Construction Update Memo. This attachment includes the project budget, the scheduled contract stmi, and the scheduled construction completion. A scheduled contract stmi is considered "complete" when the construction contract is awarded; the actual construction work is still in progress. Therefore, it is possible for a contract start to be "complete", while the scheduled construction will be completed in the future.
BUILDING
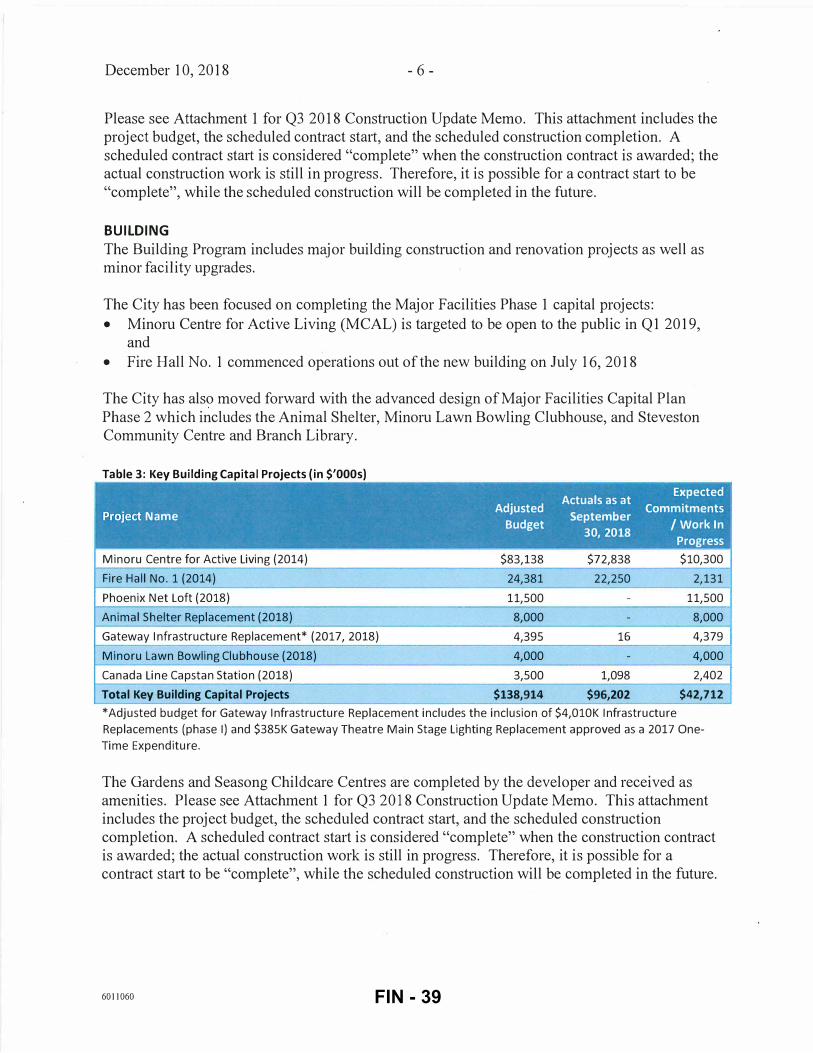
The Building Program includes major building construction and renovation projects as well as minor facility upgrades.
The City has been focused on completing the Major Facilities Phase 1 capital projects: • Minoru Centre for Active Living (MCAL) is targeted to be open to the public in Q1 2019,
and • Fire Hall No. 1 commenced operations out of the new building on July 16,2018
The City has also moved forward with the advanced design of Major Facilities Capital Plan
Phase 2 which includes the Animal Shelter, Minoru Lawn Bowling Clubhouse, and Steveston Community Centre and Branch Library.
Table 3: Key Building Capital Projects (in $'000s)
Actuals as at Expected
Project Name Adjusted
September Commitments
Budget I Work In 30,2018
Progress
Minoru Centre for Active Living (2014) $83,138 $72,838 $10,300
Fire Hall No. 1 (2014) 24,381 22,250 2,131
Phoenix Net Loft (2018) 11,500 - 11,500
Animal Shelter Replacement (2018) 8,000 - 8,000
Gateway Infrastructure Replacement* (2017, 2018) 4,395 16 4,379
Minoru Lawn Bowling Clubhouse (2018) 4,000 - 4,000
Canada Line Capstan Station (2018) 3,500 1,098 2,402
Total Key Building Capital Projects $138,914 $96,202 $42,712
*Adjusted budget for Gateway Infrastructure Replacement includes the inclusion of $4,010K Infrastructure
Replacements (phase I) and $385K Gateway Theatre Main Stage Lighting Replacement approved as a 2017 One
Time Expenditure.
The Gardens and Seasong Childcare Centres are completed by the developer and received as amenities. Please see Attachment 1 for Q3 2018 Construction Update Memo. This attachment includes the project budget, the scheduled contract start, and the scheduled construction completion. A scheduled contract start is considered "complete" when the construction contract is awarded; the actual construction work is still in progress. Therefore, it is possible for a contract stmi to be "complete", while the scheduled construction will be completed in the future.
6011060 FIN - 39
December 10, 2018 - 7-
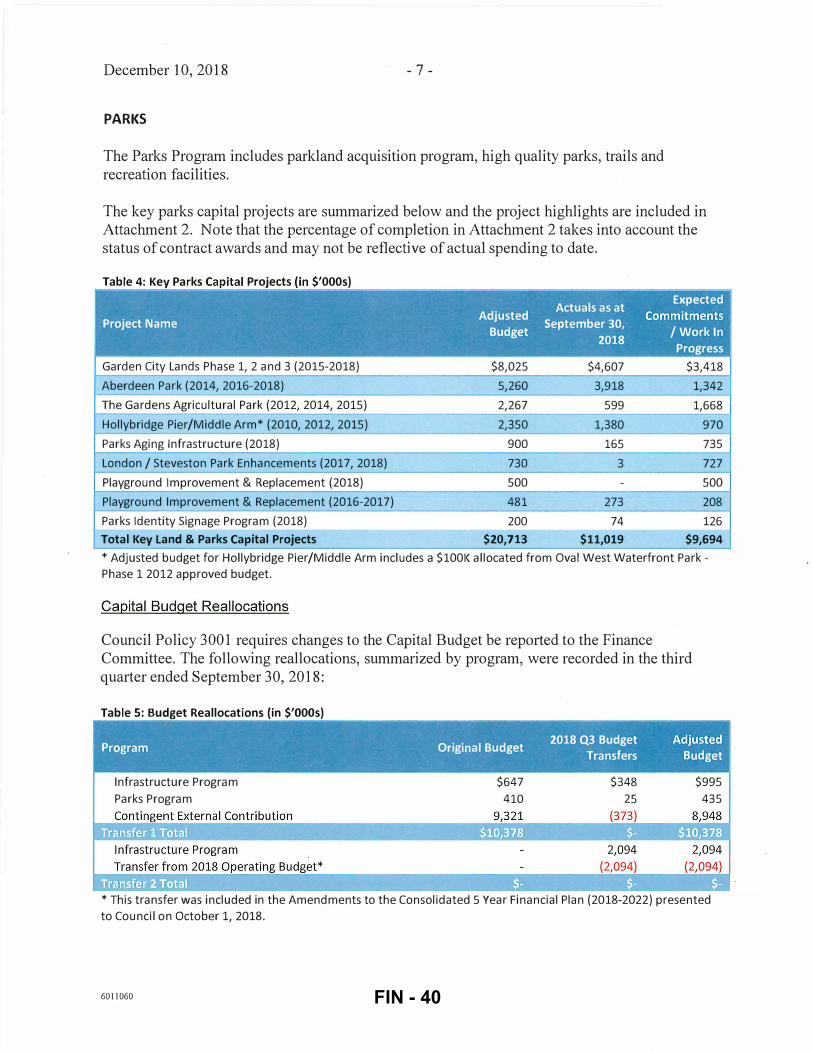
PARKS
The Parks Program includes parkland acquisition program, high quality parks, trails and recreation facilities.
The key parks capital projects are summarized below and the project highlights are included in Attachment 2. Note that the percentage of completion in Attachment 2 takes into account the status of contract awards and may not be reflective of actual spending to date.
Table 4: Key Parks Capital Projects (in $'000s) - -- ---
Project Name
- -- - -·--·· .. ------
Garden City Lands Phase 1, 2 and 3 (2015-2018)
Aberdeen Park (2014, 2016-2018)
The Gardens Agricultural Park (2012, 2014, 2015)
Hollybridge Pier/Middle Arm* (2010, 2012, 2015)
Parks Aging Infrastructure (2018)
London I Steveston Park Enhancements (2017, 2018)
Playground Improvement & Replacement (2018)
Playground Improvement & Replacement (2016-2017)
Parks Identity Signage Program (2018)
Total Key Land & Parks Capital Projects
---- ------ ·----· ·---·-·
Actuals as at Expected
Adjusted September 30,
Commitments
Budget I Work In 2018
Progress
$8,025 $4,607 $3,418
5,260 3,918 1,342
2,267 599 1,668
2,350 1,380 970
900 165 735
730 3 727
500 - 500
481 273 208
200 74 126
$20,713 $11,019 $9,694
*Adjusted budget for Hollybridge Pier/Middle Arm includes a $1001< allocated from Oval West Waterfront Park
Phase 1 2012 approved budget.
Capital Budget Reallocations
Council Policy 3001 requires changes to the Capital Budget be repmied to the Finance Committee. The following reallocations, summarized by program, were recorded in the third quarter ended September 30,2018:
Table 5: Budget Reallocations (in $'000s)
P 0 .
. 1 B d 2018 Q3 Budget Adjusted
rogram ngma u get T f B d
Infrastructure Program
Parks Program
$647 410
rans ers u get
$348 25
$995 435
*This transfer was included in the Amendments to the Consolidated 5 Year Financial Plan (2018-2022) presented
to Council on October 1, 2018.
6011060 FIN - 40
December 10,2018 - 8 -
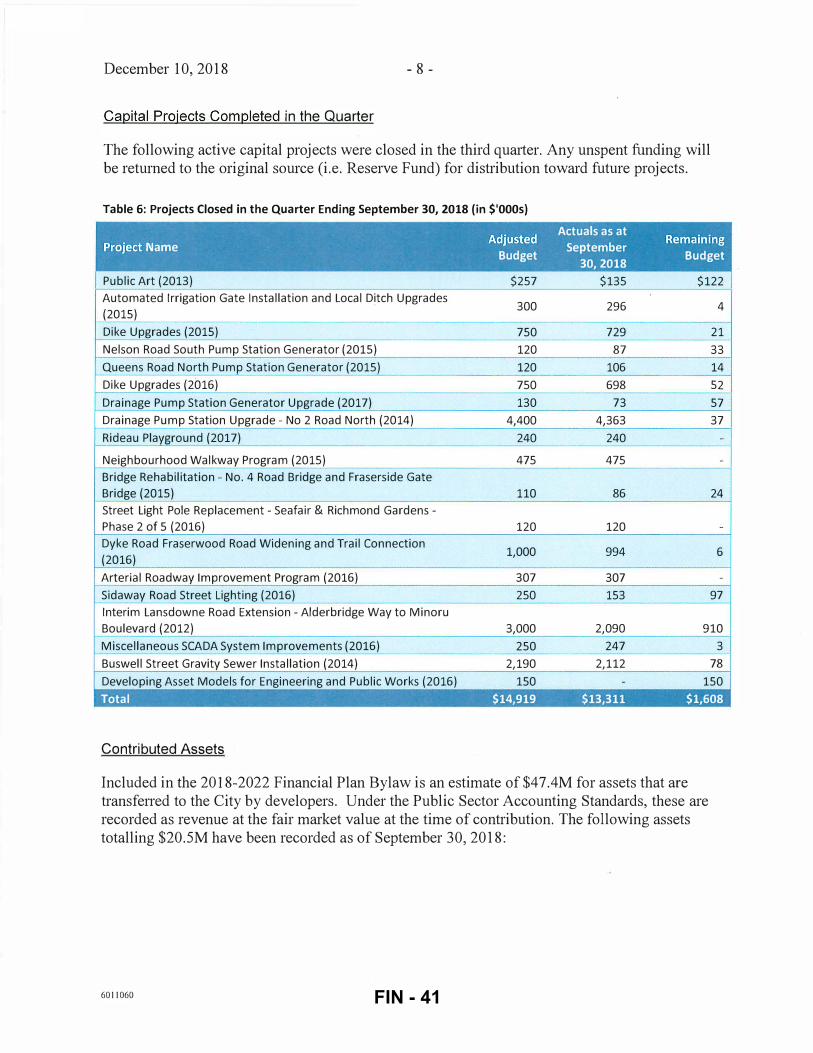
Capital Projects Completed in the Quarter
The following active capital projects were closed in the third quarter. Any unspent funding will be returned to the original source (i.e. Reserve Fund) for distribution toward future projects.
Table 6: Projects Closed in the Quarter Ending September 30, 2018 (in $'000s)
Adjusted Actuals as at
Remaining Project Name September
Budget 30,2018
Budget
Public Art (2013) $257 $135 $122
Automated Irrigation Gate Installation and Local Ditch Upgrades 300 296 4
(2015)
Dike Upgrades (2015) 750 729 21
Nelson Road South Pump Station Generator (2015) 120 87 33
Queens Road North Pump Station Generator (2015) 120 106 14
Dike Upgrades (2016) 750 698 52
Drainage Pump Station Generator Upgrade (2017) 130 73 57
Drainage Pump Station Upgrade- No 2 Road North (2014) 4,400 4,363 37
Rideau Playground (2017) 240 240 -
Neighbourhood Walkway Program (2015) 475 475 -
Bridge Rehabilitation- No. 4 Road Bridge and Fraserside Gate
Bridge (2015) 110 86 24
Street Light Pole Replacement- Seafair & Richmond Gardens-
Phase 2 of 5 (2016) 120 120 -
Dyke Road Fraserwood Road Widening and Trail Connection 1,000 994 6
(2016)
Arterial Roadway Improvement Program (2016) 307 307 -
Sidaway Road Street Lighting (2016) 250 153 97
Interim Lansdowne Road Extension- Alderbridge Way to Minoru
Boulevard (2012) 3,000 2,090 910
Miscellaneous SCADA System Improvements (2016) 250 247 3
Buswell Street Gravity Sewer Installation (2014) 2,190 2,112 78
Developing Asset Models for Engineering and Public Works (2016) 150 - 150
Total $14,919 $13,311 $1,608
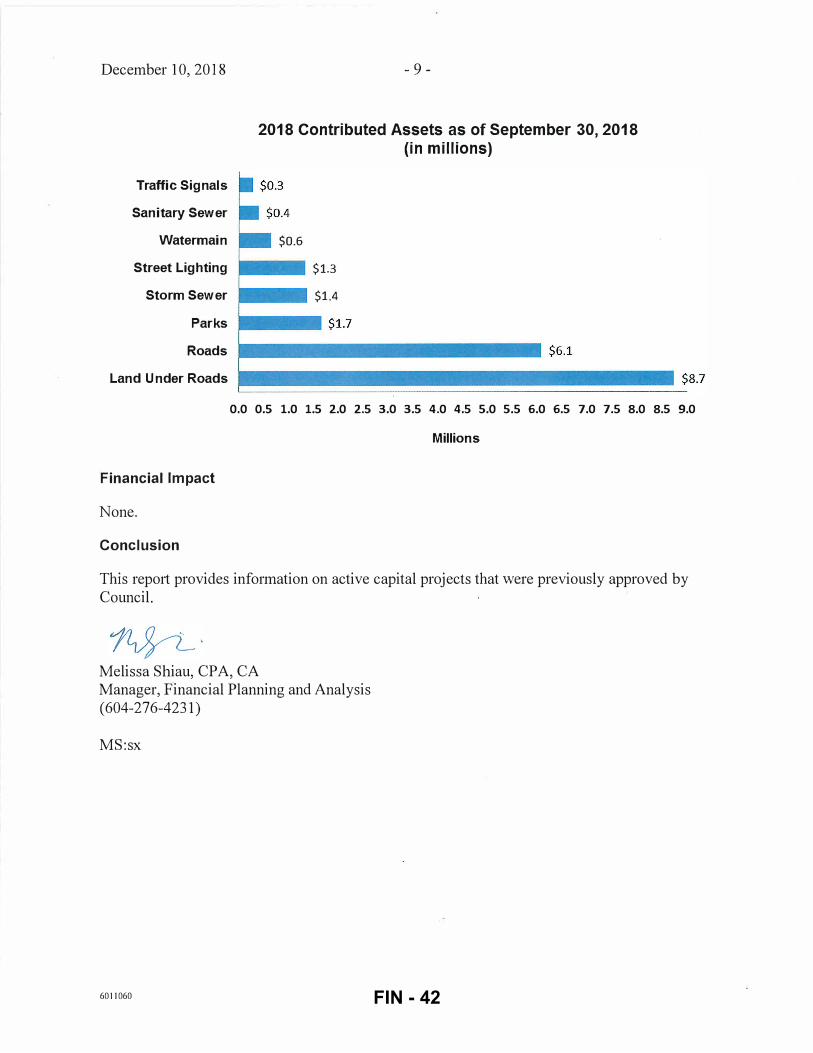
Contributed Assets
Included in the 2018-2022 Financial Plan Bylaw is an estimate of$47.4M for assets that are transferred to the City by developers. Under the Public Sector Accounting Standards, these are recorded as revenue at the fair market value at the time of contribution. The following assets totalling $20.5M have been recorded as of September 30,2018:
6011060 FIN - 41
December 10, 2018
Traffic Signals
Sanitary Sewer
Watermain
Street Lighting
Storm Sewer
Parks
Roads
Land Under Roads
Financial Impact
None.
Conclusion
- 9 -
2018 Contributed Assets as of September 30, 2018 (in millions)
$0.6
·-· $1.3
·-· $1.4
·-- $1.7
0.0 0.5 1.0 1.5 2.0 2.5 3.0 3.5 4.0 4.5 5.0 5.5 6.0 6.5 7.0 7.5 8.0 8.5 9.0
Millions
This report provides information on active capital projects that were previously approved by Council.
Melissa Shiau, CPA, CA Manager, Financial Planning and Analysis (604-276-4231)
MS:sx
6011060 FIN - 42
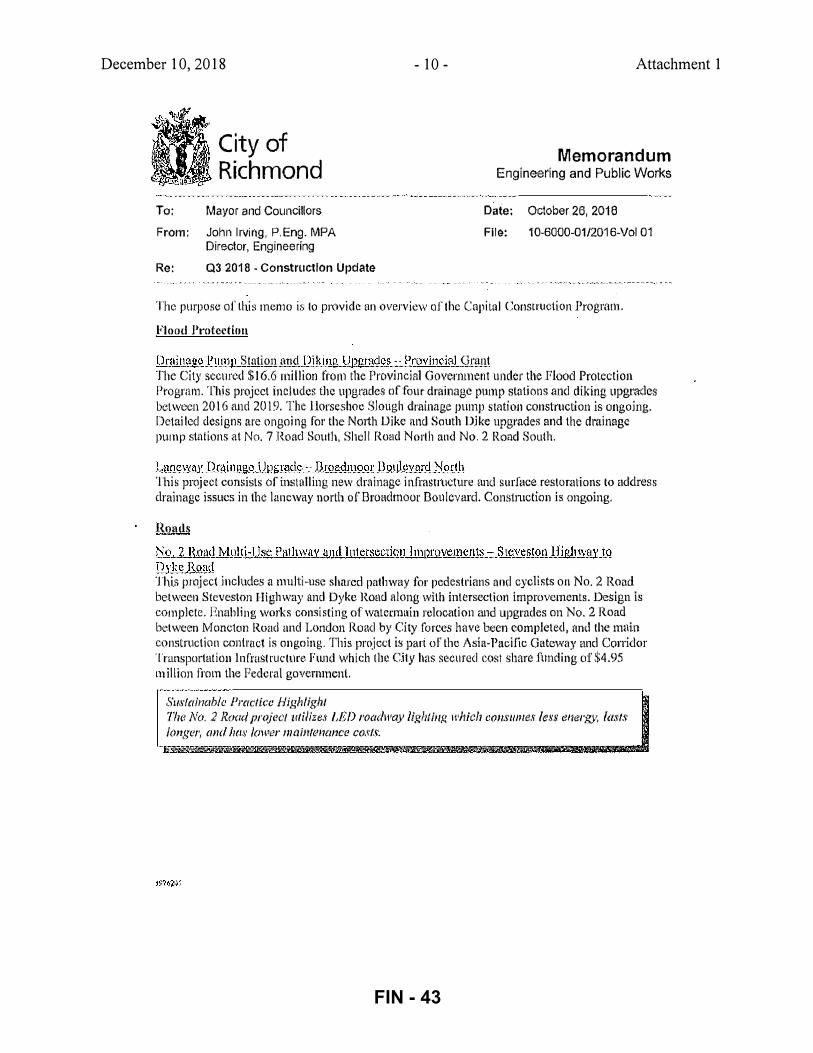
December 1 0,2018 - 10- Attachment 1
City of Richmond
Memorandum Engineering and Public Works
_, ____________ _
To; Mayor and Councillors
From: John Irving, P.Eng. MPA Director, Engineering
Re: Q3 2018 -Construction Update
Date: October 26, 2018
File: 10-6000-01/2016-Vol 01
'11-tc purpose of this memo is to provide an overview of the Capital Construction Progrnm.
Flo()d Protcctlnn
Drainage Pt!J!lP Station nnd DikiqgJ.l.J?gradc�.-=J:r:ovincial Grant ]1\c City sc\:urcd $16.6 million fhm1 the Provincial Government under the l1looc1 Protection Program. This project includes the upgrades of four drainage pump stations and diking upgrades betw·ecn 2016 and 2019. The Horseshoe Slough drainage pump station construction is ongoing. Detailed designs are ongoing for the North lJike and South Dike upgl'ades and the drainage pump stations at No. 7 Road South, Shell Road North and No. 2 Road South.
LS!!lGl'!�i!}:.I2minM.9J)pgrade ... Broadmoor Bm.tl�..Y.i!rd North
This project consists of installing new dr11inagc infrastructure and surface restorations to address drainage issues in the Janeway north ofBroadmoor Boulevard. Construction is ongoing.
Roads
No . .. U.<.oa'l !Vhilli-Use Path\Yffi.':_llnd lntersectionJ!1lPI'OV�ment.�- St�y_estoiL.Uighwayj.Q Qyi�_Roas! This pwject include,� a multl�use shared pathway for pedestrians and cycli�ts on No.2 Road between Steveston Highway and Dyke Road along ·with intersection improvements. Design is complete. Hnabling works consisting ohvatcrma[u relocation and upgmdcs on No. 2 Road between Moncton Road and London Road by City forces have been t�ompleted, and the mnin construction contnwt is ongoing. This project i!:! pan of the Asia-Pacific Gateway and Corridor Tnmspor!ation lnf'mslruclt\re Fund which the City has s�lc\ll'ed cost share funding of $4.95 million fmm the Federal government.
Sustainable Practice Highlight The No. 2 Road pn?/(W/ utilizes IJ?!) roadway lighlhlf!. which consumes less energy, lasts longer, and has lower maintcmcmce costs�
FIN - 43
December 10,2018 - 11 - Attachment 1
River Pflrkw£Is Extension The sc.ope of this projcc1 includes the construction of .n two-lane road along the former raih,vay corridor, from 200m northeast of Gilbert Road to Cambie Road. The new road will have pedestrian walkways, cycling lanes� and tmftic control devices at intersections. The nevi road will corwec:t to the existing Leslie Road, Oilberl Road, Catnbie Road and future Minoru Boulevard as well as accc.ss to the future Middle Ann Waterli"'nt Park When completed this new road would replace the existing River Road between Gilbe1i Road and Cmnbie RoHd ltnd provide n continuous alternate route to No, 3 Road and cxisliitg River Road, The design is completed. Constntction is at the contract award stage and anticipated to start by year end.
�.().l .. � J.?.�n')pgJ�1:Qg,r{!m ... :=_Y{Jii9l!§Jhi.QtltiQ!15 __ ::_Ci1Y:.Wict� The 20 I 8 Pnving Contract construction is ongoing. Recently c.omplcted locations include 9000� l 1000 blocks Westminster Highway, and 9000 block Blundell Road. Upcoming locations include Cook ltoad (Garden C1ty Road to Blundell Rond},. No, 5 Road and Daniels R(JUd intorscc!ion, and various brkc lune spot repairs.
Sustainah!e Practice Highlight 7/w asphalt mix can comain up 10 10% re(l'c/ed m]Jhalt products, which reduces the carbonfbotprinlfrom conslrlwtion activity.
S:uli1arv Sewers
BJ)ires Area Sanitar)� \Vater .J!!W llwinqge lJJJgradcs Thls projccl consists of replacing/upgrading ageing sanitary sewers and watennains and installing nevv storm sev,.ers, and in the Cook & Spires neighbourhood. Construction ofthe perimeter wntcrrnain on Cook Road and Cooney Road has been completed. The intemal subdivision sanitary, drainage ami \Vnlerwork� construction is ongoing.
Wa.ler
fv1owbrav. Pi11ott. and SuunderttA1'�lt��!l!J.9l1!JlUU�.ephl(X�rnent This project replace.s and upsizes ageing ·wutermains at the end o ftheir service life \o\'ith PVC pipe, in llne with the City's Ageing lnfrastructure Replacemcm Su·ategy. This will minirntze unplanned maintenance and improve fire· proteetion. Construction has commenced.
Buildiugs:
Minnt.l.!J.:_�'l!re few Active J...iving 'l'hc Minoru Centre for Active Livjng project remains on budget. nuHdtng cmvdope is complete, whtle mechanical, electrical, interior Hnishes, and civil/landscape v.rorks are ongoing.
��?:f������ ���::���fi::����::�:7�Jving is designed ,;;,:��(��;,l;ze;JiE:JJ Gold Standard and I.�ICOJ]JOUIIe sustainabilityfeatw·es such as low flow .fixtures and wastewater heat recovei:Jl.
FIN - 44
December 10, 2018 - 12- Attachment 1
Fire Hall No.1 This project was compl(�ted on budgel. Richmond Fire Rescue moved into the t1teiliiy in July. 'l'he Grand Opening Ceremony was held on September 15, 2018.
Sustainable Pmclic:e Highlights Fire Hall No. I constnwlion will include instaflalion ofsokll' photovo!taic roofpamls. substanlial�y <!lftetling power needs. Fire llall No. I has been designed to meal the LEJilJ Gold Standard and 1vil/ have the tlbility ro mee! Ner Zero e11ergy in the jiJture.
MinPn.Ll(f!.\YnJ1�n��J.in� .. G.htbh9\t§.>l Based on Council feedback, statTarc preparing a revised report wll.ich includes the building progrmn, site loc<Jtion and budget development The report for Council is scheduled for presentation 1n Q4 2018. Public engagemenl is ongoing and concept design is being coordinated vvith the Minoru Patk Vision Plan.
1::H1�!',l£lllJ:£.Qommunity Police Rels.t(@!i® Program dtwe1opmcnt has been coordinated and confirmc.d with the RCMP and design is underway. A contractor sbmilist has been completed through an Expression oflnterest process and it is anticipated that conslruction will commence in early 2019.
Cllildcar�_kSID!.res The construction of the Gat·dcns Childcare is c.ompletc and the Grand Opening Ceremony was held on June 29, 2018. 'llle construction orthc Scasong Childcarc is also complete and the Grand Opening Ceremony was held on September 14, 2018.
Qaleway Theatre Council approved funding as part of the 2()18 Capital Progrmn to complete Phase 1 which includes structural, electrical, lighting and building envelope upgrades. Phase ll funding is pmt of the 2019 Capitlll Program for Council considorntion. Design is anticipated to be complete by the I st quarter 2019. Construction l s anticipated Lo commence by the zn quarter 2019 and is being coordinated with theatre programming.
Phoc:!.Jili H�t1&.!1 Geotcdmicnl an<i su·Hcturnl investigations are complete. Design-Build Jlerformanc.e constructlon criteria is complete nnd design/permitting h.; in progress. It is anticipated design will be sufficiently advnnced to request pricing by lhc 2nd quartur 2019 at which time a report for Co\mcil consiclernti n will he prepared.
1n Irving, P.Eng., MPA Directot·, Engineering 604-276-4140
pc; Sl'vlT
FIN - 45
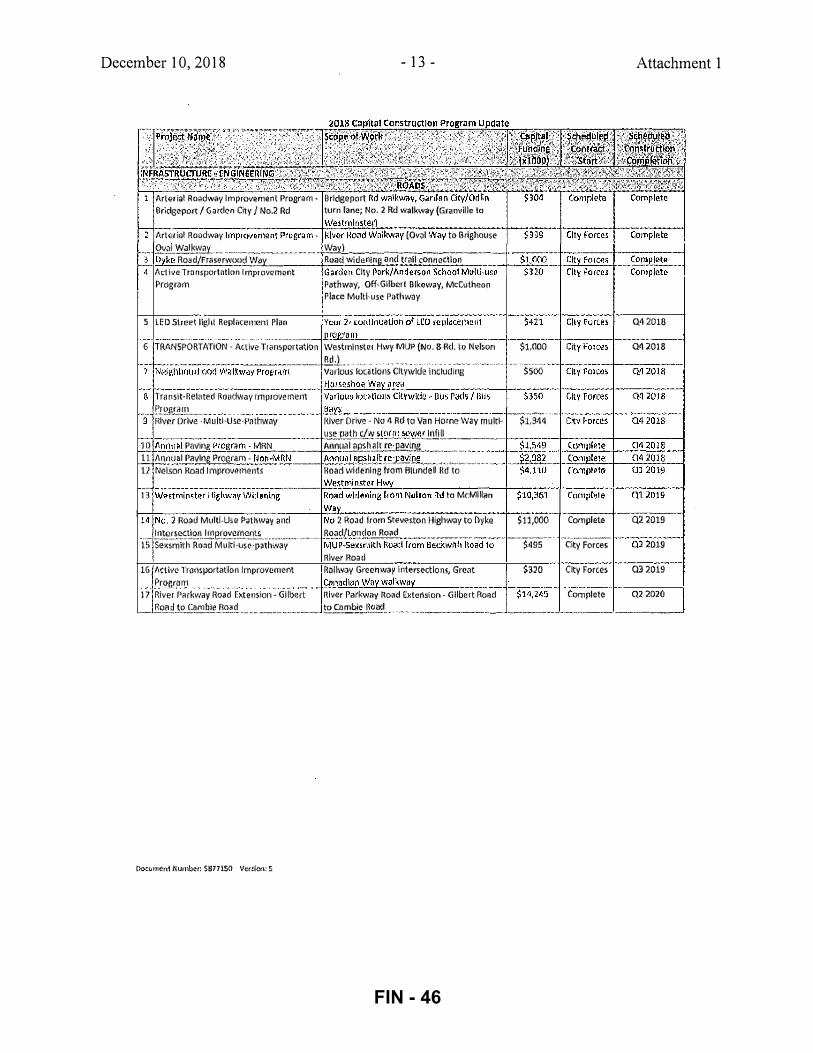
December 10, 2018 - 13 - Attachment 1
flrlelial Ro8dway lmproven1enl Program· OrkigepM I Garden Cit\' 1 No.2 Rd
Bridgepmt tw·n lane; No. 2 Rd walkway (Granville to
We!tnil ri5t�r') Arlednl Road·.vay lmpro._ v_e_m_e_n _l -Pr_o_r,_r�-r·n--. t-R:.:.Iv.:::crRond -.;;;;;;Tk;ay (OvJI W�y to Brighouse .9:'lil.'.'!V..i!'!<.�.i!Y........ . ··-··�- ----·
Wav) oyke Road/Fr<�5erwood ��- it;;;rv;;i;J;;:;;irifj'B;1{i't7;;iT'Connaciion·--···-··--.
. -$i�oo} ..... Adlve Transportation Improvement Garden Cill' Park/A�d�";;;;i1sd10ol Multl-uso ·-- $3W::::....+.:::::L:..�::::::..J.-.. ...::=!!:! Program P.;thway, Off-Gilbert Bli«)way, M�Cuthean
Pla<:ll Multi-use f1athway
5 LED Strer;t ligltl Replacement Pl�n Q4 2018 . . .
..
.
.
.
.
... --
-· ffi&.r�-------------1---
�- -----1------i 6 Tl\l\NSPORTATION- Acllve Trcn>porlo\lon We�t1nlnst�1 �lwy MUP (Nq. 8!1d. \(t N�lson $1.COO
7 'r:i(;'igi·;lioui"h-ot-)d_W_;;'i�;;;y-,-,,-og-·r-a;n ..... ----- ��olls �catlam Cltywlde Including ··
· $5oo lrans\Hlelmed Hm;dway rmpmvemelll
·- ff\>j\f_!l.I!L......... . ..... -River tJrlve ·fVlulti·Use·Pnthwny
� .. l��-�-·-·-------------·-,---------- ___ .,. ___ .... �
Kl·..er Drive- No 4 Rtlto Van Horne Wily multi- $1,344 use path c/w >l9J:I.l:' .. MlY1€1 !!:!.!!.�------·----..
1 !l. f��i�i�l Pt1Vit1g Pl<)@/ii::!l._: lv1FIN ____ , ______
A•ll1t_l_��!.!Jfl��b_l!]!!!);Jli!YJJ!i.L" ....... _ ... ... . .ll.: Annual Paving Pmgrarn- Non -�RN _________ �!'���E�l!!t!�PavinL_.�., ........... .. 12 Nelson Road 1n1provamants Road widening from Bllindelll\d to
13' v;;;;-;t,;:;;;�-;;�-iiiiJf;;;;�yW�ning __ .. ______ .. �::�:�,�:t�����m-Nel!Oillld to Mt·Miii;n $10;361"""'- Complet;'"
Q� ;1.018
1-+--------------+W=a.t..y�-· · �·· -··-.. ·-
· -·---�---��-��·· �-�· __ �--· ·-+------11-----� H No. 2 Road Mufti .. U>e f>atl!wav and No 2 Ro,Jd from StP.veston lliehway to f.\yko $11,000 Cornpleti! Q2 2019
,, !�':'L�!!.9!9!!J!!!I!r��t;!,!!_<:;'}�� ....... ... . � ........ Road/London Rood l5 Se:<:smith R<:>"d Multi·lJse·pothw�v 'i�irj;;::-_.;;;;�d ffom''Be'ci.w;i'i;l\-;;;�ri-;;-- ----$4�5
River Road
16 Active Trn11sportatlon Improvement Hollw.ly Grecnwi!y interscctlom, Great $3W Pro�ram m • • • • • Qlnadl�n_yvay walkw�y
17 River Parkway Road Exten�ion .. Gilbert River pa,kw<"/ �o�d t�hmsion- (lllbort Road
• -"''-•A"<"""�""''"m��'
City Force� 2019
City Forces Q3 2019
Complete Q2 2Q20 -- !32l'.�!".f•_l_!l_�!_tl_l�(l!!5! . . _______________ _, .!2.S:�.!!'..��-1!.�.��- . .. _______ , __________ ------------ ·- · · ------ ·--.. -- - --
tXx;U"mte(tt .:Number: 5977150 V.cr.don: 5
FIN - 46
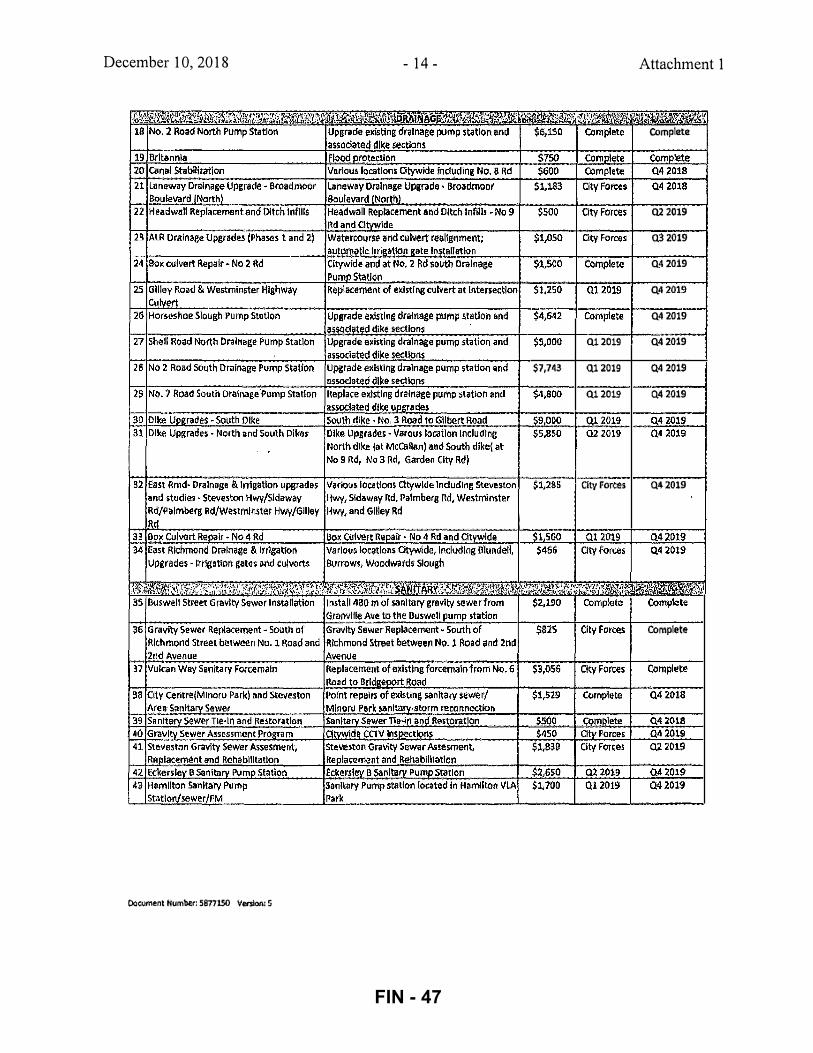
December 1 0,201 8 - 1 4- Attachment 1
COmplete
Q2 2019
U3 2019
Q42019
Q42019
Q4 2019
Q12019 Q42019
$7,743 Q12019 Q42019
Q12019 Q42019
City Forces Q42019
COmplete
OoC-\Itl'lent Number: 5877150 Versloo: 5
FIN - 47
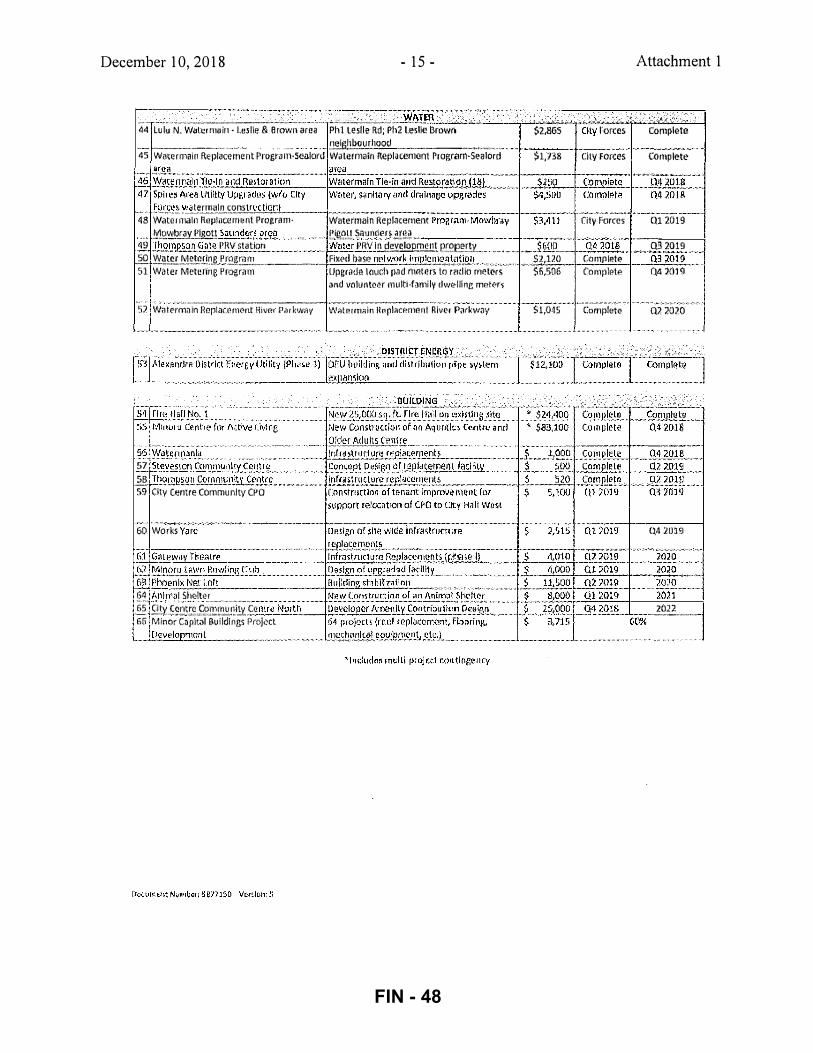
December 10,2018 - 15 -
_:._ $2,865
.... .. ............. , .. .......: .......... : .. ---'-"·:..-.: .... � ........ .. ........... �,�-----� .. : . .•.. :!!'-" TE_l! __ . ___ "". ---"-�...;.--r-"'-'-'--.,....... 44 Lulu N. Wat cr main - Le5lie & a rowfl are� Ph 1 te slle Rd; Ph2 l.eslle Browro
� City l'orce�
-- ---------------�----" · . .. ....... .. .. El.�JGI.l�Y.!J.!?_Q£_ __ .. .. _________ ., ___ ,., ... 45 Wut�nnain Rer>lacernent Program-sealonJ watermaitl Replacement P!Ogram-Sealord $1,73.8 CitY Force&
Attachment 1
.. Complete
COmplete
t!:lt�:�.�a termaln cons tructlon) �----=·���-·---:----+--,----+-·�·-·· ·-·"··· ·l·-·······-·-·--·---...
48 Water main Repl!JC(/flll�nt P1ogram- Watermaln f\epiJcernent l•rogram·Movthra\• $3.411 City Forces Ql 2019 .. _/!'),(),!�Rr.i!Y..�]£2I! .. �aul)_fll:l.r�.E!.t,l� , ,_ ..... .... eitl-;2\! !;;All MIN� 2,[!l!) , •••. .. . . , .. � .
49. .!l).21})£50il_§_aW f'f\V statkm ------·-Water PRV In ,cj��f1J£.!llflf.9fl..PE!'\'.... . ·- $6CIQ ........ : �j� WlB=- --Q':i 2019 . .?.!?. :N.\!�f!.L!.�!f!9.tln� Pt:��!!_________ Fix;•d base netvmrk.�leme!1la@.!l_ ••. . ·"' $1,120 C<Hlifllete
.. -�-·-·mfoi:9::·:� 51 Water Meterint; Program lJpgradlllO\)Ch p�d rnnt€rs to r11dio meters $6,506 tomplr.t1; Q<l 2m9
;�nd voiLHI!<lN multi-family i.lw(�·llln!l met<'rS
'• <A> �h--�---����·�---�--�--
52 Watermoin H�rlacemont Hivt>r Parkwt•Y \Nill�rmain HAfil�mmnnt Rivet P�rt.wny
57 """"'''"' =·'"·''·'·'·'·'·'·'· ��:;.-;
-� .TI.l.9.!2:�&2.n Cornn!!JlDi.'i,_£g�)!!£ .. 59 City Centre CornmuniW CPO
60 Works
§�. Anlr;lJI Sh'.'llte.r ............................. . . 65 S]�yEg!}tCSS"\'!!:[�r:i.!!: .. Co tilr�!E!'!.fi __
66 Minor C�pit<JI Buildings Pro]<�ct Deve lo rnen t L-....L:...,:.:C=;c,.:;.;�-------------···
$1,0·15 c:omp!ete Q2 20i0
(�4 2019
2022 '"'-�"·�•-••U-"�•·••••
60%
FIN - 48
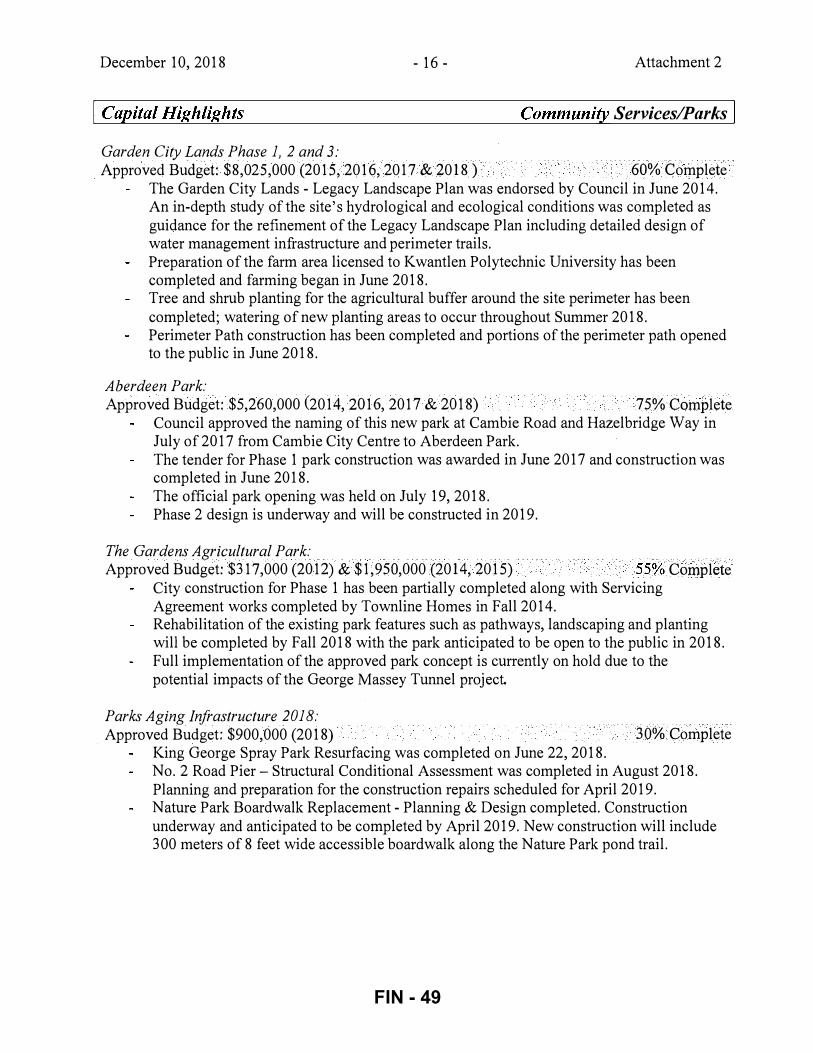
December 10, 2018 - 16 - Attachment 2
I Capital Highlights Community Services/Parks I
Garden City Lands Phase 1, 2 and 3:
Approved Budget: $8,025,000 (2015, 2016, 2017 & 2018) 60% Complete The Garden City Lands - Legacy Landscape Plan was endorsed by Council in June 2014. An in-depth study of the site's hydrological and ecological conditions was completed as guidance for the refinement of the Legacy Landscape Plan including detailed design of water management infrastructure and perimeter trails. Preparation of the farm area licensed to Kwantlen Polytechnic University has been completed and farming began in June 2018. Tree and shrub planting for the agricultural buffer around the site perimeter has been completed; watering of new planting areas to occur throughout Summer 2018. Perimeter Path construction has been completed and portions of the perimeter path opened to the public in June 2018.
Aberdeen Park: Approved Budget: $5,260,000 (2014, 2016,2017 & 2018) 75% Complete
Council approved the naming of this new park at Cambie Road and Hazelbridge Way in July of2017 from Cambie City Centre to Aberdeen Park. The tender for Phase 1 park construction was awarded in June 2017 and construction was completed in June 2018. The official park opening was held on July 19,2018. Phase 2 design is underway and will be constructed in 2019.
The Gardens Agricultural Park: Approved Budget: $317,000 (2012) & $1,950,000 (2014, 2015) 55% Complete
City construction for Phase 1 has been partially completed along with Servicing Agreement works completed by Townline Homes in Fall2014. Rehabilitation of the existing park features such as pathways, landscaping and planting will be completed by Fall2018 with the park anticipated to be open to the public in 2018. Full implementation of the approved park concept is currently on hold due to the potential impacts of the George Massey Tunnel project
Parks Aging Infrastructure 2018:
Approved Budget: $900,000 (2018) 30% Complete King George Spray Park Resurfacing was completed on June 22,2018. No.2 Road Pier- Structural Conditional Assessment was completed in August 2018. Planning and preparation for the construction repairs scheduled for April2019. Nature Park Boardwalk Replacement - Planning & Design completed. Construction underway and anticipated to be completed by April2019. New construction will include 300 meters of 8 feet wide accessible boardwalk along the Nature Park pond trail.
FIN - 49
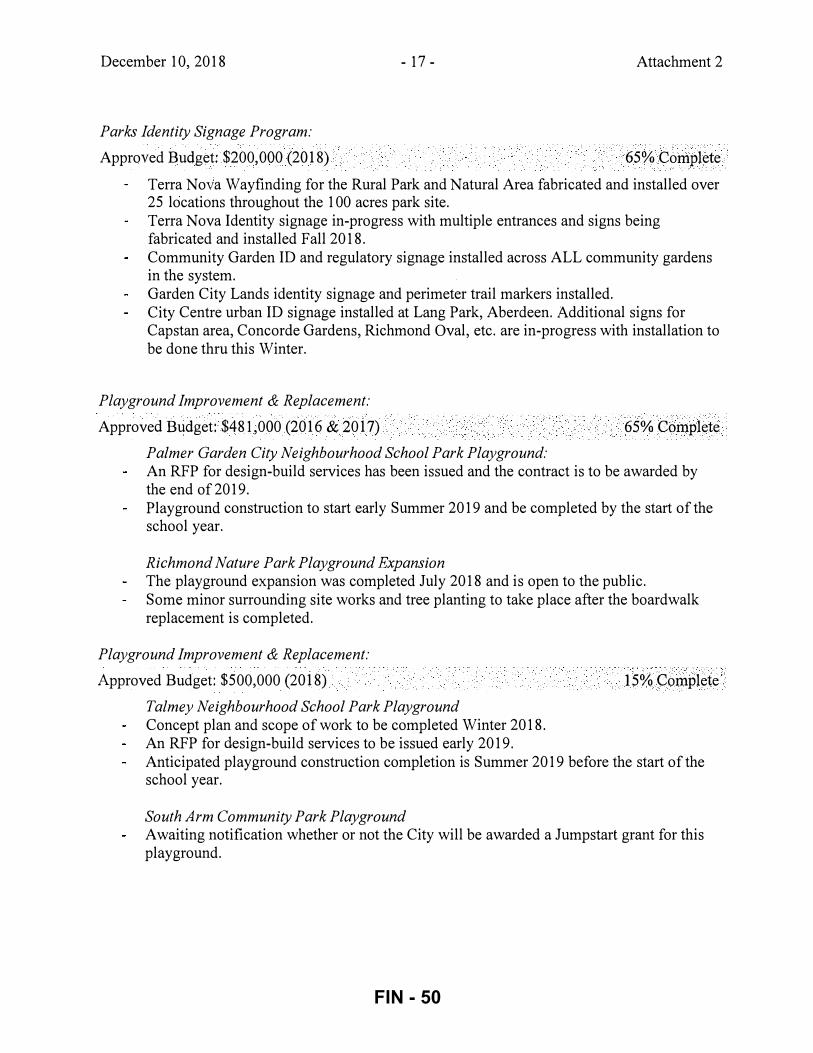
December 10, 2018 - 17- Attachment 2
Parks Identity Signage Program:
Approved Budget: $200,000 (2018) 65% Complete
Terra Nova Wayfinding for the Rural Park and Natural Area fabricated and installed over 25 locations throughout the 1 00 acres park site. Terra Nova Identity signage in-progress with multiple entrances and signs being fabricated and installed Fall2018. Community Garden ID and regulatory signage installed across ALL community gardens in the system. Garden City Lands identity signage and perimeter trail markers installed. City Centre urban ID signage installed at Lang Park, Aberdeen. Additional signs for Capstan area, Concorde Gardens, Richmond Oval, etc. are in-progress with installation to be done thru this Winter.
Playground Improvement & Replacement:
Approved Budget: $481,000 (2016 & 2017) 65% Complete
Palmer Garden City Neighbourhood School Park Playground: An RFP for design-build services has been issued and the contract is to be awarded by the end of2019. Playground construction to start early Summer 2019 and be completed by the start of the school year.
Richmond Nature Park Playground Expansion The playground expansion was completed July 2018 and is open to the public. Some minor surrounding site works and tree planting to take place after the boardwalk replacement is completed.
Playground Improvement & Replacement:
Approved Budget: $500,000 (2018)
Talmey Neighbourhood School Park Playground Concept plan and scope of work to be completed Winter 2018. An RFP for design-build services to be issued early 2019.
15% Complete
Anticipated playground construction completion is Summer 2019 before the start of the school year.
South Arm Community Park Playground Awaiting notification whether or not the City will be awarded a Jumpstart grant for this playground.
FIN - 50
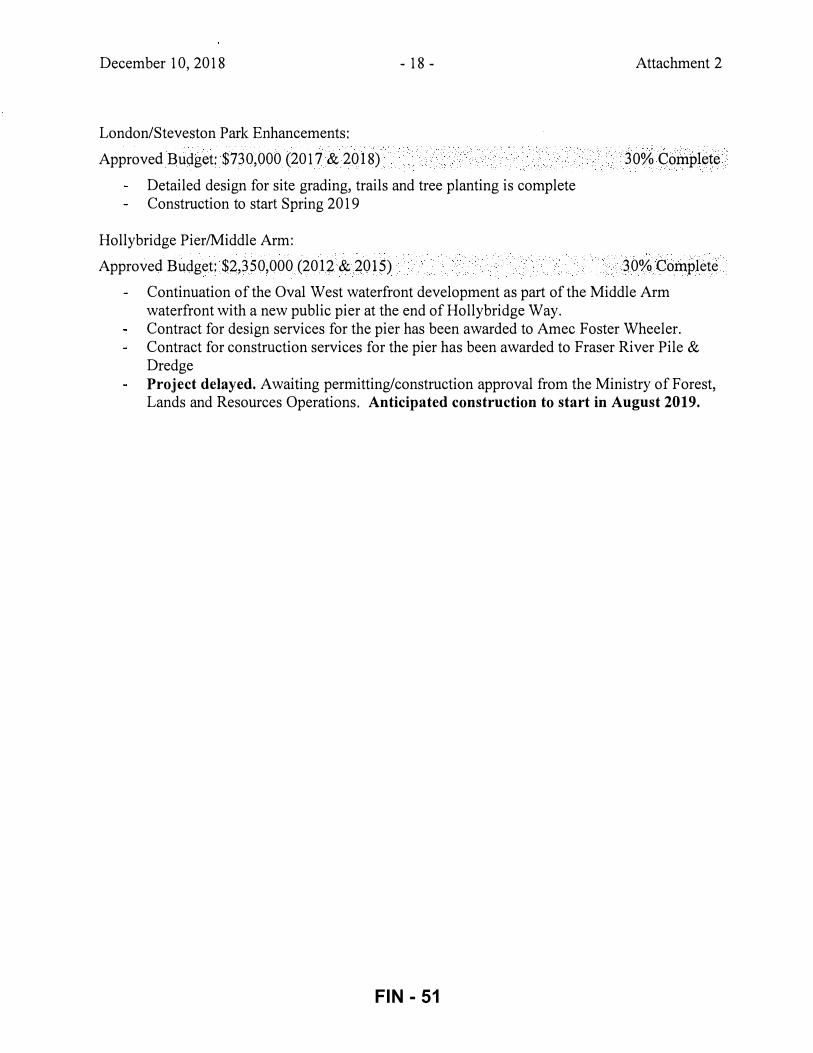
December 10, 2018 - 18 -
London/Steveston Park Enhancements:
Approved Budget: $730,000 (2017 & 2018)
Detailed design for site grading, trails and tree planting is complete Construction to start Spring 2019
Hollybridge Pier/Middle Arm:
Approved Budget: $2,350,000 (2012 & 2015)
Attachment 2
30% Complete
30% Complete
Continuation of the Oval West waterfront development as part of the Middle Arm waterfront with a new public pier at the end ofHollybridge Way. Contract for design services for the pier has been awarded to Amec Foster Wheeler. Contract for construction services for the pier has been awarded to Fraser River Pile &
Dredge Project delayed. Awaiting permitting/construction approval from the Ministry of Forest, Lands and Resources Operations. Anticipated construction to start in August 2019.
FIN - 51
To:
From:
City of Richmond
Finance Committee
George Duncan Chief Administrative Officer & President and CEO Richmond Olympic Oval
Andrew Nazareth
Report to Committee
Date: December 5, 2018
File:
General Manager, Finance and Corporate Services & Chief Financial Officer, Richmond Olympic Oval
Re: Richmond Olympic Oval - 3rd Quarter Financial Information
Staff Recommendation
That the report on Financial Information for the Richmond Olympic Oval Corporation for the third quarter ended September 30, 2018 from the Controller of the Richmond Olympic Oval Corporation be received for information.
George Duncan Chief Administrative Officer & President and CEO Richmond Olympic Oval
6034579
Andrew Nazareth General Manager, Finance and Corporate Services & Chief Financial Officer, Richmond Olympic Oval
FIN - 52
.... � -····""'" RICHMOND OLYMPIC OVAL
DATE: November 30, 2018
TO: George Duncan Chief Executive Officer, Richmond Olympic Oval Corporation
Andrew Nazareth Chief Financial Officer, Richmond Olympic Oval Corporation
John Mills Chief Operating Officer, Richmond Olympic Oval Corporation
FROM: Rick Dusanj, CPA, CA Controller, Richmond Olympic Oval Corporation
Re: Richmond Olympic Oval Corporation- 3rd Quarter 2018 Financial information
Origin
Report
This staff report deals with the third quarter financial results for the 3-month period from July 15\
2018 to September 301h, 2018 ("Q3"} which was endorsed by the Corporation's Board of Directors.
Highlights
The first nine months of operations in 2018'for the Corporation reflect a positive performance with overall metrics and financial performance tracking strongly. The following are some of the highlights of the activities undertaken by the Corporation during Q3.
Community Use As of October 3Pt, the Oval has maintained an active base of over 6,100 pass holders for nine consecutive months. At the end of Q3 2018, a total of 81% of Oval members were from the Richmond community. Members typically use the facility for a variety of activities including fitness, drop-in sports, group fitness classes, etc.
Oval Canada Day activities included activations at both SalmonFest and McArthurGien Outlet malls. The SalmonFest activities included a large booth set up, a portable climbing wall and sport demo stations. McArthurGien included three Yoga and three cycling classes in the main square which were filled to capacity.
Summer camps were very successful this year with the highest registration to date for Community Sport summer camps. One of the camp offerings this year included a basketball camp delivered by Canadian NBA player Jamal Murray which had 180 participants.
Page 1 of 5
FIN - 53
As in previous quarters, community group use continued to constitute the majority of Oval usage in
Q3. Some of the community groups from Richmond or groups with strong Richmond based
participation include, but are not limited to, Richmond Minor Hockey, Vancouver Ki Society,
Richmond Ravens, Connaught Figure Skating, Brazilian Soccer School, Volleyball BC, DRIVE
Basketball, Metro Basketball League, Dynamo Fencing, Greater Vancouver Canadians, the John MS
Lecky Boathouse, Urban Rec, Zone Golf Academy, Aura Rhythmic Gymnastics, the Non-Contact
Hockey League and Panther Cheer.
Sport Development and Events
Some of the highlights from Sport Hosting and Events held at the Oval during Q3 included the BC
Sport Rep Association Trade Show, World Cup Field Painting, NECAC Summer Family Day, John
Dumont Basketball 3x3 Classic, Hooplaw Basketball Tournament, International Taekwondo Canada
Cup, Linus Tech Expo, Katana JiuJitsu Tournament, Noah Yelazaroff Memorial 3x3 Hockey
Tournament, Heroes Challenge (Make a Wish Foundation) and the Rehab Expo. The Corporation
planned and delivered the 4th annual Forever Young 8K Run in September.
Future events secured in Q3 included the 55+ BC Games, Vancouver International Swordplay
Symposium, Free Style Canada Judges Clinic, special olympics powerlifting camp, Battle of the
Badges International basketball tournament, Vancouver Dragon's basketball home games, Linus
Tech Expo 2019, Richmond Home Show, Fire Flight Cultural Performance, Dawn Wall film
presentation and the RYU Warehouse Sale.
Q3 was an exciting quarter for the Oval's High Performance (HP) department. Events and training
camps occurring during Q3 including the 2018 Volleyball Canada Cup, Ultimate Scouting Hockey
Camp, Volleyball BC Baden Cup, Volleyball BC Training Camp, Vancouver FC preseason training
camp, Canada Games squash training camp, BC Para-Nordic camp and two Learn to speed skate
clinics in partnership with the Richmond Rockets.
National Team athletes training at the Oval during Q3 as part of formal training groups included
athletes from Volleyball Canada, Field Hockey Canada, Canadian Wheelchair Sports, BMX Canada
and Softball Canada.
Notable athlete successes during Q3 included:
• lan Ryder won the U18 gold and U21 gold at the Canada Cup and Caleigh Kuramoto won
U18 bronze. lan went on to win U18 Gold and U21 Bronze at the Pan American
Championships
• Volleyball Canada Women's National Team swept their Pan Am Group and secured a
spot at the 2019 Pan Am Games.
• Field Hockey Canada junior national team member Alexis De Armond was named the
best female player at the 6-Nations Tournament in Europe.
Page 2 of 5
FIN - 54
• Peter Isherwood won his first international match at the U.S Para Table Tennis Open.
Peter also played for the provincial Wheelchair Rugby Team and competed in athletics
during the 2017/18 seasons. • Citius women's table tennis team was 1st place and Citius men's team placed 2nd at the
2018 Canada Cup. Cindy Wang won 1st in women's singles and Gu Meng won 3rd.
Governance
Meetings of the Corporation's Audit & Finance Committee and the Board of Directors took place
during Q3.
Financial
The first 9 months of 2018 has been successful for the Corporation. The YTD results for the 9 months
ended September 30, 2018 were budgeted at an income before transfers to reserves/provisions of
$432,000 and the actual results show income of $1,184,000 indicating a favorable variance of
$752,000 (please see page 4 for the Corporation's balance sheet as of September 30, 2018 and page
5 for the statement of operations). In Q3, $335,000 was allocated to the reserves/provisions.
Comments on the Financial Results for Q3
Revenues
The Q3 portion of the estimated 2018 Games Operating Trust Fund ("GOT") distribution of $721,000
was recognized as revenue. Memberships, admissions and programs revenue was $2,239,000 in Q3
and other revenue of $511,000 primarily pertained to sponsorship, space leasing, parking, and interest
revenue. Overall, revenue was $69,000 favorable to budget
Expenses
Memberships, admissions and program services costs for Q3 2018 were $1,541,000, facility
operations costs were $1,179,000, marketing expenses were $123,000, and administration and
finance expenses were $696,000. Overall, expenditures were $135,000 favorable to budget.
Rick Dusanj, CPA, CA
Controller, Richmond Olympic Oval Corporation
cc: Shana Turner
Director, Administration & Corporate Services, Richmond Olympic Oval Corporation
Page 3 of 5
FIN - 55
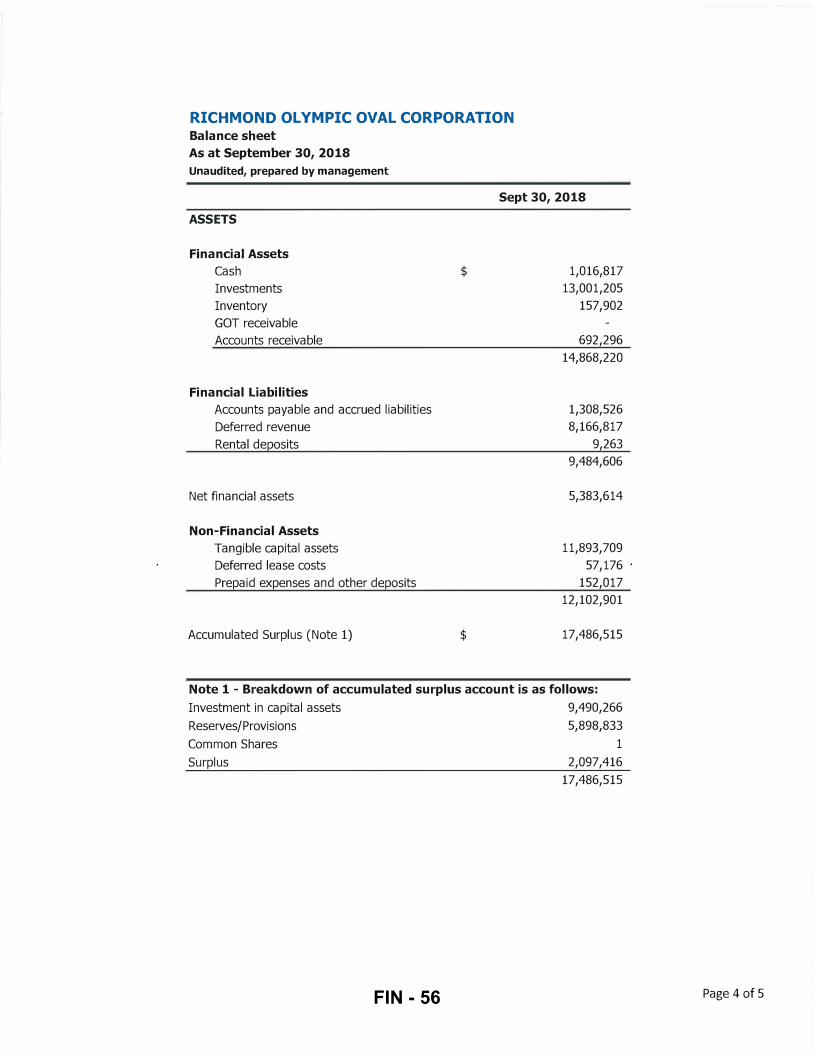
RICHMOND OLYMPIC OVAL CORPORATION
Balance sheet
As at September 30, 2018
Unaudited, prepared by management
Sept 30, 2018
ASSETS
Financial Assets
Cash
Investments
Inventory
GOT receivable
Accounts receivable
Financial Liabilities
Accounts payable and accrued liabilities
Deferred revenue
Rental deposits
Net financial assets
Non-Financial Assets
Tangible capital assets
Deferred lease costs
Prepaid expenses and other deposits
Accumulated Surplus (Note 1)
$
$
1,016,817
13,001,205
157,902
692,296
14,868,220
1,308,526
8,166,817
9,263
9,484,606
5,383,614
11,893,709
57,176
152,017
12,102,901
17,486,515
Note 1 - Breakdown of accumulated surplus account is as follows:
Investment in capital assets 9,490,266
Reserves/ Provisions
Common Shares
Surplus
5,898,833
1
2,097,416
17,486,515
Page 4 of 5 FIN - 56
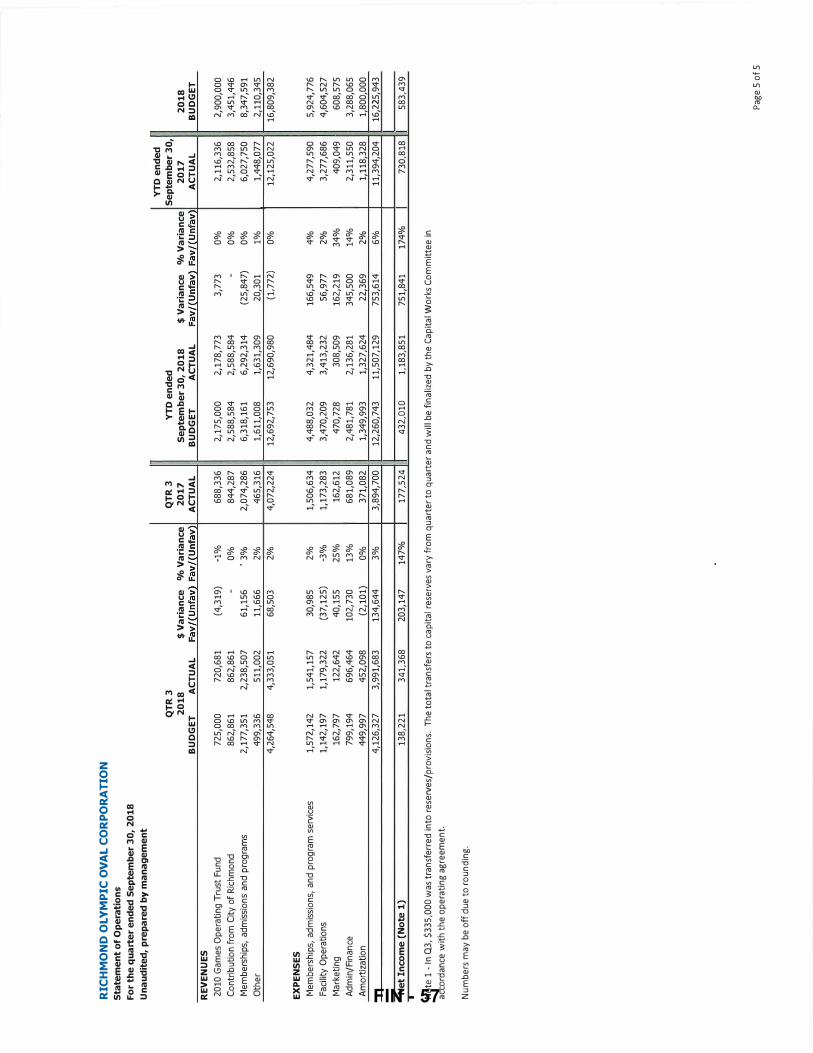
RI
CH
MO
ND
OL
YM
PI
C O
VA
L C
OR
PO
RA
TI
ON
Sta
tem
en
t o
f O
pe
rati
on
s
Fo
r th
e q
ua
rte
r e
nd
ed
Se
pte
mb
er 3
0,
20
18
Un
au
dit
ed
, p
rep
are
d b
y m
an
ag
em
en
t
RE
VE
NU
ES
2.0
10
Ga
me
s O
pe
rati
ng
Tru
st F
un
d
Co
ntr
ibu
tio
n f
rom
Cit
y o
f R
ich
mo
nd
Me
mb
ers
hip
s, a
dm
issi
on
s an
d p
rog
ram
s
Oth
er
EX
PE
NS
ES
Me
mb
ers
hip
s, a
dm
issi
on
s, a
nd
pro
gra
m s
erv
ice
s
Fa
cilit
y O
pe
rati
on
s
Ma
rke
tin
g
Ad
min
/Fin
ance
Am
ort
iza
tio
n
Ne
t In
com
e (
No
te 1
)
QT
R3
2
01
8
BU
DG
ET
A
CT
UA
L
72.
5,0
00
7
2.0
,68
1
86
2.,8
61
8
62.
,86
1
2.,1
77
,35
1
2.,2.
38
,50
7
49
9,3
36
5
11
,00
2.
4,2
64
,54
8
4,3
33
,05
1
1,5
72.
,14
2.
1,5
41
,15
7
1,1
42.
,19
7
1,1
79
,32.
2
16
2.,7
97
1
2.2
,64
2
79
9,1
94
6
96
,46
4
44
9,9
97
4
52
,09
8
4,1
2.6
,32
7
3,9
91
,68
3
13
8,2
2.1
3
41
,36
8
$ V
ari
an
ce
0/o
Va
ria
nce
F
av
/(U
nfa
v)
Fa
v/(
Un
fav
(4,3
19
) -1
%
-0
%
61
,15
6
. 3
%
11
,66
6
2.%
68
,50
3
2.%
30
,98
5
2.%
(37
,12
5)
- 3%
40
,15
5
2.5
%
10
2.,7
30
1
3%
(2.,1
01
) 0
%
13
4,6
44
3
%
2.0
3,1
47
1
47
%
QT
R3
Y
TD
en
de
d
20
17
S
ep
tem
be
r 30
, 2
01
8
$ V
ari
an
ce
0/o
Va
ria
nce
A
CT
UA
L
BU
DG
ET
A
CT
UA
L
Fa
v/(
Un
fav
) F
av
/(U
nfa
v
68
8,3
36
2
,17
5,0
00
2
,17
8,7
73
3
,77
3
0%
84
4,2.
87
2
,58
8,5
84
2
,58
8,5
84
-
0%
2,0
74
,2.8
6
6,3
18
,16
1
6,2
92
,31
4
(2.5
,84
7)
0%
46
5,3
16
1
,61
1,0
08
1
,63
1,3
09
2.
0,3
01
1
%
4,0
72.
,2.2
4
12.
,69
2.,7
53
1
2.,6
90
,98
0
(1,7
72.
) 0
%
1,5
06
,63
4
4,4
88
,03
2.
4,3
21
,48
4
16
6,5
49
4
%
1,1
73
,2.8
3
3,4
70
,2.0
9
3,4
13
,2.3
2.
56
,97
7
2.%
16
2.,6
12
4
70
,72.
8
30
8,5
09
1
62.
,2.1
9
34
%
68
1,0
89
2
,48
1,7
81
2.
,13
6,2
81
3
45
,50
0
14
%
37
1,0
82
1
,34
9,9
93
1
,32.
7,6
2.4
2
2.,3
69
2.
%
3,8
94
,70
0
12
,26
0,7
43
1
1,5
07
,12.
9
75
3,6
14
6
%
17
7,5
2.4
4
32.
,01
0
1,1
83
,85
1
75
1,8
41
1
74
%
No
te 1
-In
Q3
, $
33
5,0
00
wa
s tr
an
sfe
rre
d in
to r
ese
rve
s/p
rovi
sio
ns.
T
he
to
tal t
ran
sfe
rs t
o c
ap
ita
l re
serv
es
vary
fro
m q
ua
rte
r to
qu
art
er
an
d w
ill b
e f
ina
lize
d b
y t
he
Ca
pit
al
Wo
rks
Co
mm
itte
e i
n
acc
ord
an
ce w
ith
th
e o
pe
rati
ng
agr
ee
me
nt.
Nu
mb
ers
ma
y b
e o
ff d
ue
to
ro
un
din
g.
YT
D e
nd
ed
S
ep
tem
be
r 30
, 2
01
7
20
18
A
CT
UA
L
BU
DG
ET
2.,1
16
,33
6
2.,9
00
,00
0
2.,5
32.
,85
8
3,4
51
,44
6
6,0
2.7
,75
0
8,3
47
,59
1
1,4
48
,07
7
2.,1
10
,34
5
12
,12.
5,0
2.2
1
6,8
09
,38
2
4,2.
77
,59
0
5,9
2.4
,77
6
3,2.
77
,68
6
4,6
04
,52
7
40
9,0
49
6
08
,57
5
2.,3
11
,55
0
3,2
88
,06
5
1,1
18
,32
8
1,8
00
,00
0
11
,39
4,2.
04
1
6,2.
2.5,9
43
73
0,8
18
5
83
,43
9
Pa
ge
5 o
f 5
FIN - 57
City of Richmond Report to Committee
To: Finance Committee Date: November 28 2018
From: John Irving, P.Eng., MPA Director, Engineering
File: 10-6600-10-01 /2018-Vol 01
Chief Executive Officer, Lulu Island Energy Company
Jerry Chong, CPA, CA Director, Finance Chief Financial Officer, Lulu Island Energy Company
Re: Lulu Island Energy Company- 3rd Quarter Financial Information
Staff Recommendation
That the Lulu Island Energy Company repmi titled "Lulu Island Energy Company- 3rd Quarter
Financial Information" dated November 28,2018 from the Chief Executive Officer and Chief Financial Officer, Lulu Island Energy Company be received for information.
()d '
(Jt1ckf � Ir::, P.Eng., MP J� Cho�?' CPA�A
Director, Engineering and Director, Finance and
Chief Executive Officer, Chief Financial Officer, Lulu Island Energy Company Lulu Island Energy Company (604-276-4140) (604-276-4064)
Att. 2
6040158
REPORT CONCURRENCE
CaRENCE OF GENERAL MANAGER
_c -::::>
REVIEWED BY 1A /58
AP(LJED BY CAO
. � � -\ -
INITIALS:
,Ar)
FIN - 58
November 28,2018 - 2 -
Staff Report
Origin
Since 2009, City staff have been implementing district energy projects and providing Richmond's residents with heating and cooling energy services from sustainable district energy systems. Council adopted the program with the objectives that:
the district energy utility (DEU) will provide end users with energy costs that are competitive with conventional system energy costs based on the same level of service, and
Council retains the authority of setting customer rates, fees and charges for DEU services.
In 2013 the Lulu Island Energy Company (LIEC) was established as a wholly owned corporation of the City of Richmond for the purpose of managing district energy utilities on the City's behalf. As approved by Council in April 2014, Council authorized City staff to execute a
District Energy Utilities Agreement between the City and LIEC, assigning LIEC the function of providing district energy services on behalf of the City, including partnering with third parties to deliver such services.
This supports Council's 2014-2018 Term Goal #4 Leadership in Sustainability:
Continue advancement of the City's sustainability ji-amework and initiatives to improve the short and long term livability of our City, and that maintain Richmond's position as a leader in sustainable programs, practices and innovations.
4.1. Continued implementation of the sustainability framework.
4.2. Innovative projects and initiatives to advance sustainability.
This suppmis Council's 2014-2018 Term Goal #6 Quality Infrastructure Networks:
Continue diligence towards the development of inji-astructure networks that are safe, sustainable, and address the challenges associated with aging systems, population growth, and environmental impact.
6.1. Safe and sustainable inji-astructure.
6. 2. Jnfi'astructure is reflective of and keeping pace ·with community need.
Background
District Energy Utilities as Part of a Sustainable Community
Richmond's 2041 Official Community Plan (OCP) establishes a target to reduce community greenhouse gas (GHG) emissions 33 per cent below 2007levels by 2020 and 80 per cent by 2050. The OCP also includes a target to reduce energy use 10 per cent below 2007 levels by
6040158 FIN - 59
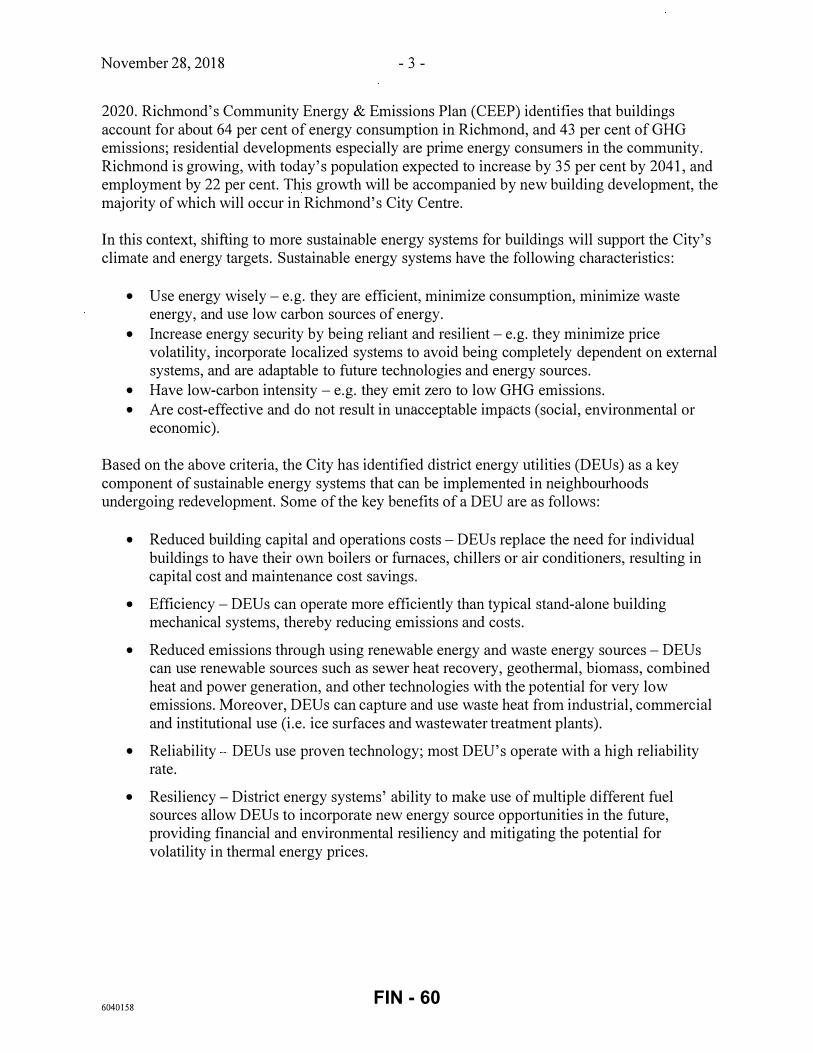
November 28,2018 - 3 -
2020. Richmond's Community Energy & Emissions Plan (CEEP) identifies that buildings account for about 64 per cent of energy consumption in Richmond, and 43 per cent of GHG emissions; residential developments especially are prime energy consumers in the community. Richmond is growing, with today's population expected to increase by 35 per cent by 2041, and employment by 22 per cent. This growth will be accompanied by new building development, the majority of which will occur in Richmond's City Centre.
In this context, shifting to more sustainable energy systems for buildings will support the City's climate and energy targets. Sustainable energy systems have the following characteristics:
• Use energy wisely- e.g. they are efficient, minimize consumption, minimize waste energy, and use low carbon sources of energy.
• Increase energy security by being reliant and resilient- e.g. they minimize price volatility, incorporate localized systems to avoid being completely dependent on external systems, and are adaptable to future technologies and energy sources.
• Have low-carbon intensity- e.g. they emit zero to low GHG emissions. • Are cost-effective and do not result in unacceptable impacts (social, environmental or
economic).
Based on the above criteria, the City has identified district energy utilities (DEUs) as a key component of sustainable energy systems that can be implemented in neighbourhoods undergoing redevelopment. Some of the key benefits of a DEU are as follows:
• Reduced building capital and operations costs- DEUs replace the need for individual buildings to have their own boilers or furnaces, chillers or air conditioners, resulting in capital cost and maintenance cost savings.
• Efficiency- DEUs can operate more efficiently than typical stand-alone building mechanical systems, thereby reducing emissions and costs.
• Reduced emissions through using renewable energy and waste energy sources- DEUs can use renewable sources such as sewer heat recovery, geothermal, biomass, combined heat and power generation, and other technologies with the potential for very low emissions. Moreover, DEUs can capture and use waste heat from industrial, commercial and institutional use (i.e. ice surfaces and wastewater treatment plants).
• Reliability DEUs use proven technology; most DEU's operate with a high reliability rate.
• Resiliency- District energy systems' ability to make use of multiple different fuel sources allow DEUs to incorporate new energy source opportunities in the future, providing financial and environmental resiliency and mitigating the potential for volatility in thermal energy prices.
6040158 FIN - 60
November 28, 2018 - 4 -
District Energy in Richmond
LIEC currently owns and operates the Oval Village District Energy Utility (OVDEU), Alexandra District Energy Utility (ADEU), and City Center District Energy Utility (CCDEU), as well advances new district energy oppmiunities. Attachment 1 indicates the current and planned future DEU areas throughout Richmond. LIEC has been recognized for excellence, leadership, innovation and sustainability through receiving thirteen awards since the company's inception, ranging from the provincial to international scale.
LIEC cmTently services eight buildings in the OVDEU service area, containing over 1,700 residential units. Energy is currently supplied from the two interim energy centres with natural gas boilers which combined provide 11 MW of heating capacity. When enough buildings are connected to the system, a permanent energy centre will be built which will produce low carbon energy. Currently the OVDEU is planned to harness energy from the Gilbert Trunk sanitary force main sewer through the implementation of the permanent energy centre in 2024. Over the next 30 years, the OVDEU system is anticipated to reduce GHG emissions by more than 52,000 tonnes of C02 as compared to business as usual1• OVDEU is developed under a concession agreement with Cmix Utilities Inc (Corix). During the concession period (30 years), Corix will design, build, finance and operate the OVDEU and will supply energy services to LIEC; LIEC owns the assets and Council sets customer rates.
LIEC provides heating and cooling services to five residential buildings, the large commercial development at "Central at Garden City", the Richmond Jamatkhana temple and Fire Hall #3, in total connecting over 1450 residential units and over 1.6 million square feet of floor area in the ADEU service area,. While some electricity is consumed for pumping and equipment operations, almost 100% of this energy is currently produced locally from the geo-exchange fields in the greenway corridor and West Cambie Park, and highly efficient air source heat pumps. The backup and peaking natural gas boilers and cooling towers in the energy centre have operated for only a few days throughout the system's operation to date. LIEC staff estimate that this has eliminated 2,340 tonnes of GHG emissions in the community.
Financial Impact
None.
1 Assumed that all energy was provided for heating. The business-as-usual (BAU) assumed that 40% of the building heating load would be provided from electricity and the remaining 60% would be from gas make-up air units.
6040158 FIN - 61
November 28, 2018 - 5 -
..
Conclusion
The LIEC 3rd Qumier Financial Inf01mation approved by LIEC Bom·d is presented to Council for information.
~ Peter Russell, MCIP RPP Senior Manager, Sustainability and District Energy
( 604-276-4130)
AP
Att. 1: Map of Current and Future District Energy Utility Areas in Richmond Att. 2: Lulu Island Energy Company- 3rd Quarter Financial Information
6040158 FIN - 62
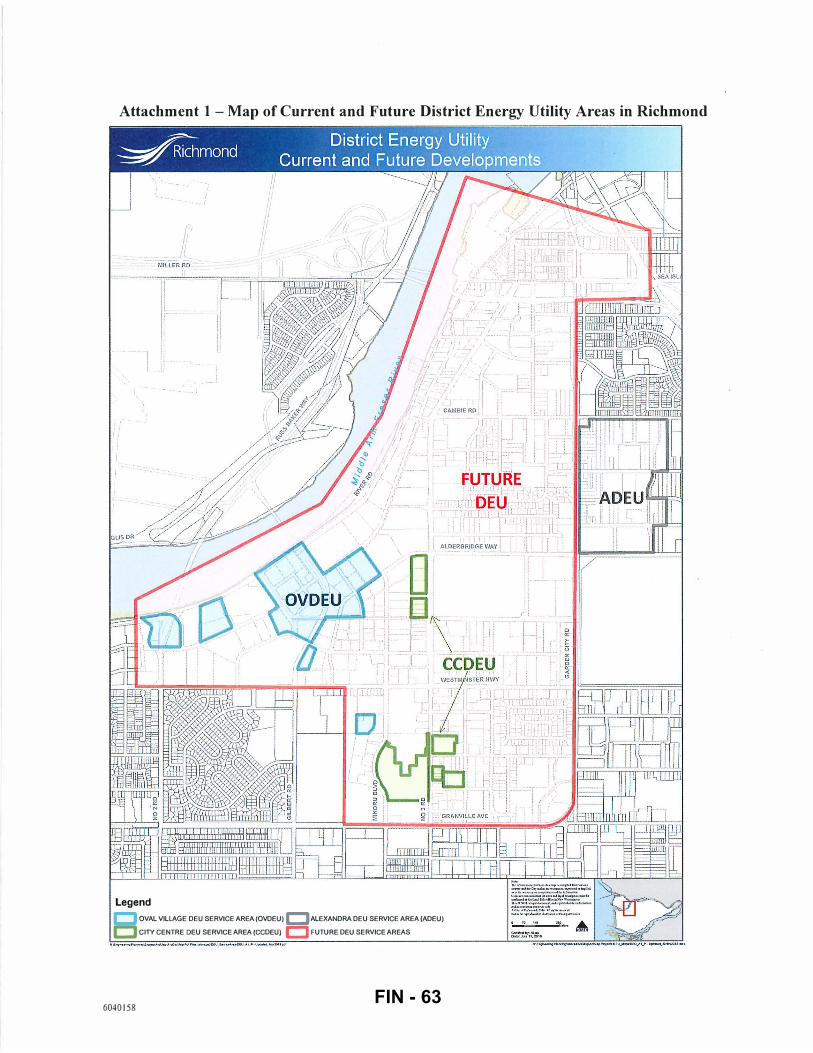
Attachment 1 -Map of Current and Future District Energy Utility Areas in Richmond
r� /(
Legend
c OVAL VILLAGE DEU SERVICE AREA (OVDEU) c ALEXANDRA DEU SERVICE AREA (ADEU)
c CITY CENTRE DEU SERVICE AREA (CCDEU) t:l FUTURE DEU SERVICE AREAS
6040158
j_ :'
!· i
FIN - 63
Attachment 2- Lulu Island Energy Company- 3�"11 Quarter Financial Information
Report
DATE:
TO:
FROM:
November 8, 2018
Board of Directors
Helen Zhao, Controller
A Lululsland 'V ENERGY COMPANY
6911 NO.3 ROAD RICHMOND, BC V6Y 2C1
Re: Lulu Island Energy Company- 3rct Quarter Financial Information
Staff Recommendation
That the 3r!l Quarter Financial Information as presented in the report titled "Lulu Island Energy Company- 3rd Quarter Financial Information" dated November 8, 2018 from the Chief Executive Officer and Chief Financial Officer, Lulu Island Energy Company, be approved.
Background
Lulu Island Energy Company (LIEC), a corporation wholly-owned by the City of Richmond, was established to provide district energy services on behalf of the City. This report was prepared with the objective to provide pre-audited financial information to the Board and LIEC's shareholder, represented by Richmond City Council.
Analysis
Financial statements have been prepared in accordance with International Financial Reporting Standards (IFRS). The LIEC's pre-audited Q3 financial information consists of a Statement of Comprehensive Income, which includes a summary of revenues, expenses, other activities and net income for the qumier (included in Attachment 1 ).
Revenues
The metered billing revenue reflects energy sales. The total metered billing revenue of $2,540,723 has slightly exceeded budget, with $1,192,292 earned from the Oval Village District Energy Utility (OVDEU) and $1,348,432 earned from the Alexandra District Energy Utility (ADEU).
6040158 FIN - 64
Cost of Sales
The cost of sales is the accumulated total of expenses attributable to the metered billing revenue, which includes utilities (electricity and natural gas), contract services and ammiization expenses. Overall, the cost of sales of $1,798,3 73 is in line with the budget. The contract expense is above budget by 2% mainly due to unscheduled repairs and maintenance. The utility expenses are slightly higher than the budget because of higher energy use by customers, which is in line with the revenue increase.
General and Administration Expenses
The general and administration expenses are expenditures that LIEC incurs to engage in business development activities and includes salaries and benefits, administration expenses, professional fees, etc. The administration expenses include the overhead allocation paid by LIEC to the City of Richmond for the supp01i provided by the City. Overall, the general and administration expenses have a favorable variance of 6%.
Contributions and Financing Expense
The contributions and financing expense section represents other sources of revenue and financing expense for the business. The finance income refers to interest earned on term deposits. The income is higher than the budget due to increased interest rates during the year. The financing expense is lower than the budget mainly due to timing of additional capital required in construction. Overall, there is a favorable variance.
LIEC's EBITA (earnings before interest, tax, and amortization), used as a proxy to measure LIEC's financial performance, at the end of the third quarter is 6% higher than the budget. The net income at the end of the third quarter is $676,863. Consistent with strategic objectives, the net income is being set aside in LIEC's equity to build a reserve ftmd for future capital replacement.
Financial Impact
None.
Conclusion
The pre-audited financial information shows that LIEC's financial position is positive.
He en Zhao, CPA, CA Controller
Attachment 1: Summary of Q3 Financial Information (unaudited)
6040158 FIN - 65

Attachment 1 -Summary of Q3 Financial Information (unaudited)
2018 Q3 2018 Q3 $Changes %Change Actual Budget
Revenues
Metered Billings (Quarterly) $ 2,540,723 $2,534,343 6,380 0%
Service fee 700,661 700,661
3,241,385 3,235,004 6,380 0%
Cost of Sales Contracts 499,404 491,677 7,727 2%
Utilities 442,779 439,388 3,391 1%
Ammiization 856,190 848,538 7,652 1%
1,798,373 1,779,603 18,770 1%
Gross margin 1,443,011 1,445,401 (12,390) (1%)
General and Administration Expenses
Salaries and benefits 453,448 461,545 (8,096) (2%)
Administration expenses 82,091 100,137 (18,046) (18%)
Insurance 65,761 65,000 761 1%
Professional Fees 31,128 48,750 (17,622) (36%)
632,429 675,432 (43,003) (6%)
Net income before other items 810,582 779,970 30,613 4%
Contributions and Financing expense Developer contributions 80,070 64,744 15,326 24%
Energy modeling review fee 21,540 20,000 1,540 8%
Finance income 74,129 30,000 44,129 147%
Financing expense (309,458) (314,639) 5,181 (2%)
(133,720) (199,896) 66,176 (33%)
Net Income $676,863 $580,074 $96,789 17%
Earnings before interest, taxes and amortization (EBITA) Net income per above 676,863 580,074 96,789 17%
Financing expense 309,458 314,639 (5,181) (2%)
Ammiization expense 856,190 848,538 7,652 1%
EBITA 1,842,511 1,743,251 99,260 6%
6040158 FIN - 66
City of Richmond Report to Committee
To: Finance Committee Date: October 26, 2018
From: John Irving, P.Eng., MPA Director, Engineering
File: 10-6600-10-01/2018-Vol 01
Chief Executive Officer, Lulu Island Energy Company
Jerry Chong, CPA, CA Director, Finance Chief Financial Officer, Lulu Island Energy Company
Re: 2019 Operating Budget for the Lulu Island Energy Company
Staff Recommendation
That the Lulu Island Energy Company report titled "20 19 Operating Budget for the Lulu Island Energy Company" dated October 26,2018 from the ChiefExecutive Officer and Chief Financial Officer, Lulu Island Energy Company be received for information.
c2f: P.Eng., MP� Jerry Chong, CPA, CA Director, Engineering and Director, Finance and
Chief Executive Officer, Chief Financial Officer, Lulu Island Energy Company Lulu Island Energy Company (604-276-4140) (604-276-4064)
Att. 2
6011863
REPORT CONCURRENCE
�?E OF GENERAL MANAGER
c >
REVIEWED BY t�58 c-:=J -
APG:;Y �AO
7 � � """'
INITIALS:
80
FIN - 67
October 26, 2018 - 2 -
Staff Report
Origin
Since 2009, City staff have been implementing district energy projects and providing Richmond's residents with heating and cooling energy services from sustainable district energy systems. Council adopted the program with the objectives that:
the district energy utility (DEU) will provide end users with energy costs that are
competitive with conventional system energy costs based on the same level of service, and
Council retains the authority of setting customer rates, fees and charges for DEU services.
In 2013 the Lulu Island Energy Company (LIEC) was established as a wholly owned corporation of the City of Richmond for the purpose of managing district energy utilities on the City's
behalf. As approved by Council in April 2014, Council authorized City staff to execute a
District Energy Utilities Agreement between the City and LIEC, assigning LIEC the function of providing district energy services on behalf of the City, including partnering with third parties to deliver such services.
This supports Council's 2014-2018 Term Goal #4 Leadership in Sustainability:
Continue advancement of the City's sustainability ji-amework and initiatives to improve the short and long term livability of our City, and that maintain Richmond's position as a leader in sustainable programs, practices and innovations.
4.1. Continued implementation of the sustainability ji-amework.
4.2. Innovative projects and initiatives to advance sustainability.
This supp01is Council's 2014-2018 Term Goal #6 Quality Infrastructure Networks:
Continue diligence towards the development of inji-astructure networks that are safe, sustainable, and address the challenges associated with aging systems, population gro-wth, and environmental impact.
6.1. Safe and sustainable inji-astructure.
6. 2. Irifi'astructure is reflective of and keeping pace with community need.
Background
District Energy Utilities as Part of a Sustainable Community
Richmond's 2041 Official Community Plan (OCP) establishes a target to reduce community greenhouse gas (GHG) emissions 33 per cent below 2007 levels by 2020 and 80 per cent by 2050. The OCP also includes a target to reduce energy use 10 per cent below 2007levels by
6011863 FIN - 68
October 26,2018 - 3 -
2020. Richmond's Community Energy & Emissions Plan (CEEP) identifies that buildings account for about 64 per cent of energy consumption in Richmond, and 43 per cent of GHG emissions; residential developments especially are prime energy consumers in the community. Richmond is growing, with today's population expected to increase by 35 per cent by 2041, and employment by 22 per cent. This growth will be accompanied by new building development, the majority of which will occur in Richmond's City Centre.
In this context, shifting to more sustainable energy systems for buildings will supp01i the City's climate and energy targets. Sustainable energy systems have the following characteristics:
• Use energy wisely- e.g. they are efficient, minimize consumption, minimize waste energy, and use low carbon sources of energy.
• Increase energy security by being reliant and resilient e.g. they minimize price volatility, incorporate localized systems to avoid being completely dependent on external systems, and are adaptable to future technologies and energy sources.
• Have low-carbon intensity- e.g. they emit zero to low GHG emissions. • Are cost-effective and do not result in unacceptable impacts (social, environmental or
economic).
Based on the above criteria, the City has identified district energy utilities (DEUs) as a key component of sustainable energy systems that can be implemented in neighbourhoods undergoing redevelopment. Some of the key benefits of a DEU are as follows:
• Reduced building capital and operations costs DEUs replace the need for individual buildings to have their own boilers or furnaces, chillers or air conditioners, resulting in capital cost and maintenance cost savings.
• Efficiency- DEUs can operate more efficiently than typical stand-alone building mechanical systems, thereby reducing emissions and costs.
• Reduced emissions through using renewable energy and waste energy sources- DEUs can use renewable sources such as sewer heat recovery, geothermal, biomass, combined heat and power generation, and other technologies with the potential for very low emissions. Moreover, DEUs can capture and use waste heat from industrial, commercial and institutional use (i.e. ice surfaces and wastewater treatment plants).
• Reliability- DEUs use proven technology; most DEU's operate with a high reliability rate.
• Resiliency- District energy systems' ability to make use of multiple different fuel sources allow DEUs to incorporate new energy source opportunities in the future, providing financial and environmental resiliency and mitigating the potential for volatility in thermal energy prices.
6011863 FIN - 69
October 26, 2018 - 4 -
District Energy in Richmond
LIEC currently owns and operates the Oval Village District Energy Utility (OVDEU), Alexandra District Energy Utility (ADEU), and City Center District Energy Utility (CCDEU), as well advances new district energy opportunities. Attachment 1 indicates the current and plmmed future DEU areas throughout Richmond. LIEC has been recognized for excellence, leadership, itmovation and sustainability through receiving thirteen awards since the company's inception, ranging from the provincial to international scale.
LIEC currently services eight buildings in the OVDEU service area, containing over 1,700 residential units. Energy is currently supplied from the two interim energy centres with natural gas boilers which combined provide 11 MW of heating capacity. When enough buildings are connected to the system, a permanent energy centre will be built which will produce low carbon energy. Currently the OVDEU is planned to harness energy from the Gilbert Trunk sanitary force main sewer through the implementation of the permanent energy centre in 2024. Over the
·next 30 years, the OVDEU system is anticipated to reduce GHG emissions by more than 52,000 tonnes of C02 as compared to business as usual1• OVDEU is developed under a concession agreement with Corix Utilities Inc (Corix). During the concession period (30 years), Corix will design, build, finance and operate the OVDEU and will supply energy services to LIEC; LIEC owns the assets and Council sets customer rates.
LIEC provides heating and cooling services to five residential buildings, the large commercial development at "Central at Garden City", the Richmond Jamatkhana temple and Fire Hall #3, in total connecting over 1450 residential units and over 1.6 million square feet of floor area in the ADEU service area,. While some electricity is consumed for pumping and equipment operations, almost 100% of this energy is currently produced locally from the geo-exchange fields in the greenway corridor and West Cambie Park, and highly efficient air source heat pumps. The backup and peaking natural gas boilers and cooling towers in the energy centre have operated for only a few days throughout the system's operation to date. LIEC staff estimate that this has eliminated 2,340 tonnes of GHG emissions in the community.
Financial Impact
None.
1 Assumed that all energy was provided for heating. The business-as-usual (BAU) assumed that 40% of the building heating load would be provided fi·om electricity and the remaining 60% would be from gas make-up air units.
6011863 FIN - 70
October 26, 2018 - 5 -
Conclusion
The LIEC 2019 Operating Budget approved by LIEC Board is presented to Council for infmmation.
Peter Russell, MCIP RPP Senior Manager, Sustainability and District Energy (604-276-4130)
AP
Att. 1: Map of Cunent and Future District Energy Utility Areas in Richmond Att. 2: 2019 Operating Budgets for the Lulu Island Energy Company
6011863 FIN - 71
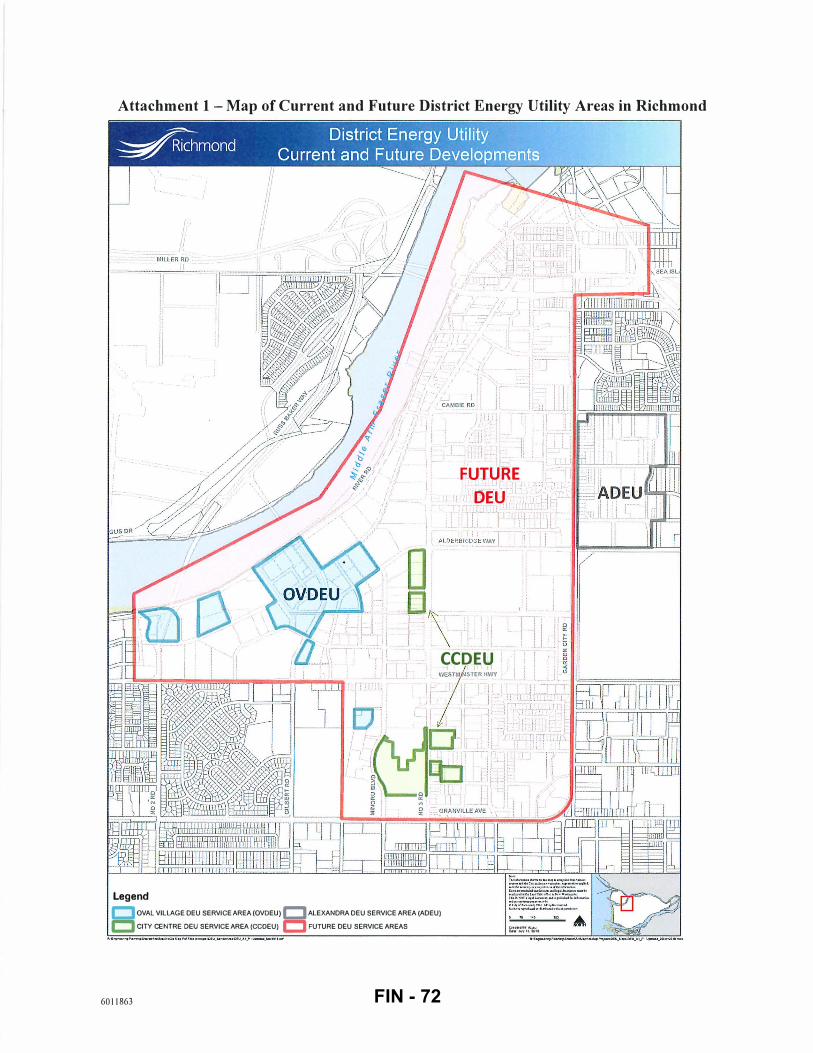
Attachment 1 -Map of Current and Future District Energy Utility Areas in Richmond
/''
Legend
I' ! i ' ,
•'
0
·, I
1 ! I '
'IJ'
. r;:. i ·1. · 1. f·,UT�RE�. ,1 . r
.
II I ' DEU l,Y' ·.�;-, � T - [I I ' · . L I r ' 1:[ I
I �LOERBRI�GE WAY I ';. JJ·t ' '..i.. I
. Or \" ! ' I l li
) . ! I
' 'I
I CCDEU ,, WESTM, STER HWY
c::J OVAL VILLAGE DEU SERVICE AREA (OVDEU) c::J ALEXANDRA DEU SERVICE AREA (ADEU)
c:::J CITY CENTRE DEU SERVICE AREA (CCDEU) c:::J FUTURE DEU SERVICE AREAS CU>IIIdt'p";AI..O� 0.11'.1J'"·21lltl
6011863 FIN - 72
Attachment 2 - 2019 Operating Budget for the Lulu Island Energy Company
A Lululsland v ENERGY COMPANY
Report
DATE: October 16, 2018
TO: John Irving Chief Executive Officer, Lulu Island Energy Company
Jerry Chong Chief Financial Officer, Lulu Island Energy Company
FROM: Alen Postolka, District Energy Manager
Helen Zhao, Controller
Re: 2019 Operating Budget for the Lulu Island Energy Company
Staff Recommendation
6911 NO.3 ROAD
RICHMOND, BC V6Y 2(1
That the 2019 Operating Budget for the Lulu Island Energy Company as presented in the staff rep01i titled, "2019 Operating Budget for the Lulu Island Energy Company" dated October 16,
2018 from the Manager and Controller, Lulu Island Energy Company be approved.
Background
Lulu Island Energy Company (LIEC), a wholly-owned corporation of the City ofRichmond, was established in 2013 to provide district energy services on behalf of the City. In 2014, the City and LIEC executed a District Energy Utilities Agreement, assigning LIEC the function of. establishing and operating district energy systems as well as providing thermal energy services on behalf of the City.
LIEC currently owns and operates the Oval Village District Energy (OVDEU) and Alexandra District Energy (ADEU) Utilities, as well advances new district energy opp01tunities. Both the West Cambie and the Oval Village neighbourhoods are experiencing rapid redevelopment. LIEC has been growing to meet this increased energy demand, while maintaining exceptional reliability and quality of service.
The ADEU system currently provides energy to five residential buildings, the "Central at Garden City" commercial development, the Richmond Jamatkhana temple and Fire Hall #3. Over 1450
6011863
FIN - 73
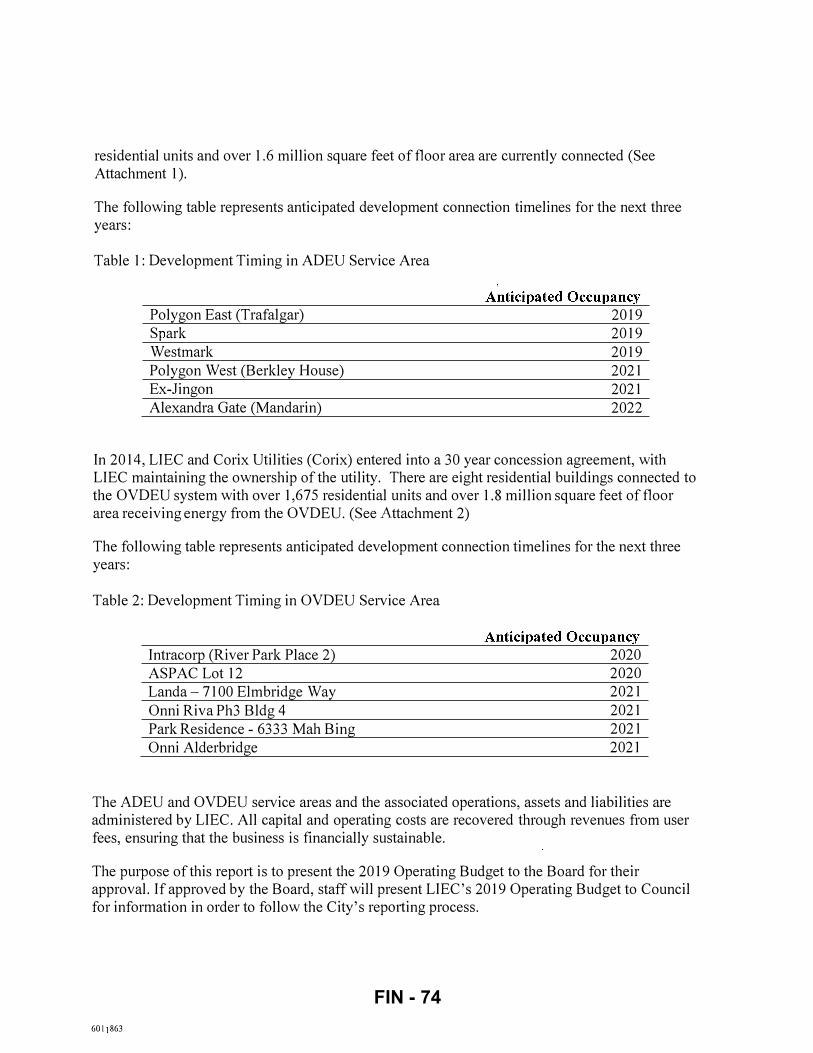
residential units and over 1.6 million square feet of floor area are currently connected (See Attachment 1 ).
The following table represents anticipated development connection timelines for the next three years:
Table 1: Development Timing in ADEU Service Area
Polygon East (Trafalgar)
S ark
Westmark
Polygon West (Berkley House)
Ex-Jingon
Alexandra Gate (Mandarin)
Anticipated Occupancy 2019
2019
2019
2021
2021
2022
In 2014, LIEC and Corix Utilities (Corix) entered into a 30 year concession agreement, with LIEC maintaining the ownership of the utility. There are eight residential buildings connected to the OVDEU system with over 1,675 residential units and over 1.8 million square feet of floor area receiving energy from the OVDEU. (See Attachment 2)
The following table represents anticipated development connection timelines for the next three years:
Table 2: Development Timing in OVDEU Service Area
Anticipated Occupancy Intracorp (River Park Place 2) 2020
ASPAC Lot 12 2020
Landa-7100 Elmbridge Way 2021
Onni Riva Ph3 Bldg 4 2021
Park Residence - 6333 Mah Bing 2021
Onni Alderbridge 2021
The ADEU and OVDEU service areas and the associated operations, assets and liabilities are administered by LIEC. All capital and operating costs are recovered through revenues from user fees, ensuring that the business is financially sustainable.
The purpose of this report is to present the 2019 Operating Budget to the Board for their approval. If approved by the Board, staff will present LIEC's 2019 Operating Budget to Council for information in order to follow the City's repmiing process.
6011863
FIN - 74
Analysis
Both OVDEU and ADEU are still new utilities in the early stages of operation, and even though some of the actual utility (electricity and natural gas), operation and maintenance costs have been used to plan the budget, the majority of these costs are still largely based on projections from the models.
Customers' energy use (building performance) is estimated based on the actual metered energy consumption, average building performance in the region and energy modeling reports prepared by the buildings' designers. The 2019 Operating Budget incorporates estimated revenues and expenses from the ADEU and OVDEU based on the current projections and development activity.
LIEC is currently classified as a Government Business Enterprise (GBE). As a GBE, LIEC is required to apply International Financial Repotiing Standards (I FRS) in the preparation of its financial statements.
Staffhave prepared the 2019 Operating Budget below under IFRS:
6011863
FIN - 75
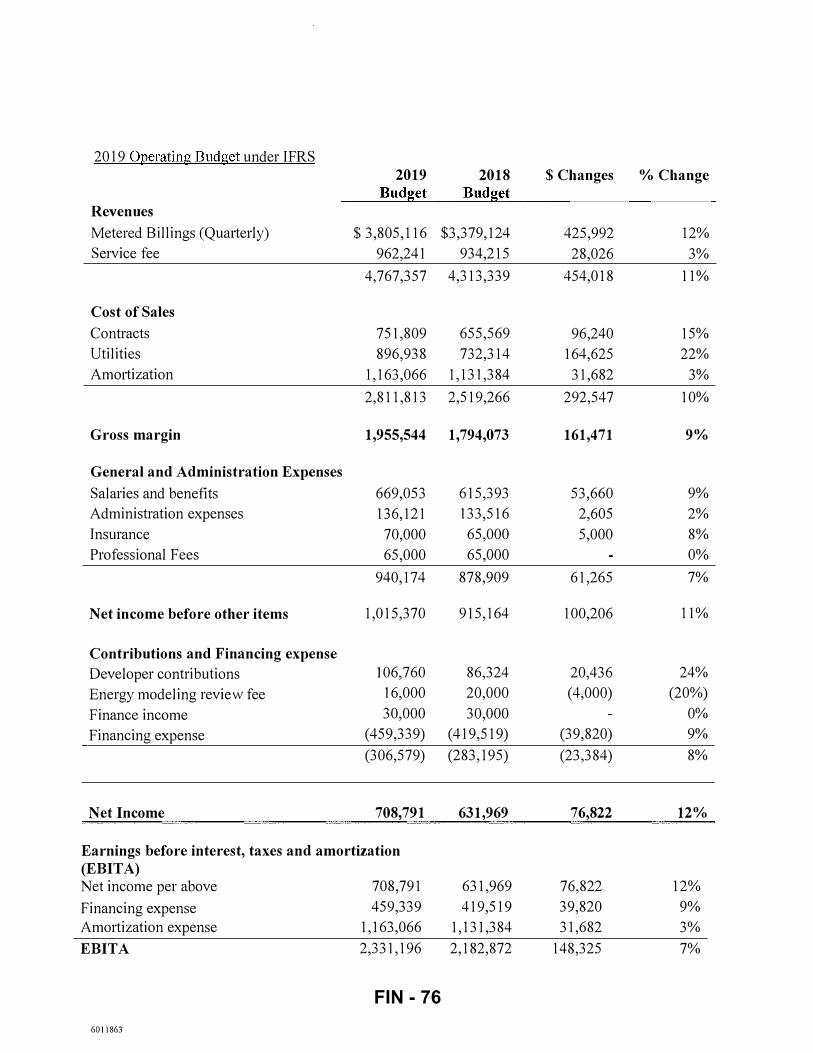
2019 OQerating Budget under IFRS
2019 2018 $Changes % Change Budget Budget
Revenues
Metered Billings (Quatierly) $ 3,805,116 $3,379,124 425,992 12%
Service fee 962,241 934,215 28,026 3%
4,767,357 4,313,339 454,018 11%
Cost of Sales
Contracts 751,809 655,569 96,240 15%
Utilities 896,938 732,314 164,625 22%
Am01iization 1,163,066 1,131,384 31,682 3%
2,811,813 2,519,266 292,547 10%
Gross margin 1,955,544 1,794,073 161,471 9%
General and Administration Expenses
Salaries and benefits 669,053 615,393 53,660 9%
Administration expenses 136,121 133,516 2,605 2%
Insurance 70,000 65,000 5,000 8%
Professional Fees 65,000 65,000 0%
940,174 878,909 61,265 7%
Net income before other items 1,015,370 915,164 100,206 11%
Contributions and Financing expense
Developer contributions I 06,760 86,324 20,436 24%
Energy modeling review fee 16,000 20,000 (4,000) (20%)
Finance income 30,000 30,000 0%
Financing expense (459,339) (419,519) (39,820) 9%
(306,579) (283, 195) (23,384) 8%
Net Income 708,791 631,969 76,822 12%
Earnings before interest, taxes and amortization (EBITA) Net income per above 708,791 631,969 76,822 12%
Financing expense 459,339 419,519 39,820 9%
Amortization expense 1,163,066 1,131,384 31,682 3%
EBITA 2,331,196 2,182,872 148,325 7%
6011863
FIN - 76
Revenues
The metered billings (user fee) revenues are expected to increase in 2019 by $425,992 to $3,805,116 (2018- 3,379,124). This reflects a full year of energy sales for a number of buildings that were connected in 20 18 and partial year of energy sales for four new buildings connected in 2019. Three new connections in the ADEU service area and one new connection in the OVDEU area are projected for 2019. The overall budgeted revenue is expected to increase by $454,018 to
$4,767,357 (2018-$4,313,339).
The Service Fee is subject to Council approval of the City's 5-Year Financial Planning Bylaw. It is based on the numerous benefits LIEC brings to the City and the local community. Staff and specialty consultants working on low carbon district energy initiatives are covered by the Service Fee. With or without LIEC, the City would need to fund these costs in order to successfully implement district energy initiatives for the City and position itself at the forefront of tackling some of the environmental challenges our world faces. The proposed service fee amount for 2019 has been increased by 3% (blend of the Consumer Price Index and Municipal Price Index) to $962,241.
Cost of sales
The cost of sales includes contracts services, utilities (electricity and natural gas) and amortization expense. The total contracts expense is increased by $96,240 to $751,809 (20 18 -
$655,569). The general increase of this expense is due to additional operation and maintenance activities needed to service additional buildings. In addition, the contracts expense is projected to be higher this year also due to the addition of one full time operator in the OVDEU service area as required by Technical Safety BC after the 4MW Interim Energy Center expansion in 2019. Staff are still reviewing this projection and requirement with Corix to identify solution how to eliminate this expense.
The increases of utilities expenses are due to more energy sales to customers. The main driver for the increase in 2019 is higher projected use of natural gas in the ADEU service area required to service additional customers due to reaching the maximum capacity of the geo-exchange fields. The utility expense will be increased by $164,625 to $896,938 (2018-$732,314).
The amortization expense is increased due to capital assets additions. Overall, the cost of sales is expected to increase by $292,547 to $2,883,459 (2018-$2,519,266)
General and administration expenses
The general and administration expenses are expenditures that LIEC incurs to supp01i business activities, such as salaries and benefits, administration expense, professional fees, insurance expense, etc. The budgeted general and administration expenses are projected to increase by
$61,265 to $940,174 (2018-$878,909):
6011863
Salaries and benefits- The increase of$53,660 is due to one additional staff, CPI indexed increase of existing salaries, and adjustments of fringe benefits as a result of new
FIN - 77
Employee Health Tax. 20% of the new staff salary will be covered by the operating budget and the rest from the capital projects.
Insurance- The premium is expected to be higher due to the additional capital assets being insured.
Administration expense the administration expense is increased by $2,605. This increase is mainly due to the CPI indexed increase in overhead allocation paid to the City of Richmond for the day-to-day supp01i that LIEC receives from the City staff.
Contributions and financing costs
The Contributions and financing costs section represents other sources of revenue and financing costs for the business.
Developers contributions (ETS fee) This revenue refers to all the distribution piping system, energy transfer station and construction costs inside the property line. These costs are paid by developers. LIEC owns these capital assets, and recognizes a contribution from developers for the amount reimbursed. Under IFRS, the revenue from the asset contributions (ETS fee) is recognized over the useful life of the equipment from the date this equipment is available for use.
Financing expense- The financing expense represents the financing costs incurred by LIEC on the concession agreement. The funding through concession agreement is used to finance the construction of the capital assets which will result in an increase in the total amount of fixed assets appearing on the LIEC balance sheet. The financing cost is expected to increase by $39,820 to $459,339 (2018- $419,519). The increase is due to the increase in LIEC acquired assets through concession agreement and concession obligations on funding used to build those assets - a new interim energy center in the OVDEU service area.
Net Income and Earnings before interest, taxes and amortization (EBITA)
EBIT A is expected to increase by $148,325 to $2,331,196 for the budgeted year. EBIT A is used to evaluate LIEC's financial performance. The net income is expected to be $708,791 in 2019. This is an increase of 12% compared to 2018 net income.
LIEC's financial sustainability and future growth must be taken into consideration when reviewing its EBITA and net income. LIEC's success is dependent upon developing in house expe1iise and securing funds for the future capital replacement as the existing infrastructure components reach end of life. Other imp01iant factors are the planning of future projects, which includes research and development, and exploratory reviews on future technology and opp01iunities. The net income will be set aside in LIEC's equity to build a reserve fund for future capital replacement and in order to ensure long term rate stability for rate payers.
6011863
FIN - 78
Financial Impact
None.
Conclusion
The 2019 Operating Budget is presented based on staff's best estimates and assumptions available at the time of writing.
lfh Pn---Alen Postolka, P.Eng. District Energy Manager
Att. 1: Oval Village DEU Service Area map Att. 2: Alexandra DEU Service Area map
6011863
Helen Zhao, CPA, CA Controller
FIN - 79
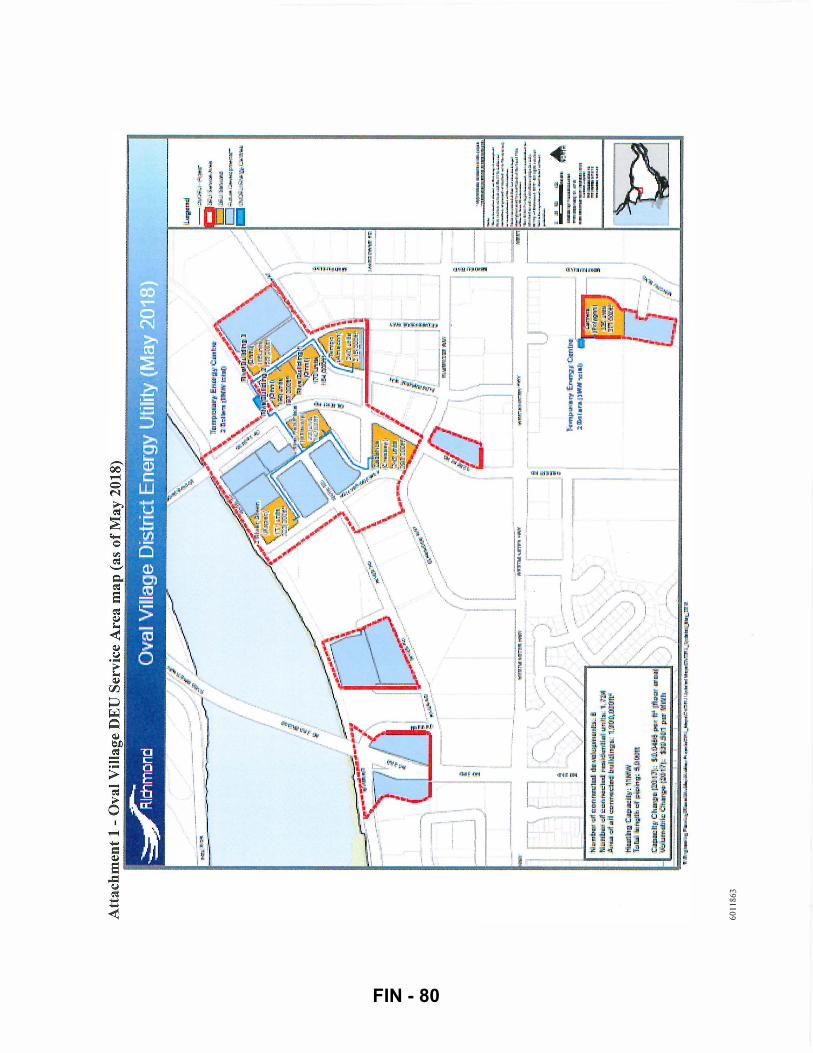
601
18
63
1 _
__
I
W.:..
.,_.,.IG
s IiI
I
{I � !i1
I
<! .. ¥
-----
N'D'�
Wi'Yi"
,-
/ l rr;w:r.u:.
� f'i\Y
-. .l ,
-1
�---
' l · i l
/ . I '�
� · .,.
o:� \ :
.l ,_... ..
� � �� ""- . .;.:;:;_;
�.
J I
••
��: � � ;;.
:�-
- .. -;.. - ,...,_.. ... ......
l J-1
� ;i
--.: :- ::: �
ll 5!
= --
-- "' l!E"
mpa:t•
r.l E�
l' e.�n
�.l
l 2
102-lil
r� Jl
WM.M
l•{t
� ��;;;;! ; . !" ;;
;;; _ ;.;; ;, =
= (,
FIN - 80
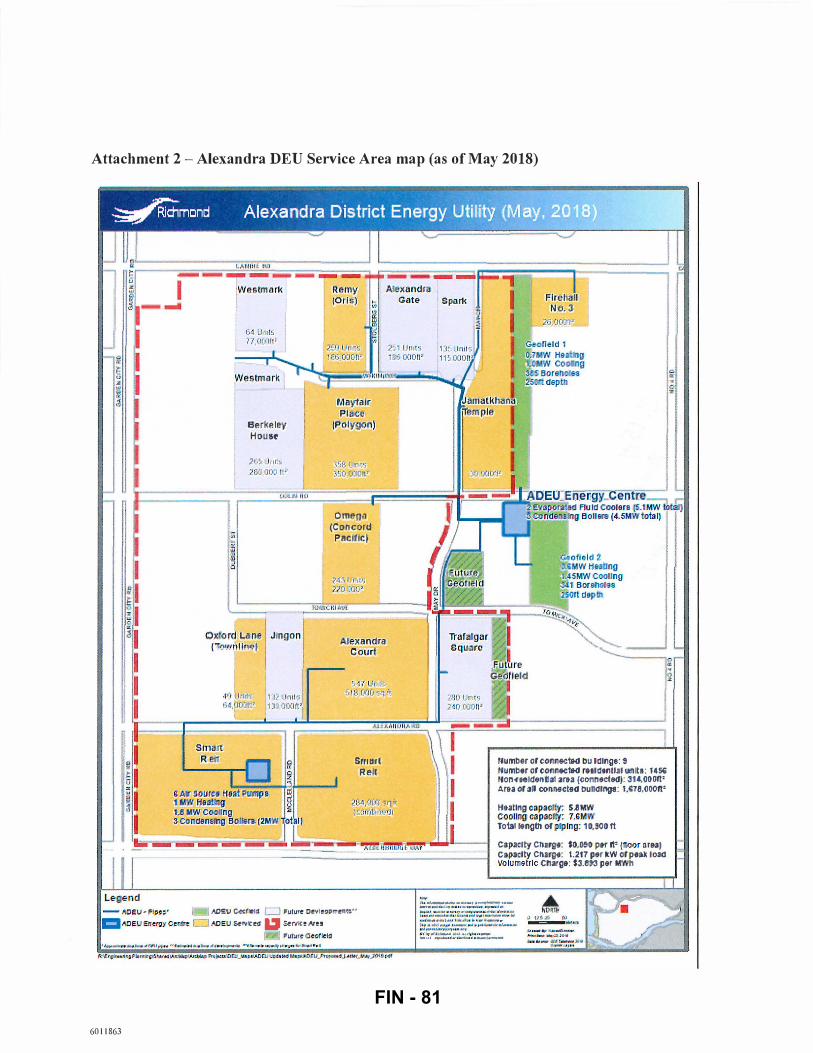
Attachment 2- Alexandra DEU Service Area map (as of May 2018)
6011863
Berkeley House
265 tti�::�
2VJ, •J t:t:• l r.
·Oxford Lune f'l\'•:wm l l'w�
\'le; l}ll1�'j :, � (l OiJOUY
Omega �Concord
Pwclflc�
Srrt�rt Reft
� 1}4,'J I;..;I >'1 � ; ... n�r \ 1:1 n o d i
AC'EfU .G.ecrteld 0 !Future Oe\'le!:Jpmen��·
.� �JYte� a �r•tto!!.o\re!l
\Future Oecnel d
rJumMr or coJmecilMII:IIlllldlnge: � rJumber ofeoJtn&ei!NI resii!&IIIL'II WI Ita: MSG rton-nehlfe.nil31 3r&oa (comnecl&d)·: 314-0il<Dft' Ar-..a or am C!JIII.Micted biiiiiiii1111J8: U7.tl,llOOit'
HNtlni!J G:ajl\3..:1(¥: UMW cooling capacity: 7.�r.tll'i' Tota:t te11gl'.h or p:!plmg: 1 D�90D It
CB;JI\liCify C!lllarg;s; jO.O&D pa;r It- (1!oor :IJ•Bal ca pacify C!lllaflJl!c U17 per kW or pe� toad ·�lll l umetrle CI1311JII': i:3.69<l p�r M'NII
�--··-�··-.:......_ ...... ...... -� -··!U- ..,.._,. · ....,. , __ ... ... .,. .. . _.. ... .. ... ........ .. ��- -�ll.u lrio<. o _ ... ._( o\o ....,.. _ l,. _. . .. .. .... ,, .. , I .............. , ..... .. 11• • illo l ,.oy.# ,_.., ..; ._ ,..o�.Mo�w�... .., u o •""''*'·"'• ""' • .,n, ... ,. .. ._.,w-.��• .... _ _ ..... _>( ... ....... .. . --•• --
FIN - 81