Untitled - Richmond, MI
299
-
Upload
khangminh22 -
Category
Documents
-
view
0 -
download
0
Transcript of Untitled - Richmond, MI
AnchorBay
Lake St. Clair
CANADA
LENOXTWP
RICHMONDTWP
CHESTERFIELDTWP
HARRISONTWP
NEW BALTIMORE
RICHMOND
NEWHAVENVILLAGE
CLAY TWP
CASCOTWP
ST. CLAIR TWP
CHINATWP
COLUMBUSTWP
IRATWP
COTTRELLVILLETWP
EASTCHINATWP
MARINECITY
ALGONAC
AnchorBay
Lake St. Clair
CANADA
LENOXTWP
RICHMONDTWP
CHESTERFIELDTWP
HARRISONTWP
NEW BALTIMORE
RICHMOND
NEWHAVENVILLAGE
CLAY TWP
CASCOTWP
ST. CLAIR TWP
CHINATWP
COLUMBUSTWP
IRATWP
COTTRELLVILLETWP
EASTCHINATWP
MARINECITY
ALGONAC
I:/GISdata/AnchorBay/AnchorBay--w-rivers-8.5x11
±
DataSources:MacombCountyDepartmentofPlanningandEconomicDevelopmentSt.ClairCountyMetropolitanPlanningCommission
4 0 42 Miles
MACOMBTWP
MTCLEMENS
CLINTONTWP
Acknowledgements
ANCHOR BAY
WATERSHED MANAGEMENT PLAN
i
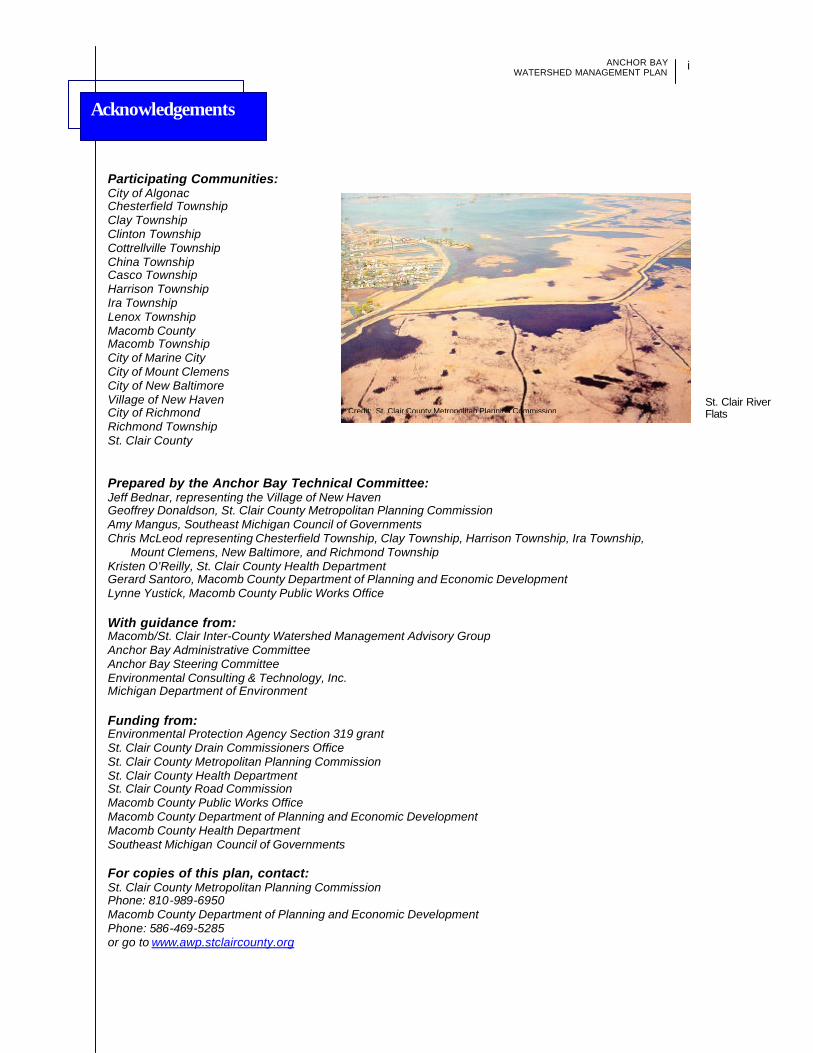
Participating Communities: City of Algonac Chesterfield Township Clay Township Clinton Township Cottrellville Township China Township Casco Township Harrison Township Ira Township Lenox Township Macomb County Macomb Township City of Marine City City of Mount Clemens City of New Baltimore Village of New Haven City of Richmond Richmond Township St. Clair County Prepared by the Anchor Bay Technical Committee: Jeff Bednar, representing the Village of New Haven Geoffrey Donaldson, St. Clair County Metropolitan Planning Commission Amy Mangus, Southeast Michigan Council of Governments Chris McLeod representing Chesterfield Township, Clay Township, Harrison Township, Ira Township,
Mount Clemens, New Baltimore, and Richmond Township Kristen O’Reilly, St. Clair County Health Department Gerard Santoro, Macomb County Department of Planning and Economic Development Lynne Yustick, Macomb County Public Works Office With guidance from: Macomb/St. Clair Inter-County Watershed Management Advisory Group Anchor Bay Administrative Committee Anchor Bay Steering Committee Environmental Consulting & Technology, Inc. Michigan Department of Environment Funding from: Environmental Protection Agency Section 319 grant St. Clair County Drain Commissioners Office St. Clair County Metropolitan Planning Commission St. Clair County Health Department St. Clair County Road Commission Macomb County Public Works Office Macomb County Department of Planning and Economic Development Macomb County Health Department Southeast Michigan Council of Governments For copies of this plan, contact: St. Clair County Metropolitan Planning Commission Phone: 810-989-6950 Macomb County Department of Planning and Economic Development Phone: 586-469-5285 or go to www.awp.stclaircounty.org
St. Clair River Flats Credit: St. Clair County Metropolitan Planning Commission
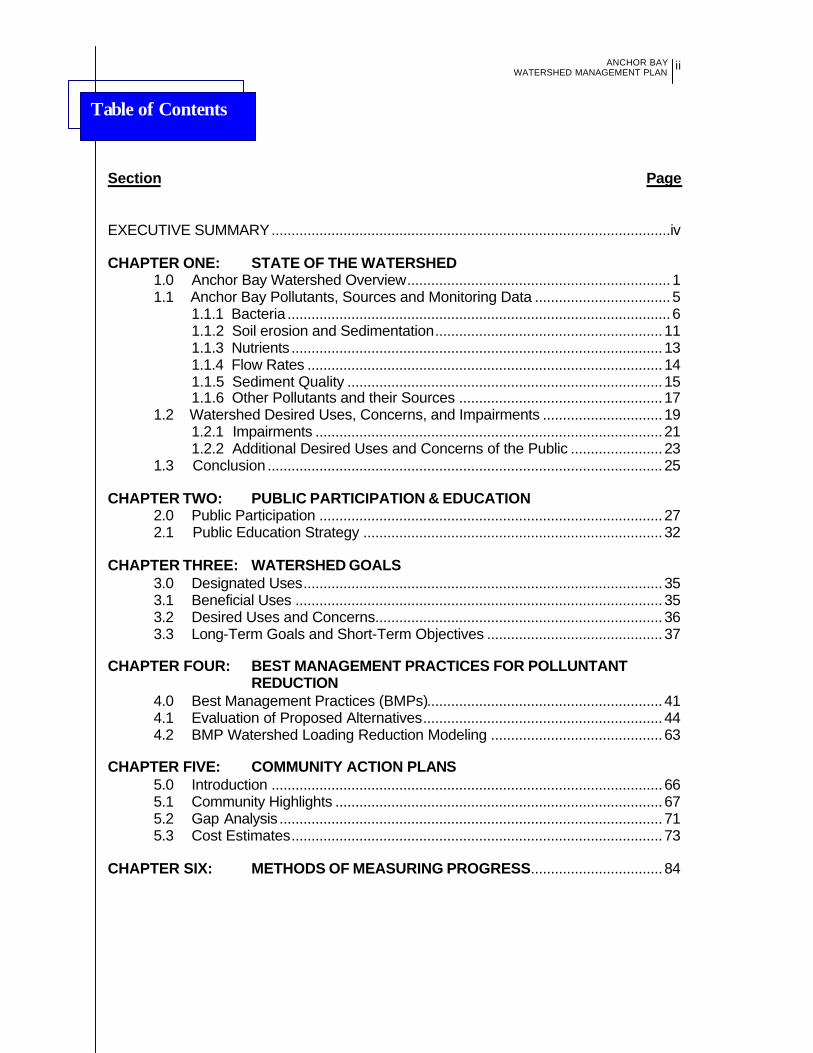
Table of Contents
ANCHOR BAY
WATERSHED MANAGEMENT PLAN
ii
Section Page EXECUTIVE SUMMARY....................................................................................................iv CHAPTER ONE: STATE OF THE WATERSHED 1.0 Anchor Bay Watershed Overview..................................................................1 1.1 Anchor Bay Pollutants, Sources and Monitoring Data ..................................5 1.1.1 Bacteria ................................................................................................6 1.1.2 Soil erosion and Sedimentation.........................................................11 1.1.3 Nutrients .............................................................................................13 1.1.4 Flow Rates .........................................................................................14 1.1.5 Sediment Quality ...............................................................................15 1.1.6 Other Pollutants and their Sources ...................................................17 1.2 Watershed Desired Uses, Concerns, and Impairments ..............................19 1.2.1 Impairments .......................................................................................21 1.2.2 Additional Desired Uses and Concerns of the Public .......................23 1.3 Conclusion ...................................................................................................25 CHAPTER TWO: PUBLIC PARTICIPATION & EDUCATION 2.0 Public Participation ......................................................................................27 2.1 Public Education Strategy ...........................................................................32 CHAPTER THREE: WATERSHED GOALS 3.0 Designated Uses..........................................................................................35 3.1 Beneficial Uses ............................................................................................35 3.2 Desired Uses and Concerns........................................................................36 3.3 Long-Term Goals and Short-Term Objectives ............................................37 CHAPTER FOUR: BEST MANAGEMENT PRACTICES FOR POLLUNTANT REDUCTION 4.0 Best Management Practices (BMPs)...........................................................41 4.1 Evaluation of Proposed Alternatives............................................................44 4.2 BMP Watershed Loading Reduction Modeling ...........................................63 CHAPTER FIVE: COMMUNITY ACTION PLANS 5.0 Introduction ..................................................................................................66 5.1 Community Highlights ..................................................................................67 5.2 Gap Analysis ................................................................................................71 5.3 Cost Estimates.............................................................................................73 CHAPTER SIX: METHODS OF MEASURING PROGRESS.................................84
Table of Contents Continued
ANCHOR BAY
WATERSHED MANAGEMENT PLAN
iii
List of Tables Table 1-12: Concerns and Desired Uses within the Watershed.....................................20 Table 3-1: Anchor Bay Watershed Impairments for Designed and Beneficial Uses ....39 Table 4-1: Menu of BMPs that Address Watershed Goals ...........................................63 Table 4-2: Types of BMPs used for Pollutant Load Reduction Study ...........................63 Table 4-3: Percentage Area for Various Model Runs ...................................................64 Table 4-4: Pollutant Load Reduction for Model Runs A-2 through A-5.........................64 Table 4-5: Percentage Areas Used and BMP Types in Model Run A-6.......................65 Table 4-6: Percentage Areas Used and BMP Types in Model Run A-7.......................65 Table 4-7: Pollutant Load Reduction for Model Run A-6 and A-7.................................67 Table 5-1: Community Interview Summary ...................................................................74 Table 5-2: Cost Estimates..............................................................................................80 Table 6-1: Evaluation Process.......................................................................................85 List of Figures Figure 1-1: Location of the Anchor Bay Watershed within the Great Lakes ....................1 Figure 1-3: 1990 Land Use for the Anchor Bay Watershed .............................................4 Figure 1-4: 2000 Land Use for the Anchor Bay Watershed .............................................5 Figure 1-8: Average Sediment Levels for TP, TKN, COD and Ammonia* .....................16 Figure 2-1: Anchor Bay Website Homepage ..................................................................31 Figure 5-1: Pet Waste Disposal Station in Algonac ........................................................68 Figure 5-2: The Pollution Solutions! Presentation is offered to schools in Both St. Clair & Macomb..............................................................................69 Figure 6-1: Evaluation Process as part of the Watershed Management Planning Cycle ..............................................................................................84 List of Appendices Appendix A: State of the Watershed Support Data Appendix B: Inventory of Typical Tributary Drains in the St. Clair Portion of the Anchor Bay Watershed Appendix C: Crapau Creek Total Maximum Daily Load (TMDL) Appendix D: Project Team Members Appendix E: Public Involvement Survey Appendix F: Community Surveys Appendix G: Macomb County’s Onsite Sewage Disposal and Onsite Water Supply Evaluation and Maintenance Ordinance Appendix H: Glossary and Acronyms Appendix I: References
ANCHOR BAY
WATERSHED MANAGEMENT PLAN
iv
EEXXEECCUUTTIIVVEE SSUUMMMMAARRYY
The Anchor Bay Watershed Management Plan recognizes the current conditions
impacting the water quality of Lake St. Clair, addresses actions needed to resolve
existing problems and identifies the steps to prevent future degradation. Over the past 2
years, representatives from both county and community agencies have worked together
to develop this plan by:
• Identifying stakeholders interested in protecting and improving water resources
• Gathering available water quality, storm water flow, and habitat information
• Identifying the known impairments to the uses of the inland streams and the bay
• Identifying and prioritizing the sources of the pollutants
• Obtaining input from community officials and the general public
• Establishing goals for the watershed
• Identifying the actions for which the communities would take responsibility
• Highlighting areas where gaps existed between the goals and the community
actions
• Developing a list of recommended activities to be implemented by the local
governmental agencies
• Presenting this information to stakeholders
This planning process resulted in a management plan that fulfills each county and
community’s requirements under the Michigan Department of Environmental Quality
(MDEQ) Phase II Watershed-based Storm Water Permit. This plan also allows the
counties and communities to qualify for Clean Michigan Initiative (CMI) grant funding for
implementation of the activities recommended in this plan.
BACKGROUND
The initial emphasis of the National Pollution Discharge Elimination System
(NPDES) under the Federal Clean Water Act of 1972 was to control discharges from
industrial and large municipal wastewater treatment plants. Once these discharges were
substantially under control, it became apparent that the combined impact of various
Executive Summary
ANCHOR BAY WATERSHED MANAGEMENT PLAN
v
smaller widespread (nonpoint) pollution sources was preventing many streams and
receiving waters from meeting state water quality standards. These diffuse sources
include failing septic systems, storm water runoff from residential lawns, agricultural
fields, parking lots, roadways and construction sites, illegal dumping, and airborne
deposition. Adequate control of all these point and nonpoint sources is necessary to
restore and maintain the use of the nation’s water resources.
St. Clair and Macomb Counties, as well as most of the communities in the Anchor Bay
Watershed, are regulated under the NPDES program and have applied for coverage
under Michigan’s Phase II Watershed-based Storm Water Permit. Instead of imposing
discharge limitations and storm water control programs, the Michigan Department of
Environmental Quality is allowing local units of government to establish goals to improve
water quality through development and implementation of a watershed management plan.
By working together, these public agencies designed a watershed management plan that
is built on the strengths of existing programs and resources, and addresses local water
quality concerns in an integrated and cost effective manner.
The development of this management plan began when the St. Clair County Drain
Commissioner’s Office was awarded a Section 319 grant from the Environmental
Protection Agency on behalf of the Macomb/St. Clair Inter-County Watershed
Management Advisory Group to fund watershed planning efforts in Anchor Bay. Three
committees, which made up the project team, were formed to aid in the development of
the plan. The Administrative Committee, with members from various St. Clair and
Macomb County agencies, was responsible for policy development and oversight related
to the Section 319 grant. The Steering Committee, which included a representative from
each community and county located in the watershed, provided local governmental input
and decision-making guidance to the project. Twelve months into the project, the
Technical Committee was formed with representatives from county and local
governments. The Technical Committee provided feedback to the project consultant in
finalizing the plan.
Executive Summary
ANCHOR BAY WATERSHED MANAGEMENT PLAN
vi
WATERSHED OVERVIEW
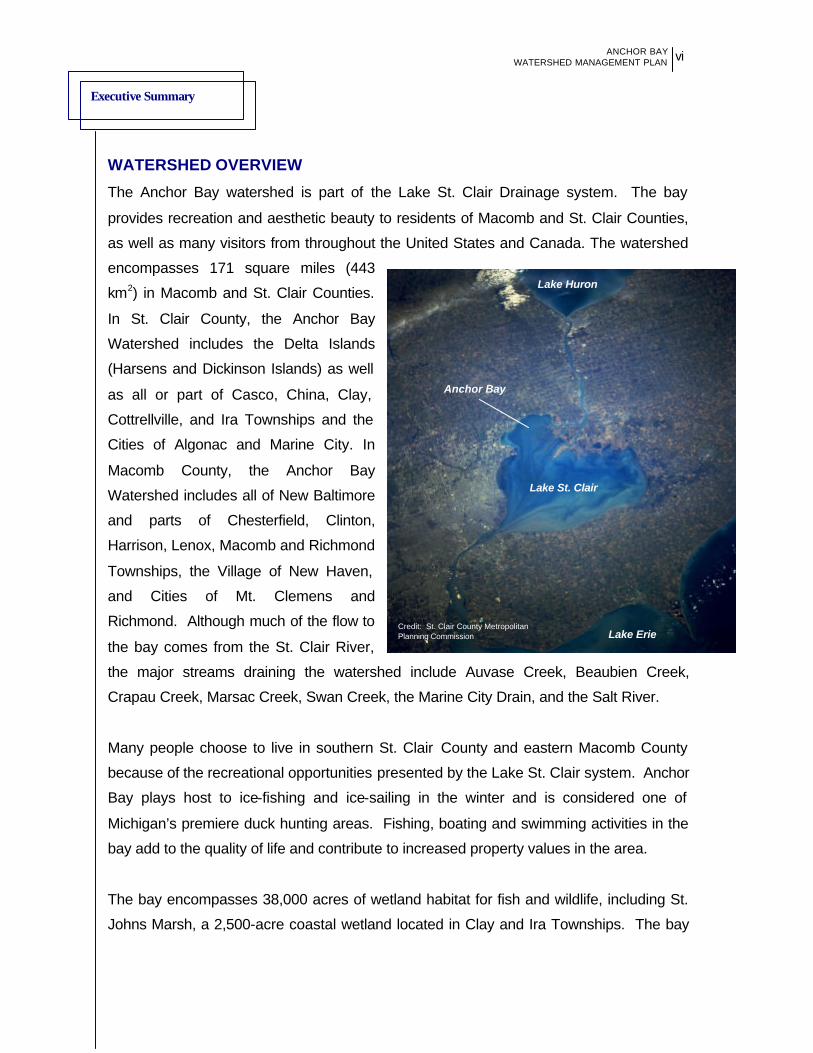
The Anchor Bay watershed is part of the Lake St. Clair Drainage system. The bay
provides recreation and aesthetic beauty to residents of Macomb and St. Clair Counties,
as well as many visitors from throughout the United States and Canada. The watershed
encompasses 171 square miles (443
km2) in Macomb and St. Clair Counties.
In St. Clair County, the Anchor Bay
Watershed includes the Delta Islands
(Harsens and Dickinson Islands) as well
as all or part of Casco, China, Clay,
Cottrellville, and Ira Townships and the
Cities of Algonac and Marine City. In
Macomb County, the Anchor Bay
Watershed includes all of New Baltimore
and parts of Chesterfield, Clinton,
Harrison, Lenox, Macomb and Richmond
Townships, the Village of New Haven,
and Cities of Mt. Clemens and
Richmond. Although much of the flow to
the bay comes from the St. Clair River,
the major streams draining the watershed include Auvase Creek, Beaubien Creek,
Crapau Creek, Marsac Creek, Swan Creek, the Marine City Drain, and the Salt River.
Many people choose to live in southern St. Clair County and eastern Macomb County
because of the recreational opportunities presented by the Lake St. Clair system. Anchor
Bay plays host to ice-fishing and ice-sailing in the winter and is considered one of
Michigan’s premiere duck hunting areas. Fishing, boating and swimming activities in the
bay add to the quality of life and contribute to increased property values in the area.
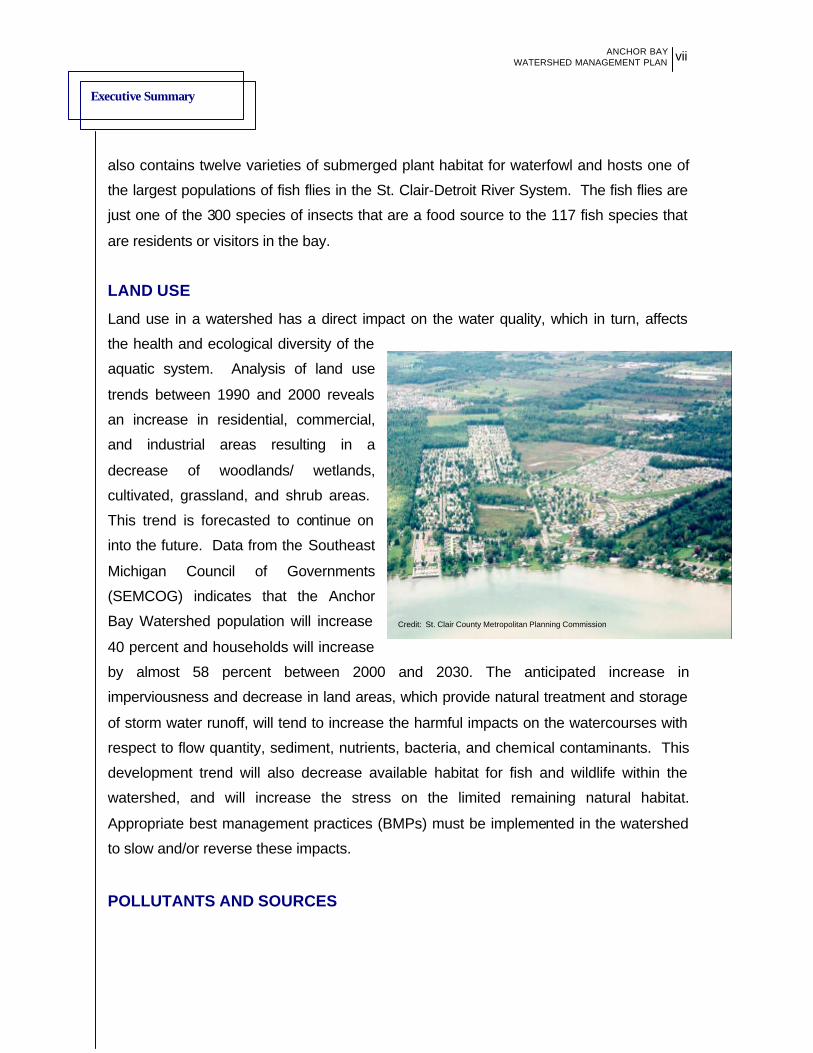
The bay encompasses 38,000 acres of wetland habitat for fish and wildlife, including St.
Johns Marsh, a 2,500-acre coastal wetland located in Clay and Ira Townships. The bay
Anchor Bay
Lake Huron
Lake Erie
Lake St. Clair
Credit: St. Clair County Metropolitan Planning Commission
Executive Summary
ANCHOR BAY WATERSHED MANAGEMENT PLAN
vii
also contains twelve varieties of submerged plant habitat for waterfowl and hosts one of
the largest populations of fish flies in the St. Clair-Detroit River System. The fish flies are
just one of the 300 species of insects that are a food source to the 117 fish species that
are residents or visitors in the bay.
LAND USE
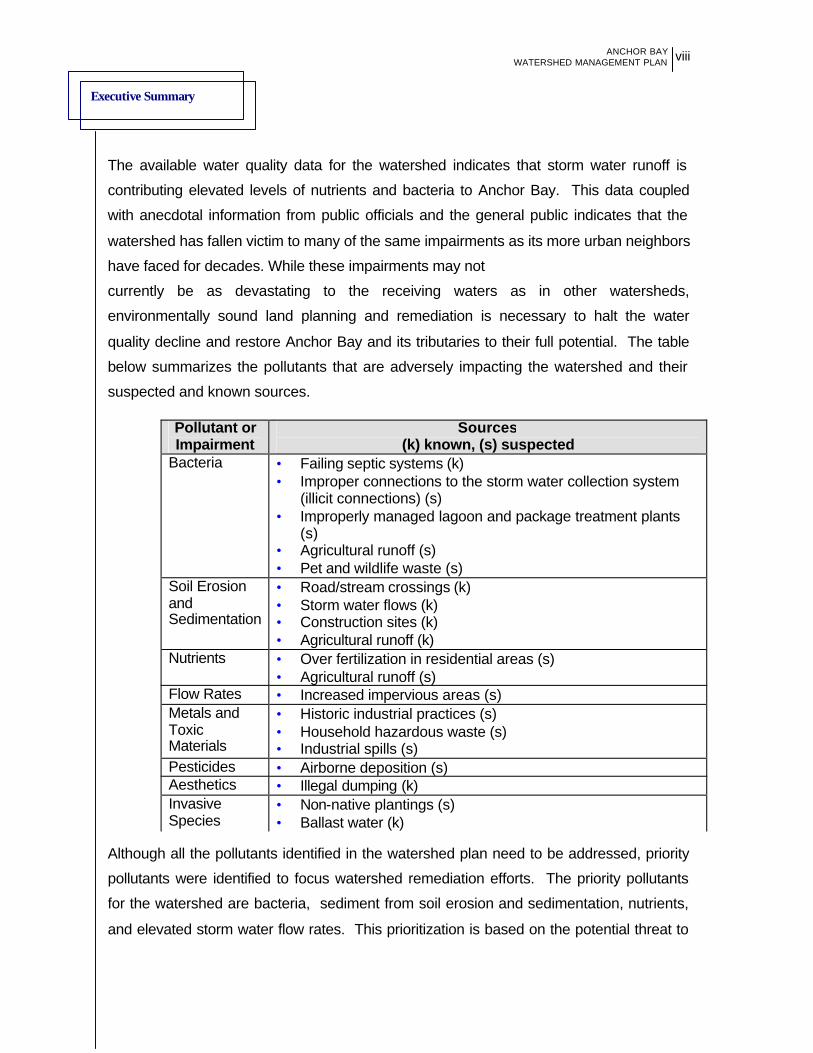
Land use in a watershed has a direct impact on the water quality, which in turn, affects
the health and ecological diversity of the
aquatic system. Analysis of land use
trends between 1990 and 2000 reveals
an increase in residential, commercial,
and industrial areas resulting in a
decrease of woodlands/ wetlands,
cultivated, grassland, and shrub areas.
This trend is forecasted to continue on
into the future. Data from the Southeast
Michigan Council of Governments
(SEMCOG) indicates that the Anchor
Bay Watershed population will increase
40 percent and households will increase
by almost 58 percent between 2000 and 2030. The anticipated increase in
imperviousness and decrease in land areas, which provide natural treatment and storage
of storm water runoff, will tend to increase the harmful impacts on the watercourses with
respect to flow quantity, sediment, nutrients, bacteria, and chemical contaminants. This
development trend will also decrease available habitat for fish and wildlife within the
watershed, and will increase the stress on the limited remaining natural habitat.
Appropriate best management practices (BMPs) must be implemented in the watershed
to slow and/or reverse these impacts.
POLLUTANTS AND SOURCES
Credit: St. Clair County Metropolitan Planning Commission
Executive Summary
ANCHOR BAY WATERSHED MANAGEMENT PLAN
viii
The available water quality data for the watershed indicates that storm water runoff is
contributing elevated levels of nutrients and bacteria to Anchor Bay. This data coupled
with anecdotal information from public officials and the general public indicates that the
watershed has fallen victim to many of the same impairments as its more urban neighbors
have faced for decades. While these impairments may not
currently be as devastating to the receiving waters as in other watersheds,
environmentally sound land planning and remediation is necessary to halt the water
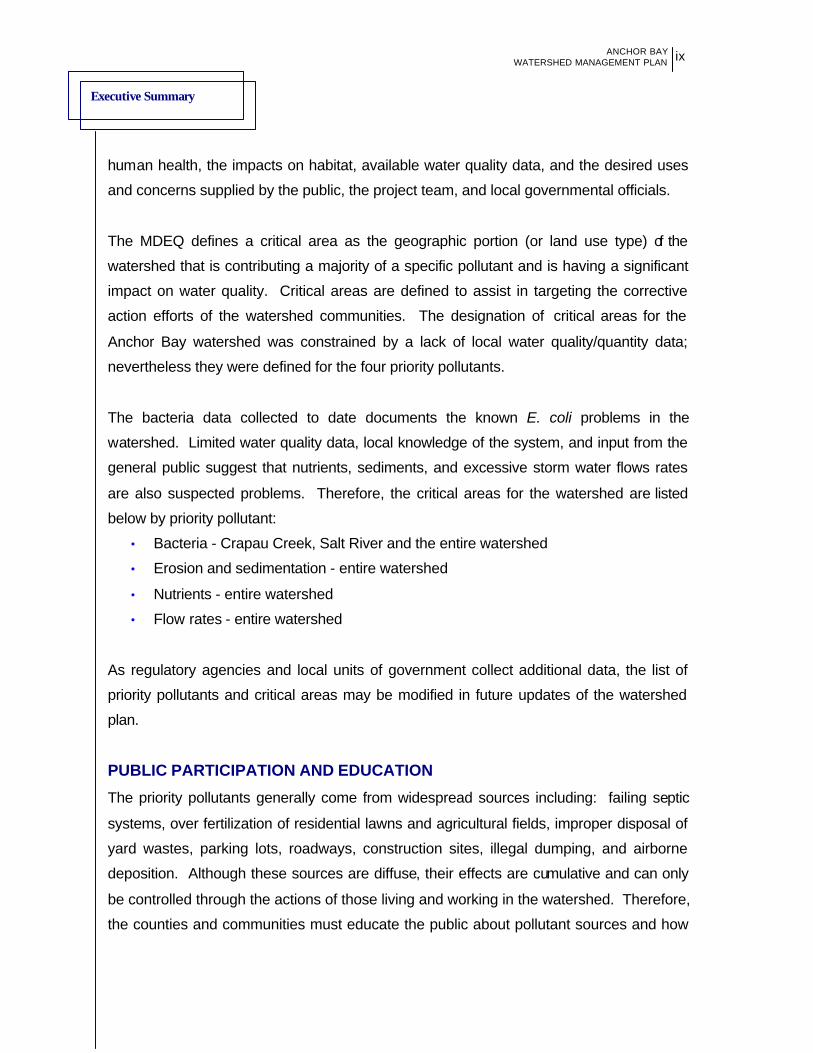
quality decline and restore Anchor Bay and its tributaries to their full potential. The table
below summarizes the pollutants that are adversely impacting the watershed and their
suspected and known sources.
Although all the pollutants identified in the watershed plan need to be addressed, priority
pollutants were identified to focus watershed remediation efforts. The priority pollutants
for the watershed are bacteria, sediment from soil erosion and sedimentation, nutrients,
and elevated storm water flow rates. This prioritization is based on the potential threat to
Pollutant or Impairment
Sources (k) known, (s) suspected
Bacteria • Failing septic systems (k) • Improper connections to the storm water collection system
(illicit connections) (s) • Improperly managed lagoon and package treatment plants
(s) • Agricultural runoff (s) • Pet and wildlife waste (s)
Soil Erosion and Sedimentation
• Road/stream crossings (k) • Storm water flows (k) • Construction sites (k) • Agricultural runoff (k)
Nutrients • Over fertilization in residential areas (s) • Agricultural runoff (s)
Flow Rates • Increased impervious areas (s) Metals and Toxic Materials
• Historic industrial practices (s) • Household hazardous waste (s) • Industrial spills (s)
Pesticides • Airborne deposition (s) Aesthetics • Illegal dumping (k) Invasive Species
• Non-native plantings (s) • Ballast water (k)
Executive Summary
ANCHOR BAY WATERSHED MANAGEMENT PLAN
ix
human health, the impacts on habitat, available water quality data, and the desired uses
and concerns supplied by the public, the project team, and local governmental officials.
The MDEQ defines a critical area as the geographic portion (or land use type) of the
watershed that is contributing a majority of a specific pollutant and is having a significant
impact on water quality. Critical areas are defined to assist in targeting the corrective
action efforts of the watershed communities. The designation of critical areas for the
Anchor Bay watershed was constrained by a lack of local water quality/quantity data;
nevertheless they were defined for the four priority pollutants.
The bacteria data collected to date documents the known E. coli problems in the
watershed. Limited water quality data, local knowledge of the system, and input from the
general public suggest that nutrients, sediments, and excessive storm water flows rates
are also suspected problems. Therefore, the critical areas for the watershed are listed
below by priority pollutant:
• Bacteria - Crapau Creek, Salt River and the entire watershed
• Erosion and sedimentation - entire watershed
• Nutrients - entire watershed
• Flow rates - entire watershed
As regulatory agencies and local units of government collect additional data, the list of
priority pollutants and critical areas may be modified in future updates of the watershed
plan.
PUBLIC PARTICIPATION AND EDUCATION
The priority pollutants generally come from widespread sources including: failing septic
systems, over fertilization of residential lawns and agricultural fields, improper disposal of
yard wastes, parking lots, roadways, construction sites, illegal dumping, and airborne
deposition. Although these sources are diffuse, their effects are cumulative and can only
be controlled through the actions of those living and working in the watershed. Therefore,
the counties and communities must educate the public about pollutant sources and how
Executive Summary
ANCHOR BAY WATERSHED MANAGEMENT PLAN
x
they can help eliminate them. To help guide and coordinate this effort, a public education
strategy was developed. (Chapter 2).
The public education strategy is a watershed-wide effort aimed at promoting water
resource stewardship and pollution prevention activities. Four educational issues were
selected to coincide with the priority pollutants. They were: Bacteria Control, Sediment
Control, Fertilizer Management, and Urban Runoff Management. Since the educational
elements are not unique to each community, they would be best implemented at the
watershed or county level.
Involving the public in watershed planning is another way to educate them about water
quality issues and more importantly gain input into what they see as the problems and
solutions.
Since changes in behavior are required to improve storm water quality, the project team
involved the public in the watershed planning process. Several meetings were held to
obtain public comment on the plan and gain insight into the problems facing the
watershed (Chapter 2). The concerns expressed by the general public reflect their
perception of what is wrong with Anchor Bay and Lake St. Clair. These concerns include:
beach closures, drinking water safety, loss of recreational opportunities, fish consumption
advisories, flooding and erosion, and habitat loss.
GOALS AND OBJECTIVES
The goals and objectives contained in the watershed plan (Chapter 3) were developed
based on the concerns expressed by the public and the community officials, and the
water quality impairments in the watershed. The following goals and objectives were
established for the Anchor Bay Watershed:
Long-term Goal 1: Restore and enhance recreational uses
Objectives: 1a. Reduce bacterial loading
1b. Reduce nutrient loading
1c. Provide additional public access to water resources
Executive Summary
ANCHOR BAY WATERSHED MANAGEMENT PLAN
xi
Long-term Goal 2: Restore and protect aquatic life, wildlife, and habitat
Objectives: 2a. Protect and re-establish riparian and in-stream habitat
2b. Reduce soil erosion and sedimentation
2c. Reduce excess runoff
2d. Protect open space and natural areas within the
watershed
Long-term Goal 3: Protect public health
Objectives: 3a. Protect drinking water supply
3b. Reduce bacterial loading
3c. Reduce pollutants resulting in fish advisories
Long-term Goal 4: Reduce impacts from peak flows
Objectives: 4a. Establish target peak flows for the tributaries
4b. Develop water resource protection and management
ordinances to reduce runoff
4c. Reduce storm water runoff quantity
4d. Minimize post-storm in-stream flow velocities
BEST MANAGEMENT PRACTICES & COMMUNITY ACTION PLANS
Numerous best management practices (BMPs) are described in Chapter 4 to aid
communities in achieving the established goals and objectives. Meetings were held with
each county and the local communities to determine which of these BMP activities they
were implementing or planning to implement (Chapter 5). From these meetings, the
project team compiled a list of the BMP activities for each community. This list should be
used during development of each agency’s storm water pollution prevention plan, which
details how each community/county will implement the recommendations in the
watershed plan. The development of these pollution prevention plans is required by the
MDEQ for Phase II communities.
Executive Summary
ANCHOR BAY WATERSHED MANAGEMENT PLAN
xii
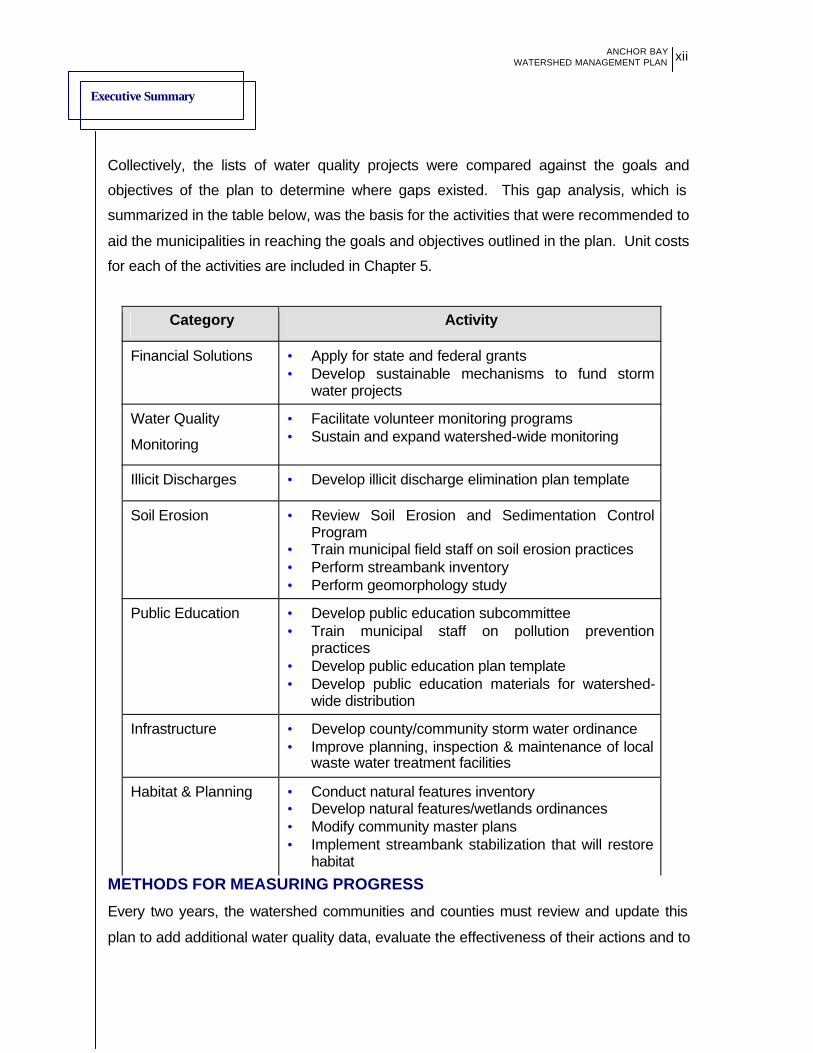
Collectively, the lists of water quality projects were compared against the goals and
objectives of the plan to determine where gaps existed. This gap analysis, which is
summarized in the table below, was the basis for the activities that were recommended to
aid the municipalities in reaching the goals and objectives outlined in the plan. Unit costs
for each of the activities are included in Chapter 5.
METHODS FOR MEASURING PROGRESS
Every two years, the watershed communities and counties must review and update this
plan to add additional water quality data, evaluate the effectiveness of their actions and to
Category Activity
Financial Solutions • Apply for state and federal grants • Develop sustainable mechanisms to fund storm
water projects
Water Quality
Monitoring
• Facilitate volunteer monitoring programs • Sustain and expand watershed-wide monitoring
Illicit Discharges • Develop illicit discharge elimination plan template
Soil Erosion • Review Soil Erosion and Sedimentation Control Program
• Train municipal field staff on soil erosion practices • Perform streambank inventory • Perform geomorphology study
Public Education • Develop public education subcommittee • Train municipal staff on pollution prevention
practices • Develop public education plan template • Develop public education materials for watershed-
wide distribution
Infrastructure • Develop county/community storm water ordinance • Improve planning, inspection & maintenance of local
waste water treatment facilities
Habitat & Planning • Conduct natural features inventory • Develop natural features/wetlands ordinances • Modify community master plans • Implement streambank stabilization that will restore
habitat
Executive Summary
ANCHOR BAY WATERSHED MANAGEMENT PLAN
xiii
fulfill each agency’s obligations under their Phase II Storm Water Permit. To aid in this
review, an evaluation process was developed to assist the local units of government in
determining if water quality improvements are being attained (Chapter 6). The process
describes an evaluation method and target for each short-term objective. Each
community and county must track the status of the storm water improvement projects that
they are implementing. This information should be discussed at quarterly Steering
Committee meetings and should be submitted annually to the agency or consultant
charged with updating the plan. The implementation and tracking of the items listed in the
evaluation plan can be completed by the local communities, the counties, and/or through
a cooperative effort. Additional evaluation techniques may be required in each agency’s
storm water pollution prevention plan.
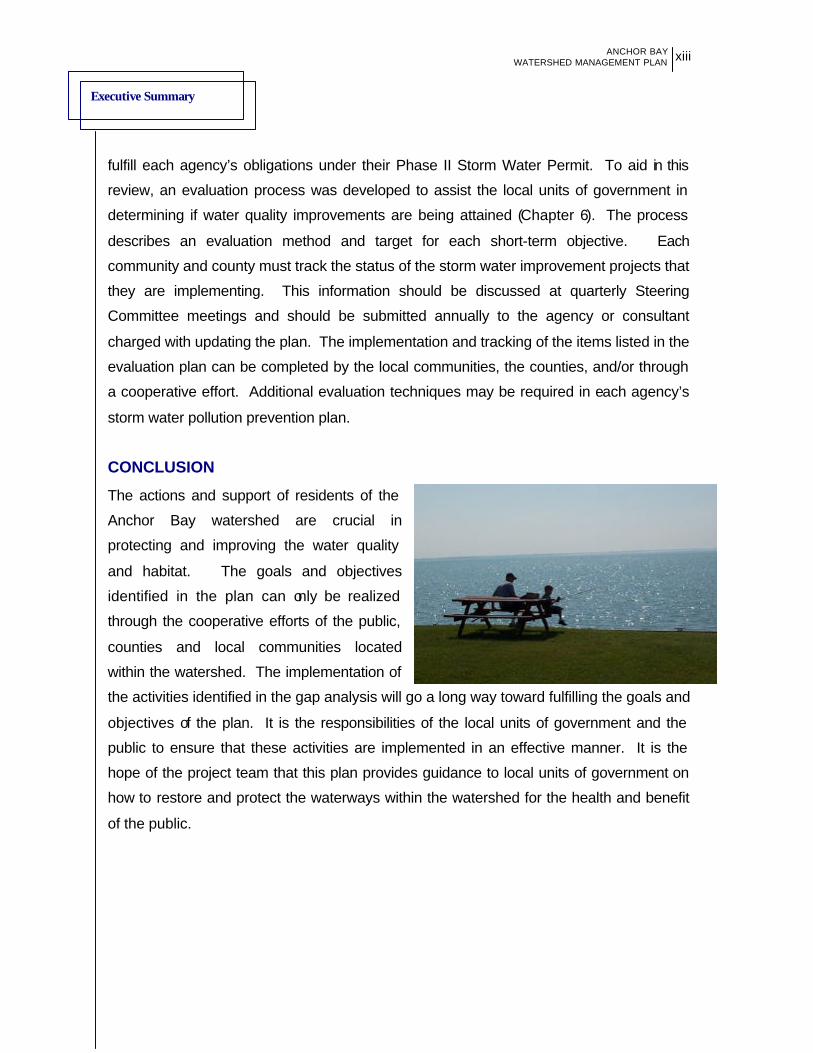
CONCLUSION
The actions and support of residents of the
Anchor Bay watershed are crucial in
protecting and improving the water quality
and habitat. The goals and objectives
identified in the plan can only be realized
through the cooperative efforts of the public,
counties and local communities located
within the watershed. The implementation of
the activities identified in the gap analysis will go a long way toward fulfilling the goals and
objectives of the plan. It is the responsibilities of the local units of government and the
public to ensure that these activities are implemented in an effective manner. It is the
hope of the project team that this plan provides guidance to local units of government on
how to restore and protect the waterways within the watershed for the health and benefit
of the public.
Chapter One
ANCHOR BAY WATERSHED MANAGEMENT PLAN
1
SSTTAATTEE OOFF TTHHEE WWAATTEERRSSHHEEDD
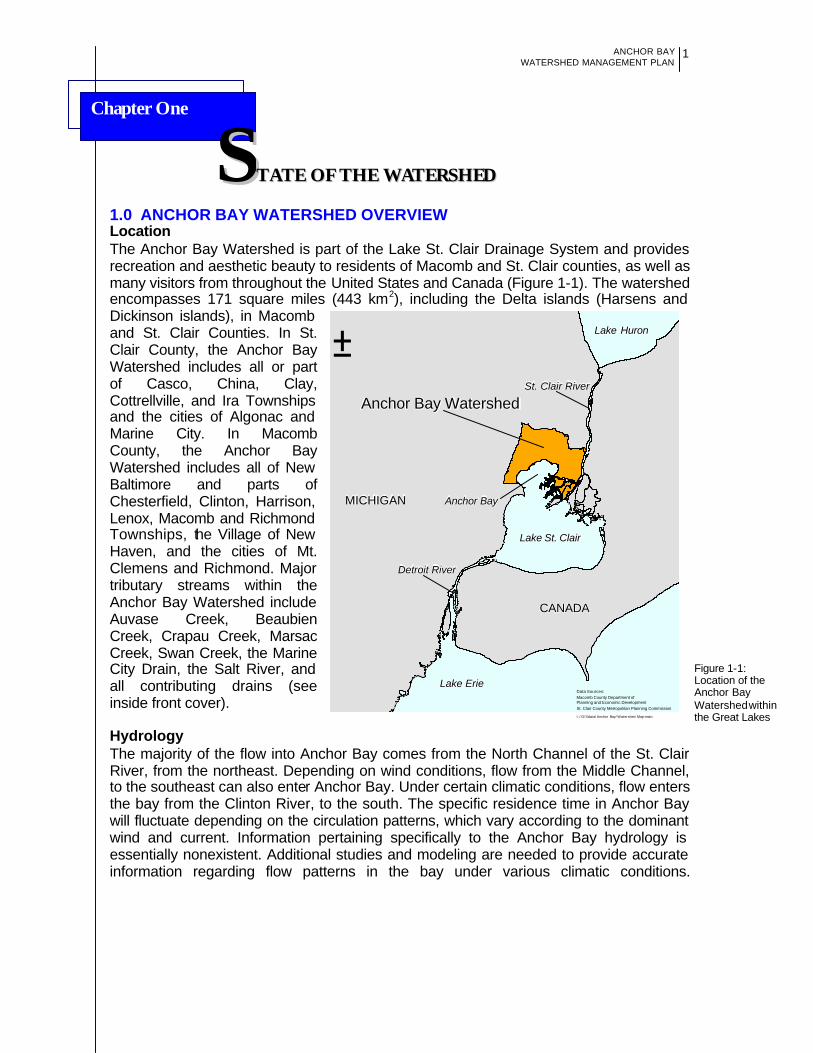
Figure 1-1: Location of the Anchor Bay Watershed within the Great Lakes
Lake St. Clair
Lake Huron
Lake Erie
CANADA
MICHIGAN
St. Clair River
Detroit River
Anchor Bay
Anchor Bay Watershed
Lake St. Clair
Lake Huron
Lake Erie
CANADA
MICHIGAN
St. Clair River
Detroit River
Anchor Bay
Anchor Bay Watershed
I:/GISdata/Anchor Bay/Watershed Map-main
Data Sources:Macomb County Department of Planning and Economic DevelopmentSt. Clair County Metropolitan Planning Commission
±
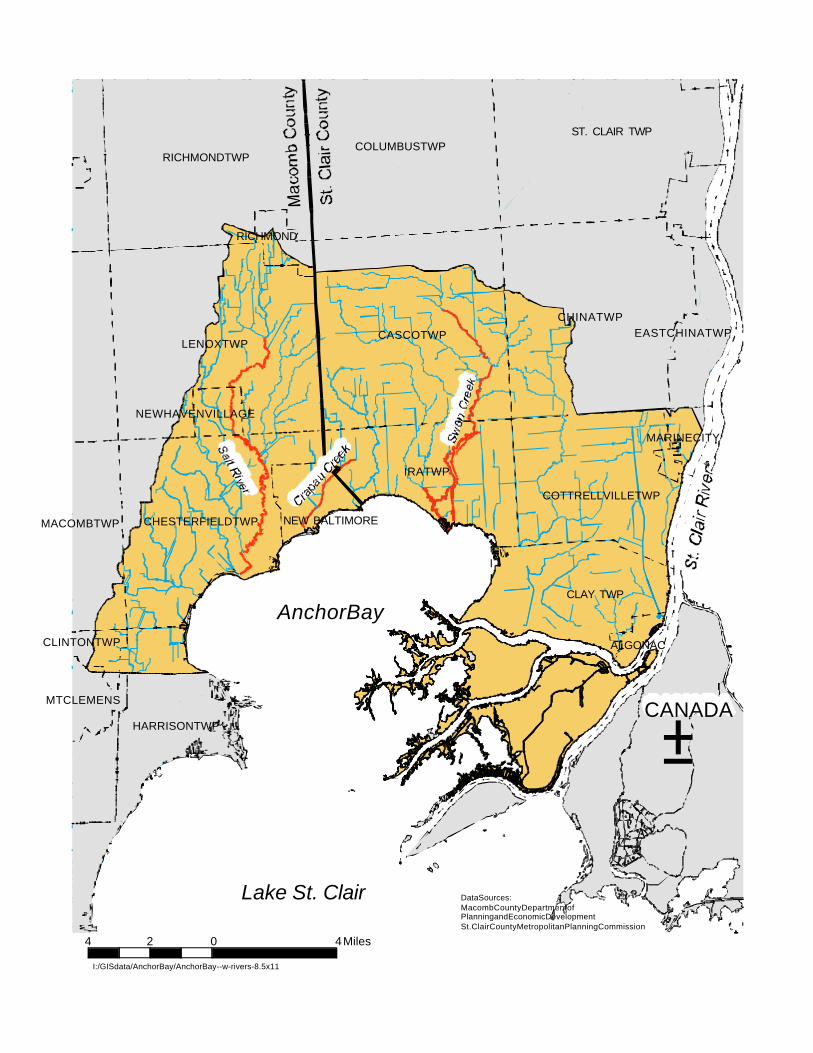
1.0 ANCHOR BAY WATERSHED OVERVIEW Location The Anchor Bay Watershed is part of the Lake St. Clair Drainage System and provides recreation and aesthetic beauty to residents of Macomb and St. Clair counties, as well as many visitors from throughout the United States and Canada (Figure 1-1). The watershed encompasses 171 square miles (443 km2), including the Delta islands (Harsens and Dickinson islands), in Macomb and St. Clair Counties. In St. Clair County, the Anchor Bay Watershed includes all or part of Casco, China, Clay, Cottrellville, and Ira Townships and the cities of Algonac and Marine City. In Macomb County, the Anchor Bay Watershed includes all of New Baltimore and parts of Chesterfield, Clinton, Harrison, Lenox, Macomb and Richmond Townships, the Village of New Haven, and the cities of Mt. Clemens and Richmond. Major tributary streams within the Anchor Bay Watershed include Auvase Creek, Beaubien Creek, Crapau Creek, Marsac Creek, Swan Creek, the Marine City Drain, the Salt River, and all contributing drains (see inside front cover). Hydrology The majority of the flow into Anchor Bay comes from the North Channel of the St. Clair River, from the northeast. Depending on wind conditions, flow from the Middle Channel, to the southeast can also enter Anchor Bay. Under certain climatic conditions, flow enters the bay from the Clinton River, to the south. The specific residence time in Anchor Bay will fluctuate depending on the circulation patterns, which vary according to the dominant wind and current. Information pertaining specifically to the Anchor Bay hydrology is essentially nonexistent. Additional studies and modeling are needed to provide accurate information regarding flow patterns in the bay under various climatic conditions.
State of the Watershed
ANCHOR BAY WATERSHED MANAGEMENT PLAN
2
Topography and Soils Topography of the Anchor Bay Watershed varies from level to gently sloping terrain. The majority of the watershed is characterized as lake plain with some limited glacial till in Macomb County. Although there is a limited area of sandy soil within the watershed, the soils are generally characterized as poorly drained with high clay content. History of the Watershed Lower reaches of the St. Clair River and Lake St. Clair generally remained unaltered until about 1900. The U.S. portion of the St. Clair basin, including Anchor Bay, was initially settled because the St. Clair River and Lake St. Clair provided numerous resources, including a transportation corridor and an abundance of fish and wildlife. Throughout the 1800s, settlers changed the land from primarily deciduous forests and lakeplain prairies into land cleared for agriculture. The lake and river continued to serve as an important regional transportation corridor. In the late 1800s, two significant developments occurred that led to rapid alterations in land-use patterns: 1) passage of the federal Swamplands Act of 1850, and 2) introduction of new technology that vastly improved transportation. For many years, access to the land was limited by the very nature of the property. In 1815, the U.S. Surveyor General reported that a large part of southeastern Michigan was a swamp and practically worthless. As a result, the Swamplands Act of 1850 provided swampland to individuals at no cost if they agreed to drain the land and develop it into a useful parcel. This law stimulated settlers to drain and fill vast areas of wetlands along the St. Clair River and Lake St. Clair. By 1873, the land between the Detroit and Clinton rivers and Anchor Bay had been almost entirely converted to agriculture. In turn, improved transportation made drained land more accessible. The advent of electric and steam railways, along with a dredged shipping channel through Lake St. Clair, led to an increased human population, multiple private and public recreational activities, and industrial development along the St. Clair River. Development, particularly on the Michigan shoreline, intensified in the 1950s, and by the mid-1970s, much of Michigan’s Lake St. Clair shoreline was fully developed. To date, Anchor Bay’s recuperative powers have exceeded man’s ability to inflict harm. The rapid development of the Lake St. Clair shoreline stressed the ecosystem, but the lake proved to be resilient. Because much of the drainage area contributing to Anchor Bay remained undeveloped into the 1980s, the assimilative capacity of the contributing streams and the nearshore waters helped habitat remained intact. However, recent nearshore algae blooms and beach closings suggest that this capacity is now being tested. Recreational Opportunities Many people choose to live in southern St. Clair County and eastern Macomb County because recreational opportunities presented by Lake St. Clair add quality to their lives and value to their property. These recreational opportunities include:
• Boating, swimming and fishing, including wintertime ice fishing
State of the Watershed
ANCHOR BAY WATERSHED MANAGEMENT PLAN
3
• Hunting (Anchor Bay is one of southeast Michigan’s premiere duck hunting areas.) • Walking and bicycling along the Bridge to Bay Trail in St. Clair County and the
Macomb Orchard Trail in Macomb County (Plans are being discussed to link these trails.)
• Points of interest, such as Cherry Beach dock in Cottrellville Township; Selfridge Air National Guard Base in Harrison Township; Algonac State Park; St. Clair Flats State Wildlife Area in Clay Township; Ira Township Park; Boat Launch in Chesterfield Township; Brandenburg Park along the bay and Pollard Park Nature Area on the Salt River in Chesterfield Township; and New Baltimore Beach and St. Johns Marsh in Clay and Ira Townships.
Because of these recreational opportunities, the health of Lake St. Clair and Anchor Bay is of tremendous importance to area residents. In many ways, Anchor Bay’s water quality is quite good. Ongoing development, however, continues to negatively impact these resources. Fish and Wildlife Habitat The Anchor Bay Watershed contains approximately 38,000 acres of ecologically sensitive land. Various wetland types include open-water wetlands, beach and shoreline wetlands, cattail wetlands, sedge wetlands, abandoned channel wetlands, wet meadow wetlands, and shrub wetlands (Figure 1-2 in Appendix A). Wetlands are critical if diverse populations of fish and wildlife unique to the area are to be preserved. St. Johns Marsh is one of the largest coastal wetlands in the Great Lakes. This 2,500-acre marsh in Clay and Ira Townships is within ¾ mile of the lakeshore and is directly influenced by water level changes in the bay. Compared to inland wetlands, coastal wetlands are more dynamic, display a greater diversity of landforms, and are less influenced by groundwater inflow. It is currently home to rare and endangered plants and wildlife, including fox snakes, prairie-fringed orchids and birds, such as the king rail. The diverse fish and wildlife species that inhabit Anchor Bay require more than simply a pollutant-free environment. They are dependent on the diverse food web that supports larger animals upon which so many sport recreational opportunities depend. At least 12 varieties of submerged plants in Anchor Bay provide an excellent habitat for waterfowl and 117 fish species that are either permanent residents or enter the system from Lake Huron and Lake Erie to spawn. Anchor Bay has one of the highest densities of fish flies in the St. Clair-Detroit River System. Fish flies, although sometimes viewed as a nuisance, provide food for fish and wildlife and are indicators of a healthy water body because they are intolerant of pollution. The fish fly larvae is just one of the 300 species of bugs, known as benthic macroinvertebrates, which live on or in the bottom of Anchor Bay. These bottom-dwelling plants and animals are the food source for larger sport fish and animals. Land Use Land use in a watershed has a direct impact on the water quality, which, in turn, affects the health of ecological diversity in the aquatic system. Between 1990 and 2000, the land use trend leaned towards an increase in residential, commercial, and industrial areas,
State of the Watershed
ANCHOR BAY WATERSHED MANAGEMENT PLAN
4
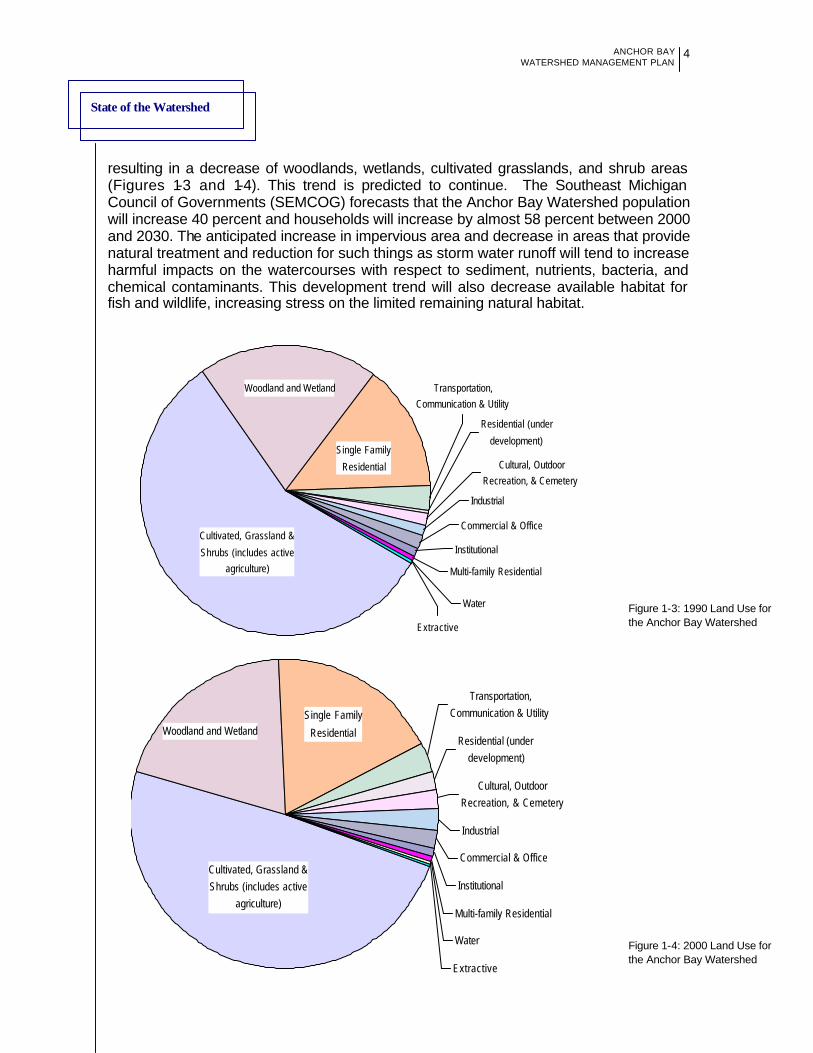
Figure 1-3: 1990 Land Use for the Anchor Bay Watershed
Figure 1-4: 2000 Land Use for the Anchor Bay Watershed
resulting in a decrease of woodlands, wetlands, cultivated grasslands, and shrub areas (Figures 1-3 and 1-4). This trend is predicted to continue. The Southeast Michigan Council of Governments (SEMCOG) forecasts that the Anchor Bay Watershed population will increase 40 percent and households will increase by almost 58 percent between 2000 and 2030. The anticipated increase in impervious area and decrease in areas that provide natural treatment and reduction for such things as storm water runoff will tend to increase harmful impacts on the watercourses with respect to sediment, nutrients, bacteria, and chemical contaminants. This development trend will also decrease available habitat for fish and wildlife, increasing stress on the limited remaining natural habitat.
Commercial & Office
Institutional
Multi-family Residential
Water
Extractive
Residential (under
development)
Cultural, Outdoor Recreation, & Cemetery
Industrial
Transportation, Communication & Utility
Cultivated, Grassland &
Shrubs (includes active agriculture)
Woodland and Wetland
Single Family
Residential
Residential (under development)
Cultural, Outdoor Recreation, & Cemetery
Industrial
Commercial & Office
Institutional
Multi-family Residential
Water
Extractive
Cultivated, Grassland & Shrubs (includes active
agriculture)
Woodland and WetlandSingle Family
Residential
Transportation, Communication & Utility
State of the Watershed
ANCHOR BAY WATERSHED MANAGEMENT PLAN
5
1.1 ANCHOR BAY POLLUTANTS, SOURCES AND MONITORING DATA The major stresses, such as reduced habitat, increased contamination of habitat, elevated bacteria concentrations at beaches, limited public access, and increasing numbers of invasive species, are now generally associated with residential development and human impact, rather than industrial activities. The pollutants that once discharged from industrial outfalls are now controlled, but pollutants associated with construction, residential, and recreational activities continue to challenge Anchor Bay’s natural recuperative powers. Wastewater and Industrial Discharges Since the onset of environmental laws, a great deal of effort has gone into controlling pollutants associated with wastewater and industrial discharges, which are regulated under permits issued by the Michigan Department of Environmental Quality (MDEQ). This program has been in place since the early 1960s and continues to be an effective mechanism for environmental control. Sixteen permitted point source discharges exist within the Anchor Bay Watershed (Table 1-1 in Appendix A). The vast majority of these are treated domestic wastewater discharges from municipalities or private developments, schools, and highway rest areas. MDEQ Personnel have indicated that permittees within the Anchor Bay Watershed are generally in compliance with discharge permits issued to them by the MDEQ under the Federal Clean Water Act and the Michigan Natural Resources and Environmental Protection Act. Much treated domestic wastewater also discharges to the Anchor Bay Watershed, and the number of these discharges is increasing as more development occurs outside of the established sewer service area. In addition to the discharges listed in Table 1-1, many industrial and municipal discharges within the St. Clair River Watershed have the potential to make a significant impact on the Anchor Bay area. These discharges are discussed in more detail in the St. Clair River Remedial Action Plan. Storm Water Runoff Like all urbanizing areas, pressure from development within the Anchor Bay Watershed has resulted in increased runoff due to reduced pervious area and development of storm water drainage systems. Changing land use patterns have dramatically altered the natural drainage throughout the area, and environmental degradation continues to result from an increased number of impervious areas, increased peak flows of storm water with resulting accelerated erosion, and decreased natural drainage and infiltration capacity. Although storm water runoff is a natural result of the hydrologic cycle, it does carry excessive pollutants of various types, including suspended solids, oils and greases, chemicals, nutrients, and bacteria. Little site-specific monitoring data exists regarding the quality and quantity of storm water being discharged to the Anchor Bay Watershed. However, data that is available shows that runoff contributes elevated levels of nutrients and bacteria directly to the bay. In addition, based on data available from similar rural and urban areas, it can be concluded that these discharges are, in fact, a significant source of local contamination within the watershed.
State of the Watershed
ANCHOR BAY WATERSHED MANAGEMENT PLAN
6
Many contaminants in storm water runoff are a result of day-to-day activities by watershed residents and visitors. A major source of nutrients in storm water runoff is from over-fertilization of residential lawns. Yard waste deposited in streams and drains by riparian property owners can elevate nutrients in the streams, cause aesthetic problems, and clog small tributary streams. Littering or improper waste disposal results in solids and floating materials that degrade the aesthetics and interfere with the flow in the bay and tributary streams. Careless disregard for domestic animal waste results in elevated bacteria contamination. Accumulated small overflows of petroleum products result in oil sheens on the bay and streams that cause aesthetic problems and interfere with oxygen transfer into the tributaries. Storm water runoff has traditionally been considered as a non-point source discharge to a watershed. However, because most runoff, particularly in urban areas, is diverted through a series of curbs, gutters, ditches, and pipes, most storm water discharges are now regulated as point sources. This change in philosophy has resulted in a storm water control program, known as the Phase I and Phase II NPDES Storm Water Permit Program. The major impact of this program in the Anchor Bay Watershed is under the Phase II program, which requires urbanized areas with a population greater than 10,000 people to develop a control program for their storm water discharges. These programs require implementation of Best Management Practices (BMPs) that will reduce the quantity and improve the quality of storm water discharged to watershed tributaries and directly to the bay. This program was adopted in March 2003 by the federal and state government in recognition of the facts that 1) storm water runoff is a significant contributor of pollution within watersheds, and 2) the traditional approach of controlling point source discharges from industrial facilities and municipal treatment plants and sewer systems would not accomplish the “fishable, swimmable, drinkable” goals established under the Clean Water Act. To be successful, the Anchor Bay Watershed Plan must establish a similar approach that looks at all sources within the watershed and develops goals, objectives, and actions that will mitigate any impacts from all sources. Otherwise, industrial and municipal discharges could be held to exceedingly stringent standards, while larger, less defined sources, such as storm water runoff, would go uncontrolled. This double standard could prevent the watershed from ever accomplishing needed corrections. 1.1.1. BACTERIA A. Bacteria Monitoring Programs The Macomb County Health Department (MCHD) was one of the first government agencies in Michigan to perform regular surface water monitoring to protect public health. Their program was established in 1990. Since then, the Macomb County Public Works Office (MCPWO), the St. Clair County Health Department (SCCHD), and the St. Clair County Drain Office (SCCDO) have established water quality monitoring programs. Over time, these programs have become better coordinated and expanded. The data collected in these programs form the baseline for this watershed management effort.
State of the Watershed
ANCHOR BAY WATERSHED MANAGEMENT PLAN
7
Macomb County In 1998, 1999, and 2000, the MCHD augmented their on-going monitoring efforts to include more detailed monitoring in the Anchor Bay Watershed. This monitoring program sampled for standard water quality parameters under wet and dry weather conditions (Table 1-2 in Appendix A). A limited number of sites with elevated bacteria levels were also identified. This monitoring program continued in 2001 and 2002. The results of the monitoring are published in the Lake St. Clair Water Quality Assessment. The 2001 report was distributed in 2002, and the 2002 report became available in 2003. Each year, the MCHD sampled during three periods – spring, summer and fall – taking samples from nearshore and offshore waters. In 1998, they also sampled inshore waters (Figure 1-5 in Appendix A). Fourteen parameters were sampled at these locations, although not all parameters were sampled all three years.
• Nearshore testing was conducted near outfalls entering the lake, including storm drains and river mouths.
• Offshore samples were taken approximately one-quarter mile from shore. • Inshore sampling, in wet and dry weather, was conducted upstream of nearshore
sites, generally one-quarter mile upstream from waterway discharge points. The MCHD performs surface water sampling at 10 locations in the watershed. One grab sample is collected at each location on a weekly basis. Sampling sites have been added as illicit discharges are suspected and as more resources become available (Table 1-3 in Appendix A). The Salt River and Crapau Creek sampling locations have routinely exceeded the daily maximum and 30-day geometric mean E. coli standards throughout the monitoring period. Table 1-4 in Appendix A, shows the results of sample analysis at these locations from 1995 through 2002. Table 1-5, in Appendix A, shows the sediment E. coli analysis from samples that were collected to determine if there was a correlation between sediment and water bacterial levels. These samples indicate no apparent correlation between the two media. MCPWO and MCHD received two Clean Michigan Initiative grants in 2001 to conduct an Illicit Discharge Elimination Program (IDEP) on county storm drains and waters of the state in the Lake St. Clair and Anchor Bay watersheds. As of June 2003, a survey of the county drain outfalls within the Anchor Bay Watershed has been completed and an inventory of outfalls entering waters of the state and open county drains is approximately 85 percent complete. The goal of this program is to locate sources of pollution entering the watercourses. This is accomplished through field crew surveys of inland watercourses, road ditches, county storm drains, and along the shoreline of Anchor Bay. These crews look for signs of failing onsite sewage disposal systems (OSDS), illegal dumping, and pollutants from municipal storm sewers. In places where a source of E. coli contamination appears to be entering a watercourse, the MCPWO and MCHD have initiated a more extensive investigation that includes additional sampling and dye testing. They also work with local municipalities to locate and eliminate pollution sources.
State of the Watershed
ANCHOR BAY WATERSHED MANAGEMENT PLAN
8
St. Clair County The SCCHD collected water quality samples for E. coli analysis at several locations within the watershed in 2000 and 2001. Although the resultant data shows no exceedances of the Michigan Water Quality Standards for E. coli for partial body contact, the standards for total body contact recreation were exceeded in the Harsens Island Main Drain at the North Channel (Location #8), the Marine City Dredge Cut (Location # 9), and the waterway at Golf Course Lane and Cottage Lane on Harsens Island (Location #10) (Figure 1-5 in Appendix A). The SCCDO and SCCHD received two Clean Michigan Initiative grants in 2002 to conduct an IDEP on county drains, natural waterways, and road drains in the Anchor Bay and Pine River watersheds. As of June 2003, 87 percent of the Anchor Bay Watershed has been completed. The remaining area is located along the shoreline of Clay Township, City of Algonac, Cottrellville Township, and Marine City. To date, most septic system failures were found in Casco and Cottrellville Townships (Figure 1-6 in Appendix A), and the least number were found in Ira Township, which contains sewered areas. The majority of violations were found entering road drains and ditches. In March 2003, SCCHD sent 112 violation letters to Anchor Bay Watershed residents. As of June 2003, 90 percent of these residents responded to the violation letters and are working toward correcting violations. SCCHD IDEP staff noted that, although there were few problems found on Harsens Island, a weekend survey might be needed to assess discharges from seasonal homes. B. Potential Sources Onsite Sewage Disposal Systems The Anchor Bay Watershed is sewered in the developed western portion, but heavily dependent on septic systems, also known as onsite sewage disposal systems (OSDS), in the more open, agricultural areas in its eastern portion. If properly sited, constructed, used, and maintained, these systems will provide reliable service over many years. However, MCHD and SCCHD personnel have indicated that soils in much of the watershed have generally very limited permeability for sewage disposal. Much of the area has a high water table and, as a result, onsite systems generally need to be specially designed and constructed to compensate for the soil types. The relatively impervious soils result in higher costs, higher failure rates, and shorter system life than in areas with highly pervious sands and gravels. To make matters worse, there are some areas, such as Harsens Island, where historic property division has left many sites without enough room for properly sized systems. This makes repair and replacement of any failed systems even more difficult. Failing onsite septic systems result in illicit discharges or a discharge of semi-treated or untreated sewage to a watercourse. These discharges often take the form of sewage seeping into a nearby improved drainage course or through “cheater pipes” that alleviate sewage backups caused by a failed drain field. To put the issue in perspective, the average residence uses 100 to 300 gallons of water daily, meaning that each failing system could contribute over 35,000 gallons of untreated
State of the Watershed
ANCHOR BAY WATERSHED MANAGEMENT PLAN
9
wastewater to its watershed annually. This, along with system failure rates higher than 25 percent in some areas, underscores the importance of local programs to assure proper installation and use of onsite systems. The SCCDO conducted a limited physical inventory of all or parts of 24 county drains within the St. Clair County portion of the watershed to determine sources of pollution and establish concerns. Detailed findings of this inventory can be found in Appendix B. This physical inventory substantiates that septic system failures are a considerable source of bacteria for county drains. It also highlights residents’ lack of action to correct illicit discharges as well as a variety of methods to temporarily relieve failures. Sewered Area Sources Three potential sources of contamination within sewered areas are illicit connections, sanitary sewer overflows (SSOs), and combined sewer overflows (CSOs). An illicit connection is a sewer pipe connected to a storm drain rather than to a sanitary sewer. Typically, these are connected inadvertently at the time of construction and are difficult to isolate because they discharge intermittently. If left uncorrected, however, these intermittent discharges contribute a significant pollutant load. SSOs occur when sanitary sewers cannot carry all water that falls during a rain event. Rather than cause sewage backups into area basements, a pump or bypass structure diverts flow to a local tributary stream. Technically, sewer breaks or equipment malfunctions that result in overflows from sanitary sewers to streams/drains are also considered to be SSOs. While there are no known SSOs within the Anchor Bay Watershed, the age of some of the development within the Anchor Bay drainage area suggests that undetected SSOs could exist. Like SSOs, CSOs are caused by rain events. CSO discharges to the Anchor Bay Watershed come from the Clinton River, which is not part of the designated watershed. However, when certain wind and current conditions are present, contaminants from Clinton River sewer systems, such as bacteria, organic chemicals, and metals, can add sediment accumulations and loadings that contribute to decreased water quality. Lagoon Systems and Package Treatment Plants Proliferation of small lagoon systems and package wastewater treatment facilities discharging to the bay and its tributaries is a concern for many county and local government officials. Increased use of these facilities can result in degradation of local and watershed-wide water quality when facility operation and maintenance is not closely monitored and regulated. Likewise, negative cumulative effects can occur when monitored and regulated discharges from various facilities are not well coordinated. In the SCCDO physical inventory, “leaking valves and embankments at water treatment facilities” is noted as a problem (Appendix B). The impacts of these facilities on an individual and collective basis can include elevated E. coli bacteria densities and nutrient concentrations as well as aesthetic and water quality degradation from excessive algae and green discoloration in facility discharges. Although these impacts are not well
State of the Watershed
ANCHOR BAY WATERSHED MANAGEMENT PLAN
10
documented, proliferation of separate sewage treatment facilities that utilize lagoons or low-volume secondary treatment plants (package plants) is becoming an increasing concern to public officials, regulators, and the general public. Agricultural Runoff Although the amount of land being used for livestock and dairy operations in the Anchor Bay Watershed has decreased over time, a significant portion of the watershed is still used for cropland, livestock and dairy operations, and equestrian activities. Stream contamination can occur from several sources related to agriculture. Direct impacts from cattle crossing streams and horse-related activities could include:
• Elevated bacteria, nutrient loading and low dissolved oxygen in the streams from manure contaminated runoff
• Streambank erosion where the banks have been leveled and stripped of grass from movement of the cattle and horses
• Destruction of stream bottom habitat and downstream sedimentation damage to the habitat from cattle walking in the stream
Additional agricultural related impacts could include:
• Elevated bacteria, nutrient loading and low dissolved oxygen levels in the streams due to manure contaminated runoff
• Increased nutrients from fertilizers • Chemical contamination from pesticides and herbicides • Increased soil erosion due to lack of buffer strips between cropland and streams.
Waste Products from Pets, Birds, and Wildlife Because all warm-blooded animals have E. coli bacteria in their digestive systems, pets, birds, and wildlife can deposit waste products directly in streams and storm sewers, or they can contaminate overland runoff that discharges to the streams. This results in elevated bacteria levels in the streams and the bay. C. Critical Area for Bacteria Crapau Creek and Salt River have been on the state’s impaired waters list (303(d) list) since 1998 for long-term violation of E. coli standards based on water quality data collected by the (MCHD) and the MDEQ. Therefore, the drainage areas are part of the critical area for bacterial contamination.
The MDEQ performed additional confirmatory sampling in 2001 in Crapau Creek, and a Total Maximum Daily Load (TMDL) was adopted for this drainage area in January 2002 (Appendix C). Two point source discharges are permitted into Crapau Creek; one is at the City of New Baltimore Wastewater Treatment Plant, and the other is at the Millstone Pond Mobile Home Park Wastewater Treatment Plant, which is a newly permitted discharge. In addition to these known point source waste loads, non-point sources also contribute to the E. coli loading. The MDEQ has established Loading Allocations (LAs) among these various sources based on the percentage of land area in the Crapau Creek Watershed.
State of the Watershed
ANCHOR BAY WATERSHED MANAGEMENT PLAN
11
Routine monitoring by both MCHD and SCCHD, observations from IDEP activities in both counties, known or suspected areas of failed onsite disposal systems, and direct discharges of raw sewage throughout both counties suggests that sewage is entering the Anchor Bay Watershed at various locations on a consistent basis, regardless of dry or wet weather. Therefore, the total critical area for bacteria in the watershed will be a dynamic definition that will vary as more data is accumulated and as more corrective action programs are implemented to eliminate sources. 1.1.2. SOIL EROSION AND SEDIMENTATION A. Soil Erosion and Sedimentation Monitoring Programs The MDEQ has stated that tributary streams within the Anchor Bay Watershed regularly flow brown for days after significant rainfall events from increased sediment loadings. In 2002, MDEQ conducted a road crossing survey to evaluate the condition of road crossings within the watershed. The survey included a physical assessment on 36 of 39 major road crossings. The assessment looked at erosion conditions, stream shape, stream appearance, surrounding land use, and stream sediment composition. The overall site ranking given to the surveyed drains showed that 10 percent were in good condition, 58 percent were in fair condition, and 32 percent were poor. The MDEQ intends to assess the remaining road/stream crossings in 2003. Both Macomb and St. Clair Counties are in the process of developing a countywide soil erosion and sedimentation control ordinance. The St. Clair County ordinance is currently under review by MDEQ. B. Potential Sources Another significant impact within the Anchor Bay Watershed is accelerated, or manmade, soil erosion and sedimentation. Erosion is the process of displacing soil particles through wind and water action. This is a natural process, which can be accelerated by construction and agricultural practices. Sedimentation is the process where the dislodged soil particles are deposited elsewhere on land, in streams, rivers, lakes, or wetlands. The predominantly clay soils found within the watershed create unique problems with sedimentation control. These clay soils tend to remain in suspension and are extremely difficult to remove from the water column using conventional sedimentation techniques. The result is highly turbid runoff in tributary streams and storm water systems that tend to remain sediment laden for an extended period of time after rainfall events. Erosion and sedimentation impacts include deposition, turbidity, increased pollutant loading, and destruction of wildlife habitat:
• Deposition affects stream morphology (shape), causing the stream to widen and become shallower, making it prone to temperature changes.
• Turbidity is cloudiness caused by sediment in water. Highly turbid water results in degradation of habitat and impaired aesthetics within waterways. Sediment particles affect fish, aquatic plants, and animals by causing starvation or suffocation. In fish, these sediment particles adhere to gill structures and lodge in feeding or breathing structures. Turbid water may also inhibit hunting, which disrupts the natural relationship of predator and prey.
State of the Watershed
ANCHOR BAY WATERSHED MANAGEMENT PLAN
12
• Pollutant loading is also increased by erosion and sedimentation. Pollutants, such as heavy metals, fertilizers, and pesticides, adhere to soil and are transported to the receiving water through erosion and sedimentation.
• Wildlife Habitat can be destroyed as sediments fill in voids created by woody debris, rocks and gravel that are used as cover by young fish and other aquatic species. Sedimentation also destroys fish and spawning areas.
Construction Construction activity usually results in compacted soils due to heavy equipment and removal of natural features, such as vegetated areas, that prevent soil erosion. When vegetation is removed, the exposed soils are more susceptible to movement by water runoff and wind. Clay based soils dominate the Macomb County portion of the watershed and much of St. Clair County. Communication from the Technical and Steering committees for the Anchor Bay Watershed Plan, as well as noted in the physical inventory conducted by the SCCDO, indicate that soil erosion and sedimentation control (SESC) measures on construction sites are not well maintained or are non existent. The SCCDO physical inventory substantiates the lack of soil erosion and sediment control measures, lack of maintenance of these measures on construction sites, and lack of enforcement of existing ordinances and programs along county drains in the St. Clair County portion of the Anchor Bay Watershed. Flows Increased impervious area due to land use changes can result in excessive flows in receiving streams. This excessive flow can be exhibited by higher peak flows, longer peak flow periods, or both. The SCCDO physical inventory indicates evidence of high flows causing streambank erosion. The results of these excess flows are increased streambank erosion, increased bottom scour, sediment resuspension, habitat destruction, and decreased diversity and number of fish and aquatic organisms. Agricultural Runoff Farming to the edge of streambanks can result in streambank erosion during runoff events and increased sediment loading from farm fields. The SCCDO physical inventory substantiates the lack of consistent agricultural practices across St. Clair County and found the existence of the following activities that contribute to soil erosion and sedimentation:
• Plowing to the edge of a county drain • Field drain ditches that cause erosion at their outlets • Livestock traffic and tractor traffic across watercourses that erode banks and
damage tree roots that would, otherwise, help stabilize soil
State of the Watershed
ANCHOR BAY WATERSHED MANAGEMENT PLAN
13
Road Crossings As evidenced by the MDEQ road crossing survey, road crossings are a source of soil erosion and sedimentation problems. Poorly designed road crossing structures, evidence of limited maintenance, and resident-built waterway crossings are also noted in the SCCDO physical inventory of county drains. C. Critical Area for Erosion and Sedimentation Sediments typically come from disturbed land on construction sites, agricultural and livestock fields without buffer strips, and eroding streambanks caused by excessive water flows. Limited data from the SCCDO drain survey and the MDEQ’s road crossing survey along with complaints on soil erosion practices on construction sites, suggests that this problem exists throughout the watershed. Therefore, the entire watershed is determined to be the critical area for erosion and sedimentation. 1.1.3. NUTRIENTS A. Nutrient Monitoring Programs Table 1-6, in Appendix A, summarizes water quality data collected in Anchor Bay by the MCHD from 1998 through 2000. A majority of locations sampled exceeded the level of concern for phosphorus (Total P = 0.05 mg/L) at least once. Nearly half of the locations displayed Dissolved Oxygen (DO < 5 mg/L) concerns at least once (Figure 1-7 in Appendix A). These exceedances suggest that Anchor Bay is being degraded by. Continued urbanization will likely aggravate this problem.
Overall, three years of compiled data shows that water at the sample locations exceeded level of concern values or had higher than average readings throughout the three-year period. This implies that this area should be a focus of additional investigations to determine the source(s) of these pollution inputs to the watershed. B. Potential Sources Phosphorus and nitrogen are chemicals that are commonly used in fertilizer to encourage rapid growth. These same chemicals increase nutrient levels in open waterways and promote algae growth in Anchor Bay. Although excessive aquatic plant and algae growth is generally phosphorus limited, increased levels of nitrogen and phosphorus can lead to low, dissolved oxygen thus exacerbating growth of aquatic nuisance plants. It is suspected that increased aquatic plant growth contributes to the public health problem by trapping fecal-contaminated waters in the near shore areas, which in turn causes beach closures. This hypothesis was included as part of the August 2000 revision of the Report and Recommendations of the Macomb County Blue Ribbon Commission on Lake St. Clair. Urban Sources Excessive use of fertilizers is the major source of nutrients from urban residential areas. Natural wetlands can remove some nutrients from storm water runoff, but development has reduced these natural filtration areas, resulting in untreated storm water runoff to tributaries and increased nutrients in the watershed and the bay.
State of the Watershed
ANCHOR BAY WATERSHED MANAGEMENT PLAN
14
Agricultural Sources Improperly managed agricultural runoff can contribute fertilizers, pesticides, and herbicides to nearby water and can also create excess particulates from soil erosion and general ecosystem damage. Although there has been a general decline in livestock sites for dairy, beef, swine and poultry, a significant equine-related agricultural industry still exists within the watershed. A significant amount of acreage is devoted to soybean, wheat, and corn production. A consistent application of agricultural BMPs, such as buffer strips, limited cattle access to streams, and implementation of nutrient management plans, will reduce these impacts within the watershed and the bay. Although limited information is available regarding agricultural runoff, public comment indicates a lack of consistent application of agricultural BMPs within the watershed. C. Critical Area for Nutrients Data from the Lake St. Clair Water Quality Assessment report shows elevated nutrient levels from inland watercourses that drain residential and agricultural areas. Although Crapau Creek and the Salt River are not officially considered impaired for nutrients, both streams could be contributing to the problem because nutrients can come from the same sewage sources that are causing the elevated E. coli readings. Since both agricultural and urban areas are potential sources for excess nutrients, the entire watershed is considered a critical area. Additional data needs to be collected to isolate specific areas within the watershed that may be considered critical for this parameter. 1.1.4. FLOW RATES A. Flow Rate Monitoring No stream flow gauges are currently installed in the Anchor Bay Watershed. Stream hydrology and geomorphology studies need to be completed within the major tributaries to determine critical flow areas with. B. Potential Sources Land Use and Impervious Surfaces Increased impervious areas within the watershed, caused by changes in land use, result in higher storm water runoff that quickly reaches tributary streams, often causing flooding and stream bank erosion. Left unchecked, the changes to the river flow will cause serious damage to the physical and biological integrity of the receiving stream. A limited physical survey, conducted by the SCCDO, highlighted that high flow rates have been a problem in many county drains (Appendix B). Impacts of increased impervious areas include:
• Water quality degradation: pollutants types and concentrations increase substantially as oils, sediment, trace metals, nitrogen, and phosphorus are washed from urban areas into waterways
• Increased flooding: peak flows are increasing two to five times over predevelopment flow rates, and runoff reaching the stream up to 50 percent faster
• Increased erosion: The channel may widen and undercut streambanks that may fall into the river
• Accelerated habitat loss in rivers and streams
State of the Watershed
ANCHOR BAY WATERSHED MANAGEMENT PLAN
15
• Biodiversity loss: Fish communities may become less diverse, and sensitive fish species may be lost
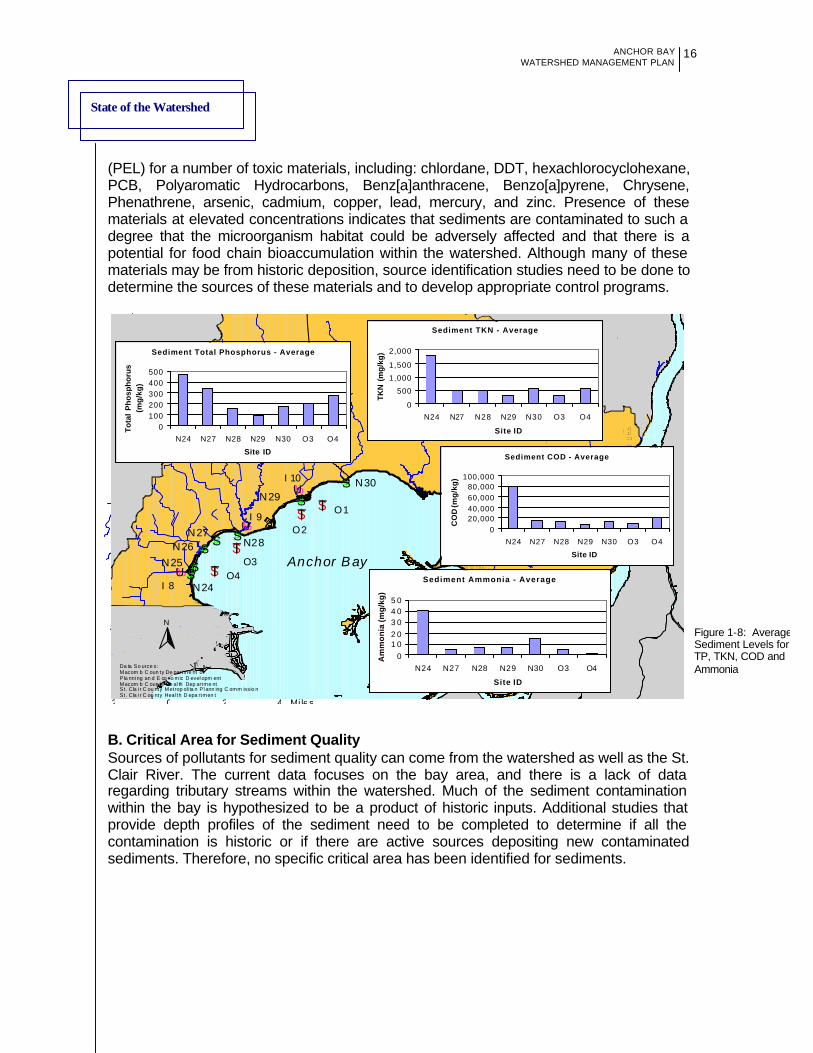
• Higher water temperatures due to heated pavement and wider, shallower streams C. Critical Area for Excessive Flow Rates Due to the absence of historical and current data within the watershed, stream hydrology and geomorphology studies need to be completed within the major tributaries to determine critical flow areas. Until these additional studies are completed, the entire watershed is considered a critical area. 1.1.5. SEDIMENT QUALITY A. Sediment Quality Monitoring Programs In the Anchor Bay System, concentrations of pollutants within sediments are generally low; however, sampling has been limited. The river drainage basins are a source of sediments and associated non-point pollution. The amount or nature of this pollution depends on land use and pollutants associated with the runoff. The highest concentration of contaminants in sediment is in the vicinity of the navigational channel. These are likely to be the result of historical industrial practices along the St. Clair River. Navigation-related maintenance dredging that removes these polluted sediments from the system and deposits them in confined disposal facilities may be beneficial. MCHD conducted sediment sampling for nutrients, oxygen-demanding materials, and metals at several nearshore and offshore locations within the Anchor Bay Watershed (Figure 1-5 in Appendix A). The sediment data generally indicates metals and bacteria contamination that exceeds guidelines established by the U. S. Environmental Protection Agency (USEPA) and the Ontario Ministry of Environment (OMOE). The SCCHD monitoring program did not include sediment sampling. Polluted sediment can contribute to long-term contaminations in the water column as well as degraded habitat. The locations and years sampled for sediment data and the conventional parameters sampled are shown in Table 1-7 and 1-8 in Appendix A. Results for selected parameters are depicted in Figure 1-8. Irwin Drain has the highest levels of sediment total phosphorus, Total Kjeldahl Nitrogen (TKN), Chemical Oxygen Demand (COD), and ammonia among the tributary sample sites (Figure 1-8 and Table 1-9 in Appendix A). Dykeman Drain also shows elevated levels of total phosphorus in the sediment. The OMOE and USEPA sediment metal pollution classification guidelines were used to compare results of metals analysis for this report. This comparison shows that sediments within Anchor Bay depicted exceedances of nearly every metal in at least one sampling location. The metals sampled, the corresponding years, and Sediment Metal Pollution Classification Guidelines are listed in Table 1-10 in Appendix A. The United States Geological Survey (USGS) report on the Areal Distribution and Concentration of Contaminants of Concern in Surficial Streambed and Lakebed Sediments, Lake Erie-Lake Saint Clair Drainages, 1990-97 indicates that sediment in Anchor Bay area exceeds Threshold Effect Levels (TEL) and/or Probable Effect levels
State of the Watershed
ANCHOR BAY WATERSHED MANAGEMENT PLAN
16
#S#S
#S#S #S
#S
#S
$T$T
$T
$T%U
%U
%U
I8
I9O2
O3
O1
O4N25
N27N28
N29
N24
N26
N30
Anchor B ay
I10
N
Da ta So urce s:Macom b C oun ty De partme nt of Pla nni ng an d E co no mic D evel opm entMacom b C oun ty He al th Dep artme ntSt. Cla i r C ou nty Metrop oli ta n Pl ann ing C omm issio nSt. Cla i r C ou nty Heal th D epa rtmen t
2 0 2 4 Mi les
Sediment Total Phosphorus - Average
0100200300400500
N24 N27 N28 N29 N30 O3 O4
Site ID
To
tal
Ph
osp
ho
rus
(mg
/kg
)
Sediment TKN - Average
0
500
1,000
1,500
2,000
N24 N27 N28 N29 N30 O3 O4
Site ID
TK
N (
mg
/kg
)
Sediment COD - Average
020,00040,00060,00080,000
100,000
N24 N27 N28 N29 N30 O3 O4
Site ID
CO
D (m
g/k
g)
Sediment Ammonia - Average
01 02 03 04 05 0
N24 N27 N28 N29 N30 O3 O4
Site ID
Am
mo
nia
(mg
/kg
)
Figure 1-8: Average Sediment Levels for TP, TKN, COD and Ammonia
(PEL) for a number of toxic materials, including: chlordane, DDT, hexachlorocyclohexane, PCB, Polyaromatic Hydrocarbons, Benz[a]anthracene, Benzo[a]pyrene, Chrysene, Phenathrene, arsenic, cadmium, copper, lead, mercury, and zinc. Presence of these materials at elevated concentrations indicates that sediments are contaminated to such a degree that the microorganism habitat could be adversely affected and that there is a potential for food chain bioaccumulation within the watershed. Although many of these materials may be from historic deposition, source identification studies need to be done to determine the sources of these materials and to develop appropriate control programs.
B. Critical Area for Sediment Quality Sources of pollutants for sediment quality can come from the watershed as well as the St. Clair River. The current data focuses on the bay area, and there is a lack of data regarding tributary streams within the watershed. Much of the sediment contamination within the bay is hypothesized to be a product of historic inputs. Additional studies that provide depth profiles of the sediment need to be completed to determine if all the contamination is historic or if there are active sources depositing new contaminated sediments. Therefore, no specific critical area has been identified for sediments.
State of the Watershed
ANCHOR BAY WATERSHED MANAGEMENT PLAN
17
1.1.6. OTHER POLLUTANTS AND THEIR SOURCES Airborne Deposition Airborne deposition directly to the Anchor Bay drainage area and water surface area is small, but significant, due to the small surface area of its drainage basin. However, the volume of airborne deposition can become even more significant when pollutants that fall on Lake Huron and its drainage basin, then flow into Anchor Bay, are also considered. It is believed that most organochlorine pesticides found in the St. Clair River – alpha-BHC, gamma-BHC (lindane), dieldrin and heptachlor epoxide – come from upstream locations, including Lake Huron. A recent study conducted by the Detroit Water and Sewerage Department, Atmospheric Deposition Study of PCBs, Mercury, and Cadmium , concluded that precipitation contained mercury, cadmium, and PCBs at analytically detectable levels. The study also showed that there was a definite “first-flush” phenomenon associated with the concentration of these materials in runoff from residential and industrial sites within the study area. That is, the first storm water runoff in a storm is more contaminated because the land surface it runs over has collected pollutants over a period of time. As the runoff continues and the land surface becomes cleaner, the quality of the runoff improves. The number and size of accidental releases of materials to the environment (commonly known as spills) have been reduced significantly over the last ten years. Historical spill events have resulted in contaminated sediment and transient water quality impacts. Spills can increase chemical contamination of the water and sediment, cause fish kills and other habitat impacts, and degrade aesthetics. Dumping trash along the banks and directly into watershed tributaries and the bay is an activity that is, unfortunately, a result of day-to-day human activities. This activity can cause fish and wildlife mortalities, reduced public enjoyment, blockages, and disease. The SCCDC physical inventory found that “dumping of refuse near watercourses” was a common activity and resulted in degraded water quality. Benthic Macroinvertebrates Freshwater benthic macroinvertebrates are animals without backbones that are larger than ½ millimeter (the size of a pencil dot). These animals live on rocks, logs, sediment, debris, and aquatic plants during some period in their life. These macroinvertebrates include crustaceans, such as crayfish, mollusks, such as clams and snails, aquatic worms, and immature forms of aquatic insects, such as stonefly and mayfly nymphs. Benthic macroinvertebrates are an important part of the food chain, especially as prey for fish. Many feed on algae and bacteria, which are on the lower end of the food chain. Some shred and eat leaves and other organic matter that enters the water. Because of their abundance and position as middleman in the aquatic food chain, these organisms play a critical role in the natural flow of energy and nutrients. As these macroinvertebrates die, they decay, leaving behind nutrients that are reused by aquatic plants and other animals in the food chain.
When these macroinvertebrates are found in large quantities, the waters are generally classified as clean or unpolluted by organic wastes. Without too much organic matter, the
State of the Watershed
ANCHOR BAY WATERSHED MANAGEMENT PLAN
18
waters usually have lots of oxygen. For example, stoneflies are often considered to be clean water organisms. But when thinking about worms and midges, water quality professionals often view these as indicators of dirty water, especially in rivers and streams. There have been many studies regarding benthic macroinvertebrates in Lake St. Clair; however no documented data is available specific to the Anchor Bay Watershed. Studies that provide information on macroinvertebrates in the Anchor Bay Watershed need to be conducted. Invasive Non-native Species Invasive plant and aquatic species pose a threat to native fish, wildlife, and natural areas in the Anchor Bay Watershed. Unlike other watershed impacts that may be attributed to land use change, the introduction of invasive species results from transient activities, such as shipping and recreational boating. If allowed to flourish in natural areas and watercourses, invasive aquatic species, such as zebra mussels and sea lamprey, can out-compete native species and eliminate a food source for mature fish and wildlife. Likewise, invasive wetland plants, such as purple loosestrife and phragmites, can overtake a diverse wetland habitat. Collectively, these exotic species cause great harm to fragile and unique natural areas in Anchor Bay.
• Phragmites is a tall plumed perennial wetland grass that ranges in height from three to 13 feet. This reed-like species is commonly found along roadsides, ditches, dredged areas, and in freshwater marshes. It can form colonies hundreds of acres in size. Phragmites chokes out more beneficial vegetation, such as cattails and other native plants that provide food and habitat to native fish and wildlife. Currently, the MDEQ, in partnership with the U.S. Army Corps of Engineers, Ducks Unlimited and other state conservation groups, are participating in a research program using beetles, herbicides, and controlled burns to eradicate or control phragmites in St. Johns Marsh and nearby Algonac State Park.
• Purple Loosestrife is a wetland perennial that can produce more than two million seeds annually. An invasion by purple loosestrife can overtake native plants in a wetland, resulting in eventual alteration of the wetland’s structure and function. No effective method of controlling purple loosestrife has yet been discovered or implemented. However mowing or cutting, burning, herbicide application, or releasing herbivore beetles to eat the plant roots has provided limited success. The Galerucella beetle has been credited with wiping out large stands of purple loosestrife in southern Michigan.
• Zebra Mussels, an invading species from Eurasia, was introduced into the Great Lakes through ballast water, which is used in ships to maintain stability in open waters and along coastal areas. The water, itself, can be contaminated with organisms that include plants, animals, bacteria, and pathogens all of which may displace native species, degrade native habitat, spread disease, and disrupt human social and economic activities that depend on water resources. The non-native zebra mussel, for example, has reduced plankton populations, clogged municipal water intakes, and impacted recreational boating in Anchor Bay.
State of the Watershed
ANCHOR BAY WATERSHED MANAGEMENT PLAN
19
1.2 WATERSHED DESIRED USES, CONCERNS, AND IMPAIRMENTS The MDEQ and the International Joint Commission (IJC) for the Great Lakes and Connecting Channels has established 17 Beneficial and Designated Uses for waterways. Of the 17, seven are considered to be impaired within Anchor Bay and/or its watershed. These seven impairments are:
1. Total body contact 2. Partial body contact 3. Warmwater/coldwater fishery 4. Indigenous aquatic life and wildlife 5. Degradation of benthos 6. Degradation of aesthetics 7. Eutrophication impacts and excessive aquatic plant growth.
Table 1-11 in Appendix A shows the Designated and Beneficial Uses used for all watersheds and the current status in Anchor Bay and the Anchor Bay Watershed. A combination of public and steering committee meetings were held to determine the desired uses and concerns that the public and elected officials felt needed to be addressed in the watershed plan. These concerns are listed in order of priority in Table 1-12 and in combination with the Beneficial and Designated Use impairments as the basis for the watershed goals and objective developed for this plan. The SCCDO physical inventory of the St. Clair County portion of the watershed highlighted some key concerns, including: seawalls replacing shorelines, enclosed piping on tributary streams, development along the watercourse, soil erosion, the dumping of refuse in or near the watercourse, wetland destruction, inadequate septic systems, and lack of public education. These concerns and others are discussed in more detail in Appendix B.
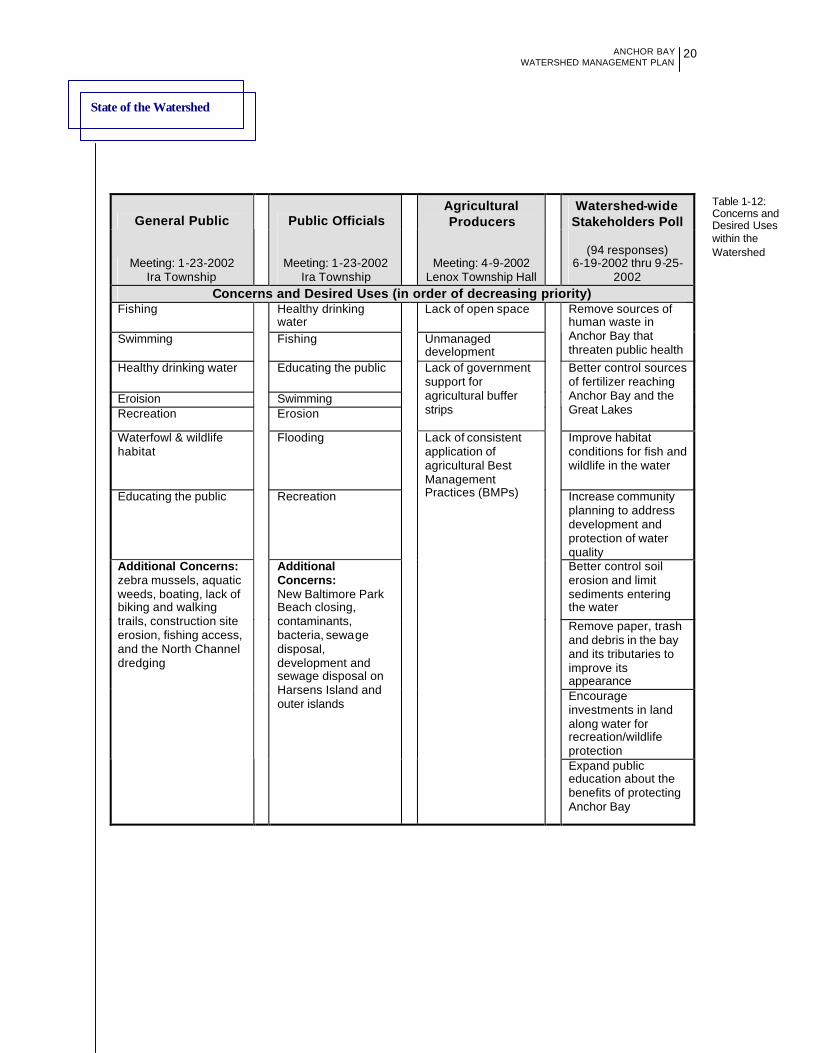
State of the Watershed
ANCHOR BAY WATERSHED MANAGEMENT PLAN
20
Table 1-12: Concerns and Desired Uses within the Watershed
General Public Public Officials Agricultural Producers
Watershed-wide Stakeholders Poll
Meeting: 1-23-2002 Ira Township
Meeting: 1-23-2002 Ira Township
Meeting: 4-9-2002 Lenox Township Hall
(94 responses)
6-19-2002 thru 9-25-2002
Concerns and Desired Uses (in order of decreasing priority) Fishing Healthy drinking
water Lack of open space
Swimming Fishing Unmanaged development
Remove sources of human waste in Anchor Bay that threaten public health
Healthy drinking water Educating the public
Eroision Swimming Recreation Erosion
Lack of government support for agricultural buffer strips
Better control sources of fertilizer reaching Anchor Bay and the Great Lakes
Waterfowl & wildlife habitat
Flooding Improve habitat conditions for fish and wildlife in the water
Educating the public Recreation Increase community planning to address development and protection of water quality Better control soil erosion and limit sediments entering the water
Remove paper, trash and debris in the bay and its tributaries to improve its appearance Encourage investments in land along water for recreation/wildlife protection
Additional Concerns: zebra mussels, aquatic weeds, boating, lack of biking and walking trails, construction site erosion, fishing access, and the North Channel dredging
Additional Concerns: New Baltimore Park Beach closing, contaminants, bacteria, sewage disposal, development and sewage disposal on Harsens Island and outer islands
Lack of consistent application of agricultural Best Management Practices (BMPs)
Expand public education about the benefits of protecting Anchor Bay
State of the Watershed
ANCHOR BAY WATERSHED MANAGEMENT PLAN
21
1.2.1. IMPAIRMENTS A. Total body contact and partial body contact
Public’s Desired Uses and Concerns : • Swimming and recreation • New Baltimore Park beach closing • Bacteria • Sewage disposal
The most obvious indication of environmental decline in Lake St. Clair and Anchor Bay is the persistence of beach closings, coupled with excessive algae growth. Bathing beaches are closed whenever E. coli bacteria levels exceed the Total Body Contact Standards established under the Michigan Water Quality Standards. If Anchor Bay is to remain a viable recreational resource, bacteria, nutrients, and undesirable algae growth that cause beach closures and affect watershed aesthetics must be corrected. New Baltimore Park Beach in Macomb County is the only designated public beach within the Anchor Bay Watershed. The challenge facing Macomb County with respect to New Baltimore Park Beach is typical of urban waterways. New Baltimore Park Beach has been sampled by the MCHD for the presence of E. coli since 1995 and for fecal coliform for many years before that. The beach was closed in 2001 for 23 days due to high bacteria counts – more than the total days it was closed during the previous seven years. The exact sources of the elevated E. coli readings have not been determined, although several agencies have undertaken efforts to reduce loadings through illicit discharge detection programs and improved system management. Not being able to determine the exact source of the elevated E. coli is not surprising given the limitations of the testing protocol, the high variability of E. coli readings in natural waterways, and sewage (both human and animal) sources in the area. Thus, a key element of this watershed plan is a logical, pragmatic approach to monitoring, identifying, and eliminating sewage sources in the watershed. B. Warmwater/coldwater fishery
Public’s Desired Uses and Concerns : • Fishing • Erosion • Flooding
Most of the toxic materials that are found in Lake St. Clair are a result of past industrial practices. These practices have been corrected, but their legacy remains. These toxins are typically found in the sediment where they are introduced to small plants and animals at the bottom of the food chain. Larger animals consume these small plants and animals but do not convert the toxic chemicals to energy. Instead, these toxic materials collect in the tissue of the consuming animal in a process known as bioaccumulation. Through bioaccumulation, low levels of toxins in the sediments are compounded in the predator fish. These higher concentrations lead to fish consumption advisories. Although Anchor Bay is a high quality recreational fishing resource, the MDEQ considers fish consumption to be impaired due to elevated levels of mercury and polychlorinated
State of the Watershed
ANCHOR BAY WATERSHED MANAGEMENT PLAN
22
biphenyls (PCBs). Mercury and PCBs build up in fish tissue and pose a health hazard to humans who eat the fish. Other tributary areas within the watershed are also under a fish consumption advisory for mercury and PCBs. PCBs were manufactured from 1926 to 1977 as a fire-retardant and were used as coolants and lubricants in electrical transformers and capacitors. The federal government made production of PCBs illegal in 1977 after learning the chemical was a threat to human health. Over time, the existence of PCBs in sediment is expected to decrease as its sources are removed from the environment. Mercury, however, may be harder to remove from waterways because it is a naturally occurring metal that enters water or soil from natural deposits, air deposition, or disposal of wastes. C. Indigenous aquatic life and wildlife; Degradation of benthos
Public Desired Uses and Concerns: • Waterfowl and wildlife habitat • Flooding
Historic land use changes within Anchor Bay Watershed have resulted in a decline in wetland acreage and elimination and/or contamination of natural fish and wildlife habitat. Future land use trends indicate that this impact will become more severe unless measures are taken to protect and enhance remaining habitat. Loss of this habitat and the resultant impacts on the aquatic life and wildlife populations has both an immediate and long-term effect on environmental health. The benthic organisms that are eliminated from the environment due to degraded habitat are an important part of the aquatic and wildlife food chain that supports a diverse biological community. Absence of these organisms results in a decline in the population and diversity of larger fish and wildlife that are important recreational and financial resources. In addition, contamination in lower organisms is magnified through the food chain to the higher level fish and wildlife, resulting in fish and wildlife consumption advisories.
Loss of spawning grounds and other important habitat to the area fish and wildlife results in a declining population. This declining population can impact the migratory waterfowl population on a long-term basis by making the watershed area less desirable for these waterfowl. The SCCDO physical inventory of county drains notes the destruction of floodplains, lack of appropriate buffers along watercourses, and direct discharge of polluted storm water to streams. The inventory also noted that there is a loss of habitat resulting from tributary enclosures and drain relocations. D. Degradation of aesthetics and eutrophication or undesirable algae
Public Desired Uses and Concerns: • Aquatic Weeds • Lack of government support for agricultural buffers • Control sources of fertilizer from reaching Anchor Bay • Remove trash from the bay and its tributaries
State of the Watershed
ANCHOR BAY WATERSHED MANAGEMENT PLAN
23
Excessive aquatic weeds and algae impair recreational opportunities and cause stress on fish and other aquatic organisms. In extreme cases, fish kills can result from excessive aquatic weeds and/or algae. These excessive growths generally result from high concentrations of phosphorus, which is discharged primarily in storm runoff from residential and agricultural sources. Economic and regulatory incentives for increased use of agricultural buffers, such as compensation for farmland set aside for this purpose, would reduce phosphorus concentrations. Public education programs about residential fertilizers would also reduce phosphorus discharges. Aesthetic impacts can occur from soil erosion that result in discolored water in streams and the bay. Control of soil erosion sources will reduce this impact. Additional aesthetic impacts occur from day-to-day human activities, such as trash that blows into streams or accumulates in storm water runoff. Green discolored water from lagoon discharges also degrades aesthetics as well as water quality. E. Healthy Drinking Water
Public Desired Uses and Concerns: • Healthy drinking water
In spite of repeated data that suggests drinking water is safe, the public remains concerned about their drinking water, especially in light of increased development and its effect on drinking water intakes. Future Source Water Assessments conducted for Ira Township and New Baltimore should determine the actual and/or potential threat that might exist. The recommended development and implementation of a Source Water Protection Study will provide a mechanism for addressing any concerns expressed by the public and/or generated by the assessment. 1.2.2. ADDITIONAL DESIRED USES AND CONCERNS OF THE PUBLIC A. Zebra Mussels Concerns regarding zebra mussels are valid and substantiated. See Section 1.1.6 for additional information. B. Financial Financial concerns must be evaluated when considering environmental improvement. On one hand, there is a cost to implement BMPs and other recommendations in this watershed plan. On the other hand, degraded environment, fish advisories, and poor water quality can result in a financial hardship for local businesses that serve recreational users. Therefore, a sustainable funding source(s) is necessary to address current and future water quality problems. C. Flooding Flooding leads to property damage and losses. Thus, the general public identifies this as a concern. What becomes less clear to the public is that the same forces that increase the frequency of flooding also degrade the environment. As development occurs,
State of the Watershed
ANCHOR BAY WATERSHED MANAGEMENT PLAN
24
hydrologic characteristics are altered and areas that previously provided infiltration and water storage are developed and turned into impervious surfaces. As a result, storm water more easily picks up fertilizers, oils, and chemicals as it moves across the pavement and into surface waters. With increased impervious surfaces, storm water runs into receiving waters more quickly, often causing flooding and stream bank erosion. Left unchecked, the changes to the river flow will cause serious damage to the physical and biological integrity of the receiving stream. D. Erosion Concerns for accelerated erosion are valid and substantiated. See Section 1.1.2 for additional information. E. Educating the Public The largest source of pollutants in the Anchor Bay Watershed is caused by activities of residents and visitors. Restoration and protection activities will never be completely successful unless people understand how they impact the environment and what they can do to reduce that impact. Therefore, public education is necessary in order to change behavior regarding limited fertilizer application, proper trash disposal, reduced construction of impervious surfaces, increased use of natural plantings and stream buffers, and other recommendations found within this watershed plan. Even the use of signs that indicate the Anchor Bay Watershed boundaries will increase watershed awareness in both residents and visitors.
The SCCDO physical inventory notes that there is a lack of public education and environmental stewardship in and around the watershed. The inventory states that “Environmental education needs to play a part in teaching the public to be aware and concerned with the world they live in. This education should be a life-long process, with an emphasis on the long-term changes in culture.” F. Manage Riparian Land, Lack of Open Space, Boating, Biking and Walking Trails, and Fishing Access Public access to the bay and the watershed is necessary for people to experience the true benefits of the watershed from a personal perspective. If people cannot enjoy the watershed, they will not support funding and commitments necessary to implement watershed improvement and enhancement plans. Therefore, land use planning must assure that adequate areas are provided for active and passive enjoyment, including boating, jogging, fishing, swimming and biking, and areas for quiet contemplation. Managing and investing in the land that comprises the riparian corridor helps to encourage recreation and wildlife protection. The Bridge to Bay Trail is an example of land along the riparian corridor that is used to provide a place for recreation as well as the protection of wildlife habitat. G. Unmanaged Development, Sewage Disposal and Development on Harsens Island and Outer Islands Future watershed development needs to comply with land use plans, and land use plans must consider the impacts that development has on environmentally sensitive areas.
State of the Watershed
ANCHOR BAY WATERSHED MANAGEMENT PLAN
25
Where development is allowed, it should use appropriate BMPs and low impact development techniques that minimize impacts both during and following construction. . Harsens Island is recognized as a unique and distinct geologic, geographic, cultural, historic, and recreational area of St. Clair County. Because of the predominate seasonal occupancy by residents and the established regulatory controls set forth by the St. Clair Flats Management Plan, Harsens Island offers a unique development challenge. The lack of centralized sanitary sewers and unfavorable conditions for onsite sewage disposal systems presents residents with limited options for sewage disposal. Future development on the island needs to be thoroughly reviewed before it occurs to assure protection of the island’s environment. 1.3 CONCLUSION Despite all that is positive about the health of Anchor Bay, in more recent years the watershed has fallen victim to many of the same impairments that its more urban neighbors have faced for decades. While these impairments may not currently be as devastating to the environment as in other watersheds, planning and remediation is necessary to halt the decline and restore the resource to its full potential. Prioritized Pollutants Although all the pollutants and pollution sources identified in the watershed plan need to be addressed, the priority is:
• Bacteria • Erosion and sedimentation • Nutrients • Flow Rates
This prioritization is based on potential impacts on the watershed, available data, and the desired uses and concerns supplied by the public, Technical and Steering Committee members, and local governmental officials. Excess E. coli bacteria will result in beach closures and possible exposure to disease causing organisms in the bay and the tributary areas. This potential public health impact results in this being the number one priority. Therefore erosion, sedimentation, nutrients and flow rates are a second priority. The significant habitat and aesthetic impacts these sources have on the entire watershed and the challenges that will be involved in controlling them make each source a priority. Critical Areas The inventory of critical areas for the Anchor Bay Watershed is limited by data availability. Data collected to date documents known E. coli problems. Additional data, along with local knowledge, suggests that nutrients and sediments are also suspected problems. While respecting local knowledge and suspicions, this document defines only critical areas that are supported by known data. Those critical areas, which require targeted community efforts, are:
• Bacteria - Crapau Creek, Salt River and the entire watershed
State of the Watershed
ANCHOR BAY WATERSHED MANAGEMENT PLAN
26
• Erosion and sedimentation - entire watershed • Nutrients - entire watershed • Flow rates - entire watershed
As additional data is collected by regulatory agencies, the list of critical areas will be modified in future updates of this watershed plan. Public Concerns Concerns expressed by the general public reflect their perception of what is wrong with Anchor Bay and Lake St. Clair. These major concerns include:
• Beach closures • Drinking water safety • Fish consumption advisories • Flooding and erosion • Habitat loss
The goals and objectives contained in the watershed plan reflect these public concerns and the impaired designated and beneficial uses in the watershed. Implementation of the BMPs in the watershed plan will achieve these goals and objectives and restore and protect the environment within the watershed.
Chapter Two
ANCHOR BAY
WATERSHED MANAGEMENT PLAN
27
PPUUBBLLIICC PPAARRTTIICCIIPPAATTIIOONN && EEDDUUCCAATTIIOONN
2.0 PUBLIC PARTICIPATION Administrative, Steering, and Technical committees provided oversight and guidance in the development of the Anchor Bay Watershed Plan. In addition, the Administrative Committee primarily was responsible for policy development and oversight of the fiscal responsibilities related to the 319 Grant that funded the planning effort. The Steering Committee provided local governmental input and decision making guidance to the project. The first Steering Committee meeting was held in September 2001 to solicit interest and participation from watershed communities. Following the first meeting, the Steering Committee met approximately every other month throughout 2002. These meetings provided a forum to discuss the purpose of the Plan, the state of the watershed, impairments in the watershed, water quality concerns of the communities, Phase II storm water regulations, and the public participation strategy. As more information was gathered from the communities and the public, water quality goals for the Plan were established by the Technical Committee and portions of the Plan were developed and forwarded to the Steering Committee for review and comment. In December 2002, the Plan was completed and presented to the Steering Committee. At this time, there was concern that the Plan needed reorganization and lacked community input. To address this concern, a Technical Committee was established to revise the Plan. The Technical Committee, with a total of seven representatives from St. Clair County, Macomb County, and local communities, provided focused feedback to the project consultant. Based on additional input from the counties, communities, and MDEQ, each chapter was revised, reorganized, and summarized to provide more concise information. As each chapter was completed, it was presented to the Steering Committee for review and comment. Once revisions of the entire Plan were completed, presentations were made available to municipal and county boards to gain additional support from the communities and Counties involved. Members of the Administrative, Steering, and Technical Committees are listed in Tables 2-1, 2-2 and 2-3 respectively (Appendix D). Beyond the Steering and Technical committee meetings and community board presentations, the Plan consultant and county representatives met individually with representatives from each community within the watershed in the summer of 2002 and 2003. The purpose of these meetings was to discuss watershed goals and objectives and develop an inventory of best management practices that were being implemented or planned by the community. At that time, the purpose of the Plan and how it fits into the Phase II storm water regulations was reemphasized. Several public meetings were held throughout the Anchor Bay watershed planning process to gain a wider range of opinions regarding water quality concerns and desired uses for the Anchor Bay Watershed. The process included surveying different stakeholder groups about their water quality concerns in Anchor Bay. The public was notified about the meetings through articles and press releases in The Macomb Daily,
Public Participation & Education
ANCHOR BAY
WATERSHED MANAGEMENT PLAN
28
Times Herald, The Voice and Detroit News . In addition, several stakeholders, including governmental agencies, environmental groups, remedial action plan groups, agricultural producers, wildlife groups, boating associations, marinas, local businesses, and public school representatives, were invited to participate in the public meetings. Representatives of most of these groups, as well as local residents, attended these meetings. A summary of each public meeting, including the complete list of concerns by meeting participants, is presented in this section. In addition, a public interest survey was circulated to concerned residents, the results of which are also presented in this document. At a public meeting on January 23, 2002, in Ira Township, a small group of stakeholders were asked to prioritize their water quality concerns in Anchor Bay. Participants identified the following activities as the most important, in order of priority:
• Fishing • Swimming • Healthy drinking water • Erosion • Recreation • Waterfowl and wildlife habitat • Educating the public • Flooding
Participants also noted concerns about zebra mussels, aquatic weeds, boating, lack of biking and walking trails, construction site erosion, fishing access, and the North Channel dredging. At the same meeting, public officials from the Anchor Bay watershed identified the following activities as the most important, in order of priority:
• Healthy drinking water • Fishing • Educating the public • Swimming • Erosion • Flooding • Recreation
Public officials also noted concerns about New Baltimore Beach closings, contaminants, bacteria, sewage disposal, drinking water, and sewage disposal on Harsens Island and outer islands, and development on outer islands and Harsens Island. On April 9, 2002, in Lenox Township, a presentation of the watershed planning process and information gathered to date was made to a group of agricultural producers. This is significant because thirty-six percent of the land use in the Anchor Bay watershed is dedicated to agriculture. Following are some of the concerns expressed at that meeting:
Public Participation & Education
ANCHOR BAY
WATERSHED MANAGEMENT PLAN
29
• Lack of open space • Over-development or unmanaged development • Lack of government support for agricultural buffer strips • Lack of consistent application of agricultural Best Management Practices
As chapters of the plan were completed, presentations were made to stakeholders on June 19, 2002, in Chesterfield Township and August 28, 2002, in Ira Township. The stakeholders at the June 19 meeting were asked to distribute the Anchor Bay Watershed Survey of Issues and Concerns and to help plan a general public meeting to be held on September 25, 2002, at Anchor Bay High School in New Baltimore (Appendix E). Surveys were distributed in municipal buildings, at local schools, at township and city meetings, and on the Anchor Bay website. Four months later, 94 surveys had been returned from stakeholders representing 14 watershed communities. Based on the survey, the following concerns were ranked in order of importance:
• Remove sources of human waste in Anchor Bay that threaten public health • Better control sources of fertilizer reaching Anchor Bay and the Great Lakes • Improve habitat conditions for fish and wildlife in the water • Increase community planning to address development and protection of water
quality • Better control soil erosion and limit sediments entering the water • Remove paper, trash, and debris in the Bay and its tributaries to improve its
appearance • Encourage investments in land along waterways for recreation and wildlife
protection • Expand public education about the benefits of protecting Anchor Bay • Minimize excessive flows that cause flooding, bank erosion, and habitat loss
These goals were reflected again when respondents were asked to state Anchor Bay issues most important to them. Those issues were:
• High bacteria levels • Water quality • Wetland protection
Respondents said they were most interested in receiving information on Anchor Bay fish and wildlife, water quality, and bacteria levels. About 50 people attended a public meeting from 7 to 9 p.m. on September 25, 2002, at Anchor Bay High School in New Baltimore. The program included a presentation on the draft Anchor Bay Watershed Management Plan, the Illicit Discharge Elimination Program, and State Storm Water Permit Regulations. Participants were divided into groups to discuss various storm water issues addressed in the watershed management plan, such as, habitat, soil erosion, sewage, water quality education, and runoff from lawns, yards, and agricultural fields. All groups were asked to devise a water quality budget to address storm water management issues in Anchor Bay. Participants said they would concentrate their resources on the following in order of priority:
Public Participation & Education
ANCHOR BAY
WATERSHED MANAGEMENT PLAN
30
• Reduce bacterial inputs • Reduce storm water flows • Preserve and increase habitat • Reduce sediment loads • Enhance recreational activities • Reduce runoff from lawns, yards, and agricultural fields
Throughout this process, it has become clear that a major concern to Anchor Bay stakeholders is raw sewage and bacteria that affect Anchor Bay quality of life issues, such as swimming and fishing. There is also concern about protecting habitat and open space. Many who were surveyed or participated in the September 25 meeting agreed that the public needs to be better educated about illicit connections, leaking septic systems, and overuse of fertilizers. In addition, some participants indicated that protecting wetlands and forested land should be as big a priority as reducing bacterial inputs to Anchor Bay. The input from public officials, watershed residents, and stakeholder groups was a primary consideration when evaluating the water quality impairments in the watershed and in the development of the goals and objectives of this plan. ANCHOR BAY WEBSITE A project website (awp.stclaircounty.org) was established as a mechanism to keep Anchor Bay stakeholders informed during the watershed planning process. The website was operational in September 2002 and is accessible from St. Clair County’s website www.stclaircounty.org. Signs were posted at municipal buildings to advertise the website address. The address was also included in newspaper articles that were written as the Plan was developed. Having information on the website allowed the public to access draft copies of the plan, the Anchor Bay Watershed Survey of Issues and Concerns, meeting schedules, and names of key decision-makers. The website also provided a mechanism to obtain public comments and concerns regarding the quality of Anchor Bay. This project website remains active at the time this plan was completed. Information there includes a fact sheet on the watershed, a list and links to project partners, a map of the watershed, and an interactive public interest survey (Figure 2-1).
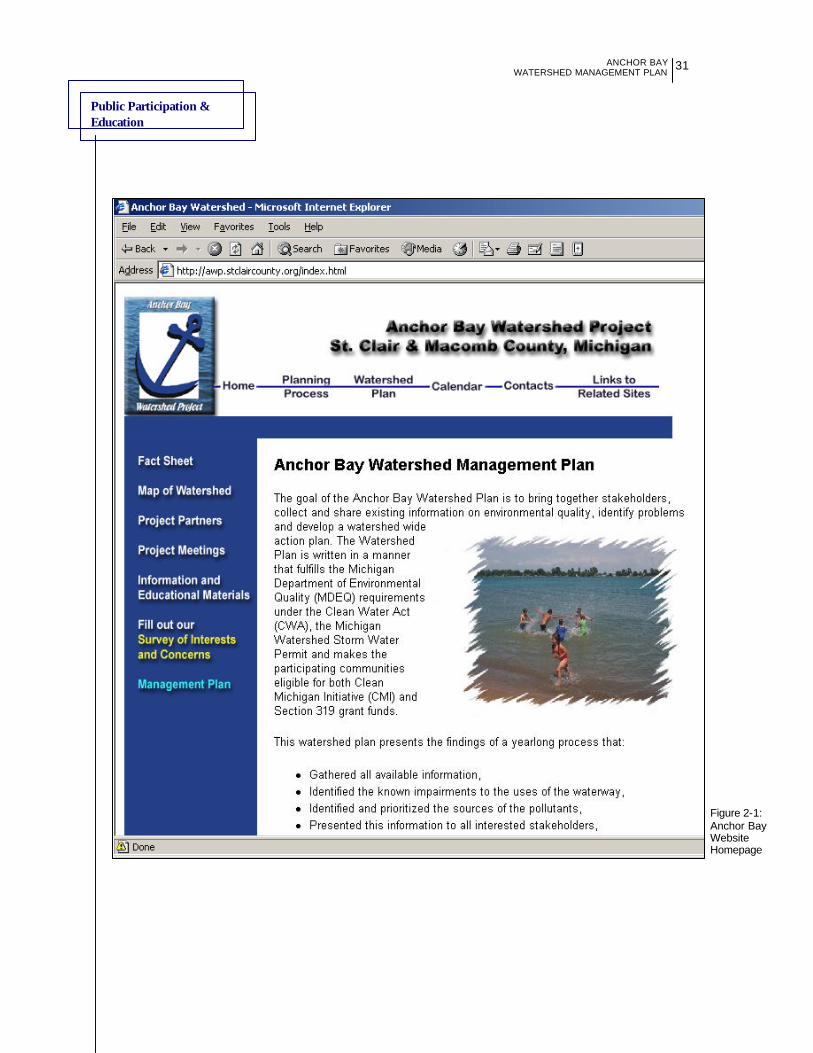
Public Participation & Education
ANCHOR BAY
WATERSHED MANAGEMENT PLAN
31
Figure 2-1: Anchor Bay Website Homepage

Public Participation & Education
ANCHOR BAY
WATERSHED MANAGEMENT PLAN
32
2.1 PUBLIC EDUCATION STRATEGY The Information and Education Strategy was developed to help minimize priority pollutant sources within the Anchor Bay watershed. The strategy aims to accomplish this by promoting a better awareness of priority pollutant problems and their solutions. Each educational issue was determined through the Anchor Bay Technical Committee and municipal input received during the May 6, 2003, Steering Committee Meeting. Municipalities and counties within the watershed are responsible for implementing the following activities, as appropriate, from 2003 to 2008. Education Issue: Bacteria Control
Source Audience Message Delivery Evaluation Failing Onsite Disposal Systems (OSDS)
OSDS Owners
OSDS Maintenance
Newsletters, Websites, Brochures, Municipal Offices, Health Depts.
Track number of OSDS failures
Illicit discharges and illegal dumping
Homeowners Report Illicit Discharges
Newsletters, Websites, Brochures, Municipal Offices, Health Depts.
Pre and Post survey
Expected Tasks: a). Create an Anchor Bay Education Committee b). OSDS Maintenance 1). Collect septic system maintenance brochure(s) for Macomb County and St. Clair County 2). Develop a set of 10 OSDS facts for newsletters and websites 3). Distribute septic system facts and post educational materials on websites c). Discharge Reporting 1). Determine best media vehicle for illicit discharge hotline publicity 2). Publicize Macomb County and St. Clair County illicit discharge reporting hotline

Public Participation & Education
ANCHOR BAY
WATERSHED MANAGEMENT PLAN
33
Education Issue: Sediment Control Source Audience Message Delivery Evaluation
Builders/ Developers
Soil Erosion and Sedimentation Control (SESC) BMPs & Enforcement
SESC Programs Track compliance; number of citations issued
New Construction
Building Inspectors
SESC and building permit coordination
SESC Programs Status of cooperation
Expected Tasks: a). Create an Anchor Bay Education Committee b). Builders/Developers 1). Determine priority SESC education issues with SESC Program staff and municipal building inspectors 2). Develop SESC brochure targeting builders and developers 3). Develop the best method for dissemination 4). Disseminate information c). Building Inspectors 1). Determine SESC educational need for local building inspectors 2). Determine the best way to disseminate information 3). Disseminate information Education Issue: Fertilizer Management
Source Audience Message Delivery Evaluation Residential lawn care
Homeowner Visitors
Limit phosphorus and applications, Fertilizer alternatives, Grass clipping disposal
Workshops, Brochures, Mass Media
Workshop attendance, Pre and Post survey
Expected Tasks: a). Create an Anchor Bay Education Committee b). Homeowners 1). Develop and gather appropriate brochures, workshop agendas, and media tools 2). Implement education activities c). Evaluation 1). Develop pre and post survey questions 2). Conduct pre surveys 3). Conduct post surveys three years after educational activities have been in place

Public Participation & Education
ANCHOR BAY
WATERSHED MANAGEMENT PLAN
34
Education Issue: Urban Runoff Management Source Audience Message Delivery Evaluation
Residents Storm water awareness
Mass Media River Day activities
Pre and Post survey
Urban Areas
Community Leaders, Municipal Engineers
Manage storm water flow and contaminants
Workshops Create and implement storm water management ordinances
Expected Tasks: a). Create an Anchor Bay Education Committee b). Residents 1). Determine consistent message and media vehicles 2). Implement activities c). Community Leaders and Municipal Engineers 1). Determine workshop needs and materials 2). Conduct workshops d). Evaluation 1). Develop pre and post survey questions 2). Conduct pre surveys 3). Conduct post surveys three years after educational activities have been in place
Chapter Three
ANCHOR BAY
WATERSHED MANAGEMENT PLAN
35
WWAATTEERRSSHHEEDD GGOOAALLSS
3.0 DESIGNATED USES The State of Michigan has developed Water Quality Standards under Part 4 of the Administrative Rules issued pursuant to Part 31 of the Natural Resources and Environmental Protection Act (1994 PA451, as amended). Rule 100 (R323.1100) of the Water Quality Standards states that all surface waters of the State of Michigan are designated for, and shall be protected for, all of the following eight uses:
• Agriculture • Industrial water supply • Public water supply at the point of intake • Navigation • Warmwater fishery* • Other indigenous aquatic life and wildlife • Partial body contact recreation • Total body contact between May 1 and October 31
*In addition, Lake St.Clair is also designated as a cold water fishery.
The status of a designated use in a watershed can be unimpaired, impaired, threatened, or under review/unknown. The use is unimpaired if the available physical and analytical data indicates that all applicable water quality standards are being consistently met. If the available physical and analytical data indicates that water quality standards are not being consistently met, then the designated use is considered to be impaired. A threatened status occurs when a watershed is currently unimpaired but could become impaired due to 1) actual and/or projected land use changes and/or 2) declining water quality trends, as shown by physical or analytical data. A use that is designated as under review or unknown means there is insufficient physical or analytical data available to determine a status for the use and additional studies are necessary. Table 3-1 lists the designated uses in the Anchor Bay Watershed. The table differentiates between the impairment status in the bay and impairment status in the watershed because these areas may have a different status for a particular designated use.
3.1 BENEFICIAL USES Annex 2 of the 1987 Protocol of the Great Lakes Water Quality Agreement between United States and Canada established fourteen beneficial uses to evaluate changes in the chemical, physical, or biological integrity of the Great Lakes System. Annex 2 defined beneficial uses as a method for evaluation rather than as a listed use. If a body of water showed any of the following impacts, then one or more of the beneficial uses was considered to be impaired:
• Restrictions on fish and wildlife consumption • Tainting of fish and wildlife flavor • Degradation of fish and wildlife populations • Fish tumors and other deformities • Bird or animal deformities or reproduction problems • Degradation of benthos • Restrictions on dredging activities
Watershed Goals
ANCHOR BAY
WATERSHED MANAGEMENT PLAN
36
• Eutrophication or undesirable algae • Restrictions on drinking water consumption, or taste and odor problems • Beach closings • Degradation of aesthetics • Added costs to agriculture and or industry • Degradation of phytoplankton and zooplankton populations • Loss of fish and wildlife habitat
All the designated and beneficial uses must be evaluated when developing a watershed plan. As can be seen by comparing the above list with the list of designated uses in Table 3-1, there are many overlaps between the two lists. As with the designated uses, beneficial use status can be unimpaired, impaired, threatened, or under review/unknown. The status definitions for designated uses also apply to beneficial uses. Beach closings offer an example of how government officials apply these definitions. If beaches are closed for water quality reasons, then the use, which would be similar to total body contact, would be impaired. If beaches are not being closed due to water quality reasons, the use is unimpaired. If changes in the tributary area might affect the beach and cause degraded water quality, then the use is threatened. Lastly, if there is insufficient data available to determine if beach closings are a problem, the status is considered to be under review/unknown. Table 3-1 lists the beneficial use status in the Anchor Bay Watershed. The table differentiates between the impairment status in the bay and watershed since these areas may have a different status for a particular designated use. 3.2 DESIRED USES AND CONCERNS Desired uses are defined as how stakeholders might want to use the watershed or how they might like the watershed to look. These desired uses are often reflective of designated or beneficial uses but can be beyond the scope of one of the defined uses, such as the construction of a nature trail within the watershed. The desired uses were established in the Anchor Bay Watershed by polling public officials, the general public, and agricultural producers. In addition to a pre-selected list of desired uses that the respondents were asked to rank, the questionnaire also asked for any additional concerns the respondent might have regarding the Anchor Bay Watershed. The results are listed below in no specific order of priority:
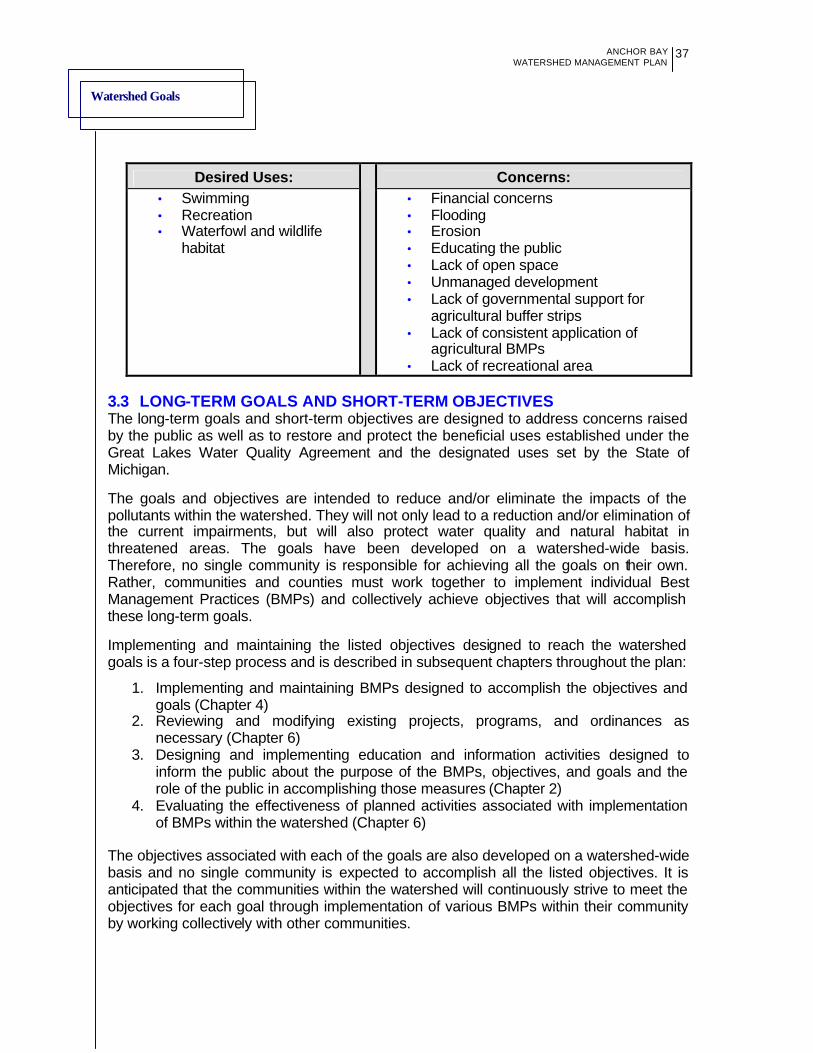
Watershed Goals
ANCHOR BAY WATERSHED MANAGEMENT PLAN
37
3.3 LONG-TERM GOALS AND SHORT-TERM OBJECTIVES The long-term goals and short-term objectives are designed to address concerns raised by the public as well as to restore and protect the beneficial uses established under the Great Lakes Water Quality Agreement and the designated uses set by the State of Michigan.
The goals and objectives are intended to reduce and/or eliminate the impacts of the pollutants within the watershed. They will not only lead to a reduction and/or elimination of the current impairments, but will also protect water quality and natural habitat in threatened areas. The goals have been developed on a watershed-wide basis. Therefore, no single community is responsible for achieving all the goals on their own. Rather, communities and counties must work together to implement individual Best Management Practices (BMPs) and collectively achieve objectives that will accomplish these long-term goals. Implementing and maintaining the listed objectives designed to reach the watershed goals is a four-step process and is described in subsequent chapters throughout the plan:
1. Implementing and maintaining BMPs designed to accomplish the objectives and goals (Chapter 4)
2. Reviewing and modifying existing projects, programs, and ordinances as necessary (Chapter 6)
3. Designing and implementing education and information activities designed to inform the public about the purpose of the BMPs, objectives, and goals and the role of the public in accomplishing those measures (Chapter 2)
4. Evaluating the effectiveness of planned activities associated with implementation of BMPs within the watershed (Chapter 6)
The objectives associated with each of the goals are also developed on a watershed-wide basis and no single community is expected to accomplish all the listed objectives. It is anticipated that the communities within the watershed will continuously strive to meet the objectives for each goal through implementation of various BMPs within their community by working collectively with other communities.
Desired Uses: Concerns: • Swimming • Recreation • Waterfowl and wildlife
habitat
• Financial concerns • Flooding • Erosion • Educating the public • Lack of open space • Unmanaged development • Lack of governmental support for
agricultural buffer strips • Lack of consistent application of
agricultural BMPs • Lack of recreational area
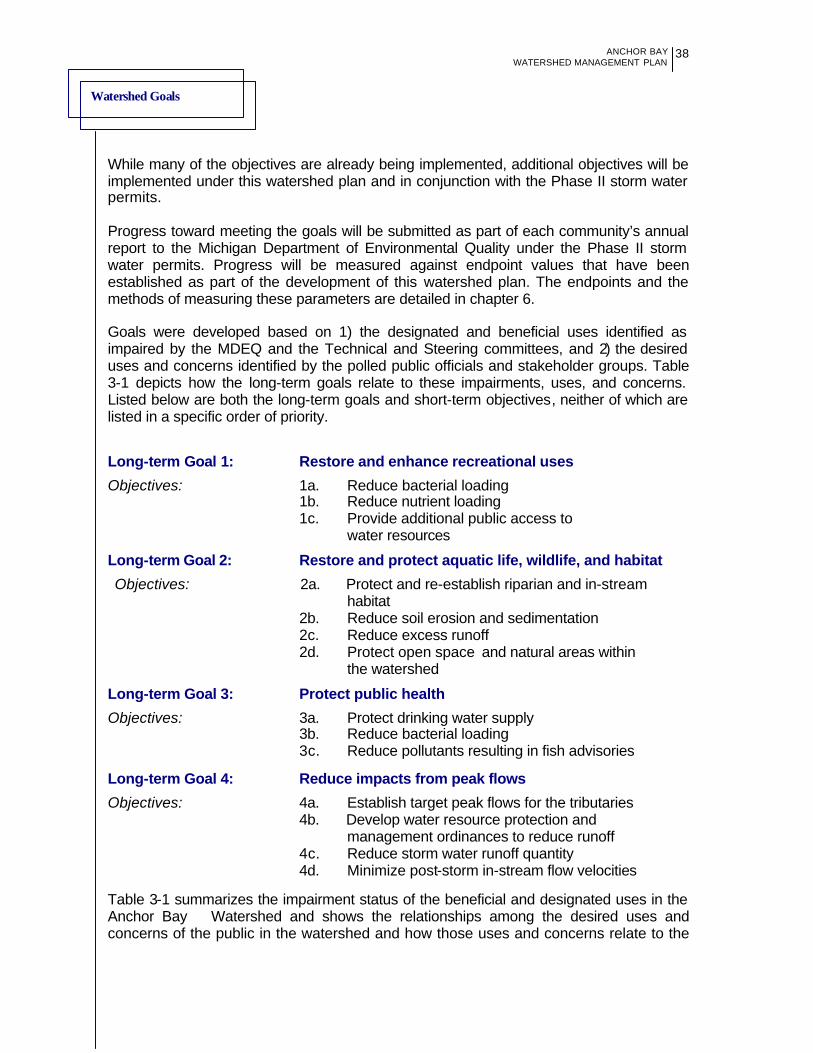
Watershed Goals
ANCHOR BAY WATERSHED MANAGEMENT PLAN
38
While many of the objectives are already being implemented, additional objectives will be implemented under this watershed plan and in conjunction with the Phase II storm water permits. Progress toward meeting the goals will be submitted as part of each community’s annual report to the Michigan Department of Environmental Quality under the Phase II storm water permits. Progress will be measured against endpoint values that have been established as part of the development of this watershed plan. The endpoints and the methods of measuring these parameters are detailed in chapter 6. Goals were developed based on 1) the designated and beneficial uses identified as impaired by the MDEQ and the Technical and Steering committees, and 2) the desired uses and concerns identified by the polled public officials and stakeholder groups. Table 3-1 depicts how the long-term goals relate to these impairments, uses, and concerns. Listed below are both the long-term goals and short-term objectives, neither of which are listed in a specific order of priority.
Long-term Goal 1: Restore and enhance recreational uses
Objectives: 1a. Reduce bacterial loading 1b. Reduce nutrient loading 1c. Provide additional public access to water resources
Long-term Goal 2: Restore and protect aquatic life, wildlife, and habitat
Objectives: 2a. Protect and re-establish riparian and in-stream habitat 2b. Reduce soil erosion and sedimentation 2c. Reduce excess runoff 2d. Protect open space and natural areas within the watershed
Long-term Goal 3: Protect public health
Objectives: 3a. Protect drinking water supply 3b. Reduce bacterial loading 3c. Reduce pollutants resulting in fish advisories Long-term Goal 4: Reduce impacts from peak flows
Objectives: 4a. Establish target peak flows for the tributaries 4b. Develop water resource protection and management ordinances to reduce runoff
4c. Reduce storm water runoff quantity 4d. Minimize post-storm in-stream flow velocities Table 3-1 summarizes the impairment status of the beneficial and designated uses in the Anchor Bay Watershed and shows the relationships among the desired uses and concerns of the public in the watershed and how those uses and concerns relate to the
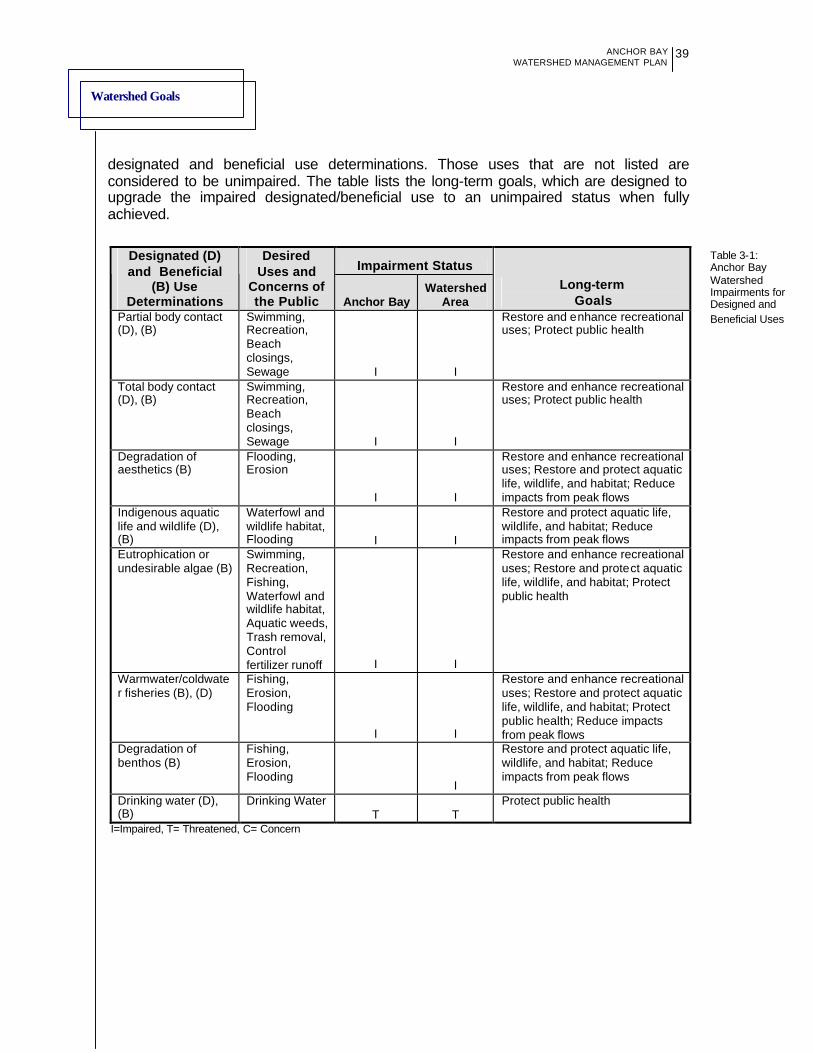
Watershed Goals
ANCHOR BAY WATERSHED MANAGEMENT PLAN
39
designated and beneficial use determinations. Those uses that are not listed are considered to be unimpaired. The table lists the long-term goals, which are designed to upgrade the impaired designated/beneficial use to an unimpaired status when fully achieved.
I=Impaired, T= Threatened, C= Concern
Impairment Status Designated (D) and Beneficial
(B) Use Determinations
Desired Uses and
Concerns of the Public Anchor Bay
Watershed Area
Long-term Goals
Partial body contact (D), (B)
Swimming, Recreation, Beach closings, Sewage I I
Restore and enhance recreational uses; Protect public health
Total body contact (D), (B)
Swimming, Recreation, Beach closings, Sewage I I
Restore and enhance recreational uses; Protect public health
Degradation of aesthetics (B)
Flooding, Erosion
I I
Restore and enhance recreational uses; Restore and protect aquatic life, wildlife, and habitat; Reduce impacts from peak flows
Indigenous aquatic life and wildlife (D), (B)
Waterfowl and wildlife habitat, Flooding I I
Restore and protect aquatic life, wildlife, and habitat; Reduce impacts from peak flows
Eutrophication or undesirable algae (B)
Swimming, Recreation, Fishing, Waterfowl and wildlife habitat, Aquatic weeds, Trash removal, Control fertilizer runoff I I
Restore and enhance recreational uses; Restore and protect aquatic life, wildlife, and habitat; Protect public health
Warmwater/coldwater fisheries (B), (D)
Fishing, Erosion, Flooding
I I
Restore and enhance recreational uses; Restore and protect aquatic life, wildlife, and habitat; Protect public health; Reduce impacts from peak flows
Degradation of benthos (B)
Fishing, Erosion, Flooding
I
Restore and protect aquatic life, wildlife, and habitat; Reduce impacts from peak flows
Drinking water (D), (B)
Drinking Water T T
Protect public health
Table 3-1: Anchor Bay Watershed Impairments for Designed and Beneficial Uses
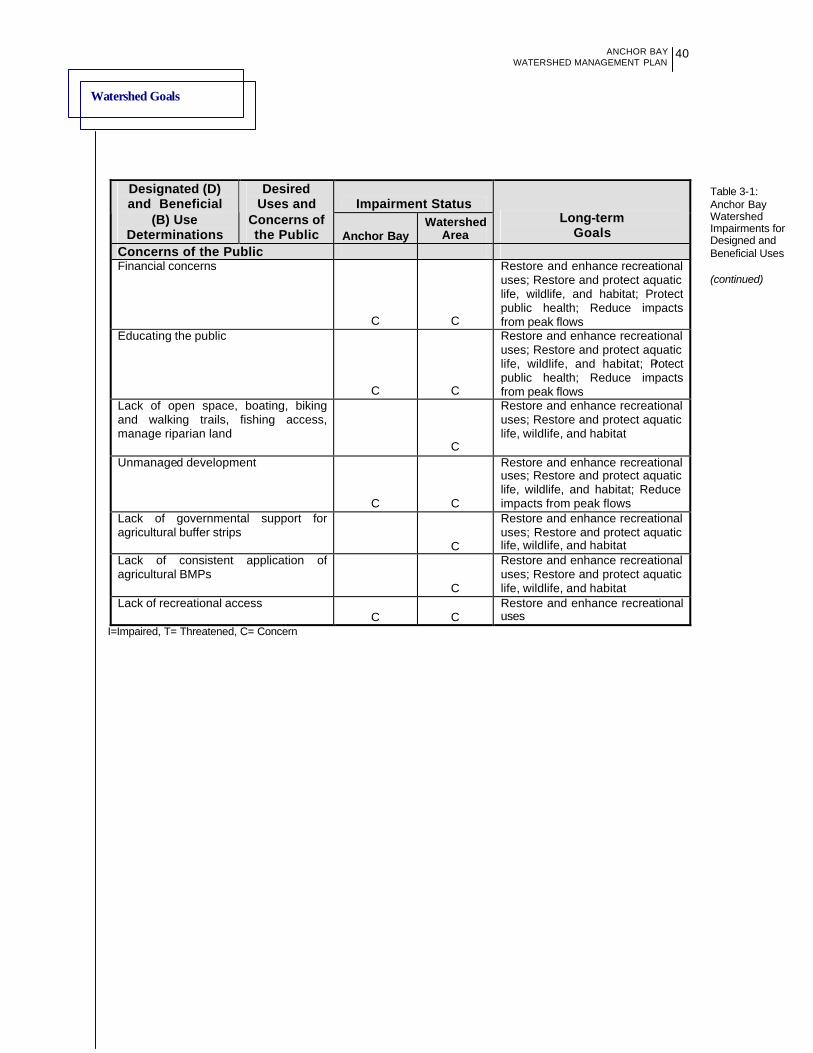
Watershed Goals
ANCHOR BAY WATERSHED MANAGEMENT PLAN
40
I=Impaired, T= Threatened, C= Concern
Impairment Status Designated (D) and Beneficial
(B) Use Determinations
Desired Uses and
Concerns of the Public Anchor Bay
Watershed Area
Long-term Goals
Concerns of the Public Financial concerns
C C
Restore and enhance recreational uses; Restore and protect aquatic life, wildlife, and habitat; Protect public health; Reduce impacts from peak flows
Educating the public
C C
Restore and enhance recreational uses; Restore and protect aquatic life, wildlife, and habitat; Protect public health; Reduce impacts from peak flows
Lack of open space, boating, biking and walking trails, fishing access, manage riparian land C
Restore and enhance recreational uses; Restore and protect aquatic life, wildlife, and habitat
Unmanaged development
C C
Restore and enhance recreational uses; Restore and protect aquatic life, wildlife, and habitat; Reduce impacts from peak flows
Lack of governmental support for agricultural buffer strips
C
Restore and enhance recreational uses; Restore and protect aquatic life, wildlife, and habitat
Lack of consistent application of agricultural BMPs
C
Restore and enhance recreational uses; Restore and protect aquatic life, wildlife, and habitat
Lack of recreational access C C
Restore and enhance recreational uses
Table 3-1: Anchor Bay Watershed Impairments for Designed and Beneficial Uses (continued)
Chapter Four
ANCHOR BAY WATERSHED MANAGEMENT PLAN
41
BBEESSTT MMAANNAAGGEEMMEENNTT PPRRAACCTTIICCEESS
4.0 BEST MANAGEMENT PRACTICES (BMPs) The pollutants identified in the earlier chapters are most often by-products of human impact on the land that makes up the Anchor Bay Watershed. In order to protect and restore Anchor Bay and its tributaries, the impact of these human activities must be minimized, either by changes in behavior or through the use of BMPs. BMPs are practices selected to address specific environmental issues and can be implemented individually or in series to address impairments within the watershed. Some BMPs are better suited to newly developing communities, while others are more applicable to established urban areas. Rural and agricultural BMPs are often dissimilar to urban BMPs but rely on many of the same concepts. The many stresses on the environment identified in the earlier chapters can be divided into several broad categories that are closely associated with the major goals of this watershed plan. Thus, BMPs proposed to be used by the communities have been organized into four long-term goals:
• Goal 1: Restore and enhance recreational uses
• Goal 2: Restore and protect aquatic life, wildlife, and habitat
• Goal 3: Protect public health
• Goal 4: Reduce impacts from peak flows
Table 4-1 below lists the BMPs that address each specific long-term goal. The BMPs are listed alphabetically and in no particular order of priority.
Long Term Goal 1: Restore and enhance recreational uses
• Conserve Riparian Land for Future Parks and Public Access (BMP 3) • Construct/Maintain Storm Water Storage Facilities (BMP 4) • Construct Wetlands (BMP 5) • Enhance Catch Basin functionality (BMP 8) • Facilitate Generally Accepted Agricultural Management Practices (GAAMPs) • Identify Areas for Recreation Enhancement (BMP 10) • Identify and Control Sanitary Sewer Overflows (SSOs) (BMP 11) • Identify and Eliminate Failing Onsite Sewage Disposal Systems (OSDSs)
(BMP12) • Identify and Eliminate Illicit Discharges (BMP 13) • Implement Financial Solutions (BMP 14) • Implement Institutional Framework for Watershed-wide Actions (BMP 15) • Implement Municipal Employee Training Programs (BMP 16) • Implement Septic System Maintenance Measures (BMP 18) • Increase Public Awareness (BMP 22) • Install/Maintain Storm Sewer Infiltration Treatment Devices (BMP 25)
Best Management Practices
ANCHOR BAY WATERSHED MANAGEMENT PLAN
42
Long Term Goal 1: Restore and enhance recreational uses (continued) • Integrate Natural Resource Protection into the Planning Process (BMP 26) • Maintain Sanitary Sewer Infrastructure (BMP 27) • Maintain Storm Water Controls (BMP 28) • Manage Public Facilities (BMP 29) • Manage Riparian Corridors (BMP 30) • Manage Lagoon Systems and Package Wastewater Treatment Plants (BMP 31) • Monitor Water Quality and Quantity (BMP 33) • Perform Storm Sewer System Maintenance and Drain Cleaning (BMP 34) • Perform Street Sweeping (BMP 35) • Preserve and Enhance Existing Wetlands/Woodlands (BMP 36) • Prevent and Remove Flow Obstructions (BMP 37) • Provide Sufficient Enforcement Capability (BMP 38) • Reduce Bacterial Runoff from Domestic Animals and Wildlife (BMP 39) • Reduce Fertilizer, Pesticide, and Herbicide Usage (BMP 42) • Utilize Comprehensive Planning for Wastewater Treatment Systems (BMP 45)
Long Term Goal 2: Restore and protect aquatic life, wildlife, and habitat
• Conduct Household Hazardous Materials Management Programs (BMP 1) • Conduct Natural Feature Inventory and Assessments (BMP 2) • Conserve Riparian Land for Future Parks and Public Access (BMP 3) • Construct/Maintain Storm Water Storage Facilities (BMP 4) • Construct Wetlands (BMP 5) • Continue/Expand Litter and Debris Cleanup and Recycling Programs (BMP 6) • Control Soil Erosion (BMP 7) • Enhance Catch Basin Functionality (BMP 8) • Facilitate Generally Accepted Agricultural Management Practices (GAAMPs)
(BMP 9) • Identify Areas for Recreation Enhancement (BMP 10) • Identify and Control Sanitary Sewer Overflows (SSOs) (BMP 11) • Identify and Eliminate Illicit Discharges (BMP 13) • Implement Financial Solutions (BMP 14) • Implement Institutional Framework for Watershed-wide Actions (BMP 15) • Implement Natural Features Protection Ordinances (BMP 17) • Implement Septic System Maintenance Measures (BMP 18) • Implement Soil Erosion and Sedimentation Control (SESC) Programs (BMP 19) • Implement Storm Water and Water Resource Protection Ordinances (BMP 20) • Implement Streambank Stabilization Measures (BMP 21) • Increase Public Awareness (BMP 22) • Install/Maintain Oil and Grease Trap Devices (BMP 23) • Install/Maintain Sediment Control Devices (BMP 24) • Install/Maintain Storm Sewer Infiltration Treatment Devices (BMP 25) • Integrate Natural Resource Protection into the Planning Process (BMP 26) • Maintain Sanitary Sewer Infrastructure (BMP 27) • Maintain Storm Water Controls (BMP 28) • Manage Public Facilities (BMP 29)
Best Management Practices
ANCHOR BAY WATERSHED MANAGEMENT PLAN
43
Long Term Goal 2: Restore and protect aquatic life, wildlife, and habitat (continued)
• Manage Riparian Corridors (BMP 30)
• Manage Lagoon Systems and Package Wastewater Treatment Plants (BMP 31) • Utilize Comprehensive Planning for Wastewater Treatment Systems (BMP 45)
Long Term Goal 3: Protect Public Health
• Conduct Household Hazardous Materials Management Programs (BMP 1) • Enhance Catch Basin Functionality (BMP 8) • Facilitate Generally Accepted Agricultural Management Practices (GAAMPs)
(BMP 9) • Identify and Control Sanitary Sewer Overflows (SSOs) (BMP 11) • Identify and Eliminate Failing Onsite Sewage Disposal Systems (OSDSs) (BMP
12) • Identify and Eliminate Illicit Discharges (BMP 13) • Implement Financial Solutions (BMP 14) • Implement Institutional Framework for Watershed-wide Actions (BMP 15) • Implement Municipal Employee Training Programs (BMP 16) • Implement Septic System Maintenance Measures (BMP 18) • Implement Storm Water and Water Resource Protection Ordinances (BMP 20) • Increase Public Awareness (BMP 22) • Install/Maintain Storm Sewer Infiltration Treatment Devices (BMP 25) • Integrate Natural Resource Protection into the Planning Process (BMP 26) • Maintain Sanitary Sewer Infrastructure (BMP 27) • Maintain Storm Water Controls (BMP 28) • Manage Public Facilities (BMP 29) • Manage Riparian Corridors (BMP 30) • Manage Lagoon Systems and Package Wastewater Treatment Plants (BMP 31) • Minimize the Use of Salt and De-icing Chemicals (BMP 32) • Monitor Water Quality and Quantity (BMP 33) • Perform Storm Sewer System Maintenance and Drain Cleanup (BMP 34) • Perform Street Sweeping (BMP 35) • Provide Sufficient Enforcement Capability (BMP 38) • Reduce Bacterial Runoff from Domestic Animals and Wildlife (BMP 39) • Reduce/Eliminate Oil and Chemical Discharges (BMP 41) • Reduce Fertilizer, Pesticide, and Herbicide Usage (BMP 42)
• Minimize the Use of Salt and Deicing Chemicals (BMP 32) • Monitor Water Quality and Quantity (BMP 33) • Perform Storm Sewer System Maintenance and Drain Cleaning (BMP 34) • Perform Street Sweeping (BMP 35) • Preserve and Enhance Existing Wetlands and Woodlands (BMP 36) • Provide Sufficient Enforcement Capability (BMP 38) • Reduce Bacterial Runoff from Domestic Animals and Wildlife (BMP 39) • Reduce/Eliminate Oil and Chemical Discharges (BMP 41) • Reduce Fertilizer, Pesticide, and Herbicide Usage (BMP 42) • Support Environmental Friendly Lawn and Garden Maintenance (BMP 43) • Support Wetland Mitigation Banking (BMP 44)
Best Management Practices
ANCHOR BAY WATERSHED MANAGEMENT PLAN
44
Long Term Goal 3: Protect Public Heath (continued) • Utilize Comprehensive Planning for Wastewater Treatment Systems (BMP 45)
4.1 EVALUATION OF PROPOSED ALTERNATIVES The watershed is comprised of diverse local communities, from rural townships to urban city centers. Subsequently, there are a variety of structural and nonstructural management alternatives, or BMPs, that could be considered across the watershed. Although each of these alternatives will most likely apply to at least one of the communities in the watershed, not all of them apply to every community. Therefore, it is important to note that each of the alternatives is a unique solution to a specific pollution source or problem. The following is a brief summary of each BMP in this management plan. There are a large number of references that detail each of these BMPs. However this summary is intended to provide a basic explanation of each practice that correlates with the specific short-term objectives of each long-term goal. Further information on BMPs can be found in the EPA Preliminary Data Summary of Urban Storm Water Best Management Practices report and on the Internet. The BMPs are listed below with corresponding symbols to identify specifically which objectives each BMP addresses. They are listed in alphabetical order and in no particular order of priority.
Long Term Goal 4: Reduce Impacts From Peak Flows
• Construct/Maintain Storm Water Storage Facilities (BMP 4) • Construct Wetlands (BMP 5) • Implement Financial Solutions (BMP 14) • Implement Institutional Framework for Watershed-wide Actions (BMP 15) • Implement Natural Features Protection Ordinances (BMP 17) • Implement Storm Water and Water Resource Protection Ordinances (BMP
20) • Increase Public Awareness (BMP 22) • Install/Maintain Storm Sewer Infiltration Treatment Devices (BMP 25) • Integrate Natural Resource Protection into the Planning Process (BMP 26) • Maintain Storm Water Controls (BMP 28) • Manage Public Facilities (BMP 29) • Monitor Water Quality and Quantity (BMP 33) • Perform Storm Sewer System Maintenance and Drain Cleaning (BMP 34) • Preserve and Enhance Existing Wetlands and Woodlands (BMP 36) • Prevent and Remove Flow Obstructions (BMP 37) • Provide Sufficient Enforcement Capability (BMP 38) • Reduce Directly Connected Impervious Surfaces (BMP 40) • Support Environmental Friendly Lawn and Garden Maintenance (BMP 43) • Support Wetland Mitigation Banking (BMP 44) • Utilize Habitat Restoration Techniques (BMP 46)
Best Management Practices
ANCHOR BAY WATERSHED MANAGEMENT PLAN
45
Conduct Household Hazardous Materials Management Programs (BMP 1) «SN The average American household contains three to ten gallons of hazardous chemicals, including items such as automotive wastes, cleaners, and paints. In general, the public is unaware of the problems associated with overuse and improper disposal of these materials. In addition, the public generally does not recognize the toxicity of materials used in and around homes. The goal of a Household Hazardous Waste Program is to:
• Minimize the purchase and usage of household hazardous materials that exhibit characteristics such as corrosivity, ignitability, reactivity, and/or toxicity, or are listed as hazardous materials by the EPA, and
• Ensure proper storage and disposal of such materials if they must be purchased and used.
The proper disposal of hazardous materials will minimize the amount of hazardous materials that will enter surface waters and groundwater supplies. Conduct Natural Feature Inventory and Assessments (BMP 2) «¨ The first step in protecting a community’s natural resources is to identify what resources should be protected, where they are located, and what benefits they provide to the community. After an inventory, it is often helpful to design an assessment of these natural features so that they can be prioritized in terms of their importance to the community and their relative need for preservation. Often, it is not feasible to protect all of the natural features in a community. However, an inventory and assessment can provide scientific rationale to support a local protection ordinance and/or the basis for avoiding the feature during site design and development. Community-wide inventories and assessments can also provide future opportunities to preserve greenways for wildlife as well as recreation. Conserve Riparian Land for Future Parks and Public Access (BMP 3) ¤«¨ Waterside property is typically in high demand and can be costly. It is often in the interest of local agencies and land conservancies to compete in the open market for riparian lands. This does not diminish the need for these agencies at all levels to continue to identify and obtain the rights to conserve riparian lands. Once the available property has been identified, funding must be secured through general funds, state programs, federal programs, and/or foundations. The acquisition of these areas can be identified by local units of government through the use of natural area inventories. In turn, riparian areas can be included in long-term land use plans and can be included in local policy decisions. The properties, once secured, can provide both recreational opportunities and environmental benefit in the riparian areas. Construct/Maintain Storm Water Storage Facilities (BMP 4) ²³zu² Storm water storage facilities are source-control devices designed to manage flow sufficiently in order to prevent downstream flooding and/or reduce erosive velocities in the receiving stream. They can either be retrofitted into existing systems or designed into new systems. Retrofitting storage into existing drainage systems is usually very expensive. Improperly sized and sited storage facilities can also cause localized
Best Management Practices
ANCHOR BAY WATERSHED MANAGEMENT PLAN
²Objective 1a: Reduce Bacterial Loading S Objective 3a: Protect Drinking Water Supply ³Objective 1b: Reduce Nutrient Loading Ë Objective 3b: Reduce Bacterial Loading ¤ Objective 1c: Provide Additional Public Access to Water Resources N Objective 3c: Reduce Pollutants Resulting in Fish Advisories «Objective 2a: Protect and Re-establish Riparian and In-stream Habitat ¡ Objective 4a: Establish Target Peak Flows for the Tributaries vObjective 2b: Reduce Soil Erosion and Sedimentation O Objective 4b: Develop Water Resource Protection and z Objective 2c: Reduce Excess Runoff Management Ordinances to Reduce Runoff ¨ Objective 2d: Protect Open Space and Natural Areas within the Watershed u Objective 4c: Reduce Storm Water Runoff Quantity ² Objective 4d: Minimize Post-storm In-stream Flow Velocities
46
parking lot and street flooding, icing in winter months, and increased downstream flooding. Local and county drain ordinances can require development standards for construction of storm water storage facilities. Wet detention ponds are small man-made lakes that can include emergent wetland vegetation around the banks, as well as within the pond area, and are designed to capture and remove particulate and certain dissolved constituents. Wet ponds are ideal for large, regional tributary areas (10 to 300 acres) where there is a need to achieve high levels of particulate and some dissolved nutrient removal, although they can also be used effectively in smaller size drainage areas. The outlet should be sized to assure retention of an adequate amount of water to support good vegetative growth while still reducing peak discharges to the receiving stream. Dry detention ponds are designed to capture runoff and release it slowly to allow most of the pollutant-laden sediments to settle. This type of detention pond is designed to be dry between storm events and is primarily used for tributary watersheds ten acres and larger, although they can be effective in smaller drainage areas also. Since the purpose of a dry detention pond is to attenuate peak flow, the outlet is usually sized to draw down the first 50 percent of volume in 12 to 16 hours and the remaining water in 24 to 32 hours. Both of these detention devices can be used to treat runoff, accumulate sediments, attenuate flow, and route floodwaters. Water from these devices could be used in sprinkler systems for green belts and commons areas in residential and commercial developments. This would provide relief for potable water systems during peak seasonal demands. The decision to use a dry or a wet detention basin is usually dictated by the location and other surrounding land uses. Either system will provide quantity management and some degree of quality enhancement if properly designed, operated, and maintained. In all cases, the pond should be configured for aesthetics, safety, and maintenance. Other possible detention devices are storage tanks connected to the existing drainage system, street storage, and parking lot storage. Storage tanks are often located underground. This category would include off-line storage and oversized collection pipes. Street and/or parking lot storage is usually accomplished through the use of restricted catch basins or undersized collection pipes that do not allow the maximum design flow from a storm event to be transported through the system as fast as it accumulates. Water that can not enter the system backs up into the streets and/or parking lots. Care needs to be taken in utilizing this BMP that the temporary flooding
Best Management Practices
ANCHOR BAY WATERSHED MANAGEMENT PLAN
²Objective 1a: Reduce Bacterial Loading S Objective 3a: Protect Drinking Water Supply ³Objective 1b: Reduce Nutrient Loading Ë Objective 3b: Reduce Bacterial Loading ¤ Objective 1c: Provide Additional Public Access to Water Resources N Objective 3c: Reduce Pollutants Resulting in Fish Advisories «Objective 2a: Protect and Re-establish Riparian and In-stream Habitat ¡ Objective 4a: Establish Target Peak Flows for the Tributaries vObjective 2b: Reduce Soil Erosion and Sedimentation O Objective 4b: Develop Water Resource Protection and z Objective 2c: Reduce Excess Runoff Management Ordinances to Reduce Runoff ¨ Objective 2d: Protect Open Space and Natural Areas within the Watershed u Objective 4c: Reduce Storm Water Runoff Quantity ² Objective 4d: Minimize Post-storm In-stream Flow Velocities
47
will not cause property damage and that icing that may form in winter months will not create a safety hazard. Construct Wetlands (BMP 5) ³«vzu² Constructed Wetlands can be designed to provide storm water retention and treatment. They attenuate peak flow from storm water runoff due to their large storage capacity, and vegetation in the wetland acts as a filter to organic materials and nutrients. Where natural wetlands have been lost due to land use changes, constructed wetlands can help to recover some of the functions that the natural wetlands provided. In addition, they can be strategically placed in accordance with an integrated storm water management program. Secondary benefits of constructed wetlands include preservation and restoration of the natural balance between surface waters and ground waters, increased wildlife habitat, improved aesthetics compared to a rectangular detention basin, and higher property values for land adjacent to the area. The MDEQ has extensive experience with constructed wetlands and provides guidance to assist with the development of sustainable constructed wetlands. Constructed wetlands by a municipality or county are usually associated with floodplain management programs. Their purpose is to provide additional storm water storage along a river or stream that may flood downstream areas. Continue/Expand Litter and Debris Cleanup and Recycling Programs (BMP 6) « Stream aesthetics, water quality, and habitat are all impacted by materials dumped into and along watercourses. Litter and debris cleanup can be achieved through adopt-a-road and local stream clean-up programs. Community organizations, schools, churches, and private companies can pledge to collect debris along local, county, and state roads, and stream banks and channels. This effort is coordinated with the local, county, or state road agencies that will remove the collected debris for proper disposal. Material recycling benefits the environment. Materials that are recycled reduce the possibility of those materials being dumped into streams, prolong the life of local landfills, and reduce the need for raw materials for new production. Control Soil Erosion (BMP 7) «v See BMPs 19 and 21. Enhance Catch Basin Functionality (BMP 8) ²³«vSË When performed on a regular basis, catch basin cleaning removes pollutants from the storm drainage system, reduces the concentration of pollutants during the first flush of storms, prevents clogging of downstream systems, restores the catch basins sediment trapping ability, and allows the in-system storage capacity of the sewers to be fully
Best Management Practices
ANCHOR BAY WATERSHED MANAGEMENT PLAN
²Objective 1a: Reduce Bacterial Loading S Objective 3a: Protect Drinking Water Supply ³Objective 1b: Reduce Nutrient Loading Ë Objective 3b: Reduce Bacterial Loading ¤ Objective 1c: Provide Additional Public Access to Water Resources N Objective 3c: Reduce Pollutants Resulting in Fish Advisories «Objective 2a: Protect and Re-establish Riparian and In-stream Habitat ¡ Objective 4a: Establish Target Peak Flows for the Tributaries vObjective 2b: Reduce Soil Erosion and Sedimentation O Objective 4b: Develop Water Resource Protection and z Objective 2c: Reduce Excess Runoff Management Ordinances to Reduce Runoff ¨ Objective 2d: Protect Open Space and Natural Areas within the Watershed u Objective 4c: Reduce Storm Water Runoff Quantity ² Objective 4d: Minimize Post-storm In-stream Flow Velocities
48
utilized. Catch basin cleaning requires the use of a vactor truck, and sumps should be cleaned before they become 40 percent full. Materials removed from the catch basins should be properly disposed of and not allowed to reenter the storm sewer system. Pollutant capture within a catch basin can be improved through the use of catch basin insert devices. Depending on the type, these devices can be used to improve sediment capture and provide oil and chemical removal. Facilitate Generally Accepted Agricultural Management Practices (GAAMPs) (BMP 9) ²³«SË In rural areas, smaller agricultural establishments and small horse farms may contribute to higher bacteria concentrations if manure is not managed properly. State agencies have the authority to manage agricultural practices through voluntary measures called Generally Accepted Agricultural Management Practices (GAAMPs). GAAMPs provide agricultural landowners with guidelines to follow in regard to nutrient and pesticide application and storage, manure management, groundwater protection, and a host of other agricultural BMPs to protect surface and groundwater as well as habitat. Established outreach programs are available to educate landowners about these recommended practices, which should be utilized as much as possible to control potential pollutants from this land use. Municipalities and the county should work closely with the local conservation district to identify and promote the use of GAAMPs in problem areas. Identify Areas for Recreation Enhancement (BMP 10) ¤¨ In order to encourage public awareness and concern for rivers, streams, and wetlands, it is important to increase opportunities for people to access these water resources. These areas provide aesthetics and accessibility by use of amenities, such as a fishing pier, a trail system, or other recreational opportunities. The public will be able to experience the human benefits that water offers and, in turn, can work to protect the resource. These spaces can be encouraged in the land use planning of local communities. Local policies and zoning can identify natural feature areas that are prime for long-term preservation or restoration. Identify and Control Sanitary Sewer Overflows (SSOs) (BMP 11) ²³«SËN Sanitary sewers designed and constructed under current standards limit the amount of storm water that can enter the system. Older systems, however, have a number of ways in which excess storm water can enter the sewage collection systems. When this storm water within a sanitary sewer collection system becomes excessive, basements will flood (with sewage) unless the excess flow is discharged to the surface waters. These sewage discharges are known as
Best Management Practices
ANCHOR BAY WATERSHED MANAGEMENT PLAN
²Objective 1a: Reduce Bacterial Loading S Objective 3a: Protect Drinking Water Supply ³Objective 1b: Reduce Nutrient Loading Ë Objective 3b: Reduce Bacterial Loading ¤ Objective 1c: Provide Additional Public Access to Water Resources N Objective 3c: Reduce Pollutants Resulting in Fish Advisories «Objective 2a: Protect and Re-establish Riparian and In-stream Habitat ¡ Objective 4a: Establish Target Peak Flows for the Tributaries vObjective 2b: Reduce Soil Erosion and Sedimentation O Objective 4b: Develop Water Resource Protection and z Objective 2c: Reduce Excess Runoff Management Ordinances to Reduce Runoff ¨ Objective 2d: Protect Open Space and Natural Areas within the Watershed u Objective 4c: Reduce Storm Water Runoff Quantity ² Objective 4d: Minimize Post-storm In-stream Flow Velocities
49
sanitary sewer overflows (SSOs). These discharges are illegal under present state and federal rules and regulations. The potential solutions to eliminate untreated SSOs are complex due to the nature of the causes and the inter-relationships of the local and regional sewerage systems that serve the communities. The solutions can be very expensive and may take time to implement. The first step is to determine where the excess flow is entering the sewer system. This can be done by smoke testing, flow measurement, or television inspection of the sewer lines, or physical observation of manhole structures on the system. Once the source(s) of the excess flow is identified, the excess water could be eliminated by:
• Disconnecting direct storm water discharges to the sanitary sewer by removing downspouts or rerouting storm drain and catch basin connections to the storm sewer
• Repairing or replacing defective manhole structures • Repairing or replacing damaged sanitary sewer lines • Constructing new sanitary or storm sewers to carry the excess flow
Identify and Eliminate Failing Onsite Sewage Disposal Systems (OSDSs) (BMP 12) ²³SË Identifying failed OSDS systems can be accomplished through regular inspections of the disposal system or by sampling the waterways. Inspections can occur during property transactions (at time-of-sale), during septic tank pump outs, or at specific periodic intervals. Surface water sampling to detect failing systems is often unreliable because the small volume of untreated sewage created by failing systems in comparison to total river flow may make it difficult to detect in surface waters. Once sewage is detected in surface waters, dye testing can be performed on homes to identify which systems are failing. This requires homeowner cooperation, which is sometimes difficult to obtain. Once a failing OSDS is identified, mechanisms are usually in place to correct the system. Depending on local ordinances and sanitary sewer availability, some homeowners may be allowed to repair their failing systems, while others may be required to connect to the municipal sewer system. Any onsite corrections need to be done under permit from the county health department and in conformance with their requirements. Either of these efforts can be very costly, especially if the systems are nontraditional or if sanitary sewers are not readily available.
Best Management Practices
ANCHOR BAY WATERSHED MANAGEMENT PLAN
²Objective 1a: Reduce Bacterial Loading S Objective 3a: Protect Drinking Water Supply ³Objective 1b: Reduce Nutrient Loading Ë Objective 3b: Reduce Bacterial Loading ¤ Objective 1c: Provide Additional Public Access to Water Resources N Objective 3c: Reduce Pollutants Resulting in Fish Advisories «Objective 2a: Protect and Re-establish Riparian and In-stream Habitat ¡ Objective 4a: Establish Target Peak Flows for the Tributaries vObjective 2b: Reduce Soil Erosion and Sedimentation O Objective 4b: Develop Water Resource Protection and z Objective 2c: Reduce Excess Runoff Management Ordinances to Reduce Runoff ¨ Objective 2d: Protect Open Space and Natural Areas within the Watershed u Objective 4c: Reduce Storm Water Runoff Quantity ² Objective 4d: Minimize Post-storm In-stream Flow Velocities
50
Identify and Eliminate Illicit Discharges (BMP 13) ²³«SËN Illicit discharge detection and elimination requires:
• Prevention, detection, and removal of all physical connections to the storm water drainage system that convey any material other than storm water
• Implementation of measures to detect, correct, and enforce against illegal dumping of materials into storm drains, streams, and lakes
• Implementation of spill prevention, containment, cleanup, and disposal techniques at commercial, industrial, and municipal facilities to prevent or reduce the discharge of spilled materials into storm water.
Crews of municipal workers should be trained on how to identify illicit discharges and locate illicit connections. Although this effort can be labor intensive, the reduction in the amount of sanitary sewage and chemicals that enter surface waters through elimination of these sources often has significant environmental benefits. Implement Financial Solutions (BMP 14) ²³¤«vz¨SËN¡Ou² Restoration efforts and environmental programs in any watershed are driven by the desire to make improvements and the availability of funds to make those improvements. Integrating storm water management programs into the daily procedures of a community will most likely incur new costs. In many cases, communities and agencies will need to explore creative solutions to finance new staff, new programs, and new requirements in their storm water program. Grants may be available, often with a local match involved, but these are short-term solutions for one-time projects. Many locally driven projects depend on grants for implementation. Communities and local citizen groups need to be aware of grants that are available and how to obtain those grants. Additionally, to maintain their long-term ability to apply for, and receive, additional grant funds, the present grants need to be effectively and efficiently managed. Many projects need to move ahead based on local contributions from fund raising, citizens, industries, and municipalities in the watershed area. Alternative solutions that have been tested include:
• Implementing a storm water utility fee, incurred by users of the storm water system
• Using impervious cover as a basis for user fees • Creating habitat stamps patterned after the duck stamp program • Enacting a one-time septic system installation fee • Establishing tree and wetland mitigation banking systems • Enacting a lawn and garden fertilizer surcharge
Best Management Practices
ANCHOR BAY WATERSHED MANAGEMENT PLAN
²Objective 1a: Reduce Bacterial Loading S Objective 3a: Protect Drinking Water Supply ³Objective 1b: Reduce Nutrient Loading Ë Objective 3b: Reduce Bacterial Loading ¤ Objective 1c: Provide Additional Public Access to Water Resources N Objective 3c: Reduce Pollutants Resulting in Fish Advisories «Objective 2a: Protect and Re-establish Riparian and In-stream Habitat ¡ Objective 4a: Establish Target Peak Flows for the Tributaries vObjective 2b: Reduce Soil Erosion and Sedimentation O Objective 4b: Develop Water Resource Protection and z Objective 2c: Reduce Excess Runoff Management Ordinances to Reduce Runoff ¨ Objective 2d: Protect Open Space and Natural Areas within the Watershed u Objective 4c: Reduce Storm Water Runoff Quantity ² Objective 4d: Minimize Post-storm In-stream Flow Velocities
51
• Charging a per-day, per-acre fee for exposed land on construction sites Implement Institutional Framework for Watershed-wide Actions (BMP 15) ²³¤«vz¨SËN¡Ou² Watersheds are a hydrologic boundary, not a political boundary. Therefore, institutional arrangements must be established so that various local, county, state, and federal jurisdictions within the watershed boundary are coordinated. It is recommended that the coordination of the watershed level be tiered as it is in government. Often, at the watershed level, there is a working group dedicated to watershed issues. This may be a council in which representatives from member communities and agencies sit on the board. It may be an independent research group that is contracted by the communities and agencies to provide data and information about the watershed. It may be a county or state agency that takes the lead on coordinating watershed issues within and outside of its political jurisdiction. Implement Municipal Employee Training Programs (BMP 16) ²³SËN Education is an important component of any program to control nonpoint source pollution. The municipality needs to establish an educational training program for staff who are routinely involved in infrastructure inspection and maintenance, open and green space maintenance, or building inspection. The training should at least address issues, such as detection of illicit connections, proper disposal of materials removed during sewer and catch basin cleaning operations, proper application of fertilizers, pesticides, and herbicides, and methods for servicing municipal vehicles that will eliminate the possibility of any contaminated runoff. Implement Natural Features Protection Ordinances (BMP 17) «¨O In order to direct development while protecting key local natural resources, it is often necessary to implement local ordinances that clarify why protection of certain features is important and how they will be protected under the law. These local ordinances can be more protective than state or federal law and can better reflect priorities of a local community. Example ordinances could address woodland, wetland, and natural features setback, soil erosion and sedimentation control, and fertilizer application. Implement Septic System Maintenance Measures (BMP 18) ²³«SË Septic tank maintenance measures can be used to prevent, detect, and control spills, leaks, overflows, and seepage from occurring in the sanitary system. Onsite sewage disposal systems should be designed, sited, operated, and maintained properly to prevent nutrient and pathogen loadings to surface waters and to reduce loadings to groundwater. Septic tanks should be pumped at least every three years, depending on the size of the family or group using the tank. Operation and maintenance ordinances can be implemented by the municipalities and/or county health departments.
Best Management Practices
ANCHOR BAY WATERSHED MANAGEMENT PLAN
²Objective 1a: Reduce Bacterial Loading S Objective 3a: Protect Drinking Water Supply ³Objective 1b: Reduce Nutrient Loading Ë Objective 3b: Reduce Bacterial Loading ¤ Objective 1c: Provide Additional Public Access to Water Resources N Objective 3c: Reduce Pollutants Resulting in Fish Advisories «Objective 2a: Protect and Re-establish Riparian and In-stream Habitat ¡ Objective 4a: Establish Target Peak Flows for the Tributaries vObjective 2b: Reduce Soil Erosion and Sedimentation O Objective 4b: Develop Water Resource Protection and z Objective 2c: Reduce Excess Runoff Management Ordinances to Reduce Runoff ¨ Objective 2d: Protect Open Space and Natural Areas within the Watershed u Objective 4c: Reduce Storm Water Runoff Quantity ² Objective 4d: Minimize Post-storm In-stream Flow Velocities
52
Implement Soil Erosion and Sedimentation Control (SESC) Programs (BMP 19) v Although the Natural Resources and Environmental Protection Act in Michigan requires that counties and municipalities implement and enforce a Soil Erosion and Sedimentation Control (SESC) program, these programs can vary with respect to their effectiveness. County agencies responsible for SESC programs need to:
• Develop effective county SESC ordinances that address state’s requirements as well as situations unique to the county
• Provide adequate staff to process permits, inspect sites, and respond to complaints
• Develop and access training programs to assure that all staff are adequately trained
• Assure that SESC programs contain adequate enforcement provisions • Develop educational programs for developers and contractors within their
county that will explain both the control mechanisms associated with, and the environmental reasons for, SESC programs
Implement Storm Water and Water Resource Protection Ordinances (BMP 20) «vz¨SOu² In undeveloped areas, or in area where redevelopment may occur, it is important to have regulations in place that can guide land development with regard to protecting the water quality, water quantity, and biological integrity of the receiving surface water. This regulation can use existing data to determine the development impact that can be tolerated by the surface waters before that system will become degraded. Future development or redevelopment can be guided to control runoff so that local streams and water resources are not negatively affected by the development to the greatest extent practical. Both the counties and CTVs can protect storm water and water resources through the development and implementation of ordinances. Implement Streambank Stabilization Measures (BMP 21) «v Streambank stabilization measures work by either reducing the force of flowing water and/or by increasing the streambank’s resistance to erosion. Three types of streambank stabilization methods exist, including: engineered methods, bioengineered methods, and biotechnical methods. Engineered methods include structures, such as riprap, gabions, deflectors, and revetments. Bioengineering methods use live plants that are embedded and arranged in the ground where they serve as soil reinforcement, hydraulic drains, and barriers to earth movement. Examples of bioengineering techniques include live stakes, live fascines, brush mattresses, live cribwall, and branch packing. Biotechnical methods include integrated use of plants and inert structural components to stabilize channel slopes, prevent erosion, and provide a natural
Best Management Practices
ANCHOR BAY WATERSHED MANAGEMENT PLAN
²Objective 1a: Reduce Bacterial Loading S Objective 3a: Protect Drinking Water Supply ³Objective 1b: Reduce Nutrient Loading Ë Objective 3b: Reduce Bacterial Loading ¤ Objective 1c: Provide Additional Public Access to Water Resources N Objective 3c: Reduce Pollutants Resulting in Fish Advisories «Objective 2a: Protect and Re-establish Riparian and In-stream Habitat ¡ Objective 4a: Establish Target Peak Flows for the Tributaries vObjective 2b: Reduce Soil Erosion and Sedimentation O Objective 4b: Develop Water Resource Protection and z Objective 2c: Reduce Excess Runoff Management Ordinances to Reduce Runoff ¨ Objective 2d: Protect Open Space and Natural Areas within the Watershed u Objective 4c: Reduce Storm Water Runoff Quantity ² Objective 4d: Minimize Post-storm In-stream Flow Velocities
53
appearance. Examples of biotechnical techniques include joint plantings, vegetated gabion mattresses, vegetated cellular grids, and reinforced grass systems. Increase Public Awareness (BMP 22) ²³¤«vz¨SËN¡Ou² Public participation and education programs are activities in which people learn about and/or work together to control storm water pollution. These programs would be based on the following four objectives: 1) to promote a clear identification and understanding of problems and solutions, 2) to identify responsible parties, 3) to promote community ownership of problems and solutions, and 4) to integrate public feedback into program implementation. To achieve these objectives, the audience needs to be identified, the program carefully designed, and program effectiveness periodically reviewed. Encouraging community ownership of the land and water resources is a key component to minimizing storm water pollution. Without public education and participation, relatively small sources of pollution will continue to accumulate in storm water despite structural controls that may be installed. Public participation and education programs can include the following activities:
• Program planning and tracking – public surveys and database • Program identity – program message, logo and tag line • Collateral material – newsletters, fact sheets, brochures, posters • Coordinating committees • Media campaign – press releases, advertising, public service announcements • Residential programs – storm drain stenciling, home toxics checklist and
alternatives, stream and river road crossing signs, native landscaping, invasive species awareness, and other neighborhood-specific projects
• Presentations – environmental booths, speakers bureau, and special events • Business programs – workshops, publications, and green business projects • Construction programs – workshops, educational materials, and certification • Consumer programs – point of purchase displays and printed grocery bags • School education – facility tours, contests, curriculum materials,
and presentations • Monitoring – Adopt-A-Stream and stream monitoring programs
Install/Maintain Oil and Grease Trap Devices (BMP 23) « Oil and grease traps remove high concentrations of petroleum products, grease, and grit by means of gravity and coalescing plates. These devices are particularly useful on industrial sites, in vehicle maintenance and washing facilities, in areas where heavy mobile equipment is used, and in restaurant kitchens and restaurant dishwashing equipment. Conventional oil and water separators have the appearance of septic tanks, but are much longer in relationship to the width. Separators for large facilities have the
Best Management Practices
ANCHOR BAY WATERSHED MANAGEMENT PLAN
²Objective 1a: Reduce Bacterial Loading S Objective 3a: Protect Drinking Water Supply ³Objective 1b: Reduce Nutrient Loading Ë Objective 3b: Reduce Bacterial Loading ¤ Objective 1c: Provide Additional Public Access to Water Resources N Objective 3c: Reduce Pollutants Resulting in Fish Advisories «Objective 2a: Protect and Re-establish Riparian and In-stream Habitat ¡ Objective 4a: Establish Target Peak Flows for the Tributaries vObjective 2b: Reduce Soil Erosion and Sedimentation O Objective 4b: Develop Water Resource Protection and z Objective 2c: Reduce Excess Runoff Management Ordinances to Reduce Runoff ¨ Objective 2d: Protect Open Space and Natural Areas within the Watershed u Objective 4c: Reduce Storm Water Runoff Quantity ² Objective 4d: Minimize Post-storm In-stream Flow Velocities
54
appearance of a municipal wastewater primary sedimentation tank. These devices are only effective for reducing abnormally high concentrations of oils and greases. Install/Maintain Sediment Control Devices (BMP 24) «v Sediment control devices, such as a barrier, basin, media filter, or other devices, are designed to remove sediment from runoff. Sediment basins are generally used at the downstream end of large drainage areas. Dikes, temporary channels, and pipes should be used to divert runoff from disturbed areas into the basin and runoff from undisturbed areas around the basin. Simpler devices are used for smaller areas; these include sediment traps, sand bag barriers, silt fences, and straw bales. Silt fences and straw bales can be placed along level contours downstream of exposed areas where only sheet flow is anticipated. A media filter is essentially a settling basin followed by a filter for particulate removal. While the most common media is sand, other filters may be used to provide dissolved pollutant removal. Media filters are used on sites with limited space or that are unsuitable for vegetation. Sand filters remove up to 90 percent of suspended materials. Sediment control devices can also be used on storm drain inlets and can include filter fabric, excavated drop traps, gravel filters, and sandbags. Maintenance is a key requirement of this BMP. Sediment traps, barriers, basins, and filters should be inspected frequently for repairs and sediment removal. Install/Maintain Storm Sewer Infiltration Treatment Devices (BMP 25) ²³«vz¨SËNu² Infiltration devices in the Anchor Bay Watershed are generally not a useful BMP because of the watershed’s predominately clay soils. However, under-drained bioretention areas, planted with prairie type plants, can provide an infiltration mechanism for storm water on a site-specific basis that will potentially eliminate runoff from small storms and reduce the quantity of runoff in larger storms. Non-infiltration storm sewer treatment devices are included in BMPs 4, 5, and 24. Integrate Natural Resource Protection into the Planning Process (BMP 26) ²³¤«vz¨SËOu² Every community should make sure that their comprehensive master plan and other local plans are consistent with, and provide necessary support to, local regulations. When a community is interested in protecting and restoring natural and water resources, the comprehensive plan is the foundation for these protection measures. The purpose for integrating natural and water resources into the planning process can range from providing recreational opportunities, protecting aquatic life, wildlife and habitat, restoring and protecting public health, and reducing peak flows. Although the
Best Management Practices
ANCHOR BAY WATERSHED MANAGEMENT PLAN
²Objective 1a: Reduce Bacterial Loading S Objective 3a: Protect Drinking Water Supply ³Objective 1b: Reduce Nutrient Loading Ë Objective 3b: Reduce Bacterial Loading ¤ Objective 1c: Provide Additional Public Access to Water Resources N Objective 3c: Reduce Pollutants Resulting in Fish Advisories «Objective 2a: Protect and Re-establish Riparian and In-stream Habitat ¡ Objective 4a: Establish Target Peak Flows for the Tributaries vObjective 2b: Reduce Soil Erosion and Sedimentation O Objective 4b: Develop Water Resource Protection and z Objective 2c: Reduce Excess Runoff Management Ordinances to Reduce Runoff ¨ Objective 2d: Protect Open Space and Natural Areas within the Watershed u Objective 4c: Reduce Storm Water Runoff Quantity ² Objective 4d: Minimize Post-storm In-stream Flow Velocities
55
purposes may vary from community to community, the process of using the comprehensive plan as the basis for resource protection still stands. This process can include writing appropriate background information, data, goals, and policies into various sections of the plan. Specific topics might include storm water management, natural areas preservation and restoration, native landscaping, riparian corridor protection and restoration, and groundwater management. Maintain Sanitary Sewer Infrastructure (BMP 27) ²³«SË Infrastructure maintenance includes the upkeep of sanitary sewer lines in order to prevent sewage from flowing into surface waters. Maintenance involves regular inspections of the piping to locate partial blockages, which could case wastewater to backup into basements or onto the surface, pipe failures, which could cause illicit discharges, and/or cross connections between the sanitary and storm systems. Dry weather inflow and infiltration problems are usually identified first within the sanitary system. Wet weather flows, which are more difficult to locate, can then be located using smoke testing, sewer televising, and/or dye testing. Maintenance personnel can perform inspections by actually walking the sewers or using a video camera to document the sewer’s condition. Successful BMP implementation can be aided by the development of Capacity Management Operation and Maintenance (CMOM) programs structured in accordance with guidelines supplied by the EPA. Maintain Storm Water Controls (BMP 28) ²³vzSËu² To be continually effective, structural BMPs that are installed to eliminate or control storm water contamination must operate at their original design parameters. This can only be achieved if the controls are routinely checked and maintained to assure they are operating as designed. For example, sediment and oil accumulations must be regularly removed from detention ponds to maintain the design retention time at the expected storm water volume. This maintenance requirement needs to be built into the on-going operational budget for storm water programs. Manage Public Facilities (BMP 29) ²«vz¨SËNu² Much of the acreage in any watershed is publicly owned or controlled. Therefore, public agencies must effectively manage facilities to treat, control, or eliminate any sources of environmental degradation on or from these sites. Public agencies set an example of how environmental management should occur by turning their sites into show places. To do this, public agencies should, at least:
• Develop a fertilizer, herbicide, and pesticide management plan for public grounds and make sure that usage is minimized to the lowest possible, yet effective, quantity
• Check all public buildings to eliminate any illicit sewer connections
Best Management Practices
ANCHOR BAY WATERSHED MANAGEMENT PLAN
²Objective 1a: Reduce Bacterial Loading S Objective 3a: Protect Drinking Water Supply ³Objective 1b: Reduce Nutrient Loading Ë Objective 3b: Reduce Bacterial Loading ¤ Objective 1c: Provide Additional Public Access to Water Resources N Objective 3c: Reduce Pollutants Resulting in Fish Advisories «Objective 2a: Protect and Re-establish Riparian and In-stream Habitat ¡ Objective 4a: Establish Target Peak Flows for the Tributaries vObjective 2b: Reduce Soil Erosion and Sedimentation O Objective 4b: Develop Water Resource Protection and z Objective 2c: Reduce Excess Runoff Management Ordinances to Reduce Runoff ¨ Objective 2d: Protect Open Space and Natural Areas within the Watershed u Objective 4c: Reduce Storm Water Runoff Quantity ² Objective 4d: Minimize Post-storm In-stream Flow Velocities
56
• Disconnect all downspouts to prevent water from flowing directly into storm sewers
• Establish bioretention areas at public buildings to minimize storm water volume impacts
Manage Riparian Corridors (BMP 30) ²³«v¨SË Sheet or overland runoff can carry large amounts of contaminants into streams and directly into the bay during wet weather events. Proper maintenance of areas adjacent to riparian corridors that are left in their natural state or are established as buffer strips provide an excellent filtering mechanism that removes suspended materials contained in the runoff. At a minimum, buffer strips should be twenty feet wide and contain native plant materials in order to provide sufficient filtering. Buffer strips are generally located adjacent to agricultural operations to reduce contamination by manure, sediment, and chemicals used for crop production. These strips can also be very effective in urban settings and can be utilized in areas that contribute to storm sewer systems as well as in direct overland runoff locations. Local units of government can provide land planning tools that will assist landowners and developers with information to properly buffer tributaries, streams, and other water features. These planning tools can utilize overlay districts, required vegetated set back areas, or natural vegetation easements to achieve proper buffering of the riparian land areas. These planning tools can, and should, be incorporated into community comprehensive plans and zoning ordinances. Manage Lagoon Systems and Package Wastewater Treatment Plants (BMP 31) ²³«S Lagoon systems and package wastewater treatment plants have been used to provide wastewater treatment in many areas of the Anchor Bay watershed. The most suitable use of these systems is in areas where failures have already occurred or where no other viable alternatives are available. From a planning perspective, these systems should not be used to gain additional land development density from that which is planned by the local unit of government. When operated correctly, lagoon systems and package wastewater treatment plants can provide adequate protection to the waterways. However over an extended period of time, these systems are often poorly maintained and operated, resulting in deteriorated discharge quality. Because state regulatory agencies may not be able to provide adequate oversight on an ongoing basis due to funding and personnel constraints, local units of government should establish a mechanism for providing review of the operations, maintenance, and discharge quality of these systems (i.e. special assessment district). When violations of discharge standards are identified, existing enforcement programs should be utilized.
Best Management Practices
ANCHOR BAY WATERSHED MANAGEMENT PLAN
²Objective 1a: Reduce Bacterial Loading S Objective 3a: Protect Drinking Water Supply ³Objective 1b: Reduce Nutrient Loading Ë Objective 3b: Reduce Bacterial Loading ¤ Objective 1c: Provide Additional Public Access to Water Resources N Objective 3c: Reduce Pollutants Resulting in Fish Advisories «Objective 2a: Protect and Re-establish Riparian and In-stream Habitat ¡ Objective 4a: Establish Target Peak Flows for the Tributaries vObjective 2b: Reduce Soil Erosion and Sedimentation O Objective 4b: Develop Water Resource Protection and z Objective 2c: Reduce Excess Runoff Management Ordinances to Reduce Runoff ¨ Objective 2d: Protect Open Space and Natural Areas within the Watershed u Objective 4c: Reduce Storm Water Runoff Quantity ² Objective 4d: Minimize Post-storm In-stream Flow Velocities
57
Minimize Salt and Deicing Chemicals Usage (BMP 32) «S The use of salt and other deicing chemicals at public buildings, streets, and highways should be minimized, while at the same time assuring that safe walking and driving conditions are maintained. Environmentally friendly alternatives (salt substitutes) should be used when appropriate. Monitor Water Quality and Quantity (BMP 33) ²³«vz¨SËN¡u² Monitoring water quantity and quality is a good mechanism to create a snapshot of present water quality conditions and to develop trend indicators of on-going water quality changes. Monitoring is used to establish baseline conditions prior to implementing BMPs and provides information to determine impaired and threatened areas within the watershed. It also provides a mechanism to measure progress toward attaining goals and information necessary for watershed management plan reviews and updates. Because of these multiple benefits, government agencies within the watershed need to create and agree upon a mutually beneficial watershed-wide water monitoring program that outlines sampling parameters, techniques, and analysis procedures (see Chapter 6). Perform Storm Sewer System Maintenance and Drain Cleaning (BMP 34) ²³«SËu Sewer system cleaning is beneficial for pipes with flat grades, particularly those that are too flat for self-cleaning velocities to be achieved on a regular basis. Cleaning drainage systems helps remove pollutants before they are allowed to re-enter the natural environment and ensures that the pipes convey their intended design flow. The removal of deposited material can be accomplished with vactors, jetters, and scrapers. During the cleansing process, the material needs to be captured so it does not discharge to the stream. It has been found that the removal efficiency for organics is between 65 and 75 percent and 55 to 65 percent for grit and non-organic material. Ongoing drain maintenance allows for full utilization of the design flow channel in the drain, which results in lower velocities and less scouring. This helps to reduce resuspension of sediments within the drain and minimizes erosive impacts on the streambed and streambanks. Perform Street Sweeping (BMP 35) ²³«SË When performed regularly, street sweeping can remove 50 to 90 percent of street pollutants, including fertilizer runoff that can potentially enter surface waters through runoff. Street sweeping can also make road surfaces less slippery during light rains, improve aesthetics by removing litter, and control some pollutants. Street sweeping equipment consists of mechanical brooms, vacuum sweepers, or a combination of both, specifically designed to remove litter, loose gravel, soil, pet waste, vehicle debris,
Best Management Practices
ANCHOR BAY WATERSHED MANAGEMENT PLAN
²Objective 1a: Reduce Bacterial Loading S Objective 3a: Protect Drinking Water Supply ³Objective 1b: Reduce Nutrient Loading Ë Objective 3b: Reduce Bacterial Loading ¤ Objective 1c: Provide Additional Public Access to Water Resources N Objective 3c: Reduce Pollutants Resulting in Fish Advisories «Objective 2a: Protect and Re-establish Riparian and In-stream Habitat ¡ Objective 4a: Establish Target Peak Flows for the Tributaries vObjective 2b: Reduce Soil Erosion and Sedimentation O Objective 4b: Develop Water Resource Protection and z Objective 2c: Reduce Excess Runoff Management Ordinances to Reduce Runoff ¨ Objective 2d: Protect Open Space and Natural Areas within the Watershed u Objective 4c: Reduce Storm Water Runoff Quantity ² Objective 4d: Minimize Post-storm In-stream Flow Velocities
58
dust, and industrial debris from road surfaces. .Sweepers that include vacuum technology are preferred from an environmental standpoint. Preserve and Enhance Existing Wetlands/Woodlands (BMP 36) ³«vz¨u² Wetlands and wetland complexes provide natural systems that soak up storm water during wet weather events, thus allowing water to infiltrate into vegetation and soil instead of running off directly to surface waters. Many pollutants are filtered out by the plants and soil prior to reaching the groundwater. Wetlands also reduce storm water velocities, reduce peak flows, increase base flows, filter out storm water pollutants, and provide habitat for numerous wildlife species. Sustainable funding for the enforcement of a wetland and woodland ordinances is an important part of ensuring success and should be incorporated into the permitting process. Since true, natural wetlands take decades to properly form, communities and developers should retain wetlands and wetland complexes in their natural state or use them to enhance larger storm water basins rather than removing them during construction and, then, re-engineer them later. Prevent and Remove Flow Obstructions (BMP 37) ²³² Prevention and removal of stream flow obstructions involves the detection of stream blockages caused by debris, sediment, and branches or trees that have fallen into the river. If cleanup is required, it is important to do so in an environmentally friendly manner that minimizes habitat disruptions. Stream cleanup should be considered in lieu of clearing, snagging, channelization, or other severe modifications. Communities and individuals are encouraged to get involved with removing smaller obstructions before they become a major problem. This may include monitoring and maintaining stream flow conditions and checking for obstructions that are hindering the flow of the river and causing upstream ponding problems. Provide Sufficient Enforcement Capability (BMP 38) ²³«vz¨SËNu² After ordinances and regulations are in place, there can often be a lack of resources and personnel to enforce the ordinance. Sometimes this means increasing the number of personnel dedicated to inspection and enforcement and/or increasing enforcement follow-through and fines. For example, since many natural features protection ordinances deal with preserving certain features on a development site, careful and regular inspection during the design and construction process is necessary in order to ensure that the ordinance requirements are being followed. Reduce Bacterial Runoff from Domestic Animals and Wildlife (BMP 39) ²«SË While E. coli is an indicator of human sewage in surface water, it also signals the presence of waste from other warm-blooded animals, which, like human sewage, can
Best Management Practices
ANCHOR BAY WATERSHED MANAGEMENT PLAN
²Objective 1a: Reduce Bacterial Loading S Objective 3a: Protect Drinking Water Supply ³Objective 1b: Reduce Nutrient Loading Ë Objective 3b: Reduce Bacterial Loading ¤ Objective 1c: Provide Additional Public Access to Water Resources N Objective 3c: Reduce Pollutants Resulting in Fish Advisories «Objective 2a: Protect and Re-establish Riparian and In-stream Habitat ¡ Objective 4a: Establish Target Peak Flows for the Tributaries vObjective 2b: Reduce Soil Erosion and Sedimentation O Objective 4b: Develop Water Resource Protection and z Objective 2c: Reduce Excess Runoff Management Ordinances to Reduce Runoff ¨ Objective 2d: Protect Open Space and Natural Areas within the Watershed u Objective 4c: Reduce Storm Water Runoff Quantity ² Objective 4d: Minimize Post-storm In-stream Flow Velocities
59
also cause disease. Therefore, animal waste should be kept from the surface waters, especially where people might want to swim. Source control can be either structural or non-structural.
• Structural controls can be fences that keep grazing animals out of streams, buffer strips along grazing areas, and lagoons to control and treat manure-contaminated runoff from agricultural operations.
• Non-structural controls can be ordinances that limit the number of animals that can be housed in a given area, require specific management measures by animal owners to keep runoff away from animal waste products, or require manure management plans.
• Non-structural controls can also consist of educational initiatives, such as signs at public beaches and parks that encourage people to pick up pet waste and discourage feeding birds.
Municipalities and counties can work with the local conservation district to encourage government agencies, civic leaders, and the agricultural community to implement source controls. Reduce Directly Connected Impervious Surfaces (BMP 40) u² A number of activities are currently underway that will reduce directly connected impervious surfaces. To date, most have not been managed in a comprehensive way. Utilizing a Low Impact Development Plan can reduce directly connected impervious surfaces. Low Impact Development Plans combine a hydrologically functional site design with pollution prevention measures to compensate for land development impacts on hydrology and water quality. The result will be a reduction in storm water peak discharge, a reduction in runoff volume, and the removal of storm water pollutants. This can apply to new residential, commercial, and industrial developments and sites that are undergoing major redevelopment. Reduce/Eliminate Oil/Chemical Discharges (BMP 41) «SN Oil and chemical discharges degrade water quality, aesthetics, and habitat. Both structural and non-structural measures can be used to eliminate the discharge of these materials.
• Structural controls can include: - Catch basin sumps - Secondary containment - Skimming basins.
Best Management Practices
ANCHOR BAY WATERSHED MANAGEMENT PLAN
²Objective 1a: Reduce Bacterial Loading S Objective 3a: Protect Drinking Water Supply ³Objective 1b: Reduce Nutrient Loading Ë Objective 3b: Reduce Bacterial Loading ¤ Objective 1c: Provide Additional Public Access to Water Resources N Objective 3c: Reduce Pollutants Resulting in Fish Advisories «Objective 2a: Protect and Re-establish Riparian and In-stream Habitat ¡ Objective 4a: Establish Target Peak Flows for the Tributaries vObjective 2b: Reduce Soil Erosion and Sedimentation O Objective 4b: Develop Water Resource Protection and z Objective 2c: Reduce Excess Runoff Management Ordinances to Reduce Runoff ¨ Objective 2d: Protect Open Space and Natural Areas within the Watershed u Objective 4c: Reduce Storm Water Runoff Quantity ² Objective 4d: Minimize Post-storm In-stream Flow Velocities
60
• Non-structural controls can include:
− Educational initiatives, such as identification of storm sewer catch basins with signs that read “Dump No Waste - Drains To Waterbody” to inhibit people from dumping pollutants into the basins
− Supplying information that directs people to approved pollutant disposal sites
− Household Hazardous Waste Programs − Storm water ordinances that prohibit people from dumping oils and
chemicals into storm sewers − Storm water pollution prevention plans by high risk businesses and/or public
facilities Reduce Fertilizer, Pesticide, and Herbicide Usage (BMP 42) ³«S Nitrogen, phosphorus, potassium, and other nutrients are necessary to maintain optimum growth of most vegetation. Fertilizer management addresses the proper selection, use, application, storage, and disposal of fertilizers. Nutrients that are applied beyond what plants require be washed off the soil and runoff into lakes, streams, and wetlands, or where the nutrients could leach into groundwater. When nutrients, such as phosphorus run off into surface waters, they can cause algae blooms and excessive aquatic plant growth. Practicing proper fertilizer management will minimize the potential for pollution of surface and ground waters. Municipalities and the counties should implement these practices on publicly owned properties and encourage landowners to implement these practices on privately owned land. Support Environmental Friendly Lawn and Garden Maintenance (BMP 43) «vz¨Ou² Proper lawn and garden maintenance involves a combination of mechanical methods and careful chemical application. Mechanical methods include:
• Proper selection of vegetation and native plants for various land uses • Incorporating integrated pest management techniques and proper watering
techniques to reduce runoff and excess transpiration • Proper lawn mowing techniques to reduce runoff rates and pollutant transport • Proper organic debris disposal • Proper pest control techniques to minimize the use of herbicides and pesticides.
Particular maintenance techniques are required on steep slopes, in or around drainage channels, streams and detention basins, and adjacent to catch basins. This BMP could be carried out though public education efforts on non-point source pollution and/or through regulations requiring licensing for landscaping and lawn care professionals.
Best Management Practices
ANCHOR BAY WATERSHED MANAGEMENT PLAN
²Objective 1a: Reduce Bacterial Loading S Objective 3a: Protect Drinking Water Supply ³Objective 1b: Reduce Nutrient Loading Ë Objective 3b: Reduce Bacterial Loading ¤ Objective 1c: Provide Additional Public Access to Water Resources N Objective 3c: Reduce Pollutants Resulting in Fish Advisories «Objective 2a: Protect and Re-establish Riparian and In-stream Habitat ¡ Objective 4a: Establish Target Peak Flows for the Tributaries vObjective 2b: Reduce Soil Erosion and Sedimentation O Objective 4b: Develop Water Resource Protection and z Objective 2c: Reduce Excess Runoff Management Ordinances to Reduce Runoff ¨ Objective 2d: Protect Open Space and Natural Areas within the Watershed u Objective 4c: Reduce Storm Water Runoff Quantity ² Objective 4d: Minimize Post-storm In-stream Flow Velocities
61
Support Wetland Mitigation Banking (BMP 44) «vz¨Ou² Wetlands are nature’s way of controlling the adverse impacts of storm water. They moderate peak flows, increase groundwater, increase low flows, and clean surface runoff. Wetland mitigation is the replacement of wetland functions through the creation or restoration of wetlands. Wetland mitigation banking provides a mechanism for establishing new wetland areas, or banks, in advance of anticipated wetland losses. These banks provide a credit that can be used to meet wetland permit conditions. Mitigation banking benefits the state’s wetland resources by providing new wetlands in advance of losses; by consolidating small mitigation projects into larger, better designed and managed units; and by encouraging integration of wetland mitigation projects with watershed based resource planning. In addition, wetland banking systems can provide profit to the municipality that can be used for funding other water resource protection activities. Utilize Comprehensive Planning for Wastewater Treatment Systems (BMP 45) ²³«¨SË Land use planning, particularly in dense or intense usage areas, must be closely related to the availability and capacities of existing and proposed public utility systems. Planning for wastewater treatment systems has historically been performed by existing wastewater providers rather than being driven by local community master planning efforts. As a result, many of the less populated areas have relied upon onsite disposal systems, lagoons, and package wastewater treatment plants. These smaller wastewater systems can be operated successfully if properly sited, operated, and maintained. Wastewater treatment system planning should be performed with careful consideration of other types of ongoing land-use planning. The planning should be part of, and reflective of, long-term land use goals embodied in the community’s or the county’s master plan. Therefore, the municipality needs to:
• Identify areas to be sewered • Identify areas where onsite treatment will be used • Control development, in accordance with health department guidelines, in areas
that will use onsite treatment • Develop and adopt a capital improvement program to finance needed sewer
system operation, maintenance, upgrades, and replacement. Public utilities are a necessary prerequisite to many forms of development, particularly urban residential development. Therefore, land use plans on a community or regional level must be closely coordinated with plans for current and future utility systems.
Best Management Practices
ANCHOR BAY WATERSHED MANAGEMENT PLAN
²Objective 1a: Reduce Bacterial Loading S Objective 3a: Protect Drinking Water Supply ³Objective 1b: Reduce Nutrient Loading Ë Objective 3b: Reduce Bacterial Loading ¤ Objective 1c: Provide Additional Public Access to Water Resources N Objective 3c: Reduce Pollutants Resulting in Fish Advisories «Objective 2a: Protect and Re-establish Riparian and In-stream Habitat ¡ Objective 4a: Establish Target Peak Flows for the Tributaries vObjective 2b: Reduce Soil Erosion and Sedimentation O Objective 4b: Develop Water Resource Protection and z Objective 2c: Reduce Excess Runoff Management Ordinances to Reduce Runoff ¨ Objective 2d: Protect Open Space and Natural Areas within the Watershed u Objective 4c: Reduce Storm Water Runoff Quantity ² Objective 4d: Minimize Post-storm In-stream Flow Velocities
62
Sewer and land use planning should take into account those areas where development is most likely to occur, where soil types are completely unsuitable for individual septic systems, and where seepage and contamination from conventional septic fields could have the greatest impact on existing waterways. Therefore, plans must consider soil and conventional septic system limitations when determining land usage and development density. Based on information provided by the U.S. Soil Conservation Service, the soils in much of the Anchor Bay Watershed have high clay content that makes infiltration of treated wastewater more difficult. Therefore, waste disposal systems must rely mainly on evapotransporation. This condition makes the use of certain types of conventional or smaller systems less desirable or even inappropriate. When planning for lot size, it is important to allow for ample space to allow infiltration and evaporation to occur, provide an area for a reserve septic field, and allow for appropriate setbacks and isolation distances. Land use and densities should be reviewed with the county health department to ensure long-term septic viability. Finally, as technology improves and the cost for such technology decreases, the availability of package treatment plants to service individual developments becomes more likely. These systems can be operated successfully and efficiently if properly sited, operated, and maintained. However, long-term maintenance can become an issue. Improper maintenance or monitoring can lead to costly repairs or complete system failure, causing substantial environmental degradation. Therefore, guidelines and policies must be set in regard to placement, maintenance, and potential funding mechanisms in order to achieve long-term system functionality. Utilize Habitat Restoration Techniques (BMP 46) « Habitat restoration techniques include in-stream structures that may be used to correct and/or improve animal habitat deficiencies over a broad range of conditions. Examples of these techniques include channel blocks, boulder clusters, covered logs, tree cover, bank cribs, log and bank shelters, channel constrictors, cross logs, revetments, and “K-shaped” dams. The majority of these structures are to be installed with hand labor and tools. After construction, a maintenance program must be implemented to ensure long-term success of the BMP.
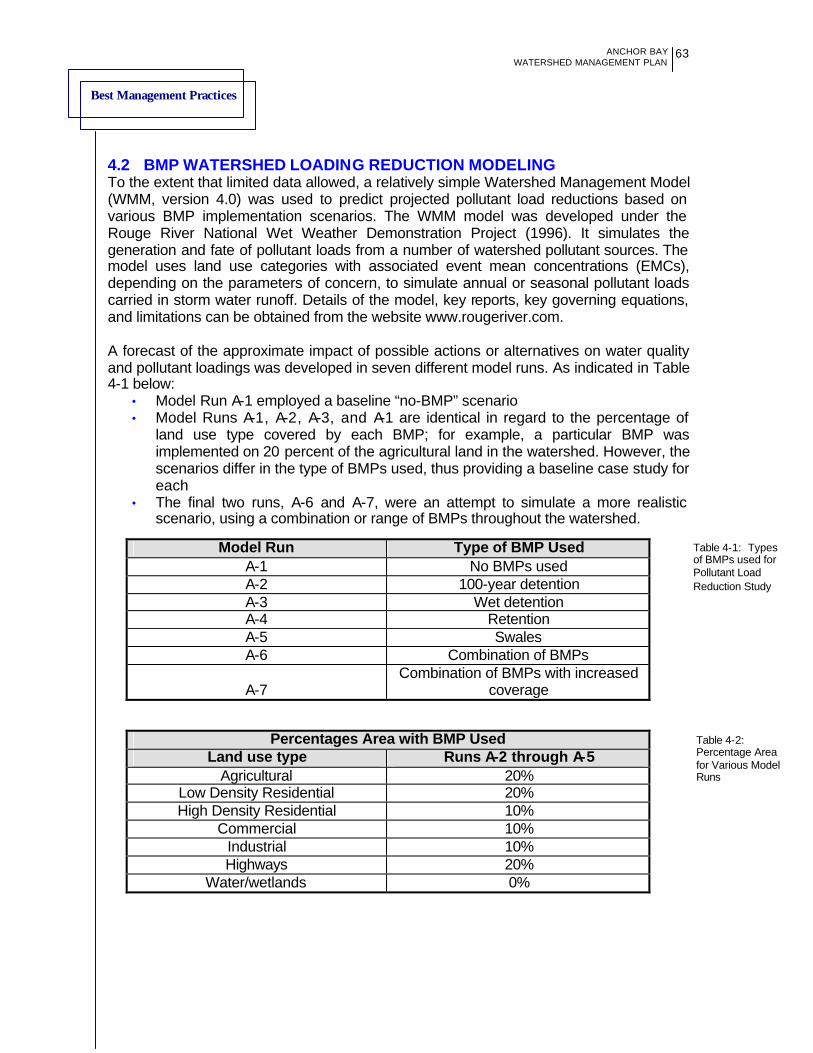
Best Management Practices
ANCHOR BAY WATERSHED MANAGEMENT PLAN
63
Table 4-1: Types of BMPs used for Pollutant Load Reduction Study
Table 4-2: Percentage Area for Various Model Runs
4.2 BMP WATERSHED LOADING REDUCTION MODELING To the extent that limited data allowed, a relatively simple Watershed Management Model (WMM, version 4.0) was used to predict projected pollutant load reductions based on various BMP implementation scenarios. The WMM model was developed under the Rouge River National Wet Weather Demonstration Project (1996). It simulates the generation and fate of pollutant loads from a number of watershed pollutant sources. The model uses land use categories with associated event mean concentrations (EMCs), depending on the parameters of concern, to simulate annual or seasonal pollutant loads carried in storm water runoff. Details of the model, key reports, key governing equations, and limitations can be obtained from the website www.rougeriver.com. A forecast of the approximate impact of possible actions or alternatives on water quality and pollutant loadings was developed in seven different model runs. As indicated in Table 4-1 below:
• Model Run A-1 employed a baseline “no-BMP” scenario • Model Runs A-1, A-2, A-3, and A-1 are identical in regard to the percentage of
land use type covered by each BMP; for example, a particular BMP was implemented on 20 percent of the agricultural land in the watershed. However, the scenarios differ in the type of BMPs used, thus providing a baseline case study for each
• The final two runs, A-6 and A-7, were an attempt to simulate a more realistic scenario, using a combination or range of BMPs throughout the watershed.
Model Run Type of BMP Used A-1 No BMPs used A-2 100-year detention A-3 Wet detention A-4 Retention A-5 Swales A-6 Combination of BMPs
A-7 Combination of BMPs with increased
coverage
Percentages Area with BMP Used Land use type Runs A-2 through A-5
Agricultural 20% Low Density Residential 20% High Density Residential 10%
Commercial 10% Industrial 10% Highways 20%
Water/wetlands 0%
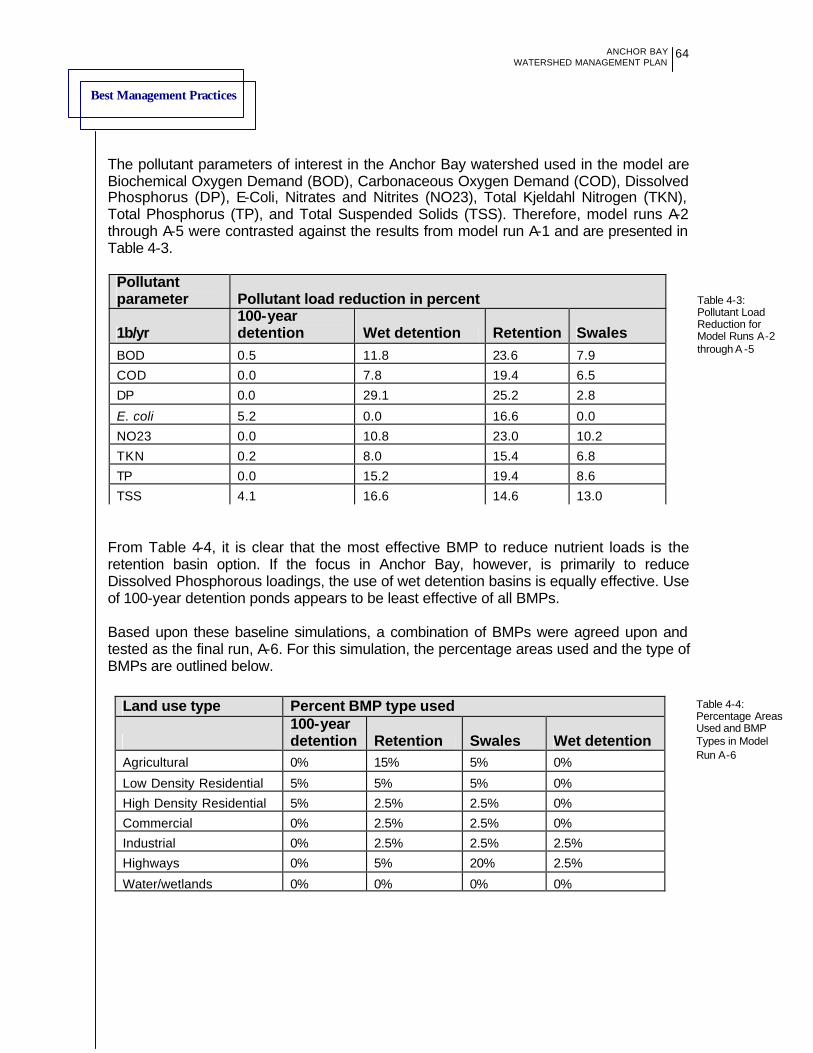
Best Management Practices
ANCHOR BAY WATERSHED MANAGEMENT PLAN
64
Table 4-3: Pollutant Load Reduction for Model Runs A-2 through A -5
Table 4-4: Percentage Areas Used and BMP Types in Model Run A-6
The pollutant parameters of interest in the Anchor Bay watershed used in the model are Biochemical Oxygen Demand (BOD), Carbonaceous Oxygen Demand (COD), Dissolved Phosphorus (DP), E-Coli, Nitrates and Nitrites (NO23), Total Kjeldahl Nitrogen (TKN), Total Phosphorus (TP), and Total Suspended Solids (TSS). Therefore, model runs A-2 through A-5 were contrasted against the results from model run A-1 and are presented in Table 4-3.
From Table 4-4, it is clear that the most effective BMP to reduce nutrient loads is the retention basin option. If the focus in Anchor Bay, however, is primarily to reduce Dissolved Phosphorous loadings, the use of wet detention basins is equally effective. Use of 100-year detention ponds appears to be least effective of all BMPs. Based upon these baseline simulations, a combination of BMPs were agreed upon and tested as the final run, A-6. For this simulation, the percentage areas used and the type of BMPs are outlined below.
Land use type Percent BMP type used
100-year detention Retention Swales Wet detention
Agricultural 0% 15% 5% 0%
Low Density Residential 5% 5% 5% 0%
High Density Residential 5% 2.5% 2.5% 0%
Commercial 0% 2.5% 2.5% 0%
Industrial 0% 2.5% 2.5% 2.5%
Highways 0% 5% 20% 2.5%
Water/wetlands 0% 0% 0% 0%
Pollutant parameter Pollutant load reduction in percent
1b/yr 100-year detention Wet detention Retention Swales
BOD 0.5 11.8 23.6 7.9
COD 0.0 7.8 19.4 6.5
DP 0.0 29.1 25.2 2.8
E. coli 5.2 0.0 16.6 0.0
NO23 0.0 10.8 23.0 10.2
TKN 0.2 8.0 15.4 6.8
TP 0.0 15.2 19.4 8.6
TSS 4.1 16.6 14.6 13.0
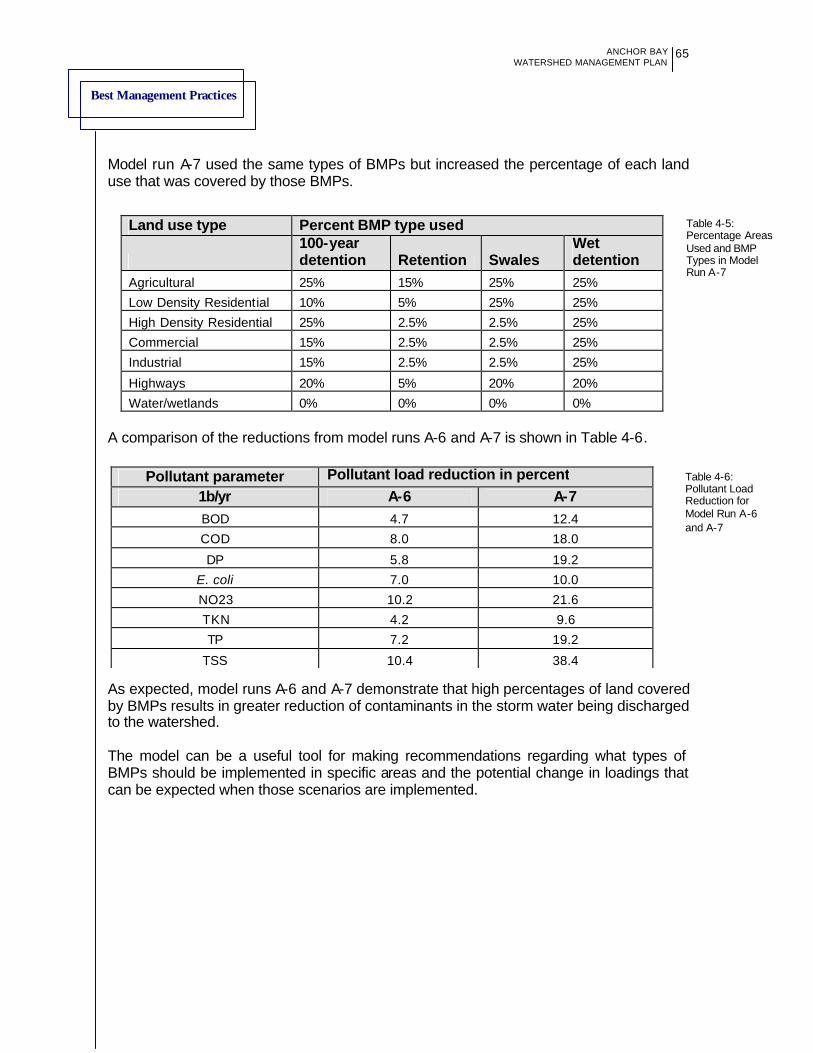
Best Management Practices
ANCHOR BAY WATERSHED MANAGEMENT PLAN
65
Table 4-5: Percentage Areas Used and BMP Types in Model Run A-7
Table 4-6: Pollutant Load Reduction for Model Run A-6 and A-7
Model run A-7 used the same types of BMPs but increased the percentage of each land use that was covered by those BMPs.
A comparison of the reductions from model runs A-6 and A-7 is shown in Table 4-6.
As expected, model runs A-6 and A-7 demonstrate that high percentages of land covered by BMPs results in greater reduction of contaminants in the storm water being discharged to the watershed. The model can be a useful tool for making recommendations regarding what types of BMPs should be implemented in specific areas and the potential change in loadings that can be expected when those scenarios are implemented.
Land use type Percent BMP type used
100-year detention Retention Swales
Wet detention
Agricultural 25% 15% 25% 25%
Low Density Residential 10% 5% 25% 25%
High Density Residential 25% 2.5% 2.5% 25%
Commercial 15% 2.5% 2.5% 25%
Industrial 15% 2.5% 2.5% 25%
Highways 20% 5% 20% 20%
Water/wetlands 0% 0% 0% 0%
Pollutant parameter Pollutant load reduction in percent 1b/yr A-6 A-7 BOD 4.7 12.4
COD 8.0 18.0
DP 5.8 19.2
E. coli 7.0 10.0
NO23 10.2 21.6
TKN 4.2 9.6
TP 7.2 19.2
TSS 10.4 38.4
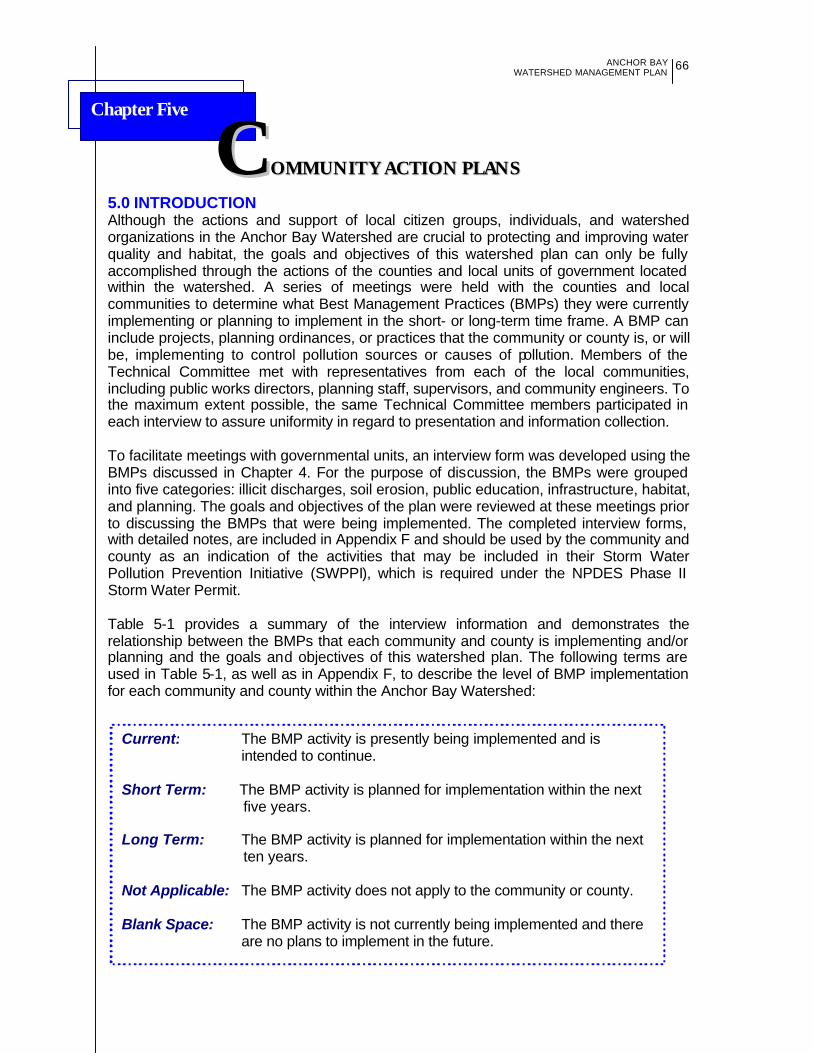
Chapter Five
ANCHOR BAY
WATERSHED MANAGEMENT PLAN
66
CCOOMMMMUUNNIITTYY AACCTTIIOONN PPLLAANNSS
5.0 INTRODUCTION Although the actions and support of local citizen groups, individuals, and watershed organizations in the Anchor Bay Watershed are crucial to protecting and improving water quality and habitat, the goals and objectives of this watershed plan can only be fully accomplished through the actions of the counties and local units of government located within the watershed. A series of meetings were held with the counties and local communities to determine what Best Management Practices (BMPs) they were currently implementing or planning to implement in the short- or long-term time frame. A BMP can include projects, planning ordinances, or practices that the community or county is, or will be, implementing to control pollution sources or causes of pollution. Members of the Technical Committee met with representatives from each of the local communities, including public works directors, planning staff, supervisors, and community engineers. To the maximum extent possible, the same Technical Committee members participated in each interview to assure uniformity in regard to presentation and information collection. To facilitate meetings with governmental units, an interview form was developed using the BMPs discussed in Chapter 4. For the purpose of discussion, the BMPs were grouped into five categories: illicit discharges, soil erosion, public education, infrastructure, habitat, and planning. The goals and objectives of the plan were reviewed at these meetings prior to discussing the BMPs that were being implemented. The completed interview forms, with detailed notes, are included in Appendix F and should be used by the community and county as an indication of the activities that may be included in their Storm Water Pollution Prevention Initiative (SWPPI), which is required under the NPDES Phase II Storm Water Permit. Table 5-1 provides a summary of the interview information and demonstrates the relationship between the BMPs that each community and county is implementing and/or planning and the goals and objectives of this watershed plan. The following terms are used in Table 5-1, as well as in Appendix F, to describe the level of BMP implementation for each community and county within the Anchor Bay Watershed: Current: The BMP activity is presently being implemented and is
intended to continue. Short Term: The BMP activity is planned for implementation within the next
five years. Long Term: The BMP activity is planned for implementation within the next
ten years. Not Applicable: The BMP activity does not apply to the community or county. Blank Space: The BMP activity is not currently being implemented and there
are no plans to implement in the future.
Community Action Plans
ANCHOR BAY WATERSHED MANAGEMENT PLAN
67
5.1 COMMUNITY HIGHLIGHTS Interview results show that many of the activities required to protect and restore the Anchor Bay Watershed are ongoing. This section highlights a number of projects that are currently taking place. Each project serves as an example of how Anchor Bay communities are currently working toward addressing water quality and/or quantity problems. Financial Solutions Although most communities have not considered how to finance projects associated with the storm water control programs, Clinton Township has developed an ordinance that allows for establishing storm water fees based on the impervious area in new development projects. These fees will be used to support programs required under this plan. Water Quality Monitoring Since 1997, Macomb County has performed monitoring in the Anchor Bay watershed through the Lake St. Clair Assessment Program. Recently, additional funding was allocated from the State of Michigan to geographically expand the Lake St. Clair Assessment Program to areas in St. Clair and Oakland Counties. This project, named the Lake St. Clair, Clinton River, and St. Clair River Water Quality Monitoring Project, is a cooperative effort between Macomb, Oakland and St. Clair counties to evaluate impairments in the St. Clair River, Clinton River, and Lake St. Clair. The project consists of developing a three-year comprehensive monitoring effort that will include the following components: • Continuous water quality monitoring at 14 fixed stations (one station within Anchor
Bay) • Automatic sampling during wet weather events for various parameters (one site
within Anchor Bay) • Manual grab sampling for various parameters (two sites within Anchor Bay) • Sediment sampling in depositional zones in Lake St. Clair and inland lakes (two
sites within Anchor Bay) • Macrophyte and algae sampling in Lake St. Clair (two sites within Anchor Bay) • Current, flow, and rainfall monitoring (one site within Anchor Bay) • A bacterial source tracking study (site to be determined) • Long-term toxin monitoring (sites to be determined). Other important aspects of the project include: development of a water quality database; improved understanding of water quality in the study area; identification of areas needing remedial actions; enhanced partnering between counties, municipalities, academia and others; public involvement; and publication of project data through a website. The complete work plan and project description for this project can be obtained by contacting the Macomb County Health Department. Illicit Discharges Illicit discharges may contribute a significant pollutant load to Anchor Bay and its tributary streams. Control and elimination of these illicit discharges generally involves locating outfalls and eliminating contaminants at the source rather than providing end-
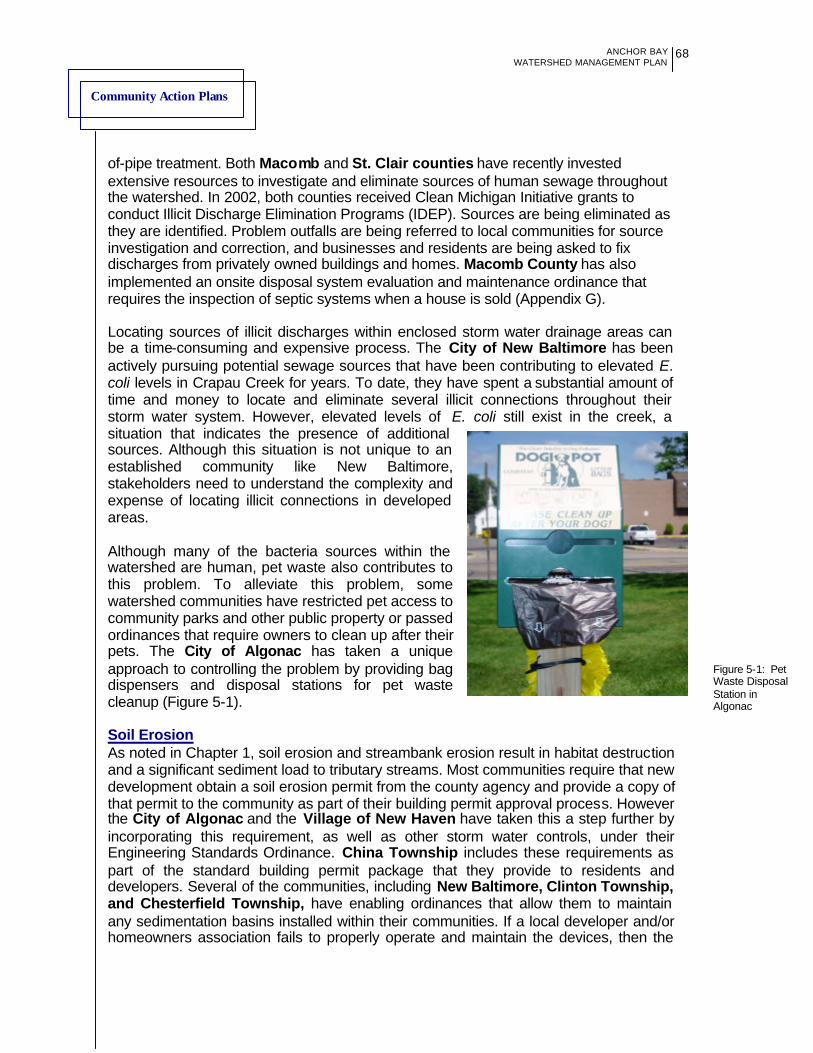
Community Action Plans
ANCHOR BAY WATERSHED MANAGEMENT PLAN
68
Figure 5-1: Pet Waste Disposal Station in Algonac
of-pipe treatment. Both Macomb and St. Clair counties have recently invested extensive resources to investigate and eliminate sources of human sewage throughout the watershed. In 2002, both counties received Clean Michigan Initiative grants to conduct Illicit Discharge Elimination Programs (IDEP). Sources are being eliminated as they are identified. Problem outfalls are being referred to local communities for source investigation and correction, and businesses and residents are being asked to fix discharges from privately owned buildings and homes. Macomb County has also implemented an onsite disposal system evaluation and maintenance ordinance that requires the inspection of septic systems when a house is sold (Appendix G). Locating sources of illicit discharges within enclosed storm water drainage areas can be a time-consuming and expensive process. The City of New Baltimore has been actively pursuing potential sewage sources that have been contributing to elevated E. coli levels in Crapau Creek for years. To date, they have spent a substantial amount of time and money to locate and eliminate several illicit connections throughout their storm water system. However, elevated levels of E. coli still exist in the creek, a situation that indicates the presence of additional sources. Although this situation is not unique to an established community like New Baltimore, stakeholders need to understand the complexity and expense of locating illicit connections in developed areas. Although many of the bacteria sources within the watershed are human, pet waste also contributes to this problem. To alleviate this problem, some watershed communities have restricted pet access to community parks and other public property or passed ordinances that require owners to clean up after their pets. The City of Algonac has taken a unique approach to controlling the problem by providing bag dispensers and disposal stations for pet waste cleanup (Figure 5-1). Soil Erosion As noted in Chapter 1, soil erosion and streambank erosion result in habitat destruction and a significant sediment load to tributary streams. Most communities require that new development obtain a soil erosion permit from the county agency and provide a copy of that permit to the community as part of their building permit approval process. However the City of Algonac and the Village of New Haven have taken this a step further by incorporating this requirement, as well as other storm water controls, under their Engineering Standards Ordinance. China Township includes these requirements as part of the standard building permit package that they provide to residents and developers. Several of the communities, including New Baltimore, Clinton Township, and Chesterfield Township, have enabling ordinances that allow them to maintain any sedimentation basins installed within their communities. If a local developer and/or homeowners association fails to properly operate and maintain the devices, then the
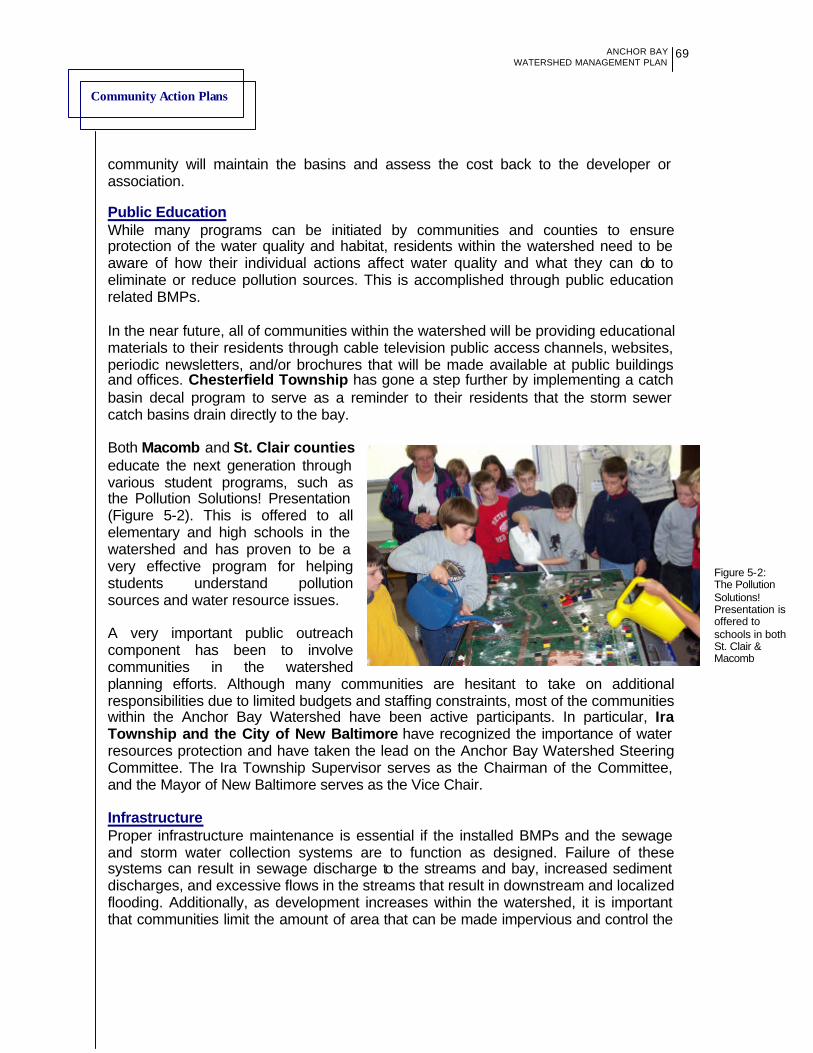
Community Action Plans
ANCHOR BAY WATERSHED MANAGEMENT PLAN
69
Figure 5-2: The Pollution Solutions! Presentation is offered to schools in both St. Clair & Macomb Counties
community will maintain the basins and assess the cost back to the developer or association. Public Education While many programs can be initiated by communities and counties to ensure protection of the water quality and habitat, residents within the watershed need to be aware of how their individual actions affect water quality and what they can do to eliminate or reduce pollution sources. This is accomplished through public education related BMPs. In the near future, all of communities within the watershed will be providing educational materials to their residents through cable television public access channels, websites, periodic newsletters, and/or brochures that will be made available at public buildings and offices. Chesterfield Township has gone a step further by implementing a catch basin decal program to serve as a reminder to their residents that the storm sewer catch basins drain directly to the bay. Both Macomb and St. Clair counties educate the next generation through various student programs, such as the Pollution Solutions! Presentation (Figure 5-2). This is offered to all elementary and high schools in the watershed and has proven to be a very effective program for helping students understand pollution sources and water resource issues. A very important public outreach component has been to involve communities in the watershed planning efforts. Although many communities are hesitant to take on additional responsibilities due to limited budgets and staffing constraints, most of the communities within the Anchor Bay Watershed have been active participants. In particular, Ira Township and the City of New Baltimore have recognized the importance of water resources protection and have taken the lead on the Anchor Bay Watershed Steering Committee. The Ira Township Supervisor serves as the Chairman of the Committee, and the Mayor of New Baltimore serves as the Vice Chair. Infrastructure Proper infrastructure maintenance is essential if the installed BMPs and the sewage and storm water collection systems are to function as designed. Failure of these systems can result in sewage discharge to the streams and bay, increased sediment discharges, and excessive flows in the streams that result in downstream and localized flooding. Additionally, as development increases within the watershed, it is important that communities limit the amount of area that can be made impervious and control the
Community Action Plans
ANCHOR BAY WATERSHED MANAGEMENT PLAN
70
locations of development to reduce the impact on waterways to the maximum extent possible. All communities that have sanitary sewer systems have maintenance programs to assure that their systems operate properly. However, the City of Mount Clemens is the only community that has formalized the program to the extent of developing a Capacity, Management, Operation, and Maintenance (CMOM) Program in accordance with EPA draft policies. Habitat and Planning Macomb County is currently conducting a Michigan Natural Features Inventory (MNFI) that will be available to all communities in Macomb County. The county will also conduct a program, called a “leaf-off flyover,” to take digital photographs of the entire county. These tools will significantly improve the ability of the county and local communities to protect, preserve, and enhance valuable wetland and woodland areas. Many communities have recreational master plans and have begun to review property that becomes available along stream corridors for possible purchase in order to protect the riparian zone from additional development. Clay Township, Ira Township, and the City of Algonac participated in development of a nature trail in St. Johns Marsh, which provides habitat protection and a venue for public education. The City of Mount Clemens installed a wet weather flow retention basin along the Clinton River as part of their combined sewer overflow (CSO) control program. Since the installation, the city went back and developed a habitat restoration project adjacent to the basin; that included planting native vegetation and soft engineering methods to stabilize the banks. Land use planning for future development in the Anchor Bay Watershed is imperative if it is going to be done in a manner that minimizes impacts on the habitat and water quality. Richmond Township has adopted an ordinance that allows for the transfer of development rights within the township to protect existing farmland. Ira Township has developed a land use master plan that reflects, and is based on, the sewer master plan for the community. These ordinances are examples of how proper planning efforts can aid with long-term protection and enhancement of the habitat and water quality within the watershed. 5.2 GAP ANALYSIS The Technical Committee evaluated community and county activities to identify gaps in the implementation phase of the watershed plan. A gap was identified where goals and/or objectives are stated but no or minimal community and county actions are being implemented or planned for future. The identified gaps can serve as recommendations for actions needed in order for the goals of this watershed plan to be accomplished. Two of the most important gaps in this watershed plan are the lack of sustainable funding for stormwater programs and the lack of water quality monitoring programs.
Community Action Plans
ANCHOR BAY WATERSHED MANAGEMENT PLAN
71
Financial Solutions Gap Analysis In order for this watershed plan and Phase II NPDES Storm Water Permit regulations to be implemented, communities and counties need to develop methods to fund storm water programs. Some possible funding mechanisms include state and federal grants, special assessment districts, and storm water utility fees. Communities and counties should work together to develop coordinated program funding strategies. Water Quality Monitoring Gap Analysis The Lake St. Clair, Clinton River, and St. Clair River Water Quality Monitoring Project has recently been developed to establish baseline conditions at select locations within the Anchor Bay watershed over the next three years. This project aids in characterizing water quality in the watershed by expanding existing monitoring programs being performed by St. Clair and Macomb counties. The communities and counties within the watershed need to develop a mechanism to sustain and expand this project beyond its initial three years. Illicit Discharge Gap Analysis Although both Macomb and St. Clair counties have initiated a program to locate illicit discharges, Phase II communities will need to submit an Illicit Discharge Elimination Plan (IDEP) and begin implementation of a program within their community by September 2004. All communities within the watershed, whether Phase II or not, should be responsible for proactively finding and eliminating illicit discharges within their jurisdiction. In order to maximize resources, the two counties and communities within them should have coordinated and complimentary IDEP activities. Before communities submit their IDEP plan to the MDEQ in September 2004, discussions should be held regarding: consistency of IDEP data; public education regarding illicit discharge reporting; reduction of bacterial runoff from domestic animals and wildlife; and identification of agricultural problem areas and how Generally Accepted Agricultural Management Practices (GAAMPs) can best be encouraged in those areas. Soil Erosion Gap Analysis Although both counties conduct Soil Erosion and Sedimentation Control (SESC) for most communities, field data has demonstrated a need to improve these programs. A detailed review of SESC programs, fee schedules, enforcement, and the number of inspections per site should be analyzed for improvements needed. Soil erosion training should also be implemented among municipal field staff so they can alert County SESC inspectors of any problems they observe in the field. Documentation of municipal employee training programs will be required as part of community and county SWPPIs. Erosion problems have also been noted at road stream crossings, along the banks of county drains, and natural waterways. Table 5-1 depicts that very little streambank stabilization is being done or planned within the watershed. Waterways and stream crossings showing evidence of erosion should be identified and prioritized for stabilization. Stream erosion is a function of the water velocity and volume carried in the stream, as well as the stability of the stream. A geomorphology study will determine
Community Action Plans
ANCHOR BAY WATERSHED MANAGEMENT PLAN
72
how stabilization efforts will affect reaches above and below the project site. If it is determined that stabilization is needed, a geomorphology study should be conducted prior to making any changes in the stream. Public Education Gap Analysis Training programs should be developed and implemented for municipal staff in the BMPs that affect storm water runoff. This training will help fulfill a communities’ Phase II requirements. The type of education a municipality should provide to fulfill this requirement includes: fertilizer, pesticide, and herbicide application methods; illicit discharge detection and reporting; fleet maintenance; storage and disposal of hazardous materials; soil erosion and sedimentation control; general stormwater awareness; and land use planning. Although an educational strategy has been included in this plan (Chapter 2), communities and counties will need to expand it into a community-specific Public Education Plan, which is due to the MDEQ in Fall 2004. In order to accomplish this in an efficient and cost effective manner, communities and the counties should establish a public education subcommittee. The subcommittee would develop a generic public education plan template for adaptation by the communities. The subcommittee would also work to develop educational materials, presentations, and outreach programs for distribution throughout the watershed. Infrastructure Gap Analysis In order to protect watercourses within the watershed, increased inspection and maintenance of storm water control facilities is needed. In order to fill this gap, communities and the counties need to assess storm water control programs and their funding sources to ensure they can be properly implemented. Storm water ordinances are needed across the watershed to ensure that proper infrastructure is built and storm water flows are managed. This is required as part of Phase II post-construction requirements. A storm water ordinance is a common method of meeting this requirement and can be developed by both the counties and local communities. Local communities could also refer to a county ordinance in their new construction specifications rather than developing their own ordinance. Package treatment plants are also part of the watershed infrastructure that needs increased planning, inspection, and maintenance. Currently, package treatment plants are permitted through the MDEQ with little or no consultation with local communities or the county. Local communities and the county should have input regarding the location, number, and amount of discharge permitted for each package treatment plant within each region and along each waterway on a cumulative basis. Habitat and Planning Gap Analysis St. Clair County should join Macomb County in its efforts to initiate a natural features inventory. These inventories aid local communities in identifying riparian land for future parks and public access, areas where wetlands may be constructed for use as regional detention and flood control, or natural features, such as woodlands and wetlands.
Community Action Plans
ANCHOR BAY WATERSHED MANAGEMENT PLAN
73
Local communities that have identified natural features for protection should utilize land use planning tools to ensure their protection. A natural features ordinance, wetland ordinance, other types of ordinances, or modification of the site plan review process for natural resource and environmental protection is needed if these features are to be protected. For example, local communities that have identified farmland as a resource to be preserved should adopt an ordinance, like Richmond Township has, that will protect existing farmland and habitat areas while allowing development in prescribed township areas. In addition, comprehensive master plans should incorporate language regarding the need for natural features protection in order to support community ordinances, policies, and practices. At a minimum, water resources should be identified as a natural feature to protect. Riparian land is one of the most important land areas that the communities and counties should protect, including the establishment of buffer zones for water quality protection. Managing riparian corridors has been identified as a gap in Table 5-1. Natural feature setbacks or overlay districts are examples of planning tools that can help protect these areas with natural vegetation buffers. The lack of habitat restoration efforts is also identified as a gap across the watershed. Bioengineering, natural plantings, tree cover, and log and bank shelters are some of the habitat improvement techniques that local communities can use on natural waterways and counties can use on drains. 5.3 COST ESTIMATES The watershed communities may not be familiar with the activities outlined in the gap analysis. To aid the communities, a table of unit costs for the effort associated with these activities was developed (See Table 5-2). A portion of the costs were developed using informational documents created by neighboring watersheds, while Technical Committee developed the remaining costs. A brief description of each activity is provided, along with a range of hours and typical hourly rates. The purpose of this table is to give communities a rough cost estimate for implementing various projects. Once a specific scope of work is developed for an activity, better costs should be obtained. Additional cost information and criteria for best management practices can be found from numerous sources including: www.cwp.org/pubs_download.htm, www.rougeriver.com/watershed, www.bmpdatabase.org, www.michigan.gov/deq, and www.epa.gov.

Community Action Plans
ANCHOR BAY WATERSHED MANAGEMENT PLAN
Table 5-1: Community Interview Summary
Key: C = Current S = Short Term L = Long Term N = Not Applicable * = County Program Blank Space = not planned
74
BMP
Best Management Practices Goals &
Objectives St. C
lair
Cou
nty
Alg
onac
Cas
co T
owns
hip
Chin
a To
wns
hip
Cla
y To
wns
hip
Cot
trel
lvill
e To
wns
hip
Ira T
owns
hip
Mar
ine
City
Mac
omb
Cou
nty
Ches
terf
ield
Tow
nshi
p
Clin
ton
Tow
nshi
p
Har
rison
Tow
nshi
p
Leno
x To
wns
hip
Mac
omb
Tow
nshi
p
Mou
nt C
lem
ens
New
Bal
timor
e
New
Hav
en
Ric
hmon
d
Ric
hmon
d To
wns
hip
1 Conduct Household Hazardous Materials Management Programs
2a, 3a, 3c C * * C C * C C C * * * * C C C
2 Conduct Natural Feature Inventory and Assessments
2a, 2b C N C C * L S * S * * C * *
3 Conserve Riparian Land for Future Parks and Public Access
1c, 2a, 2d C N C C C C C S C C C
4 Construct/Maintain Storm Water Storage Facilities
1a, 1b, 2c, 4c, 4d C C C C N C C C C,S C C C C C C
5 Construct Wetlands 1a, 2a, 2b, 2c, 4c, 4d S N C N
6 Continue/Expand Litter and Debris Clean-up and Recycling Programs
2a C C C C C C C C C S C C C C C
7 Control Soil Erosion 2a, 2b S * * * * * * * C * * * * * C C * * *
8 Enhance Catch Basin Functionality
1a, 1b, 2a, 2b, 3a, 3b C C N N N N N C C C S C C C C N
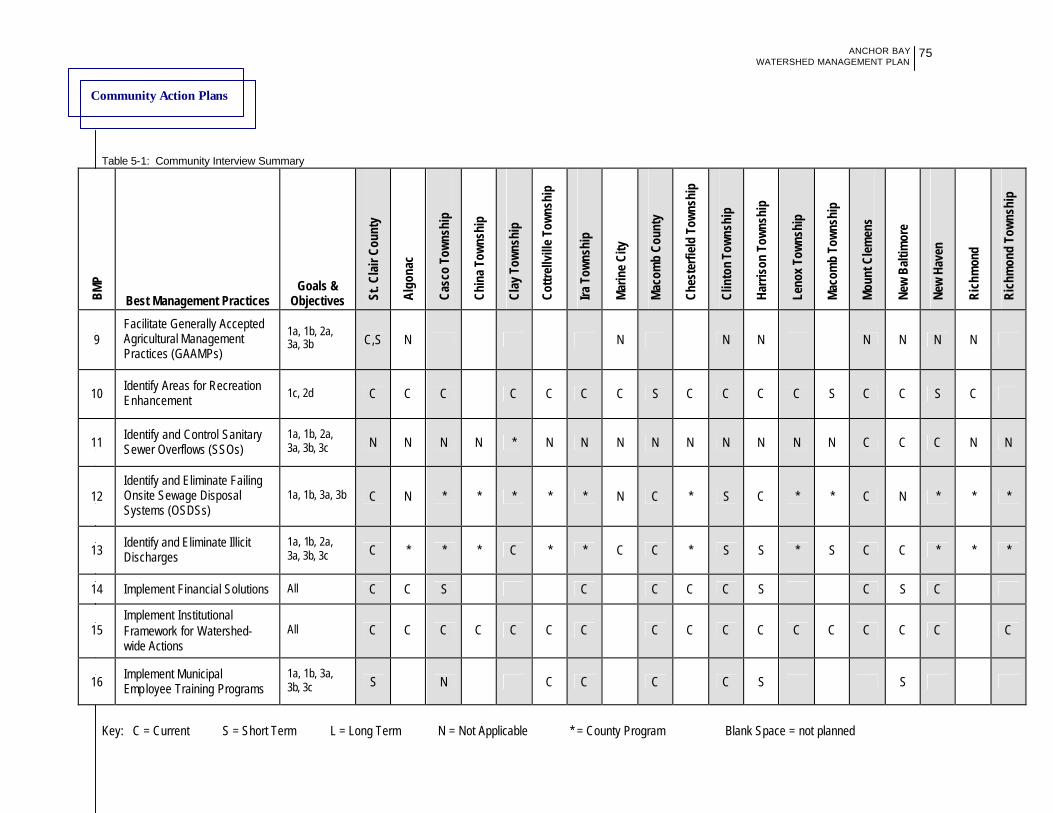
Community Action Plans
ANCHOR BAY WATERSHED MANAGEMENT PLAN
Table 5-1: Community Interview Summary
Key: C = Current S = Short Term L = Long Term N = Not Applicable * = County Program Blank Space = not planned
75
BMP
Best Management Practices Goals &
Objectives St. C
lair
Cou
nty
Alg
onac
Cas
co T
owns
hip
Chin
a To
wns
hip
Cla
y To
wns
hip
Cot
trel
lvill
e To
wns
hip
Ira T
owns
hip
Mar
ine
City
Mac
omb
Cou
nty
Ches
terf
ield
Tow
nshi
p
Clin
ton
Tow
nshi
p
Har
rison
Tow
nshi
p
Leno
x To
wns
hip
Mac
omb
Tow
nshi
p
Mou
nt C
lem
ens
New
Bal
timor
e
New
Hav
en
Ric
hmon
d
Ric
hmon
d To
wns
hip
9 Facilitate Generally Accepted Agricultural Management Practices (GAAMPs)
1a, 1b, 2a, 3a, 3b C,S N N N N N N N N
10 Identify Areas for Recreation Enhancement
1c, 2d C C C C C C C S C C C C S C C S C
11 Identify and Control Sanitary Sewer Overflows (SSOs)
1a, 1b, 2a, 3a, 3b, 3c N N N N * N N N N N N N N N C C C N N
12 Identify and Eliminate Failing Onsite Sewage Disposal Systems (OSDSs)
1a, 1b, 3a, 3b C N * * * * * N C * S C * * C N * * *
13 Identify and Eliminate Illicit Discharges
1a, 1b, 2a, 3a, 3b, 3c C * * * C * * C C * S S * S C C * * *
14 Implement Financial Solutions All C C S C C C C S C S C
15 Implement Institutional Framework for Watershed-wide Actions
All C C C C C C C C C C C C C C C C C
16 Implement Municipal Emp loyee Training Programs
1a, 1b, 3a, 3b, 3c S N C C C C S S
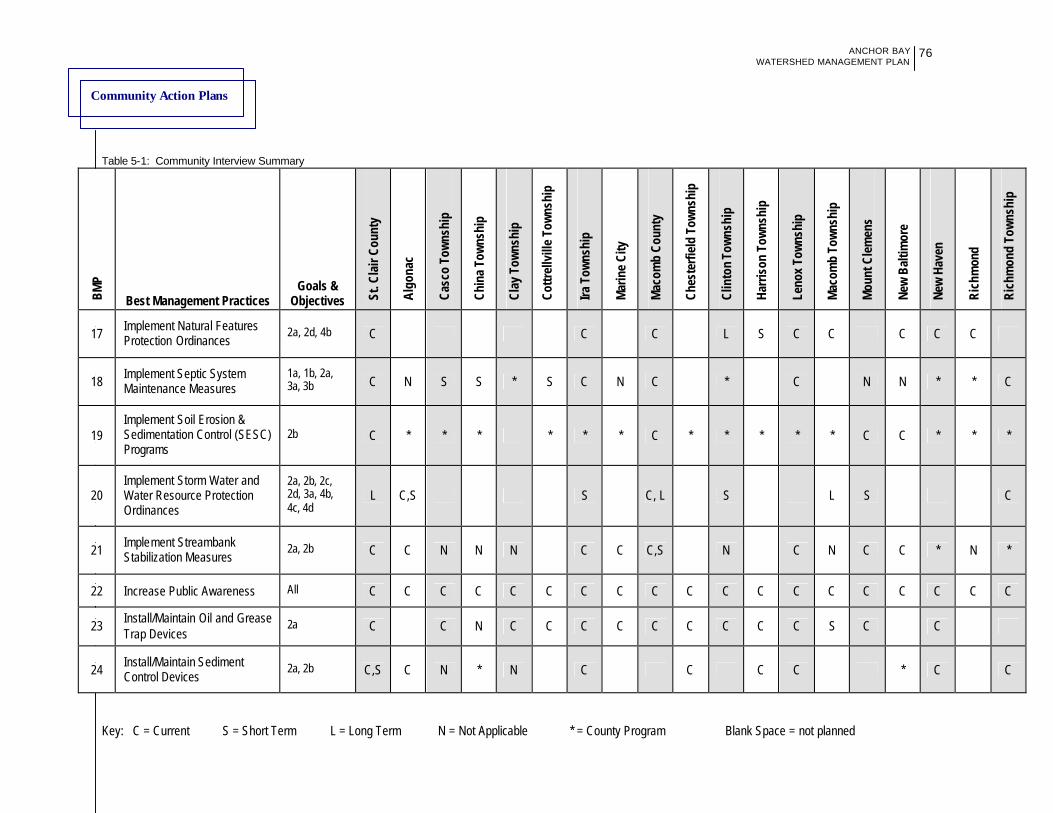
Community Action Plans
ANCHOR BAY WATERSHED MANAGEMENT PLAN
Table 5-1: Community Interview Summary
Key: C = Current S = Short Term L = Long Term N = Not Applicable * = County Program Blank Space = not planned
76
BMP
Best Management Practices Goals &
Objectives St. C
lair
Cou
nty
Alg
onac
Cas
co T
owns
hip
Chin
a To
wns
hip
Cla
y To
wns
hip
Cot
trel
lvill
e To
wns
hip
Ira T
owns
hip
Mar
ine
City
Mac
omb
Cou
nty
Ches
terf
ield
Tow
nshi
p
Clin
ton
Tow
nshi
p
Har
rison
Tow
nshi
p
Leno
x To
wns
hip
Mac
omb
Tow
nshi
p
Mou
nt C
lem
ens
New
Bal
timor
e
New
Hav
en
Ric
hmon
d
Ric
hmon
d To
wns
hip
17 Implement Natural Features Protection Ordinances
2a, 2d, 4b C C C L S C C C C C
18 Implement Septic System Maintenance Measures
1a, 1b, 2a, 3a, 3b C N S S * S C N C * C N N * * C
19 Implement Soil Erosion & Sedimentation Control (SESC) Programs
2b C * * * * * * C * * * * * C C * * *
20 Implement Storm Water and Water Resource Protection Ordinances
2a, 2b, 2c, 2d, 3a, 4b, 4c, 4d
L C,S S C, L S L S C
21 Implement Streambank Stabilization Measures
2a, 2b C C N N N C C C,S N C N C C * N *
22 Increase Public Awareness All C C C C C C C C C C C C C C C C C C C
23 Install/Maintain Oil and Grease Trap Devices
2a C C N C C C C C C C C C S C C
24 Install/Maintain Sediment Control Devices
2a, 2b C,S C N * N C C C C * C C
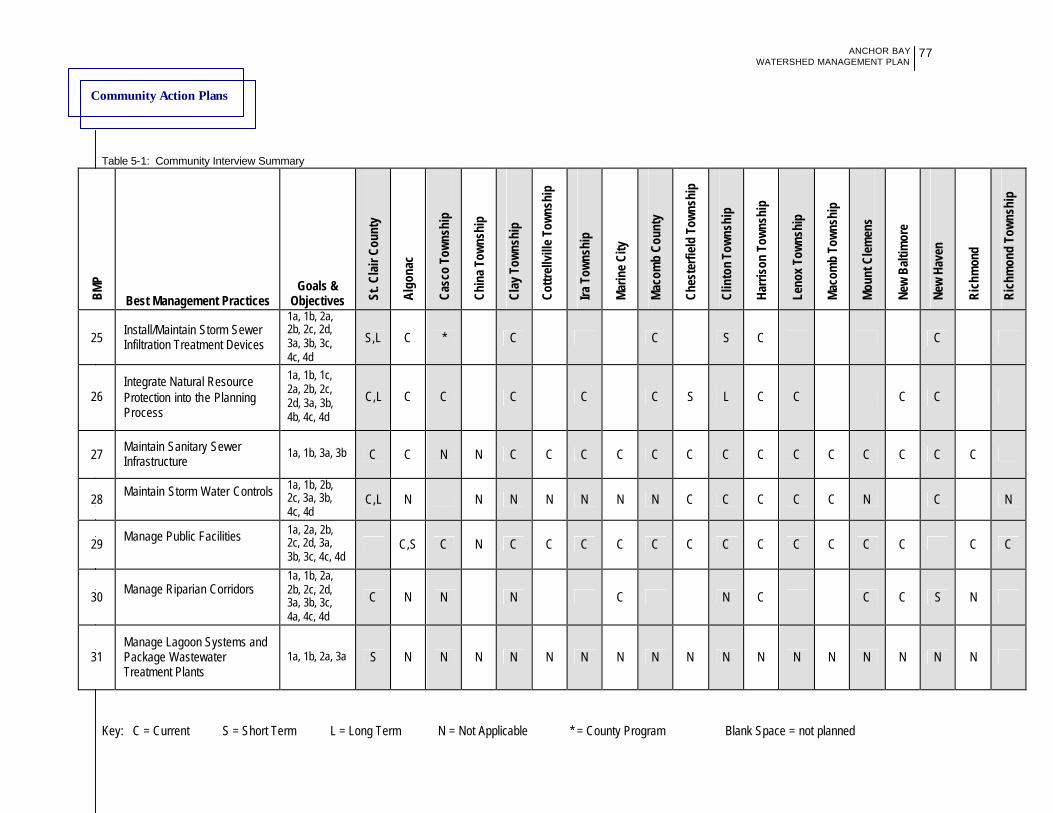
Community Action Plans
ANCHOR BAY WATERSHED MANAGEMENT PLAN
Table 5-1: Community Interview Summary
Key: C = Current S = Short Term L = Long Term N = Not Applicable * = County Program Blank Space = not planned
77
BMP
Best Management Practices Goals &
Objectives St. C
lair
Cou
nty
Alg
onac
Cas
co T
owns
hip
Chin
a To
wns
hip
Cla
y To
wns
hip
Cot
trel
lvill
e To
wns
hip
Ira T
owns
hip
Mar
ine
City
Mac
omb
Cou
nty
Ches
terf
ield
Tow
nshi
p
Clin
ton
Tow
nshi
p
Har
rison
Tow
nshi
p
Leno
x To
wns
hip
Mac
omb
Tow
nshi
p
Mou
nt C
lem
ens
New
Bal
timor
e
New
Hav
en
Ric
hmon
d
Ric
hmon
d To
wns
hip
25 Install/Maintain Storm Sewer Infiltration Treatment Devices
1a, 1b, 2a, 2b, 2c, 2d, 3a, 3b, 3c, 4c, 4d
S,L C * C C S C C
26 Integrate Natural Resource Protection into the Planning Process
1a, 1b, 1c, 2a, 2b, 2c, 2d, 3a, 3b, 4b, 4c, 4d
C,L C C C C C S L C C C C
27 Maintain Sanitary Sewer Infrastructure
1a, 1b, 3a, 3b C C N N C C C C C C C C C C C C C C
28 Maintain Storm Water Controls
1a, 1b, 2b, 2c, 3a, 3b, 4c, 4d
C,L N N N N N N N C C C C C N C N
29 Manage Public Facilities
1a, 2a, 2b, 2c, 2d, 3a, 3b, 3c, 4c, 4d
C,S C N C C C C C C C C C C C C C C
30 Manage Riparian Corridors
1a, 1b, 2a, 2b, 2c, 2d, 3a, 3b, 3c, 4a, 4c, 4d
C N N N C N C C C S N
31 Manage Lagoon Systems and Package Wastewater Treatment Plants
1a, 1b, 2a, 3a S N N N N N N N N N N N N N N N N N
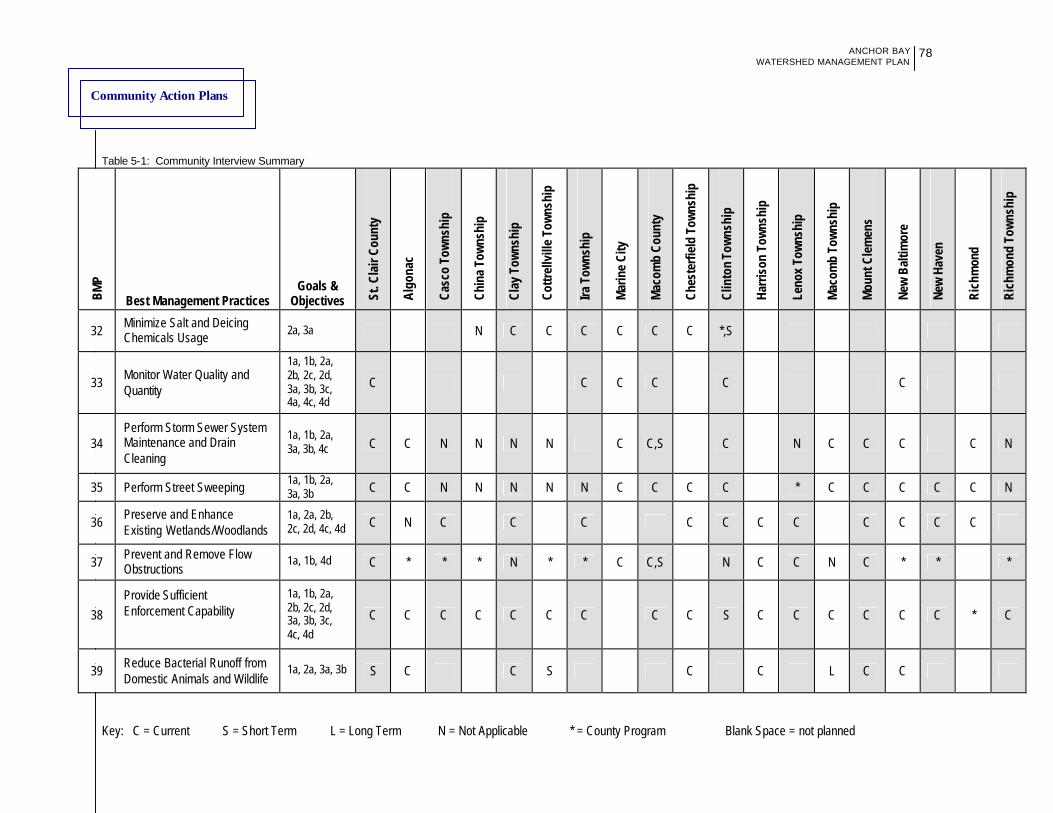
Community Action Plans
ANCHOR BAY WATERSHED MANAGEMENT PLAN
Table 5-1: Community Interview Summary
Key: C = Current S = Short Term L = Long Term N = Not Applicable * = County Program Blank Space = not planned
78
BMP
Best Management Practices Goals &
Objectives St. C
lair
Cou
nty
Alg
onac
Cas
co T
owns
hip
Chin
a To
wns
hip
Cla
y To
wns
hip
Cot
trel
lvill
e To
wns
hip
Ira T
owns
hip
Mar
ine
City
Mac
omb
Cou
nty
Ches
terf
ield
Tow
nshi
p
Clin
ton
Tow
nshi
p
Har
rison
Tow
nshi
p
Leno
x To
wns
hip
Mac
omb
Tow
nshi
p
Mou
nt C
lem
ens
New
Bal
timor
e
New
Hav
en
Ric
hmon
d
Ric
hmon
d To
wns
hip
32 Minimize Salt and Deicing Chemicals Usage
2a, 3a N C C C C C C *,S
33
Monitor Water Quality and Quantity
1a, 1b, 2a, 2b, 2c, 2d, 3a, 3b, 3c, 4a, 4c, 4d
C C C C C C
34 Perform Storm Sewer System Maintenance and Drain Cleaning
1a, 1b, 2a, 3a, 3b, 4c C C N N N N C C,S C N C C C C N
35 Perform Street Sweeping 1a, 1b, 2a, 3a, 3b C C N N N N N C C C C * C C C C C N
36 Preserve and Enhance Existing Wetlands/Woodlands
1a, 2a, 2b, 2c, 2d, 4c, 4d C N C C C C C C C C C C C
37 Prevent and Remove Flow Obstructions
1a, 1b, 4d C * * * N * * C C,S N C C N C * * *
38
Provide Sufficient Enforcement Capability
1a, 1b, 2a, 2b, 2c, 2d, 3a, 3b, 3c, 4c, 4d
C C C C C C C C C S C C C C C C * C
39 Reduce Bacterial Runoff from Domestic Animals and Wildlife
1a, 2a, 3a, 3b S C C S C C L C C
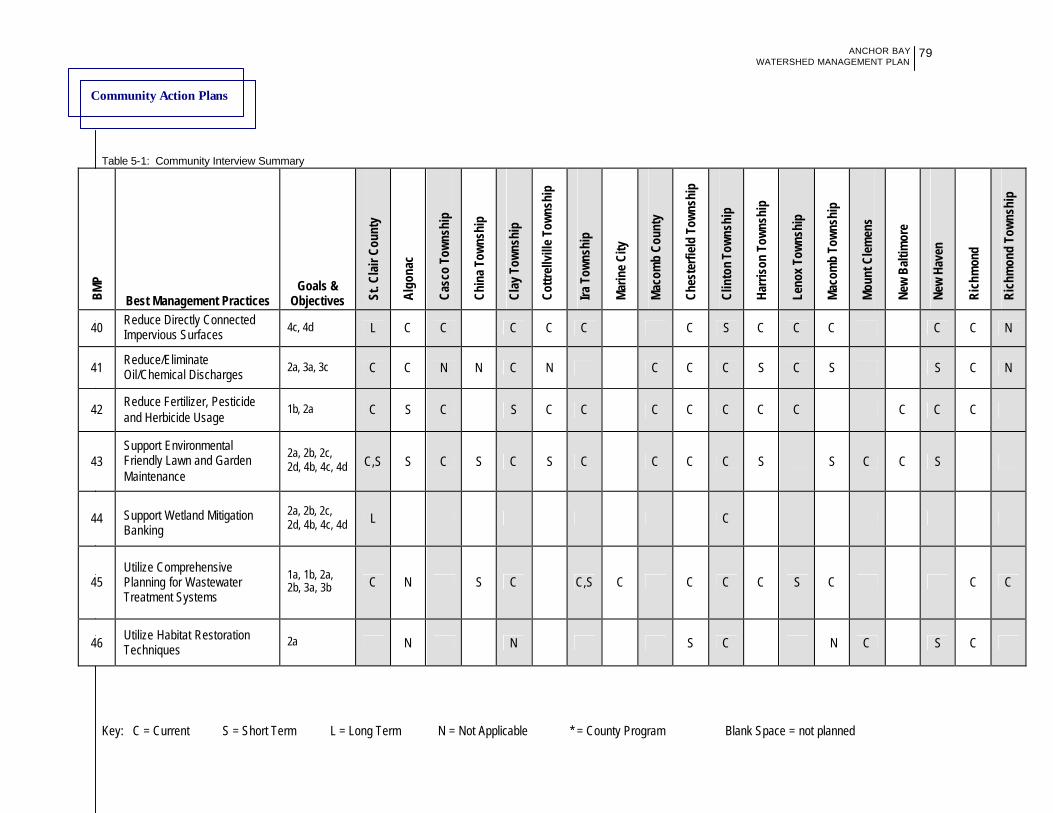
Community Action Plans
ANCHOR BAY WATERSHED MANAGEMENT PLAN
Table 5-1: Community Interview Summary
Key: C = Current S = Short Term L = Long Term N = Not Applicable * = County Program Blank Space = not planned
79
BMP
Best Management Practices Goals &
Objectives St. C
lair
Cou
nty
Alg
onac
Cas
co T
owns
hip
Chin
a To
wns
hip
Cla
y To
wns
hip
Cot
trel
lvill
e To
wns
hip
Ira T
owns
hip
Mar
ine
City
Mac
omb
Cou
nty
Ches
terf
ield
Tow
nshi
p
Clin
ton
Tow
nshi
p
Har
rison
Tow
nshi
p
Leno
x To
wns
hip
Mac
omb
Tow
nshi
p
Mou
nt C
lem
ens
New
Bal
timor
e
New
Hav
en
Ric
hmon
d
Ric
hmon
d To
wns
hip
40 Reduce Directly Connected Impervious Surfaces
4c, 4d L C C C C C C S C C C C C N
41 Reduce/Eliminate Oil/Chemical Discharges
2a, 3a, 3c C C N N C N C C C S C S S C N
42 Reduce Fertilizer, Pesticide and Herbicide Usage
1b, 2a C S C S C C C C C C C C C C
43 Support Environmental Friendly Lawn and Garden Maintenance
2a, 2b, 2c, 2d, 4b, 4c, 4d C,S S C S C S C C C C S S C C S
44
Support Wetland Mitigation Banking
2a, 2b, 2c, 2d, 4b, 4c, 4d L C
45 Utilize Comprehensive Planning for Wastewater Treatment Systems
1a, 1b, 2a, 2b, 3a, 3b C N S C C,S C C C C S C C C
46 Utilize Habitat Restoration Techniques
2a N N S C N C S C
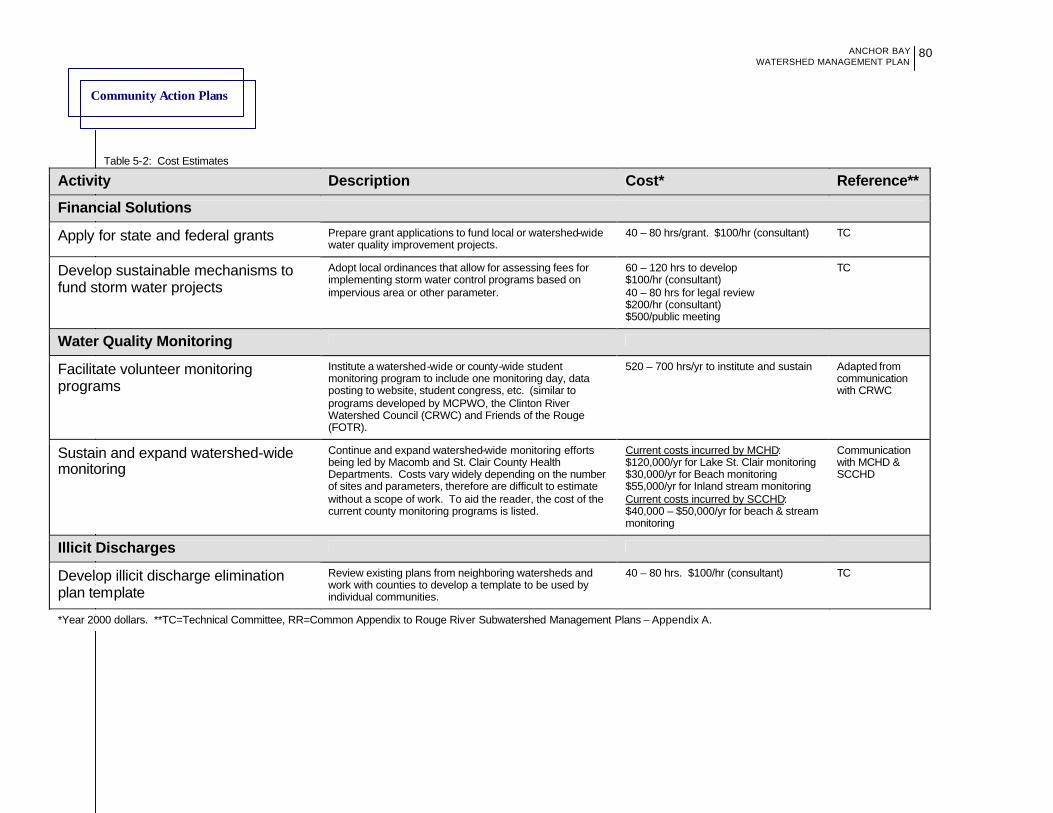
Community Action Plans
ANCHOR BAY WATERSHED MANAGEMENT PLAN
Table 5-2: Cost Estimates
80
Activity Description Cost* Reference**
Financial Solutions
Apply for state and federal grants Prepare grant applications to fund local or watershed-wide water quality improvement projects.
40 – 80 hrs/grant. $100/hr (consultant) TC
Develop sustainable mechanisms to fund storm water projects
Adopt local ordinances that allow for assessing fees for implementing storm water control programs based on impervious area or other parameter.
60 – 120 hrs to develop $100/hr (consultant) 40 – 80 hrs for legal review $200/hr (consultant) $500/public meeting
TC
Water Quality Monitoring
Facilitate volunteer monitoring programs
Institute a watershed-wide or county-wide student monitoring program to include one monitoring day, data posting to website, student congress, etc. (similar to programs developed by MCPWO, the Clinton River Watershed Council (CRWC) and Friends of the Rouge (FOTR).
520 – 700 hrs/yr to institute and sustain Adapted from communication with CRWC
Sustain and expand watershed-wide monitoring
Continue and expand watershed-wide monitoring efforts being led by Macomb and St. Clair County Health Departments. Costs vary widely depending on the number of sites and parameters, therefore are difficult to estimate without a scope of work. To aid the reader, the cost of the current county monitoring programs is listed.
Current costs incurred by MCHD: $120,000/yr for Lake St. Clair monitoring $30,000/yr for Beach monitoring $55,000/yr for Inland stream monitoring Current costs incurred by SCCHD: $40,000 – $50,000/yr for beach & stream monitoring
Communication with MCHD & SCCHD
Illicit Discharges
Develop illicit discharge elimination plan template
Review existing plans from neighboring watersheds and work with counties to develop a template to be used by individual communities.
40 – 80 hrs. $100/hr (consultant) TC
*Year 2000 dollars. **TC=Technical Committee, RR=Common Appendix to Rouge River Subwatershed Management Plans – Appendix A.
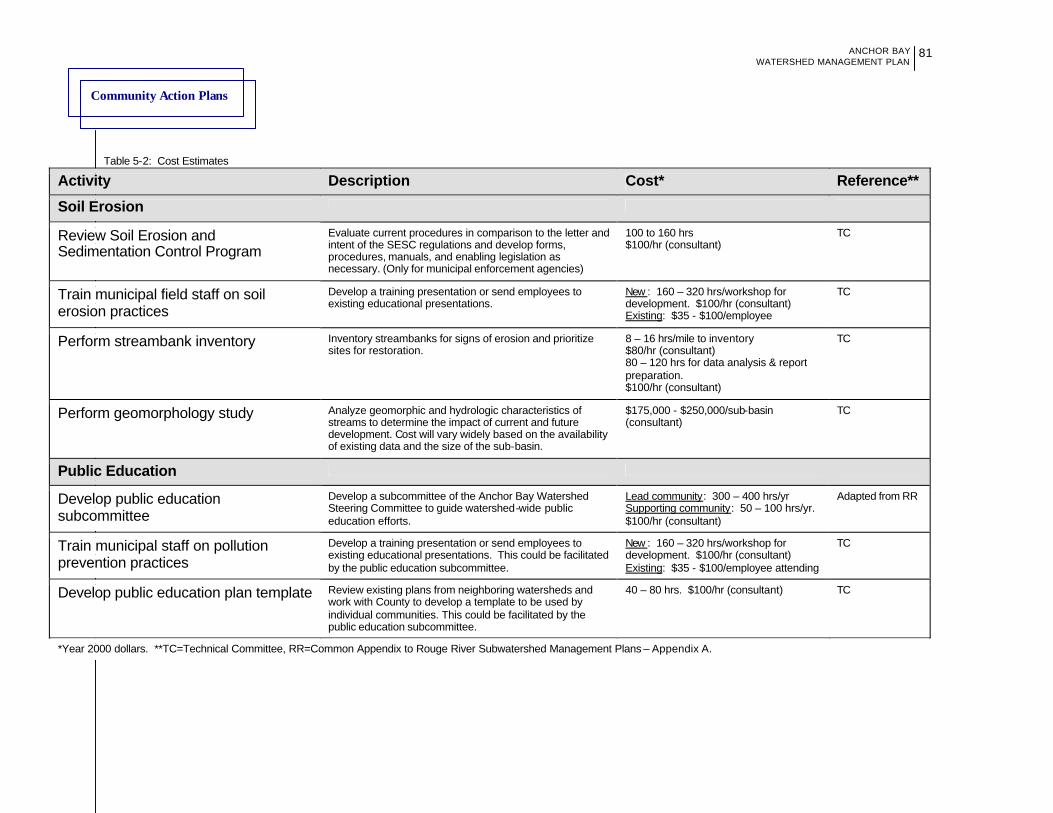
Community Action Plans
ANCHOR BAY WATERSHED MANAGEMENT PLAN
Table 5-2: Cost Estimates
81
Activity Description Cost* Reference**
Soil Erosion
Review Soil Erosion and Sedimentation Control Program
Evaluate current procedures in comparison to the letter and intent of the SESC regulations and develop forms, procedures, manuals, and enabling legislation as necessary. (Only for municipal enforcement agencies)
100 to 160 hrs $100/hr (consultant)
TC
Train municipal field staff on soil erosion practices
Develop a training presentation or send employees to existing educational presentations.
New : 160 – 320 hrs/workshop for development. $100/hr (consultant) Existing: $35 - $100/employee
TC
Perform streambank inventory Inventory streambanks for signs of erosion and prioritize sites for restoration.
8 – 16 hrs/mile to inventory $80/hr (consultant) 80 – 120 hrs for data analysis & report preparation. $100/hr (consultant)
TC
Perform geomorphology study Analyze geomorphic and hydrologic characteristics of streams to determine the impact of current and future development. Cost will vary widely based on the availability of existing data and the size of the sub-basin.
$175,000 - $250,000/sub-basin (consultant)
TC
Public Education
Develop public education subcommittee
Develop a subcommittee of the Anchor Bay Watershed Steering Committee to guide watershed-wide public education efforts.
Lead community: 300 – 400 hrs/yr Supporting community: 50 – 100 hrs/yr. $100/hr (consultant)
Adapted from RR
Train municipal staff on pollution prevention practices
Develop a training presentation or send employees to existing educational presentations. This could be facilitated by the public education subcommittee.
New : 160 – 320 hrs/workshop for development. $100/hr (consultant) Existing: $35 - $100/employee attending
TC
Develop public education plan template Review existing plans from neighboring watersheds and work with County to develop a template to be used by individual communities. This could be facilitated by the public education subcommittee.
40 – 80 hrs. $100/hr (consultant) TC
*Year 2000 dollars. **TC=Technical Committee, RR=Common Appendix to Rouge River Subwatershed Management Plans – Appendix A.
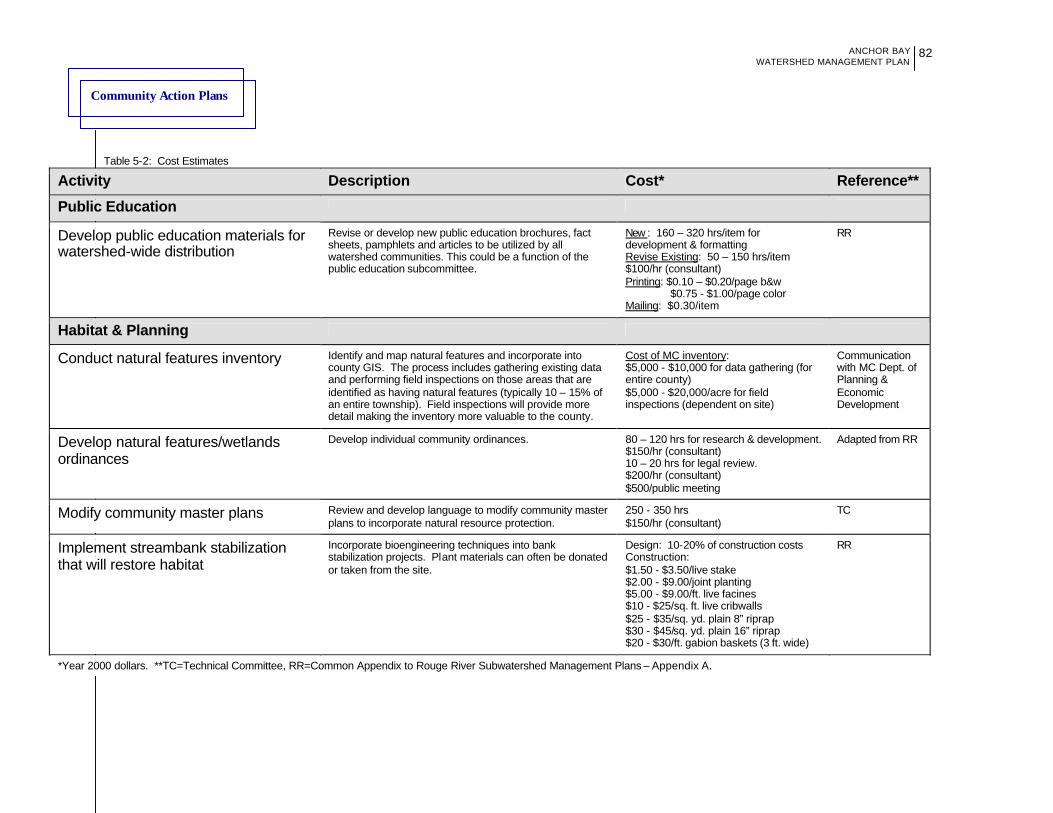
Community Action Plans
ANCHOR BAY WATERSHED MANAGEMENT PLAN
Table 5-2: Cost Estimates
82
Activity Description Cost* Reference**
Public Education
Develop public education materials for watershed-wide distribution
Revise or develop new public education brochures, fact sheets, pamphlets and articles to be utilized by all watershed communities. This could be a function of the public education subcommittee.
New : 160 – 320 hrs/item for development & formatting Revise Existing: 50 – 150 hrs/item $100/hr (consultant) Printing: $0.10 – $0.20/page b&w $0.75 - $1.00/page color Mailing: $0.30/item
RR
Habitat & Planning
Conduct natural features inventory Identify and map natural features and incorporate into county GIS. The process includes gathering existing data and performing field inspections on those areas that are identified as having natural features (typically 10 – 15% of an entire township). Field inspections will provide more detail making the inventory more valuable to the county.
Cost of MC inventory: $5,000 - $10,000 for data gathering (for entire county) $5,000 - $20,000/acre for field inspections (dependent on site)
Communication with MC Dept. of Planning & Economic Development
Develop natural features/wetlands ordinances
Develop individual community ordinances. 80 – 120 hrs for research & development. $150/hr (consultant) 10 – 20 hrs for legal review. $200/hr (consultant) $500/public meeting
Adapted from RR
Modify community master plans Review and develop language to modify community master plans to incorporate natural resource protection.
250 - 350 hrs $150/hr (consultant)
TC
Implement streambank stabilization that will restore habitat
Incorporate bioengineering techniques into bank stabilization projects. Plant materials can often be donated or taken from the site.
Design: 10-20% of construction costs Construction: $1.50 - $3.50/live stake $2.00 - $9.00/joint planting $5.00 - $9.00/ft. live facines $10 - $25/sq. ft. live cribwalls $25 - $35/sq. yd. plain 8” riprap $30 - $45/sq. yd. plain 16” riprap $20 - $30/ft. gabion baskets (3 ft. wide)
RR
*Year 2000 dollars. **TC=Technical Committee, RR=Common Appendix to Rouge River Subwatershed Management Plans – Appendix A.
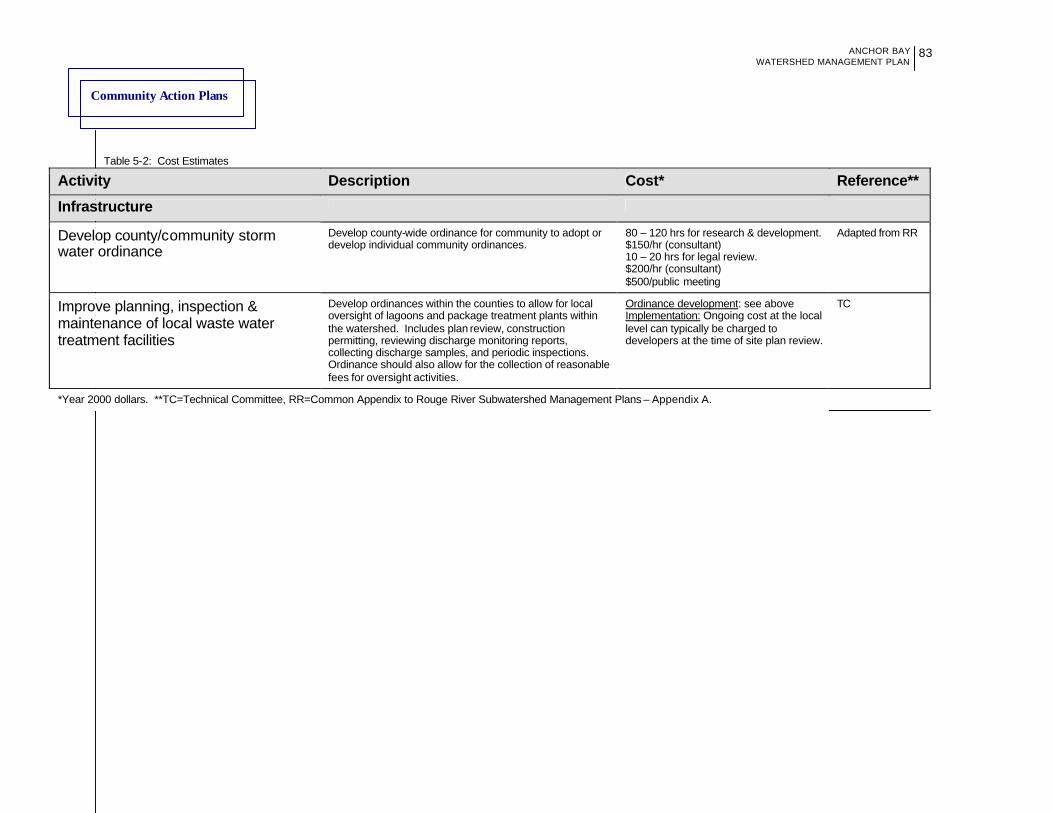
Community Action Plans
ANCHOR BAY WATERSHED MANAGEMENT PLAN
Table 5-2: Cost Estimates
83
Activity Description Cost* Reference**
Infrastructure
Develop county/community storm water ordinance
Develop county-wide ordinance for community to adopt or develop individual community ordinances.
80 – 120 hrs for research & development. $150/hr (consultant) 10 – 20 hrs for legal review. $200/hr (consultant) $500/public meeting
Adapted from RR
Improve planning, inspection & maintenance of local waste water treatment facilities
Develop ordinances within the counties to allow for local oversight of lagoons and package treatment plants within the watershed. Includes plan review, construction permitting, reviewing discharge monitoring reports, collecting discharge samples, and periodic inspections. Ordinance should also allow for the collection of reasonable fees for oversight activities.
Ordinance development: see above Implementation: Ongoing cost at the local level can typically be charged to developers at the time of site plan review.
TC
*Year 2000 dollars. **TC=Technical Committee, RR=Common Appendix to Rouge River Subwatershed Management Plans – Appendix A.
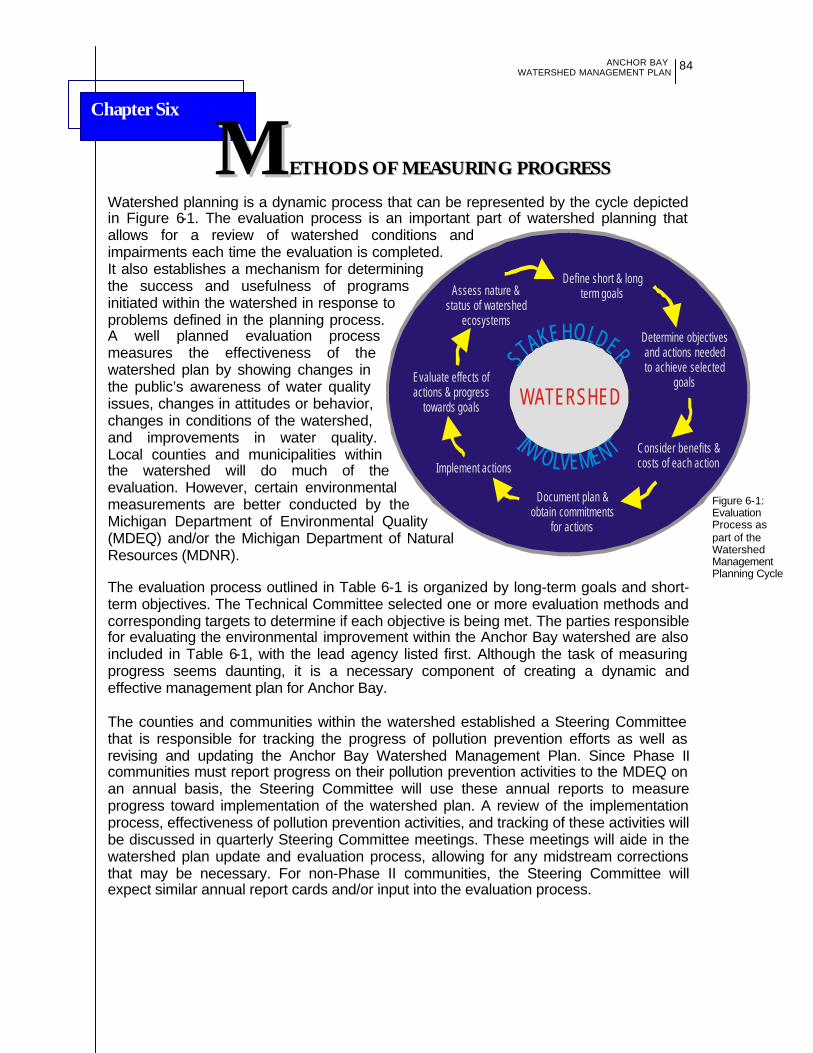
Chapter Six
ANCHOR BAY
WATERSHED MANAGEMENT PLAN
84
MMEETTHHOODDSS OOFF MMEEAASSUURRIINNGG PPRROOGGRREESSSS
INVOLVEMENT
STAKEHOLDER
WATERSHED
Define short & long term goals
Determine objectives and actions needed to achieve selected
goals
Consider benefits & costs of each action
Document plan & obtain commitments
for actions
Implement actions
Evaluate effects of actions & progress
towards goals
Assess nature & status of watershed
ecosystems
Figure 6-1: Evaluation Process as part of the Watershed Management Planning Cycle
Watershed planning is a dynamic process that can be represented by the cycle depicted in Figure 6-1. The evaluation process is an important part of watershed planning that allows for a review of watershed conditions and impairments each time the evaluation is completed. It also establishes a mechanism for determining the success and usefulness of programs initiated within the watershed in response to problems defined in the planning process. A well planned evaluation process measures the effectiveness of the watershed plan by showing changes in the public’s awareness of water quality issues, changes in attitudes or behavior, changes in conditions of the watershed, and improvements in water quality. Local counties and municipalities within the watershed will do much of the evaluation. However, certain environmental measurements are better conducted by the Michigan Department of Environmental Quality (MDEQ) and/or the Michigan Department of Natural Resources (MDNR). The evaluation process outlined in Table 6-1 is organized by long-term goals and short-term objectives. The Technical Committee selected one or more evaluation methods and corresponding targets to determine if each objective is being met. The parties responsible for evaluating the environmental improvement within the Anchor Bay watershed are also included in Table 6-1, with the lead agency listed first. Although the task of measuring progress seems daunting, it is a necessary component of creating a dynamic and effective management plan for Anchor Bay. The counties and communities within the watershed established a Steering Committee that is responsible for tracking the progress of pollution prevention efforts as well as revising and updating the Anchor Bay Watershed Management Plan. Since Phase II communities must report progress on their pollution prevention activities to the MDEQ on an annual basis, the Steering Committee will use these annual reports to measure progress toward implementation of the watershed plan. A review of the implementation process, effectiveness of pollution prevention activities, and tracking of these activities will be discussed in quarterly Steering Committee meetings. These meetings will aide in the watershed plan update and evaluation process, allowing for any midstream corrections that may be necessary. For non-Phase II communities, the Steering Committee will expect similar annual report cards and/or input into the evaluation process.
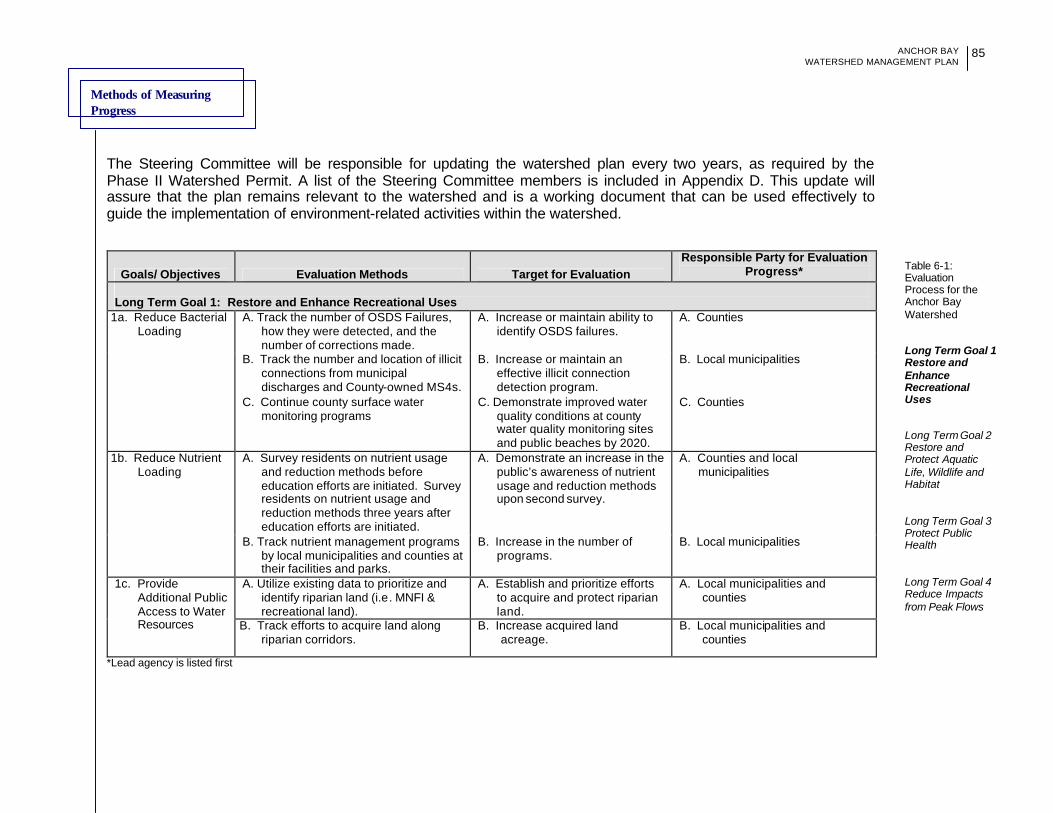
Methods of Measuring Progress
ANCHOR BAY WATERSHED MANAGEMENT PLAN
85
Table 6-1: Evaluation Process for the Anchor Bay Watershed
Long Term Goal 1 Restore and Enhance Recreational Uses Long Term Goal 2 Restore and Protect Aquatic Life, Wildlife and Habitat Long Term Goal 3 Protect Public Health Long Term Goal 4 Reduce Impacts from Peak Flows
The Steering Committee will be responsible for updating the watershed plan every two years, as required by the Phase II Watershed Permit. A list of the Steering Committee members is included in Appendix D. This update will assure that the plan remains relevant to the watershed and is a working document that can be used effectively to guide the implementation of environment-related activities within the watershed.
Goals/ Objectives Evaluation Methods Target for Evaluation Responsible Party for Evaluation
Progress* Long Term Goal 1: Restore and Enhance Recreational Uses
A. Track the number of OSDS Failures, how they were detected, and the number of corrections made.
A. Increase or maintain ability to identify OSDS failures.
A. Counties
B. Track the number and location of illicit connections from municipal discharges and County-owned MS4s.
B. Increase or maintain an effective illicit connection detection program.
B. Local municipalities
1a. Reduce Bacterial Loading
C. Continue county surface water monitoring programs
C. Demonstrate improved water quality conditions at county water quality monitoring sites and public beaches by 2020.
C. Counties
A. Survey residents on nutrient usage and reduction methods before education efforts are initiated. Survey residents on nutrient usage and reduction methods three years after education efforts are initiated.
A. Demonstrate an increase in the public’s awareness of nutrient usage and reduction methods upon second survey.
A. Counties and local municipalities
1b. Reduce Nutrient Loading
B. Track nutrient management programs by local municipalities and counties at their facilities and parks.
B. Increase in the number of programs.
B. Local municipalities
A. Utilize existing data to prioritize and identify riparian land (i.e. MNFI & recreational land).
A. Establish and prioritize efforts to acquire and protect riparian land.
A. Local municipalities and counties
1c. Provide Additional Public Access to Water Resources B. Track efforts to acquire land along
riparian corridors. B. Increase acquired land
acreage. B. Local municipalities and
counties
*Lead agency is listed first
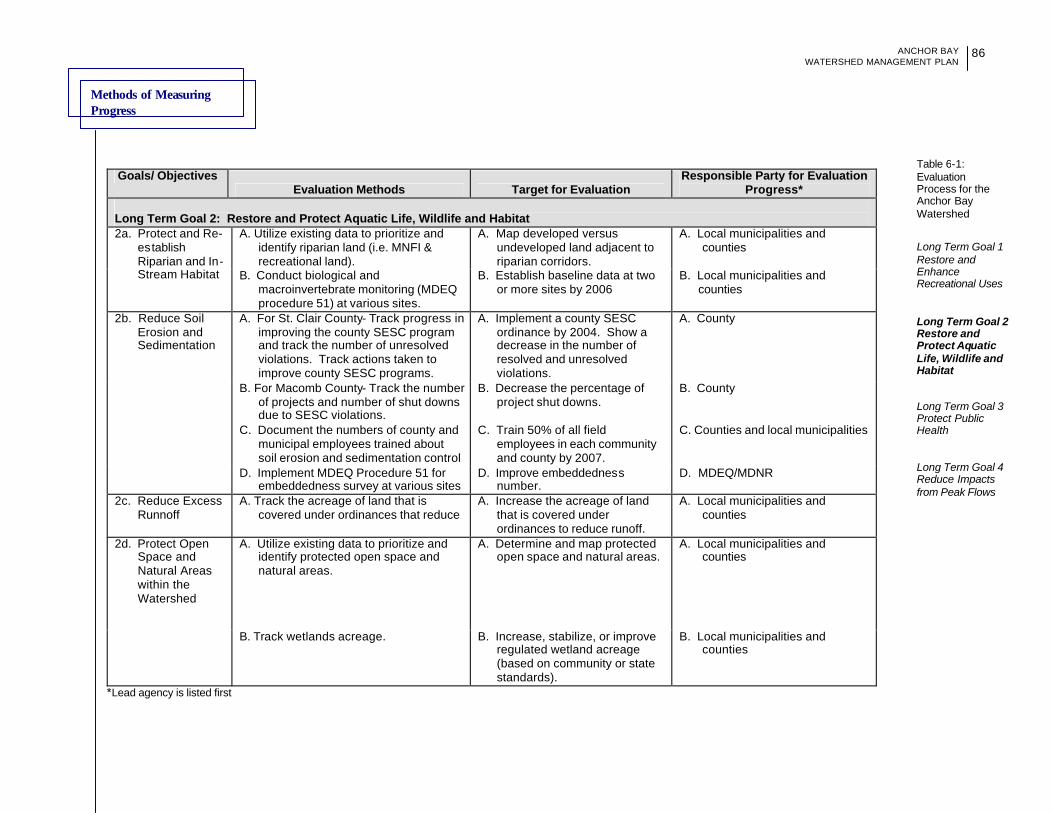
Methods of Measuring Progress
ANCHOR BAY WATERSHED MANAGEMENT PLAN
86
Table 6-1: Evaluation Process for the Anchor Bay Watershed Long Term Goal 1 Restore and Enhance Recreational Uses Long Term Goal 2 Restore and Protect Aquatic Life, Wildlife and Habitat Long Term Goal 3 Protect Public Health Long Term Goal 4 Reduce Impacts from Peak Flows
Goals/ Objectives
Evaluation Methods Target for Evaluation Responsible Party for Evaluation
Progress* Long Term Goal 2: Restore and Protect Aquatic Life, Wildlife and Habitat
A. Utilize existing data to prioritize and identify riparian land (i.e. MNFI & recreational land).
A. Map developed versus undeveloped land adjacent to riparian corridors.
A. Local municipalities and counties
2a. Protect and Re-establish Riparian and In-Stream Habitat B. Conduct biological and
macroinvertebrate monitoring (MDEQ procedure 51) at various sites.
B. Establish baseline data at two or more sites by 2006
B. Local municipalities and counties
A. For St. Clair County- Track progress in improving the county SESC program and track the number of unresolved violations. Track actions taken to improve county SESC programs.
A. Implement a county SESC ordinance by 2004. Show a decrease in the number of resolved and unresolved violations.
A. County
B. For Macomb County- Track the number of projects and number of shut downs due to SESC violations.
B. Decrease the percentage of project shut downs.
B. County
C. Document the numbers of county and municipal employees trained about soil erosion and sedimentation control
C. Train 50% of all field employees in each community and county by 2007.
C. Counties and local municipalities
2b. Reduce Soil Erosion and Sedimentation
D. Implement MDEQ Procedure 51 for embeddedness survey at various sites
D. Improve embeddedness number.
D. MDEQ/MDNR
2c. Reduce Excess Runnoff
A. Track the acreage of land that is covered under ordinances that reduce
A. Increase the acreage of land that is covered under ordinances to reduce runoff.
A. Local municipalities and counties
A. Utilize existing data to prioritize and identify protected open space and natural areas.
A. Determine and map protected open space and natural areas.
A. Local municipalities and counties
2d. Protect Open Space and Natural Areas within the Watershed
B. Track wetlands acreage. B. Increase, stabilize, or improve regulated wetland acreage (based on community or state standards).
B. Local municipalities and counties
*Lead agency is listed first
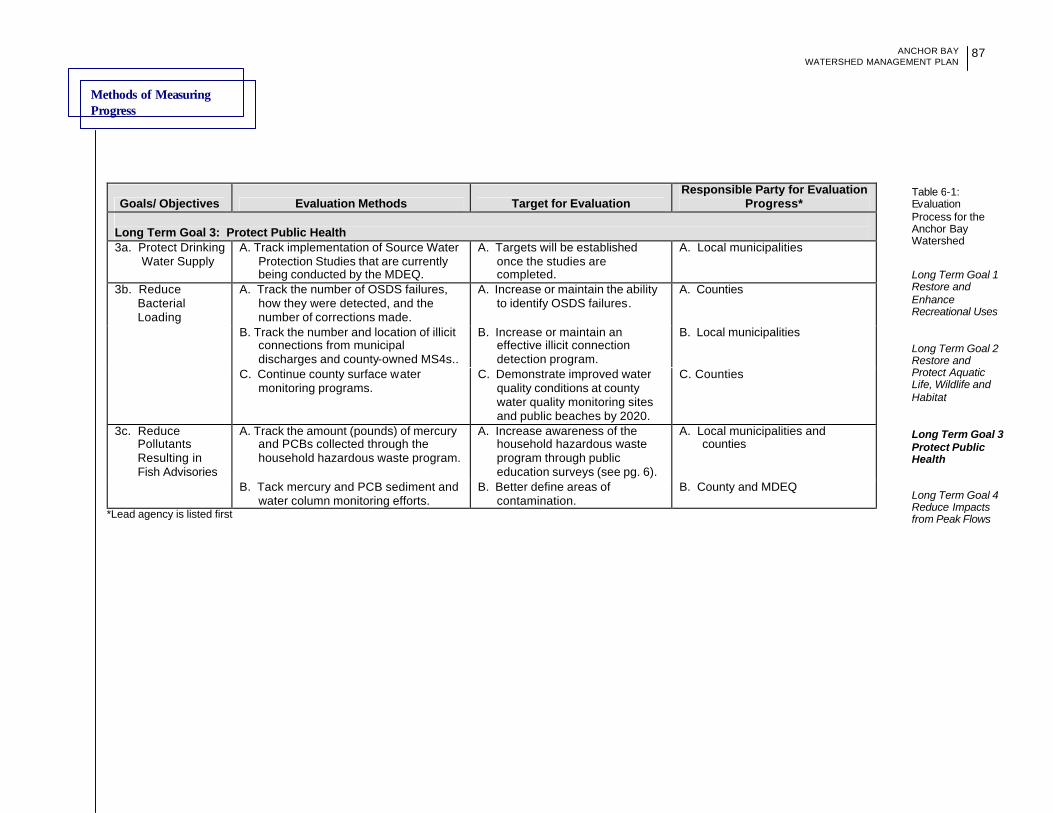
Methods of Measuring Progress
ANCHOR BAY WATERSHED MANAGEMENT PLAN
87
Table 6-1: Evaluation Process for the Anchor Bay Watershed Long Term Goal 1 Restore and Enhance Recreational Uses Long Term Goal 2 Restore and Protect Aquatic Life, Wildlife and Habitat Long Term Goal 3 Protect Public Health Long Term Goal 4 Reduce Impacts from Peak Flows
Goals/ Objectives Evaluation Methods Target for Evaluation Responsible Party for Evaluation
Progress* Long Term Goal 3: Protect Public Health 3a. Protect Drinking
Water Supply A. Track implementation of Source Water
Protection Studies that are currently being conducted by the MDEQ.
A. Targets will be established once the studies are completed.
A. Local municipalities
A. Track the number of OSDS failures, how they were detected, and the number of corrections made.
A. Increase or maintain the ability to identify OSDS failures.
A. Counties
B. Track the number and location of illicit connections from municipal discharges and county-owned MS4s..
B. Increase or maintain an effective illicit connection detection program.
B. Local municipalities
3b. Reduce Bacterial Loading
C. Continue county surface water monitoring programs.
C. Demonstrate improved water quality conditions at county water quality monitoring sites and public beaches by 2020.
C. Counties
A. Track the amount (pounds) of mercury and PCBs collected through the household hazardous waste program.
A. Increase awareness of the household hazardous waste program through public education surveys (see pg. 6).
A. Local municipalities and counties
3c. Reduce Pollutants Resulting in Fish Advisories
B. Tack mercury and PCB sediment and water column monitoring efforts.
B. Better define areas of contamination.
B. County and MDEQ
*Lead agency is listed first
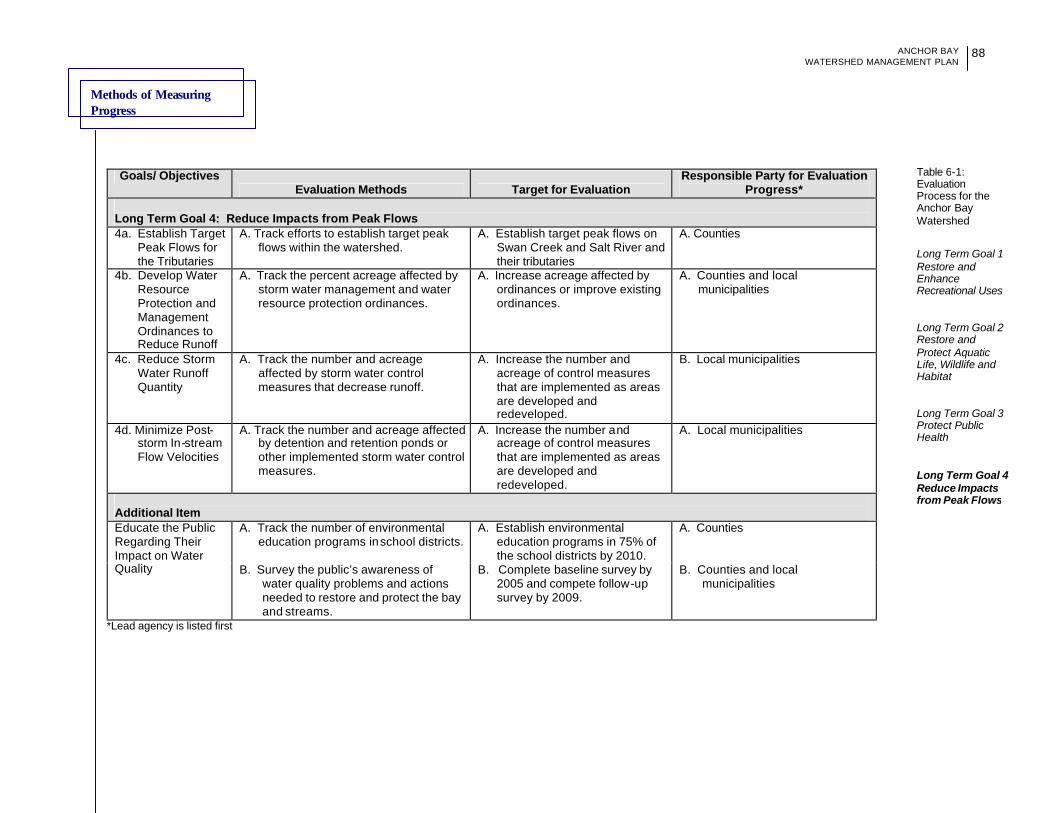
Methods of Measuring Progress
ANCHOR BAY WATERSHED MANAGEMENT PLAN
88
Table 6-1: Evaluation Process for the Anchor Bay Watershed Long Term Goal 1 Restore and Enhance Recreational Uses Long Term Goal 2 Restore and Protect Aquatic Life, Wildlife and Habitat Long Term Goal 3 Protect Public Health Long Term Goal 4 Reduce Impacts from Peak Flows
Goals/ Objectives
Evaluation Methods Target for Evaluation Responsible Party for Evaluation
Progress* Long Term Goal 4: Reduce Impacts from Peak Flows 4a. Establish Target
Peak Flows for the Tributaries
A. Track efforts to establish target peak flows within the watershed.
A. Establish target peak flows on Swan Creek and Salt River and their tributaries
A. Counties
4b. Develop Water Resource Protection and Management Ordinances to Reduce Runoff
A. Track the percent acreage affected by storm water management and water resource protection ordinances.
A. Increase acreage affected by ordinances or improve existing ordinances.
A. Counties and local municipalities
4c. Reduce Storm Water Runoff Quantity
A. Track the number and acreage affected by storm water control measures that decrease runoff.
A. Increase the number and acreage of control measures that are implemented as areas are developed and redeveloped.
B. Local municipalities
4d. Minimize Post-storm In-stream Flow Velocities
A. Track the number and acreage affected by detention and retention ponds or other implemented storm water control measures.
A. Increase the number and acreage of control measures that are implemented as areas are developed and redeveloped.
A. Local municipalities
Additional Item
A. Track the number of environmental education programs in school districts.
A. Establish environmental education programs in 75% of the school districts by 2010.
A. Counties Educate the Public Regarding Their Impact on Water Quality B. Survey the public’s awareness of
water quality problems and actions needed to restore and protect the bay and streams.
B. Complete baseline survey by 2005 and compete follow-up survey by 2009.
B. Counties and local municipalities
*Lead agency is listed first
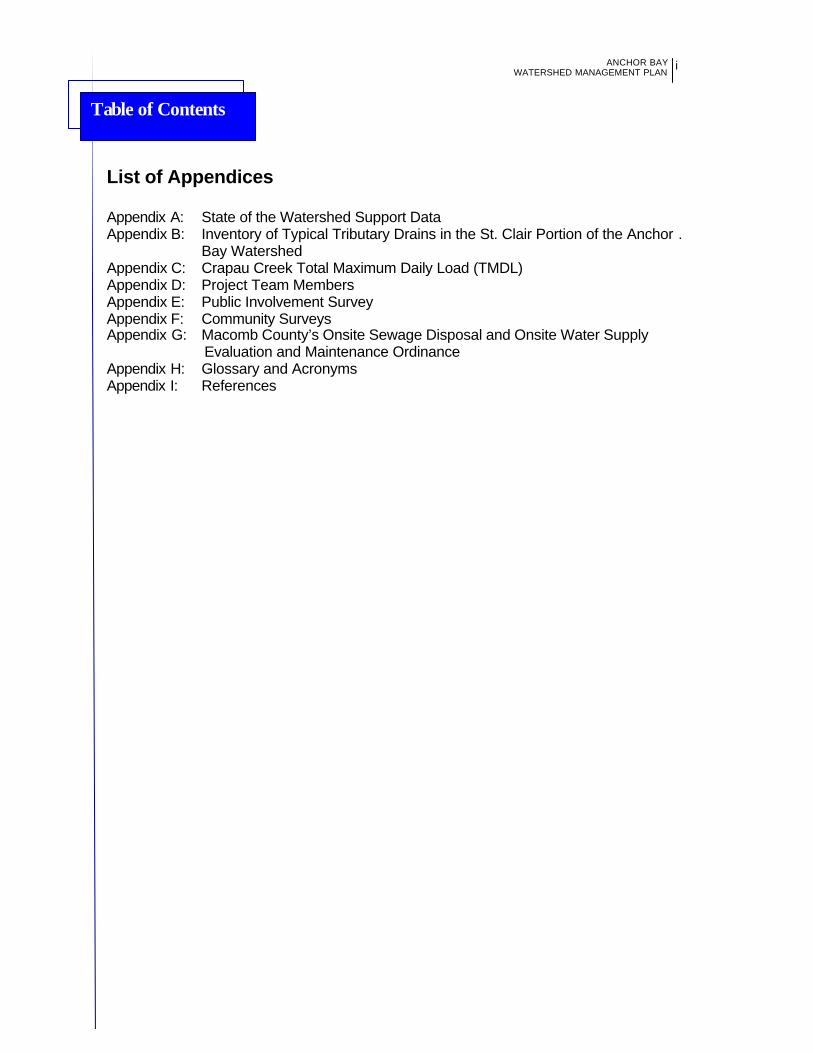
Table of Contents
ANCHOR BAY
WATERSHED MANAGEMENT PLAN
i
List of Appendices Appendix A: State of the Watershed Support Data Appendix B: Inventory of Typical Tributary Drains in the St. Clair Portion of the Anchor . Bay Watershed Appendix C: Crapau Creek Total Maximum Daily Load (TMDL) Appendix D: Project Team Members Appendix E: Public Involvement Survey Appendix F: Community Surveys Appendix G: Macomb County’s Onsite Sewage Disposal and Onsite Water Supply Evaluation and Maintenance Ordinance Appendix H: Glossary and Acronyms Appendix I: References
Anchor Bay Watershed Management Plan
Appendix A:
State of the Watershed Support Data
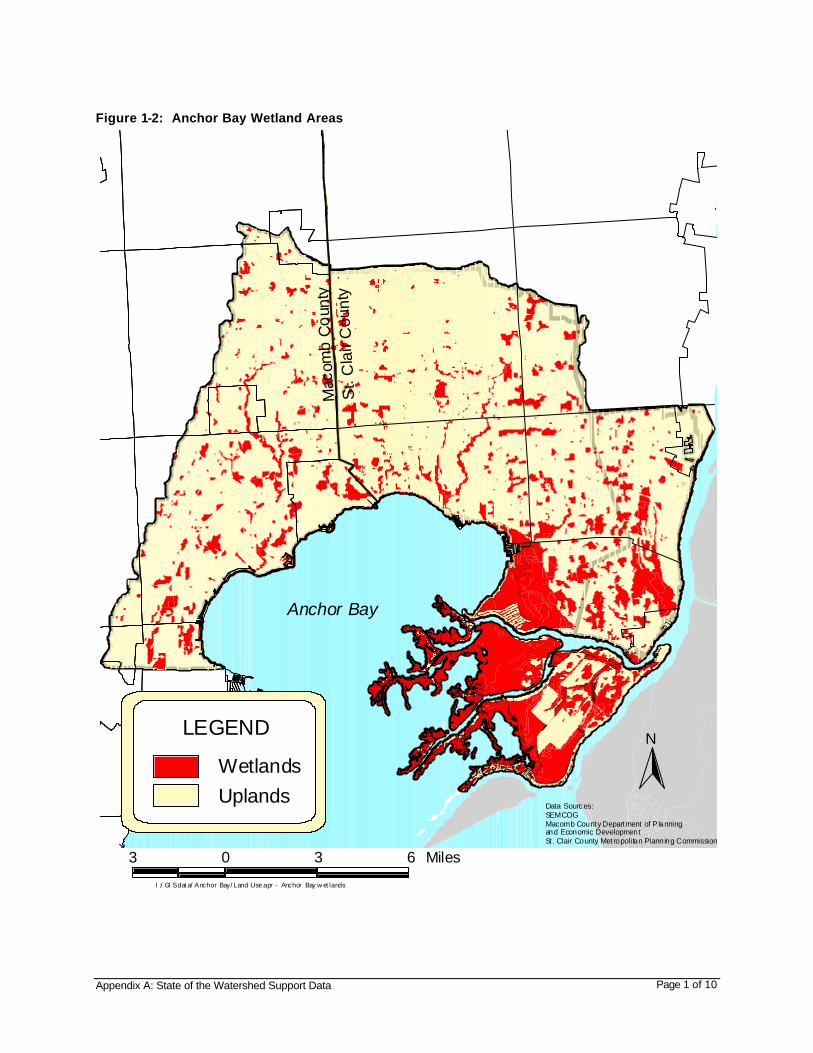
Appendix A: State of the Watershed Support Data
Page 1 of 10
Figure 1-2: Anchor Bay Wetland Areas
Mac
omb
Co
unty
St.
Cla
ir C
ount
y
Anchor Bay
I:/GISdata/Anchor Bay/Land Use.apr - Anchor Bay w etlands
3 0 3 6 Miles
Data Sourc es:SEMCOGMacomb County Department of P lanningand Economic DevelopmentSt . Clair County Metropolitan Planning Commission
NLEGEND
WetlandsUplands
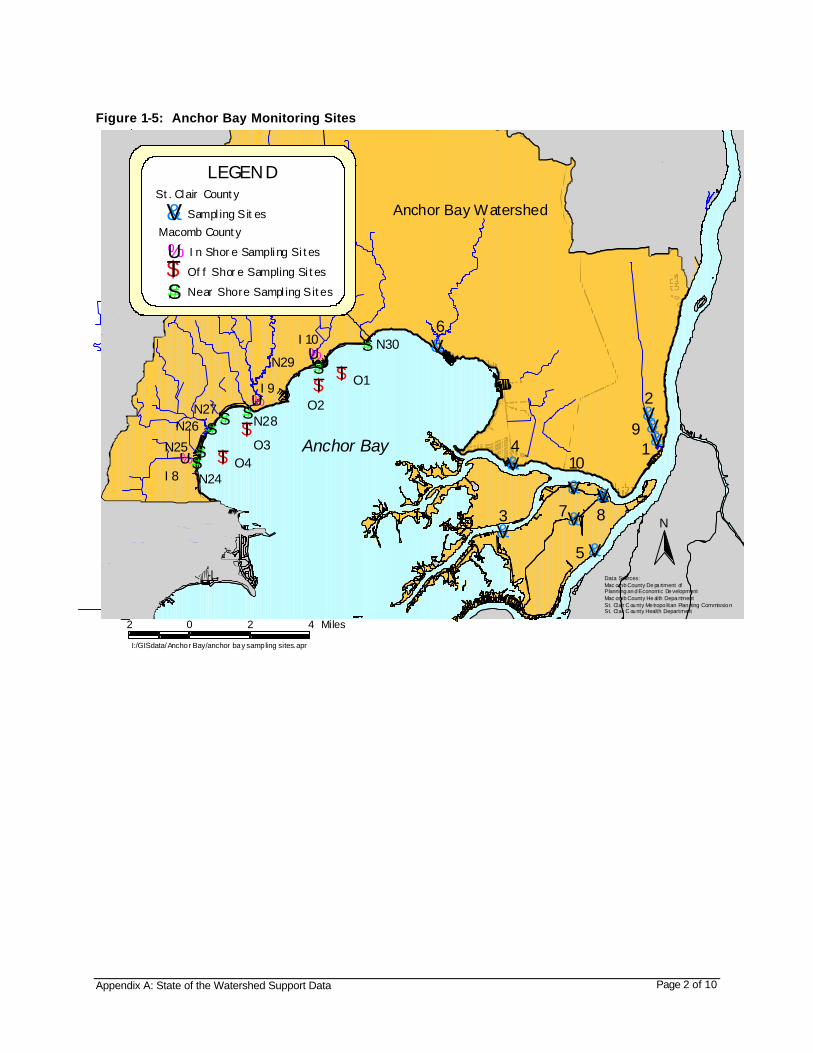
Appendix A: State of the Watershed Support Data
Page 2 of 10
Figure 1-5: Anchor Bay Monitoring Sites
#S#S
#S#S #S
#S
#S
$T$T
$T
$T%U
%U
%U
&V
&V
&V
&V
&V
&V
&V
&V&V&V
I8
I9O2
O3
O1
O4N25
N27N28
N29
N24
N26
N30
Anchor Bay
I10
1
2
3
4
5
6
9
7 8
10
LEGENDSt. Clair County
Near Shore Sampling Sites$T Off Shore Sampling Sites%U In Shore Sampling Sites
&V Sampling SitesMacomb County
#S
I:/GISdata/Anchor Bay/anchor bay sampling sites.apr
2 0 2 4 Miles
N
Data Sources:Mac omb County De pa rtment of Planning an d Economic De velopmentMac omb County He al th Depa rtmentSt. Clair C ou nty Me tropo litan Plan ning Commissio nSt. Clair C ou nty Health Department
Anchor Bay Watershed
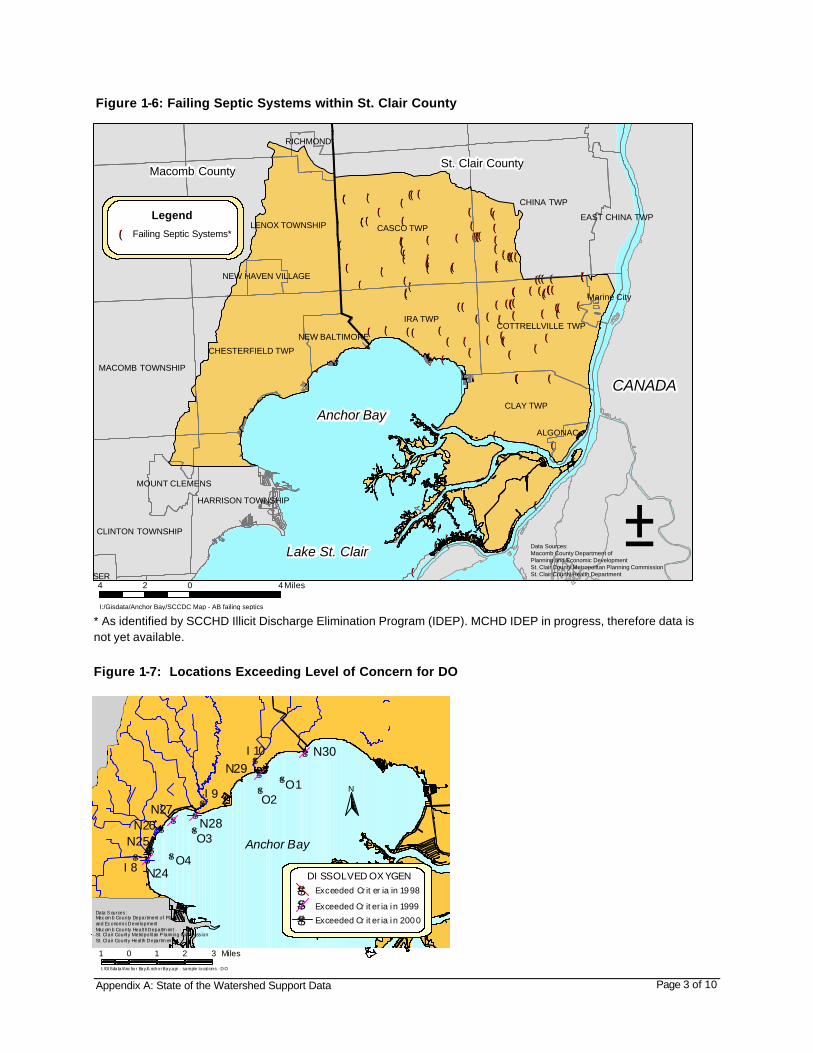
Appendix A: State of the Watershed Support Data
Page 3 of 10
I:/Gisdata/Anchor Bay/SCCDC Map - AB failing septics
!(
!(
!(
!(
!(
!(!(!(
!(
!(
!(
!(
!(!(!(
!( !(
!(
!(
!( !(!(
!(
!(
!(!(!(
!(
!(!(!(
!(!(
!(
!(!(
!(
!(
!(
!(
!(!(!(!(!(
!(
!(!(
!(
!(!(!(!(
!(!(
!(
!(!(
!(
!(
!(
!(
!(
!(!(
!(
!(
!(
!(
!(
!(
!(!(!(
!(!(
!(!(!(
!(!(
!(
!(!(
!(
!(
!(!(
!(!(!(
!(
!(
!(!(!(
!(
!(!(
!(!(!(
!(!(!(!(!(
!(!(
!(
!(!(
!(
!(
!(
!(
Anchor Bay
Lake St. Clair
CANADA
Macomb CountySt. Clair County
CLAY TWP
CASCO TWP
CHINA TWP
IRA TWPCOTTRELLVILLE TWP
EAST CHINA TWP
Marine City
ALGONAC
LENOX TOWNSHIP
MACOMB TOWNSHIP
CLINTON TOWNSHIP
CHESTERFIELD TWP
HARRISON TOWNSHIP
FRASER
NEW BALTIMORE
MOUNT CLEMENS
RICHMOND
NEW HAVEN VILLAGE
±4 0 42 Miles
Data Sources:Macomb County Department ofPlanning and Economic DevelopmentSt. Clair County Metropolitan Planning CommissionSt. Clair County Health Department
Legend
Failing Septic Systems*!(
Figure 1-6: Failing Septic Systems within St. Clair County
Figure 1-7: Locations Exceeding Level of Concern for DO
#S#S
#S#S
#S
#S
#S
#S#S
#S
#S#S
#S
#S
N25
N27N28
N29
N24
N26
N30
O2
O3
O1
O4I8
I9
I10
Anchor Bay
DISSOLVED OXYGEN
Exceeded Criteria in 2000#S Exceeded Criteria in 1999#S Exceeded Criteria in 1998
#S
I: /GI Sdata/Anc hor Bay /A nchor Bay.apr - sample locat ions - D O
1 0 1 2 3 Miles
N
Data Sources:Macom b County Department of Planni ngand Economi c DevelopmentMacom b County Health Departm entSt. Cl air County Metropolitan P lanning Comm issionSt. Cl air County Heal th Departm ent
* As identified by SCCHD Illicit Discharge Elimination Program (IDEP). MCHD IDEP in progress, therefore data is not yet available.
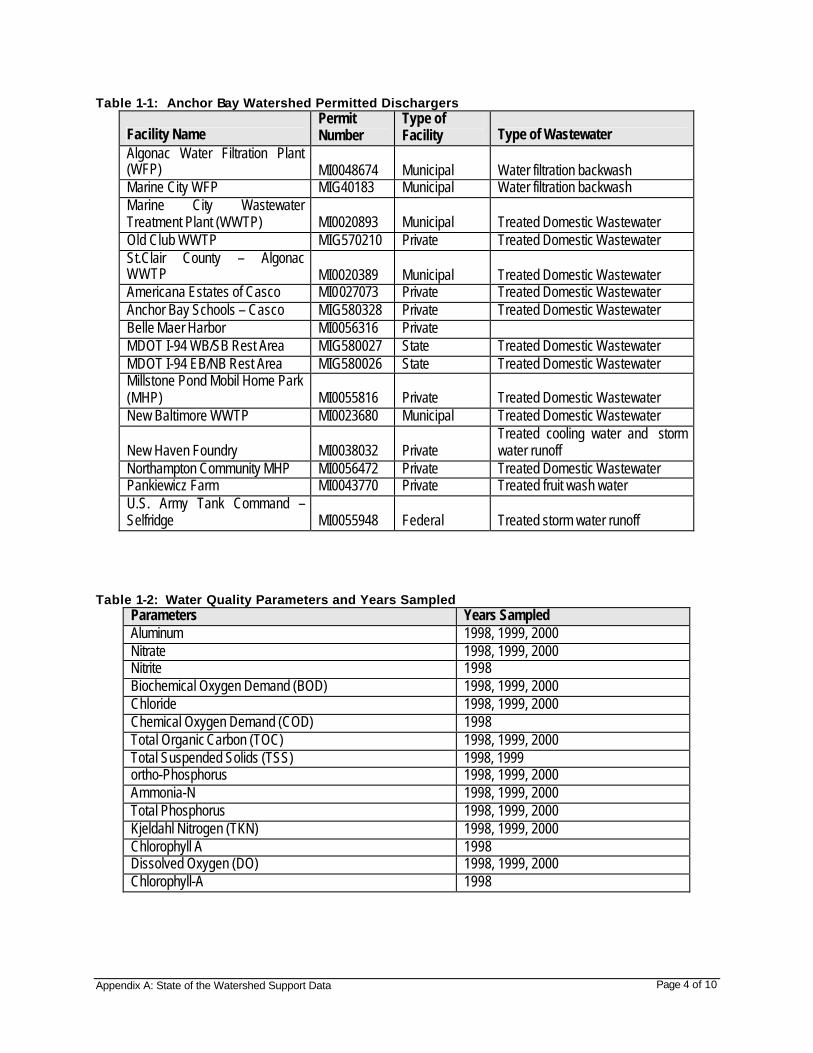
Appendix A: State of the Watershed Support Data
Page 4 of 10
Table 1-1: Anchor Bay Watershed Permitted Dischargers
Facility Name Permit Number
Type of Facility Type of Wastewater
Algonac Water Filtration Plant (WFP) MI0048674 Municipal Water filtration backwash Marine City WFP MIG40183 Municipal Water filtration backwash Marine City Wastewater Treatment Plant (WWTP) MI0020893 Municipal Treated Domestic Wastewater Old Club WWTP MIG570210 Private Treated Domestic Wastewater St.Clair County – Algonac WWTP MI0020389 Municipal Treated Domestic Wastewater Americana Estates of Casco MI0027073 Private Treated Domestic Wastewater Anchor Bay Schools – Casco MIG580328 Private Treated Domestic Wastewater Belle Maer Harbor MI0056316 Private MDOT I-94 WB/SB Rest Area MIG580027 State Treated Domestic Wastewater MDOT I-94 EB/NB Rest Area MIG580026 State Treated Domestic Wastewater Millstone Pond Mobil Home Park (MHP) MI0055816 Private Treated Domestic Wastewater New Baltimore WWTP MI0023680 Municipal Treated Domestic Wastewater
New Haven Foundry MI0038032 Private Treated cooling water and storm water runoff
Northampton Community MHP MI0056472 Private Treated Domestic Wastewater Pankiewicz Farm MI0043770 Private Treated fruit wash water U.S. Army Tank Command – Selfridge MI0055948 Federal Treated storm water runoff
Table 1-2: Water Quality Parameters and Years Sampled Parameters Years Sampled Aluminum 1998, 1999, 2000 Nitrate 1998, 1999, 2000 Nitrite 1998 Biochemical Oxygen Demand (BOD) 1998, 1999, 2000 Chloride 1998, 1999, 2000 Chemical Oxygen Demand (COD) 1998 Total Organic Carbon (TOC) 1998, 1999, 2000 Total Suspended Solids (TSS) 1998, 1999 ortho-Phosphorus 1998, 1999, 2000 Ammonia-N 1998, 1999, 2000 Total Phosphorus 1998, 1999, 2000 Kjeldahl Nitrogen (TKN) 1998, 1999, 2000 Chlorophyll A 1998 Dissolved Oxygen (DO) 1998, 1999, 2000 Chlorophyll-A 1998
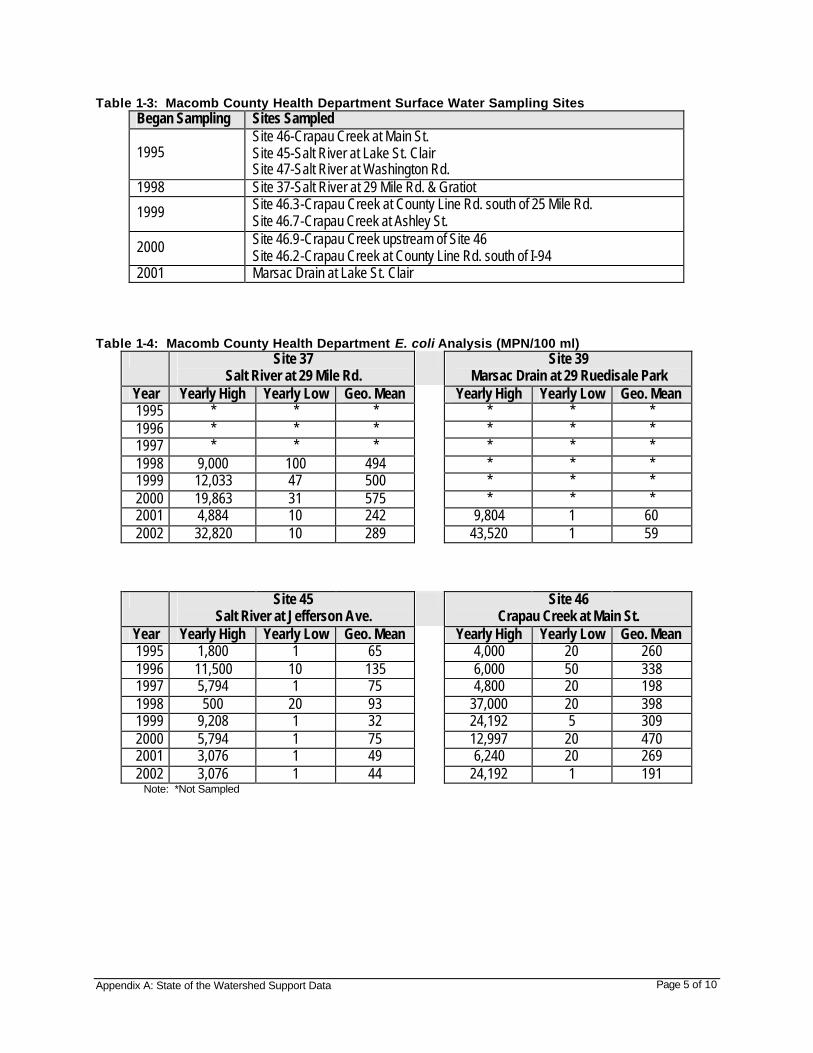
Appendix A: State of the Watershed Support Data
Page 5 of 10
Table 1-3: Macomb County Health Department Surface Water Sampling Sites Began Sampling Sites Sampled
1995 Site 46-Crapau Creek at Main St. Site 45-Salt River at Lake St. Clair Site 47-Salt River at Washington Rd.
1998 Site 37-Salt River at 29 Mile Rd. & Gratiot
1999 Site 46.3-Crapau Creek at County Line Rd. south of 25 Mile Rd. Site 46.7-Crapau Creek at Ashley St.
2000 Site 46.9-Crapau Creek upstream of Site 46 Site 46.2-Crapau Creek at County Line Rd. south of I-94
2001 Marsac Drain at Lake St. Clair
Table 1-4: Macomb County Health Department E. coli Analysis (MPN/100 ml) Site 37
Salt River at 29 Mile Rd. Site 39
Marsac Drain at 29 Ruedisale Park Year Yearly High Yearly Low Geo. Mean Yearly High Yearly Low Geo. Mean 1995 * * * * * * 1996 * * * * * * 1997 * * * * * * 1998 9,000 100 494 * * * 1999 12,033 47 500 * * * 2000 19,863 31 575 * * * 2001 4,884 10 242 9,804 1 60 2002 32,820 10 289 43,520 1 59
Site 45 Salt River at Jefferson Ave.
Site 46 Crapau Creek at Main St.
Year Yearly High Yearly Low Geo. Mean Yearly High Yearly Low Geo. Mean 1995 1,800 1 65 4,000 20 260 1996 11,500 10 135 6,000 50 338 1997 5,794 1 75 4,800 20 198 1998 500 20 93 37,000 20 398 1999 9,208 1 32 24,192 5 309 2000 5,794 1 75 12,997 20 470 2001 3,076 1 49 6,240 20 269 2002 3,076 1 44 24,192 1 191
Note: *Not Sampled
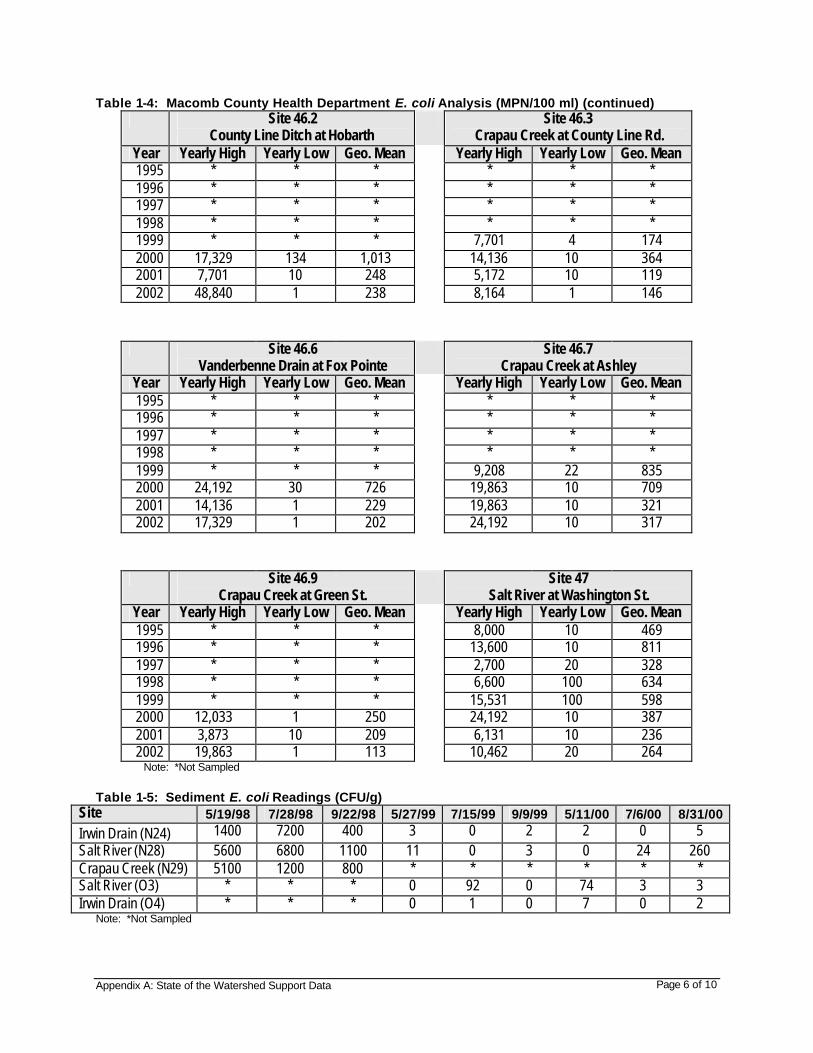
Appendix A: State of the Watershed Support Data
Page 6 of 10
Table 1-4: Macomb County Health Department E. coli Analysis (MPN/100 ml) (continued) Site 46.2
County Line Ditch at Hobarth Site 46.3
Crapau Creek at County Line Rd. Year Yearly High Yearly Low Geo. Mean Yearly High Yearly Low Geo. Mean 1995 * * * * * * 1996 * * * * * * 1997 * * * * * * 1998 * * * * * * 1999 * * * 7,701 4 174 2000 17,329 134 1,013 14,136 10 364 2001 7,701 10 248 5,172 10 119 2002 48,840 1 238 8,164 1 146
Site 46.6 Vanderbenne Drain at Fox Pointe
Site 46.7 Crapau Creek at Ashley
Year Yearly High Yearly Low Geo. Mean Yearly High Yearly Low Geo. Mean 1995 * * * * * * 1996 * * * * * * 1997 * * * * * * 1998 * * * * * * 1999 * * * 9,208 22 835 2000 24,192 30 726 19,863 10 709 2001 14,136 1 229 19,863 10 321 2002 17,329 1 202 24,192 10 317
Site 46.9 Crapau Creek at Green St.
Site 47 Salt River at Washington St.
Year Yearly High Yearly Low Geo. Mean Yearly High Yearly Low Geo. Mean 1995 * * * 8,000 10 469 1996 * * * 13,600 10 811 1997 * * * 2,700 20 328 1998 * * * 6,600 100 634 1999 * * * 15,531 100 598 2000 12,033 1 250 24,192 10 387 2001 3,873 10 209 6,131 10 236 2002 19,863 1 113 10,462 20 264
Note: *Not Sampled Table 1-5: Sediment E. coli Readings (CFU/g)
Site 5/19/98 7/28/98 9/22/98 5/27/99 7/15/99 9/9/99 5/11/00 7/6/00 8/31/00
Irwin Drain (N24) 1400 7200 400 3 0 2 2 0 5 Salt River (N28) 5600 6800 1100 11 0 3 0 24 260 Crapau Creek (N29) 5100 1200 800 * * * * * * Salt River (O3) * * * 0 92 0 74 3 3 Irwin Drain (O4) * * * 0 1 0 7 0 2
Note: *Not Sampled
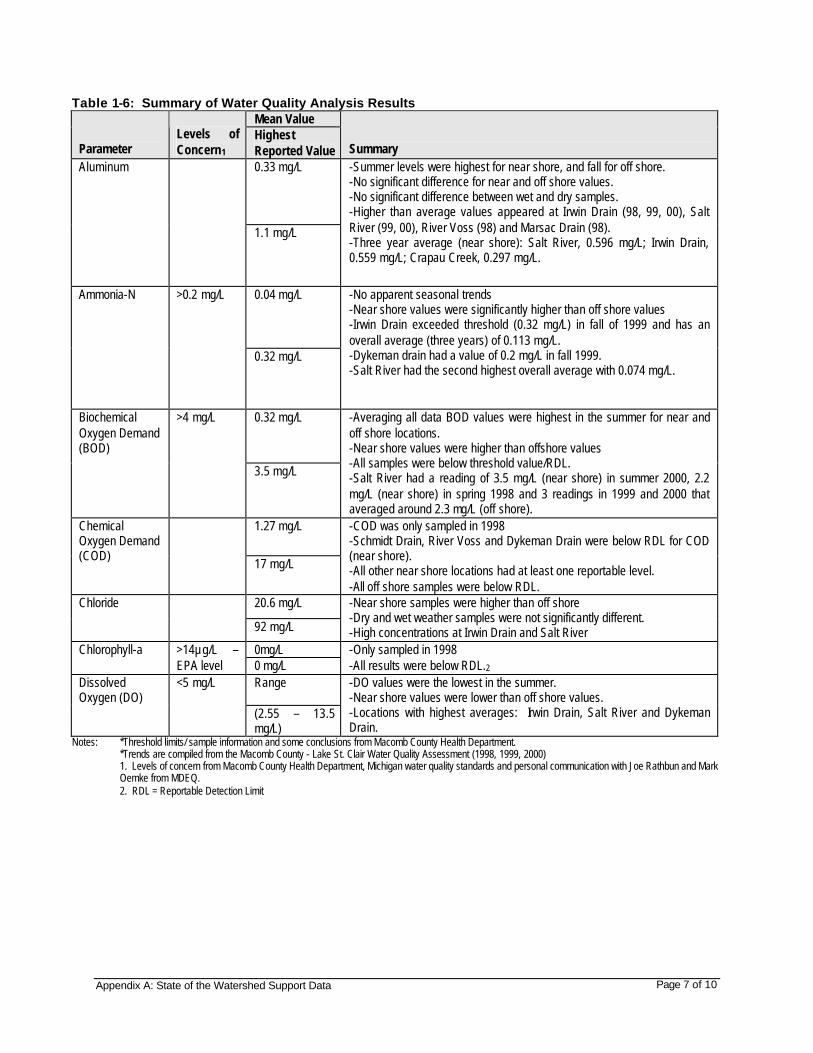
Appendix A: State of the Watershed Support Data
Page 7 of 10
Table 1-6: Summary of Water Quality Analysis Results Mean Value
Parameter Levels of Concern1
Highest Reported Value Summary 0.33 mg/L Aluminum
1.1 mg/L
-Summer levels were highest for near shore, and fall for off shore. -No significant difference for near and off shore values. -No significant difference between wet and dry samples. -Higher than average values appeared at Irwin Drain (98, 99, 00), Salt River (99, 00), River Voss (98) and Marsac Drain (98). -Three year average (near shore): Salt River, 0.596 mg/L; Irwin Drain, 0.559 mg/L; Crapau Creek, 0.297 mg/L.
0.04 mg/L Ammonia-N >0.2 mg/L
0.32 mg/L
-No apparent seasonal trends -Near shore values were significantly higher than off shore values -Irwin Drain exceeded threshold (0.32 mg/L) in fall of 1999 and has an overall average (three years) of 0.113 mg/L. -Dykeman drain had a value of 0.2 mg/L in fall 1999. -Salt River had the second highest overall average with 0.074 mg/L.
0.32 mg/L Biochemical Oxygen Demand (BOD)
>4 mg/L
3.5 mg/L
-Averaging all data BOD values were highest in the summer for near and off shore locations. -Near shore values were higher than offshore values -All samples were below threshold value/RDL. -Salt River had a reading of 3.5 mg/L (near shore) in summer 2000, 2.2 mg/L (near shore) in spring 1998 and 3 readings in 1999 and 2000 that averaged around 2.3 mg/L (off shore).
1.27 mg/L Chemical Oxygen Demand (COD)
17 mg/L
-COD was only sampled in 1998 -Schmidt Drain, River Voss and Dykeman Drain were below RDL for COD (near shore). -All other near shore locations had at least one reportable level. -All off shore samples were below RDL.
20.6 mg/L Chloride
92 mg/L
-Near shore samples were higher than off shore -Dry and wet weather samples were not significantly different. -High concentrations at Irwin Drain and Salt River
0mg/L Chlorophyll-a >14µg/L –EPA level 0 mg/L
-Only sampled in 1998 -All results were below RDL.2
Range Dissolved Oxygen (DO)
<5 mg/L
(2.55 – 13.5 mg/L)
-DO values were the lowest in the summer. -Near shore values were lower than off shore values. -Locations with highest averages: Irwin Drain, Salt River and Dykeman Drain.
Notes: *Threshold limits/ sample information and some conclusions from Macomb County Health Department. *Trends are compiled from the Macomb County - Lake St. Clair Water Quality Assessment (1998, 1999, 2000)
1. Levels of concern from Macomb County Health Department, Michigan water quality standards and personal communication with Joe Rathbun and Mark Oemke from MDEQ. 2. RDL = Reportable Detection Limit
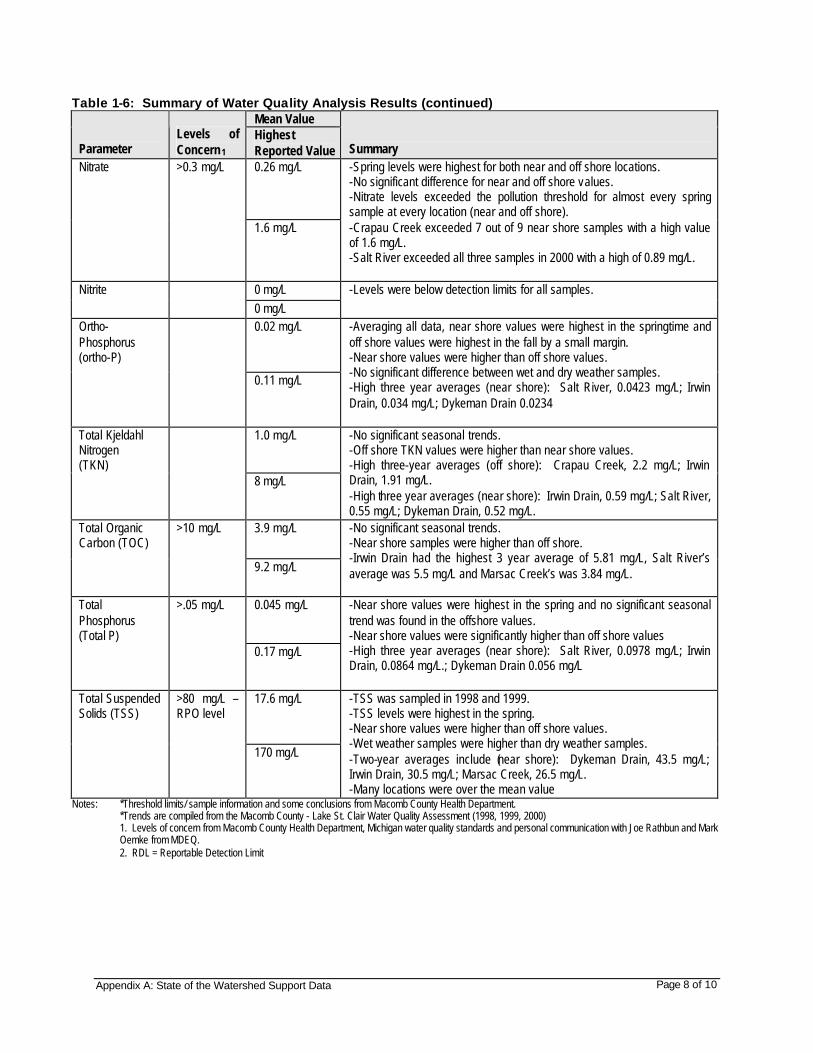
Appendix A: State of the Watershed Support Data
Page 8 of 10
Table 1-6: Summary of Water Quality Analysis Results (continued) Mean Value
Parameter Levels of Concern1
Highest Reported Value Summary 0.26 mg/L Nitrate >0.3 mg/L
1.6 mg/L
-Spring levels were highest for both near and off shore locations. -No significant difference for near and off shore values. -Nitrate levels exceeded the pollution threshold for almost every spring sample at every location (near and off shore). -Crapau Creek exceeded 7 out of 9 near shore samples with a high value of 1.6 mg/L. -Salt River exceeded all three samples in 2000 with a high of 0.89 mg/L.
0 mg/L Nitrite 0 mg/L
-Levels were below detection limits for all samples.
0.02 mg/L Ortho-Phosphorus (ortho-P)
0.11 mg/L
-Averaging all data, near shore values were highest in the springtime and off shore values were highest in the fall by a small margin. -Near shore values were higher than off shore values. -No significant difference between wet and dry weather samples. -High three year averages (near shore): Salt River, 0.0423 mg/L; Irwin Drain, 0.034 mg/L; Dykeman Drain 0.0234
1.0 mg/L Total Kjeldahl Nitrogen (TKN)
8 mg/L
-No significant seasonal trends. -Off shore TKN values were higher than near shore values. -High three-year averages (off shore): Crapau Creek, 2.2 mg/L; Irwin Drain, 1.91 mg/L. -High three year averages (near shore): Irwin Drain, 0.59 mg/L; Salt River, 0.55 mg/L; Dykeman Drain, 0.52 mg/L.
3.9 mg/L Total Organic Carbon (TOC)
>10 mg/L
9.2 mg/L
-No significant seasonal trends. -Near shore samples were higher than off shore. -Irwin Drain had the highest 3 year average of 5.81 mg/L, Salt River’s average was 5.5 mg/L and Marsac Creek’s was 3.84 mg/L.
0.045 mg/L Total Phosphorus (Total P)
>.05 mg/L
0.17 mg/L
-Near shore values were highest in the spring and no significant seasonal trend was found in the offshore values. -Near shore values were significantly higher than off shore values -High three year averages (near shore): Salt River, 0.0978 mg/L; Irwin Drain, 0.0864 mg/L.; Dykeman Drain 0.056 mg/L
17.6 mg/L Total Suspended Solids (TSS)
>80 mg/L – RPO level
170 mg/L
-TSS was sampled in 1998 and 1999. -TSS levels were highest in the spring. -Near shore values were higher than off shore values. -Wet weather samples were higher than dry weather samples. -Two-year averages include (near shore): Dykeman Drain, 43.5 mg/L; Irwin Drain, 30.5 mg/L; Marsac Creek, 26.5 mg/L. -Many locations were over the mean value
Notes: *Threshold limits/ sample information and some conclusions from Macomb County Health Department. *Trends are compiled from the Macomb County - Lake St. Clair Water Quality Assessment (1998, 1999, 2000)
1. Levels of concern from Macomb County Health Department, Michigan water quality standards and personal communication with Joe Rathbun and Mark Oemke from MDEQ. 2. RDL = Reportable Detection Limit
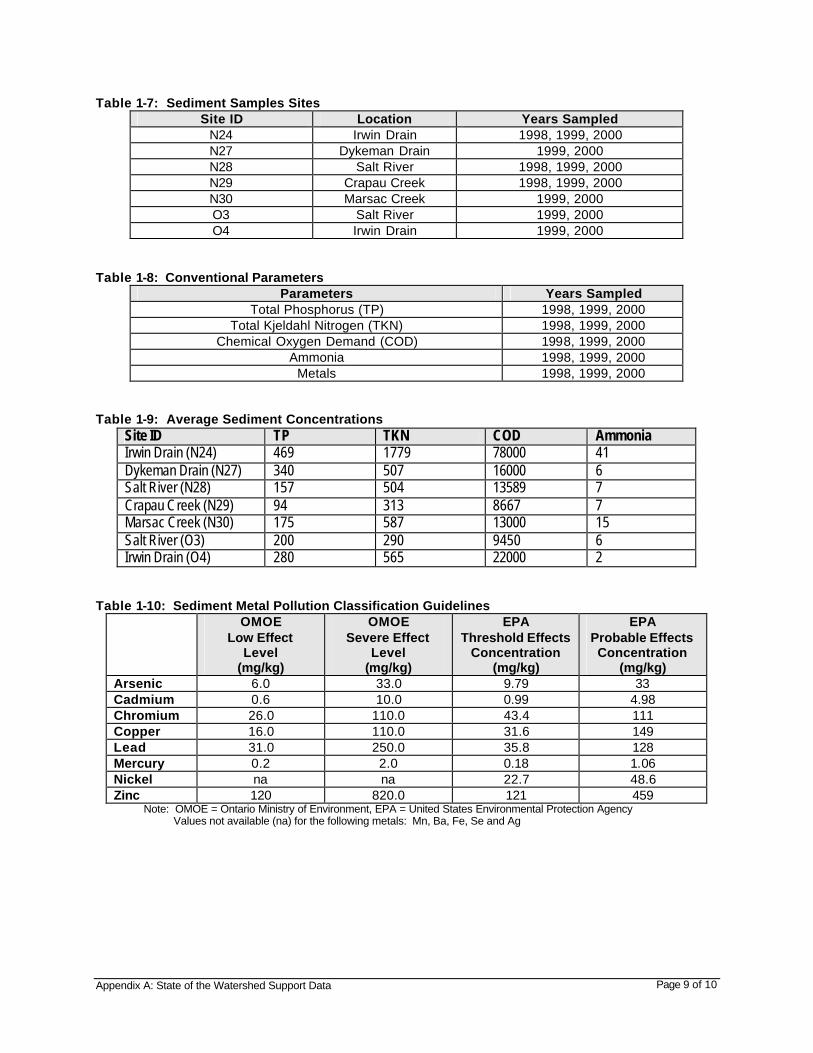
Appendix A: State of the Watershed Support Data
Page 9 of 10
Table 1-7: Sediment Samples Sites Site ID Location Years Sampled
N24 Irwin Drain 1998, 1999, 2000 N27 Dykeman Drain 1999, 2000 N28 Salt River 1998, 1999, 2000 N29 Crapau Creek 1998, 1999, 2000 N30 Marsac Creek 1999, 2000 O3 Salt River 1999, 2000 O4 Irwin Drain 1999, 2000
Table 1-8: Conventional Parameters
Parameters Years Sampled Total Phosphorus (TP) 1998, 1999, 2000
Total Kjeldahl Nitrogen (TKN) 1998, 1999, 2000 Chemical Oxygen Demand (COD) 1998, 1999, 2000
Ammonia 1998, 1999, 2000 Metals 1998, 1999, 2000
Table 1-9: Average Sediment Concentrations
Site ID TP TKN COD Ammonia Irwin Drain (N24) 469 1779 78000 41 Dykeman Drain (N27) 340 507 16000 6 Salt River (N28) 157 504 13589 7 Crapau Creek (N29) 94 313 8667 7 Marsac Creek (N30) 175 587 13000 15 Salt River (O3) 200 290 9450 6 Irwin Drain (O4) 280 565 22000 2
Table 1-10: Sediment Metal Pollution Classification Guidelines
OMOE Low Effect
Level (mg/kg)
OMOE Severe Effect
Level (mg/kg)
EPA Threshold Effects
Concentration (mg/kg)
EPA Probable Effects Concentration
(mg/kg) Arsenic 6.0 33.0 9.79 33 Cadmium 0.6 10.0 0.99 4.98 Chromium 26.0 110.0 43.4 111 Copper 16.0 110.0 31.6 149 Lead 31.0 250.0 35.8 128 Mercury 0.2 2.0 0.18 1.06 Nickel na na 22.7 48.6 Zinc 120 820.0 121 459
Note: OMOE = Ontario Ministry of Environment, EPA = United States Environmental Protection Agency Values not available (na) for the following metals: Mn, Ba, Fe, Se and Ag
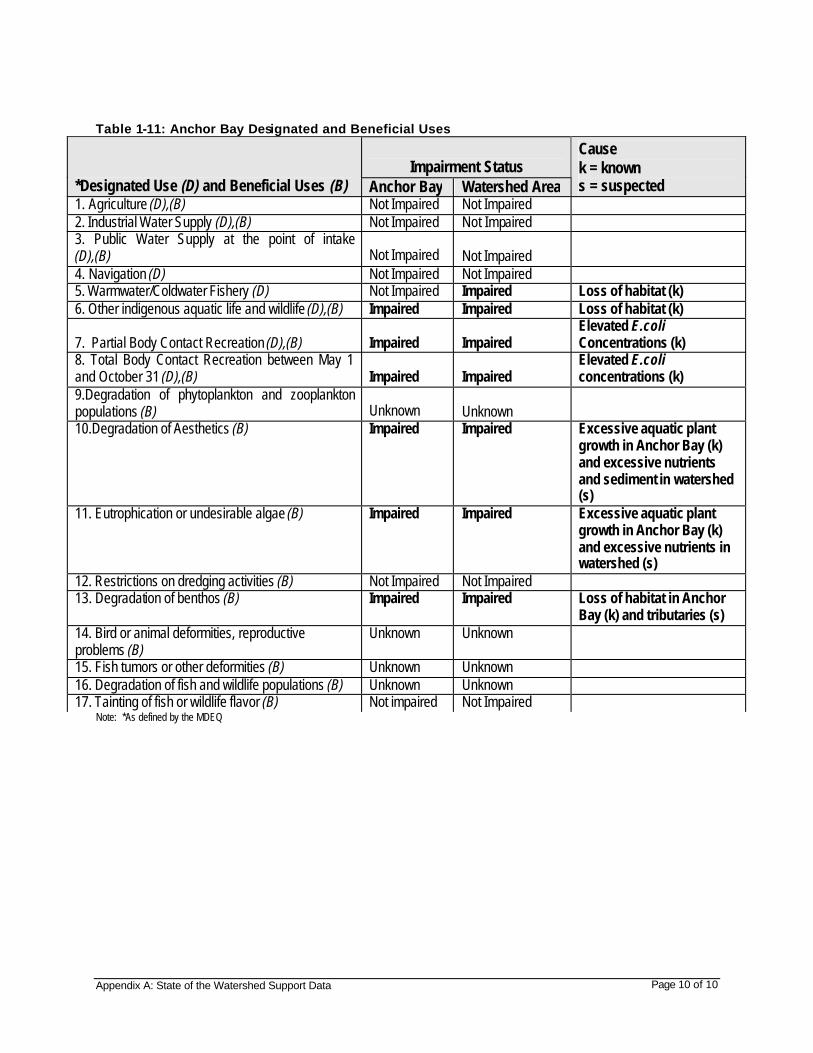
Appendix A: State of the Watershed Support Data
Page 10 of 10
Table 1-11: Anchor Bay Designated and Beneficial Uses
Note: *As defined by the MDEQ
Impairment Status *Designated Use (D) and Beneficial Uses (B) Anchor Bay Watershed Area
Cause k = known s = suspected
1. Agriculture (D),(B) Not Impaired Not Impaired 2. Industrial Water Supply (D),(B) Not Impaired Not Impaired 3. Public Water Supply at the point of intake (D),(B) Not Impaired
Not Impaired
4. Navigation (D) Not Impaired Not Impaired 5. Warmwater/Coldwater Fishery (D) Not Impaired Impaired Loss of habitat (k) 6. Other indigenous aquatic life and wildlife (D),(B) Impaired Impaired Loss of habitat (k)
7. Partial Body Contact Recreation (D),(B) Impaired Impaired
Elevated E.coli Concentrations (k)
8. Total Body Contact Recreation between May 1 and October 31 (D),(B) Impaired
Impaired
Elevated E.coli concentrations (k)
9.Degradation of phytoplankton and zooplankton populations (B) Unknown
Unknown
10.Degradation of Aesthetics (B) Impaired Impaired Excessive aquatic plant growth in Anchor Bay (k) and excessive nutrients and sediment in watershed (s)
11. Eutrophication or undesirable algae (B) Impaired Impaired Excessive aquatic plant growth in Anchor Bay (k) and excessive nutrients in watershed (s)
12. Restrictions on dredging activities (B) Not Impaired Not Impaired 13. Degradation of benthos (B) Impaired Impaired Loss of habitat in Anchor
Bay (k) and tributaries (s) 14. Bird or animal deformities, reproductive problems (B)
Unknown Unknown
15. Fish tumors or other deformities (B) Unknown Unknown 16. Degradation of fish and wildlife populations (B) Unknown Unknown 17. Tainting of fish or wildlife flavor (B) Not impaired Not Impaired
Anchor Bay Watershed Management Plan
Appendix B:
Inventory of Typical Tributary Drains in the St. Clair County Portion of the Anchor Bay Watershed
Appendix B: Inventory of Typical Tributary Drains Page 1 of 10
Inventory of Typical Tributary Drains in the St. Clair County Portion of the Anchor Bay Watershed REV. 01/15/03 Report by Daniel Rhein, Drain Inspector, for the Office of the St. Clair County Drain Commissioner Methodology: Dan Rhein wrote this report based on county drains that he walked in 2002. He took photographs and made field notes during and after the inspections. Some of the inspections were done as maintenance inspections for the Drain Commissioner’s Office. Others were done as part of the Drain Office’s Illicit Discharge Elimination Program. He also based the report on his prior knowledge and familiarity with the Anchor Bay Watershed and other similar areas in St. Clair County. Listed below are the portions of drains that he walked, with the portion of the drain indicated by a survey Section number of a township or Private Claim number (P.C.): Arnold Drain – Cottrellville Township, Section #3, #4 Bay Drain – Ira Township, Section #24 Benoit Drain and Branch No. 1 – Ira Twp. Section #6, #7; Casco Twp. #31 Beaubien Creek Drain - Cottrellville Twp. Section #5, #7, #8, #18, #19 Cartwright Drain – Clay Twp, Section #3 and City of Algonac Casco Extension Drain – Casco Twp, Section #8 Clippert Drain – Cottrellville Twp., P.C. #186 Cottrell & Extension Drain – Cottrellville Twp, Section #12 & Marine City Crapau Creek Drain – Ira Twp, Section #7, #8 Crowley Drain – Marine City Dana Drain – Clay Twp, Section #4, #9, #33 and City of Algonac Geyman Drain – Cottrellville Twp, P.C. #598 Grandchamp Drain – Cottrellville Twp, Section #7 Lester-Bammel Drain – Cottrellville Twp, Section #2, #11, P.C. # 598, P.C. #187 Marsac Creek Drain – Ira Twp, Section #7, #8, Casco Twp, Section #3 McKinley Drain - Cottrellville Twp, Section #8 Meldrum Drain – Casco Twp, Section #17 Parquett Drain – Marine City Robbins Drain – Cottrellville Twp, P.C. # 252, 253, 568 Smith-Cottrellville Drain – Cottrellville Twp, Section #9, #10 Sykes Drain – Cottrellville Twp, Section #3, #4 Townline of Ira Drain – Cottrellville Twp, Section #6, #7, #18, #19 West Marsh Drain – Cottrellville Twp, Section #9, #16, #20, #21 Wilkins Drain – Cottrellville Twp, Section #2, #11
Sources and Causes of Pollutants and Habitat Degradation: 1. Shoreline habitat replaced (or being replaced) with sea wall The land-water interface is important to wildlife. The free movement of wildlife in & out of the water is necessary for feeding, reproduction, and escaping from danger. Seawalls prevent these movements and wildlife is killed. The otherwise soil and plant contact aids in pollution
Appendix B: Inventory of Typical Tributary Drains Page 2 of 10
reduction by absorbing suspended materials and recycling them into new material for bank stabilization and wildlife food supplies. The more diversified the shoreline plant growth the more diversified is the animal life. This includes fish life as well. Abundant insect life provides food for fish. Recycling of nutrients in complex food chains disperses pollution. 2. Tributary streams being replaced with enclosed piping When open drains are replaced with enclosed piping the water life is reduced to anaerobic life forms that live in darkness and unoxygenated conditions. The resulting anaerobic processes further reduce opportunities for oxygen-producing plant life to release oxygen for downstream animal life. Dead zones occur downstream with foul gases being released along with fish kills. The septic conditions are repulsive to humans and provide a breeding ground for lower life forms such as virus and bacteria. Migrating or spawning fish are unable to pass such areas and fish eggs are destroyed. 3. Residential building encroachment upon watercourses The encroachment of a building upon a drain right-of-way is frequently remedied with pipe enclosures. Piping provides opportunities for unseen tap-ins (illicit connections) to take place. Polluting discharges are harder to trace back to the source when drains are enclosed. The fixed diameter of piping next to a building prevents future enlargement when the drainage district expands upstream. In the crowding of watercourses critical wetlands and natural habitat are destroyed. Re-routing around “lot lines” creates hydraulic bottlenecks and erosion sites during peak flows. Likelihood of direct runoff from driveways, roofs and manicured lawns (with fertilizers and pesticides) is increased. 4. Lack of soil erosion control on farms and development sites Buffers of vegetative cover are destroyed where farm pasture includes the banks of watercourses, or where crop farming is too close to the stream. Plowing is sometimes right over the edge of the bank. Field drain ditches often erode at the outlet to the drain, or carry large amounts of soil from the fields into the drain. Over-pasturing of farm fields leads to excessive vegetation wear (by hooves) and soil erosion in the form of stream sedimentation. Streambank erosion becomes excessive where livestock traffic caves in animal burrows (muskrat, woodchuck). Over-grazing leads to the destruction of shade trees and shrubs. Horses can be especially harmful to woody vegetation. Animal hoof traffic can damage soil-stabilizing tree roots. Fences should be utilized along streamsides to eliminate re-occurring soil erosion problems caused by livestock. Farmers need to sacrifice enough crop land and pasture to stabilize the existing soil types. The more unstable the soil type, the wider buffer strips should be. Sandy soils require a wider setback from the top of the bank. Soil stabilization is a problem on construction sites, also. Deep excavations expose glacial subsoils. Normally, topsoils contain measurable amounts of organic matter with useful fungi, bacteria and other organisms that aid in plant re-establishment. If the topsoil is buried or trucked away for profit, re-establishment of vegetation can be slowed. Several years or decades may pass before soil-stabilizing lifeforms become re-established. It is common knowledge that silt fencing is required on construction sites near watercourses. Problems arise when insufficient structures are lacking during construction and particularly during culvert installations. The lack of follow-up inspections leaves building sites subject to soil erosion problems particularly after work crews leave the job site. After the fact inspectors will find plastic silt fencing washed out, buried, or transported in downstream deposits.
Appendix B: Inventory of Typical Tributary Drains Page 3 of 10
5. Obstructions (human-caused and development-worsened) on tributary watercourses High flows exacerbated by developmental runoff move debris around from one part of a watercourse to downstream areas. The lack of maintenance creates the most common watershed problems. Jams and dams of trees, brush, and man-made junk deflect water flows into stream banks, causing erosion. Suspended soils kill aquatic life by burying eggs or plugging the gills of fish. Some woody debris is necessary for wildlife habitat. Fish hide in brush piles and stump root zones. Insects and snails lay eggs upon twigs and pieces of bark. Leaves and vegetation provide food for the same. Amphibians such as frogs and salamanders overwinter in debris piles. These areas provide feeding areas for raccoons and mink. But dams and obstructions have been made worse by human activities, and careful, limited maintenance is necessary to provide good habitat while stopping excessive erosion and flooding. 6. Stockpiling of foreign materials near watercourses The stockpiling of foreign materials near watercourse can create unwanted problems. The action of wind, water, and gravity can put unwanted objects in flow areas creating jams and plugging pipes. Lumber, pallets, firewood, fencepost, tires, tarps, cement blocks, and bricks gravitate to downslope areas. It has become a common practice within the watershed to store such items along watercouses. 7. Dumping of refuse near watercourses The dumping of yard refuse near watercourses is another problem in the watershed. Grass clippings and leaves dumped excessively on ditch banks prevent the growth of soil-stabilizing rooted plants. Manures and pet wastes dumped in close proximity to watercourses contaminate the water with excessive nutrients. Toxic pools of nutrients kill local streamlife. Unwanted wildlife such as: woodchucks, skunks, and rodents burrow into loose piles of refuse. Pet waste dumped near waters can also release parasites that invade aquatic hosts (i.e. waterfowl, crustaceans, turtles, and fish). A world unfit for wildlife can be unfit for humans. “Swimmer’s itch” is the result of aquatic parasites. Many well-kept yards contain refuse or dump piles near watercourses (out of sight and out of mind). 8. Lack of adequate septic systems Watershed evidence suggests that excessive nutrients and bacteria are finding their way into local watercourses. Failing septic systems and drainfields (or lack of), are located by “dead zones” of black muck, where “cheater pipes” (outflow pipes) exist. Vegetative changes from “normal” to “excessive” are often indications of a sewage outfall. The growth of nightshade vines (Solanum species) or purple loostrife (Lythrum salicaria) can be used to locate such sewage outfalls. In dry weather pipes can be traced by observing “dark green” grass fed from moist nutrient-laden sources. Blue-green algae in watercourses can occur downstream from nutrient pollution sources. Bright-green algae indicates nutrients, but in lesser quantities. Older farm homes were built before pollution concerns. “Straight pipes” (direct from the house plumbing) frequently discharge to the ditch closest to the wall lines of the house. Daylillies (Hemerocalis species) or lilac (Syringa species) bushes, thrive upon the nutrients and water supplied by the pipe, and planting done in the past can conceal the outfall with leafy growth.
Appendix B: Inventory of Typical Tributary Drains Page 4 of 10
Improper installation of pipes can contribute to watershed pollution. “Cheater pipes” are pipes used to drain off excessive liquids from failing drainfields. “French drains” are also used to conceal excessive sewage flows and leach them in to subsurface gravel or stone. Sewage outfalls can be located during seasons of snow cover and cold weather. Sewage outfalls contain warm water that melts the normal ice cover. Laundry water can be traced by following airborn fragrances contained in the soaps. 9. Poorly designed stream crossing structures Landowners in the watershed create stream crossings for vehicles and foot traffic. Hunters and recreationists like to keep their feet dry. It is popular to build footbridges from inferior materials. Often the building materials are second quality: i.e. pallets, scrapwood, used culverts, or occupational materials: i.e. scrap steel, concrete blocks, bricks, tires, and treated scrapwood. Poorly constructed bridges wash away during high flows creating constrictions in the form of debris jams. Jams in the waterway erodes soil from the stream banks. Bridges or culverts that are too small can lead to hydraulic problems, erosion and flooding. Recreational vehicles and tractor owners are often content with crossing watercourses on unimproved fords. Tires rut up soil surfaces and destroy rooted vegetation causing sedimentation, and suspension of soil particles. Aquatic life forms may be destroyed in the process. 10. Destruction of wetland areas The destruction of regulated and small, unregulated wetland areas is another problem. Unnecessary mowing can occur when local mowing ordinances and noxious weed ordinances favor close cutting to make “neat and pretty” appearances of functioning wetland vegetation. Plant growth can absorb suspended particles of soil, drops of oil, or minor pollutants. Wetland plants need to mature in order to produce food and cover for wildlife. The human mindset of “proper appearances” can diminish wetland functions. Standing waters can be an irritant to uninformed people who would rather fill low areas of the yard with soil and mow and manicure wildlife wetlands away in the name of mosquito control. Stands of native grasses are often destroyed in favor of alien lawn species. Native grasses have deeper root systems with greater soil erosion stabilization ability. 11. Road salt damage Many culverts are destroyed by road salts. Salt used to melt snow corrodes many of the metal culverts in the watershed. Tubes with no bottoms may collapse or expose the soil to water erosion. The chloride salts used to control dust on gravel roads can deteriorate metal structures also. These salt brines from underground wells can destroy bridge railings, pavement grates and anchor bolts on road structures. Salts in the watershed can alter the vegetation in the watershed. Some plants such as Common Reed (Phragmites) thrive in salted conditions while most native plants are stunted or killed by chloride compounds. Salts can deteriorate concrete structures leading to collapse of headwalls and bridge decks.
Appendix B: Inventory of Typical Tributary Drains Page 5 of 10
12. Lack of enforcement of environmental laws There are many good laws and ordinances to protect habitat and water quality, if only they were enforced. A walk through the watershed shows there is very little enforcement of existing laws. Government mandates for action fall upon deaf ears if there is not financial backing for pollution programs. Economic gains are put ahead of pollution concerns. 13. Direct runoff from dense residential developments, parking lots and roadways Watercourses should not be crowded by densely concentrated human activity. Mobile home parks in the watershed have a concentration of human activity that puts pollution into watercourses. The impervious surfaces (such as pavement driveways and cul-de-sacs) collect polluted liquids in the forms of: soaps, oils, salts, herbicides, and dissolved metals. These materials are funneled directly into watercourses with no treatment. 14. Leaking valves and embankments at water treatment facilities Sewage treatment and holding ponds should not be located by watercourses. Leaking embankments or leaking valves release concentrated pollutants to watercourses. 15. Unlimited livestock access to streams The location of livestock pasture should not allow access to watercourses with standing water. It is not necessary to have horses or cattle standing in water in order to get a drink (Livestock tends to defecate while standing in water). 16. The loss of floodplain function when natural watercourses are altered as drains Efforts to create dry land for human activity have had negative effects upon flood control and water quality. Many county drains in the watershed were once meandering watercourses, but have been filled in and or straightened. The usual process is to dig a straighter channel and to pile the resulting spoils (soils) as piles upon the new banks. Some soil is used to fill in side wetlands or unwanted meanders. The resulting arrangement reduces the stream capacity to store floodwaters. The water rushes downstream untreated. Often tributary runoff is trapped in isolated stagnant pools behind the spoil piles. The overland spilling of floodwater in a meandering stream-floodplain system is an important process. In the process of flooding, a natural process of water purification takes place. The landward spilling of dead fish, animal carcasses, wild seeds, nutrients, and pollution creates opportunities for solids to be absorbed. Through complex interaction between plants and animals particulate matter is cycled and recycled in food webs. As a result of such activity the water becomes cleaner. The water purification process functions best if adequate space exists for wetland plants and interactions. Floodplain wetlands in the form of stream meanders and connected low-lying pools, provide the best system for nutrient transport and removal. Floodplain vegetation is more lush because of abundant soil nutrients and diversified seed supplies from upstream areas. The highly diversified plants create more opportunities for wildlife feeding. The natural movement of stream channels creates soil “seed beds” for plants and feeding areas for animals. Low lying wetlands and floodplain woods also function as a habitat nursery for waterfowl, shorebirds, reptiles, amphibians, and insects (food supplies). Insects chew upon plant materials and nutrients are released. Through the interactions of fungi (mushrooms) and bacteria water is further purified beneath the cooling shade of vegetation.
Appendix B: Inventory of Typical Tributary Drains Page 6 of 10
Extra water may find its way along root channels of plants and eventually recharge ground water supplies. These floodplain functions are greatly reduced when meandering streams are prevented, and low lying wetlands are filled. (Watershed streams that have had such alteration include: Beaubien Creek, Crapaud Creek, Marsac Creek, Peters Drain, Dana Drain, Hessen Drain, West Marsh Drain and others.) 17. Children playing in watercourses Since the beginning of time, children have been attracted to playing in watercourses. In a healthy stream waterlife in the form of minnows, turtles, frogs, tadpoles, and “waterbugs” can be a natural attraction. Problems arise when waters are polluted so kids face health risks and also when children vandalize watercourses by building “dams” or bridges from discarded materials, and throw trash in the streams. A life-long respect for watercourses could prevent such activities and channel efforts toward habitat improvements. 18. General lack of education and values that promote watershed protection Walking the tributary watercourses clearly indicates that there is a lack of education affecting water quality in the Anchor Bay Watershed. Traditional values of the past have allowed practices that cannot be tolerated today. Pollution of public waters by sewage outfalls can no longer be allowed as population density increases. The pasturing of waterways by horses or cattle today effects nearby neighbors. We should not complain about the heron eating fish from our stocked pond if the waters are void of fish because of pollution. We need not complain about mosquitoes if we have destroyed their natural predators through habitat destruction. The over-spraying of lawn pesticides may interrupt the food chain by killing songbirds that feed upon insect pests. We should not complain about water quality if we are content to have a swimming pool and then back-flush it into a nearby waterway. We cannot become stewards of land if we live in rented housing and dispose of car batteries and dump used oil on the ground (because the landlord is too busy to notice). The ownership of land creates a connection between humans and nature. The “use and dump” mentality is less likely to occur if one stays upon the land, in the same locality. Land and water stewards plant trees, dig ponds, hunt, go for nature walks, watch birds, fish, and perform activities that increase awareness of land and water. Native Americans lived and survived in the watershed for thousands of years. Stewardship of the land and water was essential to their survival. Economics may suggest that the construction of boat slips (tourist dollars) be put ahead of shoreline habitat preservation. Canal lots and waterside lots with boat slips may bring extra dollars to developers and real estate agents. Steel seawalls may allow manicured lawn sod up to the waters edge. Manicured lawns demand year-long spraying programs (sometimes continuing into winter months). Spray and fertilizers can wash into the water killing fish. Fish are then harder to locate requiring distant trips across the lake. Distant trips require: food, fuel, and facilities. Long trips create sewage that needs to be disposed of. Congestion and cost at onshore pumping stations is avoided by dumping sewage offshore. Bacteria from sewage kills fish. Dying fish create nutrients and weed growth. Nutrients, weed, and bacteria drift shoreward. Shoreside pollution closes beaches. People buy swimming pools to avoid polluted water. Swimming pools isolate people from the environment. Chlorine is added to the water to control algae. Algae and dirt are back-flushed into watercourses. Water quality is degraded.
Appendix B: Inventory of Typical Tributary Drains Page 7 of 10
Swimming in a pool becomes routine. Routines can be remedied by vacations. Vacations require travel. Travel to distant watershed requires: campers, motorhomes, and boats. From long trips we bring back exotic pests and sewage. Lake weeds and strange fish show up in local waterbodies. The fish are “bait stealers”. The bait stealers are killed and tossed back into the water. Dead fish create bacteria and nutrients. Beaches are closed. Public outcry demands pollution-controlling action. Government action requires careful politics. Careful politics require government reports. Government reports have economic repercussions. Aldo Leopold in his book: A Sand County Almanac, states: “In order to make conservation easy, we have made it trivial”. He believed that paying people to do conservation work will never accomplish long term goals. Economic funding when cut off kills programs. Improving water quality in the Anchor Bay Watershed will require many changes in current practices and values. Long term goals in improving water quality require improvement in environmental education and land use planning. Environmental education needs to play a part in teaching the public to be aware and concerned with the world they live in. This education should be a life-long process, with an emphasis on the long term changes in culture. Our current culture has put an emphasis on “athletic sports”. This focus dominates by taking funding and time away from environmental education possibilities. Strong economic interests control monies associated with athletic sports. Clothes, trophies, and awards promote a competitive aura, which is short lived once educational money is spent. Conservation education is limited to a day of outdoor activity (in the fifth or sixth grade). Good conservation requires land use planning. As the population of a watershed grows, control of public access becomes an issue. Wildlands and waterways are perceived to be public property. Woodlot corners become dumping grounds for spent consumer goods. Wooded lanes and drainage ways become travel ways for unauthorized public access. Concentrated traffic degrades habitat and spooks wildlife. Water quality is also degraded. Local ordinances are enacted but damages continue without enforcement. Government ownership of land is perceived a “heavy-handed control” by “big brother”. Land use is perceived by some as a right of land ownership. Taxpayers feel justified in doing what they please (disregarding public benefit of losses). The current practice of creating public pathways for bicycles should serve as a model for long-range land use planning. The watershed-wide extensions and connections beyond political boundaries has gone beyond traditional efforts for multidisciplinary cooperation. In a similar manner, waterways should be protected for the common public benefit. Buffer zones or greenbelts should be established along watercourses to assure water quality maintenance.
Appendix B: Inventory of Typical Tributary Drains Page 8 of 10
The protection of headwaters is critical. Migrating fish move upstream and in order to survive, headwaters must be clean and pure. Wetland “buffer zones”, or vegetative belts, are necessary to filter out pollution, sediments, and other materials that degrade water quality. Watercourses need space to make hydraulic and seasonal adjustments as flow conditions change. Habitat space, in the form of vegetation, buffers wildlife from human activity. Location of Examples of Sources and Causes: 1. Shoreline habitat replaced (or being replaced) with seawalls St. Clair River and tributaries, i.e. South Algonac Anchor Bay shoreline, i.e. East Harsens Island (South of Sans Souci) North Channel shoreline -- island lots created by fill of marshland 2. Tributary Streams being replaced with enclosed piping Robbins Drain Hammer Drain Parker Drain Geyman Drain Cottrell & Extension Drain (M-29 area) Crowley Drain Parquett Drain Clippert Drain Cartwright Drain 3. Residential building encroachment upon watercourses Cottrellville & Extension Drain– M-29 & south of Carroll Street Hammer Drain – northside of Highway M-29 Geyman Drain – east of M-29 Cartwright Drain – south of Fruit Road 4. Lack of soil erosion control on farms and development sites Dana Drain – Clay Twp, Section #9 Crapau Creek Intercounty Drain– Ira Twp, Section #7 Marsac Creek Drain – Ira Twp, Section #8 St. Mary’s Drain, Ira Twp, Section #14 Tributary of Swan Creek, Ira Twp Section #15 Benoit Drain, Casco Twp, Section #31 5. Obstructions (human-caused and development-worsened) Large tributaries usually the worst: Beaubien Creek Drain – Cottrellville Twp, Section #19 Marsac Creek Drain – Ira Twp, Section # 5, 8 & 17 West Marsh Drain – Cottrellville Twp, Section #9, 16 6. Stockpiling foreign materials near watercourses Marsac Creek Drain (east of Church Road) – Ira Twp, Section #8 Benoit Drain (south of Arnold Road) – Ira Twp, Section #7 Benoit & Br #1 Drain – Casco Twp, Section #31 Cartwright Drain (south of Fruit Street) – Clay Twp, City of Algonac
Appendix B: Inventory of Typical Tributary Drains Page 9 of 10
7. Dumping of refuse near watercourses Cartwright Drain (at Scout St. and south of Fruit St.) – Clay Twp, City of Algonac Lester-Bammel Drain (West of M-29) – Cottrellville Twp, P.C. 187 Grandchamp Drain – Cottrellville Twp, Section #7 (NE) Townline of Ira Drain –Cottrellville Twp, Section #18, #19; Ira Twp, Section #24 (E¼ line) 8. Lack of adequate septic systems Smith-Cottrellville Drain – Cottrellville Twp, Section #9, (SE¼) Hammer Drain – Ira Twp, Section #23, S. of M-29 Peters Drain – Casco Twp, Section #36 Hessen Drain – Casco Twp, Section #26 West Marsh Drain – Cottrellville Twp, Section #20
9. Poorly designed stream crossing structures Beaubien Creek Drain – Section #7, 18 Benoit Branch #1 – Casco Twp, Section #31, Marsac Creek Drain – Ira Twp, Sec. #8 (SW) Lester-Bammel Drain – Cottrellville Twp 10. Destruction of wetland areas Arnold Drain – Cottrellville, Section #3 (SW) Cottrell & Extension Drain – (south of Chartier St. by cemetery) – Marine City Crapau Creek Intercounty Drain – Ira Twp, Section #7 Benoit Drain – Ira Twp, Section #7, south of Arnold Rd, west of Bethuy Rd. Dana Drain – Clay Twp Section #9 M-29 west of Algonac – to Palms Road, north & south of M-29 City of Algonac – southern-most points of land Harsens Island – south of San Souci 11. Road salt damage culverts Beaubien Creek Drain (Broadbridge Rd. west of Starville) – Cottrellville Twp, Section #18 Arnold Drain – Cottrellville Twp, Section #3, #4 Sykes Drain – Cottrellville Twp, Section #3, #4 Marsac Creek Drain – Casco Twp, Section #31, collapsed concrete & stone headwall 12. Lack of enforcement of environmental laws Arnold Drain – north of Arnold, Section #3 Dana Drain – Clay Twp. Section #9 13. Direct runoff from dense residential developments, parking lots & roadways Marsac Creek Drain (upper)– Casco Twp, Section #30 Marsac Creek Drain (lower) – Ira Twp, Section #7, #8, 14. Leaking valves and embankments at water treatment facilities Casco Township, Section #30 15. Unlimited livestock access to streams Beaubien Creek & Grandchamp Drains – Cottrellville Twp, Section #7, #17 & #18
Appendix B: Inventory of Typical Tributary Drains Page 10 of 10
16. The loss of floodplain function when natural watercourses are altered as drains Casco Drain – Casco Twp, Section #25 Beaubien Creek Drain – Cottrellville Twp, Section #19 Crapau Creek Intercounty Drain – Ira Twp, Section #7 Marsac Creek – Casco Twp, Section #31, Ira Twp, Section #7, 8 Dana Drain – Clay Twp, City of Algonac Hessen Drain – Casco Twp, Section #26 West Marsh – Cottrellville Twp, Section #20 Peters Drain – Casco Twp, Section #36 17. Children playing in watercourses Marsac Creek (upper) – Casco Twp, Section #30 Marsac Creek (lower) – Ira Twp, Section #8 Cottrell & Extension Drain – Cottellville Twp, Marine City 18. General lack of education and values that promote watershed protection Cartwright Drain – Clay Twp, City of Algonac Cottrell & Extension Drain – Cottrellville Twp, Marine City Dana Drain – Clay Twp, City of Algonac
Anchor Bay Watershed Management Plan
Appendix C:
Crapau Creek TMDL
Michigan Department of Environmental Quality
Surface Water Quality Division January 2002
Total Maximum Daily Load for Escherichia coli for Crapaud Creek,
Macomb and St. Clair Counties INTRODUCTION Section 303(d) of the federal Clean Water Act and the United States Environmental Protection Agency’s (USEPA’s) Water Quality Planning and Management Regulations (Title 40 of the Code of Federal Regulations (CFR), Part 130) require states to develop Total Maximum Daily Loads (TMDLs) for waterbodies that are not meeting Water Quality Standards (WQS). The TMDL process establishes the allowable loadings of pollutants for a waterbody based on the relationship between pollution sources and in-stream water quality conditions. TMDLs provide states a basis for determining the pollutant reductions necessary from both point and nonpoint sources to restore and maintain the quality of their water resources. The purpose of this TMDL is to identify the allowable levels of Escherichia coli (E. coli) that will result in the attainment of the applicable WQS in Crapaud Creek, a small waterbody in Macomb and St. Clair Counties. PROBLEM STATEMENT Crapaud Creek was placed on the Section 303(d) list in 1998. This TMDL addresses approximately two miles of Crapaud Creek in the city of New Baltimore. The TMDL reach is on the Section 303(d) list as: Waterbody: Crapaud Creek WBID#: 061409E County: Macomb RF3RchID: 4090002 303 Size: 2 M Location: Downtown New Baltimore at Hamer Street. Status: 2 Problem: Pathogens (Rule 100). TMDL YEAR(s): 2000 Crapaud Creek (Figures 1 and 2) was placed on the Section 303(d) list due to impairment of recreational uses by the presence of elevated levels of E. coli. Data collected in the vicinity of New Baltimore by the Macomb County Health Department began documenting elevated E. coli levels in 1996. A review of the available data indicated elevated levels of E. coli in at least 50% of the samples collected since 1996, with particularly high results in 1999. Data for 1999 indicated elevated levels for E. coli in over 90% of the samples collected (Macomb County Health Department, 2001). Monitoring data (Appendix 1) collected by the Michigan Department of Environmental Quality (MDEQ) in 2001 documented continued exceedances of the WQS at all five stations sampled (Table 1). Geometric means for the 2001 sampling period exhibited elevated levels (Figure 3), especially at the upstream stations. Monthly geometric mean E. coli concentrations in 2001 ranged from 66 E. coli per 100 milliliters (ml) in July at Green Road to 2,417 E. coli per 100 ml in June at Ashley Street, as summarized in Table 1 and Figure 4. The highest value found (80,000) was in the downstream area at Athea Street, but consistently high values were found in the upstream area at Ashley and Perrin Streets.
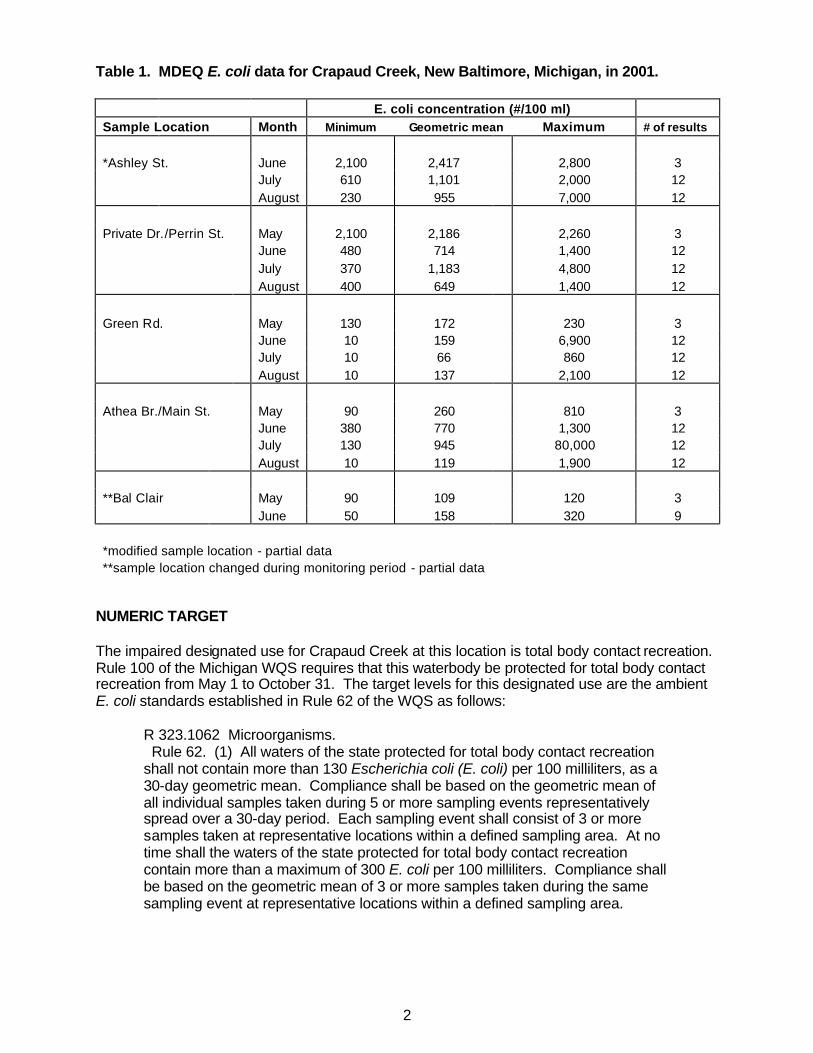
2
Table 1. MDEQ E. coli data for Crapaud Creek, New Baltimore, Michigan, in 2001. E. coli concentration (#/100 ml) Sample Location Month Minimum Geometric mean Maximum # of results *Ashley St. June 2,100 2,417 2,800 3 July 610 1,101 2,000 12 August 230 955 7,000 12 Private Dr./Perrin St. May 2,100 2,186 2,260 3 June 480 714 1,400 12 July 370 1,183 4,800 12 August 400 649 1,400 12 Green Rd. May 130 172 230 3 June 10 159 6,900 12 July 10 66 860 12 August 10 137 2,100 12 Athea Br./Main St. May 90 260 810 3 June 380 770 1,300 12 July 130 945 80,000 12 August 10 119 1,900 12 **Bal Clair May 90 109 120 3 June 50 158 320 9 *modified sample location - partial data **sample location changed during monitoring period - partial data
NUMERIC TARGET The impaired designated use for Crapaud Creek at this location is total body contact recreation. Rule 100 of the Michigan WQS requires that this waterbody be protected for total body contact recreation from May 1 to October 31. The target levels for this designated use are the ambient E. coli standards established in Rule 62 of the WQS as follows:
R 323.1062 Microorganisms. Rule 62. (1) All waters of the state protected for total body contact recreation shall not contain more than 130 Escherichia coli (E. coli) per 100 milliliters, as a 30-day geometric mean. Compliance shall be based on the geometric mean of all individual samples taken during 5 or more sampling events representatively spread over a 30-day period. Each sampling event shall consist of 3 or more samples taken at representative locations within a defined sampling area. At no time shall the waters of the state protected for total body contact recreation contain more than a maximum of 300 E. coli per 100 milliliters. Compliance shall be based on the geometric mean of 3 or more samples taken during the same sampling event at representative locations within a defined sampling area.
3
In addition, there are two permitted wastewater treatment plant (WWTP) discharges to Crapaud Creek, which have an additional target:
Rule 62. (3) Discharges containing treated or untreated human sewage shall not contain more than 200 fecal coliform bacteria per 100 milliliters, based on the geometric mean of all of 5 or more samples taken over a 30-day period, nor more than 400 fecal coliform bacteria per 100 milliliters, based on the on the geometric mean of all of 3 or more samples taken during any period of discharge not to exceed 7 days. Other indicators of adequate disinfection may be utilized where approved by the department.
The WWTP discharges will be considered in compliance with the WQS of 130 E. coli per 100 ml if their National Pollutant Discharge Elimination System (NPDES) permit limit of 200 fecal coliform per 100 ml as a monthly average is met. This is assumed because E. coli are a subset of fecal coliform (American Public Health Association, 1995). When the wastewater of concern is sewage, fecal coliform is substantially higher than E. coli (Whitman, 2001). When the point source dischargers are disinfecting their effluent and meeting their limit of 200 fecal coliform per 100 ml, it can reasonably be assumed that there are less than 130 E. coli per 100 ml in the effluent. For this TMDL, the WQS of 130 per 100 ml as a 30-day geometric mean is the target level for the TMDL reach from May 1 to October 31. As previously stated, data collected by the MDEQ in 2001 documented E. coli exceedances at all five stations sampled (Table 1). This is consistent with elevated levels found by the Macomb County Health Department in 1996 and 1999. SOURCE ASSESSMENT The Crapaud Creek watershed is located in both Macomb and St. Clair Counties. The listed TMDL reach is upstream from Hamer Street in the city of New Baltimore, Macomb County, extending into St. Clair County (Figure 1). There are two permitted point source discharges to Crapaud Creek, the city of New Baltimore WWTP and Millstone Pond Mobile Home Park WWTP. Municipalities in Macomb County include the city of New Baltimore, Lenox Township, and Chesterfield Township. The remaining municipalities, Casco Township and Ira Township, are located in St. Clair County. Table 2 shows the distribution of land in the Crapaud Creek watershed for each municipality. Table 2. Distribution of land for each municipality in the Crapaud Creek watershed.
Municipality County Watershed Area Percent Land Area (sq. mi) in Watershed Lenox Township Macomb 0.8 11 Casco Township St. Clair 1.1 15 Chesterfield Township Macomb 0.9 13 Ira Township St. Clair 1.6 22 City of New Baltimore Macomb 2.8 39 TOTAL 7.2 100
Potential pathogen sources for this waterbody include sources typically associated with urban and agricultural land uses. The 2001 monitoring data was collected during typical stream flow conditions and is indicative of both continuous and storm event inputs. Potential inputs of E. coli
4
include the two permitted point sources, as well as illicit sewer connections and urban runoff, since a majority of the watershed lies within New Baltimore. Other possible sources include agricultural runoff and pet and wildlife feces. LINKAGE ANALYSIS The link between the E. coli concentration in Crapaud Creek and the potential sources is the basis for the development of the TMDL. The linkage is defined as the cause and effect relationship between the selected indicators and the sources. This provides the basis for estimating the total assimilative capacity of the creek and any needed load reductions. For this TMDL, the primary loading of pathogens likely enters Crapaud Creek by both continuous and storm water related nonpoint sources. Due to insufficient flow upstream, sampling in 2001 began where there was an obvious stream channel and adequate water. The guiding water quality management principle used to develop the TMDL was that compliance with the numeric pathogen target in Crapaud Creek depends on the control of point source E. coli, and the control of E. coli in storm water and illicit connections. If the E. coli inputs can be controlled, then total body contact recreation in Crapaud Creek will be protected. TMDL DEVELOPMENT The TMDL represents the maximum loading that can be assimilated by the waterbody while still achieving WQS. As indicated in the Numeric Target section, the target for this pathogen TMDL is the WQS of 130 E. coli per 100 ml. Concurrent with the selection of a numeric concentration endpoint, TMDL development also defines the environmental conditions that will be used when defining allowable levels. Many TMDLs are designed around the concept of a “critical condition.” The “critical condition” is defined as the set of environmental conditions that, if controls are designed to protect, will ensure attainment of objectives for all other conditions. For example, the critical conditions for the control of point sources in Michigan are given in R 323.1090. In general, the lowest monthly 95% exceedance flow for streams is used as a design condition for point source discharges. However, for pathogens in point source discharges of treated or untreated human sewage, levels are restricted to a monthly average limit of 200 per 100 ml for fecal coliforms regardless of stream flow. Therefore, the design stream flow is not a critical condition for determining the allowable loadings of pathogens for WWTPs. In addition, other E. coli sources to Crapaud Creek arise from a mixture of wet and dry weather-driven nonpoint sources, and there is no single critical condition that is protective for all other conditions. For these sources, there are a number of different allowable loads that will ensure compliance, as long as they are distributed properly throughout space. For most pollutants, TMDLs are expressed on a mass loading basis (e.g., pounds per day). For E. coli, however, mass is not an appropriate measure, and the USEPA allows pathogen TMDLs to be expressed in terms of organism counts (or resulting concentration). Therefore, this pathogen TMDL is concentration-based consistent with R 323.1062, and the TMDL is equal to the target concentration of 130 E. coli per 100 ml. For this TMDL, an allocation strategy for nonpoint sources has been selected that assumes equal bacteria loads per unit area for all lands within the watershed. The point sources are handled consistent with Rule 62(3). The allocation process for each month of the recreational season (May through October) is outlined below.
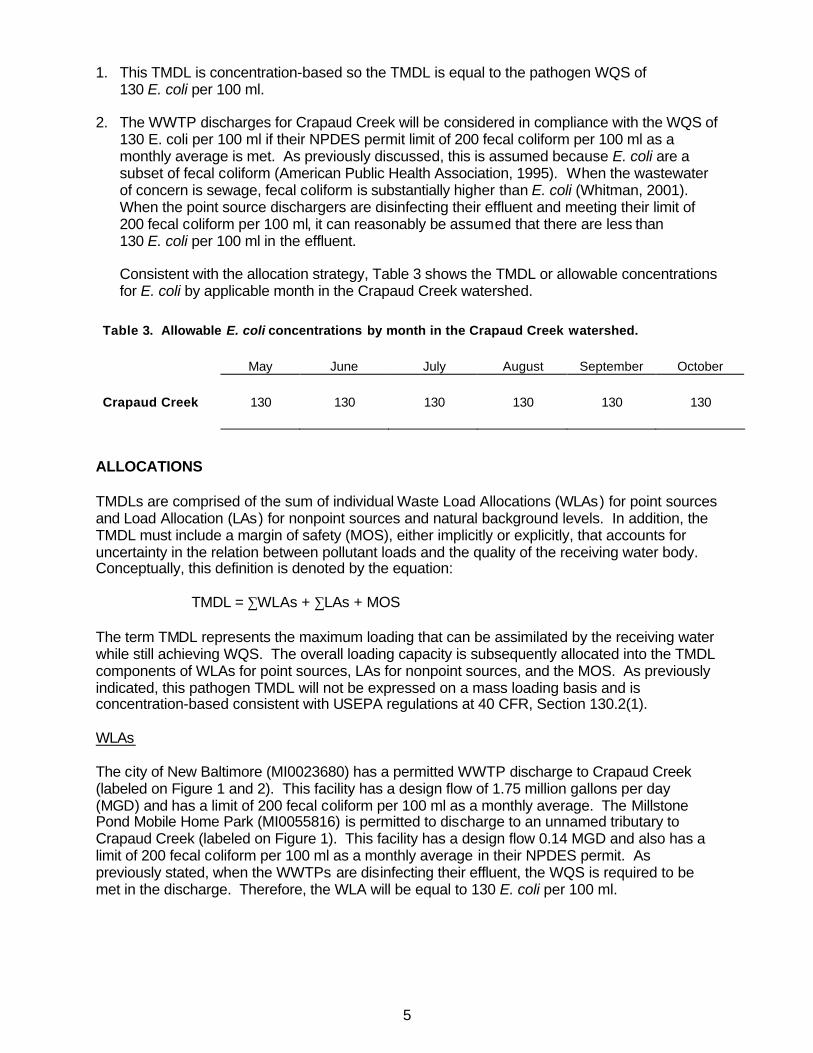
5
1. This TMDL is concentration-based so the TMDL is equal to the pathogen WQS of
130 E. coli per 100 ml. 2. The WWTP discharges for Crapaud Creek will be considered in compliance with the WQS of
130 E. coli per 100 ml if their NPDES permit limit of 200 fecal coliform per 100 ml as a monthly average is met. As previously discussed, this is assumed because E. coli are a subset of fecal coliform (American Public Health Association, 1995). When the wastewater of concern is sewage, fecal coliform is substantially higher than E. coli (Whitman, 2001). When the point source dischargers are disinfecting their effluent and meeting their limit of 200 fecal coliform per 100 ml, it can reasonably be assumed that there are less than 130 E. coli per 100 ml in the effluent. Consistent with the allocation strategy, Table 3 shows the TMDL or allowable concentrations for E. coli by applicable month in the Crapaud Creek watershed.
Table 3. Allowable E. coli concentrations by month in the Crapaud Creek watershed. May June July August September October Crapaud Creek 130 130 130 130 130 130
ALLOCATIONS TMDLs are comprised of the sum of individual Waste Load Allocations (WLAs) for point sources and Load Allocation (LAs) for nonpoint sources and natural background levels. In addition, the TMDL must include a margin of safety (MOS), either implicitly or explicitly, that accounts for uncertainty in the relation between pollutant loads and the quality of the receiving water body. Conceptually, this definition is denoted by the equation: TMDL = ∑WLAs + ∑LAs + MOS The term TMDL represents the maximum loading that can be assimilated by the receiving water while still achieving WQS. The overall loading capacity is subsequently allocated into the TMDL components of WLAs for point sources, LAs for nonpoint sources, and the MOS. As previously indicated, this pathogen TMDL will not be expressed on a mass loading basis and is concentration-based consistent with USEPA regulations at 40 CFR, Section 130.2(1). WLAs The city of New Baltimore (MI0023680) has a permitted WWTP discharge to Crapaud Creek (labeled on Figure 1 and 2). This facility has a design flow of 1.75 million gallons per day (MGD) and has a limit of 200 fecal coliform per 100 ml as a monthly average. The Millstone Pond Mobile Home Park (MI0055816) is permitted to discharge to an unnamed tributary to Crapaud Creek (labeled on Figure 1). This facility has a design flow 0.14 MGD and also has a limit of 200 fecal coliform per 100 ml as a monthly average in their NPDES permit. As previously stated, when the WWTPs are disinfecting their effluent, the WQS is required to be met in the discharge. Therefore, the WLA will be equal to 130 E. coli per 100 ml.
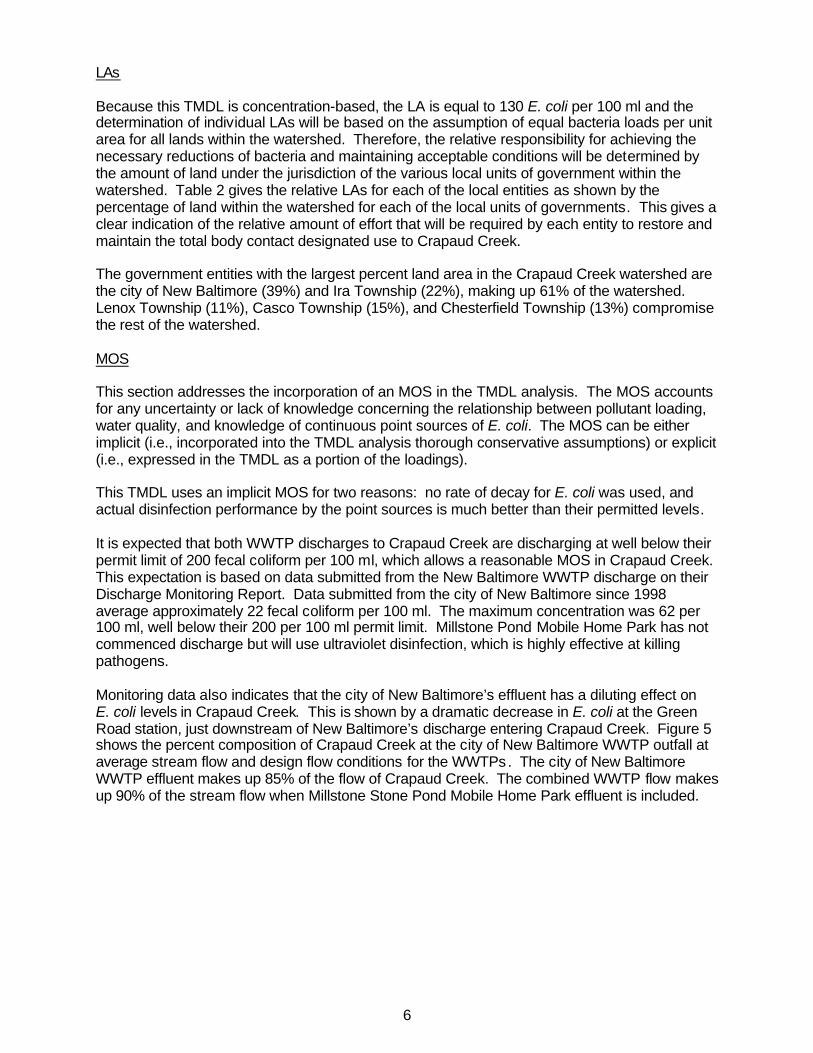
6
LAs Because this TMDL is concentration-based, the LA is equal to 130 E. coli per 100 ml and the determination of individual LAs will be based on the assumption of equal bacteria loads per unit area for all lands within the watershed. Therefore, the relative responsibility for achieving the necessary reductions of bacteria and maintaining acceptable conditions will be determined by the amount of land under the jurisdiction of the various local units of government within the watershed. Table 2 gives the relative LAs for each of the local entities as shown by the percentage of land within the watershed for each of the local units of governments. This gives a clear indication of the relative amount of effort that will be required by each entity to restore and maintain the total body contact designated use to Crapaud Creek. The government entities with the largest percent land area in the Crapaud Creek watershed are the city of New Baltimore (39%) and Ira Township (22%), making up 61% of the watershed. Lenox Township (11%), Casco Township (15%), and Chesterfield Township (13%) compromise the rest of the watershed. MOS This section addresses the incorporation of an MOS in the TMDL analysis. The MOS accounts for any uncertainty or lack of knowledge concerning the relationship between pollutant loading, water quality, and knowledge of continuous point sources of E. coli. The MOS can be either implicit (i.e., incorporated into the TMDL analysis thorough conservative assumptions) or explicit (i.e., expressed in the TMDL as a portion of the loadings). This TMDL uses an implicit MOS for two reasons: no rate of decay for E. coli was used, and actual disinfection performance by the point sources is much better than their permitted levels. It is expected that both WWTP discharges to Crapaud Creek are discharging at well below their permit limit of 200 fecal coliform per 100 ml, which allows a reasonable MOS in Crapaud Creek. This expectation is based on data submitted from the New Baltimore WWTP discharge on their Discharge Monitoring Report. Data submitted from the city of New Baltimore since 1998 average approximately 22 fecal coliform per 100 ml. The maximum concentration was 62 per 100 ml, well below their 200 per 100 ml permit limit. Millstone Pond Mobile Home Park has not commenced discharge but will use ultraviolet disinfection, which is highly effective at killing pathogens. Monitoring data also indicates that the city of New Baltimore’s effluent has a diluting effect on E. coli levels in Crapaud Creek. This is shown by a dramatic decrease in E. coli at the Green Road station, just downstream of New Baltimore’s discharge entering Crapaud Creek. Figure 5 shows the percent composition of Crapaud Creek at the city of New Baltimore WWTP outfall at average stream flow and design flow conditions for the WWTPs. The city of New Baltimore WWTP effluent makes up 85% of the flow of Crapaud Creek. The combined WWTP flow makes up 90% of the stream flow when Millstone Stone Pond Mobile Home Park effluent is included.
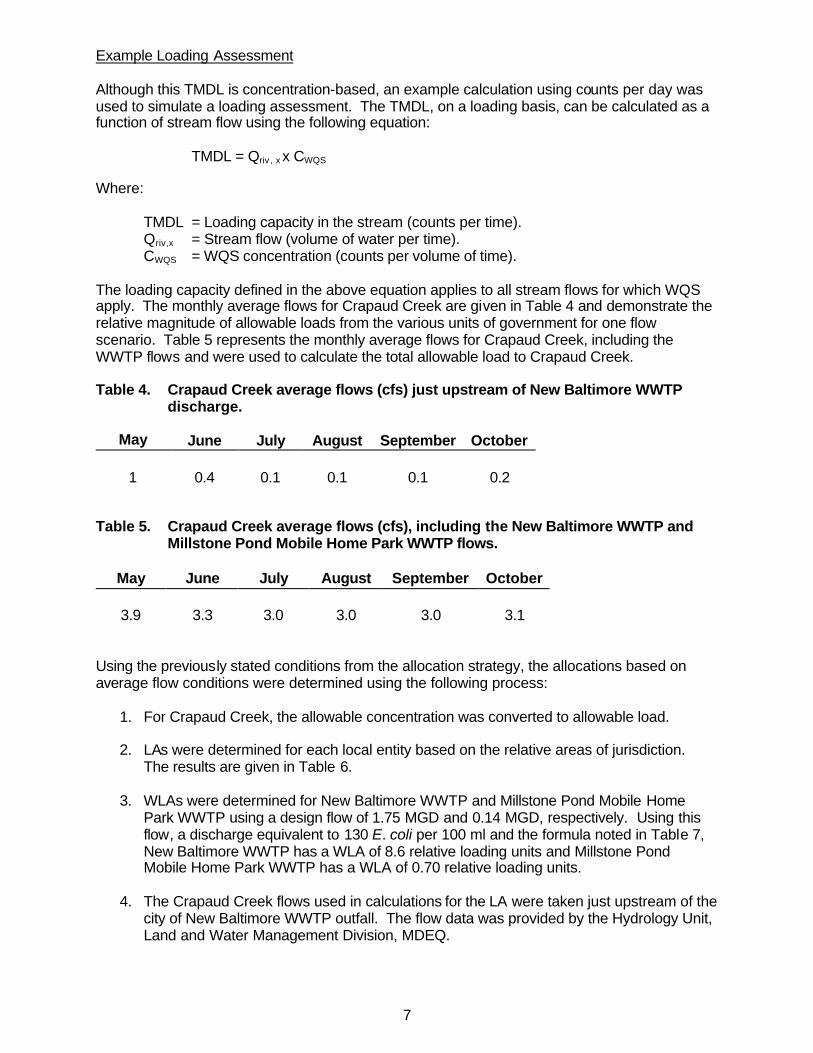
7
Example Loading Assessment Although this TMDL is concentration-based, an example calculation using counts per day was used to simulate a loading assessment. The TMDL, on a loading basis, can be calculated as a function of stream flow using the following equation: TMDL = Qriv , x x CWQS
Where:
TMDL = Loading capacity in the stream (counts per time). Qriv,x = Stream flow (volume of water per time). CWQS = WQS concentration (counts per volume of time).
The loading capacity defined in the above equation applies to all stream flows for which WQS apply. The monthly average flows for Crapaud Creek are given in Table 4 and demonstrate the relative magnitude of allowable loads from the various units of government for one flow scenario. Table 5 represents the monthly average flows for Crapaud Creek, including the WWTP flows and were used to calculate the total allowable load to Crapaud Creek. Table 4. Crapaud Creek average flows (cfs) just upstream of New Baltimore WWTP
discharge.
May June July August September October 1 0.4 0.1 0.1 0.1 0.2
Table 5. Crapaud Creek average flows (cfs), including the New Baltimore WWTP and
Millstone Pond Mobile Home Park WWTP flows.
May June July August September October
3.9 3.3 3.0 3.0 3.0 3.1 Using the previously stated conditions from the allocation strategy, the allocations based on average flow conditions were determined using the following process:
1. For Crapaud Creek, the allowable concentration was converted to allowable load.
2. LAs were determined for each local entity based on the relative areas of jurisdiction. The results are given in Table 6.
3. WLAs were determined for New Baltimore WWTP and Millstone Pond Mobile Home
Park WWTP using a design flow of 1.75 MGD and 0.14 MGD, respectively. Using this flow, a discharge equivalent to 130 E. coli per 100 ml and the formula noted in Table 7, New Baltimore WWTP has a WLA of 8.6 relative loading units and Millstone Pond Mobile Home Park WWTP has a WLA of 0.70 relative loading units.
4. The Crapaud Creek flows used in calculations for the LA were taken just upstream of the
city of New Baltimore WWTP outfall. The flow data was provided by the Hydrology Unit, Land and Water Management Division, MDEQ.
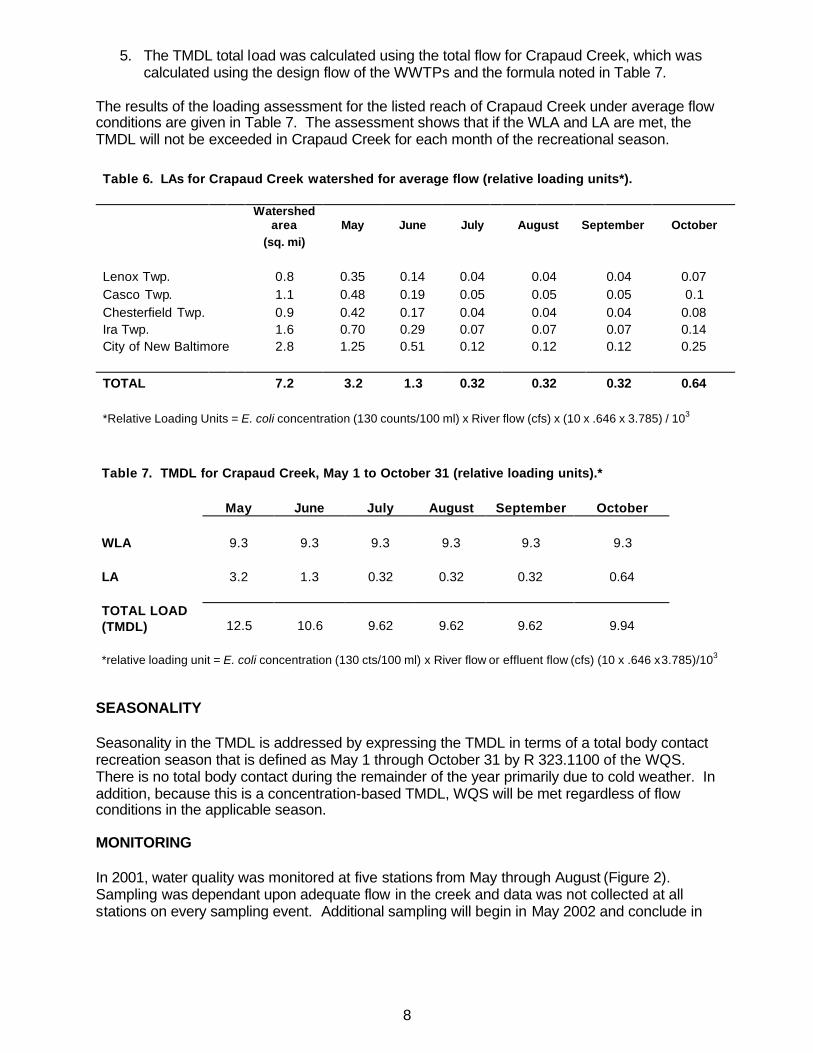
8
5. The TMDL total load was calculated using the total flow for Crapaud Creek, which was calculated using the design flow of the WWTPs and the formula noted in Table 7.
The results of the loading assessment for the listed reach of Crapaud Creek under average flow conditions are given in Table 7. The assessment shows that if the WLA and LA are met, the TMDL will not be exceeded in Crapaud Creek for each month of the recreational season. Table 6. LAs for Crapaud Creek watershed for average flow (relative loading units*).
Watershed
area May June July August September October (sq. mi) Lenox Twp. 0.8 0.35 0.14 0.04 0.04 0.04 0.07 Casco Twp. 1.1 0.48 0.19 0.05 0.05 0.05 0.1 Chesterfield Twp. 0.9 0.42 0.17 0.04 0.04 0.04 0.08 Ira Twp. 1.6 0.70 0.29 0.07 0.07 0.07 0.14 City of New Baltimore 2.8 1.25 0.51 0.12 0.12 0.12 0.25 TOTAL 7.2 3.2 1.3 0.32 0.32 0.32 0.64 *Relative Loading Units = E. coli concentration (130 counts/100 ml) x River flow (cfs) x (10 x .646 x 3.785) / 103
Table 7. TMDL for Crapaud Creek, May 1 to October 31 (relative loading units).* May June July August September October WLA 9.3 9.3 9.3 9.3 9.3 9.3 LA 3.2 1.3 0.32 0.32 0.32 0.64 TOTAL LOAD (TMDL) 12.5 10.6 9.62 9.62 9.62 9.94 *relative loading unit = E. coli concentration (130 cts/100 ml) x River flow or effluent flow (cfs) (10 x .646 x 3.785)/103
SEASONALITY Seasonality in the TMDL is addressed by expressing the TMDL in terms of a total body contact recreation season that is defined as May 1 through October 31 by R 323.1100 of the WQS. There is no total body contact during the remainder of the year primarily due to cold weather. In addition, because this is a concentration-based TMDL, WQS will be met regardless of flow conditions in the applicable season. MONITORING In 2001, water quality was monitored at five stations from May through August (Figure 2). Sampling was dependant upon adequate flow in the creek and data was not collected at all stations on every sampling event. Additional sampling will begin in May 2002 and conclude in
9
September 2002. If initial sampling in 2002 indicates WQS are exceeded, the remaining sampling will be oriented toward source identification. If these results indicate that the waterbody may be meeting WQS, sampling will be conducted at the appropriate frequency to determine if the 30-day geometric mean value of 130 E. coli per 100 ml is being met. In future years, assuming WQS are not met immediately, sampling frequency will be weekly from May through September at appropriate locations. Sampling will be adjusted as needed to assist in continued source identification and elimination. When these results indicate that the waterbody may be meeting WQS, sampling will be conducted at the appropriate frequency to determine if the 30-day geometric mean value of 130 E. coli per 100 ml is being met. REASONABLE ASSURANCE ACTIVITIES Under the NPDES permit program, the two WWTP dischargers are responsible for meeting their effluent limits for fecal coliform. Compliance is determined based on review of Discharge Monitoring Report data by the MDEQ. As previously stated, the WWTP dischargers in the watershed are presently disinfecting their effluent well below their permitted limits. Urban storm water runoff and illicit discharges are likely the dominant sources of E. coli to Crapaud Creek. Implementation activities to meet the TMDL require measures to reduce E. coli sources and loads. Under the Phase 2 storm water regulations, the need for storm water permits in the other municipalities in the watershed will be evaluated against the applicable criteria on a case-by-case basis . These requirements are likely to apply to the city of New Baltimore, Chesterfield Township and Ira Township. These permits will require activities that reduce pathogen inputs, similar to the existing Phase 1 storm water permits in more populated urban areas. In addition, Macomb and St. Clair Counties have been awarded a Section 319 Watershed Management Grant that will include activities to reduce and eliminate sources of E. coli. This grant is titled the “Anchor Bay Watershed Project” and includes Crapaud Creek. The goal of this grant is to develop a comprehensive nonpoint source watershed management plan. Objectives of the plan include the identification and correction of failing septic systems and the control of urban and agricultural storm water runoff. The grant is funded in the amount of $91,252.00 with a local match of $103,868 for a total of $195,120.00. Prepared by: Christine Thelen, Aquatic Biologist Great Lakes and Environmental Assessment Section Surface Water Quality Division Michigan Department of Environmental Quality January 22, 2001
10
REFERENCES
American Public Health Association. 1995. Standard Methods for the Examination of Water and Wastewater. 19th Edition. Creal, W. and J. Wuycheck. 2000. Federal Clean Water Act Section 303(d) List – Michigan’s
Submittal for Year 2000. Michigan Department of Environmental Quality, Surface Water Quality Division, Report Number MI/DEQ/SWQ-00/018.
Macomb County Health Department. 2001.
WWW.co.macomb.mi.us/publichealth/waterquality/monthass/SALT - MILK - CRAPAUD. Personal communication, Richard L. Whitman. United States Geological Survey, October 2001. USEPA. 2001. Protocol for Developing Pathogen TMDLs. United States Environmental
Protection Agency, 841-R-00-002.
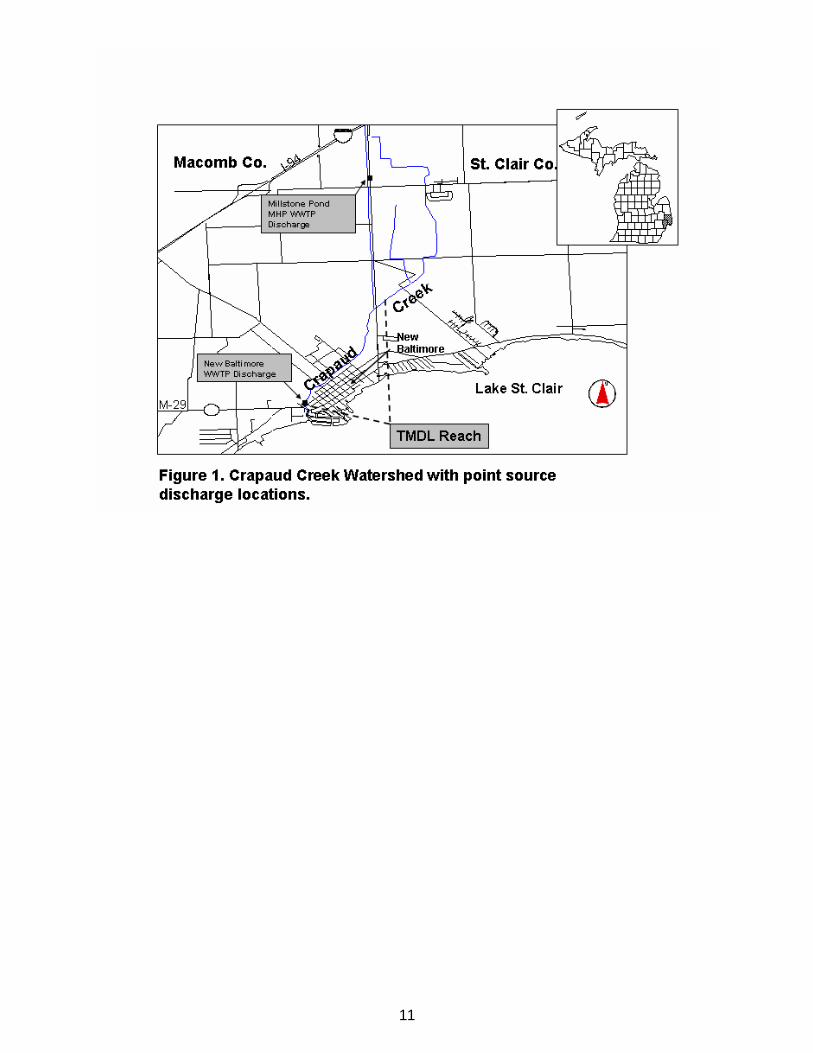
11
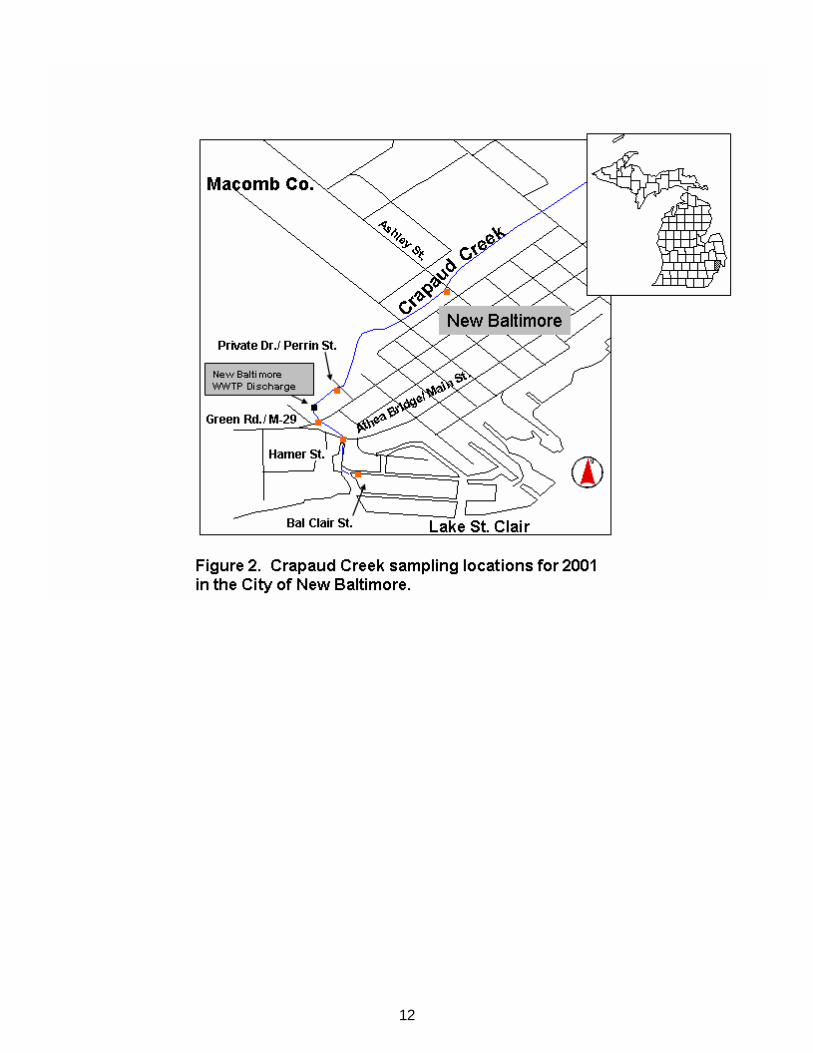
12
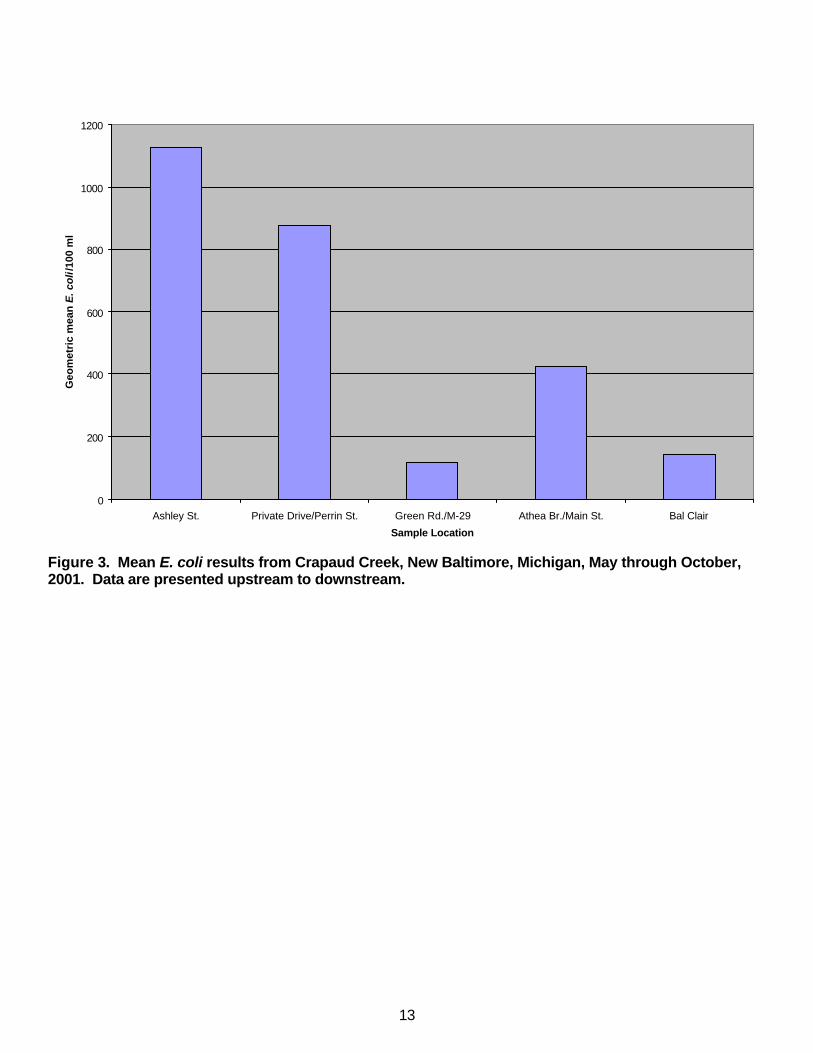
13
0
200
400
600
800
1000
1200
Ashley St. Private Drive/Perrin St. Green Rd./M-29 Athea Br./Main St. Bal Clair
Sample Location
Geo
met
ric
mea
n E
. co
li/1
00 m
l
Figure 3. Mean E. coli results from Crapaud Creek, New Baltimore, Michigan, May through October, 2001. Data are presented upstream to downstream.
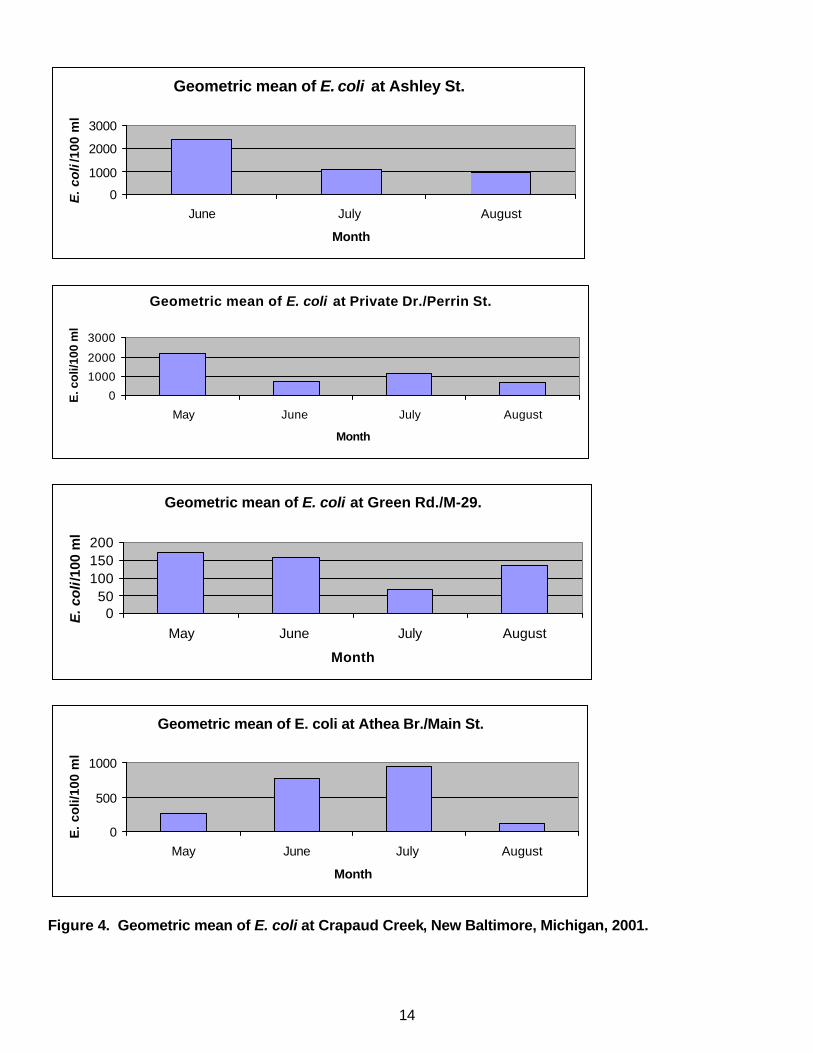
14
Geometric mean of E. coli at Ashley St.
0
1000
2000
3000
June July August
Month
E. c
oli
/100
ml
Geometric mean of E. coli at Private Dr./Perrin St.
0
1000
2000
3000
May June July August
Month
E. c
oli/
100
ml
Geometric mean of E. coli at Green Rd./M-29.
050
100150200
May June July August
Month
E. c
oli
/100
ml
Geometric mean of E. coli at Athea Br./Main St.
0
500
1000
May June July August
Month
E. c
oli/
100
ml
Figure 4. Geometric mean of E. coli at Crapaud Creek, New Baltimore, Michigan, 2001.
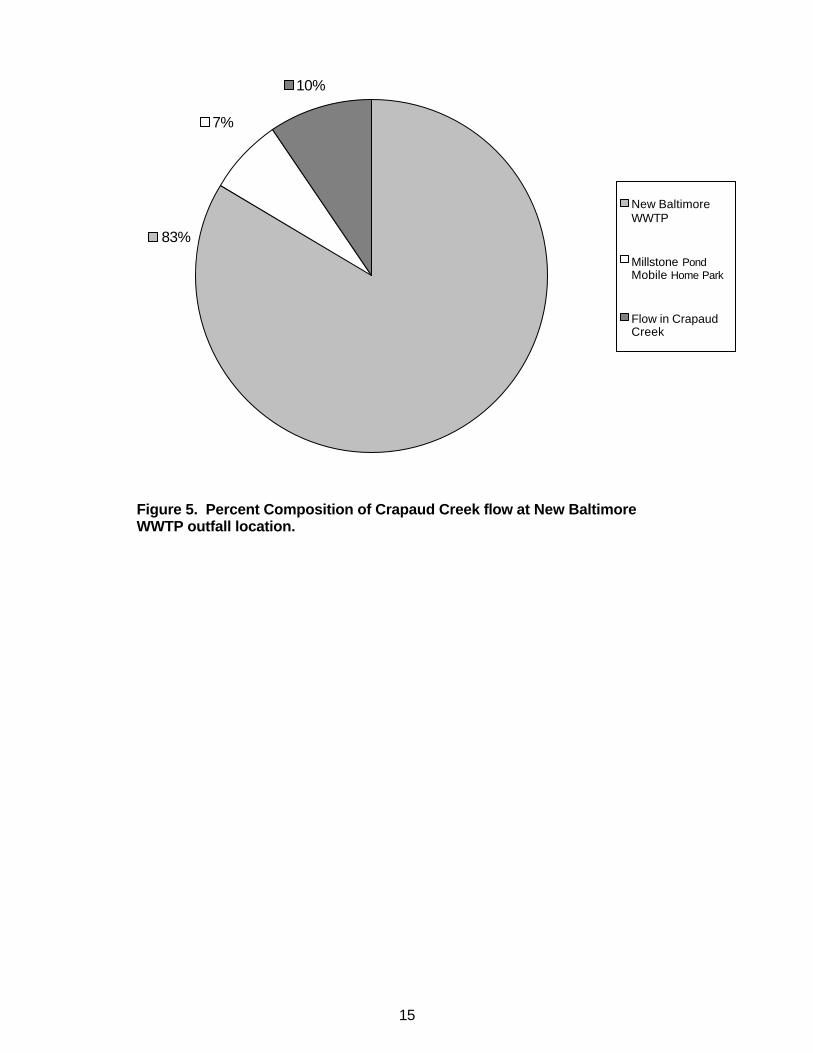
15
Figure 5. Percent Composition of Crapaud Creek flow at New Baltimore WWTP outfall location.
10%
83%
7%
New Baltimore WWTP
Millstone Pond Mobile Home Park
Flow in Crapaud Creek
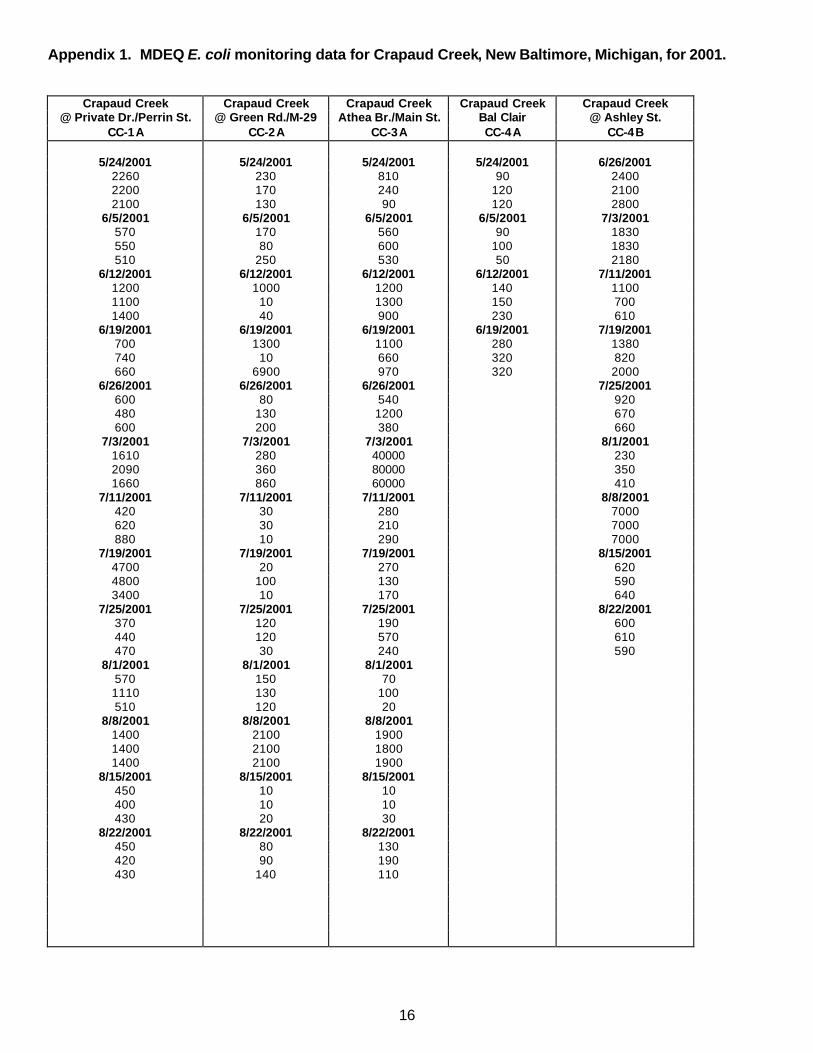
16
Appendix 1. MDEQ E. coli monitoring data for Crapaud Creek, New Baltimore, Michigan, for 2001.
Crapaud Creek Crapaud Creek Crapaud Creek Crapaud Creek Crapaud Creek @ Private Dr./Perrin St. @ Green Rd./M-29 Athea Br./Main St. Bal Clair @ Ashley St.
CC-1A CC-2A CC-3A CC-4A CC-4B
5/24/2001 5/24/2001 5/24/2001 5/24/2001 6/26/2001 2260 230 810 90 2400 2200 170 240 120 2100 2100 130 90 120 2800
6/5/2001 6/5/2001 6/5/2001 6/5/2001 7/3/2001 570 170 560 90 1830 550 80 600 100 1830 510 250 530 50 2180
6/12/2001 6/12/2001 6/12/2001 6/12/2001 7/11/2001 1200 1000 1200 140 1100 1100 10 1300 150 700 1400 40 900 230 610
6/19/2001 6/19/2001 6/19/2001 6/19/2001 7/19/2001 700 1300 1100 280 1380 740 10 660 320 820 660 6900 970 320 2000
6/26/2001 6/26/2001 6/26/2001 7/25/2001 600 80 540 920 480 130 1200 670 600 200 380 660
7/3/2001 7/3/2001 7/3/2001 8/1/2001 1610 280 40000 230 2090 360 80000 350 1660 860 60000 410
7/11/2001 7/11/2001 7/11/2001 8/8/2001 420 30 280 7000 620 30 210 7000 880 10 290 7000
7/19/2001 7/19/2001 7/19/2001 8/15/2001 4700 20 270 620 4800 100 130 590 3400 10 170 640
7/25/2001 7/25/2001 7/25/2001 8/22/2001 370 120 190 600 440 120 570 610 470 30 240 590
8/1/2001 8/1/2001 8/1/2001 570 150 70 1110 130 100 510 120 20
8/8/2001 8/8/2001 8/8/2001 1400 2100 1900 1400 2100 1800 1400 2100 1900
8/15/2001 8/15/2001 8/15/2001 450 10 10 400 10 10 430 20 30
8/22/2001 8/22/2001 8/22/2001 450 80 130 420 90 190 430 140 110
Anchor Bay Watershed Management Plan
Appendix D:
Project Team Members
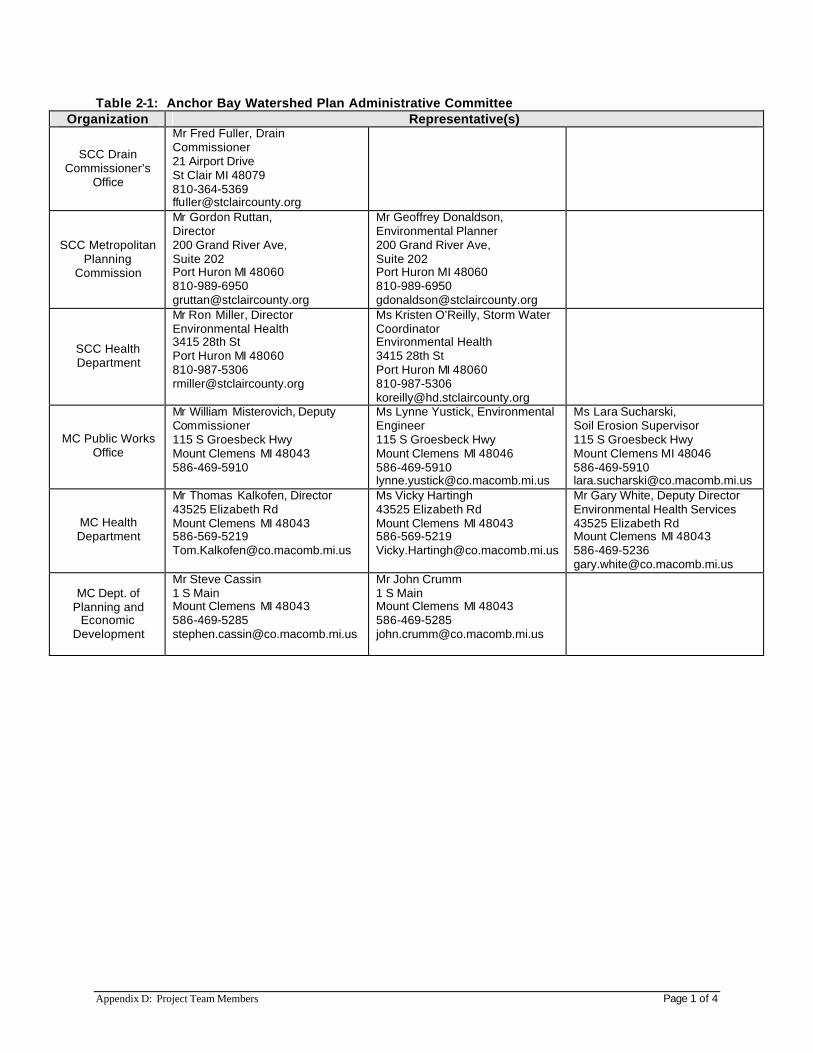
Appendix D: Project Team Members Page 1 of 4
Table 2-1: Anchor Bay Watershed Plan Administrative Committee Organization Representative(s)
SCC Drain Commissioner’s
Office
Mr Fred Fuller, Drain Commissioner 21 Airport Drive St Clair MI 48079 810-364-5369 [email protected]
SCC Metropolitan Planning
Commission
Mr Gordon Ruttan, Director 200 Grand River Ave, Suite 202 Port Huron MI 48060 810-989-6950 [email protected]
Mr Geoffrey Donaldson, Environmental Planner 200 Grand River Ave, Suite 202 Port Huron MI 48060 810-989-6950 [email protected]
SCC Health Department
Mr Ron Miller, Director Environmental Health 3415 28th St Port Huron MI 48060 810-987-5306 [email protected]
Ms Kristen O’Reilly, Storm Water Coordinator Environmental Health 3415 28th St Port Huron MI 48060 810-987-5306 [email protected]
MC Public Works Office
Mr William Misterovich, Deputy Commissioner 115 S Groesbeck Hwy Mount Clemens MI 48043 586-469-5910
Ms Lynne Yustick, Environmental Engineer 115 S Groesbeck Hwy Mount Clemens MI 48046 586-469-5910 [email protected]
Ms Lara Sucharski, Soil Erosion Supervisor 115 S Groesbeck Hwy Mount Clemens MI 48046 586-469-5910 [email protected]
MC Health Department
Mr Thomas Kalkofen, Director 43525 Elizabeth Rd Mount Clemens MI 48043 586-569-5219 [email protected]
Ms Vicky Hartingh 43525 Elizabeth Rd Mount Clemens MI 48043 586-569-5219 [email protected]
Mr Gary White, Deputy Director Environmental Health Services 43525 Elizabeth Rd Mount Clemens MI 48043 586-469-5236 [email protected]
MC Dept. of Planning and
Economic Development
Mr Steve Cassin 1 S Main Mount Clemens MI 48043 586-469-5285 [email protected]
Mr John Crumm 1 S Main Mount Clemens MI 48043 586-469-5285 [email protected]
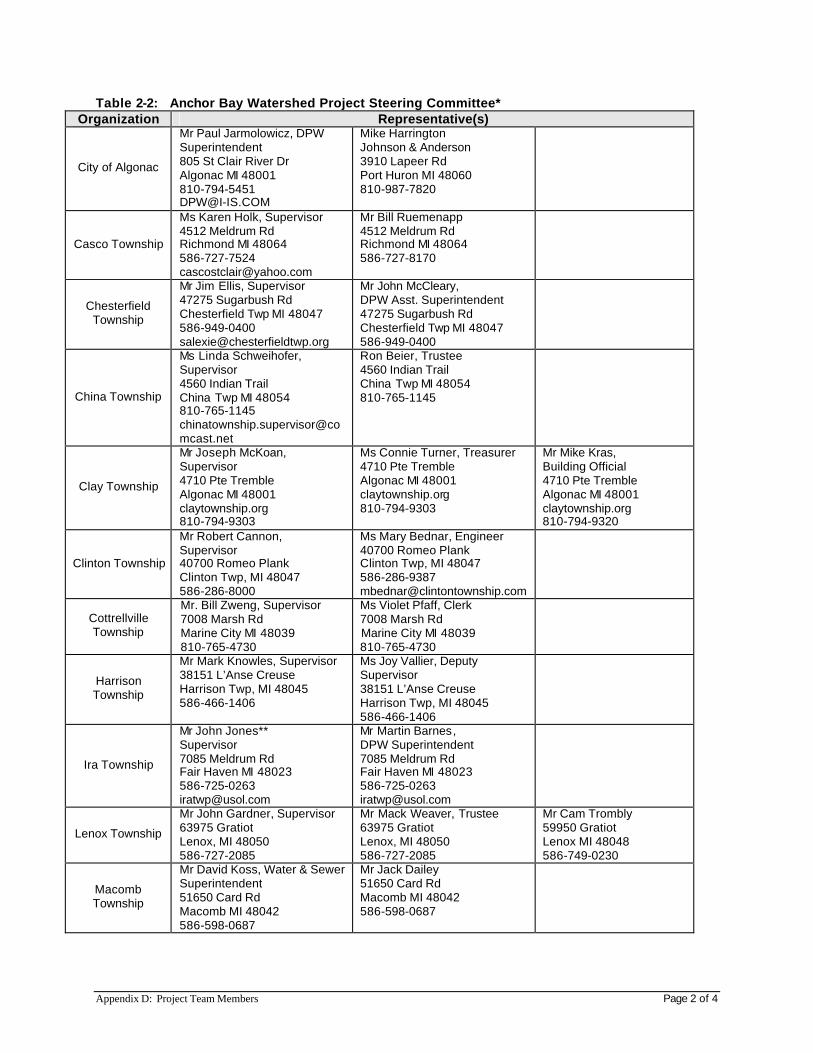
Appendix D: Project Team Members Page 2 of 4
Table 2-2: Anchor Bay Watershed Project Steering Committee* Organization Representative(s)
City of Algonac
Mr Paul Jarmolowicz, DPW Superintendent 805 St Clair River Dr Algonac MI 48001 810-794-5451 [email protected]
Mike Harrington Johnson & Anderson 3910 Lapeer Rd Port Huron MI 48060 810-987-7820
Casco Township
Ms Karen Holk, Supervisor 4512 Meldrum Rd Richmond MI 48064 586-727-7524 [email protected]
Mr Bill Ruemenapp 4512 Meldrum Rd Richmond MI 48064 586-727-8170
Chesterfield Township
Mr Jim Ellis, Supervisor 47275 Sugarbush Rd Chesterfield Twp MI 48047 586-949-0400 [email protected]
Mr John McCleary, DPW Asst. Superintendent 47275 Sugarbush Rd Chesterfield Twp MI 48047 586-949-0400
China Township
Ms Linda Schweihofer, Supervisor 4560 Indian Trail China Twp MI 48054 810-765-1145 [email protected]
Ron Beier, Trustee 4560 Indian Trail China Twp MI 48054 810-765-1145
Clay Township
Mr Joseph McKoan, Supervisor 4710 Pte Tremble Algonac MI 48001 claytownship.org 810-794-9303
Ms Connie Turner, Treasurer 4710 Pte Tremble Algonac MI 48001 claytownship.org 810-794-9303
Mr Mike Kras, Building Official 4710 Pte Tremble Algonac MI 48001 claytownship.org 810-794-9320
Clinton Township
Mr Robert Cannon, Supervisor 40700 Romeo Plank Clinton Twp, MI 48047 586-286-8000
Ms Mary Bednar, Engineer 40700 Romeo Plank Clinton Twp, MI 48047 586-286-9387 [email protected]
Cottrellville Township
Mr. Bill Zweng, Supervisor 7008 Marsh Rd Marine City MI 48039 810-765-4730
Ms Violet Pfaff, Clerk 7008 Marsh Rd Marine City MI 48039 810-765-4730
Harrison Township
Mr Mark Knowles, Supervisor 38151 L’Anse Creuse Harrison Twp, MI 48045 586-466-1406
Ms Joy Vallier, Deputy Supervisor 38151 L’Anse Creuse Harrison Twp, MI 48045 586-466-1406
Ira Township
Mr John Jones** Supervisor 7085 Meldrum Rd Fair Haven MI 48023 586-725-0263 [email protected]
Mr Martin Barnes, DPW Superintendent 7085 Meldrum Rd Fair Haven MI 48023 586-725-0263 [email protected]
Lenox Township
Mr John Gardner, Supervisor 63975 Gratiot Lenox, MI 48050 586-727-2085
Mr Mack Weaver, Trustee 63975 Gratiot Lenox, MI 48050 586-727-2085
Mr Cam Trombly 59950 Gratiot Lenox MI 48048 586-749-0230
Macomb Township
Mr David Koss, Water & Sewer Superintendent 51650 Card Rd Macomb MI 48042 586-598-0687
Mr Jack Dailey 51650 Card Rd Macomb MI 48042 586-598-0687
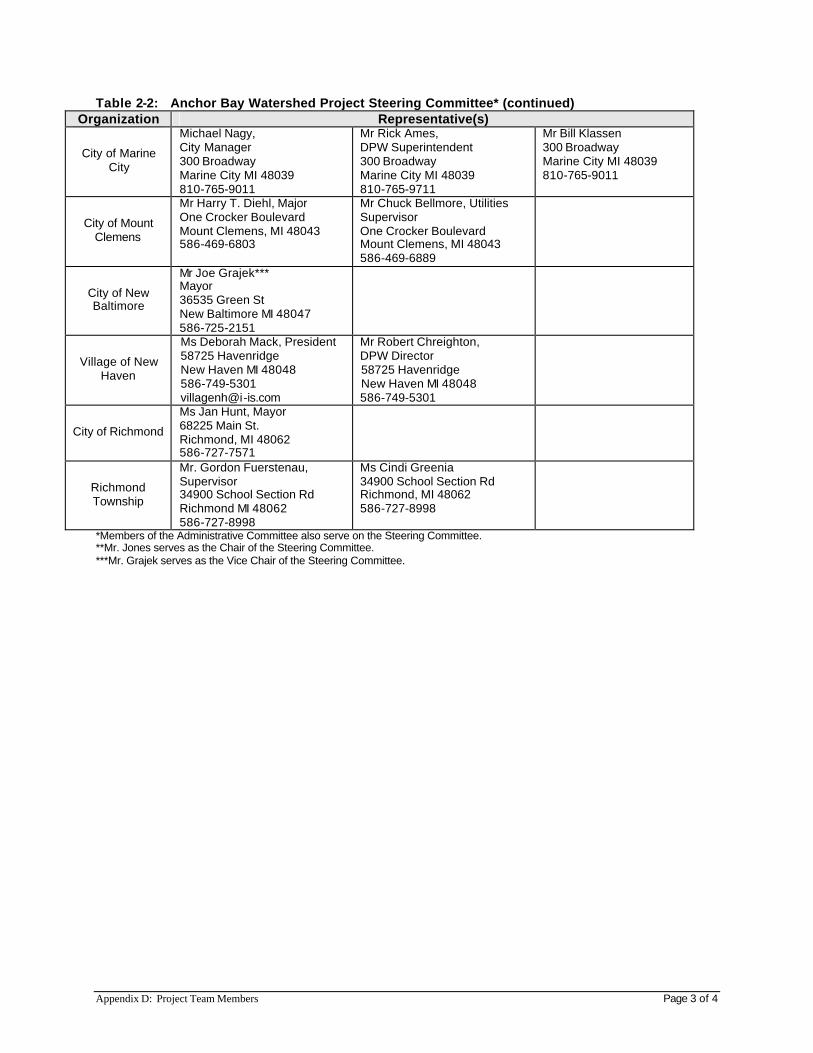
Appendix D: Project Team Members Page 3 of 4
Table 2-2: Anchor Bay Watershed Project Steering Committee* (continued) Organization Representative(s)
City of Marine City
Michael Nagy, City Manager 300 Broadway Marine City MI 48039 810-765-9011
Mr Rick Ames, DPW Superintendent 300 Broadway Marine City MI 48039 810-765-9711
Mr Bill Klassen 300 Broadway Marine City MI 48039 810-765-9011
City of Mount Clemens
Mr Harry T. Diehl, Major One Crocker Boulevard Mount Clemens, MI 48043 586-469-6803
Mr Chuck Bellmore, Utilities Supervisor One Crocker Boulevard Mount Clemens, MI 48043 586-469-6889
City of New Baltimore
Mr Joe Grajek*** Mayor 36535 Green St New Baltimore MI 48047 586-725-2151
Village of New Haven
Ms Deborah Mack, President 58725 Havenridge New Haven MI 48048 586-749-5301 [email protected]
Mr Robert Chreighton, DPW Director 58725 Havenridge New Haven MI 48048 586-749-5301
City of Richmond
Ms Jan Hunt, Mayor 68225 Main St. Richmond, MI 48062 586-727-7571
Richmond Township
Mr. Gordon Fuerstenau, Supervisor 34900 School Section Rd Richmond MI 48062 586-727-8998
Ms Cindi Greenia 34900 School Section Rd Richmond, MI 48062 586-727-8998
*Members of the Administrative Committee also serve on the Steering Committee. **Mr. Jones serves as the Chair of the Steering Committee. ***Mr. Grajek serves as the Vice Chair of the Steering Committee.
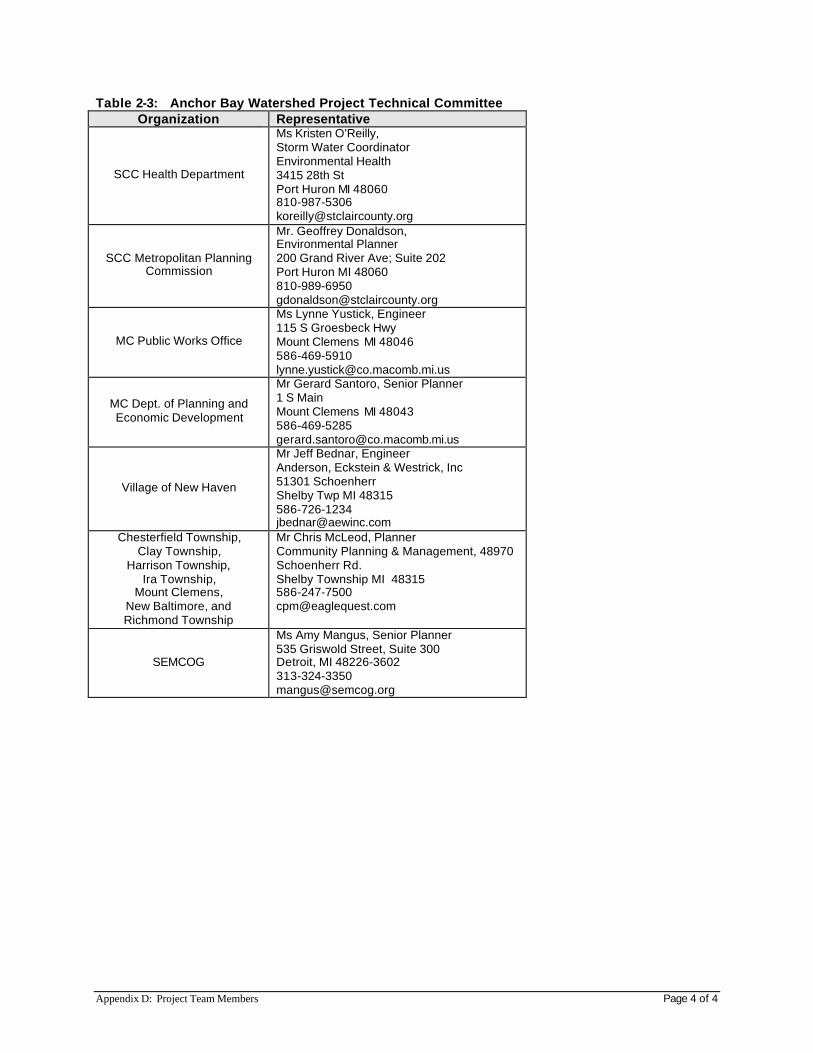
Appendix D: Project Team Members Page 4 of 4
Table 2-3: Anchor Bay Watershed Project Technical Committee Organization Representative
SCC Health Department
Ms Kristen O’Reilly, Storm Water Coordinator Environmental Health 3415 28th St Port Huron MI 48060 810-987-5306 [email protected]
SCC Metropolitan Planning Commission
Mr. Geoffrey Donaldson, Environmental Planner 200 Grand River Ave; Suite 202 Port Huron MI 48060 810-989-6950 [email protected]
MC Public Works Office
Ms Lynne Yustick, Engineer 115 S Groesbeck Hwy Mount Clemens MI 48046 586-469-5910 [email protected]
MC Dept. of Planning and Economic Development
Mr Gerard Santoro, Senior Planner 1 S Main Mount Clemens MI 48043 586-469-5285 [email protected]
Village of New Haven
Mr Jeff Bednar, Engineer Anderson, Eckstein & Westrick, Inc 51301 Schoenherr Shelby Twp MI 48315 586-726-1234 [email protected]
Chesterfield Township, Clay Township,
Harrison Township, Ira Township,
Mount Clemens, New Baltimore, and Richmond Township
Mr Chris McLeod, Planner Community Planning & Management, 48970 Schoenherr Rd. Shelby Township MI 48315 586-247-7500 [email protected]
SEMCOG
Ms Amy Mangus, Senior Planner 535 Griswold Street, Suite 300 Detroit, MI 48226-3602 313-324-3350 [email protected]

Anchor Bay Watershed Management Plan
Appendix E:
Public Involvement Survey
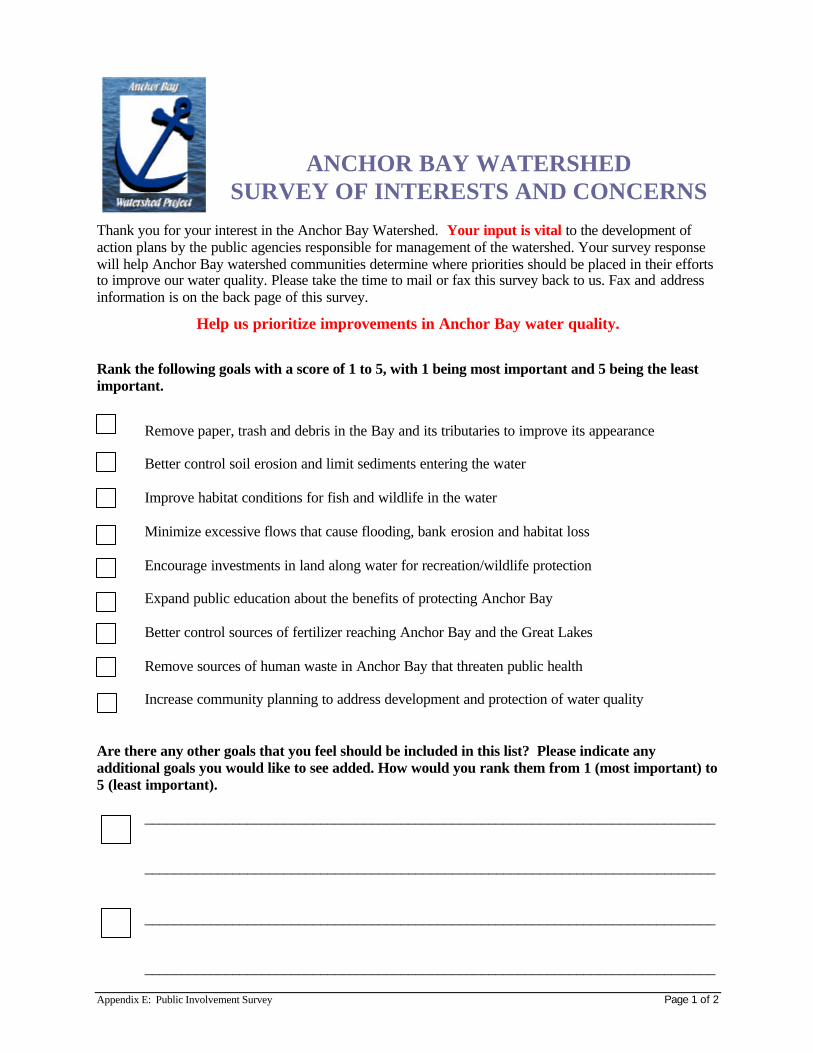
Appendix E: Public Involvement Survey Page 1 of 2
ANCHOR BAY WATERSHED SURVEY OF INTERESTS AND CONCERNS
Thank you for your interest in the Anchor Bay Watershed. Your input is vital to the development of action plans by the public agencies responsible for management of the watershed. Your survey response will help Anchor Bay watershed communities determine where priorities should be placed in their efforts to improve our water quality. Please take the time to mail or fax this survey back to us. Fax and address information is on the back page of this survey.
Help us prioritize improvements in Anchor Bay water quality.
Rank the following goals with a score of 1 to 5, with 1 being most important and 5 being the least important.
Remove paper, trash and debris in the Bay and its tributaries to improve its appearance Better control soil erosion and limit sediments entering the water Improve habitat conditions for fish and wildlife in the water Minimize excessive flows that cause flooding, bank erosion and habitat loss Encourage investments in land along water for recreation/wildlife protection Expand public education about the benefits of protecting Anchor Bay Better control sources of fertilizer reaching Anchor Bay and the Great Lakes Remove sources of human waste in Anchor Bay that threaten public health Increase community planning to address development and protection of water quality Are there any other goals that you feel should be included in this list? Please indicate any additional goals you would like to see added. How would you rank them from 1 (most important) to 5 (least important).
______________________________________________________________________________ ______________________________________________________________________________
______________________________________________________________________________
______________________________________________________________________________

Appendix E: Public Involvement Survey Page 2 of 2
What issues concerning the management of Anchor Bay are most important to you? ____________________________________________________________________________________ ____________________________________________________________________________________ What is the single most important improvement to Anchor Bay and its tributaries that you would like to see? ____________________________________________________________________________________ ____________________________________________________________________________________ What types of information about the Anchor Bay Watershed interest you most? (Check as many as apply) Water Quality __ Bacteria levels__ Parks and Public Recreation Areas __ Fish and wildlife __ How homeowners can help prevent pollution __ How businesses can prevent pollution __ How I can volunteer to help restore Anchor Bay __ Other (Specify)____________________ Which of the following is the best approach to keep you informed regarding the progress in developing a plan to restore Anchor Bay? Public meetings/workshops __ Newspaper articles __ Cable television __ Web page __ Direct mailings to your home or business __ Community newsletters __ Other (Specify)______________________________ The following information is requested so that we can keep you informed on the progress of the Anchor Bay watershed planning effort. We will send you information regarding the Anchor Bay Watershed Plan and opportunities to learn more about this project. There is an Anchor Bay public meeting in the fall of 2002, where presentations will be made and public input will be encouraged. Name__________________________ Address____________________________________ ____________________________________ Phone__________________________ E-mail ____________________________________
Mail or fax survey to:
Geoffrey Donaldson St. Clair County Metropolitan Planning Commission
200 Grand River, Suite 202 Port Huron, MI 48060 Fax: (810) 987-5931

Anchor Bay Watershed Management Plan
Appendix F:
Community Surveys
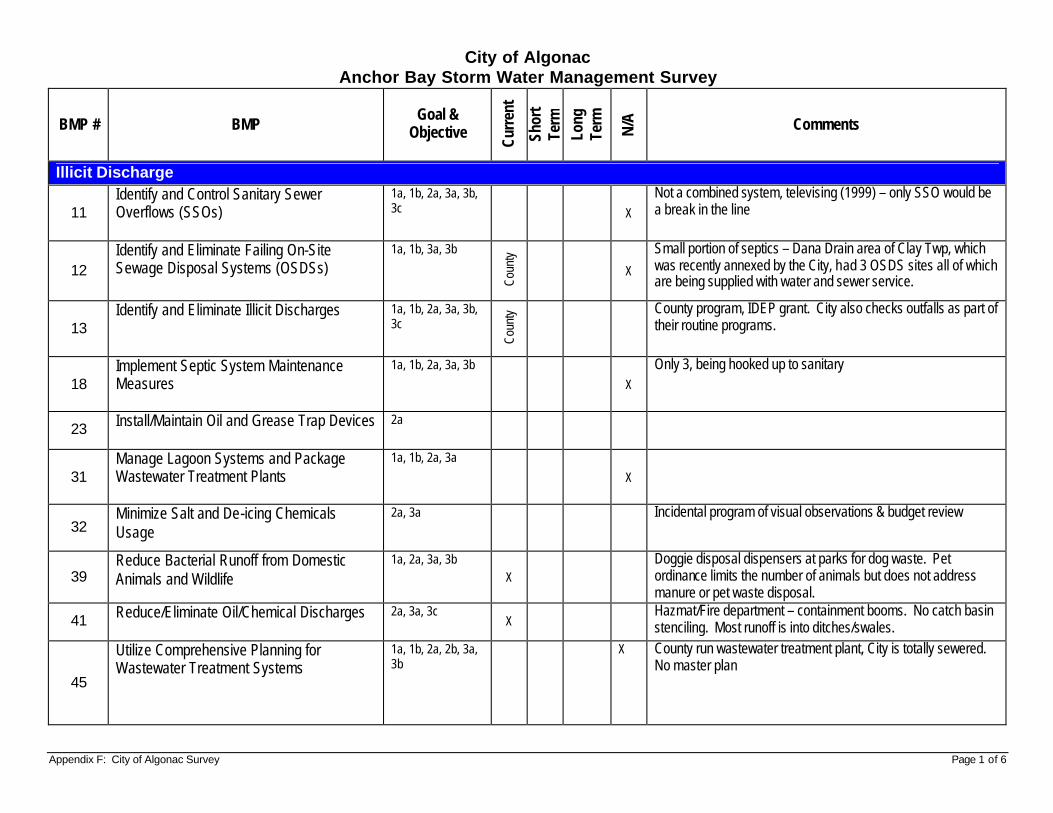
Appendix F: City of Algonac Survey Page 1 of 6
City of Algonac Anchor Bay Storm Water Management Survey
BMP # BMP Goal &
Objective
Curr
ent
Shor
t Te
rm
Long
Te
rm
N/A
Comments
Illicit Discharge
11 Identify and Control Sanitary Sewer Overflows (SSOs)
1a, 1b, 2a, 3a, 3b, 3c X
Not a combined system, televising (1999) – only SSO would be a break in the line
12 Identify and Eliminate Failing On-Site Sewage Disposal Systems (OSDSs)
1a, 1b, 3a, 3b
Coun
ty
X
Small portion of septics – Dana Drain area of Clay Twp, which was recently annexed by the City, had 3 OSDS sites all of which are being supplied with water and sewer service.
13 Identify and Eliminate Illicit Discharges
1a, 1b, 2a, 3a, 3b, 3c
Coun
ty
County program, IDEP grant. City also checks outfalls as part of their routine programs.
18 Implement Septic System Maintenance Measures
1a, 1b, 2a, 3a, 3b
X
Only 3, being hooked up to sanitary
23 Install/Maintain Oil and Grease Trap Devices
2a
31 Manage Lagoon Systems and Package Wastewater Treatment Plants
1a, 1b, 2a, 3a
X
32 Minimize Salt and De-icing Chemicals Usage
2a, 3a
Incidental program of visual observations & budget review
39 Reduce Bacterial Runoff from Domestic Animals and Wildlife
1a, 2a, 3a, 3b X
Doggie disposal dispensers at parks for dog waste. Pet ordinance limits the number of animals but does not address manure or pet waste disposal.
41 Reduce/Eliminate Oil/Chemical Discharges
2a, 3a, 3c X
Hazmat/Fire department – containment booms. No catch basin stenciling. Most runoff is into ditches/swales.
45
Utilize Comprehensive Planning for Wastewater Treatment Systems
1a, 1b, 2a, 2b, 3a, 3b
X County run wastewater treatment plant, City is totally sewered. No master plan
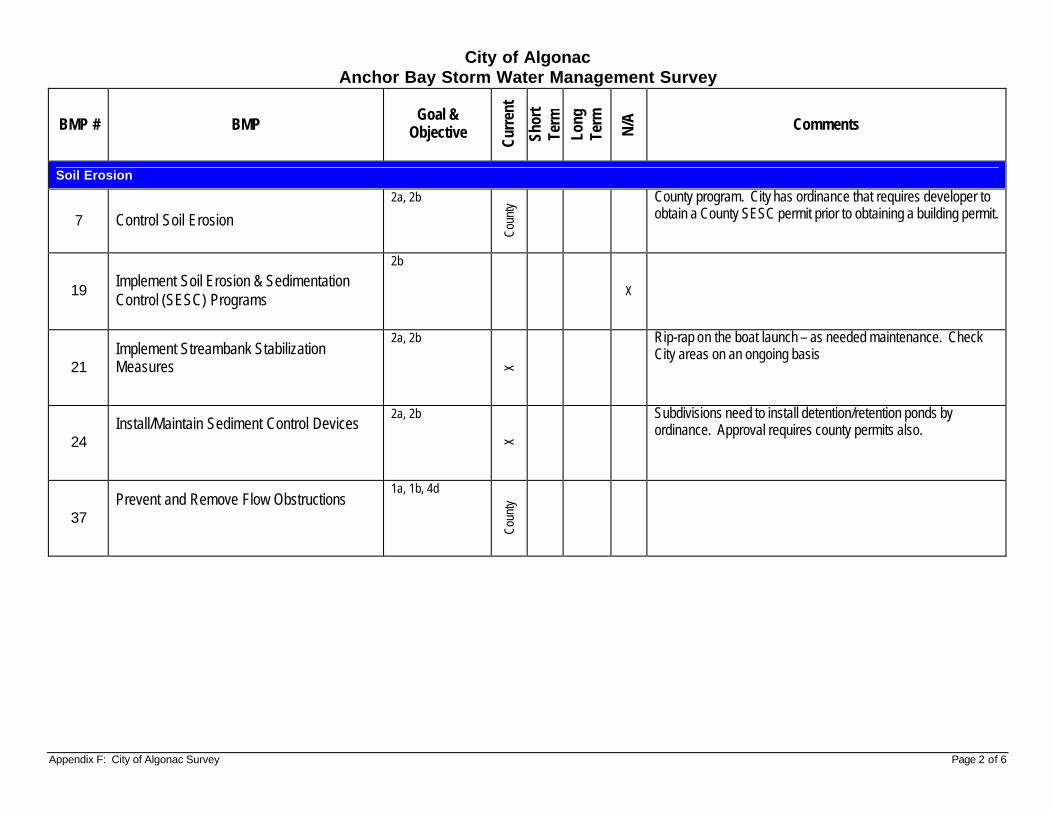
Appendix F: City of Algonac Survey Page 2 of 6
City of Algonac Anchor Bay Storm Water Management Survey
BMP # BMP Goal &
Objective
Curr
ent
Shor
t Te
rm
Long
Te
rm
N/A
Comments
Soil Erosion
7 Control Soil Erosion 2a, 2b
Coun
ty
County program. City has ordinance that requires developer to obtain a County SESC permit prior to obtaining a building permit.
19 Implement Soil Erosion & Sedimentation Control (SESC) Programs
2b
X
21 Implement Streambank Stabilization Measures
2a, 2b
X
Rip-rap on the boat launch – as needed maintenance. Check City areas on an ongoing basis
24 Install/Maintain Sediment Control Devices
2a, 2b
X
Subdivisions need to install detention/retention ponds by ordinance. Approval requires county permits also.
37 Prevent and Remove Flow Obstructions
1a, 1b, 4d
Coun
ty
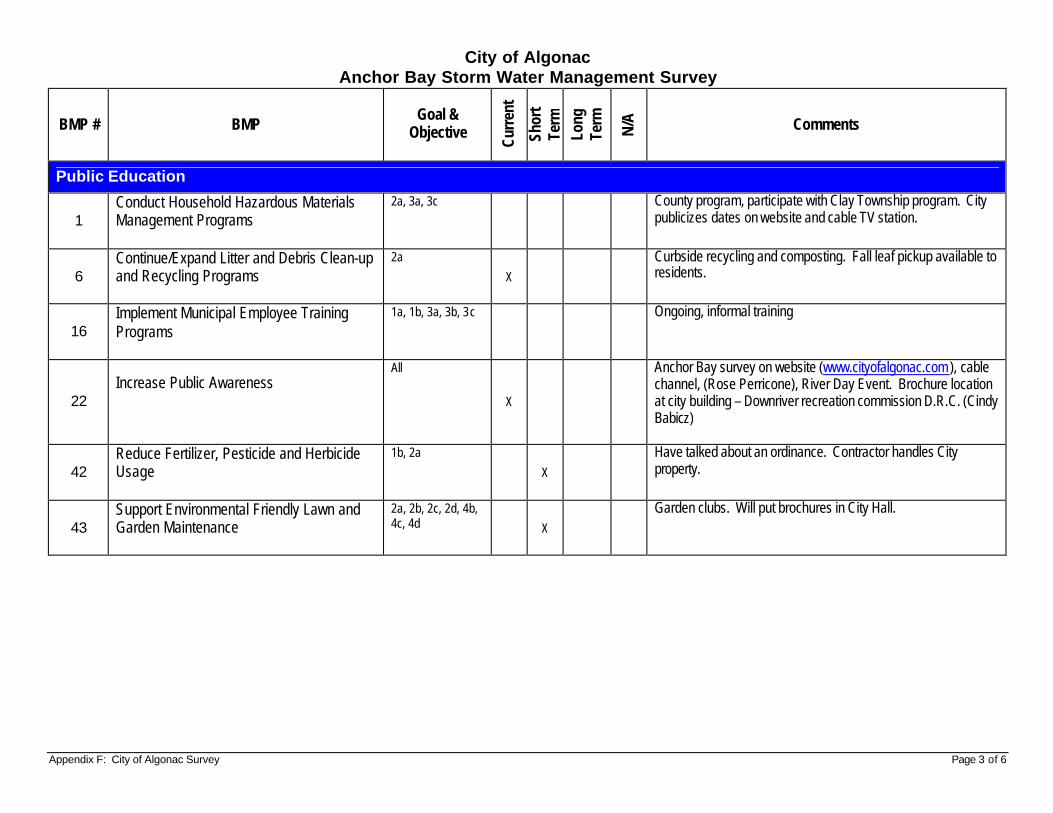
Appendix F: City of Algonac Survey Page 3 of 6
City of Algonac Anchor Bay Storm Water Management Survey
BMP # BMP Goal &
Objective
Curr
ent
Shor
t Te
rm
Long
Te
rm
N/A
Comments
Public Education
1 Conduct Household Hazardous Materials Management Programs
2a, 3a, 3c
County program, participate with Clay Township program. City publicizes dates on website and cable TV station.
6 Continue/Expand Litter and Debris Clean-up and Recycling Programs
2a
X
Curbside recycling and composting. Fall leaf pickup available to residents.
16 Implement Municipal Employee Training Programs
1a, 1b, 3a, 3b, 3c
Ongoing, informal training
22 Increase Public Awareness
All
X
Anchor Bay survey on website (www.cityofalgonac.com ), cable channel, (Rose Perricone), River Day Event. Brochure location at city building – Downriver recreation commission D.R.C. (Cindy Babicz)
42 Reduce Fertilizer, Pesticide and Herbicide Usage
1b, 2a
X
Have talked about an ordinance. Contractor handles City property.
43 Support Environmental Friendly Lawn and Garden Maintenance
2a, 2b, 2c, 2d, 4b, 4c, 4d X
Garden clubs. Will put brochures in City Hall.
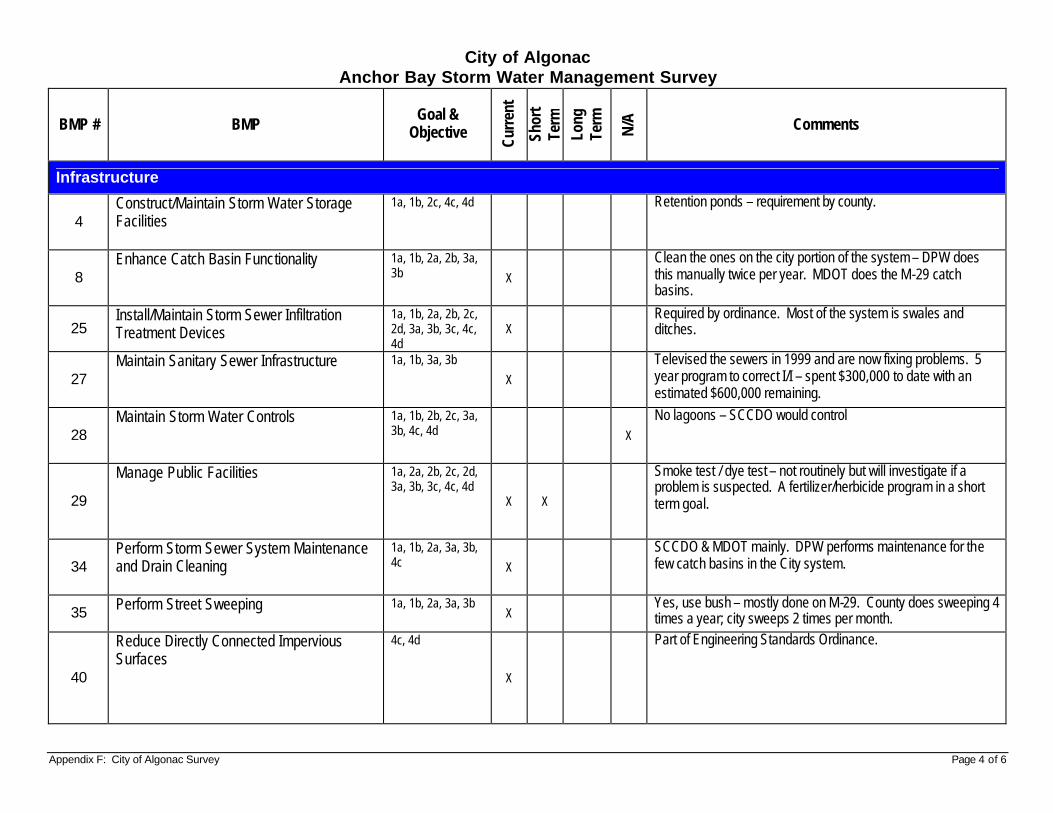
Appendix F: City of Algonac Survey Page 4 of 6
City of Algonac Anchor Bay Storm Water Management Survey
BMP # BMP Goal &
Objective
Curr
ent
Shor
t Te
rm
Long
Te
rm
N/A
Comments
Infrastructure
4 Construct/Maintain Storm Water Storage Facilities
1a, 1b, 2c, 4c, 4d
Retention ponds – requirement by county.
8 Enhance Catch Basin Functionality
1a, 1b, 2a, 2b, 3a, 3b X
Clean the ones on the city portion of the system – DPW does this manually twice per year. MDOT does the M-29 catch basins.
25 Install/Maintain Storm Sewer Infiltration Treatment Devices
1a, 1b, 2a, 2b, 2c, 2d, 3a, 3b, 3c, 4c, 4d
X Required by ordinance. Most of the system is swales and ditches.
27 Maintain Sanitary Sewer Infrastructure
1a, 1b, 3a, 3b
X
Televised the sewers in 1999 and are now fixing problems. 5 year program to correct I/I – spent $300,000 to date with an estimated $600,000 remaining.
28 Maintain Storm Water Controls
1a, 1b, 2b, 2c, 3a, 3b, 4c, 4d X
No lagoons – SCCDO would control
29
Manage Public Facilities
1a, 2a, 2b, 2c, 2d, 3a, 3b, 3c, 4c, 4d
X X
Smoke test / dye test – not routinely but will investigate if a problem is suspected. A fertilizer/herbicide program in a short term goal.
34 Perform Storm Sewer System Maintenance and Drain Cleaning
1a, 1b, 2a, 3a, 3b, 4c X
SCCDO & MDOT mainly. DPW performs maintenance for the few catch basins in the City system.
35 Perform Street Sweeping
1a, 1b, 2a, 3a, 3b X
Yes, use bush – mostly done on M-29. County does sweeping 4 times a year; city sweeps 2 times per month.
40
Reduce Directly Connected Impervious Surfaces
4c, 4d
X
Part of Engineering Standards Ordinance.
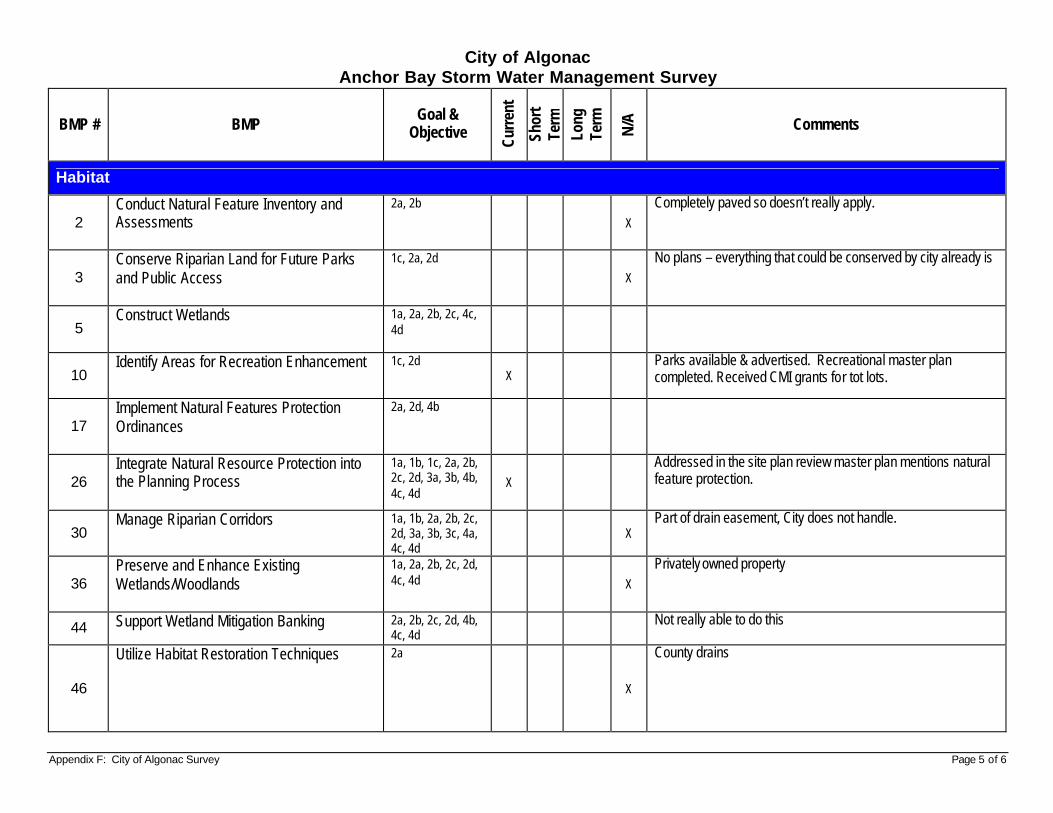
Appendix F: City of Algonac Survey Page 5 of 6
City of Algonac Anchor Bay Storm Water Management Survey
BMP # BMP Goal &
Objective
Curr
ent
Shor
t Te
rm
Long
Te
rm
N/A
Comments
Habitat
2 Conduct Natural Feature Inventory and Assessments
2a, 2b
X
Completely paved so doesn’t really apply.
3 Conserve Riparian Land for Future Parks and Public Access
1c, 2a, 2d
X
No plans – everything that could be conserved by city already is
5 Construct Wetlands
1a, 2a, 2b, 2c, 4c, 4d
10 Identify Areas for Recreation Enhancement
1c, 2d X
Parks available & advertised. Recreational master plan completed. Received CMI grants for tot lots.
17 Implement Natural Features Protection Ordinances
2a, 2d, 4b
26 Integrate Natural Resource Protection into the Planning Process
1a, 1b, 1c, 2a, 2b, 2c, 2d, 3a, 3b, 4b, 4c, 4d
X
Addressed in the site plan review master plan mentions natural feature protection.
30 Manage Riparian Corridors
1a, 1b, 2a, 2b, 2c, 2d, 3a, 3b, 3c, 4a, 4c, 4d
X Part of drain easement, City does not handle.
36 Preserve and Enhance Existing Wetlands/Woodlands
1a, 2a, 2b, 2c, 2d, 4c, 4d X
Privately owned property
44 Support Wetland Mitigation Banking
2a, 2b, 2c, 2d, 4b, 4c, 4d
Not really able to do this
46
Utilize Habitat Restoration Techniques
2a
X
County drains
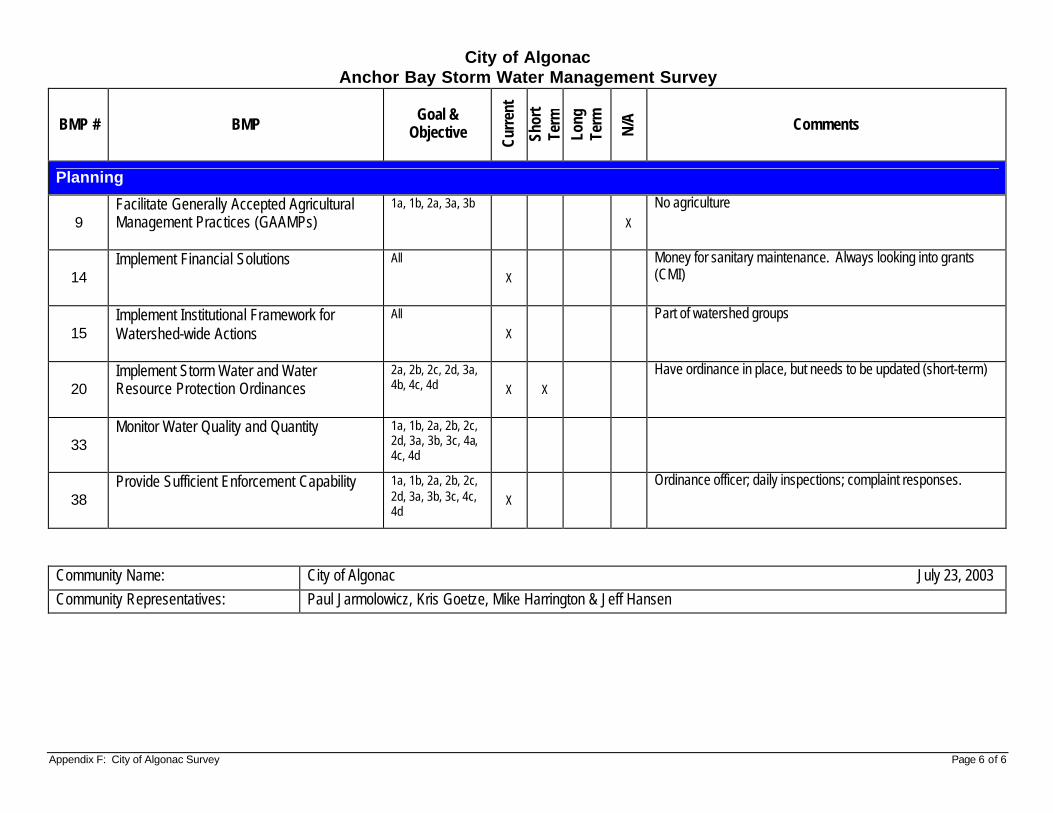
Appendix F: City of Algonac Survey Page 6 of 6
City of Algonac Anchor Bay Storm Water Management Survey
BMP # BMP Goal &
Objective
Curr
ent
Shor
t Te
rm
Long
Te
rm
N/A
Comments
Planning
9 Facilitate Generally Accepted Agricultural Management Practices (GAAMPs)
1a, 1b, 2a, 3a, 3b
X
No agriculture
14 Implement Financial Solutions
All
X
Money for sanitary maintenance. Always looking into grants (CMI)
15 Implement Institutional Framework for Watershed-wide Actions
All
X
Part of watershed groups
20 Implement Storm Water and Water Resource Protection Ordinances
2a, 2b, 2c, 2d, 3a, 4b, 4c, 4d X X
Have ordinance in place, but needs to be updated (short-term)
33 Monitor Water Quality and Quantity
1a, 1b, 2a, 2b, 2c, 2d, 3a, 3b, 3c, 4a, 4c, 4d
38 Provide Sufficient Enforcement Capability
1a, 1b, 2a, 2b, 2c, 2d, 3a, 3b, 3c, 4c, 4d
X
Ordinance officer; daily inspections; complaint responses.
Community Name: City of Algonac July 23, 2003 Community Representatives: Paul Jarmolowicz, Kris Goetze, Mike Harrington & Jeff Hansen
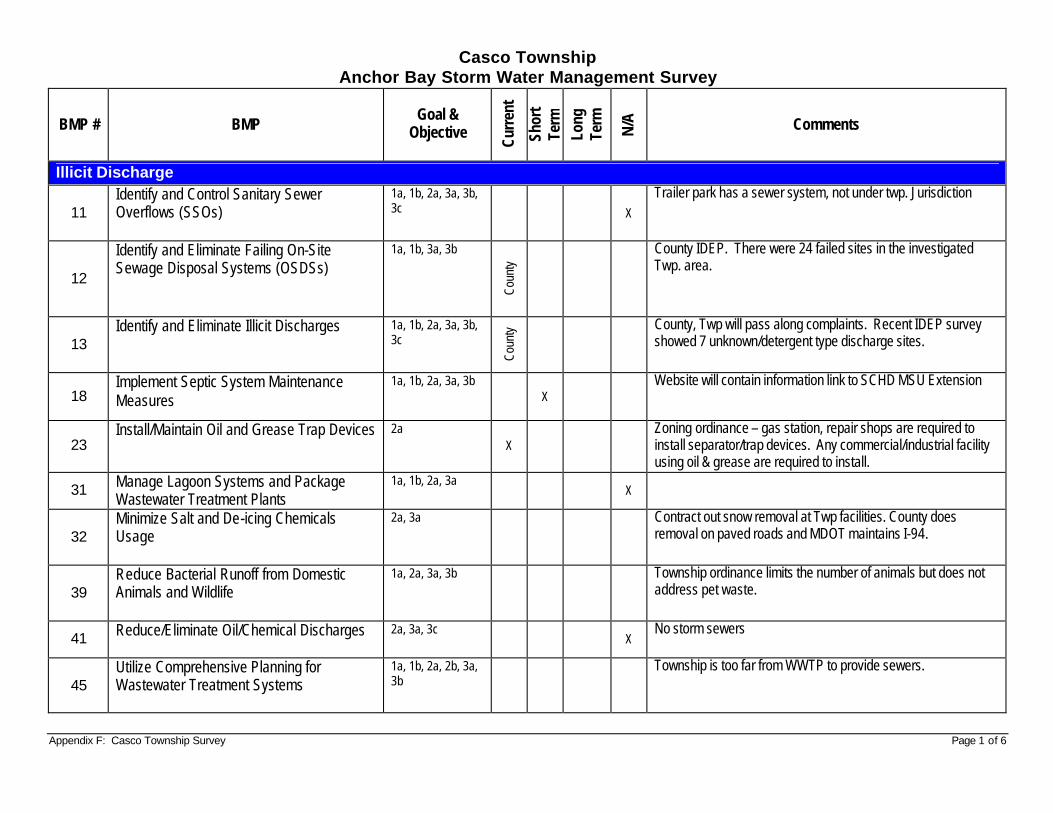
Appendix F: Casco Township Survey Page 1 of 6
Casco Township Anchor Bay Storm Water Management Survey
BMP # BMP Goal &
Objective
Curr
ent
Shor
t Te
rm
Long
Te
rm
N/A
Comments
Illicit Discharge
11 Identify and Control Sanitary Sewer Overflows (SSOs)
1a, 1b, 2a, 3a, 3b, 3c X
Trailer park has a sewer system, not under twp. Jurisdiction
12
Identify and Eliminate Failing On-Site Sewage Disposal Systems (OSDSs)
1a, 1b, 3a, 3b
Coun
ty
County IDEP. There were 24 failed sites in the investigated Twp. area.
13 Identify and Eliminate Illicit Discharges
1a, 1b, 2a, 3a, 3b, 3c
Coun
ty
County, Twp will pass along complaints. Recent IDEP survey showed 7 unknown/detergent type discharge sites.
18 Implement Septic System Maintenance Measures
1a, 1b, 2a, 3a, 3b X
Website will contain information link to SCHD MSU Extension
23 Install/Maintain Oil and Grease Trap Devices
2a X
Zoning ordinance – gas station, repair shops are required to install separator/trap devices. Any commercial/industrial facility using oil & grease are required to install.
31 Manage Lagoon Systems and Package Wastewater Treatment Plants
1a, 1b, 2a, 3a X
32 Minimize Salt and De-icing Chemicals Usage
2a, 3a
Contract out snow removal at Twp facilities. County does removal on paved roads and MDOT maintains I-94.
39 Reduce Bacterial Runoff from Domestic Animals and Wildlife
1a, 2a, 3a, 3b
Township ordinance limits the number of animals but does not address pet waste.
41 Reduce/Eliminate Oil/Chemical Discharges
2a, 3a, 3c X
No storm sewers
45 Utilize Comprehensive Planning for Wastewater Treatment Systems
1a, 1b, 2a, 2b, 3a, 3b
Township is too far from WWTP to provide sewers.
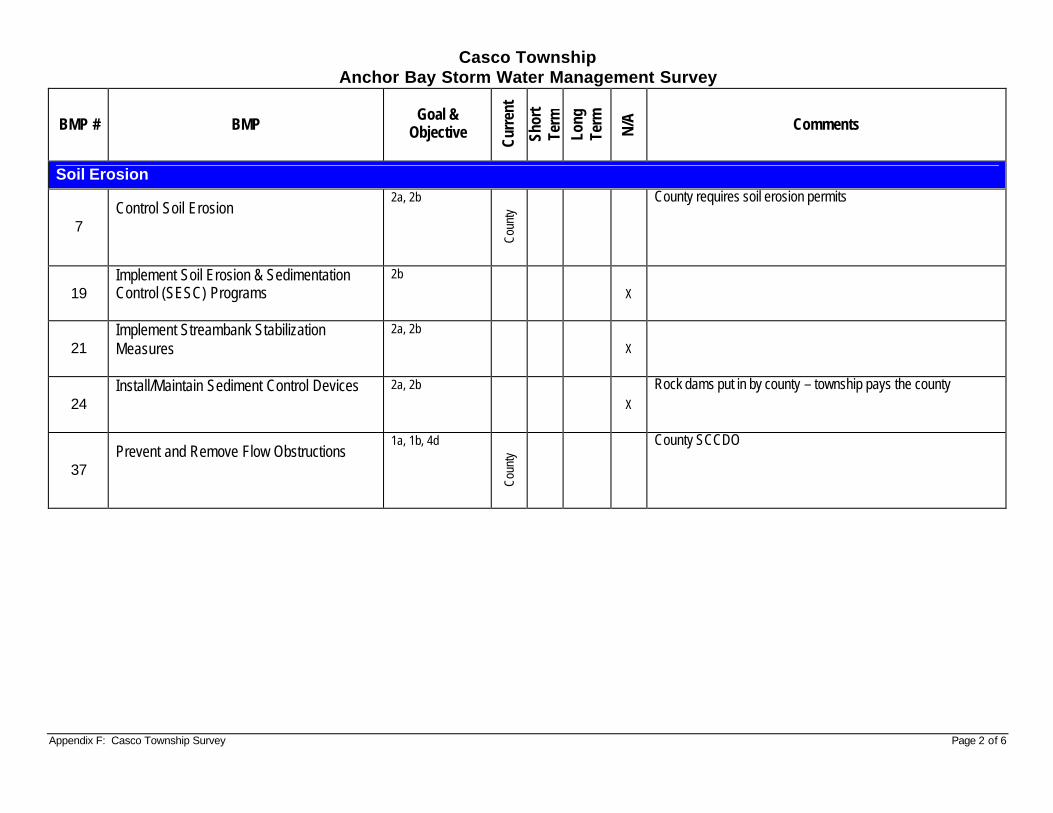
Appendix F: Casco Township Survey Page 2 of 6
Casco Township Anchor Bay Storm Water Management Survey
BMP # BMP Goal &
Objective
Curr
ent
Shor
t Te
rm
Long
Te
rm
N/A
Comments
Soil Erosion
7 Control Soil Erosion
2a, 2b
Coun
ty
County requires soil erosion permits
19 Implement Soil Erosion & Sedimentation Control (SESC) Programs
2b
X
21 Implement Streambank Stabilization Measures
2a, 2b
X
24 Install/Maintain Sediment Control Devices
2a, 2b
X
Rock dams put in by county – township pays the county
37 Prevent and Remove Flow Obstructions
1a, 1b, 4d
Coun
ty
County SCCDO
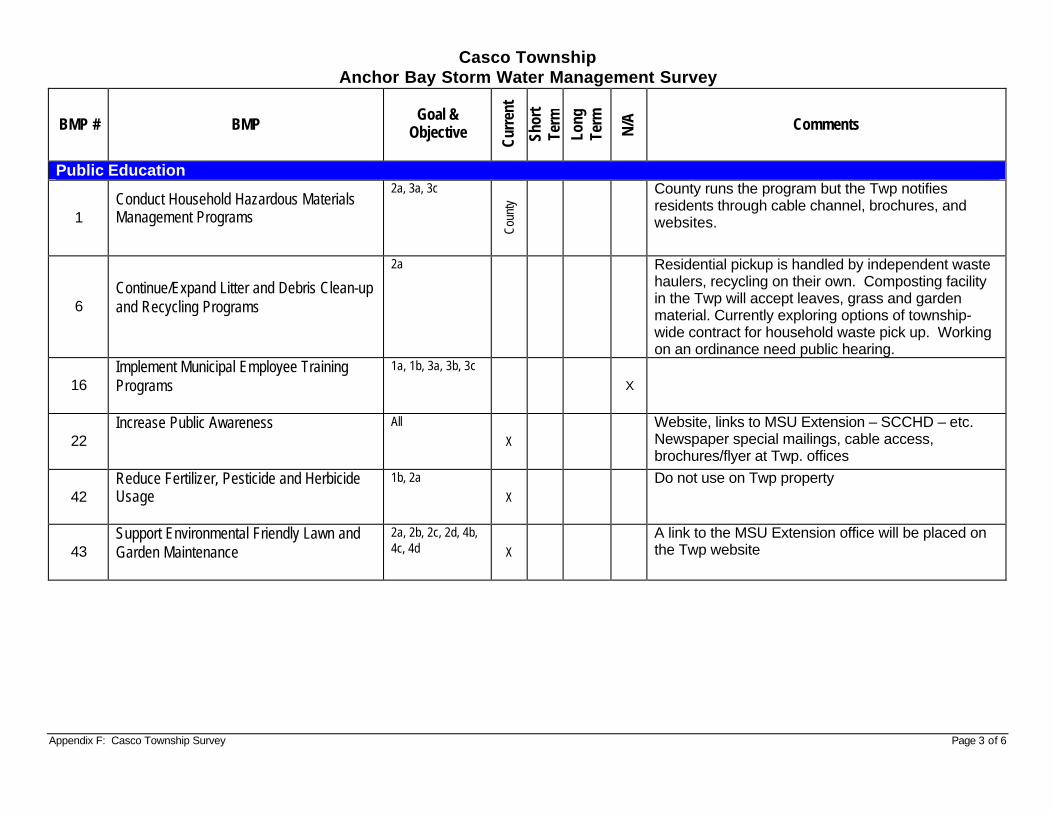
Appendix F: Casco Township Survey Page 3 of 6
Casco Township Anchor Bay Storm Water Management Survey
BMP # BMP Goal &
Objective
Curr
ent
Shor
t Te
rm
Long
Te
rm
N/A
Comments
Public Education
1 Conduct Household Hazardous Materials Management Programs
2a, 3a, 3c
Coun
ty
County runs the program but the Twp notifies residents through cable channel, brochures, and websites.
6 Continue/Expand Litter and Debris Clean-up and Recycling Programs
2a
Residential pickup is handled by independent waste haulers, recycling on their own. Composting facility in the Twp will accept leaves, grass and garden material. Currently exploring options of township-wide contract for household waste pick up. Working on an ordinance need public hearing.
16 Implement Municipal Employee Training Programs
1a, 1b, 3a, 3b, 3c
X
22 Increase Public Awareness
All
X Website, links to MSU Extension – SCCHD – etc. Newspaper special mailings, cable access, brochures/flyer at Twp. offices
42 Reduce Fertilizer, Pesticide and Herbicide Usage
1b, 2a
X Do not use on Twp property
43 Support Environmental Friendly Lawn and Garden Maintenance
2a, 2b, 2c, 2d, 4b, 4c, 4d X
A link to the MSU Extension office will be placed on the Twp website
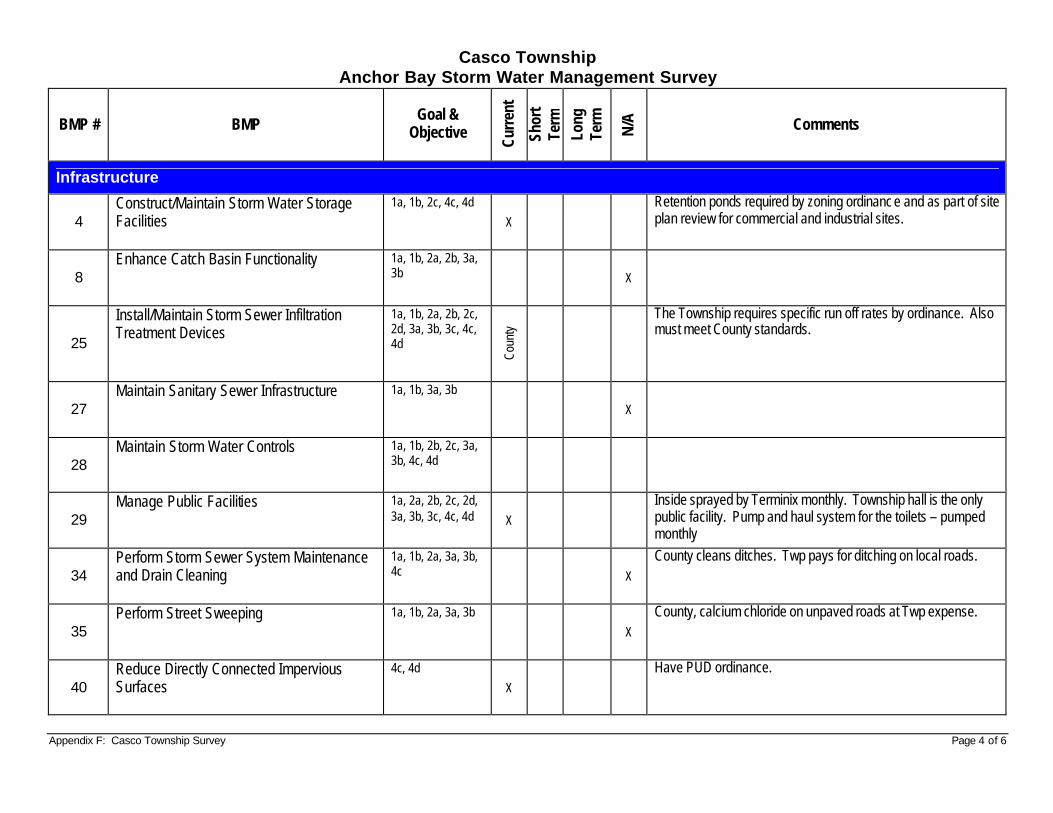
Appendix F: Casco Township Survey Page 4 of 6
Casco Township Anchor Bay Storm Water Management Survey
BMP # BMP Goal &
Objective
Curr
ent
Shor
t Te
rm
Long
Te
rm
N/A
Comments
Infrastructure
4 Construct/Maintain Storm Water Storage Facilities
1a, 1b, 2c, 4c, 4d
X
Retention ponds required by zoning ordinanc e and as part of site plan review for commercial and industrial sites.
8 Enhance Catch Basin Functionality
1a, 1b, 2a, 2b, 3a, 3b X
25
Install/Maintain Storm Sewer Infiltration Treatment Devices
1a, 1b, 2a, 2b, 2c, 2d, 3a, 3b, 3c, 4c, 4d
Coun
ty
The Township requires specific run off rates by ordinance. Also must meet County standards.
27 Maintain Sanitary Sewer Infrastructure
1a, 1b, 3a, 3b
X
28 Maintain Storm Water Controls
1a, 1b, 2b, 2c, 3a, 3b, 4c, 4d
29 Manage Public Facilities
1a, 2a, 2b, 2c, 2d, 3a, 3b, 3c, 4c, 4d X
Inside sprayed by Terminix monthly. Township hall is the only public facility. Pump and haul system for the toilets – pumped monthly
34 Perform Storm Sewer System Maintenance and Drain Cleaning
1a, 1b, 2a, 3a, 3b, 4c X
County cleans ditches. Twp pays for ditching on local roads.
35 Perform Street Sweeping
1a, 1b, 2a, 3a, 3b
X
County, calcium chloride on unpaved roads at Twp expense.
40 Reduce Directly Connected Impervious Surfaces
4c, 4d
X
Have PUD ordinance.
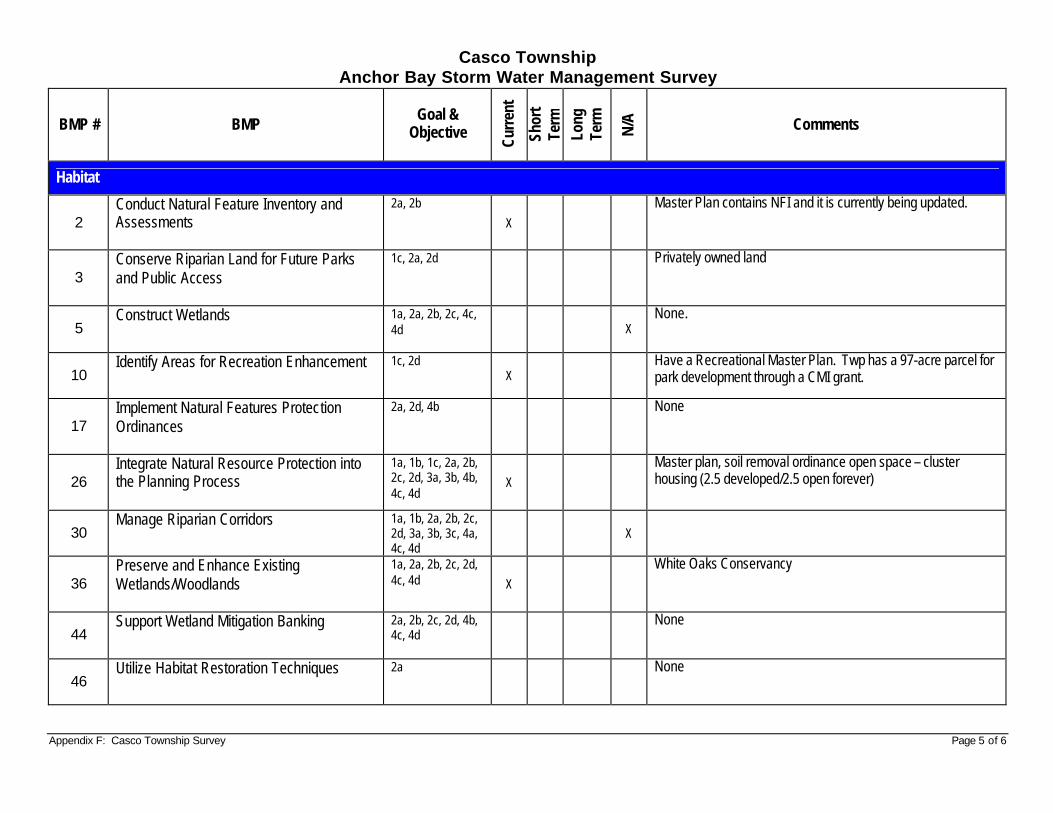
Appendix F: Casco Township Survey Page 5 of 6
Casco Township Anchor Bay Storm Water Management Survey
BMP # BMP Goal &
Objective
Curr
ent
Shor
t Te
rm
Long
Te
rm
N/A
Comments
Habitat
2 Conduct Natural Feature Inventory and Assessments
2a, 2b
X
Master Plan contains NFI and it is currently being updated.
3 Conserve Riparian Land for Future Parks and Public Access
1c, 2a, 2d
Privately owned land
5 Construct Wetlands
1a, 2a, 2b, 2c, 4c, 4d X
None.
10 Identify Areas for Recreation Enhancement
1c, 2d X
Have a Recreational Master Plan. Twp has a 97-acre parcel for park development through a CMI grant.
17 Implement Natural Features Protection Ordinances
2a, 2d, 4b
None
26 Integrate Natural Resource Protection into the Planning Process
1a, 1b, 1c, 2a, 2b, 2c, 2d, 3a, 3b, 4b, 4c, 4d
X
Master plan, soil removal ordinance open space – cluster housing (2.5 developed/2.5 open forever)
30 Manage Riparian Corridors
1a, 1b, 2a, 2b, 2c, 2d, 3a, 3b, 3c, 4a, 4c, 4d
X
36 Preserve and Enhance Existing Wetlands/Woodlands
1a, 2a, 2b, 2c, 2d, 4c, 4d X
White Oaks Conservancy
44 Support Wetland Mitigation Banking
2a, 2b, 2c, 2d, 4b, 4c, 4d
None
46 Utilize Habitat Restoration Techniques
2a
None
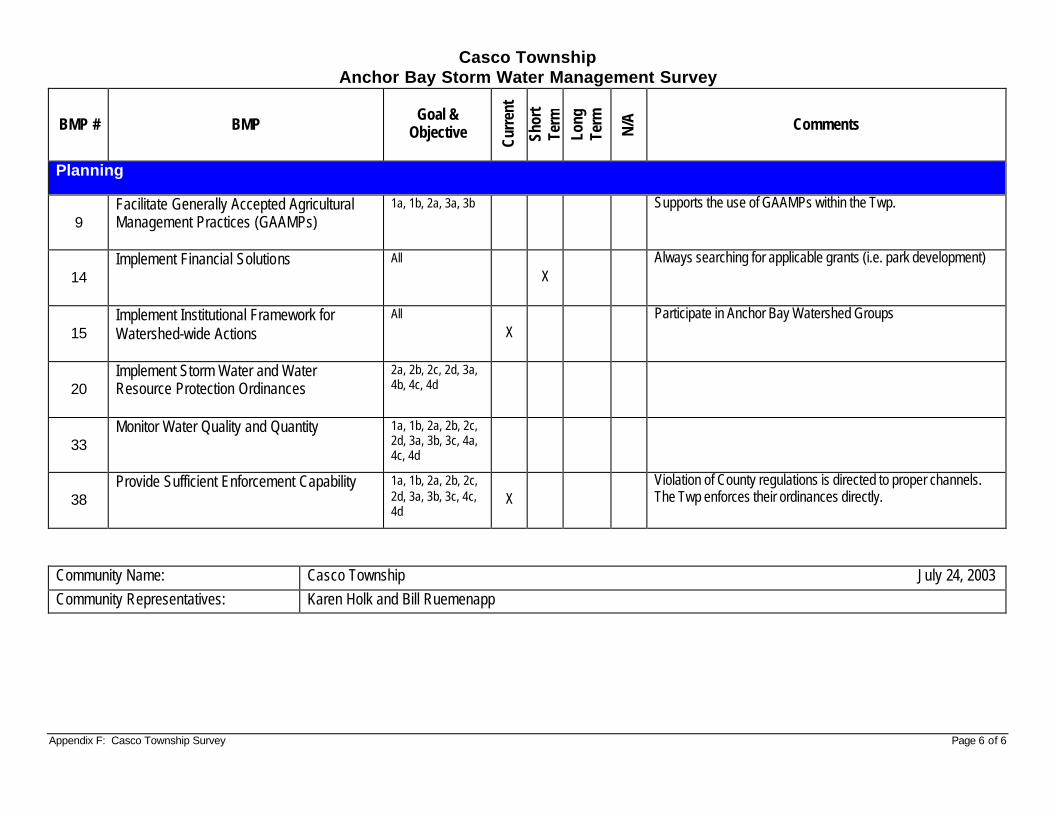
Appendix F: Casco Township Survey Page 6 of 6
Casco Township Anchor Bay Storm Water Management Survey
BMP # BMP Goal &
Objective
Curr
ent
Shor
t Te
rm
Long
Te
rm
N/A
Comments
Planning
9 Facilitate Generally Accepted Agricultural Management Practices (GAAMPs)
1a, 1b, 2a, 3a, 3b
Supports the use of GAAMPs within the Twp.
14 Implement Financial Solutions
All X
Always searching for applicable grants (i.e. park development)
15 Implement Institutional Framework for Watershed-wide Actions
All X
Participate in Anchor Bay Watershed Groups
20 Implement Storm Water and Water Resource Protection Ordinances
2a, 2b, 2c, 2d, 3a, 4b, 4c, 4d
33 Monitor Water Quality and Quantity
1a, 1b, 2a, 2b, 2c, 2d, 3a, 3b, 3c, 4a, 4c, 4d
38 Provide Sufficient Enforcement Capability
1a, 1b, 2a, 2b, 2c, 2d, 3a, 3b, 3c, 4c, 4d
X Violation of County regulations is directed to proper channels. The Twp enforces their ordinances directly.
Community Name: Casco Township July 24, 2003 Community Representatives: Karen Holk and Bill Ruemenapp
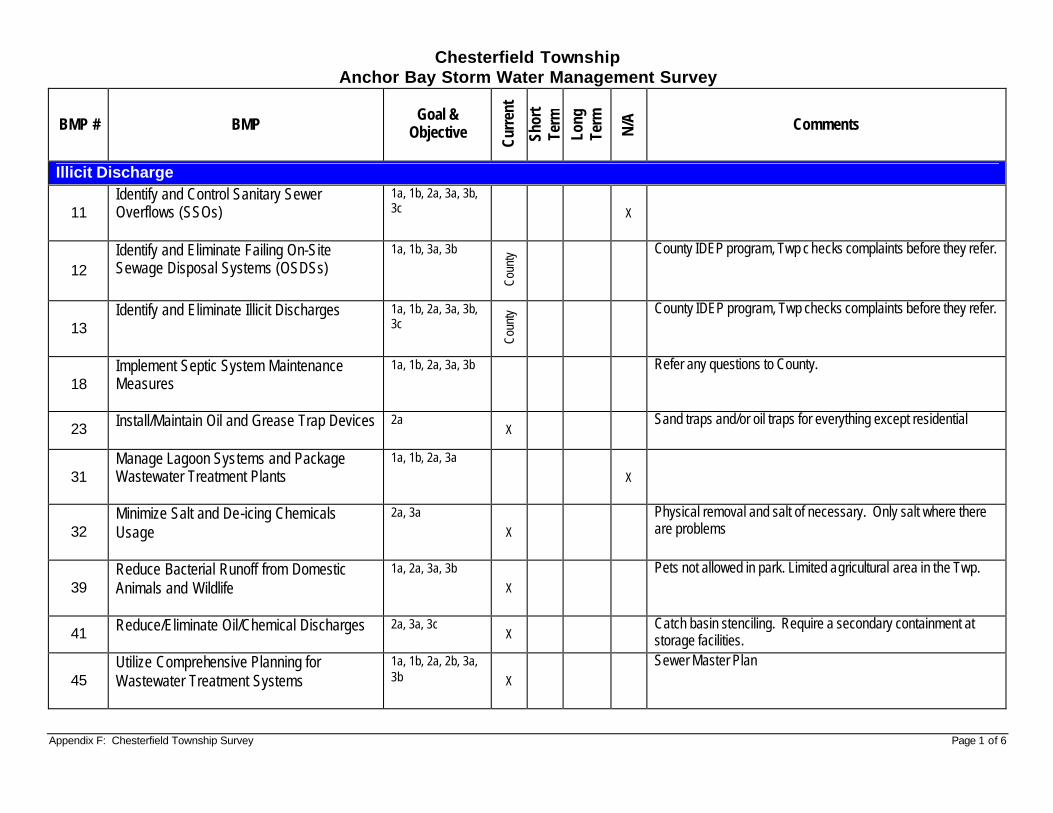
Appendix F: Chesterfield Township Survey Page 1 of 6
Chesterfield Township Anchor Bay Storm Water Management Survey
BMP # BMP Goal &
Objective
Curr
ent
Shor
t Te
rm
Long
Te
rm
N/A
Comments
Illicit Discharge
11 Identify and Control Sanitary Sewer Overflows (SSOs)
1a, 1b, 2a, 3a, 3b, 3c X
12 Identify and Eliminate Failing On-Site Sewage Disposal Systems (OSDSs)
1a, 1b, 3a, 3b
Coun
ty
County IDEP program, Twp c hecks complaints before they refer.
13 Identify and Eliminate Illicit Discharges
1a, 1b, 2a, 3a, 3b, 3c
Coun
ty
County IDEP program, Twp checks complaints before they refer.
18 Implement Septic System Maintenance Measures
1a, 1b, 2a, 3a, 3b
Refer any questions to County.
23 Install/Maintain Oil and Grease Trap Devices
2a X
Sand traps and/or oil traps for everything except residential
31 Manage Lagoon Systems and Package Wastewater Treatment Plants
1a, 1b, 2a, 3a
X
32 Minimize Salt and De-icing Chemicals Usage
2a, 3a
X
Physical removal and salt of necessary. Only salt where there are problems
39 Reduce Bacterial Runoff from Domestic Animals and Wildlife
1a, 2a, 3a, 3b
X
Pets not allowed in park. Limited agricultural area in the Twp.
41 Reduce/Eliminate Oil/Chemical Discharges
2a, 3a, 3c X
Catch basin stenciling. Require a secondary containment at storage facilities.
45 Utilize Comprehensive Planning for Wastewater Treatment Systems
1a, 1b, 2a, 2b, 3a, 3b X
Sewer Master Plan
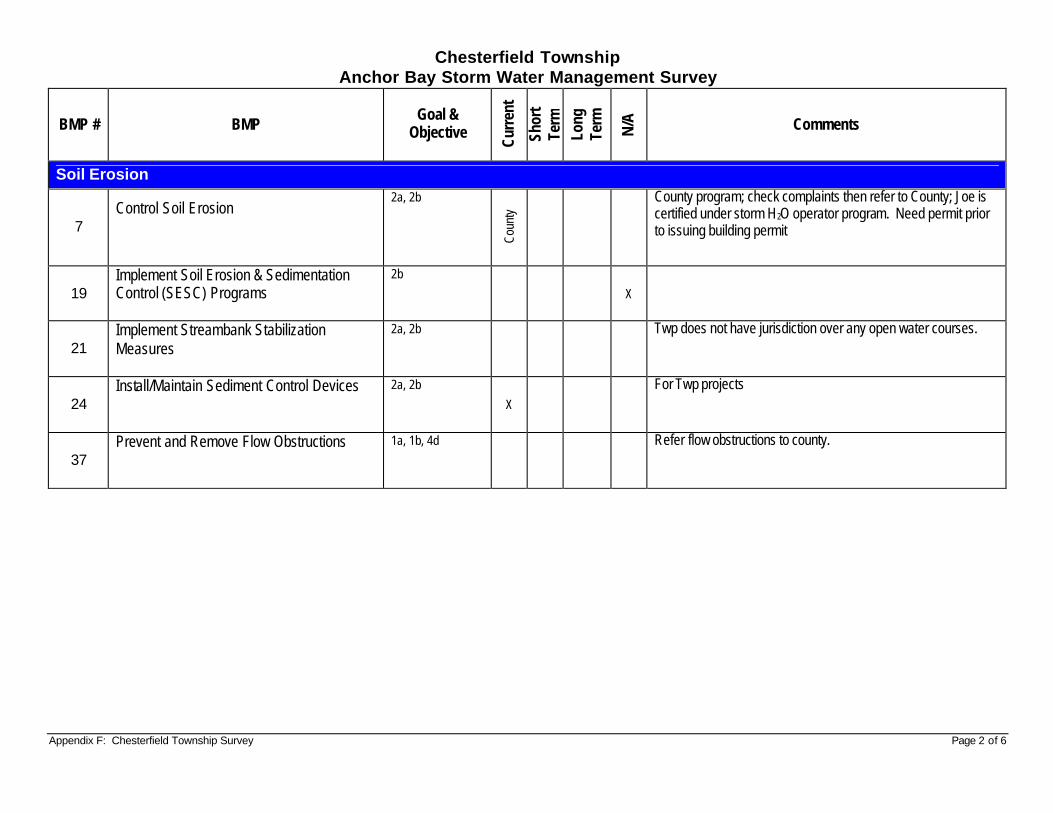
Appendix F: Chesterfield Township Survey Page 2 of 6
Chesterfield Township Anchor Bay Storm Water Management Survey
BMP # BMP Goal &
Objective
Curr
ent
Shor
t Te
rm
Long
Te
rm
N/A
Comments
Soil Erosion
7 Control Soil Erosion
2a, 2b
Coun
ty
County program; check complaints then refer to County; Joe is certified under storm H2O operator program. Need permit prior to issuing building permit
19 Implement Soil Erosion & Sedimentation Control (SESC) Programs
2b
X
21 Implement Streambank Stabilization Measures
2a, 2b
Twp does not have jurisdiction over any open water courses.
24 Install/Maintain Sediment Control Devices
2a, 2b
X
For Twp projects
37 Prevent and Remove Flow Obstructions
1a, 1b, 4d
Refer flow obstructions to county.
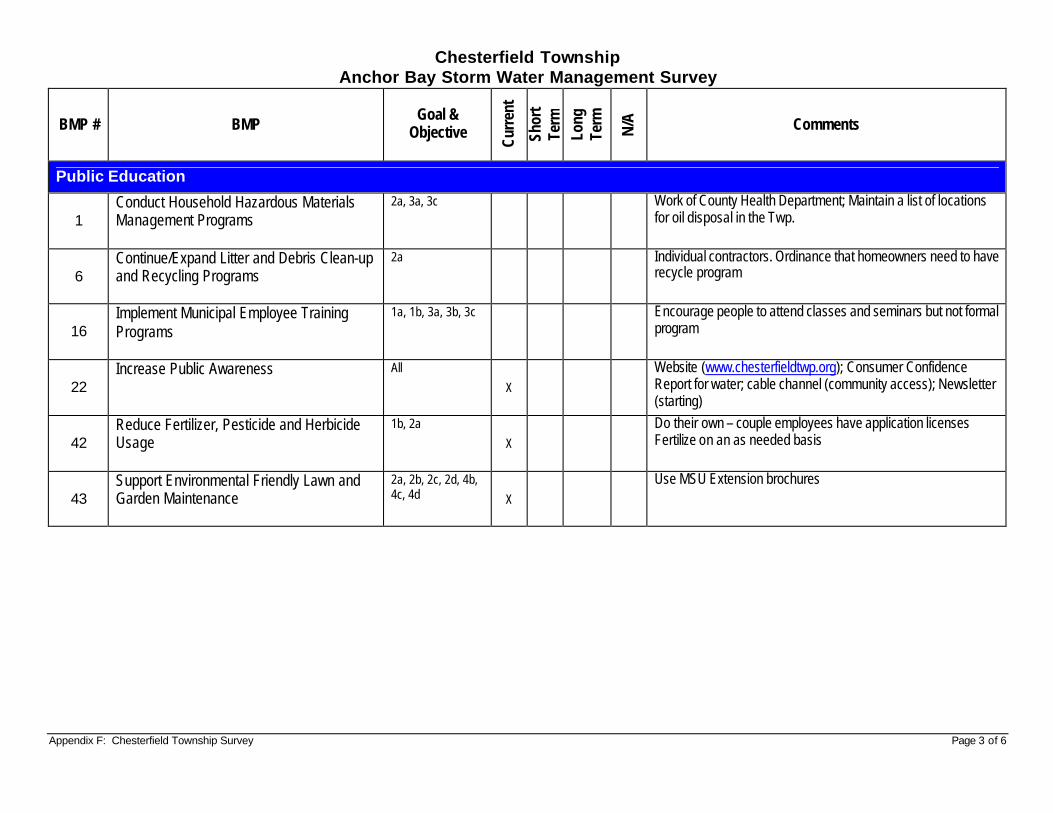
Appendix F: Chesterfield Township Survey Page 3 of 6
Chesterfield Township Anchor Bay Storm Water Management Survey
BMP # BMP Goal &
Objective
Curr
ent
Shor
t Te
rm
Long
Te
rm
N/A
Comments
Public Education
1 Conduct Household Hazardous Materials Management Programs
2a, 3a, 3c
Work of County Health Department; Maintain a list of locations for oil disposal in the Twp.
6 Continue/Expand Litter and Debris Clean-up and Recycling Programs
2a
Individual contractors. Ordinance that homeowners need to have recycle program
16 Implement Municipal Employee Training Programs
1a, 1b, 3a, 3b, 3c
Encourage people to attend classes and seminars but not formal program
22 Increase Public Awareness
All
X
Website (www.chesterfieldtwp.org); Consumer Confidence Report for water; cable channel (community access); Newsletter (starting)
42 Reduce Fertilizer, Pesticide and Herbicide Usage
1b, 2a
X
Do their own – couple employees have application licenses Fertilize on an as needed basis
43 Support Environmental Friendly Lawn and Garden Maintenance
2a, 2b, 2c, 2d, 4b, 4c, 4d X
Use MSU Extension brochures
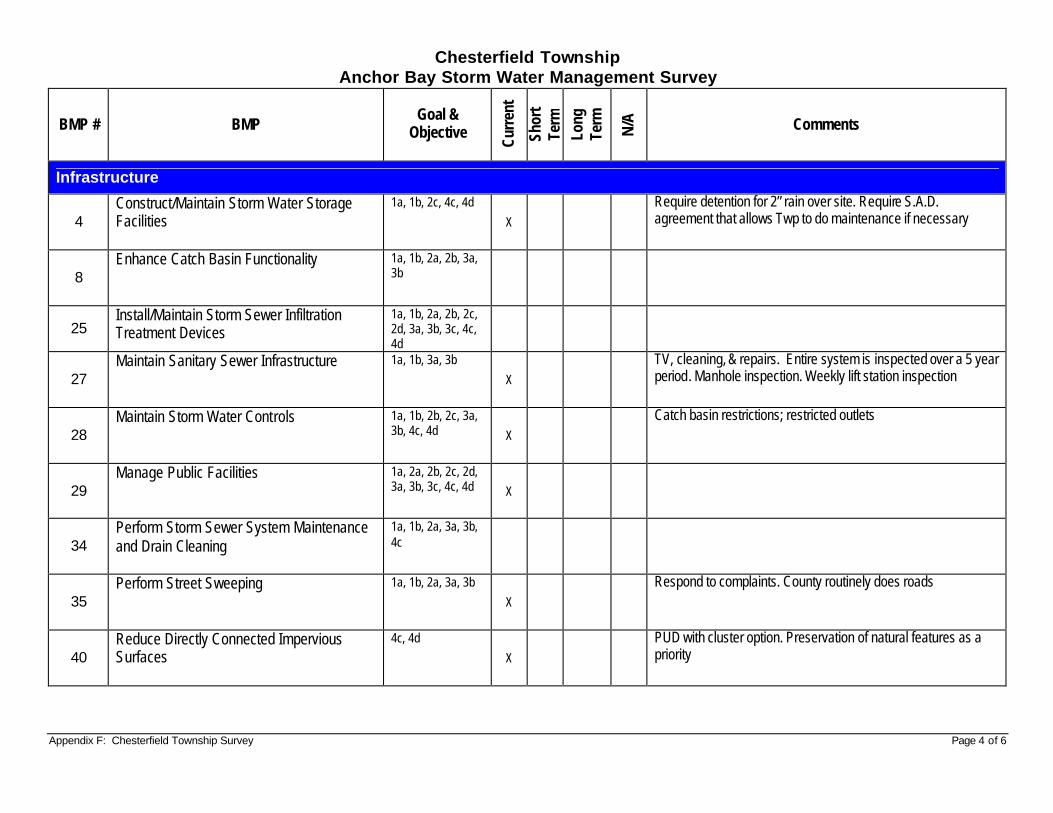
Appendix F: Chesterfield Township Survey Page 4 of 6
Chesterfield Township Anchor Bay Storm Water Management Survey
BMP # BMP Goal &
Objective
Curr
ent
Shor
t Te
rm
Long
Te
rm
N/A
Comments
Infrastructure
4 Construct/Maintain Storm Water Storage Facilities
1a, 1b, 2c, 4c, 4d
X
Require detention for 2” rain over site. Require S.A.D. agreement that allows Twp to do maintenance if necessary
8 Enhance Catch Basin Functionality
1a, 1b, 2a, 2b, 3a, 3b
25 Install/Maintain Storm Sewer Infiltration Treatment Devices
1a, 1b, 2a, 2b, 2c, 2d, 3a, 3b, 3c, 4c, 4d
27 Maintain Sanitary Sewer Infrastructure
1a, 1b, 3a, 3b
X
TV, cleaning, & repairs. Entire system is inspected over a 5 year period. Manhole inspection. Weekly lift station inspection
28 Maintain Storm Water Controls
1a, 1b, 2b, 2c, 3a, 3b, 4c, 4d X
Catch basin restrictions; restricted outlets
29 Manage Public Facilities
1a, 2a, 2b, 2c, 2d, 3a, 3b, 3c, 4c, 4d X
34 Perform Storm Sewer System Maintenance and Drain Cleaning
1a, 1b, 2a, 3a, 3b, 4c
35 Perform Street Sweeping
1a, 1b, 2a, 3a, 3b
X
Respond to complaints. County routinely does roads
40 Reduce Directly Connected Impervious Surfaces
4c, 4d
X
PUD with cluster option. Preservation of natural features as a priority
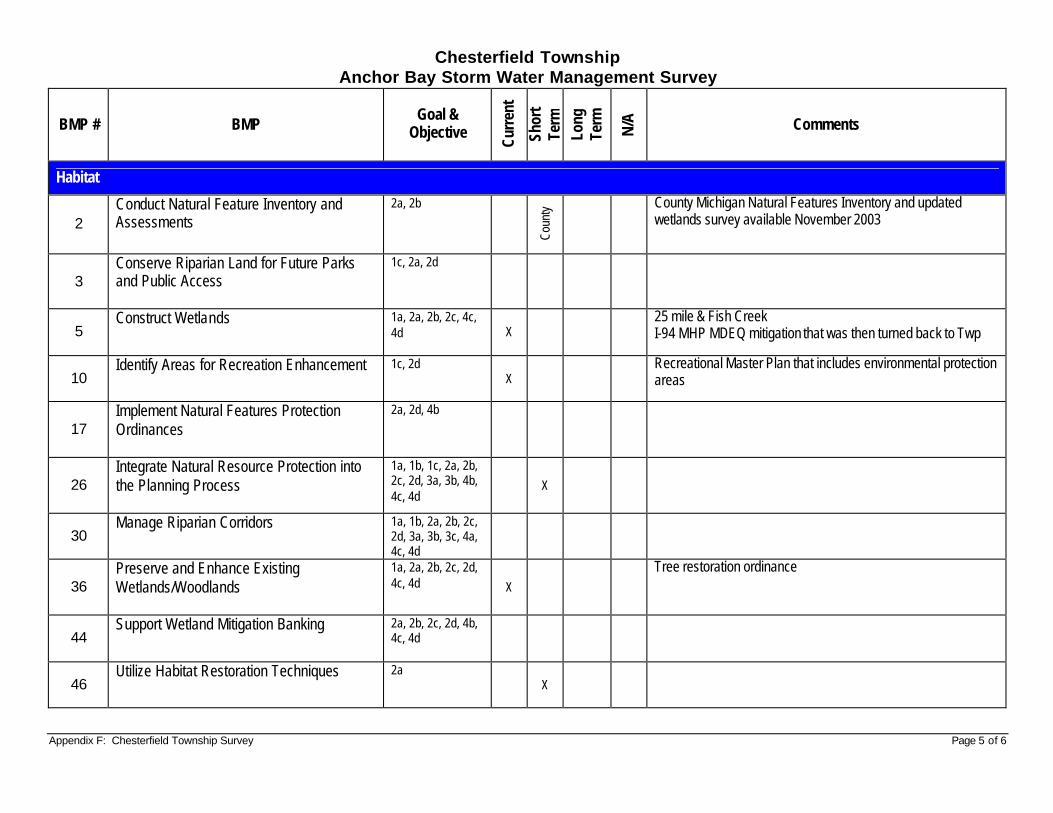
Appendix F: Chesterfield Township Survey Page 5 of 6
Chesterfield Township Anchor Bay Storm Water Management Survey
BMP # BMP Goal &
Objective
Curr
ent
Shor
t Te
rm
Long
Te
rm
N/A
Comments
Habitat
2 Conduct Natural Feature Inventory and Assessments
2a, 2b
Coun
ty
County Michigan Natural Features Inventory and updated wetlands survey available November 2003
3 Conserve Riparian Land for Future Parks and Public Access
1c, 2a, 2d
5 Construct Wetlands
1a, 2a, 2b, 2c, 4c, 4d X
25 mile & Fish Creek I-94 MHP MDEQ mitigation that was then turned back to Twp
10 Identify Areas for Recreation Enhancement
1c, 2d X
Recreational Master Plan that includes environmental protection areas
17 Implement Natural Features Protection Ordinances
2a, 2d, 4b
26 Integrate Natural Resource Protection into the Planning Process
1a, 1b, 1c, 2a, 2b, 2c, 2d, 3a, 3b, 4b, 4c, 4d
X
30 Manage Riparian Corridors
1a, 1b, 2a, 2b, 2c, 2d, 3a, 3b, 3c, 4a, 4c, 4d
36 Preserve and Enhance Existing Wetlands/Woodlands
1a, 2a, 2b, 2c, 2d, 4c, 4d X
Tree restoration ordinance
44 Support Wetland Mitigation Banking
2a, 2b, 2c, 2d, 4b, 4c, 4d
46 Utilize Habitat Restoration Techniques
2a X
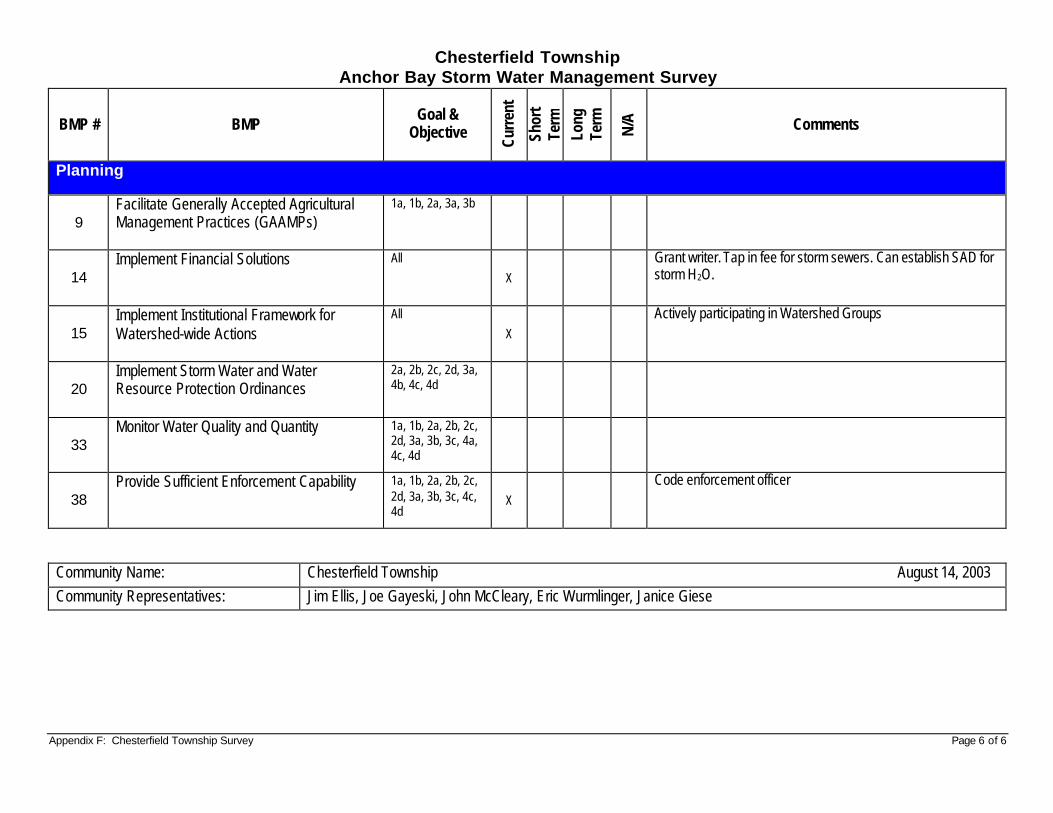
Appendix F: Chesterfield Township Survey Page 6 of 6
Chesterfield Township Anchor Bay Storm Water Management Survey
BMP # BMP Goal &
Objective
Curr
ent
Shor
t Te
rm
Long
Te
rm
N/A
Comments
Planning
9 Facilitate Generally Accepted Agricultural Management Practices (GAAMPs)
1a, 1b, 2a, 3a, 3b
14 Implement Financial Solutions
All
X
Grant writer. Tap in fee for storm sewers. Can establish SAD for storm H2O.
15 Implement Institutional Framework for Watershed-wide Actions
All
X
Actively participating in Watershed Groups
20 Implement Storm Water and Water Resource Protection Ordinances
2a, 2b, 2c, 2d, 3a, 4b, 4c, 4d
33 Monitor Water Quality and Quantity
1a, 1b, 2a, 2b, 2c, 2d, 3a, 3b, 3c, 4a, 4c, 4d
38 Provide Sufficient Enforcement Capability
1a, 1b, 2a, 2b, 2c, 2d, 3a, 3b, 3c, 4c, 4d
X
Code enforcement officer
Community Name: Chesterfield Township August 14, 2003 Community Representatives: Jim Ellis, Joe Gayeski, John McCleary, Eric Wurmlinger, Janice Giese
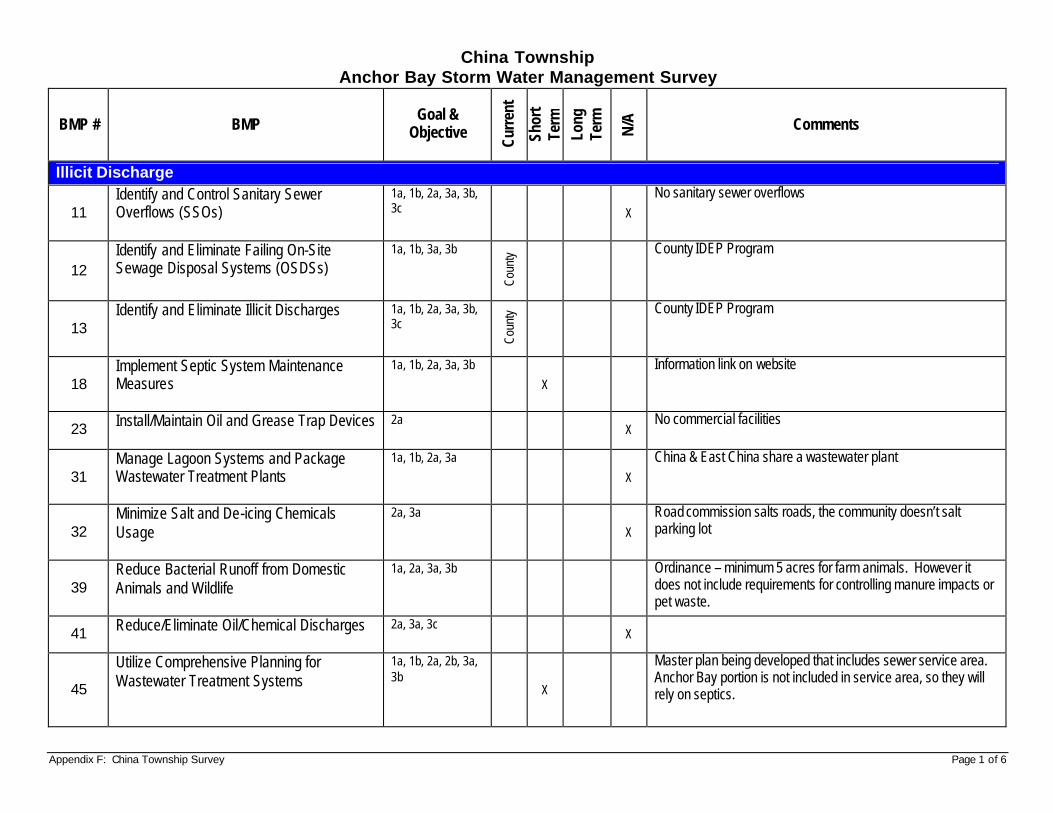
Appendix F: China Township Survey Page 1 of 6
China Township Anchor Bay Storm Water Management Survey
BMP # BMP Goal &
Objective
Curr
ent
Shor
t Te
rm
Long
Te
rm
N/A
Comments
Illicit Discharge
11 Identify and Control Sanitary Sewer Overflows (SSOs)
1a, 1b, 2a, 3a, 3b, 3c X
No sanitary sewer overflows
12 Identify and Eliminate Failing On-Site Sewage Disposal Systems (OSDSs)
1a, 1b, 3a, 3b
Coun
ty
County IDEP Program
13 Identify and Eliminate Illicit Discharges
1a, 1b, 2a, 3a, 3b, 3c
Coun
ty
County IDEP Program
18 Implement Septic System Maintenance Measures
1a, 1b, 2a, 3a, 3b
X
Information link on website
23 Install/Maintain Oil and Grease Trap Devices
2a X
No commercial facilities
31 Manage Lagoon Systems and Package Wastewater Treatment Plants
1a, 1b, 2a, 3a
X
China & East China share a wastewater plant
32 Minimize Salt and De-icing Chemicals Usage
2a, 3a
X
Road commission salts roads, the community doesn’t salt parking lot
39 Reduce Bacterial Runoff from Domestic Animals and Wildlife
1a, 2a, 3a, 3b
Ordinance – minimum 5 acres for farm animals. However it does not include requirements for controlling manure impacts or pet waste.
41 Reduce/Eliminate Oil/Chemical Discharges
2a, 3a, 3c X
45
Utilize Comprehensive Planning for Wastewater Treatment Systems
1a, 1b, 2a, 2b, 3a, 3b
X
Master plan being developed that includes sewer service area. Anchor Bay portion is not included in service area, so they will rely on septics.
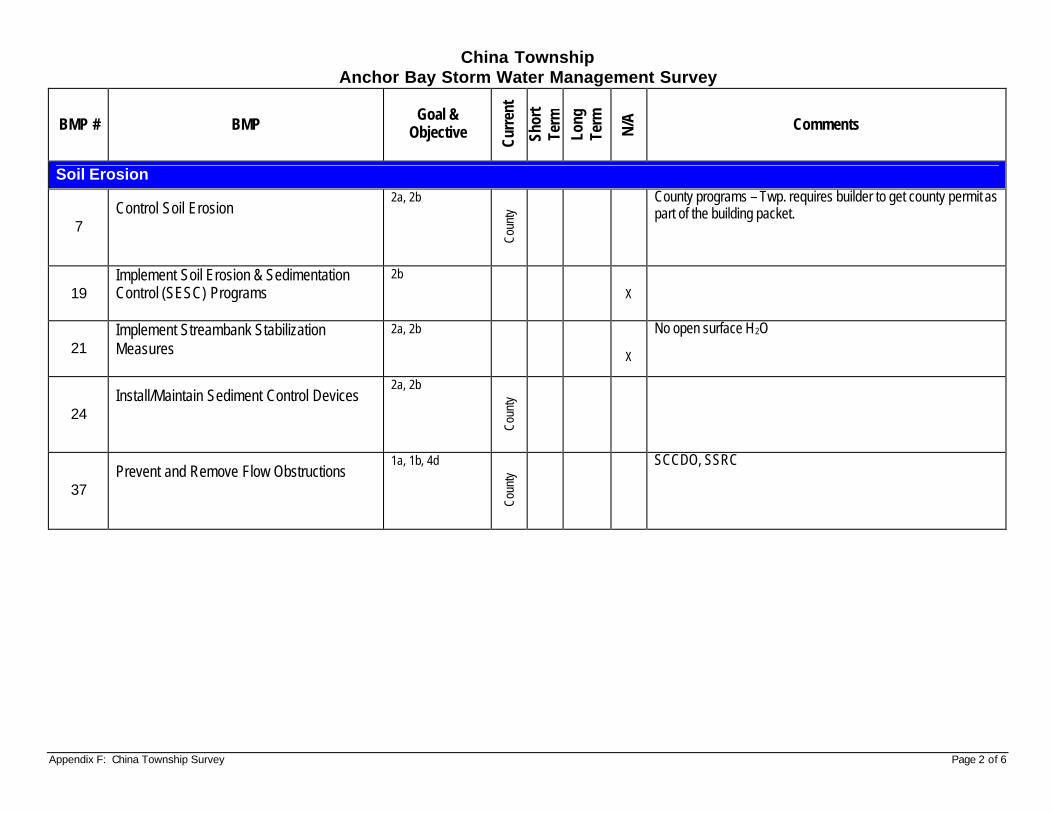
Appendix F: China Township Survey Page 2 of 6
China Township Anchor Bay Storm Water Management Survey
BMP # BMP Goal &
Objective
Curr
ent
Shor
t Te
rm
Long
Te
rm
N/A
Comments
Soil Erosion
7 Control Soil Erosion
2a, 2b
Coun
ty
County programs – Twp. requires builder to get county permit as part of the building packet.
19 Implement Soil Erosion & Sedimentation Control (SESC) Programs
2b
X
21 Implement Streambank Stabilization Measures
2a, 2b
X
No open surface H2O
24 Install/Maintain Sediment Control Devices
2a, 2b
Coun
ty
37 Prevent and Remove Flow Obstructions
1a, 1b, 4d
Coun
ty
SCCDO, SSRC
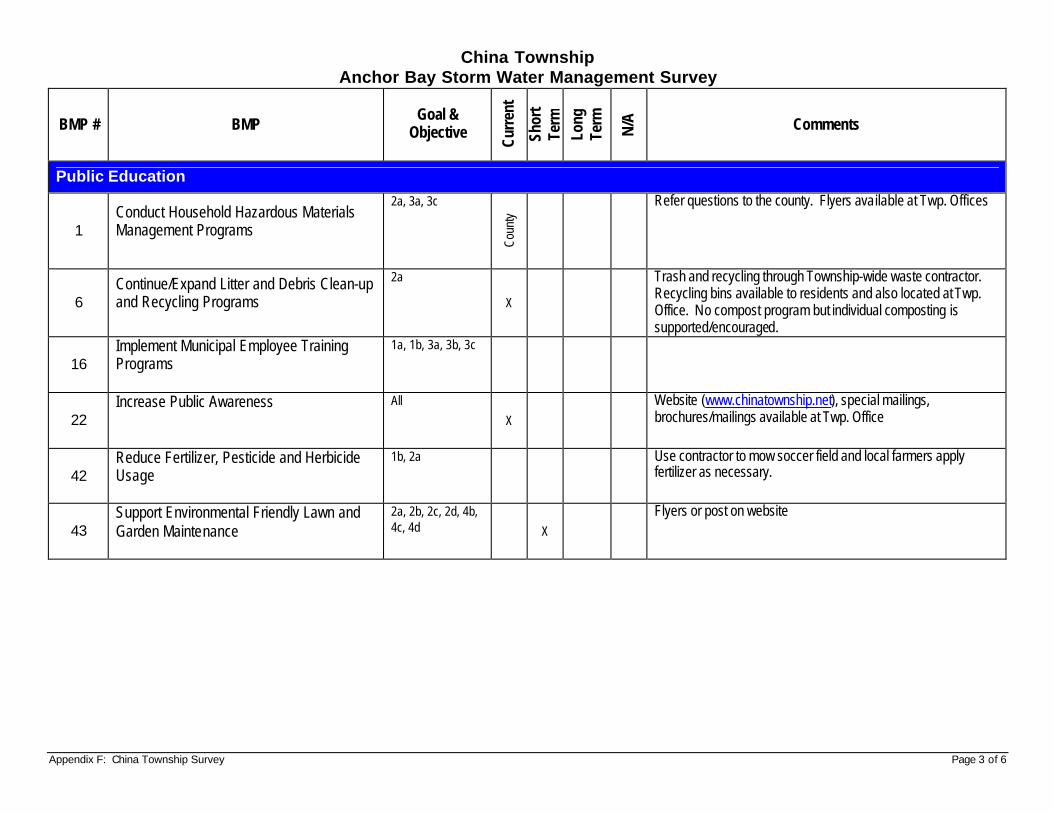
Appendix F: China Township Survey Page 3 of 6
China Township Anchor Bay Storm Water Management Survey
BMP # BMP Goal &
Objective
Curr
ent
Shor
t Te
rm
Long
Te
rm
N/A
Comments
Public Education
1 Conduct Household Hazardous Materials Management Programs
2a, 3a, 3c
Coun
ty
Refer questions to the county. Flyers available at Twp. Offices
6 Continue/Expand Litter and Debris Clean-up and Recycling Programs
2a
X
Trash and recycling through Township-wide waste contractor. Recycling bins available to residents and also located at Twp. Office. No compost program but individual composting is supported/encouraged.
16 Implement Municipal Employee Training Programs
1a, 1b, 3a, 3b, 3c
22 Increase Public Awareness
All
X
Website (www.chinatownship.net), special mailings, brochures/mailings available at Twp. Office
42 Reduce Fertilizer, Pesticide and Herbicide Usage
1b, 2a
Use contractor to mow soccer field and local farmers apply fertilizer as necessary.
43 Support Environmental Friendly Lawn and Garden Maintenance
2a, 2b, 2c, 2d, 4b, 4c, 4d X
Flyers or post on website
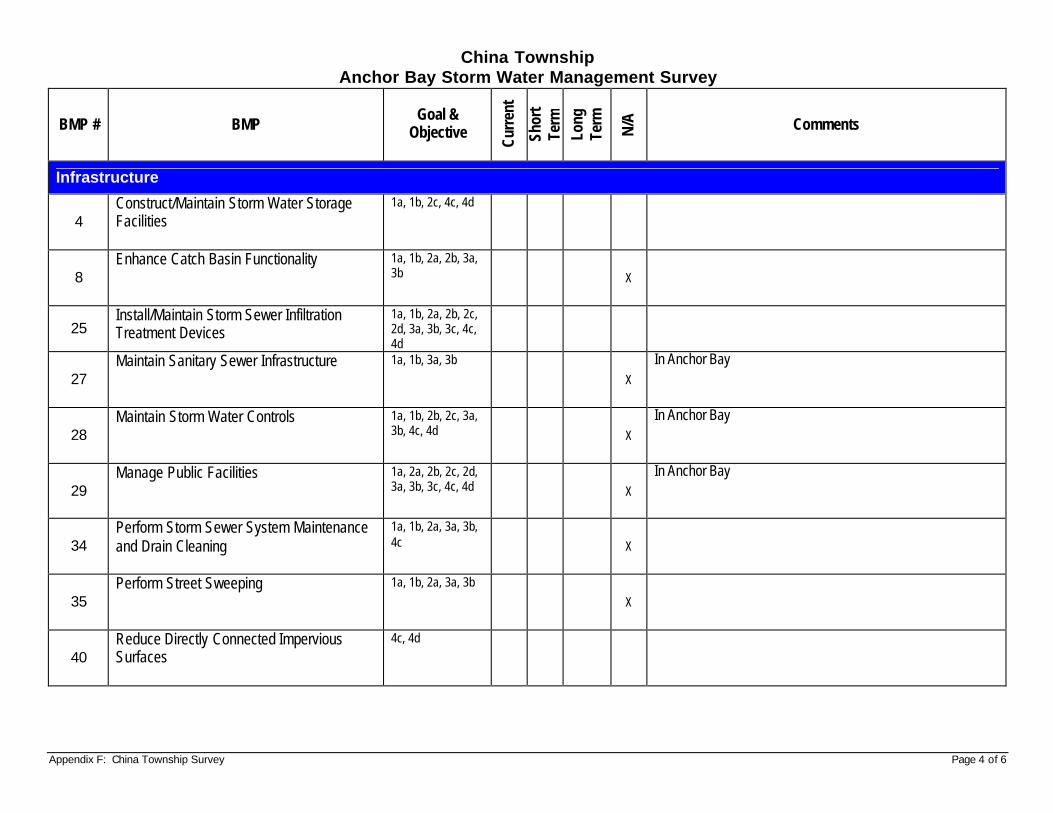
Appendix F: China Township Survey Page 4 of 6
China Township Anchor Bay Storm Water Management Survey
BMP # BMP Goal &
Objective
Curr
ent
Shor
t Te
rm
Long
Te
rm
N/A
Comments
Infrastructure
4 Construct/Maintain Storm Water Storage Facilities
1a, 1b, 2c, 4c, 4d
8 Enhance Catch Basin Functionality
1a, 1b, 2a, 2b, 3a, 3b X
25 Install/Maintain Storm Sewer Infiltration Treatment Devices
1a, 1b, 2a, 2b, 2c, 2d, 3a, 3b, 3c, 4c, 4d
27 Maintain Sanitary Sewer Infrastructure
1a, 1b, 3a, 3b
X
In Anchor Bay
28 Maintain Storm Water Controls
1a, 1b, 2b, 2c, 3a, 3b, 4c, 4d X
In Anchor Bay
29 Manage Public Facilities
1a, 2a, 2b, 2c, 2d, 3a, 3b, 3c, 4c, 4d X
In Anchor Bay
34 Perform Storm Sewer System Maintenance and Drain Cleaning
1a, 1b, 2a, 3a, 3b, 4c X
35 Perform Street Sweeping
1a, 1b, 2a, 3a, 3b
X
40 Reduce Directly Connected Impervious Surfaces
4c, 4d
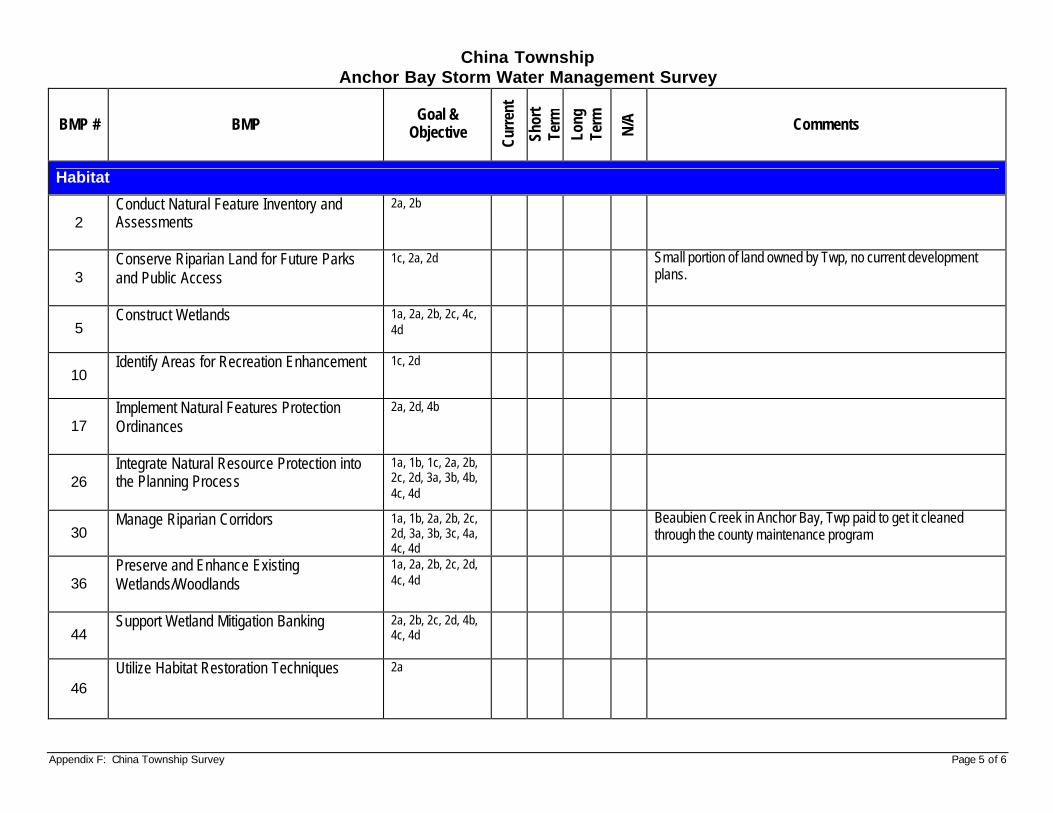
Appendix F: China Township Survey Page 5 of 6
China Township Anchor Bay Storm Water Management Survey
BMP # BMP Goal &
Objective
Curr
ent
Shor
t Te
rm
Long
Te
rm
N/A
Comments
Habitat
2 Conduct Natural Feature Inventory and Assessments
2a, 2b
3 Conserve Riparian Land for Future Parks and Public Access
1c, 2a, 2d
Small portion of land owned by Twp, no current development plans.
5 Construct Wetlands
1a, 2a, 2b, 2c, 4c, 4d
10 Identify Areas for Recreation Enhancement
1c, 2d
17 Implement Natural Features Protection Ordinances
2a, 2d, 4b
26 Integrate Natural Resource Protection into the Planning Process
1a, 1b, 1c, 2a, 2b, 2c, 2d, 3a, 3b, 4b, 4c, 4d
30 Manage Riparian Corridors
1a, 1b, 2a, 2b, 2c, 2d, 3a, 3b, 3c, 4a, 4c, 4d
Beaubien Creek in Anchor Bay, Twp paid to get it cleaned through the county maintenance program
36 Preserve and Enhance Existing Wetlands/Woodlands
1a, 2a, 2b, 2c, 2d, 4c, 4d
44 Support Wetland Mitigation Banking
2a, 2b, 2c, 2d, 4b, 4c, 4d
46 Utilize Habitat Restoration Techniques
2a
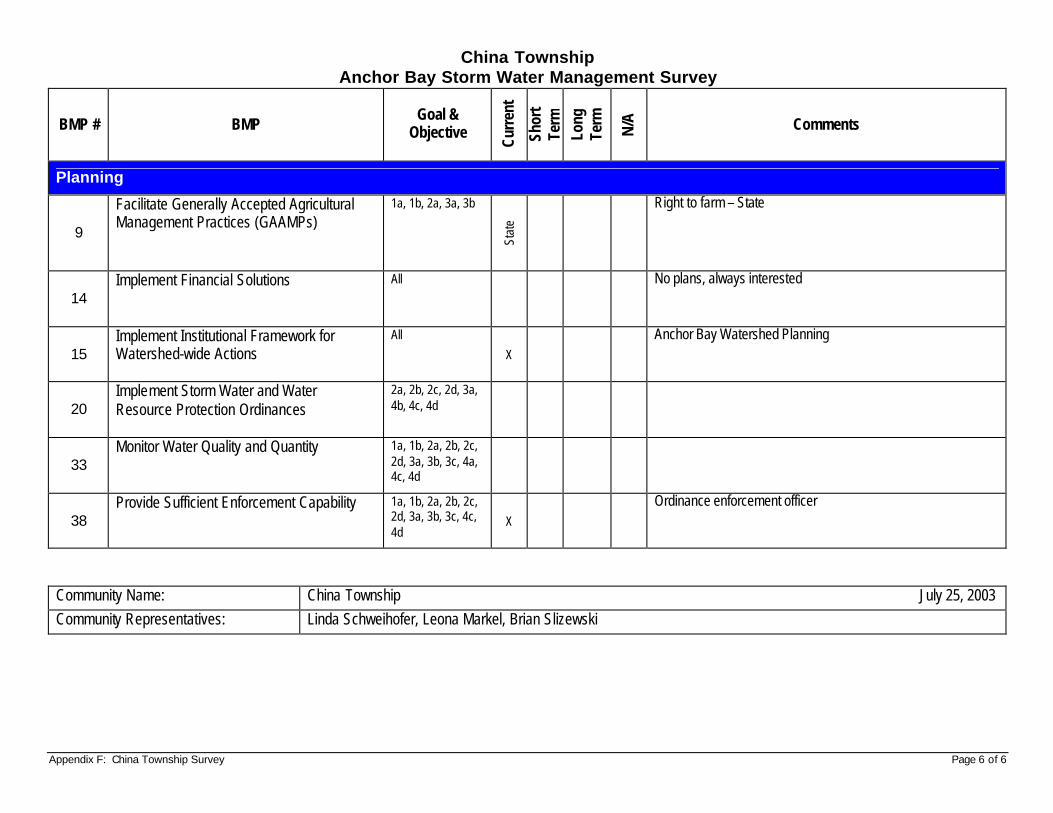
Appendix F: China Township Survey Page 6 of 6
China Township Anchor Bay Storm Water Management Survey
BMP # BMP Goal &
Objective
Curr
ent
Shor
t Te
rm
Long
Te
rm
N/A
Comments
Planning
9
Facilitate Generally Accepted Agricultural Management Practices (GAAMPs)
1a, 1b, 2a, 3a, 3b
Stat
e
Right to farm – State
14 Implement Financial Solutions
All
No plans, always interested
15 Implement Institutional Framework for Watershed-wide Actions
All
X
Anchor Bay Watershed Planning
20 Implement Storm Water and Water Resource Protection Ordinances
2a, 2b, 2c, 2d, 3a, 4b, 4c, 4d
33 Monitor Water Quality and Quantity
1a, 1b, 2a, 2b, 2c, 2d, 3a, 3b, 3c, 4a, 4c, 4d
38 Provide Sufficient Enforcement Capability
1a, 1b, 2a, 2b, 2c, 2d, 3a, 3b, 3c, 4c, 4d
X
Ordinance enforcement officer
Community Name: China Township July 25, 2003 Community Representatives: Linda Schweihofer, Leona Markel, Brian Slizewski
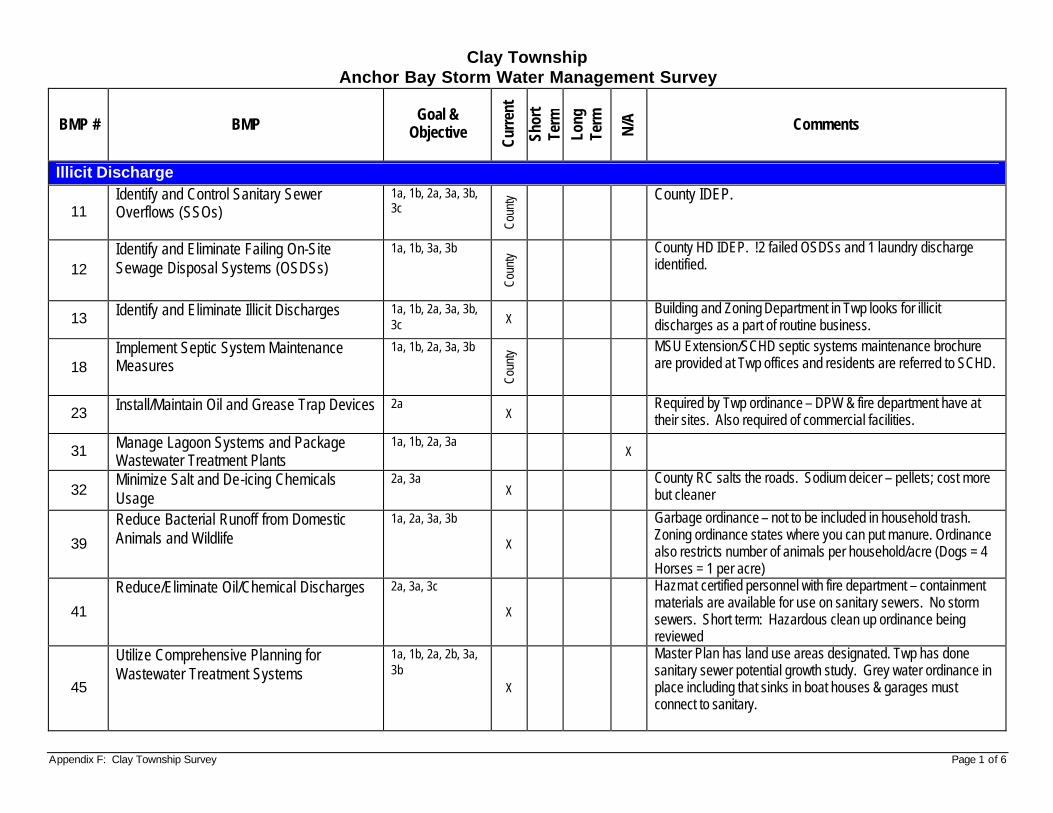
Appendix F: Clay Township Survey Page 1 of 6
Clay Township Anchor Bay Storm Water Management Survey
BMP # BMP Goal &
Objective
Curr
ent
Shor
t Te
rm
Long
Te
rm
N/A
Comments
Illicit Discharge
11 Identify and Control Sanitary Sewer Overflows (SSOs)
1a, 1b, 2a, 3a, 3b, 3c
Coun
ty
County IDEP.
12 Identify and Eliminate Failing On-Site Sewage Disposal Systems (OSDSs)
1a, 1b, 3a, 3b
Coun
ty
County HD IDEP. !2 failed OSDSs and 1 laundry discharge identified.
13 Identify and Eliminate Illicit Discharges
1a, 1b, 2a, 3a, 3b, 3c X
Building and Zoning Department in Twp looks for illicit discharges as a part of routine business.
18 Implement Septic System Maintenance Measures
1a, 1b, 2a, 3a, 3b
Coun
ty
MSU Extension/SCHD septic systems maintenance brochure are provided at Twp offices and residents are referred to SCHD.
23 Install/Maintain Oil and Grease Trap Devices
2a X
Required by Twp ordinance – DPW & fire department have at their sites. Also required of commercial facilities.
31 Manage Lagoon Systems and Package Wastewater Treatment Plants
1a, 1b, 2a, 3a X
32 Minimize Salt and De-icing Chemicals Usage
2a, 3a X
County RC salts the roads. Sodium deicer – pellets; cost more but cleaner
39
Reduce Bacterial Runoff from Domestic Animals and Wildlife
1a, 2a, 3a, 3b
X
Garbage ordinance – not to be included in household trash. Zoning ordinance states where you can put manure. Ordinance also restricts number of animals per household/acre (Dogs = 4 Horses = 1 per acre)
41
Reduce/Eliminate Oil/Chemical Discharges
2a, 3a, 3c
X
Hazmat certified personnel with fire department – containment materials are available for use on sanitary sewers. No storm sewers. Short term: Hazardous clean up ordinance being reviewed
45
Utilize Comprehensive Planning for Wastewater Treatment Systems
1a, 1b, 2a, 2b, 3a, 3b
X
Master Plan has land use areas designated. Twp has done sanitary sewer potential growth study. Grey water ordinance in place including that sinks in boat houses & garages must connect to sanitary.
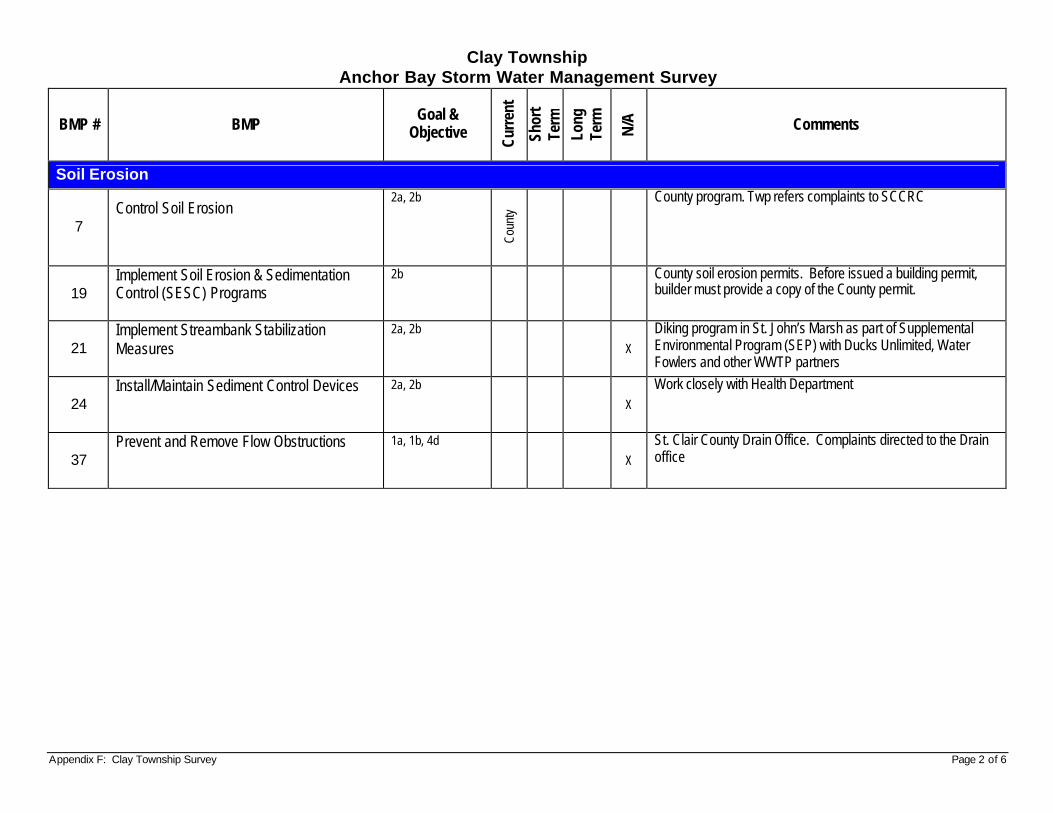
Appendix F: Clay Township Survey Page 2 of 6
Clay Township Anchor Bay Storm Water Management Survey
BMP # BMP Goal &
Objective
Curr
ent
Shor
t Te
rm
Long
Te
rm
N/A
Comments
Soil Erosion
7 Control Soil Erosion
2a, 2b
Coun
ty
County program. Twp refers complaints to SCCRC
19 Implement Soil Erosion & Sedimentation Control (SESC) Programs
2b
County soil erosion permits. Before issued a building permit, builder must provide a copy of the County permit.
21 Implement Streambank Stabilization Measures
2a, 2b
X
Diking program in St. John’s Marsh as part of Supplemental Environmental Program (SEP) with Ducks Unlimited, Water Fowlers and other WWTP partners
24 Install/Maintain Sediment Control Devices
2a, 2b
X
Work closely with Health Department
37 Prevent and Remove Flow Obstructions
1a, 1b, 4d
X
St. Clair County Drain Office. Complaints directed to the Drain office
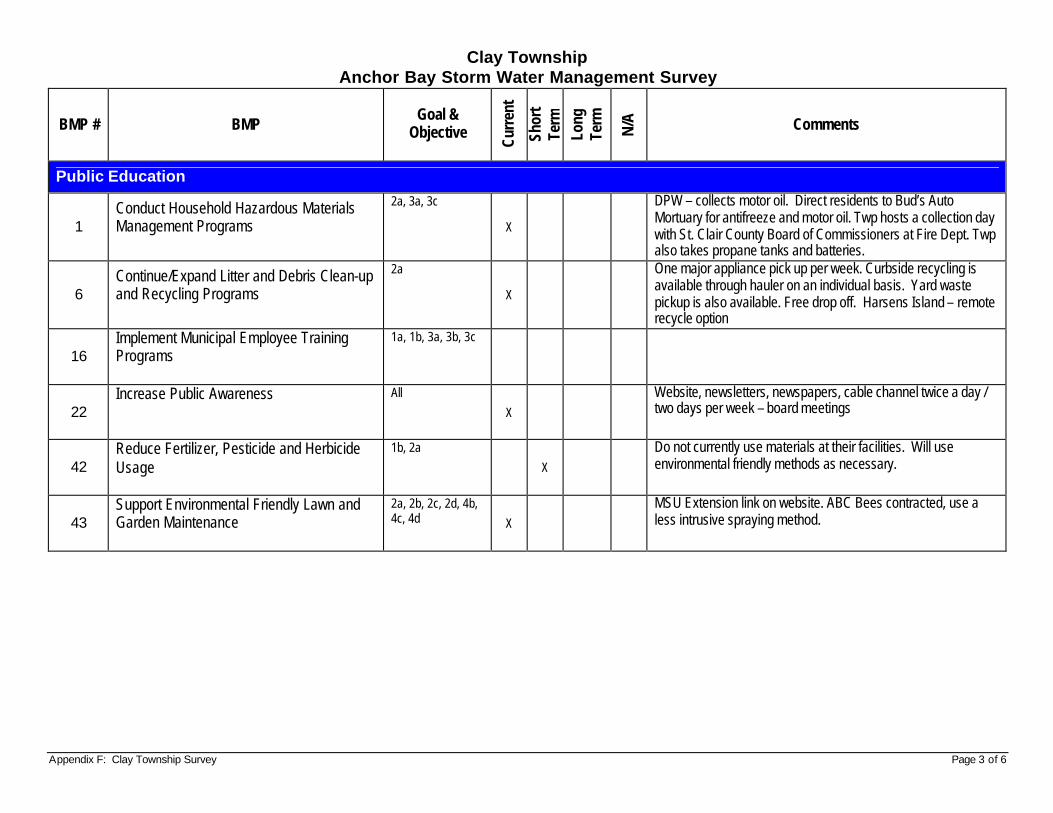
Appendix F: Clay Township Survey Page 3 of 6
Clay Township Anchor Bay Storm Water Management Survey
BMP # BMP Goal &
Objective
Curr
ent
Shor
t Te
rm
Long
Te
rm
N/A
Comments
Public Education
1 Conduct Household Hazardous Materials Management Programs
2a, 3a, 3c
X
DPW – collects motor oil. Direct residents to Bud’s Auto Mortuary for antifreeze and motor oil. Twp hosts a collection day with St. Clair County Board of Commissioners at Fire Dept. Twp also takes propane tanks and batteries.
6 Continue/Expand Litter and Debris Clean-up and Recycling Programs
2a
X
One major appliance pick up per week. Curbside recycling is available through hauler on an individual basis. Yard waste pickup is also available. Free drop off. Harsens Island – remote recycle option
16 Implement Municipal Employee Training Programs
1a, 1b, 3a, 3b, 3c
22 Increase Public Awareness
All
X
Website, newsletters, newspapers, cable channel twice a day / two days per week – board meetings
42 Reduce Fertilizer, Pesticide and Herbicide Usage
1b, 2a
X
Do not currently use materials at their facilities. Will use environmental friendly methods as necessary.
43 Support Environmental Friendly Lawn and Garden Maintenance
2a, 2b, 2c, 2d, 4b, 4c, 4d X
MSU Extension link on website. ABC Bees contracted, use a less intrusive spraying method.
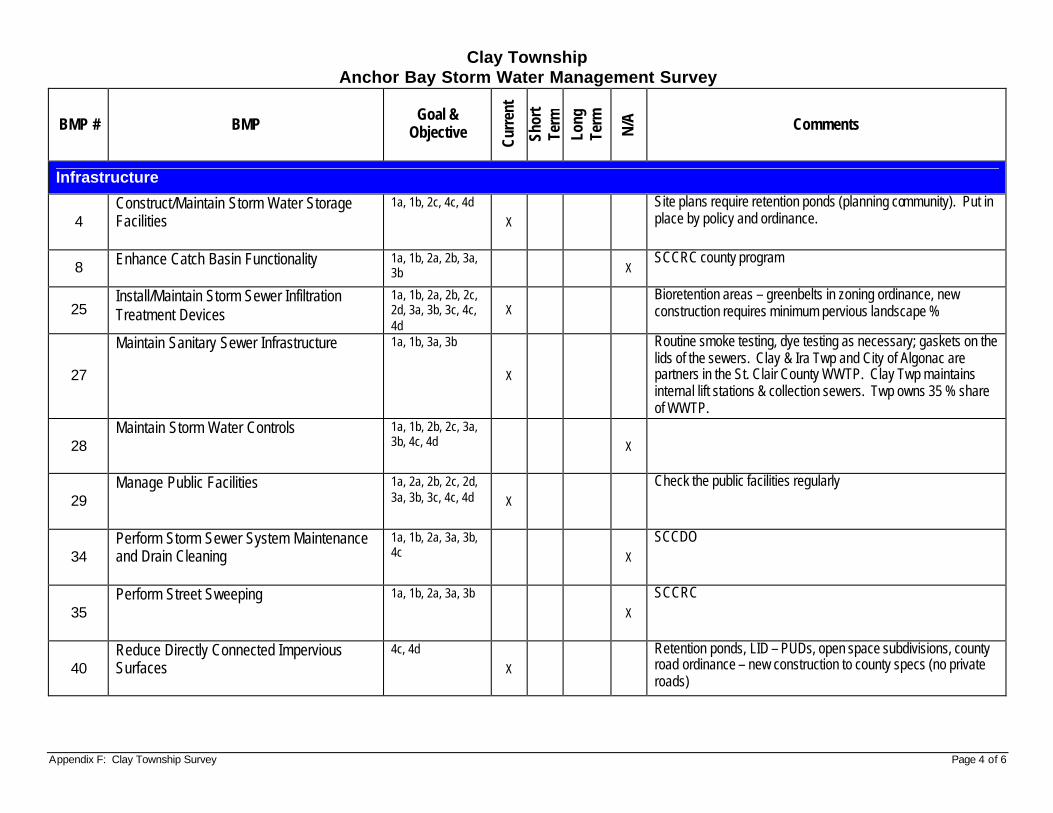
Appendix F: Clay Township Survey Page 4 of 6
Clay Township Anchor Bay Storm Water Management Survey
BMP # BMP Goal &
Objective
Curr
ent
Shor
t Te
rm
Long
Te
rm
N/A
Comments
Infrastructure
4 Construct/Maintain Storm Water Storage Facilities
1a, 1b, 2c, 4c, 4d
X
Site plans require retention ponds (planning community). Put in place by policy and ordinance.
8 Enhance Catch Basin Functionality
1a, 1b, 2a, 2b, 3a, 3b X
SCCRC county program
25 Install/Maintain Storm Sewer Infiltration Treatment Devices
1a, 1b, 2a, 2b, 2c, 2d, 3a, 3b, 3c, 4c, 4d
X Bioretention areas – greenbelts in zoning ordinance, new construction requires minimum pervious landscape %
27
Maintain Sanitary Sewer Infrastructure
1a, 1b, 3a, 3b
X
Routine smoke testing, dye testing as necessary; gaskets on the lids of the sewers. Clay & Ira Twp and City of Algonac are partners in the St. Clair County WWTP. Clay Twp maintains internal lift stations & collection sewers. Twp owns 35 % share of WWTP.
28 Maintain Storm Water Controls
1a, 1b, 2b, 2c, 3a, 3b, 4c, 4d X
29 Manage Public Facilities
1a, 2a, 2b, 2c, 2d, 3a, 3b, 3c, 4c, 4d X
Check the public facilities regularly
34 Perform Storm Sewer System Maintenance and Drain Cleaning
1a, 1b, 2a, 3a, 3b, 4c X
SCCDO
35 Perform Street Sweeping
1a, 1b, 2a, 3a, 3b
X
SCCRC
40 Reduce Directly Connected Impervious Surfaces
4c, 4d
X
Retention ponds, LID – PUDs, open space subdivisions, county road ordinance – new construction to county specs (no private roads)
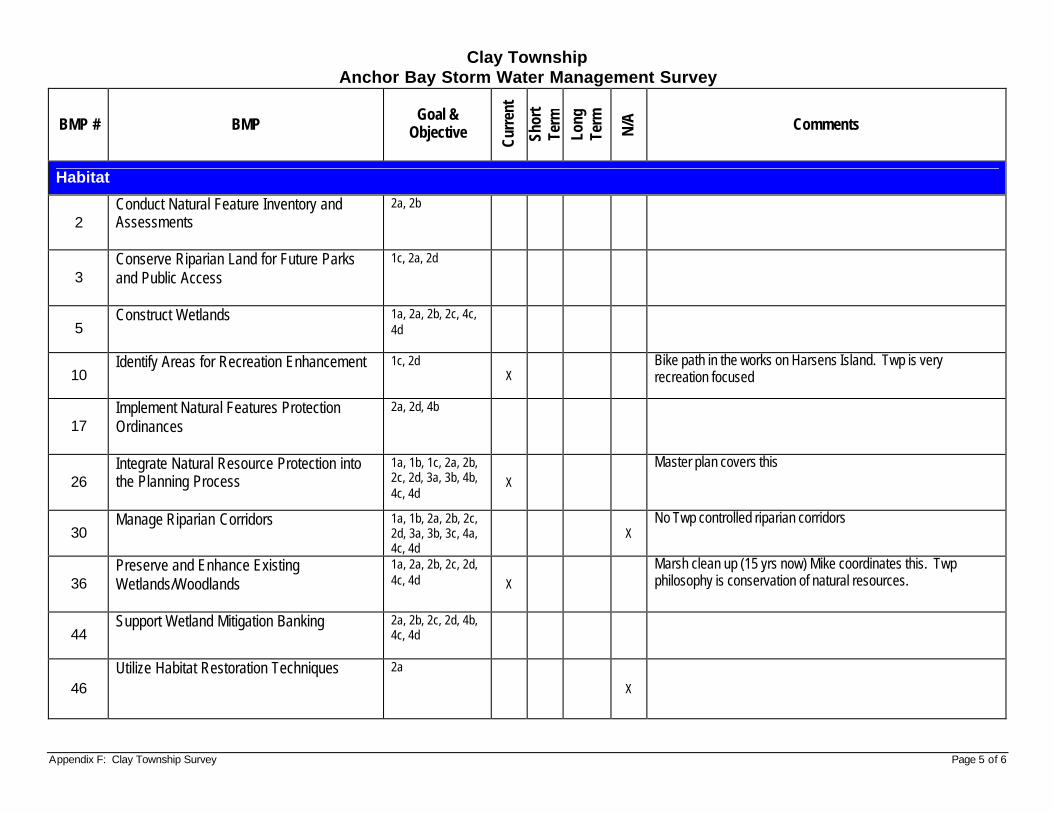
Appendix F: Clay Township Survey Page 5 of 6
Clay Township Anchor Bay Storm Water Management Survey
BMP # BMP Goal &
Objective
Curr
ent
Shor
t Te
rm
Long
Te
rm
N/A
Comments
Habitat
2 Conduct Natural Feature Inventory and Assessments
2a, 2b
3 Conserve Riparian Land for Future Parks and Public Access
1c, 2a, 2d
5 Construct Wetlands
1a, 2a, 2b, 2c, 4c, 4d
10 Identify Areas for Recreation Enhancement
1c, 2d X
Bike path in the works on Harsens Island. Twp is very recreation focused
17 Implement Natural Features Protection Ordinances
2a, 2d, 4b
26 Integrate Natural Resource Protection into the Planning Process
1a, 1b, 1c, 2a, 2b, 2c, 2d, 3a, 3b, 4b, 4c, 4d
X
Master plan covers this
30 Manage Riparian Corridors
1a, 1b, 2a, 2b, 2c, 2d, 3a, 3b, 3c, 4a, 4c, 4d
X No Twp controlled riparian corridors
36 Preserve and Enhance Existing Wetlands/Woodlands
1a, 2a, 2b, 2c, 2d, 4c, 4d X
Marsh clean up (15 yrs now) Mike coordinates this. Twp philosophy is conservation of natural resources.
44 Support Wetland Mitigation Banking
2a, 2b, 2c, 2d, 4b, 4c, 4d
46 Utilize Habitat Restoration Techniques
2a
X
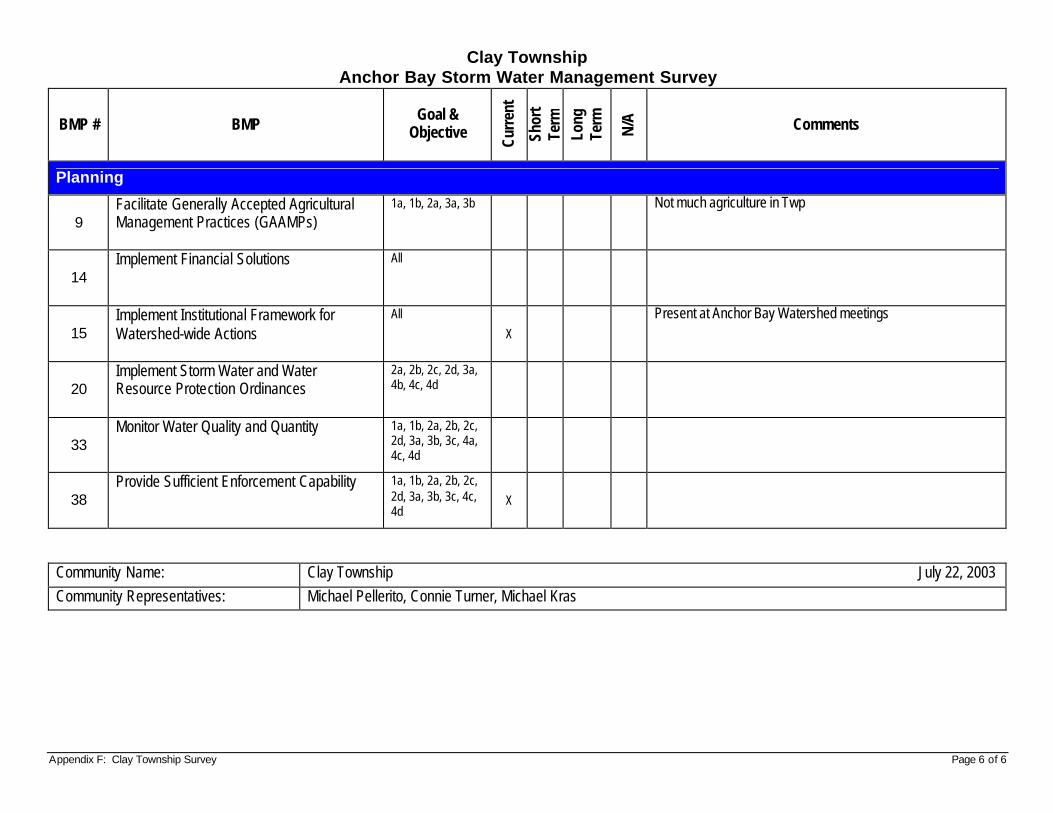
Appendix F: Clay Township Survey Page 6 of 6
Clay Township Anchor Bay Storm Water Management Survey
BMP # BMP Goal &
Objective
Curr
ent
Shor
t Te
rm
Long
Te
rm
N/A
Comments
Planning
9 Facilitate Generally Accepted Agricultural Management Practices (GAAMPs)
1a, 1b, 2a, 3a, 3b
Not much agriculture in Twp
14 Implement Financial Solutions
All
15 Implement Institutional Framework for Watershed-wide Actions
All
X
Present at Anchor Bay Watershed meetings
20 Implement Storm Water and Water Resource Protection Ordinances
2a, 2b, 2c, 2d, 3a, 4b, 4c, 4d
33 Monitor Water Quality and Quantity
1a, 1b, 2a, 2b, 2c, 2d, 3a, 3b, 3c, 4a, 4c, 4d
38 Provide Sufficient Enforcement Capability
1a, 1b, 2a, 2b, 2c, 2d, 3a, 3b, 3c, 4c, 4d
X
Community Name: Clay Township July 22, 2003 Community Representatives: Michael Pellerito, Connie Turner, Michael Kras
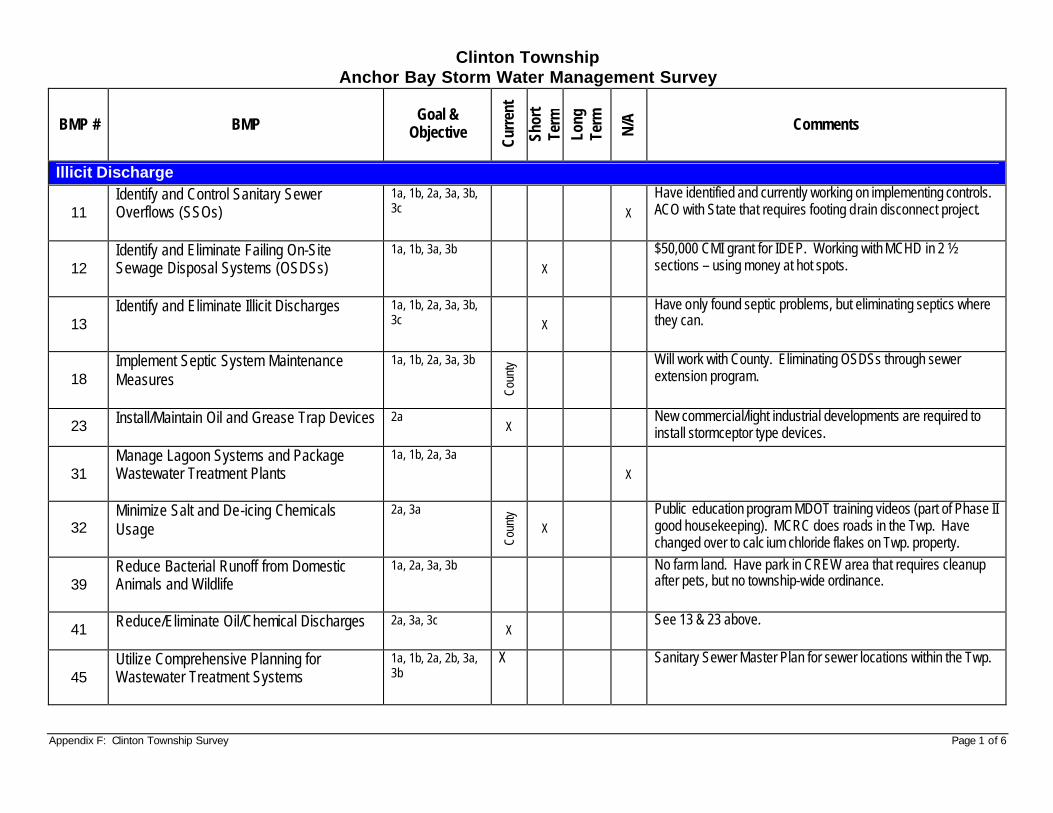
Appendix F: Clinton Township Survey Page 1 of 6
Clinton Township Anchor Bay Storm Water Management Survey
BMP # BMP Goal &
Objective
Curr
ent
Shor
t Te
rm
Long
Te
rm
N/A
Comments
Illicit Discharge
11 Identify and Control Sanitary Sewer Overflows (SSOs)
1a, 1b, 2a, 3a, 3b, 3c X
Have identified and currently working on implementing controls. ACO with State that requires footing drain disconnect project.
12 Identify and Eliminate Failing On-Site Sewage Disposal Systems (OSDSs)
1a, 1b, 3a, 3b
X
$50,000 CMI grant for IDEP. Working with MCHD in 2 ½ sections – using money at hot spots.
13 Identify and Eliminate Illicit Discharges
1a, 1b, 2a, 3a, 3b, 3c X
Have only found septic problems, but eliminating septics where they can.
18 Implement Septic System Maintenance Measures
1a, 1b, 2a, 3a, 3b
Coun
ty
Will work with County. Eliminating OSDSs through sewer extension program.
23 Install/Maintain Oil and Grease Trap Devices
2a X
New commercial/light industrial developments are required to install stormceptor type devices.
31 Manage Lagoon Systems and Package Wastewater Treatment Plants
1a, 1b, 2a, 3a
X
32 Minimize Salt and De-icing Chemicals Usage
2a, 3a C
ount
y
X Public education program MDOT training videos (part of Phase II good housekeeping). MCRC does roads in the Twp. Have changed over to calc ium chloride flakes on Twp. property.
39 Reduce Bacterial Runoff from Domestic Animals and Wildlife
1a, 2a, 3a, 3b
No farm land. Have park in CREW area that requires cleanup after pets, but no township-wide ordinance.
41 Reduce/Eliminate Oil/Chemical Discharges
2a, 3a, 3c X
See 13 & 23 above.
45 Utilize Comprehensive Planning for Wastewater Treatment Systems
1a, 1b, 2a, 2b, 3a, 3b
X Sanitary Sewer Master Plan for sewer locations within the Twp.
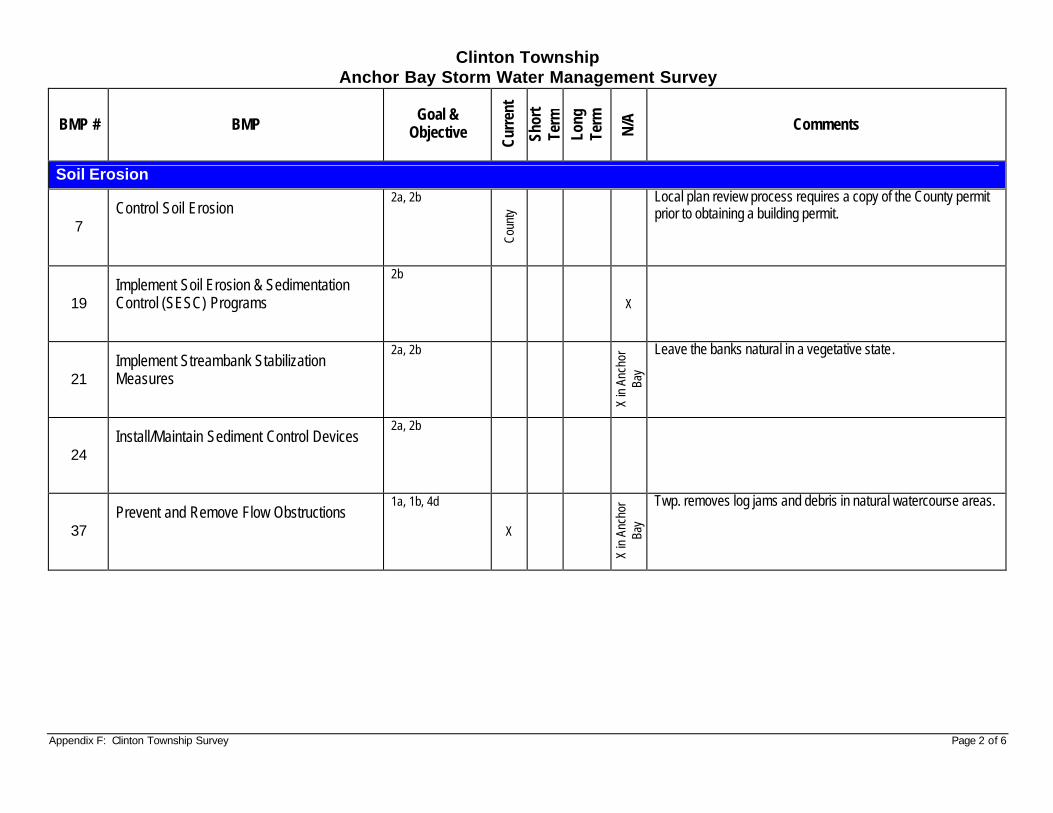
Appendix F: Clinton Township Survey Page 2 of 6
Clinton Township Anchor Bay Storm Water Management Survey
BMP # BMP Goal &
Objective
Curr
ent
Shor
t Te
rm
Long
Te
rm
N/A
Comments
Soil Erosion
7 Control Soil Erosion
2a, 2b
Coun
ty
Local plan review process requires a copy of the County permit prior to obtaining a building permit.
19 Implement Soil Erosion & Sedimentation Control (SESC) Programs
2b
X
21 Implement Streambank Stabilization Measures
2a, 2b
X in
Anc
hor
Bay
Leave the banks natural in a vegetative state.
24 Install/Maintain Sediment Control Devices
2a, 2b
37 Prevent and Remove Flow Obstructions
1a, 1b, 4d
X
X in
Anc
hor
Bay
Twp. removes log jams and debris in natural watercourse areas.
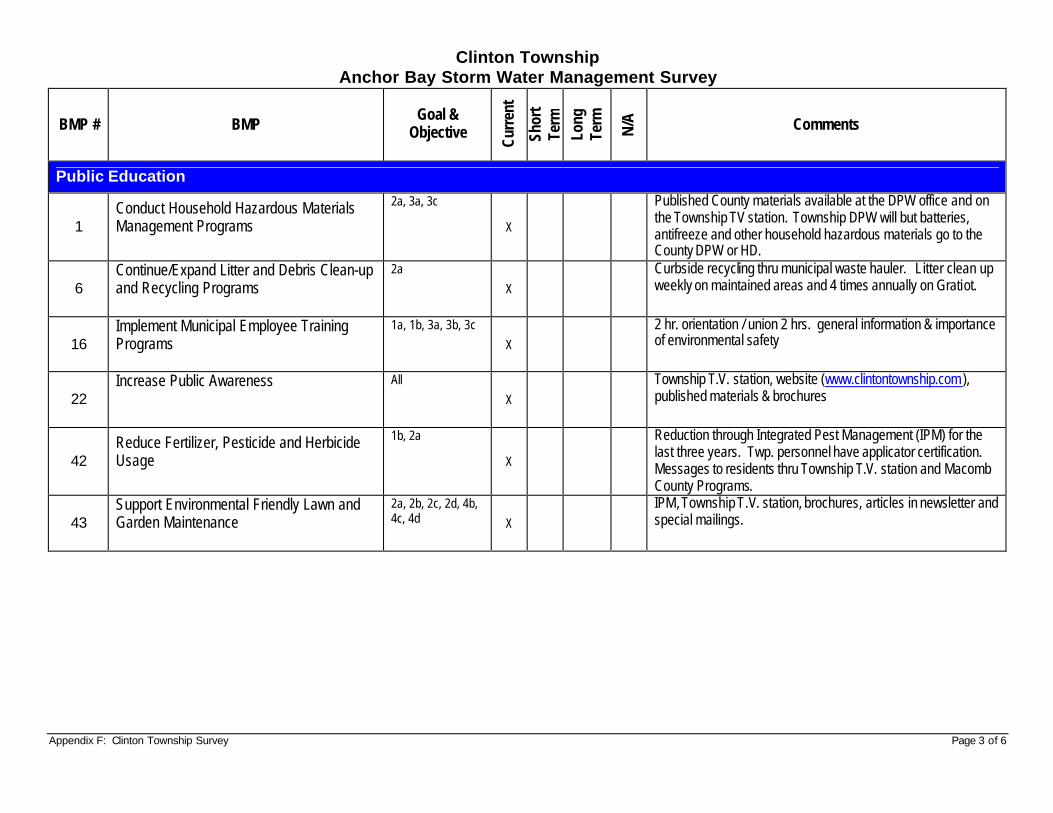
Appendix F: Clinton Township Survey Page 3 of 6
Clinton Township Anchor Bay Storm Water Management Survey
BMP # BMP Goal &
Objective
Curr
ent
Shor
t Te
rm
Long
Te
rm
N/A
Comments
Public Education
1 Conduct Household Hazardous Materials Management Programs
2a, 3a, 3c
X
Published County materials available at the DPW office and on the Township TV station. Township DPW will but batteries, antifreeze and other household hazardous materials go to the County DPW or HD.
6 Continue/Expand Litter and Debris Clean-up and Recycling Programs
2a
X
Curbside recycling thru municipal waste hauler. Litter clean up weekly on maintained areas and 4 times annually on Gratiot.
16 Implement Municipal Employee Training Programs
1a, 1b, 3a, 3b, 3c
X
2 hr. orientation / union 2 hrs. general information & importance of environmental safety
22 Increase Public Awareness
All
X
Township T.V. station, website (www.clintontownship.com ), published materials & brochures
42 Reduce Fertilizer, Pesticide and Herbicide Usage
1b, 2a
X
Reduction through Integrated Pest Management (IPM) for the last three years. Twp. personnel have applicator certification. Messages to residents thru Township T.V. station and Macomb County Programs.
43 Support Environmental Friendly Lawn and Garden Maintenance
2a, 2b, 2c, 2d, 4b, 4c, 4d X
IPM, Township T.V. station, brochures, articles in newsletter and special mailings.
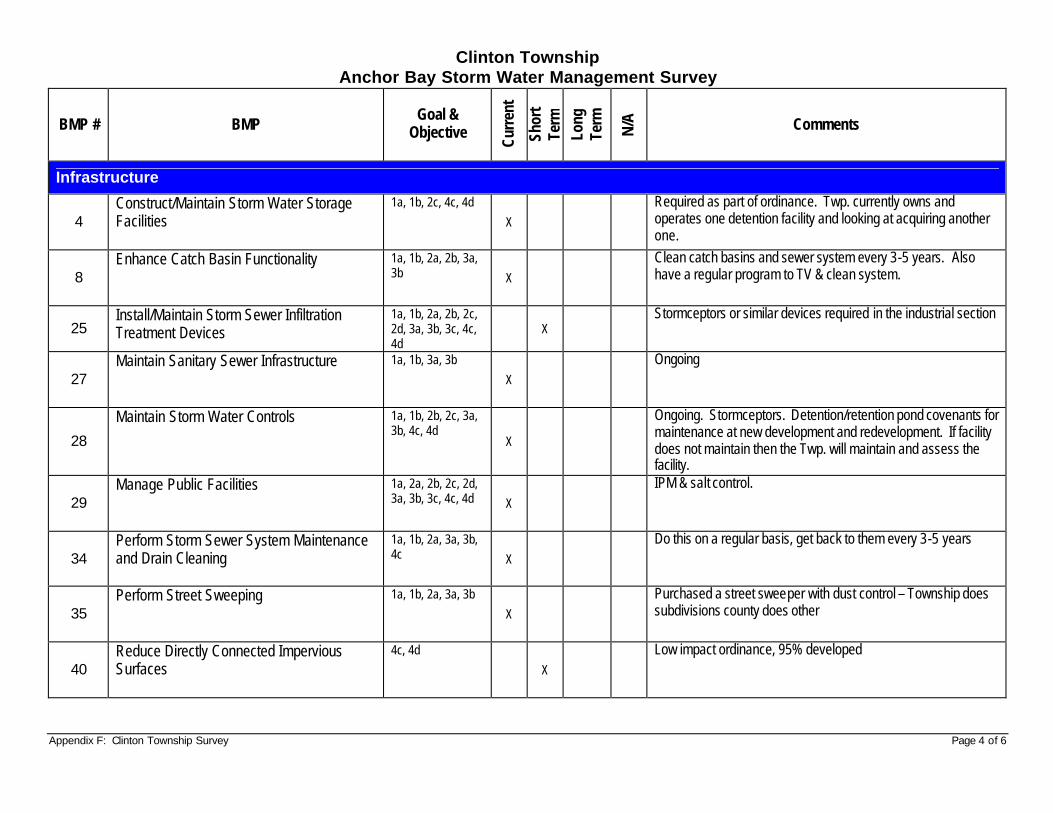
Appendix F: Clinton Township Survey Page 4 of 6
Clinton Township Anchor Bay Storm Water Management Survey
BMP # BMP Goal &
Objective
Curr
ent
Shor
t Te
rm
Long
Te
rm
N/A
Comments
Infrastructure
4 Construct/Maintain Storm Water Storage Facilities
1a, 1b, 2c, 4c, 4d
X
Required as part of ordinance. Twp. currently owns and operates one detention facility and looking at acquiring another one.
8 Enhance Catch Basin Functionality
1a, 1b, 2a, 2b, 3a, 3b X
Clean catch basins and sewer system every 3-5 years. Also have a regular program to TV & clean system.
25 Install/Maintain Storm Sewer Infiltration Treatment Devices
1a, 1b, 2a, 2b, 2c, 2d, 3a, 3b, 3c, 4c, 4d
X Stormceptors or similar devices required in the industrial section
27 Maintain Sanitary Sewer Infrastructure
1a, 1b, 3a, 3b
X
Ongoing
28
Maintain Storm Water Controls
1a, 1b, 2b, 2c, 3a, 3b, 4c, 4d
X
Ongoing. Stormceptors. Detention/retention pond covenants for maintenance at new development and redevelopment. If facility does not maintain then the Twp. will maintain and assess the facility.
29 Manage Public Facilities
1a, 2a, 2b, 2c, 2d, 3a, 3b, 3c, 4c, 4d X
IPM & salt control.
34 Perform Storm Sewer System Maintenance and Drain Cleaning
1a, 1b, 2a, 3a, 3b, 4c X
Do this on a regular basis, get back to them every 3-5 years
35 Perform Street Sweeping
1a, 1b, 2a, 3a, 3b
X
Purchased a street sweeper with dust control – Township does subdivisions county does other
40 Reduce Directly Connected Impervious Surfaces
4c, 4d
X
Low impact ordinance, 95% developed
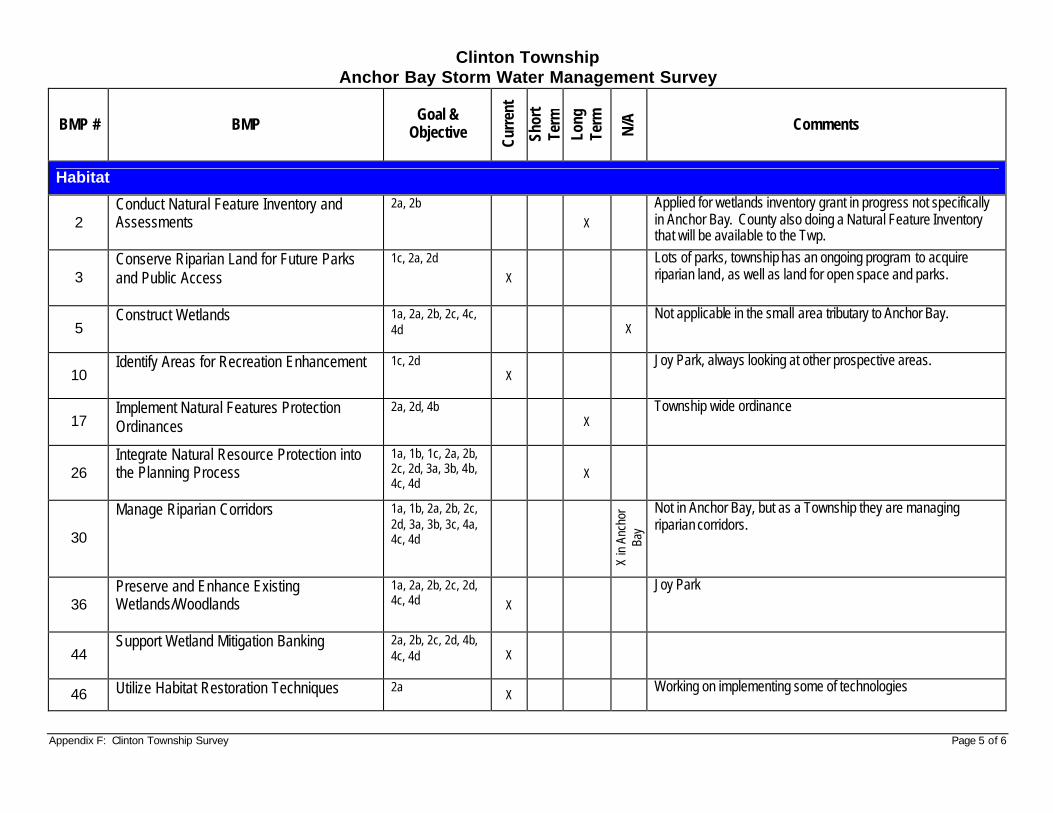
Appendix F: Clinton Township Survey Page 5 of 6
Clinton Township Anchor Bay Storm Water Management Survey
BMP # BMP Goal &
Objective
Curr
ent
Shor
t Te
rm
Long
Te
rm
N/A
Comments
Habitat
2 Conduct Natural Feature Inventory and Assessments
2a, 2b
X
Applied for wetlands inventory grant in progress not specifically in Anchor Bay. County also doing a Natural Feature Inventory that will be available to the Twp.
3 Conserve Riparian Land for Future Parks and Public Access
1c, 2a, 2d
X
Lots of parks, township has an ongoing program to acquire riparian land, as well as land for open space and parks.
5 Construct Wetlands
1a, 2a, 2b, 2c, 4c, 4d X
Not applicable in the small area tributary to Anchor Bay.
10 Identify Areas for Recreation Enhancement
1c, 2d X
Joy Park, always looking at other prospective areas.
17 Implement Natural Features Protection Ordinances
2a, 2d, 4b X
Township wide ordinance
26 Integrate Natural Resource Protection into the Planning Process
1a, 1b, 1c, 2a, 2b, 2c, 2d, 3a, 3b, 4b, 4c, 4d
X
30
Manage Riparian Corridors
1a, 1b, 2a, 2b, 2c, 2d, 3a, 3b, 3c, 4a, 4c, 4d
X in
Anc
hor
Bay
Not in Anchor Bay, but as a Township they are managing riparian corridors.
36 Preserve and Enhance Existing Wetlands/Woodlands
1a, 2a, 2b, 2c, 2d, 4c, 4d X
Joy Park
44 Support Wetland Mitigation Banking
2a, 2b, 2c, 2d, 4b, 4c, 4d X
46 Utilize Habitat Restoration Techniques
2a X
Working on implementing some of technologies
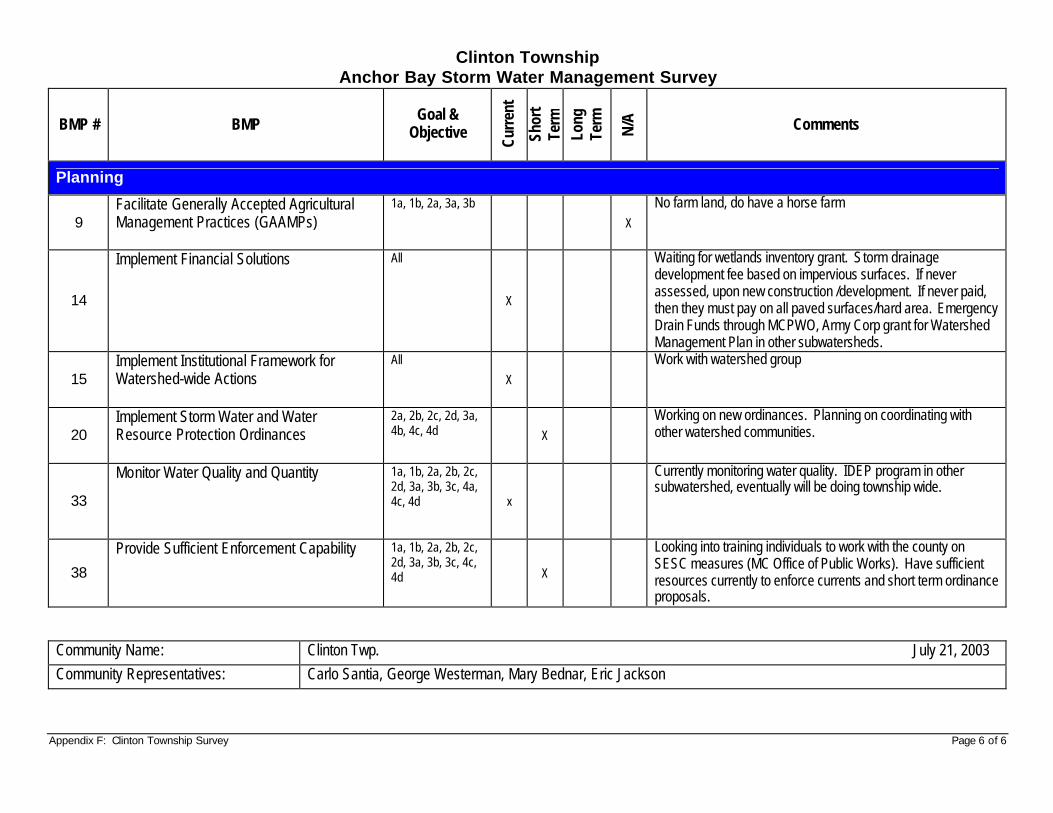
Appendix F: Clinton Township Survey Page 6 of 6
Clinton Township Anchor Bay Storm Water Management Survey
BMP # BMP Goal &
Objective
Curr
ent
Shor
t Te
rm
Long
Te
rm
N/A
Comments
Planning
9 Facilitate Generally Accepted Agricultural Management Practices (GAAMPs)
1a, 1b, 2a, 3a, 3b
X
No farm land, do have a horse farm
14
Implement Financial Solutions
All
X
Waiting for wetlands inventory grant. Storm drainage development fee based on impervious surfaces. If never assessed, upon new construction /development. If never paid, then they must pay on all paved surfaces/hard area. Emergency Drain Funds through MCPWO, Army Corp grant for Watershed Management Plan in other subwatersheds.
15 Implement Institutional Framework for Watershed-wide Actions
All
X
Work with watershed group
20 Implement Storm Water and Water Resource Protection Ordinances
2a, 2b, 2c, 2d, 3a, 4b, 4c, 4d X
Working on new ordinances. Planning on coordinating with other watershed communities.
33
Monitor Water Quality and Quantity
1a, 1b, 2a, 2b, 2c, 2d, 3a, 3b, 3c, 4a, 4c, 4d x
Currently monitoring water quality. IDEP program in other subwatershed, eventually will be doing township wide.
38
Provide Sufficient Enforcement Capability
1a, 1b, 2a, 2b, 2c, 2d, 3a, 3b, 3c, 4c, 4d X
Looking into training individuals to work with the county on SESC measures (MC Office of Public Works). Have sufficient resources currently to enforce currents and short term ordinance proposals.
Community Name: Clinton Twp. July 21, 2003 Community Representatives: Carlo Santia, George Westerman, Mary Bednar, Eric Jackson
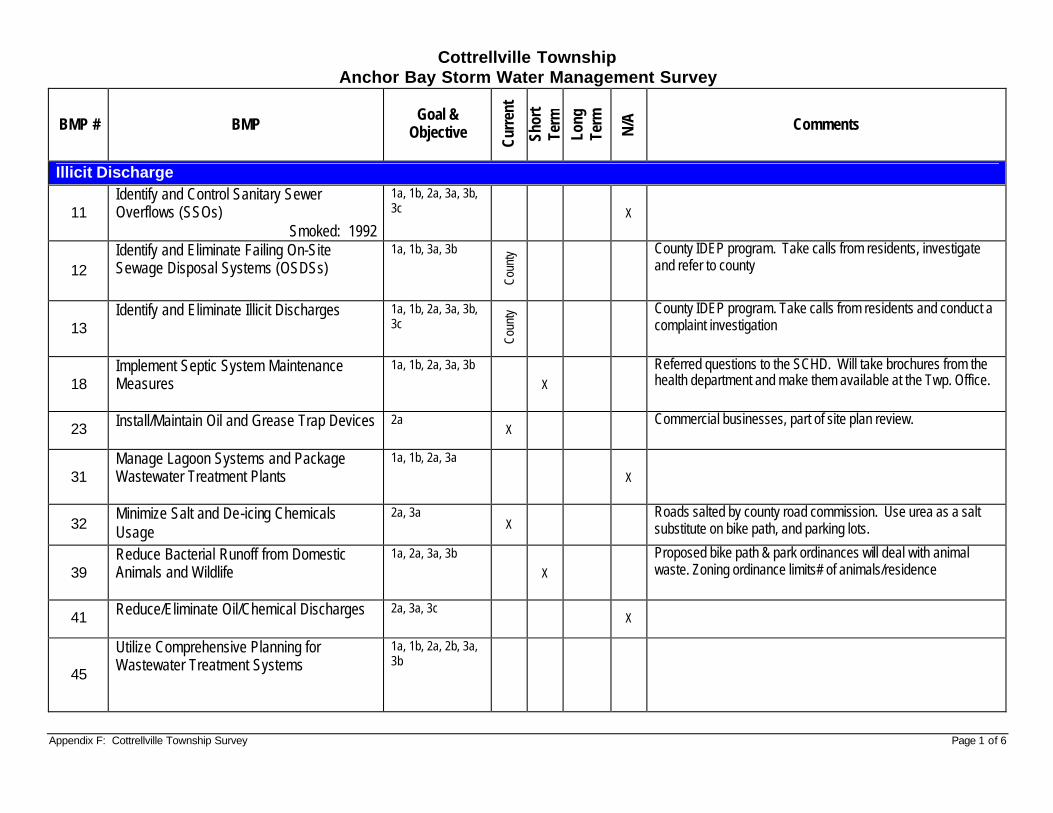
Appendix F: Cottrellville Township Survey Page 1 of 6
Cottrellville Township Anchor Bay Storm Water Management Survey
BMP # BMP Goal &
Objective
Curr
ent
Shor
t Te
rm
Long
Te
rm
N/A
Comments
Illicit Discharge
11 Identify and Control Sanitary Sewer Overflows (SSOs)
Smoked: 1992
1a, 1b, 2a, 3a, 3b, 3c X
12 Identify and Eliminate Failing On-Site Sewage Disposal Systems (OSDSs)
1a, 1b, 3a, 3b
Cou
nty
County IDEP program. Take calls from residents, investigate and refer to county
13 Identify and Eliminate Illicit Discharges
1a, 1b, 2a, 3a, 3b, 3c
Coun
ty
County IDEP program. Take calls from residents and conduct a complaint investigation
18 Implement Septic System Maintenance Measures
1a, 1b, 2a, 3a, 3b
X
Referred questions to the SCHD. Will take brochures from the health department and make them available at the Twp. Office.
23 Install/Maintain Oil and Grease Trap Devices
2a X
Commercial businesses, part of site plan review.
31 Manage Lagoon Systems and Package Wastewater Treatment Plants
1a, 1b, 2a, 3a
X
32 Minimize Salt and De-icing Chemicals Usage
2a, 3a X
Roads salted by county road commission. Use urea as a salt substitute on bike path, and parking lots.
39 Reduce Bacterial Runoff from Domestic Animals and Wildlife
1a, 2a, 3a, 3b
X
Proposed bike path & park ordinances will deal with animal waste. Zoning ordinance limits# of animals/residence
41 Reduce/Eliminate Oil/Chemical Discharges
2a, 3a, 3c X
45
Utilize Comprehensive Planning for Wastewater Treatment Systems
1a, 1b, 2a, 2b, 3a, 3b
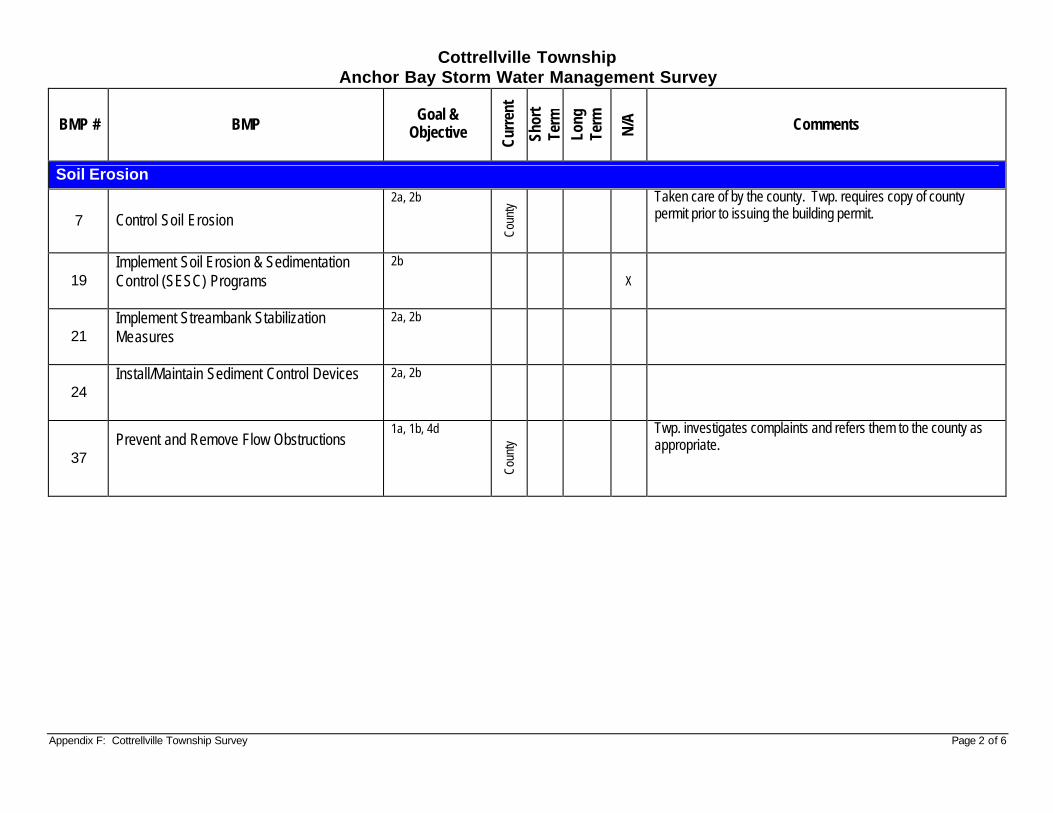
Appendix F: Cottrellville Township Survey Page 2 of 6
Cottrellville Township Anchor Bay Storm Water Management Survey
BMP # BMP Goal &
Objective
Curr
ent
Shor
t Te
rm
Long
Te
rm
N/A
Comments
Soil Erosion
7 Control Soil Erosion 2a, 2b
Coun
ty
Taken care of by the county. Twp. requires copy of county permit prior to issuing the building permit.
19 Implement Soil Erosion & Sedimentation Control (SESC) Programs
2b
X
21 Implement Streambank Stabilization Measures
2a, 2b
24 Install/Maintain Sediment Control Devices
2a, 2b
37 Prevent and Remove Flow Obstructions
1a, 1b, 4d
Coun
ty
Twp. investigates complaints and refers them to the county as appropriate.
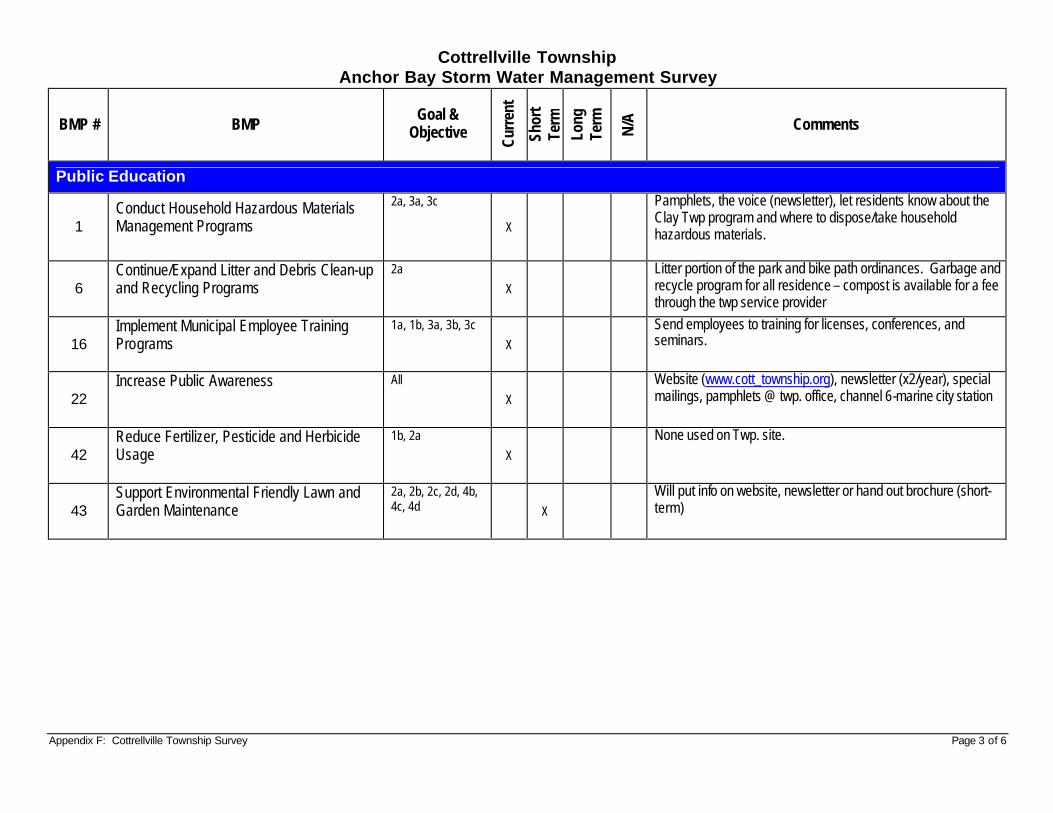
Appendix F: Cottrellville Township Survey Page 3 of 6
Cottrellville Township Anchor Bay Storm Water Management Survey
BMP # BMP Goal &
Objective
Curr
ent
Shor
t Te
rm
Long
Te
rm
N/A
Comments
Public Education
1 Conduct Household Hazardous Materials Management Programs
2a, 3a, 3c
X
Pamphlets, the voice (newsletter), let residents know about the Clay Twp program and where to dispose/take household hazardous materials.
6 Continue/Expand Litter and Debris Clean-up and Recycling Programs
2a
X
Litter portion of the park and bike path ordinances. Garbage and recycle program for all residence – compost is available for a fee through the twp service provider
16 Implement Municipal Employee Training Programs
1a, 1b, 3a, 3b, 3c
X
Send employees to training for licenses, conferences, and seminars.
22 Increase Public Awareness
All
X
Website (www.cott_township.org), newsletter (x2/year), special mailings, pamphlets @ twp. office, channel 6-marine city station
42 Reduce Fertilizer, Pesticide and Herbicide Usage
1b, 2a
X
None used on Twp. site.
43 Support Environmental Friendly Lawn and Garden Maintenance
2a, 2b, 2c, 2d, 4b, 4c, 4d X
Will put info on website, newsletter or hand out brochure (short-term)
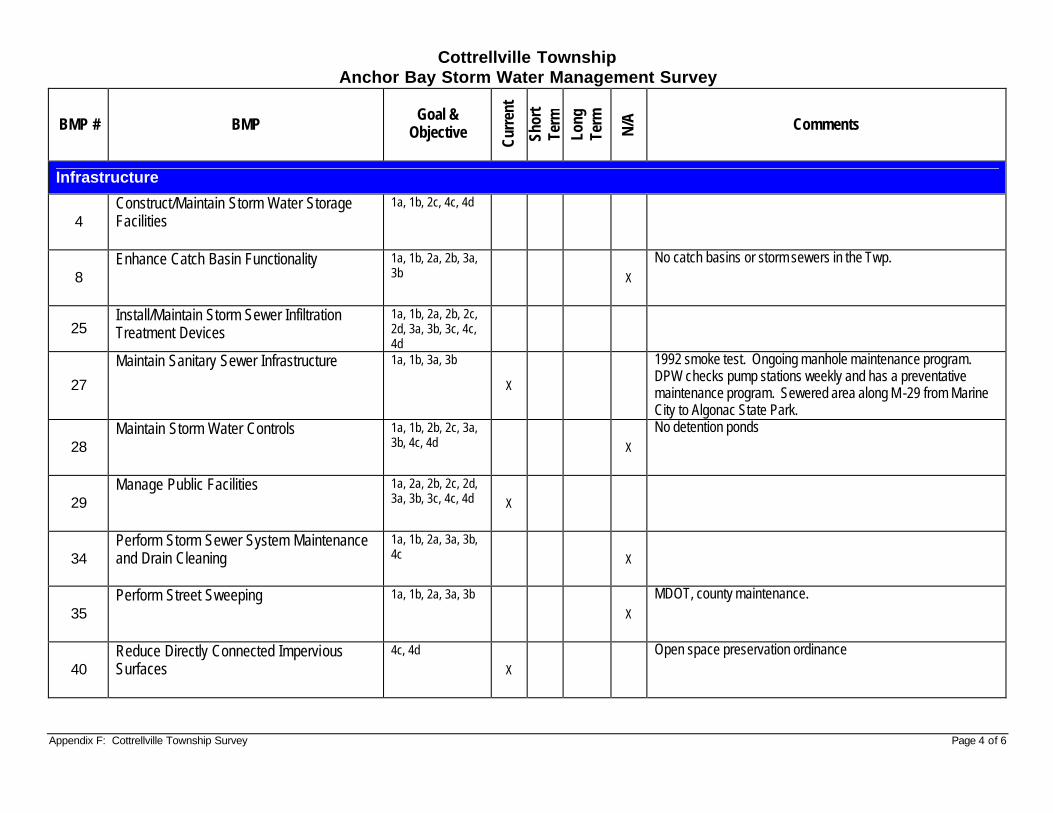
Appendix F: Cottrellville Township Survey Page 4 of 6
Cottrellville Township Anchor Bay Storm Water Management Survey
BMP # BMP Goal &
Objective
Curr
ent
Shor
t Te
rm
Long
Te
rm
N/A
Comments
Infrastructure
4 Construct/Maintain Storm Water Storage Facilities
1a, 1b, 2c, 4c, 4d
8 Enhance Catch Basin Functionality
1a, 1b, 2a, 2b, 3a, 3b X
No catch basins or storm sewers in the Twp.
25 Install/Maintain Storm Sewer Infiltration Treatment Devices
1a, 1b, 2a, 2b, 2c, 2d, 3a, 3b, 3c, 4c, 4d
27
Maintain Sanitary Sewer Infrastructure
1a, 1b, 3a, 3b
X
1992 smoke test. Ongoing manhole maintenance program. DPW checks pump stations weekly and has a preventative maintenance program. Sewered area along M -29 from Marine City to Algonac State Park.
28 Maintain Storm Water Controls
1a, 1b, 2b, 2c, 3a, 3b, 4c, 4d X
No detention ponds
29 Manage Public Facilities
1a, 2a, 2b, 2c, 2d, 3a, 3b, 3c, 4c, 4d X
34 Perform Storm Sewer System Maintenance and Drain Cleaning
1a, 1b, 2a, 3a, 3b, 4c X
35 Perform Street Sweeping
1a, 1b, 2a, 3a, 3b
X
MDOT, county maintenance.
40 Reduce Directly Connected Impervious Surfaces
4c, 4d
X
Open space preservation ordinance
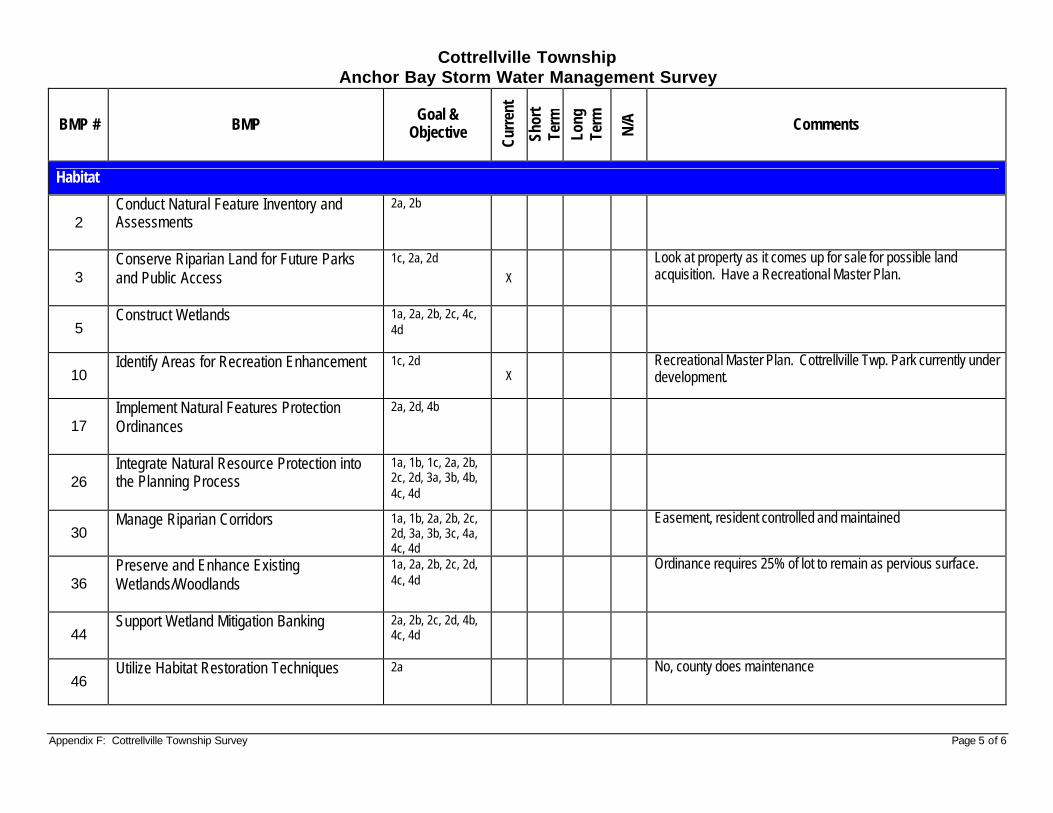
Appendix F: Cottrellville Township Survey Page 5 of 6
Cottrellville Township Anchor Bay Storm Water Management Survey
BMP # BMP Goal &
Objective
Curr
ent
Shor
t Te
rm
Long
Te
rm
N/A
Comments
Habitat
2 Conduct Natural Feature Inventory and Assessments
2a, 2b
3 Conserve Riparian Land for Future Parks and Public Access
1c, 2a, 2d
X
Look at property as it comes up for sale for possible land acquisition. Have a Recreational Master Plan.
5 Construct Wetlands
1a, 2a, 2b, 2c, 4c, 4d
10 Identify Areas for Recreation Enhancement
1c, 2d X
Recreational Master Plan. Cottrellville Twp. Park currently under development.
17 Implement Natural Features Protection Ordinances
2a, 2d, 4b
26 Integrate Natural Resource Protection into the Planning Process
1a, 1b, 1c, 2a, 2b, 2c, 2d, 3a, 3b, 4b, 4c, 4d
30 Manage Riparian Corridors
1a, 1b, 2a, 2b, 2c, 2d, 3a, 3b, 3c, 4a, 4c, 4d
Easement, resident controlled and maintained
36 Preserve and Enhance Existing Wetlands/Woodlands
1a, 2a, 2b, 2c, 2d, 4c, 4d
Ordinance requires 25% of lot to remain as pervious surface.
44 Support Wetland Mitigation Banking
2a, 2b, 2c, 2d, 4b, 4c, 4d
46 Utilize Habitat Restoration Techniques
2a
No, county does maintenance
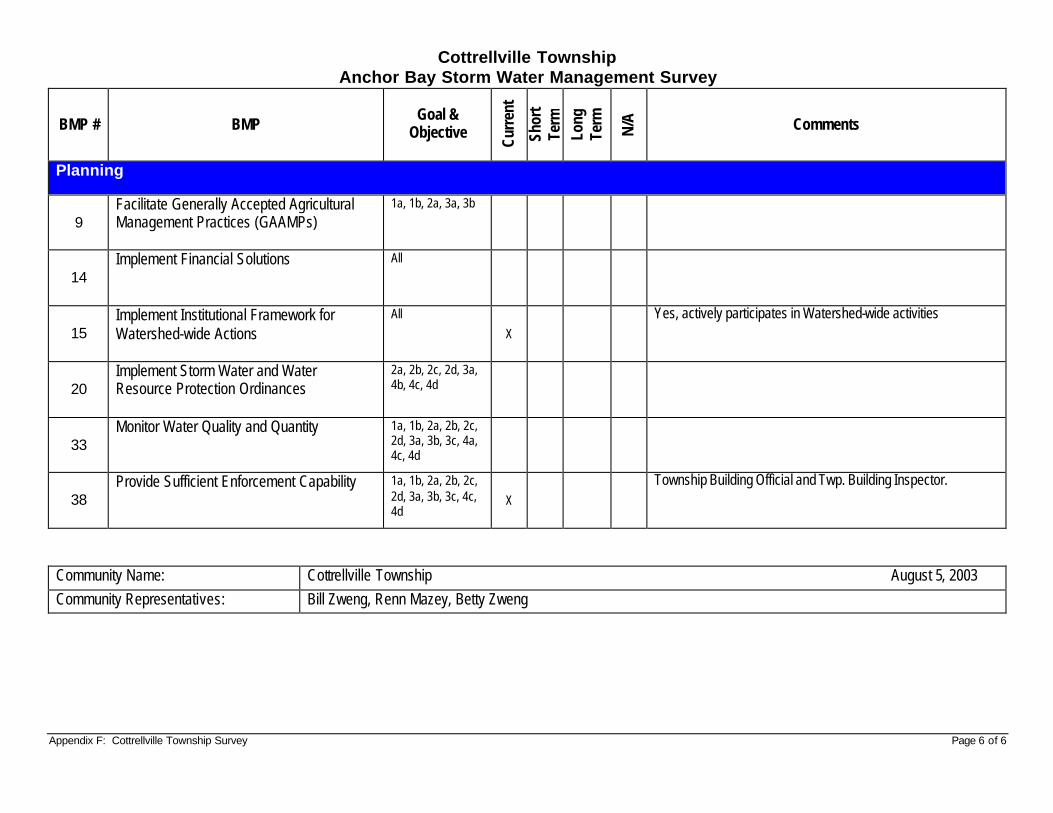
Appendix F: Cottrellville Township Survey Page 6 of 6
Cottrellville Township Anchor Bay Storm Water Management Survey
BMP # BMP Goal &
Objective
Curr
ent
Shor
t Te
rm
Long
Te
rm
N/A
Comments
Planning
9 Facilitate Generally Accepted Agricultural Management Practices (GAAMPs)
1a, 1b, 2a, 3a, 3b
14 Implement Financial Solutions
All
15 Implement Institutional Framework for Watershed-wide Actions
All
X
Yes, actively participates in Watershed-wide activities
20 Implement Storm Water and Water Resource Protection Ordinances
2a, 2b, 2c, 2d, 3a, 4b, 4c, 4d
33 Monitor Water Quality and Quantity
1a, 1b, 2a, 2b, 2c, 2d, 3a, 3b, 3c, 4a, 4c, 4d
38 Provide Sufficient Enforcement Capability
1a, 1b, 2a, 2b, 2c, 2d, 3a, 3b, 3c, 4c, 4d
X
Township Building Official and Twp. Building Inspector.
Community Name: Cottrellville Township August 5, 2003 Community Representatives: Bill Zweng, Renn Mazey, Betty Zweng
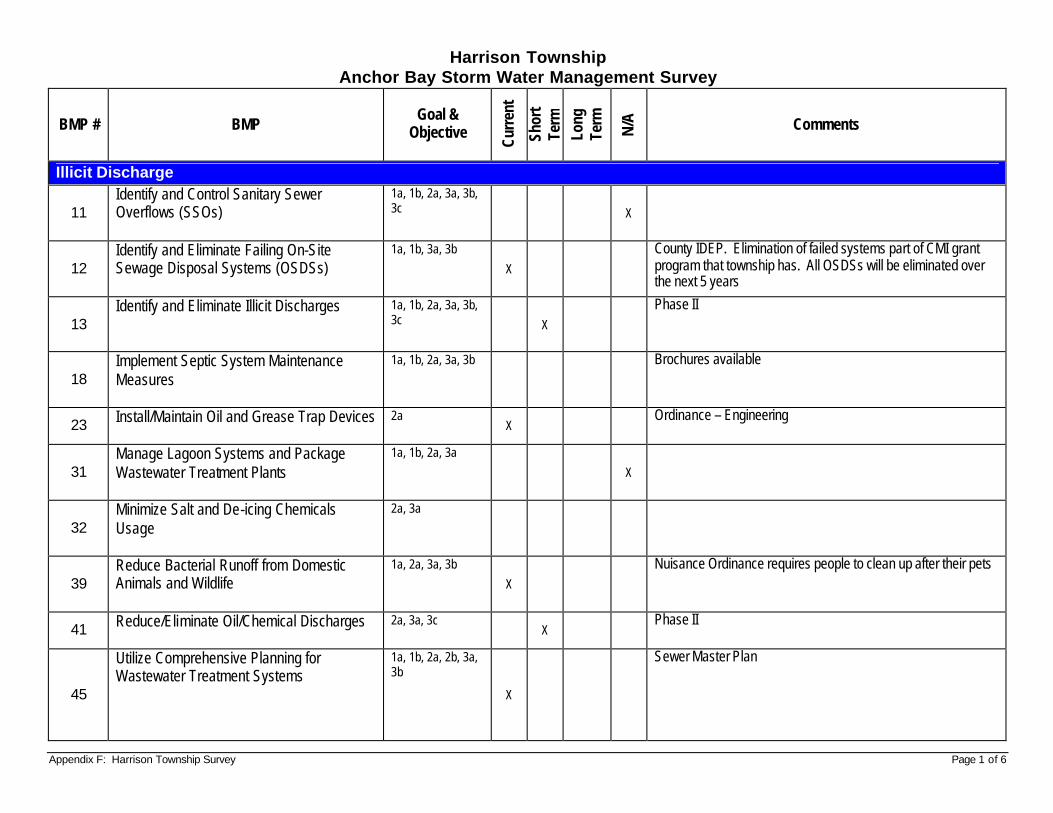
Appendix F: Harrison Township Survey Page 1 of 6
Harrison Township Anchor Bay Storm Water Management Survey
BMP # BMP Goal &
Objective
Curr
ent
Shor
t Te
rm
Long
Te
rm
N/A
Comments
Illicit Discharge
11 Identify and Control Sanitary Sewer Overflows (SSOs)
1a, 1b, 2a, 3a, 3b, 3c X
12 Identify and Eliminate Failing On-Site Sewage Disposal Systems (OSDSs)
1a, 1b, 3a, 3b
X
County IDEP. Elimination of failed systems part of CMI grant program that township has. All OSDSs will be eliminated over the next 5 years
13 Identify and Eliminate Illicit Discharges
1a, 1b, 2a, 3a, 3b, 3c X
Phase II
18 Implement Septic System Maintenance Measures
1a, 1b, 2a, 3a, 3b
Brochures available
23 Install/Maintain Oil and Grease Trap Devices
2a X
Ordinance – Engineering
31 Manage Lagoon Systems and Package Wastewater Treatment Plants
1a, 1b, 2a, 3a
X
32 Minimize Salt and De-icing Chemicals Usage
2a, 3a
39 Reduce Bacterial Runoff from Domestic Animals and Wildlife
1a, 2a, 3a, 3b
X
Nuisance Ordinance requires people to clean up after their pets
41 Reduce/Eliminate Oil/Chemical Discharges
2a, 3a, 3c X
Phase II
45
Utilize Comprehensive Planning for Wastewater Treatment Systems
1a, 1b, 2a, 2b, 3a, 3b
X
Sewer Master Plan
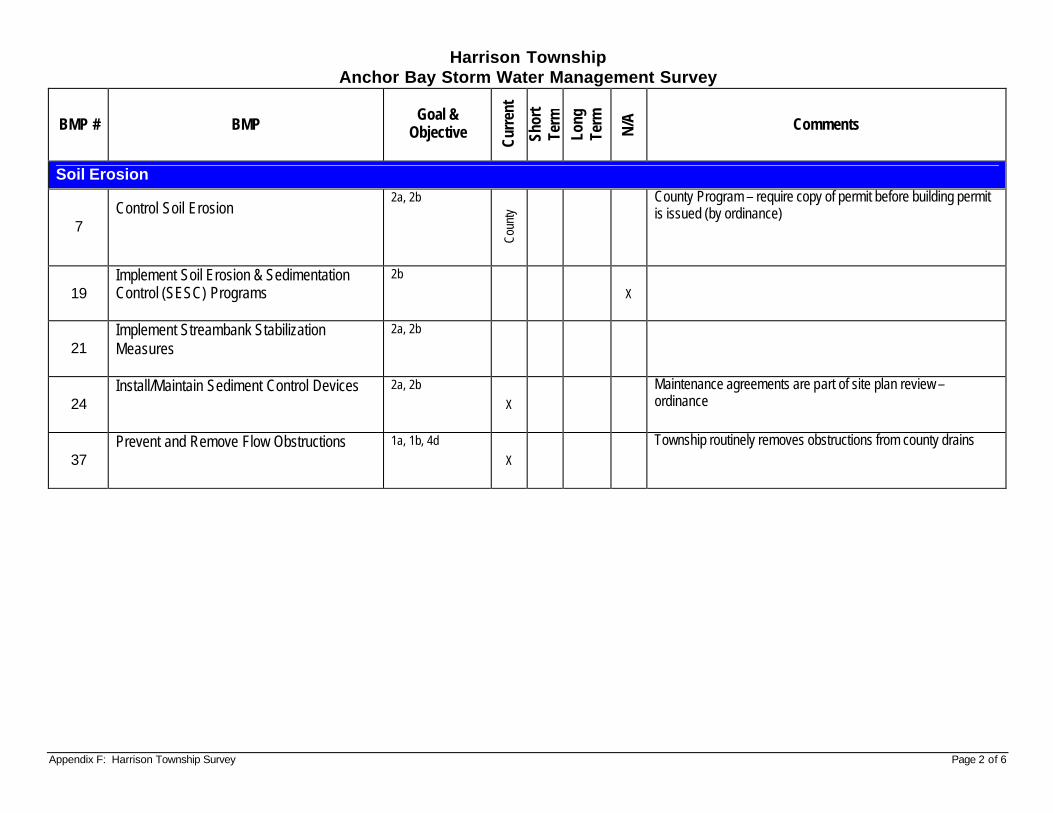
Appendix F: Harrison Township Survey Page 2 of 6
Harrison Township Anchor Bay Storm Water Management Survey
BMP # BMP Goal &
Objective
Curr
ent
Shor
t Te
rm
Long
Te
rm
N/A
Comments
Soil Erosion
7 Control Soil Erosion
2a, 2b
Coun
ty
County Program – require copy of permit before building permit is issued (by ordinance)
19 Implement Soil Erosion & Sedimentation Control (SESC) Programs
2b
X
21 Implement Streambank Stabilization Measures
2a, 2b
24 Install/Maintain Sediment Control Devices
2a, 2b
X
Maintenance agreements are part of site plan review – ordinance
37 Prevent and Remove Flow Obstructions
1a, 1b, 4d
X
Township routinely removes obstructions from county drains
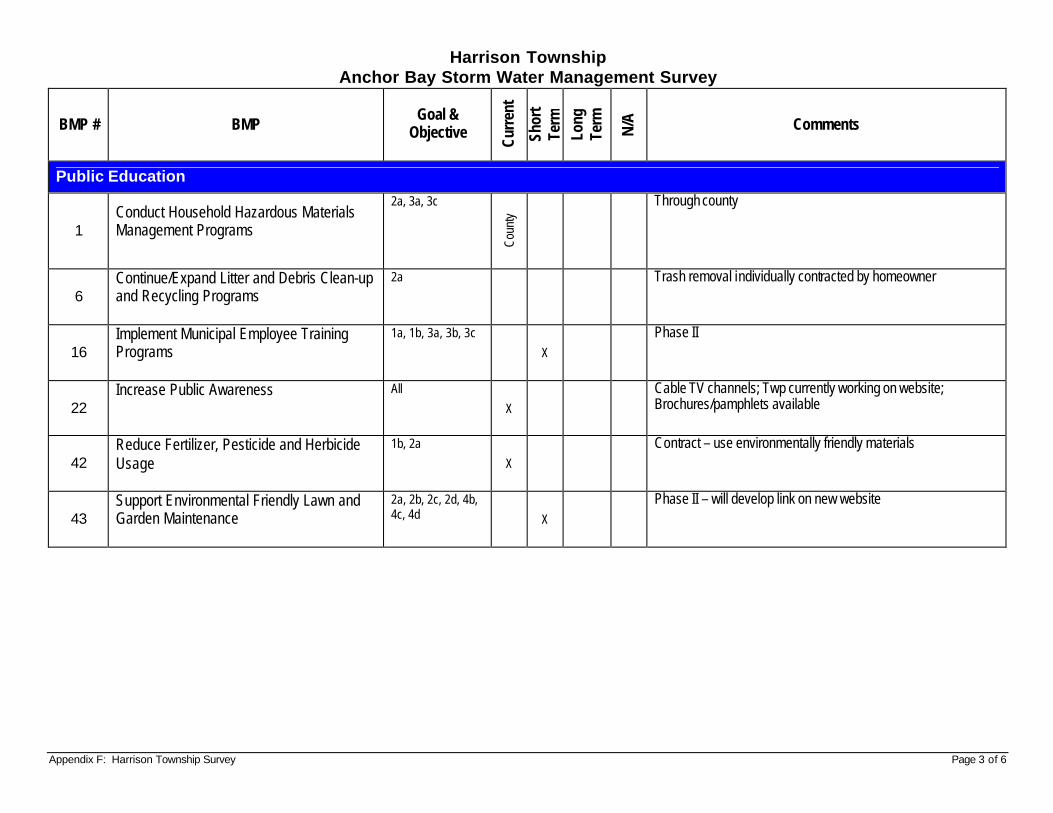
Appendix F: Harrison Township Survey Page 3 of 6
Harrison Township Anchor Bay Storm Water Management Survey
BMP # BMP Goal &
Objective
Curr
ent
Shor
t Te
rm
Long
Te
rm
N/A
Comments
Public Education
1 Conduct Household Hazardous Materials Management Programs
2a, 3a, 3c
Coun
ty
Through county
6 Continue/Expand Litter and Debris Clean-up and Recycling Programs
2a
Trash removal individually contracted by homeowner
16 Implement Municipal Employee Training Programs
1a, 1b, 3a, 3b, 3c
X
Phase II
22 Increase Public Awareness
All
X
Cable TV channels; Twp currently working on website; Brochures/pamphlets available
42 Reduce Fertilizer, Pesticide and Herbicide Usage
1b, 2a
X
Contract – use environmentally friendly materials
43 Support Environmental Friendly Lawn and Garden Maintenance
2a, 2b, 2c, 2d, 4b, 4c, 4d X
Phase II – will develop link on new website
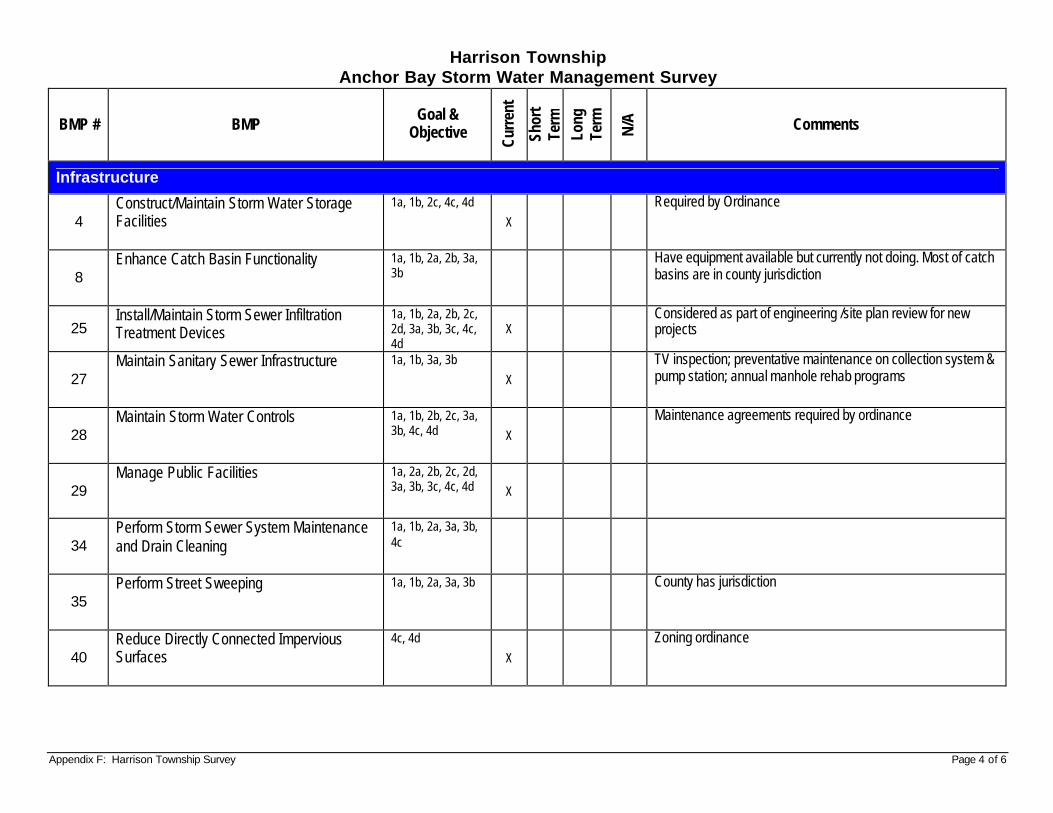
Appendix F: Harrison Township Survey Page 4 of 6
Harrison Township Anchor Bay Storm Water Management Survey
BMP # BMP Goal &
Objective
Curr
ent
Shor
t Te
rm
Long
Te
rm
N/A
Comments
Infrastructure
4 Construct/Maintain Storm Water Storage Facilities
1a, 1b, 2c, 4c, 4d
X
Required by Ordinance
8 Enhance Catch Basin Functionality
1a, 1b, 2a, 2b, 3a, 3b
Have equipment available but currently not doing. Most of catch basins are in county jurisdiction
25 Install/Maintain Storm Sewer Infiltration Treatment Devices
1a, 1b, 2a, 2b, 2c, 2d, 3a, 3b, 3c, 4c, 4d
X Considered as part of engineering /site plan review for new projects
27 Maintain Sanitary Sewer Infrastructure
1a, 1b, 3a, 3b
X
TV inspection; preventative maintenance on collection system & pump station; annual manhole rehab programs
28 Maintain Storm Water Controls
1a, 1b, 2b, 2c, 3a, 3b, 4c, 4d X
Maintenance agreements required by ordinance
29 Manage Public Facilities
1a, 2a, 2b, 2c, 2d, 3a, 3b, 3c, 4c, 4d X
34 Perform Storm Sewer System Maintenance and Drain Cleaning
1a, 1b, 2a, 3a, 3b, 4c
35 Perform Street Sweeping
1a, 1b, 2a, 3a, 3b
County has jurisdiction
40 Reduce Directly Connected Impervious Surfaces
4c, 4d
X
Zoning ordinance
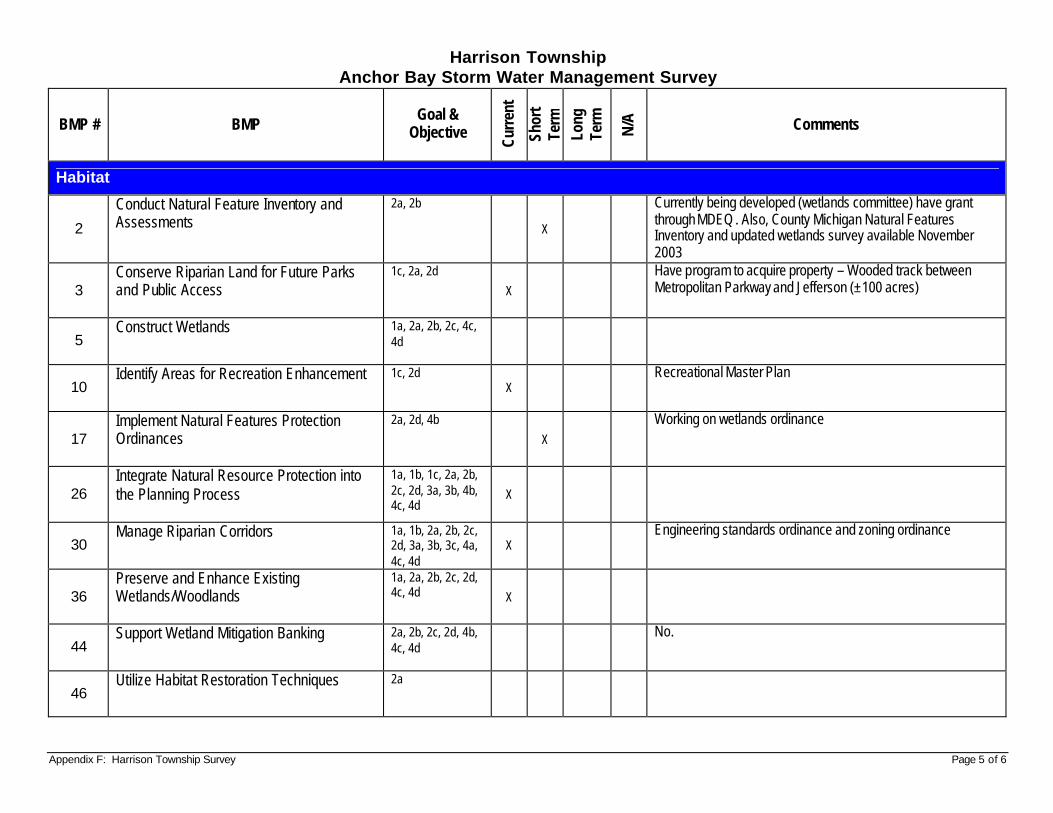
Appendix F: Harrison Township Survey Page 5 of 6
Harrison Township Anchor Bay Storm Water Management Survey
BMP # BMP Goal &
Objective
Curr
ent
Shor
t Te
rm
Long
Te
rm
N/A
Comments
Habitat
2
Conduct Natural Feature Inventory and Assessments
2a, 2b
X
Currently being developed (wetlands committee) have grant through MDEQ . Also, County Michigan Natural Features Inventory and updated wetlands survey available November 2003
3 Conserve Riparian Land for Future Parks and Public Access
1c, 2a, 2d
X
Have program to acquire property – Wooded track between Metropolitan Parkway and Jefferson (±100 acres)
5 Construct Wetlands
1a, 2a, 2b, 2c, 4c, 4d
10 Identify Areas for Recreation Enhancement
1c, 2d X
Recreational Master Plan
17 Implement Natural Features Protection Ordinances
2a, 2d, 4b
X
Working on wetlands ordinance
26 Integrate Natural Resource Protection into the Planning Process
1a, 1b, 1c, 2a, 2b, 2c, 2d, 3a, 3b, 4b, 4c, 4d
X
30 Manage Riparian Corridors
1a, 1b, 2a, 2b, 2c, 2d, 3a, 3b, 3c, 4a, 4c, 4d
X Engineering standards ordinance and zoning ordinance
36 Preserve and Enhance Existing Wetlands/Woodlands
1a, 2a, 2b, 2c, 2d, 4c, 4d X
44 Support Wetland Mitigation Banking
2a, 2b, 2c, 2d, 4b, 4c, 4d
No.
46 Utilize Habitat Restoration Techniques
2a
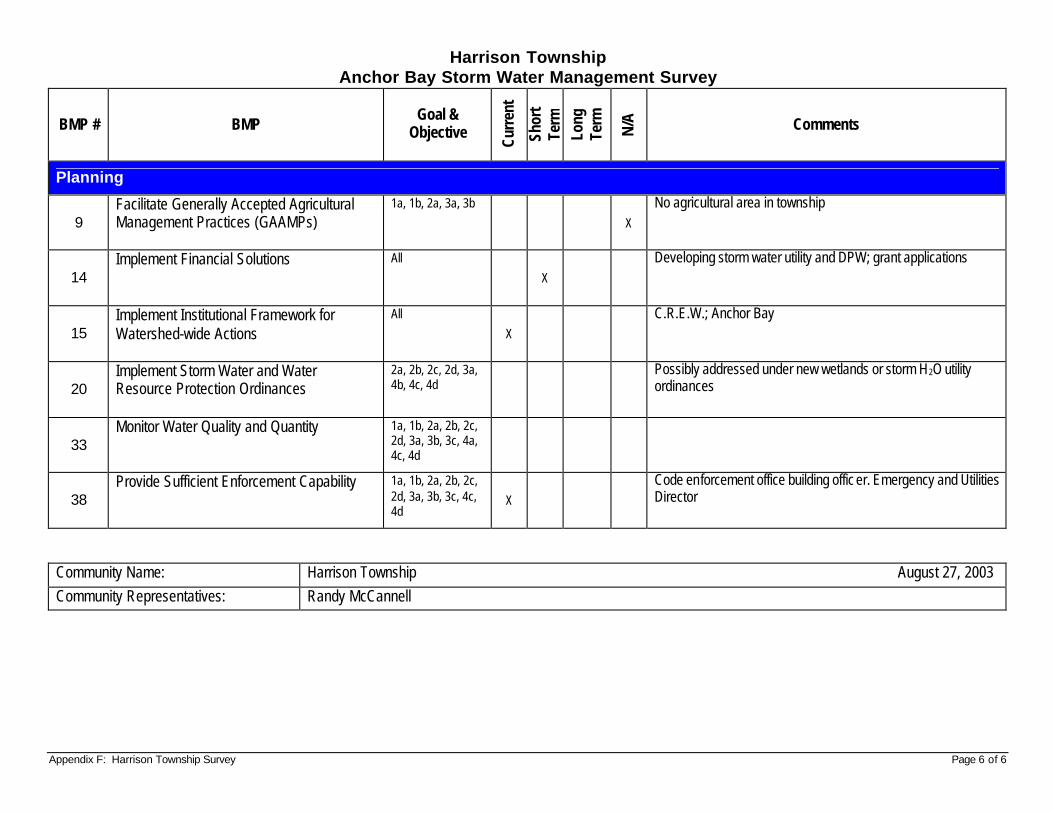
Appendix F: Harrison Township Survey Page 6 of 6
Harrison Township Anchor Bay Storm Water Management Survey
BMP # BMP Goal &
Objective
Curr
ent
Shor
t Te
rm
Long
Te
rm
N/A
Comments
Planning
9 Facilitate Generally Accepted Agricultural Management Practices (GAAMPs)
1a, 1b, 2a, 3a, 3b
X
No agricultural area in township
14 Implement Financial Solutions
All
X
Developing storm water utility and DPW; grant applications
15 Implement Institutional Framework for Watershed-wide Actions
All
X
C.R.E.W.; Anchor Bay
20 Implement Storm Water and Water Resource Protection Ordinances
2a, 2b, 2c, 2d, 3a, 4b, 4c, 4d
Possibly addressed under new wetlands or storm H2O utility ordinances
33 Monitor Water Quality and Quantity
1a, 1b, 2a, 2b, 2c, 2d, 3a, 3b, 3c, 4a, 4c, 4d
38 Provide Sufficient Enforcement Capability
1a, 1b, 2a, 2b, 2c, 2d, 3a, 3b, 3c, 4c, 4d
X
Code enforcement office building offic er. Emergency and Utilities Director
Community Name: Harrison Township August 27, 2003 Community Representatives: Randy McCannell
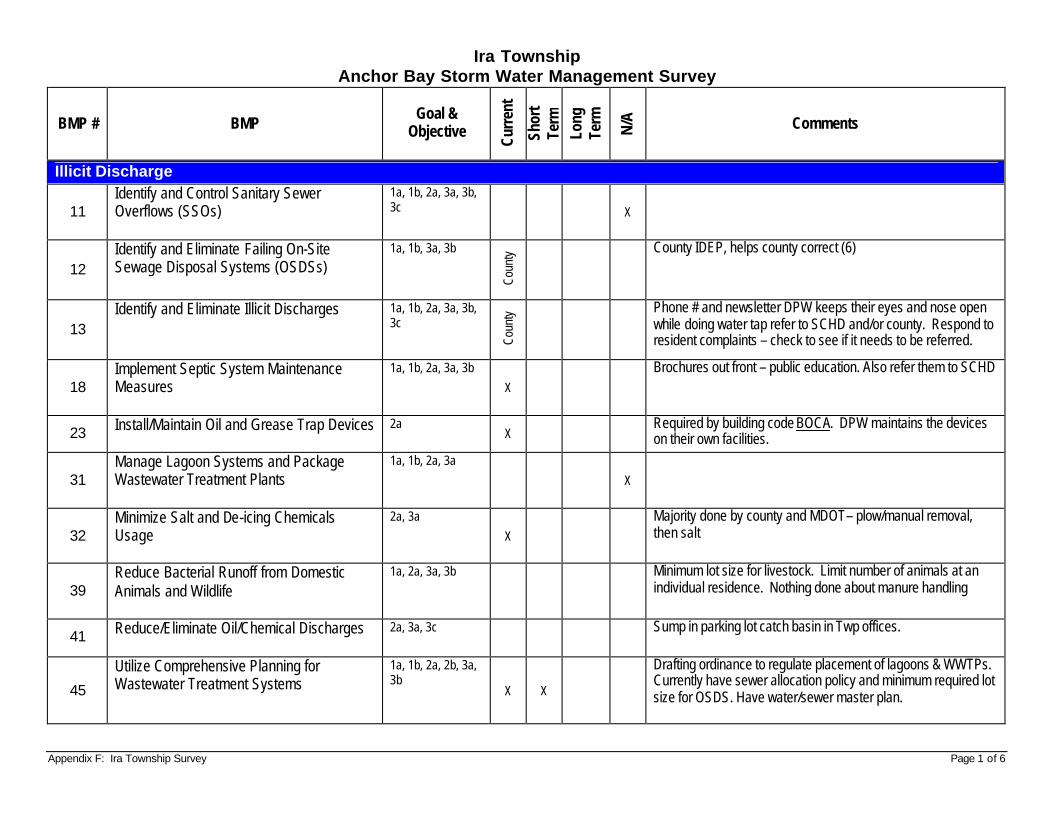
Appendix F: Ira Township Survey Page 1 of 6
Ira Township Anchor Bay Storm Water Management Survey
BMP # BMP Goal &
Objective
Curr
ent
Shor
t Te
rm
Long
Te
rm
N/A
Comments
Illicit Discharge
11 Identify and Control Sanitary Sewer Overflows (SSOs)
1a, 1b, 2a, 3a, 3b, 3c X
12 Identify and Eliminate Failing On-Site Sewage Disposal Systems (OSDSs)
1a, 1b, 3a, 3b
Coun
ty
County IDEP, helps county correct (6)
13 Identify and Eliminate Illicit Discharges
1a, 1b, 2a, 3a, 3b, 3c
Coun
ty
Phone # and newsletter DPW keeps their eyes and nose open while doing water tap refer to SCHD and/or county. Respond to resident complaints – check to see if it needs to be referred.
18 Implement Septic System Maintenance Measures
1a, 1b, 2a, 3a, 3b
X
Brochures out front – public education. Also refer them to SCHD
23 Install/Maintain Oil and Grease Trap Devices
2a X
Required by building code BOCA. DPW maintains the devices on their own facilities.
31 Manage Lagoon Systems and Package Wastewater Treatment Plants
1a, 1b, 2a, 3a
X
32 Minimize Salt and De-icing Chemicals Usage
2a, 3a
X
Majority done by county and MDOT – plow/manual removal, then salt
39 Reduce Bacterial Runoff from Domestic Animals and Wildlife
1a, 2a, 3a, 3b
Minimum lot size for livestock. Limit number of animals at an individual residence. Nothing done about manure handling
41 Reduce/Eliminate Oil/Chemical Discharges
2a, 3a, 3c
Sump in parking lot catch basin in Twp offices.
45
Utilize Comprehensive Planning for Wastewater Treatment Systems
1a, 1b, 2a, 2b, 3a, 3b
X X
Drafting ordinance to regulate placement of lagoons & WWTPs. Currently have sewer allocation policy and minimum required lot size for OSDS. Have water/sewer master plan.
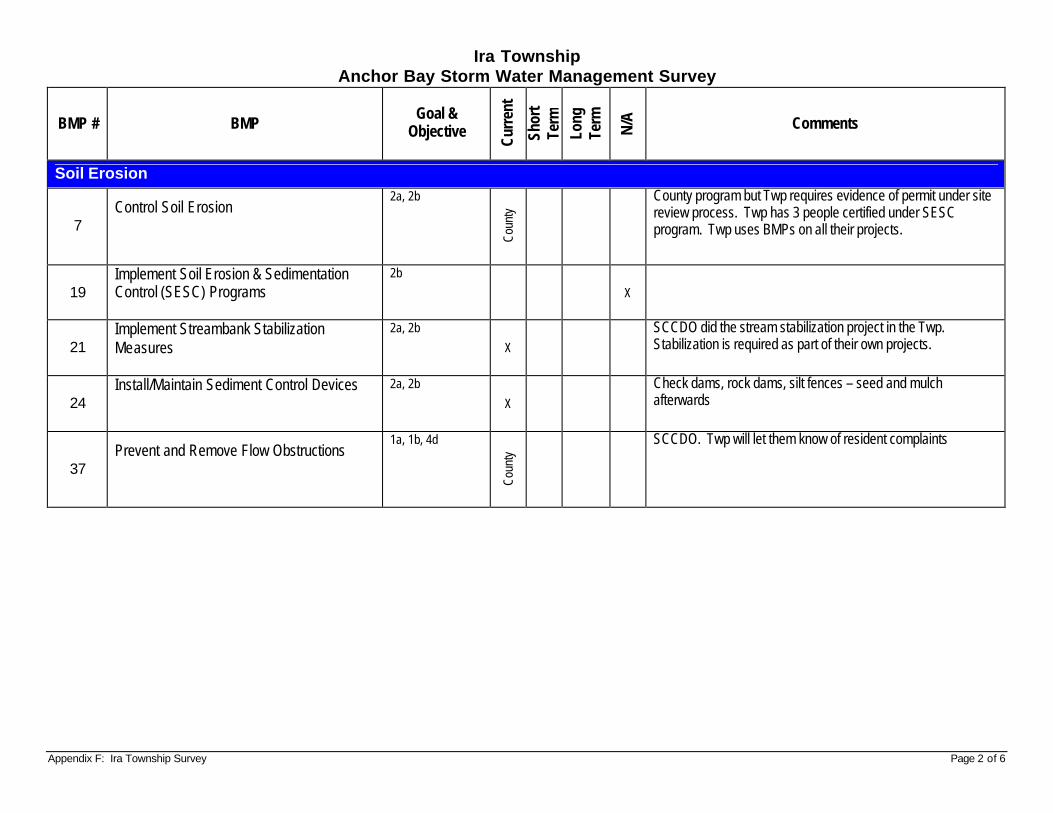
Appendix F: Ira Township Survey Page 2 of 6
Ira Township Anchor Bay Storm Water Management Survey
BMP # BMP Goal &
Objective
Curr
ent
Shor
t Te
rm
Long
Te
rm
N/A
Comments
Soil Erosion
7 Control Soil Erosion
2a, 2b
Coun
ty
County program but Twp requires evidence of permit under site review process. Twp has 3 people certified under SESC program. Twp uses BMPs on all their projects.
19 Implement Soil Erosion & Sedimentation Control (SESC) Programs
2b
X
21 Implement Streambank Stabilization Measures
2a, 2b
X
SCCDO did the stream stabilization project in the Twp. Stabilization is required as part of their own projects.
24 Install/Maintain Sediment Control Devices
2a, 2b
X
Check dams, rock dams, silt fences – seed and mulch afterwards
37 Prevent and Remove Flow Obstructions
1a, 1b, 4d
Coun
ty
SCCDO. Twp will let them know of resident complaints
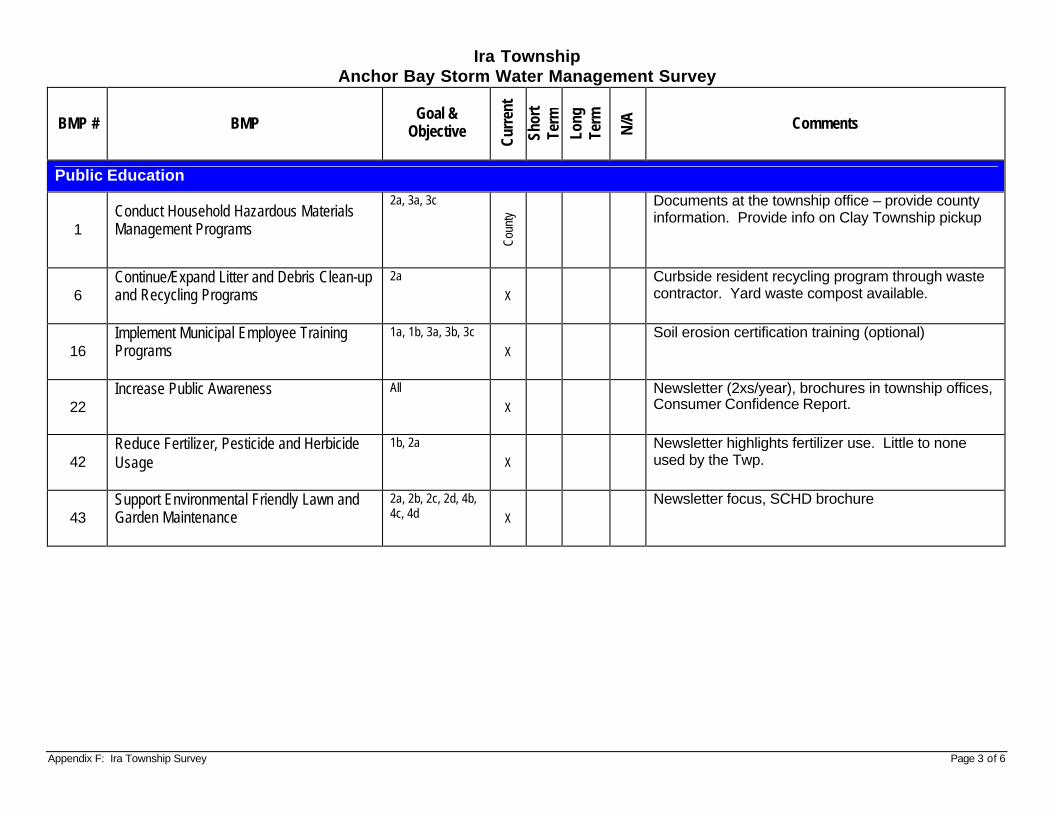
Appendix F: Ira Township Survey Page 3 of 6
Ira Township Anchor Bay Storm Water Management Survey
BMP # BMP Goal &
Objective
Curr
ent
Shor
t Te
rm
Long
Te
rm
N/A
Comments
Public Education
1 Conduct Household Hazardous Materials Management Programs
2a, 3a, 3c
Coun
ty
Documents at the township office – provide county information. Provide info on Clay Township pickup
6 Continue/Expand Litter and Debris Clean-up and Recycling Programs
2a
X Curbside resident recycling program through waste contractor. Yard waste compost available.
16 Implement Municipal Employee Training Programs
1a, 1b, 3a, 3b, 3c
X Soil erosion certification training (optional)
22 Increase Public Awareness
All
X Newsletter (2xs/year), brochures in township offices, Consumer Confidence Report.
42 Reduce Fertilizer, Pesticide and Herbicide Usage
1b, 2a
X Newsletter highlights fertilizer use. Little to none used by the Twp.
43 Support Environmental Friendly Lawn and Garden Maintenance
2a, 2b, 2c, 2d, 4b, 4c, 4d X
Newsletter focus, SCHD brochure
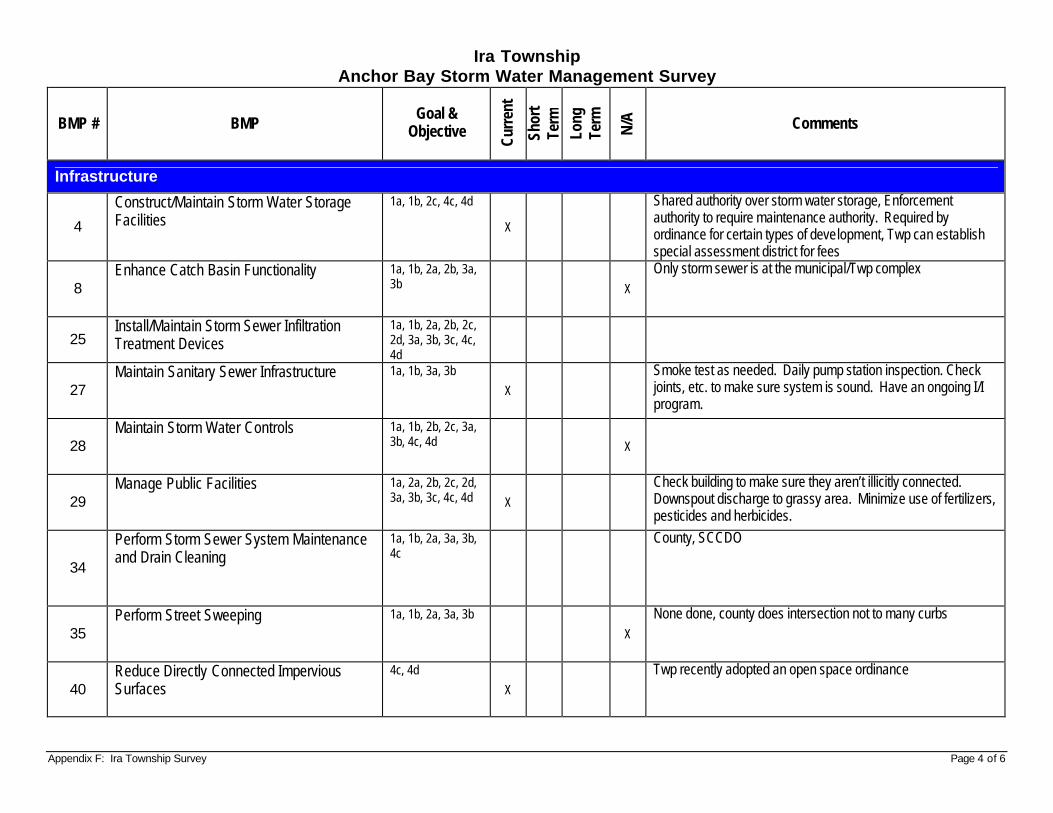
Appendix F: Ira Township Survey Page 4 of 6
Ira Township Anchor Bay Storm Water Management Survey
BMP # BMP Goal &
Objective
Curr
ent
Shor
t Te
rm
Long
Te
rm
N/A
Comments
Infrastructure
4
Construct/Maintain Storm Water Storage Facilities
1a, 1b, 2c, 4c, 4d
X
Shared authority over storm water storage, Enforcement authority to require maintenance authority. Required by ordinance for certain types of development, Twp can establish special assessment district for fees
8 Enhance Catch Basin Functionality
1a, 1b, 2a, 2b, 3a, 3b X
Only storm sewer is at the municipal/Twp complex
25 Install/Maintain Storm Sewer Infiltration Treatment Devices
1a, 1b, 2a, 2b, 2c, 2d, 3a, 3b, 3c, 4c, 4d
27 Maintain Sanitary Sewer Infrastructure
1a, 1b, 3a, 3b
X
Smoke test as needed. Daily pump station inspection. Check joints, etc. to make sure system is sound. Have an ongoing I/I program.
28 Maintain Storm Water Controls
1a, 1b, 2b, 2c, 3a, 3b, 4c, 4d X
29 Manage Public Facilities
1a, 2a, 2b, 2c, 2d, 3a, 3b, 3c, 4c, 4d X
Check building to make sure they aren’t illicitly connected. Downspout discharge to grassy area. Minimize use of fertilizers, pesticides and herbicides.
34
Perform Storm Sewer System Maintenance and Drain Cleaning
1a, 1b, 2a, 3a, 3b, 4c
County, SCCDO
35 Perform Street Sweeping
1a, 1b, 2a, 3a, 3b
X
None done, county does intersection not to many curbs
40 Reduce Directly Connected Impervious Surfaces
4c, 4d
X
Twp recently adopted an open space ordinance
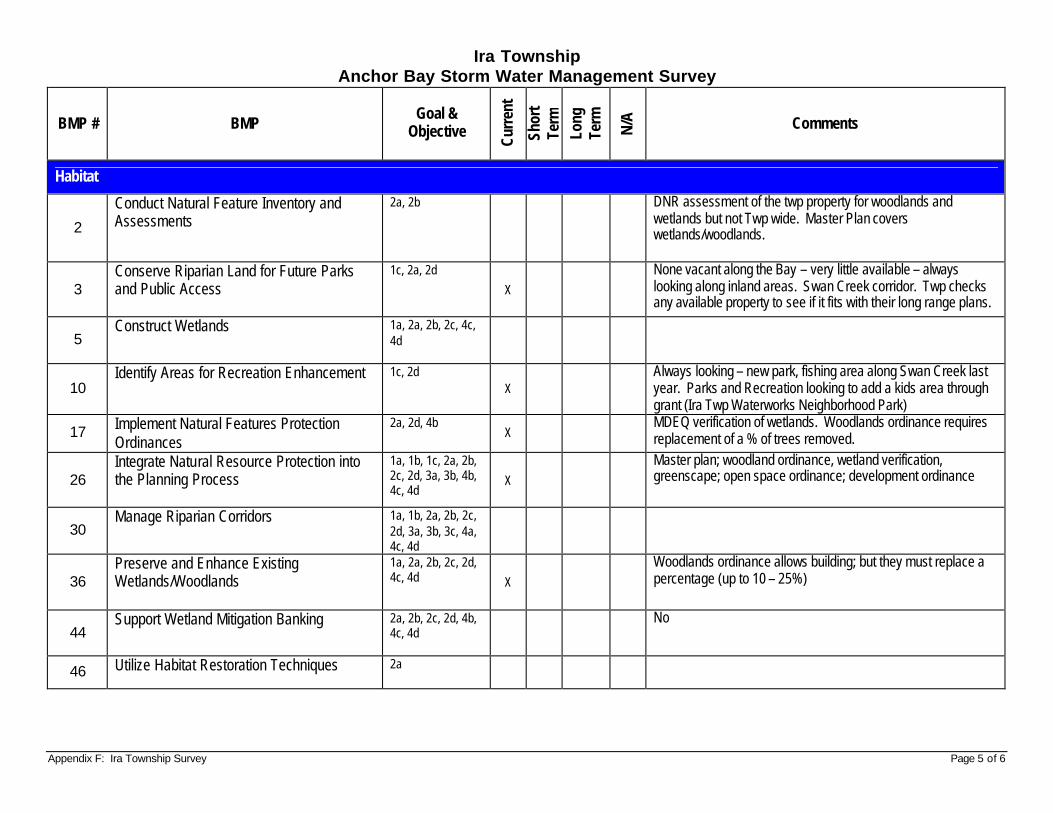
Appendix F: Ira Township Survey Page 5 of 6
Ira Township Anchor Bay Storm Water Management Survey
BMP # BMP Goal &
Objective
Curr
ent
Shor
t Te
rm
Long
Te
rm
N/A
Comments
Habitat
2
Conduct Natural Feature Inventory and Assessments
2a, 2b
DNR assessment of the twp property for woodlands and wetlands but not Twp wide. Master Plan covers wetlands/woodlands.
3 Conserve Riparian Land for Future Parks and Public Access
1c, 2a, 2d
X
None vacant along the Bay – very little available – always looking along inland areas. Swan Creek corridor. Twp checks any available property to see if it fits with their long range plans.
5 Construct Wetlands
1a, 2a, 2b, 2c, 4c, 4d
10 Identify Areas for Recreation Enhancement
1c, 2d X
Always looking – new park, fishing area along Swan Creek last year. Parks and Recreation looking to add a kids area through grant (Ira Twp Waterworks Neighborhood Park)
17 Implement Natural Features Protection Ordinances
2a, 2d, 4b X
MDEQ verification of wetlands. Woodlands ordinance requires replacement of a % of trees removed.
26 Integrate Natural Resource Protection into the Planning Process
1a, 1b, 1c, 2a, 2b, 2c, 2d, 3a, 3b, 4b, 4c, 4d
X
Master plan; woodland ordinance, wetland verification, greenscape; open space ordinance; development ordinance
30 Manage Riparian Corridors 1a, 1b, 2a, 2b, 2c,
2d, 3a, 3b, 3c, 4a, 4c, 4d
36 Preserve and Enhance Existing Wetlands/Woodlands
1a, 2a, 2b, 2c, 2d, 4c, 4d X
Woodlands ordinance allows building; but they must replace a percentage (up to 10 – 25%)
44 Support Wetland Mitigation Banking
2a, 2b, 2c, 2d, 4b, 4c, 4d
No
46 Utilize Habitat Restoration Techniques
2a
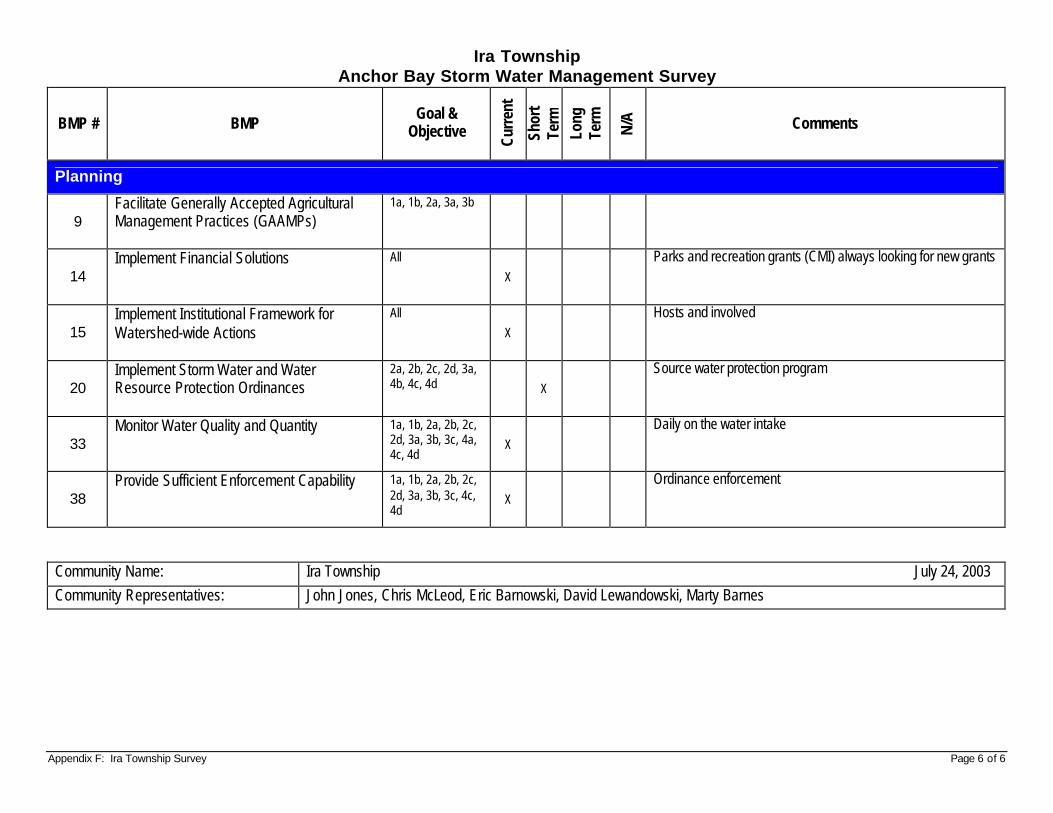
Appendix F: Ira Township Survey Page 6 of 6
Ira Township Anchor Bay Storm Water Management Survey
BMP # BMP Goal &
Objective
Curr
ent
Shor
t Te
rm
Long
Te
rm
N/A
Comments
Planning
9 Facilitate Generally Accepted Agricultural Management Practices (GAAMPs)
1a, 1b, 2a, 3a, 3b
14 Implement Financial Solutions
All
X
Parks and recreation grants (CMI) always looking for new grants
15 Implement Institutional Framework for Watershed-wide Actions
All
X
Hosts and involved
20 Implement Storm Water and Water Resource Protection Ordinances
2a, 2b, 2c, 2d, 3a, 4b, 4c, 4d X
Source water protection program
33 Monitor Water Quality and Quantity
1a, 1b, 2a, 2b, 2c, 2d, 3a, 3b, 3c, 4a, 4c, 4d
X
Daily on the water intake
38 Provide Sufficient Enforcement Capability
1a, 1b, 2a, 2b, 2c, 2d, 3a, 3b, 3c, 4c, 4d
X
Ordinance enforcement
Community Name: Ira Township July 24, 2003 Community Representatives: John Jones, Chris McLeod, Eric Barnowski, David Lewandowski, Marty Barnes
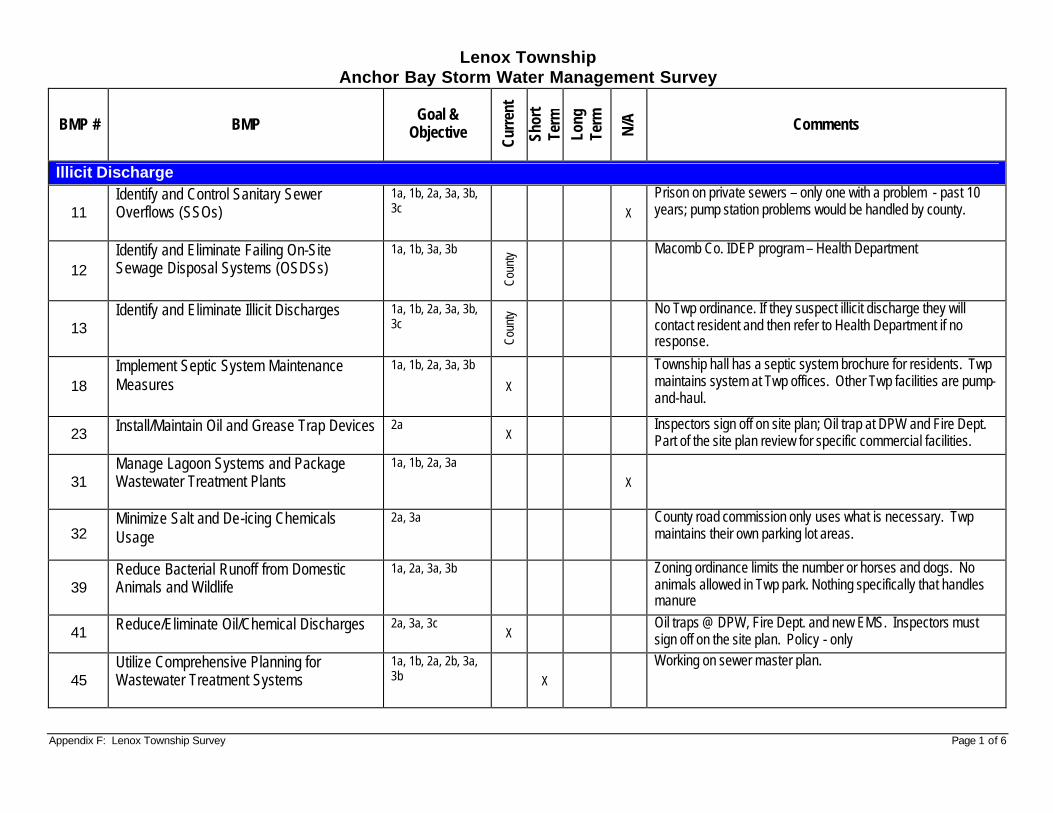
Appendix F: Lenox Township Survey Page 1 of 6
Lenox Township Anchor Bay Storm Water Management Survey
BMP # BMP Goal &
Objective
Curr
ent
Shor
t Te
rm
Long
Te
rm
N/A
Comments
Illicit Discharge
11 Identify and Control Sanitary Sewer Overflows (SSOs)
1a, 1b, 2a, 3a, 3b, 3c X
Prison on private sewers – only one with a problem - past 10 years; pump station problems would be handled by county.
12 Identify and Eliminate Failing On-Site Sewage Disposal Systems (OSDSs)
1a, 1b, 3a, 3b
Coun
ty
Macomb Co. IDEP program – Health Department
13 Identify and Eliminate Illicit Discharges
1a, 1b, 2a, 3a, 3b, 3c
Coun
ty
No Twp ordinance. If they suspect illicit discharge they will contact resident and then refer to Health Department if no response.
18 Implement Septic System Maintenance Measures
1a, 1b, 2a, 3a, 3b
X
Township hall has a septic system brochure for residents. Twp maintains system at Twp offices. Other Twp facilities are pump-and-haul.
23 Install/Maintain Oil and Grease Trap Devices
2a X
Inspectors sign off on site plan; Oil trap at DPW and Fire Dept. Part of the site plan review for specific commercial facilities.
31 Manage Lagoon Systems and Package Wastewater Treatment Plants
1a, 1b, 2a, 3a
X
32 Minimize Salt and De-icing Chemicals Usage
2a, 3a
County road commission only uses what is necessary. Twp maintains their own parking lot areas.
39 Reduce Bacterial Runoff from Domestic Animals and Wildlife
1a, 2a, 3a, 3b
Zoning ordinance limits the number or horses and dogs. No animals allowed in Twp park. Nothing specifically that handles manure
41 Reduce/Eliminate Oil/Chemical Discharges
2a, 3a, 3c X
Oil traps @ DPW, Fire Dept. and new EMS. Inspectors must sign off on the site plan. Policy - only
45 Utilize Comprehensive Planning for Wastewater Treatment Systems
1a, 1b, 2a, 2b, 3a, 3b
X
Working on sewer master plan.
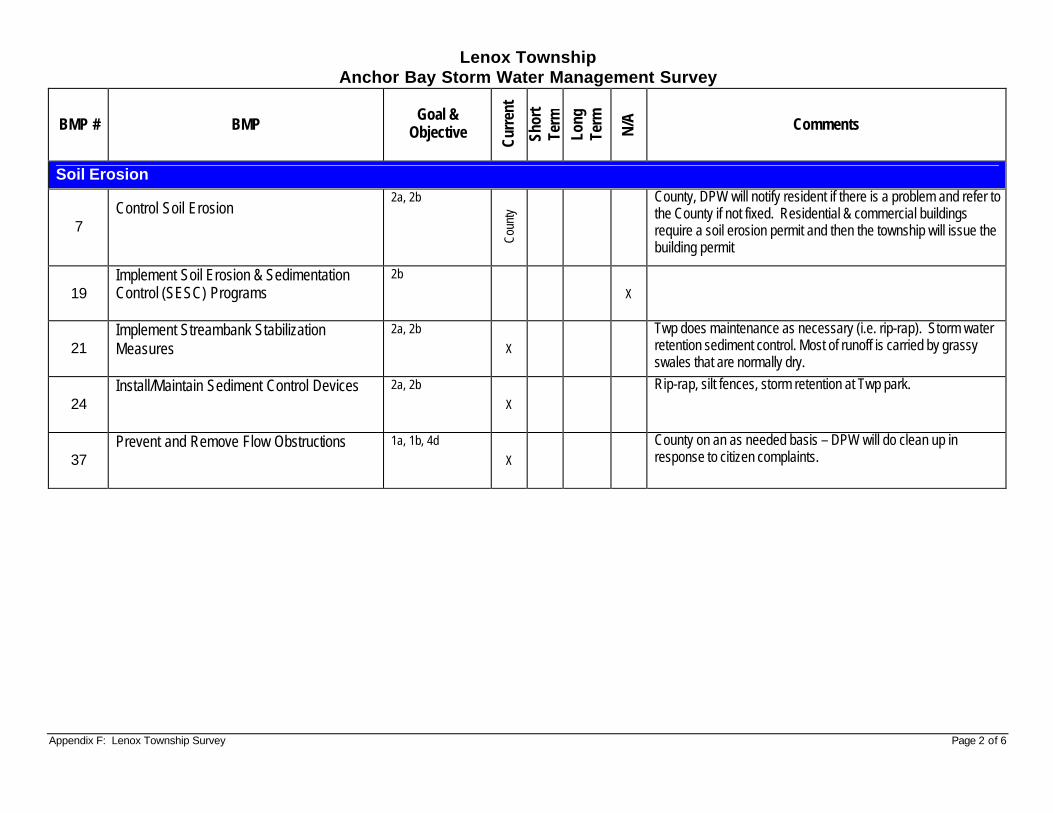
Appendix F: Lenox Township Survey Page 2 of 6
Lenox Township Anchor Bay Storm Water Management Survey
BMP # BMP Goal &
Objective
Curr
ent
Shor
t Te
rm
Long
Te
rm
N/A
Comments
Soil Erosion
7 Control Soil Erosion
2a, 2b
Coun
ty
County, DPW will notify resident if there is a problem and refer to the County if not fixed. Residential & commercial buildings require a soil erosion permit and then the township will issue the building permit
19 Implement Soil Erosion & Sedimentation Control (SESC) Programs
2b
X
21 Implement Streambank Stabilization Measures
2a, 2b
X
Twp does maintenance as necessary (i.e. rip-rap). Storm water retention sediment control. Most of runoff is carried by grassy swales that are normally dry.
24 Install/Maintain Sediment Control Devices
2a, 2b
X
Rip-rap, silt fences, storm retention at Twp park.
37 Prevent and Remove Flow Obstructions
1a, 1b, 4d
X
County on an as needed basis – DPW will do clean up in response to citizen complaints.
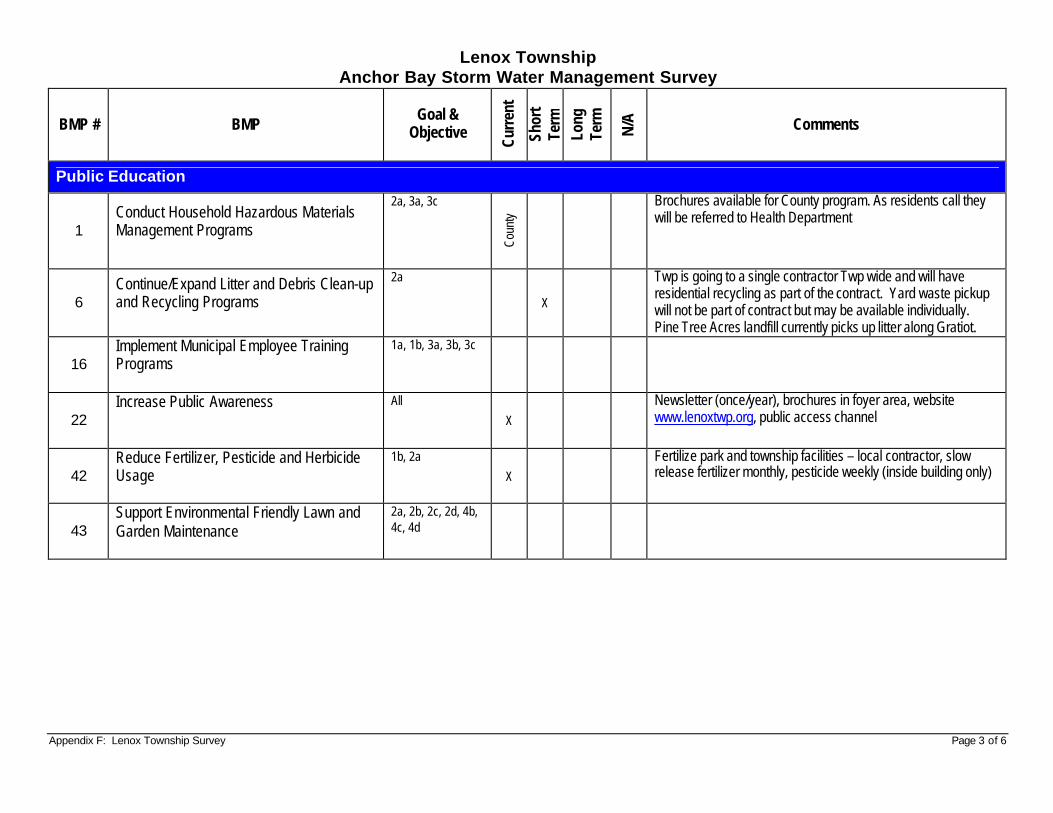
Appendix F: Lenox Township Survey Page 3 of 6
Lenox Township Anchor Bay Storm Water Management Survey
BMP # BMP Goal &
Objective
Curr
ent
Shor
t Te
rm
Long
Te
rm
N/A
Comments
Public Education
1 Conduct Household Hazardous Materials Management Programs
2a, 3a, 3c
Coun
ty
Brochures available for County program. As residents call they will be referred to Health Department
6 Continue/Expand Litter and Debris Clean-up and Recycling Programs
2a
X
Twp is going to a single contractor Twp wide and will have residential recycling as part of the contract. Yard waste pickup will not be part of contract but may be available individually. Pine Tree Acres landfill currently picks up litter along Gratiot.
16 Implement Municipal Employee Training Programs
1a, 1b, 3a, 3b, 3c
22 Increase Public Awareness
All
X
Newsletter (once/year), brochures in foyer area, website www.lenoxtwp.org, public access channel
42 Reduce Fertilizer, Pesticide and Herbicide Usage
1b, 2a
X
Fertilize park and township facilities – local contractor, slow release fertilizer monthly, pesticide weekly (inside building only)
43 Support Environmental Friendly Lawn and Garden Maintenance
2a, 2b, 2c, 2d, 4b, 4c, 4d
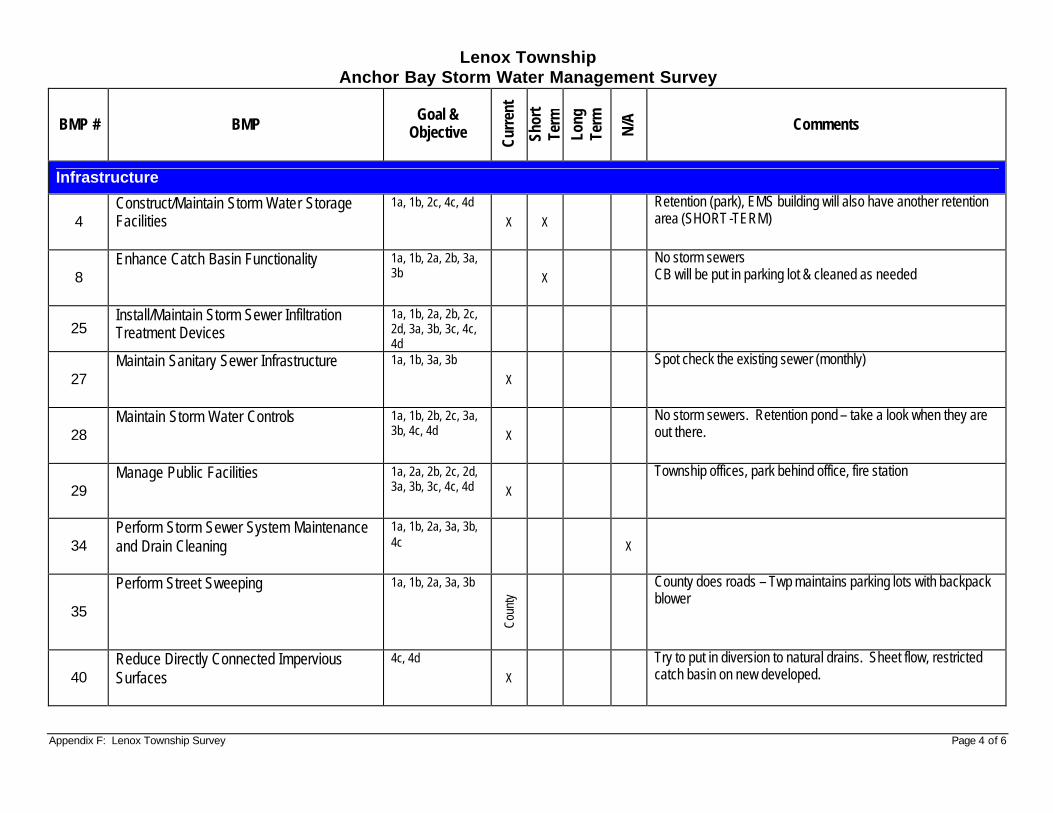
Appendix F: Lenox Township Survey Page 4 of 6
Lenox Township Anchor Bay Storm Water Management Survey
BMP # BMP Goal &
Objective
Curr
ent
Shor
t Te
rm
Long
Te
rm
N/A
Comments
Infrastructure
4 Construct/Maintain Storm Water Storage Facilities
1a, 1b, 2c, 4c, 4d
X X
Retention (park), EMS building will also have another retention area (SHORT -TERM)
8 Enhance Catch Basin Functionality
1a, 1b, 2a, 2b, 3a, 3b X
No storm sewers CB will be put in parking lot & cleaned as needed
25 Install/Maintain Storm Sewer Infiltration Treatment Devices
1a, 1b, 2a, 2b, 2c, 2d, 3a, 3b, 3c, 4c, 4d
27 Maintain Sanitary Sewer Infrastructure
1a, 1b, 3a, 3b
X
Spot check the existing sewer (monthly)
28 Maintain Storm Water Controls
1a, 1b, 2b, 2c, 3a, 3b, 4c, 4d X
No storm sewers. Retention pond – take a look when they are out there.
29 Manage Public Facilities
1a, 2a, 2b, 2c, 2d, 3a, 3b, 3c, 4c, 4d X
Township offices, park behind office, fire station
34 Perform Storm Sewer System Maintenance and Drain Cleaning
1a, 1b, 2a, 3a, 3b, 4c X
35
Perform Street Sweeping
1a, 1b, 2a, 3a, 3b
Coun
ty
County does roads – Twp maintains parking lots with backpack blower
40 Reduce Directly Connected Impervious Surfaces
4c, 4d
X
Try to put in diversion to natural drains. Sheet flow, restricted catch basin on new developed.
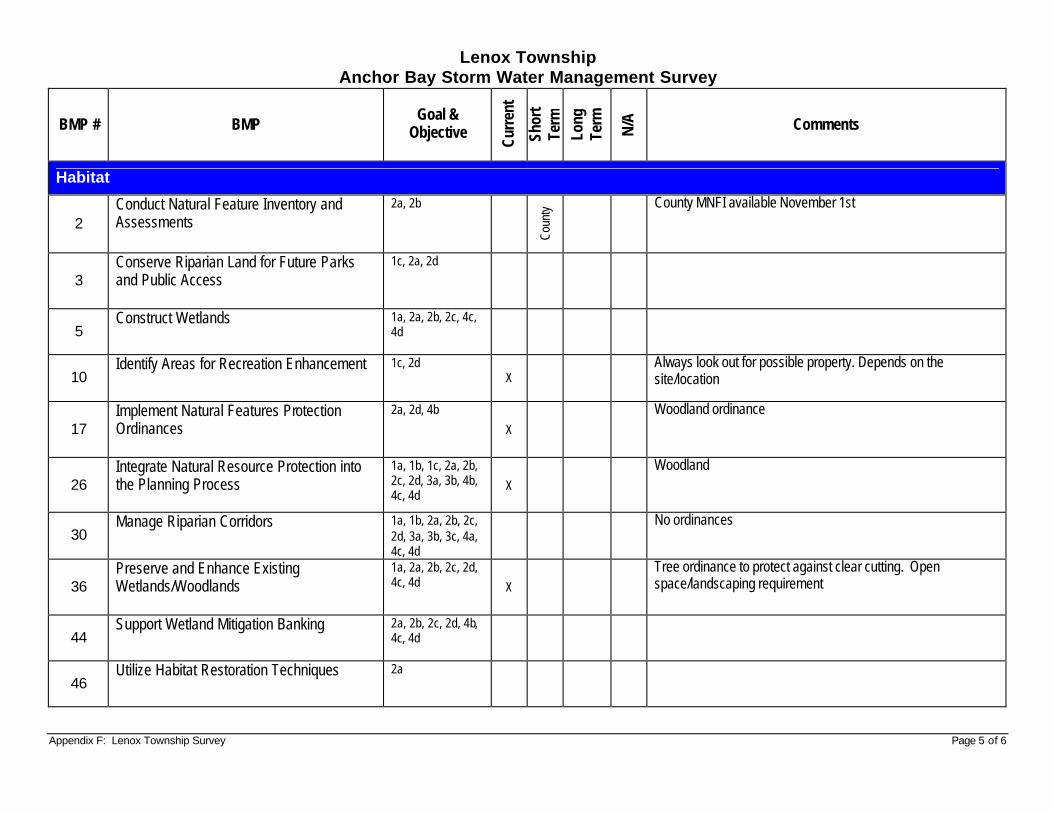
Appendix F: Lenox Township Survey Page 5 of 6
Lenox Township Anchor Bay Storm Water Management Survey
BMP # BMP Goal &
Objective
Curr
ent
Shor
t Te
rm
Long
Te
rm
N/A
Comments
Habitat
2 Conduct Natural Feature Inventory and Assessments
2a, 2b
Coun
ty
County MNFI available November 1st
3 Conserve Riparian Land for Future Parks and Public Access
1c, 2a, 2d
5 Construct Wetlands
1a, 2a, 2b, 2c, 4c, 4d
10 Identify Areas for Recreation Enhancement
1c, 2d X
Always look out for possible property. Depends on the site/location
17 Implement Natural Features Protection Ordinances
2a, 2d, 4b
X
Woodland ordinance
26 Integrate Natural Resource Protection into the Planning Process
1a, 1b, 1c, 2a, 2b, 2c, 2d, 3a, 3b, 4b, 4c, 4d
X
Woodland
30 Manage Riparian Corridors
1a, 1b, 2a, 2b, 2c, 2d, 3a, 3b, 3c, 4a, 4c, 4d
No ordinances
36 Preserve and Enhance Existing Wetlands/Woodlands
1a, 2a, 2b, 2c, 2d, 4c, 4d X
Tree ordinance to protect against clear cutting. Open space/landscaping requirement
44 Support Wetland Mitigation Banking
2a, 2b, 2c, 2d, 4b, 4c, 4d
46 Utilize Habitat Restoration Techniques
2a
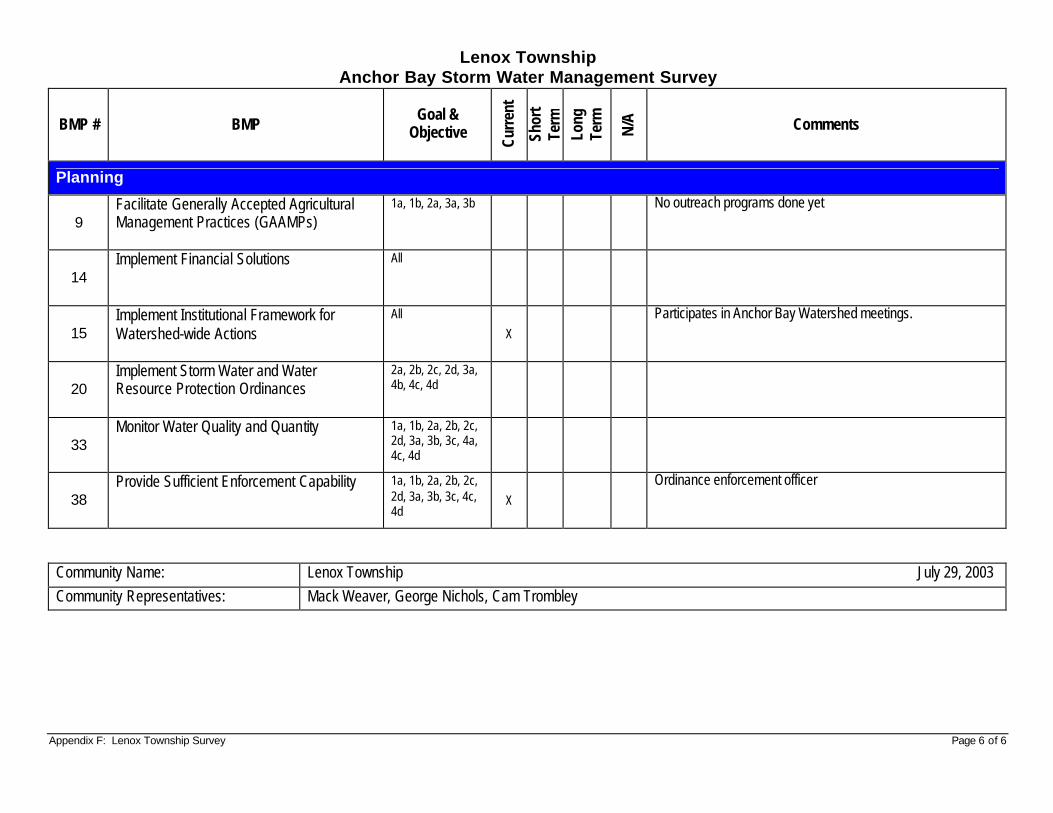
Appendix F: Lenox Township Survey Page 6 of 6
Lenox Township Anchor Bay Storm Water Management Survey
BMP # BMP Goal &
Objective
Curr
ent
Shor
t Te
rm
Long
Te
rm
N/A
Comments
Planning
9 Facilitate Generally Accepted Agricultural Management Practices (GAAMPs)
1a, 1b, 2a, 3a, 3b
No outreach programs done yet
14 Implement Financial Solutions
All
15 Implement Institutional Framework for Watershed-wide Actions
All
X Participates in Anchor Bay Watershed meetings.
20 Implement Storm Water and Water Resource Protection Ordinances
2a, 2b, 2c, 2d, 3a, 4b, 4c, 4d
33 Monitor Water Quality and Quantity
1a, 1b, 2a, 2b, 2c, 2d, 3a, 3b, 3c, 4a, 4c, 4d
38 Provide Sufficient Enforcement Capability
1a, 1b, 2a, 2b, 2c, 2d, 3a, 3b, 3c, 4c, 4d
X Ordinance enforcement officer
Community Name: Lenox Township July 29, 2003 Community Representatives: Mack Weaver, George Nichols, Cam Trombley
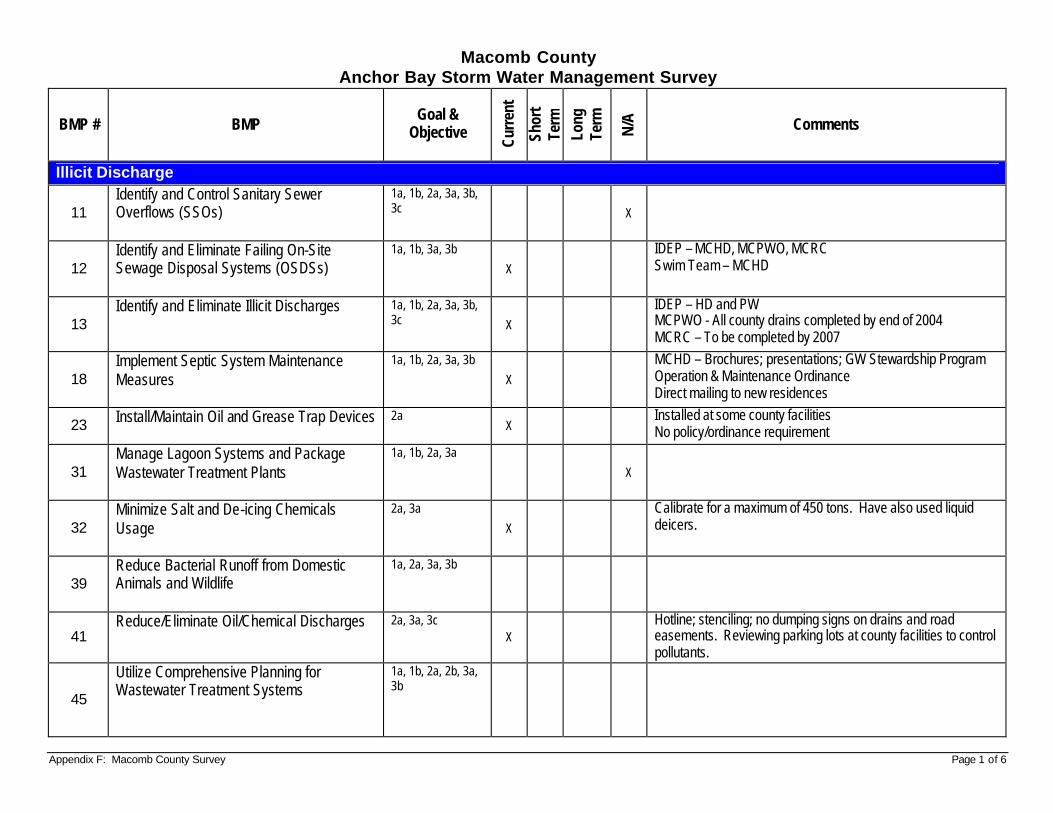
Appendix F: Macomb County Survey Page 1 of 6
Macomb County Anchor Bay Storm Water Management Survey
BMP # BMP Goal &
Objective
Curr
ent
Shor
t Te
rm
Long
Te
rm
N/A
Comments
Illicit Discharge
11 Identify and Control Sanitary Sewer Overflows (SSOs)
1a, 1b, 2a, 3a, 3b, 3c X
12 Identify and Eliminate Failing On-Site Sewage Disposal Systems (OSDSs)
1a, 1b, 3a, 3b
X
IDEP – MCHD, MCPWO, MCRC Swim Team – MCHD
13 Identify and Eliminate Illicit Discharges
1a, 1b, 2a, 3a, 3b, 3c X
IDEP – HD and PW MCPWO - All county drains completed by end of 2004 MCRC – To be completed by 2007
18 Implement Septic System Maintenance Measures
1a, 1b, 2a, 3a, 3b
X
MCHD – Brochures; presentations; GW Stewardship Program Operation & Maintenance Ordinance Direct mailing to new residences
23 Install/Maintain Oil and Grease Trap Devices
2a X
Installed at some county facilities No policy/ordinance requirement
31 Manage Lagoon Systems and Package Wastewater Treatment Plants
1a, 1b, 2a, 3a
X
32 Minimize Salt and De-icing Chemicals Usage
2a, 3a
X
Calibrate for a maximum of 450 tons. Have also used liquid deicers.
39 Reduce Bacterial Runoff from Domestic Animals and Wildlife
1a, 2a, 3a, 3b
41 Reduce/Eliminate Oil/Chemical Discharges
2a, 3a, 3c X
Hotline; stenciling; no dumping signs on drains and road easements. Reviewing parking lots at county facilities to control pollutants.
45
Utilize Comprehensive Planning for Wastewater Treatment Systems
1a, 1b, 2a, 2b, 3a, 3b
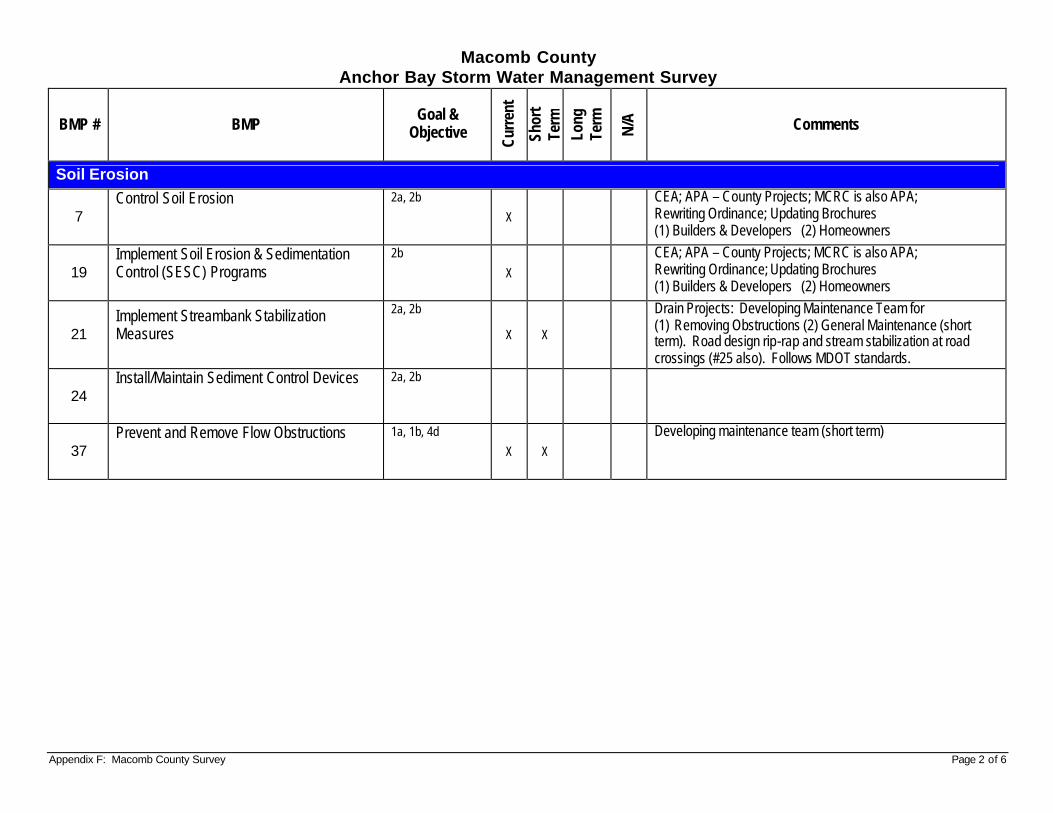
Appendix F: Macomb County Survey Page 2 of 6
Macomb County Anchor Bay Storm Water Management Survey
BMP # BMP Goal &
Objective
Curr
ent
Shor
t Te
rm
Long
Te
rm
N/A
Comments
Soil Erosion
7 Control Soil Erosion
2a, 2b
X
CEA; APA – County Projects; MCRC is also APA; Rewriting Ordinance; Updating Brochures (1) Builders & Developers (2) Homeowners
19 Implement Soil Erosion & Sedimentation Control (SESC) Programs
2b
X
CEA; APA – County Projects; MCRC is also APA; Rewriting Ordinance; Updating Brochures (1) Builders & Developers (2) Homeowners
21 Implement Streambank Stabilization Measures
2a, 2b
X X
Drain Projects: Developing Maintenance Team for (1) Removing Obstructions (2) General Maintenance (short term). Road design rip-rap and stream stabilization at road crossings (#25 also). Follows MDOT standards.
24 Install/Maintain Sediment Control Devices
2a, 2b
37 Prevent and Remove Flow Obstructions
1a, 1b, 4d
X X
Developing maintenance team (short term)
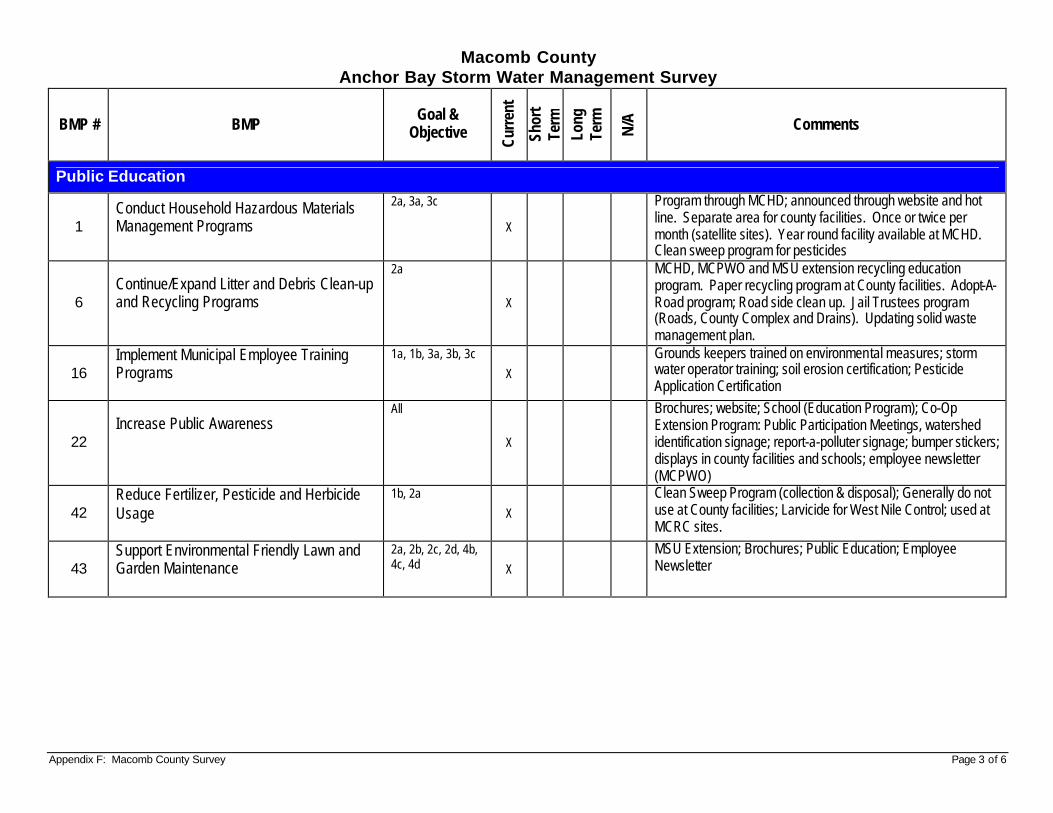
Appendix F: Macomb County Survey Page 3 of 6
Macomb County Anchor Bay Storm Water Management Survey
BMP # BMP Goal &
Objective
Curr
ent
Shor
t Te
rm
Long
Te
rm
N/A
Comments
Public Education
1 Conduct Household Hazardous Materials Management Programs
2a, 3a, 3c
X
Program through MCHD; announced through website and hot line. Separate area for county facilities. Once or twice per month (satellite sites). Year round facility available at MCHD. Clean sweep program for pesticides
6 Continue/Expand Litter and Debris Clean-up and Recycling Programs
2a
X
MCHD, MCPWO and MSU extension recycling education program. Paper recycling program at County facilities. Adopt-A-Road program; Road side clean up. Jail Trustees program (Roads, County Complex and Drains). Updating solid waste management plan.
16 Implement Municipal Employee Training Programs
1a, 1b, 3a, 3b, 3c
X
Grounds keepers trained on environmental measures; storm water operator training; soil erosion certification; Pesticide Application Certification
22 Increase Public Awareness
All
X
Brochures; website; School (Education Program); Co-Op Extension Program: Public Participation Meetings, watershed identification signage; report-a-polluter signage; bumper stickers; displays in county facilities and schools; employee newsletter (MCPWO)
42 Reduce Fertilizer, Pesticide and Herbicide Usage
1b, 2a
X
Clean Sweep Program (collection & disposal); Generally do not use at County facilities; Larvicide for West Nile Control; used at MCRC sites.
43 Support Environmental Friendly Lawn and Garden Maintenance
2a, 2b, 2c, 2d, 4b, 4c, 4d X
MSU Extension; Brochures; Public Education; Employee Newsletter
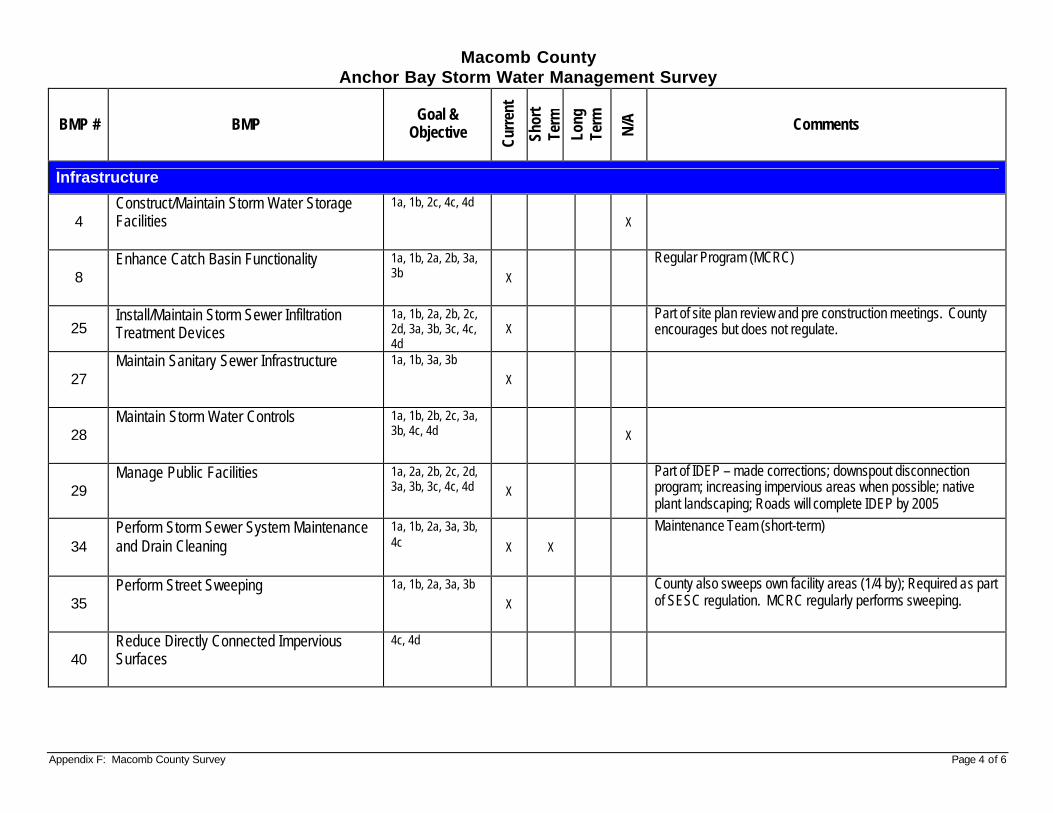
Appendix F: Macomb County Survey Page 4 of 6
Macomb County Anchor Bay Storm Water Management Survey
BMP # BMP Goal &
Objective
Curr
ent
Shor
t Te
rm
Long
Te
rm
N/A
Comments
Infrastructure
4 Construct/Maintain Storm Water Storage Facilities
1a, 1b, 2c, 4c, 4d
X
8 Enhance Catch Basin Functionality
1a, 1b, 2a, 2b, 3a, 3b X
Regular Program (MCRC)
25 Install/Maintain Storm Sewer Infiltration Treatment Devices
1a, 1b, 2a, 2b, 2c, 2d, 3a, 3b, 3c, 4c, 4d
X Part of site plan review and pre construction meetings. County encourages but does not regulate.
27 Maintain Sanitary Sewer Infrastructure
1a, 1b, 3a, 3b
X
28 Maintain Storm Water Controls
1a, 1b, 2b, 2c, 3a, 3b, 4c, 4d X
29 Manage Public Facilities
1a, 2a, 2b, 2c, 2d, 3a, 3b, 3c, 4c, 4d X
Part of IDEP – made corrections; downspout disconnection program; increasing impervious areas when possible; native plant landscaping; Roads will complete IDEP by 2005
34 Perform Storm Sewer System Maintenance and Drain Cleaning
1a, 1b, 2a, 3a, 3b, 4c X X
Maintenance Team (short-term)
35 Perform Street Sweeping
1a, 1b, 2a, 3a, 3b
X
County also sweeps own facility areas (1/4 by); Required as part of SESC regulation. MCRC regularly performs sweeping.
40 Reduce Directly Connected Impervious Surfaces
4c, 4d
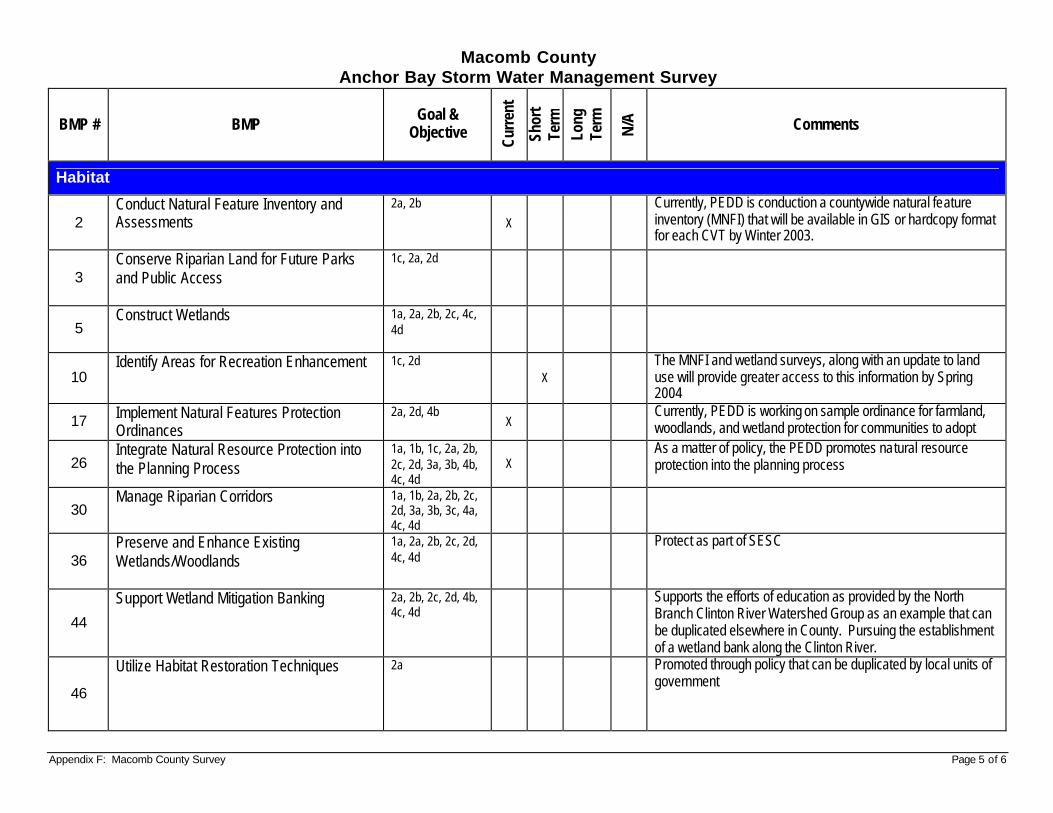
Appendix F: Macomb County Survey Page 5 of 6
Macomb County Anchor Bay Storm Water Management Survey
BMP # BMP Goal &
Objective
Curr
ent
Shor
t Te
rm
Long
Te
rm
N/A
Comments
Habitat
2 Conduct Natural Feature Inventory and Assessments
2a, 2b
X
Currently, PEDD is conduction a countywide natural feature inventory (MNFI) that will be available in GIS or hardcopy format for each CVT by Winter 2003.
3 Conserve Riparian Land for Future Parks and Public Access
1c, 2a, 2d
5 Construct Wetlands
1a, 2a, 2b, 2c, 4c, 4d
10 Identify Areas for Recreation Enhancement
1c, 2d X
The MNFI and wetland surveys, along with an update to land use will provide greater access to this information by Spring 2004
17 Implement Natural Features Protection Ordinances
2a, 2d, 4b X
Currently, PEDD is working on sample ordinance for farmland, woodlands, and wetland protection for communities to adopt
26 Integrate Natural Resource Protection into the Planning Process
1a, 1b, 1c, 2a, 2b, 2c, 2d, 3a, 3b, 4b, 4c, 4d
X As a matter of policy, the PEDD promotes natural resource protection into the planning process
30 Manage Riparian Corridors 1a, 1b, 2a, 2b, 2c,
2d, 3a, 3b, 3c, 4a, 4c, 4d
36 Preserve and Enhance Existing Wetlands/Woodlands
1a, 2a, 2b, 2c, 2d, 4c, 4d
Protect as part of SESC
44
Support Wetland Mitigation Banking
2a, 2b, 2c, 2d, 4b, 4c, 4d
Supports the efforts of education as provided by the North Branch Clinton River Watershed Group as an example that can be duplicated elsewhere in County. Pursuing the establishment of a wetland bank along the Clinton River.
46
Utilize Habitat Restoration Techniques
2a Promoted through policy that can be duplicated by local units of government
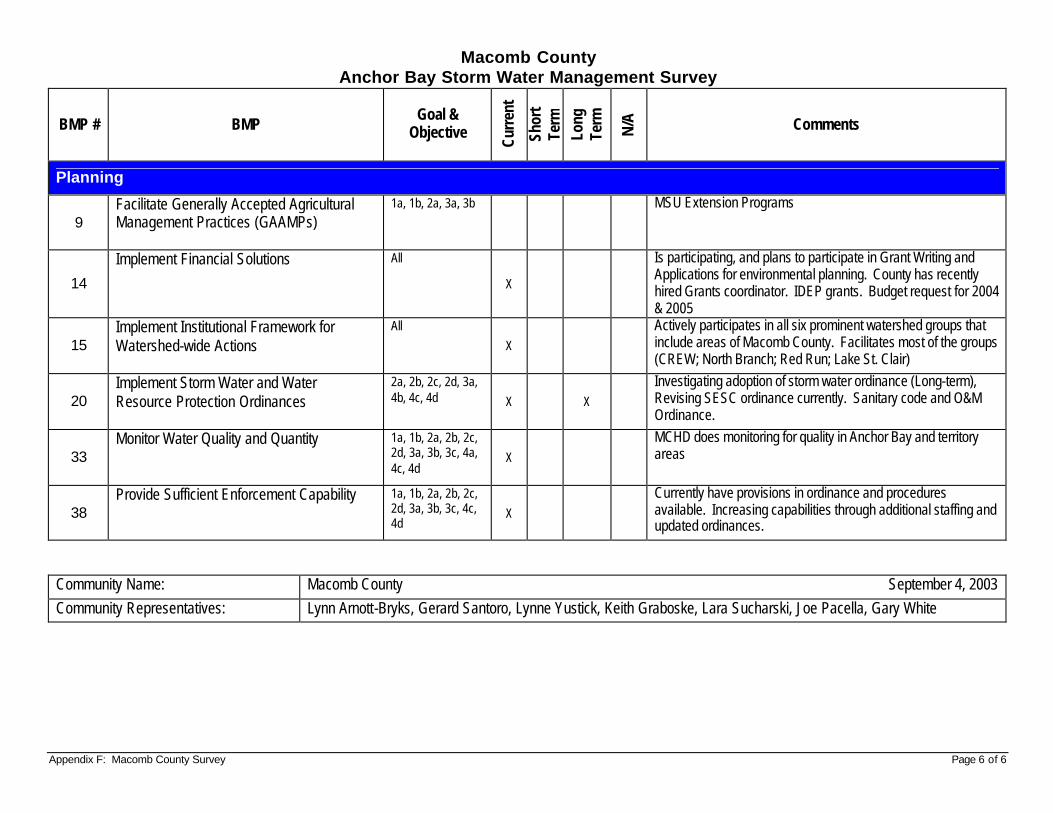
Appendix F: Macomb County Survey Page 6 of 6
Macomb County Anchor Bay Storm Water Management Survey
BMP # BMP Goal &
Objective
Curr
ent
Shor
t Te
rm
Long
Te
rm
N/A
Comments
Planning
9 Facilitate Generally Accepted Agricultural Management Practices (GAAMPs)
1a, 1b, 2a, 3a, 3b
MSU Extension Programs
14
Implement Financial Solutions
All
X
Is participating, and plans to participate in Grant Writing and Applications for environmental planning. County has recently hired Grants coordinator. IDEP grants. Budget request for 2004 & 2005
15 Implement Institutional Framework for Watershed-wide Actions
All
X
Actively participates in all six prominent watershed groups that include areas of Macomb County. Facilitates most of the groups (CREW; North Branch; Red Run; Lake St. Clair)
20 Implement Storm Water and Water Resource Protection Ordinances
2a, 2b, 2c, 2d, 3a, 4b, 4c, 4d X X
Investigating adoption of storm water ordinance (Long-term), Revising SESC ordinance currently. Sanitary code and O&M Ordinance.
33 Monitor Water Quality and Quantity
1a, 1b, 2a, 2b, 2c, 2d, 3a, 3b, 3c, 4a, 4c, 4d
X
MCHD does monitoring for quality in Anchor Bay and territory areas
38 Provide Sufficient Enforcement Capability
1a, 1b, 2a, 2b, 2c, 2d, 3a, 3b, 3c, 4c, 4d
X
Currently have provisions in ordinance and procedures available. Increasing capabilities through additional staffing and updated ordinances.
Community Name: Macomb County September 4, 2003 Community Representatives: Lynn Arnott-Bryks, Gerard Santoro, Lynne Yustick, Keith Graboske, Lara Sucharski, Joe Pacella, Gary White
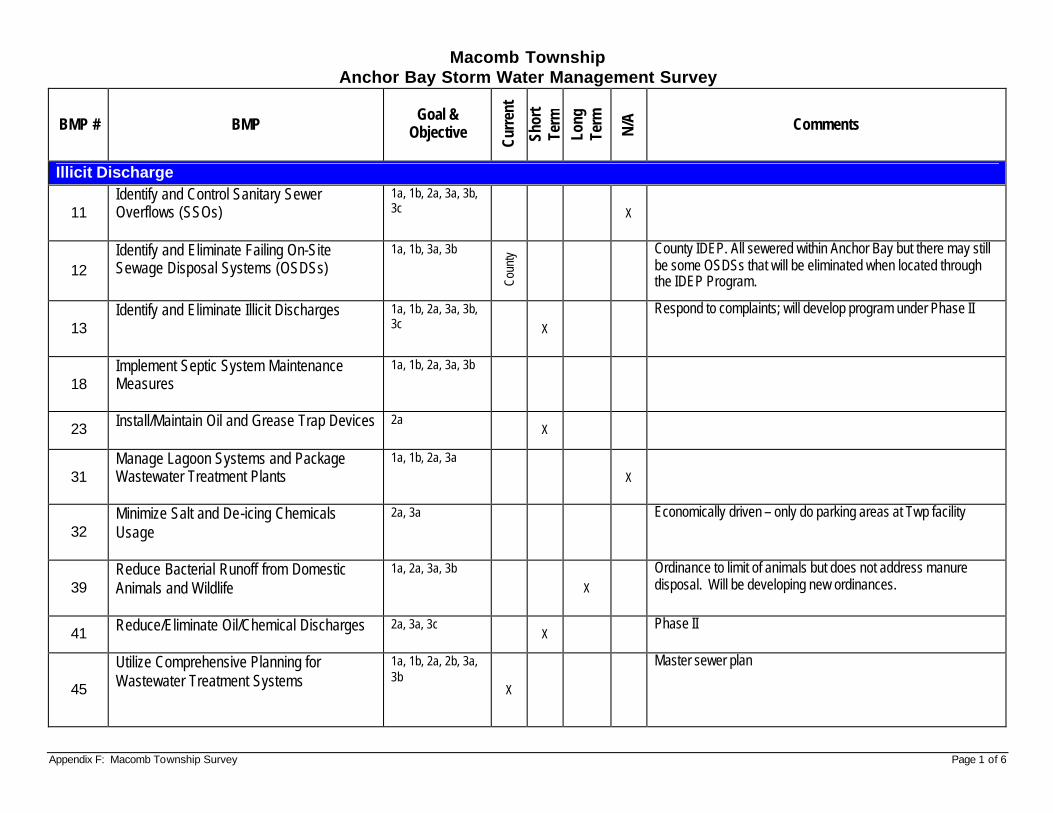
Appendix F: Macomb Township Survey Page 1 of 6
Macomb Township Anchor Bay Storm Water Management Survey
BMP # BMP Goal &
Objective
Curr
ent
Shor
t Te
rm
Long
Te
rm
N/A
Comments
Illicit Discharge
11 Identify and Control Sanitary Sewer Overflows (SSOs)
1a, 1b, 2a, 3a, 3b, 3c X
12 Identify and Eliminate Failing On-Site Sewage Disposal Systems (OSDSs)
1a, 1b, 3a, 3b
Coun
ty
County IDEP. All sewered within Anchor Bay but there may still be some OSDSs that will be eliminated when located through the IDEP Program.
13 Identify and Eliminate Illicit Discharges
1a, 1b, 2a, 3a, 3b, 3c X
Respond to complaints; will develop program under Phase II
18 Implement Septic System Maintenance Measures
1a, 1b, 2a, 3a, 3b
23 Install/Maintain Oil and Grease Trap Devices
2a X
31 Manage Lagoon Systems and Package Wastewater Treatment Plants
1a, 1b, 2a, 3a
X
32 Minimize Salt and De-icing Chemicals Usage
2a, 3a
Economically driven – only do parking areas at Twp facility
39 Reduce Bacterial Runoff from Domestic Animals and Wildlife
1a, 2a, 3a, 3b
X
Ordinance to limit of animals but does not address manure disposal. Will be developing new ordinances.
41 Reduce/Eliminate Oil/Chemical Discharges
2a, 3a, 3c X
Phase II
45
Utilize Comprehensive Planning for Wastewater Treatment Systems
1a, 1b, 2a, 2b, 3a, 3b
X
Master sewer plan
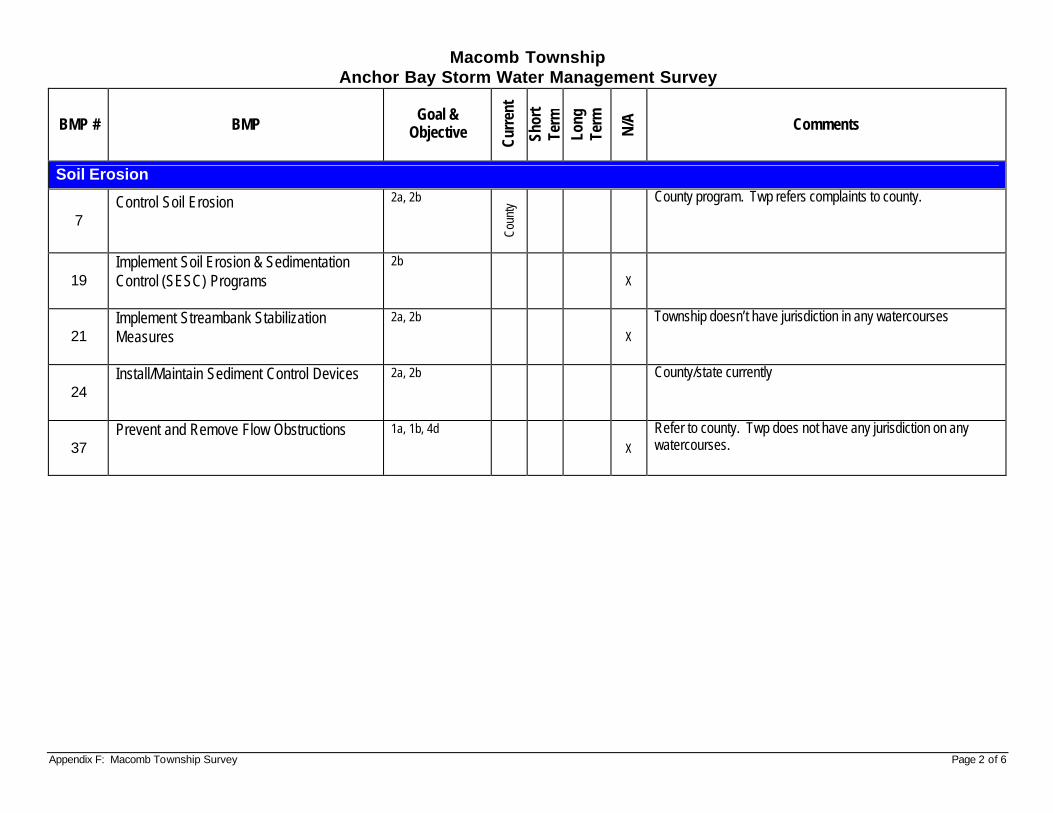
Appendix F: Macomb Township Survey Page 2 of 6
Macomb Township Anchor Bay Storm Water Management Survey
BMP # BMP Goal &
Objective
Curr
ent
Shor
t Te
rm
Long
Te
rm
N/A
Comments
Soil Erosion
7 Control Soil Erosion
2a, 2b
Coun
ty
County program. Twp refers complaints to county.
19 Implement Soil Erosion & Sedimentation Control (SESC) Programs
2b
X
21 Implement Streambank Stabilization Measures
2a, 2b
X
Township doesn’t have jurisdiction in any watercourses
24 Install/Maintain Sediment Control Devices
2a, 2b
County/state currently
37 Prevent and Remove Flow Obstructions
1a, 1b, 4d
X
Refer to county. Twp does not have any jurisdiction on any watercourses.
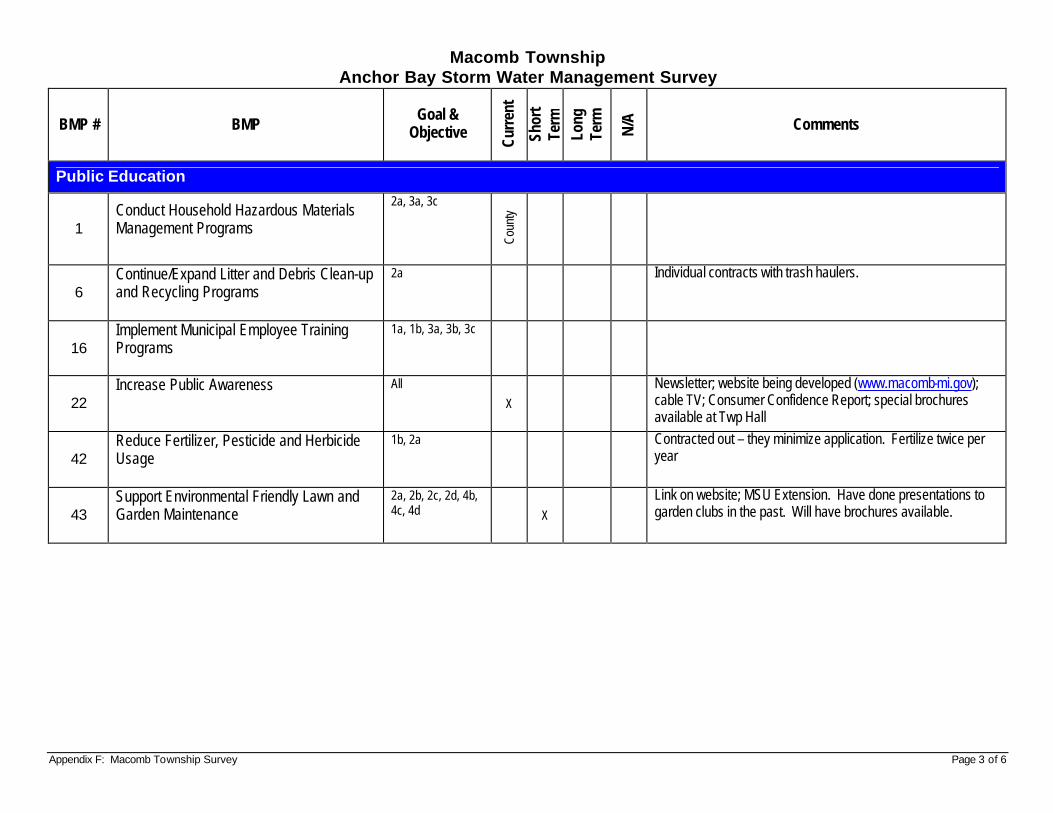
Appendix F: Macomb Township Survey Page 3 of 6
Macomb Township Anchor Bay Storm Water Management Survey
BMP # BMP Goal &
Objective
Curr
ent
Shor
t Te
rm
Long
Te
rm
N/A
Comments
Public Education
1 Conduct Household Hazardous Materials Management Programs
2a, 3a, 3c
Coun
ty
6 Continue/Expand Litter and Debris Clean-up and Recycling Programs
2a
Individual contracts with trash haulers.
16 Implement Municipal Employee Training Programs
1a, 1b, 3a, 3b, 3c
22 Increase Public Awareness
All
X
Newsletter; website being developed (www.macomb-mi.gov); cable TV; Consumer Confidence Report; special brochures available at Twp Hall
42 Reduce Fertilizer, Pesticide and Herbicide Usage
1b, 2a
Contracted out – they minimize application. Fertilize twice per year
43 Support Environmental Friendly Lawn and Garden Maintenance
2a, 2b, 2c, 2d, 4b, 4c, 4d X
Link on website; MSU Extension. Have done presentations to garden clubs in the past. Will have brochures available.
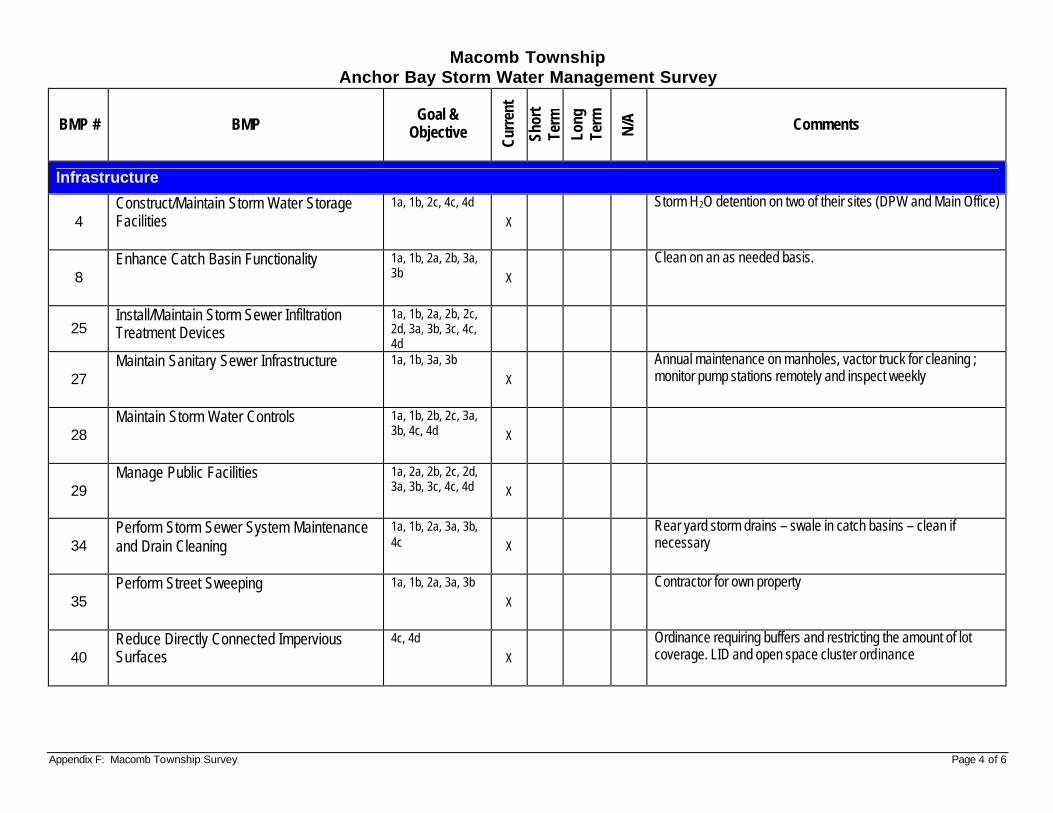
Appendix F: Macomb Township Survey Page 4 of 6
Macomb Township Anchor Bay Storm Water Management Survey
BMP # BMP Goal &
Objective
Curr
ent
Shor
t Te
rm
Long
Te
rm
N/A
Comments
Infrastructure
4 Construct/Maintain Storm Water Storage Facilities
1a, 1b, 2c, 4c, 4d
X
Storm H2O detention on two of their sites (DPW and Main Office)
8 Enhance Catch Basin Functionality
1a, 1b, 2a, 2b, 3a, 3b X
Clean on an as needed basis.
25 Install/Maintain Storm Sewer Infiltration Treatment Devices
1a, 1b, 2a, 2b, 2c, 2d, 3a, 3b, 3c, 4c, 4d
27 Maintain Sanitary Sewer Infrastructure
1a, 1b, 3a, 3b
X
Annual maintenance on manholes, vactor truck for cleaning ; monitor pump stations remotely and inspect weekly
28 Maintain Storm Water Controls
1a, 1b, 2b, 2c, 3a, 3b, 4c, 4d X
29 Manage Public Facilities
1a, 2a, 2b, 2c, 2d, 3a, 3b, 3c, 4c, 4d X
34 Perform Storm Sewer System Maintenance and Drain Cleaning
1a, 1b, 2a, 3a, 3b, 4c X
Rear yard storm drains – swale in catch basins – clean if necessary
35 Perform Street Sweeping
1a, 1b, 2a, 3a, 3b
X
Contractor for own property
40 Reduce Directly Connected Impervious Surfaces
4c, 4d
X
Ordinance requiring buffers and restricting the amount of lot coverage. LID and open space cluster ordinance
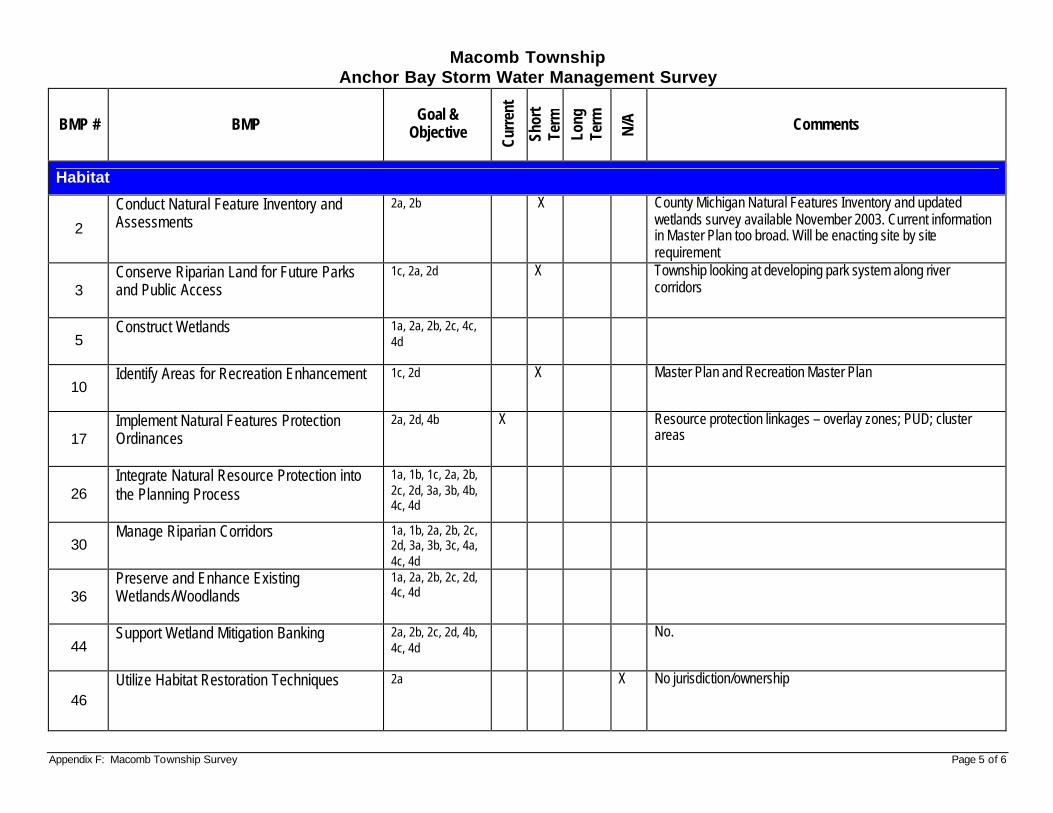
Appendix F: Macomb Township Survey Page 5 of 6
Macomb Township Anchor Bay Storm Water Management Survey
BMP # BMP Goal &
Objective
Curr
ent
Shor
t Te
rm
Long
Te
rm
N/A
Comments
Habitat
2
Conduct Natural Feature Inventory and Assessments
2a, 2b X County Michigan Natural Features Inventory and updated wetlands survey available November 2003. Current information in Master Plan too broad. Will be enacting site by site requirement
3 Conserve Riparian Land for Future Parks and Public Access
1c, 2a, 2d X Township looking at developing park system along river corridors
5 Construct Wetlands
1a, 2a, 2b, 2c, 4c, 4d
10 Identify Areas for Recreation Enhancement
1c, 2d X Master Plan and Recreation Master Plan
17 Implement Natural Features Protection Ordinances
2a, 2d, 4b X Resource protection linkages – overlay zones; PUD; cluster areas
26 Integrate Natural Resource Protection into the Planning Process
1a, 1b, 1c, 2a, 2b, 2c, 2d, 3a, 3b, 4b, 4c, 4d
30 Manage Riparian Corridors
1a, 1b, 2a, 2b, 2c, 2d, 3a, 3b, 3c, 4a, 4c, 4d
36 Preserve and Enhance Existing Wetlands/Woodlands
1a, 2a, 2b, 2c, 2d, 4c, 4d
44 Support Wetland Mitigation Banking
2a, 2b, 2c, 2d, 4b, 4c, 4d
No.
46 Utilize Habitat Restoration Techniques
2a X No jurisdiction/ownership
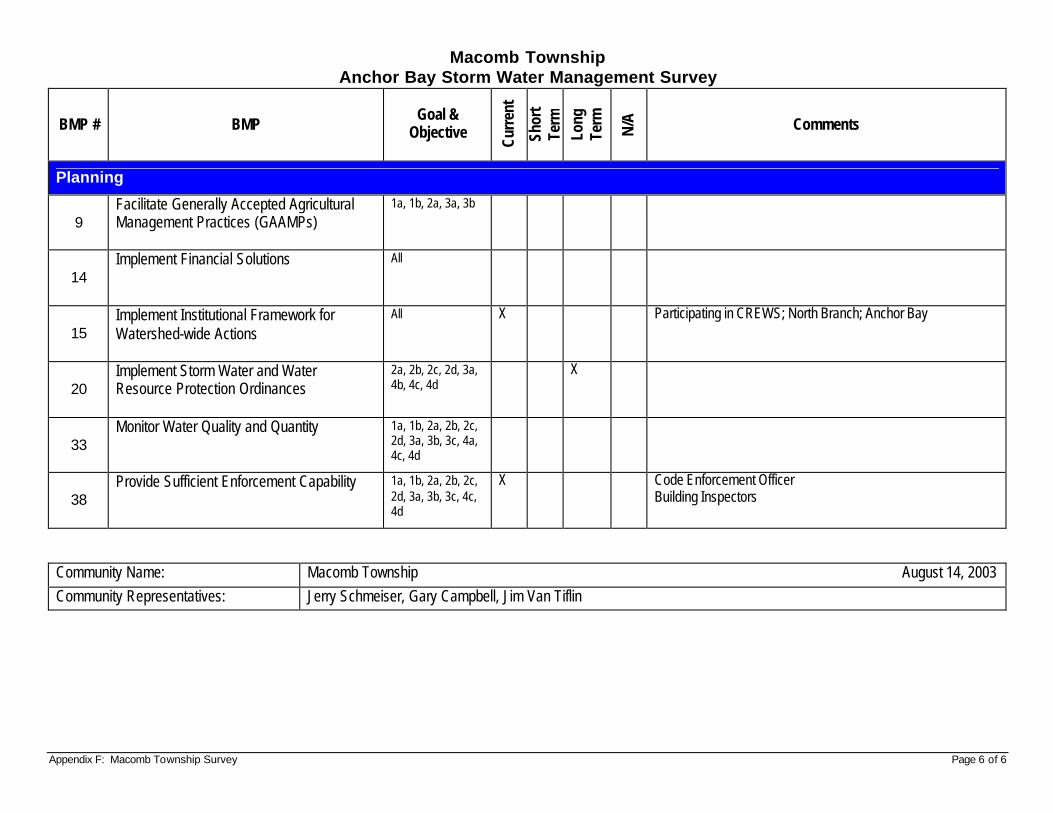
Appendix F: Macomb Township Survey Page 6 of 6
Macomb Township Anchor Bay Storm Water Management Survey
BMP # BMP Goal &
Objective
Curr
ent
Shor
t Te
rm
Long
Te
rm
N/A
Comments
Planning
9 Facilitate Generally Accepted Agricultural Management Practices (GAAMPs)
1a, 1b, 2a, 3a, 3b
14 Implement Financial Solutions
All
15 Implement Institutional Framework for Watershed-wide Actions
All X Participating in CREWS; North Branch; Anchor Bay
20 Implement Storm Water and Water Resource Protection Ordinances
2a, 2b, 2c, 2d, 3a, 4b, 4c, 4d
X
33 Monitor Water Quality and Quantity
1a, 1b, 2a, 2b, 2c, 2d, 3a, 3b, 3c, 4a, 4c, 4d
38 Provide Sufficient Enforcement Capability
1a, 1b, 2a, 2b, 2c, 2d, 3a, 3b, 3c, 4c, 4d
X Code Enforcement Officer Building Inspectors
Community Name: Macomb Township August 14, 2003 Community Representatives: Jerry Schmeiser, Gary Campbell, Jim Van Tiflin
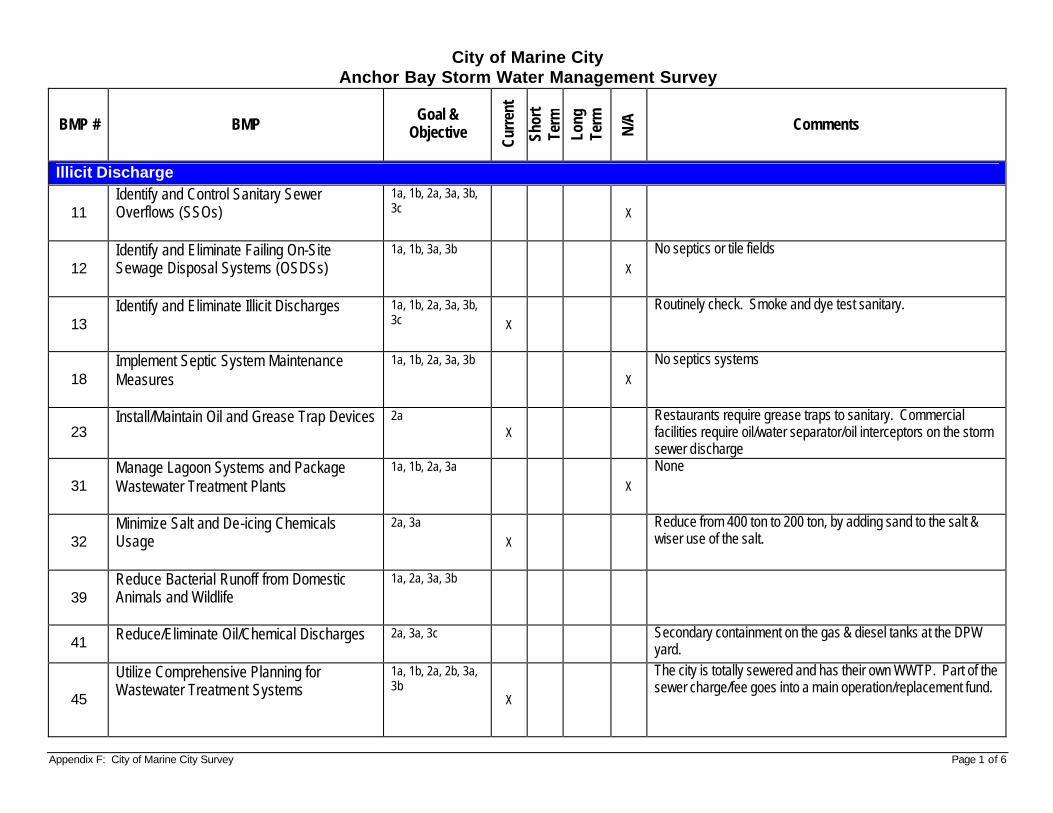
Appendix F: City of Marine City Survey Page 1 of 6
City of Marine City Anchor Bay Storm Water Management Survey
BMP # BMP Goal &
Objective
Curr
ent
Shor
t Te
rm
Long
Te
rm
N/A
Comments
Illicit Discharge
11 Identify and Control Sanitary Sewer Overflows (SSOs)
1a, 1b, 2a, 3a, 3b, 3c X
12 Identify and Eliminate Failing On-Site Sewage Disposal Systems (OSDSs)
1a, 1b, 3a, 3b
X
No septics or tile fields
13 Identify and Eliminate Illicit Discharges
1a, 1b, 2a, 3a, 3b, 3c X
Routinely check. Smoke and dye test sanitary.
18 Implement Septic System Maintenance Measures
1a, 1b, 2a, 3a, 3b
X
No septics systems
23 Install/Maintain Oil and Grease Trap Devices
2a X
Restaurants require grease traps to sanitary. Commercial facilities require oil/water separator/oil interceptors on the storm sewer discharge
31 Manage Lagoon Systems and Package Wastewater Treatment Plants
1a, 1b, 2a, 3a
X
None
32 Minimize Salt and De-icing Chemicals Usage
2a, 3a
X
Reduce from 400 ton to 200 ton, by adding sand to the salt & wiser use of the salt.
39 Reduce Bacterial Runoff from Domestic Animals and Wildlife
1a, 2a, 3a, 3b
41 Reduce/Eliminate Oil/Chemical Discharges
2a, 3a, 3c
Secondary containment on the gas & diesel tanks at the DPW yard.
45
Utilize Comprehensive Planning for Wastewater Treatment Systems
1a, 1b, 2a, 2b, 3a, 3b
X
The city is totally sewered and has their own WWTP. Part of the sewer charge/fee goes into a main operation/replacement fund.
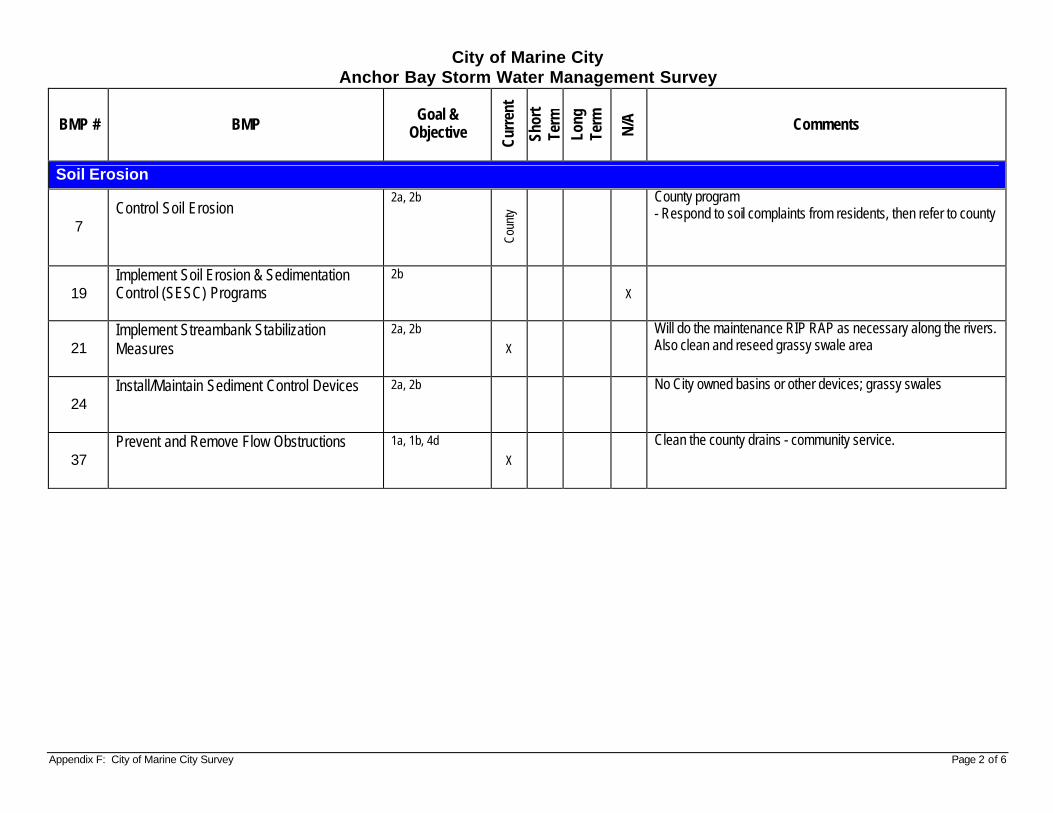
Appendix F: City of Marine City Survey Page 2 of 6
City of Marine City Anchor Bay Storm Water Management Survey
BMP # BMP Goal &
Objective
Curr
ent
Shor
t Te
rm
Long
Te
rm
N/A
Comments
Soil Erosion
7 Control Soil Erosion
2a, 2b
Coun
ty
County program - Respond to soil complaints from residents, then refer to county
19 Implement Soil Erosion & Sedimentation Control (SESC) Programs
2b
X
21 Implement Streambank Stabilization Measures
2a, 2b
X
Will do the maintenance RIP RAP as necessary along the rivers. Also clean and reseed grassy swale area
24 Install/Maintain Sediment Control Devices
2a, 2b
No City owned basins or other devices; grassy swales
37 Prevent and Remove Flow Obstructions
1a, 1b, 4d
X
Clean the county drains - community service.
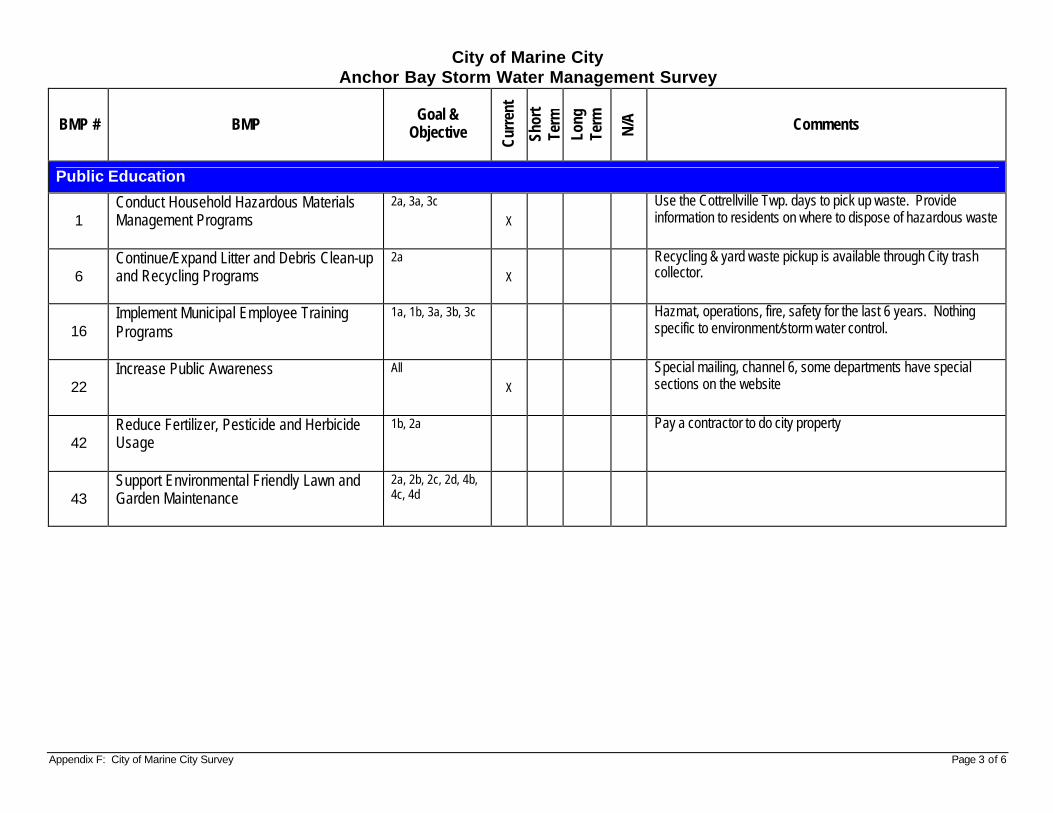
Appendix F: City of Marine City Survey Page 3 of 6
City of Marine City Anchor Bay Storm Water Management Survey
BMP # BMP Goal &
Objective
Curr
ent
Shor
t Te
rm
Long
Te
rm
N/A
Comments
Public Education
1 Conduct Household Hazardous Materials Management Programs
2a, 3a, 3c
X
Use the Cottrellville Twp. days to pick up waste. Provide information to residents on where to dispose of hazardous waste
6 Continue/Expand Litter and Debris Clean-up and Recycling Programs
2a
X
Recycling & yard waste pickup is available through City trash collector.
16 Implement Municipal Employee Training Programs
1a, 1b, 3a, 3b, 3c
Hazmat, operations, fire, safety for the last 6 years. Nothing specific to environment/storm water control.
22 Increase Public Awareness
All
X
Special mailing, channel 6, some departments have special sections on the website
42 Reduce Fertilizer, Pesticide and Herbicide Usage
1b, 2a
Pay a contractor to do city property
43 Support Environmental Friendly Lawn and Garden Maintenance
2a, 2b, 2c, 2d, 4b, 4c, 4d
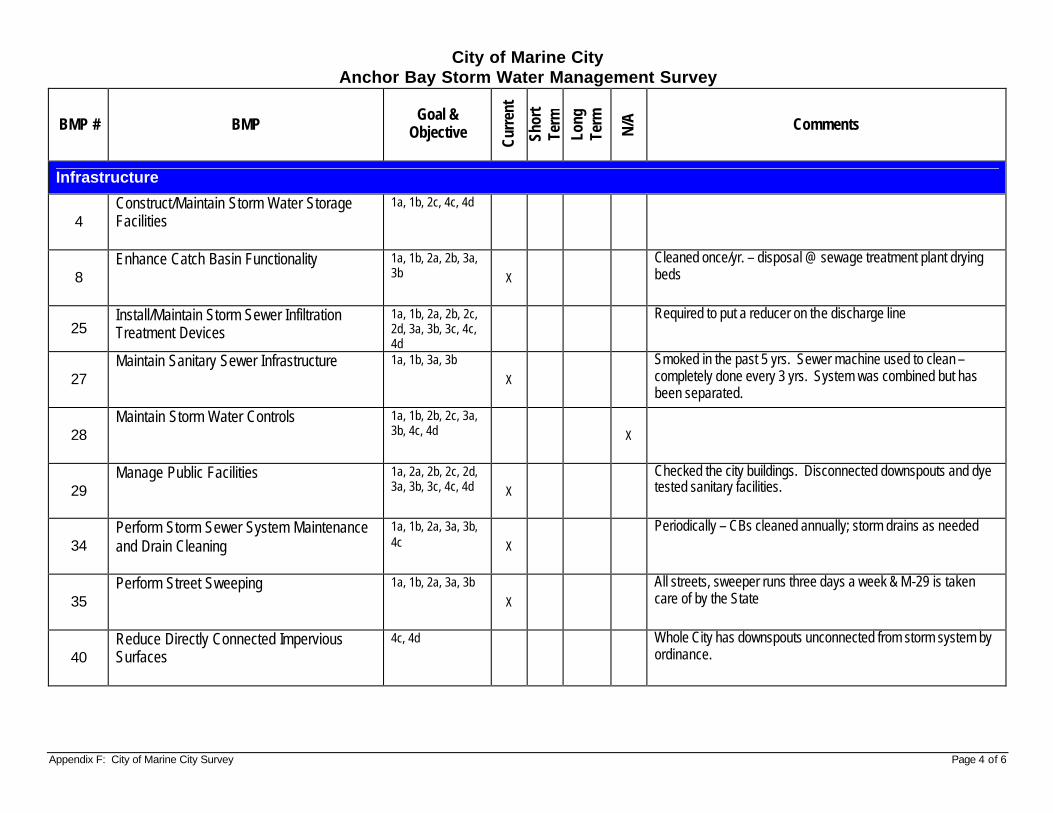
Appendix F: City of Marine City Survey Page 4 of 6
City of Marine City Anchor Bay Storm Water Management Survey
BMP # BMP Goal &
Objective
Curr
ent
Shor
t Te
rm
Long
Te
rm
N/A
Comments
Infrastructure
4 Construct/Maintain Storm Water Storage Facilities
1a, 1b, 2c, 4c, 4d
8 Enhance Catch Basin Functionality
1a, 1b, 2a, 2b, 3a, 3b X
Cleaned once/yr. – disposal @ sewage treatment plant drying beds
25 Install/Maintain Storm Sewer Infiltration Treatment Devices
1a, 1b, 2a, 2b, 2c, 2d, 3a, 3b, 3c, 4c, 4d
Required to put a reducer on the discharge line
27 Maintain Sanitary Sewer Infrastructure
1a, 1b, 3a, 3b
X
Smoked in the past 5 yrs. Sewer machine used to clean – completely done every 3 yrs. System was combined but has been separated.
28 Maintain Storm Water Controls
1a, 1b, 2b, 2c, 3a, 3b, 4c, 4d X
29 Manage Public Facilities
1a, 2a, 2b, 2c, 2d, 3a, 3b, 3c, 4c, 4d X
Checked the city buildings. Disconnected downspouts and dye tested sanitary facilities.
34 Perform Storm Sewer System Maintenance and Drain Cleaning
1a, 1b, 2a, 3a, 3b, 4c X
Periodically – CBs cleaned annually; storm drains as needed
35 Perform Street Sweeping
1a, 1b, 2a, 3a, 3b
X
All streets, sweeper runs three days a week & M-29 is taken care of by the State
40 Reduce Directly Connected Impervious Surfaces
4c, 4d
Whole City has downspouts unconnected from storm system by ordinance.
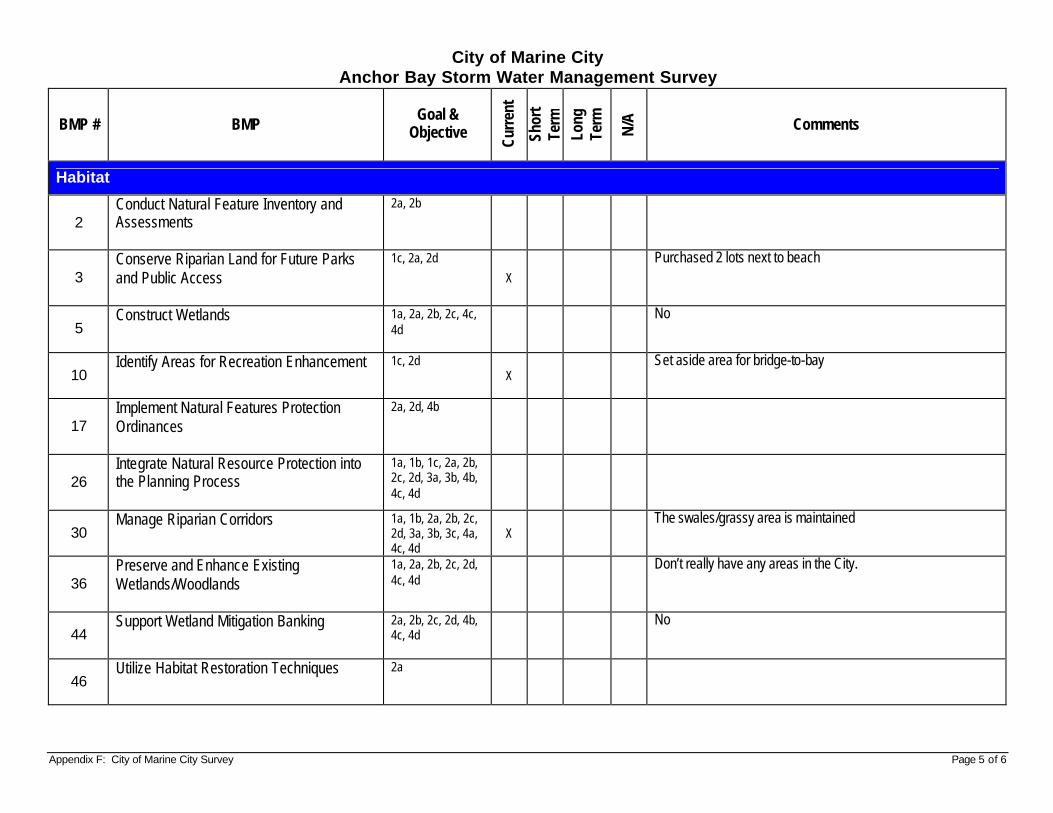
Appendix F: City of Marine City Survey Page 5 of 6
City of Marine City Anchor Bay Storm Water Management Survey
BMP # BMP Goal &
Objective
Curr
ent
Shor
t Te
rm
Long
Te
rm
N/A
Comments
Habitat
2 Conduct Natural Feature Inventory and Assessments
2a, 2b
3 Conserve Riparian Land for Future Parks and Public Access
1c, 2a, 2d
X
Purchased 2 lots next to beach
5 Construct Wetlands
1a, 2a, 2b, 2c, 4c, 4d
No
10 Identify Areas for Recreation Enhancement
1c, 2d X
Set aside area for bridge-to-bay
17 Implement Natural Features Protection Ordinances
2a, 2d, 4b
26 Integrate Natural Resource Protection into the Planning Process
1a, 1b, 1c, 2a, 2b, 2c, 2d, 3a, 3b, 4b, 4c, 4d
30 Manage Riparian Corridors
1a, 1b, 2a, 2b, 2c, 2d, 3a, 3b, 3c, 4a, 4c, 4d
X The swales/grassy area is maintained
36 Preserve and Enhance Existing Wetlands/Woodlands
1a, 2a, 2b, 2c, 2d, 4c, 4d
Don’t really have any areas in the City.
44 Support Wetland Mitigation Banking
2a, 2b, 2c, 2d, 4b, 4c, 4d
No
46 Utilize Habitat Restoration Techniques
2a
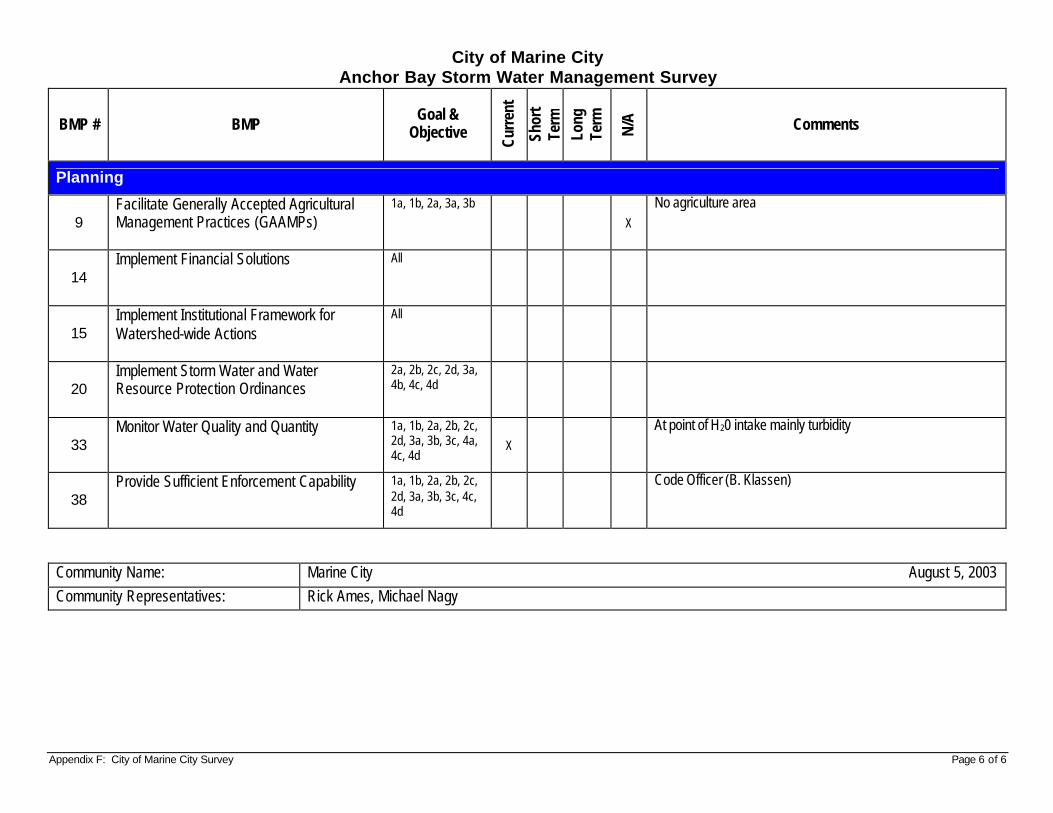
Appendix F: City of Marine City Survey Page 6 of 6
City of Marine City Anchor Bay Storm Water Management Survey
BMP # BMP Goal &
Objective
Curr
ent
Shor
t Te
rm
Long
Te
rm
N/A
Comments
Planning
9 Facilitate Generally Accepted Agricultural Management Practices (GAAMPs)
1a, 1b, 2a, 3a, 3b
X
No agriculture area
14 Implement Financial Solutions
All
15 Implement Institutional Framework for Watershed-wide Actions
All
20 Implement Storm Water and Water Resource Protection Ordinances
2a, 2b, 2c, 2d, 3a, 4b, 4c, 4d
33 Monitor Water Quality and Quantity
1a, 1b, 2a, 2b, 2c, 2d, 3a, 3b, 3c, 4a, 4c, 4d
X
At point of H20 intake mainly turbidity
38 Provide Sufficient Enforcement Capability
1a, 1b, 2a, 2b, 2c, 2d, 3a, 3b, 3c, 4c, 4d
Code Officer (B. Klassen)
Community Name: Marine City August 5, 2003 Community Representatives: Rick Ames, Michael Nagy
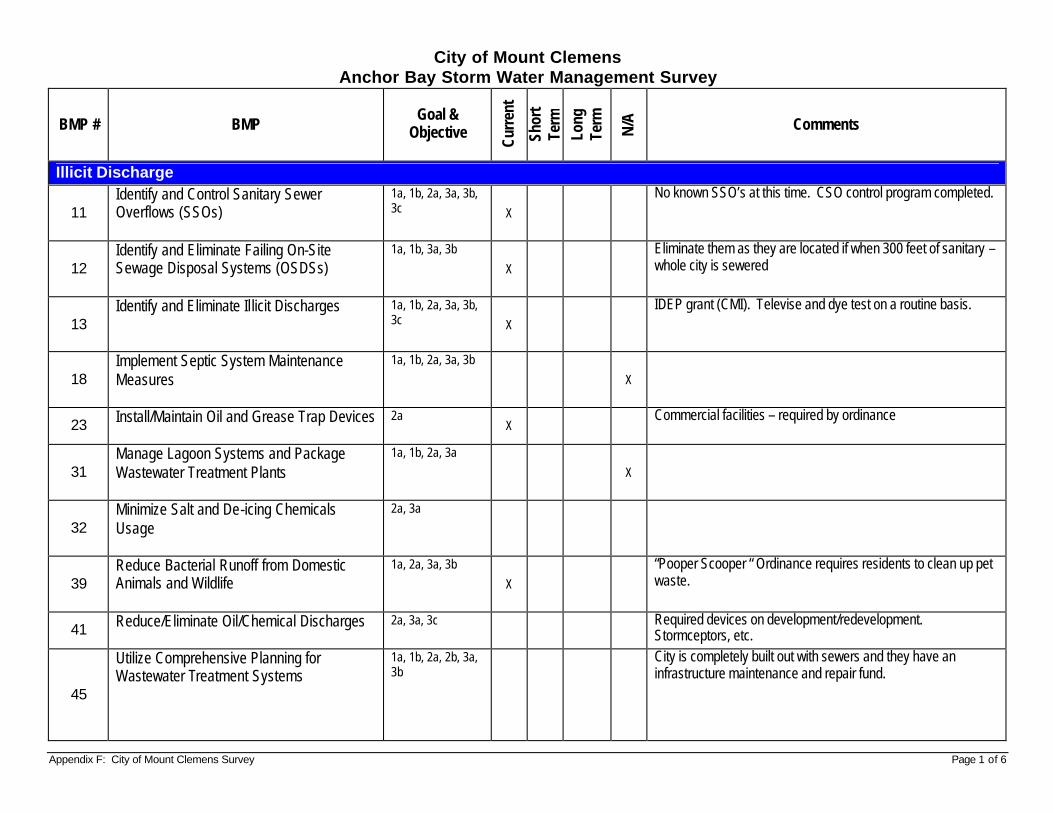
Appendix F: City of Mount Clemens Survey Page 1 of 6
City of Mount Clemens Anchor Bay Storm Water Management Survey
BMP # BMP Goal &
Objective
Curr
ent
Shor
t Te
rm
Long
Te
rm
N/A
Comments
Illicit Discharge
11 Identify and Control Sanitary Sewer Overflows (SSOs)
1a, 1b, 2a, 3a, 3b, 3c X
No known SSO’s at this time. CSO control program completed.
12 Identify and Eliminate Failing On-Site Sewage Disposal Systems (OSDSs)
1a, 1b, 3a, 3b
X
Eliminate them as they are located if when 300 feet of sanitary – whole city is sewered
13 Identify and Eliminate Illicit Discharges
1a, 1b, 2a, 3a, 3b, 3c X
IDEP grant (CMI). Televise and dye test on a routine basis.
18 Implement Septic System Maintenance Measures
1a, 1b, 2a, 3a, 3b
X
23 Install/Maintain Oil and Grease Trap Devices
2a X
Commercial facilities – required by ordinance
31 Manage Lagoon Systems and Package Wastewater Treatment Plants
1a, 1b, 2a, 3a
X
32 Minimize Salt and De-icing Chemicals Usage
2a, 3a
39 Reduce Bacterial Runoff from Domestic Animals and Wildlife
1a, 2a, 3a, 3b
X
“Pooper Scooper “ Ordinance requires residents to clean up pet waste.
41 Reduce/Eliminate Oil/Chemical Discharges
2a, 3a, 3c
Required devices on development/redevelopment. Stormceptors, etc.
45
Utilize Comprehensive Planning for Wastewater Treatment Systems
1a, 1b, 2a, 2b, 3a, 3b
City is completely built out with sewers and they have an infrastructure maintenance and repair fund.
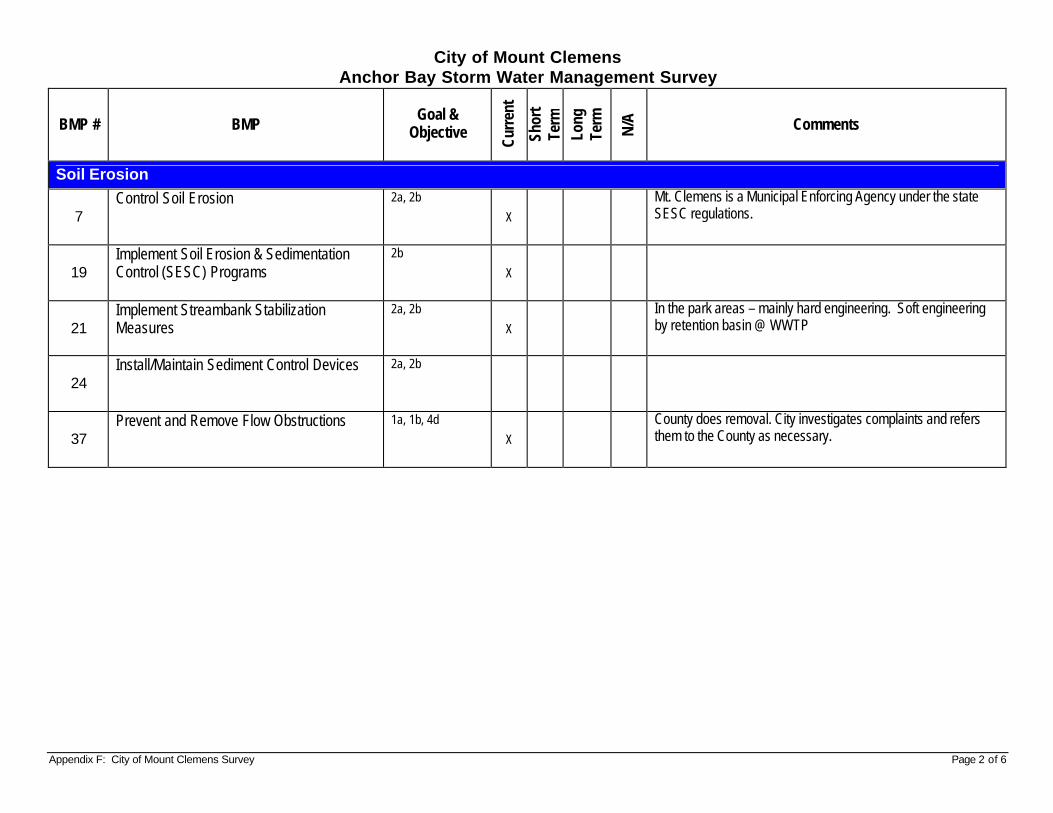
Appendix F: City of Mount Clemens Survey Page 2 of 6
City of Mount Clemens Anchor Bay Storm Water Management Survey
BMP # BMP Goal &
Objective
Curr
ent
Shor
t Te
rm
Long
Te
rm
N/A
Comments
Soil Erosion
7 Control Soil Erosion
2a, 2b
X
Mt. Clemens is a Municipal Enforcing Agency under the state SESC regulations.
19 Implement Soil Erosion & Sedimentation Control (SESC) Programs
2b
X
21 Implement Streambank Stabilization Measures
2a, 2b
X
In the park areas – mainly hard engineering. Soft engineering by retention basin @ WWTP
24 Install/Maintain Sediment Control Devices
2a, 2b
37 Prevent and Remove Flow Obstructions
1a, 1b, 4d
X
County does removal. City investigates complaints and refers them to the County as necessary.
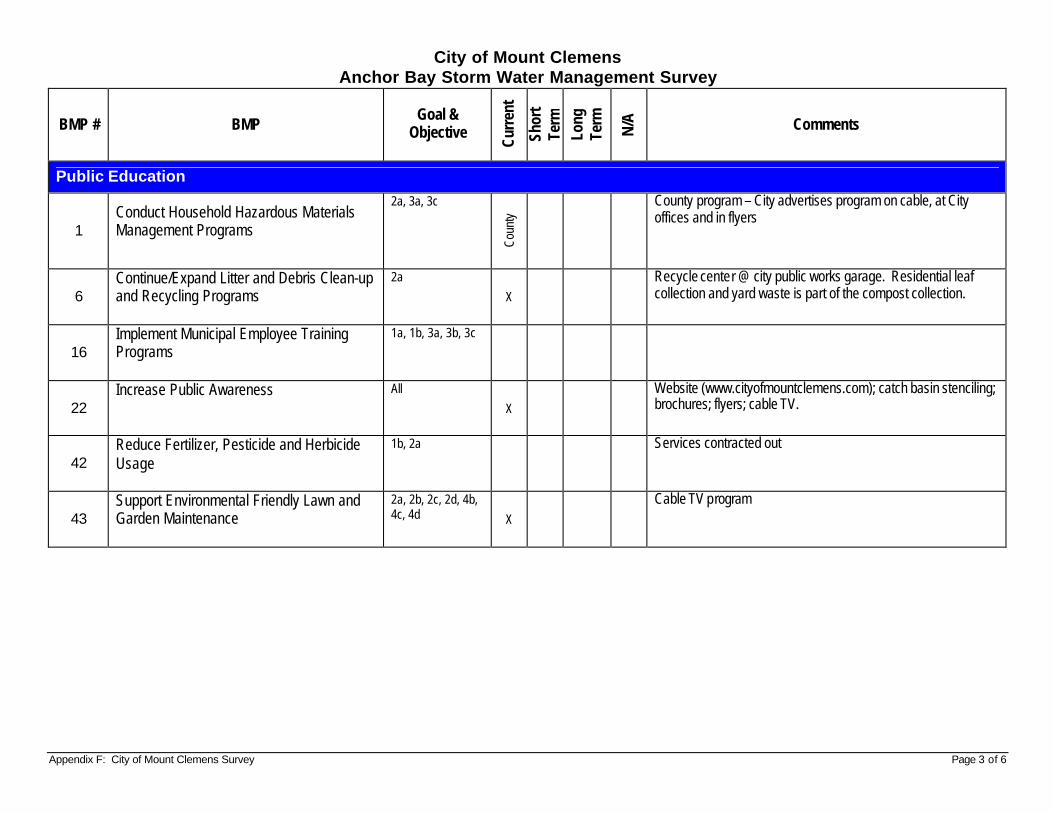
Appendix F: City of Mount Clemens Survey Page 3 of 6
City of Mount Clemens Anchor Bay Storm Water Management Survey
BMP # BMP Goal &
Objective
Curr
ent
Shor
t Te
rm
Long
Te
rm
N/A
Comments
Public Education
1 Conduct Household Hazardous Materials Management Programs
2a, 3a, 3c
Coun
ty
County program – City advertises program on cable, at City offices and in flyers
6 Continue/Expand Litter and Debris Clean-up and Recycling Programs
2a
X
Recycle center @ city public works garage. Residential leaf collection and yard waste is part of the compost collection.
16 Implement Municipal Employee Training Programs
1a, 1b, 3a, 3b, 3c
22 Increase Public Awareness
All
X
Website (www.cityofmountclemens.com); catch basin stenciling; brochures; flyers; cable TV.
42 Reduce Fertilizer, Pesticide and Herbicide Usage
1b, 2a
Services contracted out
43 Support Environmental Friendly Lawn and Garden Maintenance
2a, 2b, 2c, 2d, 4b, 4c, 4d X
Cable TV program
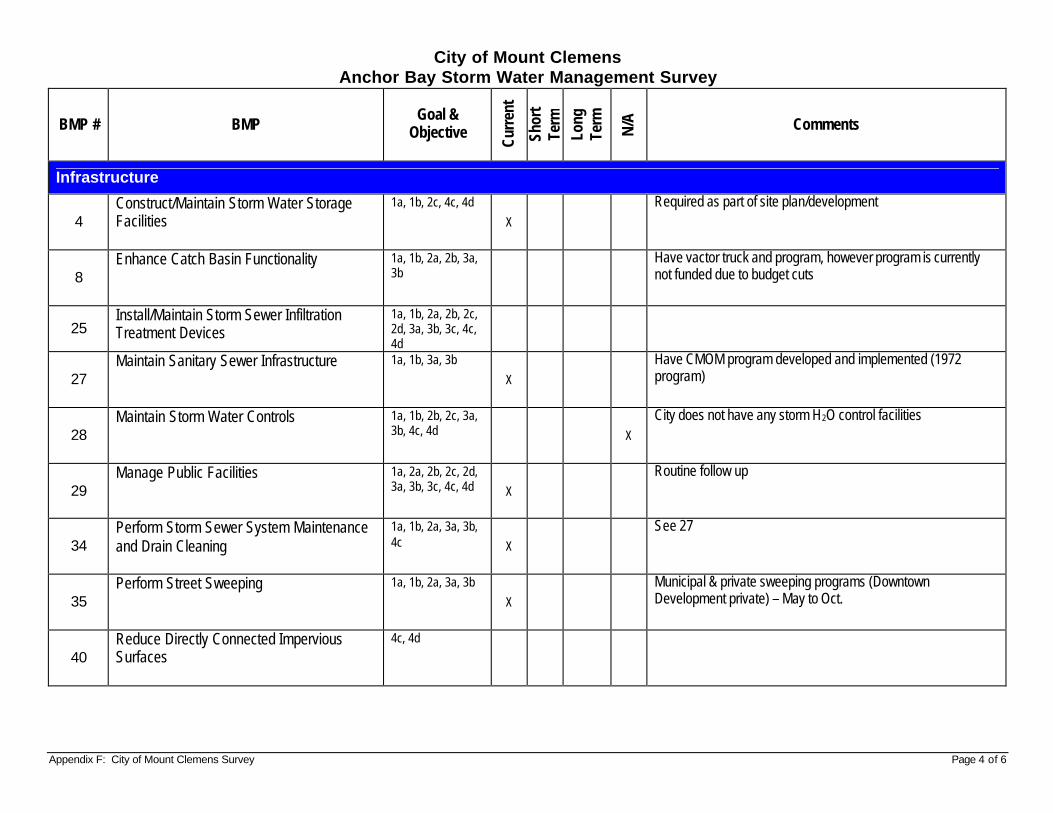
Appendix F: City of Mount Clemens Survey Page 4 of 6
City of Mount Clemens Anchor Bay Storm Water Management Survey
BMP # BMP Goal &
Objective
Curr
ent
Shor
t Te
rm
Long
Te
rm
N/A
Comments
Infrastructure
4 Construct/Maintain Storm Water Storage Facilities
1a, 1b, 2c, 4c, 4d
X
Required as part of site plan/development
8 Enhance Catch Basin Functionality
1a, 1b, 2a, 2b, 3a, 3b
Have vactor truck and program, however program is currently not funded due to budget cuts
25 Install/Maintain Storm Sewer Infiltration Treatment Devices
1a, 1b, 2a, 2b, 2c, 2d, 3a, 3b, 3c, 4c, 4d
27 Maintain Sanitary Sewer Infrastructure
1a, 1b, 3a, 3b
X
Have CMOM program developed and implemented (1972 program)
28 Maintain Storm Water Controls
1a, 1b, 2b, 2c, 3a, 3b, 4c, 4d X
City does not have any storm H2O control facilities
29 Manage Public Facilities
1a, 2a, 2b, 2c, 2d, 3a, 3b, 3c, 4c, 4d X
Routine follow up
34 Perform Storm Sewer System Maintenance and Drain Cleaning
1a, 1b, 2a, 3a, 3b, 4c X
See 27
35 Perform Street Sweeping
1a, 1b, 2a, 3a, 3b
X
Municipal & private sweeping programs (Downtown Development private) – May to Oct.
40 Reduce Directly Connected Impervious Surfaces
4c, 4d
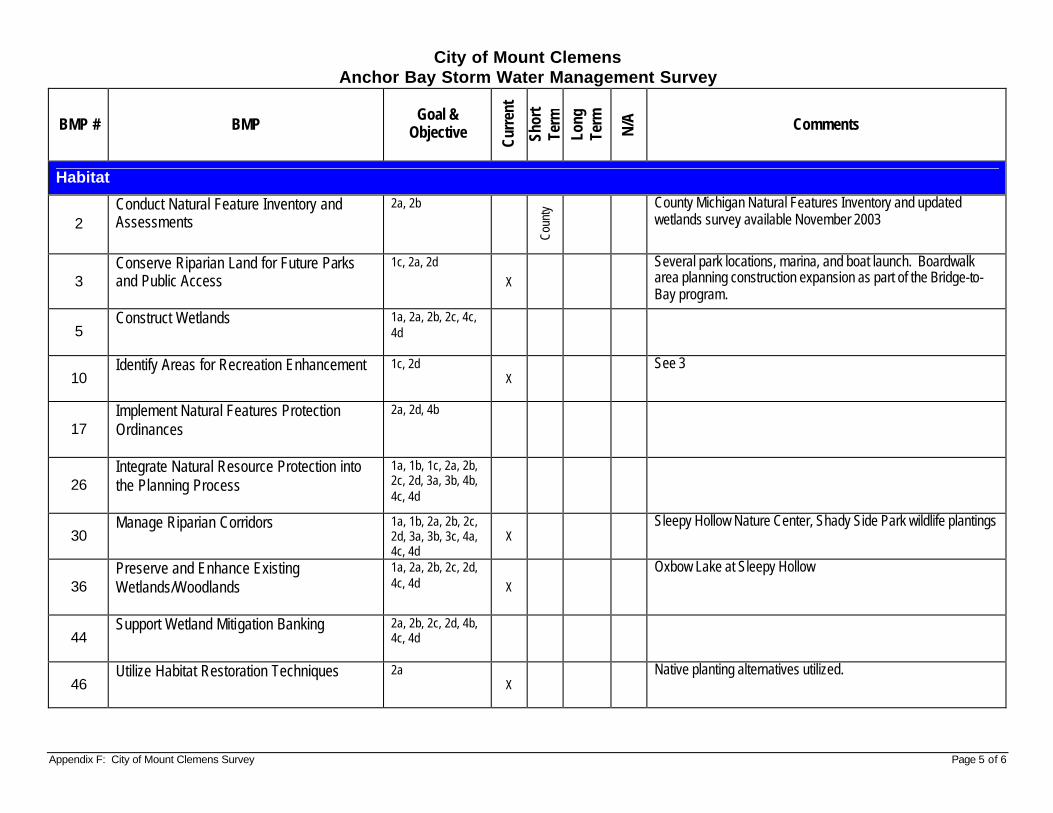
Appendix F: City of Mount Clemens Survey Page 5 of 6
City of Mount Clemens Anchor Bay Storm Water Management Survey
BMP # BMP Goal &
Objective
Curr
ent
Shor
t Te
rm
Long
Te
rm
N/A
Comments
Habitat
2 Conduct Natural Feature Inventory and Assessments
2a, 2b
Coun
ty
County Michigan Natural Features Inventory and updated wetlands survey available November 2003
3 Conserve Riparian Land for Future Parks and Public Access
1c, 2a, 2d
X
Several park locations, marina, and boat launch. Boardwalk area planning construction expansion as part of the Bridge-to-Bay program.
5 Construct Wetlands
1a, 2a, 2b, 2c, 4c, 4d
10 Identify Areas for Recreation Enhancement
1c, 2d X
See 3
17 Implement Natural Features Protection Ordinances
2a, 2d, 4b
26 Integrate Natural Resource Protection into the Planning Process
1a, 1b, 1c, 2a, 2b, 2c, 2d, 3a, 3b, 4b, 4c, 4d
30 Manage Riparian Corridors
1a, 1b, 2a, 2b, 2c, 2d, 3a, 3b, 3c, 4a, 4c, 4d
X Sleepy Hollow Nature Center, Shady Side Park wildlife plantings
36 Preserve and Enhance Existing Wetlands/Woodlands
1a, 2a, 2b, 2c, 2d, 4c, 4d X
Oxbow Lake at Sleepy Hollow
44 Support Wetland Mitigation Banking
2a, 2b, 2c, 2d, 4b, 4c, 4d
46 Utilize Habitat Restoration Techniques
2a X
Native planting alternatives utilized.
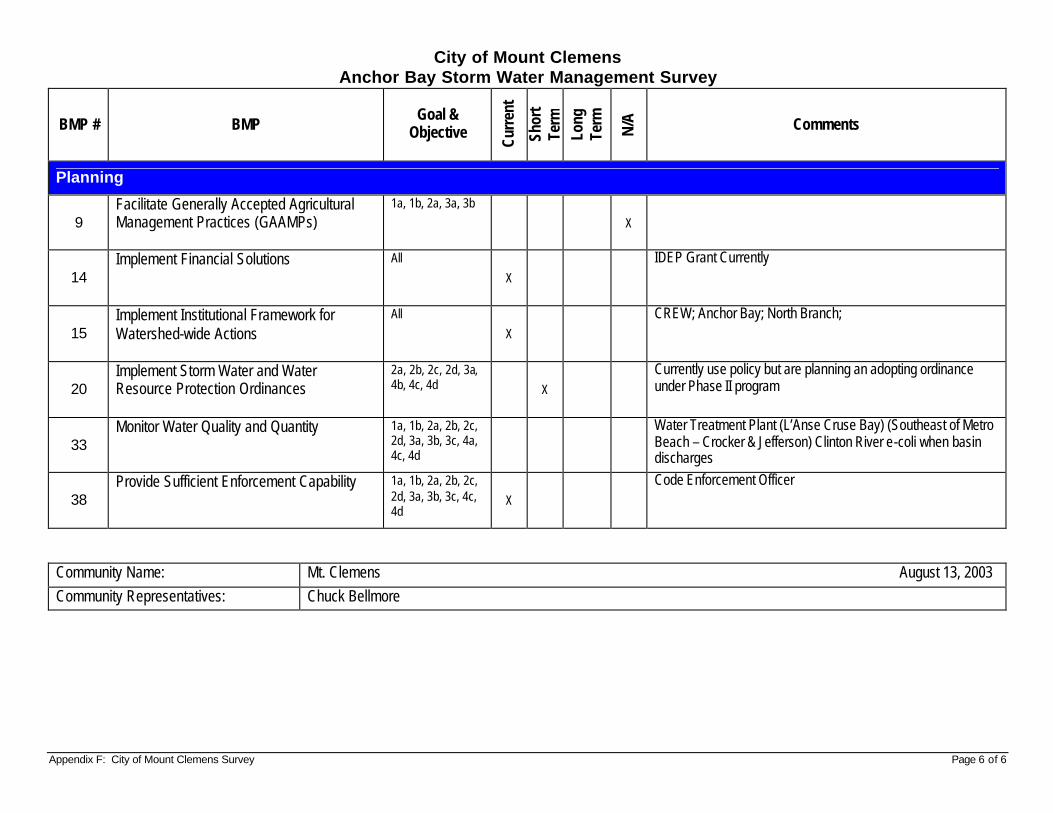
Appendix F: City of Mount Clemens Survey Page 6 of 6
City of Mount Clemens Anchor Bay Storm Water Management Survey
BMP # BMP Goal &
Objective
Curr
ent
Shor
t Te
rm
Long
Te
rm
N/A
Comments
Planning
9 Facilitate Generally Accepted Agricultural Management Practices (GAAMPs)
1a, 1b, 2a, 3a, 3b
X
14 Implement Financial Solutions
All
X
IDEP Grant Currently
15 Implement Institutional Framework for Watershed-wide Actions
All
X
CREW; Anchor Bay; North Branch;
20 Implement Storm Water and Water Resource Protection Ordinances
2a, 2b, 2c, 2d, 3a, 4b, 4c, 4d X
Currently use policy but are planning an adopting ordinance under Phase II program
33 Monitor Water Quality and Quantity
1a, 1b, 2a, 2b, 2c, 2d, 3a, 3b, 3c, 4a, 4c, 4d
Water Treatment Plant (L’Anse Cruse Bay) (Southeast of Metro Beach – Crocker & Jefferson) Clinton River e-coli when basin discharges
38 Provide Sufficient Enforcement Capability
1a, 1b, 2a, 2b, 2c, 2d, 3a, 3b, 3c, 4c, 4d
X
Code Enforcement Officer
Community Name: Mt. Clemens August 13, 2003 Community Representatives: Chuck Bellmore
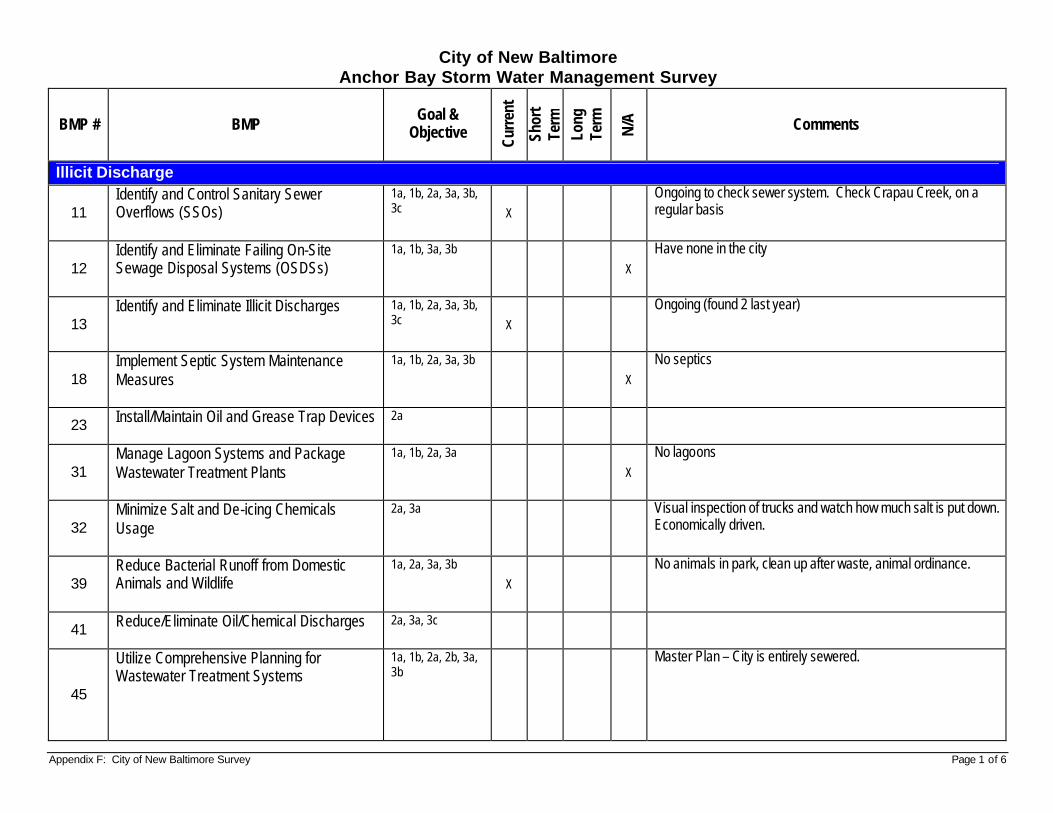
Appendix F: City of New Baltimore Survey Page 1 of 6
City of New Baltimore Anchor Bay Storm Water Management Survey
BMP # BMP Goal &
Objective
Curr
ent
Shor
t Te
rm
Long
Te
rm
N/A
Comments
Illicit Discharge
11 Identify and Control Sanitary Sewer Overflows (SSOs)
1a, 1b, 2a, 3a, 3b, 3c X
Ongoing to check sewer system. Check Crapau Creek, on a regular basis
12 Identify and Eliminate Failing On-Site Sewage Disposal Systems (OSDSs)
1a, 1b, 3a, 3b
X
Have none in the city
13 Identify and Eliminate Illicit Discharges
1a, 1b, 2a, 3a, 3b, 3c X
Ongoing (found 2 last year)
18 Implement Septic System Maintenance Measures
1a, 1b, 2a, 3a, 3b
X
No septics
23 Install/Maintain Oil and Grease Trap Devices
2a
31 Manage Lagoon Systems and Package Wastewater Treatment Plants
1a, 1b, 2a, 3a
X
No lagoons
32 Minimize Salt and De-icing Chemicals Usage
2a, 3a
Visual inspection of trucks and watch how much salt is put down. Economically driven.
39 Reduce Bacterial Runoff from Domestic Animals and Wildlife
1a, 2a, 3a, 3b
X
No animals in park, clean up after waste, animal ordinance.
41 Reduce/Eliminate Oil/Chemical Discharges
2a, 3a, 3c
45
Utilize Comprehensive Planning for Wastewater Treatment Systems
1a, 1b, 2a, 2b, 3a, 3b
Master Plan – City is entirely sewered.
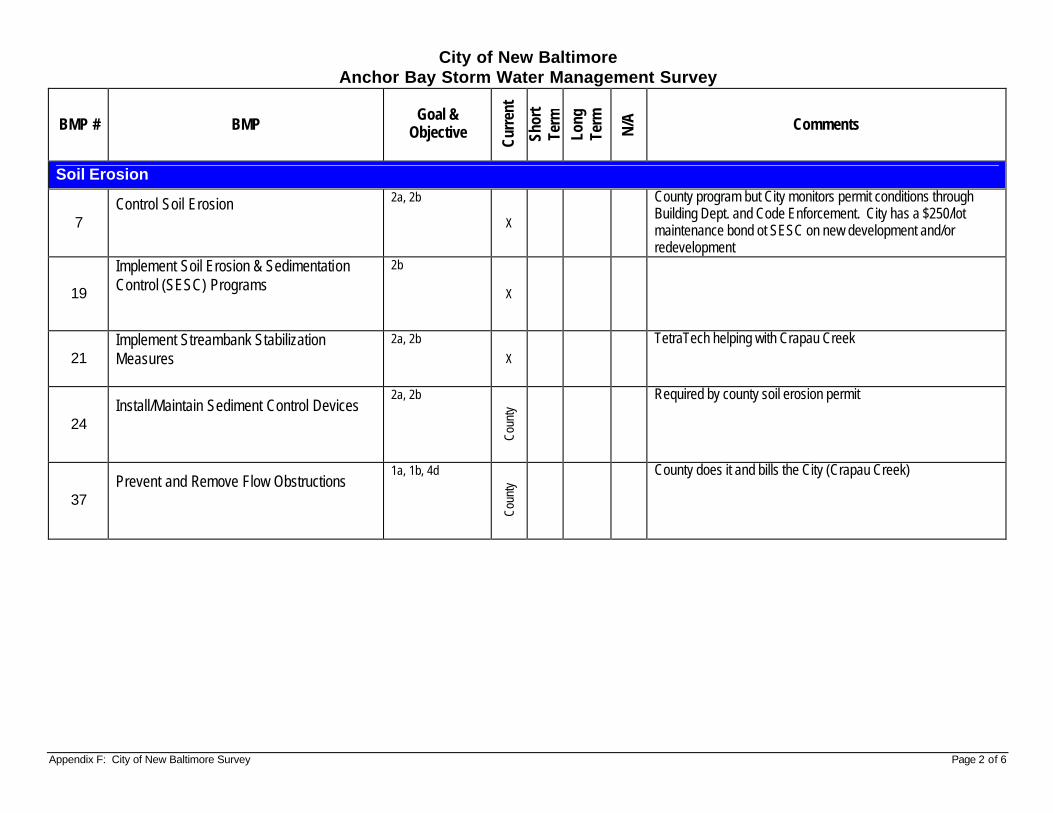
Appendix F: City of New Baltimore Survey Page 2 of 6
City of New Baltimore Anchor Bay Storm Water Management Survey
BMP # BMP Goal &
Objective
Curr
ent
Shor
t Te
rm
Long
Te
rm
N/A
Comments
Soil Erosion
7 Control Soil Erosion
2a, 2b
X
County program but City monitors permit conditions through Building Dept. and Code Enforcement. City has a $250/lot maintenance bond ot SESC on new development and/or redevelopment
19
Implement Soil Erosion & Sedimentation Control (SESC) Programs
2b
X
21 Implement Streambank Stabilization Measures
2a, 2b
X
TetraTech helping with Crapau Creek
24 Install/Maintain Sediment Control Devices
2a, 2b
Coun
ty
Required by county soil erosion permit
37 Prevent and Remove Flow Obstructions
1a, 1b, 4d
Coun
ty
County does it and bills the City (Crapau Creek)
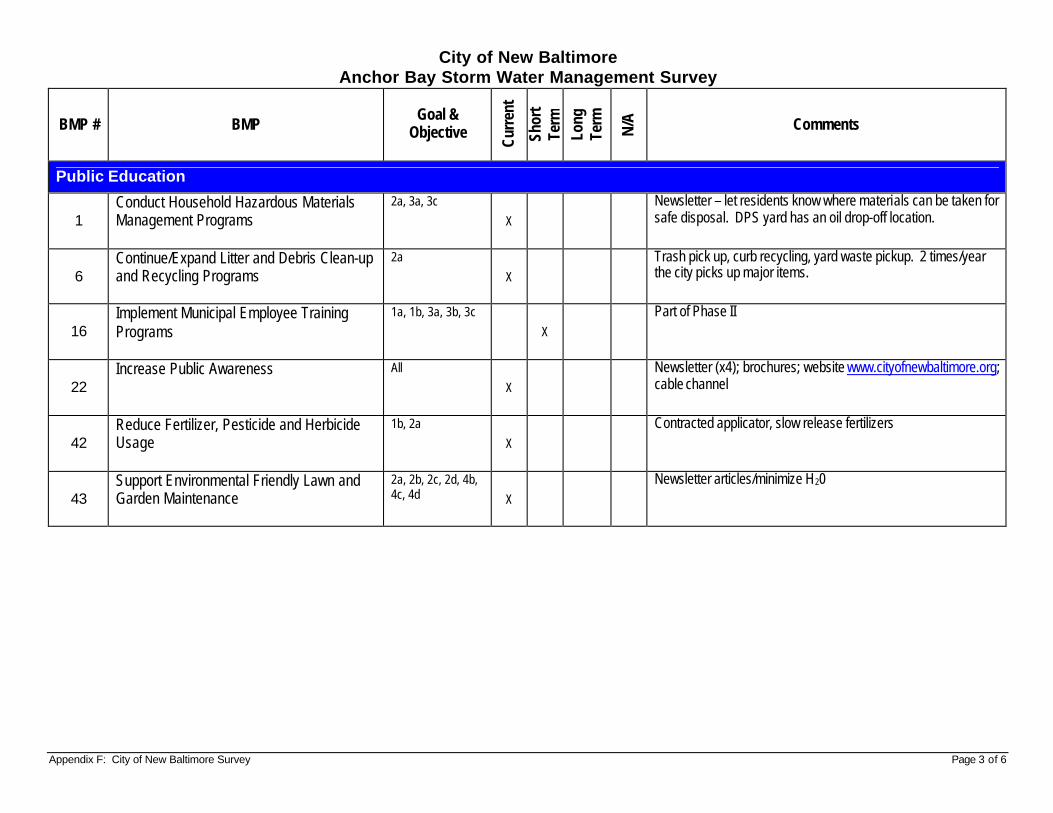
Appendix F: City of New Baltimore Survey Page 3 of 6
City of New Baltimore Anchor Bay Storm Water Management Survey
BMP # BMP Goal &
Objective
Curr
ent
Shor
t Te
rm
Long
Te
rm
N/A
Comments
Public Education
1 Conduct Household Hazardous Materials Management Programs
2a, 3a, 3c
X
Newsletter – let residents know where materials can be taken for safe disposal. DPS yard has an oil drop-off location.
6 Continue/Expand Litter and Debris Clean-up and Recycling Programs
2a
X
Trash pick up, curb recycling, yard waste pickup. 2 times/year the city picks up major items.
16 Implement Municipal Employee Training Programs
1a, 1b, 3a, 3b, 3c
X
Part of Phase II
22 Increase Public Awareness
All
X
Newsletter (x4); brochures; website www.cityofnewbaltimore.org; cable channel
42 Reduce Fertilizer, Pesticide and Herbicide Usage
1b, 2a
X
Contracted applicator, slow release fertilizers
43 Support Environmental Friendly Lawn and Garden Maintenance
2a, 2b, 2c, 2d, 4b, 4c, 4d X
Newsletter articles/minimize H20
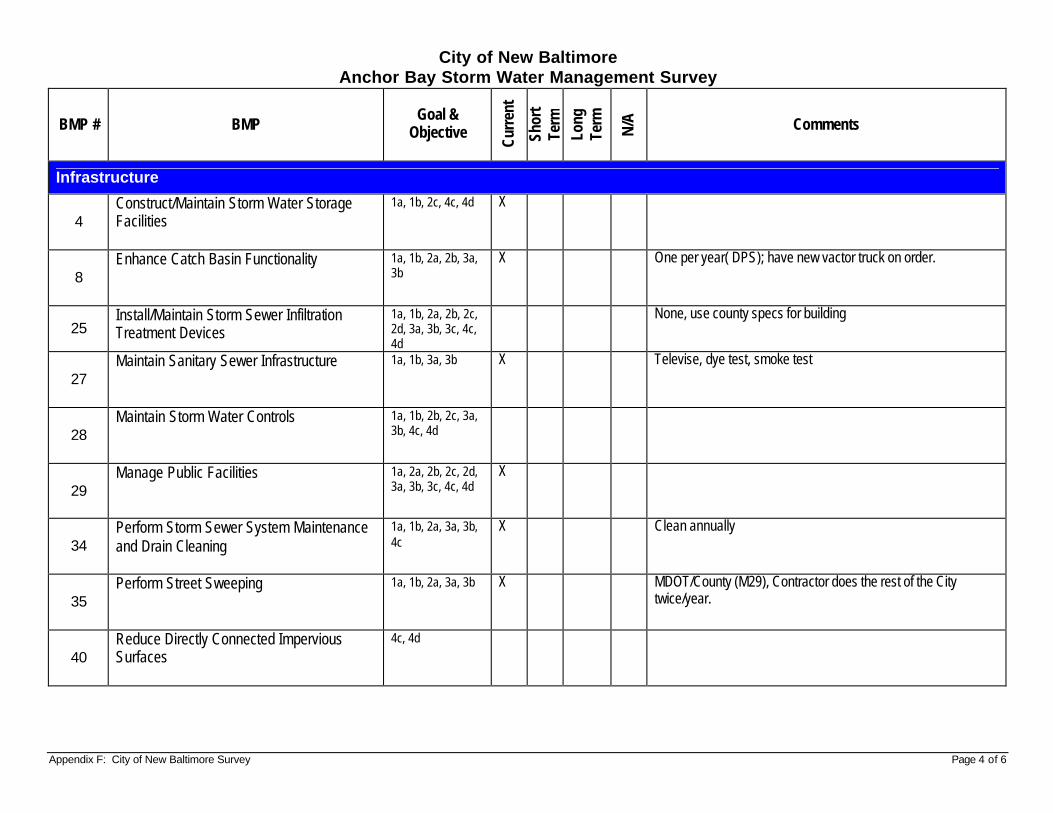
Appendix F: City of New Baltimore Survey Page 4 of 6
City of New Baltimore Anchor Bay Storm Water Management Survey
BMP # BMP Goal &
Objective
Curr
ent
Shor
t Te
rm
Long
Te
rm
N/A
Comments
Infrastructure
4 Construct/Maintain Storm Water Storage Facilities
1a, 1b, 2c, 4c, 4d X
8 Enhance Catch Basin Functionality
1a, 1b, 2a, 2b, 3a, 3b
X One per year( DPS); have new vactor truck on order.
25 Install/Maintain Storm Sewer Infiltration Treatment Devices
1a, 1b, 2a, 2b, 2c, 2d, 3a, 3b, 3c, 4c, 4d
None, use county specs for building
27 Maintain Sanitary Sewer Infrastructure
1a, 1b, 3a, 3b X Televise, dye test, smoke test
28 Maintain Storm Water Controls
1a, 1b, 2b, 2c, 3a, 3b, 4c, 4d
29 Manage Public Facilities
1a, 2a, 2b, 2c, 2d, 3a, 3b, 3c, 4c, 4d
X
34 Perform Storm Sewer System Maintenance and Drain Cleaning
1a, 1b, 2a, 3a, 3b, 4c
X Clean annually
35 Perform Street Sweeping
1a, 1b, 2a, 3a, 3b X MDOT/County (M29), Contractor does the rest of the City twice/year.
40 Reduce Directly Connected Impervious Surfaces
4c, 4d
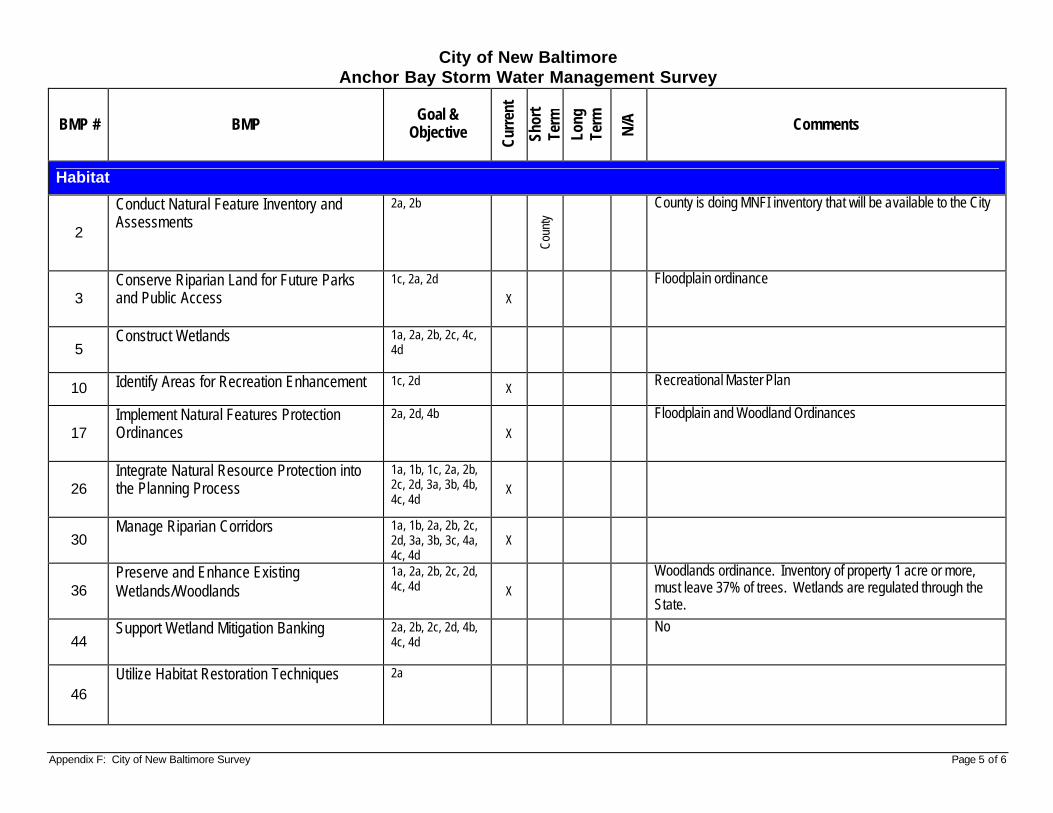
Appendix F: City of New Baltimore Survey Page 5 of 6
City of New Baltimore Anchor Bay Storm Water Management Survey
BMP # BMP Goal &
Objective
Curr
ent
Shor
t Te
rm
Long
Te
rm
N/A
Comments
Habitat
2
Conduct Natural Feature Inventory and Assessments
2a, 2b
Coun
ty
County is doing MNFI inventory that will be available to the City
3 Conserve Riparian Land for Future Parks and Public Access
1c, 2a, 2d
X
Floodplain ordinance
5 Construct Wetlands
1a, 2a, 2b, 2c, 4c, 4d
10 Identify Areas for Recreation Enhancement
1c, 2d X
Recreational Master Plan
17 Implement Natural Features Protection Ordinances
2a, 2d, 4b
X
Floodplain and Woodland Ordinances
26 Integrate Natural Resource Protection into the Planning Process
1a, 1b, 1c, 2a, 2b, 2c, 2d, 3a, 3b, 4b, 4c, 4d
X
30 Manage Riparian Corridors 1a, 1b, 2a, 2b, 2c,
2d, 3a, 3b, 3c, 4a, 4c, 4d
X
36 Preserve and Enhance Existing Wetlands/Woodlands
1a, 2a, 2b, 2c, 2d, 4c, 4d X
Woodlands ordinance. Inventory of property 1 acre or more, must leave 37% of trees. Wetlands are regulated through the State.
44 Support Wetland Mitigation Banking
2a, 2b, 2c, 2d, 4b, 4c, 4d
No
46 Utilize Habitat Restoration Techniques
2a
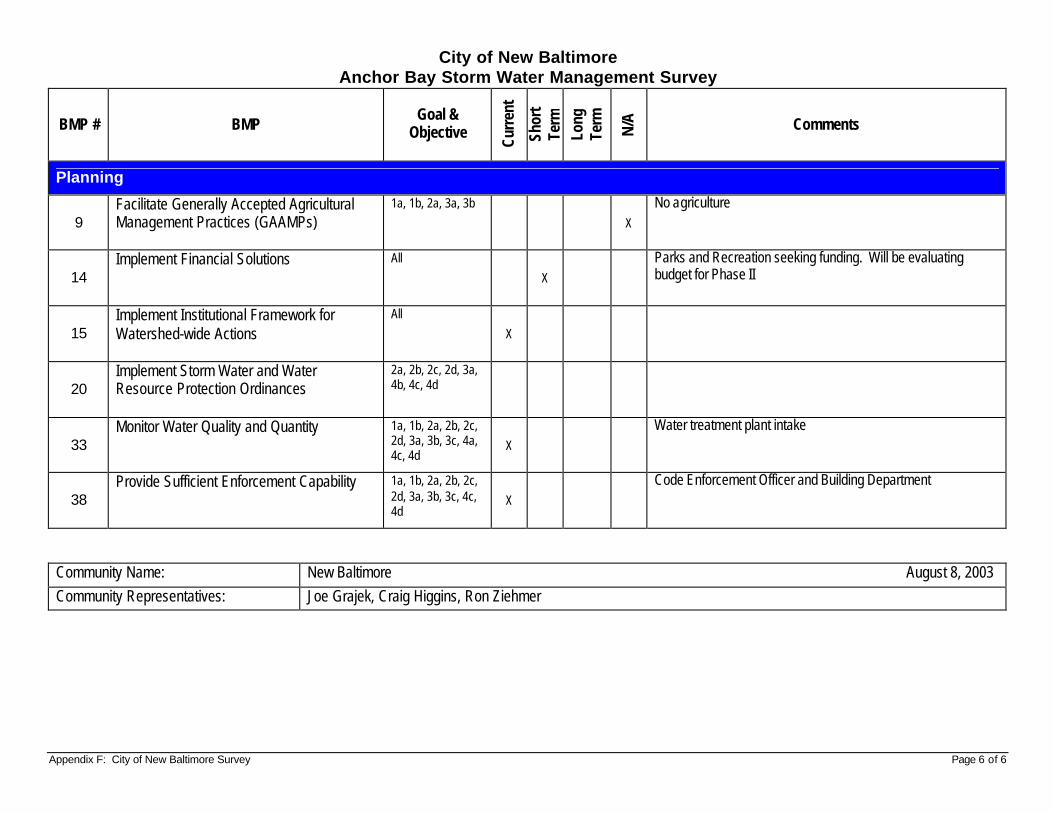
Appendix F: City of New Baltimore Survey Page 6 of 6
City of New Baltimore Anchor Bay Storm Water Management Survey
BMP # BMP Goal &
Objective
Curr
ent
Shor
t Te
rm
Long
Te
rm
N/A
Comments
Planning
9 Facilitate Generally Accepted Agricultural Management Practices (GAAMPs)
1a, 1b, 2a, 3a, 3b
X
No agriculture
14 Implement Financial Solutions
All
X
Parks and Recreation seeking funding. Will be evaluating budget for Phase II
15 Implement Institutional Framework for Watershed-wide Actions
All
X
20 Implement Storm Water and Water Resource Protection Ordinances
2a, 2b, 2c, 2d, 3a, 4b, 4c, 4d
33 Monitor Water Quality and Quantity
1a, 1b, 2a, 2b, 2c, 2d, 3a, 3b, 3c, 4a, 4c, 4d
X
Water treatment plant intake
38 Provide Sufficient Enforcement Capability
1a, 1b, 2a, 2b, 2c, 2d, 3a, 3b, 3c, 4c, 4d
X
Code Enforcement Officer and Building Department
Community Name: New Baltimore August 8, 2003 Community Representatives: Joe Grajek, Craig Higgins, Ron Ziehmer
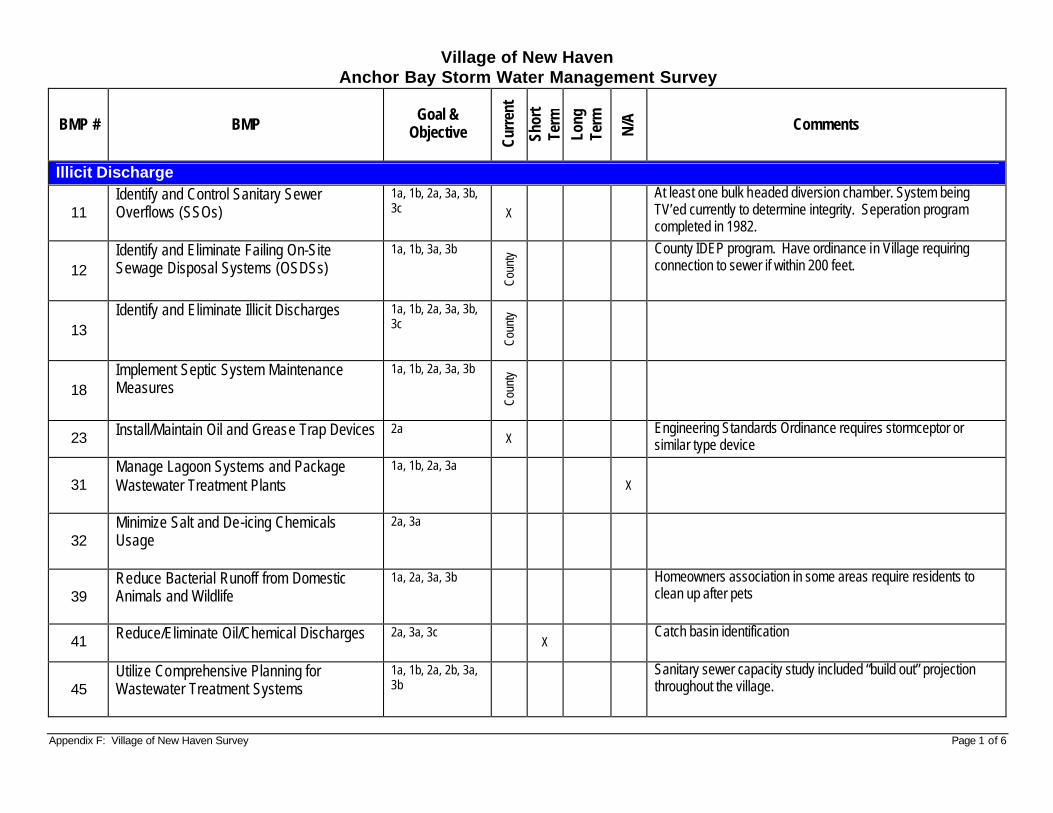
Appendix F: Village of New Haven Survey Page 1 of 6
Village of New Haven Anchor Bay Storm Water Management Survey
BMP # BMP Goal &
Objective
Curr
ent
Shor
t Te
rm
Long
Te
rm
N/A
Comments
Illicit Discharge
11 Identify and Control Sanitary Sewer Overflows (SSOs)
1a, 1b, 2a, 3a, 3b, 3c X
At least one bulk headed diversion chamber. System being TV’ed currently to determine integrity. Seperation program completed in 1982.
12 Identify and Eliminate Failing On-Site Sewage Disposal Systems (OSDSs)
1a, 1b, 3a, 3b
Coun
ty
County IDEP program. Have ordinance in Village requiring connection to sewer if within 200 feet.
13 Identify and Eliminate Illicit Discharges
1a, 1b, 2a, 3a, 3b, 3c
Coun
ty
18 Implement Septic System Maintenance Measures
1a, 1b, 2a, 3a, 3b
Coun
ty
23 Install/Maintain Oil and Grease Trap Devices
2a X
Engineering Standards Ordinance requires stormceptor or similar type device
31 Manage Lagoon Systems and Package Wastewater Treatment Plants
1a, 1b, 2a, 3a
X
32 Minimize Salt and De-icing Chemicals Usage
2a, 3a
39 Reduce Bacterial Runoff from Domestic Animals and Wildlife
1a, 2a, 3a, 3b
Homeowners association in some areas require residents to clean up after pets
41 Reduce/Eliminate Oil/Chemical Discharges
2a, 3a, 3c X
Catch basin identification
45 Utilize Comprehensive Planning for Wastewater Treatment Systems
1a, 1b, 2a, 2b, 3a, 3b
Sanitary sewer capacity study included “build out” projection throughout the village.
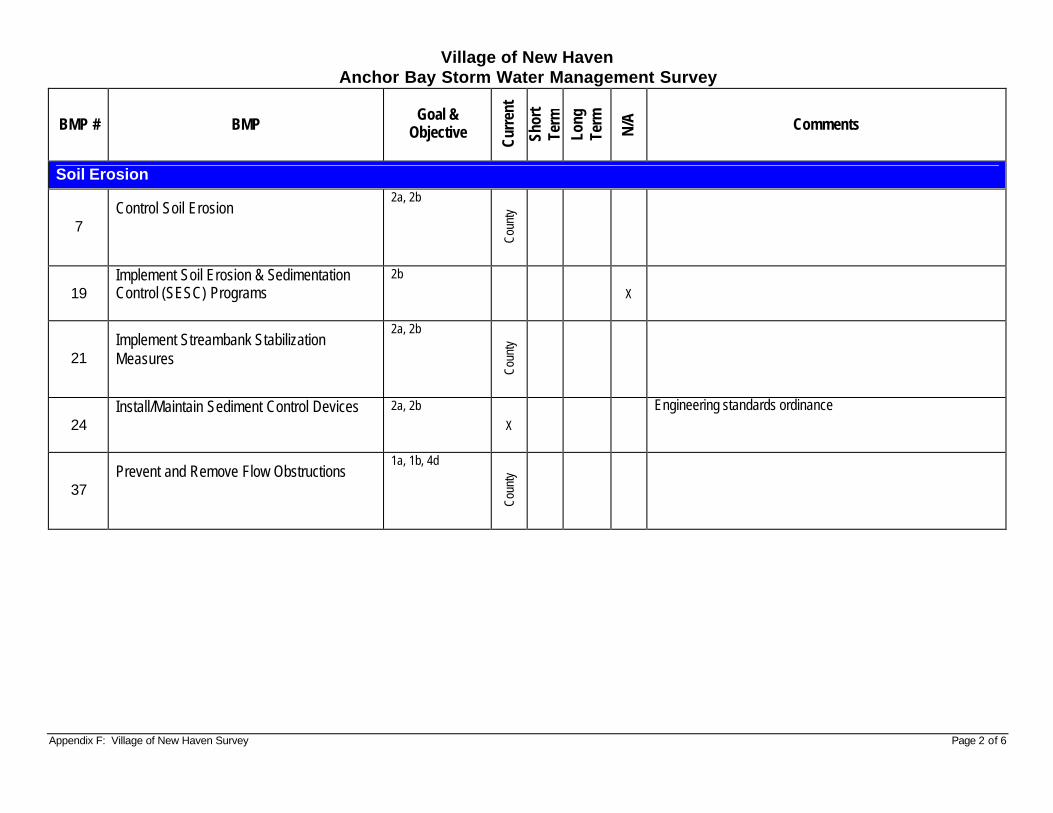
Appendix F: Village of New Haven Survey Page 2 of 6
Village of New Haven Anchor Bay Storm Water Management Survey
BMP # BMP Goal &
Objective
Curr
ent
Shor
t Te
rm
Long
Te
rm
N/A
Comments
Soil Erosion
7 Control Soil Erosion
2a, 2b
Coun
ty
19 Implement Soil Erosion & Sedimentation Control (SESC) Programs
2b
X
21 Implement Streambank Stabilization Measures
2a, 2b
Coun
ty
24 Install/Maintain Sediment Control Devices
2a, 2b
X
Engineering standards ordinance
37 Prevent and Remove Flow Obstructions
1a, 1b, 4d
Coun
ty
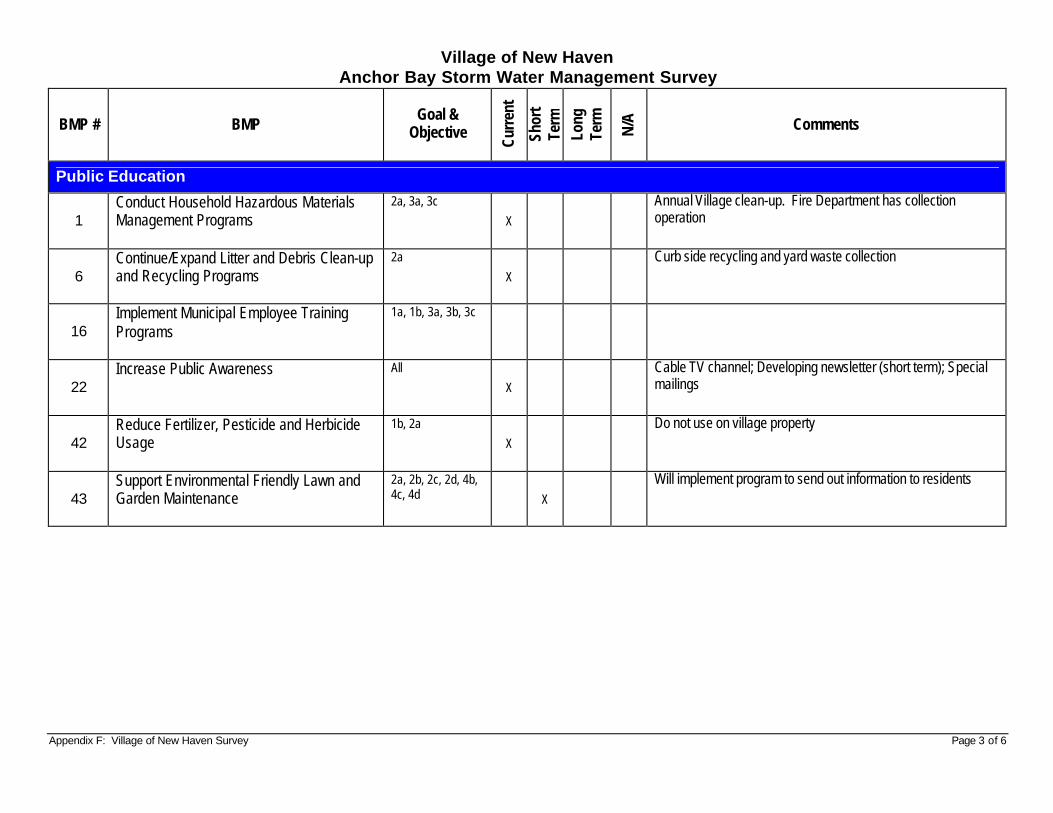
Appendix F: Village of New Haven Survey Page 3 of 6
Village of New Haven Anchor Bay Storm Water Management Survey
BMP # BMP Goal &
Objective
Curr
ent
Shor
t Te
rm
Long
Te
rm
N/A
Comments
Public Education
1 Conduct Household Hazardous Materials Management Programs
2a, 3a, 3c
X
Annual Village clean-up. Fire Department has collection operation
6 Continue/Expand Litter and Debris Clean-up and Recycling Programs
2a
X
Curb side recycling and yard waste collection
16 Implement Municipal Employee Training Programs
1a, 1b, 3a, 3b, 3c
22 Increase Public Awareness
All
X
Cable TV channel; Developing newsletter (short term); Special mailings
42 Reduce Fertilizer, Pesticide and Herbicide Usage
1b, 2a
X
Do not use on village property
43 Support Environmental Friendly Lawn and Garden Maintenance
2a, 2b, 2c, 2d, 4b, 4c, 4d X
Will implement program to send out information to residents
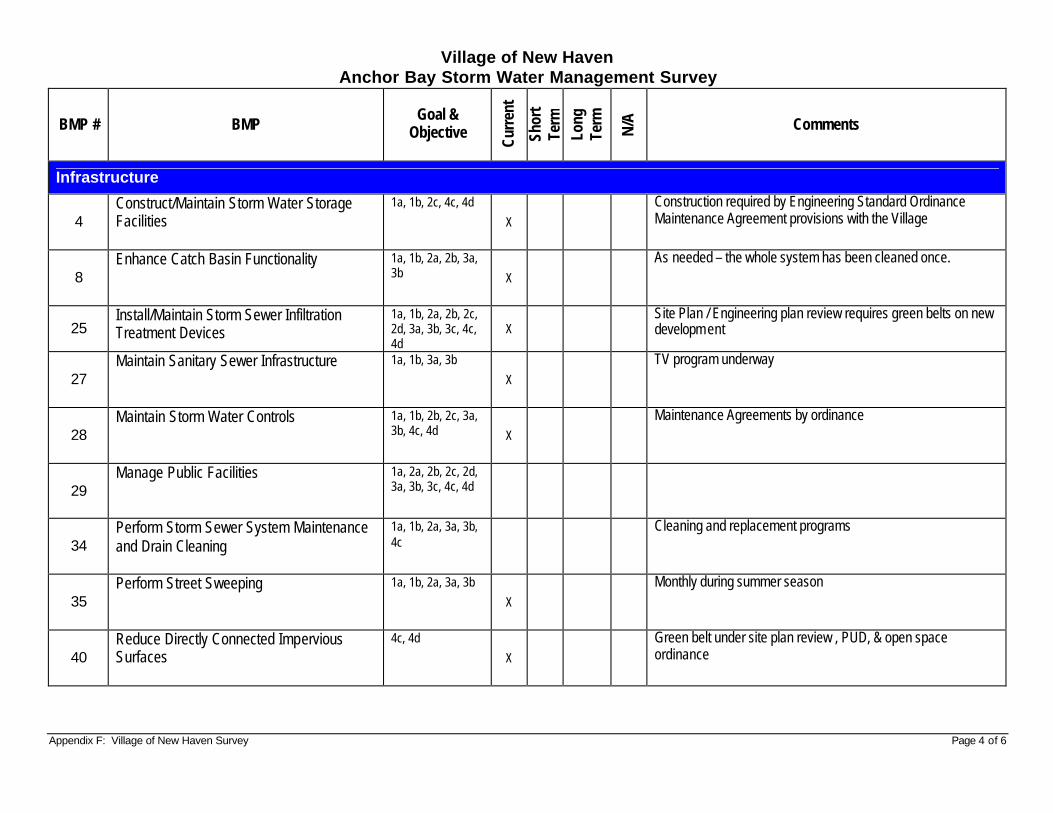
Appendix F: Village of New Haven Survey Page 4 of 6
Village of New Haven Anchor Bay Storm Water Management Survey
BMP # BMP Goal &
Objective
Curr
ent
Shor
t Te
rm
Long
Te
rm
N/A
Comments
Infrastructure
4 Construct/Maintain Storm Water Storage Facilities
1a, 1b, 2c, 4c, 4d
X
Construction required by Engineering Standard Ordinance Maintenance Agreement provisions with the Village
8 Enhance Catch Basin Functionality
1a, 1b, 2a, 2b, 3a, 3b X
As needed – the whole system has been cleaned once.
25 Install/Maintain Storm Sewer Infiltration Treatment Devices
1a, 1b, 2a, 2b, 2c, 2d, 3a, 3b, 3c, 4c, 4d
X Site Plan / Engineering plan review requires green belts on new development
27 Maintain Sanitary Sewer Infrastructure
1a, 1b, 3a, 3b
X
TV program underway
28 Maintain Storm Water Controls
1a, 1b, 2b, 2c, 3a, 3b, 4c, 4d X
Maintenance Agreements by ordinance
29 Manage Public Facilities
1a, 2a, 2b, 2c, 2d, 3a, 3b, 3c, 4c, 4d
34 Perform Storm Sewer System Maintenance and Drain Cleaning
1a, 1b, 2a, 3a, 3b, 4c
Cleaning and replacement programs
35 Perform Street Sweeping
1a, 1b, 2a, 3a, 3b
X
Monthly during summer season
40 Reduce Directly Connected Impervious Surfaces
4c, 4d
X
Green belt under site plan review , PUD, & open space ordinance
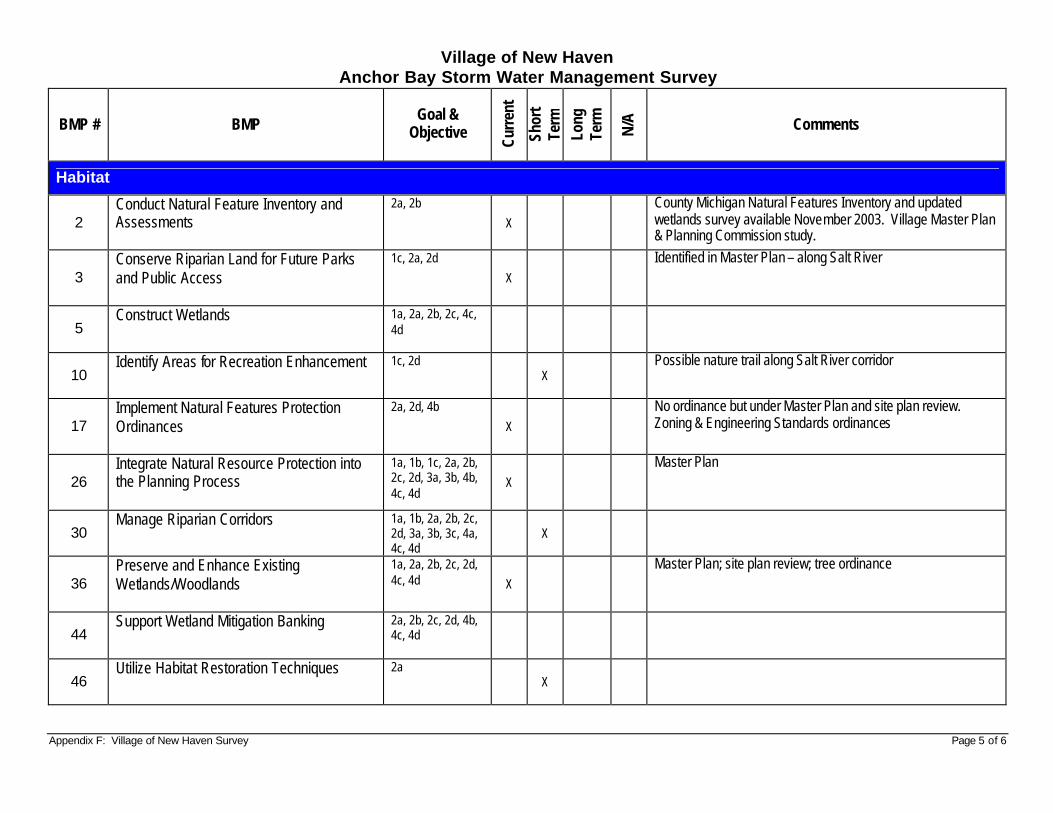
Appendix F: Village of New Haven Survey Page 5 of 6
Village of New Haven Anchor Bay Storm Water Management Survey
BMP # BMP Goal &
Objective
Curr
ent
Shor
t Te
rm
Long
Te
rm
N/A
Comments
Habitat
2 Conduct Natural Feature Inventory and Assessments
2a, 2b
X
County Michigan Natural Features Inventory and updated wetlands survey available November 2003. Village Master Plan & Planning Commission study.
3 Conserve Riparian Land for Future Parks and Public Access
1c, 2a, 2d
X
Identified in Master Plan – along Salt River
5 Construct Wetlands
1a, 2a, 2b, 2c, 4c, 4d
10 Identify Areas for Recreation Enhancement
1c, 2d X
Possible nature trail along Salt River corridor
17 Implement Natural Features Protection Ordinances
2a, 2d, 4b
X
No ordinance but under Master Plan and site plan review. Zoning & Engineering Standards ordinances
26 Integrate Natural Resource Protection into the Planning Process
1a, 1b, 1c, 2a, 2b, 2c, 2d, 3a, 3b, 4b, 4c, 4d
X
Master Plan
30 Manage Riparian Corridors
1a, 1b, 2a, 2b, 2c, 2d, 3a, 3b, 3c, 4a, 4c, 4d
X
36 Preserve and Enhance Existing Wetlands/Woodlands
1a, 2a, 2b, 2c, 2d, 4c, 4d X
Master Plan; site plan review; tree ordinance
44 Support Wetland Mitigation Banking
2a, 2b, 2c, 2d, 4b, 4c, 4d
46 Utilize Habitat Restoration Techniques
2a X
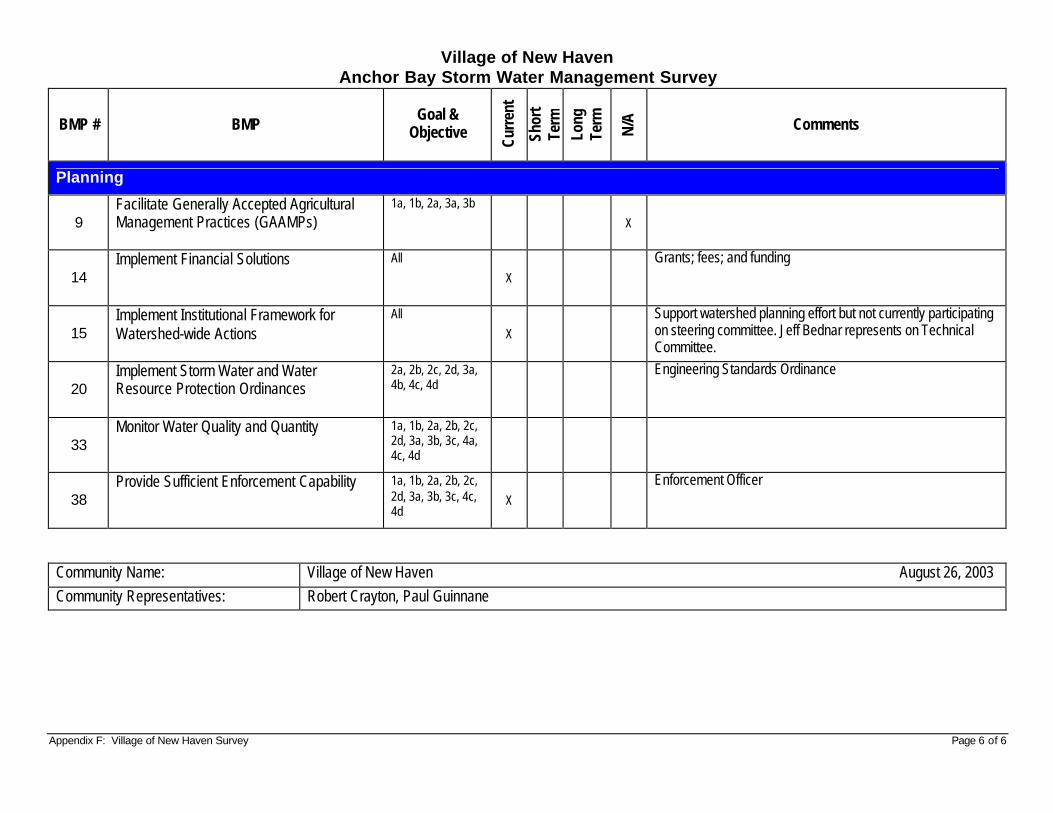
Appendix F: Village of New Haven Survey Page 6 of 6
Village of New Haven Anchor Bay Storm Water Management Survey
BMP # BMP Goal &
Objective
Curr
ent
Shor
t Te
rm
Long
Te
rm
N/A
Comments
Planning
9 Facilitate Generally Accepted Agricultural Management Practices (GAAMPs)
1a, 1b, 2a, 3a, 3b
X
14 Implement Financial Solutions
All
X
Grants; fees; and funding
15 Implement Institutional Framework for Watershed-wide Actions
All
X
Support watershed planning effort but not currently participating on steering committee. Jeff Bednar represents on Technical Committee.
20 Implement Storm Water and Water Resource Protection Ordinances
2a, 2b, 2c, 2d, 3a, 4b, 4c, 4d
Engineering Standards Ordinance
33 Monitor Water Quality and Quantity
1a, 1b, 2a, 2b, 2c, 2d, 3a, 3b, 3c, 4a, 4c, 4d
38 Provide Sufficient Enforcement Capability
1a, 1b, 2a, 2b, 2c, 2d, 3a, 3b, 3c, 4c, 4d
X
Enforcement Officer
Community Name: Village of New Haven August 26, 2003 Community Representatives: Robert Crayton, Paul Guinnane
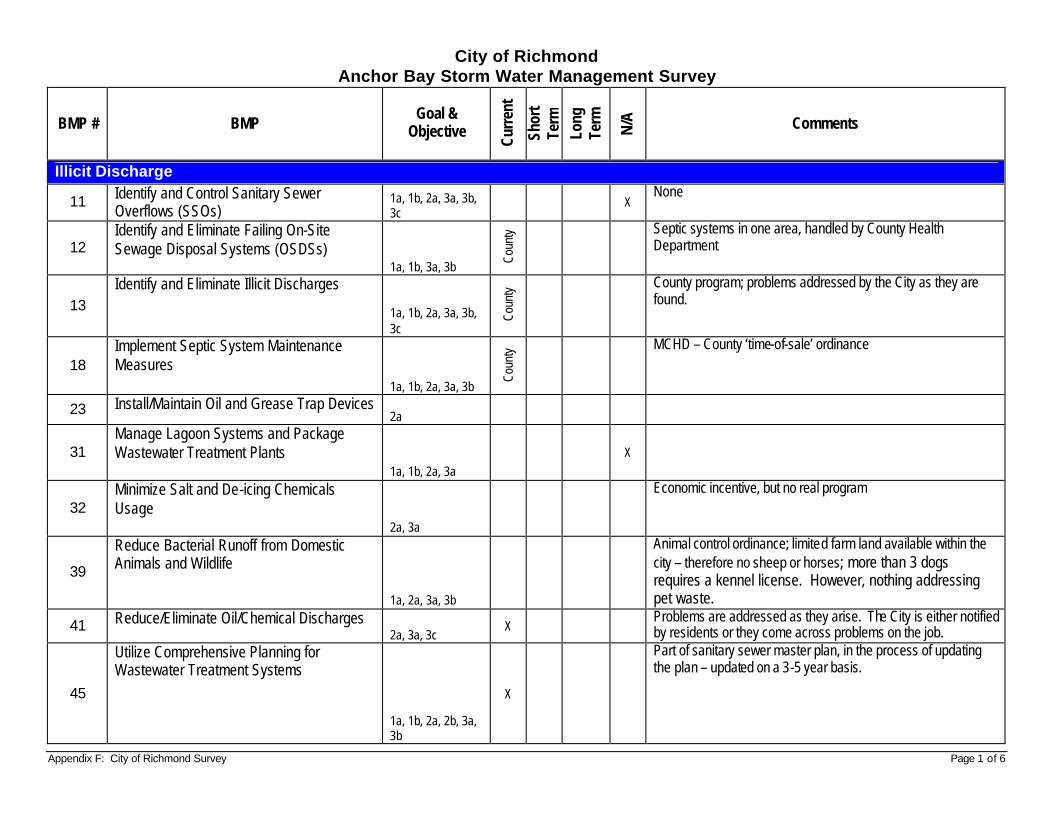
Appendix F: City of Richmond Survey Page 1 of 6
City of Richmond Anchor Bay Storm Water Management Survey
BMP # BMP Goal &
Objective
Curr
ent
Shor
t Te
rm
Long
Te
rm
N/A
Comments
Illicit Discharge
11 Identify and Control Sanitary Sewer Overflows (SSOs)
1a, 1b, 2a, 3a, 3b, 3c
X None
12 Identify and Eliminate Failing On-Site Sewage Disposal Systems (OSDSs)
1a, 1b, 3a, 3b
Coun
ty
Septic systems in one area, handled by County Health Department
13 Identify and Eliminate Illicit Discharges
1a, 1b, 2a, 3a, 3b, 3c
Coun
ty
County program; problems addressed by the City as they are found.
18 Implement Septic System Maintenance Measures
1a, 1b, 2a, 3a, 3b
Coun
ty
MCHD – County ‘time-of-sale’ ordinance
23 Install/Maintain Oil and Grease Trap Devices 2a
31 Manage Lagoon Systems and Package Wastewater Treatment Plants 1a, 1b, 2a, 3a
X
32 Minimize Salt and De-icing Chemicals Usage 2a, 3a
Economic incentive, but no real program
39
Reduce Bacterial Runoff from Domestic Animals and Wildlife
1a, 2a, 3a, 3b
Animal control ordinance; limited farm land available within the city – therefore no sheep or horses; more than 3 dogs requires a kennel license. However, nothing addressing pet waste.
41 Reduce/Eliminate Oil/Chemical Discharges 2a, 3a, 3c
X Problems are addressed as they arise. The City is either notified by residents or they come across problems on the job.
45
Utilize Comprehensive Planning for Wastewater Treatment Systems
1a, 1b, 2a, 2b, 3a, 3b
X
Part of sanitary sewer master plan, in the process of updating the plan – updated on a 3-5 year basis.
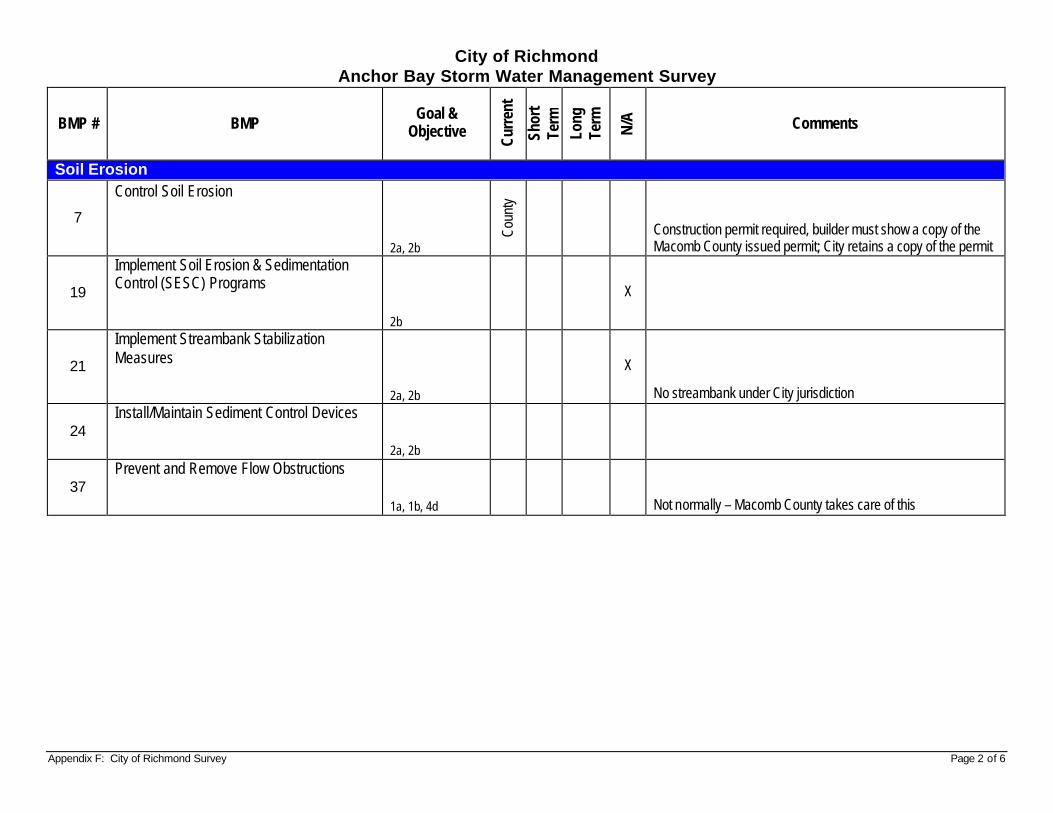
Appendix F: City of Richmond Survey Page 2 of 6
City of Richmond Anchor Bay Storm Water Management Survey
BMP # BMP Goal &
Objective
Curr
ent
Shor
t Te
rm
Long
Te
rm
N/A
Comments
Soil Erosion
7
Control Soil Erosion 2a, 2b
Coun
ty
Construction permit required, builder must show a copy of the Macomb County issued permit; City retains a copy of the permit
19
Implement Soil Erosion & Sedimentation Control (SESC) Programs 2b
X
21
Implement Streambank Stabilization Measures 2a, 2b
X
No streambank under City jurisdiction
24 Install/Maintain Sediment Control Devices 2a, 2b
37 Prevent and Remove Flow Obstructions 1a, 1b, 4d Not normally – Macomb County takes care of this
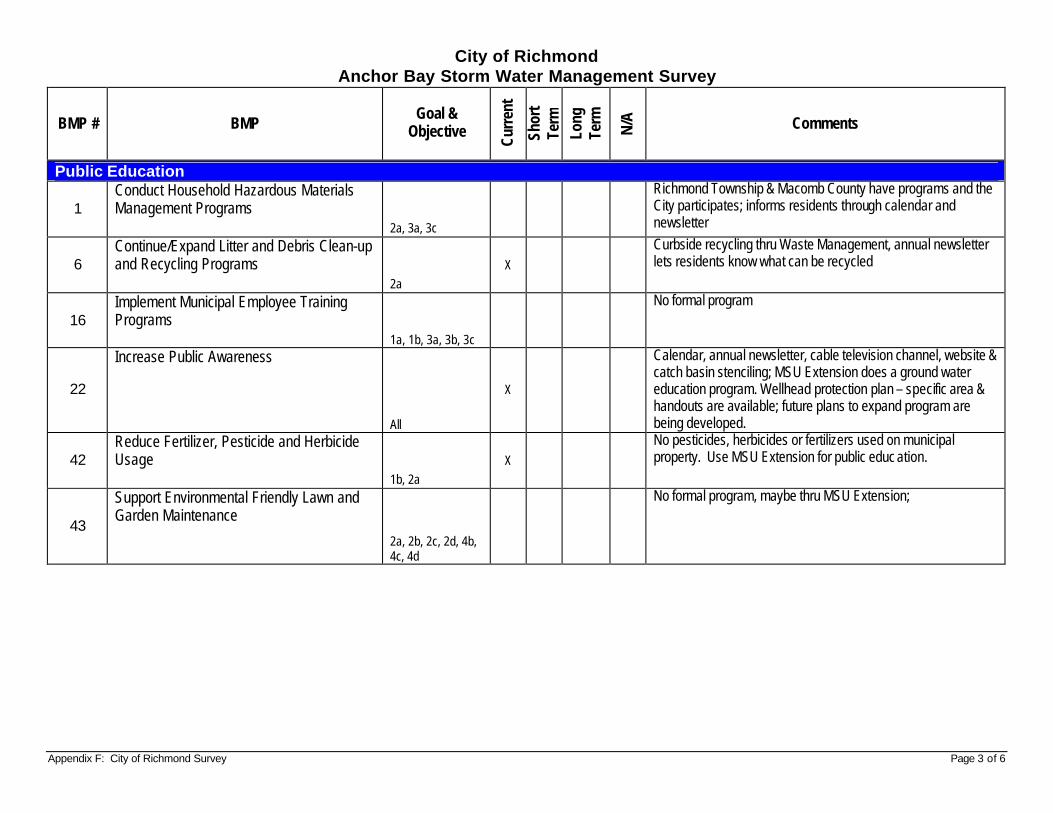
Appendix F: City of Richmond Survey Page 3 of 6
City of Richmond Anchor Bay Storm Water Management Survey
BMP # BMP Goal &
Objective
Curr
ent
Shor
t Te
rm
Long
Te
rm
N/A
Comments
Public Education
1 Conduct Household Hazardous Materials Management Programs 2a, 3a, 3c
Richmond Township & Macomb County have programs and the City participates; informs residents through calendar and newsletter
6 Continue/Expand Litter and Debris Clean-up and Recycling Programs 2a
X
Curbside recycling thru Waste Management, annual newsletter lets residents know what can be recycled
16 Implement Municipal Employee Training Programs 1a, 1b, 3a, 3b, 3c
No formal program
22
Increase Public Awareness
All
X
Calendar, annual newsletter, cable television channel, website & catch basin stenciling; MSU Extension does a ground water education program. Wellhead protection plan – specific area & handouts are available; future plans to expand program are being developed.
42 Reduce Fertilizer, Pesticide and Herbicide Usage 1b, 2a
X
No pesticides, herbicides or fertilizers used on municipal property. Use MSU Extension for public educ ation.
43
Support Environmental Friendly Lawn and Garden Maintenance
2a, 2b, 2c, 2d, 4b, 4c, 4d
No formal program, maybe thru MSU Extension;
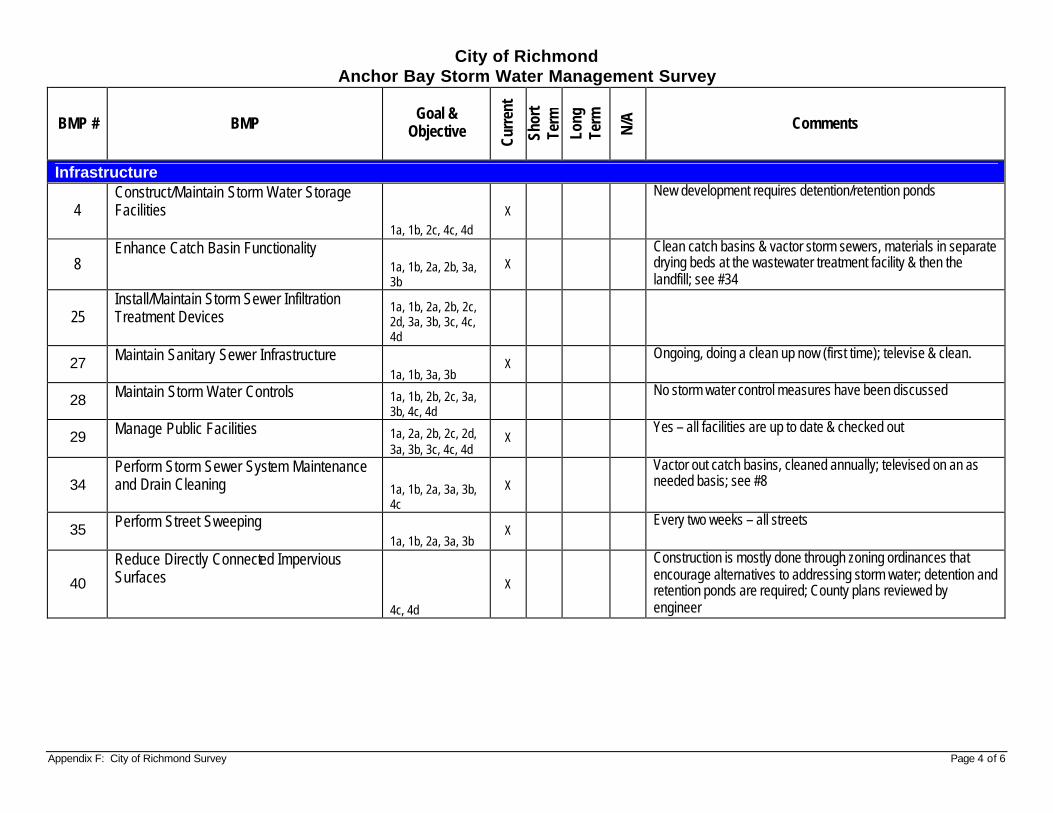
Appendix F: City of Richmond Survey Page 4 of 6
City of Richmond Anchor Bay Storm Water Management Survey
BMP # BMP Goal &
Objective
Curr
ent
Shor
t Te
rm
Long
Te
rm
N/A
Comments
Infrastructure
4 Construct/Maintain Storm Water Storage Facilities 1a, 1b, 2c, 4c, 4d
X
New development requires detention/retention ponds
8 Enhance Catch Basin Functionality
1a, 1b, 2a, 2b, 3a, 3b
X Clean catch basins & vactor storm sewers, materials in separate drying beds at the wastewater treatment facility & then the landfill; see #34
25 Install/Maintain Storm Sewer Infiltration Treatment Devices
1a, 1b, 2a, 2b, 2c, 2d, 3a, 3b, 3c, 4c, 4d
27 Maintain Sanitary Sewer Infrastructure 1a, 1b, 3a, 3b
X Ongoing, doing a clean up now (first time); televise & clean.
28 Maintain Storm Water Controls
1a, 1b, 2b, 2c, 3a, 3b, 4c, 4d
No storm water control measures have been discussed
29 Manage Public Facilities
1a, 2a, 2b, 2c, 2d, 3a, 3b, 3c, 4c, 4d
X Yes – all facilities are up to date & checked out
34 Perform Storm Sewer System Maintenance and Drain Cleaning
1a, 1b, 2a, 3a, 3b, 4c
X
Vactor out catch basins, cleaned annually; televised on an as needed basis; see #8
35 Perform Street Sweeping 1a, 1b, 2a, 3a, 3b
X Every two weeks – all streets
40
Reduce Directly Connected Impervious Surfaces
4c, 4d
X
Construction is mostly done through zoning ordinances that encourage alternatives to addressing storm water; detention and retention ponds are required; County plans reviewed by engineer
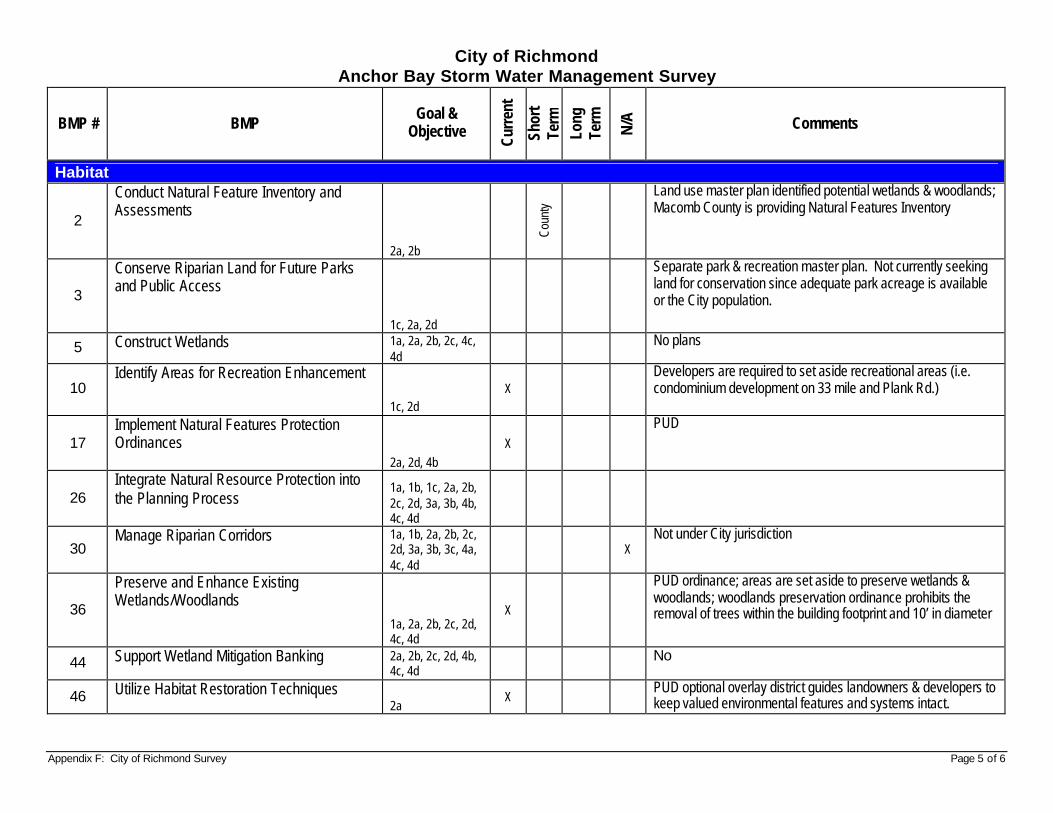
Appendix F: City of Richmond Survey Page 5 of 6
City of Richmond Anchor Bay Storm Water Management Survey
BMP # BMP Goal &
Objective
Curr
ent
Shor
t Te
rm
Long
Te
rm
N/A
Comments
Habitat
2
Conduct Natural Feature Inventory and Assessments
2a, 2b
Coun
ty
Land use master plan identified potential wetlands & woodlands; Macomb County is providing Natural Features Inventory
3
Conserve Riparian Land for Future Parks and Public Access 1c, 2a, 2d
Separate park & recreation master plan. Not currently seeking land for conservation since adequate park acreage is available or the City population.
5 Construct Wetlands 1a, 2a, 2b, 2c, 4c, 4d
No plans
10 Identify Areas for Recreation Enhancement 1c, 2d
X Developers are required to set aside recreational areas (i.e. condominium development on 33 mile and Plank Rd.)
17 Implement Natural Features Protection Ordinances 2a, 2d, 4b
X
PUD
26 Integrate Natural Resource Protection into the Planning Process
1a, 1b, 1c, 2a, 2b, 2c, 2d, 3a, 3b, 4b, 4c, 4d
30 Manage Riparian Corridors 1a, 1b, 2a, 2b, 2c,
2d, 3a, 3b, 3c, 4a, 4c, 4d
X Not under City jurisdiction
36
Preserve and Enhance Existing Wetlands/Woodlands
1a, 2a, 2b, 2c, 2d, 4c, 4d
X
PUD ordinance; areas are set aside to preserve wetlands & woodlands; woodlands preservation ordinance prohibits the removal of trees within the building footprint and 10’ in diameter
44 Support Wetland Mitigation Banking
2a, 2b, 2c, 2d, 4b, 4c, 4d
No
46 Utilize Habitat Restoration Techniques 2a
X PUD optional overlay district guides landowners & developers to keep valued environmental features and systems intact.
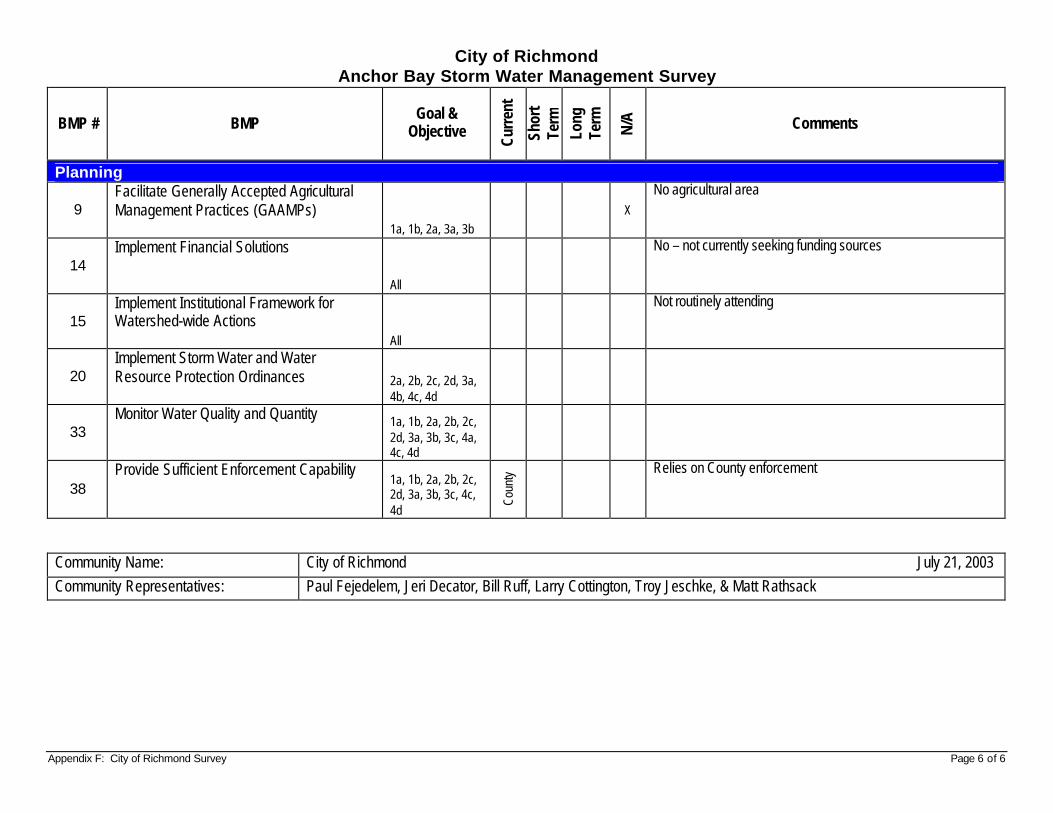
Appendix F: City of Richmond Survey Page 6 of 6
City of Richmond Anchor Bay Storm Water Management Survey
BMP # BMP Goal &
Objective
Curr
ent
Shor
t Te
rm
Long
Te
rm
N/A
Comments
Planning
9 Facilitate Generally Accepted Agricultural Management Practices (GAAMPs) 1a, 1b, 2a, 3a, 3b
X
No agricultural area
14 Implement Financial Solutions All
No – not currently seeking funding sources
15 Implement Institutional Framework for Watershed-wide Actions All
Not routinely attending
20 Implement Storm Water and Water Resource Protection Ordinances
2a, 2b, 2c, 2d, 3a, 4b, 4c, 4d
33 Monitor Water Quality and Quantity
1a, 1b, 2a, 2b, 2c, 2d, 3a, 3b, 3c, 4a, 4c, 4d
38 Provide Sufficient Enforcement Capability
1a, 1b, 2a, 2b, 2c, 2d, 3a, 3b, 3c, 4c, 4d
Coun
ty
Relies on County enforcement
Community Name: City of Richmond July 21, 2003 Community Representatives: Paul Fejedelem, Jeri Decator, Bill Ruff, Larry Cottington, Troy Jeschke, & Matt Rathsack
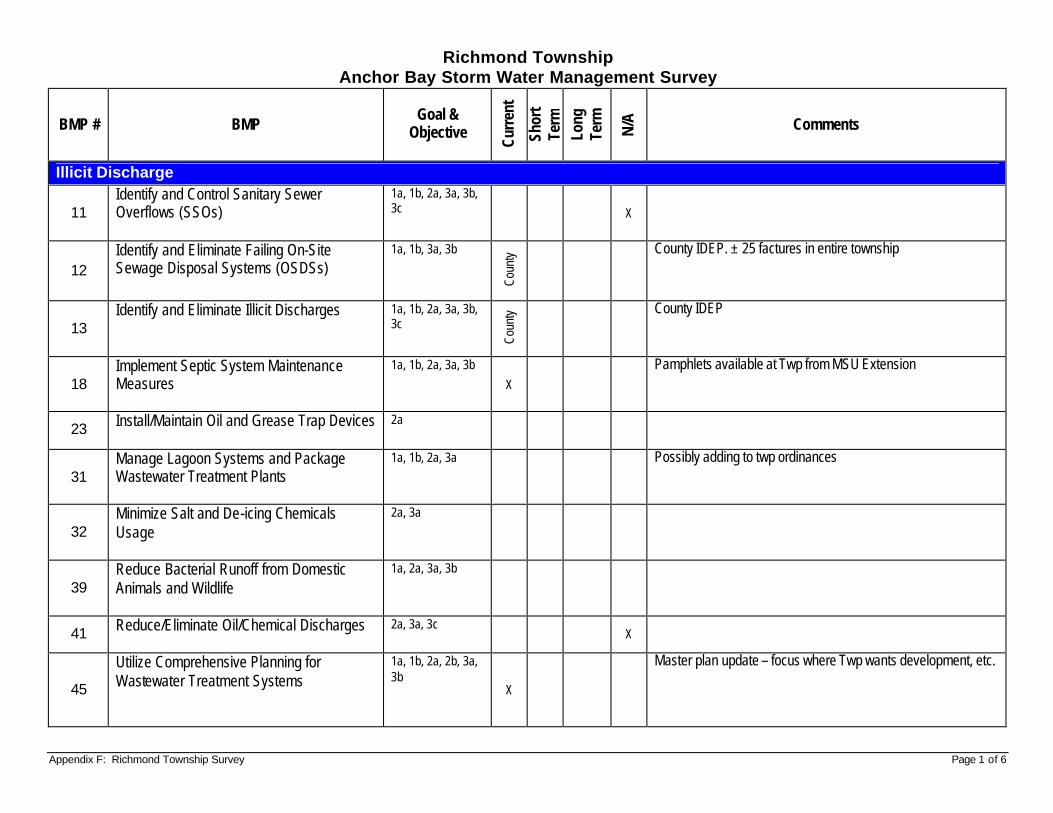
Appendix F: Richmond Township Survey Page 1 of 6
Richmond Township Anchor Bay Storm Water Management Survey
BMP # BMP Goal &
Objective
Curr
ent
Shor
t Te
rm
Long
Te
rm
N/A
Comments
Illicit Discharge
11 Identify and Control Sanitary Sewer Overflows (SSOs)
1a, 1b, 2a, 3a, 3b, 3c X
12 Identify and Eliminate Failing On-Site Sewage Disposal Systems (OSDSs)
1a, 1b, 3a, 3b
Coun
ty
County IDEP. ± 25 factures in entire township
13 Identify and Eliminate Illicit Discharges
1a, 1b, 2a, 3a, 3b, 3c
Coun
ty
County IDEP
18 Implement Septic System Maintenance Measures
1a, 1b, 2a, 3a, 3b
X
Pamphlets available at Twp from MSU Extension
23 Install/Maintain Oil and Grease Trap Devices
2a
31 Manage Lagoon Systems and Package Wastewater Treatment Plants
1a, 1b, 2a, 3a
Possibly adding to twp ordinances
32 Minimize Salt and De-icing Chemicals Usage
2a, 3a
39 Reduce Bacterial Runoff from Domestic Animals and Wildlife
1a, 2a, 3a, 3b
41 Reduce/Eliminate Oil/Chemical Discharges
2a, 3a, 3c X
45
Utilize Comprehensive Planning for Wastewater Treatment Systems
1a, 1b, 2a, 2b, 3a, 3b
X
Master plan update – focus where Twp wants development, etc.
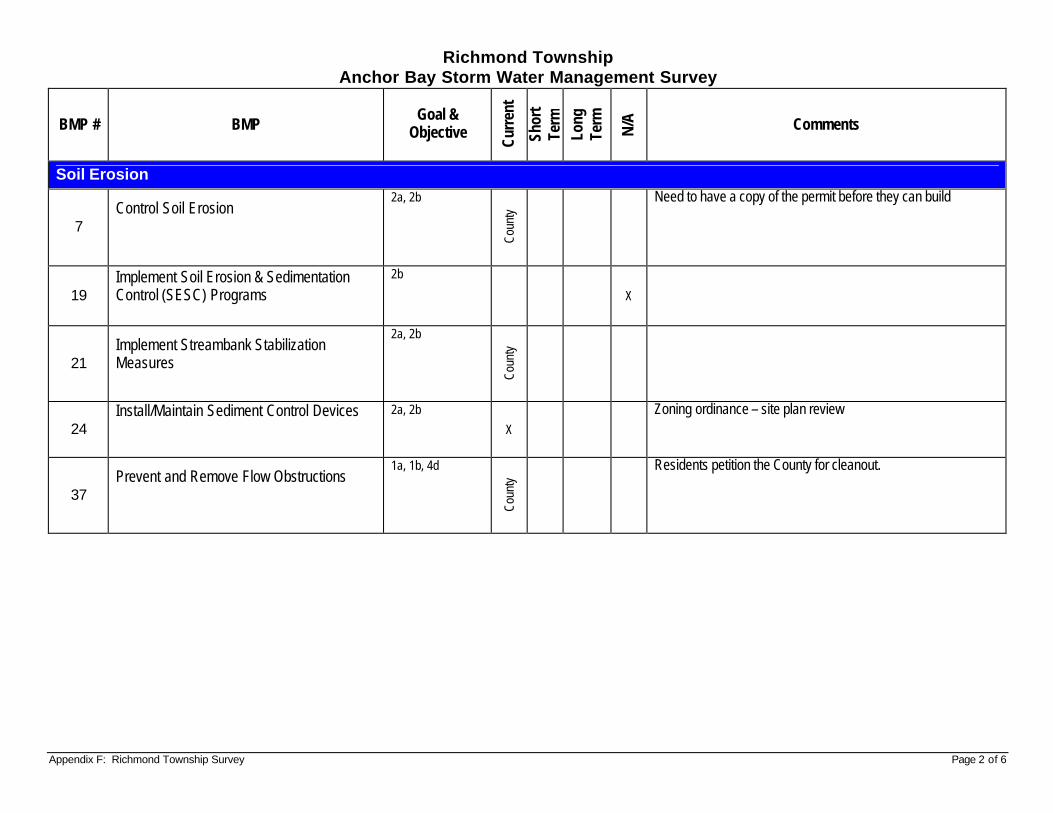
Appendix F: Richmond Township Survey Page 2 of 6
Richmond Township Anchor Bay Storm Water Management Survey
BMP # BMP Goal &
Objective
Curr
ent
Shor
t Te
rm
Long
Te
rm
N/A
Comments
Soil Erosion
7 Control Soil Erosion
2a, 2b
Coun
ty
Need to have a copy of the permit before they can build
19 Implement Soil Erosion & Sedimentation Control (SESC) Programs
2b
X
21 Implement Streambank Stabilization Measures
2a, 2b
Coun
ty
24 Install/Maintain Sediment Control Devices
2a, 2b
X
Zoning ordinance – site plan review
37 Prevent and Remove Flow Obstructions
1a, 1b, 4d
Coun
ty
Residents petition the County for cleanout.
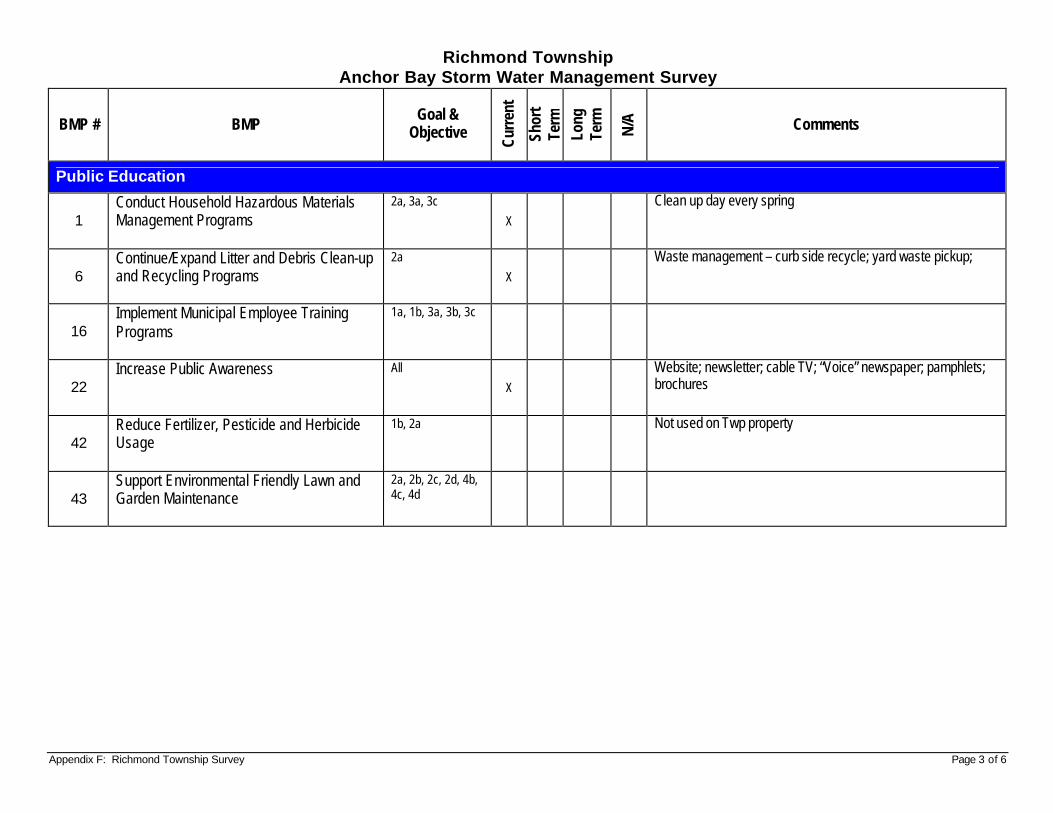
Appendix F: Richmond Township Survey Page 3 of 6
Richmond Township Anchor Bay Storm Water Management Survey
BMP # BMP Goal &
Objective
Curr
ent
Shor
t Te
rm
Long
Te
rm
N/A
Comments
Public Education
1 Conduct Household Hazardous Materials Management Programs
2a, 3a, 3c
X
Clean up day every spring
6 Continue/Expand Litter and Debris Clean-up and Recycling Programs
2a
X
Waste management – curb side recycle; yard waste pickup;
16 Implement Municipal Employee Training Programs
1a, 1b, 3a, 3b, 3c
22 Increase Public Awareness
All
X
Website; newsletter; cable TV; “Voice” newspaper; pamphlets; brochures
42 Reduce Fertilizer, Pesticide and Herbicide Usage
1b, 2a
Not used on Twp property
43 Support Environmental Friendly Lawn and Garden Maintenance
2a, 2b, 2c, 2d, 4b, 4c, 4d
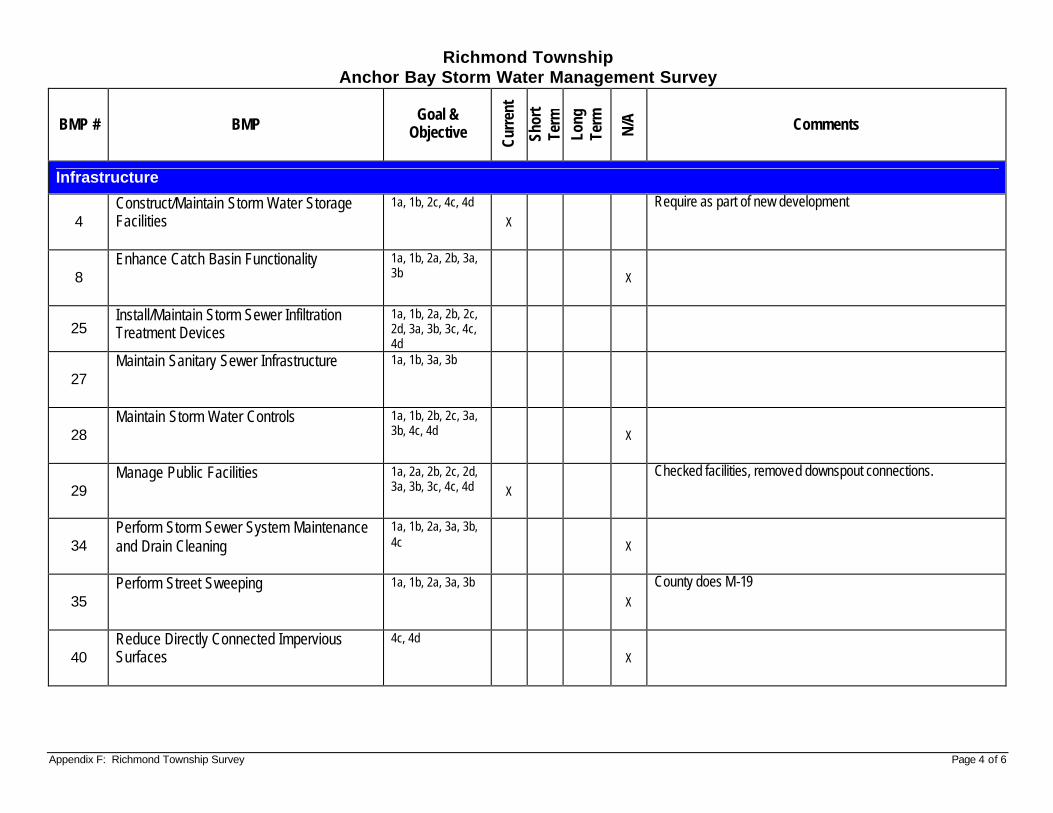
Appendix F: Richmond Township Survey Page 4 of 6
Richmond Township Anchor Bay Storm Water Management Survey
BMP # BMP Goal &
Objective
Curr
ent
Shor
t Te
rm
Long
Te
rm
N/A
Comments
Infrastructure
4 Construct/Maintain Storm Water Storage Facilities
1a, 1b, 2c, 4c, 4d
X
Require as part of new development
8 Enhance Catch Basin Functionality
1a, 1b, 2a, 2b, 3a, 3b X
25 Install/Maintain Storm Sewer Infiltration Treatment Devices
1a, 1b, 2a, 2b, 2c, 2d, 3a, 3b, 3c, 4c, 4d
27 Maintain Sanitary Sewer Infrastructure
1a, 1b, 3a, 3b
28 Maintain Storm Water Controls
1a, 1b, 2b, 2c, 3a, 3b, 4c, 4d X
29 Manage Public Facilities
1a, 2a, 2b, 2c, 2d, 3a, 3b, 3c, 4c, 4d X
Checked facilities, removed downspout connections.
34 Perform Storm Sewer System Maintenance and Drain Cleaning
1a, 1b, 2a, 3a, 3b, 4c X
35 Perform Street Sweeping
1a, 1b, 2a, 3a, 3b
X
County does M-19
40 Reduce Directly Connected Impervious Surfaces
4c, 4d
X
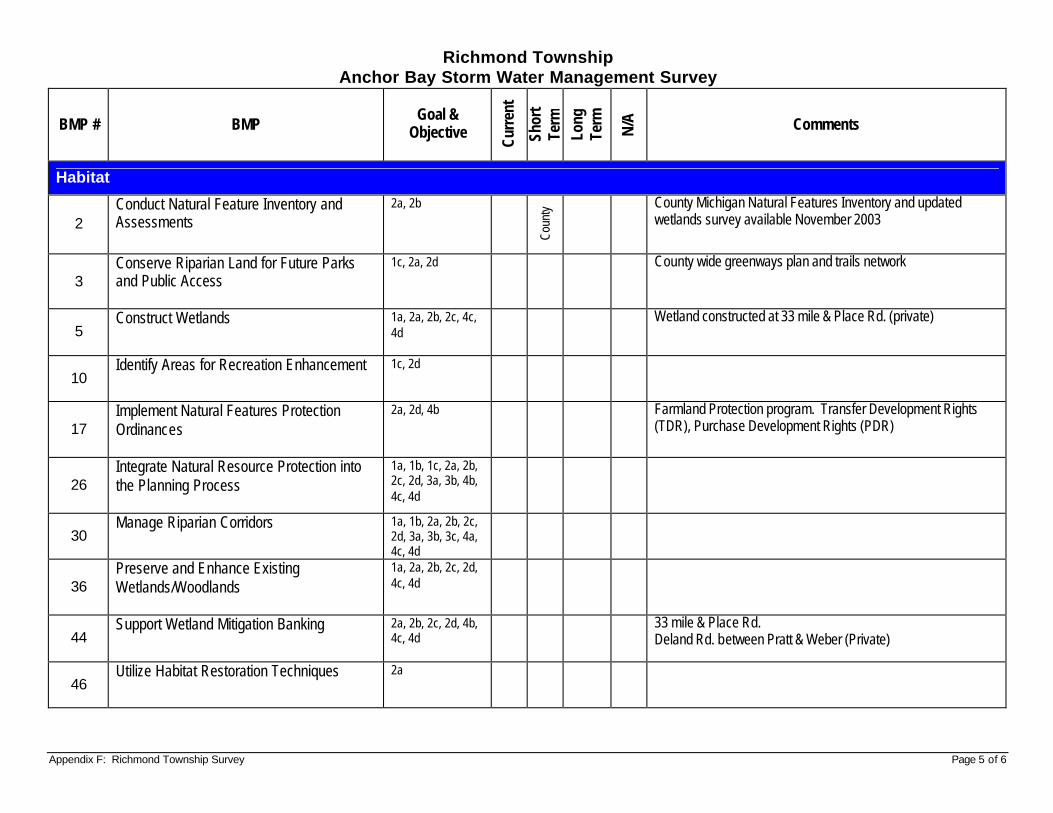
Appendix F: Richmond Township Survey Page 5 of 6
Richmond Township Anchor Bay Storm Water Management Survey
BMP # BMP Goal &
Objective
Curr
ent
Shor
t Te
rm
Long
Te
rm
N/A
Comments
Habitat
2 Conduct Natural Feature Inventory and Assessments
2a, 2b
Coun
ty
County Michigan Natural Features Inventory and updated wetlands survey available November 2003
3 Conserve Riparian Land for Future Parks and Public Access
1c, 2a, 2d
County wide greenways plan and trails network
5 Construct Wetlands
1a, 2a, 2b, 2c, 4c, 4d
Wetland constructed at 33 mile & Place Rd. (private)
10 Identify Areas for Recreation Enhancement
1c, 2d
17 Implement Natural Features Protection Ordinances
2a, 2d, 4b
Farmland Protection program. Transfer Development Rights (TDR), Purchase Development Rights (PDR)
26 Integrate Natural Resource Protection into the Planning Process
1a, 1b, 1c, 2a, 2b, 2c, 2d, 3a, 3b, 4b, 4c, 4d
30 Manage Riparian Corridors
1a, 1b, 2a, 2b, 2c, 2d, 3a, 3b, 3c, 4a, 4c, 4d
36 Preserve and Enhance Existing Wetlands/Woodlands
1a, 2a, 2b, 2c, 2d, 4c, 4d
44 Support Wetland Mitigation Banking
2a, 2b, 2c, 2d, 4b, 4c, 4d
33 mile & Place Rd. Deland Rd. between Pratt & Weber (Private)
46 Utilize Habitat Restoration Techniques
2a
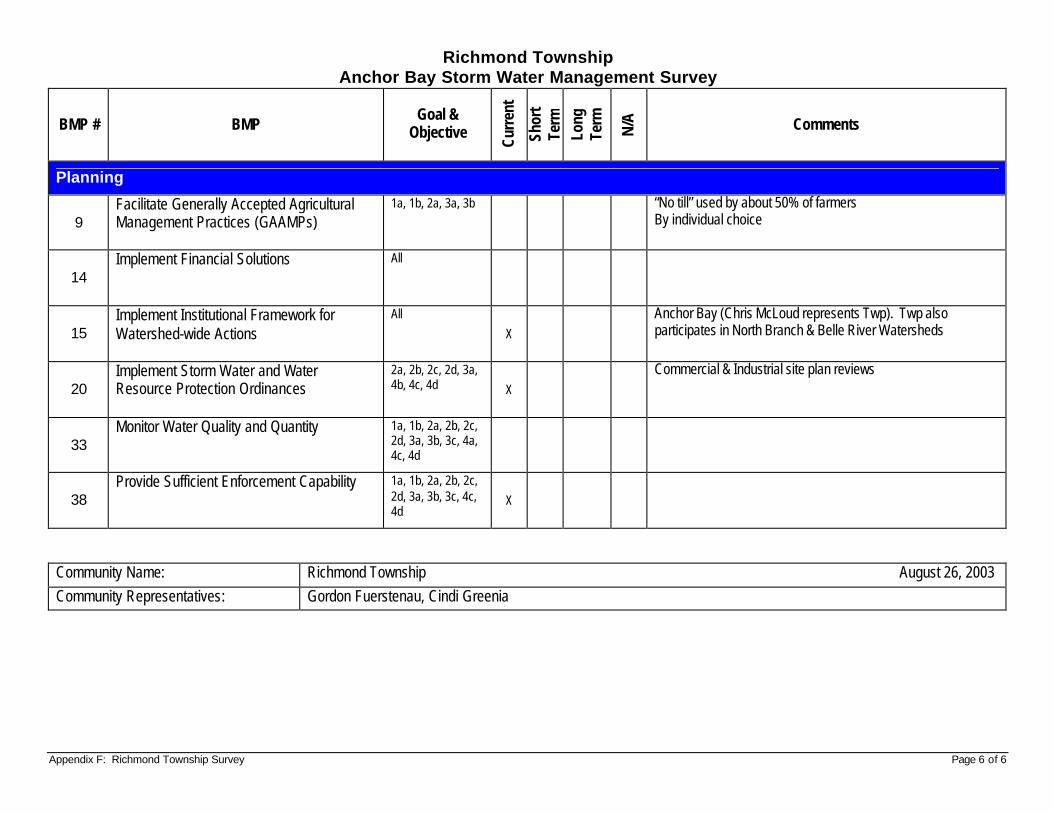
Appendix F: Richmond Township Survey Page 6 of 6
Richmond Township Anchor Bay Storm Water Management Survey
BMP # BMP Goal &
Objective
Curr
ent
Shor
t Te
rm
Long
Te
rm
N/A
Comments
Planning
9 Facilitate Generally Accepted Agricultural Management Practices (GAAMPs)
1a, 1b, 2a, 3a, 3b
“No till” used by about 50% of farmers By individual choice
14 Implement Financial Solutions
All
15 Implement Institutional Framework for Watershed-wide Actions
All
X
Anchor Bay (Chris McLoud represents Twp). Twp also participates in North Branch & Belle River Watersheds
20 Implement Storm Water and Water Resource Protection Ordinances
2a, 2b, 2c, 2d, 3a, 4b, 4c, 4d X
Commercial & Industrial site plan reviews
33 Monitor Water Quality and Quantity
1a, 1b, 2a, 2b, 2c, 2d, 3a, 3b, 3c, 4a, 4c, 4d
38 Provide Sufficient Enforcement Capability
1a, 1b, 2a, 2b, 2c, 2d, 3a, 3b, 3c, 4c, 4d
X
Community Name: Richmond Township August 26, 2003 Community Representatives: Gordon Fuerstenau, Cindi Greenia
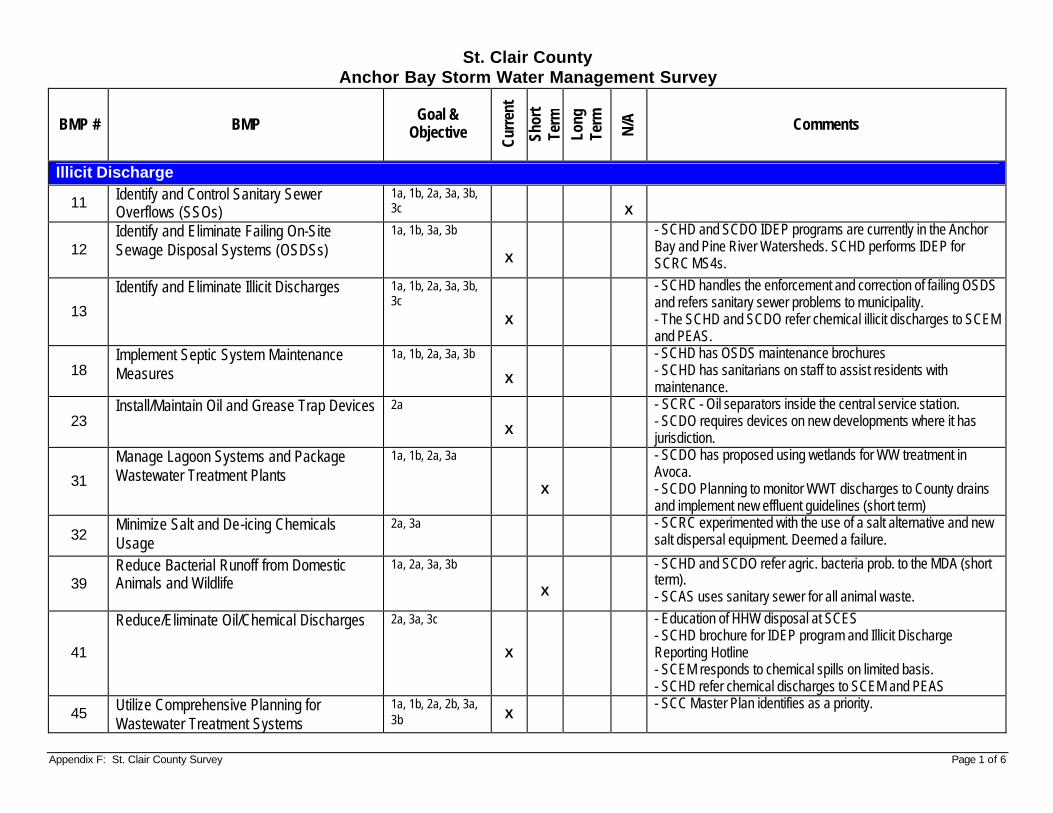
Appendix F: St. Clair County Survey Page 1 of 6
St. Clair County Anchor Bay Storm Water Management Survey
BMP # BMP Goal &
Objective
Curr
ent
Shor
t Te
rm
Long
Te
rm
N/A
Comments
Illicit Discharge
11 Identify and Control Sanitary Sewer Overflows (SSOs)
1a, 1b, 2a, 3a, 3b, 3c
X
12 Identify and Eliminate Failing On-Site Sewage Disposal Systems (OSDSs)
1a, 1b, 3a, 3b
X
- SCHD and SCDO IDEP programs are currently in the Anchor Bay and Pine River Watersheds. SCHD performs IDEP for SCRC MS4s.
13
Identify and Eliminate Illicit Discharges
1a, 1b, 2a, 3a, 3b, 3c
X
- SCHD handles the enforcement and correction of failing OSDS and refers sanitary sewer problems to municipality. - The SCHD and SCDO refer chemical illicit discharges to SCEM and PEAS.
18 Implement Septic System Maintenance Measures
1a, 1b, 2a, 3a, 3b
X
- SCHD has OSDS maintenance brochures - SCHD has sanitarians on staff to assist residents with maintenance.
23 Install/Maintain Oil and Grease Trap Devices
2a
X
- SCRC - Oil separators inside the central service station. - SCDO requires devices on new developments where it has jurisdiction.
31
Manage Lagoon Systems and Package Wastewater Treatment Plants
1a, 1b, 2a, 3a
X
- SCDO has proposed using wetlands for WW treatment in Avoca. - SCDO Planning to monitor WWT discharges to County drains and implement new effluent guidelines (short term)
32 Minimize Salt and De-icing Chemicals Usage
2a, 3a
- SCRC experimented with the use of a salt alternative and new salt dispersal equipment. Deemed a failure.
39 Reduce Bacterial Runoff from Domestic Animals and Wildlife
1a, 2a, 3a, 3b
X
- SCHD and SCDO refer agric. bacteria prob. to the MDA (short term). - SCAS uses sanitary sewer for all animal waste.
41
Reduce/Eliminate Oil/Chemical Discharges
2a, 3a, 3c
X
- Education of HHW disposal at SCES - SCHD brochure for IDEP program and Illicit Discharge Reporting Hotline - SCEM responds to chemical spills on limited basis. - SCHD refer chemical discharges to SCEM and PEAS
45 Utilize Comprehensive Planning for Wastewater Treatment Systems
1a, 1b, 2a, 2b, 3a, 3b X
- SCC Master Plan identifies as a priority.
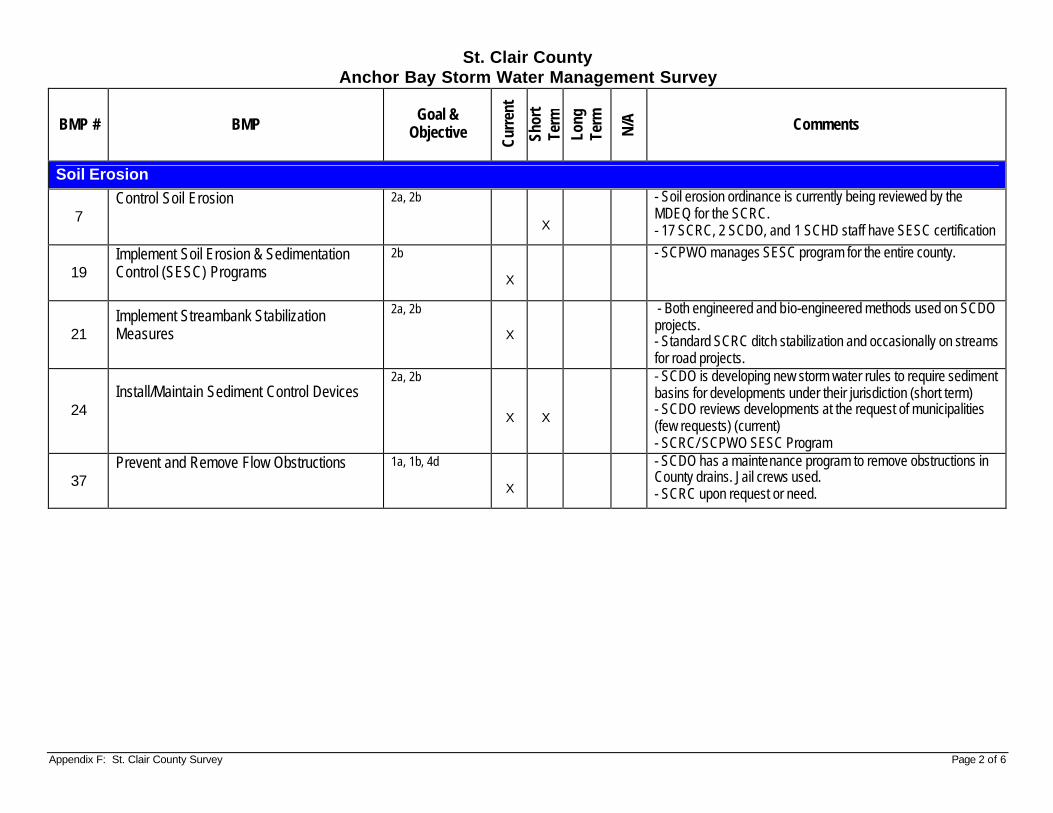
Appendix F: St. Clair County Survey Page 2 of 6
St. Clair County Anchor Bay Storm Water Management Survey
BMP # BMP Goal &
Objective
Curr
ent
Shor
t Te
rm
Long
Te
rm
N/A
Comments
Soil Erosion
7 Control Soil Erosion
2a, 2b
X
- Soil erosion ordinance is currently being reviewed by the MDEQ for the SCRC. - 17 SCRC, 2 SCDO, and 1 SCHD staff have SESC certification
19 Implement Soil Erosion & Sedimentation Control (SESC) Programs
2b
X
- SCPWO manages SESC program for the entire county.
21 Implement Streambank Stabilization Measures
2a, 2b
X
- Both engineered and bio-engineered methods used on SCDO projects. - Standard SCRC ditch stabilization and occasionally on streams for road projects.
24 Install/Maintain Sediment Control Devices
2a, 2b
X
X
- SCDO is developing new storm water rules to require sediment basins for developments under their jurisdiction (short term) - SCDO reviews developments at the request of municipalities (few requests) (current) - SCRC/ SCPWO SESC Program
37 Prevent and Remove Flow Obstructions
1a, 1b, 4d
X
- SCDO has a maintenance program to remove obstructions in County drains. Jail crews used. - SCRC upon request or need.
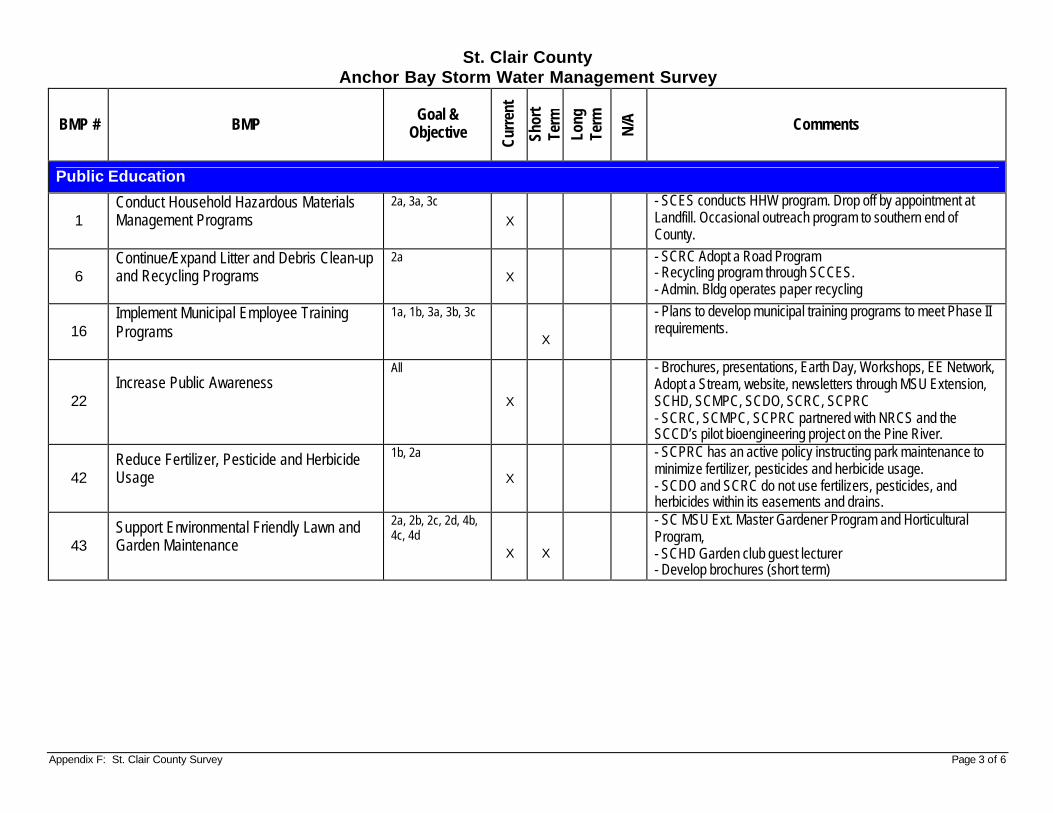
Appendix F: St. Clair County Survey Page 3 of 6
St. Clair County Anchor Bay Storm Water Management Survey
BMP # BMP Goal &
Objective
Curr
ent
Shor
t Te
rm
Long
Te
rm
N/A
Comments
Public Education
1 Conduct Household Hazardous Materials Management Programs
2a, 3a, 3c
X
- SCES conducts HHW program. Drop off by appointment at Landfill. Occasional outreach program to southern end of County.
6 Continue/Expand Litter and Debris Clean-up and Recycling Programs
2a
X
- SCRC Adopt a Road Program - Recycling program through SCCES. - Admin. Bldg operates paper recycling
16 Implement Municipal Employee Training Programs
1a, 1b, 3a, 3b, 3c
X
- Plans to develop municipal training programs to meet Phase II requirements.
22 Increase Public Awareness
All
X
- Brochures, presentations, Earth Day, Workshops, EE Network, Adopt a Stream, website, newsletters through MSU Extension, SCHD, SCMPC, SCDO, SCRC, SCPRC - SCRC, SCMPC, SCPRC partnered with NRCS and the SCCD’s pilot bioengineering project on the Pine River.
42 Reduce Fertilizer, Pesticide and Herbicide Usage
1b, 2a
X
- SCPRC has an active policy instructing park maintenance to minimize fertilizer, pesticides and herbicide usage. - SCDO and SCRC do not use fertilizers, pesticides, and herbicides within its easements and drains.
43 Support Environmental Friendly Lawn and Garden Maintenance
2a, 2b, 2c, 2d, 4b, 4c, 4d
X
X
- SC MSU Ext. Master Gardener Program and Horticultural Program, - SCHD Garden club guest lecturer - Develop brochures (short term)
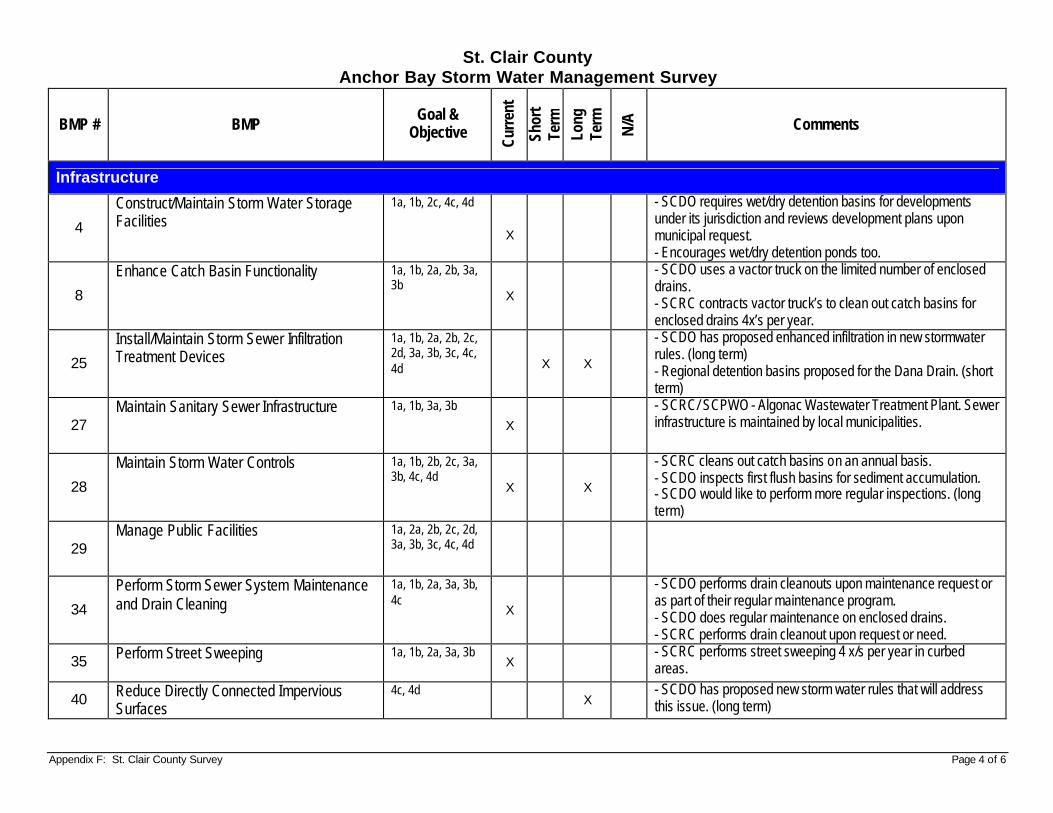
Appendix F: St. Clair County Survey Page 4 of 6
St. Clair County Anchor Bay Storm Water Management Survey
BMP # BMP Goal &
Objective
Curr
ent
Shor
t Te
rm
Long
Te
rm
N/A
Comments
Infrastructure
4
Construct/Maintain Storm Water Storage Facilities
1a, 1b, 2c, 4c, 4d
X
- SCDO requires wet/dry detention basins for developments under its jurisdiction and reviews development plans upon municipal request. - Encourages wet/dry detention ponds too.
8
Enhance Catch Basin Functionality
1a, 1b, 2a, 2b, 3a, 3b
X
- SCDO uses a vactor truck on the limited number of enclosed drains. - SCRC contracts vactor truck’s to clean out catch basins for enclosed drains 4x’s per year.
25
Install/Maintain Storm Sewer Infiltration Treatment Devices
1a, 1b, 2a, 2b, 2c, 2d, 3a, 3b, 3c, 4c, 4d X X
- SCDO has proposed enhanced infiltration in new stormwater rules. (long term) - Regional detention basins proposed for the Dana Drain. (short term)
27 Maintain Sanitary Sewer Infrastructure
1a, 1b, 3a, 3b
X
- SCRC/ SCPWO - Algonac Wastewater Treatment Plant. Sewer infrastructure is maintained by local municipalities.
28
Maintain Storm Water Controls
1a, 1b, 2b, 2c, 3a, 3b, 4c, 4d
X X
- SCRC cleans out catch basins on an annual basis. - SCDO inspects first flush basins for sediment accumulation. - SCDO would like to perform more regular inspections. (long term)
29 Manage Public Facilities
1a, 2a, 2b, 2c, 2d, 3a, 3b, 3c, 4c, 4d
34
Perform Storm Sewer System Maintenance and Drain Cleaning
1a, 1b, 2a, 3a, 3b, 4c
X
- SCDO performs drain cleanouts upon maintenance request or as part of their regular maintenance program. - SCDO does regular maintenance on enclosed drains. - SCRC performs drain cleanout upon request or need.
35 Perform Street Sweeping
1a, 1b, 2a, 3a, 3b X
- SCRC performs street sweeping 4 x/s per year in curbed areas.
40 Reduce Directly Connected Impervious Surfaces
4c, 4d X
- SCDO has proposed new storm water rules that will address this issue. (long term)
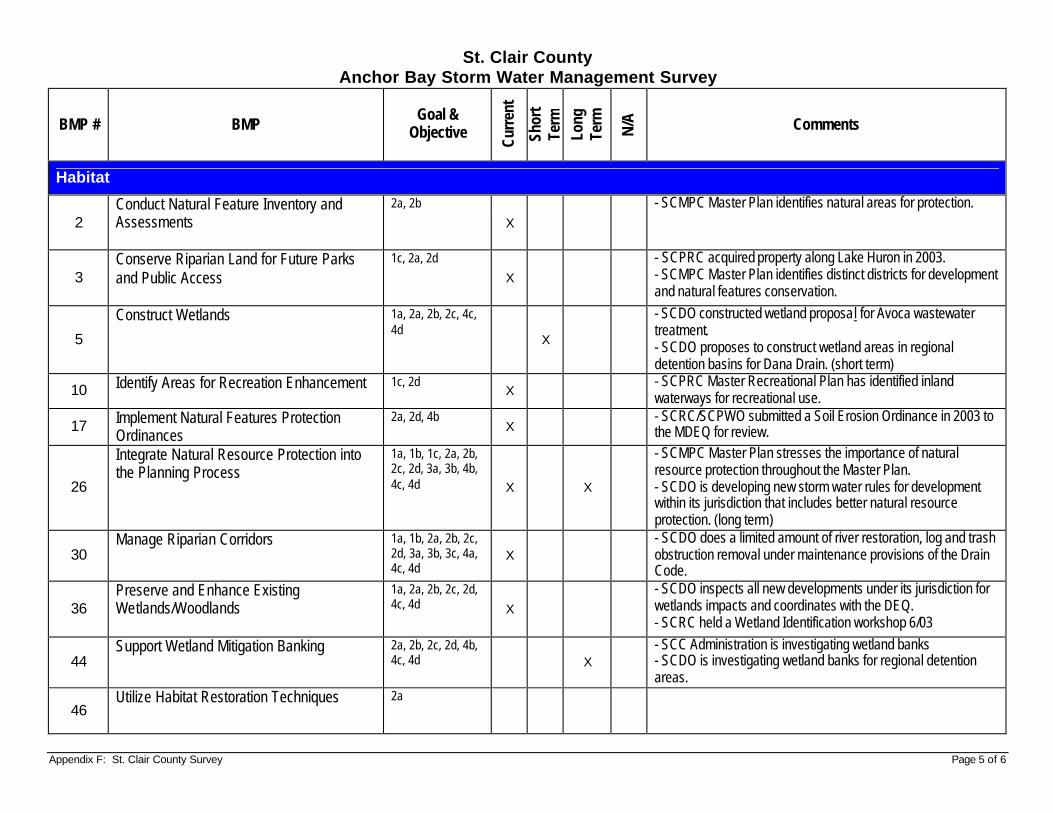
Appendix F: St. Clair County Survey Page 5 of 6
St. Clair County Anchor Bay Storm Water Management Survey
BMP # BMP Goal &
Objective
Curr
ent
Shor
t Te
rm
Long
Te
rm
N/A
Comments
Habitat
2 Conduct Natural Feature Inventory and Assessments
2a, 2b
X
- SCMPC Master Plan identifies natural areas for protection.
3 Conserve Riparian Land for Future Parks and Public Access
1c, 2a, 2d
X
- SCPRC acquired property along Lake Huron in 2003. - SCMPC Master Plan identifies distinct districts for development and natural features conservation.
5
Construct Wetlands
1a, 2a, 2b, 2c, 4c, 4d
X
- SCDO constructed wetland proposal for Avoca wastewater treatment. - SCDO proposes to construct wetland areas in regional detention basins for Dana Drain. (short term)
10 Identify Areas for Recreation Enhancement
1c, 2d X
- SCPRC Master Recreational Plan has identified inland waterways for recreational use.
17 Implement Natural Features Protection Ordinances
2a, 2d, 4b X
- SCRC/SCPWO submitted a Soil Erosion Ordinance in 2003 to the MDEQ for review.
26
Integrate Natural Resource Protection into the Planning Process
1a, 1b, 1c, 2a, 2b, 2c, 2d, 3a, 3b, 4b, 4c, 4d X X
- SCMPC Master Plan stresses the importance of natural resource protection throughout the Master Plan. - SCDO is developing new storm water rules for development within its jurisdiction that includes better natural resource protection. (long term)
30 Manage Riparian Corridors
1a, 1b, 2a, 2b, 2c, 2d, 3a, 3b, 3c, 4a, 4c, 4d
X - SCDO does a limited amount of river restoration, log and trash obstruction removal under maintenance provisions of the Drain Code.
36 Preserve and Enhance Existing Wetlands/Woodlands
1a, 2a, 2b, 2c, 2d, 4c, 4d X
- SCDO inspects all new developments under its jurisdiction for wetlands impacts and coordinates with the DEQ. - SCRC held a Wetland Identification workshop 6/03
44 Support Wetland Mitigation Banking
2a, 2b, 2c, 2d, 4b, 4c, 4d X
- SCC Administration is investigating wetland banks - SCDO is investigating wetland banks for regional detention areas.
46 Utilize Habitat Restoration Techniques
2a
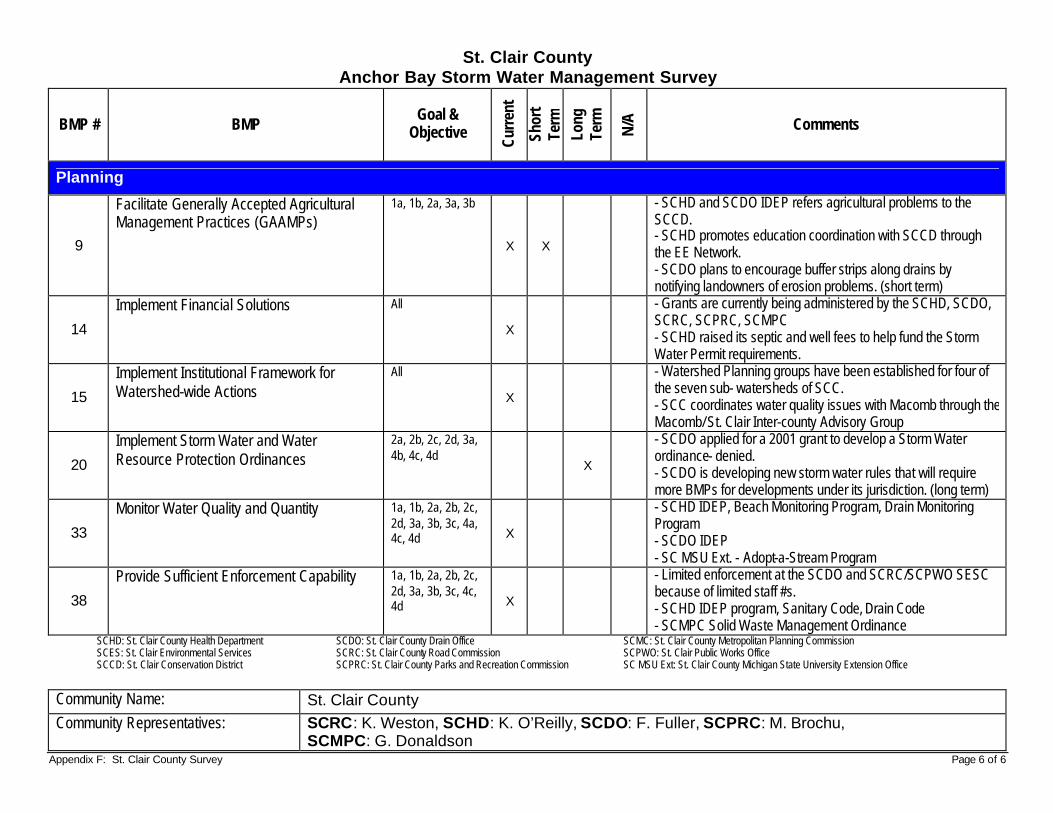
Appendix F: St. Clair County Survey Page 6 of 6
St. Clair County Anchor Bay Storm Water Management Survey
BMP # BMP Goal &
Objective
Curr
ent
Shor
t Te
rm
Long
Te
rm
N/A
Comments
Planning
9
Facilitate Generally Accepted Agricultural Management Practices (GAAMPs)
1a, 1b, 2a, 3a, 3b
X X
- SCHD and SCDO IDEP refers agricultural problems to the SCCD. - SCHD promotes education coordination with SCCD through the EE Network. - SCDO plans to encourage buffer strips along drains by notifying landowners of erosion problems. (short term)
14
Implement Financial Solutions
All
X
- Grants are currently being administered by the SCHD, SCDO, SCRC, SCPRC, SCMPC - SCHD raised its septic and well fees to help fund the Storm Water Permit requirements.
15
Implement Institutional Framework for Watershed-wide Actions
All
X
- Watershed Planning groups have been established for four of the seven sub- watersheds of SCC. - SCC coordinates water quality issues with Macomb through the Macomb/ St. Clair Inter-county Advisory Group
20
Implement Storm Water and Water Resource Protection Ordinances
2a, 2b, 2c, 2d, 3a, 4b, 4c, 4d
X
- SCDO applied for a 2001 grant to develop a Storm Water ordinance- denied. - SCDO is developing new storm water rules that will require more BMPs for developments under its jurisdiction. (long term)
33
Monitor Water Quality and Quantity
1a, 1b, 2a, 2b, 2c, 2d, 3a, 3b, 3c, 4a, 4c, 4d X
- SCHD IDEP, Beach Monitoring Program, Drain Monitoring Program - SCDO IDEP - SC MSU Ext. - Adopt-a-Stream Program
38
Provide Sufficient Enforcement Capability
1a, 1b, 2a, 2b, 2c, 2d, 3a, 3b, 3c, 4c, 4d X
- Limited enforcement at the SCDO and SCRC/SCPWO SESC because of limited staff #s. - SCHD IDEP program, Sanitary Code, Drain Code - SCMPC Solid Waste Management Ordinance
SCHD: St. Clair County Health Department SCDO: St. Clair County Drain Office SCMC: St. Clair County Metropolitan Planning Commission SCES: St. Clair Environmental Services SCRC: St. Clair County Road Commission SCPWO: St. Clair Public Works Office SCCD: St. Clair Conservation District SCPRC: St. Clair County Parks and Recreation Commission SC MSU Ext: St. Clair County Michigan State University Extension Office
Community Name: St. Clair County Community Representatives: SCRC: K. Weston, SCHD: K. O’Reilly, SCDO: F. Fuller, SCPRC: M. Brochu,
SCMPC: G. Donaldson
Anchor Bay Watershed Management Plan
Appendix G:
Macomb County’s Onsite Sewage Disposal
and Onsite Water Supply Evaluation and Maintenance Ordinance
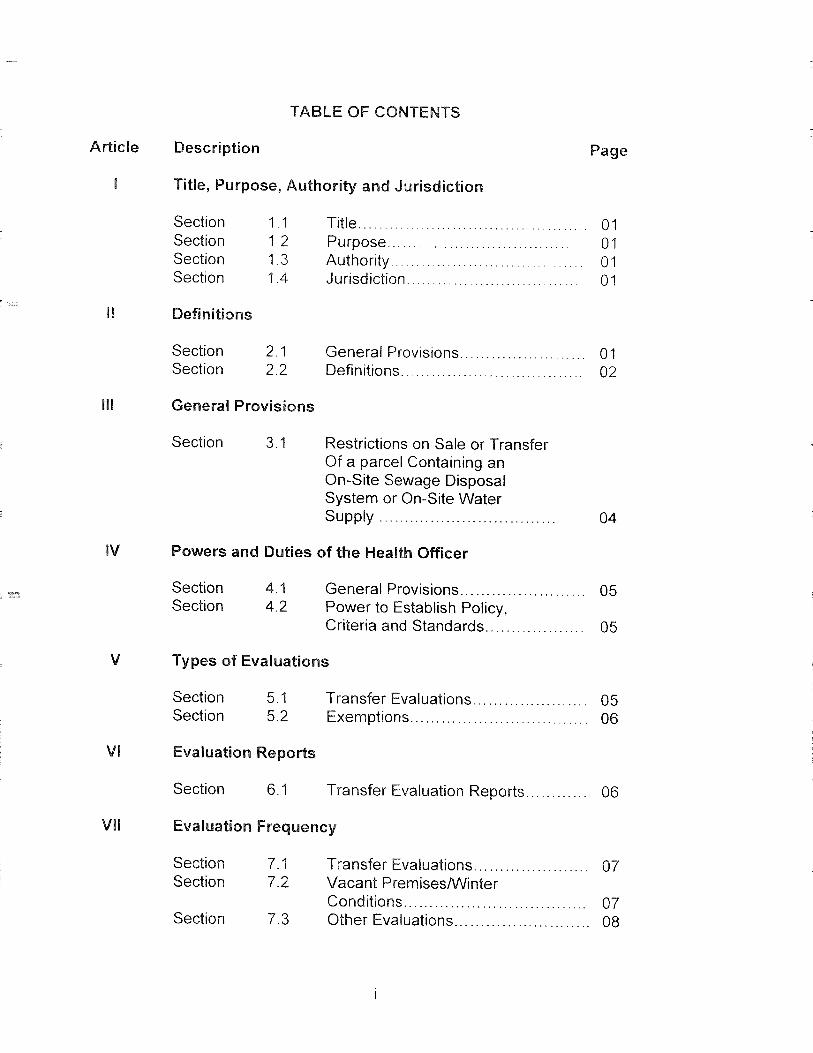
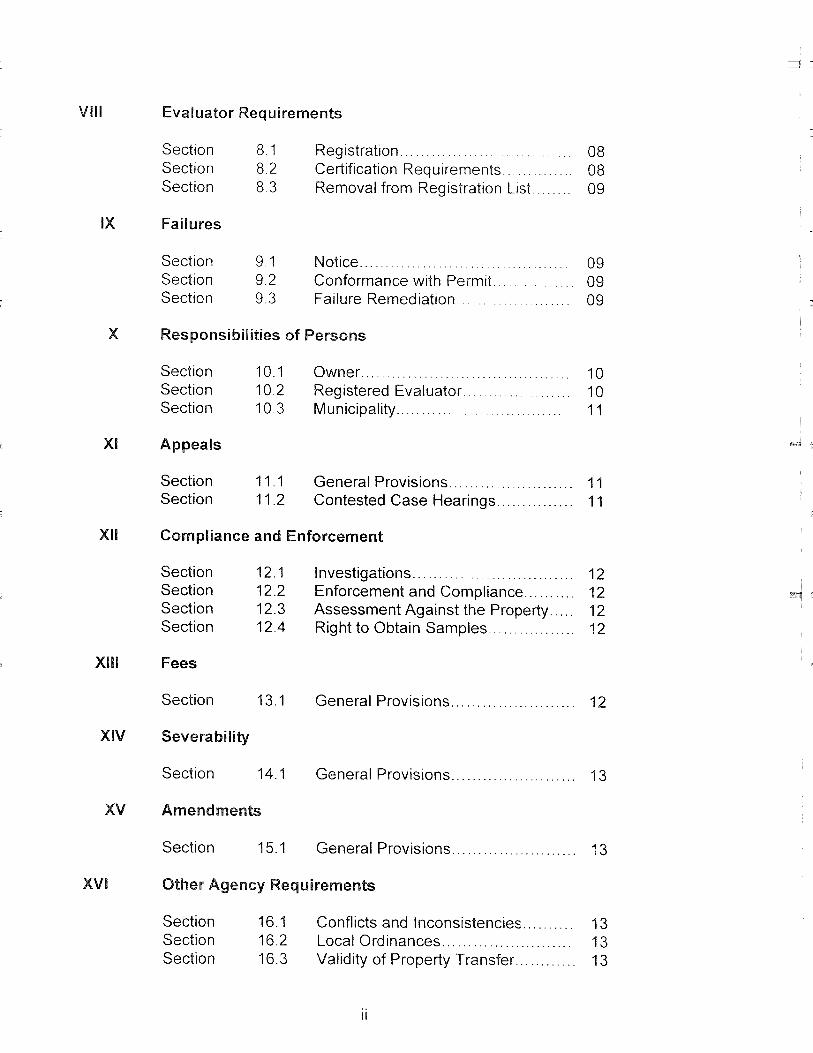
Anchor Bay Watershed Management Plan
Appendix H:
Glossary and Acronyms
Appendix H: Glossary and Acronyms Page 1 of 4
AOC: Great Lakes Area of Concern designated by the International Joint Commission Aluminum (Al): Aluminum is a natural occurring metal in the environment, but may be present in elevated concentrations resulting from human sources. (Ref 1) Ammonia (NH3): Plant nutrient; source of nitrogen which is needed to build protein. Ammonia in aquatic systems is derived from the natural breakdown of nitrogenous organic material, or as a result of industrial discharge. Levels above 0.2 mg/L may indicate pollution. (Ref 1) Arithmetic Mean: A statistical measure describing the central tendency of a set of data points, calculated by dividing the sum of the data points by the number of data points in the data set. Benthos: Organisms that live on the lake or river bottom Bioaccumulation: The increasing concentration of chemical substances through successive levels of the food chain. Body Contact Recreation: Term used to define state water quality standards for bacterial contamination, to protect the health of people who participate in water recreation activities such as swimming (full-body contact) or fishing and boating (partial-body contact) BMP: Best Management Practices Buffer Strips: Protective strips of land surrounding bodies of water which can trap and hold pollutants contained in runoff. Biochemical Oxygen Demand (BOD): A measure of the amount of organic material in the body of water that is available for decomposition by aerobic (oxygen-consuming) microbiological processes. Values exceeding 4 mg/L may indicate pollution. (Ref 1) Chemical Oxygen Demand (COD): Chemical oxygen demand is a measure of the organic content and pollution strength of a water sample. COD measures the amount of oxygen required to chemically oxidize the organic material in the sample. This test measures the total oxidizable carbon content, excluding aromatics, pyridines, and some alkyl compounds. (Ref 1) Chloride: An inorganic ion found in all natural waters, deriving from natural origin or from human uses in agriculture, industry and road de-icing. (Ref 1) Chlorophyll a: The green photosynthetic pigment found in the cells of algae. Measurement of chlorophyll a in water gives an indication of the trophic state of an aquatic system. In general, increased amounts of chlorophyll indicate higher concentrations of phytoplankton and higher productivity. (Ref 1) CMOM Standards: Capacity, management, operation, and maintenance standards for SSO management (see SSO) Combined Sewer Overflow or CSO: Describes a discharge into a body of water, usually the result of a heavy rain or snowmelt that exceeds the capacity of the combined storm and sanitary system. Untreated CSOs are a major source of microorganisms that threaten public health. Conservation Easement: Land set aside for conservation purposes.
Appendix H: Glossary and Acronyms Page 2 of 4
Detention Pond: Ponds created to detain water from running off. Dissolved Oxygen: A direct measurement of the amount of oxygen in the system available to support aquatic life. Values above 7 mg/L are desirable, levels below 5 mg/L are considered problematic. Levels below 2 mg/L are lethal to many aquatic organisms. (Ref 1) Escherichia coli (E. coli): A bacterium that is the predominant facultative anaerobe in the digestive tract of humans and warm-blooded animals. Used as an indicator of the presence of human or animal fecal matter in water. (Ref 1) EPA: The United States Environmental Protection Agency. Eutrophic: Describes a body of water which has an excess of aquatic growth. Eutrophication: Naturally, the slow evolutionary process of aging of freshwater lakes leading to an increase in productivity and a decrease in depth. Accelerated lake aging due to man’s activities (i.e., cultural eutrophication) decreases artificial increases in productivitiy due to the addition of nutrients usually phosphorus, and increased sedimentation due to soil erosion. IDEP: Illicit Discharge Elimination Program IJC: International Joint Commission Illicit Connections: Connections of sanitary sewer to the storm sewer system. Impairment or Impaired Use: The degradation or destruction of a productive use of a water body (e.g., boating, fishing, fish and wildlife habitat or drinking water supply). Impoundment: A body of water confined by a dam, dike, floodgate, or other barrier. Limnology: The study of the physical, chemical, meteorological, and biological aspects of fresh water. Log Jam: A cluster of logs in the river. Macroinvertebrate: An animal without a backbone large enough to be seen without magnification. MDEQ: Michigan Department of Environmental Qualtiy MDNR: Michigan Department of Natural Resources MDOT: Michigan Department of Transportation Metals: A wide variety of metals are found in aquatic sediments. Many metals are naturally occurring, but can also be derived from human activity. Low concentrations of many metals are necessary as nutrients for living organisms, however, higher concentrations in the environment may be toxic to aquatic organisms, especially benthic (bottom-dwelling) organisms. Metals are persistent pollutants and can bio-accumulate in some forms. (Ref 1)
Appendix H: Glossary and Acronyms Page 3 of 4
Microcystis: Nuisance blue-green algal blooms. MML: Michigan Municipal League NAFSMA: National Association of Flood and Storm Water Management Agencies Nitrate (NO3
-): Plant nutrient; source of nitrogen which is needed to build protein. The most oxidized form of nitrogen. Derived from the natural breakdown of nitrogenous organic material, agricultural run-off or discharge of sewage. Levels above 0.3 mg/L may stimulate excessive algal growth if phosphorus is not limiting. (Ref 1) Nitrite (NO2
-): Usually not present in high concentrations, very quickly oxidized to nitrate under aerobic conditions. (Ref 1) NOAA: National Oceanic and Atmospheric Administration Nonpoint Source Pollution: Pollution entering water bodies that is diffused, e.g., surface runoff from agriculture or urbanized areas. NPDES: National Pollutant Discharge Elimination System. Nutrient Loadings: The addition of nitrogen or phosphorus to a body of water. On-Site Disposal System: Usually a septic tank with a drain field. Ortho-Phosphorus: The simplest form of phosphorus found in aquatic systems. Since algae readily consume it, it is usually found in low concentrations. (Ref 1) PCB: Polychlorinated biphenyl, a class of persistent toxic organic compounds manufactured for use in a wide variety of industrial and product applications related to its fire retardant and electrolytic properties. Severely restricted in Michigan in 1977 due to environmental contamination problems related to its use. PEP: Public Education Plan Phosphorus Limited: The condition where the amount of phosphorus determines the productivity of the lake. Point Source Pollution: Pollution from concentrated, well defined sources such as wastewater treatment system pipes or storm water pipes. Probable Effects Concentration (PEC): The concentrations above which harmful effects on benthic organisms are expected to occur frequently. (MDEQ). RAP: Remedial Action Plan RDL: Reportable Detection Limit Riparian: Term used when relating to a river bank.
Appendix H: Glossary and Acronyms Page 4 of 4
RPO: Rouge Program Office RRAC: Rouge River Advisory Council Sanitary Sewer Overflow or SSO: Describes an unlawful, untreated sewage discharge into a water body from a sewer system designed to transport only sanitary waste. Sedimentation: The deposition of eroded soil and sand particles in the bottom of water bodies. Alteration of natural landscapes to support residential, commercial, and industrial activity can increase erosion and flows that increase the rate of sedimentation. SEMCOG: Southeast Michigan Council of Governments SRF: State Revolving Fund SWPPI: Stormwater Pollution Prevention Initiative Threshold Effects Concentration (TEC): The concentrations below which harmful effects on benthic organisms are not expected. (MDEQ) Total Kjeldahl Nitrogen (TKN): Total Kjeldahl nitrogen is a measure of non-bioavailable nitrogen forms; ammonia and organic nitrogen. These forms may become bioavailable if oxidized by natural processes. Kjeldahl nitrogen may result from municipal and industrial discharges, fertilizer runoff, or natural bio-reduction. (Ref 1) Total Organic Carbon (TOC): Total Organic Carbon is a measure of the oxidizable carbon available in a water sample. It includes aromatic hydrocarbons, non-biodegradable organic carbon, straight chain aliphatic, and organic nitrogen. As TOC increases, the trophic status of the lake moves toward eutrophication as a respiration increases and dissolved oxygen levels decrease. (Ref 1) Total Phosphorus: Essential plant nutrient, which is usually in short supply in aquatic systems. Therefore, it often serves as a limiting factor for algal growth. Found in fertilizers and detergents. (Ref 1) Total Suspended Solids (TSS): A measure of the mass of the total solid material per unit volume in a water sample including dissolved and non-dissolved materials. (Ref 1) Treatment Plant Bypass: When a sewage treatment plant directs excess sewage that it cannot handle due to high-flow conditions into a nearby river. Wetland: An area that is regularly saturated by surface water or groundwater and is characterized by a prevalence of vegetation that is adapted for life in saturated soil conditions.
Anchor Bay Watershed Management Plan
Appendix I:
References
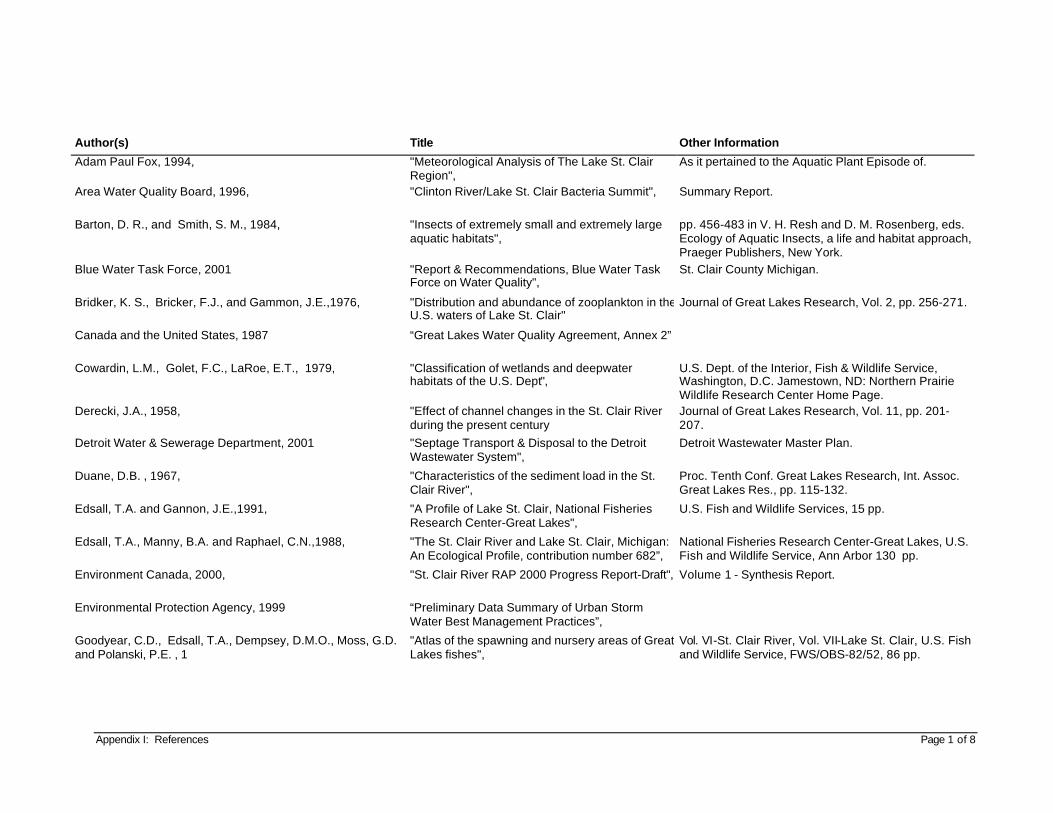
Appendix I: References Page 1 of 8
Author(s) Title Other Information
Adam Paul Fox, 1994, "Meteorological Analysis of The Lake St. Clair Region",
As it pertained to the Aquatic Plant Episode of.
Area Water Quality Board, 1996, "Clinton River/Lake St. Clair Bacteria Summit", Summary Report.
Barton, D. R., and Smith, S. M., 1984, "Insects of extremely small and extremely large aquatic habitats",
pp. 456-483 in V. H. Resh and D. M. Rosenberg, eds. Ecology of Aquatic Insects, a life and habitat approach, Praeger Publishers, New York.
Blue Water Task Force, 2001 "Report & Recommendations, Blue Water Task Force on Water Quality",
St. Clair County Michigan.
Bridker, K. S., Bricker, F.J., and Gammon, J.E.,1976, "Distribution and abundance of zooplankton in the U.S. waters of Lake St. Clair"
Journal of Great Lakes Research, Vol. 2, pp. 256-271.
Canada and the United States, 1987 “Great Lakes Water Quality Agreement, Annex 2”
Cowardin, L.M., Golet, F.C., LaRoe, E.T., 1979, "Classification of wetlands and deepwater habitats of the U.S. Dept",
U.S. Dept. of the Interior, Fish & Wildlife Service, Washington, D.C. Jamestown, ND: Northern Prairie Wildlife Research Center Home Page.
Derecki, J.A., 1958, "Effect of channel changes in the St. Clair River during the present century
Journal of Great Lakes Research, Vol. 11, pp. 201-207.
Detroit Water & Sewerage Department, 2001 "Septage Transport & Disposal to the Detroit Wastewater System",
Detroit Wastewater Master Plan.
Duane, D.B. , 1967, "Characteristics of the sediment load in the St. Clair River",
Proc. Tenth Conf. Great Lakes Research, Int. Assoc. Great Lakes Res., pp. 115-132.
Edsall, T.A. and Gannon, J.E.,1991, "A Profile of Lake St. Clair, National Fisheries Research Center-Great Lakes",
U.S. Fish and Wildlife Services, 15 pp.
Edsall, T.A., Manny, B.A. and Raphael, C.N.,1988, "The St. Clair River and Lake St. Clair, Michigan: An Ecological Profile, contribution number 682”,
National Fisheries Research Center-Great Lakes, U.S. Fish and Wildlife Service, Ann Arbor 130 pp.
Environment Canada, 2000, "St. Clair River RAP 2000 Progress Report-Draft", Volume 1 - Synthesis Report.
Environmental Protection Agency, 1999 “Preliminary Data Summary of Urban Storm Water Best Management Practices”,
Goodyear, C.D., Edsall, T.A., Dempsey, D.M.O., Moss, G.D. and Polanski, P.E. , 1
"Atlas of the spawning and nursery areas of Great Lakes fishes",
Vol. VI-St. Clair River, Vol. VII-Lake St. Clair, U.S. Fish and Wildlife Service, FWS/OBS-82/52, 86 pp.
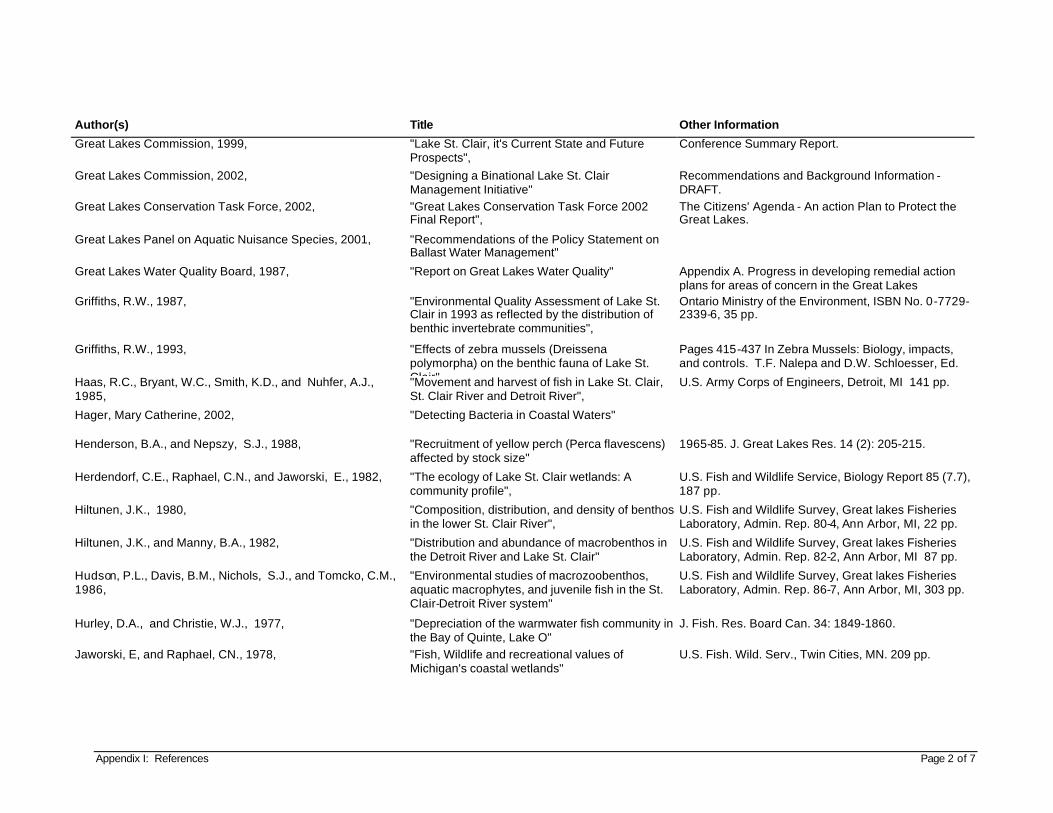
Appendix I: References Page 2 of 7
Author(s) Title Other Information
Great Lakes Commission, 1999, "Lake St. Clair, it's Current State and Future Prospects",
Conference Summary Report.
Great Lakes Commission, 2002, "Designing a Binational Lake St. Clair Management Initiative"
Recommendations and Background Information - DRAFT.
Great Lakes Conservation Task Force, 2002, "Great Lakes Conservation Task Force 2002 Final Report",
The Citizens' Agenda - An action Plan to Protect the Great Lakes.
Great Lakes Panel on Aquatic Nuisance Species, 2001, "Recommendations of the Policy Statement on Ballast Water Management"
Great Lakes Water Quality Board, 1987, "Report on Great Lakes Water Quality" Appendix A. Progress in developing remedial action plans for areas of concern in the Great Lakes
Griffiths, R.W., 1987, "Environmental Quality Assessment of Lake St. Clair in 1993 as reflected by the distribution of benthic invertebrate communities",
Ontario Ministry of the Environment, ISBN No. 0-7729-2339-6, 35 pp.
Griffiths, R.W., 1993, "Effects of zebra mussels (Dreissena polymorpha) on the benthic fauna of Lake St. Clair"
Pages 415-437 In Zebra Mussels: Biology, impacts, and controls. T.F. Nalepa and D.W. Schloesser, Ed.
Haas, R.C., Bryant, W.C., Smith, K.D., and Nuhfer, A.J., 1985,
"Movement and harvest of fish in Lake St. Clair, St. Clair River and Detroit River",
U.S. Army Corps of Engineers, Detroit, MI 141 pp.
Hager, Mary Catherine, 2002, "Detecting Bacteria in Coastal Waters"
Henderson, B.A., and Nepszy, S.J., 1988, "Recruitment of yellow perch (Perca flavescens) affected by stock size"
1965-85. J. Great Lakes Res. 14 (2): 205-215.
Herdendorf, C.E., Raphael, C.N., and Jaworski, E., 1982, "The ecology of Lake St. Clair wetlands: A community profile",
U.S. Fish and Wildlife Service, Biology Report 85 (7.7), 187 pp.
Hiltunen, J.K., 1980, "Composition, distribution, and density of benthos in the lower St. Clair River",
U.S. Fish and Wildlife Survey, Great lakes Fisheries Laboratory, Admin. Rep. 80-4, Ann Arbor, MI, 22 pp.
Hiltunen, J.K., and Manny, B.A., 1982, "Distribution and abundance of macrobenthos in the Detroit River and Lake St. Clair"
U.S. Fish and Wildlife Survey, Great lakes Fisheries Laboratory, Admin. Rep. 82-2, Ann Arbor, MI 87 pp.
Hudson, P.L., Davis, B.M., Nichols, S.J., and Tomcko, C.M., 1986,
"Environmental studies of macrozoobenthos, aquatic macrophytes, and juvenile fish in the St. Clair-Detroit River system"
U.S. Fish and Wildlife Survey, Great lakes Fisheries Laboratory, Admin. Rep. 86-7, Ann Arbor, MI, 303 pp.
Hurley, D.A., and Christie, W.J., 1977, "Depreciation of the warmwater fish community in the Bay of Quinte, Lake O"
J. Fish. Res. Board Can. 34: 1849-1860.
Jaworski, E, and Raphael, CN., 1978, "Fish, Wildlife and recreational values of Michigan's coastal wetlands"
U.S. Fish. Wild. Serv., Twin Cities, MN. 209 pp.
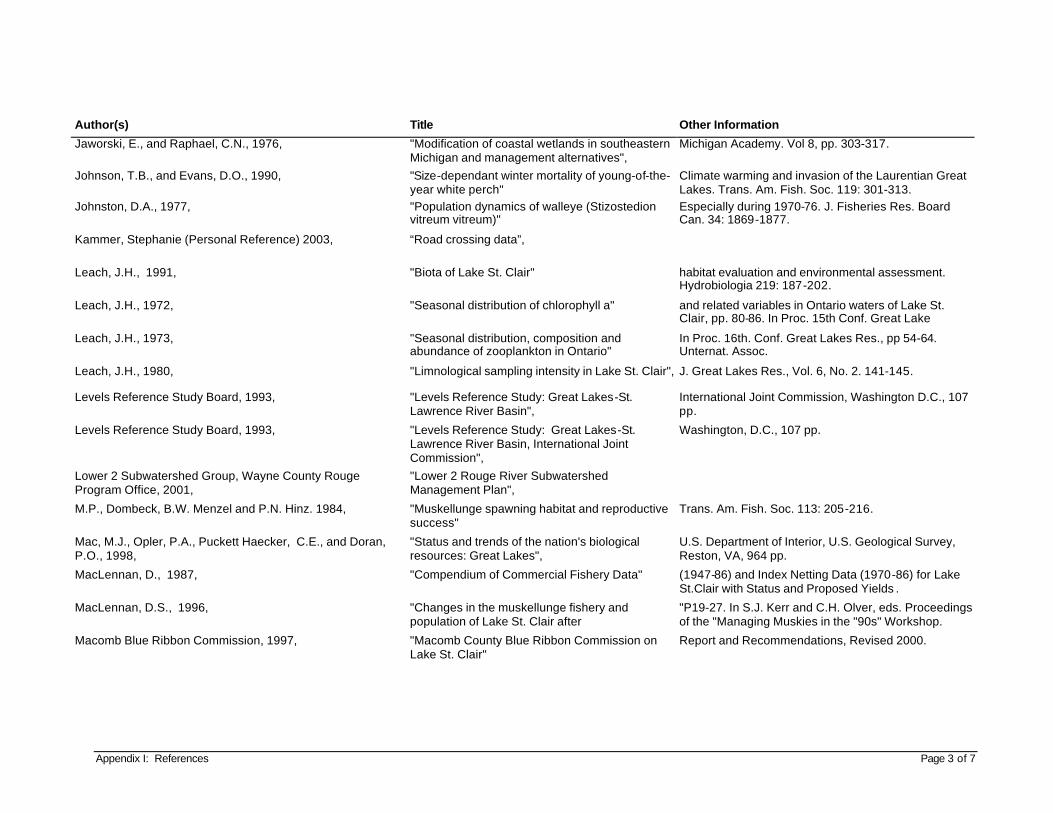
Appendix I: References Page 3 of 7
Author(s) Title Other Information
Jaworski, E., and Raphael, C.N., 1976, "Modification of coastal wetlands in southeastern Michigan and management alternatives",
Michigan Academy. Vol 8, pp. 303-317.
Johnson, T.B., and Evans, D.O., 1990, "Size-dependant winter mortality of young-of-the-year white perch"
Climate warming and invasion of the Laurentian Great Lakes. Trans. Am. Fish. Soc. 119: 301-313.
Johnston, D.A., 1977, "Population dynamics of walleye (Stizostedion vitreum vitreum)"
Especially during 1970-76. J. Fisheries Res. Board Can. 34: 1869-1877.
Kammer, Stephanie (Personal Reference) 2003, “Road crossing data”,
Leach, J.H., 1991, "Biota of Lake St. Clair" habitat evaluation and environmental assessment. Hydrobiologia 219: 187-202.
Leach, J.H., 1972, "Seasonal distribution of chlorophyll a" and related variables in Ontario waters of Lake St. Clair, pp. 80-86. In Proc. 15th Conf. Great Lake
Leach, J.H., 1973, "Seasonal distribution, composition and abundance of zooplankton in Ontario"
In Proc. 16th. Conf. Great Lakes Res., pp 54-64. Unternat. Assoc.
Leach, J.H., 1980, "Limnological sampling intensity in Lake St. Clair", J. Great Lakes Res., Vol. 6, No. 2. 141-145.
Levels Reference Study Board, 1993, "Levels Reference Study: Great Lakes-St. Lawrence River Basin",
International Joint Commission, Washington D.C., 107 pp.
Levels Reference Study Board, 1993, "Levels Reference Study: Great Lakes-St. Lawrence River Basin, International Joint Commission",
Washington, D.C., 107 pp.
Lower 2 Subwatershed Group, Wayne County Rouge Program Office, 2001,
"Lower 2 Rouge River Subwatershed Management Plan",
M.P., Dombeck, B.W. Menzel and P.N. Hinz. 1984, "Muskellunge spawning habitat and reproductive success"
Trans. Am. Fish. Soc. 113: 205-216.
Mac, M.J., Opler, P.A., Puckett Haecker, C.E., and Doran, P.O., 1998,
"Status and trends of the nation's biological resources: Great Lakes",
U.S. Department of Interior, U.S. Geological Survey, Reston, VA, 964 pp.
MacLennan, D., 1987, "Compendium of Commercial Fishery Data" (1947-86) and Index Netting Data (1970-86) for Lake St.Clair with Status and Proposed Yields .
MacLennan, D.S., 1996, "Changes in the muskellunge fishery and population of Lake St. Clair after
"P19-27. In S.J. Kerr and C.H. Olver, eds. Proceedings of the "Managing Muskies in the "90s" Workshop.
Macomb Blue Ribbon Commission, 1997, "Macomb County Blue Ribbon Commission on Lake St. Clair"
Report and Recommendations, Revised 2000.
Appendix I: References Page 4 of 7
Author(s) Title Other Information
Macomb County Blue Ribbon Commission on Lake St. Clair, 2000,
"Report and Recommendations" Revised March 13, 2000.
Macomb County Health Department, 1999, "Surface Water Quality Report",
Macomb County Health Department, 2001, “Lake St. Clair Water Quality Assessment”,
Main 1-2 Subwatershed Group, Wayne County Rouge Program Office, 2001,
"Main 1-2 Rouge River Subwatershed Management Plan",
Main 3-4 Subwatershed Group, Wayne County Rouge Program Office, 2001,
"Main 3-4 Rouge River Subwatershed Management Plan",
Mangus, Amy (Personal Reference), 2003 “SEMCOG, Land use trends and data”,
Martz, D., 1999, "The Need for Adequate Monitoring & Surveillance Programs In Macomb County"
Other Areas Contributing to Lake St.Clair.
McCauley, C., 1984, "An annotated bibliography on the macrozoobenthos and aquatic marcophyte of the St.Clair River, Lake St.Clair, and the Detroit River",
U.S. Fish and Wildlife Service, Great Lakes Fisheries Laboratory, Admin. Rep. 85-2, Ann Arbor, MI.
Michigan Center for Geographic Information (MCGI), “Wetland data”,
Michigan Department of Community Health, 2001, "Important Facts to Know If You Eat Michigan Fish",
Michigan 2001 Fish Advisory.
Michigan Department of Environmental Quality Surface Water Quality Division
"Michigan's Industrial Storm Water Permit Program - Guidance"
Michigan Department of Environmental Quality Surface Water Quality Division, Michigan State University Institute of Water Research, Michigan State University Extension, 2000,
“Developing a Watershed Management Plan for Water Quality: An Introductory Guide”
Michigan Department of Environmental Quality Surface Water Quality Division and United States Environmental Protection,1993, Agency, 1993
"Construction Site Storm Water"
Michigan Department of Environmental Quality Surface Water Quality Division, 2000
"Strategy for the Regulatory Control and Correction of Illegal Overflows from Separate Sanitary Sewer Systems in Michigan"
Michigan Department of Environmental Quality, 1997, "State of the Great Lakes Annual Report", Office of the Great Lakes, 44 pp.
Appendix I: References Page 5 of 7
Author(s) Title Other Information
Michigan/Department of Environmental Quality/Stormwater Quality-00/122, 2000,
"Michigan Fish Contaminant Monitoring Program" 2000 Annual Report.
Middle One Subwatershed Group, Wayne County Rouge Program Office, 2001
“Middle On e Rouge River Subwatershed Management Plan”,
MIT Sea Grant Center for Coastal Resources, 2001, "Ballast Water Background"
Nalepa, T.F., Gostenik, G.W., Hartson, D.J., Fanslow, D.L. and Lang, G.A. , 1996,
"Changes in the freshwater mussel community of Lake St.Clair: from Unionida
J. Great Lakes Research 22(2):354-369. International Association of Great Lakes Research.
Natural Resources Defense Council, 2001 "Testing the Waters", A Guide to Water Quality at Vacation Beaches
Natural Resources Defense Council, 2001 "Clean Water & Oceans": Oceans: In Depth: Report
Nichols, K.H., 1999, "Evidence for a trophic cascade effect on North-shore western Lake Erie"
J. Great Lakes Research 25(4):942-949.
Ohio Lake Erie Commission, 2000, "Lake Erie", Protection & Restoration Plan.
Ontario Ministry of Environment, 1984, "Beak International Incorporated11996; LIS 117C; Ontario Ministry of Environment, 1996 c"
Ontario Ministry of the Environment, 1998, "St.Clair River Remedial Action Plan, The St. Clair River Area of Concern",
Stage 1 1997 Update.
Quinn, F.H., 1981, "Secular changes in annual and seasonal Great Lakes precipitation 1854-1979"
Water Resources Research, Vol. 17, pp. 1619-1624.
R. P. Auclair, 1960, "White Perch in Main", Maine Dep. Inland Fish. Game, Fish. Bull. Augusta, 16 pp.
Raphael, C.N., and Jaworski, E.,1982, "The St.Clair River delta: A unique lake delta", Geography Bulletin, Vol. 21, pp. 7-28.
Raphael, C.N., and Jawors ki, E., 1982, "The St. Clair River delta: A unique lake delta", Geogr. Bulletin, vol. 21 pp. 7-28.
Roseman, E.F., 2000, "Physical and biological processes influencing walleye early life history I"
Doctoral dissertation. Department of Fisheries and Wildlife, Michigan State University, East Lansing
Sachdev, S.C., and Furlong, R., 1973, "Sedimentation in the St. Clair River delta" Muscamoot Bay Area, Michigan, Geological Society of America, North-Central Section, Vol. 5, 346 pp.
Samadpour, Mansour, Ph.D., 1999, "Microbial Source Tracking Study of the Blossom Beach"
Department of Environment Health, University of Washington.
Appendix I: References Page 6 of 7
Author(s) Title Other Information
Schloesser, D.W., 1986, "A field guide to valuable underwater aquatic plants of the Great Lakes",
U.S. Fish and Wildlife Service, Great Lakes Fisheries Laboratory, Ann Arbor and MSU Coop. Extn. Service Ext. Bull. E-1902, East Lansing, 32 pp. Schloesser, D.W., and Kovalak, W.P., 1991, "Infestation of unionids by Driesena polymorpha
in a power plant canal in Lake St. Clair" Journal of Shellfish Research, Vol. 10, pp. 355-359.
Schloesser, D.W., and Manny, B.A., 1985, "Potential use of low-altitude aerial photography to identify submerged macrophytes",
U.S. Fish and Wildlife Service, Great Lakes Fisheries Laboratory, Admin, Rep. No. 85-1, Ann Arbor, MI
Schloesser, D.W., and Manny, B.A., 1982, "Distribution and relative abundance of submerged aquatic macrophytes in the St. Clair-Detroit River Ecosystem"
U.S. Fish and Wildlife Service, Great Lakes Fisheries Laboratory, USFWS-GLFl/AR-82-7, Ann Arbor, MI.
Schwab, D.J., Clites, A.H., Murthy, C.R., Sandall, J.E., Meadows, L.A. and G.A., 1997,
"The effect of wind on transport and circulation in Lake St. Clair",
Journal of Geophysical Research, Vol. 94 (C4), pp. 4947-4958.
Scott, W.B., and Rasmussen, W.J., Rowan, D.J., Brodeur, J., and Hontela, A., 2000,
"The invasion of the lower Great Lakes by the White Perch"
Roccus americanus (Gmelin). J. Fish. Res. Board Can. 20:1189-1195.
Southeast Michigan Council of Governments (SEMCOG) “Putting Southeast Michigan’s Water Quality Plan Into Action: Tools for Local Governments”
Sherwood, G.D., Rasmussen, J.B., Rowan, D.J., Brodeur, J. and Hontela, A. , 2000,
"Bioenergetic costs of heavy metal exposure in yellow perch
In situ estimates with a radiotracer (137Cs) technique. Can J. Fish Aquat. Sci. 57:441-450.
Sly, P.G., and Busch, W.-D.N., 1992, "Introduction to the process, procedure, and concepts used in the development of an aquatic habitat classification system for lakes",
p. 1-15. In W.-D.N. Busch and P.G. Sly (ed). The development of an aquatic habitat classification system for lakes. CRC Press, Ann Arbor.
Smithsonian Environmental Research Center, 1998 "National Ballast Water Information Clearinghouse"
St. Clair County Board of Commissioners, 2001, "Blue Water Task Force on Water Quality", Report & Recommendations, St. Clair County Michigan.
St. Clair River Bi-National Public Advisory Committee, 1994, "St. Clair River Stage 1 RAP Report",
Stynes, Daniel J., Tsung Chiung Wu, and Mahoney, Edward M, 1995,
"1994 Michigan Boating Survey"
Suns, K., Crawford, G., and Russel, D., 1985, "Organochlorine and mercury residues in young-of-year spottail shiners"
Lake St. Clair, and Lake Erie, J. of Great Lakes Res. 11:347-352.
Synnestvedt, S., 1997, "The importance of large benthic invertebrates to the diet and growth",
Fisheries Technical Report #2031. Ann Arbor.
Appendix I: References Page 7 of 7
Author(s) Title Other Information
Talhelm, Daniel R. and Vrana, Kenneth J., 1998, "Status of Potential of Michigan Natural Resources, Special Report 77-Boating and Underwater Recreation",
Michigan State University Extension, Agricultural Experiment Station Reports-04089577.
The Nature Conservancy Great Lakes Program, 1994, "The conservation of biological diversity in the Great Lakes ecosystem",
Issues and opportunities, 118 pp.
Thomas, M.V., 1997. "Diet of the round goby in the St. Clair River and Lake St. Clair, 1993",
Michigan Department of Natural Resources Fisheries Technical Report #96-2. Ann Arbor, MI.
Thomas, Micheal and Haas Robert, Michigan Department of Natural Resources Fisheries Division, Mt. Clemens Fisheries, 2002 Research Station,
"Status of the Fisheries in Michigan Waters of Lake Erie and Lake St. Clair,"
Prepared for the GLFC Lake Erie Committee Meeting, Buffalo, New York, March 27, 2002.
U.S. Army Corps of Engineers & the Great Lakes Commission, 1999,
"Understanding & Adapting to Great Lakes water level changes",
Living with Lakes.
U.S. Department of the Interior, U.S. Geological Survey, 1996,
"Areal Distribution & Concentrations of Contaminants of Concern in Surficial Streambed and Lakebed Sediment, Lake Erie-Lake St. Clair Drainages, 1990-97"
Water-Resources Investigations Report 00-4200.
U.S. Department of the Interior, U.S. Geological Survey, 1996-98,
"Water Quality in Lake Erie-Lake St. Clair Drainages, MI, OH, NY and PA",
D.N. Myers, M.A. Thomas, J.W. Frey, S.J. Rheaume & D.T. Button, 2000.
U.S. Environmental Protection Agency and Environment Canada, 1988,
"Upper Great Lakes Connecting Channels Study, Vol. 1",
Executive Summary, 50 pp. International Joint Commission.
U. S. Geological Survey, 2003, http://www.usgs.gov
United States Coast Guard, revised 2001, "Ballast Water Brochure"
Upper Great Lakes Connecting Channels Study Management Committee, 1988,
"Upper Great Lakes Connecting Channels Study",
Volume I, 49 pp.
Vigmostad, Karen E., 1999, "State of the Great Lakes Islands Project", Proceedings from the 1996 U.S. Canada Great" Lakes Islands Workshop,
Department of Resource Development, Michigan State University, 124 pp., East Lansing, Michigan.
Wayne County Department of Environment Wayne County Illicit Connection/Discharge Elimination Training Program
Wightman, R.W., 1961, "The St. Clair delta", M.A. Thesis, University of Western Ontario, London, 140 pp.
Yoon, Hae-Jin (Personal Reference) 2002,
"MDEQ, Industry Compliance"