Richmond College Preparatory
23
2/1/22, 11:35 AM School Accountability Report Card https://sarconline.org/public/print/07617960110973/2020-2021 1/23 Richmond College Preparatory 2020—2021 School Accountability Report Card Reported Using Data from the 2020—2021 School Year California Department of Education Address: 1014 Florida Ave Richmond, CA , 94804-2474 Principal: Diana Gurrola-Ramirez & Sarah Lego Phone: (510) 235-2066 Grade Span: K-8 By February 1 of each year, every school in California is required by state law to publish a School Accountability Report Card (SARC).The SARC contains information about the condition and performance of each California public school. Under the Local Control Funding Formula (LCFF) all local educational agencies (LEAs) are required to prepare a Local Control and Accountability Plan (LCAP), which describes how they intend to meet annual school-specific goals for all pupils, with specific activities to address state and local priorities. Additionally, data reported in an LCAP is to be consistent with data reported in the SARC. For more information about SARC requirements, see the California Department of Education (CDE) SARC web page at https://www.cde.ca.gov/ta/ac/sa/. For more information about the LCFF or LCAP, see the CDE LCFF web page at https://www.cde.ca.gov/fg/aa/lc/. For additional information about the school, parents/guardians and community members should contact the school principal or the district office. DataQuest DataQuest is an online data tool located on the CDE DataQuest web page at https://dq.cde.ca.gov/dataquest/ that contains additional information about this school and comparisons of the school to the district and the county. Specifically, DataQuest is a dynamic system that provides reports for accountability (e.g., test data, enrollment, high school graduates, dropouts, course enrollments, staffing, and data regarding English learners). California School Dashboard The California School Dashboard (Dashboard) https://www.caschooldashboard.org/ reflects California’s new accountability and continuous improvement system and provides information about how LEAs and schools are meeting the needs of California’s diverse student population. The Dashboard contains reports that display the performance of LEAs, schools, and student groups on a set of state and local measures to assist in identifying strengths, challenges, and areas in need of improvement.
-
Upload
khangminh22 -
Category
Documents
-
view
1 -
download
0
Transcript of Richmond College Preparatory

2/1/22, 11:35 AM School Accountability Report Card
https://sarconline.org/public/print/07617960110973/2020-2021 1/23
Richmond College Preparatory2020—2021 School Accountability Report Card
Reported Using Data from the 2020—2021 School YearCalifornia Department of Education
Address: 1014 Florida Ave Richmond, CA , 94804-2474
Principal: Diana Gurrola-Ramirez & Sarah Lego
Phone: (510) 235-2066 Grade Span: K-8
By February 1 of each year, every school in California is required by state law to publish a School Accountability Report Card (SARC).The SARC contains informationabout the condition and performance of each California public school. Under the Local Control Funding Formula (LCFF) all local educational agencies (LEAs) arerequired to prepare a Local Control and Accountability Plan (LCAP), which describes how they intend to meet annual school-specific goals for all pupils, with specificactivities to address state and local priorities. Additionally, data reported in an LCAP is to be consistent with data reported in the SARC.
For more information about SARC requirements, see the California Department of Education (CDE) SARC web page at https://www.cde.ca.gov/ta/ac/sa/.
For more information about the LCFF or LCAP, see the CDE LCFF web page at https://www.cde.ca.gov/fg/aa/lc/.
For additional information about the school, parents/guardians and community members should contact the school principal or the district office.
DataQuest
DataQuest is an online data tool located on the CDE DataQuest web page at https://dq.cde.ca.gov/dataquest/ that contains additional information about thisschool and comparisons of the school to the district and the county. Specifically, DataQuest is a dynamic system that provides reports for accountability (e.g., testdata, enrollment, high school graduates, dropouts, course enrollments, staffing, and data regarding English learners).
California School DashboardThe California School Dashboard (Dashboard) https://www.caschooldashboard.org/ reflects California’s new accountability and continuous improvement system andprovides information about how LEAs and schools are meeting the needs of California’s diverse student population. The Dashboard contains reports that display theperformance of LEAs, schools, and student groups on a set of state and local measures to assist in identifying strengths, challenges, and areas in need ofimprovement.

2/1/22, 11:35 AM School Accountability Report Card
https://sarconline.org/public/print/07617960110973/2020-2021 2/23
About This School
Contact Information (School Year 2021—2022)
Last updated: 2/1/22
Diana Gurrola-Ramirez & Sarah Lego Principal, Richmond College Preparatory
About Our SchoolRichmond College Prep's (RCP) mission is to, first, ground its students in an understanding of their history. We help them learn who they are and where theycome from so they can recognize the impact they will have in the world. We want our students to be passionate learners and curious self-starters who takeownership of their education. We strive to empower them with the confidence and courage to express themselves and commit to positive choices. We intend thatthey will achieve their rigorous academic goals and embrace any opportunity that comes their way. We want our students to see themselves as leaders who know how to use the power of their voice as a catalyst for change in their community and in the widerworld. RCP is fighting every day to reverse educational inequality to ensure students have the fundamentals needed to excel in literacy and all academic pursuits.Program activities support students’ development of Social and Emotional Learning (SEL) skills. SEL helps students develop a range of skills they need for schooland life. Social-Emotional skills include the ability to:
Set and achieve positive goalsFeel and show empathy for othersEstablish and maintain positive relationshipsMake responsible decisionsUnderstand and manage emotions
ContactRichmond College Preparatory 1014 Florida Ave Richmond, CA 94804-2474 Phone: (510) 235-2066 Email: [email protected]
District Contact Information (School Year 2021—2022)District Name West Contra Costa Unified
Phone Number (510) 231-1100
Superintendent Hurst, Kenneth C.
Email Address [email protected]
Website www.wccusd.net
School Contact Information (School Year 2021—2022)School Name Richmond College Preparatory
Street 1014 Florida Ave
City, State, Zip Richmond, CA , 94804-2474
Phone Number (510) 235-2066
Principal Diana Gurrola-Ramirez & Sarah Lego
Email Address [email protected]
Website http://www.rcpschools.org
County-District-School (CDS) Code 07617960110973

2/1/22, 11:35 AM School Accountability Report Card
https://sarconline.org/public/print/07617960110973/2020-2021 3/23
School Description and Mission Statement (School Year 2021—2022)
Description of Richmond College Prep Schools:
Richmond College Prep Schools are in the Santa Fe/Coronado neighborhoods of Richmond, California. We serve students in the immediate community as well asstudents living in the Iron Triangle and surrounding areas. We were founded in 2004 as a Montessori preschool program and began with 20 students. We havesince grown into a preschool and Richmond College Prep K-8 Charter School (RCPK8) consisting of an elementary and a middle school. The elementary andmiddle schools serve approximately 534 children. Our teachers, administrators, and staff are dedicated to all our students’ academic success and social-emotionalwell-being. Students are exposed to a rigorous academic curriculum as well as mindful awareness practices. Richmond College Prep Schools has a history ofacademic success and continues to work with excellence.
Mission Statement:
Richmond College Prep Schools’ mission is to change our community through education by providing preschool, elementary, and middle school academicservices resulting in grade-appropriate academic achievement, cultural enrichment, and strong moral character.
Vision:
Richmond College Prep Schools are committed to intellectually challenging and emotionally nurturing educational environments for children in Richmond,California as the basis for student success and productive citizenship. We demonstrate that all children, no matter what their circumstances, can be highlyeducated and successful citizens if they are provided rigorous educational programs and adequate social support. We support both children and their families toensure that all our children are well-educated and productive community members.
Last updated: 2/1/22
2/1/22, 11:35 AM School Accountability Report Card
https://sarconline.org/public/print/07617960110973/2020-2021 4/23
Student Enrollment by Grade Level (School Year 2020—2021)
Grade Level Number of Students
Grade 1 60
Grade 2 60
Grade 3 58
Grade 4 61
Grade 5 55
Grade 6 58
Grade 7 54
Grade 8 56
Kindergarten 86
Total Enrollment 548
Last updated: 2/1/22
Student Enrollment by Student Group (School Year 2020—2021)
Student Group Percent of Total Enrollment
Female 49.60%
Male 50.40%
Non-Binary 0.00%
American Indian or Alaska Native 0.20%
Asian 0.00%
Black or African American 23.00%
Filipino 0.20%
Hispanic or Latino 74.80%
Native Hawaiian or Pacific Islander 0.40%
Two or More Races 1.50%
White 0.00%
Student Group (Other) Percent of Total Enrollment
English Learners 32.70%
Foster Youth 0.20%
Homeless 0.90%
Migrant 0.00%
Socioeconomically Disavantaged 75.40%
Students with Disabilities 8.90%
2/1/22, 11:35 AM School Accountability Report Card
https://sarconline.org/public/print/07617960110973/2020-2021 5/23
A. Conditions of Learning
State Priority: BasicThe SARC provides the following information relevant to the State priority: Basic (Priority 1):
Degree to which teachers are appropriately assigned and fully credentialed in the subject area and for the pupils they are teaching;Pupils have access to standards-aligned instructional materials; andSchool facilities are maintained in good repair

2/1/22, 11:35 AM School Accountability Report Card
https://sarconline.org/public/print/07617960110973/2020-2021 6/23
Credentialed Teachers Assigned Out-of-Field (considered "out-of-field" under ESSA) (School Year 2020—2021)
Indicator Number
Credentialed Teachers Authorized on a Permit or Waiver
Local Assignment Options
Total Out-of-Field Teachers
Last updated:
Note: For more information refer to the Updated Teacher Equity Definitions web page at https://www.cde.ca.gov/pd/ee/teacherequitydefinitions.asp.

2/1/22, 11:35 AM School Accountability Report Card
https://sarconline.org/public/print/07617960110973/2020-2021 7/23
Quality, Currency, Availability of Textbooks and Other Instructional Materials (School Year 2021—2022)Year and month in which the data were collected: August 2021
SubjectTextbooks and Other Instructional Materials/year of
AdoptionFrom Most Recent
Adoption?Percent Students Lacking Own
Assigned Copy
Reading/Language Arts Reading/Language Arts Reading/Language Arts Allgrades (TK - 8):
Reader's and Writer's Workshop - Lucy Calkins
Lower Elementary (TK - 4):
National Geographic REACH
Upper Elementary (6 - 8):
English 3D Houghton Mifflin Harcourt
Yes 0%
Mathematics Mathematics (TK - 4):
Engage NY
Mathematics (5 - 8):
Open-Up
Yes 0%
Science Lower Elementary (TK - 4):
Mystery Science
Upper Elementary (6 - 8):
Teachers' Curriculum Institute (TCI)
0%
History-Social Science 0%
Foreign Language 0%
Health Health Upper Elementary (5 - 8):
Advocates for Youth
0%
Visual and Performing Arts 0%
Science Lab Eqpmt (Grades9-12)
N/A N/A 0%
Note: Cells with N/A values do not require data.
Last updated: 2/1/22

2/1/22, 11:35 AM School Accountability Report Card
https://sarconline.org/public/print/07617960110973/2020-2021 8/23
School Facility Conditions and Planned Improvements
One of our top priorities is to maintain a safe, clean, and functional school facility. The custodial staff cleans the campus daily. The school conducts an annualaudit and an annual community survey to make identified repairs. The custodial staff makes repairs to the grounds as the need arises. Administrators conductfacility walkthroughs, on average each quarter, to check the cleanliness and safety of the school facilities. They coordinate with the Richmond Fire Departmentand the County Health Department. Security is maintained with locked doors and security gates that have video monitoring supervised by our Charter Office staff.
Richmond College Prep has annual inspections by the Richmond Fire Department and the County Health Department. Inspection results are posted on-site andmay be viewed at the front office. Because facility improvements were completed during the 2018 summer (replacing HVAC units and LED lighting on the Chartercampus) and Richmond College Prep is not in need of any additional maintenance to ensure good repair at this time, there are no planned facility improvementsfor the 2021-22 school year.
Last updated: 2/1/22
School Facility Good Repair StatusUsing the most recently collected Facility Inspection Tool (FIT) data (or equivalent), provide the following:
Determination of repair status for systems listedDescription of any needed maintenance to ensure good repairThe year and month in which the data were collectedThe rate for each system inspectedThe overall rating
Year and month of the most recent FIT report: null 2018
System Inspected Rating Repair Needed and Action Taken or Planned
Systems: Gas Leaks, Mechanical/HVAC, Sewer Fair
Interior: Interior Surfaces Fair
Cleanliness: Overall Cleanliness, Pest/Vermin Infestation Fair
Electrical: Electrical Fair
Restrooms/Fountains: Restrooms, Sinks/Fountains Fair
Safety: Fire Safety, Hazardous Materials Fair
Structural: Structural Damage, Roofs Fair
External: Playground/School Grounds, Windows/Doors/Gates/Fences Fair
Overall Facility RateYear and month of the most recent FIT report: null 2018
Overall Rating Good
Last updated: 2/1/22

2/1/22, 11:35 AM School Accountability Report Card
https://sarconline.org/public/print/07617960110973/2020-2021 9/23
B. Pupil Outcomes
State Priority: Pupil AchievementThe SARC provides the following information relevant to the State priority: Pupil Achievement (Priority 4):
Statewide assessments (i.e., California Assessment of Student Performance and Progress [CAASPP] System includes the Smarter Balanced SummativeAssessments for students in the general education population and the California Alternate Assessments [CAAs] for English language arts/literacy [ELA] andmathematics given in grades three through eight and grade eleven. Only eligible students may participate in the administration of the CAAs. CAAs items arealigned with alternate achievement standards, which are linked with the Common Core State Standards [CCSS] for students with the most significant cognitivedisabilities).
The CAASPP System encompasses the following assessments and student participation requirements: 1. Smarter Balanced Summative Assessments and CAAs for ELA in grades three through eight and grade eleven. 2. Smarter Balanced Summative Assessments and CAAs for mathematics in grades three through eight and grade eleven. 3. California Science Test (CAST) and CAAs for Science in grades five, eight, and once in high school (i.e., grade ten, eleven, or twelve).
SARC Reporting in the 2020–2021 School Year Only Where the most viable option, LEAs were required to administer the statewide summative assessments for ELA and mathematics. Where a statewide summativeassessment was not the most viable option for the LEA (or for one or more grade-level[s] within the LEA) due to the pandemic, LEAs were allowed to reportresults from a different assessment that met the criteria established by the State Board of Education (SBE) on March 16, 2021. The assessments were required tobe:
Aligned with CA CCSS for ELA and mathematics;Available to students in grades 3 through 8, and grade 11; andUniformly administered across a grade, grade span, school, or district to all eligible students.
Options: Note that the CAAs could only be administered in-person following health and safety requirements. If it was not viable for the LEA to administer theCAAs in person with health and safety guidelines in place, the LEA was directed to not administer the tests. There were no other assessment options available forthe CAAs. Schools administered the Smarter Balanced Summative Assessments for ELA and mathematics, other assessments that meet the SBE criteria, or acombination of both, and they could only choose one of the following:
Smarter Balanced ELA and mathematics summative assessments;Other assessments meeting the SBE criteria; orCombination of Smarter Balanced ELA and mathematics summative assessments and other assessments.
College and Career Ready: The percentage of students who have successfully completed courses that satisfy the requirements for entrance to the University ofCalifornia and the California State University, or career technical education sequences or programs of study.
2/1/22, 11:35 AM School Accountability Report Card
https://sarconline.org/public/print/07617960110973/2020-2021 10/23
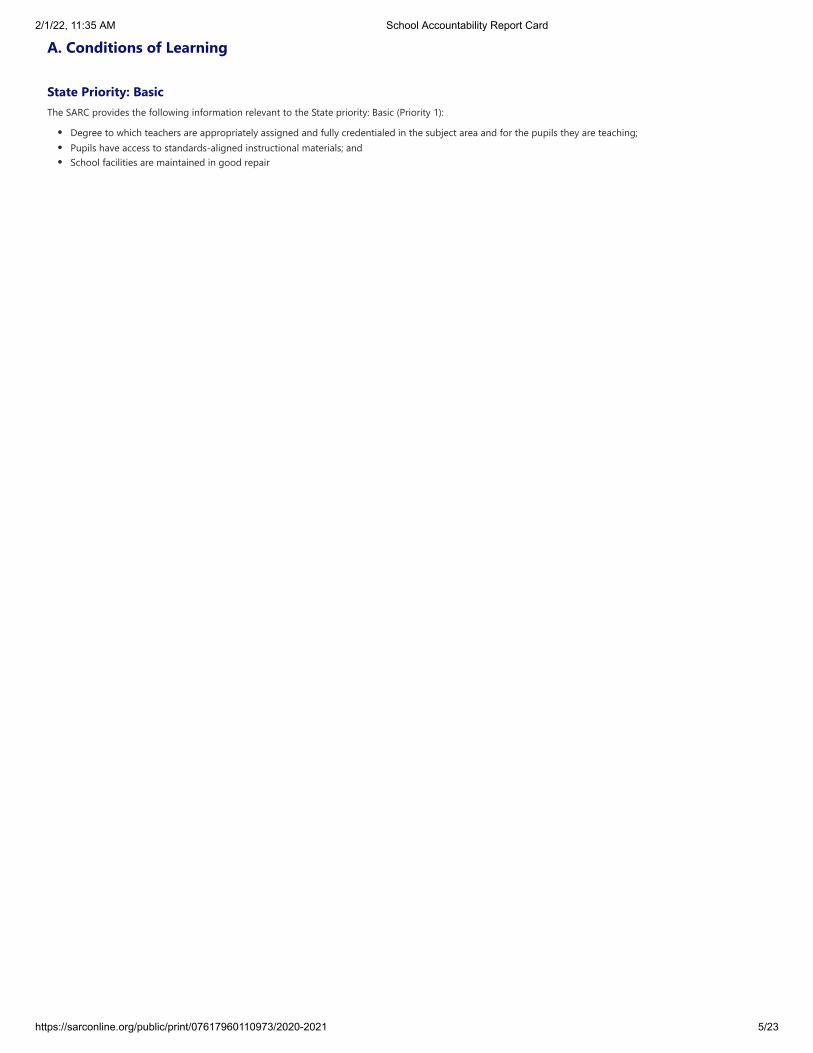
Local Assessment Test Results in ELA by Student Group Assessment Name(s): NWEA MAP Test in Reading Grades Three through Eight and Grade Eleven (School Year 2020—2021)
Student GroupTotal
EnrollmentNumber Tested
Percent Tested
Percent Not
Tested
Percent At or
Above Grade Level
All Students 350 286 82 18 43
Female 176 146 83 17 53
Male 174 140 80 20 32
American Indian or Alaska Native 1 N/A N/A N/A N/A
Asian 0 N/A N/A N/A N/A
Black or African American 87 59 68 17 53
Filipino 0 N/A N/A N/A N/A
Hispanic or Latino 258 225 87 13 44
Native Hawaiian or Pacific Islander 0 N/A N/A N/A N/A
Two or More Races 4 N/A N/A N/A N/A
White 0 N/A N/A N/A N/A
English Learners 124 104 84 16 21
Foster Youth 1 N/A N/A N/A N/A
Homeless 3 N/A N/A N/A N/A
Military 0 N/A N/A N/A N/A
Socioeconomically Disadvantaged 262 219 84 16 39
Students Receiving Migrant Education Services 0 N/A N/A N/A N/A
Students with Disabilities 26 26 100 0 15
*At or above the grade-level standard in the context of the local assessment administered. Note: LEAs/schools will populate this table for schools in cases where the school administered a local assessment. Note: LEAs/schools will populate double dashes (--) in this table when the number of students is ten or less, either because the number of students in this category istoo small for statistical accuracy or to protect student privacy. Note: In cases where the school administered only the CAASPP assessment, LEAs/schools will populate this table with “N/A” values in all cells, meaning this table isNot Applicable for this school.
Last updated: 2/1/22

2/1/22, 11:35 AM School Accountability Report Card
https://sarconline.org/public/print/07617960110973/2020-2021 11/23
Local Assessment Test Results in ELA by Student Group Assessment Name(s): NWEA MAP Test Results in Math Grades Three through Eight and Grade Eleven (School Year 2020—2021)
Student GroupTotal
EnrollmentNumber Tested
Percent Tested
Percent Not
Tested
Percent At or
Above Grade Level
All Students 350 286 82 18 26
Female 176 144 82 18 24
Male 174 142 82 18 28
American Indian or Alaska Native 1 N/A N/A N/A N/A
Asian 0 N/A N/A N/A N/A
Black or African American 87 63 72 28 19
Filipino 0 N/A N/A N/A N/A
Hispanic or Latino 258 220 85 15 29
Native Hawaiian or Pacific Islander 0 N/A N/A N/A N/A
Two or More Races 4 N/A N/A N/A N/A
White 0 N/A N/A N/A N/A
English Learners 124 98 79 21 10
Foster Youth 1 N/A N/A N/A N/A
Homeless N/A N/A N/A 3 N/A
Military 0 N/A N/A N/A N/A
Socioeconomically Disadvantaged 262 219 84 16 23
Students Receiving Migrant Education Services 0 N/A N/A N/A N/A
Students with Disabilities 26 26 100 0 12
*At or above the grade-level standard in the context of the local assessment administered. Note: LEAs/schools will populate this table for schools in cases where the school administered a local assessment. Note: LEAs/schools will populate double dashes (--) in this table when the number of students is ten or less, either because the number of students in this category istoo small for statistical accuracy or to protect student privacy. Note: In cases where the school administered only the CAASPP assessment, LEAs/schools will populate this table with “N/A” values in all cells, meaning this table isNot Applicable for this school.
Last updated: 2/1/22

2/1/22, 11:35 AM School Accountability Report Card
https://sarconline.org/public/print/07617960110973/2020-2021 12/23
Career Technical Education (CTE) Programs (School Year 2020—2021)
Over the past four years Richmond College Preparatory (RCP) has increased its emphasis on building 21st Century workforce skills in our student body toencourage curiosity and self-confidence about technology. RCP is committed to offering a range of courses that will prepare our students for college and career.Our students work with real things (e.g. models, hands-on projects, gardens). This constructivist approach to teaching and learning is the basis of our educationalprogram. Constructivist schools provide academically rich, rigorous environments that foster achievement (especially in underachieving students) and enablechildren to build a solid foundation for success as adults.
Although RCP does not have a structured Career Technical Education Program, we offer the following classes in the After-School program for 3rd-8th gradestudents (in-person or through distance learning depending on our requirements for the pandemic):
Music ProductionGame DesignMakerspace teaches students visual communication through drawing from varying perspectives, sketch modeling, and material studies, emphasizing safetypractices as students are taught to use manual and power tools. Makerspace includes Gravits, graphic design software which teaches students tocommunicate with a laser cutter to produce their designsCreative Artistry (aka Anyone Can Do Art) which teaches basic art vocabulary, skills, media, and concepts to 3rd through 5th grades
Last updated: 2/1/22

2/1/22, 11:35 AM School Accountability Report Card
https://sarconline.org/public/print/07617960110973/2020-2021 13/23
State Priority: Other Pupil OutcomesThe SARC provides the following information relevant to the State priority: Other Pupil Outcomes (Priority 8):
Pupil outcomes in the subject area of physical education

2/1/22, 11:35 AM School Accountability Report Card
https://sarconline.org/public/print/07617960110973/2020-2021 14/23
C. Engagement
State Priority: Parental InvolvementThe SARC provides the following information relevant to the State priority: Parental Involvement (Priority 3):
Efforts the school district makes to seek parent input in making decisions for the school district and each school site
Opportunities for Parental Involvement (School Year 2021-2022)
RCP has a full-time Family and Community Engagement Coordinator ([email protected] or www.rcpschools.org) who holds weekly parent meetings,Family Nights, a bi-weekly African American Affinity Group called Melanin Mamas, and numerous other events over the year to engage parents in school life. Dueto the pandemic, the Coordinator prioritizes the items listed below:
1. Engaging families via Zoom to keep parents engaged with school activities and receive their input and feedback on our learning and enrichment programs.
2. Engaging parents to attend the School Site Council (SSC), The Parent Tea Party, English Learner Advisory Committee (ELAC), and workshops and training forparents to develop advocacy skills, including how to support their student(s) in core subjects. RCP supports parents in understanding academic standards (bothState and local assessments), the use of technology, how to monitor their child’s academic progress, and how to support the success of their child.
3. Providing (in-person or virtually, as appropriate) family nights (e.g. Literacy and Math Nights), SSC, ELAC, Friday parent meetings (Melanin Mamas), and the GoPublic Schools Workshop, a five-week training course for parents that focuses on giving parents resources, tools, and knowledge on how to advocate for theirchild, on how the school governance works, on the different ways children learn, on academic standards, etc.
4. Engaging families to ensure that social-emotional needs are being met by providing coordination-of-services referrals and workshop opportunities to developsocial-emotional skills to support their students.

2/1/22, 11:35 AM School Accountability Report Card
https://sarconline.org/public/print/07617960110973/2020-2021 15/23
State Priority: Pupil EngagementThe SARC provides the following information relevant to the State priority: Pupil Engagement (Priority 5):
High school dropout rates; andHigh school graduation ratesChronic Absenteeism

2/1/22, 11:35 AM School Accountability Report Card
https://sarconline.org/public/print/07617960110973/2020-2021 16/23
Chronic Absenteeism by Student Group (School Year 2020—2021)
Student GroupCumulative Enrollment
Chronic Absenteeism
Eligible Enrollment
Chronic Absenteeism
Count
Chronic Absenteeism
Rate
All Students 559 557 137 24.6
Female 277 276 61 22.1
Male 282 281 76 27.0
American Indian or Alaska Native 0 0 0 27.0
Asian 1 1 1 0
Black or African American 129 128 60 46.9
Filipino 2 2 1 0
Hispanic or Latino 417 416 72 17.3
Native Hawaiian or Pacific Islander 2 2 0 0.0
Two or More Races 8 8 3 37.5
White 0 0 0 0.0
English Learners 217 217 42 19.4
Foster Youth 2 2 1 0
Homeless 5 5 4 0
Socioeconomically Disadvantaged 432 431 103 23.9
Students Receiving Migrant Education Services 0 0 0 0.0
Students with Disabilities 50 50 12 24.0
Last updated:

2/1/22, 11:35 AM School Accountability Report Card
https://sarconline.org/public/print/07617960110973/2020-2021 17/23
State Priority: School ClimateThe SARC provides the following information relevant to the State priority: School Climate (Priority 6):
Pupil suspension rates;Pupil expulsion rates; andOther local measures on the sense of safety
Suspensions and Expulsions (data collected between July through June, each full school year respectively)
RateSchool
2018-2019School
2020–2021District
2018-2019District
2020–2021State
2018-2019State
2020–2021
Suspensions 5.30% 0.00% 5.56% 0.01% 3.47% 0.20%
Expulsions 0.00% 0.00% 0.02% 0.00% 0.08% 0.00%
Note: Data collected during the 2020–21 school year may not be comparable to earlier years of this collection due to differences in learning mode instruction inresponse to the COVID-19 pandemic.
Suspensions and Expulsions for School Year 2019—2020 Only (data collected between July through February, partial school year due to the COVID-19 pandemic)
RateSchool
2019-2020District
2019-2020State
2019-2020
Suspensions 1.40% 3.45% 2.45%
Expulsions 0.00% 0.06% 0.05%
Note: The 2019–2020 suspensions and expulsions rate data are not comparable to other year data because the 2019–2020 school year is a partial school year due tothe COVID-19 crisis. As such, it would be inappropriate to make any comparisons in rates of suspensions and expulsions in the 2019–2020 school year compared toother school years.
Last updated: 2/1/22
School Safety Plan (School Year 2021-2022)
The RCP School Safety Plan details appropriate responses for a variety of emergency situations, including fire, earthquake, and shelter-in-place. The plandescribes the steps necessary to ensure the safety of our students and staff in the event of an emergency. Involved in the School Safety Plan are administrators,maintenance and operations staff, office staff, teachers and support staff, and local emergency response organizations such as Richmond Fire Department andRichmond Police Department. Prior to the necessity of distance learning due to COVID-19, the school conducted monthly drills with staff, teachers, students, andschool-based emergency response teams. We will resume these drills as in-person instruction becomes possible again.
The School Safety Plan details responses to health, safety, and risk in consultation with our insurance carriers and risk management consultants. RCP’s Board ofDirectors plus staff, parents, and students from the School Site Council reviewed the School Safety Plan in October 2021 and will do so annually. The key elementsare as follows:
Compliance with Education Code Section 44237 which requires that all prospective employees of the school submit to a criminal background check andfurnish a criminal record summary. This requirement will be a condition of employment.Compliance with California Penal Code section 11166 which requires any child care custodian who, in his or her professional capacity or within the scope ofhis or her employment, has knowledge of or observes a child who he or she knows or reasonably suspects has been a victim of child abuse to report theknown or suspected instance of child abuse to a child protective agency immediately, or as soon as practically possible, by telephone and to prepare andsend a written report thereof within thirty-six (36) hours of receiving the information concerning the incident.All RCP K-8 employees will have child abuse training by an accredited training program as all employees are Mandated Reporters.All new RCP K-8 employees will be required to undergo a pre-employment physical examination, including a tuberculosis test. All new employees arerequired to submit at least three professional references as a part of the employment application. New employee references are checked thoroughly. Newstaff are required to participate in employee orientation sessions to inform and educate them about school rules, practices, and policies.Employees who will be handling student food are trained in the best and safest practices for food handling, distribution of meals, and food storage byaccredited organizations.RCP K-8 students will be provided a nutritious breakfast prior to class start time, lunch, and an afternoon snack.Fire drills, earthquake drills, and shelter-in-place drills are conducted on a monthly schedule when in-person instruction is possible. Written instructions areavailable to personnel for each drill type.Staff, students, and volunteers are trained in case of natural and human-made disasters, including fire, earthquake, and other emergencies.RCP K-8 has strict guidelines for administering medication to students. Parent consent, medical professional recommendations, and thorough record-keeping are required and are in place.The appropriate professional medical response team (Fire Department, medical emergency response) will be contacted in case of a student, staff, orvolunteer medical emergency. A defibrillator machine is kept on campus and staff is trained in its use. Staff trains in first aid and CPR and the handling of

2/1/22, 11:35 AM School Accountability Report Card
https://sarconline.org/public/print/07617960110973/2020-2021 18/23
blood-borne pathogens and communicable diseases and conditions.RCP K-8 will ensure that a qualified practitioner will conduct vision, hearing, and scoliosis screening, as mandated by state regulation. The practitioner willprovide information and training to teachers and other appropriate staff members to help meet the needs of medically fragile students.Due to a national staff shortage, RCP K-8 is searching for a replacement for our full-time school counselor who left last year. When found, they will be oncampus daily or counsel virtually. Part-time occupational and speech therapists work on campus or virtually.Emotional support training (i.e. Mindful Life) sessions are available to all students on campus, and a Toolbox (a curriculum of coping skills and practices) isincluded in the daily lesson plans of teachers to practice with students.Strong policies and procedures are in place for when a student is injured or becomes sick, and parents must be notified. Parents are provided with writtenreports about accidents and incidents involving their student(s).Student and staff records are secured in locked storage areas. Students must sign-in/out when they come late to school or leave early.All classrooms are locked and/or gate access to the classrooms is locked. Classrooms have telephones and the offices are equipped with intercom systemswith visual capability.All staff attend online sexual harassment training at the beginning of each year.RCP K-8 is a drug, alcohol, and tobacco-free campus.
Last updated: 2/1/22

2/1/22, 11:35 AM School Accountability Report Card
https://sarconline.org/public/print/07617960110973/2020-2021 19/23
D. Other SARC informationThe information in this section is required to be in the SARC but is not included in the state priorities for LCFF.
Average Class Size and Class Size Distribution (Elementary) School Year 2018—2019
Grade Level Average Class Size Number of Classes *1-20 Number of Classes *21-32 Number of Classes 33+
K 31.00 0 3 0
1 31.00 0 2 0
2 31.00 0 2 0
3 31.00 0 2 0
4 31.00 0 2 0
5 31.00 0 2 0
6 31.00 0 2 0
Other** 31.00 0 4 0
* Number of classes indicates how many classes fall into each size category (a range of total students per class).
** "Other" category is for multi-grade level classes.
Average Class Size and Class Size Distribution (Elementary) School Year 2019—2020
Grade Level Average Class Size Number of Classes *1-20 Number of Classes *21-32 Number of Classes 33+
K 31.00 0 3 0
1 31.00 0 2 0
2 31.00 0 2 0
3 31.00 0 2 0
4 31.00 0 2 0
5 31.00 0 2 0
6 31.00 0 2 0
Other** 31.00 0 4 0
* Number of classes indicates how many classes fall into each size category (a range of total students per class).
** "Other" category is for multi-grade level classes.
2/1/22, 11:35 AM School Accountability Report Card
https://sarconline.org/public/print/07617960110973/2020-2021 20/23
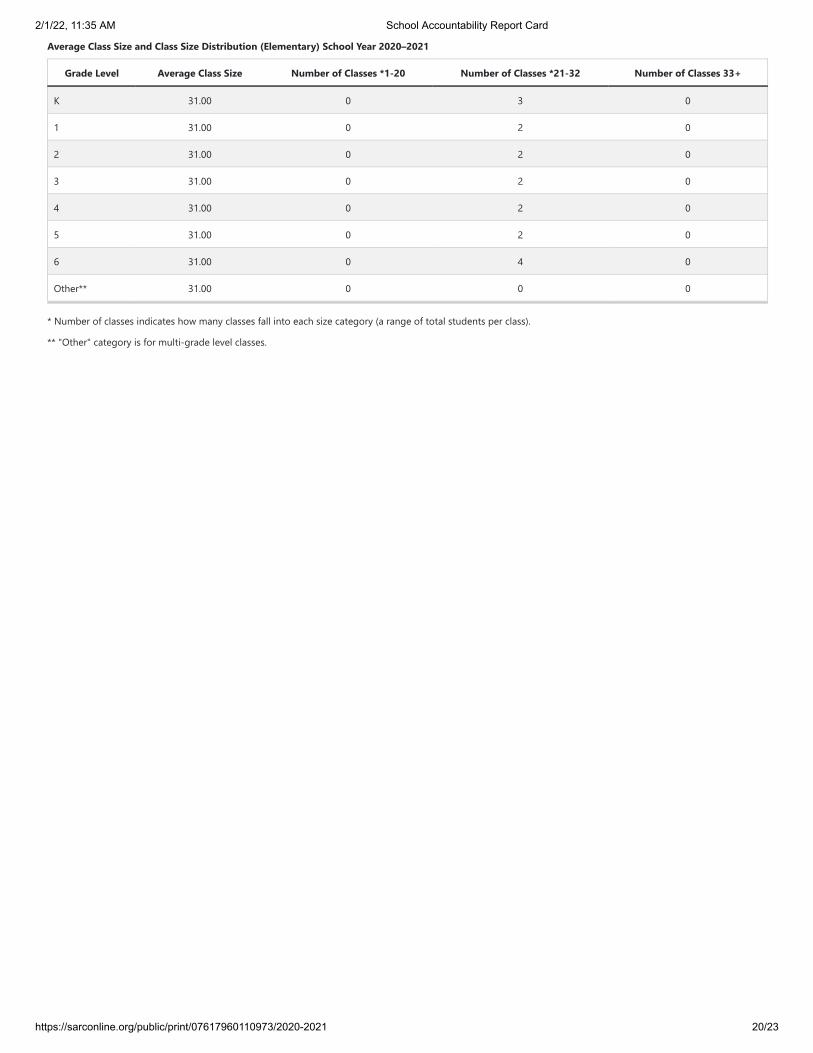
Average Class Size and Class Size Distribution (Elementary) School Year 2020–2021
Grade Level Average Class Size Number of Classes *1-20 Number of Classes *21-32 Number of Classes 33+
K 31.00 0 3 0
1 31.00 0 2 0
2 31.00 0 2 0
3 31.00 0 2 0
4 31.00 0 2 0
5 31.00 0 2 0
6 31.00 0 4 0
Other** 31.00 0 0 0
* Number of classes indicates how many classes fall into each size category (a range of total students per class).
** "Other" category is for multi-grade level classes.

2/1/22, 11:35 AM School Accountability Report Card
https://sarconline.org/public/print/07617960110973/2020-2021 21/23
Ratio of Pupils to Academic Counselor (School Year 2020—2021)
Title Ratio
Pupils to Academic Counselor* 548.0
Last updated: 1/1/00
* One full time equivalent (FTE) equals one staff member working full time; one FTE could also represent two staff members who each work 50 percent of full time.
Student Support Services Staff (School Year 2020—2021)
Title Number of FTE* Assigned to School
Counselor (Academic, Social/Behavioral or Career Development) 1.00
Library Media Teacher (Librarian) 1.00
Library Media Services Staff (Paraprofessional) 0.00
Psychologist 0.50
Social Worker 0.50
Nurse 0.00
Speech/Language/Hearing Specialist 0.25
Resource Specialist (non-teaching) 1.00
Other 0.00
Last updated: 1/1/00
* One full time equivalent (FTE) equals one staff member working full time; one FTE could also represent two staff members who each work 50 percent of full time.
Expenditures Per Pupil and School Site Teacher Salaries (Fiscal Year 2019—2020)
LevelTotal Expenditures Per
PupilExpenditures Per Pupil
(Restricted)Expenditures Per Pupil
(Unrestricted)Average Teacher
Salary
School Site $11523.00 $1010.00 $10513.00 $57130.00
District N/A N/A -- $76460.00
Percent Difference – School Site andDistrict
N/A N/A -- --
State N/A N/A $8443.83 $84665.00
Percent Difference – School Site andState
N/A N/A -- --
Last updated: 2/1/22
Note: Cells with N/A values do not require data.

2/1/22, 11:35 AM School Accountability Report Card
https://sarconline.org/public/print/07617960110973/2020-2021 22/23
Types of Services Funded (Fiscal Year 2020–2021)
RCP programs and services that support and assist students:
Summer Learning Program:
Summer Learning Program to combat learning loss resulting from distance learning for students who were chronically absent and/or missed a certain portion ofinstruction due to lack of supervision and support at home. Our program focuses on English Language Arts (ELA), Math remediation through small grouplearning, and exploratory learning through hands-on projects.
With the aim of serving every grade-level, the program seeks to support up to 100 students daily from 9am-1pm and includes lunch & enrichment activities in theafternoons. We push for academic growth during the summer to bring these students closer to grade-level while also supporting them in returning to the routineof in-person education and practicing habits for success. Saturday School:
RCP supports students throughout the regular school year with an added day of learning on Saturdays, reviewing and reinforcing academic concepts taughtduring the previous week. We engage students in project-based learning and tutorials to strengthen the new knowledge being taught in the school year. OurSaturday School instructors also act as case managers, tracking their students’ academic progress and liaising with families to foster a personalized engagementplan for home and school.
Mindful Life:
Mindful Life Project (MLP) is an educational non-profit organization that supports schools across the Bay Area and beyond through mindfulness-based social-emotional learning programs. MLP’s comprehensive approach supports the mental and emotional well-being of students, teachers, and families, transformingschools from the inside out to create cultures and climates where mental and emotional well-being is everyone’s experience. RCP provides the following:
1:1 check-ins with students, teachers, and parentsSmall-group sessions with students (2:1 or 4:1)Small-group sessions with parentsSmall-group sessions to teach mindfulness to teachers and professional development in which teachers learn to teach MLP’s methods to their studentsWhole-class and whole-school programs, known as Mindful CommunityA small-group intervention program, called Rise-Up, which includes eight students per grade level who have the greatest need to deepen their mindfulnesspractice and use expressive arts, yoga, and performing arts to release stress and trauma so they can thrive in the whole-school community.
Permaculture:
A permaculture garden space is a long-term “food forest” style garden including fruit trees, berries, perennial herbs, flowers, and annual vegetables that requireless maintenance and are highly productive. It fosters inspiration and connection to the natural world while also providing social-emotional learningopportunities.
The “food forest” is a living outdoor education space providing nature-centered education that can inspire interest in natural sciences. It is a space to learn aboutgardening, environmental sciences, eating healthy foods, and the importance of sustainability and caring for the Earth and community.
East Bay Center for Performing Arts
In-School Music Program:
Studies have shown that music can produce several positive effects on a child’s brain. Music activates both the left and right brain at the same time, and theactivation of both hemispheres can maximize learning and improve memory. RCP’s In-School Music Program ensures that every student receives standards-aligned weekly music instruction throughout the school year to facilitate long-term positive impact on student learning and school culture. All students performtwice a year at school gatherings, celebrating their accomplishments and developing confidence and pride in their work. These performances are speciallydesigned to include the whole family, strengthening familiarity with RCP’s on-site resources and developing a sense of shared community.
Brazilian Jiu-Jitsu
Brazilian Jiu-Jitsu is an optional program offered to students. It teaches the art of self-defense with an emphasis on safety, discipline, and skill development.Students at different levels practice in separate classes and may participate in Mixed Martial Arts (MMA) age-appropriate matches against other organizations.
Graphic Design
Graphic design is very important in today’s society. It is displayed in nearly every aspect of our daily lives, from the printed page, commercials, groceries, clothingto book covers and more. Our Graphic Design class is headed by Daniella Nebel Cantu. Mrs. Cantu will teach students how to convert thoughts and ideas into

2/1/22, 11:35 AM School Accountability Report Card
https://sarconline.org/public/print/07617960110973/2020-2021 23/23
visual representations that communicate a specific message to the viewing audience. Students will learn page layout techniques, the concept of branding, how toutilize Adobe’s Illustrator software, symmetry and balance, repetition, flow, and how to use typography and pictures in design. Students will also learn of career-related opportunities. The class projects will produce student designs in labels, stickers, plaques, signs, and clothing in the year-end showcase.
Last updated: 2/1/22
Teacher and Administrative Salaries (Fiscal Year 2019—2020)
Category District Amount State Average For Districts In Same Category
Beginning Teacher Salary $49923.00 $50897.00
Mid-Range Teacher Salary $78321.00 $78461.00
Highest Teacher Salary $101764.00 $104322.00
Average Principal Salary (Elementary) $115729.00 $131863.00
Average Principal Salary (Middle) $122569.00 $137086.00
Average Principal Salary (High) $133464.00 --
Superintendent Salary $265200.00 $297037.00
Percent of Budget for Teacher Salaries 31.00% 32.00%
Percent of Budget for Administrative Salaries 5.00% 5.00%
For detailed information on salaries, see the CDE Certificated Salaries & Benefits web page at https://www.cde.ca.gov/ds/fd/cs/.
Last updated:
Professional Development
Measure 2019-2020 2020–2021 2021-2022
Number of school days dedicated to Staff Development and Continuous Improvement 10 14 14