
Preparatory Attention: Experiment and Theory
39
Consciousness and Cognition 9, 396–434 (2000) doi:10.1006/ccog.1999.0429, available online at http://www.idealibrary.com on Preparatory Attention: Experiment and Theory David LaBerge 1 Simon’s Rock College of Bard, Great Barrington, Massachusetts 01230 Laurent Auclair Universite ´ de Savoie, Chambery, France and Eric Sieroff Universite ´ de Paris, Paris, France This study investigated attention to a spatial location using a new spatial preparation task. Participants responded to a target dot presented in the center of a display and ignored a distractor dot presented to the right or left of the center. In an attempt to vary the level of preparatory attention directed to the target, the distractor dot was presented prior to the onset time of the target and the relative frequency of distractor dots to target dots within a block of trials was varied. The results from the first three experiments showed that when instructions induce weak preparatory attention to the target location, response times to a target on target-only trials increase substantially as the percentage of trials containing a distractor increases from 0 to 75%. In Experiments 2 and 3, instructions and display sa- liency were used to induce strong preparatory attention to the target location, resulting in almost constant response times across distractor percentages. Experiment 4 varied percent- age of target trials in the absence of distractors, with the result that response times decreased as target trial percentage increased. Accounts of these data by early ‘‘activity-based’’ and late ‘‘criterion-based’’ attention theories are compared, and the early theory is given a more detailed description within the context of a cognitive neuroscience theory of attention. 2000 Academic Press Many of the attention tasks used in experiments published over the past several decades were designed to measure the selective aspect of attention during the presen- tation of a target display (for reviews, see LaBerge, 1995; Pashler, 1998). In a typical selective-attention task, the display contains a target item along with one or more distractor items. For example, a target may be a letter positioned somewhere in a clock-like circle of several letters, or a target may be a green T located in a field of randomly placed red T’s and red and green X’s, or a target may be the center letter in a three-letter display. The purpose of these experiments usually was to determine the effects on attention of distractors, specifically their number, their positions with respect to the target, and their shared attributes with the target. The effects of these variables on attentional operations are presumed to occur during the presentation of the display, whose duration is typically less than 1 s. In a typical conjunction search 1 Address correspondence and reprint requests to David LaBerge, Simon’s Rock College, 84 Alford Road, Great Barrington, MA 01230. Fax: (413) 528-7365. 396 1053-8100/00 $35.00 Copyright 2000 by Academic Press All rights of reproduction in any form reserved.
-
Upload
univ-paris5 -
Category
Documents
-
view
1 -
download
0
Transcript of Preparatory Attention: Experiment and Theory

Consciousness and Cognition 9, 396–434 (2000)
doi:10.1006/ccog.1999.0429, available online at http://www.idealibrary.com on
Preparatory Attention: Experiment and Theory
David LaBerge1
Simon’s Rock College of Bard, Great Barrington, Massachusetts 01230
Laurent Auclair
Universite de Savoie, Chambery, France
and
Eric Sieroff
Universite de Paris, Paris, France
This study investigated attention to a spatial location using a new spatial preparationtask. Participants responded to a target dot presented in the center of a display and ignoreda distractor dot presented to the right or left of the center. In an attempt to vary the levelof preparatory attention directed to the target, the distractor dot was presented prior to theonset time of the target and the relative frequency of distractor dots to target dots withina block of trials was varied. The results from the first three experiments showed that wheninstructions induce weak preparatory attention to the target location, response times to atarget on target-only trials increase substantially as the percentage of trials containing adistractor increases from 0 to 75%. In Experiments 2 and 3, instructions and display sa-liency were used to induce strong preparatory attention to the target location, resulting inalmost constant response times across distractor percentages. Experiment 4 varied percent-age of target trials in the absence of distractors, with the result that response times decreasedas target trial percentage increased. Accounts of these data by early ‘‘activity-based’’ andlate ‘‘criterion-based’’ attention theories are compared, and the early theory is given amore detailed description within the context of a cognitive neuroscience theory of attention. 2000 Academic Press
Many of the attention tasks used in experiments published over the past severaldecades were designed to measure the selective aspect of attention during the presen-tation of a target display (for reviews, see LaBerge, 1995; Pashler, 1998). In a typicalselective-attention task, the display contains a target item along with one or moredistractor items. For example, a target may be a letter positioned somewhere in aclock-like circle of several letters, or a target may be a green T located in a field ofrandomly placed red T’s and red and green X’s, or a target may be the center letterin a three-letter display. The purpose of these experiments usually was to determinethe effects on attention of distractors, specifically their number, their positions withrespect to the target, and their shared attributes with the target. The effects of thesevariables on attentional operations are presumed to occur during the presentation ofthe display, whose duration is typically less than 1 s. In a typical conjunction search
1 Address correspondence and reprint requests to David LaBerge, Simon’s Rock College, 84 AlfordRoad, Great Barrington, MA 01230. Fax: (413) 528-7365.
3961053-8100/00 $35.00Copyright 2000 by Academic PressAll rights of reproduction in any form reserved.

PREPARATORY ATTENTION 397
task, for example, the duration of attention given to each item is estimated to be inthe range of 10–50 ms (Treisman & Sato, 1990).
Other attention-related tasks were designed to measure operations of selective at-tention prior to the presentation of the target display. In these tasks, a cue typicallyis presented at a specific time interval before the target display with the purpose ofdirecting the observer’s attention to a particular item or location of the upcomingtarget display. When the cue-target delay itself is of interest, the cue–target delaysare varied within a trial block or across trial blocks; typically, response time decreasesto a minimum at a 500-ms delay and then slowly increases or remains relativelyconstant thereafter (Posner, 1978).
To measure the effects of endogenous or top-down control of attention in cueingtasks, a symbolic cue is typically presented, e.g., a centrally located arrow pointingto the right or left; this cue is assumed to induce the observer to direct attention tothe right or left location where a target object is likely to appear. If the target appearsin the uncued location, the response time is longer than when the target appears inthe cued location, indicating that attention must be shifted from the cued location tothe uncued location in order to process the target. Thus, in these tasks, attention ispresumed to be directed to the cued location before the target appears.
In order to distinguish attention generated prior to the target display from attentiongenerated at the time of the target display, we use the terms preparatory attentionand brief attention respectively. Both aspects are selective, as is a third aspect, main-tenance attention (LaBerge, 1995). Maintenance attention refers to attending to anexperience for its own sake, so it occurs at the time of the display, as does briefattention. But the typical duration of both preparatory and maintenance is prolongedin contrast to the typically brief duration of attention evoked at the time of a display.Also, it could be said that both preparatory attention and maintenance attention in-volve expectations: preparatory attention is typically based on the expectation thata particular object will occur in a particular location, and maintenance attention maybe accompanied by expectations that a particular experience will continue. All threeaspects of attention, brief attention, preparatory attention, and maintenance attention,are assumed to involve the same brain pathways, according to the triangular circuittheory of attention (LaBerge, 1995, 1997).
If attention is actively directed to a particular location before the onset of the targetdisplay, it is presumably subject to distraction by items occurring prior to the targetdisplay, just as attention to a target is subject to distraction by other items occurringduring the target display. When distractors occur before target onset, and when dis-tractors are simply expected to occur, they may compete with preparatory attentionto an upcoming target, with the result that less attention is allocated to the target.Therefore, distractors can be used as a means of varying the amount of attentiondirected to a particular target attribute or location, whether that attention is beingdirected at a location or attribute at the time of the target display or attention isbeing directed at a location or attribute in the time interval prior to the target display.
The purpose of this study was to vary preparatory attention during the time intervalprior to the onset of a target display by occasionally presenting distractors duringthis preparatory period. Three boxes were displayed throughout each trial, and thetarget was a black square dot which appeared inside the center box. The target ap-

398 LABERGE, AUCLAIR, AND SIEROFF
peared at random times in a 300-ms interval (or, in some conditions, in a 1800-msinterval) which began approximately 1300 ms after the onset of the three-box warningsignal. Prior to the onset of the target a distractor dot sometimes appeared in the boxlocated to the left or right of the center box. It was assumed that, during the initialtrials of a trial-block, the observer would begin to anticipate (prepare for attentionally)the occurrence of a distractor as well as the occurrence of a target and that thestrengths of these anticipations would vary with the percentages of distractor andtarget trials within a trial block.
The main independent variable of the present experiments was the percentage oftrials in which a distractor dot appeared in a trial block. The corresponding hypothesiswas as follows: If the appearance of distractor dots in a series of trials induces theobserver to attend to the location of a distractor box (or distractor boxes), then thegreater the percentage of distractor trials the less the attention directed toward the cen-tral target box; the less the attention that is directed to the central box during thepreparatory interval the longer the response time given to the target dot when it ap-pears. Thus, the response time to the target dot was used as a measure of the amountof preparatory attention generated to the target during the interval prior to the onsetof the target display. The response time to the target dot may also be regarded as anindirect measure of the preparatory attention directed to the distractor.
Since response time to the target dot was intended to be the indicator of preparatoryattention, it was desirable to eliminate other factors which could influence attentionto the target and therefore affect the response-time indicator. The main source ofother attention-demanding factors were the characteristics of the target display itself.To minimize selective attention effects, no distracting items appeared at the sametime as the target dot, and an attempt was made to make the selective discriminationof the target location as easy as possible by separating the three boxes sufficientlyto reduce errors and misses to a level below 1%.
Plan of the Present Study
Four experiments are reported. The first experiment was designed to demonstratethat the change in percentage of distractor trials produces a substantial change inresponse times to a target, which would support the hypothesis that distractor-trialpercentage influences preparatory attention. The first experiment also compares theeffects of distractor trials on target response times when distractor trials contain twodistractors instead of only one distractor. The second experiment examines the effectof percentage of distractor trials on target response times under weak and stronginstructions in an attempt to test conflicting predictions by late and early attentiontheories and to separate the cueing function of the distractors from their attention-competing function. The third experiment attempts to provide independent evidencethat the strong instructions of Experiment 2 affect attention operations, and Experi-ment 4 attempts to show that the amount of preparatory attention can be changed bytarget probability alone, without any distractors being present. Finally, the conclu-sions drawn from the results of these experiments are interpreted in the context ofthe criterion-based and the triangular-circuit activity-based theories of attention.

PREPARATORY ATTENTION 399
EXPERIMENT 1: EFFECT OF DISTRACTOR TRIALS ON THE RESPONSETIME TO A TARGET
The procedure of this experiment required subjects to detect the presence of a dotin the center box of three boxes displayed in a horizontal line. The displays, whichmade up a trial, are shown in Fig. 1. The three boxes were displayed continuouslythroughout a trial, and the onset of the three boxes served as a warning signal. Onsome percentage of trials a dot appeared in one of the two outside boxes, but thesubject was instructed to respond only to the appearance of the dot in the center box.Sometimes no dot appeared on a trial, sometimes a distractor dot was followed bya central target dot, sometimes a distractor dot was followed by no dot, and sometimesthe target dot was the only event on a trial. The timed response to the target-onlytrials was regarded as the measure of main interest in this experiment, and theseresponse times were expected to increase as the percentage of distractor trials in-creased.
The design of the experiment varied the percentage of distractor trials across fourlevels; 0, 25, 50, and 75%, and measured the effects of these distractor-trial percent-ages on preparatory attention by observing the time taken to respond to the target.In these four blocks of trials, a target dot appeared in the center box (without adistractor) 50, 37.5, 25, or 12.5% of the time, respectively, while the percentages of
FIG. 1. The stimulus displays presented on a trial of Experiment 1 in which one distractor occurredbefore the target. Other types of trials included two distractors prior to the target, target-only trials, andtrials containing neither target nor distractors.

400 LABERGE, AUCLAIR, AND SIEROFF
no-dot trials were 50, 37.5, 25, or 12.5%, respectively. When a distractor dot occurredon a trial, it was followed by a target dot 50% of the time and followed by no dot50% of the time. For example, in a 25% distractor-trial block, the distractor appearedalone 12.5% of the time, the distractor was followed by a target 12.5% of the time,the target appeared alone 37.5% of the time, and the no-dot trial occurred 37.5% ofthe time. Thus, the percentage of trials on which a target dot occurred was 50%across all conditions, so that the overall percentage of trials in which a responseoccurred was maintained at 50% across all conditions to avoid changes in level ofresponse bias (e.g., LaBerge, Legrand, & Hobbie, 1969). However, this constraintforced the percentage of target-only trials to vary inversely with the percentage ofdistractor trials, given that some of the distractor trials contained targets.
It was decided to include trials on which a target followed a distractor in an attemptto increase the attention-attracting strength of a distractor. When a target follows adistractor with a short delay, the target appears to be a reinforcement for the act ofattending to the distractor. Thus, the appearance of a distractor can function as a cueto an upcoming target, and the expectation of a distractor can function as a competitorwith the target for preparatory attention. This tentative hypothesis was confirmed bypreliminary data which showed stronger distractor trial effects when the distractorsometimes was followed by the target than when the distractor never was followedby the target. This issue is discussed further in the discussion section of Experiment3 and in the ‘‘General Discussion.’’
The design of this experiment also varied the number of distractors which appearedon distractor trials; in one condition a distractor trial contained one distractor dot,which appeared in one of the two outside boxes; in the other condition a distractortrial contained two distractor dots half of the time (which appeared successively inboth outside boxes), and one distractor dot the other half of the time. The targetended a distractor trials half of the time, and the other half of the time the distractortrial ended without a target appearing. Thus, the effects of distractor trials containingone dot could be compared when the one-dot distractor trial occurred along withdouble-dot distractor trials and when the one-dot distractor trial was the only kindof distractor trial.
In order to induce participants to maintain preparatory attention over an extendedperiod of time, the targets and distractors were presented at randomly chosen timeswithin a trial following the onset of the warning signal display. On trials containingone distractor, there were three different delays between the onset of the warningsignal and the distractor; when a target followed a distractor there were also threedelays between the distractor offset and the target onset. On target-only trials, therewere three delays between the onset of the warning signal and the target onset, andthese delays were the same as the delays between the warning signal and the targeton the distractor trials in which a distractor intervened between the warning signalonset and the target onset.
In the condition in which two distractors appeared on a trial, there were threedelays between the warning signal and the first distractor, three delays between thefirst and second distractor, and three delays between the second distractor and thetarget (on trials in which the target followed a distractor). Thus, in the condition inwhich distractor trials contained either one or two distractors the target-only trials

PREPARATORY ATTENTION 401
contained six delays, three delays which were relatively short in duration (matchingthe warning-signal-to-target durations when there was one intervening distractor) andthree delays which were relatively long in duration (matching the warning-signal-to-target durations when there were two intervening distractors). The two delayclasses were called Short and Long, and there were three delay durations within eachdelay class.
Method
Participants. The participants were eight undergraduate students enrolled at Si-mon’s Rock College, and their ages ranged from 17 to 20. They participated on avoluntary basis, and after the experiment they were fully informed of the group resultsand the implications of these results for our understanding of the attention process.For each participant, informed consent was obtained according to the regulations ofthe college committee on research.
Stimuli. The trial began with the display of three boxes, positioned horizontally,and the three boxes remained until the trial was terminated (see Fig. 1). The size ofeach box was 4 3 4 mm, and the size of the black square dot which appeared withina box was 2.5 3 2.5 mm. The distance between the boxes was 3.5 mm. The approxi-mate viewing distance (eye-to-screen) was 45 cm.
The presentation of stimulus displays and the recording of the responses werecontrolled by an IBM computer; the stimuli were displayed as white figures on the16-inch black screen of the monitor. The software that controlled stimulus presenta-tions and response recordings was developed in the first author’s laboratories at theUniversity of Minnesota and the University of California, Irvine.
Design and procedure. The design contained four main conditions: distractor level(one distractor on a trial vs one or two distractors on a trial), distractor percentage(0, 25, 50, 75%), delay class (Short vs Long), and delay duration (three durationswithin each delay class). The one-distractor condition contained only the short delayclass, while the one-or-two-distractor condition contained a mix of the short andlong delay classes. The one-or-two-distractor condition contained both one and twodistractor trials in equal proportions. All conditions were given within each of twosessions, and each session took place on separate days within a week of each other.
The orders in which the distractor levels were given across the 2 days (1–2, 2–1and 2–1, 1–2) were balanced across the eight participants. Within each distractorlevel condition there were four blocks of trials, and each block corresponded to adistractor percentage. The orders in which these percentage-blocks occurred werebalanced by a Latin square across the participants. Thus, there were four blocks oftrials within each of the two conditions given in each day’s session. Participants wereinstructed at the beginning of the experiment ‘‘to press the right shift key promptlywhen a dot appeared in the center box, and do not respond when a dot appears inone of the other boxes.’’ No further instructions were given as conditions of theexperiment were changed from trial-block to trial-block. Because participants pre-sumably had to become acquainted with the new block conditions in the first severaltrials of each block, the first 12 trials of each block were removed in the data analysis.
One-distractor condition. Each block of the one-distractor condition contained 48trials. A (distractor) dot appeared in one of the outside boxes on 0, 12, 24, or 36

402 LABERGE, AUCLAIR, AND SIEROFF
TABLE 1Frequencies of Trial Types within
a Block of Trials
Percentage ofdistractor trials
0 25 50 75
Target-only 24 18 12 6Nothing 24 18 12 6Distractor-only 0 6 12 18Distractor-then-target 0 6 12 18
trials (0, 25, 50, or 75% of the time), and when it appeared it was followed by acenter (target) dot 50% of the time and by no dot 50% of the time. The side of thedistractor dot was balanced within each block of trials. In these blocks of trials, adistractor dot appeared alone on 0, 6, 12, or 18 trials (0, 12.5, 25, 37.5% of the time),respectively, and it was followed by a target on 0, 6, 12, or 18 trials (0, 12.5, 25,37.5% of the time), respectively; a target appeared alone on 24, 18, 12, or 6 trials(50, 37.5, 25, or 12.5% of the time), respectively, and the no-dot trials occurred on24, 18, 12, or 6 trials (50, 37.5, 25, or 12.5% of the time), respectively (see Table1). Thus, the percentage of trials in which a center dot occurred was 50% across allconditions, so that the overall percentage of trials in which a response occurred wasalso maintained at 50% across all conditions. However, the percentage of target-onlytrials varied inversely with the percentage of distractor trials (for reasons previouslydescribed).
When a distractor appeared on a trial, the time delay between the onset of thewarning signal (the appearance of the three-box display) and the onset of the dis-tractor varied randomly at 444, 740, or 1036 ms, and when a target followed thedistractor it followed at 740, 592, or 444 ms, respectively. The duration of the dis-tractor dot was 148 ms, so that the total duration from the onset of the warning signalto the onset of the target was either 1332, 1480, or 1628 ms, respectively. When nodistractor appeared on a trial (a target-only trial), the time delay between the onsetof the warning signal and the onset of the target varied randomly at 1332, 1480,or 1628 ms. Thus, the three time intervals between onsets of the warning signaland the onset of the target (when it occurred) were the same for distractor trials andtarget-only trials. The intertrial interval was 296 ms, and the response wait time was592 ms.
One-or-two-distractor condition. A block of this condition contained 96 trials (witha rest period after 48 trials) for each of the 25, 50, and 75% distractor blocks and48 trials for the 0% distractor block. The partitioning of these trials among the trialtypes (distractor or distractors followed by target, distractor, or distractors followedby no target, target-only, and neither target nor distractor) followed the same percent-ages as in the one-distractor condition. Half of the trials within a block of this condi-tion contained two distractors, and one distractor dot appeared in one outside boxand the other distractor dot appeared in the other outside box. The side of the first

PREPARATORY ATTENTION 403
FIG. 2. Mean response times to the target as a function of distractor-trial percentage on target-onlytrials in Experiment 1. Data from eight participants.
dot was balanced within a block of trials. The other half of the trials within a blockof this condition contained one distractor, which appeared equally often in the twooutside boxes. When two distractors appeared on a trial there were three delays, (a)a delay between the warning signal and the first distractor, (b) a delay between thefirst distractor and the second distractor, and (c) a delay between the second distractorand the target (when it appeared). These duration triplets for the long delay class hadthe following time values: (a) 1036, 740, and 444 ms; (b) 444, 592, and 740 ms; and(c) 444, 740, and 1036 ms. Since the duration of each of the two distractor dots was148 ms, the total durations between warning signal onset and target onset were 2220,2368, and 2516 ms, respectively. When no distractor appeared on a trial, the longdurations between the onset of the warning signal and the onset of the target were2220, 2368, and 2516 ms. For the one-distractor trials (which occurred equally oftenwith the two-distractor trials in this condition) the short durations were 1332, 1480,or 1628 ms, as was the case in the one-distractor condition already described. Thetime intervals for the two-distractor trials are labeled long delays and the time inter-vals for the one-distractor trials are labeled short delays for the purpose of analysis.
Results
The mean response times to targets on target-only trials are shown in Fig. 2, andthe mean response times to targets on distractor trials are shown in Fig. 3. The datawere based on responses on the trials that followed the first 12 trials of responsetimes from each block for each participant. It was assumed that a participant wasbecoming acquainted with the percentage characteristics of the block condition within

404 LABERGE, AUCLAIR, AND SIEROFF
FIG. 3. Mean response times to the target as a function of distractor trial percentage on trials inwhich the target followed one or two distractors in Experiment 1. Legend: 1DS, target following onedistractor in the one-distractor condition (short delay); 1&2DS, target following one distractor in theone-or-two-distractor condition (short-delay); 1&2DL, target following the second distractor in the one-or-two-distractor condition (long delay). Data from the same task and from the same eight participantsas the data shown in Fig. 2.
the initial 12 trials, so that the remaining trials of a block would then approximatemore closely the asymptotic level of response times to the conditions of that blockthan did the entire set of trials from that block. Two within-subjects ANOVAs ofthe data in Fig. 2 were carried out, one for the two short-delay curves (one curvefrom the one-distractor condition and one curve from the two-distractor condition)and the other for the short- and long-delay curves of the two-distractor condition.
Target-only trials. The ANOVA of the two short-delay curves in Fig. 2 was a 4 32 3 3 3 2 factorial design involving percentages of distractor trials, distractor condi-tion (one vs one and two distractors on a trial), delay duration, and session. The onlysignificant main effect was the percentage of distractor trials, F(3, 21) 5 12.65, p ,.001, and the only significant interaction effect was delay duration by session, F(2,14) 5 5.74, p 5 .015. The delay duration by session interaction was produced byan effect of delay during the first session (309, 292, 261 ms for delay durations of1332, 1480, and 1628 ms, respectively), and no effect of delay duration during thesecond session (297, 296, 283 ms for the same delay durations, respectively).
The ANOVA of the short- and long-delay curves of responses on target-only trialsof the one-or-two-distractor condition in Fig. 2 was a 4 3 2 3 3 3 2 factorial designinvolving percentages of distractor trials, delay class (short vs long), delay duration,and session. The only significant main effect was percentage of distractor trials, F(3,21) 5 16.78, p , .001, and the only interaction effect was delay duration by session,F(2, 14) 5 3.99, p 5 .042. The delay duration by session interaction was producedby an effect of delay during the first session (306, 296, and 295 ms for delay durationsof 1332, 1480, and 1628 ms, respectively), and no effect of delay duration duringthe second session (286, 290, and 280 ms for the same delay durations, respectively).

PREPARATORY ATTENTION 405
Target-following-distractor trials. The ANOVA of the two short-delay curves inFig. 3 (one short-delay curve for the distractor trials in the one-distractor conditionand the other short-delay curve for the one-distractor trials in the one-or-two dis-tractor condition) was a 3 3 2 3 3 3 2 within-subjects factorial design involvingpercentages of distractor trials, distractor conditions (one vs one and two distractors),delay durations, and sessions. The only significant main effect was distractor condi-tion, F(1, 7) 5 10.31, p 5 .015, and there were no significant interactions.
The ANOVA of the short- and long-delay curves of the two-distractor conditionin Fig. 3 involved a 3 3 2 3 3 3 2 factorial design involving percentage of distractortrials, delay class (short vs long), delay duration, and session. The only significantmain effect was delay class, F(1, 7) 5 39.51, p , .001, and the only significantinteraction was delay class by delay duration, F(2, 14) 5 9.50, p 5 .002. The delayclass by delay duration interaction was produced by an effect of delay duration forthe long delay class (237, 242, and 258 ms for delay durations of 2220, 2368, and2516 ms, respectively), and no effect of delay duration for the short delay class (281,280, and 279 ms for delay durations of 1332, 1480, and 1628 ms, respectively).
For all the curves shown in Figs. 2 and 3, errors and misses were less than 1%(for the one-distractor condition, the percentages of errors and misses were 0.7 and0.5%, respectively, and for the two-distractor condition the percentages of errors andmisses were 0.3 and 0.3%, respectively).
Discussion
The main finding of Experiment 1 is that percentage of distractor trials had a sig-nificant effect on response time to the target on target-only trials (shown in Fig. 2).The strength of the total effect appears to be quite substantial, since the amount ofRT change (approximately 45 ms) is well over 10% of the lowest RT value (269ms). The frequencies of errors and misses were negligible in this experiment, whichsuggests that the process of selecting the target location is independent of distractortrial percentage.
Apparently adding trials containing two distractor to trials containing one distractordoes not produce a detectable increase in the slope of the function relating percentageof distractor trials to response time. A comparison of the two short-delay curves ofFig. 2 shows a small difference in overall level of response time, but this differenceis not supported by statistical analysis. The addition of more than two distractors ona distractor trial may produce an increase in the level of the curve relating responsetime to distractor trial percentage, but there is no indication in these data that present-ing more than one distractor on a distractor trial will produce an appreciable increasein the slope of the one-distractor curve.
In contrast to the data of Fig. 2, the data in Fig. 3 show no significant effect ofdistractor trial percentage on response time for target-following-distractor trials. Theoccurrence of a distractor just prior to a target within a trial appears to cancel thebetween-trial effect of distractor trial percentage shown in Fig. 2. Because the targetfollows a distractor 50% of the time across all distractor trial percentages (and nodot stimulus follows a distractor the other 50% of the time), the occurrence of adistractor predicts the immanent appearance of the target equally often across the

406 LABERGE, AUCLAIR, AND SIEROFF
three distractor trial percentages. Furthermore, the delays between the distractor andthe target within a trial were shorter than the delays between the warning signal andthe target on target-only trials, so that preparatory activity for the target may be higherfor these data, resulting in faster response times.
When the percentage of distractor trials is varied in the design of Experiment 1,the percentage of target-only trials does not remain constant, but varies in an inversemanner. Specifically, when the distractor trial percentage is 0%, the target trial per-centage is 50%, and when the distractor trial percentage is 75%, the target trialpercentage is 12.5%. Therefore, the obtained change in response times, shown inFig. 2, is possibly produced by an unknown combination of the two manipulations:the frequency of distractor trials and the frequency of target trials.
A direct way to assess the contribution of the change in target trial percentage tothe data in Fig. 2 is to carry out an experiment in which target trial percentage isvaried without the presence of distractor events. This estimation of effects of targettrial percentage alone on target response times is postponed to Experiment 4, whileExperiments 2 and 3 attempt to provide additional data that will be helpful in givingan adequate theoretical account of the results of Experiment 1.
EXPERIMENT 2: EFFECT OF INSTRUCTIONS AND DISTRACTOR TRIALSON THE RESPONSE TIME TO A TARGET
The main finding of Experiment 1, shown in Fig. 2, is that the percentage of dis-tractor trials affects the response time to a target on trials in which the target appearsalone. This finding appears to support the hypothesis that when distractors have ap-peared on recent trials, they affect attentional preparations for the target in the intervalof time just prior to its next onset. Experiment 2 addresses the question of where theattentional preparations take place in the processing system. Late attention theoriestypically assume that attentional preparations take place in the decision stage of pro-cessing, where signals and noise are accumulated and produce a response when theaccumulation of signals reaches a specific criterion level (e.g., Mulligan & Shaw,1981; Rouder & Ratcliff, 1998; Sperling & Dosher, 1986; Pashler, 1998). Early atten-tion theories typically assume that the signal can be selectively amplified more thannoise at the sensory stage of processing, before information reaches the responsedecision stage (e.g., Brunia, 1999; Hawkins et al. 1990; Heinze et al., 1994; LaBerge,1997; Mangun & Hillyard, 1991; Woldorff et al., 1993). The term preparatory atten-tion specifies that the operations which selectively amplify the stimulus signal arein existence prior to the onset of the target stimulus.
Both theories provide straightforward accounts of the increase in response time tothe target on target-only trials, shown in Fig. 2. According to a late criterion theory,increasing distractor trials increases the noise that accompanies a target dot and there-fore more information needs to be accumulated at the time of the target display toassure that the target signal had indeed occurred. An early theory of attention assumesthat the signals arising from the target stimulus are modified before they reach acriterion mechanism that produces a decision. The modification of the target signalsis produced by the level of preparatory attention that is directed to the target and

PREPARATORY ATTENTION 407
distractor locations prior to and extending into the time that the target display occurs.The relative amounts of preparatory attention directed to the target and distractor aredetermined by the memory of the relative frequency of recent target and distractortrials. An increase in the relative frequency of distractor trials reduces the amountof preparatory attention given to the center location on a given trial and, consequently,there is less enhancement of the incoming target signal when it arrives.
Therefore, preparatory attention increases the signal-to-noise ratio of the stimulusinput (Brunia, 1999; LaBerge, 1997). When attention is directed to a particular loca-tion before the stimulus appears, the preparatory attentional activity existing at thesite of attentional expression potentiates the activity arriving there from the sensoryreceptors when the stimulus appears. For simplicity, we may interpret this potentia-tion as the combining or adding of sensory activity to the activity already producedby preparatory attention. Thus, it is the existence of prior attentional activity at thetarget and distractor sites which in effect modulates the signal-to-noise ratio corre-sponding to target or distractor stimuli.
The particular proportion of recent distractor and target trials generates correspond-ing levels of expectancy for the target and distractor, which in turn produce corre-sponding levels of preparatory attention. For example, in the 75%-distractor-trialcondition, the subject is likely to expect a distractor to occur before a target onmost trials, and therefore the subject is likely to attend in a preparatory mannerto the distractor locations following the onset of the warning signal. Then when atarget appears (without a distractor appearing first) there is less attentional activityat the target site to augment the incoming activity from the target stimulus. Asa consequence, the response time to the target (on target-only trials) under the75%-distractor condition is long relative to the 50%-, 25%-, and 0%-distractor-trialconditions.
The amount of attentional activity in location sites of the target and distractor priorto the onset of the target display is assumed not to be an all-or-none affair, but rathera continuously variable modulation process. When the target is selected to receivepreparatory attention on a particular trial, the level of activity of attention may bevaried from low to high. For example, while carrying a full bowl of soup across theroom, one continuously anticipates (prepares to observe) any movement of the souptoward the edge of the bowl, and the intensity of this preparatory attention increaseswith the perceived value of the carpet upon which one is walking.
This early attention account of preparatory attention can be described in terms ofspecific brain structures by adding a few new assumptions to the triangular circuittheory of attention. Fig. 9 shows the major modules of control, amplification, andexpression of attention, joined by a triangular set of connections. A more detaileddescription of the operations of the components of the modified triangular circuittheory is given in the ‘‘General Discussion.’’
The present early attentional account of the RT curves shown in Fig. 2 involvesthe description of attentional operations both before and after the onset of the targetdisplay. The operations before the target display onset involve preparatory atten-tion, and the operations after the target display involve both preparatory and briefattention. The initiation of preparatory attention occurs when the three-box warning

408 LABERGE, AUCLAIR, AND SIEROFF
signal is presented. Preparatory attention is distributed across the three boxesaccording to operations in the selective and modulatory control modules, whichare located in frontal areas of the cortex. The target and distractor locations areassumed to be mapped in these control sites, and recent target and distractor trialfrequencies are stored in the target and distractor columns within the selective con-trol module. These records in the selective control module form the basis of expecta-tions, and subjects can access this information directly if they were simply asked topredict whether a target or distractor would appear first on a given trial, regardless ofwhether they attend to the target or distractor location in a preparatory or anticipatorymanner.
The selective control module registers not only the recent target and distractorevents, but also registers the effects of instructions concerning what is to be selec-tively attended. In the procedure of Experiment 1, it is assumed that the instructionsto respond to the dot only when it appears in the center box added some amount ofactivation to the target sites in the selection module.
In order for the expectancies in the selection module to produce preparatory atten-tion, the selection control must activate corresponding target and distractor sites inthe modulatory control module. The modulatory control, in turn, directly activatesthe target and distractor sites in the posterior cortex where the target signals arriveand are potentiated by these already-active sites. Thus, when the warning signal ap-pears, the sites of attentional expression to location in the posterior cortex begin toreceive activation from the frontal cortical modulation site. This activation occurs inboth target and distractor sites, according to the relative frequencies with which tar-gets and distractors have recently been observed.
When the target stimulus appears, activation from the sensory receptors enters thetarget and distractor sites, but, owing to the large sensory difference between thetarget and distractor in the present task, the level of activity entering the target sitealways substantially exceeds the level of activity entering the distractor site, so thaterrors and misses remain near zero. Hence, at target onset, the target site activitywill almost always exceed the distractor site activity, even if the level of preparatoryattention directed to a distractor site exceeds the preparatory attention directed to atarget site (as is likely in the 75%-distractor-trial condition). As a result, the rates oferrors and misses remain virtually at zero, while the effects of recent target and dis-tractor trials modulate the activity level of the target site before the target stimulusoccurs. When activity from the target stimulus arrives at the target site, the existingattentional activity combines with the sensory activity and the increased activity issent on to a criterion mechanism. Thus, the potentiation of target sensory activityproduced by preparatory attention at the (early) posterior cortical site is decreasedas the percentage of recent distractor trials is increased.
In an attempt to generate opposing predictions by the late and early theories, Exper-iment 2 introduces a new instruction for the preparatory attention task used in Experi-ment 1. The new instruction asks the participant to attend to the central box. In theold instruction, the participant was instructed to respond only to the central dot andnot to respond to a dot that appeared to the right or left of center. The new instructionwas assumed to produce strong attention to the central target location, and the oldinstruction is assumed to produce weak attention to the central location.

PREPARATORY ATTENTION 409
What changes are predicted by the two theories for the curve that relates responsetime to the percentage of distractor trials when attentional instructions are changedfrom weak to strong? If a late theory mechanism increases attention by lowering thecriterion, then the overall response time of the curve should decrease; that is, thecurve shown in Fig. 2 should be translated downward. The slope of the curve couldbe reduced slightly, owing to a possible floor effect, but since the effects of distractortrials are still present, they should continue to increase the criterion in the mannerin which they increased the criterion to produce the slope of the RT curve in shownin Fig. 2. Also, the late theory predicts that errors should increase if the overallresponse-time curve decreases sufficiently because a greatly lowered criterion willallow low proportions of target elements present in the distractor stimulus to triggera response.
The early attention prediction, based on the triangular-circuit theory, assumes thatinstructions to attend to the center location produces a ‘‘selective’’ effect in the modu-latory control, as well as adds substantial activity to the target site within the selectivemodule. Instead of distributing its effects across all three boxes, the modulatory con-trol is narrowed to only the center box. Thus, the same target and distractor expectan-cies, registered in the selective control, give rise to modulatory control over onlythe center location when the strong attention instructions are given and give rise tomodulatory control over all three locations when the weak attention instructions aregiven.
The theoretical structure which determines which box location sites in the selectivecontrol will influence box-location sites in the modulatory control is the motivation-based basal ganglia (see Fig. 10). Briefly stated, the assumption is that the instructionto attend only to the center box creates a basal ganglia-related state in which onlythe center box is ‘‘of interest’’; in contrast, the instruction to respond only when thedot appears in the center box creates a basal ganglia-related state in which all threeboxes are ‘‘of interest.’’ The operation of the basal ganglia output upon the circuitconnecting the selective and modulatory controls is described in more detail in the‘‘General Discussion’’ section.
Given these additional assumptions to the triangular circuit theory, it is predictedthat instructions to attend to the center box will not only add substantial activity tothe target site in the selective module, but will also induce the modulatory controlto activate only the location site of the target. Therefore, the level of target activationin the modulatory control will be high and virtually constant across all distractor trialpercentages.
In view of these considerations, the early, activity-based, theory predicts a flat RTcurve for target-only trials of the strong instruction condition, while the late, criterion-based, theory predicts a rising RT curve. Both theories predict that the overall curvefor the strong attention instruction will lie below the curve of the weak attentioninstruction.
A second purpose of using a strong attention condition was to attempt to separatea possible time-cueing function of the distractor from a possible attention-competitionfunction. If the effects of the distractor trial percentage can be virtually elimi-nated on target-only trials while the response time of the target on target-after-distractor remains below the response time of the target on target only trials, then

410 LABERGE, AUCLAIR, AND SIEROFF
it would appear that the two functions of the distractor have been experimentallyseparated.
Method
Participants. The participants were eight undergraduate students at the Universitede Savoie, at Chambery, France. There were five females and three males whoseages ranged from 22 to 27 years with a mean of 24.4 years. Participation was volun-tary, and they were treated according to the guidelines of the Universite de Savoie.
Stimuli. The trial began with the display of three boxes, positioned horizontallywithin a 24 3 24 mm frame, and this display remained until the trial was terminated(see Fig. 1). The size of each box was 5 3 5 mm, and the size of the black squaredot which appeared within a box was 3.5 3 3.5 mm. The distance between the boxeswas 4.5 mm. The approximate viewing distance (eye-to-screen) was 50 cm.
The presentation of displays and recording of responses were controlled by a Mac-intosh Quadra 800 (AppleT) computer. The stimuli were displayed on a 16-inchApple monitor with a 832 3 624 pixel resolution. The software which controlledthe presentation of stimulus displays was PsychLabT.
Design and procedure. The design contained three main conditions: instruction(weak vs strong), distractor trial percentage (0, 25, 50, and 75%), and duration ofthe delay between the warning signal onset and the target onset (1800, 2000, and 2200ms). When a distractor occurred on a trial, there was only one distractor. Therefore theway a block of trials in each distractor percentage was constructed was the same as theway blocks of trials were constructed in the one-distractor condition of Experiment 1.
The instructions were carefully worded. For the weak-instruction condition, partic-ipants were told at the beginning of the experiment ‘‘to press the right shift key ofthe computer keyboard when a black square appears in the center square, and respondto the dot only when it appears in the center square.’’ For the strong-instructioncondition, participants were told at the beginning of the experiment ‘‘to fixate yourattention on the center square and to press the response key only when a black squareappeared in the center square’’; and these instructions were repeated before eachdistractor percentage condition. Each subject ran the strong condition 1 month afterthey ran the weak condition.
Each block of distractor conditions contained 60 trials. The orders in which thedistractor percentage conditions occurred were balanced by a Digram-balanced latinsquare (Keppel, 1991, pp. 338–369). The order of distractor conditions for each sub-ject was reversed between the two instruction conditions.
The delay durations between the warning signal onset and the distractor onset werevaried randomly among the values of 600, 1000, and 1400 ms. On the trials in whicha target followed a distractor, the intervals between the distractor and target were1000, 800, and 600 ms, respectively. Since the duration of the distractor was 200ms, the time delays between the warning signal and the target onset were 1800, 2000,and 2200 ms, not only on trials in which the target followed a distractor, but alsoon trials in which a target appeared without a distractor intervening between thewarning signal and the target. The intertrial interval was 600 ms.

PREPARATORY ATTENTION 411
Results
Target-only trials. The mean response time to targets on target-only trials areshown in Fig. 4 for the two instruction conditions. The first 12 response-time trialswere removed from the data, as in Experiment 1. The ANOVA of response timeson target-only trials was a 2 3 4 3 3 factorial design involving instructions (weakand strong), distractor trial percentages (0, 25, 50, and 75%), and delay between thewarning signal and target (1800, 2000, and 2200 ms). There were two significantmain effects: instructions, F(1, 7) 5 11.16, p 5 .001, and distractor percentage, F(3,21) 5 8.51, p 5 .001. The overall level of mean response time for the strong instruc-tions was approximately 60 ms lower than that of the weak instructions. However,at the 0% distractor trials, the difference in mean response times was not significant,F(1, 7) 5 0.71, p 5 .42, suggesting that there was no appreciable practice effectfrom the weak instruction session to the strong instruction session.
The only significant interaction was between instructions and distractor trial per-centage, F(3, 21) 5 12.40, p 5 .001. A planned comparison showed that this interac-
FIG. 4. Mean response times to the target as a function of distractor-trial percentage and instructionson target-only trials in Experiment 2. In the weak-attention condition, participants were instructed torespond only to the dot when it appeared in the center location; in the strong-attention condition, partici-pants were instructed to attend strongly to the center location at all times and respond to the dot whenit appeared there. Data from eight participants.

412 LABERGE, AUCLAIR, AND SIEROFF
tion was produced by a significant effect of distractor trial percentage under the weakinstructions, F(3, 21) 5 12.88, p 5 .00005, and no effect of distractor trial percentageunder the strong instruction, F(3, 21) 5 1.78, p 5 .18. Moreover, the analysis ofthe weak instruction data indicated that mean response time increased linearly withdistractor trial percentage, F(1, 7) 5 22.05, p 5 .002, with a residual of F(1, 21) 50.755, p 5 .39.
In order to evaluate the near-zero slope of the strong attention curve of Fig. 4,each participant’s four response time values, corresponding to the 0-, 25-, 50-, and75%-distractor-trial percentages, were converted to a slope value for each instructioncondition, by fitting a straight line to the four values by the least-squares method(e.g., LaBerge & Brown, 1986, Appendix). The mean slope for the strong conditionwas 0.21 ms and for the weak condition was 1.17 ms (based on the unit of 1%). Forpurposes of evaluating by eye the mean slopes of the data shown in Fig. 4, the strongand weak slopes could be converted, based on a unit of 25 percentage points, to 5.25for the strong condition and 29.25 for the weak condition. The ANOVA of theseslope values revealed a significant effect only for instructions, F(1, 7) 5 11.69, p 5.001.
Using the error-variance estimates of the ANOVA, the slope of the strong instruc-tion curve of Fig. 4 was tested against zero, t (7) 5 1.25, p 5 .25, and the slope ofthe weak instruction curve was tested against zero, t(7) 5 4.70, p 5 .002. The stan-dard error of slope for the strong instruction was 0.17 and for the strong conditionwas 0.25 (based on a unit of 1%). Thus confidence intervals could be set for theestimated mean slope of the strong instruction condition. The range of two sigmasbelow and above the obtained mean slope of 0.21 is 20.12 to 0.54 ms per percentagepoint or from 23 to 13.5 ms per 25 percentage points.
Therefore, the slope data, based on eight subjects, supports the mean response-time data in showing that the slope of the strong attention curve is much lower thanthe slope of the weak attention curve. The slope data goes further and shows thatthe mean slope of the strong attention curve is ‘‘close’’ to zero. The only evidenceof a departure from zero slope occurred when the distractor trial condition changedfrom 50 to 75%. An ad hoc test of this response-time change yielded a t(1, 7) 52.41, p 5 .045.
Errors and misses. For the target-only trials of the strong-instructions condition,the mean percentage of errors was 0.03% and the mean percentage of misses was0.28%. For the weak-instructions condition, the mean percentage of errors was 0.05%and the mean percentage of misses was 0.16%.
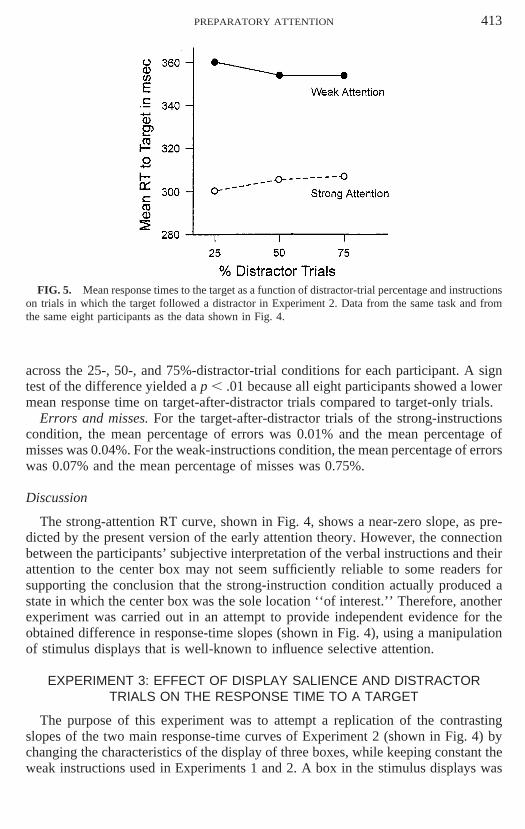
Target-following-distractor trials. The mean response times on trials in which thetarget followed a distractor on a trial are shown in Fig. 5. The ANOVA of these datawas a 2 3 3 3 3 factorial design, involving instructions (weak and strong), distractortrial percentage (25, 50, and 75%), and delay (1800, 2000, and 2200 ms). The onlysignificant effect was delay, F(2, 14) 5 11.24, p 5 .001. The effect of instructionsapproached significance, F(1, 7) 5 3.72, p 5 .095; a sign test yielded a p 5 .077,based on the finding that seven of eight subjects showed faster responses under thestrong condition.
The mean response times of the strong condition of the target-after-distractor trialsand for the target-alone trials (i.e., the lower curves in Figs. 4 and 5) were averaged
PREPARATORY ATTENTION 413
FIG. 5. Mean response times to the target as a function of distractor-trial percentage and instructionson trials in which the target followed a distractor in Experiment 2. Data from the same task and fromthe same eight participants as the data shown in Fig. 4.
across the 25-, 50-, and 75%-distractor-trial conditions for each participant. A signtest of the difference yielded a p , .01 because all eight participants showed a lowermean response time on target-after-distractor trials compared to target-only trials.
Errors and misses. For the target-after-distractor trials of the strong-instructionscondition, the mean percentage of errors was 0.01% and the mean percentage ofmisses was 0.04%. For the weak-instructions condition, the mean percentage of errorswas 0.07% and the mean percentage of misses was 0.75%.
Discussion
The strong-attention RT curve, shown in Fig. 4, shows a near-zero slope, as pre-dicted by the present version of the early attention theory. However, the connectionbetween the participants’ subjective interpretation of the verbal instructions and theirattention to the center box may not seem sufficiently reliable to some readers forsupporting the conclusion that the strong-instruction condition actually produced astate in which the center box was the sole location ‘‘of interest.’’ Therefore, anotherexperiment was carried out in an attempt to provide independent evidence for theobtained difference in response-time slopes (shown in Fig. 4), using a manipulationof stimulus displays that is well-known to influence selective attention.
EXPERIMENT 3: EFFECT OF DISPLAY SALIENCE AND DISTRACTORTRIALS ON THE RESPONSE TIME TO A TARGET
The purpose of this experiment was to attempt a replication of the contrastingslopes of the two main response-time curves of Experiment 2 (shown in Fig. 4) bychanging the characteristics of the display of three boxes, while keeping constant theweak instructions used in Experiments 1 and 2. A box in the stimulus displays was

414 LABERGE, AUCLAIR, AND SIEROFF
modified by making the top and bottom lines thicker by adding two lines above thetop line and two lines below the bottom line. For the strong-attention condition, onlythe center box was given the extra lines, and for the weak-attention condition, allthree boxes were given the extra lines.
In order to emphasize the thicker top and bottom lines, the first 800 ms of a trialshowed the unmodified boxes, and then the modified boxes appeared. Thus, the high-lighting of the center box alone produced a feature singleton, which attracts attentionto its location when it ‘‘pops-out’’ 800 ms after the onset of the warning signal(Treisman & Gelade, 1980; Yantis, 1993).
Method
Participants. The participants were eight undergraduate students at Simon’s RockCollege, none of whom had been in previous experiments of this kind. There werefive males and three females who volunteered, and informed consent was obtainedaccording to the regulations of the college committee on research. Their ages rangedfrom 17 to 20.
Stimuli. The stimuli were the same as used in Experiment 2, with the exceptionthat two lines were added to the top and bottom of specific boxes. For the strong-attention condition, only the center box had an additional pair of lines added aboveand below the standard box, and for the weak-attention condition, all three boxeshad an addition pair of lines added above and below the standard box. For eachcondition the modified outlines of the boxes appeared after the three thin boxes hadbeen displayed for 800 ms. The presentation of displays and recording of responseswere controlled by the same devices described in Experiment 1.
Design and procedure. The design and procedure was the same as in Experiment2, except for three features: (1) the instructions were the same for both conditions andwere the same instructions as were used in Experiment 1 and in the weak-instructioncondition of Experiment 2: ‘‘Press the right shift key of the computer keyboard whena black square appears in the center square, and respond to the dot only when itappears in the center square’’; (2) the order of running the two conditions was bal-anced across participants and the participants ran the two conditions on differentdays; and (3) each distractor trial condition contained 48 trials.
Results
Target-only trials. The mean response times to targets on target-only trials areshown in Fig. 6 for the two display conditions. The first 12 response-time trials wereremoved from the data, as in Experiments 1 and 2. The ANOVA was a 2 3 4 33 3 2 design involving conditions (strong and weak), distractor trial percentages (0,25, 50, and 75%), delay between the warning signal and target (1800, 2000, and2200 ms), and days (1 and 2). The only significant effects were the main effect ofdistractor trial percentage, F(3, 18) 5 5.04, p 5 .01, and the distractor trial percentageby condition interaction, F(3, 18) 5 6.83, p 5 .003.
Errors and misses. For the weak-attention condition, the mean percentage of errorswas 1.0% and the mean percentage of misses was 0.1%. For the strong-attention
PREPARATORY ATTENTION 415
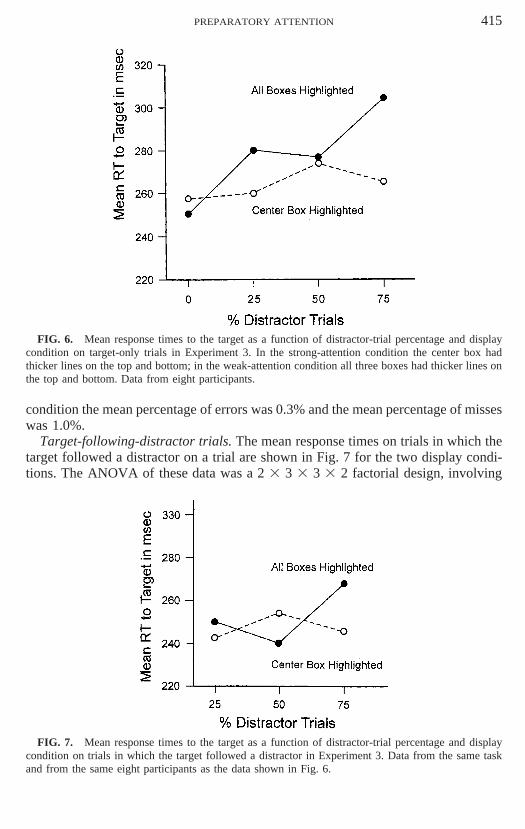
FIG. 6. Mean response times to the target as a function of distractor-trial percentage and displaycondition on target-only trials in Experiment 3. In the strong-attention condition the center box hadthicker lines on the top and bottom; in the weak-attention condition all three boxes had thicker lines onthe top and bottom. Data from eight participants.
condition the mean percentage of errors was 0.3% and the mean percentage of misseswas 1.0%.
Target-following-distractor trials. The mean response times on trials in which thetarget followed a distractor on a trial are shown in Fig. 7 for the two display condi-tions. The ANOVA of these data was a 2 3 3 3 3 3 2 factorial design, involving
FIG. 7. Mean response times to the target as a function of distractor-trial percentage and displaycondition on trials in which the target followed a distractor in Experiment 3. Data from the same taskand from the same eight participants as the data shown in Fig. 6.

416 LABERGE, AUCLAIR, AND SIEROFF
conditions (strong and weak), distractor trial percentage (25, 50, and 75 ms), delay(1800, 2000, and 2200 ms), and days (1 and 2). The only significant effect was condi-tion 3 delay, F(2, 14) 5 10.54, p 5.002.
The mean response times of the strong condition of the target-after-distractor trialsand for the target-alone trials (i.e., the lower curve in Figs. 6 and 7) were averagedacross the 25-, 50-, and 75%-distractor-trial conditions for each participant. A signtest of the difference yielded a p , .01, because all eight participants showed a lowermean response time on target-after-distractor trials compared to target-only trials.
Errors and misses. For the target-after-distractor trials of the strong attention con-dition, the mean percentage errors was 0.3%, and the mean percentage of misses was1.0%.
The slopes of the curves shown in Fig. 6, estimated by the least-squares method(LaBerge & Brown, 1986, Appendix), were 0.16 ms for the strong condition and0.62 ms for the weak condition. The slope estimate for the strong condition of thisexperiment is slightly less than the slope estimate for the strong condition of Experi-ment 2, which was 0.21 ms. The slope estimate for the weak condition of this experi-ment is close to the 0.59-ms slope of the one-distractor curve of Experiment 1, owingto the fact that the participants in this experiment and Experiment 1 were from thesame college-student population.
Discussion
The pattern of results of Experiment 3 is similar to that of Experiment 2 and there-fore supports the assumption that the strong instructions of Experiment 2 producedstronger preparatory attention to the center target location than the weak instructions(particularly over the distractor-trial percentages of 25, 50, and 75%). Experiment 2was designed (1) to determine whether the pattern of results of Experiment 1 couldbe explained by a decision criterion operating at the time that the target was presentedor by changes in the level of activity existing at the location sites of the target anddistractor existing at the time the target was presented and (2) to determine that thedistractor functions not only as a cue that the target is about to appear (on target-after-distractor trials), but also that the distractor functions as a competitor for atten-tion during the preparatory interval prior to the target onset on target-only trials.
Early-attention ‘‘activity-based’’ account. The pairs of RT curves from the target-only trials shown in Figs. 4 and 6 appear to confirm the predictions derived fromthe early theory described at the beginning of the report of Experiment 2. Both theinstruction to attend to the center box in Experiment 2 and the saliency or ‘‘pop-out’’ of the center box in Experiment 3 presumably make the center box an ‘‘objectof interest,’’ while the instruction to respond to the dot when it appears in the centerbox in Experiment 2 and the equal saliency of all three boxes in Experiment 3 presum-ably make all three boxes ‘‘objects of interest.’’ Moreover, the pair of strong attentionconditions in these two experiments are assumed to add considerable activation tothe selective control module compared to the activation added under weak-attentionconditions. As a consequence the activity levels of the target and distractor sites inthe modulatory control are very different in the strong- and weak-attention conditions.In the strong-attention condition the output from the basal ganglia inhibits the projec-

PREPARATORY ATTENTION 417
tion of activity from the distractor site in the selection control to the distractor sitein the modulation control and releases inhibition on the projection of the now higheractivity from the target site in the selection control to the target site in the modulationcontrol.
The activity from the modulatory control is sent to the posterior sites of attentionalexpression, where it preactivates target and distractor sites, which in turn interactwith the incoming target activity to elevate the signal-to-noise ratio in the activitysubsequently projected to a criterion mechanism. The response times generated bythe criterion mechanism are thus strongly influenced by the level of preactivation inthe target and distractor sites which intervene between the sensory receptors and thecriterion mechanism in this early attention account of the data in Figs. 4 and 6.
Late-attention ‘‘criterion-based’’ account. The traditional assumption of late theo-ries of attention is that changes in attention in tasks like the one in the present experi-ment are produced by changing the criterion for how much sensory input from adisplay must be accumulated at the decision stage before triggering a response. Thecriterion assumption easily predicts the target-only data from Experiment 1 (Fig. 2):the reasoning is that an increase in the percentage of distractor trials produces morenoise (more distractor signals whenever a target dot appears) and, therefore, to avoidcommitting misses when a target appears (produced by not receiving enough targetsignals in a given amount of time), more information must be accumulated to triggera response. But if more information is accumulated each time a dot appears, thenwhen a dot appears in an outside box, the targetlike signals produced by the distractordot now have a greater likelihood of accumulating to the criterion and triggering anerror response.
It could be assumed that errors and misses in Experiment 1 were near zero becausethe target stimulus itself has a very high signal-to-noise ratio, owing to the largespatial separation between the target and distractor, and this ratio is only slightlydecreased by the noise produced by the increases in distractor trial percentage. It canbe shown mathematically that criterion models predict that large changes in meanresponse times can take place in response to increases in noise, while the probabilityof errors remains near zero. Two large classes of criterion models are counter modelsand random-walk models (for a review see Luce, 1986). In counter models, the onsetof a stimulus produces a series of signal and noise elements, and these elements entertwo kinds of counters, one for signals and the other for noise. The first counter toaccumulate the criterion count generates a decision corresponding to its type ofcounter. In random-walk models, the series of elements results in the movement ofa point toward a signal boundary or a noise boundary (the distance of the boundariesfrom the start point represent the criteria). Formally, the random walk model can beconceived as an interactive counter model, in which the addition of one element toone counter produces the subtraction of one element from the other counter.
Both the counter models and random-walk models, in their most general and simpleforms, have been compared with respect to two predictions (LaBerge, 1994) whichare relevant to the present description of a criterion account of the data of Experiments2 and 3. When the signal is large relative to noise, the probability of a correct responseremains near 1.00 for appropriately large criterion values (see Figs. 7 and 8 of La-Berge, 1994). When the criterion value changes, the resulting mean reaction time

418 LABERGE, AUCLAIR, AND SIEROFF
can increase substantially if the time for each element to enter a counter or movethe random walk one step is appropriately large (see Fig. 10 of LaBerge, 1994). Thus,both counter and random-walk versions of criterion models can predict the obtainedslopes of the RT curves under weak instructions, in which increase in distractor noiseproduces an increase in mean RT while the probability of correct responding remainsnear 1.00.
In Experiments 2 and 3, when attention to the center location is increased by thestrong-attention conditions, the increase in attention to the center location should beproduced by a change in the response criterion. The large decreases in slope of thestrong-attention curve compared to the weak-attention curve shown in Figs. 4 and 6would seem to indicate that the strong instructions must have lowered considerablythe criterion settings associated with each distractor trial percentage. According to acriterion theory, the presence of distractor noise should still induce the participantto adjust the criterion upward as distractor noise increases with the increase in dis-tractor trial percentage. As the criterion level decreases, a given change in noise levelwill have a greater effect on response time. Therefore, if one assumed that the amountof criterion change was constant as distractor trial percentage increased across thedistractor trial percentages (i.e., from 0, 25, 50, to 75%), then one would predict thatthe slope of the target-only curve would actually increase from the weak- to strong-attention conditions. The influence of a ‘‘floor effect’’ on the almost-horizontal slopesof the strong-attention curves in Figs. 4 and 6 can be ruled out because the responsetimes in the strong-attention curves of Figs. 5 and 7 are consistently and significantlylower than the strong-attention curves of Figs. 4 and 6 by approximately 20 ms.
A ‘‘noise-suppression’’ account. The distractor inhibition mechanism in the pres-ent version of the early theory has a parallel in a version of attention theories in whichit is assumed that the criterion is combined with a ‘‘noise-reduction’’ mechanism thatcan exclude channels that produce noise (Pashler, 1998). On this assumption, it couldbe assumed that increases in preparatory attention to the central target location inthe present tasks takes place by filtering or attenuating activity arising from dots atthe outside locations. In this way distractor signals can be suppressed before theyreach the decision stage, which is another way of saying that the signal-to-noise ratioof the stimulus is increased prior to the criterion. Under strong attention conditions,the noise-suppressor is set at or near maximum; under weak conditions, the noise-suppressor allows some distractor signals to reach the decision stage, so that whenthe distractor trial percentage increases there is an increase in noise, which inducesan increase in the criterion level, producing longer response times.
Although both the ‘‘noise-suppression’’ mechanism and the distractor-inhibitionmechanism of the present early theory operate on the distractor activity, the distractorinhibition occurs in the control modules of the frontal cortex, but the output fromthese control modules to the posterior cortical sites of attentional expression producestarget enhancement, not distractor inhibition (all long-range cortico-cortical neuronsare excitatory). Therefore, the immediate effect on activity from an incoming targetstimulus is to increase the signal part of the input, not to decrease or suppress thenoise part of the input. It may be noted that some versions of the early attentiontheory assume that early selection operates not by enhancement of the target but bysuppression or attenuation of the distractor (e.g., Moran & Desimone, 1985; Treis-

PREPARATORY ATTENTION 419
man, 1988). A third version of the early theory could assume that selection occursboth by target enhancement and by distractor suppression.
Clearly, combining a noise-suppression mechanism with a criterion mechanismwill account for the RT data from target-only trials shown in Figs. 4 and 6. Strictlyspeaking, such a theory would be classified as an early-late theory because the noise-suppression mechanism operates before the criterion. However, it is not clear howthe noise-suppression mechanism works, nor where it may be located in brain struc-tures. Also, it is not clear what mechanism produces the changes in criterion necessaryto generate the increases in RT in the weak attention curves of Figs. 4 and 6. In theearly attention theory described here, the circuitry and brain location of the distractorinhibition mechanism is specified, and a description is given of how it operates inboth the weak- and strong-attention conditions. And since the positive slope of theweak-attention curves of Experiments 1, 2, and 3 can be derived without changingthe criterion values as distractor trial percentage changes, the criterion mechanismis not crucial for accounting for the general pattern of results of these experiments.However, a criterion mechanism is deemed important for generating theoretical ac-counts of the details of response time distributions.
Cueing and competitive functions of the distractor. Turning to the response-timedata from trials in which the target followed a distractor (Figs. 5 and 7), it appearsthat both weak- and strong-attention conditions produce curves with slopes close tozero. These near-zero slopes appear to be consistent with the near-zero slopes ob-tained for the target-following-distractor data in Experiment 1. Since a near-zeroslope was also obtained for target-only trials under strong attention instructions, itwould seem that the occurrence of a distractor in the target-following-distractor trialsacts as a cue, inducing the subject to temporarily attend strongly to the target location,regardless of the distractor trial percentage.
The distractor-target intervals in these experiments are relatively short: 400–700ms in Experiment 1 and 600–1000 ms in Experiments 2 and 3. As in the case of thetarget-only trials, strong attention overshadows the effects of recent distractor-trialpercentages. The level of this momentary stronger preparatory attention induced bya distractor is expected to vary across the weak- and strong-attention conditions be-cause it adds to the already high strength of attention generated in all of the trialsof the strong-attention condition. Therefore, this assumption could account for thedifference in overall response-time levels of the target-only curves of Figs. 4 and 6and the target-after-distractor curves in Figs. 5 and 7. It could also account for thedifferences in the overall response-time levels of the curves in Fig. 3 if it is assumedthat the second distractor (long delay) produces stronger attention than the first dis-tractor (short delay) in the one-or-two distractor conditions and that the first distractorin the one-or-two distractor condition produces less attention than the only distractorin the one-distractor condition.
Thus, the relatively flat and lower response times of the target-after-distractor dataappear to support the hypothesis that, in these tasks, a distractor acts as a cue for anupcoming target. It is conjectured that the strength of the cueing function of thedistractor should be reduced by increasing the delay between the distractor and targeton distractor trials. This particular hypothesis requires further research to be ade-quately tested.

420 LABERGE, AUCLAIR, AND SIEROFF
If a distractor functions as a strong cue, as it seems to be the case in the presentexperiments, then it should possess strong attention-attraction properties; that is, itshould also function as a distractor and compete for attention with the target duringthe preparatory interval. This hypothesis is supported by the large effects of dis-tractor-trial percentage in the weak-attention conditions of the present experiments.But in Experiments 2 and 3, the strong attention conditions seem to virtually confineattention to the central target location and thereby block the attention-competitionfunction of the outside dots. However, under the strong attention conditions, the cue-ing function of the outside dots appears to remain, since the target-after-distractorresponse times of Figs. 5 and 7 are significantly below the corresponding target-onlyresponse times of Figs. 4 and 6. Thus, the present data appear to support the hypothe-sis that the distractor dots function both as cues and competitors for preparatoryattention in these experiments. Future research is intended to provide a more system-atic inquiry into the hypothesized dual function of the distractor cue in this task.
EXPERIMENT 4: EFFECT OF TARGET-TRIAL PERCENTAGE ONRESPONSE TIME TO A TARGET
Experiment 4 attempts to assess the effect of target frequency alone on the timeto detect a visual target. In Experiments 1, 2, and 3, target-trial percentage variedinversely with distractor-trial percentage, and therefore this factor could contributeto the increase in response times with distractor-trial percentage in the curves shownin Fig. 2 and in the weak-attention conditions of Figs. 4 and 6.
As in the first three experiments, the experimental procedure required subjects todetect the presence of a dot in the center box of three horizontally positioned boxes.However, during trials of this experiment no distractors were presented. The threeboxes were displayed continuously throughout a trial. The onset of the three boxesagain served as the warning signal, and participants were instructed to press the rightshift key when the dot appeared in the center box. The trials in which a dot appearedin the center box varied in values of 100, 75, 50, and 12.5%, and three randomlyselected delay intervals separated the onset of the warning signal from the onset ofthe target.
In the design of Experiment 4, the probability of a response was not constant acrossconditions, but increased directly with the target percentage. Therefore, obtained dif-ferences in response times across the four percentages of target trials may reflectresponse bias as well as the perceptual bias for the target location.
Method
Participants. The participants were the eight undergraduate students at Simon’sRock College who had participated in Experiment 1. Participation was voluntary andthey were fully informed of the group results and the implications of these resultsfor our understanding of the attention process. Informed consent was obtained foreach participant according to the regulations of the college committee on research.
Stimuli. The stimuli and viewing conditions were the same as in Experiment 1.Design and procedure. The design contained two conditions: target percentage
(100, 75, 50, and 12.5%), and the same delay durations as in the one-distractor condi-tion of Experiment 1 (1332, 1480, and 1628 ms). Each participant served in one

PREPARATORY ATTENTION 421
session, which contained four blocks of trials, one for each target percentage. Eachblock contained 48 trials, and the order of blocks was balanced across the 8 partici-pants by two different 4 3 4 Latin squares. In all other respects the procedure wasthe same as the procedure of Experiment 1.
Results and Discussion
Shown in Fig. 6 are the mean response times to targets as a function of the percent-age of target trials (vs no-dot trials) within a trial-block. The data were adjusted by theremoval of the first 12 trials from each block, as was done in the other experiments.
The ANOVA of the data shown in Fig. 6 was a 4 3 3 factorial design involvingpercentage of target trials and delay duration. The only significant main effect waspercentage of target trials, F(3, 42) 5 21.48, p , .001. The mean response timesacross delay durations were quite similar: 245, 239, and 243 ms for the three delaydurations of 1332, 1480, and 1628 ms, respectively. The interaction between percent-age of target trials and delay duration was not significant. Errors and misses wereless than 1% (the relative frequencies of error and misses were .001 and .002, respec-tively).
The main finding of Experiment 4 is that percentage of target trials by itself hasa clear effect on response time. The amount of the response time change betweentarget trial percentages of 50 and 12.5%, shown in Fig. 8, is approximately 20 ms,and the slope of this segment of the curve is 0.27 ms. In comparison, the slope ofthe one-distractor curve of Experiment 1 across the same range of target-trial percent-ages (i.e., the entire curve in Fig. 2) is 0.59. An ANOVA of these slopes, involving
FIG. 8. Mean response time to the target as a function of target-trial percentage in Experiment 4.Data from eight participants.

422 LABERGE, AUCLAIR, AND SIEROFF
the two variables of Experiment (1 vs 4) and delay (three durations) yielded an F(1,14) 5 4.81, p , .05, and no other significant effects. Thus, there is a significantdistractor component of the slope of the one-distractor curve of Experiment 1.
Therefore, the slope of the one-distractor curve of Fig. 2, and by implication theslopes of the other response-time curves of this study produced by weak attentionconditions, is not produced solely by changes in relative frequencies of distractorevents as the distractor-trial percentage changes. The response time increases in thesecurves is apparently being produced also by changes in the relative frequency oftarget events.
GENERAL DISCUSSION
Experiments 1, 2, and 3 show that, under relatively weak instructions to attend toa target location, response times to a target on trials containing only a target increasesubstantially as a function of the percentage of trials in which a distractor recentlyappeared. Experiment 4 shows that response time to a target decreases, but at asmaller rate, as a function of the percentage of trials in which the target recentlyappeared. The combined results suggest that, in the weak-attention conditions of Ex-periments 1, 2, and 3, the response times to targets in target-only trials are influencedby both the percentage of recent distractor trials and the percentage of recent targettrials. Therefore, these findings appear to support the hypothesis that when distractorsand targets have appeared on recent trials, they affect attentional preparations for atarget in the trial that is currently in progress.
Experiments 2 and 3 increased the strength of attention to the central target locationto see if the changes in response time would follow predictions from a criterion-baseddecision (late) theory of attention or the activity-based (early) theory of attention. Thecriterion-based theory assumed that the level of the decision criterion would be lowerwhen attention was increased to the center target location, but distractor trial effectswould still remain. Therefore, the predicted RT curve for target-only trials under thestrong attention condition should be translated downward from the RT curve underthe weak-attention condition. The activity-based theory of attention predicted thatthe strong attention condition would increase target activity and suppress distractoractivity in control sites of attention with the result that the target sites in the expressionsites of attention would be highly activated regardless of the distractor trial percent-age. Therefore the predicted RT curve for target-only trials under the strong attentionshould be flat and lower than the RT curve under the weak-attention condition. Theresults favored the activity-based early theory of attention and were unfavorable tothe criterion-based late theory of attention.
A second mechanism of attention, the ‘‘noise-reduction’’ mechanism (Pashler,1998) was considered. This mechanism operates by selectively suppressing the infor-mation from the distractor ‘‘channels.’’ When the noise-suppression mechanism iscombined with the criterion mechanism, an adequate account can be given of thetarget-only data of both the weak and strong attention conditions obtained in Experi-ments 2 and 3 (Figs. 4 and 6). However, it is not clear how the noise-suppressionmechanism is evoked, nor where in the cognitive system it resides.
In contrast, the present triangular circuit theory places the distractor inhibition

PREPARATORY ATTENTION 423
mechanism in the circuitry connecting the basal ganglia to the modulatory control,and a plausible description is given of the circuitry based on known principles ofconnectivity between the basal ganglia, the thalamus, and frontal cortical areas.
Modifications in the Triangular-Circuit Theory Suggested by the Present Data
While the triangular circuit theory of attention (LaBerge, 1995, 1997, 1998, 1999)emphasizes the role of early attentional processing, it does not rule out the existenceof a late criterion mechanism whose mode of operation influences the form of re-sponse-time distributions. Rather, the early theory assumes that attention changes thesignal-to-noise ratio of the stimulus input before the effects of the stimulus inputreach the criterion stage. The present early theory assumes that a criterion mechanismfollows the events described by the diagram in Fig. 9 (i.e., the events following thetop-down operation of the triangular circuit that produces the expression of spatialattention in the parietal area). Mathematical models of the criterion process can con-nect theory with response-time data in a manner which provides quantitative predic-tions (for reviews of models, see Luce, 1986 and Townsend & Ashby, 1983). Crite-rion models based on the accumulations of target and distractor signals are describedby LaBerge (1962, 1994) and Smith and Vickers (1988). A criterion model of the
FIG. 9. Triangular-circuit theory of visual attention to a spatial location. Stimulus input througharea V1 and the superior colliculus produce an expression of orientation in the parietal area, whichactivates frontal cortical areas of attentional control (shaded rectangles indicate columns which code fortarget and distractors). Frontal areas of control return activation to the parietal area via two routes withina triangular circuit: one direct and the other indirect through a thalamic nucleus, which produces anexpression of attention in that parietal area. The selective control selects the location in the parietal areato which attention will be directed, and the modulatory control varies the intensity of attentional activitydirected to that selected location. Connections between the selective control and modulatory controlareas are also produced through two routes within a triangular circuit: one direct and the other indirectthrough a thalamic nucleus.

424 LABERGE, AUCLAIR, AND SIEROFF
accumulation of activity differences between a target and a distractor (based on thethalamocortical circuit) that generates responses directly from the expression of atten-tion to location (or to stimulus attributes) is described by LaBerge, Carlson, andWilliams (1997). Details of the relationships between these models and the presentdata are beyond the scope of the present paper.
The main change in the triangular circuit theory suggested by the present experi-ments is the division of attentional control into two submodules: a selection moduleand a modulatory module. The schematic diagram in Fig. 9 shows theoretical repre-sentations, in terms of brain structures, of the expression, enhancement, and controlof spatial attention to the central box (target) and to the outside boxes (distractors)during a trial of the distractor task in the weak-attention conditions of Experiments1, 2, and 3. Brain areas of top-down control are assumed to be part of systems ofworking memory (e.g., Baddeley, 1995; Goldman-Rakic, 1987), in which two kindsof processing are prominent: storage of information in highly accessible form overshort periods of time and executive control, which governs encoding, retrieval, andcommands for the expression of attention in other areas of the brain. The direct con-nections between frontal (including premotor and prefrontal), pulvinar, and parietalareas have been confirmed in several anatomical tracing studies (for a review seeSelemon & Goldman-Rakic, 1988). The connections within the frontal cortex appearplausible, given the known interconnectivity with the prefrontal and premotor areasand between these cortical areas and underlying thalamic nuclei (e.g., Selemon &Goldman-Rakic, 1988; Jones, 1985; Fuster, 1989).
In Fig. 9, the attentional command component of working memory is representedby two related subareas of control, labeled selective control and modulatory control.Both components of control are assumed to be activated when the three boxes appearas a warning signal and when a dot appears in one of the boxes during a trial. Withineach area of control is a cluster of cortical columns which represent the target anda cluster of cortical columns which represent a distractor. It should be noted that indistributed cortical coding of similar locations and similar objects there is consider-able overlap of cortical columns which are activated by both types of stimuli. There-fore, when the descriptive phrase ‘‘cluster of columns’’ is used here, there is nonecessary implication that the column clusters are disjoint.
The columns within the modulatory and selective control areas are assumed tostore the cumulative record of recent stimulus events. Previous studies have shownthat locations attended to on recent trials of an experiment affect subsequent responsetimes to those locations. LaBerge and Brown (1986) varied the range of locations(along a horizontal line) in which stimuli were presented and found that as range oflocations became more narrow, the response times to a given stimulus within thatrange decreased. Presumably, when stimulus locations are clustered in close proxim-ity, the effects of recent trials mutually strengthen the residual activity at neighboringlocations more than at remote locations, which in turn contributes to greater prepara-tory attention for those locations. In a recent study by Carlson (1998), stimuli werepresented to the left and right of a center fixation point with different frequencies,and when these locations were tested with probe stimuli, the response times of theprobe stimuli showed lower response times to the more frequent location. Thus, thesestudies showed that a particular stimulus location produced different response times

PREPARATORY ATTENTION 425
depending on the frequency with which that location or closely proximate locationshad been presented on recent trials.
Similarly, in the present experiments, the occurrences of target and distractorevents are assumed to be stored in working memory, and these memories inducepreparatory attention directed to their locations when the warning signal begins atrial. When the stimulus display (in the form of a cue or an appropriate warningsignal) activates spatial locations, all columns of the selective control module areactivated, but the columns storing the more frequent recent events are activated morestrongly (as indicated by the darker shading within the target control columns in Fig.9). In the selective control area, the activity in the target column is produced mainlyby the memory of the instructions to observe and respond to the central target and lessstrongly by the memory of recent target and distractor events. The low percentages oferrors and misses obtained in the present experiments are consistent with this assump-tion. In the modulatory control area, the initial activity levels of the target and dis-tractor columns are produced mainly by projections from the selective control, wherethe frequencies of recent target and distractor trials are stored.
After the onset of a cue or warning signal produces the initial levels of activityin the selective and modulatory control areas, the selective control area activates thearea of modulatory control via the triangular circuit involving a nucleus of the thala-mus, which serves the frontal area. The ventrolateral nucleus serves the premotorarea, which is a likely site of modulatory control, and the mediodorsal nucleus servesthe prefrontal area, which is a likely site of selective control (for PET evidence ofthe involvement of these thalamic nuclei in a preparatory attention task, see Liotti,Fox, & LaBerge, 1994). As the target columns in the modulatory control increasetheir activity, they undergo interference from activity in the distractor columns. Thisinterference may occur both in the cortico-cortical connection and in the cortico-thalamocortical connection of the triangular circuit. The connection between the se-lective control columns and the modulatory control columns involving the thalamusis shown in Fig. 10. The structure of this circuit is the standard thalamocortical circuit,which includes the inhibitory neurons of the reticular nucleus of the thalamus. Theoperation of this circuit has been simulated (LaBerge, Carter, & Brown, 1992), andthe stimulation results show that a small initial difference in the input firing rates ofthe target and distractor pathways can be transformed into a large difference in firingrates at the cortical columns, favoring the target over the distractor (a sample of thesimulation is shown in Fig. 5 of LaBerge, 1999). Thus, when the selective controlcolumns activate the modulatory control columns, a small difference between theactivity levels in the selective control columns will be amplified as it is passed throughthe thalamocortical circuit, which provides input to the columns of the modulatorycontrol. The process of amplifying a small difference between target and distractorsites involves both an increase in activity of the initially higher activity site and adecrease in activity of the initially lower activity site.
To account for the increase in response time to the target-only trials produced bythe increase in percentage of distractor trials, it is assumed that the modulatory controlactivates preparatory attentional activity in parietal sites where incoming target activ-ity arrives. Preparatory attentional activity at the target sites is combined with theincoming target activity to increase the signal-to-noise ratio of the target stimulus.

426 LABERGE, AUCLAIR, AND SIEROFF
As the level of preparatory activity at the distractor site is decreased and the levelof preparatory activity at the target site is increased (by decreasing distractor trialpercentage), the signal-to-noise ratio of the information entering the decision criterionmechanism is increased, with the result that mean response time decreases.
Basal Ganglia and Motivational Influences
The modulatory control area is influenced not only by activity sent from the selec-tive control area, but also by activity arising from the basal ganglia, which is a brainstructure believed to be crucial for the communication of motivational states to thefrontal cortex (via the thalamus). The basal ganglia maintain tonic inhibition of thethalamocortical circuits serving the frontal cortical areas, and this enduring inhibitionprevents an augmentation of activity in frontal cortical columns, thereby preventingunwarranted actions from being initiated.
The increase in activation of a particular cluster of frontal columns is made possiblewhen the inhibitory fibers from the basal ganglia themselves are inhibited (for adescription of the circuits by which the basal ganglia are assumed to control thecontrol areas in the frontal cortex see LaBerge, 1998). This disinhibition is presumedto occur when the perceived object is of interest to the individual; in other words,when active areas in the posterior cortex (representing the attribute or location of theobject) activate appropriate circuits within the basal ganglia, perceptions of the objectare associated with motivational states.
Under the weak-attention conditions of the present experiments, basal ganglia tonicinhibition of the thalamocortical input to the target and distractor columns of modula-tory control (and from other brain areas to the selective control) is assumed to bereduced, which represents a cognitive state in which all three boxes are ‘‘of interest’’(see Fig. 10). By blocking basal ganglia inhibition of the thalamocortical loops serv-ing the modulatory control, the inputs from both target and distractor columns of theselective control are free to interact. The interaction has already been described asone which takes in small differences in input activity levels and delivers large differ-ences in output activity levels.
However, under the strong attention condition, the object ‘‘of interest’’ is the targetbox, and the perception of the target box in posterior cortex directly activates a partic-ular patch of neurons in the basal ganglia. As a result, the basal ganglia releases tonicinhibition of the target pathway between the selective and modulatory controls, butmaintains inhibition of the distractor pathways. Therefore, only the target site withinthe modulatory control is activated, and the level of this activation is higher than thelevel under weak-attention conditions, owing to the additional target activation addedto the selective control and to the absence of competition from distractor activitywhile the thalamocortical circuit performs its enhancement operation.
Because the stored effects of recent occurrences of distractors in the selective con-trol are prevented from being communicated to the modulatory control, the target-only curve in the strong attention condition (Figs. 4 and 6) is predicted to show azero slope. A generalization that is suggested by these considerations of narrowingattention to an object’s location is that it can cancel other influences on attention,for example, the influences of recent trial events (as in the present study) or thepresence of nearby distractors in the target display (LaBerge et al. 1991).

PREPARATORY ATTENTION 427
Pathways of Visual Orienting
The relationship of preparatory attention to orienting is shown in Fig. 9. There aretwo main pathways leading from the primary visual cortex (V1) to the parietal cortexthat serve orienting; one pathway contains synapses in intermediate cortical areas,and the other pathway contains synapses in the superior colliculus (which projectsits fibers to the parietal area via synapses in the pulvinar nucleus of the thalamus).Another pathway of orienting (not shown here) connects the retina directly with thesuperior colliculus. These pathways are assumed to produce bottom-up activation ofthe parietal area; for example, when the three boxes of the present experiments arepresented as the warning signal, three locations are activated in the parietal spatialarea. The activations are typically produced by abrupt onsets of stimuli, and the activ-ity levels decay rapidly.
These patterns of activations in the parietal area produced from the ‘‘bottom-up’’direction are regarded here as expressions of orientation, not expressions of attention(LaBerge, 1999). When activity in the three location sites of the parietal area areprojected to the frontal cortical areas, they activate corresponding locations in themodulatory and selective control areas. Subsequently, the selective control site in-duces the modulatory control site to return activation to only one location (e.g., thecenter box) of the parietal area, which receives additional and more prolonged activa-tion, while activity at the other locations decays. This activation in the single selectedlocation is considered here to be an expression of attention in the parietal area becauseit involves the triangular circuit, which augments the activity in the particular parietalsite to a sufficiently high level and sustains the activity for a moderate (i.e., nonbrief)duration of time. Thus, although many noncontiguous locations can express orienta-tion at the same time, only one noncontiguous location appears to be able to expressattention at a given time, particularly when the attentional intensity is high.
Integration of the Triangular Circuit with the Theory of the Spread ofPreparatory Attention
When preparatory attention is directed to only one particular location by the selec-tive control and augmented to a high level by the modulatory control, activation isassumed to spread to neighboring locations, with the activity level decreasing inintensity as distance increases from the attended location (LaBerge & Brown, 1989;LaBerge, 1995; LaBerge et al., 1997). The momentary distribution of preparatoryattention at its highest level of intensity (just prior to the onset of an expected targetat the attended location) is assumed to resemble back-to-back exponential distribu-tions, with a small plateau at the peak whose width is the size of the attended area.The spread of this intensity distribution has been measured by the response times ofprobe stimuli and found to resemble a V-curve (LaBerge & Brown, 1986, 1989;LaBerge et al., 1997).
Although the intensity at the central peak of the activity distribution decreasesrapidly following a shift of attention to other locations, during the time it is at ahigh intensity, preparatory attention is moderately intense in locations adjacent tothe attended location. Thus, it could be said that, for a brief duration of time, attentionis expressed at more than one location at the same time.

428 LABERGE, AUCLAIR, AND SIEROFF
When distractors and targets appear in many different and overlapping locations,then traces of this activity produce high levels of activity in modulatory columnsthat represent all of these locations, which may exist in all four quadrants of thevisual field. If a target is presented along with a distractor, regardless of the distancebetween them, the activity in both target and distractor columns quickly increasesto a higher level. The pattern of activities in these columns is sent to the selectiveand modulatory controls, where the pattern of activity across these columns changes,as the selective control target and distractor columns induce the modulatory controlto increase its target columns activity and to decrease its distractor column activity(a control map of location in one frontal hemisphere contains all quadrants of thevisual field, e.g., Funahashi, Bruce, & Goldman-Rakic, 1989). The resulting changesof activity in the modulatory control columns are then sent back to the target columnsof the parietal areas. Here, the target columns continue to maintain the high level ofactivity which was produced at the onset of the stimuli, while the activity in thedistractor column decays to a new lower level controlled by the lower level of activityin the modulatory distractor columns.
If recordings were made of a cell in each of these parietal columns, the time courseof cell activations would show an initial increase in activity of both target and dis-tractor cells, followed by a decrease in activity of distractor cells, while the targetcolumn cells remained at the same level. This time pattern of target and distractoractivity in a selective attention task is the signature of a selection-by-suppressionmechanism (LaBerge, 1999).
Theoretical Accounts of Selection by Suppression in the Attention Literature
The division of attentional control into modulatory and selective components pro-vides a new way of accounting for data in attention experiments which show selectionby suppression of distractors (e.g., Cepeda, Cave, Bichot, & Kim, 1998; Chelazzi,Miller, Duncan, & Desimone, 1993; Moran & Desimone, 1985). The general patternof results from these experiments indicates that the expression of attention to a partic-ular target object is produced mainly by a reduction in activity at locations corre-sponding to the distractor object or objects and not mainly by the increase in activityat locations corresponding to the target object. One hypothesis accounts for this pat-tern of results by assuming that local circuits within the cortical areas of attentionalexpression enable the active target site to inhibit activity at distractor sites.
According to the present account, the main inhibitory processing in these selectiveattention tasks which show selection by suppression of distractor sites occurs in thefrontal control areas, not in the local circuits of posterior cortical areas where attentionis expressed. In a frontal map, widely separated location sites in the visual field areclose enough (Funahashi, Bruce, & Goldman-Rakic, 1989) to be interconnectedthrough the lateral inhibitory fibers of the reticular nucleus of the thalamus. If theactivity is initially at a high level in the distractor and target columns of the frontalmodulatory control area, then the modulatory activity for the target column is main-tained, while activity in the distractor columns is suppressed. Then, activity initiallysent from distractor sites in the frontal area to the distractor sites in the posteriorcortical areas simply decays when the target display occurs, while the activity initially

PREPARATORY ATTENTION 429
FIG. 10 Diagram of the major elements of the standard thalamo-cortical circuit connecting the tha-lamic neurons with columns of the frontal cortex. Relative activity levels within clusters of columnscorresponding to the target location (T) and the distractor location (D) are represented by the shadedrectangles. The inputs to these columns of modulatory control arise from (1) the current activity levelswithin corresponding columns in the selective control area (see Fig. 9) and (2) the reduction of tonicinhibitory activity in fibers arising from the basal ganglia.
sent from target sites in the frontal area to the target sites in the posterior corticalareas remains constant. In this way the pattern of activity in the posterior corticalsites (parietal in the case of location-based attention and occipitotemporal sites inthe case of object-based attention) of target and distractors would show a pure selec-tion-by-suppression pattern.
This account can be described in more detail with the help of the theoretical dia-grams shown in Figs. 9 and 10. When a series of trials contains stimuli at targetand at distractor locations, the effects of attending to these stimuli are stored in thecorresponding columns in the selective and modulatory control area. Then, when astimulus display [a warning signal, or cue, or a target plus distractor(s)] activates thespatial pathways of the brain, the target and distractor columns in the modulatoryand selective control areas increase their activation to a level which depends upontheir recent frequency of occurrence. When the target stimulus occurs, the activity inthe target columns in the selective control area increases and both target and distractor

430 LABERGE, AUCLAIR, AND SIEROFF
columns activate the columns in the modulatory control area, which sends high acti-vation to both distractors and target sites in the posterior cortex. When the targetappears, the existing high activity in both target and distractor columns of the modula-tory control changes. The appearance of the target adds considerable activity to thetarget site in the selective control, and then the thalamocortical circuit connecting theselective control to the modulatory control suppresses the activity of the modulatorydistractor columns without producing a further increase in the activity of the targetcolumns. As this process develops over time following the target onset, the targetand distractor columns in the modulatory control send their activities to target anddistractor sites in the posterior cortex. The level of activity in target sites of modula-tory and posterior cortical areas remains approximately constant, while the level ofactivity in the distractor site of the posterior cortex begins to decay because there isless activity arriving from the distractor site in the modulatory control. Thus, at theonset of a target display, the predicted pattern of activation over time in the posteriorcortical sites of attention expression will first show an increase in both distractor andtarget columns (from a base level) produced by the warning signal (or cue, or target-distractor display), and then, when the frontal control areas are activated and returnactivation to the posterior sites, the activation in the posterior sites will continue toincrease for both distractor and target columns until the activity in the distractorcolumns of the modulatory control area begins to decrease. At that time, the distractoractivity in the posterior columns will begin to decay, while the target activity remainsat its initial high level. This is the general pattern of target and distractor activityover time shown by several cellular recording studies of attentional selection (e.g.,Chelazzi et al., 1993).
Thus, the inhibitory suppression of distractor activity during selective attention,according to the present account, can take place mainly in the frontal areas of thebrain instead of mainly in the posterior areas. The decrease in neural activity at poste-rior cortical distractor sites is assumed here to represent decay of the activity projectedto it from frontal areas, not inhibition by local corticol sources. One structure, pro-posed here, which contains the kind of circuitry which would produce inhibition ofdistractor site activity in the frontal control areas is the thalamocortical circuit, illus-trated schematically in Fig. 10. Other circuit structures which may perform the samefunction may lie in the frontal cortical columns themselves and may be activatedboth by the cortico-cortical inputs and the thalamocortical inputs.
Not all selective attention tasks in the literature show the expression of attentionby suppression of target activity. Some attention studies show attentional selectionin which enhancement of the target dominates suppression of the distractor (e.g.,Maunsell, 1995; Spitzer, Desimone, & Moran, 1988). According to the present the-ory, selection by increase in target site activity within the modulatory and selectivecontrol areas will occur when the initial activity levels in the target and distractorsites in these areas is not high. This can come about when the discrimination of thetarget is difficult, when the distractor is not presented frequently (or is absent) in ablock of trials, or when the display of the target does not contain features whichstrongly activate distractor sites. In the Spitzer, Desimone, and Moran (1988) study,only one stimulus was given at a time (e.g., a green bar), so that on target trials, thedistractor representation in the selective control area was not highly activated. When

PREPARATORY ATTENTION 431
the target was made harder to discriminate, activity at the target site increased. Inthe Maunsell study, the target and distractors were well separated, so that there waslittle selective interference between target and distractor representations in the selec-tive control area. In contrast to these procedures, the procedures which typically pro-duce selection by suppression often appear to depend upon selective interferencebetween the target and distractors presented together in a display.
Negative priming. The assumption, made by the triangular circuit theory, that re-cent target and distractor trials leave their traces in frontal cortical columns wouldappear to provide the basis of an account of negative priming. The negative primingeffect (e.g., Tipper, MacQueen, & Brehaut, 1988) is commonly described as the in-crease in response time to a target item on a given trial when that item was a distractoron the previous trial. The account follows the same lines of reasoning as the accountof the distractor trial effect already described in this section, except that the propertyof the target and distractor that is attended to in the present task is location, whilethe property of the targets and distractors responded to in typical negative primingexperiments is an attribute of the stimuli, such as color or shape. When a dot appearsin a distractor location over a recent series of trials, the response time to that dot ina target location (on a target-only trial) increases. The top-down sources of attentionalcontrol accumulate a record of recent appearances of distractor occurrences (and tar-get occurrences as well), and when a new trial begins, these sources produce atten-tional activation of both targets and distractors as a function of their accumulatedrecords. Thus, each trial begins with an attentional bias toward potential distractorsand targets, and attention generated during the target display is added to this bias todetermine how fast the target item will be processed.
Selective and modulatory attention. The variations of the experimental task de-scribed and tested here appear to measure the intensity of preparatory attention to aspecific location in visual space while attention is sustained over time durations ofapproximately 1 to 3 s. Under weak attention conditions, the intensity of preparatoryattention apparently was varied by changing the relative frequency of distractors andtargets (in Experiments 1, 2, and 3) and by changing the relative frequency of targetsto no-targets (in the target-only task of Experiment 4). Selective attention was appar-ently so easy in both tasks that errors and misses were virtually absent, suggestingthat selective control of attention did not systematically change when modulatorycontrol is changed. Therefore, the present tasks appear to provide a measure of prepa-ratory attention that separates the effects of modulatory attention from selective atten-tion.
Selective attention is assumed to influence the duration of attention by determiningwhere attention is directed or to what attention is directed. While attention is directedto a location or object, the intensity of attention can change, if time is providedfor activity in modulatory control sites to be changed. Low attentional intensities,represented by low levels of activity in cortical columns of attentional expression(e.g., in cortical areas representing locations, objects, or thoughts) can be producedquickly after attentional shifts to a new location or new object of thought (as in visualsearch or associative thinking), so that the attentional ‘‘dwell time’’ on a location orthought need be only brief. In contrast, high attentional intensities, represented byhigh activity levels in cortical columns of attentional expression, are not achieved

432 LABERGE, AUCLAIR, AND SIEROFF
in fractions of a second, but require seconds to develop. Hence, high intensities ofcortical activation are not expected during typical search tasks or typical rapid think-ing, in which the dwell time of attention on any one item is a fraction of a second.Longer durations necessary to the production of high attentional intensity are moretypically found in preparation tasks but even here the intensity level may not be highunless the nature of the task requires it, for example, by displaying the target verybriefly following a long preparatory interval (e.g., LaBerge & Brown, 1989; La-Berge & Buchsbaum, 1990; LaBerge, Carlson, Williams, & Bunney, 1997; Liottiet al., 1994) or by motivating the participant appropriately (e.g., the strong instructioncondition of Experiment 2). Thus, selective control is assumed to operate quickly(in milliseconds) because columns are presumed to function at low intensities andtherefore take less time to reach effective levels; this allows more shifts of attentionper unit of time; in contrast, modulatory control is assumed to operate relativelyslowly (in seconds) because columns must take time to develop moderate to highintensities; this allows fewer shifts of attention per unit of time.
The brain pathways involved in sustaining attention at moderate and high levelsduring preparatory attention are assumed to be the same pathways involved in sus-taining attention at these levels in maintenance attention, in which cortical activityis continued for its own sake and not for the explicit purpose of responding to anexpected immanent event. In particular, during maintenance attention, selective con-trol is assumed to be crucial in determining what and how long particular corticalcolumns will be activated, and modulatory control is assumed to be crucial in de-termining how intense the activity will be.
Application of the Present Tasks to Early Diagnosis of Frontal Deficits
If the control of attention is located in frontal areas, then neural damage in thisarea should affect the ability of the patient to resist the effects of distractors. If recentdistractor events have a greater effect on a patient’s ability to attend to the centerlocation of the present task, then a larger slope is expected for the target-only responsetimes as a function of distractor trial percentage. Because the weak attention taskappears to be sensitive to distractor effects, this task may show greater-than-normalslopes for individuals who are in early stages as well as in late stages of a frontaldisorder.
ACKNOWLEDGMENTS
The author is grateful to the students at Simon’s Rock College and at the Universite de Savoie forvolunteering to participate in the experiments of this study and to Dr. Anne O’Dwyer for assistancewith accessing the computer-based statistical analyses of data of Experiments 1, 3, and 4. Dr. JaniceLawry provided helpful discussions of several issues treated in this article.
REFERENCES
Baddeley, A. (1995). Working memory. In M. S. Gazzaniga (Ed.), The cognitive neurosciences (pp. 755–764). Cambridge, MA: MIT Press.
Brunia, C. H. M. (1999). Neural aspects of anticipatory behavior. Acta Psychologica, 101, 213–242.

PREPARATORY ATTENTION 433
Carlson, R. L. (1998). Modulating visual spatial processing through preparatory attention and thresh-olds. Doctoral Dissertation, University of California, Irvine.
Cepeda, N. J., Cave, K. R., Bichot, N. P., & Kim, M.-S. (1998). Spatial selection via feature-driveninhibition of distractor locations. Perception & Psychophysics, 60, 727–746.
Chelazzi, L., Miller, E. K., Duncan, J., & Desimone, R. (1993). A neural basis for visual search ininferior temporal cortex. Nature, 363, 345–347.
Damasio, A. R. (1994). Descartes’ error. New York: Avon Books.
Funahashi, S., Bruce, C. J., & Goldman-Rakic, P. S. (1989). Mnemonic coding of visual space in themonkey’s dorsolateral prefrontal cortex. Journal of Neurophysiology, 61, 331–349.
Fuster, J. M. (1989). The prefrontal cortex. (2nd ed.). New York: Raven.
Goldman-Rakic, P. S. (1997). Circuitry of primate prefrontal cortex and regulation of behavior by repre-sentational memory. In F. Plum (Ed.), Handbook of physiology, the nervous system, higher functionsof the brain (Section 1, Vol. V, Part 1, pp. 373–417). Bethesda, MD: American PhysiologicalSociety.
Jones, E. G. (1985). The thalamus. New York: Plenum.
Hawkins, H. L., Hillyard, S. A., Luck, S. J., Mouloua, M., Downing, C. J., & Woodward, D. P. (1990).Visual attention modulates signal detectability. Journal of Experimental Psychology: Human Per-ception and Performance, 16, 802–811.
Heinze, H. J., Mangun, G. R., Burchert, W., Hinrichs, H., Scholz, M. Munte, T. F., Gos, A., Scherg,M., Johannes, S., Hundeshagen, H, Gazzaniga, M. S., & Hillyard, 1994. Combined spatial andtemporal imaging of brain activity during visual selective attention in humans. Nature, 372, 543–546.
Kahneman, D. (1973). Attention and effort. Englewood Cliffs, NJ: Prentice–Hall.
LaBerge, D. (1962). A recruitment theory of simple behavior. Psychometrika, 27, 375–396.
LaBerge, D. (1994). Quantitative models of attention and response processes in shape identificationtasks. Journal of Mathematical Psychology, 38, 198–243.
LaBerge, D. (1995). Attentional processing: The brain’s art of mindfulness. Cambridge, MA: HarvardUniv. Press.
LaBerge, D. (1997). Attention, awareness, and the triangular circuit. Consciousness and Cognition, 6,149–181.
LaBerge, D. (1998). Attention as the intensification of cortical activity. Revue de Neuropsychologie, 8,53–81.
LaBerge, D. (1999). Networks of Attention. In M. S. Gazzaniga (Ed.), The new cognitive neurosciences(pp. 711–724). Cambridge, MA: MIT Press.
LaBerge, D., & Buchsbaum, M. S. (1990). Positron emission tomographic measurements of pulvinaractivity during an attention task. Journal of Neuroscience, 10, 613–619.
LaBerge, D., & Brown, V. (1986). Variations in size of the visual field in which targets are presented:An attentional range effect. Perception & Psychophysics, 40, 188–200.
LaBerge, D., & Brown, V. (1989). Theory of attentional operations in shape identification. PsychologicalReview, 96, 101–124.
LaBerge, D., Brown, V., Carter, M., Bash, D., & Hartley, A. (1991). Reducing the effects of adjacentdistractors by narrowing attention. Journal of Experimental Psychology: Human Perception andPerformance, 7, 65–76.
LaBerge, D., Carlson, R. L., & Williams, J. K. (1997). Toward an analytic model of attention to visualshape. In A.A.J. Marley (Ed.), Choice, decision, and measurement (pp. 389–410). New Jersey:Erlbaum.
LaBerge, D., Carlson, R. L., Williams, J. K., & Bunney, B. (1997). Shifting attention in visual space:Tests of moving-spotlight models versus an activity-distribution model. Journal of ExperimentalPsychology: Human Perception and Performance, 23, 1380–1392.

434 LABERGE, AUCLAIR, AND SIEROFF
LaBerge, D., Carter, M., & Brown, V. (1992). A network simulation of thalamic circuit operations inselective attention. Neural Computation, 4, 318–331.
Liotti, M., Fox, P. T., & LaBerge, D. (1994). PET measurements of attention to closely spaced visualshapes. Society for Neuroscience Abstracts, 20, 354.
Luce, R. D. (1986). Response times. New York: Oxford Univ. Press.Mangun, G. R., & Hilllyard, S. A. (1991). Modulations of sensory-evoked brain potentials indicate
changes in perceptual processing during visual-spatial priming. Journal of Experimental Psychol-ogy: Human Perception and Performance, 17, 1057–1074.
Maunsell, J. H. R. (1995). The brain’s visual world: Representation of visual targets in cerebral cortex.Science, 3, 764–769.
Moran, J., & Desimone, R. (1985). Selective attention gates visual processing in the extrastriate cortex.Science, 229, 782–784.
Mulligan, R., & Shaw, M. L. (1981). Attending to simple auditory and visual signals. Perception andPsychophysics, 30, 447–454.
Pashler, H. E. (1998). The psychology of attention. Cambridge, MA: MIT Press.
Posner, M. I. (1978). Chronometric explorations of mind. Hillsdale, NJ: Erlbaum.Ratcliff, R., & Rouder, J. N. (1998). Modeling response times for two-choice decisions. Psychological
Science, 9, 347–356.
Selemon, L. D., & Goldman-Rakic, P. S. (1988). Common cortical and subcortical targets of the dorsolat-eral prefrontal and posterior parietal cortices in the rhesus monkey: Evidence for a distributed neuralnetwork subserving spatially guided behavior. Journal of Neuroscience, 11, 4049–4068.
Smith, P. L., & Vickers, D. (1988). The accumulator model of two-choice discrimination. Journal ofMathematical Psychology, 32, 135–168.
Sperling, G., & Dosher, B. A. (1986). Strategy and optimization in human information processing. InK. Boff, L. Kauffman, & J. Thomas (Eds.), Handbook of perception and performance (Vol. 1,pp. 1.1–1.65). New York: Wiley.
Spitzer, H., R., Desimone, R., & Moran, J. (1988). Increased attention enhances both behavioral andneuronal performance. Science, 240, 338–340.
Tipper, S. P., MacQueen, G. M., & Brehaut, J. C. (1988). Negative priming between response modalities:Evidence for the central locus of inhibition in selective attention. Perception & Psychophysics, 43,45–52.
Townsend, J. T., & Ashby, F. G. (1983). Stochastic modeling of elementary psychological processes.New York: Cambridge Univ. Press.
Treisman, A. (1988). Features and objects: The Fourteenth Bartlett Memorial Lecture. Quarterly Journalof Experimental Psychology A, 40, 201–237.
Treisman, A., & Gelade, G. (1980). A feature integration theory of attention. Cognitive Psychology, 12,97–136.
Treisman, A., & Sato, S. (1990). Conjunction search revisited. Journal of Experimental Psychology:Human Perception and Performance, 16, 459–478.
Woldorff, M. G., Gallen, C. C., Hampson, S. A., Hillyard, S. A., Pantev, C., Sobel, D., & Bloom F. E.(1993). Modulation of early sensory processing in human auditory cortex during auditory selectiveattention. Proceedings of the National Academy of Sciences (USA), 90, 8722–8726.
Yantis, S. (1993). Stimulus-driven attentional capture. Current Directions in Psychology, 2, 156–161.
Received August 25, 1999