
UR Scholarship Repository - University of Richmond
74
University of Richmond UR Scholarship Repository Master's eses Student Research 7-1-1956 An appraisal of the utility of current measures in estimating the population subregions of Virginia Mary Boehling Duley Follow this and additional works at: hp://scholarship.richmond.edu/masters-theses is esis is brought to you for free and open access by the Student Research at UR Scholarship Repository. It has been accepted for inclusion in Master's eses by an authorized administrator of UR Scholarship Repository. For more information, please contact [email protected]. Recommended Citation Duley, Mary Boehling, "An appraisal of the utility of current measures in estimating the population subregions of Virginia" (1956). Master's eses. Paper 104.
-
Upload
khangminh22 -
Category
Documents
-
view
0 -
download
0
Transcript of UR Scholarship Repository - University of Richmond

University of RichmondUR Scholarship Repository
Master's Theses Student Research
7-1-1956
An appraisal of the utility of current measures inestimating the population subregions of VirginiaMary Boehling Duley
Follow this and additional works at: http://scholarship.richmond.edu/masters-theses
This Thesis is brought to you for free and open access by the Student Research at UR Scholarship Repository. It has been accepted for inclusion inMaster's Theses by an authorized administrator of UR Scholarship Repository. For more information, please [email protected].
Recommended CitationDuley, Mary Boehling, "An appraisal of the utility of current measures in estimating the population subregions of Virginia" (1956).Master's Theses. Paper 104.

J
AH A..-PPRilSAL or m umxn OF OORR!NT BASUP.ES
IN ~Tnro fBE l>OPULATIO?f
OJ' SUBREGIONS OF VIOOINU.
A ?RESIS Bf.raMI'i"1'1J) TO THE G.RAOO'ATE FACULTI
OF TS· UNIVERSITY Of RIO~OND llt OANDIDACI
FOR TSE DmREE 01 MASTER OF ARm IU EOONOW:CB

11n•n thank.a are due »r. Lorin J.. Thompson, Director.of tho ............. , . ' .
lltl'HU of Population and Roonoaic Research oi' the University of Virginia,
who aided as oubstantiall.7 in the preparation of thia thesis.and who
t'lade a.ail.able to me the faoilitios of the Bureau. 11' appi.'eQiation is.
&lao expressed to Dr. !boa& c. Bandera ot the Ul\iveraity o£ Riehm.end
toi- b18 guidance through rq tbeai1 work• fo »i-. Berman P. !homal,
Cbail"ml.11 or the Dapartment of Econord.os of the u~ wrsi ty of R1cbmon41
I ea eopec1al..l.r gratef\ll fo'P hia instll'UOtion and enoouragement tbrougb
out.., ~i. 110l"k•
» .. B. »• .August 1956
u

1v
Chaptet' t, nttl?DOOCTION • • • • • • • • • • • " • • • • ·• • • • • l
U. P.!CENT ATmAPTS 'ro ESZlWl.TE POPDLATlON BELOW mE STATE ~·~····· ................... 10
Arithllotio Taoh.'"lique:u ProJection and J.pportiorment 12 lligratio:c. and Hatural Incl"fll.ae Lðoda • • • • • • • 14 llotboda Utilising S:flllPtom&tic Data , • • • •• • .. • 17 Pron tic:m. Method • .. • • .. • • • • • • • • • • • • .. 20 Cmulal Ratio Method ••••••• - ........ It • • 2.1. "Vital P.atea• Method.. ., • • • • • • • • - ,. • • .. • • 24
" ' ,
W. A WLTIPJ',E..FAC'.l\lR TmmUQU.E • • fl • • • • • • , • • • , 31
Birthe • ., .......... , • • •• • • • • • • • 39 Doaths " • • • • • • • • • "' ~ • fl • • • • • • • • • 40 School •l"Ol.lman~ 'It • ., • • • • • .. • • • • "' • 111 • • 4l Coverod lbployment • • ti. • • , .. .. • • • • • • • , .. 4J
. . . . . zv. OOtll'ARlSON OF PJl'.OOLfS OBTAINED FIWM. TECHNlQO&S 01 ES1'I-~ ~ POPOLATIOR • • • • ., • • • • •. • • 46
'· !lIE PWA.C\ATION OF CURRl!!MT FS.uw:rsa FOR 'iim SUBRmlOHS 01 VIRCUlr.IA AID CO.NUUJSIOHS * • ., • • • • • • .. ,. • • 57
Conolt.U11ons • • • • • · • • • • • .. •••• . . . . . .. . • • • • • • • • • • • • • • • • • • . .. . . . . .
'' • • • • • • • • • • • • • • • • • • • • • • • • • • • • •
w.

UB't or TABLES
l. Subregions of Virginia-EstiaaUon or 1950 Popula.tJ.on ba' Aritbtlsetic Proj'Sot:Lon and b;r Apportiomnent ·• ·• ·• ·• ·• ·• l3
. 2., ~tios of: Population to Symptotmtics Data in Virginia • ·• 20
3. Pl"o?'ation Method of Population .Eatimatiozu · Virginia_,· 1950 • * ........................... .
4•. Batiol or Population to Symptomatic Data-Bubngiona ot· Virginia, 1940 and 1950 • • • • • • • • • • • • • • • 23
s. Estimation of. Popule.tion by Censal 'aa.tio U..tbod U•ing· · Suhool En:rol..l.ment l>ata • • • • • • • • • • • • - • • • 25
6. llluatrat.ion ot 11'1t&l ftateatt lhthod of Population · · · latimation • , • • • • • • • • • • • • • • • • • • ·• i. 28
7 • h&quenq Distribution ot P$rcentaga l>iff11t*$naeo Between Changas in lbploymeut d Population h;r Stat.a, 1940-· 19~ • • • • • • • .. • • •• • • • • •. • • •• • • • ·• YI
a.. Relationship of Covered to Total Wage and Ba.lacy &a.ploy-aont by Subt.-eSiona of V1l"ginia1 1950 • • • • • • • • •
9. Obanges in Humber o£ lllrtba 1n S&l.Gott9d States a.fld SuJ>...· regions of Virginia and 1n Population, 1940 o:r.d· 1950 •
io. Changes 1n luaberf.l of .Du.tha in Select1ecl States and Su'bMgion• or Virgt.nia and in Population, l941J · arid· 1950 •
u. Changes 1n ScboOl Enrol.JJant in BelActod Ste.tors and. Subregiona of Virginia. Uld. in Population; l940·and 1950 •
12• Chanpa in Oo"f'ered ~loymmt in Selet;ted· States and · Subrepono of Virginia and in Population; 1940 and l9SO • • • • • • * • • • • . • • " • • • .,. • • • • • • • 43
13. .&imaey.of Percenta.ge.n.vlations from Population Standard of Popu.lation Estimates bt'.Various Met.bode tor Ste:tllle) 1950 • • • • • • • • • • • • • • • • • • • 49
iv

LIST OF TAB:L§ (Continued)
14. Summary of' PGroant.e\B'!l Devlaticma from Population Strmdat'd of Po~t1on Estimates by Varl.O"..S Methods tor Su.brogions ot Virginia., 1950 • • • • • • • • • • • 52
l.5., Indaxeo or Change 1n Birth31t J>M).thS, Sobool :&1rollamt, and Oovet:'ed. Employment in the Subregions or Virginia, 1950 a.."ld 1954 Over 1940 • • • • • • • • • • 59
16. Population or t.be Subregions of Vi~J Ceeus Count and Eatimaw• tor l9SOJ EatimatoB for 1954 • • • 60
17. Percentage Obanges 1950 to 1954 1n Population ot Sllb-Ngions of Yirginicu low.' Sets of !Gtlma't$a for 1954
v

LIST OF ILLUS'!RlTIONS
l:'aga
l. Subregions of Virginia • • • • • - • • • • • • • • • • 7

CHAPTER I
nrrromCTION
The Med tor estimating population below the state level du.ring
!nteroensal ~riod• baa been reooguind fol' a mwber of ;years. Many
va.ri.ed utbode b&ft been fJt188•&te4 u pcasible measures J this tb&&is
wUl examine and test S01MJ ot these current measures nth resP9ct to
tbe situation in Vil"ginia and 1lill alJto uperiment with a new technique•
The measurement ot currant population trends is important to
the etticient opention of many siegmonta or the economy. In order to
make intercensal studies of terWJ.ty1 mot'bidity1 mortal.1ty1 employment,
unemployment, and relief ratea, intercensal estimaws of population are
UCHIUlllUY• Tha7 are also baaic to tbe estimation of pel' ca.pita incomes
and aales of wrious items. The worth of arq atudie1 suppo~ related
to population in pal"tioular a1'988 ot necessity domande t'fJl1able, up-.to
elate population estimates.1
l
AtJ ur. Calvin r. Schmid stated 1n the 1ornord to a study or population trends 1n the State of Waabingtona
1Utu1"" long-term plans for 'Virtuall.7 ewey type of governmental program or aotivlty, as nll &a tor buoineoa, industry, &g?'ioultun1 and even the profeaaiou, can be developed more etteo ... 'lively and intelligently if reliable data on population trends and fontcuts are av.lilable.
2
Xt 1• the pa.rpo1e of this t.bans thmi to teat the p:rocedut"ea tor e•t.1.
mating local populations by uaing data for Virginia.
In tryill.8 to eats.mate populati.on 'be~w the at.at. leval; the
twenty-three subregions or V1®nia as outlined by the Bureau.or Popula
tl.on and Economc Research at the Uni'ftl"lity of Virg.1.nia were .used. '?he
~ties tmd o1 ties of Virginia nre gNuped into these subregions by'
the &reau so.. JG&t'll ago on the baaia of geographical. pro:dmity and
some degree ot Similarity in economic activity.
lazr,r naeorut _,. be suggested tor using the regions instead of
t:rying to work with the 1ndiv14ual oounUe1 and oit1e1 qt Virginia. Among
the most important is ti. cnuabersomeneaa ot the task in'\folved with. tho
oountie• and.oit1ea atnoe tbey.m.uuber- ninety-eight end thirty-two,
reapocti~, at the present time. The censua population count in 1950
showed the •xtreme varia:ti0,ns 1n sise among tb&mJ the lat-geat pol1 t1cal.
enUtJ'i Richmond City• with 2301310 :tnbab1tants1 was about aixt7-1even
times larger in populatio~ then Oraig County; the 1mallest antity1 'Id.th a
. 1caim r.· Schmid and otheriJ,. fgpµlat:l.op !114. Enl"Ollient ~n~ am\ forcca.sa~te.te .2l Wnshin!:Wl'.\ (Sea't.tJ.ea Washington S~t• Censua Boal'Cl, 1953), P• 1.

3
populat1on nuabe't"ing only 31452 in 1950• Ot the subregiona whioh wen
.~ in tbU study, tb9 lugest bad a population. of 4461200 in 1950 while
"11& amallout b&4 33,.473 ~bi.tents• the la111ge~ being only thirte~n ti.mos
&a great .ae the amalleat.. In particular, it baa been demonstrated that
\be degne or distortion resulting from eetimatim is more likely to be
greater when smaller entities are uaod. Tberef'ore1 in order to reduce
diatortion to • min1mtm and to make the task less ~bers?me, tho twenty
th:ree subrogione he.ve been used in praferenoe to the individual oountiea
and oiti•• of VirPn1a..•
The nature of the data used in th• preparation of populati0t1
estimates makes 1t desirable to use the larger areas. Reporting of births
and deaths may not alway• be mad• on tha bu1e of reaidanco of the lndi
Yidual bu.t rather where the birth or death occurred. In most cases, uae
of the whNgion reduces the error ot reaidenco wr8Us plac• of ocour
Nne•• Again, when covered emplo~t is one of the factors uaed in
estimating population, the inherent aitus PNblem caused b.r roporting bJ'
location of employment inst.Gad ot residenoe of worker is Yirtually elimt
nated through w.t• 0£ the subreg.i.o?UJ o£ Virgiu1a •
. Jnothtlr problem connected 1d.th eat.imatea tor indiY:f..dual counties
and cities ad.a•• froia the anneation procedures in 111ilioh county tomto.,,- is acquired. b7 a oity. Thia croa.tea maq minor probloma which &re
tc-oubiesom.o in preparing ostiaates for small a.nu.· St.tiatica avaU&ble
from tlle re:porting ageuoiea are very otten on~, faro, and som6U.s fift
~s behind tho reclassU'ications of areas duo to enMX&tions and the

4
inoovporationa of- new independent c1 tiaa. 'rbeae diffioul tie a a re all .
e.1.rcul'!rntnted when larger area.a, au.ch as tha twent,y-thrs~ subregions or .V1rg1nie.1 an used •..
The subregions ¢~ Virgi.nia a.a outlined by the Bureau of Popula
tion and Economic ReaoaNh are as follont
1.c-H Hort.hsid• Hampton P.oad.8
1.c-s Southside Hampton !loads
l.l Ba.atel'n Shore
.1.2 South&m rid.enter
Arlington and J'eir£u: countieSJ Alaandria and Falla Church oit1oa
Cbeaterfi91d1 Dimdddie1 Henri.oo, Prince George countieDJ Colonial HG1ght$t Hopewell, Petersbu.rg, Riohmond citiea
Hampton, ftewpot>t fiawa1 au4 11areick citiee
Bor!olk, Prince•• Anne DOUJlti••J lorfolk, Portsmouth, South Norfolk, Virginia Beaoh csiti(')o
. . .Aocoaaok and Northampton counties
Gt"Bensvi.lle, Isle or Wight1 Ban""'" mond1 Southampton, Su:rey 1 Sussex COUD.tiGSJ Suftolk city
Oba:rlea City, J'e.mfUJ City, lew K.ont, York countiea• Willlam.sburg city
EBaex, Gloucester, ling and Qu.e•u, King William, Ms.then 1 Middlesex counti••
lti.ng George, tancaeter1 Hortht.mbarla.nd1 Ri.cbmond; Weatmoreland oountioe
Caroline, Hanover, 8PotaylTIU1.ia1 SW.ford C()l.JntieGf Fredericlaibnrg citJ
;
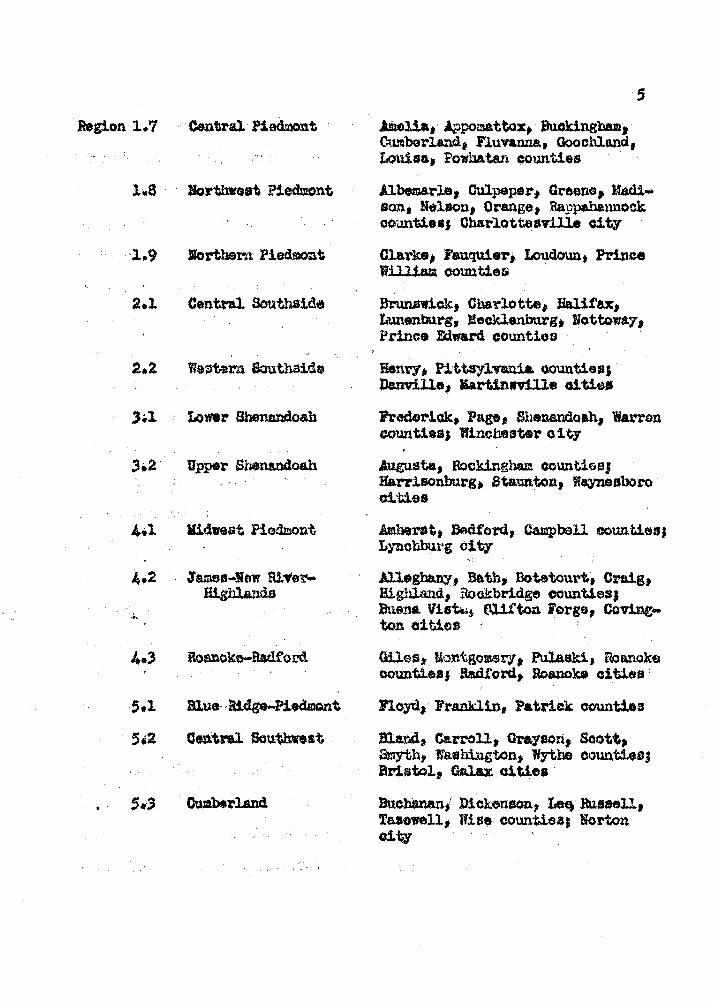
.Region l.7 Central Piedmont .beliat ~pomattox, · Jlu.cldng'.ball1 Ol.mberla..'"1.dt Fluvanna, Goochland• Louisa, PowhAtan·counties
i.s · · Horthtn'tat Piedmont Albemarle, OulpeptU:"t Greene, ~ aon• Nelson, Orange, ilappahannock 001llltiea1 Oharl.otteaville oity
·l.9 Northern Piedmcmt. Cla-rke; Fauquier, Loudoun, Prince William counties
2.1 Central SoutbSide Brunnie.k, Cbal'lotte, Halifax, Lunenbu.rg, Mecklenburg, Uottowa.:;1 Prl.nce Fdnrd counties
2.2 Wa~tern Southaide ihtney. P.t;t,taylvaui& OOUUtif.tSJ llanville1 Ma.rt.tnnille aitielt
3•l. Lower Shenandoah hoder1.Ck, Page, Shenandoah, Warran counties J Winchester city
3•a Upper Shenandoah Augusta, Rockingham count1esJ •. Harrieonburg, Staunton, l'\V?lG&boro
cities
4•1 Midwest Piedmont Am.beret, &dford, Campbell oountiea; Lynobburg city
4,2 1amee-!iew liver- Al.le~ 1 Bath, Botetout-t1 Craig, .W.ghlands Highland, Rook.bridgo count1esJ
-. Buena Vi&U.J (IJ.it'toni'orge, CovilJ€-ton cities
4 • .) Boe.noke-Rad.ford Gilest Uontg01M1ey1 Pulaski, noanoke counties J Radford; Roanoke cities '
s.1 Blue--~t :rlo~,· Franklin, Patrick counties
5,2 Central Southwat Bla.ndt Ca.?TOll1 Gn.ysort1 Scott, Smyth, Waahing+..on, Wythe countieSJ Bristol, Galax o1 tiea
.. S•3 Cwabsrland DucbaM.nt Diokonson, ~ Ruuell1 i'ut'rl'Mll1 Wise counties; Norton oity

6
The cnp on pag9 7 eb:>n the geographical proximity of the counties
and citioa 1n eaoh region.
Thua ta?' in the tirst chapter, the need for intercensal eat1ma:teu
of popnl.stion below the state level baa been demonstrated. The possible
meaning and wol"th of up-to-date and reliable estimates of area population
tnmdo to tho economist, to tho demographer, to too busineseman, to the
manutacturer • and to the government of'ficial haw been pointed out.
Also, use of the twenty-thrff au.bregiona of Virginie. as the entities for
popul.at.1.on ostimates has been «Jtplo.iued. as beina leao oumberaome tMn uoa
ot t.ba counties and oi tiost as probably ou·tting dam on too degree of
diatortiont e.nd as elitdlmtint; mariy probleins involved with the data
which wet'$ used ns .factors in some of the esti.Mting metbodo. Leat.ly,
this first sootion wUl bo concluded with a brief' exple.nation of what !a
to follow in the next four chapten .. "lh
Cha.pt.r ll deals 1fith :t"Gcent attempte to estimate population
du.ring tnt'9rcensal periods, nth primary emphae:sia on the techniques most
wtdG»ly us.d nt the pt"esont t.ilu,, The oldest of ·the ~athoda deacribad in
thia section mmk98 use or ma;ijlwma.tieal teohniquaa, arithmetic projection
and appol"tion:nsnt, in. which reliano0 is placed on dov&lopments of tho
recent pa.Gt decade,. .Although t"Olativaly little succosa has been oxperi
anoed with these mathematical toohnique:s during the past two decades,
tJloy are still used by man,y states. Anothel' aoh&ma, and perhaps the moot
tJ.me-consumi.nf;t, is that currently used by the Bllnau o.f the Cenaus fol'
estimating the population of states. This method utilizes statistics

------ -- -------------------------------
FIGURE I
THE SUBREGIONS OF VIRGINIA
"-- - --

on aorool enrollment to provide the migration factor plus tho actual
natural illoreas-& figures which a.re the net or births over deaths. Actu
ally, thore are two versions oi' t!rl..!l scbemei Method I referred to by
the Bureau or the Censua aa being th., ahort-out wrsiouJ and Method II,
a longer 1nvolvad technique in cu.rre11t use b.r th& llut'tlau. A eatisi'actory
degree of S'.teooa:a bas bten oxpsriencad with Mathod II.
the latest attempts to nrr!ve at rolinblfl interconBal population
estimates conoem themselves with simple symptoaatio data, BUcll a.a birtlw,
d.ntha1 school cemb9rsh1p, cat' rog1att"&.tionn1 regieter.-ed voters, wJ:d.
county welfare recipients. T\lFO methods utilizing ·t.hese cympto.mAtiO de.ta
an, th3 proration and the connal ratio tochniqtws. .bothor metb:Jd doaig
nated as "vital rate311 inwlvos compt1ting two estimatoo of population by
applying tho ostim&tsd birt.h and death r&tes to th:s llUI:lber of births and . . . deaths, rsopeot1vely, and avoraging tha two reaults.
Chapter m pro~ant:> a demn.i.p·tion. of a nf»w mi$thod of population
estimation developed by th'3 Baroau of Population aud Economic R.eaearoh •.
This taolmiqua, ttl."lned a multiple f'e.ctor method, also em.ploys ByO.ptomatic
data. four fac.rtora are used as m'i.'tasures oi' changt.t in births, in deaths,
in school enrollment aa expNGeed by e.voraga da.111 attenda.nca in public,
pdma:ry1 elem.entaey, and high schools, and in employment as measured by
employment oove:rud under the Unenrgloyment Com:penaation Act of Virginia.
The third chapter will also include the e.etual meawroii:ent of
thtuse dynmdc forces in o~rat.ion in the economes of amall areas or
Virginia and the relationship ot these forces to population trendrJ•

9
Bach .factor-birtlw1 dsatbs, school ent><>llient; and covered. employment
'Will. be considered aepan:~ly and 1.n combination with otr~'l'a a.is poasible
indieatoro oi' the trend of population growth or diminution 1n the twen·ty
tbree subregions of Virginia.· The yearis 1940 and 1950 will bo used as
benol:lma:rk years tor the obvioua reasono that census counts are complete
!or those yeara and they encompass :the most Naont past decade. Rola
t.1.onahips o!tb& four factora to population trends in the forty-eisht
states awl the District of Columbia will wo be pointed out.
Chapter IV preaenta the :reaulta obtained when tll8 raotort1 are
oom'binsd into a single estimator of population, an index ot obange, and
e.pplied to the 1940-So data. fQr the Vit"ginia eubregions and the stat.ea.
The results are testod foe' accuracy and compared with results obtained from.
...,.ral otli.ar rooent method••
Presented 1n th9 conoludin{t chapter ate 9atimatea of population
tor tho eubregions oi' Virginia for 1954 baaed on the multiple factor
tsolmique. Estimates based on sev9ral other methods are aluo included.
!ha oan.olus1ons that may bo dram fcoa ~ appraisal cf au?'nnt moaeurea
of e:stimating interceneal. population aro discussed, while i'u~r use or the multJ.ple !actor technique ifS suggested ..

CH!?TE..-:i. ll
RECENT ATTDJ.PTS TO ESTmATE POPULli.TIOI BELOW 'l'ltE STATE k~Ef.a
In this chapter a nu.mbel" of techni<iues in present-day uoe will
be diaCU11sed and teoted on the su.bNgions of Virginia. !he extent ot
uaga of the vai-ious m.ethodo was studied by the Bureau. of the Census juot
lut. ;year. The result# ot their SU.1"1"8Y of current methods of making
population eatimaws by agtu141ea 1n atate gowft\lllents throughout the
oountl'f were pul>Hebed in a pupblet dated lww 61 19551 under th!I titlo
'*Oul"rent Status ot P4PUlat10t1 Estimates Prepered by state .lg.Jncias.•
·file Bureau ol the Ce.nous £t>und that in all but Hven et.ates there
ua at lout one agenoy preparing the e111t1mo.tes tor looal arean, line
ate.tea had tw or mal"G agenoiea aldng eatitu:tit$ tol.9 localities, '?ha
most popular techrdque UfJtd ne ZIO!ll!l form or the migration and na.tu:ral
increase method. in 1Jbich tho6& component11 of population change nre
estia&ted. aoparatelJ'• ot tbe t'U'ty-ona att.te agenc!•a sul."Veyed1 sixtAten
used one or anotbrn• !'ol'tl of this technique, ?ha Ttlri&tion of th1• method.
u H\ up by th& Bureau of tho Cenaua for making its annual state estimates
10

ll
ua followed byei&ht of the sixteen estate -.genoieis using migration end
Six states usod natural im.n:-eaae alone. This method involved.
.tldding postcensal: natural 1noreaae (the exoesa o! birth& ovsi- deathe) to
the census count. lo allowance is 1nl4e tor net :ln- or out-migration 1n
'tthis method. Other llletbods included arithmetic proJection, utUized. by
nine agencies, which involved applying the average 79o:rly increase in
the most recent intercensal period to the po:stoensal yea\:' to·find ~ly
aboolute gl'O'flth,
, !be oansal ratio method was the teohnique applied by aix mre
state agenoiett. In this technique eymptoma.tio data.1 suoh u mtbool data,
birtha and deatllB1 are used end related to tlWt laat census counts as
rati.oa~ Theae ratios an then applied to postoensa.1 sympto•tio data on
the p~se that the ratios remained constant. Still another :method
utuized to some extent na , the technique cleveloped by Donald , J • ·· Bogao
designated as "vital n~s. 11 · Birth and death rates were .found for tha
etnaus year and applied to nmbers of births and dn.tha in a aubseq,u.cm.t
:rear to obtain two s~p&rate ostiuio.tes o.f p0pulation which wel"e t.htln
avoraged.1
These· va:r:f.64 ~tbods eurve~ by thG Bureau ot th~ Census are dis
cuieed in the next sections. Oortein ones are tAst.ed on the twenty-thl'ea
subregions of V:l:rgillie..

Atithme;ll!). l!ohniguest ProJec\t2a !l!4 Am~.ortionnisnt
'lhe al'ithmetio projection tocbnique used the average yeai-l,
inoreaae in the aost recent ~teraGnSal period for the e.raa in question
as boing equal. to tho 7earl1 absolute growth in the posteensal per1od,1
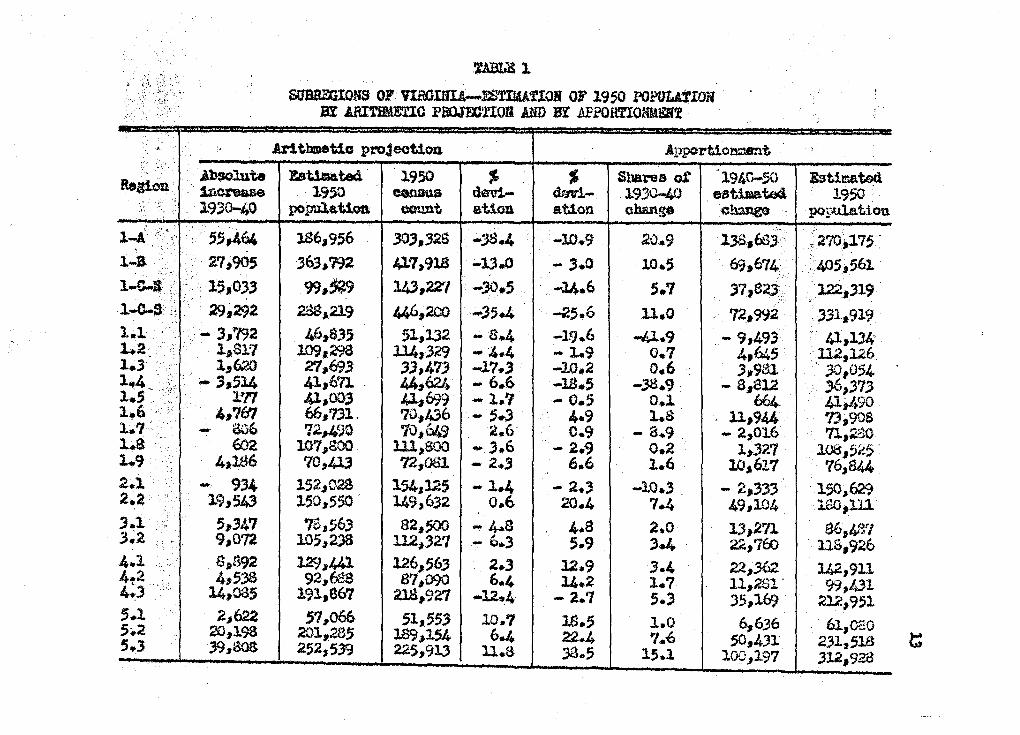
fl:nst lf the decade 1930-40 are s·tudied u tho baeia for proJeotion into
the l9.40's, tho est.im&tes contained in Table l would result. (T'ne pro
~eotion ia actu~ swie i'o?' 1950 ainoe the census ct that y&ar may be
t1SOO :for companaon. !lo averaging as Med.eel in thia insw1oe beoauae
ten times tho average yearq growth in the 19.3Q-JJ) decade would be eq.ual
to the actual 1.ncrease in the census oount.)
The average percentage dov.latlon (aigrus diaregarded) of tha
estiu.tes for 1950 using the anthmetio projection method was io.1. Tba
quadratic mean deviation, that is1 the sq\l&re t"Oot of the arithmetic
mean of tu. aquaN:J ot the deviations, yielded l.4 .. 6.
The second mathematical techniqt.ie tested was the apportionment
formula which ns used by the Bur"'1 ot the Census from 1926 to 19.34 for
its ostJ.mates of at.ate and city popule.tion.2 'tll8 underlying &eSU!1pt1on
1n this utbod ia tba.t the est1me:ted poatcenaal 1ncre11.1e or <leorense in
the state population n.a divided among the areas ot the stato according
1 ~·t P• 2,
2Bobe.rt O. Schmitt, •s110rt-eut Method.a of Estimating County Population,•!_~~~ ~~cam 8J;at.j,~_t1_~ .U1"1oia.tion, 47 (258) 1 lune 1952, 2321 citing Benry s. ShvJook, Ir., "Methods of Estimating Pootceneal Populationa,• &megp§R: Jg.umaJ. a! l\lNJ.g Be!J.th, Vol,. as, l9JS, P• 1042•
. A.
,'" ;J•
'"· ·· .. ·.·
1-A 1-B ..
SS,464 27,905
1-c....tl :-' .. ; ·. 151033 l.~· ;: ... : 291292
lal · · · • 3/192 1.2 . l.1Sl7 J..3.. . J.,620 l~ .. . ,, ~ 3153.4 l..S. '· 171 1 .. 6 . 4,7f:17 l.~"/ .. ·: - 606 i.a , 602 1 .. 9 '· 41186 2.1 - 934 2.2. 1915.43
3.i .. 5,347 3~2 " 9,072 .4.l 4t2 .. 4.-3 ..
S+l s.2 5.3
s,s92 4,5:)8
14,oas 2,622
20,193 39,gos
til3LE 1
stms.EGIONS OF· VIOOilfU-ESmAf!Oli OF 1950 POPULA.1'.ION BI A.Rr.l'.tBmG PBOOmTIOD .llil> BI AP.OORTIOmtU'?
EstJ.ma.ted 1950 · J.950 cenuua
popula:tJ.on count
186,956 363,792
w,w 2SSJ2.t9 . 46,S3.5 J.09,298 21,693 41,671. . 411003 66,7)1. 72.,490
101 .. 000 70,413
152.,028 150,550 ?S,56)
1051238
l.29,441 92,6..~
191,867 57,066
201,285 252,539
303,328 417,918
143,?21
446,2'..i"O 5l,l32
l.l.4,.329 'J'J,473 44,024· u,699 70,436 70,649
m,soo 72,001
154,125. 1491632. 82.,;oo
112,)27
126#563 87,a:JO
2l.St9a7
51,553 l.89,1.54 225,913
-'8-4 -13.0 -30.5 -35.4 - a .. 4 .... -4.4 -17.'J - 6.6 - l.7 - 5 .. 3
2.6 -3.6 - 2.3 -1-4
o.6 - 4.S - 6 .. 3
2.3 6.4
-l.2..4 10.7 6-4
ll..S
-10.9
- 3.0 -J4.6 -w?5.6 -19.6 -1..9 -10.2 -1.8.5 - o.s
4.9 0.9
- 2.9 6.6
- a.; 20-4 4.s 5.9 .
12.9 u.z
-2..7 J.8.5 22.4 )3.5
.. Shana o£ 1940-50 l9.3Q-40 estimated. change ·c!.wlg$
isti!!'At.9;d 1950.
po!:,uJ.atiou
20.9 138,633:. ~-270,17~~ 1.0.5 &;J .. 674 . ·-405 561.
II' .•
s.7 ;7,s2j .. --122.319
u.o -41.9
o.7 o.6
-38.9 O.,.J. i..s
- 8.9 0.2 J..6
-10.3 7.4 2.0 3.4. .;.4 l.7 5.3
72,992. . - 9,JlJ3
4,645. .:;.9a1
- s1e12 664.
11,944 - 2,016
l,327 10,617
- 2,333 49,w4 JJ,271. 22,100 22,362 11,261" 35,169
6,636 S0,4Jl
100,197
. 331.919
... 41,~ "112 126 " , ..
;30,054 . 36,;;7J
.41)490 73,908 7l,.2SO
l.08,5~5 ~ 76,844
150,623 · 1.$0,lll
86,l;l'/ . llS,926
l.42,911 99,431
212,951 61,~JO
2.31,516 .312,928

to thei'l" Bbat"OS in the &ta:t& Cb.a.nge Of the previous intero•naal. decade,.
Thi.a _thod, when applied to the tnnty-t.hria• subnglons or Virginie. on
'\be 1930-.40 baa•, produeed estimates fo-r 1950 whi.cb were ll.ightl.y morn
1n $?TOr then those obtained from the projection method.· Theae estimat~a
a-re inOluded in Table l. The averago pe't'oantage devia·tJ.on na l.'lt4 and
tbs ·quadr&tic mean deT.le.t1on was 14,9
Hig:rntios and Ns.tur!l ls2roa.a2 ~1~.'!.
The migration and natural 1ncr9aae methods were formulated by
the Bureau of the 0.nim.s and are used in tJieiv cu:rrent ;;yearly eatimaWitl
of the popule.tionn of atateu. ~N techniqu"&s ,a" based on the t"ea.aoning
that t..l:ie popUlation ot u at'Ga at too olos& of 11. pel"iod is equal to its
population at the begirm..tng of tbo poriod pltUJ natural increase {the
exeoae of bi?'ths ov.sr deatha), pluu or minus the net in-migration 01· cr..it
aigration., 1
Tl» mgration factor ia eatimated in tlfO liJ&yS by the Censua
Bu:reau, thu.8 d.1.ftQrentiating me·thod I from Method II. Both are beood on .
ohanges 1n sohool enrollment :ttgui~oa, the prooedure cl.esignated M.ethod X
bting simpler in operation tt'ian Method II.
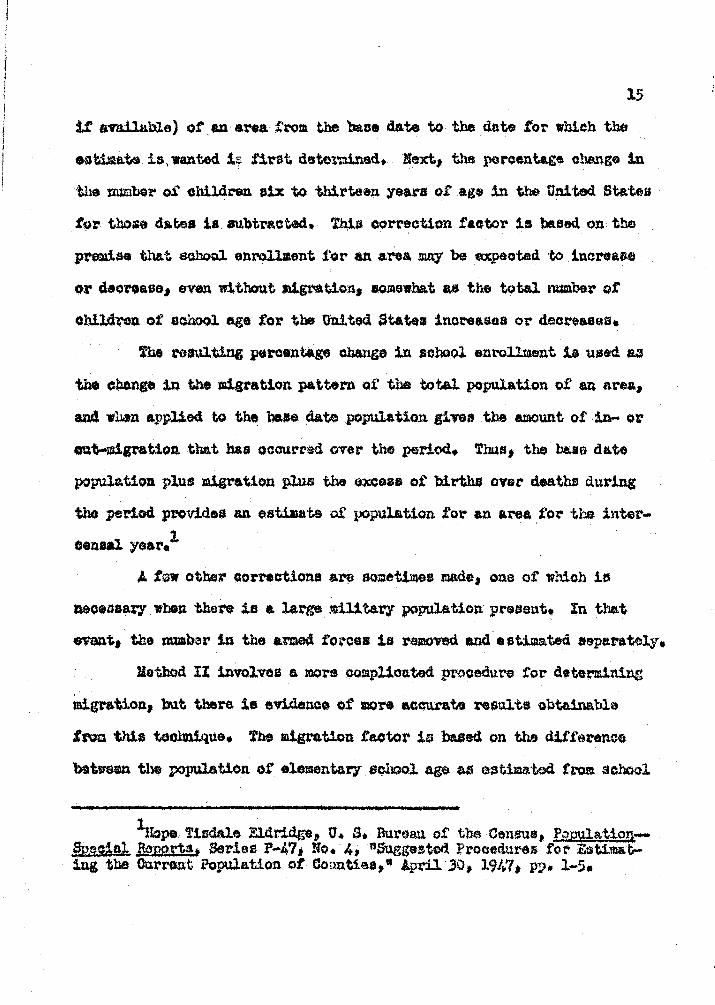
In 11'thod I the peroentago chlmge in enrollient 1n the elementary
grades (one throuy)l eight) of the public schools (and private and parochial,
15
it available) of an &Na trom the base date to the date tor which the ,
eatime:te ia, wanted 1;; fi?"Bt determined• lext1 the pere&nt.&gf! obango in
tl.te numbs?" 0£ e~ren six to thirteen years or ago 1n the Uni te<l Sta:t.as
f9r those ds.tea iaau.'btract.ed. Thia .correction :t:&ctor is baaed. on tbs
pt..U.ae that school enrollment .f.~or an area may be expected to .inarea.se
oic daol"GaBD1 even without Jl1gtoat1on1 aol'AGwha.t as thfl total rn&mber of'
obild-ren ct school age for the United States incree.sea Ot'" decreaaea.
The resulting percentage change in aohoQl enrollment 1a used aa
the cbange in the migration pattern of the total population of an area,
and Yllitn applied to the bue date population givea .the amount of .in- or
~t-migration that has ocou.rred ovet" the period., Thus, tbe buo date
population plus migration plus the oxcoaa ot birthl ovol" deaths during
the :pel"1od. pl"Ovides an estimat& o£ }:!Qpulation for an area for the inter
censal yt>ar.1
A tra other corrections are so:metillleu ma.de 1 one of which io
r.&&oeaaar,y when thel'e io a large ~litaey population present. In that
evant, the mm.her 1n the armed fo~·ces is removed and estimated separately.
Uothod IX involves a more oomplioated praoedu~ tor d•termining
migration, bu.t there is e'Vidence of more ac~te l"GBults obte.inable
t~a this technique. fhe migration taotor 1£1 ba.oed on the dit'£erence
b9ttreen tbe population of e1ementa17 sQl10ol age as e8tima.ted tram school

emrol..lJDent da:ta and tho expected population of elementa.r:r school llP•
had there be• no migration since the base d&to.
16
In otde1" to determine tho expected popul&tion six through thir-
ten ;years of age on the estiute date, eurvival rates are applied to a
tdngle-~t-age diatribu.tion of the desired cohort in the la•t cenr11G
poptll.ation coun·ti. tme, the proper cohort on the be.•e date is "a8""
to the estiute date desired. '?ha population of aoh:>ol age on the base
date is related to ochool enrollment on that date and expressed as a
l'&Uo. When this rat.to is $.ppl.ied to school enrollment on the eatimat&
date, an estimated popul.&tion of sohool age including the offoo·t 0£ migra
tion is obtain~.
f"tl& dillet'$ooe between t..i-ia estimated population and tho expsotod
population which na obtained tt'!.·ough application of survival rates is
the net oba.np chie to m!.gntion. in thia age it'OUP• Dividing the mig~a
tion f igu.re b;r the base date population of thf.I pl"Opett age group ;yield.I a
percentage change vhioh is applied to total population aa the rate of
lld.pation. This application ia bruled on the a.uum.ption that the migra
tion rate of childl'en 11 the same aa that of all agelll oombinod.1
!be ~ desori.ption 1& brief and does not include mention of
~ ot the spacial 14Juatmenta mnde. Honver1 it dOtJs offer a general
idea ot the .f\ulctioning of this technique of population estimation ..
Neithsl' Method l UO't Method ll employing ltligration and natural. lncrease

17
wu. tested on the 1940-SO data for the suln'egions or Vil'ginia. Gn.de
agcs diatnbut1ons are not published £or the localltiea o£ Virginia. They
are awJ.l.able only on th& state lem. .A.1'10; dil'ferential migration
ntea du?'ing the nr 7ear1 wen such that these method.a ttould hardly be
~c~ . to yield rosul ta aignifioantJ.7 more aocu:ra·te than some or the
1hort-cu.t aethods teated. J'or these reasons the Jligration and natural
increase method.a were not teated on the subregions.
!Niso methods ban been tested~ tv' the lhreau of th6 Cen8\11 ac
~chu1..que1 for population eatiaat1on ot states. Their concl\'la1on n.st
• • • that Method II on the ave'r-.ge UJA1 be expected to :yield more aocurate estlme.tee tlian MotllOd I, and that on the anrage either mq be dei.'tmded upon to yield mora accurate estiaatea 'than YOUJ.d arithmetic proJeotion based on figures .t'ro:t the last two censuaea, or tho !pportionment method f'orsnerly used b7 . the Bureau oi' the CR4U$a
A teobniquo ot population estimation baaed on the changes in one
or more oeriea of 1tatiatical. data. believed to he "11ll'tom&tic or tM
d.1.reotion, ot popula·tJ.on change ia a. short-cut method aa compared w1 th
tho migration and natural increase •thods previously discussed. A con-'
e1,4era,ble U10W1t o.f et..t~nt work u being don• in testing ftriOUS. indi
cators for ~1r rollab1llty.
. . . Oym.ptoma:tie data -., be either indirect, that 1s1 in ttnita .other
than persons, or di.Nat, expressed in terms of mmben of people.

18
Utility outJ.ets1 housing unita, rural route boxes• reg1atered.paoaen8$~
automobilea1 and postal reooipts &re· among tho&9 indica.tora which would
olaasif7 e.e indirect ll1JIP~mat1c data. Direct and «pressed 1n nwa.bero
of persons, whttbei- l.Wted. to certain. elements of' the Population or all
elaents, al'e such data a.a biioths1 deatho1 scbool.enrollment1 oitq
d1V9Ctoriee, elect.ion ?'egiStors, oouney" welfaret'eoipienta, and &mplo.1-
aent.1
In the 1ndiv1dual instance or teating 1n a pa.rtiQUJ.ar ata.t.e ott
area, tho tirat docUion to be made id the choice or ounentlf availa.blo
data. ·The bl.lea tor ohooaing suitable de.ta would include the following:
l) Aocurate oftic1&l records are maintained and are mad& awil
a.ble to the public e.t t-eaeonable interral• ot time, at
lout bien:o!.ally.
2) Data tor both the J\OOt recet oensua and the poatcenaal
P*riod IW't bo eompan.ble and available.
J) ·Et.oh kind of data •hould oomprl.ete a larga number or oaa&o
or at loat repreaent a rel&tivel.3' large percentage 0£ the
population or which it is symptom.e.tio.
4) 1'llO ratio of oymptomatic data. to total population .t.a t>Ol.&.
tivel,r constant from area to area and year to yea-r.2
10&rl •~ Man; •Symptomatic Data in Popul&tion Estimatasi ProblOlll and timitatione,• {?gsee.l."ch Stwii!!. .2.t the State College .2! Wash~ 19(2) '. June 1951 (Pull.man, Waabingtons State College of laah-j,ngton) 1 P!' W7 • .
2Dclrdtt~ .21?.•. Si!tn P• 2,32.,

19
Tnera also remains the question of· th~ dagree to which the.data talc& into
account the.· effect ()f 'l"Ol.e'Vl.Ult' factors othor than population cbange,.1
With tbeae prl.riciples in mind-the cboio& of which ••rl.ea ot
Symptomatic ~t& to ba utsed is made. nw t&ohuique of applying the ckta
to the individual 111.tuation is another problem, ond urious techniques
would be tried and the roBUl.t,. teated :tor accur-aey. Tttr0e techniques
utilising s;mptoaatic data bs.n been applied to the tmbragiona or Vil"
giniaJ they are described and the reaults shown 1n the next aection••
'the 1eri.ea or data uaed in Vi?'ginia we\•e number· or year1':f
bi~ths• number of' ;yearly dee.thaJ school anrollment a.a expressed by &Yfj~
age daily atterA.a:nce (adjusted) in the public primaey, eleMntary1 and
high echoollfJ a.'>ld empl.oymenii, that is, the average yearly covend emplcy
Pnt ~r the Unemployment Gompawsa.tion .Act. Reasona tor these choices
are· explained in thB xiext chcp·t.or. Table 2 gives the re.tioa or popul.&
tion to these aerioa or ttj'lnptomatiG data in Virginia, t.hB ooefficionts
of variation among the twenty-three aabregions, and the corrolntion
<'oefticienta between·1940 and 1950 by subregion.

l'ABLE 2 ,
RATIOS OF POPtTLATIOK TO Sl1A.ProMATIO DA'rA IN VLRGIBIA
. , .. P8.tio Coefficient of Oo~raletion coor-
i)'pe 01· data (for entire state) val'iation (23 ticient between i'Albrogiorui) 1940 and 19$0
.. by subroirion 1940 1950 19/JJ 1950
Dirth.s 46.SJ,,DJ. 39.5840 12 .• s s.4 pluo ,.61 ' .
Deaths 93.8614 l.12.6504 1).9 is.a plus .73
Sohool. 'enrollment 5.4529 6.2158 12.1 ie.6 plws .,94
Covered ·' Glalpl.oymrm.t . a.4409. 6,t963 73.0 49.5 plus .96
fromtisn Mg:tIDqd
Tba proration method consisted of e. siinple allocation of post
oansal 1tate popul.a:tJ.oti on the bo.ais of each ty;pe of symptomatic dat&
und&r consideN.tion. ,:tt wa:s simplo and hvlopendent of deoomdal census . ' ' . . data btlt dependent upt)n o. reliahlG postoonsal estimate of state popula-
t1c:n1. The D.u"G&a ot the Oeneu1t annual. state estimates might prove most
trustwo:rtbi in the majority of caaea.
'l'ht aocuraey- of the proNt1on •thod deperids upon the thitil"Ge of . l
equality in the population-to-symptomatic de.ta ra.tioa for all subregions,
Table 2 givea the coefficients of variation tor tiu. indicaton selected.

&ngl.y, bi?'tlut lfOu.ld appear to ho the moat ~liablo etztittator for l9SO
e:ntl covered cmplayt:-ent tho loast, ainoe tlle 1.nt0rsub~gioual d:U'ferencep
were lowont Q!ilf.)n/l .birthn and htghe1.1t e.mong numbere ot covered err.ployo•Dt
'l'ablA ) prce•nta a atilir:.c.tton 0£ the proration 12·thod !or the
m.ibt-egions cf Virg1n1a. 1n 1950• F.oti.~i;(;s !"rom thfJ aingle. i11.d!oeton
WlY' be avornged tt.nd weitJ;htMt in man;y <U.ts:'Gk"atl.'t •1~ so as to pnrdde tho
~ot. accurate cstilim.tes-. 8ohm1.t.t1 1n his aJl&l..,~ir using the thirty-nine
OOUl'lt.iea of th9 Stat9 ·of WastJ.ngton1 S\l.ih'e&t$4 weighting by the 'reoipro
ca.1.ta ct th& ratios .of eynptOE'.atio date. to eta~ popultlt1on.. Alt.o used
by &1'.mitt1 and providing t..,,. 1t0~t ru3cul"n.te results in his atudy, wan a
waight.ing nyntem. 1.lSing tM raciprocals ot the ooe!f.iciuts or variation.
SeJ:W.t1# worked. wit:..b. 31.x sorl.~a ot r..i"l!1)toootio data in We.ahington and. eo
ohose the three aerie1 in each 04lll• wtd.oh ~ated the highest degres
ot 'VDl1di t;r •1 Those weighting ~tb>de wera ter;totl on the subregions cf
Vi1.'"B1nie. and are inolw.'led in Tttble 14 in Chapter IV.
S!sln!!l Rit1o 1t6~
Th'l oensal t'atic tochniqu.9 inwlwd a. mamber of eteps1 tirst ot
which no thtf c~..itation ot oenaal ratios or population to aymptonvitic
data for ea.ch subregion. Tl.10StJ J.<atiol for 1940 and 1950 S:or: the areas
of Virginia using the fO\U" StJriea ot 8'1l'!Ptomatio data chcuu~n al"O shown
h'l Table 4.

,.;
Pff?RAT!Olf 'l!ETOOD pF POPULATION ESTDilTION: VIRGIML\.t 19.50 .
Share .Popu- Share Fopu- Share of ::.p9pu- Share of Po~· .Population of J.ation o£ la.ti.on achoo1 lation covered lation eatima t.es:
Region b1.rtba eatima:te deatba estiaate en\"OU- estimate empl.o';ment, eatitlate e<iual. aent nigh ting
l~ l0.68 3;4,435 5.90 195,S02 6.27 208,001 5.94 197,130 2.38,862 l
l....l.B llw59. 384,635 l.4.02 /JJS,m 9.86 321,222 22.37 742,389 4?9,881 l.....c-!f' 4.ss 151,996 J.63 l.27,105 .3.78 125,446 4.51 149,672 . l.'.38,555 1...C-S . 13.71. 456,982 12.12 402,224 10.37 344,147 12.02 398,905 . 400.564 l .. l l.-46 481453 2.11 72.,015 1.40 46,462. .es 29,204. 49,034 l..2 3.70 12.2,791 4.22 uo,o4S 3,.90 129,428 2 ... 61 S6,6J.S 119,721 l.J .94 31,196 l.00 .33,187 LOl ;;3,519 .64 21,240 29,786 1.4 l.l7 3S,S29 1.91 631'!io'-1 l.51 so.112 .. 76 25,222 . .. 44.,388 l.S l.ll 36,S.37 l.61 53~1 l....53 50~776 .,61 20 244 .·.JIJ 322 sn' , .. ' 1.6 2.02 67,037 2.43 80,644 2 ... 24 74,33$ l .. 70 ,41$ ; ; 6-'),{n:J
l.7 1.94 64,.382 2.s4 · 94,251 2.61 86,6J.S .TJ 24,226 . 67.3f:J:J l.S ,3.0J. 99,892 3.U w,,101 .3.-61 ll91804 2.49 82,6.3,5 l07,6o8 1.9 2.03 67/Jf:f; 2.3s 77,989 2.32 76,_993 .1'0 23,2.31 61,.396
2.1. 4.~14 157,305 s.:;a l7S,545 5.s6 194,,475 2 .. 96 9s,233 157,140 2.2 ,4.80 159,.m 4.18 l.38,721 5.18 171,908 7.22 239,6o9 177,384
3.l. a.32 76,993 2.ea 95,578 2 •. 79 we~591 2.72 90,258 ··76,358 :;.2 3.19 1051866 3-.37 111;840 3,..34 llC,844 4.19 139,053 116,901
4.l. 3.63 120,46'3 4.os 135,402 4 .. 02 lJ3,4ll 5.23 173,567 140,712 4.2 :a.44 S0,976 2.a3 93,919 3.04 100,88.1 2.5:; 8.3,963 89,936 4.3 6.05 200,780 6./J7 2ll,400 6.61 219,365 9.37 :no,9w 2;35,h26
S.l 1-46 48145:3 l.56 s1,m 1.99 66,042 .51 16,925 45,798 5.2 5.25 1741231 5.21 172,903 7,.J.J 236,622 4.41 146,.354 l.82,528 t;,. '3 s.12 2f:f:J,477 5 .. aa 195.tl.'.38 9..,63 319,588 4.90 l.62,614 236,"/04
..

TABL3 4
RATIOS OP POPUUTIOlf 1'0 s~c DA.u.-....stmmmDNS OJ' VIRG!Iili. 1940 A.FD 1950 , . '. .. .._.
ScbOol ..
Covered . . . B11;'~
... ·Doatba .. ei'l:rollmont- ~~'t
~ •'
1940 l9SO 1940 l'JSO 1940 1950. 1940 ~950 1-.l' 4,4..&l)S 33.SJ09 l.16~7· 'l?a~ll 1.02 9.05 . 12.:;7 10.29 1-B . 60.3m 4't-1(~4 t.a.62 ,, 97.:;s 6.40 7.94 .4.2$ 1.77 ~: 50'.-l'lSa .%.mo. 92.45'' 127.Jl 6.09 ·1.ll 5 .. Eo 6.41 ~: Sl..2828 38~6) . a.3-66. l.21.SS .6.so S.o6 6.S) 7.49
l
J..l to.)421 ,43.25$9 M.6? 'FJJ,/J 6.oJ. 6.86 22.42 ll.,rJ9 l.2 42.91p; 'J7.IJ71'1 71.32. 91.s3 5.49 ·s.48 10.sa S.S2 1..3 : 49.6628 4lJ.Z/0 89,.6J. 109.:39 5.(..0 '6._20 19.(J:j 10.;6 1.4 S5.5"'1S1 41.5136 76.C?. oo.<:s~ 411199 ·s.56 22.lG U.76 J..S S0-402S 44.6935 71,,91. 91.04 4.sa ·s.io .31.Jl 13.90 46 4$ .. 2962 43 .. 0001 · 81,..t,2. 102.83 4.94 ·5~89 11.13 8.-37 1.1 47 . .-3794 42.6110. SS.63. 37.M S.04 '5.0S 32 ... 22 19.41 i..s 47.Sl.J6 42.4933 89•86. 'Y/-47 5.44 ·s.oo u..aa 9.05 49·. 'Jfi$.9047 42.4006 66.12' 100.sl 5.34 ·;.32 43.31 20.S'.6_
2.1 42.3535 38.6472 94.01 99.yt 4.s5 4 .. 93 21 .. 81 l0.51 2.2 40..a631 :n.0035 l.Ol.16 121,.SS 5.l.6 ·5.40 s.o'.'J 4.l8 . 3.l. 50.&'.)92 J;l.7240 86At44 9-3.21 S.49 S.5S 9.s1 6.12 3.2 49.9045 42-3536 96•55' m .. a s . .66 6-28 7.99 ;.41 4.1 50.2916 42.6569 99.,30 106.oo s.4s .s..as 6.69 ,4.$:& 4-2 49 .. 051~ 44.1409 100.6;. W6.47 s.01 ·5.36 10.63 6.94 4.3 49.6J.82 1.2.6094 104.52. u;.oo 5.26 '6.20 6.45 4.72 5.1 41.~ 41..9813 109.77 ll6all 4.15 i..a6 49.14 20.29 5.2 42.3293 4.;.0287 lll.OJ . w.03 5.0l 4.96 l.4.19 s.66 5.3 32.5975 3~.7435 ll7.li//. W.72 i..;s 4-'JJ 10~ 9+31

The second atep 1rm>lved • .. the application of the censal ratios
to postcen.sal aymptomatie data to obtain tentative poatcenw pcipulation
est1lnates.1 Tllo· wlUl'llption · mldei:fylng this step was tlla.t the ·ratios or
population to e,mpt.oaatic data. were relatively stable over time. The
••t1matea were then adJust.d to m&ke t.bem total an indcipendeni atat*""w1de
estdmate. ·Alt Uluatrated 1n fable 51 the 19/IJ cei1hl i-atios 0£ popula•
tion to school. enrollt!ent we~ a,pplied to the 1950 school enrollment
figuraa for a prel1trlnaey eethute for 1950. '1'1"&J actunl state census
oount tor 1950 was.then unod as th9 control, and the tflntat.1.ve regional
estimates nrc adjunted to 1·t. The last column Ohows the pereentego
diffet"Gnces between the estimates and t..lw actual 1950 Census collllt• . .
Th• average peroentag$ deviation. waa 6.as, while the ata.ndatd
error of t)Stime:te reached s.25. &8Ultei obtai.."l!!d when estimates baaed
on tbe ttther aeries YffH'e used ·and "woighted by -.arious techniques en·• .
8hown 1n Table 14 in Chaptor IV.
~'lfViial. .&\tet". ~tllqd '
niu ttv.1.W ntez• met.bod dwelopod b,y Donald J,. Bogue ns ·a
mdifi.sd wr:sictn of a pro<V.>duro· auggeoWd by P. K. fthelpton in ·the late
thirties. Sinott the number of births and deaths which occur each year · . " " :
&lCCllS a popnlatifln ia rougbl7 proportional t.o the alie af th9 populat1on1
1t.ft::l 1'elt that through the use of· a fn statistical refinements thia

·.TA.BI& s
f 19.40 ratio• 1950 . · Peel 1 m1 oaey Shares &!ti.mates· Pel." ceut
ot popule:tion scllcol popula.tion · . in adJwsted to ditterence---. f?.egion . to school enroll- osUmte state stato ellti.mates tmd .. enrollment. me.at . for 1950 . total CQ1l$U.8 count Oemst\S counts -:c
i-A" 7.02 33:;524 235,,.338 7.96 264,167 . -l.2.9 l-B, 6.J,JJ
.. 52,642 . 3S6,909 . 11.40 378,330 -9·5 ..
1-c-ri 6 .. 09 20,152. 1221-726 ..
4-16 l.38,057 -:hh. 1-C-S 6.50 :;;,370 359.,90; 12..l.S 404,215 -9.4: l .. l 6.01. 7,458' 44,s22 l.52 50,444 -t.4 l.2 5.49 20,862 l.J.4,532 J..87 128.,433 ,£12.,; · .. 1.3 5.60 ;,m 30,234 J.,.O) 34,1.S2. f 2.J... l. .• 4 : 4.99· S,0.32 40,000 l..3.5 44,802 ~ 0.4. 1 .. s · 4.58 S,l.80 71.,464 L.27 42$147 ,t.· i.1 1. .. 6 4.94 ll,960 59,082 2.00 66,374 -·.5.s l.7. 5.04 13,905 10,001 2.31 78,653 . fll .. 3 ... · LS 5.44 19,274 104,851 :;.;s ll7,8lJ f ;.4. L.9 5.34 12,388 66,152 . 2.24 . 74,338 ,L 3.1 2.1 4.s5 31,285 151,732 · s.13 170,24$. ,£10.5 2.2 s.16 27,f/17 142,916 4.84 160,621., .;.. ¥'1.3
3.1 5 .. 49 l,4.,858 81,570 2.76 91,596 .· fll.O 3.2 s.66· 17,881 101,206 3--43 ll.3,831 f l.J 4-l 5.45 21,425 116,766 3.95 lJl,088 ;.. J.6 4-2 5.01 16~24$ $2,Jrl 2 .. 79 92,591 I- 6.:;. 4-3 5.26 .35,290 l.S5,625 6.28 208,413 . -4.s 5 .. 1 4.1$ 10,612 J.4)040 1..49 49,448 - 4~1 ; 5.2 5.01 38,097 190,866 6.46 ~387 fl.3 .. 3 5.3 4.5a ., 51,.369 235,270 '7.97 264,499 /.17.l.

pl.1'J.noi:ple cGJUld be converted into a technique for making po1toensal pop11-·
1ation eatilu.tea.· T.ll$ method itself involvoti relating the crude birth . . .
and death '£'«.tee> of 41. nkree. tor which a posteensal popula.tion estimate
••• de11red to tho lalolrn·or accarately estimated rates for the larg<tt"
area-a• in th& eas. o! Virainia, relating the.subregions to the stAt.1».1
Estimates ba#ed on the birth raw and the daath rate are obta.ined
and averaged., Boca.uae of. thtt inverse relation between annual cli.angea in
the two, a combination or the tYO setles 11hould tend to ult& the estimates
ot & eub-area agree aiora cloaely with the tNnd of the larger are& than
•1th.er ser-les alone.2 Admittedly, there are d.1£.ferenoes betwesn: birth
and dea.th n.te t-reJndo among ar&&s., but the d1.fterences do not become
large daring an intercenaal period .. 3
Ta.bl• G contains an application or the ttntal ratea• method 'I»
the tRnt)'-three subregions of lit'ginia, using. 1940 as the bu.Gt\ year fer
estimates or 1950• Ozie atep.whieh Bogue outlined bas not been includedJ
that ia, 1nnst1gating bOw the crude birth and d&&th. rates ot tho various
aubregiona bavo behaived 1n tlMJ recent past hi relation to the trend ot
1noMld 1. Bogue, ftJ. '!'oohnique tor Ma.ld.na.htensive Population Eatiiw.tee,n ianl!Y: .Qf. ~ AmeEtc!ll Statiatj.oa;t [email protected], 45 (250), June 1950, p • l5iJ.
· 2P. l. Whelpton, Needed f2miJ.a.Usm .f@sear,h (Lancaster, Pennsylw.nia: Tho So1once Press Printing Company, 1938~ p .. 151 <)it.ing Harold Hotelling and Ylcy llct.Uing1 ~Cauetta of Birth .Hate Fluctuations,• l.<r<lrnal S:. lm. gerioy .~tftisY..o~ :&ascQiation, 26 (174) 1 lune l9Jl, PP• l.35-149.
27
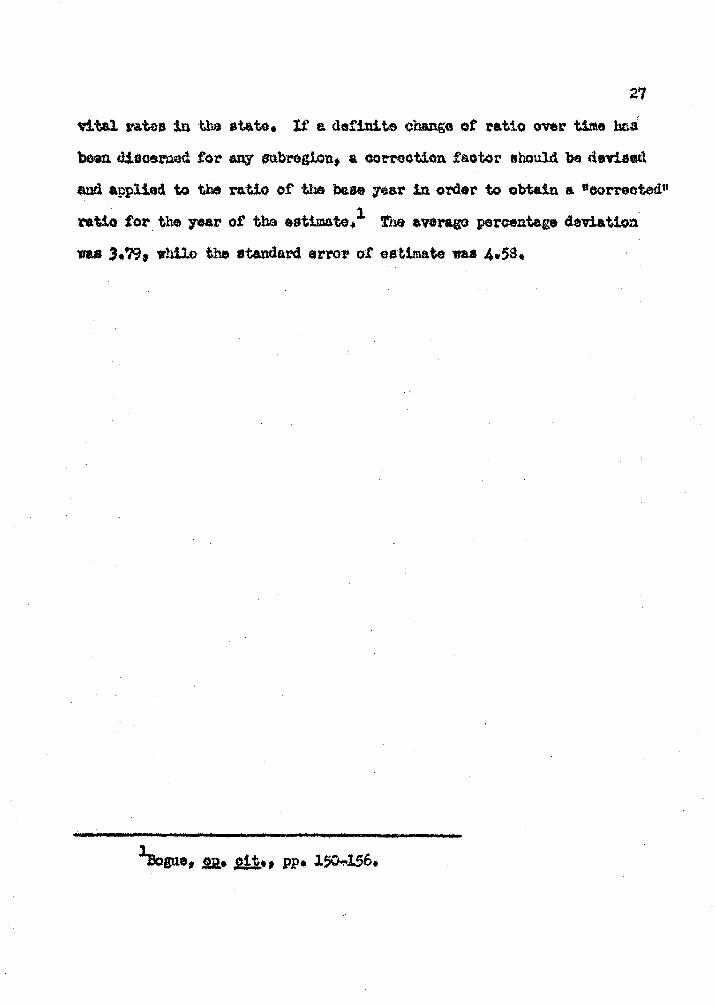
v.l.tal. rates 1n ·t.hit at.ate. If a. de!'init.e ehange of t"&tio over time baa
b&w. diacsmed £or any etlbregi.ont a correction £aotot' should ba devised
~ applied to the ro.tio of the base year in o?'Cle-r to obtain a "oorreotedtt
ratio for the )'Ur of too esttmate.1 Th& e.verago percentage deviation
na 3.79, whilo the standard errott ot e1rtimate was 4.;s.

1'AltLI 6 ILLUSf!LttIOS OF 111ITAL ~· l!E!BDD OJ' FOPDLATIOfi l!'Sfll5A'llOH
stop ls Computation 0£ Crude Dirth and Jn.nth Rates· tor ftrginia and the Sa.bntgiorus, · 1940
., llumber ot 1940 Crudo iat1o of sub- Jfuabsr of C:\lde ·.Ratio ot eub-.Region birtba, 1939-40 censua birth regional i-a~ deaths. 19~ doath rogio.tu:U. rate
.averap population t"ate to state average rate tO st4·te .·
l...j. 2,,585 131,492 19.6 91}.7 l,106 8.4 . oo.o l-B S,375 335,887 16.o 77.3 3,16l. U.2. · l06r/7 1-:C-lf l,.4h7 ai.,496 17.4 64.l 848 10.0 95 .. 2 l.....C...S: 4,584 258,927 17.7 ss.s 2,366 ll•l 105-.,7
l.l. 843 ;o,627 16.6 80.2 732 14.4 137.l 1.2 2,478 107,481 23.1 lll.6 i.381 UaS 121.9 l.J 515 2.6,CY/3 19.S 95~6 292 ll.2 106,7 l.4 m 45,l.SS 17.6 ss.o ~ 13 .. .0 l2J~S la.5 784 40,s26 19,.2 92.s Sl.S 12.7 1240 l.6 l,246 61.~964 ~-0.1 97.1 736 llti.9 m~.3 l.? 1~541 TJ,296 21.0 101.4 S49 ll.6 uo.s 1.s 2,223 lCll,19$ '2JJ.7 100.0 i.200 ll•2 106.7 l.9 i.317 66,22.7 19.9 96.iJ. 779 llaS ll2.4 2.1 3,631. 152,962 23,,,7 114.; l.,632 10.7 lOi~9 2.2 3,143 131.007 24-0 ll5.9 l,Z'/4 9.7 92.4 3.l lg422 73-216 19-4 93.7 862 ll.S 112.4 3.2 l,$42. 96,166 19.2 92.s 989 10.) . 9d.l.
4,.i 2,404 120,549 19.9 96.1 1,236 10.2 t?'7.l <
4.2 l .. 7'Jl ss,150 20.2 97.6 884 10.0 9; .. 2 4.3 3,401. 177,782 19.l 943 i,en 9.4 89.-5 5,.1 l,315 54,444 24.2 ll6.9 488 9.0 85-.7 5.2 4~172 181,,007 23.0 lll.1 l,6oS s.9 84.S 5.3 6,J.98 212,7.3J. 30.; 147-.3 1,726 S.l 71.1 Stat& SS,358 2,611.m 20.7 100.0 28,034 w.; 100.0

mn.E 6· (contimled) ..
Estimated·· ~ .. ltfttiated lfwlbcl" l Awrage ·C.Nde ,.. of Estimated ct:'Ude .of Estimated eatiated ;Shares Region birth births popula.- d~th deatba popul.a- popul.a- of
n.te,. 1950 1950 'Mon mt.et 1950 1950 ti on ti.on eotimate
l-A 21.4 ' 8,761 3r/4,4Q2. 7.l l,754 247,,042 ;uo,122 9.10 1-B 19,-.l 9,503 497.539 9.,5 4,159 437.,789 467,'6&4 13.70 l-C-1· .. 20.S 3,755 l.S0,529 s.; l,JJS 133,-882 l57t206 4.\..61 i-c-a·.· 21...l u,.239 535,024 9.4 3,597 382,660 453,842 13..,45 1.1 19.S . l,192 60,.202 12.,2 645 521869 . ;6,536 l.65· l.2 ';:1.6 :;.034 109,928 .10.s l,250 u;,741 JJ.2~834 3.31 . l•.3 2,3.6 TIS 32.s39 9 .. 5 299 'Jl,474 32tl.56 ··94. l.4 2l.Q 960 45{/ll+ .n..o 565 . 51,.364 .· 48,5.39 1.42 l.a5 .za.9 906 3·j,563 . lO.S 4f!;Q . 44,,444 .42,0(}4 l..23 . l.6 ;, 24.0 l,655 &l,958 '10.J. 7l9 71,lBS . 70 t O'"l3 . ~06. l.'7 25.0 l,,59.) 6.3,720 9.s &45 86,224 74,972 2~19 l..S 24.7 2,471 100,040 9.~ l,146 120,632 ll0,,J36 J.24 L.9 23.7 1,6;8 69_.9;s 10.0 697 IJ),7C-O 69,SZ1 2+04 2.1 2SJ 3,s93 1371'562 9.1 i,;95 175,275 156,418 4.59 2.2 ?J"' 6 3,932 137 4$2 8.2 l 1 2J,.O 151,220 144.1351 4.2.) ~· I .
,3.l. 23.1 l,900 82,251 10.0 857 . 85,700 83.9'16 2-46 3.-2 22.:w9 2,619 ll4,.J67 8.7 1,000 ll4,942 l.1416.54 ).)6
4.1 2."J.7 a,m . 125,654 s.6 1,,209 1.40,581. 13.3,llS 3.90 4.2 24.l. l,.999 82,946 s.5 S4J. I 9S194l. 90,944 2.66 4.3 22 .. s 4,953 217.456 s.o 1,891 I 236,375 226,916 6.65 5.1 28.9 1,199 .u~ss 7.6 463 60,921. $1,204 l.50 5.2 Z'l.4 4,.303 157,044 . 7.5. 1,545 · 206,000 lSl,522 5.32. 5.3 36~ 6#653 l.82,775 6.9 l,745 252,898 217,836 6.39 State 2.4.1 Sl.,986 s.9 29,600 3~12,652

.,
tABL'E 6 (cont.1.lm'id)
Step 31 Adjustllent or Estimated PopUlation to Centn18 Touu "Vital aateart r&athod
Estimated Per oent n&gion popalation deviation ti-om
(~ueted) census
l-A 302,000 -0.4 l-B 454,659 ,la.a 1-0-1 152,991 ,t6,e l-0-S . 446,362 o.o l.l 541758 .J,7.1 ' i.2 109,848 -.3.9 l.;3 31,196 -6.a l.4 47,125 ./.;.6. 11'5 l.D1820 ·il•l. l.6 68,365 -3.0 1.7 72,679 .J.2, .. 9 1.8 107,525 -.;.s 1.9 67{/0l -6.l
2.1 . 152,327 -1.2 2.2 140,.:;go -6.2
3.1 611640 -1.0 3.2 lll;SOS -0.7
4.1 129,428 /:J..3 4 .. 2 ss,277 /.1.4 4..3 220,69.a ,to.e 5.l ' •· ; _49,700 ' -.3·4 5.2 176,554 -6.7
'•' 2121064 -6.l

. CH.APTER 111
A WLT~AC:DJR TfmmlQU_E
A •tbod of population eattmat.1.cm developod by. tho Bttreau ot
Population and iconcmd.o R&HO.reh et tn. Uniwrsity cf VirSinia inwl~s
~ ft!ghting and comb1n1:t1on of tom.• aorl.es of aymptomat1o dnta1 each
ap:reaffd .a a il¥1a of obango owr the base period• The r-eaaima tor
the obo109 of data cd the tGchnique ot combination we-re bs.aed on W?'
'l:tmt &ft.Uabilitq ot tba etatis-M.eai $.e?i.eo aml ease with which tl.lo7
aft t'r&Upoffd into 1ndicatol.'8 o£ tho tl"Ond of population change. Tho
pui*.QOH.n& to obtain a eml'tr«ltmeth'>d ot estimation with conside11-
a.ble Nli&bUitQ.
With ns.peot to tbs ~tic data ohoaa and its an11abili ty 1
ti. nuabof' ot J>irtbs and tha l1Wilba~ of dec.thS by locality~ be obtainGd.
1d.tb!n •is o:r eight moutba ot tbdr oocurranoa. School enl'Cllment
ftgun11.(intl:d.s ~.tho &Tilt"ag$ da1l3 attenQan0()1 e.djustOd for tuition
pupil.a, ot thet publ!.o prl..llu\rf • elnentat"Y• u4 high school.a) a-re a'9'Sil
abltl leas t.baa cme yev atwi- thb completion of the tchool year. Cova~
. ~11l'llt tm!llbara by locality an publishtd quarierl.7 l>y the Urum~t
31

32
~tion ~ enywhon fNm two to three qual'tera aftAr ~
plotion of the period 1n qu.oetion. .USO, these series of data are e.'ftil
able tor tho most ~t census ~ar mi a" ooaparabl.e to the da:to. for
tho ptnt-oensal. ~riod.
fiie nticmale fol" ueing da·ta on b1rths and deatha is .tair~
obT.f.ot18 81nce the&• an direct mea81J.l"e4 o~ 1n the popnlat1on. Xf
births ant ~ing or 1f ~ s:mmbel" of dee.the la rising in an e."41
the ueuapt1on would bo that the popala.tion la 1nereuing t>eoauae the
imabor 0£ \\fOMA in tho oh:Ud-boa.rtng ap group would be :1.noreaslng or
the tmmbGr of porsono expo•ed to death bad rl.sen. lbwewr, when ar.t.
Wu of ebal!ge in births is applied to total. population• an onreBU
u:te WOUl4 retult in U.a w1*1 the birth rate 1.tselt 1a riaing (aa 1n
.at • .,..... during tb!t l940...19SO dtoade), anct then would be a tuaenor
- underes'Mmat.1on when there is a dfflJ.n1ng birth nte" The sue ia
t1'W.\ Of the dn.tb. :rate, onlJ' tm ,...,.:rM oeou.rl'94 during tho 1940-1950
decade when the death rate decl.11*1 ill t11l ~t a few 1tatas and tfllb..
Ms.tone ·Uld t.M. population eatiate• based on the o~ in the m.m'ber,
of daatha wn low. Beoauae ot th.$se opposite obange• in tli:rec\ioa o.r
t1ae •l'GQ Wnh u4 death Mte• 1n most al"M8 during th• 19.40-1950
4"14•1 a •abiutS.o:a and ant"8giq ot the ttto tended to oarioel aom'I of
the •!'TOJO wbio.h n.8Ul.te<l frolll use ot one noaaare •lone.
The wae ot b1:rtbl and d&atluJ1 ho'll•9&r1 do•• not Siw effect ou:r
"11\11 to 1-ppentnga Which My tnduce in· or ou.t.-ndgratio.u. ot aiaubl.e
propontona. Births and. deaths at~ not sensitive indicators in that

33
~do mt generaJ.l1 immadia.tel.y renaet liligration, and, 1n tact, ~
not show atgn.t!on · at all bat· •impl.v a c!wlae 1n th& bi~ er dMith nte
itself.
, !be othal" tllO IMNUl\lt"el selected, aobool em.-ollmont and aovered
aploym•nt1 are conaidered to be moN smut1tJ.w indioatora of rdgration
~a. School enroll.ment W1y not i-e.fleot rti((l"ation quite aa quicrkl,y
aa empl.opaent •1noe there !s a dtterrent tor -the ta.mi~ 1fith ohUdNn.
ot •~bool age to pull up tttak•• and llO'ft.to a nn aru. beton the achool
;rear is .completed. !be bead of tl1& household mar move on to accept. a
good job offer (and the Mft 1'0u'ld be reflected in employment etatlatios),
thmt aon4 tot" the te.mlly at the end ot thAl •ohool tem or ;rear. ·Even
more illpol"tant, migration 1• an easier t&aak tor unaarried ma.le• a:Qd·
temha; if the 911pl.oyment. •alttr6 ls not eo~id.ltred in eatim&ting ~
Uon1 the impact of their mofta into or out of an area woold not be
d"°nstn.ted tor Mve'Nl ~' untU tblq married and bore childND.1
Htlt their ch:Ud:ren to school, or died.
:COn M&SUl'e of' school enrollment bat long been oonaidered a
eood. indicator of the di1."e#t1on of Digration. Indeed, the Sld.gr&tion
et! natu;ral :1neN&H uthod ()f the D\mitau of the Cftnlll• discussed in the
last ebapt.i- is based on the as9Umption tha\ the mipaUon rate of the
total population 1• the same aa that or Children 111 ti. eomol ag& group,.
The uasun et ••hool •nu:•ollment used by the Qenaua and thee measure or
pref •t'ence acco1.'ding to ~ demographer• 1• the number or 111ohool
ehUdren aged 6 through 1-' ,.ara. Since the 'l"~rementa ot law pertain

~' ' ... : . ".
34
to tb1• group aliaoat without exception, it 1• pn1um.d that thia group
Will be loaat·affected b,r aey innuence othett than ·~ an increase
in· population ot that ap.
~r, in the mlti}Jh-taetor .. teohnique herein desoribedt
sobool enrolh\ent it COJDilO&ed of average.ddJ.1' attendanoo (ad.Just.Gd fol"
tuition pupUt) in the public prlm&l"3"t ol.ementar,y; and high Joh>ol••
!his 1• u.se4 u the uuure tor aevenl. reuou. In the first plue,
data cm. oge-grade dietrl.bution• are not publlohad tor the localities of
Yirgln!a.1 biting a:v&lla.ble onl.T on thtl ato.ta lnel ao that tbe preterr&d
maaure cannot b9 obtained• &condlJ, altbough &ftre.go dailJ •ttendance
tisutte• fov the primar.r, elantary1 IU1d high sob:>ola J1JJ11 be gotten
~'fntel3' so that tm :tint two mg.ht m ~- to prov.ld4a t.b$ age
paap most eloMl7 appNldJl:lating the c~ group, tb9 figures are not
adjusted for ~ tion pupils fro• outsid• the area.- And. beca.u.n or ·.the
incluaion ot the •ightb. srado at var;rtng times throughout the state,.
ad,Juatrlents and retineMO.t• in ·m&n7 at"eU lfOUld be nece•S&t7 to mt.kilt the
d&-ta ooape.rabl.e. Another roaaon. tor using the total attendance aclJuf.Jtod.
_.-that tbia f'J&ure ia published and no turthe:r 4omputation ia·X10oaaa&ry.
11nall11 and s:st.lmportant1 there has not boen tsufficiont e'f!denoe.
tbat all ~ 1'eJfinementa and edjuatments aiJHd a.t Se<N.ring a ••le&n•
liSUft haw produo.d relUlta which are •ignifiosntq b&ttev t.hen the
orudet" ab:>t1itn" setbod1 provide.
Xt baa alroacty hon pointed out that the utili1ation of u
empl01D19Ut meuu..-. mq pick up migration aoi-e quJ.okJ.7 than aq other

'·;:
'' ~. ·Al.so; tbfl aigRtion of .J'O.\lll8·.unma.rried populati01t p?lt'ti~o.rly-1
•:urti ottn ocoul"&I for tb$. purpose ot proou.l'ing better emplo1lf*lt• A
faotor which. demcnatl'atM· th& ollanpa in emplo)>'ment will reoe1w the
fol."M of thie m18l'Ation,. 'ffhet'$t.a none of the ot®i- th'ree faotora ~reas.v
discussed will •.
Sonvcn.•1 · it is not intend• that elllplo:nacmt alone ba u«\ as t.l~
p.tde to esti.aating population tl"Gillia 1u an. $.ft&• .Grant.Gd t.h&t. it ·1•.
a oonaitive,indica.tor1 .ap~t would be een.litiw to ~tharf'oroel
b(laid.4\la ¢gration1 eapeoiai:cy- econozio oonditions,. For t~-Nason.a.n
uplor-nt indicator &lone.would ttmd to onro&tiate ht&T.Llr 1µ IQot\ \. . . ..
I ,.
'W$lt&1:$ ~nta and. othclr taotorr. ten4 to de~~ JJmuediat. out-migration
foUo'flins. losa 0£ Job1h Some demogl"apherti. baTI> obJacted to; i~P use a.a
data •mtom.ati~ of pQy.ll&.tion ch.a.ng• becau.Ga ot this. ta.ot~ .Bu.t it
dQea not ••• Ql.Ge.r why. tbia -bould mako l1m1 ted use ot t11' measure ,
.bptt&ctioal.t. Au at~t.to dt~N• -.conoai~ conditions trom migration.
le.not oi.'.>mpl•~ 'uat1tia.bl• for an e:xpanding cmipl.opumt picture pd,
higha:r rolati'Y& Jl'$t' ta.pita. ~oozce in an &re4 -xv ~· dtot'd_ the
attraction to bring ne1'r&Sidenta there. Lorin Tbo:apson found in A
·~ f>f th& t:ol.a~onab.ipa bet.1'fean ;popUJ.at:ton, ld.gration, and income
level tha.t •poli07 decisions either by industry or gov~nment 1ntluenoe
the ~tion ot BUbatanttal m.mbara ot people. to particula~ e:rea.a.•1

the~ polio-y decisioiut oonoel'ning the opGll1.ns or oloeing of plant.81
efticea, •to•, hat?O a d1\"'eot baa..-ing on the ooonomio outlook ot \he
00ilm'm1ty. Olle of the ooncluaJ.one of tbs study vas that olosor analyaea
of •ban.Sing pattemB of employm-mt and incoma C>f areas should be m4e
tn preparing ahol!"t-- and long-range torecasts of popalation.1
. . !he obangcs u ~t fl'Oll J.940 to 1950 by otatee, uairta . .
the total eit?ployed. in the oiv1:U.an labor !ol"ce l4 yer.rs of. age and oTar . .
aocording to th9 oonsus, were exvr9asc4 as ind~• and conelc.t.Gd with . ..
~ lnduea ot cbanp in tht population. 'lM oo?Tele.tion ooatfioiont . '
using the product moment mntbod na /.- .as:u., which ~esta a notico-
able t.iepee of mationaMp. ln the raaJorl:tJ' ot castuJ the ob.&ngfl ht
eaplo)'Unt DB greatQ thml t.bat in population, r&flect.1ug ~more .
~~i.UJ so™1ru economic piotu.\"it ot 1950 ..- oomparad nib 1940•
lto._,.r, tb• cU:vergenoieo nro nei thai- too gl"9&t no~ too mtmet'OUS to
oonolude that tho biggest taotor 1tl tba.1 Nlat.tonebip na obanco.,, Tab~ 7
anowo a distnmtton. ef et'?W& in tho ~o ot oaplo:,n:itmt ~pa:'04
with the induea of populeti®. in the to~-eiJht atates and the Distnct
of Coluabia. '!'he average dnia.t1on1 aigna d.tsreprded, was .09a per cant,
For tho subregions of Vlrginia thlt ave31e devle:U.on be~ the
index.of total wage~ Nlaey esnplo111ent and .'fihe tndu of poJ)tll.atioa
ti• Popul.at.1.on Aeaoci&·tion of .Am6rtoa, Pl:'inceton• 1n' .ter.1ey, April 19-201 1952.

37
ft8 mch highu•• .2303.' Hoirewr, a correlation coetfioient bet'ffttq the
5.ndmree.-ot l-·.9078 ~sta a relo.tionsh1p worth noting.
J'.REQUJ.mC! J:>ISTRIBUTIOH OJ' P~ DIF.irERmCES BIT'•'l:ai CHANGES IR mPU>ntm AND POl'ULATIOH
-.0300 to .... 0001 .0001 to .0299 .o:;oo to .0599
· ,0600 to .oa99 .0900 to .1199 .1200 to . .u.99 .isoo to .1m
. +1800 to .2f199
BI BrATES1 1940-1950
Frequency
3 6 6 9 '1
' lO 4
l
;
Ba'fing e:Jtplo1Dl.t w.b)" an ~t measure ns included in the t
aultiple-futcr teohnique1 tm ~Uon ~s to be given concern-. .
1llg th& partioulaia ?Ma3Ul"9 used, Complete employment figures like tht
ocsus counts Jrutt used 111 the correlations are, ot oourae, o!3ly aml
Gl>l• evoq ten 7ea.i-.. Covered ~t as npoMed b;y th$ Unemplo,,..
Mnt Compensa.Uon ~ l"BUins thca met complete curZ"Otlt 1ooal
~mt _...ire available isl lirginia. For tbie .reason it was ·used
!a tbe eatb&atet tor tb8 aubregion•J and although oowred eiapl.o111ft~
ate.tiatS,oa an not the most oompl.&tct on the state level.1 the;y wei-a used
b the to•t. wa on the otatea £011 J'lll'POP• of ~ty.,
Te d.uouat.t"&w the extent ot ooverage of wo?bt'a 1n tha aubregions
of V!:rstnia ~ S is inoludod. 1t mq au.ggast ha.avier weighting ot this

lAoto~ in t.boso.anu when it npresentas SU.ch a large pe:roentage ot
total ea~t and. oorN:Jpondi:nqJ¥ d4orea11ed night wner& oowrod
-.p~t 11 not a significant shaN.
'.tUlt.B 8
~OBBmP. 01 OOViRED m mt.AL WAGE .AID SALARI JXPIDDrlf.t.' :at SUBUlIONa O!" 1.IRGINIA.t 1950
Begiou re-r cent legicm 1e cent.
1-A 23.3 l-.9 14.s i ... a ', ·.68.4 2.1 · so.'1 l-0-M 42.4 ~.2 79.5 1...0-S t 31·9 3J. 56.l l.l 29•'7 3.a 62.3 1.,2 46-2 4.1 65.9 113 33.6 4.2 51,.6 44 36.2 '·' 65.0 lw5 20.4 5.1 21.s l.6 J,JJ,.7 s.a 54.0 47 24 .. 6 s.3 53.,7 i.a 39.0 S~t. 47.1
Ti. four sen.ea o£ f1111p'toatic data 3uat diaeu.ss.4 o.~ w!1es4 as ·
ta •. that ia1 theJ' a:e not changed into M\1o• o:t population to the··
Mrl.eo1 but the peroentap.e~ in the uuab4nt of birth11 fo't' namplo,
ls u-4 as Vl$ J.ndax. fhia cu.u out a 11me1 ot oomputa.t.tons n•oes'817
~ another sbo~t atbod d.G&fed.bed 1n Ohaptu- lI·i th& ••nnl Ntio
tecb::d.qu-.
Tb.a aotuaJ..nt-up ot the mlti.~actor teohniql.V) may be ,aee.
mra Clea't'lt 1n tb8 papa tba.1; tolln', wh1oh eho1f nupl.ea of the mak:G-up

of Moh taator lu the oubregiona of Virginia. and in ·the tort7-eight
.-w•· and t.ha nt.otl"ict of . Columbia.
for the ea.bregj.one tbs mm.bttre of' births aa N,POrtod by t.b4
Yirginia Sta.ta ~rtmen:t; of' HNJ.th1 1hrean ot Vital Statistics, to>f
19391 ;&-91.0, and 1941 were aven.eed arid. used d the bnse, 191+()1 for pu.r-.
poaes ot e:stimating the 1950 populatiou. for the eta.tee tW. IJUlibev ctit
bi'rtha 1n 1940 wa; used. u the l>aS•• Th.a jl(N.l"C• fo-r th.e birth de.ta .a • .. 4 • •
the Satietigp.! As·-ao~. of tle United Sta.te•1 1953• &me ot. ~ indO'X9S ~ . ' . .
of ohanp :ropreaanting the numbfJr o£ bil'the in 19.50 over tbe 1940 'beJao I •' ~
an show in Tabl.• 91 a.long 'Id.th tho obange in censu• population counts. \ . ' ~ ' .. ~
Tho indexes are ool"rGlated using ~ producirtaoment OOrrela'Uon method• > .. ' •
. Tho oon-ele.U.ol\ coeft1cient £0-r thi!l illl'hregions or 'fi.'l"&inia I • f o
bert.weea:. the index31' ot Population chlan.ge and \b.6 indexea of' alwlg• 1l1
the ~r ot birtha •• f .973t 1rh11e the c.On-elatioll oo•t'ticient tor
tu States AUvi the. ll111triot ot Columbia was .j. -.a68. Al • 1nd1:ddual
.tn41oator of. population tt-end the c'llange 111 the DWI.be\." or binu wou.ld1
fJf Gel'Ne1 bea.vU.7 owftlti•:t.e tor n•rli' all ai-eu. . !he aftr&p ~
f.tion et tha bdta.'e•. ot ld.rthfl And popuh:Uon t'or t.l» •tat~us n1 .354SJ
a1l4 fo-e the ngicma o£. Virg1rd.&; •20841 thtl qudnt1o aan dni&Uon
tor the atatea _. t37511 whU• for the region• it 't'O-. tio .21as.

CWJlG.&S Ill UmmER 0]' .W:ft?US 11'1 SELECTV..O STATES II.ND DUBP.m!ONS 01 W.QINI.A. .AND Ili .POPULATION, 1940 AND 1950
State or I ltlll'b&t'" of births Index of chanp 1na llUbregion 1940 19.50 _!)lrtb.s Popul.a. t1011
Alabama 62;938 82,616 l.;31.27 1.ooos Ar.Laona ll,50.3 20,a23 1.8102 1,.;014 Al"'kanld '81lt'13 45,592 l.1850 .9795 Ca.U.fomia. 112;287 24418'71 2.1800 l-5326 Colol'&do 2110:3L 33,BSS i.6uo 1.1796 Connecticut .. . 251548 40,6a0 1.;900 i.1744
1-A . 2.e948 8,761 2.9718 .2.,)06S
w 51563 9,;03 l.'1082 .l.2.442 1-c-H l,6$4. 31755 2.2298 .l.6951 1-""S ,,,049 n,2s9 2.,2359 .l.'r.'J.33 11111. S.39 l,192 i.4207 1.0100 i.2 2,503 3,034 ' i.2121 lt06Y!
.,..,.
' ~ ... :. .. ............ ___ . __ .
2be data on. llUllbet'f o£ death& oorntsponded to the birth dataJ
that ia1 tor :tho subregions, tM nu.mbitr• :in 19391 19401 and 1941. were
averaged for use as the 19.40 base. In tha case ot thtl atatea the a4t.ual
muabert oi' d.eatb&t in l9AO wre uaed.~· Since .the death raw ithlt na
4eoHn1ng 111 most &N&I du.ring the 1940-19.50 d•cade,. it is l'ait".q obvioua ·
\hat ·the bde:xaa of obange in numben of deaths would be not14ea.bl.T lowe~
ihm the iwiexos ot popal.a.tion O.banae• Thia is demonstra.W 1n lf&blo l.O,
which include• the ex;per:f.enoo ot ••leoted st.at.Ni and subngiona •.
tht con-elation oodficient. btitwaen the itadexeo of change in
deatha and ln popUl.a.t.ion among the •tat.a na I- • 7741 while uioaa the .

IUbreg,iono ot V1r31nia the ooetticiant obtained ftom the produ.ct,..comont
111&\bod was/. •949• !he e:verago deviation of \hs iudexe:s in the atates
_. •13541 and .the .aqu&N ~t o£ t.M aw~ or th6 m.m of tM •q~Nd
dsvlations ., .1617, For tll5 sub~giona the awn.ge deviation. N&~
tl.730t while ~ quadratic flM2l dmatl.on ino~ to 1iWJ2•
nm..:s 10
GiIANGES IN ~.S OF DUTIL~ IN SEL..~ STATZS Aim SUB!tmIONS 01 VlRGINll AJm D FQPI.JLtaIOS, 1940 .AND 1950
State or !km~ o~ deat..ba Indo: of cha:nl,'G int
·1U1».-egion 1940 1950 DM.ths .Popul6t1cn
Alabama 291554 261836 .9000 1;0800 Ui•ona 51556 6,422 i.1559 l.5014 ~ 17,247 15,41.l .. 8935 1/ffl') Califomia 79,7J:J. 93,.?W l.2385 l.5326 Colorado 12,291 12,ato .m1 1.11~6 OomMtieut 18,070 19,liJ i.0;83 l.1744 l....t. 111.29 11754 l•S536 2.30&J 1-B 3,790 4,159 l.0974 i.zv~ 1-0-lf 914 l 138 , l.24,l 1.6951 1-o-s 3,095 31597 l.1622 1.72)3 l.l 729 645 S848 i.0100 • •
i.2 11390 l,250 ·8993 l.0637
boa the b'\J.!tiPi\I; @.ltrast. of th& United si.tes, 1953 and 1943• The
data include pu.blio •l.ementa.'ry and ~ sobool enrolllla:nt and &l..$0
data .tor ldnderp~. !ho school onrollm.ellt data tor the aubi-egio.ns
of Virg1.n.1a include the average d.ail1' attendance adjusted tor the public
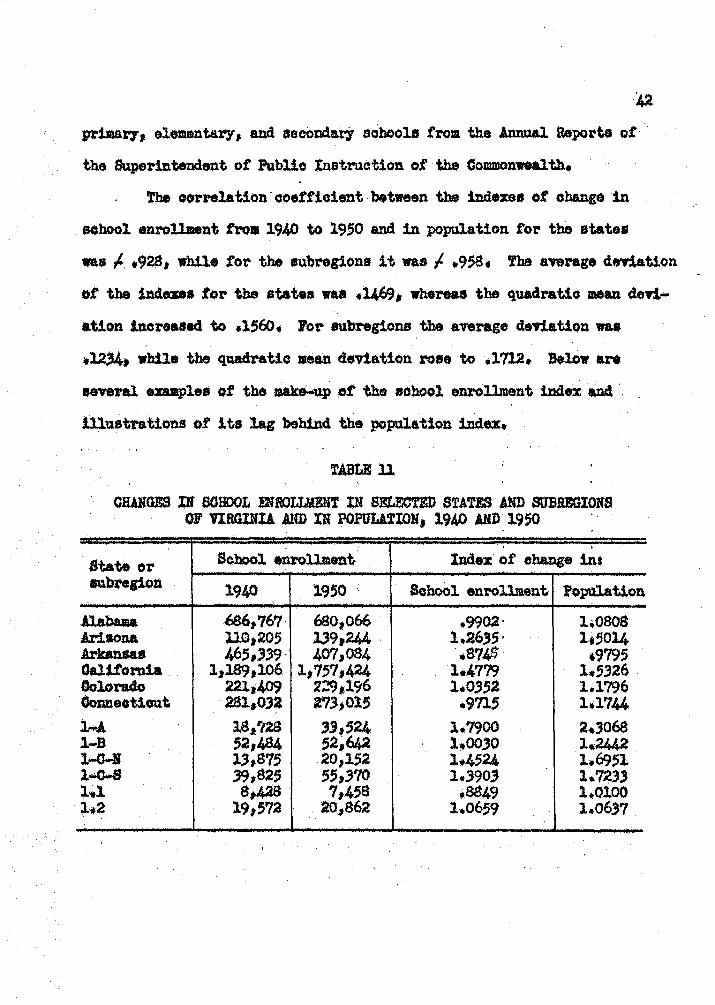
.prima.171 elem.entu'y 1 and Seci:>ndaey Schools from the ,Annual J;lepo~ta of· .
the Superintendent of Public Instruction of the Commonwealth.
The correlation·coefficient.between the indema of change in
school enrollment from 1940 to 1950 and in population tor the 1tate1
was /.. t92$• while tor the 1ubregions it was .;. .9ss. !ha avenge dff'liation
of' the indaa• tor the states watt •l.469; whereas the quadratio mean d.ni
ation increased to .1560. for subregions the average deviation was
tl2341 while the quadratic mean deviation rose to .1712, ts.low a"
nveral oxamplea of the JB&ke....up ot the aohool elll'Ollment index &nd ·
illustrations or its lag behind the population index.
TABLE 11
ClUHGES llf SCHOOL maoLLMENT IN SELECTED STAT.ES AND stJBRIGIOIS OF VIRGilll AHD IN POPULA.1'ION1 1940 AND' 1950 .
State or School enrollment Index of ehange ins aubl"8gio!l 1940 l9SO School enrollment Population
Alabama 686,767· 680,066 .9902· i.osos Arbon& uo,205 139,244 . l.263,. 145014 Arkarula• 465,339. 407,004 ·,.s71+& ,9795 OalitomU. 1,189,106 i,757,424 ·1.4779 l.S.326 . Colorado 2211409 2Z9,l96 i.0352 1·1796 Gormeotiout 281,032 r73,0l5 .9715 i.1744 1-..A l.8~?28 131S2.4 i.7900 2.3068 l-B 52,484 52,642 i.0030 l.2442 l-0-N 13,875 20,1;2 1114524 1.6951 1-0-S 39,S2!i 5;,:no i.:;90, 1•7233 1-.l s,429 7,4;8 .8849 i.0100 i.2 19,572 '20,862 i.06;9 l,06.)7

Tlli1J eourco of covered aployJltm.t data i"or the state& was the
"Handbook of Uno:aplo1li101\t Insurance 1J.nane1al Da:ta1 .1938-19481 n. p!\b-. . - . .
lieh84 bl th9 J.lepart.ment ot Labcn."t Bureau. of ~l.o1JB0t h<nirl.t1.• in '
hoemb9r 1949; and the 1950 auppl~t pu.bliaMd ill Jugu.et 1951• the ' ' '
JeU:i.1 employaent. figures arie &Wra(NS Gt montbl.7 mm.bel"f. '!be data to-r
the nbregi.on.s of: V1l'81D1A ar. also· &'V'>r&1•I of monthly OOTered employ
~t ~rs, N~rted b7 tho Unaplo,ment C'Jomp<m.sation Commisa1on1
l>iv!.•1.cm oi' Rneai"Ch, Statiat1cs1 and lni'omation,. in qumrq repo\"ts•
Jor the baH ;yea&- 1940 tbs ~\ •ta.tistio:J waN not nadil.7 aftil
able, eo tm data for 1939 ware used instead in th& oue ot th9 a.tb-> ' '
U11L! 12'
CH.l5QES D COVERED ~f IN SELECTED STATES AND WBU'GIOIS 01 VIRGmIA Mm IN f'OPULi.TIOlf, 1940 AND 1950 .
,,._~ .. ,.,,• .. : ... Oowred empluy!Mnt . State· Cl' "
Inda: of chtt.nee int aubngion 1940 1950 Covered employment , ~Qpu;Lation
Alabuul 288,869 409t910 l.4190 i.osoo . ·~iv.,, ·~308 '106,235 . lt7615 1.5014 .~.
i?>kan.~ l.461171 22),162 l.5266 .9795 Cal.Uornia· l 13'SO 1698' a,5~'"44:3 i.s291 ' l.;5326 Colo rt.do lJ.3,464 2.0!),323 2.5334 i.:r..w6 Oonno1tUut ~94,S<JO 616,.345 ' 1.2454 . "
1.1744 1-J. l0,632 2914$6 ;a.7133 2.306$ 1-i "18,502 U0,$23 l.4ll7 i.~ l..g....a ' ! 15,003 22,361. l.4025 l .. 6951 l-c-8 37.9ll 59,$81 1.5·716 l.72.33 lttJ.' a,ass 4,337 l.9207 ' ' i .. 0100 i.2 '10,160 12,954 l.2750 l.0637

The average deviation. of the indexes for the at.a.tea na .J327,
While tor the eubrogions it as .srn. The •tandard •nor• ftr& s3782
and ,7219, H:apeotiftq•, The oorrelat1on coeft101,,nt obta1ne4 using
the produc~llent.aotbod ft8 .J. *40:J to~ th9 states and f ,.JOO t~r ·the I
*t~c,ma. Among the ~· t>f change. 1u' cownd eploymen\ $.a ~
•bate• a.U·were '.roum w be eubstant.ia.U;y b1~ than t.ha;ohan1'3s in •A
population (tbltrtf nre·only five that nre leea than 10 p<el'\:~tage
point& high&~) 1 .. pfimarily i-e:f'leoting tho gt'Orih of employsent ·eligible
UDdfn." unuployment, ~ti.on plJ.uut &.iring the 1940-1950 deoa4e, and
1JlfJ · tnorease 1n tl'i8 paroent&!I$ ot CCYel"t!ld to total cmploym94t 1 te.if ~
Th•rEll wu an average increase of 6,s1 per cent in the rat1~ of cowr-•d
'? total wage lWd Bal.al"/ epl~ among the stat~s from 1940 w 1950,
the •vens• pro;iortion t.X>Wr.i inonastng fro11 44.87 to ,l.74 per oent.
~ the ·eu.brogione ·of Virginia the avon.ge proportion or wrken
oovel'Ml under tJnentplo~t Compenaa:tion ro:ie fi'olt. 37•3 por cent in 1940
·to .44.6 pett oent in l9S01 Ol" an ave~ of 7.; per oeat. . .
It ma1 h4 felt that the covered cmapl~t taotor dif'ters too
f':!"ft.:-.t:l;y £1."0m tho cb&;Qge in. population in most c*.&etJ to be ot ant .. .
practical aignii'i@anc•t. ?art1culai-J.r among the· aubntgiona of Virsirda ' . ~
during th& 1940-1950 decade the clinrpnoie1 nn extremAh· ffo~i-1
allua1on to f-1>1.e 4 u Obapter U 1 showing the ratios of popul.at10l'l to
coftl"Od emplo,.nt1 auqeats that aince the ratio decrea1e4 subetantully
'be'CW'een 1940 ud 19501 this factor M'f oontinlle tO gro11 to 'f)e more npre
sentative of popu1-t.i.on trend.a. .Aud the greater tba proportion t)'()ftrod

45
npio,mant ~cor:iea to .tote.l eaployment, the amallel' 1l1ll be tbs positiw
enoro betffen the oonred ~t·ind«: and the·popW.ation index.
!heretoi-e, it is reasonable to at$11Ume that covered. cployaent wUl prow ;
to be a DON reli&ble e1tlmatol." in t,~ pt:esant.. ®oad.e• Sir.a..,. honTGl"t
it. n• not.abown :tobe au.ch in the 1940-1950 d~o, tbs "9igb.tgi'V'O.ll
this taoior as much redttoe4 u ie llluetratod !n the nut ch&ptlel'•

CHAPTER 1V
COHPARI&"JN or RESULTS OBT.mn:n Ff[)M Tromu:QtH!S 01 mnumo llTJROJNSAL PO~lOK
"'1311 !0t1r ••rioa or ~toaat1c data Wied in the MU.t.iple ... fMtor
technique ax..'4 expJ.a1ned in the laat chapter w&re rela.ted and e:xpNSsed
in p. lmlltiph oorrel.&tJ.on ooef.ticient for the states and for the iSub
l'&gj.ons of Virgi.nia, !h$ ooetficiont to?: the stat&e wa1 .f. 1t9.53, whU.e
that tor tho fJUbrogions n.s f •994• The. est!maUng equation used J:i • indn of bJ.rthaJ X;i • f.rdn: 0£ deathaJ X, • :tndu or school onrollm$lltJ .
x4 •index ot covered eapl#'J11$nt;J Is •index o! po}iul.ationJ the multiple
~saion equat:Lo~ in aoore. !om •ro u follow111
J!t.atmt, :: /. .-12871246 X1 /. ,21?28!?12 !,a /. .6.\b~2230 X3 - .00515387 XJ. . x, . ' .,,. .0363 ~ . . . ..
IWJ:u!or:! = /. .3f1174375 x1 I .354:;os66 ta ~ .549sasoa :r, ,;. ,0:;6462'7 x4 x, - .2!>1!5 . . .
!he e3't1aatea obtained from the eque.tion fol' the state• toi- 1950
un oo~ tor reliability w1:~'1 tbose obtained tram the Ceruru.a Bu.ram ta
aethode of at~tton Pi natural ino~, with l>onel.4 Bogue• s tt.n.W ·
,·. t'&tet• te~, e.n<1 with the antbm.tattc methods alee diacntesfld in the
46

4'1
eeoond chapter. The reau.lt.a of the t.1ts i'or aocu.raoy o! these lattait
Mthod8 were puhU.ebed :ln tho aer!gs i:t2WOlrl.W. Re?if!t Aupst 19541
1n tm a"tt!ole b;y Uessre. Siegel, Shr,1ock1 and Greenberg of tba u. s. &.t.reau of the OeMUs•l
!be cdteri.a 1fh1oh •N u.se<l to ~ thG acauraQY of tba
e1tJ.mate11 an those outl.imd in tha eited utiole. One odter1on u.a&i1
\M awftlge deviation, u lklply the atitmetto uan or the pe~ o•nt
dftiat1o111 dial"Ggariing •ign. Another na the quadratio mean deviation
which 111 the aqu,are not ot tM ari tla:rUo nan of tJlll equarea of the
cleviations• Th.ta latte~ te1t potn·ts oi..it the method• wllioh Jteld 'rt\J.a-.
t.i:nl1" 1ep en"Ors. fbo two tests ban been alluded to prev10'UJl17
end were used in \ho enadnatton ot 'ftri.oaa othtt' Mtbod.s contained in
Chapter n. ' ' Jnotmr 91' of ata.pbeauing the rele.t1ftl1' 1&1."p enon produced
lV" 8ftl' ot the 11etboia 18 to eurda• bow Ml\f On'O\'iJ exoe.ed. a eertein
ftlue• A final cheok ado na the agrogate uuaber of po•its.ve 4ev.l.
atl.omt1 enabling the 1dent1ficatton of aethods which ten4 to OTOf'estJ.matG
•n ot~ tblin ~l"f»JU.te.2
Tab.lo 13 oontaina data from Table l ln t.M Wr!9& £29io1Qg1ga;l ~ ) F -
11. St Sieplt n. s. Shcyook• Jr.,,, and. B. Greenberg, •Aocu.ntr.1 of fostoensal Estimates or Population for States and.Citi&s.~ Nitta.em lwlsUPWAl IMtt!• 19 (4) t Augwlt l954t . P• 442•
~. PP• 441-442.•

the equation bal«i on •tour fe.ctQn,• estimates bued on a 11apl•l" weight
ing prooedure o! the tour £aotot".s1 and estJ.ates baised on an equal ftigbt
!ng of onl1' threo 0£ the faotot"D• The est.ira&tu obtaillecl tl'01I. the multiple
repos:s1on $qUAt.ion uaing tour fectore nre not adjusted to the nat.iomU.
total •inM ti. et:m or "bheae ne less than 1501000, or on4f .oo ot l pq
o.nt in d991aticm fJ."OUl t.m cen.aus natimW. total. of 1950• To t'tfl'Ork the
eat.biates em adJu.1t tllOJI to th.ti 0G111U• count would not haw produo•d
Ch.llm.pa u nsul.ta· eignit1can.t ~to warrant the taak.
!ma aaea.ros ot &:rd.&Uon :trom the population standard 8'J
•:xrwdne4 1n Table l3 ehow that t.l» ~tipl.6-.f's.otor regression anal.yaia
pl'OduMd e•t.imates ot corud.4-ra.bl.¥ greatel" 1"eliabillt, than the otbsr
method• tested. However, in the atriot sense, it is not juatU'iable ·to
~n these re:nilta ritb. the others rdnce the weighting of th& faotiora
wae baHd on a be.ckftrd look, !ha.t iut the census oount.e tor 1950 ""
uaod in the HgnBaion. ~a.is itoeltJ the l"ellability ot est1matsa
t~ ~ partic:rol.ar regreuion eqµe:tton 1IOUld ·not. be d.'*Onatrated UtttU
th• curftnt decade. the degNO or aimilarit.T between cn.u:Tent eetima.wa
t~ th. equation and actual. population oounta (U there nM W:q afti.1-
able) would de~ upon tb9 degzree to which the f'oui- factoff ooatim.\94.
to UOO\lJlt ten• the •riation 1n ·population change.a.
. . b tour teowrs Upl"US.aed u bd•xea ot ohanp 1l'Or9 also
1M1ght.Gd and aterapd·into a sill8le estimator bya •1-ple~ prueeduro1 tho
relnllta or which are .:t.eo nho1tn :1J1 Te.bl•· lJ• 11'Nlt1 tbs indexee ot
births eDd ooverect, .aploJm,ent wre weighted equally and ""'"ged into a

UBlZ 13 . · SUJiliiRt OF PEOOEftAGE DMATm."lS FBOM ?OPUUTIOB SWIDA RD OF POPULATION . ESm4A'?ES
·.' . ,: BX VARIOUS li4El'W.OO FOR ST.ATES, l.950
Migration Four r.oree ' and
natural Bopt.s Four factor faGtot:> .... ··moasun .. !ncreaso •vital Ari.th-- Qeomat,,.. .factor a imp la equal
rates." mo tic rio regreeeion nigh ting w:igb.ting
I II oquatiou procedure proaednre
.Adju.s.tAd to national. total ..
Statea~, .1950 •'
,.,.
Aw~: doviaUOD ~..P.-4 3.47 4.)S 6.-39 6.35 3.55;. 3.66 Qwuln:t.:te:· .run d$viation 1.3a 4.73 5.54 . s.01 · a..01 4.72 4-45 Dniationa ot 10% or mon 10 2 4 ll ll 2 0 lln"iatioos of S,. er more 22 • u 19 24 23 ll ll
Wot l.djnnt.Gd to natiOD&l. .
total Sta.teas 1950
Avenge dev.tatioil 5.36 3.89 4.39. 7.42 1.04 2.57 4.36 4.53 'iuadftltio mean deviation 7-41 4.,,94 5.53 9,.57 9.03 J.J,4 f).67 5.44 Dniations c£ l()j o'?' more lO 2 3 ll l2 0 5 l l>evis.t.toruJ o£ ~ Ot" mc>ft 2.2 lJ l8 28 29 8 15 24 Poait.1.on dm.ations 29 . 2l.
' 24 s $ 2S 35 36

so ~ J.Jtaox. tlrl.• indc.x cmd the 11\dexea or eke.tho and aomol ent'Oll
MDt wre then wighted equally {bf one) &md averaged into. a flingl.e
fftiaawr·of .obange. The restll.ta of tbilJ a.rbitrar,y weighting prooeduN
produeed aurpr1111nglf good eetimat~H•• estimate• which after djustman\
to the· naUonal total nmke4 in rtiliabili ty w1 th those obta.1ne4 from tbo
invol'ffd and longtlv' migration and Mtull'al increase htbod · ;u,,
· the Qther weighting procedure tested also pl'Oduoed w17 ffli
abl• ••Mal.tAJ• u compared nth the e:1timo.t&a f"rom other teebniques.
!he 1114••• of births• dMtlvs1 and tchool t!Oll"Ollaent (lfith COTared. employ
raent · exeiude4) nre e.~ :lnto a fWlgl& eatir.rla.tor of pop.tlation o~J
when adJuatad to th• no.tdollal. total, the'"* resulted rio ••timate• which
abtnrtMl a dftiaUori or u much aa 10 pel.'fMmtap points.
Xtt _,. aafel.7 bit~ froa the reaaul.te of the .fongoing
~a tb&t.t popuh:Uon. caati.Mtion at the •·ta:t.. 14"01 ._,.be appl"Oub&d
IU.Ooeastunr tht"Ough uae of IJhol"'t-ov.t to.etllada inwlving oerlea of
J71Uptowit1e data; as well as fl"Oll the laborioua and exact migration and
aatum tnonaa• atbodet ln other 1"0nla1 because a mettiod is~
and more pnoiM with JM.tdfold refirultlentt and adJustmenta, th.ore em be
no 9.#tmftmM that the reJJUlta pt'Oduce4 wUl bo e1gn1i'itnmtl1 mar. Nli
able than ~U. p~d•• J\trther lnvetJt!ption or Mriea ot sympto
•tio data end tll$ir h11\t~r1ettll)r demon•tl'&ted relaUonabipe With ebugos
!a popalatiou .4t the atate le1rel ahould b9 undertaken u an adjuact to
the oo:ntit'NAU.oa or naearoh iii the field ot population eotisation already
•sun•

51
l'.n an enmf.flA:tion of tho rosult• obtained fro• techniques wb1oh
••Umattld. !nterttnlU·populaUon below ti. state level• it should bo
kept in mind tl:at. the 4-gree ot i-eliab1lity wbioh may be reuonabl7
approximated. would 'be lass than on tile stato l8T8l• O.ner,ally1 tbe
amaller the enti tie• ueed a1 the be.sea for eotime:t1on1 . the l.m.t"pr the
pert\eatap.·enora which relUl.t ay be •xpectecl to be.
· fable 14 gives the ruultn ot t,W, same taato or measures ot
«•rtat1on 1fhiob -~ applied to th& otats estburt•s on tho estimate•
fol: 1950 tor tbe twent1-thrff 1Nln-eg1ons of Yit'g;ln:la"' !he result• aN
OOltiD.GW upon in the Pfl'l'qnlpha that f olln.
At·. Arl.thmetJ.e proJection ~huique. The estimates based oa
th!o ltlethod prcKtuced among tho h.1.gMst aveni.ge end quad.re.tic mean dovi
ats.one f'Nt1 the popW.atJ.on. standard of all the method11 tested., c.rhe
eo-umatea wre not ad.justed to the atat. total a~,.c• thia would defet.t
the vo1"ldng or tJie teohniqmt 1 taelf •
Bt .tpporU0111Dm1t •tbod., !be estima:tes obtainad •hand tblJ.
lon•t tegree or reliabilJ.t,. cm thf.t particular deo.ade te1ted, slightly
"11 ~·•or the aritmeUc pro3eot1on toobnique• The ·rcur~ilt1 of teat
iUB tho oatimd,a11 a't"ft ttholm Qllly ·B.tl 114lu11ted to the state total Since
i.luJ· raethod !.tselt 1•· bal<ld. op.· a given ewtl'Ol total.
CJ Pi"Oration Method with equal. Wighting of estimates J:)affd on.
tour ·taotora. fhl• abort-out •thod produced. re8Ul ta which nre better
than A tnd ! bu..t.Whiob. •H su~tantially le•a,nliable than ·'""al
Othe't \eo.l'aliquea t•eted •.

. · W'.JJUUtY 01' PROO~ DEVIATIONS J'am.t PO.."PULATIOlf STANDABD OF POPULATION ESTIMATES DI VARIOUS W!."'TWDS roe. smmmoNs .. OF nRGinll, l.950
.. Scthod · -Mati.eure
l B CL D lC 1 G Ii l J I: . L Ii ... ". l ...
Adjusted to lfta.to tot;o.i &llbr.egiows; 1950
«
Anrage deviation 11-4 ~?'a.tie meatl d.ev-1-
1..41. u.63 6.5,; . 3.~ 2.,.96. 3.7-j . ~ 52 . ->• . , .3.lO
. S.J.6 4."'l~ ation llw9 9.30 13.9$ 3.70 4--SS 4-Jl 3.86 Deviations of' lOJ o.r 'I...
/ moro l2 s 12 6 l 0 0 0 0 ~nations of 5% or
more .... .; l4 lO 19 12 7 3 9 6 3
Not adjusted to state .total
Subregions; 1950
Average deviation 10.1 'J,,,7; 3.44 4.00 2.36 s .. 32 3.71 2.69 J,.60 Quadratio .MQn dGTi-
a ti.on 14.6 4.5;;: 3.95 5.18 .. 2.99 9.99 4.56 :;.25 4.15 Dav:l&ti.ona of' ~ o-r
more e Dmliations of~ or-
l. a 2 0 10 l Q 0
mo:re 14 7 4 6 3 l.6 6 .3 5 Pontiw deviations 7 lS 9 14 l2 15 15 ll a

53
Di ProNticn ll&tbod with each estimate nighted by tM recip?'O
cal ot the ntio of otaw population to t-ba pa.rtlculai- aeries ot sympto
u.tio data. 'lhis weighting proc.UUre es augaested by Scbmi tt and used
in bis tf;etl on .t.M oountiel or t11* St.iite of Washington. For exutple,
th& $Stiaate for a subre81on bssed. on ita ahare of births in 19~ would
be w1ghte4 by l di:dd$d by 46.8/114 or .021349, tho rat1o. or otate popU
lation to num.bel' of birtha in 19/J) ~ing 46.SJJ)4. · Weights bao&d. on the
othEYe> thrff factors 'fOUld b9 obtained in the "ue manner and applied to
each pnlltdnary estims.te, l'98pectiWly. 11~, the 8Ull ·of. ·the
weig~ted estimateo would be divided by the ewt of the nights with the
quotient l*ep~enting the final popul&tion estimate.,
The eatiUtes obtain9d trom' thill "ighting teohniqutt aid not
prow wry reliable, the derie.tionsbeing l.nrige enough to discounge
Bt1 extensive use or the pl'OCedure in Vit'ginia. fhi1 eatilUn.tes in D
rank~ in reliability at th• bottma ot the techn.1q,ue$ teated along nth
tbJ arithMtio utbods.
I. horation method with eaeh estiu.te 11'9ighted by the Nciprc
oal ot :lt8 ooeffioisnt of "fariation. !b.ls 1r11ghting scheme wu a.too
ued by' Scbai tt in WafJh.1.ngton and prOwd the most l!IUCCtUiSlul. of those
tested tbet-e. The pmcedttt"& tollo1'9d ie essentially the uue a.a ti.
weighting in DJ bb.,,.,,.r, the reaipt"Ocal of the ooe.f.ficient ot 11e.r1at1on
uong tbtJ·, ratio• of popalation · tO e,mptom.e.tic data in the oubNgions
i• ued betead of the reoiprooal of the. actual ratio of population to
a~tlc de.ta in the ttate. fol" e::x:ampl•, the prelimtna.ey eatimttte

54
for a eumgion 1n 1950 be.sad on the aha.re or total deaths in th., stat.&
'#hteh,tbat subregion acoount.d fol' in 1950 1l0Uld be nighted by l divided
'b7 JJ.9 oi- .,071942. ·the coefficient of u'dation among tbs 'r11.~os. ot
population to dee.tbs in the 11t1bl"'l3giona in 1940 n.e 13,9 •.
,The average deviation uong theoe est.Us.ten ns 6.,53 pel" cont
while the (1UAd1'ltiO JIO-.U devi&.t1on. roafJ.-to a.46. There were tlfelva
~tJ~ns ot mortt than 5 1'1$1" oont, ot which aix -reached moro than lO
~-oent • .bong the weighting eyutema applied to the eatimates from
tb9 pl'O:r&Uon •tbodt the uoe of the reciprocal 0£ the ooefi'icient of'
'ftria.tioa proved aoat esuao•1stu.1,.
'• · Censal ntio aat.bod uaing tw.i- taotata weipted. by the
reoiprocala of the ooatf!cienta of variation. Th9 estimates obtain&d
tl'Olll the oenl&l.ntio aethod for the eubl'egiona proved quite reliable.
mum nob ot the four eattam.te• •• weighted by the reoipt'Ooal of the
ooeffioi.ent of varl.ationot the roepectivetaeto:r, and the four avenged
into ·a $iugl.e eat1mate1· the tinal eatiutea ahond an average dev1atJ.oa
of 3•75 per cent and a quadra~o 1H&ll dniation ot 4•52 per t:Gt;.
ut~n· a.QJU&tm..nt to the state 'iotalt' tho utiu:te• produced. •l.iihtl.1'
greater dniation1. there waa produced onl7 flll9 devJ.r-tion in exoeas
ot 10 pe~ oent, while ae-nm oatima.tea sbond devie.tioud 5 per oent. or
more.·
G. Cenaal re.t1o t&almique wtl.ng tlire& factors . weighted. bf ·the
re-dprocall of the ooetf'1o1enta of variation. The. eatimAte. based on
the rat.1.oa of' population to covered employment. were 1'XCludedJ tbooe

55
ftaulttng froa the co:mbination and weighting ot the other three taotora
p~ eatJ..-.te• •lrl.ch deviated e-ron l.ess from the popul.at.1.o~ 11tandard
'\ban Ps fbHo e11tiute& "" th& most· reliable &aid• ·from those baa-4
on the multiple regreasion ~~UonJ onJ¥ tht'oe aubngional estilnat.ea
were u 111ob. as 5 per eent in et"roti ~ then wre none u . auoh. a• lO
por cent in dev.i.atiGrl•
Bi !ogu.e• a •ntal rates• ~olmiquo. the est1mat&a obtained
trom this simple ahort,...out met.bod exhibited a oonsicle:rable 4-&X"" ot
relia'bi.U;t.7. lhen adjusted to the at.ate total for· 19501 1;lle7 eho-4
an av•rage deviation ot 3.79 per cent and a quadt"atic mean deviation
of 4.ss per oent. Whil• nine e1tiutea •re in deviation ; per oent oi
iaon; · then wre none d JaUCh aa lO per cent. in error.
It,· ftm.r-ta.ctor multiple regrea81on ~uation. The•• eaU.t.ea
p10ved. t.ha most reliable of .ii tested. b &Terage de'ria.tion was only
2.,,6 per cet and the qwuil"atio •an dniation only 2.99 per C$Ut., file
eat.111ate11 were not a4juste4 to tbs • t&te total for 1950 aina. the sum
•• onl1 .20 or l P')\" cent leoii than the oenaws count ..
I.. 1oo.r-faotor .simpler ni&htin& proff<lure. flben the ~ . . .
of bl.rthll·and ooyereQ.·eapJ.o;yaent ware aV9l"apd into a •inil• ind•x1 an4
th.ta ind.a in mm ave~ged. 1'1 th the•• of deathS and acmoo1. onl'Olllae.nt,
rol" the subregions, ti. resulting eatiae.te• exhibited 'rather high dmations• ·An average 4"iation of s.32· per. oent and t. quadratia man dni•
atioa ot 9•99 per· cent wroul.d tend tu diBCOUr&&$ much further ll•e of this
arbitrary. nighting procedure.

56
Kl Four-te.otor equal weight.tng prooedt.tr6 eubat1 tu ting cenis-.iu
total entploymeiit for u. c. c. covered employment. This was inoluded
only to Ulustrat.a that with a oomplot9 emp.1.oyn;etit count (or u 1nolu
eivo as may ba ob-t.ainJJd) tha e1mplost weighting vroceduro p'rCX:hwod quito
reliablia eetimtoG for th9 subregions. After adjus;1tment to the e~ta
total, tho eatimtas sbM'!ad. e. 3.52 t:>9r cent. rA.verage dovlation and a
quadltatic mean deviation of 4-Jl ?$r oent. ·
LI 7hl'M-i'o.cter mu.ltipl.e rcgl'Ouiou equation. When oowr&d
~nt was t"emVOti fl'Olll the a."lalysis1 the multiple rogreasion equa
tion in aoore tom becuet
x, • ,l .n510688 x1 ;. .JJJ46J240 ~ ' .s:u~a356 x3 - .2191
RoamAl. of tba fourth factor pl'Ctluced estJ.mates which were only slightly
aaoro in deviation trcm the population at&ndard tl1M the four-faotoi
ngnsaion &fA\~tiou pt'OT.ld.&d. An ave~ deviation ef 2,.69 per cent
and a quadratio mean dwiation ot J.2; par cent l'Gaul.ted,. !ba oati?Qat,33
"9N not adjusted to the ate.ta total. s1noa tho oum was but .is of l per
o.nt 1n excess or too census eotmt tor 1950.
Ml 'lbree.-factor ttqw\l weighting ti'JChniquo• A simple aTeraging
ot tbo indexes of births, deaths, and school enrolli:tent produced surpris-
1ngly good es·thlate:J tor the subregions tor 19;0. Aft.or adJustment to ··if'!.
-, ,''-\
the State toteJ. they deviatod on t.}» AW~ Only 3•l0 p!tt" cent ftonl t.he
oanaus figures. The· quadratic moan deviation nu 3.86 per centi onl.T
. '1uoee estimate• were 5 ,Otr more pewenta.go points in error and nono :ue!'e
u mch as 10 per cent,

TtIE PREPARATION OV CUR~ &STDUTES FOR Tim SUBRmlONS OF VIRGINIA ARD CONOLUSIONS
Bsti.ma.teu tor the tl'Jenty-three nbregiona ot• Virginia for 1954
were p~ usine sevenLJ. techniques. Tlv.t roetboda chosen were tboso
that produced eastiml'J.tes i"ot• 1950 which exhibited ·the lowest pet"Oentage
clevlations troia the population at&ndal"Cl. Included are throe seta of
eatimat&s pl"&pal"ed from tbs llllltiple regression equat1o~ based on the
Changes between l.91..0 and 19501 BoBU&'a "vltal ratesn technique, and thei
otn8al Tatio uthod weighted by tbs reciprocals of the c0e.f.ficitmt8
of n.riatiOlt in 1950•
The percentage ohanps which each aet of ostiwltes for 1954
retloctG4:f ovo:r tho 1950 Cenarul ave eompa?"ed tor 01.zdlat"ity of trend
and degree ot ine-rease or decrease. An.other set of eat.1Jllatee prepared
at ·the Bureau of Po~tion and Economic Reaearoh by Hr. J. L. La.n03stci
••• al.80 eompa.Nd 'd.th tho1e obtained bf the short-Cut metb:>da. Ur.
Lano&ster•s •stlmatol fol" the counties and cities were made using the
migration and natural inOl"eMe Uethod II of the Bttreau ot the Census
57

'o '•' "c
vith a ten, aQJustmenta~ . Instead of age-grad• distributions which are
not avallablo on th• local level in Virginia.1 the anrage d.aUy 1ne111l><!ir
f'Jhip figures wre used. Tho comparison of the four •eta of estimates
ls tound in Table 17.,
be of· tba est111aten 'MU."8 adjua·ted to t..lte census estimate .for
th9 State at ViC"gl.nia for .July 1954 of 31500,000.1
Th• at.ate tot.!.l fer
1954 used as the control £or the throe aseta of eatimat.ffo prepared bot"ein
was 31678,0001 .or an estimated. e..7 per cent higher than the os.nsu• i'i@ll°O•
It-. a CQllJGfV&tift estimate arrived at after obta.Udng n.unhtrous otat3
figune fl'OUl difi'et'tln.'t lltOthoWl of eutimation.- Also, tbs estimat.4 .obtai11$d
bJ' Ht-., I.ancas~r we.a very cl~stt1 at 316701000 ..
!able lS prtts.nts tbo irdexea or oba:oge in the .tout- factora
tyJ:lptoutic of .tho direction of population chane;fil tor 1950and1954
(crJ'flr .the 1940 .b&se) for the S\ibregiorus ot Virlin1a•
Th9 population eatimat6s fQl.• the subregions in. 1954 using the ,.
indens 1n 'lablA 15 in th& multiple regression equation we~ e.d.Juotod
to tll9 etat~ contt"Ol total of 31678.,000 and are present94 in fable 161
along witb th& census 1950 eount. The estim.atea prepared tor 1950 £ro11
the 'NgreNlon equationara also given with the P1J1"CGr1tage d8Viations
froDl the population standa~ poin~ out •. , &rr sil~lo ?ositive oi- ·
IJ;eg&tiw 41JV1ation in 1950 ~ be psrpetuc.ted throu.gh UM 0£ tM hmft .. . ,. . .
; '

tABLB 15 ItmEIES OF ClW1GI Ill m~. J>&'.mS,, SCHOOL urnoumn, .on coumm m?LOYJ&m IN THE
SUlWXUOBB OJ' VI~fill\• 1950 AID 1954 OVER 1940
Births Jlaaths School em:ollaeut Covered employment IW~
1950 1954 1950 1954 1950 1954 1950 1954
l~• 2.9718 3.9261 1.5;.36 J..75ll i.7900 2.8100 2.7733 :J.~n.o l...;B 1.1002 2.0252 1.0974 i.crm l.0030 l....2143 1J.ll7 J,.,..5254 l-0-ll 2..,22% 3.2625 . l.2451 l • .3457 1.4524 .l.9401 l.AS.25 2.1650 l.--0-S· 2.2359 3.2482 1.1622 1..2452 l.390.3 l.8529 1.5716 l.MB.3 l.l.. l.~ l:.6317 .0046 .8WIS .8849 .9370 l..9207 l.8139 l..2 . l..212l. 1.3268 .9993 .3403 1.0659 l..l.003 . l.2750 J...4346 l.J· J...4762 2.1905 l.0275 1.1409 l.1596 l.3567 2.3935 2.61~ l-4 l..J.800 L..2435 .9512 ,.9276 .8868 .9660 J..8557 l,."/545 i.s · l..USS i.3259 .916o .872.l. .9r14 .9109 2.3014 2.5798 l.6
·l.f l.2899 l.4349 .941J3 .9212 .9545 l.0972 i.5100 l.6492
l.7 I'· la0297 l.0840 .9872 .3797 .9554 .9396 1.6:JOO l.4716 i.s · l.l02l_ l.1913 .9£{,'6 .9438 .97a:;; l..0264 l.'7146 l.9'720 l..9 42"/44 1.Sl6S .9064 .9441 .9'~SO Wl.46 2.2596 3.0&-JS 2.1. I l.JYlf37 l.lZ77 .9l'-OJ .9053 .9915 i.0305 2.0904 2.1481 2.a i.2264 l..27ff/ .9575 .9351 l.0912 1.1934 l • .%54 i.4054 3+1 1 • .3185 l.3130 l.OllS .9l194 l.ll49 l.2271 J..8069 1.9105 ~.'*2· l..3591 l. • .38.5l 1.0040 .9910 1.0519 1.1298 l.7261 4748.3
4.J. l.2.424 1.2403 .9959 .9006 .9727 1.0321 1.4358 .l.48CtJ 4-2 l..1124 L.0478 .9600 -~)73 .9349 .9586 l.5120 43685 4.3- 1..3838 1.5060 l.lll7 .9210 1.043$ 1.1943 J..68J3 ., l.8431 5.l. .921.i. .$765 .93;;5 .,S'J27 .aoss .8591 2.2933 2.714S s.a
' l.,00~8 1..0.339 •• 9473 .9Z16. l.0540 l.0934 l.63J$ l.6599
5.3 1.0195 .Bi3Sl .9636 .5470 i.1049 l.~'"'75 1 .. 1914 .am State l..4341 1.6645 l...0403 l.0274 l.0372 1 .. 2484 1.5622 l..'ll6l

TABLE l6 .PO...t:IULATIOU OF THE SUBREGIONS OF, VIOODI.At CENSUS COUNT AID &STIMATES !OR 1950;
· ' ·· . IS'WAATF8 FOR 1954
C4n.Bl18 Estimated Fercentap Fst.imated Ragion . ' l9Sil population 1950 population devia.Uon · 1954 population
J...i.A ... ·30~,32$ .. . 302,539. . -0.24 417,453 . l;..B . . 417,9113 .. 425,266. /:)..'16 . . 482,l.fJ5 l-G'-1. . l4J,227 146;136 /2.0J 195,302 l+s-_'. .446,200 J;32,U::;3 -3.0) . . 573 1769 "· 1 .. 1
.. 51,132 .. 53~ /.4.49 56,27;3 '
J..2 ' 114,329 1~_;. .. 19a kJ.76 120,.6.3$ l.3 . 33,47J 3.3.1668 f!J.r;s A2.,297 l.4 . 44,624 45,3.30 /l.5S 46,343 i,.s I.:. 41.1(:/:)9 41,010. -1.6; 42,297 l.6 , 70,416 65,64:>. - -6.80 70.985 l.7 ?J,649 .· "13.UO j.3.50 70,6l8 i.a m,aoo ll0.1124 -1.50 ll.2,915 i.9 ' 7'2,001 72.,333 ,lo.35 .. a21 019 2~1
. 154,125 160~304 ,l4.01 ·• 157,,l+lS.
21t2 . .. , 149.,632 145"942 -2-47 l.50~30
.;;1 82,500 ~ 871193 . /.5.6:1 8'8,640 3.2 .. 112,327 lll$86o -0.42 ' l.12,915 4.1 . 126~56.3 J.2$;937 ;!1.92 125,78B 4.2 87,0'-10 ss.on ,!1.13 82,755 4.3 21.B,927 213,872. -2 .. .31 2l.7,73S .
5 .. 1 51,553 l,Bjl;BB -5.9S 46,711 5..2 189,154 186,809 -1.24 lS6sl07 s.3 225,913 221.,070 -o.82 196,405 State 3,318,,600 3,312;135 ..;·.2() 3,078,000

hble 17 tJOnt.!d.rul tho !)9rcentcge changes ft'Om 1950 ·that four . ' "
-trend abown 'by the f'i~t three aets of eotimates •hic:.h wore m&de using. . .
flbc'l>'t-au.t nwthod.tJ. E9timates I and n ·"· oi' COUrde_, baaed on tho
O&nl$ four .f'aotorst changes in ,..arly bi.rt.ha, 4e&thi; 111ohool ent"Ol.lmont
as GXpl'OSSed 1V l\'Verag& ~attendance ad.Justed, aud oovered_wploy
fll6mt. Bats.ates IV,. oonta.irdng thi.IJ au:aw tot• the subregions oi' eatim&t,aa
ado tor t.he individual counti•ll and oitiea by tho migration and natural.
inorea.M Ustbod lI, show divergent tre:wit:a to·r a munbsr or tho aubregiona. ·
&mp:cy b$e&U•• some ot thou• last eutimatos 'l1JA':i differ lrom a
dagre~ of unanimity among the other three; it 1s not to bo implied tMt
~ of l:at1at.tel3 IY aN in erro~. Tlvn.•e ia actually no baaia upon
whlch anyone ins1Woti?lg th9 edtimatee might categorioalJ.y. claim exs.ot
~11 ot one .est oi' eatimatoa o'f'Or anotbln·. lfowent"1 where a region
would ha in qu~:stion du0 to divergont tNnds manifested by tba savoftll
1eta of estimate•, en investigation of' the social and eoonomio :toroea
in operation in the eubrogiona should 'bl made. Exemi.nation ot the
tndi'ri.dual factors used in the 1~gre1aion equation would bo of help
along wtth &1J1 other kno.wl00ge of tba area whieb might be obtained. Tbs
llm.tationa inherent ~ any atatiattcal aeries ehould &lwayo be aaknowl
ectpd1 whil• S.t would al.80 be rea&mbered that :some area• are iJU\ply
ditticult to analyse and. do uot oou olo•• to fi tti.:lB any pat~rn th&\
f11J.7 haw been displayed by the ao-c•ll~ a:nn:ap •l'R-•

Bub-
tABLR 17
P&1DF&TME CHAOOES 1950 TO 1954 Dt PO?tJI.AT!ON OF SUBREGIONS Qf iIBGIHlit .fOUR S!T8 OF ESTIMAT'i.8 IUR 1954
.bgvesoion CensaJ.'mtio ~tion and·· equation aetbod Vit.al rates natural increase ll
reJ.lon I II (
llI xv
1-A ~37.62. . .f..J/J..90 ,£.;2.53. . l·2'ih49 ..
1-B ro • .38. AJ.,.86 " 9,.04 ,£.u.79 l...c-If f,36.36 f 31·99 .j.2.S.IJ) ,Ll.8.89 J.-0...S 1'2a.59 ,l29.oo /.W?.17 f.22..4?
l.l ,t10.o; f.. s.62 /.12.21 - 0.23 i.2 /.. 5.52
"f.. '•'-' .;. 4,as /. 4,.97
l.) ;t26 • .;6 B6 • .;6 /.:;J2(t95 /._ 9,64 l.4 ·~ 3,a5 ~ J+.6$ ' ,(. 4,.6$ ,;. a.80 i.s l.4J f 8-49 t'll.l4 .;.. l,21 1.6 -/. Ot7S · jlio.l.S 1-12.27 . ,4.ll.50 . l.7 - 0 .. 04 - l.09 - o.!>6 f.. i.a2 1.8 ~ i.oo ~ 2.:;1 ~ 3.96 -/. 2.42 . i.9 A.3.19 t£13.;ta ;!ll.73 .;.. 9.93
2.1 .,t. a.u /.. o-94 f i.42 f J.'4 2.2 I- 0.53 /. 2,25 I- ;,73 .;.. 7.(:// .
3.1 /._ 7.,44 .J. 1~65 .J.: 2.09 ~ 5,43 3.2 "j. o.s2 /. 1.18 "f. 3.14 '/- 3.~i'l
4.1 - o.61 - 0.32 - 0.32 /._ s.ru. 4.2 - 4.98' ""'3.29 - :r:.S7 /. .;.~ 4.3 - o.s4 ;. s.67 /. 5.84 .j. 7.79
•.
s.1 ... 9.39 ..... 2.97 - s.a.; /. 3.22 s.2 -1.61 /. 1,31 f. 2.86 /. 2.a3 s.J -1:;.o6 -u.92 -10.62 - 0,.42
State 1'10.a; ;10.a,; · /.10.a.; ,l10.59

5fsmglus1op.§.
The purpose or tbs thesis 1ru to attempt to appr&i•• ••veral
techniques in current usa.p for makjng intercensal population tHthlati>ti' . .
and to •J':PIS'l.'1ment. 'lfith a new •tMd• The pa.rtiaular need at'C'eaaed n• . . .
reliable; utJ--to-<taw population estimates in areas below tho at.at. level.
The twentr-three mbt"egl.ons of Virgin1.a. nre used ae th• su'bJecta of
the teat# on snggeated p-roc$dures.
· The 111AIJ1 eets 0£ e1timate1 tor 19!>0 mad.a from O'LR'rent sethod1
wre tes·fied by various measureas ot deviation from the population.
atandard. It ma.1 be concluded that ill the State ot Virginia. during the
laJt dee.de the "vital ratea11 and censal. ratio teohniquea.oi'£ered i-ell
able estimate• through short-out aeana.
!he nmltiple-ta.ctor tee.bnique making ua• of tour aedee ot
aymptcat.tio data expreeaed. ae indexe• of ohange in multiple ngresaio11
equaticnt alJlo afforded roliable population estimates. Tho estimating
eciuation uy eontimt• to account 1n a aatiatactory degree for the popd.
la t.i.011 ebangell that talta place in the current dtload.•• _ That NS.ins
tf>b$ soenJ however, the method tshould otfev wt"tlrtrhile indioationa ot
'bNnd• in the 8UbNgiona durl.ng the 1ntaroell$.l 7eara. The pr.paraUon
Of Pov•ral eete ot eaUmates using a.iort-out methods which haw proTed
reliable in the past decad• would be ct pn.otical UM and aignifioan•
w anr atate &'Pd.~ partiea therein dosiJ'1>ua or the information tha.t
ounent·population estimates pNvid••
':
..

~ ox.act :mmber11 o.r poople are not or prim<t importanoe to the
uoai- ot ngional. po11Ulation statistic•. Indeed, it would b6 1mposnj.blo'.
to attain auoh certainty, particularly 0J1 the level of ema.ller areas · .
tr.an stat.ea,_ lb:·, Jlarold ~rn in Nl ~liotaent of toreouting at the
aational level tbOught it 'fOUld beooJBO 11inoreaaingly ditfioult• to esti
aate the popula tioa "tor period• as ahort as ff81l five yeara • • •
tmletUJ e$onondc oond1t1ou ~ 1tabili11od.•1
The t.rend and oX'Wnt
of pwth or d•allne w1 thin na1onab.l.e llmi ts 1a the question wboq
~ provid•I tllt ks1 to the foniUJ.ation 0£ planu to~ governmental
~ bus~a• actJ;ri.ey 1n the social axld eoonomic a_pbertu1. The mu.l:t.iplo
tacw?" tt\'ilmi~ he:rein suggested JAa1 not cn11' offer rellablo iSldica:boi-s
ot p"puhtion t"1lde1 bl.it in ti. eD.minat.1.on of the tour dynuic tot"Cflat
in operation 1n regiorus below thG at.ate l•vel. will atrotd a bro&Ur
Yi" ot the sooio-eoommric make-up or the aNaa 1nvolve4.
. .
· 1aarold.F. Dorn, "Pitfalls in Population Forecasts and ProJections,• Journal~ the .America.a Statistical J.ssociation, 45 (251) 1 Septem-ber 19501 P• 3.32.

Bog11e, Donil.d J. •J. Technique tor Making 1.k:tenaive .:Population Eat.tmato11,• ~·i!.!h!. Am!W!ll fH:4tistioM. Aa=>ocia1tismr 4S (June 1950); 149-l.6.3 •.
Dom, &rold:V. np1tf~s in Popul.ation Jroncasts en<1 ProjeoUona,11 -iS7ml!l. i!, t.h$ MeGS J3ta~i~'fY.c~ j::tt!Oo,i?.t.:ls»b 45 (September l9SO), )ll-34. ' .
~ I • '
lldddge1 Hope !iad&l4h u. s. Bur.au Gt the C9ll8Ua• fopul,atiog Sru!S!1'1. .l!eary, Sede1 P-471 Jo. 41 "Bugg•sted Proo9dures tor Eatim&ting ~ C-\u•rent J!opulation of Counties," Apll'il 30• 1947.
) ' 1aaen1 Carl It., "8131Ptomatio Date. in Population lstimateat l?robl91J141J
and, Lirdt&tiona,t.a ~auron b;4ieJ!. .at !b!. St&!e! ,go_lJ.1n 9l.. !aehingjgjb 19 {June l9Sl ~ 101-10. hl l-.n, lfaahiligton1 State College of Washington.
Boraid1 Calvin F • t and othent• . lszpql,Mion Jm!! Jnrollmf!n~ km:\S .ml · fornys!t!:-§:!f!t& gt Jitl~1'2ll• &t&tt.lea WUhin.gtou State C.n:N9 »oarcl, 1953. .
Sohtd.tt.,. Bc~rt o •. •Bhort-ea.t !l•tboda of lstimating County Popule:tion1• lRJ:t~R.t~ArlltE!om S~!J.m\1MAA2!e.!J.on,1.7 (J·ane 1952)1 232-2.38·
; ' • r i
Si•gel, J. s., Shryock, Rt s., Jr,.t And Oraenber1b B. •.&ocut"e.01 of .. Poatoeual Eatim&tes o£ i1opull!.t1on for St-9.teG and Citiee,n >mertsm. !oois?l&?S.0&1 ~ne.-.., 19 (.Al.igu.ut 1954), ~.
fhompaon, Lorin A• ~atterna of Popal&tion Change, W.gra\ion• and Income Level. a Unpu.blisbed paper read be.tore ·ti~ Annual Ueeting ot the Poptllation Aaaoo:iation of Amerloat Princeton. New larsey• April. 19-2Cl I 19,52.
Vn~t Co!tipenaat1on Comndli$:\.on1 Dl'Viaion of Reftlarch, StAt.tlsttca, and Womation• "Number oi' Covered latabliabments, Employment by Months, Quat"tet-lY Groso Wa~:J and Awn.go Quarterly Wagers Por Workar by County and Independent City-St.aw Qf Yi~,•
\.

66
V. s. Bul'ae.u of tho Cen.sns. 9}tn-en~ fopµl!;!iion Rogg.£11!, Ser-las P-2S, lb. U6. •Ou.rrwJ.t Status of Population Estimates Frepar6d by State .lgenoies,n Juno 61 1955•
---· a.umn.t. Pom:tJ&tJ!m &P2rt9, &riee P-25, No. 20, •niustr5:M.w Examples of Tfl\l Uethod:J cf Estimo:ting the Current Populntion ot S..U .Areas," May 61 1949•
----• !h!rran\ fogulp.!;i.oa .tmI>0t]!., Serles P-25, lo. l24t October 21.,, l.9.55.
-~ ..... • !~sis AbattfAA sl. ~ Un!M Stat!!• ·19jJ,. 74th ttd. Wuh!ngton, u. ~., 1953. · . ' .
---·· stays,ttc.!l ,l\bstr1&c;l a! .:tb!.11Qit&d §t..ateas m,. 64th ed, Wasbington.,- .o. o., l.943•. ·
---• . L !t. 9JJ!1Jll!!! !!! ,F.oimlA;;i.qnc 132Q.• Vol+ IX, SU!!.t.!&.tetift12l s!. tbs f~M:oJb Part l, u. s. Surmiia:ey.,,
'
__ ,,_ .. ,..,,,. ... • L. L. 2fn!?W! SJ.! ~1 ~· Vol. ll1 !Jfl!re.ct•rAa~o! 9.t ~ feesl!teH?!ll Pan 461 Virg:lnia.
· · · • · L h !l!rum• · !! ~~na 12A:Q.• .· Vol. II, Ob!~gttx:.J,stlqg, !Jl. th!!, FopgJ.!!tion,. Pe.rt 11 United St&tea Sunlmary &ndJJ:abt.ma-llistriOt or eo1umW.a.
---· • L. .L. C!Jl!ll~ st f9m:41.!t!G• · l'!JJIJ..·· Vol. ll; 9tl!D:P!dtJ.l.!if.ea sl, !a PppyJJ\tioa, Part 7, Uts.n-f;romillg.
' v. s.hpal"t~nt ot Labor, Bureau of' Fapl~t &cutlt,. "!iandbook ot tJnempl.Qymentinsun.nce J'ina.ncial Data, 1938~1946• and the •1950 Su,ppl~t .. •,.
Yil'ginia l>rbpartment ot Education. NmY!J,, RSEQi:ta !JS..~ J!w?.!dn1¥¥t!\tnt at .flt)JJ& ,hs;twe»on !Ii..~ ~~Yu 1939-40, · 1949-50, 195;;..54. Biehwr"1& · 1l1. vision o! ~:-oba.sina and Printing. · . ·
lbeivton, Pt x. H!ed'Jd fswBlatioa Renearc_Q. Lancaster1 PenruJ7lftnitL1 . the Soieuc• Press Printing Colllpa.ny1 1938• · . . · .

VI f A
· Maey Bo9hllng Moy W8.3 born in Riuhmond1 .Virginia; on October 9•
1930. She.attended a l.Ocal ~oh1al. otlh®l and st.. 0.rt~e•a High
· School' hi Riohmond, i"nm which Oho wal graduatsd h I~ 1947.• Xn lune
19511 sh$ NCHtived the Bachelor of Art.a Degree in Economics .from th& "" . ' ..
Oolltap of Wow. F.ooholle, low Rochf>lle, Bew York-. ·"fhe toll.owing year
na·.,,pe.i 1n tho' Oradiie;te &l~l of the Uniwruity of Mobm.ond1 nioh
aond, Vi~s. •. Th& author.•• ma.rd.ed in Sep"""8ber 1954 to ffObert
lUngstonl>.iley, ra. n • . ·.: _hom ·luM 19'2 thraugh-Janua17 l9531 lllra. Duley ns employed. aa
an indwltrlel relatione e.nalyat by th& RegioMl Wage St.abil.Ue:t1~
bN ·in· .Riomoild. From february 1953 to September 195.lu abe wa.s a
NNareh .e.usist$..nt at tho F~erlll R'i)ffJ."VO Bank of atobmont\, ·She nu . . . '· ,. . ' '
al.SQ emPlored. u a research assistant and statistician by th.$ Burea.7,i ot
POpulation and EcQnomic n.see.t'Oh ot the Un!.wreity of Virginia ·u ~lotteSYill-Gr 'Virgini&1 from September .. 1954 through June 19;6,.
Sri~ . Du1q is . cur~ntly npl.oyed bf ·the Fedentl n.sem :B£ll\k or Rich-
11Dnd u a l"81Mt'Oh aaaoci&ta111
67