Age-related reduction in microcolumnar structure correlates with cognitive decline in ventral but...
23
Age-related reduction in microcolumnar structure correlates with cognitive decline in ventral but not dorsal area 46 of the rhesus monkey Luis Cruz 1 , Daniel L. Roe 3 , Brigita Urbanc 1 , Andrew Inglis 2 , H. E. Stanley 2 , and Douglas L. Rosene 3,4 1 Department of Physics, Drexel University, Philadelphia, PA 19104 2 Center for Polymer Studies and Department of Physics, Boston University, Boston, MA 02215 3 Department of Anatomy and Neurobiology, Boston University School of Medicine, Boston, MA 02118 4 Yerkes National Primate Research Center, Emory University, Atlanta GA 30322 Abstract The age-related decline in cognitive function that is observed in normal aging monkeys and humans occurs without significant loss of cortical neurons. This suggests that cognitive impairment results from subtle, sub-lethal changes in the cortex. Recently, changes in the structural coherence in mini- or microcolumns without loss of neurons have been linked to loss of function. Here we use a density map method to quantify microcolumnar structure in both banks of the sulcus principalis (prefrontal cortical area 46) of 16 (ventral) and 19 (dorsal) behaviorally tested female rhesus monkeys from 6 to 33 years of age. While total neuronal density does not change with age in either of these banks, there is a significant age-related reduction in the strength of microcolumns in both regions on the order of 40%. This likely reflects a subtle but definite loss of organization in the structure of the cortical microcolumn. The reduction in strength in ventral area 46 correlates with cognitive impairments in learning and memory while the reduction in dorsal area 46 does not. This result is congruent with published data attributing cognitive functions to ventral area 46 that are similar to our particular cognitive battery which does not optimally tap cognitive functions attributed to dorsal area 46. While the exact mechanisms underlying this loss of microcolumnar organization remain to be determined, it is plausible that they reflect age-related alterations in dendritic and/or axonal organization which alter connectivity and may contribute to age-related declines in cognitive performance. Keywords Aging; Cerebral Cortex; Cognition; Correlation; Minicolumns; Microcolumns; Density Map; Neuronal Organization; Prefrontal Cortex; Primate Brain Corresponding Author: Luis Cruz, Department of Physics, 3141 Chestnut Street, Drexel University, Philadelphia, PA 19104, Phone: 339-927-1783 Fax: 215-895-5934, Email: [email protected]. Section Editor: Dr. Charles R. Gerfen Publisher's Disclaimer: This is a PDF file of an unedited manuscript that has been accepted for publication. As a service to our customers we are providing this early version of the manuscript. The manuscript will undergo copyediting, typesetting, and review of the resulting proof before it is published in its final citable form. Please note that during the production process errors may be discovered which could affect the content, and all legal disclaimers that apply to the journal pertain. NIH Public Access Author Manuscript Neuroscience. Author manuscript; available in PMC 2010 February 18. Published in final edited form as: Neuroscience. 2009 February 18; 158(4): 1509–1520. doi:10.1016/j.neuroscience.2008.11.033. NIH-PA Author Manuscript NIH-PA Author Manuscript NIH-PA Author Manuscript
-
Upload
independent -
Category
Documents
-
view
2 -
download
0
Transcript of Age-related reduction in microcolumnar structure correlates with cognitive decline in ventral but...
Age-related reduction in microcolumnar structure correlates withcognitive decline in ventral but not dorsal area 46 of the rhesusmonkey
Luis Cruz1, Daniel L. Roe3, Brigita Urbanc1, Andrew Inglis2, H. E. Stanley2, and Douglas L.Rosene3,41 Department of Physics, Drexel University, Philadelphia, PA 191042 Center for Polymer Studies and Department of Physics, Boston University, Boston, MA 022153 Department of Anatomy and Neurobiology, Boston University School of Medicine, Boston, MA021184 Yerkes National Primate Research Center, Emory University, Atlanta GA 30322
AbstractThe age-related decline in cognitive function that is observed in normal aging monkeys and humansoccurs without significant loss of cortical neurons. This suggests that cognitive impairment resultsfrom subtle, sub-lethal changes in the cortex. Recently, changes in the structural coherence in mini-or microcolumns without loss of neurons have been linked to loss of function. Here we use a densitymap method to quantify microcolumnar structure in both banks of the sulcus principalis (prefrontalcortical area 46) of 16 (ventral) and 19 (dorsal) behaviorally tested female rhesus monkeys from 6to 33 years of age. While total neuronal density does not change with age in either of these banks,there is a significant age-related reduction in the strength of microcolumns in both regions on theorder of 40%. This likely reflects a subtle but definite loss of organization in the structure of thecortical microcolumn. The reduction in strength in ventral area 46 correlates with cognitiveimpairments in learning and memory while the reduction in dorsal area 46 does not. This result iscongruent with published data attributing cognitive functions to ventral area 46 that are similar toour particular cognitive battery which does not optimally tap cognitive functions attributed to dorsalarea 46. While the exact mechanisms underlying this loss of microcolumnar organization remain tobe determined, it is plausible that they reflect age-related alterations in dendritic and/or axonalorganization which alter connectivity and may contribute to age-related declines in cognitiveperformance.
KeywordsAging; Cerebral Cortex; Cognition; Correlation; Minicolumns; Microcolumns; Density Map;Neuronal Organization; Prefrontal Cortex; Primate Brain
Corresponding Author: Luis Cruz, Department of Physics, 3141 Chestnut Street, Drexel University, Philadelphia, PA 19104, Phone:339-927-1783 Fax: 215-895-5934, Email: [email protected] Editor: Dr. Charles R. GerfenPublisher's Disclaimer: This is a PDF file of an unedited manuscript that has been accepted for publication. As a service to our customerswe are providing this early version of the manuscript. The manuscript will undergo copyediting, typesetting, and review of the resultingproof before it is published in its final citable form. Please note that during the production process errors may be discovered which couldaffect the content, and all legal disclaimers that apply to the journal pertain.
NIH Public AccessAuthor ManuscriptNeuroscience. Author manuscript; available in PMC 2010 February 18.
Published in final edited form as:Neuroscience. 2009 February 18; 158(4): 1509–1520. doi:10.1016/j.neuroscience.2008.11.033.
NIH
-PA Author Manuscript
NIH
-PA Author Manuscript
NIH
-PA Author Manuscript

IntroductionWhile conventional wisdom posits that age-related cognitive decline is the result of age-relatedneuronal loss, this notion has not stood up to experimental scrutiny. Recent studies haveasserted that cognitive decline in normal aging, in contrast to other age-relatedneurodegenerative disorders such as Alzheimer’s disease, is not accompanied by significantloss of neurons in the cerebral cortex (e.g. Pakkenberg and Gundersen, 1997; Peters et al.,1998; Pakkenberg et al., 2003). Considerable evidence have instead implicated other brainchanges including changes in synapses, dendrites, and white matter that would likely altercortical information processing and may therefore better account for age-related cognitivedecline (e.g. Peters and Rosene, 2003). This evidence does not rule out other subtle changesthat might be occurring in gray matter and that may equally well contribute to corticaldysfunction. One important feature of the cortex, and a possibly vulnerable element, are thevertical arrays of neurons called minicolumns. Minicolumns, or “microcolumns” as referredto in this paper, are usually found spanning from the subcortical white matter to the pial surface(Mountcastle, 1997; 2003). Microcolumns sometimes share terminology with other possiblyrelated intracortical elements such as bundles of apical dendrites (Peters, 1994; Rockland andIchinohe, 2004) or axons of pyramidal cells and pyramidal cell modules (DeFelipe, 1990;Jones, 2000). Following the early physiological studies by Mountcastle (1957) and Hubel andWiesel (1963; 1969; 1977) on the much larger macrocolumns, microcolumns have beencharacterized as a fundamental unit of organization and function (Mountcastle, 1997; 2003;Peters and Sethares, 1996; Constantinidis et al., 2001; Buxhoeveden and Casanova, 2002;Vercelli et al., 2004). This characterization, however, is not universally accepted as numerouscritiques question the validity of the microcolumn as a fundamental unit of organization orfunction (Swindale, 1990; Purves et al., 1992; Jones, 2000; Rockland and Ichinohe, 2004;Buxhoeveden and Casanova, 2005; Krieger et al., 2007). Other studies of “whisker columns”or barrels in the rodent somatosensory cortex (the anatomical equivalent of a functional corticalcolumn) indicate that these columns are not a functional unit consisting of cells with similarfunctional properties (Helmstaedter et al., 2007). Even further, others argue that the very wellestablished and much studied ocular dominance columns seem not to serve a purpose (Hortonand Adams, 2005).
Independent of the exact function of the microcolumn, a growing body of studies have reportedstructural changes in microcolumns that are related to a general loss of cognitive function innormal aging and in various disease states. These studies have dealt with differences in neurondistribution in general, and within microcolumns in particular, and span topics from normalaging (Cruz et al., 2004), Alzheimer’s disease and Lewy body dementia (VanHoesen andSolodkin, 1993; Buldyrev et al., 2000), schizophrenia (Benes and Bird, 1987; Buxhoevedenet al., 2000), Down’s syndrome (Buxhoeveden et al., 2002), autism (Casanova et al., 2003),dyslexia (Casanova et al., 2002), to drug (cocaine) manipulation during development(Buxhoeveden et al., 2006). Interestingly, while we have noted that the number of corticalneurons is largely preserved in normal aging monkeys, evidence of age-related physiologicaldisruption of orientation selective microcolumns has been reported (Schmolesky et al., 2000;Leventhal et al., 2003). These investigators reported a loss of orientation and directionselectivity in microcolumns in V1 and demonstrated that administration of GABA agoniststemporarily restored normal stimulus selectivity to these neurons. Since small GABAergicinterneurons are an important, though poorly understood, component of the microcolumn(Mountcastle, 1997) this suggests that there may well be a disruption within the microcolumnas part of normal aging.
We previously reported a 40% loss of microcolumnar strength in area 46 of the ventral bankof sulcus principalis in aging monkeys and determined that this loss of strength correlates withcognitive decline (Cruz et al., 2004). In the present study, we examine age-related changes in
Cruz et al. Page 2
Neuroscience. Author manuscript; available in PMC 2010 February 18.
NIH
-PA Author Manuscript
NIH
-PA Author Manuscript
NIH
-PA Author Manuscript

microcolumns in tissue from a larger cohort of normal aging monkeys and comparemicrocolumnarity in area 46 of the prefrontal cortex in the upper (dorsal) and lower (ventral)banks of the mid level of sulcus principalis. In terms of function, damage to the lateral prefrontalcortex, including areas 9, 46, and 9/46, is well-known to cause deficits in performance of tasksrequiring executive functions, noting that this broad area also takes part in operations thatinclude abstraction, response selection, working memory operations, memory encoding andretrieval. Data from humans and monkeys, as reviewed by Petrides (2005), suggests that forthe mid lateral prefrontal cortices that we examine, ventral area 46 is likely involved inprocessing information in conjunction with the posterior parietal, temporal, and occipitalassociation cortices for both the encoding and retrieval aspects of memory processes. Incontrast, dorsal area 46 is likely involved in monitoring working memory operations importantfor processes such as abstraction or set shifting.
To quantify the microcolumnar structure of these two areas we apply a density map analysis(Cruz et al., 2005) to images from ventral 46 (46V) and dorsal 46 (46D) from a cohort of 19normal aging female rhesus monkeys. The goal of this comparison is to determine if thepreviously observed loss of microcolumnar strength reported in a smaller cohort for 46V (Cruzet al., 2004) is localized to 46V or a more global age-related effect, and to explore the possibilitythat changes in these areas are related to their specific cognitive functions.
2. Experimental Procedures2.1 Subjects
Brain tissue was obtained from 19 female rhesus monkeys ranging from 6.4-32.9 years of age.This material was derived from archived tissue samples available from a study of the neuralbases of age-related cognitive decline. Hence no animals were utilized explicitly for this study.Under the procedures of that study, animals were selected from the population of monkeys atthe Yerkes National Primate Research Center (YNPRC) at Emory University according to strictselection criteria that excluded any monkeys with health or experimental histories that couldhave affected the brain or cognitive function. The life span of the rhesus monkey compared tothe human corresponds approximately to a ratio of 1:3 (Tigges et al., 1988). Monkeys thereforecan be considered young adults at age 5 when they reach sexual maturity, which would roughlycorrespond to a 15 year old human. Few monkeys live beyond 30 years of age, which wouldroughly correspond to humans over 90 years old (Tigges et al., 1988; Roth et al., 2004).
2.2 Animal ProceduresAfter entering the study monkeys were first maintained at the YNPRC, and subsequently atthe Laboratory Animal Science Center of the Boston University Medical Center. Both facilitiesare fully accredited by the Association for the Assessment and Accreditation of LaboratoryAnimal Care. All procedures were approved by the Institutional Animal Care and UseCommittee of both Emory University and Boston University Medical Campus, and conformedto the NIH Guide for the Care and Use of Laboratory Animals, and the U.S. Public HealthService Policy on Humane Care and Use of Laboratory Animals. Monkeys received initialMRI scans to ensure there was no occult pathology in the brain and then were tested on a batteryof cognitive tests to characterize learning and memory (e.g. Herndon et al., 1997) and executivefunction (Moore et al., 2005). At the conclusion, monkeys were tranquilized with ketaminehydrochloride, deeply anesthetized with sodium pentobarbital, and killed by exsanguinationduring transcardial perfusion of the brain with 4 to 8 liters of warm (37 °C) fixative containingeither 4% paraformaldehyde alone or a mixture of 1% paraformaldehyde and 1.25%glutaraldehyde in 0.1M phosphate buffer (pH 7.4). Immediately after perfusion fixation of thebrain, the brain was blocked, in situ, in the coronal stereotactic plane. One hemisphere wasthen cryoprotected in graded solutions culminating with 20% glycerol and 2% DMSO in
Cruz et al. Page 3
Neuroscience. Author manuscript; available in PMC 2010 February 18.
NIH
-PA Author Manuscript
NIH
-PA Author Manuscript
NIH
-PA Author Manuscript

phosphate buffer (0.1 M, pH 7.4) after which the blocks were flash frozen by immersion in−75 °C isopentane (Rosene et al., 1986). All blocks were stored at −80 °C until cut.
2.3 Tissue ProcessingFrozen blocks were oriented on the freezing stage of a sledge microtome and frozen sectionscut in the coronal stereotactic plane into 8 interrupted series of 30 μm thick sections and oneseries of 60 μm thick sections so that sections in each series were spaced 300 μm apart. One30 μm thick series and the 60 μm thick series were mounted on subbed microscope slides,allowed to dry overnight and then stained for Nissl substance with thionin, dehydrated, cleared,and coverslipped. This cryoprotection and cutting procedure produced minimal shrinkage ordistortion so that (x,y,z) dimensions were largely preserved through the cutting procedure(Rosene et al., 1986). Once mounted, the sections adhered rapidly to the subbed surface of theslide before they dried, preserving the x-y relationships within the section which was a requisitefor all of our analyses described below. However, as sections dried and were subsequentlystained, dehydrated and coverslipped, they shrank in the z dimension (thickness) from theoriginally cut thickness of 30 μm to an average mounted section thickness of 7 to 10 μm, asdetermined using the Bioquant Image Analysis system equipped with a Heidenhain stagemicrometer that measured z axis position to 0.1 μm. Hence the analysis of neuronal locationswas limited to this collapsed x-y projection as discussed below.
2.4 Cytoarchitectonic Regions to be StudiedArea 46 is a neocortical subdivision of the prefrontal cortex that is implicated in workingmemory and executive functions (Goldman and Rosvold, 1970; Goldman et al., 1971;Goldman-Rakic, 1988; Petrides, 2000a; Petrides, 2000b; Moore et al., 2002a; Moore et al.,2002b). Area 46 in the upper and lower bank of the middle part of sulcus principalis wasselected for study, where in coronal sections the cortex is relatively flat (Figure 1(a) and (b)).Our analysis was limited to layer 3 of area 46 for several reasons. First, layer 3 is where themajority of cortico-cortical projections that subserve cortical information transfer originate andwhere the cortico-cortical projecting pyramidal cells have been most carefully studied (e.g.Page et al., 2002; Duan et al., 2003; Chang et al., 2005) making this layer particularly pertinentto the cortical cognitive functions that change with age. Second, as shown in Figure 1(c) and(d), neurons in layer 3 are relatively loosely packed compared to the smaller, more tightlypacked neurons found in adjacent layers 2 and 4. This fact facilitated the reliable identificationof neurons, a requirement for our quantitative analysis. Third, because microcolumns spanfrom layer 6 to layer 2 and spacing and other features vary widely across layers, a compositeaverage from all layers would obscure real features. Since analysis of all of the layers of cortexwas beyond the scope of our technical capacity, we chose to limit this investigation to layer 3for the reasons cited as well as to follow-up on our previous investigation (Cruz et al., 2004).Due to this restriction, however, we cannot yet assess whether columnarity in other layers isaffected by age, or how they may relate to cognitive functions.
2.5 Digital PhotographyTwo 30 μm thick Nissl-stained sections per case spaced 300–600 μm apart from area 46 in themiddle third of the sulcus principalis were selected (Figure 1(a) and (b)) according to thearchitectonic criteria of Petrides and Pandya (1994). The levels were matched across all cases.A series of photomicrographs from both banks of sulcus principalis were digitized from bothsections with a digital camera at 1280×1024 resolution using a 10× objective on a Nikon E600microscope. These photomicrographs spanned from the bottom of layer 1 through the top oflayer 4 and were then cropped such that a square central area of resolution 512×512 pixels wasentirely inside layer 3 (Figures 1(c) and (d)). In each bank of the sulcus, four adjacent (non-overlapping) 10× images of layer 3 were acquired. Due to differences in acquisition equipment
Cruz et al. Page 4
Neuroscience. Author manuscript; available in PMC 2010 February 18.
NIH
-PA Author Manuscript
NIH
-PA Author Manuscript
NIH
-PA Author Manuscript
used, there were slight differences in digital magnification across subjects, where all imagesfor each subject had areas of either 320 μm×320 μm (1.6 pixels per μm), 332 μm×332 μm (1.54pixels per μm), or 341 μm×341 μm (1.5 pixels per μm). Images from dorsal area 46 from all19 monkeys were acquired, but due to tissue artifacts images from ventral area 46 in only 16of the 19 monkeys were acquired. Also, small regions in the images containing tissue folds,large blood vessels, or other artifacts were computationally excluded to avoid including areasof the tissue from which no neuronal data was obtained. In total, 8 images (4 photomicrographs× 2 sections of area 46) from each of 19 subjects in dorsal area 46 and from 16 of those subjectsin ventral area 46 were analyzed for a total of 280 images.
2.6 Identification of XY Coordinates of NeuronsTo locate all of the neurons in every image, a semi-automatic method of neuron detection wasfirst applied (Cruz et al., 2005) to get the majority of the neuronal locations with an accuracyof about 80–85% but with the disadvantage of obtaining about 15–20% false positives. Usingan off-the-shelf image editing program, all of these neuronal markings were then manuallycorrected to eliminate the false positives and to add the missed neurons in every image afterwhich the final (x,y) coordinates for detected neurons were recorded. All of these (x,y)coordinates were independently corroborated using our newly developed Automated NeuronRecognition Algorithm (ANRA) (Inglis et al., 2008) optimized for layer 3 of the cortex.
2.7 Density Map Method and Microcolumnar QuantitiesMicrocolumns are vertical arrays of neurons with dimensions in the micrometer scale (Jones,2000). Figure 2 shows an example of neurons that line up in a fashion typical of layer 3microcolumns. To characterize the degree of microcolumnarity of a region of tissue, wedeveloped the density map method that can be used to quantitatively assess and comparedifferent regions in terms of degree of microcolumnarity. This density map method was initiallypresented by Buldyrev et al. (2000) and a more detailed quantification and validation was givenin Cruz et al. (2005). Briefly, the density map method calculates the density correlation functiong(x,y) using as input the (x,y) neuronal coordinates from an image. This function g(x,y) can bemapped to a two-dimensional grayscale image in which different shades of gray areproportional to the average neuronal density relative to the location of each neuron in the regionof interest (ROI). This quantity represents the local neuronal density at a particular location(x,y) as opposed to the global neuronal density that specifies the sample-wide average neuronaldensity with a single number. Thus, the density map represents the average neuronalneighborhood (local) surrounding a typical neuron within a larger ROI.
Operationally, the density map is calculated by first assigning indices (i=1,2,3…N) to all theneurons in the sample. Next, we define an origin outside of the sample (Figure 3(a)) and createa copy of the locations for the neuron labeled 1 and shift this copy so that neuron 1 overlaysthe origin (Figure 3(b)). This process is repeated for each of the detected neurons (Figure 3(c))until an overlay of N copies of the locations in the sample is obtained (Figure 3(d), right image).Over this overlay we then center a grid of bins of size D (Figure 3(d)) and count how manyneurons fall in each bin, thus constructing one matrix (from the grid) of accumulated neuronsm(x,y) for the sample. We define g(x,y) = m(x,y)/ND2, in which g(x,y) has units of an averagedensity of objects at position (x,y). This density function would be uniform if locations ofobjects (neurons) are uncorrelated, but will show patterns when there are any spatialcorrelations between the objects. For the case of neurons forming microcolumns in the cortex,their density map exhibits one central vertical ridge, sometimes accompanied by two lesspronounced parallel neighboring ridges (Figure 3(d)).
From the resulting density map, we quantify the microcolumnar structure by extracting thefollowing measures (Figure 3(e)):
Cruz et al. Page 5
Neuroscience. Author manuscript; available in PMC 2010 February 18.
NIH
-PA Author Manuscript
NIH
-PA Author Manuscript
NIH
-PA Author Manuscript
• S, strength of microcolumns (dimensionless ratio of the neuronal density within amicrocolumn to the average neuronal density of the ROI),
• T, degree of microcolumnar periodicity (dimensionless ratio of the neuronal densityof neighboring microcolumns to the average neuronal density),
• W, microcolumnar width,
• P, distance between microcolumns,
• L, length (vertical span) of microcolumns,
• Y, distance between neurons within a microcolumn (perpendicular to pia and parallelto microcolumns).
In this study, one density map per monkey per area (dorsal or ventral) was calculated using foreach area the 8 images acquired as described above (see Digital Photography section inExperimental Procedures above). From each density map the six microcolumnar propertiesplus the neuronal density were then calculated. Thus, for each subject two sets ofmicrocolumnar properties were obtained, one for each area (dorsal and ventral).
2.8 Behavioral Assessment of Young Adult and Aging Rhesus MonkeysMonkeys were given a battery of behavioral tests known to be sensitive to age-related cognitiveimpairments (Herndon et al., 1997). These tests included the Delayed Non-match to Sampletest (DNMS), both its acquisition (learning) at a 10 second delay (DNMS-10) and DNMSperformance (recognition memory) at longer delays (2 minute delay, DNMS-120), and theDelayed Recognition Span Task (DRST) which is a test of working memory span and is givenin both spatial and object modalities. We also calculated the Cognitive Impairment Index (CII)which is a composite average of the impairment in z-scores relative to young adults ofperformance on DNMS-10, DNMS-120, and DRST spatial. The details of these are describedin Herndon et al. (1997). The tests are administered in the order listed and are all positivelyrewarded. For a variety of reasons not all monkeys completed all tests. Studies in monkeys andhumans suggest that recognition memory aspects of the DNMS and DRST are largelydependent upon the integrity of the medial temporal lobe limbic system (including theentorhinal, perirhinal, and parahippocampal cortices) while other aspects such as rule learning(DNMS acquisition), working memory, and spatial location on the DRST are largely dependentupon the integrity of the lateral prefrontal cortex including area 46 of the sulcus principalis(Petrides, 2005).
2.9 Statistical MethodsWhen comparing means between groups of parameters from our density map analysis t-testswith a significance level of p ≤ 0.05 two-tailed were used. Whenever testing for correlationsbetween two sets of parameters the Spearman’s rank correlation coefficient was used. Whilea more traditional Pearson correlation calculation measures linear trends in data, the Spearmancorrelation coefficient was used to assess how well the relationship between two variablescould be related to an arbitrary monotonic function without making any assumptions about thefrequency distribution of the variables, i.e. without the assumption that the relationship betweenthe variables is linear or requiring the variables to be measured on interval scales. For thecorrelation calculations a significance level to p ≤ 0.05 two-tailed was used.
3. ResultsAs described in the Experimental Procedures section, we examined digital images acquiredfrom ROIs from area 46 in the dorsal (N=19) and ventral banks (N=16) of sulcus principalis.
Cruz et al. Page 6
Neuroscience. Author manuscript; available in PMC 2010 February 18.
NIH
-PA Author Manuscript
NIH
-PA Author Manuscript
NIH
-PA Author Manuscript
We note that results from 14 of the 16 monkeys examined for ventral area 46 were studiedpreviously, but only results on microcolumnar strength were reported (Cruz et al., 2004).
In Table 1 we list age, total number of neurons found in all ROIs per monkey, tissue area, andneuronal density for all sections from each of the monkeys analyzed. On average, there were1,037 neurons found per region per monkey over an average tissue area of about 796,786μm2 per region per monkey.
When analyzing all the cases as one population, we find that the average density is <ρ> =0.001305 ± 0.000282 neurons/μm2. When grouping neuronal density by region (dorsal orventral), the average neuronal density is <ρ>D = 0.001410 ± 0.000064 neurons/μm2 in dorsal46 and <ρ>V = 0.001180 ± 0.000059 neurons/μm2 in ventral 46 (Table 2). This differencebetween the densities in the two regions is statistically significant (p=0.012). In Figure 4(a) weshow the individual neuronal densities ρ (in units of thousandths of neurons per μm2) as afunction of age. This graph shows that there is no significant effect of age on neuronal densityconfirming previous reports that neurons from area 46 are not lost with age (Peters et al.,1994;Smith et al., 2004).
3.1 Microcolumnar MeasuresMicrocolumnar Parameters—Similar to neuronal density, the measures of microcolumnarorganization derived from the density map, with the exception of microcolumnar strength (seebelow), do not show significant changes with age. In particular, Figure 4(b) shows themicrocolumnar width W. The population average is <W> = 12.303 ± 0.552 μm with regionaverages <W>D = 12.592 ± 0.873 μm and <W>V = 11.959 ± 0.641 μm which are notsignificantly different. This figure also shows that there is no significant change ofmicrocolumnar width with age.
The distance between microcolumns P has a population average of <P> = 26.188 ± 1.400 μm.When comparing this by region we found that on average <P>D = 26.52 ± 1.92 μm and<P>V = 25.79 ± 2.11 μm, which is not significantly different. Moreover, like W, there is nosignificant change in the distance between microcolumns with age as shown in Figure 4(c).
Figures 4(d) and (e) show the degree of microcolumnar periodicity T and length L. Theirpopulation averages are <T> = 1.024 ± 0.014 and <L> = 37.66 ± 0.93 μm. The average valuesof T grouped by region are <T>D = 1.06 ± 0.02 and <T>V = 0.98 ± 0.02 and the average valuesof the length <L>D = 35.25 ± 0.95 μm and <L>V = 40.53 ± 1.40 μm where both differences inT and in L per region are significant (p=0.002 for T; p=0.004 for L). However, similar to Wand P, no significant age-related changes in either of these parameters with age are detected.
The population average for the vertical distance between neurons within a microcolumn Y (i.e.neuron-neuron distance along the microcolumn) is <Y> = 19.43 ± 0.45 μm. Grouping by regionwe found that on average, values for Y are <Y>D = 18.09 ± 0.29 μm and <Y>V = 21.03 ± 0.77μm, which are significantly different (p=0.002). However, when plotted as a function of age,Y also does not show any significant age-related change (Figure 4(f)).
Microcolumnar Strength—The average strength of microcolumns S (ratio of the densityof neurons in the microcolumn to the total density of neurons in the ROI) for the wholepopulation is <S> = 1.204 ± 0.013. When grouping by region we obtain <S>D = 1.202 ± 0.020for 46D and <S>V = 1.207 ± 0.018 for 46V with no statistically significant difference betweenthe two areas. Figure 5(a) and (b) show S per region vs age and documents a significant age-related reduction in S as a function of age in both area 46D and 46V (we plot S-1 instead ofS to obtain a quantity that is zero when there is no microcolumnarity). These data confirm ourprevious findings based on some of the same subjects for 46V (Cruz et al., 2004) and extend
Cruz et al. Page 7
Neuroscience. Author manuscript; available in PMC 2010 February 18.
NIH
-PA Author Manuscript
NIH
-PA Author Manuscript
NIH
-PA Author Manuscript
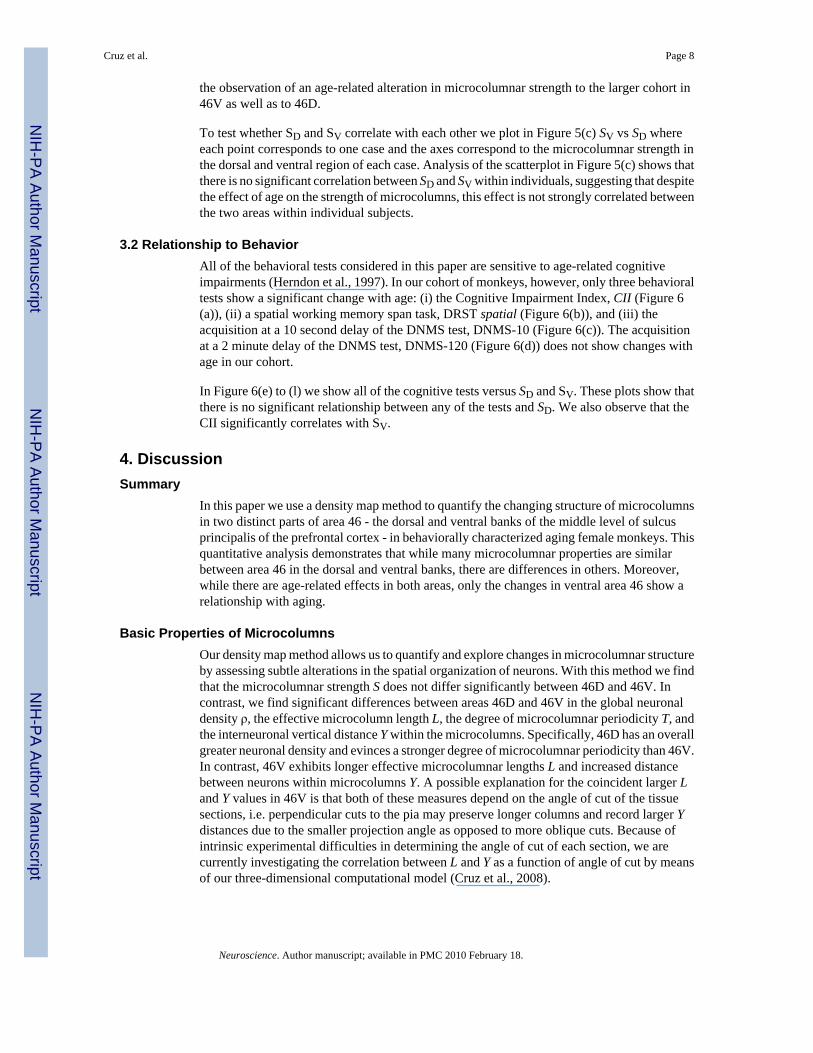
the observation of an age-related alteration in microcolumnar strength to the larger cohort in46V as well as to 46D.
To test whether SD and SV correlate with each other we plot in Figure 5(c) SV vs SD whereeach point corresponds to one case and the axes correspond to the microcolumnar strength inthe dorsal and ventral region of each case. Analysis of the scatterplot in Figure 5(c) shows thatthere is no significant correlation between SD and SV within individuals, suggesting that despitethe effect of age on the strength of microcolumns, this effect is not strongly correlated betweenthe two areas within individual subjects.
3.2 Relationship to BehaviorAll of the behavioral tests considered in this paper are sensitive to age-related cognitiveimpairments (Herndon et al., 1997). In our cohort of monkeys, however, only three behavioraltests show a significant change with age: (i) the Cognitive Impairment Index, CII (Figure 6(a)), (ii) a spatial working memory span task, DRST spatial (Figure 6(b)), and (iii) theacquisition at a 10 second delay of the DNMS test, DNMS-10 (Figure 6(c)). The acquisitionat a 2 minute delay of the DNMS test, DNMS-120 (Figure 6(d)) does not show changes withage in our cohort.
In Figure 6(e) to (l) we show all of the cognitive tests versus SD and SV. These plots show thatthere is no significant relationship between any of the tests and SD. We also observe that theCII significantly correlates with SV.
4. DiscussionSummary
In this paper we use a density map method to quantify the changing structure of microcolumnsin two distinct parts of area 46 - the dorsal and ventral banks of the middle level of sulcusprincipalis of the prefrontal cortex - in behaviorally characterized aging female monkeys. Thisquantitative analysis demonstrates that while many microcolumnar properties are similarbetween area 46 in the dorsal and ventral banks, there are differences in others. Moreover,while there are age-related effects in both areas, only the changes in ventral area 46 show arelationship with aging.
Basic Properties of MicrocolumnsOur density map method allows us to quantify and explore changes in microcolumnar structureby assessing subtle alterations in the spatial organization of neurons. With this method we findthat the microcolumnar strength S does not differ significantly between 46D and 46V. Incontrast, we find significant differences between areas 46D and 46V in the global neuronaldensity ρ, the effective microcolumn length L, the degree of microcolumnar periodicity T, andthe interneuronal vertical distance Y within the microcolumns. Specifically, 46D has an overallgreater neuronal density and evinces a stronger degree of microcolumnar periodicity than 46V.In contrast, 46V exhibits longer effective microcolumnar lengths L and increased distancebetween neurons within microcolumns Y. A possible explanation for the coincident larger Land Y values in 46V is that both of these measures depend on the angle of cut of the tissuesections, i.e. perpendicular cuts to the pia may preserve longer columns and record larger Ydistances due to the smaller projection angle as opposed to more oblique cuts. Because ofintrinsic experimental difficulties in determining the angle of cut of each section, we arecurrently investigating the correlation between L and Y as a function of angle of cut by meansof our three-dimensional computational model (Cruz et al., 2008).
Cruz et al. Page 8
Neuroscience. Author manuscript; available in PMC 2010 February 18.
NIH
-PA Author Manuscript
NIH
-PA Author Manuscript
NIH
-PA Author Manuscript

Microcolumnar Properties and AgeWhile the microcolumnar strength does not differ between 46D and 46V, there is a significantage-related reduction in S for both areas. This reduction in microcolumnar strength is morethan a statistical property of the tissue and can be visualized as a literal loss of microcolumnarorganization. In Figure 7 we show two images from each of three cases studied here for whichtheir values of S span the numerical range observed in this study. The top row consists of twoimages depicting a case with stronger microcolumnarity (a–b) than the two other cases ((c–d)and (e–f)), indicated by the numerical value of S for each case.
Interestingly, even though S declines with age in both areas, only in 46V this decline correlateswith the CII, a composite measure of the impairment indicated by the DNMS-10, DNMS-120,and DRST spatial scores. By comparing SV with SD we further show that these two quantitiesdo not correlate with each other, suggesting that although both decay with age, the two changesare independent and only SV correlates with the cognitive tests considered in this paper. Thefact that the age-related loss of microcolumnar strength in 46D does not correlate with the age-related behavioral impairments in this group of subjects while the loss of strength in 46V does,likely reflects the differential function of these two areas. Petrides (2000b; 2005) reviewed dataon both the differential function and connectivity of 46D and 46V and concluded that thesetwo areas had specialized functions. While the exact nature of these functions still remains tobe determined, the executive function and temporal ordering that Petrides ascribed to 46Dseems unlikely to be directly tapped by the battery of memory tasks available on this cohortof subjects. In contrast, the involvement in memory functions that Petrides ascribed to 46V issupported by the behavioral deficits observed in our cohort of subjects.
Insights into Possible Mechanisms using a Computational ApproachThe reported age-related change in microcolumnar strength S raises the question of possiblemechanisms underlying this change. There are numerous neurobiological variables that couldbe related to this change. To gain some insight into which of these variables are relevant, andthus possible underlying mechanism(s), we previously developed a two-dimensionalcomputational model (Cruz et al., 2004) to explore possible relationships between loss ofmicrocolumnar strength and age-related changes in neuronal locations in the cortex given thatthe number of neurons and neuronal density do not change with age. Using this model, wedemonstrated that the observed reduction of microcolumnar strength in 46V observed in agedmonkeys could be accounted for if neuron locations in layer 3 of an average young monkeywere computationally displaced by small random increments with an overall averagedisplacement of about 3 μm, i.e. less than a neuronal radius. Close inspection of the neuronaldistributions generated using this computational model corroborated that these distributionsvisually resembled those typically found in tissue, such as those depicted in Figure 7, whenmatched to similar values of S.
Such small displacements could result from many factors but illustrate the subtle nature of thechange that can be detected with the density map method without the need of gross pathology.An on-going study extending this computational model of small neuronal displacements tothree-dimensions (Cruz et al., 2008; Cruz et al., unpublished) shows that these conclusions arepreserved when the z dimension is considered in the computational model.
Potential Biological MechanismsBased on our findings, it is plausible that the observed changes in microcolumnar measuresreflect subtle age-related displacements in neuron location. Although this conclusion by itselfdoes not establish a biological mechanism for such displacements, it suggests a number ofpossible candidates. It is clear that the brain is dynamic and changing throughout the lifespan.Synapses change morphology on a time scale of minutes to hours in response to long-term
Cruz et al. Page 9
Neuroscience. Author manuscript; available in PMC 2010 February 18.
NIH
-PA Author Manuscript
NIH
-PA Author Manuscript
NIH
-PA Author Manuscript

potentiation (Leuner et al., 2003; Lynch, 2004; Lambrecht and LeDoux, 2004). Synapticplasticity is also seen in response to hormonal manipulations, though the time scale formorphological changes is on the order of a month (Weeks 2003). Dendrites also sprout orregress (Weeks, 2003; Grill and Riddle, 2002). There is growing evidence that even in the adultbrain new neurons are generated and integrate themselves into functional circuits (Shors et al.,2001). Furthermore, while it is increasingly difficult to find evidence for significant neuronalloss in normal aging, the literature on aging provides evidence of a variety of changes in layer3 neurons in the aging brain. Page et al. (2002), Duan et al. (2003), Morrison and Hof (2007)and Dickstein et al. (2007) have all documented dendritic atrophy including changes inbranching patterns and spine density. In addition, while basic membrane properties of layer 3pyramidal neurons are preserved, there are changes in synaptic input and action potentialgeneration that also indicate significant alterations in function (e.g. Luebke et al., 2004; Changet al., 2005). There are also a variety of degenerative changes in myelin (Peters 2002), andeven loss of cortico-cortical axons (Sandell and Peters, 2003), which generally originate fromlayer 3 where our measurements were conducted. Consequently, it is plausible that one or moreof these brain changes contribute to the observed subtle displacements of neurons and mayunderlie our measured changes in the strength of microcolumnarity.
ConclusionThe quantitative density map approach utilized in this study demonstrates age-related changesin measures of microcolumnarity in area 46 of the prefrontal cortex. Our study shows that thereis an age-related loss of microcolumnar strength in both 46D and 46V, however, only the lossof microcolumnar strength in 46V is associated with age-related cognitive impairment in aglobal cognitive impairment index that assesses learning, recognition memory, and workingmemory. These data are also consistent with the view that a loss in the strength of microcolumnsis a consequence of subtle changes in the organization of neurons within microcolumns, butbecause subtle changes in complex systems can cause significant changes due to theirinterconnectivity and cooperativity, these changes may have functional consequences forinformation processing in the aging brain. The data also demonstrate that even within parts ofthe same cytoarchitectonic area, there may be further subtle anatomical and functionaldissociations that are discernible with the methods we have developed. Finally, if the reductionsin S with age in both areas examined reflect a more global age-related disruption that resultsin a loss of neuronal coherence within microcolumns throughout the brain, the lack ofcorrelation with age-related cognitive impairment for the measures of 46D implies that ourbattery of behavioral tests is insensitive to the functional changes in that area.
SoftwareThe code containing the density map method used in this work to quantify microcolumns isavailable in the download section of www.physics.drexel.edu/~ccruz/micros/.
AcknowledgmentsThis work was supported by the National Institutes of Health grants R01-AG021133, P01-AG000001 and P51-RR00165, the Alzheimer Association, and the Bechtel Foundation.
ReferencesBenes FM, Bird ED. An analysis of the arrangement of neurons in the cingulate cortex of schizophrenic
patients. Archives of General Psychiatry 1987;44:608–616. [PubMed: 3606326]Buldyrev SV, Cruz L, Gomez-Isla T, Gomez-Tortosa E, Havlin S, Le R, Stanley HE, Urbanc B, Hyman
BT. Description of microcolumnar ensembles in association cortex and their disruption in Alzheimerand Lewy body dementias. Proc Natl Acad Sci 2000;97:5039–5043. [PubMed: 10805766]
Cruz et al. Page 10
Neuroscience. Author manuscript; available in PMC 2010 February 18.
NIH
-PA Author Manuscript
NIH
-PA Author Manuscript
NIH
-PA Author Manuscript

Buxhoeveden DP, Casanova MF. The minicolumn and evolution of the brain. Brain Behav Evol2002;60:125–151. [PubMed: 12417819]
Buxhoeveden, D.; Casanova, MF. Encephalization, minicolumns, and hominid evolution. In: Casanova,MF., editor. Neocortical modularity and the cell minicolumn. New York: Nova Science Publishers;2005. p. 117-136.
Buxhoeveden D, Roy E, Switala A, Casanova MF. Reduced interneuronal space in schizophrenia. BiolPsychiatry 2000;47:681–683. [PubMed: 10809534]
Buxhoeveden D, Fobbs A, Roy E, Casanova M. Quantitative comparison of radial cell columns in childrenwith Down’s syndrome and controls. J Intellect Disabil Res 2002;46:76–81. [PubMed: 11851858]
Buxhoeveden DP, Hasselrot U, Buxhoeveden NE, Booze RM, Mactutus CF. Microanatomy in 21 dayrat brains exposed prenatally to cocaine. International Journal of Developmental Neuroscience2006;24:335–341. [PubMed: 16814973]
Casanova MF, Buxhoeveden DP, Cohen M, Switala AE, Roy EL. Minicolumnar pathology in dyslexia.Annals of Neurology 2002;52:108–110. [PubMed: 12112057]
Casanova MF, Buxhoeveden D, Gomez J. Disruption in the inhibitory architecture of the cell minicolumn:Implications for autism. Neuroscientist 2003;9:496–507. [PubMed: 14678582]
Chang Y-M, Rosene DL, Killiany RJ, Mangiamele LA, Luebke JI. Increased action potential firing ratesof layer 2/3 pyramidal cells in the prefrontal cortex are significantly related to cognitive performancein aged monkeys. Cerebral Cortex 2005;15:409–418. [PubMed: 15749985]
Constantinidis C, Franowicz MN, Goldman-Rakic PS. Coding specificity in cortical microcircuits: amultiple-electrode analysis of primate prefrontal cortex. J Neurosci 2001;21:3646–3655. [PubMed:11331394]
Cruz L, Roe DL, Urbanc B, Cabral H, Stanley HE, Rosene DL. Age-related reduction in microcolumnarstructure in area 46 of the rhesus monkey correlates with behavioral decline. Proc Natl Acad Sci2004;101:15846–15851. [PubMed: 15520373]
Cruz L, Buldyrev SV, Peng S, Roe DL, Urbanc B, Stanley HE, Rosene DL. A statistically based densitymap method for identification and quantification of regional differences in microcolumnarity in themonkey brain. J Neuro Methods 2005;141:321–332.
Cruz L, Urbanc B, Inglis A, Rosene DL, Stanley HE. Generating a model of the Three-dimensional SpatialDistribution of Neurons using Density Maps. Neuroimage 2008;40:1105–1115. [PubMed:18291677]
DeFelipe J, Hendry SHC, Hashikawa T, Molinari M, Jones EG. A Microcolumnar Structure of MonkeyCerebral-Cortex Revealed by Immunocytochemical Studies of Double Bouquet Cell Axons.Neuroscience 1990;37:655–673. [PubMed: 1701039]
Dickstein DL, Kabaso D, Rocher AB, Luebke JI, Wearne SL, Hof PR. Changes in the structuralcomplexity of the aged brain. Aging Cell 2007;6:275–284. [PubMed: 17465981]
Duan H, Wearne SL, Rocher AB, Macedo A, Morrison JH, Hof PR. Age-related Dendritic and SpineChanges in Corticocortically Projecting Neurons in Macaque Monkeys. Cerebral Cortex2003;13:950–961. [PubMed: 12902394]
Goldman PS, Rosvold HE. Localization of function within the dorsolateral prefrontal cortex of the rhesusmonkey. Exp Neurol 1970;27:291–304. [PubMed: 4987453]
Goldman PS, Rosvold HE, Vest B, Galkin TW. Analysis of the delayed alternation deficit produced bydorsolateral prefrontal lesions in the rhesus monkey. J Comp Phys Psy 1971;77:212–220.
Goldman-Rakic PS. Topography of cognition: Parallel distributed networks in primate association cortex.Ann Rev Neurosci 1988;11:137–156. [PubMed: 3284439]
Grill JD, Riddle DR. Age-related and laminar-specific dendritic changes in the medial frontal cortex ofthe rat. Brain Res 2002;937:8–21. [PubMed: 12020857]
Helmstaedter M, de Kock CPJ, Feldmeyer D, Bruno RM, Sakmann B. Reconstruction of an averagecortical column in silico. Brain Research Reviews 2007;55:193–203. [PubMed: 17822776]
Herndon JG, Moss MB, Rosene DL, Killiany RJ. Patterns of cognitive decline in aged rhesus monkeys.Behav Brain Res 1997;87:25–34. [PubMed: 9331471]
Horton JC, Adams DL. The cortical column: a structure without a function. Phil Trans R Soc B2005;360:837–862. [PubMed: 15937015]
Cruz et al. Page 11
Neuroscience. Author manuscript; available in PMC 2010 February 18.
NIH
-PA Author Manuscript
NIH
-PA Author Manuscript
NIH
-PA Author Manuscript

Hubel DH, Wiesel TN. Shape and arrangement of columns in cat’s striate cortex. J Physiol 1963;165:559–568. [PubMed: 13955384]
Hubel DH, Wiesel TN. Anatomical demonstration of columns in the monkey striate cortex. Nature1969;221:747–750. [PubMed: 4974881]
Hubel DH, Wiesel TN. Functional architecture of macaque visual cortex. Proc R Soc Lond B 1977;198:1–59. [PubMed: 20635]
Inglis A, Cruz L, Roe DL, Stanley HE, Rosene DL, Urbanc B. Automated retrieval of neuron locationfrom Nissl-stained tissue. J Microscopy 2008;230:339–347.
Jones EG. Microcolumns in the cerebral cortex. Proc Natl Acad Sci 2000;97:5019–21. [PubMed:10805761]
Krieger P, Kuner T, Sakmann B. Synaptic connections between layer 5B pyramidal neurons in mousesomatosensory cortex are independent of apical dendrite bundling. Journal of Neuroscience2007;27:11473–11482. [PubMed: 17959790]
Lambrecht R, LeDoux J. Structural plasticity and memory. Nature Reviews Neuroscience 2004;5:45–54.
Leuner B, Falduto J, Shors T. Associative Memory Formation Increases the Observation of DendriticSpines in the Hippocampus. The Journal of Neuroscience 2003;23:659–665. [PubMed: 12533625]
Luebke JI, Chang Y-M, Moore TL, Rosene DL. Normal aging results in decreased synaptic excitationand increased synaptic inhibition of layer 2/3 pyramidal cells in the monkey prefrontal cortex.Neuroscience 2004;125:277–288. [PubMed: 15051166]
Leventhal AG, Wang Y, Pu M, Zhou Y, Ma Y. GABA and its agonists improved visual cortical functionin senescent monkeys. Science 2003;300:812–815. [PubMed: 12730605]
Lynch MA. Long-Term Potentiation and Memory Physiol. Rev 2004;84:87–136.Moore TL, Killiany RJ, Herndon JG, Rosene DL, Moss MB. Impairment in abstraction and set shifting
in aged Rhesus monkeys. Neurobiol Aging 2002a;5717:1–10.Moore TL, Killiany RJ, Rosene DL, Prusty S, Hollander W, Moss MB. Impairment of executive function
induced by hypertension in the rhesus monkey (Macaca mulatta). Behav Neurosci 2002b;116:387–396. [PubMed: 12049319]
Moore TL, Killiany RJ, Herndon JG, Rosene DL, Moss MB. A non-human primate test of abstractionand set shifting: An automated adaptation of the Wisconsin Card Sorting Test. Journal ofNeuroscience Methods 2005;146:165–173. [PubMed: 16054506]
Morrison JH, Hoff PR. Life and death of neurons in the aging cerebral cortex. International Review ofNeurobiology 2007;81:41–57. [PubMed: 17433917]
Mountcastle VB. Modality and topographic properties of single neurons of cat’s somatic sensory cortex.J Neurophysiol 1957;20:408–434. [PubMed: 13439410]
Mountcastle VB. The columnar organization of the neocortex. Brain 1997;120:701–722. [PubMed:9153131]
Mountcastle VB. Untitled - introduction. Cerebral Cortex 2003;13:2–4. [PubMed: 12466209]Page TL, Einstein M, Duan H, He Y, Flores T, Rolshud D, Erwin JM, Wearne SL, Morrison JH, Hof PR.
Morphological alterations in neurons forming corticocortical projections in the neocortex of agedPatas monkeys. Neuroscience Letters 2002;317:37–41. [PubMed: 11750991]
Pakkenberg B, Gundersen HJG. Neocortical neuron number in humans: Effect of sex and age. Journalof Comparative Neurology 1997;384:312–320. [PubMed: 9215725]
Pakkenberg B, Pelvig D, Marner L, Bundgaard MJ, Gundersen HJG, Nyengaard JR, Regeur L. Agingand the human neocortex. Experimental Gerontology 2003;38:95–99. [PubMed: 12543266]
Peters, A. The organization of the primary visual cortex in the macaque. In: Peters, A.; Rockland, KS.,editors. Cerebral cortex. Vol. 10. New York: Plenum Press; 1994. p. 1-35.
Peters A. The effects of normal aging on myelin and nerve fibers: A review. Journal of Neurocytology2002;31:581–593. [PubMed: 14501200]
Peters A, Rosene DL. In aging, is it gray or white? Journal of Comparative Neurology 2003;462:139–143. [PubMed: 12794738]
Peters A, Sethares C. Myelinated axons and the pyramidal cell modules in monkey primary visual cortex.The Journal of Comparative Neurology 1996;365:232–255. [PubMed: 8822167]
Cruz et al. Page 12
Neuroscience. Author manuscript; available in PMC 2010 February 18.
NIH
-PA Author Manuscript
NIH
-PA Author Manuscript
NIH
-PA Author Manuscript
Peters A, Leahu D, Moss MB, McNally KJ. The effects of aging on area-46 of the frontal-cortex of therhesus-monkey. Cerebral Cortex 1994;4:621–635. [PubMed: 7703688]
Peters A, Morrison JH, Rosene DL, Hyman BT. Feature article: are neurons lost from the primate cerebralcortex during normal aging? Cereb Cortex 1998;8:295–300. [PubMed: 9651126]
Petrides, M.; Pandya, DN. Comparative architectonic analysis of the human and macaque frontal cortex.In: Grafman, J.; Boller, F., editors. Handbook of Neuropsychology. Vol. 9. 1994. p. 17-58.
Petrides M. Dissociable roles of mid-dorsolateral prefrontal and anterior inferotemporal cortex in visualworking memory. Journal of Neuroscience 2000a;20:7496–7503. [PubMed: 11007909]
Petrides M. The role of the mid-dorsolateral prefrontal cortex in working memory. Experimental BrainResearch 2000b;133:44–54.
Petrides M. Lateral prefrontal cortex: architectonic and functional organization. Phil Trans R Soc B2005;360:781–795. [PubMed: 15937012]
Purves D, Riddle DR, LaMantia AS. Iterated patterns of brain circuitry (or how the cortex gets its spots).Trends Neurosci 1992;15:362–368. [PubMed: 1279855]
Rockland KS, Ichinohe N. Some thoughts on cortical minicolumns. Exp Brain Res 2004;158:265–277.[PubMed: 15365664]
Rosene DL, Roy NJ, Davis BJ. A cryoprotection method that facilitates cutting frozen sections of wholemonkey brains for histological and histochemical processing without freezing artifact. J HistochemCytochem 1986;34:1301–1315. [PubMed: 3745909]
Roth GS, Mattison JA, Ottinger MA, Chachich ME, Lane MA, Ingram DK. Aging in rhesus monkeys:Relevance to human health interventions. Science 2004;305:1423–1426. [PubMed: 15353793]
Sandell JH, Peters A. Disrupted myelin and axon loss in the anterior commissure of the aged rhesusmonkey. The Journal of Comparative Neurology 2003;466:14–30. [PubMed: 14515238]
Schmolesky MT, Wang Y, Pu M, Leventhal AG. Degradation of stimulus selectivity of visual corticalcells in senescent rhesus monkeys. Nat Neurosci 2000;3:384–390. [PubMed: 10725929]
Shors TJ, Miesegaes G, Beylin A, Zhao M, Rydel T, Gould E. Neuro-genesis in the adult is involved inthe formation of trace memories. Nature 2001;410:372–375. [PubMed: 11268214]
Smith DE, Rapp PR, McKay HM, Roberts JA, Tuszynski MH. Memory Impairment in Aged PrimatesIs Associated with Focal Death of Cortical Neurons and Atrophy of Subcortical Neurons. Journal ofNeuroscience 2004;24:4373–4381. [PubMed: 15128851]
Swindale NV. Is the cerebral cortex modular? Trends Neurosci 1990;13:487–492. [PubMed: 1703679]Tigges J, Gordon TP, McClure JM, Hall EC, Peters A. Survival rate and life span of rhesus monkeys at
the Yerkes Regional Primate Research Center. American Journal of Primatology 1988;15:263–273.Van Hoesen GW, Solodkin A. Some modular features of temporal cortex in humans as revealed by
pathological changes in Alzheimer’s Disease. Cerebral Cortex 1993;3:465–475. [PubMed: 7505138]Vercelli AE, Garbossa D, Curtetti R, Innocenti GM. Somatodendritic minicolumns of output neurons in
the rat visual cortex. European Journal of Neuroscience 2004;20:495–502. [PubMed: 15233758]Weeks JC. Thinking globally, acting locally: steroid hormone regulation of the dendritic architecture,
synaptic connectivity and death of an individual neuron. Prog Neurobiol 2003;70:421–442. [PubMed:14511700]
Cruz et al. Page 13
Neuroscience. Author manuscript; available in PMC 2010 February 18.
NIH
-PA Author Manuscript
NIH
-PA Author Manuscript
NIH
-PA Author Manuscript

Fig. 1.Panel (a) shows a coronal section of the frontal lobe at the level of the sulcus principalis, area46, where photographs were digitized (scale = 5mm). Panel (b) shows a higher magnificationof the boxed area from (a) with two boxes delineating areas of layer 3 from the ventral (bottom)and dorsal (top) banks of the sulcus illustrating the location of layer 3 (scale = 1mm). Panels(c) and (d) are higher magnification photomicrographs of the boxes in (b) illustrating typicalimages that were analyzed using the density map method. Image (c) is from the ventral and (d)is from the dorsal bank of the sulcus principalis (scale for both panels = 100μm).
Cruz et al. Page 14
Neuroscience. Author manuscript; available in PMC 2010 February 18.
NIH
-PA Author Manuscript
NIH
-PA Author Manuscript
NIH
-PA Author Manuscript
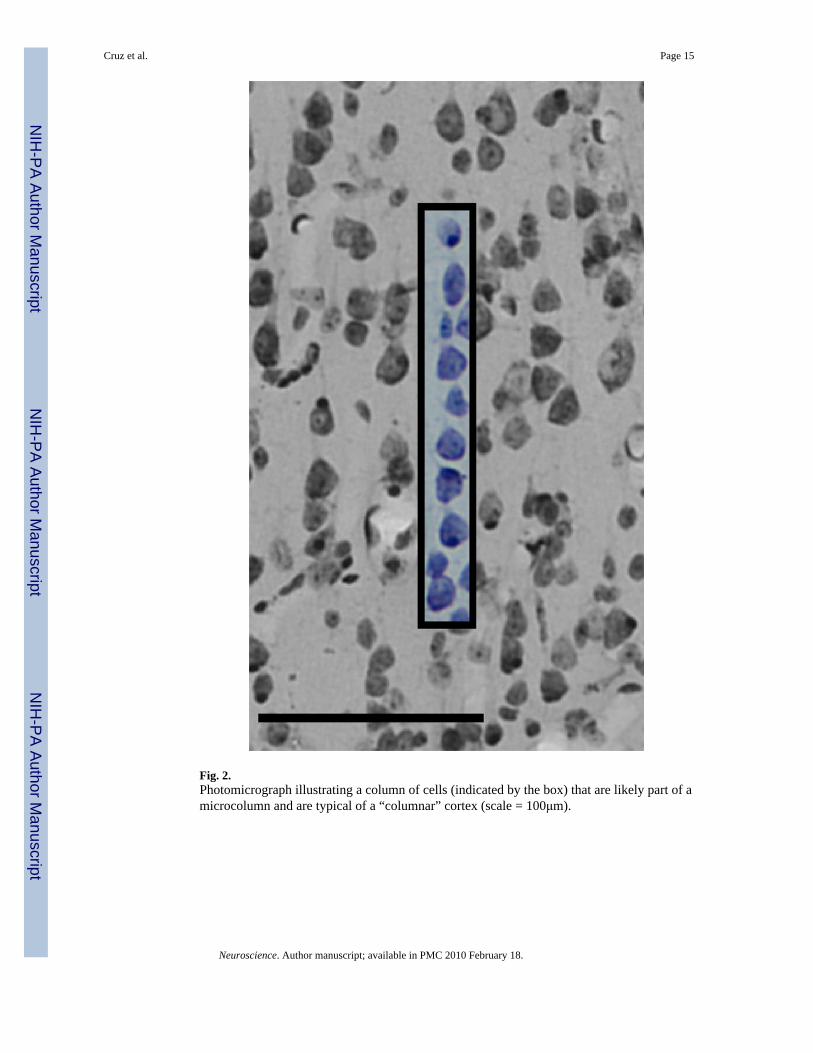
Fig. 2.Photomicrograph illustrating a column of cells (indicated by the box) that are likely part of amicrocolumn and are typical of a “columnar” cortex (scale = 100μm).
Cruz et al. Page 15
Neuroscience. Author manuscript; available in PMC 2010 February 18.
NIH
-PA Author Manuscript
NIH
-PA Author Manuscript
NIH
-PA Author Manuscript

Fig. 3.Schematic diagram illustrating the construction of a density map. In (a) (x,y) neuronalcoordinates are identified (inside shaded box) and an origin outside the image, marked by astar, is chosen. A copy of the coordinates is made and is shifted so that the neuron identifiedby the number 1 overlays the origin (b). In (c) three copies corresponding to three differentneurons are overlayed on the same origin. This process continues for all of the identifiedneurons to obtain a single overlay of the positions of all the neurons, shown for this exampleat the right of the arrow in (d). A grid is then defined in (d) creating a matrix, or density map,whose elements are the number of neurons inside each bin. In (e) the definitions of themicrocolumnar properties are depicted. The microcolumnar strength S and periodicity T arecalculated as the density of neurons in the indicated boxes divided by the total density of thesample. The width W and the length L correspond to the width and length of the centralmicrocolumn, as marked in the figure where the semi ellipsoids indicate the extent of themicrocolumn. The distance P is the distance between the central microcolumn and nearestmicrocolumns. The distance Y is the distance from the origin (star) to the highest density pointsinside the box used to calculate S. This distance corresponds to the distance between any neuronand its upper or lower neighbor neurons within the same microcolumn.
Cruz et al. Page 16
Neuroscience. Author manuscript; available in PMC 2010 February 18.
NIH
-PA Author Manuscript
NIH
-PA Author Manuscript
NIH
-PA Author Manuscript

Fig. 4.Neuronal density and microcolumnar properties for all of the cases analyzed. Bulletscorrespond to dorsal area (N=19) while open squares to ventral area (N=16). The graphscorrespond to (a) neuronal density ρ, (b) width W, (c) inter-column distance P, (d) degree ofmicrocolumnar periodicity T, (e) length L, and (f) interneuronal distance of microcolumns Y.The lines are regression (best fit) lines. Asterisks indicate quantities that are significantlydifferent between groups.
Cruz et al. Page 17
Neuroscience. Author manuscript; available in PMC 2010 February 18.
NIH
-PA Author Manuscript
NIH
-PA Author Manuscript
NIH
-PA Author Manuscript

Cruz et al. Page 18
Neuroscience. Author manuscript; available in PMC 2010 February 18.
NIH
-PA Author Manuscript
NIH
-PA Author Manuscript
NIH
-PA Author Manuscript
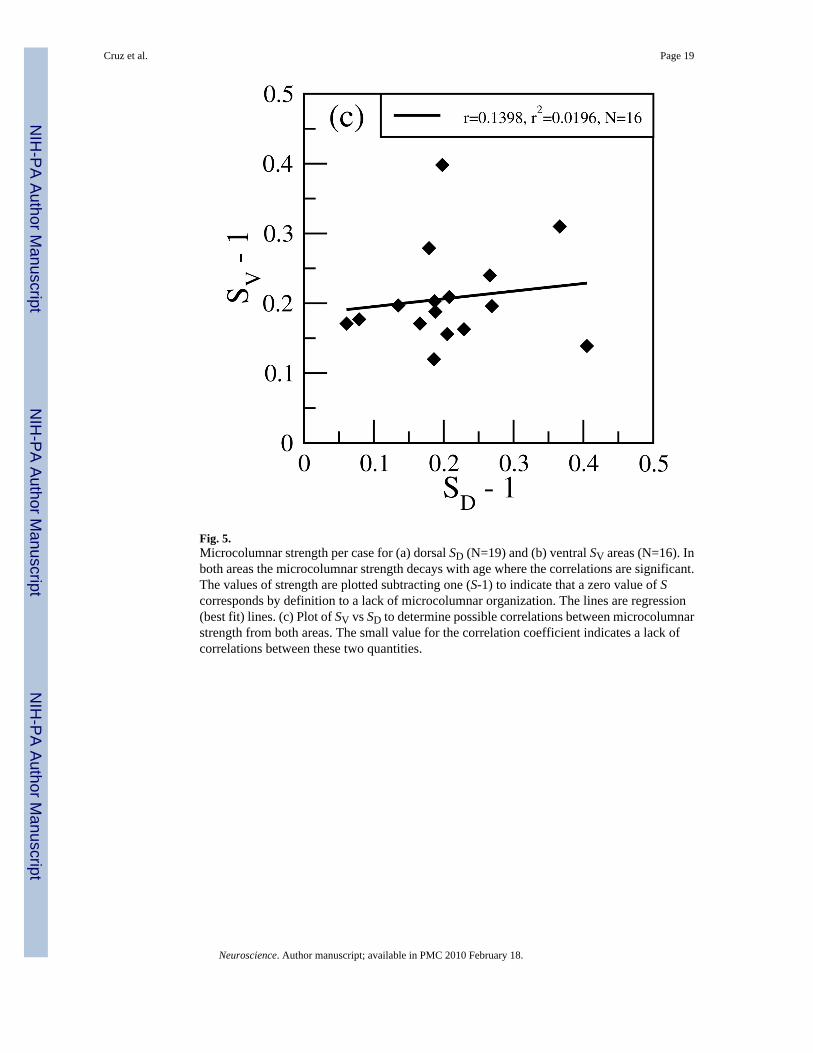
Fig. 5.Microcolumnar strength per case for (a) dorsal SD (N=19) and (b) ventral SV areas (N=16). Inboth areas the microcolumnar strength decays with age where the correlations are significant.The values of strength are plotted subtracting one (S-1) to indicate that a zero value of Scorresponds by definition to a lack of microcolumnar organization. The lines are regression(best fit) lines. (c) Plot of SV vs SD to determine possible correlations between microcolumnarstrength from both areas. The small value for the correlation coefficient indicates a lack ofcorrelations between these two quantities.
Cruz et al. Page 19
Neuroscience. Author manuscript; available in PMC 2010 February 18.
NIH
-PA Author Manuscript
NIH
-PA Author Manuscript
NIH
-PA Author Manuscript
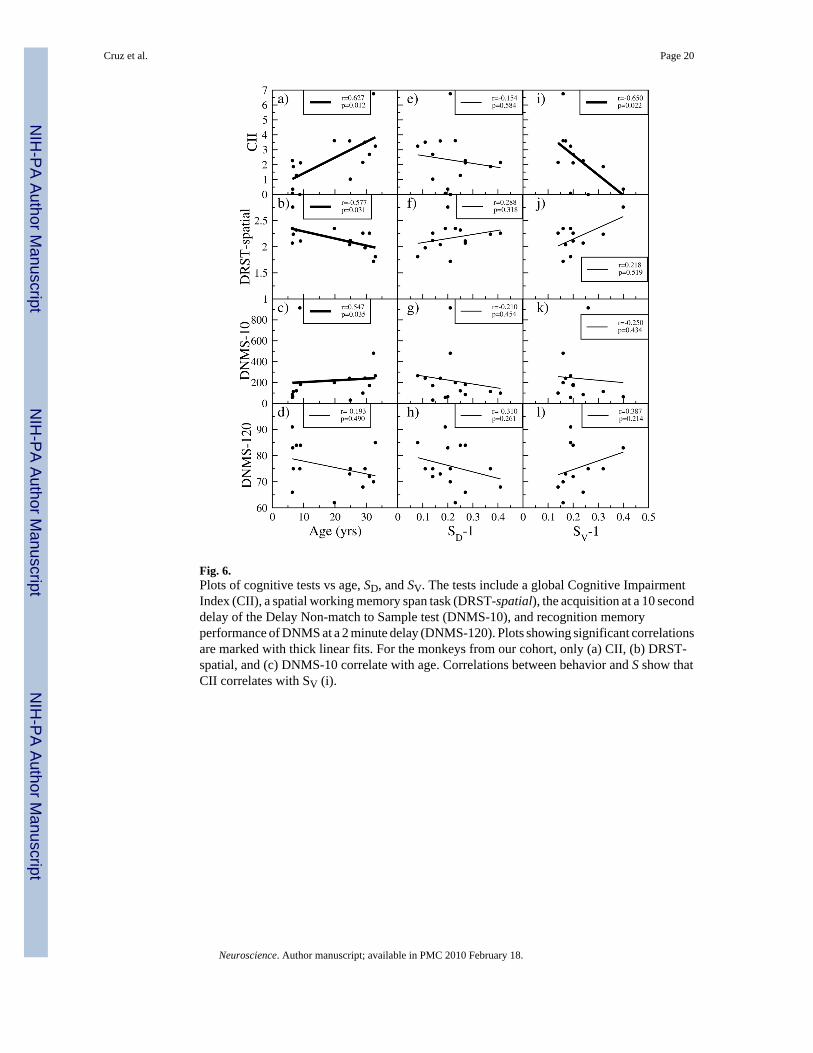
Fig. 6.Plots of cognitive tests vs age, SD, and SV. The tests include a global Cognitive ImpairmentIndex (CII), a spatial working memory span task (DRST-spatial), the acquisition at a 10 seconddelay of the Delay Non-match to Sample test (DNMS-10), and recognition memoryperformance of DNMS at a 2 minute delay (DNMS-120). Plots showing significant correlationsare marked with thick linear fits. For the monkeys from our cohort, only (a) CII, (b) DRST-spatial, and (c) DNMS-10 correlate with age. Correlations between behavior and S show thatCII correlates with SV (i).
Cruz et al. Page 20
Neuroscience. Author manuscript; available in PMC 2010 February 18.
NIH
-PA Author Manuscript
NIH
-PA Author Manuscript
NIH
-PA Author Manuscript
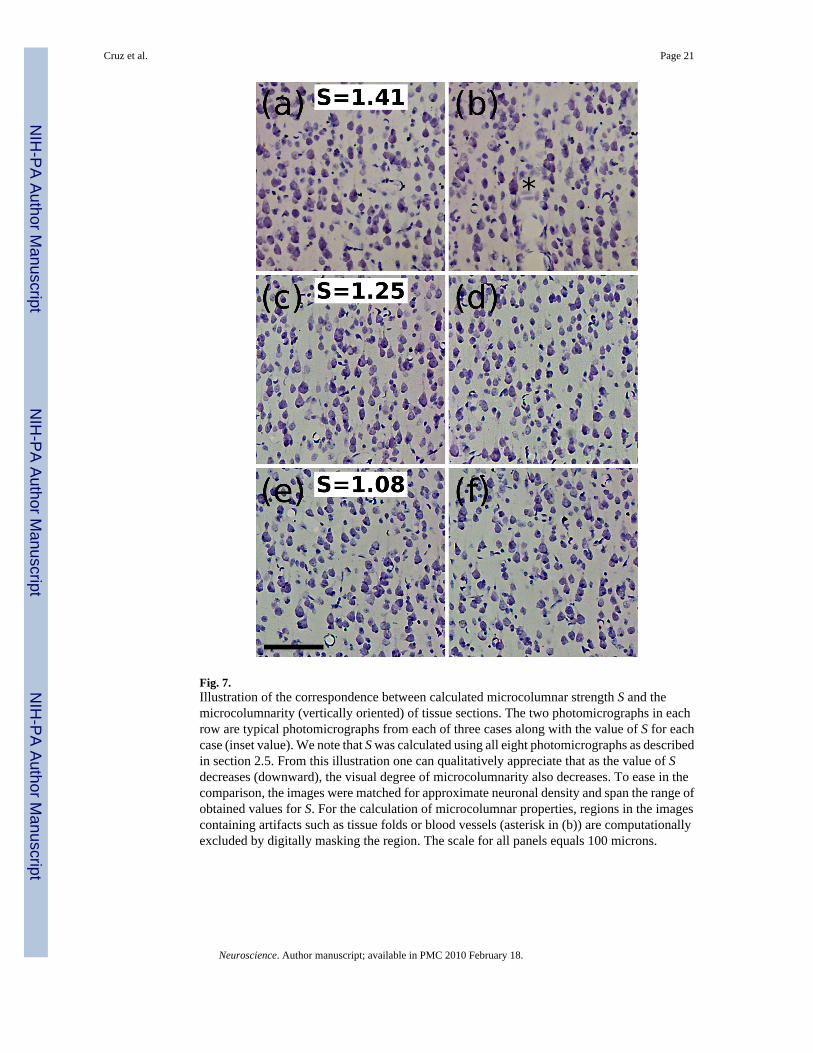
Fig. 7.Illustration of the correspondence between calculated microcolumnar strength S and themicrocolumnarity (vertically oriented) of tissue sections. The two photomicrographs in eachrow are typical photomicrographs from each of three cases along with the value of S for eachcase (inset value). We note that S was calculated using all eight photomicrographs as describedin section 2.5. From this illustration one can qualitatively appreciate that as the value of Sdecreases (downward), the visual degree of microcolumnarity also decreases. To ease in thecomparison, the images were matched for approximate neuronal density and span the range ofobtained values for S. For the calculation of microcolumnar properties, regions in the imagescontaining artifacts such as tissue folds or blood vessels (asterisk in (b)) are computationallyexcluded by digitally masking the region. The scale for all panels equals 100 microns.
Cruz et al. Page 21
Neuroscience. Author manuscript; available in PMC 2010 February 18.
NIH
-PA Author Manuscript
NIH
-PA Author Manuscript
NIH
-PA Author Manuscript

NIH
-PA Author Manuscript
NIH
-PA Author Manuscript
NIH
-PA Author Manuscript
Cruz et al. Page 22Ta
ble
1A
ge, n
umbe
r of n
euro
ns, t
otal
are
a, a
nd n
euro
nal d
ensi
ty fo
r eac
h of
the
fem
ale
mon
key
brai
ns a
naly
zed.
Dor
sal (
N=1
9)V
entr
al (N
=16)
Cas
eA
geN
umbe
r of
Neu
rons
Are
a (m
icro
ns2 )
Den
sity
(neu
rons
/μm
2 )N
umbe
r of
Neu
rons
Are
a (m
icro
ns2 )
Den
sity
(neu
rons
/μm
2 )
220
.412
7486
9639
.06
0.00
1465
012
7284
2646
.74
0.00
1509
5
2011
.811
6877
7935
.94
0.00
1501
410
7690
3038
.94
0.00
1191
5
2332
.311
0877
6342
.97
0.00
1427
284
887
6961
0.00
0967
0
2629
1215
7698
47.6
60.
0015
782
1091
8131
87.0
50.
0013
416
4131
.912
3076
0883
.98
0.00
1616
511
1688
0355
.38
0.00
1267
7
6532
.910
3477
2062
.50.
0013
393
963
8666
37.0
50.
0011
112
766.
410
6177
3761
.33
0.00
1371
214
1486
7924
.48
0.00
1629
2
776.
410
3979
8823
.44
0.00
1300
710
8083
2301
.10.
0012
976
9024
.918
4578
1601
.56
0.00
2360
5
969
1043
7363
86.3
30.
0014
164
849
8680
18.5
10.
0009
781
978.
898
376
8789
.06
0.00
1278
677
183
9924
.97
0.00
0917
9
100
24.7
1256
7996
65.6
30.
0015
707
1187
8355
82.7
40.
0014
206
104
28.9
481
3679
12.1
10.
0013
074
951
8440
15.4
30.
0011
268
119
3110
0478
0706
.64
0.00
1286
011
3386
6540
.79
0.00
1307
5
125
19.8
1050
7667
64.4
50.
0013
694
686
7901
15.6
30.
0008
682
129
6.7
794
7299
50.7
80.
0010
877
900
8007
96.2
60.
0011
239
130
7.7
1046
7751
67.5
80.
0013
494
180
29.6
786
7693
81.2
50.
0010
216
188
6.5
824
7232
44.5
30.
0011
393
701
8605
83.1
40.
0008
146
Neuroscience. Author manuscript; available in PMC 2010 February 18.

NIH
-PA Author Manuscript
NIH
-PA Author Manuscript
NIH
-PA Author Manuscript
Cruz et al. Page 23
Table 2Average Values of Measures of Microcolumnarity
Dorsal Ventral
S 1.202 1.207
T 1.06* 0.98*
P 26.52 μm 25.79 μm
W 12.592 μm 11.959 μm
L 35.3* μm 40.5* μm
Y 18.1* μm 21.0* μm
ρ 0.00141* neu./μm2 0.00118* neu./μm2
*significantly different, p<0.05.
Neuroscience. Author manuscript; available in PMC 2010 February 18.