Age dependence of regional proton metabolites T 2 relaxation times in the human brain at 3 T
13
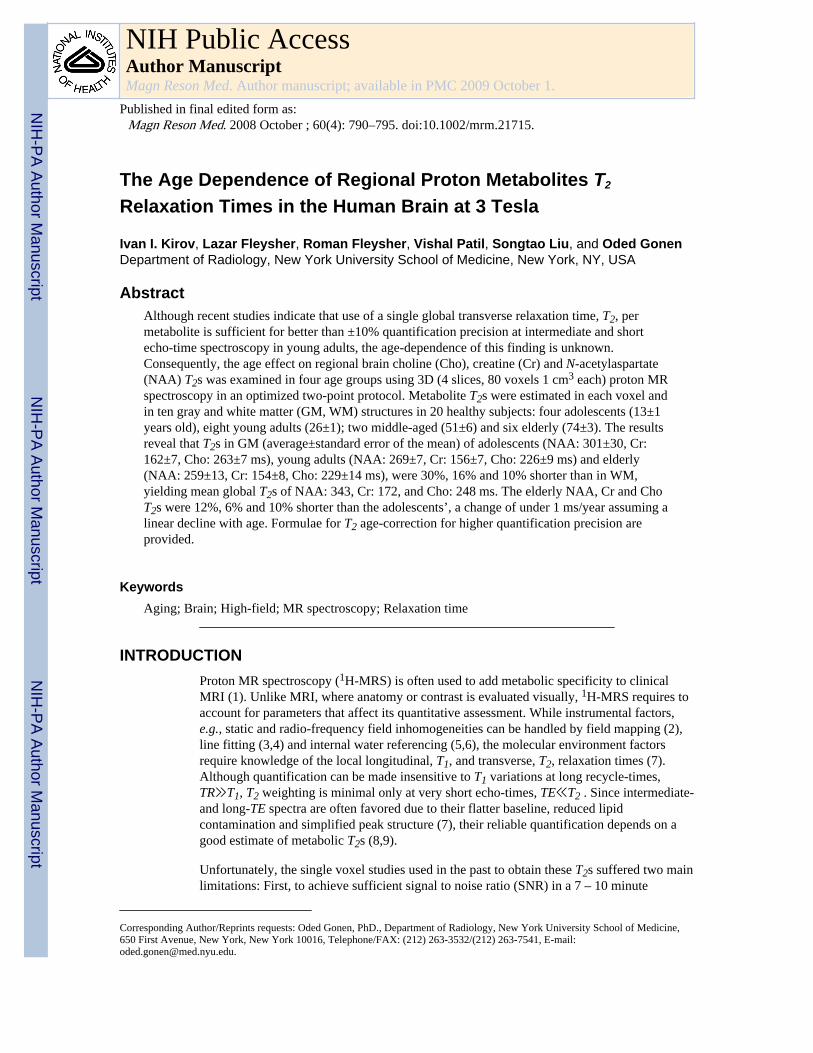
The Age Dependence of Regional Proton Metabolites T 2 Relaxation Times in the Human Brain at 3 Tesla Ivan I. Kirov, Lazar Fleysher, Roman Fleysher, Vishal Patil, Songtao Liu, and Oded Gonen Department of Radiology, New York University School of Medicine, New York, NY, USA Abstract Although recent studies indicate that use of a single global transverse relaxation time, T 2 , per metabolite is sufficient for better than ±10% quantification precision at intermediate and short echo-time spectroscopy in young adults, the age-dependence of this finding is unknown. Consequently, the age effect on regional brain choline (Cho), creatine (Cr) and N-acetylaspartate (NAA) T 2 s was examined in four age groups using 3D (4 slices, 80 voxels 1 cm 3 each) proton MR spectroscopy in an optimized two-point protocol. Metabolite T 2 s were estimated in each voxel and in ten gray and white matter (GM, WM) structures in 20 healthy subjects: four adolescents (13±1 years old), eight young adults (26±1); two middle-aged (51±6) and six elderly (74±3). The results reveal that T 2 s in GM (average±standard error of the mean) of adolescents (NAA: 301±30, Cr: 162±7, Cho: 263±7 ms), young adults (NAA: 269±7, Cr: 156±7, Cho: 226±9 ms) and elderly (NAA: 259±13, Cr: 154±8, Cho: 229±14 ms), were 30%, 16% and 10% shorter than in WM, yielding mean global T 2 s of NAA: 343, Cr: 172, and Cho: 248 ms. The elderly NAA, Cr and Cho T 2 s were 12%, 6% and 10% shorter than the adolescents’, a change of under 1 ms/year assuming a linear decline with age. Formulae for T 2 age-correction for higher quantification precision are provided. Keywords Aging; Brain; High-field; MR spectroscopy; Relaxation time INTRODUCTION Proton MR spectroscopy ( 1 H-MRS) is often used to add metabolic specificity to clinical MRI (1). Unlike MRI, where anatomy or contrast is evaluated visually, 1 H-MRS requires to account for parameters that affect its quantitative assessment. While instrumental factors, e.g., static and radio-frequency field inhomogeneities can be handled by field mapping (2), line fitting (3,4) and internal water referencing (5,6), the molecular environment factors require knowledge of the local longitudinal, T 1 , and transverse, T 2 , relaxation times (7). Although quantification can be made insensitive to T 1 variations at long recycle-times, TR≫T 1 , T 2 weighting is minimal only at very short echo-times, TE≪T 2 . Since intermediate- and long-TE spectra are often favored due to their flatter baseline, reduced lipid contamination and simplified peak structure (7), their reliable quantification depends on a good estimate of metabolic T 2 s (8,9). Unfortunately, the single voxel studies used in the past to obtain these T 2 s suffered two main limitations: First, to achieve sufficient signal to noise ratio (SNR) in a 7 – 10 minute Corresponding Author/Reprints requests: Oded Gonen, PhD., Department of Radiology, New York University School of Medicine, 650 First Avenue, New York, New York 10016, Telephone/FAX: (212) 263-3532/(212) 263-7541, E-mail: [email protected]. NIH Public Access Author Manuscript Magn Reson Med. Author manuscript; available in PMC 2009 October 1. Published in final edited form as: Magn Reson Med. 2008 October ; 60(4): 790–795. doi:10.1002/mrm.21715. NIH-PA Author Manuscript NIH-PA Author Manuscript NIH-PA Author Manuscript
-
Upload
independent -
Category
Documents
-
view
3 -
download
0
Transcript of Age dependence of regional proton metabolites T 2 relaxation times in the human brain at 3 T
The Age Dependence of Regional Proton Metabolites T2
Relaxation Times in the Human Brain at 3 Tesla
Ivan I. Kirov, Lazar Fleysher, Roman Fleysher, Vishal Patil, Songtao Liu, and Oded GonenDepartment of Radiology, New York University School of Medicine, New York, NY, USA
AbstractAlthough recent studies indicate that use of a single global transverse relaxation time, T2, permetabolite is sufficient for better than ±10% quantification precision at intermediate and shortecho-time spectroscopy in young adults, the age-dependence of this finding is unknown.Consequently, the age effect on regional brain choline (Cho), creatine (Cr) and N-acetylaspartate(NAA) T2s was examined in four age groups using 3D (4 slices, 80 voxels 1 cm3 each) proton MRspectroscopy in an optimized two-point protocol. Metabolite T2s were estimated in each voxel andin ten gray and white matter (GM, WM) structures in 20 healthy subjects: four adolescents (13±1years old), eight young adults (26±1); two middle-aged (51±6) and six elderly (74±3). The resultsreveal that T2s in GM (average±standard error of the mean) of adolescents (NAA: 301±30, Cr:162±7, Cho: 263±7 ms), young adults (NAA: 269±7, Cr: 156±7, Cho: 226±9 ms) and elderly(NAA: 259±13, Cr: 154±8, Cho: 229±14 ms), were 30%, 16% and 10% shorter than in WM,yielding mean global T2s of NAA: 343, Cr: 172, and Cho: 248 ms. The elderly NAA, Cr and ChoT2s were 12%, 6% and 10% shorter than the adolescents’, a change of under 1 ms/year assuming alinear decline with age. Formulae for T2 age-correction for higher quantification precision areprovided.
KeywordsAging; Brain; High-field; MR spectroscopy; Relaxation time
INTRODUCTIONProton MR spectroscopy (1H-MRS) is often used to add metabolic specificity to clinicalMRI (1). Unlike MRI, where anatomy or contrast is evaluated visually, 1H-MRS requires toaccount for parameters that affect its quantitative assessment. While instrumental factors,e.g., static and radio-frequency field inhomogeneities can be handled by field mapping (2),line fitting (3,4) and internal water referencing (5,6), the molecular environment factorsrequire knowledge of the local longitudinal, T1, and transverse, T2, relaxation times (7).Although quantification can be made insensitive to T1 variations at long recycle-times,TR≫T1, T2 weighting is minimal only at very short echo-times, TE≪T2 . Since intermediate-and long-TE spectra are often favored due to their flatter baseline, reduced lipidcontamination and simplified peak structure (7), their reliable quantification depends on agood estimate of metabolic T2s (8,9).
Unfortunately, the single voxel studies used in the past to obtain these T2s suffered two mainlimitations: First, to achieve sufficient signal to noise ratio (SNR) in a 7 – 10 minute
Corresponding Author/Reprints requests: Oded Gonen, PhD., Department of Radiology, New York University School of Medicine,650 First Avenue, New York, New York 10016, Telephone/FAX: (212) 263-3532/(212) 263-7541, E-mail:[email protected].
NIH Public AccessAuthor ManuscriptMagn Reson Med. Author manuscript; available in PMC 2009 October 1.
Published in final edited form as:Magn Reson Med. 2008 October ; 60(4): 790–795. doi:10.1002/mrm.21715.
NIH
-PA Author Manuscript
NIH
-PA Author Manuscript
NIH
-PA Author Manuscript

acquisition, even at the higher 3 T clinical field, requires 3.5 – 8 cm3 voxels, leading towhite and gray matter (WM, GM) partial volume effects. Second, each different regionrequires separate acquisitions, limiting the number that can be studied in a single session.This forced two implicit assumptions on quantitative 1H-MRS: (i) That the same global T2sare good for the entire brain; and (ii) that all healthy subjects share the same T2 values.
Fortunately, multivoxel methods used recently to address these limitations with better spatialresolution and coverage have substantiated both assumptions in controls (8,9), showing thatthey lead to under ±10% quantification bias (8). Although 1H-MRS is used across all ages,these studies focused on young adults, leaving unknown any age effects on regional T2s ofN-acetylaspartate (NAA), total creatine (Cr) and choline (Cho). To test the hypothesis that aglobal T2 per metabolite may still apply to controls of all ages we measured the brain’sregional T2 distributions at 3 T in healthy adolescents, young adults, middle aged and elderlysubjects at 1 cm3 spatial resolution. Extensive brain coverage was obtained with three-dimensional (3D) 1H-MRS in a precision-optimized two-point protocol (10,11).
MATERIALS AND METHODSHuman Subjects
Twenty healthy volunteers with no history of neurological conditions were recruited for thisstudy: Four adolescents (3 female), 13±1years old (yo); eight young adults (4 women), 26±1yo, two middle-aged (1 woman), 51±6 yo; and six elderly (3 women), 74±3 yo. Healthystatus in the elderly was established based on a Mini Mental State Examination (MMSE) forgeneral cognitive performance (12); Global Deterioration Scale (GDS) to exclude cognitionrelated functional issues (13); Brief Cognitive Rating Scale (BCRS) interview for memoryperformance and global functioning (14); and a physical exam with screening MRI as wellas blood work-up for general medical conditions. For the younger cohorts, “healthy” statuswas established based on negative answers to a questionnaire detailing 28 disqualifyingneurological conditions before the study and an “unremarkable” MRI confirmed by aneuroradiologist after the scan. Participants or their guardians gave IRB-approved writteninformed consent.
MR Data AcquisitionAll experiments were done in a 3 T Magnetom Trio (Siemens AG, Erlangen, Germany) witha circularly-polarized transmit-receive head coil (TEM3000 MRI Instruments, Minneapolis,MN). The 1H-MRS volume-of-interest (VOI) was image-guided over axial, sagittal andcoronal T1-weighted spin-echo (TE/TR=7.3/600 ms) MRI acquired at 240×240 mm2 field-of-view (FOV), 256×256 matrix and 5 mm thick slices, as shown in Figs. 1 and 2. Ourchemical-shift imaging (CSI) based auto-shim produced consistent full-width at halfmaximum (FWHM) whole-head water linewidth of 27±4 Hz (15). The 10 cm anterior-posterior (AP) ×8 cm left-right (LR) ×4 cm inferior-superior (IS) =320 cm3 VOI was excitedusing PRESS (TR=1260 ms, TE see below) with water suppression enhanced through T1effects (16,17). The VOI was encoded using two-slab second-order Hadamard spectroscopicimaging into 4 (IS) slices, each partitioned with 16×16 CSI over a 16×16 cm2 (AP×LR)FOV, as shown in Figs. 1 and 2, in 11 minutes (18,19). This yielded 320 voxels, a nominal 1cm3 each, or approximately 1.12×1.12×1.0=1.25 cm3 given the FWHM of the point spreadfunction for the uniform 2D phase encoding in the axial planes (19–21). The 1H-MRSsignals were acquired with 512 complex points at 500 ms/pt digitization rate for a ±1 kHzacquisition bandwidth with the carrier frequency centered 2.7 ppm upfield from the waterresonance, i.e., between the Cr and NAA.
Kirov et al. Page 2
Magn Reson Med. Author manuscript; available in PMC 2009 October 1.
NIH
-PA Author Manuscript
NIH
-PA Author Manuscript
NIH
-PA Author Manuscript

Choice of TE and acquisition strategyThe strive for spatial resolution and T2 precision in the noisy MRS experiment makes for along acquisition. To maximize its efficiency we employed two strategies: 3D 1H-MRS thatyields the same SNR/unit-time as single-voxel methods (22) but covers a much largervolume (18); and a two-point T2 estimation paradigm that optimizes not just the two TEs,but also the number of averages (N1 and N2) at each, for the best precision/unit-time (11).Given that literature Cho, Cr and NAA T2s of young adults lie in the 130–260 ms range(8,9), the protocol was tuned for T2s around T2
0 = 180 ms, which led to TE1=35 ms(minimum for our setup), N1=1 and TE2 =260 ms (TE1+1.25×T2
0), N2=3 (10,11). Theuncertainty in the resultant T2s remains similar over a −25% to +40% range about T2
0, asshown in Fig. 2 of reference (8). This strategy led to a 44 minute protocol: Eleven min. atTE1 and 33 min. at TE2.
Post Processing and T2 metabolite CalculationThe MRS data were processed offline using in-house software. Residual water signal wasremoved in the time domain (23) and the data voxel shifted to align the CSI grid with theNAA VOI. The data was then zero-filled in the axial (CSI-encoded) planes from 16×16 to256×256, Fourier transforms in the time, AP and LR dimensions and a Hadamard transformalong the IS direction followed. No temporal or spatial filters were applied. [Although zero-filling does not add any information content to the raw data, our rationale is that it canincrease the effective spatial resolution by providing overlapping voxels, thereby reducingpartial volume artifacts (24,25)]. The spectra were automatically corrected for frequency andzero-order phase shifts in reference to the NAA peak in each voxel (18).
The relative levels of NAA, Cr, and Cho in every voxel in the VOI were estimated fromtheir peak areas obtained with the parametric spectral modeling and least-squaresoptimization method of Soher et al. (3), as shown in Fig. 3. This process uses a priorispectral information and includes non-parametric baseline signal componentscharacterization and Lorenz-Gauss lineshape assumption. Analysis of this baseline modelingshowed that for spectra with 5 Hz linewidth, the mean errors of the fit are 3.4%, 2.3% and2.8% for NAA, Cr and Cho (26).
Proton T2 relaxation times for NAA, Cho and Cr in each voxel were estimated using (8),
[1]
where S1 and S2 are the metabolite’s peak areas at TE1, and TE2. Five GM and five WMstructures were manually outlined on the MRI, as shown in Figs. 1 and 3 and our softwareaveraged the metabolites’ T2s in all the voxels in the 256×256 T2 map that fell completely orpartially within each. No CSF partial volume correction was made to the estimatedmetabolite levels since it self-cancels in the S1 / S2 ratio of Eq. [1]. Similarly, the small B1variations across the VOI will also affect both S1 and S2 in Eq. [1] in a multiplicative waysince the same pulses are used to acquire both and, therefore, will cancel out. As a result,both the partial volume and the B1 variations will have some effect on the voxel SNR, andconsequently, a minor influence on the precision of the T2 but not on its accuracy.
RESULTSExamples of the position of the VOI in the brains and the resultant 1H spectra matricesobtained at the short and long TEs from an adolescent and an elderly subject are shown inFigs. 1 and 2. The WM and GM structures outlined for the regional T2 estimates, are shown
Kirov et al. Page 3
Magn Reson Med. Author manuscript; available in PMC 2009 October 1.
NIH
-PA Author Manuscript
NIH
-PA Author Manuscript
NIH
-PA Author Manuscript
in Figs. 1 and 3, together with sample spectra from adolescents and elderly at both TEs.These spectra are overlaid with the fitted model functions comprising NAA, Cho, Cr,glutamate, glutamine, aspartate and lactate at the short, TE1=35 ms, and just NAA, Cr andCho at the long TE2=260 ms. Expanded for detail in Fig. 3, these spectra demonstrate thecharacteristic SNR, linewidth and overall quality of the fit, from which the T2s are derivedvia Eq. [1].
The average NAA, Cr, and Cho SNRs at TE1, estimated as the peak-height divided by twicethe root-mean-square of the noise [see 4.3.14 in (27)], were 40±7.0, 18±5.0 and 15±4.0[mean±standard deviation (SD)]. All T2s were corrected for the T1-weighting incurred byour use of the 1.260 s TR, assuming an average T1 value of ~1.2 s for each of the threemetabolites reported in the literature (28). The T2s in each of the examined brain regionshown in Figs. 1 and 3 in the adolescents, young adults and elderly are compiled in Table 1,and the histograms from all 320 voxels in the VOI of each adolescent and elderly are plottedin Fig. 4. Note the inter-subject T2 distribution similarities, reflected by the histogramsoverlap for each metabolite in the two age-extreme cohorts. The GM and WM T2s means ±standard-error of the mean (SEM) for the three metabolites in each of the four cohortsstudied, are plotted versus age in Fig. 5.
The results show that the T2s (mean±SEM) in the GM of the adolescents (NAA: 301±30, Cr:162±7, Cho: 263±7 ms), young adults (NAA: 269±7, Cr: 156±7, Cho: 226±9 ms) andelderly (NAA: 259±13, Cr: 154±8, Cho: 229±14 ms), were 30%, 16% and 10% shorter thanin their WM. Furthermore, in both GM and WM the T2s of NAA, Cr and Cho in the elderlywere 12%, 6% and 10% shorter than in the same regions in the adolescents. Assuming alinear decline, these represent changes of less than 1 ms/year of aging in each moiety, asshown in Fig. 5.
The spectral fitting software also estimates the metabolites’ FWHM linewidth, Δω in eachvoxel: 2.91±0.07, 3.16±0.15, 3.31±0.07, 3.33±0.05 Hz (mean±SEM) in the adolescents,young adults, middle-aged and the elderly cohorts. Assuming Lorentzian lineshapes, thecorresponding T2*s (=1/πΔω) were 109±4, 101±2, 96±5 and 95±6 ms. Since these Δω–sscale down from the 27±4 Hz FWHM in the 8×10×4 cm3 VOI approximately as its ratio tothe 1×1×1 cm3 voxel, indicates that macroscopic susceptibility dominates the linewidth, asdescribed by Li et al. (29).
DISCUSSIONAlthough 1H-MRS is also used in pediatric and geriatric populations, all T2 studies known tous at 3 T to date focused on young adults in their 20–30s (8,9,28,30,31). Yet it is known thatover the 60–80 years separating the two age-extreme groups, the human brain undergoesmorphologic and physiologic changes that could affect T2. Of these, atrophy is the bestknown and easiest to see, e.g., by comparing ventricle and subarachnoid spaces in Fig. 1versus 2 (32). Since atrophy in normal aging involves neuronal shrinkage, axonal andmyelin degeneration (33,34), the resulting increase in the fraction of small neurons andcorresponding reduction in their water content may combine to decrease metabolite T2s. Inaddition, progressive iron (+3Fe) buildup with age (as transferrin, ferritin and hemosiderin)first observed by Hallgren and Sourander (35), especially in the basal ganglia, has shown astrong correlation with T2* decline (36,37).
These morphological and biochemical age-related changes, motivated us to assess, for thefirst time, the inter- and intra-subject variability of metabolites’ T2s within and betweenadolescents, young adults, middle-aged and the elderly. Our aim was to obtain these T2s and
Kirov et al. Page 4
Magn Reson Med. Author manuscript; available in PMC 2009 October 1.
NIH
-PA Author Manuscript
NIH
-PA Author Manuscript
NIH
-PA Author Manuscript

ascertain if, or at what consequence, can a global value for each still be (conveniently) usedfor absolute metabolic quantification anywhere in the brain of any healthy subject.
Indeed, for the purpose of metabolic quantification, this premise is supported by our results.Specifically, the variations in T2 among the brain structures and tissue type (GM or WM)studied is less than 35% for any metabolite, regardless of age. In all age groups the averageT2 values of metabolites in the GM are shorter than in the WM by less than 30% for NAA,16% for Cr, and 10% for Cho, as shown in Table 1 and Fig. 5. The extent of thesedifferences suggests that use of a single set of one T2 value per metabolite: 343, 172 and 248ms for NAA, Cr and Cho anywhere in the brain of healthy subjects of any age would impactquantification precision by less than ±10% for TEs under 100 ms. For example, neglectingthe range of T2s at TE = 35 ms would yield errors of less than 3.6% for NAA, 3.4% for Crand 3.5% for Cho.
The intra-subject variations in these T2s can be inferred from their coefficient of variation(CV). When obtained with this two-point method it cannot be lower than the instrumentnoise contribution of 3.6/SNR4 (8,11). (SNR4 would have been achieved if the entireexperiment was spent for 1+3=4 averages at TE1, ). The CVs in a singlevoxel which represent the instrumental noise contribution, therefore, are 4.7/SNR4 ≈5% forNAA, 3.6/SNR4 ≈10% for Cr, and 3.8/SNR4 ≈13% for Cho (see Fig. 2 in reference (8)) .The observed CVs of the T2s, estimated from the half-width at half maximum of therespective histograms in Fig. 4, ~35%, 29% and 27% for NAA, Cr and Cho, arecombination of instrumental and biological noise. Assuming that these noise sources areindependent and therefore, add in quadrature: CV2
total=CV2biology+CV2
instrument, indicatesthat the biological intra-subject T2s variations are 35%, 27% and 24% for NAA, Cr andCho.
Based on the reported data we conjecture that quantification precision can be improved byusing age-specific metabolite T2s obtained for GM and WM using a linear approximation,
[2]
The intercept, A, and slope, B, for each metabolite in either tissue type are derived from andpresented in the age versus T2 plots of Fig. 5. These age-corrections for the T2s can improvethe accuracy of absolute metabolic quantification between the young and elderly comparedwith the set of a single T2 per metabolite for both tissue types and all ages proposed above. Itis also noteworthy that due to the similarity in the rates of T2 decline with age in the WMand GM, shown in Fig. 5, it is unlikely that they reflect the preferential deposition of ironwith age in the GM described in (35).
CONCLUSIONSThe inter- and intra- subject T2 uniformity found across subjects spanning over six decadessubstantiates three assumptions frequently made in the past for reasons of expediency: thatfor T2 correction in 1H-MRS metabolic quantification a single T2 value per metabolite issufficient in (i) any brain region, (ii) of any healthy subject, and (iii) at any age. Despite a(very) gradual (less than 1 ms/year) decrease with age in the T2s of the three mainmetabolites and their differences between tissue types, the use of a set of one T2 permetabolite will yield a precision of better than ±10% in metabolic quantification atintermediate and short, TEs≤100 ms. The regional T2s provided for various tissue types and
Kirov et al. Page 5
Magn Reson Med. Author manuscript; available in PMC 2009 October 1.
NIH
-PA Author Manuscript
NIH
-PA Author Manuscript
NIH
-PA Author Manuscript
the expressions for their age dependence facilitate improvement of the accuracy ofquantification approaching it biological variability.
AcknowledgmentsWe thank Drs. Andrew A. Maudsley of the University of Miami and Brian J. Soher of Duke University for the useof their SITools-FITT spectral modeling software. This work was supported by NIH Grants EB01015, NS050520,NS29029 and NS39135.
References1. Ross BD, Bluml S. Magnetic resonance Spectroscopy of the human brain. Anat Rec. 2001; 265:54–
84. [PubMed: 11323770]2. Gruetter R, Tkac I. Field mapping without reference scan using asymmetric echo-planar techniques.
Magn Reson Med. 2000; 43(2):319–323. [PubMed: 10680699]3. Soher BJ, Young K, Govindaraju V, Maudsley AA. Automated spectral analysis III: application to
in vivo proton MR spectroscopy and spectroscopic imaging. Magn Reson Med. 1998; 40(6):822–831. [PubMed: 9840826]
4. Provencher SW. Automatic quantitation of localized in vivo 1H spectra with LCModel. NMRBiomed. 2001; 14(4):260–264. [PubMed: 11410943]
5. Simmons A, Smail M, Moore E, Williams SC. Serial precision of metabolite peak area ratios andwater referenced metabolite peak areas in proton MR spectroscopy of the human brain. Magn ResonImaging. 1998; 16(3):319–330. [PubMed: 9621973]
6. Dong Z, Dreher W, Leibfritz D. Toward quantitative short-echo-time in vivo proton MRspectroscopy without water suppression. Magn Reson Med. 2006; 55(6):1441–1446. [PubMed:16598735]
7. Jansen JF, Backes WH, Nicolay K, Kooi ME. 1H MR spectroscopy of the brain: absolutequantification of metabolites. Radiology. 2006; 240(2):318–332. [PubMed: 16864664]
8. Zaaraoui W, Fleysher L, Fleysher R, Liu S, Soher BJ, Gonen O. Human brain-structure resolvedT(2) relaxation times of proton metabolites at 3 Tesla. Magn Reson Med. 2007; 57(6):983–989.[PubMed: 17534907]
9. Tsai SY, Posse S, Lin YR, Ko CW, Otazo R, Chung HW, Lin FH. Fast mapping of the T2 relaxationtime of cerebral metabolites using proton echo-planar spectroscopic imaging (PEPSI). Magn ResonMed. 2007; 57(5):859–865. [PubMed: 17457864]
10. Fleysher L, Fleysher R, Liu S, Zaaraoui W, Gonen O. Optimizing the precision-per-unit-time ofquantitative MR metrics: Examples for T(1), T(2), and DTI. Magn Reson Med. 2007; 57(2):380–387. [PubMed: 17260375]
11. Fleysher R, Fleysher L, Gonen O. The optimal MR acquisition strategy for exponential decayconstants estimation. Magn Reson Imaging. 2007
12. Folstein MF, Robins LN, Helzer JE. The Mini-Mental State Examination. Arch Gen Psychiatry.1983; 40(7):812. [PubMed: 6860082]
13. Reisberg B, Ferris SH, de Leon MJ, Crook T. Global Deterioration Scale (GDS). PsychopharmacolBull. 1988; 24(4):661–663. [PubMed: 3249768]
14. Reisberg B, Ferris SH. Brief Cognitive Rating Scale (BCRS). Psychopharmacol Bull. 1988; 24(4):629–636. [PubMed: 3249764]
15. Hu J, Javaid T, Arias-Mendoza F, Liu Z, McNamara R, Brown TR. A fast, reliable, automaticshimming procedure using 1H chemical-shift-imaging spectroscopy. J Magn Reson B. 1995;108(3):213–219. [PubMed: 7670755]
16. Ogg RJ, Kingsley PB, Taylor JS. WET, a T1- and B1-insensitive water-suppression method for invivo localized 1H NMR spectroscopy. J Magn Reson B. 1994; 104(1):1–10. [PubMed: 8025810]
17. Bottomley PA. Spatial localization in NMR spectroscopy in vivo. Ann N Y Acad Sci. 1987;508:333–348. [PubMed: 3326459]
Kirov et al. Page 6
Magn Reson Med. Author manuscript; available in PMC 2009 October 1.
NIH
-PA Author Manuscript
NIH
-PA Author Manuscript
NIH
-PA Author Manuscript
18. Goelman G, Liu S, Hess D, Gonen O. Optimizing the efficiency of high-field multivoxelspectroscopic imaging by multiplexing in space and time. Magn Reson Med. 2006; 56(1):34–40.[PubMed: 16767711]
19. Goelman G, Liu S, Gonen O. Reducing voxel bleed in Hadamard-encoded MRI and MRS. MagnReson Med. 2006; 55(6):1460–1465. [PubMed: 16685718]
20. Brooker HR, Mareci TH, Mao JT. Selective Fourier transform localization. Magn Reson Med.1987; 5(5):417–433. [PubMed: 3431402]
21. Mareci T, Brooker H. Essential considerations for spectral localization using indirect gradientencoding of spatial information. J Magn Reson. 1991; 92:229–246.
22. Macovski A. Noise in MRI. Magn Reson Med. 1996; 36(3):494–497. [PubMed: 8875425]23. Marion D, Ikura M, Bax A. Improved solvent suppression in one- and two-dimensional NMR
spectra by convolution of time domain data. J Magn Reson. 1989; 84:425–430.24. Du YP, Parker DL, Davis WL, Cao G. Reduction of partial-volume artifacts with zero-filled
interpolation in three-dimensional MR angiography. J Magn Reson Imaging. 1994; 4(5):733–741.[PubMed: 7981519]
25. Bernstein MA, Fain SB, Riederer SJ. Effect of windowing and zero-filled reconstruction of MRIdata on spatial resolution and acquisition strategy. J Magn Reson Imaging. 2001; 14(3):270–280.[PubMed: 11536404]
26. Soher BJ, Young K, Maudsley AA. Representation of strong baseline contributions in 1H MRspectra. Magn Reson Med. 2001; 45(6):966–972. [PubMed: 11378873]
27. Ernst, RR.; Bodenhausen, G.; Wokaun, A. The International Series of Monographs on Chemistry.Oxford: Clarendon Press; 1987. Principles of Nuclear Magnetic Resonance in One and TwoDimensions; p. 152
28. Traber F, Block W, Lamerichs R, Gieseke J, Schild HH. 1H metabolite relaxation times at 3.0tesla: Measurements of T1 and T2 values in normal brain and determination of regionaldifferences in transverse relaxation. J Magn Reson Imaging. 2004; 19(5):537–545. [PubMed:15112302]
29. Li BS, Regal J, Gonen O. SNR versus resolution in 3D 1H MRS of the human brain at highmagnetic fields. Magn Reson Med. 2001; 46(6):1049–1053. [PubMed: 11746567]
30. Mlynarik V, Gruber S, Moser E. Proton T (1) and T (2) relaxation times of human brainmetabolites at 3 Tesla. NMR Biomed. 2001; 14(5):325–331. [PubMed: 11477653]
31. Barker PB, Hearshen DO, Boska MD. Single-voxel proton MRS of the human brain at 1.5 T and3.0 T. Magn Reson Med. 2001; 45(5):765–769. [PubMed: 11323802]
32. Kemper, TL. Neuroanatomical and neuropathological changes during aging and dementia.Knoefel, MLAaJE., editor. New York: Oxford University Press; 1994. p. 728
33. Peters A. The effects of normal aging on myelin and nerve fibers: a review. J Neurocytol. 2002;31(8–9):581–593. [PubMed: 14501200]
34. Dickstein DL, Kabaso D, Rocher AB, Luebke JI, Wearne SL, Hof PR. Changes in the structuralcomplexity of the aged brain. Aging Cell. 2007; 6(3):275–284. [PubMed: 17465981]
35. Hallgren B, Sourander P. The effect of age on the non-haemin iron in the human brain. JNeurochem. 1958; 3(1):41–51. [PubMed: 13611557]
36. Brass SD, Chen NK, Mulkern RV, Bakshi R. Magnetic resonance imaging of iron deposition inneurological disorders. Top Magn Reson Imaging. 2006; 17(1):31–40. [PubMed: 17179895]
37. Mitsumori F, Watanabe H, Takaya N, Garwood M. Apparent transverse relaxation rate in humanbrain varies linearly with tissue iron concentration at 4.7 T. Magn Reson Med. 2007; 58(5):1054–1060. [PubMed: 17969101]
Kirov et al. Page 7
Magn Reson Med. Author manuscript; available in PMC 2009 October 1.
NIH
-PA Author Manuscript
NIH
-PA Author Manuscript
NIH
-PA Author Manuscript
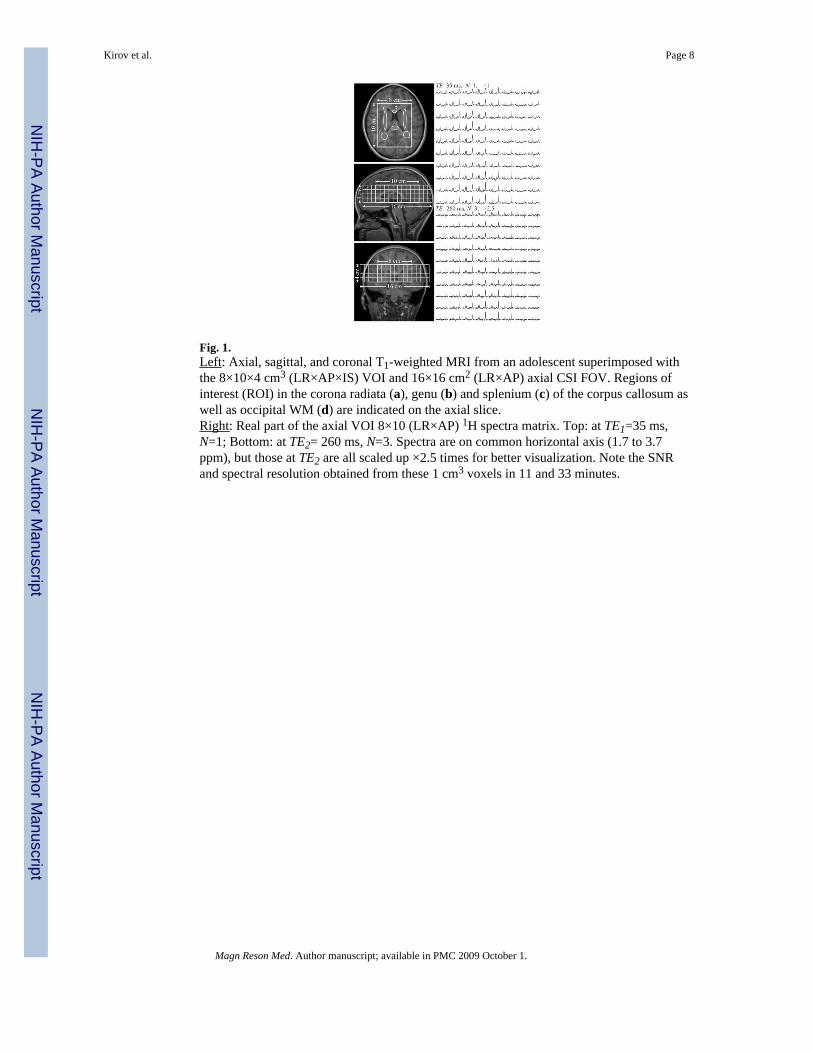
Fig. 1.Left: Axial, sagittal, and coronal T1-weighted MRI from an adolescent superimposed withthe 8×10×4 cm3 (LR×AP×IS) VOI and 16×16 cm2 (LR×AP) axial CSI FOV. Regions ofinterest (ROI) in the corona radiata (a), genu (b) and splenium (c) of the corpus callosum aswell as occipital WM (d) are indicated on the axial slice.Right: Real part of the axial VOI 8×10 (LR×AP) 1H spectra matrix. Top: at TE1=35 ms,N=1; Bottom: at TE2= 260 ms, N=3. Spectra are on common horizontal axis (1.7 to 3.7ppm), but those at TE2 are all scaled up ×2.5 times for better visualization. Note the SNRand spectral resolution obtained from these 1 cm3 voxels in 11 and 33 minutes.
Kirov et al. Page 8
Magn Reson Med. Author manuscript; available in PMC 2009 October 1.
NIH
-PA Author Manuscript
NIH
-PA Author Manuscript
NIH
-PA Author Manuscript
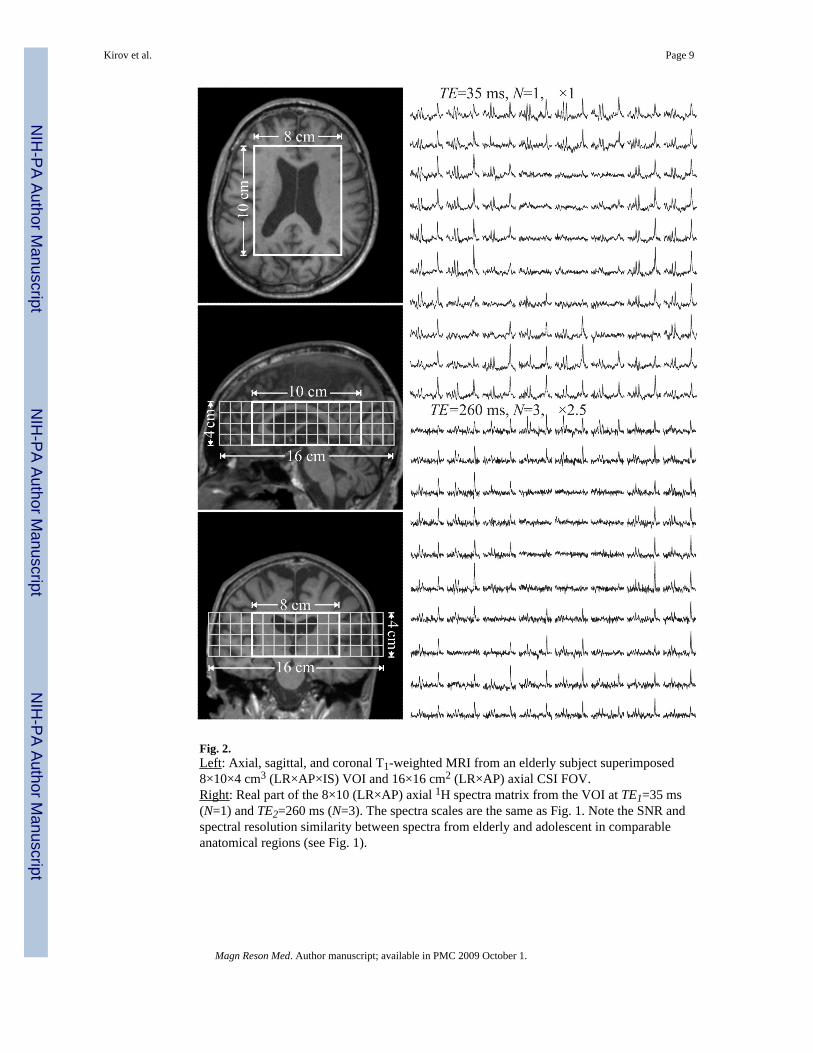
Fig. 2.Left: Axial, sagittal, and coronal T1-weighted MRI from an elderly subject superimposed8×10×4 cm3 (LR×AP×IS) VOI and 16×16 cm2 (LR×AP) axial CSI FOV.Right: Real part of the 8×10 (LR×AP) axial 1H spectra matrix from the VOI at TE1=35 ms(N=1) and TE2=260 ms (N=3). The spectra scales are the same as Fig. 1. Note the SNR andspectral resolution similarity between spectra from elderly and adolescent in comparableanatomical regions (see Fig. 1).
Kirov et al. Page 9
Magn Reson Med. Author manuscript; available in PMC 2009 October 1.
NIH
-PA Author Manuscript
NIH
-PA Author Manuscript
NIH
-PA Author Manuscript
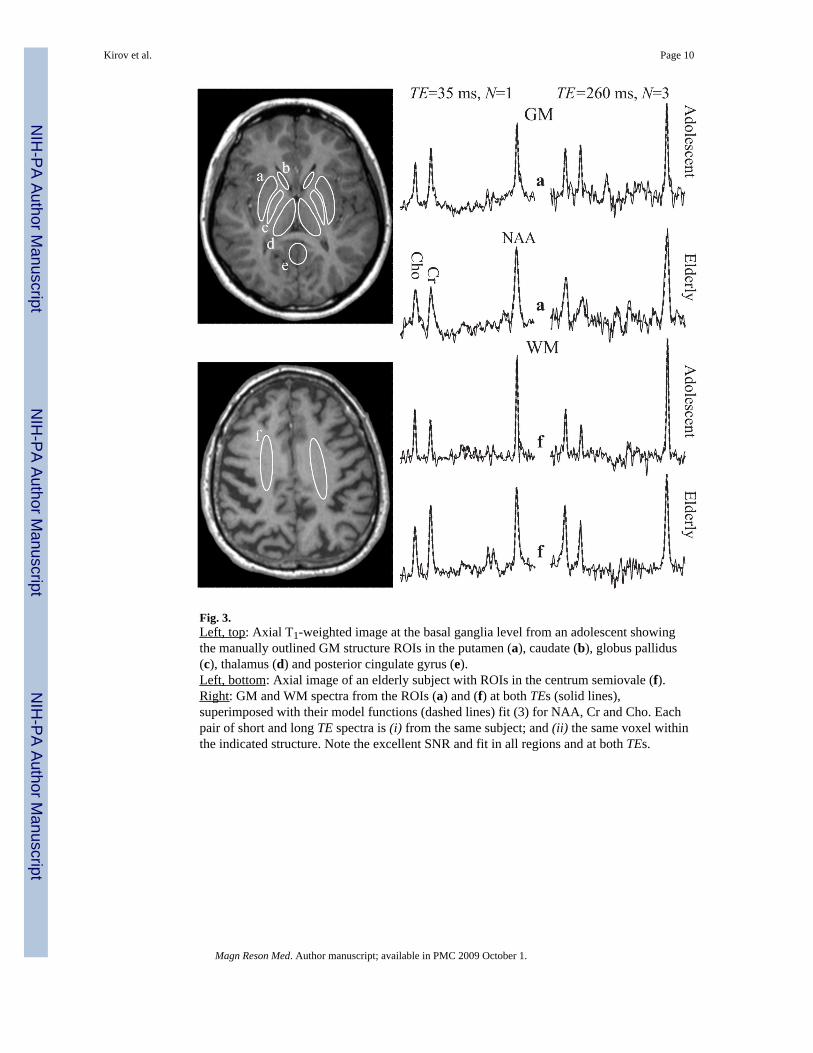
Fig. 3.Left, top: Axial T1-weighted image at the basal ganglia level from an adolescent showingthe manually outlined GM structure ROIs in the putamen (a), caudate (b), globus pallidus(c), thalamus (d) and posterior cingulate gyrus (e).Left, bottom: Axial image of an elderly subject with ROIs in the centrum semiovale (f).Right: GM and WM spectra from the ROIs (a) and (f) at both TEs (solid lines),superimposed with their model functions (dashed lines) fit (3) for NAA, Cr and Cho. Eachpair of short and long TE spectra is (i) from the same subject; and (ii) the same voxel withinthe indicated structure. Note the excellent SNR and fit in all regions and at both TEs.
Kirov et al. Page 10
Magn Reson Med. Author manuscript; available in PMC 2009 October 1.
NIH
-PA Author Manuscript
NIH
-PA Author Manuscript
NIH
-PA Author Manuscript

Fig. 4.Histograms of NAA, Cr and Cho T2s from all 320 voxels for all the adolescents (N=4) andelderly subjects (N=6). Note that the 60 year age difference does not appear to affect theinter-subject similarity of the respective histograms.
Kirov et al. Page 11
Magn Reson Med. Author manuscript; available in PMC 2009 October 1.
NIH
-PA Author Manuscript
NIH
-PA Author Manuscript
NIH
-PA Author Manuscript
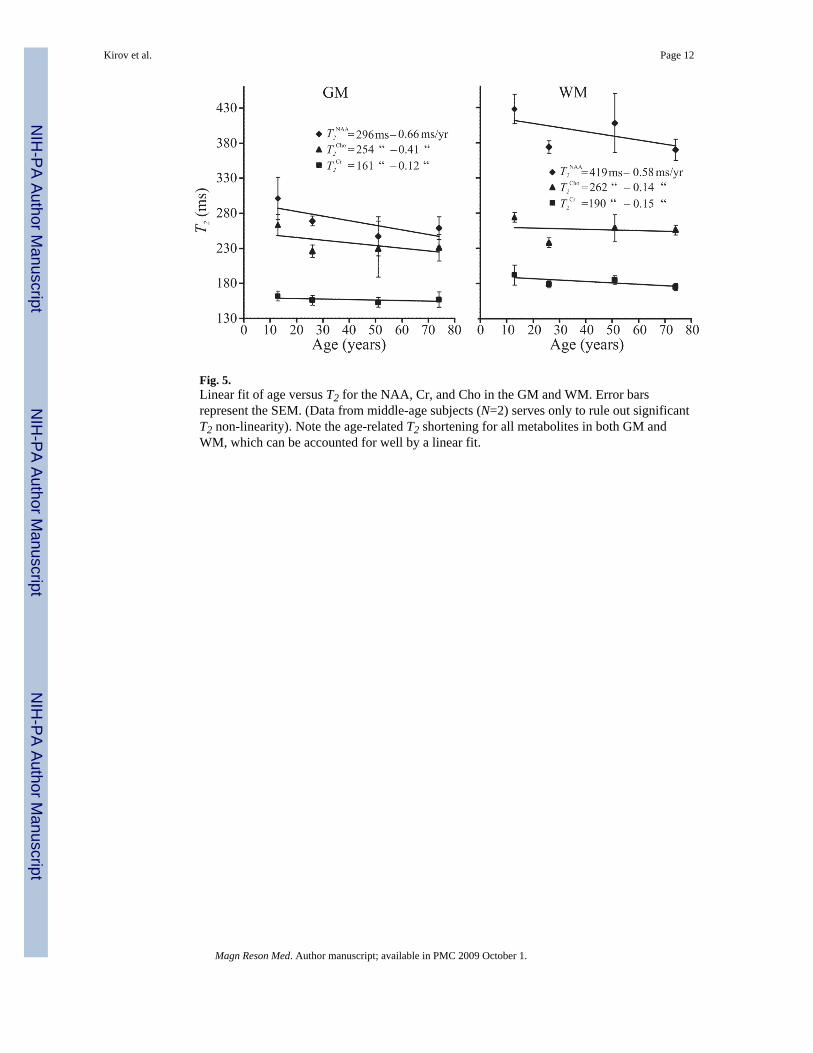
Fig. 5.Linear fit of age versus T2 for the NAA, Cr, and Cho in the GM and WM. Error barsrepresent the SEM. (Data from middle-age subjects (N=2) serves only to rule out significantT2 non-linearity). Note the age-related T2 shortening for all metabolites in both GM andWM, which can be accounted for well by a linear fit.
Kirov et al. Page 12
Magn Reson Med. Author manuscript; available in PMC 2009 October 1.
NIH
-PA Author Manuscript
NIH
-PA Author Manuscript
NIH
-PA Author Manuscript

NIH
-PA Author Manuscript
NIH
-PA Author Manuscript
NIH
-PA Author Manuscript
Kirov et al. Page 13
Tabl
e 1
Mea
n va
lues
of p
roto
n T 2
rela
xatio
n tim
es a
t 3 T
(in
mill
isec
onds
± S
EM) o
f N-a
cety
lasp
arta
te (N
AA
), cr
eatin
e (C
r) a
nd c
holin
e (C
ho) i
n th
e va
rious
GM
and
WM
bra
in re
gion
s ind
icat
ed (c
f. Fi
gs. 1
and
3) i
n4
adol
esce
nts,
8 yo
ung
adul
ts, 2
mid
dle-
aged
, and
6 e
lder
ly su
bjec
ts. C
C –
cor
pus c
allo
sum
.
GM
:
T 2 N
AA
(ms)
T 2 C
r (m
s)T 2
Cho
(ms)
Ado
lesc
ent
You
ngM
iddl
e- a
ged
Eld
erly
Ado
lesc
ent
You
ngM
iddl
e- a
ged
Eld
erly
Ado
lesc
ent
You
ngM
iddl
e- a
ged
Eld
erly
Cau
date
300±
2330
6±19
203±
4528
0±33
184±
1019
4±6
147±
3618
4±28
258±
1121
1±4
254±
024
0±11
Thal
amus
277±
1326
7±14
288±
4428
5±15
162±
1715
2±4
152±
416
4±5
268±
2124
1±12
241±
2523
5±18
Cin
gula
te g
yrus
421±
4027
7±11
271±
921
5±18
162±
916
0±5
173±
3314
7±6
278±
1825
5±10
324±
4529
1±26
Glo
bus p
allid
us27
5±5
252±
821
9±24
255±
814
4±9
141±
514
9±27
145±
924
0±12
191±
1118
1±5
206±
9
Puta
men
310±
2626
3±13
205±
022
3±15
161±
915
7±6
151±
1113
2±9
271±
1221
6±15
196±
220
6±16
GM
ave
rage
301±
3026
9±7
247±
2825
9±13
162±
715
6±7
153±
715
4±8
263±
722
6±9
229±
4022
9±14
WM
:
Sple
nium
of C
C40
5±32
375±
2432
7±19
314±
1520
5±10
164±
418
3±14
193±
1229
2±9
236±
2220
7±22
266±
31
Gen
u of
CC
361±
2932
6±21
405±
7431
0±55
251±
3620
2±17
175±
1516
2±10
279±
1724
7±18
233±
2626
0±32
Cen
trum
sem
iova
le45
8±11
397±
1640
1±22
391±
1319
0±2
187±
218
6±11
186±
727
8±10
245±
625
8±22
259±
15
Occ
ipita
l46
1±20
366±
1349
3±81
360±
1818
8±11
175±
519
7±32
169±
1028
9±21
228±
827
2±23
235±
16
Cor
ona
radi
ata
400±
2136
2±21
389±
6738
3±22
180±
717
3±5
180±
2117
4±8
256±
1723
4±7
269±
4325
1±10
WM
ave
rage
428±
2137
4±9
408±
4237
1±16
192±
1417
9±5
185±
617
8±5
274±
723
8±7
259±
1925
3±5
GM
+WM
365±
3633
8±19
345±
7132
2±25
177±
1517
2±7
172±
1316
7±8
268±
823
4±7
247±
3024
2±11
GM
+WM
ave
rage
343
172
248
Magn Reson Med. Author manuscript; available in PMC 2009 October 1.