Growth, Metabolites, Protein Profile and Esterase Enzyme of ...
18
American Journal of Plant Sciences, 2018, 9, 902-919 http://www.scirp.org/journal/ajps ISSN Online: 2158-2750 ISSN Print: 2158-2742 DOI: 10.4236/ajps.2018.94069 Mar. 30, 2018 902 American Journal of Plant Sciences Growth, Metabolites, Protein Profile and Esterase Enzyme of Wheat Grown under Osmotic Stress with Exogenous Application of Allium sativum Hamdia M. Abd El-Samad * , M. D. Mostafa Department of Botany and Microbiology, Faculty of Science, Minia University, El-Minia, Egypt Abstract The present work was conducting to ameliorate the saline injury by using natural products in garlic extract application on growth, metabolites, protein pattern and esterase enzyme of wheat plants. This study was conducting that wheat plant cv. Gimiza 11 response to osmotic stress effects and in general showed a variable response between different organs. The aerial parts of plants not only alleviated salinity injury but activated the fresh and dry matter productions. In root these parameters decreased as increasing salinity stress. Length of the shoots, roots and spikes run parallel with the previous results. Photosynthetic pigment enhanced markedly the increasing osmotic stress le- vels. The effect of garlic was reflected on the accumulation of soluble sugar and soluble protein in both roots and spikes, and a reduction of Na + and in- crease in K + under garlic treatments was recorded. In the present study, staining intensity of protein bands of wheat plant was decreased as osmotic stress increased but the number of bands was increased up to −0.9 MPa, after that level a slight decrease was recorded (for control induction, 12 bands, −0.3 MPa, 16 bands, −0.6 MPa 14 bands, −0.9 14 bands, −1.2 MPa 11 bands and final 11 bands for −1.5 MPa). Induction protein band for control plus garlic was 12 bands, for −0.3 MPa OSL plus garlic was 13 bands, for −0.6 MPa OSL plus garlic was 12 bands, for −0.9 MPa OSL plus garlic was 12 bands, for −1.2 MPa OSL was 8 bands and finally for −1.5 MPa OSL plus garlic was 9 bands. Electrophoresis studies of esterase showed wide variations in their intensi- ties and densities among all treatments. There were 6 isozymes forms of es- terase under OSL and with garlic but intensity was different. It seems that garlic extract was able to enhance the tolerance of the wheat plant to osmot- ic stress. How to cite this paper: Abd El-Samad, H.M. and Mostafa, M.D. (2018) Paper Title. American Journal of Plant Sciences, 9, 902-919. https://doi.org/10.4236/ajps.2018.94069 Received: October 27, 2017 Accepted: March 27, 2018 Published: March 30, 2018 Copyright © 2018 by authors and Scientific Research Publishing Inc. This work is licensed under the Creative Commons Attribution International License (CC BY 4.0). http://creativecommons.org/licenses/by/4.0/ Open Access
-
Upload
khangminh22 -
Category
Documents
-
view
0 -
download
0
Transcript of Growth, Metabolites, Protein Profile and Esterase Enzyme of ...

American Journal of Plant Sciences, 2018, 9, 902-919 http://www.scirp.org/journal/ajps
ISSN Online: 2158-2750 ISSN Print: 2158-2742
DOI: 10.4236/ajps.2018.94069 Mar. 30, 2018 902 American Journal of Plant Sciences
Growth, Metabolites, Protein Profile and Esterase Enzyme of Wheat Grown under Osmotic Stress with Exogenous Application of Allium sativum
Hamdia M. Abd El-Samad*, M. D. Mostafa
Department of Botany and Microbiology, Faculty of Science, Minia University, El-Minia, Egypt
Abstract
The present work was conducting to ameliorate the saline injury by using natural products in garlic extract application on growth, metabolites, protein pattern and esterase enzyme of wheat plants. This study was conducting that wheat plant cv. Gimiza 11 response to osmotic stress effects and in general showed a variable response between different organs. The aerial parts of plants not only alleviated salinity injury but activated the fresh and dry matter productions. In root these parameters decreased as increasing salinity stress. Length of the shoots, roots and spikes run parallel with the previous results. Photosynthetic pigment enhanced markedly the increasing osmotic stress le-vels. The effect of garlic was reflected on the accumulation of soluble sugar and soluble protein in both roots and spikes, and a reduction of Na+ and in-crease in K+ under garlic treatments was recorded. In the present study, staining intensity of protein bands of wheat plant was decreased as osmotic stress increased but the number of bands was increased up to −0.9 MPa, after that level a slight decrease was recorded (for control induction, 12 bands, −0.3 MPa, 16 bands, −0.6 MPa 14 bands, −0.9 14 bands, −1.2 MPa 11 bands and final 11 bands for −1.5 MPa). Induction protein band for control plus garlic was 12 bands, for −0.3 MPa OSL plus garlic was 13 bands, for −0.6 MPa OSL plus garlic was 12 bands, for −0.9 MPa OSL plus garlic was 12 bands, for −1.2 MPa OSL was 8 bands and finally for −1.5 MPa OSL plus garlic was 9 bands. Electrophoresis studies of esterase showed wide variations in their intensi-ties and densities among all treatments. There were 6 isozymes forms of es-terase under OSL and with garlic but intensity was different. It seems that garlic extract was able to enhance the tolerance of the wheat plant to osmot-ic stress.
How to cite this paper: Abd El-Samad, H.M. and Mostafa, M.D. (2018) Paper Title. American Journal of Plant Sciences, 9, 902-919. https://doi.org/10.4236/ajps.2018.94069 Received: October 27, 2017 Accepted: March 27, 2018 Published: March 30, 2018 Copyright © 2018 by authors and Scientific Research Publishing Inc. This work is licensed under the Creative Commons Attribution International License (CC BY 4.0). http://creativecommons.org/licenses/by/4.0/
Open Access

H. M. A. El-Samad, M. D. Mostafa
DOI: 10.4236/ajps.2018.94069 903 American Journal of Plant Sciences
Keywords
Garlic, Wheat, SDS Page, Esterase, NaCl Level
1. Introduction
Soil salinity is a major abiotic stress that limits plant growth and productivity. A high concentration of Na+ is harmful to plants because of its interference with K+ nutrition and, consequently, alteration of enzyme activities and cellular meta-bolism [1] [2]. In order to prevent accumulation of toxic amounts of Na+ in the cytosol, active Na+ efflux into the apoplast and its compartmentalization inside the vacuole occur [3] [4]. Plant’s behavioral response to salinity is complex, and different mechanisms are adopted by plants when they encounter salinity [5] [6]. Hassanein [7] studied that the ability of peanut (Arachis hypogaea L.) to grow at high concentrations of NaCl may be due to the alteration in gene expression. SDS-PAGE analysis has revealed that plants grown under NaCl showed induc-tion (127 kDa and 52 kDa) or repression (260 kDa and 38 kDa) in the synthesis of few polypeptides. In addition, nine different esterase isoenzymes were de-tected in embryos of seeds germinated in 105 mM NaCl, whereas only five of them were detected in the embryos of untreated seeds. In all salinity imposed plants, there were sharp increases in band intensity and the number of isoforms of investigated enzyme. A comparative account of the polymorphic expression of two antioxidative enzymes (peroxidase and superoxide), two hydrolyzing en-zymes (esterase and acid phosphatase) and total proteins was estimated from five mangroves leaves of two different habitats [8]. Garlic, a bulb producing crop in the family liliaceae, has a very strong pungent sensation and it is known to contain an essential oil (sulphur) compounds, volatile oil and amino acids. The fresh extracts of Allium sativum can be used to improve the vegetative growth of many plants such as squash [9]. Treatment plants with garlic extract can be used to ameliorate biotic and abiotic stresses [10]. Thus the present work was con-ducted to ameliorate the saline injury by using natural products to protect the human healthy from chemical damaging. Thus garlic extract application was used to counteract salinity effects on growth and metabolic constituents of wheat plants.
2. Materials and Methods
2.1. Experimental Sites and Osmotic Stress Treatments
A pot experiment was carried out in open environment at the garden of the Fa-culty of Science-Minia University during winter season (from the beginning of November to the middle of March, 2015). Wheat grain cv. Gimiza 11 which brought from three different breeding programs. Wheat seeds were surface steri-lized by immersion in a mixture of ethanol 96% and H2O2 (1:1) for 3 minutes,

H. M. A. El-Samad, M. D. Mostafa
DOI: 10.4236/ajps.2018.94069 904 American Journal of Plant Sciences
followed by several washings with sterile distilled water. The concentrations of NaCl were chosen after preliminary experiments in which the grains were sub-jected to different concentrations of NaCl. Eight grains were sown per pot, each pot contained 3.8 kg of garden clay soil in three replicates. All pots were irri-gated with tap water for two weeks. The seedlings were then treated with five different concentrations of NaCl solutions −0.3 MPa, −0.6 MPa, −0.9 MPa, −1.2 MPa and −1.5 MPa in addition of control irrigated only with water after two weeks from sowing in the first group. In order to maintain the osmotic potential, the soil moisture content was kept near field capacity using tap water.
2.2. Osmotic Stress and Treatments with Garlic Treatment
The previous treatments were repeated for irrigation with garlic treatment 0.5% as second groups. Fresh garlic was collected, drying in oven for 24 h at105˚C and grinding by blinder to gain powder. After that a water extract was prepared as weighted 0.5 g of this powder and dissolved in 100 ml distilled water, boiling at 100˚C for 1.5 h, then cooling and filtrate with Whitman filter paper, the filtrate of garlic was ready for treatments. Each pot of NaCl solutions −0.3 MPa, −0.6 MPa, −0.9 MPa, −1.2 MPa and −1.5 MPa in addition with control was irrigated with 100 ml of garlic extract. Three replicate was made for each treatment and plants were grown in natural conditions for crop yield production.
2.3. Laboratory Analysis for Metabolities
Roots, shoots and spikes dry weights and length were determined at the end of the experiment. The photosynthetic pigments were determined by Metzner [11]. Leaf area (Cm2 plant−1) was determined by measuring the leaf length and the maximum width and applying the formula: Leaf area = k (leaf length × leaf maximum width) (1) where (K = 0.75). The coefficient k was calculated and as-signed different values for different grasses [12] [13] and recently reviewed and given a value of 0.75 for monocot [14]. Water content in plant tissue organs was calculated by using fresh and dry weight values [15]. Succulent index was deter-mined as the water content per unit area of leaves [16]. Harvest index (HI): HI is an index of shoot dry matter allocated to crop yield production. (2) HI = Eco-nomic yield/biological yield = (wt. of spike/total wt. of shoot) [17]. The deter-mination of dry matter yields was done after the organs were separately oven-dried at 80˚C. Successive weighting was carried out until the constant dry weight of each sample was reached. Soluble sugar was determined by using anthrone-sulfuric acids method in water extracted sample [18]. Soluble protein contents were measured according to Lowry [19] in also water extracted sam-ples. Nitrate reductase activity was measured as nitrate reductase activity was determined according to Jawarski [20]. Na+ and K+ was measured Flamphoto-meteric by Williams and Twin 1960 [21]. Gel preparation: The electrophoresis was carried out in vertical polyacrylamide gels, using the slab gel apparatus “SE 600, vertical slab gel”. Polyacrylamide gel electrophoresis was carried out ac-

H. M. A. El-Samad, M. D. Mostafa
DOI: 10.4236/ajps.2018.94069 905 American Journal of Plant Sciences
cording to Laemmli [22] with 12% acrylamide plus 1.0% SDS for protein analy-sis. Esterase isozyme was carried out by Tansley and Orton (1983) [23] as weighting 1 g of fresh leaf sample and grinding in liquid N with 1 ml of Tris HCl plus EDTA buffer PH 7.8 until homogenization. Then centrifugation for 15 min at 12,000 rpm. The supernatant will be used for esterase, 20 μl per sample was then loaded directly into the wells with a syringe. Due to the presence of 2 μ of 20% sucrose plus bromophenol blue in the sample application buffer, it is denser higher than the surrounding upper buffer. Hence, the sample equilibrates at the bottom of the well. Stain solution for enzyme contain Na-phosphate (0.1 M) 100 ml (PH 6.8), α-naphthyl acetate (1.0) and Fast blue RR salt 100 mg. After that, incubate the gel under light at 25˚C for 30 - 60 min or until the chromatic bands appear.
3. Statistical Analysis
The experimental data were subjected to the one way analysis of variances (ANOVA test) using the SPSS version 16 and the means were separated by the least significant differences, L.S.D. at 0.05% [24].
4. Results
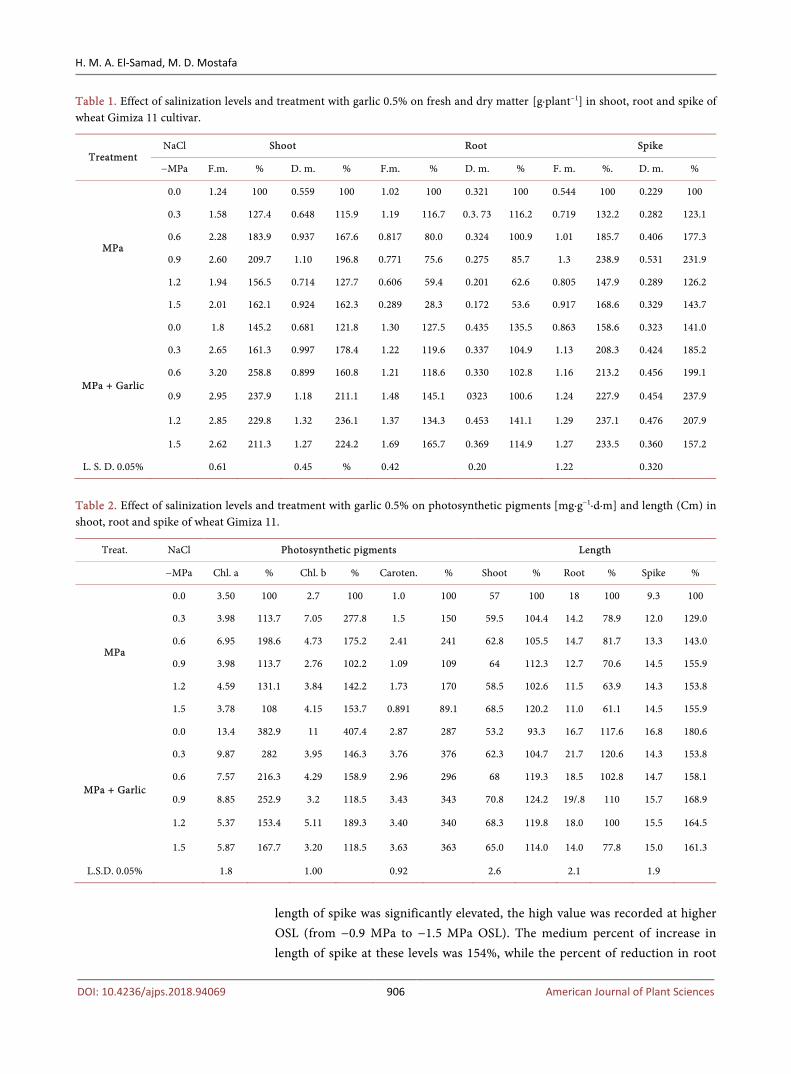
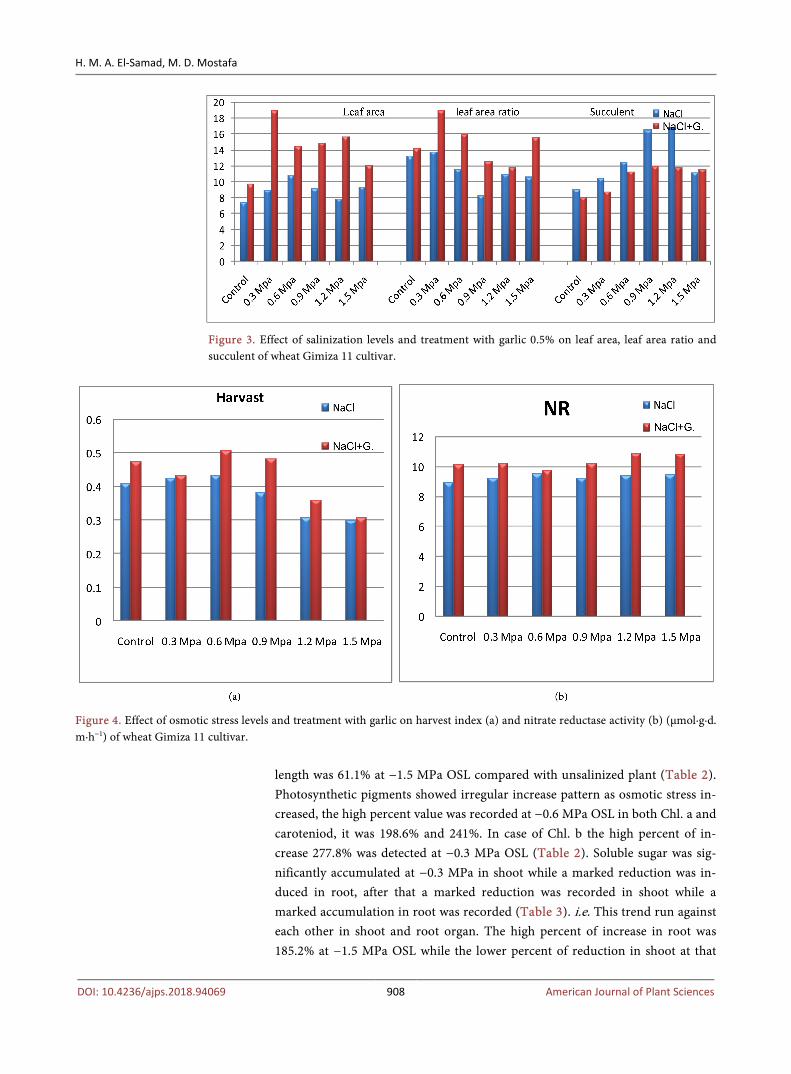
From present data it can be observed that wheat plant response variably to in-crease osmotic stress levels (OSL) according to its organs, while fresh and dry matter in shoot and spike were increased, in root they were significantly reduced as elevating osmotic stress in the soil (Table 1 & Figure 1). The high value of increasing percent in fresh and dry matter was recorded at −0.9 MPa OSL in shoot and spike organs, it was 209.7%, 196.8%, 238.9% and 231.9% compared with control plants 100% (Table 1). While in root the lower value of reduction percent in fresh and dry matter was recorded at −1.5 MPa OSL, it was 28.3% and 53.6% compared with 100% control plants (Table 1). Water content was signifi-cantlly elevated with increasing OSL in both shoots and spikes. The maximum value of this enhancement was recorded at −0.9 MPa OSL, it was 220.3% and 244.1% respectively (Figure 2). However, in root water content was significantly decreased especially at higher OSL (−1.5 MPa). The percent of reduction was 16.7% compared with control plant 100% (Figeur 2). While leaf area of wheat plants was significantly increased; leaf area ratio was markedly decreased with increasing osmotic stress (Figure 3). The high value in leaf area was recorded at −0.6 MPa NaCl level, however the low value in leaf area ratio was obtained at high osmotic stress level (from −0.9 MPa to −1.5 MPa OSL). Leaf succulent was gradually enhanced as increasing osmotic stress levels; the high value was obtained at −0.9 MPa and −1.2 MPa OSL (Figure 3). Harvest index was slightly activated from −0.3 MPa to −0.6 MPa osmotic stress, above that a slightly lowering effect was observed (Figure 4(a)). Length of three wheat organs responded variably to increase osmotic stress levels (Table 2). While length of shoot organ become around the control value, root length was markedly decreased. On the other side
H. M. A. El-Samad, M. D. Mostafa
DOI: 10.4236/ajps.2018.94069 906 American Journal of Plant Sciences
Table 1. Effect of salinization levels and treatment with garlic 0.5% on fresh and dry matter [g·plant−1] in shoot, root and spike of wheat Gimiza 11 cultivar.
Treatment NaCl Shoot Root Spike
−MPa F.m. % D. m. % F.m. % D. m. % F. m. %. D. m. %
MPa
0.0 1.24 100 0.559 100 1.02 100 0.321 100 0.544 100 0.229 100
0.3 1.58 127.4 0.648 115.9 1.19 116.7 0.3. 73 116.2 0.719 132.2 0.282 123.1
0.6 2.28 183.9 0.937 167.6 0.817 80.0 0.324 100.9 1.01 185.7 0.406 177.3
0.9 2.60 209.7 1.10 196.8 0.771 75.6 0.275 85.7 1.3 238.9 0.531 231.9
1.2 1.94 156.5 0.714 127.7 0.606 59.4 0.201 62.6 0.805 147.9 0.289 126.2
1.5 2.01 162.1 0.924 162.3 0.289 28.3 0.172 53.6 0.917 168.6 0.329 143.7
MPa + Garlic
0.0 1.8 145.2 0.681 121.8 1.30 127.5 0.435 135.5 0.863 158.6 0.323 141.0
0.3 2.65 161.3 0.997 178.4 1.22 119.6 0.337 104.9 1.13 208.3 0.424 185.2
0.6 3.20 258.8 0.899 160.8 1.21 118.6 0.330 102.8 1.16 213.2 0.456 199.1
0.9 2.95 237.9 1.18 211.1 1.48 145.1 0323 100.6 1.24 227.9 0.454 237.9
1.2 2.85 229.8 1.32 236.1 1.37 134.3 0.453 141.1 1.29 237.1 0.476 207.9
1.5 2.62 211.3 1.27 224.2 1.69 165.7 0.369 114.9 1.27 233.5 0.360 157.2
L. S. D. 0.05% 0.61 0.45 % 0.42 0.20 1.22 0.320
Table 2. Effect of salinization levels and treatment with garlic 0.5% on photosynthetic pigments [mg∙g−1∙d∙m] and length (Cm) in shoot, root and spike of wheat Gimiza 11.
Treat. NaCl Photosynthetic pigments Length
−MPa Chl. a % Chl. b % Caroten. % Shoot % Root % Spike %
MPa
0.0 3.50 100 2.7 100 1.0 100 57 100 18 100 9.3 100
0.3 3.98 113.7 7.05 277.8 1.5 150 59.5 104.4 14.2 78.9 12.0 129.0
0.6 6.95 198.6 4.73 175.2 2.41 241 62.8 105.5 14.7 81.7 13.3 143.0
0.9 3.98 113.7 2.76 102.2 1.09 109 64 112.3 12.7 70.6 14.5 155.9
1.2 4.59 131.1 3.84 142.2 1.73 170 58.5 102.6 11.5 63.9 14.3 153.8
1.5 3.78 108 4.15 153.7 0.891 89.1 68.5 120.2 11.0 61.1 14.5 155.9
MPa + Garlic
0.0 13.4 382.9 11 407.4 2.87 287 53.2 93.3 16.7 117.6 16.8 180.6
0.3 9.87 282 3.95 146.3 3.76 376 62.3 104.7 21.7 120.6 14.3 153.8
0.6 7.57 216.3 4.29 158.9 2.96 296 68 119.3 18.5 102.8 14.7 158.1
0.9 8.85 252.9 3.2 118.5 3.43 343 70.8 124.2 19/.8 110 15.7 168.9
1.2 5.37 153.4 5.11 189.3 3.40 340 68.3 119.8 18.0 100 15.5 164.5
1.5 5.87 167.7 3.20 118.5 3.63 363 65.0 114.0 14.0 77.8 15.0 161.3
L.S.D. 0.05% 1.8 1.00 0.92 2.6 2.1 1.9
length of spike was significantly elevated, the high value was recorded at higher OSL (from −0.9 MPa to −1.5 MPa OSL). The medium percent of increase in length of spike at these levels was 154%, while the percent of reduction in root

H. M. A. El-Samad, M. D. Mostafa
DOI: 10.4236/ajps.2018.94069 907 American Journal of Plant Sciences
Figure 1. Effect of salinization levels and treatment with garlic 0.5% on morphological view of wheat Gimiza 11 cultivar.
Figure 2. Effect of salinization levels and treatment with garlic 0.5% on water content of shoot, root and spike of wheat Gimiza 11 cultivar.
H. M. A. El-Samad, M. D. Mostafa
DOI: 10.4236/ajps.2018.94069 908 American Journal of Plant Sciences
Figure 3. Effect of salinization levels and treatment with garlic 0.5% on leaf area, leaf area ratio and succulent of wheat Gimiza 11 cultivar.
Figure 4. Effect of osmotic stress levels and treatment with garlic on harvest index (a) and nitrate reductase activity (b) (μmol∙g∙d. m∙h−1) of wheat Gimiza 11 cultivar.
length was 61.1% at −1.5 MPa OSL compared with unsalinized plant (Table 2). Photosynthetic pigments showed irregular increase pattern as osmotic stress in-creased, the high percent value was recorded at −0.6 MPa OSL in both Chl. a and caroteniod, it was 198.6% and 241%. In case of Chl. b the high percent of in-crease 277.8% was detected at −0.3 MPa OSL (Table 2). Soluble sugar was sig-nificantly accumulated at −0.3 MPa in shoot while a marked reduction was in-duced in root, after that a marked reduction was recorded in shoot while a marked accumulation in root was recorded (Table 3). i.e. This trend run against each other in shoot and root organ. The high percent of increase in root was 185.2% at −1.5 MPa OSL while the lower percent of reduction in shoot at that

H. M. A. El-Samad, M. D. Mostafa
DOI: 10.4236/ajps.2018.94069 909 American Journal of Plant Sciences
Table 3. Effect of salinization levels and treatment with garlic 0.5% on soluble protein and soluble sugar [mg∙g−1 d∙m.] in shoot and root of wheat Gimiza 11 cultivar.
Treat. NaCl Soluble protein Soluble Sugar
−MPa Shoot % Root % Spike % Shoot % Root % Spike %
MPa
0.0 26.5 100 15.7 100 23.2 100 228.6 100 33.2 100 66.3 100
0.3 26.8 101.1 12.5 79.6 52.0 224.1 283.4 123.9 29.1 87.7 87.0 131.2
0.6 35.2 132.8 18.4 117.2 38.0 163.8 157.9 69.1 58.5 176..2 90.0 135.7
0.9 36.0 135.8 23.2 147.8 23.6 100.4 105.7 46.2 53.3 160.2 140.3 211.6
1.2 38.4 144.9 20.8 132.5 17.9 77.2 174.4 76.3 44.5 134.0 55.0 82.9
1.5 48.2 181.9 29.2 185.9 13.6 58.6 113.5 49.7 61.5 185.2 54.3 81.9
MPa + Garlic
0.0 24.9 93.6 25.2 159.9 29.1 125.4 263.4 100 123.1 370.8 182.3 274.9
0.3 34.4 129.8 35.1 223.6 29.8 128.4 116.1 50.8 71.3 214.8 122.4 184.6
0.6 38.11 143.8 59.4 378.3 33.5 144.4 116.5 50.8 126.6 381.3 137.6 207.5
0.9 37.11 140.0 26.0 165.6 26.0 112.1 53.5 23.4 125.6 378.3 96.1 144.9
1.2 23.5 122.6 26.5 168.8 34.9 150.4 98.8 43.2 113.6 342.2 121.2 182.8
1.5 23.9 90.0 28.1 185.8 35.2 151.7 69.4 30.4 46.8 140.9 75.8 114.3
L. S. D. 0.05% 2.0 1.9 2.2 2.1 2.6 2.4
level was 49.7% (Table 3). In spike soluble sugar increased at −0.3 MPa and −0.6 MPa and reaches a high value at −0.9 MPa OSL, the percent of increase was 211.6%. Above which a significant lowering effect was recorded compared with control plants. Soluble protein was gradually increased in both shoot and root whereas in spike a huge accumulation at −0.3 MPa and −0.6 MPa OSL was de-tected and produced a value of control at −0.9 MPa OSL (Table 3). After that level a significant reduction was recorded reach 58.6% as compared with unsali-nized plants (Table 3). Nitrate reductase activity was more or less unchanged with elevating OSL (Figure 4(b)). Na+ content was significantly enhanced in different three organs shoot, root and spike (Figure 5(a)). This trend was more prominent at higher salinity levels ranked shoot higher than spike and root or-gan. i.e. Na+ more translocated from root to ariel portions shoot and spike. Po-tassium showed three situations towards salinity effects firstly in shoot where K+ was markedly lowered, secondly in root where K+ showed irregular pattern in root and thirty in spike where K+ was significantly increased as increasing salin-ity levels (Figure 5(b)).
Application of garlic extract resulted a significant increase in the fresh, dry matter and water content of shoot, root and spike of wheat plants (Table 1 & Figure 1 and Figure 2). This activation effect was more pronounced in shoot and spike than in root organ which reach a more than 2.5-folds compare with untreated plants. The high value was recorded at −0.6 MPa, −1.2 MPa and −1.5 MPa OSL in shoot, spike and root respectively. The medium percent of increase at all osmotic stress levels was 219.8%, 203.3%, 136.7%, 112.9%, 224% and

H. M. A. El-Samad, M. D. Mostafa
DOI: 10.4236/ajps.2018.94069 910 American Journal of Plant Sciences
Figure 5. Effect of salinization levels and treatment with garlic 0.5% on Na+ [mg∙g−1∙d∙m.] (a) and K+ [mg∙g−1 d∙m.] (b) of wheat Gimiza 11 cultivar. 197.5% in fresh and dry matter of shoot, root and spike respectively compared with control plant 100% (Table 1).
Treatment soil media with garlic extract 0.5% enhancement length of shoot, root and spike organs. This enhancement effect was more detected in spike than in root and shoot organs (Table 2). The medium percent of increase at all os-motic stress levels was 139.8%, 102.2%, 161.3% in length of shoot, root and spike compared with control plants. Application of garlic extract induced a surprise activation in photosynthetic pigments content reach a 2.5-folds as in carotenoids at all salinity levels and, 1.5-folds in Chl.a especially at lower osmotic stress levels (Table 2). The medium percent of increase at all osmotic stress levels was 214.5%, 146.3%, 343.6% in case Chl.a, Chl.b and carotenoids respectively (Table 2). The production of leaf area, leaf area ratio and harvest index was markedly activated with garlic treatment at all osmotic stress levels tested. The high value was detected at −0.3 MPa OSL in both leaf area and leaf area ratio (Figure 3). On the other hand leaf succulent was markedly decreased with garlic application (Figure 3). Garlic application 0.5% significantly accumulated soluble protein in three different organs, this more effective in root reach about 3-folds at −0.6 MPa OSL than control plants (Table 3). The medium percent of increase in so-luble protein at all osmotic stress levels was 125.2%, 224.4% and 137.4% compared with control plant 100% in shoot, root and spike respectively (Table 3). Garlic

H. M. A. El-Samad, M. D. Mostafa
DOI: 10.4236/ajps.2018.94069 911 American Journal of Plant Sciences
fertilizer induced a huge accumulation in soluble sugar in root and spike while no marked change was induced in shoot organ. The medium percent of increase in soluble sugar at all osmotic stress levels was 291.5% and 166.8% in root and spike respectively as compared with control plant 100% (Table 3). Adding garlic extract to the soil stimulate the nitrate reductase activity as compared with con-trol plants (Figure 4(b)). Treatment tested soil with garlic decreased the accu-mulation of Na+ while enhanced the accumulation of K+ in shoot, root and spike, this more effective in both root and spike organs (Figure 5(a) & Figure 5(b)).
In protein analysis by electrophoresis showed that protein bands with mole-cular weight 33 kDa, 117 kDa and 156 kDa and 208 kDa was restricted for −0.3 MPa OSL and these bands were disappeared at −0.3 MPa OSL plus garlic treat-ments while restricted induction protein bands with molecular weight 205 kDa (Table 4 and Figure 6). Whereas at −0.6 MPa OSL restricted induction protein bands with molecular weight 103 kDa, and 201 kDa, which disappeared at −0.6 plus garlic treatments while restricted induction protein bands with molecular weight 26 kDa, 140 kDa and 189 kDa (Table 4 and Figure 6). In plants treated with −0.9 MPa OSL restricted induction protein bands with molecular weight 67 kDa, 141 kDa and 193 kDa which dissapered at −0.9 MPa OSL plus garlic
Table 4. Protein pattern of wheat cultivar Gimiza 11 in response of salinity stress (0.0, −0.3 MPa, −0.6 MPa, −0.9 MPa, −1.2 MPa and −1.5 MPa OSL) and garlic application 0.5% as compared with control plants.
M. W. NaCl (MPa) NaCl (MPa) + Garlic
0.0 0.3 0.6 0.9 1.2 1.5 0.0 + G 0.3 + G 0.6 + G 0.9 + G 1.2 + G 1.5 + G
Synthesized polypeptides (KDa)
6 5 6 3 3 3 7 6 5 3 3 10
10 7 8 6 7 5 10 7 8 8 7 11
14 10 14 8 14 8 14 10 14 14 14 25
19 14 19 14 19 11 19 14 19 19 25 28
24 19 24 19 22 21 24 19 22 22 31 31
25 21 27 22 27 25 25 21 31 27 40 54
28 24 31 27 31 27 28 24 44 31 54 97
34 28 40 31 44 31 34 27 54 46 178 127
39 40 47 44 51 54 39 40 84 53 180
49 47 57 51 78 97 48 47 26 82
59 60 90 84 145 185 59 57 140 142
155 70 151 67 155 151 189 198
Marker polypeptides (KDa)
75 103 141 205
90 201 193
33
117
156
208
Total bands 12 18 14 14 11 11 12 13 12 12 8 9

H. M. A. El-Samad, M. D. Mostafa
DOI: 10.4236/ajps.2018.94069 912 American Journal of Plant Sciences

H. M. A. El-Samad, M. D. Mostafa
DOI: 10.4236/ajps.2018.94069 913 American Journal of Plant Sciences
Figure 6. Protein pattern of wheat cultivar Gimiza 11 in response of salinity stress (0, −0.3 MPa, −0.6 MPa, −0.9 MPa, −1.2 MPa and −1.5 MPa) and garlic application 0.5% as compared with control plants.
treatments and restricted induction protein bands with molecular weight 46 kDa, 53 kDa, 82 kDa, 142 kDa and 198 kDa (Table 4 and Figure 6). However at −1.2 MPa OSL restricted induction protein bands with molecular weight 145 kDa which disappeared at −1.2 MPa OSL plus garlic treatments with no induc-tion specific protein bands (Table 4 and Figure 6). Finally at plants irrigated with −1.5 MPa OSL restricted induction protein bands with molecular weight 185 kDa which disappeared at −1.5 MPa OSL plus garlic treatments and re-stricted induction protein bands with molecular weight 127 kDa and 180 kDa (Table 4 and Figure 6). The intensity of protein bands was strongly increased with garlic treatments at all salinity levels. Esterase enzyme EST expression un-der the influence of different osmotic stress levels was visualized in Figure 7. A total of 6 different esterase isoenzyme forms were detected. Staining intensity of 6 esterase isoenzyme forms (EST-1, EST-2, EST-3, EST-4, EST 5 and EST-6) de-creased progressively with increasing OSL and reached a low intensity at higher OSL (−1.2 MPa and −1.5 MPa OSL). These bands showed a lower staining ex-pression based on decreasing of enzyme activity when wheat plants grown under a higher osmotic stress levels. However the six esterase forms were expressed progressively under the influence of garlic applications at all osmotic stress levels used (Figure 7).
5. Discussion
Wheat plant cv. Gimiza 11 has tolerant characteristic in response to osmotic stress effects and in general showed a variable response between different organs. This effect can be recorded in both shoots and spikes, the aerial parts of plants. The aerial parts of plants not only alleviated salinity injury and activated the fresh and dry matter productions. In roots these parameters decreased as in-creasing salinity stress. The high percent of activation was observed at −0.9 MPa OSL in shoots and spikes, 209.7%, 196.8%, 238.9% and 126.2% above the control

H. M. A. El-Samad, M. D. Mostafa
DOI: 10.4236/ajps.2018.94069 914 American Journal of Plant Sciences
(a)
(a)
Figure 7. Esterase isozymes forms pattern of wheat cultivar Gimiza 11 in response of salinity stress (0.0, −0.3 MPa, −0.6 MPa, −0.9 MPa, −1.2 MPa and −1.5 MPa OSL) and garlic application 0.5% as compared with control plants. value 100%. Length of the shoots, roots and spikes run parallel with the previous results. This was supported by results obtained with Hamdia and Shaddad (2016) [7]. Our results indicating that photosynthetic pigment enhanced mar-

H. M. A. El-Samad, M. D. Mostafa
DOI: 10.4236/ajps.2018.94069 915 American Journal of Plant Sciences
kedly as elevating osmotic stress; this induced an increasing effect in the produc-tion of fresh and dry matter which finally induced an activation role of photo-synthetic processes that have a positive effect on leaf area enlargement. The pro-tective effect of garlic was reflected on the accumulation of soluble sugar and soluble protein in both roots and spikes which related with the increase in os-motic pressure of cell sap that induced an increase in the water uptake in these organs. This situation induced a higher production of fresh and dry matter of wheat plants. Also, another supporting view is the enhancement biosynthesis of pigments which related with the increase of nitrate reductase activity in chlo-roplast that finally affected on photosynthetic processes of wheat plants under osmotic stress conditions with garlic application [25]. On the other side garlic applications have a positive effect on the reduction of osmotic stress signal so-dium ions in the three different wheat organs especially at higher OSL. At the same time garlic treatments increase K+ in roots, shoots and spikes indicating its controlling role as cofactor in protein synthesis in root and spikes as described in this result. This coincides with higher production of growth parameters (fresh, dry matter, length of different organs, leaf area, leaf area ratio, harvest index and a lowering in succulent index). Parida, and Das (2006) [25] showed that the ability of plants to tolerate salt is determined by multiple biochemical pathways that facilitate retention and/or acquisition of water, protect chloroplast functions, and maintain ion homeostasis. Essential pathways include those that lead to synthesis of osmotically active metabolites, specific proteins, and certain free radical scavenging enzymes that control ion and water flux and support scavenging of oxygen radicals or chaperones. The ability of plants to detoxify radicals under conditions of salt stress is probably the most critical requirement [3] [6] [26]. The reduction of Na+ and increased in K+ explained the protective role of garlic in modified the osmotic stress tolerance of wheat plants. Alghabari (2015) [27] used 10%, 20% and 30% of garlic extract and showed maximum concentration of exogenous foliar applied garlic extract recorded an enhance-ment in plant height in dry biomass accumulation in leaf and root, spike length, spikelet/spike and/plant grain weight at higher salinity levels of wheat and alfa-lafa plant. Protective role of Allium sativum is tested for the first time on plant growth and yield of field crops. Osmotic stress induced recovery with exogenous applications of garlic extract may be due to different sulfur containing com-pounds like alliin (S-allyl cysteine sulfoxide) and alliinase are stable under dry environment and stable at 60˚C. This sulfur contain compound allicin can easily diffuse across phospholipid membrane and into the cytoplasm thus may serve as osmo-regulator under osmotic stress [27]. In the present study, staining intensi-ty of protein bands of wheat plant was decreased as osmotic stress increased but the number of bands was increased up to −0.9 MPa, after that level a slight de-crease was recorded (for control induction 12 bands, −0.3 MPa 16 bands, −0.6 MPa 14 bands, −0.9 MPa 14 bands, −1.2 MPa 11 bands and final 11 bands for −1.5 MPa). This indicated that there were a number of protein bands disap-

H. M. A. El-Samad, M. D. Mostafa
DOI: 10.4236/ajps.2018.94069 916 American Journal of Plant Sciences
peared and expressed another under osmotic stress treatments. After treatments wheat plants with 0.5% garlic extract the protein band was significantly de-creased in comparison with garlic applications (for control expressed 12 bands, −0.3 MPa expressed 13 bands, −0.6 MPa expressed 12 bands, −0.9 MPa ex-pressed 12 bands, −1.2 MPa expressed 8 bands and finally 9 bands for −1.5 MPa). However the staining intensity of these bands was progressively increased when compared with untreatments plants. The intensity of isoenzyme bands was used as an indication for the activity of enzymes [7] [28]. On the other side a six esterase bands were induced as salinity treatments. Staining intensity of 6 este-rase isoenzyme forms (EST-1, EST-2, EST-3, EST-4, EST 5 and EST-6) was de-creased progressively with increasing OSL and reached a low intensity at higher OSL. These six bands showed a lower expression based on the decreasing of staining intensity [9]. Unlike my results Radic et al. (2009) [29] indicated that esterase activity increased with increasing salt treatments and consider as indica-tion of tolerance plant species against stress. They also reported that esterase ac-tivities and their isoenzymic patterns could be used as bio indicators of salinity. These results confirms the previous data for wheat plants can tolerate the delete-rious effect of salinity and the role of allopathic effect of garlic treatments in en-hancement these tolerance. Supported these results Morsy et al. (2009) [9] found that garlic or onion extracts significantly improved all plant growth characteris-tics of pea and cucumber plant respectively. Garlic extract can be used to alle-viate biotic and abiotic stresses. The interactive effect of drought stress and the usage of natural substances resulted in significant increases in growth parame-ters, photosynthetic pigments, N, P and K content in leaves, enzymes activity and proline concentration compared with untreated plants. In addition, Abdo et al. (2012) [30] used garlic cloves (30 ml/L) for minimizing the harmful effects of environmental pollution caused by cadmium on vegetative and reproductive growth as well as on leaf anatomy and physiological behavior of soybean. More-over, Abbas and Akladious (2013) and Ali et al. (2013) [31] [32] reported that the usage of natural products can protect plants against abiotic and biotic stress by regulating many physiological processes. Moreover, foliar spray with garlic extract enhanced all the above parameters that of the control plants and salinity stressed plants [10].
Acknowledgements
My greet loving Prof Dr. Hamdia for all member of my family (Father M. Abd El-Samad, mother Karema Kotob, Brother Ahmed and Naema sister) which en-couragements. Co-authors are highly grateful to my father Mostafa Mahmoud, my sister Eman, my mother and my brother. And also, Dr. Shaban H. Abd El-Aziz for their great helps and support.
References
[1] Ward, J.M., Maser, P. and Schroder, J.I. (2009) Plant Ion Channels Gene Families,

H. M. A. El-Samad, M. D. Mostafa
DOI: 10.4236/ajps.2018.94069 917 American Journal of Plant Sciences
Physiology and Function Genomics Analyses. Annual Review of Physiology, 71, 59-82. https://www.ncbi.nlm.nih.gov/pmc/articles/PMC4790454/ https://doi.org/10.1146/annurev.physiol.010908.163204
[2] Horie, T., Karahara, I. and Katsuhara, M. (2012) Salinity Tolerance Mechanisms in Glycophytes: A Over Review with the Centeral Focus on Rice Pants. Rice (N Y), 5, 11. https://www.ncbi.nlm.nih.gov/pmc/articles/PMC5520831/ https://doi.org/10.1186/1939-8433-5-11
[3] Apse, M.P. and Blumwald, E. (2007) Na+ Transport in Plants. FEBS Letters, 581, 2247-2254. https://www.ncbi.nlm.nih.gov/pubmed/17459382 https://doi.org/10.1016/j.febslet.2007.04.014
[4] Kabala, K. and Russak, M. (2012) Na+/H+ Antiport Activity in Plasma Membrane and Tonoplast Vesicles Isolated from NaCl-Treated Cucumber Roots. Biologia Plantarum, 56, 377-382. https://docslide.com.br/documents/nah-antiport-activity-in-plasma-membrane-and-tonoplast.html https://doi.org/10.1007/s10535-012-0103-5
[5] Yokoi, S., Bressan R.A. and Hasegawa, P.M. (2002) Salt Stress Tolerance of Plants. JIRCAS Working Report, 25-33. http://www.plantstress.com/articles/salinity_m/salinity_m_files/jircas.pdf
[6] Abd El-Samad, H.M. and Shaddad, M.A.K. (2016) Mechanisms of Salt Tolerance of Wheat Cultivars. Triticeae Genomics and Genetics, 7, 1-16. http://biopublisher.ca/index.php/tgg/article/view/2189
[7] Hassanein, A. (1999) Alterations in Protein and Esterase Patterns of Peanut in Re-sponse to Salinity Stress. Biologia Plantarum, 42, 241-248. https://link.springer.com/article/10.1023/A:1002112702771 https://doi.org/10.1023/A:1002112702771
[8] Dasgupta, N., Nandy, P., Tiwari, C. and Das, S. (2010) Salinity-Imposed Changes of Some Isozymes and Total Leaf Protein Expression in Five Mangroves from Two Different Habitats. Journal of Plant Interactions, 5, 11-221. http://www.tandfonline.com/doi/full/10.1080/17429140903438076 https://doi.org/10.1080/17429140903438076
[9] Morsy, S.M., Drgham, E.A. and Mohamed, G.M. (2009) Effect of Garlic and Onion Extracts or Their Intercropping on Suppressing Damping-Off and Powdery Mildew Diseases and Growth Characteristics of Cucumber. Egyptian Journal of Phytopa-thology, 37, 35-46. http://www.ejp.eg.net/vol37.no1/4.pdf
[10] Mohamed, H.I. and Akladiou, S.A. (2014) Influence of Garlic Extract on Enzymatic and Non Enzymatic Antioxidants in Soybean Plants (Glycine max) Grown under Drought Stress. Life Science Journal, 19, 46-58. http://www.lifesciencesite.com/lsj/life1103s/009_22962life1103s14_46_58.pdf
[11] Metzner, H., Rau, H. and Senger, H. (1965) Untersuchungen zur Synchronisierbar-keit einzelner Pigment-Mungel Mutanten von Chlorella. Pla, 65, 186-194. https://doi.org/10.1007/BF00384998
[12] McKee, G.W. (1974) A Coefficient for Computing Leaf Area in Hybrid Corn. Jour-nal of Agrobiology, 56, 240-241. http://scholar.google.co.uk/scholar?q=.+Agronomy+Journal
[13] Beadle, C.L. (1993) Growth Analysis. In: Hall, D.O., Scurlock, J.M.O., Bolharnor-denkampfh, R., Leegood, R.C. and Long, S.P., Eds., Photosynthesis and Production in a Changing Environment: A Field and Laboratory Manual, Chapman and Hall, London, 36-46.

H. M. A. El-Samad, M. D. Mostafa
DOI: 10.4236/ajps.2018.94069 918 American Journal of Plant Sciences
http://www.scirp.org/(S(i43dyn45teexjx455qlt3d2q))/reference/ReferencesPapers.aspx?ReferenceID=1987112
[14] Norman, J. and Campbell, G.S. (1994) Canopy Structure. In: Pearcy, R.W., Ehlerin-ger, J., Moony, H.A. and Rundel, P.W., Eds., Plant Physiological Ecology, Chapman & Hall, London, 301-326.
[15] Lai, K.L. and Liu, L.F. (1988) Increased Plant Regeneration Frequency in Water Stressed Rice Tissue Cultures. Journal Crop Science, 57, 553–557. https://doi.org/10.1626/jcs.57.553
[16] Romero-Aranda, R. and Syvertsen, J.P. (1996) The Influence of Foliar Applied Urea Nitrogen and Saline Solution on Net Gas Exchange of Citrus Leaves. Journal of the American Society for Horticultural Science, 121, 501-506. http://journal.ashspublications.org/content/121/3/501.full.pdf
[17] Bonhomme, R., Varlet, M., Grancher, C. and Chartier, P. (1974) The Use of He-mispherical Photographs for Determining Leaf Index of Young Crops. Photosyn-thesis, 8, 299-301. https://en.wikipedia.org/wiki/Hemispherical_photography
[18] Fales, F.W. (1951) The Assimilation and Degradation of Carbohydrates of Yeast Cells. The Journal of Biological Chemistry, 193, 113-118. http://www.jbc.org/content/193/1/113.full.pdf
[19] Lowry, O.H., Roserbrough, N.J., Farr, A.L. and Randall, R.J. (1951) Protein Mea-surement with the Folin Phenol Reagent. Journal of Biological Chemistry, 193, 265-275. http://en.wikipedia.org/wiki/Journal_of_Biological_Chemistry
[20] Jaworski, E.G. (1971) Nitrate Reductase Assay in Intact Plant Tissues. Biochemical and Biophysical Research Communications, 43, 1274-1279. https://doi.org/10.1016/S0006-291X(71)80010-4
[21] Williams, V. and Twine, S. (1960) Flame Photometric Method for Sodium, Potas-sium and Calcium. In: Peach, K. and Tracey, M.V., Eds., Modem Methods of Plant Analysis, Springer-Verlag, Berlin, Vol. 5, 3-5. https://en.wikipedia.org/wiki/The_Williams_Brothers22
[22] Laemmli, U.K. (1970) Cleavage of Structural Proteins during the Assembly of the Head of Bacteriophage T4. Natu, 227, 680-685. https://doi.org/10.1038/227680a0
[23] Tansley, S.D. and Orton, T.J. (1983) Isozymes in Plant Genetics and Breeding, Parts A & B. Elsevier, Amsterdam. https://www.abebooks.com/9780444422262/Isozymes-Plant-Genetics-Breeding-Part-0444422269/plp
[24] Steel, R.G. and Torrie, J.H. (1960) Principles and Procedures of Statistics. McGraw-Hill Book Co., New York. http://garfield.library.upenn.edu/classics1977/A1977DU23500002
[25] Parida, A.K. and Das, A.B. (2005) Salt Tolerance and Salinity Effects on Plants: A Review. Ecotoxicology and Environmental Safety, 60, 324-349. https://www.ncbi.nlm.nih.gov/pubmed/15590011
[26] Abd El-Samad, H.M. (2016) The Potential Role of Osmotic Pressure to Exogenous Application of Phytohormones on Crop Clants Crown under Different Osmotic Stress. American Journal of Plant Sciences, 7, 937-948. http://www.scirp.org/journal/ajps https://doi.org/10.4236/ajps.2016.76089
[27] Alghabari, F. (2015) Exogenous Applied Allium sativum Alleviate Salinity Induced Stress in Late Sown Wheat and Alfalfa. Scientia Agriculturae, 11, 69-75. http://pscipub.com/Journals/Data/JList/Scientia%20Agriculturae/2015/Volume%2011/Issue%202/4.pdf
H. M. A. El-Samad, M. D. Mostafa
DOI: 10.4236/ajps.2018.94069 919 American Journal of Plant Sciences
[28] Hassanein, R.A., Rassony, F.M., Barakat, D.M. and Khalil, R.R. (2009) Physiological Effects of Nicotinamide and Ascorbic acid on Zea mays Plant Grown under Salinity Stress. 1 Changes in Growth, Some Relevant Metabolic Activities and Oxidative Defense System. Research Journal of Agriculture and Biological Sciences, 1, 72-80.
[29] Radic, S. and Kozlina, P.B. (2009) Differential Esterase Activity in Leaves and Roots of Centaurea ragusina L. as a Onsequence of Salinity. Periodicum Biologorum, 112, 253-258. https://bib.irb.hr/datoteka/476877.radic_raguz.pdf
[30] Abdo, F.A., Nassar, D.M., Gomaa, E.F. and Nassar, A. (2012) RMA. Minimizing the Harmful Effects of Cadmium on Vegetative Growth, Leaf Anatomy, Yield and Phy-siological Characteristics of Soybean Plant (Glycine max (L.) Merrill) by Foliar Spray with Active yeast Extract or with Garlic Cloves Extract. Research Journal of Agriculture and Biological Sciences, 8, 24-35. https://www.researchgate.net/publication/265554168
[31] Abbas, S.M. and Akladious, S.A. (2013) Application of Carrot Root Extract Induced Salinity Tolerance in Cowpea (Vigna sinensis L.) Seedlings. Pakistan Journal of Bo-tany, 45, 795-806. https://www.pakbs.org/pjbot/PDFs/45(3)/11.pdf
[32] Ali, A.A., Mohamed, H.I., Mansour, M.T.M. and Omar, M.R. (2013) Suppression of Powdery Mildew on Flax by Foliar Application of Essential Oils. Journal of Phyto-pathology, 6, 376-381. https://www.ncbi.nlm.nih.gov/pmc/articles/PMC4564152/ https://doi.org/10.1111/jph.12080
Abbreviations
OSL: Osmotic stress levels, EST: Esterase enzyme.