CHEST Recent Advances in Chest Medicine Recent Advances in Chest Medicine
Upload
khangminh22Category
view
1download
0
Advances in Clinical and Experimental Medicine
Impact Factor (IF) – 1.179Ministry of Science and Higher Education – 15 pts.Index Copernicus (ICV) – 155.19 pts.
2018, Vol. 27, No. 3 (March)
MONTHLY ISSN 1899-5276 (PRINT) ISSN 2451-2680 (ONLINE) www.advances.umed.wroc.pl


ISSN 1899-5276 (PRINT) ISSN 2451-2680 (ONLINE) www.advances.umed.wroc.pl
Advances in Clinical and Experimental Medicine
MONTHLY 2018 Vol. 27, No. 3 (March)
Editor-in-ChiefMaciej Bagłaj
Vice-Editor-in-ChiefDorota Frydecka
Advances in Clinical and Experimental Medicine is a peer-reviewed open access journal published by Wroclaw Medical University. Its abbreviated title is Adv Clin Exp Med. Journal publishes original papers and reviews encompassing all aspects of medicine, including molecular biology, biochemi-stry, genetics, biotechnology and other areas. It is published monthly, one volume per year.
Editorial BoardPiotr DzięgielMarian KlingerHalina MilnerowiczJerzy Mozrzymas
International Advisory BoardReinhard Berner (Germany)Vladimir Bobek (Czech Republic)Marcin Czyz (UK) Buddhadeb Dawn (USA)Kishore Kumar Jella (USA)
Thematic EditorsMarzenna Bartoszewicz (microbiology)Marzena Dominiak (dentistry)Paweł Domosławski (surgery)Maria Ejma (neurology)Jacek Gajek (cardiology)Katarzyna Kapelko-Słowik (internal medicine)Mariusz Kusztal (nephrology and transplantology)Rafał Matkowski (oncology)Robert Śmigiel (pediatrics)Paweł Tabakow (experimental medicine)Anna Wiela-Hojeńska (pharmaceutical sciences)Marcin Ruciński (basic sciences)Katarzyna Neubauer (gastroenterology)Ewa Milnerowicz-Nabzdyk (gynecology)
SecretaryKatarzyna Neubauer
Piotr PonikowskiMarek SąsiadekLeszek SzenbornJacek Szepietowski
Statistical EditorsDorota DiakowskaLeszek Noga Lesław Rusiecki
Technical EditorshipPaulina Kunicka Joanna GudarowskaAgnieszka KwiatkowskaMarek Misiak
English Language Copy EditorsSherill Howard PociechaJason SchockMarcin TereszewskiEric Hilton
Pavel Kopel (Czech Republic) Tomasz B. Owczarek (USA)Ivan Rychlík (Czech Republic)Anton Sculean (Switzerland)Andriy B. Zimenkovsky (Ukraine)
Editorial Officeul. Marcinkowskiego 2–6 50-368 Wrocław, PolandTel.: +48 71 784 12 05 E-mail: [email protected]
PublisherWroclaw Medical UniversityWybrzeże L. Pasteura 1 50-367 Wrocław, Poland
© Copyright by Wroclaw Medical University, Wrocław 2018
Online edition is the original version of the journal

Editorial Policy Advances in Clinical and Experimental Medicine (Adv Clin Exp Med) is an independent multidisciplinary forum for exchange of scientific and clinical information, publishing original research and news encompassing all aspects of medicine including molecular biology, biochemistry, genetics, biotechnology and other areas. During the review process, the Editorial Board conforms to the “Uniform Requirements for Manuscripts Submitted to Biomedical Journals: Writing and Editing for Biomedical Publication” approved by the International Committee of Medical Journal Editors (www.ICMJE.org/). The journal publishes (in English only) original papers and reviews. Short works considered original, novel and significant are given priority. Experimental studies must include a statement that the experimental protocol and informed consent procedure were in compliance with the Helsinki Convention and were approved by an ethics committee.
For all subscription related queries please contact our Editorial Office:
For more information visit the journal’s website:
www.advances.umed.wroc.pl
Pursuant to the ordinance no. 13/XV R/2017 of the Rector of Wroclaw Medical University (as of February 7, 2017) from February 8, 2017 authors are requ-ired to pay a fee amounting to 300 euros for each manuscript accepted for publication in the journal “Advances in Clinical and Experimental Medicine.”
Pursuant to the ordinance no. 134/XV R/2017 of the Rector of Wroclaw Medical University (as of December 28, 2017) from January 1, 2018 authors are requ-ired to pay a fee amounting to 700 euros for each manuscript accepted for publication in the journal “Advances in Clinical and Experimental Medicine.”
Indexed in: MEDLINE, Science Citation Index Expanded, Journal Citation Reports/Science Edition,
Scopus, EMBASE/Excerpta Medica, Ulrich’sTM International Periodicals Directory, Index Copernicus
Typographic design: Monika Kolęda, Piotr GilDTP: Wydawnictwo UMW, TYPOGRAFCover: Monika KolędaPrinting and binding: EXDRUK

MONTHLY 2018, Vol. 27, No. 3 (March)
ISSN 1899-5276 (PRINT) ISSN 2451-2680 (ONLINE)
www.advances.umed.wroc.pl
Advancesin Clinical and Experimental Medicine
Contents
© Copyright by Wroclaw Medical University, Wrocław 2018
Original papers305 Masoumeh Nemati, Naser Ajami, Mehrdad Asghari Estiar, Saleheh Rezapour, Reyhaneh Ravanbakhsh Gavgani,
Shahryar Hashemzadeh, Hossein Samadi Kafil, Ebrahim SakhiniaDeregulated expression of HDAC3 in colorectal cancer and its clinical significance
313 Andrzej Miskiewicz, Grzegorz Szparecki, Marek Durlik, Grażyna Rydzewska, Ireneusz Ziobrowski, Renata GórskaThe correlation between pancreatic dysfunction markers and selected indices of periodontitis
321 Özlem Kurnaz-Gömleksiz, Özlem Kücükhüseyin, Elif Özkök, Zehra Buğra, Oğuz Öztürk, Hülya Yilmaz-AydoğanAre IVS4 SNPs of OLR1 gene associated with coronary artery disease: Is there a linkage between IVS4 SNPs?
327 Piotr Czempik, Daniel Cieśla, Piotr Knapik, Łukasz KrzychMortality of patients with acute kidney injury requiring renal replacement therapy
335 Magdalena Lachowska, Paulina Glinka, Kazimierz NiemczykAir-conducted and skull-tap cervical vestibular evoked myogenic potentials in determining nerve division involvement in vestibular schwannoma patients
343 Elżbieta Pac-Kożuchowska, Anna Rakuś-Kwiatosz, Paulina KrawiecCord blood lipid profile in healthy newborns: A prospective single-center study
351 Maciej Bura, Alicja Bukowska, Michał Michalak, Aleksandra Bura, Mariusz J. Nawrocki, Marek Karczewski, Iwona Mozer-LisewskaExposure to hepatitis E virus, hepatitis A virus and Borrelia spp. infections in forest rangers from a single forest district in western Poland
357 Nur Şahin, Mine Genç, Gülüzar Arzu Turan, Esin Kasap, Serkan GüçlüA comparison of 2 cesarean section methods, modified Misgav-Ladach and Pfannenstiel-Kerr: A randomized controlled study
363 Ewa Z. Gieysztor, Ludwika Sadowska, Anna M. Choińska, Małgorzata Paprocka-BorowiczTrunk rotation due to persistence of primitive reflexes in early school-age children
367 Magdalena Izdebska, Marta Hałas-Wiśniewska, Iwona Adamczyk, Ismena Lewandowska, Iga Kwiatkowska, Maciej Gagat, Alina GrzankaThe protective effect of niacinamide on CHO AA8 cell line against ultraviolet radiation in the context of main cytoskeletal proteins
379 Iwona Żychowska, Dorota Suszek, Magdalena Dryglewska, Maria Majdanβ2-microglobulin as a marker of systemic lupus erythematosus activity
383 Magdalena Kopeć-Mędrek, Eugene J. KucharzFibulin-3 and other cartilage metabolism biomarkers in relationship to calprotectin (MRP8/14) and disease activity in rheumatoid arthritis patients treated with anti-TNF therapy
391 Jolanta Artym, Maja Kocięba, Ewa Zaczyńska, Barbara Adamik, Andrzej Kübler, Michał Zimecki, Marian KruzelImmunomodulatory properties of human recombinant lactoferrin in mice: Implications for therapeutic use in humans
401 Agnieszka Chmielarczyk, Monika Pobiega, Grzegorz Ziółkowski, Monika Pomorska-Wesołowska, Dorota Romaniszyn, Lech Krawczyk, Jadwiga Wójkowska-MachSevere infections caused by multidrug-resistant non-fermentative bacilli in southern Poland
Reviews409 Izabela Łaczmańska, Justyna Kuliczkowska-Płaksej, Agnieszka Stembalska
Short stature in genetic syndromes: Selected issues

Contents304
415 Marcin Kubik, Alicja Dąbrowska-Kugacka, Ewa Lewicka, Ludmiła Daniłowicz-Szymanowicz, Grzegorz RaczakPredictors of poor outcome in patients with left ventricular noncompaction: Review of the literature
423 Ryszard R. Kacała, Krzysztof Wronecki, Arkadiusz Kacała, Zygmunt Domagała, Michał PorwolikIn memory of professor Czesław Niżankowski, Head of the Department of Anatomy, Wroclaw Medical University
429 Zbyszko Chowaniec, Anna SkoczyńskaPlasma lipid transfer proteins: The role of PLTP and CETP in atherogenesis

DOI10.17219/acem/66207
Copyright© 2018 by Wroclaw Medical University This is an article distributed under the terms of the Creative Commons Attribution Non-Commercial License(http://creativecommons.org/licenses/by-nc-nd/4.0/)
Address for correspondenceEbrahim SakhiniaE-mail: [email protected]
Funding sourcesThis study was supported by Tabriz Genetic Analysis Center (TGAC) of Tabriz University of Medical Sciences, Iran.
Conflict of interestNone declared
AcknowledgementsWe would like to express our deep gratitude to the patients and the staff of the Endoscopy Department of Tabriz Imam Reza Hospital, and also to the staff at TGAC for their helpful collaboration.
Received on July 10, 2016Reviewed on August 9, 2016Accepted on October 21, 2016
AbstractBackground. To date, 4 classes of histone deacetylases (HDACs) have been identified in humans. Class I HDACs are zinc-dependent and NAD+-independent enzymes, and include 4 isoforms closely related to yeast RPD3: HDAC1, 2, 3, and 8.
Objectives. The aims of the study were to quantitatively evaluate the expression of HDAC3 in colorectal cancer (CRC) and to correlate its expression levels with clinicopathological parameters.
Material and methods. We characterized expression patterns of HDAC3 as class I HDAC isoforms in a cohort of 48 CRC patients by quantitative (real-time) reverse transcription polymerase chain reaction (RT-PCR). In addition, the potential relationship between HDAC3 expression levels and clinicopathological parameters in patients suffering from CRC was explored.
Results. We found that HDAC3 was highly expressed in colorectal tumors compared to normal colorectal tissues (p < 0.05). Furthermore, we found significant correlations between HDAC3 expression levels and tumor differentiation grades (p < 0.05).
Conclusions. In this prospective study we identified a pronounced HDAC3 expression pattern in CRC. Our findings support an important role of HDAC3 as a complementary molecular marker for existing his-topathological diagnostic elements; it might also have applications in prognostic and targeted therapy. Furthermore, HDAC3 can be used as a biomarker to differentiate between tumor borders and margins, and it may also be useful for characterizing field cancerization in CRC.
Key words: HDAC3, deregulation, prognosis, colorectal cancer
Original papers
Deregulated expression of HDAC3 in colorectal cancer and its clinical significance
Masoumeh Nemati1,A,C,D,F, Naser Ajami2,C–F, Mehrdad Asghari Estiar3,C,E,F, Saleheh Rezapour4,B,F, Reyhaneh Ravanbakhsh Gavgani1,B,F, Shahryar Hashemzadeh5,6,B,F, Hossein Samadi Kafil7,A,E,F, Ebrahim Sakhinia4,A,C,E,F
1 Department of Biology, Faculty of Natural Sciences, Tabriz University, Iran2 Department of Medical Genetics, Faculty of Medicine, Mashhad University of Medical Sciences, Iran3 Department of Medical Genetics, Tehran University of Medical Sciences, Iran4 Division of Medical Genetics, Faculty of Medicine, Tabriz University of Medical Sciences, Iran5 Liver and Gastrointestinal Diseases Research Center, Tabriz University of Medical Sciences, Iran6 Department of General and Thoracic Surgery, Tabriz University of Medical Sciences, Iran7 Drug Applied Research Center, Tabriz University of Medical Sciences, Iran
A – research concept and design; B – collection and/or assembly of data; C – data analysis and interpretation; D – writing the article; E – critical revision of the article; F – final approval of the article
Advances in Clinical and Experimental Medicine, ISSN 1899-5276 (print), ISSN 2451-2680 (online) Adv Clin Exp Med. 2018;27(3):305–311

M. Nemati, et al. HDAC3 expression in colorectal cancer306
Introduction
Every year in the world over 1.36 million new cases of colorectal cancer (CRC) are diagnosed and more than 600,000 patients die of the disease, making it the 3rd most common cancer and the 4th most common cause of can-cer death in both men and women.1,2 The incidence of CRC varies considerably from country to country, but the rates are the highest in economically developed countries.3 Despite low rates of CRC incidence in south Asia, recent studies in Iran have indicated a significant increase in the rate of the disease in the past 3 decades.4 Approximately 3,641 new cases of CRC per year are diagnosed in Iran, out of which 2,262 die annually, accounting for roughly 6.3% of all cancer deaths in the country.5 The increased prevalence of obesity and decreasing physical activity in many parts of Iran, resulting from westernization, will probably continue to contribute to the growing CRC incidence and mortality, and make it a major public health burden.6 The progres-sion of CRC is a multistep process that often develops over more than 10 years, which means there are opportunities for early diagnosis and even prevention.7 It begins as small adenomatous polyps and develops into an advanced large adenoma with high-grade dysplasia, and then progresses to invasive and metastatic carcinoma.8 The adenoma-to-carcinoma sequence requires multiple cumulative genetic changes and was first described by Fearon and Vogelstein.9
Genetic and genomic lesions, such as chromosomal translocations, point mutations, deletions, insertions, and amplification, have long been considered major causes of cancer. The activation of oncogenes and the inactivation of tumor-suppressor genes are end points of these changes. However, cancer formation and progression is not limited to these changes. Along with gene mutations, epigenetic al-terations such as aberrant DNA methylation and aberrant posttranslational histone modifications, including acety-lation, methylation, phosphorylation, etc., may also play a pivotal role in tumor initiation and progression. These changes have as their end point deregulated expression of oncogenes and/or tumor suppressor genes.10,11
Up until now, the most widely studied epigenetic modi-fication in human cancers has been cytosine methylation of DNA within the dinucleotide CpG, particularly the in-activation of tumor-suppressor genes by promoter hyper-methylation.12 Apart from cytosine methylations, there has been an increase in our knowledge about the involve-ment of aberrant patterns of posttranscriptional histone modifications in cancer development, including CRC. In CRC, acetylations and methylations of histone and their reversions are the best studied phenomena. In particular, acetylation of lysine residues of histone 3 and histone 4 has become one of the best studied modifications of this type.13 Acetylation of core histones by histone acetyltransferases (HATs) results in chromatin opening and the activation of gene transcription; in contrast, histone deacetylases (HDACs) remove the acetyl group from histones, allowing
compacted chromatin to reform, with transcriptional gene inactivation as the outcome.14 Dynamic levels of reversible acetylation are the result of the balance of the opposing activities of HATs and HDACs, which plays an impor-tant regulatory role in the transcription of many genes.15
Based on this balance, both positive and negative effects of HDACs on oncogenesis and inhibition of oncogenes can be expected. Disturbances in this balance might have dramatic outcomes on the cell phenotype. Studies on the pathogenesis of leukemias have provided the most infor-mative evidence on how this balance is shifted in can-cer cells.16 Indeed, acute promyelocytic leukemia was the first malignancy in which the involvement of HDACs was shown.17 HDACs are known to play a regulatory role in a wide variety of physiological cellular processes, including cell differentiation, cell cycle progression, DNA replica-tion, transcription, gene silencing, and the response to genotoxic stress; however, these regulatory enzymes are also increasingly being found to be involved in cancer.18
To date, 4 classes of HDACs have been identified in humans. Class I HDACs are zinc-dependent and NAD+-independent enzymes, and include 4 isoforms – HDAC1, 2, 3, and 8 – that are closely related to yeast RPD3.19–21 Our study was designed to identify the HDAC3 gene expres-sion pattern in CRC. Furthermore, we aimed to investigate the potential applications of HDAC3 expression analysis in accurately determining tumor margins during surgery and possible field cancerization. A tertiary objective in this study was to correlate HDAC3 expression levels and clinicopathological variables in patients suffering from CRC. Finally, we used the receiver operating characteristic (ROC) curves and the areas under the ROC curves (AUC) to evaluate the feasibility of using HDAC3 as a diagnostic biomarker for the detection of CRC.
Material and methods
Subjects
A cohort of 48 patients (22 males and 25 females) with colorectal tumors, all of which had matched tumor-adjacent normal (TAN) samples, was selected for gene expression analysis using quantitative (real-time) reverse transcription polymerase chain reaction (qRT-PCR). Tis-sue samples were gathered from consenting patients at the time of diagnostic procedures or during primary curative surgical resections at Imam Reza Hospital of Tabriz Uni-versity of Medical Sciences (TUMS), Iran. Clinicopatho-logical data were collected on all the patients in order to investigate correlations with HDAC3 expression levels. All the specimens were subjected to immediate snap-freezing in liquid nitrogen and archived at –80°C until the histo-pathological examination and review. Surgical pathologic staging was determined according to the TNM staging system of the American Joint Committee on Cancer and

Adv Clin Exp Med. 2018;27(3):305–311 307
World Health Organization (WHO) classifications. Ethical approval for this study was granted by the Ethics Commit-tee of TUMS. The molecular studies for this work were done in the Tabriz Genetic Analysis Center of TUMS.
RNA extraction and qRT-PCR
For the HDAC expression analysis, 48 paired snap-fro-zen CRC and TAN samples were incubated overnight at 4°C in an RNA stabilization reagent (RNAlater, Qiagen, Hilden, Germany) and were subjected to total RNA ex-traction using the RNeasy Mini Kit (Qiagen) according to the manufacturer’s instructions. After assessing the RNA concentration by spectrophotometer, the RNA was incubated with DNase to remove contaminating genomic DNA. Briefly, 3 μL of RNA was treated with 1 μL of DNase I, 1 μL of buffer and 5 μL of water, and incubated at 37°C for 30 min. In order to stop DNase, 1 μL of EDTA was added and incubated at 65°C for 10 min. Then, 2 μg total RNA was reverse transcribed to first strand cDNA us-ing a random hexamer primer and reverse transcriptase. The reactions were incubated at 37°C for 10 min, followed by 50°C for 1 h and final denaturation at 70°C for 15 min. Negative control samples were included in each set of reac-tions. Then, cDNAs were diluted 5-fold and 2 μL was used in each PCR. The primers for HDAC3 and glyceraldehyde phosphate dehydrogenase (GAPDH) were purchased from the Takapouzist Company (Tehran, Iran). The cDNA was amplified using qRT-PCR (the Rotor-Gene 3000, Cor-bett Life Science, Mortlake, Australia) with SYBR Green. For each gene, qRT-PCR was performed in triplicate in 25 µL of reaction volume consisting of 6 μL SYBR Green master mix (TaKaRa Bio Inc. Kusatsu, Japan), 0.5 μL of each gene-specific forward and reverse primer, 2 μL of cDNA from each sample, and RNase free water to bring the reaction mixture up to the final volume. Thermal
cycling parameters of 40 cycles were carried out as fol-lows: 95°C for 5 min for 1 cycle, 95°C for 30 s, 58°C for 30 s, 72°C for 30 s, and 72°C for 5 min as the final extension. The PCR primer sequences of HDAC3 and GAPDH, used as internal controls, are shown in Table 1.
Relative quantification
The relative expression of HDAC3 in tumor and TAN tissues was calculated using the comparative cycle thresh-olds (Ct) that were determined with the amplification plots within the logarithmic phase for each sample. Ct is defined as the number of PCR cycles at which the florescence signal is detected from the amplification of the target gene within a sample that increases to a threshold value of 10 times the standard deviation of the background emission. The start-ing amount of the target cDNA is inversely proportionate to Ct. ∆Ct values were calculated by subtracting GAPDH Ct from the test gene Ct. Relative mRNA levels were deter-mined by subtracting normal control ∆Ct values from CRC ∆Ct values to give a ∆∆Ct value and conversion through 2–∆∆CT.
Data analysis
The Spearman’s rank correlation coefficient was used for nonparametric data that were not normally distributed in our study. In addition, the Kruskal and Mann-Whitney tests were used for statistical analysis in each of the di-agnostic groups. P-values <0.05 were considered statisti-cally significant. The ROC curve and the AUC were used to assess the feasibility of using HDAC3 as a diagnostic biomarker for the detection of CRC.
Results
HDAC expression levels in colorectal cancer
We used the qRT-PCR method to analyze the expression of the HDAC3 gene in CRC. We used GAPDH for normal-ization of the gene expression data. In this cohort study, the expression of HDAC3 was significantly higher in CRC compared to TAN tissues (p < 0.03) (Fig. 1).
Table 1. Primers used for PCR
Gene Primer
HDAC3F: TAGGGATGAGATACAGACAAGG
R: GAAGCAGGGAAGAAATAAGG
GAPDHF: CATGGCCTCCAAGGAGTAAG
R: GCTTGAGCACAGGGTACTTTA
Fig. 1. HDAC3 is overexpressed in colorectal cancer (CRC). Analyses of the HDAC3 expression levels were performed in CRC tissues (n = 48) and tumor-adjacent normal (TAN) tissues. The HDAC3 expression level was significantly higher in CRC samples than in TAN tissues
T – tumor; M – marginal samples.

M. Nemati, et al. HDAC3 expression in colorectal cancer308
Correlation of HDAC3 expression with clinicopathological parameters
We further evaluated the relationship between the ex-pression levels of HDAC3 in the patients’ CRC tissues and clinicopathological characteristics of the patients using non-parametric tests. Regarding the clinicopathological variables, the patients were grouped according to their overall HDAC3 expression pattern, and we found that the HDAC3 expression significantly increased with tumor dif-ferentiation grade. High HDAC3 expression levels were associated with poor tumor differentiation, indicated by a high (G3) tumor grade (p < 0.04) (Table 2).
ROC curve assay for HDAC3 capability as a CRC marker
To shed light on the sensitivity and specificity of the HDAC3 expression levels as a tumor marker in CRC, an ROC curve was constructed and the area under the curve was calculated. The value of the AUC was 0.72 out of 1 for the HDAC3 assay (Fig. 2). This indicated that HDAC3 may be used as a potential diagnostic biomarker for CRC, and probably as a predictive and prognostic biomarker for CRC as well.
Fig. 2. The diagnostic performance of the HDAC3 expression data indicates that the AUC-ROC is 0.72 out of 1 ROC – receiver operating characteristics; AUC – the area under the ROC curve.
Table 2. Selected clinicopathological features of participants with CRC, and relationships between the HDAC3 expression levels in cancer tissue samples (n = 48)
Clinicopathological variables Median Min Max p-value HDAC3
Age <50 >50
1.34052848551.7360728985
0.256048700.43010254
3.941964773.86531151
0.22
Gender male female
1.49107552601.4761881470
0.256048700.28638478
3.941964773.04533229
0.58
Tumor size <3 ≥3
1.11123803201.6676598620
0.549790960.25604870
1.199648933.94196477
0.17
Tumor differentiation grade 1: well grade 2: moderate grade 3: poor
1.20944894601.39928176002.4119166165
0.256048700.286384781.96567964
3.865311513.941964773.04533229
0.04*
Depth T2,T3
T4
1.24561207851.7376342220
0.418087870.25604870
2.453170533.94196477
0.77
Lymph node metastasis absent present
1.22471505701.8470684360
0.256048700.33843934
3.148670803.94196477
0.20
Venous invasion absent present
1.23998116801.6707825090
0.286384780.25604870
3.865311513.94196477
0.45
AJCC stage classification I, II III, IV
1.6562104611.88508279
1.1844103450.4017753
2.6307213953.49364853
0.21
Liver metastasis absent present
1.39928176002.3796243590
0.256048700.46511126
3.941964773.04533229
0.31
* the p-value for tumor differentiation is <0.05, indicating statistical significance; AJCC – American Joint Committee on Cancer.
curve
specificity
AUC = 0.72

Adv Clin Exp Med. 2018;27(3):305–311 309
Discussion
There are obvious logical reasons to study CRC. Based on new cases diagnosed worldwide, it is one of the most common causes of cancer, with at least 5-year survival rate. The prognosis of CRC patients is largely dependent on the stage at diagnosis. Early diagnosis is therefore critical for increasing survival time in CRC. Recently, non-invasive means of surveillance – in particular molecular markers – have facilitated early diagnosis of the disease.22 Notwith-standing the growing improvements in early diagnosis and treatment of CRC as a result of using a multidisciplinary approach, this disease remains seriously life-threatening for millions of people around the world, and the search for novel diagnostic and prognostic biomarkers is indispens-able to prevent CRC-related mortalities.23,24 Thus, devel-oping new strategies for CRC screening that will lead to higher rates of early CRC diagnosis is one way to reduce the socio-economic burden of CRC until the advent of more effective therapeutic strategies.25
Investigating whether HDAC3 expression has clinical implications in CRC, sheds light on the role of HDAC3 in CRC. Our decision to undertake this study is supported by recent evidence that HDAC3 is an important member of the HDACs. HDAC3 is a well-studied epigenetic fac-tor that is required for a wide repertoire of cellular pro-cesses due to its ability to regulate gene expression and function.26,27 To our knowledge, this is the first study to investigate HDAC3 expression in CRC using qRT-PCR. We used this technique for HDAC3 transcripts on 48 tumors and matched TAN tissues. We found HDAC3 to be highly expressed in the tumors of most patients with CRC (p < 0.03). Our findings are consistent with previous studies reporting noted changes of HDAC3 in a number of different human cancers. For example, deregulation of HDAC3 is frequently seen in ovarian carcinoma, breast carcinoma, prostate carcinoma, liver carcinoma, astrocytic glial tumors, pancreatic carcinoma, Hodgkin’s lymphoma, acute lymphoblastic leukemia, and CRC.28–38 Most of the reports show the upregulation of HDAC3.
In line with our findings, Wilson et al. observed the de-regulation of HDAC3 and other Class I HDACs in human colon cancer for the first time. Using Western blot analysis, they reported increased expression of HDAC3 protein in the tumor samples compared with adjacent normal tissue. In addition, they observed higher expression of HDAC3 in a panel of 10 established colon cancer cell lines when compared with a normal small intestinal cell line. Based on the results of cell culture studies done by this group, it has been suggested that in as much as the expression of Class I HDACs, including HDAC3, is restricted to the prolifera-tive compartment of normal small intestinal and colonic epithelium cells, one physiological role of Class I HDACs may be to maintain cell proliferation. Consistent with this function, pharmacological suppression of HDACs in colon cancer cells leads to cell cycle arrest and stimulates the p21
promoter, consequently increasing the expression of p21, a Cdk inhibitor that is an important regulator of the cell cycle. This finding indicated that HDAC3 is involved in the inhibition of p21.36 Indeed, inhibitors of HDACs have recently been noted for their potential to induce differen-tiation, apoptosis and transformed cell growth arrest in a wide spectrum of cancers.37,39–43 It should be noted that HDAC3 is located on human chromosome 5q31.3 and at least 50 non-histone proteins (including RUNX3, GATA1, GATA2, E2F, c-Myc, p53, SHP, YY1, NF-κB, STAT3, MEF2D, etc.) have been identified as its substrates.44,45
Although it has been proposed that HDAC3 is upregulated in colorectal carcinoma, it is not amplified at the DNA lev-el. Furthermore, HDAC3 is expressed at higher levels in the proliferating cells of the colonic crypts, which might show that its levels are higher in colorectal carcinoma, because the cells are cycling.46
In our study, HDAC3 showed an increased expression in association with one of the advanced disease clinicopatho-logical parameters, namely poor differentiation. Thus, it can be used as a prognostic biomarker indicating a poor outcome of the disease. This is compatible with the first report of HDACs as adverse prognostic factors in colorectal tumors, which was demonstrated by Weicher et al. us-ing immunohistochemical analysis.37 Regulation of genes involved in the differentiation process in various tissues is one key role of HDACs, and their inhibitors induce ter-minal differentiation. Disturbance of the balance between proliferation and differentiation is one of the hallmarks of cancer. Cancer cells exhibit shifted or no differentia-tion, and display infinite proliferation that results in an undifferentiated, immature state. Interestingly, HDAC inhibitors restore the balance, stimulating tumor cells to differentiate and decreasing their proliferative ability.47 No other correlations of HDAC3 with clinicopathological parameters were found.
The main finding of this study is the occurrence of overexpressed transcripts in tumor-adjacent histologi-cally normal human colorectal tissues, as shown by the qRT-PCR expression analysis. As Fig. 3 shows, 13 of 48 tumor-adjacent histologically normal tissues had over-lapped expression of HDAC3 with tumor tissues. Interest-ingly, most of the matched tumors of these patients were well-differentiated tumors. The most likely explanation for this result may be field cancerization, which is a descrip-tion for the occurrence of genetic changes in histologically normal tissues adjacent to tumors.48 However, the use of HDAC3 as a marker for characterizing field cancerization in CRC needs further evaluation and requires analyses of the deacetylation profiles of its several downstream targets. On the other hand, HDAC3 can be used as a bio-marker to discriminate between tumor borders and mar-gins. The use of the HDAC3 gene expression data dur-ing surgery can help surgeons improve the rigor of their work, reducing surgical error in tumor removal. Similarly, Hashemzadeh et al. reported the same result for the STC2

M. Nemati, et al. HDAC3 expression in colorectal cancer310
gene in CRC.49 Taken together, our data may support the rare literature that shows field cancerization in CRC.50 Furthermore, combining multiple gene expression data and correlating the data to distances from tumor margins might be effective for delineating the tumor margin and molecular alterations that are characteristic of field of can-cerization in CRC. Finally, increasing our understanding of early events in the pathogenesis of CRC is crucial for identifying new targets for the prevention and treatment of this malignancy.
In conclusion, this study demonstrates that high levels of HDAC3 expression in qRT-PCR data are associated with poor prognosis in CRC. In addition, we propose that this data may be applicable to delineating the tumor margin. Finally, al-though some other biomarkers have been explored providing prognostic data in extensive CRC studies over the past few decades, our findings suggest that HDAC3 is a prognostic biomarker for CRC and can serve as a potential therapeutic target for this malignancy. One problem may arise from us-ing these genes as biological markers for determining cancer status: the variability among different patients, even with the same type of cancer. This makes it impossible to use only one marker as a dependable method. For this reason, the integra-tion of multiple expression data sets might be effective for diagnostic, prognostic and targeted therapy purposes.
References1. Siegel R, Ma J, Zou Z, Jemal A. Cancer statistics, 2014. CA: Cancer J Clin.
2014;64(1):9–29.2. Ferlay J, Soerjomataram I, Dikshit R, et al. Cancer incidence and mor-
tality worldwide: Sources, methods and major patterns in GLOBO-CAN 2012. Int J Cancer. 2015;136(5):E359–386.
3. Center MM, Jemal A, Smith RA, Ward E. Worldwide variations in colorectal cancer. CA: Cancer J Clin. 2009;59(6):366–378.
4. Hasanpour M, Galehdari H, Masjedizadeh A, Ajami N. A unique pro-file of adenomatous polyposis coli gene mutations in Iranian patients suffering sporadic colorectal cancer. Cell J. 2014;16(1):17–24.
5. Malekzadeh R, Bishehsari F, Mahdavinia M, Ansari R. Epidemiology and molecular genetics of colorectal cancer in iran: A review. Arch Iran Med. 2009;12(2):161–169.
6. Magalhaes B, Peleteiro B, Lunet N. Dietary patterns and colorec-tal cancer: Systematic review and meta-analysis. Eur J Cancer Prev. 2012;21(1):15–23.
7. Soreide K, Nedrebo BS, Knapp JC, Glomsaker TB, Soreide JA, Korner H. Evolving molecular classification by genomic and proteomic bio-markers in colorectal cancer: Potential implications for the surgical oncologist. Surg Oncology. 2009;18(1):31–50.
8. Markowitz SD, Bertagnolli MM. Molecular origins of cancer: Molecu-lar basis of colorectal cancer. N Engl J Med. 2009;361(25):2449–2460.
9. Fearon ER, Vogelstein B. A genetic model for colorectal tumorigen-esis. Cell. 1990;61(5):759–767.
10. Ropero S, Esteller M. The role of histone deacetylases (HDACs) in human cancer. Mol Oncol. 2007;1(1):19–25.
11. Migliore L, Migheli F, Spisni R, Coppedè F. Genetics, cytogenetics, and epigenetics of colorectal cancer. J Biomed Biotechnol. 2011;2011: 792362. doi: 10.1155/2011/792362
12. Esteller M. Cancer epigenomics: DNA methylomes and histone-mod-ification maps. Nat Rev Genet. 2007;8(4):286–298.
13. Schweiger MR, Hussong M, Rohr C, Lehrach H. Genomics and epigenomics of colorectal cancer. Wiley Interdiscip Rev Syst Biol Med. 2013;5(2):205–219.
14. Glozak MA, Seto E. Histone deacetylases and cancer. Oncogene. 2007; 26(37):5420–5432.
15. Sun WJ, Zhou X, Zheng JH, et al. Histone acetyltransferases and deacetylases: Molecular and clinical implications to gastrointesti-nal carcinogenesis. Acta Biochim Biophys Sin. 2012;44(1):80–91.
16. Minucci S, Pelicci PG. Histone deacetylase inhibitors and the prom-ise of epigenetic (and more) treatments for cancer. Nat Rev Cancer. 2006;6(1):38–51.
17. Minucci S, Nervi C, Lo Coco F, Pelicci PG. Histone deacetylases: A com-mon molecular target for differentiation treatment of acute myeloid leukemias? Oncogene. 2001;20(24):3110–3115.
18. Fang JY. Histone deacetylase inhibitors, anticancerous mechanism and therapy for gastrointestinal cancers. J Gastroenterol Hepatol. 2005;20(7):988–994.
19. Watson PJ, Fairall L, Santos GM, Schwabe JW. Structure of HDAC3 bound to co-repressor and inositol tetraphosphate. Nature. 2012; 481(7381):335–340.
20. Yang XJ, Seto E. The Rpd3/Hda1 family of lysine deacetylases: From bac-teria and yeast to mice and men. Nat Rev Mol Cell Biol. 2008;9(3): 206–218.
21. Delcuve GP, Khan DH, Davie JR. Roles of histone deacetylases in epi-genetic regulation: Emerging paradigms from studies with inhibi-tors. Clin Epigenetics. 2012;4(1):5.
22. de la Chapelle A. Genetic predisposition to colorectal cancer. Nat Rev Cancer. 2004;4(10):769–780.
23. Gallagher DJ, Kemeny N. Metastatic colorectal cancer: From improved survival to potential cure. Oncology. 2010;78(3–4):237–248.
24. Coppede F, Lopomo A, Spisni R, Migliore L. Genetic and epigenetic biomarkers for diagnosis, prognosis and treatment of colorectal can-cer. World J Gastroenterol. 2014;20(4):943–956.
Fig. 3. Expression level of HDAC3 in marginal samples
T – tumor; M – marginal samples.

Adv Clin Exp Med. 2018;27(3):305–311 311
25. Langan RC, Mullinax JE, Raiji MT, et al. Colorectal cancer biomarkers and the potential role of cancer stem cells. J Cancer. 2013;4(3):241–250.
26. Jiang Y, Hsieh J. HDAC3 controls gap 2/mitosis progression in adult neural stem/progenitor cells by regulating CDK1 levels. Proc Natl Acad Sci U S A. 2014;111(37):13541–1356.
27. Telles E, Seto E. Modulation of cell cycle regulators by HDACs. Front Biosci (Schol Ed). 2012;4:831–839.
28. Hayashi A, Horiuchi A, Kikuchi N, et al. Type-specific roles of histone deacetylase (HDAC) overexpression in ovarian carcinoma: HDAC1 enhances cell proliferation and HDAC3 stimulates cell migration with downregulation of E-cadherin. Int J Cancer. 2010;127(6):1332–1346.
29. Muller BM, Jana L, Kasajima A, et al. Differential expression of his-tone deacetylases HDAC1, 2 and 3 in human breast cancer – overex-pression of HDAC2 and HDAC3 is associated with clinicopathologi-cal indicators of disease progression. BMC cancer. 2013;13:215.
30. Weichert W, Roske A, Gekeler V, et al. Histone deacetylases 1, 2 and 3 are highly expressed in prostate cancer and HDAC2 expression is associated with shorter PSA relapse time after radical prostatecto-my. Br J Cancer. 2008;98(3):604–610.
31. Wu LM, Yang Z, Zhou L, et al. Identification of histone deacetylase 3 as a biomarker for tumor recurrence following liver transplantation in HBV-associated hepatocellular carcinoma. PLoS One. 2010;5(12): e14460.
32. Liby P, Kostrouchova M, Pohludka M, et al. Elevated and deregulated expression of HDAC3 in human astrocytic glial tumours. Folia Biol. 2006;52(1–2):21–33.
33. Lehmann A, Denkert C, Budczies J, et al. High class I HDAC activity and expression are associated with RelA/p65 activation in pancre-atic cancer in vitro and in vivo. BMC cancer. 2009;9:395.
34. Adams H, Fritzsche FR, Dirnhofer S, Kristiansen G, Tzankov A. Class I histone deacetylases 1, 2 and 3 are highly expressed in classical Hodgkin’s lymphoma. Expert Opin Ther Targets. 2010;14(6):577–584.
35. Moreno DA, Scrideli CA, Cortez MA, et al. Differential expression of HDAC3, HDAC7 and HDAC9 is associated with prognosis and sur-vival in childhood acute lymphoblastic leukaemia. Br J Haematol. 2010;150(6):665–673.
36. Wilson AJ, Byun DS, Popova N, et al. Histone deacetylase 3 (HDAC3) and other class I HDACs regulate colon cell maturation and p21 expression and are deregulated in human colon cancer. J Biol Chem. 2006;281(19):13548–13558.
37. Weichert W, Roske A, Niesporek S, et al. Class I histone deacetylase expression has independent prognostic impact in human colorec-tal cancer: Specific role of class I histone deacetylases in vitro and in vivo. Clin Cancer Res. 2008;14(6):1669–1677.
38. Spurling CC, Godman CA, Noonan EJ, Rasmussen TP, Rosenberg DW, Giardina C. HDAC3 overexpression and colon cancer cell prolifera-tion and differentiation. Mol Carcinog. 2008;47(2):137–147.
39. Bradbury CA, Khanim FL, Hayden R, et al. Histone deacetylases in acute myeloid leukaemia show a distinctive pattern of expression that changes selectively in response to deacetylase inhibitors. Leu-kemia. 2005;19(10):1751–1759.
40. Singh BN, Zhou H, Li J, et al. Preclinical studies on histone deacety-lase inhibitors as therapeutic reagents for endometrial and ovarian cancers. Future Oncol. 2011;7(12):1415–1428.
41. Giudice FS, Pinto DS Jr, Nor JE, Squarize CH, Castilho RM. Inhibition of histone deacetylase impacts cancer stem cells and induces epi-thelial-mesenchyme transition of head and neck cancer. PLoS One. 2013;8(3):e58672.
42. Katoch O, Dwarakanath BS, Agrawala PK. HDAC inhibitors: Applica-tions in oncology and beyond. HOAJ Biology. 2013;2(1):2.
43. Carson R, Celtikci B, Fenning C, et al. HDAC inhibition overcomes acute resistance to MEK inhibition in BRAF-mutant colorectal can-cer by downregulation of c-FLIPL. Clin Cancer Res. 2015;21(14):3230–3240. doi: 10.1158/1078-0432.CCR-14-2701
44. Li Z, Zhu WG. Targeting histone deacetylases for cancer therapy: From molecular mechanisms to clinical implications. Int J Biol Sci. 2014;10(7):757–770.
45. Kim HJ, Bae SC. Histone deacetylase inhibitors: Molecular mecha-nisms of action and clinical trials as anti-cancer drugs. Am J Transl Res. 2011;3(2):166–179.
46. Bhaskara S, Knutson SK, Jiang G, et al. Hdac3 is essential for the main-tenance of chromatin structure and genome stability. Cancer Cell. 2010;18(5):436–447.
47. Hagelkruys A, Sawicka A, Rennmayr M, Seiser C. The biology of HDAC in cancer: The nuclear and epigenetic components. Handb Exp Phar-macol. 2011;206:13–37.
48. Haaland CM, Heaphy CM, Butler KS, Fischer EG, Griffith JK, Bisof-fi M. Differential gene expression in tumor adjacent histological-ly normal prostatic tissue indicates field cancerization. Int J Oncol. 2009;35(3):537–546.
49. Hashemzadeh S, Arabzadeh AA, Estiar MA, et al. Clinical utility of measuring expression levels of Stanniocalcin 2 in patients with colorectal cancer. Med Oncol. 2014;31(10):237.
50. Stypula-Cyrus Y, Damania D, Kunte DP, et al. HDAC up-regulation in early colon field carcinogenesis is involved in cell tumorigenicity through reg-ulation of chromatin structure. PLoS One. 2013;8(5): e64600.


DOI10.17219/acem/68395
Copyright© 2018 by Wroclaw Medical University This is an article distributed under the terms of the Creative Commons Attribution Non-Commercial License(http://creativecommons.org/licenses/by-nc-nd/4.0/)
Address for correspondenceHulya Yilmaz-AydoganE-mail: [email protected]
Funding sourcesThe present work was supported by the Research Fund of Istanbul University, Turkey. Project No. T-966/06102006.
Conflict of interestNone declared
Received on May 17, 2016Reviewed on June 27, 2016Accepted on January 10, 2017
AbstractBackground. The OLR1 gene has been identified as a candidate gene for coronary artery disease (CAD). Six single-nucleotide polymorphisms (SNPs) of the OLR1 gene located within intron 4 (IVS4-27G>C, IVS4-73C>T, IVS4-14A>G), intron 5 (IVS5-70A>G, IVS5-27G>T) and 3’UTR (188C>T) comprise a linkage disequilibrium (LD) block, which is strongly associated with the elevated risk of CAD.
Objectives. We aimed to investigate the effects of the OLR1 IVS4-14A>G and -73C>T SNPs on metabolic parameters in Turkish CAD patients, and the linkage between these 2 genetic variants.
Material and methods. The present study was carried out in 97 CAD patients and 78 healthy individuals. The OLR1 IVS4 genotypings were performed by polymerase chain reaction – restriction fragment length polymorphism (PCR-RFLP) method.
Results. Serum high-density lipoprotein (HDL) cholesterol levels and body mass index (BMI) were higher in control subjects with IVS4-73CC genotype than in T allele carriers (CT+TT) (respectively, p = 0.002 and p = 0.024), while BMI values were lower in patients with CC genotype (p = 0.046). Patients with IVS4-14G allele (AG+GG) had a statistically higher low-density lipoprotein (LDL) cholesterol level (p = 0.027) than patients with -14AA genotype. Also the systolic blood pressure (SBP) levels were statistically higher in IVS4-73C allele carriers (CT+CC) than in non-carriers (TT) (p = 0.045). A strong linkage between IVS4-14A>G and -73C>T SNPs of the OLR1 gene was detected in patients (D’= 0.76).
Conclusions. Our results indicated that the intron 4-14A>G and -73C>T SNPs of the OLR1 gene can be inherited together. The present data also suggests that the OLR1 gene may contribute to the development of hypercholesterolemia in patients with CAD.
Key words: single nucleotide polymorphism, coronary artery disease, serum lipids, linkage disequilibrium, OLR1 gene
Original papers
Are IVS4 SNPs of OLR1 gene associated with coronary artery disease: Is there a linkage between IVS4 SNPs?
Özlem Kurnaz-Gömleksiz 1,B–D, Özlem Kücükhüseyin1,B,D, Elif Özkök2,C, Zehra Buğra3,B,C, Oğuz Öztürk1,E,F, Hülya Yilmaz-Aydoğan1,A,C–F
1 Department of Molecular Medicine, Institute for Experimental Medicine, Istanbul University, Turkey2 Department of Neuroscience, Institute for Experimental Medicine, Istanbul University, Turkey3 Department of Cardiology, Faculty of Medicine, Istanbul University, Turkey
A – research concept and design; B – collection and/or assembly of data; C – data analysis and interpretation; D – writing the article; E – critical revision of the article; F – final approval of the article
Advances in Clinical and Experimental Medicine, ISSN 1899-5276 (print), ISSN 2451-2680 (online) Adv Clin Exp Med. 2018;27(3):321–326

O. Kurnaz-Gömleksiz, et al. Linkage between OLR1 IVS4 SNPs and CAD322
Introduction
Elevated plasma and tissue levels of oxidized low-density lipoprotein (ox-LDL), as well as traditional risk factors, in-cluding age, sex, diabetes mellitus, hypercholesterolemia, high blood pressure, obesity, and smoking, were shown to have contributory effects on the development of athero-sclerotic lesions.1,2 Under some pathological conditions, such as acute myocardial infarction (AMI) and coronary artery disease (CAD), increased levels of ox-LDL have been re-ported. Ox-LDL, which also regulates LOX-1 activity, shows pro-atherogenic effects through oxidized low density lipo-protein (lectin-like) receptor 1 (OLR1, LOX-1).3–6 The OLR1 gene has been identified as a candidate gene which may be associated with AMI and CAD.3,4 OLR1 is induced by pro-atherogenic stimuli and by inflammatory cytokines, and it is upregulated in ischemia reperfusion injury in the rat.2,5,7
The OLR1 gene is mapped on 12p13.1-p12.3 constitut-ing 6 exons and 5 introns. First 3 exons show functional consistency with different functional domains of protein (cytoplasmic, transmembrane and neck domain), and the other 3 exons encode the carbohydrate recognition domain and are similar to those in other C-type lectin genes.8 Seven polymorphisms have been identified on the OLR1 gene. Six of them (in intron 4, 5 and 3’UTR region) are in linkage disequilibrium (LD).9
Association studies have shown a role for the OLR1 gene variants in AMI susceptibility. In particular, 6 of the 7 single-nucleotide polymorphisms (SNPs) of the OLR1 gene locat-ed within intron 4 (IVS4-27G>C, IVS4-73C>T [rs3736234], IVS4-14A>G [rs3736235]), intron 5 (IVS5-70A>G, IVS5-27G>T) and 3’UTR (188C>T) comprise a linkage dis-equilibrium block, which is strongly associated with the elevated risk of CAD.10,11
A new splicing isoform (lacking the exon 5) of the OLR1 gene with a new function is named LOXIN.9 In humans, the incidence of myocardial infarction was negatively as-sociated with the LOXIN mRNA and protein expression levels. LOXIN lacks the ligand-binding site, but interacts with the full-length OLR1 receptors by blocking their cel-lular expression, ox-LDL binding activity, and uptake.12 The expression of LOXIN mRNA is dramatically related to the OLR1 LD polymorphism. Macrophages of subjects with the “no risk” polymorphism have higher levels of mRNA as well as protein expression than macrophages of subjects carrying the risk haplotype.12 The OLR1 gene IVS4-14A>G (rs3736235) polymorphism influences the transcription of 2 isoforms OLR1/LOXIN, whose ratio could allow the identification of subjects who are at cardiovascular disease risk. Subjects carrying the mutant IVS4-14G allele express less LOXIN than those with the wild type IVS4-14A allele.12
The aim of the present work was to investigate the ef-fects of the OLR1 IVS4-14A>G (rs3736235) and -73C>T (rs3736234) polymorphisms on lipid parameters in Turk-ish CAD patients and to show the linkage disequilibrium between these 2 polymorphisms.
Material and methods
Patient selection and clinical investigation
The study protocol was approved by both the Ethical Committee of the Faculty of Medicine and the Research Fund of Istanbul University, Turkey. All the procedures were in accordance with the Helsinki Declaration laid down in 1964 and its later amendments. All participants in study signed informed consent forms in accordance with ethics guidelines regarding the study. OLR1 IVS4-73C>T and -14A>G gene polymorphisms were studied in 97 patients with CAD (31 women, 66 men). The presence of CAD was documented by an angiography in patients with acute coronary syndrome. Angiographic inclusion criteria were: ≥50% stenosis of at least 1 major coronary vessel because of atherosclerosis, and a vascular event, de-fined as myocardial infarction, percutaneous transluminal coronary angioplasty or coronary artery by-pass graft-ing.13 Patients were included irrespective of concomitant risk factors for atherosclerosis such as smoking, arterial hypertension and diabetes mellitus.
To identify normal distribution of the OLR1 IVS4-73C>T and -14A>G genotypes, we enrolled a control population of 78 healthy unrelated individuals (35 women, 43 men). This group primarily included the spouses of CAD pa-tients and volunteers. A coronary angiography was not performed on these individuals, and therefore the pres-ence of atherosclerotic coronary arteries could not be ex-cluded. However, none of these individuals had any history of vascular event. Before the subjects were admitted into the study, their medical history was taken with special emphasis on coronary risk factors, including smoking, family history of CAD, hypertension, diabetes mellitus, and hyperlipidemia. The study was approved by the Ethics Committee of the Faculty of Medicine, Istanbul University, and written informed consent was obtained from each participant.
Genotyping
Genomic DNA was extracted from human leukocyte nuclei isolated from whole blood by standard methods.14 IVS4-73C>T and -14A>G genotypes were performed by the method described by Trabetti et al.7
Statistical analysis
All statistical analyses were performed by SPSS for Win-dows v. 20.0 (SPSS Inc., Chicago, USA). To evaluate the difference in the occurrence of the OLR1 IVS4-73C>T and -14A>G genotypes in the study groups, the c2 test was used. Differences in the distributions of genotypes accord-ing to clinical phenotypes (presence or absence of left ven-tricular hypertrophy – LVH) were assessed by using the c2 test in 2 × 2 tables. In order to determine the relative

Adv Clin Exp Med. 2018;27(3):321–326 323
risks, odds ratios (ORs) and 95% confidence intervals (CIs) were used. Lipid and the other parametric analyses were compared by the Student’s t and ANOVA tests. The link-age between the -73C>T and -14A>G polymorphisms was assessed by using D’ and r2 values obtained through the Haploview Program (Broad Institute, Cambridge, USA) and p-values of <0.05 were considered as statistically significant.
Results
Patient characteristics
Demographic, biochemical and clinical data is summa-rized in Table 1. There were significant differences in the frequencies of the total cholesterol (TC) levels (p = 0.023) and smoking (p = 0.001) between patients with CAD and the control subjects. However, no significant differences were detected in systolic and diastolic blood pressures, sex, BMI, concentrations of serum TG, LDL-cholesterol, HDL-cholesterol, and very low-density lipoprotein (VLDL) cholesterol between patients with CAD and the control subjects (p > 0.05).
Distributions of the OLR1 IVS4 -14A>G and IVS4 -73C>T genotypes
The distributions of genotypes and alleles of OLR1 IVS4-73C>T and -14A>G are shown in Table 2. No significant deviation from Hardy-Weinberg equilibrium (HWE) was observed for OLR1 IVS4 polymorphisms in the study
groups (p > 0.05). In addition, statistical analysis revealed no significant difference in the genotype and allele frequen-cies of OLR1 IVS4 in the study groups (p > 0.05).
Haplotype analysis
IVS4-14G allele carriers in the control group also carried IVS4-73T allele (p = 0.008). Moreover, it was determined that most patients with IVS4-14 G allele carry IVS4-73T allele (p < 0.001) (Table 3). Therefore, we assessed haplo-type analysis and found an observed LD with D’= 0.741 be-tween IVS4-14A>G and -73C>T polymorphisms (p > 0.05) (Fig. 1). On the other hand, haplotype frequencies of IVS4- 14A>G and IVS4-73C>T were estimated, and the
Table 1. Characteristics of the study population
Baseline characteristics Control (n = 78) CAD (n = 97)
Age [years] (X ±SD) 58.05 ±10.43 59.93 ±9.70
Sex (women/men) (n) 35/43 31/66
BMI [kg/m2] (X ±SD) 25.19 ±3.63 26.08 ±3.10
SBP [mm Hg] (X ±SD) 121.53 ±13.46 123.56 ±27.02
DBP [mm Hg] (X ±SD) 73.14 ±8.97 77.02 ±16.62
TC [mmol/L] (X ±SD) 4.87 ±1.37 5.40 ±1.36*
TG [mmol/L] (X ±SD) 1.56 ±0.71 1.64 ±0.98
HDL-cholesterol [mmol/L] (X ±SD) 1.01 ±0.35 0.98 ±0.19
LDL-cholesterol [mmol/L] (X ±SD) 3.19 ±1.24 3.41 ±1.15
VLDL-cholesterol [mmol/L] (X ±SD) 0.73 ±0.40 0.74 ±0.54
Smoking (%) 46.3 69.1†
Type 2 DM (%) – 24.2
Hypertension (%) – 38.2
LVH – 25.6
The results are shown as X (mean) ±SD (standard deviation). CAD – patients with coronary artery disease; BMI – body mass index; SBP – systolic blood pressure; DBP – diastolic blood pressure; TC – total cholesterol; TG – triglyceride; HDL – high-density lipoprotein; LDL – low-density lipoprotein; VLDL – very low-density lipoprotein; LVH – left ventricular hypertrophy; n – number of individuals; * p = 0.023; † p = 0.001.
Table 2. The distributions of OLR1 IVS4-73C>T and IVS4-14A>G genotypes and alleles in the study groups
Distributions of studied OLR1 SNPs Control group CAD group
IVS4-73C>T n = 78 n = 91
Genotypesn(%)
CC 4 (5.1) 8 (8.8)
TT 25 (32.1) 28 (30.8)
CT 49 (62.8) 55 (60.4)
C allele n(%) 57 (36.53) 71 (39.01)
T allele n(%) 99 (63.46) 111 (60.98)
IVS4-14A>G n = 76 n = 97
Genotypesn(%)
AA 26 (34.2) 22 (22.7)
GG 11 (14.5) 15 (15.5)
AG 39 (51.3) 60 (61.9)
A allele n(%) 91 (59.86) 104 (53.60)
G allele n(%) 61 (40.13) 90 (46.36)
X2 test was used to compare genotypes in the study group. For determining allele frequencies gene count method was used. CAD – patients with coronary artery disease; n – number of individuals.
Fig. 1. The linkage disequilibrium (LD) analysis of IVS4-14A>G and IVS4-73C>T
LD plot was generated by HaploView software v. 4.2. The pairwise LD value (D1 = 0–100) is given in the colored pink square with “74”, which indicates D1 = 0.74. A value of 100 (D1 = 1) represents maximum possible linkage disequilibrium.
Table 3. Interactions between OLR1 IVS4-14A>G and IVS4-73C>T variants
OLR1 IVS4-14AG
Control group CAD group
OLR1 IVS4-73CT OLR1 IVS4-73CT
CC CT+TT CC CT+TT
AA 4 (18.2%) 18 (81.8%) 7 (33.3%) 14 (66.7%)
AG+GG – 47(100%) 1 (5.5%) 66 (98.5%)
p-value p = 0.008* p < 0.001*
X2 test was used to compare genotypes in the study group. For determining allele frequencies gene count method was used. *p < 0.05 indicates statistical significance (Fisher’s exact test).

O. Kurnaz-Gömleksiz, et al. Linkage between OLR1 IVS4 SNPs and CAD324
following 4 haplotypes with frequency were observed: G-T (39.9%); A-C (33.8%); A-T (22.1%); G-C (4.3%) (p > 0.05) (Table 4).
Association of the OLR1 IVS4-14A>G and IVS4-73C>T SNPs with lipid and metabolic parameters
Patients with IVS4-14 G allele (AG+GG genotypes) have significantly higher LDL-cholesterol levels (p = 0.027) (Fig. 2) and higher TC, as close to statistical significance (p = 0.063) (Fig. 3) than patients with IVS4-14AA geno-types (Table 5). Also, we found that the controls carrying
the -14G allele were prone to high levels of LDL-cholesterol (12.5%) and TC (10.08%) without any statistical signifi-cance (Table 5).
As shown in Table 5, in patients with IVS4-73 T allele (CT+TT), the BMI values increased compared to those with IVS4-73 CC genotype (p = 0.046), while they decreased in the controls with T allele compared to those with CC gen-otype (p = 0.024). When we analyzed the effects of IVS4 -73 variant on the serum lipid profile, it was observed that the HDL-cholesterol levels were statistically lower in the control subjects with IVS4-73 T allele than in those with IVS4-73 CC genotype (p = 0.002) (Table 5). Also, SBP levels were statistically higher in the IVS4-73C allele carriers (CT+CC) than in the IVS4-73TT genotype carriers (C allele: 127.17 ±30.09 vs TT genotype: 115.83 ±19.76; p = 0.045) in the group of patients (Table 5).
Discussion
Genetic risk factors are considered to be responsible for about half of CAD events. In recent years, several functional SNPs of the OLR1 gene have been associated with CAD in hu-mans. One of these functional SNPs is the IVS4-14A>G.15 IVS4-14A allele encodes a truncated OLR1 splice isoform, LOXIN, which lacks a part of the extracellular domain resulting in reduced binding capacity for ox-LDLs, and the cellular expression of the full-length OLR1 receptors and their ox-LDL binding activity.15,16 LOXIN expression pro-vides increased resistance to ox-LDL-induced macrophage apoptosis and atherogenesis in vitro. It was shown that IVS4-14A allele carriers are protected from cardiovascular disease, whereas homozygous IVS4-14G allele carriers are predisposed to cardiovascular disease in vivo.3,15 However, the effect of the OLR1 IVS4-14A>G SNP on lipoprotein metabolism has not yet been investigated.
Chen et al. reported that the intron 4/G allele frequencies of the OLR1 gene were higher in the white population than in the black population in Women’s Ischemia Syndrome Evaluation (WISE) Study (49.2% vs 18.8%; p < 0.001).10 In the WISE study, it was found an association between the common genetic 3'UTR 188C>T variation in the OLR1
Fig. 2. The distribution of LDL-cholesterol levels between OLR1-14G>A polymorphism
Fig. 3. The distribution of TC levels between OLR1-14G>A polymorphism
Table 4. Haplotype associations of OLR1 IVS4-14A>G and -73C>T polymorphisms
Haplotype associationFrequencies
X2 p-valueoverall patients controls
GT 0.399 0.422 0.369 0.795 0.3726
AC 0.338 0.339 0.335 0.001 0.9695
AT 0.221 0.193 0.258 1.524 0.217
GC 0.043 0.046 0.038 0.216 0.6425
To evaluate the combined effect of OLR1 IVS4-14A>G and -73C>T polymorphisms on CAD, the haplotype frequencies for significant loci and the standardized disequilibrium coefficient (D’) for pairwise linkage disequilibrium (LD) were calculated using r2 and LOD values (LOD is the log of the likelihood odds ratio, r2 is the correlation coefficient between the 2 loci). The 1st allele indicates OLR1 IVS4-14A>G; the 2nd allele indicates OLR1 IVS4-73C>T polymorphism.D’ = 0.741; r2 = 0.274; LOD = 9.04; LD = 74.

Adv Clin Exp Med. 2018;27(3):321–326 325
gene and stenosis severity of CAD. They also suggested that the IVS4 -14A>G, the intron 5 T>G and the 3’UTR 188C>T polymorphisms of the OLR1 gene were in sig-nificant linkage disequilibrium, and therefore exhibited similar genotype/allele frequencies. They asserted that all 3 polymorphisms could be considered a single marker for discussion purpose. They also found no significant associa-tion between OLR1 polymorphisms (in the intron 4 G>A the intron 5 T>G, and the 3’UTR T>C) and plasma lipid levels (TC, LDL-cholesterol, HDL-cholesterol, and TG).10
Trabetti et al. found a similar distribution frequency of the IVS4-73TT homozygous allele among AMI and non-AMI cases.7 They observed the association between the IVS4-73C>T and CAD, as close to statistical significance (p = 0.065). Mango et al. examined 7 OLR1 polymorphisms (K167N, 3’UTR 188C>T, IVS4+27G>C, IVS4-73C>T, IVS4-14A>G, IVS5-70A>G, IVS5-27G>T) and found that 6 of them (except K167N) comprised a linkage disequilib-rium block behaving as a single SNP.11
In the present study, no significant associations were observed between OLR1 IVS4-73C>T and -14A>G geno-types and alleles and the risk of CAD (p > 0.05). In general, serum lipid pattern was shown to indicate a predisposition to hyperlipidemic profile, as an independent CAD risk fac-tor. In patients with CAD, IVS4-14G allele was associated with moderately higher cholesterol levels (in excess of 12%) in its carriers than in the IVS4-14AA genotype carriers
(p = 0.063). When we investigated the effects of the IVS4-73C>T SNP on serum lipid levels and other characteristics in the controls, we observed that the HDL-cholesterol levels and BMI were lower in the IVS4 -73 T allele (CT+TT geno-type) carriers than in non-carriers (CC genotype) (p = 0.002 and p = 0.024, respectively). In healthy controls with IVS4-73CC genotype, BMI was higher than in controls with TT and CT genotypes (p > 0.05). In contrast to det-rimental effects of IVS4-73 T allele on lipids, it was related to a favorable effect on BMI. Although the distribution of OLR1 IVS4-14A>G and IVS4-73C>T SNPs was similar in patient and control groups, it was observed that the 2 IVS4 polymorphisms of the OLR1 gene were in a very high linkage disequilibrium (D’ = 0.74; r2 = 0.274). This finding indicates that both of the IVS4 SNPs of the OLR1 gene can be inherited together. Furthermore, the OLR1 IVS4-14A>G SNP has an unfavorable lipid profile (high total and LDL-cholesterol levels), though it is not associ-ated with the risk of CAD.
Several studies reported that the OLR1 3’UTR 188C>T and IVS4-73C>T SNPs were in a linkage disequilibrium block.10,11 In our previous study, 3’UTR 188TT genotype was associated with increased SBP levels in patients with CAD.1 Moreover, we found that the SBP levels were sta-tistically higher in the normal IVS4-73C allele carriers (CT+CC) than in the rare homozygote IVS4-73TT geno-type carriers (115.83 ±19.76 vs 127.17 ±30.09; p = 0.045)
Table 5. The effects of OLR1 IVS4-73C>T and IVS4-14A>G genotypes and alleles on serum lipoprotein levels, BMI and blood pressure in patients group
GroupsOLR1 IVS4-14A>G genotypes OLR1 IVS4-73C>T genotypes
AA AG+GG GG AG+AA CC CT+TT TT CT+CC
Control
TC [mmol/L] 4.66 ±1.10 5.23 ±1.35 5.31 ±1.15 4.99 ±1.33 5.02 ±0.91 4.90 ±1.40 4.88 ±1.29 4.92 ±1.43
TG [mmol/L] 1.70 ±1.29 1.79 ±0.75 1.77 ±0.90 1.77 ±0.99 2.41 ±0.97 1.69 ±0.94 1.90 ±0.87 1.66 ±0.99
HDL-C [mmol/L] 0.97 ±0.27 0.98 ±0.37 1.05 ±0.52 0.96 ±0.30 1.02 ±0.35 0.89 ±0.08§ 1.06 ±0.45 0.97 ±0.36
LDL-C [mmol/L] 3.03 ±0.97 3.41 ±1.38 3.35 ±0.81 3.27 ±1.34 3.22 ±0.72 3.23 ±1.28 3.03 ±1.11 3.33 ±1.31
VLDL-C [mmol/L] 0.77 ±0.33 0.80 ±0.60 0.81 ±0,41 0.78 ±0.47 0.80 ±0.46 0.74 ±0.43 0.76 ±0.40 077 ±0.45
BMI [kg/m2] 25.46 ±3.44 24.93 ±3.21 23.53 ±3.06 25.40 ±3.25 29.26 ±3.92 25.03 ±3.55¤ 25.51 ±4.82 25.17 ±3.14
SBP [mm Hg] 122.72 ±16.08 120.42 ±7.43 119.09 ±7.00 121.55 ±11.48 117.50 ±5.00 120.97 ±11.58 121.19 ±16.27 120.60 ±8.67
DBP [mm Hg] 70.0 ±9.25 73.51 ±7.21 70.98 ±9.44 72.67 ±7.99 67.50 ±5.00 73.58 ±8.60 75.71 ±14.54 72.20 ±6.79
Patients
TC [mmol/L] 4.96 ±1.32 5.58 ±1.35* 5.67 ±151 5.39 ±1.34 5.03 ±1.41 5.42 ±1.37 5.27 ±1.55 5.43 ±1.31
TG [mmol/L] 1.46 ±0.73 1.76 ±1.15 1.81 ±0.85 1.67 ±1.11 1.45 ±0.77 1.71 ±1.12 1.65 ±0.83 1.71 ±1.19
HDL-C [mmol/L] 1.05 ±0.31 1.09 ±0.30 0.94 ±0.21 1.02 ±0.31 1.00 ±0.45 1.10 ±0.29 1.01 ±0.32 0.98 ±0.28
LDL-C [mmol/L] 2.94 ±1.04 3.58 ±1.15† 3.57 ±1.32 3.40 ±1.12 2.78 ±1.06 3.45 ±1.16 3.38 ±1.20 3.39 ±1.17
VLDL-C [mmol/L] 0.66 ±0.31 0.78 ±0.30 0.83 ±0.42 0.74 ±058 0.64 ±0.30 0.77 ±0.58 0.74 ±0.41 0.78 ±0.42
BMI [kg/m2] 26.25 ±3.35 26.10 ±3.07 26.33 ±3.04 26.09 ±3.16 24.50 ±1.76 26.41 ±3.20¥ 26.38 ±3.12 26.22 ±3.19
SBP [mm Hg] 120.0 ±19.76 124.13 ±29.11 122.0 ±25.69 123.36 ±27.54 124.37 ±19.89 123.97 ±28.75 115.83 ±19.76 127.17 ±30.09Ψ
DBP [mm Hg] 75.45±11.00 76.95 ±18.15 74.33 ±18.98 77.04 ±16.27 78.12 ±14.12 77.37 ±17.57 72.71 ±15.25 79.27 ±17.69
The results are shown as mean ±standard deviation. TC – total cholesterol; TG – triglyceride; HDL-C – high-density lipoprotein cholesterol; LDL-C – low-density lipoprotein cholesterol; VLDL-C – very low-density lipoprotein cholesterol; BMI – body mass index; SBP – systolic blood pressure; DBP – diastolic blood pressure. Statistical analyses were performed by using the Student’s t-test. * p = 0.063; † p = 0.027; § p = 0.002; ¤ p = 0.024; ¥ p = 0.046; Ψ p = 0.045.

O. Kurnaz-Gömleksiz, et al. Linkage between OLR1 IVS4 SNPs and CAD326
in the group of patients. When we analyzed these SNPs (-73C>T and 3’UTR 188C>T), our findings showed that most of the IVS4-73C allele carriers also have OLR1 3’UTR 188T allele (89.5%). This finding suggests the possibil-ity of an interaction between these 2 SNPs (-73C>T and 3’UTR 188C>T) and hypertension in the presence of CAD. Although the definite mechanism requires further re-search, we think that the intron 4 variations of the OLR1 gene may result in an increased risk of CAD by increasing the SBP levels.
As a conclusion, our study is the first one to investi-gate the IVS4-14A>G and -73C>T variants of the OLR1 gene in the Turkish population. It was shown that the IVS4-14A>G and -73C>T SNPs of the OLR1 gene com-prise a linkage disequilibrium block. Our results are in agreement with the hypothesis that the intron 4 SNPs of the OLR1 gene are inherited together. The -14A>G SNP was associated with increased levels of TC and LDL-cholesterol in the patient group, while normal homozy-gote -73CC genotype was associated with increased levels of HDL-cholesterol in the control subjects. The present findings suggest that the OLR1 gene IVS4 gene variants might play a role in hypercholesterolemia as an indepen-dent CAD risk factor in the Turkish population.
References1. Kurnaz O, Akadam-Teker AB, Yilmaz-Aydoğan H, Tekeli A, Isbir T.
The LOX-1 3’UTR188CT polymorphism and coronary artery disease in Turkish patients. Mol Biol Rep. 2012;39(4):4351–4358.
2. Mango R, Predazzi IM, Romeo F, Novelli G. LOX-1/LOXIN: The yin/yang of atheroscleorosis. Cardiovasc Drugs Ther. 2011;25:489–494.
3. Vecchione L, Gargiu E, Borgiani P, et al. Genotyping OLR1 gene: A genomic biomarker for cardiovascular diseases. Recent Pat Cardio-vasc Drug Discov. 2007;2(2):147–151.
4. Freeman MW. Scavenger receptors in atherosclerosis. Curr Opin Hema-tol. 1997;4:41–47.
5. Ishigaki T, Ohki I, Utsunomiya-Tate N, Tate SI. Chimeric structural stabilities in the coiled-coil structure of the NECK domain in human lectin-like oxidized low-density lipoprotein receptor 1 (LOX-1). J Bio-chem. 2007;141(6):855–866.
6. Steinbrecher UP. Receptors for oxidized low density lipoprotein. Bio-chim Biophys Acta. 1999;1436:279–298.
7. Trabetti E, Biscuola M, Cavallari U, et al. On the association of the oxi-dised LDL receptor 1 (OLR1) gene in patients with acute myocardial infarction or coronary artery disease. Eur J Hum Genet. 2006;14:127–130.
8. Mehta JL, Chen J, Hermonat PL, Romeo F, Novelli G. Lectin-like oxi-dized low-density lipoprotein receptor-1(LOX-1): A critical player in the development of atherosclerosis and related disorders. Car-diovasc Res. 2006;69:36–45.
9. Mango R, Biocca S, Del Vecchio F, et al. In vivo and in vitro studies sup-ports that a new splicing isoform of OLR1 gene is protective against acute myocardial infarction. Circ Res. 2005;97:152–158.
10. Chen Q, Reis SE, Kammerer C, et al. Genetic variation in lectin-like oxidized low-density lipoprotein receptor 1(LOX1) gene and the risk of coronary artery disease. Circulation. 2003;107:3146–3151.
11. Mango R, Clementi F, Borgiani P, et al. Association of single nucleotide polymorphisms in the oxidised LDL receptor 1 (OLR1) gene in patients with acute myocardial infarction. J Med Genet. 2003;40:933–936.
12. Gambino R, Bo S, Musso G, Pagano G, Cassader M. Loxin polymor-phism is associated with increased resistin levels and with oxidative status. Clin Biochem. 2011;44:1015–1017.
13. Sahn DJ, De Maria A, Kisslo J, Weyman A. Recommendations regard-ing quantitation in M-mode echocardiography: Result of a survey of echocardiographic measurements. Circulation. 1978;58:1072–1083.
14. Miller SA, Dykes DD, Poleskey HS. A simple salting out procedure for extracting DNA from human nucleated cells. Nucleic Acids Res. 1988;16:1215.
15. Musso G, Cassader M, Michieli FD, Saba F, Bo S, Gambino R. Effect of lectin-like oxidized LDL receptor-1 polymorphism on liver dis-ease, glucose homeostasis, and postprandial lipoprotein metabolism in nonalcoholic steatohepatitis. Am J Clin Nutr. 2011;94:1033–1042.
16. Takanabe-Mori R, Ono K, Sowa N, et al. Lectin-like oxidized low-den-sity lipoprotein receptor-1 is required for the adipose tissue expres-sion of proinflammatory cytokines in high-fat diet-induced obese mice. Biochem Biophys Res Commun. 2010;398:576–80.

DOI10.17219/acem/64937
Copyright© 2018 by Wroclaw Medical University This is an article distributed under the terms of the Creative Commons Attribution Non-Commercial License(http://creativecommons.org/licenses/by-nc-nd/4.0/)
Address for correspondenceAndrzej MiskiewiczE-mail: [email protected]
Funding sourcesThe research was funded by the authors' institu-tion, the Medical University of Warsaw, Poland (grant No. 1S14/NM1/13).
Conflict of interestNone declared
Received on March 31, 2016Reviewed on July 1, 2016Accepted on September 1, 2016
AbstractBackground. Periodontitis is a major risk factor of systemic diseases with inflammatory etiology. Numer-ous studies have established the connection between periodontal condition and diabetes, but there are no reports in the literature on the relationship between periodontitis and other pancreas conditions. The activity of pancreatic enzymes is an important parameter of pancreatic damage, and is also a diagnostic marker of acute and chronic pancreatitis, and the bleeding index determines the periodontitis activity. To date, the periodontal status in both of the above-mentioned conditions has not been examined.
Objectives. The objective of the study was to provide a clinical evaluation of oral cavity hygiene and the condition of periodontal tissues in patients diagnosed with pancreatic adenocarcinoma or chronic pancreatitis and in the control group, and to assess the correlation between the activity of periodontitis and the concentra-tion of glycated hemoglobin HbA1c, lipase activity and pancreatic amylase in serum from the examined groups.
Material and methods. The serum activity levels of amylase, lipase and HbA1c concentration were correlated with periodontitis activity markers in patients diagnosed with chronic pancreatitis (n = 41), pancreatic cancer (n = 29) and in the control group (n = 50).
Results. In the group with chronic pancreatitis, we have found a positive association between the bleeding on probing (BOP) and the amylase activity (r = 0.64) as well as the lipase (r = 0.62; p < 0.05). The patients diagnosed with pancreatic cancer evinced a higher value of the inflammatory response index, namely 1.51, than the other studied groups (H = 24.94; p = 0.01). Patients diagnosed with chronic pancreatitis evinced the highest periodontitis activity indices: BOP: 62.53% (H = 61.31; p = 0.01) and probing depth (PD): 4.14 ±0.89 mm (H = 22.43; p < 0.0001).
Conclusions. The study showed that periodontitis in patients with pancreatic cancer is independent of the state of oral hygiene. In the group of patients with chronic pancreatitis, the observed positive correlation between the bleeding index and the enzyme activity suggests interaction between the examined diseases.
Key words: chronic pancreatitis, periodontitis, pancreatic cancer
Original papers
The correlation between pancreatic dysfunction markers and selected indices of periodontitis
Andrzej Miskiewicz1,A–F, Grzegorz Szparecki2,B–D, Marek Durlik3,A,B,D,E, Grażyna Rydzewska4,A,B,D,E, Ireneusz Ziobrowski3,A,B,E, Renata Górska1,A–F
1 Department of Periodontology and Oral Diseases, Medical University of Warsaw, Poland2 Department of Pathology, Medical University of Warsaw, Poland3 Department of Gastroenterological Surgery and Transplantation, Central Clinical Hospital of the Ministry of Internal Affairs, Warszawa, Poland4 Department of Internal Medicine and Gastroenterology with Inflammatory Bowel Diseases Unit, Central Clinical Hospital of the Ministry of Internal Affairs, Warszawa, Poland
A – research concept and design; B – collection and/or assembly of data; C – data analysis and interpretation; D – writing the article; E – critical revision of the article; F – final approval of the article
Advances in Clinical and Experimental Medicine, ISSN 1899-5276 (print), ISSN 2451-2680 (online) Adv Clin Exp Med. 2018;27(3):313–319

A. Miskiewicz, et al. Pancreatic conditions and periodontitis314
Introduction
Pancreatic adenocarcinoma is the 4th and 6th most com-mon cause of death in the USA and Europe, respectively, among cancer-caused deaths.1 The 5-year survival rate occurs in 6% of cases.2 Therefore, when the final diagnosis is made, the neoplastic cells are no longer confined to the pancreas only, but are also present in other body organs, which in turn rules out the possibility of surgical interven-tion. The recent clinical reports state that the patient’s survival rate in cases where surgery on pancreatic tumors is possible has not increased.3 However, if performed in the early stages, on less than 2 cm primary tumor size, the surgery may significantly reduce the death risk ratio (HR = 1.41). A global effort is, therefore, currently being made in order to elaborate pancreatic cancer markers to help detect pancreatic cancer cases at a much earlier stage. On the other hand, exacerbation of chronic pancreatitis as well as first episodes of acute pancreatitis are among the most common reasons for gastrointestinal hospital-ization emergencies.4 Additionally, chronic pancreatitis severely deteriorates the quality of the patient’s life causing constant and recurring pain, unexpected exacerbations, and eventually leads to the patient’s exocrine dysfunction. One of the most common problems faced by the currently conducted medical research is the neoplastic transforma-tion occurring in the cases of ongoing chronic pancreati-tis. Clinical signs of pancreatic deficiency, such as the afore-mentioned chronic abdominal pains, diabetes and malnutrition, are common for pancreatic cancer as well as for chronic pancreatitis. Moreover, both conditions modulate their course. Therefore, a case of an already diagnosed chronic pancreatitis does not rule out the possibility of an accompanying case of a developed neo-plasm. According to earlier studies conducted and pub-lished by Zhang et al. and Wong et al., nucleic acid may be detected in the resting saliva and gingival crevicular fluid in patients suffering from pancreatic cancer and chronic pancreatitis.5,6
The most frequent marker determined in serum in the case of suspected pancreatitis is amylase. In the cases of acute pancreatitis or acute exacerbation of chronic pan-creatitis, its activity increased above 1000 IU/L indicates, with a sensitivity of up to 95%, exocrine pancreatic dysfunc-tion (exocrine insufficiency). In addition, determination of serum lipase activity increases the sensitivity of detec-tion of the disease. The level of 600 IU/L is adopted as the cut-off point indicating pancreas damage. Increased levels of the activity of these pancreatic enzymes also occur in the course of cancer of the salivary glands, stomach, intestines, and lungs. There are currently no studies reporting the correlation between the activity of these enzymes and peri-odontitis markers. Exocrine damage can mutually present with endocrine dysfunction, leading to impaired glucose tolerance and diabetes. One of the markers of glycemic control is glycated hemoglobin. So far, the involvement
of these factors in patients with pancreatic cancer, devel-oped in the course of chronic inflammation of this organ, has not been examined.
Periodontitis is caused by a wide spectrum of condi-tions affecting tissues surrounding a tooth. The clinical activity of the inflammatory periodontal process leads to alveolar bone osteolysis and connective tissue attach-ment loss. The course of the disease is modulated by pan-creatic conditions, especially diabetes, which affects the immunological system of the host.7 Moreover, if left un-treated, diabetes may modulate the course of inflamma-tion in the periodontium, which is measured by Il-1β and β-glucuronidase concentration.8 Despite ample research carried out in this field, no clear correlation between peri-odontal activity markers and pancreatic dysfunction has been proven yet. The studies cited above made an attempt at assessing the occurrence of cytokines, enzymes and bac-terial titres in patients with pancreatic conditions; however, no periodontitis activity parameters have been taken into consideration in those studies.
Material and methods
The study was conducted in the Central Clinical Hospi-tal of the Ministry of Internal Affairs in Warszawa, Poland from April 2012 to August 2015.
In the study, we took into account 3 groups of individu-als: patients diagnosed with pancreatic adenocarcinoma (n = 29); chronic pancreatitis patients (n = 41) and a control group (n = 50). The study groups were matched in line with the age of the participants, their gender and race, so that the data to be collected could be used to make a reliable comparison using relevant statistical tests.
The patients enrolled in the 1st study group were pa-tients of the Gastroenterological Surgery Ward diagnosed with pancreatic adenocarcinoma. The diagnosis was made initially by means of standard radiographic techniques and was subsequently confirmed following the surgery by means of a histopathological examination. The group consisted of 29 patients at the age of 41–81 years (median: 59.9 years). All admitted patients were referred to the ward upon an initial diagnosis of resectable pancreatic tumor, made based upon the criteria published by Wong et al. with the use of a computed tomography.9 The periodontal ex-amination was performed 1 day before the planned surgery. Edentulous patients as well as those who had fewer than 20 teeth, used removable prosthetic devices, showed signs of fungal infections, or did not brush their teeth at least twice a day were all excluded from this group. Further-more, patients with pancreatic tumor in stage III and IV were excluded – the criteria adapted were the involvement of the celiac axis or the superior mesenteric artery, portal vein or superior mesenteric vein. The history of antibiot-ics therapy in the past 3 months or chemotherapy/radio-therapy in the past 2 years were also criteria for exclusion.

Adv Clin Exp Med. 2018;27(3):313–319 315
The 2nd group consisted of 41 patients from the Gastro-enterology Ward of the hospital mentioned above diag-nosed with chronic pancreatitis, at the age of 20–87 years (median: 48.2 years). As for the newly diagnosed patients undergoing hospitalization in the ward for the first time, the diagnosis was confirmed in line with the TIGARO scale according to Etemad and Whitcomb.10 The exacerba-tions in the ongoing chronic pancreatitis patients were di-agnosed using standard laboratory tests and radiographic techniques. The most common complaints among patients included in this group were newly occurring or exacerbated abdominal pains. From this group we excluded patients with alcohol abuse history as well as tobacco smoking pa-tients. In addition, we used the same dental criteria for exclusion as in group 1.
The control group consisted of 50 patients of the Gas-troenterology Ward, Department of Internal Medicine and Endocrinology Clinic. The age range was 29–69 years (median: 45.6 years). The probands selected to this group evinced no clinically relevant conditions regarding the digestive system organs. The inclusion to the group was made based on computed tomography and/or abdominal ultrasonography in order to exclude signs of pancreatic conditions including enlarged head of pancreas, and a di-lated pancreatic duct and common bile duct.11 Moreover, to avoid bias in the study, we excluded patients with microli-thiasis, the sphincter of Oddi dysfunction and cystic fibro-sis.12 In this way we selected a group of probands among the hospitalized patients who were free of pancreatic and bile duct disorders. The periodontal examination was per-formed subsequently if the proband met the criteria in order to exclude the influence of the proposed treatment.
The study was carried out based on the consent issued by the Bioethical Committee of the Medical University of Warsaw on 25th April, 2012. The study was conducted with the understanding and written consent of each en-rolled patient. The patients included in the study agreed to participate in it by signing the informed consent form approved by the University Board of Ethics.
Periodontal examination
All included in the study probands underwent a dental and periodontal examination. It encompassed dental an-amnesis concerning previous dental treatment, oral fungal infections, use of oral antibiotics, and everyday oral hy-giene procedures. All the included patients brushed their teeth at least twice a day with toothpaste containing fluo-ride. Periodontal examination was performed by 1 dentist using a WHO 621 calibration dental probe. The measure-ments were performed in 6 diagnostic locations around every present tooth. According to the American Academy of Periodontology (AAP) classification of periodontal dis-ease, we measured the following periodontal parameters:
ù the plaque index (PI), measured on all surfaces of each tooth, according to a simplified scale by O`Leary: the
proportion of surfaces covered with dental plaque to all examined surfaces [%];
ù the bleeding on probing index (BOP), measured as the percentage of bleeding sites around of each toot [%], according to Ainamo’s scale;
ù the probing depth (PD), the distance measured be-tween the marginal border of the gingiva and the periodontal pocket bottom (a WHO 621 calibration dental probe);
ù the connective tissue attachment loss (CAL) level, measured by the distance between the cemento-enamel junction and the periodontal pocket bottom.13
All the gathered data was included in the documentation and analyzed according to the AAP diagnosis criterion guidelines.
Statistical analysis
The numerical variables were tested for normality using the Lilliefors test. Since our data did not follow the nor-mal distribution pattern, non-parametric tests were used. To assess the correlation between the endo- and exocrine dysfunction markers and the periodontal state, the Spear-man's correlation coefficient was used. The differences the between the groups, as far as the hyperreactive inflamma-tory phenotype was concerned, were measured using the Kruskal-Wallis ANOVA, and p-values <0.05 were deemed statistically relevant. All calculations were performed on STATISTICA v. 10 (StatSoft, Tulsa, USA).
Clinical and laboratory procedures
Ten mL blood were drawn by venipuncture from every proband enrolled in the study. The serum amylase and li-pase activity were measured by the automatic biochemical analyzer with colorimetric method on Cobas® 6000 (Roche Diagnostics, Indianapolis, USA). A 5 mL EDTA whole blood sample was obtained for HbA1c measurement, made by the turbidimetric immunoassay inhibition method on Cobas Integra® (Roche Diagnostics). All the measurements were performed in the central laboratory of the hospital adhering to the proper standardization methods set by the National Chamber of Laboratory Diagnosticians (KIDL).
The authors assumed the glycated hemoglobin blood levels HbA1c amounting to 6.0% (42 mmol/mol), reflecting the mean glucose blood level of 126 mg/dL (7.0 mmol/L) as the breakpoint level of long-term control of glycemia in the blood. This coefficient was calculated based on the formula of the linear regression of blood glucose levels (1.5944 HbA1c [mmol/L] − 2.5944) in accordance with the criteria of the American Diabetes Association (ADA)con-firmed in 2014 by the Polish Diabetes Association (PTD) in their definition of the purpose of treatment aiming at maintaining target glycemia.14

A. Miskiewicz, et al. Pancreatic conditions and periodontitis316
Results
As a result of the clinical study, the data classifying the patients by periodontitis stage were obtained for individual study groups: patients with pancreatic adenocarcinoma, chronic pancreatitis and control group. In patients diag-nosed with pancreatic cancer, the mean amylase activity was 31.9 IU/L (NS – non-significant), lipase activity 38.2 IU/L (NS) and the glycated hemoglobin 6.0%. The high-est values of the studied parameters were obtained in pa-tients with chronic pancreatitis: the mean lipase activity was 222.9 IU/L (p < 0.0001; H = 45.7831), amylase activity 311.6 IU/L (p = 0.004; H = 55.6381) and the concentration of glycated hemoglobin was 8.8% (p = 0.01, H = 25.631). Discussed results are presented in Table 1.
Periodontitis activity
The most frequently diagnosed disease entity was mod-erate periodontitis, which occurred in all studied groups and in the control group at the level of 44–68%. The least frequent diagnosis was generalized severe periodontal dis-ease (2–12%), while mild periodontal disease was found in pancreatic cancer patients and in the control group (42–44%).
In the group of patients diagnosed as suffering from chronic pancreatitis, the values of the periodontal param-eters were substantially higher than in other study groups. The periodontitis activity levels measured using the BOP index amounted to 62.53% (p = 0.01; H = 61.31946). More-over, the long-term periodontitis advancement ratios were the highest in this study group and amounted to a mean PD of 4.14 ±0.89 mm (p < 0.0001; H = 22.43578) and CAL 3.52 ±1.42 mm (p = 0.001; H = 43.97138). In the group of patients diagnosed with pancreatic cancer, the bleeding index BOP was estimated as 25.24% (NS), thus achieving the lowest value in the studied groups. Similarly, the mean PD ratio amounted to 2.81 ±0.87 mm (NS). In the control group the lowest value of the clinical attachment level was
noted at CAL 1.61 ±1.02 (NS), whereas the PD and BOP parameters amounted respectively to 3.67 ±1.08 mm (NS) and 35.32% (NS). The calculated clinical periodontitis ac-tivity level ratio was the highest in the group of patients suffering from pancreatic cancer 1.51 ±0.47 (p = 0.01; H = 24.94914), whereas as far as patients with chronic pancreatitis were concerned, it amounted to 0.91 ±0.31 (NS), and in the control group it was noted at the level of 0.65 ±0.16 (NS) (Table 1).
In order to estimate the impact of oral cavity hygiene on obtained bleeding index result, the BOP/PI ratio was calculated for all studied groups. The highest value was obtained in the group of patients with pancreatic cancer – 1.51 (p = 0.01; H = 24.94914). The values below 1.0 were obtained in the group of patients with chronic pancreati-tis and in the control group. The patients diagnosed with pancreatic cancer evinced a hyperreactive inflammatory phenotype as measured by BOP/PI inflammatory index compared with the patients diagnosed with chronic pan-creatitis and the control group (p = 0.01; H = 24.94914) (Fig. 1).
Correlation between glycated hemoglobin, pancreatic lipase and amylase activity and periodontitis parameters
In the group of patients diagnosed with chronic pancre-atitis, we observed a strong positive correlation between the HbA1c percentage and the periodontal inflammatory parameters measured clinically (r = 0.31 ÷ 0.43; p < 0.05). On the other hand, there was no correlation between long-term glycemia measured by this parameter and CAL (r = 0.14; p > 0.05). The highest correlation coefficients were achieved between the bleeding index BOP and the lipase and amylase activity in the serum amounting respec-tively to r = 0.62 and r = 0.64 for p < 0.05. The Spearman's correlation coefficients are presented in Table 2.
Table 1. The characteristics of the groups, taking into consideration the determination of pancreatic enzymes, HbA1c concentration and periodontitis parameters
Investigated parameters
Condition Investigated groups vs control
pancreatic cancer
chronic pancreatitis
control group
pancreatic cancer chronic pancreatitis
p-value H-value p-value H-value
PI [%] 16.96 69.39 37.81 NS NA NS NA
BOP [%] 25.24 62.53* 35.32 NS NA 0.01 61.31946
PD [mm] 2.81 ±0.87 4.14 ±0.89* 3.67 ±1.08 NS NA <0.0001 22.43578
CAL [mm] 2.51 ±1.54 3.52 ±1.42* 1.61 ±1.02 NS NA 0.001 43.97138
HbA1c [%] 6.0 8.8* 5.6 NS NA 0.01 25.631
Amylase [IU/L] 31.9 311.6* 36.2 NS NA 0.004 55.6381
Lipase [IU/L] 38.2 222.9* 41.3 NS NA <0.0001 45.7831
Inflammatory index 1.51 ±0.47* 0.91 ±0.31 0.65 ±0.16 0.01 24.94914 NS NA
PI – plaque index; BOP – bleeding on probing; PD – probing depth; CAL – connective tissue attachment loss level; the inflammatory index was calculated as the BOP/PI ratio; * p < 0.05 (statistically insignificant); NS – statistically non-significant; NA – not applicable; the calculated data was presented as mean ±standard deviation.

Adv Clin Exp Med. 2018;27(3):313–319 317
The patients with elevated HbA1c levels (>6.0%) were subjected to a continued study, as far as the influence of long-term glycemia on periodontium is concerned (Fig. 2). A strong positive correlation between the immunological lesion in periodontium and hyperglycemia (r = 0.47 ÷ 0.63; p < 0.05) was proven. Furthermore, the CAL was shown to correlate strongly with hyperglycemia in this group as well (r = 0.502; p < 0.05) as opposed to a general sample of all
patients with chronic periodontitis. The Spearman's cor-relation coefficients are presented in Table 2.
To separate the effects of hyperglycemia associated with an endocrine pancreatic dysfunction from the effects of its exocrine function, we searched for a correlation be-tween the amylase activity and the periodontium state in the group of patients with well-controlled glycemia, that is with the HbA1c percentage below 6.0% in the studied
Table 2. Correlation between amylase activity, lipase activity, HbA1c percentage, and periodontal parameters in patients with chronic pancreatitis and in patients with an elevated (>6.0%) HbA1c level
Correlation Amylase activity Lipase activity HbA1c % > 6.0% HbA1c %
Mean PD 0.531730* 0.516398* 0.439446* 0.475526*
BOP 0.643098* 0.625721* 0.379577* 0.632620*
PI 0.483115* 0.514514* 0.310178* 0.602690*
CAL 0.154078** 0.248069** 0.142726** 0.502961*
Fig. 2. Scatterplot matrix to help demonstrate the correlation between HbA1c percentage and BOP (only patients with an elevated HbA1c level were shown)
All numbers refer to the table refer to the Spearman's correlation coefficient; * p < 0.05; **p >0.05.
Fig. 1. Inflammatory index values obtained in studied groups
median25–75%non-outlier range
.
.
.
.
.
.
.cancer healthychronic pancreatitis
pancreas condition

A. Miskiewicz, et al. Pancreatic conditions and periodontitis318
groups. The study findings have shown a moderately strong correlation between the lipase activity and the bleeding on probing index (r = 0.347; p < 0.05). The study has not demonstrated any statistically relevant differences be-tween the other periodontitis parameters and the activity of pancreatic enzymes.
Discussion
The study carried out on the population of patients diag-nosed with pancreatic diseases showed a strong correlation between the clinically observed periodontitis activity levels and the pancreatic lipase and amylase activity. Groups of patients divided as per the long-term glycemia crite-rion were also analyzed using the glycated hemoglobin ratio. The studies conducted so far point to the influence of diabetes on the state of the periodontium. However, no data has so far been made available concerning the effects of pancreatic diseases, which may secondarily lead to un-controlled glycemia. The authors of the study have taken both of these factors into consideration and conducted an analysis based on the diagnosis as well as on the long-term control of glycaemia (HbA1c < 6.0%).
Our study sheds a new light on the concomitance of peri-odontitis and pancreas diseases in the context of inflam-matory status indices as described above. The conducted study may be indicative of mutual modulation of pancreas diseases and periodontitis. Observed positive correlation between the bleeding index BOP and the activity of pan-creatic enzymes in serum may indicate a common com-ponent of inflammatory process in chronic pancreatitis and periodontal disease. The excessive bleeding observed with a small presence of local factors in patients with pan-creatic cancer suggests the excessive activity of periodon-titis, sometimes referred to as an overactive phenotype. So far, the cause of high values of the BOP index at a rela-tively low PI rate is not known, although the dysfunctions of CD14 axis receptor, NF-κB factors and NOTCH pathway proteins are postulated.
The activity of the axis mentioned above triggers a pri-mary pathomechanism in selected systemic conditions, which consequently engages the activity of the NLRP 2 and 3 proteins mediated by NF-κB, such as diabetes and hypertension.15,16 Therefore, the inflammation mediated by the inflammasome complex may constitute a common de-nominator in periodontitis and a lifestyle risk factor. In our study, we analyzed 4 basic periodontal parameters. These parameters cover various aspects of chronic inflammation encountered in periodontium. The plaque index reflects the causal factor of inflammation. The bleeding index re-flects the host’s vascular response in terms of hyperemia, the dilation of capillaries and increased blood flow in the region. PD and CAL refer to the long-term stages of chronic inflammation including destructive processes character-istic of a chronic inflammatory response.
The authors considered BOP in correlation with PI in the study, because their intention was to emphasize the importance of the exacerbation of a transient inflamma-tory response in the periodontium as a reaction to the biomass of the bacterial plaque depending on the patient’s condition. An observation of this type could be a sign of an overactive phenotype of the patient noted during examina-tion (excessive bleeding as a response to a small amount of accretions on teeth).17
The progress of chronic pancreatitis impairs both the endo- and exocrine functions of the organ. It is hard to separate these 2 processes, as they concur and intermingle. In order to do this, we selected a group of patients with well-controlled glycemia in chronic pancreatitis. In this group, as described in the results, we found a moderate cor-relation between the amylase activity and CAL. Although this correlation was not as prominent as the strong correla-tion between hyperglycemia and periodontal inflamma-tion, this effect was clearly separable from the elevated li-pase activity in the serum linked to a long-term attachment loss. All inflammatory processes, including periodontitis, are caused by a plethora of factors, and many parameters may modulate its progress. Therefore, the correlation we found in our study was far from the simple 1:1 ratio; how-ever, the effect of exocrine deficiency alone is undeniable.
Since our study included a group of patients diagnosed with pancreatic cancer with accompanying chronic pan-creatitis patients, we found it necessary to take into ac-count the possible peculiarities concerning the inflamma-tory response in these patients. There was no difference in the long-term outcome of the inflammation measured by CAL. This means that the chronic inflammatory response, regardless of the underlying risk factors and modulating pancreatic factors, is similar in its final stage. However, the course and mechanisms might vary. The ratio, when elevated, shows a hyperreactive state of tissues in terms of an early inflammatory response.
References1. Michaud DS. Epidemiology of pancreatic cancer. Minerva Chir. 2004;
59:99–111.2. Yadav D, Lowenfels AB. The epidemiology of pancreatitis and pan-
creatic cancer. Gastroenterology. 2013;144:1252–1261.3. Bilimoria K, Bentrem DJ, Ko CY, Stewart AK, Winchester DP, Talamon-
ti MS. National failure to operate on early stage pancreatic cancer. Ann Surg. 2007;246:173–180.
4. Yang AL, Vadhavkar S, Singh G, Omary M. Epidemiology of alcohol-related liver and pancreatic disease in the United States. Arch Intern Med. 2008;168:649–656.
5. Zhang L, Farrell JJ, Zhou H, et al. Salivary transcriptomic biomark-ers for detection of resectable pancreatic cancer. Gastroenterology. 2010;138:949–957.
6. Wong DT, Zhang J, Farrell J, et al. Salivary biomarkers for pancreatic cancer detection. J Clin Oncol. 2009;27(Suppl 15S):4630.
7. Camen GC, Caraivan O, Olteanu M, et al. Inflammatory reaction in chronic periodontopathies in patients with diabetes mellitus: His-tological and immunohistochemical study. Rom J Morphol Embryol. 2012;53:55–60.

Adv Clin Exp Med. 2018;27(3):313–319 319
8. Yoon AJ, Cheng B, Philipone E, Turner R, Lamster IB. Inflammatory biomarkers in saliva: Assessing the strength of association of diabe-tes mellitus and periodontal status with the oral inflammatory bur-den. J Clin Periodontol. 2012;39:434–440.
9. Wong JC, Raman S. Surgical resectability of pancreatic adenocarci-noma: CTA. Abdom Imaging. 2010;35:471–480.
10. Etemad B, Whitcomb DC. Chronic pancreatitis: Diagnosis, classifi-cation, and new genetic developments. Gastroenterology. 2001;120: 682–707.
11. Tanaka S, Nakaizumia A, Ioka T, et al. Main pancreatic duct dilatation: A sign of high risk for pancreatic cancer. Jpn J Clin Oncol. 2002;68: 237–242.
12. Petrone MC, Arcidiacono PG, Testoni PA. Endoscopic ultrasonogra-phy for evaluating patients with recurrent pancreatitis. World J Gas-troenterol. 2008;14:1016–1022.
13. Mombelli A. Clinical parameters: Biological validity and clinical util-ity. Periodontol 2000. 2005;39:30–39.
14. Nathan DM, Kuenen J, Borg R, et al. Translating the A1C assay into estimated average glucose values. Diabetes Care. 2008;31:1473–1478.
15. Wali JA, Masters SL, Thomas HE. Linking metabolic abnormalities to apop-totic pathways in Beta cells in type 2 diabetes. Cells. 2013;2: 266–283.
16. Yin Y, Pastrana JL, Li X, et al. Inflammasomes: Sensors of metabol-ic stresses for vascular inflammation. Front Biosci. 2013;18:638–649.
17. Kornman KS, Crane A, Wang HY, et al. The interleukin-1 genotype as a severity factor in adult periodontal disease. J Clin Periodontol. 1997;24:72–77.


DOI10.17219/acem/65066
Copyright© 2018 by Wroclaw Medical University This is an article distributed under the terms of the Creative Commons Attribution Non-Commercial License(http://creativecommons.org/licenses/by-nc-nd/4.0/)
Address for correspondencePiotr CzempikE-mail: [email protected]
Funding sourcesNone declared
Conflict of interestNone declared
AcknowledgementsWe acknowledge the contribution made by depart-ments that regularly report to the Silesian Registry of ICUs. Special thanks should be given to profes-sors Hanna Misiołek and Dariusz Maciejewski, and to doctors Danuta Gierek, Agnieszka Misiewska-Kaczur and Andrzej Moczała.
Received on April 30, 2016Reviewed on June 19, 2016Accepted on September 06, 2016
AbstractBackground. Acute kidney injury (AKI) in critically ill patients has a deleterious impact on the prognosis, especially when renal replacement therapy (RRT) is required. This issue has not yet been investigated in the intensive care setting in Poland.
Objectives. The aim of the study was to evaluate the short-term outcomes of AKI-RRT subjects, based on a large registry population.
Material and methods. This observational multicenter study covered 100 demographic and clinical vari-ables from the Silesian Registry of ICUs regarding 15,030 adult patients hospitalized between October 2011 and December 2014. The study group comprised 1,234 AKI individuals (8.2%) who required RRT. The primary outcome was ICU mortality. The length of ICU stay (LOS) was considered the secondary outcome. Observed mortality was compared to that predicted by the Acute Physiology and Chronic Health Evaluation II (APACHE II).
Results. The overall mortality of the patients in the registry was 43.9%; it was higher in AKI-RRT subjects than in non-AKI-RRT counterparts (69.4% vs 41.0%; p < 0.01). The median APACHE II score among AKI-RRT subjects was 26 (IQR: 20–32) points. The observed mortality among AKI-RRT patients was significantly higher than predicted by APACHE II, particularly in individuals with lower baseline risk (overall difference: 14.4%). Six patient-related variables independently predicted ICU mortality with moderate accuracy (area under the receiver operating characteristic, AUROC = 0.675; 95% CI 0.65–0.70). The ICU LOS of AKI-RRT subjects was longer than that of the controls (9.8 [IQR: 4.0–19] vs 5.7 [IQR: 2.1–12] days; p < 0.001).
Conclusions. The mortality of critically ill AKI patients requiring RRT was significantly higher than in the overall ICU population. APACHE II scores underestimate mortality, especially in low-risk AKI-RRT subjects, and therefore should not be used in prognostic models in this cohort.
Key words: acute kidney injury, renal replacement therapy, intensive care unit, mortality
Original papers
Mortality of patients with acute kidney injury requiring renal replacement therapy
Piotr Czempik1,C,D, Daniel Cieśla2,B, Piotr Knapik3,F, Łukasz Krzych1,A,E
1 Department of Anaesthesiology and Intensive Care, School of Medicine in Katowice, Medical University of Silesia, Poland2 Department of Science, Education and New Medical Technologies, Silesian Centre for Heart Diseases, Zabrze, Poland3 Department of Cardiac Anesthesiology and Intensive Care, Silesian Centre for Heart Diseases, Zabrze, Poland
A – research concept and design; B – collection and/or assembly of data; C – data analysis and interpretation; D – writing the article; E – critical revision of the article; F – final approval of the article
Advances in Clinical and Experimental Medicine, ISSN 1899-5276 (print), ISSN 2451-2680 (online) Adv Clin Exp Med. 2018;27(3):327–333

P. Czempik, et al. Acute kidney injury in the intensive care unit328
Introduction
Acute kidney injury (AKI) is a common and clinically important problem in critically ill patients treated in in-tensive care units (ICUs) worldwide. It remains an inde-pendent risk factor of poor outcome, particularly when the patients require renal replacement therapy (RRT).
Nisula et al. found that almost 40% of all ICU pa-tients suffered from AKI, of whom 10% underwent RRT.1 In the Program to Improve Care in Acute Renal Disease (PICARD) trial, as many as 64% of AKI patients required RRT.2 The PICARD study also acknowledged that AKI-RRT ICU patients constitute a unique group of patients with multiple comorbidities, often developing multiple organ failure, reaching a hospital mortality of 37%.2 Regarding the latter issue, Ostermann et al. reported a prevalence of acute renal failure of 7.6% according to RIFLE criteria, with a mortality rate of 56.8%, which was 7 times higher than in subjects without AKI.3 Independent risk factors for mortality included advanced age, the Acute Physiol-ogy and Chronic Health Evaluation II (APACHE II) score, the number of failed organs, terminal illness, RIFLE stage, mechanical ventilation, urgent surgery, and nonsurgical reasons for admission. Interestingly, in their prospective multicenter study, Vesconi et al. reported that mortality in AKI-RRT patients was 54%, with no difference between 2 pre-specified doses of RRT.4 Finally, in the largest multina-tional, multicenter study of AKI patients in ICUs to date, the Beginning and Ending Supportive Therapy for the Kidney (BEST Kidney) trial, the prevalence of AKI-RRT was 5–6% and resulted in a mortality rate of 60%, which was much higher than predicted by the Simplified Acute Physiology Score III (SAPS III).5
Surprisingly, this issue has not yet been investigated extensively in critically ill patients treated in Polish ICUs. Therefore, on the basis of data from a large registry, we sought to analyze short-term outcomes of AKI-RRT pa-tients in a mixed ICU cohort.
Material and methods
The project was carried out as a registry observational multicenter study. Data regarding adult patients hospital-ized in multidisciplinary ICUs in the Silesian Voivodship, Poland, was derived from the web-based Silesian Registry of Intensive Care Units, which works under the auspices of the Silesian Chamber of the Polish Society of Anes-thesiology and Intensive Therapy. Although the registry is accessible to 37 ICUs covering 270 beds, it is voluntary and only about 50% of the units report regularly.
At the time of data extraction (December 31, 2014) there were 15,030 patients in the registry. All consecu-tive patients who required RRT during hospitalization in ICUs, independent of the type provided (intermittent or continuous) were screened. Exclusion criteria included
pre-existing end-stage chronic kidney disease (n = 186) and RRT initiated before admission to the ICU (n = 172).
The study group comprised 1,234 patients with AKI who required RRT (AKI-RRT) (8.2% of all the subjects in the registry), hospitalized between October 2011 and Decem-ber 2014. Acute kidney injury was defined as acute dete-rioration of kidney function requiring initiation of RRT, and corresponded to class 3 of AKI in the Acute Kidney Injury Network (AKIN) classification and class F (failure) in the RIFLE classification.6 Initiation of RRT was at the discretion of a treating physician and there was no protocol for the therapy initiation.
The available demographic and clinical data were re-trieved. The data included 100 variables organized into 24 categories related to the pre-admission period, the moment of admission and the ICU stay. The primary outcome was crude ICU mortality. Observed mortality was additionally compared to mortality predicted by APACHE II scores.7 The length of ICU stay (LOS) was considered the second-ary outcome.
All the data was anonymized. The study was approved by the Ethics Committee of the Medical University of Sile-sia and was performed in accordance with the ethical stan-dards laid down in the 1964 Declaration of Helsinki and its later amendments. Due to the non-interventional nature of the study, the Ethics Committee waived the requirement for informed consent.
The statistical analysis was performed using licensed MedCalc statistical software v. 16.1 (MedCalc Software, Ostend, Belgium). Continuous variables were presented as median and interquartile range (IQR, i.e., 25–75 pc), whereas categorical variables were presented as percent-ages. All variables were tested for normal distribution using the Shapiro-Wilk test. Between-group differences for continuous variables were assessed using the Kruskal-Wallis test; for categorical variables, the χ2 test was used.
The possible impact of the clinical and demographic pa-rameters on mortality was initially screened by bivariate analyses. Odds ratios (ORs) and 95% confidence intervals (CIs) were calculated. Variables with a p-value <0.05 were subjected to a multivariate analysis. The forward logistic re-gression method was applied. Logistic ORs with 95% CIs were subsequently estimated. The receiver operating characteristic (ROC) curve was implemented to analyze the value of clini-cal parameters in predicting mortality in AKI-RRT patients. A p-value <0.05 was considered statistically significant.
Results
Out of 15,030 patients, 1,234 (8.2%) developed AKI re-quiring RRT. The patient characteristics are shown in Ta-ble 1. The median age of AKI-RRT patients was 66 years (IQR: 56–75); 790 of them (64%) were male. On ICU ad-mission, their median APACHE II score was 26 points (IQR: 20–32).

Adv Clin Exp Med. 2018;27(3):327–333 329
The overall mortality of the patients in the registry was 43.9%. AKI-RRT subjects had statistically significantly higher crude ICU mortality (69.4%) than non-AKI-RRT
patients (41.0%) (p < 0.01). The observed mortality in all the registry patients was comparable to that predicted by APACHE II scores, whereas a significantly higher risk
Table 1. Pre-ICU admission clinical data
Variable All(n = 1234)
Non-survivors (n = 856)
Survivors(n = 378) OR (95% CI) p-value
Age [years] 66 (56–75) 67 (57–76) 64 (54–74) 1.01 (1.00–1.02) <0.001
Females, n (%) 444 (35.9) 303 (35.4) 141 (37.3) 0.92 (0.72–1.18) 0.52
Hospitalization prior to ICU [days] 2 (1–7) 2 (1–7) 2 (0–6) 1.01 (0.99–1.02) 0.049
Alcohol abuse, n (%) 132 (10.7) 82 (9.6) 50 (13.2) 0.69 (0.48–1.01) 0.057
Auto-aggressive systemic disease, n (%) 35 (2.8) 20 (2.3) 15 (3.9) 0.58 (0.29–1.14) 0.116
Malignancies, n (%) 59 (4.8) 39 (4.5) 20 (5.3) 0.85 (0.49–1.49) 0.577
CAD, n (%) 609 (49.3) 456 (53.3) 153 (40.5) 1.68 (1.31–2.14) <0.001
DM, n (%) 384 (31.1) 265 (30.9) 119 (31.5) 0.98 (0.75–1.27) 0.850
Cachexia (BMI < 18.5), n (%) 51 (4.1) 36 (4.2) 15 (3.9) 1.06 (0.57–1.96) 0.847
Arterial hypertension, n (%) 648 (52.5) 466 (54.4) 182 (48.1) 1.29 (1.01–1.64) 0.041
Previous stroke, n (%) 67 (5.4) 44 (5.1) 23 (6.1) 0.84 (0.50–1.41) 0.500
Solid organ transplantation, n (%) 8 (0.06) 7 (0.08) 1 (0.03) 3.11 (0.38–25.4) 0.289
CHF, n (%) 556 (45.1) 387 (45.2) 169 (44.7) 1.02 (0.80–1.30) 0.870
CKD, n (%) 384 (31.1) 269 (31.4) 115 (30.4) 1.05 (0.81–1.36) 0.726
CRF, n (%) 120 (9.7) 92 (10.7) 28 (7.4) 1.50 (0.97–2.34) 0.069
Chronic neurologic disease, n (%) 53 (4.3) 36 (4.2) 17 (4.5) 0.93 (0.52–1.68) 0.82
Atherosclerosis, n (%) 465 (37.7) 357 (41.7) 108 (28.6) 1.79 (1.38–2.32) <0.001
Obesity (BMI > 35), n (%) 83 (6.7) 50 (5.8) 33 (8.7) 0.65 (0.41–1.02) 0.06
CAD – coronary artery disease; DM – diabetes mellitus; BMI – body mass index (kg m–2); CHF – chronic heart failure; CKD – chronic kidney disease; CRF – chronic respiratory failure.
(a)
4 815
25
40
55
75
85
711
17
27
41
54
68
82
APACHE0-4
APACHE5-9
APACHE10-14
APACHE15-19
APACHE20-24
APACHE25-29
APACHE30-34
APACHE>34
Mor
talit
y
Predicted Observed
(b)
4 815
25
40
55
75
8599
50 51 55
70 6675 79
Mor
talit
y
Predicted Observed
APACHE0-4
APACHE5-9
APACHE10-14
APACHE15-19
APACHE20-24
APACHE25-29
APACHE30-34
APACHE>34
Fig. 1. Observed vs predicted mortality in all registry patients (a) and in subgroups: patients with acute kidney injury requiring renal replacement therapy (b); and patients without acute kidney injury (c) (based on Knaus et al.7)
(c)
48
15
25
40
55
75
85
49
15
25
38
52
67
83
Mor
talit
y
Predicted Observed
APACHE0-4
APACHE5-9
APACHE10-14
APACHE15-19
APACHE20-24
APACHE25-29
APACHE30-34
APACHE>34
predicted observedpredicted observed
predicted observed

P. Czempik, et al. Acute kidney injury in the intensive care unit330
of death was found among AKI-RRT patients than was predicted by the score, particularly in low-risk categories of patients (Fig. 1). The median ICU LOS was 12.8 days (IQR: 7.5–21.9). This was longer in AKI-RRT subjects than in the controls (9.8 days [IQR: 4.0–19] vs 5.7 days [IQR: 2.1–12], respectively]; p < 0.001).
By bivariate analyses we identified 31 potential risk factors for mortality in AKI-RRT patients. The non-survivors were significantly older than the survivors (67 years [IQR: 57–76] vs 64 years [IQR: 54–74]; p < 0.001). All between-group differences regarding demographics, parameters upon ICU admission and ICU stay are presented in Tables 2–5. The non-survivors scored higher on APACHE II (27 points [IQR: 21–32] vs 24 points [IQR: 18–30]; p < 0.001), SAPS III (66 [IQR: 45–84] vs 60 points [IQR: 44–76]; p = 0.003) and the simplified Therapeutic Intervention Scoring System 28 (TISS-28) during the first 24 h (39 points [IQR: 34–45] vs 38 points [IQR: 32–44]; p = 0.014). The Glasgow Coma Scale (GCS) score in the non-survivors was lower than in the survivors (6 points [IQR: 3–12] vs 10 points [IQR: 5–14]; p < 0.001).
ICU LOS was significantly shorter in the non-survivors than in the survivors (8 days [IQR: 2.8–17.6] vs 12.8 days [IQR: 7.5–21.9]; p < 0.001]. The 2 groups also differed sig-nificantly with regard to the duration of hospitalization prior to ICU admission, with the non-survivors being treated outside the ICU for longer periods of time (2 days [IQR: 1–7] vs 2 days [IQR: 0–6]; p = 0.049).
In a logistic regression model, only 6 variables were named as independent determinants of mortality in AKI-RRT patients (Fig. 2) with an area under the ROC curve (AUROC) of 0.675 (95% CI 0.65–0.70).
Discussion
On the basis of data from a large registry, we conducted an in-depth investigation of mortality among AKI patients requiring RRT in ICUs. Our study showed high hospital mortality (69.4%) among AKI-RRT patients, which was significantly higher than predicted by an acknowledged
Table 2. Primary ICU admission diagnosis
Variable Total (n = 1234)
Non-survivors (n = 856)
Survivors (n = 378) OR (95% CI) p-value
Severe sepsis, n (%) 232 (18.8) 157 (18.3) 75 (19.8) 0.91 (0.67–1.23) 0.53
Severe metabolic disorder, n (%) 123 (9.9) 90 (10.5) 33 (8.7) 1.23 (0.81–1.87) 0.34
Infection, n (%) 277 (22.4) 213 (24.9) 64 (16.9) 1.62 (1.19–2.22) 0.002
Circulatory insufficiency, n (%) 656 (53.2) 508 (59.3) 148 (39.1) 2.27 (1.77–2.91) <0.001
MODS, n (%) 323 (26.2) 245 (28.6) 78 (20.6) 1.54 (1.15–2.06) 0.003
SCA, n (%) 253 (20.5) 191 (22.3) 62 (16.4) 1.46 (1.07–2.01) 0.018
Acute respiratory failure, n (%) 815 (66.0) 603 (70.4) 212 (56.1) 1.87 (1.45–2.40) <0.001
Acute neurologic disease, n (%) 36 (2.9) 23 (2.7) 13 (3.4) 0.77 (0.39–1.55) 0.47
SAP, n (%) 56 (4.5) 45 (5.3) 11 (2.9) 1.85 (0.95–3.62) 0.07
Postsurgical status, n (%) 377 (30.6) 273 (31.9) 104 (27.5) 1.23 (0.94–1.61) 0.124
TBI, n (%) 17 (1.4) 10 (1.2) 7 (1.8) 0.63 (0.24–1.66) 0.35
Multiple trauma, n (%) 35 (2.8) 15 (1.7) 20 (5.3) 0.32 (0.16–0.63) 0.001
Shock, n (%) 492 (39.9) 386 (45.1) 106 (28.0) 2.11 (1.62–2.73) <0.001
Obtunded consciousness, n (%) 446 (36.1) 352 (41.1) 94 (24.9) 2.11 (1.61–2.76) <0.001
Acute on chronic respiratory failure, n (%) 63 (5.1) 44 (5.1) 19 (5.0) 1.02 (0.59–1.78) 0.93
Poisoning, n (%) 24 (1.9) 16 (1.9) 8 (2.1) 0.88 (0.37–2.08) 0.77
MODS – multiple organ dysfunction syndrome; SCA – sudden cardiac arrest; SAP – severe acute pancreatitis; TBI – traumatic brain injury.
Table 3. Direct ICU admission diagnosis
Variable Total (n = 1234)
Non-survivors (n = 856)
Survivors (n = 378) OR (95% CI) p-value
Circulatory insufficiency, n (%) 952 (77.3) 704 (82.2) 248 (65.6) 2.43 (1.84–3.20) <0.001
Renal failure, n (%) 691 (56.0) 480 (56.1) 211 (55.8) 1.01 (0.79–1.29) 0.93
Respiratory failure, n (%) 1087 (88.1) 775 (90.5) 312 (82.5) 2.02 (1.42–2.87) <0.001
Multiple trauma, n (%) 38 (3.1) 17 (2.0) 21 (5.6) 0.34 (0.18–0.66) 0.001
Metabolic disorders, n (%) 516 (41.8) 376 (43.9) 140 (37.0) 1.33 (1.04–1.71) 0.024
Obtunded consciousness, n (%) 695 (56.3) 507 (59.2) 188 (49.7) 1.47 (1.15–1.87) 0.002

Adv Clin Exp Med. 2018;27(3):327–333 331
Fig. 2. Independent predictors of mortality in patients with AKI requiring RRT
In boxes on the right-hand side: logistic ORs and 95% CIs.In brackets on the left-hand side: direct – direct reason for ICU admission; ICU – data covering entire ICU stay; primary – primary diagnosis upon ICU admission; ICU – intensive care unit; MODS – multiple organ dysfunction syndrome.
0.1 1 10 100OR
Catecholamine use (ICU)
Obtunded (ICU)
Cir. insuff. (direct)
Infection (primary)
MODS (primary)
Multiple trauma (primary)
4.47 (2.64–7.56)
2.00 (1.54–2.60)
1.78 (1.32–2.40)
1.65 (1.19–2.29)
1.42 (1.05–1.94)
0.20 (0.15–0.61)
Table 4. Clinical data upon ICU admission
Variable Total (n = 1234)
Non-survivors (n = 856)
Survivors (n = 378) OR (95% CI) p-value
GCS score 7 (3–13) 6 (3–12) 10 (5–14) 0.92 (0.89–0.95) <0.001
APACHE II* 26 (20–32) 27 (21–32) 24 (18–30) 1.04 (1.02–1.06) <0.001
SAPS III* 64 (45–81) 66 (45–84) 60 (44–76) 1.01 (1.00–1.02) 0.003
24 h TISS-28* 39 (33–45) 39 (34–45) 38 (32–44) 1.02 (1.01–1.04) 0.014
Catecholamine use, n (%) 718 (58.2) 536 (62.6) 182 (48.1) 1.80 (1.41–2.30) <0.001
Obtunded consciousness, n (%) 798 (64.7) 594 (69.4) 204 (53.9) 1.93 (1.51–2.48) <0.001
Endocavitary stimulation, n (%) 19 (1.5) 14 (1.6) 5 (1.3) 1.24 (0.44–3.47) 0.68
Mechanical ventilation, n (%) 882 (71.5) 648 (75.7) 234 (61.9) 1.92 (1.48–2.49) <0.001
Intubated, n (%) 887 (71.9) 654 (76.4) 233 (61.6) 2.01 (1.55–2.61) <0.001
GCS – Glasgow Coma Scale; APACHE II – Acute Physiology and Chronic Health Evaluation II; SAPS III – Simplified Acute Physiology Score III; TISS-28 –Therapeutic Intervention Scoring System 28; * calculations based on the worst values recorded during the first 24 h post ICU admission.
Table 5. Clinical data during ICU stay
Variable Total (n = 1234)
Non-survivors (n = 856)
Survivors (n = 378) OR (95% CI) p-value
Catecholamine use, n (%) 1158 (93.8) 832 (97.2) 326 (86.2) 5.53 (3.35–9.12) <0.001
Antibiotics, n (%) 1146 (92.9) 799 (93.3) 347 (91.8) 1.25 (0.79–1.97) 0.333
CRRT, n (%) 1092 (88.5) 764 (89.2) 328 (86.8) 1.27 (0.88–1.83) 0.209
IHD, n (%) 208 (16.9) 141 (16.5) 67 (17.7) 0.91 (0.66–1.26) 0.588
ECMO, n (%) 21 (1.7) 18 (2.1) 3 (0.8) 2.68 (0.79–9.17) 0.115
IABP, n (%) 79 (6.4) 67 (7.8) 12 (3.2) 2.59 (1.38–4.85) 0.003
Surgery in ICU, n (%) 275 (22.3) 202 (23.6) 73 (19.3) 1.29 (0.96–1.74) 0.096
Tracheostomy, n (%) 287 (23.3) 194 (22.7) 93 (24.6) 0.89 (0.68–1.19) 0.457
Invasive ventilation, n (%) 1070 (86.7) 761 (88.9) 309 (81.7) 1.79 (1.28–2.51) <0.001
Non-invasive ventilation, n (%) 81 (6.6) 33 (3.9) 48 (12.7) 0.28 (0.17–0.44) <0.001
CRRT – continuous renal replacement therapy; IHD – intermittent hemodialysis; ECMO – extracorporeal membrane oxygenation; IABP – intra-aortic balloon pump counter-pulsation.
catecholamine use (ICU)
obtunded (ICU)
cir. insuff. (direct)
infection (primary)
MODS (primary)
multiple trauma (primary)

P. Czempik, et al. Acute kidney injury in the intensive care unit332
method, i.e., APACHE II score (a difference of 14.4%). We also identified 5 risk factors for this compromised outcome.
Acute kidney injury is a worldwide problem that fre-quently occurs in the ICU setting. Irrespective of its nature, this clinical phenomenon often has a heterogeneous etiol-ogy and difficult, mainly supportive, management. First, it is strongly recommended to stratify all patients at risk of AKI according to their susceptibilities and exposures.6 However, when preventive and treatment strategies are ineffective in halting the progression of AKI, RRT should be initiated to avoid life-threatening changes in the flu-id, electrolyte, and acid-base balance. Additionally, AKI occurrence and its sequelae may be difficult to predict by simple statistical algorithms.
Our main results are in line with previous international findings in AKI ICU patients3,5; however, it should be borne in mind that RRT has in itself been confirmed to be an in-dependent risk factor for mortality.8 This may explain the discrepancy between the observed and predicted death rates previously revealed in the BEST Kidney trial.5 How-ever, Bagshaw et al. opposed this assumption, showing that RRT-treated patients were fundamentally different from non-treated patients across a spectrum of variables, causing a possible bias in observational data.9 Remarkably, it has been emphasized that mortality prognostication using APACHE II scores can depend on the population studied and may be associated with substantial errors.10
More compliant findings relate to possible predictors of death. In our study, the use of any catecholamines (vasopressors, inotropic agents) was associated with the greatest increase in mortality in AKI-RRT patients (i.e., 4.5 times). Independently, circulatory failure as a direct admission diagnosis increased the mortality risk almost 2-fold (OR = 1.78). On the one hand, the use of catechol-amines is demanded by a patient’s poor circulatory con-dition, revealed by hypotension and decreased heart function. On the other hand, its institution may lead to hemodynamic instability. Both scenarios promote re-nal hypoperfusion, which has been reported as a key risk factor for AKI.11 The use of vasopressors per se may also be associated with a poor prognosis in patients with severe AKI.12 Additionally, patients with hemodynamic instabil-ity often receive excessive amounts of fluid to optimize cardiac output, especially when there is no hemodynamic algorithm in place. As it happens, fluid overload has been confirmed to increase mortality, including in AKI-RRT patients.13,14
In our study, significant infection as a direct reason for admission was also associated with higher mortality in AKI-RRT patients (OR = 1.65). It is well-known that septic patients more frequently develop AKI, require RRT, have higher mortality and ICU LOS.15 About 40% of septic subjects develop AKI and 50% of all AKI may be related to sepsis.16 Moreover, sepsis has been found to be an in-dependent predictor of mortality in AKI-RRT patients
with traumatic brain injury.17 Interestingly, hemodynam-ic failure may exacerbate the deleterious effect of sepsis. The duration of mean arterial pressure below 65 mm Hg, the daily fluid balance, the number of days on vasopres-sors, and high doses of vasopressors were associated with worse outcomes.18
Interestingly, AKI-RRT patients hospitalized due to mul-tiple trauma had lower mortality. Traumatic patients are likely to have fewer factors predisposing to AKI in the pre-admission period, and hence their renal dysfunction is usually reversible. This is in agreement with data show-ing that AKI in this population is rare.19
Our study has several limitations. Firstly, the final pre-diction model had only moderate diagnostic accuracy. Taking into consideration the fact that we thoroughly in-vestigated a broad spectrum of variables, the most probable explanation for this is the heterogeneous pathophysiol-ogy of AKI in our ICU cohort. Secondly, we lacked some important clinical data that might have influenced the outcomes in the AKI-RRT population, including creati-nine concentration, fluid balance, the timing of RRT, or trending in RIFLE classifications. However, entering all these additional parameters into a large database would require enormous effort on the part of attending physi-cians and potentially discourage them from reporting. It must be borne in mind that reporting to this registry is entirely voluntary, and that the registry was not set up specifically to research AKI. Next, there were no accurate definitions for some conditions given, e.g., the broad term ‘shock’ without specifying what type of shock should be considered: cardiogenic, hemorrhagic, anaphylactic, etc. The observational nature of our project is an obvious limi-tation of all registries, as it may lead to a systematic error. Additionally, the registry covers only 1 region in Poland and is not representative of the whole country. Finally, only 40–50% of Silesian ICUs report to the registry on a regu-lar basis. However, the large number of patients analyzed may alleviate this drawback. Even when all of these short-comings are considered, the clinical evidence presented above should be of interest to an international audience, as it is the first in-depth insight into the problem of AKI-RRT in Polish ICUs.
Conclusions
Mortality among critically ill AKI patients requiring RRT is significantly higher than in the overall ICU popu-lation. APACHE II scores underestimate mortality, espe-cially in low-risk AKI-RRT subjects, and therefore should not be used in prognostic models in this cohort. Although it is difficult to accurately identify all the predictors of the compromised outcome in this unique population, the prognosis of patients with multiple trauma is the most favorable.

Adv Clin Exp Med. 2018;27(3):327–333 333
References
1. Nisula S, Kaukonen KM, Vaara ST, et al. Incidence, risk factors and 90-day mortality of patients with acute kidney injury in Finnish inten-sive care units: The FINNAKI study. Crit Care Med. 2013;39:420–428.
2. Mehta RL, Pascual MT, Soroko S, et al. Spectrum of acute renal fail-ure in the intensive care unit: The PICARD experience. Kidney Int. 2004;66:1613–1621.
3. Ostermann M, Chang RW. Acute kidney injury in the intensive care unit according to RIFLE. Crit Care Med. 2007;35:1837–1843.
4. Vesconi S, Cruz DN, Fumagalli R, et al. Delivered dose of renal replace-ment therapy and mortality in critically ill patients with acute kidney injury. Crit Care. 2009;13:R57.
5. Uchino S, Bellomo R, Morimatsu H, et al. The beginning and end-ing supportive therapy for the kidney (B.E.S.T. kidney) investigators. Continuous renal replacement therapy: A worldwide practice sur-vey. Intens Care Med. 2007;33:1563–1570.
6. Kidney Disease: Improving Global Outcomes (KDIGO) Acute Kidney Injury Work Group. KDIGO Clinical Practice Guideline for Acute Kid-ney Injury. Kidney Int Suppl. 2012;2:1–138.
7. Knaus WA, Draper EA, Wagner DP, Zimmerman JE. APACHE II: A sever-ity of disease classification system. Crit Care Med. 1985;13:818–829.
8. Elseviers MM, Lins RL, Van der Niepen P, et al. Renal replacement ther-apy is an independent risk factor for mortality in critically ill patients with acute kidney injury. Crit Care. 2010;14:R221.
9. Bagshaw SM, Uchino S, Kellum JA, et al. Association between renal replacement therapy in critically ill patients with severe acute kid-ney injury and mortality. J Crit Care. 2013;28:1011–1118.
10. Śmiechowicz J. Prognostic scoring systems for mortality in inten-sive care units: the APACHE model. Anaesthesiol Intensive Ther. 2015;47: 87–88.
11. Clec’h C, Razafimandimby D, Laouisset M, Chemouni F, Cohen Y. Incidence and outcome of contrast-associated acute kidney injury in a mixed medical-surgical ICU population: A retrospective study. BMC Nephrol. 2013;4:14–31.
12. Mehta RL, Kellum JA, Shah SV, et al. Acute kidney injury network. Report of an initiative to improve outcomes in acute kidney injury. Crit Care. 2007;11(2):R31.
13. Payen D, de Pont AC, Sakr Y, Spies C, Reinhart K, Vincent JL. A pos-itive fluid balance is associated with a worse outcome in patients with acute renal failure. Crit Care. 2008;12:R74.
14. Xu J, Shen B, Fang Y, et al. Postoperative fluid overload is a useful pre-dictor of the short-term outcome of renal replacement therapy for acute kidney injury after cardiac surgery. Medicine. 2015;94(33):e1360.
15. Piccinni P, Cruz DN, Gramaticopolo S, et al. Prospective multicenter study on epidemiology of acute kidney injury in the ICU: A critical care nephrology Italian collaborative effort (NEFROINT). Minerva Anestesiol. 2011;77:1072–1083.
16. Uppalapati A, Kellum JA. The critically ill patient with acute kidney injury. In: Kellum JA, Bellomo R, Ronco C, eds. Continuous Renal Replacement Therapy. 2nd ed. New York, NY: Oxford University Press; 2010 [e-book].
17. Lopes JA, Jorge S, Resina C, et al. Acute kidney injury in patients with sepsis: A contemporary analysis. Int J Infect Dis. 2009;13:176–181.
18. Wang X, Jiang L, Wen Y, et al. Risk factors for mortality in patients with septic acute kidney injury in intensive care units in Beijing, China: A multicenter prospective observational study. Biomed Res Int. 2014;2014:172620. doi:10.1155/2014/172620
19. Beitland S, Moen H, Os I. Acute kidney injury with renal replacement therapy in trauma patients. Acta Anaesth Scand. 2010;54:833–840.


DOI10.17219/acem/65484
Copyright© 2018 by Wroclaw Medical University This is an article distributed under the terms of the Creative Commons Attribution Non-Commercial License(http://creativecommons.org/licenses/by-nc-nd/4.0/)
Address for correspondenceMagdalena LachowskaE-mail: [email protected]
Funding sourcesNone declared
Conflict of interestNone declared
Received on March 28, 2016Reviewed on June 19, 2016Accepted on September 30, 2016
AbstractBackground. Air-conducted and skull-tap cervical vestibular evoked myogenic potentials (AC-cVEMP and Tap-cVEMP) have been shown to be very promising tools in clinical practice. They are noninvasive, easy to obtain and – importantly – they require little time and the cost of the instruments is low.
Objectives. The aim of this study was to evaluate the usefulness of the combined use of AC- and Tap-cVEMPs as a diagnostic tool for advanced assessment of vestibular schwannoma in determining tumor origin, and to investigate whether the results are helpful for a surgeon as an additional source of information about the tumor before surgery.
Material and methods. AC- and Tap-cVEMPs were acquired (with EMG-based biofeedback) from the sternocleidomastoid muscles (SCM) of 30 vestibular schwannoma patients just before surgery. The results were compared to the surgical information about nerve bundle involvement in the tumor and the size of the tumor obtained from magnetic resonance imaging (MRI).
Results. On the tumor side, abnormal corrected amplitude asymmetry ratios were detected in 73.33% of the patients, abnormalities in P1-latencies in 70% of the patients, and both in 90% of the patients. The cervi-cal vestibular evoked myogenic potential (cVEMP) results indicated the affected nerve division to be the inferior in 23.33% of the patients, the superior in 20% of the patients, and both in 46.67% of the patients. No cVEMP abnormalities were found in 10% of cases. The combined results of both AC- and Tap-cVEMP were significantly compatible with the surgical information about the tumor origin. The number of abnormalities was significantly correlated with the tumor size.
Conclusions. The information provided by the combined application of AC- and Tap-cVEMPs might be useful for a surgeon in presurgical planning, providing more detailed information about the tumor and the affected nerve division in the internal auditory canal. It is not a diagnostic replacement for MRI in vestibular schwan-noma patients; however, in our opinion, AC- and Tap-cVEMPs may serve as additional sources of information about the tumor before the surgery.
Key words: vestibular schwannoma, cerebellopontine angle tumor, sternocleidomastoid muscle, vestibular nerve, unilateral hearing loss
Original papers
Air-conducted and skull-tap cervical vestibular evoked myogenic potentials in determining nerve division involvement in vestibular schwannoma patients
Magdalena LachowskaA–F, Paulina GlinkaB,C, Kazimierz NiemczykE,F
Department of Otolaryngology, Medical University of Warsaw, Poland
A – research concept and design; B – collection and/or assembly of data; C – data analysis and interpretation; D – writing the article; E – critical revision of the article; F – final approval of the article
Advances in Clinical and Experimental Medicine, ISSN 1899-5276 (print), ISSN 2451-2680 (online) Adv Clin Exp Med. 2018;27(3):335–341

M. Lachowska, P. Glinka, K. Niemczyk. AC- and Tap-cVEMPs in vestibular schwannoma336
Introduction
Vestibular schwannoma is a benign tumor that grows slowly. It arises from the 8th cranial nerve complex, mainly from the vestibular part, pressing on the acoustic branch, but there are cases arising from the acoustic bundle as well. The 8th cranial nerve divides into individual nerves in the lateral part of the internal auditory canal: the cochlear nerve, the superior vestibular nerve and the inferior vestib-ular nerve.1–3 The cochlear bundle starts more anteriorly, and the vestibular ones more posteriorly. The facial nerve courses anteriorly, like the cochlear nerve, but remains superior to it. Going from the fundus of the internal audi-tory canal to the cerebellopontine angle, the nerves rotate altogether about 90°, so that the cochlear nerve enters the angle more posteriorly, but remains the most inferior.1
Due to the division of the vestibulocochlear nerve into individual nerves, the presence of a tumor can affect the function of these nerves depending on which nerve is com-pressed. This explains the unilateral tinnitus and senso-rineural hearing loss, which are the symptoms usually re-ported by vestibular schwannoma patients. As mentioned earlier, the tumor enlarges slowly; vestibular dysfunction is compensated at the brainstem level, which is why vertigo is not such a frequent complaint. In addition, facial nerve paresis or palsy may also be observed in some patients with facial nerve compression, as it shares the same trajectory as the cochlear nerve in the auditory canal. As the schwan-noma grows, it may press on adjacent nerves outside the internal auditory canal and brainstem structures. These are rare but potentially serious consequences, emphasizing the need for the use of sensitive diagnostic tools in patients suspected of potential vestibular schwannoma. In our de-partment, the general protocol is to follow a diagnostic procedure for vestibular or acoustic schwannoma using the standard tests with the complementary addition of air-conducted and skull-tap cervical vestibular evoked myo-genic potentials (AC-cVEMP and Tap-cVEMP).4
Cervical vestibular evoked myogenic potentials (cVEMPs) are short-latency electromyograms that can be elicited by acoustic, vibration or skull-tap stimuli. They measure the vestibulo-colic reflex recorded from the sternocleidomastoid muscle (SCM). In the literature on sensory organs, the saccule is presented as the one re-sponsible for AC-cVEMPs.5,6 Since most of the saccular innervation is carried by the inferior vestibular nerve, its function is essential in the generation of AC-cVEMPs.7–9 The utricle is presented as the main sensory origin of Tap-cVEMPs.10–12 Brantberg et al. reported that when the function of the superior vestibular nerve is affected, as in vestibular neuritis, skull-tap cVEMPs are more often abnormal than AC-cVEMPs.11 Tap-cVEMPs can still be recorded despite selective section of the inferior vestibular bundle.12
The rapid development of VEMP-related research and our own recent experience with AC- and Tap-cVEMPs
have led us to use cVEMPs as an integral part of our diag-nostic battery in various vestibular problems, particularly in patients with vestibular schwannoma.13 VEMPs are non-invasive and easy to obtain; also, they require little time and the cost of the instruments is low, which are important advantages in clinical practice nowadays.
Performing both AC-cVEMPs and Tap-cVEMPs may be helpful in identifying the functional integrity of the inferi-or and superior vestibular bundles of the 8th nerve. The aim of this study was to evaluate the usefulness of combined AC- and Tap-cVEMPs as a diagnostic tool for advanced assessment of vestibular schwannoma in determining the tumor origin. In this study we did not seek a diagnostic replacement test for MRIs in vestibular schwannoma pa-tients; rather, we investigated whether the information from the combined use of AC-cVEMPs and Tap-cVEMPs might be helpful for a surgeon as an additional source of information about the tumor before surgery.
Material and methods
The subjects and testing protocol
This prospective study involved 30 patients, 15 females (50%) and 15 men (50%), aged from 20 to 57 years (mean age 40.90 ±11.05 years) with diagnosed vestibular schwan-noma and with no other otological or neurological prob-lems. The recordings were obtained with each subject lying comfortably on a bed with the upper body elevated 30°. The subjects were instructed to relax and lift their heads during recordings to provide tonic background SCM activ-ity, without shoulder or abdominal muscle activity if pos-sible. At all times a researcher was present, directing the patient to decrease or increase the head lift to correct the contraction level of the muscle and to stay within the se-lected root mean square (RMS) EMG activity levels, using continuous pre- and poststimulus biofeedback EMG activ-ity monitoring for guidance as described in our previous study.13 All the patients were able to perform the head lift without any issues.
The AC- and Tap-cVEMP recordings were performed and analyzed 1–3 days before the surgical tumor removal. The same very experienced otosurgeon performed all the procedures. He was asked to carefully describe the tumor origin and the nerve bundles that were involved in the tu-mor, and to provide the researchers with this information after surgery. In order to avoid bias in his descriptions, the surgeon was blind to the VEMP results before the opera-tions; likewise, the VEMPs were analyzed before surgery, so the researchers were blind to the surgical information about the tumor origin.
The study was approved by the Medical University of Warsaw Institutional Ethics Committee Review Board and all the participating subjects signed informed consent forms.

Adv Clin Exp Med. 2018;27(3):335–341 337
Stimulus and signal acquisition characteristics
All the cVEMPs were acquired using a SmartEP, a fully computerized 2-channel evoked potential system (Intel-ligent Hearing Systems Corp., Miami, USA). Surface elec-trodes were placed on the skin above the SCM. The in-verting (−) electrodes were positioned bilaterally on the sternum and the SCM junction, and the non-inverting (+) ones were placed bilaterally on the midpoint of the SCM between the mastoid and the sternum. The ground elec-trode was placed on the upper part of the sternum. All electrode impedances were 3 kΩ or less.
In this study, 2 types of stimuli were used. The acous-tic stimuli consisted of a single 500 Hz frequency exact Blackman window tone burst of 5 ms duration, presented bilaterally. The acoustic stimuli were delivered via ER3a insert earphones (Etymotic Research Inc., Elk Grove Vil-lage, USA) at 100 dB nHL. For the skull-tapping recordings, we used an automated skull-tapping device (Intelligent Hearing Systems Corp., Miami, USA) that was stabilized on the patient’s skull with a headband that ensured a fixed distance and contact pressure. In addition, an EMG stan-dardization method integrated into the acquisition soft-ware was used to further minimize the variability of the cVEMP recordings, as described in our previous study.13 The skull tapper was placed on the skull at 3 locations: at the midline of the forehead for bilateral symmetrical stimulation and signal acquisition, and behind the left and then the right ears on the mastoid process.
Both the acoustic and skull-tapping evoked recordings were acquired using the head-lifting method so that the SCMs were bilaterally contracted as described above. The acquisition parameters were as follows: a sampling period of 400 ms with 5 K amplification of the signal, 6 dB per octave band pass filter, 30 Hz high-pass cutoff and 1500 Hz low-pass cutoff. The AC-cVEMPs were collected by averaging 3 sets of 64 sweeps and the Tap-cVEMPs were acquired by averaging 3 sets of 32 sweeps. Fewer sweeps were used to average the Tap-cVEMPs due to the gener-ally larger amplitude of the responses generated by skull tapping compared to the auditory counterpart. For both types of recordings a stimulation rate of 3.1/s was used.
VEMP data analysis
The recorded electrophysiological responses were then normalized according to the prestimulus (base) RMS EMG calculations.14–17 The resulting VEMP waveforms were an-alyzed for a response presence for each type of stimulation (acoustic and tapping) in the time domain. The first dis-tinctive positive peak was identified as P1 (or p13), followed by a distinctive negative trough N1 (or n23). The latencies and amplitudes were measured. Normalized values were used to assess the corrected asymmetry ratios (corrAR) between the left and right side measurements.17 Responses
from the ear with vestibular schwannoma that were not detected were assigned an amplitude of 0, which means the corrected amplitude ratio in those cases was 100%. A corrAR >34% was considered abnormal. Latencies greater than the mean +2SD of 13.31 ms (AC-cVEMP) and 10.77 ms (Tap-cVEMP) were considered abnormal (based upon data collected from 22 healthy ears in subjects without any oto-logical or neurological problems as controls).
Results
Vestibular schwannoma was diagnosed on 1 side in all the patients, confirmed by MRI. It was found in 12 (40%) patients on the right side and in 18 (60%) patients on the left side. In maximum diameter, the tumor size ranged from 4 to 37 mm, with the average of 13.80 mm (±8.05 mm) and a median of 13.00 mm.
In all healthy ears (those without the tumor), cVEMPs were preserved. In each patient, the healthy side was used as a reference. On the tumor side, in AC- and Tap-cVEMP responses, abnormalities of corrected amplitude asymme-try ratios (corrAR ≥ 35%) were detected in 22 out of 30 pa-tients (73.33%), abnormalities in P1 latencies in 21 out of 30 patients (70%), and either corrAR and/or P1 latency in 27 out of 30 patients (90%).18
Table 1 shows AC- and Tap-cVEMP results for the ves-tibular schwannoma side and the healthy ear for all stimu-lation types. It includes the mean and median values for P1 corrected amplitudes, corrected amplitude asymmetry ratios and P1 latencies. The differences between the tumor side and the healthy side proved to be significant.
Figure 1 shows an example of a set of recordings from 1 vestibular schwannoma patient (tumor size 10 × 14 × 8 mm). The AC- and Tap-cVEMP averaged waveforms are shown in separate panels. In this patient, the schwannoma was diagnosed on the left side. Visual inspection of the presented waveforms, P1 latency mea-surements and amplitude calculations revealed the tumor to be located on the superior bundle of the left vestibular nerve. This AC- and Tap-cVEMP result was then con-firmed by the surgeon describing the tumor located on that nerve bundle.
Like in the previous example, Fig. 2 shows waveforms recorded from another vestibular schwannoma patient, but this time the tumor was located on the right side and was larger (21 × 24 × 32 mm), involving both vestibular nerve divisions. This tumor location established by the AC- and Tap-cVEMP results was then confirmed by the surgeon.
The combined AC- and Tap-cVEMPs results indicated the affected nerve bundle to be the inferior one in 23.33% of the patients, the superior one in 20% of the patients, and both bundles in 46.67% of the patients. No cVEMP abnormalities were found in 10% of the patients (Table 2). The surgical information revealed the following tumor locations: inferior vestibular nerve in 40% of the patients,

M. Lachowska, P. Glinka, K. Niemczyk. AC- and Tap-cVEMPs in vestibular schwannoma338
Fig. 1. An example of a set of recordings obtained from 1 vestibular schwannoma patient (tumor size 10 × 14 × 8 mm, located on the left side, superior bundle of the vestibular nerve)
AC-cVEMP and Tap-cVEMP averaged waveforms are shown in separate panels. The 1st row in each panel shows responses from the right sternocleidomastoid muscle (SCM); the 2nd shows responses from the left SCM to ipsilateral stimulation (AC stimulus delivered to the ear via inserted earphone and tap stimulus delivered to the mastoid using a skull tapper); the bottom 2 rows show waveforms recorded from the right and left SCM (3rd and 4th rows from the top, respectively) to bilateral acoustic stimulation (AC-cVEMP) and to forehead tapping (Tap-cVEMP); in each recording the P1 wave is marked.
Table 1. Means (±SD) and medians for peak-to-peak amplitudes, corrected amplitude asymmetry ratios (corrAR) of AC- and Tap-cVEMPs in the tumor sites and the healthy ears of vestibular schwannoma patients (n = 30)
Mean ±SD Median Mean ±SD Median
both ears stimulated at the same time One ear stimulated (ipsilateral to the recording site)
AC- -cVEMP
corrected amplitudes
healthy site 18.18 10.65 15.66 22.17 12.42 21.97
tumor site 6.93 7.24 5.27 10.32 10.79 7.06
corrAR (%) 53.64 35.90 41.58 49.87 38.70 31.35
significance (p-value) 0.0000* 0.0003*
latencies
healthy site 13.57 0.70 13.60 13.70 0.73 13.80
tumor site 13.95 1.50 13.70 13.94 0.85 13.80
latency asymmetry (ms) 0.88 1.25 0.40 0.79 0.69 0.60
significance (p-value) 0.0854 0.0332*
forehead tapping One mastoid tapping (ipsilateral to the recording site)
Tap- -cVEMP
corrected amplitudes
healthy site 19.42 8.44 18.50 16.48 10.05 12.59
tumor site 14.73 9.97 14.11 12.20 10.25 10.83
corrAR (%) 30.47 24.63 23.63 27.02 29.31 17.04
significance (p-value) 0.0196* 0.0300*
latencies
healthy site 12.41 2.09 11.90 13.29 2.81 12.80
tumor site 14.23 3.20 13.20 14.58 3.46 14.40
latency asymmetry (ms) 1.90 1.93 1.20 1.96 2.27 1.40
significance (p-value) 0.0309* 0.0031*
* Significant differences (p < 0.05) between the tumor site and healthy site (Wilcoxon signed-rank test).
Table 2. Compatibility between the surgical information and AC- and Tap-cVEMP results
AC- and Tap-cVEMP result Surgical information Compatibility between the results(surgical and VEMP)
affected nerve number of patients affected nerve number of patients statistical significance
inferior 7 inferior 12
p = 0.0002superior 6 superior 3
both 14 both 12
normal result 3 cochlear 3
The p-value represents the level of significance.
180.00 uV
100 ms 100 ms
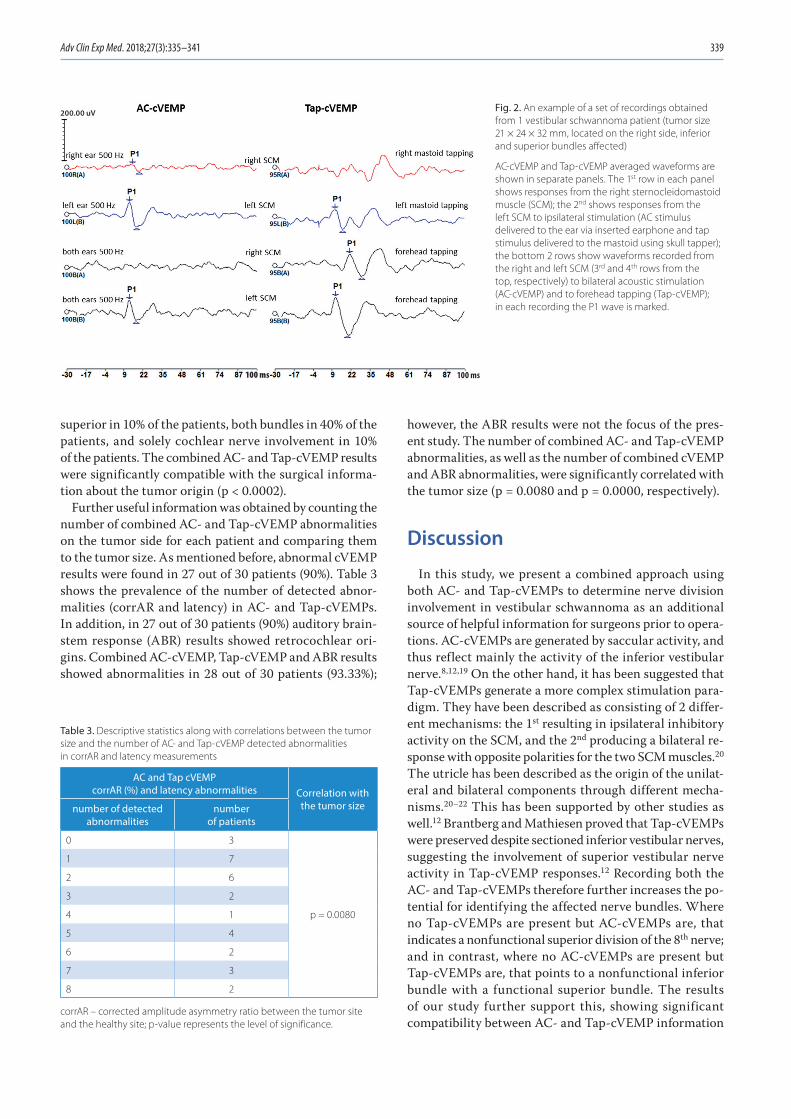
Adv Clin Exp Med. 2018;27(3):335–341 339
superior in 10% of the patients, both bundles in 40% of the patients, and solely cochlear nerve involvement in 10% of the patients. The combined AC- and Tap-cVEMP results were significantly compatible with the surgical informa-tion about the tumor origin (p < 0.0002).
Further useful information was obtained by counting the number of combined AC- and Tap-cVEMP abnormalities on the tumor side for each patient and comparing them to the tumor size. As mentioned before, abnormal cVEMP results were found in 27 out of 30 patients (90%). Table 3 shows the prevalence of the number of detected abnor-malities (corrAR and latency) in AC- and Tap-cVEMPs. In addition, in 27 out of 30 patients (90%) auditory brain-stem response (ABR) results showed retrocochlear ori-gins. Combined AC-cVEMP, Tap-cVEMP and ABR results showed abnormalities in 28 out of 30 patients (93.33%);
however, the ABR results were not the focus of the pres-ent study. The number of combined AC- and Tap-cVEMP abnormalities, as well as the number of combined cVEMP and ABR abnormalities, were significantly correlated with the tumor size (p = 0.0080 and p = 0.0000, respectively).
Discussion
In this study, we present a combined approach using both AC- and Tap-cVEMPs to determine nerve division involvement in vestibular schwannoma as an additional source of helpful information for surgeons prior to opera-tions. AC-cVEMPs are generated by saccular activity, and thus reflect mainly the activity of the inferior vestibular nerve.8,12,19 On the other hand, it has been suggested that Tap-cVEMPs generate a more complex stimulation para-digm. They have been described as consisting of 2 differ-ent mechanisms: the 1st resulting in ipsilateral inhibitory activity on the SCM, and the 2nd producing a bilateral re-sponse with opposite polarities for the two SCM muscles.20 The utricle has been described as the origin of the unilat-eral and bilateral components through different mecha-nisms.20–22 This has been supported by other studies as well.12 Brantberg and Mathiesen proved that Tap-cVEMPs were preserved despite sectioned inferior vestibular nerves, suggesting the involvement of superior vestibular nerve activity in Tap-cVEMP responses.12 Recording both the AC- and Tap-cVEMPs therefore further increases the po-tential for identifying the affected nerve bundles. Where no Tap-cVEMPs are present but AC-cVEMPs are, that indicates a nonfunctional superior division of the 8th nerve; and in contrast, where no AC-cVEMPs are present but Tap-cVEMPs are, that points to a nonfunctional inferior bundle with a functional superior bundle. The results of our study further support this, showing significant compatibility between AC- and Tap-cVEMP information
Fig. 2. An example of a set of recordings obtained from 1 vestibular schwannoma patient (tumor size 21 × 24 × 32 mm, located on the right side, inferior and superior bundles affected)
AC-cVEMP and Tap-cVEMP averaged waveforms are shown in separate panels. The 1st row in each panel shows responses from the right sternocleidomastoid muscle (SCM); the 2nd shows responses from the left SCM to ipsilateral stimulation (AC stimulus delivered to the ear via inserted earphone and tap stimulus delivered to the mastoid using skull tapper); the bottom 2 rows show waveforms recorded from the right and left SCM (3rd and 4th rows from the top, respectively) to bilateral acoustic stimulation (AC-cVEMP) and to forehead tapping (Tap-cVEMP); in each recording the P1 wave is marked.
Table 3. Descriptive statistics along with correlations between the tumor size and the number of AC- and Tap-cVEMP detected abnormalities in corrAR and latency measurements
AC and Tap cVEMPcorrAR (%) and latency abnormalities Correlation with
the tumor sizenumber of detected abnormalities
number of patients
0 3
p = 0.0080
1 7
2 6
3 2
4 1
5 4
6 2
7 3
8 2
corrAR – corrected amplitude asymmetry ratio between the tumor site and the healthy site; p-value represents the level of significance.
200.00 uV
100 ms 100 ms

M. Lachowska, P. Glinka, K. Niemczyk. AC- and Tap-cVEMPs in vestibular schwannoma340
about the affected nerve bundle and surgical information about the tumor origin.
MRI scans provide information on the presence of a tu-mor, its location in the internal auditory canal and its size. This information is essential for the diagnosis and for a surgeon; however, it does not say which nerve divisions are involved in the pathological process. In our study, the combined information from AC- and Tap-cVEMP results was significantly correlated with the surgical findings about the tumor origin. The cVEMP results were found to be normal in 3 patients, but in 1 of those patients, ABRs showed retrocochlear disorders (in the remaining 2, the ABRs were normal). This means that in our study, the elec-trophysiological findings of cVEMPs alone and combined cVEMPs and ABRs were helpful in identifying the tumor origin in 90% and 93.33% of the patients, respectively. As mentioned before, in both cases, this information was significantly correlated with the surgical findings. This shows that AC- and Tap-cVEMPs assessment is essential in vestibular schwannoma, and can provide the surgeon with helpful additional information about the probable involvement of nerve bundles in the tumor. This informa-tion, combined with ABR results and MRIs, can be helpful in presurgical planning and patient counseling. The elec-trophysiological tests (cVEMPs and ABRs) show how much residual vestibular and cochlear function is present prior to surgery, providing the surgeon with information that is very useful in decisions about additional intraoperative monitoring of hearing. In our department, intraoperative monitoring of hearing is routinely used in every vestibular schwannoma surgery performed via the middle fossa ap-proach and in many other ear operations; however, hearing is not routinely monitored intraoperatively in most other oto- or neurosurgical facilities. Electrophysiological results might be useful when counseling patients and inform-ing them of realistic possible outcomes of surgery, such as the chances of preserving hearing, the risk of hearing loss during surgery, or if a patient is likely to develop vertigo after the tumor removal and therefore require vestibular rehabilitation. However, postoperative management was not analyzed in this study.
The results presented in this study show a good correla-tion between the tumor size and the number of abnormali-ties detected in AC- and Tap-cVEMPs, considering corrAR and the latencies of the responses. Those results further support the findings of Lin et al. and Taylor et al., who also found significant correlations between their tests results and tumor size.23,24 However, they used ocular vestibular evoked myogenic potentials (oVEMPs) to investigate the superior vestibular nerve division instead of Tap-cVEMPs. In our department, cVEMPs are used due to their longer history and more extensive research, but recently we have also been investigating the usefulness of oVEMPs. Although recent research on oVEMPs has been encouraging in terms of clinical practice, the technique of this vestibular testing method still needs to be refined to be used as a routine
clinical test. Cervical VEMPs are quite easy to obtain and can be efficiently used with quantification methods for ongoing muscle activity monitoring. With constant EMG monitoring, the amplitudes can easily be normalized ac-cording to the prestimulus (base) RMS calculations, as in this study. In the near future, we plan to include oVEMPs in our routine diagnostic tests in patients with vestibular problems, ensuring that the adaptation of muscle activity quantification methods we use is properly carried out.14–17
This article describes our VEMP findings in 30 vestibular schwannoma patients from a still growing data collection which we plan to present in the near future. We believe that further investigations in vestibular schwannoma patients are needed to confirm the clinical utility of AC-cVEMPs and Tap-cVEMPs as presurgical tests providing additional information to a surgeon about the nerve bundles involved in the pathological process. Currently, we are collecting ocular VEMP data (using both air-conducted and bone-conducted stimuli) from a growing patient population. In the near future, when sufficient patient population data has been collected, we plan to analyze different combina-tions of AC-cVEMP, Tap-cVEMP and oVEMP to evaluate the clinical usefulness of different testing protocols. Our attempt to establish the most clinically useful VEMP test-ing protocol will be presented in a subsequent paper.
In conclusion, the information provided by the com-bined application of AC- and Tap-cVEMPs can be useful to surgeons in presurgical planning, providing detailed information about the tumor and the affected nerve divi-sion in the internal auditory canal. MRI scans provide information on the presence of a tumor, its location in the internal auditory canal and its size, which is essential for the diagnosis and for the operation, but it does not provide information about the nerve divisions involved in the path-ological process. In our opinion, AC- and Tap-cVEMPs may serve as additional sources of information about the tumor before surgery.
References1. Silverstein H. Cochlear and vestibular gross and histologic anatomy
(as seen from postauricular approach). Otolaryngol Head Neck Surg. 1984;92(2):207–211.
2. Schefter RP, Harner SG. Histologic study of the vestibulocochlear nerve. Ann Otol Rhinol Laryngol. 1986;95(2 Pt 1):146–150.
3. Rubinstein D, Sandberg EJ, Cajade-Law AG. Anatomy of the facial and vestibulocochlear nerves in the internal auditory canal. AJNR Am J Neuroradiol. 1996;17(6):1099–1105.
4. Sterkers O, Martin C, Arnold W. Vestibular schwannoma. In: Anniko M, Bernal-Sprekelsen M, Bonkowsky V, Bradley P, Iurato S, eds. Otorhi-nolaryngology, Head and Neck Surgery – European Manual of Medi-cine. Leipzig: Springer Verlag; 2010:92–97.
5. Young ED, Fernandez C, Goldberg JM. Responses of squirrel mon-key vestibular neurons to audio-frequency sound and head vibra-tion. Acta Otolaryngol. 1977;84(5–6);352–360.
6. Murofushi T, Curthoys IS. Physiological and anatomical study of click-sensitive primary vestibular afferents in the guinea pig. Acta Otolar-yngol. 1997;117(1):66–72.
7. Townsend GL, Cody DT. The averaged inion response evoked by acoustic stimulation: Its relation to the saccule. Ann Otol Rhinol Laryngol. 1971;80(1):121–131.

Adv Clin Exp Med. 2018;27(3):335–341 341
8. Murofushi T, Halmagyi GM, Yavor RA, Colebatch JG. Absent vestib-ular evoked myogenic potentials in vestibular neurolabyrinthitis. An indicator of inferior vestibular nerve involvement? Arch Otolar-yngol Head Neck Surg. 1996;122(8):845–848.
9. Murofushi T, Matsuzaki M, Mizuno M. Vestibular evoked myogenic potentials in patients with acoustic neuromas. Arch Otolaryngol Head Neck Surg. 1998;124(5):509–512.
10. Brantberg K, Tribukait A. Vestibular evoked myogenic potentials in response to laterally directed skull taps. J Vestib Res. 2002;12(1):35–45.
11. Brantberg K, Tribukait A, Fransson PA. Vestibular evoked myogenic potentials in response to skull taps for patients with vestibular neu-ritis. J Vestib Res. 2003;13(2–3):121–130.
12. Brantberg K, Mathiesen T. Preservation of tap vestibular evoked myo-genic potentials despite resection of the inferior vestibular nerve. J Vestib Res. 2004;14(4):347–351.
13. Yavuz E, Lachowska M, Pierchała K, Morawski K, Niemczyk K, Delga-do RE. Clinical use of skull tap vestibular evoked myogenic poten-tials for the diagnoses of the cerebellopontine angle tumor patients. BioMed Res Int. 2014;2014:135457. doi:10.1155/2014/135457
14. Colebatch JG. Properties of rectified averaging of an evoked-type signal: Theory and application to the vestibular-evoked myogenic potential. Exp Brain Res. 2009;199(2):167–176.
15. McCaslin DL, Jacobson GP, Hatton K, Fowler AP, DeLong AP. The effects of amplitude normalization and EMG targets on cVEMP inte-raural amplitude asymmetry. Ear Hear. 2013;34(4):482–490.
16. van Tilburg MJ, Herrmann BS, Guinan JJ Jr, Rauch SD. Normalization reduces intersubject variability in cervical vestibular evoked myo-genic potentials. Otol Neurotol. 2014;35(8):222–227.
17. Papathanasiou ES, Murofushi T, Akin FW, Colebatch JG. International guidelines for the clinical application of cervical vestibular evoked myogenic potentials: An expert consensus report. Clin Neurophysiol. 2014;125(4):658–666.
18. Welgampola MS, Colebatch JG. Vestibulocollic reflexes: Normal values and the effect of age. Clin Neurophysiol. 2001;112(11):1971–1979.
19. Tsutsumi T, Tsunoda A, Noguchi Y, Komatsuzaki A. Prediction of the nerves of origin of vestibular schwannomas with vestibular evoked myogenic potentials. Am J Otol. 2000;21(5):712–715.
20. Brantberg K, Westin M, Löfqvist L, Verrecchia L, Tribukait A. Vestibu-lar evoked myogenic potentials in response to lateral skull taps are dependent on two different mechanisms. Clin Neurophysiol. 2009; 120(5):974–979.
21. Kushiro K, Zakir M, Ogawa Y, Sato H, Uchino Y. Saccular and utricu-lar inputs to sternocleidomastoid motoneurons of decerebrate cats. Exp Brain Res. 1999;126(3):410–416.
22. Todd NP, Rosengren SM, Colebatch JG. A source analysis of short-latency vestibular evoked potentials produced by air- and bone-con-ducted sound. Clin Neurophysiol. 2008;119(8):1881–1894.
23. Lin KL, Chen CM, Wang SJ, Young YH. Correlating vestibular schwan-noma size with vestibular-evoked myogenic potential results. Ear Hear. 2014;35(5):571–576.
24. Taylor RL, Kong J, Flanagan S, et al. Prevalence of vestibular dys-function in patients with vestibular schwannoma using video head-impulses and vestibular-evoked potentials. J Neurol. 2015;262(5): 1228–1237.


DOI10.17219/acem/65854
Copyright© 2018 by Wroclaw Medical University This is an article distributed under the terms of the Creative Commons Attribution Non-Commercial License(http://creativecommons.org/licenses/by-nc-nd/4.0/)
Address for correspondenceElżbieta Pac-KożuchowskaE-mail: [email protected]
Funding sourcesNone declared
Conflict of interestNone declared
Received on August 20, 2016Reviewed on September 2, 2016Accepted on October 17, 2016
AbstractBackground. Atherosclerosis may originate during the fetal period, therefore it is reasonable to identify early risk markers of lifestyle diseases.
Objectives. The aim of the study was to determine the relationship between fetal and maternal factors, and the neonatal cord blood lipid profile in term newborns.
Material and methods. In the study group, there were 206 healthy Polish newborns. Newborn character-istics included sex, gestational age at birth, Apgar score, and anthropometric data (weight and length at birth, neonatal ponderal index, head, chest and abdominal circumferences, placenta weight, and placental-fetal weight ratio). Cord blood samples were collected for total cholesterol (TC), high-density lipoprotein (HDL), low-density lipoprotein (LDL), and triglycerides (TG). Information regarding selected maternal factors was collected.
Results. The cord blood concentration of TC (p = 0.0007), HDL (p = 0.001) and LDL (p = 0.003) was higher in girls than in boys. A significant positive correlation was found between TG and gestational age (p < 0.0001; r = 0.29). Significant negative correlations between maternal preconception BMI and TC (p = 0.03; r = −0.14), HDL (p = 0.04; r = −0.13) and LDL (p = 0.02; r = −0.15) were observed.
Conclusions. In our study group, the influence of the newborns’ gender, gestational age and mothers’ preconception BMI on lipid concentration was observed. Further investigations are needed to determine markers in cord blood that may predict future metabolic disorders.
Key words: cord blood, lipids, placenta, atherosclerosis, newborns
Original papers
Cord blood lipid profile in healthy newborns: A prospective single-center study
Elżbieta Pac-KożuchowskaA–F, Anna Rakuś-KwiatoszC–F, Paulina KrawiecC–F
Department of Paediatrics and Gastroenterology, Medical University of Lublin, Poland
A – research concept and design; B – collection and/or assembly of data; C – data analysis and interpretation; D – writing the article; E – critical revision of the article; F – final approval of the article
Advances in Clinical and Experimental Medicine, ISSN 1899-5276 (print), ISSN 2451-2680 (online) Adv Clin Exp Med. 2018;27(3):343–349

E. Pac-Kożuchowska, A. Rakuś-Kwiatosz, P. Krawiec. Cord blood lipids in newborns344
Introduction
Cardiovascular diseases, mainly ischemic heart disease and stroke, are the leading causes of death in the world.1 The genetic and lifestyle risk factors of these diseases are well known, and include hypercholesterolemia, hyperten-sion, smoking, obesity, and inadequate physical activity. As the prevalence of these factors (particularly hyperlip-idemia and obesity) has been increasing in the pediatric population, research on the earliest determinants of these disorders has been proposed.2 There are studies suggest-ing that cardiovascular diseases originate in childhood, and it has even been determined that atherosclerosis may originate during the fetal period.3
In the 1980s, English physician and epidemiologist Da-vid Barker of the University of Southampton formulated a hypothesis stating that the intrauterine environment influences patterns of physiological processes in the fetus that, in certain conditions, may influence the presence of medical disorders in future life. The assumption seems to be in line with the fetal programming theory, accord-ing to which an unfavorable setting in the womb causes lifelong alterations in the structure and function of the fetal tissues. Furthermore, these programmed changes may result in an earlier manifestation of metabolic disorders. Barker described the connection between birth weight and death rates from lifestyle diseases. He noticed a strict correlation between low birth weights and high morbidity and mortality rates from cardiovascular diseases in certain regions of England and Wales.4 When analyzing data from Hertfordshire, concerning the birth weight of all newborns from 1911 and their development through the infancy pe-riod, Barker noted that, over a period of 60 years, the people whose birth weight was higher had lower mortality rates from cardiovascular disease and stroke.5
Many studies have confirmed the importance of proper intrauterine development, and all the factors that affect it, for future life. Therefore, it is reasonable to search for the first risk markers of lifestyle diseases as early as the neo-natal or even fetal period. The aim of the present study was to examine possible relationships among several fetal and maternal factors, and the neonatal cord blood lipid profile in term newborns in order to detect any possible characteristics that may predispose neonates to a higher risk of developing cardiovascular diseases in the future.
Material and methods
This prospective study was conducted in the Depart-ment of Neonatology at Independent Public Voivodeship Specialist Hospital in Chełm. The study group consisted of healthy newborns from singleton pregnancies that were free of complications, born at term (between 38 and 42 weeks), with 5-minute Apgar scores ≥8 points. Record-ed newborn characteristics included sex, gestational age
at birth, Apgar score at the 1st, 5th and 10th minute after birth, as well as anthropometric data – birth weight, birth length, and head, chest and abdominal circumferences. Newborn length was measured on a length board to the nearest centimeter, and the circumferences were assessed with a non-stretchable tape measure to the nearest half centimeter. The neonatal ponderal index (NPI) was com-puted according to the following formula:
NPI [g/m3] = (weight [g]/length3 [cm3]) × 100.
After the delivery, placenta weight was measured and placental [g] to fetal [g] weight ratio was calculated. The birth weight and placental weight were measured with an electronic scale to the nearest 5 grams.
In all the newborns, umbilical cord blood samples were collected for total cholesterol (TC), high-density lipoprotein (HDL), low-density lipoprotein (LDL) and triglycerides (TG). Serum lipid concentrations were assessed using the en-zymatic spectrophotometric method (Advia Hematology System, Siemens AG, Munich, Germany). Data regarding the mother’s age, parity, weight and height before pregnan-cy, antenatal events or complications, as well as maternal health problems, education and family history were col-lected from medical records. The mothers’ preconception body mass index (BMI) was calculated according to the following formula:
BMI [kg/m2] = body weight [kg]/height2 [m2].
Maternal weight gain during pregnancy was computed by subtracting from the mother’s weight at delivery her weight before the pregnancy.
The statistical analysis was carried out using STATIS-TICA v. 10 software (StatSoft, Tulsa, USA). The results are presented as means ±SD. Comparisons between 2 groups were performed using the Mann-Whitney U test. The Kruskal-Wallis H test was used to check differences among more than 2 means. Spearman’s rank correlation coefficient was used for the analysis of correlations be-tween parameters. The results were considered statistically significant at p < 0.05.
Written informed consent was obtained from the moth-ers before enrollment in the study. The study was approved by the Bioethics Committee at the Medical University of Lublin (KE-0254/74/2009).
Results
A total of 206 newborns, including 115 boys (56%) and 91 girls (44%), were recruited for the study. Out of them, 91 newborns (44%) were born to primipara mothers, 69 (33%) were from second parities, and 46 (23%) came from ≥3 parities. The majority of the children (128; 62%) were born by spontaneous vaginal delivery, while 78 (38%) were born by elective cesarean section. The characteristics of the newborns and mothers are presented in Table 1.

Adv Clin Exp Med. 2018;27(3):343–349 345
There were significant differences between females and males in birth weight and length, as well as in head and chest circumferences and placental-fetal ratio. Maternal factors did not differ significantly between boys and girls.
The cord blood concentration of TC (p = 0.0007), HDL (p = 0.001) and LDL (p = 0.003) was found to be higher in girls than in boys. The concentration of TG was also higher in girls; however, this difference did not reach sta-tistical significance. Table 2 presents the concentration of lipids according to the newborns’ gender. As shown in Table 3, there were no differences in cord blood lipid profile between newborns delivered naturally and those delivered by cesarean section. The analysis of variance showed significant differences between the TC concentra-tions of newborns from 1st and 2nd pregnancies (F = 3.30;
p = 0.04) and between the TG concentrations of newborns from 1st and 2nd pregnancies (H = 10.17; p = 0.006).
Relationships between selected clinical parameters of the newborns and their cord blood lipid profiles are
Table 1. Characteristics of the newborns and mothers (means ±SD)
Parameter Alln = 206
Femalesn = 91
Malesn = 115
p-value between females and males
newborns
Gestational age [week] 39.5 ±1 39.6 ±1.0 39.6 ±0.9 0.99
1 min Apgar 8.9 ±1.0 8.9 ±0.7 8.9 ±1.3 0.68
5 min Apgar 9.2 ±0.9 9.2 ±0.6 9.2 ±0.7 0.65
10 min Apgar 9.2 ±0.6 9.2 ±0.5 9.2 ±0.6 0.69
Birth weight [g] 3406.7 ±438.8 3317.2 ±406 3477.6 ±452.5 0.02
Length [cm] 55.9 ±2.9 55.5 ±2.6 56.2 ±3.0 0.03
Head circumference [cm] 34.4 ±1.4 34.0 ±1.3 34.6 ±1.4 0.003
Chest circumference [cm] 33.4 ±1.7 33.0 ±1.6 33.6 ±1.6 0.04
Abdominal circumference [cm] 32.7 ±2.0 32.6 ±1.8 32.8 ±2.1 0.6
Neonatal ponderal index [g/m3] 19.4 ±2.5 19.5 ±2.3 19.6 ±2.1 0.81
Placental weight [g] 676.1 ±133.7 682.1 ±128.6 671.4 ±137.9 0.59
Placental-fetal weight ratio 0.2 ±0.03 0.203 ±0.04 0.193 ±0.03 0.007
Total cholesterol [mg/dL] 78 ±33.1 84.2 ±36.9 73.1 ±28.9 0.0007
High density lipoprotein [mg/dL] 24.1 ±9.1 25.9 ±8.4 22.7 ±9.6 0.001
Low density lipoprotein [mg/dL] 25.6 ±17.9 28.0 ±18.6 23.8 ±17.3 0.003
Triglycerides [mg/dL] 57.1 ±50.4 60.7 ±67.8 54.3 ±30.2 0.69
mothers
Age [years] 27.2 ±5.1 27.0 ±5.4 27.5 ±4.9 0.4
Preconception weight [kg] 59.7 ±11.6 58.7 ±12.7 60.4 ±10.6 0.45
Height [cm] 164.9 ±5.6 165.0 ±6.1 164.8 ±5.1 0.76
Preconception BMI [kg/m2] 21.9 ±4.0 21.5 ±4.6 22.2 ±3.6 0.21
Weight gain in pregnancy [kg] 16.2 ±5.8 16.0 ±5.5 16.4 ±6.0 0.74
Table 2. Spearman’s rank correlation coefficient among cord blood lipids (by gender)
ParameterFemales Males
TC TG LDL HDL TC TG LDL HDL
TC – 0.49* 0.80* 0.58* – 0.30* 0.83* 0.63*
TG 0.49* – 0.36* −0.04* 0.30* – 0.23* −0.18*
LDL 0.80* 0.36* – 0.34 0.83* 0.23* – 0.50*
HDL 0.58* −0.04 0.34* – 0.63* −0.18* 0.50* –
* p-values <0.05 are statistically significant; TC – total cholesterol; TG – triglycerides; LDL – low-density lipoprotein; HDL – high-density lipoprotein.
Table 3. Cord blood lipid profile according to the type of delivery
ParameterVaginal delivery n = 128
Cesarean section n = 78
p-value
TC [mg/dL] 76.6 ±29.8 80.23 ±38.3 0.22
HDL [mg/dL] 24.2 ±9.3 23.9 ±9.1 0.79
LDL [mg/dL] 25.0 ±17.6 26.7 ±18.7 0.21
TG [mg/dL] 54.2 ±36.3 61.6 ±67.9 0.20
TC – total cholesterol; TG – triglycerides; LDL – low-density lipoprotein; HDL – high-density lipoprotein.
TC – total cholesterol; TG – triglycerides; LDL – low-density lipoprotein; HDL – high-density lipoprotein.

E. Pac-Kożuchowska, A. Rakuś-Kwiatosz, P. Krawiec. Cord blood lipids in newborns346
presented in Table 4. A significant positive correlation was found between the concentration of TG and gestational age (p < 0.0001; r = 0.29) and weak negative correlations were noted between the TG concentration and Apgar scores at the 1st and 5th minute after birth (p = 0.03, r = −0.15; p = 0.04; r = −0.14, respectively). There were no correla-tions between the lipid profiles and the anthropometric parameters of the newborns, their NPIs, placental weights or placental-fetal weight ratios.
Significant negative correlations were observed between the maternal preconception BMIs and TC (p = 0.03; r = −0.14), HDL (p = 0.04; r = −0.13) and LDL (p = 0.02; r = −0.15) con- centrations. However, there was no correlation between the TG concentration and the maternal BMI. There were also no correlations between cord blood lipid profile and maternal age, preconception weight or weight gain during pregnancy.
Discussion
In the present study, the mean TC concentration was higher than in the study of 137 Polish newborns (78 mg/dL vs 65.05 mg/dL); however, the mean TG concentration corresponds with the results of that study (57.1 mg/dL vs 58.75 mg/dL).6 The mean HDL in this study was higher (24.1 mg/dL vs 19.63 mg/dL) and the mean LDL was lower (25.6 mg/dL vs 34.12 mg/dL) than in that study group.6 Taking into consideration some inter-population vari-ances, the TG concentration was higher in Iranian term newborns than in Polish ones, which may suggest the pres-ence of some differences among various ethnic groups and put some societies at an increased risk of cardiovascular diseases developing from early childhood.7
The present study noted that the cord blood concentra-tion of TC, HDL and LDL was significantly higher in girls than in boys; these findings correspond with some pre-vious studies. Gender related differences in cord serum lipids were also studied in 548 term singletons from Spain. Cord TC and LDL were significantly higher in females than in males, which suggests that gender related factors might influence lipid levels as early as the delivery period.8 In a group of 100 healthy term infants born in India, cord blood levels of TC, HDL and LDL were significantly higher in females than in males.9 Cord blood lipid profiles were also analyzed in 378 full-term Iranian newborns; accord-ing to the study, female neonates had significantly higher concentrations of TC and HDL than males. Other factors were not significantly different between genders.7 A simi-lar trend was found in studies that included both full-term and pre-term newborns. TC and HDL were significantly higher in girls than in boys.10 The differences found in the present study correspond with another Polish study, which showed that gender does influence the concentration of lip-ids in the cord blood serum of newborns from gestational weeks 36–42; in the study population, TC, LDL and HDL were higher in girls.6 However, in a study involving also very preterm babies (born between 28th and 42th week), umbilical blood lipid concentration (TC, HDL, LDL, very low density lipoprotein, TG) did not differ significantly between genders.11
In the present study, a significant positive correlation was found between the TG concentration and gestational age, which is consistent with observations made by other researchers.7,12 However, it should be noted that in a study by Kharb et al., the opposite trend was reported.9 Never-theless, we found no relationship between the cholesterol concentrations and gestational age in the term newborns in our study group. In this context, in the Iranian birth cohort study, the cholesterol concentrations did not dif-fer between pre-term and full-term neonates, while in the Canadian cohort, newborn concentrations of LDL and HDL were lower at more advanced gestational ages.12,13
Newborns who are small for their gestational age, as well as those who are large for their gestational age, are thought
Table 4. Relationships among clinical characteristics and cord blood lipid profiles
Parameter TC HDL LDL TG
Gestational agep-valuecorrelation coefficient
0.58(−)
0.34(−)
0.76(−)
<0.00010.29
1 min Apgarp-valuecorrelation coefficient
0.89(−)
0.39(−)
0.99(−)
0.03−0.15
5 min Apgarp-valuecorrelation coefficient
0.59(−)
0.94(−)
0.54(−)
0.04−0.14
10 min Apgarp-valuecorrelation coefficient
0.86(−)
0.72(−)
0.91(−)
0.10(−)
Birth weightp-valuecorrelation coefficient
0.64(−)
0.99(−)
0.54(−)
0.60(−)
Lengthp-valuecorrelation coefficient
0.71(−)
0.61(−)
0.72(−)
0.70(−)
Head circumference p-valuecorrelation coefficient
0.33(−)
0.45(−)
0.29(−)
0.50(−)
Chest circumference p-valuecorrelation coefficient
0.97(−)
0.50(−)
0.74(−)
0.90(−)
Abdominal circumference p-valuecorrelation coefficient
0.17(−)
0.52(−)
0.18(−)
0.99(−)
Neonatal Ponderal Index p-valuecorrelation coefficient
0.12(−)
0.42(−)
0.14(−)
0.09(−)
Placental weightp-valuecorrelation coefficient
0.67(−)
0.13(−)
0.88(−)
0.49(−)
Placental-fetal ratiop-valuecorrelation coefficient
0.38(−)
0.07(−)
0.44(−)
0.64(−)
TC – total cholesterol; TG – triglycerides; LDL – low-density lipoprotein; HDL – high-density lipoprotein.

Adv Clin Exp Med. 2018;27(3):343–349 347
to be at a higher risk of cardiovascular diseases later in life, so the importance of birth weight as a component in the analysis is clear.4,14 Some observational studies should be mentioned, although they considered both pre-term and full-term infants. A follow-up study involving 3447 Finn-ish women revealed that coronary heart disease in women is associated with low birth weight and even more strongly with short body length at birth.15 Similarly, a study of a co-hort of Finnish men confirmed that men with low birth weights, particularly those who are thin at birth (with lower NPIs), have high death rates from coronary heart disease; the rates increase further if the mother’s BMI increased during pregnancy.16 NPIs were strongly related to placental weight.16 In both sexes, the effect of impaired fetal growth on the risk of coronary heart disease was augmented by catch-up growth.15,16 This influence was more accen-tuated in girls whose growth was accelerated, and in boys whose catch-up growth resulted in gaining body mass. The authors suggested that different body proportions are associated with an increased risk for the sexes: short birth length in woman and thinness in men.15 A U-shaped relationship between the birth weight of full-term new-borns and several components of metabolic syndrome at the age of 8 was confirmed in a different study. The high-risk cluster consisted of children with increased triceps skin folds and lower placental to fetal weight ratios. At the age of 8, they tended to have higher BMIs, blood pressure, serum TC and TG concentrations, and lower HDL concentration.17
In the present study of term newborns, no correlations were found between the lipid profile and anthropometric parameters of the newborns, but in other studies, some trends were noticed. The mean serum lipid levels (TG, TC, LDL, and very low density lipoprotein) were higher in groups with low birth weight (<2500 g) and high birth weight (>4000 g) than in the group with normal weight.11 In the previously mentioned Iranian study, the TG con-centrations in babies who were small for their gestational age were significantly higher than in the babies with the appropriate weight for their gestational age.10 Moreover, in the children who were small for their gestational age, the highest TG concentrations and the lowest LDL concentra-tions were noticed in comparison to the group with the age-appropriate weight.10 Other Iranian researchers reported that the birth weight correlated with the cord TG level.13
In the present study, no correlations were observed be-tween the lipid profiles and anthropometric parameters of the newborns, such as their birth weight and length, head, chest and abdominal circumferences or NPIs, which corresponds to previous findings.7 Similarly, Badiee and Kelishadi found no significant correlations between an infant’s NPI, birth weight, length, head circumference and any lipid concentrations in a population of Iranian term newborns; only chest circumference significantly correlated with TG.7 In a different study, TG levels were significantly higher in babies with higher NPIs (>10th percentile).10
Significant differences between females and males were found in birth weight, length, head and chest circumfer-ences, as well as the placental-fetal index. In a similar Finnish study, which involved 3447 women and 3302 men, general variances in birth parameters were described, such as head circumference, birth weight and length, while the mean placental weights were similar.15,16
It is vital to observe how the anthropometric param-eters of newborns influence the potential risk of devel-oping cardiovascular diseases in the future. The authors of a follow-up study of 219 people whose size at birth had been recorded noticed that reduced rates of fetal growth are related to an impaired lipid profile in adult life.18 Ab-dominal circumference proved to be especially notice-able, because it reflects the size of the liver in the newborn – the liver plays an essential role in cholesterol metabolism. Those who had a small abdominal circumference as infants tended to have raised serum concentrations of TC and LDL as adults. The relationship observed was independent of gestational age, which suggests that reduced fetal growth is more important than premature birth. The human fetus responds to nutrient deprivation by maintaining brain growth at the expense of the torso. Also, fetal adaptations to hypoxemia reduce umbilical venous flow through the hepatic tissue, which leads to liver growth impairment. This may suggest that impaired liver growth during preg-nancy may permanently alter lipid metabolism.18 Another result corresponds to the concept of “brain sparing”: LDL levels in Indian neonates with higher abdominal circum-ferences (>32 cm) were significantly lower than in those with lower abdominal circumferences.10
In recent years, there has been an increasing interest in placenta, as deeper understanding of early human devel-opment might throw a new light on the problem of the epi-demic of metabolic diseases.19 Studies concern not only the association between placental size and pregnancy compli-cations, but also the development of diseases in adult life.20 In Norway, placenta weight percentile curves for singleton deliveries and birth weight to placental weight ratios in male and female infants were produced on the basis of data from nearly 200,000 deliveries.21 Subsequently, percentile curves for the ratio of placental weight to birth weight were created for singleton and twin deliveries in Canada.22
The ratio of placental weight to birth weight can be used as a marker of intrauterine growth restriction, as it cor-relates better than birth weight itself with an increased risk for cardiovascular diseases, such as high systolic blood pressure in childhood.23 Placental weight tended to be an independent predictor of coronary heart disease among men in Finland.16 In women, this trend was not noteworthy, but a significant correlation between hazard ratios for coronary heart disease and an increased placen-tal weight to birth weight ratio was noticed.15 It has often been repeated that Martyn et al. demonstrated a U-shaped association between the placenta to birth weight ratio and subsequent deaths from coronary heart disease. Death

E. Pac-Kożuchowska, A. Rakuś-Kwiatosz, P. Krawiec. Cord blood lipids in newborns348
rates were lowest if the placenta weighed just below 20% of birth weight.24 Barker et al. also observed that blood pressure and the risk of hypertension among men and women around 50 years of age can be predicted by studying the placenta to birth weight ratio. The highest blood pres-sure was among people who had been small babies with large placentas.20 A prospective analysis based on a popu-lation of 31,307 Norwegian men and women showed that the placenta to birth weight ratio was positively associ-ated with cardiovascular disease mortality, particularly with stroke.25 As a large size of placenta relative to birth weight could be a sign of an inefficient placenta, this could express an adaptation to a difficult intrauterine environ-ment. In our study, no correlations between the lipid pro-file and placental weight or placental-fetal weight ratio were found. In the Canadian study mentioned above, the placental-fetal weight ratio was also unrelated to other components analyzed, such as the TG concentration or HDL/apolipoprotein A concentration.12
It has been suggested that there is a link between the body composition of a pregnant woman and increased levels of cardiovascular risk factors in her offspring. Gen-erally, lipids do not cross the placenta easily, but the pla-centa possesses receptors for lipoproteins and has vari-ous lipases, making fatty acids available to the growing organism.26 This may link accumulations of maternal fat (expressed as BMI, for example) with certain cord blood lipid profiles. However, in late gestation, the main source of cholesterol seems to be fetal synthesis de novo.26 Nev-ertheless, extremes of maternal body composition in preg-nancy – both undernourishment and obesity – are associ-ated with adverse effect in the offspring. An association has been described between low weight and BMI in mother and dyslipidemia in adult offspring.27 In another study, TC and LDL levels were significantly higher in subjects whose mothers’ BMI was ≤25 kg/m2 compared to >25 kg/m2.11
Some researchers have concluded that in developed countries pre-pregnancy BMI is a significant predictor of fetal growth.28 A relationship between low maternal preconceptional BMI (<20 kg/m2) and fetal growth re-striction and pre-term delivery has been documented.29 However, high obesity rates bring new threats. An Ameri-can study revealed that, with the high frequency of obe-sity, abnormal body habitus has a stronger influence than diabetes mellitus during pregnancy on the prevalence of deliveries that are large for their gestational age.30 Obese women have increased rates of both fetal macro- and microsomia, because the fetoplacental unit develops under conditions of both excess nutrients and chronic inflammation.14,30 In an Asian population with an ethnic predisposition to metabolic syndrome, underweight and overweight mothers were associated with an atherogenic lipid profile in the cord blood. A preconception maternal BMI of ≥25 kg/m2 correlated significantly with cord TG, whereas a preconception BMI <18 kg/m2 correlated with low HDL.13
Surprisingly, some gender differences have been found to affect the offspring’s future health. Maternal BMI dur-ing pregnancy was not related to developing coronary heart disease in daughters, but in sons such a trend was observed.15,16 The results of the present study are to some extent in line with this finding. Significant negative cor-relations between maternal preconception BMI and con-centrations of TC, HDL and LDL were observed. However, there was no correlation between the TG concentrations and maternal BMI. According to other authors, maternal preconceptional BMI or post-delivery BMI had no influ-ence on the neonates’ lipid profiles.7,10 Also, maternal lipid profile characterized by hyperlipidemia compared to the same woman’s non-pregnancy lipid profile had only a weak influence on the newborn’s cardio-metabolic com-ponents.12,26 In well-nourished populations, nutritional factors are probably of much less importance to fetal growth; they may be more vital in developing countries.31
In the current study, population preconception weight and weight gain during pregnancy did not affect any compo-nents of the analysis.
As in a previous study, the present research found no correlation between the cord blood lipid profile and ma-ternal age.7 In different studies, TC and LDL were sig-nificantly lower in neonates whose mothers were younger than 30 years of age than in the case of older mothers.11 Maternal age was also inversely associated with the new-borns’ TG and HDL concentrations.12
Conclusions
To conclude, fetal cardiovascular adaptations appear to have a long-term influence on health in postnatal life. The placenta may be of importance in determining these changes. Our study described differences between the genders in cord blood lipid profiles. The influence of ges-tational age and the mothers’ preconception BMI on lipid concentrations was also observed. Further investigations are needed, focusing not only on short-term outcomes, such as the influence of various harmful factors on the anthropometry of the offspring, but also on some bio-chemical markers in umbilical cord blood that may be used in the diagnosis of metabolic disorders. It is possible that in the future, by detecting such factors and markers, the identification of newborns with a higher risk for developing cardiovascular diseases will be possible.
References1. World Health Organisation media centre. The top 10 causes of death.
http://www.who.int/mediacentre/factsheets/fs310/en/. Accessed June 10, 2016.
2. Myśliwiec M, Walczak M, Małecka-Tendera E, et al. Management of familiar hypercholesterolemia in children and adolescents. Posi-tion paper of the Polish Lipid Expert Forum. J Clin Lipidol. 2014;8(2): 173–180.
3. Cohen MS. Fetal and childhood onset of adult cardiovascular dis-eases. Pediatr Clin North Am. 2004;51:1697–1719.

Adv Clin Exp Med. 2018;27(3):343–349 349
4. Barker DJ, Osmond C, Law CM. The intrauterine and early postnatal origins of cardiovascular disease and chronic bronchitis. J Epidemiol Community Health. 1989;43(3):237–240.
5. Barker DJ, Winter PD, Osmond C, Margetts B, Simmonds SJ. Weight in infancy and death from ischaemic heart disease. Lancet. 1989; 2(8663):577–580.
6. Pac-Kożuchowska E. The concentration of lipid parameters in new-borns and in older children. Med Wieku Rozwoj. 2013;17(1):53–63.
7. Badiee Z, Kelishadi R. Cord blood lipid profile in a population of Ira-nian term newborns. Pediatr Cardiol. 2008;29(3):574–579.
8. Bastida S, Sánchez-Muniz FJ, Cuesta C, Perea S, Aragonés A. Male and female cord blood lipoprotein profile differences throughout the term-period. J Perinat Med. 1997;25(2):184–191.
9. Kharb S, Kaur R, Singh V, Sangwan K. Birth weight, cord blood lipo-protein and apolipoprotein levels in Indian newborns. Int J Prev Med. 2010;1(1):29–33.
10. Nayak CD, Agarwal V, Nayak DM. Correlation of cord blood lipid het-erogeneity in neonates with their anthropometry at birth. Indian J Clin Biochem. 2013;28(2):152–157.
11. Aletayeb SMH, Dehdashtian M, Aminzadeh M, et al. Correlation between umbilical cord blood lipid profile and neonatal birth weight. Pediatr Pol. 2013;88(6):521–525.
12. Morrison KM, Anand SS, Yusuf S, et al. Maternal and pregnancy relat-ed predictors of cardiometabolic traits in newborns. PLoS One. 2013; 8(2):e55815.
13. Kelishadi R, Badiee Z, Adeli K. Cord blood lipid profile and associat-ed factors: Baseline data of a birth cohort study. Paediatr Perinat Epi-demiol. 2007;21(6):518–524.
14. Frias AE, Grove KL. Obesity: A transgenerational problem linked to nutrition during pregnancy. Semin Reprod Med. 2012;30(6):472–478.
15. Forsén T, Eriksson JG, Tuomilehto J, Osmond C, Barker DJ. Growth in utero and during childhood among women who develop coronary heart disease: Longitudinal study. BMJ. 1999;319(7222):1403–1407.
16. Forsén T, Eriksson JG, Tuomilehto J, Teramo K, Osmond C, Barker DJ. Mother’s weight in pregnancy and coronary heart disease in a cohort of Finnish men: Follow up study. BMJ. 1997;315(7112):837–840.
17. Huang RC, Burke V, Newnham JP, et al. Perinatal and childhood ori-gins of cardiovascular disease. Int J Obes (Lond). 2007;31(2):236–244.
18. Barker DJ, Martyn CN, Osmond C, Hales CN, Fall CH. Growth in utero and serum cholesterol concentrations in adult life. BMJ. 1993; 307(6918): 1524–1527.
19. Thornburg KL, O’Tierney PF, Louey S. Review: The placenta is a program-ming agent for cardiovascular disease. Placenta. 2010;31(Suppl): 54–59.
20. Barker DJ, Bull AR, Osmond C, Simmonds SJ. Fetal and placental size and risk of hypertension in adult life. BMJ. 1990;301(6746):259–262.
21. Thompson JM, Irgens LM, Skjaerven R, Rasmussen S. Placenta weight percentile curves for singleton deliveries. BJOG. 2007;114(6):715–720.
22. Almog B, Shehata F, Aljabri S, Levin I, Shalom-Paz E, Shrim A. Placen-ta weight percentile curves for singleton and twins deliveries. Pla-centa. 2011;32(1):58–62.
23. Hemachandra AH, Klebanoff MA, Duggan AK, Hardy JB, Furth SL. The association between intrauterine growth restriction in the full-term infant and high blood pressure at age 7 years: Results from the Collaborative Perinatal Project. Int J Epidemiol. 2006;35(4):871–877.
24. Martyn CN, Barker DJ, Osmond C. Mothers' pelvic size, fetal growth, and death from stroke and coronary heart disease in men in the UK. Lancet. 1996;348(9037):1264-1268.
25. Risnes KR, Romundstad PR, Nilsen TI, Eskild A, Vatten LJ. Placental weight relative to birth weight and long-term cardiovascular mor-tality: Findings from a cohort of 31,307 men and women. Am J Epi-demiol. 2009;170(5):622–631.
26. Herrera E, Ortega-Senovilla H. Lipid metabolism during pregnancy and its implications for fetal growth. Curr Pharm Biotechnol. 2014; 15(1):24–31.
27. Ravelli AC, van Der Meulen JH, Osmond C, Barker DJ, Bleker OP. Obe-sity at the age of 50 y in men and women exposed to famine prena-tally. Am J Clin Nutr. 1999;70(5):811–816.
28. Neggers Y, Goldenberg RL. Some thoughts on body mass index, micronutrient intakes and pregnancy outcome. J Nutr. 2003;133 (5 Suppl 2):1737–1740.
29. Ehrenberg HM, Dierker L, Milluzzi C, Mercer BM. Low maternal weight, failure to thrive in pregnancy, and adverse pregnancy outcomes. Am J Obstet Gynecol. 2003;189(6):1726–1730.
30. Ehrenberg HM, Mercer BM, Catalano PM. The influence of obesity and diabetes on the prevalence of macrosomia. Am J Obstet Gyne-col. 2004;191(3):964–968.
31. Osrin D, Costello AML. Maternal nutrition and fetal growth: Practi-cal issues in international health. Semin Neonatol. 2000;5(3):209–219.


DOI10.17219/acem/65787
Copyright© 2018 by Wroclaw Medical University This is an article distributed under the terms of the Creative Commons Attribution Non-Commercial License(http://creativecommons.org/licenses/by-nc-nd/4.0/)
Address for correspondenceMaciej BuraE-mail: [email protected]
Funding sourcesThis research was funded by Poznan University of Medical Sciences, Poland (No. of funds 502-01-02205314-04519) and the Regional Blood Center in Poznań, Poland
Conflict of interestNone declared
AcknowledgementsWe would like to thank Dr Hanna Skalisz from the Regional Blood Center in Poznań and forest rangers from the Międzychód forest division for their support in the organization of the study, and Dr Michał Chojnicki for rapid transportation of the BDs’ samples.
Received on July 14, 2016Reviewed on July 26, 2016Accepted on October 12, 2016
AbstractBackground. Hepatitis E virus (HEV) infection is an emerging problem in developed countries. At least 2 zoonotic genotypes of the virus (HEV-3 and HEV-4) infect human beings. There are some data suggesting that forest rangers (FRs) can be at a higher risk of contact with HEV.
Objectives. The aim of this study was to assess the prevalence of HEV exposure markers in FRs from a single forest district in Greater Poland in relation to anti-HAV (hepatitis A virus) IgG, and anti-Borrelia spp. IgM and IgG antibodies.
Material and methods. In total, 138 participants (48 FRs and 90 blood donors – BDs) were tested for anti-HEV IgM and IgG (EUROIMMUN Medizinische Labordiagnostika AG, Luebeck, Germany) and 96 individuals (48 FRs and 48 BDs) were tested for anti-HAV IgG (ARCHITECT immunoassays, Abbott Laboratories, Wies-baden, Germany); anti-Borrelia IgM and IgG (EUROIMMUN kits) were assessed in FRs only.
Results. Anti-HEV markers were detected in 3 participants (2.2%; IgM in 1 FR, IgG in 2 BDs), less frequently than anti-HAV (16 out of 96 individuals, about 17%; FRs 19% vs BDs 15%) or anti-Borrelia antibodies (18 out of 48 individuals, 37.5%) (p < 0.0001 for both). Older study participants (≥45 years of age) were more frequently HAV-seropositive (29% vs 4% of the younger individuals; p = 0.0012).
Conclusions. We failed to unequivocally prove HEV exposure in FRs. The HAV seroprevalence in this study paralleled the situation in the general population. Exposure to Borrelia spp. in FRs was common.
Key words: hepatitis A virus, hepatitis E virus, Borrelia, seroprevalence, Poland
Original papers
Exposure to hepatitis E virus, hepatitis A virus and Borrelia spp. infections in forest rangers from a single forest district in western Poland
Maciej Bura1,A–F, Alicja Bukowska2,A,B,E, Michał Michalak3,C,D, Aleksandra Bura4,B–D, Mariusz J. Nawrocki5,6,B,D, Marek Karczewski7,A,C,E, Iwona Mozer-Lisewska1,E,F
1 Department of Infectious Diseases, Hepatology and Acquired Immunodeficiencies, Poznan University of Medical Sciences, Poland2 Regional Blood Center in Poznań, Poland3 Department of Computer Science and Statistics, Poznan University of Medical Sciences, Poland4 Department of Infectious Diseases, Jozef Strus Multidisciplinary Municipal Hospital in Poznań, Poland5 Department of Biochemistry and Molecular Biology, Poznan University of Medical Sciences, Poland6 Department of Anatomy, Poznan University of Medical Sciences, Poland7 Department of General and Transplant Surgery, Poznan University of Medical Sciences, Poland
A – research concept and design; B – collection and/or assembly of data; C – data analysis and interpretation; D – writing the article; E – critical revision of the article; F – final approval of the article
Advances in Clinical and Experimental Medicine, ISSN 1899–5276 (print), ISSN 2451–2680 (online) Adv Clin Exp Med. 2018;27(3):351–355

M. Bura, et al. HAV, HEV and Borrelia seroprevalence (Poland)352
Introduction
Hepatitis E virus (HEV) is an important etiologic agent of enterically transmitted hepatitis worldwide.1 In devel-oped European countries, this infection was previously considered only in persons returning from highly endemic areas – some parts of Asia and Africa. However, aware-ness of its presence in industrialized parts of the world has significantly increased in recent years.2–4
The virus belongs to the Hepeviridae family, Orthohepe-virus genus.5 Its virions are small (27–34 nm), non-envel-oped and icosahedral particles containing positive-sense single-stranded RNA, approx. 7.2 kb in length. Four HEV genotypes representing 1 serotype have been identified as a cause of human infections, all of which are classified as members of the Orthohepevirus A species. Genotypes 1 and 2 (HEV-1 and HEV-2) are present in developing ar-eas of the world (Asia and Africa) and can induce large waterborne outbreaks. Genotype 3 (HEV-3), which has worldwide distribution (including Europe), and genotype 4 (HEV-4), predominant in Asia, cause zoonotic infections – pigs, wild boars and deer represent recognized reservoir animals for these variants of the virus. Recently, a sin-gle case of HEV-7-related disease resulting from contact with dromedaries has also been reported.6 A broad range of clinical presentations may be related to HEV infection, from an asymptomatic course to severe hepatitis.7,8
It is recognized that contact with HEV reservoir animals may be related to occupational exposure to this virus.9–11 A few reports have suggested that forest rangers (FRs) can be one of the populations at risk of HEV infection.12–16
The aim of the present study was to assess the seropreva-lence of HEV exposure markers among FRs from a single forest district in western Poland in relation to anti-HAV (hepatitis A virus) IgG and anti-Borrelia spp. antibodies.
Material and methods
The study involved 48 out of 52 FRs from a single for-est division in western Poland (Międzychód forest divi-sion) who were screened for anti-Borrelia antibodies in the Laboratory of the Department of Infectious Dis-eases, Jozef Strus Multidisciplinary Municipal Hospital in Poznań in December, 2014, and agreed to participate in this analysis.
Additionally, we recruited 90 unpaid voluntary healthy blood donors (BDs) from the Regional Blood Center in Poznań (west-central Poland) to form the control group.
All the study participants were asked to complete a sim-ple short questionnaire on their demographic, travel and culinary habits, and medical history.
Serologic testing
Anti-Borrelia IgM and IgG detection was performed in a 2-step procedure. First, ELISA tests were used (anti-Bor-relia ELISA [IgM] and anti-Borrelia plus VlsE ELISA [IgG]); next, for sera that were positive in this initial screening, con-firmation line-blot tests were performed using Anti-Borrelia EUROLINE-RN-AT-adv (IgM) or Anti-Borrelia EUROLINE-RN-AT (IgG) (EUROIMMUN Medizinische Labordiagnos-tika AG, Luebeck, Germany). Positive results were defined as the presence of the appropriate antibodies (IgM and/or IgG) detected by both screening and confirmatory testing. Anti-Borrelia testing was performed in FRs only (n = 48).
For the HAV seroprevalence assessment (anti-HAV) in 96 individuals (48 FRs and 48 BDs), we used a chemiluminescent microparticle immunoassay, ARCHITECT HAVAb-IgG kits (Abbott Laboratories, Wiesbaden, Germany).
HEV exposure was assessed in all the study participants (n = 138) with IgM and IgG antibody enzyme immunoassay tests (Anti-Hepatitis E Virus ELISA [IgM] and Anti-Hep-atitis E Virus ELISA [IgG]; EUROIMMUN Medizinische Labordiagnostika AG, Luebeck, Germany). Additionally, other kits were also used for the detection of anti-HEV IgM in the FRs (MP Diagnostics ASSURE® HEV IgM Rapid Test, MP Biomedicals Asia Pacific Pte. Ltd., Singapore).
All the serologic tests were carried out according to the manufacturers’ instructions.
Hepatitis E virus RNA testing
It was planned that the search for HEV RNA would be performed only in anti-HEV IgM-positive participants of the study.
RNA extraction and reverse transcription
Total RNA was extracted with the QIAamp Viral RNA Mini Kit (Qiagen, Hilden, Germany) from 140 μL of se-rum according to the manufacturer’s instructions, and then stored at −80°C for downstream applications. For reverse transcription (RT), 8.25 μL samples of the extracted RNA were used. First, the RNA was incubated with 1.75 μM oligo d(T)23, 1.25 μM random primers pd(N)6 and 0.5 mM dNTP mix at 70°C for 5 min, then it was reverse-transcribed into cDNA using Invitrogen Moloney Murine Leukemia Virus (M-MLV) Reverse Transcriptase (Thermo Fisher Scientific, Carlsbad, USA). The final volume of 20 μL RT mix con-tained 4 μL of 5X First Strand Buffer, 10 U of RNaseOUT™ Recombinant Ribonuclease Inhibitor and 100 U M-MLV Reverse Transcriptase (all ingredients by Thermo Fisher Scientific, Carlsbad, USA). The cycling parameters were: 10 min at 25°C, 60 min at 37°C, 15 min at 75°C, followed by a 4°C hold.

Adv Clin Exp Med. 2018;27(3):351–355 353
Real-time polymerase chain reaction assay
Detection of HEV RNA was performed in a LightCycler® 480 instrument (Roche Molecular Diagnostics, Pleasanton, USA) using the TaqMan® approach. Primers and probes for real-time polymerase chain reaction (RT-PCR) were synthesized based on the highly conserved region of the different HEV genotypes in the ORF3 region, where the primers and probe anneal. The forward primer (JVHEVF; 5’-GGTGGTTTCTGGGGTGAC-3’), reverse primer (JVHEVR; 5’-AGGGGTTGGTTGGATGAA-3’) and probe (JVHEVP; 5’-TGATTCTCAGCCCTTCGC-3’) described by Jothikumar et al. were employed for HEV detection by RT-PCR.17 The TaqMan® probe was labeled with a 6-carboxy fluo-rescein fluorophore (6-FAM) at the 5’ end and a Black Hole Quencher-1 (BHQ-1) at the 3’ end (both primers and probes were provided by DNA Sequencing and Oligonucleotides Syn-thesis Laboratory, Polish Academy of Science, Warsaw).
The 10 μL reaction mixture contained 5 μL of 2 × Light-Cycler® 480 Probes Master (Roche Molecular Diagnostics, Basel, Switzerland), 500 nM of primers, 200 nM of probe, and finally 1 μL of cDNA added as a template. Cycling conditions were optimized to 1 cycle of initial denaturation for 10 min at 95°C, followed by 55 amplification cycles at 95°C (10 s), 55°C (25 s) and 72°C (10 s). The products from the TaqMan® RT-PCR were analyzed on 2% agarose gels.
Ethical issues
Informed consent was signed by all the FRs and BDs. The study was approved by the Bioethics Committee of Poznan University of Medical Sciences (reference No. 155/15).
Statistical analysis
Numerical data were presented as mean values and stan-dard deviations. The comparison of age was performed by Student’s t-test. The assumption of normal distribu-tion of the data was checked using the Shapiro-Wilk test. The homogeneity of variances was verified by Levene’s test. Nominal data were presented as numbers and percent-ages. The comparison was done using the χ2 test of in-dependence. The statistical analysis was performed with STATISTICA v. 12 software (StatSoft Inc., Tulsa, USA). Results were considered significant at p < 0.05.
Results
The baseline characteristics of all the study participants are presented in Table 1.
Anti-HEV antibodies were detected in 3 participants (2.2%). In the FR group there was a positive anti-HEV re-sult in a single individual: a 43-year-old man with anti-HEV IgM antibodies only (which were found with both IgM-detecting tests), but no anti-HEV IgG or HEV-RNA were detected. He had never had an icteric disease and was anti-HAV negative, but tested positive for anti-Borrelia IgG antibodies. In the BDs only, anti-HEV IgG was found in 2 men (aged 42 and 55 years) out of 90 persons (2.2%); anti-HAV were not detected in either of them.
The results of the assessment for Borrelia antibodies indicated exposure to these bacteria in 37.5% of the FRs (Table 2). In this group, anti-HEV results were positive much less frequently than anti-Borrelia (p < 0.0001).
Anti-HAV testing was performed in 96 individuals: all the FRs and 48 sex-matched BDs. It was positive in 16 per-sons (16.7%): 9 of the FRs (18.7%) and 7 of the BDs (14.6%) (p = 0.5839). Overall, HAV seroprevalence was significantly higher in comparison to HEV seroprevalence (p = 0.0001) and lower than Borrelia seroprevalence (p = 0.0055).
The anti-HAV positive individuals were older (51.9 ±7.8 years) than the HAV-seronegative study participants (44.0 ±7.9 years; p = 0.0004); this was also true when the 2 groups were analyzed separately (among the FRs: 52.6 ±9.1 years and 43.3 ±9.0 years, respectively, p = 0.0078; among the BDs: 51.1 ±6.3 years and 44.6 ±6.8 years, re-spectively, p = 0.0221). Susceptibility to HAV infection (as expressed by a lack of anti-HAV IgG) was more frequent among individuals under 45 years of age (46 out of 48 in-dividuals, 95.8%) than in older individuals (34 out of 48 individuals, 70.8%; p = 0.001).
Table 1. Baseline characteristics of the study participants (n = 138)
Parameter FRs (n = 48) Control group, BDs (n = 90) p-value
Age, mean ±SD (range); median [years]
45.0 ±9.6 (29–65);44.5
44.1 ±6.5 (29–58);43.5
0.5349
Men, n (%) 34 (70.8%) 66 (73.3%) 0.7542
Consumption of raw/undercooked meat 38 (79.2%) 34 (38.2%) <0.0001
Consumption of seafood 27 (56.2%) 42 (47.2%) 0.3117
Travel abroad 47 (97.9%) 72 (80.0%) 0.0036
Table 2. Exposure to Borrelia spp. in serological assessment among FRs (n = 48)
Anti-Borrelia antibodies testing method(s) IgM(+) IgG(+)
ELISA, n (%) 4* (8.3%) 24 (50.0%)
ELISA + blot, n (%) 4* (8.3%) 18 (37.5%)
* All ELISA IgM-positive patients were also blot-IgM, ELISA-IgG and blot IgG-positive.

M. Bura, et al. HAV, HEV and Borrelia seroprevalence (Poland)354
In the study, 6 FRs mentioned having had an icteric disease in the past. Viral hepatitis was recognized in 2 of them, while the diagnostic conclusions were not known in the remaining cases; all but 1 were HAV IgG-seroposi-tives. The BDs had no jaundice in their medical histories.
In total, 9 of the study participants (3 FRs and 6 BDs) declared that they had had vaccinations against hepatitis A; anti-HAV antibodies were found in only 4 of them (2 FRs, including 1 with a history of icteric hepatitis, and 2 BDs).
Discussion
In this study, HEV exposure markers (as expressed by anti-HEV positivity) were found in only a few participants (2.2%), less frequently than anti-HAV and anti-Borrelia antibodies. Moreover, in spite of the detection of anti-HEV IgM in 1 FR (confirmed by 2 different assays), further tests for anti-HEV IgG and HEV-RNA in this asymptomatic individual proved to be negative. The lack of clinical symptoms characteristic of acute hepatitis does not exclude the possibility of infec-tion, because contact with HEV is usually subclinical.7
On the other hand, it is also possible that this FR had a primary infection with Epstein-Barr virus (EBV) or cyto-megalovirus (CMV) at the time of the HEV testing. It has been shown that the polyclonal stimulation of B cells caused by these viruses can be a source of false anti-HEV IgM positivity; due to the limited volume of available serum, the further investigation of this possibility was impossible.18 For this reason, we postulate that the correlation between the presence of IgM antibodies and a recent HEV infection in this case is arguable – it could be a false positive result.
We are going to discuss the results of this study in the context of the particular study population and in view of the available knowledge regarding HEV seroprevalence in Poland.
Data from a few existing reports suggest that FRs consti-tute an increased-risk group for contact with HEV. Drem-sek et al. proved the presence of anti-HEV IgG in an aver-age of 17.8–21.4% (range: 5.6–28%) of FRs from eastern Germany, depending on the diagnostic test used (com-mercial vs in-house, respectively), compared to 11.1–12.3% (p < 0.01) in the control group.13 Even higher values (in con-trol populations as well) were found by French researchers: Carpentier et al. reported HEV seroprevalence of 31.2% (compared to 19% in the control group) and Chaussade et al. reported 36.4% (compared to 26.1% in the control group).14,15 Similar data were quoted by Yoon et al. (31.3% in a mixed population of skilled agricultural, forestry, and fishery workers, odds ratio 6.6) in a South Korean analysis.16 On the other hand, lower seroprevalence was observed in FRs from Iowa, USA (5.7% vs 0% in the control group).12 It is believed that higher HEV seroprevalence in FRs may be caused by the following factors: contact with reservoir animals, some culinary habits more com-mon in this professional group (eating raw/undercooked
meat, including game meat) and common membership in hunting communities.
Significantly, in spite of much more frequent consumption of food containing raw meat (including game meat) by FRs than by the control group, a high percentage of study partici-pants who had travelled abroad (all but 1 person) and consid-erable exposure to the forest environment (anti-Borrelia IgG antibody seropositivity of 37.5%, coinciding with other Polish data on this subject), our study was unable to unequivocally establish the features characteristic of contact with HEV (anti-HEV IgG) in this professional group.19
In a recent publication on the HEV exposure of 1027 hunt-ers from all over the country, the presence of anti-HEV IgG was confirmed in 20.3% of cases.20 According to 2 other reports, HEV seroprevalence among the patients of the Department of Infectious Diseases in Poznań (n = 182), and the Department of Internal Medicine in Łódź, central Poland (n = 212), as well as HCV-positive patients (n = 149) from the Department of Infectious Diseases and Hepatology in Łódź was 15.9%, 7.5% and 10%, respectively.21,22
In the context of these data, the low values in the pres-ent study are surprising. In our opinion, there are at least 2 possible causes of these findings. Firstly, the available serologic tests have variable and, unfortunately, imper-fect accuracy in the detection of anti-HEV markers. De-spite the fact that the EUROIMMUN tests used in this analysis were compared with the assays of other manu-facturers, knowledge about the diagnostic performance of these tests is very limited.23,24 Moreover, in our re-cent investigation of the seroprevalence of anti-HEV IgG among 105 HIV patients and 105 age- and sex-matched BDs, using the EUROIMMUN assay, we reported similar low rates of this HEV exposure marker: 0.95% and 3.8%, respectively.25 Additionally, it should be stressed that anti-HEV IgG tests in general have suboptimal sensitivity.26 Secondly, exposure to HEV can differ depending on the geographical region (even within the same country) and related elements, such as environmental factors, climate, socioeconomic status, hygienic and sanitary conditions, culinary habits, and agricultural traditions (especially related to livestock husbandry). For example, in Corn-wall (United Kingdom), a coastal clustering of hepatitis E cases was observed.27 In a large study among French BDs, HEV seroprevalence varied significantly – from 8% to 86% – depending on the area.28 Similar conclusions were drawn in the previously mentioned study by Sadkowska-Todys et al., according to which HEV seroprevalence dif-fered significantly depending on the region: from 3.85% in the Kuyavia-Pomerania region (mid-northern Poland) to 41.7% in the Opole Province (south-western Poland).20 Unfortunately, values for other provinces were not given. Additionally, these considerations are complicated by the fact that anti-HEV IgG prevalence in wild boars (recog-nized reservoir animals) in the aforementioned regions of Poland was inversely proportional to values for hunters from these regions: 29% for the Opole Province and 68%

Adv Clin Exp Med. 2018;27(3):351–355 355
for the Kuyavia-Pomerania region (unfortunately, data for Greater Poland are not available).29
Determining the factors influencing these discrepancies is challenging.
The HAV seroprevalence found in the present small study reflects the epidemiological situation in countries with very low hepatitis A endemicity, which currently in-clude Poland.30 Moreover, there was no difference in this respect between FRs and the control group.
In view of the lack of medical documentation confirming the vaccination of the study participants against hepati-tis A, we believe that at least 5 out of 9 individuals who declared active HAV immunization (HAV seronegative) confused it with hepatitis B vaccinations, even though the question they had to answer was unequivocal and emphasized the differences between vaccinations against hepatitis A and B. This corresponds to what we frequently observe in daily real-life practice.
The common susceptibility to HAV infection found in this study, including among individuals over 45 years of age (70%), suggests that active hepatitis A immunoprophylaxis can also be recommended for these persons, especially when a higher risk of HAV exposure exists. For the FRs participating in the present analysis, the rationale for such an action could be travelling abroad (reported by all but 1 person in this group) and frequent consumption of seafood (56%).
Conclusions
In the present HEV seroprevalence study among FRs from a single forest district in western Poland, we failed to unequivocally prove exposure to the virus in this pop-ulation. For more in-depth understanding of this issue, further research is necessary among larger populations of FRs in various regions of the country, using diagnostic tests with established reliability. The HAV seroprevalence among the FRs in this study paralleled the situation in the general population and can justify vaccination against hepatitis A in this professional group. Exposure of FRs to Borrelia spp. was considerable.
References1. Rein DB, Stevens GA, Theaker J, Wittenborn JS, Wiersma ST. The glob-
al burden of hepatitis E virus genotypes 1 and 2 in 2005. Hepatology. 2012;55:988–997.
2. Tsang TH, Denison EK, Williams HV, Venczel LV, Ginsberg MM, Vugia DJ. Acute hepatitis E infection acquired in California. Clin Infect Dis. 2000;30:618–619.
3. Inoue J, Ueno Y, Nagasaki F, et al. Sporadic acute hepatitis E occurred constantly during the last decade in northeast Japan. J Gastroenterol. 2009;44:329–337.
4. Lapa D, Capobianchi MR, Garbuglia AR. Epidemiology of hepa-titis E virus in European countries. Int J Mol Sci. 2015;16:25711–25743.
5. Smith DB, Simmonds P, Jameel S, et al.; International Commit-tee on Taxonomy of Viruses Hepeviridae Study Group. Consensus proposals for classification of the family Hepeviridae. J Gen Virol. 2014;95:2223–2232.
6. Lee GH, Tan BH, Chi-Yuan Teo E, et al. Chronic infection with came-lid hepatitis E virus in a liver transplant recipient who regularly con-sumes camel meat and milk. Gastroenterology. 2016;150:355–357.
7. Said B, Ijaz S, Kafatos G, et al.; Hepatitis E Incident Investigation Team. Hepatitis E outbreak on cruise ship. Emerg Infect Dis. 2009;15:1738–1744.
8. Crossan CL, Simpson KJ, Craig DG, et al. Hepatitis E virus in patients with acute severe liver injury. World J Hepatol. 2014;6:426–434.
9. Lewis HC, Wichmann O, Duizer E. Transmission routes and risk fac-tors for autochthonous hepatitis E virus infection in Europe: A sys-tematic review. Epidemiol Infect. 2010;138:145–166.
10. De Schryver A, De Schrijver K, François G, et al. Hepatitis E virus infection: An emerging occupational risk? Occup Med (Lond). 2015;65:667–672.
11. Ivanova A, Tefanova V, Reshetnjak I, et al. Hepatitis E virus in domes-tic pigs, wild boars, pig farm workers, and hunters in Estonia. Food Environ Virol. 2015;7:403–412.
12. Karetnyi YV, Gilchrist MJ, Naides SJ. Hepatitis E virus infection preva-lence among selected populations in Iowa. J Clin Virol. 1999;14:51–55.
13. Dremsek P, Wenzel JJ, Johne R, et al. Seroprevalence study in forest-ry workers from eastern Germany using novel genotype 3- and rat hepatitis E virus-specific immunoglobulin G ELISAs. Med Microbiol Immunol. 2012;201:189–200.
14. Carpentier A, Chaussade H, Rigaud E, et al. High hepatitis E virus seroprevalence in forestry workers and in wild boars in France. J Clin Microbiol. 2012;50:2888–2893.
15. Chaussade H, Rigaud E, Allix A, et al. Hepatitis E virus seroprevalence and risk factors for individuals in working contact with animals. J Clin Virol. 2013;58:504–508.
16. Yoon Y, Jeong HS, Yun H, et al. Hepatitis E virus (HEV) seropreva-lence in the general population of the Republic of Korea in 2007–2009: A nationwide cross-sectional study. BMC Infect Dis. 2014;14:517.
17. Jothikumar N, Cromeans TL, Robertson BH, Meng XJ, Hill VR. A broad-ly reactive one-step real-time RT-PCR assay for rapid and sensitive detection of hepatitis E virus. J Virol Methods. 2006;131:65–71.
18. Fogeda M, de Ory F, Avellón A, Echevarría JM. Differential diagnosis of hepatitis E virus, cytomegalovirus and Epstein-Barr virus infection in patients with suspected hepatitis E. J Clin Virol. 2009;45:259–261.
19. Richard S, Oppliger A. Zoonotic occupational diseases in forestry workers – Lyme borreliosis, tularemia and leptospirosis. Ann Agric Environ Med. 2015;22:43–50.
20. Sadkowska-Todys M, Baumann-Popczyk A, Wnukowska N, Pop- czyk B, Kucharczyk B, Gołąb E. Occurrence and prevalence of select-ed zoonotic agents: Echinococcus multilocularis, Trichinella spira-lis and hepatitis E virus (HEV) in the population of Polish hunters – Results of the study conducted in 2010–2012. Przegl Epidemiol. 2015;69:673–678.
21. Bura M, Michalak M, Chojnicki M, Czajka A, Kowala-Piaskowska A, Mozer-Lisewska I. Seroprevalence of anti-HEV IgG in 182 Polish patients. Postepy Hig Med Dosw. 2015;69:320–326.
22. Ślusarczyk J, Szemraj J, Jabłkowska-Górecka K, Juszczyk G, Białkowska J. Koinfekcja wirusem zapalenia wątroby typu E (HEV) u pacjentów zakażonych wirusem zapalenia wątroby typu C (HCV). Przegl Epidemiol. 2015;69(Suppl 1):13.
23. Dreier J, Juhl D. Autochthonous hepatitis E virus infections: A new transfusion-associated risk? Transfus Med Hemother. 2014;41:29–39.
24. Avellon A, Morago L, Garcia-Galera Del Carmen M, Munoz M, Eche-varría JM. Comparative sensitivity of commercial tests for hepatitis E genotype 3 virus antibody detection. J Med Virol. 2015;87:1934–1939.
25. Bura M, Bukowska A, Bura A, Michalak M, Mozer-Lisewska I. Hepatitis E virus antibodies in HIV-infected patients and blood donors from western Poland: A preliminary report. Adv Clin Exp Med. 2017;26: 577–579.
26. Khudyakov Y, Kamili S. Serological diagnostics of hepatitis E virus infection. Virus Res. 2011;161:84–92.
27. Hunter JG, Madden RG, Stone AM, et al. Coastal clustering of HEV; Cornwall, UK. Eur J Gastroenterol Hepatol. 2016;28:323–327.
28. Mansuy JM, Gallian P, Dimeglio C, et al. A nationwide survey of hepatitis E viral infection in French blood donors. Hepatology. 2016;63:1145–1154.
29. Larska M, Krzysiak MK, Jabłoński A, Kęsik J, Bednarski M, Rola J. Hep-atitis E virus antibody prevalence in wildlife in Poland. Zoonoses Pub-lic Health. 2014;62:105–110.
30. Bura M, Mozer-Lisewska I. Quo vadis, HAV? Hepatologia. 2016;16:17–24.


DOI10.17219/acem/66215
Copyright© 2018 by Wroclaw Medical University This is an article distributed under the terms of the Creative Commons Attribution Non-Commercial License(http://creativecommons.org/licenses/by-nc-nd/4.0/)
Address for correspondenceNur ŞahinE-mail: [email protected]
Funding sourcesNone declared
Conflict of interestNone declared
Received on June 7, 2016Reviewed on September 21, 2016Accepted on October 21, 2016
AbstractBackground. The modified Misgav-Ladach method (MML) is a minimally invasive cesarean section pro-cedure compared with the classic Pfannenstiel-Kerr (PK) method.
Objectives. The aim of the study was to compare the MML method and the PK method in terms of intra-operative and short-term postoperative outcomes.
Material and methods. This prospective, randomized controlled trial involved 252 pregnant women sched-uled for primary emergency or elective cesarean section between October, 2014 and July, 2015. The primary outcome measures were the duration of surgery, extraction time, Apgar score, blood loss, wound complica-tions, and number of sutures used. Secondary outcome measures were the wound infection, time of bowel restitution, visual analogue scale (VAS) scores at 6 h and 24 h after the operation, limitations in movement, and analgesic requirements. At 6 weeks after surgery, the patients were evaluated regarding late complications.
Results. There was a significant reduction in total operating and extraction time in the MML group (p < 0.001). Limitations in movement were lower at 24 h after the MML operation, and less analgesic was required in the MML group. There was no difference between the 2 groups in terms of febrile morbidity or the duration of hospitalization. At 6 weeks after the operation, no complaints and no additional complications from the surgery were noted.
Conclusions. The MML method is a minimally invasive cesarean section. In the future, as surgeons’ experi-ence increases, MML will likely be chosen more often than the classic PK method.
Key words: cesarean section, postoperative pain, Pfannenstiel incision, modified Misgav-Ladach technique, operating time
Original papers
A comparison of 2 cesarean section methods, modified Misgav-Ladach and Pfannenstiel-Kerr: A randomized controlled study
Nur Şahin1,A–F, Mine Genç1,A,D, Gülüzar Arzu Turan1,B,C, Esin Kasap2,A–C, Serkan Güçlü3,D–F
1 Department of Obstetrics and Gynecology, Sifa University, Izmir, Turkey2 Department of Obstetrics and Gynecology, Karatas Hospital, Izmir, Turkey3 Department of Obstetrics and Gynecology, Kent Hospital, Izmir, Turkey
A – research concept and design; B – collection and/or assembly of data; C – data analysis and interpretation; D – writing the article; E – critical revision of the article; F – final approval of the article
Advances in Clinical and Experimental Medicine, ISSN 1899-5276 (print), ISSN 2451-2680 (online) Adv Clin Exp Med. 2018;27(3):357–361

N. Şahin, et al. Comparison of 2 cesarean section methods358
Introduction
Cesarean sections (C/S) are among the most common abdominal surgical procedures in women. Approximately 15% of all deliveries are performed by the abdominal route worldwide.1–3 According to the national registry of the Turk-ish Health Ministry, in 2014 the proportion of abdominal deliveries was 67% in medical school hospitals, 37% in pub-lic hospitals and 71% in private hospitals. The percentage at Sifa University Medical School Hospital in 2014 was 65%.
Cesarean sections are performed in both elective or emer-gency cases. Fetal distress, a previous C/S history, cephalo-pel-vic disproportion, eclampsia, preeclampsia, malpresentation, and placenta previa are the main indications for C/S.
Various surgical procedures have been defined for C/S. In the early 20th century, Pfannenstiel described a trans-verse incision of the abdomen, which is still the most com-monly used method.4 In 1926, Kerr proposed a transverse lower uterine segment incision and double-layer uterine suture with peritoneal closure.5 Joel-Cohen described a new transverse incision technique in 1972, and Stark modified it in 1994.6,7 This technique is also called the Misgav-Ladach method. In the modified Misgav-Ladach method (MML), skin closure is achieved with continuous subcuticular sutures or clips and mattress stitches, accord-ing to the surgeon’s preference.
In this prospective study, we sought to compare the MML and Pfannenstiel-Kerr (PK) methods in terms of in-traoperative and short-term postoperative outcomes.
Material and methods
This randomized controlled trial involved 252 pregnant women scheduled for primary emergency or elective C/S. All the procedures were performed at Sifa University
Medical School Hospital between October, 2014 and July, 2015. The approval of the university ethics committee was obtained before beginning the study. Written informed consent was obtained from each patient.
Inclusion criteria were: a gestational age >36 weeks, the first C/S (the women could have delivered vaginally before) and an obstetric indication for C/S. The same 2 surgeons performed all the C/S procedures. Exclusion criteria were: the presence of any additional surgical procedure, such as myomectomy, cystectomy or tubal ligation, placenta previa, placental abruption, preeclampsia, eclampsia, or HELLP syn-drome. A flow diagram showing the selection of the study population is presented in Fig. 1. The patients were random-ized into 2 groups using a computer-generated random num-ber list: PK (n = 126) and MML (n = 126). The organizer informed the surgeons (SG, NS) of the patient’s group assign-ment immediately before the surgery. The nurses who record-ed the VAS scores were blinded to the patient’s group. VAS scores were used to assess pain after the operation (on a scale where 0 = no pain and 10 = maximum pain). The anesthesi-ologist decided on the type of anesthesia (general was used in 19% of the patients, spinal or epidural in 81%).
Description of the modified Misgav-Ladach technique
A Joel-Cohen skin incision was performed with a straight superficial transverse cut in the skin about 3 cm below the line of the spinae iliacae anteriores superiores, and the subcutaneous tissue was opened upwards in the mid-line so as to reach the rectus sheath above the insertion of the pyramidalis muscles.7 The parietal peritoneum was opened digitally at the upper level of the intermuscular space. The fetus was extracted from a transverse lower uterine segment incision, and the placenta was removed by transabdominal uterine massage combined with light
Fig. 1. The selection of the study population
assessed for eligibility
(n = 260)
randomization
(n = 252)
excluded (n = 8)
not suitable (n = 6)
refused to participate (n = 2)
classic Pfannenstiel
method (n = 126)modi�ied Misgav-Ladach
method (n = 126)allocation
analysis
follow-upfollowed (n = 126)
lost (n = 0)followed (n = 126)
lost (n = 0)
analyzed (n = 126)
excluded (n = 0)
analyzed (n = 126)
excluded (n = 0)

Adv Clin Exp Med. 2018;27(3):357–361 359
cord traction. Closure of the uterine incision was accom-plished with a 1-layer continuous No. 1 polyglactin 910 suture (Vicryl, Ethicon Inc., Somerville, USA), using ad-ditional hemostatic stitches as required. The visceral and parietal peritoneum and the rectus muscles were left un-sutured. The rectus sheath was closed using a continuous No. 1 polyglactin 910 suture. The subcutaneous tissue was sutured if its depth exceeded 2 cm. The skin was closed with a continuous subcuticular suture.
Description of the Pfannenstiel-Kerr technique
The skin was opened with a Pfannenstiel incision, and the incision was extended through the subcutaneous tissue until the rectus sheath was exposed; the latter was then opened in the midline.4 Scissors were used to extend the rectus sheath incision laterally, and to separate it from the pyramidalis and rectus muscles. After lateral extension of the uterine incision with uterine scissors, fetal extraction and removal of the placenta using transabdominal uterine massage combined with light cord traction were performed. Closure of the uterine incision was accomplished with a 1-layer continuous No. 1 polyglactin 910 suture. The vis-ceral and parietal peritoneum were closed with a continuous No. 2/0 polyglactin 910 suture. The rectus sheath was closed with a continuous No. 1 polyglactin 910 suture. The sub-cutaneous tissue was sutured if its depth exceeded 2 cm. The skin was closed with a continuous subcuticular suture.
Primary and secondary measures of postoperative outcomes
The primary outcome measures were the duration of surgery (between skin incision and skin closure), extrac-tion time (until delivery of the neonate), Apgar score, blood loss, wound complications, and number of sutures used.
Secondary outcome measures were the wound infec-tion, time of bowel restitution, VAS scores from 0 to 10 at 6 h and 24 h after the operation, limitations in movement, and analgesic requirements. At 6 weeks after the surgery, patients were evaluated for late complications.
Statistical analysis
All statistical analyses were performed using RStudio v. 0.98.501 (RStudio Inc., Boston, MA, USA). The Mann-Whitney U test was used to compare the study groups. Probability values <0.05 were considered statistically sig-nificant. For each group, a minimum of 126 subjects was required to have 80% power (α: 0.05) with a 10% difference in Apgar scores.
Results
The patient characteristics are shown in Table 1. There was no difference between the groups in terms of mean maternal age, gestational age, BMI, C/S indication, or the type of anesthesia. There was a significant reduction in to-tal operating time in the MML group (16.9 min) compared with the PK group (35.2 min; p < 0.001), and the mean ex-traction time was significantly shorter in the MML group (p < 0.001). There was no difference in Apgar scores. Pri-mary outcomes are shown in Table 2.
All the patients began a regular diet 6 h after the surgery and were mobilized at 10 h after the surgery. The 6-hour post-op VAS score (VAS0) and the 24-hour score (VAS1) were significantly lower in the MML group (MML: 3.54 VAS0, 1.46 VAS1; PK: 6.36 VAS0, 3.64 VAS1; p < 0.001). Limitation in movement, evaluated 24 h after the opera-tion, was lower in the MML group (Fig. 2), and less anal-gesic was required in the MML group (1.8 doses; Fig. 3). There were no differences in febrile morbidity or the dura-tion of hospitalization. At 6 weeks after the operation, we received no complaints or reports of additional complica-tions related to the surgery.
Discussion
The present study compared the PK and MML meth-ods. In recent studies, shorter operating times have been reported with MML.8–12 Franchi et al. reported similar op-erating times with both methods, but a shorter extraction
Table 1. Patients’ demographic data
(Mean ±SD) MML(n = 126)
PK(n = 126) p-value
Age [years] 31.4 ±4.7 30.2 ±5.4 0.080
BMI [kg/m2] 29.22 ±3.97 30.23 ±5.09 0.251
Gestational age [weeks] 38.82 ±0.6 38.42 ±1.6 0.120
Type of anesthesia n (%)generalregional
22 (17.5)104 (82.5)
31 (23.6)95 (76.4)
0.155
Table 2. Operation details
(Mean ±SD) MML(n = 126)
PK(n = 126) p-value
Operating time [min] 16.89 ±2.45 35.24 ±4.81 <0.001
Extraction time [s] 85.2 ±40.1 190.3 ±78.6 <0.001
Apgar score (1 min) 8.8 ±2.7 8.3 ±2.4 0.121
Blood loss [mL] 205 ±146 370 ±251 0.001
Post-op – pre-op [g/dL] 0.36 ±0.95 0.56 ±0.83 0.001
Post-op – pre-op [%] 0.95 ±3.08 1.36 ±2.85 0.011
Number of sutures used 3.2 ±1.2 5.3 ±2.5 0.001
MML – modified Misgav-Ladach method; PK – Pfannenstiel-Kerr method.
MML – modified Misgav-Ladach method; PK – Pfannenstiel-Kerr method.

N. Şahin, et al. Comparison of 2 cesarean section methods360
time with MML.13 We also found a shorter operating time with MML than with the PK method. A shorter operating time may be particularly important in emergencies as op-posed to elective cases. It is of primary importance that the duration between incision and entrance to the abdomen was shorter, which provides a shorter time for delivering the baby. Although better results for neonatal outcomes would be expected under this condition, in most studies addressing this issue, no difference has been reported for neonatal outcomes between the 2 methods.9,10,13,14 We also found no difference in Apgar scores between the groups.
Another reason for the shorter operating time with MML is that the visceral and parietal peritoneal layers were left unsutured after the closure of the uterus. Suturing the peri-toneal layers is an unnecessary step, because the peritone-um does not heal by the approximation of the wound edges; a new peritoneal layer is formed within 24–48 h. Adhesions are formed as vascular bridges to supply oxygen to ischemic areas of tissue, and necrosis often occurs around peritoneal sutures, providing focal points for adhesions.15–17 More-over, leaving the subcutaneous tissue unsutured does not increase the incidence of wound complications.18,19 In the present study, we found that significantly fewer sutures were used in the MML group. The reduction in cost achieved in the MML method by using fewer sutures and less anes-thesia is particularly important for developing countries.
Stark and Finkel demonstrated reduced use of antibiotics and less postoperative febrile morbidity with MML.7 How-ever, other studies have found similar results for wound infection in the 2 methods.9,20 A prophylactic antibiotic
was given to all the patients in the present study, and we did not note any infection in either group. As in other recent studies, we found significantly less blood loss in the MML group.21 This was associated with several procedural dif-ferences: the subcutaneous tissue was not cut, the rectus muscles were stretched instead of being cut and the fascia layer was not opened upwards from the midline.
All the procedures were performed by the same 2 ex-perienced surgeons to avoid variation. A nurse blinded to the patient group recorded the postoperative data (VAS scores, the need for analgesics, scores for movement limita-tion) to prevent bias during the study. Early mobilization is known to reduce the risk of thrombosis, ileus and in-fections. Early restitution of oral intake facilitates physi-cal recovery through rapid replacement of protein loss. The lower analgesic requirements during the early postop-erative period in the MML group are associated with lower tissue trauma due to blunt access to the abdominal cavity, without the blood vessels and nerves of the subcutaneous tissue being incised.19
Higher scores were recorded for VAS0 and VAS1 in the PK group than the MML group in our study. The patients in the MML group reported less postoperative discomfort, indicating that MML is a less traumatic C/S approach. In another study, it was demonstrated that the MML meth-od resulted in better short-term quality of life scores, es-pecially in terms of reduced bodily pain and postoperative complications compared with the PK method.17
Conclusions
We suggest that in the future, with increased experi-ence on the part of surgeons, the minimally invasive MML cesarean section method will be chosen more often than the classic PK method.
References1. Menacker F, Curtin SC. Trends in cesarean birth and vaginal birth after
previous cesarean, 1991–1999. Natl Vital Stat Rep. 2001;49(13):1–16.2. Thomas J, Paranjothy S; Royal College of Obstetricians and Gynaeco-
logists Clinical Effectiveness Support Unit. The National Sentinel Cae-sarean Section Audit Report. London: RCOG Press; 2001.
3. Cai WW, Marks JS, Chen CH, Zhuang YX, Morris L, Harris JR. Increased caesarean section rates and emerging patterns of health insurance in Shanghai, China. Am J Public Health. 1998;88:777–780.
4. Pfannenstiel J. On the advantages of a transverse cut of the fascia above the symphysis for gynecological laparotomies, and advice on surgical methods and indications. Samml Klin Vortr Gynakol. 1987; 68:1–22.
5. Kerr JMM. The technic of cesarean section with special reference to the lower uterine segment incision. Am J Obstet Gynecol. 1926;12: 729–734.
6. Joel-Cohen S. Abdominal and Vaginal Hysterectomy: New Techniques Based on Times and Motion Studies. London: Heinemann; 1972.
7. Stark M, Finkel AR. Comparison between the Joel-Cohen and Pfan-nenstiel incisions in cesarean section. Eur J Obstet Gynecol Reprod Biol. 1994;53:121–122.
8. Song SH, Oh MJ, Kim T, Hur JY, Saw HS, Park YK. Finger-assisted stretching technique for cesarean section. Int J Gynaecol Obstet. 2006;92(3):212–216.
7
6
5
4
3
2
1
0
Fig. 3. Comparison of secondary outcomes (VAS scores and analgesics by number)
VPS-0 VPS-1 analgesics
classic MML
60
50
40
30
20
10
0
Fig. 2. Comparison of primary outcomes (operating time in min; bleeding in mL; sutures by number)
suturesbleedingoperation time
600
500
400
300
200
100
0
6
5
4
3
2
1
0
classic MML

Adv Clin Exp Med. 2018;27(3):357–361 361
9. Bjorklund K, Kimaro M, Urassa E, Lindmark G. Introduction of the Misgav Ladach caesarean section at an African tertiary centre: A ran-domised control trial. BJOG. 2000;107(2):209–216.
10. Darj E, Nordstrom ML. The Misgav Ladach method for cesarean sec-tion compared to the Pfannenstiel method. Acta Obstet Gynecol Scand. 1999;78(1):37–41.
11. Wallin G, Fall O. Modified Joel-Cohen technique for caesarean deliv-ery. BJOG. 1999;106(3): 221–226.
12. Xavier P, Ayres-De-Campos D, Reynolds A, Guimaraes M, Costa-San-tos C, Patricio B. The modified Misgav-Ladach versus the Pfannen-stiel-Kerr technique for cesarean section: A randomized trial. Acta Obstet Gynecol Scand. 2005;84(9):878–882.
13. Franchi M, Ghezzi F, Raio L, et al. 2002. Joel-Cohen or Pfannenstiel incision at cesarean delivery: Does it make a difference? Acta Obstet Gynecol Scand. 2002;81:1040–1046.
14. Naki MM, Api O, Celik H, Kars B, Yasar E, Unal O. Comparative study of Mis-gav-Ladach and Pfannenstiel-Kerr cesarean techniques: A random-ized controlled study. J Matern Fetal Neonatal Med. 2011;24 (2): 239–244.
15. Malvasi A, Tinelli A, Farine D, et al. Effects of visceral peritoneal clo-sure on scar formation at cesarean delivery. Int J Gynaecol Obstet. 2009;105:131–135.
16. Malvasi A, Tinelli A, Guido M, Zizza A, Farine D, Stark M. Should the visceral peritoneum at the bladder flap closed at cesarean sections? A post-partum sonographic and clinical assessment. J Matern Fetal Neonatal Med. 2010;23: 662–669.
17. Fatusic Z, Hudic I, Sinanovic O, Kapıdzıc M, Hotic N, Music A. Short-term postnatal quality of life in women with previous Misgav Ladach caesarean section compared to Phannenstiel-Dorffler caesarean section method. J Matern Fetal Neonatal Med. 2011;24(9):1138–1142.
18. Federici D, Lacelli B, Muggiasca L, Agarossi A, Cippolla L, Conti M. Cesarean section using the Misgav Ladach method. Int J Gynaecol Obstet. 1997;57(3):273–279.
19. Kulas T, Habek D, Karsa M, Vukovic M. Modified Misgav Ladach meth-od for cesarean section: Clinical experience. Gynecol Obstet Invest. 2008;65:222–226.
20. Franchi M, Ghezzi F, Balestreri D, et al. A randomized clinical trial of two surgical techniques for cesarean section. Am J Perinatol. 1998; 15:589–594.
21. Li M, Zou L, Zhu J. Study on modification of the Misgav Ladach meth-od for cesarean section. J Tongji Med Univ. 2001;21(1):75–77.


DOI10.17219/acem/67458
Copyright© 2018 by Wroclaw Medical University This is an article distributed under the terms of the Creative Commons Attribution Non-Commercial License(http://creativecommons.org/licenses/by-nc-nd/4.0/)
Address for correspondenceEwa GieysztorE-mail: [email protected]
Funding sourcesNone declared
Conflict of interestNone declared
Received on August 24, 2016Reviewed on October 27, 2016Accepted on December 1, 2016
AbstractBackground. The angle of trunk rotation (ATR) is a measurement that allows an objective assessment of a growing child’s spine. Early detection of trunk rotation prevents the progression of scoliosis. One of the factors that predispose children to the formation of faulty posture may be primitive reflexes, which should be integrated in the central nervous system (CNS) by the age of one year. If retained, primitive reflexes affect children’s physical development as well as their development at school.
Objectives. The aim of the study was to determine the prevalence of trunk asymmetry and the persistence of primitive reflexes and their inter-relationships in early school-age children.
Material and methods. In this population-based survey, 61 children, average age 6.3 years (SD ±1.43), were examined. The ATR was examined using a scoliometer. The degree of integration of reflexes was assessed using tests developed by S. Goddard to assess the asymmetrical tonic neck reflex (ATNR), symmetrical tonic neck reflex (STNR), and spinal Galant reflex (SGR) on a 0–4 scale. Spearman’s rank correlation coefficient and the χ2 test were used in the statistical analysis.
Results. In almost half of the children body rotation was observed, in most cases toward the right (p = 0.012). This asymmetry was positively correlated with non-integrated Galant reflex on the same side (r = 0.335, p = 0.050). The presence of trunk rotation is associated with sex: There was higher frequency of asymmetry among the girls than among the boys.
Conclusions. In the evaluation of scoliosis, it could be useful to examine primitive reflexes as a possible reason for trunk rotation. In the treatment of scoliosis, primitive reflex integration methods should be used in some cases.
Key words: children, the angle of trunk rotation, primitive reflex integration, scoliosis
Original papers
Trunk rotation due to persistence of primitive reflexes in early school-age children
Ewa Z. GieysztorA–D,F, Ludwika SadowskaA,E,F, Anna M. ChoińskaA,E,F, Małgorzata Paprocka-BorowiczE,F
Department of Physiotherapy, Faculty of Health Sciences, Wroclaw Medical University, Poland
A – research concept and design; B – collection and/or assembly of data; C – data analysis and interpretation; D – writing the article; E – critical revision of the article; F – final approval of the article
Advances in Clinical and Experimental Medicine, ISSN 1899-5276 (print), ISSN 2451-2680 (online) Adv Clin Exp Med. 2018;27(3):363–366

E. Gieysztor, et al. Trunk rotation and reflexes364
Axial rotation of the vertebrae is a feature of spinal de-formity in idiopathic scoliosis (IS). Rotation pivots around the long axis of the spine and results in rib humps in the thoracic region and muscle shafts in the lumbar region. Their size depends on the scoliosis angle measured using the Cobb method.1
There are several hypotheses regarding the underlying cause of trunk rotation in scoliosis. Among them, asym-metrical hip joint rotation range has been considered.2 Many of them define scoliosis as idiopathic. On the other hand, in pediatric neurology it has been observed that bad posture and repeated movements are caused by primitive reflexes which, if not integrated, could lead to asymme-try in various body parts and could also have an impact on spine rotation.3
Primitive reflexes are a natural part of prenatal and neo-natal neurological development, but if they persist after 6–8 months of a child’s life, they have an impact on the child’s neurological, emotional and physical develop-ment.4–6 In the present study we focused on 3 primitive reflexes that we have found to have the greatest impact on posture: the asymmetric tonic neck reflex (ATNR), the symmetric tonic neck reflex (STNR), and the spinal galant reflex (SGR).
The angle of trunk rotation is the parameter measured by the Bunnell scoliometer. It is an objective assessment technique consisting of an easy and economical examina-tion, and it can be used widely to monitor or prevent scolio-sis.7 There is a precise formula for converting scoliometer angles to Cobb angles. For example, 5° on the scoliometer is an 11° Cobb angle, and 7° on the scoliometer corresponds to a 20° Cobb angle.8,9
In this paper we investigated whether persistent primi-tive reflexes co-exist with trunk rotation. The hypoth-esis is that persistent asymmetric primitive reflexes have an impact on trunk rotation.
Material and methods
Participants
The study was approved by the Wroclaw Medical Univer-sity Ethics Committee (Wrocław, Poland). All the parents of the patients were informed of the purpose and process of the examinations and gave their written consent prior to the study.
The data was collected from 61 healthy children from schools in Lower Silesia (Poland). The participants’ age range was 5–9 years old; the average age was 6.3 years (SD ±1.43). The group included 36 girls and 25 boys. Condi-tions for exclusion were special educational and rehabili-tation needs. Each child was assessed individually using primitive reflex tests (ATNR, STNR and SGR), and a trunk rotation test with Bunnell’s scoliometer.
Measurement of primitive reflexes
The tests were carried out with the child in a quadruped position with hips flexed to 90°, elbows extended, hands flat, fingers extended, and head in a neutral position.5,10
In the asymmetrical tonic neck reflex test, the exam-iner gently and slowly rotated the child’s head to both sides. The procedure was carried out passively with a stop point at the midline. This sequence was repeated 4 times. The ATNR was measured on both the left side (ATNR L) and the right side (ATNR R).
The symmetrical tonic neck reflex was tested by the ex-aminer with the child’s head passively bent and extended. The STNR was measured for flexion (STNR FLX) and extension (STNR EXT).
The spinal Galant reflex was tested by stimulating the side of the back, laterally from the spine. The test was car-ried out on both the left side (SGR L) and right side (SGR R).
The classification of the reflexes was done using God-dard’s 5-point rating scale (0–4).11 The higher the children scored on the primitive reflex test, the lower the degree of primitive reflex integration they presented.
Measurement of trunk rotation
The children were also given trunk rotation tests using Bunnell’s scoliometer.7,8 The measurements were conduct-ed in the Adams forward bend test position. The results were classified in 4 levels: 0, 1–3, 4–6, >7. Level 0 means no abnormality, and the other levels indicate the degree of deformity in the trunk. The higher the scoliometer mea-surement, the greater the trunk rotation.
Statistical analysis
The statistical analysis was carried out using STATIS-TICA v. 12 software (StatSoft Inc., Tulsa, USA). Descriptive statistics were computed for all the variables. The results are presented as mean and standard deviation (SD±) or percentages. The normality of distribution was assessed using the Shapiro-Wilk test. The occurrence of right and left rib humps and the occurrence of primitive reflexes in relation to sex were calculated using the χ2 test with the Yates correction. Spearman’s rank correlation was applied for dependency between variables. Differences were con-sidered statistically significant when p < 0.05.
Results
Based on the tests, most of the children had non-persis-tent STNR FLX, which is the most integrated reflex among those studied. Nearly half of the group had retained SGR on both sides. ATNR P and STNR EXT occurred in over half of the children examined. The most frequently occur-ring persistent reflex was ATNR L, and the least frequently

Adv Clin Exp Med. 2018;27(3):363–366 365
occurring persistent reflex was STNR FLX. Neither STNR, FLX nor ATNR R were found at the maximum intensity in any of the children.
A comparison of the data from the boys and girls is shown in Table 1. The persistence of primitive reflexes differed between the sexes, especially in ATNR L and R. The girls’ results were better in the integration of the reflexes, but the difference wasn’t statistically significant (p > 0.050).
The participants’ scoliometer rates in the trunk rota-tion tests are shown in Table 2. Right rotation is more frequent than left rotation, and the difference in the fre-quency of right and left rotation is statistically significant at p = 0.012.
When the scoliometer results were considered in rela-tion to the children’s sex, we found that trunk rotation occurred moderately more frequently in girls (p = 0.296). In the group of boys, trunk rotation was observed in 54%, while in the group of girls it was seen in 57%. The dif-ference in the frequency of right or left rotation was also compared between boys and girls; 38% of the boys had right trunk rotation, while among the girls it was 49%. The results were not statistically significant (p = 0.181).
The statistical analysis showed a correlation between the persistence of primitive reflexes and trunk rotation. A significant correlation was found between the spinal Galant reflex and right trunk rotation (p < 0.050). There was no statistically significant correlation between other primitive ref lexes and trunk rotation (p > 0.050; Table 3).
Discussion
Studies on trunk rotation have been widely conduct-ed on children with IS.2,12 There are also many studies about the effectiveness of various kinds of scoliosis treat-ment.13–17 Our work contributes to the discussion of what the causes of IS may be. The present study shows that one of the causes of trunk rotation may lie in neurodevelop-mental disturbances. Asymmetry in the muscle tone in-duced by an involuntary response caused by a reflex, which is repeated each time the child moves his or her head, causes changes in the nervous tracts, and even though the intensity of the reflex decreases with age, motor pat-terns are impeded. Nearly half of the children examined in this study had a low level of primitive reflex integra-tion, and this correlated with the trunk rotation screening results. In our study 2–3% of the results were positive for trunk rotation values greater than or equal to 7° on the scoliometer. These results correspond with those of other researchers: Bunnell reported 2–3%, Yawn et al. 4.1% and Fong et al. 0.1–7.45.9,18,19
We have also found that most of the trunk rotation was situated on the right side of the trunk. This is sim-ilar to the results reported by Grivas et al., who found that left trunk asymmetry was less common than right in a group of 2071 children 5.5–18 years old.20 They also mentioned that girls were found to present a higher fre-quency of asymmetry than boys. In our study we also found a higher frequency of asymmetry in girls than in boys.
Table 1. Occurrence of primitive reflexes on a 5-point scale (0–4) in relation to sex
Scale
Reflex
SGR L SGR R ATNR L ATNR R STNR FLX STNR EXT
♂ ♀ ♂ ♀ ♂ ♀ ♂ ♀ ♂ ♀ ♂ ♀% n % n % n % n % n % n % n % n % n % n % n % n
0 42 10 38 14 42 10 54 20 17 4 19 7 29 7 32 12 79 19 81 30 29 7 32 12
1 21 5 16 6 29 7 8 3 33 8 51 19 33 8 49 18 13 3 11 4 42 10 38 14
2 17 4 24 9 17 4 22 8 25 6 19 7 13 3 11 4 4 1 3 1 17 4 19 7
3 17 4 14 5 8 2 8 3 17 4 8 3 25 6 5 2 4 1 3 1 13 3 3 1
4 4 1 5 2 4 1 2 2 8 2 0 0 0 0 0 0 0 0 0 0 0 0 3 1
p-value 0.949* 0.311* 0.238* 0.154* 0.217* 0.649*
* χ2 test.
Table 2. Occurrence of right and left rib humps. The difference between right- and left-sided rib hump occurrence is statistically significant at p = 0.012 (χ2 test)
Scoliometer rate
Right-sided rib hump Left-sided rib hump
% n % n
0 54 33 75 46
1–3 20 12 10 6
4–6 24 15 12 7
>7 2 1 3 2
Table 3. Correlations between reflexes and trunk rotation
Reflex R rotation L rotation
ATNR L r = 0.151 r = –0.100
ATNR R r = 0.079 r = –0.127
STNR FLX r = 0.040 r = –0.205
STNR EXT r = 0.109 r = 0.002
SGR L r = 0.156 r = –0.134
SGR R r = 0.335* r = 0.044
* significant correlation (Spearman’s rank correlation coefficient).

E. Gieysztor, et al. Trunk rotation and reflexes366
Among the girls in our study trunk rotation of various intensities was observed in 57%, while it was noted in 54% of the boys.
We have found no studies dealing with the impact of persistent primitive reflexes on posture, and therefore we have started to investigate the issue. In this study we found persistent primitive reflexes at the maximum level (4 points) in 2–5% of the participants. Grzywniak, whose research was conducted in two groups of healthy children (one group with learning difficulties, and a second group of children growing up in an orphanage), indicated that none of the children had 4 points in any of the examined reflexes, but the author emphasized that if a child has one persistent primitive reflex, he or she must also have an-other, in a state of mutual influence.21 Neurodevelopmental problems can impact a child’s progress in many areas, and this is therefore worth studying.
Scoliosis is not only a health problem, but also re-sults in high costs to society.22 Observations published by Chowańska et al. suggest that the use of a scoliometer decreases the costs of screening for scoliosis and facilitates to initiation of proper treatment.23
Examinations in cases of trunk rotation or scoliosis should involve not only physical examinations of asym-metry, but also screening for primitive reflexes. If some of them persist, it is justified to conduct primitive reflex integration therapy to break the cycle of involuntary move-ments and teach children new corrective patterns used in some methods of physiotherapy treatment. If primi-tive reflex integration therapy is undertaken, correction at the basic neurological level could stop the progression of scoliosis.
In conclusion, there is a need for ongoing research to ob-serve the impact of reflexive movements on body posture. However, applying reflex integration therapy in the treat-ment of scoliosis and posture defects may help eliminate neurological causes of rotation of the spine in selected cases.
References 1. Krawczyński A, Kotwicki T, Szulc A, Samborski W. Clinical and radio-
graphic measurement of the rotation of the vertebrae in patients with idiopathic scoliosis. Ortop Traumatol Rehabil. 2006;6:602–607.
2. Kotwicki T, Walczak A. Szulc A. Trunk rotation and hip joint range of rotation in adolescent girls with idiopathic scoliosis: does the‘ dinner plate’ turn asymmetrically? Scoliosis. 2008;3:1.
3. Ellis MD, Drogos J, Carmona C, Keller T, Dewald JPA. Neck rotation modulates flexion synergy torques, indicating an ipsilateral reticulo-spinal source for impairment in stroke. J Neurophysiol. 2012; 11:3096–3104.
4. Gieysztor EZ, Choińska AM, Paprocka-Borowicz M. Persistence of primitive reflexes and associated motor problems in healthy pre-school children. Arch Med Sci. 2018;1:167–173.
5. Goddard-Blythe S, Hyland D. Screening for neurological dysfunction in the specific learning difficulty child. Br J Occup Ther. 1998;61:459–464.
6. Sadowska L. Vaclav Vojta’s neurokinesiological concept for the diag-nosis and therapy of children with disturbances of motor develop-ment. Ortop Traumatol Rehabil. 2001;3:519–526.
7. Amendt LE, Ause-Ellias KL, Eybers JL. et al. Validity and reliability testing of the Scoliometer®. Phys Ther. 1990;70:108–117.
8. Bunnell WP. An objective criterion for scoliosis screening. J Bone Jt Surg Am. 1984;66:1381–1387.
9. Bunnell WP. Selective screening for scoliosis. Clin Orthop. 2005;434: 40–45.
10. Goddard-Blythe S. Attention, Balance and Coordination: The A.B.C. of Learning Success. Wiley-Blackwell; 2009.
11. Goddard-Blythe S. The role of primitive survival reflexes in the devel-opment of the visual system. Journ Behav Opt. 1995;6(2):31–36.
12. Samuelsson L, Noren L. Trunk rotation in scoliosis the influence of curve type and direction in 150 children. Acta Orthop Scand. 1997; 68:273–276.
13. Białek M, M’hango A, Kotwicki T. Monitoring of changes in trunk rota-tion during scoliosis physiotherapy. Scoliosis. 2007;2:1.
14. Wnuk B, Blicharska I, Błaszczak E, Durmała J. The impact of the der-otational mobilization of manual therapy according to Kaltenborn-Evjenth on the angle of trunk rotation in patients with adolescent idiopathic scoliosis – Pilot study. Direct observation. Ortop Trauma-tol Rehabil. 2015;17:343–350.
15. Białek M, Kotwicki T, M’hango A, Szulc A. Angle of trunk rotation in primary and compensatory scoliotic curve in children after individual rehabilitation with FITS method. Ann Acad Med Siles. 2007;61:45–48.
16. Kim KD, Hwangbo PN. Effects of the Schroth exercise on the Cobb’s angle and vital capacity of patients with idiopathic scoliosis that is an operative indication. J Phys Ther Sci. 2016;28:923–926.
17. Borysov M, Borysov A. Scoliosis short-term rehabilitation (SSTR) according to ‘Best Practice’ standards – are the results repeatable? Scoliosis. 2012;7:1.
18. Yawn BP, Yawn RA, Hodge D, et al. A population-based study of school scoliosis screening. JAMA. 1999;282:1427–1432.
19. Fong DY, Lee CF, Cheung KM, et al. A meta-analysis of the clinical effectiveness of school scoliosis screening. Spine. 2010;35:1061–1071.
20. Grivas TB, Vasiliadis ES, Koufopoulos G, et al. Study of trunk asym-metry in normal children and adolescents. Scoliosis. 2006;1:19.
21. Grzywniak C. The effect of the form of persistent trace reflexes to rise the difficulties of school. Szk Spec. 2010;98–112.
22. Kowalski IM, Dwornik M, Lewandowski R, et al. Early detection of idio-pathic scoliosis – analysis of three screening models. Arch Med Sci. 2015;11:1058–1064.
23. Chowańska J, Kotwicki T, Rosadziński K. Sliwiński Z. School screen-ing for scoliosis: Can surface topography replace examination with scoliometer? Scoliosis. 2012;7:9.

DOI10.17219/acem/68289
Copyright© 2018 by Wroclaw Medical University This is an article distributed under the terms of the Creative Commons Attribution Non-Commercial License(http://creativecommons.org/licenses/by-nc-nd/4.0/)
Address for correspondenceMagdalena IzdebskaE-mail: [email protected]
Funding sourcesThis study was supported by a research task within the framework of the statutory activities and stu-dents' research (Collegium Medicum in Bydgoszcz, Nicolaus Copernicus University in Toruń, Poland).
Conflict of interestNone declared
Received on October 7, 2016Reviewed on October 18, 2016Accepted on January 5, 2017
AbstractBackground. Niacinamide is a stable and water-soluble form of vitamin B3, a valuable and versatile cos-metic ingredient, which is well absorbed and tolerated by the skin. A large body of literature has reported on the antioxidant and cell repair properties of niacinamide. Therefore, it has been shown to be useful in the protection of the skin against ultraviolet B (UVB) radiation and free radicals. Despite numerous hypotheses on the mechanism of vitamin B3, its protective effects have not yet been fully elucidated.
Objectives. The aim of the study was to determine the protective effects of niacinamide on CHO AA8 cell line against UVB radiation. We assessed the following factors: cell death, cell cycle phase distributions, reorganization of main cytoskeletal proteins, such as F-actin, vimentin and β-tubulin, and also alterations at the ultrastructural level.
Material and methods. The material used for our research was Chinese hamster ovary cell line (CHO AA8). We used 4 research groups: 1) control cells; 2) cells treated with niacinamide; 3) cells exposed to UV radia-tion; and 4) cells co-incubated with niacinamide and next exposed to ultraviolet. The cell death and cell cycle were evaluated by a Tali® based-image cytometer. A fluorescence microscope was used to assess the reorganization of cytoskeletal proteins, whereas a transmission electron microscope enabled the evaluation of the alterations at the ultrastructural level of cells.
Results. We showed that UV-induced apoptosis and cell cycle distributions during treatment with niacina-mide resulted in a non-statistical significance in cell survival and no significant changes in the morphology and cytoskeleton in comparison to the control group. In turn, a combination of both factors led to an increase in the population of live cells and a decreased level of apoptotic cells in comparison to UV-exposed cells.
Conclusions. Our results confirmed the harmful effects of UV radiation on CHO AA8 cell line. Furthermore, niacinamide can protect cells against these factors, and the mechanism of action may be related to the stabilization of the cell cytoskeleton.
Key words: UV radiation, F-actin, vimentin, niacinamide, β-tubulin
Original papers
The protective effect of niacinamide on CHO AA8 cell line against ultraviolet radiation in the context of main cytoskeletal proteins
Magdalena Izdebska1,A,C,D,F, Marta Hałas-Wiśniewska1,A,C,D,F, Iwona Adamczyk2,A,B,F, Ismena Lewandowska2,A,B,F, Iga Kwiatkowska2,A,B,F, Maciej Gagat1,C,E,F, Alina Grzanka1,C,E,F
1 Department of Histology and Embryology, Faculty of Medicine, Collegium Medicum in Bydgoszcz, Nicolaus Copernicus University in Toruń, Poland2 Students' Research Group of Cell Biology and Ultrastructure, Department of Histology and Embryology, Faculty of Medicine, Collegium Medicum in Bydgoszcz,
Nicolaus Copernicus University in Toruń, Poland
A – research concept and design; B – collection and/or assembly of data; C – data analysis and interpretation; D – writing the article; E – critical revision of the article; F – final approval of the article
Advances in Clinical and Experimental Medicine, ISSN 1899-5276 (print), ISSN 2451-2680 (online) Adv Clin Exp Med. 2018;27(3):367–378

M. Izdebska, et al. Niacinamide protects CHO AA8 cells against UV368
Introduction
Vitamin B3, also known as niacin (nicotinic acid vita-min), is found in several forms, including niacinamide (nicotinamide; Niac). Furthermore, as niacin cannot be synthesized by the human body, it has to be delivered to the organism from the environment. It can be found in many foods, such as green vegetables, beans, milk, eggs, yeast, and meat or fish. Vitamin B3 is involved in the mech-anisms of DNA repair and genomic stability. Furthermore, niacin deficiency results in an increased rate of somatic mutations and toxicity caused by reactive oxygen spe-cies (ROS), which is associated with an increased risk of cancer and its elevated progression rate.1,2 Niacinamide is an amide form of vitamin B3, and it is also known as the precursor of important cofactors: niacinamide adenosine dinucleotide (NAD+) and its phosphate derivative – nia-cinamide adenosine dinucleotide phosphate (NADP).3 These cofactors and their reduced forms (NADH and NADPH) are involved in more than 40 cellular biochemi-cal reactions, including cellular biochemistry and energy metabolism, and in the mechanisms of cell protection against ROS.1 From the clinical point of view, nicotinic acid and niacinamide are useful in the treatment of vari-ous types of diseases. It has been shown that high doses of nicotinic acid may be potent in hypercholesterolemia treatment due to the reduction of lipids, e.g., low density lipoprotein (LDL), fatty acids (FAs) or cholesterol, as well as by the increase of high density lipoprotein (HDL).1,4
On the other hand, niacinamide is a clinically attractive pharmacological agent for the prevention of type 1 dia-betes mellitus due to the protection of islets.5 Likewise, Feng et al. indicated that nicotinamide may be used in the treatment of cardiac diseases and strokes as well as fetal alcohol syndrome (precursor of Bacterial NAD+).6 More-over, niacinamide, through an increase of intercellular NADP levels, improves and stabilizes the skin barrier, and also shows strong antioxidant properties.7 The effect on the epidermal barrier function is probably associated with stimulating the differentiation of keratinocytes and/or the upregulated synthesis of ceramide and keratins. The above-mentioned factors and durability, water solu-bility and good penetration through the stratum corneum are the reasons why it is also widely used in sunscreens and anti-aging cosmetics.8
Ultraviolet radiation (UV) is one of the most common fac-tors leading to skin cancer and photoaging. It is one of the major sunlight wavelengths on the light spectrum and it has been divided into 3 sections: UVC, UVB and UVA.9 UVC (wavelengths: 100–180 nm) is effectively blocked from reaching the Earth’s surface by the stratospheric ozone layer of the atmosphere. As the reports indicate, exposure to UV leads to skin burns and carcinogenesis. It is widely used in germicidal lamps. UVB (wavelengths: 280–315 nm) reaches the Earth’s surface in approx. 1–10% and induces unfavorable consequences to eyes and the
skin. However, it is involved in the synthesis of vitamin D3. Furthermore, the waves of UVB are absorbed by the skin with the consequence of sunburns, tanning, wrinkling or photoaging, which lead to skin cancer. UVA is not blocked by the stratospheric ozone layer and reaches the Earth’s surface in approx. 90–99%. As UVA is character-ized by long wavelengths (315–400 nm) and low energy, it can penetrate deeper into the skin than other UV types. It causes photoaging and leads to skin cancer. However, UVA is used in medicine, in the treatment of psoriasis, and in solariums.9
Due to that, niacinamide is known as an anti-aging agent and it is characterized by many beneficial prosperities. We examined its potential protective effect against ultraviolet ra-diation on an in vitro cell model of fibroblasts. To our knowl-edge, this study for the first time demonstrated the influence of niacinamide on the main cytoskeletal proteins such as F-actin, vimentin and β-tubulin in CHO AA8 cells. Moreover, we suggested that alterations of the cytoskeletal structure can be crucial to the protective effect of this compound.
Material and methods
Cell cultures and experimental treatments
The Chinese hamster ovary cell line (CHO AA8), kindly provided by Prof. M.Z. Zdzienicka (Department of Mo-lecular Cell Genetics, Collegium Medicum in Bydgoszcz, Nicolaus Copernicus University in Toruń, Poland), was routinely grown in Minimum Essential Medium (MEM, Lonza Group AG, Basel, Switzerland) supplemented with 10% fetal bovine serum (FBS, Gibco/Invitrogen Life Technologies, Carlsbad, CA, USA), 50 μg/mL gentamycin (Sigma-Aldrich Co., St. Louis, USA) and 1% non-essential amino acids (Sigma-Aldrich). Cells were cultured in 5% CO2, in a humidified atmosphere of 95% air, at 37°C. For further experiments, after 80% confluence, the cells were removed by trypsin (Sigma-Aldrich) and subcultured on 6- or 12-well plates. After 24 h culture, the cells were treated with niacinamide (Sigma-Aldrich) at a final con-centration of 1 and 10 mM to the cell medium, or exposed to ultraviolet radiation for 5 and 15 min. The doses of nia-cinamide were chosen based on the literature, while the time of UV exposure was previously described by us as inducing visible alterations in cells.10,11 In order to check the combination of both factors, first, CHO AA8 cells were preincubated with niacinamide for 24 h, and next the medium was partially removed and the cells were exposed to an indicated dose of ultraviolet light at a wavelength of 254 nm (UV). After exposure, the incubation was con-tinued with fresh medium and cultured for 24 h for the next experiments. The control cells were grown at identi-cal conditions without treatment with niacinamide and/or UV radiation.

Adv Clin Exp Med. 2018;27(3):367–378 369
Based-image cytometry assay
In order to determine cell death, the cells were stained with propidium iodide (PI) and Annexin V-Alexa Fluor® 488 (Tali® Apoptosis Kit – Annexin V-Alexa Fluor® 488 & Propidium Iodide, Invitrogen, Thermo Fisher Scien-tific, Waltham, USA) according to the protocol previously described.12 The cell pellets were resuspended in an An-nexin Binding Buffer (ABB) and incubated with 5 μL of An-nexin V-Fluor® 488 (Invitrogen, Thermo Fisher Scientific) in the dark for 20 min. Then, the cells were centrifuged at 300 g × 5 min and washed with ABB, whereupon 1 μL of propidium iodide was added for 4 min (incubation in the dark). Finally, the stained cells were loaded into a Tali® Cellular Slides (Invitrogen, Thermo Fisher Scientific) and analyzed with a Tali® based-image cytometer (Invitrogen, Thermo Fisher Scientific) in accordance with the instruc-tion manual. The results were analyzed on the assumption that the viable cells were characterized by negative signal for PI and Annexin V; apoptotic cells represent early and late apoptosis (all with positive signal for Annexin V-Alexa Fluor 488); necrotic cells were only PI-positive.
We measured cell cycle distribution using propidium iodide and a Tali® based-image cytometer (Invitrogen, Thermo Fisher Scientific).12 The CHO AA8 cells were harvested by trypsin and fixed with ice-cold 70% ethanol in distillated water, and stored at −20ºC for a few days. Afterwards, the cells were centrifuged at 650 g × 7 min, and were then rinsed with 1 mL of cold phosphate buffered saline (PBS) and centrifuged at 500 g × 5 min. Subsequently, the cell pellets were resuspended in Tali® Cell Cycle Kit (Invitrogen, Thermo Fisher Scientific) and incubated in the dark for 30 min. The Tali® cell cycle program was used to determine the fractions of cells in the sub-G1, G2/M, S, G0/G1 phases from the cell cycle distribution.
Each experiment was repeated in triplicate, and the re-sults were analyzed using FCS Express 4 Plus Researches Edition (deNovo Software, v. 4.03; Glendale, CA, USA).
Fluorescence staining of cytoskeletal proteins
To understand the protective mechanism of niacina-mide, alterations in the main cytoskelatal proteins were analyzed. The CHO AA8 cells were cultured on the coverslips. First, in order to perform fluorescence stain-ing of β-tubulin (microtubules), the cells were fixed in 3,3′-dithiodipropionic acid (DTSP) (Sigma-Aldrich Co.), diluted in microtubule-stabilizing buffer (MTSB) (1 mM EGTA, 10 mM PIPES, 4% polyethylene glycol); Sigma-Aldrich Co.; 1:50, 10 min at room temperature (RT), and were washed with DTSP in 0,5% Triton X-100 in MTSB (TSB) (1:50, 10 min, RT). Next, the cells were permeabilized with Triton-X 100 (Serva, Heidelberg, Ger-many) in TSB (10 min, RT) and incubated with 4% para-formaldehyde (PFA) (Serva) in HBSS (Hanks’ Balanced
Salt Solution, Sigma-Aldrich Co.) for 20 min at RT. Then, the CHO AA8 cells were rinsed in PBS (3 × 5 min, RT) and blocked in 1% bovine serum albumin (BSA)-PBS (15 min, RT). In turn, for fluorescence staining of vimentin and F-actin (intermediate filaments and microfilaments, respectively), the material was fixed in 4% PFA (20 min, RT), rinsed with PBS (3 × 5 min, RT) and blocked in 1% BSA in PBS (15 min, RT). Afterwards, the CHO AA8 cells were incubated with the primary antibody special for vimentin (Sigma-Aldrich) and β-tubulin (Sigma-Aldrich) at a dilution 1:60 and 1:80 in 1% BSA-PBS, respectively (1 h, RT). After the series of washes with PBS (3 × 5 min, RT), the second-ary antibody tetramethylrhodamine (TRITC) anty-mouse IgG (Sigma-Aldrich Co.) was used (1:85 in PBS, 1 h, RT). In order to visualize microfilaments (F-actin), the cells were incubated with Alexa Fluor 488® conjugated with phalloidin (Invitrogen, Thermo Fisher Scientific, Mo-lecular Probes; 1:40 in PBS, 20 min, RT). Next, the nu-clei of cells were stained by 4',6-diamidyno-2-fenyloindol (DAPI) (Sigma-Aldrich Co.; 1:20000 in PBS, 10 min, RT) and after the final rinse with PBS, the slides were mounted in Aqua-Poly/Mount (Polysciences Inc., Warrington, USA). The fluorescence analysis was performed using the Nikon Eclipse E800 fluorescence microscope (Nikon, Tokyo, Ja-pan) and NIS-Elements 4.0 software (Nikon).
Assessment of ultrastructural alterations
In order to assess the ultrastructural alterations, a trans-mission electron microscope was used. After the cells were cultured, the material was fixed with 3.6% glutaraldehyde (Polyscience, Warrington, PA, USA) in 0.1 M sodium caco-dylate buffer (Roth, Karlsruhe, Germany) for 30 min at RT and rinsed with 0.1 M cacodylate buffer (pH 7.4). Then, following the use of 1% osmium tetroxide in cacodylate buffer (1 h, RT), the CHO AA8 cells were washed with 0.1 M cacodylate buffer and dehydrated through a graded series of alcohols (30–90%) and acetone (90–100%). Sub-sequently, the study material was embedded in Epon 812 (Roth), and polymerization of the resin occurred for a few days (24 h at 37°C and 120 h at 65°C). Afterwards, the parts of the material selected were cut into ultra-thin sections us-ing a Reichert Om-U3 ultra-microtome (Vienna, Austria), placed on copper grids and stained with 1% uranyl acetate. The prepared material was examined using a JEM-100CX electron microscope (Jeol, Tokyo, Japan).
Statistical analysis
Statistical comparisons between the 2 groups of cell death and cell cycle data were performed using a 2-tailed Mann-Whitney U test. Differences between the groups were considered significant when p < 0.05. GraphPad Prism 5.0 (GraphPad Software, San Diego, CA, USA) was used for the statistical analyses.

M. Izdebska, et al. Niacinamide protects CHO AA8 cells against UV370
Results
Effect of niacinamide and/or UV on cell death
We studied the occurrence of cell death of CHO AA8 cells with treatment by various concentrations of niacina-mide, different time of exposure to UV, and their combi-nation. The analysis of cell death was performed using a Tali® Image-based cytometer, following Annexin V-Alexa
Fluor 488® and Propidium Iodide double staining. The rep-resentative plots were presented in Fig. 1 A and the mean percentage of results is presented in Table 1. In the CHO AA8 cells, no statistically significant differences in the percentage of live and apoptotic cells were observed follow-ing the treatment with all niacinamide doses as compared to the control. However, the exception was statistically significant increase in the percentage of Annexin V-pos-itive cells after incubation with niacinamide at 10 mM concentration. In turn, the data demonstrated that
Fig. 1. Based-image cytometric analysis of cell death using Annexin V-Alexa Fluor 488 and PI assay
A – representative plots; B – the percentage of viable cells; C – the percentage of apoptotic cells; D – the percentage of necrotic cells.The cells were treated with different concentration of niacinamide (1 and 10 mM) for 24 h, exposed to 5 and 15 min UV, and with both factors combined; asterisks indicate statistically significant differences from control cells (p < 0.05).
Table 1. The mean percentage of cell death results
Cells groups CTRL24h 1 mM Niac 10 mM Niac 5 min UV 15 min UV 1 mM Niac/
5 min UV1 mM Niac/15 min UV
10 mM Niac/5 min UV
10 mM Niac/15 min UV
IP–/A- 95.63 93.68 93 87.01* 75.08* 93.49 91.44 93.87 87.89*
IP–/A+ 1.78 2.57 5.19* 10.61* 25.5* 5.29* 5.8* 2.31 3.92
IP+/A– 2.01 2.53 2.14 3.58 1.41 3.95 4.11 2.36 7.72*
* Statistically significant results in comparison to the control (p < 0.05); CTRL – control; Niac – niacinamide; UV – ultraviolet.

Adv Clin Exp Med. 2018;27(3):367–378 371
ultraviolet radiation decreased the mean percentage of vi-able cells in time-dependent manner from 87.01% for 5 min to 75.08% for 15 min. Besides, we showed that the popula-tion of apoptotic cells ranged from 10.61% following 5 min of UV radiation to 25.5% after 15 min exposure to UV. In addition, the CHO AA8 cells exposed to ultraviolet ir-radiation resulted in a statistically significant decrease of cell viability, thereby leading to the statistically signifi-cant increase of apoptotic cells in comparison to untreated cells (Fig. 1 B–D).
As shown in Fig. 1 B, after combined treatment with niacinamide and UV radiation, we did not observe statisti-cally significant differences of cell viability in comparison to control, except for 10 mM Niac/15 min UV, whereas the mean percentage of live cells was 87.89%. Furthermore, following treatment with 1 mM Niac/5 min UV and 1 mM Niac/15 min UV, the Annexin V staining showed statisti-cally significant differences in the population of apoptotic cells in comparison to untreated cells (from 1.78% for con-trol to 5.29% and 5.8%, respectively). The data demonstrat-ed that preincubation with increasing doses of niacinamide and exposure for UV resulted in a statistically significant increase in the mean percentage of viable cells (except-ing 10 mM Niac/5 min UV) in comparison to the results following only UV radiation, thus reducing the Annexin V-positive population of cells (Fig. 1 B, C).
Cell cycle redistribution following the treatment with niacinamide and/or UV
During the project, the effect of the treatment with nia-cinamide and/or UV radiation on the cell cycle of CHO AA8 cell line was examined. Propidium iodide (PI) staining and an image-based cytometric analysis were used to de-termine cell cycle distribution and the results are shown in Fig. 2 and Table 2. Our data presented that the incuba-tion with 1 mM and 10 mM niacinamide led to an increase in the cell population of sub-G1 phase (Fig. 2 A). In turn, proportions of cells in sub-G1 phase increased from 4.83% (control) to 12.78% (5 min) and 29.01% (15 min) following UV radiation in a time-dependent manner. As regards the population of cells in sub-G1, after co-incubation with chosen doses of niacinamide and exposure to UV, there was a statistically significant increase in comparison with the population of control cells (Fig. 2 A). Nevertheless, we observed a statistically significant decrease in the mean percentage of cells classified as G2/M in comparison with the control as a consequence of treatment with all doses of niacinamide, both the exposure times of ultraviolet ra-diation and all combinations of these factors (Fig. 2 B). Concurrently, there were non-statistical differences in the population of cells categorized as S phase when compared with untreated cells excepting the cells treated with 1 mM niacynamide and exposed to UV light for 15 min (decrease
Fig. 2. Based-image cytometric analysis of cell cycle distribution in CHO AA8 cells treated with different concentrations of niacinamide (1 and 10 mM) for 24 h, exposed to 5 and 15 min of UV, co-incubated with Niac, and next exposed to UV
The percentage of cells in: A – sub-G1 phase; B – G2/M phase; C – S phase; D – with G0/G1 DNA content; asterisks indicate statistically significant differences from control cells (p < 0.05).
doses [mM] and time of exposure [min]

M. Izdebska, et al. Niacinamide protects CHO AA8 cells against UV372
to 14.32%) (Fig. 2 C). Similarly, a statistically significant de-crease in the proportions of cells in G0/G1 phase was detected after 15 min of ultraviolet radiation. On the other hand, we also observed that the CHO AA8 cells treated with 1 mM Niac and 10 mM Niac/15 min UV were characterized by a sta-tistically significant increase in G0/G1 phase population. Moreover, as shown in Fig. 2 D, the median percentage of cells in G0/G1 was at a similar level as in the case of control cells.
Fluorescence staining of the main cytoskeletal proteins
Morphological changes of cytoskeleton architecture depended on the times and doses of factors. The control cells were characterized by oval nuclei, regular shape, size and numerous actin stress fibers, typical for fibroblasts (Fig. 3 A). After 24 h of niacinamide treatment, the cells
Table 2. The mean percentage of cell cycle distributions
Cells groups CTRL24 h 1 mM Niac 10 mM Niac 5 min UV 15 min UV 1 mM Niac/
5 min UV1 mM Niac/15 min UV
10 mM Niac/5 min UV
10 mM Niac/15 min UV
Sub-G1 4.83 6.86 10.73* 12.78* 29.01* 5.64 12.10* 8.79* 10.83*
G2/M 33.24 20.42* 21.21* 26.24* 23.63* 18.74* 22.10* 21.13* 15.64*
S 21.26 19.77 22.79 19.27 14.32* 19.45 20.79 22.33 22.40
G0/G1 42.57 51.98* 40.44 40.21 32.97* 40.79 41.98 46.29 49.92*
* Statistically significant results in comparison to the control (p < 0.05); CTRL – control; Niac – niacinamide; UV – ultraviolet.
Fig. 3. CHO AA8 cells stained for F-actin; cell nuclei labeled with DAPI
A – control cells; B – cells treated with 1 mM of niacinamide; C – cells treated with 10 mM of niacinamide; D – cells exposed to 5 min UV; E – cells exposed to 15 min UV; the combination of both factors: F – 1 mM Niac/5 min UV; G – 1 mM Niac/15 min UV; H – 10 mM Niac/5 min UV; I – 10 mM Niac/15 min UV; Bar = 50 μm.

Adv Clin Exp Med. 2018;27(3):367–378 373
possessed actin filaments in the perinuclear area and in-tensive fluorescence of F-actin in the cortical part of the cell, like in untreated cells (Fig. 3 B, C). In turn, according to our previous results (cell death analysis), we noticed shrunk cells with depolymerization of the actin network following UV irradiation. After 5 min of ultraviolet ex-posure, F-actin formed a ring-like structure around the nucleus. However, in the enlarged cells, the actin network was expanded (Fig. 3 D). Following exposure of 15 min, strong F-actin rearrangement was observed in most of shrunk cells (Fig. 3 E). The assessment of F-actin struc-ture showed that in the case of following groups – 1 mM Niac/5 min UV and 1 mM Niac/15 min UV numerous stress fibres were clearly visible (Fig. 3 F, G). The cells co-treated with higher concentration of niacinamide (10 mM) and next exposed to UV had a voluminous ac-tin network and contained more bundles of stress fibers, especially in the enlarged cells (Fig. 3 H, I). Furthermore,
fluorescence staining of microfilaments showed their ac-cumulation in the cortical part and at the border between neighboring cells (Fig. 3 F–I).
In turn, in control cells, vimentin and microtubules were well-developed and were characterized by regular scaffold of thin filaments (Fig. 4 A, 5 A). Our cytoskeletal studies revealed that after exposure of the CHO AA8 cells to nia-cinamide, a network of intermediate filaments was regu-lar and there appeared some cells with intensity labeling of vimentin in the nuclear area (Fig. 4 B, C). Similar to the observation of F-actin, the image of 5 and 15 min expo-sure of UV showed the large population of apoptotic cells which were characterized by rounded shape, shrunk nu-clei and strong reorganization of vimentin bundles (Fig. 4 D, E). Following treatment with combination of all doses of niacinamide and both the exposure times of UV irradia-tion, our observation revealed that part of cells possessed thick vimentin bundles in perinculear region (Fig. 4 F–I).
Fig. 4. CHO AA8 cells stained for vimentin (intermediate filaments); cell nuclei labeled with DAPI
A – control cells; B – cells treated with 1 mM of niacinamide; C – cells treated with 10 mM of niacinamide; D – cells exposed to 5 min UV; E – cells exposed to 15 min UV; the combination of both factors: F – 1 mM Niac/5 min UV; G – 1 mM Niac/15 min UV; H – 10 mM Niac/5 min UV; I – 10 mM Niac/15 min UV; Bar = 50 μm.

M. Izdebska, et al. Niacinamide protects CHO AA8 cells against UV374
Furthermore, we also observed the small population of shrunken cells with strongly labeled of vimentin in the nucleus area and some enlarged cells, where the network of intermediate filaments were strongly extended (Fig. 4 G–I).
As shown in Fig. 5 (β-tubulin staining), following treat-ment with different concentrations of Niac, the population of altered cells was very small. Some CHO AA8 cells were characterized by strongly labeled β-tubulin localized in the perinuclear region, and some enlarged cells presented thick microtubules (Fig. 5 B, C). Additionally, we observed that UV radiation promoted changes in the distribution of main cytoskeletal protein such as β-tubulin in the CHO AA8 cells. The shorter time of UV exposure led to a high concentration of microtubules as ring-like structure in the perinuclear area. Furthermore, the cells presenting thick β-tubulin were oc-casionally also observed. Besides, fluorescence microscopic observation of microtubules demonstrated that the longer time of UV radiation (15 min) resulted in reorganization
of β-tubulin, especially in apoptotic cells (Fig. 5 D, E). An in-teresting fact worth emphasizing is that after exposure of the CHO AA8 cells to all combinations of chosen factors, we observed a cell population with a visible mitotic spindle (Fig. 5 F–I inserts). Moreover, as shown in Fig. 5 F–I, a strongly expanded network of tubulin with thick bundles was noticed in most of the enlarged cells. After the higher dose of Niac (10 mM) and time of UV exposure (15 min), the higher labeling of β-tubulin in the perinuclear region was seen (Fig. 5 I).
Furthermore, compared to untreated CHO AA8 cells, treatment with both niacinamide and UV radiation caused the alterations in cell shape from spindle type, typical for fibroblasts, to more rounded and flattened. Also, micro-scopic observation revealed a smaller population of cells with hallmarks characteristics for apoptosis, such as shrinkage of the cells or chromatin condensation, than in the case of ultraviolet exposure alone.
Fig. 5. CHO AA8 cells stained for β-tubulin (microtubules); cell nuclei labeled with DAPI
A – control cells; B – cells treated with 1 mM of niacinamide; C – cells treated with 10 mM of niacinamide; D – cells exposed to 5 min UV; E – cells exposed to 15 min UV; the combination of both factors: F – 1 mM Niac/5 min UV; G – 1 mM Niac/15 min UV; H – 10 mM Niac/5 min UV; I – 10 mM Niac/15 min UV; Bar = 50 μm.

Adv Clin Exp Med. 2018;27(3):367–378 375
Alterations at the ultrastructural level
The last step of our studies was the ultrastructure analy-sis of the CHO AA8 cells cultured with niacinamide, ex-posed to different time of UV and treated with both factors. The alterations were performed using a transmission elec-tron microscope (TEM) and these methods confirmed our previous observations. Namely, the control cells possessed a regular shape and an oval single nucleus (Fig. 6 A). TEM revealed that treatment with niacinamide resulted in the presence of some giant cells and cells with swollen mito-chondria or a small amount of vacuoles, probably cantained fine fibrillar material. Nevertheless, a population of these cells did not show significant morphological differences in comparison with the untreated cells (Fig. 6 B, C). In turn, following the exposure to ultraviolet radiation, the cells were characterized by visible morphological changes in the nucleus area and cytoplasm. After 5 min of UV radiation, the alterations were related to the marginalization of chro-matin and segmented/lobulated nuclei (Fig. 6 D). Besides, some UV-irradiated cells (15 min) presented acute damage manifestation and they included a degenerated cytoplasm
and/or extensive cytoplasmic vacuolization, swollen and disturbed mitochondria, and shrunk nuclei with a high condensation of chromatin (Fig. 6 E). On the other hand, electron micrographs of the CHO AA8 cells treated with both niacinamide and UV rays showed no dramatic chang-es in size and shape of cells in comparison to the popula-tion of untreated cells. We only observed an irregular shape of nucleus (segmented) with visible nucleolus, especially in the cells following 1 mM Niac/15 min UV and 10 mM Niac/5 min UV (Fig. 6 G, H), whereas, as showed in Fig. 6 F, I, significant changes in the ultrastructure of the CHO AA8 cells were not clearly observed.
Discussion
UV radiation is involved in many different harmful processes in cells. It has been reported that UV exposure results in the formation of cyclobutane-pyrimidine dimers (CPDs) and 6–4 photoproducts (6–4 PPs), which evoke the most abundant cytotoxic and mutagenic DNA lesions.13 Rastogi et al. have described a number of biological effects
Fig. 6. Transmission electron micrographs of CHO AA8 cells
A – electron micrographs of control cells; B – cells treated with 1 mM of niacinamide; C – cells treated with 10 mM of niacinamide; D – cells exposed to 5 min UV; E – cells exposed to 15 min UV; the combination of both factors: F – 1 mM Niac/5 min UV; G – 1 mM Niac/15 min UV; H – 10 mM Niac/5 min UV; I – 10 mM Niac/15 min UV; Bar = 5 μm.

M. Izdebska, et al. Niacinamide protects CHO AA8 cells against UV376
of UV radiation, including alterations in proteins or DNA, N2 fixation, as well as a reduction in cell growth and di-vision.14 Furthermore, Britt showed that UV radiation induces DNA damage and alterations in replication and transcription, leading to deletions of nitrogenous basis.15 Moreover, UV radiation results in the induction of oxi-dative stress, and it is involved in skin carcinogenesis.16 The research presented here was performed on one of the experimental models commonly used in many biological, pharmaceutical and medical studies – Chinese hamster ovary cell line (CHO AA8).
According to the literature, vitamins are necessary for proper cell functioning, development, and metabolism in each organism. It is known that the group of 13 vitamins, including vitamin A, C, B, K, and D has many beneficial features and probably prevent cancers and various dis-eases, such as cardiac disorders, arthritis and diabetes. This is why a diet rich in vegetables and fruits, and hence rich in many vitamins, is an important factor in main-taining good skin condition. In particular, vitamins A, B, C, and E exert an effect on moisture, spots, redness, and wrinkles of the skin. Among them, niacinamide (an amide form of vitamin B3) has been described as an agent that can improve skin condition stabilize epidermal barrier function and inhibit photocarcinogenesis.2,8
In the present study, we reported that niacinamide spe-cifically induces reorganization of main cytoskeleton pro-teins such as F-actin, vimentin and β-tubulin, resulting in the protection against UV irradiation-induced apop-tosis in CHO AA8 cell line. We found that UV radiation results in the decrease of cell survival and the increase in the percentage of apoptotic cells. Similar data was presented by Grzanka et al., where the CHO AA8 cells were irradiated by UVC for 2 min at a fluency of 100 J/m. They also observed morphological changes typical for pro-grammed cell death.17 It has also been reported that UV radiation results in cell death in mammalian cell lines, including non-small cell lung cancer (A549), breast cancer (MCF7), human kidney cells (293), HeLa cells, and kera-tinocytes.11,18–21 What is more, the data presented here showed that the treatment of CHO AA8 cell line with different concentrations of niacinamide did not induce the increase in cell population characterized by hallmarks typical for apoptosis. According to Knip et al., compounds of niacin, such as niacinamide, are non-toxic, while Iwata et al. suggested that the amides of vitamin B may pro-mote differentiations in HL-60.1,22,23 We presented here that the combination of niacinamide and exposure to UVB resulted in the decrease of the number of apoptotic cells as compared to UV-irradiated CHO AA8 cells. Surjana et al. suggested that nicotinamide (= niacinamide) pos-sesses protective properties against ultraviolet radiation. In their study on human keratinocytes HaCaT and ex vivo skin pre-treated with nicotinamide and exposed to ssUV (UVA + UVB), they demonstrated that these forms of ni-acin enhanced the repair of UV-induced DNA damage
through the reduction of CPDs and 8oxoG.3,24 Further-more, other studies showed that nicotinamide prevented immune suppression (human and mice) and cellular energy loss (human keratinocytes) induced by ultraviolet irradia-tion, and also by carcinognesis (mice).3,25
Here, we confirmed that ultraviolet irradiation induces apoptosis, which was manifested by the higher percentage of sub-G1 cells population and the lower percentage of cells with DNA content corresponding to S phase. Several other studies also revealed that UV results in G2 arrest of cell cycle in human keratinocytes, human skin fibroblasts W1 and in SV40 cells.26,27 Surjana et al. reported that amides of niacin did not affect cell division.3 The data presented here also shows that nicotinamide did not cause significant changes in CHO AA8 cell cycle distributions.
Despite numerous hypotheses, the protective mecha-nisms of niacinamide action against UV radiation are still not well understood. The knowledge of the cytoskeleton has been expanding for several decades, and it is known that this structure plays a critical role in almost all cel-lular processes. In our study, we observed that UV radia-tion led to the reorganization and degradation of F-actin, β-tubulin and vimentin. Similar changes in the micro-filament network were described by Veselká and Janisch, Grzanka et al. and Klimaszewska-Wiśniewska et al. They also noticed that UV-irradiated cells were characterized by the presence of F-actin aggregates and high-intensity fluorescence of actin fibers, especially in the perinuclear re-gions in shrunk cells.11,17,28 Desozua et al. suggested that the alterations in actin cytoskeleton may be a reference to the assessment of apoptosis.29 Furthermore, the disturbances of microfilament reorganization may result in incorrect cells adherence, and then lead to apoptosis, which in our experiments was confirmed by the presence of rounded cells population and a higher percentage of apoptotic cell after irradiation by UV.30 Veselká and Janisch presented the effect of UV radiation on the microtubule network in fibroblast L929 cell lines and showed its reduction, thick-ening and fragmentation.28,30 Our results also showed re-stricted distribution of β-tubulin in UV-irradiated cells. Moreover, Grzanka et al. demonstrated that UV exposure results in disassembly in microtubules and condensation of intermediate filaments in the perinculear area in other cell lines.17 Here, after UV irradiation, CHO AA8 cells also possessed the depolymerized vimentin, most strongly located in the nuclear region. Our studies confirmed the negative effect of UV on morphology and cytoskeletal proteins, and we suggest that these changes lead to cell death. Based on our knowledge, there are no similar pa-pers on the effect of niacinamide as a factor applied alone and in combination with UV on Chinese hamster ovary cell line, especially in the context of cytoskeleton network. In the present study, we showed that niacinamide-treated cells did not show significant differences in cytoskeletal structures as compared to untreated cells. Moreover, we noticed that after pre-treatment with niacinamide and

Adv Clin Exp Med. 2018;27(3):367–378 377
then exposure to UV, the CHO AA8 cells seemed to be more flattened and thus more attached to the surface in comparison to UV-irradiated cells. This was confirmed by the fact that we observed intensive fluorescence of mi-crofilaments in the cortical area in cells, which suggests enhanced adherent properties of the cells. Furthermore, we noticed a higher number of stress fibers and enlarged cells characterized by an extensive, bold network of cytoskeletal proteins. In addition, the presence of strongly labeled vi-mentin in ring-like form localized in the perinuclear region may augment filament assembly to build new intermediate filaments, and hence strengthen the network.31 Moreover, we showed that pre-treatment with niacinamide and then exposure to UV promotes cell growth and division in the form of visible mitotic figures and similar percentages of cells in S phase. In summary, we suggest that the amide of vitamin B3 induces the stabilization of microfilaments and intermediate filaments.
Our transmission electron microscope results present-ed cells which were characterized by visible condensa-tion of chromatin, nucleus segmentation, vacuolization of cytoplasm, or swollen mitochondria after ultraviolet irradiation. Likewise, Grzanka et al. showed that Chi-nese hamster ovary cells after exposure to UV irradia-tion exhibited similar alterations.17 Furthermore, other authors described the appearance of alterations in different UV-treated types of cell lines such as non-small lung can-cer A549 and melanoma WM35 cells lines.11,32 On the oth-er hand, niacinamide-treated cells predominantly showed essentially normal ultrastructure; in addition, swollen mi-tochondria were sporadically presented. Similar results were reported by Petrali et al., who described the protective effect of niacinamide on human lymphocytes and showed that the chosen amide of vitamin B3 did not cause signifi-cant changes at the ultrastructural level as compared to the control.33 The results presented here showed that the treat-ment with a combination of both factors (niacinamide and UV) induced visible changes in the nucleus area and less destruction of the cytoplasm as compared to ultraviolet irradiated CHO AA8 cells. In this paper, we described for the first time the influence of niacinamide and its combi-nation with UV on the ultrastructural changes in the CHO AA8 cells.
It has been shown that vitamin B3 protects human ke-ratinocytes against UV irradiation. Lin et al. have shown that co-incubation with niacin enhances the pro-survival pathway (through mTOR, AKT, S6) in HaKaT cells, and thus protects against cell death induced by UV.34 More-over, the effect of niacinamide on the primary melano-cytes cell line has been reported by Thomson et al. They suggested that this form of vitamin B enhances the repair of DNA damage.24 Several other studies described the protective properities of niacinamide.3,7,33,35,36 Neverthe-less, the data presented here allows us to assume that niacinamide protects CHO AA8 cells against ultraviolet exposure.
In conclusion, we described for the first time the influ-ence of niacinamide on cytoskeletal proteins such as F-actin, vimentin and β-tubulin, also at the ultrastructural level in Chinese hamster ovary cell line. Moreover, our results also confirmed the harmful effects of UV radiation on chosen experimental material. Data presented in this paper may provide new information on niacinamide in the context of protection properties. Furthermore, we suggest-ed that this compound can protect cells against ultraviolet irradiation, and the mechanism of action may be related to the stabilization of cell cytoskeleton. These results are very important for the development of primary biologi-cal sciences, because the full mechanism of niacinamide is still unexplained.
References1. Sauve AA. NAD+ and vitamin B3: From metabolism to therapies.
J Pharmacol Exp Ther. 2008;324:883–893.2. Kirkland JB. Niacin status and treatment-related leukemogenesis.
Mol Cancer Ther. 2009;8:725–732.3. Surjana D, Halliday GM, Damian DL. Nicotinamide enhances repair
of ultraviolet radiation-induced DNA damage in human keratino-cytes and ex vivo skin. Carcinogenesis. 2013;34:1144–1149.
4. Carlson LA. Niaspan, the prolonged release preparation of nicotin-ic acid (niacin), the broad-spectrum lipid drug. Int J Clin Pract. 2004; 58:706–713.
5. Gale EA, Bingley PJ, Emmett CL, Collier T; European Nicotinamide Diabetes Intervention Trial (ENDIT). A randomised controlled trial of intervention before the onset of type 1 diabetes. Lancet. 2004;363: 925–931.
6. Feng Y, Paul IA, LeBlanc MH. Nicotinamide reduces hypoxic isch-emic brain injury in the newborn rat. Brain Res Bull. 2006;69:117–122.
7. Lorencini M, Brohem CA, Dieamant GC, Zanchin NI, Maibach HI. Active ingredients against human epidermal aging. Ageing Res Rev. 2014;15:100–115.
8. Gehring W. Nicotinic acid/niacinamide and the skin. J Cosmet Der-matol. 2004;3:88–93.
9. Narayanan DL, Saladi RN, Fox JL. Ultraviolet radiation and skin can-cer. Int J Dermatol. 2010;49:978–986.
10. Surjana D, Halliday GM, Damian DL. Role of nicotinamide in DNA damage, mutagenesis, and DNA repair. J Nucleic Acids. 2010. doi: 10.4061/2010/157591
11. Klimaszewska-Wiśniewska A, Redzimska M, Izdebska M, Grzanka A. Ultraviolet radiation (UV) induces f-action rearrangement and cell death in the A549 human lung cancer cell line. Med Biol Sci. 2014;28: 17–21.
12. Klimaszewska-Wiśniewska A, Hałas-Wiśniewska M, Nadrowski T, Gagat M, Grzanka D, Grzanka A. Paclitaxel and the dietary flavo-noid fisetin: A synergistic combination that induces mitotic catas-trophe and autophagic cell death in A549 non-small cell lung can-cer cells. Cancer Cell Int. 2016;16:10.
13. Sinha RP, Häder DP. UV-induced DNA damage and repair: A review. Photochem Photobiol Sci. 2002;1:225–236.
14. Rastogi RP, Richa, Kumar A, Tyagi MB, Sinha RP. Molecular mech-anisms of ultraviolet radiation-induced DNA damage and repair. J Nucleic Acids. 2010;592980. doi:10.4061/2010/592980
15. Britt AB. Repair of DNA damage induced by solar UV. Plant Physiol. 1995;108(3):891–896.
16. Armstrong BK, Kricker A. The epidemiology of UV induced skin can-cer. J Photochem Photobiol B. 2001;63:8–18.
17. Grzanka D, Domaniewski J, Grzanka A, Zuryn A. Ultraviolet radiation (UV) induces reorganization of actin cytoskeleton in CHOAA8 cells. Neoplasma. 2006;53:328–332.
18. Ferguson HA, Marietta PM, Van Den Berg CL. UV-induced apopto-sis is mediated independent of caspase-9 in MCF-7 cells: A model for cytochrome c resistance. J Biol Chem. 2003;278:45793–45800.

M. Izdebska, et al. Niacinamide protects CHO AA8 cells against UV378
19. Wu S, Loke HN, Rehemtulla A. Ultraviolet radiation-induced apopto-sis is mediated by Daxx. Neoplasia. 2002;4:486–492.
20. Kulms D, Pöppelmann B, Shwarz T. Ultraviolet radiation-induced interleukin-6 release in HeLa cells is mediated via membrane events in a DNA damage-independent way. J Biol Chem. 2000;275:15060–15066.
21. Katiyar SK, Mantena SK, Meeran SM. Silymarin protects epidermal keratinocytes from ultraviolet radiation-induced apoptosis and DNA damage by nucleotide excision repair mechanism. PLoS One. 2011;6: e21410.
22. Knip M, Douek IF, Moore WP, et al. Safety of high-dose nicotinamide: A review. Diabetologia. 2000;43:1337–1345.
23. Iwata K, Ogata S, Okumura K, Taguchi H. Expression of CD38 in human promyelocytic leukemia HL-60 cell line during differentiation by nia-cin-related compounds. Biosci Biotechnol Biochem. 2003;67:1836–1839.
24. Thompson BC, Surjana D, Halliday GM, Damian DL. Nicotinamide enhances repair of ultraviolet radiation-induced DNA damage in pri-mary melanocytes. Exp Dermatol. 2014;23:509–511.
25. Park J, Halliday GM, Surjana D, Damian DL. Nicotinamide prevents ultraviolet radiation-induced cellular energy loss. Photochem Pho-tobiol. 2010;86:942–948.
26. Gentile M, Latonen L, Laiho M. Cell cycle arrest and apoptosis pro-voked by UV radiation-induced DNA damage are transcriptionally highly divergent responses. Nucleic Acids Res. 2003;31:4779–4790.
27. Lo HL, Nakajima S, Ma L, et al. Differential biologic effects of CPD and 6-4PP UV-induced DNA damage on the induction of apoptosis and cell-cycle arrest. BMC Cancer. 2005;5:135.
28. Veselká R, Janisch R. The effect of UV irradiation on changes in cyto-skeleton and viability of mouse fibroblasts L929 cell line. Scripta Med-ica. 2000;73:393–408.
29. Desozua M, Gunning PW, Stehn JR. The actin cytoskeleton as a sen-sor and mediator of apoptosis. Bioarchitecture. 2012;2:75–87.
30. Weinreb O, Dovrat A, Dunia I, Benedetti EL, Bloemendal H. UV-A-related alterations of young and adult lens water-insoluble alpha-crystallin, plasma membranous and cytoskeletal proteins. Eur J Bio-chem. 2001;268:536–543.
31. Al-Maghrebi M, Brulé H, Padkina M, Allen C, Holmes WM, Zehner ZE. The 3’ untranslated region of human vimentin mRNA interacts with protein complexes containing eEF-1gamma and HAX-1. Nucleic Acids Res. 2002;30:5017–5028.
32. Hussein MR, Haemel AK, Sudilovsky O, Wood GS. Genomic instabil-ity in radial growth phase melanoma cell lines after ultraviolet irra-diation. J Clin Pathol. 2005;58:389–396.
33. Petrali JP, Oglesby SB, Meier HL. Ultrastructural correlates of the protec-tion afforded by niacinamide against sulfur mustard-induced cytotoxic-ity of human lymphocytes in vitro. Ultrastruct Pathol. 1990; 14:253–262.
34. Lin F, Xu W, Guan C, et al. Niacin protects against UVB radiation-induced apoptosis in cultured human skin keratinocytes. Int J Mol Med. 2012;29:593–600.
35. LeClaire RD, Kell W, Bavari S, Smith TJ, Hunt RE. Protective effects of niacinamide in staphylococcal enterotoxin-B-induced toxicity. Toxicology. 1996;22:69–81.
36. Benavente CA, Schnell SA, Jacobson EL. Effects of niacin restriction on sirtuin and PARP responses to photodamage in human skin. PLoS One. 2012;7:e42276.

DOI10.17219/acem/68291
Copyright© 2018 by Wroclaw Medical University This is an article distributed under the terms of the Creative Commons Attribution Non-Commercial License(http://creativecommons.org/licenses/by-nc-nd/4.0/)
Address for correspondenceIwona ŻychowskaE-mail: [email protected]
Funding sourcesNone declared
Conflict of interestNone declared
Received on September 22, 2016Reviewed on December 13, 2016Accepted on January 5, 2017
AbstractBackground. Systemic lupus erythematosus (SLE) is characterized by alternating periods of activity and remission. A portion of the patients suffers from the chronically active form of the disease. The search for clinically useful markers of its activity is ongoing. At present, it is suggested that β2-microglobulin (β2M) may be useful in assessing SLE activity.
Objectives. The objective of the paper was to investigate the relationship between serum β2M concentra-tion and SLE activity.
Material and methods. The study group consisted of 69 SLE patients (62 women and 7 men), aged 34.5 ±11 years (19–69). Patients with kidney failure and infection were excluded from the study group. The concentration of β2M was measured using an ELISA test. SLE activity was assessed with Systemic Lupus Erythematosus Disease Activity Index 2000 (SLEDAI-2K), and by measuring the levels of C3 and C4 comple-ment components, anti-double stranded DNA antibodies (anti-dsDNA antibodies) and β2M. The relationship between β2M and the clinical manifestation of SLE was also covered in the study.
Results. The study revealed a statistically significant correlation between β2M concentration and SLEDAI-2K disease activity index (p < 0.05; r = 0.6), anti-dsDNA titer (p < 0.05; r = 0.3), and C4 component serum level (p < 0.05; r = −0.3). β2M concentration was significantly higher in patients with arthritis and/or myositis (p = 0.005), vasculitis (p = 0.005), and hematological manifestations of SLE (p = 0.02).
Conclusions. Periodical determination of β2M concentration in SLE patients may prove helpful in assessing the disease activity.
Key words: systemic lupus erythematosus, disease activity, β2-microglobulin
Original papers
β2-microglobulin as a marker of systemic lupus erythematosus activity
Iwona ŻychowskaA–D, Dorota SuszekB–D, Magdalena DryglewskaB,D, Maria MajdanE,F
Department of Rheumatology and Connective Tissue Diseases, Medical University of Lublin, Poland
A – research concept and design; B – collection and/or assembly of data; C – data analysis and interpretation; D – writing the article; E – critical revision of the article; F – final approval of the article
Advances in Clinical and Experimental Medicine, ISSN 1899-5276 (print), ISSN 2451-2680 (online) Adv Clin Exp Med. 2018;27(3):379–382

I. Żychowska, et al. β2M and systemic lupus erythematosus activity380
Introduction
Systemic lupus erythematosus (SLE) is an autoim-mune disease leading to chronic inflammation of nu-merous tissues and organs. The pathogenesis of SLE is complex and associated, i.a., with excessive activa-tion of T and B cells, apoptosis impairment, and inad-equate immune complex clearance. Excessive B cell activation results in the overproduction of autoantibod-ies, which combine with chromatin, creating immune complexes and inducing inflammation.1 In daily prac-tice, SLE activity is evaluated with the use of standard-ized disease activity assessment tools: Systemic Lupus Erythematosus Disease Activity Index 2000 (SLEDAI-2K), British Isles Lupus Assessment Group (BILAG), and by ver-ifying the laboratory parameters: C3 and C4 complement components, anti-C1q antibodies, anti-double stranded DNA antibodies (anti-dsDNA titer).2–4
In Polish conditions, circulating anti-C1q antibodies have been recently studied as the marker for lupus ne-phritis, while anti-ribosomal P protein antibodies titer and IL-10 concentration in exhaled breath condensate as general markers of the disease activity.5–7
The search for new SLE activity markers is ongoing. In recent years, the effectiveness of marking the β2-micro- globulin (β2M) serum concentrations in monitoring SLE activity has been consistently highlighted. β2M is a low-molecular-weight protein found on the surface of nucleated cells, including lymphocytes and macrophages. As a result of T and B cells activation, β2M is released, resulting in the elevation of its serum concentration level. The increased concentration of the protein is found chiefly in patients suffering from lymphoproliferative diseases, kidney failure and autoimmune diseases.8,9 So far, few studies have been carried out that have tackled the relationship between SLE activity and β2M blood concentration.10–13
Patients and methods
The study was carried out on a group of 69 SLE pa-tients (62 women and 7 men) aged 34.5 ±11 years (19–69), hospitalized at the Department of Rheumatology and
Connective Tissue Diseases of the Medical University of Lublin between 2013 and 2014. All patients met the 1997 SLE diagnosis criteria of the American College of Rheu-matology. The average disease duration was 5.8 ±4.8 years (0.5–19). Mucocutaneous symptoms were found in 22 pa-tients (31.9%), arthritis in 7 patients (10.1%), 8 patients (11.6%) were diagnosed with lupus nephritis, hematological symptoms were found in 6 patients (8.7%), and vasculitis in 8 patients (11.6%). None of the patients were diagnosed with nervous system disorder or serositis. Patients suffer-ing from infection, cancer and kidney failure were excluded from the study group.
In all the patients, SLE activity was assessed through checking the concentration of C3 and C4 components, anti-dsDNA antibodies and β2M, as well as using SLEDAI-2K. β2M serum concentration was measured using an ELISA test. C3 and C4 components levels were measured by turbidimetry, and anti-dsDNA antibodies concentration was determined by ELISA.
The statistical analysis was done using STATISTICA v. 10.0 software (StatSoft, Kraków, Poland). All data was given as means ±SD. Nonparametric tests were used: the Mann-Whitney U test and Spearman’s rank correlation coefficient. Differences were considered significant at p < 0.05.
Results
Table 1 shows the selected parameters of disease activity assessment in the group of SLE patients. The study group revealed a statistically significant correlation between β2M concentration and anti-dsDNA antibodies titer (p < 0.05; r = 0.3), C4 component (p < 0.05; r = −0.3), and SLEDAI-2K (p < 0.05; r = 0.6) (Fig. 1–3). No significant relationship was found between β2M and C3 component, the patients’ age or the duration of the disease.
Table 2 presents mean concentrations of β2M in SLE pa-tients with different clinical manifestations of the disease. β2M concentration was significantly higher in patients with
Fig. 1. The correlation between β2M concentration and anti-dsDNA antibodies titer
anti-dsDNA – anti-double stranded DNA antibodies; β2M – β2-microglobulin.
r = 0.3
0 100 200 300 400 500 600 700
anti-dsDNA, IU/mL
1
2
3
4
5
6
7
8
9
ß2M
, ug/
mL

Adv Clin Exp Med. 2018;27(3):379–382 381
arthritis and/or myositis (p = 0.005), vasculitis (p = 0.005) and hematological manifestations of SLE (p = 0.02).
No statistically significant deviation of β2M concentra-tion was found in patients suffering from cutaneous and/or mucosal manifestations or kidney damage (Table 2).
Table 1. Selected markers of disease activity in SLE patients
Disease activity parameters
Mean value ±SD Range % positive
results
anti-dsDNA [IU/mL](positive >60)
200.2 ±175.1 18.5–597.2 34 (49.3%)
C3 [mg/dL](norm 12–36)
86.8 ±22.9 33.5–134.0 36 (52.2%)
C4 [mg/dL](norm 90–170)
16.6 ±8.2 0.9–34.6 23 (33.3%)
β2M [µg/mL](norm 0–3)
3.0 ±1.2 1.8–8.6 24 (34.8%)
SLEDAI-2K 4.7 ±4.1 0–20 –
anti-dsDNA – anti-double stranded DNA antibodies; β2M – β2-micro-globulin; C3 – C3 complement components; C4 – C4 complement components; SLE – systemic lupus erythematosus; SLEDAI-2K – Systemic Lupus Erythematosus Disease Activity Index 2000.
Fig. 3. The correlation between β2M concentration and SLEDAI-2K
β2M – β2-microglobulin; SLEDAI-2K – Systemic Lupus Erythematosus Disease Activity Index 2000.
Fig. 2. The correlation between β2M concentration and C4 component
β2M – β2-microglobulin; C4 – C4 complement.
r = -0.3
-5 0 5 10 15 20 25 30 35 40
C4, mg/dL
1
2
3
4
5
6
7
8
9
ß2M
, ug/
mL
r = 0.6
-2 0 2 4 6 8 10 12 14 16 18 20 22
SLEDAI-2K
1
2
3
4
5
6
7
8
9
ß2M
, ug/
mL
Table 2. Comparison of β2M concentration in patients with different SLE clinical manifestations
SLE manifestations Mean concentration of β2M ±SD p-value
Cutaneous and/or mucosal(+), n = 22(−), n = 47
3.2 ±1.22.9 ±1.2
ns
Vasculitis(+), n = 8(−), n = 61
4.7 ±1.82.8 ±0.9
0.005
Arthritis and/or myositis(+), n = 7(−), n = 62
4.9 ±2.22.8 ±0.8
0.005
Serositis(+), n = 0(−), n = 69
––
–
Kidney(+), n = 8(−), n = 61
2.7 ±0.63.0 ±1.2
ns
Neurological(+), n = 0(−), n = 69
––
–
Hematological(+), n = 6(−), n = 63
3.8 ±1.02.8 ±1.2
0.02
β2M – β2-microglobulin; SLE – systemic lupus erythematosus; ns – nonsignificant.

I. Żychowska, et al. β2M and systemic lupus erythematosus activity382
Discussion
Considerable importance has been attached recently to early detection of SLE exacerbation and to monitoring its activity. The search for sensitive markers of the disease activity continues to enable anticipation of exacerbation at the preclinical stage. The significance of β2M in monitor-ing SLE activity has been highlighted lately. This study revealed that increased β2M level was found in 34.8% of the patients, and correlated with the disease activity mark-ers such as SLEDAI-2K, anti-dsDNA antibodies titer, and C4 component. Considerably higher β2MG levels were found in patients with musculoskeletal system involve-ment, hematological symptoms and vasculitis.
The study by Kim et al., conducted on 100 SLE patients, revealed increased β2M concentration in 97% of patients. β2M concentration was significantly higher in patients with serositis, oral erosions and symptoms of lupus ne-phritis. Much like in the case of the study described in the present paper, a statistically significant correlation was found between β2M and anti-dsDNA antibodies titer, C3 component and hemoglobin concentration, and SLE-DAI disease activity score.10 Hermansen et al. examined 26 SLE patients and proved the relationship between β2M concentration and disease activity scored according to SLEDAI, C3 complement component and daily protein-uria. They also found a significant correlation between the concentration of β2M and cytokines responsible for SLE pathogenesis: IL-6, IL-8, IL-10, IL-18, IFN-α.11 Similar results were obtained by Skare et al. – in a group of 129 SLE patients, β2M concentration correlated with SLEDAI, OB, anti-dsDNA antibodies, and C3.12 Wakabayashi et al. proved that β2M concentration decreased throughout the course of immunosuppressive treatment.13
The cause of elevated β2M concentration in SLE patients is not fully understood. Some researchers suggest the β2M increase may result from increased lymphocyte turnover in autoimmune disease, or the presence of immune com-plexes formed by β2M with anti-β2M antibodies removed by kidneys.10,14,15 An experimental study on diseased SLE mice with β2M deficiency revealed differences in the clini-cal picture of the disease – a higher percentage of mice with cutaneous symptoms, with a lower percentage of kid-ney damage. The results suggest a possible influence of β2M on the clinical course of SLE.16
The number of studies assessing the significance of β2M in monitoring SLE activity is scarce. So far, only a small group of patients has been studied, with very few studies fo-cused on the influence of treatment on β2M concentration. The authors consider it viable to include β2M in the process of assessing SLE activity, and to monitor β2M concentration in the same patients over different disease activity periods.
References1. Kyttaris VC, Krishnan S, Tsokos GC. Systems biology in systemic lupus
erythematosus: Integrating genes, biology and immune function. Autoimmunity. 2006;39:705–709.
2. Gladman DD, Ibenz D, Urowitz MB. Systemic Lupus Erythematosus Disease Activity Index 2000. J Rheumatol. 2002;29:288–291.
3. Gordon C, Sutcliffe N, Skan J, Stoll T, Isenberg DA. Definition and treatment lupus flares measured by the BILAG index. Rheumatology. 2003;42:1372–1379.
4. Trendelenburg M. Antibodies against C1q in patients with systemic lupus erythematosus. Springer Semin Immunopathol. 2005;27:276–285.
5. Smykał-Jankowiak K, Niemir ZI, Polcyn-Adamczak M. Do circulating antibodies against C1q reflect the activity of lupus nephritis? Pol Arch Med Wewn. 2011;121:287–295.
6. Olesińska M, Chwalińska-Sadowska H, Wiesik-Szewczyk E, Mielnik P, Zabek J. Clinical manifestation of systemic lupus erythematosus in patients with antiribosomal P protein antibodies. Pol Arch Med Wewn. 2010;120:76–81.
7. Nielepkowicz-Goździńska A, Fendler W, Robak E, et al. Exhaled cyto-kines in systemic lupus erythematosus with lung involvement. Pol Arch Med Wewn. 2013;123:141–148.
8. Evrin PE, Strom T. Beta 2-microglobulin and its binding activity in serum from patients with SLE. Ann Rheum Dis. 1984;43:267–274.
9. Bień E, Balcerska A. Znaczenie kliniczne β2-mikroglobuliny w chorobie nowotworowej u dorosłych i dzieci. Współcz Onkol. 2003;7:333–338.
10. Kim HA, Jeon JY, Yoon JM, Suh CH. Beta 2-microglobulin can be a dis-ease activity marker in systemic lupus erythematosus. Am J Med Sci. 2010;339:337–340.
11. Hermansen ML, Hummelshøj L, Lundsgaard D, et al. Increased serum β2-microglobulin is associated with clinical and immunological markers of disease activity in systemic lupus erythematosus. Lupus. 2012;21:1098–1104.
12. Skare TL, Ferri K, Santos MA. Systemic lupus erythematosus activity and beta two microglobulin levels. Sao Paulo Med J. 2014;132:239–242.
13. Wakabayashi K, Inokuma S, Matsubara E, et al. Serum β2-microglobulin level is a useful indicator of disease activity and hemophagocytic syndrome complication in systemic lupus erythematosus and adult-onset Still’s disease. Clin Rheumatol. 2013;32:999–1005.
14. Ooi BS, Ooi YM, Pesce AJ, Pollak VE. Antibodies to beta 2-microglobu-lin in the sera of patients with systemic lupus erythematosus. Immu-nology. 1977;33:535–341.
15. Revillard JP, Vincent C, Rivera S. Anti-beta2-microglobulin lympho-cytoxic autoantibodies in systemic lupus erythematosus. J Immunol. 1979;122:614–618.
16. Chan OT, Paliwal V, McNiff JM, Park SH, Bendelac A, Shlomchik MJ. Deficiency in beta2-microglobulin, but not CD1, accelerates sponta-neous lupus skin disease while inhibiting nephritis in MRL-Fas (lpr) mice: An example of disease regulation at the organ level. J Immunol. 2001;167:2985–2990.

DOI10.17219/acem/68362
Copyright© 2018 by Wroclaw Medical University This is an article distributed under the terms of the Creative Commons Attribution Non-Commercial License(http://creativecommons.org/licenses/by-nc-nd/4.0/)
Address for correspondenceMagdalena Kopeć-MędrekE-mail: [email protected]
Funding sourcesThis study was supported by Medical University of Silesia, Katowice, Poland (KNW-1-045/N/3/0).
Conflict of interestNone declared
Received on September 28, 2016Reviewed on October 9, 2016Accepted on January 9, 2017
AbstractBackground. Fibulin-3 (Fib-3) is a new potential biomarker of articular cartilage metabolism.
Objectives. The aim of the study was to evaluate the effect of anti-TNF therapy on serum fibulin-3, cartilage oligomeric matrix protein (COMP), procollagen II C-propeptide (PIICP), and urinary C-terminal telopeptide of type II collagen (CTX-II) levels in relation to calprotectin (MRP8/14) and disease activity in rheumatoid arthritis patients.
Material and methods. In the study, 35 female patients with rheumatoid arthritis (RA) were investigated. The concentration of fibulin-3, COMP, PIICP, MRP8/14, and urinary CTX-II in serum was measured before and after anti-TNF therapy. Ten healthy women were investigated as the controls.
Results. The concentration of fibulin-3 in RA patients before treatment did not differ significantly from the concentration of fibulin-3 in the control group. A significantly higher concentration of fibulin-3 was noted prior to treatment in the group of women with a worse response to the therapy (non-responders) compared to the concentration of fibulin-3 in the healthy women. During the anti-TNF therapy, the serum fibulin-3 level decreased in patients. The fibulin-3 level correlated with CRP and ESR after anti-TNF treatment. Significant lowering of MRP8/14 was noted in the patients after anti-TNF therapy. No correlation between fibulin-3 and MRP8/14 was observed in the study group or in the control group.
Conclusions. During the anti-TNF therapy, the serum fibulin-3 level decreased in RA patients. Serum MRP8/14 concentration also decreased. No correlation between fibulin-3 and MRP8/14 was observed in the study group before and after the treatment. We found a poor correlation between serum fibulin-3 and other cartilage metabolism biomarkers after anti-TNF therapy.
Key words: rheumatoid arthritis, fibulin-3, calprotectin
Original papers
Fibulin-3 and other cartilage metabolism biomarkers in relationship to calprotectin (MRP8/14) and disease activity in rheumatoid arthritis patients treated with anti-TNF therapy
Magdalena Kopeć-MędrekA–D,F, Eugene J. KucharzA,E,F
Department of Internal Medicine and Rheumatology, School of Medicine in Katowice, Medical University of Silesia, Poland
A – research concept and design; B – collection and/or assembly of data; C – data analysis and interpretation; D – writing the article; E – critical revision of the article; F – final approval of the article
Advances in Clinical and Experimental Medicine, ISSN 1899-5276 (print), ISSN 2451-2680 (online) Adv Clin Exp Med. 2018;27(3):383–389

M. Kopeć-Mędrek, E. Kucharz. Fibulin-3 and other cartilage biomarkers384
Introduction
Rheumatoid arthritis (RA) is a chronic systemic inflam-matory disease associated with synovial inflammation as well as cartilage and bone destruction. Production of pro-inflammatory cytokines: tumor necrosis factor (TNF), interleukin-6 (IL-6) and interleukin-17 (IL-17), causes the release of proteolytic enzymes, matrix metalloprotein-ases, and degradation of the connective tissue of the joint. Cartilage metabolism may be monitored with evaluation of the synthesis and degradation of cartilage products. Biological markers are the object of increasing interest in diagnostics and osteoarthritis (OA) monitoring.1 In the case of rheumatoid arthritis, attempts have been made for many years to find biomarkers which would facilitate monitoring the activity of the disease and predicting the response to treatment in RA patients. Indicators of the disease activity – erythrocyte sedimentation rate (ESR) and C-reactive protein (CRP) – as well as prognostic fac-tors like rheumatoid factor (RF), anti-cyclic citrullinated peptide (aCCP) and others, applied in everyday rheumatol-ogy practice seem to be insufficient. An analysis of single indicators in laboratory diagnostics for cartilage damage in the course of rheumatoid arthritis or osteoarthritis may not be of much use; however, combining several indicators could make the task easier.
Fibulin-3 (Fib-3), also known as an epidermal growth factor containing a fibulin-like extracellular matrix pro-tein-1 (EFEMP1) and an epidermal growth factor (EGF) containing fibulin-like ECM protein, is an extracellular glycoprotein (one of 7 members of the fibulin family). During development, fibulin-3 is expressed in the mes-enchyme, stimulating the growth of bone and cartilage structures. Fibulin-3 stimulates the expression of the tis-sue inhibitor of metalloproteinase-1 (TIMP-1) and tissue inhibitor of metalloproteinase-3 (TIMP-3), and inhibits the expression matrix metalloproteinases MMP-2, MMP-3 and MMP-9. It also inhibits angiogenesis.2 Recently, Wak-abayashi et al. showed that the over-expression of fibu-lin-3 in the clonal murine cell line negatively regulated chondrocyte differentiation.3 Compared to age-matched healthy subjects, median levels of serum Fib-3 were el-evated in osteoarthritis patients. These findings indicate that Fibulin-3 peptides (Fib3-1 and Fib3-2) may constitute a potential biochemical marker of articular cartilage me-tabolism.4 Fibulin-3 is present in various tissues, including the eye and blood vessels. It is highly expressed in epithe-lial and endothelial cells and is located in their basement membranes.2
The cartilage oligomeric matrix protein (COMP), also designated as thrombospondin 5 (TSP5), is a well-known 425-kDa non-collagenous glycoprotein present in the ex-tracellular matrix of the articular cartilage. COMP was also found in other tissues, including the synovium and tendon. COMP has shown promise as a potential biomark-er for monitoring the progression of destruction of the
joint cartilage, both in osteoarthritis and in rheumatoid arthritis.5
Type II collagen is the basic type of collagen building the ar-ticular cartilage; therefore, the urinary C-terminal telopeptide of type II collagen (CTX-II) – indicator of cartilage degradation, as well as procollagen II C-propeptide (PIICP) – marker of type II collagen synthesis in the cartilage, may also be helpful in as-sessing the degree of cartilage damage in arthritis.6
MRP8/14 is a myeloid-related protein also known as cal-protectin, S100A8/A9 or calgranulin A and B, released from activated granulocytes and macrophages in the synovium and synovial fluid during inflammation. Calprotectin causes proinflammatory effects in vitro on phagocytes and endothelial cells, and promotes inflammation in vivo.7 MRP8/14 is a potentially more sensitive biomarker of dis-ease activity in rheumatoid arthritis than conventional in-flammatory indexes such as the erythrocyte sedimentation rate (ESR) and C-reactive protein (CRP), because it directly reflects inflammation in the synovium.8
The aim of the study was to evaluate the effect of anti-TNF therapy on serum fibulin-3, COMP, PIICP, and uri-nary CTX-II levels in relation to calprotectin and disease activity in rheumatoid arthritis patients.
Patients and methods
A total of 35 female patients with RA classified according to the revised criteria of the American College of Rheuma-tology 1987 were qualified for the study. Patient charac-teristics are shown in Table 1. All the patients had active diseases (Disease Activity Score 28 – DAS28 > 5.1) and did not achieve remission after the application of at least 2 synthetic disease-modifying drugs. Anti-TNF treatment was administered over a 9-month period. Moreover, the study group was divided into patients who responded well to the anti-TNF treatment – called group of responders – comprising patients with remission (DAS28 < 2.6) and patients with low diseases activity (DAS28 < 3.2), and into those who did not react to the treatment in a sufficient way – group of non-responders (DAS28 > 3.2). Patients were also given methotrexate and prednisone in a stable dose.
Table 1. Patient characteristics
RA patients Patients (n = 35)
Age [years], mean ±SD 48.29 ±11.55
Female, n (%) 35 (100)
RA duration [years] 8.3 ±3.1
DAS28 > 5.1, n (%) 35 (100)
Methotrexate in a dose of 25 mg/week, n (%) 35 (100)
Prednisone (mg/d), mean ±SD 2.78 ±2.08
Anti-TNF treatment, n (%)– adalimumab– certolizumab– etanercept– golimumab
10 (28.5)5 (14.2)
19 (54.2)1 (3.1)

Adv Clin Exp Med. 2018;27(3):383–389 385
The study included only female patients. After a clinical examination and additional test results, it was possible to exclude from this group patients with potential factors which could have had some impact on the concentration of the determined markers, i.e., renal and liver insuffi-ciency, heart failure, endocrinopathy, or neoplastic disease. None of the patients smoked cigarettes. As the control group, 10 healthy women matched in terms of age and body mass index (BMI) were investigated.
The concentration of fibulin-3, COMP, PIICP, MRP8/14, and urinary CTX-II in serum was measured before the treatment as well as following 36 weeks of anti-TNF ther-apy. Blood and urine samples were taken in the morning (8 a.m.) after overnight fasting. Serum was stored at −20°C. The serum fibulin-3 level was measured using an Enzyme-linked Immunosorbent Assay Kit (ELISA Kit For Fibulin3 FBLN3; Cloud-Clone Corp., Katy, USA); the concentration of COMP in serum was measured with Human Cartilage Oligomeric Matrix Protein ELISA (BioVendor Research and Diagnostic Products, Laboratorni medicina a.s., Brno, Czech Republic); the serum PIICP level was measured with an Enzyme-linked Immunosorbent Assay Kit (ELISA For Procolagen C-Terminal Propeptide PIICP; Cloud-Clone Corp.); and the urinary CTX-II level was measured with an Enzyme-linked Immunosorbent Assay Kit (ELISA For Cross Linked C Telopeptide Of Type II Collagen -CTX-II; Cloud-Clone Corp.); urinary CTX-II level was corrected by the urinary creatinine (Cr) concentration. No patients had marked kidney or liver function impairment that may have altered the urinary CTX-II levels.
The concentration of MRP8/14 in serum was measured with a PhiCal® Calprotectin ELISA Kit (Immundiagnostik, Bensheim, Germany).
The erythrocyte sedimentation rate and C-reactive protein level were assayed with routinely used methods. A total of 28 joints (proximal inter-phalangeals 1–5, meta-carpophalangeals 1–5, wrists, elbows, shoulders, and knees) were assessed with regard to swelling and pain. DAS28 was calculated as the disease activity index. Hemo-globin concentration was taken into account in the study group. According to recent findings, it may be closely re-lated to the disease activity and progression of radiological changes in patients with RA.9
Statistical analysis
The obtained results were expressed as mean ±stan-dard deviation (SD). Significant difference was determined by adopting a limiting error value equal to 95%, which cor-responds to p < 0.05. Calculations for dependent samples were carried out using the Wilcoxon non-parametric pair test. The Mann-Whitney U test was used to carry out comparisons between the groups. An analysis of correla-tions was conducted using Spearman’s R rank correlation. Meanwhile, multiple regression analysis was applied in or-der to determine the existing interdependences.
Results
Table 2 presents the concentration of fibulin-3, COMP, uCTX-II, PIICP, and MRP8/14, values of ESR, CRP, DAS28, the number of painful and swollen joints, and the concen-tration of hemoglobin in the serum of RA patients before and after the treatment, divided into responders (63%) and non-responders (37%), as well as the mean values of the
Table 2. The results (mean ±SD) regarding fibulin-3, COMP, uCTX-II, PIICP, MRP8/14, ESR, CRP, DAS28, TEN, SW, and HGB before the treatment (baseline) and after 9 months of anti-TNF therapy
MarkersAll patients
(n = 35)Responders
(n = 22)Non-responders
(n = 13) Control group (n = 10)
baseline after therapy baseline after therapy baseline after therapy
Fibulin-3 [ng/mL] 110.25 ±50.86 77.03 ±48.98* 98.32 ±48.16 64.73 ±44.31* 130 ±5.68 97.85 ±51.68* 83 ±23.52***
COMP [ng/mL] 1189.13 ±399.21 1088.43 ±28.55 1159.40 ±374.63 1126.16 ±293.86 1239.44 ±448.98 1024.57 ±257.78 1122.71 ±243.31
uCTX-II [pg/mL] 438.14 ±244.43 406.14 ±267.50 402.79 ±269.40 486.62 ±273.26 497.96 ±189.99 269.95 ±200.25* 414.17 ±154.99
PIICP [pg/mL] 2767.20 ±953.66 3232.59 ±1326.95 2814.11 ±961.16 3554.88 ±1477.09 2687.82 ±974.30 2687.17 ±811.24 3481.68 ±1186.0
MRP8/14 [ng/mL] 2421.83 ±2015.28 844.35 ±702.93* 2465.93 ±2228.63 733.31 ±723.15* 2347.22 ±1675.02 1032.26 ±65* 404.97 ±211.58**
ESR [mm/h] 35.08 ±23.91 18.34 ±12.45* 30.72 ±20.37 15.77 ±11.15* 42.46 ±28.30 22.69 ±13.75* –
CRP [mg/L] 15.09 ±21.07 6.04 ±6.46* 10.91 ±11.04 5.05 ±4.74* 22.16 ±30.95 7.715 ±8.62 –
DAS 28 6.65 ±0.91 2.95 ±1.07* 6.47 ±0.91 2.37 ±0.61* 6.97 ±0.86 3.93 ±97* –
TEN 18.27 ±7.64 2.11 ±2.59* 17.86 ±8.10 1.09 ±1.30* 18.92 ±7.07 3.84 ±3.31* –
SW 12 ±7.65 1.28 ±2.81* 10.81 ±7.76 0.36 ±0.72* 14 ±7.31 2.84 ±4.16* –
HGB [g%] 12.90 ±1.5 13.44 ±1.22* 12.9 ±1.37 13.63 ±1.16* 12.91 ±1.75 13.12 ±1.30 –
COMP – cartilage oligomeric matrix protein; uCTX-II – C-terminal telopeptide of collagen type II; PIICP – C-propeptide of collagen type II; MRP8/14 – calprotectin; ESR – erythrocyte sedimentation rate; CRP – C-reactive protein; DAS28 – diseases activity score 28; TEN – tender joint count; SW – swollen joint count; HGB – hemoglobin concentration; * statistical significance of the difference (baseline vs after therapy) p-value < 0.05; ** statistical significance of the difference (all patients before treatment (baseline) vs control group), p-value < 0.05; *** statistical significance of the difference (non-responders before treatment (baseline) vs control group), p-value < 0.05.

M. Kopeć-Mędrek, E. Kucharz. Fibulin-3 and other cartilage biomarkers386
abovementioned parameters (with the exception of ESR, CRP, DAS28, the number of painful and swollen joints, and the hemoglobin concentration) measured in the control group.
The mean serum concentration of fibulin-3 in RA pa-tients before the treatment did not differ significantly from the mean serum concentration of fibulin-3 in the blood serum of women from the control group.
Statistically significant higher mean concentration of fibulin-3 compared to the mean concentration of fib-ulin-3 in the serum of healthy women was noted prior to treatment in the group of women with a worse response to the anti-TNF therapy (non-responders).
After 9 months of treatment, a statistically significant decrease in the mean concentration of fibulin-3 was ob-served in the serum of all patients with rheumatoid ar-thritis, treated with TNF inhibitors, both in the group of responders and in the group of non-responders.
No statistically significant difference was noted be-tween the mean concentration of COMP in the serum of patients from the study group before the treatment (including responders and non-responders) and the mean concentration of COMP in the serum of healthy women. After 9 months of anti-TNF therapy, no significant changes were noted in the mean concentration of COMP in the serum of RA patients, although the overall trend showed a decrease in the concentration of COMP after the treat-ment (Table 2).
No statistically significant difference was noted between the mean concentration of PIICP in the serum of patients from the study group before the treatment (including re-sponders and non-responders) and the mean concentration of PIICP in the serum of healthy women. After treatment, no statistically significant differences were observed in the mean concentration of PIICP in the serum of RA patients. However, the overall trend showed an increasing concen-tration of PIICP after the treatment (Table 2).
The mean uCTX-II concentration in patients constitut-ing the control group did not differ from the mean uCTX-II concentration in women from the control group. The uCTX-II concentration in RA patients did not change sig-nificantly following the treatment. Only after taking into account the responders and non-responders in the study group was it stated that a statistically significant decrease of uCTX-II concentration in urine for women treated with TNF inhibitors was observed in the group that did not respond to therapy properly.
A statistically significant higher mean concentration of MRP 8/14 was noted in the serum of RA patients before the treatment compared to the mean MRP8/14 concen-tration in the serum of healthy women. After 9 months of observation, a significant decrease of the mean con-centration of MRP8/14 was noted in the serum of patients after anti-TNF therapy, both in the group which achieved its therapeutic goal (low disease activity or remission) and in those patients who did not experience a decrease of the DAS28 value <3.2.
The ESR, CRP level, the DAS28 index, as well as the number of painful and swollen joints were decreased in all patients following the treatment. A decrease in CRP con-centration in serum was not statistically significant in the group of patients with insufficient response to therapy. Following anti-TNF therapy, the concentration of hemo-globin increased significantly in all patients as well as in the group of patients who positively responded to the treatment. Such a tendency was not observed in the group of non-responders.
Correlations between fibulin-3 and the remaining pa-rameters in the study groups are presented in Table 3.
In the group of RA patients, a statistically significant correlation was observed between the concentrations of fibulin-3 and COMP in the serum before the treat-ment. A positive significant correlation was also noted
Table 3. Correlation between serum fibulin-3 level and other markers in RA patients before and after anti-TNF therapy
Correlation
All patients Responders Non-responders
baseline after therapy baseline after therapy baseline after therapy
R R R R R R
Fib-3/COMP 0.404* 0.299 0.376 0.534* 0.461 0.060
Fib-3/uCTX-II 0.104 −0.314 0.124 −0.285 −0.351 0.236
Fib-3/PIICP −0.242 −0.097 −0.221 0.088 −0.439 −0.027
Fib-3/MRP8/14 0.380 0.269 0.373 0.027 0.478 −0.076
Fib-3/ESR 0.333 0.367* 0.392 0.171 0.208 0.544
Fib-3/CRP 0.255 0.411* 0.311 0.455* 0.256 0.345
Fib-3/DAS 28 0.351* 0.310 0.244 −0.123 0.412 0.398
Fib-3/TEN 0.043 0.096 −0.041 −0.300 0.218 0.207
Fib-3/SW 0.267 0.189 0.371 0.262 0.179 −0.313
Fib-3/HGB 0.046 −0.142 0.261 0.223 −0.159 −0.506
Fib-3 – serum fibulin-3; COMP – cartilage oligomeric matrix protein; uCTX-II – C-terminal telopeptide of collagen type II; PIICP – C-propeptide of collagen type II; MRP8/14 – calprotectin; ESR – erythrocyte sedimentation rate; CRP – C-reactive protein; DAS28 – diseases activity score 28; TEN – tender joint count; SW – swollen joint count; HGB – hemoglobin concentration; * statistically significant p-value < 0.05.

Adv Clin Exp Med. 2018;27(3):383–389 387
between the concentrations of fibulin-3 and DAS28 before the treatment. Following anti-TNF therapy, a significant positive correlation was observed between the concentra-tions of fibulin-3 and selected inflammatory indexes (ESR and CRP) in the entire group of patients. After the treat-ment, a significant positive correlation between fibulin-3 and CRP concentrations was observed also in the group of responders. Moreover, in this group there was a signifi-cant correlation between fibulin-3 and COMP concentra-tions. In the study groups, no other significant relations were stated between fibulin-3 and the remaining tested indicators of cartilage metabolism, inflammatory indexes, painful and swollen joints, and hemoglobin concentration.
In the group of healthy women who constituted the con-trol group, no statistically significant correlations were noted between fibulin-3 and COMP, uCTX-II, PIICP, and MRP8/14.
In the group of RA patients, relations between the re-maining cartilage metabolism markers (uCTX-II, PIICP, COMP) and inflammatory indexes were small. A significant negative correlation was shown in the entire group of pa-tients between PIICP and CRP concentrations (R = −0.505; p < 0.005) before the treatment, and between uCTX-II and DAS28 (R = −0.348; p < 0.05) after the treatment. In the group of non-responders, a correlation was noted between the COMP concentration and SW (R = 0.589; p < 0.005) following the treatment. Moreover, a correlation between PIICP and hemoglobin concentrations (R = 0.752; p < 0.005) was stated in this group before the treatment.
Correlations between MRP8/14 and the remaining pa-rameters in the RA patients’ groups are presented in Ta-ble 4. A statistically significant positive correlation between MRP8/14 and ESR and CRP was observed before the treat-ment in the entire group of RA patients and in the group of responders. However, such a relation did not occur in those groups after the treatment, nor did it appear in the group of non-responders. In the group of responders, a significant
correlation after the treatment was reported only between MRP8/14 and the number of painful joints. In the group of non-responders, a significant negative correlation between MRP8/14 and hemoglobin concentrations was observed be-fore the treatment. In none of the tested groups of RA pa-tients were there statistically significant relations observed between the serum MRP8/14 concentration and the serum COMP and PIICP concentrations and uCTX-II.
In the control group, a significant negative correlation was noted between the serum MRP8/14 level and uCTX-II (R = 0.709; p < 0.05).
The conducted multivariate regression analysis with a dependent variable fibulin-3, and independent variables such as the concentration of COMP, uCTX-II, PIICP, MRP8/14, ESR, CRP, TEN, SW and hemoglobin concen-tration in RA patients after 9 months of anti-TNF therapy, has shown a significant positive correlation between the concentration of fibulin-3 in serum and the concentration of CRP (β = 0.550; p = 0.000).
The multivariate regression analysis (multi-factor analy-sis) with a dependent variable MRP8/14, and independent variables – cartilage metabolism markers – such as the concentration of COMP, uCTX-II, PIICP, and fibulin-3 in RA patients after 9 months of anti-TNF therapy, has shown a significant negative correlation only between the concentration of PIICP in serum and the concentration of serum MRP8/14 (β = −0.408; p < 0.05).
Discussion
One of the more important and interesting discover-ies in recent years involved the identification of fibulin in the serum of osteoarthritis patients. Henrotin et al. suggest that fibulin-3 peptides (Fib 3-1 and Fib 3-2) are potential biomarkers of osteoarthritis.4 The search for re-ports on fibulin-3 in patients with rheumatoid arthritis
Table 4. Correlation between serum MRP8/14 level and others markers in RA patients before and after anti-TNF therapy
Correlation
All patients Responders Nonresponders
baseline after therapy baseline after therapy baseline after therapy
R R R R R R
MRP8/14/COMP 0.030 0.111 0.136 0.031 −0.208 −0.016
MRP8/14/uCTX-II 0.009 −0.282 −0.000 −0.177 −0.060 −0.483
MRP8/14/PIICP −0.535 −0.569 −0.457 −0.360 −0.752 −0.769
MRP8/14/ESR 0.533* 0.268 0.544* 0.193 0.445 0.272
MRP8/14/CRP 0.525* 0.271 0.521* 0.181 0.457 0.339
MRP8/14/DAS 28 0.182 0.142 0.207 −0.233 0.225 0.035
MRP8/14/TEN −0.072 −0.018 0.009 0.441* −0.033 0.125
MRP8/14/SW 0.052 0.004 0.274 −0.210 −0.382 −0.135
MRP8/14/HGB −0.295 −0.090 −0.097 0.151 −0.648* −0.465
MRP8/14 – calprotectin; COMP – cartilage oligomeric matrix protein; uCTX-II – C-terminal telopeptide of collagen type II; PIICP – C-propeptide of collagen type II; ESR – erythrocyte sedimentation rate; CRP – C-reactive protein; DAS28 – diseases activity score 28; TEN – tender joint count; SW – swollen joint count; HGB – hemoglobin concentration; * statistically significant p-value < 0.05.

M. Kopeć-Mędrek, E. Kucharz. Fibulin-3 and other cartilage biomarkers388
in the Medline database returned no results. In rheuma-toid arthritis, just like in osteoarthritis, articular cartilage is damaged. Also, the pathomechanism of this phenom-enon seems to be different. Advanced destructive changes may be confirmed by imaging tests (MRI, USG or X-ray), but so far no biochemical marker or group of biomarkers have been found. That would probably allow for a quicker and more precise monitoring of cartilage damage, and help with the identification of groups of patients more or less responsive to modern treatment, thus enabling quicker therapy verification.
The obtained results indicate a lack of differences in the concentration of fibulin-3 in serum between RA patients and healthy individuals (only in the group of non-respond-ers was the concentration of fibulin-3 before the treatment higher than in the control group).
In RA patients treated with anti-TNF inhibitors, a sta-tistically significant decrease of fibulin-3 concentration in serum was observed after the treatment. Interestingly, the concentration of fibulin-3 was decreased both in the group of responders and in the group of non-responders. Lack of literature data regarding this issue makes it impos-sible to compare the obtained results with those of other authors. Increased concentration of fibulin-3 peptides in serum (Fib3-1 and Fib3-2) was described only in osteo-athritis patients.4 The results of this work suggest that TNF blockade modifies the release and expression of fibulin-3 in RA patients. This is also illustrated by the fact that af-ter the treatment, and therefore after lowering the degree of inflammation, the concentration of fibulin-3 in serum strictly correlated with the value of ESR and CRP in the entire group of RA patients (in the group of responders – correlation only with CRP concentration). Such a rela-tion was not observed between fibulin-3 and MRP8/14, although Garcia-Arias et al. stated that serum MRP8/14 levels strongly correlated with laboratory assessments of joint inflammation in RA patients (ESR and CRP).8
With regard to the relation between fibulin-3 and other biomarkers of cartilage metabolism assessed in this study, the concentration of fibulin-3 in the group of RA patients did not correlate (both before and after the treatment) with the concentration of urinary CTX-II and the concentration of PIICP in serum. Contrary to the observations of Ma-rotte et al., the concentrations of uCTX-II and PIICP did not significantly differ between the tested group before the treatment and the control group.10 Moreover, these concentrations did not change in a statistically signifi-cant way following 9-month anti-TNF therapy (except for the significant decrease of uCTX-II concentration in the group of non-responders). Meanwhile, the lack of changes in uCTX-II concentration for RA patients during the treat-ment coincides with the observations of Marotte et al., con-ducted during a 1-year observation of patients treated with infliximab.10 The concentration of COMP in the serum of RA patients did not change after anti-TNF therapy as well. On the other hand, Crnkic M. et al. described in their
report the decrease of COMP concentration in the serum of RA patients treated with infliximab or etanercept.11
Meanwhile, in this work a statistically significant cor-relation was observed between the concentrations of fibu-lin-3 and COMP in RA patients before the treatment and after the treatment in the group of responders.
The concentration of MRP8/14 was higher in the group of RA patients before the treatment than in the control group, and it decreased in a statistically significant way in all groups of RA patients after anti-TNF therapy, which is in accordance with the results obtained by other au-thors.8 As expected, after the treatment, the values of ESR, CRP, DAS 28, TEN, and SW decreased, but not all patients achieved remission or low disease activity.
After the treatment, a significant increase was noted in hemoglobin concentration in all groups of RA patients (also in the group of responders and non-responders). How-ever, its concentration did not correlate with the concentra-tion of fibulin-3 before or after the treatment.
It seems that further studies are needed in order to gain a better understanding of the role of fibulin-3 in the car-tilage metabolism of RA patients.
The correlation the cartilage biomarkers with other in-flammatory factors such as tumor necrosis factor, inter-leukin-6 and interleukin-17 seems to be a very interesting subject for further investigations.
Conclusions
Higher concentration of fibulin-3 in the serum was found in RA patients who did not respond to the treatment in a sufficient way (non-responders).
During the anti-TNF therapy, the serum fibulin-3 level decreased in patients regardless of whether they achieved remission or low disease activity.
The concentration of fibulin-3 correlated with CRP and ESR after the treatment in the entire group of patients.
No correlation between fibulin-3 and MRP8/14 was ob-served in the study group (before and after the treatment) nor in the control group.
A correlation between fibulin-3 and COMP in the group of RA patients before and after the treatment was observed only in the group of responders.
The analysis of multivariate regression indicated that the concentration of C-reactive protein in serum is the most significant parameter (assessed in this work) with which the concentration of fibulin-3 in serum correlates.
References1. Rousseau JC, Garnero P. Biological markers in osteoarthritis. Bone.
2012;51:265–277.2. Zhang Y, Marmorstein LY. Focus on molecules: Fibulin-3 (EFEMP1).
Exp Eye Res. 2010;90:374–375.3. Wakabayashi T, Matsumine A, Nakazora S, et al. Fibulin-3 negative-
ly regulates chondrocyte differentiation. Biochem Biophys Res Com-mun. 2010;391:1116–1121.

Adv Clin Exp Med. 2018;27(3):383–389 389
4. Henrotin Y, Gharbi M, Mazzucchelli G, Dubuc JE, De Pauw E, Deberg M. Fibulin 3 peptides Fib3-1 and Fib3-2 are potential biomarkers of osteoarthritis. Arthritis Rheum. 2012;64:2260–2267.
5. Larrson E, Erlandsson Harris H, Lorentzen JC, et al. Serum concen-trations of cartilage oligomeric matrix protein, fibrinogen and hyal-uronan distinguish inflammation and cartilage destruction in exper-imental arthritis in rats. Rheumatology. 2002;41:996–1000.
6. Elsaid KA, Chichester CO. Review: Collagen markers in early arthritic diseases. Clin Chim Acta. 2006;365:68–77.
7. Brun JG, Jonsson R, Haga HJ. Measurement of plasma calprotectin as an indicator of arthritis and diseases activity in patients with inflam-matory rheumatic disaeses. J Rheumatol. 1994;21:733–738.
8. García-Arias M, Pascual-Salcedo D, Ramiro S, et al. Calprotectin in rheumatoid arthritis. Mol Diagn Ther. 2013;17:49–56.
9. Möller B, Scherer A, Förger F, Viliger P, Finckh A. Anaemia may add information to standardized disease activity assessment to predict radiographic damage in rheumatoid arthritis: A prospective cohort study. Ann Rheum Dis. 2014;73:691–696.
10. Marotte H, Gineyts E, Miossec P, Delmas PD. Effects of infliximab therapy on biological markers of synovium activity and cartilage breakdown in patients with rheumatoid arthritis. Ann Rheum Dis. 2009;68:1197–1200.
11. Crnkic M, Mansson B, Larsson L, Geborek P, Heinegard D, Saxne T. Serum cartilage oligomeric matrix protein (COMP) decreases in rheu-matoid arthritis patients treated with infliximab or etanercept. Arthri-tis Res Ther. 2003;5:181–185.


DOI10.17219/acem/68440
Copyright© 2018 by Wroclaw Medical University This is an article distributed under the terms of the Creative Commons Attribution Non-Commercial License(http://creativecommons.org/licenses/by-nc-nd/4.0/)
Address for correspondenceMichał ZimeckiE-mail: [email protected]
Funding sourcesThis study was supported in part by a grant from PharmaReview Corporation, Houston, USA.
Conflict of interestNone declared
Received on May 27, 2016Reviewed on June 7, 2016Accepted on January 12, 2017
AbstractBackground. Trauma and major surgery cause extensive immune hyporeactivity in patients. Thus, the preventive, preoperative application of immunoregulatory therapeutics may normalize this immune reactivity and decrease morbidity and mortality in these subjects.
Objectives. The aim of this study was to investigate the immunomodulatory actions of recombi-nant human lactoferrin (rhLF) in mice, and to relate these effects to in vitro actions of rhLF on tumor necrosis factor alpha (TNF-α) production in lipopolysaccharide-stimulated whole blood cell cultures (LPS-stimulated WBCC) from patients admitted to intensive care units.
Material and methods. BALB/c and CBA mice were used. rhLF was tested for allergic response to ovalbumin (OVA), delayed-type hypersensitivity (DTH) to OVA, and carrageenan-induced inflammation in an air pouch. Blood samples from 30 patients diagnosed with severe sepsis/septic shock (Apache II 21 ±1, mortality rate 40%) were collected on days 1, 3 and 5 of observation. The effects of rhLF on LPS-induced TNF-α production were measured in WBCCs.
Results. Recombinant human lactoferrin reduced the parameters of OVA-induced inflammation and inhibited the elicitation phase of DTH and carrageenan-induced inflammation in mice. The majority of patients from whom whole blood cell cultures (WBCC) were established showed a strong hyporeactivity to LPS upon admission. rhLF exerted differential effects on the production of LPS-induced TNF-α in those cultures on days 1, 3 and 5 of observation. Cytokine production was upregulated only in patients with sustained anergy to LPS, and inhibited or unchanged in moderately reactive patients.
Conclusions. Evidence for the potential preventive or therapeutic utility of rhLF in patients with impaired immune reactivity has been demonstrated.
Key words: human recombinant lactoferrin, mice, pleurisy, septic patients, tumor necrosis factor alpha
Original papers
Immunomodulatory properties of human recombinant lactoferrin in mice: Implications for therapeutic use in humans
Jolanta Artym1,C,E,F, Maja Kocięba1,B,E, Ewa Zaczyńska1,B,C,F, Barbara Adamik2,B,C,E,F, Andrzej Kübler2,B,E, Michał Zimecki1,A–F, Marian Kruzel3,A,F
1 Laboratory of Immunobiology, Institute of Immunology and Experimental Therapy, Wrocław, Poland2 Department of Anesthesiology and Intensive Therapy, Wroclaw Medical University, Poland3 University of Texas, Houston Medical School, USA
A – research concept and design; B – collection and/or assembly of data; C – data analysis and interpretation; D – writing the article; E – critical revision of the article; F – final approval of the article
Advances in Clinical and Experimental Medicine, ISSN 1899-5276 (print), ISSN 2451-2680 (online) Adv Clin Exp Med. 2018;27(3):391–399

J. Artym, et al. Lactoferrin in the prevention of immune imbalance392
Introduction
Trauma and major surgical interventions cause extensive immune hyporeactivity in patients at all ages. Immune dysfunction may further provoke organ failure and lead to the development of septic conditions in some patients. This is often heralded by depressed ability to produce lipopolysaccharide (LPS)-inducible cytokines in blood cultures.1 The response of individual patients to clinical insult may vary considerably, being either excessive or in-sufficient, and both types of reactions may be harmful and may lead to postoperative complications.2 Unfortunately, preventive measures regarding postoperative complica-tions have not yet been implemented into clinical practice. Therefore, the complex immunological monitoring of pa-tients elected for surgery is strongly recommended, as part of a personalized therapy to prevent sepsis.3 Alternatively, the preventive, preoperative application of immunoregulatory therapies, which can normalize the immunological tempera-ment of patients, would be an attractive approach to decrease morbidity and mortality in patients undergoing surgery.
Lactoferrin (LF), a protein involved in iron metabo-lism, represents a key element of the innate immunity in mammals. LF is contained in 2 reservoirs: the excre-tory fluids and the secondary granules of neutrophils.4 It exhibits a wide array of immunological activities in vitro and in vivo.5 The concentration of LF in circulation may increase several-fold during sepsis, trauma, hemodialy-sis, or extracorporeal circulation, which classifies LF as an acute-phase protein.6–9 The strategies for preventive and/or therapeutic systemic or local applications of LF have already been proven effective in clinical trials on several categories of patients, including septic ones.10–13
In our earlier studies, we showed that bovine milk-de-rived LF (bLF) exhibited immunoregulatory in vitro effects on the immune reactivity of blood lymphocytes derived from septic and trauma patients.14,15 In addition, orally ap-plied bLF appeared to be immunoregulatory with respect to cytokine production in healthy human individuals and ameliorated postsurgical hyporeactivity in patients un-dergoing thyroid resection.16,17 In turn, bLF significantly tempered the surgery-induced blood levels of tumor necro-sis factor alpha (TNF-α) and interleukin-6 (IL-6) in mice.18 Bovine milk-derived LF used in some clinical trials and the rhLFs expressed in yeast or transgenic plants are given orally because of the potential immunogenicity of parenteral ad-ministration.12,13,19–21 Amino acid sequence homology and sugar moiety have to be compatible with the human immune system. In fact, sugar moieties in LF play a crucial role in the interaction with the host’s cell receptors.22,23 Therefore, there is an urgent need for LF that is fully compatible with humans in order to avoid species-specific incompatibilities and to ensure adequate therapeutic effect.
The aim of this report was: 1) to validate the immuno-modulatory activity of Chinese hamster ovary (CHO)-expressed recombinant human LF (rhLF) in several
mouse in vivo models, including ovalbumin (OVA)-in-duced pleurisy, carrageenan inflammation in an air pouch and delayed-type hypersensitivity (DTH) to OVA, and 2) to translate these results from mice into human in vitro studies of the immune reactivity of whole blood cell cul-tures (WBCC) in septic patients admitted to intensive care units (ICU). The effects of rhLF on LPS-induced TNF-α levels in WBC cultures, as measured on days 1, 3 and 5 following a diagnosis of severe sepsis/septic shock in ICU patients was our main criterion in the evaluation of LF as a potential protective measure against sepsis.
Material and methods
Mice
BALB/c and CBA female mice, 8–10 weeks old, were delivered by the Institute of Laboratory Medicine in Łódź, Poland. The mice were fed with commercial, granulated food and water ad libitum. The studies obtained the per-mission of the Local Ethics Committee from the Institute of Immunology and Experimental Therapy, Wrocław, Po-land (No. 2/2011 and No. 57/2012).
Reagents
CHO-derived rhLF was supplied by PharmaReview Cor-poration (Houston, USA); dexamethasone (Dexaven®) was from Jelfa (Jelenia Góra, Poland); Maalox (aluminii hydroxy-dum 3.5 g and magnesi hydroxydum 4.0 g in 100 mL) were from Rhone-Poulenc Rorer Theraplix (Montrouge Cedex, France); AErrane (Isofluranum) was from Baxter (Warsza-wa, Poland); Freund’s complete adjuvant (cFa), Freund’s in-complete adjuvant (iFa), and fetal calf serum (FCS) came from BD Biosciences (San Jose, USA); RPMI-1640 medium and Hanks’ medium were from CytoGen GmbH (Wetzlar, Germany). Ovalbumin, LPS from E. coli (serotype O111:B4), carrageenan, trypan blue, Giemsa, May-Grünwald stains, and all other reagents were acquired from Sigma-Aldrich (St. Louis, USA). Human TNF-α ELISA Ready-Set-Go was provided by eBioscience (San Diego, USA).
Mice in vivo models
Delayed-type hypersensitivity to ovalbumin
CBA mice (6 per group) were sensitized subcutane-ously with 5 µg OVA emulsified in cFa at the base of the tail (Fig. 1A). After 4 days, the mice were challenged with 50 µg OVA in iFa (50 µL total) in each of their hind foot-pads. After 24 h, the footpad thickness was measured us-ing a spring caliper (Swiss Precision Instruments; Garden Grove, USA). rhLF was administered intraperitoneally (i.p.) to mice in doses of 50 μg–5 mg, 30 min after the adminis-tration of the eliciting dose of the antigen. The reference

Adv Clin Exp Med. 2018;27(3):391–399 393
drug – dexamethasone (Dex) – was given at a dose of 50 μg. Background mice (BG) were not sensitized, but received the challenging dose of OVA in iFa; the value from this non-specific inflammatory response was subtracted from the responses measured in sensitized mice. All results were presented as a mean value of antigen-specific in-crease of footpad thickness measured in 6 mice per group (12 feet per determination) and expressed in DTH units (1 DTH unit = 0.01 cm) ±standard error (SE).
Carrageenan-induced inflammation in the air-pouch model
An air pouch was formed by subcutaneous injection (s.c.) into the dorsal region of BALB/c mice (7 per group), under halothane anesthesia, of 5 mL of sterile air (23G × 11/4 needle,
5 mL syringe). On day 5, the air pouch was given an ad-ditional 2 mL of sterile air, and an inflammatory process was elicited by the injection of 1% carrageenan in 0.9% NaCl into the air pouches. Recombinant human lactoferrin was administered i.p. at 100 μg, 500 μg, and 2.5 mg doses, 1 h before the injection of carrageenan (Fig. 1B). The mice from the BG group were administered 0.9% NaCl into the air pouches. Control mice were given 0.2 mL of 0.9% NaCl i.p., followed by carrageenan, into the air pouches. Dex was administered i.p. at a dose of 50 μg, 1 h before the injection of carrageenan. On the next day, 1 mL of 0.9% NaCl was injected into the pouches, and the exudates were aspirated with a syringe and transferred into tubes and centrifuges at 800 × g for 5 min. Viable cells in the pellets were enumer-ated in a light microscope using trypan blue dye.
Generation of the allergic, humoral immune response to ovalbumin
BALB/c mice (7 per group) were immunized i.p. with 50 µg of OVA in 0.2 mL of Maalox (as an adjuvant) (Fig. 1C). After 14 days, the mice were given the eliciting dose of OVA intrapleurally (12.5 µg in 50 µL of 0.9% NaCl), using a sy-ringe with a 2 mm needle. This group of mice is hereafter referred to as the sensitized control mice. Recombinant human lactoferrin (100 µg/dose) was given buccally, us-ing a pipette, in a volume of 25 µL of 0.9% NaCl, 24 h and 3 h before the administration of the eliciting dose of OVA (a total dose of rhLF 200 µg/mouse). These mice are de-scribed as the rhLF groups. Control mice were given Dex in a single dose of 20 µg i.p., 3 h before the elicitation of the allergic response (Dex group). Mice treated i.p. with Maal-ox only (without a sensitizing dose of OVA), but receiving the eliciting dose of OVA intrapleurally, are named the BG group. Twenty-four hours after the elicitation of an al-lergic pulmonary inflammation, the cell numbers in the pleural cavity were determined. The mice were killed by cervical dislocation. The skin from the abdomen was removed, the chest opened with scissors, and the pleural cavities were washed with 0.2 mL of 0.9% NaCl contain-ing ethylenediaminetetraacetic acid (EDTA) (10 mM) for each cavity. Then, 50 µL of the pleural lavage was taken in order to determine the number of cells. Cell numbers were enumerated in a Bürker hemocytometer. The degree of mastocyte degranulation in the pleural fluid was deter-mined by a histologist at 1000× magnification, following the staining of the cell pellet smears with Giemsa and May-Grünwald reagents.
Human studies (ex vivo)
Patients
Thirty adult patients diagnosed with severe sepsis/septic shock according to the definitions for sepsis and organ failure were consecutively added to the study group.24
Fig. 1. Experimental design of the tests
A – delayed-type hypersensitivity to OVA; B – carrageenan-induced inflammation in the air-pouch model; C – allergic pleurisy to OVA. See Material and methods section for a description of the experimental protocols.
A
B
C
– –

J. Artym, et al. Lactoferrin in the prevention of immune imbalance394
Patients were hospitalized in the mixed ICU at the Uni-versity Teaching Hospital in Wrocław, Poland. The Ethics Committee of Wroclaw Medical University approved the study protocol (KB-424/214), and the need for informed consent from unconscious patients was waived due to the observational nature of the study. Blood samples for anal-ysis were collected from a blood catheter to tubes with sodium citrate as an anticoagulant at baseline (the day of severe sepsis/septic shock diagnosis), and on days 3 and 5 of treatment. The mean age of the patients was 64 years, with a predominance of males (63%). The main diagnosis on admission was intra-abdominal infection (47%) and pneumonia (43%); 1 patient was diagnosed with a urinary tract infection; 1 with skin and soft tissue infection; and 1 with meningitis. The mean length of ICU stay was 24 days. Septic shock was diagnosed in 73% of patients, and the ICU mortality rate was 40%. Gram-negative patho-gens were identified in 16 patients (53%) and Gram-positive ones were found in 14 patients (47%). The clinical status of the patients was assessed with the Acute Physiology and Chronic Health Evaluation II score (APACHE II) upon ad-mission to the ICU, and with the Sequential Organ Failure Assessment score (SOFA) upon inclusion into the study, and on day 3 and 5 of observation. The baseline charac-teristics of patients are shown in Table 1.
The control group consisted of 7 healthy individuals (22–64 years old) with only a single blood draw for the evaluation of the effect of LF on LPS-induced cytokine
production in whole blood cultures. Informed consent from these healthy donors was obtained.
Induction of cytokines in human WBCC
The venous blood samples were diluted 5 times with RPMI-1640 medium within 1 h, and distributed in 1 mL aliquots into 24-well culture plates. Four cultures were es-tablished and supplemented as follows: 1) 0.1 mL of the cul-ture medium (control); 2) 100 ng/mL of LPS; 3) 50 μg/mL of LF; and 4) 50 μg/mL of LF followed 1 h later by 100 ng/mL of LPS. After an overnight incubation at 37°C, the cul-tures were terminated and supernatants frozen at –80°C until immunoassays could be done to determine cytokine determination. The concentrations of TNF-α were mea-sured by an ELISA kit according to the manufacturer’s instructions.
Statistics
The results are presented as mean values ±SE. Brown-Forsythe’s test was used to determine the homogeneity of variance between the groups. When the variance was homogenous, the analysis of variance (one-way ANOVA) was applied, followed by post hoc comparisons with Tukey’s test to estimate the significance of the differences between the groups. Nonparametric data were evaluated with the Kruskal-Wallis analysis of variance, as indicated in the text. Significance was determined at p < 0.05. Statistical analysis was performed using Statistica v. 7 for Windows.
Results
Suppressive effect of rhLF on the effector phase of delayed-type hypersensitivity to OVA in mice
As shown in Fig. 2, rhLF given to mice together with the eliciting dose of the antigen (OVA) suppressed the mani-festation of DTH, in a dose-dependent manner, as mea-sured by footpad edema. The most effective dose of rhLF was 5 mg (reduction of footpad edema by 50%), which was similar to Dex (47%).
Inhibitory effect of rhLF on exudate cell numbers in the air-pouch model in mice
The results presented in Fig. 3 revealed a dose-dependent inhibitory effect of rhLF administration on the number of cells infiltrating the air pouches. The 500 μg dose ap-peared to be the most effective, whereas a dose 5 times higher (2.5 mg) showed only negligible activity. Such a dose-dependent anti-inflammatory action of rhLF resem-bles the similar kinetics of bLF action in the model of OVA-induced pleurisy and indicates that the anti-inflammatory
Table 1. Baseline characteristics of patients under study
Parameter Patients (n = 30)
Age [years] 64 ±3
Gender M/F 19/11
APACHE II score 21 ±1
SOFA score day 1day 3day 5
9 ±18 ±17 ±1
PCT [ng/mL] day 1day 3day 5
23.4 ±4.219.4 ±5.77.1 ±3.2
Reason for ICU admission, n (%)surgicalmedicaltrauma
18 (60)9 (30)3 (10)
Diagnosis on admission, n (%)intra-abdominal infectionpneumonia other
14 (47)13 (43) 3 (10)
Septic shock, n (%) 22 (73)
Length of ICU stay 24 ±4
ICU mortality, n (%) 12 (40)
The results are presented as mean values ±SE. M/F – male/female; APACHE II – Acute Physiology and Chronic Health Evaluation II; SOFA – Sequential Organ Failure Assessment; PCT – procalcitonin; ICU – intensive care unit.

Adv Clin Exp Med. 2018;27(3):391–399 395
Amelioration of ovalbumin-induced pleurisy by rhLF in mice
As shown in Fig. 4, sensitized control mice con-tained almost 7-fold higher cell numbers in their pleu-ral exudates then BG (non-sensitized) mice (14.2 × 10⁶ vs 3.2 × 10⁶). The application of rhLF reduced the cell num-ber to 3.9 × 10⁶ (by 72.5%). Dex lowered the cell numbers to background levels. Recombinant human lactoferrin was also effective in reducing the numbers of degranulated mastocytes in the pleural cavities from 80.4% in sensitized control mice to 64.9%. Dex was also effective (a reduction of 66.3%) (data not shown).
Effects of rhLF on LPS-induced TNF-α production in WBCC
Venous blood from patients admitted to the ICU was taken on day 1, and again on days 3 and 5. WBCC cultures were established and the effects of rhLF on cytokine pro-duction were investigated in LPS-stimulated cultures as described in Material and methods section.
Among the 30 patients, 6 subjects did not survive a 5-day hospitalization period and 1 was discharged before day 5 (the incomplete data from these patients are inconclu-sive, and thus are not shown). The patients underwent routine evaluation of cellular and biochemical laboratory parameters in their blood and urine. Here, we focused on the effects of rhLF in WBC cultures on LPS-induced TNF-α production, a major pro-inflammatory mediator which serum levels predict survival rates in ICU patients.26
Fig. 2. Suppression of the manifestation of OVA-induced delayed-type hypersensitivity by rhLF
Mice were sensitized with OVA in cFa at the base of the tail and 4 days later, the reaction was elicited by injection of OVA in iFa in each of the hind foot pads, as described in Material and methods section. Recombinant human lactoferrin was administered i.p. to the mice in the indicated doses, 30 min after the administration of the eliciting dose of antigen. Dex was given at a 50 μg dose. All results are presented as the mean value of antigen-specific increase in footpad thickness measured in 6 mice per group (12 feet/determination) and expressed in DTH units (1 DTH unit = 0.01 cm) ±SE; * p < 0.05 when compared with the control group.
Fig. 3. Inhibition of exudate cell numbers in carrageenan-induced inflammation in air pouches by rhLF
The air pouches were formed by subdermal injection of 5 mL and then 2 mL of sterile air into the dorsal region of the mice. An inflammatory process was elicited by an injection of 1% carrageenan solution into the formed air pouches. Recombinant human lactoferrin was administered i.p. in the indicated doses, 1 h before the administration of carrageenan. Dex was given i.p. at a 50 μg dose. The cell numbers in the pouch exudates were determined 24 h later. The results are presented as the mean values from 7 mice per group ±SE; * p < 0.05 when compared with the control group.
Fig. 4. The effect of rhLF on the cell numbers in the pleural exudates
The mice were sensitized with OVA and an allergic reaction to OVA was elicited after 14 days as described in Material and methods section. Recombinant human lactoferrin was administered bucally (100 µg/dose) at 24 and 3 h before the eliciting dose of OVA. Dex was used at a single dose of 20 µg i.p., 3 h before the elicitation of the allergic response. The cell numbers in the pleural exudates were determined 24 h later. The results are presented as the mean values from 7 mice per group ±SE; * p < 0.05 when compared with the control group.
action of bLF has, in fact, an immunoregulatory charac-ter.25 The 100 μg rhLF dose was similarly effective as Dex used at a dose of 50 μg.

J. Artym, et al. Lactoferrin in the prevention of immune imbalance396
Seven healthy individuals constituted the control group. The majority of patients exhibited a strong hyporeactivity to LPS stimulus 1 day after the admission to the ICU, as assessed by TNF-α production, with a tendency for recov-ery on subsequent days. The analysis of the effects of rhLF on LPS-induced TNF-α production revealed several major patterns. Therefore, for the visualization of the regulatory effects of rhLF, the patients were classified into 3 catego-ries. Such an approach was used in the past to enable the proper evaluation of the regulatory effects of LF in patients and normal subjects.14–17 The tables also include additional information, such as survival, presence or absence of septic
shock, reason for admittance to the ICU, and type of bacte-rial infection. Although the subgroups of patients were very small, it may be concluded that mortality of patients was associated with septic shock, strong hyporeactivity, Gram-negative infection, and surgical intervention as the reason for ICU admittance; and that survival was correlated with increased immune reactivity of blood cells to LPS, Gram-positive infection, and other than surgical reasons for ICU admittance.
One of the responsiveness patterns – hyporeactive pa-tients with spontaneous recovery for TNF-α production (patients No. 1, 2, 4, 5, 13, 17–19, and 23–25) – showed
Table 2. The effects of rhLF on LPS-inducible TNF-α production in hyporeactive patients with spontaneous immune recovery for cytokine production
Patient No. Day Control LPS rhLF rhLF/LPS Septic shock Reason for admission to ICU
Infection type(Gram+/–)
1
1 18 52 12 67
yes medical Gram–3 8 26 9 162
5 3 179 6 100
2
1 ND 114 ND 126
yes surgical Gram–3 ND 102 ND 172
5 ND 174 ND 308
4
1 ND 31 ND 56
no trauma Gram+3 ND 15 ND 64
5 ND 174 ND 178
5
1 ND ND ND 13
yes surgical Gram–3 ND 305 ND 263
5 ND 805 ND 843
13
1 ND 89 ND 106
yes medical Gram+3 ND 151 ND 283
5 12 356 ND 501
17
1 23 65 17 103
yes surgical Gram–3 19 144 16 138
5 13 84 15 101
18
1 14 74 16 90
yes surgical Gram–3 17 97 16 158
5 24 166 19 284
19
1 13 20 12 38
yes medical Gram+3 26 123 28 146
5 22 189 43 235
23
1 ND 49 ND 40
no other Gram–3 ND 66 ND 114
5 ND 128 ND 214
24
1 ND 10 ND 14
yes medical Gram–3 ND 9 ND 12
5 ND 124 ND 140
25
1 ND 8 ND 9
yes medical Gram–3 ND 30 ND 29
5 ND 393 ND 319
ND – not detected; the WBC cultures were established and supplemented as follows: 1) 0.1 mL of the culture medium (control); 2) 100 ng/mL of LPS; 3) 50 μg/mL of LF; and 4) 50 μg/mL of LF followed 1 h later by 100 ng/mL of LPS; after an overnight incubation at 37°C, the cultures were terminated and supernatants frozen at –80°C until cytokine determination. This description also relates to Tables 3–5.
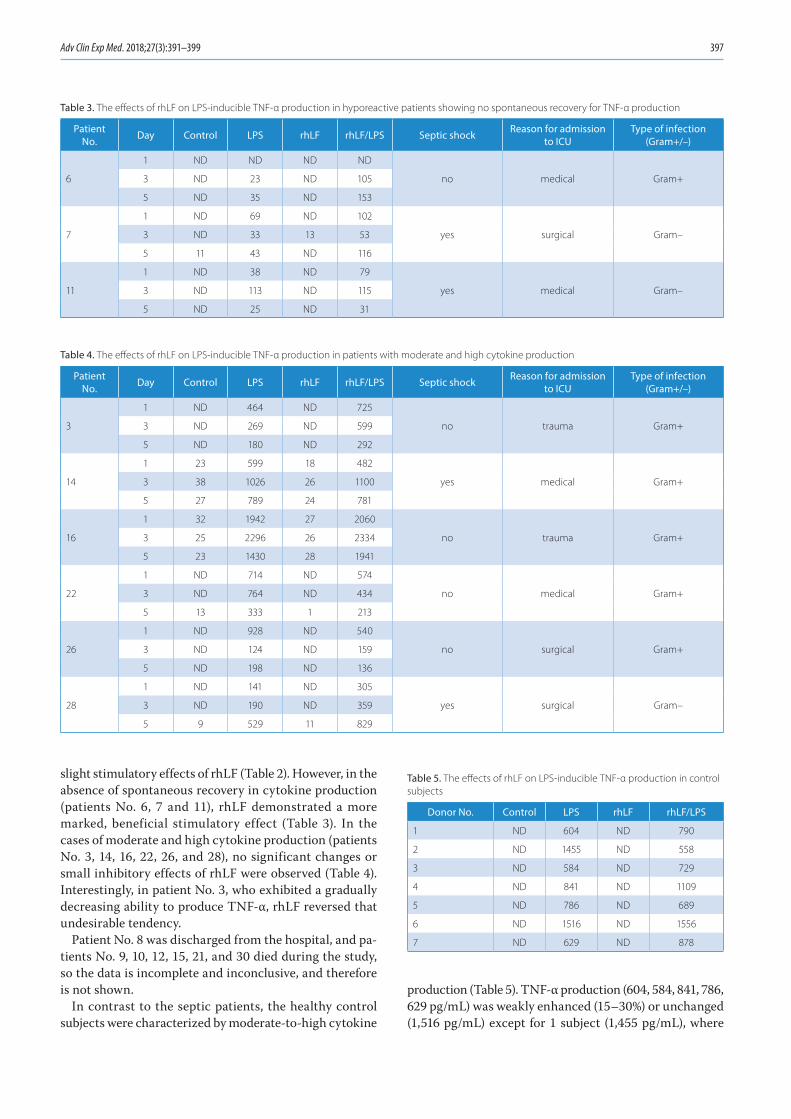
Adv Clin Exp Med. 2018;27(3):391–399 397
slight stimulatory effects of rhLF (Table 2). However, in the absence of spontaneous recovery in cytokine production (patients No. 6, 7 and 11), rhLF demonstrated a more marked, beneficial stimulatory effect (Table 3). In the cases of moderate and high cytokine production (patients No. 3, 14, 16, 22, 26, and 28), no significant changes or small inhibitory effects of rhLF were observed (Table 4). Interestingly, in patient No. 3, who exhibited a gradually decreasing ability to produce TNF-α, rhLF reversed that undesirable tendency.
Patient No. 8 was discharged from the hospital, and pa-tients No. 9, 10, 12, 15, 21, and 30 died during the study, so the data is incomplete and inconclusive, and therefore is not shown.
In contrast to the septic patients, the healthy control subjects were characterized by moderate-to-high cytokine
production (Table 5). TNF-α production (604, 584, 841, 786, 629 pg/mL) was weakly enhanced (15–30%) or unchanged (1,516 pg/mL) except for 1 subject (1,455 pg/mL), where
Table 3. The effects of rhLF on LPS-inducible TNF-α production in hyporeactive patients showing no spontaneous recovery for TNF-α production
Patient No. Day Control LPS rhLF rhLF/LPS Septic shock Reason for admission
to ICUType of infection
(Gram+/–)
6
1 ND ND ND ND
no medical Gram+3 ND 23 ND 105
5 ND 35 ND 153
7
1 ND 69 ND 102
yes surgical Gram–3 ND 33 13 53
5 11 43 ND 116
11
1 ND 38 ND 79
yes medical Gram–3 ND 113 ND 115
5 ND 25 ND 31
Table 4. The effects of rhLF on LPS-inducible TNF-α production in patients with moderate and high cytokine production
PatientNo. Day Control LPS rhLF rhLF/LPS Septic shock Reason for admission
to ICUType of infection
(Gram+/–)
3
1 ND 464 ND 725
no trauma Gram+3 ND 269 ND 599
5 ND 180 ND 292
14
1 23 599 18 482
yes medical Gram+3 38 1026 26 1100
5 27 789 24 781
16
1 32 1942 27 2060
no trauma Gram+3 25 2296 26 2334
5 23 1430 28 1941
22
1 ND 714 ND 574
no medical Gram+3 ND 764 ND 434
5 13 333 1 213
26
1 ND 928 ND 540
no surgical Gram+3 ND 124 ND 159
5 ND 198 ND 136
28
1 ND 141 ND 305
yes surgical Gram–3 ND 190 ND 359
5 9 529 11 829
Table 5. The effects of rhLF on LPS-inducible TNF-α production in control subjects
Donor No. Control LPS rhLF rhLF/LPS
1 ND 604 ND 790
2 ND 1455 ND 558
3 ND 584 ND 729
4 ND 841 ND 1109
5 ND 786 ND 689
6 ND 1516 ND 1556
7 ND 629 ND 878

J. Artym, et al. Lactoferrin in the prevention of immune imbalance398
60% inhibition was observed. This effect of rhLF differed from that of the highly responsive patient No. 16, in whom TNF-α production was not inhibited, confirming our previ-ous findings that high production of this cytokine in blood cell cultures was beneficial in postoperative patients.14,15
Discussion
This report represents the first comparison of rhLF im-munomodulatory effects in vivo in a mouse model with hu-man in vitro effects in whole blood cell cultures of patients with sepsis. Firstly, we demonstrated that rhLF exhibited similar anti-inflammatory properties to other types of LFs in mouse models.18,25,27 Secondly, we analyzed in vitro im-munoregulatory properties of rhLF in WBCC of septic patients in terms of LPS-inducible TNF-α production, and we revealed that the protein acted as an adequate sensor and regulator of the patients’ cell response to the bacte-rial antigen.
Several mechanisms have been proposed to explain the anti-inflammatory actions of LFs in mouse models. In the pleurisy model, toll-like receptors (TLRs), in par-ticular TLR4, could be a good candidate for the mediation of the protective action of LF in this experimental model since LF downregulates the function of these receptors.28 Apart from normalization of the immune response, the parameters associated with this model and the composi-tion of cell types in the pleural infiltrate, we showed that the concentration of IL-5 in the pleural exudates, a major mediator of allergic response, was strongly reduced.25 Re-combinant human lactoferrin was also able to suppress another type of antigen-specific immune response – the cellular response to OVA, similar to that previously dem-onstrated for bovine lactoferrin.29 We showed that inhi-bition of the cellular response to OVA by endogenously LF-induced steroids may contribute to the suppressive action of LF in the cellular immune response.29 In this study, we demonstrated for the first time that LF can also inhibit nonspecific inflammation in a classical pharma-cological model, such as carrageenan-induced inflamma-tion in air pouch. The suppressive effect on the number of air pouch-infiltrating cells was dose-dependent, with an optimal rhLF dose of 500 μg, which surpassed the effect of dexamethasone. Inhibition of IL-6 and TNF-α produc-tion by LF could play a role in this model, as demonstrated in the case of carrageenan-induced inflammation of foot-pad edema in rats.30
Having established that rhLF has the ability to sup-press in mice the manifestations of the inflammatory processes of basic immunological types (antigen-specif-ic and nonspecific), we wished to evaluate its potential ability to modulate the deeply altered immune reactiv-ity of the peripheral blood cells of septic patients. As ex-pected, we revealed the true immunoregulatory nature of rhLF in the WBCC of septic patients and confirmed
our earlier observations on the immunoregulatory actions of bLF in several human models. Orally administered bLF appeared to be immunoregulatory with respect to cyto-kine production in healthy individuals and ameliorated hyporeactivity in surgical patients.16,17 In addition, in vi-tro studies showed that bLF exhibited immunoregulatory properties with regard to LPS-inducible TNF-α and IL-6 production in the WBCC of septic and trauma patients.14,15 Of particular importance in this study was the use of novel CHO-expressed rhLF, which should be more appropri-ate for clinical use than recombinant LFs manufactured in yeast or transgenic plants, due to the mammalian-type glycosylation profile.12,21,22 In addition, by analyzing the responsiveness of patients’ WBCC over 3 time points (days 1, 3 and 5 following the admission to the ICU), we were able to demonstrate the differential kinetics of the LPS-induced TNF-α production among the patients. In particular, we verified a maintained or even a decreasing hyporeactivity, spontaneous recovery of cytokine production, or a moder-ate cytokine production throughout that period. The ef-fects of rhLF on LPS-induced TNF-α production in blood cell cultures were, in fact, anticipated, taking into account the immunoregulatory nature of the protein. The spon-taneously recovering hyporeactivity was not significantly affected, but the sustaining anergy or decreasing reactivity to LPS were upregulated. These effects of rhLF on healthy individuals demonstrating normal responsiveness to LPS stimulus were regulatory, as previously described.16
Several mechanisms may account for the immuno-regulatory effects of lactoferrin in the presented studies. The protein, by downregulating TLR-dependent signal-ing pathways, may inhibit NF-κB activation, and therefore TNF-α production.28 In the mouse model of endotoxemia, LF given prior to LPS inhibited all the studied cytokines (TNF-α, IL-6, and IL-10) in serum, as well as inducible ni-tric oxide.27 On the other hand, when administered to mice after endotoxic shock, LF strongly inhibited TNF-α and nitric oxide, but the levels of IL-6 and IL-10 did not sig-nificantly change.27 Such results indicate that pretreatment of mice with LF induces a strong hyporeactivity to LPS, or to surgery alone.18 On the other hand, the sustained levels of IL-6 and IL-10, when LF is given in the course of en-dotoxemia, ensure adequate protection by counteracting the activity of the proinflammatory mediators.27 LF also has the unique ability to regulate the expression of cyclo-oxygenases (COX). It strongly downregulates the expression of COX-2, but also has the ability to weakly stimulate COX-1 expression in human WBCCs.22 Since prostaglandin E2 (PGE2) mediates the inflammatory response after trauma, the ability of LF to inhibit PGE2 production is highly relevant in explaining its anti-inflammatory action in septic shock and trauma.31 Such an assumption may be supported by the find-ing that both inducible nitric oxide and PGE2 were inhibited by LF in endotoxemic mice.32 On the other hand, the upregu-lation of intrinsic COX-1 expression by LF may be significant in disrupting the hyporeactivity of LPS-tolerant cells.

Adv Clin Exp Med. 2018;27(3):391–399 399
In view of the data presented above, we postulate that apart from determining a patient’s immunoreactivity prior to elective surgery, the application of LF before or even after surgery should be beneficial to the patient. Thanks to the immunoregulatory nature of LF, the protein will sense the immune status of the patient and modify it ac-cordingly. Overall, these studies provide a strong argu-ment for continuing trials aimed at the application of LF as an agent reducing the risk of septic conditions in patients scheduled for surgery.
Conclusions
In conclusion, this study presents evidence for the po-tential preventive and therapeutic use of rhLF in patients with impaired immune reactivity.
References1. Börgermann J, Friedrich I, Flohé S, et al. Tumor necrosis factor-alpha
production in whole blood after cardiopulmonary bypass: Downreg-ulation caused by circulating cytokine-inhibitory activities. J Thorac Cardiovasc Surg. 2002;124:608–617.
2. Houdijk AP, Meijer C, Cuesta MA, Meyer S, Van Leeuwen PA. Periop-erative anti-endotoxin strategies. Scand J Gastroenterol. 1997;32(222): 93–97.
3. Almansa R, Wain J, Tamayo E, et al. Immunological monitoring to pre-vent and treat sepsis. Crit Care. 2013;17:109.
4. García-Montoya IA, Cendón TS, Arévalo-Gallegos S, Rascón-Cruz Q. Lactoferrin a multiple bioactive protein: An overview. Biochim Bio-phys Acta. 2012;1820:226–236.
5. Legrand D, Elass E, Carpentier M, Mazurier J. Lactoferrin: A modula-tor of immune and inflammatory responses. Cell Mol Life Sci. 2005;62: 2549–2559.
6. Berkestedt I, Herwald H, Ljunggren L, Nelson A, Bodelsson M. Ele-vated plasma levels of antimicrobial polypeptides in patients with severe sepsis. J Innate Immun. 2010;2:478–482.
7. Modig J, Samuelsson T, Hällgren R. The predictive and discriminative value of biologically active products of eosinophils, neutrophils and complement in bronchoalveolar lavage and blood in patients with adult respiratory distress syndrome. Resuscitation. 1986;14:121–134.
8. Hällgren R, Venge P, Wikström B. Hemodialysis-induced increase in serum lactoferrin and serum eosinophil cationic protein as signs of local neutrophil and eosinophil degranulation. Nephron. 1981;29: 233–238.
9. Stammers AH, Christensen KA, Lynch J, Zavadil DP, Deptula JJ, Sydzyik RT. Quantitative evaluation of heparin-coated versus non-heparin-coated bypass circuits during cardiopulmonary bypass. J Extra Corpor Technol. 1999;31:135–141.
10. Edeleva NV, Sergeeva TV, Nemtsova ER, Shcherbitskaia I, Yakubovs-kaia RI, Osipova NA. Antioxidants ceruloplasmin and lactoferrin in the prevention and treatment of postoperative complications in cancer patients. Anesteziol Reanimatol. 2001;5:61–64.
11. Chissov VI, Yakubovskaia RI, Nemtsova ER, et al. Antioxidants treat-ment of severe post-operative proinflammatory and septic compli-cations. Khirurgiia. 2008;11:14–19.
12. Guntupalli K, Dean N, Morris PE, et al. For the TLF LF-0801 Investi-gator Group: A phase 2 randomized, double-blind, placebo-con-trolled study of the safety and efficacy of talactoferrin in patients with severe sepsis. Crit Care Med. 2013;41:706–716.
13. Akin IM, Atasay B, Dogu F, et al. Oral lactoferrin to prevent noso-comial sepsis and necrotizing enterocolitis of premature neonates and effect on T-regulatory cells. Am J Perinatol. 2014;31:1111–1120.
14. Adamik B, Zimecki M, Właszczyk A, Berezowicz P, Kübler A. Lactofer-rin effects on the in vitro immune response in critically ill patients. Arch Immunol Ther Exp. 1998;46:169–176.
15. Właszczyk A, Zimecki M, Adamik B, Durek G, Kübler A. Immunological status of patients subjected to cardiac surgery: Effect of lactoferrin on proliferation and production of interleukin 6 and tumor necro-sis factor alpha by peripheral blood mononuclear cells in vitro. Arch Immunol Ther Exp. 1997;45:201–212.
16. Zimecki M, Właszczyk A, Cheneau P, et al. Immunoregulatory effects of a nutritional preparation containing bovine lactoferrin taken oral-ly by healthy individuals. Arch Immunol Ther Exp. 1998;46:231–240.
17. Zimecki M, Właszczyk A, Wojciechowski R, Dawiskiba J, Kruzel M. Lac-toferrin regulates the immune responses in post-surgical patients. Arch Immunol Ther Exp. 2001;49:325–333.
18. Zimecki M, Właszczyk A, Zagulski T, Kübler A. Lactoferrin lowers serum interleukin 6 and tumor necrosis factor alpha levels in mice subjected to surgery. Arch Immunol Ther Exp. 1998;46:97–104.
19. Ochoa TJ, Chea-Woo E, Baiocchi N, et al. Randomized double-blind controlled trial of bovine lactoferrin for prevention of diarrhea in chil-dren. J Pediatr. 2013;162:349–356.
20. Takeuchi Y, Yamamura T, Takahashi S, et al. Long-term enteral immu-nonutrition containing lactoferrin in tube-fed bedridden patients: Immunological and nutritional status. J Am Coll Nutr. 2012; 31:206–213.
21. Zavaleta N, Figueroa D, Rivera J, Sanchez J, Alfaro S, Lönnerdal B. Effi-cacy of rice-based oral rehydration solution containing recombinant human lactoferrin and lysozyme in Peruvian children with acute diar-rhea. J Pediatr Gastoenterol Nutr. 2007;44:258–264.
22. Kruzel ML, Actor JK, Zimecki M, et al. Novel recombinant human lactoferrin: Differential activation of oxidative stress related gene expression. J Biotechnol. 2013;168:666–675.
23. Zimecki M, Artym J, Kocięba M, Duk M, Kruzel ML. The effect of car-bohydrate moiety structure on the immunoregulatory activity of lac-toferrin in vitro. Cell Mol Biol Lett. 2014;19:284–296.
24. Dellinger RP, Levy MM, Carlet JM, et al. Surviving Sepsis Campaign: International guidelines for management of severe sepsis and sep-tic shock: 2008. Crit Care Med. 2008;36:296–327.
25. Zimecki M, Artym J, Kocięba M, Kaleta-Kuratewicz K, Kruzel ML. Lac-toferrin restrains allergen-induced pleurisy in mice. Inflamm Res. 2012;61:1247–1255.
26. La Manna G, Cappuccilli ML, Cianciolo G, et al. Cardiovascular disease in kidney transplant recipients: The prognostic value of inflammatory cytokine genotypes. Transplantation. 2010;89:1001–1008.
27. Kruzel ML, Harari Y, Mailman D, Actor JK, Zimecki M. Differential effects of prophylactic, concurrent and therapeutic lactoferrin treatment on LPS-induced inflammatory responses in mice. Clin Exp Immunol. 2002;130:25–31.
28. Ando K, Hasegawa K, Shindo K, et al. Human lactoferrin activates NF-kappaB through the Toll-like receptor 4 pathway while it inter-feres with the lipopolysaccharide-stimulated TLR4 signaling. FEBS J. 2010;277:2051–2066.
29. Zimecki M, Artym J, Kocięba M. Endogenous steroids are respon-sible for lactoferrin-induced myelopoiesis in mice. Pharmacol Rep. 2009;61:705–710.
30. Zimecki M, Międzybrodzki R, Szymaniec S. Oral treatment of rats with bovine lactoferrin inhibits carrageenan-induced inflammation; correlation with decreased cytokine production. Arch Immunol Ther Exp (Warsz). 1998;46:361–365.
31. Strong VE, Mackrell PJ, Concannon EM, et al. Blocking prostaglan-din E2 after trauma attenuates pro-inflammatory cytokines and improves survival. Shock. 2000;14:374–379.
32. Talukder MJ, Harada E. Bovine lactoferrin protects lipopolysaccha-ride-induced diarrhea modulating nitric oxide and prostaglandin E2 in mice. Can J Physiol Pharmacol. 2007;85:200–208.


DOI10.17219/acem/68545
Copyright© 2018 by Wroclaw Medical University This is an article distributed under the terms of the Creative Commons Attribution Non-Commercial License(http://creativecommons.org/licenses/by-nc-nd/4.0/)
Address for correspondenceAgnieszka ChmielarczykE-mail: [email protected]
Funding sourcesThis work was supported by a grant from the National Science Center (No. DEC-2012/05/B/NZ7/02880). The sponsor provided the funding for the project only.
Conflict of interestNone declared
AcknowledgementsThe work presented here was carried out in a col-laboration between all authors. All authors have seen and approved the manuscript. Some of the results shown in this publication were presented as a poster at the 9th Healthcare Infection Society Conference: November 16–18, 2014, Lyon, France.
Received on May 2, 2016Reviewed on October 10, 2016Accepted on January 17, 2017
AbstractBackground. The impact of multidrug-resistant organisms (MDROs), including non-fermentative bacilli (NFBs), is rising and underestimated, especially in intensive care units (ICUs). The growing prevalence of mul-tidrug resistance (MDR) and extensive drug resistance (XDR) is challenging for clinicians, as the treatment options are limited.
Objectives. The purpose of this study was to analyze the extent of the epidemiological problem of multidrug-resistant, extensively drug-resistant and pandrug-resistant (PDR) non-fermentative bacilli isolated from pneumonia and bloodstream infections (BSIs) in patients hospitalized in southern Poland.
Material and methods. This study included 253 NFBs belonging to Acinetobacter sp. (ACI), Pseudomonas sp. (PAR), and Stenotrophomonas sp. (STM). The microorganisms were identified, and susceptibility testing was performed using a semi-automatic system. The different patterns of resistance were defined as MDR, XDR, or PDR strains. Epidemiological typing of A. baumannii from ICUs was performed by repetitive polymerase chain reaction (rep-PCR).
Results. More than half of the strains (57.7%) were isolated within ICUs. ACI-strains came significantly more often from ICU wards. The highest prevalence of ACI and PAR was found in pneumonia, whereas STM dominated in BSIs. ACIs were more frequently resistant than other pathogens to all studied antibiotics except colistin (n = 76; 58.9%), and they belonged to the XDR category. DiversiLab demonstrated the presence of 2 dominant clones in the ACI group, both classified as European Clone 2 (EUII).
Conclusions. Our results indicate serious potential therapeutic problems related to high antibiotic resistance of ACI isolates. The stratification of drug resistance (MDR/XDR/PDR) may become an important tool for the assessment of public health epidemiology and microbiological hazards at the local, national, and interna-tional level. It allows clear presentation of the issues concerning the epidemiology of highly resistant bacilli, and the exchange of information between medical staff and local representatives of public health for the implementation of effective measures to reduce drug resistance.
Key words: pneumonia, multidrug resistance, non-fermentative bacilli, bloodstream infections
Original papers
Severe infections caused by multidrug-resistant non-fermentative bacilli in southern Poland
Agnieszka Chmielarczyk1,A–D,F, Monika Pobiega1,B,C, Grzegorz Ziółkowski2,B, Monika Pomorska-Wesołowska3,B, Dorota Romaniszyn1,C, Lech Krawczyk2,E, Jadwiga Wójkowska-Mach1,A,E,F
1 Chair of Microbiology, Jagiellonian University Medical College, Kraków, Poland2 Higher School of Medicine in Sosnowiec, Poland3 Department of Microbiology, Analytical and Microbiological Laboratory, KORLAB Non-public Healthcare Center, Ruda Śląska, Poland
A – research concept and design; B – collection and/or assembly of data; C – data analysis and interpretation; D – writing the article; E – critical revision of the article; F – final approval of the article
Advances in Clinical and Experimental Medicine, ISSN 1899-5276 (print), ISSN 2451-2680 (online) Adv Clin Exp Med. 2018;27(3):401–407

A. Chmielarczyk, et al. Infections caused by MDR NF bacilli402
Introduction
The impact of multidrug-resistant organisms (MDROs), including non-fermentative bacilli (NFBs), in intensive care units (ICUs) is rising and underestimated.1
Pseudomonas aeruginosa (PAR) shows an intrinsic re-sistance to many antibiotics and can horizontally acquire novel resistance genes.2 This may be one of the reasons for the increasing number of reports of multi-drug resis-tant (MDR) strains.3 In particular, nosocomial isolates of Acinetobacter and Pseudomonas may exhibit high rates of resistance to antimicrobials. Carbapenems are impor-tant agents for the treatment of severe infections caused by P. aeruginosa and A. baumannii. Carbapenem resis-tance poses a real threat to prognosis, because treatment options are limited. Carbapenems are one of the groups of antibiotics with enhanced activity, but these agents can also be inactivated by various mechanisms.4
Colistin is a key therapeutic option for the treatment of carbapenem-resistant A. baumannii and P. aeruginosa, alone or in combination with other agents, such as tigecy-cline, ampicillin–sulbactam, and carbapenems. Monother-apy is usually recommended for uncomplicated infections, while combination therapy is normally recommended for severe infections, such as bacteremia and pneumonia, al-though at least in some cases, the advantage of combina-tion therapy remains a matter of debate.5 It is supposed that colistin resistance emerges under selective pressure in individual patients rather than through patient-to-pa-tient transmission.6 A surveillance study of US hospitals revealed that 5.3% of all Acinetobacter strains were resis-tant to colistin.7
In recent decades, a substantial reduction in mortality rates in ICUs has been reported, but the antimicrobial resistance profile of microorganisms causing infections has significantly changed. Several factors may explain the rapid spread of MDROs in ICUs: new mutations, the selec-tion of resistant strains, and poor antibiotic management. Most guidelines have different recommendations depend-ing on the risk of the presence of MDROs.1,8
Objectives
Modern medicine requires clear and explicit criteria to describe the phenomena of public health, and one of the major problems of public health is microbial drug resis-tance. The aim of this study was to analyze the extent of the epidemiological problem of highly multidrug-re-sistant (MDR), extensively drug-resistant (XDR) and pan-drug-resistant (PDR) non-fermentative bacilli isolated from pneumonia and bloodstream infections (BSIs) in patients hospitalized in southern Poland.
Material and methods
Population description
This laboratory-based, multicenter study comprised consecutive non-repetitive NFB isolates received from pneumonia and BSIs, from hospitalized and non-hospi-talized patients throughout southern Poland (Małopolska and Silesia regions), collected between January 1, 2013 and December 31, 2013. The study included patients from 12 hospitals, 3 long-term care and outpatient care facili-ties operated by the Chair of Microbiology at Jagiellonian University Medical College (Kraków, Poland), and 2 col-laborative laboratories from the Silesia region. Pneumonia and BSI were diagnosed in accordance with the definitions of the European Center for Disease Prevention and Control (ECDC).9
A single strain was derived from the first sample col-lected in the case of the first episode of infection; during recurrent infection, a further strain was qualified for the study, provided that 14 days had passed since the first epi-sode of infection, in the absence of clinical symptoms be-tween the episodes. To confirm a diagnosis of BSI, at least 2 samples were taken. In the cases when a blood sample was taken to confirm a diagnosis of pneumonia, the bacterial isolate was treated as the cause of pneumonia (if lacking an isolate from bronchoalveolar lavage fluid).
Relevant information about the patients, such as age, sex, type of infection, and place of hospitalization was also collected. According to information gathered by the collaborating laboratories, patients were classified as one of the following: hospital patients; patients from ICUs (n = 146; 57.7%), the Department of Internal Medicine (n = 63; 24.9%) or the pulmonary medicine ward (n = 29; 11.5%); or outpatients, including residents of long-term care facilities (LTCFs), people with infections diagnosed by a physician, and those staying in nursing homes or re-ceiving home care (n = 15; 5.9%). The tested strains came from pneumonia (n = 197; 77.9%), BSIs (n = 52; 20.5%) and meningoencephalitis (n = 4; 1.6%).
Bacterial isolates
In 2013, 2,763 samples were examined in the collabo-rating laboratories. Microbiological examinations were performed on blood (1,721 samples), pleural puncture fluid (124 samples), and tracheobronchial aspirates and bronchoalveolar lavage fluid, when available (918 samples).
Microorganisms were identified using a semi-automatic system (Phoenix; Becton-Dickinson, Warszawa, Poland), according to standard methods. Among the samples test-ed, 253 were positive for pathogens belonging to NFBs. The studied strains belonged to the following groups: 1) ACI (Acinetobacter baumannii, n = 125; Acinetobacter junii, n = 1; Acinetobacter radioresistens, n = 1; Acineto-bacter lwoffii, n = 1; and Acinetobacter ursingii, n = 1);
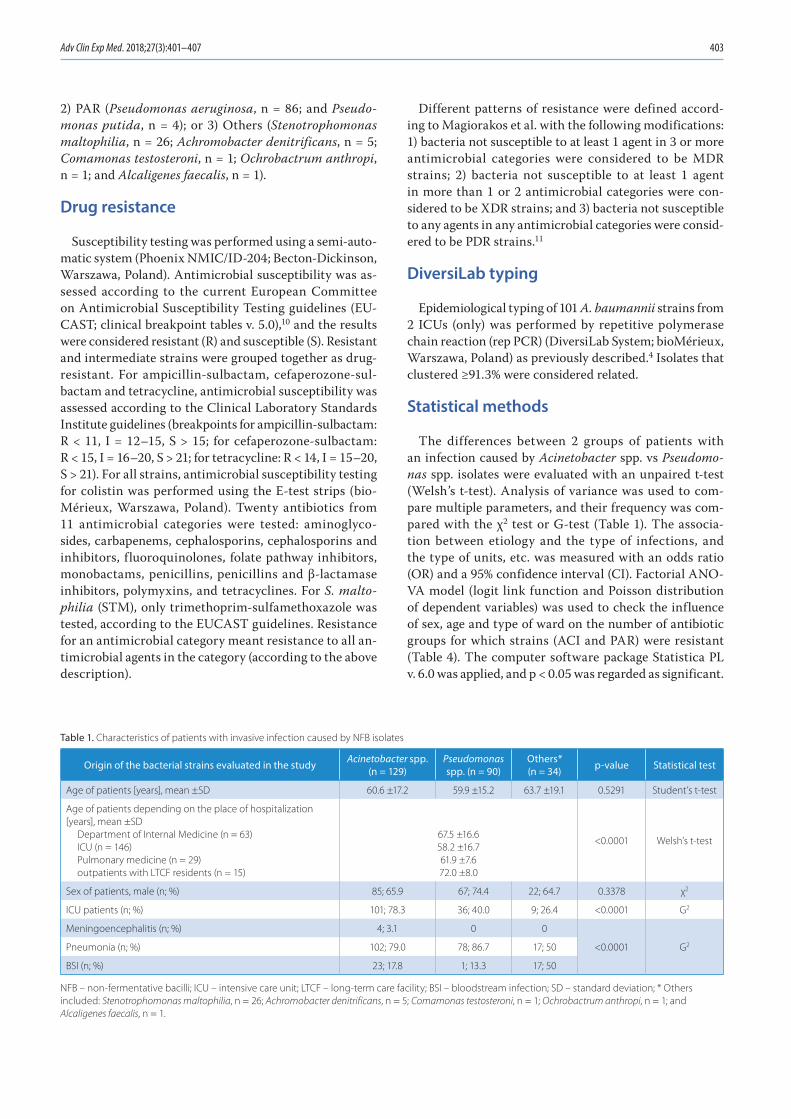
Adv Clin Exp Med. 2018;27(3):401–407 403
2) PAR (Pseudomonas aeruginosa, n = 86; and Pseudo-monas putida, n = 4); or 3) Others (Stenotrophomonas maltophilia, n = 26; Achromobacter denitrificans, n = 5; Comamonas testosteroni, n = 1; Ochrobactrum anthropi, n = 1; and Alcaligenes faecalis, n = 1).
Drug resistance
Susceptibility testing was performed using a semi-auto-matic system (Phoenix NMIC/ID-204; Becton-Dickinson, Warszawa, Poland). Antimicrobial susceptibility was as-sessed according to the current European Committee on Antimicrobial Susceptibility Testing guidelines (EU-CAST; clinical breakpoint tables v. 5.0),10 and the results were considered resistant (R) and susceptible (S). Resistant and intermediate strains were grouped together as drug-resistant. For ampicillin-sulbactam, cefaperozone-sul-bactam and tetracycline, antimicrobial susceptibility was assessed according to the Clinical Laboratory Standards Institute guidelines (breakpoints for ampicillin-sulbactam: R < 11, I = 12–15, S > 15; for cefaperozone-sulbactam: R < 15, I = 16–20, S > 21; for tetracycline: R < 14, I = 15–20, S > 21). For all strains, antimicrobial susceptibility testing for colistin was performed using the E-test strips (bio-Mérieux, Warszawa, Poland). Twenty antibiotics from 11 antimicrobial categories were tested: aminoglyco-sides, carbapenems, cephalosporins, cephalosporins and inhibitors, fluoroquinolones, folate pathway inhibitors, monobactams, penicillins, penicillins and β-lactamase inhibitors, polymyxins, and tetracyclines. For S. malto-philia (STM), only trimethoprim-sulfamethoxazole was tested, according to the EUCAST guidelines. Resistance for an antimicrobial category meant resistance to all an-timicrobial agents in the category (according to the above description).
Different patterns of resistance were defined accord-ing to Magiorakos et al. with the following modifications: 1) bacteria not susceptible to at least 1 agent in 3 or more antimicrobial categories were considered to be MDR strains; 2) bacteria not susceptible to at least 1 agent in more than 1 or 2 antimicrobial categories were con-sidered to be XDR strains; and 3) bacteria not susceptible to any agents in any antimicrobial categories were consid-ered to be PDR strains.11
DiversiLab typing
Epidemiological typing of 101 A. baumannii strains from 2 ICUs (only) was performed by repetitive polymerase chain reaction (rep PCR) (DiversiLab System; bioMérieux, Warszawa, Poland) as previously described.4 Isolates that clustered ≥91.3% were considered related.
Statistical methods
The differences between 2 groups of patients with an infection caused by Acinetobacter spp. vs Pseudomo-nas spp. isolates were evaluated with an unpaired t-test (Welsh’s t-test). Analysis of variance was used to com-pare multiple parameters, and their frequency was com-pared with the χ2 test or G-test (Table 1). The associa-tion between etiology and the type of infections, and the type of units, etc. was measured with an odds ratio (OR) and a 95% confidence interval (CI). Factorial ANO-VA model (logit link function and Poisson distribution of dependent variables) was used to check the influence of sex, age and type of ward on the number of antibiotic groups for which strains (ACI and PAR) were resistant (Table 4). The computer software package Statistica PL v. 6.0 was applied, and p < 0.05 was regarded as significant.
Table 1. Characteristics of patients with invasive infection caused by NFB isolates
Origin of the bacterial strains evaluated in the study Acinetobacter spp. (n = 129)
Pseudomonas spp. (n = 90)
Others*(n = 34) p-value Statistical test
Age of patients [years], mean ±SD 60.6 ±17.2 59.9 ±15.2 63.7 ±19.1 0.5291 Student’s t-test
Age of patients depending on the place of hospitalization [years], mean ±SD
Department of Internal Medicine (n = 63)ICU (n = 146)Pulmonary medicine (n = 29)outpatients with LTCF residents (n = 15)
67.5 ±16.658.2 ±16.761.9 ±7.672.0 ±8.0
<0.0001 Welsh’s t-test
Sex of patients, male (n; %) 85; 65.9 67; 74.4 22; 64.7 0.3378 χ2
ICU patients (n; %) 101; 78.3 36; 40.0 9; 26.4 <0.0001 G2
Meningoencephalitis (n; %) 4; 3.1 0 0
<0.0001 G2Pneumonia (n; %) 102; 79.0 78; 86.7 17; 50
BSI (n; %) 23; 17.8 1; 13.3 17; 50
NFB – non-fermentative bacilli; ICU – intensive care unit; LTCF – long-term care facility; BSI – bloodstream infection; SD – standard deviation; * Others included: Stenotrophomonas maltophilia, n = 26; Achromobacter denitrificans, n = 5; Comamonas testosteroni, n = 1; Ochrobactrum anthropi, n = 1; and Alcaligenes faecalis, n = 1.

A. Chmielarczyk, et al. Infections caused by MDR NF bacilli404
Ethics
The use of data collected for scientific purposes of this study was approved by the Bioethics Committee of Jagiel-lonian University Medical College (No. KBET/362/B/2012). All data entered into the electronic database and analyzed during this research were previously anonymized and de-identified.
Results
Study population
The average age of the study population was 60.8 years (SD: 16.3 years). There was a predominance of males (n = 174); however, there was no association between the occurrence of microbial species and the sex or age of pa-tients (Table 1). The age of outpatients differed from the age of inpatients and LTCF patients; significantly older patients received home care or stayed in LTCFs, and significantly younger patients were treated in hospital (Table 1).
ACI strains came significantly more often from ICU wards, whereas PAR strains were from pulmonology wards, outpatients, and residents of LTCFs (g2 = 52.762; p < 0.0001) (Table 1). The tested NFB strains appeared with different frequencies in different types of infections. The highest prevalence of ACI and PAR was found in pneumonia, and STM in BSIs (Table 2). Regardless of the type of unit, PAR strains were significantly less frequent in pneumonia than ACI (OR: 0.21; 95% CI: 0.133–0.335), and in BSIs, strains from the Others group were significantly more frequently observed compared with other infections (OR: 4.74; 95% CI: 2.208–10.19) (Table 2). Differentiating between ICU and non-ICU units, ACI strains were significantly more frequent in pneumonia in ICUs than other species (OR: 5.8; 95% CI: 3.11–10.86) (Table 2). In the case of BSI, there were considerably more isolated strains from the Others group in non-ICU units than other species (OR: 25.3; 95% CI: 4.75–134.89) (Table 2).
Drug resistance
More than 75% of ACI strains were resistant to 14 of 16 anti- microbials. Among ACI strains, the proportion of XDR strains was the highest among all 3 studied groups of patho-gens (n = 99; 76.1%), and most of these isolates were resis-tant to all studied antibiotics with the exception of colistin (n = 76; 58.9%) (Table 3). The minimal inhibitory concen-tration (MIC50) for colistin in the ACI group was 1 mg/L.
Two PAR strains (2.2%) were resistant to all studied antibiotics with the exception of netilmicin and colistin. XDR PAR strains were less common than XDR ACI, 8.9% vs 76.1% (OR: 0.049; 95% CI: 0.022–0.109). MDR strains occurred with a frequency of 28.9% (n = 26) (Table 3). The MIC50 for colistin in the PAR group was 1 mg/L.
In strains from the Others group, 97% were susceptible to sulphametoxazole-trimetoprim (SXT), and only 1 – S. maltophilia – was resistant to SXT.
No PDR strains were identified in the studied group. Almost 60% of ACI strains were nearly PDR strains, and they were susceptible only to polymyxin antimicrobials.
Factorial ANOVA analysis
In the model of factorial analysis, the Poisson distribu-tion of the dependent variable (effect) and the logit link function were assumed. The model showed a significant fit (χ2 = 151.5078; df = 9; p < 0.0001). The analysis of param-eters (Table 4) shows that the NFBs isolated from infec-tions in ICUs were resistant to more antibiotic groups than
Table 2. Frequency of isolation of NFB strains in various types of severe infection
Infections caused by NFB in hospital
patients Meningitis BSI Pneumonia
ACI
No.
ICU 3 (75%) 19 (82.6%) 79 (77.5%)
non-ICU 1 (25%) 4 (17.4%) 23 (22.5%)
total 4 (100%) 23 (100%) 102 (100%)
Prevalencea (%) 3.2 1.3 11.1
PAR
No.
ICU 0 (0%) 8 (66.7%) 28 (35.9%)
non-ICU 0 (0%) 4 (33.3%) 50 (64.1%)
total 0 (0%) 12 (100%) 78 (100%)
Prevalenceb (%) 0.0 0.7 8.5
Others*
No.
ICU 0 (0%) 2 (11.8%) 7 (41.2%)
non-ICU 0 (0%) 15 (88.2%) 10 (58.8%)
total 0 (0%) 17 (100%) 17 (100%)
Prevalencec (%) 0.0 1.0 1.9
ACI – Acinetobacter baumannii; BSI – bloodstream infection; ICU – intensive care units; NFB – non-fermentative bacilli; PAR – Pseudomonas aeruginosa; * Others included: Stenotrophomonas maltophilia, n = 26; Achromobacter denitrificans, n = 5; Comamonas testosteroni, n = 1; Ochrobactrum anthropi, n = 1; and Alcaligenes faecalis, n = 1;a calculated as follows:
(number of ACI meningitis/number of all cerebrospinal fluid cultures) × 100%(number of ACI BSI/number of all blood cultures) × 100%(number of ACI pneumonia/number of all BAL cultures) × 100%;
b calculated as follows:(number of PAR meningitis/number of all cerebrospinal fluid cultures) × 100%(number of PAR BSI/number of all blood cultures) × 100%(number of PAR pneumonia/number of all BAL cultures) × 100%;
c calculated as follows:(number of OTHERS meningitis/number of all cerebrospinal fluid cultures) × 100%(number of OTHERS BSI/number of all blood cultures) × 100%(number of OTHERS pneumonia/number of all BAL cultures) × 100%;BAL – bronchoalveolar lavage.

Adv Clin Exp Med. 2018;27(3):401–407 405
isolates from other wards. In addition, ACI organisms were resistant to more antibiotic groups than the PAR organ-isms (STM were not considered in the model).
DiversiLab typing
DiversiLab demonstrated the presence of 2 dominant clones in the ACI group. Clone 1 included 24 isolates and clone 2 included 55 isolates. Both of these clones were clas-sified as European Clone 2 (EUII). Other listed clones (3–6) consisted of 2 strains. Twelve strains were distinguished as unique. Two isolates were non-typable. Most isolates belonging to clone 1 (67.8%) and clone 2 (80%) were sus-ceptible only to colistin. Among the unique isolates, 30% had a pattern of resistance to colistin alone.
Discussion
Non-fermentative Gram-negative bacilli have emerged as major agents of pneumonia (especially ventilator-as-sociated), and their resistance to antibiotics, particularly to carbapenems, has become a therapeutic challenge.
Acinetobacter baumannii has become one of the most difficult nosocomial pathogens to control and treat, with a mortality rate of ~30%,12 and P. aeruginosa is a highly virulent organism with a mortality rate of 40–60%.5 Aci-netobacter baumannii can also cause bloodstream, urinary tract, and wound infections.13
In our study, the highest prevalence of ACI and PAR was found in pneumonia, and STM was significantly more frequently observed in BSIs.
The most serious issue in the treatment of A. baumannii infection are XDR strains, because the number of active agents is limited.14 Our study also showed that the greatest problem was the extremely drug-resistant A. baumannii (76%), compared with MDR strains (14.6%).
The highest resistance among A. baumannii strains in our study was observed for aminoglycosides, cepha-losporins, f luoroquinolones, carbapenems, and SXT. According to the European Antimicrobial Resistance Surveillance Network (EARS-Net), antibiotic resistance
Table 3. Resistance of the type of MDR to a selected group of antibiotics
Antimicrobial (sub-)classes and antimicrobials used for testing
Acinetobacter spp.
(n = 129)
Pseudomonas spp.
(n = 90)
Aminoglycosides (%)
gentamicin 82.9 28.9
tobramycin 81.4 23.3
amikacin 86.0 30.0
netilmicin 83.7 22.2
Antipseudomonal carbapenems (%)
imipenem 79.8 31.1
meropenem 80.6 38.9
Extended-spectrum cephalosporins (%)
ceftazidime 92.2 25.6
cefepime 92.2 28.9
Antipseudomonal fluoroquinolones (%)
ciprofloxacin 91.5 47.8
levofloxacin 90.7 47.8
penicillins (piperacillin) (%) n/a 26.7
Penicillins and β-lactamase inhibitors (%)
ticarcillin-clavulanic acid n/a 28.9
piperacillin-tazobactam 90.7 24.4
ampicillin-sulbactam 77.5 n/a
monobactams (%) n/a 96.7
folate pathway inhibitors (%) 91.5 n/a
tetracyclines (%) 89.9 n/a
cephalosporins and inhibitors (%) n/a 17.8
Polymyxins (%)
colistin 0.0 0.0
Type of resistance
sensitive (%) 5.4 27.8
MDR (%) 14.6 28.9
XDR (%) 76.1 8.9
PDR (%) 0.0 0.0
Other (%) 3.9 34.4
MDR – multidrug-resistant; XDR – extensively drug-resistant; PDR – pandrug-resistant; n/a – not applicable.
Table 4. Independent predictors of antimicrobial resistance: Factorial ANOVA analysis
Estimate Std Err L-R χ2 p-value
Age of patients 0.000262 0.002001 0.017154 0.8958
Type of patient care: internal medicine 0.140364 0.178104 0.703742 0.4015
Type of patient care: intensive care units 0.406582 0.167152 9.066479 0.0026
Type of patient care: outpatients −0.37352 0.304834 1.507221 0.2196
Type of patient care: pulmonary medicine −0.08715 0.1922 0.192896 0.6605
Sex of patients: male −0.03265 0.036124 0.822937 0.3643
Studied non-fermentative bacilli: ACI 0.322053 0.041334 66.68041 <0.0001
ACI – Acinetobacter baumannii; Std Err – standard error; L-R – likelihood ratio.

A. Chmielarczyk, et al. Infections caused by MDR NF bacilli406
in Acinetobacter species shows large variations across Europe, with generally high percentages of resistance reported in southern Europe and lower percentages in northern Europe. Combined resistance to fluoroqui-nolones, aminoglycosides and carbapenems was ≥20% in 12 of the 23 countries reporting susceptibility results for 10 or more isolates. Carbapenem-resistant A. bauman-nii reached >25% in 8 of the 18 countries reporting data. Resistance to polymyxins, a group of last-line antibiotics, was observed in 5% of the isolates, mostly from southern Europe.15
In 2010, the European Centre for Disease Prevention and Control (ECDC) reported that ~15% of P. aeruginosa strains were MDR, in contrast to 1993, when the reported value was only 4%.16 It is worrying to note that 1/3 of the isolates were MDR, and 8.9% were XDR. Taken together, this means that ~40% of the population are at risk of seri-ous problems with the treatment of severe infections, such as BSI and pneumonia.
According to EARS-Net, ~32.3% of the PAR isolates from invasive infections in 2013 were carbapenem-resistant, which is comparable to our results (about 1/3 of the stud-ied strains were resistant to imipenem). This is more than in previous reports from Poland, where only 10.5% of the isolates were carbapenem-resistant.17
We also noted a high number of PAR strains resistant to aminoglycosides (~30%). Such a problem does not ex-ist in countries such as Sweden (3%) or Norway (1.5%), but the situation is different in Greece (40%) or the Czech Republic (25%).15
The percentage of strains resistant to fluoroquinolones is also worrying, as about half of the tested strains were resistant. This rate is also higher than in Scandinavian countries, where <10% of strains isolated from invasive in-fections are resistant to those antimicrobials. Furthermore, attention should be paid to the use of fluoroquinolones. Similar results were obtained in the case of urinary tract infections caused by PAR in Poland, which is understand-able, as those antimicrobials are intended for use in urinary tract infections.18
Carbapenem-resistant strains are mostly susceptible to polymyxins; however, these antimicrobials are known to be toxic and are used as drugs of last resort. In our study, the greatest therapeutic problem was represented by the strains that were nearly pandrug-resistant and susceptible only to colistin. No strains resistant to colistin were re-ported in Poland.
It is of particular interest that, in our study, BSIs were frequently caused by bacteria from the OTHERS group, mainly STM. The World Health Organization (WHO) clas-sified this pathogen as one of the leading MDROs in hos-pital settings.19 STM causes a wide range of infections, including respiratory tract infections and BSIs. Despite the large number of different global surveillance studies, there are still limited data on the prevalence and susceptibil-ity patterns of STM.20 The worldwide prevalence of STM
in BSIs was ~0.8% in 2000–2004.21 It is difficult to assess how large the problem with STM was in our study popula-tion, because there were no data from other multicenter studies. However, reports from the German KISS program show a growing involvement of STM in the etiology of hos-pital infections, and the proportion of STM increased from 1.646 to 2.102 between 2001 and 2004.21
There are limited antimicrobial options for infections due to STM because of its extensive resistance to most antibiotics. One drug recommended as a drug of choice is SXT.22 Resistance rates may vary between different re-gions but, in general, they are <10%.23,24 One study from Poland on a set of 80 STM clinical isolates showed that only 71.3% of the strains were susceptible to SXT.25 Here, we detected only 1 resistant strain, which is not consistent with previous reports.
Conclusions
Our results indicate serious potential therapeutic prob-lems related to the high antibiotic resistance of A. bau- mannii isolates. The stratification of drug resistance (MDR/XDR/PDR) may become an important tool for the assessment of public health epidemiology and microbio-logical hazards at the local, national, and international levels. It allows a clear presentation of the issues concern-ing the epidemiology of highly resistant bacilli, and the exchange of information between medical staff and local representatives of public health for the implementation of effective measures to reduce drug resistance. The grow-ing prevalence of MDR and XDR is challenging for cli-nicians, because the treatment options are limited. New antimicrobial agents and treatment protocols are needed.
References1. Martín-Loeches I, Diaz E, Vallés J. Risks for multidrug-resistant patho-
gens in the ICU. Curr Opin Crit Care. 2014;20(5):516–524.2. Rossolini GM. Acquired metallo-beta-lactamases: An increasing clin-
ical threat. Clin Infect Dis. 20051;41(11):1557–1558.3. Obritsch MD, Fish DN, MacLaren R, Jung R. Nosocomial infections
due to multidrug-resistant Pseudomonas aeruginosa: Epidemiol-ogy and treatment options. Pharmacotherapy. 2005;25:1353–1364.
4. Higgins PG, Dammhayn C, Hackel M, Seifert H. Global spread of car-bapenem-resistant Acinetobacter baumannii. J Antimicrob Chemother. 2010;65(2):233–238. Erratum in: J Antimicrob Chemother. 2010;65(6):1317.
5. Rossolini GM, Mantengoli E. Treatment and control of severe infec-tions caused by multiresistant Pseudomonas aeruginosa. Clin Micro-biol Infect. 2005;11(4):17–32.
6. Qureshi ZA, Hittle LE, O’Hara JA, et al. Colistin-resistant Acineto-bacter baumannii: Beyond carbapenem resistance. Clin Infect Dis. 2015;60(9):1295–1303.
7. O’Hara JA, Ambe LA, Casella LG, et al. Activities of vancomycin-con-taining regimens against colistin-resistant Acinetobacter bauman-nii clinical strains. Antimicrob Agents Chemother. 2013;57(5):2103–2108.
8. Vallés J, Martin-Loeches I, Torres A, et al. Epidemiology, antibiotic therapy and clinical outcomes of healthcare-associated pneumo-nia in critically ill patients: A Spanish cohort study. Intensive Care Med. 2014;40(4):572–581.

Adv Clin Exp Med. 2018;27(3):401–407 407
9. European Centre for Disease Prevention and Control – An agen-cy of the European Union. http://ecdc.europa.eu/en/publications/Publications/healthcare-associated-infections-HAI-ICU-protocol.pdf Accessed August 2016.
10. EUCAST: Clinical breakpoints. http://www.eucast.org/clinical_break-points/ Accessed September 25, 2015.
11. Magiorakos AP, Srinivasan A, Carey RB, et al. Multidrug resistant, extensively drug-resistant and pan-drug-resistant bacteria: An inter-national expert proposal for interim standard definitions for acquired resistance. Clin Microbial Infect. 2012;18:268–281.
12. Perez F, Hujer AM, Hujer KM, Decker BK, Rather PN, Bonomo RA. Global challenge of multidrug-resistant Acinetobacter baumannii. Antimicrob Agents Chemother. 2007;51(10):3471–384.
13. Antunes LC, Visca P, Towner KJ. Acinetobacter baumannii: Evolution of a global pathogen. Pathog Dis. 2014;71(3):292–301.
14. Maragakis LL, Perl TM. Acinetobacter baumannii: Epidemiology, anti-microbial resistance, and treatment options. Clin Infect Dis. 2008; 15;46(8):1254–1263. doi:10.1086/529198
15. Annual Epidemiological Report 2014. Antimicrobial resistance and healthcare-associated infections. http://ecdc.europa.eu/en/health-topics/antimicrobial_resistance/database/Pages/database.aspx. Accessed August, 2015.
16. Obritsch MD, Fish DN, MacLaren R, Jung R. National surveillance of antimicrobial resistance in Pseudomonas aeruginosa isolates obtained from intensive care unit patients from 1993 to 2002. Anti-microb Agents Chemother. 2004;48(12):4606–4610.
17. Sacha P, Michalska A, Ojdana D, et al. Identification of plasmid OXA and other β-lactamase genes among carbapenem-resistant isolates of Pseudomonas aeruginosa from the Clinical University Hospital in north-eastern Poland. New Microbiol. 2015;38(2):271–275.
18. Pobiega M, Wojkowska-Mach J, Maciag J, et al. Virulence and antibi-
otic resistance of Pseudomonas aeruginosa isolated from patients with urinary tract infections in southern Poland. Chemotherapy. 2014; 60(4):253–260.
19. Brooke JS. New strategies against Stenotrophomonas maltophilia: A serious worldwide intrinsically drug-resistant opportunistic patho-gen. Expert Rev Anti Infect Ther. 2014;12(1):1–4.
20. Farrell DJ, Sader HS, Flamm RK, Jones RN. Ceftolozane/tazobactam activity tested against Gram-negative bacterial isolates from hospi-talised patients with pneumonia in US and European medical cen-tres (2012). Int J Antimicrob Agents. 2014; 43(6):533–539.
21. Meyer E, Schwab F, Gastmeier P, Rüden H, Daschner FD. Is the prev-alence of Stenotrophomonas maltophilia isolation and nosocomial infection increasing in intensive care units? Eur J Clin Microbiol Infect Dis. 2006;25:711–714.
22. Wang CH, Lin JC, Lin HA, et al. Comparisons between patients with trimethoprim-sulfamethoxazole-susceptible and trimethoprim-sul-famethoxazole-resistant Stenotrophomonas maltophilia monomi-crobial bacteremia: A 10-year retrospective study. J Microbiol Immu-nol Infect. 2014;49(3):378–386.
23. Chung HS, Hong SG, Kim YR, et al. Antimicrobial susceptibility of Ste-notrophomonas maltophilia isolates from Korea, and the activity of antimicrobial combinations against the isolates. J Korean Med Sci. 2013;28(1):62–66.
24. Livermore DM, Hope R, Brick G, Lillie M, Reynolds R; BSAC Working Parties on Resistance Surveillance. Non-susceptibility trends among Pseudomonas aeruginosa and other non-fermentative Gram-neg-ative bacteria from bacteraemias in the UK and Ireland, 2001–06. J Antimicrob Chemother. 2008;62(2):ii55–63.
25. Hankiewicz-Ziołkowska K, Mikucka A, Gospodarek E. Clinical strains isolation and antibiotic susceptibility of Stenotrophomonas malto-philia. Med Dosw Mikrobiol. 2010;62(2):127–134.


DOI10.17219/acem/67051
Copyright© 2018 by Wroclaw Medical University This is an article distributed under the terms of the Creative Commons Attribution Non-Commercial License(http://creativecommons.org/licenses/by-nc-nd/4.0/)
Address for correspondenceAgnieszka StembalskaE-mail: [email protected]
Funding sourcesNone declared
Conflict of interestNone declared
AcknowledgementsThe authors are grateful to Dr. Błażej Misiak for his support in preparing the manuscript.
Received on April 25, 2016Reviewed on June 23, 2016Accepted on November 15, 2016
AbstractShort stature, which is defined as height below 2 standard deviations of the mean height for the age and sex, is one of the most frequent reasons for medical consultations in children. Short stature may occur due to a constitutional delay in growth, familial short stature or chronic diseases, including many genetic syndromes, metabolic and endocrine disorders. In this article the authors provide a mini-review of the most frequent genetic syndromes associated with short stature that should be taken into account in the differential diagnosis process. Syndromes caused by chromosomal aberrations and gene mutations were divided into 2 main groups: syndromes that are associated with intrauterine growth retardation (IUGR) and those in which IUGR does not occur in the natural history of the patient. The authors described the most important anomalies in each syndrome. Metabolic diseases and skeletal dysplasias were omitted, as they are major separate groups of diseases involving growth delay.
Key words: intrauterine growth retardation, short stature, genetic syndromes
Reviews
Short stature in genetic syndromes: Selected issues
Izabela Łaczmańska1,D,E, Justyna Kuliczkowska-Płaksej2,D,E, Agnieszka Stembalska1,D,F
1 Department of Genetics, Wroclaw Medical University, Poland2 Department of Endocrinology, Diabetology and Isotope Therapy, Wroclaw Medical University, Poland
A – research concept and design; B – collection and/or assembly of data; C – data analysis and interpretation; D – writing the article; E – critical revision of the article; F – final approval of the article
Advances in Clinical and Experimental Medicine, ISSN 1899-5276 (print), ISSN 2451-2680 (online) Adv Clin Exp Med. 2018;27(3):409–414

I. Łaczmańska, J. Kuliczkowska-Płaksej, A. Stembalska. Short stature in genetic syndromes410
Short stature in children, defined as height 2 stan-dard deviations (SD) below the mean for their age and sex, is a relatively frequent cause of referral to endocri-nologists.1 Importantly, the majority of young patients have non-hormonal causes of short stature, and pediatric endocrinology should therefore be perceived as a multi-disciplinary field that requires comprehensive medical knowledge and broad insight into the possible mechanisms of short stature.1,2 The causes of short stature originate from various mechanisms, many of which remain un-known.3 The most common causes include physiologi-cal variants (constitutional growth delay); familial short stature; chronic diseases with intrauterine growth restric-tion (IUGR), which can be accompanied by dysmorphic features; hormonal diseases; and genetic causes including chromosomal, monogenic or complex disorders.2
In this paper, we describe the most common genetic syndromes characterized by short stature that are caused by chromosomal aberrations or gene mutations. We do not go into metabolic diseases such as mucopolysaccharidoses or genetic disorders that are not syndromes, such as cystic fibrosis and skeletal dysplasias (a heterogeneous group of more than 350 disorders), which are also associated with short stature.4–6 We provide a mini-review of selected clini-cal issues that should improve clinical awareness of genetic syndromes associated with short stature.
Genetic syndromes
The term “genetic syndrome” refers to multiple different features that develop together and give rise to a specific clinical manifestation − a recognizable pattern of symp-toms or abnormalities with one known, supposed or un-known cause.3
According to the Winter-Baraitser Dysmorphology Da-tabase (London Medical Database), short stature has been reported in more than 1334 genetic syndromes, includ-ing 300 clinical entities with short stature characterized by prenatal onset.7
Short stature in children with syndromic diseases may be caused either by growth hormone (GH) deficiency (hypopituitarism) or GH resistance (e.g., bone dysplasias, Laron syndrome), and also by nutritional problems with unknown mechanisms.8 In several genetic syndromes, insulin-like growth factor-1 (IGF-1) determines IUGR.8 Indeed, GH and IGF-1 are crucial for growth processes and are the final hormones in a complex network of different hormones, enzymes and receptors encoded by numerous genes in which allelic variation may contribute to the de-velopment of GH deficiency and insensitivity.8
It should be noted that when IUGR is observed dur-ing the pregnancy, the child can immediately be referred to an appropriate specialist before or after birth. Genetic disorders with short stature but without IUGR are usually diagnosed later in the patient‘s life.3
Genetic syndromes with short stature and IUGR
Chromosomal aberrations
The 1p36 syndrome
The 1p36 syndrome is the most common subtelomeric deletion syndrome, with an incidence from 1 in 5000 to one in 10,000 live births. It is characterized by intellectual dis-ability, epilepsy, hypotonia and facial features like straight eyebrows, deep-set eyes, a flat nasal bridge, a pointed chin and midface hypoplasia.9 Growth retardation and obesity are also frequent clinical findings. Some patients present with IUGR and microcephaly. Two different phenotypes have been reported: with retarded growth and with obesity (similar to the Prader-Willi syndrome phenotype).10,11
Postnatal growth of patients with the 1p36 syndrome does not exceed the 50th percentile. Similarly, the mean birth weight is significantly lower than in the general popu-lation.9 Additionally, it has been reported that about 40% of patients develop various skeletal anomalies including delayed bone age, scoliosis, and asymmetry of the lower limbs.12
Monogenic diseases
The 3-M syndrome
The 3-M syndrome is a rare autosomal recessive disorder with only a few dozen patients identified worldwide. This disorder is caused by point mutations in 1 of 3 genes: cullin 7 (CUL7, OMIM 609577), obscuring like-1 (OBSL1, OMIM 610991), and coiled-coil domain-containing protein-8 (CCDC8, OMIM 614145). However, mutations in other genes have also been found to act in the development of this syndrome. The 3-M syndrome is characterized by severe IUGR and postnatal growth retardation, with the mean height reaching about 120–130 cm in adults. Children with the 3-M syndrome have a low birth weight and delayed bone age. Characteristic features of the 3-M syndrome are a large head, short neck, prominent trapezii, a deformed sternum, short thorax, hyperlordosis, short fifth finger, prominent heels and loose joints, as well as hypogonadism in males. Notably, mental intellectual dis-ability has not been reported in 3-M syndrome patients.13
Bloom syndrome
Bloom syndrome (BS) is an autosomal recessive disor-der characterized by immunodeficiency, an increased risk of various types of cancers, and growth deficiency with se-vere IUGR.14 The exact incidence of BS is unknown, with about 200 cases reported; the incidence is related to ethnic-ity, as the syndrome is more prevalent in Ashkenazi Jews

Adv Clin Exp Med. 2018;27(3):409–414 411
(one in 48,000 live births). It has been shown that mutations in the Bloom syndrome gene (BLM gene, OMIM 210900) underlie the development of BS. This gene encodes the DNA helicase that is responsible for genome stability. Mutations in the BLM gene are associated with a high risk of muta-tions and chromosome aberrations.14 More than 90% of BS patients remain below the 5th percentile of weight through-out their lives. More than 75% of BS patients are shorter at every age than the normal population. In addition, the patients present a low body mass index. Growth delay is the most consistent clinical finding in BS patients, while the rest of the features, such as facial teleangiectasias, immu-nodeficiency, and small testicular size in males, are usually not observed in infancy.14 Moreover, deceleration of skeletal growth is observed. It has been suggested that gastroaeso-phageal reflux, recurrent gastrointestinal infections, dietary intake, and also intrinsic immune dysfunction rather than malignancy are responsible for the patients’ stunting.14
Cornelia de Lange syndrome
Cornelia de Lange syndrome (CdLS), with a frequency from 1 in 10000 to 1 in 50,000, is caused by mutations in the nipped-B-like gene (NIPBL, OMIM 608667) in 60% of affected individuals; mutations in the structural main-tenance of chromosomes 1A (SMC1A, OMIM 300040) in 5%; or in the structural maintenance of chromosomes 3 (SMC3, OMIM 606062) in 1% (genetic heterogeneity). Because of a lack of any known mutations in about 40% of patients, the role of other genes has been postulated in the etiology of this syndrome. It should be noted that a diagnosis of CdLS is based mainly on clinical manifes-tations. Clinical features that are characteristic of CdLS, include specific craniofacial features (microbrachycepha-ly, synophrys, arched eyebrows, long eyelashes, upturned nose, and widely spaced teeth), cryptorchidism, hirsutism, cardiac defects, hearing loss, myopia, and mental impair-ment with autistic tendencies. Growth retardation with IUGR occurs in most newborns with CdLS. Height and weight are below the 5th percentile throughout the patient’s whole life (with proportionate short stature).15
Floating-Harbor syndrome
Floating-Harbor Syndrome (FHS) is a very rare genetic syndrome (the exact frequency is unknown) characterized by low birth weight (from –3 SD to 0 SD), short stature, de-layed bone age (below –2 SD, with normalization between 6 and 12 years of age), craniofacial abnormalities, skeletal anomalies (brachydactyly, clinodactyly, short thumbs, prominent joints, clavicular abnormalities), deficits in ex-pressive language, a high-pitched voice, and mild to moder-ate intellectual disability with behavioral disturbances.16 In addition, gastroesophageal reflux, renal anomalies, hearing loss, hyperopia, and/or strabismus and genital anomalies have been reported. The diagnosis is based
on clinical manifestations; however, a molecular analysis of the SRCAP gene should be recommended. Heterozygous truncation mutations in exon 34 have been found in 13 unrelated patients with classical features of FHS.16 Growth delay in FHS individuals is considerable after birth (even below the 3rd percentile), and the final height may reach the 20th percentile. In the majority of cases, the final height is between –2 and –4 SDs (about 140–155 cm in adults).16
Non-Mendelian inheritance
Russell-Silver syndrome
Russell-Silver syndrome (RSS), with an incidence from one in 50,000 to one in 100,000 live births, is caused by hy-pomethylation of the paternal imprinting center 1 (ICR1) located on chromosome 11p15.5 in 35–50% of patients with RSS. ICR1 regulates expression of the insulin-like growth factor-2 (IGF-2) gene. Notably, IGF-2 exerts important ef-fects on growth, especially during fetal development. Pa-tients with the hypomethylation defect tend to have inap-propriately increased levels of IGF-1 and IGFBP-3, which might suggest a reduced sensitivity to IGF-1.17 About 10% of RSS cases are caused by a maternal uniparental disomy of chromosome 7. Other causes of RSS, such as chromosome 7 anomalies or 11p15.5 duplications, are rarely reported, but 40% of RSS patients have unknown disease etiology. Clinical features characteristic of RSS are IUGR (<10th percentile), postnatal growth delay with height below the 3rd percentile, facial asymmetry, a high forehead, small jaw, triangular face, clinodactyly, short arms, skeletal asymmetry, feeding disor-ders, and developmental delay.3 Patients with RSS have a low birth weight (about 1900–2000 g) and decreased postnatal growth, usually below the 3rd percentile, with delayed bone age. The final height is 151.2 cm for men and 139.9 cm for women. Importantly, GH therapy might have beneficial ef-fects in terms of improving the final height of RSS children.3
Genetic syndromes with short stature without IUGR
Chromosomal aberrations
Down syndrome
Down syndrome (DS) is the most common cause of intellectual disability regardless of gender. It is a well-characterized syndrome with a mean prevalence of 1 in 800 live births. The cause of DS is a trisomy of all or part of chromosome 21 (OMIM 190685). It is associated with distinctive dysmorphic features, mental retardati-on, growth hormone deficiency, and muscular hypotonia in infancy. In some individuals with DS, congenital mal-formations occur, including heart defects (in 30–40% of DS

I. Łaczmańska, J. Kuliczkowska-Płaksej, A. Stembalska. Short stature in genetic syndromes412
patients), duodenal stenosis or atresia, imperforate anus, and Hirschsprung disease. Celiac disease, hypothyroid-ism, hearing and vision problems, as well as an increased risk of leukemia development are also observed. Intellec-tual disability, speech delay and behavioral problems are present with varying expression.18 The mean birth length in DS newborns is 48 cm. From the age of 6 months to 3 years, the growth rate is lower than in healthy children. The final height (161.5 cm and 147.5 cm for men and wom-en, respectively) is reached at 15–16 years of age, with a de-creased pubertal growth rate.19
Prader-Willi syndrome
Prader-Willi syndrome (PWS) is a neurodevelopmental disorder with a prevalence from 1 in 10,000 to 1 in 30,000 live births. Clinical features characteristic of PWS are mus-cular hypotonia, suction difficulties in infancy, then pro-gressive obesity, short stature, hypogonadism, behavioral abnormalities, mental impairment, and sleep disturbances. Dysmorphic features observed in PWS patients include characteristic facial features (narrow bifrontal diameter, almond-shaped palpebral fissures, a narrow nasal bridge, a thin upper lip with a downturned mouth), small hands and feet and scoliosis.3 The diagnosis of PWS is based on a molecular analysis of the patient’s DNA and microde-letion detection in the patient’s chromosomes. The absence of paternal copies of genes localized in region 15q11-13 may be caused by microdeletion (in about 70% of PWS cases), a maternal uniparental disomy of 15q11-13 (20–25%), or methylation silencing (2–5%).3 It is now being increas-ingly recognized that patients with a maternal uniparental disomy might be at risk of specific psychiatric and be-havioral comorbidities, including psychotic and affective disorders, as well as autism-spectrum disorders.20
The stature of PWS patients in the first 2 years of life is below the 3rd percentile; in the next 10–12 years the height reaches the 10th percentile; and after 12–14 years of age it falls below the 5th percentile. The average adult height is 155 cm and 148 cm for males and females, respectively.3 The cause of short stature is GH deficiency (in 80% of children with PWS, and 50% of adults), and no pubertal growth spurt. Pa-tients with PWS have abnormal hypothalamic function with decreased secretion of hormones that regulate GH and go-nadotropin production. Postmortem studies of patients with PWS have revealed decreased volumes of paraventricular nuclei and a number of oxytocin neurons. In addition, struc-tural alterations in the region responsible for the secretion of growth hormone releasing-hormone (GHRH) that might lead to decreased production of GH have been observed.3
Turner syndrome
Turner syndrome (TS) is caused by a lack of all or part of one X chromosome, and it occurs in 1 in 2500 live-born females. Notably, TS is associated with growth failure
(stature disproportion), cardiac anomalies (very often coarctation of the aorta), renal anomalies, pubertal delay, hypergonadotropic hypogonadism with primary amenor-rhoea, lymphedema, and dysmorphic features (a webbed neck, a high-arched palate, short metacarpals, scoliosis, Madelung deformity in 7%), hearing difficulties, hypothy-roidism, and glucose intolerance.21 Some patients present developmental delays, nonverbal learning disabilities and behavioral problems, but these features vary among TS patients.22
Chromosome X monosomy is present in about 70% of TS cases and is of maternal origin.21 In addition, spe-cific structural chromosomal aberrations may underlie the development of TS, including an isochromosome X, deletion in the short or long arm of an X chromosome or a ring X formation. Furthermore, mosaic forms with more than one population of cells (abnormal or normal 46, XX) or with sequences of chromosome Y might occur. In about 5% of TS patients the SRY gene is present, which requires additional diagnostic procedures.21
Short stature is observed in about 95% of TS patients. The adult height, without medical intervention, reaches 143 cm, about 20 cm below the normal range. It is diag-nosed mainly at the age of 5 years.21,22
The 18q- syndrome
The 18q- syndrome is a deletion syndrome with a fre-quency of 1 in 40,000 live births. The structural abnor-malities of 18q- include proximal interstitial deletions, complex cryptic rearrangements, and distal deletions. Most cases are sporadic, although familial cases have been also reported. It has been shown that the phenotype expression is characterized by a high inter-individual vari-ability depending on the size of the deletion. The most typical features include growth delay accompanied by GH deficiency, intellectual disability, autoimmune disorders, microcephaly, midface hypoplasia, a flat philtrum, a broad nasal bridge, hearing impairment, eye anomalies, neuro-logic and genitourinary abnormalities. One study mapped a 2Mb critical region for GH insufficiency to the 18q23 locus.23 Interestingly, several genes playing an important role in GH response are located within this region, includ-ing the myelin basic protein gene (MBP), and the galanin receptor 1 gene (GALR1). Chromosome analysis is recom-mended in suspected cases, and also in parents for recur-rent risk evaluation.24
Monogenic diseases
Laron syndrome
Laron syndrome (LS) is an autosomal recessive disorder with a prevalence of 1 in 1,000,000, characterized by short stature with normal or increased serum GH and low IGF-1

Adv Clin Exp Med. 2018;27(3):409–414 413
levels. It is caused by mutations in the extracellular domain of the GH receptor (GHR) gene (OMIM 600946), which re-sult in low GH binding protein levels and decreased IGF-1 production (OMIM 262500). The clinical features include reduced birth length without IUGR; delayed bone age and bone maturation; severe short stature; no clear pubertal spurt; occasionally blue sclerae and hip degeneration; and rarely, congenital abnormalities like strabismus, cataract or aortic stenosis occur. Sleep disorders, obesity, delayed dentition, and genital anomalies may also occur.25,26 Post-natal growth is slowed and disproportional. Adult stature ranges from –3 to –12 SD (OMIM 262500). The final mean height is 119 cm in females and 124 cm in males.27
Leri-Weill syndrome
Leri-Weill dyschondrosteosis (LWD) is a dominantly in-herited disorder with a prevalence of 1 in 2000 live births. It originates from a homozygous defect in the short stature homeobox gene (SHOX, OMIM 312865) or the short stature homeobox Y-linked gene (SHOXY, OMIM 400020). Dys-morphic features in LWD include short stature, mesomelia and Madelung wrist deformation with deformity of the distal radius, ulna and proximal carpal bones (OMIM 127300). Stature is decreased for both sexes (–2.3 SDs for girls and –1.8 SDs for boys). In addition, decreased arm spans might appear (–3.2 SDs for girls and –2.3 SDs for boys) connected with early development of mesomelia in the arms.28
Noonan syndrome
Noonan syndrome (NS) is an autosomal dominant disor-der and one of the most common genetic syndromes, with a prevalence from 1 in 1000 to 1 in 2500 live births.29 About 20% of NS cases are familial. A diagnosis of NS is based mainly on clinical manifestations and genetic screening for mutations in several genes, including protein tyro-sine phosphatase non-receptor type 11 (PTPN11, OMIM 176876), son of sevenless drosophila homolog 1 (SOS1, OMIM 182530), V-RAF-1 murine leukemia viral oncogene homolog 1 (RAF1, OMIM 164760), V-KI-RAS2 kirsten rat sarcoma viral oncogene homolog (KRAS, OMIM 190070), V-RAF murine sarcoma viral oncogene homolog B1 (BRAF, OMIM 164757), neuroblastoma Ras viral oncogene homo-log (NRAS, OMIM 164790), and mitogen-activated protein kinase 1 (MAP2K1, OMIM 176872). However, it should be noted that negative results of molecular tests do not exclude a diagnosis of NS due to considerable genetic het-erogeneity.30 Children with mutations in the PTPN11 gene have mild GH resistance. Importantly, NS is character-ized by distinctive dysmorphic features and congenital anomalies such as short stature, a characteristic facial appearance (hypertelorism, ptosis, low-set and posteri-orly rotated ears), congenital heart defects (pulmonary valve stenosis with dysplastic leaflets in 50% of NS cases
and hypertrophic obstructive cardiomyopathy in 20%), as well as chest and spinal deformaties. Mild intellectual disability, learning difficulties, feeding problems in early childhood, hearing defects, cryptorchidism, and abnormal pigmentation are also frequently observed in NS patients.6 Final height is about 161–167 cm in males and 150–155 cm in females. More than 50% of females and 40% of males are below the 3rd percentile, but about 30% of NS patients have normal height in adulthood.31
Other syndromes
Because of its high frequency (8 in 1000 live births), fetal alcohol syndrome (FAS) is another disorder associated with short stature that should be taken into account in dif-ferential diagnosis. The biological pathway responsible for FAS development is still unknown, but the role of epigen-etic mechanisms is postulated.32
This syndrome is caused by alcohol exposure in preg-nancy and has lifelong consequences for the affected child and the whole family. It is characterized by facial anomalies (smoothing of the philtrum, a thin upper lip, short palpe-bral fissure length), delayed bone age, short stature, func-tional impairments, behavioral problems, and intellectual disability. The nervous system injury caused by alcohol in the fetal period is irreversible.33
The growth of FAS children is delayed compared to the healthy population. Also, IUGR is observed and body length at birth is low. A body mass index below the 3rd per-centile is reported in 22% of FAS children, in comparison to 3% in healthy children.34 Abnormalities in the central nervous system may be manifested by microcephaly.
A diagnosis of FAS syndrome requires the involve-ment of a variety of professional medical specialists and often encounters considerable diagnostic difficulties. Due to the social stigma, information about alcohol con-sumption in pregnancy is often concealed from medical professionals.33
Conclusions
Short stature can be a physiological feature without further implications; however, it is also one of the most frequent clinical characteristics in a number of genetic syndromes and other diseases. Assessment of growth de-lay should include the use of sex-specific reference data for standing height, head circumference and weight, as well as anteroposterior radiography of the left hand and wrist to determine skeletal maturation (bone age). Because it is easy to detect, primary care physicians usually refer young patients with short stature to endocrinologists and/or geneticists to complete the diagnostic process. A great deal of attention and a detailed clinical investigation should be offered to all patients with short stature.

I. Łaczmańska, J. Kuliczkowska-Płaksej, A. Stembalska. Short stature in genetic syndromes414
Indications for therapy with recombinant GH vary de-pending on the country of origin. In Poland, GH therapy is reimbursed in cases of short stature associated with PWS, TS, hypopituitarism with hyposomatotropinemia and chronic renal insufficiency. In the USA, GH therapy is also indicated in cases of IUGR, NS and idiopathic short stature < –2.25 SD. Recombinant GH therapy in skeletal dysplasias are still under investigation, but several studies from Japan argue for efficacy of this approach.35
Children with genetic syndromes, very often associated with intellectual disability and dysmorphic features, are usually first referred to clinical geneticists and after that to other specialists, among them pediatric endocrinolo-gists. However, when clinical features other than short stature are mildly expressed, some patients with genetic syndromes are first diagnosed by endocrinologists. A dia-gnosis of short stature in children should be based on ex-tensive cooperation between clinical geneticists and pe-diatric endocrinologists.
References 1. Johnston Rohrbasser LB. Genetic testing of the short child. Horm Res
Paediatr. 2011;76(3):13–16. 2. Petriczko E, Horodnicka-Jozwa A, Walczak M. Diagnostic evaluation
before growth hormone deficiency recognition (exclusion criteria). Endokrynol Pediatr. 2009;9:13–22.
3. Siklar Z, Berberoglu M. Syndromic disorders with short stature. J Clin Res Pediatr Endocrinol. 2014;6(1):1–8.
4. Krakow D, Rimoin DL. The skeletal dysplasias. Genet Med. 2010;12(6): 327–341.
5. Muenzer J. Overview of the mucopolysaccharidoses. Rheumatology (Oxford). 2011;50(5):v4–12.
6. Phung OJ, Coleman CI, Baker EL, et al. Recombinant human growth hormone in the treatment of patients with cystic fibrosis. Pediatrics. 2010;26(5):e1211–1226.
7. Winter-Baraitser Dysmorphology Database (London Medical Data-base) http://www.lmdatabases.com/ Accessed April 18, 2016.
8. Kelnar CJ. Growth hormone therapy for syndromic disorders. Clin Endocrinol (Oxf ). 2003;59(1):12–21.
9. Sangu N, Shimojima K, Shimada S, Ando T, Yamamoto T. Growth patterns of patients with 1p36 deletion syndrome. Congenit Anom (Kyoto). 2014;54(2):82–86.
10. Gajecka M, Mackay KL, Shaffer LG. Monosomy 1p36 deletion syn-drome. Am J Med Genet C Semin Med Genet. 2007;15:145C(4), 346–356.
11. Keppler-Noreuil KM, Carroll AJ, Finley WH, Rutledge SL. Chromo-some 1p terminal deletion: Report of new findings and confirmation of two characteristic phenotypes. J Med Genet. 1995;32(8):619–622.
12. Battaglia A, Hoyme HE, Dallapiccola B, et al. Further delineation of deletion 1p36 syndrome in 60 patients: A recognizable phenotype and common cause of developmental delay and mental retardation. Pediatrics. 2008;121(2):404–410.
13. Holder-Espinasse M. 3-M Syndrome. In: Pagon RA, Adam MP, Arding-er HH, Bird TD, Dolan CR, Fong CT, Smith RJH, Stephens K. GeneRe-views® [Internet]. Seattle (WA): University of Washington; 1993–2014. Published March 25, 2002. Updated January 26, 2012. Accessed April 18, 2016.
14. Keller C, Keller KR, Shew SB, Plon SE. Growth deficiency and malnu-trition in Bloom syndrome. J Pediatr. 1999;134(4):472–479.
15. Boyle MI, Jespersgaard C, Brøndum-Nielsen K, Bisgaard AM, Tümer Z. Cornelia de Lange syndrome. Clin Genet. 2015;88(1):1–12.
16. Nikkel SM, Dauber A, de Munnik S, et al. The phenotype of Floating-Harbor syndrome: Clinical characterization of 52 individuals with mutations in exon 34 of SRCAP. Orphanet J Rare Dis. 2013;8:63.
17. Iliev DI, Kannenberg K, Weber K, Binder G. IGF-I sensitivity in Silver-Russell syndrome with IGF2/H19 hypomethylation. Growth Horm IGF Res. 2014;24(5):187–191.
18. Roizen NJ, Patterson D. Down’s syndrome. Lancet. 2003;361(9365): 1281–1289.
19. Myrelid A, Gustafsson J, Ollars B, Annerén G. Growth charts for Down’s syndrome from birth to 18 years of age. Arch Dis Child. 2002;87(2): 97–103.
20. Krefft M, Frydecka D, Adamowski T, Misiak B. From Prader-Willi syn-drome to psychosis: Translating parent-of-origin effects into schizo-phrenia research. Epigenomics. 2014;6(6):677–688.
21. Gawlik A, Malecka-Tendera E. Transitions in endocrinology: Treat-ment of Turner’s syndrome during transition. Eur J Endocrinol. 2013;170(2):R57–74.
22. Pinsker JE. Clinical review: Turner syndrome: Updating the paradigm of clinical care. J Clin Endocrinol Metab. 2012;97(6):E994–1003.
23. Cody JD, Hale DE, Brkanac Z, Kaye CI, Leach RJ. Growth hormone insufficiency associated with haploinsufficiency at 18q23. Am J Med Genet. 1997;71(4):420–425.
24. Linnankivi T, Tienari P, Somer M, et al. 18q deletions: Clinical, molecu-lar, and brain MRI findings of 14 individuals. Am J Med Genet A. 2006; 140(4):331–339.
25. Laron Z, Kauli R. Fifty seven years of follow-up of the Israeli cohort of Laron Syndrome patients – from discovery to treatment. Growth Horm IGF Res. 2016;28:53–56. doi: 10.1016/j.ghir.2015.08.004
26. Goswami S, Ghosh S, Chowdhury S. Growth hormone insensitivity syndrome: A sensitive approach. Indian J Endocrinol Metab. 2012;16(5): 817–818.
27. Laron Z, Lilos P, Klinger B. Growth curves for Laron syndrome. Arch Dis Child. 1993;68(6):768–770.
28. Ross JL, Kowal K, Quigley CA, et al. The phenotype of short stature homeobox gene (SHOX) deficiency in childhood: Contrasting chil-dren with Leri-Weill dyschondrosteosis and Turner syndrome. J Pedi-atr. 2005;147(4):499–507.
29. Romano AA, Allanson JE, Dahlgren J, et al. Noonan syndrome: Clini-cal features, diagnosis, and management guidelines. Pediatrics. 2010; 126(4):746–759.
30. Agarwal P, Philip R, Gutch M, Gupta KK. The other side of Turner’s: Noonan’s syndrome. Indian J Endocrinol Metab. 2013;17(5):794–798.
31. Roberts AE, Allanson JE, Tartaglia M, Gelb BD. Noonan syndrome. Lancet. 2013;381(9863):333–42.
32. Varadinova M, Boyadjieva N. Epigenetic mechanisms: A possible link between autism spectrum disorders and fetal alcohol spectrum dis-orders. Pharmacol Res. 2015;102:71–80.
33. Landgraf MN, Nothacker M, Kopp IB, Heinen F. The diagnosis of fetal alcohol syndrome. Dtsch Arztebl Int. 2013;110(42):703–710.
34. Klug MG, Burd L, Martsolf JT, Ebertowski M. Body mass index in fetal alcohol syndrome. Neurotoxicol Teratol. 2003;25:689–696.
35. Kanazawa H, Tanaka H, Inoue M, Yamanaka Y, Namba N, Seino Y. Effi-cacy of growth hormone therapy for patients with skeletal dyspla-sia. J Bone Miner Metab. 2003;21(5):307–310.

DOI10.17219/acem/67457
Copyright© 2018 by Wroclaw Medical University This is an article distributed under the terms of the Creative Commons Attribution Non-Commercial License(http://creativecommons.org/licenses/by-nc-nd/4.0/)
Address for correspondenceMarcin KubikE-mail: [email protected]
Funding sourcesNone declared
Conflict of interestNone declared
Received on April 6, 2016Reviewed on November 7, 2016Accepted on December 1, 2016
AbstractLeft ventricular noncompaction (LVNC) is a unique inherited cardiomyopathy, characterized by an increased risk of adverse cardiovascular events such as heart failure, arrhythmia or sudden cardiac death. Although in comparison to dilated cardiomyopathy, the number of clinical studies concerning LVNC is still small, it is quickly increasing, which reflects a huge effort of the cardiovascular society to develop data to improve understanding of this cardiomyopathy. However, the predictors of adverse outcomes in LVNC are not well established. The aim of this review is to systematize the available data obtained from the medical literature in order to establish a proper prognosis, so that affected patients can receive the most appropriate treat-ment. The review considers issues connected with various areas of risk in LVNC, referring to its incidence and prevalence, comorbidity, genetics, morphology, symptoms, thromboembolic events, incidence of arrhythmia, sudden cardiac death, and mortality. Beginning with a genetic approach to the disease, passing through diagnostic tools, and finishing with issues relating to invasive methods of treatment, the article points out the most important and valuable clues for predicting a poor prognosis in LVNC. The review confirms that LVNC is not a disease, but a type of cardiac abnormality laden with a variety of prognostic factors of poor outcomes in terms of life-threatening ventricular arrhythmia and progression of heart failure. Thus, establishing a proper prognosis for individual patients is crucial for implementing the most appropriate treatment, and it should be based on the outcomes of a variety of clinical tests.
Key words: cardiovascular risk factors, sudden cardiac death, left ventricular noncompaction
Reviews
Predictors of poor outcome in patients with left ventricular noncompaction: Review of the literature
Marcin KubikA–D, Alicja Dąbrowska-KugackaB,D,E, Ewa LewickaE, Ludmiła Daniłowicz-SzymanowiczB, Grzegorz RaczakF
Department of Cardiology and Electrotherapy, Medical University of Gdańsk, Poland
A – research concept and design; B – collection and/or assembly of data; C – data analysis and interpretation; D – writing the article; E – critical revision of the article; F – final approval of the article
Advances in Clinical and Experimental Medicine, ISSN 1899-5276 (print), ISSN 2451-2680 (online) Adv Clin Exp Med. 2018;27(3):415–422

M. Kubik, et al. Predictors of poor outcome in LVNC416
Left ventricular noncompaction (LVNC) is a unique inherited cardiomyopathy that has gained increasing at-tention in the past decade.1 It was first described in 1926 by R.T. Grant and it is characterized by a spongy morpho-logical appearance of the left ventricular (LV) myocardium due to prominent trabeculae and deep intertrabecular re-cesses.1–3 Left ventricular systolic dysfunction, heart fail-ure, thromboembolism, arrhythmia, and sudden cardiac death (SCD) occur in the natural history of this cardiomy-opathy, which is characterized by an increased risk of ad-verse cardiovascular events.3 Despite the increasing efforts of the cardiovascular community to better understand LVNC, clinical research remains limited and the predic-tors of adverse outcomes of LVNC are not well-established.
The aim of this review is to summarize contemporary (2000 to 2015) literature about LVNC regarding its inci-dence and prevalence, comorbidity, genetics, morphology (and morphological mimicry), symptoms, thromboembolic events, incidence of arrhythmia, SCD, and mortality. Spe-cial attention was paid to predictors of adverse outcomes in patients with LVNC.
Prevalence
Left ventricular noncompaction is diagnosed in 0.05% to 0.26% of adult patients referred for echocardiographic examinations, with male predominance; however, some studies report a prevalence from 0.01% to 1.3% in the gen-eral population.1,4,5 In the affected patients, LVNC is the cause of heart failure in 3–4/100 individuals.5 The rate of familial involvement appears to vary from 18 to 33%.4
Genetics
The genes involved in this cardiomyopathy gener-ally encode sarcomeric or cytoskeletal proteins. In cases of LVNC with congenital heart disease, disturbances of the NOTCH signaling pathway may occur, and the genetic basis of LVNC may play an important role in estimating the risk of adverse outcomes. It is known that LVNC may have incidental as well as familial origins. The literature provides some information on associations of LVNC with a number of mutations in the genes that are probably re-sponsible for its occurrence, for the higher risk of adverse outcomes and for the familial incidence (Table 1).5–7 Klaas-sen et al. noticed that sarcomeric gene mutations account for approx. 17% of LVNC cases.8 In other studies, associa-tions of LVNC with a wide number of genetically deter-mined syndromes and the molecular background of these mutations have been reported (Table 2, 3).9–11
From the clinical point of view, it is worth pointing out some aspects of the genetically-induced poor outcomes in LVNC. Xu et al. noticed that some gene mutations are similar in various types of cardiomyopathies, e.g.,
Table 1. Proteins with possible genetic modifications in reference to left ventricular noncompaction (LVNC)
Proteins with gene mutations probably responsible for the occurrence of LVNC
1. tafazzin (G4.5, TAZ) 2. dystrobrevin (DTNA) 3. lamin A/C (LMNA) 4. mitochondrial proteins 5. frataxin 6. tropomyosin 1 (TPM 1) 7. alpha-actin (ACTC) 8. protein SCN5A 9. myosin binding protein C (MYBPC3)10. cardiac troponin T (TNNT2)11. cardiac troponin I (TNNI3)12. beta-myosin heavy chain (MYH7)13. other
Proteins with gene mutations associated with worse outcomes in LVNC (heart failure, conduction disturbances, ventricular
arrhythmia and sudden cardiac death)
1. protein SCN5A2. myosin binding protein C (MYBPC3)3. cardiac troponin T (TNNT2)4. cardiac troponin I (TNNI3)5. beta-myosin heavy chain (MYH7)
Genes responsible for familial incidence of LVNC
1. G4.5 gene (TAZ) mutations
Table 2. Genetically determined syndromes associated with left ventricular noncompaction
1. dystrophinopathies 2. dystrobrevinopathies 3. myotonic dystrophy type 1 and 2 4. zaspopathy 5. myoadenylate-deaminase
deficiency 6. Charcot-Marie-Tooth disease 7. mitochondrial disorder 8. Barth syndrome 9. laminopathy10. Friedreich ataxia11. Pompe’s disease12. Turner syndrome13. Ohtahara syndrome14. Roifman syndrome15. Noonan syndrome
16. neuromuscular disorder17. Nail-patella syndrome18. Melnick-Needles syndrome19. MIDAS syndrome20. DiGeorge syndrome21. Beals-Hecht syndrome22. congenital adrenal
hyperplasia23. distal 4q trisomy/distal 1q
monosomy24. del 1q syndrome25. distal 5q deletion26. monosomy 1p3627. trisomy 1128. trisomy 1329. LEOPARD syndrome
Table 3. Genetically determined syndromes associated with a higher incidence of left ventricular noncompaction (LVNC) in relation to the type of molecular disorder
1. Mutations within the same group of genes associated with LVNC: a) associated with cardiac-specific loss of succinate dehydrogenase b) mutations in TTR gene – DiGeorges syndrome c) mutation in TAZ gene – Barth syndrome
2. Mutations directly linked to the contractile apparatus: a) mutations in MYH8 gene – Beals-Hecht syndrome b) mutations in FLNA gene – Melanick-Needles Syndrome
3. Mutations connected with poor prognosis and indirectly connected with LVNC:
a) potassium channel, voltage gated KQT-like subfamily Q, member 1 – KCNQ1 – congenital adrenal hyperplasia
TTR – transthyretin; TAZ – taffazine; MYH8 – myosin heavy chain 8; FLNA – filamin A.

Adv Clin Exp Med. 2018;27(3):415–422 417
mutations in the beta-myosin heavy chain (βMHC) and cardiac troponin T (cTnT) genes.12 These mutations are associated with hypertrophic cardiomyopathy (HCM), di-lated cardiomyopathy (DCM), restrictive cardiomyopathy (RCM) as well as LVNC. The authors also noticed that some mutations are responsible for changing the phenotype from HCM to LVNC and from DCM to LVNC. In addi-tion, some mutations can be classified as benign/mild (with low to moderate penetrance, causing only mild symptoms of heart failure with no incidence of SCD or necessity for heart transplantation), and some as moderate/malignant (with high penetrance, early-onset age, moderate to severe symptoms, heart failure in NYHA functional class III–IV and SCD), i.e., the malignant cTnT Arg131Trp mutation as-sociated with both DCM and LVNC.12 Xu et al. suggested a possible connection between the mechanisms of decreas-ing Ca2+-sensitivity in mutations associated with LVNC and DCM. They also considered a possible similarity in genetic mechanisms in patients who progressed from HCM to DCM and in those who progressed from HCM to LVNC, which might suggest phenotypical continuity between cardiomy-opathies or an "overlap cardiomyopathy syndrome”. This hypothesis was supported by a more recent demonstration of cTnT mutations in RCM and LVNC patients, which may lead to difficulty in clinically diagnosing these phenotypes.12
The genetic basis may also be responsible for poorer outcomes in patients with LVNC and atrioventricular or intraventricular conduction disturbances (i.e., left bundle branch block) or ventricular arrhythmia. The key examples are mutations in the SCN5A gene (responsible for isolated cardiac conduction defects and associated with an in-creased susceptibility for lethal ventricular arrhythmia), which are seen not only in LVNC but also in Lev’s disease and in the LQT3 syndrome. The increased cardiovascular risk of ventricular arrhythmia in LVNC is also noticed in other gene mutations, i.e., beta-myosin heavy chain gene (MYH7) mutations. This mutation also tends to occur in Brugada syndrome and severe form of HCM (early onset, complete penetrance, and increased risk of SCD). In ad-dition, the pathogenesis of HCM is associated with muta-tions of the gene encoding for troponin T and I, and also for MYBPC3. Mutations in the latter gene are responsible for the inability of the cardiac myosin-binding protein C to interact with myosin and titin. All these gene muta-tions may also occur in LVNC and may be responsible for increasing cardiovascular risk of the disease.
In conclusion, ion channel and contractile protein gene mutations influence the clinical presentation of LVNC and its outcome. The genetic basis and similarities to other cardiac and muscle diseases make LVNC something more than a cardiac disease: it is a systemic muscle disease de-pendent on the severity of gene penetration in other neu-ronal and muscular tissues.
It has been reported in different studies that the progno-sis of LVNC also depends on cardiac and neuromuscular comorbidity.10 Furthermore, the genetic similarity to DCM
and HCM may induce not only a genetic but also an ana-tomical overlap syndrome, which may hinder the diagnosis of LVNC in echocardiographic examination.
Right ventricular involvement
Concomitant damage of the right ventricle (RV) in LVNC is not rare and it can be difficult to distinguish between noncompaction and arrhythmogenic right ventricular car-diomyopathy (ARVD). Although the criteria for ARVD were established in 1994 by the ARVD Task Force, the presence of RV enlargement, abnormal global RV wall mo-tion, focal hypokinesis or dyskinesis, bulges concomitant with a two-layer RV structure, a prominent endocardium and excessive trabeculation − even if they coexist with typical LV morphology for LVNC − may lead to a diagnosis of ARVD rather than LVNC. Włodarska et al. examined 9 individuals (7 males), mean age 37.9 years, with a negative family history and initial diagnosis of ARVD, who pre-sented with palpitations, syncope, pre-syncope and fatigue. Sustained (VT) or non-sustained ventricular tachycardia (nsVT) of LV-origin morphology was recorded in 3 out of the 9 patients and polymorphic VT in 2 of them. En-domyocardial biopsies were performed, and the diagnosis of ARVD was confirmed in only 1 individual, showing a damaged myocardium surrounded by fibro-fatty tissue, which is distinctive for ARVD.13
The involvement of the RV in the pathologic process of LVNC is essential in patients referred for cardioverter-defibrillator (ICD) implantation. Sakai et al. indicated that due to a thinner RV wall, its involvement in LVNC pathology makes it prone to perforation in the presence of an ICD lead.14
Left ventricular noncompaction in children
Left ventricular noncompaction is the third most com-mon cardiomyopathy in the pediatric population, after dilated and hypertrophic cardiomyopathies.1 Children affected by LVNC have a lower general incidence of heart failure than adults; however, mortality in symptomatic LVNC patients is higher in children and adolescents (9–10% per year) than in adults (1–5% per year).4 The prev-alence of ventricular arrhythmias is similar in children and in adults.15 It is noteworthy that a higher incidence of familial cases is observed in the pediatric population than in adults: approx. 44%. Ozgur et al. reported almost 90% of LVNC children showing ventricular systolic dys-function and 21% died during the mean observation period (1.3 years ±1.1 years). Tachypnea, a failure to thrive, recur-rent pneumonia and fatigue were the most frequent clinical symptoms. An early age at presentation and increased LV end-diastolic diameter were markers of a poor prognosis.16

M. Kubik, et al. Predictors of poor outcome in LVNC418
Pregnancy
The prognosis in pregnant women with LV hypertra-beculation/LVNC is uncertain and data is inconsistent. There are also studies that point to LVNC as the cause of peripartum cardiomyopathy.7 Sarmaa et al. analyzed 12 pregnancies in 7 females with LVNC. Four out of 12 preg-nancies were delivered by caesarean sections, 3 by emer-gency caesarean sections due to fetal clinical condition, and 5 by natural birth. Only 2 out of 7 women developed VT during the postpartum period, but symptoms of heart failure were present in 6 out of 12 pregnancies. Two of the children were diagnosed with LVNC; and 2 out of the 12 newborns died. Finally, the authors reported that 50% of LVNC females developed heart failure symptoms during pregnancy. Ventricular arrhythmias were present in 16% of the pregnancies, and were ultimately treated with abla-tion or ICD implantation.4 Stöllberger et al. reported that women with LV hypertrabeculation/LVNC and no evi-dence of systolic dysfunction or arrhythmias can proceed through pregnancy without problems.17 This was in agree-ment with results reported by Gati et al., who performed echocardiography on 102 asymptomatic pregnant women in the first and third trimesters and in the postpartum period. Twenty-six of these women (25%) developed in-creased trabeculations during pregnancy, and 8 of them fulfilled the criteria for LVNC. During the mean 24-month postpartum observation period, complete resolution was observed in 19 women (73%), and marked reduction in the trabeculated layer in 5 of them. This study shows that preg-nancy may induce LV hypertrabeculation in a significant proportion of pregnant women, probably due to increased LV loading conditions.18 Thus, in pregnant women with LV hypertrabeculation that fulfills the LVNC criteria (es-pecially in those without heart failure symptoms or ven-tricular arrhythmias) it is very important to determine the final diagnosis after the postpartum period.
Electrocardiography
It has been shown that a standard 12-lead ECG examina-tion can provide information on the risk of adverse out-comes in patients with LVNC. Fragmented narrow or wide QRS complexes are associated with higher mortality and lower left ventricular ejection fraction (LVEF). Moreover, the presence of fragmented narrow QRS complexes seems to be an independent predictor of all-cause mortality and heart transplantation in patients with LVNC.19 Left bundle branch block (LBBB, 21–44%), atrial fibrillation (7–26%) and VT (4–30%) frequently occur in LVNC, and often are associated with the genetic disorders described above. The overall prevalence of ventricular arrhythmia in LVNC is estimated to be from 6 to 60%, whereas the incidence of SCD is 18%.4,13 Akhbour et al. reported that LBBB was associated with LV lateral wall involvement. Despite its
statistical independence of LVEF, LBBB seemed to be more frequent in patients with LVEF <35%.20 Akhbour et al. also pointed out that although ECGs are rarely normal in pa-tients with LVNC, risk stratification requires more than a simple ECG strip; a 24-h ECG recording, a 7-day tele-metric ECG monitoring/recording or an arrhythmia loop recorder may be helpful in further risk stratification.21–24
Cardiac magnetic resonance
A few studies aimed to assess the prognostic role of car-diac magnetic resonance (CMR) imaging in patients with LVNC. In a recent study by Wan et al., late gadolinium enhancement (LGE) in CMR was found in only 19 out of 47 patients diagnosed with LVNC. However, the pres-ence of LGE was associated with a higher incidence of pre-mature ventricular contractions (79% vs 29%; p < 0.001) and non-sustained VT (47% vs 7%; p < 0.003).25
Symptoms
Greutmann et al. diagnosed 132 patients with isolated LVNC in a single-center study and concluded that mortal-ity is especially high in symptomatic patients, and that they are at risk of major adverse events such as systemic em-bolism, sustained ventricular arrhythmia, and admission to a hospital for heart failure. The predictors of adverse outcomes defined as cardiovascular death and heart trans-plantation are NYHA functional class III/IV or admission to a hospital due to heart failure symptoms, sustained ven-tricular arrhythmia, and systemic embolization.26
Stöllberger et al. examined 59 inpatients and 54 out-patients with LVNC and noticed that the inpatients were more symptomatic (symptoms of heart failure, exertional dyspnea, palpitations, vertigo, syncope), had higher mor-tality and a shorter time between LVNC diagnosis and death than outpatients. It is noteworthy that 55% of LVNC patients had heart failure symptoms and 69% had ex-ertional dyspnea. The inpatients were older, more fre-quently had advanced heart failure, systolic dysfunction, diabetes, and more extensive hypertrabeculation than the outpatients.27
Thromboembolism
Thromboembolism is another complication that may be related to LVNC. Thromboembolic events are reported in 5–38% of cases.4 Stöllberger et al. retrospectively in-vestigated the records of 144 LVNC patients to assess the rate and risk factors of stroke and embolism.28 Out of 144 subjects, 22 (15%) had undergone a thromboembolic event (stroke in 21 patients and peripheral embolism in one). The cause of stroke or embolism was cardioembolic in

Adv Clin Exp Med. 2018;27(3):415–422 419
14 cases (64%), atherosclerotic in 5 (23%) and undeter-mined in 3 (14%). Among the patients with a cardioem-bolic cause, almost 93% had either atrial fibrillation or LV systolic dysfunction determined as the presence of frac-tional shortening less than 25%, and almost 29% had both atrial fibrillation and LV dysfunction. The researchers also noted that the prevalence of arterial hypertension and the mean age in patients with stroke or an embolic episode was higher than in those without thromboembolic events (59 vs 32% and 60 vs 53 years, respectively). It should be emphasized that among these 22 individuals, only one patient was on appropriate anticoagulation therapy with low-molecular-weight heparin; the others were treated with 100 mg of aspirin daily or with a vitamin K antagonist with an INR (International Normalized Ratio) below the therapeutic level.28
Arrhythmia
The risk of developing severe ventricular arrhythmias such as VT or VF is increased in individuals with LVNC, especially those with LV systolic function impairment. Ventricular tachycardia was present in 36% of adult LVNC patients in a study by Aras et al.29 In a retrospective study by Kobza et al., 8 out of 12 adult patients (67%) with LVNC had ICDs implanted due to VT; in another report, arrhyth-mia-induced syncope occurred in 2 out of 18 LVNC pa-tients (10%).30,31 There is data on the occurrence of poly-morphic VT resistant to beta-blockers and requiring ICD implantation.22 Okubo et al. also observed an increased risk of ventricular arrhythmia (up to 47% of individuals with LVNC), including VT and VF in patients with LVNC and decreased LV systolic function. Those authors sug-gested that ventricular arrhythmias may account for half of the deaths in LVNC patients.32 It has also been noted that palpitations in LVNC may suggest self-limiting VT and may be associated with worse outcomes.21
Devices and pharmacological therapy
According to some studies, the implantation of ICD devices is recommended in patients with LVNC and ven-tricular arrhythmia, especially in those with depressed systolic function determined by LVEF less than 31%. The cut-off point of 31% predicts the majority of adverse events (death, heart failure, ventricular arrhythmia, and stroke) in LVNC patients with a sensitivity of 71% and specificity of 90%. However, this particular finding does not conflict with the fact that higher LVEF values (35%) are commonly considered predictive of VT. Published in 2015 (by the European Society of Echocardiography) guidelines on ventricular arrhythmia and SCD stated for the first time that it is reasonable to apply the same therapeutic criteria
to LVNC and non-ischemic dilated cardiomyopathy, be-cause of their similarity (Fig. 1). The guidelines state that it is important to take under consideration LV function and the severity of ventricular arrhythmia.33 However, it should be emphasized that there is no sufficient evidence for ICD implantation in primary prevention in patients with LVNC only due to the presence of LVNC, especially since inappropriate ICD discharges are another risk factor of poor outcome.34 Kobza et al. reported appropriate ICD discharge in 37% of 30 LVNC patients (42% implanted for secondary and 33% for primary prevention) during 40 months of follow-up.35 This rate was higher than in the study of Stöllberger et al. where the rate of appropriate discharge was in 3 out of 154 observed patients (2%).34 This was explained by the difference between groups in the number of implantad CRTs with defibrillators (CRT-Ds), which significantly improved LV systolic function, in 20% vs 67% of the participants, respectively.34 Furthermore, some authors suggest that, in case of ventricular arrhyth-mia in patients with LVNC but without severe systolic dysfunction, ICD implantation prevents SCD.32,36 Okubo et al. suggest that if severe systolic dysfunction and other classical indications for CRT are present, resynchroniza-tion therapy should be implemented to cause reverse LV re-modeling, resulting in a decrease in the occurrence of fatal ventricular arrhythmia and SCD. It is worth noticing that those authors implanted CRT on the basis of the presence of dyssynchrony in echocardiography.32 In another report by Stöllberger et al., LV hypertabeculation regressed with LV systolic function improvement, which was seen after the initiation of biventricular pacing.36
It has been reported that not only treatment with CRT-Ds but also pharmacological therapy may improve LV func-tion, increase LVEF, decrease the probability of ventricular arrhythmia, and decrease the degree of noncompaction.4 In fact, worse outcomes are observed when no pharma-cological or device therapy is administered, or when the medications or devices used are inappropriate.
Prognosis
There are only a few reports referring to annual mor-tality from LVNC. Stöllberger et al. consider the progno-sis in LVNC at least controversial. In their study, the an-nual mortality was estimated at 4.81% during 65 months observing 154 patients with LVNC. SCD was observed in 3 patients (2%) during this period, and mortality due to progression of heart failure in 11 patients (7%).32 In an-other study of 381 LVNC patients, the 5-year event-free survival rate after diagnosis was estimated at 58%.8
Stöllberger et al. noticed a correlation between LVNC and neuromuscular disease, which was associated with a higher risk of arrhythmia.32 In another study, the same au-thors reported that inpatients with LVNC and neuromuscular disorders have worse prognoses than outpatients with regard

M. Kubik, et al. Predictors of poor outcome in LVNC420
to neurologic findings and mortality.27 During a mean follow-up of 3.8 years, the mortality rate was at the level of 5.8% per year. Patients diagnosed with LVNC as inpatients had a significantly higher mortality rate than those diagnosed as outpatients (12.1% vs 2.1% per year, respectively) and a shorter time between LVNC diagnosis and death (1.7 years vs 4.6 years, respectively). The overall mortality during the follow-up was 21.6% due to heart failure (32% of the causes), SCD (13.6%), pulmonary embolism (9%), and stroke (4.5%).27
In addition, Sarma et al. noticed that apart from de-creased LVEF (especially LVEF <31%), such parameters as atrial fibrillation, left atrial dimension exceeding 40 mm, advanced age, associated neuromuscular disease, and heart failure with dilated LV are also linked to poorer prognosis and higher mortality.4
Conclusions
The results of this review confirm that LVNC is not a uni-form disease, but rather a cardiac abnormality encountered in different clinical situations. On the basis of this litera-ture review we can conclude that LVNC is a cardiomyopa-thy associated with a variety of prognostic factors of poor outcome in terms of life threatening ventricular arrhyth-mia and progression of heart failure (Table 4). The prog-nostic factors of a poor outcome in LVNC seem to be similar to DCM and other cardiomyopathies and include the presence of atrial fibrillation, low LVEF, symptomatic heart failure, enlarged LV cavity dimension and volume, etc. In turn, its genetic connection with morbidities depen-dent on modifications of ion channels explains the higher probability of life-threatening ventricular arrhythmia and SCD. The higher probability of symptomatic LVNC with
Fig. 1. Therapeutic proceeding depending on the various clinical manifestations of left ventricular noncompaction (LVNC); based on the European Society of Cardiology guidelines for the management of patients with ventricular arrhythmias and prevention of sudden cardiac death (published in 2015)
OPT – optimal pharmacotherapy; AA – anti-arrhythmics; ACEI – angiotensin converting enzyme inhibitor; BB – beta-blockers; MRA – mineralocorticoid receptor antagonists; N/OAC – non-vitamin K antagonist/oral anticoagulants; SR – sinus rhythm; AF – atrial fibrillation; VA – ventricular arrhythmia; VT – ven-tricular tachycardia; nsVT – nonsustained VT; VF – ventricular fibrillation; ICD – implantable cardioverter-defibrillator; CRT – cardiac resynchronization ther-apy; CRT-ICD – CRT with ICD; EPS – electrophysiological study; CAD – coronary artery disease; TIA – transient ischemic attack; HF – heart failure; LVEF – left ventricular ejection fraction; NYHA – New York Heart Association scale; LBBB – left bundle branch block; AV – atrioventricular; HTX – heart transplantation.
Diagnosis ofLVNC
AF OPT, AA
QRS>130ms, NYHA III-IV, LVEF<35%, OPT≥3mc,
≥1-y predictedsurvival
CRT AV-nodeablation
no symptomsno heart failureno arrhythmias
Observation
HF OPT(ACEI, BB, MRA)
LVEF≤35%, HYHA II-III, OPT≥3mc, ≥1y predicted
survival
ICD
QRS≥150msLVEF≤35%
NYHA II-III, SRCRT-ICD
LBBB (QRS≥120ms)
LVEF≤35%NYHA III, SR
CRT-ICD
LBBB (QRS≥130ms)
LVEF ≤30%NYHA II, SR
CRT-ICDNYHA IV waiting
for HTX ICD
LVEF≤35%, NYHA IVa, OPT≥3mc, ≥1y predicted
survival
QRS>150ms CRT
LBBB (QRS>120ms) CRT
Stroke/TIA/Systemicembolism
Other causesprobable ordiagnosed
Treatmentaccording to the
cause
Lifelong N/OAC
VA
Identificationand treatment
potentiallyarrhythmogenic
disorders
OPT(ACEI, BB, MRA)
Moderate to high risk of CAD
Coronarography/-plasty
nsVT
Symptomatic
Further OPT, AA,EPS/ablation
Further diagnosisand treatment
according to the cause
Asymptomatic Further OPT, AA
Unstable VT/VF ICDEPS/ablation
Further OPT, AA
Stable VT
Further OPT, AA, EPS/ablation,
Coronarography/-plasty

Adv Clin Exp Med. 2018;27(3):415–422 421
higher mortality rates in children and adolescents than in adults, as well as better prognoses in outpatients vs in-patients, may be explained by the severity and the clinical significance of the genetic and morphological abnormali-ties.26 All of the above seems to vary a great deal among patients with LVNC and this is the reason patients with LVNC should undergo investigations assessing their in-dividual risk for arrhythmia and heart failure progression and should be closely followed up.
It is also important to remember that due to the frequent association between LVNC and neuromuscular diseases, all patients suffering from LVNC should be referred to neu-rologists.26 In turn, it seems reasonable to use the Cardiac Disease in Pregnancy assessment tool and perform indi-vidual exercise testing to assess the cardiovascular risk in pregnant women.17
On the basis of the current knowledge collected in this review, the authors consider worth pointing out the need to establish SCD-in-LVNC risk model. This can only be
achieved by close cooperation between cardiologists from different health care institutions worldwide and by creating a national and later global LVNC registry. A model of this kind would probably help cardiologists properly estimate the clinical risk of an individual patient with LVNC and unify communication among cardiologists in this field.
References 1. Zhang W, Chen H, Qu X, Chang CP, Shou W. Molecular mechanism
of ventricular trabeculation/compaction and the pathogenesis of the left ventricular noncompaction cardiomyopathy (LVNC). Am J Med Genet. 2013;163C:144–156.
2. Grant RT. An unusual anomaly of the coronary vessels in the mal-formed heart of a child. Heart. 1926;13:273–283.
3. Marron BJ, Towbin JA, Thiene G, et al. Contemporary definitions and classification of the cardiomyopathies. An American Heart Asso-ciation Scientific Statement from the Council on Clinical and Out-comes Research and Functional Genomics and Translational Biolo-by Interdisciplinary Working Groups; and Council on Epidemiology and Prevention. Circulation. 2006;113:1807–1816. doi:10.1161/CIRCU-LATIONAHA.106.174287
4. Sarma RJ, Chanab A, Elkayamc U. Left ventricular noncompaction. Prog Cardiovasc Dis. 2010;52:264–273. doi:10.1016/j.pcad.2009.11.001
5. Connolly HM, Attenhofer-Jost CH. Isolated left ventricular noncom-paction. http://www.uptodate.com/contents/isolated-left-ventric-ular-noncompaction (Accessed on Nov 21, 2014).
6. Finsterer J, Stöllberger C, Sehnal E, Valentin A, Huber J, Schmiedel J. Apical ballooning (Takotsubo syndrome) in mitochondrial disorder during mechanical ventilation. J Cardiovasc Med. 2007;8:859–863.
7. Rehfeldt KH, Pulido JN, Mauermann WJ, Click RL. Left ventricular hypertrabeculation/noncompaction in a patient with peripartum cardiomyopathy. Int J Cardiol. 2010;139:e18–e20.
8. Klaassen S, Probst S, Oechslin E, et al. Mutations in sarcomere pro-tein genes in left ventricular noncompaction. Circulation. 2008;117: 2893–28901.
9. Stöllberger C, Finsterer J. Left ventricular hypertrabeculation/non-compaction. J Am Soc Echocardiogr. 2004;17:91–100.
10. Finsterer J, Stöllberger C, Blazek G. Neuromuscular implications in left ventricular hypertrabeculation/noncompaction. Int J Cardiol. 2006; 110:288–300.
11. GeneCards Human Gene Database: Weizmann Institute of Science. http://www.genecards.org (Accessed on Feb 6, 2016).
12. Xu Q, Dewey S, Nguyen S, Gomes AV. Malignant and benign mutations in familial cardiomyopathies: Insights into mutations linked to com-plex cardiovascular phenotypes. J Mol Cell Cardiol. 2010;48:899–909. doi:10.1016/j.yjmcc.2010.03.005
13. Włodarska EK, Woźniak O, Konka M, Piotrowska-Kownacka D, Wal-czak E, Hoffman P. Isolated ventricular noncompaction mimicking arrhythmogenic right ventricular cardiomyopathy – a study of nine patients. Int J Cardiol. 2010;145(1):107–111. doi:10.1016/j.ijcard.2009. 05.062
14. Sakai Y, Sato Y, Matsuo S, et al. Perforation of the right ventricular free wall by an ICD lead in a patient with isolated noncompaction of the ventricular myocardium. Int J Cardiol. 2007;117:e104–e106. doi: 10.1016/j.ijcard.2006.11.223
15. Celiker A, Ozkutlu S, Dilber E, Karagöz. Rhythm abnormalities in chil-dren with isolated ventricular noncompaction. Pacing Clin Electro-physiol. 2005;28:1198–1202.
16. Ozgur S, Senocak F, Orun UA, et al. Ventricular non-compaction in children: Clinical characteristics and course. Intact Cardiovasc Tho-rac Surg. 2011;12(3):370–373. doi:10.1510/icvts.2010.246694
17. Stöllberger C, Streit N, Yoshida T, Wegner C, Finsterer J. Left ventric-ular hypertrabeculation/noncompaction and pregnancy. Int J Car-diol. 2014;172(1):271–273.
18. Gati S, Papadakis M, Papamichael ND, et al. Reversible de novo left ventricular trabeculations in pregnant women: Implications for the diagnosis of left ventricular noncompaction in low-risk populations. Circulation. 2014;130(6):475–483.
19. Ning XH, Tang M, Chen KP, et al. The prognostic significance of frag-mented QRS in patients with left ventricular noncompaction cardio-
Table 4. Predictors of poor outcome in patients with left ventricular noncompaction
1. mutations in genes: SCN5A, MYBPC3, TNNT2, TNNI3, MYH7 or X-linked G4.5
2. mutations in genes encoding βMHC or cTnT proteins (especially cTnT Arg131Trp mutation)
3. New York Heart Association class III–IV, palpitations, syncope, heart failure symptoms
4. late gadolinium enhancement in cardiac magnetic resonance examination
5. sustained ventricular arrhythmia, ventricular tachycardia, ventricular fibrillation
6. hospital admission due to heart failure
7. systemic embolization
8. inpatient’s left ventricular noncompaction diagnosis
9. left ventricular fractional shortening <25%, left ventricular ejection fraction <31%
10. arterial hypertension
11. advanced age
12. inadequate anticoagulation
13. atrial fibrillation
14. pregnancy and post-partum period
15. left atrial dimension >40 mm
16. neuromuscular disorder
17. heart failure with dilated left ventricle
18. young age at presentation
19. cardiac and neuromuscular comorbidity
20. thin right ventricle wall in a presence of implanted cardioverter- defibrillator (ICD)
21. fragmented narrow QRS complex
SCN5A – sodium voltage-gated channel alfa subunit 5 (human); MYBPC3 – myosine binding protein C (cardiac); TNNT2 – troponin T type 2 (cardiac); TNNI3 – troponin T type 3 (cardiac); MYH7 – myosin heavy chain 7 (human); βMHC – beta myosin heavy chain (human, cardiac).

M. Kubik, et al. Predictors of poor outcome in LVNC422
myopathy. Can J Cardiol. 2012;28:508–514. doi:10.1016/j.cjca.2012. 01.011
20. Akhbour S, Fellat I, Fennich N, et al. Electrocardiographic findings in correlation to magnetic resonance imaging patterns in African patients with isolated ventricular noncompaction. Anatol J Cardiol. 2015;15:550–555. doi:10.5152/akd.2014.5577
21. Lim HE, Pak HN, Shim WJ, Ro YM, Kim YH. Epicardial ablation of ven-tricular tachycardia associated with isolated ventricular noncompac-tion. Pacing Clin Electrophysiol. 2006;29:797–799.
22. Serés L, Lopez J, Larrousse E, Moya A, Perefferrer D, Valle V. Isolated noncompaction left ventricular myocardium and polymorphic ven-tricular tachycardia. Clin Cardiol. 2003;26:46–48.
23. Kubik M, Dąbrowska-Kugacka A, Lewicka E, et al. Left ventricular noncompaction in a former athlete – a case report. Pol Prz Kardiol. 2013;15(4):298–300.
24. Finsterer J, Stöllberger C, Tymms T, Fazio G, Siejka S. Shall a pilot with left ventricular hypertrabeculation/noncompaction fly passengers? Int J Cardiol. 2010;145(1):72–73. doi:10.1016/j.ijcard.2009.04.031
25. Wan J, Zhao S, Cheng H, et al. Varied distributions of late gadolinium enhancement found among patients meeting cardiovascular mag-netic resonance criteria for isolated left ventricular non-compaction. J Cardiovasc Magn Reson. 2013;15:20. doi: 10.1186/1532-429X-15-20
26. Greutmann M, Mah ML, Silversides CK, et al. Predictors of adverse outcome in adolescents and adults with isolated left ventricular non-compaction. Am J Cardiol. 2012;109:276–281. doi:10.1016/j.amjcard. 2011.08.043
27. Stöllberger C, Blazek G, Winkler-Dworak M, Finsterer J. In- and out-patients with noncompaction: Differences in cardiac and neuro-muscular co-morbidity. Int J Cardiol. 2010;140:108–131. doi:10.1016/j.ijcard.2008.10.041
28. Stöllberger C, Blazek G, Dobias C, Hanafin A, Wegner C, Finsterer J. Frequency of stroke and embolism in left ventricular hypertrabecula-tion/noncompaction. Am J Cardiol. 2011;108:1021–1023. doi:10.1016/j.amjcard.2011.05.039
29. Aras D, Tufekcioglu O, Ergun K, et al. Clinical features of isolated ven-tricular noncompaction in adults long-term clinical course, echocar-diographic properties, and predictors of left ventricular failure. J Card Fail. 2006;12:726–733.
30. Kobza R, Jenni R, Erne P, Oechslin E, Duru F. Implantable cardiovert-er–defibrillators in patients with left ventricular noncompaction. Pacing Clin Electrophysiol. 2008;31:461–467.
31. He T, Zeng HS, Le WB, Li XH, Lu ZY. Clinical characterization and out-come of patients with noncompaction of ventricular myocardium. Zhonghua Xin Xue Guan Bing Za Zhi 2007;35:548–551.
32. Stöllberger C, Keller H, Blazek G, Bichler K, Wegner C, Finsterer J. Car-diac devices and neuromuscular disorders in left ventricular noncom-paction. Int J Cardiol. 2011;148(1):120–123. doi:10.1016/j.ijcard.2011. 01.067
33. Okubo K, Sato Y, Matsumoto N, et al. Cardiac resynchronization and cardioverter defibrillation therapy in a patient with isolated non-compaction of the ventricular myocardium. Int J Cardiol. 2009;136: e66–e68.
34. Priori SG, Blomström-Lundqvist C, Mazzanti A, et al. The task force for the management of patients with ventricular arrhythmias and the prevention of sudden cardiac death of the European Society of Car-diology: 2015 ESC Guidelines for the management of patients with ventricular arrhythmias and the prevention of sudden cardiac death. Eur Heart J. 2015;36:2793–2867. doi:10.1093/eurheartj/ehv316
35. Kobza R, Steffel J, Erne P, et al. Implantable cardioverter–defibrillator and cardiac resynchronization therapy in patients with left ventric-ular noncompaction. Heart Rhythm. 2010;7:1545–1549. doi:10.1016/j.ijcard.2011.01.067
36. Stöllberger C, Keller H, Finsterer J. Disappearance of left ventricu-lar hypertrabeculation/noncompaction after biventricular pacing in a patient with polyneuropathy. J Card Fail. 2007;13:211–214.

DOI10.17219/acem/63743
Copyright© 2018 by Wroclaw Medical University This is an article distributed under the terms of the Creative Commons Attribution Non-Commercial License(http://creativecommons.org/licenses/by-nc-nd/4.0/)
Address for correspondenceRyszard R. KacałaE-mail: [email protected]
Funding sourcesNone declared
Conflict of interestNone declared
Received on March 20, 2016Reviewed on March 27, 2016Accepted on June 17, 2016
AbstractProfessor Czesław Niżankowski was an academic teacher and researcher at several universities; head of the Department of Anatomy at Wroclaw Medical University (1966–1982); and head of the Department of Bio-logical Sciences at the Wrocław School of Physical Education (since 1972 University School of Physical Education in Wrocław), as well as the chancellor there. He contributed greatly to the development of mor-phological sciences, supervising many doctoral and post-doctoral works. He dedicated considerable time to the preparation of anatomical specimens of lungs, hearts and organs of the gastrointestinal tract. At the Museum of Anatomy, there are over 100 specimens of lungs prepared using the forced air technique improved by Professor Niżankowski, along with specimens of the bronchial tree and vascular system prepared using a corrosive technique. Professor Niżankowski was an active member of scientific societies in Wrocław and in other cities in Poland. For his accomplishments, he received a number of ministerial and state awards, including the Knight’s Cross of the Order of Polonia Restituta, and was granted an honorary doctorate by Wroclaw Medical University.
Key words: Czesław Niżankowski, history of anatomy, Polish medical universities, Department of Anatomy
Reviews
In memory of professor Czesław Niżankowski, Head of the Department of Anatomy, Wroclaw Medical University
Ryszard R. Kacała1,A–D,F, Krzysztof Wronecki2,B,C,E, Arkadiusz Kacała3,B–D, Zygmunt Domagała1,B,E, Michał Porwolik1,B,E
1 Department of Anatomy, Wroclaw Medical University, Poland2 Faculty of Physical Education and Physiotherapy, Opole University of Technology, Poland3 Department of General Radiology, Interventional Radiology and Neuroradiology, Wroclaw Medical University, Poland
A – research concept and design; B – collection and/or assembly of data; C – data analysis and interpretation; D – writing the article; E – critical revision of the article; F – final approval of the article
Advances in Clinical and Experimental Medicine, ISSN 1899-5276 (print), ISSN 2451-2680 (online) Adv Clin Exp Med. 2018;27(3):423–427

R. R. Kacała, et al. In memory of professor Czesław Niżankowski424
The life of Professor Czesław Niżankowski is linked with three Polish cities. He was born on July 14, 1914, in Kraków, and spent his childhood and most of his teenage years there until 1932. In Lviv, were he studied, he took his first job at the university and lived there until the autumn of 1944. After the war, he moved to Wrocław, where he lived and worked from 1945 onward. This reflects a pattern shared by many Poles in the 20th century, whose lives were af-fected by World War II and who had to change their places of residence.
Czesław Niżankowski, son of Jan Niżankowski, a civil servant, and Zofia, née Klinger, a housewife, spent his childhood, along with his sister Jadwiga and his brother Adam, at 12 Topolowa Street in Kraków. Professor began his studies in Kraków in 1931 at the Department of Phi-losophy.1 After one year, he moved to Lviv, where, start-ing in 1932, he was a student of veterinary medicine at the Lviv Academy of Veterinary Medicine, completing his studies on March 18, 1937, without defending his de-gree. On November 25, 1939, due to the war, the Council of Professors made a resolution to delay the diploma ex-amination until August 31, 1940.2 On October 28, 1940, Czesław Niżankowski passed the state examination in Lviv, at that time a part of the Soviet Union (the university was known as the Lviv Veterinary Institute). In 1939, during his studies, he began to work as a volunteer at the Depart-ment of Comparative Anatomy. After that, he worked as an acting assistant (October 2, 1935 – November 15,1937) and a junior assistant (November 15, 1937 – September 1, 1939). Throughout the war, he worked as a senior assistant (November 12, 1939 – September 12,1944).3
Czesław Niżankowski’s interests went beyond veteri-nary medicine; he also studied medicine in Lviv at the Faculty of Medicine of Jan Kazimierz University from 1932 to 1937. He continued his studies during the war, from 1941–1942 (student record book 146/42), but did not com-plete them due to the war. In autumn 1944 he moved back to Kraków after receiving a Kennkarte (a German identity document) on October 3, 1944. He stayed in his hometown until the end of the war. In March 1945 he was admitted
to the 5th year of medical studies at Jagiellonian University in Kraków,4 but received his Doctor of Medicine degree in Wrocław, where he passed his final examinations.5
Like many other scientists from Lviv, in the autumn of 1945 Niżankowski moved to Wrocław, which had been regained by Poland and was being repopulated by migrants, mostly from eastern regions of the country. Wrocław had been severely devastated during the war and working there required considerable sacrifice and dedication.
Niżankowski began his academic career as a senior re-search assistant on December 1, 1945, at the Department of Comparative Anatomy of the Faculty of Veterinary Medicine at the new combined University of Wrocław and Wrocław University of Science and Technology.6 In 1946, he received his doctorate in veterinary medicine. In 1947 Niżankowski was moved to the Faculty of Medi-cine and began work as a senior research assistant in the Department of Anatomy, headed by Professor Tadeusz Marciniak.7,8 From 1946 to 1950 Niżankowski held anatomy classes at the Institute of Physical Education at University of Wrocław and Wrocław University of Science and Technol-ogy. Then, once the Wrocław School of Physical Education (WSWF) was established, he became a lecturer in anatomy and biomechanics there, continuing this work until 1970.
The newly established WSWF needed experienced staff, and Dr. Czesław Niżankowski was appointed to the position of deputy professor, becoming the head of the Department of Biological Science at the WSWF from 1950 to 1970. He was the dean of the WSWF from 1958 to 1965,when he succeeded Professor Tadeusz Marciniak as the chancellor of the school (in 1972 renamed Univer-sity School of Physical Education in Wrocław), a position he held until 1990.9 It was during Niżankowski’s years as chancellor, in December 1966, when the Wrocław School of Physical Education became the second in Poland quali-fied to grant PhD degrees (the first being in Warszawa). This was an important milestone, increasing the ranking and scientific prestige of University of Wrocław.
From 1947 to 1964, Niżankowski also lectured in anato-my for artists at the State College of Fine Arts in Wrocław
1. Professor Niżankowski with his favorite pipe
2. Young Czesław Niżankowski in a lab coat

Adv Clin Exp Med. 2018;27(3):423–427 425
(1947–1964), and starting in 1966 he taught normal hu-man anatomy for anthropology students at the Department of Natural Sciences at University of Wrocław.10 However, the principal place of employment for Professor Niżankowski was the Department of Descriptive Anatomy in the Faculty of Medicine, where he worked as a senior research assis-tant beginning on September 1, 1947.11 He taught classes and was one of the closest colleagues of Professor Tadeusz Marciniak. From September 1, 1953, Niżankowski was em-ployed as a senior research assistant at Wroclaw Medical University.12 He was responsible for the teaching process in the Department of Anatomy. In 1961, Niżankowski de-fended his post-doctoral thesis entitled "The Typology of Coronary Heart Disease in Man”, which was one of the major achievements in the field of morphology at Wroclaw Medical University during the 20-year-long history of the Polish People’s Republic.13 In 1962, he was appointed as-sistant professor, and held this position until 1966.
After the death of Professor Marciniak, Niżankowski became the head of the Department of Anatomy (1966–1982). His work at the Department of Anatomy was mainly focused on teaching: giving lectures, teaching classes and mentoring young researchers. Interestingly, each of the junior and senior research assistants had to sit with Pro-fessor Niżankowski and take exams in anatomical knowl-edge, despite the fact that they themselves were teaching classes. He dedicated considerable time to the prepara-tion of anatomical specimens of lungs, heart and organs of the gastrointestinal tract. At the Museum of Anatomy there are over 100 specimens of lungs prepared using the forced air technique, which was improved by Professor Niżankowski, and specimens of the bronchial tree and vascular system prepared using a corrosive technique. A separate group of specimens prepared using the cor-rosive technique includes injection-fixed human hearts that present the internal anatomy of the heart and organs of the gastrointestinal and urinary tracts.14
Starting in 1970, Czesław Niżankowski was also the di-rector of the Institute of Biostructure at Wroclaw Medi-cal University. His scientific interest was focused on the anatomy of the heart, lungs and gastrointestinal tract. Dur-ing his academic career, he participated in international conventions of anatomists, and published 84 papers that he authored or co-authored.15 Many of these works were published in "Folia Morphologica", including:
“Abnormal Origin of Arteries from the Aortic Arch in Man”16
“Varieties of the Course of the Sciatic Nerve in Man”17
“Suggestion for a New Classification of the Shape of the Human Renal Pelvis with Consideration of the Number of Renal Papillae”18
“Studies on the Sciatic Nerve Course in Man in the Fetal Period”19
“Cor Biloculare in Man”20
“Contribution to Studies on the Apparent Ascent of the Spinal Cord in Human Fetuses”21
“Fossa Ovalis of the Interatrial Septum in Humans”22
Niżankowski received the title professor extraordina-rius in 1969, and professor ordinarius in 1976. In 1981, he was one of the organizers of the finals of Scapula Aurea, a competition for medical students in Poland. Professor Niżankowski retired in 1982, but remained an active re-searcher.23 In recognition of his many years of research and teaching, Wroclaw Medical University granted Czesław Niżankowski an honorary doctorate in 1983. During his many years of service as head of the Department of Anatomy, Professor Niżankowski actively supported young scholars, and was the supervisor for 19 doctoral dissertations:
1. Jarosińska A. Zależność pomiaru filipińskiego od wybranych cech morfologicznych i wieku inteligencji u dzieci wrocławskich [Correlations Between the Philippine Measurement and Selected Morphological Traits, Age and Intelligence in Children from Wrocław]. Wrocław, Poland; 1967 [in Polish].
2. Golema M. Zmiany kątowe w stawach ćwiczącego podczas wykonywania ćwiczeń z przyborami i ćwiczenia dwójkowego [Angular Changes in Human Joints While Ex-ercising with Equipment and in Pairs]. Wrocław, Poland; 1967 [in Polish].
3. Professor Czesław Niżankowski at a lecture in anatomy
4. Professor Czesław Niżankowski discussing the research work of an assistant from the Department of Anatomy
5. Professor Czesław Niżankowski with his future successor, Associate Professor Mieczysław Ziółkowski

R. R. Kacała, et al. In memory of professor Czesław Niżankowski426
3. Socha S. Badanie zależności pomiędzy wybranymi ce-chami somatycznymi i sprawnościowymi a wynikami spor-towymi u miotaczy [An Analysis of the Correlation Between Selected Somatic and Fitness Traits and Sports Performance in Throwers]. Wrocław, Poland; 1967 [in Polish].
4. Socha O. Budowa i funkcja stopy u pływaków i osób nieuprawiających pływania [The Anatomy and Function of the Foot in Swimmers and Non-Swimmers]. Wrocław, Poland; 1969 [in Polish].
5. Soczyński L. Przebieg żyły śledzionowej u człowieka w populacji polskiej [The Course of the Human Splenic Vein in Polish Population]. Wrocław, Poland; 1967 [in Polish].
6. Sygula JE. Przebieg naczyń krwionośnych okrężnicy człowieka w populacji polskiej [The Course of Blood Ves-sels in the Human Colon in Polish Population]. Wrocław, Poland; 1967 [in Polish].
7. Rajchel Z. Analiza cech kończyny dolnej w zależności od typu budowy ciała [An Analysis of Lower Extremity Traits Depending on the Type of Body Shape]. Wrocław, Poland; 1970 [in Polish].
8. Skarżyńska T. Cechy antropometryczne ręki i stopy człowieka w okresie prenatalnym [Anthropometric Charac-teristics of the Human Hand and Foot During the Prenatal Period]. Wrocław, Poland; 1971 [in Polish].
9. Ćwioro E. Przebieg oraz zespolenia tętnic nabrzusznych u człowieka w populacji polskiej [The Course and Anasto-mosis of Human Epigastric Arteries in Polish Population]. Wrocław, Poland; 1971 [in Polish].
10. Hanusiewicz A. Zmiany inwolucyjne połączeń stawowych kręgosłupa u człowieka [Involutive Chang-es in Human Vertebral Joints]. Wrocław, Poland; 1971 [in Polish].
11. Stankiewicz S. Morfologia tętnic pęcherzyka żółciowego w obrazie rentgenowskim [Morphology of Arter-ies in the Gallbladder in X-Ray Images]. Wrocław, Poland; 1972 [in Polish].
12. Kędzia A. Zlewisko żylne w obrębie dołu i bruzdy bocznej mózgu [Venous Drainage Within the Cranial Fossa and Lateral Sulcus]. Wrocław, Poland; 1972 [in Polish].
13. Magnowski L. Zmiany w położeniu jelit ze szczegól-nym uwzględnieniem kątnicy i okrężnicy w okresie prenatal-nym u człowieka [Changes in the Position of the Intestines, with Particular Consideration of the Cecum and Colon, During the Prenatal Period in Humans]. Wrocław, Poland; 1973 [in Polish].
14. Sikora ZS. Tętniczo-oskrzelowy układ segmentarny płata górnego płuca lewego i jego odmiany w populacji pol-skiej [The Arterobronchial Segmental System of the Left Lung Lobe and Its Variants in Polish Population]. Wrocław, Poland; 1973 [in Polish].
15. Stępińska B. Zmiany kształtu i wymiarów głowy noworodków pod wpływem porodu i dynamika procesu normalizacji [Changes in the Shape and Dimensions of the Head in Newborns Caused by Delivery, and the Dynam-ics of the Normalization Process]. Wrocław, Poland; 1973 [in Polish].
16. Marek J. Badanie zmienności cech opisowych i po-miarowych ślinianki podżuchwowej w rozwoju prenatalnym u człowieka [An Analysis of Diversity in Descriptive and Measurable Traits of the Submandibular Salivary Gland in Humans]. Wrocław, Poland; 1977 [in Polish].
17. Kazimierczak-Gierlak L. Badania nad rozwojem trzustki człowieka w okresie płodowym [Studies on the De-velopment of the Human Pancreas During the Fetal Period]. Wrocław, Poland; 1977 [in Polish].
18. Suder E. Typologia tętnicy udowej u człowieka w okre-sie płodowym [Typology of the Human Femoral Artery Dur-ing the Fetal Period]. Wrocław, Poland; 1978 [in Polish].
19. Kindli R. Rozwój kości gnykowej człowieka w okresie płodowym [The Development of the Human Hyoid Bone During the Fetal Period]. Wrocław, Poland; 1979 [in Polish].
Professor Czesław Niżankowski also supervised the preparation of three post-doctoral dissertations:
1. Goździecki S. Związki cech kefalometrycznych i kra-niometrycznych u człowieka [Correlations between Cepha-lometric and Craniometric Traits in Humans]. Wrocław, Poland; 1970 [in Polish].
2. Bożiłow W. Badania nad budową i rozwojem ekstero-receptorów i proprioreceptorów człowieka w okresie prena-talnym [Studies on the Structure and Development of Hu-man Exteroceptors and Proprioceptors During the Fetal Period]. Wrocław, Poland; 1972 [in Polish].
3. Ziółkowski M. Macica i jajowody w rozwoju płodowym u człowieka [Fetal Development of the Human Uterus and Fallopian Tubes]. Wrocław, Poland; 1976 [in Polish].
Professor Niżankowski was a member of many scientific societies in Wrocław: the Polish Anatomical Society, the Polish Anthropological Society, the Polish Medical Asso-ciation and the Polish Copernicus Society of Naturalists in Wrocław. For his work at universities in Wrocław he was granted a number of medals, including the Meritorious Activist of Physical Culture Decoration, the Medal of the National Education Commission, Scientific Award of the City of Wrocław, the Gold Cross of Merit and the Knight’s Cross of the Order of Polonia Restituta.
Professor Czesław Niżankowski was an ambitious and active scientist who supported and created the foundations of the study of anatomical sciences in Wrocław. He shared his knowledge for many years, giving numerous lectures and teaching students at four of Wrocław’s universities. He was appointed to serve in the administration of both Wroclaw Medical University and the Wrocław School of Physical Education. The crowning achievements of his work were his elections to the post of chancellor of the Wrocław School of Physical Education (since 1972 Universi-ty School of Physical Education in Wrocław) and to the post of director of the Institute of Biostructure at Wroclaw Medi-cal University. Professor Nizankowski’s legacy includes a large group of students who continue the development of anatomy departments at the universities in Wrocław.

Adv Clin Exp Med. 2018;27(3):423–427 427
References1. Identity Card issued by Jagiellonian University in Kraków on Octo-
ber 28, 1931.2. Degree certificate from the Academy of Veterinary Medicine in Lviv.3. Personal files of Czesław Niżankowski.4. Student record book – Universitatis Cracoviensis – Facultatis Medici-
nae.5. Degree certificate of Doctor of Medicine issued in Wrocław on June
30, 1951.6. Employment document for the position of senior research assis-
tant at the Department of Comparative Anatomy, School of Veter-inary Medicine
7. Employment document for the position of senior research assis-tant at the Department of Descriptive Anatomy, School of Medicine.
8. Kacała RR, Woźniak S, Porwolik M, et al. Remembrance of Profes-sor Tadeusz Marciniak – Lviv Tradition in Wrocław. Adv Clin Exp Med. 2015;24(1);173–178.
9. Information materials with the list of teachers and curricula for the academic year 1966–67, WSWF in Wrocław.
10. Private archive; document with the description of places of employ-ment and work periods at universities in Wrocław.
11. Letter from the chancellor of Wrocław University of Technology, July 4, 1947.
12. Letter from the chancellor of the Medical Academy in Wrocław August, 1953.
13. Achievements in Morphology Within the 20-Year-Long History of the Polish People’s Republic. Folia Morphol (Warsz). 1964;15(23)(4);345.
14. Specimens in the collection of the Museum of Anatomy at the Department of Anatomy, description by Professor Tadeusz Marcini-ak from the book “Medical Academy in Wrocław 1950–1960”, 65–66.
15. Niżankowski C. Report from the 20th Congress of Czechoslovak Morphologists, Brno September 25–29, 1972. Folia Morphol (Warsz). 1973;33(2).
16. Niżankowski C, Rajchel Z, Ziółkowski M. Abnormal origin of arter-ies from the aortic arch in man. Folia Morphol (Warsz). 1975;34(2).
17. Niżankowski C, Słociak J, Szybejko J. Varieties of the course of the sciatic nerve in man. Folia Morphol (Warsz). 1972;31(4).
18. Niżankowski C. Suggestion for a new classification of the shape of the human renal pelvis with consideration of the number of renal papil-lae. Folia Morphol (Warsz). 1978;37(4).
19. Niżankowski C, Ziółkowski M. Studies on the sciatic nerve course in man in the fetal period”. Folia Morphol (Warsz). 1979;38(4).
20. Niżankowski C, Rajchel Z, Ziółkowski M. Cor biloculare in man. Folia Morphol (Warsz). 1976;35(1).
21. Niżankowski C, Kurlej W. Contribution to studies on the apparent ascent of the spinal cord in human fetuses”. Folia Morphol (Warsz). 1982;41(1).
22. Niżankowski C, Ziółkowski M, Marek J, Rabczyński J. Fossa ovalis of the interatrial septum in humans”. Folia Morphol (Warsz). 1982;41(4).
23. Proof of employment at the Medical Academy in Wrocław.


DOI10.17219/acem/67968
Copyright© 2018 by Wroclaw Medical University This is an article distributed under the terms of the Creative Commons Attribution Non-Commercial License(http://creativecommons.org/licenses/by-nc-nd/4.0/)
Address for correspondenceZbyszko ChowaniecE-mail: [email protected]
Funding sourcesNone declared
Conflict of interestNone declared
Received on March 6, 2016Revised on November 13, 2016Accepted on December 20, 2016
AbstractCardiovascular diseases are still the main cause of death in Poland and throughout the world. Independent risk factors of cardiovascular disease, in addition to elevated LDL cholesterol, are both low HDL levels and high levels of non-HDL cholesterol. Plasma phospholipid-transfer protein (PLTP) and cholesteryl ester transfer protein (CETP) both play a major role in the metabolism of those lipoproteins. A lack of these proteins increases HDL and lowers LDL levels. In the light of current knowledge, it seems reasonable to search for compounds that may decrease the activity of CETP, and thus reduce the incidence of cardiovascular disease. Whereas on the one hand there are reports about the adverse effect of torcetrapib and the lack of therapeutic effects of dalcetrapib, on the other hand the question arises whether the CETP inhibitors that are currently in clinical trials will rise to the challenges before them. Currently, it is known that the activity of PLTP, while affecting the metabolism of lipoproteins, especially HDL, plays a major role in atherogenesis. Still, there are some contradictions and controversies about the effect of PLTP on reverse cholesterol transport (RCT). There are a number of studies about the role that PLTP plays in the pathogenesis of various diseases. Further studies are needed to clearly determine the impact of PLTP activity on the formation and development of pathological processes in the cardiovascular system.
Key words: cholesteryl ester transfer protein, atherogensis, plasma phospholipid-transfer protein
Reviews
Plasma lipid transfer proteins: The role of PLTP and CETP in atherogenesis
Zbyszko ChowaniecA–D, Anna SkoczyńskaA,C,E,F
Department and Clinic of Internal and Occupational Diseases and Hypertension, Wroclaw Medical University, Poland
A – research concept and design; B – collection and/or assembly of data; C – data analysis and interpretation; D – writing the article; E – critical revision of the article; F – final approval of the article
Advances in Clinical and Experimental Medicine, ISSN 1899-5276 (print), ISSN 2451-2680 (online) Adv Clin Exp Med. 2018;27(3):429–436

Z. Chowaniec, A. Skoczyńska. Lipid transfer proteins in atherogenesis430
Plasma phospholipid-transfer protein (PLTP) belongs to the family of lipid-binding and lipid-transfer proteins.1 PLTP’s main function is its impact on the distribution and metabolism of high-density lipoproteins (HDL) and reverse cholesterol transfer (RCT). In plasma, PLTP catalyzes the transfer of phospholipids, mainly phosphatidylcholine, be-tween lipoprotein classes.2–4 It also plays a role in oxidative stress modulation and in the etiology of neurodegenerative diseases, it may have an impact on the coagulation process and immune functions.3,5,6
Cholesteryl ester transfer protein (CETP) belongs to a group of proteins which play a major role in lipid me-tabolism by transporting cholesteryl esters (CE) from HDL to low-density lipoproteins (LDL), intermediate density li-poprotein (IDL), very low-density lipoprotein (VLDL), and chylomicrons in exchange for triglyceride (TG) transport to HDL. It has been reported that CETP is involved in the genesis of cardiovascular disease by its impact on lipid metabolism.5–7
PLTP and CETP are in the family of lipid-transfer pro-teins, which also includes lipoprotein binding protein (LBP).8,9 About 25% of each of these proteins is shared by all of them, while about 21% of each total protein is spe-cific to it.10 The PLTP gene is located on chromosome 20.11 PLTP contains 476 sugar moieties, and its molecular weight is about 80 kDa.1 Different sugar residues result in dif-ferences in the weights of various proteins. A 3D model of PLTP is a boomerang-shaped particle consisting of 2 domains with similar tertiary structures. Each domain has a binding site for a phospholipid molecule’s acyl group.12 CETP is a hydrophobic glycoprotein consisting of 476 amino acids with a mass of 53 kDa. Its 3D structure resembles a banana shape measuring about 3 × 3 × 13 nm. The protein consists of the N-terminal and C-terminal domain of the β-barrel structure and the central part of the β-sheet structure that contains the active site.13
Regulation of activity and concentration of lipid transfer proteins
PLTP expression is PPAR-gamma dependent; i.e., it is stimulated by agonists of peroxisome proliferator-activated receptors type gamma such as sterols, glucose, fibrates and chenodeoxycholic acid.14 The same factors regulate ATP-binding cassette transporter protein A1 (ABCA1) expression and phospholipid efflux from cells.2 Binding phospholipids and facilitating their transfer be-tween lipoprotein in plasma, PLTP plays a key role in li-poprotein remodeling. However, its influence on nascent HDL formation is not clear.4 A diet rich in fat and a high level of glucose increase the rate of PLTP gene transcrip-tion and the activity of the protein.15 A similar effect oc-curred in patients treated with fibrates.16 Also, human
apolipoproteins apoA-I, apoA-II and apoE, increased PLTP activity, whereas elevated levels of insulin triggered the opposite effect.15 PLTP concentration decreased during an increase in lipopolysaccharide (LPS) concentration in plasma due to the presence of a bacterial infection or after LPS injection into mice. At the same time, active inflammation caused an increase in the concentration of PLTP, and its concentration correlated with the level of C-reactive protein.17 PLTP level also increased with age, body mass index and triglyceride level.18 Higher val-ues of PLTP have been observed in patients with type 1 diabetes and type 2 diabetes, as well as in patients with cardiovascular disease.19 On the other hand, plasma PLTP activity was independently decreased by acute hypergly-cemia and hyperinsulinemia in humans, and these data do not support a direct role of short-term hyperglycemia in up-regulating plasma PLTP levels.20
PLTP protein is omnipresent in the human body. The highest concentrations have been observed in the lungs, placenta and ovaries.1 Most of the protein pro-duction occurs in the liver, which is responsible for 25% of plasma PLTP activity. Plasma PLTP exists in 2 forms: active, which has the ability to transfer phospholipids, and inactive.21 In healthy individuals the amount of the inactive form varies between 50–90% of the total protein. The inac-tive form is absent in people with hypoalphalipoprotein-emia, e.g., in patients with Tangier disease, with lecithin-cholesterol acyltransferase (LCAT) deficiency, with apoA-I deficiency or family-deficient HDL.22 The inactive form is converted into the active form with the participation of apoE. These observations suggest the hypothesis that inactive PLTP is a reservoir for active PLTP, and can be quickly activated, but this requires further investigation.
Previous observations indicate that CETP is produced in the liver, spleen, adipose tissue, intestines, kidney, ad-renal gland, heart and skeletal muscles.23 CETP is also present in cerebrospinal fluid and sperm. Significant expression of CETP in macrophages has been detected.3 The main factor increasing the concentration of CETP in plasma is consumption of food rich in cholesterol and fat. It has been shown that the concentration of CETP and its activity increases in rabbit serum after high-fat diet intake.24 It was recently proved that women with a waist circumference greater than 90 cm and men with a waist circumference greater than 100 cm have higher CETP activity than those with a smaller waist size. It was also shown that in patients who were on a well-defined diet containing a specified amount of cholesterol, both serum CETP activity and the concentration of CETP mRNA in adipocytes increased when the amount of cholesterol in the diet increased. The concentration of the CETP also depends on hormone levels, e.g., increased levels of cor-ticosteroids or decreased levels of thyroid hormone lead to a reduction in the activity of CETP.25 Fibrates have been shown to reduce the activity of CETP.16

Adv Clin Exp Med. 2018;27(3):429–436 431
The role of PLTP and CETP in lipoprotein metabolism
PLTP in serum mediates the transfer of phospholipids from triglyceride rich lipoproteins (e.g., VLDL or chylo-microns) to HDL, and thus is involved in the formation of chylomicrons or VLDL remnants, and in HDL matura-tion (Fig. 1). According to Albers et al., the mechanism pre-sumably works by binding PLTP to phospholipids on the HDL surface, which causes the separation of small, lipid-poor particles comprised of apoA-I and phospholipids and leads to the formation of unstable surface HDL particles, which then leads to the fusion of unstable particles and the formation of a new, bigger, stable HDL particle.26 However, according to Settasatian et al., PLTP promotes the binding of 2 particles of HDL and then the diffusion into 2 parts, forming a particle of phospholipids containing apo-A and a stable, larger HDL particle.27
It is worth noting that there are conflicting reports about the impact of PLTP overexpression on HDL cholesterol levels. Based on some observational research, PLTP over-expression causes the total level of HDL to fall, but the level of preβ-HDL rises because of it. However, most observa-tions show that the level of HDL increases with increased PLTP activity.26,27
Initially it was shown that PLTP played a key role in RCT from peripheral tissues, including transport from ath-erosclerotic plaque macrophages; the cholesterol is then
transported to the liver and eliminated by biliary excre-tion. It is likely that cholesterol transport begins with the activation of the signaling pathways of ABCA1 proteins. Lee-Ruecert et al. studied ABCA1-dependent cholesterol efflux from peripheral macrophages from mice that lacked PLTP and showed that, compared to wild mice, cholesterol efflux was impaired. This effect was eliminated by strong stimulation of an ABCA1-dependent signaling pathway.29 Albers et al. have shown that the level of PLTP in macro-phages is regulated by an up-regulation mechanism when cholesterol levels are high.11
Presumably, PLTP binds directly to protruding lipid do-mains of the cell membranes of macrophages and fibro-blasts, which are in close proximity to ABCA1, causing JAK2 phosphorylation, which results in a further increase in PLTP connections and apolipoproteins to lipid domains, resulting in the dissolution and removal of the lipids from the cell and immediate transfer by PLTP particles accept-ing lipids, such as preβ-HDL.11 On the other hand, there are reports that active PLTP in the presence of apoA-I leads to the formation of faulty HDL particles that are less effi-cient in the uptake of cholesterol from peripheral tissues.30 It has also been shown that RCT is less efficient in trans-genic mice overexpressing PLTP, which may indicate that elevated levels of PLTP may promote atherogenesis by the accumulation of cholesterol in the blood vessel wall.31
PLTP activity can be monitored by phospholipid carry-ing capacity from VLDL and LDL to HDL. PLTP activity is strongly correlated with the concentration of triglycer-ides in plasma and triglyceride content in HDL particles; this is probably due to the increased ability of phospholipid binding by HDL particles rich in triglycerides.32
CETP has the ability to transfer cholesteryl esters and triglyceride esters between all lipoproteins. However, its main task is transporting cholesteryl ester (CE) from HDL particles to VLDL, IDL and LDL, and triglycerides in the opposite direction (Fig. 1). The activity of the protein leads to the preservation of a specific lipid balance between li-poprotein fractions. This was demonstrated by a study by Barter et al., in HDL, LDL and VLDL particles were incubated in the presence of CETP. They observed CE transfer between each lipoprotein fraction, and "given equal concentrations of esterified cholesterol in all lipo-protein fractions, the relative probability of picking up (and depositing) a molecule of esterified cholesterol in HDL : VLDL : LDL is 28.9 : 4.65 : 1”.33
Under physiological conditions, the activity of CETP is determined by the rate of metabolism of both HDL and LDL.34 In case of excessive CETP activity, modification of the lipid bi-directional transfer is minor, in contrast to a state of reduced CETP activity, which limits the ex-change of lipids. Interestingly, under physiological condi-tions, when the concentration of VLDL is correct, CEs are transported mostly to LDL; when the concentration of VLDL is elevated, as it is in, e.g., diabetes, cholesteryl esters are transported mostly to VLDL particles, which are
Fig. 1. Schematic representation of the pathway of HDL remodeling by the action of (a) PLTP and (b) CETP according to Zannis et al.28
a
b

Z. Chowaniec, A. Skoczyńska. Lipid transfer proteins in atherogenesis432
potentially strongly pro-atherosclerotic. It was also shown that the activity of CETP increases after a meal and is high-er in patients with lipid disorders. As mentioned before, CETP activity is limited by the metabolism of LDL, as has also been shown by examining patients taking 3-hydroxy-3-methylglutaryl-coenzyme reductase inhibitors.
The use of statin drug induces a significant reduction in total CETP activity and plasma mass concentration. Total CETP-mediated CE transport from high density lipoproteins to apoB-containing lipoproteins has been significantly reduced with drug therapy.35
There are 2 hypotheses pertaining the mechanism of CETP activity. One of them is based on the theory that CETP mediates the transfer of cholesteryl esters as its car-rier between lipoprotein particles. At first CETP connects to the lipoprotein and there is an exchange of both choles-teryl esters and triglycerides. Then CETP dissociates from lipoproteins and circulates until it connects with another lipoprotein, when another exchange of CE and TG takes place. Thus, CETP activity maintains a balance among all lipoprotein levels. According to the second hypothesis, CETP participates in the exchange of cholesteryl esters and triglycerides by producing a tunnel. It is assumed that the N-terminal portion of the protein combines with HDL first, then the C-terminal reacts with LDL or VLDL and forms a triple complex. This leads to changes in the shape of CETP, which form a hydrophobic tunnel that allows the transport of lipids between lipoprotein particles.36 It is worth noting that it has been shown that during the incubation of CETP with HDL particles, CETP has the ability to connect a few particles of CETP to one HDL particle. There was no evi-dence, however, that a CETP particle could attach to 2 HDL particles, which seems to preclude the possibility of such a connection.37 Due to conflicting reports, more research is needed to definitively confirm one theory.
PLTP and atherosclerosis
Atherosclerosis progression is exacerbated by 3 main factors: increased levels of lipoproteins containing apo-lipoprotein B (apoB), vascular endothelial injuries, and increased levels of pro-inflammatory factors. The primary event in atherogenesis is cholesterol deposition in the sub-endothelial space of a vessel’s wall. This cholesterol (mainly free, and less in the form of cholesteryl esters) originates from circulating lipoproteins. Physiologically, LDL, as well as remnants resulting from the hydrolysis of the TG contained in chylomicrons and VLDL, continually enter the subendothelial space and re-enter circulation. In some conditions, the subendothelial extracellular matrix retains cholesterol-rich lipoproteins and oxidative modifications of these lipoproteins occur. Many cellular and extracel-lular processes, including endothelial alterations, inflam-matory responses and intracellular cholesterol accumula-tion in macrophages, lead to the formation of foam cells,
then fatty streaks, and in the end atherosclerotic plaque. It is clear that a high level of atherogenic lipoproteins is as-sociated with increased accumulation of them in vessel walls, thus the relationship between blood cholesterol and atherosclerosis is obvious.38 Elevated LDL levels and decreased HDL levels are independent risk factors for car-diovascular disease. PLTP and CETP are the main proteins involved in these molecules’ metabolism.
Animal models
The majority of the animal model observations suggest that elevated levels of systemic PLTP promote atherogene-sis. On the other hand, there are reports that locally elevated PLTP, for example in macrophages in arteries, may have an anti-atherogenic effect, and PLTP-deficient mice had a significantly lower risk of atherosclerosis.39 More research studying the effects of PLTP and the consequences of both excess and deficiency is needed. Today there is an increas-ing number of studies on the role of PLTP in the immune system. Lipopolysaccharides (LPS) are located on the cell surface of Gram-negative bacteria. LPS do not form stable particles but undergo numerous modifications thanks to PLTP. LPS play an important role in the activation of the immune system. LPS binding to LPS binding protein (LBP) activates Toll-like receptor 4, resulting in increased levels of pro-inflammatory cytokines and activation of the inflam-mation process. Simultaneously, activation of the immune system is also an important mechanism in atherogenesis.40
It was recently shown that there is an alternative route of LPS elimination, by binding to HDL and elimination in the liver.41 According to Hailman et al., PLTP may be a key mediator in binding LPS to HDL.42 Incubation of LPS with HDL in the presence of PLTP leads to the binding of the particles. It has also been shown that mice with reduced levels of PLTP have a higher ability to accumu-late LPS in serum than mice with naturally high levels of PLTP. According to Gautier and Lagrost, PLTP may play a role in the reverse transport of LPS, as in the transport of cholesterol.41 Mice with naturally high levels of PLTP were observed to have lower concentration of LPS and they develop less severe inflammation. Moreover, the reverse LPS transport via HDL and PLTP may increase the rate of elimination of LPS by biliary excretion. Mice lacking PLTP had higher concentrations of LPS in the blood, lower resistance to septic shock and a lower survival rate than mice with normal concentration of PLTP in serum.41
Human studies
Albers et al. showed that PLTP activity in patients with sepsis or systemic inflammatory response syndrome was significantly higher compared to the control group. It was also confirmed that PLTP deficiency is associated with

Adv Clin Exp Med. 2018;27(3):429–436 433
a poor response to inflammation and often causes full-blown sepsis leading to death. In turn, increased PLTP activity is associated with less tissue damage caused by bacterial infection.11 Their study showed that elevated levels of PLTP may be a compensatory mechanism of the inflammatory process and suggested that reduced lev-els of PLTP activity in patients with sepsis may be a bad prognostic factor. Increased levels of PLTP activity may be useful in the prevention and treatment of septic shock.
There is a growing interest in the role of PLTP in the development of other diseases. The PLTP concentration in cerebrospinal fluid (CSF) is reduced in the active phase of multiple sclerosis, and it increases in the inactive phase. Reduced PLTP activity in CSF is also observed in neu-rodegenerative diseases including Alzheimer’s disease. In neoplastic disorders such as leukemias, gliomas, lung cancer, prostate cancer and breast cancer, PLTP activ-ity in serum varies. In addition, it has been shown that the concentration of PLTP may be a prognostic factor for survival in patients with a breast cancer.43 Differences in serum PLTP levels in patients with cancer indicate that PLTP may be an important regulating factor in the neo-plastic process.
CETP and atherosclerosis
Animal models
There are species of animals that naturally lack CETP ac-tivity, e.g., mice and rats, unlike rabbits, which have a very high activity of that protein. A decrease in HDL cholesterol and increased LDL and VLDL levels have been observed after human CETP was injected into mice.44 The forma-tion of atherosclerotic plaque in transgenic mice that have a simian CETP gene has also been described; in this case atherosclerosis was the result of changes mediated by CETP activity in lipoproteins.45 On the other hand, there are studies suggesting that CETP has an anti-atherogenetic effect. The protective effect of CETP was also observed in transgenic mice with elevated triglyceride levels.46 Rabbits are very vulnerable to the development of athero-sclerosis caused by a high-fat diet. When simultaneously providing such a diet and injections containing oligode-oxynucleotides with an antisense nucleotide sequence, significantly lower concentrations of CETP mRNA, lower total cholesterol and higher HDL were observed, which was associated with a lower risk of atherosclerosis.47 Studies have also shown a much lower incidence of atherosclerosis among rabbits treated with CETP inhibitors compared to rabbits who did not receive the drug, which was associ-ated with significantly higher HDL levels and lower levels of non-HDL cholesterol.48 On the other hand, inhibition of CETP activity and increases in HDL cholesterol in rab-bits vaccinated with a CETP vaccine were not associated with prevention of aortic lesion development.49
Human studies
There is no unanimous standpoint about the role that CETP plays in the pathogenesis of atherosclerosis in hu-mans. A CETP gene mutation in intron 14 that is present in up to 2% of Japanese people leads to reduced activity of the protein and elevated levels of HDL. Furthermore, a mutation in exon 15 that is found in 7% of Japanese people is also associated with elevated levels of HDL. However, studies conducted in Honolulu on a population of pa-tients of Japanese origin with those mutations have not found a statistically significant difference in the incidence of heart disease or stroke. There is no evidence that the mutations themselves have a protective effect. The results suggest that the protective effect of CETP deficiency is as-sociated with the presence of higher levels of HDL in these individuals. Moreover, the protective effect of the muta-tions disappears when HDL levels are lowered.34 On the other hand, many observations indicate that reduced levels of CETP have a protective effect on vessels. Several CETP gene mutations (e.g., TaqIB, I405V and 629C > A) that lead to reduced protein concentrations in serum have been identified so far. In a 2008 meta-analysis involving more than 113,000 respondents, it was shown that all of these mutations are associated with higher levels of HDL and lower risk of cardiovascular disease.50
Therapeutic options
The reports outlined above indicate that lower blood CETP concentration and lower CETP activity can have an anti-atherogenetic effect and thus can reduce the risk of cardiovascular disease. That fact creates a potential reference point for the evaluation of new drugs that are inhibitors of CETP. So far, 3 active compounds – torce-trapib, dalcetrapib and anacetrapib – have been tested on a large scale (Table 1). Toracetrapib works by increasing CETP’s affinity for HDL, which ultimately leads to a reduc-tion in the concentration of CETP that might participate in the transfer of TG between esterified cholesterol (EC) and lipoproteins.51 The efficacy of the drug was studied in the randomized, widespread ILLUMINATE study, which compared the effectiveness of atorvastatin alone with that of a combination of atorvastatin and torcetrapib. Initially, the results were very promising. HDL cholesterol levels in patients receiving the atorvastatin-torcetrapib combination were about 72% higher, but LDL cholesterol was 25% lower, compared to patients taking atorvastatin alone. Nevertheless, the study was terminated early be-cause of a statistically significant higher mortality rate (93 deaths vs 59), both from cardiovascular (49 vs 35 people) and other causes (40 people vs 20). It is important to men-tion that among the participants taking toracetrapib, there were more deaths due to cancer and infections, although there was no statistical difference in the incidence of these diseases in the 2 groups. Moreover, the use of torcetrapib

Z. Chowaniec, A. Skoczyńska. Lipid transfer proteins in atherogenesis434
was associated with increased blood pressure, aldosterone, sodium and bicarbonate levels and decreased potassium levels. In animal studies the effect of torcetrapib on RCT remains unknown, as it has varying responses according to the animal species and models utilized.5
Another active compound which has been subjected to extensive clinical trials is dalcetrapib. It probably works by altering the conformation of CETP. Clinical reports show that dalcetrapib has no effect on either blood pres-sure or on the renin-angiotensin-aldosterone system.52 Dalcetrapib has been used in a large-scale randomized trial, called Dal-OUTCOMES. That study was also stopped prematurely – this time not because of side effects, but because of a lack of therapeutic effect. The drug, despite increasing HDL levels without an increase in LDL, did not bring the desired result of reducing cardiovascular risk.
Currently, high hopes are associated with a clinical trial of anacetrapib. As an addition to statin therapy, 100 mg of anacetrapib daily more than doubles HDL levels and reduces LDL levels by 40%; at the same time, it has no effect on blood pressure or aldosterone levels. Anacetra-pib binds to a different site on CETP than dalcetrapib and induces a conformational change in the CETP mol-ecule correlating with reduced CETP activity in humans. An anacetrapib-mediated CETP blockade can occur at the stage of the transfer of cholesteryl ester from smaller HDL3 particles to HDL2; it can also inhibit regeneration
Table 1. Major studies utilizing CETP inhibitors in the prevention of atherosclerotic progression in human subjects (according to Quintão and Cazita, with modifications5)
CETP inhibitor Human trials Patients Effect
Torcetrapib
RADIANCEpatients with heterozygous familial
hypercholesterolemia or patients with mixed dyslipidemia
no beneficial effect
ILLUSTRATE in ACS patients no beneficial effect
ILLUMINATE
patients with history of cardiovascular disease (including MI, stroke, ACS, unstable angina, PAD,
and cardiac revascularization), patients with type 2 DM without previous cardiovascular disease
adverse off-target effects
progression of carotid
atherosclerosis patients with familial hyper-cholesterolemia no beneficial effect
Dalcetrapib
Dal-VESSEL
patients with CHD or CHD risk equivalent, with HDL-C levels <50 mg/dL
reduction of arterial inflammation
Dal-OUTCOMESpatients with recent ACS, patients with stable CHD,
CHD risk equivalents or at elevated risk for CHD
in patients with recent ACS increase in HDL cholesterol levels but no effect on the risk of recurrent cardio-vascular
events
Evacetrapib ACCELERATE patients at high-risk for vascular outcomesdecrease in LDL cholesterol but no effect on the major
cardiovascular events
Anacetrapib
DEFINE patients with or at high risk for CHDvery large increases in HDL cholesterol and significant reductions in LDL cholesterol and other atherogenic
particles and an acceptable side-effect profile
REVEALhistory of MI, cerebrovascular atherosclerotic disease, PAD or DM with symptomatic CHD
significant reduction of cardiovascular events; very large increases in HDL cholesterol; significant reductions in LDL cholesterol and other atherogenic particles; reduced risk
of DM; insignificant increase in blood pressure
ACS – acute coronary syndrome; MI – myocardial infarction; PAD – peripheral vascular disease; CHD – coronary heart disease; DM – diabetes mellitus.
of HDL3 and formation of pre-β HDL from HDL2 and decrease the transfer of CE from HDL to atherogenic LDL (Fig. 2).53 As noted above, CETP reduces circulating HDL levels by transferring cholesteryl ester (CE) from HDL to larger lipoproteins, such as chylomicrons, VLDL and LDL, in exchange for triglyceride. This creates smaller, cho-lesterol-depleted HDL (remodeling), which is potentially beneficial in removing excess tissue cholesterol, but also small, cholesterol-depleted LDL (SD-LDL), which is highly atherogenic. Inhibiting the latter without impairing HDL remodeling may be critical to the success of anacetrapib.53
Results of phase III clinical trial REVEAL has shown efficacy of anacetrapib from reducing non-HDL cho-lesterol which leads to decreased cardiovascular events in patients with atherosclerotic vascular disease. The main mechanism working is anacetrapib-mediated decrease of apoB-rich lipoproteins and decrease of lipoprotein a levels. Also it does not seem to dysfunctional HDL particles or changes in apolipoproteins that promote atherogenesis were produced by anacetrapib. In addition anacetrapib has beneficial effect on carbohydrate homeostasis, how-ever slightly higher SBP and DBP were observed.54 Despite this, REVEAL has shown that anacetrapib could be useful therapeutic option for patients with high-risk coronary disease, especially for those who have statin intolerance or administration of statin is insufficient.

Adv Clin Exp Med. 2018;27(3):429–436 435
Conclusions
Lipid transfer proteins PLTP and CETP both play a major role in the metabolism of atherogenic and anti-atherogenic lipoproteins. Decreases in CETP mass or activity increase HDL and lower LDL levels. It seems reasonable to search for factors that may decrease the activity of CETP, and thus reduce the incidence of cardiovascular disease. At present, there are some controversies about the effect of PLTP on reverse cholesterol transport. Further studies are needed to clearly determine the impact of PLTP on the cardiovascular system.
References 1. Day JR, Albers JJ, Lofton-Day CE, et al. Complete cDNA encoding
human phospholipid transfer protein from human endothelial cells. Biol Chem. 1994;269:9388–9391.
2. Huuskonen J, Olkonnen VM, Jauhiainien M, Ehnholm C. The impact of phospholipid transfer protein (PLTP) on HDL metabolism. Athero-sclerosis. 2001;155:269–281.
3. Masson D, Jiang XC, Lagrost L, Tall AR. The role of plasma lipid trans-fer proteins in lipoprotein metabolism and atherogenesis. J Lipid Res. 2009;50:201–206. doi: 10.1194/jlr.R800061-JLR200
4. Ji A, Wroblewski JM, Webb NR, van der Westhuyzen DR. Impact of phospholipid transfer protein on nascent high-density lipoprotein formation and remodeling. Arterioscler Thromb Vasc Biol. 2014;34: 1910–1916.
5. Quintão EC, Cazita PM. Lipid transfer proteins: Past, present and per-spectives. Atherosclerosis. 2010;209:1–9.
6. Jiang XC1, Jin W, Hussain MM. The impact of phospholipid transfer protein (PLTP) on lipoprotein metabolism. Nutr Metab. 2012;9(1):75.
7. Di Bartolo B, Takata K, Duong M, Nicholls SJ. CETP inhibition in CVD prevention: An actual appraisal. Curr Cardiol Rep. 2016;18(5):43.
8. Bruce C, Beamer LJ, Tall AR. The implications of the structure of the bactericidal/permeability-increasing protein on the lipid-transfer function of the cholesteryl ester transfer protein. Curr Opin Struct Biol. 1998;8:426–434.
9. Yamashita S, Hirano K, Sakai N, Matsuzaw Y. Molecular biology and pathophysiological aspects of plasma cholesteryl ester transfer pro-tein. Biochim Biophys Acta. 2000;1529:257–275.
10. Tu AY, Deeb SS, Iwasaki L, Day JR, Albers JJ. Organization of human phospholipid transfer protein gene. Biochem Biophys Res Comm. 1995;207:552–558.
11. Albers JJ, Vuletic S, and Cheung MC. Role of plasma phospholipid transfer protein in lipid and lipoprotein letabolism. Biochim Biophys Acta. 2012;1821:345–357.
12. Beamer LJ, Carrol SF, Eisenberg D. Crystal structure of human BPI and two bound phospholipids at 2.4 angstrom resolution. Science. 1997;276:1861–1864.
13. Qiu XY, Mistry A, Ammirati MJ. Crystal structure of cholesteryl ester transfer protein reveals a long tunnel and four bound lipid mole-cules. Nat Struct Mol Biol. 2007;14:106–113.
14. Bouly M, Masson D, Gross B, et al. Induction of the phospholipid trans-fer protein gene accounts for the high density lipoprotein enlargement in mice treated with fenofibrate. J Biol Chem. 2001;276:25841–25847.
15. Riemens SC, van Tol A, Sluiter WJ, Dullaart RP. Plasma phospholip-id transfer protein activity is lowered by 24-h insulin and acipi-mox administration: Blunted response to insulin in type 2 diabetic patients. Diabetes. 1999;48:1631–1637.
16. Lewis GF. Are the lipid-modifying effects of fibrates mediated by alter-ations in plasma lipid transfer activity? Clin Sci. 2006;111:185–187.
17. Levels JH, Pajkrt D, Schultz M, et al. Alterations in lipoprotein homeo-stasis during human experimental endotoxemia and clinical sepsis. Biochim Biophys Acta. 2007;1771:1429–1438.
18. Tzotzas T, Desrumaux C, Lagrost L. Plasma phospholipid transfer pro-tein (PLTP): Review of an emerging cardiometabolic risk factor. Obes Rev. 2009;10:403–411.
Fig. 2. The role of CETP in reverse cholesterol transport according to Durrington et al.53

Z. Chowaniec, A. Skoczyńska. Lipid transfer proteins in atherogenesis436
19. Desrumaux C, Athias A, Bessede G, et al. Mass concentration of plas-ma phospholipid transfer protein in normolipidemic, type IIa hyper-lipidemic, type IIb hyperlipidemic, and non-insulin-dependent dia-betic subjects as measured by a specific ELISA. Arterioscler Thromb Vasc Biol. 1999;19:266–275.
20. Oomen PH, van Tol A, Hattori H, Smit AJ, Scheek LM, Dullaart RP. Human plasma phospholipid transfer protein activity is decreased by acute hyperglycaemia: Studies without and with hyperinsulinae-mia in type 1 diabetes mellitus. Diabet Med. 2005;22:768–774.
21. Oka T, Kujiraoka T, Ito M, et al. Distribution of phospholipid trans-fer protein in human plasma: presence of two forms of phospholip-id transfer protein, one catalytically active and the other inactive. J Lipid Res. 2000;41:1651–1657.
22. Oka T, Yamashita S, Kujiraoka T, et al. Distribution of human plasma PLTP mass and activity in hypo- and hyperalphalipoproteinemia. J Lipid Res. 2002;43:1236–1243.
23. Drayna, D, Jarrnagin AS, McLean J, et al. Cloning and sequencing of human cholesteryl ester transfer protein cDNA. Nature. 1987;327: 632–634.
24. Son YS, Zilversmit DB. Increased lipid transfer activities in hyperlip-idemic rabbit plasma. Arteriosclerosis. 1986;6:345–351.
25. Dedecjus M, Masson D, Gautier T, et al. Low cholesteryl ester transfer protein (CETP) concentration but normal CETP activi-ty in serum from patients with short-term hypothyroidism. Lack of relationship to lipoprotein abnormalities. Clin Endocrinol. 2003;58:581–588.
26. Albers JJ, Wolfbauer G, Cheung MC, et al. Functional expression of human and mouse plasma phospholipid transfer protein: Effect of recombinant and plasma PLTP on HDL subspecies. Biochim Bio-phys Acta. 1995;1258:27–34.
27. Settasatian N, Duong M, Curtiss LK, et al. The mechanism of the remodeling of high density lipoproteins by phospholipid transfer protein. J Biol Chem. 2001;276: 26898–26905.
28. Zannis VI. et al. HDL Biogenesis, Remodeling, and Catabolism. In: von Eckardstein A, Kardassis D, eds. High Density Lipoproteins. Handbook of Experimental Pharmacology, vol. 224. Springer, Cham; 2015.
29. Lee-Rueckert M, Vikstedt R, Metso J, Ehnholm C, Kovanen PT, Jauhi-ainen M. Absence of endogenous phospholipid transfer protein impairs ABCA1-dependent efflux of cholesterol from macrophage foam cells. J Lipid Res. 2006;47:1725–1732.
30. Moerland M, Samyn H, van Gent T, et al. Acute elevation of plasma PLTP activity strongly increases pre-existing atherosclerosis. Arterio-scler Thromb Vasc Biol. 2008;28:1277–1282.
31. Moerland M, Samyn H, van Gent T, et al. Atherogenic, enlarged, and dysfunctional HDL in human PLTP/apoA-I double transgenic mice. J Lipid Res. 2007;48:2622–2631.
32. Cheung MC, Wolfbauer G, Deguchi H, Fernandez JA, Griffin JH, Albers JJ. Human plasma phospholipid transfer protein specific activ-ity is correlated with HDL size: Implications for lipoprotein physiol-ogy. Biochim Biophys Acta. 2009;1791:206–211.
33. Barter PJ, Hopkins GJ, Calvert GD. Transfers and exchanges of esterified cholesterol between plasma lipoproteins. Biochem J. 1982;208:1–7.
34. Barter PJ, Brewer Jr HB, Chapman MJ, Hennekens CH, Rader DJ, Tall AR. Cholesteryl ester transfer protein. A novel target for raising HDL and inhibiting atherosclerosis. Arterioscler Thromb Vasc Biol. 2003;23: 160–167.
35. Guerin M, Lassel TS, Le Goff W, Farnier M, Chapman MJ. Action of atorvastatin in combined hyperlipidemia: preferential reduction
of cholesteryl ester transfer from HDL to VLDL1 particles. Arterioscler Thromb Vasc Biol. 2000;20:189–197.
36. Zhang L, Yan F, Zhang S, et al. Structural basis of transfer between lipoproteins by cholesteryl ester transfer protein. Nat Chem Bio. 2012; 8:342–349.
37. Zhang M, Charles R, Tong H, et al. HDL surface lipids mediate CETP binding as revealed by electron microscopy and molecular dynam-ics simulation. Sci Rep. 2015;5:1-8. doi:10.1038/srep08741
38. Tabas I. Cholesterol and phospholipid metabolism in macrophages. Biochim Biophys Acta. 2000;1529:164–174.
39. Valenta DT, Bulgrien JJ, Bonnet DJ, Curtiss LK. Macrophage PLTP is atheroprotective in LDLr-deficient mice with systemic PLTP defi-ciency. J Lipid Res. 2008;49:24–32.
40. Miller SI, Ernst RK, Bader MW. LPS, TLR4 and infectious disease diver-sity. Nat Rev Microbiol. 2005;3:36–46.
41. Gautier T, Lagrost L. Plasma PLTP (phospholipid-transfer protein): an emerging role in oka’reverse lipopolysaccharide transport’ and innate immunity. Biochem Soc Trans. 2011;39: 984–988.
42. Hailman E, Albers JJ, Wolfbauer G, Tu AY, Wright SD. Neutralization and transfer of lipopolysaccharide by phospholipid transfer protein. J Biol Chem. 1996;271:12172–12178.
43. Ferkingstad E, Frigessi A, Lyng H. Indirect genomic effects on sur-vival from gene expression data. Genome Biol. 2008;9:R58–R72.
44. Jiang XC, Masucci-Magoulas L, Mar J, et al. Down-regulation of mRNA for the low density lipoprotein receptor in transgenic mice containing the gene for human cholesteryl ester transfer protein: mechanism to explain accumulation of lipoprotein B particles. J Biol Chem.1993;268:27406–27412.
45. Marotti KR, Castle CK, Boyle TP, Lin AH, Murray RW, Melchior GW. Severe atherosclerosis in transgenic mice expressing simian cho-lesteryl ester transfer protein. Nature. 1993;364:73–75.
46. Kako Y, Massé M, Huang LS, Tall AR, Goldberg IJ, et al. Lipoprotein lipase deficiency and CETP in streptozotocin-treated apoB-express-ing mice. J Lipid Res. 2002;43:872–877.
47. Sugano M, Makino N, Sawada S, et al. Effect of antisense oligonu-cleotides against cholesteryl ester transfer protein on the devel-opment of atherosclerosis in cholesterol-fed rabbits. J Biol Chem. 1998;273:5033–5036.
48. Okamoto H, Yonemori F, Wakitani K, Minowa T, Maeda K, Shinkai H. A cholesteryl ester transfer protein inhibitor attenuates atheroscle-rosis in rabbits. Nature. 2000;406:203–207.
49. Aghebati T, Badiee A, Mohammadpour AH, et al. Anti-atherosclero-sis effect of different doses of CETP vaccine in rabbit model of ath-erosclerosis. Biomed Pharmacother. 2016; 81,468–473.
50. Thompson A, Di Angelantonio E, Sarwar N. Association of choles-teryl ester transfer protein genotypes with CETP mass and activity, lipid levels, and coronary risk. JAMA.2008;299:2777–2788.
51. Clark RW, Ruggeri RB, Cunningham D, Bamberger MJ. Description of the torcetrapib series of cholesteryl ester transfer protein inhibi-tors, including mechanism of action. J Lipid Res. 2006;47:537–552.
52. Stroes ES, Kastelein JJ, Benardeau A, et al. Dalcetrapib: No off-target toxicity on blood pressure or on genes related to the renin-angioten-sin-aldosterone system in rats. Br J Pharmacol. 2009;158:1763–1770.
53. Durrington PN. Cholesteryl ester transfer protein (CETP) inhibitors. Br J Cardiol. 2012;19:126–133.
54. Filippatos TD, Kei A, Elisaf MS. Anacetrapib, a new CETP inhibitor: The new tool for the management of dyslipidemias? Diseases. 2017;5:21. doi:10.3390/diseases5040021


Advances in Clinical and Experimental
Medicine
Copyright © 2022 FDOKUMEN