Advances in Molecular Cytogenetics to Study the Leukemia Genome
9
labmedicine.com September 2007 Volume 38 Number 9 LABMEDICINE 527 Feature Advances in Molecular Cytogenetics to Study the Leukemia Genome Jon C. Strefford, BSc, PhD, PCCC, Christine J. Harrison, BSc, PhD, FRCPath (Leukaemia Research Cytogenetics Group, Cancer Sciences Division, University of Southampton, UK) DOI: 10.1309/JL7FK85EBGMWH4FL
Transcript of Advances in Molecular Cytogenetics to Study the Leukemia Genome
labmedicine.com September 2007 � Volume 38 Number 9 � LABMEDICINE 527
Feature
Advances in Molecular Cytogenetics to Study the Leukemia GenomeJon C. Strefford, BSc, PhD, PCCC, Christine J. Harrison, BSc, PhD, FRCPath(Leukaemia Research Cytogenetics Group, Cancer Sciences Division, University of Southampton, UK)DOI: 10.1309/JL7FK85EBGMWH4FL
In 1960, Nowell and Hungerford discovered the first recur-rent chromosomal abnormality in human cancer. It ap-peared as a small abnormal chromosome, the Philadelphiachromosome (Ph), found in patients with chronic myeloidleukemia (CML).1 With the advent of chromosomalbanding techniques in the early 1970s,2,3 the Ph wasshown to result from the balanced translocation
t(9;22)(q34;q11.2).4 Later, other rearrangements were identifiedin acute myeloid leukemia (AML); the translocation,t(15;17)(q22;q11) in acute promyelocytic leukemia;5 inversionof chromosome 16, inv(16)(p13q22), in the abnormal marroweosinophils from patients with acute myelomonocytic leukemia;6
and t(8;21)(q22;q22) in acute myeloblastic leukemia.7 Theserearrangements became associated with a favourable outcome inAML.8 In acute lymphoblastic leukemia (ALL), the independentprognostic association of specific chromosomal changes have alsobeen known for some time. For example, high hyperdiploidy(51-65 chromosomes) is linked to a good outcome in childhoodALL,9 while the Ph is a high-risk abnormality in both childrenand adults.10,11 To date, cytogenetic analysis remains a valuableapproach for the genome-wide detection of chromosomal abnor-malities, in particular balanced rearrangements with no associ-ated gain or loss of chromosomal material.
Technical improvements throughout the 1980s increased theresolution of cytogenetics, enabling the detection of smaller chro-mosomal abnormalities. However, cytogenetic analysis is depend-ent on the existence of dividing cells, which may not be presentin all leukemia samples. During the 1980s and 1990s, fluores-cence in situ hybridization (FISH) became established as a cyto-genetic technique. This molecular approach greatly enhanced theaccuracy of chromosomal analysis. Fluorescence in situ hybridiza-tion uses fluorescently-labeled probes specific for genes or wholechromosomes. Multiple probes can be differentially labeled tosimultaneously visualize a number of target sequences.
More recently, array-based comparative genomic hybridiza-tion (aCGH) has been developed as a valuable complementarytool. It was based on established FISH technology and measureschromosomal imbalances throughout the genome. In conjunc-tion with conventional cytogenetics, the application of FISHand aCGH has facilitated the identification of novel chromoso-mal abnormalities as well as improved the understanding of themolecular genotype underlying established rearrangements.
This article focuses on recent technical developments in thefield of molecular cytogenetics and its application to the study ofthe leukemia genome, beginning with the pivotal developmentof single- and multiple-color FISH, culminating in state-of-the-art technologies of comparative leukemia genomics.
Technological Developments
Fluorescence In Situ HybridizationFluorescence in situ hybridization provides the link between
molecular biology and conventional cytogenetics, hence thewidely-used nomenclature “molecular cytogenetics.” It is basedon the ability of a single-stranded DNA probe to anneal to itscomplementary sequence in a target genome. The DNA insert ofinterest is propagated in a vector. The choice of vector is depend-ent on the size of the DNA fragment; for example, yeast artificialchromosomes (YAC; 0.2 to 2 Mb in size), bacterial artificialchromosomes (BAC; 50 to 70 Kb), P1 (70 to 100 Kb), PAC(130 to 150 Kb), or cosmids (30 to 45 Kb). Probes are made by
standard procedures for DNA extraction and labeling. There are3 main types of FISH probes: 1) repetitive sequence, which hy-bridize to repetitive alpha (or beta) satellite sequences present inthe centromeres of all human chromosomes. These can be usedto identify the origin of chromosomes in metaphase and enu-merate specific chromosomes in interphase cells, providing arapid and accurate method to ascertain chromosome copy num-ber; 2) locus-specific, usually focused on genes, which are usedto identify rearrangements, deletions, and gains in both inter-phase and metaphase cells; and 3) whole chromosome paints,chromosome specific probe libraries prepared from flow-sortedchromosomes. They are applied to metaphase chromosomes todetermine the origin of structural abnormalities.
Interphase FISHThe main advantage of interphase FISH (iFISH) is the
possibility to visualise probes in the non-dividing cells.12 Thisprovides a considerable advantage in some hematological malig-nancies, where the proliferative index is low, the mitotic cells donot represent the neoplastic clone, or when conventional cytoge-netic analysis is unsuccessful. It allows rapid screening of largenumbers of cells and, thus, detection of low-level chromosomalabnormalities. It is effective in a range of sample types, includingblood and bone marrow smears, cytospins, and trephinesections, as well as standard cytogenetic cultures. In combinationwith immunophenotyping, it can detect aberrations in specificcell lineages.13-16
The authors’ group recently carried out iFISH screening ofmore than 2,300 children with ALL for the presence of specificchromosomal abnormalities of prognostic significance, includingBCR-ABL and ETV6-RUNX1 fusions, as well as rearrangementof the MLL gene.17 This approach increased the accuracy of de-tection to 2%, 25%, and 2%, respectively. The application ofspecific centromeric probes detected hidden high hyperdiploidyin an unexpectedly high percentage of patients with a normaland failed cytogenetic result at 33% (21/64 patients) and 59%(32/54 patients), respectively. Thus, this iFISH screeningapproach ensured that patients were assigned to the correct riskgroup and, consequently, received the most appropriate therapy.
Multicolor FISH TechniquesThe development of multiple-color FISH technologies has
allowed simultaneous detection of increasing numbers of genomicregions. In 1989, it was demonstrated that probes could be differ-entially labeled, combined in known ratios, and detected with acombination of fluorochromes.18 In 1996, when 2 groupsreported 24-color chromosome painting,19,20 the potential ofthese innovative procedures was realized. They used a combinato-rial approach to probe labeling, whereby each chromosome waslabeled with a unique combination of 5 fluorochromes. Spectralkaryotyping (SKY) employed Fourier-transformed spectrometryto identify chromosomes based on the spectral signature of eachpixel, while multiplex-FISH (mFISH) (Figure 1A) used a set ofspecific narrow band pass filters followed by computer-assisted,pseudo-color assignment. This multicolor technology has furtherevolved to include chromosome arm painting,21,22 chromosomeband painting (mBAND) (Figure 1B),23 centromere enumera-tion,24 and sub-telomeric identification.25 These revolutionarytechniques have been widely applied to cytogenetic analysis. Forexample, in the study of acute leukemia, mFISH has been used touncover cryptic chromosomal abnormalities and fully characterizeill-defined and complex karyotypes.26-39 Thus, multiple-color FISHhas significantly improved the interpretation of chromosomal
528 LABMEDICINE � Volume 38 Number 9 � September 2007 labmedicine.com
Feature

abnormalities and our understanding of the mechanisms underly-ing their formation.
Comparative Genomic HybridizationComparative genomic hybridization (CGH) represents an-
other significant technical development in molecularcytogenetics.40 It has been widely applied to the study of cancer cellsfor the detection of whole or partial chromosomal gains or losses. Inbrief, DNA from a cancer specimen (test DNA), labeled with 1fluorescent reporter molecule, is mixed with a differentially labeledcontrol DNA (reference DNA) and competitively hybridized to atarget genome. In chromosome-based CGH (cCGH) the targetis normal metaphase spreads, to which the 2 DNA populationscompete for hybridization sites. The ratio of the level of fluorescencebetween the 2 DNA samples reflects the copy number changes inthe test sample, which are mapped onto the chromosomes.
Chromosome-based CGH has now been largely supersededby DNA microarray-based CGH (aCGH). Although the samplepreparation and hybridization are similar to cCGH, a microarraycontaining genome sequences acts as the target, allowing copynumber changes to be mapped to the genome at high resolution(Figure 2).41-43 The fluorescence ratio between test and referenceDNA is measured and plotted using sophisticated software pack-ages. Extracted data may be aligned against the genomic sequence.
The initial aCGH approaches used arrays made from large-insert genomic clones, such as BAC DNA.41,43 A range of BACplatforms now provide total coverage of the human genome.44,45
Arrays manufactured from other nucleic acids such as cDNA,42
selected PCR products,46 and oligonucleotides47-49 are nowwidely available.
Chromosome-based CGH has been used in the cytogeneticstudy of ALL to assist in the characterization of chromosomalabnormalities,50 including the identification of the chromosomes
labmedicine.com September 2007 � Volume 38 Number 9 � LABMEDICINE 529
Feature
A
B
Figure 1_Multicolor metaphase chromosomes. Representativemetaphase from a child with ALL visualised by mFISH. The differential24 pseudocolor assignment of each chromosome pair facilitates iden-tification of each individual chromosome, while shifts in color high-light interchromosomal rearrangements. Partial mBAND karyogramshowing chromosome 5 rearrangements in the same patient as A.The left-hand chromosome indicates the color banding pattern of anormal chromosome 5. The other 3 chromosomes show the abnormalchromosome 5 and the translocation and insertion of chromosome 5regions into chromosomes 11 and 18, respectively.
Figure 2_ACGH methodology. (A-D) Diagrams illustrating the individual steps of the aCGH technique.
A B C D
involved in high hyperdiploid karyotypes and in defining theregions of amplification and deletion of chromosomes 21, 9p,and 12q, respectively.51-57 More recently, aCGH has identifiedsome novel regions of recurrent copy number alterations in B-lineage ALL, involving chromosomes 21, 9, 6, 12, 15, 8, and17, which were observed among highly complex chromosomalchanges not seen at the resolution of cytogenetic analysis.58,59
Specific genetic abnormalities are also important in the classifi-cation and progression of T-lineage ALL. Microarray-basedCGH has identified a number of novel genetic abnormalitiesand has begun to unravel complex patterns of geneticalterations in these patients.60-62 Combining data from relatedstudies will substantiate those findings relevant to leukemogene-sis and highlight those novel genomic regions with significantclinical associations.
One specific example comes from deletions of the shortarm of chromosome 9 (9p) in B-lineage ALL. Although we haveobserved that all deletions encompassed the CDKN2A gene,they were shown by aCGH to be heterogeneous in both locationand extent. This finding was of interest as previously publisheddata had suggested that cytogenetically-visible alterations of 9pconferred an adverse clinical outcome,63,64 while deletions specif-ically targeting CDKN2A showed no such correlation.65,66 It istherefore possible that the size of the deletion and the inclusionof other genes on 9p may constitute the genetic mechanismlinked to outcome, which aCGH has the capacity to resolve.
Similar observations have been made in the identification of novel co-operating abnormalities in AML,8,67-69 which maybe responsible for driving leukemogenesis and providing poten-tial therapeutic targets.
Global Expression Profiling Global expression profiling (GEP) uses array-based tech-
nologies to measure the expression of thousands of genes in asingle experiment. They exploit the ability of cDNA moleculesto hybridize to their complementary sequence on the array, sothat the intensity of a given array feature is a reflection of therelative expression of the gene in question.Although discussions on GEP techniques falloutside the field of molecular cytogenetics,some interesting findings have emerged fromthe correlation of data from both technolo-gies. Microarray-based CGH or GEP, usedindependently, highlight genomic regions thatare either altered in copy number or expres-sion, facilitating gene discovery in these re-gions. Used together, a correlation betweengene expression and the fold change in copynumber has been observed.42,70 Furthermore,gene expression signatures have provided in-sight into the underlying genetic alterationsresponsible for cancer development and pro-gression. Identification of the genes and path-ways involved have advanced our understandingof disease mechanisms, assisted in accuratediagnosis and prognostication, and led to amore targeted approach to treatment. Specifi-cally, distinct expression profiles have beenassociated with the significant cytogeneticsubgroups of ALL and AML.71,72 Amongthese patients, specific expression patternswere associated with prediction of relapseand the development of secondary AML.73,74
Recent Studies Using These Technologies
Intrachromosomal Amplification of Chromosome 21(iAMP21) in B-Lineage ALL
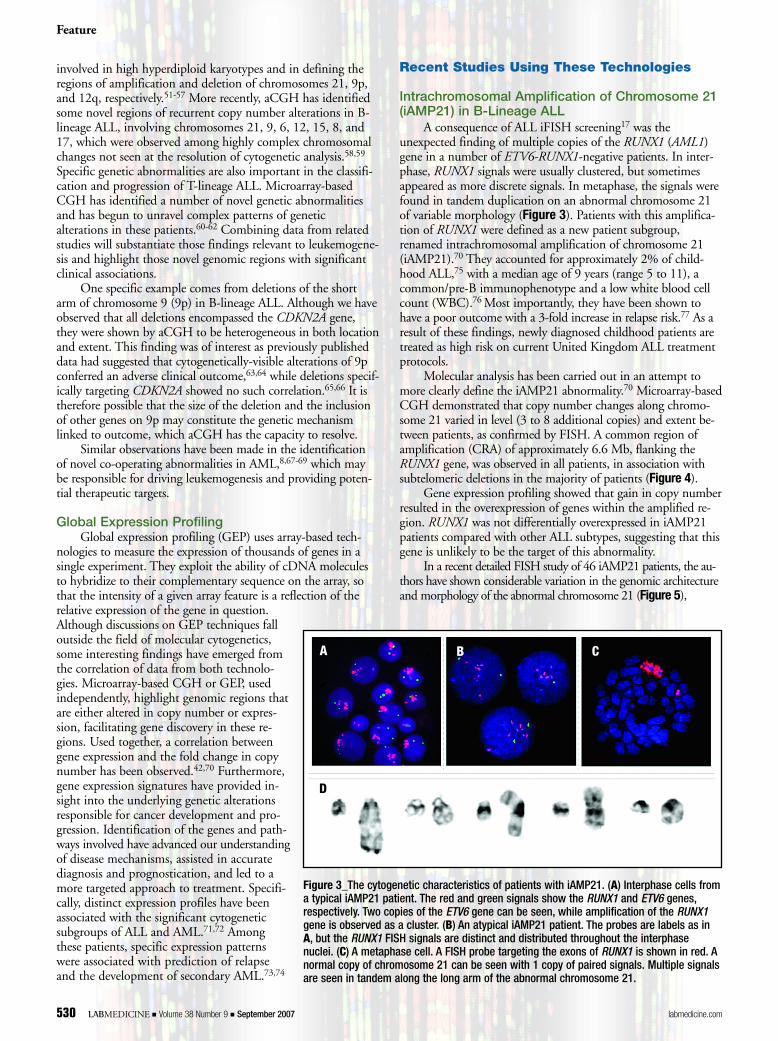
A consequence of ALL iFISH screening17 was theunexpected finding of multiple copies of the RUNX1 (AML1)gene in a number of ETV6-RUNX1-negative patients. In inter-phase, RUNX1 signals were usually clustered, but sometimesappeared as more discrete signals. In metaphase, the signals werefound in tandem duplication on an abnormal chromosome 21of variable morphology (Figure 3). Patients with this amplifica-tion of RUNX1 were defined as a new patient subgroup,renamed intrachromosomal amplification of chromosome 21(iAMP21).70 They accounted for approximately 2% of child-hood ALL,75 with a median age of 9 years (range 5 to 11), acommon/pre-B immunophenotype and a low white blood cellcount (WBC).76 Most importantly, they have been shown tohave a poor outcome with a 3-fold increase in relapse risk.77 As aresult of these findings, newly diagnosed childhood patients aretreated as high risk on current United Kingdom ALL treatmentprotocols.
Molecular analysis has been carried out in an attempt tomore clearly define the iAMP21 abnormality.70 Microarray-basedCGH demonstrated that copy number changes along chromo-some 21 varied in level (3 to 8 additional copies) and extent be-tween patients, as confirmed by FISH. A common region ofamplification (CRA) of approximately 6.6 Mb, flanking theRUNX1 gene, was observed in all patients, in association withsubtelomeric deletions in the majority of patients (Figure 4).
Gene expression profiling showed that gain in copy numberresulted in the overexpression of genes within the amplified re-gion. RUNX1 was not differentially overexpressed in iAMP21patients compared with other ALL subtypes, suggesting that thisgene is unlikely to be the target of this abnormality.
In a recent detailed FISH study of 46 iAMP21 patients, the au-thors have shown considerable variation in the genomic architectureand morphology of the abnormal chromosome 21 (Figure 5),
Feature
530 LABMEDICINE � Volume 38 Number 9 � September 2007 labmedicine.com
A
D
B C
Figure 3_The cytogenetic characteristics of patients with iAMP21. (A) Interphase cells froma typical iAMP21 patient. The red and green signals show the RUNX1 and ETV6 genes,respectively. Two copies of the ETV6 gene can be seen, while amplification of the RUNX1gene is observed as a cluster. (B) An atypical iAMP21 patient. The probes are labels as inA, but the RUNX1 FISH signals are distinct and distributed throughout the interphasenuclei. (C) A metaphase cell. A FISH probe targeting the exons of RUNX1 is shown in red. Anormal copy of chromosome 21 can be seen with 1 copy of paired signals. Multiple signalsare seen in tandem along the long arm of the abnormal chromosome 21.
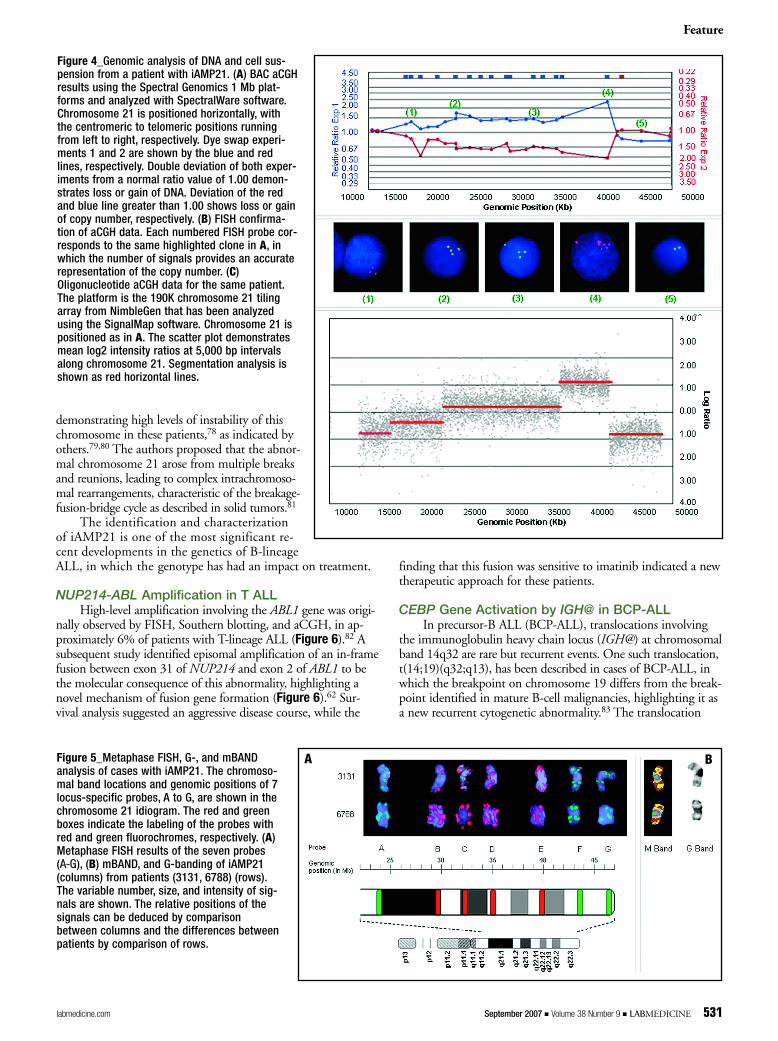
demonstrating high levels of instability of thischromosome in these patients,78 as indicated byothers.79,80 The authors proposed that the abnor-mal chromosome 21 arose from multiple breaksand reunions, leading to complex intrachromoso-mal rearrangements, characteristic of the breakage-fusion-bridge cycle as described in solid tumors.81
The identification and characterizationof iAMP21 is one of the most significant re-cent developments in the genetics of B-lineageALL, in which the genotype has had an impact on treatment.
NUP214-ABL Amplification in T ALLHigh-level amplification involving the ABL1 gene was origi-
nally observed by FISH, Southern blotting, and aCGH, in ap-proximately 6% of patients with T-lineage ALL (Figure 6).82 Asubsequent study identified episomal amplification of an in-framefusion between exon 31 of NUP214 and exon 2 of ABL1 to bethe molecular consequence of this abnormality, highlighting anovel mechanism of fusion gene formation (Figure 6).62 Sur-vival analysis suggested an aggressive disease course, while the
finding that this fusion was sensitive to imatinib indicated a newtherapeutic approach for these patients.
CEBP Gene Activation by IGH@ in BCP-ALLIn precursor-B ALL (BCP-ALL), translocations involving
the immunoglobulin heavy chain locus (IGH@) at chromosomalband 14q32 are rare but recurrent events. One such translocation,t(14;19)(q32;q13), has been described in cases of BCP-ALL, inwhich the breakpoint on chromosome 19 differs from the break-point identified in mature B-cell malignancies, highlighting it asa new recurrent cytogenetic abnormality.83 The translocation
Feature
labmedicine.com September 2007 � Volume 38 Number 9 � LABMEDICINE 531
Figure 4_Genomic analysis of DNA and cell sus-pension from a patient with iAMP21. (A) BAC aCGHresults using the Spectral Genomics 1 Mb plat-forms and analyzed with SpectralWare software.Chromosome 21 is positioned horizontally, withthe centromeric to telomeric positions runningfrom left to right, respectively. Dye swap experi-ments 1 and 2 are shown by the blue and redlines, respectively. Double deviation of both exper-iments from a normal ratio value of 1.00 demon-strates loss or gain of DNA. Deviation of the redand blue line greater than 1.00 shows loss or gainof copy number, respectively. (B) FISH confirma-tion of aCGH data. Each numbered FISH probe cor-responds to the same highlighted clone in A, inwhich the number of signals provides an accuraterepresentation of the copy number. (C)Oligonucleotide aCGH data for the same patient.The platform is the 190K chromosome 21 tilingarray from NimbleGen that has been analyzedusing the SignalMap software. Chromosome 21 ispositioned as in A. The scatter plot demonstratesmean log2 intensity ratios at 5,000 bp intervalsalong chromosome 21. Segmentation analysis isshown as red horizontal lines.
Figure 5_Metaphase FISH, G-, and mBANDanalysis of cases with iAMP21. The chromoso-mal band locations and genomic positions of 7locus-specific probes, A to G, are shown in thechromosome 21 idiogram. The red and greenboxes indicate the labeling of the probes withred and green fluorochromes, respectively. (A)Metaphase FISH results of the seven probes (AA--GG), (B) mBAND, and G-banding of iAMP21(columns) from patients (3131, 6788) (rows).The variable number, size, and intensity of sig-nals are shown. The relative positions of thesignals can be deduced by comparisonbetween columns and the differences betweenpatients by comparison of rows.
A B

involved the CEBPA gene, a member of the CCAAT/EnhancerBinding Protein (CEBP) gene family of transcription factors,which was upregulated as a consequence of juxtaposing to theIGH@ promoter element.84 Inactivation of CEBPA is observedin myeloid leukemia,85 with mutation of CEBPA observed inapproximately 8% of AML.86-88
The involvement of CEBPA with IGH@ led to the discov-ery of the involvement of CEBPD, CEBPE, CEBPB, andCEBPG genes in the t(8;14)(q11;q32), t(14;14)(q11;q32)/inv(14)(q11q32), t(14;20)(q32;p13), and an alternative break-point of t(14;19)(q32;q13), respectively.89 These recent FISHand cloning studies have highlighted recurrent IGH@ transloca-tions targeting 5 members of the CEBP gene family, which is anunprecedented observation in a single disease type. The mostsignificant finding was that in lymphoid malignancies, the CEBPgenes were upregulated, as demonstrated by quantitative PCR,and appeared to act as potent oncogenes, in contrast to the roleof CEBPA in myeloid malignancies, where it behaves as a classictumor suppressor.
ConclusionDuring the last 20 years, molecular cytogenetics has become
established as a significant research and diagnostic tool. It beganwith conventional cytogenetic analysis and the integration of
FISH for the in situ detection of DNA sequences. The utilityand flexibility was expanded by the introduction of multiple-probe, multiple-color approaches, culminating in the ability toscan the whole genome in a single experiment. The relativemerits of each cytogenetic/molecular cytogeneticist methodol-ogy are summarized in Table 1. Molecular cytogenetics hasbridged the gap between traditional chromosome-based studiesand molecular sequence-based techniques. It has played animportant role in the detection and characterization of manyimportant chromosomal abnormalities, which has significantlycontributed to our understanding of the leukemic process.With the recent development of high-resolution aCGH, com-plemented by GEP, molecular cytogenetics has been revolution-ized and will continue to contribute significantly to thediscovery of new cancer genes highlighting novel moleculartargets for therapy in acute leukemia. LM
Acknowledgements: The authors wish to thank LeukaemiaResearch, UK, for financial support.
1. Nowell PC, Hungerford, DA. A minute chromosome in human chronicgranulocytic leukemia. Science. 1960;132:1497.
2. Caspersson T, Zech L, Johansson C. Analysis of human metaphasechromosome set by aid of DNA-binding fluorescent agents. Exp Cell Res.1970;62:490–492.
Feature
532 LABMEDICINE � Volume 38 Number 9 � September 2007 labmedicine.com
Figure 6_FISH analysis of patients withepisomal amplification of the NUP214-ABL1 fusion. (A) Representativetetraploid metaphase hybridized with aprobe specific for the BCR and ABLgenes. BCR signals (green) indicate the 4copies located to BCR loci on the chro-mosomes 22. Multiple red signals indi-cate amplification of the ABL1 gene. Theadditional signals are randomly distrib-uted throughout the metaphase and arenot specifically hybridized to the chromo-somes. Sequential hybridization withwhole chromosome paint 9 indicates 4copies of chromosome 9 (green) with theABL signals (red) in the expected location on chromosome 9 in addition to the extra signals. (B) Cells hybridized with a red and greenprobe for NUP214 and ABL1 showing the presence of both genes on the amplified episomes.
A B
C
3. Seabright M. A rapid banding technique for human chromosomes. Lancet.1971;2:971–972.
4. Rowley JD. A new consistent chromosomal abnormality in chronicmyelogenous leukaemia identified by quinacrine fluorescence and Giemsastaining. Nature. 1973;243(5405):290–293.
5. Rowley JD, Golomd HM, Vardiman J. Further evidence for a nonrandomchromosomal abnormality in acute promyelocytic leukemia. Int J Cancer.1977;20(869).
6. Le Beau MM, Larson RA, Bitter MA, et al. Association of an inversion ofchromosome 16 with abnormal marrow eosinophils in acute myelomonocyticleukemia. A unique cytogenetic-clinicopathological association. N Engl J Med.1983;309:630–636.
7. Rowley JD. Identificaton of a translocation with quinacrine fluorescence in a patient with acute leukemia. Ann Genet. 1973;16:109–112.
8. Grimwade D, Walker H, Oliver F, et al. The importance of diagnosticcytogenetics on outcome in AML: Analysis of 1,612 patients entered into theMRC AML 10 trial. The Medical Research Council Adult and Children'sLeukaemia Working Parties. Blood. 1998;92:2322–2333.
9. Secker-Walker LM, Lawler SD, Hardisty RM. Prognostic implications ofchromosomal findings in acute lymphoblastic leukaemia at diagnosis. Br Med J. 1978;2:1529–1530.
10. Gotz G, Weh HJ, Walter TA, et al. Clinical and prognostic significance of the Philadelphia chromosome in adult patients with acute lymphoblasticleukemia. Ann Hematol. 1992;64:97–100.
11. Ribeiro RC, Abromowitch M, Raimondi SC, et al. Clinical and biologichallmarks of the Philadelphia chromosome in childhood acute lymphoblasticleukemia. Blood. 1987;70:948–953.
12. Cremer T, Landegent J, Bruckner A, et al. Detection of chromosomeaberrations in the human interphase nucleus by visualization of specific targetDNAs with radioactive and non-radioactive in situ hybridization techniques:Diagnosis of trisomy 18 with probe L1.84. Hum Genet. 1986;74:346–352.
13. Bentz M, Schroder M, Herz M, et al. Detection of trisomy 8 on blood smearsusing fluorescence in situ hybridization. Leukemia. 1993;7:752–757.
14. Muhlmann J, Thaler J, Hilbe W, et al. Fluorescence in situ hybridization(FISH) on peripheral blood smears for monitoring Philadelphia chromosome-positive chronic myeloid leukemia (CML) during interferon treatment: A newstrategy for remission assessment. Genes Chromosomes Cancer. 1998;21:90–100.
15. Haferlach T, Loffler H, Nickenig C, et al. Cell lineage specific involvement inacute promyelocytic leukaemia (APL) using a combination of May-Grunwald-Giemsa staining and fluorescence in situ hybridization techniques for the detectionof the translocation t(15;17)(q22;q12). Br J Haematol. 1998;103:93–99.
16. Gahn B, Wendenburg B, Troff C, et al. Analysis of progenitor cell involvementin B-CLL by simultaneous immunophenotypic and genotypic analysis at thesingle cell level. Br J Haematol. 1999;105:955–959.
17. Harrison CJ, Moorman AV, Barber KE, et al. Interphase molecular cytogeneticscreening for chromosomal abnormalities of prognostic significance inchildhood acute lymphoblastic leukaemia: A UK Cancer Cytogenetics GroupStudy. Br J Haematol. 2005;129:520–530.
18. Nederlof PM, Robinson D, Abuknesha R, et al. Three-color fluorescence insitu hybridization for the simultaneous detection of multiple nucleic acidsequences. Cytometry. 1989;10:20–27.
19. Schrock E, du Manoir S, Veldman T. Multicolor spectral karyotyping of human chromosomes. Science. 1996;273:494–497.
20. Speicher MR, Gwyn-Ballard S, Ward DC. Karyotyping human chromosomesby combinatorial multi-fluor FISH. Nature Genetics. 1996;12:368–375.
21. Speicher MR, Petersen S, Uhrig S, et al. Analysis of chromosomal alterationsin non-small cell lung cancer by multiplex-FISH, comparative genomichybridization, and multicolor bar coding. Lab Invest. 2000;80:1031–1041.
22. Karhu R, Ahlstedt-Soini M, Bittner M, et al. Chromosome arm-specificmulticolor FISH. Genes Chromosomes Cancer. 2001;30:105–109.
23. Chudoba I, Hickmann G, Friedrich T, et al. mBAND: A high resolutionmulticolor banding technique for the detection of complex intrachromosomalaberrations. Cytogenet Genome Res. 2004;104:390–393.
24. Henegariu O, Bray-Ward P, Artan S, et al. Small marker chromosomeidentification in metaphase and interphase using centromeric multiplex fish(CM-FISH). Lab Invest. 2001;81:475–481.
Feature
labmedicine.com September 2007 � Volume 38 Number 9 � LABMEDICINE 533
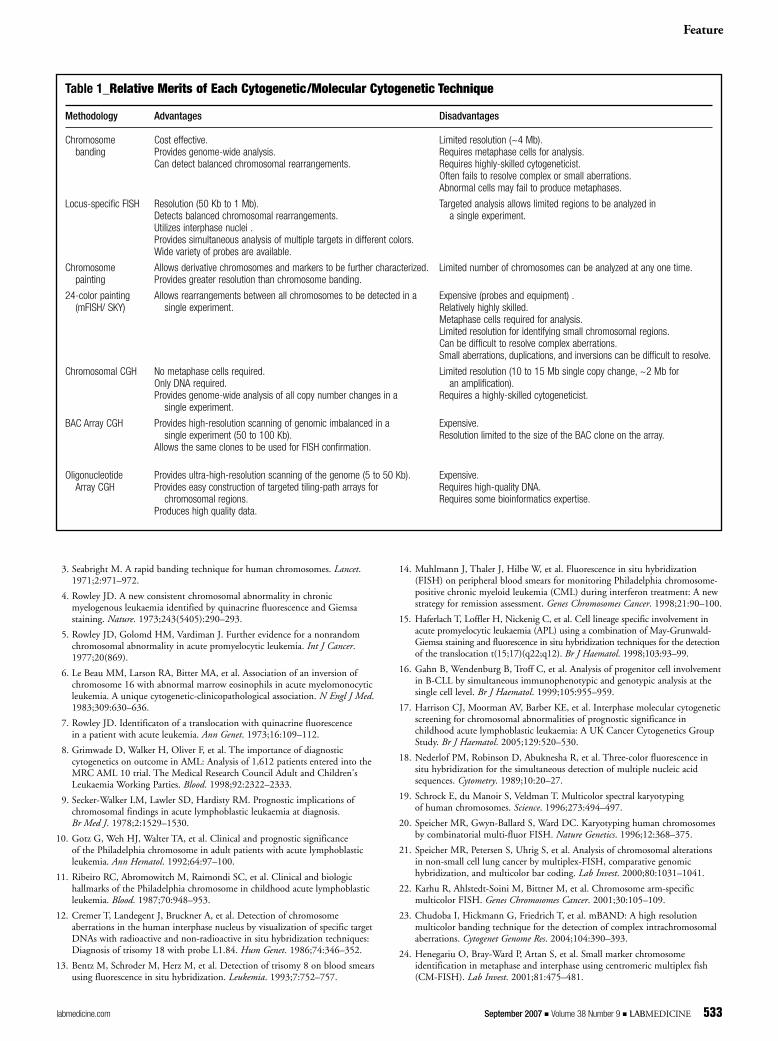
Table 1_Relative Merits of Each Cytogenetic/Molecular Cytogenetic Technique
Methodology Advantages Disadvantages
Chromosome Cost effective. Limited resolution (~4 Mb).banding Provides genome-wide analysis. Requires metaphase cells for analysis.
Can detect balanced chromosomal rearrangements. Requires highly-skilled cytogeneticist.Often fails to resolve complex or small aberrations.Abnormal cells may fail to produce metaphases.
Locus-specific FISH Resolution (50 Kb to 1 Mb). Targeted analysis allows limited regions to be analyzed in Detects balanced chromosomal rearrangements. a single experiment.Utilizes interphase nuclei .Provides simultaneous analysis of multiple targets in different colors.Wide variety of probes are available.
Chromosome Allows derivative chromosomes and markers to be further characterized. Limited number of chromosomes can be analyzed at any one time.painting Provides greater resolution than chromosome banding.
24-color painting Allows rearrangements between all chromosomes to be detected in a Expensive (probes and equipment) .(mFISH/ SKY) single experiment. Relatively highly skilled.
Metaphase cells required for analysis.Limited resolution for identifying small chromosomal regions.Can be difficult to resolve complex aberrations.Small aberrations, duplications, and inversions can be difficult to resolve.
Chromosomal CGH No metaphase cells required. Limited resolution (10 to 15 Mb single copy change, ~2 Mb for Only DNA required. an amplification).Provides genome-wide analysis of all copy number changes in a Requires a highly-skilled cytogeneticist.
single experiment.
BAC Array CGH Provides high-resolution scanning of genomic imbalanced in a Expensive.single experiment (50 to 100 Kb). Resolution limited to the size of the BAC clone on the array.
Allows the same clones to be used for FISH confirmation.
Oligonucleotide Provides ultra-high-resolution scanning of the genome (5 to 50 Kb). Expensive.Array CGH Provides easy construction of targeted tiling-path arrays for Requires high-quality DNA.
chromosomal regions. Requires some bioinformatics expertise.Produces high quality data.

25. Brown J, Saracoglu K, Uhrig S, et al. Subtelomeric chromosomerearrangements are detected using an innovative 12-color FISH assay (M-TEL). Nat Med. 2001;7:497–501.
26. Elghezal H, Le Guyader G, Radford-Weiss I, et al. Reassessment of childhoodB-lineage lymphoblastic leukemia karyotypes using spectral analysis. GenesChromosomes Cancer. 2001;30:383–392.
27. Mathew S, Rao PH, Dalton J, et al. Multicolor spectral karyotyping identifiesnovel translocations in childhood acute lymphoblastic leukemia. Leukemia.2001;15:468–472.
28. Nordgren A, Heyman M, Sahlen S, et al. Spectral karyotyping and interphaseFISH reveal abnormalities not detected by conventional G-banding.Implications for treatment stratification of childhood acute lymphoblasticleukaemia: Detailed analysis of 70 cases. Eur J Haematol. 2002;68:31–41.
29. Lu XY, Harris CP, Cooley L, et al. The utility of spectral karyotyping in the cytogenetic analysis of newly diagnosed pediatric acute lymphoblasticleukemia. Leukemia. 2002;16:2222–2227.
30. Nordgren A, Schoumans J, Soderhall S, et al. Interphase fluorescence in situhybridization and spectral karyotyping reveals hidden genetic aberrations inchildren with acute lymphoblastic leukaemia and a normal banded karyotype.Br J Haematol. 2001;114:786–793.
31. Helias C, Leymarie V, Entz-Werle N, et al. Translocation t(5;14)(q35;q32) inthree cases of childhood T cell acute lymphoblastic leukemia: A new recurringand cryptic abnormality. Leukemia. 2002;16:7–12.
32. Mohr B, Bornhauser M, Thiede C, et al. Comparison of spectral karyotypingand conventional cytogenetics in 39 patients with acute myeloid leukemia andmyelodysplastic syndrome. Leukemia. 2000;14:1031–1038.
33. Zhang FF, Murata-Collins JL, Gaytan P, et al. Twenty-four-color spectralkaryotyping reveals chromosome aberrations in cytogenetically normal acutemyeloid leukemia. Genes Chromosomes Cancer. 2000;28:318–328.
34. Brown J, Jawad M, Twigg SR, et al. A cryptic t(5;11)(q35;p15.5) in 2 childrenwith acute myeloid leukemia with apparently normal karyotypes, identified bya multiplex fluorescence in situ hybridization telomere assay. Blood. 2002;99:2526–2531.
35. Schoch C, Kern W, Kohlmann A, et al. Acute myeloid leukemia with acomplex aberrant karyotype is a distinct biological entity characterized bygenomic imbalances and a specific gene expression profile. Genes ChromosomesCancer. 2005;43:227–238.
36. Schoch C, Haferlach T, Bursch S, et al. Loss of genetic material is morecommon than gain in acute myeloid leukemia with complex aberrantkaryotype: A detailed analysis of 125 cases using conventional chromosomeanalysis and fluorescence in situ hybridization including 24-color FISH. Genes Chromosomes Cancer. 2002;35:20–29.
37. Trost D, Hildebrandt B, Beier M, et al. Molecular cytogenetic profiling ofcomplex karyotypes in primary myelodysplastic syndromes and acute myeloidleukemia. Cancer Genet Cytogenet. 2006;165:51–63.
38. Van Limbergen H, Poppe B, Michaux L, et al. Identification of cytogeneticsubclasses and recurring chromosomal aberrations in AML and MDS withcomplex karyotypes using M-FISH. Genes Chromosomes Cancer. 2002;33:60–72.
39. Barouk-Simonet E, Soenen-Cornu V, Roumier C, et al. Role of multiplexFISH in identifying chromosome involvement in myelodysplastic syndromesand acute myeloid leukemias with complex karyotypes: A report on 28 cases.Cancer Genet Cytogenet. 2005;157:118–126.
40. Kallioniemi A, Kallioniemi OP, Sudar D. Comparative genomic hybridisationfor molecular genetic analysis of solid tumours. Science. 1992;258:818–821.
41. Pinkel D, Segraves R, Sudar D, et al. High resolution analysis of DNA copynumber variation using comparative genomic hybridization to microarrays.Nat Genet. 1998;20:207–211.
42. Pollack JR, Perou CM, Alizadeh AA, et al. Genome-wide analysis of DNAcopy-number changes using cDNA microarrays. Nat Genet. 1999;23:41–46.
43. Solinas-Toldo S, Lampel S, Stilgenbauer S, et al. Matrix-based comparativegenomic hybridization: Biochips to screen for genomic imbalances. GenesChromosomes Cancer. 1997;20:399–407.
44. Ishkanian AS, Malloff CA, Watson SK, et al. A tiling resolution DNAmicroarray with complete coverage of the human genome. Nat Genet.2004;36:299–303.
45. Krzywinski M, Bosdet I, Smailus D, et al. A set of BAC clones spanning thehuman genome. Nucleic Acids Res. 2004;32:3651–3660.
46. Dhami P, Coffey AJ, Abbs S, et al. Exon array CGH: Detection of copy-number changes at the resolution of individual exons in the human genome.Am J Hum Genet. 2005;76:750–762.
47. Brennan C, Zhang Y, Leo C, et al. High-resolution global profiling of genomicalterations with long oligonucleotide microarray. Cancer Res. 2004;64:4744–4748.
48. Callagy G, Pharoah P, Chin SF, et al. Identification and validation ofprognostic markers in breast cancer with the complementary use of array-CGH and tissue microarrays. J Pathol. 2005;205:388–396.
49. Barrett MT, Scheffer A, Ben-Dor A, et al. Comparative genomic hybridizationusing oligonucleotide microarrays and total genomic DNA. Proc Natl Acad Sci USA. 2004;101:17765–17770.
50. Kristensen TD, Wesenberg F, Jonsson OG, et al. High-resolution comparativegenomic hybridisation yields a high detection rate of chromosomal aberrationsin childhood acute lymphoblastic leukaemia. Eur J Haematol.2003;70:363–372.
51. Larramendy ML, Huhta T, Vettenranta K, et al. Comparative genomichybridization in childhood acute lymphoblastic leukemia. Leukemia.1998;12:1638–1644.
52. Larramendy ML, Huhta T, Heinonen K, et al. DNA copy number changes inchildhood acute lymphoblastic leukemia. Haematologica. 1998;83:890–895.
53. Kanerva J, Niini T, Vettenranta K, et al. Loss at 12p detected by comparativegenomic hybridization (CGH): Association with TEL-AML1 fusion andfavorable prognostic features in childhood acute lymphoblastic leukemia(ALL). A multi-institutional study. Med Pediatr Oncol. 2001;37:419–425.
54. Ma SK, Wan TS, Cheuk AT, et al. Characterization of additional geneticevents in childhood acute lymphoblastic leukemia with TEL/AML1 genefusion: A molecular cytogenetics study. Leukemia. 2001;15:1442–1447.
55. Jarosova M, Holzerova M, Jedlickova K, et al. Importance of usingcomparative genomic hybridization to improve detection of chromosomalchanges in childhood acute lymphoblastic leukemia. Cancer Genet Cytogenet.2000;123:114–122.
56. Scholz I, Popp S, Granzow M, et al. Comparative genomic hybridization in childhood acute lymphoblastic leukemia: Correlation with interphasecytogenetics and loss of heterozygosity analysis. Cancer Genet Cytogenet.2001;124:89–97.
57. Haas O, Henn T, Romanakis K, et al. Comparative genomic hybridization as part of a new diagnostic strategy in childhood hyperdiploid acutelymphoblastic leukemia. Leukemia. 1998;12:474–481.
58. Strefford JC, Worley H, Barber K, et al. Genome complexity in acutelymphoblastic leukaemia is revealed by array-based comparative genomichybridization. Oncogene. 2007:pub ahead of print.
59. Paulsson K, Heidenblad M, Morse H, et al. Identification of crypticaberrations and characterization of translocation breakpoints using array CGHin high hyperdiploid childhood acute lymphoblastic leukemia. Leukemia.2006;20:2002–2007.
60. van Vlierberghe P, Meijerink JP, Lee C, et al. A new recurrent 9q34 duplicationin pediatric T-cell acute lymphoblastic leukemia. Leukemia. 2006;20:1245–1253.
61. van Vlierberghe P, van Grotel M, Beverloo HB, et al. The crypticchromosomal deletion, del(11)(p12p13), as a new activation mechanism ofLMO2 in pediatric T- cell acute lymphoblastic leukemia. Blood. 2006;[Epubahead of print].
62. Graux C, Cools J, Melotte C, et al. Fusion of NUP214 to ABL1 on amplifiedepisomes in T-cell acute lymphoblastic leukemia. Nat Genet. 2004;36:1084–1089.
63. Heerema NA, Sather HN, Sensel MG, et al. Association of chromosome arm9p abnormalities with adverse risk in childhood acute lymphoblastic leukemia:A report from the Children's Cancer Group. Blood. 1999;94:1537–1544.
64. Hann I, Vora A, Harrison G, et al. Determinants of outcome after intensifiedtherapy of childhood lymphoblastic leukaemia: Results from Medical ResearchCouncil United Kingdom acute lymphoblastic leukaemia XI protocol. Br J Haematol. 2001;113:103–114.
65. Mirebeau D, Acquaviva C, Suciu S, et al. The prognostic significance ofCDKN2A, CDKN2B and MTAP inactivation in B-lineage acutelymphoblastic leukemia of childhood. Results of the EORTC studies 58881and 58951. Haematologica. 2006;91:881–885.
66. van Zutven LJ, van Drunen E, de Bont JM, et al. CDKN2 deletions have noprognostic value in childhood precursor-B acute lymphoblastic leukaemia.Leukemia. 2005;19:1281–1284.
67. Paulsson K, Heidenblad M, Strombeck B, et al. High-resolution genome-widearray-based comparative genome hybridization reveals cryptic chromosomechanges in AML and MDS cases with trisomy 8 as the sole cytogeneticaberration. Leukemia. 2006;20:840–846.
68. Schoch C, Haferlach T, Haase D, et al. Patients with de novo acute myeloidleukaemia and complex karyotype aberrations show a poor prognosis despiteintensive treatment: A study of 90 patients. Br J Haematol. 2001;112: 118–126.
69. Rucker FG, Bullinger L, Schwaenen C, et al. Disclosure of candidate genes in acute myeloid leukemia with complex karyotypes using microarray-basedmolecular characterization. J Clin Oncol. 2006;[Epub ahead of print].
Feature
534 LABMEDICINE � Volume 38 Number 9 � September 2007 labmedicine.com

70. Strefford JC, Van Delft F, Robinson H, et al. Complex genomic alterations and gene expression in acute lymphoblastic leukemia with intrachromosomalamplification of chromosome 21. Proc Natl Acad Sci USA. 2006;103:8167–8172.
71. Yeoh EJ, Ross ME, Shurtleff SA, et al. Classification, subtype discovery, andprediction of outcome in pediatric acute lymphoblastic leukemia by geneexpression profiling. Cancer Cell. 2002;1:133–143.
72. Ross ME, Mahfouz R, Onciu M, et al. Gene expression profiling of pediatricacute myelogenous leukemia. Blood. 2004;104:3679–3687.
73. Valk PJ, Verhaak RG, Beijen MA, et al. Prognostically useful gene-expressionprofiles in acute myeloid leukemia. N Engl J Med. 2004;350:1617–1628.
74. Bullinger L, Döhner K, Bair E, et al. Use of gene-expression profiling toidentify prognostic subclasses in adult acute myeloid leukemia. N Engl J Med.2004;350:1605–1616.
75. Harewood L, Robinson H, Harris R, et al. Amplification of AML1 on aduplicated chromosome 21 in acute lymphoblastic leukemia: A study of 20cases. Leukemia. 2003;17:547–553.
76. Robinson HM, Broadfield ZJ, Cheung KL, et al. Amplification of AML1 inacute lymphoblastic leukemia is associated with a poor outcome. Leukemia.2003;17:2249–2250.
77. Moorman AV, Richards SM, Robinson HM, et al. Prognosis of children withacute lymphoblastic leukaemia (ALL) and intrachromosomal amplification ofchromosome 21 (iAMP21). Blood. 2007;109:2327–2330.
78. Robinson HM, Harrison CJ, Moorman AV, et al. Intrachromosomalamplification of chromosome 21 (iAMP21) may arise from a breakage-fusion-bridge cycle. Genes Chromosomes Cancer. 2007;46:318–326.
79. Le Coniat M, Romana SP, Berger R. Partial chromosome 21 amplification in a child with acute lymphoblastic leukemia. Genes Chromosomes Cancer.1995;14:204–209.
80. Busson-Le Coniat M, Nguyen Khac F, Daniel MT, et al. Chromosome 21abnormalities with AML1 amplification in acute lymphoblastic leukemia.Genes Chromosomes Cancer. 2001;32:244–249.
81. McClintock B. The stability of broken ends of chromosomes in Zea mays.Genetics. 1941;41:234–282.
82. Barber KE, Martineau M, Harewood L, et al. Amplification of the ABL genein T-cell acute lymphoblastic leukemia. Leukemia. 2004;18:1153–1156.
83. Robinson HM, Taylor KE, Jalali GR, et al. t(14;19)(q32;q13): A recurrenttranslocation in B-cell precursor acute lymphoblastic leukemia. GenesChromosomes Cancer. 2004;39:88–92.
84. Chapiro E, Russell L, Radford-Weiss I, et al. Overexpression of CEBPAresulting from the translocation t(14;19)(q32;q13) of human precursor B acute lymphoblastic leukemia. Blood. 2006;108:3560–3563.
85. Mueller BU, Pabst T. C/EBPalpha and the pathophysiology of acute myeloidleukemia. Curr Opin Hematol. 2006;13:7–14.
86. Pabst T, Mueller BU, Zhang P, et al. Dominant-negative mutations of CEBPA,encoding CCAAT/enhancer binding protein-alpha (C/EBPalpha), in acute myeloid leukemia. Nat Genet. 2001;27:263–270.
87. Leroy H, Roumier C, Huyghe P, et al. CEBPA point mutations inhematological malignancies. Leukemia. 2005;19:329–334.
88. Fitzgibbon J, Smith LL, Raghavan M, et al. Association between acquireduniparental disomy and homozygous gene mutation in acute myeloidleukemias. Cancer Res. 2005;65:9152–9154.
89. Akasaka T, Balasas T, Russell LJ, et al. Five members of the CEBPtranscription factor family are targeted by recurrent IGH-transloactions in B-cell precursor acute lymphoblastic leukemia (BCP-ALL). Blood.2007;109:3451–3461.
Feature
labmedicine.com September 2007 � Volume 38 Number 9 � LABMEDICINE 535