advances in accounting behavioral research
247
-
Upload
khangminh22 -
Category
Documents
-
view
3 -
download
0
Transcript of advances in accounting behavioral research

ADVANCES IN ACCOUNTING
BEHAVIORAL RESEARCH
i

ADVANCES IN ACCOUNTING
BEHAVIORAL RESEARCH
Series Editor: Vicky Arnold
Volumes 1–4: Series Editor: James E. Hunton
Volumes 5–7: Series Editor: Vicky Arnold
ii
ADVANCES IN ACCOUNTING BEHAVIORAL RESEARCH VOLUME 8
ADVANCES INACCOUNTING
BEHAVIORAL RESEARCHEDITED BY
VICKY ARNOLD
Department of Accounting, School of Business, University of Connecticut, USA
and Department of Accounting and Business Information Systems, University of
Melbourne, Australia
Associate Editors:
B. DOUGLAS CLINTON
Northern Illinois University, USA
PETER LUCKETT
University of New South Wales, Australia
ROBIN ROBERTS
University of Central Florida, USA
CHRIS WOLFE
Texas A&M University, USA
SALLY WRIGHT
University of Massachusetts Boston, USA
Amsterdam – Boston – Heidelberg – London – New York – Oxford
Paris – San Diego – San Francisco – Singapore – Sydney – Tokyo
2005
iii
r 2005 Elsevier Ltd. All rights reserved.
This work is protected under copyright by Elsevier Ltd, and the following terms and conditions apply to its use:
PhotocopyingSingle photocopies of single chapters may be made for personal use as allowed by national copyright laws. Permissionof the Publisher and payment of a fee is required for all other photocopying, including multiple or systematic copying,copying for advertising or promotional purposes, resale, and all forms of document delivery. Special rates areavailable for educational institutions that wish to make photocopies for non-profit educational classroom use.
Permissions may be sought directly from Elsevier’s Rights Department in Oxford, UK: phone (+44) 1865 843830, fax(+44) 1865 853333, e-mail: [email protected]. Requests may also be completed on-line via the Elsevierhomepage (http://www.elsevier.com/locate/permissions).
In the USA, users may clear permissions and make payments through the Copyright Clearance Center, Inc., 222Rosewood Drive, Danvers, MA 01923, USA; phone: (+1) (978) 7508400, fax: (+1) (978) 7504744, and in the UKthrough the Copyright Licensing Agency Rapid Clearance Service (CLARCS), 90 Tottenham Court Road, LondonW1P 0LP, UK; phone: (+44) 20 7631 5555; fax: (+44) 20 7631 5500. Other countries may have a local reprographicrights agency for payments.
Derivative WorksTables of contents may be reproduced for internal circulation, but permission of the Publisher is required for externalresale or distribution of such material. Permission of the Publisher is required for all other derivative works, includingcompilations and translations.
Electronic Storage or UsagePermission of the Publisher is required to store or use electronically any material contained in this work, including anychapter or part of a chapter.
Except as outlined above, no part of this work may be reproduced, stored in a retrieval system or transmitted in anyform or by any means, electronic, mechanical, photocopying, recording or otherwise, without prior written permissionof the Publisher.Address permissions requests to: Elsevier’s Rights Department, at the fax and e-mail addresses noted above.
NoticeNo responsibility is assumed by the Publisher for any injury and/or damage to persons or property as a matter ofproducts liability, negligence or otherwise, or from any use or operation of any methods, products, instructions orideas contained in the material herein. Because of rapid advances in the medical sciences, in particular, independentverification of diagnoses and drug dosages should be made.
First edition 2005
British Library Cataloguing in Publication DataA catalogue record is available from the British Library.
ISBN: 0-7623-1218-1ISSN: 1475-1488 (Series)
8 The paper used in this publication meets the requirements of ANSI/NISO Z39.48-1992 (Permanence of Paper).Printed in The Netherlands.
ELSEVIER B.V.
Radarweg 29
P.O. Box 211
1000 AE Amsterdam
The Netherlands
ELSEVIER Ltd
84 Theobalds Road
London
WC1X 8RR
UK
ELSEVIER Ltd
The Boulevard, Langford
Lane, Kidlington
Oxford OX5 1GB
UK
ELSEVIER Inc.
525 B Street, Suite 1900
San Diego
CA 92101-4495
USA
Working together to growlibraries in developing countries
www.elsevier.com | www.bookaid.org | www.sabre.org
iv
CONTENTS
LIST OF CONTRIBUTORS vii
REVIEWER ACKNOWLEDGEMENTS ix
EDITORIAL POLICY AND SUBMISSIONGUIDELINES
xi
BELIEF REVISION IN ACCOUNTING: ALITERATURE REVIEW OF THE BELIEF-ADJUSTMENT MODEL
Jennifer Kahle, Robert Pinsker and Robin Pennington 1
AUDITOR CALIBRATION IN THE REVIEW PROCESSNoel Harding, Sally Hughes and Ken T. Trotman 41
LINGUISTIC DELIVERY STYLE, CLIENTCREDIBILITY, AND AUDITOR JUDGMENT
Christie L. Comunale, Thomas R. Sexton andTerry L. Sincich
59
CLIENT INQUIRY VIA ELECTRONICCOMMUNICATION MEDIA: DOES THE MEDIUMMATTER?
Anna Noteberg and James E. Hunton 87
ROLE MORALITY AND ACCOUNTANTS’ETHICALLY SENSITIVE DECISIONS
Robin R. Radtke 113
v
THE EFFECT OF MANAGER’S MORAL EQUITY ONTHE RELATIONSHIP BETWEEN BUDGETPARTICIPATION AND PROPENSITY TO CREATESLACK: A RESEARCH NOTE
Adam S. Maiga 139
ASYMMETRIC EFFECTS OF ACTIVITY-BASEDCOSTING SYSTEM COST REALLOCATION
M.G. Fennema, Jay S. Rich and Kip Krumwiede 167
EXAMINING THE ROLE OF CULTURE ANDACCULTURATION IN INFORMATION SHARING
Stephen B. Salter and Axel K.-D. Schulz 189
THE EFFECTS OF VALUE ATTAINMENT ANDCOGNITIVE ROLES OF BUDGETARYPARTICIPATION ON JOB PERFORMANCE
Vincent K. Chong, Ian R.C. Eggleton andMichele K.C. Leong
213
CONTENTSvi
LIST OF CONTRIBUTORS
Vincent K. Chong UWA Business School, The University ofWestern Australia, Australia
Christie L. Comunale School of Professional Accountancy, LongIsland University – C.W. Post Campus,USA
Ian R. C. Eggleton Waikato Management School, Universityof Waikato, New Zealand
M. G. Fennema Department of Accounting, Florida StateUniversity, USA
Noel Harding School of Accounting, University of NewSouth Wales, Australia
Sally Hughes School of Accounting, University of NewSouth Wales, Australia
James E. Hunton Accountancy Department, Bentley College,USA and Department of Accounting andInformation Management, UniversiteitMaastricht, The Netherlands
Jennifer Kahle School of Accountancy, University ofSouth Florida, USA
Kip Krumwiede College of Business and Economics, BoiseState University, USA
Michele K. C. Leong UWA Business School, The University ofWestern Australia, Australia
Adam S. Maiga School of Business Administration,University of Wisconsin – Milwaukee, USA
Anna Noteberg Department of Business Studies,Universiteit van Amsterdam, TheNetherlands
vii
Robin Pennington Department of Accounting andInformation Management, University ofTennessee, USA
Robert Pinsker College of Business and PublicAdministration, Old Dominion University,USA
Robin R. Radtke Department of Accounting, The Universityof Texas at San Antonio, USA
Jay S. Rich College of Business, Illinois StateUniversity, USA
Stephen B. Salter Universidad Adolfo Ibanez Escuela deNegocios, College of BusinessAdministration, University of Cincinnati,USA
Axel K-D. Schulz Department of Accounting and BusinessInformation Systems, The University ofMelbourne, Australia
Thomas R. Sexton College of Business, Stony BrookUniversity, USA
Terry L. Sincich Information Systems and Decision SciencesDepartment, University of South Florida,USA
Ken T. Trotman School of Accounting, University of NewSouth Wales, Australia
LIST OF CONTRIBUTORSviii
Mohammed AbdolmohammadiBentley College, USA
Elizabeth AlmerPortland State University, USA
Philip BeaulieuUniversity of Calgary, Canada
Jean BedardNortheastern University, USA
James BierstakerVillanova University, USA
Dennis M. BlineBryant College, USA
Wray BradleyUniversity of Tulsa, USA
Gary BraunUniversity of Texas at El Paso,USA
Rich BrodyUniversity of New Haven, USA
Shimin ChenUniversity of Louisiana atLafayette, USA
Vincent ChongThe University of WesternAustralia, Australia
Freddie ChooSan Francisco State University,USA
Janne ChungYork University, Canada
Bryan ChurchGeorgia Tech University, USA
Jeff CohenBoston College, USA
William N. DillaIowa State University, USA
Jesse DillardPortland State University, USA
Craig EmbySimon Fraser University, Canada
Dann FisherKansas State University, USA
Clark HamptonUniversity of Connecticut, USA
REVIEWER ACKNOWLEDGEMENTS
The Editor and Associate Editors at AABR would like to thank the many
excellent reviewers who have volunteered their time and expertise to make
this an outstanding publication. Publishing quality papers in a timely
manner would not be possible without their efforts.
ix
Joanne P. HealyKent State University, USA
Karen L. HooksFlorida Atlantic University, USA
Stacy KovarKansas State University, USA
Tanya LeeUniversity of North Texas, USA
Theresa LibbyWilfred Laurier University,Canada
Tim LindquistThe University of Northern Iowa,USA
Jill McKinnonMacquarie University, Australia
Mario MalettaNortheastern University, USA
Maureen MaschaMarquette University, USA
Elaine MauldinUniversity of Missouri, USA
Rob NieschwietzUniversity of Colorado at Denver,USA
Andreas NikolaouBowling Green State University,USA
Hossein NouriThe College of New Jersey, USA
Ed O’DonnellArizona State University, USA
Laurie PantSuffolk University, USA
Robert J. ParkerUniversity of New Orleans, USA
Will QuilliamUniversity of South Florida, USA
Randall RentfroFlorida Atlantic University, USA
Andrew J. RosmanUniversity of Connecticut, USA
Scott SummersBrigham Young University, USA
Steve SuttonUniversity of Connecticut, USA
Linda ThorneYork University, Canada
Kristin WentzelLa Salle University, USA
John WermertDrake University, USA
Patrick WheelerUniversity of Missouri, USA
Brett WilkinsonBaylor University, USA
Bernard Wong-On-WingWashington State University, USA
Alex YenUniversity of Connecticut, USA
REVIEWER ACKNOWLEDGEMENTSx
EDITORIAL POLICY AND
SUBMISSION GUIDELINES
Advances in Accounting Behavioral Research (AABR) publishes articles en-
compassing all areas of accounting that incorporate theory from and con-
tribute new knowledge and understanding to the fields of applied
psychology, sociology, management science, and economics. The journal
is primarily devoted to original empirical investigations; however, literature
review papers, theoretical analyses, and methodological contributions are
welcome. AABR is receptive to replication studies, provided they investigate
important issues and are concisely written. The journal especially welcomes
manuscripts that integrate accounting issues with organizational behavior,
human judgment/decision making, and cognitive psychology.
Manuscripts will be blind-reviewed by two reviewers and an associate editor.
The recommendations of the reviewers and associate editor will be used to
determine whether to accept the paper as is, accept the paper with minor re-
visions, reject the paper or to invite the authors to revise and resubmit the paper.
Manuscript Submission
Manuscripts should be forwarded to the editor, Vicky Arnold, at
[email protected] via e-mail. All text, tables, and figures
should be incorporated into a Word document prior to submission. The
manuscript should also include a title page containing the name and address
of all authors and a concise abstract. Also, include a separate Word doc-
ument with any experimental materials or survey instruments. If you are
unable to submit electronically, please forward the manuscript along with
the experimental materials to the following address:
Vicky Arnold, Editor
Advances in Accounting Behavioral Research,
Department of Accounting U41A
School of Business
University of Connecticut
Storrs, CT 06269-2041
xi
References should follow the APA (American Psychological Association)
standard. References should be indicated by giving (in parentheses) the
author’s name followed by the date of the journal or book; or with the date
in parentheses, as in ‘suggested by Earley (2000)’.
In the text, use the form Rosman et al. (1995) where there are more than
two authors, but list all authors in the references. Quotations of more than
one line of text from cited works should be indented and citation should
include the page number of the quotation, e.g. (Dunbar, 2001 p. 56).
Citations for all articles referenced in the text of the manuscript should be
shown in alphabetical order in the Reference list at the end of the man-
uscript. Only articles referenced in the text should be included in the Ref-
erence list. Format for references is as follows:
For journals:
Dunn, C.L., & Gerard, G.J. (2001). Auditor efficiency and effectiveness with
diagrammatic and linguistic conceptual model representations. International
Journal of Accounting Information Systems, 2(3), 1–40.
For books:
Ashton, R.H., & Ashton, A.H. (1995). Judgment and decision-making research
in accounting and auditing. New York, NY: Cambridge University Press.
For a thesis:
Smedley, G.A. (2001). The effects of optimization on cognitive skill acquisition
from intelligent decision aids. Unpublished doctoral dissertation, University.
For a working paper:
Thorne, L., Massey, D.W., & Magnan, M. (2000). Insights into selection-
socialization in the audit profession: An examination of the moral reasoning
of public accountants in the United States and Canada. Working paper
York University, North York, Ontario.
For papers from conference proceedings, chapters from book, etc.:
Messier, W.F. (1995). Research in and development of audit decision aids. In:
R.H. Ashton, & A.H. Ashton (Ed.), Judgment and decision making in
accounting and auditing (pp. 207–230). New York: Cambridge University Press.
EDITORIAL POLICY AND SUBMISSION GUIDELINESxii
BELIEF REVISION IN
ACCOUNTING: A LITERATURE
REVIEW OF THE
BELIEF-ADJUSTMENT MODEL
Jennifer Kahle, Robert Pinsker and Robin Pennington
ABSTRACT
The belief-adjustment model has been an integral part of accounting
research in belief revision, especially in the examination of order effects.
Hogarth and Einhorn ((1992) Cognitive Psychology, 24, 1–55) created
the belief-adjustment model to serve as a theoretical framework for
studying individuals’ decision-making processes. The model examines
several aspects of decision-making, such as encoding, response mode, and
task factors. The purpose of this chapter is to provide a comprehensive
examination of the accounting studies that have used the theoretical
framework of the belief-adjustment model in auditing, tax, and financial
accounting contexts. Roberts’ ((1998) Journal of the American Taxation
Association, 20, 78–121) model of tax accountants’ decision-making is
used as a guideline to organize the research into categories. By using
Roberts’ categorization, we can better sort out the mixed results of some
prior studies and also expand the review to include a more comprehensive
look at the model and its application to accounting. While many variables
have been examined with respect to their effect on accounting professionals’
Advances in Accounting Behavioral Research
Advances in Accounting Behavioral Research, Volume 8, 1–40
Copyright r 2005 by Elsevier Ltd.
All rights of reproduction in any form reserved
ISSN: 1475-1488/doi:10.1016/S1475-1488(04)08001-9
1
belief revisions, most studies examine them in isolation and do not consider
the interaction effects that these variables may have. Our framework also
identifies areas of the belief-adjustment model that need further research.
INTRODUCTION
Professional judgment in accounting has been described in general terms as
a continuous and incremental process (Gibbins, 1984). Most judgment tasks
involve evidence that is evaluated in a sequential nature. Although
sequential processing can provide economy in decision-making in terms of
smaller demands on memory and information-processing load, it can also
have detrimental effects, such as order effects in belief updating. Order
effects, biases, and the use of heuristics resulting from the method by which
individuals update their beliefs have been found in various areas of
accounting, including auditing (e.g., Ashton & Ashton, 1988; Asare, 1992),
tax (e.g., Pei, Reckers, & Wyndelts, 1990), and financial reporting (Pinsker,
2004).
Much of the judgment and decision-making accounting literature has
been influenced by Hogarth and Einhorn’s (1992) theory of belief revision.
The theory accounts for order effects as they arise from the interaction of
information-processing strategies and task characteristics. In particular,
Hogarth and Einhorn’s belief-adjustment model assumes people handle
belief revision tasks by a general, sequential anchoring and adjustment
process in which current opinion, or the anchor, is adjusted by the impact of
succeeding pieces of evidence. The model predicts that under conditions of
evaluating a short series of simple information, a primacy effect will occur
(i.e., the decision-maker will place more weight on the earliest information
received) if the judgment is made after viewing all the evidence. However, if
a short series of mixed (i.e., both positive and negative relative to a current
hypothesis) information is evaluated piece-by-piece, differential weighting of
the mixed information will produce a recency effect (i.e., the decision-maker
will place more weight on the latest information received).
An abundance of accounting literature examining recency effects has been
motivated by the belief-adjustment model and findings of order effects in the
psychology literature. Findings suggest that, in the absence of some
mitigating influence, many accounting judgments are subject to recency
effects. From a normative perspective, the sequence of evidence evaluation
should not affect the conclusion drawn from the evidence (Christian &
Reneau, 1990). The implications for accounting professionals may be
JENNIFER KAHLE ET AL.2
systematic biases in judgments leading to reduced efficiency and effec-
tiveness.
The purpose of this chapter is to provide a comprehensive review of the
accounting studies that have used the theoretical framework of the belief-
adjustment model in auditing, tax, and financial accounting contexts. The
emphasis will be on the factors that have been shown to influence or mitigate
order effects. Roberts’ (1998) model of tax accountants’ decision-making will
be used as a guideline to organize the factors into five main categories,
including (1) individual psychological factors, (2) environmental factors, (3)
input task factors, (4) processing factors, and (5) output task factors. This
categorization is similar to that of Gibbins’ (1984) model of professional
judgment in public accounting, whose groups include the person, stimulus,
environment, decision, and judgment process. Categorization in this manner
recognizes the separate influences of both external (environmental and task)
and internal (individual) factors and reflects the recommendation by
Hogarth and Einhorn (1992) to study further procedural and task variables
that can affect belief revision. In an evaluation of recency effects in audit
judgments, Trotman and Wright (2000) noted that results have been mixed
across studies. By using Roberts’ (1998) categorizations, we can better
understand the mixed results of the prior auditing studies, and also expand
the review to include a more comprehensive look at the model and its
application to various areas of accounting.
The remainder of this chapter is organized into four sections. The first
section describes the belief-adjustment model as proposed by Hogarth and
Einhorn (1992). The following section discusses the general applications of
the belief-adjustment model to accounting. Next, factors tested for
association with belief revision are reviewed and categorized. The final
section provides some concluding remarks as well as suggested directions for
future research.
THE BELIEF-ADJUSTMENT MODEL
Order Effects
Bayes’ theorem was the dominant normative model of belief revision in
accounting prior to 1988. The theorem gained popularity because it is a
logical consequence of conditional probabilities. However, research in
behavioral decision-making suggests that it is incomplete as a descriptive
model of belief revision as it cannot adequately predict intuitive revision
Belief Revision in Accounting 3
(Ashton & Ashton, 1988). Some researchers suggest that the discrepancy
is due to the tendency for intuitive revisions to be driven by task charac-
teristics, such as presentation order of information, which are irrelevant to
the normative model (Pitz, Downing, & Reinhold, 1967). A large body of
literature in psychology and accounting (e.g., Hogarth & Einhorn, 1992;
Ashton & Ashton, 1988; Pei et al., 1992a, b; Kennedy, 1993) has confirmed
the existence of presentation order effects on individual belief revisions.
Hogarth and Einhorn (1992, p. 3) define order effects with the following
example:
There are two pieces of evidence, A and B. Some subjects express an opinion after seeing
the information in the order A–B; others receive the information in the order B–A. An
order effect occurs when opinions after A–B differ from those after B–A.
Primacy occurs when an individual places more weight on the earlier
evidence in the sequence, while recency occurs when an individual places
more weight on the latter (more recent) evidence in the sequence.
Hogarth and Einhorn (1992) developed a ‘‘belief-adjustment model’’ to
more fully explain how evidence is encoded and processed. They adapted the
general concept of anchoring and adjustment (i.e., forming a belief and then
adjusting it based on new information to form a new belief) to include
heuristics into the model. Research since 1988 has provided descriptive
validity for using the belief-adjustment model, rather than Bayes’ theorem,
to explain belief revision (e.g., Ashton & Ashton, 1988; Pei et al., 1990;
Bamber, Ramsay, & Tubbs, 1997).
There are four distinct aspects in which the belief-adjustment model differs
from Bayesian probability (Krishnamoorthy, Mock, & Washington, 1999).
The belief-adjustment model (1) predicts that belief revision is influenced by
the order in which evidence is evaluated; (2) entails an anchoring and
adjustment strategy where the extent of belief revision is based on the size of
the anchor (current opinion), a strategy that violates the fundamental tenets
of Bayesian probability theory; (3) explicitly models the decision-maker’s
sensitivity toward evidence; and (4) allows one to increase or decrease
support for a hypothesis (e.g., that an account is fairly stated) without
affecting support for its complement (e.g., that an account is not fairly
stated). In an examination of four theoretical models of belief revision,
including a version of Bayesian inference, Krishnamoorthy et al. found that
the belief-adjustment model is the only model that captures both the
direction and magnitude of auditors’ belief revisions. Hogarth and Einhorn’s
(1992) theory of belief revision accounts for order effects by examining the
interaction of task characteristics and information processing strategies.
JENNIFER KAHLE ET AL.4
Task Variables
In forming their model, Hogarth and Einhorn (1992) considered three task
variables: (1) the complexity of the individual items of evidence to be
processed, (2) the length of the series of items, and (3) the manner in which
judgments are elicited, which will be referred to as response mode.1
Complexity is a function of the amount of information for each piece of
evidence that needs to be processed as well as the lack of familiarity with the
task (i.e., less familiar equals more complex and vice versa). Complexity is
important to belief revision since it relates to human processing ability. As
complexity increases, people may resort to simplifying strategies to ease
cognitive strain (Hogarth & Einhorn, 1992).
Length of series refers to the number of pieces of evidence to be evaluated.
Based on their review of several studies, Hogarth and Einhorn (1992)
consider a series of between 2 and 12 items to be ‘‘short’’ and a series of 17
or more items ‘‘long.’’ To distinguish length of series from complexity,
remember that complexity results from the amount of information
processing required and not necessarily the length of the series. As Arnold,
Collier, Leech, and Sutton (2000) indicate, a ‘‘complex’’ task is one that is
unfamiliar to the decision-maker (as noted in the previous paragraph) or
one that requires heavy information processing (defined as either a large
number or a long series of items). Therefore, a complex task could result
from a short series of evidence (if unfamiliar or full of detail) or
automatically from a long series. A ‘‘simple’’ task results from a short
series of familiar items.
Response mode concerns the manner in which judgments are elicited. Hogarth
and Einhorn (1992) consider two types: Step-by-Step (SbS) and End-of-Sequence
(EoS). The SbS mode is a ‘‘sequential’’ procedure whereby participants express
their beliefs each time they integrate a new piece of evidence. On the other hand,
the EoS mode is a ‘‘simultaneous’’ procedure in which participants express their
opinions only after all the information has been presented.
Encoding
Hogarth and Einhorn (1992) also acknowledge the impact of the method by
which individuals encode or process information on their subsequent
judgments. Accordingly, the predictions of the belief-adjustment model are
affected by two additional encoding variables: (1) processing mode (SbS
versus EoS), and (2) task type (evaluation versus estimation).
Belief Revision in Accounting 5
While related, the processing mode cannot be solely determined by the
required response mode. When the task is completed in an SbS response
mode, the individual must employ an SbS process by adjusting his or her
opinion incrementally for each piece of evidence processed. However, if a
task is completed in an EoS response mode, an individual can employ either
an SbS or an EoS processing mode. The EoS processing mode requires an
individual to aggregate all items prior to integrating them with the anchor,
which can be cognitively demanding. Thus, the processing mode should
depend on the cognitive demands of the task. Generally, the SbS processing
mode will be used when the task is more complex. This allows the individual
to continually integrate information with the anchor. The EoS mode is
expected to be used for a simpler task where aggregating the latter
information is cognitively easier.
In addition to task complexity, psychology and accounting research have
examined processing mode with respect to level of experience. Specifically,
Yates (1990) indicated less experienced individuals employ a sequential
(SbS) decision-making process. As individual decision-makers gain experi-
ence, they develop more ‘‘sophisticated’’ decision-making processes,
consistent with an EoS processing mode (Anderson, 1988). Further, less-
experienced individuals may employ an SbS processing mode to reduce
cognitive load (Arnold et al., 2000) or to reduce the effort necessary to
process a task (Hunton & McEwen, 1997).
Hogarth and Einhorn (1992) also make a distinction between evaluation
and estimation tasks. In evaluation tasks, information is encoded as positive
or negative relative to the hypothesis under consideration. Here, evidence is
seen as bipolar relative to the hypothesis and can be expressed by some
value on the continuum between ‘‘false’’ and ‘‘true.’’ On the other hand,
estimation tasks involve assessing a ‘‘moving average’’ that reflects the
position of each new piece of evidence relative to current opinion (involving
a unipolar scale). Research in accounting judgments has generally required
and found support for the use of the evaluation form of the model (Ashton
& Ashton, 1988; Tubbs, Messier, & Knechel, 1990).
To our knowledge, no accounting study has used the estimation task. As
Hogarth and Einhorn (1992, p. 9) indicated, estimation tasks use data that
fit ‘‘averaging models;’’ whereas, evaluation tasks use data that fit ‘‘adding
models.’’ In the auditing domain (where the majority of belief-adjustment
model research has taken place), Messier and Tubbs (1994) contend that an
auditor would evaluate an item and its relationship to an audit assertion
before revising beliefs about the assertion. Thus, auditors in particular are
assumed to generally employ an additive model when revising beliefs
JENNIFER KAHLE ET AL.6
(consistent with an evaluation task). Although there have been accounting
studies that used only positive or negative information in their tasks (e.g.,
Ashton & Ashton, 1988; Tubbs et al., 1990), the results obtained were
measured and analyzed in an additive fashion.2
Anchoring and Adjustment Process
The belief-adjustment model assumes that people revise beliefs through a
sequential anchoring and adjustment process in which the current opinion (an
anchor) is adjusted by the impact of subsequent pieces of information. The
algebraic form of the belief-adjustment model can generally be written as3
Sk ¼ Sk�1 þ wk½sðxkÞ � R�
where
Sk ¼ degree of belief in some hypothesis, after evaluating k pieces of
evidence (0pSkp1)
Sk�1 ¼ anchor or prior belief. The initial strength of belief is denoted S0
sðxkÞ ¼ subjective evaluation of the kth piece of evidence (Different
people may accord the same evidence, xk, different evaluations)
R ¼ the reference point against which the impact of the kth piece of
evidence is evaluated
wk ¼ the adjustment weight for the kth piece of evidence (0pwkp1).
The adjustment weight for the kth piece of evidence, wk, can be further
defined as
wk ¼aSk�1 when sðxkÞpR
bð1� Sk�1Þ when sðxkÞ4R
(
where
a ¼ the sensitivity toward negative evidence, and
b ¼ the sensitivity toward positive evidence.
The formula implies that wk is related to the strength of the anchor
through a ‘‘contrast’’ effect such that large anchors are ‘‘hurt’’ more than
smaller ones by the same negative evidence. Thus, the magnitude of the
belief revision is proportional to the prior belief, Sk�1; for negative
evidence and proportional to the inverse of the prior belief, 1� Sk�1; forpositive evidence. The a and b variables are constants, which represent an
Belief Revision in Accounting 7
individual’s sensitivity toward negative and positive evidence, respec-
tively, and are posited to be functions of both individual and external
variables.
For SbS processing, the adjustment weight, wk, will depend on the sign of
the new evidence and the level of the anchor, Sk�1; as described above.
However, under an EoS processing mode, the individual makes only one
adjustment, and the model can be simplified to
Sk ¼ S0 þ wk½sðx1; :::; xkÞ � R�,
where s(x1,y, xk) is some function, possibly a weighted average of the items
that follow the anchor.
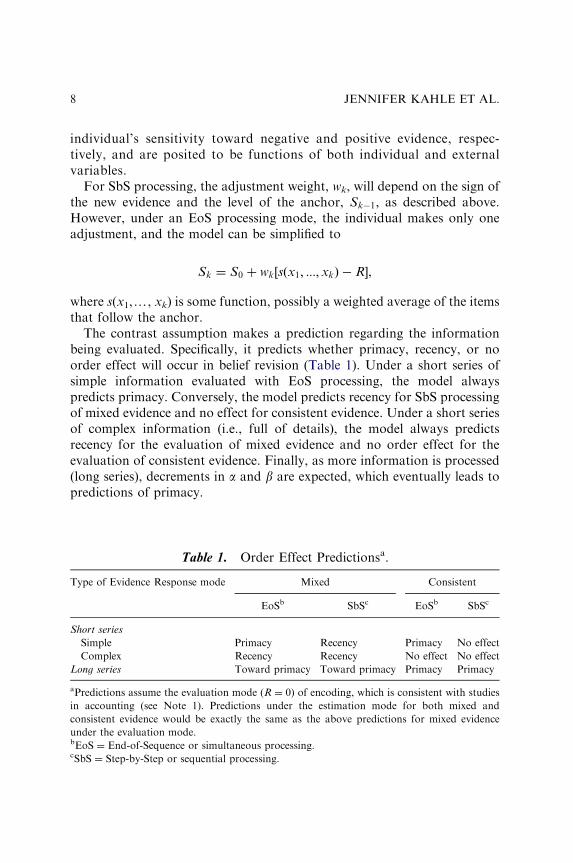
The contrast assumption makes a prediction regarding the information
being evaluated. Specifically, it predicts whether primacy, recency, or no
order effect will occur in belief revision (Table 1). Under a short series of
simple information evaluated with EoS processing, the model always
predicts primacy. Conversely, the model predicts recency for SbS processing
of mixed evidence and no effect for consistent evidence. Under a short series
of complex information (i.e., full of details), the model always predicts
recency for the evaluation of mixed evidence and no order effect for the
evaluation of consistent evidence. Finally, as more information is processed
(long series), decrements in a and b are expected, which eventually leads to
predictions of primacy.
Table 1. Order Effect Predictionsa.
Type of Evidence Response mode Mixed Consistent
EoSb SbSc EoSb SbSc
Short series
Simple Primacy Recency Primacy No effect
Complex Recency Recency No effect No effect
Long series Toward primacy Toward primacy Primacy Primacy
aPredictions assume the evaluation mode (R ¼ 0) of encoding, which is consistent with studies
in accounting (see Note 1). Predictions under the estimation mode for both mixed and
consistent evidence would be exactly the same as the above predictions for mixed evidence
under the evaluation mode.bEoS ¼ End-of-Sequence or simultaneous processing.cSbS ¼ Step-by-Step or sequential processing.
JENNIFER KAHLE ET AL.8
BELIEF REVISION IN ACCOUNTING
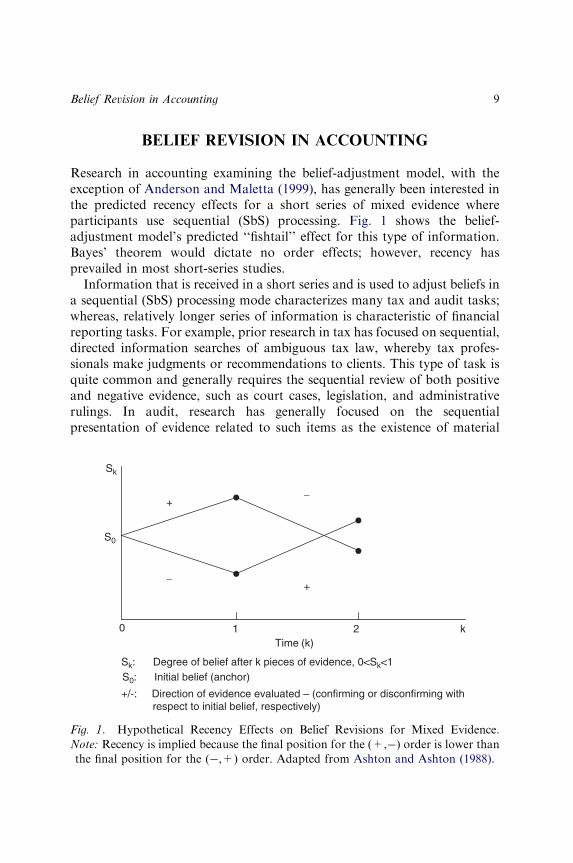
Research in accounting examining the belief-adjustment model, with the
exception of Anderson and Maletta (1999), has generally been interested in
the predicted recency effects for a short series of mixed evidence where
participants use sequential (SbS) processing. Fig. 1 shows the belief-
adjustment model’s predicted ‘‘fishtail’’ effect for this type of information.
Bayes’ theorem would dictate no order effects; however, recency has
prevailed in most short-series studies.
Information that is received in a short series and is used to adjust beliefs in
a sequential (SbS) processing mode characterizes many tax and audit tasks;
whereas, relatively longer series of information is characteristic of financial
reporting tasks. For example, prior research in tax has focused on sequential,
directed information searches of ambiguous tax law, whereby tax profes-
sionals make judgments or recommendations to clients. This type of task is
quite common and generally requires the sequential review of both positive
and negative evidence, such as court cases, legislation, and administrative
rulings. In audit, research has generally focused on the sequential
presentation of evidence related to such items as the existence of material
0 1 2 k
Time (k)
Sk: Degree of belief after k pieces of evidence, 0<Sk<1
S0: Initial belief (anchor)
+/-: Direction of evidence evaluated – (confirming or disconfirming with respect to initial belief, respectively)
S0
+
Sk
−+
−
Fig. 1. Hypothetical Recency Effects on Belief Revisions for Mixed Evidence.
Note: Recency is implied because the final position for the (+,�) order is lower than
the final position for the (�,+) order. Adapted from Ashton and Ashton (1988).
Belief Revision in Accounting 9
errors or fraud, going concern judgments, inventory write-downs, or internal
control evaluations. As mentioned by Trotman and Wright (2000), due to
time constraints, a short series of information is relevant since auditors
typically are not expected to obtain an extended set of evidence (e.g., over 15
items) for a particular assertion. In financial reporting, the sequential release
of a longer series of information items is characteristic of the new online
business-reporting model favored by the American Institute of Certified
Public Accountants (AICPA) and other regulatory constituents (2002).
Initial studies of the belief-adjustment model in accounting were primarily
concerned with testing the applicability of the model to a particular
accounting area (e.g., audit or tax). The initial belief revision study in
accounting by Ashton and Ashton (1988) tested the strength of the evidence
presented, the response mode, and the initial anchor. Since then, a variety of
other individual and external variables have been included as factors
important in the prediction of order effects. Recency effects consistent with
the belief-adjustment model have generally been found to be robust in the
absence of some mitigating factor.
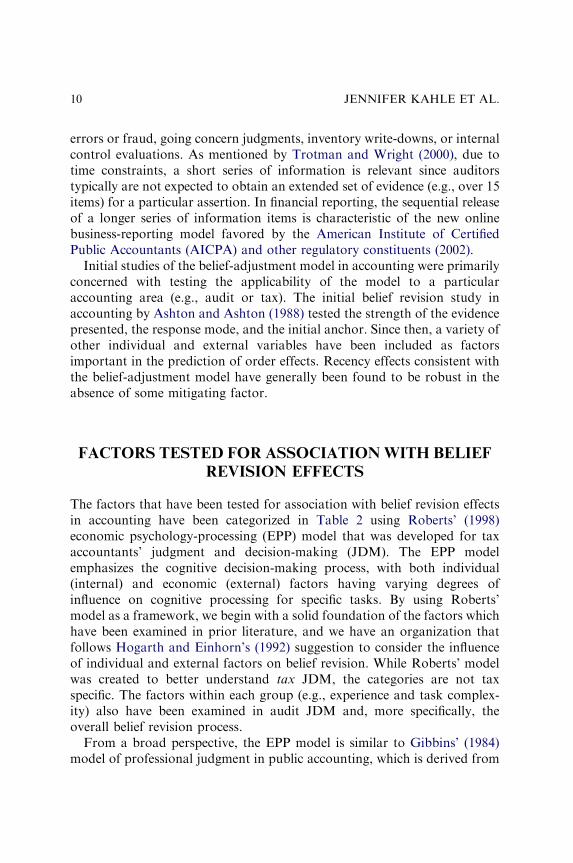
FACTORS TESTED FOR ASSOCIATIONWITH BELIEF
REVISION EFFECTS
The factors that have been tested for association with belief revision effects
in accounting have been categorized in Table 2 using Roberts’ (1998)
economic psychology-processing (EPP) model that was developed for tax
accountants’ judgment and decision-making (JDM). The EPP model
emphasizes the cognitive decision-making process, with both individual
(internal) and economic (external) factors having varying degrees of
influence on cognitive processing for specific tasks. By using Roberts’
model as a framework, we begin with a solid foundation of the factors which
have been examined in prior literature, and we have an organization that
follows Hogarth and Einhorn’s (1992) suggestion to consider the influence
of individual and external factors on belief revision. While Roberts’ model
was created to better understand tax JDM, the categories are not tax
specific. The factors within each group (e.g., experience and task complex-
ity) also have been examined in audit JDM and, more specifically, the
overall belief revision process.
From a broad perspective, the EPP model is similar to Gibbins’ (1984)
model of professional judgment in public accounting, which is derived from
JENNIFER KAHLE ET AL.10
general learning models and includes the person, stimulus, environment,
decision, and judgment process. Comparable with Gibbins’ model, Roberts’
(1998) model contains five groups including individual, external, and
processing categories. We chose to use Roberts’ model because it takes a
more detailed approach than Gibbins. Specifically, Roberts identifies actual
factors that have been examined in prior JDM literature based upon his
review of 52 tax JDM papers. Roberts’ five groups include the following:
1. Individual factors: internal characteristics unique to the decision-maker.
These include cognitive factors, such as knowledge, as well as affective
factors, such as ethical attitudes or risk preferences.
2. Environmental factors: economic risks and rewards associated with the
decision-making environment. These include external influences such as
the incentives or pressures due to the professional role (e.g., tax versus
audit), client preference pressures, or the inherent risk in the environment
(e.g., fraud detection).
3. Task input factors: external characteristics of the decision-making task,
which may impact how information is processed. These include items
such as information load and task complexity.
Table 2. Categorization of Factors Tested for Association with
Belief Revision.
Individual psychological factors Input task factors
Cognitive Strength of evidence
Years of experience Type of evidence (consistent or mixed)
Style Response mode (SbS vs. EoS)
Task relevant knowledge Task complexity
Number of cues
Affective
Initial beliefs Processing factors
Sensitivity toward evidence Processing Mode (SbS vs. EoS)
Professional attitudes Accountability (cognitive effort)
Documentation (cognitive effort)
Environmental factors Review process
Professional roles Control over evidence order
Inherent risk Group discussion
Experimental markets Time pressure (cognitive effort)
Client characteristics
Economic benefit to firm Output task factors
Likelihood judgment
Tax decision (e.g., recommendation to client)
Audit decision (e.g., going concern)
Belief Revision in Accounting 11
4. Decision-processing factors: strategies used by decision makers to simplify
the judgment process. These strategies generally have been found to
influence cognitive effort through such pressures as accountability,
decision aids, or the review process.
5. Task output factors: type of decision required. For instance, consulting
and reviewing tasks are expected to influence the decision-making process
differently.
Similar to the broader JDM literature, the extant belief revision literature
has examined a multitude of variables and their effects on belief revision.
However, until now, there has been no clear, overall organization of these
variables. Using Roberts’ (1998) groupings will allow future research to
more directly draw conclusions about any general effects of each group and
potential interactions between the groups of factors. A solid organizational
framework will allow us to identify which areas are in need of additional
research. It also will enable researchers to better ensure that they have
considered (or controlled for) all possible influences on the belief revision
process. Finally, this categorization may allow future research to examine
the belief revision process as a whole by simultaneously examining factors
from each fundamental group mentioned earlier.
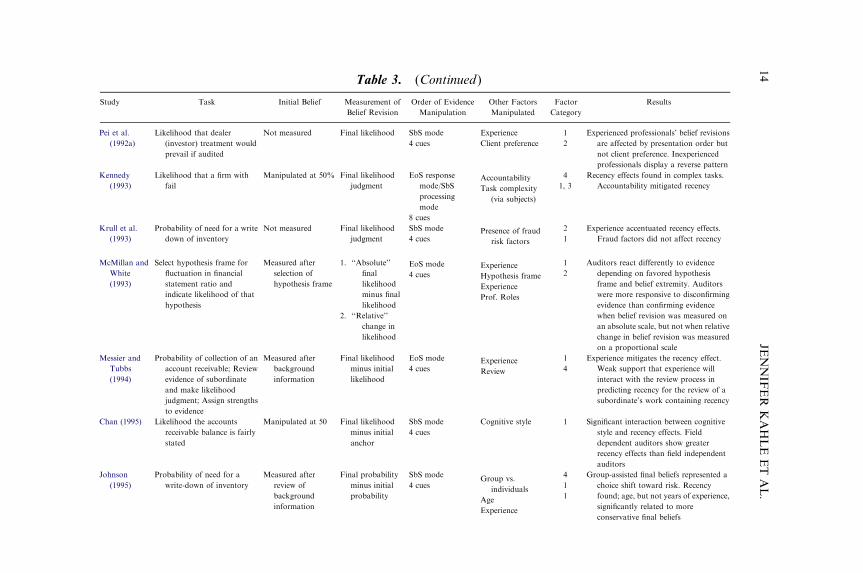
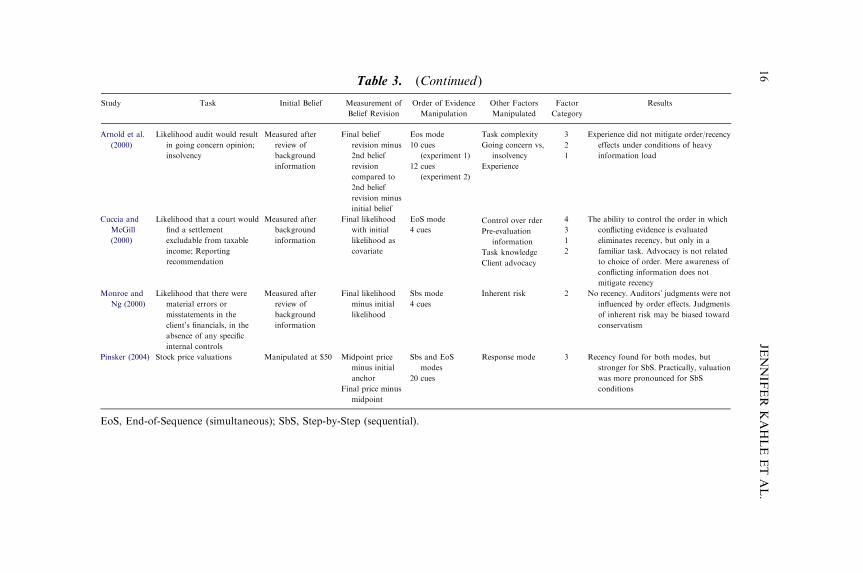
Table 3 provides chronologically a list of belief revision studies in
accounting and highlights the factors listed in Table 2. Specifically, of the 25
accounting studies listed, 19 have used the SbS processing mode. While a
few studies have used the EoS mode or consistent information, these have
generally been examined in addition to the SbS mode and mixed
information for comparison purposes. All but one of the studies have used
a short series of information (between 4 and 10 cues), with 4 cues being the
most common choice. These studies, along with the related findings, will be
discussed as they relate to the following sections.
Individual Psychological Factors
Individual psychological factors include both cognitive and affective factors.
Sixteen of the 25 studies listed examine, directly or indirectly, at least one
individual psychological factor. Studies of individual factors in accounting
have primarily focused on experience, a cognitive factor, and sensitivity
toward evidence, an affective factor. Task-relevant knowledge and
individual attitudes, including prior beliefs, have also been examined.
JENNIFER KAHLE ET AL.12
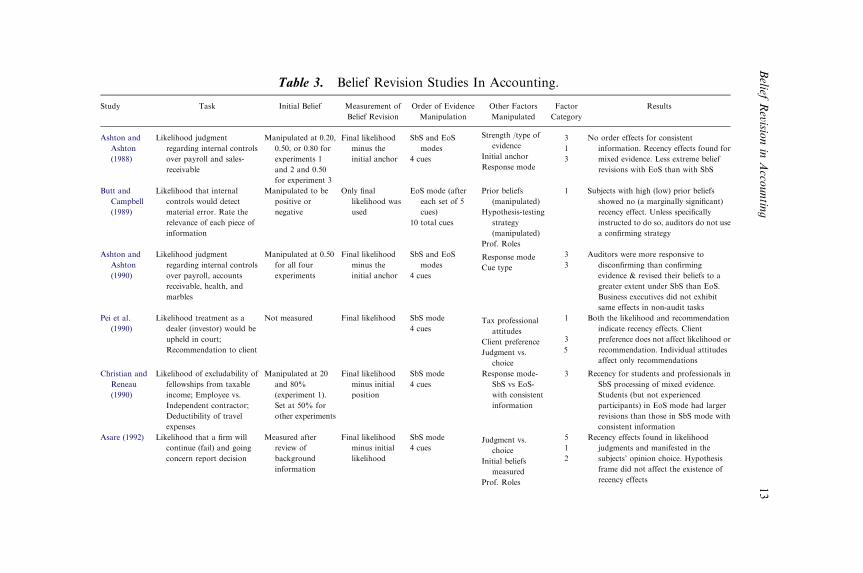
Table 3. Belief Revision Studies In Accounting.
Study Task Initial Belief Measurement of
Belief Revision
Order of Evidence
Manipulation
Other Factors
Manipulated
Factor
Category
Results
Ashton and
Ashton
(1988)
Likelihood judgment
regarding internal controls
over payroll and sales-
receivable
Manipulated at 0.20,
0.50, or 0.80 for
experiments 1
and 2 and 0.50
for experiment 3
Final likelihood
minus the
initial anchor
SbS and EoS
modes
4 cues
Strength /type of
evidence
Initial anchor
Response mode
3 No order effects for consistent
information. Recency effects found for
mixed evidence. Less extreme belief
revisions with EoS than with SbS
1
3
Butt and
Campbell
(1989)
Likelihood that internal
controls would detect
material error. Rate the
relevance of each piece of
information
Manipulated to be
positive or
negative
Only final
likelihood was
used
EoS mode (after
each set of 5
cues)
10 total cues
Prior beliefs
(manipulated)
Hypothesis-testing
strategy
(manipulated)
Prof. Roles
1 Subjects with high (low) prior beliefs
showed no (a marginally significant)
recency effect. Unless specifically
instructed to do so, auditors do not use
a confirming strategy
Ashton and
Ashton
(1990)
Likelihood judgment
regarding internal controls
over payroll, accounts
receivable, health, and
marbles
Manipulated at 0.50
for all four
experiments
Final likelihood
minus the
initial anchor
SbS and EoS
modes
4 cues
Response mode
Cue type
3 Auditors were more responsive to
disconfirming than confirming
evidence & revised their beliefs to a
greater extent under SbS than EoS.
Business executives did not exhibit
same effects in non-audit tasks
3
Pei et al.
(1990)
Likelihood treatment as a
dealer (investor) would be
upheld in court;
Recommendation to client
Not measured Final likelihood SbS mode
4 cuesTax professional
attitudes
Client preference
Judgment vs.
choice
1 Both the likelihood and recommendation
indicate recency effects. Client
preference does not affect likelihood or
recommendation. Individual attitudes
affect only recommendations
3
5
Christian and
Reneau
(1990)
Likelihood of excludability of
fellowships from taxable
income; Employee vs.
Independent contractor;
Deductibility of travel
expenses
Manipulated at 20
and 80%
(experiment 1).
Set at 50% for
other experiments
Final likelihood
minus initial
position
SbS mode
4 cues
Response mode-
SbS vs EoS-
with consistent
information
3 Recency for students and professionals in
SbS processing of mixed evidence.
Students (but not experienced
participants) in EoS mode had larger
revisions than those in SbS mode with
consistent information
Asare (1992) Likelihood that a firm will
continue (fail) and going
concern report decision
Measured after
review of
background
information
Final likelihood
minus initial
likelihood
SbS mode
4 cuesJudgment vs.
choice
Initial beliefs
measured
Prof. Roles
5 Recency effects found in likelihood
judgments and manifested in the
subjects’ opinion choice. Hypothesis
frame did not affect the existence of
recency effects
1
2
Belief
Revisio
nin
Acco
untin
g13
Pei et al.
(1992a)
Likelihood that dealer
(investor) treatment would
prevail if audited
Not measured Final likelihood SbS mode
4 cues
Experience
Client preference
1 Experienced professionals’ belief revisions
are affected by presentation order but
not client preference. Inexperienced
professionals display a reverse pattern
2
Kennedy
(1993)
Likelihood that a firm with
fail
Manipulated at 50% Final likelihood
judgment
EoS response
mode/SbS
processing
mode
8 cues
Accountability
Task complexity
(via subjects)
4 Recency effects found in complex tasks.
Accountability mitigated recency1, 3
Krull et al.
(1993)
Probability of need for a write
down of inventory
Not measured Final likelihood
judgment
SbS mode
4 cuesPresence of fraud
risk factors
Experience
2 Experience accentuated recency effects.
Fraud factors did not affect recency1
McMillan and
White
(1993)
Select hypothesis frame for
fluctuation in financial
statement ratio and
indicate likelihood of that
hypothesis
Measured after
selection of
hypothesis frame
1. ‘‘Absolute’’
final
likelihood
minus final
likelihood
2. ‘‘Relative’’
change in
likelihood
EoS mode
4 cues Hypothesis frame
Experience
Prof. Roles
1 Auditors react differently to evidence
depending on favored hypothesis
frame and belief extremity. Auditors
were more responsive to disconfirming
evidence than confirming evidence
when belief revision was measured on
an absolute scale, but not when relative
change in belief revision was measured
on a proportional scale
2
Messier and
Tubbs
(1994)
Probability of collection of an
account receivable; Review
evidence of subordinate
and make likelihood
judgment; Assign strengths
to evidence
Measured after
background
information
Final likelihood
minus initial
likelihood
EoS mode
4 cuesExperience
Review
1 Experience mitigates the recency effect.
Weak support that experience will
interact with the review process in
predicting recency for the review of a
subordinate’s work containing recency
4
Chan (1995) Likelihood the accounts
receivable balance is fairly
stated
Manipulated at 50 Final likelihood
minus initial
anchor
SbS mode
4 cues
Cognitive style 1 Significant interaction between cognitive
style and recency effects. Field
dependent auditors show greater
recency effects than field independent
auditors
Johnson
(1995)
Probability of need for a
write-down of inventory
Measured after
review of
background
information
Final probability
minus initial
probability
SbS mode
4 cuesGroup vs.
individuals
Age
Experience
4 Group-assisted final beliefs represented a
choice shift toward risk. Recency
found; age, but not years of experience,
significantly related to more
conservative final beliefs
1
1
Table 3. (Continued)
Study Task Initial Belief Measurement of
Belief Revision
Order of Evidence
Manipulation
Other Factors
Manipulated
Factor
Category
ResultsJE
NNIF
ER
KAHLEET
AL.
14

Cushing and
Ahlawat
(1996)
Likelihood that a firm will
continue and going
concern report decision
Measured after
background
information
Final likelihood
minus initial
likelihood
SbS mode
4 cues
Documentation
requirement
Judgment vs.
choice
4 Recency effect in the audit judgments of
no-documentation subjects, but not
among subjects who performed the
documentation task. No recency effect
on decision for type of report to issue
5
Hite and
Stock
(1996)
Probability of employee vs.
independent contractor;
Rate the strength of each
piece of evidence
Measured after
background
information
Final likelihood
minus initial
likelihood
SbS and EoS
modes
4 cues
Response mode
prior beliefs
3 Recency effects for SbS mode, even when
subjects have internalized prior beliefs.
Taxpayers were more sensitive to
negative than positive information.
Assigning (rather than measuring)
prior beliefs can lead to incorrect
inferences
1
Trotman and
Wright
(1996)
Likelihood that a firm will
continue; Assess the
strength of internal
controls
Measured after
background
information
Final likelihood
minus initial
likelihood
SbS and EoS
4 cuesResponse mode
Experience
3 Experienced managers do not display
recency effects. Students exhibit
recency for both tasks and both
response modes. Seniors exhibit
recency in all cases except EoS mode
for control evaluation task
1
Bamber et al.
(1997)
Likelihood that Inventory
fraud exists and likelihood
of collecting account
receivable; Rate each piece
of evidence
Manipulated at 50% Final likelihood
minus the
initial anchor
SbS mode
2 cuesExperience
Task (within subj)
1 Recency supported. Confirmation
proneness holds over both experience
levels and both contexts. Auditors are
also more sensitive to evidence when
the possibility of fraud exists
3
Tuttle et al.
(1997)
Stock trades in experimental
market (revise security
price beliefs)
Measured as initial
security price
Final price minus
initial price
SbS mode
4 cues
Experimental
market setting
2 Recency effect was found in experimental
asset markets
Ahlawat
(1999)
Likelihood of viability of
client (going concern)
Measured after
background
information
Final likelihood
minus initial
likelihood
SbS mode
6 cues
Group vs.
individual
accuracy,
confidence, and
severity of
recency
4 Recency found in individual auditors, but
not groups. Group memory was more
accurate and groups were more
confident than individuals
Anderson and
Maletta
(1999)
Likelihood of a material error
in sales/receivables and
number of planned audit
hours
Measured after
review of
background
information
Final likelihood
minus initial
likelihood
SbS mode
4 cuesInherent risk
Proportional vs.
Absolute
Measure
2 Auditors are susceptible to primacy effects
in settings that are relatively low in
inherent risk
1
Mayper et al.
(1999)
Likelihood that court will
uphold deduction of
worthless security; Final
recommendation to client
Measured after
background
information
Final likelihood
judgment with
initial
likelihood as a
covariate
EoS mode
4 cues
Staff conclusion 4 Order of arguments did not affect
reviewers’ likelihood assessments or
final recommendation. Staff conclusion
did affect likelihood assessment
Belief
Revisio
nin
Acco
untin
g15
Arnold et al.
(2000)
Likelihood audit would result
in going concern opinion;
insolvency
Measured after
review of
background
information
Final belief
revision minus
2nd belief
revision
compared to
2nd belief
revision minus
initial belief
Eos mode
10 cues
(experiment 1)
12 cues
(experiment 2)
Task complexity
Going concern vs,
insolvency
Experience
3 Experience did not mitigate order/recency
effects under conditions of heavy
information load
2
1
Cuccia and
McGill
(2000)
Likelihood that a court would
find a settlement
excludable from taxable
income; Reporting
recommendation
Measured after
background
information
Final likelihood
with initial
likelihood as
covariate
EoS mode
4 cues
Control over rder
Pre-evaluation
information
Task knowledge
Client advocacy
4 The ability to control the order in which
conflicting evidence is evaluated
eliminates recency, but only in a
familiar task. Advocacy is not related
to choice of order. Mere awareness of
conflicting information does not
mitigate recency
3
1
2
Monroe and
Ng (2000)
Likelihood that there were
material errors or
misstatements in the
client’s financials, in the
absence of any specific
internal controls
Measured after
review of
background
information
Final likelihood
minus initial
likelihood
Sbs mode
4 cues
Inherent risk 2 No recency. Auditors’ judgments were not
influenced by order effects. Judgments
of inherent risk may be biased toward
conservatism
Pinsker (2004) Stock price valuations Manipulated at $50 Midpoint price
minus initial
anchor
Final price minus
midpoint
Sbs and EoS
modes
20 cues
Response mode 3 Recency found for both modes, but
stronger for SbS. Practically, valuation
was more pronounced for SbS
conditions
EoS, End-of-Sequence (simultaneous); SbS, Step-by-Step (sequential).
Table 3. (Continued)
Study Task Initial Belief Measurement of
Belief Revision
Order of Evidence
Manipulation
Other Factors
Manipulated
Factor
Category
ResultsJE
NNIF
ER
KAHLEET
AL.
16
Cognitive-Experience
A large amount of accounting literature has found support for the idea that
a decision-maker’s experience has an effect on his or her judgment,
particularly for complex tasks (e.g., Davis & Solomon, 1989; Church, 1990;
Libby & Luft, 1993). Specifically, society expects more experienced
professionals to make higher quality judgments. Arguably, this should
occur because experienced decision-makers possess richer knowledge and
memory structures, as well as higher levels of confidence, which leads to
lower levels of sensitivity toward evidence received (Trotman & Wright,
2000). Based on this prior research, studies in belief revision posit that
greater order effects (lower performance) should occur among less
experienced individuals. However, findings in the belief revision literature
generally have not supported this view.
Experience in belief revision has been studied by examining the number of
years of experience (Pei et al., 1992a; Krull et al., 1993), age (Johnson, 1995),
experience titles (McMillan & White, 1993; Messier & Tubbs, 1994;
Trotman & Wright, 1996; Bamber et al., 1997), and task-related
experience/knowledge (Kennedy, 1993; Arnold et al., 2000; Cuccia &
McGill, 2000). Task-related experience, however, may be confounded with
input task factors. For example, an individual who has less experience with a
task is likely to consider the task more complex. Further, Trotman and
Wright (2000) argue that besides the task, experience is likely to have an
interactive effect with response mode and amount of information.
Measuring any single factor in isolation may be a cause of the lack of
consistent results supporting recency effects in experience studies. The
studies that examined task-related experience with task complexity will be
discussed later in conjunction with the discussion of input task factors.
Pei et al. (1992a) examined the impact of tax professionals’ experience on
belief revisions about ambiguous tax treatments. They found a significant
recency effect for experienced (5–13 years) tax managers, but not for
inexperienced (2–4 years) tax managers. One explanation for this result is
that a second manipulated factor, client preference, may have dominated the
results for the inexperienced participants. (Client preference is an environ-
mental factor and will be discussed in greater detail in the section
‘‘Environmental Factors.’’)
Krull et al. (1993) found similar results, whereby more experienced audit
managers exhibited greater recency effects than less experienced managers.
They, however, expected these somewhat counter-intuitive results. They
provided their participants with little background information, leading them
to predict that experienced participants would be more likely to recognize
Belief Revision in Accounting 17
the inadequacy of this information and place greater weight on the
subsequent information received.
Asare (1992) investigated order effects with different hypothesis frames
(viable or failing audit client) using audit partners and managers. He used
four pieces of evidence (two contrary and two mitigating) in both frames.
Significant recency order effects were found for both frames for these
experienced auditors.
Messier and Tubbs (1994) contend that the magnitude of the contrast
effect could be reduced if the participants had additional experience with the
stimuli. Consistent with this reasoning, they found that experience mitigated
recency effects. Only weak support was found for the proposition that
experience and the review process interacted to reduce recency effects. The
inconsistencies were arguably due to their use of different experience levels
(seniors and managers), task differences (more versus less background
information), and response mode (SbS versus EoS).
While not specifically hypothesized, McMillan and White (1993) found
that experience level (staff, seniors, and manager/partners) had no signi-
ficant effect on belief revisions for auditors after they evaluated confirming
or disconfirming evidence relative to a chosen hypothesis frame. Similarly,
Bamber et al. (1997) examined experience as it related to evidence sensi-
tivity. They concluded that inexperienced auditors (staff) were not more
sensitive to confirming evidence than experienced auditors (seniors).
Johnson (1995) examined two measures of experience: years on the job
and age of the participant. Age, but not years of experience, was signifi-
cantly associated with more conservative final beliefs. Despite the conser-
vatism related to age effect, recency did exist in an inventory write-down
task.
In sum, the majority of studies find either no recency effect for experi-
enced participants or more of a recency effect with experience. Therefore, we
conclude that the evidence suggests that experience does not necessarily
mitigate recency. However, task and response mode differences, the use of
different experience manipulations, and interactions between individual and
external factors make interpretation of the results across studies difficult.
Future research should continue to consider experience as an important
cognitive factor and seek to determine if experience only fails to mitigate
recency bias or actually increases recency bias.
Cognitive–Style
One accounting study manipulated cognitive style to find out if there was an
interaction with order effects. Chan (1995) had professional auditors assess
JENNIFER KAHLE ET AL.18
the likelihood that the accounts receivable balance of a fictional company
was fairly stated. Using the Group Embedded Figure Test (GEFT), he
separated auditors into field-dependent (those that have ‘‘spectator’’
learning approaches and are not able to separate items of information
from their contexts) and field-independent (those who have ‘‘active’’
learning approaches and tend to differentiate information into well-
distinguished components). Results indicated a significant interaction
between cognitive style and order effects, as the field-dependent auditors
showed greater recency effects than their field-independent counterparts.
These results add credence to understanding the learning and processing
behaviors of decision-makers and perhaps even training them to be more
active in learning about task procedures.
Affective–Sensitivity to Evidence
Hogarth and Einhorn (1992) discuss the importance of an individual’s
sensitivity to negative and positive evidence. These parameters are often
described as sensitivity toward disconfirming and confirming evidence,
respectively. Confirming or disconfirming evidence is determined with
respect to a professional’s initial hypothesis. Similarly, an individual who is
sensitive to negative or positive evidence may be paralleled to someone who
is an advocate or a skeptic, respectively. That is, the individual views
information as positive or negative with respect to the client-favored
position.
Sensitivity is a critical element of the belief-adjustment model. It is posited
to be a constant for each individual decision-maker. The contrast effect,
which determines whether there will be an order effect, is diluted as one’s
sensitivity to evidence decreases. Sensitivity, as posited by Hogarth and
Einhorn (1992), is a function of both individual factors (e.g., experience) and
external factors (e.g., client preference).
The model suggests that in the absence of prior information or biases,
people will be highly sensitive to evidence, but as they become more
committed to their beliefs, as with a long series of information, sensitivity
will decline. For example, as discussed by Messier and Tubbs (1994),
individuals with more experience (an individual factor) should be more
confident in an initial impression of a problem. This higher confidence
should lead the individual to be less sensitive toward confirming and
disconfirming evidence, resulting in a smaller recency effect. Messier and
Tubbs’ research supports this theory. However, Krull et al. (1993) found
opposite results for their experienced versus inexperienced participants.
They suggest that differences in the ambiguity of the initial information
Belief Revision in Accounting 19
provided to the participants may help explain the seemingly conflicting
results. Experienced auditors may have been better able to appreciate the
inadequacy of the initial information and were more sensitive, in general, to
subsequent information.
An individual may inherently be more prone to a particular sensitivity
toward evidence, or the individual’s professional role may affect his or her
sensitivity. There is evidence from psychology as well as accounting that
individuals have a general tendency to search for or give more weight to
evidence that confirms an initial hypothesis (e.g., Church, 1990; Klayman &
Ha, 1987) and is often referred to as a confirmation bias. Conversely, some
evidence from the auditing literature supports disconfirmation bias,
arguably due to the auditor’s role requiring professional skepticism (e.g.,
Ashton & Ashton, 1990; McMillan & White, 1993). These biases affect an
individual’s weighting of evidence, and consequently, can affect the
predictions of Hogarth and Einhorn’s (1992) model. In fact, recency effects
may become negligible if the decision-maker maintains an extremely
asymmetrical sensitivity toward evidence (Pei et al., 1990).
Eight accounting studies in belief revision have looked at an individual’s
sensitivity toward evidence. These studies primarily looked at sensitivity as
it is influenced by the accountant’s professional role. For example, several
studies examined whether auditors were more sensitive to disconfirming
evidence or whether tax professionals exhibited biases related to their
professional roles as client advocates. The studies will be detailed in the
discussion for ‘‘Professional Roles’’ in the section on ‘‘Environmental
Factors.’’
Bamber et al. (1997) attempted to measure an individual’s sensitivity to
evidence. By controlling for the subjective strength of evidence and the
degree of the contrast, they examined whether auditors were more sensitive
to a particular type of evidence. Bamber et al. discussed five possible
sensitivities, including evidence neutrality, confirmation bias, disconfirma-
tion bias, positive evidence bias, and negative evidence bias. They found that
auditors were more sensitive to confirming evidence, which is consistent with
the confirmation bias findings from the psychology literature (e.g., Lord,
Ross, & Lepper, 1979; Nisbett & Ross, 1980).
Affective–Professional Attitudes
Pei et al. (1990) suggested that tax preparers’ attitudes might affect their
recommendations to clients and possibly their decision processes as well.
They explored tax professionals’ attitudes relative to (1) the relative
frequency of evasion, (2) the morality of evasive or aggressive tax reporting,
JENNIFER KAHLE ET AL.20
(3) the individual’s self-insight as to their aggressiveness, and (4) the
perception of the tax professional’s responsibilities to client and govern-
ment. In the study, tax professionals were asked to express a belief about the
likelihood of an ambiguous tax treatment (dealer versus investor classifica-
tion) prevailing upon an audit and to provide a recommendation to the
client. A significant recency effect was found for both the likelihood and
recommendation. Only the morality and self-insight attitudes were
associated with the client recommendation, and none were significantly
related to the likelihood judgment. Therefore, this study provides some
evidence that individual attitudes can impact a tax professional’s final
judgment.
Affective–Initial Beliefs
Accounting studies have recognized the importance of correctly measuring
the initial anchor (belief) and the participants’ belief revisions. The belief-
adjustment model relies heavily on prior beliefs as an input into the model.
Prior beliefs provide an anchor from which decision-makers adjust when
presented with additional evidence (Butt & Campbell, 1989).
Originally, many studies used background facts to manipulate a
participant’s initial belief. Ashton and Ashton (1988) manipulated initial
belief by describing the likelihood that controls would prevent or detect
material error to be 20, 50, or 80%. They found support for Hogarth and
Einhorn’s (1992) contention that smaller (larger) anchors are helped (hurt)
more by positive (negative) evidence than larger (smaller) anchors. Many
later studies (Ashton & Ashton, 1990; Kennedy, 1993; Bamber et al., 1997;
Pinsker, 2004) assigned an initial belief to the participants in order to
provide a consistent starting point for measuring recency.
Rather than assigning an initial belief, Butt and Campbell (1989)
recognized that having participants come to their own conclusions about
the initial belief gave more assurance that the researcher had actually
captured their priors. They measured participants’ initial beliefs after
presenting them with background information designed to induce either low
or high priors, and found recency effects only for participants with induced
low prior beliefs. Asare (1992) recognized that there also could be possible
source credibility issues in manipulating initial beliefs and similarly,
measured participants’ initial beliefs on likelihood scales. Unlike Butt and
Campbell, Asare found recency effects in both groups examined.
Hite and Stock (1996) found significant differences between belief
revisions for participants receiving assigned prior beliefs and those whose
prior beliefs were measured. They theorized that participants do not
Belief Revision in Accounting 21
internalize an assigned prior belief, therefore, the mean belief revision for
these participants may include measurement error. Hite and Stock
concluded that assigned prior beliefs are appropriate only when: (1) actual
priors are close to those assigned, (2) participants have no prior beliefs, or
(3) participants have weak internal priors.
McMillan and White (1993) recognized the possible scale effects that
could result from the strength of the initial belief in measuring a
participant’s belief revision. They pointed out, for example, that if a
participant’s initial likelihood score was 70% and the participant evaluates
confirming evidence, a 30-point range is available for upward revision.
Conversely, if the participant evaluates disconfirming evidence, a 70-point
range is available for downward revision. To control for scale effects, they
used a proportional measure for the participants’ belief revisions in addition
to the usual absolute measure. They found that the two measures of belief
revision do not provide consistent results for the effect of evidence direction
on the magnitude of belief revision. However, Anderson and Maletta (1999)
found that the scaled (proportional) measure of belief revision is consistent
with the unscaled (absolute) measure in their study of primacy effects.
With the exception of the last two studies mentioned above, the vast
majority of the accounting studies have used the final judgment minus the
beginning judgment as the measurement of belief revision. However, it is
important for future research to recognize the potential limitation of an
absolute measure due to the scale effects discussed above. Furthermore, a
comparison of the proportional measure to the belief-adjustment model’s
measurement of belief revision (as used by Bamber et al., 1997) reveals that
both have a similar method for examining belief revision processes when the
strength of evidence is constant for all evidence.
In general, the research to date suggests that individual psychological
factors, such as experience, fail to mitigate recency bias. However, limited
research concerning cognitive learning style shows active learning approaches
may mitigate some recency bias. Affective factors such as sensitivity to
evidence, professional attitude, and initial belief have been shown to affect
final judgments either directly or indirectly. Both confirmation and
disconfirmation biases have been documented with respect to sensitivity to
evidence and professional role. Initial beliefs have been shown to effect belief
revision differentially depending on whether the initial belief has been
assigned or measured. With respect to cognitive and affective factors, limited
research demonstrates that experience does not necessarily reduce sensitivity
to evidence. Studies have provided conflicting results, which indicates the need
for future research in the area of individual affective psychological factors.
JENNIFER KAHLE ET AL.22
Environmental Factors
As previously discussed, Hogarth and Einhorn’s (1992) model outlines a
framework explaining how external variables and processing factors interact
to produce order effects in belief updating. There are two types of external
variables – environmental and input task factors. Environmental factors
concern risks and rewards that are present in the decision-maker’s
environment. This may be due to the role of the decision-maker, the
particular characteristics of the client she/he is serving, or the inherent risk
present in the decision environment. Decision-makers do not operate in a
vacuum, and cognitive models should reflect the potential influence of items
such as the client, regulatory agencies, and professionals’ employers
(Roberts, 1998). Studies which have examined these environmental factors
are discussed below. Input task factors are described and discussed in the
following section.
Professional Roles
Hogarth and Einhorn (1992) suggest that an individual’s professional role
might produce differential ‘‘sensitivities’’ to evidence, and they discuss how
these differential sensitivities are considered to be advocate or skeptic
attitudes. Within each decision context, accounting professionals face
pressures that may cause them to be differentially sensitive to positive and
negative evidence. Accountants are charged with professional skepticism in
audit and assurance services (AICPA, 1995, AU, 316.16). On the other
hand, tax professionals have an obligation to act as a client advocate and to
interpret the law in the client’s best interests (AICPA, 1995). As discussed by
Cuccia and McGill (2000), the tax professional is a goal-oriented decision-
maker with an incentive to propose and defend client-favored propositions.
All accounting professionals must maintain objectivity in their professional
judgments (AICPA, 1995) and face litigation risks in both audit and tax for
non-objectivity. (Tax professionals face penalties for overly aggressive
positions under Code Section 6694.) Thus, the role of the accountant should
influence the process of belief revision. Seven studies in addition to the
Bamber et al. (1997) study mentioned previously, examine professional roles
and their influence on sensitivity to evidence in the belief-adjustment
process. The studies that have examined auditor belief revision will be
discussed first followed by the studies that have examined tax professionals’
belief revision.
Ashton and Ashton (1990) used both auditors and business executives for
auditing and non-auditing tasks. Their results indicated auditors were more
Belief Revision in Accounting 23
sensitive to disconfirming than confirming evidence, but business executives
were statistically indifferent.
Butt and Campbell (1989) had participants use a confirming, disconfirm-
ing, or neutral strategy to evaluate the strength of an internal control
system. They found recency effects with participants who had low initial
beliefs. However, they found no support for the use of a confirming strategy,
and concluded that auditors were more naturally disconfirming.
Asare (1992) manipulated the participants’ hypothesis frame to investi-
gate the effects of confirmation bias and order effects. He had participants
make judgments about the failure (viability) of a firm and choose the type of
opinion they would issue. In support of the belief-adjustment model, he
found that recency exists in both belief revisions and audit report choices.
Hypothesis frame did not affect the existence of recency, and thus,
experienced auditors did not exhibit a confirmatory strategy.
McMillan and White (1993) found that auditors’ belief revisions were
significantly larger for disconfirming evidence than for confirming evidence
when the absolute measure is used (similar to Ashton & Ashton, 1988,
1990), but not significantly different when the proportional measure is used.
This raises issues about whether the absolute measure, which has been used
by most studies in belief revision, is the most appropriate way to measure
belief revisions.
Overall, studies examining audit professionals tend to find that auditors
are more sensitive to disconfirming evidence. This is not surprising in light
of their role and their requirement to exhibit professional skepticism.
Conversely, Christian and Reneau (1990) found that professional tax
participants were much more influenced by evidence supporting than by
evidence opposing the client’s preferred treatment. This was contrary to the
equal sensitivity displayed by student participants in the same ambiguous
tax judgment case. Christian and Reneau suggested that the professionals’
asymmetric sensitivity may be due in part to the client advocacy relationship
between tax professionals and their clients. Consistent with the idea that the
advocacy role of tax professionals may influence belief revision, Pei et al.
(1992a) found that the client preference induced an attention directing effect
such that the tax professional was more sensitive to evidence favoring the
client’s preferred treatment.
Cuccia and McGill (2000) included a measure of client advocacy in their
experiment examining tax professionals’ judgments of an ambiguous tax
issue, and the potential mitigating influence of control over order of
evidence evaluation. They found that 57% of participants chose to examine
positive evidence first, but that client advocacy was not related to that
JENNIFER KAHLE ET AL.24
choice. Thus, confirmation proneness was ruled out as an alternative
explanation to the mitigating influence of control.
Tax professionals appear to be driven by the client preference in their
judgments, which seems reasonable given their charge to be client advocates.
Importantly, these studies appear to find differences in belief revision
between auditors and tax professionals, indicating the important influence
of professional roles on sensitivity to evidence. The evidence regarding tax
professionals reflects a tendency toward a client advocacy in most cases,
rather than the tendency to be biased toward disconfirming evidence as
shown by auditors. Future research should also examine whether profes-
sional role effects are dependent upon the particular decision environment
(audit or tax task).
Inherent Risk
Four studies have examined audit fraud or inherent risk as an environ-
mental factor that can influence the robustness of the belief-adjustment
model. Krull et al. (1993) suggested that perceptions of very high (low) risk
of fraud factors should foster heightened (lessened) sensitivity to evidence
suggestive that fraud exists. Results indicated that the presence or absence of
fraud signals did not mitigate or accentuate order effects. Thus, auditors’
sensitivity to information may not be differentially affected by the perceived
risk of fraud. However, this is based on the effect of fraud factors on the
belief revision. They note the limitation that no attempt was made to
separately measure the effect of the fraud factors on sensitivity to evidence.
Bamber et al. (1997) investigated whether auditors exhibited different
sensitivity toward evidence when the initial hypothesis involved a possible
irregularity. They measured sensitivity to evidence for a non-fraud case and
a fraud case and found that auditors’ attitudes changed in response to the
audit context. Auditors exhibited a heightened sensitivity (conservatism)
when confronted with the possibility of fraud.
In a somewhat atypical belief revision study in accounting, Anderson and
Maletta (1999) examined auditors’ susceptibility to primacy. They predicted
that primacy would result when there was a low-risk audit environment and
an information sequence with late positive information. Their argument was
based on prior psychology research, which states that primacy is a function
of diminishing cognitive effort in the evaluation of a sequence of
information, and that cognitive effort depends upon the risk associated
with the decision task (Anderson, 1981; Fiske, Kinder, & Larter, 1983). In
addition, Anderson and Maletta argued that auditors, by nature, have a
heightened sensitivity to negative information, and thus, may not exhibit
Belief Revision in Accounting 25
diminished cognitive effort with late negative information. The results were
consistent with their predictions for primacy in a low-risk, late positive
information situation.
Finally, Monroe and Ng (2000) had auditors investigate the likelihood
there were material errors or misstatements in a fictional client’s financial
statements, in the absence of any specific, related internal controls. No
recency effects were found, as auditor judgments were not influenced by
order. Similar to Bamber et al. (1997), judgments of inherent risk may have
been biased toward conservatism, and thus outweighed recency effects. It
appears that auditors tended to be more sensitive toward disconfirming
evidence, potentially due to their role requirement to maintain professional
skepticism. In other words, they placed more weight on disconfirming
evidence regardless of presentation order. Thus, it appears that increased
inherent risk may exacerbate the tendency toward conservatism.
Experimental Markets
In a unique application of the belief-adjustment model to a more complex
setting, Tuttle, Coller, & Burton (1997) examined the basic order effect
predictions using an experimental assets market. Contrary to the efficient
market hypothesis, which states that the market impounds new information
quickly and without bias into security prices, they found the existence of
recency effects in a market setting. Their study provides support for the
robust nature of the belief-adjustment model and demonstrates that
systematic, individual biases can survive in a market setting.
Client Characteristics
Client characteristics, such as the size or importance of a client, revenue
potential, and risk preference/aggressiveness are expected to influence
accountants’ decisions. For instance, studies have found a link between
client risk preference and aggressiveness of tax recommendations (e.g.,
Schisler, 1994). While these are important environmental characteristics, we
could find no studies that specifically examined the impact of these variables
on belief revision. This is an area that future research may want to address.
Input Task Factors
Task factors are the second type of external variables discussed. Beginning
with Ashton and Ashton (1988), some of the basic predictions for task
variables were tested in accounting. As the literature has developed, belief
JENNIFER KAHLE ET AL.26
revision predictions have been examined under more complex environments,
including those where the individual has control over the order of evidence,
where documentation is required, where accountability is salient, where the
information load is higher, and even in an experimental market setting.
Nineteen of the 25 accounting belief revision studies cited have examined at
least one of the following task factors.
Type of Evidence and Response Mode
It may be recalled that response mode, in combination with the complexity
of the information, should dictate the processing mode an individual will
use. According to the belief-adjustment model, SbS processing must be used
with SbS response mode. However, SbS or EoS processing can be used with
EoS response mode depending on cognitive demands. Predictions of the
belief-adjustment model also depend on the type of the evidence (e.g.,
whether it is mixed or consistent).
Ashton and Ashton (1988) were the first to test Hogarth and Einhorn’s
(1992) model in an accounting environment. They used a series of five
experiments to test the basic model predictions for consistent versus mixed
information, EoS versus SbS response modes, and the strength of initial
evidence with consistent information (two task variables). No order effects
were found for consistent information, but recency was found for mixed
evidence. Results generally supported the belief-adjustment model predic-
tions of no order effects for consistent information, recency effects for mixed
evidence, and less extreme revisions with the EoS than the SbS response
mode. A later study by Ashton and Ashton (1990) using a series of two
‘‘accounting’’ studies and two ‘‘non-accounting’’ studies confirmed the
results.
Most studies in accounting have investigated the SbS mode with mixed
evidence, and have generally found the existence of recency effects. A few
studies, in addition to Ashton and Ashtons’ (1988, 1990), have specifically
looked at comparing EoS versus SbS response mode and mixed versus
consistent evidence. Consistent with the model predictions, Christian and
Reneau (1990) found that recency effects existed for both students and
experienced tax professionals when mixed evidence regarding an ambiguous
tax case is presented in a SbS mode. However, they found conflicting results
for consistent evidence. Students exhibited larger belief revisions in the EoS
mode than in the SbS mode, but experienced participants were unaffected by
response mode. Christian and Reneau pointed to the need to measure an
individual’s sensitivity to evidence before conclusions regarding response
mode can be appropriately drawn.
Belief Revision in Accounting 27
Hite and Stock (1996) also supported model predictions with their study
involving taxpayer judgments of an ambiguous tax issue (independent
contractor versus employee). In the participants’ evaluation of mixed
evidence, results were consistent with a recency effect in the SbS response
mode and a tendency toward primacy in the EoS mode. Similarly, Trotman
and Wright (1996) found that, for less experienced participants, recency
existed for a going concern task in either response mode, but not in the EoS
mode for a control evaluation task. However, they did not find recency
effects for more experienced participants in either response mode.
Pinsker (2004) examined stock price valuations from unsophisticated
investors given a different frequency of consistent information releases.
Continuous (SbS) conditions had significantly different valuations in the
direction of the information provided than periodic (EoS) conditions at the
midpoint evaluation of information releases, but not after all of the
information had been released. However, recency was detected after all
information items were released.
Making accurate conclusions regarding the EoS response mode is difficult
since the particular response mode does not automatically guarantee that
the EoS processing mode will be used. Overall, it appears that the SbS
processing model predictions are supported for recency in the evaluation of
mixed evidence and mixed for consistent evidence. The results of these
studies have important implications for practice in both audit and tax tasks.
In particular, when a task requires SbS processing and responses, a recency
bias may be inherent. Structuring the review process as EoS may be helpful
in alleviating some of the bias introduced during the evidence collection
stage. Future research should consider task processing characteristics and
examine task structure as a means of potentially mitigating the recency bias.
Task Complexity
As previously discussed, predictions regarding task complexity are often
commingled with experience predictions. Hogarth and Einhorn (1992)
define complexity as a function of (1) the amount of information that needs
to be processed (task factor), as well as (2) the lack of familiarity with the
task (individual factor). Familiarity with a task can overcome task
characteristics and render an inherently complex task to be one that is
relatively ‘‘simple’’ for an experienced person (Trotman & Wright, 1996).
Although the belief-adjustment model predicts recency effects for the SbS
mode regardless of task complexity, several authors (e.g., Kennedy, 1993;
Trotman & Wright, 1996; Arnold et al., 2000) have suggested that
complexity or experience may mitigate the effect.
JENNIFER KAHLE ET AL.28
Kennedy (1993) explored task complexity by using two groups of
participants; those who should be unfamiliar (M.B.A. students) and those
who should be familiar (auditors) with a going concern judgment task. She
suggested that task complexity can affect the processing mode used by an
individual. When the task is complex, individuals are likely to use a SbS
processing strategy to ease the cognitive demands of the task. Conversely,
easier tasks should elicit an EoS processing strategy and be less susceptible
to recency effects. She found evidence consistent with EoS processing and
no recency effects for auditors. Consistent with expectations, she did find
recency effects for the MBA students.
Similarly, Trotman and Wright (1996) examined task complexity and
experience, suggesting that the interaction of these variables was likely to be
instrumental in determining whether a task was ‘‘simple’’ or ‘‘complex’’ for
an individual to perform. They considered the judgments of students,
seniors, and managers in both a going concern case and an internal control
evaluation case. Trotman and Wright expected that the familiarity of each
task would depend on the participants’ experience level, and that
participants performing more familiar (simpler) tasks would exhibit less
recency. Their results support the predicted experience effect. A recency
effect was found for students and seniors for both tasks. The use of EoS
response mode mitigated this effect for seniors in the more familiar task. In
contrast, managers did not exhibit recency effects for either task.
One of the more recent studies to include the effect of task experience on
belief revision is Cuccia and McGill (2000). They examined tax profes-
sionals’ likelihood judgments in a familiar versus an unfamiliar task. Similar
to Trotman and Wright (1996), Cuccia and McGill found that if an
individual has control over the order in which evidence is examined, recency
is mitigated in a familiar task, but not in an unfamiliar task.
Arnold et al. (2000) took a different approach to task complexity. They
operationalized complexity as high information load (number of cues). They
argued that even given a high level of task familiarity, a task could still be
considered complex within the definition set forth by the belief-adjustment
model if the information load received by the decision-maker was high (a
condition consistent with many accounting tasks). Under both going
concern and insolvency experiments, Arnold et al. found experience did not
mitigate recency under conditions of high information load. This result
raises some questions as to the methodology for measuring task complexity
in future research. Specifically, it would appear that an interaction of
response mode, task familiarity/experience, and information load is present
and needs to be considered simultaneously in future studies.
Belief Revision in Accounting 29
Environmental factors and input task factors are the external factors that
influence the belief revision process of accounting professionals. As
discussed above, research has found that these factors influence how
individuals interpret information and ultimately make decisions. The
specific environment created by items such as client factors, the decision-
maker’s role, and inherent risk in the decision-maker’s environment can
differ for each decision-maker. To completely understand the belief revision
process, researchers must account for the effects of these factors. By
grouping the factors according to Roberts’ classifications, we separate these
external factors from those that are internal (unique characteristics of the
specific decision-maker). Thus, we can more appropriately identify what
factors may be able to be externally controlled (e.g., choosing more
conservative clients) versus those that may be need to be internally
controlled (e.g., gaining more experience or knowledge with an issue).
Processing Factors
Seven studies have attempted to identify factors that may mitigate or
eliminate the recency bias. Aside from the mixed results for experience as a
mitigating factor, other potential mitigating factors that are particularly
meaningful to accounting have been examined. These factors include
accountability, required documentation, the review process, use of groups,
and control over the order of evidence evaluation.
Kennedy (1993) examined whether accountability, defined as the
requirement to justify one’s judgments to others, mitigates recency.
Generally, accountability is thought to have the ability to influence the
information attended to, the complexity and type of information processing,
and ultimately the decision or judgment made. Kennedy suggested that
accountability may induce individuals who resort to effort-saving strategies,
such as SbS processing, to supply the requisite effort for EoS processing,
thereby overcoming recency. She asked MBA students and audit managers
to make going concern judgments using EoS response mode. MBA students
who were less familiar with the task exhibited recency effects. However,
when accountability was imposed, no recency effects were found, suggesting
that accountability mitigates recency. Audit managers who were familiar
with the task were not expected to, and did not, exhibit recency under either
condition.
Using similar logic (e.g., that greater effort will mitigate recency), Cushing
and Ahlawat (1996) examined documentation as a potential mitigating
JENNIFER KAHLE ET AL.30
factor. Documentation can be viewed as a processing factor eliciting greater
cognitive involvement, similar to accountability. Cushing and Ahlawat
asked auditors to draft a memorandum to the audit partner providing
reasons supporting the recommended audit opinion. The documentation
task was expected to induce greater effort resulting in better information
recall and comprehension, greater levels of attention to the task, and
improved problem-solving representation. All of these factors should
contribute to a process that did not place undue weight on information
received most recently. As predicted, a recency effect was present in the
audit judgments of no-documentation participants, but disappeared among
those who performed the documentation task.
Two studies have examined how the review process affects the predictions
of the belief-adjustment model. Messier and Tubbs (1994) proposed that a
review responsibility produces an averaging process when integrating the
beliefs of one’s own with a subordinate. They predicted that experience and
the review process would interact in predicting recency effects when an
auditor reviewed a subordinate’s judgment that contained a recency effect.
However, their results did not support their prediction.
Mayper, Anderson, and Kilpatrick (1999) examined the impact of the
review process in a tax setting using a staff’s tax memorandum. The
memorandum included the staff’s arguments for and against the deduction
of a worthless security and their final conclusion on the judgments of a tax
manager or partner reviewer. Mayper et al. found that the order of
argument presentations in the memorandum did not produce a recency (or
primacy) effect in the reviewers’ judgments. This provides support for the
effectiveness of the review process in reducing recency effects. However,
Mayper et al. were careful to point out that experience (partner and
managers were used here) may be an alternative explanation for the
mitigated recency effect.
Two auditing studies examined whether or not use of groups in the
decision-making process would mitigate recency. Johnson (1995) investi-
gated the probability of a need for the write-down of inventory in both
group and individual decision-making contexts. Although recency was
discovered overall, information order did not result in recency for the
group-assisted condition. In fact, for the bad news–good news sequence, the
group-assisted condition actually revised their final valuation downward,
indicating a primacy effect. Additionally, the manner of the revision for the
group-assisted conditions was in the direction of greater risk. The groups
actually revised their probabilities of inventory obsolescence downward for
all information orders.
Belief Revision in Accounting 31
Ahlawat (1999) had auditors state their likelihood of client viability in a
going concern case using either group or individual decision-making
processes. Results indicated recency effects for individual auditors, but
not for groups. Additionally, group memory was more accurate and groups
were more confident as compared to individuals.
A final processing factor, control over the order in which evidence is
evaluated, was examined by Cuccia and McGill (2000). Control over order
is important in tasks such as the search of tax databases, which allow
organized access to selected pieces of evidence. For example, a search of tax
court cases may allow the professional to review all the positive cases first or
all of the negative cases first. As discussed by Cuccia and McGill, an
individual’s ability to process information depends on the congruence of the
information’s organization with its intended use. Allowing control over
evidence evaluation order would facilitate the use of a preferred decision
strategy, thereby reducing the complexity of the task and the susceptibility
to recency. Results of the study found ability to control the order of
evaluation of conflicting evidence eliminated recency in a familiar task.
Recency was observed only when participants had no context-relevant
knowledge or were precluded from structuring the task. Additionally, mere
knowledge (pre-evaluation information) that conflicting evidence would
exist was not sufficient to mitigate recency.
The factors discussed above examine order effects in a more complex and
realistic environment. Results indicate that accountability, documentation,
reviewing, using groups, and controlling evidence order can be effective in at
least reducing, if not eliminating, recency effects. Given that many of these
characteristics (e.g., accountability, review) are present in both audit and tax
contexts, the previously observed recency biases may be easily mitigated in a
real-world environment.
Justification requirements and accountability pressures influence the
amount of cognitive effort individuals will exert on a decision task. Thus,
research on processing factors provides further evidence that researchers
cannot look at the effect of one variable in isolation of other factors.
Inclusion of these processing factors provides researchers a path for
examining ways to overcome many effort-related decision biases. It is
important for future research to continue to consider the effects of recency
and other biases within the context of these processing factors to enable
accurate conclusions to be drawn about the true consequences to accounting
decisions.
While recent research has examined more complex environments, there
are still additional variables as recommended by Hogarth and Einhorn
JENNIFER KAHLE ET AL.32
(1992) that have not been previously examined. These variables include:
time pressure, temporal delays, the effects of interrupting updating tasks,
and how roles and incentives might affect differential sensitivity to negative
and positive information. These factors are relevant in an accounting
environment and deserve attention in belief revision research.
Output Task Factors
An output task factor refers to the actual decision of the participant in an
experiment (as opposed to the judgment process used to arrive at the
decision). In the accounting literature, the most common decisions
requested from participants have been likelihood judgments. Audit
participants have judged items such as the likelihood of material error in
an account, the likelihood of collection of an account, and the likelihood
that a firm will continue. Tax participants have been asked to judge the
likelihood of events such as whether a court will rule in favor of an
ambiguous expense deduction (income exclusion), whether an individual
should be considered an independent contractor, or whether a client meets
the requirements of a real estate investor or dealer. Financial participants
have judged the price for one share of stock. Although all studies have an
output task factor, three studies have explicitly discussed this factor as a
variable in their results.
Asare (1992) pointed out that there is a distinction between judgment and
choice. The observed differences in likelihood assessments do not allow an
inference that different actions always will result. Therefore, he examined
the separate effects of order presentation on likelihood judgments and
choices. In addition to asking participants to assess the likelihood that a firm
will continue, Asare also asked them to make a going concern report
decision. He found support for recency in both the judgment and the choice.
Inconsistent with Asare’s (1992) results, Cushing and Ahlawat (1996)
were not able to replicate the recency effects for the decision in a similar
going concern task. However, consistent with Asare (1992), in a tax
experiment where subjects provided the client recommendation as well as a
likelihood assessment, Pei et al. (1990) found that both dimensions exhibited
recency effects.
To date, the limited research in this area suggests that perhaps recency
effects carry over from the judgment task and influence output task factors,
such as choice. Although most researchers have been concerned with
whether presentation order affects the judgment processes of individuals, it
Belief Revision in Accounting 33
is often a dichotomous decision (e.g., recommendation whether or not to
deduct and expense, decision to issue a going concern opinion, etc.) that
affects the client. Thus, there is value in understanding how likelihood
judgments are manifested into actions or decisions. Future research should
examine if recency effects automatically carry over from the judgment
process to the action or if this occurs in only certain situations.
CONCLUDING REMARKS
In the absence of some mitigating factor, recency predictions of the belief-
adjustment model have generally been supported in auditing, tax, and
financial reporting tasks. Of the 25 studies we have included in this paper, 21
found recency effects for at least some combination of the factors
researchers included in their studies. This is consistent with the basic
predictions of Hogarth and Einhorn’s (1992) belief-adjustment model.
Many of these 21 studies, along with the other 4 studies, also found specific
factors that either outweighed or mitigated recency effects or created
entirely different biases (e.g., confirmation bias).
Trotman and Wright (2000) suggested that the Hogarth and Einhorn
(1992) model needs to be adapted and revised to include the uniqueness of
auditing (accounting) tasks. While the belief-adjustment model appears to
be a reasonable model for examining accountant’s belief revisions, we agree
that the model can be expanded to better fit accounting tasks. While
Hogarth and Einhorn (1992) suggest that individual and external variables
influence the belief-adjustment process, they only distinguish their overall
predictions for three task variables (complexity, length of the series of items,
and response mode) and two encoding variable (processing mode and task
type). The model does not make specific predictions about experience, client
pressures, accountability, professional roles, time pressure, the review
process, etc. These are factors that are specifically important to belief
revision in accounting and should be incorporated into the model.
The 25 studies provide clear evidence that (1) individual psychological
factors such as experience, initial beliefs, and sensitivity toward evidence;
(2) environmental factors such as individual role and inherent risk; (3) input
task factors such as type of evidence and response mode; (4) processing
factors such as processing mode and accountability; and (5) output task
factors such as likelihood judgment and recommendation (or choice), all can
impact the process by which accountants update their beliefs. The current
JENNIFER KAHLE ET AL.34
chapter’s application of Roberts’ (1998) framework to the belief-adjustment
model literature seems appropriate as a framework and represents a much-
needed summation of the research stream.
Prior studies have not provided a general framework from which to view
the belief revision process. By using Roberts’ (1998) categorization, we have
provided such a framework. As can be seen from the studies reviewed in the
current chapter, each of these categories of factors affects the way
accountants make decisions. More importantly, as several of the studies
indicate, the factors can interact with one another, thus, providing detailed
information about the belief revision process.
The factor categories may be thought of as an overall framework where
each category influences other categories within the model. A true
understanding of the process by which individuals revise beliefs should be
examined with all of these categories in mind. For instance, an individual’s
experience level may influence his or her initial belief (as well as subsequent
belief revisions) in a sequential decision task. The subsequent belief revisions
also may be impacted by that individual’s sensitivity to evidence, which may
first be influenced by their professional role (e.g., as an advocate or a
skeptic). Additionally, task factors, such as response mode, and processing
factors that may mitigate biases (e.g., accountability) or otherwise influence
how individuals revise their beliefs should be considered in understanding
the complete process.
As presented in Table 3, our review indicates that 17 of the studies
included one or more variables from at least two of the factor categories.
Sixteen studies examined individual psychological factors, with six of those
studies examining multiple individual factors. Ten studies examined at least
one environmental factor, while 11 studies examined at least one task factor.
Seven studies specifically investigated processing factors, and three studies
directly compared output task factors.
Most studies examined variables from either the individual or the external
factor categories. These processing factors were examined primarily to
understand whether they had any mitigating influence on the biases
associated with the belief-adjustment process (e.g., recency effects). There
is room for additional examination of processing and mitigating factors,
especially in conjunction with the other factor categories. These mitigating
factors are important in forming more realistic expectations about how
presentation order might affect accounting professionals in their true
environment. Accountability pressures, the review process, control over
order evaluation, and group discussion are all relevant factors that influence
an accounting professional’s decisions. These items should be considered in
Belief Revision in Accounting 35
order to more accurately generalize the findings from behavioral experi-
ments to accounting practice.
Some of the conflicting evidence found in the accounting studies,
especially in the area of experience, may be attributable to differences in
the researchers’ experimental designs. The differences include the actual task
used, response mode variations, number and length of cues used, control of
the initial anchor, and belief revision measurement. By controlling for these
differences in future studies, researchers can begin to understand better
under what conditions experience, and other factors, influence accountants’
belief revisions. Conflicting results may also be due to the moderating
influences of some factors on other factors. For example, accountability
may mitigate order effects for inexperienced accountants, but not
experienced accountants. Knowledge of the particular individual, environ-
mental, input task, processing, and output factors present in the
environment under investigation will enable more accurate conclusions to
be drawn about these variables’ effects on accountants’ decisions.
Future Directions
Based upon the research in this area, all individuals, regardless of experience
level, appear to be susceptible to biases in judgment and decision making.
Thus, we suggest rather than focusing on whether a particular bias exists,
the aim of future research should be not only to better understand the
judgment process, but more importantly to improve judgment and decision-
making.
Using our framework, we can identify areas of the belief-adjustment
model that need further research. One aspect of the belief-adjustment model
that has not been fully examined is the effect of individual and
environmental factors on an individual’s sensitivity to evidence. Prior
research has generally failed to separate this effect from the impact that
these factors have on belief revision. An individual’s sensitivity to evidence is
a large factor in whether the predicted contrast effect will occur. While
Bamber et al. (1997) measured sensitivity, they did not examine whether
greater sensitivity translates into a larger recency effect. Additionally,
examining sensitivity more closely may provide more insight into how
information is actually processed.
Related to this issue is the use of process-tracing measures to more closely
examine cue usage by individuals. If individuals use the anchoring and
adjustment heuristic, the contrast effect may result in recency effects.
JENNIFER KAHLE ET AL.36
However, individuals may not necessarily spend more time on these later
cues. Thus, training accountants to allocate their time spent evaluating
evidence in a particular manner may be able to mitigate recency effects.
The effects of temporal delay and interruptions are additional factors that
are particularly interesting in the accounting environment. Information in
audit, reporting, and tax tasks is often received piecemeal. Interruptions
during tasks may cause delays or pauses between the review of evidence, and
possibly reduce the effect of the contrast. As Kennedy (1993) indicated,
recency can result from an effort-related judgment bias. If recency can be
mitigated by effort-inducing strategies, it is possible that time pressure and
payment incentives may induce the requisite effort needed to mitigate
recency as well.
Much more research is needed in examining plausible methods for
mitigating recency effects. As Arnold et al. (2000), Krull et al. (1993), and
Asare (1992) found, experience alone does not mitigate recency. Strategies
are necessary to avoid potentially disastrous results (e.g., not identifying a
going concern problem when one exists (Asare, 1992)).
Previous strategies examined for mitigating recency effects have included
making group decisions, explanation, (which is related to accountability) as
well as counterexplanation. As Ahlawat (1999) found, group decision-
making helped ease cognitive load, so that effort-reducing strategies (e.g.,
recency) were not needed. Additionally, making auditors (for example)
accountable for their decisions (by writing explanations/reasons for their
decisions) did result in reduced recency effects as compared to those not held
accountable (Kennedy, 1993). However, Koonce (1992) argued that
auditors could still arrive at lower quality decisions (including order
effects), because they would not investigate the reasons why a result
occurred (i.e. counterexplanation). Psychology research has shown that the
use of counterexplanation will negate any observed explanation effect
(Anderson & Sechler, 1986). Thus, one potentially rich area for future
research in all accounting domains is to follow the psychological literature
by examining whether or not counterexplanation ‘‘recreates’’ recency effects
previously mitigated by use of accountability/explanation.
NOTES
1. ‘‘Response mode’’ and ‘‘presentation mode’’ have been used interchangeably inthe literature. Both, essentially, are referring to the same concept. Similar to Arnoldet al. (2000), we use the term ‘‘response mode’’ in this chapter to be consistent withHogarth and Einhorn’s (1992) terminology.
Belief Revision in Accounting 37
2. Psychology studies have extensively used estimation tasks (see Lopes, 1985,1987; Anderson, 1981). Results have generally supported Hogarth and Einhorn’s(1992) model predictions.3. The evaluation form of the model is presented (see Hogarth & Einhorn, 1992,
pp. 9–12.) The reasons, similar to those cited by Bamber et al. (1997), are that (1) inevaluation tasks, evidence is often seen as bipolar relative to the hypothesis, which issimilar to many accounting tasks; (2) previous research in accounting has tended toemploy the evaluation form; and (3) previous research in accounting supports thepredictions of the evaluation form, but has not examined the estimation form of themodel (Ashton & Ashton, 1988; Tubbs et al., 1990).
ACKNOWLEDGMENTS
This chapter has benefited from the comments and suggestions from Vicky
Arnold, the editor. We are also grateful to Rich White for his suggestions on
an earlier version of this chapter.
REFERENCES
Ahlawat, S. S. (1999). Order effects and memory for evidence in individual versus group
decision making in auditing. Journal of Behavioral Decision Making, 12, 71–88.
American Institute of Certified Public Accountants (1995). AICPA Professional Standards and
Code of Professional Conduct.
American Institute of Certified Public Accountants. (2002). The business reporting model of the
future. The CPA Letter: Education Supplement, 82, G1–G2.
Anderson, B. H., & Maletta, M. J. (1999). Primacy effects on the role of risk in auditor belief-
revision processes. Auditing: A Journal of Practice and Theory, 18, 75–89.
Anderson, C., & Sechler, E. (1986). Effects of explanation and counterexplanation on the
development and use of social theories. Journal of Personality and Social Psychology, 50,
24–34.
Anderson, M. (1988). A comparative analysis of information search and evaluation behavior of
professional and non-professional financial analysts. Accounting, Organizations and
Society, 13, 431–446.
Anderson, N. H. (1981). Foundations of information integration theory. New York, NY:
Academic Press.
Arnold, V., Collier, P., Leech, S. A., & Sutton, S. (2000). The effect of experience on order and
recency bias in decision making by professional accountants. Accounting and Finance, 40,
107–132.
Asare, S. K. (1992). The auditor’s going concern decision: Interaction of task variables and the
sequential processing of evidence. The Accounting Review, 67, 379–393.
Ashton, A. H., & Ashton, R. H. (1988). Sequential belief revision in auditing. The Accounting
Review, 63, 623–641.
Ashton, A. H., & Ashton, R. H. (1990). Evidence-responsiveness in professional judgment:
Effects of positive versus negative evidence and presentation mode. Organizational
Behavior and Human Decision Processes, 46, 1–19.
JENNIFER KAHLE ET AL.38
Bamber, E. M., Ramsay, R. J., & Tubbs, R. M. (1997). An examination of the descriptive
validity of the belief-adjustment model and alternative attitudes to evidence in auditing.
Accounting, Organizations and Society, 22, 249–268.
Butt, J., & Campbell, T. L. (1989). The effects of information order and hypothesis-testing
strategies on auditors’ judgments. Accounting, Organizations and Society, 14, 471–479.
Chan, M. M. K. (1995). The moderating effects of cognitive style and recency effects on the
auditors’ belief revision process. Managerial Auditing Journal, 10, 22–28.
Christian, C., & Reneau, H. (1990). Updating beliefs in legal tax research: An experimental test
of the belief revision model. Working paper, Arizona State University.
Church, B. K. (1990). Auditors’ use of confirmatory processes. Journal of Accounting Literature,
9, 81–112.
Cuccia, A. D., & McGill, G. A. (2000). The role of decision strategies in understanding
professionals’ susceptibility to judgment biases. Journal of Accounting Research, 38,
419–435.
Cushing, B. E., & Ahlawat, S. S. (1996). Mitigation of recency bias in audit judgment: The effect
of documentation. Auditing: A Journal of Practice and Theory, 15, 110–122.
Davis, J., & Solomon, I. (1989). Experience, expertise, and expert-performance research in
public accounting. Journal of Accounting Literature, 8, 150–164.
Fiske, S. T., Kinder, D. R., & Larter, W. M. (1983). The novice and the expert: Knowledge-
based strategies in political cognition. Journal of Experimental Social Psychology, 19,
381–400.
Gibbins, M. (1984). Propositions about the psychology of professional judgment in public
accounting. Journal of Accounting Research, 22, 103–125.
Hite, P. A., & Stock, T. (1996). Taxpayer belief revision and the importance of controlling for
prior beliefs. Advances in Taxation, 8, 81–99.
Hogarth, R. M., & Einhorn, H. J. (1992). Order effects in belief updating: The belief-adjustment
model. Cognitive Psychology, 24, 1–55.
Hunton, J. E., & McEwen, R. A. (1997). An assessment of the relation between analysts’
earnings forecast accuracy, motivational incentives and cognitive information search
strategy. The Accounting Review, 72, 497–515.
Johnson, E. N. (1995). Effects of information order, group assistance, and experience on
auditors’ sequential belief revision. Journal of Economic Psychology, 16, 137–160.
Kennedy, J. (1993). Debiasing audit judgment with accountability: A framework and
experimental results. Journal of Accounting Research, 31, 231–245.
Klayman, J., & Ha, Y. (1987). Confirmation, disconfirmation, and information in hypothesis
testing. Psychological Review, 94, 211–228.
Koonce, L. (1992). Explanation and counterexplanation during audit analytical review. The
Accounting Review, 67, 59–76.
Krishnamoorthy, G., Mock, T. J., & Washington, M. T. (1999). A comparative evaluation of
belief revision models in auditing. Auditing: A Journal of Practice and Theory, 18,
105–127.
Krull, G., Jr., Reckers, P. M. J., & Wong-on-Wing, B. (1993). The effect of experience,
fraudulent signals and information presentation order on auditors’ beliefs. Auditing: A
Journal of Practice and Theory, 12, 143–153.
Libby, R., & Luft, J. (1993). Determinants of judgment performance in accounting settings:
Ability, knowledge, motivation, and environment. Accounting Organizations, and
Society, 18, 425–450.
Belief Revision in Accounting 39
Lopes, L. L. (1985). Averaging rules and adjustment processes in Bayesian influence. Bulletin of
the Psychonomic Society, 23, 509–512.
Lopes, L. L. (1987). Procedural debiasing. Acta Psychologica, 64, 167–185.
Lord, C., Ross, L., & Lepper, M. (1979). Biased assimilation and attitude polarization: The
effects of prior theories on subsequently considered evidence. Journal of Personality and
Social Psychology, 37, 2098–2109.
Mayper, A. G., Anderson, U., & Kilpatrick, B. G. (1999). Tax workpaper review: The impact of
staff conclusions and argument presentation. Advances in Taxation, 11, 145–167.
McMillan, J. J., & White, R. A. (1993). Auditors’ belief revisions and evidence search: The
effect of hypothesis frame, confirmation bias, and professional skepticism. The
Accounting Review, 68, 443–465.
Messier, W. F., Jr., & Tubbs, R. M. (1994). Recency effects in belief revision: The impact of
audit experience and the review process. Auditing: A Journal of Practice and Theory, 13,
57–72.
Monroe, G. S., & Ng, J. (2000). An examination of order effects in auditors’ inherent risk
assessments. Accounting and Finance, 40, 151–166.
Nisbett, R., & Ross, L. (1980).Human inference: Strategies and shortcomings of social judgment.
Englewoods Cliffs, NJ: Prentice-Hall.
Pei, B. K. W., Reckers, P. M. J., & Wyndelts, R. W. (1990). The influence of information
presentation order on professional tax judgment. Journal of Economic Psychology, 11,
119–146.
Pei, B. K. W., Reckers, P. M. J., & Wyndelts, R. W. (1992a). Tax professionals’ belief revision:
The effects of information presentation sequence, client preference, and domain
experience. Decision Sciences, 23, 175–199.
Pei, B. K. W., Reed, S., & Koch, B. (1992b). Auditor belief revision in a performance auditing
setting: An application of the belief adjustment model. Accounting, Organizations, and
Society(17), 169–183.
Pinsker, R. (2004). Order effects in a more frequently reported information environment:
Laboratory evidence opposing the belief-adjustment model’s primacy prediction. Working
paper, Old Dominion University.
Pitz, G. F., Downing, L., & Reinhold, H. (1967). Sequential effects in the revision of subjective
probabilities. Canadian Journal of Psychology, 21, 381–393.
Roberts, M. (1998). Tax accountants’ judgment-decision-making research: A review and
synthesis. Journal of the American Taxation Association, 20, 78–121.
Schisler, D. L. (1994). An experimental examination of factors affecting tax preparers’
aggressivness – A prospect theory approach. The Journal of the American Taxation
Association, 16(2), 124–142.
Trotman, K., & Wright, A. (1996). Recency effects: Task complexity, decision mode, and task-
specific experience. Behavioral Research in Accounting, 8, 175–193.
Trotman, K., & Wright, A. (2000). Order effects and recency: Where do we go from here?
Accounting and Finance, 40, 169–182.
Tubbs, R. M., Messier, W. F., Jr., & Knechel, W. R. (1990). Recency effects in the auditor’s
belief revision process. The Accounting Review, 65, 452–460.
Tuttle, B., Coller, M., & Burton, F. G. (1997). An examination of market efficiency:
Information order effects in a laboratory market. Accounting, Organization and Society,
22, 89–103.
Yates, F. J. (1990). Judgment and decision making. Englewood Cliffs, NJ: Prentice-Hall.
JENNIFER KAHLE ET AL.40
AUDITOR CALIBRATION IN
THE REVIEW PROCESS
Noel Harding, Sally Hughes and Ken T. Trotman
ABSTRACT
A recent change to audit workpaper review has been the movement toward
delegating more review tasks to senior auditors and including more staff
auditors in the review process. This study investigates the efficiency and
effectiveness implications of this change. It considers the calibration of
reviewers of different levels of experience on both conceptual and me-
chanical errors. The results reveal that reviewers are miscalibrated (over-
confident) in their workpaper error judgments. No differences are found
in the calibration of staff and senior auditors across hierarchical level or
type of error. The implications for audit effectiveness are discussed in the
paper.
INTRODUCTION
The review process plays a critical role in maintaining the quality of an audit
(Bamber & Ramsay, 1997; Rich, Solomon, & Trotman, 1997a, b). It pro-
vides additional assurance that sufficient and appropriate audit work has
been performed and that all audit objectives have been achieved. Tradi-
tionally, a team of auditors performed an audit via a sequential and iterative
Advances in Accounting Behavioral Research
Advances in Accounting Behavioral Research, Volume 8, 41–57
Copyright r 2005 by Elsevier Ltd.
All rights of reproduction in any form reserved
ISSN: 1475-1488/doi:10.1016/S1475-1488(04)08002-0
41
process with multiple, hierarchical layers of review (Solomon, 1987). Al-
though seniors were involved in the review process, managers and partners
performed the majority of the review activities. Due to competitive pressures
for cost-effective audits and the expense associated with hierarchical reviews
performed by experienced auditors, the review process has become a target
for possible cost savings. In this regard, some audit firms have redesigned
their review practices and procedures. These changes include a review proc-
ess now characterized by real-time coaching, the review of audit work being
conducted by interview, the delegation of more review tasks to seniors and
the inclusion of staff auditors in the review process (Rich et al., 1997b;
Winograd, Gerson & Berlin, 2000). Several studies have examined the ef-
fectiveness and efficiency implications of these changes (Ramsay, 1994;
Bamber & Ramsay, 1997; Harding & Trotman, 1999; Bamber & Ramsay,
2000). This study extends these earlier studies by examining reviewer cal-
ibration, a measure of reviewer performance that has not previously been
examined in the literature.
When conducting workpaper review, the reviewer is required to examine
large amounts of workpaper documentation that must be recalled when con-
sidering the probity of subsequent workpaper documentation and the con-
clusions contained therein. While reviewers have the opportunity to refer back
to the previously reviewed workpapers, they will often rely on their memory
in order to improve review efficiency (Libby & Trotman, 1993). This reliance
on memory, however, can jeopardize review effectiveness and efficiency if the
reviewer’s memory is incomplete and/or inaccurate. A reviewer’s confidence
in their memory for workpaper documentation is, therefore, important as it
will determine how the reviewer will use the judgment, and the subsequent
action they will take (Sniezek & Henry, 1989). Calibration is a measure of the
appropriateness of the expressed level of confidence. It assesses the proficiency
of a judge (Oskamp, 1962) since it measures the relationship between judg-
ment accuracy and judgment confidence.
Ideally, confidence should increase with accuracy to give a well calibrated
reviewer. An auditor who is miscalibrated can be either overconfident or
underconfident in their judgment. Overconfidence occurs when, on average, a
reviewer’s confidence is greater than their accuracy. Underconfidence occurs
when, on average, a reviewer’s accuracy is greater than their confidence. A
miscalibrated reviewer is likely to make poor judgments, which in turn, will
impact upon the effectiveness and efficiency of the review process (Beck,
Solomon, & Tomassini, 1985; Sprinkle & Tubbs, 1998).
There can be several costs incurred if a decision-maker is miscalibrated.
Overconfidence might mean that a decision-maker disregards contradictory
NOEL HARDING ET AL.42
evidence or, alternatively, fails to search for additional information that
would lead them to question their original decision (Pincus, 1991). In con-
trast, underconfidence may result in excessive collection of evidence to sup-
port a judgment, leading to a reduction in efficiency. Therefore, delegation
of review tasks to miscalibrated reviewers can lead to poor performance
and/or increased audit hours, both of which are undesirable in an environ-
ment increasingly characterized by competition, fee, and legal pressures
(e.g., Winograd et al., 2000).
A consistent finding in the literature is that individuals, including audi-
tors, are overconfident (e.g., Plous, 1993). If workpaper reviewers; are sim-
ilarly overconfident in their review judgments, the reliance that audit firms
place on the review process may not be justified. An overconfident reviewer
might, for example, place excessive reliance on inaccurate memory for audit
evidence contained in the workpapers previously reviewed.
A number of recent studies have examined the accuracy of reviewers in
detecting different types of workpaper errors (Ramsay, 1994; Bamber &
Ramsay, 1997; Harding & Trotman, 1999; Tan & Trotman, 2003). Ram-
say (1994) suggested that seniors and managers use different review tem-
plates to guide their review of the workpapers, arguing that managers
focus more on conceptual errors while seniors focus more on mechanical
errors.1 He found that managers performed better than seniors on con-
ceptual errors and seniors performed better than managers on mechanical
errors. Harding and Trotman (1999) extended these results to audit staff.
They found that staff auditors identified more mechanical errors than
seniors, while the opposite was true for conceptual errors. Bamber and
Ramsay (1997) investigated the effect of specialized reviews on reviewers’
performance. That is, the effects of directing an auditor to perform a
review that focuses on identifying particular types of errors, either me-
chanical (seniors) or conceptual (managers). The results revealed that re-
viewers were more accurate when directed to perform a comprehensive as
opposed to a focused review. Tan and Trotman (2003) have recently
demonstrated that these hierarchical differences in review performance
may be influenced by preparer stylization and a reviewer’s sensitivity to
that stylization.
Despite its importance in understanding the effectiveness and efficiency of
the review process, only one study has, to date, examined reviewer confi-
dence in workpaper error judgments with no study examining the relation-
ship between confidence and accuracy (i.e., calibration). Bamber and
Ramsay (2000) examined the confidence that seniors and managers had in
performing all encompassing versus specialized reviews. They found that
Auditor Calibration in the Review Process 43
seniors were more confident when performing specialized as compared to all
encompassing reviews. There was no difference in confidence for managers.2
The present study extends earlier research examining hierarchical differ-
ences in reviewer accuracy (e.g., Ramsay, 1994; Harding & Trotman, 1999)
by investigating hierarchical differences in reviewer calibration. This study
allows us to assess more completely the appropriateness of moving the re-
view process to lower levels in the audit firm hierarchy.
The results of our study reveal that reviewers are miscalibrated (over-
confident) in their workpaper error judgments. Contrary to expectations,
there are no differences in the level of overconfidence across hierarchical
level or type of error. The results suggest that while the inclusion of staff
auditors in the review process might improve review efficiency, their inclu-
sion in this study neither adds to nor detracts from review effectiveness.
HYPOTHESIS DEVELOPMENT
Calibration has been extensively studied in the psychology literature (see
Lichtenstein, Fischhoff & Phillips (1982) and Plous (1993) for reviews). With
a few exceptions, when making judgments for at least moderately difficult
tasks, miscalibration in the form of overconfidence is the norm. Undercon-
fidence, however, is often identified for simple tasks where the percentage of
subjects making the correct judgment is above �70%. This is referred to as
the hard–easy effect.
In auditing, initial research suggested that auditors were generally well
calibrated and might even tend towards underconfidence (Tomassini,
Solomon, Romney, & Krogstad, 1982). Mladenovic and Simnett (1994),
consistent with the hard–easy effect identified in the psychology literature,
found that overconfidence increases as the task becomes less predictable
(more difficult). Given the difficult nature of audit judgments, it is perhaps
not surprising that recent studies show auditors to be overconfident. For
example, Simnett (1996) found auditor overconfidence on a prediction of
failure task. Kennedy and Peecher (1997) found that audit staff, seniors, and
managers were all overconfident in their technical knowledge. Moeckel and
Plumlee (1989) investigated auditor’s confidence in the recognition of audit
evidence and found that auditors can be just as confident in their inaccurate
memories as their accurate memories.
Workpaper review is of moderate to high difficulty. It requires a consid-
erable amount of time and is characterized by multiple levels of review. It
NOEL HARDING ET AL.44
involves the examination and integration of large amounts of information
that, of itself, might not be important, but could be critical when combined
with other information. Given the difficulty of the review process and the
consistent findings of overconfidence, we anticipate that the auditors in the
present study will be miscalibrated (overconfident) in their recognition of
workpaper errors. We test the following hypothesis.
H1. Auditors are overconfident in their recognition of workpaper errors.
While we argue that auditors will be overconfident in their workpaper
judgments, the long standing hierarchical nature of the review process, and
research findings that report hierarchical differences in reviewer accuracy
across error types (e.g., Ramsay, 1994; Bamber & Ramsay, 1997; Harding &
Trotman, 1999), suggest that there might be differences across hierarchical
levels.
A reviewer’s confidence in their memory for workpaper documentation
is affected by their ability to retrieve information from their memory,
which in turn, is a function of the type of elaboration that occurred during
the encoding of that information (Craik & Tulving, 1975). Elaboration at
encoding is a function of the depth of processing. Craik and Tulving iden-
tified two types of processing; deep and shallow processing. Deep process-
ing at encoding occurs when evidence receives full attention, is entirely
analyzed and ‘‘enriched by association’’ (p. 270). Shallow processing of
information occurs when evidence is not attended to fully and is only
analyzed at a surface level. If a reviewer has performed an in depth analysis
of certain aspects of the workpapers, their ability to retrieve information
from their memory is greater for those areas and likely to lead to increased
confidence.
Depth of processing is also argued to impact accuracy. Indeed, this has
been the theoretical foundation of studies reporting hierarchical differences
in reviewer accuracy (e.g., Ramsay, 1994; Bamber & Ramsay, 1997; Harding
& Trotman, 1999). These studies argue that accuracy for conceptual errors
increases with experience due to increased attention directed toward this
aspect of the workpapers. Accuracy for mechanical errors, they argue, de-
creases with experience, as these errors are no longer the primary focus of
the reviewer’s attention. It is, therefore, anticipated that confidence and
accuracy will increase with the amount of elaboration at encoding. If, for
example, mechanical errors are the focus of the reviewer’s attention, both
confidence and accuracy will increase for these types of errors.
In terms of the relationship between accuracy and confidence, Glenberg
and Epstein (1985), Brothwell, Deffenbacher, and Brigham (1987) and
Auditor Calibration in the Review Process 45
Glenberg and Epstein (1987) all provide evidence of a positive association. It
might, therefore, be expected that there are no hierarchical differences in
overconfidence as changes in accuracy are associated with corresponding
changes in confidence. However, highlighting that the relationship may be
more complex in an auditing context, Moeckel and Plumlee (1989) report
results showing both a positive and negative association.
In addition, experience may have an effect in addition to influencing
accuracy and the amount of elaboration. If this is the case, hierarchical
differences in the level of overconfidence might be expected. There is only a
limited literature examining the effect of experience on confidence. In ac-
counting domains, the results have been mixed. Raiborn and Estes (1986)
(cited in Pincus, 1991) observed a positive relationship, while Snowball
(1980) observed a negative relationship. Weber (1978) and Pincus (1991)
both observed no significant relationship.
While Pincus (1991) found no relationship between experience and con-
fidence across her entire sample, she did observe a positive relationship when
the decision made was consistent with an unqualified opinion and a negative
relationship when the decision made was consistent with a modified opinion.
This, she speculated, might be the result of an availability heuristic in that
auditors are more commonly faced with a situation where an unqualified
opinion is issued.
An alternative explanation for the results reported in Pincus (1991) relates
to the implications of the decision (see Solomon, Ariyo, & Tomassini, 1985;
Mladenovic & Simnett, 1994). A decision leading to a modified opinion
might be argued to have greater implications than one leading to an un-
qualified opinion. Auditors in Pincus’ study may have been less confident in
a decision leading to a modified opinion and this lack of confidence was
amplified with experience as auditors become more aware of the implica-
tions of their decisions. In this regard, Sprinkle and Tubbs (1998) found that
auditors were less willing to rely on their memory (less confident) for in-
formation of greater importance.
Seniors being more experienced than staff auditors at workpaper review
are argued to be more confident than staff auditors in their review judg-
ments. This is particularly the case for mechanical errors, as there are also
likely to be differences in confidence derived from the perceived importance
and mechanical errors across hierarchical levels. While there may be some
variations depending on the next level of review (Rich et al., 1997a; Tan &
Trotman, 2003) the importance for seniors of mechanical errors, by com-
parison to conceptual errors, is low. Staff auditors, however, view mechan-
ical errors as critical to their career progression. The prevention and/or
NOEL HARDING ET AL.46
identification of mechanical errors is an important factor in staff auditors’
performance evaluation. We argue that these factors will lead to a decrease
in confidence for staff auditors and an increase in confidence for seniors. If
reviewers are overconfident (as proposed in H1), these changes in confidence
will reduce overconfidence for staff auditors and increase overconfidence for
seniors. We test the following hypothesis.
H2. Staff auditors will be better calibrated (less overconfident) in the
recognition of mechanical errors than senior auditors.
On the other hand, seniors are acutely aware of the importance of con-
ceptual errors thereby reducing their confidence. Staff auditors, on two
counts, are likely to be more confident. First, these errors are less the focus
of their work compared to mechanical errors. In addition, staff auditors are
unlikely to have the same appreciation of the importance of conceptual
errors as their senior colleagues. Given that experience is argued to temper
confidence on review matters relating to conceptual errors (and inexperience
increases confidence) we argue that staff auditors will be more confident
(and more overconfident) than seniors on conceptual errors. We test the
following hypothesis.
H3. Senior auditors will be better calibrated (less overconfident) in the
recognition of conceptual errors than staff auditors.
METHOD
The same participants and research instrument in Harding and Trotman’s
(1999) study were used in this study. However, Harding and Trotman only
analyzed the accuracy of participants’ responses to workpaper error ques-
tions. This paper analyzes the calibration of reviewers’ workpaper error
judgments. A 2� (2) experiment was designed to examine the impact of
experience and the type of error on reviewer calibration. The between-subject
variable was experience (staff, senior) and the within-subject variable was the
error type (mechanical, conceptual).
Subjects
Our analysis is based on a sample of 20 senior auditors and 20 staff auditors
from a then ‘‘big 6’’ accounting firm.3 The mean experience of the staff and
Auditor Calibration in the Review Process 47
senior auditors in our sample was 2.13 and 4.77 years respectively. The
experience of senior and staff auditors was significantly different
(t ¼ 10.653, two-tailed p ¼ 0.001). From the original sample of 42 in
Harding and Trotman (1999), one auditor was dropped because of incom-
plete confidence levels and one was dropped because their review notes were
not legible.
Research Instrument and Administration
The research instrument used in Harding and Trotman (1999) and this study
is the same as that developed by Ramsay (1994).4 Subjects were asked to
perform a review of a set of hypothetical workpapers relating to the pro-
vision for doubtful debts account for a manufacturing firm. Subjects were
given three envelopes, each individually labeled (A, B, C) and a sheet out-
lining the general instructions. After the subjects read the general instruc-
tions they were instructed to open envelope A, which contained the
workpapers and blank pages upon which to write review notes. Subjects
were given 40min in order to complete the review. Subjects were instructed
to review the workpapers as they would in a real audit, but were not told
that they would be using their review notes or that they would be tested on
the content of the workpapers. Following the review, the workpapers were
collected and a line was ruled under the last review note on each page.
Thereafter, subjects were asked to open envelope B, which contained a true/
false questionnaire containing 16 questions. These included errors that ex-
isted in the workpapers and filler items, that is, errors that did not exist in
the workpapers. The recognition test included seven conceptual errors, four
mechanical errors, four mechanical filler items, and one conceptual filler
item. This was the same true/false test as used by Ramsay (1994). Following
Ramsay (1994) and Bamber and Ramsay (2000) subjects were also asked to
indicate the confidence they had in their response to each of the 16 questions
on a 3-point scale: 1 – I am certain of my answer; 2 – I believe my answer is
correct; and 3 – I guess my answer is correct. Materials in envelope C elicited
demographic information.
Subjects completed the research materials in one of three sessions con-
ducted at the offices of the then ‘‘big 6’’ firm involved. At least one of the
authors was present on each occasion in order to administer the materials.
Each session began with an introduction of the author(s) by a senior mem-
ber of the firm who also emphasized the firm’s support for the research being
NOEL HARDING ET AL.48
conducted. In each session, subjects worked diligently and appeared to take
the task seriously.
Method of Analysis
Calibration refers to the accuracy of the decision-maker’s confidence. That
is, is the confidence level assigned appropriate given the accuracy of the
responses? The greater the confidence, the greater should be the accuracy.
While there are a number of methods of calculating calibration (see Yates,
1990) we chose the method that distinguishes between over and under con-
fidence given the differences in consequences for auditing. This method
which allows an assessment of direction and magnitude of any miscalibrated
judgments has been used in other accounting/auditing studies (e.g., Dilla,
File, Solomon, & Tomassini 1991; Pincus, 1991; Simnett, 1996; Kennedy &
Peecher, 1997). It provides an over/underconfidence score calculated using
the following equation:
Over=underconfidence ¼1
N
X
T
i¼1
ni Pi � Cið Þ
where N is the total number of probability assessments, ni the number of
times a probability response was used, Pi the probability response category
(i.e., 1.0, 0.75, 0.50), Ci the percentage of correct responses for each prob-
ability category and T the total number of probability response categories
(three in the present study).
A positive score indicates overconfidence while a negative score indicates
underconfidence. Interpretation of this score, however, must proceed with
caution. A score of zero may represent one of two possibilities. It may
indicate that the decision maker is perfectly calibrated or that overconfi-
dence/underconfidence at one probability response category is perfectly
offset by underconfidence/overconfidence at another probability response
category. Similarly, a positive (negative) score should be interpreted as in-
dicating that, over the three probability response categories, the decision-
maker is, on average, overconfident (underconfident). It is therefore
necessary to interpret this score in conjunction with calibration curves,
which plot perfect calibration (called the ‘‘identity line’’) against the average
percentage correct answers at each probability level. These calibration
curves are shown in Table 2.
As noted above, subjects indicated their confidence on a 3-point scale: 1 –
I am certain of my answer; 2 – I believe my answer is correct; and 3 – I guess
Auditor Calibration in the Review Process 49

my answer is correct. It was therefore necessary to assign percentages to
each of these responses. Responses 1, 2 and 3 were coded 100%, 75% and
50%, respectively.5 Subjects had access to their review notes (but not the
workpapers) when completing the recognition test. In order to calculate
calibration, it was necessary to exclude the responses to questions that were
noted in the subject’s review notes. In doing so, the questions that remained
represented a true test of memory and calibration. Two of the authors
independently examined each of the review notes with a view to identifying
those that related to a question on the recognition test. The small number of
disagreements between coders were resolved. For each subject, all recog-
nition test questions identified in the workpapers were removed from the
data set. This meant that from zero to three questions were removed for
each staff auditor (average 1.45) and zero to five questions removed for each
senior (average 2.15).
RESULTS
Consistent with Bamber and Ramsay (2000), our analysis is based on the
actual errors contained in the true–false test.6 Table 1 reports the over/
underconfidence score and the number of subjects who were overconfident,
perfectly calibrated, and underconfident.
Table 1 (panel A) reveals that subjects were generally overconfident in
their workpaper review judgments. Of the 40 subjects, 29 were overconfi-
dent.7 The mean over/underconfidence score of 0.151 was significantly dif-
ferent from zero (t ¼ 5.124, two-tailed po0.001). There was no difference in
the over/underconfidence score between senior (0.139) and staff auditors
(0.163) (t ¼ 0.396, p ¼ 0.694). While subjects were well calibrated at the
50% probability response category (percent correct 51.06), the percentage
correct was significantly different from that expected for perfect calibration
at the 75% probability response category (percent correct 59.33; two-tailed
p ¼ 0.005) and 100% probability response category (percent correct 80.73;
two-tailed po0.001). These results provide support for H1. Auditors in our
study were overconfident in their recognition of workpaper errors. We dis-
cuss the implications of this finding in the following section.
Table 1 (panel B) further disaggregates this overconfidence across type of
error and hierarchical level. Table 2 reports the percentage of correct re-
sponses (accuracy) at each probability response category for each of the four
research conditions. The table also plots accuracy against the identity line
NOEL HARDING ET AL.50
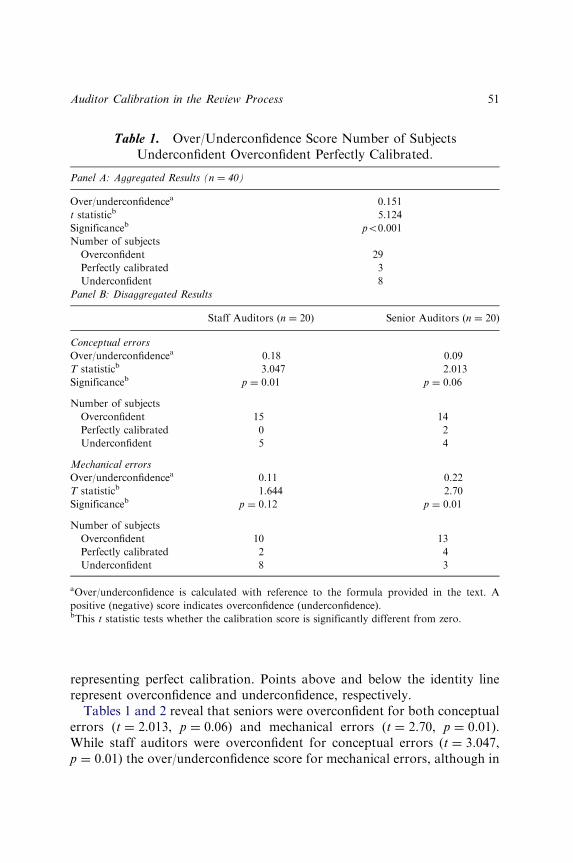
representing perfect calibration. Points above and below the identity line
represent overconfidence and underconfidence, respectively.
Tables 1 and 2 reveal that seniors were overconfident for both conceptual
errors (t ¼ 2.013, p ¼ 0.06) and mechanical errors (t ¼ 2.70, p ¼ 0.01).
While staff auditors were overconfident for conceptual errors (t ¼ 3.047,
p ¼ 0.01) the over/underconfidence score for mechanical errors, although in
Table 1. Over/Underconfidence Score Number of Subjects
Underconfident Overconfident Perfectly Calibrated.
Panel A: Aggregated Results (n ¼ 40)
Over/underconfidencea 0.151
t statisticb 5.124
Significanceb po0.001
Number of subjects
Overconfident 29
Perfectly calibrated 3
Underconfident 8
Panel B: Disaggregated Results
Staff Auditors (n ¼ 20) Senior Auditors (n ¼ 20)
Conceptual errors
Over/underconfidencea 0.18 0.09
T statisticb 3.047 2.013
Significanceb p ¼ 0.01 p ¼ 0.06
Number of subjects
Overconfident 15 14
Perfectly calibrated 0 2
Underconfident 5 4
Mechanical errors
Over/underconfidencea 0.11 0.22
T statisticb 1.644 2.70
Significanceb p ¼ 0.12 p ¼ 0.01
Number of subjects
Overconfident 10 13
Perfectly calibrated 2 4
Underconfident 8 3
aOver/underconfidence is calculated with reference to the formula provided in the text. A
positive (negative) score indicates overconfidence (underconfidence).bThis t statistic tests whether the calibration score is significantly different from zero.
Auditor Calibration in the Review Process 51
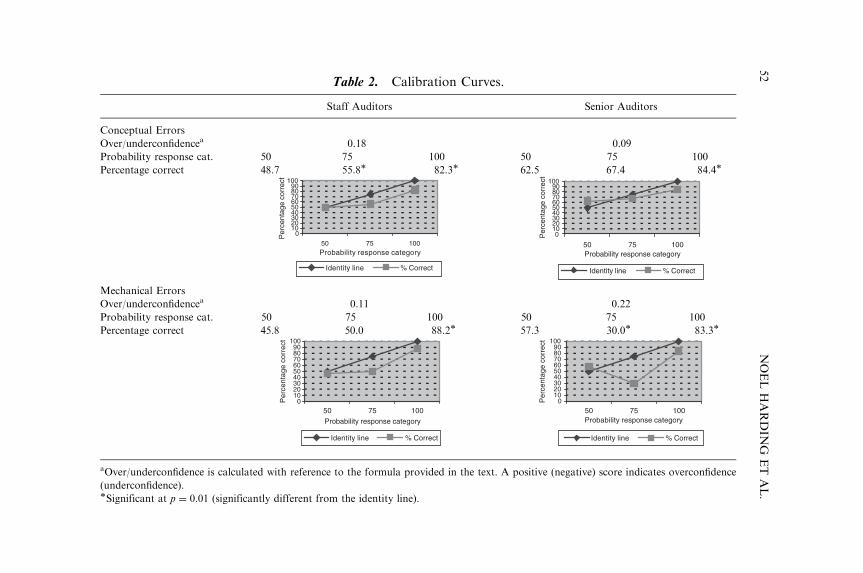
Table 2. Calibration Curves.
Staff Auditors Senior Auditors
Conceptual Errors
Over/underconfidencea 0.18 0.09
Probability response cat. 50 75 100 50 75 100
Percentage correct 48.7 55.8� 82.3� 62.5 67.4 84.4�
0102030405060708090
100
50 75 100
Probability response category
Pe
rce
nta
ge
co
rre
ct
Identity line % Correct
0102030405060708090
100
50 75 100
Probability response category
Pe
rce
nta
ge
co
rre
ct
Identity line % Correct
Mechanical Errors
Over/underconfidencea 0.11 0.22
Probability response cat. 50 75 100 50 75 100
Percentage correct 45.8 50.0 88.2� 57.3 30.0� 83.3�
0102030405060708090
100
50 75 100
Probability response category
Pe
rce
nta
ge
co
rre
ct
Identity line % Correct
0102030405060708090
100
50 75 100
Probability response category
Pe
rce
nta
ge
co
rre
ct
Identity line % Correct
aOver/underconfidence is calculated with reference to the formula provided in the text. A positive (negative) score indicates overconfidence
(underconfidence).�Significant at p ¼ 0.01 (significantly different from the identity line).
NOELHARDIN
GET
AL.
52
the direction of overconfidence, was not statistically significant (t ¼ 1.644,
p ¼ 0.12). In each of the four research conditions, at least 50% of the sub-
jects were overconfident. As was the case for the aggregate analysis, our
subjects were well calibrated at the 50% probability response category, and
overconfident at the 75% and 100% probability response categories in each
of the four research conditions.
H2 and H3, taken together, predict a significant interaction between re-
viewers’ calibration for the nature of the item in the recognition test (me-
chanical or conceptual) and the experience of the reviewer (staff or senior).
Contrary to expectations, the results from a 2� (2) repeated measures
ANOVA revealed no significant interaction between error type and expe-
rience (F ¼ 2.125, p ¼ 0.153). H2 predicted that staff auditors would be
better calibrated than senior auditors in the recognition of mechanical errors
while H3 predicted that the opposite would be true for conceptual errors.
Although in the expected direction, there was no significant difference in the
calibration scores between staff and senior auditors for mechanical errors
(t ¼ 1.056, one-tailed p ¼ 0.149) or conceptual errors (t ¼ 1.102, one-tailed
p ¼ 0.139). Therefore, our data do not support H2 or H3.8
DISCUSSION AND CONCLUSIONS
The literature on the ability of reviewers to identify various workpaper
errors in the review process (Ramsay, 1994; Bamber & Ramsay, 1997, 2000;
Harding & Trotman, 1999) has provided useful insights into differences in
reviewer accuracy and efficiency across different experience levels of re-
viewers. These studies, however, have not examined the calibration of
reviewer judgments. Calibration measures the relationship between judg-
ment accuracy and judgment confidence. A well-calibrated judge is more
likely to act appropriately on their judgment, irrespective of whether that
judgment is correct or not. An overconfident reviewer, on the other hand,
believes they are correct when, in fact, they are incorrect. Overconfidence
could mean, for example, that the reviewer chooses not to reinspect the
workpapers or ignores contradictory evidence. Given the importance of
the review process in ensuring that errors are identified and corrected before
the final opinion is issued, calibration is an important element of a review-
er’s performance. This study provides insights into the effectiveness of
the review process and the appropriateness of delegating specific aspects
of the review process to less experienced auditors.
Auditor Calibration in the Review Process 53
The results revealed that senior and staff auditors were miscalibrated
(overconfident) in their workpaper review judgments. When reviewers
confidently rely on their inaccurate memory, they are less likely to re-inspect
the workpapers. An incomplete or inaccurate recall of workpaper
contents might mean that deficient or incomplete audit procedures are not
identified. Given that the identification and correction of deficient or in-
complete work is the primary purpose of the review process, reviewer over-
confidence is an issue that should be addressed by audit firms. Audit firms
should exercise caution when delegating review tasks to seniors and staff
auditors.
The results show that there was no difference in the levels of overcon-
fidence between seniors and staff auditors on either conceptual or mechan-
ical errors. That is, staff and senior auditors are equally aware (or more
precisely based on the results of this study, equally unaware) of the accuracy
and completeness of their memory for workpaper contents. Combining
these results with Bamber and Ramsay (1997, 2000) and Harding and Trot-
man (1999), there are some important practical implications for audit firms
with respect to changes in the review process. The effectiveness of staff
auditors in identifying mechanical errors, the fact that they have similar
calibration levels to seniors on these errors, and their lower cost means that
it is appropriate for staff auditors to play a role in the review process. As
noted above, the results do not suggest that a greater number of mechanical
errors will be found with the inclusion of staff auditors. Rather, they suggest
that a similar outcome will be achieved, at lower cost, if staff auditors
instead of seniors perform the review work; however, the same conclusion
could not be drawn for conceptual errors. While staff and senior auditors
might be equally aware (or unaware) of when they are incorrect, only senior
auditors are likely to be able to correct their inaccurate understanding by re-
inspecting the workpapers. Staff auditors will not have this ability, even if
they do re-inspect the workpapers.
From these results, it is tempting to suggest a specialized review with staff
considering mechanical errors and seniors considering conceptual errors.
However, Bamber and Ramsay (1997, 2000) indicate that these specialized
reviews are less effective and efficient than comprehensive reviews. There-
fore, our overall conclusion based on the combined research is that there are
benefits of having both staff auditors and seniors carrying out comprehen-
sive reviews for a client. The addition of the staff auditors will add to the
quality of documentation and provide training in review. These benefits
need to be compared to the additional cost of the time they spend on re-
views.
NOEL HARDING ET AL.54
NOTES
1. Examples of mechanical errors include missing tick marks and numbers onone workpaper not agreeing with the original calculation of the numbers locatedon another workpaper. Examples of conceptual errors include use of an impropermateriality threshold for the type of client and the inadequate explanation or jus-tification of audit conclusions (Bamber & Ramsay, 2000).2. As part of additional analysis, Bamber and Ramsay (2000) calculated a sur-
rogate for calibration. This measure involved examining accuracy when subjectsindicated they were certain of their answer. No analysis was performed when subjectsindicated they were less than certain.3. Subjects were selected by the firm involved on the basis of experience and
ability.4. Minor ‘‘semantic changes’’ were made to the workpapers and the True/False
questionnaire in order to make them appropriate to Australian auditors.5. The descriptions attached to responses 1 and 3 meant that coding did not
represent a major problem. Coding for response 2, however, was problematic. Giventhe absence of any compelling reason to code otherwise, a response of 2 was coded75%. It is recognized, however, that subjects may have inferred that I believe myanswer is correct to mean something other than being 75% confident. With this inmind, we re-calculated all scores using 80% and 70%. Our statistical inferences wereunchanged with the use of these alternative figures.6. We re-analyzed the data including both actual errors and filler items. All in-
ferences were unchanged.7. Of the eight subjects who were underconfident, four were seniors and four were
staff auditors. Two staff auditors and one senior were perfectly calibrated.8. Similar results were obtained when the analysis was repeated for all questions
(actual errors and filler items).
ACKNOWLEDGMENTS
We thank Michael Bamber, Amna Khalifa, and Roger Simnett for their
useful comments. We also acknowledge the financial support of an
Australian Research Council Discovery Grant to Ken Trotman.
REFERENCES
Bamber, E. M., & Ramsay, R. J. (1997). An investigation of the effects of specialization in audit
workpaper review. Contemporary Accounting Research, 14(3), 501–513.
Bamber, E. M., & Ramsay, R. J. (2000). The effects of specialization in audit workpaper review
on review efficiency and reviewer’ confidence. Auditing: A Journal of Practice and The-
ory, 19(2), 147–157.
Auditor Calibration in the Review Process 55
Beck, P. J., Solomon, I., & Tomassini, L. A. (1985). Subjective prior probability distributions
and audit risk. Journal of Accounting Research, 23(1), 37–56.
Brothwell, R., Deffenbacher, K., & Brigham, J. (1987). Correlation of eyewitness accuracy and
confidence: Optimality hypothesis revisited. Journal of Applied Psychology, 72(Novem-
ber), 691–695.
Craik, F., & Tulving, E. (1975). Depth of processing and the retention of words in episodic
memory. Journal of Experimental Psychology: General, 104(3), 268–294.
Dilla, W., File, R. D., Solomon, I., & Tomassini, L. A. (1991). Predictive bankruptcy judgments
by auditors. In: L. Poneman & D. Gabhat (Eds), Probabilistic approach auditing: ad-
vances in behavioral research. Berlin: Springer.
Glenberg, A., & Epstein, W. (1985). Calibration of comprehension. Journal of Experimental
Psychology: Learning Memory and Cognition, 11(October), 702–718.
Glenberg, A., & Epstein, W. (1987). Inexpert calibration of comprehension. Memory and Cog-
nition, 15(January), 84–93.
Harding, N., & Trotman, K. (1999). Hierarchical differences in audit workpaper review per-
formance. Contemporary Accounting Research, 16(4), 671–684.
Kennedy, J., & Peecher, M. (1997). Judging auditors’ technical knowledge. Journal of Ac-
counting Research, 35(2), 279–293.
Libby, R., & Trotman, K. T. (1993). The review process as a control for differential recall of
evidence in auditor judgments. Accounting, Organizations and Society, 18(6), 559–574.
Lichtenstein, S., Fischhoff, B., & Phillips, L. D. (1982). Calibration of probabilities. The state of
the art to 1980. In: D. Kahneman, P. Slovic & A. Tversky (Eds), Judgment under
uncertainty: Heuristics and biases. Cambridge: Cambridge University Press.
Mladenovic, R., & Simnett, R. (1994). Examination of contextual effects and changes in task
predictability on auditor calibration. Behavioral Research in Accounting, 6, 178–203.
Moeckel, C. L., & Plumlee, R. D. (1989). Auditors’ confidence in accurate and inaccurate
recognition of audit evidence. The Accounting Review, 64(4), 653–666.
Oskamp, S. (1962). The relationship of clinical experience and training methods to several
criteria of clinical prediction. Psychological Monographs, 76(28), 547.
Pincus, K. V. (1991). Audit judgment confidence. Behavioral Research in Accounting, 3, 39–64.
Plous, S. (1993). The psychology of judgment and decision making. New York: McGraw Hill.
Raiborn, D. D., & Estes, R. (1986). The impact of personal characteristics on materiality
decisions. In: M. Massoud (Ed.), Proceedings-1986 western accounting association annual
meeting: the economics of accounting.
Ramsay, R. (1994). Senior/manager differences in audit workpaper review performance. Jour-
nal of Accounting Research, 32(1), 127–135.
Rich, J. S., Solomon, I., & Trotman, K. T. (1997a). The audit review process: A character-
ization from the persuasion perspective. Accounting, Organizations and Society, 22(5),
481–505.
Rich, J. S., Solomon, I., & Trotman, K. T. (1997b). Multi-auditor judgment/decision making
research: A decade later. Journal of Accounting Literature, 16, 86–126.
Simnett, R. (1996). The effect of information selection, information processing and task com-
plexity on predictive accuracy of auditors. Accounting, Organizations and Society, 21(7/
8), 699–719.
Sniezek, J. A., & Henry, R. A. (1989). Accuracy and confidence in group judgments. Organ-
izational Behavior and Human Decision Processes, 43(1), 1–28.
NOEL HARDING ET AL.56
Snowball, D. (1980). Some effects of accounting expertise and information load: An empirical
study. Accounting Organizations and Society, 5, 323–338.
Solomon, I. (1987). Multi-auditor judgment/decision making research. Journal of Accounting
Literature, 6, 1–25.
Solomon, I., Ariyo, A., & Tomassini, L. A. (1985). Contextual effects on the calibration of
probabilistic judgments. Journal of Applied Psychology, 70(3), 528–532.
Sprinkle, G. B., & Tubbs, R. M. (1998). The effect of audit risk and information importance on
auditor memory during working paper review. The Accounting Review, 73(4), 475–502.
Tan, H. T., & Trotman, K. T. (2003). Reviewers’ responses to anticipated stylization attempts
by preparers of audit workpapers. The Accounting Review, 78(2), 581–604.
Tomassini, L. A., Solomon, I., Romney, M. B., & Krogstad, J. L. (1982). Calibration of
auditor’s probabilistic judgments: Some empirical evidence. Organizational Behavior and
Human Performance, 30(3), 391–406.
Yates, J. F. (1990). Judgment and decision making. Englewood Cliffs, NJ: Prentice-Hall.
Weber, R. (1978). Auditor decision making on overall system reliability: Accuracy, consensus
and the usefulness of a simulation decision aid. Journal of Accounting Research, 16(2),
368–388.
Winograd, B. N., Gerson, J. S., & Berlin, B. L. (2000). Audit Practices of Pricewaterhouse-
Coopers. Auditing: A Journal of Practice and Theory, 19(2), 175–182.
Auditor Calibration in the Review Process 57

This page intentionally left blank
58
LINGUISTIC DELIVERY STYLE,
CLIENT CREDIBILITY, AND
AUDITOR JUDGMENT
Christie L. Comunale, Thomas R. Sexton and
Terry L. Sincich
ABSTRACT
This chapter introduces linguistic delivery style to auditing research,
demonstrates how linguistic delivery style relates to client credibility, and
shows how linguistic delivery style and client credibility influences audi-
tors’ judgment. Two hundred auditors participated in an analytical pro-
cedures task. The results indicate that high client credibility and powerful
linguistic delivery style increase the auditor’s assessed likelihood that the
explanation accounts for the fluctuation and decrease their intent to per-
form additional testing. Moreover, powerless linguistic delivery style from
an otherwise high credibility client leads to auditor judgments and inten-
tions that are indistinguishable from those that arise from a low credibility
client. Finally, evidence indicates that linguistic delivery style is a fourth
component of credibility.
Advances in Accounting Behavioral Research
Advances in Accounting Behavioral Research, Volume 8, 59–86
Copyright r 2005 by Elsevier Ltd.
All rights of reproduction in any form reserved
ISSN: 1475-1488/doi:10.1016/S1475-1488(04)08003-2
59
INTRODUCTION
SAS No. 56 (America Institute of certified Public Accountants, AICPA,
1988) requires that auditors use analytical procedures in the planning and
review stages of the audit. In addition, SAS No. 99 (AICPA, 2002) requires
that auditors gather information necessary to identify risks of material
misstatement due to fraud by considering the results of the analytical pro-
cedures performed in planning the audit. Frequently, while employing an-
alytical procedures, the auditor must engage in management inquiry to
investigate unexpected findings. In addition, SAS No. 99 directs auditors to
inquire of management and others within the entity about the risks of fraud.
Such inquiry often takes the form of oral exchanges of questions and re-
sponses.
The effectiveness and efficiency of the management inquiry process de-
pend heavily on the perceived credibility of the management source (Mautz
1958). Nonaudit research indicates that perceived credibility is composed of
three factors: competence, trustworthiness, and objectivity (Berlo, Lemert,
& Mertz, 1969; McCroskey, 1966). Audit research demonstrates that au-
ditors are sensitive to all three factors and illustrates a positive relationship
between each factor and perceptions of messenger credibility and accept-
ability of audit evidence (Joyce & Biddle, 1981; Bamber, 1983; Rebele,
Heinz, & Briden, 1988; Anderson, Koonce, & Marchant, 1994; Hirst, 1994;
Peecher, 1996; Ayers & Kaplan, 1998; Goodwin, 1999; Beaulieu, 2001).
Research in communications suggests that linguistic delivery style – the
presence of hedges, hesitations, and faulty grammar – also influences per-
ceived credibility. Interestingly, audit research literature has not explored
linguistic delivery style. This study introduces linguistic delivery style to the
audit literature by showing the effects of powerful or powerless language on
the auditor’s evaluation of the client’s credibility and hence on the auditor’s
likelihood assessments and planning decisions in the management inquiry
process.
Three possible outcomes may result from the influence of linguistic delivery
style. First, linguistic delivery style may not have a discernible effect. Second,
the auditor may be inefficient if he or she appropriately questions a valid
explanation when the client uses a particularly powerless form of speech.
Finally, the auditor may be ineffective if he or she inappropriately accepts an
insufficient explanation because the client uses a particularly powerful form of
speech. While the two latter outcomes are important, this study examines only
the first kind, that is, the effects of client credibility and linguistic delivery style
on auditors’ likelihood assessments and planning decisions in the case where
CHRISTIE L. COMUNALE ET AL.60
the client’s explanation is valid. This outcome was chosen as the focus of this
study primarily because both auditors and clients seek to streamline the audit
process, thereby reducing audit effort and costs.
Consistent with the existing audit literature, this study provides
evidence that client credibility influences auditors’ likelihood assessments
and planning decisions. In addition, the evidence suggests that the
client’s linguistic delivery style influences auditors’ likelihood assessments
and planning decisions. Finally, while researchers have recognized compe-
tence, trustworthiness, and objectivity as components of credibility,
linguistic delivery style appears to be a fourth component. Moreover, the
supplemental results suggest that powerless linguistic delivery style from an
otherwise high-credibility client leads to auditor judgments and intentions
that are indistinguishable from those that arise from a low-credibility client,
thereby requiring the auditor to perform additional work.
MODELING FRAMEWORK AND
HYPOTHESIS DEVELOPMENT
This study relies on research in psychology, communications, and
auditing to generate the hypotheses, identify the components of credibility
and linguistic delivery style, and build the research model (shown in Fig. 1).
The model posits that client credibility and linguistic delivery style have
direct effects on auditors’ likelihood assessments and planning decisions
during analytical procedures. In addition, the model suggests that linguistic
delivery style influences the auditor’s perceptions of client credibility.
Message Content
During analytical procedures, the auditor may request an explanation from
the client for a significant account balance fluctuation. The client’s oral
explanation constitutes the message in this study. Message content is held
constant and thus is not shown in the research model. Message content is
theoretically independent of the linguistic delivery style of the client and
refers to the literal meaning of the words used in the explanation, separate
and distinct from any linguistic cues regarding the strength of the client’s
belief and confidence in the explanation. Specifically, the power of the cli-
ent’s linguistic delivery style does not alter the message content although it
Linguistic Delivery Style, Client Credibility, and Auditor Judgment 61
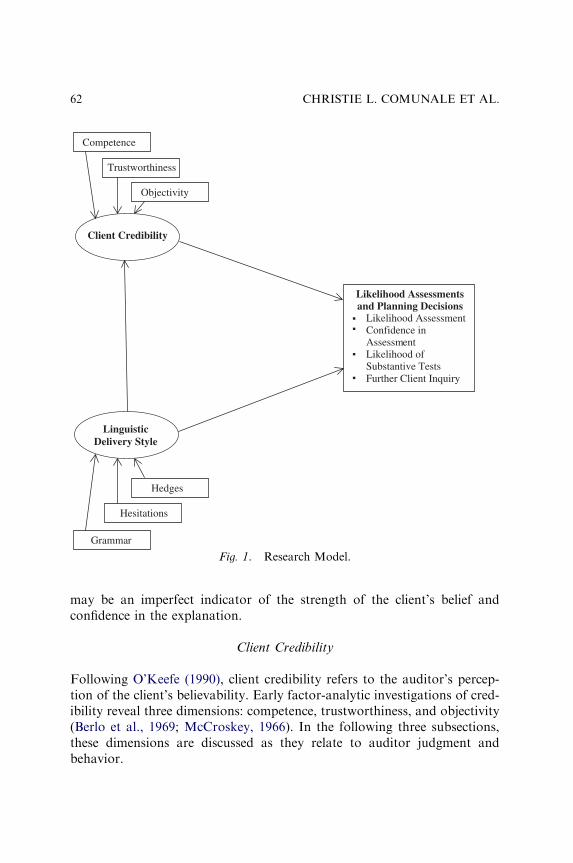
may be an imperfect indicator of the strength of the client’s belief and
confidence in the explanation.
Client Credibility
Following O’Keefe (1990), client credibility refers to the auditor’s percep-
tion of the client’s believability. Early factor-analytic investigations of cred-
ibility reveal three dimensions: competence, trustworthiness, and objectivity
(Berlo et al., 1969; McCroskey, 1966). In the following three subsections,
these dimensions are discussed as they relate to auditor judgment and
behavior.
Client Credibility
Competence
Trustworthiness
Objectivity
Linguistic
Delivery Style
Hedges
Hesitations
Grammar
Likelihood Assessments
and Planning Decisions Likelihood Assessment Confidence in
Assessment Likelihood of
Substantive Tests Further Client Inquiry
Fig. 1. Research Model.
CHRISTIE L. COMUNALE ET AL.62
Competence
Audit research suggests that auditors are sensitive to the expertise or com-
petence of the source (Bamber, 1983). Rebele et al. (1988) find that auditors
place more reliance on evidence obtained from a high-expertise source than
on evidence obtained from a low-expertise source in an accounts receivable
collections task. In the same light, Anderson et al. (1994) find that auditors
judge evidence gained from a more competent source as more reliable than
evidence gained from source of lesser competence.
Trustworthiness
Audit research finds mixed results concerning auditor sensitivity to source
trustworthiness. Bernardi (1994) finds no difference in fraud detection rates
among auditors considering information from a low- versus a high-integrity
client. Likewise, Kaplan and Reckers (1984) find that auditors are insen-
sitive to client integrity in the initial audit planing process. On the other
hand, Goodwin (1999) finds that auditors evaluating management-provided
evidence involving obsolete inventory are sensitive to management’s integ-
rity. Beaulieu (2001) finds that judgments of client integrity relate negatively
to risk judgments, audit evidence extent recommendations, and fee recom-
mendations. Ayers and Kaplan (1998) discover that audit-firm partners
utilize their assessments of client integrity in client acceptance decisions.
Finally, Peecher (1996) reports that management’s integrity influences the
auditor’s acceptance of a client-provided explanation in analytical proce-
dures.
Objectivity
Audit research demonstrates that auditors are more sensitive to the objec-
tivity of the source when the source is an individual within, as opposed to
outside, the firm under investigation. Hirst (1994) finds that auditors assess
explanations received from fellow auditors as more diagnostic than those
provided by the client’s chief financial officer. Joyce and Biddle (1981) dis-
cover that auditors assess information from an independent credit agency as
more diagnostic than information received from the client’s credit manager.
Finally, Brown (1983) finds that auditors evaluating internal auditor reli-
ability consider objectivity more important than competence and
performance.
Linguistic Delivery Style
O’Keefe (1990) notes that the factors of competence, trustworthiness, and
objectivity represent only the most general dimensions of perceived
Linguistic Delivery Style, Client Credibility, and Auditor Judgment 63
credibility. He argues that the delivery characteristics of the message also
may influence perceived credibility and thus warrant further investigation.
Erickson, Lind, Johnson, and O’Barr (1978), Lind and O’Barr (1979), and
O’Barr (1982) examine courtroom transcripts and develop linguistic clusters
that, they argue, exhibit high and low communicative power. They find that,
on an average, uneducated witnesses use ‘‘low-social power’’ forms of
speech – hedges, hesitations, intensifiers, tag questions, deictic words or
phrases,1 and polite form – whereas lawyers, judges, and expert witnesses
typically use ‘‘high-social power’’ forms of speech. Their findings suggest
that speakers using high-social power speech are perceived as possessing a
greater depth of knowledge about the topic and therefore more credible than
speakers using low-social power speech. Haleta (1996) finds that students
rate teachers using language devoid of hedges, intensifiers, deictic phrases,
and hesitation forms as significantly more credible than teachers who use
these linguistic characteristics.
A number of studies find that hedges and hesitations are often
perceived as lowest in power and more strongly associated with lower per-
ceptions of messenger credibility and message believability. Wright and
Hosman (1983) discover that high levels of hedging significantly reduce
credibility ratings. Vinson and Johnson (1989) reveal that both hedges
and hesitations have negative effects on perceptions of messenger credibility.
Hosman and Wright (1987) find that lower levels of hedges and
hesitations produce more positive speaker and message evaluations. More
recently, Adkins and Brashers (1995) show that the user of a powerful
language style in a computer-mediated group is generally perceived as more
credible, attractive, and persuasive than the user of a powerless language
style.
In addition to hedges and hesitations, linguistic research indicates that
other delivery characteristics such as mispronunciation, poor organization,
slow speech rate, low levels of diversity, and faulty grammar are associated
with decreased ratings of speaker effectiveness and credibility (Harms, 1961;
Miller & Hewgill, 1964; McGuire, 1973). Koonce and Phillips (1996) find in
an analytical procedures task that when information pertaining to the cli-
ent’s suggested non-error cause is easy to comprehend, auditors judge that
cause more plausible than when the same information is difficult to com-
prehend. Thus, research in both communication and audit judgment suggest
that linguistic delivery style may influence the auditor’s likelihood assess-
ments and planning decisions, a phenomenon that has not been studied in
the audit literature.
CHRISTIE L. COMUNALE ET AL.64
Research Hypotheses
Based on the research cited above, this study investigates whether the ma-
nipulation of linguistic delivery style influences the auditor’s perception of
the client’s credibility. In other words, while the manipulation of the client’s
credibility is expected to influence the auditor’s perception of the client’s
credibility, the manipulation of the linguistic delivery style of the client is
also expected to affect the auditor’s perception of the client’s credibility.
H1. The auditor’s perception of client credibility will be higher when
manipulated linguistic delivery style is more powerful.
Also based on the research cited above, this study examines the effects of
client credibility and linguistic delivery style on auditor likelihood assess-
ments and planning decisions. The research hypotheses are as follows:
H2. High client credibility will:
� Increase the auditor’s likelihood that the client-provided explanation ac-
counts for the fluctuation.� Increase the auditor’s confidence in his/her likelihood assessment.� Decrease the auditor’s intention to perform additional substantive testing.� Decrease the auditor’s intention to gather additional client-provided ex-
planations.
H3. Powerful linguistic delivery style will:
� Increase the auditor’s likelihood that the client-provided explanation ac-
counts for the fluctuation.� Increase the auditor’s confidence in his/her likelihood assessment.� Decrease the auditor’s intention to perform additional substantive testing.� Decrease the auditor’s intention to gather additional client-provided ex-
planations.
RESEARCH METHODOLOGY
Experimental Procedure
The context of this study is preliminary analytical procedures. Two hundred
auditors employed by two of the Big 4 accounting firms participated in the
Linguistic Delivery Style, Client Credibility, and Auditor Judgment 65
experiment at the firms’ annual professional training workshops. One
hundred eighty-one study participants were audit seniors; the remaining 19
participants were audit managers.
Each auditor was asked to assume that he or she was an audit team
supervisor of a new manufacturing client and was performing preliminary
analytical procedures. Each auditor was provided with the firm’s financial
information including comparative financial statements of the current year’s
unaudited account balances and the prior year’s audited (by a predecessor
firm) account balances. The account balances included a sizable inventory
fluctuation (19.3%), although no reason was given for the cause of the
fluctuation or whether it reflected a change or error in the account balance.
The auditors were asked to assume that this fluctuation warranted inves-
tigation through a client-provided explanation.2
The auditors were then provided with background information about the
assistant controller, the member of the firm who would provide the expla-
nation for the fluctuation. This information referenced the assistant con-
troller’s competence, trustworthiness, and objectivity – the three factors
comprising credibility. These factors were manipulated as either consistently
high or consistently low. The high client credibility condition portrayed the
assistant controller as qualified, candid, and impartial, while the low client
credibility condition portrayed the assistant controller as unqualified, not
candid, and potentially biased. The wordings of the credibility manipula-
tions are shown in the appendix.
Next, the auditor groups were provided with the assistant controller’s
explanation for the fluctuation, delivered once using a compact disc player.
There was no opportunity for clarification of the explanation and no as-
sumption was made regarding its validity. The linguistic delivery style of the
explanation was manipulated as either powerful or powerless. Powerful lin-
guistic delivery style is free of hedges, hesitations, and faulty grammar. In
contrast, powerless linguistic delivery style includes hedges, hesitations, and
faulty grammar. The wordings of the linguistic delivery style manipulations
are shown in the appendix.
Auditors then indicated their assessment of the likelihood that the client’s
explanation accounted for the fluctuation and their confidence in that as-
sessment. They also indicated the likelihoods that they would perform sub-
stantive tests and that they would conduct further client inquiry. The first
three responses were on 0–100 scale and the client inquiry response was on a
7-point Likert-type scale, with endpoints of ‘‘unlikely’’ and ‘‘likely.’’ See
Table 1. Next, they replied to the items designed to check the manipulations
of credibility and linguistic delivery style (shown in Table 2). Finally, the
CHRISTIE L. COMUNALE ET AL.66
auditors provided demographic information. The entire experiment took
�1 h to complete.
Data were collected on three dates at three US locations, with two data-
collection sessions conducted at the same time on the same day (in different
rooms) in the Northeast, a third data-collection session in the Southeast,
and a fourth in the West. In the Northeast, the manipulated linguistic de-
livery style (powerful or powerless) was randomly assigned to the rooms in
which the auditors were already present.3 At the data-collection sessions in
the Southeast and in the West, all the auditors were in the same room and
thus were constrained to hear the same manipulated linguistic delivery style.
However, participants were randomly assigned to either the high or low
manipulated credibility group.4 Table 3 presents sample demographics
across locations and across treatments.
For quantitative demographic measures (e.g., age and experience), the
means for the four experimental conditions were compared using a non-
parametric analysis of variance (Kruskal–Wallis test). Table 3, panel B,
shows statistically significant differences (po0.001) for age and months of
overall audit experience, but not months of manufacturing experience. For
qualitative demographic measures (e.g., gender and current position), the
proportions of auditors in each of the four experimental conditions were
compared using a w2: Table 3, panel B, shows statistically significant dif-
ferences (po0.001) for current position (supervising senior or manager), but
not for gender or audit experience in manufacturing.
Table 1. Questions Designed to Elicit the Dependent Variables.
Likelihood Assessment How likely do you think it is that Joe Smith’s explanation accounts
for the fluctuation in inventory? Please indicate with a percentage
of 0–100%, where 0 is least likely and 100 is most likely:
_________%
Confidence in
Likelihood
Assessment
How confident are you in your likelihood percentage? Please
indicate with a percentage of 0–100%, where 0 is least confident
and 100 is most confident: _________%.
Change in Substantive
Tests
Given Joe’s explanation, how likely are you to change your
substantive test of details relating to the inventory account?
Please indicate with a percentage of 0–100%, where 0 is least
likely and 100 is most likely: _________%
Further Client Inquiry How likely are you to inquire of another member of WEBER’s
management regarding the significant fluctuation in the
inventory account?
Linguistic Delivery Style, Client Credibility, and Auditor Judgment 67
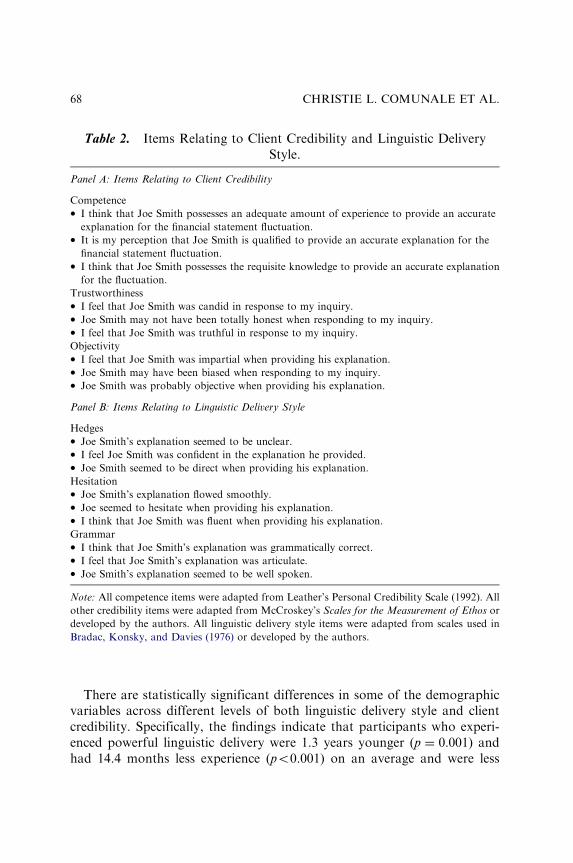
There are statistically significant differences in some of the demographic
variables across different levels of both linguistic delivery style and client
credibility. Specifically, the findings indicate that participants who experi-
enced powerful linguistic delivery were 1.3 years younger (p ¼ 0:001) andhad 14.4 months less experience (po0.001) on an average and were less
Table 2. Items Relating to Client Credibility and Linguistic Delivery
Style.
Panel A: Items Relating to Client Credibility
Competence� I think that Joe Smith possesses an adequate amount of experience to provide an accurate
explanation for the financial statement fluctuation.� It is my perception that Joe Smith is qualified to provide an accurate explanation for the
financial statement fluctuation.� I think that Joe Smith possesses the requisite knowledge to provide an accurate explanation
for the fluctuation.
Trustworthiness� I feel that Joe Smith was candid in response to my inquiry.� Joe Smith may not have been totally honest when responding to my inquiry.� I feel that Joe Smith was truthful in response to my inquiry.
Objectivity� I feel that Joe Smith was impartial when providing his explanation.� Joe Smith may have been biased when responding to my inquiry.� Joe Smith was probably objective when providing his explanation.
Panel B: Items Relating to Linguistic Delivery Style
Hedges� Joe Smith’s explanation seemed to be unclear.� I feel Joe Smith was confident in the explanation he provided.� Joe Smith seemed to be direct when providing his explanation.
Hesitation� Joe Smith’s explanation flowed smoothly.� Joe seemed to hesitate when providing his explanation.� I think that Joe Smith was fluent when providing his explanation.
Grammar� I think that Joe Smith’s explanation was grammatically correct.� I feel that Joe Smith’s explanation was articulate.� Joe Smith’s explanation seemed to be well spoken.
Note: All competence items were adapted from Leather’s Personal Credibility Scale (1992). All
other credibility items were adapted from McCroskey’s Scales for the Measurement of Ethos or
developed by the authors. All linguistic delivery style items were adapted from scales used in
Bradac, Konsky, and Davies (1976) or developed by the authors.
CHRISTIE L. COMUNALE ET AL.68
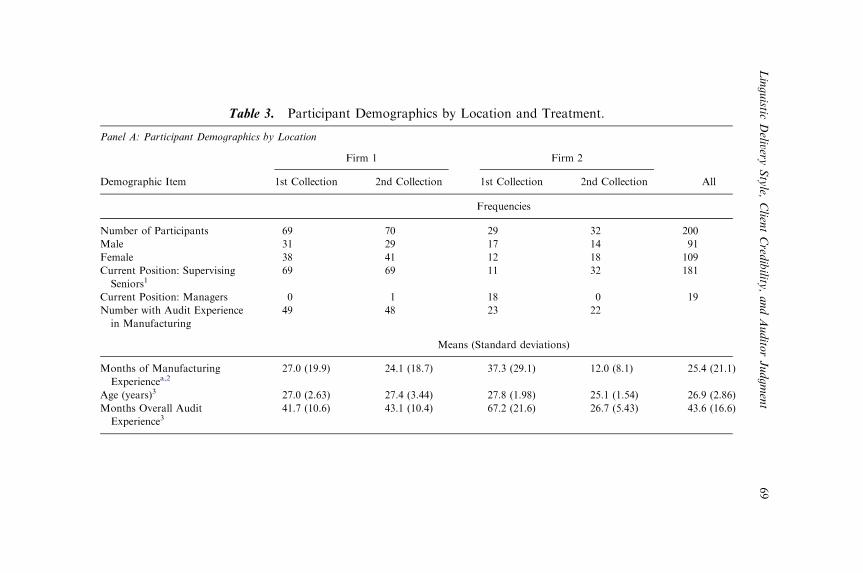
Table 3. Participant Demographics by Location and Treatment.
Panel A: Participant Demographics by Location
Firm 1 Firm 2
Demographic Item 1st Collection 2nd Collection 1st Collection 2nd Collection All
Frequencies
Number of Participants 69 70 29 32 200
Male 31 29 17 14 91
Female 38 41 12 18 109
Current Position: Supervising
Seniors169 69 11 32 181
Current Position: Managers 0 1 18 0 19
Number with Audit Experience
in Manufacturing
49 48 23 22
Means (Standard deviations)
Months of Manufacturing
Experiencea,227.0 (19.9) 24.1 (18.7) 37.3 (29.1) 12.0 (8.1) 25.4 (21.1)
Age (years)3 27.0 (2.63) 27.4 (3.44) 27.8 (1.98) 25.1 (1.54) 26.9 (2.86)
Months Overall Audit
Experience341.7 (10.6) 43.1 (10.4) 67.2 (21.6) 26.7 (5.43) 43.6 (16.6)
Linguistic
Delivery
Style,
Clien
tCred
ibility
,andAudito
rJudgment
69
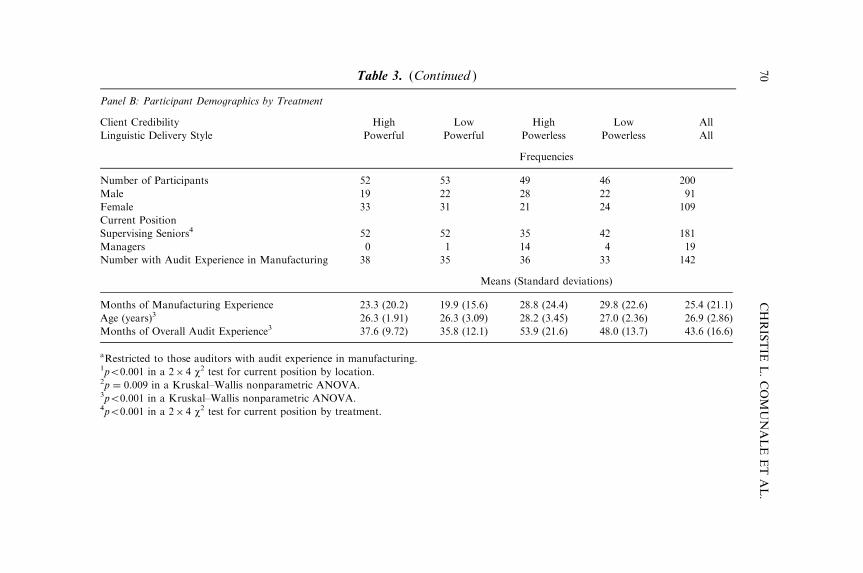
Table 3. (Continued )
Panel B: Participant Demographics by Treatment
Client Credibility High Low High Low All
Linguistic Delivery Style Powerful Powerful Powerless Powerless All
Frequencies
Number of Participants 52 53 49 46 200
Male 19 22 28 22 91
Female 33 31 21 24 109
Current Position
Supervising Seniors4 52 52 35 42 181
Managers 0 1 14 4 19
Number with Audit Experience in Manufacturing 38 35 36 33 142
Means (Standard deviations)
Months of Manufacturing Experience 23.3 (20.2) 19.9 (15.6) 28.8 (24.4) 29.8 (22.6) 25.4 (21.1)
Age (years)3 26.3 (1.91) 26.3 (3.09) 28.2 (3.45) 27.0 (2.36) 26.9 (2.86)
Months of Overall Audit Experience3 37.6 (9.72) 35.8 (12.1) 53.9 (21.6) 48.0 (13.7) 43.6 (16.6)
aRestricted to those auditors with audit experience in manufacturing.1po0.001 in a 2� 4 w2 test for current position by location.2p ¼ 0.009 in a Kruskal–Wallis nonparametric ANOVA.3po0.001 in a Kruskal–Wallis nonparametric ANOVA.4po0.001 in a 2� 4 w2 test for current position by treatment.
CHRISTIE
L.COMUNALE
ET
AL.
70
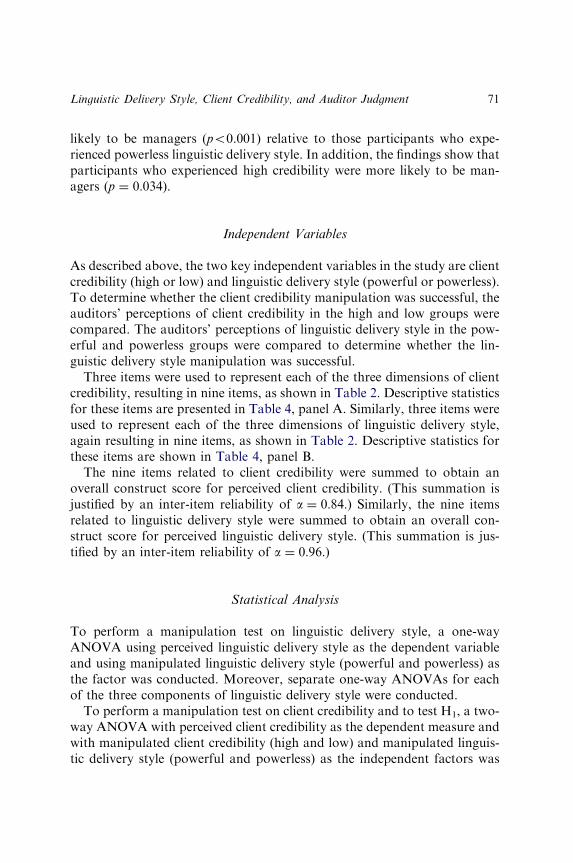
likely to be managers (po0.001) relative to those participants who expe-
rienced powerless linguistic delivery style. In addition, the findings show that
participants who experienced high credibility were more likely to be man-
agers (p ¼ 0:034).
Independent Variables
As described above, the two key independent variables in the study are client
credibility (high or low) and linguistic delivery style (powerful or powerless).
To determine whether the client credibility manipulation was successful, the
auditors’ perceptions of client credibility in the high and low groups were
compared. The auditors’ perceptions of linguistic delivery style in the pow-
erful and powerless groups were compared to determine whether the lin-
guistic delivery style manipulation was successful.
Three items were used to represent each of the three dimensions of client
credibility, resulting in nine items, as shown in Table 2. Descriptive statistics
for these items are presented in Table 4, panel A. Similarly, three items were
used to represent each of the three dimensions of linguistic delivery style,
again resulting in nine items, as shown in Table 2. Descriptive statistics for
these items are shown in Table 4, panel B.
The nine items related to client credibility were summed to obtain an
overall construct score for perceived client credibility. (This summation is
justified by an inter-item reliability of a ¼ 0:84:) Similarly, the nine items
related to linguistic delivery style were summed to obtain an overall con-
struct score for perceived linguistic delivery style. (This summation is jus-
tified by an inter-item reliability of a ¼ 0:96:)
Statistical Analysis
To perform a manipulation test on linguistic delivery style, a one-way
ANOVA using perceived linguistic delivery style as the dependent variable
and using manipulated linguistic delivery style (powerful and powerless) as
the factor was conducted. Moreover, separate one-way ANOVAs for each
of the three components of linguistic delivery style were conducted.
To perform a manipulation test on client credibility and to test H1, a two-
way ANOVA with perceived client credibility as the dependent measure and
with manipulated client credibility (high and low) and manipulated linguis-
tic delivery style (powerful and powerless) as the independent factors was
Linguistic Delivery Style, Client Credibility, and Auditor Judgment 71
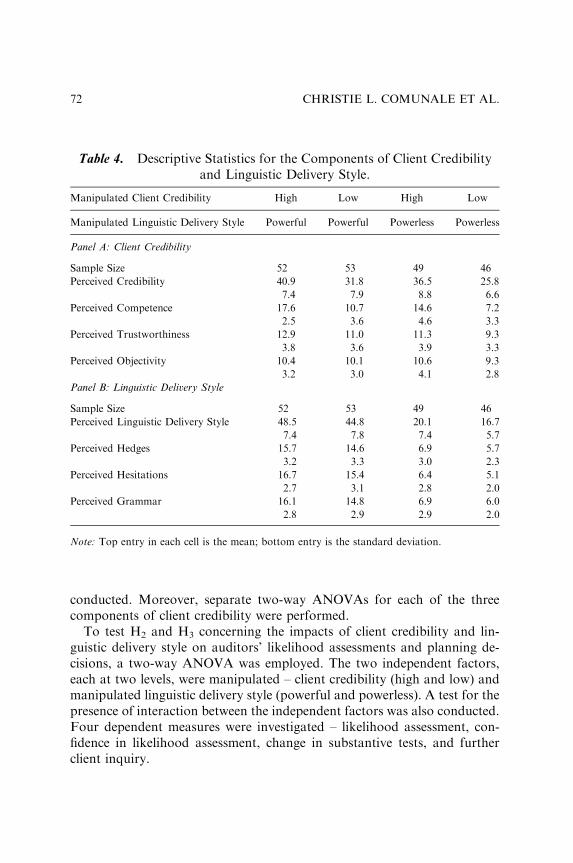
conducted. Moreover, separate two-way ANOVAs for each of the three
components of client credibility were performed.
To test H2 and H3 concerning the impacts of client credibility and lin-
guistic delivery style on auditors’ likelihood assessments and planning de-
cisions, a two-way ANOVA was employed. The two independent factors,
each at two levels, were manipulated – client credibility (high and low) and
manipulated linguistic delivery style (powerful and powerless). A test for the
presence of interaction between the independent factors was also conducted.
Four dependent measures were investigated – likelihood assessment, con-
fidence in likelihood assessment, change in substantive tests, and further
client inquiry.
Table 4. Descriptive Statistics for the Components of Client Credibility
and Linguistic Delivery Style.
Manipulated Client Credibility High Low High Low
Manipulated Linguistic Delivery Style Powerful Powerful Powerless Powerless
Panel A: Client Credibility
Sample Size 52 53 49 46
Perceived Credibility 40.9 31.8 36.5 25.8
7.4 7.9 8.8 6.6
Perceived Competence 17.6 10.7 14.6 7.2
2.5 3.6 4.6 3.3
Perceived Trustworthiness 12.9 11.0 11.3 9.3
3.8 3.6 3.9 3.3
Perceived Objectivity 10.4 10.1 10.6 9.3
3.2 3.0 4.1 2.8
Panel B: Linguistic Delivery Style
Sample Size 52 53 49 46
Perceived Linguistic Delivery Style 48.5 44.8 20.1 16.7
7.4 7.8 7.4 5.7
Perceived Hedges 15.7 14.6 6.9 5.7
3.2 3.3 3.0 2.3
Perceived Hesitations 16.7 15.4 6.4 5.1
2.7 3.1 2.8 2.0
Perceived Grammar 16.1 14.8 6.9 6.0
2.8 2.9 2.9 2.0
Note: Top entry in each cell is the mean; bottom entry is the standard deviation.
CHRISTIE L. COMUNALE ET AL.72
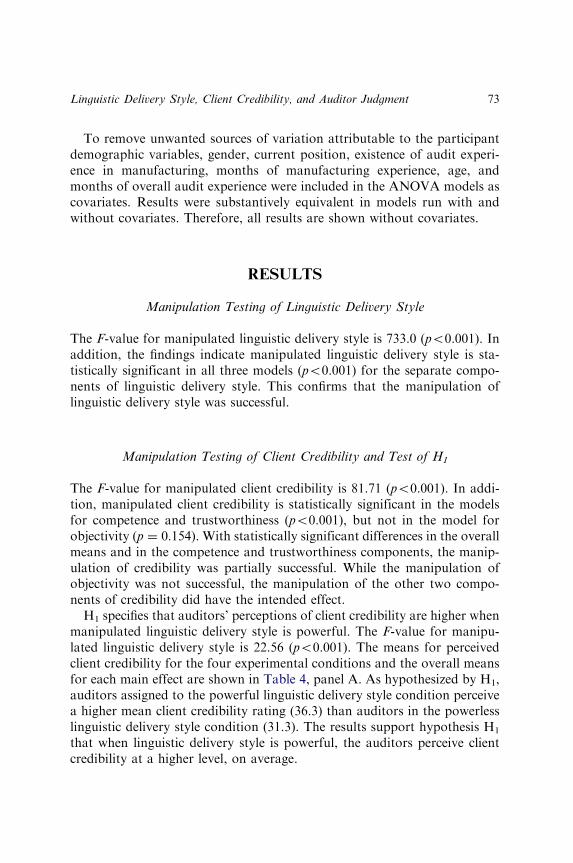
To remove unwanted sources of variation attributable to the participant
demographic variables, gender, current position, existence of audit experi-
ence in manufacturing, months of manufacturing experience, age, and
months of overall audit experience were included in the ANOVA models as
covariates. Results were substantively equivalent in models run with and
without covariates. Therefore, all results are shown without covariates.
RESULTS
Manipulation Testing of Linguistic Delivery Style
The F-value for manipulated linguistic delivery style is 733.0 (po0.001). In
addition, the findings indicate manipulated linguistic delivery style is sta-
tistically significant in all three models (po0.001) for the separate compo-
nents of linguistic delivery style. This confirms that the manipulation of
linguistic delivery style was successful.
Manipulation Testing of Client Credibility and Test of H1
The F-value for manipulated client credibility is 81.71 (po0.001). In addi-
tion, manipulated client credibility is statistically significant in the models
for competence and trustworthiness (po0.001), but not in the model for
objectivity (p ¼ 0:154). With statistically significant differences in the overall
means and in the competence and trustworthiness components, the manip-
ulation of credibility was partially successful. While the manipulation of
objectivity was not successful, the manipulation of the other two compo-
nents of credibility did have the intended effect.
H1 specifies that auditors’ perceptions of client credibility are higher when
manipulated linguistic delivery style is powerful. The F-value for manipu-
lated linguistic delivery style is 22.56 (po0.001). The means for perceived
client credibility for the four experimental conditions and the overall means
for each main effect are shown in Table 4, panel A. As hypothesized by H1,
auditors assigned to the powerful linguistic delivery style condition perceive
a higher mean client credibility rating (36.3) than auditors in the powerless
linguistic delivery style condition (31.3). The results support hypothesis H1
that when linguistic delivery style is powerful, the auditors perceive client
credibility at a higher level, on average.
Linguistic Delivery Style, Client Credibility, and Auditor Judgment 73
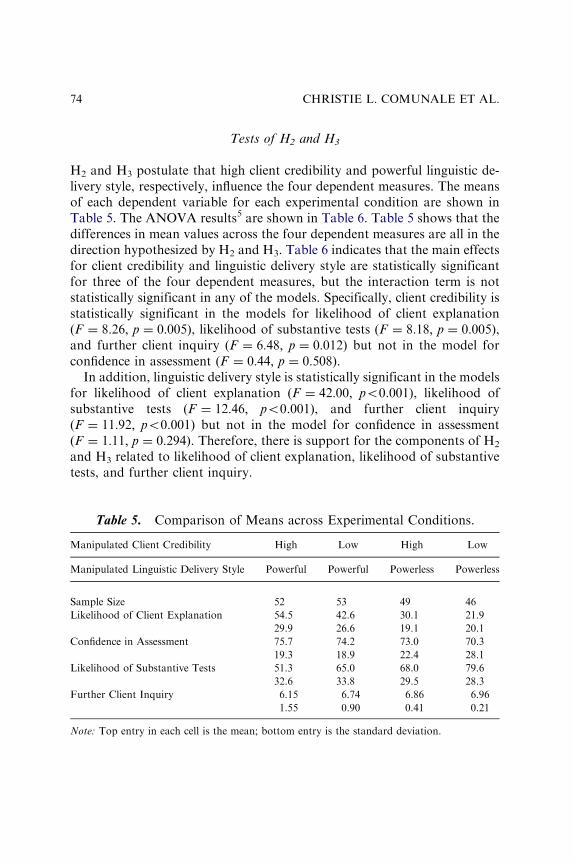
Tests of H2 and H3
H2 and H3 postulate that high client credibility and powerful linguistic de-
livery style, respectively, influence the four dependent measures. The means
of each dependent variable for each experimental condition are shown in
Table 5. The ANOVA results5 are shown in Table 6. Table 5 shows that the
differences in mean values across the four dependent measures are all in the
direction hypothesized by H2 and H3. Table 6 indicates that the main effects
for client credibility and linguistic delivery style are statistically significant
for three of the four dependent measures, but the interaction term is not
statistically significant in any of the models. Specifically, client credibility is
statistically significant in the models for likelihood of client explanation
(F ¼ 8:26; p ¼ 0:005), likelihood of substantive tests (F ¼ 8:18; p ¼ 0:005),and further client inquiry (F ¼ 6:48; p ¼ 0:012) but not in the model for
confidence in assessment (F ¼ 0:44; p ¼ 0:508).In addition, linguistic delivery style is statistically significant in the models
for likelihood of client explanation (F ¼ 42:00; po0.001), likelihood of
substantive tests (F ¼ 12:46; po0.001), and further client inquiry
(F ¼ 11:92; po0.001) but not in the model for confidence in assessment
(F ¼ 1:11; p ¼ 0:294). Therefore, there is support for the components of H2
and H3 related to likelihood of client explanation, likelihood of substantive
tests, and further client inquiry.
Table 5. Comparison of Means across Experimental Conditions.
Manipulated Client Credibility High Low High Low
Manipulated Linguistic Delivery Style Powerful Powerful Powerless Powerless
Sample Size 52 53 49 46
Likelihood of Client Explanation 54.5 42.6 30.1 21.9
29.9 26.6 19.1 20.1
Confidence in Assessment 75.7 74.2 73.0 70.3
19.3 18.9 22.4 28.1
Likelihood of Substantive Tests 51.3 65.0 68.0 79.6
32.6 33.8 29.5 28.3
Further Client Inquiry 6.15 6.74 6.86 6.96
1.55 0.90 0.41 0.21
Note: Top entry in each cell is the mean; bottom entry is the standard deviation.
CHRISTIE L. COMUNALE ET AL.74
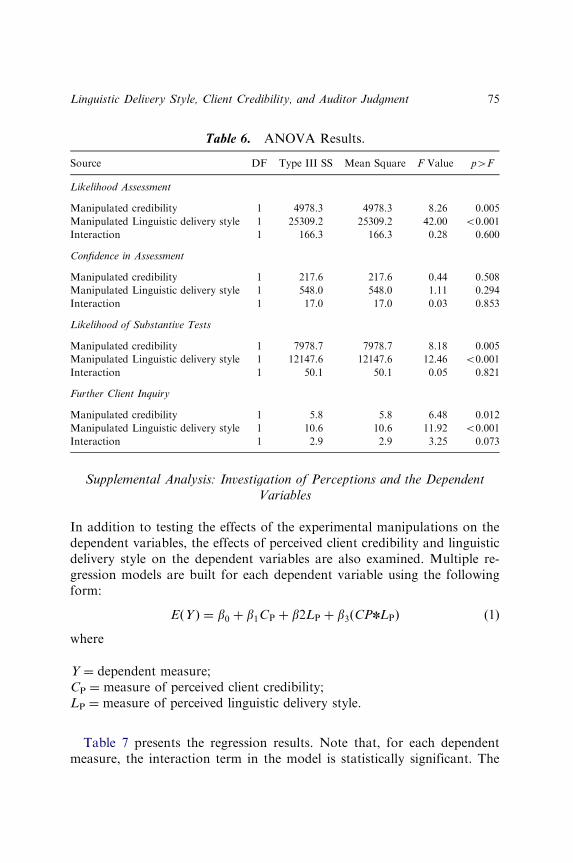
Supplemental Analysis: Investigation of Perceptions and the Dependent
Variables
In addition to testing the effects of the experimental manipulations on the
dependent variables, the effects of perceived client credibility and linguistic
delivery style on the dependent variables are also examined. Multiple re-
gression models are built for each dependent variable using the following
form:
EðY Þ ¼ b0 þ b1CP þ b2LP þ b3ðCPnLPÞ (1)
where
Y ¼ dependent measure;
CP ¼ measure of perceived client credibility;
LP ¼ measure of perceived linguistic delivery style.
Table 7 presents the regression results. Note that, for each dependent
measure, the interaction term in the model is statistically significant. The
Table 6. ANOVA Results.
Source DF Type III SS Mean Square F Value p4F
Likelihood Assessment
Manipulated credibility 1 4978.3 4978.3 8.26 0.005
Manipulated Linguistic delivery style 1 25309.2 25309.2 42.00 o0.001
Interaction 1 166.3 166.3 0.28 0.600
Confidence in Assessment
Manipulated credibility 1 217.6 217.6 0.44 0.508
Manipulated Linguistic delivery style 1 548.0 548.0 1.11 0.294
Interaction 1 17.0 17.0 0.03 0.853
Likelihood of Substantive Tests
Manipulated credibility 1 7978.7 7978.7 8.18 0.005
Manipulated Linguistic delivery style 1 12147.6 12147.6 12.46 o0.001
Interaction 1 50.1 50.1 0.05 0.821
Further Client Inquiry
Manipulated credibility 1 5.8 5.8 6.48 0.012
Manipulated Linguistic delivery style 1 10.6 10.6 11.92 o0.001
Interaction 1 2.9 2.9 3.25 0.073
Linguistic Delivery Style, Client Credibility, and Auditor Judgment 75
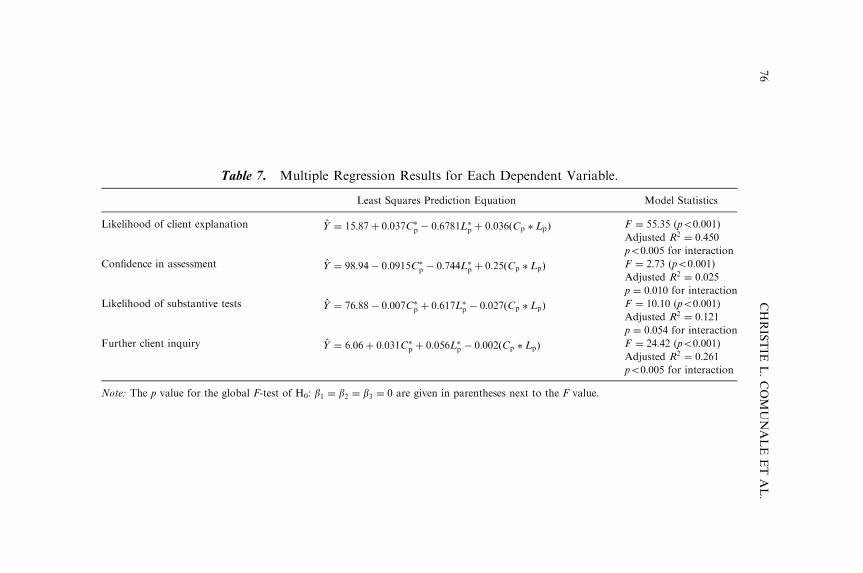
Table 7. Multiple Regression Results for Each Dependent Variable.
Least Squares Prediction Equation Model Statistics
Likelihood of client explanation Y ¼ 15:87þ 0:037C�p � 0:6781L�
p þ 0:036ðCp � LpÞ F ¼ 55:35 (po0:001)
Adjusted R2 ¼ 0:450
po0:005 for interaction
Confidence in assessment Y ¼ 98:94� 0:0915C�p � 0:744L�
p þ 0:25ðCp � LpÞ F ¼ 2:73 (po0:001)
Adjusted R2 ¼ 0:025
p ¼ 0:010 for interaction
Likelihood of substantive tests Y ¼ 76:88� 0:007C�p þ 0:617L�
p � 0:027ðCp � LpÞ F ¼ 10:10 (po0:001)Adjusted R2 ¼ 0:121
p ¼ 0:054 for interaction
Further client inquiry Y ¼ 6:06þ 0:031C�p þ 0:056L�
p � 0:002ðCp � LpÞ F ¼ 24:42 (po0:001)
Adjusted R2 ¼ 0:261po0:005 for interaction
Note: The p value for the global F-test of H0: b1 ¼ b2 ¼ b3 ¼ 0 are given in parentheses next to the F value.
CHRISTIE
L.COMUNALE
ET
AL.
76
estimates of b3 given in the least squares prediction equation have the ex-
pected signs (positive for likelihood of client explanation and confidence in
assessment; negative for likelihood of substantive tests and further client
inquiry).
If b3 ¼ 0; then the rate of change in the dependent variable with respect to
perceived linguistic delivery style equals b2 in Eq. (1) – a rate of change that
is independent of the level of perceived client credibility. On the other hand,
when b3 differs from zero, the rate of change in the dependent variable with
respect to perceived linguistic delivery style is represented by b2 þ b3CP in
Eq. (1) – a rate of change that depends on the level of perceived client
credibility.
To understand better the nature of the interactions detected, the regres-
sion models are examined at both a low and high level of perceived client
credibility (Neter, Kutner, Wasserman, & Nachtsheim, 1996). The 10th
percentile of the distribution is selected for the low level – the value 22. The
90th percentile of the distribution is selected for the high level – the value 46.
These percentile values are referred to as ‘‘low’’ and ‘‘high’’ perceived client
credibility. At each of these levels, the estimated model parameters are used
to estimate the slope of the regression line relating the dependent measure to
perceived linguistic delivery style. From Eq. (1), this slope is b2 þ b3CP;which represents the change in the dependent variable for a unit increase in
perceived linguistic delivery style when perceived client credibility is fixed at
the value CP. Thus, the slope is b2 þ 22b3 at the low level of credibility and
b2 þ 46b3 at the high level of perceived credibility.
Table 8 shows the estimated slopes and corresponding significance tests
for each regression model; and Fig. 2 presents graphs of the estimated lines
for low and high perceived client credibility. For three of the four dependent
measures, the estimated slopes of the regression lines are not statistically
significantly different from zero when the auditors perceived client credi-
bility is low. In the case of the dependent measure further client inquiry, the
estimated slope is positive and statistically significant. However, this result is
misleading due to the bounded nature of the dependent variable. In fact, the
sample data reveal that all auditors who perceived client credibility at 27 or
below answered the ‘‘inquiry’’ question the same (at a level of ‘‘7’’).6 There-
fore, linguistic delivery style has little influence on any of the four dependent
variables when perceived client credibility is low.
When the auditors perceive client credibility as high, the estimated slopes
of the regression lines for all four dependent measures are statistically sig-
nificantly different from zero. Note also that the slopes are positive for
likelihood of client explanation and confidence in assessment, and negative
Linguistic Delivery Style, Client Credibility, and Auditor Judgment 77
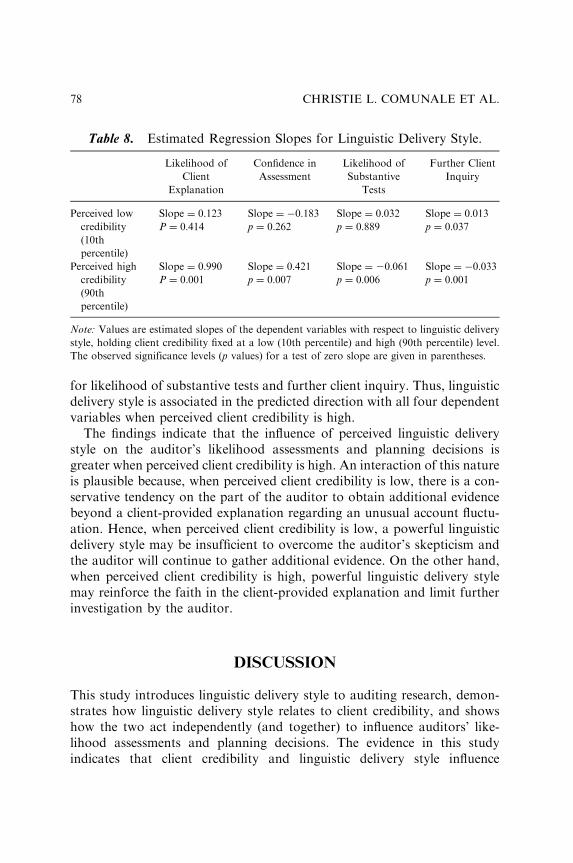
for likelihood of substantive tests and further client inquiry. Thus, linguistic
delivery style is associated in the predicted direction with all four dependent
variables when perceived client credibility is high.
The findings indicate that the influence of perceived linguistic delivery
style on the auditor’s likelihood assessments and planning decisions is
greater when perceived client credibility is high. An interaction of this nature
is plausible because, when perceived client credibility is low, there is a con-
servative tendency on the part of the auditor to obtain additional evidence
beyond a client-provided explanation regarding an unusual account fluctu-
ation. Hence, when perceived client credibility is low, a powerful linguistic
delivery style may be insufficient to overcome the auditor’s skepticism and
the auditor will continue to gather additional evidence. On the other hand,
when perceived client credibility is high, powerful linguistic delivery style
may reinforce the faith in the client-provided explanation and limit further
investigation by the auditor.
DISCUSSION
This study introduces linguistic delivery style to auditing research, demon-
strates how linguistic delivery style relates to client credibility, and shows
how the two act independently (and together) to influence auditors’ like-
lihood assessments and planning decisions. The evidence in this study
indicates that client credibility and linguistic delivery style influence
Table 8. Estimated Regression Slopes for Linguistic Delivery Style.
Likelihood of
Client
Explanation
Confidence in
Assessment
Likelihood of
Substantive
Tests
Further Client
Inquiry
Perceived low
credibility
(10th
percentile)
Slope ¼ 0:123 Slope ¼ �0:183 Slope ¼ 0:032 Slope ¼ 0:013
P ¼ 0:414 p ¼ 0:262 p ¼ 0:889 p ¼ 0:037
Perceived high
credibility
(90th
percentile)
Slope ¼ 0:990 Slope ¼ 0:421 Slope ¼ 20:061 Slope ¼ �0:033
P ¼ 0:001 p ¼ 0:007 p ¼ 0:006 p ¼ 0:001
Note: Values are estimated slopes of the dependent variables with respect to linguistic delivery
style, holding client credibility fixed at a low (10th percentile) and high (90th percentile) level.
The observed significance levels (p values) for a test of zero slope are given in parentheses.
CHRISTIE L. COMUNALE ET AL.78

auditors’ likelihood assessments and planning decisions in the expected di-
rections.
Moreover, the supplemental results suggest that powerless linguistic de-
livery style from an otherwise high credibility client leads to auditor judg-
ments and intentions that are indistinguishable from those that arise from a
low-credibility client. The interaction, which is statistically significant using
the perceived variables but not statistically significant using the manipulated
0102030405060708090
100
9 13 17 21 25 29 33 37 41 45 49 53 57 61
Linguistic Delivery Style
Lik
elih
oo
d
0
10
20
30
40
50
60
70
80
90
100
9 13 17 21 25 29 33 37 41 45 49 53 57 61
Linguistic Delivery Style
Con
fid
ence
High Credibility Low Credibility
High Credibility Low Credibility
Panel A: Likelihood of Client Explanation
Panel B: Confidence in Assessment
Fig. 2. Graphs Depicting the Interaction Term in Each Dependent Variable.
Linguistic Delivery Style, Client Credibility, and Auditor Judgment 79
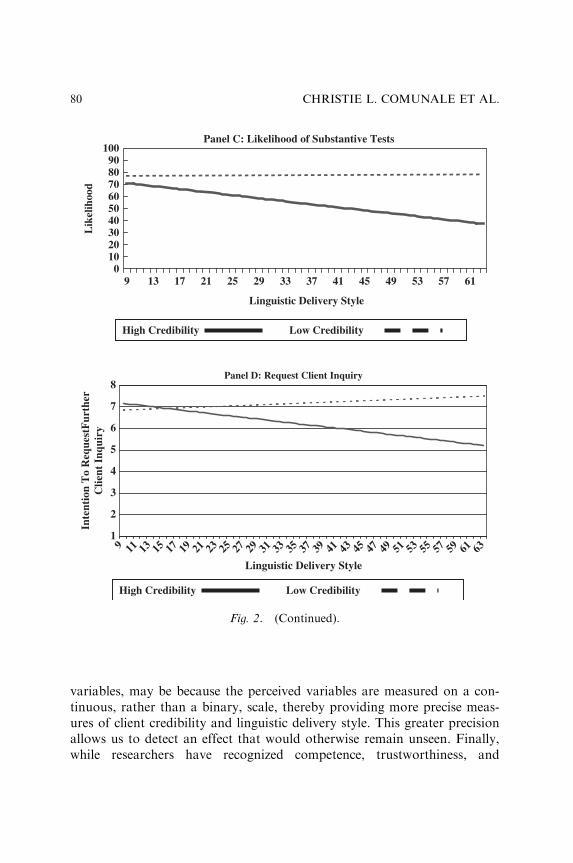
variables, may be because the perceived variables are measured on a con-
tinuous, rather than a binary, scale, thereby providing more precise meas-
ures of client credibility and linguistic delivery style. This greater precision
allows us to detect an effect that would otherwise remain unseen. Finally,
while researchers have recognized competence, trustworthiness, and
0102030405060708090
100
9 13 17 21 25 29 33 37 41 45 49 53 57 61
Linguistic Delivery Style
Lik
elih
ood
1
2
3
4
5
6
7
8
9 11 13 15 17 19 21 23 25 27 29 31 33 35 37 39 41 43 45 47 49 51 53 55 57 59 61 63
Inte
nti
on
To
Req
ues
tFu
rth
er
Cli
ent
Inq
uir
y
High Credibility Low Credibility
High Credibility Low Credibility
Panel D: Request Client Inquiry
Panel C: Likelihood of Substantive Tests
Linguistic Delivery Style
Fig. 2. (Continued).
CHRISTIE L. COMUNALE ET AL.80
objectivity as components of credibility, the evidence from this study in-
dicates that linguistic delivery style may be a fourth component.
The good news is that the results indicate that a low-credibility client
cannot alter the auditor’s likelihood assessments and planning decisions
using powerful linguistic delivery style. The bad news, for the client, is that a
high-credibility client with powerless linguistic delivery style may induce
auditor responses equivalent to those of a low-credibility client. This may
occur due to obscurities introduced by the elements of powerless linguistic
delivery style. This may result in greater audit work and greater audit cost to
the client.
These results imply that clients should communicate in powerful linguistic
delivery style. Failure to do so may result in increased audit effort and costs,
the allocation of which will depend on the extent to which the auditor can
charge the client for additional audit work arising from this inefficiency.
Whatever the ultimate allocation, powerless linguistic delivery style may
lead to higher overall audit costs when the client, ironically, has otherwise
high credibility. While formal communication skills have long been empha-
sized as important for auditors (Brune, 2003; Canadian Institute of Char-
tered Accountants, 2000), this study also demonstrates the need for good
interviewing skills, from the interviewee’s perspective.
LIMITATIONS AND FUTURE RESEARCH
This study has two primary limitations that provide opportunities for future
research. First, the scenario limits the examination of linguistic delivery style
to the issue of efficiency (Type I error), which is studied only when sufficient
explanations exist. In other words, it is not possible to address whether
linguistic delivery style influences effectiveness (Type II error) and whether
linguistic delivery style matters when insufficient explanations exist.
Second, the auditor’s likelihood assessment of the client’s explanation and
the confidence in that explanation occur simultaneously with the auditor’s
planning decisions, which are intermediate judgments regarding the need for
additional information. Therefore, we cannot be sure that all of the
dependent measures are not simply capturing the same underlying uncer-
tainty at this intermediate point. Thus, the iterative nature of the process
leading to the final judgment (can the auditor believe the client’s represen-
tation after additional audit work) cannot be studied given the current
design.
Linguistic Delivery Style, Client Credibility, and Auditor Judgment 81
The influence of the individual components of linguistic delivery style and
client credibility on the dependent variables cannot be assessed due to the
experimental design utilized in this study. However, the primary concern
was that the manipulation of linguistic delivery style and client credibility
was sufficiently strong to produce the hypothesized effects if indeed they
existed. In fact, the powerless linguistic delivery style and low client cred-
ibility manipulations used in this study were quite strong; hence, the re-
search findings may be amplified.
Every effort was made to ensure that the message content was independ-
ent of the linguistic delivery style. For example, the sentences ‘‘Sales were
lower in the third quarter relative to the second quarter’’ and ‘‘Sales were
um y lower in the third quarter relative to the second quarter’’ carry the
same content despite the introduction of the hesitation ‘‘um.’’
All the participants in the Southeast heard the same linguistic delivery
style manipulation. Similarly, all the participants in the West heard the
other linguistic delivery style manipulation. Since participants may vary in
their sensitivity to linguistic delivery style across geographic locations, this
unintended crossing of linguistic delivery style and region could explain in
part the absence of an interactive effect using the manipulated variables
while an interactive effect was observed using the perceived variables.
In addition, a 7-point scale was used to measure the dependent variable
‘‘Further Client Inquiry,’’ which creates endpoint problems that violate
statistical assumptions used in the analysis. Consequently, this may present
difficulties in analyzing and interpreting results.
Only one scenario was used in this study so the results may not generalize
to other scenarios. Moreover, participants were exposed to audio explana-
tions only, while a video explanation might have been more realistic. In
addition, the auditors in this experiment were not subject to review as they
are in a typical audit engagement. Finally, the focus is on one kind of
undesirable outcome (performing additional audit work when no errors
exist) and a second kind of undesirable outcome (accepting a client’s faulty
explanation when errors do exist) may be of even greater importance to the
auditor.
Despite these limitations, the results of this study represent an important
contribution to the understanding of the client–auditor relationship
by demonstrating the role of linguistic delivery style in the client
inquiry process. In an era of increasing scrutiny of the audit function,
client–auditor communication has become even more crucial to audit
success, and these results can assist auditors in improving this vital audit
process.
CHRISTIE L. COMUNALE ET AL.82
NOTES
1. These are words or phrases that show or point out directly, such as the wordsthis, that, and those. For example, ‘‘I never work that hard’’ is weaker than ‘‘I neverwork hard.’’2. Three separate pilot studies were conducted using student participants to test
the efficacy of the linguistic delivery style and client credibility manipulations, as wellas to assess overall understandability of the instrument. Based on pilot study feed-back, the wording of several variable items was refined to improve the clarity ofexperimental scripts.3. Auditors were assigned to rooms according to training session, which were
unrelated to the purposes of this study. There is no reason to suspect that theauditors in one room differed from those in the other room with respect to assess-ment of credibility or sensitivity to linguistic delivery style.4. Initial credibility assessments were not captured at this stage to avoid potential
biases that might occur if participants anchored on these assessments when their finalassessments were made later in the study.5. Because the dependent variables violate the normal distribution and constant
variance assumption, an ANOVA based on ranks is also conducted. The results areessentially identical to the parametric ANOVAs. Therefore, the ANOVA resultsbased on the actual data are reported.6. There are very few observations at the ‘‘low’’ level of credibility. Consequently,
slope estimates at the ‘‘low’’ level yield potentially unreliable results.
ACKNOWLEDGMENTS
The authors gratefully acknowledge the guidance and advice of Drs. Gary L.
Holstrum, James Hunton, Rosann W Collins, and Jacqueline Reck of the
University of South Florida, who were members of Dr. Comunale’s disser-
tation committee. We are also indebted to the referees whose comments and
suggestions greatly improved the quality and the presentation of this chapter.
REFERENCES
Adkins, M., & Brashers, D. E. (1995). The power of language in computer-mediated groups.
Management Communication Quarterly, 8(3), 289–322.
American Institute of Certified Public Accountants (AICPA). (1988). Statement on Auditing
Statements No. 56: Analytical Procedures. New York: AICPA.
American Institute of Certified Public Accountants (AICPA). (2002). Statement on Auditing
Statements No. 99: Consideration of Fraud in a Financial Statement Audit. New York:
AICPA.
Linguistic Delivery Style, Client Credibility, and Auditor Judgment 83
Anderson, U. L., Koonce, L., & Marchant, G. (1994). The effects of source-competence in-
formation and its timing on auditor’s performance of analytical procedures. Auditing:
A Journal of Practice and Theory, 13(Spring), 137–148.
Ayers, S., & Kaplan, S. (1998). Potential differences between engagement and risk review
partners and their effect on client acceptance judgments. Accounting Horizons (June),
12(2), 139–153.
Bamber, E. M. (1983). Expert judgment in the audit team: A source reliability approach.
Journal of Accounting Research, 21(Autumn), 396–412.
Beaulieu, P. R. (2001). The effects of judgments of new client’s integrity upon risks judgments,
audit evidence, and fees. Auditing: A Journal of Practice and Theory, 20(September),
85–99.
Berlo, D. K., Lemert, J. B., & Mertz, R. J. (1969). Dimensions for evaluating the acceptability
of message sources. Public Opinion Quarterly, 33(4), 563–576.
Bernardi, R. A. (1994). Fraud detection: The effect of client integrity and competence and
auditor cognitive style. Auditing: A Journal of Practice and Theory, 13(Supplement),
68–84.
Bradac, J. J., Konsky, C. W., & Davies, R. A. (1976). Two studies of the effects of linguistic
diversity upon judgments of communicator attributes and message effectiveness. Com-
munication Monographs, 4, 70–79.
Brown, P. R. (1983). Independent auditor judgment in the evaluation of internal audit func-
tions. Journal of Accounting Research, 21(Autumn), 444–455.
Brune, C. (2003). The artful interviewer. The Internal Auditor, 60(2), 25–27.
Canadian Institute of Chartered Accountants (CICA). (2000). Audit enquiry: Seeking more
reliable evidence from audit enquiry. Toronto, Canada. (CICA).
Erickson, B., Lind, A. E., Johnson, B. C., & O’Barr, W. M. (1978). Speech style and impression
formation in a court setting: The effects of ‘‘powerful’’ and ‘‘powerless’’ speech. Journal
of Experimental Social Psychology, 14(May), 266–279.
Goodwin, J. (1999). The effects of source integrity and consistency of evidence on auditors’
judgments. Auditing: A Journal of Practice and Theory, 18(Fall), 1–16.
Haleta, L. L. (1996). Student perceptions of teachers’ use of language: The effects of powerful
and powerless language on impression formation and uncertainty. Communication in
Education, 45(January), 16–28.
Harms, L. S. (1961). Listener judgments of status cues in speech. Quarterly Journal of Speech,
47, 164–168.
Hirst, D. E. (1994). Auditor’s sensitivity to source reliability. Journal of Accounting Research,
32(Spring), 113–126.
Hosman, L. A., Wright, J. W. (1987). The effects of hedges and hesitations on impression
formation in a simulated courtroom context. Western Journal of Speech Communication,
51(Spring), 173–188.
Joyce, E. J., Biddle, G. C. (1981). Are auditor’s judgments sufficiently regressive? Journal of
Accounting Research, 19(Autumn), 323–349.
Kaplan, S. E., & Reckers, P. M. J. (1984). An empirical examination of auditors’ initial plan-
ning process. Auditing: A Journal of Practice and Theory (Fall), 4(1), 1–19.
Koonce, L., & Phillips, F. (1996). Auditor’s comprehension and evaluation of client-suggested
causes in analytical procedures. Behavioral Research in Accounting, 8, 32.
CHRISTIE L. COMUNALE ET AL.84
Lind, E. A., & O’Barr, W. M. (1979). The social significance of speech in the courtroom. In:
H. Giles & R. St Clair (Eds), Language and social psychology (pp. 66–87). England: Basil
Blackwell (U.S. distribution, Baltimore MD: University Park Press).
Mautz, R. K. (1958). The nature and reliability of audit evidence. The Journal of Accountancy
(May), 105(5), 40–47.
McCroskey, J. C. (1966). Scales for the measurement of ethos. Speech Monographs, 33, 65–72.
McGuire, W. J. (1973). Persuasion, resistance, and attitude change. In: I. Pool (Ed.), Handbook
of Communication (pp. 16–252). Chicago, IL: McNally College Publishing Company.
Miller, G. R., & Hewgill, M. A. (1964). The effect of variations in nonfluency on audience
ratings of source credibility. Quarterly Journal of Speech, 50, 36–44.
Neter, J., Kutner, M. H., Wasserman, W., & Nachtsheim, C. J. (1996). Applied linear statistical
models (4th ed.). New York, NY: McGraw-Hill/Irwin.
O’Barr, W. M. (1982). Linguistic evidence: Language, power, and strategy in the courtroom.
New York: Academic Press.
O’Keefe, D. J. (1990). Persuasion: Theory and research. Newbury Park: Sage Publications.
Peecher, M. E. (1996). The influence of auditors’ justification processes on their decisions:
A cognitive model and experimental evidence. Journal of Accounting Research (Spring),
34(1), 125–140.
Rebele, J. E., Heintz, J. A., & Briden, G. E. (1988). Independent auditor sensitivity to evidence
reliability. Auditing: A Journal of Practice and Theory, 8 (Fall), 43–52.
Vinson, L., & Johnson, C. (1989). The use of written transcripts in powerful and powerless
language research. Communication Reports, 2, 16–21.
Wright, J. W., & Hosman, L. A. (1983). Language style and sex bias in the courtroom: The
effects of male and female use of hedges and intensifiers on impression formation.
Southern Speech Communication Journal, 48, 137–152.
APPENDIX
Client Credibility Manipulations
High Client Credibility
During your controls testing, you had one other interaction with Joe Smith.
At that time, it was revealed to you that Joe possessed both a CPA and an
MBA and has over 20 years of accounting experience (competence). More-
over, during this previous interaction, he seemed, in your opinion, to pro-
vide candid responses to your questions (trustworthiness). As far as you
know, Joe had no vested interest that would have caused him to provide
biased responses (objectivity).
Low Client Credibility
During your controls testing, you had one other interaction with Joe Smith.
At that time, it was revealed to you that this is Joe’s first year as assistant
controller. Moreover, it is your understanding that Joe does not possess any
Linguistic Delivery Style, Client Credibility, and Auditor Judgment 85
professional certifications and has not completed any post-graduate work
(competence). During this previous interaction, you were not quite sure
whether Joe was entirely candid when responding to your questions (trust-
worthiness). As far as you know, Joe could have a vested interest that would
have caused him to provide biased responses (objectivity).
Linguistic Delivery Style Manipulations
Powerful Linguistic Delivery Style
The year over year increase in inventory is part of our overall strategic plan.
One of our goals at Weber is to be the leading provider of appliances in the
Southeast. To accomplish this goal we must deliver quality products to our
customers, on time, every time. Unfortunately, we received numerous com-
plaints last year regarding product shortages. Therefore, we increased the
production of our more popular models. The elimination of product short-
ages at our retail outlets will greatly improve customer satisfaction.
Powerless Linguistic Delivery Style
Hmmm (hesitation)yI’m thinkin’ (grammar and hedge) that, that has
somethin’ (grammar) to do with our um (hesitation)y.overall plan. A goal
here, you know, (hedge) is to be ah (hesitation)yleading provider of ap-
pliances. So, I believe (hedge) we’ve been tryin’ (grammar) to deliver prod-
ucts, quality products, on time. I’m pretty sure (hedge) that we got
(grammar) some complaints last year about runnin’ outta (grammar) our
stuff. Maybe (hedge) we started increasin’ (grammar) the production, prob-
ably (hedge) of our better sellers. By steppin’ (grammar) up production, we
ah (hesitation) ycan maybe (hedge) make our customers happy.
CHRISTIE L. COMUNALE ET AL.86
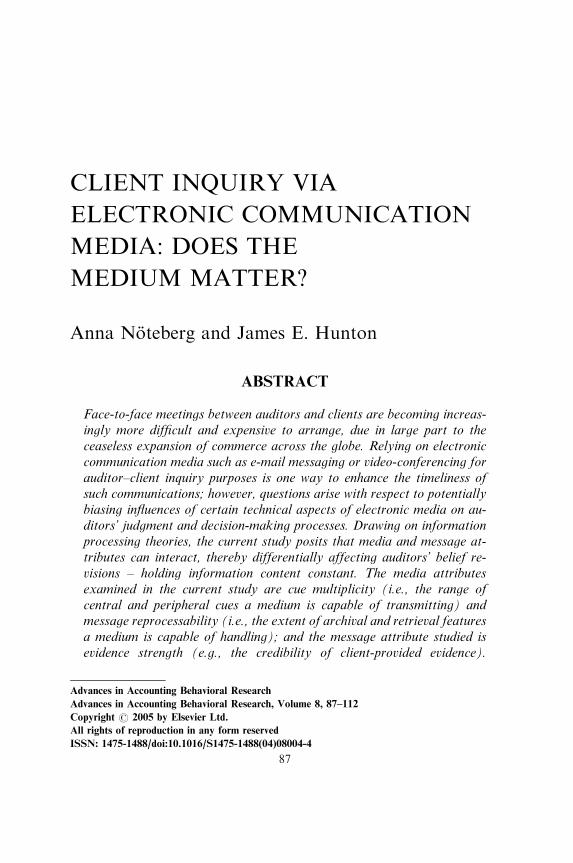
CLIENT INQUIRY VIA
ELECTRONIC COMMUNICATION
MEDIA: DOES THE
MEDIUM MATTER?
Anna Noteberg and James E. Hunton
ABSTRACT
Face-to-face meetings between auditors and clients are becoming increas-
ingly more difficult and expensive to arrange, due in large part to the
ceaseless expansion of commerce across the globe. Relying on electronic
communication media such as e-mail messaging or video-conferencing for
auditor–client inquiry purposes is one way to enhance the timeliness of
such communications; however, questions arise with respect to potentially
biasing influences of certain technical aspects of electronic media on au-
ditors’ judgment and decision-making processes. Drawing on information
processing theories, the current study posits that media and message at-
tributes can interact, thereby differentially affecting auditors’ belief re-
visions – holding information content constant. The media attributes
examined in the current study are cue multiplicity (i.e., the range of
central and peripheral cues a medium is capable of transmitting) and
message reprocessability (i.e., the extent of archival and retrieval features
a medium is capable of handling); and the message attribute studied is
evidence strength (e.g., the credibility of client-provided evidence).
Advances in Accounting Behavioral Research
Advances in Accounting Behavioral Research, Volume 8, 87–112
Copyright r 2005 by Elsevier Ltd.
All rights of reproduction in any form reserved
ISSN: 1475-1488/doi:10.1016/S1475-1488(04)08004-4
87
Research findings from a laboratory experiment with 189 graduate ac-
counting students indicate the following: (1) when client-provided evi-
dence is strong, neither message reprocessability nor cue multiplicity
significantly affect the auditors’ belief revisions; (2) when evidence is
weak and reprocessability is present, higher cue multiplicity leads to sig-
nificantly greater belief revision in favor of the client; (3) when evidence
is weak and reprocessability is absent, lower cue multiplicity results in
significantly greater belief revision in favor of the client. Study results
suggest theoretical and practical implications for globally distributed
auditor–client communications.
INTRODUCTION
The use of electronic communication media within and among organiza-
tions is increasing at an exponential rate (Strauss & McGrath, 1994; Baltes,
Dickson, Sherman, Bauer, & LaGanke, 2002). The integration of digital
communication technologies into business entities provides opportunities
for people in geographically dispersed locations to rapidly contact one an-
other for a variety of purposes, such as sharing information, discussing
ideas, forming relationships, and making decisions. The primary driver of
this technological trend is the growing dispersion of commercial enterprises
across the globe.
Audit firms are expanding their organizational boundaries across the
world as well, primarily because their clients are globally extending their
commercial reach. Thus, auditors are making increasing use of electronic
communication media for intra-firm and auditor–client communications, as
the relatively slow speed and high cost of face-to-face exchanges are quite
constraining. While one objective of incorporating electronic media into
auditor–client communications is to enhance the timeliness of such ex-
changes, questions arise as to whether certain media and message attributes
can bias the interpretation of the message content.
The purpose of the current study is to examine the potentially biasing
effects of two media attributes and one message attribute. The first media
attribute, cue multiplicity, reflects the range of central and peripheral mes-
sage cues that can be transmitted by a particular medium. The second media
attribute, message reprocessability, refers to the extent to which a medium is
capable of archiving and retrieving messages. The message attribute under
examination is evidence strength, or the credibility of evidential matter
ANNA NOTEBERG AND JAMES E. HUNTON88
underlying a client’s argument. Information processing theories suggest that
the media and message attributes will interact such that auditors’ belief
revisions will be differentially affected, depending on the attribute states.
In this study, we develop hypotheses based on the belief adjustment model
(Einhorn & Hogarth, 1985; Ashton & Ashton, 1988; Hogarth & Einhorn,
1992) and dual processing models (Chaiken, 1980; Petty & Cacioppo, 1981)
of information processing. We conduct a 2� 2� 2 between-subjects exper-
iment to test the hypotheses. The independent variables are cue multiplicity
(low, high), message reprocessability (absent, present), and evidence
strength (weak, strong). The scenario involves an auditor who identifies a
potentially serious problem – a large part of the client’s inventory is seem-
ingly obsolete and the auditor believes that the inventory may be over-
valued by a material amount. Using electronic media for communication,
the chief financial officer (CFO) expresses disagreement with the auditor’s
conclusions and explains why an inventory write-down is not necessary. The
dependent variable reflects the extent of belief revision, in favor of the cli-
ent’s position, exhibited by the participants.
Study findings indicate that belief revision is unaffected by cue multiplic-
ity, message reprocessability or the interaction of both when the client-
provided evidence is strong. However, when evidence is weak, the effect of
cue multiplicity inverts depending on the state of message reprocessability.
Specifically, in the presence of reprocessability, higher cue multiplicity leads
to greater belief revision toward the client’s preferred position, as predicted;
unexpectedly however, when reprocessability is absent, lower cue multiplic-
ity results in greater belief revision in favor of the client. This is the first
study to examine how auditors’ belief adjustments can be differentially af-
fected by interactions among certain electronic communication media and
message attributes. The value of this research lies in its contribution to
extant information processing theory and audit practice.
The next section discusses background literature and develops study hy-
potheses. The following sections explain the research method, present the
study findings, and discuss the implications for information processing the-
ory and audit practice.
BACKGROUND AND HYPOTHESES
Auditor–Client Inquiry
The planning phase of an audit includes performing analytical review pro-
cedures aimed at directing attention to potential problem areas. Analytical
Client Inquiry Via Electronic Communication Media 89
review procedures involve four phases: (1) developing an understanding of
the client’s business activities and searching for unusual fluctuations in a
company’s financial statements (mental representation); (2) generating po-
tential causes for any observed inconsistencies (hypothesis generation);
(3) gathering diagnostic information (information search); and (4) analyzing
findings to identify the most likely hypothesis and arrive at a diagnosis
(hypothesis evaluation) (Koonce, Walker, & Wright, 1993). The current
study focuses on the information search phase of analytical review proce-
dures. More specifically, this study examines a particular information source
– client inquiry (Hirst & Koonce, 1996).
During analytical review, auditors might notice one or more unusual
relationships in the clients’ account representations. When this happens,
auditors often ask managers to explain how and why such situations arose.
During inquires, auditors are aware that managers’ explanations can be
biased toward supporting the underlying transactions giving rise to the un-
usual relationships. Accordingly, auditors are professionally skeptical in
such situations. Possible reasons why managers can bias their arguments
toward supporting the current state of accounts are found in agency theory
(e.g., Jensen & Meckling, 1976).
One assumption in agency theory is that managers (agents) will attempt to
take self-serving advantage of private information they possess of which
owners (principals) are unaware. Intervening in the principal–agent rela-
tionship are independent auditors who represent the principals’ interests.
Agency theory suggests that managers with a higher (lower) motivation to
maintain their information-asymmetric advantage over the principals will
likely be less (more) honest with and forthcoming toward auditors (Hirst &
Koonce, 1996). Under such circumstances, when auditors attempt to gather
information via client inquiry about unusual account fluctuations, managers
with higher levels of self-serving interests might try harder to persuade the
auditors to accept current account representations.
From both academic and practical standpoints, it is important to under-
stand how persuasive intentions of this nature can influence auditors’ belief
revision processes and judgments, as auditors might unknowingly make
suboptimal choices and decisions under certain conditions (e.g., Jensen &
Meckling, 1976). The condition of interest in the current study involves the
electronic communication media through which auditor–client communi-
cations are exchanged.
Although auditors and clients may be scattered across the world, they
nevertheless need to communicate with each other about important audit
issues in a timely manner. One way for auditors and clients to establish
ANNA NOTEBERG AND JAMES E. HUNTON90
prompt communication exchanges is through the use of electronic commu-
nication media, such as e-mailing or video-conferencing. While this solution
might be efficient from time and cost perspectives, questions arise regarding
the effectiveness of such media. The media-task fit model developed by
Noteberg, Benford, and Hunton (2003) proposes that the effectiveness of
auditor–client inquires are affected by the fit between task and technology
attributes. In the current study, we test a proportion of the media-task fit
model, and predict that certain media attributes can unintentionally bias
auditors’ belief revisions and judgments, as next discussed.
Belief Adjustment
According to the anchoring-and-adjustment heuristic, individuals anchor on
initial beliefs regarding a subject matter, obtain and evaluate additional
evidence, and then adjust their initial anchor accordingly. The belief ad-
justment model (BAM) (Einhorn & Hogarth, 1985; Ashton & Ashton, 1988;
Hogarth & Einhorn, 1992) predicts that individuals revise their beliefs on
the basis of evidence direction and strength. The current study holds ev-
idence direction constant, meaning that the client presents evidence that
attempts to disconfirm the auditor’s initial belief state. This factor is held
steady because it reflects the audit condition of interest: a client is attempt-
ing to persuade an auditor to accept a current account representation.
However, the client may provide either strong or weak evidential cues to the
auditor in this circumstance. While the positive main effect of evidence
strength on judgments is not a new issue to investigate (e.g., Hogarth &
Einhorn, 1992), the current study is unique, as it examines the potential
interaction of evidence strength with two electronic communication media
attributes – reprocessability and cue multiplicity.
Reprocessability
Reprocessability refers to an electronic communication media feature that
allows communicators to re-examine messages (Dennis & Valacich, 1999).
Reprocessability is particularly prominent in electronic media that allow for
vast information storage, such as e-mail or voice mail. It is a media attribute
that acts as an ‘‘externally recorded memory’’ (Sproull, 1991) and thereby
aids in understanding the situation, particularly as the volume, complexity
Client Inquiry Via Electronic Communication Media 91
and equivocality of messages increase (Noteberg et al., 2003). The current
study examines the effect of reprocessability on auditors’ belief revisions.
Two processing strategies implicit in the BAM (sequential and simulta-
neous) are reviewed to explain potential effects of reprocessability on belief
revision. According to the BAM, individuals use one of two information-
processing strategies when faced with multiple pieces of evidential matter.
Sequential processing takes place when individuals adjust their beliefs in-
crementally after evaluating each piece of evidence. Simultaneous processing
means that individuals adjust their initial anchor only after evaluating the
full aggregate set of evidential matter.
According to the ‘‘dilution effect’’ (Ashton & Ashton, 1988), disconfir-
mation-prone individuals make stronger belief revisions when information is
elicited in a sequential format, as compared to a simultaneous format.
Ashton and Ashton (1988) note that auditors are generally disconfirmation-
prone; therefore, sequential evaluation of consistently negative evidence will
result in more extreme belief change than simultaneous processing of the
same evidence. Consequently, belief revision should be stronger when in-
dividuals process evidence sequentially as opposed to simultaneously. The
primary reason for the dilution effect is that sequential evidence processing
offers more opportunities to anchor and adjust than does simultaneous
processing, thereby resulting in more extreme revisions in the direction of
the evidence (Francis & Schipper, 1999).
Returning to the media attribute of interest, let us first contemplate the
use of a medium that lacks reprocessability, i.e., messages are not stored for
later re-examination. For instance, if an auditor holds a telephone conver-
sation with a client during which multiple issues are discussed, the auditor is
likely to process the evidential matter simultaneously upon reflection of the
whole conversation. One could argue that the auditor sequentially processes
information as received during the conversation, but research evidence sug-
gests that cognitive conversation processes (e.g., listening, speaking, adjust-
ing, and coordinating) effectively block sequential anchoring and adjusting
(Schober & Brennan, 2003). Even if some degree of sequential processing
takes place during conversation, the lack of a message archive effectively
prevents post-conversation sequential adjusting (Schober & Brennan, 2003).
Hence, simultaneous post-conversation processing of all evidential matter is
likely to occur.1
Next, assume that the medium used for message conveyance allows the
auditor to re-examine evidential cues after an initial exposure to evidence
collection. To the extent that auditors utilize a medium’s reprocessing ca-
pability, the subsequent assessment of each piece of information can evoke a
ANNA NOTEBERG AND JAMES E. HUNTON92
sequential processing strategy.2 Hence, we expect that the extent of belief
revision will increase with the presence, as compared to the absence, of
reprocessability, as stated in the first Hypothesis
H1. There is a positive relationship between reprocessability and belief
revision.
While we assume that the second media attribute examined in this study (cue
multiplicity) will also positively affect belief revision, we posit that its impact
will vary depending on the interaction of evidence strength and the medi-
um’s reprocessing capability, as next discussed.
Cue Multiplicity
While the BAM only considers content-related evidence cues in its predic-
tion of individuals’ belief revision processes, we extend the model by incor-
porating peripheral (i.e., non-content related) cues. If given the opportunity,
it is likely that message senders with persuasive intentions (e.g., clients) will
employ peripheral cues (e.g., body language and voice intonation) to per-
suade the recipients (e.g., auditors) of their messages. Given that some
electronic media allow for the conveyance of such peripheral cues while
others do not, it is important to consider both central and peripheral cues, in
order to understand decision-makers’ potential reactions to persuasive
evidence.3
According to dual processing models, such as the elaboration likelihood
model (Petty & Cacioppo, 1981) and the heuristic-systematic model
(Chaiken, 1980), message recipients can sequentially or simultaneously fol-
low two routes when processing persuasive information – a central route
(systematic) and a peripheral (heuristic) route.4 When following the central
route, message recipients systematically scrutinize the validity of arguments
(i.e., central cues) contained in a persuasive message, and revise their initial
beliefs based on the content-related cues included in the message. The cur-
rent study incorporates two levels of evidence strength (weak and strong)
into the experimental design. The purpose of manipulating the validity of
arguments or central cues in this manner is to discriminate message effects,
which are processed via the central route, from media effects, which trigger
peripheral route processing.
When following a peripheral information-processing route, decision-
makers factor secondary, personal, and social cues into their belief revisions,
which may or may not be related to the central message (Chen & Chaiken,
Client Inquiry Via Electronic Communication Media 93
1999). For instance, peripheral cues such as source attractiveness and voice
inflections can hold persuasive powers without demanding considerable
mental effort. In a laboratory experiment, Comunale, Sexton, and Sincich
(2005) demonstrated that auditors were affected by the linguistic manner
(e.g., hedges and hesitations in speech) in which a client delivered expla-
nations. They found that auditors incorporate linguistic delivery style into
their evaluation of client credibility, thereby supporting the assumption that
peripheral cues play an important role in auditors’ belief revisions.
In the current study, cue multiplicity represents the extent to which the
medium makes available various peripheral cues. Communication media
may hold a high or low level of cue multiplicity. Media that restrict the
availability of peripheral factors offer a low level of cue multiplicity (e.g.,
e-mail messages), whereas those that provide access to such cues provide a
high level of cue multiplicity (e.g., audio–video presentations).
Previous research has examined the impact of cue multiplicity on various
communication outcomes, such as effectiveness and efficiency of managers’
decisions (e.g., Daft & Lengel, 1986; Daft, Lengel, & Klebe Trevino, 1987;
Kraut, Galegher, Fish, & Chalfonte, 1992; Rice, 1992; Hollingshead,
McGrath, & O’Connor, 1993; Dennis & Kinney, 1998; Suh, 1999), attitude
change (Matheson & Zanna, 1989), and communicator likeability
(Weisband & Atwater, 1999). The current study examines the effect of cue
multiplicity on auditors’ belief revisions, assuming that the peripheral cues
support the central message.
As suggested by Chaiken and Eagly (1983), we posit that high cue mul-
tiplicity enables peripheral processing by drawing the message recipient’s
attention to the sender’s peripheral cues. Thus, assuming that peripheral
signals are directionally aligned with the central cues, a medium with high
cue multiplicity is expected to enhance the persuasive power of the message,
as compared to a medium with low cue multiplicity. However, we also
hypothesize that the belief revision effect of cue multiplicity is moderated by
the strength of the evidence and the presence or absence of reprocessability,
as reviewed next.
Interactive Effects
When evidence is weak and reprocessability is absent, greater cue multi-
plicity is likely to have a positive effect on belief revision because the pe-
ripheral cues are supporting the central message. When evidence is weak and
reprocessability is present, the positive effect of cue multiplicity will be
ANNA NOTEBERG AND JAMES E. HUNTON94
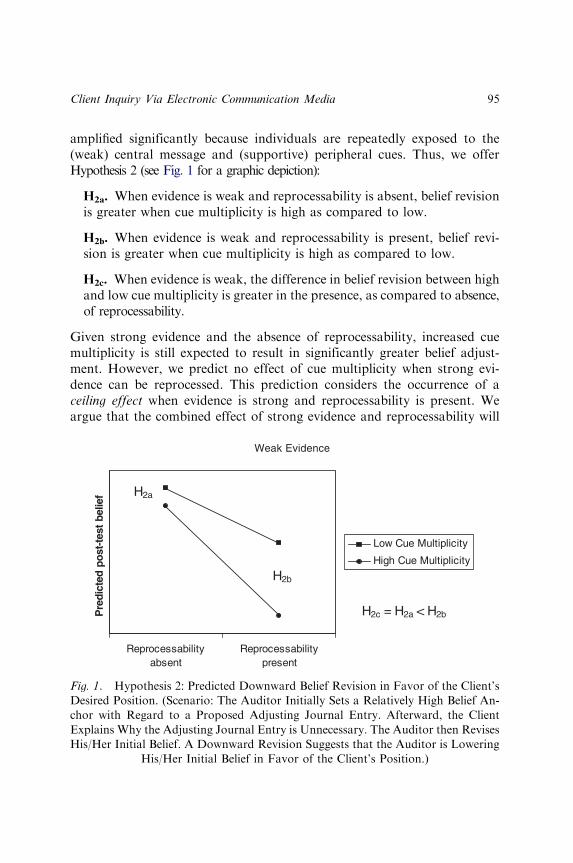
amplified significantly because individuals are repeatedly exposed to the
(weak) central message and (supportive) peripheral cues. Thus, we offer
Hypothesis 2 (see Fig. 1 for a graphic depiction):
H2a. When evidence is weak and reprocessability is absent, belief revision
is greater when cue multiplicity is high as compared to low.
H2b. When evidence is weak and reprocessability is present, belief revi-
sion is greater when cue multiplicity is high as compared to low.
H2c. When evidence is weak, the difference in belief revision between high
and low cue multiplicity is greater in the presence, as compared to absence,
of reprocessability.
Given strong evidence and the absence of reprocessability, increased cue
multiplicity is still expected to result in significantly greater belief adjust-
ment. However, we predict no effect of cue multiplicity when strong evi-
dence can be reprocessed. This prediction considers the occurrence of a
ceiling effect when evidence is strong and reprocessability is present. We
argue that the combined effect of strong evidence and reprocessability will
Reprocessability
absent
Reprocessability
present
Pre
dic
ted
po
st-
test
belief
Low C
Weak Evidence
ue Multiplicity
High Cue Multiplicity
H2c = H2a < H2b
H2a
H2b
Fig. 1. Hypothesis 2: Predicted Downward Belief Revision in Favor of the Client’s
Desired Position. (Scenario: The Auditor Initially Sets a Relatively High Belief An-
chor with Regard to a Proposed Adjusting Journal Entry. Afterward, the Client
Explains Why the Adjusting Journal Entry is Unnecessary. The Auditor then Revises
His/Her Initial Belief. A Downward Revision Suggests that the Auditor is Lowering
His/Her Initial Belief in Favor of the Client’s Position.)
Client Inquiry Via Electronic Communication Media 95
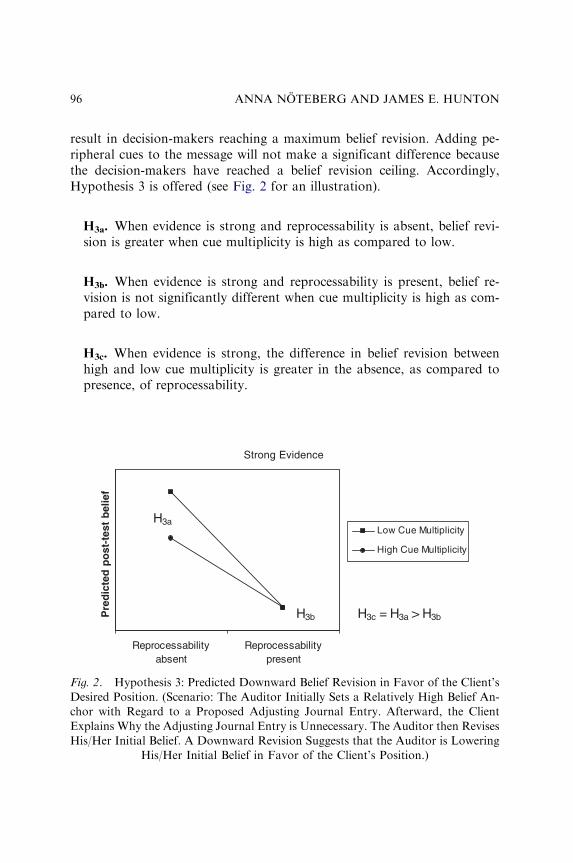
result in decision-makers reaching a maximum belief revision. Adding pe-
ripheral cues to the message will not make a significant difference because
the decision-makers have reached a belief revision ceiling. Accordingly,
Hypothesis 3 is offered (see Fig. 2 for an illustration).
H3a. When evidence is strong and reprocessability is absent, belief revi-
sion is greater when cue multiplicity is high as compared to low.
H3b. When evidence is strong and reprocessability is present, belief re-
vision is not significantly different when cue multiplicity is high as com-
pared to low.
H3c. When evidence is strong, the difference in belief revision between
high and low cue multiplicity is greater in the absence, as compared to
presence, of reprocessability.
Reprocessability
absent
Reprocessability
present
Pre
dic
ted
po
st-
test
belief
Low Cue Multiplicity
High Cue Multiplicity
H3c = H3a > H3b
H3a
H3b
Strong Evidence
Fig. 2. Hypothesis 3: Predicted Downward Belief Revision in Favor of the Client’s
Desired Position. (Scenario: The Auditor Initially Sets a Relatively High Belief An-
chor with Regard to a Proposed Adjusting Journal Entry. Afterward, the Client
Explains Why the Adjusting Journal Entry is Unnecessary. The Auditor then Revises
His/Her Initial Belief. A Downward Revision Suggests that the Auditor is Lowering
His/Her Initial Belief in Favor of the Client’s Position.)
ANNA NOTEBERG AND JAMES E. HUNTON96
METHOD
We designed and administered a computerized laboratory experiment to test
the research hypotheses. The experiment reflects a 2 (cue multiplicity: low,
high) �2 (message reprocessability: absent, present) �2 (evidence strength:
weak, strong) between-subjects design. Participants were randomly assigned
to treatment conditions.
Experimental Procedure
Participants were instructed to assume the role of an audit partner of a large
accounting firm. The client firm was a computer manufacturer called ‘‘Mi-
croClone.’’5 The senior manager on the audit had uncovered a potential
problem with the client’s finished goods inventory, which was currently
valued at h2 million. Specifically, due to the recent introduction of 5th
generation computers, part of the inventory (4th generation computers)
might be over-valued by about h400,000 (see the appendix for complete
wording of the background information presented to all participants). Next,
the company’s CFO reacted to the auditor’s concern with five arguments
defending why the 4th generation computers should not be written down.6
All arguments, whether strong or weak, attempted to persuade the auditor
not to book the recommended inventory write-down.
Experimental Manipulations
Evidence strength is a function of source objectivity (e.g., Abdel-Khalik,
Snowball, & Wragge, 1983), source independence (e.g., Brown, 1983), and
evidence verifiability (e.g., Spires, 1991; Goodwin, 1999). All three aspects
were used to manipulate the relative strength of CFO-provided arguments.
Following each of the five arguments, the CFO referred to a secondary
source who confirmed the argument. In the weak evidence condition, the
CFO referred to an internal source (i.e., a mid-level employee). This treat-
ment was designed to weaken the perception of source objectivity and
independence. Strong arguments contained the same message content as the
weak arguments, but the CFO referred to ‘well-known experts’ in the field
who confirmed the arguments in published articles. The use of an external
source was intended to strengthen the perception of source objectivity and
independence. To further reinforce the strong argument manipulation, the
senior manager on the audit verified the genuineness of the published article;
Client Inquiry Via Electronic Communication Media 97
on the other hand, participants in the weak message condition were not ex-
plicitly told that the evidence provided by the secondary source was verified.7
Following the first round of arguments, participants in the reprocessabil-
ity absent (present) condition were not (were) allowed to re-examine the
CFO-provided arguments. To ensure that participants in the ‘reprocess-
ability present’ condition actually reprocessed the messages, the computer
software presented for a second time each of the five arguments (in random
order) before allowing the participants to record their post-argument belief
state.8
We manipulated cue multiplicity by presenting the CFO’s arguments in
either e-mail or audio–video format. E-mail is low in cue multiplicity, as it
does not allow for any peripheral cues, such as body language and voice
intonation. In the audio–video clips, the CFO conveyed the arguments using
the same wording as the e-mails. The actor was male, around 50 years of
age, dressed in a dark suit and wore glasses, i.e., a stereotypical business
professional. The video clips showed his head and upper torso in an office
environment, i.e., seated at a desk in daylight next to a computer. The actor
asserted the same serious tone in his voice across the five clips. His pres-
entation style was free of hedges, hesitations, and faulty grammar in an
attempt to induce a perception of high source credibility (Comunale et al.,
2005). Thus, the peripheral cues present in the audio–video clips, but not
available in the e-mail treatment, were (1) professional looking businessman,
(2) sincere look on his face, (3) credible grammar, (4) serious voice tone, and
(5) orderly business office environment.
Dependent Measure
Recall that the CFO in the case provided evidence aimed at persuading the
auditor to revise his/her initial belief from a relatively high (strong) position
to a lower (weaker) state. Hence, the dependent variable used to test the
hypotheses was the extent of downward belief revision regarding the pro-
posed inventory valuation write-down, after being exposed to the client’s
arguments. The participants responded to the following statement: ‘‘Given
the available information, I strongly believe that MicroClone should write
down its 4th generation inventory by h400,000’’ (1 ¼ strongly disagree, 7 ¼
strongly agree). The participants’ initial belief anchor was first measured
after reading the background information. Then, once the participants were
exposed to the five counter-arguments offered by the chief executive officer
(CEO) (i.e., the treatments), they responded to the same statement once
ANNA NOTEBERG AND JAMES E. HUNTON98
again. Thus, the dependent variable metric is calculated as the post-test
belief, adjusted for the effect of the covariate (pre-test belief). This metric is
referenced as ‘‘belief revision.’’
RESULTS
Sample Demographics
The sample is comprised of 189 part-time graduate students in accounting
with prior work experience. Individual cell sizes for all eight conditions
range from 21 to 26, with a median cell size of 23 and a mode of 26. The
mean (s.d.) age of participants is 26.67 (5.21) and the age range is between
20 and 52 years. There are 123 male participants (65.1%) and 66 (34.9%)
female participants. The number of participants in their first, second, and
third year of graduate education, respectively, are 131 (69.3%), 38 (20.1%),
and 20 (10.6%). Most participants have some work experience in the field of
accounting and/or auditing; specifically, 13 (6.9%) indicate no work expe-
rience, 21 (11.1%) record less than a year of experience, 44 (23.3%) specify
between 1 and 2 years of experience, 96 (50.8%) note between 3 and 5 years
of experience, 13 (6.9%) hold between 5 and 10 years of experience, and 1
(0.5%) possesses more than 10 years of work experience. At the time of the
experiment, each participant was enrolled at one of two Dutch universities.9
Manipulation Checks
Participants were asked the extent to which they agreed with a statement
indicating that the messages were strong (1 ¼ strongly disagree, 7 ¼
strongly agree). The response means (s.d.) are as follow: weak evidence
treatment 4.44 (1.81) and strong evidence treatment 5.16 (1.46). An
ANOVA indicates statistical significance between the two treatments
(F ¼ 8:88; po0:01). As a further check on evidence strength, participants
were asked to state the extent to which they agreed (1 ¼ strongly disagree,
7 ¼ strongly agree) with the following statements: (1) ‘‘The arguments in
favor of a lower write-down provided by Tom van Breukelen were con-
vincing,’’ and (2) ‘‘The arguments in favor of a lower write-down provided
by Tom van Breukelen were credible.’’ The mean (s.d.) for the two questions
are: (1) convincing – 3.90 (4.58) for weak evidence, 4.76 (4.58) for strong evidence; (2)
credible – 4.57 (1.63) for weak evidence, 5.28 (1.35) for strong evidence. Based on
ANOVA tests, the means for both questions are significantly different (po0:001)
Client Inquiry Via Electronic Communication Media 99
between the weak and strong evidence conditions, and they are directionally consistent
with expectations. Hence, the manipulation of evidence strength was successful.
Participants also stated the extent to which they agreed with a statement
indicating that they were allowed to review the five arguments after receiving
the first exposure but before recording their second belief (1 ¼ strongly
disagree, 7 ¼ strongly agree). The response mean (s.d.) is 3.72 (2.46) for the
‘reprocessability absent’ group and 6.31 (1.46) for the ‘reprocessability
present’ group. An ANOVA indicates a significant difference between the
two means (F ¼ 78:16; po0:01), suggesting a successful manipulation of
reprocessability.
To test for cue multiplicity, participants were asked whether they were
exposed to the CFO’s arguments via e-mail or audio–video media. All par-
ticipants in the e-mail condition correctly responded to this question. How-
ever, out of 98 subjects in the high cue multiplicity condition, 16 stated that
they had been exposed to e-mail messages. One possible reason for some
participants responding incorrectly could be that they misinterpreted the
question; that is, all participants were exposed to written attachments fol-
lowing each e-mail or audio–video message (i.e., either an internal or ex-
ternal source verified each argument in writing); hence, participants in the
high cue multiplicity condition might have thought that the verifying at-
tachments were e-mail messages when responding to this manipulation
check question. A Pearson w2 test (w2 ¼ 136:99; po0:01) indicates a signif-
icant difference between treatment groups, and additional sensitivity testing
of participants in the high cue multiplicity condition who did and did not
respond correctly to this question reveals no significant difference in their
pre–post belief revisions (p40:90). Thus, the manipulation of cue multi-
plicity was successful.
Parametric Assumptions
To assess whether the post-test belief scores meet the normality assumption,
Kolmogorov–Smirnov and Shapiro–Wilk tests were conducted. Both tests
are significant at po0:001; indicating that the data are not normally dis-
tributed. However, between-subjects ANCOVA models are robust to non-
normality if the skewness of each treatment condition is in the same direc-
tion and the largest variance is o4 times the smallest variance (Torrance,
2002). The study meets both conditions, as response distributions in all eight
treatment conditions are positively skewed and the largest variance
(s ¼ 4:06) is 3.87 times the smallest variance (s ¼ 1:05). An additional
ANNA NOTEBERG AND JAMES E. HUNTON100
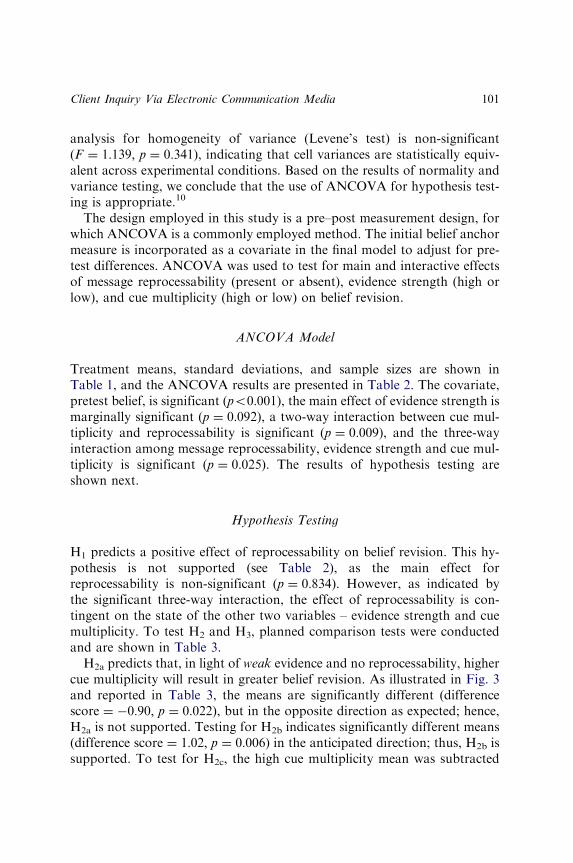
analysis for homogeneity of variance (Levene’s test) is non-significant
(F ¼ 1:139; p ¼ 0:341), indicating that cell variances are statistically equiv-
alent across experimental conditions. Based on the results of normality and
variance testing, we conclude that the use of ANCOVA for hypothesis test-
ing is appropriate.10
The design employed in this study is a pre–post measurement design, for
which ANCOVA is a commonly employed method. The initial belief anchor
measure is incorporated as a covariate in the final model to adjust for pre-
test differences. ANCOVA was used to test for main and interactive effects
of message reprocessability (present or absent), evidence strength (high or
low), and cue multiplicity (high or low) on belief revision.
ANCOVA Model
Treatment means, standard deviations, and sample sizes are shown in
Table 1, and the ANCOVA results are presented in Table 2. The covariate,
pretest belief, is significant (po0:001), the main effect of evidence strength is
marginally significant (p ¼ 0:092), a two-way interaction between cue mul-
tiplicity and reprocessability is significant (p ¼ 0:009), and the three-way
interaction among message reprocessability, evidence strength and cue mul-
tiplicity is significant (p ¼ 0:025). The results of hypothesis testing are
shown next.
Hypothesis Testing
H1 predicts a positive effect of reprocessability on belief revision. This hy-
pothesis is not supported (see Table 2), as the main effect for
reprocessability is non-significant (p ¼ 0:834). However, as indicated by
the significant three-way interaction, the effect of reprocessability is con-
tingent on the state of the other two variables – evidence strength and cue
multiplicity. To test H2 and H3, planned comparison tests were conducted
and are shown in Table 3.
H2a predicts that, in light of weak evidence and no reprocessability, higher
cue multiplicity will result in greater belief revision. As illustrated in Fig. 3
and reported in Table 3, the means are significantly different (difference
score ¼ �0:90; p ¼ 0:022), but in the opposite direction as expected; hence,
H2a is not supported. Testing for H2b indicates significantly different means
(difference score ¼ 1:02; p ¼ 0:006) in the anticipated direction; thus, H2b is
supported. To test for H2c, the high cue multiplicity mean was subtracted
Client Inquiry Via Electronic Communication Media 101
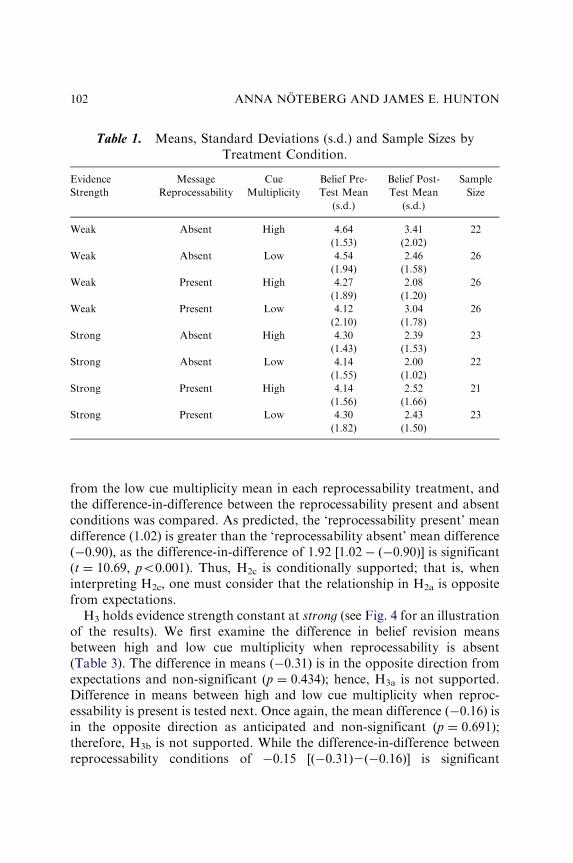
from the low cue multiplicity mean in each reprocessability treatment, and
the difference-in-difference between the reprocessability present and absent
conditions was compared. As predicted, the ‘reprocessability present’ mean
difference (1.02) is greater than the ‘reprocessability absent’ mean difference
ð�0:90Þ; as the difference-in-difference of 1.92 ½1:02� ð�0:90Þ� is significant(t ¼ 10:69; po0:001). Thus, H2c is conditionally supported; that is, when
interpreting H2c, one must consider that the relationship in H2a is opposite
from expectations.
H3 holds evidence strength constant at strong (see Fig. 4 for an illustration
of the results). We first examine the difference in belief revision means
between high and low cue multiplicity when reprocessability is absent
(Table 3). The difference in means ð�0:31Þ is in the opposite direction from
expectations and non-significant (p ¼ 0:434); hence, H3a is not supported.
Difference in means between high and low cue multiplicity when reproc-
essability is present is tested next. Once again, the mean difference ð�0:16Þ isin the opposite direction as anticipated and non-significant (p ¼ 0:691);therefore, H3b is not supported. While the difference-in-difference between
reprocessability conditions of �0:15 ½ð�0:31Þ2ð�0:16Þ� is significant
Table 1. Means, Standard Deviations (s.d.) and Sample Sizes by
Treatment Condition.
Evidence
Strength
Message
Reprocessability
Cue
Multiplicity
Belief Pre-
Test Mean
(s.d.)
Belief Post-
Test Mean
(s.d.)
Sample
Size
Weak Absent High 4.64 3.41 22
(1.53) (2.02)
Weak Absent Low 4.54 2.46 26
(1.94) (1.58)
Weak Present High 4.27 2.08 26
(1.89) (1.20)
Weak Present Low 4.12 3.04 26
(2.10) (1.78)
Strong Absent High 4.30 2.39 23
(1.43) (1.53)
Strong Absent Low 4.14 2.00 22
(1.55) (1.02)
Strong Present High 4.14 2.52 21
(1.56) (1.66)
Strong Present Low 4.30 2.43 23
(1.82) (1.50)
ANNA NOTEBERG AND JAMES E. HUNTON102
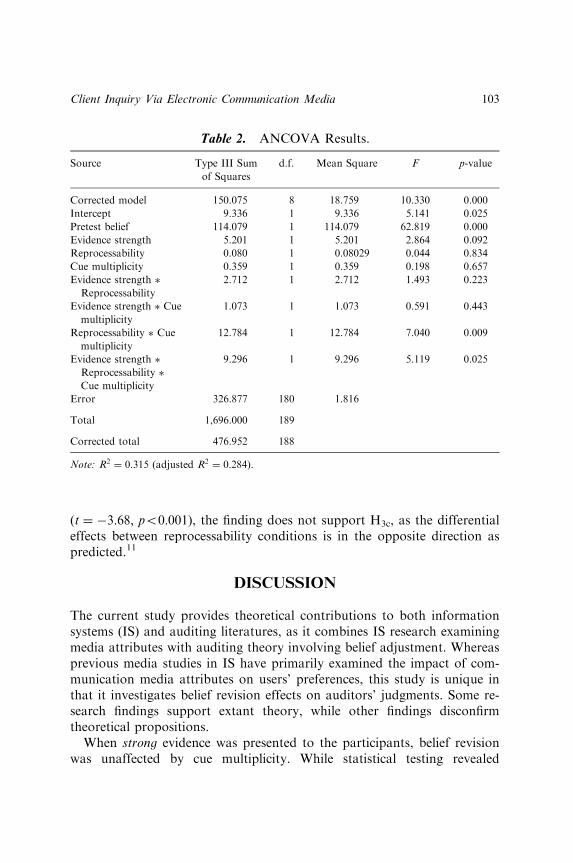
(t ¼ �3:68; po0:001), the finding does not support H3c, as the differential
effects between reprocessability conditions is in the opposite direction as
predicted.11
DISCUSSION
The current study provides theoretical contributions to both information
systems (IS) and auditing literatures, as it combines IS research examining
media attributes with auditing theory involving belief adjustment. Whereas
previous media studies in IS have primarily examined the impact of com-
munication media attributes on users’ preferences, this study is unique in
that it investigates belief revision effects on auditors’ judgments. Some re-
search findings support extant theory, while other findings disconfirm
theoretical propositions.
When strong evidence was presented to the participants, belief revision
was unaffected by cue multiplicity. While statistical testing revealed
Table 2. ANCOVA Results.
Source Type III Sum
of Squares
d.f. Mean Square F p-value
Corrected model 150.075 8 18.759 10.330 0.000
Intercept 9.336 1 9.336 5.141 0.025
Pretest belief 114.079 1 114.079 62.819 0.000
Evidence strength 5.201 1 5.201 2.864 0.092
Reprocessability 0.080 1 0.08029 0.044 0.834
Cue multiplicity 0.359 1 0.359 0.198 0.657
Evidence strength �
Reprocessability
2.712 1 2.712 1.493 0.223
Evidence strength � Cue
multiplicity
1.073 1 1.073 0.591 0.443
Reprocessability � Cue
multiplicity
12.784 1 12.784 7.040 0.009
Evidence strength �
Reprocessability �
Cue multiplicity
9.296 1 9.296 5.119 0.025
Error 326.877 180 1.816
Total 1,696.000 189
Corrected total 476.952 188
Note: R2 ¼ 0:315 (adjusted R2 ¼ 0:284).
Client Inquiry Via Electronic Communication Media 103
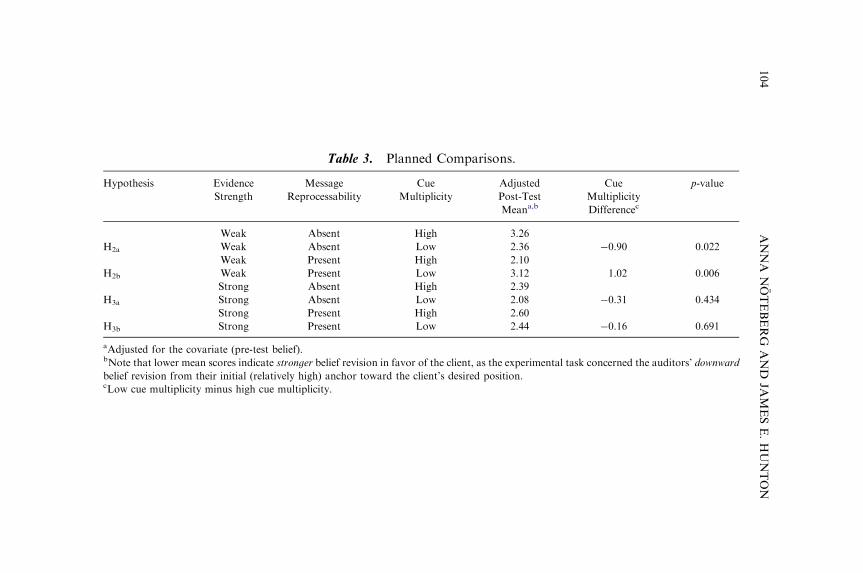
Table 3. Planned Comparisons.
Hypothesis Evidence
Strength
Message
Reprocessability
Cue
Multiplicity
Adjusted
Post-Test
Meana,b
Cue
Multiplicity
Differencec
p-value
Weak Absent High 3.26
H2a Weak Absent Low 2.36 �0.90 0.022
Weak Present High 2.10
H2b Weak Present Low 3.12 1.02 0.006
Strong Absent High 2.39
H3a Strong Absent Low 2.08 �0.31 0.434
Strong Present High 2.60
H3b Strong Present Low 2.44 �0.16 0.691
aAdjusted for the covariate (pre-test belief).bNote that lower mean scores indicate stronger belief revision in favor of the client, as the experimental task concerned the auditors’ downward
belief revision from their initial (relatively high) anchor toward the client’s desired position.cLow cue multiplicity minus high cue multiplicity.
ANNA
NOTEBERG
AND
JAMESE.HUNTON
104
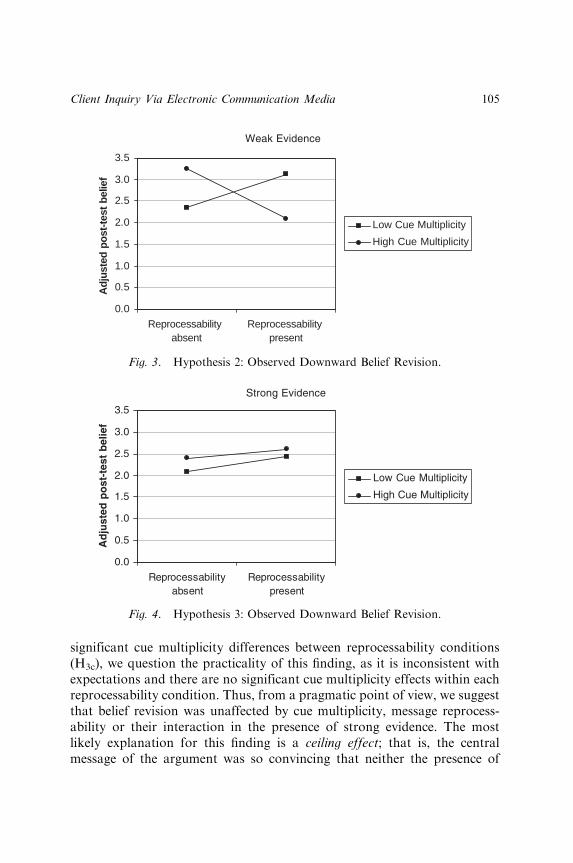
significant cue multiplicity differences between reprocessability conditions
(H3c), we question the practicality of this finding, as it is inconsistent with
expectations and there are no significant cue multiplicity effects within each
reprocessability condition. Thus, from a pragmatic point of view, we suggest
that belief revision was unaffected by cue multiplicity, message reprocess-
ability or their interaction in the presence of strong evidence. The most
likely explanation for this finding is a ceiling effect; that is, the central
message of the argument was so convincing that neither the presence of
0.0
0.5
1.0
1.5
2.0
2.5
3.0
3.5
Reprocessabilityabsent
Reprocessabilitypresent
Adj
uste
d po
st-t
est
belie
f
Low Cue Multiplicity
High Cue Multiplicity
Weak Evidence
Fig. 3. Hypothesis 2: Observed Downward Belief Revision.
0.0
0.5
1.0
1.5
2.0
2.5
3.0
3.5
Reprocessability
absent
Reprocessability
present
Ad
jus
ted
po
st-
tes
t b
eli
ef
Low Cue Multiplicity
High Cue Multiplicity
Strong Evidence
Fig. 4. Hypothesis 3: Observed Downward Belief Revision.
Client Inquiry Via Electronic Communication Media 105
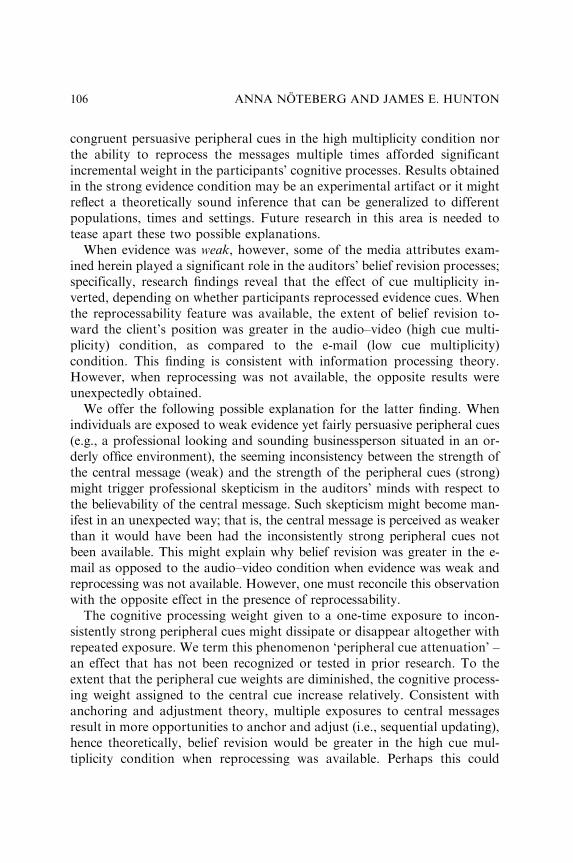
congruent persuasive peripheral cues in the high multiplicity condition nor
the ability to reprocess the messages multiple times afforded significant
incremental weight in the participants’ cognitive processes. Results obtained
in the strong evidence condition may be an experimental artifact or it might
reflect a theoretically sound inference that can be generalized to different
populations, times and settings. Future research in this area is needed to
tease apart these two possible explanations.
When evidence was weak, however, some of the media attributes exam-
ined herein played a significant role in the auditors’ belief revision processes;
specifically, research findings reveal that the effect of cue multiplicity in-
verted, depending on whether participants reprocessed evidence cues. When
the reprocessability feature was available, the extent of belief revision to-
ward the client’s position was greater in the audio–video (high cue multi-
plicity) condition, as compared to the e-mail (low cue multiplicity)
condition. This finding is consistent with information processing theory.
However, when reprocessing was not available, the opposite results were
unexpectedly obtained.
We offer the following possible explanation for the latter finding. When
individuals are exposed to weak evidence yet fairly persuasive peripheral cues
(e.g., a professional looking and sounding businessperson situated in an or-
derly office environment), the seeming inconsistency between the strength of
the central message (weak) and the strength of the peripheral cues (strong)
might trigger professional skepticism in the auditors’ minds with respect to
the believability of the central message. Such skepticism might become man-
ifest in an unexpected way; that is, the central message is perceived as weaker
than it would have been had the inconsistently strong peripheral cues not
been available. This might explain why belief revision was greater in the e-
mail as opposed to the audio–video condition when evidence was weak and
reprocessing was not available. However, one must reconcile this observation
with the opposite effect in the presence of reprocessability.
The cognitive processing weight given to a one-time exposure to incon-
sistently strong peripheral cues might dissipate or disappear altogether with
repeated exposure. We term this phenomenon ‘peripheral cue attenuation’ –
an effect that has not been recognized or tested in prior research. To the
extent that the peripheral cue weights are diminished, the cognitive process-
ing weight assigned to the central cue increase relatively. Consistent with
anchoring and adjustment theory, multiple exposures to central messages
result in more opportunities to anchor and adjust (i.e., sequential updating),
hence theoretically, belief revision would be greater in the high cue mul-
tiplicity condition when reprocessing was available. Perhaps this could
ANNA NOTEBERG AND JAMES E. HUNTON106
partially account for the higher belief revision in the audio–video condition,
as compared to the e-mail condition, when reprocessability was present and
evidence strength is weak. Future research should focus more attention on
the peripheral cue attenuation effect.
We admit, however, that the unexpected negative effect of cue multiplicity
when reprocessability was absent could be due to an experimental artifact;
that is, in the absence of reprocessability, the participants’ cognitive capacity
was possibly overtaxed when they processed high cue multiplicity (audio–
video) messages. Participants had no control over the speed of audio–video
message presentation, other than pushing the play or stop button. Thus,
audio–video clips were played at a pre-determined speed. These factors
could have increased complexity and uncertainty among participants due to:
(1) the presence of peripheral cues that taxed the cognitive processing load
and (2) the participants’ inability to control the speed of information re-
ception. As a result, participants may have preferred to be conservative in
their beliefs, thereby revising their beliefs only to a very limited extent. On
the other hand, e-mail recipients in the absence of reprocessability were able
to read messages at their own pace and they revised their beliefs more
strongly than the video recipients. This may have occurred because (1) they
had no peripheral cues to process thereby focusing more cognitive process-
ing attention on the central, albeit weak, message and (2) the technology did
not force them to process the information at a certain speed. As a result,
they were less uncertain about the conveyed information and less conserv-
ative in their belief revisions. Preliminary evidence for the suggested expla-
nation of our unexpected finding can be found in post-hoc testing. Namely,
given weak evidence and the absence of reprocessability, higher response
variance was found when cue multiplicity was high as compared to low. This
finding suggests that participants who were exposed to weak messages in audio–
video format were significantly less consistent in their judgments than e-mail
recipients, suggesting some level of confusion and possibly information overload
caused by the combination of high cue multiplicity and no reprocessability.
From a practical standpoint, results from the current study suggest that the
auditing profession should consider various advantages and disadvantages
offered by computer-mediated communication with clients. While the use of
electronic communication media to collect evidential matter from clients is
timely and cost efficient, auditors should be aware that certain media at-
tributes might unintentionally bias their judgments, particularly when the
clients hold persuasive intentions. Naturally, definitive conclusions in this
regard cannot be made from a single study, as more research is needed in this
area.
Client Inquiry Via Electronic Communication Media 107
For instance, future studies might focus more on peripheral cues. Only
peripheral cues that generally support the direction of the central message
cues were considered in this study. It would be interesting to investigate the
interactive effect of cue format (central vs. peripheral), cue strength (strong
or weak), and cue direction (confirming or disconfirming an initial belief) on
belief revision. We also recommend that future research study the impact
and use of electronic media for two-way communication, i.e., where com-
munication parties interact with each other. In such scenarios, attributes
other than those examined in this study could be investigated. Most of the
other attributes would revolve around the concept of synchronicity, i.e.,
whether interaction occurs in real-time (synchronous) or with a time delay
(asynchronous) (e.g., Burgoon et al., 2000). Related to the concept of sync-
hronicity, one could also study the impact of another media attribute, re-
hearsability (e.g., Dennis & Valacich, 1999) or the extent to which the
medium allows for message rehearsal before transmission, on audit judg-
ment and decision making. Finally, future research should explore how
audit teams can effectively use computer-mediated communication technol-
ogy during all phases of the audit. Indeed, this is an exciting line of research
– one that is relevant to the burgeoning demand for and growing use of
electronic communication media in global commerce.
NOTES
1. One could argue that some auditors would write down what they discuss withclients via a telephone conversation and such notes would serve as a reprocessablearchive. To the extent that auditors re-examine and reflect on such written records,post-conversation sequential reprocessing of evidence might occur. However, even ifthis were the case, personally recorded evidence of this nature is often incomplete,inaccurate and biased to some degree due to simultaneous demands of mental fil-tering, linguistic writing, and cognitive conversation processing (Schober & Brennan,2003). One could further argue that the auditor could mentally recall and re-examineeach piece of evidence gathered during a conversation. However, memory decay andrecall filtering would likely dilute and bias this form of sequential processing.2. This would be the case even if auditors engaged in some degree of sequential
processing during conversation, and/or simultaneous anchoring and adjusting post-conversation before subsequent reprocessing of the messages.3. Note that this study is limited in that it considers only peripheral cues that
support the underlying, disconfirming message provided by central cues. Thus, ourpredictions apply only to scenarios where the message source is perceived as per-suasive both in terms of central as well as peripheral message cues.4. Although the Elaboration Likelihood Model and the Heuristic–Systematic
Model differ in some important aspects (see Eagly & Chaiken (1993) for a detailed
ANNA NOTEBERG AND JAMES E. HUNTON108
review), these differences are not central to our study. For this reason, the termscentral and peripheral are used interchangeably with the terms systematic and heu-ristic here.5. The scenario is based on the classroom case ‘‘MicroClone, Inc.’’ (Kistler &
Strickland, 1997).6. The five arguments provided by MicroClone’s CFO were presented in random
order.7. Pilot tests revealed that explicitly mentioning verification in the ‘strong evi-
dence’ treatment and not mentioning verification in the ‘weak evidence’ treatmentwas an effective manipulation. However, we recognize that participants in the ‘weakevidence’ condition may have believed that the internal source was either easilyverifiable or presumed verified. Either belief would drive the results toward the null,not the alternative, hypothesis.8. Participants could re-examine the arguments as many times as they desired;
however, they were all purposefully exposed to the messages for at least a secondtime because the cognitive aspect of the reprocessability hypothesis assumes that theelectronic media is capable of reprocessability and that the message recipient takesadvantage of such functionality.9. There are no significant differences ðp40:10Þ across treatment conditions for
the following demographic variables: university, experimental session, age, gender,year of graduate study, educational background, and work experience.10. Additional testing using non-parametric tests agree with the results of up-
coming parametric tests.11. The difference-in-difference analysis (H3c) results in a considerably smaller
standard deviation than the single difference scores for H3a ð�0:31Þ and H3b ð�0:16Þ:Hence, we find statistical significance regarding the former but not the latter meancomparisons.
ACKNOWLEDGMENTS
We thank the reviewers and participants of the European Conference of
Information Systems, where an earlier version of this chapter was presented
in 2004 and many useful comments were provided.
REFERENCES
Abdel-Khalik, A. R., Snowball, D. A., & Wragge, J. H. (1983). The effects of certain internal
audit variables on the planning of external audit programs. Accounting Review, 58(2),
215–227.
Ashton, A. H., & Ashton, R. H. (1988). Sequential belief revision in auditing. Accounting
Review, 63(4), 623–641.
Baltes, B. B., Dickson, M. W., Sherman, M. P., Bauer, C. C., & LaGanke, J. S. (2002).
Computer-mediated communication and group decision making: A meta-analysis. Or-
ganizational Behavior and Human Decision Processes, 87(1), 156–179.
Client Inquiry Via Electronic Communication Media 109
Brown, P. R. (1983). Independent auditor judgment in the evaluation of internal audit func-
tions. Journal of Accounting Research, 21(2), 444–455.
Burgoon, J. K., Bonito, J. A., Bengtsson, B., Cederberg, C., Lundeberg, M., & Allspach,
L. (2000). Interactivity in human–computer interaction: A study of credibility, under-
standing and influence. Computers in Human Behavior, 16, 553–574.
Chaiken, S. (1980). Heuristic versus systematic information processing and the use of source versus
message cues in persuasion. Journal of Personality and Social Psychology, 39, 752–766.
Chaiken, S., & Eagly, A. H. (1983). Communication modality as a determinant of persuasion:
The role of communicator salience. Journal of Personality and Social Psychology, 45(2),
241–256.
Chen, S., & Chaiken, S. (1999). The heuristic-systematic model in its broader context. In:
S. Chaiken & Y. Trope (Eds), Dual-process theories of social psychology. New York:
Guildford Press.
Comunale, C. L., Sexton, T. R., & Sincich, T. (2005). Linguistic delivery style, client credibility,
and auditor judgment. Advances in Accounting Behavioral Research, 8, 61–90.
Daft, R. L., & Lengel, R. H. (1986). Organizational information requirements, media richness
and structural design. Management Science, 32, 554–571.
Daft, R. L., Lengel, R. H., & Klebe Trevino, L. (1987). Message equivocality media selection
and manager performance: Implications for information systems. MIS Quarterly,
September 1987, 11(3), 335–366.
Dennis, A. R., & Kinney, S. T. (1998). Testing media richness theory in the new media: The
effects of cues, feedback, and task equivocality. Information Systems Research, 9(3),
256–274.
Dennis, A. R., & Valacich, J. S. (1999). Rethinking media richness: Toward a theory of media
synchronicity. Paper presented at the 32nd Hawaii international conference on system
sciences, Maui, Hawaii.
Eagly, A. H., & Chaiken, S. (1993). The psychology of attitudes. Fort Worth, TX: Harcourt
Brace Jovanovich.
Einhorn, H. J., & Hogarth, R. M. (1985). A contrast/surprise model for updating beliefs.
Working Paper, University of Chicago.
Francis, J., & Schipper, K. (1999). Have financial statements lost their relevance? Journal of
Accounting Research Autumn, 37(2), 319–352.
Goodwin, J. (1999). The effects of source integrity and consistency of evidence on auditors’
judgments. Auditing: A Journal of Practice & Theory, 18(2), 1–16.
Hirst, E., & Koonce, L. (1996). Audit analytical procedures: A field investigation. Contem-
porary Accounting Research, 13(2), 457–486.
Hogarth, R. M., & Einhorn, H. J. (1992). Order effects in belief updating: The belief-adjustment
model. Cognitive Psychology, 24, 1–55.
Hollingshead, A. B., McGrath, J. E., & O’Connor, K. M. (1993). Group task performance and
communication technology: A longitudinal study of computer-mediated versus face-to-
face work groups. Small Group Research, 24(3), 307–333.
Jensen, M. C., & Meckling, W. H. (1976). Theory of the firm: Behavior, agency costs and
ownership structure. Journal of Financial Economics, 3, 305–360.
Kistler, L. H., & Strickland, S. (1997). Instructional case: Microclone Inc. Issues in Accounting
Education, 12(2), 427–434.
Koonce, L., Walker, N. R., & Wright, W. F. (1993). A cognitive characterization of audit
analytical review. Auditing: A Journal of Practice & Theory, 12(Supplement), 57–76.
ANNA NOTEBERG AND JAMES E. HUNTON110
Kraut, R. E., Galegher, J., Fish, R., & Chalfonte, B. (1992). Task requirements and media
choice in collaborative writing. Human–Computer Interaction, 7(4), 375–407.
Matheson, K., & Zanna, M. P. (1989). Persuasion as a function of self-awareness in computer-
mediated communication. Social Behavior, 4, 99–111.
Noteberg, A., Benford, T. L., & Hunton, J. E. (2003). Matching electronic communication
media and audit tasks. International Journal of Accounting Information Systems, 4,
27–55.
Petty, R. E., & Cacioppo, J. T. (1981). Attitudes and persuasion: Classic and contemporary
approaches. Dubuque, Iowa: W.C. Brown.
Rice, R. E. (1992). Task analyzability, use of new media, and effectiveness: A multi-site ex-
ploration of media richness. Organization Science, 3, 457–500.
Schober, M. F., & Brennan, S. E. (2003). Processes of spoken discourse: The role of the partner.
In: A. C. Graesser, M. A. Gernsbacher & S. R. Goldman (Eds), Handbook of discourse
processes (pp. 123–164). Hillsdale, NJ: Lawrence Erlbaum.
Spires, E. (1991). Auditors’ evaluation of test-of-control strength. The Accounting Review, April,
66(2), 259–276.
Sproull, R. F. (1991). A lesson in electronic mail. In: L. Sproull & S. Kiesler (Eds), Connections:
New ways of working in the networked organization (pp. 177–184). Cambridge, MA: MIT
Press.
Strauss, S. G., & McGrath, J. E. (1994). Does the medium matter? The interaction of task type
and technology on group performance and member reactions. Journal of Applied Psy-
chology, 79, 87–97.
Suh, K. S. (1999). Impact of communication medium on task performance and satisfaction: An
examination of media-richness theory. Information & Management, 35, 295–312.
Torrance, M. (2002). Introduction to analysis of variance, from http://www.staffs.ac.uk/person-
al/sciences/smt15/mt15/rm3/lecture_web/index.htm. Accessed on December 1, 2004.
Weisband, S., & Atwater, L. (1999). Evaluating self and others in electronic and face-to-face
groups. Journal of Applied Psychology, 84, 632–639.
APPENDIX
Experimental Case
Please assume the role of a partner at a large audit firm. You are the partner
in charge of the audit of MicroClone Inc., a manufacturer of IBM-com-
patible personal computers.
The senior manager on the audit, Steven de Wit, who reports directly to
you, has extensively analyzed the company’s finished goods inventory. 25%
(2,000 units) of the finished goods inventory is comprised of 4th generation
computers and the remaining 75% (6,000 units) is represented by 5th gen-
eration computers (the latest microprocessor chip available on the market).
MicroClone’s inventory of 2,000 units of 4th generation computers is pres-
ently valued at cost (h1,000 per unit), for a total of h2,000,000.
Client Inquiry Via Electronic Communication Media 111
Steven de Wit has identified what might be a problem concerning the 4th
generation inventory. He noted that, during the 4th quarter, MicroClone
began shipping personal computers using the 5th generation chips; thus, he
is concerned that the value of the 4th generation computers remaining in the
inventory might be overstated.
After listening to Steven, you are also concerned about a potential over-
valuation problem because 4th generation computers will eventually become
obsolete by industry standards. Your and Steve’s analyses suggest that each
4th generation computer in the inventory should be valued at h800, not
h1,000. Thus, you believe that MicroClone’s estimate of 4th generation
computers could be overstated by as much as h200 per unit, yielding a
potential over-valuation of h400,000 – at the most.
You have decided to take the inventory issue directly to Tom van
Breukelen, the chief financial officer (CFO) of MicroClone. Your aim is to
negotiate with van Breukelen the appropriate over-valuation estimate,
which can range from h0 to h400,000. You ask van Breukelen to explain his
point of view regarding the 4th generation issue by sending him an e-mail
message with the following content:
To: Tom van Breukelen
From: You
Dear Mr van Breukelen,
I have some questions about the finished goods inventory.
Specifically, I want to ask you about the h2 million valuation of the 4th
generation microcomputers. By industry standards, the 4th generation
computers will likely become obsolete as the new, faster 5th generation
models become more widely adopted.
According to your records, about 25% (2,000 units) of your
company’s finished goods inventory is in 4th generation models, which
are valued at h1,000 each, for a total inventory valuation of h2,000,000.
Based on my preliminary analyses, your 4th generation computers
might be over-valued by around h200 per unit. Therefore, the finished
goods inventory appears to be overvalued by h400,000 at the most,
which means that your pre-tax profits also could be overstated by that
amount.
I am concerned about this situation because h400,000 is material
to your financial statements taken as a whole.
Kind regards,
ANNA NOTEBERG AND JAMES E. HUNTON112
ROLE MORALITY AND
ACCOUNTANTS’ ETHICALLY
SENSITIVE DECISIONS
Robin R. Radtke
ABSTRACT
If individuals exhibit less ethical behavior in the workplace than in their
personal decisions, this may constitute evidence of role morality behavior.
Role morality can be defined as ‘‘claim(ing) a moral permission to harm
others in ways that, if not for the role, would be wrong’’ (Applbaum,
1999. Ethics for adversaries: The morality of roles in public and profes-
sional life (p. 3). Princeton, NJ: Princeton University Press.) To inves-
tigate this issue, 55 practicing accountants completed and returned the
experimental survey. Results show that in many situations, business de-
cisions were less ethical than personal decisions, consistent with the theory
of role morality. The implications and limitations of this study as they
relate to practicing accountants are discussed.
INTRODUCTION
The importance of ethical decision-making in the accounting profession has
recently received renewed attention. Concerns about unethical activities
Advances in Accounting Behavioral Research
Advances in Accounting Behavioral Research, Volume 8, 113–138
Copyright r 2005 by Elsevier Ltd.
All rights of reproduction in any form reserved
ISSN: 1475-1488/doi:10.1016/S1475-1488(04)08005-6
113
related to the failure of Enron is one of the latest examples. Accountability
to the client in terms of pressure to present a favorable financial picture of a
corporation’s health may often lead to ethical breaches (Chartier, 2002).
Because of the Enron example concerning dubious accounting practices and
other documented cases of fraud over the last few years, public confidence in
the accounting profession may be diminishing. While calls for effective
codes of conduct and increased monitoring and accountability of the ac-
counting profession are not new (National Commission on Fraudulent
Financial Reporting, 1987), the credibility crisis remains. New calls for reg-
ulation both within and outside the accounting profession are specifically
concerned with violations of ethical standards (Pitt, 2002). Within this cli-
mate, investigation of accountants’ ethical decision-making processes is
particularly important.
Since recent examples suggest that at least some accountants are making
unethical business decisions, research is needed to investigate whether these
accountants make unethical decisions in both personal and business situ-
ations or whether they exhibit more ethical decisions in personal situations,
consistent with the theory of role morality. Implications for ethical
training and/or screening programs may vary significantly based on these
findings.
The remainder of the chapter is organized as follows. In the first section of
the chapter, relevant literature is reviewed and research questions are de-
veloped. Next, the experimental design is described. The data analysis and
results are presented in the third section. The chapter concludes with a
discussion of the limitations and implications for future research.
RELEVANT THEORY AND RESEARCH QUESTIONS
Role Morality and Ethically Sensitive Decisions
Mostly everyone deals with situations that contain ethical issues on a regular
basis in both personal and business decisions. Undoubtedly, many of these
situations are quite complex and difficult to reconcile. When pondering an
ethically sensitive situation, many factors may come into play. One com-
monly accepted ethical principle is universalism, which suggests that once a
certain action, such as theft, is determined to be wrong, it should always be
considered wrong. Thus, if one ascribes to the principle of universalism and
agrees that theft is wrong, one would not steal regardless of whether the
situation is of a personal or business nature.
ROBIN R. RADTKE114
If individuals exhibit less ethical behavior in the workplace than they do
in their personal decisions, this is consistent with the theory of role morality.
Role morality can be defined as ‘‘claim(ing) a moral permission to harm
others in ways that, if not for the role, would be wrong’’ (Applbaum, 1999,
p. 3). Role morality at its extremes can be seen in such examples as Sanson,
the executioner of Paris (Applbaum, 1999, p. 15) and Adolf Eichmann, a
middle-level Schutzstaffel (SS) officer who was responsible for the depor-
tation of millions of European Jews to Nazi death camps (Applbaum, 1995,
p. 470). Less extreme examples are present everyday in many professional
realms and include a doctor denying a patient involved in a clinical trial, a
treatment that the doctor has reason to believe is beneficial (Applbaum,
1999, p. 48), a CEO engaging in a strategy of secrecy wherein certain in-
formation is concealed from the public to advance the purposes of the CEO
(Applbaum, 1999, p. 183), and a campaign strategist who willfully distorts
an opponents’ record to smear his/her reputation in the eyes of the public
(Applbaum, 1999, p. 3).
An alternative, less extreme definition of role morality is ‘‘the extent to
which one succeeds in meeting the demands and obligations of one’s role’’
(Werhane & Freeman, 1999, p. 3). This definition is consistent with the view
that role morality and common-sense morality often prescribe the same ac-
tion. Specifying in more detail how role morality relates to common-sense
morality is the starting point in developing an understanding of how indi-
viduals can undertake actions consistent with the former and not the latter.
Fig. 1 shows a graphical depiction of the overlaps among role morality,
common-sense morality, and self-interest, as suggested by Kerssens-van
Drongelen and Fisscher (2003). Much of role morality overlaps with com-
mon-sense morality, such that only infrequently will individuals be faced
with situations where they must choose between the two. In these situations,
however, in order for an individual to choose role morality over common-
sense morality, the individual must ‘‘excuse oneself from a common moral
obligation by appealing to a role or the institution that creates the role’’
(Luban, 1988, p. 116). One way to achieve this end is through moral dis-
engagement.
Bandura, Barbaranelli, Caprara, and Pastorelli (1996) suggest that moral
disengagement allows individuals to displace their moral control in order to
engage in detrimental conduct. Several methods may be used to achieve this
disengagement including displacement of responsibility, moral justification,
disregarding or distorting the consequences of actions, and dehumanization.
Displacement of responsibility allows individuals to pass on responsibility
for actions to a legitimate authority who has dictated the actions to be
Role Morality and Accountants’ Ethically Sensitive Decisions 115
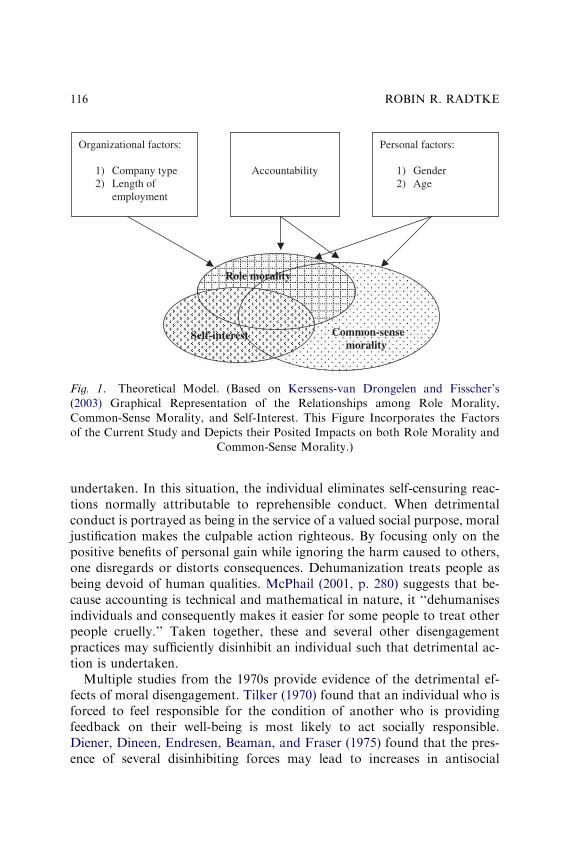
undertaken. In this situation, the individual eliminates self-censuring reac-
tions normally attributable to reprehensible conduct. When detrimental
conduct is portrayed as being in the service of a valued social purpose, moral
justification makes the culpable action righteous. By focusing only on the
positive benefits of personal gain while ignoring the harm caused to others,
one disregards or distorts consequences. Dehumanization treats people as
being devoid of human qualities. McPhail (2001, p. 280) suggests that be-
cause accounting is technical and mathematical in nature, it ‘‘dehumanises
individuals and consequently makes it easier for some people to treat other
people cruelly.’’ Taken together, these and several other disengagement
practices may sufficiently disinhibit an individual such that detrimental ac-
tion is undertaken.
Multiple studies from the 1970s provide evidence of the detrimental ef-
fects of moral disengagement. Tilker (1970) found that an individual who is
forced to feel responsible for the condition of another who is providing
feedback on their well-being is most likely to act socially responsible.
Diener, Dineen, Endresen, Beaman, and Fraser (1975) found that the pres-
ence of several disinhibiting forces may lead to increases in antisocial
Organizational factors:
1) Company type 2) Length of
employment
Accountability
Personal factors:
1) Gender 2) Age
Common-sense
morality
Role morality
Self-interest
Fig. 1. Theoretical Model. (Based on Kerssens-van Drongelen and Fisscher’s
(2003) Graphical Representation of the Relationships among Role Morality,
Common-Sense Morality, and Self-Interest. This Figure Incorporates the Factors
of the Current Study and Depicts their Posited Impacts on both Role Morality and
Common-Sense Morality.)
ROBIN R. RADTKE116

behavior, while Bandura, Underwood, and Fromson (1975) found that
lower personal responsibility and dehumanization led to increased aggres-
siveness. More recent efforts in the area have found that moral disengage-
ment reduced anticipatory self-censure and prosocialness and promoted
affective and cognitive reactions conducive to detrimental conduct and ag-
gression (Bandura et al., 1996). Additionally, Bandura, Caprara, Barba-
ranelli, Pastorelli, and Regalia (2001) found that both perceived academic
and self-regulatory efficacy reduced transgressiveness both directly and by
increasing adherence to moral self-sanctions for harmful conduct and pro-
socialness. Bandura (2002, p. 114) also comments that industrywide collec-
tive moral disengagement practices such as those associated with the
tobacco industry ‘‘require a large network of otherwise considerate people
performing jobs drawing on their expertise and social influence in the service
of a detrimental enterprise.’’
Thus, moral disengagement provides a basis for understanding how role
morality behavior could depart from common-sense morality. Within the
accounting profession examples of role morality may include such behavior
as earnings management or allowing a questionable audit adjustment or tax
treatment.
Other Factors Potentially Impacting Ethically Sensitive Decisions
Accountability
Accountability is one factor that may impact individuals’ ethically sensitive
decision-making and role morality behavior. Defined as having to justify a
decision to an external party, accountability may alter one’s thought process
(Weigold & Schlenker, 1991) and compel an individual to conform to the
expectations of the evaluator, when those expectations are made clear to the
individual (Tetlock, 1985; Tetlock, Skitka, & Boettger, 1989). This induces
the individual to make that decision, which the evaluator is expecting when
the individual knows he or she must explain the decision to the evaluator.
Absence of accountability leaves the individual without certain knowledge
of the expectations of the evaluator and without the perceived benefits of
conformity.
Ashton, Kleinmuntz, Sullivan, and Tomassini (1988, p. 130) attest to the
importance of accountability within an auditing setting by stating that ‘‘be-
cause of the environment, the professional auditor must be prepared to
justify, document, and take responsibility for his/her judgments and deci-
sions.’’ Related research has shown that auditors have a good understanding
Role Morality and Accountants’ Ethically Sensitive Decisions 117
of the inherent accountability in their profession (Emby & Gibbins, 1988).
Accountability has also been shown to affect various auditing decisions in
experimental settings. Johnson and Kaplan (1991) found that accountable
auditors showed higher consensus and self-insight (the extent to which an
auditor is aware of his/her own judgment process) than those who were not
accountable. Accountable audit managers were found to be more likely to
issue qualified opinions in a study by Lord (1992), while Buchman, Tetlock,
and Reed (1996) found that the audit report chosen by experienced auditors
matched the expectation of the evaluator (the client or the partner in
charge). In a study involving both executive MBA students and auditors,
Kennedy (1993) concluded that effort-related biases such as recency can be
mitigated by accountability. While several earlier studies found that ac-
countability exacerbates the dilution effect (Hackenbrack, 1992; Messier &
Quilliam, 1992), more recent results have not supported this finding (Glover,
1997; Hoffman & Patton, 1997). More recently, Turner (2001) found support
for the results of Peecher (1996) in that accountability demands may represent
bias-instigators instead of bias-mitigators, while Asare, Trompeter, and
Wright (2000) found accountable auditors focused more on testing potential
error hypotheses and increased the breadth of hypotheses tested.
In summary, accountability can have varying impacts in different decision
contexts. Several accounting studies have shown, however, that accountable
subordinates often make judgments consistent with the views of their su-
pervisors or clients in situations such as inventory valuation (Ponemon,
1995), financial reporting (Hackenbrack & Nelson, 1996), interpretation of
tax standards (Cuccia, Hackenbrack, & Nelson, 1995), and litigation dis-
closure (Buchman et al., 1996). These results suggest that accountability
may compel accountants to make decisions they otherwise might not make.
If these decisions are unethical, then accountability may be a factor that
impacts role morality behavior as is posited in Fig. 1.
Additional Organizational and Personal Variables
While accountability may be the primary variable affecting role morality
behavior, various organizational and personal variables may also be related
to accountants’ reactions to ethically sensitive situations of a personal and
business nature. Specifically, two organizational and two personal factors
are included in the regression analyses of this study – company type (public
accounting versus private industry), and length of employment with the
firm, and gender, and age.1 A discussion of each of these variables follows
and a graphical depiction is included in Fig. 1.
ROBIN R. RADTKE118
Undoubtedly, many differences exist between accountants working in
public accounting and private industry. For example, the hierarchical nature
and low retention rates of the public accounting profession suggest that
conformity pressures may be particularly acute. Although accountants
working in private industry may also face various pressures within the
company, these pressures may not be as severe as in public accounting.
Thus, accountants may self-select into public or private accounting as a
result of the firm socialization process. Ponemon (1992a) found that the
ethical development of staff and seniors was higher than that of managers
and partners and posited that accountants with higher levels of ethical de-
velopment (than the firm norm) may leave public accounting for private
industry before entering the management ranks. Jeffrey and Weatherholt
(1996) suggest that this migration may cause accountants in private industry
to exhibit higher levels of ethical development, despite similar educational
and experience bases. This may cause fewer differences in responses to eth-
ically sensitive situations of a personal and business nature in accountants
working in private industry.
Length of employment with the firm may also impact whether accountants
are susceptible to role morality behavior. Results of firm socialization studies
suggest that promotion constitutes an employee screening process, signaling
to upper management, which employees should be retained (Nystrom &
McArthur, 1989). More specifically, individuals who are promoted are per-
ceived by upper management to have personal characteristics similar to
those of the corporate culture (Weick, 1979; Lockheed, 1980; Smircich,
1983). Individuals’ cognitive characteristics, including moral reasoning,
have been found to become more homogeneous as they advance in man-
agement levels within an organization (Fisher, Merron, & Torbert, 1987;
Avolio & Gibbons, 1988). The result of this firm socialization process may
promote different responses to ethically sensitive situations of a personal
and business nature in those accountants with a longer tenure with the firm.
The personal variables of gender and age may also affect an accountant’s
susceptibility to role morality behavior. In most cases, age may be correlated
with length of employment with the firm (r ¼ 0:8930; p ¼ 0:0001 in the
current study), causing the effects of these variables to be similar. Gender is
a variable that has traditionally been shown to affect many decision con-
texts. Specifically, males and females in the general population have been
found to be virtually identical with respect to moral development (Rest,
1986), while several studies of accounting professionals and students, alter-
natively, show that female accountants demonstrate a higher level of moral
reasoning (Shaub, 1994; Ameen, Guffey, & McMillan, 1996). Further,
Role Morality and Accountants’ Ethically Sensitive Decisions 119
recent evidence of a growing number of female whistle-blowers (Moak,
2004; www.cnn.com, 2002) lends support to the contention that females may
be less susceptible to firm socialization and may exhibit fewer differences in
responses to ethically sensitive situations of a personal and business nature.
Development of Research Questions
In order to measure whether accountants exhibit behavior consistent with
the theory of role morality, two sets of responses to ethically sensitive sit-
uations are necessary for each accountant. Specifically, comparison of ac-
countants’ responses to ethically sensitive situations framed in both personal
and business settings would allow identification of those accountants whose
decisions differ. Thus,
RQ1. Do accountants react to ethically sensitive situations of a personal
and business nature in a similar manner (which is inconsistent with the
theory of role morality)?
RQ2. Is potential role morality behavior affected by accountability,
company type, length of employment with the firm, gender, or age?
METHODOLOGY
Participants
Accountants from both public accounting and private industry were solic-
ited to act as participants. Companies of both types with local offices in a
metropolitan city in the southwest were randomly selected. Appropriate
contact personnel were requested to garner participation from their staffs.
These personnel were asked to provide the number of staff who would
participate in a study of ‘‘reactions to ethically sensitive situations.’’ The
surveys were then sent to contact personnel for distribution. Of the 116
surveys sent for distribution, 55 (47%) were returned completed.
Instrument
The survey instrument was comprised of two main parts. In one section,
participants responded to two matched sets of ethically sensitive situations:
ROBIN R. RADTKE120
of a personal and business nature.2 The second section elicited demographic
and work environment data, including measures of perceived accountability
pressure.3 The ethically sensitive situations were used in a previous study by
Radtke (2000) and were generally consistent with the definition of an ethical
issue as proposed by both Velasquez and Rostankowski (1985) and Jones
(1991): an ethical issue occurs when a person’s actions, freely performed,
may harm or benefit others. The 16 ethically sensitive situations corre-
sponded to two matched sets of eight situations each, when personal and
business situations dealing with the same issue were paired together. Of the
eight issues, four were patterned after those of the Defining Issues Test
(Rest, 1979) – situations dealing with theft, withholding information from
authorities, freedom of speech, and racial discrimination. The other four
issues were similar, but more situation specific, dealing with copying soft-
ware, cheating on taxes, deception/honesty, and trading on inside informa-
tion. In order to obtain two matched sets of eight situations each, every
situation was chosen specifically for its ability to be framed in both a per-
sonal and business setting (although ensuring that participants perceive the
matched situations to be comparable is impossible). Also, each business
situation was general enough such that a practicing accountant working in
any business area should be able to formulate an answer. For each situation,
participants were asked to indicate their probable action on the issue on the
five-point scale of yes, probably yes, unsure, probably no, and no. The
resulting 16 ethically sensitive situations are presented in the appendix.4
Consistent with Dreike and Moeckel (1995), the survey instrument in-
cluded a combination of situations representing some actions that are ob-
viously illegal, some that would fall under issues addressed by the AICPA
Code of Professional Conduct (AICPA, 2003), and some that may be con-
sidered as inappropriate or gray areas. Including situations of varying de-
grees of ethical content makes the survey instrument richer and less
repetitive. The issue of whether the participants perceived the situations to
have significant ethical content is difficult to ascertain and control. Dreike
and Moeckel (1995) point out that even though they used a survey con-
taining ethical situations consistent with the Velasquez and Rostankowski
(1985) definition, the 66 auditors in their study who rated eight ethical
situations each only viewed 56% of the situations as actually containing an
ethical issue.
Pretesting the ethically sensitive situations consisted of several steps. First,
several colleagues familiar with ethics research reviewed the situations for
general readability and design. Second, the entire instrument was completed
by 44 cost accounting students (32 undergraduate and 12 graduate students
Role Morality and Accountants’ Ethically Sensitive Decisions 121
who would be reasonably familiar with the types of situations presented).
Third, a number of colleagues and doctoral students reviewed the compa-
rability of the situations that were matched in terms of personal and busi-
ness settings. In nearly all cases, the vast majority of the matched situations
were easily judged as comparable.
RESULTS
Preliminary Analyses
For the 55 participants, the average age was 34, while 20 of the participants
who reported their gender were female and 31 were male. Nearly 40% of the
participants were from public accounting, while most of the private industry
participants worked at oil and gas firms. The sample was almost equally
split between CPA and non-CPA respondents. Table 1 shows the remaining
sample characteristics.
A summary of the responses to the 16 ethically sensitive situations is
shown in Table 2. Interestingly, responses to some of the situations were
quite homogeneous (situations 1, 4, and 8 had one response chosen by over
half the participants), while responses to the majority of the situations were
quite diverse. At the extremes, 40 (72.7%) respondents answered ‘‘No’’ to
situation 8, while responses to other situations were extremely diverse (e.g.,
situations 7, 10, and 14 had at least 10% of the respondents choosing each
of the possible responses, while nearly half of the respondents chose yes or
probably yes and over half of the respondents chose no or probably no for
situation 2).
For further statistical analyses, the responses ranging from yes to no were
coded from 1 to 5, with 1 representing the least ethical response and 5 rep-
resenting the most ethical response. Due to the phrasing of some questions,
the order of the responses was reversed (such that a response of yes would be
representative of the most ethical response and would be coded as 5), so that
participants would not always expect the least ethical response to appear first.
Specifically, questions 5, 6, 7, 8, 11, 13, 14, 15, and 16 were reverse ordered
and coded accordingly. Based on this coding, a mean response was calculated
for each question and for each participant. The mean responses (shown in
Table 2) for the questions range from 1.42 on situation 8 to 4.29 on situation
1. The mean response of 1.42 on situation 8 represents a somewhat unethical
response about reporting/withholding information in a business setting. The
mean response of 4.29 on situation 1 represents a somewhat ethical response
ROBIN R. RADTKE122
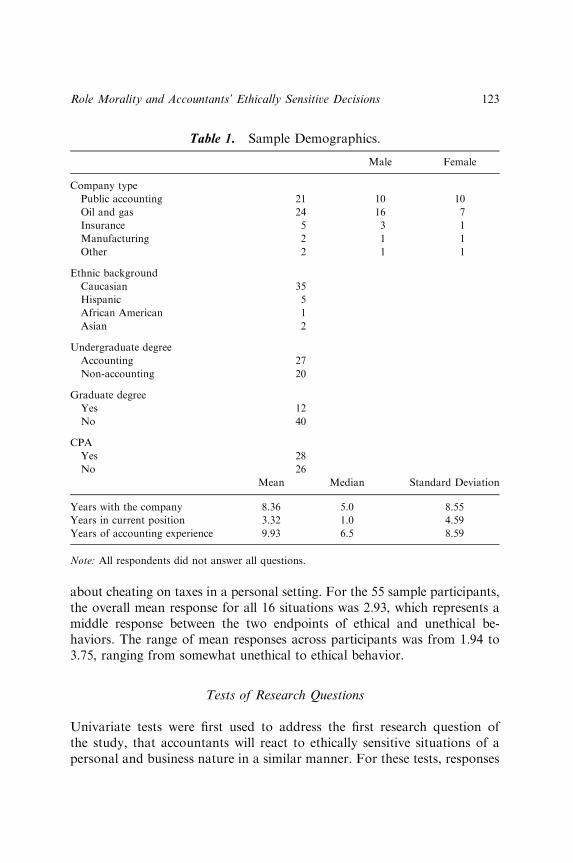
about cheating on taxes in a personal setting. For the 55 sample participants,
the overall mean response for all 16 situations was 2.93, which represents a
middle response between the two endpoints of ethical and unethical be-
haviors. The range of mean responses across participants was from 1.94 to
3.75, ranging from somewhat unethical to ethical behavior.
Tests of Research Questions
Univariate tests were first used to address the first research question of
the study, that accountants will react to ethically sensitive situations of a
personal and business nature in a similar manner. For these tests, responses
Table 1. Sample Demographics.
Male Female
Company type
Public accounting 21 10 10
Oil and gas 24 16 7
Insurance 5 3 1
Manufacturing 2 1 1
Other 2 1 1
Ethnic background
Caucasian 35
Hispanic 5
African American 1
Asian 2
Undergraduate degree
Accounting 27
Non-accounting 20
Graduate degree
Yes 12
No 40
CPA
Yes 28
No 26
Mean Median Standard Deviation
Years with the company 8.36 5.0 8.55
Years in current position 3.32 1.0 4.59
Years of accounting experience 9.93 6.5 8.59
Note: All respondents did not answer all questions.
Role Morality and Accountants’ Ethically Sensitive Decisions 123
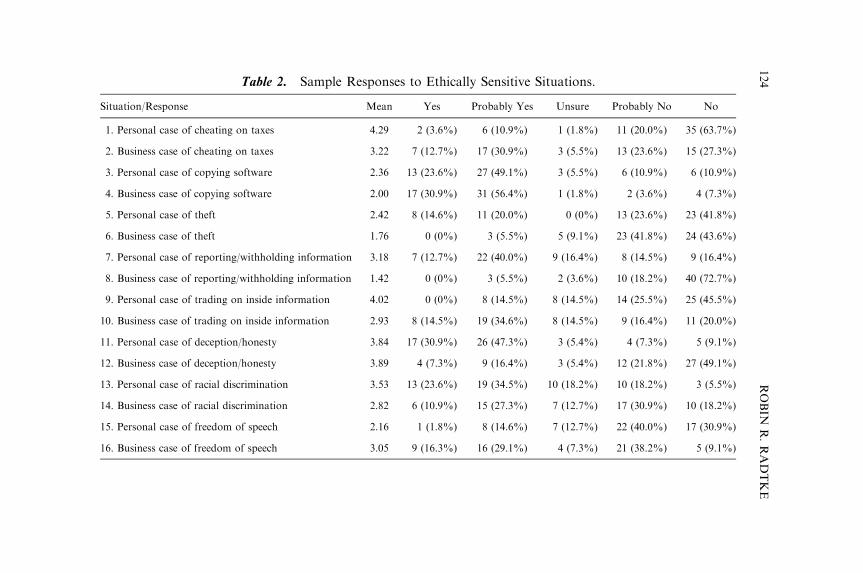
Table 2. Sample Responses to Ethically Sensitive Situations.
Situation/Response Mean Yes Probably Yes Unsure Probably No No
1. Personal case of cheating on taxes 4.29 2 (3.6%) 6 (10.9%) 1 (1.8%) 11 (20.0%) 35 (63.7%)
2. Business case of cheating on taxes 3.22 7 (12.7%) 17 (30.9%) 3 (5.5%) 13 (23.6%) 15 (27.3%)
3. Personal case of copying software 2.36 13 (23.6%) 27 (49.1%) 3 (5.5%) 6 (10.9%) 6 (10.9%)
4. Business case of copying software 2.00 17 (30.9%) 31 (56.4%) 1 (1.8%) 2 (3.6%) 4 (7.3%)
5. Personal case of theft 2.42 8 (14.6%) 11 (20.0%) 0 (0%) 13 (23.6%) 23 (41.8%)
6. Business case of theft 1.76 0 (0%) 3 (5.5%) 5 (9.1%) 23 (41.8%) 24 (43.6%)
7. Personal case of reporting/withholding information 3.18 7 (12.7%) 22 (40.0%) 9 (16.4%) 8 (14.5%) 9 (16.4%)
8. Business case of reporting/withholding information 1.42 0 (0%) 3 (5.5%) 2 (3.6%) 10 (18.2%) 40 (72.7%)
9. Personal case of trading on inside information 4.02 0 (0%) 8 (14.5%) 8 (14.5%) 14 (25.5%) 25 (45.5%)
10. Business case of trading on inside information 2.93 8 (14.5%) 19 (34.6%) 8 (14.5%) 9 (16.4%) 11 (20.0%)
11. Personal case of deception/honesty 3.84 17 (30.9%) 26 (47.3%) 3 (5.4%) 4 (7.3%) 5 (9.1%)
12. Business case of deception/honesty 3.89 4 (7.3%) 9 (16.4%) 3 (5.4%) 12 (21.8%) 27 (49.1%)
13. Personal case of racial discrimination 3.53 13 (23.6%) 19 (34.5%) 10 (18.2%) 10 (18.2%) 3 (5.5%)
14. Business case of racial discrimination 2.82 6 (10.9%) 15 (27.3%) 7 (12.7%) 17 (30.9%) 10 (18.2%)
15. Personal case of freedom of speech 2.16 1 (1.8%) 8 (14.6%) 7 (12.7%) 22 (40.0%) 17 (30.9%)
16. Business case of freedom of speech 3.05 9 (16.3%) 16 (29.1%) 4 (7.3%) 21 (38.2%) 5 (9.1%)
ROBIN
R.RADTKE
124
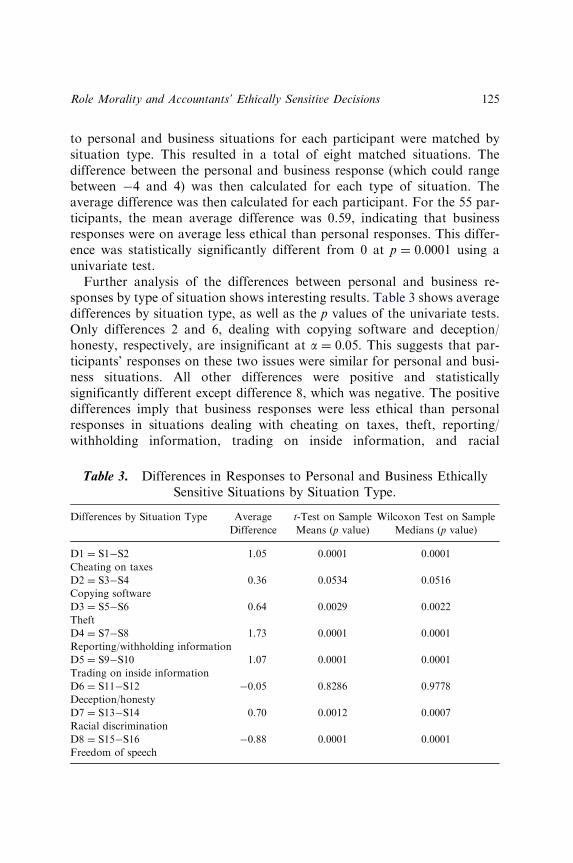
to personal and business situations for each participant were matched by
situation type. This resulted in a total of eight matched situations. The
difference between the personal and business response (which could range
between �4 and 4) was then calculated for each type of situation. The
average difference was then calculated for each participant. For the 55 par-
ticipants, the mean average difference was 0.59, indicating that business
responses were on average less ethical than personal responses. This differ-
ence was statistically significantly different from 0 at p ¼ 0:0001 using a
univariate test.
Further analysis of the differences between personal and business re-
sponses by type of situation shows interesting results. Table 3 shows average
differences by situation type, as well as the p values of the univariate tests.
Only differences 2 and 6, dealing with copying software and deception/
honesty, respectively, are insignificant at a ¼ 0:05: This suggests that par-
ticipants’ responses on these two issues were similar for personal and busi-
ness situations. All other differences were positive and statistically
significantly different except difference 8, which was negative. The positive
differences imply that business responses were less ethical than personal
responses in situations dealing with cheating on taxes, theft, reporting/
withholding information, trading on inside information, and racial
Table 3. Differences in Responses to Personal and Business Ethically
Sensitive Situations by Situation Type.
Differences by Situation Type Average
Difference
t-Test on Sample
Means (p value)
Wilcoxon Test on Sample
Medians (p value)
D1 ¼ S1�S2 1.05 0.0001 0.0001
Cheating on taxes
D2 ¼ S3�S4 0.36 0.0534 0.0516
Copying software
D3 ¼ S5�S6 0.64 0.0029 0.0022
Theft
D4 ¼ S7�S8 1.73 0.0001 0.0001
Reporting/withholding information
D5 ¼ S9�S10 1.07 0.0001 0.0001
Trading on inside information
D6 ¼ S11�S12 �0.05 0.8286 0.9778
Deception/honesty
D7 ¼ S13�S14 0.70 0.0012 0.0007
Racial discrimination
D8 ¼ S15�S16 �0.88 0.0001 0.0001
Freedom of speech
Role Morality and Accountants’ Ethically Sensitive Decisions 125
discrimination. The one negative difference implies that business respons-
es were more ethical than personal responses in situations dealing with
freedom of speech. These results suggest that accountants react differently
to ethically sensitive situations of a personal and business nature. Specif-
ically, in the majority of the situations examined, business responses were
less ethical than personal responses, consistent with the theory of role mo-
rality.
A more complete analysis of these differences requires the use of regres-
sion analysis with control variables.5 The dependent variables for regression
purposes are the matched responses by situation type. This allows for com-
parison of responses for each participant for each situation type based on
varying the situation setting between the two options of personal and
business. The control variables previously identified are accountability,
company type (public accounting versus private industry), length of em-
ployment with the firm, gender, and age. A total of nine regressions were
run, one for each type of ethically sensitive situation previously identified,
and one across all participants’ responses to all situations. The regression
equation is as follows:
Matched Responses ¼ aþ b1P=Bþ b2ACCTþ b3COTþ b4LENGTH
þ b5GENDERþ b6AGEþ x
Variables included in the regression have been previously discussed in the
development of research questions section of the chapter. Variable coding is
as follows: P/B (0 ¼ business setting and 1 ¼ personal setting), COT
(0 ¼ private industry and 1 ¼ public accounting), and GENDER
(0 ¼ male and 1 ¼ female). The accountability variable, ACCT, represents
the accountability pressure felt by each participant in either the business or
personal setting. The business accountability equals the sum of each par-
ticipants’ responses to the four accountability scales for the business setting
(accountability to superiors/company, accounting profession, clients/other
companies, and general public), while the personal accountability represents
the accountability felt to oneself.6 Each of these scaled measures can po-
tentially range from 1 (low) to 7 (high); the business measure can thus range
from 4 to 28. For the sample participants the average for the personal
measure is 6.64, with a range of 4–7, while the average for the business
measure is 22.95, with a range of 14–28, indicating that most participants
felt a relatively sizable amount of accountability pressure both to themselves
and to the business-related entities included in the study. Since the personal
and business measures are based on different scales (i.e., a 4 on the personal
ROBIN R. RADTKE126
measure represents the midpoint of the scale, while a 4 on the business
measure represents the minimum value), the scales were standardized by
dividing the personal measure by 7 and the business measure by 28.
Results of the regression are shown in Table 4 and support the propo-
sition that business responses were less ethical than personal responses,
consistent with the theory of role morality. The personal or business setting
variable is significant in six of the nine regressions. In five of these cases,
including across all situations, the parameter estimate was positive, indi-
cating that the business response was less ethical than the personal response.
The significance of the regression across all situations including all partic-
ipants’ responses addresses the potential concern over the matching of sit-
uations by situation type. The only control variables that were significant
were accountability in the situation dealing with copying software, and age
in the situation of trading on inside information. Taken as a whole, the
results of this study suggest that business responses to ethically sensitive
situations are less ethical than personal responses, consistent with the theory
of role morality.
To further investigate the effect of accountability in the business situa-
tions, a regression was run including only the business responses, excluding
the setting (P/B) variable and including the other five variables mentioned
above. As such, the accountability measure in this regression represents the
accountability felt by each participant in the business setting. Results show
that the accountability measure is positive and significant (b ¼ 0:050;t ¼ 2:12), indicating that those participants who felt greater accountability
pressure at work were more likely to choose more ethical responses, con-
trary to the expectations of this study. None of the other control variables
show significant results.
DISCUSSION
The results of this study support the premise that accountants react differ-
ently to ethically sensitive situations of a personal and business nature,
consistent with the theory of role morality and inconsistent with the concept
of universalism. Specifically, in the majority of the situations examined,
business decisions were less ethical than personal decisions, consistent with
the theory of role morality. Whether accountants work in public accounting
or private industry, length of employment with the firm, age, and gender did
not significantly affect accountants’ reactions to ethically sensitive situa-
tions. Additional results support the contention that greater perceived
Role Morality and Accountants’ Ethically Sensitive Decisions 127
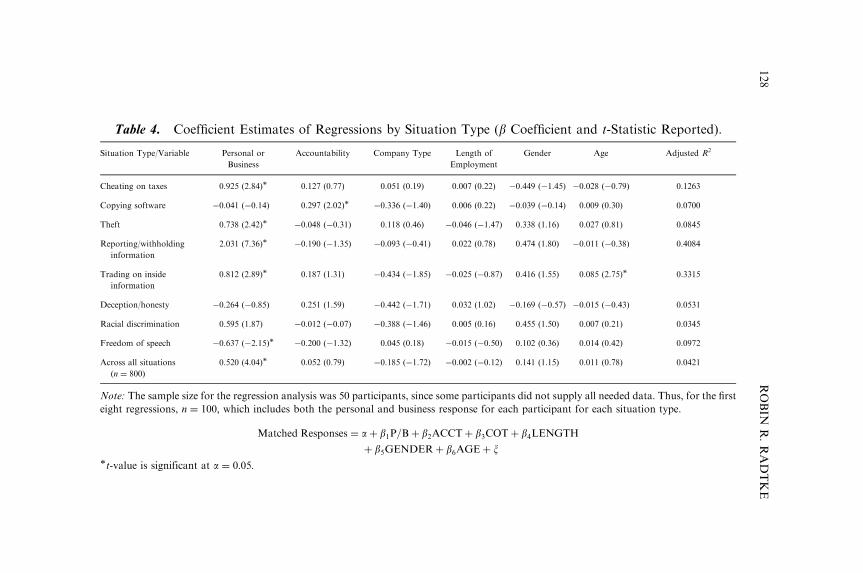
Table 4. Coefficient Estimates of Regressions by Situation Type (b Coefficient and t-Statistic Reported).
Situation Type/Variable Personal or
Business
Accountability Company Type Length of
Employment
Gender Age Adjusted R2
Cheating on taxes 0.925 (2.84)� 0.127 (0.77) 0.051 (0.19) 0.007 (0.22) �0.449 (�1.45) �0.028 (�0.79) 0.1263
Copying software �0.041 (�0.14) 0.297 (2.02)� �0.336 (�1.40) 0.006 (0.22) �0.039 (�0.14) 0.009 (0.30) 0.0700
Theft 0.738 (2.42)� �0.048 (�0.31) 0.118 (0.46) �0.046 (�1.47) 0.338 (1.16) 0.027 (0.81) 0.0845
Reporting/withholding
information
2.031 (7.36)� �0.190 (�1.35) �0.093 (�0.41) 0.022 (0.78) 0.474 (1.80) �0.011 (�0.38) 0.4084
Trading on inside
information
0.812 (2.89)� 0.187 (1.31) �0.434 (�1.85) �0.025 (�0.87) 0.416 (1.55) 0.085 (2.75)� 0.3315
Deception/honesty �0.264 (�0.85) 0.251 (1.59) �0.442 (�1.71) 0.032 (1.02) �0.169 (�0.57) �0.015 (�0.43) 0.0531
Racial discrimination 0.595 (1.87) �0.012 (�0.07) �0.388 (�1.46) 0.005 (0.16) 0.455 (1.50) 0.007 (0.21) 0.0345
Freedom of speech �0.637 (�2.15)� �0.200 (�1.32) 0.045 (0.18) �0.015 (�0.50) 0.102 (0.36) 0.014 (0.42) 0.0972
Across all situations
ðn ¼ 800Þ
0.520 (4.04)� 0.052 (0.79) �0.185 (�1.72) �0.002 (�0.12) 0.141 (1.15) 0.011 (0.78) 0.0421
Note: The sample size for the regression analysis was 50 participants, since some participants did not supply all needed data. Thus, for the first
eight regressions, n ¼ 100; which includes both the personal and business response for each participant for each situation type.
Matched Responses ¼ aþ b1P=Bþ b2ACCTþ b3COTþ b4LENGTH
þ b5GENDERþ b6AGEþ x�t-value is significant at a ¼ 0:05:
ROBIN
R.RADTKE
128

accountability pressure is associated with more ethical responses in the
business setting.
This evidence implies that accountants may tend to view ethically sen-
sitive situations of a business nature differently from those of a personal
nature. Specifically, they may not perceive acting less ethically in business
situations negatively; they may believe they are expected to act in a certain
manner that is consistent with their role. Firm socialization may be one
factor related to this behavior. As previously discussed, firm socialization
theory suggests that individuals who are promoted are perceived by upper
management to have personal characteristics similar to those of the corpo-
rate culture (upper management) (Weick, 1979; Lockheed, 1980; Smircich,
1983). The results of the current study suggest that accountants may not
actually change their moral beliefs to be consistent with those of upper
management, but may merely change their business ethics so as to appear to
have consistent beliefs and increase their promotion potential. These results
are somewhat conflicting with those of Ponemon (1990, 1992a) and Shaub
(1994) who found that moral reasoning level and position level within the
firm are inversely related. These studies suggest that those who are retained
by public accounting firms have lower moral reasoning levels.
These results are at least partially tempered by the accountability findings
that greater perceived accountability pressure is associated with more ethical
responses in the business setting. This suggests that one way to try to avoid
role morality behavior is to make individuals accountable for their actions.
This is consistent with an increase in perceptions of personal responsibility
for actions as a means to avoid moral disengagement. In the current climate
of diminishing confidence in the accounting profession, the policy implica-
tions of this result are promising, given calls for increased monitoring of
auditors by the Sarbanes-Oxley Act, for example.
Focusing on additional factors shown to be consistent with moral disen-
gagement could also aid in avoiding role morality behavior. Specifically,
avoiding distortion of consequences and dehumanization by being aware of the
harm caused to others and focusing on the end users of the accounting process
would minimize chances for moral disengagement, whereby an individual
would be more prone toward role morality behavior. Firm training programs
that recognize the importance of these sorts of factors may prove beneficial.
The results of the current study represent a new avenue of investigation
into understanding accountants’ decision-making in ethically sensitive sit-
uations. Previous studies have focused on associating certain behaviors such
as making questionable independence judgments (Ponemon & Gabhart,
1990), underreporting audit time (Ponemon, 1992b), and avoidance of
Role Morality and Accountants’ Ethically Sensitive Decisions 129
whistle-blowing (Brabeck, 1984; Arnold & Ponemon, 1991) with lower levels
of moral reasoning. The present study shows that the nature of the decision
(whether the decision is personal or business) may be another critical factor
in influencing accountants’ ethically sensitive decisions.
Another interesting finding of the study is the lack of differences between
public accountants and non-public accountants, as well as among individuals
based on the length of tenure with the firm. Since these factors have been
shown to be significant in other studies, additional analysis is warranted.
Results of this study should be interpreted with caution due to several
limitations. First, the survey elicited responses to eight matched sets of eth-
ically sensitive scenarios. These responses may not be representative of ac-
countants’ responses to other types of ethically sensitive situations. Second,
the majority of the sample participants from private industry were from oil
and gas firms. Inclusion of more participants from other types of private
industry firms would broaden the generalizability of the results. Third, per-
ceptions of the ethical nature of the ethically sensitive situations may have
varied across participants (i.e., not all participants may have considered all
situations to contain significant ethical issues). A related concern is that the
magnitude of the ethically sensitive situations may have been interpreted to be
different across the personal and business settings. Also, participants may not
have perceived situations that were paired together as a personal and business
example of a similar situation to really be representative of similar situations
(although obviously, a personal and business setting cannot be identical).
Additionally, limitations typically associated with exploratory research and
survey instruments apply to this study as well.
Notwithstanding these general limitations, the results of this study support the
premise that accountants react differently to ethically sensitive situations of a
personal and business nature. Specifically, in the majority of the situations ex-
amined, business decisions were less ethical than personal decisions, consistent
with the theory of role morality. This evidence implies that accountants may be
susceptible to role morality behavior in the workplace by means of moral dis-
engagement, as well as the effects of firm socialization. Whether this affects the
quality of accountants’ ethically sensitive decisions has yet to be determined.
NOTES
1. Education level was also considered as a control variable, since previousresearch has found that an individual’s level of moral reasoning increases witheducation (Thoma, 1986; McNeel, 1994). In the current sample, 40 participantsreported having an undergraduate degree, while only 12 reported having a graduate
ROBIN R. RADTKE130
degree. Despite this small variation in education level across participants, theregressions were run including a variable representing education level. Resultsshowed no significant variation from those not including an education level variable.2. Ethically sensitive scenarios (or vignettes) were used in which the participants
are asked to place themselves in the situations and indicate their probable reaction.Vignettes were deemed to be the preferable research technique by Cavanaugh andFritzsche (1985, p. 291) in their study of techniques available to investigate indi-viduals’ ethical principles and behavior and have been used in many previous studieson ethical behavior (Reidenbach & Robin, 1988, 1990; Flory, Phillips, Reidenbach,& Robin, 1992; Hunt & Vasquez-Parraga, 1993; Dreike & Moeckel, 1995).3. Additional measures pertaining to daily activities on the job and whether the
questionnaire was completed at work or at home were also included in this section.Statistical analysis of these measures showed that they were not significantly relatedto the variables investigated in the study.4. Note that the ethically sensitive situations as they appear in the appendix are
ordered such that the personal and business scenarios dealing with each type ofsituation are grouped together. This ordering is solely for presentation purposes; the16 situations were randomly ordered in the actual questionnaire.5. Given the continuous nature of two of the regression variables, natural log
transformations were performed on age and length of employment. Regression re-sults using the transformations were virtually identical to those without the trans-formations. Consequently, regression results with the transformations are notreported in the chapter. As mentioned earlier in the chapter, age and length ofemployment were highly positively correlated at 0.8930. To ensure that multicol-linearity was not a problem in the regressions, variance inflation factors (VIFs) werecomputed. Since none of the VIFs were greater than the threshold value of 10 (Neter,Wasserman, & Kutner, 1990, p. 409), both variables were included in the regressions.6. Generally, accountability is thought of in terms of external parties. Given the
wide range of settings in the personal ethically sensitive situations included in thestudy, however, it was considered to be quite difficult to determine to whom anindividual may feel responsible across the various settings. Thus, the measure ofpersonal responsibility or accountability included in the study represents a constantmeasure across all personal ethically sensitive situations.
ACKNOWLEDGMENTS
The author expresses appreciation for the helpful comments of Scott Jackson,
Timothy Louwers, Austin Reitenga, Richard Scamell, editor Vicky Arnold,
associate editor Robin Roberts, and two anonymous reviewers.
REFERENCES
Ameen, E., Guffey, D., & McMillan, J. (1996). Gender differences in determining the ethical
sensitivity of future accounting professionals. Journal of Business Ethics, 15(5), 591–597.
Role Morality and Accountants’ Ethically Sensitive Decisions 131
American Institute of Certified Public Accountants (AICPA). (2003). Code of professional con-
duct. New York, NY: AICPA.
Applbaum, A. (1995). Professional detachment: The executioner of Paris. Harvard Law Review,
109(1), 458–486.
Applbaum, A. (1999). Ethics for adversaries: The morality of roles in public and professional life.
Princeton, NJ: Princeton University Press.
Arnold, D., & Ponemon, L. (1991). Internal auditors’ perceptions of whistle-blowing and the
influence of moral reasoning: An experiment. Auditing: A Journal of Theory and Practice,
10(2), 1–15.
Asare, S., Trompeter, G., & Wright, A. (2000). The effect of accountability and time budgets on
auditors’ testing strategies. Contemporary Accounting Research, 17(4), 539–560.
Ashton, R., Kleinmuntz, D., Sullivan, J., & Tomassini, L. (1988). Audit decision making. In:
A. R. Abdel-khalik & I. Solomon (Eds), Research opportunities in auditing: The second
decade (pp. 95–132). Sarasota, FL: The American Accounting Association.
Avolio, B., & Gibbons, T. (1988). Developing transformational leaders: A life span approach.
In: J. Conger & R. Kanungo (Eds), Charismatic leadership: The elusive factor in organ-
izational effectiveness (pp. 276–308). San Francisco, CA: Jossey-Bass.
Bandura, A. (2002). Selective moral disengagement in the exercise of moral agency. Journal of
Moral Education, 31(2), 101–119.
Bandura, A., Barbaranelli, C., Caprara, G., & Pastorelli, C. (1996). Mechanisms of moral
disengagement in the exercise of moral agency. Journal of Personality and Social
Psychology, 71(2), 364–374.
Bandura, A., Caprara, G., Barbaranelli, C., Pastorelli, C., & Regalia, C. (2001). Sociocognitive
self-regulatory mechanisms governing transgressive behavior. Journal of Personality and
Social Psychology, 80(1), 125–135.
Bandura, A., Underwood, B., & Fromson, M. (1975). Disinhibition of aggression through
diffusion of responsibility and dehumanization of victims. Journal of Research in
Personality, 9, 253–269.
Brabeck, M. (1984). Ethical characteristics of whistle-blowers. Journal of Research in Person-
ality, 18(1), 41–53.
Buchman, T., Tetlock, P., & Reed, R. (1996). Accountability and auditors’ judgments about
contingent events. Journal of Business Finance and Accounting, 23(3), 379–398.
Cavanaugh, G., & Fritzsche, D. (1985). Using vignettes in business ethics research. In:
L. Preston (Ed.), Research in corporate social performance and policy (pp. 279–293).
Greenwich, CT: JAI Press.
Chartier, J. (2002). Accounting fraud on the rise (January 11). CNNMoney. http://money.cnn.com/
2002/01/11/companies/acct_scandals
Cuccia, A., Hackenbrack, K., & Nelson, M. (1995). The ability of professional standards to
mitigate aggressive reporting. The Accounting Review, 70(2), 227–248.
Diener, E., Dineen, J., Endresen, K., Beaman, A., & Fraser, S. (1975). Effects of altered
responsibility, cognitive set, and modeling on physical aggression and deindividuation.
Journal of Personality and Social Psychology, 31(2), 328–337.
Dreike, E., & Moeckel, C. (1995). Perceptions of senior auditors: Ethical issues and factors
affecting actions. Research on Accounting Ethics, 1, 331–348.
Emby, C., & Gibbins, M. (1988). Good judgment in public accounting: Quality and justifi-
cation. Contemporary Accounting Research, 4(2), 287–313.
ROBIN R. RADTKE132
Fisher, D., Merron, K., & Torbert, W. (1987). Human development and managerial effective-
ness. Group and Organizational Studies, 12(3), 257–273.
Flory, S., Phillips, T., Reidenbach, R., & Robin, D. (1992). A multidimensional analysis of
selected ethical issues in accounting. The Accounting Review, 67(2), 284–302.
Glover, S. (1997). The influence of time pressure and accountability on auditors’ processing on
nondiagnostic information. Journal of Accounting Research, 35(2), 213–226.
Hackenbrack, K. (1992). Implications of seemingly irrelevant audit evidence in audit judgment.
Journal of Accounting Research, 30(1), 126–136.
Hackenbrack, K., & Nelson, M. (1996). Auditors’ incentives and their application of financial
accounting standards. The Accounting Review, 71(1), 43–59.
Hoffman, V., & Patton, J. (1997). Accountability, the dilution effect, and conservatism in
auditors’ fraud judgments. Journal of Accounting Research, 35(2), 227–237.
Hunt, S., & Vasquez-Parraga, A. (1993). Organizational consequences, marketing ethics and
salesforce supervision. Journal of Marketing Research, 30(1), 78–90.
Jeffrey, C., & Weatherholt, N. (1996). Ethical development, professional commitment, and rule
observance attitudes: A study of CPAs and corporate accountants. Behavioral Research
in Accounting, 8, 8–31.
Johnson, V., & Kaplan, S. (1991). Experimental evidence on the effects of accountability on
auditor judgments. Auditing: A Journal of Practice and Theory, 10(Supplement), 96–113.
Jones, T. (1991). Ethical decision making by individuals in organizations: An issue-contingent
model. Academy of Management Review, 16(2), 366–395.
Kennedy, J. (1993). Debiasing audit judgment with accountability: A framework and exper-
imental results. Journal of Accounting Research, 31(2), 231–245.
Kerssens-van Drongelen, I., & Fisscher, O. (2003). Ethical dilemmas in performance measure-
ment. Journal of Business Ethics, 45(1), 51–63.
Lockheed, G. (1980). Know then decide. In: T. Wallsten (Ed.), Cognitive processes in choice and
decision behavior (pp. 143–154). Hillsdale, NJ: Lawrence Erlbaum Associates Inc.
Lord, A. (1992). Pressure: A methodological consideration for behavioral research in auditing.
Auditing: A Journal of Practice and Theory, 11(2), 89–108.
Luban, D. (1988). Lawyers and justice. Princeton, NJ: Princeton University Press.
McNeel, S. (1994). College teaching and student moral development. In: J. Rest & D. Narvaez
(Eds), Moral development in the professions (pp. 27–43). Hillsdale, NJ: Lawrence
Erlbaum Associates, Inc.
McPhail, K. (2001). The other objective of ethics education: Re-humanising the accounting
profession – a study of ethics education in law, engineering, medicine and accountancy.
Journal of Business Ethics, 34(3/4), 279–298.
Messier, W., Jr., & Quilliam, W. (1992). The effect of accountability on judgment: Development
of hypotheses for auditing. Auditing: A Journal of Practice and Theory, 11(Supplement),
123–151.
Moak, E. (2004). Female whistleblowers: Contributions, motivations, and society’s response.
Georgetown University Law Center www.law.georgetown.edu.
National Commission on Fraudulent Financial Reporting (the Treadway Commission). (1987).
Report of the national commission on fraudulent financial reporting. Washington, DC:
NCFFR.
Neter, J., Wasserman, W., & Kutner, M. (1990). Applied linear statistical models (3rd ed.). Burr
Ridge, IL: Richard D. Irwin, Inc.
Role Morality and Accountants’ Ethically Sensitive Decisions 133
Nystrom, P., & McArthur, A. (1989). Organizations’ roles in career theory. In: M. Arthur,
D. Hall & B. Lawrence (Eds), Handbook of career theory (pp. 490–505). Cambridge,
England: Cambridge University Press.
Peecher, M. (1996). The influence of auditors’ justification processes on their decisions: A cog-
nitive model and experimental evidence. Journal of Accounting Research, 34(1), 125–140.
Pitt, H. (2002). Public statement by SEC chairman: Regulation of the accounting profession
(January 17). Washington, DC: U.S. Securities & Exchange Commission.
Ponemon, L. (1990). Ethical judgments in accounting: A cognitive-developmental perspective.
Critical Perspectives in Accounting, 1(2), 191–215.
Ponemon, L. (1992a). Ethical reasoning and selection-socialization in accounting. Accounting,
Organizations and Society, 17(3–4), 239–258.
Ponemon, L. (1992b). Auditor underreporting of time and moral reasoning: An experimental
lab study. Contemporary Accounting Research, 9(1), 171–189.
Ponemon, L. (1995). The objectivity of accountants’ litigation support judgments. The Ac-
counting Review, 70(3), 467–488.
Ponemon, L., & Gabhart, D. (1990). Auditor independence judgments: A cognitive-developmental
model and experimental evidence. Contemporary Accounting Research, 7(1), 227–251.
Radtke, R. (2000). The effects of gender and setting on accountants’ ethically sensitive deci-
sions. Journal of Business Ethics, 24(4), 299–312.
Reidenbach, R., & Robin, D. (1988). Some initial steps toward improving the measurement of
ethical evaluations of marketing activities. Journal of Business Ethics, 7(11), 871–879.
Reidenbach, R., & Robin, D. (1990). Toward the development of a multidimensional scale for
improving evaluations of business ethics. Journal of Business Ethics, 9(8), 639–653.
Rest, J. (1979).Development in judging moral issues. Minneapolis, MN: University ofMinnesota Press.
Rest, J. (1986). Moral development: Advances in research and theory. New York, NY: Praeger.
Shaub, M. (1994). An analysis of factors affecting the cognitive moral development of auditors
and auditing students. Journal of Accounting Education, 12(1), 1–24.
Smircich, L. (1983). Concepts of culture and organizational analysis. Administrative Science
Quarterly, 28(3), 339–358.
Tetlock, P. (1985). Accountability: The neglected social context of judgement and choice. In:
B. Staw & L. Cummings (Eds), Research in organizational behavior, 9 (pp. 279–332).
Greenwich, CT: JAI Press.
Tetlock, P., Skitka, L., & Boettger, R. (1989). Social and cognitive strategies for coping with
accountability: Conformity, complexity, and bolstering. Journal of Personality and Social
Psychology, 57(4), 632–640.
Thoma, S. (1986). Estimating gender differences in the comprehension and preference of moral
issues. Developmental Review, 6(2), 165–180.
Tilker, H. (1970). Socially responsible behavior as a function of observer responsibility and
victim feedback. Journal of Personality and Social Psychology, 14(2), 95–100.
Turner, C. (2001). Accountability demands and the auditors’ evidence search strategy: The
influence of reviewer preferences and the nature of the response (belief vs. action).
Journal of Accounting Research, 39(3), 683–706.
Velasquez, M., & Rostankowski, C. (1985). Ethics: Theory and practice. Englewood Cliffs, NJ:
Prentice-Hall.
Weick, K. (1979). Cognitive processes in organizations. In: B. Staw (Ed.), Research in organ-
ization behavior 1 (pp. 41–74). Greenwich, CT: JAI Press.
ROBIN R. RADTKE134
Weigold, M., & Schlenker, B. (1991). Accountability and risk taking. Personality and Social
Psychology Bulletin, 17(1), 25–29.
Werhane, P., & Freeman, R. (1999). Business ethics: The state of the art. International Journal
of Management Reviews, 1, 1–16.
www.cnn.com. (2002). Time names whistleblowers as persons of the year (December 23). http://
www.cnn.com/2002/US/12/23/time.persons.of.year
APPENDIX
Ethically Sensitive Situations
(1) You are preparing your personal tax return. During the year you made
several substantial charitable contributions which totaled $1,700. Ad-
ditionally, you made several smaller contributions for which you did
not receive receipts. You estimate the value of these items at no more
than $150. When preparing this year’s tax return, you notice that by
claiming just over $2,000 in charitable expenses (instead of $1,850) you
would drop to a lower tax bracket which would save you about $100 in
taxes. Do you claim over $2,000 in charitable contributions?
(2) Assume you are a tax accountant within your company. During the
prior year, the company purchased an asset for $55,000. Normal ship-
ping, handling, insurance, and setup costs totaled $7,000. This makes the
cost basis of the asset $62,000. Owing to a problem installing the asset,
however, an additional cost of $5,000 was incurred. You are aware that
unusual expenditures on asset installment should be capitalized (making
the cost basis of the asset $67,000), but expensing these costs for tax
purposes lowers the company’s taxes for the current year. The controller
of your company has made it clear that she favors aggressive tax po-
sitions and that the probability of these expenditures being audited is
minimal. Do you expense the additional cost of $5,000 for tax purposes?
(3) You and your brother regularly enjoy competing at computer games. He
recently purchased a relatively costly new game and installed it on his
PC. You have since been playing the game at his house, but he has
gotten the upper hand, since he can practice anytime he wants. He offers
to install the game on your PC from the same disk. You’re not sure if
you should do this since the software is licensed to be installed on only
one computer, but he says everyone does it all the time. Since you hate
losing to him, you consider it. Do you copy the game onto your PC?
(4) At work you use many different software packages. Several weeks ago
your supervisor ordered a new package for you that several of your
Role Morality and Accountants’ Ethically Sensitive Decisions 135
colleagues are currently using. The software is now late in arriving.
The package would aid you tremendously in completing your current
project, but is not absolutely necessary. Earlier today your supervisor
brought her copy of the software over to you and suggested that you
copy it onto your computer for use until your copy arrives. You know
that the software is licensed to be installed onto only one computer.
Do you copy the software?
(5) Yesterday you drove to the store with your neighbor and her young
son. When you got back to the car, your neighbor noticed that her
son picked up a small item from the store worth about $5 that wasn’t
paid for. Your neighbor reprimanded the child and then turned to
you and said she was ready to go. You asked her if she was going to
go back into the store to pay for the item. She said it’s not worth the
hassle. Do you refuse to drive her home unless she goes back to the
store and pays for the item?
(6) While at a colleague’s home you notice several piles of supply items
from the office including notepads, diskettes, and boxes of pens.
When you ask your colleague about this, she explains that she often
brings work home from the office and even if she uses some of the
work supplies for personal projects, she sometimes uses personal
items for work-related efforts, so it all washes out in the end anyway.
Although the supplies don’t total a substantive amount, you are
concerned that they have been removed from the office and wonder
what else your colleague may ‘‘borrow’’ for personal use. Do you tell
your superior about your colleague’s actions?
(7) You and your friend are watching the evening news when a picture of
a man wanted for questioning is shown. You recognize the man as an
old acquaintance of your friend. You ask your friend when was the
last time he saw the man. He tells you he actually ran into him last
week, but had no idea of any illegal activities he may have been
engaged in. You ask your friend whether he is going to call the au-
thorities to report his encounter with the man and he says that he
doesn’t want to get involved. Do you call the authorities to report
your friend’s association with the man?
(8) You and a colleague of yours started work at the same time after
graduating college. Both of you are quick learners, but he seems to
always get things done faster and is continually receiving praise from
your superior who supervises you both. Since your company operates
on flexible hours, you and your colleague rarely leave the office at the
same time. Yesterday you left at the same time, however, and you
ROBIN R. RADTKE136
noticed that he was taking files home with him to work on. Since your
company considers you salaried employees, you don’t receive over-
time. On the one hand you think that if your colleague wants to spend
his personal time on work that’s his problem, but on the other hand
he’s making you look bad. Do you tell your superior about your
colleague’s actions?
(9) Last week you discussed your personal investments over lunch with a
friend of yours from college. Your friend told you that since he has
been working at a brokerage firm, he’s privy to a wealth of inside
information about a variety of stocks. Over the course of the meal,
several pieces of information about stocks that you own are disclosed.
Your friend also tells you how to use this information discreetly and
suggests that you may want to use it to your advantage. He divulges
that he has done this several times without being caught. Do you
trade your stock based on this inside information?
(10) While at lunch with several of your colleagues last week you over-
heard a discussion about a client company’s financial situation. An
accountant working closely with the company noticed significant de-
creases in sales and receivables. He wasn’t sure exactly how bad it was
until he heard a rumor at the company about the possibility of filing
for bankruptcy. You’re now worried because you own a significant
block of shares in the company. Do you sell the shares based on this
inside information?
(11) Two of your good friends are engaged in negotiations for the sale/
purchase of a used car. Several years ago the seller of the car was
involved in an accident which you witnessed, but the buyer is unaware
of. The car sustained substantial damage, but was repaired. Now the
seller is representing the car as never having been in an accident. The
difference in the appraisal value of the car is difficult to measure. Do
you tell the buyer of the car about the accident?
(12) While on a trip out of town on business you had dinner with your sister.
Your company has a policy of reimbursing dinner expenses up to $50
per meal. The total cost for this meal for both you and your sister was
$35.70. The cost of your meal alone was $16.30. You know that others in
your company routinely submit claims for dinner expenses for nonbusi-
ness parties. Do you claim the entire amount for reimbursement?
(13) Yesterday your second grader came home and started watching car-
toons. During one of the programs he said ‘‘see that little boy, he’s
not as smart as I am.’’ The little boy was of a different race and when
you asked your son why he thought that, he said his teacher had told
Role Morality and Accountants’ Ethically Sensitive Decisions 137
him so during school. Do you take action to reprimand the teacher on
the basis of racial discrimination?
(14) A couple of weeks ago your division posted a job opening. You told a
good friend of yours who was looking to switch jobs about the po-
sition and she submitted a resume. She met the job qualifications and
was one of three candidates interviewed. She told you that she
thought the interview went very well and was excited about the pos-
sibility of being hired. Your direct superior also told you that he
enjoyed interviewing your friend and that in his opinion, she should
get the job. Yesterday when you came into the office you found out
that one of the other candidates got the job. When inquiring as to the
reasons that your friend didn’t get an offer, you were told that al-
though her credentials were the best of the three, her personality just
didn’t fit with the rest of the employees in the division. You are
somewhat suspicious of this explanation, since your friend is a mi-
nority and you have heard some of the senior personnel in the division
make racial slurs. Do you investigate the matter further on the
grounds of racial discrimination?
(15) While talking with your neighbor he tells you that at the next neigh-
borhood association meeting he intends to use the open forum time to
plug his company’s new product line. The neighborhood association
has rules about this, but the president is often somewhat negligent in
enforcing them. When you tell your friend that he probably shouldn’t
use the meeting time in this way, he responds by saying that it’s a free
country and he can speak about anything he wants to. Do you at-
tempt to contact the president and others in the association to try to
block your friend from speaking?
(16) Based on your recent work-team experiences you were asked by your
division head to draft a memo highlighting the good and bad points.
You recalled many of each and drafted the memo accordingly. After
your supervisor reviewed the memo she told you to tone it down a bit.
You ask her what she means by that and she basically tells you that in
her opinion it’s not good to give either too much praise or too many
admonishments. You say that is counterproductive to the purpose of
the memo to not disclose the actual occurrences. She tells you to print
the memo as is at your own risk. You feel that you’ve done the job
that was asked of you and you have a right to tell it like it is. Do you
print the memo as is?
ROBIN R. RADTKE138
THE EFFECT OF MANAGER’S
MORAL EQUITY ON THE
RELATIONSHIP BETWEEN BUDGET
PARTICIPATION AND PROPENSITY
TO CREATE SLACK: A RESEARCH
NOTE
Adam S. Maiga
ABSTRACT
This chapter uses agency theory and ethics literature to assess the mod-
erating effect of manager’s moral equity on the relation between budget
participation and propensity to create slack. Moral equity is the major
evaluative criterion for ethical judgment, is based on the overall concept of
fairness, justice and right and is often very influential in contemporary
moral thought (Robin & Reidenbach (1996) Journal of Business, 5(1)
17–28). The results indicate that a manager’s moral equity moderates the
effect of budget participation. For managers with high moral equity, the
relationship between participation and manager’s propensity to create
slack is significantly negative while, for managers with low moral equity,
the relationship is significantly positive. Further analyses indicate that
Advances in Accounting Behavioral Research
Advances in Accounting Behavioral Research, Volume 8, 139–165
Copyright r 2005 by Elsevier Ltd.
All rights of reproduction in any form reserved
ISSN: 1475-1488/doi:10.1016/S1475-1488(04)08006-8
139
high budget participation and high moral equity result in less propensity
to create slack than high budget participation and low moral equity.
INTRODUCTION
A major concern expressed in the literature is that the use of participative
budgetary control processes may result in the generation of slack budgets
(Antle & Eppen 1985). Budgetary participation is the means by which sub-
ordinate managers influence plans and their methods of implementation,
thereby sharing in the decision-making process with their superiors on mat-
ters that affect their areas of responsibility (Milani, 1975; Brownell, 1982).
Budget slack, defined as overstated expenses, understated revenues, or un-
derestimated performance capabilities, allows managers to obtain excess
resources and to shirk more effectively (Lukka, 1988).1
Several accounting studies invoke the principal-agent framework to argue
that subordinates have more accurate information than their superiors re-
garding local conditions, i.e., private information about local conditions
(Merchant, 1981; Christensen, 1982; Chow, Cooper, & Waller, 1988; Waller,
1988). Subordinates’ participation in the budget-setting process may give
superiors the opportunity to gain access to local information (Baiman, 1982;
Baiman & Evans, 1983; Magee, 1980). Participation allows subordinates to
communicate or reveal some of their private information that may be in-
corporated into the standards or budgets against which their performance
would be assessed (Baiman & Evans, 1983). But subordinates may misrep-
resent or withhold some of their private information, resulting in under-
stated revenues and overstated expenses, which could lead to budgetary
Slack (Christensen, 1982; Merchant, 1985; Pope, 1984; Young, 1985).
The results of prior studies examining the relationship between subordi-
nates’ participation and budgetary slack have not been consistent. For ex-
ample, Dunk (1993), Merchant (1985), Cammann (1976), and Onsi (1973)
report evidence suggesting that participation reduces the amount of budget
slack. On the other hand, Lukka (1988) and Young (1985) report that
budget participation and the creation of slack may be positively related; and
Collins (1978) reports that the relationship between budgetary participation
and budgetary slack is not significant.
The above studies view budgetary slack as an organizational or behavioral
issue (Douglas & Wier, 2000) based on moral hazard2 and are not designed to
distinguish wealth maximization from alternative preferences such as ethics,
ADAM S. MAIGA140
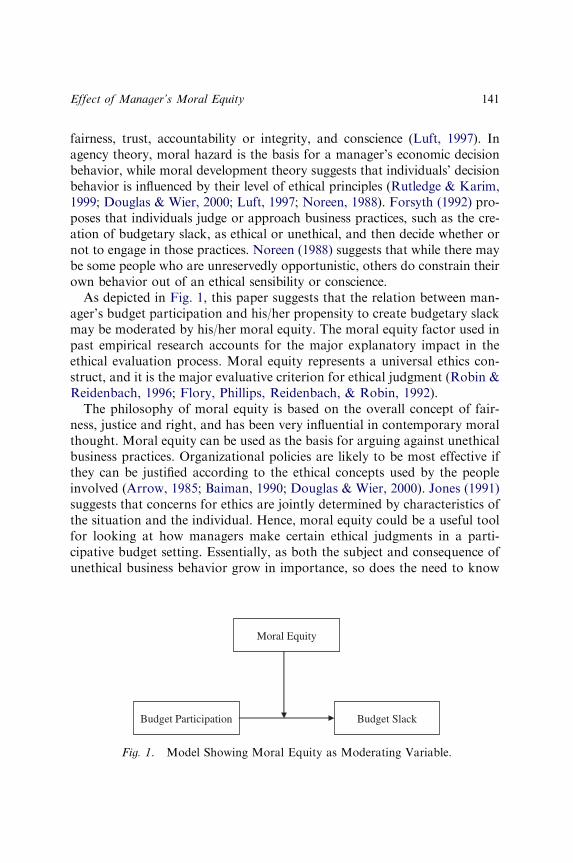
fairness, trust, accountability or integrity, and conscience (Luft, 1997). In
agency theory, moral hazard is the basis for a manager’s economic decision
behavior, while moral development theory suggests that individuals’ decision
behavior is influenced by their level of ethical principles (Rutledge & Karim,
1999; Douglas & Wier, 2000; Luft, 1997; Noreen, 1988). Forsyth (1992) pro-
poses that individuals judge or approach business practices, such as the cre-
ation of budgetary slack, as ethical or unethical, and then decide whether or
not to engage in those practices. Noreen (1988) suggests that while there may
be some people who are unreservedly opportunistic, others do constrain their
own behavior out of an ethical sensibility or conscience.
As depicted in Fig. 1, this paper suggests that the relation between man-
ager’s budget participation and his/her propensity to create budgetary slack
may be moderated by his/her moral equity. The moral equity factor used in
past empirical research accounts for the major explanatory impact in the
ethical evaluation process. Moral equity represents a universal ethics con-
struct, and it is the major evaluative criterion for ethical judgment (Robin &
Reidenbach, 1996; Flory, Phillips, Reidenbach, & Robin, 1992).
The philosophy of moral equity is based on the overall concept of fair-
ness, justice and right, and has been very influential in contemporary moral
thought. Moral equity can be used as the basis for arguing against unethical
business practices. Organizational policies are likely to be most effective if
they can be justified according to the ethical concepts used by the people
involved (Arrow, 1985; Baiman, 1990; Douglas & Wier, 2000). Jones (1991)
suggests that concerns for ethics are jointly determined by characteristics of
the situation and the individual. Hence, moral equity could be a useful tool
for looking at how managers make certain ethical judgments in a parti-
cipative budget setting. Essentially, as both the subject and consequence of
unethical business behavior grow in importance, so does the need to know
Budget SlackBudget Participation
Moral Equity
Fig. 1. Model Showing Moral Equity as Moderating Variable.
Effect of Manager’s Moral Equity 141
the grounds on which managers tend to make ethical judgments and their
impact of those judgments. Such insights will help to expand upon previous
studies. Also, the empirical investigation of this study will help to under-
stand how the manager’s level of moral equity impacts the relationship
between budget participation and propensity to create slack.
Many scholars have highlighted, from both the theoretical and empirical
perspectives, the impact of a manager’s budget participation on budget slack.
Most contributions, however, did not analyze the link between a manager’s
budget participation and his/her propensity to create slack within the context
of the manager’s moral equity. The purpose of this study is to assess the
moderating effect of manufacturing business unit3 managers’ moral equity on
the relationship between the extent of their budget participation and propen-
sity to create slack. This study proposes that moral equity influences managers’
behavior in participative budgeting. Specifically, managers with high moral
equity may use their influence primarily to reduce slack while managers with
low moral equity may use their influence primarily to create slack.
The remainder of this chapter is organized as follows. The next section
draws upon previous literature to develop a theoretical framework linking
the variables of interest. The methodology and statistical results are dis-
cussed in the third and fourth sections, respectively. The paper concludes
with a discussion of the findings and suggestions for future research.
LITERATURE REVIEW AND HYPOTHESIS
DEVELOPMENT
Agency theory posits that information asymmetry may systematically in-
fluence the extent to which participation leads to slack budgets. Information
asymmetry arises when subordinates (agents) are in possession of informa-
tion that affects the decision process between subordinates and superiors
(principals) (e.g., Baiman & Evans, 1983; Penno, 1984; Coughlan & Sch-
midt, 1985). When the agent has private information that is not available to
the firm (i.e., information asymmetry), the principal can no longer verify if
the agent’s decisions are in accordance with the firm’s interests. This pro-
vides the agent with the opportunity to shirk by making decisions that
conflict with the interests of the firm. When the agent is under conditions of
an incentive to shirk and an opportunity to shirk (e.g., private information),
the problem of moral hazard can occur.
Magee (1980) proposes that budgets could be improved if principals were
aware of local information held by subordinates prior to the budgets being set,
ADAM S. MAIGA142
i.e., information asymmetry is eliminated. Baiman (1982), Chow (1988),
Blanchard and Chow (1983), and Waller (1988) argue that subordinates in
many organizational settings have more accurate information than their su-
periors on the factors influencing performance. Baiman and Evans (1983)
propose that firms in which subordinates have such information, participa-
tion-based management control systems allow subordinates to reveal or com-
municate some of their private information that may then be incorporated into
the standards or budgets against which their performance is evaluated.
Unfortunately, agents may misrepresent or withhold from their principals
some or all of their locally- based information, which could lead to budgets
containing slack (Christensen, 1982; Baiman & Sivaramakrishnan, 1991). The
argument for agents either falsifying or withholding their private information
is that managers plan to have slack in their budgets to enable budgeted
objectives to be met and improve the likelihood that they will be compensated
for their efforts. For example, Waller (1988) argues that if subordinates be-
lieve their communicated private information will be employed in standard
setting for the purpose of performance evaluation, they may have an incentive
to bias their communications to facilitate the setting of relatively easy stand-
ards. This problem, Waller (1988) stresses, is particularly salient when sub-
ordinates’ pay schemes are budget-based and the budget-setting process is
participative. As managerial compensation is often based on budget achieve-
ment and information provided by agents is likely to be used in their per-
formance evaluation (Christensen, 1982; Baiman & Evans, 1983), the
prospect of dysfunctional consequences arising from the presence of infor-
mation asymmetry may be non-trivial. Young (1985) warns that the existence
of private information in conjunction with participation may result in sub-
ordinates intentionally building excess resource requirements into budgets or
consciously understating production capabilities.
These agency-based studies capture behavior shifts in response to incen-
tives in particular settings, but do not provide decisive tests of the simple
self-interest model vs. plausible alternative utility functions. Luft (1997)
questions the commonly cited belief that self-interest is a good approxima-
tion for behavior and argues that prior tests have lacked the power to
distinguish between self-interested and ethical models of behavior. Thus,
while the agency-based studies offer evidence for the existence of a pref-
erence for wealth, they do not offer evidence against the existence of other
significant preferences (Luft, 1997).
Hence, this study proposes that whether managers are predisposed to
pursuing self-interests or organizational interests depend upon their level of
moral equity. Ethical concerns typically arise in situations where self-interest
Effect of Manager’s Moral Equity 143

conflicts with a moral duty to others (Bowie & Duska, 1990). DeGeorge
(1992) asserts that ethically motivated agents exercise effective self-control
that no amount of external control can match, and that researchers should
utilize, promote, and incorporate such motivation.
A person who fails to recognize a moral issue will fail to employ moral
decision-making schemata (Jones, 1991). The consideration of budget slack
from the perspective of ethical decision-making assumes that a person must
be able to recognize budget slack creation as a moral issue. Slack creation
may be inconsistent with role-related norms and desired virtues of profes-
sional managers, and the resource misallocation that results is detrimental to
other organizational units and to investors (Merchant, 1995). Thus, creation
of budget slack is an ethical dilemma – a predicament with a moral com-
ponent (Douglas & Wier, 2000). Opportunistic behavior on the part of the
agent may be controlled in part by the agents’ concerns for reputation or
ethics (see Arrow, 1985; Baiman, 1990), and the idea that individuals can be
strongly motivated to pursue organizational interests (i.e., without the pros-
pect of self-interest) has been shown in the literature. For example, in an
experimental study, Stevens (2002) investigated the effects of two potential
controls for opportunistic self-interest – reputation and ethics. The results
provide strong evidence that reputation and ethics reduce budgetary slack.
While slack levels under a slack-inducing pay scheme were higher than in
prior experimental studies, subjects still restricted the amount of slack in
their budgets below the maximum, and thereby failed to maximize their pay.
This result is consistent with findings of Evans, Hanna, Krishnan, Moser
(2001) that subjects often sacrifice wealth to make honest reports of pro-
ductive capability. In Evans et al. (2001), budgetary slack is negatively as-
sociated with a measure of ethical responsibility from the pre-experiment
personality questionnaire as well as reputation and ethical concerns ex-
pressed in the exit questionnaire. As information asymmetry regarding pro-
ductive capability increased, subordinates expressed lower reputation
concerns, thereby reducing the superior’s ability to monitor the slack in
their budget. Ethical concerns, however, were not diminished with increases
in information asymmetry. These results suggest that reputation is a socially
mediated control whereas ethics is an internally mediated control for op-
portunistic self-interest.
In an experimental study, Douglas, Davidson, & Schwartz (2001) inves-
tigated auditors’ ethical judgments in situations typical of those they face in
practice. Results indicate that ethical orientation is related to ethical judg-
ments in high (but not low) moral intensity situations. These results support
Jones’ (1991) issue-contingent argument that suggests that differences in
ADAM S. MAIGA144
characteristics of a moral issue itself, its moral intensity, affect individuals’
responses to the issue.
The chapter paper proposes that in participatory budgeting, the individ-
ual’s level of moral equity influences his or her attempts to create budgetary
slack. For subordinates with high moral equity, budget participation and
budgetary slack may be inversely related. In a high budget participation
setting, managers are likely to make use of all possible sources of informa-
tion in order to increase the accuracy of the budget decision (Gul, 1991).
Since information availability is improved through participation, parti-
cipative budgeting will lead to more analytical and accurate decision-mak-
ing. Therefore, in a high participatory budget, subordinates with high moral
equity will use their private information to produce an accurate budget, i.e.,
to reduce slack and benefit the organization. In contrast, when budget par-
ticipation is low, subordinates with high moral equity will have little op-
portunity to share their private information, and superiors will have only
limited success in attempting to reduce slack. Therefore, there is less op-
portunity to reduce budgetary slack.
For individuals with low moral equity, budget participation provides op-
portunities for the subordinate to create slack. For these individuals, the
relation between budget participation and budgetary slack is positive, i.e., as
budget participation increases, budgetary slack increases. Since the subor-
dinate has low moral equity, he/she may use participation to introduce slack
and gain favorable future evaluations (i.e., the subordinate seeks to max-
imize self-interest).
The proposed effects of moral equity on the relationship between budget
participation and budgetary slack results in the following hypothesis, stated
in alternative form:
H1. There is an interaction between moral equity and participative
budgeting that affects budgetary slack. For managers with high moral
equity, increasing budget participation will decrease budgetary slack. For
managers with low moral equity, increasing budgetary participation will
increase budgetary slack.
RESEARCH METHOD
Sample
A questionnaire was administered to a sample of managers (plant managers,
manufacturing managers, operations managers, marketing managers,
Effect of Manager’s Moral Equity 145
research managers, distribution managers) from manufacturing companies
in the USA Manufacturing organizations were selected for study, as the use
of budgets in such organizations is common. The primary source of sample
selection was the Industry Week series. For this study, an initial mailing list
of 1,103 business units was obtained and a random sample of 650 names was
selected.4 A cover letter explained the purpose of the study with an exhor-
tation for participation and cooperation. Based on the survey responses, two
criteria were used to select the participants: (1) each participant had budget
responsibility in the subunit and (2) each unit was a profit-center (see ap-
pendix, part II). An abbreviated copy of the questionnaire used in the study
appears in the appendix.
In the first 3 weeks, 167 questionnaires were returned; that was followed
by a second mailing which resulted in 56 new responses. Of the 223 returned
questionnaires, only 193 were usable.5 In an attempt to increase the number
of respondents, 150 non-respondents were chosen randomly and contacted
by telephone; that resulted in a return of 78 questionnaires of which 58 were
usable.6 Overall, this data collection led to 251 usable responses7 with a
38.61% response rate.
Measurement and Validation of Variables
The variables used to answer the research question are budget slack, budget
participation, and moral equity. The measurement of the variables is ob-
tained from average responses from the questionnaire results. The factor
loadings, explained variances, and reliability measures are reported in
Table 1. The appendix contains an abbreviated copy of the research ques-
tionnaire used to measure the self-reported variables in this study.
Propensity to Create Slack
Propensity to create slack is operationalized using the three-item scale used in
Kren (1993) and adapted from Merchant (1985). Merchant’s original four-
item scale was examined by Hughes and Kwon (1990) who suggested deleting
one item to improve the scale’s reliability. Thus this study uses the three items
suggested by Hughes and Kwon (1990). The response scale is a 7-point
Likert-type scale ranging from one (strongly disagree) to seven (strongly
agree). Principal component analysis with varimax rotation was used to ex-
amine the extent to which these measures are interrelated and produced one
factor with total variance of 88.208% and an eigenvalue greater than one.
Cronbach alpha was 0.928, indicating that the measures are reliable.
ADAM S. MAIGA146
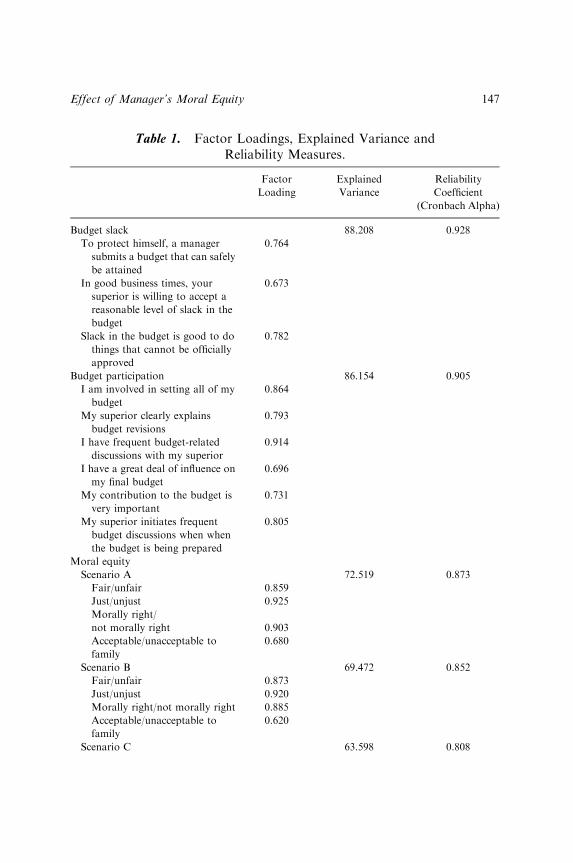
Table 1. Factor Loadings, Explained Variance and
Reliability Measures.
Factor
Loading
Explained
Variance
Reliability
Coefficient
(Cronbach Alpha)
Budget slack 88.208 0.928
To protect himself, a manager
submits a budget that can safely
be attained
0.764
In good business times, your
superior is willing to accept a
reasonable level of slack in the
budget
0.673
Slack in the budget is good to do
things that cannot be officially
approved
0.782
Budget participation 86.154 0.905
I am involved in setting all of my
budget
0.864
My superior clearly explains
budget revisions
0.793
I have frequent budget-related
discussions with my superior
0.914
I have a great deal of influence on
my final budget
0.696
My contribution to the budget is
very important
0.731
My superior initiates frequent
budget discussions when when
the budget is being prepared
0.805
Moral equity
Scenario A 72.519 0.873
Fair/unfair 0.859
Just/unjust 0.925
Morally right/
not morally right 0.903
Acceptable/unacceptable to
family
0.680
Scenario B 69.472 0.852
Fair/unfair 0.873
Just/unjust 0.920
Morally right/not morally right 0.885
Acceptable/unacceptable to
family
0.620
Scenario C 63.598 0.808
Effect of Manager’s Moral Equity 147
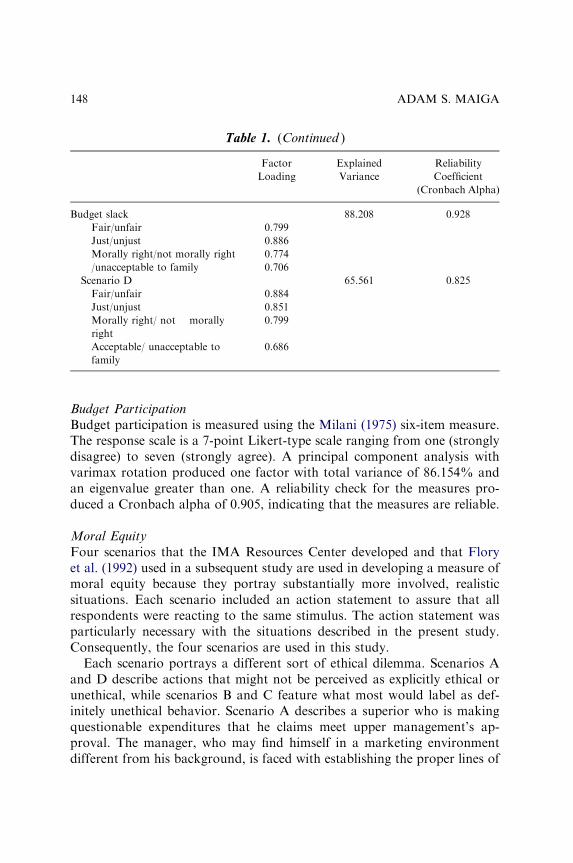
Budget Participation
Budget participation is measured using the Milani (1975) six-item measure.
The response scale is a 7-point Likert-type scale ranging from one (strongly
disagree) to seven (strongly agree). A principal component analysis with
varimax rotation produced one factor with total variance of 86.154% and
an eigenvalue greater than one. A reliability check for the measures pro-
duced a Cronbach alpha of 0.905, indicating that the measures are reliable.
Moral Equity
Four scenarios that the IMA Resources Center developed and that Flory
et al. (1992) used in a subsequent study are used in developing a measure of
moral equity because they portray substantially more involved, realistic
situations. Each scenario included an action statement to assure that all
respondents were reacting to the same stimulus. The action statement was
particularly necessary with the situations described in the present study.
Consequently, the four scenarios are used in this study.
Each scenario portrays a different sort of ethical dilemma. Scenarios A
and D describe actions that might not be perceived as explicitly ethical or
unethical, while scenarios B and C feature what most would label as def-
initely unethical behavior. Scenario A describes a superior who is making
questionable expenditures that he claims meet upper management’s ap-
proval. The manager, who may find himself in a marketing environment
different from his background, is faced with establishing the proper lines of
Table 1. (Continued )
Factor
Loading
Explained
Variance
Reliability
Coefficient
(Cronbach Alpha)
Budget slack 88.208 0.928
Fair/unfair 0.799
Just/unjust 0.886
Morally right/not morally right 0.774
/unacceptable to family 0.706
Scenario D 65.561 0.825
Fair/unfair 0.884
Just/unjust 0.851
Morally right/ not morally
right
0.799
Acceptable/ unacceptable to
family
0.686
ADAM S. MAIGA148
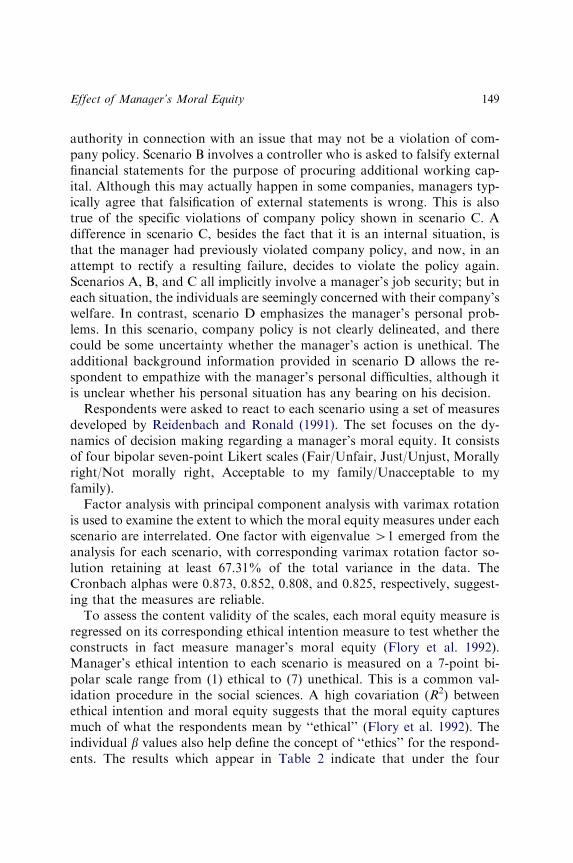
authority in connection with an issue that may not be a violation of com-
pany policy. Scenario B involves a controller who is asked to falsify external
financial statements for the purpose of procuring additional working cap-
ital. Although this may actually happen in some companies, managers typ-
ically agree that falsification of external statements is wrong. This is also
true of the specific violations of company policy shown in scenario C. A
difference in scenario C, besides the fact that it is an internal situation, is
that the manager had previously violated company policy, and now, in an
attempt to rectify a resulting failure, decides to violate the policy again.
Scenarios A, B, and C all implicitly involve a manager’s job security; but in
each situation, the individuals are seemingly concerned with their company’s
welfare. In contrast, scenario D emphasizes the manager’s personal prob-
lems. In this scenario, company policy is not clearly delineated, and there
could be some uncertainty whether the manager’s action is unethical. The
additional background information provided in scenario D allows the re-
spondent to empathize with the manager’s personal difficulties, although it
is unclear whether his personal situation has any bearing on his decision.
Respondents were asked to react to each scenario using a set of measures
developed by Reidenbach and Ronald (1991). The set focuses on the dy-
namics of decision making regarding a manager’s moral equity. It consists
of four bipolar seven-point Likert scales (Fair/Unfair, Just/Unjust, Morally
right/Not morally right, Acceptable to my family/Unacceptable to my
family).
Factor analysis with principal component analysis with varimax rotation
is used to examine the extent to which the moral equity measures under each
scenario are interrelated. One factor with eigenvalue 41 emerged from the
analysis for each scenario, with corresponding varimax rotation factor so-
lution retaining at least 67.31% of the total variance in the data. The
Cronbach alphas were 0.873, 0.852, 0.808, and 0.825, respectively, suggest-
ing that the measures are reliable.
To assess the content validity of the scales, each moral equity measure is
regressed on its corresponding ethical intention measure to test whether the
constructs in fact measure manager’s moral equity (Flory et al. 1992).
Manager’s ethical intention to each scenario is measured on a 7-point bi-
polar scale range from (1) ethical to (7) unethical. This is a common val-
idation procedure in the social sciences. A high covariation (R2) between
ethical intention and moral equity suggests that the moral equity captures
much of what the respondents mean by ‘‘ethical’’ (Flory et al. 1992). The
individual b values also help define the concept of ‘‘ethics’’ for the respond-
ents. The results which appear in Table 2 indicate that under the four
Effect of Manager’s Moral Equity 149
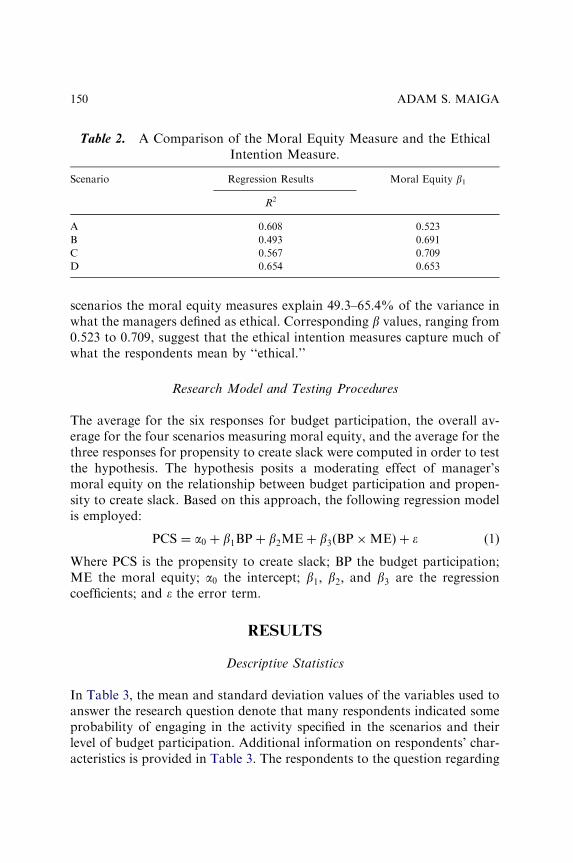
scenarios the moral equity measures explain 49.3–65.4% of the variance in
what the managers defined as ethical. Corresponding b values, ranging from
0.523 to 0.709, suggest that the ethical intention measures capture much of
what the respondents mean by ‘‘ethical.’’
Research Model and Testing Procedures
The average for the six responses for budget participation, the overall av-
erage for the four scenarios measuring moral equity, and the average for the
three responses for propensity to create slack were computed in order to test
the hypothesis. The hypothesis posits a moderating effect of manager’s
moral equity on the relationship between budget participation and propen-
sity to create slack. Based on this approach, the following regression model
is employed:
PCS ¼ a0 þ b1BPþ b2MEþ b3ðBP�MEÞ þ � (1)
Where PCS is the propensity to create slack; BP the budget participation;
ME the moral equity; a0 the intercept; b1; b2; and b3 are the regression
coefficients; and � the error term.
RESULTS
Descriptive Statistics
In Table 3, the mean and standard deviation values of the variables used to
answer the research question denote that many respondents indicated some
probability of engaging in the activity specified in the scenarios and their
level of budget participation. Additional information on respondents’ char-
acteristics is provided in Table 3. The respondents to the question regarding
Table 2. A Comparison of the Moral Equity Measure and the Ethical
Intention Measure.
Scenario Regression Results Moral Equity b1
R2
A 0.608 0.523
B 0.493 0.691
C 0.567 0.709
D 0.654 0.653
ADAM S. MAIGA150
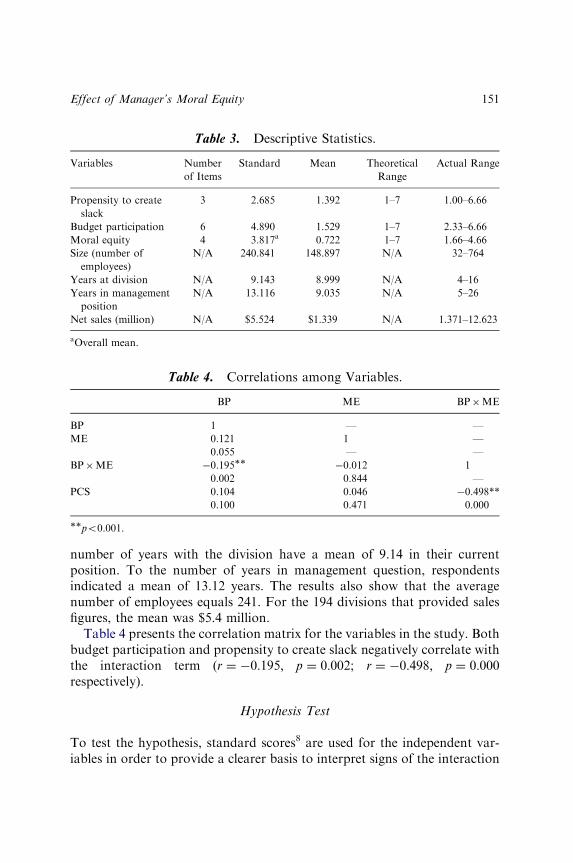
number of years with the division have a mean of 9.14 in their current
position. To the number of years in management question, respondents
indicated a mean of 13.12 years. The results also show that the average
number of employees equals 241. For the 194 divisions that provided sales
figures, the mean was $5.4 million.
Table 4 presents the correlation matrix for the variables in the study. Both
budget participation and propensity to create slack negatively correlate with
the interaction term (r ¼ �0:195; p ¼ 0:002; r ¼ �0:498; p ¼ 0:000respectively).
Hypothesis Test
To test the hypothesis, standard scores8 are used for the independent var-
iables in order to provide a clearer basis to interpret signs of the interaction
Table 3. Descriptive Statistics.
Variables Number
of Items
Standard Mean Theoretical
Range
Actual Range
Propensity to create
slack
3 2.685 1.392 1–7 1.00–6.66
Budget participation 6 4.890 1.529 1–7 2.33–6.66
Moral equity 4 3.817a 0.722 1–7 1.66–4.66
Size (number of
employees)
N/A 240.841 148.897 N/A 32–764
Years at division N/A 9.143 8.999 N/A 4–16
Years in management
position
N/A 13.116 9.035 N/A 5–26
Net sales (million) N/A $5.524 $1.339 N/A 1.371–12.623
aOverall mean.
Table 4. Correlations among Variables.
BP ME BP�ME
BP 1 — —
ME 0.121 1 —
0.055 — —
BP�ME �0.195�� �0.012 1
0.002 0.844 —
PCS 0.104 0.046 �0.498**
0.100 0.471 0.000
��po0.001.
Effect of Manager’s Moral Equity 151
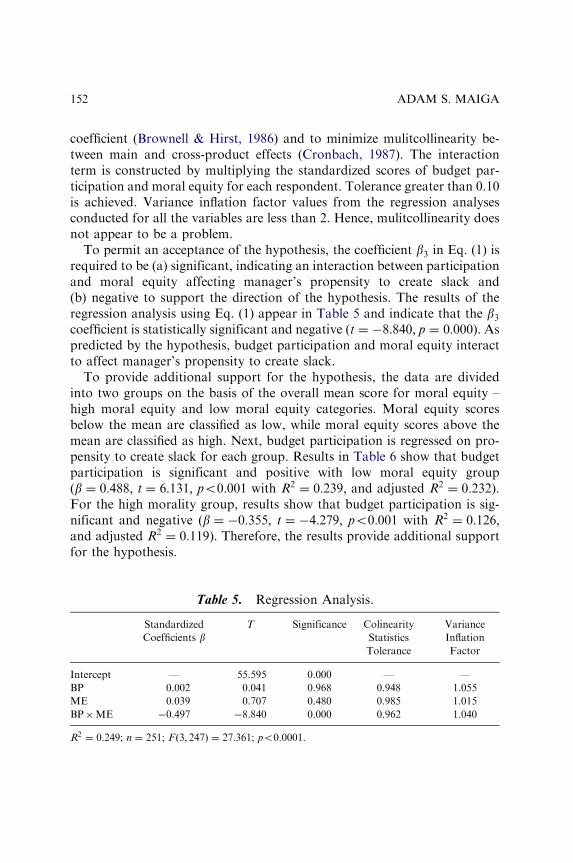
coefficient (Brownell & Hirst, 1986) and to minimize mulitcollinearity be-
tween main and cross-product effects (Cronbach, 1987). The interaction
term is constructed by multiplying the standardized scores of budget par-
ticipation and moral equity for each respondent. Tolerance greater than 0.10
is achieved. Variance inflation factor values from the regression analyses
conducted for all the variables are less than 2. Hence, mulitcollinearity does
not appear to be a problem.
To permit an acceptance of the hypothesis, the coefficient b3 in Eq. (1) is
required to be (a) significant, indicating an interaction between participation
and moral equity affecting manager’s propensity to create slack and
(b) negative to support the direction of the hypothesis. The results of the
regression analysis using Eq. (1) appear in Table 5 and indicate that the b3coefficient is statistically significant and negative (t ¼ �8:840; p ¼ 0:000). As
predicted by the hypothesis, budget participation and moral equity interact
to affect manager’s propensity to create slack.
To provide additional support for the hypothesis, the data are divided
into two groups on the basis of the overall mean score for moral equity –
high moral equity and low moral equity categories. Moral equity scores
below the mean are classified as low, while moral equity scores above the
mean are classified as high. Next, budget participation is regressed on pro-
pensity to create slack for each group. Results in Table 6 show that budget
participation is significant and positive with low moral equity group
(b ¼ 0:488; t ¼ 6:131; po0:001 with R2 ¼ 0:239; and adjusted R2 ¼ 0:232).For the high morality group, results show that budget participation is sig-
nificant and negative (b ¼ �0:355; t ¼ �4:279; po0:001 with R2 ¼ 0:126;and adjusted R2 ¼ 0:119). Therefore, the results provide additional supportfor the hypothesis.
Table 5. Regression Analysis.
Standardized
Coefficients b
T Significance Colinearity
Statistics
Tolerance
Variance
Inflation
Factor
Intercept — 55.595 0.000 — —
BP 0.002 0.041 0.968 0.948 1.055
ME 0.039 0.707 0.480 0.985 1.015
BP�ME �0.497 �8.840 0.000 0.962 1.040
R2 ¼ 0:249; n ¼ 251; F ð3; 247Þ ¼ 27:361; po0.0001.
ADAM S. MAIGA152

Table 6. Regression Results For Low And High Moral Equity Groups.
Regression Results for Low Moral Equity Regression Results for High Moral Equity
b S.E. t Significance b S.E. t Significance
Intercept 2.740 0.074 37.144 0.000 2.729 0.072 38.093 0.000
BP 0.419 0.068 6.131 0.000 �0.335 0.078 �4.279 0.000
R2 0.239 0.126
Adjusted-R2 0.232 0.119
F 37.586 (po0.000) 18.307 (po0.000)
N 122 129
Effect
ofManager’s
MoralEquity
153
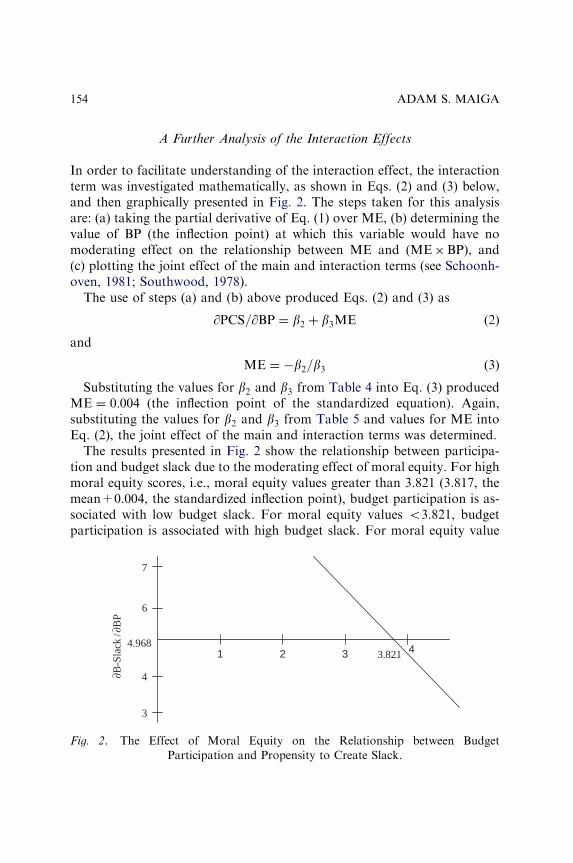
A Further Analysis of the Interaction Effects
In order to facilitate understanding of the interaction effect, the interaction
term was investigated mathematically, as shown in Eqs. (2) and (3) below,
and then graphically presented in Fig. 2. The steps taken for this analysis
are: (a) taking the partial derivative of Eq. (1) over ME, (b) determining the
value of BP (the inflection point) at which this variable would have no
moderating effect on the relationship between ME and (ME�BP), and
(c) plotting the joint effect of the main and interaction terms (see Schoonh-
oven, 1981; Southwood, 1978).
The use of steps (a) and (b) above produced Eqs. (2) and (3) as
@PCS=@BP ¼ b2 þ b3ME (2)
and
ME ¼ �b2=b3 (3)
Substituting the values for b2 and b3 from Table 4 into Eq. (3) produced
ME ¼ 0:004 (the inflection point of the standardized equation). Again,
substituting the values for b2 and b3 from Table 5 and values for ME into
Eq. (2), the joint effect of the main and interaction terms was determined.
The results presented in Fig. 2 show the relationship between participa-
tion and budget slack due to the moderating effect of moral equity. For high
moral equity scores, i.e., moral equity values greater than 3.821 (3.817, the
mean+0.004, the standardized inflection point), budget participation is as-
sociated with low budget slack. For moral equity values o3.821, budget
participation is associated with high budget slack. For moral equity value
1 2 3 43.8214.968
6
7
4
3
∂B
-Sla
ck/∂
BP
Fig. 2. The Effect of Moral Equity on the Relationship between Budget
Participation and Propensity to Create Slack.
ADAM S. MAIGA154
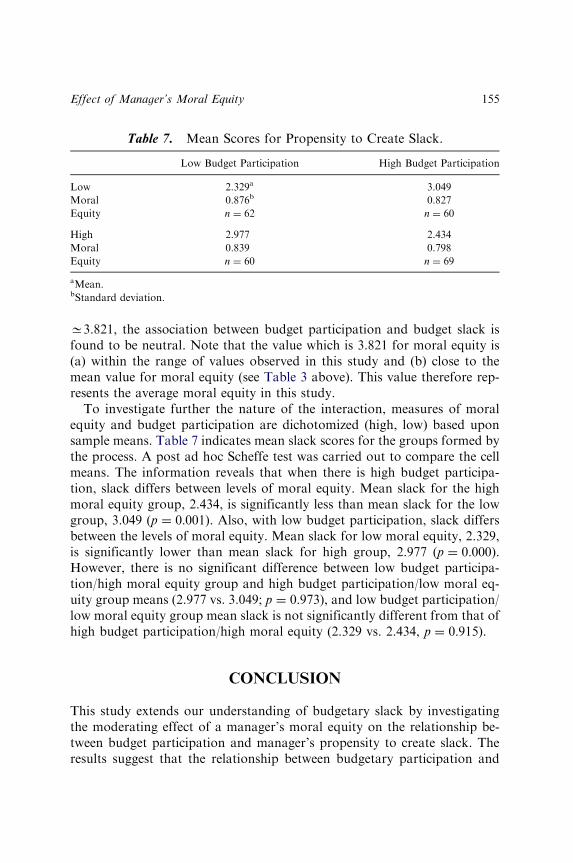
C3.821, the association between budget participation and budget slack is
found to be neutral. Note that the value which is 3.821 for moral equity is
(a) within the range of values observed in this study and (b) close to the
mean value for moral equity (see Table 3 above). This value therefore rep-
resents the average moral equity in this study.
To investigate further the nature of the interaction, measures of moral
equity and budget participation are dichotomized (high, low) based upon
sample means. Table 7 indicates mean slack scores for the groups formed by
the process. A post ad hoc Scheffe test was carried out to compare the cell
means. The information reveals that when there is high budget participa-
tion, slack differs between levels of moral equity. Mean slack for the high
moral equity group, 2.434, is significantly less than mean slack for the low
group, 3.049 (p ¼ 0:001). Also, with low budget participation, slack differs
between the levels of moral equity. Mean slack for low moral equity, 2.329,
is significantly lower than mean slack for high group, 2.977 (p ¼ 0:000).However, there is no significant difference between low budget participa-
tion/high moral equity group and high budget participation/low moral eq-
uity group means (2.977 vs. 3.049; p ¼ 0:973), and low budget participation/
low moral equity group mean slack is not significantly different from that of
high budget participation/high moral equity (2.329 vs. 2.434, p ¼ 0:915).
CONCLUSION
This study extends our understanding of budgetary slack by investigating
the moderating effect of a manager’s moral equity on the relationship be-
tween budget participation and manager’s propensity to create slack. The
results suggest that the relationship between budgetary participation and
Table 7. Mean Scores for Propensity to Create Slack.
Low Budget Participation High Budget Participation
Low 2.329a 3.049
Moral 0.876b 0.827
Equity n ¼ 62 n ¼ 60
High 2.977 2.434
Moral 0.839 0.798
Equity n ¼ 60 n ¼ 69
aMean.bStandard deviation.
Effect of Manager’s Moral Equity 155
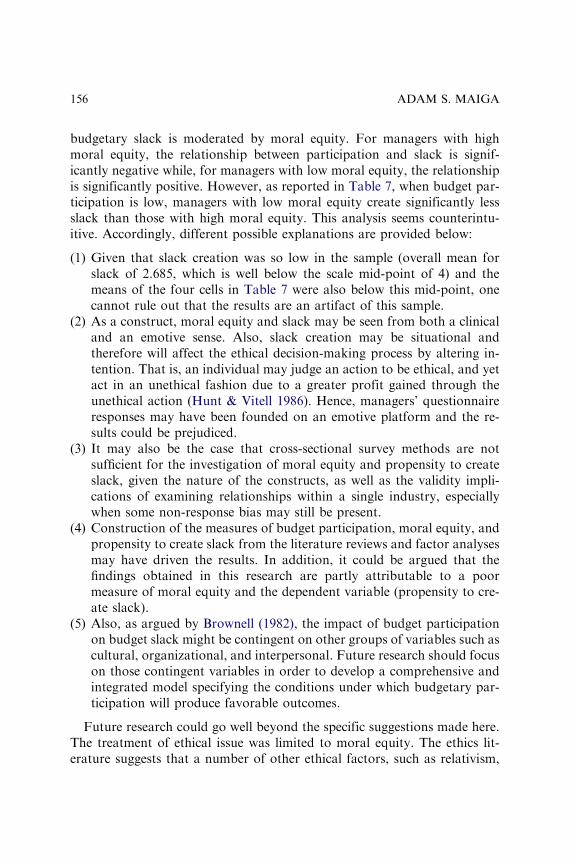
budgetary slack is moderated by moral equity. For managers with high
moral equity, the relationship between participation and slack is signif-
icantly negative while, for managers with low moral equity, the relationship
is significantly positive. However, as reported in Table 7, when budget par-
ticipation is low, managers with low moral equity create significantly less
slack than those with high moral equity. This analysis seems counterintu-
itive. Accordingly, different possible explanations are provided below:
(1) Given that slack creation was so low in the sample (overall mean for
slack of 2.685, which is well below the scale mid-point of 4) and the
means of the four cells in Table 7 were also below this mid-point, one
cannot rule out that the results are an artifact of this sample.
(2) As a construct, moral equity and slack may be seen from both a clinical
and an emotive sense. Also, slack creation may be situational and
therefore will affect the ethical decision-making process by altering in-
tention. That is, an individual may judge an action to be ethical, and yet
act in an unethical fashion due to a greater profit gained through the
unethical action (Hunt & Vitell 1986). Hence, managers’ questionnaire
responses may have been founded on an emotive platform and the re-
sults could be prejudiced.
(3) It may also be the case that cross-sectional survey methods are not
sufficient for the investigation of moral equity and propensity to create
slack, given the nature of the constructs, as well as the validity impli-
cations of examining relationships within a single industry, especially
when some non-response bias may still be present.
(4) Construction of the measures of budget participation, moral equity, and
propensity to create slack from the literature reviews and factor analyses
may have driven the results. In addition, it could be argued that the
findings obtained in this research are partly attributable to a poor
measure of moral equity and the dependent variable (propensity to cre-
ate slack).
(5) Also, as argued by Brownell (1982), the impact of budget participation
on budget slack might be contingent on other groups of variables such as
cultural, organizational, and interpersonal. Future research should focus
on those contingent variables in order to develop a comprehensive and
integrated model specifying the conditions under which budgetary par-
ticipation will produce favorable outcomes.
Future research could go well beyond the specific suggestions made here.
The treatment of ethical issue was limited to moral equity. The ethics lit-
erature suggests that a number of other ethical factors, such as relativism,
ADAM S. MAIGA156
idealism, and contractualism, may have significant effects on behavior. Al-
so, future research may need to investigate whether individuals have voice,
choice, or both in participative budgeting (Libby, 1999) and assess the im-
pact on budget slack within the ethical context. The implications of these
effects for budgeting remain to be investigated. Finally, field evidence of
these issues and well-designed experimental and case studies, and archival
tests are needed to distinguish among different explanations for observed
behavior to support the predictions being tested.
Despite these limitations, the current research is important. The current
study demonstrates that moral equity is an important variable in the re-
lationship between budget participation and budget slack. The findings,
based on the research question, suggest that organizational goals may take
precedence over self-interest for those managers with high moral equity.
Since this study is the first systematic investigation on the moderating effect
of moral equity on the relationship between budget participation and man-
ager’s propensity to create slack, it may enhance the richness of agency
research and provide additional insights to resolve some of the complex
relationships and issues in this traditional, but still important and
interesting, research area.
NOTES
1. Slack can also serve a positive purpose in the organization. For example, Cyertand March (1992) suggest that slack can be used to absorb fluctuations in an un-certain operating environment. Merchant (1989) suggests that superiors may allowslack in subordinates’ budgets to encourage coordination, motivation, and innova-tion. This contrasts with the agency theory perspective that budgetary slack is aninefficiency reflecting the effect of moving from an environment with perfect infor-mation to one with information asymmetry (e.g., Magee, 1980; Christensen, 1982;Baiman & Evans, 1983; Penno, 1984).2. Moral hazard is defined as an incentive to act in one’s self-interest in conflict
with the organization’s overall goals while being able to hide those actions throughprivately held information (Baiman, 1982).3. The term business unit is used to refer to a self-contained sub-unit (e.g., di-
vision) of a larger corporation.4. Research budget constraints did not allow larger sample size selection.5. The unusable returned questionnaires were either incomplete or did not meet
the two selection criteria.6. Because of contravening company policy, some preferred not to participate.7. Discriminant analysis was used to compare the early vs. late respondents
(Fowler, 1993). Results revealed that the two groups did not differ significantly ineither the level of the variables or in the relationship between the variables at the 0.05level. This suggests that non-response bias is not a problem.
Effect of Manager’s Moral Equity 157
8. The independent variables were transformed into new measurement variableswith a mean of 0 and standard deviation of 1.
ACKNOWLEDGMENTS
The author wishes to thank the editor, associate editor, and two anonymous
reviewers for the helpful comments. Additionally, the author acknowledges
the comments and suggestions provided by Fred A. Jacobs of Georgia State
University.
REFERENCES
Antle, R., & Eppen, G. D. (1985). Capital rationing and organizational slack in capital budg-
eting. Management Science, 31, 163–174.
Arrow, K. J. (1985). The economics of agency. In: J. W. Pratt & R. J. Zeckhauser (Eds),
Principals and agents: The structure of business (pp. 37–51). Boston, MA: Harvard
Business School Press.
Baiman, S. (1982). Agency research in managerial accounting: A survey. Journal of Accounting
Literature, (Spring), 154–213.
Baiman, S. (1990). Agency research in managerial accounting: A second look. Accounting,
Organizations and Society, 15(4), 341–371.
Baiman, S., & Evans, J. H., III (1983). Pre-decision information and participative management
control systems. Journal of Accounting Research, (Autumn), 21(2), 371–395.
Baiman, S., & Sivaramakrishnan, K. (1991). The value of private pre-decision information in a
principal-agent context. The Accounting Review, 66(4), 747–766.
Blanchard, G. A., & Chow, C. W. (1983). Allocating indirect costs for improved management
performance. Strategic Finance, 64(9), 38–41.
Bowie, N., & Duska, R. (1990). Business Ethics (2nd ed.). Englewood Cliffs, NJ: Prentice Hall.
Brownell, P. (1982). The role of accounting data in performance evaluation, budgetary par-
ticipation, and organizational effectiveness. Journal of Accounting Research, 20, 12–27.
Brownell, P., & Hirst, M. (1986). Reliance on accounting information, budgetary participation,
and task uncertainty. Journal of Accounting Research, 24(2), 241–249.
Cammann, C. (1976). Effects of the use of control systems. Accounting, Organizations and
Society, 1, 301–313.
Chow, C. W., Cooper, J. C., & Waller, W. S. (1988). Participative budgeting: Effects of a truth-
inducing pay scheme and information asymmetry on slack and performance. The Ac-
counting Review, 63, 111–122.
Christensen, J. (1982). The determination of performance standards and participation. Journal
of Accounting Research, 20, 589–603.
Collins, F. (1978). The interaction of budget characteristics and personality variables with
budgetary response attitudes. The Accounting Review, (April), 53(2), 324–335.
Coughlan, A. T., & Schmidt, R. M. (1985). Executive compensation, management turnover,
and firm performance: An empirical investigation. Journal of Accounting & Economics, 7,
43–66.
ADAM S. MAIGA158
Cronbach, L. J. (1987). Statistical tests for moderator variables: Flaws in analysis recently
proposed. Psychological Bulletin, 102(3), 414–417.
Cyert, F. L., & March, J. (1992). The Behavioral Theory of the Firm (2nd ed.). Cambridge, MA:
Blackwell Publishers.
DeGeorge, R. (1992). Agency theory and the ethics of agency. In: N. E. Bowie & R. E. Freeman
(Eds), Ethics and agency theory: An introduction (pp. 59–72). New York, NY: Oxford
University Press.
Douglas, P. C., Davidson, R. A., & Schwartz, B. N. (2001). The effect of organizational culture
and ethical orientation on accountants’ ethical judgments. Journal of Business Ethics,
34(2), 101–121.
Douglas, P. C., & Wier, B. (2000). Integrating ethical dimensions into a model of budgetary
slack creation. Journal of Business Ethics, 28, 267–277.
Dunk, A. (1993). The effect of budget emphasis and information asymmetry on the relation
between budgetary participation and slack. The Accounting Review, (April), 68(2),
400–410.
Evans, J. H., III, Hannan, R., Krishnan, R., & Moser, D. (2001). Honesty in managerial
reporting. The Accounting Review, 76, 537–559.
Flory, S., Phillips, T., Reidenbach, E., & Robin, D. (1992). A multidimensional analysis of
selected ethical issues in accounting. The Accounting Review, (April), 67(2), 284–302.
Forsyth, D. R. (1992). Judging the morality of business practices: The influence of personal
moral philosophies. Journal of Business Ethics, 11(5), 461–475.
Fowler, F. J., Jr. (1993). Survey Research Methods. Newbury Park, CA: Sage.
Gul, F. A. (1991). The effects of management accounting systems and environmental uncer-
tainty on small business manager’s performance. Accounting and Business Research, 22,
57–61.
Hughes, M. A., & Kwon, S. Y. (1990). An integrative framework for theory construction and
testing. Accounting, Organizations and Society, 15, 179–191.
Hunt, S. D., & Vitel, S. J. (1986). A general theory of marketing ethics. Journal of Macro-
marketing, 6(1), 5–16.
Jones, T. M. (1991). Ethical decision making by individuals in organizations: An issue-con-
tingent model. Academy of Management Review, 15, 366–392.
Kren, L. (1993). Control system effects on budget slack. Advances in Management Accounting,
2, 109–118.
Libby, T. (1999). The influence of voice and explanation on performance in a participative
budgeting setting. Accounting, Organizations and Society, 24(2), 125–137.
Luft, J. L. (1997). Fairness, ethics and the effect of management accounting on transaction
costs. Journal of Management Accounting Research, 9, 199–216.
Lukka, K. (1988). Budgetary biasing in organizations: Theoretical framework and empirical
evidence. Accounting, Organization and Society, 13, 281–301.
Magee, R. P. (1980). Equilibria in budget participation. Journal of Accounting Research, (Au-
tumn), 18(2), 551–573.
Merchant, K. A. (1981). The design of the corporate budgeting system: Influences on man-
agerial behavior and performance. The Accounting Review, 56, 813–829.
Merchant, K. A. (1985). Budgeting and the propensity to create budgetary slack. Accounting,
Organizations and Society, 10, 201–210.
Merchant, K. A. (1989). Rewarding Results: Motivating Profit Center Managers. Boston, MA:
Harvard Business School Press.
Effect of Manager’s Moral Equity 159
Merchant, K. A. (1995). Ethical Issues Related to ‘‘Results-Oriented’’ Management Control
Systems. In: Ethical issues in accounting: Proceedings of the professionalism and Ethics
seminar. Professionalism and Ethics Committee of the American Accounting Associa-
tion, St. Charles, IL, (June), 3(1), 2–4.
Milani, K. (1975). The relationship of participation in budget-setting to industrial supervisor
performance and attitudes: A field study. The Accounting Review, 50(2), 274–284.
Noreen, E. (1988). The economics of ethics: A new perspective on agency theory. Accounting,
Organizations and Society, 13(4), 359–369.
Onsi, M. (1973). Factor analysis of behavioral variables affecting budgetary slack. The Ac-
counting Review, (July), 48(3), 535–548.
Penno, M. (1984). Asymmetry of pre-decision information and managerial accounting. Journal
of Accounting Research, 22, 177–191.
Pope, P. F. (1984). Information asymmetries in participative budgeting: A bargaining approach.
Journal of Business Finance & Accounting, 11, 41–59.
Reidenbach, R. E., & Ronald, D. P. (1991). An Application and extension of a multidimen-
sional ethics scale to selected marketing practices and marketing groups. Academy of
Marketing Science, 19(2), 83–92.
Robin, D. P., & Reidenbach, R. E. (1996). The perceived importance of an ethical issue as an
influence on the ethical decision-making of ad managers. Journal of Business Research,
5(1), 17–28.
Rutledge, R. W., & Karim, K. E. (1999). The influence of self-interest and ethical considerations
on manager’s evaluation judgments. Accounting, Organizations and Society, 24, 173–184.
Schoonhoven, C. B. (1981). Problems with contingency theory: Testing assumptions hidden
within the language of contingency theory. Administrative Science Quarterly, 26,
349–377.
Southwood, K. E. (1978). Substantive theory and statistical interaction: Five models. American
Journal of Sociology, 83, 1154–1203.
Stevens, D. E. (2002). The effects of reputation and ethics on budgetary slack. Journal of
Management Accounting Research, 14, 153–171.
Waller, W. S. (1988). Slack in participating budgeting: The joint effect of a truth-inducing pay
scheme and risk preferences. Accounting, Organizations and Society, 13, 87–98.
Young, S. M. (1985). Participative budgeting: The effects of risk aversion and asymmetric
information on budgetary slack. Journal of Accounting Research, (Autumn), 23(2),
829–842.
APPENDIX
PART I
SCENARIOS (Adopted from IMA Research Center)
The following four scenarios were used in this study. Each scenario ap-
peared on a separate page followed by brief instructions, a randomized
presentation of the scales, the univariate ethics measure, and the behavioral
intention measure as shown below.
ADAM S. MAIGA160
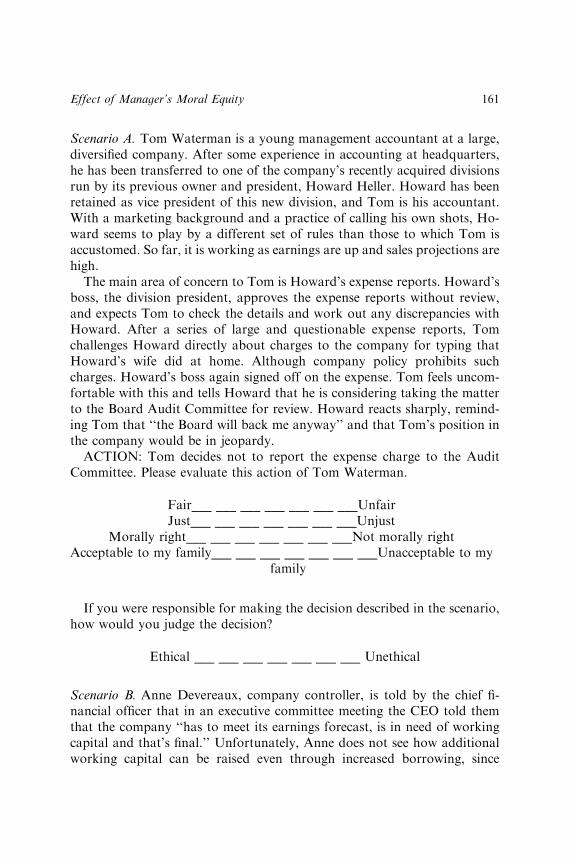
Scenario A. Tom Waterman is a young management accountant at a large,
diversified company. After some experience in accounting at headquarters,
he has been transferred to one of the company’s recently acquired divisions
run by its previous owner and president, Howard Heller. Howard has been
retained as vice president of this new division, and Tom is his accountant.
With a marketing background and a practice of calling his own shots, Ho-
ward seems to play by a different set of rules than those to which Tom is
accustomed. So far, it is working as earnings are up and sales projections are
high.
The main area of concern to Tom is Howard’s expense reports. Howard’s
boss, the division president, approves the expense reports without review,
and expects Tom to check the details and work out any discrepancies with
Howard. After a series of large and questionable expense reports, Tom
challenges Howard directly about charges to the company for typing that
Howard’s wife did at home. Although company policy prohibits such
charges. Howard’s boss again signed off on the expense. Tom feels uncom-
fortable with this and tells Howard that he is considering taking the matter
to the Board Audit Committee for review. Howard reacts sharply, remind-
ing Tom that ‘‘the Board will back me anyway’’ and that Tom’s position in
the company would be in jeopardy.
ACTION: Tom decides not to report the expense charge to the Audit
Committee. Please evaluate this action of Tom Waterman.
Fair___ ___ ___ ___ ___ ___ ___Unfair
Just___ ___ ___ ___ ___ ___ ___Unjust
Morally right___ ___ ___ ___ ___ ___ ___Not morally right
Acceptable to my family___ ___ ___ ___ ___ ___ ___Unacceptable to my
family
If you were responsible for making the decision described in the scenario,
how would you judge the decision?
Ethical ___ ___ ___ ___ ___ ___ ___ Unethical
Scenario B. Anne Devereaux, company controller, is told by the chief fi-
nancial officer that in an executive committee meeting the CEO told them
that the company ‘‘has to meet its earnings forecast, is in need of working
capital and that’s final.’’ Unfortunately, Anne does not see how additional
working capital can be raised even through increased borrowing, since
Effect of Manager’s Moral Equity 161
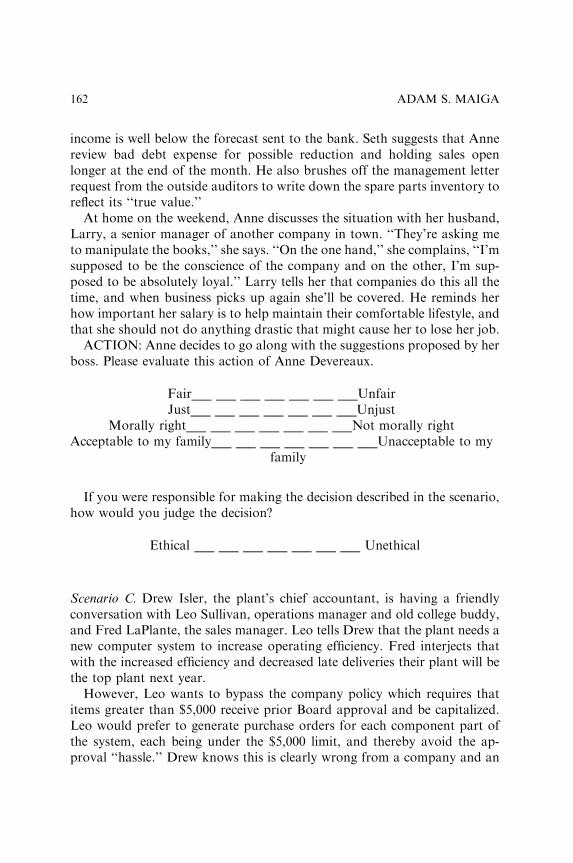
income is well below the forecast sent to the bank. Seth suggests that Anne
review bad debt expense for possible reduction and holding sales open
longer at the end of the month. He also brushes off the management letter
request from the outside auditors to write down the spare parts inventory to
reflect its ‘‘true value.’’
At home on the weekend, Anne discusses the situation with her husband,
Larry, a senior manager of another company in town. ‘‘They’re asking me
to manipulate the books,’’ she says. ‘‘On the one hand,’’ she complains, ‘‘I’m
supposed to be the conscience of the company and on the other, I’m sup-
posed to be absolutely loyal.’’ Larry tells her that companies do this all the
time, and when business picks up again she’ll be covered. He reminds her
how important her salary is to help maintain their comfortable lifestyle, and
that she should not do anything drastic that might cause her to lose her job.
ACTION: Anne decides to go along with the suggestions proposed by her
boss. Please evaluate this action of Anne Devereaux.
Fair___ ___ ___ ___ ___ ___ ___Unfair
Just___ ___ ___ ___ ___ ___ ___Unjust
Morally right___ ___ ___ ___ ___ ___ ___Not morally right
Acceptable to my family___ ___ ___ ___ ___ ___ ___Unacceptable to my
family
If you were responsible for making the decision described in the scenario,
how would you judge the decision?
Ethical ___ ___ ___ ___ ___ ___ ___ Unethical
Scenario C. Drew Isler, the plant’s chief accountant, is having a friendly
conversation with Leo Sullivan, operations manager and old college buddy,
and Fred LaPlante, the sales manager. Leo tells Drew that the plant needs a
new computer system to increase operating efficiency. Fred interjects that
with the increased efficiency and decreased late deliveries their plant will be
the top plant next year.
However, Leo wants to bypass the company policy which requires that
items greater than $5,000 receive prior Board approval and be capitalized.
Leo would prefer to generate purchase orders for each component part of
the system, each being under the $5,000 limit, and thereby avoid the ap-
proval ‘‘hassle.’’ Drew knows this is clearly wrong from a company and an
ADAM S. MAIGA162
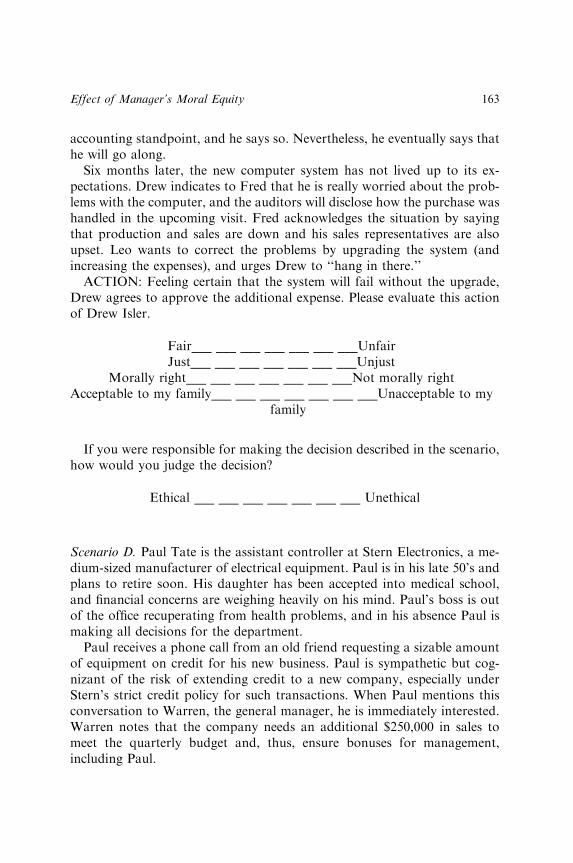
accounting standpoint, and he says so. Nevertheless, he eventually says that
he will go along.
Six months later, the new computer system has not lived up to its ex-
pectations. Drew indicates to Fred that he is really worried about the prob-
lems with the computer, and the auditors will disclose how the purchase was
handled in the upcoming visit. Fred acknowledges the situation by saying
that production and sales are down and his sales representatives are also
upset. Leo wants to correct the problems by upgrading the system (and
increasing the expenses), and urges Drew to ‘‘hang in there.’’
ACTION: Feeling certain that the system will fail without the upgrade,
Drew agrees to approve the additional expense. Please evaluate this action
of Drew Isler.
Fair___ ___ ___ ___ ___ ___ ___Unfair
Just___ ___ ___ ___ ___ ___ ___Unjust
Morally right___ ___ ___ ___ ___ ___ ___Not morally right
Acceptable to my family___ ___ ___ ___ ___ ___ ___Unacceptable to my
family
If you were responsible for making the decision described in the scenario,
how would you judge the decision?
Ethical ___ ___ ___ ___ ___ ___ ___ Unethical
Scenario D. Paul Tate is the assistant controller at Stern Electronics, a me-
dium-sized manufacturer of electrical equipment. Paul is in his late 50’s and
plans to retire soon. His daughter has been accepted into medical school,
and financial concerns are weighing heavily on his mind. Paul’s boss is out
of the office recuperating from health problems, and in his absence Paul is
making all decisions for the department.
Paul receives a phone call from an old friend requesting a sizable amount
of equipment on credit for his new business. Paul is sympathetic but cog-
nizant of the risk of extending credit to a new company, especially under
Stern’s strict credit policy for such transactions. When Paul mentions this
conversation to Warren, the general manager, he is immediately interested.
Warren notes that the company needs an additional $250,000 in sales to
meet the quarterly budget and, thus, ensure bonuses for management,
including Paul.
Effect of Manager’s Moral Equity 163
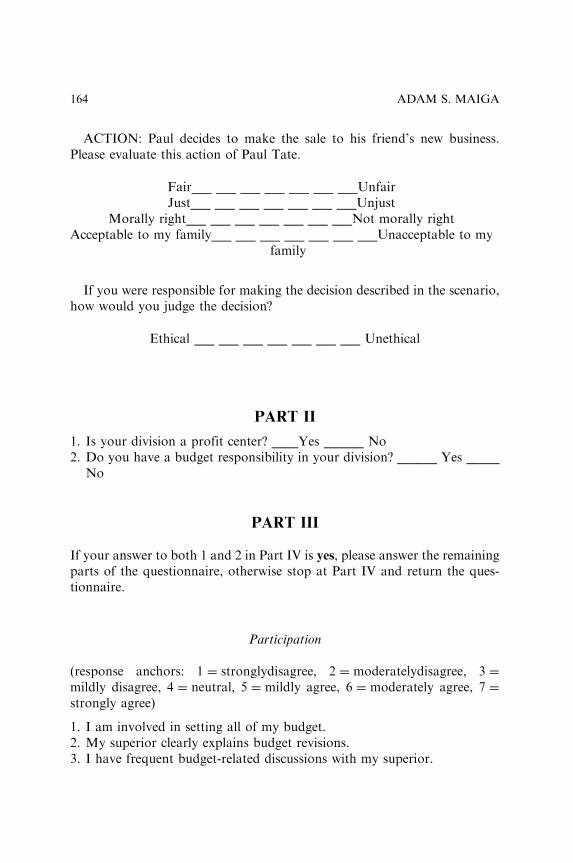
ACTION: Paul decides to make the sale to his friend’s new business.
Please evaluate this action of Paul Tate.
Fair___ ___ ___ ___ ___ ___ ___Unfair
Just___ ___ ___ ___ ___ ___ ___Unjust
Morally right___ ___ ___ ___ ___ ___ ___Not morally right
Acceptable to my family___ ___ ___ ___ ___ ___ ___Unacceptable to my
family
If you were responsible for making the decision described in the scenario,
how would you judge the decision?
Ethical ___ ___ ___ ___ ___ ___ ___ Unethical
PART II
1. Is your division a profit center? ____Yes ______ No
2. Do you have a budget responsibility in your division? ______ Yes _____
No
PART III
If your answer to both 1 and 2 in Part IV is yes, please answer the remaining
parts of the questionnaire, otherwise stop at Part IV and return the ques-
tionnaire.
Participation
(response anchors: 1 ¼ stronglydisagree; 2 ¼ moderatelydisagree; 3 ¼
mildly disagree, 4 ¼ neutral; 5 ¼ mildly agree, 6 ¼ moderately agree, 7 ¼
strongly agree)
1. I am involved in setting all of my budget.
2. My superior clearly explains budget revisions.
3. I have frequent budget-related discussions with my superior.
ADAM S. MAIGA164

4. I have a great deal of influence on my final budget.
5. My contribution to the budget is very important.
6. My superior initiates frequent budget discussions when the budget is
being prepared.
Budget Slack
(response anchors: 1 ¼ strongly disagree, 2 ¼ moderately disagree, 3 ¼
mildly disagree, 4 ¼ neutral; 5 ¼ mildly agree, 6 ¼ moderately agree, 7 ¼
strongly agree)
1. To protect himself, a manager submits a budget that can safely be at-
tained.
2. In good business times, your superior is willing to accept a reasonable
level of slack in the budget.
3. Slack in the budget is good to do things that cannot be officially ap-
proved.
PART IV
Please answer the following:
1. What is the number of employees is your company? ___________
2. What is your approximate dollar volume of sales? _____________
3. Number of years is this position? ___________
4. Number of years in management? __________
Effect of Manager’s Moral Equity 165

This page intentionally left blank
166
ASYMMETRIC EFFECTS OF
ACTIVITY-BASED COSTING
SYSTEM COST REALLOCATION
M. G. Fennema, Jay S. Rich and Kip Krumwiede
ABSTRACT
Despite the many proposed benefits of activity-based costing (ABC),
many managers oppose implementing it. One important reason for this
resistance that has generally not been addressed in the literature is the
effect of cost reallocations on managers’ evaluations and compensation.
This study examines how the impact of installing an ABC system on
managers’ bonuses affects their support for ABC implementation. Be-
cause ABC systems usually allocate costs in different proportions than
traditional systems, some products may appear to be more profitable
while others may appear less so. This, in turn, causes the business units
responsible for the products to appear to be more or less profitable.
Based on prospect theory (Kahneman & Tversky (1979). Economet-
rica, 47, 263–291; Tversky & Kahneman (1992). Journal of Risk and
Uncertainty, 5, 297–323), we predict that the negative effect on man-
agers’ support for ABC in business units reporting less profit is greater
than the positive effect on managers’ support in the more profitable units.
The results of an experiment support this prediction. Since management
support is critical to successful system implementation, this asymmetric
effect has implications for cost management system changes.
Advances in Accounting Behavioral Research
Advances in Accounting Behavioral Research, Volume 8, 167–187
Copyright r 2005 by Elsevier Ltd.
All rights of reproduction in any form reserved
ISSN: 1475-1488/doi:10.1016/S1475-1488(04)08007-X
167
INTRODUCTION
Increased global competition has motivated organizations to improve their
products and customer service. Such improvements typically include the
development of superior information systems that allow managers to track
customers, increase production efficiencies, and manage costs. One such
information system involves the calculation of product costs. Having ac-
curate product costs is critical in deciding whether the product can compete
against other companies’ products and also in the pricing of the item.
Determining product costs, however, is generally difficult to do. While
some costs are easily traced to specific products, many costs are expended to
produce a wide range of products. Assigning these ‘‘indirect’’ costs to in-
dividual products has always been difficult but has become increasingly so
as more automation is introduced into the production process. This auto-
mation has led to a higher percentage of indirect costs and therefore less
accurate product costs.
A highly publicized innovation developed over the last two decades to
produce better product cost information is activity-based costing (ABC).
When properly implemented and maintained, ABC systems assign indirect
costs based on resource consumption and generally provide more accurate
product costs than traditional cost allocation systems. However, replacing
old product cost information systems with newer ABC systems is not a
simple matter. ABC systems are generally complex and pose significant
implementation challenges (Kennedy & Affleck-Graves, 2001). Thus, in
spite of many proposed benefits of ABC, the majority of firms have not
implemented it (Kennedy & Affleck-Graves, 2001). Gosselin (1997) referred
to this as the ‘‘ABC paradox.’’
Because the information generated by the system affects many managers
in an organization, significant resistance to successful implementation can
arise. For example, Argyris and Kaplan (1994) describe situations in which
individuals engage defensive routines to block implementation when the
information from an ABC system will be highly embarrassing or potentially
threatening to them. An inability to overcome opposition can result in costly
failure of the implementation effort. One important reason for this resist-
ance that has generally not been addressed in the literature is how the
impact of cost reallocations on managers’ evaluations and compensation
affects their support for the new cost system. Because an ABC system re-
allocates indirect costs, some products may appear more profitable and
others may appear less so. The managers responsible for those products will
likewise be affected, since their divisions will appear to be more or less
M.G. FENNEMA ET AL.168
profitable. Thus, their support for the adoption of the new system may be
related to the profit effect on their division.
The major premise of this study is that although losses in profitability for
some products will be more or less mirrored by increases in profitability in
others, the reactions to prospective gains and losses by the managers re-
sponsible for the affected products will not be identical. Specifically, we
predict that the negative effect on managers’ support for ABC in business
units that will become less profitable is greater than the positive effect on
managers’ support in units that become more profitable. This prediction is
derived from the asymmetric value function in prospect theory (Kahneman
& Tversky, 1979; Tversky & Kahneman, 1992). The following sections de-
scribe the process of product costing, the proposed effect of ABC system
implementation on manager resistance, and the results of an experiment that
support this prediction.
BACKGROUND
Product Costing
The determination of a product’s cost requires an analysis of the resources
expended to create the product. Such costs are categorized as either direct or
indirect costs. Direct costs are those that are traceable to the final product
while indirect costs are those that are not. For example, the production of a
wooden desk involves several direct material costs including a certain
amount of wood and a set number of pieces of hardware. Determining the
cost of these inputs is relatively easy. In addition, human labor to cut the
wood or assemble the desk is also considered a direct cost since a standard
amount of time could be established for these operations. The calculation of
indirect costs is much more difficult than that of direct costs. In the desk
example, indirect costs might include items such as the depreciation (or rent)
expense for cutting equipment. Also included might be expenditures for
property taxes on the factory building and the salaries of factory supervi-
sors. Although all of these costs are incurred to produce the desks, they are
not traceable to specific desks. Therefore, these costs are more difficult to
assign to each desk.
Traditional cost accounting systems generally pool all indirect costs to-
gether and then spread them to products based on some volume-based
measure such as direct labor hours. For the desk example, the estimated
total annual amount of factory indirect costs might be divided by the
Asymmetric Effects of Activity-Based Costing System Cost Reallocation 169
estimated total annual direct labor hours to get a predetermined overhead
rate. This rate would then be applied to each desk based on the number of
direct labor hours required to produce it. This type of cost allocation system
yields reasonably accurate product costs as long as all the products made in
the factory consume similar percentages of indirect costs. Of course, if the
desk factory only made one type and size of desk, the traditional system
would be highly accurate.
However, if a factory makes diverse products, the traditional system is not
likely to provide accurate product costs. If the plant that makes desks also
makes tables, it is unlikely that a traditional system will allocate indirect
costs in the proportion that resources are consumed. For example, if tables
require less cutting of wood than do desks, the traditional system would
assign less indirect costs to each table based simply on the number of direct
labor hours consumed by each product. Even if the tables require more
setup and material handling costs than desks, they would still be allocated
lower overhead costs. The result would be distorted product costs for both
products. Such distortions caused by the limitations of traditional volume-
based allocation methods have been widely discussed in the literature (see
Kaplan & Cooper, 1998, Chapters 3 and 6, or Cokins, 2001, Chapter 1, for
overviews).
The goal of a cost system is to assign indirect costs to products in the
proportion that they are consumed by the product. Since traditional systems
often fail to achieve this goal, many companies have attempted to imple-
ment ABC. However, implementing ABC can be quite difficult. The next
section discusses ABC system implementation and the problems that can
arise.
ABC System Implementation and Manager Resistance
Organizational change has been the subject of much study (e.g., Goodman
& Dean, 1982; Beer, Eisenstat, & Spector, 1990; Huff, Huff, & Barr, 2001).
One example of organizational change is the implementation of a new
management accounting information system. Probably the most widely dis-
cussed innovation of the past two decades in management accounting in-
formation systems is ABC.
The promise of ABC is quite inviting. By focusing on the activities that a
product requires, ABC can provide a more precise allocation of indirect
costs, resulting in more accurate product costs. This increased accuracy
enables firms to make better critical decisions such as pricing and market
M.G. FENNEMA ET AL.170
entry and exit decisions. Cooper and Kaplan (1991) also identify benefits
associated with lean production, such as reducing inventories, increasing
common components, increasing quality by minimizing total quality costs,
and assessing customer profitability. Ness and Cucuzza (1995) suggest that
once ABC is part of a firm’s critical management systems it becomes a
powerful tool, supporting continuous rethinking and improving not only
products and services but also process and market strategies. Ittner, Lanen,
and Larcker (2002) find some evidence that using ABC enhances manufac-
turing performance and some weak evidence that profits are enhanced when
ABC matches a plant’s operational characteristics. Kennedy and Affleck-
Graves (2001) find that firms adopting ABC outperform non-ABC firms by
up to 27% in both higher stock returns and accounting measures such as
return on equity and profit margin.
Although the potential benefits are significant, the introduction of any
new technology can be costly. ABC systems require significant investment in
model design and data-gathering costs. But since these systems generate
information that affects many individuals within a firm, behavioral and
organizational factors are of greater concern. In their models of cost man-
agement system implementation, Shields and Young (1989, 1995) identify
the linkage between the cost management system and performance evalu-
ation and compensation as one of seven behavioral and organizational var-
iables that are required for successful system implementation. Indeed, in an
empirical study of 143 firms, Shields (1995) finds this linkage to be empir-
ically correlated with success. Cokins (2001) notes that individuals involved
in successful ABC implementations spend 90% of their efforts on organ-
izational behavior issues and only 10% on technical issues. Unfortunately,
most organizations do just the opposite. The behavioral costs take the form
of barriers to implementation erected by individuals who feel that they may
be negatively affected by the new system.
Previous studies have addressed many reasons why managers might op-
pose the implementation of ABC. Cooper, Kaplan, Maisel, Morrissey, and
Oehm (1992) describe the process eight companies went through in trying to
implement ABC. Two of the company examples address behavioral issues
relating to the ABC implementation process. In Farrall, Inc. (Chapter 5),
representatives from the sales department committed only 5% of their time
to ABC implementation, compared with 10–100% committed from repre-
sentatives in accounting and information system departments. Sales and
marketing employees are often hesitant to help with ABC implementation
because they either do not value ABC or worry about what the results will
show. Williams Brothers Metals (Chapter 6) discusses the negative reaction
Asymmetric Effects of Activity-Based Costing System Cost Reallocation 171
of product-line managers whose product margins are hurt by the ABC
analysis. One manager, whose two largest products now appeared unprof-
itable, believed the ABC information was ‘‘fundamentally flawed.’’ He
questioned the assumptions that the ABC model was built on and even
claimed they are ‘‘completely wrong.’’ Cooper et al. (1992) also found that
most firms involved with implementing ABC systems did not create the
critical link from the system to performance evaluation and compensation.
Argyris and Kaplan (1994) explore such barriers, identifying potential
embarrassing or threatening situations that can arise from an ABC system.
Examples include the identification of non-value-added activities (e.g., re-
work) or finding other production inefficiencies that had been hidden by the
old system. Faced with this situation, not only will affected managers not
support the ABC system, they will also respond defensively to block its
implementation. With barriers in place by affected stakeholders, successful
implementation is unlikely.
Indeed, successful implementation seems to be elusive in practice. Ittner et
al. (2002) find only 26% of U.S. manufacturing plants use ABC extensively.
Kennedy and Affleck-Graves (2001) find 20.1% of the top 1,000 firms in the
U.K. (ranked by sales) to be using ABC. Ness and Cucuzza (1995) observe
from their consulting experiences that employee resistance is the single big-
gest obstacle to successful ABC implementation. They find managers are
commonly nervous about revealing detailed information that could be used
to make them look bad or dramatically change the definitions of success and
failure. Nevertheless, the authors recommend that measurement and incen-
tive systems be tied to the ABC numbers.
Academic research relating to ABC implementation has likened it to an
innovation in a firm’s cost information system (Gosselin, 1997; Shields,
1995; Anderson, 1995). Studies have explained implementation of informa-
tion systems using a ‘‘process stage’’ model (Cooper & Zmud, 1990; Kwon
& Zmud, 1987). Anderson (1995) suggests integrating the system with man-
agement information and reward systems is critical to reaching the accept-
ance and usage stages. She states, ‘‘Implementation of ABC systems is
unlikely to succeed until these stakeholders’ concerns are addressed’’ (p. 9).
Krumwiede (1998) finds top management and nonaccounting support to be
critical to reaching the highest stages of implementation success (i.e., routine
and integrated).
Prior behavioral research on the resistance to ABC implementation has
focused on various organizational and individual factors but not on em-
ployee resistance to ABC implementation. This study uses an experimental
approach to explore the effect of changes in performance evaluation and
M.G. FENNEMA ET AL.172
compensation resulting from ABC adoption on manager resistance. Clearly,
changes in compensation caused by a new ABC system can result in a
threatening situation for affected managers. However, while some studies
(e.g., see Mak & Roush, 1994) have examined the issue of performance
evaluation in an ABC environment, no study has investigated the potential
effect on managers’ support when compensation is based upon division per-
formance. In this situation, indirect costs will be reallocated, causing some
divisions to appear more profitable while others appear to be less profitable.
Consider the following example. A company has two divisions, one that
produces product A and another that makes an equal amount of product B.
Managers’ bonuses are based on a percentage of division profitability. The
current product costing system calculates the cost of A to be $5 per unit and
that of B to be $11 per unit. An ABC system calculates the unit costs to be
$7 for A and $9 for B. The same total costs exist, but they are applied to the
products in different ways. Since Division A would appear less profitable
and Division B would appear more so, a critical question arises: What effect
would such a shift of costs have on the two division managers’ support for
the new ABC system?
THEORY DEVELOPMENT AND HYPOTHESIS
Since the allocation of indirect costs to products is typically a zero-sum
game (i.e., any amount taken from one product is allocated to another), it
might be assumed that the effect on the support of managers responsible for
those products would be opposite but equal since the effect on their bonuses
would be opposite but equal. Such would be the predictions from standard
economic theory. But that theory has not been found to be particularly
descriptive of actual behavior in many situations (see Kahneman & Tversky,
1979). Prospect theory (Kahneman & Tversky, 1979; Tversky & Kahneman,
1992) has been proposed and widely tested as an alternative to standard
economic theory. This theory suggests asymmetrical reactions to expected
gains and losses. It has been applied in recent accounting studies relating to
budgetary slack (Lau & Eggleton, 2003), risk-taking tendencies in capital
budgeting decisions (Moreno, Kida, & Smith, 2002), framing effects in a
classic Asian disease-type business scenario (Chang, Yen, & Duh, 2002),
and loss aversion by traders in financial markets (Willman & Fenton-
O’Creevy, 2002).
There are two characteristics of prospect theory that are important to the
current situation (refer to Fig. 1 for an example of a prospect theory value
Asymmetric Effects of Activity-Based Costing System Cost Reallocation 173
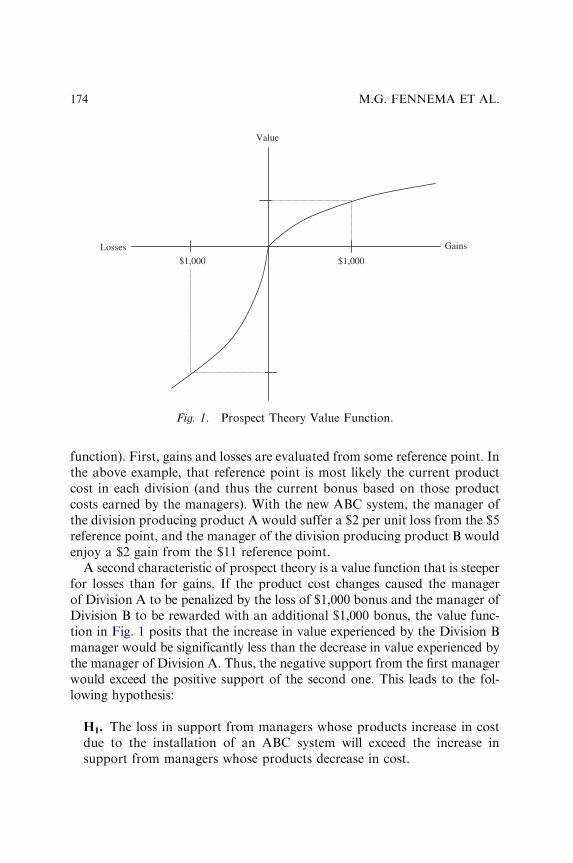
function). First, gains and losses are evaluated from some reference point. In
the above example, that reference point is most likely the current product
cost in each division (and thus the current bonus based on those product
costs earned by the managers). With the new ABC system, the manager of
the division producing product A would suffer a $2 per unit loss from the $5
reference point, and the manager of the division producing product B would
enjoy a $2 gain from the $11 reference point.
A second characteristic of prospect theory is a value function that is steeper
for losses than for gains. If the product cost changes caused the manager
of Division A to be penalized by the loss of $1,000 bonus and the manager of
Division B to be rewarded with an additional $1,000 bonus, the value func-
tion in Fig. 1 posits that the increase in value experienced by the Division B
manager would be significantly less than the decrease in value experienced by
the manager of Division A. Thus, the negative support from the first manager
would exceed the positive support of the second one. This leads to the fol-
lowing hypothesis:
H1. The loss in support from managers whose products increase in cost
due to the installation of an ABC system will exceed the increase in
support from managers whose products decrease in cost.
Gains Losses
Value
$1,000$1,000
Fig. 1. Prospect Theory Value Function.
M.G. FENNEMA ET AL.174
The following experiment was designed to test this hypothesis using two
groups of participants. The first group included upper level college students
who have been trained to understand how ABC systems can improve man-
agerial decision making. The second involved practicing Certified Public
Accountants (CPAs). Since prior experience in a broad domain often results
in more defined knowledge structures about the decision process (Vera-
Munoz, Kinney, & Bonner, 2001), the experienced CPA participants were
chosen to validate the results of the student group.
METHODOLOGY
Participants/Task
Ninety-one university business students (junior and senior level accounting
majors) and 77 CPAs participated in a two-part exercise. The students were
enrolled in an accounting class where traditional and ABC product costing
systems had been taught. The two parts of their exercise were conducted two
days apart. The CPAs had an average of 14.8 years of professional expe-
rience and their data were collected during a one-day continuing profes-
sional education class, with the first part of the exercise completed in the
morning session and second part in the afternoon session.
In the first part of the exercise, participants were asked to examine a
company’s unit costs for a product under a current traditional costing sys-
tem and under a proposed ABC system. They were then asked to assume the
role of the chief financial officer (CFO) of the company and answer three
questions designed to measure the amount of their support for the proposed
system. The primary measure was the participant’s support for the new
system, on a 7-point Likert-type scale. The scale had verbal descriptions of
‘‘Would Strongly Support’’ and ‘‘Would Strongly Object to’’ at the end-
points and ‘‘Indifferent’’ at the midpoint. Participants were also asked to
assess the maximum the company should pay to install the new ABC system,
and to estimate the percentage of the cost of the new system that should be
allocated to each of two divisions. A copy of the instrument is included in
Appendix A.
In the second part (see Appendix B), participants were asked to play
the role of the manager of one of two divisions, either the Standard Division
or the Deluxe Division. In this part, the participants were shown the effect
of the proposed ABC system on the profitability of the divisions, and
therefore how it would affect their bonus. This effect was symmetric, with
Asymmetric Effects of Activity-Based Costing System Cost Reallocation 175
the managers of the Standard Division receiving an extra $7,200 bonus and
the managers of the Deluxe Division losing the same amount. Participants
were then asked to answer the same three questions again.
Design
After assuming the CFO role in Part 1 of the experiment, participants
were randomly assigned to one of the between-participant conditions of
either the manager of the Standard Division or the Deluxe Division for Part
2. The dependent variables are the absolute value of the change (from the
CFO role to the division manager role) in the three variables that were used
to measure support for the new system.
RESULTS AND DISCUSSION
Tables 1 and 2 contain the descriptive results for the student participants
and CPA participants, respectively. All changes in support were calculated
and analyzed at the individual level. Panel A in each table contains the
results of the first part of the experiment for each group of participants.
Recall that in the first part, the participants were all assigned to the role of
the CFO of the firm. As such, it would be expected that there would be no
differences between the responses of those who would be in the two manager
roles. This is the case for both the students and the CPAs. It is interesting to
note that although these business students were taught about the benefits of
ABC systems, there was not overwhelming overall support for the proposed
system (i.e., 3.4 is nearly exactly in the middle of the 7-point scale). Also
note that for the CPAs the amounts to be allocated to the two divisions do
not add up to 100% because three participants allocated zero to both of the
divisions and one participant’s allocations did not add to 100%.
In Part 2 of the experiment, participants were assigned to one of the two
manager roles, and Panel B in Tables 1 and 2 contains the responses from
that part of the experiment. Panel C shows the increase or decrease in
support from that of the CFO role to that of the two division manager roles.
As expected, overall support for the system (as measured by the 7-point
scale), increased for the Standard Division managers and decreased for
those in the Deluxe Division. Similarly, the amount to be paid for the system
increased for those in the Standard Division and decreased for managers of
the Deluxe Division. Finally, the amount of the system’s cost to be allocated
M.G. FENNEMA ET AL.176
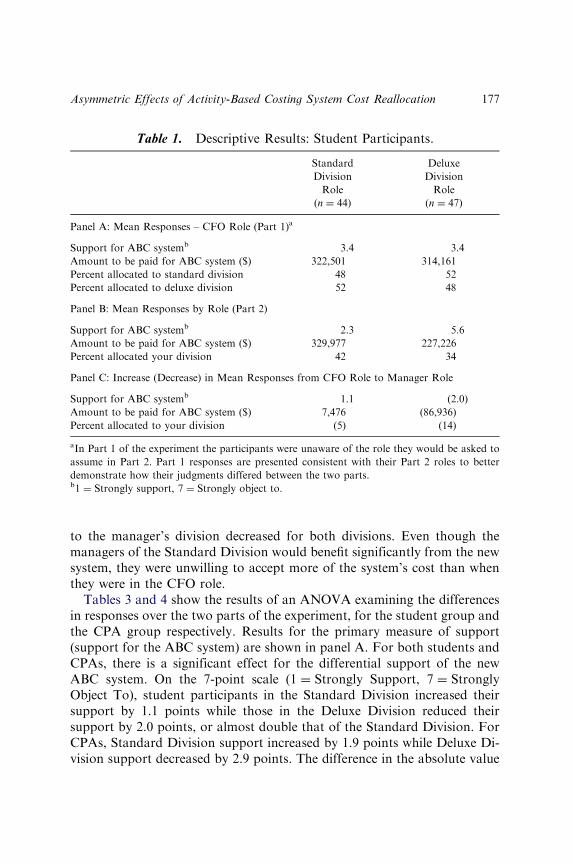
to the manager’s division decreased for both divisions. Even though the
managers of the Standard Division would benefit significantly from the new
system, they were unwilling to accept more of the system’s cost than when
they were in the CFO role.
Tables 3 and 4 show the results of an ANOVA examining the differences
in responses over the two parts of the experiment, for the student group and
the CPA group respectively. Results for the primary measure of support
(support for the ABC system) are shown in panel A. For both students and
CPAs, there is a significant effect for the differential support of the new
ABC system. On the 7-point scale (1 ¼ Strongly Support, 7 ¼ Strongly
Object To), student participants in the Standard Division increased their
support by 1.1 points while those in the Deluxe Division reduced their
support by 2.0 points, or almost double that of the Standard Division. For
CPAs, Standard Division support increased by 1.9 points while Deluxe Di-
vision support decreased by 2.9 points. The difference in the absolute value
Table 1. Descriptive Results: Student Participants.
Standard Deluxe
Division Division
Role Role
(n ¼ 44) (n ¼ 47)
Panel A: Mean Responses – CFO Role (Part 1)a
Support for ABC systemb 3.4 3.4
Amount to be paid for ABC system ($) 322,501 314,161
Percent allocated to standard division 48 52
Percent allocated to deluxe division 52 48
Panel B: Mean Responses by Role (Part 2)
Support for ABC systemb 2.3 5.6
Amount to be paid for ABC system ($) 329,977 227,226
Percent allocated your division 42 34
Panel C: Increase (Decrease) in Mean Responses from CFO Role to Manager Role
Support for ABC systemb 1.1 (2.0)
Amount to be paid for ABC system ($) 7,476 (86,936)
Percent allocated to your division (5) (14)
aIn Part 1 of the experiment the participants were unaware of the role they would be asked to
assume in Part 2. Part 1 responses are presented consistent with their Part 2 roles to better
demonstrate how their judgments differed between the two parts.b1 ¼ Strongly support, 7 ¼ Strongly object to.
Asymmetric Effects of Activity-Based Costing System Cost Reallocation 177
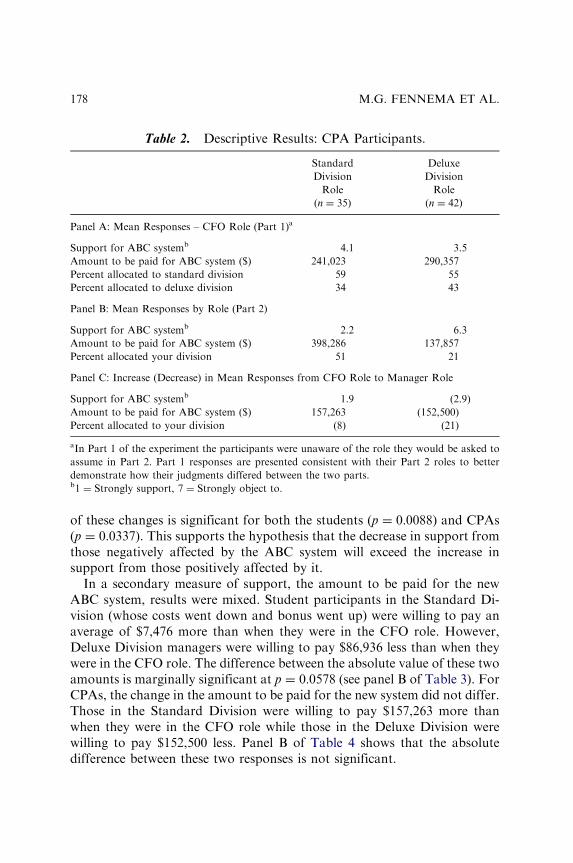
of these changes is significant for both the students (p ¼ 0:0088) and CPAs
(p ¼ 0:0337). This supports the hypothesis that the decrease in support from
those negatively affected by the ABC system will exceed the increase in
support from those positively affected by it.
In a secondary measure of support, the amount to be paid for the new
ABC system, results were mixed. Student participants in the Standard Di-
vision (whose costs went down and bonus went up) were willing to pay an
average of $7,476 more than when they were in the CFO role. However,
Deluxe Division managers were willing to pay $86,936 less than when they
were in the CFO role. The difference between the absolute value of these two
amounts is marginally significant at p ¼ 0:0578 (see panel B of Table 3). For
CPAs, the change in the amount to be paid for the new system did not differ.
Those in the Standard Division were willing to pay $157,263 more than
when they were in the CFO role while those in the Deluxe Division were
willing to pay $152,500 less. Panel B of Table 4 shows that the absolute
difference between these two responses is not significant.
Table 2. Descriptive Results: CPA Participants.
Standard Deluxe
Division Division
Role Role
(n ¼ 35) (n ¼ 42)
Panel A: Mean Responses – CFO Role (Part 1)a
Support for ABC systemb 4.1 3.5
Amount to be paid for ABC system ($) 241,023 290,357
Percent allocated to standard division 59 55
Percent allocated to deluxe division 34 43
Panel B: Mean Responses by Role (Part 2)
Support for ABC systemb 2.2 6.3
Amount to be paid for ABC system ($) 398,286 137,857
Percent allocated your division 51 21
Panel C: Increase (Decrease) in Mean Responses from CFO Role to Manager Role
Support for ABC systemb 1.9 (2.9)
Amount to be paid for ABC system ($) 157,263 (152,500)
Percent allocated to your division (8) (21)
aIn Part 1 of the experiment the participants were unaware of the role they would be asked to
assume in Part 2. Part 1 responses are presented consistent with their Part 2 roles to better
demonstrate how their judgments differed between the two parts.b1 ¼ Strongly support, 7 ¼ Strongly object to.
M.G. FENNEMA ET AL.178
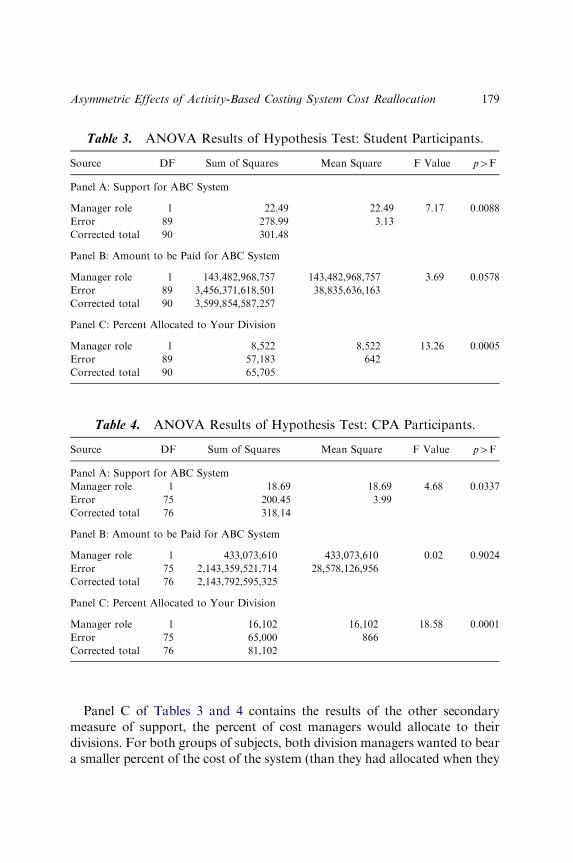
Panel C of Tables 3 and 4 contains the results of the other secondary
measure of support, the percent of cost managers would allocate to their
divisions. For both groups of subjects, both division managers wanted to bear
a smaller percent of the cost of the system (than they had allocated when they
Table 3. ANOVA Results of Hypothesis Test: Student Participants.
Source DF Sum of Squares Mean Square F Value p4F
Panel A: Support for ABC System
Manager role 1 22.49 22.49 7.17 0.0088
Error 89 278.99 3.13
Corrected total 90 301.48
Panel B: Amount to be Paid for ABC System
Manager role 1 143,482,968,757 143,482,968,757 3.69 0.0578
Error 89 3,456,371,618,501 38,835,636,163
Corrected total 90 3,599,854,587,257
Panel C: Percent Allocated to Your Division
Manager role 1 8,522 8,522 13.26 0.0005
Error 89 57,183 642
Corrected total 90 65,705
Table 4. ANOVA Results of Hypothesis Test: CPA Participants.
Source DF Sum of Squares Mean Square F Value p4F
Panel A: Support for ABC System
Manager role 1 18.69 18.69 4.68 0.0337
Error 75 200.45 3.99
Corrected total 76 318.14
Panel B: Amount to be Paid for ABC System
Manager role 1 433,073,610 433,073,610 0.02 0.9024
Error 75 2,143,359,521,714 28,578,126,956
Corrected total 76 2,143,792,595,325
Panel C: Percent Allocated to Your Division
Manager role 1 16,102 16,102 18.58 0.0001
Error 75 65,000 866
Corrected total 76 81,102
Asymmetric Effects of Activity-Based Costing System Cost Reallocation 179

were in the CFO role), but Deluxe Division managers were even more un-
willing to bear the costs (p ¼ 0:0005 for students, p ¼ 0:0001 for CPAs).
These results also support the prospect theory-based hypothesis in this study.
CONCLUSIONS AND LIMITATIONS
This study documents an asymmetric effect of reallocating product costs on
managers who have an interest in ABC system information. Specifically,
these results provide evidence that the loss in support from managers whose
products increase in cost exceeds the increase in support from those whose
products decrease in cost. This was true over three possible measures of
support for the student participants and two for the CPA participants. This
simple but powerful finding has consequences for both theoretical models of
ABC implementation and practical applications.
Many prior studies have identified various inhibitors to ABC implemen-
tation success. In their models of cost management system implementation,
Shields and Young (1989, 1995) identify the link between the cost manage-
ment system and performance evaluation and compensation as one of seven
behavioral and organizational variables that are required for successful
system implementation. As noted earlier, Shields (1995) found this com-
pensation linkage to be correlated with success. Unfortunately, previous
studies (e.g., Cooper et al., 1992) have found that most firms involved with
implementing ABC systems do not create the critical link from the system to
performance evaluation and compensation. The current study underscores
the importance of this connection, and it also adds the finding that man-
agers will be asymmetrically affected by equal changes in that compensa-
tion. Identifying this effect helps develop a more complete theory of
individuals’ resistance to ABC implementation.
On a practical level, those attempting to install a new innovation such as
ABC need to anticipate individual resistance. Leonard-Barton (1987) likens
system implementation to an internal marketing campaign. By building on
system positives and countering negative ones, implementation managers can
speed the system change effort. Since cost reallocations can cause significant
loss of support from negatively affected managers, steps must be taken to
reduce that effect. Such measures might include temporary compensation
adjustments or permanent changes in the performance-based compensation
system, such as increased use of nonfinancial measures in bonus contracts
(Ittner, Larcker, & Rajan, 1997). In any case, the effect of such actions
M.G. FENNEMA ET AL.180
should be well thought out to take into account the varying effects on the
managers.
As with all experimental research, the findings of this study need to be
considered in light of its limitations. The student participants in this study
lack experience in making decisions about the value of cost management
systems. However, the CPA group had much more experience and helps to
validate the results of the less experienced group. The design of this study
has limitations as well. The various pressures and incentives that would be
present for real-world decision makers are not present in our experiment. As
discussed in Lipe and Salterio (2000), experimental studies attempting to
model real-world phenomenon require simplifying assumptions that impair
realism. For example, the participants in this study took on both CFO and
Division Manager roles. In actual practice, these decision makers would
have very different backgrounds and priorities. Also, there may be other
company-wide incentives (e.g., stock plan) that affect a division manager’s
decision making. Another limitation of this study is that the division man-
agers may have various products, some of which show higher costs and
some showing lower costs using ABC. Finally, this study focuses on the
economic and behavioral impact of ABC on the division manager. It ignores
whether or not ABC is actually beneficial for the company as a whole.
This study adds to the limited body of research on manager resistance to
activity-based costing. Future studies might add to our knowledge by ad-
dressing ways to mitigate the asymmetric effect on managers’ support. Dif-
ferent compensation schemes might be examined in order to determine what
measures can be taken to increase support at the lowest cost. The goal of
these studies should be to increase our understanding of how managers
perceive changes in their environment. In this way, more accurate costing
can be achieved with increased support from affected managers.
REFERENCES
Anderson, S. W. (1995). A framework for assessing cost management system changes: The case
of activity based costing implementation at General Motors, 1986–1993. Journal of
Management Accounting Research, 7, 1–51.
Argyris, C., & Kaplan, R. (1994). Implementing new knowledge: The case of activity based
costing. Accounting Horizons, 8, 83–105.
Beer, M., Eisenstat, R., & Spector, B. (1990). Why change programs don’t produce change.
Harvard Business Review, 68, 158–166.
Chang, C. J., Yen, S., & Duh, R. (2002). An empirical examination of competing theories to
explain the framing effect in accounting-related decisions. Behavioral Research in Ac-
counting, 14, 35–64.
Asymmetric Effects of Activity-Based Costing System Cost Reallocation 181
Cokins, G. (2001). Activity-based cost management. New York, NY: Wiley.
Cooper, R., & Kaplan, R. (1991). The design of cost management systems. Englewood Cliffs, NJ:
Prentice-Hall.
Cooper, R., Kaplan, R., Maisel, L., Morrissey, E., & Oehm, R. (1992). Implementing activity-
based cost management. Montvale, NJ: Institute of Management Accountants.
Cooper, R. B., & Zmud, R. W. (1990). Information technology implementation research: A
technological diffusion approach. Management Science, 36(2), 123–139.
Goodman, P., & Dean, J. (1982). Creating long-term organizational change. In: P. S. Goodman
and Associates (Ed.), Changes in organizations: New perspectives on theory, research, and
practice. San Francisco, CA: Jossey-Bass.
Gosselin, M. (1997). The effect of strategy and organizational structure on the adoption and
implementation of activity-based costing. Accounting, Organizations and Society, 22(2),
105–122.
Huff, A. S., Huff, J. O., & Barr, P. S. (2001). When firms change direction. New York, NY:
Oxford University Press.
Ittner, C. D., Lanen, W. N., & Larcker, D. F. (2002). The association between activity-based
costing and manufacturing performance. Journal of Accounting Research, 40(3), 711–726.
Ittner, C. D., Larcker, D. F., & Rajan, M. V. (1997). The choice of performance measures in
annual bonus contracts. The Accounting Review, 72(2), 231–255.
Kahneman, D., & Tversky, A. (1979). Prospect theory: An analysis of decision under risk.
Econometrica, 47, 263–291.
Kaplan, R. S., & Cooper, R. (1998). Cost & effect. Boston, MA: Harvard Business School Press.
Kennedy, T., & Affleck-Graves, J. (2001). The impact of activity-based costing techniques on
firm performance. Journal of Management Accounting Research, 13, 19–45.
Krumwiede, K. R. (1998). The implementation stages of activity-based costing and the impact
of contextual and organizational factors. Journal of Management Accounting Research,
10, 239–277.
Kwon, T. H., & Zmud, R. W. (1987). Unifying the fragmented models of information systems
implementation. In: R. J. Boland & R. Hirscheim (Eds), Critical issues in information
systems research. New York, NY: Wiley.
Lau, C. M., & Eggleton, I. R. C. (2003). The influence of information asymmetry and budget
emphasis on the relationship between participation and slack. Accounting & Business
Research, 33(2), 91–104.
Leonard-Barton, D. (1987). Implementing structured software methodologies: A case of inno-
vation in process technology. Interfaces, 17, 6–17.
Lipe, M. G., & Salterio, S. E. (2000). The balanced scorecard: Judgmental effects of common
and unique performance measures. The Accounting Review, 75(3), 283–298.
Mak, Y., & Roush, M. (1994). Flexible budgeting and variance analysis in an activity-based
costing environment. Accounting Horizons, 8, 93–103.
Moreno, K., Kida, T., & Smith, J. F. (2002). The impact of affective reactions on risky decision
making in accounting contexts. Journal of Accounting Research, 40(5), 1331–1349.
Ness, J., & Cucuzza, T. (1995). Tapping the full potential of ABC. Harvard Business Review, 73,
130–138.
Shields, M. (1995). An empirical analysis of firms’ implementation experiences with activity-
based costing. Journal of Management Accounting Research, 7, 148–166.
Shields, M., & Young, S. (1989). A behavioral model for implementing cost management
systems. Journal of Cost Management, 3, 17–27.
M.G. FENNEMA ET AL.182
Shields, M., & Young, S. (1995). Behavioral and organizational issues. In: B. Brinker (Ed.),
Handbook of cost management. New York: Warren Gorham Lamont.
Tversky, A., & Kahneman, D. (1992). Advances in prospect theory: Cumulative representation
of uncertainty. Journal of Risk and Uncertainty, 5, 297–323.
Vera-Munoz, S. C., Kinney, W. R., & Bonner, S. E. (2001). The effects of domain experience
and task presentation format on accountants’ information relevance assurance. The
Accounting Review, 76(3), 405–429.
Willman, P., & Fenton-O’Creevy, M. (2002). Traders, managers and loss aversion in investment
banking: A field study. Accounting, Organizations & Society, 27(1, 2), 85–98.
APPENDIX A
Product Costing Case: Part 1
Micro Computer Industries makes memory boards for microcomputers.
They began operations in 1986 and had sales of about $10 million last year.
The production process involves the assembly of various memory board
circuits. Two types of memory boards are currently made, a Standard model
and a Deluxe model. Prices in this industry are very competitive, so prices
are based on competitors’ prices.
The company is organized into two divisions, one for each type of mem-
ory board. The senior officers (i.e., the chief executive officer, chief operating
officer, and chief financial officer) are salaried and are given stock options.
The managers of the two divisions are paid a salary and a substantial bonus,
based on the profitability of their division determined by the selling price
minus product costs and a portion of allocated administrative costs. Product
costs are determined by a traditional cost accounting system, where fixed
overhead is allocated based on direct labor hours. Exhibit A.1 shows the
unit costs for the two types of memory boards under the current traditional
system.
Recently, the CFO of the company has been attempting to improve the
accuracy of the product costing system. One attempt involves the possible
use of an ABC system. It is estimated that the cost of installing such a
system would be between $200,000 and $500,000, with the most likely cost
of $350,000. Four activities were identified and their rate per activity was
calculated. Exhibit A.2 shows the unit costs under the proposed ABC system
for the month of January, in which 1,137 memory boards were made in
the Standard Division and 288 memory boards were made in the Deluxe
Division.
Asymmetric Effects of Activity-Based Costing System Cost Reallocation 183
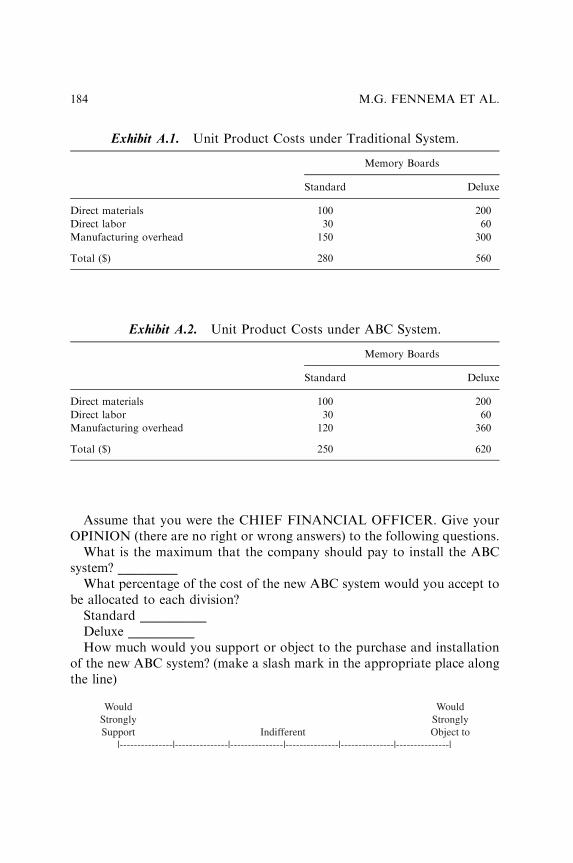
Assume that you were the CHIEF FINANCIAL OFFICER. Give your
OPINION (there are no right or wrong answers) to the following questions.
What is the maximum that the company should pay to install the ABC
system? _________
What percentage of the cost of the new ABC system would you accept to
be allocated to each division?
Standard __________
Deluxe __________
How much would you support or object to the purchase and installation
of the new ABC system? (make a slash mark in the appropriate place along
the line)
|---------------|---------------|---------------|---------------|---------------|---------------|
Would
Strongly
Support
Would
Strongly
Object toIndifferent
Exhibit A.1. Unit Product Costs under Traditional System.
Memory Boards
Standard Deluxe
Direct materials 100 200
Direct labor 30 60
Manufacturing overhead 150 300
Total ($) 280 560
Exhibit A.2. Unit Product Costs under ABC System.
Memory Boards
Standard Deluxe
Direct materials 100 200
Direct labor 30 60
Manufacturing overhead 120 360
Total ($) 250 620
M.G. FENNEMA ET AL.184

APPENDIX B
Product Costing Case: Part 2 (STANDARD condition)
Micro Computer Industries makes memory boards for microcomputers.
They began operations in 1986 and had sales of about $10 million last year.
The production process involves the assembly of various memory board
circuits. Two types of memory boards are currently made, a Standard model
and a Deluxe model. Prices in this industry are very competitive, so prices
are based on competitors’ prices.
The company is organized into two divisions, one for each type of mem-
ory board. The senior officers (i.e., the chief executive officer, chief operating
officer, and chief financial officer) are salaried and are given stock options.
The managers of the two divisions are paid a salary and a substantial bonus,
based on the profitability of their division which is determined by the selling
price minus product costs and a portion of allocated administrative costs.
Product costs are determined by a traditional cost accounting system, where
fixed overhead is allocated based on direct labor hours. Exhibit B.1 shows
the unit costs for the two types of memory boards under the current tra-
ditional system.
Recently, the CFO of the company has been attempting to improve the
accuracy of the product costing system. One attempt involves the possible
use of an ABC system. It is estimated that the cost of installing such a
system would be between $200,000 and $500,000, with the most likely cost
of $350,000. Four activities were identified and their rate per activity was
calculated. Exhibit B.2 shows the unit costs under the proposed ABC system
for the month of January, in which 1,137 memory boards were made in the
Exhibit B.1. Unit Product Costs under Traditional System.
Memory Boards
Standard Deluxe
Direct materials 100 200
Direct labor 30 60
Manufacturing overhead 150 300
Total ($) 280 560
Asymmetric Effects of Activity-Based Costing System Cost Reallocation 185

Standard Division and 288 memory boards were made in the Deluxe
Division.
Remember that, as manager of the STANDARD division, your bonuses
are based on the profitability of that division. Exhibit B.3 shows the bonus
calculations for the current year.
If the ABC system had been in place in the current year, the bonus
calculation (ignoring the allocation of the system’s cost) would have been as
in Exhibit B.4.
Assume that you are the MANAGER of the STANDARD Division.
Give your OPINION (there are no right or wrong answers) to the following
questions.
What is the maximum that the company should pay to install the ABC
system? _________
What percentage of the cost of the new ABC system would you accept to
be allocated to your division? ________________
Exhibit B.2. Unit Product Costs under ABC System.
Memory Boards
Standard Deluxe
Direct materials 100 200
Direct labor 30 60
Manufacturing overhead 120 360
Total ($) 250 620
Exhibit B.3. Current Year Actual Bonus Calculation.
Division
Standard Deluxe
Unit sales 12,000 6,000
Selling price per unit ($) 450 950
Cost per unit ($) 280 560
Gross margin ($) 2,040,000 2,340,000
Allocated administration costs ($) 900,000 1,100,000
Profit ($) 1,140,000 1,240,000
Bonus (2% of profit) ($) 22,800 24,800
M.G. FENNEMA ET AL.186
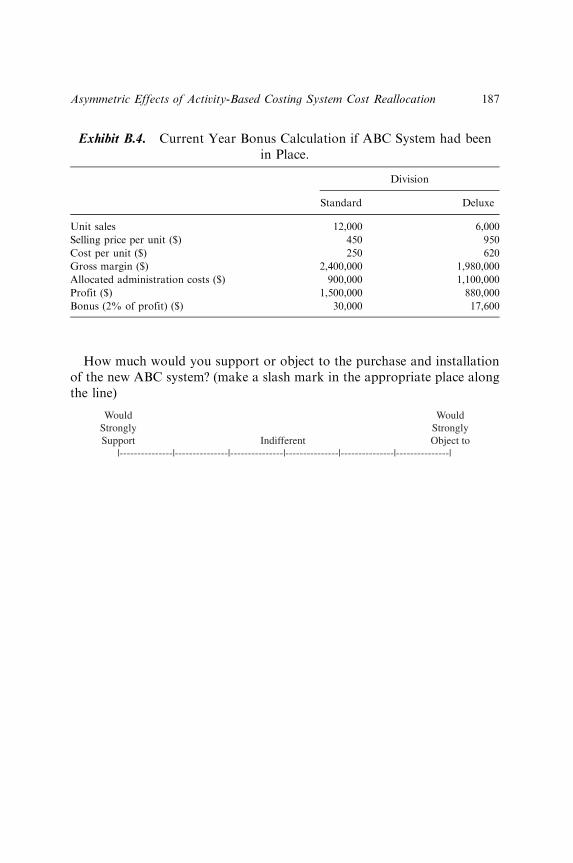
How much would you support or object to the purchase and installation
of the new ABC system? (make a slash mark in the appropriate place along
the line)
|---------------|---------------|---------------|---------------|---------------|---------------|
Would
Strongly
Support
Would
Strongly
Object toIndifferent
Exhibit B.4. Current Year Bonus Calculation if ABC System had been
in Place.
Division
Standard Deluxe
Unit sales 12,000 6,000
Selling price per unit ($) 450 950
Cost per unit ($) 250 620
Gross margin ($) 2,400,000 1,980,000
Allocated administration costs ($) 900,000 1,100,000
Profit ($) 1,500,000 880,000
Bonus (2% of profit) ($) 30,000 17,600
Asymmetric Effects of Activity-Based Costing System Cost Reallocation 187

This page intentionally left blank
188
EXAMINING THE ROLE OF
CULTURE AND ACCULTURATION
IN INFORMATION SHARING
Stephen B. Salter and Axel K.-D. Schulz
ABSTRACT
In the current environment, an important firm asset is the employee
knowledge base, which in a large part depends on employee willingness to
share information. Yet prior research has noted that while employees are
delighted to reveal success they are often reluctant to reveal errors. While
there are many factors affecting managers’ reluctance to reveal errors,
this study focuses on cultural differences between Chinese migrants and
Anglo residents as well as the role of acculturation. This is particularly
relevant given the very significant foreign direct investment into China,
and migration of managers and high-end technical staff from portions of
Greater China to the management and higher technical classes of the
Anglo world. Prior studies including Chow, Harrison, McKinnon, and Wu
(1999a). Accounting, Organizations and Society, 24, 561–582, Chow,
Deng, and Ho (2000). Journal of Management Accounting Research, 12,
65–95, and Tinsley and Pillutla (1998). Journal of International Business
Studies, 29(4), 711–728, provide conflicting views and evidence for dif-
ferences in information sharing between Chinese and Anglo managers,
and there is no accounting or management literature that deals with
changes in information sharing behavior in the migration process.
Advances in Accounting Behavioral Research
Advances in Accounting Behavioral Research, Volume 8, 189–212
Copyright r 2005 by Elsevier Ltd.
All rights of reproduction in any form reserved
ISSN: 1475-1488/doi:10.1016/S1475-1488(04)08008-1
189

This study employs an experiment to test for differences in individuals’
willingness to share information about a prior costing error. Using a
sample of students from two different nationalities drawn from a major
Australian university (Australian and Hong Kong SAR, China), this
study finds that migrant Chinese share less information than Anglo-
Australians. This study further provides empirical evidence that the rel-
ative change in willingness to share this information when the supervisor is
removed from the decision context is lower for the migrant Chinese than
for the Anglo-Australians. Finally, this study finds evidence for accultur-
ation as the willingness of migrant Chinese managers changes with the
length of their stay in the new society. Acculturation occurs relatively
quickly and highly acculturated Chinese information-sharing behavior is
not significantly different from the Australian-born subjects.
INTRODUCTION
In the current knowledge-based environment, a large portion of a firm’s
assets are in its information and knowledge. Often, the source of this
knowledge is the database of best practices and past failures that accumu-
lates among employees.1 While there are many aspects of information shar-
ing in organizations, this study focuses on the impact of cultural differences
as well as the effect of changes in cultural differences over time (accultur-
ation) in relation to individuals revealing past errors. In particular, this
study centers on differences in culture between Anglo-Australian residents
and Chinese migrants.2
How to encourage the release of information through control systems has
been widely debated in the Anglo world (see, e.g., Chenhall, 1992; Nanni,
Dixon, & Vollman, 1992; Peters, 1994; Smith, 1994; Levinthal & March,
1993). Periodically removing the supervisor, who has the ability to punish
subordinates based on the information revealed, has been suggested as one
possible solution to reduce the risk of information sharing (Peters, 1994;
Chow et al., 1999a). In addition to Anglo studies, several authors have tried
to extend the research on information sharing to other cultures, primarily
Greater China,3 only to find that the results are inconsistent. Chow et al.
(1999a) and Chow, Schulz, and Wu (1999b) find no statistical differences in
base propensity to share information between Australian and Chinese
(Taiwanese) managers. In contrast, Chow et al. (2000) report significantly
more sharing by Peoples Republic of China (PRC) managers than American
STEPHEN B. SALTER AND AXEL K.-D. SCHULZ190
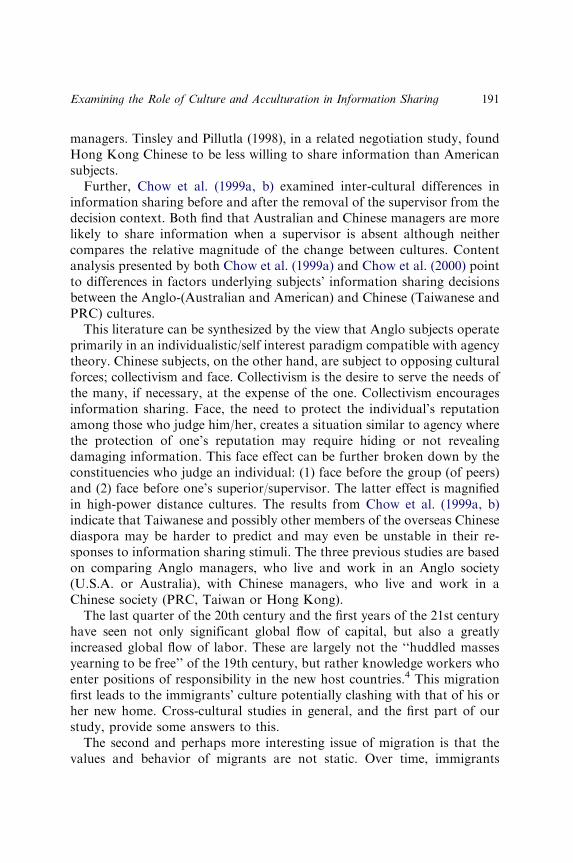
managers. Tinsley and Pillutla (1998), in a related negotiation study, found
Hong Kong Chinese to be less willing to share information than American
subjects.
Further, Chow et al. (1999a, b) examined inter-cultural differences in
information sharing before and after the removal of the supervisor from the
decision context. Both find that Australian and Chinese managers are more
likely to share information when a supervisor is absent although neither
compares the relative magnitude of the change between cultures. Content
analysis presented by both Chow et al. (1999a) and Chow et al. (2000) point
to differences in factors underlying subjects’ information sharing decisions
between the Anglo-(Australian and American) and Chinese (Taiwanese and
PRC) cultures.
This literature can be synthesized by the view that Anglo subjects operate
primarily in an individualistic/self interest paradigm compatible with agency
theory. Chinese subjects, on the other hand, are subject to opposing cultural
forces; collectivism and face. Collectivism is the desire to serve the needs of
the many, if necessary, at the expense of the one. Collectivism encourages
information sharing. Face, the need to protect the individual’s reputation
among those who judge him/her, creates a situation similar to agency where
the protection of one’s reputation may require hiding or not revealing
damaging information. This face effect can be further broken down by the
constituencies who judge an individual: (1) face before the group (of peers)
and (2) face before one’s superior/supervisor. The latter effect is magnified
in high-power distance cultures. The results from Chow et al. (1999a, b)
indicate that Taiwanese and possibly other members of the overseas Chinese
diaspora may be harder to predict and may even be unstable in their re-
sponses to information sharing stimuli. The three previous studies are based
on comparing Anglo managers, who live and work in an Anglo society
(U.S.A. or Australia), with Chinese managers, who live and work in a
Chinese society (PRC, Taiwan or Hong Kong).
The last quarter of the 20th century and the first years of the 21st century
have seen not only significant global flow of capital, but also a greatly
increased global flow of labor. These are largely not the ‘‘huddled masses
yearning to be free’’ of the 19th century, but rather knowledge workers who
enter positions of responsibility in the new host countries.4 This migration
first leads to the immigrants’ culture potentially clashing with that of his or
her new home. Cross-cultural studies in general, and the first part of our
study, provide some answers to this.
The second and perhaps more interesting issue of migration is that the
values and behavior of migrants are not static. Over time, immigrants
Examining the Role of Culture and Acculturation in Information Sharing 191
change their tastes, advertising and media usage, voting patterns, consump-
tion patterns, and behavior and values. This process is commonly referred to
as acculturation (see Kim, La Roche, & Tomiuk, 2004; Yammarino & Jung,
1998; Ueltschy & Krampf, 1997; Berry, 1997 for summaries). Cross-cultural
studies are insufficient to address this change. They tell only half the story
(i.e., how did the migrant’s values differ from his new host country prior to
migrating). The second part of our study investigates the effect of accul-
turation crucial to managers (i.e., changing attitudes to information shar-
ing). Our question is how behavior changes over time, if at all. In order to be
as relevant as possible, this study examines a group of the overseas Chinese
diaspora that is far more likely to immigrate to Anglo-culture nations
(i.e., citizens of Hong Kong SAR).
The results indicate that when there are disincentives to share information,
Chinese participants, with little or no acculturation, were significantly less
likely to disclose information than Anglo participants. The behavior is similar
to that described by Tinsley and Pillutla (1998). With the removal of the
supervisor, both groups disclosed more, but the Anglos exhibited significantly
larger growth in willingness to share information. Finally, the behavior of the
immigrants change over time; and acculturation brings decision patterns of
these immigrants closer to, but not completely in line with, that of the host
society. The pace of acculturation appears to be rapid with a clear break at 5
years. These results indicate that managers in immigrant receiving countries
need to manage not only the cross-cultural differences that immigrants bring
with them, but also the process of change as immigrant workers adjust or fail
to adjust their behavior to the norms of their adopted country.
This paper now continues with a brief review of the literature followed by
hypotheses, methodology, results, and conclusion.
LITERATURE REVIEW
Explanations of information sharing have taken a number of different
directions. A substantial body of literature has examined agency-based expla-
nations and proposed solutions. An alternative stream of research has exam-
ined the impact of culture on behavior patterns. Two of these studies (Chow
et al., 1999a; Tinsley & Pillutla, 1998) have attempted to link cultural tenets
and agency explanations. Given trends in cross-national movements of per-
sons, there also appears to be a need to examine the impact of acculturation on
information sharing behavior. This section of the paper reviews relevant lit-
erature for each of these streams and proposes three hypotheses.
STEPHEN B. SALTER AND AXEL K.-D. SCHULZ192
Why Are Managers Reluctant to Release Information?
Examining the Basic Literature
Persuading employees to be open is not always easy (see, e.g., Chow et al.,
1999b). Why are managers reluctant to release information? The extant
literature appears to argue that economic consequences and perception of
personal gain or loss drives information sharing behavior. As Chow et al.
(1999b, p. 440) explain:
Despite the large number of students who had indicated a concern with the company’s
welfare and ethics, concern for their own job security and prospects had deterred many
of them from fully sharing information about their mistakes. This deterrent effect, in
turn, had depended on the expected reaction of the company and superior to the in-
formation disclosure.
This response appears to be tied closely to prior U.S. work in escalation of
commitment using an agency framework.5 In the agency studies, fear of loss
cause subordinates not to report mistakes if supervisors appear to have no
way of finding out. Kanodia, Bushman, and Dickhaut (1989), for example,
developed an equilibrium model in which deliberately failing to correct
errors and, in fact, escalating them is rational in an agency framework.
While this behavior may be irrational from the firm’s perspective, it may be
rational to the decision maker when the decision maker’s reputation is at
stake and information asymmetries are present. Harrell and Harrison (1994)
present evidence that respondents not only cover up errors, but also escalate
commitment to decisions when incentive to shirk and asymmetric informa-
tion are both present, as predicted by agency theory.
In the information-sharing literature, one proposed method of enhancing
the likelihood of information sharing is by withdrawing supervisors. Chow
et al. (1999a) proposed that doing so will cause a related reduction in threat
to the participants and hence an increase in the willingness to share infor-
mation. Such a reduced threat can have the equivalent valence of many
other types of truth-inducing incentives.
Why Are Managers Reluctant to Release Information?
Examining the Cross-Cultural Literature
The extant literature suggests that there are certain universal information-
sharing behaviors by managers. However, a growing body of research,
including Chow, Kato, and Merchant (1996), Chow, Kato, and Shields
(1994), Birnberg and Snodgrass (1988), Harrison, McKinnon,
Examining the Role of Culture and Acculturation in Information Sharing 193
Panchapakesan, and Leung (1994), Merchant, Chow, and Wu (1995), and
O’Connor (1995) suggests that people in different nations often vary in how
they react to given job-related conditions or decisions.
In the case of the impact of culture on information sharing, there are a
number of competing studies and theories. Tinsley and Pillutla (1998) and
Chow et al. (1999a) provide conflicting cultural models of information
sharing but the same results. Both papers find residents of greater China
relatively unwilling to share information. In the case of Chow et al. (1999a),
the original expectation based on Hofstede (1980) was that the Chinese were
more collectivist than Anglo-Australians and would share more information
for the benefit of all. The results showed this not to be the case. On the basis
of open questions, the results were ascribed to the Chinese sense of face – a
desire not to be shamed in front of their peers. Tinsley and Pillutla (1998),
using the Schwartz (1992) value study, hypothesize that Hong Kong res-
idents balance competing dimensions in decision making. While they value
self-transcendence (collectivism), they are also conservative and hence re-
sistant to change. An integral part of this conservatism is a desire to avoid
the disruption caused by information sharing which is associated with the
need of the individual to maintain face. Tinsley and Pillutla (1998) find that
conservatism (face) dominates the decision process, and Hong Kong sub-
jects share less information than Americans. Chow et al. (2000), on the other
hand, studying subjects in the PRC argue and find the opposite to Tinsley
and Pillutla (1998). They posit and find that a person in a collectivist society
will be more inclined to share information that is beneficial to the collective.
Chow et al. (2000), however, does not involve the disclosure of information
before a supervisor but simply within groups of equals.
Contrasting Chow et al. (2000) with the Tinsley and Pillutla (1998) model,
both acknowledge the intuitive link between collectivism and information
sharing in the Chinese society; however, the difference arises in the impor-
tance of the counterforce of face. Chow et al. (2000) see face as a byproduct
of and dominated by collectivism, with the citizens of Greater China being
collectivist and information sharing. Tinsley and Pillutla (1998) start with
the Schwartz (1987) view of collectivism being overshadowed by face as part
of Chinese conservatism (a desire to avoid change or suggest that something
is not actually what it appears to be).
Tinsley and Pillutla’s (1998) position is very much in line with the views of
Ho (1976) and Redding and Wong (1986). Redding and Wong (1986) argue
that one of the features that distinguish the importance of face in Chinese
cultures is the sheer degree of concern with it. Ho (1976, p. 867), for
example, explains the dynamic of face as follows: ‘‘Face is lost when the
STEPHEN B. SALTER AND AXEL K.-D. SCHULZ194
individual fails to meet essential requirements placed upon him by virtue of
the social position he occupies.’’ Thus an individual who fails to achieve a
promised commitment, whatever the reason, suffers a loss of face and hence
a loss of psychic income in addition to any personal monetary consequences.
Persons disappointing either a superior or a group may lose face. In both
cases, perceived failure leads to a loss of face from a superior or from a
group as a whole. Whether one loses face before a superior or subordinate,
the perception of that loss is measured with regard to external constituen-
cies. Thus, ‘‘yface is assessed in terms of what others think of him’’ (Ho,
1976, p. 871). It is possible that Chow, Deng and Ho (2000) removes part of
face by removing the supervisor but the net effect of the papers cited in the
preceding paragraphs is that combined effect of collectivism and face on
information sharing remains an open question and one worth reexamining.
Given the opposite views in the prior literature, our initial starting point
or anchor is that Chinese managers who have migrated to an Anglo country
will have a different propensity to reveal private information than Anglo
managers residing in the same country. As such, we hypothesize
H1. Chinese immigrant managers will have a different propensity to re-
veal private information than born and raised Anglo-resident managers.
Drawing on the cultural model of Hofstede (1980, 1991) supplemented by
the work of Ho (1976) on face, Chow et al. (1999a) also proposed an in-
teraction between the cultural origin and the effect of the removal of the
supervisor on information-sharing behavior. While Chow et al. (1999a) did
not find statistical support for this hypothesis, as both types of managers
responded similarly to the removal of the supervisor, further content anal-
ysis suggested that Anglo-Australian managers used different decision mod-
els and criteria than Taiwanese-Chinese (hereinafter referred to as Chinese)
managers in their decision to reveal information.
Australian subjects were presented in the Chow et al. (1999a) study as
fairly simple and calculative. The role of a supervisor is to reward success
and punish failure. Thus, the presence of a supervisor provides the major
barrier to information disclosure and, as such, provides the incentive for
subordinates not to disclose information about prior mistakes that could
harm the individual’s prospects. The removal of a supervisor results in the
removal of this barrier to information disclosure. The Chinese were pre-
sented as facing a more complex series of factors in making the decision to
reveal information. Chinese managers face three barriers to information
sharing: (1) a desire to avoid a loss of face before the group; (2) a desire to
avoid a loss of face before the supervisor; and (3) the perception of the
Examining the Role of Culture and Acculturation in Information Sharing 195
superior as the greater authority and the legitimate and obliged decision
maker (power distance).
While two of these barriers are removed when the supervisor is with-
drawn, loss of face before the group remains. Thus, one might anticipate a
smaller increase in the propensity to share information for members of the
Chinese society vis-a-vis the Anglo-Australians whose major significant
barrier to sharing, fear of punishment, has been removed. Based on these
cultural perspectives, we therefore propose that Chinese managers who have
migrated to an Anglo country will exhibit a relatively lower level of will-
ingness to release private information about an error in response to the
removal of a supervisor than Anglo managers who are residing in the same
country. Our second hypothesis is
H2. The change in willingness to release private information about a
prior mistake, as a result of the removal of the supervisor, would be lower
for Chinese immigrant managers than born and raised Anglo-resident
managers.
Acculturation and Information Sharing
If one believes the extant literature, cross-national differences in values can
and do affect behavior. Even if a manager never plans to immigrate, she/he
is still likely to encounter cross-cultural control issues. Large-scale immi-
gration6 makes it increasingly unclear from whence an American, Canadian,
or Australian manager has drawn their values and how they may react to
particular decision-making situations.
While non-native-born individuals may either immediately or never ab-
sorb the new culture, considerable evidence from marketing and other social
science literature suggests that the values and behaviors of immigrants
change over time as they interact with the existing workforce (see Ueltschy
& Krampf (1997) and Yammarino & Jung (1998) for summaries), a process
referred to as acculturation. In each of these studies, immigrant group
members are found to hold norms and values somewhere between those of
the culture of origin and the host society. The more acculturated the in-
dividual, the greater the progression toward the attitudes and values of the
host society (Faber, O’Guinn, & Meyer, 1987). Studies of Latino immi-
grants have, for example, noted differences in media preferences and ad-
vertising effectiveness (Hayes-Bautista, Schinck, Chapa, & Soto, 1984;
Adelson, 1989; Ueltschy & Krampf, 1997). The marketing literature
STEPHEN B. SALTER AND AXEL K.-D. SCHULZ196
contains a similar stream of literature on Chinese immigrants which is
summarized in Lee and Tse (1994).
The process of acculturation is not linear and takes place in stages
(Ueltschy & Krampf, 1997). Studying Mexican immigrants to the U.S.,
Ueltschy and Krampf (1997) identified three statistically viable clusters of
behaviors with members of each cluster varying in terms of level of accul-
turation to media.
1. A low acculturation cluster of persons who have lived in the U.S. between
1 and 5 years
2. A bicultural cluster of persons born in Mexico who have lived in the U.S.
from 10 to 15 years
3. A high acculturation cluster of persons born in the U.S. of non-U.S.
parents and grand parents; this group is not particularly dissimilar from
the Anglo residents around them
These differences between the groups in the sample translate into significant
differences in advertising preferences. Lee and Tse (1994) use a four-part a
priori classification of Hong Kong and Canadian subjects based on immi-
gration laws and status, including English-speaking Caucasian Canadians
and three levels of Chinese immigrants. Like Ueltschy and Krampf (1997),
they find significantly different media usage patterns in each group but use a
breaking point for immigrants of 7 years based on the elapsed time since a
major change in immigration law.
In summary, the extant literature seems to indicate that immigrants grow
closer to the host country in tastes and behavior over time. The previous
literature (Chow et al., 1999a, 2000) finds that Australian subjects are ex-
pected to begin at a lower level of information sharing than Chinese and
increase their likelihood of sharing information (about a prior mistake) to a
greater extent than Chinese subjects in response to the removal of the su-
pervisor. Therefore, as the migrant Chinese group becomes more accultur-
ated, they will also show a much greater increase in likelihood of sharing
information in response to the removal of the supervisor than their
un-acculturated peers. Thus our third hypothesis is
H3. There is a positive relationship between the change in the willingness
to release private information about a prior mistake when the supervisor
is removed and the degree of acculturation.
Examining the Role of Culture and Acculturation in Information Sharing 197
RESEARCH METHODS
Overview of Design
An experiment was designed to focus on private information disclosure of
Chinese immigrants and Australian residents and the effect of acculturation
on Chinese immigrants’ disclosure behavior. A 2� (2) repeated factorial de-
sign was utilized to test hypotheses 1–3. The first factor represented the type
of culture and was assessed in terms of ethnic origin and country of birth,
with subjects being classified into two categories of Australian and Chinese
(more detail about the categories is provided in subsequent discussion). The
second factor represented the removal of the supervisor, which was manip-
ulated within subjects. Participants were required to make two decisions with
the removal of the supervisor occurring between the first and second deci-
sion. To test H3, we split the Chinese group into a high- and low-acculturated
subgroup on the basis of tenure in Australia, which resulted in a 3� (2)
repeated factorial design. After the split, the first factor represented the level
of acculturation ranging from low-acculturated Chinese to high-acculturated
Chinese to Australian groups. The second factor remained the removal of the
supervisor. The dependent variable was the subjects’ degree of willingness to
disclose private information revealing prior personal mistake.
Decision Task
The decision task was adapted from the Chow et al. (1999a) instruments.
Each subject received an experimental booklet containing instructions and
the experimental material. Participants were asked to read the experimental
material carefully and assume the role of a department manager of a hy-
pothetical plant. The instructions also contained very explicit statements to
the effect that there was no ‘‘correct’’ or ‘‘incorrect’’ response to the ex-
periment, but rather that the best response was one that most closely re-
flected their true feelings and belief.
The experimental material consisted of a background note and two ques-
tions. For the background note, subjects were provided with information
about their recent promotion to department manager and a decision they
had taken to endorse a new technology shortly after their promotion. Sub-
jects were told that after endorsing the new technology, they found out that
they had underestimated the variable costs of the new technology. In
hindsight, if they had correctly estimated the variable cost, the best decision
STEPHEN B. SALTER AND AXEL K.-D. SCHULZ198
would have been to stay with the old technology. Subjects were further
informed that the organization monitors performance very closely but does
not track actual costs and revenues from individual projects. This allowed
them to work very hard to squeeze cost savings and revenues from other
projects to make up for the higher than planned costs of the new technology.
Subjects were further told that they had just been invited to attend a meeting
with another department manager in another plant, who was also consid-
ering adopting a new technology. Subjects were informed that the technology
was very similar to the one they had adopted and that the other manager had
also underestimated the variable costs associated with the technology.
Following the background note, subjects had to make two decisions. For
both decisions, the participants had to indicate the degree to which they would
reveal their mistake in underestimating the variable cost of the new technology
in order that people in the other plant would make a better decision. For the
first decision, subjects were told that their supervisor would be attending the
same meeting with the other department manager. For the second decision,
subjects were informed that their supervisor was now not attending the meeting
with the other department manager and that there was little chance of an-
ything that was said would find its way back to the supervisor.
Further, subjects were also asked to indicate the extent to which their two
decisions truly reflected how they would think and act if they were in the
manager’s place. Finally, subjects were asked to indicate their ethnic origin
along with their country of birth and information about the tenure in
Australia or any other country in which they have lived. Demographic in-
formation about their gender was also collected.
Dependent Variable
The dependent variable measured the degree to which the individual would
reveal their private information about prior personal failure. Subjects were
asked to indicate to what extent they would definitely reveal their own
mistake of underestimating. They recorded their answer on a 9-point scale
ranging from 1 (definitely not reveal) to 9 (definitely reveal).
Independent Variables
The independent variables were culture/degree of acculturation and the
presence or absence of the supervisor. In measuring culture/acculturation,
Examining the Role of Culture and Acculturation in Information Sharing 199
the prior research was examined for precedent. Researchers have used a
variety of measures to operationalize culture/acculturation. These include
the following:
1. Self-identification. This approach has been deemed most appropriate by
cross-cultural behavioral researchers, especially those in cultural anthro-
pology and social psychology (Cohen, 1978, Minor, 1992; Kara & Kara,
1996).
2. Place of birth. Padilla (1980) and Valencia (1985) use place of birth (U.S.
vs. foreign born) to proxy for acculturation.
3. Place of birth/time in country groupings. Both Lee and Tse (1994) and
Ueltschy and Krampf (1997) use time-bounded clusters, which then form
the basis of testing the main hypotheses of their study.7
We divide our sample initially into Australian born and non-Australian
born. All of the Australian-born participants identify themselves as
Caucasian and the Chinese sample was of Chinese ethnic origin. This re-
moves the possibility of Australian-born Chinese ethnic origin subjects and
means that place of birth and self-identified origin collapse into one. The
two broad categories can be described as Australian born and Chinese born.
Within the Chinese-born sample, an initial regression indicates that time in
country affects the difference in likelihood that the individual is going to
reveal their prior error between when the supervisor is present and when the
supervisor is absent. We are then faced with choosing a viable break point to
group our Chinese-born sample. Fortunately, the immigration-based ap-
proaches taken by Lee and Tse (1994) and the rules of thumb of Ueltschy
and Krampf (1997) can be synthesized. This study uses a categorization
consistent with Ueltschy and Krampf (1997) of less than 5 years and 5 or
more years living in the new country. This categorization is also consistent
with Australian immigration rules specifically requiring immigration appli-
cations to be resubmitted at the end of each phase of education. Our second
year students, who are resident for more than 5 years, would have to have
completed at least two immigration reviews before the Australian Govern-
ment (high school and college entry) or have achieved permanent residence
by migrating themselves or been part of a family migration.
The two groups, Australian born and Chinese born, were used to test for
initial cultural differences in H1 and H2 and three groups Australian Born
Culture (ABC), Chinese Born High Acculturation (CHA) and Chinese Born
Low Acculturation (CLA) were used for the purpose of testing the impact of
acculturation H3. The ABC group consists of participants born in Australia,
essentially of Anglo ethnic origin, born in a country with a dominant Anglo
STEPHEN B. SALTER AND AXEL K.-D. SCHULZ200
culture. The CHA group consists of Chinese participants, born in
Hong Kong, with 5 or more years of tenure in Australia. While members
of this group were not born in a country with a dominant Anglo culture,
their tenure for 5 or more years in Australia provided them with a high level
of opportunity to become acculturated with the Anglo culture. The CLA
group consists of Chinese participants, born in Hong Kong, with less than 5
years of tenure in Australia. Members of this group were born in a country
that does not have a dominant Anglo culture and their tenure in Australia
has been minimal, providing them with only a low level of opportunity to
become acculturated with the Anglo culture.
The role of the supervisor in preventing or enhancing information disclo-
sure was manipulated within subjects by the removal of the supervisor in the
second decision. For the first decision, subjects were told that the supervisor
was attending the meeting between themselves and the other plant managers
(‘‘supervisor present’’ condition), while for the second decision the supervisor
was not attending the meeting (‘‘supervisor absent’’ condition).
Manipulation Checks
A question testing for the respondents’ willingness to answer the questions
truthfully was included in the experimental instrument.8 Participants were
asked to respond on a 9-point scale ranging from 1 (‘‘not at all’’) to 9
(‘‘totally’’). Five participants were omitted for failing to answer the ques-
tion. This resulted in 115 usable responses. The mean response of the 115
participants was 7.157 (significantly greater than the midpoint of the scale,
t ¼ 18:403; p ¼ 0:000). Of the 115 participants, 7 responded below the mid-
point of the scale. The 115 usable responses did not significantly differ
between treatment groups on this question. These results provide comfort
that participants not only responded truthfully, but also did not system-
atically interact with the treatment groups. As such, all 115 responses were
retained for the main analysis.9
Participants
All participants were enrolled in the same second-year management ac-
counting subject at the time of the experiment.10 Demographic data was
obtained for gender. While the distribution of the 57 male and 58 female
Examining the Role of Culture and Acculturation in Information Sharing 201
subjects was not consistent across all treatments, a post hoc comparison
between gender and the dependent variable was not significant.
RESULTS
Analysis
To test the hypotheses, a combination of two repeated ANOVA tests (for H1
and H2) as well as a linear regression and Bonferroni contrast tests (for H3)
were employed. Bonferroni contrast tests were used to test the very specific a
priori relationships of interest in H3. All directional hypotheses were tested
using 1-tailed tests. All of the analysis was conducted using SYSTAT 10.
Descriptive Statistics
To test the first two hypotheses, the sample was split on the basis of country
of birth. A few general trends emerged from the descriptive statistics re-
ported in Table 1. In all situations and for all sample subgroups, the will-
ingness to reveal information was greater than the midpoint of the scale
indicating a propensity to reveal private information about a prior mistake.
On average, the Chinese migrant sample had a lower propensity to reveal
information than the Anglo-Australian sample. This is concomitant with
Tinsley and Pillutla (1998) findings that American managers show a greater
willingness to share information than Chinese managers in negotiation
strategies. In the supervisor absent condition, there was an increase for both
the Chinese sample and Australian sample in the willingness to reveal pri-
vate information about a prior mistake.
To address the issue of acculturation, the complete Chinese sample was
split into two subgroups resulting in three groups: ABC, CHA, and CLA, as
discussed previously. This sample breakdown reveals some general trends
between the CHA and CLA groups reported in the descriptive statistics
(refer Table 2). On average, the CLA group was less willing to reveal in-
formation than the CHA group. Although the CHA group increased their
willingness to disclose information once the supervisor was removed, the
CLA group did not. Finally, examining the responses in Table 2, the results
show a positive trend between the difference in willingness to reveal the
information (supervisor absent vs. supervisor present) and the degree of
acculturation from CLA (�0.066)11 to CHA (+1.100) to ABC (+1.300).
STEPHEN B. SALTER AND AXEL K.-D. SCHULZ202
Hypothesis Testing
H1 postulates that migrant Chinese managers working in an Australian
culture will have a different propensity to reveal information about a prior
mistake than resident Australian managers. From the data shown in Table 1
and the results in Table 3, H1 was supported. The results show that Chinese
participants were significantly (F ¼ 4:916; p ¼ 0:029; two-tailed) less likelyto disclose information (mean ¼ 6:138) than Australian participants
(mean ¼ 6:850). These results are consistent with those previously found
by Tinsley and Pillutla (1998).
H2 proposed that the removal of the supervisor would result in a smaller
increase in information sharing for migrant Chinese than Australian res-
ident subjects. The descriptive statistics reported in Table 1 and the results
reported in Table 3 show that the tendency to release information when the
supervisor is absent is marginally significantly (F ¼ 2:286; p ¼ 0:068;12 one-tailed) greater for Australian subjects (difference in means ¼ 1.300) than
Chinese subjects (difference in means ¼ 0.831). As the difference is only
marginally significant, H2 was not supported. One of the potential expla-
nations for the nonsignificant difference could be that subjects highly ac-
culturated to the Australian context show behavior consistent with the
Australian subjects. This explanation is tested more specifically when ex-
amining H3.
Table 1. Means (Standard Deviations) for Australian Born vs. Chinese
Born Participants.
Supervisor Culture Partial Means
Australian Chinese
Supervisor present
Mean 6.200 5.723 5.930
S.D. (2.070) (1.972) (2.021)
Supervisor absent
Mean 7.500 6.554 6.965
S.D. (1.632) (1.924) (1.821)
Partial means 6.850 6.138
(1.632) (1.956)
N 60 65 115
Note: Higher values indicate a greater willingness to definitely reveal mistakes.
Examining the Role of Culture and Acculturation in Information Sharing 203
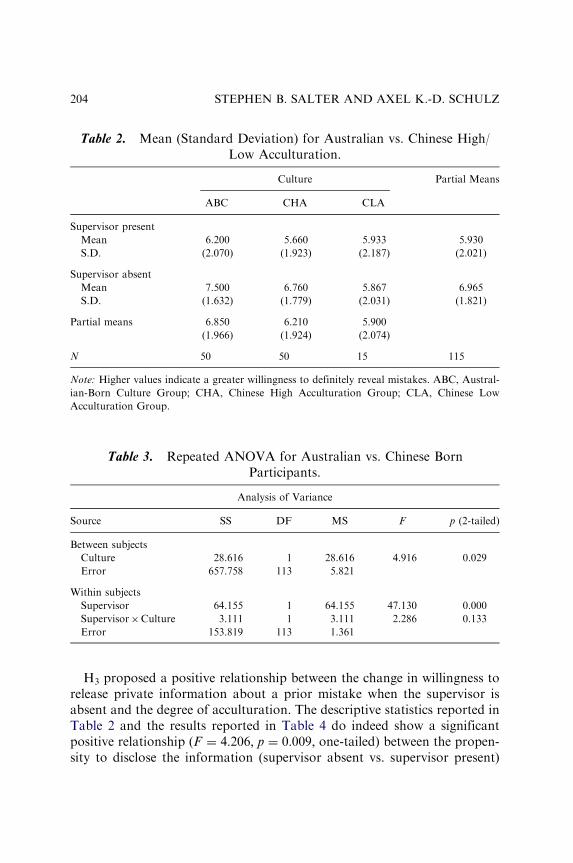
H3 proposed a positive relationship between the change in willingness to
release private information about a prior mistake when the supervisor is
absent and the degree of acculturation. The descriptive statistics reported in
Table 2 and the results reported in Table 4 do indeed show a significant
positive relationship (F ¼ 4:206; p ¼ 0:009; one-tailed) between the propen-
sity to disclose the information (supervisor absent vs. supervisor present)
Table 2. Mean (Standard Deviation) for Australian vs. Chinese High/
Low Acculturation.
Culture Partial Means
ABC CHA CLA
Supervisor present
Mean 6.200 5.660 5.933 5.930
S.D. (2.070) (1.923) (2.187) (2.021)
Supervisor absent
Mean 7.500 6.760 5.867 6.965
S.D. (1.632) (1.779) (2.031) (1.821)
Partial means 6.850 6.210 5.900
(1.966) (1.924) (2.074)
N 50 50 15 115
Note: Higher values indicate a greater willingness to definitely reveal mistakes. ABC, Austral-
ian-Born Culture Group; CHA, Chinese High Acculturation Group; CLA, Chinese Low
Acculturation Group.
Table 3. Repeated ANOVA for Australian vs. Chinese Born
Participants.
Analysis of Variance
Source SS DF MS F p (2-tailed)
Between subjects
Culture 28.616 1 28.616 4.916 0.029
Error 657.758 113 5.821
Within subjects
Supervisor 64.155 1 64.155 47.130 0.000
Supervisor�Culture 3.111 1 3.111 2.286 0.133
Error 153.819 113 1.361
STEPHEN B. SALTER AND AXEL K.-D. SCHULZ204
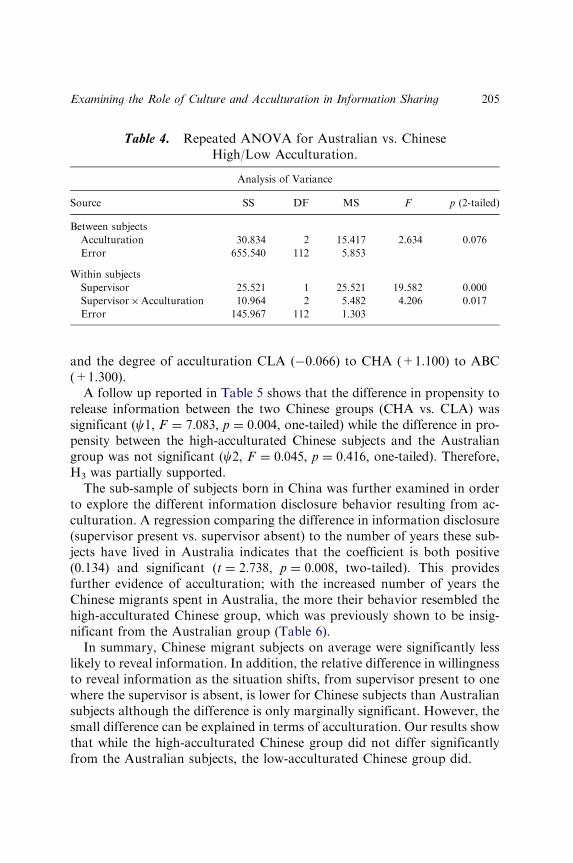
and the degree of acculturation CLA (�0.066) to CHA (+1.100) to ABC
(+1.300).
A follow up reported in Table 5 shows that the difference in propensity to
release information between the two Chinese groups (CHA vs. CLA) was
significant (c1; F ¼ 7:083; p ¼ 0:004; one-tailed) while the difference in pro-
pensity between the high-acculturated Chinese subjects and the Australian
group was not significant (c2; F ¼ 0:045; p ¼ 0:416; one-tailed). Therefore,H3 was partially supported.
The sub-sample of subjects born in China was further examined in order
to explore the different information disclosure behavior resulting from ac-
culturation. A regression comparing the difference in information disclosure
(supervisor present vs. supervisor absent) to the number of years these sub-
jects have lived in Australia indicates that the coefficient is both positive
(0.134) and significant (t ¼ 2:738; p ¼ 0:008; two-tailed). This provides
further evidence of acculturation; with the increased number of years the
Chinese migrants spent in Australia, the more their behavior resembled the
high-acculturated Chinese group, which was previously shown to be insig-
nificant from the Australian group (Table 6).
In summary, Chinese migrant subjects on average were significantly less
likely to reveal information. In addition, the relative difference in willingness
to reveal information as the situation shifts, from supervisor present to one
where the supervisor is absent, is lower for Chinese subjects than Australian
subjects although the difference is only marginally significant. However, the
small difference can be explained in terms of acculturation. Our results show
that while the high-acculturated Chinese group did not differ significantly
from the Australian subjects, the low-acculturated Chinese group did.
Table 4. Repeated ANOVA for Australian vs. Chinese
High/Low Acculturation.
Analysis of Variance
Source SS DF MS F p (2-tailed)
Between subjects
Acculturation 30.834 2 15.417 2.634 0.076
Error 655.540 112 5.853
Within subjects
Supervisor 25.521 1 25.521 19.582 0.000
Supervisor�Acculturation 10.964 2 5.482 4.206 0.017
Error 145.967 112 1.303
Examining the Role of Culture and Acculturation in Information Sharing 205
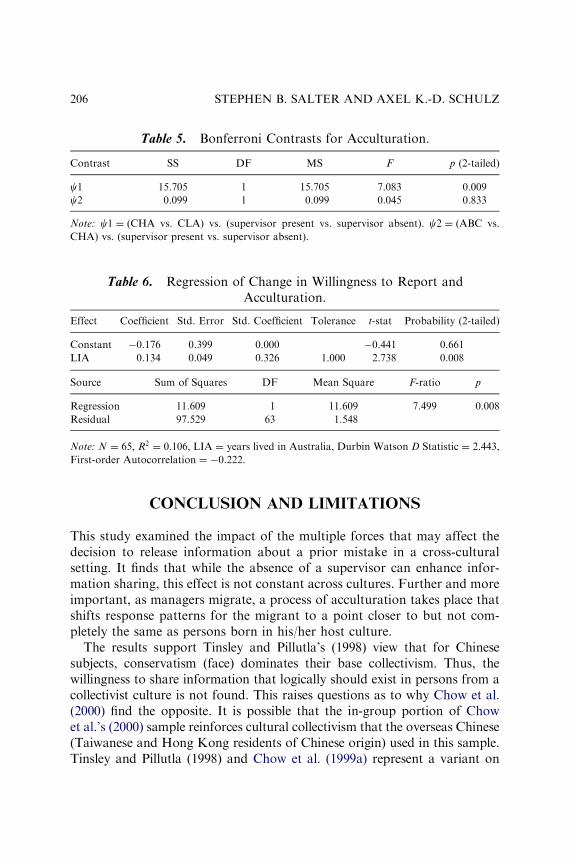
CONCLUSION AND LIMITATIONS
This study examined the impact of the multiple forces that may affect the
decision to release information about a prior mistake in a cross-cultural
setting. It finds that while the absence of a supervisor can enhance infor-
mation sharing, this effect is not constant across cultures. Further and more
important, as managers migrate, a process of acculturation takes place that
shifts response patterns for the migrant to a point closer to but not com-
pletely the same as persons born in his/her host culture.
The results support Tinsley and Pillutla’s (1998) view that for Chinese
subjects, conservatism (face) dominates their base collectivism. Thus, the
willingness to share information that logically should exist in persons from a
collectivist culture is not found. This raises questions as to why Chow et al.
(2000) find the opposite. It is possible that the in-group portion of Chow
et al.’s (2000) sample reinforces cultural collectivism that the overseas Chinese
(Taiwanese and Hong Kong residents of Chinese origin) used in this sample.
Tinsley and Pillutla (1998) and Chow et al. (1999a) represent a variant on
Table 5. Bonferroni Contrasts for Acculturation.
Contrast SS DF MS F p (2-tailed)
c1 15.705 1 15.705 7.083 0.009
c2 0.099 1 0.099 0.045 0.833
Note: c1 ¼ (CHA vs. CLA) vs. (supervisor present vs. supervisor absent). c2 ¼ (ABC vs.
CHA) vs. (supervisor present vs. supervisor absent).
Table 6. Regression of Change in Willingness to Report and
Acculturation.
Effect Coefficient Std. Error Std. Coefficient Tolerance t-stat Probability (2-tailed)
Constant �0.176 0.399 0.000 �0.441 0.661
LIA 0.134 0.049 0.326 1.000 2.738 0.008
Source Sum of Squares DF Mean Square F-ratio p
Regression 11.609 1 11.609 7.499 0.008
Residual 97.529 63 1.548
Note: N ¼ 65; R2 ¼ 0:106; LIA ¼ years lived in Australia, Durbin Watson D Statistic ¼ 2.443,
First-order Autocorrelation ¼ �0.222.
STEPHEN B. SALTER AND AXEL K.-D. SCHULZ206
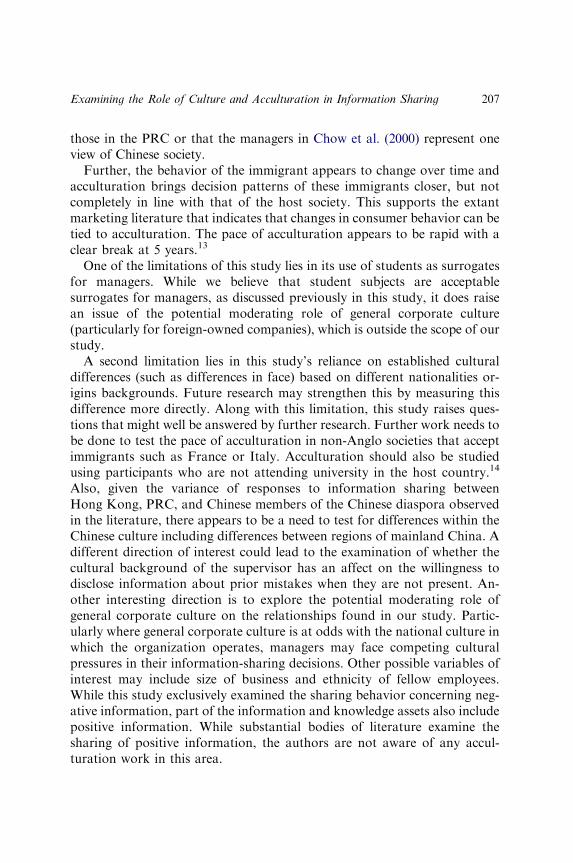
those in the PRC or that the managers in Chow et al. (2000) represent one
view of Chinese society.
Further, the behavior of the immigrant appears to change over time and
acculturation brings decision patterns of these immigrants closer, but not
completely in line with that of the host society. This supports the extant
marketing literature that indicates that changes in consumer behavior can be
tied to acculturation. The pace of acculturation appears to be rapid with a
clear break at 5 years.13
One of the limitations of this study lies in its use of students as surrogates
for managers. While we believe that student subjects are acceptable
surrogates for managers, as discussed previously in this study, it does raise
an issue of the potential moderating role of general corporate culture
(particularly for foreign-owned companies), which is outside the scope of our
study.
A second limitation lies in this study’s reliance on established cultural
differences (such as differences in face) based on different nationalities or-
igins backgrounds. Future research may strengthen this by measuring this
difference more directly. Along with this limitation, this study raises ques-
tions that might well be answered by further research. Further work needs to
be done to test the pace of acculturation in non-Anglo societies that accept
immigrants such as France or Italy. Acculturation should also be studied
using participants who are not attending university in the host country.14
Also, given the variance of responses to information sharing between
Hong Kong, PRC, and Chinese members of the Chinese diaspora observed
in the literature, there appears to be a need to test for differences within the
Chinese culture including differences between regions of mainland China. A
different direction of interest could lead to the examination of whether the
cultural background of the supervisor has an affect on the willingness to
disclose information about prior mistakes when they are not present. An-
other interesting direction is to explore the potential moderating role of
general corporate culture on the relationships found in our study. Partic-
ularly where general corporate culture is at odds with the national culture in
which the organization operates, managers may face competing cultural
pressures in their information-sharing decisions. Other possible variables of
interest may include size of business and ethnicity of fellow employees.
While this study exclusively examined the sharing behavior concerning neg-
ative information, part of the information and knowledge assets also include
positive information. While substantial bodies of literature examine the
sharing of positive information, the authors are not aware of any accul-
turation work in this area.
Examining the Role of Culture and Acculturation in Information Sharing 207
This study triangulates three views of culture in Schwartz (1992), Hofstede
(1980) and Ho (1976) in preparing its hypotheses. However, as Harrison and
McKinnon (1999) would argue, since each of these descriptions of culture
focuses on the values of each society, our study may be ‘‘limited in its ability
to examine and understand the dynamic process of management control sys-
tems and their cultural interplays.’’ Other lenses, particularly those emerging
from anthropology, sociology, and history literatures, may provide valuable
additional insights. In addition, this study is limited by the potential of a
laboratory experiment involving a simplified information-sharing task.
Finally, while this study is intended to build the academic knowledge
base, there are certain implications for managers and management control
system designers. If companies want to utilize the talents of the world’s
brightest and best, they must realize that this comes at a price. That price is
constant vigilance and understanding of how people from different cultures
respond to and change their response to their work context over time.
ACKNOWLEDGMENTS
The authors would like to acknowledge the helpful comments made by
Margaret Abernethy, Andrea Drake, Chee Chow, Graeme Harrison, Jane
Hronsky, and the participants of the 2001 AAANZ Conference and faculty
at workshops at the University of Melbourne, University of Wisconsin and
Bowling Green State University. U.S. Department of Education’s BIE pro-
gram and the University of Melbourne Faculty of Economics and Commerce
and Visiting Scholar Award provided financial support for this project.
NOTES
1. As Macintosh (1994) noted, the manner in which these employees gather, storeand move information should be of vital interest to accounting and informationsystem managers.2. We are using a very general definition of migrants as ‘‘individuals who moved
from their country of origin to a new country.’’3. Greater China includes the Peoples Republic of China and other areas where
persons of Chinese origin dominate the business culture. This group of countriestypically includes Singapore, Hong Kong and Taiwan.4. See for example ‘‘After the Flood,’’ The Economist Newspaper, September 7,
2000 and Bogumil and Lawrence (2000).
STEPHEN B. SALTER AND AXEL K.-D. SCHULZ208
5. Agency theory has arguably had more influence on (Western) financial eco-nomics and accounting than any other theory in the last 20 years (Baiman, 1982,1990; Watts & Zimmerman, 1990). The key feature that distinguishes it from classicaleconomics is the assumption that there may be a divergence of goals between themanager (agent) and the firm’s owners (principal). Managers act in their self-interestrather than the firm’s interest (i.e., shirk) when two conditions are simultaneouslysatisfied: first, there is an incentive for them to do so (they stand to gain personally bytaking a particular action), and second, information asymmetry exists between themand principals, who have less information than the agents.6. If there is a defining demographic trend in these ‘‘immigrant Anglo countries’’
of the world, it has been the return of significant waves of immigrants from culturesthat have little or no relation to existing cultures. In Australia, for example, over20% of the population is composed of immigrants and 40% of these immigrants areChinese (SBS Television, 2000). In the 1996 Canadian census, approximately 25% ofthe population is first generation immigrants and of those immigrants approximately20% are from South and East Asia. Although the U.S. sees itself as a nation ofimmigrants, it has a smaller immigrant population with immigrants contributingapproximately 8% of the population in 1990. However, the role of Chinese immi-grants in the U.S. has been a topic of increasing importance as the percentage ofChinese immigrants among total U.S. immigrants has increased from 9.1% in 1960to 37% in 1992 (Min, 1995).7. Lee and Tse (1994) (Hong Kong and Canadian subjects) use a four-part a priori
classification viz:(1) English-speaking Caucasian Canadians (those who had lived inCanada for more than 10 years); (2) Long-time Hong Kong immigrants (those whoemigrated to Canada more than 7 years ago); (3) New Hong Kong immigrants (thosewho emigrated to Canada less than 7 years ago); and (4) Hong Kong residents (HK,ethnic Chinese who had lived in Hong Kong for more than 10 years). Hong Kongresidents and Caucasian Canadians were included as the anchoring points for com-parison purposes. Ueltschy and Krampf (1997), based on clustering of responses to amultivariate scale, define a three-part classification specifically: (1) Cluster 1 a lowacculturation group that have lived in the U.S. between 1 and 5 years; (2) Cluster 2 abicultural group born in Mexico but having lived in the U.S. from 10 to 15 years; and(3) Cluster 3 a high acculturation group born in the U.S. as were their parents andgrand parents but not particularly dissimilar from the Anglo residents around them.8. This question was included to test for any systematic differences across subject
groups in terms of how truthful subjects were in responding to the questions in theinstrument.9. To gain further comfort all of the analyses reported in this study were also
conducted with a covariate controlling for the response on the manipulation checkquestion. The covariate was coded 1 for a response below the midpoint of the scaleand 2 for a response above the midpoint. Results obtained were consistent with thosereported in this study.10. We believe that student subjects are acceptable surrogates for managers in our
study, as these subjects were studying (i.e., working) in an environment culturallyrepresentative of their future working environment insofar as national culture.11. CLA/Supervisor absent 5.867 minus CLA supervisor present 5:933 ¼ �0:066
in Table 2.
Examining the Role of Culture and Acculturation in Information Sharing 209
12. Table 3 provides the results for a two-tailed test. The one-tail p-value is ob-tained by dividing the two-tail p-value by 2.13. We tested a further break at 10 years and found no evidence of significant
further acculturation.14. It is interesting to note that the Australian government seems to recognize the
value of university training as a source of acculturation by their policy that foreignerseducated at Australian universities need to obtain only 90% of the points required ofother potential candidates for permanent residence.
REFERENCES
Adelson, A. (1989). English role in Hispanic marketing, The New York Times, (January 26),
D19, col 1.
Baiman, S. (1982). Agency research in management accounting: A survey. Journal of Accounting
Literature, 1, 154–213.
Baiman, S. (1990). Agency research in management accounting: A second look. Accounting,
Organizations and Society, 15, 341–371.
Berry, J. W. (1997). Immigration, acculturation, and adaptation. Applied Psychology: An In-
ternational Review, 46, 5–34.
Birnberg, J., & Snodgrass, C. (1988). Culture and control: A field study. Accounting, Organ-
izations and Society, 13, 447–464.
Bogumil, A., & Lawrence, W. (2000). Foreign knowledge workers as a strategic staffing option.
Academy of Management Executive, 14(4), 71–84.
Chenhall, R. (1992). Contemporary performance measurement. Accounting Communique
(Vol. 39). Australian Society of CPAs.
Chow, C., Deng, J., & Ho, J. (2000). The openness of knowledge sharing within organizations:
A cross-cultural investigation. Journal of Management Accounting Research, 12, 65–95.
Chow, C., Harrison, G., McKinnon, J., & Wu, A. (1999a). Cultural influences on information
sharing in Chinese and Anglo-American organizations: An exploratory study. Account-
ing, Organizations and Society, 24, 561–582.
Chow, C., Kato, Y., & Merchant, K. (1996). The use of organizational controls and their effects
on data manipulation and management myopia: A Japan vs. U.S. comparison. Ac-
counting, Organizations and Society, 21, 175–192.
Chow, C., Kato, Y., & Shields, M. (1994). National culture and the preference for management
controls: An exploratory study of the firm-labor market interface. Accounting, Organ-
izations and Society, 19, 381–400.
Chow, C., Schulz, A., & Wu, A. (1999b). Roz Inc.: A case for extending management ac-
counting coverage to managers’ information acquisition process. Journal of Accounting
Education, 17, 429–442.
Cohen, R. (1978). Ethnicity: Problem and focus in anthropology. Annual Review of Anthro-
pology, 7, 379–403.
Faber, R., O’Guinn, T., & Meyer, T. (1987). Television portrayals of Hispanics: A comparison
of ethnic perceptions. International Journal of Intercultural Relations, 11, 155–169.
Harrell, A., & Harrison, P. (1994). An incentive to shirk, privately held information and man-
agers’ project evaluation decisions. Accounting, Organizations and Society, 19, 569–577.
STEPHEN B. SALTER AND AXEL K.-D. SCHULZ210
Harrison, G., & McKinnon, J. (1999). Cross-cultural research in management control systems
design: A review of the current state. Accounting, Organizations and Society, 24, 483–509.
Harrison, G., McKinnon, J., Panchapakesan, S., & Leung, M. (1994). The influence of culture
on organizational design and planning and control in Australia and the United States
compared with Singapore and Hong Kong. Journal of International Financial Manage-
ment and Accounting, 5, 242–261.
Hayes-Bautista, D., Schinck, W., Chapa, J., & Soto, S. (1984). Hispanic shoppers. Washington
DC: Food Marketing Institute.
Ho, D. Y. (1976). On the concept of ‘Face’. American Journal of Sociology, 81, 867–884.
Hofstede, G. (1980). Culture’s consequences: International differences in work-related values.
Beverly Hills, CA: Sage.
Hofstede, G. (1991). Cultures and organizations: Software of the mind. Berkshire, UK: McGraw-
Hill.
Kanodia, C., Bushman, R., & Dickhaut, J. (1989). Escalation errors and the sunk cost effect:
An explanation based on reputation and information asymmetry. Journal of Accounting
Research, 27(1), 59–77.
Kara, A., & Kara, N. (1996). Ethnicity and consumer choice: A study of Hispanic decision
processes across acculturated levels. Journal of Applied Business Research, 12(2), 22–36.
Kim, C. Laroche., La Roche, M., & Tomiuk, M. (2004). The Chinese in Canada: A study in
ethnic change with emphasis on gender roles. Journal of Social Psychology, 144(1), 5–30.
Lee, W., & Tse, D. (1994). Changing media consumption in a new home: Acculturation patterns
among Hong Kong immigrants to Canada. Journal of Advertising, 23(1), 57.
Levinthal, D., & March, J. (1993). The myopia of learning. Strategic Management Journal, 14,
95–112.
Macintosh, N. (1994). Management accounting and control systems. Chichester: Wiley.
Merchant, K., Chow, C., & Wu, A. (1995). Measurement, evaluation and reward of profit
centre managers: A cross-cultural field study. Accounting, Organizations and Society, 20,
619–638.
Min, P. (1995). Chinese-Americans: Contemporary trends and issues. Thousand Oaks, CA: Sage.
Minor, M. (1992). Comparing the Hispanic and Non Hispanic markets: How different are they?
Journal of Service Marketing, 6(2), 29–32.
Nanni, A., Jr., Dixon, J., & Vollman, T. (1992). Integrated performance measurement: Man-
agement accounting to support the new manufacturing realities. Journal of Management
Accounting Research, 4, 1–19.
O’Connor, N. (1995). The influence of organizational culture on the usefulness of budget
participation by Singaporean-Chinese managers. Accounting, Organizations and Society,
20, 383–403.
Padilla, A. (1980). The role of cultural and ethnic loyalty in acculturation. In: A. Padilla (Ed.),
Acculturation: Theory, models and some new findings (pp. 47–84). Boulder, CO: Westview
Press.
Peters, T. (1994). The Tom Peters seminar: Crazy times call for crazy organizations. London:
Macmillan.
Redding, G., & Wong, G. Y. Y. (1986). The psychology of Chinese organizational behavior. In:
M. H. Bond (Ed.), The psychology of the Chinese people (pp. 267–295). Hong Kong:
Oxford University Press.
Schwartz, S. (1987). Toward a universal psychological structure of human values. Journal of
Personality and Social Psychology, 53, 550–562.
Examining the Role of Culture and Acculturation in Information Sharing 211
Schwartz, S. (1992). Universals in the content and structure of values: Theoretical advances and
empirical tests in 20 countries. In: M. P. Zana (Ed.), Advances in experimental social
psychology, (Vol. 25, pp. 1–65). New York, NY: Academic Press.
Smith, M. (1994). New tools for management accountants. Melbourne: Longman Professional
Publishing.
Ueltschy, L., & Krampf, R. (1997). The influence of acculturation on advertising effects to the
Hispanic market. Journal of Applied Business Research, 13(2), 87.
Valencia, H. (1985). Hispanic values and cultural research. Journal of Academy of Marketing
Science, 17, 23–28.
Watts, R., & Zimmerman, J. (1990). Positive accounting theory: A ten-year retrospective. The
Accounting Review, 65(1), 131–156.
Yammarino, J., & Jung, D. (1998). Chinese Americans and leadership: A levels of analysis
perspective. The Journal of Applied Behavioral Science, March, 34(1), 47–67.
STEPHEN B. SALTER AND AXEL K.-D. SCHULZ212
THE EFFECTS OF VALUE
ATTAINMENT AND COGNITIVE
ROLES OF BUDGETARY
PARTICIPATION ON JOB
PERFORMANCE
Vincent K. Chong, Ian R. C. Eggleton and
Michele K. C. Leong
ABSTRACT
This chapter examines the effects of the value attainment and cognitive
roles of budgetary participation on job performance. A structural model
consisting of variables such as budgetary participation, job-relevant in-
formation, job satisfaction, and job performance is proposed and tested
using a survey questionnaire on 70 senior managers, drawn from a cross-
section of the financial services sector. Their responses are analyzed using
a structural equation modeling (SEM) technique. The results reveal that
budgetary participation is positively associated with job-relevant infor-
mation. These results lend support to the cognitive effect of budgetary
participation, which suggests that subordinates participate in the budget
setting process to share information. In addition, the results suggest that
budgetary participation is positively associated with job satisfaction.
Advances in Accounting Behavioral Research
Advances in Accounting Behavioral Research, Volume 8, 213–233
Copyright r 2005 by Elsevier Ltd.
All rights of reproduction in any form reserved
ISSN: 1475-1488/doi:10.1016/S1475-1488(04)08009-3
213

These results support the value attainment role of budgetary participa-
tion, which increases subordinates’ levels of job satisfaction. Furthermore,
the results reveal that there are positive relationships between job-relevant
information and job satisfaction, job-relevant information and job per-
formance, and job satisfaction and job performance.
INTRODUCTION
Since the pioneering work of Argyris (1952) concerning the behavioral as-
pects of budgeting, a sizable body of research has developed in management
accounting examining the effect of budgetary participation on job
performance (see Covaleski, Evans, Luft, & Shields, 2003, for a compre-
hensive review). To date, the results of empirical evidence on the cognitive
role of budgetary participation on job performance have produced consist-
ent outcomes (Chenhall & Brownell, 1988; Kren, 1992; Chong & Chong,
2002).1 Kren (1992) developed a research model, which explicitly
examined the cognitive function of budgetary participation on job per-
formance. He argues that budgetary participation can facilitate the acqui-
sition and use of job-relevant information. Job-relevant information, in
turn, can improve performance. Specifically, Kren finds that budgetary
participation affects job performance indirectly through job-relevant
information.
A review of the literature on participative budgeting indicates that value
attainment is another role of budgetary participation (Locke & Schweiger,
1979; Locke & Latham, 1990; Shields & Shields, 1998). Indeed, numerous
studies have recognized the value attainment role of budgetary participation
(see e.g. Chenhall, 1986; Chenhall & Brownell, 1988; Chong & Bateman,
2000). However, no studies have explicitly tested its impact on subordinates’
job performance, and its potential influence within a cognitive model of
budgetary participation. The value attainment role of budgetary participa-
tion theoretically affects subordinates’ levels of job satisfaction (Shields &
Shields, 1998). Specifically, the value attainment effect of budgetary par-
ticipation suggests that allowing subordinates to participate in the budget-
setting process will increase the likelihood that they will feel satisfied with
their values (French, Israel, & As, 1960; Strauss, 1963; Lowin, 1968; Locke
& Schweiger, 1979). Subordinates’ values may include: (1) the opportunity
to express their views, (2) the feeling of being treated equally, and (3) the
desire for respect or dignity (Argyris, 1955; Davis, 1957). To date, the
VINCENT K. CHONG ET AL.214
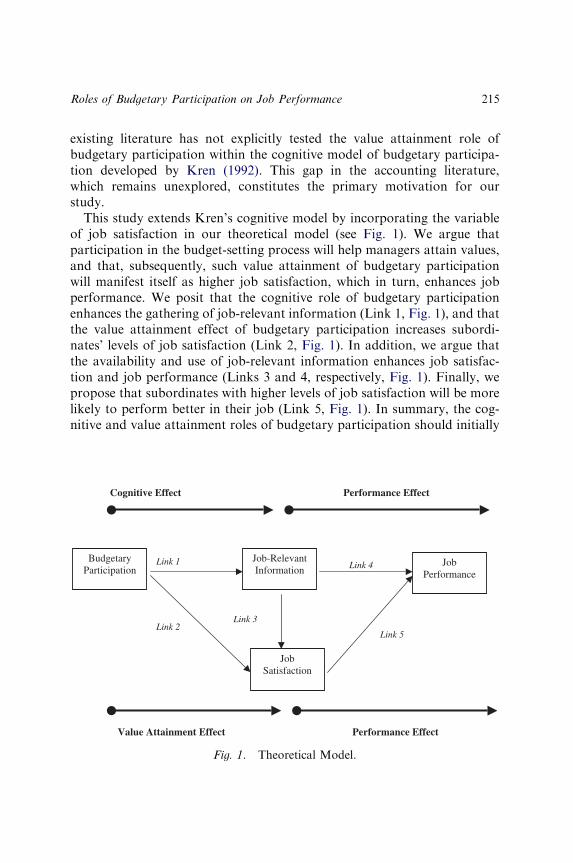
existing literature has not explicitly tested the value attainment role of
budgetary participation within the cognitive model of budgetary participa-
tion developed by Kren (1992). This gap in the accounting literature,
which remains unexplored, constitutes the primary motivation for our
study.
This study extends Kren’s cognitive model by incorporating the variable
of job satisfaction in our theoretical model (see Fig. 1). We argue that
participation in the budget-setting process will help managers attain values,
and that, subsequently, such value attainment of budgetary participation
will manifest itself as higher job satisfaction, which in turn, enhances job
performance. We posit that the cognitive role of budgetary participation
enhances the gathering of job-relevant information (Link 1, Fig. 1), and that
the value attainment effect of budgetary participation increases subordi-
nates’ levels of job satisfaction (Link 2, Fig. 1). In addition, we argue that
the availability and use of job-relevant information enhances job satisfac-
tion and job performance (Links 3 and 4, respectively, Fig. 1). Finally, we
propose that subordinates with higher levels of job satisfaction will be more
likely to perform better in their job (Link 5, Fig. 1). In summary, the cog-
nitive and value attainment roles of budgetary participation should initially
Cognitive Effect Performance Effect
Budgetary Participation
Link 2
Link 1 Job-RelevantInformation
Job Satisfaction
Job Performance
Link 5
Link 4
Link 3
Value Attainment Effect Performance Effect
Fig. 1. Theoretical Model.
Roles of Budgetary Participation on Job Performance 215
enhance job-relevant information and job satisfaction, which in turn, lead to
higher job performance.
The remainder of the chapter is organized as follows: In the next section,
the relevant literature is reviewed and hypotheses underlying the study are
developed. Subsequent sections present the research method, results, and
conclusion and limitations of the study.
RESEARCH MODEL AND THEORETICAL
DEVELOPMENT
The Cognitive Effect Hypothesis: The Relationship between Budgetary
Participation and Job-Relevant Information
The first hypothesis is concerned with the relationship between budgetary
participation and job-relevant information (Link 1 of Fig. 1).2 Prior ac-
counting literature suggests that budgetary participation provides an op-
portunity for subordinates to gather job-relevant information to facilitate
their decision-making process (Kren & Liao, 1988; Chenhall & Brownell,
1988; Kren, 1992; Magner, Welker, & Campbell, 1996). For example, Kren
and Liao (1988) suggest that participation provides cognitive benefits, which
enable the subordinates to clarify and comprehend the means by which
objectives can be fulfilled. Chenhall and Brownell (1988), on the other hand,
claim that budgetary participation allows managers to acquire job-relevant
information that assists and clarifies their role expectations, the methods
used in fulfilling their role expectations, or the consequences of role per-
formance. Kren (1992) and Magner et al. (1996) find that budgetary par-
ticipation is positively associated with job-relevant information. The
psychological literature (see Latham & Saari, 1979; Campbell & Gingrich,
1986) also indicates that budgetary participation has a positive and direct
effect on job-relevant information.
In summary, the above literature review and empirical evidence suggest
that budgetary participation serves as a cognitive function by enabling
managers to obtain, exchange, and disseminate job-relevant information.
Hence, this study postulates that the cognitive role of budgetary participa-
tion is positively associated with job-relevant information. The following
hypothesis is tested:
H1. Budgetary participation is positively associated with job-relevant
information.
VINCENT K. CHONG ET AL.216
The Value Attainment Effect Hypothesis: The Relationship between
Budgetary Participation and Job Satisfaction
The second hypothesis is concerned with the relationship between budg-
etary participation and job satisfaction (Link 2 of Fig. 1). The notion of the
value attainment role of budgetary participation suggests that allowing
subordinates to participate in the budget-setting process will increase the
likelihood that they will feel satisfied with their values (French et al., 1960;
Strauss, 1963; Lowin, 1968; Locke & Schweiger, 1979).3 Prior studies (e.g.
Chenhall & Brownell, 1988; Lau & Tan, 2003) support the value attainment
role of budgetary participation. For example, Chenhall and Brownell
(1988, p. 231) conclude that ‘‘yparticipation is most helpful in decreasing
managers’ role ambiguity, and that decreased role ambiguity improves
job satisfaction.’’ Chenhall and Brownell attribute their findings to the
managers’ opportunity to participate in a budget-setting process, which
allows them to attain their values (i.e. to reduce the level of role ambiguity).
Consequently, these managers felt highly satisfied with their job because
of such value attainment. Similarly, Lau and Tan (2003) find that bud-
getary participation is likely to improve subordinates’ levels of job satis-
faction because allowing them to get involved in the budget-setting
process enhances their ability to meet their budget targets (i.e. to meet their
values).
In addition, subordinates who participate in the budget-setting process
may experience feelings of dignity and self-respect (Cherrington, 1980;
Shields & Shields, 1998). Shields and Shields (1998) suggest that budgetary
participation helps to increase the subordinates’ self-esteem, morale, and to
enhance their job satisfaction. They claim that the positive relationship be-
tween budgetary participation and job satisfaction is due to the fact that
‘‘ythe act of participation allows a subordinate to experience self-respect
and feelings of equality arising from the opportunity to express his or her
values’’ (Shields & Shields, 1998, p. 59). Furthermore, the opportunity to
participate in the budget-setting process may cause subordinates to feel that
their jobs are more fulfilling and induce them to exert greater work-related
effort (see Deci & Ryan, 1985). Prior research suggests that the exertion of
effort in the job itself provides fulfillment of peoples’ intrinsic needs to be
competent and effective, hence contributing to job satisfaction (Aronson &
Mills, 1959; Cardozo, 1965; Emmons, 1986).
In summary, the above discussion suggests that the value attainment role
of budgetary participation is expected to increase subordinates’ levels of job
satisfaction. Thus, the formal hypothesis is as follows:
Roles of Budgetary Participation on Job Performance 217
H2. Budgetary participation is positively associated with job satisfaction.
The Relationship between Job-Relevant Information and Job Satisfaction
The third hypothesis is concerned with the relationship between job-relevant
information and job satisfaction (Link 3 of Fig. 1). A review of the literature
suggests that job-relevant information is related to subordinates’ job sat-
isfaction (see O’Reilly & Caldwell, 1979; White & Mitchell, 1979; Griffin,
1983; Lau & Tan, 2003). Lau and Tan (2003, p. 23), for example, find that
‘‘yjob-relevant information, which promotes feeling of success through
successful task completion, was associated with improved subordinates’ job
satisfaction.’’ Lau and Tan’s argument was based on the needs-satisfaction
model proposed by Salancik and Pfeffer (1977, 1978), which suggests that
the expectation of feeling success (failure) is associated with feelings of sat-
isfaction (dissatisfaction). In addition, the needs-satisfaction model suggests
that needs fulfillment leads to increased job satisfaction. Specifically, it is
argued that ‘‘yjobs which fulfill a person’s needs are satisfying; those that
do not are not satisfying’’ (Salancik & Pfeffer, 1977, p. 428).
In summary, the more job-relevant information that subordinates have
about how to perform their job, the more job satisfaction they will have.
Thus, the following hypothesis is tested:
H3. Job-relevant information is positively associated with job satisfaction.
The Relationship between Job-Relevant Information and Job Performance
The fourth hypothesis is concerned with the relationship between job-
relevant information and job performance (Link 4 of Fig. 1). Job-relevant
information gathered through a participative process could enhance an in-
dividual’s ability to perform (Beehr & Love, 1983). The existing literature
suggests that the use of job-relevant information enhances job performance
(see e.g. Campbell & Gingrich, 1986; Kren, 1992; Chong & Chong, 2002).
Kren (1992), for example, finds that job-relevant information is positively
associated with job performance. He attributes his results to the fact that
job-relevant information helped subordinates to improve their action choic-
es through better-informed effort, and consequently, improved perform-
ance. Kren (1992, p. 512) summarizes the usefulness of job-relevant
information for decision making as follows:
VINCENT K. CHONG ET AL.218
yJob-relevant information can improve performance because it allows more accurate
predictions of environmental states and thus allows more effective selection of appro-
priate courses of action.
Chong and Chong (2002) conclude that the use of job-relevant information
improves subordinates’ job performance because job-relevant information
allows them to improve their decision choices. In summary, the above dis-
cussion suggests that the higher the level of job-relevant information, the
higher the level of subordinates’ job performance. Hence, the following
hypothesis is tested:
H4. Job-relevant information is positively associated with job performance.
The Relationship between Job Satisfaction and Job Performance
The fifth hypothesis is concerned with the relationship between job satis-
faction and job performance (Link 5 of Fig. 1). Recall that a primary ob-
jective of this study is to demonstrate the value attainment role of budgetary
participation on subordinates’ job performance. Numerous prior account-
ing studies (see e.g. Choo & Tan, 1997; Poznanski & Bline, 1997) have
demonstrated that job satisfaction is an antecedent to job performance. For
example, Choo and Tan (1997) find that job satisfaction mediates the re-
lationship between disagreement in budgetary performance evaluation style
and job performance. Specifically, they find that when subordinates’ pre-
ferred budgetary performance evaluation styles differed from their superi-
ors’ preferred budgetary performance evaluation styles, this disagreement
leads to lower levels of job satisfaction and poorer job performance amongst
subordinates. A dissatisfied subordinate may be more likely than a highly
satisfied subordinate to decide simply not to perform in his or her job (see
Franken, 1982). For example, Franken (1982, p. 451) claims that:
Job dissatisfaction is an important issue because it has been linked toythe decision
simply to not perform. ydissatisfaction is likely to lead to ysimply poor performance.
In addition, a subordinate who is satisfied with his or her job is assumed to
perform better (Locke, 1986; Katzell, Thompson, & Guzzo, 1992). Katzell
et al. (1992, p. 198) suggest that job satisfaction should be regarded as an
attitudinal state of arousal that disposes one to exert effort. These studies
attribute such findings (i.e. that there is a positive relationship between job
satisfaction and job performance), to the fact that highly satisfied subor-
dinates are more likely to exert additional effort to perform. Effort refers to
‘‘the amount of energy spent on [an] act per unit of time’’ (Naylor,
Roles of Budgetary Participation on Job Performance 219
Pritchard, & Ilgen, 1980, p. 6). It represents the force, energy, or activity by
which work is accomplished (see Naylor et al., 1980; Ilgen & Klein, 1988).
Brown and Peterson (1994) found that increased effort leads to improved
job performance.4
In summary, the above discussion suggests that the higher the levels of job
satisfaction, the higher the levels of subordinates’ job performance. Thus,
the following hypothesis is tested:
H5. Job satisfaction is positively associated with job performance.
RESEARCH METHOD
The data collection method used in this study was a mailed survey ques-
tionnaire. This method was employed as it enables a large random sample to
be tested, which enhances external validity. A total of 141 senior-level man-
agers from firms in the financial services sector were randomly drawn from
the Kompass Australia (1999) business directory. Telephone calls were made
to ensure that each of the senior-level managers selected would receive the
questionnaire, and would be the person involved in answering the ques-
tionnaire. Most importantly, these managers were called to ensure that they
held budget responsibilities in their respective firms. Respondents were in-
volved in the preparation of budgets for planning and control purposes.
Since all of the respondents occupied positions of high responsibility and
accountability, their role of budgetary participation in our sample is not one
of pseudo-participation.5
Each participant was sent a survey questionnaire with a covering letter
explaining the objective of the study and a reply paid self-addressed enve-
lope. To enhance our response rate, each respondent was promised a gift
voucher of 15 Australian dollars for returning the completed questionnaire.
Each questionnaire was pre-coded to enable non-respondents to be traced
and follow-up to be executed. A follow-up letter and another copy of the
questionnaire were sent to those people who had not responded after four
weeks. The response rate to the mail-out was 54%.6 Of the 77 question-
naires, seven were excluded from the study because they were considered
outliers.7 This resulted in 70 usable responses for the final data analysis. The
organizations surveyed have an average of 908 employees. Each manager,
on average, was responsible for 98 employees. The average age of each
participant was 42 years. The average length of time spent in the position
VINCENT K. CHONG ET AL.220
was nearly 4 years and each manager had, on average, 10 years experience in
his or her current area of responsibility.
Measurement of Variables
Budgetary participation was measured by a three-item scale, similar to those
used by Kren (1992) and Magner et al. (1996), which was originally devel-
oped by Milani (1975). These three similar items were chosen to insure that
the budgetary participation scale would be comparable with those of Kren
(1992) and Magner et al. (1996). The three items were: (1) ‘‘To what extent
are you involved in setting your budget?’’, (2) ‘‘How much influence do you
feel you have on the final budget?’’, and (3) ‘‘How do you view your con-
tribution to the budget?’’. Each item was measured on a 7-point Likert-type
scale (scored 1–7), with higher values on the item scale indicating higher
budgetary participation. Cronbach’s alpha coefficient (Cronbach, 1951) ob-
tained for this scale was 0.89, which indicates high internal reliability for the
scale (Nunnally, 1967).
Job-relevant information was measured using Kren’s (1992) three-item, 7-
point Likert-type scale. The objective of this measure is to assess the extent
to which managers’ perceived information availability is necessary for the
purposes of evaluating important decision alternatives and making effective
job-related decisions. The scale ranges from 1 (strongly disagree) to 7
(strongly agree). The three items were: (1) ‘‘I am always clear about what is
necessary to perform well on my job’’, (2) ‘‘I have adequate information to
make optimal decisions to accomplish my performance objectives’’, and (3)
‘‘I am able to obtain the strategic information necessary to evaluate im-
portant decision alternatives’’. Cronbach’s alpha coefficient obtained for
this scale was 0.77, which indicates satisfactory internal reliability for the
scale.
Job satisfaction was measured by a two-item, 7-point Likert-type scale
developed by Dewar and Werbel (1979). The two items were: (1) ‘‘All in all,
I am satisfied with my job’’, and (2) ‘‘In general, I like working in this
company’’. Cronbach’s alpha coefficient obtained for this scale was 0.91,
which indicates high internal reliability for the scale.
A single-item, 7-point Likert-type scale was used to measure job per-
formance as it was consistent with numerous prior accounting studies (e.g.
Merchant, 1981, 1984; Mia & Chenhall, 1994; Dunk, 1995). Respondents
were asked to rate their overall performance from ‘‘well below average’’ to
‘‘well above average’’ on a fully anchored 7-point Likert-type scale.
Roles of Budgetary Participation on Job Performance 221
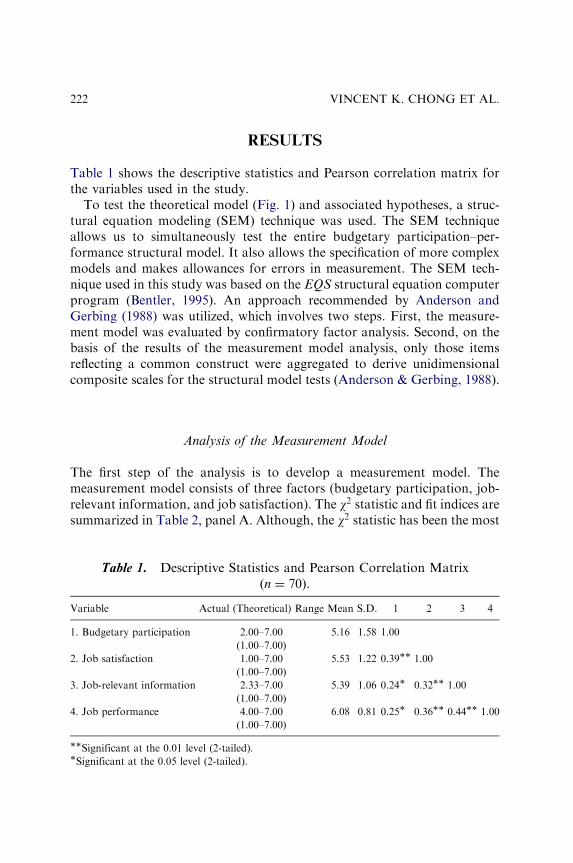
RESULTS
Table 1 shows the descriptive statistics and Pearson correlation matrix for
the variables used in the study.
To test the theoretical model (Fig. 1) and associated hypotheses, a struc-
tural equation modeling (SEM) technique was used. The SEM technique
allows us to simultaneously test the entire budgetary participation–per-
formance structural model. It also allows the specification of more complex
models and makes allowances for errors in measurement. The SEM tech-
nique used in this study was based on the EQS structural equation computer
program (Bentler, 1995). An approach recommended by Anderson and
Gerbing (1988) was utilized, which involves two steps. First, the measure-
ment model was evaluated by confirmatory factor analysis. Second, on the
basis of the results of the measurement model analysis, only those items
reflecting a common construct were aggregated to derive unidimensional
composite scales for the structural model tests (Anderson & Gerbing, 1988).
Analysis of the Measurement Model
The first step of the analysis is to develop a measurement model. The
measurement model consists of three factors (budgetary participation, job-
relevant information, and job satisfaction). The w2 statistic and fit indices are
summarized in Table 2, panel A. Although, the w2 statistic has been the most
Table 1. Descriptive Statistics and Pearson Correlation Matrix
ðn ¼ 70Þ.
Variable Actual (Theoretical) Range Mean S.D. 1 2 3 4
1. Budgetary participation 2.00–7.00 5.16 1.58 1.00
(1.00–7.00)
2. Job satisfaction 1.00–7.00 5.53 1.22 0.39�� 1.00
(1.00–7.00)
3. Job-relevant information 2.33–7.00 5.39 1.06 0.24� 0.32�� 1.00
(1.00–7.00)
4. Job performance 4.00–7.00 6.08 0.81 0.25� 0.36�� 0.44�� 1.00
(1.00–7.00)
��Significant at the 0.01 level (2-tailed).�Significant at the 0.05 level (2-tailed).
VINCENT K. CHONG ET AL.222
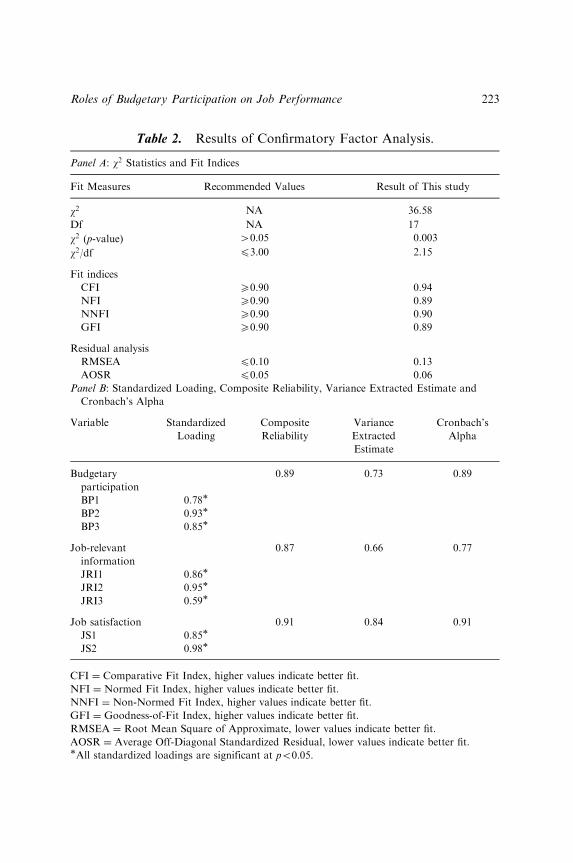
Table 2. Results of Confirmatory Factor Analysis.
Panel A: w2 Statistics and Fit Indices
Fit Measures Recommended Values Result of This study
w2 NA 36.58
Df NA 17
w2 (p-value) 40.05 0.003
w2/df p3.00 2.15
Fit indices
CFI X0.90 0.94
NFI X0.90 0.89
NNFI X0.90 0.90
GFI X0.90 0.89
Residual analysis
RMSEA p0.10 0.13
AOSR p0.05 0.06
Panel B: Standardized Loading, Composite Reliability, Variance Extracted Estimate and
Cronbach’s Alpha
Variable Standardized
Loading
Composite
Reliability
Variance
Extracted
Estimate
Cronbach’s
Alpha
Budgetary
participation
0.89 0.73 0.89
BP1 0.78�
BP2 0.93�
BP3 0.85�
Job-relevant
information
0.87 0.66 0.77
JRI1 0.86�
JRI2 0.95�
JRI3 0.59�
Job satisfaction 0.91 0.84 0.91
JS1 0.85�
JS2 0.98�
CFI ¼ Comparative Fit Index, higher values indicate better fit.
NFI ¼ Normed Fit Index, higher values indicate better fit.
NNFI ¼ Non-Normed Fit Index, higher values indicate better fit.
GFI ¼ Goodness-of-Fit Index, higher values indicate better fit.
RMSEA ¼ Root Mean Square of Approximate, lower values indicate better fit.
AOSR ¼ Average Off-Diagonal Standardized Residual, lower values indicate better fit.�All standardized loadings are significant at po0.05.
Roles of Budgetary Participation on Job Performance 223
often used indicator for model fit, it is not as useful as other fit indicators
(Browne & Mels, 1994). Bollen and Long (1993) suggest the use of multiple
model fit indicators. The results shown in Table 2, panel A reveal that the w2
statistic for our measurement model does not fit the data (w2 ¼ 36:58;po0.003). However, the value of the w2 divided by the degree of freedom is
2.15, which is below the cutoff value of 3 and is indicative of model fit
(Hartwick & Barki, 1994; Segars & Grover, 1993). Further, the fit measures
such as comparative fit index (CFI) and non-normed fit index (NNFI) are
0.94 and 0.90, respectively, which meets or exceeds the 0.90minimum
threshold (Bentler & Bonett, 1980; Anderson & Gerbing, 1988; Hair et al.,
1998). The normed fit index ðNFI ¼ 0:89Þ and goodness-of-fit index
(GFI ¼ 0.89) fall marginally short of the desired 0.90 criteria. The root
mean square error of approximate (RMSEA) is 0.13, indicating a reasonable
fit, although this value is somewhat higher than desired (Segars & Grover,
1993; Hartwick & Barki, 1994; Fogarty, Singh, Rhoads, & Moore, 2000).
Finally, the average off-diagonal standardized residual is 0.06, suggesting a
marginal fit. Taken together, the fit indices seem to be adequate and re-
specification is not necessary. Furthermore, the tests for convergent validity
and discriminant validity provide further support for this decision.
Convergent Validity Test
The convergent validity of the scale is assessed by three measures: stand-
ardized loading, composite reliability, and variance extracted estimate
(Fornell & Larcker, 1981). The results shown in Table 2, panel B, reveal that
the standardized loadings for all the items of the three scales are highly
significant (po0.05). The composite reliability reflects the internal consist-
ency of the indicators measuring a given factor (Fornell & Larcker, 1981). It
is analogous to Cronbach’s (1951) alpha coefficient for measuring the re-
liability of a multiple-item scale. The composite reliability is 0.87 or greater
for each scale, indicating that the items comprising each scale are highly
correlated. Variance extracted estimates assess the amount of variance that
is captured by an underlying factor in relation to the amount of variance due
to measurement error (see Fornell & Larcker, 1981). The variance extracted
estimates for three of the factor scales exceeds the minimum level of 0.50
recommended by Fornell and Larcker (1981). Taken together, these results
provide support for the convergent validity of the three scales.
Discriminant Validity Test
Discriminant validity is inferred when measures of each construct converge
on their respective true scores, which are different from the scores of other
VINCENT K. CHONG ET AL.224
constructs (see Churchill, 1979). The discriminant validity of the three scales
is assessed using the procedure outlined by Bagozzi, Yi, and Phillips (1991).
Specifically, a model is estimated in which the correlation between (1)
budgetary participation and job-relevant information; (2) budgetary par-
ticipation and job satisfaction; (3) job-relevant information and job satis-
faction, respectively, are restricted to unity (i.e. the correlation is fixed at
1.0). The fits of the constrained models are then compared with those of the
original unconstrained models. The results of the discriminant validity
analysis for the three scales are shown in Table 3.
As shown in Table 3, panel A, the w2 difference tests are significant for the
models, which estimate the correlations between the budgetary participation
and job-relevant information scales (w2ð1Þ ¼ 63:45; po0.01), the budgetary
participation and job satisfaction scales (w2ð1Þ ¼ 12:26; po0.05), and job-
relevant information and job satisfaction scales (w2ð1Þ ¼ 8:16; po0.05).
These results suggest that the above-mentioned scales exhibit very strong
properties of discriminant validity. A further test for the discriminant va-
lidity of the three scales is conducted by comparing the variance extracted
estimates with the squared of the correlations between the latent constructs
(Fornell & Larcker, 1981). As shown in Table 3, panel B, the variance
extracted estimates for all constructs exceed the squared of the correlations.
These results provide strong support for the discriminant validity of the
three scales.
Analysis of the Structural Model
The hypotheses are tested by relying on the standardized parameter esti-
mates for the theoretical model as shown in Fig. 2. As expected, the results
reveal that H1, which states that budgetary participation is positively as-
sociated with job-relevant information, is statistically significant (standard-
ized path coefficient ¼ 0:24; po0.05). Thus, these results support H1 and
lend support to the cognitive effect of budgetary participation, which sug-
gests that subordinates participate in the budget-setting process to share
information. In addition, the results shown in Fig. 2 reveal that budgetary
participation is positive and statistically significantly associated with job
satisfaction (standardized path coefficient ¼ 0:34; po0.05). These results
support H2. Support is also found for H3, H4, and H5, since significantly
positive relationships are demonstrated between job-relevant information
and job satisfaction (H3), job-relevant information and job performance
(H4), and job satisfaction and job performance (H5) (standardized path
Roles of Budgetary Participation on Job Performance 225
coefficients ¼ 0.24, 0.36, and 0.24, respectively po0.05). Overall, the model
accounts for 24% of the variance in job performance (R2 ¼ 0:24; see Fig. 2).In order to understand better the impact of the linkage between budgetary
participation and job performance, a model that excluded the value attain-
ment effect of budgetary participation (i.e. job satisfaction) is tested for
comparison purposes. As expected, budgetary participation is positive and
statistically significantly associated with job-relevant information (stand-
ardized path coefficient ¼ 0:36; po0.05), and job-relevant information is
also positive and significantly associated with job performance (standard-
ized path coefficient ¼ 0:45; po0.05). The cognitive effect model accounts
for 21% of the variance in job performance ðR2 ¼ 0:21Þ: Recall that the
value attainment-cognitive effect model accounts for 24% of the variance in
job performance, while the cognitive effect model alone accounts for only
21% of the variance in the job performance. Taken together, these results
reveal that the introduction of the value attainment effect into the cognitive
effect model result in a statistically significant (F change ¼ 3:06; po0.043,
1-tailed) increase in R2, suggesting that the combined value attainment and
cognitive effect improve the predictive ability of our model.
CONCLUSION AND LIMITATIONS
The main objective of this study is to test the impact of the value attainment
role of budgetary participation on job performance, and its influence within
the cognitive model. This study contributes to the participative budgeting
literature in a number of ways. First, it introduces the value attainment role
of budgetary participation to the accounting literature, and explicitly ex-
amines this role of budgetary participation on job performance. Second, it
provides empirical support to the value attainment role of budgetary par-
ticipation, which was theorized to increase subordinates’ job satisfaction.
This result is consistent with our value attainment effect hypothesis and
prior studies (e.g. Chenhall & Brownell, 1988; Chong & Bateman, 2000).
In addition, this study extends prior studies by incorporating the value
attainment role of budgetary participation into the cognitive model. The
results of this study reveal that the joint effects of the value attainment and
cognitive roles of budgetary participation significantly improved subordi-
nates’ job performance. Furthermore, the results of this study provide ad-
ditional empirical evidence to support the robustness of the findings of prior
studies that examined the cognitive role of budgetary participation (e.g.
Kren, 1992; Magner et al., 1996).
VINCENT K. CHONG ET AL.226
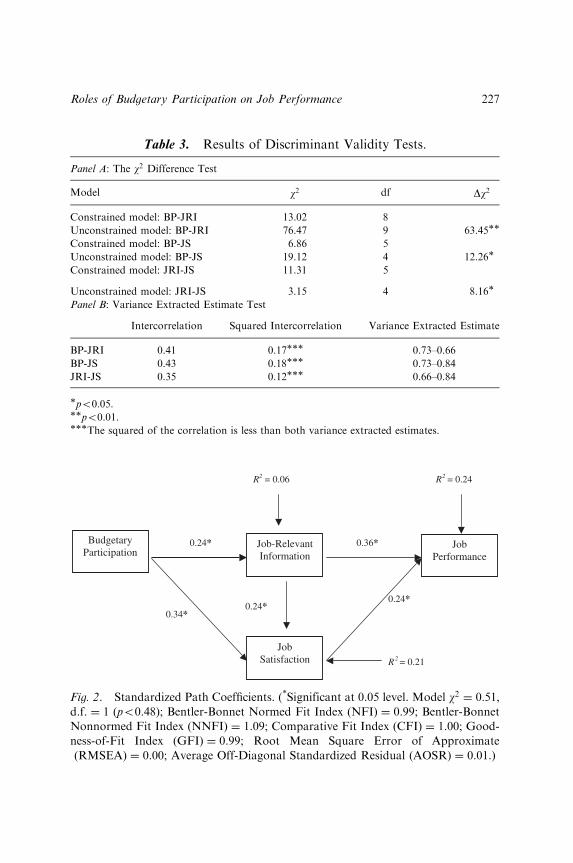
Table 3. Results of Discriminant Validity Tests.
Panel A: The w2 Difference Test
Model w2 df Dw2
Constrained model: BP-JRI 13.02 8
Unconstrained model: BP-JRI 76.47 9 63.45��
Constrained model: BP-JS 6.86 5
Unconstrained model: BP-JS 19.12 4 12.26�
Constrained model: JRI-JS 11.31 5
Unconstrained model: JRI-JS 3.15 4 8.16�
Panel B: Variance Extracted Estimate Test
Intercorrelation Squared Intercorrelation Variance Extracted Estimate
BP-JRI 0.41 0.17��� 0.73–0.66
BP-JS 0.43 0.18��� 0.73–0.84
JRI-JS 0.35 0.12��� 0.66–0.84
�po0.05.��po0.01.���The squared of the correlation is less than both variance extracted estimates.
Budgetary Participation
0.34*
0.24* Job-RelevantInformation
Job Satisfaction
Job Performance
0.24*
0.36*
0.24*
R2 = 0.06 R
2 = 0.24
R2 = 0.21
Fig. 2. Standardized Path Coefficients. (*Significant at 0.05 level. Model w2 ¼ 0:51;d.f. ¼ 1 (po0.48); Bentler-Bonnet Normed Fit Index (NFI) ¼ 0.99; Bentler-Bonnet
Nonnormed Fit Index (NNFI) ¼ 1.09; Comparative Fit Index (CFI) ¼ 1.00; Good-
ness-of-Fit Index (GFI) ¼ 0.99; Root Mean Square Error of Approximate
(RMSEA) ¼ 0.00; Average Off-Diagonal Standardized Residual (AOSR) ¼ 0.01.)
Roles of Budgetary Participation on Job Performance 227
Several limitations of this study need to be noted. First, sample was se-
lected from the financial services sector. Hence, in generalizing the results to
other industries, caution should be exercised. Further studies that compare
two industries such as the manufacturing and financial services sectors
would be worthwhile. A related issue to the sample is the use of relatively
small sample size ðn ¼ 70Þ in this study. Prior studies (e.g. Bentler & Bonnet,
1980; Zimmerman, Eason, & Gowan, 1999) have criticized the problems
associated with the use of small sample size for structural equation mode-
ling. An alternative approach, path analysis, could be used as it would likely
yield similar results to structural equation modeling regarding the signif-
icance of the relations between variables. Second, this study uses a self-
rating scale to measure job performance which is likely to have resulted in
higher leniency and lower variability errors in this measure (Prien & Liske,
1962; Thornton, 1968). Thus, care should be taken in interpretation of the
results. Future studies could employ different research methods (e.g. lon-
gitudinal field studies) to investigate systematically the theoretical relation-
ships proposed in this study. In addition, future study may also consider
employing objective measures of performance (e.g. return-on-investment or
return-on-assets to measure performance).
Third, this study focuses on an examination of the value attainment and
cognitive roles of budgetary participation without considering the potential
motivational function of budgetary participation on job performance (Nouri
& Parker, 1998; Chong & Chong, 2002; Wentzel, 2002). An attempt to test
the three roles (i.e. motivational, cognitive, and value attainment) of budg-
etary participation in a single study would provide more insight into the
process as to how budgetary participation really affects job performance.
Finally, while this study tested a recursive model, a non-recursive model
might be more applicable to the situation. In other words, there could be
simultaneous links between (1) budgetary participation and job-relevant in-
formation; (2) job-relevant information and both job satisfaction and per-
formance, and (3) job satisfaction and job performance. Applying the test of a
non-recursive model was not possible in this study due to identification
problems. Future research may attempt to test for a non-recursive model of
participative budgeting.
NOTES
1. The cognitive mechanism suggests that the process of participation improvessubordinate’s performance by increasing the quality of decisions as a result of the
VINCENT K. CHONG ET AL.228
subordinate sharing job-relevant information with the superior (Kren, 1992; Shields& Shields, 1998, p. 59).2. Job-relevant information refers to information that assists job-related decision-
making (Kren, 1992). It is also known as ex-ante information (see Baiman, 1982),decision-facilitating information (see Demski & Feltham, 1976; Magee, 1986; Hilton,1994), and task-relevant knowledge (Murray, 1990; Wier, 1993).3. Pinder (1984, p. 95) suggests that ‘‘yvalues are those things that a person
believes are conducive to his/her welfare’’, while Locke (1983, p. 1034) claims that‘‘ya value is what a person consciously or subconsciously desires, wants, or seeks toattain’’. As noted earlier, subordinates’ values may include: (1) the opportunity toexpress their views, (2) the feeling of being treated equally, or (3) the desire forrespect or dignity (Argyris, 1955; Davis, 1957). It is suggested that values play animportant role in determining job satisfaction (Katzell, 1964).4. In general, it is suggested that increased effort can either lead to immediate
performance increases if it is directed toward current performance, or lead to delayedperformance increases if it is directed toward learning (see Bonner & Sprinkle, 2002).The focus of this study is to investigate the increased effort, which is directed towardcurrent performance (i.e. immediate performance), rather than directed towardlearning (i.e. delayed performance).5. Pseudo-participation refers to a budget-setting process in which subordinates
are involved, but the superior makes the final decision. It is a consultative-typebudgeting process in which the subordinate’s input to the budget is being ignored(Argyris, 1952; see also Pasewark & Welker, 1990). Pasewark and Welker (1990)suggest pseudo-participation can have a de-motivating effect on subordinates.6. We tested for non-response bias using the approach suggested by Oppenheim
(1966, p. 34). No statistically significant differences in the mean scores between theearly and late responses were found.7. The seven responses considered as outliers were from individuals in companies
that employed substantially more people than the other firms. These seven firmsemployed a range of 10,000–140,000 employees. We conducted a univariate assess-ment of the values of the standardized scores, which revealed that all these sevenresponses exceeded the recommended threshold standardized values (Z scores) rangefrom 73 to 74 (Hair, Anderson, Tatham, & Black. 1998, p. 65). The structuralequation modeling (SEM) analyses were repeated before the exclusion of the sevenoutliers. The results revealed that there were no differences between SEM resultsbased on 77 (before exclusion of the seven responses) and those based on 70 re-sponses. This implies that our results are relatively robust to variations in the size(i.e. number of employees) of the sample.
ACKNOWLEDGEMENTS
The authors appreciate the helpful comments and suggestions of
Vicky Arnold (Editor), the Associate Editor, two anonymous reviewers,
and seminar participants at York University, Toronto on the earlier drafts
of this chapter. An earlier version of this paper was presented at the 2001
Roles of Budgetary Participation on Job Performance 229
Asian-Pacific Conference on International Accounting Issues, Rio de
Janeiro, Brazil.
REFERENCES
Anderson, J. C., & Gerbing, D. W. (1988). Structural equation modeling in practice: a review
and recommended two-step approach. Psychological Bulletin, 103(3), 411–423.
Argyris, C. (1952). The impact of people on budgets. New York: Controllership Foundation.
Argyris, C. (1955). Organizational leadership and participative management. Journal of Busi-
ness, 28, 1–7.
Aronson, E., Mills, J. (1959). The effect of severity of initiation on liking for a group. Journal of
Abnormal and Social Psychology, (September), 59, 177–181.
Bagozzi, R. P., Yi, Y., & Phillips, L. W. (1991). Assessing construct validity in organizational
research. Administrative Science Quarterly, 36, 421–458.
Baiman, S. (1982). Agency research in managerial accounting. Journal of Accounting Literature,
1, 154–213.
Beehr, T. A., & Love, K. G. (1983). A meta-model of the effects of goal characteristics, feed-
back, and role characteristics in human organizations. Human Relations, 36(2), 151–166.
Bentler, P. M. (1995). EQS structural equation program manual. Encino, CA: Multivariate
Software, Inc.
Bentler, P. M., & Bonnet, D. G. (1980). Significance tests and goodness-of-fit in the analysis of
covariance structure. Psychological Bulletin, 88(3), 588–600.
Bollen, K., & Long, I. S. (1993). Tests for structural equation models. Newbury Park, CA: Sage
Publication.
Bonner, S. E., & Sprinkle, G. B. (2002). The effects of monetary incentives on efforts and task
performance: theories, evidence, and a framework for research. Accounting, Organiza-
tions and Society, 27, 303–345.
Brown, S. P., & Peterson, R. A. (1994). The effect of effort on sales performance and job
satisfaction. Journal of Marketing, 70, 74–80.
Browne, M., & Mels, G. (1994). RAMONA users’ guide. Columbus, OH: The Ohio State
University.
Campbell, D. J., & Gingrich, K. F. (1986). The interactive effects of task complexity and
participation on task performance: a field experiment. Organizational Behavior and Hu-
man Decision Processes, 38(2), 162–180.
Cardozo, R. N. (1965). An experimental study of consumer effort, expectation, and satisfaction.
Journal of Marketing Research, 2, 244–249.
Chenhall, R. H. (1986). Authoritarianism and participative budgeting: a dyadic analysis. The
Accounting Review, 61(2), 263–272.
Chenhall, R. H., & Brownell, P. (1988). The effect of participative budgeting on job satisfaction
and performance: role ambiguity as an intervening variable. Accounting, Organizations
and Society, 13(3), 225–233.
Cherrington, D. J. (1980). The work ethic: working values and values that work. New York:
Amacom.
Chong, V. K., & Bateman, D. (2000). The effects of role stress on budgetary participation and
job satisfaction-performance linkages: a test of two different models. Advances in Ac-
counting Behavioral Research, 3, 91–118.
VINCENT K. CHONG ET AL.230
Chong, V. K., & Chong, K. M. (2002). Budget goal commitment and informational effects of
budget participation on performance: a structural equation modeling approach. Be-
havioral Research in Accounting, 14, 65–86.
Choo, F., & Tan, K. B. (1997). A study of the relations among disagreement in budgetary
performance evaluation style, job-related tension, job satisfaction and performance.
Behavioral Research in Accounting, 9, 199–218.
Churchill, G. A. (1979). A paradigm for developing better measures of marketing constructs.
Journal of Marketing Research, 16, 64–73.
Cronbach, L. J. (1951). Coefficient alpha and the internal structure of tests. Psychometrika, 16,
297–334.
Covaleski, M. A., Evans, J. H., Luft, J. L., & Shields, M. D. (2003). Budgeting research: three
theoretical perspectives and criteria for selective integration. Journal of Management
Accounting Research, 15, 3–49.
Davis, K. (1957). Management by participation: its place in today’s business world. Manage-
ment Review, 46, 69–79.
Deci, E. L., & Ryan, R. M. (1985). Intrinsic motivation and self determination in human be-
haviour. New York: Plenum.
Demski, J. S., & Feltham, G. A. (1976). Cost determination: a conceptual approach. Ames: Iowa
State University Press.
Dewar, R., & Werbel, J. (1979). Universalistic and contingency predictions of employee sat-
isfaction and conflict. Administrative Science Quarterly, 24(3), 426–448.
Dunk, A. S. (1995). The joint effects of budgetary slack and task uncertainty on subunit
performance. Accounting and Finance, 35(2), 61–75.
Emmons, R. A. (1986). Personal strivings: an approach to personality and subjective well-being.
Journal of Personality and Social Psychology, 51, 1058–1068.
Fogarty, T. J., Singh, J., Rhoads, G. K., & Moore, R. K. (2000). Antecedents and consequences
of burnout in accounting: beyond the role stress model. Behavioral Research in Ac-
counting, 12, 31–67.
Fornell, C., & Larcker, D. F. (1981). Evaluating structural equation models with observable
variables and measurement error. Journal of Marketing Research, 18, 39–50.
Franken, R. E. (1982). Human motivation. Monterey, CA: Brooke/Cole Publishing Company.
French, J. R. P., Jr., Israel, J., & As, D. (1960). An experiment on participation on Norwegian
factory: Interpersonal dimensions of decision-making. Human Relations, 13, 3–19.
Griffin, R. W. (1983). Objective and social sources of information in task redesign: a field
experiment. Administrative Science Quarterly, 28, 184–200.
Hair, J. F., Jr., Anderson, R. E., Tatham, R. L., & Black, W. C. (1998). Multivariate data
analysis with readings. Englewood Cliffs, NJ: Prentice-Hall International, Inc.
Hartwick, J., & Barki, H. (1994). Explaining the role of user participation in information system
use. Management Science, 40(4), 440–465.
Hilton, R. W. (1994). Managerial accounting. New York: McGraw-Hill, Inc.
Ilgen, D. R., & Klein, H. J. (1988). Individual motivation and performance: Cognitive influ-
ences on effort and choice. In: J. P. Campbell & R. J. Campbell (Eds), Productivity in
organizations (pp. 143–176). San Francisco: Jossey-Bass.
Katzell, R. A. (1964). Personal values, job satisfaction, and job behavior. In: H. Borow (Ed.),
Man in a world at work. Boston: Houghton Mifflin.
Katzell, R. A., Thompson, D. E., & Guzzo, R. A. (1992). How job satisfaction and job per-
formance are and are not linked. In: C. J. Cranny, P. C. Smith & E. F. Stone (Eds), Job
Roles of Budgetary Participation on Job Performance 231
Satisfaction: How people feel about their jobs and how it affects their performance.
New York: Lexington Books.
Kompass Australia. (1999). Prahran: Peter Isaacson.
Kren, L. (1992). Budgetary participation and managerial performance: The impact of infor-
mation and environmental volatility. The Accounting Review, 67(3), 511–526.
Kren, L., & Liao, W. M. (1988). The role of accounting information in the control of organ-
izations: a review of the evidence. Journal of Accounting Literature, 7, 280–309.
Latham, G. P., & Saari, L. M. (1979). Importance of supportive relationships in goal setting.
Journal of Applied Psychology, 64, 151–156.
Lau, C. M., & Tan, S. L. C. (2003). The effects of participation and job-relevant information on
the relationship between evaluative style and job satisfaction. Review of Quantitative
Finance and Accounting, 21(17), 17–34.
Locke, E. A. (1983). The nature and causes of job satisfaction. In: M. D. Dunnette (Ed.),
Handbook of industrial and organizational psychology. New York: Wiley.
Locke, E. A. (1986). Job attitudes in historical perspective. In: D. Wren (Ed.), Paper dedicated
to the development of modern management. Briarcliff Manor, NY: Academy of Man-
agement.
Locke, E. A., & Latham, G. P. (1990). A theory of goal setting and task performance. Englewood
Cliffs, NJ: Prentice-Hall.
Locke, E. A., & Schweiger, D. M. (1979). Participation in decision-making: one more look.
Research in Organizational Behavior, 1, 265–339.
Lowin, A. (1968). Participative decision making: A model, literature critique, and prescriptions
for research. Organizational Behavior and Human Performance, 3, 68–106.
Magee, R. P. (1986). Advanced management accounting. New York: Harper & Row.
Magner, N., Welker, R. B., & Campbell, T. L. (1996). Testing a model of cognitive budgetary
participation processes in a latent variable structural equations framework. Accounting
and Business Research, 27(1), 41–50.
Merchant, K. A. (1981). The design of the corporate budgeting system: influences on man-
agerial behavior and performance. The Accounting Review, 56(4), 813–829.
Merchant, K. A. (1984). Influences on departmental budgeting: an empirical examination of a
contingency model. Accounting, Organizations and Society, 9(3/4), 291–307.
Mia, L., & Chenhall, R. H. (1994). The usefulness of management accounting systems, func-
tional differentiation and managerial effectiveness. Accounting, Organizations and So-
ciety, 19(1), 1–13.
Milani, K. (1975). The relationship of participation in budget setting to industrial
supervisor performance and attitudes: a field study. The Accounting Review, 50(2),
274–284.
Murray, D. (1990). The performance effects of participative budgeting: An integration of in-
tervening and moderating variables. Behavioral Research in Accounting, 2, 104–123.
Naylor, J. C., Pritchard, R. D., & Ilgen, D. R. (1980). A theory of behavior in organizations.
New York: Academic Press.
Nouri, H., & Parker, R. J. (1998). The relationship between budgetary participation and job
performance: The roles of budget adequacy and organizational commitment. Account-
ing, Organizations and Society, 23(5/6), 467–483.
Nunnally, J. C. (1967). Psychometric theory. New York: McGraw-Hill.
Oppenheim, A. N. (1966). Questionnaire design and attitudes measurement. London: Heinemann
Educational Books, Ltd.
VINCENT K. CHONG ET AL.232
O’Reilly, C. A., & Caldwell, D. F. (1979). Informational influence as a determinant of perceived
task characteristics and job satisfaction. Journal of Applied Psychology, 64, 157–165.
Pasewark, W., & Welker, R. (1990). A Vroom-Yetton evaluation of subordinate participation
in budgetary decision making. Journal of Management Accounting Research, 2, 113–126.
Pinder, C. C. (1984). Work motivation. Glenview, IL: Scott Foresman.
Prien, E. P., & Liske, R. E. (1962). Assessment of higher-level personnel: III. Rating criteria:
A comparative analysis of supervision ratings and incumbent self-rating of job per-
formance. Personnel Psychology, 15, 187–194.
Poznanski, P. J., & Bline, D. M. (1997). Using structural equation modeling to investigate the
causal ordering of job satisfaction and organizational commitment among staff ac-
countants. Behavioral Research in Accounting, 9, 154–171.
Salancik, G. R., & Pfeffer, J. (1977). An examination of need-satisfaction model of job design.
Administrative Science Quarterly, 22, 427–456.
Salancik, G. R., & Pfeffer, J. (1978). A social information process approach to job attitudes and
task design. Administrative Science Quarterly, 23, 224–253.
Segars, A. H., & Grover, V. (1993). Re-examining perceived ease of use and usefulness:
A confirmatory factor analysis. MIS Quarterly, 17(4), 517–525.
Shields, J. F., & Shields, M. D. (1998). Antecedents of participative budgeting. Accounting,
Organizations and Society, 23(1), 49–76.
Strauss, G. (1963). Some notes on power-equalization. In: H. Leavitt (Ed.), The social science of
organizations: Four perspectives. Englewood Cliffs, NJ: Prentice-Hall, Inc.
Thornton, G. C. (1968). The relationship between supervisory and self-appraisals of executive
performance. Personnel Psychology, 21, 441–456.
Wentzel, K. (2002). The influence of fairness perceptions and goal commitment on managers’
performance in a budget setting. Behavioral Research in Accounting, 14, 247–271.
White, S. E., & Mitchell, T. M. (1979). Job enrichment versus social cues: A comparison and
competitive test. Journal of Applied Psychology, 64, 1–9.
Wier, B. (1993). The effects of task relevant knowledge, goal level, goal commitment, and
motivation on the participation-performance linkage: an empirical examination.
Unpublished Ph.D. Thesis, Texas Tech University.
Zimmerman, R. A., Eason, P., & Gowan, M. (1999). Taxpayer performance between income
tax and consumption tax: Behavioral life cycle effects. Behavioral Research in Account-
ing, 11, 111–142.
Roles of Budgetary Participation on Job Performance 233

This page intentionally left blank
234