advances in international accounting - ACCORD UNIVERSITY
277
-
Upload
khangminh22 -
Category
Documents
-
view
2 -
download
0
Transcript of advances in international accounting - ACCORD UNIVERSITY


ADVANCES IN INTERNATIONAL
ACCOUNTING
i

ADVANCES IN INTERNATIONAL
ACCOUNTING
Series Editor: J. Timothy Sale
Volume 10: Edited by T. S. Doupnik and S. B. Salter
Volume 11–15: Edited by J. T. Sale
Volume 16: Edited by J. Timothy Sale, S. B. Salter and
D. J. Sharp
Volume 17: Edited by J. Timothy Sale, S. B. Salter and
D. J. Sharp
ii

ADVANCES IN INTERNATIONAL ACCOUNTING VOLUME 18
ADVANCES ININTERNATIONALACCOUNTING
EDITED BY
J. TIMOTHY SALEDepartment of Accounting, University of Cincinnati, USA
Associate Editors:
STEPHEN B. SALTER
Department of Accounting, University of Cincinnati, USA
DAVID J. SHARP
Accounting and Control Area, University of Western Ontario,
Canada
Amsterdam – Boston – Heidelberg – London – New York – Oxford
Paris – San Diego – San Francisco – Singapore – Sydney – Tokyo
2005
iii

r 2005 Elsevier Ltd. All rights reserved.
This work is protected under copyright by Elsevier Ltd, and the following terms and conditions apply to its use:
PhotocopyingSingle photocopies of single chapters may be made for personal use as allowed by national copyright laws. Permissionof the Publisher and payment of a fee is required for all other photocopying, including multiple or systematic copying,copying for advertising or promotional purposes, resale, and all forms of document delivery. Special rates areavailable for educational institutions that wish to make photocopies for non-profit educational classroom use.
Permissions may be sought directly from Elsevier’s Rights Department in Oxford, UK: phone (+44) 1865 843830, fax(+44) 1865 853333, e-mail: [email protected]. Requests may also be completed on-line via the Elsevierhomepage (http://www.elsevier.com/locate/permissions).
In the USA, users may clear permissions and make payments through the Copyright Clearance Center, Inc., 222Rosewood Drive, Danvers, MA 01923, USA; phone: (+1) (978) 7508400, fax: (+1) (978) 7504744, and in the UKthrough the Copyright Licensing Agency Rapid Clearance Service (CLARCS), 90 Tottenham Court Road, LondonW1P 0LP, UK; phone: (+44) 20 7631 5555; fax: (+44) 20 7631 5500. Other countries may have a local reprographicrights agency for payments.
Derivative WorksTables of contents may be reproduced for internal circulation, but permission of the Publisher is required for externalresale or distribution of such material. Permission of the Publisher is required for all other derivative works, includingcompilations and translations.
Electronic Storage or UsagePermission of the Publisher is required to store or use electronically any material contained in this work, including anychapter or part of a chapter.
Except as outlined above, no part of this work may be reproduced, stored in a retrieval system or transmitted in anyform or by any means, electronic, mechanical, photocopying, recording or otherwise, without prior written permissionof the Publisher.
Address permissions requests to: Elsevier’s Rights Department, at the fax and e-mail addresses noted above.
NoticeNo responsibility is assumed by the Publisher for any injury and/or damage to persons or property as a matter ofproducts liability, negligence or otherwise, or from any use or operation of any methods, products, instructions orideas contained in the material herein. Because of rapid advances in the medical sciences, in particular, independentverification of diagnoses and drug dosages should be made.
First edition 2005
British Library Cataloguing in Publication DataA catalogue record is available from the British Library.
ISBN: 0-7623-1235-1ISSN: 0897-3660 (Series)
∞ The paper used in this publication meets the requirements of ANSI/NISO Z39.48-1992 (Permanence of Paper).Printed in The Netherlands.
ELSEVIER B.V.
Radarweg 29
P.O. Box 211
1000 AE Amsterdam,
The Netherlands
ELSEVIER Ltd
84 Theobalds Road
London
WC1X 8RR
UK
ELSEVIER Ltd
The Boulevard, Langford
Lane, Kidlington
Oxford OX5 1GB
UK
ELSEVIER Inc.
525 B Street, Suite 1900
San Diego
CA 92101-4495
USA
Working together to growlibraries in developing countries
www.elsevier.com | www.bookaid.org | www.sabre.org
iv

CONTENTS
LIST OF CONTRIBUTORS ix
EDITORIAL BOARD xi
REVIEWER ACKNOWLEDGMENT xiii
CORPORATE GOVERNANCE AND INVESTORREACTION TO REPORTED EARNINGS: ANEXPLORATORY STUDY OF LISTED CHINESECOMPANIES
Dominica Suk-yee Lee, Jerry Han, Woody Wu andChee W. Chow
1
CULTURAL INFLUENCES ON INDIGENOUS USERS’PERCEPTIONS OF THE IMPORTANCE OFDISCLOSURE ITEMS: EMPIRICAL EVIDENCE FROMPAPUA NEW GUINEA
Ken Ngangan, Shahrokh M. Saudagaran andFrank L. Clarke
27
FIRM-SPECIFIC DETERMINANTS OF INCOMESMOOTHING IN BANGLADESH: AN EMPIRICALEVALUATION
Ahsan Habib 53
BANK EARNINGS MANAGEMENT IN EMERGINGMARKET ECONOMIES: THE CASE OF MEXICO
Alejandro Hazera 73
v

ADOPTION AND BENEFITS OF MANAGEMENTACCOUNTING SYSTEMS: EVIDENCE FROMFINLAND AND AUSTRALIA
Johanna Hyvonen 97
INVESTMENTS IN HUMAN CAPITAL IN DIFFERENTINSTITUTIONAL ENVIRONMENTS
Juha-Pekka Kallunki, Pasi Karjalainen andMinna Martikainen
121
RISK IN AUDIT PRICING: THE ROLE OFFIRM-SPECIFIC DIMENSIONS OF RISK
Jussi Nikkinen and Petri Sahlstrom 141
IAS VERSUS U.S. GAAP: ASSESSING THE QUALITYOF FINANCIAL REPORTING IN SOUTH AFRICA,THE UNITED KINGDOM, AND THE UNITED STATES
Jenice Prather-Kinsey and Sandra Waller Shelton 153
USING ‘‘STATEMENT OF INTERMEDIATEBALANCES’’ AS TOOL FOR INTERNATIONALFINANCIAL STATEMENT ANALYSIS IN AIRLINEINDUSTRY
C. Richard Baker, Yuan Ding and Herve Stolowy 169
TRANSFER PRICING PRACTICES ANDREGULATORY ACTIONS IN THE U.S. AND U.K.: ACROSS-COUNTRY COMPARISON AND ANALYSIS
Rasoul H. Tondkar, Wendy W. Achilles andJoyce van der Laan Smith
199
THE IMPACT OF SOCIAL AND ECONOMICDEVELOPMENT ON CORPORATE SOCIAL ANDENVIRONMENTAL DISCLOSURE IN HONG KONGAND THE U.K.
Jason Zezheng Xiao, Simon S. Gao, Saeed Heravi andYuk C. Q. Cheung
219
CONTENTSvi

COMPLIANCE WITH MANDATORY DISCLOSUREREQUIREMENTS BY NEW ZEALAND LISTEDCOMPANIES
Joanna Yeoh 245
Contents vii

This page intentionally left blank
viii

LIST OF CONTRIBUTORS
Wendy W. Achilles East Carolina University, USA
C. Richard Baker Adelphi University, USA
Yuk C. Q. Cheung NTHYK Tai Po Secondary School, HK
Chee W. Chow San Diego State University, USA
Frank L. Clarke University of Newcastle, Australia
Yuan Ding HEC School of Management, Paris, France
Simon S. Gao Napier University, UK
Ahsan Habib Lincoln University, New Zealand
Jerry Han Hong Kong University Business School,Hong Kong
Alejandro Hazera University of Rhode Island, USA
Saeed Heravi Cardiff Business School, UK
Johanna Hyvonen University of Oulu, Finland
Juha-Pekka Kallunki University of Oulu, Finland
Pasi Karjalainen University of Oulu, Finland
Dominica Suk-yee Lee The Chinese University of Hong Kong,Hong Kong
Minna Martikainen Laurea Polytechnic, Finland
Ken Ngangan University of Papua New Guinea, Papua,New Guinea
Jussi Nikkinen University of Vaasa, Finland
Jenice Prather-Kinsey University of Missouri – Columbia, USA
Petri Sahlstrom University of Vaasa, Finland
ix

Shahrokh M.Saudagaran
Milgard School of Business, University ofWashington – Tacoma, USA
Sandra Waller Shelton Depaul University, USA
Herve Stolowy HEC School of Management, Paris, France
Rasoul H. Tondkar Virginia Commonwealth University, USA
Joyce van der LaanSmith
Virginia State University, USA
Woody Wu The Chinese University of Hong Kong,Hong Kong
Jason Zezheng Xiao Cardiff Business School, UK
Joanna Yeoh Institute of Chartered Accountants of NewZealand, New Zealand
LIST OF CONTRIBUTORSx

Ajay AdkihariThe American University
Teresa ConoverUniversity of North Texas
Timothy DoupnikUniversity of South Carolina
Helen GernonUniversity of Oregon
O. Finley GravesUniversity of North Texas
Sidney GrayUniversity of New South Wales
Lyle HandfieldCGA – Canada
Graeme HarrisonMacquarie University
Gordian NdubizuDrexel University
Grace PownallEmory University
Lee RadebaughBrigham Young University
Ahmed Riahi-BelkaouiUniversity of Illinois at Chicago
Clare RobertsUniversity of Aberdeen
L. Murphy SmithTexas A & M University
Herve StolowyGroupe HEC
Rasoul TondkarVirginia CommonwealthUniversity
Judy TsuiCity University of Hong Kong
EDITORIAL BOARD
xi

This page intentionally left blank
xii

REVIEWER ACKNOWLEDGMENT
The Editors of Advances in International Accounting wish to thank the
following individuals who served as ad hoc reviewers for Volume 18.
Bikki Jaggi
Rutgers University, USA
xiii

This page intentionally left blank
xiv

CORPORATE GOVERNANCE
AND INVESTOR REACTION TO
REPORTED EARNINGS:
AN EXPLORATORY STUDY OF
LISTED CHINESE COMPANIES
Dominica Suk-yee Lee, Jerry Han, Woody Wu and
Chee W. Chow
ABSTRACT
This study explores the determinants of listed Chinese companies’ gov-
ernance practices. It also examines how these companies’ governance
practices affect domestic investors’ reaction to their earnings reports.
Using publicly disclosed financial information and data directly collected
from 148 domestically listed Chinese companies, the findings are con-
sistent with investors in these companies basing their valuation decisions,
at least in part, on these companies’ earnings reports. This is indicated by
the significant relationship between ‘‘unexpected’’ earnings and cumula-
tive abnormal returns. However, the hypothesized effects of governance
practice/choice are, on the whole, not supported. There also is no sys-
tematic relation between governance choice and ownership structure. We
interpret these findings to imply that in the Chinese securities market, the
Advances in International Accounting
Advances in International Accounting, Volume 18, 1–25
Copyright r 2005 by Elsevier Ltd.
All rights of reproduction in any form reserved
ISSN: 0897-3660/doi:10.1016/S0897-3660(05)18001-5
1

institutional factors and infrastructure (e.g., legal liability, information
intermediation, market for managers, and takeovers) are not yet suffi-
ciently developed to permit individual domestic investors to exert signif-
icant influence via their actions in the capital markets.
INTRODUCTION
This study examines how listed Chinese companies’ governance practices
affect domestic investors’ reaction to their earnings reports. It also explores
the determinants of listed Chinese companies’ governance practices. The
objective is to both increase our understanding of the microstructure of the
Chinese securities market, and to help Chinese authorities to better target
and fine-tune their regulatory initiatives.
This topic is of interest because the total market capitalization of com-
panies listed on China’s two stock exchanges (Shanghai and Shenzhen) had
reached 2,720.6 billion yuan by the beginning of the year 2000, or about
one-fifth of the country’s gross domestic product (The Securities Daily,
January 1, 2000). This pooling of capital undoubtedly has fueled much of
China’s phenomenal economic growth of the past decade. As such, in-
creased understanding of how investors evaluate listed Chinese firms can
further enhance the effectiveness of this capital pooling process.
BACKGROUND ON THE CHINESE
SECURITIES MARKET
A substantial body of empirical evidence (mostly from the developed econ-
omies) has shown that investors are not passive price takers in the market.
Rather, they appraise the future prospects of different companies based on
an evaluation of the available information on each company, often engaging
the services of financial and information intermediaries. When a company’s
information is incomplete or not considered to be credible, investors will
‘‘price-protect’’ themselves via requiring a higher expected rate of return
(i.e., lowering the price that they would pay for the company’s shares). This
finding suggests that both the total amount of ownership capital made
available to listed companies (as compared to other uses of these resources,
including consumption, direct investments in assets, and the granting of
credit), and how this total amount is distributed among them, would depend
DOMINICA SUK-YEE LEE ET AL.2

on investors’ evaluation of the available information. To the extent that
these effects are also operational in the nascent Chinese securities market,
they can significantly affect the speed and direction of that country’s eco-
nomic development.
Extensive studies have also shown that both the availability of informa-
tion to investors, and the latter’s use of this information are affected by a
myriad of factors. These factors exist at many levels, from that of the
economy (e.g., regulations regarding stock listing, legal liability, accounting
methods, and disclosures), to that of institutions with a role in information
production and dissemination (e.g., auditor certification requirements and
competition for audit clients), to that of individual companies (e.g., own-
ership and asset structure, internal controls). Reviews of this literature are
provided by Watts and Zimmerman (1986, 1990) among others. With the
Chinese securities markets having a relatively short history, systematic
studies of this type are only beginning to be performed in the Chinese
setting. Some results consistent with those in the developed economies have
been reported (e.g., DeFond, Wong, & Li, 1999). This suggests that at least
some of the forces at work in the more developed economies also may be
operational in the Chinese economy.
For its part, the Chinese government has taken actions aimed at increas-
ing the integrity of financial transactions and their related disclosures. For
example, a Securities Committee of the State Council and a China Securities
Regulatory Commission were established in 1992 to oversee the operations
of the securities markets and stock exchanges. Relating to accounting and
disclosure, the first set of regulations was promulgated by the Ministry of
Finance in 1992. Labeled ‘‘Accounting System for Selected Shareholding
Companies,’’ this regulation required listed Chinese companies to prepare
balance sheets, income statements, and statements of changes in financial
position in conformance with international accounting practices, and to
make these available to the public in audited annual reports within 4 months
of the fiscal year end (typically the same as calendar year end). Listed com-
panies are also required to provide semi-annual reports by the end of Au-
gust, although these do not have to be audited. In addition, the ‘‘Provisional
Regulations Governing the Issuing and Trading of Shares,’’ promulgated by
the State Council in 1993, required the timely disclosure of significant events
that may have material impacts on share prices.
Since issuance of these early regulations, ten other accounting and dis-
closure standards have been enacted amidst the issuance of over 30 exposure
drafts of proposed standards (Li & He, 2000; Tang, 2000, also see Xiang,
1998; Pacter, 2001 for overviews of recent securities and accounting/
Corporate Governance and Investor Reaction 3

disclosure regulations in China). There are also recent initiatives to increase
the legal liability of companies and auditors for fraudulent or deficient fi-
nancial disclosure (DeFond et al., 1999). Many of these initiatives are pat-
terned after those in the developed economies – especially the U.S. – and
represent a big step forward from the relatively unregulated void of a decade
ago. Nevertheless, collectively they still are quite limited in scope when
compared to the range of standards and institutions of the more developed
economies. China also has not yet developed a large corps of information
intermediaries like financial analysts. As a result, the primary source of
information on listed Chinese companies still tends to be the companies
themselves (Poon, Firth, & Fung, 1998). As such, listed companies’ earnings
reports can have a proportionally much larger impact on securities prices
(hence the amount and mix of capital made available to listed companies) in
China than in the more developed economies.
Another salient feature of the Chinese securities market is that under
Chinese securities law, listed companies are mandated to have three classes
of ownership shares: state shares, institutional shares, and shares issued to
individuals (Tang, Chow, & Cooper, 1994). State shares are held by the
central government or government ministries, provincial, municipal, and
city governments. These shares are prohibited from trading. Institutional
shares (also called legal entity shares) are owned by separate legal entities,
such as investment institutions, other enterprises, and the foreign partners of
a corporatized joint venture. These shares also cannot be traded on the two
exchanges, though they can be sold to other legal entities through a nation-
wide, computerized, Securities Trading Automated Quotation (STAQ) sys-
tem. Finally, individual shares can be classified into ones restricted to trad-
ing domestically by Chinese citizens (‘‘A shares’’), and ones that can be sold
to foreign individuals and entities (‘‘B shares’’). Some Chinese companies
also are listed on the Hong Kong Stock Exchange (‘‘H shares’’) and New
York Stock Exchange (‘‘Y shares’’), but these are few in number. Another
distinction between A and B shares is that the former are subject to domestic
accounting and disclosure standards, whilst B shares are required to con-
form to International Accounting Standards. Thus, for a Chinese company
with both A and B shares, two sets of financial reports have to be prepared,
which typically are made available to the public on the same day. Com-
parisons of reported earnings under Chinese and international accounting
standards have found them to have significant differences in many cases
(Chen, Gul, & Su, 1999). However, the markets for A and B shares are
effectively segmented, as these two types of shares have been found to trade
at substantially different prices despite having the same rights to assets and
DOMINICA SUK-YEE LEE ET AL.4

dividends (Poon et al., 1998). Given this evidence on market segmentation,
the current study focuses on the reactions of internal investors (owners of A
shares) to domestically listed firms’ annual earnings reports. Internal inves-
tors are, by far, the largest source of privately sourced capital to the listed
companies. This domestic focus also helps to control for the effects of ex-
traneous variables, such as the competition from companies from other
countries and the variability of accounting and disclosure practices in the
global capital markets.
CORPORATE GOVERNANCE AND INTEGRITY OF
FINANCIAL REPORTING
The term ‘‘corporate governance’’ typically refers to the set of oversight
activities undertaken by the board of directors to ensure that the firm ap-
propriately discharges its fiduciary duties to stakeholders, including accurate
information disclosures. Governance mechanisms are held to reduce the
agency costs that arise when there is a separation of ownership and man-
agement, and attain this result via safeguarding assets and improving per-
formance (Shleifer & Vishny, 1997; Agrawal & Knoeber, 1996; Brickley,
Coles, & Terry, 1994), as well as guarding against fraudulent financial re-
porting (DeChow, Sloan, & Sweeney, 1996; Beasley, 1996; McMullen,
1996).
Aspects of corporate governance that have received attention include the
size of, and mix between inside and outside members on the board of di-
rectors (Weisbach, 1988; Byrd & Hickman, 1992), whether the CEO also
serves as the chairman of the board (Loebbecke, Eining, & Willingham,
1989; DeChow et al., 1996), and the existence of compensation, nomination,
and audit committees (Beasley, 1996; DeChow et al., 1996; McMullen,
1996). Rosenstein and Wyatt (1990), for example, have found the appoint-
ment of outside directors to be associated with positive abnormal returns in
the market. This finding is consistent with investors expecting outside di-
rectors to improve future performance. Focusing on management compen-
sation, Core, Holthausen, & Larcker (1999) found that CEO compensation
was higher at firms with ineffective governance structures, while the findings
of Beatty and Zajac (1994) are consistent with the board of directors being
less effective if the CEO also serves as its chairman. Relating to financial
reporting, Beasley (1996) compared firms with financial reporting fraud to
no-fraud firms, and found that the proportion of independent outside
Corporate Governance and Investor Reaction 5

directors on the board had a significant negative effect on the likelihood of
financial reporting fraud.
Focusing on committees of the board of directors, Braiotta (1994) iden-
tified audit committees as being ‘‘a significant element of corporate ac-
countability and governance (that) help engender a high degree of integrity
in the financial reporting process.’’ Indeed, McMullen and Raghunandan
(1996) have found that companies without financial reporting problems are
more likely to have audit committees consisting entirely of outside directors.
This finding suggests that the other committees of the board are also likely
to perform similar oversight functions relating to other major determinants
of manager actions.
Some governance mechanisms (e.g., a board of directors) have long been
part of company operations in the West and in the past decade, attention to
these mechanisms has significantly increased (e.g., COSO (U.S.), 1992;
CICA (Canada), 1995; CCG, Hampel Report (UK), 1998; OECD, 1999).
Chinese regulatory authorities are also paying increasing attention to the
governance practices of business enterprises. For example, several govern-
ment agencies in Shanghai have jointly promulgated a set of guidelines on
the governance of state-owned-enterprises (Jiefang Daily, Dec 4, 1998).
More generally, Chinese government authorities have repeatedly expressed
the intent to introduce U.S.-type governance to establish a ‘‘modern enter-
prise system’’ (Tam, 1999, p. 40).
The increased attention to corporate governance implies acceptance that
governance practices can positively affect firm performance and/or the
soundness of financial reporting. There is indirect evidence supporting the
existence of linkages among companies’ governance structures/processes
and financial disclosures. In the U.S. setting, DeAngelo (1988) has found
that earnings numbers are used by dissident stockholders who wage proxy
contests for seats on the board of directors, and also by incumbent man-
agers who exercise their accounting discretion to defend themselves. A re-
lated study by Collins and DeAngelo (1990) found that market and analyst
reactions to reported earnings are more pronounced than in prior periods
during a proxy contest. From a different angle, Merchant’s (1985a, b) find-
ing from a field study, that net income targets are the most important form
of control imposed on managers, also suggests that companies are con-
cerned with linking their controls to external financial reports.
In the case of China, a recent study by Xu and Wang (1999) has reported
a positive relationship between corporate governance and performance in
Chinese firms. However, performance was only narrowly defined as reported
earnings. More important, ownership structure was used to proxy for
DOMINICA SUK-YEE LEE ET AL.6

governance, without attention to specific governance practices. As such,
there is much room for further exploring the nature and impacts of gov-
ernance practices in listed Chinese companies. To provide focus for an in-
vestigation pertaining to financial reporting, we specify the following
(information) hypothesis based on the extant (Western) literature:
H1. (Information Hypothesis). Investor reactions to reported earnings by
listed Chinese companies are higher for companies with stronger govern-
ance mechanisms.
Two points related to this information hypothesis are worthy of note.
First, in focusing on companies’ governance practices, it must be acknowl-
edged that this is only one of the many factors that can affect firm valuation.
Several studies have begun to examine other aspects of the Chinese securities
market, such as the impacts of reporting using domestic versus International
Accounting Standards (e.g., Bao & Chow, 1999), the pricing of initial public
offerings (e.g., Mok & Hui, 1998), the effects of qualified audit opinions
(e.g., Chen et al., 2000) and auditor switching behavior (e.g., DeFond et al.,
1999). By extending attention to the role of governance practices, the cur-
rent study complements these other efforts to develop a more holistic un-
derstanding of the Chinese securities market.
Second, an implicit assumption of the hypothesis is that there exist dif-
ferences among listed Chinese companies’ corporate governance mecha-
nisms. This empirically testable expectation is premised on the well-
established principal-agent theory and the large body of related empirical
studies. The theory is that investors would price-protect themselves – thus
reducing the value of the company – from potential actions that manage-
ment may take to benefit at the expense of shareholders. The potential to
reduce this dead-weight loss, in turn, creates incentives for company man-
agement to voluntarily adopt processes and mechanisms that reduce the
potential for such opportunistic behavior. Tests of this theory in Western
settings have consistently supported its predictions, and a comprehensive
review of this literature is provided by Watts and Zimmerman (1986, 1990).
Examples of mechanisms that managers have been found to voluntarily
adopt include the terms of debt covenants (e.g., Leftwich, 1980), the use of
external auditors (e.g., Chow, 1982), and voluntary disclosures (e.g., Left-
wich, Watts, & Zimmerman, 1981; Chow & Wong-Boren, 1987; Meek &
Gray, 1989). Since governance mechanisms are also expected to reduce
management’s potential for personal gain at the firm’s expense, listed com-
panies’ governance structures should vary with the factors that affect the
extent of the management versus investor conflict.
Corporate Governance and Investor Reaction 7

Applying the tenets of principal-agent theory to listed Chinese companies
requires considering the unique features of the Chinese securities market. In
particular, the mandated segmentation of ownership into several classes
(discussed in the preceding subsection) suggests that there may be some
divergence of interests among these classes of shareholders. Owners of state
shares are unlikely to have earnings or asset integrity as primary concerns, in
part because the government officials themselves are not the residual claim-
ants, and in part because they often have other objectives for policy, such as
full employment, social stability, and supporting the development of certain
sectors. Owners of institutional shares likely will be more concerned with
asset preservation and profitability, and given their block ownership, may
be in a position to assert more influence, including direct interventions and
gaining representation on the board of directors. Finally, individual share
investors are most directly affected by firm profitability and reporting in-
tegrity. While dispersed ownership may dilute the influence of individual
shareholders, concern for the reactions of such investors as a group still
could create incentives for improved governance practices.
Much more research is needed to fully understand the incentives and av-
enues of influence of the three classes of shareholders. Nevertheless, there still
seems to exist sufficient basis for expecting that a listed Chinese company’s
choice of governance practices would depend on the distribution of its share
ownership among the three distinct groups. The following (governance choice)
hypothesis reflects this general expectation of a systematic relationship:
H2. There is a systematic relationship between the ownership structures
of listed Chinese companies and their governance practices.
METHODOLOGY
Testing the two hypotheses required data to be collected from different
sources and using different methods. To facilitate explanation, the models
used for hypothesis testing are first presented, and then used as the structure
for explaining the nature of the variables and the data collection process.
Model and Variables for the Information Hypothesis (H1)
The model for testing H1 was of the following form, with company
subscripts omitted:
DOMINICA SUK-YEE LEE ET AL.8

URð�2;þ2Þ ¼ a0 þ b0UEþ b1CEOþ b2UE � CEO
þ b3OUTDIR%þ b4UE �OUTDIR%
þ b5GOVERNþ b6UE �GOVERN
þ b7INTAUDþ b8UE � INTAUD
þ b9POLICYþ b10UE � POLICY
þ b11UE � LTAþ b12UE � PUB% ð1Þ
where
UR (–2, +2) ¼ the cumulative market-adjusted ‘‘abnormal’’ return to
company’s A shares over the 5-day interval surrounding annual earnings
announcement,
UE ¼ unexpected earnings,
CEO ¼ 0 if the chairman of BOD is the same person as the CEO, 1
otherwise,
OUTDIR% ¼ percentage of directors who are outsiders,
GOVERN ¼ average score for 5-item corporate governance scale,
INTAUD ¼ equals 1 if there is an internal audit department, 0 otherwise,
POLICY ¼ average score for 12 questions on the existence of formal work
manuals or policies in making various operation decisions,
LTA ¼ log of company’s total assets, and
PUB% ¼ percentage of ownership by individuals.
The general form of this regression is patterned after prior research on the
informativeness of accounting disclosures (e.g., Alford, Jones, Leftwich, &
Zmijewski, 1993; Amir, Harris, & Venuti, 1993; Barth & Clinch, 1996; Cho
& Jung, 1991). As mentioned above, the dependent variable, UR (–2, +2),
was the cumulative market-adjusted ‘‘abnormal’’ return to the company’s A
shares over the 5-day interval surrounding annual earnings announcement.
UE was unexpected earnings, and CEO, OUTDIR%, GOVERN,
INTAUD, and POLICY measured various aspects of the company’s gov-
ernance practices. LTA and PUB% were included to control for the size of a
company and its share ownership by individual (i.e., non-governmental and
non-institutional) investors.
To calculate the cumulative abnormal returns, UR, daily returns were
obtained from the Taiwan Economic Journal China Data Base. The equally
weighted (with dividend) return of each exchange was used as the market
return for deriving the market-adjusted abnormal returns. Annual earnings
Corporate Governance and Investor Reaction 9

announcement dates were manually extracted from China Securities Daily,
Shanghai Financial Times, Shanghai Securities News, Shenzhen Journal of
Commerce, and the Shenzhen Securities Times, which are the primary venues
for listed companies to publish their (required) annual financial reports. For
deriving unexpected earnings (UE), an expectations model was required.
Since the short histories of China’s two stock exchanges (and the even
shorter histories of most listings) precluded sufficient time series data for
model estimation, we used the random walk to proxy for market expecta-
tions. The two control variables, LTA and PUB%, were derived from the
listed companies’ annual reports.
In contrast, the governance practice variables are not part of companies’
annual reports, though most should be obtainable by an inquisitive outsider,
and incentives exist for companies with stronger governance to make such
data available to investors (the potential implications of these measures’
public availability will be explored further in the results section). A survey
approach was used to collect these data, where the surveys were personally
delivered to a top manager of each sample company. Specifically, we sought
the following information for each company:
CEO ¼ whether the CEO also served as the chairman of the board (0 ¼ yes,
1 ¼ no).
OUTDIR% ¼ the proportion of directors who were not employees.
INTAUD ¼ whether the company had a distinct, internal audit
department,
GOVERN ¼ the company’s average score on following five 0/1 questions:
1. Whether the Chairman of the BOD and the CEO are the same person?
2. Whether there were fixed terms on the board of directors?
3. Whether the board had an audit committee?
4. Whether the board had a nominations committee?
5. Whether the board had a compensation committee?
This set of four governance-related variables was broadly based on extant
research on governance (e.g., Bacon, 1993; Beasley, 1996; Blair, 1995; Byrd
& Hickman, 1992; Braiotta, 1994; DeChow et al., 1996; McMullen, 1996;
Weisbach, 1988). The numerical value of GOVERN was the sum of the five
answers divided by 5 (hence, the range of this variable was 0–1.0). With the
assignment of the zero and one values to answers (reversed between the
CEO measure and the other four), a higher score is consistent with the
literature’s concept of stronger governance.
DOMINICA SUK-YEE LEE ET AL.10

Whereas CEO, OUTDIR%, GOVERN, and to some extent, INTAUD
dealt with practices at the board of directors level, the POLICY variable
focused more on the company’s routine operations. Inclusion of these more
internally focused variables is premised on the effectiveness of external
mechanisms being dependent on internal governance structures that simul-
taneously operate in the firm (Demsetz & Lehn, 1985; Bathala & Rao, 1995;
Daily, 1996). POLICY was the average score from questions asking, on 7-
point scales, the degree to which the company had explicit written policies
regarding operational 12 activities. This set of 12 activities was broadly
based on extant research on management controls (e.g., Anthony, Dearden,
& Govindarajan, 1992; Flamholtz, Das, & Tsui, 1985; Merchant, 1985a;
Kren & Liao, 1988; Lincoln, Hanada, & McBride, 1986), with many specific
items being from Khandwalla (1977) and Gordon and Narayanan (1984).
The value of POLICY was the average of the numerical answers to ques-
tions regarding the existence of formal work manuals or policies in making
the following 12 operation decisions, where the values assigned were
1 ¼ none or unclear, and 7 ¼ detailed and clear:
1. External financing;
2. Allocation of resources among internal units;
3. Development of new products and/or services;
4. Capital budgeting;
5. Sourcing of non-labor inputs;
6. Product or service pricing;
7. Product or service mix;
8. Hiring and firing of personnel;
9. Salary adjustments;
10. Personnel performance evaluation;
11. Bonus determination; and
12. Day to day operations.
To ensure that the wording and items on the questionnaire were relevant
to the Chinese context, members of the research team conducted pilot in-
terviews at several companies each in Shanghai and Shenzhen. Minor re-
visions were made based on the feedback from these pilot tests.
For each company, a packet was prepared that contained two copies each
of the questionnaire and a cover letter that requested cooperation, explained
the purpose of the questionnaire, and promised anonymity for both com-
pany and respondent. The use of two questionnaires was designed to allow
for some validation across responses from each company.
Corporate Governance and Investor Reaction 11

Based on the research team’s prior experience with similar endeavors in
China, a personal approach to data collection was adopted where the top
management of each company was contacted to secure its cooperation. Per-
sonal experience and prior research further suggested that the person(s)
making the contact had to have the proper guanxi with the company’s
managers. In the Chinese business community, guanxi is cultivated mainly
for the reciprocal exchange of favors (Luo, 1997). It denotes trust, facilitates
action (Alston, 1989), and has long been valued as one of the most important
factors in conducting business in China. For example, in an interview study
of managers in Chinese state-owned, collectively hybrid, and private com-
panies, Xin and Pearce (1996) found that guanxi is especially important for
managers in private Chinese companies to secure resources and protection.
Given cost considerations and the importance of guanxi, it was decided to
only target listed companies headquartered in the Shanghai and Shenzhen
areas. For companies in the Shanghai area, two faculty members of the
accounting and finance department of a leading university in Shanghai were
engaged to personally visit each company. If the visit succeeded in gaining
cooperation in the survey, then the packet of two questionnaires was left for
distribution. Since the information being sought was more likely to be
known to higher-level managers, the contact in each company was asked to
target managers at higher ranks (including themselves). For the companies
in Shenzhen, the research team was able to obtain the assistance of a top
manager from one of the sample companies, who assisted in the distribution
and collection of the questionnaires.
The personal contacts were initiated in 1998, such that data for 1997 were
sought. This personal approach produced highly favorable response rates.
Out of a target sample of 100 listed companies from Shanghai and 59 from
Shenzhen, 184 completed questionnaires were received from 93 Shanghai
companies, and 110 were received from 55 companies in Shenzhen (to-
tal ¼ 148 companies). All but two of the companies (both were from
Shanghai) returned two completed questionnaires.
Demographic data on the respondents suggest that they should be suf-
ficiently informed and experienced to provide accurate answers to the ques-
tions. Out of the respondents from Shanghai, 77 reported that they were
members of top management and 68 were from middle management, with
only 35 being from other ranks. For Shenzhen, 21 respondents were from
top management, 72 indicated that they were from the middle rank, and
only 17 were from other ranks. In terms of years of employment with the
current company, the means were 10.89 and 5.75 years for Shanghai and
Shenzhen, respectively.
DOMINICA SUK-YEE LEE ET AL.12
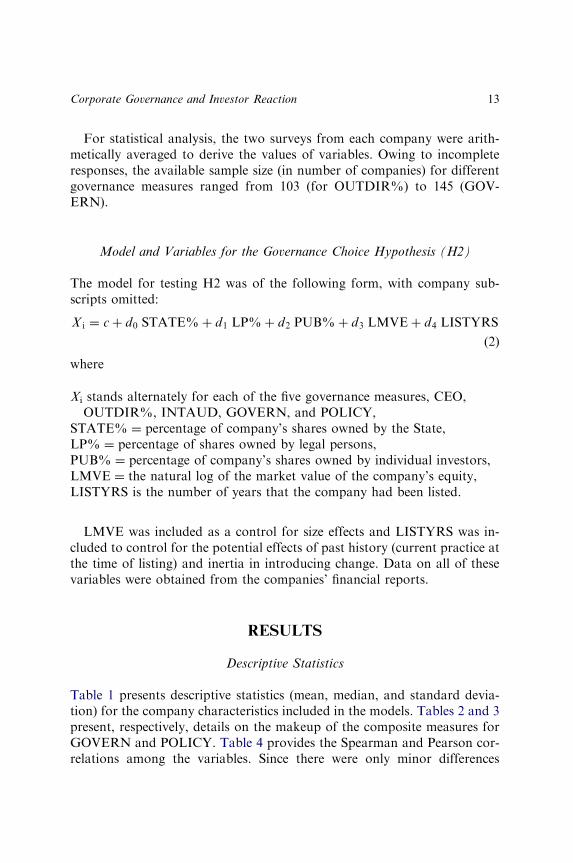
For statistical analysis, the two surveys from each company were arith-
metically averaged to derive the values of variables. Owing to incomplete
responses, the available sample size (in number of companies) for different
governance measures ranged from 103 (for OUTDIR%) to 145 (GOV-
ERN).
Model and Variables for the Governance Choice Hypothesis (H2)
The model for testing H2 was of the following form, with company sub-
scripts omitted:
X i ¼ cþ d0 STATE%þ d1 LP%þ d2 PUB%þ d3 LMVEþ d4 LISTYRS
(2)
where
Xi stands alternately for each of the five governance measures, CEO,
OUTDIR%, INTAUD, GOVERN, and POLICY,
STATE% ¼ percentage of company’s shares owned by the State,
LP% ¼ percentage of shares owned by legal persons,
PUB% ¼ percentage of company’s shares owned by individual investors,
LMVE ¼ the natural log of the market value of the company’s equity,
LISTYRS is the number of years that the company had been listed.
LMVE was included as a control for size effects and LISTYRS was in-
cluded to control for the potential effects of past history (current practice at
the time of listing) and inertia in introducing change. Data on all of these
variables were obtained from the companies’ financial reports.
RESULTS
Descriptive Statistics
Table 1 presents descriptive statistics (mean, median, and standard devia-
tion) for the company characteristics included in the models. Tables 2 and 3
present, respectively, details on the makeup of the composite measures for
GOVERN and POLICY. Table 4 provides the Spearman and Pearson cor-
relations among the variables. Since there were only minor differences
Corporate Governance and Investor Reaction 13

between the Shanghai and Shenzhen companies, only aggregate data for the
total sample are presented for parsimony.
Table 1 shows that on average, 33.75% of the sample companies’
shares are owned by the state (STATE%). The percentages of ownership
by legal persons (LP%) and individual domestic investors (PUB%) are
similar (26.77 and 25.63%, respectively). Individually as well as collectively,
these ownership percentages would seem adequate for exerting some
influence on managerial behavior. It is also of interest to note that the
three classes of ownership sum to less than 100%. The small shortfall
represents ownership by foreign investors (B shares) as well as relati-
vely small percentages of ownership by members of management and em-
ployees.
Table 1. Descriptive Statistics for Selected Company Characteristics.
Variable Name N Median Mean Std. Dev.
TA 148 10.38 19.70 33.46
STATE% 148 37.75 33.75 27.47
LP% 148 15.53 26.77 26.76
PUB% 148 21.79 25.63 19.60
MVE 148 4.47 9.36 19.64
CEO 144 1.00 0.87 0.34
TOTDIR 145 9.00 9.52 3.13
OUTDIR 112 3.00 3.58 2.65
OUTDIR% 103 0.33 0.37 0.24
INTAUD 137 1.00 0.66 0.47
GOVERN 145 0.40 0.41 0.17
POLICY 142 5.63 5.48 1.03
TA ¼ total book value of assets, measured in RMB 100 million.
STATE% ¼ percentage of shares owned by the State.
LP% ¼ percentage of shares owned by legal persons.
PUB% ¼ percentage of shares owned by the public.
MVE ¼ market value of common equity, measured in RMB 100 million.
TOTDIR ¼ total number of directors.
OUTDIR ¼ number of outside directors.
OUTDIR% ¼ percentage of directors who are outsiders.
GOVERN ¼ average score for 5-item corporate governance scale.
CEO ¼ 0 if the chairman of BOD is the same person as the CEO, 1 otherwise.
INTAUD ¼ 1 if there is an internal audit department, 0 otherwise.
POLICY ¼ average score for 12 questions on the existence of formal work manuals or policies
in making various operation decisions.
DOMINICA SUK-YEE LEE ET AL.14

Table 1 also shows that on an average, the sample companies’ boards of
directors have 9.52 members, with 37% (or 3.58 members) being outsiders.
In most of the companies, the CEO does not simultaneously serve as the
chairman of the board (CEO ¼ 0:87), and the majority of the companies do
have a distinct, internal audit department.
Regarding the aggregate GOVERN measure, the theoretical range was
0–1, and Table 1 shows that its mean value was 0.41. The details provided in
Table 2 show that this relatively high number was primarily due to the CEO
measure and most companies (88.3%) having fixed terms for board
Table 2. Descriptive Statistics for Components of the
GOVERN Variable.
Component Mean Std.
Dev.
1. Chairman and CEO are the same person? (1 ¼ no; 0 ¼ yes) 0.866 0.340
2. Fixed-term appointments for corporate directors? (1 ¼ yes; 0 ¼ no) 0.883 0.306
3. Existence of audit committee on the corporate board? (1 ¼ yes;
0 ¼ no)
0.159 0.357
4. Existence of nomination committee on the corporate board?
(1 ¼ yes; 0 ¼ no)
0.055 0.229
5. Existence of compensation committee on the corporate board?
(1 ¼ yes; 0 ¼ no)
0.066 0.245
Table 3. Descriptive Statistics for Components of the
POLICY Variablea.
Component Mean Std. Dev.
1. Policy on raising financial resources. 5.755 1.217
2. Policy on allocating financial resources. 5.341 1.162
3. Policy on new product/service development. 5.323 1.291
4. Policy on major capital investment decisions. 5.844 1.212
5. Policy on finding non-labor resources. 5.168 1.392
6. Policy on product/service pricing. 5.529 1.358
7. Policy on product/service mix and marketing. 5.353 1.363
8. Policy on hiring and firing. 5.658 1.354
9. Policy on salary/wages adjustments. 5.560 1.292
10. Policy on performance evaluation. 5.346 1.331
11. Policy on bonus and compensation. 5.407 1.292
12. Policy on daily operations. 5.604 1.343
aResponse scale: 1 ¼ ‘‘None or unclear’’, 7 ¼ ‘‘Detailed and clear’’.
Corporate Governance and Investor Reaction 15

Table 4. Correlations between Company Characteristics.
Variable TA STATE% LP% PUB% MVE OUTDIR% GOVERN CEO INTAUD POLICY
TA 0.095 �0.079 �0.145 0.231 �0.147 0.058 0.012 0.001 0.056
(0.25) (0.34) (0.08) (0.00)� (0.12) (0.49) (0.89) (1.00) (0.51)
STATE% 0.187 �0.783 �0.329 �0.104 �0.231 0.037 0.015 0.188 �0.088
(0.02)� (0.00)� (0.00)� (0.21) (0.01)� (0.66) (0.86) (0.03)� (0.30)
LP% �0.099 �0.742 �0.117 �0.065 0.108 �0.083 0.096 �0.225 �0.034
(0.23) (0.00)� (0.16) (0.43) (0.26) (0.32) (0.25) (0.01)� (0.68)
PUB% �0.255 �0.277 �0.004 0.349 0.161 �0.014 �0.148 0.000 0.052
(0.00)� (0.00)� (0.95) (0.00)� (0.09) (0.87) (0.08) (1.00) (0.54)
MVE 0.285 �0.143 �0.069 0.500 �0.053 0.244 �0.00 �0.155 0.104
(0.00)� (0.08) (0.40) (0.00)� (0.58) (0.00)� (0.99) (0.07) (0.22)
OUTDIR% �0.114 �0.169 0.002 0.130 �0.028 �0.062 0.103 0.109 0.187
(0.23) (0.07) (0.98) (0.17) (0.77) (0.52) (0.28) (0.27) (0.05)�
GOVERN �0.065 0.028 �0.045 �0.020 �0.010 �0.039 0.336 0.080 �0.010
(0.44) (0.74) (0.59) (0.81) (0.91) (0.68) (0.00)� (0.35) (0.90)
CEO 0.023 0.001 0.118 �0.168 �0.082 0.079 0.389 �0.139 �0.096
(0.79) (0.99) (0.16) (0.04)� (0.33) (0.41) (0.00)� (0.10) (0.26)
INTAUD 0.014 0.168 �0.204 �0.009 �0.073 0.097 0.094 �0.139 0.233
(0.87) (0.05)� (0.02)� (0.92) (0.40) (0.33) (0.27) (0.10) (0.01)�
POLICY 0.049 �0.065 �0.065 0.028 0.105 0.202 �0.012 �0.096 0.288
(0.56) (0.44) (0.44) (0.74) (0.21) (0.03)� (0.89) (0.26) (0.00)�
Notes: (1) Pearson correlations are reported on the upper-right part of the table.
(2) Spearman correlations are reported on the lower-left part of the table.
(3) Significance levels are shown in parentheses.�Significant at p ¼ 0.05.
DOMIN
ICA
SUK-Y
EELEE
ET
AL.
16

members. All three measures related to the operations (as compared to
setup) of the board of directors tended toward the low end, with only 15.9,
5.5, and 6.6%, respectively, of the sample companies reporting the existence
of an audit committee, a nomination committee, and a compensation com-
mittee on the board.
Focusing on the POLICY variable (Table 3), most of the sample com-
panies report that they have established rather extensive internal policies
relating to the 12 aspects of operations. The mean values for all 12 com-
ponents are above 5.5 (range: 5.168–5.844) on a response scale of 1 to 7.
Finally, consider the correlations among company characteristics
(Table 4). Given the virtually identical patterns of significant correlations
between the Pearson and Spearman results, only the former (upper-right
part of the table) will be discussed.
Since a higher percentage ownership by one class of shareholders implies
lower ownership percentages by other classes, it is not surprising to find
negative and significant correlations between STATE% and LP%, and be-
tween STATE% and PUB%. But the correlation between LP% and PUB%
is not significant, reflecting the fact that there are residual (and relatively
minor) classes of other owners (e.g., employees). The positive and significant
correlation between TA and MVE is similarly not surprising.
The positive and significant correlation between MVE and PUB% sug-
gests that companies with larger total market values of equity tend to have
higher percentages of ownership by individual investors. To the extent that
listed companies with higher market values of equity also are more impor-
tant to the Chinese economy (especially considering the significant and
positive correlation between TA and MVE) this finding may give impetus to
considering the role of individual investors in such companies.
Turning to the correlations with governance practices, STATE% has a
negative and significant correlation with OUTDIR%. Thus, companies with
higher percentages of their ownership in the hands of the state tend to have
proportionally fewer outside directors, perhaps reflecting the relatively low-
er influence of non-state owners and state officials’ preference for directly
influencing company management. The positive and significant correlation
between STATE% and INTAUD, in conjunction with the negative and
significant correlation between LP% and INTAUD, suggest that state of-
ficials are more focused than the other classes of owners on internal con-
trols. Finally, there is a positive and significant correlation between CEO
and GOVERN, and ones between OUTDIR% and POLICY, and between
INTAUD and POLICY. These correlations suggest that there may be some
complementarities across governance practices. It is worthy of note,
Corporate Governance and Investor Reaction 17

however, that except for the –0.783 correlation between ownership variables
STATE% and LP%, all of the significant correlations are at very modest
levels (0.349–0.187 in absolute values).
Test of the Governance Choice Hypothesis (H1)
Table 5 presents the results of a regression based on Eq. (1). The 1997 fiscal
year was used to ensure that all variables were from the same time period.
(Recall discussion of data collection for the governance variables.) Models
using 3- and 11-day ‘‘windows’’ for cumulating abnormal returns, and var-
ious subsets of the independent variables yielded qualitatively similar re-
sults. Hence they are omitted.
Table 5 shows that the regression as a whole has an adjusted R2 of 0.06.
While this statistic is not remarkable, it is in the typical range for regressions
of this type. Further, the equation as a whole has an F value of 2.59, which is
significant at the 0.001 level.
Consistent with prior studies of the Chinese securities market (e.g., Abdel-
khalik, Wong, & Wu, 1999; Haw, Qi, & Wu, 1999), there is a positive and
significant correlation between UE and cumulative abnormal return. This
suggests that domestic Chinese investors do make use of the listed compa-
nies’ annual earnings reports. Focusing on the governance practice varia-
bles, H1 implies that there would be positive and significant coefficients for
these variables’ interaction terms with UE. This pattern is not uniformly
observed, with the coefficients for UE � CEO and UE �GOVERN being
negative, rather than positive as predicted (�0.451 and –2.663, respectively).
The interactions that are positive are uniformly not statistically significant,
while the negative coefficient for UE �GOVERN is significant at the 0.05
level ðt ¼ �2:12Þ: Overall, these results fail to support H1.
Since POLICY relates to companies’ internal policies and process, one
could attribute the lack of significance for this variable to outsiders’ lack of
access to such detailed information. However, such an explanation seems to
be less tenable for the GOVERN variable, which pertains to the board of
directors. In this case, the significant negative interaction term between
GOVERN and UE implies that individual investors reacted less, rather than
more, to the unexpected earnings reported by companies with stronger
board of directors related governance structures. This is a decidedly coun-
terintuitive result.
While the available data precluded an exhaustive investigation into the
potential causes of this unexpected finding, some exploratory analysis still
DOMINICA SUK-YEE LEE ET AL.18

was possible. We speculated that the governance practices of a company
may have affected the timeliness of its annual reports, conditional on the
favorable versus unfavorable nature of the earnings change. In turn, the
timing of earnings announcement could have shifted investors’ reactions to
a period outside the days we had used to cumulate abnormal returns.
To evaluate the efficacy of the announcement date explanation, we col-
lected data on the reporting delay for each sample company, defined as the
number of days between fiscal year end and publication of the annual re-
port. This measure was used as the dependent variable in a regression of the
form in Eq. (1). Neither the main effect due to GOVERN, nor its interaction
term with unexpected earnings was close to statistical significance.
Table 5. Cumulative 5-Day Abnormal Returns as a Function of
Unexpected Earnings and Governance Practices.
Variable Coeff. t-statistic
Intercept �0.011 �0.38
UE 2.172 2.35�
CEO �0.007 �0.47
UE*CEO �0.451 �0.73
OUTDIR% �0.018 �0.97
UE*OUTDIR% 0.260 0.34
GOVERN 0.013 0.37
UE*GOVERN �2.663 �2.12�
INTAUD 0.012 1.21
UE*INTAUD 0.006 0.03
POLICY �0.001 �0.17
UE*POLICY 0.035 0.47
UE*LTA �0.107 �1.01
UE*PUB% �0.008 �1.60
Adjusted R2 ¼ 0.06
F-value ¼ 2.59
Significance level ¼ 0.00
UE ¼ unexpected earnings.
CEO ¼ 0 if the chairman of BOD is the same person as the CEO, 1 otherwise.
OUTDIR% ¼ percentage of directors who are outsiders.
GOVERN ¼ average score for 5-item corporate governance scale.
INTAUD ¼ 1 if there is an internal audit department, 0 otherwise.
POLICY ¼ average score for 12 questions on the existence of formal work manuals or policies
in making various operation decisions.
LTA ¼ log of total assets.
PUB% ¼ percentage of shares owned by individuals.�Significant at 0.05 level.
Corporate Governance and Investor Reaction 19

As an added test, we cumulated each company’s market-adjusted daily
returns for the 12 months surrounding announcement of its 1997 earnings,
and regressed this against the governance variables in a model of the form in
Eq. (1). Again, both the main and interaction effects due to GOVERN were
far from being statistically significant. Thus, our overall results fail to in-
dicate a significant role for governance practices in domestic Chinese in-
vestors’ use of reported earnings, and in addition leaves us with an
unexpected result that calls for attention from future research.
Test of the Governance Choice Hypothesis (H2)
Recall that H1 was predicated on listed companies’ governance choices
being responsive to investor expectations. Hence, evidence on the relation
between ownership structure and governance practices (the focus of H2)
could shed light on the H1 results. Table 6 presents the results of regressions
Table 6. Regression Results on Governance Practices.
Dependent
Variable
Intercept STATE% LP% PUB% LMVE LISTYRS Adj. R2 F-value
(sig. level)
CEO 0.886 0.003 0.004 �0.002 0.015 �0.004 0.05 2.59
(4.92) (1.40) (1.78) (�0.99) (0.42) (�2.82)� (0.03)
OUTDIR% 0.570 �0.003 �0.001 0.001 �0.040 �0.001 0.05 2.19
(4.02) (�1.48) (�0.61) (0.68) (�1.37) (�0.77) (0.06)
GOVERN 0.480 �0.001 �0.002 �0.001 0.010 0.001 0.0 0.67
(5.22) (�1.19) (�1.55) (�0.98) (0.55) (0.89) (0.65)
INTAUD 0.824 �0.000 �0.004 0.002 �0.091 0.001 0.04 2.12
(3.18) (�0.03) (�1.35) (0.63) (�1.79) (0.62) (0.07)
POLICY 6.307 �0.020 �0.019 �0.010 0.129 0.008 0.05 2.42
(11.55) (�2.85)� (�2.74)� (�1.53) (1.19) (1.77) (0.04)
STATE% ¼ percentage of shares owned by the State.
LP% ¼ percentage of shares owned by legal persons.
PUB% ¼ percentage of shares owned by the public.
LMVE ¼ log of market value of common equity, measured in RMB 100 million.
LISTYRS ¼ the number of years that the company had been listed.
CEO ¼ 0 if the chairman of BOD is the same person as the CEO, 1 otherwise.
OUTDIR% ¼ percentage of directors who are outsiders.
GOVERN ¼ average score for 5-item corporate governance scale.
INTAUD ¼ 1 if there is an internal audit department, 0 otherwise.
POLICY ¼ average score for 12 questions on the existence of formal work manuals or policies
in making various operation decisions.
Significance levels are shown in parentheses.�Significant at 0.05 level.
DOMINICA SUK-YEE LEE ET AL.20

using the model in Eq. (2). Each regression used a different governance
measure as the dependent variable.
Table 6 shows that the regression for GOVERN is not significant. There
is no relationship between this variable and the company characteristics that
we had hypothesized would affect this choice. All four remaining regressions
are at least moderately significant (p ¼ 0:07–0.03). In the case of CEO, the
only significant independent variable was the number of years that the
company had been listed. The negative sign of its coefficient indicates that
the separation between CEO and board chairmanship was proportionally
less in companies with longer listing histories.
Table 6 also shows two other coefficients as being significant. Both are in
the regression with POLICY as the dependent variable. They indicate that
as the percentage of ownership by the state and legal persons increases, the
company tends to have less developed sets of internal policies. Perhaps this
reflects the power, and preference, of these two owner groups to exercise
influence and/or oversight via other means, including direct interventions
and directives. A caveat is that three significant regression coefficients out of
a total of 25 does not strongly dispel the possibility that the results are due
to chance. Perhaps future research can shed further light on this, and other
possible explanations.
SUMMARY AND DISCUSSION
The key findings from this study are as follows. First, investors in the do-
mestically listed Chinese companies do seem to base their valuation
decisions, at least in part, on these companies’ earnings reports. This was
indicated by the significant relationship between ‘‘unexpected’’ earnings and
cumulative abnormal returns. However, the hypothesized effects of govern-
ance practice/choice are, on the whole, not supported. Furthermore, one
aspect of governance is found to have an effect opposite in direction to that
expected.
Second, the Chinese companies’ choices of governance practices are, on
the whole, not systematically related to ownership structure. Though a
couple of significant relations are found, the possibility that these are due to
chance cannot be dismissed.
On the whole, we interpret these findings to imply that in the Chinese
securities market, the institutional factors and infrastructure (e.g., legal li-
ability, information intermediation, market for managers, and takeovers)
are not yet sufficiently developed to permit individual investors to exert
Corporate Governance and Investor Reaction 21

significant influence via their market reactions. The segmented nature of
share ownership (e.g., state and legal person shares) also may be a contrib-
utory factor in at least two ways. One is that these two classes of owners
tend to hold over half of the shares, so individual owners are in the minority
and thus have proportionally limited influence. The other is that these two
classes of owners may have objectives that differ from the (presumed) wealth
maximization objective of individual owners. If China desires to attract
more private capital to listed companies, and to increase these companies’
attention to investor wealth maximization (in part via increased effective-
ness and accountability), a potential implication is that the segmentation of
company ownership needs to be loosened or eliminated, along with in-
creasing the transparency of company operations.
In seeking policy implications of this type, it is important to recognize that,
while this study has progressed over prior studies in getting more detailed
measures of companies’ governance practices, these measures are based on
self-reporting in surveys. While the responses to board of director level gov-
ernance practices may be more straightforward, those relating to internal
operating processes and policies are more subject to judgmental error. Access
to companies’ internal data would improve the accuracy and reliability of
these measures. Second, we have implicitly assumed that every component of
governance practice plays an equally important or intensive role. Further
investigation, such as focused surveys or interviews, could help to develop a
more appropriate weighting scheme. Third, our measures may only capture
the surface of phenomena. For example, we lack information on how outside
board members are appointed. It may be that the appointment of outside
board members is just ‘‘window dressing’’ (Menon & Williams, 1994;
Wallace, 1995), and that companies are primarily concerned with the wishes
of the state and legal person owners. Considerations like these suggest that
there is much room for increasing both the scope and depth of the inves-
tigation, in particular relating to the potential conflict of interests among the
three classes of owners, the avenues that each class has to exert influence, and
how these affect the operations of listed Chinese companies.
ACKNOWLEDGEMENT
The authors are indebted to Shijun Cheng for his assistance in data col-
lection, and to the Hong Kong Research Grants Council for its financial
support (RGC grant number CUHK 160/96H).
DOMINICA SUK-YEE LEE ET AL.22

REFERENCES
Abdel-khalik, A. R., Wong, K., & Wu, A. (1999). The association between disclosure of ac-
counting information and security prices in China’s emerging capital market. Interna-
tional Journal of Accounting, 34, 467–489.
Agrawal, A., & Knoeber, C. R. (1996). Firm performance and mechanisms to control agency
problems between managers and shareholders. Journal of Financial and Quantitative
Analysis, 31, 377–397.
Alford, A., Jones, J., Leftwich, R., & Zmijewski, M. (1993). The relative informativeness of
accounting disclosures in different countries. Journal of Accounting Research, 31(Suppl.),
183–223.
Alston, J. P. (1989). Guanxi, and Inhwa: Managerial principles in Japan, China, and Korea.
Business Horizons, 32, 26–31.
Amir, E., Harris, T. S., & Venuti, E. (1993). A comparison of the value relevance of U.S. versus
Non-U.S. GAAP accounting measures using form 20-F reconciliations. Journal of Ac-
counting Research, 31(Suppl.), 230–263.
Anthony, R. N., Dearden, J., & Govindarajan, V. (1992). Management control systems. Home-
wood, IL: Irwin.
Bacon, J. (1993). Corporate boards and corporate governance. New York: The Conference
Board.
Bao, B., & Chow, L. (1999). The usefulness of earnings and book value for equity valuation in
emerging capital markets: Evidence from listed Chinese companies in the People’s Republic
of China. Journal of International Financial Management and Accounting, 10, 85–104.
Barth, M. E., & Clinch, G. (1996). International accounting differences and their relation to
share prices: Evidence from U.K., Australian, and Canadian firms. Contemporary Ac-
counting Research, 13, 135–170.
Bathala, C., & Rao, R. P. (1995). The determinants of board composition: An agency theory
perspective. Managerial and Decision Economics, 16, 59–69.
Beasley, M. (1996). An empirical analysis of the relation between the board of director com-
position and financial statement fraud. The Accounting Review, 71, 443–465.
Beatty, R. P., & Zajac, E. J. (1994). Managerial incentives, monitoring, and risk bearing: A
study of executive compensation, ownership, and board structure in initial public of-
ferings. Administrative Science Quarterly, 39, 313–335.
Blair, M. (1995). Ownership and control: Rethinking corporate governance for the twenty-first
century. Washington, DC: Brookings Institute.
Braiotta, L. (1994). The audit committee handbook. New York: Wiley.
Brickley, J., Coles, J., & Terry, R. L. (1994). Outside directors and the adoption of poison pills.
Journal of Financial Economics, 35, 371–390.
Byrd, J. W., & Hickman, K. A. (1992). Do outside directors monitor managers? Evidence from
tender offer bids. Journal of Financial Economics, 32(Suppl.), 195–221.
Canadian Institute of Chartered Accountants (CICA). (1995). Criteria of Control Board Guid-
ance on Control (CoCo). Toronto, Ontario, Canada: CICA.
Chen, C. J. P., Gul, F. A., & Su, X. (1999). A comparison of reported earnings under Chinese
GAAP versus IAS: Evidence from the Shanghai Stock Exchange. Accounting Horizons,
13, 91–111.
Cho, J. Y., & Jung, K. (1991). Earnings response coefficients: A synthesis of theory and em-
pirical evidence. Journal of Accounting Literature, 10, 85–116.
Corporate Governance and Investor Reaction 23

Chow, C. W. (1982). The demand for external auditing: Size, debt and ownership influences.
Accounting Review, 57, 272–291.
Chow, C. W., & Wong-Boren, A. (1987). Voluntary financial disclosure by mexican corpo-
rations. Accounting Review, 62, 541–544.
Collins, D. W., & DeAngelo, L. E. (1990). Accounting information and corporate governance:
Market and analyst reactions to earnings of firms engaged in proxy contests. Journal of
Accounting and Economics, 13, 213–247.
Committee of Sponsoring Organizations of the Treadway Commission (COSO). (1992). Inter-
nal control-integrated framework. Jersey City, NJ: American Institute of Certified Public
Accountants.
Committee on Corporate Governance (CCG). (1998). Final report of committee (Hampel Re-
port). London, UK: Gee Publishing Company.
Core, J. E., Holthausen, R., & Larcker, D. F. (1999). Corporate governance, chief executive
officer compensation, and firm performance. Journal of Financial Economics, 51, 371–406.
Daily, C. (1996). Governance patterns in bankruptcy reorganizations. Strategic Management
Journal, 17, 355–375.
DeAngelo, L. E. (1988). Managerial competition, information costs, and corporate governance:
The use of accounting performance measures in proxy contests. Journal of Accounting
and Economics, 10, 3–36.
DeChow, P., Sloan, R., & Sweeney, A. (1996). Causes and consequences of earnings manip-
ulation: An analysis of firms subject to enforcement actions by the SEC. Contemporary
Accounting Research, 13, 1–36.
DeFond, M. L., Wong, T. J., & Li, S. H. (1999). The impact of improved auditor independence
on audit market concentration in China. Journal of Accounting and Economics, 28,
269–305.
Demsetz, H., & Lehn, K. (1985). The structure of corporate ownership: Causes and conse-
quences. Journal of Political Economy, 98, 1155–1177.
Flamholtz, E., Das, T., & Tsui, A. (1985). Toward an integrative framework of organizational
control. Accounting, Organizations and Society, 10, 35–50.
Gordon, L. A., & Narayanan, V. K. (1984). Management accounting systems, perceived en-
vironmental uncertainty and organization structure: An empirical investigation. Ac-
counting, Organizations and Society, 9, 33–48.
Haw, I. M., Qi, D., & Wu, Y. W. (1999). Value-relevance of earnings in an emerging capital
market: The case of A-shares in China. Pacific Economic Review, 4, 337–347.
Khandwalla, P. N. (1977). The design of organizations. New York: Harcourt Brace Jovanovich.
Kren, L., & Liao, W. (1988). The role of accounting information in the control of organizations:
A review of the evidence. Journal of Accounting Literature, 7, 280–309.
Leftwich, R. (1980). Market failure fallacies and accounting information. Journal of Accounting
and Economics, 2, 193–211.
Leftwich, R., Watts, R., & Zimmerman, J. (1981). Voluntary corporate disclosure: The case of
interim reporting. Journal of Accounting Research, ðSuppl:Þ, 19, 50–77.
Li, R., & He, H. (2000). An analysis of the development and current situation of the civil legal
liabilities of CPAs in China. China Accounting and Finance Review 2, 1, 104–120.
Lincoln, J., Hanada, M., & McBride, K. (1986). Organizational structures in Japanese and U.S.
manufacturing. Administrative Science Quarterly, 31, 338–364.
Loebbecke, J., Eining, M., & Willingham, J. (1989). Auditors’ experience with material irreg-
ularities: Frequency, nature, and detectability. Auditing: A Journal of Practice and The-
ory, 9, 1–28.
DOMINICA SUK-YEE LEE ET AL.24

Luo, Y. (1997). Guanxi and performance of foreign-invested enterprises in China: An empirical
inquiry. Management International Review, 37, 51–70.
McMullen, D. (1996). Audit committee performance: An investigation of the consequences
associated with audit committees. Auditing: A Journal of Practice and Theory, 15,
87–103.
McMullen, D., & Raghunandan, K. (1996). Enhancing audit committee effectiveness. Journal
of Accountancy, 182, 79–81.
Meek, G. K., & Gray, S. J. (1989). Globalization of stock markets and foreign listing require-
ments: Voluntary disclosures by continental European companies listed on the London
Stock Exchange. Journal of International Business Studies, 20, 315–336.
Menon, K., & Williams, J. (1994). The use of audit committees for monitoring. Journal of
Accounting and Public Policy, 13, 121–139.
Merchant, K. (1985a). Control in business organizations. Boston, MA: Pitman.
Merchant, K. (1985b). Organizational controls and discretionary program decision making:
A field study. Accounting, Organizations & Society, 10, 67–85.
Mok, H. M. K., & Hui, Y. V. (1998). Underpricing and aftermarket performance of IPOs in
Shanghai, China. Pacific-Basin Finance Journal, 6, 453–474.
Organization for Economic Cooperation and Development (OECD). (1999). Draft Principles of
Corporate Governance, Washington, DC.
Pacter, P. (2001). Accounting standards in China: A progress report. Accounting & Business,
4(2), 22.
Poon, W. P. H., Firth, M., & Fung, H. G. (1998). Asset pricing in segmented capital markets:
Preliminary evidence from China-domiciled companies. Pacific-Basin Finance Journal, 6,
307–319.
Rosenstein, S., & Wyatt, J. G. (1990). Outside directors, board independence and shareholder
wealth. Journal of Financial Economics, 26, 175–191.
Shleifer, A., & Vishny, R. (1997). A survey of corporate governance. Journal of Finance, 52,
737–783.
Tam, O. K. (1999). The development of corporate governance in China. Cheltenham, UK and
Northampton, MA: Edward Elgar.
Tang, Y. W. (2000). Bumpy road leading to internationalization: A review of accounting de-
velopment in China. Accounting Horizons, 14(1), 93–102.
Tang, Y. W., Chow, L., & Cooper, B. (1994). Accounting and finance in China – A review of
current practice (2nd ed.). Hong Kong: Longman.
Wallace, W. (1995). Are outside directors put on boards just for show?Wall Street Journal, B22.
Watts, R., & Zimmerman, J. (1986). Positive accounting theory. Englewood Cliffs, NJ: Prentice-
Hall.
Watts, R., & Zimmerman, J. (1990). Positive accounting theory: A ten-year perspective. Ac-
counting Review, 65, 131–156.
Weisbach, M. (1988). Outside directors and CEO turnover. Journal of Financial Economics, 20,
431–460.
Xiang, B. (1998). Institutional factors influencing China’s accounting reforms and standards.
Accounting Horizons, 12, 105–119.
Xin, K. R., & Pearce, J. L. (1996). Guanxi: Connections as substitutes for formal institutional
support. Academy of Management Journal, 39, 1641–1658.
Xu, X., & Wang, Y. (1999). Ownership structure and corporate governance in Chinese stock
companies. China Economic Review, 10, 75–98.
Corporate Governance and Investor Reaction 25

This page intentionally left blank
26

CULTURAL INFLUENCES ON
INDIGENOUS USERS’
PERCEPTIONS OF THE
IMPORTANCE OF DISCLOSURE
ITEMS: EMPIRICAL EVIDENCE
FROM PAPUA NEW GUINEA
Ken Ngangan, Shahrokh M. Saudagaran and
Frank L. Clarke
ABSTRACT
This study investigates the cultural determinism hypothesis that financial
statement users from different cultural groups will have different percep-
tions regarding the importance of accounting information disclosure. Ex-
amination of the perceptual differences of three cultural groups from: (1)
Papua New Guinea, (2) other developing countries, and (3) developed
western countries, shows that while significant differences exist in ac-
counting information perception between financial statement users from
the developed western countries and developing countries (including Papua
New Guinea), there appears to be no significant difference in the percep-
tions of users in the developing countries. In general, the results support the
cultural determinism thesis in accounting. This has implications for the
Advances in International Accounting
Advances in International Accounting, Volume 18, 27–51
Copyright r 2005 by Elsevier Ltd.
All rights of reproduction in any form reserved
ISSN: 0897-3660/doi:10.1016/S0897-3660(05)18002-7
27

designing of appropriate accounting and reporting systems for use in the
developing countries. It also raises questions about some of the country
classifications traditionally reported in the international accounting liter-
ature. An important implication is the warning it sends to the International
Accounting Standards Board and any other aspiring global standard set-
ters about their penchant for selling Anglo-American standards, packaged
as ‘international’ or ‘global’ standards, to the developing countries.
INTRODUCTION
Over the past decade, the effort to harmonize financial reporting globally
has gathered momentum under the auspices of the International Accounting
Standards Committee (IASC) and its successor – The International Ac-
counting Standards Board (IASB). Underlying the push for the interna-
tional harmonization of accounting standards is the implicit assumption
that the accounting information needs of users are similar notwithstanding
their different socio-economic and political backgrounds. However, a grow-
ing body of literature argues that significant and influential differences exist
between the cultural environments of the developed and developing coun-
tries which may engender differences in the information needs of financial
statement users in each (Briston, 1978; Wallace, 1988; Perera, 1989a;
Baydoun & Willett, 1995; Chow, Shields, & Wu, 1999; Patel, 2003). Ac-
counting practices in developed countries are a product of the economic,
regulatory, social, and political conditions that prevail in those countries
(Mueller, 1967; Meek & Saudagaran, 1990).1 Transporting those practices,
either overtly or in the guise of ‘international accounting standards (IASs)’,
to developing countries with underlying environments that differ markedly
from the developed countries, should not be expected to have optimum
results for constituents in the developing countries.
Studies have been conducted mainly in the developed countries to exam-
ine the information needs of financial statement users both within a country
(e.g., Firth, 1978; McNally, Eng, & Hasseldine, 1982; Wallace, 1988;
Abu-Nassar & Rutherford, 2000) and users across different countries (e.g.,
Baker, Chenhall, Haslem, & Juchau, 1977; Chang & Most, 1981; Choi &
Levich, 1990; Salter, Roberts, & Kantor, 1995). Whereas different methods
have been used in the analyses and somewhat different conclusions reached,
there is a consensus that the information needs of users differ between
various user groups within a single country and between users of the same
class across different countries. However, much of this work has focused
KEN NGANGAN ET AL.28

primarily on user groups in developed countries. Little empirical research
has investigated the information needs of users in developing countries.
This chapter reports the examination of differences and similarities in user
preferences for different aspects of accounting information disclosure, with
a view to explain the difference in preferences in terms of cultural grouping
affiliations. It develops and tests the general hypothesis that no significant
difference exists in the perceptions of financial statement users of different
nationalities, specifically from developed and developing countries, regard-
ing the disclosure of accounting information in financial statements.
We investigate the cultural determinism hypothesis that financial statement
users from different cultural groups will have different perceptions regarding
the importance of accounting information disclosure. We do this by inves-
tigating the perceptions of financial statement users of different nationalities
based in Papua New Guinea (PNG). We include financial statement users of
other nationalities to facilitate comparison and determine whether (1) the
information needs of users from a developing country are different from
those of users from a developed country (Perera, 1985), and (2) the infor-
mation needs of users from a developing country are similar to those of users
from other developing countries (Wallace, 1988). Examination of the per-
ceptual differences of three cultural groups from: (1) PNG, (2) other devel-
oping countries (ODC), and (3) developed western countries (DWC), shows
that while significant differences exist in accounting information perception
between financial statement users from the DWC and developing countries
(including PNG), there appears to be no significant difference in the percep-
tions of users in the developing countries. In general, the results support the
cultural determinism thesis in accounting. This has implications for the de-
signing of appropriate accounting and reporting systems for use in the de-
veloping countries. It also raises questions about some of the multicountry
classifications (i.e., British Commonwealth group) traditionally reported in
the international accounting literature. Finally, an important implication is
the warning it sends to the IASB and any other aspiring global standard
setters about their penchant for selling Anglo-American standards, packaged
as ‘international’ or ‘global’ standards, to the developing countries.
CULTURAL GROUPING AFFILIATION AND
HYPOTHESES FORMULATION
Culture has been subject to numerous interpretations in the social science
literature. An early view was that culture could be explained only by
Cultural Influences on Indigenous Users’ Perceptions 29

reference to specific cultures (e.g., White, 1949). After reviewing the liter-
ature on culture, Kroeber and Kluckhohn (1952, p. 181) concluded that no
consensus existed. Jahoda (1984, p. 140) noted that ‘culture is arguably the
most elusive term in the vocabulary of the social sciences’ and Segall (1984,
p. 153) emphasized the point by asserting that ‘no single definition [of cul-
ture] is embraced even by all anthropologists, in whose discipline the con-
cept is central.’ Consequently, Segall noted that there was no need to push
for a definition of culture:
We of course cannot (and don’t) do without culture but it matters not at all that we
cannot pin down the concept. We don’t need to. When we try to, we may end up with a
definition that leads us erroneously to a conclusion that we are studying the wrong
things. (1984, pp. 161–162)
Certainly most definitions of culture have emphasized on values, ideas, be-
liefs, and meaning systems. An early definition proposed by Kroeber and
Kluckhohn (1952) also included ideas and values. After reviewing uses of
the concept over 150 years, Kroeber and Kluckhohn proposed the following
definition:
Culture consists of patterns, explicit and implicit, of and for behavior acquired and
transmitted by symbols, constituting the distinctive achievements of human groups,
including their embodiments in artifacts; the essential core of culture consists of tra-
ditional (i.e., historically derived and selected) ideas and especially their cultural systems
may on the one hand be considered as products of action, on the other hand as con-
ditioning elements of further action. (1952, p. 181)
Other early definitions of culture included that by Fayerweather (1959, p. 7)
who defined culture as ‘the attitudes, beliefs and values of a society.’ Whitely
and England (1977) reviewed the 164 definitions analyzed by Kroeber and
Kluckhohn (1952) and redefined culture as ‘the knowledge, beliefs, art, laws,
morals, customs and other capabilities of one group distinguishing it from
other groups.’ More recently, Rohner (1984, pp. 119–120) defined culture as
‘the totality of equivalent and complementary learned meanings maintained
by a human population, or by identifiable segments of a population, and
transmitted from one generation to the next.’ Similarly, Takatera and
Yamamoto (1987) noted that culture is often regarded as an expression of
norms, values, and customs. Perera (1989b) noted that culture is used to
refer to the fact that members of a given group tend to share common
frameworks of meanings, social understandings, values, beliefs, and sym-
bols, a notion similar to Hofstede’s (1980, p. 25) definition of culture as ‘the
collective programming of the mind which distinguishes the members of one
human group from another’. More informally, Hofstede (1984, p. 113)
KEN NGANGAN ET AL.30

referred to culture as ‘a system of meanings in the heads of multiple in-
dividuals within a population.’ He described the content of mental programs
as values and identified four sets of norm values, which he termed dimen-
sions of culture (Hofstede, 1980).2 His explication of the concept pervades
most of the accounting studies relating to the influence of culture on na-
tional accounting practices.
Given the frequent reference to Hofstede (1980) in the literature, it ap-
peared reasonable for this study to likewise adopt Hofstede’s definition, for
it emphasizes values and meaning systems that are consistent with a ma-
jority of definitions of culture over the years (Rohner, 1984). Its use here
allows this inquiry to mesh with those preceding it (e.g., Gray, 1988; Perera,
1989b; Belkaoui & Picur, 1991). In the Hofstede tradition, culture is char-
acterized as a system of shared cognition of a group of individuals, a system
entailing their knowledge-in-common and their holding of beliefs-in-com-
mon. This follows Goodenough’s (1971) view of culture where he proposed
that culture can be viewed as a system of shared cognition in which the mind
generates a culture by means of finite number of rules or by means of
unconscious logic. As a system of shared cognition it may be seen as ‘a
unique system for perceiving and organizing materials, phenomena, events,
behaviors, and emotions’ (Rossi & O’Higgins, 1980, p. 63). Such a focus
usefully captures the idiosyncratic national settings in which accounting is
employed and the information it produces is used. Culture in this sense is the
coordinating force that facilitates the orderly functioning of the society
embracing it.
Our focus is on the idiosyncratic and indigenous perceptions of account-
ing information. Accordingly, a cognitive functioning view of culture is
adopted to investigate the influence of culture on accounting. Using the
cognitive emphasis, different categories of nationalities act as networks of
subjective meanings or shared frames of reference, which in general, mem-
bers of each category enjoy. To that end Belkaoui and Picur (1991, p. 119)
noted that the different cultural groups in accounting create different cog-
nition or systems of knowledge for communication within and between
cultures. That is the focus of this study.
This chapter pursues those differences with respect to three nationality
groupings regarding the disclosure of accounting information: (1) Papua
New Guineans, (2) nationals from selected DWC, and (3) nationals from
selected ODC.3 Each of the three groupings of nationalities is identified
as a cultural category in which the members share substantial common
cognitive characteristics distinguishing them from the members of the other
categories. This fits Hofstede’s survey results (1983, pp. 335–355) that
Cultural Influences on Indigenous Users’ Perceptions 31

demonstrated significant cultural differences between Anglo-American
countries and many developing countries.
Justification for this study of national cultures within the developed and
developing country categories arises from the argument in the extant inter-
national accounting literature to the effect that significant differences exist
in the cultural environments of developed and developing countries (Jaggi,
1975; Perera, 1989b; Wallace, 1990; Saudagaran & Diga, 1997). Jaggi (1975)
examined the cultural environment and value orientations on the reliability
of disclosures in annual reports of developed and developing countries. He
noted that culture has an impact on the value orientation of managers in the
two categories of countries. Perera (1989b) examined Hofstede’s four soci-
etal value dimensions and found significant cultural differences between the
DWC and many developing countries. Differences are most easily identi-
fiable in the areas associated with Hofstede’s individualism versus collec-
tivism and large versus small power distance cultural dimensions.
A pervading issue in the normative literature on accounting in developing
countries, questions the appropriateness of the transfer of accounting technol-
ogy from the developed countries to the developing countries, mainly through
colonialism. Those transfers have emerged mainly through colonization:
The real issue to resolve in respect of transfer of accounting technology is the tension
between national cultures of developing countries and cultures of exporting countries.
(Emphasis added; Wallace, 1990, p. 5)
By virtue of the different economic, social, and legal systems under which
(so often) importers and exporters of accounting and other commercial
practices operate, that tension is not surprising.
It is further argued in the international accounting literature that notwith-
standing considerable diversity, similarities in the cultural environments may
also be observed between countries. Wallace (1990) for example, noted that
although the developing countries are not a homogeneous group they have
similar cultural characteristics. They are often viewed as being at the ‘thresh-
old of economic growth.’ Most developing countries have imported account-
ing technology from those developed countries that were once their colonizers
(Briston, 1978; Hove, 1989; Saudagaran & Diga, 2003). It has traditionally
been postulated that as a result of the colonization period cultural charac-
teristics inherited from the colonizers within the developing country category
may lead to similar cognition or systems of knowledge regarding the per-
ception of accounting information disclosure. This can be widely observed in
the international accounting classification studies that typically lump a group
of countries in the category generally labeled ‘British influence’. The common
KEN NGANGAN ET AL.32

link between these countries is that they were all British colonies at some
point in their history (Mueller, 1968; American Accounting Association,
1977; Nair & Frank, 1980; Doupnik & Salter, 1993). However, based on a
study of postcolonial accountancy regimes in five Southeast Asian countries,
Saudagaran and Diga (2003) question the significance of the colonial link
relative to other variables shaping accounting regimes in developing countries
and conclude that ‘conventional explanations in terms of each country’s co-
lonial history were found to be wanting because they provided few insights to
the prevalent dynamics in these countries’ (p. 76). This is of relevance this
study since, as described in the next section, the subjects in the study are all
from countries that are former British colonies.
Whereas several previous attempts have been made to examine the in-
fluence of national culture on accounting (e.g., Soeters & Schreuder, 1988;
Belkaoui & Picur, 1991; Zarzeski, 1996; Patel, 2003), unlike them, this study
examines the influence of nationality on perceptions of accounting infor-
mation. Hofstede’s (1987) definition of national culture as the shared mental
programming of most members of a nation is extended here to encompass a
group of nations wherein, the literature argues, the populace share similar
cultural characteristics. Hence, the extended definition of national culture
for this study is the shared idiosyncratic mental programming peculiar to most
members of each category of nationalities.
Other studies (e.g., Soeters & Schreuder, 1988; Belkaoui & Picur, 1991)
have established that culture influences the cognitive structure and knowledge
systems of individuals within the various cultural groups in accounting. Pre-
vious studies have identified also significant differences in the cultural envi-
ronments of developed and developing countries (Wallace & Briston, 1993).
As a result of those differences, the cognitive structures and knowledge sys-
tems regarding the importance of accounting information disclosure are likely
to differ between the nationality groupings of users of financial statements. To
test this relationship, the following hypotheses are stated in their null form.
The overall null hypothesis tested is:
There is no significant difference between the perceptions of financial
statement users of different nationalities regarding the importance of ac-
counting information disclosure.
The null hypotheses associated with the pairs of the three cultural groups
are:
H1. There is no significant difference between the perceptions of users
from PNG and those in the DWC regarding the importance of accounting
information disclosure.
Cultural Influences on Indigenous Users’ Perceptions 33

H2. There is no significant difference between the perceptions of users
from PNG and those in the ODC regarding the importance of accounting
information disclosure.
H3. There is no significant difference between the perceptions of users
from the DWC and those in the ODC regarding the importance of ac-
counting information disclosure.
SAMPLE, DATA, AND RESEARCH DESIGN
Selection of Information Items
A questionnaire was developed and administered among subjects in PNG.
Construction of a list of items of financial and nonfinancial information that
a reporting company might be expected to disclose in its financial statements
in PNG, was the initial step in the development of the questionnaire. Se-
lection of items for inclusion in the survey instrument was based on four
general criteria, that:
1. the item, relevant to developing countries, had been included in one or
more of the previous studies;
2. the item is required to be disclosed by the Papua New Guinea Association
of Accountants’ (PNGAA) standards, the adopted IASs and is required
disclosure under the PNG Companies Act and other legal rules which
specify the disclosure of such items in the financial statements;
3. the item relates to a controversial issue in the country such as the claim
for compensation by land owners in areas where major resource projects
are undertaken or to control the importation of raw materials into the
country by companies;
4. the item is generally regarded in the literature as being of relevance and
significance to users of financial statements in developing countries.
An item was selected if it met one or more of the above criteria. On the
basis of the above criteria 40 information items were selected for inclusion in
the questionnaire survey (see the appendix).
Research Instrument
Respondents were asked to examine each of the 40 items and indicate
the degree of importance they attached to each in the context of financial
KEN NGANGAN ET AL.34

information disclosure. In judging each item of information they were asked
to use as a frame of reference, the anticipated approach of a person using the
annual reports as a major input in reaching a financial decision about a
company. This was consistent with the decision-usefulness theme coursing
through the conceptual framework exercises in the developed countries that
might be regarded as exemplars by those in the developing countries.
As the focus of the study was on general purpose financial reporting, no
particular decision was specified. Thus, the decisions may be to buy, hold, or
sell shares of a company; to bargain on behalf of employees for more wages
or better working conditions; to lend money to the company; to refuse/grant
a company supplier’s credit, or government import license or tax holiday; or
to ascertain the contributions of the company to society.
The expected responses were structured according to the following five-
point Likert scale:
1. the item is unimportant
2. the item is slightly important
3. the item is moderately important
4. the item is important
5. the item is very important
Sample Selection
The population from which the sample was selected was located in Port
Moresby (the capital city of PNG). A total of 726 questionnaires were
mailed to subjects selected from the PNG population of users of financial
statement, employing the stratified sampling technique used in similar stud-
ies (e.g., Firth, 1978; Wallace, 1988). In this study, it facilitated the acqui-
sition of data with a known level of precision regarding the necessary
subdivisions of the population (e.g., Cochran, 1977). The total sample of
726 subjects consisted of 400 Papua New Guineans, 156 subjects from the
DWC, and 170 from ODC. The sample from the DWC included subjects
from Australia, New Zealand, and the United Kingdom. The sample from
ODC included subjects from Uganda, Tanzania, India, and Sri Lanka.
Survey Responses
Postage prepaid envelopes were provided with the questionnaires and
the responses were reviewed upon receipt. Each useable response was
numbered in the order in which it was received. Responses, which were
Cultural Influences on Indigenous Users’ Perceptions 35

either incomplete or improperly completed, were eliminated from the anal-
ysis. As respondents did not disclose their addresses, such questionnaires
could not be returned for rectification. Information on the sample and re-
sponse rates by each of the three nationality groups is presented in Table 1.
Response rates refer to the number of useable completed questionnaires.
A total of 12 responses were eliminated from the analysis because they were
either incomplete or were not properly completed. Of the 400 questionnaires
distributed to PNG nationals, 209 responses were received for a response
rate of 52.25%; 68 of 156 questionnaires distributed to nationals of DWC
were completed for a response rate of 43.59%; and of the 170 questionnaires
distributed to nationals of ODC 41 were completed for a response rate of
24.12%. Thus, of the total 726 questionnaires mailed to the user groups, 318
completed questionnaires were received for an overall response rate of
43.8% from respondents (financial statement users) in PNG.
The response rate of 43.8% is reasonable when compared with other
similar previous studies (e.g., Wallace, 39.2%; Firth, 40.27%; Chenhall &
Juchau, 46.44%). However, the presence of nonresponse bias (with respect
to the other 56.2%) could entail a viewpoint significantly different from that
of the respondents and affect the validity of the results of the research. In an
attempt to establish whether the response rate resulted in any bias, the data
obtained were examined using the Oppenheim test (1966) to determine
whether the responses of the first 50 returns were significantly different from
the last 50 returns. The t-test was then applied to examine whether there was
any statistically significant difference between the mean scores of the two
groups. Table 2 presents the results of the test of nonresponse bias indicating
no significant difference at the 0.05 level between the two groups of re-
sponses. Accordingly, the results of the returned samples can comfortably
be generalized to represent the entire population of users of corporate an-
nual reports sampled for the study.
In this study, the 40 disclosure items were halved and the correlation
between the two scores is calculated to test for reliability (Carmines &
Table 1. Summary of Survey Response Rates.
Nationality Group Total Sampled Useable Responses Response Rates (%)
Papua New Guinea 400 209 52.25
Developed country 156 68 43.59
Developing country 170 41 24.12
Overall 726 318 43.80
KEN NGANGAN ET AL.36

Zellar, 1981). Table 3 presents the results of the test of reliability of the 40
disclosure items. It reveals that both the Guttman split-half and the Spear-
man–Brown correlation coefficients are high. The alpha coefficients for the
separate sections used for the split-half computations and for the whole test,
are also reported in Table 3.
Data Analysis
The number of items included in the survey presents problems for analysis.
One accommodating mechanism is to reduce the 40 information items into
relatively homogeneous groups. Factor analysis was used to effect the re-
duction to identify patterns of relationships amongst the variables (Kim,
1978) and to generate an understanding of underlying structure so as to
combine the variables into new variables (factors) smaller than the original
set they encompass. In this study, the factor analysis performed on the 40
information items extracted 10 factors that satisfied Kaiser’s (eigenvalue
greater than one) criterion and accounted for 65.4% of the variance.
The research hypotheses were tested using one-way analysis of variance
(ANOVA) to compare the means of the 10 factors extracted by the factor
analysis. One-way ANOVA was employed because of its common use in the
Table 2. Test of Nonresponse Bias.
Group Cases Mean Std. Dev. F Prob. t df Prob.
1 50 3.6915 0.637 1.18 0.562 1.36 98 0.177
2 50 3.5250 0.586
Notes: Prob. ¼ 2-tail probability; df ¼ degrees of freedom. Not significant at the 0.05 level.
Table 3. Reliability Coefficients for the 40 Disclosure Items.
Correlation between forms 0.7396
Guttman split-half 0.8488
Spearman–Brown 0.8503
Alpha for part 1 0.8966
Alpha for part 2 0.8909
Notes: The Spearman–Brown coefficient for both equal and unequal lengths ¼ 0.8503; No. of
items ¼ 40; 20 items in part 1 and 20 items in part 2; No. of cases ¼ 318.
Cultural Influences on Indigenous Users’ Perceptions 37

previous studies investigating user preferences for disclosure items. Upon
testing the significance of the difference among the means of the three
groups simultaneously, the next step in the analysis was to determine which
group means were significantly different from one another. Again, ANOVA
was used to test for differences between the three pairs of nationality
groupings.4
RESULTS
The overall null hypothesis of no group differences was examined by testing
for a between-subjects effect of the three nationality groupings. The results
presented in Table 4 show that the hypothesis of no group difference is
rejected at the 0.05 level. Except for factors 8 and 9 significant differences
were found. Significant differences were found to exist across all three na-
tionality groupings. Basically, the different cultural groups in accounting
represented different cognition or systems of knowledge regarding the per-
ception of accounting information disclosure. Cultural affiliations could be
inferred to lead to different cognition or systems of knowledge, which in
turn, has the potential for inducing different perceptions of the relative
importance of particular disclosure items.
Hypotheses 1–3 were tested by examining differences between the three
pairs. The results presented in Table 5 show that the hypothesis of no
difference between PNG and the DWC is rejected at the 0.05 level. Except
for factors 6, 8, and 9 significant differences in perception were found with
respect to all the other factors. Thus, significant differences were found to
exist between Papua New Guineans and nationals of the DWC. Member-
ship in the two cultural groups in accounting, entailed different cognition or
systems of knowledge in respect to perceptions of accounting information
disclosure.
The results presented in Table 6 show that the hypothesis of no difference
between PNG and ODC is accepted at the 0.05 level. Except for factors 6
and 7, no significant differences were found. Papua New Guineans were
thereby found to entertain generally similar perceptions as those of the
nationals of ODC. This suggests that the cognitive structures of the two
groups of respondents from developing nations were the same, or substan-
tially similar, in respect of the named disclosure items. Affiliations in the two
cultural groups appear therefore to lead to similar cognition or systems of
knowledge, leading in turn to similar perceptions of disclosure items.
KEN NGANGAN ET AL.38

Table 4. Test of Hypothesis for Differences between Papua New
Guinea, Developed Western Countries, and Other Developing Countries.
Factors Mean of Responses Test of Significance
PNG DWC ODC F-ratio F-prob.
F1 Employment and training 3.439 2.746 3.429 24.484 0.000�
F2 Comparative figures 3.626 3.276 3.793 4.948 0.008�
F3 Share ownership 3.832 3.382 4.012 12.227 0.000�
F4 Company background details 3.754 3.279 3.764 10.868 0.000�
F5 Future events 4.040 3.673 4.031 6.607 0.002�
F6 Related companies/businesses 3.951 4.029 4.358 4.887 0.008�
F7 Forecasted statements 3.895 3.142 3.594 18.217 0.000�
F8 Details of company directors and managers 3.414 3.463 3.402 0.067 0.935
F9 Investment financing 3.887 3.726 4.049 2.974 0.053
F10 Transactions in foreign currency 3.435 2.860 3.524 9.652 0.000�
Sample size 209 68 41
Notes: PNG ¼ Papua New Guinea, DWC ¼ Developed Western Countries, ODC ¼ Other
Developing Countries.�Significant at the 0.05 level.
Table 5. Test of Hypothesis for Difference between Papua New Guinea
and Developed Western Countries.
Factors Mean of Responses Test of Significances
PNG DWC F-ratio F-prob.
F1 Employment and training 3.439 2.746 48.658 0.000�
F2 Comparative figures 3.626 3.276 7.210 0.008�
F3 Share ownership 3.832 3.382 18.670 0.000�
F4 Company background details 3.754 3.279 21.288 0.000�
F5 Future events 4.039 3.673 11.958 0.001�
F6 Related companies/businesses 3.951 4.029 0.531 0.467
F7 Forecasted statements 3.895 3.142 38.342 0.000�
F8 Details of company directors and managers 3.414 3.463 0.122 0.727
F9 Investment financing 3.887 3.725 3.022 0.083
F10 Transactions in foreign currency 3.435 2.860 17.792 0.000�
Sample size 209 68
Notes: PNG ¼ Papua New Guinea, DWC ¼ Developed Western Countries.�Significant at the 0.05 level.
Cultural Influences on Indigenous Users’ Perceptions 39

The results presented in Table 7 show that the hypothesis of no difference
between the DWC and ODC is rejected at the 0.05 level. Except for factor 8,
significant differences were found with respect to the others. Thus, signif-
icant differences were found to exist between the nationals of the DWC and
the developing countries, suggesting that the cognitive structure of the two
cultural groups differed, potentially creating different cognition or systems
of knowledge for the perception of disclosure items.
Discussion
The overall hypothesis relating to the three nationality groups (PNG, DWC,
and ODC) was rejected at the 0.05 level suggesting that significant differ-
ences exist in the perceptions of financial statement users across different
nationalities. That result is consistent with the findings of other cross-cul-
tural studies investigating user preference for accounting information dis-
closure (e.g., Baker et al., 1977; Chang & Most, 1981) and has direct
implications for the adoption of IASs. Success, failure, and future directions
of international convergence efforts depend on an understanding of the
Table 6. Test of Hypothesis for Difference between Papua New Guinea
and Other Developing Countries.
Factors Mean of Responses Test of Significances
PNG ODC F-ratio F-prob.
F1 Employment and training 3.439 3.429 0.006 0.939
F2 Comparative figures 3.626 3.793 1.241 0.266
F3 Share ownership 3.832 4.012 2.163 0.143
F4 Company background details 3.754 3.764 0.006 0.938
F5 Future events 4.041 4.031 0.006 0.939
F6 Related companies/businesses 3.951 4.358 9.499 0.002�
F7 Forecasted statements 3.895 3.594 4.088 0.044�
F8 Details of company directors and managers 3.414 3.412 0.004 0.950
F9 Investment financing 3.887 4.049 1.935 0.165
F10 Transactions in foreign currency 3.435 3.524 0.278 0.598
Sample size 209 41
Notes: PNG ¼ Papua New Guinea, ODC ¼ Other Developing Countries.�Significant at the 0.05 level.
KEN NGANGAN ET AL.40

extent to which proposed accounting mechanisms are universal or culturally
dependent. A similar view is shared by Cooke and Wallace (1990, p. 83):
If accounting is determined by its environment, present efforts at international account-
ing harmonization will have to rely on the ability of national accounting bodies or
governments to impose international accounting standards on their environments re-
gardless of their desirability.
It is to be noted that the nationalities of subjects surveyed here were all
traditionally grouped under the British sphere of influence. Thus, the de-
velopment of accounting and reporting practices in these countries have
accordingly been influenced by the British accounting model (Walton,
1986). The survey results demonstrate that different cultural groups in ac-
counting create different cognition or systems of knowledge for communi-
cation between cultures. Thus, differences in perceptions regarding the use
of accounting information exist across countries even within the British
sphere of influence. As such, the effectiveness of the British accounting
model as a proviso of relevant accounting information for the sort of de-
cisions on hand in each country is very much debatable.
The test of difference between pairs of nationality groups yielded some
interesting results. The hypothesis of no difference between PNG and
Table 7. Test of Hypothesis for Difference between Developed Western
Countries and Other Developing Countries.
Factors Mean of Responses Test of Significances
DWC ODC F-ratio F-prob.
F1 Employment and training 2.746 3.429 21.983 0.000�
F2 Comparative figures 3.276 3.793 6.387 0.013�
F3 Share ownership 3.382 4.012 16.928 0.000�
F4 Company background details 3.279 3.764 9.987 0.002�
F5 Future events 3.673 4.031 5.531 0.021�
F6 Related companies/businesses 4.029 4.358 5.528 0.021�
F7 Forecasted statements 3.142 3.594 4.902 0.029�
F8 Details of company directors and managers 3.463 3.402 0.085 0.772
F9 Investment financing 3.726 4.049 4.904 0.029�
F10 Transactions in foreign currency 2.860 3.524 10.835 0.001�
Sample size 68 41
Notes: DWC ¼ Developed Western Countries, ODC ¼ Other Developing Countries.�Significant at the 0.05 level.
Cultural Influences on Indigenous Users’ Perceptions 41

nationals of other developing nations was accepted at the 0.05 level indi-
cating that no significant difference exists in perception between users from
PNG and the ODC (with a British colonial background) regarding the type
of accounting information that may be needed for decision making within
the developing country contexts. The results support the development
of regional accounting associations between the developing nations and
the sharing of accounting techniques and principles among developing
countries.
The hypotheses of no difference between PNG and DWC and between the
DWC and the developing countries were rejected at the 0.05 level. The
results indicate a significant linkage between cultural groupings and differ-
ences in perceptions regarding accounting information disclosure. The re-
sults also suggest significant differences between information disclosure
perceptions in DWC and developing countries (with the same [British] cul-
tural backgrounds). These results further cast doubt on the wisdom of the
proliferation of IASs and their acquiescent adoption by developing coun-
tries. IASs are often characterized to be an internationalization of western
accounting standards, especially those of Britain and the U.S.A. (Hove,
1989; Perera, 1985). If, as it appears, the information needs differ between
the developing countries and the developed countries, advocacy of the IASC
and the IASB’s standards is most likely misplaced. Those engaging in that
advocacy might be better employed redirecting their efforts to assist the
accountancy bodies of the developing nations to design the indigenous ac-
counting standards and reporting systems appropriate to their needs.
CONCLUDING REMARKS
Just as the United States’ accounting practices are not entirely appropriate
in the United Kingdom or France, neither are U.S., U.K., or French ac-
counting practices entirely appropriate in developing countries such as
PNG. While the general need for information exists in all these countries,
the specific nature, structure, focus, and quantity of information needed in
developed and developing countries respectively, may vary considerably.
Thus, unless the business environments and user needs in developed and
developing countries correspond, it is unlikely that the export of developed
country accounting systems to and the import of them into a developing
country such as PNG will be harmonious. As evidenced in this study, this
also applies to countries in the same accounting cluster (i.e., British Com-
monwealth countries).
KEN NGANGAN ET AL.42

This study provides further evidence questioning the continued adoption
of IASs and the promotion of that practice by the developing countries in
general and by PNG in particular. In light of the evidence adduced through
this study, developing countries would appear to be well advised to reassess
their strategies and accordingly design accounting and reporting systems
geared toward meeting the information needs of users within the specific
developing country contexts. The development of an appropriate account-
ing model for a developing country seems a far cry from the mere adoption
of IASs.
Some have argued that, like most other technologies, accounting has to be
transferred to the developing countries initially. This means that a pattern of
growth of accounting technology, such as that in the U.S., U.K. and other
developed countries, has not yet occurred in developing countries. Part of
the reason is that developing countries are trying to catch up very rapidly,
resulting in many social and economic imbalances in the process. As Mi-
rghani (1982, p. 68) stated:
Developing countries cannot afford to wait for accounting to evolve as it has in de-
veloped countries because the influences that shaped accounting in developed countries
are unlikely to occur in developing countries to the same degree. Instead, a carefully
designed strategy for the development of accounting as an effective tool for the economic
development process must be adopted by each developing country in view of its own
specific environment.
Accordingly, we argue that although a developing country is dependent
initially upon the transfer of accounting technology from more developed
countries, it is not in its long-run interest to depend entirely, or uniquely, on
such a transfer. Thus, the indigenous accounting professions in each devel-
oping country should appraise the adopted accounting technology and ad-
just it to make it compatible with their local economic, political, social, and
cultural environments. As Needles (1976, p. 50) observed:
Far from being substitutes for each other, the obtaining of accounting technology from
advanced countries and the building up of an indigenous accounting technological and
professional capacity are complementary.
Further research is needed to investigate the information needs of users in
the developing country context, especially in terms of the investigation of
the varying effects of culture as cognition on the one hand and the impact of
indigenous nation specific cultures on the other. Nation-specific cultures
include, organizational culture, occupational culture, level and country of
education, and membership in professional associations. Observations in
this study, point to the need for further conceptual and empirical research
Cultural Influences on Indigenous Users’ Perceptions 43

on the nature and consequences of cultural determinism in accounting, es-
pecially in the developing country context.
NOTES
1. The term ‘accounting practices’ is used here in the sense defined by the Amer-ican Institute of Certified Public Accountants that stated, ‘‘No attempt is made hereto distinguish between principles, practices and methods. The term ‘practices’ isgenerally used to include all of these. It is also used with regard to presentation,classification and disclosure of items in financial statements’’ (AICPA, 1964, p. 22).2. The norm values (cultural dimensions) enunciated by Hofstede (1980) are: (1)
power distance – the extent to which hierarchy and an unequal distribution of powerin institutions and organizations are accepted, (2) uncertainty avoidance – the degreeto which society feels uncomfortable with ambiguity and an uncertain future, (3)individualism (versus collectivism) – a preference for a loosely knit social fabric or anindependent, tightly knit social fabric, and (4) masculinity (versus femininity) – theextent to which gender roles are differentiated and performance and visible achieve-ment (traditional masculine values) are emphasized over relationships and caring(traditional feminine values).3. A common approach taken to group countries in the developed and developing
category is to use Hofstede’s four value dimensions (e.g., Harrison, 1993). However,since the nationalities of subjects in this study, especially for the developing countrycategory, were not included in Hofstede’s survey, no attempt was made to groupnationalities according to the four dimensions of culture proposed by Hofstede(1980). Instead, the international accounting literature was surveyed to see howresearchers classified the countries concerned. A similar approach was taken byWallace (1990) to classify countries based on their level of development in his lit-erature review on accounting in developing countries.4. The test for differences between pairs of nationality groupings can also be
conducted using the Scheffe test, a multiple comparison technique for all possiblepairs. The results of the Scheffe test for all three pairs of nationality groupings weresimilar to the results of the one-way ANOVA test reported in this study.
ACKNOWLEDGMENT
The authors wish to thank workshop participants at the University of Papua
New Guinea, the University of Newcastle (Australia), the Congress of the
European Accounting Association in Copenhagen, the Asian Academic
Accounting Association conference in Penang, and the Asia-Pacific Con-
ference on International Accounting Issues in Rio De Janeiro for their
helpful comments. Ken Ngangan thanks AuSAid and the University of
Papua New Guinea for the financial support provided during his Ph.D.
candidature.
KEN NGANGAN ET AL.44

REFERENCES
Abu-Nassar, M., & Rutherford, B. A. (2000). External reporting in less developed countries
with moderately sophisticated capital markets: A study of user needs and information
provision in Jordan. Research in Accounting in Emerging Economies, 4, 227–246.
American Accounting Association. (1977). Report of committee on international accounting
operations and education 1975–76. Accounting Review(Suppl.), 65–132.
American Institute of Certified Public Accountants. (1964). Professional accounting in twenty
five countries. New York: AICPA.
Baker, H. K., Chenhall, R. H., Haslem, J. A., & Juchau, R. H. (1977). Disclosure of material
information – A cross national comparison. International Journal of Accounting, 13(1),
1–18.
Baydoun, N., & Willett, R. J. (1995). Cultural relevance of Western accounting systems to
developing countries. Abacus, 31(1), 67–92.
Belkaoui, A., & Picur, R. D. (1991). Cultural determinism and the perception of accounting
concepts. International Journal of Accounting, 26, 118–131.
Briston, R. J. (1978). The evolution of accounting in developing countries. International Journal
of Accounting, 14(1), 105–120.
Carmines, E. G., & Zellar, R. A. (1981). Reliability and validity assessment. Beverly Hills, CA:
Sage Publications.
Chang, L. S., & Most, K. S. (1981). An international comparison of investor uses of financial
statements. International Journal of Accounting, 17(1), 43–60.
Choi, F. D. S., & Levich, R. M. (1990). The capital market effects of international accounting
diversity. Homewood, IL: Dow Jones-Irwin.
Chow, W. C., Shields, M. D., & Wu, A. (1999). The importance of national culture in the design
and preference for management controls for multinational operations. Accounting Or-
ganizations and Society, 24, 441–461.
Cochran, W. G. (1977). Sampling techniques. New York: Wiley.
Cooke, T. E., & Wallace, R. S. O. (1990). Financial disclosure regulation and its environment:
A review and further analysis. Journal of Accounting and Public Policy, 9(2), 79–110.
Doupnik, T. S., & Salter, S. B. (1993). An empirical test of a judgmental international clas-
sification of financial reporting practices. Journal of International Business Studies, 24(1),
41–60.
Fayerweather, J. (1959). The executive overseas. Syracuse: Syracuse University Press.
Firth, M. (1978). A study of the consensus of the perceived importance of disclosure of in-
dividual items in corporate annual reports. International Journal of Accounting, 14(1),
57–70.
Goodenough, W. H. (1971). Culture, language and society. MA: Addison-Wesley.
Gray, S. J. (1988). Towards a theory of cultural influence on the development of accounting
systems internationally. Abacus, 24(1), 1–15.
Harrison, G. (1993). Reliance on accounting performance measures in superior evaluative style
– The influence of national culture and personality. Accounting, Organizations and So-
ciety, 18(4), 319–339.
Hofstede, G. (1980). Culture’s consequences. Beverly Hills, CA: Sage Publications.
Hofstede, G. (1983). Dimensions of national cultures in fifty countries and three regions. In: J.
B. Deregowski, S. Dziurawiec & R. C. Annis (Eds), Explanations in cross-cultural psy-
chology. London: Sweet and Zeitlinger.
Cultural Influences on Indigenous Users’ Perceptions 45

Hofstede, G. (1984). The cultural relativity of the quality of life concept. Academy of Man-
agement Review, 3, 389–398.
Hofstede, G. (1987). The cultural context of accounting. In: B. E. Cushing (Ed.), Accounting
and culture. Sarasota, FL: AAA.
Hove, M. R. (1989). The inappropriateness of international accounting standards in LDC: The
case of IAS No. 24 – Related party disclosures – Concerning transfer pricing. Inter-
national Journal of Accounting, 24(2), 165–179.
Jaggi, B. L. (1975). The impact of the cultural environment on financial disclosures. Interna-
tional Journal of Accounting, 10(2), 75–84.
Jahoda, G. (1984). Do we need a concept of culture? Journal of Cross-Cultural Psychology,
15(2), 139–151.
Kim, J. (1978). Factor analysis: Statistical methods and practical issues. Beverly Hills, CA: Sage
Publications.
Kroeber, A. L., & Kluckhohn, C. (1952). Culture: A critical review of concepts and definitions.
Cambridge, MA: Peabody Museum.
McNally, G. M., Eng, L. H., & Hasseldine, C. R. (1982). Corporate financial reporting in New
Zealand: An analysis of user preferences, corporate characteristics and disclosure prac-
tices. Accounting and Business Research, 13(Winter), 11–20.
Meek, G. K., & Saudagaran, S. M. (1990). A survey of research of financial reporting in a
transnational context. Journal of Accounting Literature, 9, 145–182.
Mirghani, A. M. (1982). A framework for a linkage between microaccounting and macroac-
counting for purposes of development planning in developing countries. International
Journal of Accounting, 18(1), 57–68.
Mueller, G. G. (1967). International accounting. New York: Macmillan.
Mueller, G. G. (1968). Accounting principles generally accepted in the United States versus
those generally accepted elsewhere. International Journal of Accounting, 3(2), 91–104.
Nair, R. D., & Frank, W. G. (1980). The impact of disclosure and measurement practices on
international accounting classifications. Accounting Review(July), 426–450.
Needles, B. E. (1976). Implementing a framework for the international transfer of accounting
technology. International Journal of Accounting, 12(1), 45–62.
Oppenheim, A. N. (1966). Questionnaire design and attitude measurement. London: Heinemann.
Patel, C. (2003). Some cross-cultural evidence on whistle-blowing as an internal control mech-
anism. Journal of International Accounting Research, 2, 69–96.
Perera, M. H. B. (1985). The relevance of international accounting standards to developing coun-
tries. Working Paper 85–8. School of Financial Studies. University of Glasgow, Scot-
land, UK
Perera, M. H. B. (1989a). Accounting in developing countries: A case for localised uniformity.
British Accounting Review, 21(2), 141–158.
Perera, M. H. B. (1989b). Towards a framework to analyze the impact of culture on accounting.
International Journal of Accounting, 25(1), 42–57.
Rohner, R. P. (1984). Toward a conception of culture for cross-cultural psychology. Journal of
Cross-Cultural Psychology, 15(2), 111–138.
Rossi, I., & O’Higgins, E. (1980). The development of theories of culture. In: I. Rossi (Ed.),
People in culture. New York: Praeger.
Salter, S. B., Roberts, C. B., & Kantor, J. (1995). Financial reporting practices in the Car-
ibbean: A comparison and analysis in light of the import model of financial reporting.
Research in Accounting in Emerging Economies, 3, 99–122.
KEN NGANGAN ET AL.46

Saudagaran, S. M., & Diga, J. (1997). Accounting regulation in ASEAN: A choice between the
global and regional paradigms of harmonization. Journal of International Financial
Management and Accounting, 8(1), 1–32.
Saudagaran, S. M., & Diga, J. (2003). Post-colonial accountancy regulation in ASEAN: Ac-
counting ideology in a transnational context. Working Paper. Oklahoma State University,
Stillwater, Oklahoma.
Segall, M. H. (1984). More than we need to know about culture, but are afraid not to ask.
Journal of Cross-Cultural Psychology, 15(2), 153–163.
Soeters, J., & Schreuder, U. (1988). The interaction between national and organizational cul-
tures in accounting firms. Accounting Organizations and Society, 13(1), 75–85.
Takatera, S., & Yamamoto, M. (1987). The cultural significance of accounting in Japan. Paper
presented at workshop on accounting and culture. European Institute for Advanced
Studies in Management (EIASM), Brussels.
Wallace, R. S. O. (1988). Intranational and international consensus on the importance of
disclosure items in financial reports: A Nigerian case study. British Accounting Review,
20(December), 223–265.
Wallace, R. S. O. (1990). Accounting in developing countries: A review of the literature. In:
R. S. O. Wallace, J. M. Samuels & R. J. Briston (Eds), Research in third world account-
ing. London: JAI Press.
Wallace, R. S. O., & Briston, R. (1993). Improving the accounting infrastructure in developing
countries. Research in Accounting in Emerging Economies, 2, 201–224.
Walton, P. (1986). The export of British accounting legislation to Commonwealth countries.
Accounting and Business Research, 16(3), 353–357.
White, L. (1949). The science of culture. New York: Grove Press.
Whitely, W., & England, G. W. (1977). Managerial values as a reflection of culture and the
process of industrialization. Academy of Management, 20(3), 439–453.
Zarzeski, M. T. (1996). Spontaneous harmonization effects of culture and market forces on
accounting disclosure practices. Accounting Horizons, 10(1), 18–37.
Cultural Influences on Indigenous Users’ Perceptions 47

APPENDIX. RESEARCH INSTRUMENT
No. Question Very
Important
Important Moderately
Important
Slightly
Important
Unimportant
1 Discussion of major factors likely to
influence next year’s financial results 5 4 3 2 1
2 Details of company directors (e.g., names,
salaries, outside affiliations) 5 4 3 2 1
3 Details of senior management (e.g.,
names, ages, salaries, functional
responsibilities)5 4 3 2 1
4 Statement of company objectives 5 4 3 2 15 Historical summary of important
operating and financial data 5 4 3 2 1
6 Breakdown of borrowings (e.g., long-
term/short-term, date of maturity,
security)5 4 3 2 1
7 Forecast of next year’s profits 5 4 3 2 18 Information relating to investments (e.g.,
names, % ownership) 5 4 3 2 1
9 A statement of value added 5 4 3 2 110 Information on dividend per share (e.g.,
% growth, dividend policies) 5 4 3 2 1
11 Source and use of funds statement 5 4 3 2 112 Earnings per share details (e.g., amount,
growth rate) 5 4 3 2 1
KEN
NGANGAN
ET
AL.
48

13 Information relating to research and
development (e.g., progress with new
product development, planned
expenditures)
5 4 3 2 1
14 Information on transactions with
Government (e.g., money exchanged
with government such as government
guaranteed loans)
5 4 3 2 1
15 Inflation adjusted annual accounts as
supplementary statements 5 4 3 2 1
16 Brief narrative history of the company 5 4 3 2 117 Information relating to capital
expenditures (e.g., expenditure in past
year, planned expenditures)5 4 3 2 1
18 Information on major industry trends in
which the company operates 5 4 3 2 1
19 Forecasted cash flow for the next 2–5
years 5 4 3 2 1
20 Structure of share ownership 5 4 3 2 121 Information on tax payment status of
company (e.g., deferred tax, tax
expense)5 4 3 2 1
22 Statement of the rate of return required by
the company on its projects 5 4 3 2 1
23 Number of employees 5 4 3 2 124 Indications of employee morale (e.g.,
labor turnover, strikes, absenteeism) 5 4 3 2 1
25 Details of foreign representatives (e.g.,
managers, directors, financiers) 5 4 3 2 1
Cultu
ralInfluences
onIndigenousUsers’
Percep
tions
49

26 Amount expended on human resources
(e.g., training, welfare facilities) 5 4 3 2 1
27 Information relating to the company’s
employee pension plan 5 4 3 2 1
28 Information on corporate social
responsibility (e.g., attitude of
company, expenditures)5 4 3 2 1
29 Advertising and publicity information
(e.g., expenditure in past year, planned
expenditure)5 4 3 2 1
30 Competitive position of the company in
the industry in which it operates 5 4 3 2 1
31 Company’s contribution to PNG’s
economic development (e.g., amount of
exports)5 4 3 2 1
32 Factors affecting company’s future 5 4 3 2 133 Detailed related multinational enterprises
(e.g., names, % ownership, other
subsidiaries)5 4 3 2 1
34 A statement of transactions in foreign
currency 5 4 3 2 1
35 Comparative income statement figures for
the last 2 years 5 4 3 2 1
APPENDIX. (Continued )
No. Question Very
Important
Important Moderately
Important
Slightly
Important
Unimportant
KEN
NGANGAN
ET
AL.
50

36 Comparative income statement figures for
the last 5 years 5 4 3 2 1
37 Comparative balance sheet figures for the
last 2 years 5 4 3 2 1
38 Comparative balance sheet figures for the
last 5 years 5 4 3 2 1
39 Directors’ declaration on the veracity
(correctness) of annual reports 5 4 3 2 1
40 Information relating to the company’s
subsidiaries (e.g., names, % ownership) 5 4 3 2 1
Cultu
ralInfluences
onIndigenousUsers’
Percep
tions
51

This page intentionally left blank
52

FIRM-SPECIFIC DETERMINANTS
OF INCOME SMOOTHING IN
BANGLADESH: AN EMPIRICAL
EVALUATION
Ahsan Habib
ABSTRACT
The purpose of this chapter is to empirically examine the existence of
income smoothing and determinants of smoothing behavior in Bangladesh.
Using Eckel’s (1981), Abacus (June), 28–40, ‘‘comparison of the var-
iance of sales and profit’’ method, this study finds that a fair number of
Bangladeshi firms engage in income smoothing. Particularly, 46 firms out
of a sample of 107 firms with available data, engage in at least one type of
income-smoothing behavior. Further, a logistic regression result indicates
that firms characterized by sponsors having the largest ownership stake
among all the equity holders and smaller firms engage more in income
smoothing. Also, firms that have high debt to equity ratio engage more in
smoothing behavior.
INTRODUCTION
The purpose of this chapter is to empirically examine the existence of in-
come smoothing and the determinants of managerial income-smoothing
Advances in International Accounting
Advances in International Accounting, Volume 18, 53–71
Copyright r 2005 by Elsevier Ltd.
All rights of reproduction in any form reserved
ISSN: 0897-3660/doi:10.1016/S0897-3660(05)18003-9
53

behavior in Bangladesh. Simply put, income smoothing refers to minimizing
fluctuations in earnings over time. Givoly and Ronen (1981, p. 175) define
smoothing, ‘‘as a form of signaling whereby managers use their discretion
over the choice among accounting alternatives within generally accepted
accounting principles so as to minimize fluctuations of earnings over time
around the trend they believe best reflects their views of investors’ expec-
tations of the company’s future performance.’’
The topic of income smoothing is an extensively researched one with
Hepworth (1953) being credited with first generating the idea of income
smoothing.1 Numerous researchers over the last four decades or so have
enriched the income-smoothing literature by focusing on: the concept of
income smoothing, the existence of income smoothing, the techniques used
to smooth income, and the motivations for smoothing.2
There are two different types of smooth income streams: those that are
naturally smooth and those that are intentionally smoothed by manage-
ment. A naturally smooth income stream results from an income generating
process that produces a smooth income stream. An intentionally smoothed
income stream can be the result of real smoothing or artificial smoothing. As
the name implies, real smoothing occurs when management takes action to
structure the revenue-generating events of the organization to produce a
smooth income stream. Artificial smoothing, on the other hand, occurs
when management manipulates the timing of accounting entries to produce
a smooth income stream (Albrecht & Richardson, 1990, p. 713).
Initial studies on income smoothing were concerned with the issue of how
to appropriately measure income smoothing. While the results of early
studies were inconclusive, recent evidence (Moses, 1987; Belkaoui & Picur,
1984) generally has supported the hypothesis of existence of income
smoothing. This finding has prompted a second era in the literature inves-
tigating what firm characteristics are associated with income smoothing.
This chapter is the first of its kind in Bangladesh, and hence looks at both
the existence of smoothing and firm characteristics associated with such
smoothing. Using Eckel’s (1981) ‘comparison of the variance of sales and
profit’ method, this study finds that a fair number of Bangladeshi firms
engage in income smoothing. Particularly, 46 firms out of a sample of 107
firms with available data, engage in at least one type of income-smoothing
behavior. Further, a logistics regression result indicates that firms
characterized by sponsors having the largest ownership stake among all
the equity holders and smaller firms engage more in income smoothing.
Also, firms that have high debt to equity ratio engage more in smoothing
behavior.
AHSAN HABIB54

This chapter will be of interest to regulators, i.e., the Securities & Ex-
change Commission of Bangladesh (BSEC) in deciding whether to police
income-smoothing behavior of firms in Bangladesh. If BSEC perceives in-
come smoothing to be a form of earnings management that needs to be
constrained for efficient operation of the capital market, then this argument
sounds quite logical. However, for that to happen, BSEC needs to know
what firm characteristics are associated with income smoothing.
Also domestic and foreign institutional investors as well as individual
investors will find the results useful in allocating their portfolios. If they
perceive income smoothing as a desirable property of firm earnings on the
ground that it smoothes out the year-to-year variability of earnings, then
they will include firms in their portfolio that engage in income-smoothing
behavior. However, the opposite will occur if they believe that smoothing is
a form of earnings management and management expropriates their re-
sources by engaging in such behavior.
APPROACHES TO THE STUDY OF INCOME
SMOOTHING
Albrecht and Richardson (1990) identify three approaches to the study of
income smoothing based on the extant literature:
1. The classical approach: The classical approach to studying income
smoothing involves an examination of the relation between the choice of
a smoothing variable (operating expenses, ordinary expenses, or extraor-
dinary items) and its effect on reported income. However, these studies
suffer from at least three shortcomings. First, the studies typically utilize
an expectancy model (linear, first-difference model, etc.) of ‘normalized’
income that may not be representative of the underlying earnings process.
Second, these studies concentrate on one smoothing variable and this
may well bias the results. Some companies could use that variable alone
or in combination with other, while some companies may not use that
variable at all. Third, some studies consider the effects of the smoothing
variable in one period only, ignoring the intertemporal effects.
2. The income variability approach: Imhoff (1977) was the first researcher to
attempt to separate management’s artificial-smoothing behavior from
real smoothing actions or naturally smooth income stream. He asserts
that, sales revenue of a company represents the real economic actions of
the firm, and would therefore incorporate real smoothing activities if they
Income Smoothing in Bangladesh 55

exist. Then artificial smoothing behavior can be discerned by comparing
the variance of ordinary income to the variance of sales. Imhoff, however,
implicitly assumed that artificial and real smoothings were mutually ex-
clusive, and hence, studied the effects of smoothing on only those com-
panies that exhibited high sales variability. Eckel (1981) corrected for this
by including firms that exhibited low variability of sales from his sample.
3. The sector approach: Another popular approach for studying income
smoothing is based on the idea of dual economy sector derived from
models of sectorial economic differentiation. This model divides the in-
dustrial structure of the economy into two distinct sectors consisting of
the core and periphery sectors. As the name implies, the firms in the core
economy sector are noted for high productivity, high profits, intensive
utilization of capital, high incidence of monopoly elements, and a high
degree of unionization. On the one hand, peripheral industries are char-
acterized by their small firm size, labor intensity, low profits, low pro-
ductivity, intensive product–market competition, lack of unionization,
and low wages. It is hypothesized that firms in the core industry face less
uncertainty and hence less need for income smoothing. On the other,
firms in the periphery industry have more opportunity and predisposition
to smooth both their operating flows and reported income measures.
Using this classification scheme, Belkaoui and Picur (1984) separate 171
companies from 42 industries into 114 core and sector firms and 57 pe-
riphery sector firms. They compare the change in operating income and
change in ordinary income to the change in expenses. Their findings
indeed show that firms in the periphery sector show a greater depth of
smoothing behavior than do firms in the core sector. Using a sample of
512 companies over 1974–1985, Albrecht and Richardson (1990), how-
ever, fail to find support for the differential-smoothing behavior in the
core and periphery sectors.
The early literature focused mainly on identifying whether income
smoothing exists or not. This literature was criticized for its failure to in-
corporate the motivations for smoothing. Lambert (1984) suggests that the
proper test for smoothing is to determine whether smoothing is more in
evidence when there is relatively greater incentive for it to exist. The fol-
lowing discussion identifies the following incentives for smoothing:
1. Firm size,
2. Debt financing,
3. Firm profitability, and
4. Ownership structure.
AHSAN HABIB56

Firm Size
Arguments for larger firms to engage in more smoothing activities are hy-
pothesized because:
1. Larger firms get more public as well as regulatory and governmental
actions. Regulators may consider large upward earnings fluctuations to
be a sign of monopolistic practice, while large downward fluctuations
may signal crisis and cause panic (Moses, 1987, p. 362).
2. Larger firms have a wide array of smoothing instruments (e.g., research
and development expenditure, non-recurring items, etc.,) available com-
pared to smaller firms.
3. Large, mature firms should have synchronized revenue and expense cycle
because of fewer uncertainties in the environment. Thus, the earning
streams of large firms are probably naturally smoothed.
Debt Financing
When firms raise money through debt financing (be it long-term bank loans
or public debt), capital providers rely on lending agreements or debt cov-
enants. This agreement restricts (many of these restrictions are expressed in
terms of accounting numbers) certain managerial actions that could be det-
rimental to the interests of the lenders (like issuing more debt, paying out
dividend in excess of a certain percentage of earnings, etc.). If the cost of
violating this agreement is fairly high for the lender, then the party will in
extreme cases engage in earnings management to avoid violating debt cov-
enant or will engage in smoothing to give the impression that the company
maintains a steady flow of income, which will assure the payment due to the
lenders.
Firm Profitability
A manager’s ability to smooth income is largely limited by the firm’s profit
potential even though the conventional income smoothing studies have
typically presupposed that a manager has unlimited ability to smooth in-
come. Firm with successive years of poor performance will have fewer in-
struments available to smooth income. Hence, firms with higher profitability
will have greater potential for smoothing income.
Income Smoothing in Bangladesh 57

Ownership Structure
If a corporation has a diffuse ownership structure and a manager has little
equity stake in the company (typical of U.S. and U.K. companies), then the
manager of this management-controlled firm might try to present the op-
erating result of the firm in the most favorable manner possible in order to
avoid stockholder unrest, or to lessen the probability of takeover attempts.
Contrary to this, if the ownership is concentrated with few blockholders
(usually family members), then the manager (in most cases nominated by the
family) does not need earnings manipulation as a job-preserving strategy,
because the owners possess control of the firm. The arguments suggest that
in Bangladesh (characterized by concentrated ownership structure) (Habib,
2003; Chowdhury, 1999), ownership concentration and income smoothing
should be negatively associated.
Extant literature identifies the existence of management compensation
schemes to be one determinant of income smoothing. If executives are
awarded stock options and the market price of stock can be increased
through a smoothed stream of income, then a positive relationship is
expected between compensation schemes and income smoothing. However,
in Bangladesh, no listed company grants stock options to its executives.
Even though an annual bonus is paid (annual reports just note the gross
amount paid), no detailed information is available as to the content of the
plans. Hence, whether managers in Bangladesh smooth income to make sure
that they are entitled to a steady flow of bonus, cannot be empirically
examined.
REVIEW OF RELATED LITERATURE
As mentioned previously, the early literature on income smoothing typically
utilized an expectancy model (linear, first-difference model, etc.) of ‘nor-
malized’ income. Imhoff (1977) is the first one to suggest that normalized
earnings could be a function of an independent variable-like sales assuming
that sales revenue is not subject to smoothing. He first regresses income and
sales on time. He then defines variability as the size of the R2 for each
regression. For example, if the sales (R2)4income (R2), then the sales time
series is defined as less variable than the income time series. Additionally,
Imhoff regresses income on sales (I ¼ f ðSÞ) to determine the extent to
which income is related to sales. Imhoff applies the following two criteria to
AHSAN HABIB58

classify smoothers:
1. Smooth income stream and a weak association between sales and income,
or
2. A smooth (variable) income (sales) stream.
Using 94 industrial companies, he fails to find any evidence of smoothing.
Eckel (1981, p. 33) provides an alternative conceptual framework that ad-
dresses the shortcomings of Imhoff’s methodology. Particularly, he notes that:
. . . it is not the degree of variability in the income time series that the income smoothing
hypothesis is addressing, but rather whether or not the reported income variability is a
function of any overt actions undertaken on the part of management to explicitly reduce
the variability of reported income and distort the representation of the economic reality
of the firm.
Eckel proposes that the coefficient of variation (CV) of change in gross sales
should be greater than the CV of change in income for a firm to be
smoother. Using 62 firms from 1951–1970, he identifies only two firms (3%)
to be income smoother compared to eight firms (13%) according to Imhoff’s
definition. He interprets his results as documenting the lack of smoothing
behavior in contrast to most other studies that provide evidence of earnings
smoothing.
Michelson, Jordan-Wagner, and Wootton (1995) evaluate three major
propositions: (a) the tendency of firms to become income smoothers; (b) the
difference in the returns of smoothing and non-smoothing firms’ common
stocks; and (c) the relationship between perceived market risk and income
smoothing. Employing four different smoothing variables (operating in-
come after depreciation, pre-tax income, income before extraordinary items,
and net income), the authors show that investors do not give preference to
smoother income streams and smoothing does not increase the market value
of the firm as smoothers consistently under-perform non-smoothers. On the
issue of market perception of risk, their results indicate that smoothing firms
have consistently lower betas than non-smoothers. The difference, however,
is not statistically significant.
Moses (1987) tests for a relationship between income smoothing and var-
ious firm-specific factors that have been used in the economic consequence
literature. Moses takes accounting change to be the smoothing device be-
cause of its purely discretionary nature. To operationalize expected earnings,
Moses uses a simple random walk model (as a robustness check he uses prior
year’s earnings plus average earnings growth over 5 preceding years, 5 years’
average of return on assets, etc.). Over the period 1975–1980, Moses analyzes
Income Smoothing in Bangladesh 59

212 discretionary accounting changes and finds that size, bonus compensa-
tion, and pre-change earnings deviation were significantly positively asso-
ciated with income smoothing. Ownership control (defined as the percentage
of the largest single party stock ownership) is not associated with smoothing.
Carlson and Bathala (1997), on the other hand, find evidence that as the
proportion of inside ownership increases, there is a corresponding increase
in the probability of the firm being an income smoother. This result implies
that managers with more ownership have more discretion to alter reported
income in such a manner as to enhance their own personal well being
(Gordon, 1964). They also find that the share of institutional investors, debt
financing, dispersion of stock ownership, profitability, and compensation
variables are positively related to smoothing, but size is negatively related.
They had a sample of 265 firms with 172 (93) being classified as smoothers
(non-smoothers), respectively.
RESEARCH DESIGN
As noted earlier, the purpose of this chapter is to find out the existence of
smoothing among the listed firms of Bangladesh and to empirically examine
the firm-specific characteristics associated with smoothing. To do that,
sample companies are categorized into smoothers and non-smoothers based
on the ‘‘comparison of the variance of sales and profit’’ method proposed by
Eckel (1981).
Because managers could choose a combination of smoothing instruments,
the following four measures of income are chosen as the instruments of
smoothing:
1. Gross profit (GP) ¼ Sales�cost of goods sold (COGS),
2. Earnings before interest and taxes (EBIT) ¼ Sales�COGS�operating
expenses,
3. Pre-tax profit (PRETAXPRO) ¼ Sales�COGS�operating expenses�in-
terest cost,
4. Net income (NI) ¼ Sales�COGS�operating expenses�interest cost�tax
provision.
Using the Eckel’s approach, the relative coefficient of variation is com-
puted in the following manner
CVIðcoefficient of variation of incomeÞ ¼ ðs DincomeÞ=ðm DincomeÞ (1)
AHSAN HABIB60

where s Dincome is the standard deviation of change in income over the
sample period for each firm, m Dincome the mean change in income over the
sample period for each firm, Dincome ¼ DGP, DEBIT, DPRETAXPRO,
and DNI over the sample period for each firm, and Dsales the mean of
change in sales over the sample period for each firm.
CVsðcoefficient of variation of salesÞ ¼ ðs DsalesÞ=ðm DsalesÞ (2)
where s Dsales is the standard deviation of change in sales over the sample
period for each firm, and m Dsales is the mean of change in sales over the
sample period for each firm.
CVISðrelative coefficient of variation in incomeÞ ¼ CVI=CVS (3)
If the CVIS ratio is less than one, then the firm will be classified as an
income smoother. Since the standard deviation and mean of the changed
income and sales series are to be calculated, a restriction is imposed in
selecting the sample. To have a sufficient number of observations to get
meaningful coefficient of variation measure, sample firms need to have at
least 5 years of changed income and sales series. For example, a firm with
income and sales data available from 1997–2002 will be included as there
will be changed data series available from 1998 to 2002 (because of first
differencing, the observation pertaining to 1997 will be lost).
Four measures are used to determine if a firm is a smoother or non-
smoother based on the four smoothing variables (GP, EBIT, PRETAX-
PRO, and NI). First, the absolute value of CVIS (|CVIS|) is calculated for
each firm for each of the four income measures. Then firms are classified
into four categories as follows:
� SMOOTH_1: Firms are classified as smoothers if any of the |CVIS| for the
four income measures (GP, EBIT, PRETAXPRO, and NI) are between
0 and 1.00.� SMOOTH_2: A little more restrictive criterion is imposed for firms be-
longing to this model. Firms are classified as smoothers if the |CVIS| for at
least two of the four income measures are between 0 and 1.00.� SMOOTH_3: A somewhat more restrictive criterion applies in this model.
Firms are classified as smoothers if the |CVIS| for at least three of the four
income measures are between 0 and 1.00� SMOOTH_4: This is the most restrictive of all models. Firms are classified
as smoothers if the |CVIS| for all the four income measures are between
0 and 1.00.
Income Smoothing in Bangladesh 61

Discussion so far has focused on research design issues dealing with the
existence of smoothing. To identify the firm-specific determinants of
smoothing, the following logistic regression model is used:
SMOOTHit ¼ b0 þ b1 SIZEit þ b2 DEBTit þ b3 PROFITit þ b4 OWNit þ �it (4)
where SMOOTH, the dependent variable, takes a value of one if the firm is
classified as an income smoother, and zero otherwise; SIZE is the natural
logarithm of total assets; DEBT is total liabilities divided by total assets;
PROFIT is proxied by return on sales (ROS) defined as the ratio of net
income to sales; and OWN is a dummy variable representing ownership of
share capital taking a value of one when ownership by sponsors is the largest
ownership category among all the equity holders, and zero otherwise (equity
holders besides sponsors are foreign owners, government shareholders, in-
dividual shareholders, institutional shareholders, shareholding by employees
and others.).
Four separate regressions are run to account for the different smoothing
categories (SMOOTH_1, SMOOTH_2, SMOOTH_3, and SMOOTH_4).
Based on the discussion above, SIZE, DEBT, and PROFIT are expected
to have positive coefficients while the sign for OWN is expected to be neg-
ative. The independent variables for each firm are averaged over the avail-
able sample years (minimum of 6 and maximum of 11 years).
SAMPLE SELECTION
Firms listed with the Dhaka Stock Exchange (DSE) and having at least
5 years of changed sales and four measures of smoothing instruments
(GP, EBIT, PRETAXPRO, and NI) are selected over the sample period of
1991–2001. Financial firms are excluded (with DSE code 100, 150, and 700).
The nature of the operation of firms belonging to these categories renders
their managerial decision-making non-comparable to other firms. Because
of the longer time series required to perform relative coefficient of variation
measure and the fact that many firms do not report details about their
ownership structure, a final sample of 107 firms with a sufficient longer time
series of Sales, GP, EBIT, PRETAXPRO, and NI and complete ownership
data are selected for conducting the empirical analysis (financial data are
from Bangladesh Bank 2002, 2001, and 1998). Table 1 gives the time series
available for calculating the coefficient of variation measure and their
industry composition.
AHSAN HABIB62

Out of 107 sample firms with sufficient data, 47% (fifty firms) have 10
years of changed data while the remaining 53% are scattered over various
fiscal years. Looking at the industry composition in Panel B it is evident that
the maximum number of firms belong to textile industry (26 or 24%) fol-
lowed by firms in the food & allied products sector (21 or 19%). Pharma-
ceuticals and chemicals, and engineering sectors, too, are heavily
represented in the sample.
Table 1. Sample Periods and Industry Composition.
Panel A: Sample Periods
Period Covered Firms Percentage Cumulative (%)
1992–2001 50 46.7 46.7
1992–2000 7 6.5 53.3
1992–1999 3 2.8 56.1
1992–1998 1 0.9 57.0
1992–1997 1 0.9 57.9
1993–2001 3 2.8 60.7
1993–2000 3 2.8 63.6
1994–2001 4 3.7 67.3
1995–2001 7 6.5 73.8
1995–2000 3 2.8 76.6
1995–1999 1 0.9 77.6
1996–2001 9 8.4 86.0
1996–2000 6 5.6 91.6
1997–2001 9 8.4 100.0
Total 107 100.0
Panel B: Industry Composition
Industry Number Percentage
Engineering 15 14.0
Food & allied products 21 19.6
Fuel and Power 3 2.8
Jute 4 3.7
Textiles 26 24.2
Pharmaceuticals & chemicals 19 17.8
Paper & printing 3 2.8
Services and real estate 3 2.8
Miscellaneous 13 12.1
Total 107 100.0
Income Smoothing in Bangladesh 63

EMPIRICAL RESULTS
Table 2, Panel A shows the CV measure of sales and four smoothing in-
struments. Median values show that CV_Dsales has the least relative var-
iability (1.37) followed by CV_DGP (1.79). Although mean change in sales
are negative in 22% of the cases, this figure rises to 37% when it comes to
the net income measure.
Panel B shows the descriptive statistics for the absolute value of the
smoothing measure. This is arrived at by dividing the coefficient of various
income measures (CV_DGP, CV_DEBIT, CV_DPRETAXPRO, and
CV_DNI) by the coefficient of sales. Firms are classified as smoothers if
Table 2. Descriptive Statistics for Sales and Income Smoothing
Instruments.
Panel A: Coefficient of variation
Variable Mean Median % Negative
CV_Dsales 0.41 1.37 22
CV_DGP 3.89 1.79 24
CV_DEBIT 17.61 2.55 29
CV_DPRETAXPRO 0.21 2.21 36
CV_DNI 0.36 2.08 37
Panel B: Absolute values of CVIS for smoothing measures
Smoothing measure Mean Median 1st Quartile 3rd Quartile
CV_DGP/CV_Dsales 2.67 1.26 0.81 2.32
CV_DEBIT/CV_Dsales 6.57 2.03 1.11 3.99
CV_DPRETAXPRO/CV_Dsales 4.75 1.98 1.14 3.57
CV_D NI/CV_Dsales 5.42 2.06 1.07 3.38
Panel C: Classification of firms by smoothing measure
Smoothing measure Number of Firms Percentage (%)
Sample Smoothing
GP 107 46 43
EBIT 107 29 27
PRETAXPRO 107 20 19
NI 107 14 13
Note: Maximum number of sample years represented is 11 spanning from 1991 to 2001 while
the minimum is six, spanning from 1996 to 2001.
AHSAN HABIB64

the absolute score lies in the range of 0–1.00. The mean and median value of
absolute smoothing scores of 107 firms lie well above the upper bound of
1.00. Only the 1st quartile value of CV_DGP/CV_Dsales is below 1.00
meaning that 25% of 107 firms have an absolute smoothing score of 0.81 or
below based on the CV_DGP/CV_Dsales measure.
Panel C makes a finer partition of the result in Panel B by classifying firms
as smoothers based on the four categories that increasingly become more
restrictive. Forty-six firms or 43% of the sample firms engage in some form
of smoothing, i.e., for these firms any of the |CVIS| of the four income
measures (GP, EBIT, PRETAXPRO, and NI) are between 0 and 1.00. This
percentage is monotonically decreasing with only 14 firms or 13% of the
sample firms engaging in smoothing by employing all four income measures.
Table 3 presents descriptive statistics of the variables that are expected
to influence managerial income-smoothing decisions. Overall, firms are
highly leveraged with a mean (median) of 0.78 (0.66), respectively and
Table 3. Descriptive Statistics and Differences in Means for
Independent Variables.
Panel A: Descriptive Statistics
Variable Mean Median 1st Quartile 3rd Quartile
DEBT 0.78 0.66 0.53 0.85
PROFIT (ROS) �0.03 0.02 �0.06 0.08
SIZE 3.39 3.45 3.06 3.72
OWN 0.62
Panel B: Differences in Means of Independent Variables
Variable Mean Difference t statistic p (two-tailed)
Smoother Non-Smoother
DEBT 0.91 0.68 �0.23 �2.19 0.03
PROFIT
(ROS)
�0.06 �0.005 0.055 0.93 0.32
SIZE 3.25 3.50 0.25 2.32 0.02
OWN 0.54 0.67 0.13 1.35 0.18
Notes: Number of firms is 107. Maximum number of sample years represented is 11 spanning
from 1991 to 2001 while the minimum is 6, spanning from 1996 to 2001. All independent
variables are averaged over the sample period pertaining to the respective firms.To eliminate the
influence of extreme values, ROS values exceeding 1.00 and �1.00 are winsorized at 1.00 and
�1.00, respectively.
Income Smoothing in Bangladesh 65

characterized by low profitability with a median return on sales of just 2%.
In 66 firms out of a sample pool of 107 firms, ownership by the sponsors is
the largest among all the equity holders.
Panel B compares the difference in means of the independent variables
among the smoother and non-smoother firms. The result is based on Model 1
where 46 (61) firms are classified as smoother (non-smoother), respectively.
Smoothing firms are more leveraged, less profitable, lower in size, and have a
comparatively small number of cases where ownership by sponsors is the
largest among the equity holders. However, only the difference in leverage
and size are statistically significant. Thus, the univariate statistics support the
debt covenant hypothesis as well as the ownership hypothesis. However, the
results on size and profitability variable is contrary to what is hypothesized.
CORRELATION ANALYSIS
Table 4 presents Pearson correlation coefficients among the smoothing
measures and variables hypothesized to influence smoothing decision. As
expected all the smoothing variables (SMOOTH_1–SMOOTH_4) are sig-
nificantly positively related at the 1% level. However, as one moves down
vertically from SMOOTH_1 to SMOOTH_4, the correlation coefficients on
smoothing variables decrease monotonically (from 0.70 to 0.45). On the
other hand, as one goes horizontally, say from, SMOOTH_4, coefficients
increase monotonically from 0.45 to 0.81.
For the sake of brevity, the discussion on the relationship between
smoothing measures and other independent variables focuses on
SMOOTH_1 alone. SMOOTH_1 is significantly positively related to DEBT
(r ¼ 0:21; p ¼ 0:03), and significantly negatively related to SIZE (r ¼ �0:22;p ¼ 0:02). Although, SMOOTH_1 is negatively related to OWN, the
relationship is not statistically significant (r ¼ �0:13; p ¼ 0:18). Such is the
case with PROFIT.
Regarding the correlation among the independent variables, PROFIT
and DEBT are significantly negatively correlated (r ¼ �0.24, p ¼ 0.01). So
are SIZE and DEBT (r ¼ �0.22, p ¼ 0.02). OWN has no significant rela-
tionship with any of the other three independent variables.
REGRESSION ANALYSIS
Table 5 presents the main regression results. Four models (SMOOTH_1,
SMOOTH_2, SMOOTH_3, and SMOOTH_4) are treated as the dependent
AHSAN HABIB66

Table 4. Pearson Correlation Coefficients for Smoothing Categories and Variables Hypothesized to
Influence Smoothing Decisions.
SMOOTH_1 SMOOTH_2 SMOOTH_3 SMOOTH_4 DEBT PROFIT SIZE OWN
SMOOTH_1 1.000
SMOOTH_2 0.702�� 1.000
(0.000)
SMOOTH_3 0.552�� 0.786�� 1.000
(0.000) (0.000)
SMOOTH_4 0.447�� 0.636�� 0.809�� 1.000
(0.000) (0.000) (0.000)
DEBT 0.209� 0.136 0.163� 0.197� 1.000
(0.031) (0.162) (0.093) (0.042)
PROFIT (ROS) �0.091 �0.015 0.063 0.078 �0.239� 1.000
(0.353) (0.882) (0.521) (0.425) (0.013)
SIZE �0.221� �0.183 �0.196� �0.133 �0.224� 0.078 1.000
(0.022) (0.059) (0.044) (0.174) (0.020) (0.0423)
OWN �0.131 �0.082 0.033 0.021 �0.029 �0.136 �0.063 1.000
(0.179) (0.403) (0.738) (0.832) (0.765) (0.162) (0.518)
Notes: Number of firms is 107. Maximum number of sample years represented is 11 spanning from 1991 to 2001 while the minimum is 6,
spanning from 1996 to 2001. All independent variables are averaged over the sample period pertaining to the respective firms. Two-tailed
significance level in parentheses. To eliminate the influence of extreme values, ROS values exceeding 1.00 and �1.00 are winsorized at 1.00 and
�1.00, respectively.�Significant at the 0.05 level (two-tailed).��Significant at the 0.01 level (two-tailed).
IncomeSmoothingin
Bangladesh
67

variable one at a time while DEBT, PROFIT, SIZE and OWN act as the
independent variables.
In the regression that uses SMOOTH_1 as the dependent variable, SIZE
enters the regression with a significantly negative coefficient (�0.72 and
a p ¼ 0.07). This result is contrary to what was hypothesized, i.e., larger
firms are expected to engage in more smoothing. One interpretation of this
finding is that in Bangladesh executive stock option schemes do not exist
(Chowdhury, 1999, p. 66) and hence managers do not have the incentive to
Table 5. Logistic Regression Results.
Variable SMOOTH_1 SMOOTH_2 SMOOTH_3 SMOOTH_4
Constant 2.02 1.37 0.74 �0.72
z-statistic 1.34 0.88 0.43 �0.37
p 0.18 0.38 0.67 0.71
DEBT 0.72 0.34 0.47 0.65
z-statistic 1.45 0.88 1.18 1.57
p 0.15 0.38 0.24 0.12
PROFIT (ROS) �0.53 �0.20 0.21 0.23
z-statistic �1.00 �0.37 0.42 0.46
p 0.32 0.71 0.68 0.65
SIZE �0.72 �0.70 �0.82 �0.56
z-statistic �1.83 �1.67 �1.71 �1.04
p 0.07 0.10 0.09 0.30
OWN �0.71 �0.47 0.16 0.18
z-statistic �1.65 �1.02 0.30 0.28
p 0.10 0.31 0.76 0.78
Log likelihood �67.13664 �59.69459 �48.71872 �39.32016
Restricted log
likelihood
�73.11188 �62.51782 �51.54403 �41.51413
LR statistic (4 df) 11.95048 5.646465 5.650621 4.387948
Probability (LR
stat)
0.017723 0.227152 0.226804 0.356041
McFadden R2 0.081727 0.045159 0.054814 0.052849
Notes: Number of firms is 107. Maximum number of sample years represented is 11 spanning
from 1991 to 2001, while the minimum is 6, spanning from 1996 to 2001. All independent
variables are averaged over the sample period pertaining to the respective firms. Two-tailed
significance level in parentheses. To eliminate the influence of extreme values, ROS values
exceeding 1.00 and �1.00 are winsorized at 1.00 and �1.00, respectively. The LR statistic tests
the joint null hypothesis that all slope coefficients except the constant are zero. This is the
analog of the F-statistic in linear regression models and tests the overall significance of the
model. Restricted log likelihood is the maximized log likelihood, when all slope coefficients
(except for the constant term) are restricted to zero.
AHSAN HABIB68

produce a smoothed income stream that will boost the stock price up.
Usually it is the larger firms that are potential candidates for awarding
executive stock options. If management believes that accounting funda-
mentals do not play any role in share valuation, then they will not bother
with borrowing from the future to make current performance look better (if
they find current performance to be poor) or deferring current period in-
come for the future to make future performance look better (if the future
performance is expected to be poor).
Smaller firms, on the other hand, suffer from leverage problems. Corre-
lation analysis shows that firm size and leverage is significantly negatively
correlated. If the cost of violating debt agreements is fairly high, then the
borrower could engage in smoothing income to give the impression that the
company maintains a steady flow of income that will assure the payment
due to the lenders.
OWN enters the regression with a negative sign and the coefficient is mar-
ginally significant (�0.71 and a p ¼ 0.10). This implies that firms character-
ized by sponsors having the largest stake among all the equity holders engage
in less smoothing. If the ownership is concentrated with few blockholders
(usually family members), then the manager (in most cases nominated by the
family) does not need earnings manipulation as a job preserving strategy
because the owners possess control of the firm. The coefficient on DEBT is
positive as expected but not statistically significant (0.72 and a p ¼ 0.15).
Firm with higher debt engage in more smoothing to create the impression that
these firms do have a smoothed income stream that will make them unlikely
to default on their principal and interest payment obligations. The coefficient
on PROFIT is neither statistically significant, nor does it have the expected
sign. The SMOOTH_1 has an R2 of about 8% and the model fit is significant
at the 2% level with an LR statistic of 11.95.
SUPPLEMENTAL ANALYSIS
To see whether observations belonging to 1992–2001 time frames had a
different impact on the regression coefficients, the regression in Table 5 was
rerun with the 1992–2001 sample data (n ¼ 50) and all other observations
excluding the 1992–2001 time frame (n ¼ 57). Unreported results with the
1992–2001 data show that SIZE is significantly negative as in the full sam-
ple. However, OWN loses its significance. All other variables are statistically
insignificant. The result from regression excluding the 1992–2001 observa-
tions fared worse with no coefficient having statistical significance.
Income Smoothing in Bangladesh 69

INDUSTRY INFLUENCE
As noted in the sample selection section, the textile, food & allied product and
pharmaceutical industries are heavily represented in the sample with 24, 19
and 18% of the total sample, respectively. To assess the possible industry
influence, a dummy variable was added to represent one of these three in-
dustries. Untabulated results indicate that the textile industry dummy was
significantly negatively related to the dependent variable SMOOTH_1 (�1.41
with p ¼ 0.01). The coefficient on SIZE and OWN, however, remained sig-
nificantly (marginally significantly) negatively related to SMOOTH_1. Sim-
ilarly, when a dummy was included to account for the food & allied industry,
the coefficient was negative but not significant (�0.85 with p ¼ 0.14). The
significance level of SIZE and OWN became stronger when the food dummy
was added. Finally, the dummy variable for pharmaceutical industry was
positive but not statistically significant (0.70 with p ¼ 0.21). SIZE and OWN,
however, remained negatively related to SMOOTH_1.
CONCLUDING REMARKS
This study has empirically examined whether income smoothing exists in the
context of Bangladesh and if so, what firm-specific characteristics are asso-
ciated with managerial smoothing behavior. Using a sample of 107 firms
listed with the Dhaka Stock Exchange, the study finds that about 46 firms
(43% of the sample observations) engage in at least one type of income
smoothing behavior. Firms that are smaller in size, ownership concentrated
with sponsors, and having higher leverage engage more in income smoothing.
This study has just looked at what motivates managers to smooth income.
An important extension of this research would be to see how the market
reacts to smoothing. Usually, smoothing connotes a negative tone but as
mentioned in the introductory section, smoothing could well act as a signa-
ling device in an environment where alternate corporate disclosure practices
are not well developed.
NOTES
1. However, Buckmaster (1992) documents a frequent and continuing recognitionof income smoothing properties and management preferences for smooth accountingincome time-series in the accounting and business literature from the beginning ofthe twentieth century up to the publication of Hepworth’s 1953 article.
AHSAN HABIB70

2. For a comprehensive overview of the income smoothing literature around theseissues, see Stolowy and Breton (2000).
ACKNOWLEDGMENTS
I thank anonymous reviewers for their constructive comments. Professor
Santi Narayan Ghosh provided insightful comments on an earlier version of
this paper. All remaining errors are mine.
REFERENCES
Albrecht, W. D., & Richardson, F. M. (1990). Income smoothing by economy sector. Journal of
Business Finance & Accounting, 17(5), 713–730.
Bangladesh Bank, Statistics Department. (2002), (2001) and (1998). Balance sheet analysis of
Joint Stock Companies listed on the Dhaka and Chittagong Stock Exchange. Dhaka,
Bangladesh.
Belkaoui, A., & Picur, R. D. (1984). The smoothing of income numbers: Some empirical
evidence on systematic differences between core and periphery industrial sectors. Journal
of Business Finance & Accounting, 11(4), 527–545.
Buckmaster, D. (1992). Income smoothing in accounting and business literature prior to 1954.
The Accounting Historians Journal, 19(2), 147–171.
Carlson, S. J., & Bathala, C. T. (1997). Ownership differences and firms’ income smoothing
behavior. Journal of Business Finance & Accounting, 24(2), 179–196.
Chowdhury, D. (1999). Performance-related pay: An assessment of profit-sharing and employee
share ownership schemes Bureau of Business Research, Dhaka: University of Dhaka.
Eckel, N. (1981). The income smoothing hypothesis revisited. Abacus, 17(1), 28–40.
Givoly, D., & Ronen, J. (1981). ‘‘Smoothing’’ manifestations in fourth quarter results of
operations: Some empirical evidence. Abacus, 17(2), 174–193.
Gordon, M. (1964). Postulates, principles and research in accounting. The Accounting Review,
39, 251–263.
Habib, A. (2003). Governance through ownership: A synthesis of research on causes and con-
sequences of corporate ownership structure and preliminary empirical evidence from Bang-
ladesh. Working Paper, University of Dhaka.
Hepworth, S. R. (1953). Smoothing periodic income. The Accounting Review, 28(1), 32–39.
Imhoff, E. A., Jr (1977). Income smoothing – A case for doubt. Accounting Journal ðSpringÞ,
85–100.
Lambert, R. (1984). Income smoothing as rational equilibrium behavior. The Accounting
Review, 59(4), 604–618.
Michelson, S. E., Jordan-Wagner, J., & Wootton, C. W. (1995). A market based analysis of
income smoothing. Journal of Business Finance & Accounting, 22(8), 1179–1193.
Moses, O. D. (1987). Income smoothing and incentives: Empirical tests using accounting
changes. The Accounting Review, 62(2), 358–377.
Stolowy, H., & Breton, G. (2000). A framework for the classification of accounts manipulations.
Working Paper, HEC School of Management, France.
Income Smoothing in Bangladesh 71

This page intentionally left blank
72

BANK EARNINGS MANAGEMENT
IN EMERGING MARKET
ECONOMIES: THE CASE OF
MEXICO
Alejandro Hazera
ABSTRACT
In the mid-late 1990s, developing countries in several parts of the world
experienced severe currency devaluations that were accompanied by deep
economic downturns. For some regions, international financial organiza-
tions have documented that deficient financial reporting standards and
practices contributed to the onset and magnitude of the crises by under-
stating banks’ problem loans and capital adequacy problems. However,
little research has been conducted concerning the role of financial report-
ing in the post-devaluation reconstruction of financial systems. As such,
this paper examines the role of financial reporting in the post-1994
devaluation restructuring of the Mexican banking system. Emphasis is
placed on examining whether the country’s three largest banks delayed
the recognition of loan losses in the late 1990s. The results provide
evidence that banks took advantage of weaknesses in financial reporting
standards to delay the recognition of loan losses.
Advances in International Accounting
Advances in International Accounting, Volume 18, 73–95
Copyright r 2005 by Elsevier Ltd.
All rights of reproduction in any form reserved
ISSN: 0897-3660/doi:10.1016/S0897-3660(05)18004-0
73

INTRODUCTION
In recent years the financial reporting standards published by the Interna-
tional Accounting Standards Board (IASB) and the Financial Accounting
Standards Board (FASB) have been promoted as alternative bodies of
accounting standards available for the adoption of uniform sets of stand-
ards by all countries. To a large extent, several developing countries have
adopted or declared their intention to adopt IASB Standards (IASs). Even
with this progress, standard setters have raised concerns that the adoption
of IASs by developing countries is not occurring sufficiently rapidly and that
some countries may be adopting IASs in a ‘‘piecemeal’’ fashion that allows
companies to affect the reliability and transparency of financial reports.
To some extent, the adoption of IASs by developing countries is most
urgently needed for the countries’ financial sectors. Since the mid-1990s,
developing countries in several regions of the world have experienced severe
currency devaluations that have been accompanied by financial sector col-
lapse. These crises have included such nations as Mexico (1994), Thailand
(1997), Korea (1998), and Russia (1998). In some instances, international
financial authorities have argued that inadequate financial reporting stand-
ards for banks’ loan loss provisions and reserves enabled financial institu-
tions to conceal the extent of their loan and capital adequacy problems.1
Accordingly, in a recent report, the International Monetary Fund (IMF)
(2000, p. 126), states that authorities should ensure that:
new private and privatized banks are subject to effective corporate governance, as well as
proper regulation and supervision to avoid abuses, including insider lending. In addition,
accompanying reforms of the legal and regulatory environment – including the ac-
counting frameworkywill also be required.
To a large extent, the Mexican financial crisis of the 1990s provides the most
comprehensive illustration of the relationship between emerging market
financial crises and financial reporting reforms. In December 1994, the
country experienced a severe currency devaluation that initiated a credit and
capital crisis in the country’s banks that lasted during the latter half of the
1990s. In response, the country undertook several steps to support its flag-
ging banking system. The government sought international financial assist-
ance to recapitalize the country’s financial institutions. New financial
reporting standards for banks were promulgated. The country’s financial
system was reorganized by merging smaller domestic banks with larger ones
and permitting foreign institutions to purchase domestic banks.
ALEJANDRO HAZERA74

In undertaking the final step, it was widely recognized in the country’s
financial press that the government had ‘‘bought time’’ in the post-deval-
uation period for small banks to merge with larger institutions by prom-
ulgating new financial reporting standards, which permitted banks to report
artificially low loan loss provisions and reserves. A larger issue, however,
may have concerned the country’s larger banks. After the initial consoli-
dation of the country’s smaller banks (1995–1998), large banks stated in
their 1998 annual reports that they had returned to profitability and that
they possessed adequate capital. During 1999, however, two of these banks
reported sharp increases in their loan loss provisions. Also, the banks con-
tinued to transfer large amounts of (current) commercial loans to govern-
ment agencies. By 2001, the write-offs had become so large that all the three
banks had been acquired by foreign financial institutions. As a result, for the
first time in the country’s history, virtually the entire financial system was
owned by foreign financial institutions.
Given these events, this paper examines whether the country’s largest
banks engaged in earnings and capital management from the final quarter of
1997 to the final quarter of 2000. Emphasis is placed on assessing whether
the banks used new, ‘‘post-crisis’’ financial reporting standards to delay the
recognition of loan losses. An examination is also made of whether banks
may have transferred loans to government agencies instead of reserving
those loans.
THE RECENT EVOLUTION OF THE MEXICAN
BANKING SYSTEM
The Mexican banking system traditionally possessed two dominant char-
acteristics.2 First, in a reflection of the country’s traditional nationalism,
only Mexican nationals were allowed to own Mexican banks. Second, in a
pattern common throughout much of Latin America, three banks, Banco
Nacional de Mexico (BANAMEX) Banco de Comercio (Bancomer), and
Banco Serfin (Serfin), continually possessed a disproportionate share of the
financial system’s loans and deposits. In the early 1980s, the system was
permanently altered as the collapse of the international petroleum market,
chronic corruption in the financial system, and the increasing dominance of
the ‘‘big three’’ banks, compelled the outgoing administration of Lopez
Portillo (1976–1982) to nationalize the nation’s financial institutions in
September of 1982.3
Bank Earnings Management in Emerging Market Economies 75

In the latter part of that decade, as the economy recovered, the presidential
administration of Carlos Salinas de Gortari (1988–1994) attempted to relieve
the country of its persistent crises by modernizing and restructuring the Mex-
ican economy.4 As part of this effort, the government proposed to reprivatize
the country’s banks. The legal basis for the privatization was the 1990 Ley para
Regular Las Agrupaciones Financieras (Law to Regulate Financial Groups)
(Comision Nacional Bancaria y de Valores, 1990). The statute’s purpose was to
encourage the formation of large, Mexican-controlled financial services holding
companies. However, in contrast to the past exclusion of foreign investors from
participation in the financial system, the law allowed for minority foreign
ownership in the financial groups’ holding companies.
From 1991 through 1994, the law accomplished its objectives. The number
of official financial groups listed in the Mexican Stock Exchange’s Anuario
Financiero (Financial Annual) (Bolsa Mexicana de Valores, 1991–1994) in-
creased from 6 in 1991 to 22 in 1994. Also, in keeping with the law’s opening
to foreign investors, the capital structures of 15 groups incorporated minority
foreign ownership. Even with this reorganization, however, the three groups
associated with the traditionally three largest banks, Banco Nacional de
Mexico Accival (BANACCI), Grupo Financiero Bancomer (GFB), and
Grupo Financiero Serfin (GFSERFIN), accounted for approximately
53.71% of the total assets of the 16 groups for which data are provided in
the Stock Exchange’s 1994 Anuario Financiero (Financial Annual).
In December 1994, the country entered another prolonged economic cri-
ses as a major currency devaluation initiated a period of recession, high
inflation, and high interest rates. Correspondingly, a credit and capital crisis
in the country’s financial system commenced. By the beginning of 1995, the
severity of the crisis compelled the Mexican government to appeal to the
United States and international financial organizations for a ‘‘bailout’’
package to recapitalize the nation’s financial system. The final plan totaled
47.5 billion U.S. dollars. Twenty billion dollars of the loan package were
loaned by the United States and $10 billion were provided by the Bank for
International Settlement. As a precondition for the aid, the Mexican gov-
ernment was required to gradually adopt international capital adequacy
standards and Generally Accepted Accounting Principles (GAAP).
Internationalization of Capital Requirements
As a precondition for international financial assistance, Mexico was com-
pelled to gradually adopt the requirements of the 1988 Basel Accord and its
ALEJANDRO HAZERA76

1996 amendment. The 1988 Basel Accord, adopted by the G-10, formally
links credit risk to minimum capital requirements. The accord requires that
‘‘eligible capital’’ be a minimum (currently) 8% of risk-weighted assets. The
1996 amendment, which was to be implemented by member banks by 1998,
allows banks to use internal models to manage market risk and provides
guidance on implementation of models. However, banks are also required to
maintain a prudential level of capital to address specific risk.
In order to begin complying with these accords, the country’s National
Banking and Securities Commission (NBSC), the primary government agency
responsible for overseeing banks and issuing financial reporting standards for
banks, issued circular 1423 (1999) (Comision Nacional Bancaria y de Valores,
1999). The circular requires banks to establish risk committees and audit
committees, prepare formal risk control manuals, and form independent in-
ternal audit departments. In addition, the NBSC issued circulars 1480 (2000)
(Comision Nacional Bancaria y de Valores, 2000) and 1506 (2001) (Comision
Nacional Bancaria y de Valores, 2001). Circular 1480 provides more stringent
standards for assessing commercial credit and provides guidance on the cor-
responding reserves that should be established for each level of credit risk.
Circular 1506 addresses banks’ operating risk and provides guidance on the
formation and operation of audit committees.5
In general, the circulars encouraged a rapid movement toward compliance
with the Basel accords. Most notably, the International Monetary Fund, in
the 2001 (p. 63) assessment of Mexico’s financial system stability, concluded
that almost all Mexican banks ‘‘ycomply with international capital ade-
quacy standards.’’ In support of this assertion, the report states that the
‘‘yadjusted net worth for the eight largest privately-owned banks wasy
estimated to have risen from 2.7 percent of risk weighted assets at end-1999
to 8.6 percent at end 2000y’’.
Internationalization of Financial Reporting Standards
In conjunction with the gradual movement toward adopting international
capital requirements, the NBSC began forming a new set of financial
reporting standards for banks. The initial standards were published in
Circular 1343 (1997) (Comision Nacional Bancaria y de Valores, 1997). The
most urgent need involved standards regarding the classification of loans as
past-due and the size of loan loss reserves.
Prior to the 1994 devaluation, in accordance with NBSC standards,
Mexican banks’ financial statements usually utilized only the term
Bank Earnings Management in Emerging Market Economies 77

‘‘past-due.’’ In general, loans were considered ‘‘past-due’’ when a payment
had not been received within 15–30 days of its due date. However, only the
missed payment was considered ‘‘past-due’’ while the remainder was con-
sidered ‘‘current.’’ Also, in a possible indication of a lack of recognition
given to the concept of ‘‘non-performance,’’ banks were allowed to continue
accruing interest for 60 days on the (partial) amounts classified as past-due.
The amounts recognized as ‘‘current’’ (i.e., the remainder of the loan) con-
tinued to accrue interest indefinitely. By contrast, U.S. standards require the
recognition of a loan as ‘‘non-performing’’ after an installment on the loan
has not been received 90 days after its due date. Once a payment has not
been received (within 90 days) the entire amount of the loan is classified as
non-performing. Also, interest accrual on the loan ceases.
Regarding the size of loan reserves, prior to the 1994 devaluation, official
Mexican methods for estimating the underlying risk in loan portfolios were
similar to the methodology of many countries. For example, as in many
countries, NBSC standards required banks to estimate debtors’ credit qual-
ity on the basis of several qualitative factors. On the basis of this assessment,
loan portfolios were classified into five ‘‘risk’’ levels labeled as ‘‘A,’’ ‘‘B,’’
‘‘C,’’ ‘‘D,’’ and ‘‘E.’’ Loans labeled as ‘‘A’’ were considered current and
collectible; thus, no reserves were established against this category. The
other categories represented increasing degrees of risk that required banks
to reserve the following minimum percentages against each category: B –
1%, C – 20%, D – 60%, and E – 100%. The total reserve, however, was
required to equal a minimum of 60% of the banks’ ‘‘past-due’’ loan port-
folios (as defined above).
In Circular 1343, the NBSC modified the standards regarding loan loss
provisions and reserves in several respects. With regard to loans, the standards
required that Mexican banks classify the entire amount of a loan as past-due
after a payment is 90 days overdue. However, in an indication of a recognition
given to the concept of non-performance, banks were required to cease ac-
cruing interest on ‘‘past-due’’ loans. Thus, banks’ financial statements should
now provide a more accurate picture of past-due loans. Nevertheless, the new
Mexican standards only require that banks reserve 45% of past-due loans;
thus, loan reserves should be considerably less than 100% of past-due loans.
To a large extent, the new standards seemingly improved the financial
reporting practices of Mexican banks. Most notably, for the 1998 reporting
year, nine of the ten banks, which filed financial statements with the
Mexican stock exchange indicated in their financial statement footnotes that
they had followed the provisions of circular 1343 in accounting for their
loan loss provisions and reserves. Thus, in accordance with international
ALEJANDRO HAZERA78

GAAP, these banks followed the practice of classifying the entire amount of
a loan as past-due when payment had not been received within 90 days of
the due date. Also, the banks did not accrue interest on loans classified as
past-due. However, in following a provision that may be weaker than in-
ternational GAAP (i.e., the ‘‘45% rule’’), the banks may have established
loan reserves that were less than 100% of their past-due loan portfolios.
RESTRUCTURING OF THE FINANCIAL SYSTEM
On the basis of the financial aid and regulatory reforms discussed above, the
Mexican government undertook an unprecedented restructuring and open-
ing of the financial system. The focal point of the program was the Fondo
Bancario de Proteccion al Ahorro (FOBAPROA) (Fund for the Protection
of Savings). The agency was similar to the Resolution Trust Corporation
(RTC) formed by the United States during the Savings and Loans crisis of
the late 1980s. As such, FOBAPROA’s main activities were to provide
assistance to depositors, intervene in insolvent banks, and purchase the non-
performing loan portfolios of banks. In 1999, as the financial system sta-
bilized, FOBAPROA’s non-performing loan portfolio was consolidated
with the debt of the Mexican government. Also, FOBAPROA was replaced
with Instituto para la Proteccion de Ahorro Bancario (IPAB, Institute for
the Protection of Savings). IPAB was generally charged with the same mis-
sion as FOBAPROA.
As individual banks came under greater financial stress in the late 1990s,
large amounts of non-performing loans were transferred to FOBAPROA.
Under the typical loan transfer arrangement, the banks would transfer non-
performing loans to FOBAPROA. The banks would then receive Mexican
government grade bonds for the amount of the loans. Quite frequently, how-
ever, the agreement would include a ‘‘loss sharing’’ provision, which would
obligate the bank to reimburse FOBAPROA for 25% of uncollectible loans.
As the pace of transfers increased, a two-stage reorganization of the
banking system commenced. During the first stage (1995–1997) smaller
banks that had been rendered insolvent by the financial crisis were either
merged with other (domestic and foreign) financial institutions or liquidated
and taken over by the government. By the end of this phase of consolidation
(approximately the end of 1998), only 10 banks listed on the Mexican stock
exchange. As shown in Table 1, however, the same ‘‘big three’’ banks,
dominated the money markets. BANACCI possessed 19.92% of total loans
and 25.23% of demand deposits; BANCOMER possessed 21.56% of total
Bank Earnings Management in Emerging Market Economies 79

loans and 22.61% of demand deposits; and GFSERFIN possessed 13.57%
of total loans and 10.71% of demand deposits.
At the end of 1998, these banks expressed optimism about their capital
adequacy. For example, BANCOMER, in its 1998 annual report (Grupo
Financiero Bancomer, 1998, p. 56) stated that its ratio of net capital to
assets at risk had reached 16.4% at the end of 1998. In a similar manner, in
its 1998 annual report (Grupo Financiero Banacci, 1998, p. 54) BANACCI
stated that its ratio of net capital to assets at risk was 18.8% as of the end of
1998. Both the banks also emphasized that these levels of reserves were
substantially above regulatory requirements.
However, in a contrary signal, the institutions continued to transfer
large amounts of commercial loans to government agencies, especially
FOBAPROA. These negative signals were confirmed when the banks began
the second wave of consolidation. In March of 2000, Bancomer agreed to be
acquired by Banco Bilbao Vizcaya of Spain. In May 2000, Banco Santander
Mexicano, the affiliate of the Spanish bank, acquired a controlling interest
in Serfin from IPAB. Finally, on May 17, 2001, the foreign takeover of the
‘‘big three’’ was completed as Citibank announced that it would acquire a
controlling interest in BANACCI.
THE ‘‘BIG THREE’’ FINANCIAL INSTITUTIONS AND
FINANCIAL MANAGEMENT
As discussed above, the financial crisis of the late 1990s forced the Mexican
government to restructure the country’s financial system. Concurrently, the
Table 1. Relative Size of Big Three Institutions – 12/31/98.
Bank Current Loans Demand Deposits Time Deposits
Pesos % Pesos % Pesos %
Banacci 155,582.48 19.92 63,267.88 25.23 98,312.03 17.37
Bancomer 168,366.92 21.56 56,678.62 22.61 119,409.22 21.10
GFSerfin 106,002.57 13.57 26,849.51 10.71 75,535.84 13.35
Other 351,102.23 44.95 103,921.28 41.45 272,591.44 48.17
Total 781,054.20 100.00 250,717.29 100.00 565,848.53 100.00
Note: Monetary amounts are in thousands of pesos.
Source: Mexican National Banking and Securities Commission, 2000 Annual Report on
Financial Institutions.
ALEJANDRO HAZERA80

government attempted to adopt international capital adequacy require-
ments and rewrote the financial reporting standards for Mexican financial
institutions. As a result of these efforts, by 1998, the system incorporated a
smaller number of banks. However, the same ‘‘big three’’ banks continued
to dominate the loan and deposit markets. Initially, these institutions re-
ported a return to profitability and expressed optimism about their capital
adequacy. However, in a signal contrary to the institutions’ optimism, dur-
ing 1999, the institutions transferred large amounts of commercial loans to
government agencies. Shortly thereafter in 2000 and 2001, the institutions
were acquired by foreign institutions. Given these contrary signals con-
cerning the banks’ financial position, concerns were expressed that, as the
possibility of foreign acquisition of the three largest banks became more
imminent, the banks had delayed the establishment of loan reserves for non-
performing loans. Such a pattern for troubled banks in developing countries
was discerned in a study by Beattie et al. (1995, pp. 123, 124), who state that:
Supervisory concerns arise in particular where banks, for whatever reason, have been
consistently under provisioning against likely loan losses. In such cases the need for
large-scale catch up provisions or loan-write-offs may arise, typically in periods of re-
cession and generalised financial distress. y. Supervisory authorities may then be faced
with a choice between (belatedly) enforcing stringent provisioning standards, thereby
depleting banks’ stated regulatory capital and aggravating financial instability, and
adopting a policy of forebearance under which banks are permitted to mask their pro-
spective loan losses in the hope that the passage of time will enable them to repair their
balance sheets.
In the Mexican context, this pattern would have been manifested by super-
visory authorities’ allowing banks to underreport loan losses and subse-
quently providing the banks with capital infusions that allowed banks
to record large ‘‘catch-up’’ provisions. Thereafter, in the period leading up
to acquisition by foreign institutions, the banks would have been required to
follow more stringent standards regarding loans.
In order to investigate the possibility of this scenario, the big
three’s financial statements for the period starting the final quarter of
1997 and ending the final quarter of 2000 were examined. The financial
statements were those published in the NBSC’s annual report Comision
Nacional Bancaria y de Valores, 1997–2000 on the country’s banking
system. This period provides the most comparable data since the new fi-
nancial reporting standards for banks were initially implemented in 1997
and took effect at the beginning of 1998. Also, this period incorporates the
transition of the big three banks from domestic to foreign owned financial
institutions.
Bank Earnings Management in Emerging Market Economies 81

Two aspects of the cases are examined. First, the banks’ financial margins
are examined in order to obtain evidence on whether banks under-reserved
non-performing loans and subsequently recorded a ‘‘catch-up’’ adjustment.
This examination encompasses three steps. First, interest income and ex-
pense are examined to ascertain movements in the banks’ pre-provision
financial margin. Second, movements in the financial margin after consid-
ering the loan loss provision are examined to determine if the banks may
have recorded any unusually large changes in the provision, which may have
represented a ‘‘catch-up’’ adjustment. Finally, trends in loan loss reserves on
the banks’ balance sheets are examined to determine whether the banks
recorded any large increases in their loan reserves in conjunction with the
large increase in the provision.
After examining the banks’ financial margins, trends in the banks’ capital
adequacy are examined in order to obtain evidence on whether the banks
may have transferred loans to the government in lieu of establishing loan
reserves. This examination is based on two assumptions. First, it is assumed
that past-due loans are deemed uncollectible and written off before loans
categorized as ‘‘current.’’ Second, it is assumed that any increase in
FOBAPROA loans during the period offsets any corresponding decrease in
consumer/commercial loans.
On the basis of these parameters, a three step process is used to examine
the banks’ capital adequacy. First, in order to ascertain a preliminary
perspective of the banks’ capital adequacy under the level of reserves as
reported in their balance sheets, the reported shareholders equity to current
loans ratio (hereafter referred to as the ‘‘capital ratio’’) is compared to
the ratio that would have been reported had the bank provisioned 100%
of its non-performing loans. Second, in order to ascertain the amount of
loan transfers to FOBAPROA and other government agencies, any
increase in loans to the government is compared with the decrease in
consumer/commercial loans. The amount of possible capital contribution
by FOBAPROA is then calculated by deducting the amount of reserves
available to absorb non-performing current loans from the amount of
loans effectively transferred to the government. Finally, the possible
impact on capital adequacy of the FOBAPROA capital contribution is ob-
tained by comparing the capital ratio, as reported by the bank, with the
capital ratio that would have been reported if the amount of loans trans-
ferred by the bank to FOBAPROA had been reserved. GFSERFIN,
the country’s most troubled bank is examined first. BANCOMER and
BANACCI, the second largest and the largest banks, are subsequently
considered.
ALEJANDRO HAZERA82

GFSERFIN
As stated above, GFSERFIN was traditionally the country’s third largest
bank. During the early 1990s, in order to overcome its perennial ‘‘third
place’’ status, the bank undertook an aggressive loan program. However,
the low credit quality of some of its new clients exacerbated the bank’s credit
and capital problems after the 1994 peso devaluation. In the second quarter
of 1999, the bank’s shareholders informed the Mexican government that
they would no longer provide needed capital. Thus, the government was
compelled to takeover the bank and provide it with an additional 1.3 billion
dollars in capital.
The bank’s perennial difficulties are reflected in its income statement. As
shown in Table 2, interest income remained at approximately the same level
for 1998 (42.18 million pesos) and 1999 (41.16 million pesos). Interest ex-
pense constituted 85 and 93% of interest income for 1998 and 1999, re-
spectively, while the pre-provision financial margin declined from 22 to 11%
of interest income during the same period.
Examination of the post-provision financial margin shows that the bank
may have recorded a ‘‘catch-up’’ provision in the second quarter of 1999.
For 1998, the provision for loan losses ranged from less than 1% of interest
income for the first quarter to 15% for the third quarter. Subsequently, in
the second quarter of 1999, the bank recognized a provision equaling 73%
of the interest income. As a result, the bank’s (post-provision) financial
margin, which had varied from 8 to 26% of interest income during 1998,
dropped abruptly to 65% for the second quarter of 1999. Net income, which
had remained at low/stable levels during 1998 (and the first quarter of 1999),
correspondingly dropped to a loss of 54% for the second quarter of 1999.
This sharp variation in the bank’s loan loss provision was made possible
by the aforementioned 45% rule. As shown in Table 3, from the fourth
quarter of 1997 through the third quarter of 1998 the loan reserve varied
between 61 and 67% of past-due loans. This percentage was above the 45%
Mexican GAAP minimum but below a 100% provisioning requirement.
However, for the fourth quarter of 1998 the reserve rose to 74% of past-due
loans and abruptly jumped to 126% for the second quarter of 1999. There-
after, the reserve exceeded past due loans.
Comparison of the bank’s reported capital ratio with the ratio that would
have been reported under a ‘‘100%’’ reserve indicates that the bank was
experiencing a severe lack of capital in the periods before the adjustment. As
shown in Table 3, based on a loan reserve/past-due loan ratio of 60–75%,
the bank was able to maintain an equity/loan ratio between 7 and 9% from
Bank Earnings Management in Emerging Market Economies 83

Table 2. Percentage Income Statements for the ‘‘Big Three’’ Banks.
Income Statement Percentages
Total Total 1999 Total 1998
2000 1999 IV III II I 1998 IV III II I
GFSerfin
Interest incomea 27.09 41.16 10.67 9.55 8.94 11.99 42.18 13.41 11.21 9.29 8.26
Interest income (%) 100 100 100 100 100 100 100 100 100 100 100
Interest expense (82) (93) (90) (88) (98) (95) (85) (88) (84) (85) (84)
Adjustment for inflation (0) 4 1 3 5 6 8 9 6 6 10
Pre-financial margin (%) 18 11 11 15 7 11 22 21 23 21 26
Loan loss provision (0) (20) (12) (4) (73) 2 8 9 15 7 0
Post-financial margin (%) 18 (9) (1) 11 (65) 9 14 12 8 14 26
Other (14) (2) 2 (9) 11 (9) (13) (11) (8) (12) (25)
Net income (%) 3 (11) 1 2 (54) 1 1 1 0 2 1
Bancomer
Interest incomea 57.32 61.75 14.33 14.47 14.16 18.78 64.06 20.42 15.92 13.94 13.79
Interest income (%) 100 100 100 100 100 100 100 100 100 100 100
Interest expense (74) (74) (71) (74) (75) (75) (77) (76) (79) (77) (75)
Adjustment for inflation 3 3 3 2 3 5 4 6 4 3 2
Pre-financial margin (%) 29 29 32 28 27 30 27 30 25 26 27
Loan loss provision (6) 13 28 9 6 10 7 10 7 4 5
Post-financial margin (%) 23 16 5 20 21 20 20 19 18 22 22
Other (21) (12) (3) (16) (17) (12) (18) (13) (20) (26) (18)
Net income (%) 3 5 1 3 4 8 2 6 (2) (4) 4
ALEJA
NDRO
HAZERA
84

Banacci
Interest incomea 62.52 70.89 16.12 16.59 16.67 21.51 70.51 23.78 17.58 14.64 14.50
Interest income (%) 100 100 100 100 100 100 100 100 100 100 100
Interest expense (65) (66) (65) (65) (67) (67) (71) (66) (76) (73) (73)
Adjustment for inflation 2 2 2 0 1 3 3 2 2 2 5
Pre-financial margin (%) 37 36 37 36 34 36 31 36 27 29 31
Loan loss provision 5 18 7 21 30 15 9 11 8 7 8
Post-financial margin (%) 32 18 30 14 4 21 22 25 18 22 23
Other (19) (6) (16) (4) 8 (11) (14) (8) (24) (12) (13)
Net income (%) 14 12 14 11 12 10 9 17 (6) 11 10
Source: Mexican National Banking and Securities Commission, 2000 Annual Report on Financial Institutions.aInterest Income in millions of pesos.
BankEarningsManagem
entin
Emerg
ingMarket
Economies
85

1998 through the first quarter of 1999. However, a 100% LLR/NPL ratio
would have reduced this ratio to 4–6%. Thus, the bank would have needed a
capital infusion to maintain its capital adequacy.
Movements in the bank’s loan reserves and loan portfolio suggest that it
received a capital infusion from the government. Regarding the loan port-
folio, as shown in Table 4, current loans increased from 137.17 million pesos
at the end of 1997 to 148.16 million pesos at June 30, 1999. This rise was
largely attributable to a rise in FOBAPROA loans of 25.3 million pesos. The
new FOBAPROA loans, however, were partially offset by a decline in
Commercial/Consumer loans of 10.31 million pesos. Thus, FOBAPROA
loans may have effectively replaced non-performing commercial loans.6
Movements in the bank’s loan reserves suggest that the bank would have
been unable to maintain a positive capital ratio without this FOBAPROA
support. As shown in Table 5, the bank’s loan loss reserves increased from
9.41 million pesos on December 31, 1997 to 14.07 million pesos on June 30,
1999. During this same period, the bank added a provision of 14.74 million
pesos. Thus, a total of 10.08 million pesos in loans were written off during
this period. In this same period, past-due loans decreased by 4.26 million
pesos. Thus, an amount of 5.82 million pesos that constitutes approximately
one-half of the decrease of 10.31 million pesos (43.53 million pesos to 33.22
Table 3. Selected Balance Sheet Ratios – Big Three Banks.
Item 2000 1999 1998 1997
IV III II I IV III II I IV III II I IV
GFSerfin
Loan reserves/past due loans (%) 766 243 238 215 157 126 126 70 74 67 66 61 61
Equity/loans (as reported) (%) 11 9 8 6 7 7 7 9 9 9 9 9 9
Equity/loans
(adjusted for 100% reserve) (%)
16 14 13 9 11 9 9 6 6 5 5 4 4
Bancomer
Loan reserves/past due loans (%) 118 135 84 80 80 67 58 58 58 58 58 58 58
Equity/loans (as reported) (%) 11 13 14 14 14 15 14 13 12 10 11 12 12
Equity/loans
(adjusted for 100% reserve) (%)
13 15 12 12 12 10 7 7 6 5 5 6 6
Banacci
Loan reserves/past due loans (%) 106 100 100 100 106 100 75 63 61 61 61 61 55
Equity/loans (as reported) (%) 21 19 19 24 23 22 20 18 16 15 16 17 16
Equity/loans
(adjusted for 100% reserve) (%)
21 19 19 24 24 22 16 11 9 8 9 9 7
ALEJANDRO HAZERA86

Table 4. Changes in Composition of Loan Portfolios of Big Three Banks 1998-Catch Up Adjustment.
GFSerfin Bancomer Banacci
12/31/97 6/30/99 Change 12/31/97 9/30/99 Change 12/31/97 9/30/99 Change
Total current loans 137.17 148.16 10.99 221.69 177.57 �44.12 180.54 175.73 �4.81
FOBAPROA 76.13 101.43 25.30 49.27 50.34 1.07 43.3 43.97 0.67
Other governmental 17.51 13.51 �4.00 18.5 35.58 17.08 5.11 21.44 16.33
Commercial/consumer 43.53 33.22 �10.31 153.92 91.65 �62.27 132.13 110.32 �21.81
Other 1.09 2.25 1.16 0.30 0.01 �0.29 0.00 0.00 0.00
Note: Monetary amounts are in thousands of pesos.
Source: Mexican National Banking and Securities Commission, 2000 Annual Report on Financial Institutions.
BankEarningsManagem
entin
Emerg
ingMarket
Economies
87

million pesos) in Commercial/Consumer loans during the period was avail-
able to absorb non-performing current loans. If this amount is deducted
from the total increase in FOBAPROA and government loans, the bank
may have received an effective capital contribution of 15.48 million pesos.
Table 5. Movements in ‘‘Big Three’’ Banks’ Loan Reserves 12/31/97
Through Date of Catch Up Adjustment.
GFSerfin Bancomer Banacci
Balance 12/31/97 9.41 18.48 22.62
Add: Additional provision 12/31/97
to 9/30/98
14.74 8.58 17.94
Less: Balance date of catch up adj. �14.07 �14.49 �25.31
Loans written off 1/1/98-’’catch-up
adjustment’’
10.08 12.57 15.25
Decrease in past-due loans �4.26 �10.66 �15.57
Amount of reserve available for
current loans
5.82 1.91 �0.32
Change in loans to FOBAPROA 25.30 17.08 0.67
Change in loans to other
governmental
�4.00 1.07 16.33
Total change in government loans 21.03 18.15 17.00
Less: Amount of reserve available
for current loans
�5.82 �1.91 0.32
Implied capital contribution 15.48 16.24 17.32
Current equity (as reported) 10.05 25.94 38.09
Current loans (as reported) 148.15 177.57 175.73
Current loans/current equity
(as reported) (%)
6.78 14.61 21.68
Equity, assuming transfers to
government constitute capital
contribution
�5.43 9.70 20.77
Current loans, assuming transfers to
government constitute capital
contribution
132.67 161.33 158.41
Current loans/current equity,
assuming transfers to government
constitute capital contribution
(%)
�4.09 6.01 13.11
Note: Monetary amounts are in millions of pesos. GfSerfin’s ‘‘catchup’’ date is June 30, 1999.
The ‘‘catchup’’ date for Bancomer and Banacci is September 30, 1999.
Source: Mexican National Banking and Securities Commission, 2000 Annual Report on
Financial Institutions.
ALEJANDRO HAZERA88

As shown in Table 5, if this portion of loans had been written off, the bank’s
reserve ratio would have decreased from 6.78 to �4.09%. Thus, without the
FOBAPROA loans, the bank may have been unable to maintain a positive
capital ratio.
In the post-catch up period, the bank’s loan reserve policy improved
markedly. As stated above, from the second quarter of 1999 through the
fourth quarter of 2000, the bank maintained reserves, which were consid-
erably greater than the past due loans. Also, as shown in Table 6, from the
second quarter of 1999 to the first quarter of 2000, the bank’s past-due loans
decreased by 10.55 million pesos, an amount only slightly greater than the
decline of 9.53 million pesos in its loan loss reserves. Thus, after the catch-up
adjustment, the bank continually maintained sufficient reserves to absorb
possible credit risk in its current loan portfolio.
BANCOMER
As indicated above, BANCOMER was traditionally the country’s second
largest bank. During the early 1990s, the bank pursued more conservative
lending policies than GFSERFIN. Thus, BANCOMER entered the sample
period in a stronger financial position than its smaller competitor. This
relative financial strength is shown in the bank’s financial statements.
As shown in Table 2, interest income rose from 13.79 million pesos in the
first quarter of 1998 to 20.42 million pesos in the last quarter of that year;
however, by the last quarter of 1999, interest income had declined to 14.33
million pesos. The ‘‘pre-provision’’ financial margin remained in a relatively
stable range of 25–32% of interest income during 1998 and 1999.
Movements in the ‘‘post-provision’’ margin, however, suggest the possi-
bility of a ‘‘catch-up’’ adjustment. As shown in Table 2, the provision for
loan losses constituted 5% of interest income for the first quarter of 1998
and fluctuated between 4 and 10% of interest income through the third
quarter of 1999. In the fourth quarter of 1999, however, the provision leapt
to 28%. Correspondingly, the ‘‘post-provision’’ financial margin, which had
fluctuated between 18 and 22% of interest income from the first quarter of
1998 through the third quarter of 1999, dropped to 5% for the fourth
quarter of 1999.
The bank seemingly used the 45% rule to delay the recognition of losses
that might have been recognized under a ‘‘100% rule.’’ As derived from the
bank’s balance sheet (Table 3), loan loss reserves constituted 58% of past-
due loans from the final quarter of 1997 through the second quarter of 1999.
Bank Earnings Management in Emerging Market Economies 89

However, in a sign that the bank moved rapidly to recognize non-perform-
ing loans, the ratio leapt to 67 and 80% at the end of the third and fourth
quarters of 1999, respectively. In an admission of its use of the 45% rule, the
bank states in its 1999 annual report (p. 66) that the increment in the loan
loss provision in 1999 resulted from a decision to increase reserves ‘‘y to
80% (from 58% in 1998)y’’ of past-due loans. Even with this increase,
however, the bank’s loan reserves did not exceed past-due loans until the
third quarter of 2000.
In an indication of a capital adequacy problem, adherence to a reserve
equal to 100% of past-due loans in the periods prior to the ‘‘catch-up’’ ad-
justment would have severely lowered the bank’s equity/loan ratio. As shown
in Table 3, based on a reserve ratio of 58%, the bank was able to maintain an
equity/loan ratio between 10 and 15% from 1998 through the second quarter
of 1999. However, with a reserve ratio of 100%, the equity/loan ratio for 1998
and the first half of 1999 would have decreased to approximately 5–7%.
As a result, the bank would have required a probable infusion of capital
from the government to maintain its capital ratio. As shown in Table 4,
current loans decreased from 221.69 million pesos at the end of 1997 to 177.57
Table 6. Comparison of Change in Past-Due Loans and Loan Loss
Reserves Date of Catch-Up Adjustment to 12/31/00.
Date of Catch-Up
Adjustment
December 31, 2001 Net Change
GFSerfina
Past-due loans 11.14 0.59 �10.55
Loan-loss reserve 14.07 4.54 �9.53
Net change �1.02
Bancomerb
Past-due loans 21.47 20.68 �0.79
Loan-loss reserve 14.49 23.12 8.63
Net change 7.84
Banaccib
Past-due loans 25.23 7.61 �17.62
Loan-loss reserve 25.31 8.18 �17.13
Net change �0.49
Note: Monetary amounts are in millions of pesos.
Source: Mexican National Banking and Securities Commission, 2000 Annual Report on
Financial Institutions.a6/30/99.
ALEJANDRO HAZERA90

million pesos by September 30, 1999. Most of this decline was attributable to
commercial/consumer loans, which decreased by 62.27 million pesos. How-
ever, while loans from FOBAPROA remained at approximately the same
level during this period (49.27 million pesos by December 31, 1997 and 50.34
million pesos by September 30, 1999), loans to other governmental agencies
increased by 17.08 million pesos. Thus, non-performing commercial loans
may have been transferred to the government in lieu of being reserved.
Movements in the bank’s loans provisions and reserves suggest that
the bank’s capital ratio would have been significantly reduced without
FOBAPROA support. As shown in Table 5, BANCOMER’s loan loss re-
serves decreased from 18.48 million pesos by December 31, 1997 to 14.49
million pesos by September 30, 1999. During this same period, the bank added
a provision of 8.58 million pesos. Thus, a total of 12.57 million pesos in loans
were written off from the end of 1997 through the third-quarter of 1999.
Correspondingly, as shown in Table 5, past-due loans decreased by 10.66 mil-
lion pesos. Thus, if the assumption is made that the decrease in past-due loans
was attributable to the write-off of loans, only 1.91 million pesos of reserves
were available to absorb non-performing current loans during this period.
Given the large decrease in commercial loans (62.27 million pesos), it is unlikely
that the bank could have maintained its capital ratio without a capital con-
tribution by the government. In this context, as shown in Table 5, if the 1.91
million pesos of remaining reserves are considered, 16.24 million pesos of non-
performing current loans may have been effectively transferred to the govern-
ment. As shown in Table 5, without this implied re-capitalization, the bank’s
equity/loan ratio would have decreased from approximately 14.61 to 6.01%.
As in the case of GFSERFIN, in the post catch-up period, the bank seems
to have established a more conservative reserve policy. As stated above,
from the third quarter of 1999 to the third quarter of 2000 the bank in-
creased its loan reserve to past-due loan ratio from 57.52 to 135.1%. Also,
as shown in Table 6, after the catch-up adjustment, past-due loans decreased
by only 0.79 million pesos while 8.63 million pesos was added to loan loss
reserves. Thus, after the ‘‘catch-up,’’ the bank continuously established suf-
ficient reserves to compensate for both its past due loans and any credit risk
in its current loan portfolio.
BANACCI
As described above, Banco Nacional de Mexico (BANACCI) was tradi-
tionally Mexico’s largest bank. In the years before the financial crisis, the
Bank Earnings Management in Emerging Market Economies 91

bank maintained relatively high credit standards. As a result, BANACCI,
which was cited by analysts as the institution most capable of surviving the
financial crisis, entered the sample period in the strongest financial position
of any of the ‘‘big three’’ institutions.
The relative financial stability is reflected in the bank’s income statements.
As shown in Table 2, interest income for the first quarter of 1998 was 14.50
million pesos and then fluctuated between 14.64 million pesos and 23.78
million pesos for the remaining quarters of 1998 and 1999. Interest expense
ranged between 65 and 76% of interest income during the same period. The
margin before deducting loan reserves fluctuated between 27 and 37%.
As in the case of GFSerfin and Bancomer, movements in the loan loss
provision suggest the possibility of a ‘‘catch-up’’ adjustment. As shown in
Table 2, the provision rose from 8% of interest income for the first quarter
of 1998 to 30% of interest income for the second quarter of 1999. Corre-
spondingly, the post-provision margin declined from 23 to 4% of interest
income from the first quarter of 1998 to the second quarter of 1999.
As in the case of its sister institutions, BANACCI may have used the 45%
rule to delay the recognition of non-performing loans. As shown in Table 3,
the loan loss reserve approximated 61% of past-due loans during 1998 and
rose to 75% of past-due loans for the second quarter of 1999. Thereafter,
loan loss reserves approximated past-due loans.
Adherence to a 100% ratio would have lowered the bank’s equity/loan
ratio. As shown in Table 3, based on a loan reserve to past-due loan ratio of
approximately 61%, the bank was able to maintain an equity/loan ratio of
16 to 17% from the fourth quarter of 1997 through 1998. However, with a
reserve ratio of 100%, the equity/loan ratio for this period would have been
7 to 9%.
As in the case of its sister institutions, BANACCI seems to have replaced
some of its consumer/commercial loans with FOBAPROA loans. As shown
in Table 4, the bank’s current loan portfolio declined by 4.81 million pesos
from the final quarter of 1997 to the third quarter of 1999. A decline in
commercial/consumer loans of 21.81 million pesos was partially offset by
increases in loans to FOBAPROA of 0.67 million pesos and loans to other
governmental agencies of 16.33 million pesos. Thus, loans to governmental
agencies seem to have replaced 17 million pesos in commercial loans.
As shown in Table 5, BANACCI’s loan loss reserves increased from 22.62
million pesos by December 31, 1997 to 25.31 million pesos by September 30,
1999. During this same period, the bank added a provision of 17.94 million
pesos. Thus, 15.25 million pesos in loans were written off from the end of
1997 through the third quarter of 1999. As shown in Table 5, non-performing
ALEJANDRO HAZERA92

loans decreased by 15.57 million pesos. Accordingly, if the assumption is
made that the decrease in past-due loans was attributable to the write-off of
past-due loans, 0.32 million pesos of the reserves were available to absorb
non-performing current loans. Accordingly, the bank may have received a
capital contribution of 17.32 million pesos from the government. As shown in
Table 5, without this capital contribution, the bank’s current equity/loan ratio
would have decreased from 21.68 to 13.11%. As a result, while the bank’s
capital ratio would have declined without the government contribution, the
bank still would have adhered to approximate regulatory standards (i.e., 8%).
As in the case of its sister institutions, BANACCI seems to have adopted
a more stringent reserve policy in the post catch-up period. As stated above,
in the post catch-up period the bank established reserves that were virtually
equal to its past-due loans. Also, as shown in Table 6, in the post catch-up
period the bank’s past-due loans decreased by 17.62 million pesos while its
loan reserves decreased by a (virtually equal) 17.13 million pesos. Thus,
either the bank did not cover the credit risk in its current loan portfolio or it
felt that all of its credit risk had been transferred and was reflected in its
past-due loan portfolio. Given the general optimism regarding BANACCI,
the latter seems more likely.
CONCLUSION
In the late 1990s, Mexico suffered a severe economic downturn that resulted
from the 1994 peso devaluation. As a result, its banks experienced severe
credit and capital crises. In response, the Mexican government received
foreign assistance, established a bank bailout agency, rewrote the financial
reporting principles for its banks, and engaged in a two stage restructuring
of the banking system.
During the first stage, some smaller banks were consolidated with larger
financial domestic institutions and others were sold to foreign financial in-
stitutions. The Mexican press asserted that, in order to expedite this process,
the government had promulgated accounting principles that would allow
the banks to understate the loan loss provision and reserves. In the second
phase of the consolidation, the country’s larger banks were eventually sold
to foreign entities.
This paper has examined the three largest banks’ financial data for the
period 1998–2000 to ascertain whether larger institutions, like their smaller
counterparts, may have managed their earnings and/or capital. In general, the
case of the three largest banks suggests that the new accounting standards
Bank Earnings Management in Emerging Market Economies 93

allowed banks to establish reserves that were far less than their past-due loan
portfolios. As a result, banks were allowed to delay or avoid recognition of
loan losses. Also, in the pre-catch-up period, banks were seemingly able to
transfer large amounts of loans to either FOBAPROA or ‘‘other government
agencies’’ without first recognizing either the non-performance of the loans or
the corresponding loan losses. In the post-catch-up period, however, banks
established reserves equal to their past-due loan portfolios and seemingly
transferred loans to past-due status on a more expedient basis.
In general, these patterns suggest that the economic pressures presented
by the imminent acquisition of the banks by foreign institutions rather than
the earlier promulgation of new standards was the impetus that caused the
banks to follow more stringent practices. Given this tendency, financial
reporting authorities should encourage developing countries to adopt strin-
gent standards that comply with internationally accepted norms. Addition-
ally, mechanisms should be adopted for ascertaining whether countries are
adhering to international standards. Finally, banks and governments should
be encouraged to disclose the rationale and balance sheet effects of capital
contributions. Some may argue that such standards will place a great deal
of stress on banks attempting to survive. However, only early recognition of
loan losses will reduce the ultimate cost of restructuring developing coun-
tries’ financial systems.
NOTES
1. See for example, Petersen (1998).2. For a description of the traditional Mexican financial system, see Brothers and
Solis (1966), Thompson (1979), and Maxfield (1990).3. For an explanation of the nationalization, see Tello (1984).4. As part of this effort, the government eased restrictions on foreign investment,
balanced the federal budget, liberalized trade, and privatized several government-owned industries.5. The circular requires that the audit committee be involved in designing the
bank’s internal control system, designating the external auditor, designing the in-stitution’s code of ethics, and reviewing the institution’s financial statements. Also,regarding the internal audit function, the circular states that internal auditors shouldconsistently review and test the internal control system, review the bank’s financialstatements, and provide information to the bank’s external auditors.6. In a manner that suggests the possible improper classification of non-perform-
ing loans, examination of the bank’s balance sheet shows that the increase inFOBAPROA loans effectively replaced a virtually equal decrease in ‘‘other assets.’’
ALEJANDRO HAZERA94

REFERENCES
Beattie, V. A., Casson, P. D., Dale, R. S., McKenzie, G. W., Sutcleffe, C. M. S., & Turner, M. J.
(1995). Banks and bad debts. Chichester: Wiley.
Bolsa Mexicana de Valores. (1991–1994). Anuario financiero (financial annual). Mexico, DF:
Bolsa Mexicana de Valores.
Brothers, D. S., & Solis, M. (1966). Mexican financial development. Austin, TX: University of
Texas Press.
Comision Nacional Bancaria y de Valores. (1990). Ley Para Regular las Agrupaciones Finaci-
eras. Mexico, DF: Comision Nacional Bancaria y de Valores.
Comision Nacional Bancaria y de Valores. (1997–2000). Informacion estadistica (Statistical in-
formation). Mexico, DF: Comision Nacional Bancaria y de Valores (www.cnbv.gob.mx).
Comision Nacional Bancaria y de Valores. (1997). Circular no. 1343. Mexico, DF:
Comision Nacional Bancaria y de Valores.
Comision Nacional Bancaria y de Valores. (1999). Circular no. 1423. Mexico, DF: Comision
Nacional Bancaria y de Valores.
Comision Nacional Bancaria y de Valores. (2000). Circular no. 1480. Mexico, DF:
Comision Nacional Bancaria y de Valores.
Comision Nacional Bancaria y de Valores. (2001). Circular no. 1506. Mexico, DF: Comision
Nacional Bancaria y de Valores.
Grupo Financiero Banacci. (1998). Informe annual 1998. Mexico, DF: Grupo Financiero
Banacci.
Grupo Financiero Bancomer. (1998). Informe annual 1998. Mexico, DF: Grupo Financiero
Bancomer.
International Monetary Fund. (2000).World economic outlook – focus on transitional economies.
Washington, DC: International Monetary Fund (October).
International Monetary Fund (Monetary and Exchange Affairs and Western Hemisphere
Departments). (2001). Mexico – financial system stability assessment. Washington, DC:
International Monetary Fund (October).
Maxfield, S. (1990). Governing capital, international finance and Mexican politics. Ithaca,
NY: Cornell University Press.
Petersen, M. (1998). UN Report Faults Big Accountants in Asia Crisis. New York Times.
October 24, C1.
Tello, C. (1984). La nacionalizacion de la banca en Mexico (The nationalization of banks in
Mexico). Mexico, DF: Veintiuno Editores.
Thompson, J. K. (1979). Inflation, financial markets, and economic development – the experience
of Mexico. Greenwich, CT: JAI Press.
Bank Earnings Management in Emerging Market Economies 95

This page intentionally left blank
96

ADOPTION AND BENEFITS OF
MANAGEMENT ACCOUNTING
SYSTEMS: EVIDENCE FROM
FINLAND AND AUSTRALIA
Johanna Hyvonen
ABSTRACT
This study provides empirical evidence on management accounting prac-
tices in Finnish manufacturing companies. It identifies the adoption of the
management accounting practices, received benefits from the adoption
and intentions to emphasize the practices in the future. The results in-
dicate that financial measures like product profitability analysis and
budgeting for controlling costs is likely to be important in the future, but it
is also clear that greater emphasis will be placed on newer practices like
customer satisfaction surveys and employee attitudes. The results of the
management accounting practices are compared to the findings of a sim-
ilar study based on Australian data.
INTRODUCTION
The importance of the relative benefits that firms obtain by using financial or
non-financial performance measures has been of particular interest in the
Advances in International Accounting
Advances in International Accounting, Volume 18, 97–120
Copyright r 2005 by Elsevier Ltd.
All rights of reproduction in any form reserved
ISSN: 0897-3660/doi:10.1016/S0897-3660(05)18005-2
97

accounting literature (see, for instance, Chenhall & Langfield-Smith, 1998;
Lynch & Cross, 1992). The increasing importance of non-financial measures
is reported in many surveys (Bhimani, 1994; Banerjee & Kane, 1996; Roberts,
1995; Lebas, 1996; Groot, 1996). As Ittner and Larcker (1998) point out, one
of the main reasons for growing interest in non-financial measures is the fact
that they can provide information about future profits or firm value that is
not present in current profits. Kaplan and Norton (1996) state that non-
financial indicators or investments in intangible assets may be better predic-
tors of future financial performance than historical accounting figures. It has
also been noticed that traditional management accounting techniques are not
optimal for firms operating in the environment of global competition, rapid
technological change and the development of new management approaches
like total quality management (TQM) or just-in-time (Bromwich & Bhimani,
1994; Bunce, Fraser, & Woodcock, 1995; Chenhall & Langfield-Smith, 1998).
Recently developed techniques, like activity-based costing (ABC), value chain
analysis, target costing, product life-cycle analysis, shareholder value anal-
ysis, customer satisfaction surveys, employee-based methods, balanced per-
formance measures, and benchmarking are proposed as ways of linking
operations to the company’s strategies and objectives.
This chapter investigates the management accounting practices used by
Finnish firms. Both financial and non-financial performance measures, and
recently developed techniques like employee attitudes and customer-satis-
faction surveys are of special interest. The findings of the survey are com-
pared to the results reported by Chenhall and Langfield-Smith (1998) who
analysed management accounting practices in Australian firms. This makes
it possible to compare differences and similarities in management account-
ing practices between these two countries.
A recent paper by Wijewardena and De Zoysa (1999) provides a com-
parative analysis of management accounting practices in Australia and Ja-
pan. They find, among other things, that while management accounting
practices of Australian companies place an emphasis on cost control tools at
the manufacturing stage, those of Japanese companies devote a much
greater attention to cost planning and cost reduction tools at the product
design stage. There have been several studies investigating the management
accounting practices and their benefits in many countries (Bhimani in U.K.
(1994), McKinnon & Bruns (1992) in the U.S. and Roberts (1995) in
France). Bhimani (1996) reports evidence on management accounting prac-
tices in different European countries. Brierley, Cowton, and Drury (2001)
investigate product costing practices in Europe. Lukka and Granlund (1996)
and Virtanen, Malmi, Vaivio, and Kasanen (1996) analyse the cost
JOHANNA HYVONEN98

accounting practices in Finland by using a sample of industrial manufac-
turing firms. Malmi (1999) investigates the diffusion of ABC in Finnish
firms. Cost accounting practices have been reported on earlier and certain
newer techniques, like activity-based costing have been of interest in Finland
but not management accounting practices on the whole and not even the
emphasis that companies intend to place on those practices in the future.
This chapter contributes to the management accounting literature by
providing a European perspective to management accounting systems. This
study also provides evidence of the differences and similarities between
Australia and another technology-intensive country, Finland.
BACKGROUND
Finland was in deep recession in the beginning of 1990s. Yet it managed to
rise from the recession to an unforeseeable level in economy. Some Finnish
companies have succeeded extremely well in global competition. Finland
occupies the highest rankings in numerous international studies investigat-
ing competitiveness and innovation. The United Nations Human Develop-
ment Report (2001) ranks Finland as the most technologically advanced
country. Finland is also ranked high as an environment for innovation. The
International Institute for Management Development (IMD) recognized
Finland as the second most appealing place for research and development
investment in 2002 (Cornelius, Schwab & Porter, 2002). Also, The World
Economic Forum (WEF, 2002) ranked Finland second in 2002 in terms of
competitiveness based upon the strength of Finnish technological innova-
tion, effective public institutions and the extensive networking between
companies and research institutes.
DATA AND RESEARCH DESIGN
The data used in the study were collected by sending a survey to 132 Finnish
firms at the business unit level. The business unit was chosen because dif-
ferent business units may use different control systems. The design of the
survey follows that used by Chenhall and Langfield-Smith (1998), De
Meyer, Nakane, Miller, and Ferdows (1989), Miller, De Meyer, and Nakane
(1992), Joye and Blayney (1990), and Innes and Mitchell (1995).
The survey was pilot tested by a group of managers from eight different
companies before mailing the questionnaire. A total of 51 responses were
Adoption and Benefits of Management Accounting Systems 99

received with a response rate of 39%. This is a fairly high rate given the
number of total items (188) in the questionnaire and the fact that the ter-
minology can be at least partly unfamiliar for the respondents. On the other
hand, if the respondents are not familiar with the techniques presented in the
questionnaire, then these techniques are not likely to be emphasized in their
organization. So the large variety of questions is not likely to affect the
reliability of the answers but it might affect the respondents’ willingness to
fill in the questionnaire. The sample consists mainly of large firms operating
in three industries that are important for Finland, i.e. forest, metal and
electronics industries. These were chosen because one would expect that
leading companies use advanced management tools. Some of the companies
are among the largest in their field in the world and simultaneously leading
companies in their business lines. To examine for non-response bias, the first
ten and last ten responses were compared to test whether the responses differ
between the two groups. The results indicate that there are no statistically
significant differences between the groups.
The questionnaire has 45 preselected management accounting practices.
On the left-hand side of the questionnaire, the respondents are asked
whether their businesses had adopted each management accounting prac-
tice. Then they were asked to indicate the degree of benefit the practice has
had over the last 3 years using a seven-item scale. On the right-hand side of
the questionnaire, the respondents were asked to indicate the emphasis the
business unit will place on each practice over the next 3 years also on a
seven-item scale.
The Chenhall and Langfield-Smith (1998) study investigated large Aus-
tralian manufacturing companies. These companies were strategic business
units or companies in their own right. By using 78 responses, they analysed
the adoption of management accounting practices and their importance in
the future. Machinery and equipment was the largest industry with 21 re-
spondents; food and beverages had 13 respondents as well as the group other
manufacturing. A majority of the respondents (67) were chief accountants or
group controllers. The study reported in this chapter is also made mainly in
big manufacturing companies and the background of the respondents is
similar so these two data sets should be suitable for comparison.
Demographic Data
The target group of the questionnaire is a business unit. The main industries
in the data are in the forest industry and metal industry with each group
JOHANNA HYVONEN100

forming 35% of the sample. The electronics industry represents 16% and
chemical industry 4% of the responses. The rest belong to a group of other
industries (10%), which mainly consists of units providing different services.
The majority of the respondents (65%) belong to senior management,
27% to middle management and 8% are specialists. 74% represent the
accounting function, 14% the production function, 8% research and de-
velopment and one of the respondents belongs to the human resources
function. 72.5% of the respondents have academic education and 27.5%
have polytechnic or college education.
The unit size is measured by the number of personnel and the turnover of
the unit. 15.7% of the respondents have 20–100 employees; 11.8% have
101–200; 27.5% have 201–500; 19.6% have 501–1000; and 25.5% more than
1000 employees. The units are big; 45% of the respondents have turnover of
160 million euros or more, and only five of the respondents have turnover of
less than 20 million euros. Altogether their turnovers account for a con-
siderable amount of the gross national product. Also majority of the com-
panies responding to survey are consolidated companies. The demographic
data are shown in Table 1.
RESULTS
Table 2 reports the results of the adoption of management accounting
practices in Finland and Australia. This table is divided into three equal
panels in order to help the discussion and is not meant to imply that adop-
tion (or benefits) is either high or low in any absolute sense. Management
accounting practices that belong to the first panel have relative high adop-
tion, those that belong to the second panel have relative moderate and the
last fifteen in the third panel have relative low adoption. Management ac-
counting practices are divided into long-term planning, budgeting systems,
product costing, performance evaluation and decision support systems.
Traditional techniques in management accounting refer to the use of
budgeting systems for planning and control and performance measures such
as ROI and divisional profit among other things. Recently developed con-
temporary techniques refer to practices like benchmarking, activity-based
techniques, balanced performance measures, team-based measures, employ-
ee-based measures and strategic planning.
The results reported in Table 2 indicate that a high proportion of the
respondents in the survey have adopted most of the practices. 20 out of 45
practices are adopted by at least 90% of the firms and 43 items are adopted
Adoption and Benefits of Management Accounting Systems 101

by at least 71% of the firms. The high adoption rates on management
accounting practices may exist because the questionnaire asks for adoption
over the last 3 years regardless of the level of adoption. However, the level of
adoption is likely to vary across companies.
Budgeting for controlling costs is adopted by every business unit in the
sample. Budgeting for cash flows and budgeting for evaluating managers’
performance also have a relative high adoption rate. Among the budgeting
practices, budgeting for planning financial position is ranked lowest, but still
has an adoption rate of 84%. Chenhall and Langfield-Smith report similar
results using data for Australian firms. In Australia, budgeting for financial
position has the highest adoption rate (adopted by all units). That, however,
Table 1. Demographic Data.
Number %
Position at work
Senior management 33 64.7
Middle management 14 25.5
Specialist 4 7.8
Educational background
Academic 37 72.5
Polytechnic or college 14 27.5
Annual sales in million euros
2–10 2 3.9
11–40 6 11.8
41–80 8 15.7
81–160 12 23.5
4160 23 45.1
Function
Production 7 13.7
Human resources 1 2.0
Finance 38 74.5
Research and development 4 7.8
Number of employees
20–100 8 15.7
101–200 6 11.8
201–500 14 27.5
501–1000 10 19.6
41000 13 25.5
Industry classification
Forest industry 18 35.3
Metal industry 18 35.3
Electronics industry 8 15.7
Other 7 13.7
JOHANNA HYVONEN102

Table 2. Relative Adoption Rates of Management Accounting Practices in Finland and Australia.
Management Accounting Practice Finland CLS
Rank
Management Accounting Practice Finland CLS
Rank
% Rank % Rank
Panel I: High Adoption Rate
Budgeting for controlling costs 100 1 2 Budgeting for evaluating managers’
performance
94 4 a
Performance evaluation: qualitative
measures
98 2 12 Product costing: variable costing 94 4 4
Capital budgeting measures like
ROI, payback
96 3 b Performance evaluation: ROI 94 4 3
Budgeting for planning cash flows 96 3 2 Performance evaluation: production
processes
94 4 a
Performance evaluation: employee
attitudes
96 3 3 Performance evaluation: customer
satisfaction surveys
94 4 4
Product profitability analysis 96 3 3 Long range forecasting 92 5 9
Formal strategic planning 94 4 4 Performance evaluation: divisional
profit
92 5 9
Strategic plans developed together
with budgets
94 4 12
Panel II: Moderate Adoption Rate
Performance evaluation: ongoing
supplier evaluations
92 5 14 Budgeting for compensating managers 86 8 13
Budgeting for coordinating activities
across the business units
90 6 5 Product costing: absorption costing 86 8 16
Performance evaluation: budget
variance analysis
90 6 4 Activity-based management 86 8 21
Performance evaluation: cash flow
ROI
90 6 15 Budgeting linking financial position,
resources & activities
84 9 17
90 6 6 84 9 1
Adoptio
nandBenefits
ofManagem
entAcco
untin
gSystem
s103

Table 2. (Continued )
Management Accounting Practice Finland CLS
Rank
Management Accounting Practice Finland CLS
Rank
% Rank % Rank
Benchmarking of operational
processes
Budgeting for planning financial
position
Capital budgeting measures like
IRR, NPV
88 7 b Benchmarking of management
processes
84 9 8
Budgeting for planning day-to-day
operations
88 7 2 Benchmarking carried out with outside
organizations
84 9 18
Performance evaluation: non-
financial measures
88 7 7
Panel III: Low Adoption Rate
Strategic plans developed separate
from budgets
82 10 20 Performance evaluation: controllable
profit
71 14 10
Product costing: activity-based
costing
80 11 24 Performance evaluation: residual
income
71 14 23
Performance evaluation: team
performance
80 11 12 Cost-volume-profit analysis 71 14 14
Benchmarking of product
characteristics
80 11 12 Product life-cycle analysis 71 14 20
Benchmarking of strategic priorities 80 11 8 Economic value or shareholder value
analysis
71 14 22
Benchmarking carried out within
the wider organization
80 11 15 Operations research techniques 69 15 25
Target costing 78 12 27 Value chain analysis 51 16 26
Performance evaluation: balanced
scorecard
73 13 11
CLS ¼ ranking in the Chenhall and Langfield-Smith (1998) study of Australian firms.aNot included in Chenhall and Langfield-Smith (1998) study.bCapital budgeting tools is one practice in Chenhall and Langfield-Smith (1998) study. It is ranked 2.
JOHANNA
HYVONEN
104

is not among the highest adoption rates in Finland. The number one practise
in Finland (budgeting for controlling costs) is ranked as number two in
Australia. The importance of budgets in Finland is also confirmed by Ek-
holm and Wallin (2000) who conclude that the annual budget is not yet
ready to be thrown away. Bruggeman, Slagmulder, and Waeytens (1996)
report that activity-based budgeting has been adopted in 13.8% of Belgian
companies. In Greece, the most frequent reply to how the budget was used
was either as a framework to the firm’s planning or a guide to expenditure
during the year (Ballas & Venieris, 1996).
The most adopted long-term planning practice is capital budgeting meas-
ures (ROI and payback) which is ranked number three with an adoption
rate of 96%. Formal strategic planning, strategic plans developed together
with budgets, long-range forecasting are all adopted by at least 92%. Cap-
ital budgeting measures are divided into two groups, i.e. ROI and payback
method forming one and measures like internal rate of return (IRR) and net
present value (NPV) forming the other. Chenhall and Langfield-Smith use
only one measure, i.e. capital budgeting tools. This practice is ranked
number two by Australian firms.
The three measures for product costing are variable costing, absorption
costing and activity-based costing. Variable costing has a relatively high
adoption rate (ranked 4), absorption costing has a moderate adoption rate
and activity-based costing has a relatively low adoption rate. Lukka and
Granlund (1996) report the dominance of variable costing in Finland. Var-
iable costing is frequently used for external reporting in Finland most prob-
ably due to the fact that Finnish firms still prefer to use variable costing.
Lukka and Granlund (1996) point out that 5% of the respondents are cur-
rently implementing ABC and 25% are considering implementing it. Malmi
(1996) provides empirical evidence about activity-based costing in Finnish
metal and engineering industries. The results show that ABC is used in
13.7% of the units. Laitinen (1995) reports that in three different business
categories 39%, 26.7% and 39.3% of the firms have considered or have
implemented an ABC system. In Chenhall and Langfield-Smith study, all the
above-mentioned three product costing measures have the lowest adoption
rates and of these measures, absorption costing was ranked the highest (16).
Performance evaluation measures include both financial and non-finan-
cial ones. Some of the techniques are traditional and some are recently
developed. The highest ranking performance evaluation measure in Finnish
firms is qualitative measures (2) and the second highest is employee attitudes
(3). The other performance evaluation measures with high adoption rates
are return on investment (ROI) (4), production processes (4), customer
Adoption and Benefits of Management Accounting Systems 105

satisfaction surveys (4) and divisional profit (5). These include conventional
financial measures but many of them are non-financial. In the Chenhall and
Langfield-Smith study, the non-financial performance measures like cus-
tomer satisfaction and employee attitudes have a moderate adoption rate;
measures like ROI, budget variance analysis and divisional profit have a
relatively high adoption rate. Non-financial measures are ranked number
seven in Australia. In Denmark, the most widely used traditional perform-
ance measures are material costs and labour costs per unit used in seven out
of ten firms (Israelsen, Anderson, Rohde, & Sorensen, 1996). From non-
financial measures, inventory turnover, percent on-time-deliveries and out-
going quality yield are the most widely used. Barbato, Collini, and Quagli
(1996) report of little interest in Italy in adopting non-financial measures as
part of performance-appraisal systems. He also reports that companies of-
ten keep track of non-financial measures but do not seem to integrate them
into a total performance evaluation system. The Dutch evidence (Boons,
Roozen, & Weerd de, 1994) also suggests the dominance of accounting-
based indicators in performance evaluation.
Product profitability analysis is ranked highest (3) on decision support
systems in Finnish firms. In fact, it is the only measure in the high adoption
rate category. The second highest measure is benchmarking of operational
processes, which has a relatively moderate adoption rate (90%). Bench-
marking of operational processes was the highest ranked (6) decision sup-
port system in Chenhall and Langfield-Smith study. Benchmarking of
strategic priorities is ranked 11 by Finnish firms and benchmarking of
management processes is ranked 9. Many of these decision support systems
are ranked in a category of low adoption rates both in Finland and Aus-
tralia. For example, value chain analysis is ranked last in Finland with
adoption rate of 51% and it is second last in Australia with adoption rate of
49%. Operations research techniques, shareholder value analysis and prod-
uct life-cycle analysis are also in a category of low adoption rate.
Activity-based management (ABM) is ranked 8 and it has a moderate
adoption rate. Virtanen et al. (1996) report that none of the 12 Finnish
companies interviewed in their study have tried new cost accounting
technologies other than ABC/ABM. A paper by Malmi (1996) points out
that the ABM is used in 12.7% of the Finnish companies. In Belgium,
13.8% of the companies reported of ABM being in operation (Bruggeman et
al., 1996). One of the newer practices, target costing, has a moderate adop-
tion rate and this is also the case in the Lukka and Granlund (1996) study
where only 1% of the respondents were implementing it and 6% were
considering it.
JOHANNA HYVONEN106

Similar results are reported in Sweden (Ask, Ax, & Jonsson, 1996) where
only 1% of the respondents indicated an interest in target costing. Israelsen
et al. (1996) report that about half of the Danish companies systematically
include target costs in the development of new products. Benchmarking is
used by one of four companies. Half carry out systematic analyses of key
processes, with only one-third of these having developed information shar-
ing agreements with partners (Israelsen et al., 1996).
The Ask et al. (1996) survey also investigates the respondent’s satisfaction
with the received accounting information in general. On a scale from 1 (very
satisfied) to 5 (very dissatisfied) the mean of all respondents is 2.4 and median
2 indicating that the firms are satisfied with the accounting information they
receive. This does not vary across different functions. Mendoza and Bescos
(2001) report the degree of satisfaction with all information managers receive
in 11 French companies. On product costs, 44% of all managers express a
high degree of satisfaction and 29% stated that they are dissatisfied. On
operating costs, 47.5% are very satisfied and 23.3% dissatisfied.
Management Accounting Practices: Past Benefits
Tables 3–5 present the relative benefits of the management accounting
practices included in Table 2 during the past 3 years and the relative future
emphasis to be placed on these practices over next 3 years. Standard de-
viations are also shown in Tables 3–5 to express the diversity of responses.
Divisional profit (performance measurement) is ranked number one when
asked about the degree of benefit over last 3 years. Many of the companies
in the survey are business units that are part of a consolidated group; that
may explain the high rank. Other performance evaluation practices in the
high benefit category are ROI, budget variance analysis, production proc-
esses, customer satisfaction surveys and employee attitudes. Budgeting for
controlling costs is ranked number two and it is the only budgeting measure
on the high benefit category. In product costing, the number one measure is
variable costing which is ranked three. Absorption costing is also ranked
high in tenth place. Quite many of the long-term planning practices are
included in the high benefit category: capital budgeting measures like ROI
and payback, strategic plans developed together with budgets, formal stra-
tegic planning and long-range forecasting. The only decision support system
that is in the high benefit category is product profitability analysis.
The respondents seem to obtain low benefits from many of the decision
support systems. They are also ranked low in adoption rates. The high
Adoption and Benefits of Management Accounting Systems 107

Table 3. Management Accounting Practices with High Benefit: Past Benefits and Future Emphasis.
Management Accounting Practice Relative Benefits Relative Future Emphasis
Past 3 Years Next 3 Years
Finland CLS
Rank
Finland CLS
Rank
Mean SD Rank Mean SD Rank
Performance evaluation: divisional profit 5.43 1.80 1 4 5.49 1.65 7 5
Budgeting for controlling costs 5.39 1.30 2 1 5.75 1.28 2 1
Product costing: variable costing 5.04 1.76 3 21 5.56 1.35 5 32
Performance evaluation: qualitative measures 4.86 1.44 4 24 5.72 0.90 3 26
Performance evaluation: ROI 4.86 2.02 5 2 5.53 1.37 6 4
Capital budget measures like ROI, payback 4.84 1.86 6 a 5.34 1.65 10 a
Performance evaluation: budget variance analysis 4.76 1.84 7 3 4.84 1.49 23 6
Strategic plans developed with budgets 4.74 1.64 8 6 5.31 1.53 11 9
Product profitability analysis 4.67 1.72 9 15 5.76 1.20 1 3
Product costing: absorption costing 4.63 2.22 10 9 5.46 1.68 8 25
Performance evaluation: production processes 4.47 1.83 11 b 5.23 1.31 12 b
Performance evaluation: customer satisfaction surveys 4.39 1.70 12 11 5.61 0.98 4 12
Performance evaluation: employee attitudes 4.34 1.66 13 34 5.44 0.99 9 31
Formal strategic planning 4.33 1.84 14 10 4.86 1.67 22 2
Long range forecasting 4.26 1.75 15 26 4.98 1.61 18 11
The Relative Benefits columns list management accounting practices in order of the average benefits derived from using each practice during
the past 3 years and the Relative Future Emphasis columns show the future emphasis to be given to each practice.
CLS ¼ relative rankings in the Chenhall and Langfield-Smith (1998) study of Australian firms.aCapital budgeting tools is one measure in Chenhall and Langfield-Smith (1998) study. It is ranked 5 on past benefits and 7 on future
emphasis.bNot included in Chenhall and Langfield-Smith (1998) study.
JOHANNA
HYVONEN
108

Table 4. Management Accounting Practices with Moderate Benefit: Past Benefits and Future Emphasis.
Management Accounting Practice Relative Benefits Relative Future Emphasis
Past 3 Years Next 3 Years
Finland CLS
Rank
Finland CLS
Rank
Mean SD Rank Mean SD Rank
Budgeting for evaluating managers’ perform 4.14 1.65 16 a 5.06 1.43 15 a
Benchmarking of operational processes 4.08 2.03 17 25 5.13 1.59 14 13
Budgeting for planning cash flows 4.06 1.68 18 12 4.63 1.63 27 10
Performance evaluation: cash flow ROI 4.02 2.00 19 17 4.89 1.39 20 22
Performance evaluation: ongoing supplier evaluations 3.90 1.91 20 18 5.04 1.35 17 19
Budge for compensating managers 3.86 2.08 21 23 4.73 1.62 24 33
Performance evaluation: non-financial measures 3.73 1.93 22 14 4.98 1.39 19 20
Strategic plans developed separately 3.63 2.29 23 13 4.33 1.99 34 34
Budgeting for coordinating activities 3.57 1.84 24 16 5.15 1.56 13 16
Budget for planning financial position 3.53 2.06 25 7 4.51 1.66 30 8
Performance evaluation: controllable profit 3.53 2.35 26 8 4.48 1.77 32 15
Budget for planning day-to-day operations 3.41 1.92 27 19 4.06 1.86 39 17
Benchmarking of product characteristics 3.35 2.16 28 27 4.54 1.59 29 28
Capital budget measures like IRR, NPV 3.33 1.85 29 b 4.00 1.65 41 b
Product costing: activity-based costing 3.32 2.12 30 38 5.07 1.45 16 29
The Relative Benefits columns list management accounting practices in order of the average benefits derived from using each practice during
the past 3 years and the Relative Future Emphasis columns show the future emphasis to be given to each practice.
CLS ¼ relative rankings in the Chenhall and Langfield-Smith (1998) study of Australian firms.aNot included in Chenhall and Langfield-Smith (1998) study.bCapital budgeting tools is one measure in Chenhall and Langfield-Smith (1998) study. It is ranked 5 on past benefits and 7 on future
emphasis.
Adoptio
nandBenefits
ofManagem
entAcco
untin
gSystem
s109

Table 5. Management Accounting Practices with Low Benefit: Past Benefits and Future Emphasis.
Management Accounting Practice Relative Benefits Relative Future Emphasis
Past 3 Years Next 3 Years
Finland CLS
Rank
Finland CLS
Rank
Mean SD Rank Mean SD Rank
Benchmarking of management processes 3.30 2.04 31 29 4.65 1.51 26 14
Cost-volume-profit analysis 3.27 2.21 32 31 4.26 1.71 36 35
Budget linking financial position, resources & activities 3.25 2.07 33 36 4.48 1.79 31 30
Benchmarking with outside organisations 3.22 1.87 34 35 4.61 1.31 28 27
Benchmarking of strategic priorities 3.16 2.00 35 33 4.46 1.59 33 24
Activity-based management 3.10 1.89 36 42 4.26 1.63 37 36
Benchmarking carried out within the wider organization 3.10 2.04 37 32 4.30 1.69 35 18
Performance evaluation: team performance 3.08 2.02 38 28 4.67 1.48 25 21
Target costing 2.94 2.00 39 30 4.07 1.62 38 40
Performance evaluation: balanced scorecard 2.80 2.29 40 22 4.89 2.05 21 23
Performance evaluation: residual income 2.67 2.35 41 20 4.03 2.06 40 39
Product life-cycle analysis 2.65 2.16 42 41 4.00 1.78 42 38
Operations research techniques 2.53 2.05 43 39 3.69 1.70 44 41
Economic or shareholder value analysis 2.34 1.91 44 37 3.82 1.87 43 37
Value chain analysis 1.41 1.65 45 40 3.61 1.87 45 42
The Relative Benefits columns list management accounting practices in order of the average benefits derived from using each practice during
the past 3 years and the Relative Future Emphasis columns show the future emphasis to be given to each practice.
CLS ¼ relative rankings in the Chenhall and Langfield-Smith (1998) study of Australian firms.
JOHANNA
HYVONEN
110

benefit category includes many recently developed non-financial measures as
well as traditional financial measures. One ranking worth noticing is share-
holder value analysis, which is ranked as low as 44, since the Institute of
Management Accountants (IMA, 1996) found in a survey that 35% of its
respondents used EVAs or similar measures and 45% expected to use them
in the future.
Finnish evidence is similar to the results reported by Chenhall and La-
ngfield-Smith. Direct comparisons of t-tests between Finnish and Australian
practices were also completed. No significant differences were found.
The results indicate that the respondents seem to obtain high benefits
from the financial measures like budgeting for controlling costs, ROI (per-
formance evaluation), divisional profit (performance evaluation), capital
budgeting tools among others. On the other hand, some of the recently
developed non-financial measures are ranked higher in Finland. Qualitative
measures (performance evaluation) are ranked fourth in Finland, 24 in
Australia and employee attitudes (performance evaluation) are ranked 13 in
Finland and 34 in Australia.
Management Accounting Practices: Future Emphasis
Tables 3–5 also report the emphasis the firms intend to place on each man-
agement accounting practice over the next 3 years. The results show that
product profitability is expected to be the most important practice in the
future. Budgeting for controlling costs is ranked the next most important
measure and qualitative measures (performance evaluation) is ranked
number 3. The newer techniques like customer satisfaction survey (4) and
employee attitudes (9) are going to be important in the future. Financial
measures are also going to keep their status. Divisional profit, variable
costing, ROI in performance evaluation and on capital budgeting, and ab-
sorption costing are all ranked high.
Budgeting seems to be focusing on controlling costs; the next most im-
portant measure is budgeting for coordinating activities across the business
units, which rises from rank 24 to 13. The biggest change is use of the
balanced scorecard, which rises from rank number 40 to number 21. As
Roberts (1995) points out, tableau de bord (TB) is a similar instrument
panel or dashboard for a business, which collects key information needed
for steering or piloting the business. TB tends to emphasize physical num-
bers as these numbers are seen as fundamental – changes in them will be
reflected later in accounting numbers. Fisher (1995) and Brancato (1995)
Adoption and Benefits of Management Accounting Systems 111

have identified three principal reasons why firms are adopting non-financial
measures: (1) perceived limitations in traditional accounting-based measures
(2) competitive pressure and (3) outgrowth of other initiatives like TQM.
One noticeable non-financial measure is customer satisfaction (rising from
rank 12 to rank 4). Anderson, Fornell, and Lehmann (1994) point out that
higher customer satisfaction improves financial performance by increasing
the loyalty of existing customers, reducing price elasticities, lowering mar-
keting costs through positive word-of-mouth advertising, reducing transac-
tion costs and enhancing firm reputation.
Table 6 shows those managing accounting practices that have at least a
six-point difference in ranking between past benefits and future emphasis. It
shows those management accounting practices where the degree of emphasis
is expected to change. Results indicate that relatively greater future em-
phasis will be placed on product profitability analysis, customer satisfaction
surveys, budgeting for coordinating activities across business units, activity-
based costing, benchmarking carried out with outside organizations, team
performance and balanced scorecard. Practices that are expected to be given
a decreased emphasis in the future are formal strategic planning, budgeting
for planning cash flows, budgeting for planning day-to-day operations and
capital budgeting measures like IRR and payback.
Discussion about Finnish Situation
The results reported so far indicate that the recently developed techniques
are relatively more adopted in Finland than in Australia. This may be partly
because of the different sample period in the studies: the Australian results
reported by Chenhall and Langfield-Smith were made in 1998 and the de-
velopment of new techniques has been quite recent. On the other hand, the
organizations presented in this study are leading companies in their field in
the world and one would expect that pioneer companies use the most ad-
vanced techniques. There has not been that much innovations in the man-
agement accounting practices in Finland until the last decade so
organizations are quite easily motivated to try some of the new practices.
Joining the European Union in 1995 changed the accounting legislation.
The preference of variable costing might stem from the past. Contrary to
many other countries, variable costing was allowed in external reporting in
Finland. So far the change in legislation is not seen in product costing
principles; variable costing still dominates.
JOHANNA HYVONEN112

A quality-focused management philosophy has been ruling in Finland for
some time now. Quite a few of the new management accounting innovations
are derivates from that philosophy. Lukka and Granlund (1996) also report
on the importance of the quality. Certification to quality standards is em-
phasized. Different kinds of supplier partnerships are going to be even more
important in the future.
The respondents participating in this study belong to large firms. Lukka
and Granlund (1996) find some support in their study for the statement, that
the larger the unit, the more willing it is to introduce activity-based costing.
Table 6. Management Accounting Practices with At Least Six-Point
Difference Between Ranking of Past Benefits and Future Emphasis.
Management Accounting Practice Relative Rankings
Past benefits Future benefits Difference
Increased ranking
Product profitability analysis 9 1 8a
Performance evaluation: customer
satisfaction surveys
12 4 8a
Budgeting for coordinating activities
across business units
24 13 11a
Product costing: activity-based costing 30 16 14a
Benchmarking carried out with outside
organizations
34 28 6a
Performance evaluation: team
performance
38 25 13a
Performance evaluation: balanced
scorecard
40 21 19a
Decreased ranking
Performance evaluation: divisional profit 1 7 6
Performance evaluation: budget variance
analysis
7 23 16
Formal strategic planning 14 22 8b
Budgeting for planning cash flows 18 27 9a
Strategic plans developed separate from
budgets
23 34 11
Budgeting for planning day-to-day
operations
27 39 12b
Capital budgeting measures like IRR,
payback
29 41 12a
All t-tests are two-tailed tests of significance.aSignificant at the 1% level.bSignificant at the 5% level.
Adoption and Benefits of Management Accounting Systems 113

Malmi (1996) reports that larger size differentiates ABC users from non-
users. Virtanen et al. (1996) also find this to be true in Finland. Large
organizations have the time, money and resources for experimenting with
new tools. These companies need a lot of capital for running the business, so
technology and manufacturing is also emphasized from the strategic point
of view.
Finland is a technology-intensive economy. Technology innovations help
organizations to achieve their goals in increasing competition. Different
kinds of enterprise resource planning (ERP) systems have been implemented
or are in the process of being implemented. Also other technologies, like
supply chain management (SCM) or customer relationship management
(CRM) technologies are going to be emphasized in the future in Finland.
Dugdade (1994) also points out the importance of information technology in
the U.K. Many of the companies in this sample are technology-driven and
use manufacturing techniques like TQM. Different information technology
systems provide opportunities to provide information according to needs.
The spread of the firms in terms of industry and size gives possibilities for
comparisons. Table 7 shows the most beneficial management accounting
practices by different industries. In the forest industry, the most beneficial
practices have been traditional financial measures, but the future emphasis is
also going to be on non-financial measures like customer satisfaction sur-
veys (performance evaluation) and qualitative measures (performance eval-
uation). The respondents from the metal industry ranked divisional profit
(performance evaluation) and budgeting for controlling costs number one
and two respectively; the future emphasis is also going to be on these
measures. The only non-financial measure in the top five for the metal
industry is qualitative measures (performance evaluation), which is ranked
number four at past benefits and also on future emphasis. The respondents
in the electronics industry ranked the measures differently. Measures like
ROI (performance evaluation), capital budgeting measures like ROI and
payback or budget variance analysis are not among the most beneficial
measures neither in the past nor in the future. On the other hand, there are
measures like non-financial measures (performance evaluation), employee
attitudes (performance evaluation) or strategic plans developed together
with budgets that are not seen beneficial by forest or metal industry. Some
of the measures are seen beneficial by all industries, i.e. variable costing
(product costing), budgeting for controlling costs, qualitative measures
(performance evaluation) and product profitability analysis.
Table 8 shows classification by the number of employees. In general, the
larger the firm, the more relative benefits are derived from the practices.
JOHANNA HYVONEN114

Table 7. Management Accounting Practices: A Comparison of Most Beneficial Practices Between Industries.
Management Accounting Practice Relative Benefits Relative Future Emphasis
Past 3 Years Next 3 Years
Industry
Forest Metal Electronics Forest Metal Electronics
Mean Rank Mean Rank Mean Rank Mean Rank Mean Rank Mean Rank
Performance evaluation: ROI 5.83 1 5.00 5 3.75 26 6.22 1 5.44 10 4.71 26
Performance evaluation: divisional profit 5.59 3 5.94 1 4.75 7 5.12 13 6.00 1 5.00 20
Product costing: variable costing 4.94 6 5.11 3 5.25 1 5.50 8 5.76 5 5.75 3
Capital budgeting measures like ROI, payback 5.61 2 4.94 6 3.50 30 6.00 2 5.33 13 4.43 31
Budgeting for controlling costs 5.44 4 5.44 2 4.63 8 5.61 6 5.89 2 5.75 3
Performance evaluation: non-financial measures 3.61 25 3.11 32 5.13 2 4.71 21 4.88 18 5.25 12
Performance evaluation: employee attitudes 4.11 16 4.35 15 5.00 3 5.17 11 5.50 9 5.88 2
Performance evaluation: qualitative measures 4.89 7 5.06 4 4.75 6 5.83 4 5.78 4 5.38 10
Product profitability analysis 4.67 8 4.39 14 4.88 4 5.88 3 5.65 6 5.75 3
Performance evaluation: budget variance analysis 5.06 5 4.06 18 4.50 11 5.03 14 4.56 27 4.88 22
Long range forecasting 3.53 28 4.50 11 4.75 5 4.50 28 5.17 15 5.50 8
Strategic plans development together with budgets 4.35 13 4.72 8 3.82 23 5.00 17 5.22 14 6.13 1
Product costing: absorption costing 4.28 15 4.61 9 4.63 10 4.88 19 5.81 3 5.25 13
Performance evaluation: customer satisfaction surveys 4.44 12 4.06 20 3.88 22 5.61 15 5.56 8 5.25 14
Adoptio
nandBenefits
ofManagem
entAcco
untin
gSystem
s115

Table 8. Management Accounting Practices: A Comparison of Most Beneficial Practices by Number of
Employees.
Management Accounting Practice Relative Benefits Relative Future Emphasis
Past 3 Years Next 3 Years
Number of employees
20–200 201–500 501–1000 41000 20–200 201–500 501–1000 41000
Mean Rank Mean Rank Mean Rank Mean Rank Mean Rank Mean Rank Mean Rank Mean Rank
Performance evaluation: divisional profit 5.27 4 5.71 1 5.60 1 6.00 1 5.15 12 5.43 7 5.70 3 5.75 9
Product costing: absorption costing 5.58 1 4.70 14 5.30 4 5.31 8 5.64 3 4.64 28 5.50 6 5.92 5
Performance evaluation: ROI 4.69 10 5.31 3 4.90 9 5.75 2 5.21 11 5.46 6 5.00 16 6.42 1
Product profitability analysis 4.21 26 4.42 17 5.60 2 5.38 7 5.07 16 5.83 1 5.90 1 6.31 2
Budgeting for controlling costs 5.43 2 5.50 2 5.20 5 5.38 6 6.00 1 5.36 10 5.50 5 6.08 4
Product costing: variable costing 5.36 3 4.83 10 5.40 3 5.42 4 5.79 2 5.08 15 5.50 7 5.83 7
Capital Budget measures like ROI, payback 4.85 6 4.93 8 4.70 13 5.67 3 4.93 17 5.29 13 5.00 15 6.17 3
Performance evaluation: budget variance analysis 5.09 5 5.07 5 5.11 17 5.42 5 5.13 8 4.57 29 4.50 29 4.92 30
Strategic plans developed with budgets 4.79 8 5.08 4 4.70 14 5.17 9 5.36 7 5.00 17 5.20 9 5.73 10
Performance evaluation: qualitative measures 4.69 11 5.00 7 5.10 8 5.08 10 5.62 4 5.71 2 5.80 2 5.77 8
Performance evaluation: customer satisfaction surveys 4.42 20 4.62 15 4.70 16 4.92 12 5.31 9 5.69 3 5.60 4 5.85 6
Product costing: activity-based costing 4.83 7 4.00 28 3.50 40 3.42 38 5.14 13 5.50 4 4.60 25 5.00 26
Performance evaluation: production processes 4.38 22 5.00 6 5.20 6 4.54 19 5.23 10 5.50 5 5.20 10 5.00 27
Performance evaluation: employee attitudes 4.17 27 4.07 27 4.60 18 4.92 11 5.46 5 5.21 14 5.50 8 5.62 11
JOHANNA
HYVONEN
116

Also, the emphasis on future management accounting practices is higher in
larger firms. The largest firms (41,000 employees) in the sample obtain the
most benefits from traditional financial measures and the emphasis is also
going to be on those measures in the future. This also applies for the firms
with the number of employees between 501 and 1000 except that their future
emphasis also includes non-financial measures like qualitative measures
(performance evaluation) and customer satisfaction surveys (performance
evaluation). Product profitability analysis will be emphasized more in the
future regardless of the size of the firm. All respondent groups see budgeting
for controlling costs beneficial and it will keep its status also in the future.
Non-financial measures like qualitative measures and customer satisfaction
surveys will be emphasized even more in the future. The larger firms will no
longer emphasize budget variance analysis. Divisional profit in performance
evaluation will lose its status by all respondent groups.
CONCLUSIONS
The purpose of this chapter was to describe the relative adoption rates,
received benefits and future emphasis of management accounting practices
in Finland. All the management accounting variables have been adopted by
the majority of the respondents. A common feature for all the categories is
even greater future emphasis on highest ranked practices. Also, the relative
benefits from the last 3 years and the future emphasis in next 3 years are
generally bigger when the size of the firm increases. The increased emphasis
on both financial and non-financial measures of all kinds has been reflected
already in a 1991 Ernst and Young’s study (IQS, 1991).
The three most beneficial practices in management accounting are tra-
ditional financial measures including divisional profit in performance eval-
uation, budgeting for controlling costs and variable costing. A lot of the
companies in the survey are investment-intensive so controlling costs is im-
portant. The focus on costs may also be explained by the time of the survey;
signals of a recession were seen during that time. Future emphasis is on
product profitability analysis, budgeting for controlling costs and qualita-
tive measures in performance evaluation. Financial measures are going to be
important in the future but it was also seen that greater emphasis is going to
be placed on newer practices. The results indicate that Finnish firms put
greater emphasis to recently developed non-financial measures than the
Australian firms reported by Chenhall and Langfield-Smith (1998).
Adoption and Benefits of Management Accounting Systems 117

When compared to other studies done in Europe, the differences in man-
agement accounting techniques are not distinct. Shields (1998), Macintosh
(1998) and Lukka and Granlund (1998) also point out a certain homoge-
neity in Europe.
This study has certain limitations. The chosen sample is not random: it
focused mainly on three different manufacturing industries and business
units belonging to large firms. The findings should be seen as representing
these firms and not as generally representative of Finnish firms. Large units
are also more likely to be familiar with the latest concepts. Also the ter-
minology in the questionnaire was difficult and the respondents might have
been unable to understand some of the variables. Despite these facts, the
results of the study provide some perspectives of the management account-
ing practices used in Finland and the differences between these practices in
Finland and in Australia. Finally, the time of the survey is likely to be
influencing the results of this survey. In certain economical situation, some
of the practices are likely to be emphasized more and therefore further
research of the management accounting practices is needed.
ACKNOWLEDGMENT
I am grateful for the valuable comments and suggestions by Professors
Juha-Pekka Kallunki and Robert Chenhall.
REFERENCES
Anderson, E. W., Fornell, C., & Lehmann, D. R. (1994). Customer satisfaction, market share,
and profitability: Findings from Sweden. Journal of Marketing Research, 58, 53–66.
Ask, U., Ax, C., & Jonsson, S. (1996). Cost management in Sweden: From modern to
post-modern. In: A. Bhimani (Ed.), Management accounting: European perspectives
(pp. 199–217). Oxford: Oxford University Press.
Ballas, A., & Venieris, G. (1996). A survey of management accounting practices in Greek firms.
In: A. Bhimani (Ed.), Management accounting: European perspectives (pp. 123–139).
Oxford: Oxford University Press.
Banerjee, J., & Kane, W. (1996). Report on CIMA/JBA survey. Management Accounting, 74,
30–37.
Barbato, M. B., Collini, P., & Quagli, A. (1996). Management accounting in Italy. In: A.
Bhimani (Ed.), Management accounting: European perspectives (pp. 140–163). Oxford:
Oxford University Press.
Bhimani, A. (1994). Monitoring performance measures in UK firms. Management Accounting
(UK), 72, 34–36.
JOHANNA HYVONEN118

Bhimani, A. (1996). Management accounting: European perspectives. Oxford: Oxford University
Press.
Boons, A. N. A. M., Roozen, R. A., & Weerd de, R. J. (1994). Kosteninformatie in de Ne-
derlandse Industrie. In: Relevantie, methoden en ontwikkelingen. Rotterdam: Coopers &
Lybrand.
Brancato, C. K. (1995).New performance measures – A research report. Report no. 1118-95-RR.
New York, NY: The Conference Board.
Brierley, J. A., Cowton, C. J., & Drury, C. (2001). Research into product costing practice: A
European perspective. European Accounting Review, 10, 215–256.
Bromwich, M., & Bhimani, A. (1994). Management accounting: Pathways to progress. London:
The Chartered Institute of Management Accountants.
Bruggeman, W., Slagmulder, R., & Waeytens, D. (1996). Management accounting changes: The
Belgian experience. In: A. Bhimani (Ed.),Management accounting: European perspectives
(pp. 1–30). Oxford: Oxford University Press.
Bunce, P., Fraser, R., & Woodcock, L. (1995). Advanced budgeting: A journal to advanced
management systems. Management Accounting Research, 6, 253–266.
Chenhall, R., & Langfield-Smith, K. (1998). Adoption and benefits of management accounting
practices: An Australian study. Management Accounting Research, 9, 1–19.
Cornelius, P., Schwab, K., & Porter, M. E. (2002). IMD World Competitiveness Report. IMD,
Lausanne.
De Meyer, A., Nakane, J., Miller, J., & Ferdows, K. (1989). Flexibility: The next competitive
battle the manufacturing futures survey. Strategic Management Journal, 10, 135–144.
Dugdade, D. (1994). Theory and practice: The views of CIMA and students. Management
Accounting (UK), 72, 56–59.
Ekholm, B-G., & Wallin, J. (2000). Is the annual budget really dead? The European Accounting
Review, 9, 519–539.
Fisher, J. (1995). Use of nonfinancial performance measures. In: S. M. Young (Ed.), Readings in
management accounting (pp. 329–335). Englewood Cliffs, NJ: Prentice-Hall.
Groot, T. L. C. M. (1996). Managing costs in Netherlands: Past theory. In: A. Bhimani (Ed.),
Management accounting: European perspectives (pp. 164–179). Oxford: Oxford Univer-
sity Press.
Human Development Report (2001). Making new technologies work for human development.
Oxford: Oxford University Press for the United Nations Development Programme
(UNDP).
Innes, J., & Mitchell, F. (1995). A survey of activity-based costing in the UK’s largest com-
panies. Management Accounting Research, 6, 137–153.
Institute of Management Accountants (1996). Are corporate America’s financial measurements
outdated? Montvale, NJ: IMA.
IQS (1991). International Quality Study: The definitive study of the best international quality
management practises. Cleveland, OH: Ernst & Young and American Quality Founda-
tion.
Israelsen, P., Anderson, M., Rohde, C., & Sorensen, P. E. (1996). Management accounting in
Denmark: Theory and practice. In: A. Bhimani (Ed.),Management accounting: European
perspectives (pp. 31–53). Oxford: Oxford University Press.
Ittner, C. D., & Larcker, D. F. (1998). Are nonfinancial measures leading indicators of financial
performance? An analysis of customer satisfaction. Journal of Accounting Research, 36,
1–35.
Adoption and Benefits of Management Accounting Systems 119

Joye, M. P., & Blayney, P. I. (1990). Cost and Management Accounting Practices in Australian
Manufacturing Companies: Survey Results. Monograph no. 7, The Accounting and
Finance Foundation, University of Sydney.
Kaplan, R. S., & Norton, D. P. (1996). The balanced scorecard. Boston: Harvard University
Press.
Laitinen, E. K. (1995). Management Accounting Systems (MAS) in three types of Finnish firms:
Challenges for management accounting. Finnish Journal of Business Economics, 46,
391–414.
Lebas, M. (1996). Management accounting practice in France. In: A. Bhimani (Ed.), Manage-
ment accounting: European perspectives (pp. 74–99). Oxford: Oxford University Press.
Lukka, K., & Granlund, M. (1996). Cost accounting in Finland: Current practice and trends of
development. The European Accounting Review, 5, 1–28.
Lukka, K., & Granlund, M. (1998). It’s a small world of management accounting practices.
Journal of Management Accounting Research, 10, 153–179.
Lynch, R. L., & Cross, K. F. (1992). Measure up – Yardsticks for continuous improvement.
Cambridge, MA: Basil Blackwell.
Macintosh, N. B. (1998). Management accounting in Europe: A view from Canada. Manage-
ment Accounting Research, 9, 495–500.
Malmi, T. (1996). ABC in Finnish metal and engineering industries. The Finnish Journal of
Business Economics, 45, 243–264.
Malmi, T. (1999). Activity-based costing diffusion across organizations: An exploratory em-
pirical analysis of Finnish firms. Accounting, Organization and Society, 24, 649–672.
McKinnon, S. M., & Bruns, W. J. (1992). Management information and accounting informa-
tion: What do managers want. Advances in Management Accounting, 1, 55–80.
Mendoza, C., & Bescos, P-L. (2001). An explanatory model of managers’ information needs:
Implications for management accounting. The European Accounting Review, 10, 257–
289.
Miller, J. G., De Meyer, A., & Nakane, J. (1992). Benchmarking global manufacturing. Home-
wood IL: Irwin.
Roberts, A. (1995). Management accounting in France. Management Accounting (U.K.),
March, 44–46.
Shields, M. D. (1998). Management accounting practices in Europe: A perspective from the
States. Management Accounting Research, 9, 501–513.
Virtanen, K., Malmi, T., Vaivio, J., & Kasanen, E. (1996). Drivers of management accounting
in Finland. In: A. Bhimani (Ed.), Management accounting: European perspectives
(pp. 54–73). Oxford: Oxford University Press.
WEF. (2002). Global competitiveness report. New York: Oxford University Press for the World
Economic Forum.
Wijewardena, H., & De Zoysa, A. (1999). A comparative analysis of management accounting
practices in Australia and Japan: An empirical investigation. The International Journal of
Accounting, 34, 49–70.
JOHANNA HYVONEN120

INVESTMENTS IN HUMAN
CAPITAL IN DIFFERENT
INSTITUTIONAL ENVIRONMENTS
Juha-Pekka Kallunki, Pasi Karjalainen and
Minna Martikainen
ABSTRACT
This chapter investigates the proportion of labor costs that represents
investments in human capital, and the rate of amortization of this asset in
all six countries for which the required data are available in the Com-
pustat Global Vantage database. The sample includes countries with dif-
ferent financial and legal systems, which enables us to investigate how the
growth and depreciation rates of human capital and the resulting human
capital asset ratio differ in different institutional environments. The re-
sults indicate that the estimated proportion of labor expenses that rep-
resents investments in human capital is large in the so-called common-law
countries with a market-based financial system. On the other hand, the
depreciation rate of the estimated human capital assets is lower in these
countries. The results, therefore, indicate that the human capital assets
are high in equity-oriented financial reporting environments. The results
also indicate that the estimated ratios of the human capital asset to mar-
ket value of equity are reasonably related to firm characteristics that are
Advances in International Accounting
Advances in International Accounting, Volume 18, 121–140
Copyright r 2005 by Elsevier Ltd.
All rights of reproduction in any form reserved
ISSN: 0897-3660/doi:10.1016/S0897-3660(05)18006-4
121

hypothesized to be determinants of the human capital asset ratios. Finally,
these results remain the same in different industries.
INTRODUCTION
As pointed out by Amir and Lev (1996), among others, investments in
intangible assets such as brand development, research and development or
human capital are of crucial importance for firms in the knowledge-based
economy. Consequently, valuation of intangible assets is an important issue
from equity holder’s point of view, too. There is a large body of literature
investigating the stock market valuation of firms’ investments in intangible
assets. Bublitz and Ettredge (1989), for instance, found that the slope co-
efficient of regressing stock returns on R&D costs is positive suggesting that
stock market values R&D expenditures as an asset rather than a cost. Sim-
ilar results are reported by Chaucin and Hirschey (1993) and Green, Stark
and Thomas (1996), among others. Ballester, Livnat, and Sinha (1998) use
Ohlson’s (1995) valuation approach to estimate the proportion of a firm’s
labor expenses that the market views as an investment in human capital.
This chapter investigates the proportion of labor costs that represents
investments in human capital, and the rate of depreciation of this asset by
using the Compustat Global Vantage data from all six countries in which
firms voluntarily or obligatorily report labor costs in their published finan-
cial statements. Requirements for financial reporting are set by the legal and
financial environment of the country. In the so-called common-law coun-
tries with the market-based financial system, financial reporting is aimed at
providing the information needed by equity-investors. In these countries, the
growth/depreciation rates of the human capital can be assumed to be high/
low, because investors have broad information set available for their de-
cision making. The uniform Compustat industry sector code is used to in-
vestigate the human capital in different industries aside from the country-
specific effects. The economic relevance of the estimated human capital is
assessed by examining its firm-specific determinants. The chapter contrib-
utes to the literature that investigates the market valuation of intangible
assets, especially the paper by Ballester et al. (1998). While Ballester et al.
(1998) investigate the market valuation of firms’ labor expenditures in U.S.
where some firms voluntarily disclose these costs in their financial reports;
the current chapter investigates the degree and determinants of the human
capital in different countries with different financial reporting environment.
JUHA-PEKKA KALLUNKI ET AL.122

HUMAN CAPITAL AND ITS DETERMINANTS
Valuing Human Capital in Ohlson (1995) Framework
Earlier studies estimating the value of human capital have mainly been
focusing on the value of individual employees to the firm. For instance, Lev
and Schwartz (1971) approximated the value of human capital as the present
value of earnings of all employees for the remaining active service life.
Flamholtz (1971) improved this approach by allowing the possibility of
employees’ career movements within the firm or the possibility of employees
leaving the firm before retirement or death.
Jaggi and Lau (1974) developed a stochastic model that used groups of
employees as the basis for the valuation of human capital. This approach is
based on the fact that it is much easier to predict patterns of group behavior
than those of individual behavior. More recently, Rosett (2000) used data
from union contracts to estimate labor stock for firms with a relatively large
fraction of unionized work force. He defines the firm’s labor stock as the
present value of the expected cost of compensating employees.
Ballester et al. (1998) used an equity valuation model to estimate the
growth and depreciation rates of the human capital. This approach is mo-
tivated by the literature that investigates the stock market valuation of R&D
expenditures. For instance, Hirschey and Weygandt (1985) estimated the
market valuation and the amortization rate for advertising and R&D ex-
penditures. They found that advertising and R&D expenditures have a
positive impact on a firm’s Tobin Q (ratio of market value and replacement
cost of assets) suggesting that the market treats these expenditures as in-
tangible capital investments.
As Ballester et al. (1998) points out, the equity valuation model based on
the so-called residual income can be used to explicitly measure the invest-
ments in the human capital asset and the depreciation rate of this asset.
Residual income valuation is based on the assumption that a firm’s market
value is given by the present value of its expected dividends. Assuming the
clean surplus in accounting, Ohlson (1995) shows that its market value can
also be computed as the sum of its reported book value and the infinite sum
of discounted residual income as follows:
MVt ¼ BVt
X
1
i¼1
EER
tþi � rfBVtþi�1
ð1þ rf Þi
� �
(1)
Investments in Human Capital in Different Institutional Environments 123

where BVt is the book value (as reported) at time t, E [.] the expectations
based on information at time t, ERt the reported earnings for period t and rf
the cost of equity capital (risk-free interest rate given risk neutrality).
It can be demonstrated that under additional assumptions of risk neu-
trality and an autoregressive structure on the time series of residual income,
the market value (MV) is a function of current book value (BV) and current
abnormal earnings (see Ohlson, 1995 and also Myers, 1999) as follows:
MVt ¼ a1BVt þ a2ðERt � rfBVt�1Þ þ gnt (2)
Abnormal earnings are calculated as current earnings minus the risk-free
rate times the beginning of period book value. The variable nt captures
information other than that pertaining to abnormal earnings, and a and g
are functions of the risk-free rate and the time series properties of abnormal
earnings and other information.
Suppose a fraction b (where 0obo1) of the labor expenses (wt) in each
period represents increase in the human capital of the firm.
Moreover, it is assumed that labor expenses grow at a certain rate of g
percent every year, such that wt ¼ ð1þ gÞwt�1: Further, if the rate of de-
preciation for this asset is d (where 0odo1), then the value of the human
capital asset at the end of period t (Lt) is given by the following:
Lt ¼ bwt þ ð1� dÞLt�1 (3)
After incorporating the value of Lt�1; Lt can be written as
Lt ¼ bwt 1þ1� d
1þ g
� �
þ1� d
1þ g
� �2
þ1� d
1þ g
� �3
þ � � � þ1� d
1þ g
� �t" #
¼ bwt
1þ g
dþ g
� �
� bfwt ð4Þ
where the second equality is the sum of the series as t approaches infinity
and f is defined as ð1þ gÞ=ðdþ gÞ:Similarly, for large t,
Lt�1 ¼ bfwt�1 (5)
Reported earnings ðERt Þ are based on a full expensing of labor costs.
Alternatively, an accounting system that capitalizes the investment in hu-
man capital will report earnings (Et), which, after making adjustments for
additions to and depreciation of the human capital asset, are given by
Et ¼ ERt þ bwt � dLt�1 (6)
JUHA-PEKKA KALLUNKI ET AL.124

The accounting system will show book value of equity that is equal to the
full-expensing book value plus the human capital asset Lt. By inserting these
adjusted values (under capitalization of some labor costs) of earnings and
book values in Eq. (2) we get the following:
MVt ¼ a1ðBVt þ LtÞ þ a2ðERt þ bwt � dLt�1 � rf ðBVt�1 þ Lt�1ÞÞ þ gnt (7)
Eqs. (2) and (7) represent valuation equations which are based on two
different accounting systems – one that has full expensing of labor costs, and
another that capitalizes some of these costs. Both these valuation equations
will provide the same value if each follows the clean surplus relationship.
Moreover, it is assumed that the abnormal earnings follow the Markovian
process. However, the two systems may have different valuation conse-
quences if some further assumptions about the earnings generating process
are made to obtain less complicated valuation equation.
In particular, the Markovian process assumes that the expected abnormal
earnings in the current period are equal to abnormal earnings in the prior
period multiplied by a persistence coefficient. This particular coefficient is
assumed to be less than one. Under full expensing of labor costs book value
is consistently understated. Moreover, book value will be more grossly un-
derstated to the extent that the investment in human capital grows over
time. Therefore, under full expensing, abnormal earnings are actually ex-
pected to increase period by period, instead of declining as assumed by the
Markovian process. The accounting system that is based on capitalization of
some labor costs is likely to generate abnormal earnings that better fit the
underlying Markovian assumptions for valuation process. This holds at
least until the human capital asset stops growing.
The application of the valuation equation that is based on a partial cap-
italization of labor expenses for a subset of firms that experienced a positive
growth in labor expenses is described. Such firms can be assumed to be at
the stage where the investment in human capital is growing.
Assume that the dynamics of the human capital asset can be described as
in Eqs. (3) and (4). After substituting the values of Lt and Lt�1 and some
manipulation, Eq. (7) can be written as follows:
MVt ¼ a1BVt þ a2ðERt � rfBVt�1Þ þ ða1bfþ a2bÞwt
� ða2dbfþ rfa2bfÞwt�1 þ gnt
� A00 þ A1BVt þ A2ðE
Rt � rfBVt�1Þ þ A3wt þ A4wt�1 ð8Þ
Investments in Human Capital in Different Institutional Environments 125

where
A00 � gnt
A1 � a1
A2 � a2
A3 � ða1bfþ a2bÞ ¼ ðA1bfþ A2bÞ
A4 � � A2bf½dþ rf �
and
f � ð1þ gÞ=ðdþ gÞ
The parameters of interest in the above relationship are A1; A2; b (the
investment portion of labor expenditures) and d (the amortization rate for
human capital). Although the above relationship is linear in the dependent
variables, it is not linear in these parameters. Therefore, the non-linear
regression technique is needed to estimate the model.
Firm-Specific Factors Affecting the Human Capital Asset
It can be hypothesized that there are certain firm-specific factors that affect
the proportion of labor costs that is regarded as investments in human
capital by the stock market. In other words, the estimated human capital is
likely to be affected by certain economic characteristics of the firm. Ballester
et al. (1998) suggest that the following firm characteristics should be linked
to the ratio of the human capital asset to the market value of equity.
1. Average salary (the ratio of labor expense to the number of employees).
Firms employing quality and skilled labor are likely to invest more in
training and developing their human capital, and a skilled labor force
commands higher salaries. Therefore, this type of firms should have
higher ratios of human capital to market value, and it can be hypoth-
esized that there exists a positive relationship between average salary and
the estimated human capital asset.
2. Labor intensity (the ratio of labor expense to sales). The labor-intensive
firms can be assumed to invest intensively in retention and training of
personal. It is, therefore, hypothesized that there exists positive relation
between the ratio of labor expense to sales and human capital.
3. Operating uncertainty (the standard deviation of the return on equity
measured over the sample period). It is hypothesized that there exists a
positive relationship between operating uncertainty, measured by the
JUHA-PEKKA KALLUNKI ET AL.126

standard deviation of the return on equity, and the ratio of human capital
to market value. This is because firms are expected to make larger in-
vestments in human capital in order to prepare employees to fast changes
in business environment.
4. Profitability (return on asset). It is hypothesized that profitable firms do
not need to make investments in human capital. Therefore, the negative
relation is expected to exist between investments in human capital and
profitability measured by the return on assets (income before extraor-
dinary items divided by total assets).
5. Growth (the average growth rate of sales during the sample period). It is
hypothesized that there would exist a negative relation between the
growth and the investments in human capital. This is because it is ex-
pected that a growing firm needs to have all its available resources to
sustain its growth, and no extra assets are assumed to be used in human
capital investments.
6. Size (the log of total assets). It is hypothesized that there would exist a
negative relation between size of the firm and the investments in human
capital. This is because it is assumed that larger firms do not need to have
employees to carry out more than the limited amount of tasks.
Factors Creating International Differences in the Human Capital Asset
It can be hypothesized that there are certain country-specific factors that are
likely to influence the estimated human capital asset. These factors include
the financial and legal systems of the country. Countries are often classified
into bank- and market-based financial systems based on the relative im-
portance of the stock market and banking sector in the financing of firms
(see, for instance, Demirguc-Kunt & Maksimovic, 2002). In a market-based
financial system, firms have to disclose accounting and other value-relevant
information to get the financing from the public stock market. In a bank-
based system, firms can finance their investments through private negoti-
ations with banks, and they do not necessarily need to disclose additional
financial information except that required by the legislation. Therefore, it
can be assumed that the firms need for disclosing labor-related information
is greater in a market-based system than in a bank-based system. It is,
however, an empirical question as to what extent these differences in dis-
closing the labor-related costs create differences in a degree of the human
capital assets in different countries. This is due to the fact that stock prices
should reflect all value-relevant information in an efficient stock market
regardless of the financial system of the country.
Investments in Human Capital in Different Institutional Environments 127

The U.K. and the U.S. are typical examples of countries with market-
based financial system, whereas Germany is an example of a country with a
clear bank-based system.
Ball, Kothari, and Robin (2000) and Leuz, Nanda, and Wysocki (2003),
among others, argue that the information content of financial reports across
countries is affected by certain institutional factors. The most important
institutional variable causing differences in accounting income across coun-
tries is the legal system. In the so-called code-law countries, setting and
enforcement occur under codified law in which the role of governmental
processes is vital. In the so-called common-law countries, the role of the
market is more important. In common-law countries the shareholders’ point
of view comes first, while in code-law countries the other stakeholders’ needs
are more important. Given these differences in the legal environments of
countries, it can be assumed that the value-relevance of labor-related costs is
greater in common-law countries than in code-law countries.
RESEARCH DESIGN
The Data
The sample consists of all active industrial firms from six countries, i.e.
Germany, Finland, France, Switzerland, the U.K. and the U.S. The sample
covers all firms in which the necessary data of labor costs are available for a
9-year or longer period during the sample period from 1991 to 2001. All
variables used in the study are retrieved from the Compustat Global Van-
tage Database. The Compustat data item ‘Labor and related expense’ are
used as a labor costs variable for the U.S. firms where the staff expense is
not reported separately by the company but is reported in a note to the
financial statements. The Compustat data item ‘Staff expense-total’ is used
as a labor costs variable for other countries because the staff expense is
reported separately by the company on the financial statements.
The parameters of the human capital valuation model are estimated for
each firm in non-linear time-series regressions. These estimates are then used
to calculate the ratios of human capital asset to the market value of equity
for each firm. The economic relevance of the resulting human capital asset
ratios is then tested by using the sample of whole panel data and the sample
of different countries and industries. The observations that are higher than
95% decile or lower than 5% decile are eliminated to exclude outliers.
JUHA-PEKKA KALLUNKI ET AL.128

Finally, the observations where the ratios of human capital asset to the
market value of equity exceed 0.9 are deleted.
Methods and Preliminary Data Analysis
Following Ballester et al. (1998), this paper uses the Ohlson (1995) frame-
work to estimate the proportion of labor costs that represents investments in
human capital and the rate of amortization of this asset. Eq. (8) in the
previous section is estimated in the following form in time-series regressions
(see Ballester et al., 1998):
MVt
BVt�1
¼ A0 þ A1
BVt
BVt�1
þ A2
Et
BVt�1
þ A3
wt
BVt�1
þ A4
wt�1
BVt�1
(9)
where MVt is the market value of equity in the end of the year t, BVt�1 is the
book value of equity in the end of year t�1, Et is the earnings for year t, wt is
the extent of the labor costs in year t, and wt�1 is the extent of the labor costs
in year t� 1:In addition, the following non-linear dependencies exist between the
slopes (A0�A4) of the model as described in the previous section:
A0 � a0
A1 � a1
A2 � a2
A3 � a1bfþ a2b
A4 � � a2bfðdþ rf Þ
and
f �1þ g
dþ g
The average growth rate in labor expenses (g) is calculated as the average
growth rate over the estimation period. The risk-free interest rate is calcu-
lated as the average value of 1-month short-term interest rate over the
period of 1991–2001 in each country. The parameters of model (9) are
estimated by using the non-linear estimation procedure. The parameters b
and d are restricted to fall between 0 and 0.5. The estimated parameters are
used to calculate the value of the human capital (HU) and the ratio of
the human capital asset to the market value of equity (HU/MV) for each
Investments in Human Capital in Different Institutional Environments 129

firm-year observation in the period 1991–2001 as follows:
HUit ¼ bidiwit (10)
HUit
MVit
¼bidiwit
MVit
(11)
The ratio of the human capital asset to the market value of equity (HU/
MV) describes the importance of the human capital asset to the market
valuation of the firm i.e. it tells how investments in human capital are
reflected in the market value of the firm. If the value of the ratio is low, the
stock market considers the human capital as a value-increasing activity and
vice versa. In other words, if the human capital is expected to produce future
benefits for the firm, these expectations should be reflected also as an in-
creasing market value of equity and vice versa.
The study uses the firm-specific mixed panel estimation procedure to in-
vestigate if the different firm-specific characteristics can be used to explain
the ratio of the human capital asset to the market value of equity.
The estimation procedure includes the ARMA (1,1) model to consider the
possible first-order autocorrelation of dependent variable. At first, each
firm-specific characteristic is regressed separately against the ratio of the
human capital asset to the market value of equity. The model is estimated
for whole panel data, i.e. over different years and countries as follows:
HUit
MVit
¼ mþ ai þ b1X it þ �it (12)
where X is the following firm-specific characteristics:
WATEMP the labor cost divided by the number of employees, LAB-
ORINT the labor cost divided by the sales, ROA the income before ex-
traordinary items divided by 2-year average of total asset, Log(assets) the
log of total assets, Std. Dev. ROE the standard deviation of ratio ROE
calculated over period 1991–2001 where ROE is income before extraordi-
nary items divided by the book value of equity, Msalesgrowth the average
growth rate of sales over the whole period 1991–2001. m an intercept term, aithe firm-specific random effect, b1 the estimated regression coefficient of the
Xit and �t an error term.
The effect of the firm-specific characteristic on the ratio of the human
capital asset to the market value of equity is also investigated by estimating
the model where all independent variables are in the same model. The
model is estimated for both the whole panel data and different countries as
JUHA-PEKKA KALLUNKI ET AL.130

follows:
HUit
MVit
¼ mþ ai þ b1WATEMPit þ b2LABORINTit þ b3ROAit
þ b4LogðassetsÞit þ b5Std: Dev: ROEit þ b6Msalesgrowthit þ �itð13Þ
where the dependent and independent variables are the same as described in
Eq. (12), m is an intercept term, ai the firm-specific random effect, bi are the
estimated regression coefficients, and �t is an error term.
The industry-specific regression coefficients are estimated to investigate
how different firm-specific characteristics are associated with the ratio of
human capital asset to the market value of equity in different industries. The
following model is estimated:
HUit
MVit
¼ mþ ai þX
gkIkWATEMPit þX
gkIkLABORINTit
þX
gkIkROAit þX
gkIkLogðassetsÞit
þX
gkIkStd: Dev: ROEit
þ gkIkMsalesgrowthit þ �it ð14Þ
where the dependent and independent variables are the same as described
in Eq. (12), subscript k refers to the industry, gk refers to the industry-
specific regression coefficients for the different firm-specific variables, I is
an industry dummy variable taking a value of one for industry k, zero
otherwise, m an intercept term, ai the firm-specific random effect, and �t is anerror term.
As a preliminary data analysis, Table 1 reports country-specific descrip-
tive statistics of the variables used in the empirical analysis. The results
indicate that the human capital asset constitutes an essential part of the
market value of firms in all countries. The estimated proportion of human
capital asset is more than 20% of the market value of equity in all countries.
In the U.S., where the firms are allowed to report labor costs voluntarily, the
average value of the ratio of human capital asset to the market value of
equity is the lowest. The highest means of this ratio are reported in Germany
and Switzerland. As a whole the preliminary results indicate that the es-
timated proportion of labor costs that represents investments in human
capital is large in all countries but there are no distinct differences in the
intensity of human capital investments or the stock market valuation of the
human capital asset in different countries.
Investments in Human Capital in Different Institutional Environments 131

EMPIRICAL RESULTS
Table 2 reports the results of estimating the non-linear time-series regres-
sions as described in model (9). The estimated proportion of labor costs that
represents investments in human capital, b; and the estimated depreciation
rate of the human capital, d; from these regressions will be used to calculate
Table 1. Descriptive Statistics of Variables for Sample
Period – 1991–2001.
Variable Statistics Countries
Germany Finland France Switzerland U.K. U.S. All
HU/MV Mean 0.283 0.244 0.237 0.286 0.263 0.224 0.255
Min 0.000 0.000 0.000 0.000 0.000 0.000 0.000
Max 0.898 0.840 0.875 0.898 0.854 0.899 0.899
WATEMP Mean 42.430 33.903 33.887 55.674 30.266 51.005 42.516
Min 20.557 17.450 20.521 29.229 12.199 10.274 10.274
Max 68.398 47.114 58.168 85.448 46.342 82.773 85.448
LABORINT Mean 0.236 0.222 0.235 0.273 0.215 0.316 0.258
Min 0.050 0.116 0.108 0.108 0.110 0.129 0.050
Max 0.434 0.448 0.426 0.438 0.373 0.571 0.571
ROA Mean 4.185 5.382 3.389 4.372 7.369 7.680 5.706
Min �3.836 �0.301 �0.979 �3.287 �1.412 �1.852 �3.953
Max 12.839 12.581 8.424 12.559 13.954 16.819 16.820
Log(assets) Mean 13.028 13.314 14.014 13.492 13.621 14.441 13.735
Min 7.343 10.317 11.162 11.904 9.825 9.787 7.343
Max 18.286 16.615 18.310 15.115 16.854 17.706 18.310
Std.Dev.ROE Mean 9.861 9.173 6.557 8.383 7.712 9.275 8.795
Min 1.726 4.196 1.533 2.433 1.648 2.070 1.533
Max 59.140 32.959 16.781 22.409 33.717 29.619 59.140
Msalesgrowth Mean 0.088 0.121 0.106 0.082 0.110 0.123 0.108
Min 0.002 0.038 0.048 �0.033 0.042 0.027 �0.033
Max 0.229 0.342 0.283 0.239 0.164 0.279 0.342
HU/MV is the ratio of the estimated human capital asset to the market value of equity.
WATEMP is the ratio of labor expense to the number of employees.
LABORINT is the ratio of labor expense to the sales.
ROA is the income before extraordinary items divided by the average of most recent two years
of assets.
Log(assets) is the log of total assets.
Std.Dev.ROE is the standard deviation of return on equity measured over whole sample period.
Msalesgrowth is the average growth rate of sales during the whole sample period.
JUHA-PEKKA KALLUNKI ET AL.132

the amount of the human capital asset for each firm. As predicted, the signs
of the estimated slope coefficients of earnings, a2; are positive in all coun-
tries. The estimated proportion of labor costs that represents investments in
human capital, b; varies across countries. The highest bs are reported in the
U.K. and U.S., indicating that a relatively large proportion of labor costs is
regarded as investments in human capital in countries that can be described
as common-law countries with a market-based financial system.
The results reported in Table 2 also indicate that, in all countries, the
estimated depreciation rate of the human capital asset, d; is smaller than the
proportion of labor costs that represents investments in the human capital,
Table 2. Non-Linear Regression Results Based on Time-Series Data
(Model 9).
Variable Statistics Country
Germany Finland France Switzerland U.K. U.S.
Intercept (a0) (A1) Mean �0.645 �1.147 0.839 �0.363 �0.754 �1.550
Median �0.221 �0.543 0.338 �0.149 �0.419 �0.589
Min �119.615 �15.782 �44.988 �11.825 �10.736 �72.973
Max 19.231 6.534 33.085 10.995 4.951 13.057
Book value (a1) (A2) Mean 1.456 1.283 0.881 0.652 0.858 1.396
Median 0.353 0.559 0.453 0.496 0.572 1.037
Min �20.036 �5.827 �19.138 �2.997 �2.495 �11.751
Max 107.874 17.541 18.327 5.784 5.085 50.801
Earnings (a2) Mean 4.976 5.363 5.872 5.780 5.646 6.834
Median 1.497 2.524 4.482 4.941 4.193 3.667
Min �76.610 �19.148 �32.042 �0.912 �3.544 �84.783
Max 216.844 56.230 71.220 22.644 46.051 72.612
Beta (b) Mean 0.284 0.134 0.245 0.286 0.325 0.291
Median 0.424 0.061 0.118 0.417 0.500 0.327
Min 0.000 0.000 0.000 0.000 0.000 0.000
Max 0.500 0.500 0.500 0.500 0.500 0.500
Delta (d) Mean 0.145 0.180 0.150 0.189 0.128 0.179
Median 0.000 0.015 0.000 0.046 0.000 0.012
Min 0.000 0.000 0.000 0.000 0.000 0.000
Max 0.500 0.500 0.500 0.500 0.500 0.500
N 893 141 311 236 415 805
a1 (A1) is the coefficient of book value of equity.
a2 (A2) is the earnings valuation coefficient.
Beta (b) is the proportion of current labor costs that represents investment in the human capital
asset of a firm.
Delta (d) is the rate of depreciation in the human capital asset of a firm.
Investments in Human Capital in Different Institutional Environments 133

b: This means that the human capital asset increases faster than it decreases.
In the U.K., which is a clear common-law country with a market-based
financial system, the estimated d gets the lowest (0.13) and the estimated b
gets the highest (0.33) value of all countries in the sample. This indicates that
the human capital asset of the British firms increases clearly faster than it
depreciates. These results are consistent with Hirschey and Weygandt (1985)
who report a depreciation rate of 10–20% for research and development
costs, but are clearly smaller than those reported by Ballester et al. (1998)
who found an average depreciation rate of 34% for human capital.
Table 3 reports the results of testing whether the estimated growth and
depreciation rates of the human capital, i.e. the estimated b and d differ
across countries. The numbers reported in the table are the values of the t-
test statistics for testing whether the sample means of the estimated b and d
coefficients are significantly different in different countries. The results re-
ported in Panel B of Table 3 confirm those reported in Table 2. The mean
values of the estimated bs are significantly different in different countries
suggesting that the proportion of current labor costs that represent invest-
ment in human capital differs across countries. To illustrate, the results
reported in Table 2 indicate that the estimated growth rate in human capital
is the highest for the British firms (the mean b equals to 0.325), and the
results reported in panel A of Table 3 confirm that the differences in the
growth rates between the British firms and the firms from other countries are
statistically significant. Panel B of Table 3 also reports the results of testing
whether the estimated depreciation rates of human capital asset, d; are sig-
nificantly different across countries. The results indicate that the estimated
ds are significantly different across countries in many cases, but the differ-
ences are not as clear as they were in the case of the estimated bs. It,
therefore, seems that the human capital assets grows at clearly different
rates, but vanishes about at the same rate in different countries.
Table 4 reports the results of investigating, whether the different firm-
specific characteristics are related to the ratio of human capital asset to the
market value of equity. The signs of the estimated coefficients are as expected,
and the statistically significant slopes are reported for the average salary,
labor intensity and profitability. These results indicate that the estimated
human capital asset makes economic sense, because it is reasonably related to
the firm characteristics that can be assumed to be the determinants of the
human capital asset. The positive relation between the average salary and the
ratio of human capital asset to the market value of equity indicates that firms
that employ quality skill labor are likely to invest more in training and
developing their human capital. The positive relation between the ratio of
JUHA-PEKKA KALLUNKI ET AL.134

labor intensiveness and the ratio of human capital asset to the market value
indicates that the labor-intensive firms invest intensively in retention and
training of personnel. The negative relation between the profitability of the
firm and the ratio of human capital asset to the market value reveals that the
profitable firms do not necessarily need to invest heavily in the human capital.
When all independent variables are included into the same model, the
signs of the estimated coefficients for the average salary, labor intensity and
Table 3. Results of Testing whether Mean Values for Estimated Growth
Rates (b) and Depreciation Rates (d) in Table 2 Differ across Countries.
Country Finland France Switzerland U.K. U.S.
Panel A: t-Values for Beta Coefficients
Germany 9.74 2.67 �0.08 �3.11 �0.62
(0.001)� (0.008)� (0.935) (0.002)� (0.534)
Finland �5.94 �7.66 �11.14 �10.23
(0.001)� (0.001)� (0.001)� (0.001)�
France �2.11 �4.86 �3.12
(0.035)� (0.001)� (0.002)�
Switzerland �2.22 �0.33
(0.027) (0.740)
U.K. 2.71
(0.007)�
Panel B: t-Values for Delta Coefficients
Germany �1.78 �0.39 �2.76 1.37 �3.23
(0.075) (0.699) (0.006)� (0.170) (0.001)�
Finland 1.30 �0.37 2.42 0.05
(0.195) (0.712) (0.016)� (0.963)
France �1.99 1.42 �1.94
(0.047)� (0.156) (0.052)
Switzerland 3.46 0.60
(0.001)� (0.548)
U.K. �4.11
(0.001)�
The mean differences of Beta and Delta coefficients are compared between two countries, one at
a time, and t-values for the null hypothesis that the variance across two countries are equal, are
as reported.
The p-values are presented in parentheses below the t-values.�Represents the mean differences of Beta and Delta coefficients that are statistically significant
at the 5% level or better.
Investments in Human Capital in Different Institutional Environments 135

Table 4. Regression Results Based on Firm-Specific Mixed Panel Estimation Procedure (Models 12 and 13).
All Countries
Variable Exp sign Intercept (1) (2) (3) (4) (5) (6)
WATEMP LABORINT ROA Log(asset) Std.Dev.ROE Msales growth N �2 res log likelihood
Eq. (12): HU=MV ¼ mþ aþ b1X þ �
1 + 0.235 0.002 918 �1331.3
(0.001)� (0.009)�
2 + 0.167 0.537 918 �1353.2
(0.001)� (0.001)�
3 � 0.353 �0.008 918 �1355.3
(0.001)� (0.001)�
4 �/+ 0.464 �0.012 918 �1331.7
(0.001)� (0.176)
5 �/+ 0.273 0.003 919 �1329.5
(0.001)� (0.136)
6 � 0.318 �0.107 919 �1337.4
(0.001)� (0.752)
Eq. (13): HU=MV ¼ mþ aþ b1WATEMPþ b2LABORINTþ b3ROAþ b4LogðassetÞ þ b5Std.Dev.ROEþb6Msalesgrowthþ �
All 0.443 0.002 0.369 �0.008 �0.021 0.002 �0.063 915 �1348.3
(0.001)� (0.002)� (0.004)� (0.001)� (0.02)� (0.395) (0.858)
WATEMP is the ratio of labor expense to the number of employees.
LABORINT is the ratio of labor expense to the sales.
ROA is income before extraordinary items divided by the average of assets in most recent 2 years.
Log(assets) is the log of total assets.
Std.Dev.ROE is the standard deviation of return on equity measured over whole sample period.
Msalesgrowth is the average growth rate of sales during the whole sample period.
Random intercept statement used to relax the assumption of a common intercept and coefficients across firms.
�2 res log likelihood is the likelihood maximum of the estimated regression equation.
The significance levels are presented in parentheses below the estimated coefficient.�Represents coefficients that are statistically different from zero at the 5% level or better.
JUHA-PEKKA
KALLUNKIET
AL.
136

profitability remain as expected and statistically significant. The sign of the
size coefficient becomes negative and statistically significant. The signs of the
operating uncertainty and growth are as expected but remain insignificant.
Table 5 reports the results of the industry-specific regression, where the
ratio of human capital asset to the market value of equity is regressed on its
firm-specific determinants. The results indicate that the signs of the esti-
mated slopes of the firm-specific characteristics are as predicted. This sup-
ports the results reported in Table 4.
The results also indicate that there exists a positive relation between the
average salary and the ratio of human capital asset to the market value of
Table 5. Regression Results Based on Firm-Specific Mixed Panel
Estimation Procedure (Model 14).
All Countries (n ¼ 879)
Industry Intercept WATEMP LABORINT ROA Log(asset) Std.Dev.ROE Msales growth
Intercept 0.486
(0.002)�
I1000 0.005 �0.021 �0.012 �0.025 �0.002 1.146
(0.031)� (0.967) (0.011)� (0.140) (0.766) (0.308)
I2000 0.003 0.393 �0.006 �0.028 �0.003 0.178
(0.115) (0.269) (0.057)� (0.066)� (0.682) (0.880)
I3000 �0.003 0.329 �0.009 �0.010 0.003 �0.766
(0.370) (0.653) (0.299) (0.659) (0.722) (0.641)
I3500 0.008 1.342 �0.018 �0.060 �0.003 1.011
(0.093)� (0.059)� (0.008)� (0.108) (0.881) (0.686)
I6000 0.000 0.211 �0.010 �0.019 0.004 0.212
(0.729) (0.322) (0.001)� (0.098)� (0.384) (0.749)
I8000 0.004 0.590 �0.021 �0.066 0.021 0.350
(0.099)� (0.248) (0.002)� (0.045)� (0.068)� (0.765)
I9000 0.003 0.901 �0.004 �0.013 �0.010 �2.697
(0.068)� (0.062)� (0.510) (0.484) (0.548) (0.078)�
Using Model 14, HU/MV is regressed with firm-specific variables, i.e. WATEMP, LABORINT,
ROA, Log(asset), Std.Dev.ROE and Msalesgrowth accross different industries. The industry
dummies are as follows:
I1000 ¼ Basic Materials.
I2000 ¼ Consumer Discretionary.
I3000 ¼ Consumer Staples.
I3500 ¼ Health Care.
I6000 ¼ Capital Goods.
I8000 ¼ Information Technology.
I9000 ¼ Utilities.�Represents coefficients that are statistically different from zero at the 10% level or better.
Investments in Human Capital in Different Institutional Environments 137

equity in four industries. The statistically significant relationships between
the labor intensity and the ratio of human capital asset to the market value
of equity are reported in two industries. The results also clearly indicate that
almost in all industries the profitability of the firm is significantly negatively
related to the ratio of human capital asset to the market value of equity. It,
therefore, seems that the profitability of the firm has an important role to
play in all industries when explaining the estimated human capital assets.
The size of the firm is significantly related to the ratio of human capital asset
to the market value of equity in three industries, whereas the operating
Table 6. Regression Results Based on Firm-Specific Mixed Panel
Estimation Procedure (Model 13).
Variables Exp sign Country
Germany Finland France Switzerland U.K. U.S.
Intercept 0.234 0.940 0.587 1.200 �0.269 1.173
(0.347) (0.222) (0.257) (0.018)� (0.448) (0.001)�
WATEMP + �0.001 �0.004 �0.001 0.006 0.005 0.003
(0.441) (0.273) (0.665) (0.001)� (0.009)� (0.005)�
LABORINT + 0.499 0.608 0.328 0.130 0.936 0.105
(0.059)� (0.248) (0.491) (0.772) (0.002)� (0.648)
ROA � �0.006 �0.026 �0.018 �0.025 �0.005 �0.004
(0.055)� (0.001)� (0.023)� (0.001)� (0.094)� (0.080)�
Log(Assets) �/+ �0.002 �0.048 �0.008 �0.144 0.011 �0.054
(0.908) (0.352) (0.797) (0.002)� (0.666) (0.001)�
Std.Dev.ROE �/+ 0.002 0.005 �0.014 �0.000 0.006 �0.005
(0.545) (0.728) (0.439) (0.995) (0.388) (0.408)
Msalesgrowth � 0.272 0.373 �0.359 0.750 0.446 �1.544
(0.717) (0.740) (0.790) (0.632) (0.788) (0.036)�
N 227 56 118 77 143 272
Using Model 13, HU/MV is regressed with the six different firm-specific variables, i.e.
WATEMP, LABORINT, ROA, Log(asset), Std.Dev.ROE and Msalesgrowth in different
countries.
WATEMP is the ratio of labor expense to the number of employees.
LABORINT is the ratio of labor expense to the sales.
ROA is income before extraordinary items divided by average of most recent 2 years of assets.
Log(assets) is the log of total assets.
Std.Dev.ROE is the standard deviation of return on equity measured over whole sample period.
Msalesgrowth is the average growth rate of sales during the whole sample period.
Random intercept statement used to relax assumption of a common intercept and coefficients
across firms.
The significance levels are presented in parentheses below the estimated coefficient.�Represents coefficients that are statistically different from zero at the 10% level or better.
JUHA-PEKKA KALLUNKI ET AL.138

uncertainty and the growth of the firm have no effect on the ratio of human
capital asset to the market value of equity.
Table 6 reports the results of regressing the ratio of human capital asset to
the market value of equity on the firm-specific characteristics in different
countries. A strong relation between the estimated human capital assets and
its economic determinants is observed in the U.K. and, especially, in the
U.S., which both can be regarded as countries with the market-based fi-
nancial system. In countries with a clear bank-based financial system, i.e.
Germany and France, the relation between the estimated human capital
assets and its economic determinants is somewhat lower. Therefore, it seems
that the economic relevance of the estimated human capital asset is about
the same in countries with a different financial system.
CONCLUSIONS
This chapter applies the Ohlson’s (1995) framework to estimate the pro-
portion of labor costs that represents investments in human capital, and the
rate of depreciation of this asset by using international data. The results
indicate that the estimated proportion of labor expenses that represents
investments in human capital is large in the so-called common-law countries
with a market-based financial system. On the other hand, the depreciation
rate of the estimated human capital assets is lower in these countries.
For the whole panel data, the results of testing whether the estimated
parameters and the resulting human capital asset ratios make economic
sense indicate that the average salary, the labor intensity and the profita-
bility seem to be the economic determinants of the human capital asset ratio
as predicted by the theory. Industry-specific results also confirm the findings
that different firm-specific characteristics can be used to explain the ratio of
human capital asset to the market value of equity in some sense. Country-
specific regression results strongly support the hypothesis that the negative
association between the profitability and the human capital asset ratio
makes economic sense.
ACKNOWLEDGMENT
We thank OKO Bank of Finland, Jenny ja Antti Wihurin Rahasto,
Liikesivistysrahasto, Kaupallisten – ja Teknisten Tieteiden Tukisaatio,
Marcus Wallenbergin Liiketaloudellinen Tutkimussaatio and Oulun ylio-
piston Tukisaatio for their financial support.
Investments in Human Capital in Different Institutional Environments 139

REFERENCES
Amir, E., & Lev, L. (1996). Value-relevance of non-financial information: The wireless com-
munications industry. Journal of Accounting and Economics, 22, 3–30.
Ball, R., Kothari, S. P., & Robin, A. (2000). The effect of international institutional factors on
properties of accounting earnings. Journal of Accounting and Economics, 29, 1–51.
Ballester, M., Livnat, J., & Sinha, N. (1998). Labor costs and investments in human capital.
Manuscript.
Bublitz, B., & Ettredge, M. (1989). The information in discretional outlays: Advertising, re-
search and development. Accounting Review, 64, 108–124.
Chaucin, K. W., & Hirschey, M. (1993). Advertising, R&D expenditures and the market value
of the firm. Financial Management, 22, 231–258.
Demirguc-Kunt, A., & Maksimovic, V. (2002). Funding growth in bank-based and market-
based financial systems: Evidence from firm-level data. Journal of Financial Economics,
65, 337–363.
Flamholtz, E. (1971). A model for human resource valuation: A stochastic process with service
rewards. The Accounting Review, 46, 253–267.
Green, J. P., Stark, A. W., & Thomas, H. M. (1996). U.K. evidence on the market valuation of
research and development expenditures. Journal of Business Finance and Accounting, 23,
191–216.
Hirschey, M., & Weygandt, J. J. (1985). Amortization policy for advertising and research and
development expenditures. Journal of Accounting Research, 23, 326–335.
Jaggi, B., & Lau, H.-S. (1974). Toward a model for human resource valuation. The Accounting
Review, 49, 321–329.
Leuz, C., Nanda, D., & Wysocki, P. D. (2003). Earnings management and investor protection:
An international comparison. Journal of Financial Economics, 69, 505–527.
Lev, B., & Schwartz, A. (1971). On the use of the economic concept of human capital in
financial statements. The Accounting Review(January), 46, 103–111.
Myers, J. N. (1999). Implementing residual income valuation with linear information dynamics.
The Accounting Review(January), 74, 1–28.
Ohlson, J. A. (1995). Earnings, book values, and dividends in security valuations. Contemporary
Accounting Research, 11, 661–687.
Rosett, J. G. (2000). Equity risk and the labor stock: The case of union contracts. Working Paper,
Tulane University.
JUHA-PEKKA KALLUNKI ET AL.140

RISK IN AUDIT PRICING:
THE ROLE OF FIRM-SPECIFIC
DIMENSIONS OF RISK
Jussi Nikkinen and Petri Sahlstrom
ABSTRACT
This chapter investigates the impact of the firm-specific dimensions of risk
suggested in the finance literature, the financial risk, operating leverage
and business risk on audit fees. It is hypothesized that audit fees are
related to these three dimensions of risk, size, audit complexity and a set
of the agency theory based control variables. The hypothesis is empir-
ically tested using a sample from the U.K. audit market. The results of the
study show that audit fees as hypothesized are positively related to fi-
nancial leverage, operating leverage and business risk of a firm and that
the control variables behave according to expectations. This implies that
the three dimensions of the firm-specific risk are taken into account in
audit pricing decisions and should therefore be incorporated into models
when investigating the audit pricing issues.
INTRODUCTION
Many studies recognize the role of risk inherent in audit pricing.1 For ex-
ample, Simunic and Stein (1987) point out that auditing is a business in
Advances in International Accounting
Advances in International Accounting, Volume 18, 141–151
Copyright r 2005 by Elsevier Ltd.
All rights of reproduction in any form reserved
ISSN: 0897-3660/doi:10.1016/S0897-3660(05)18007-6
141

which the auditor must assume the risk of an uncertain rate of returns and
consequently the auditor’s pricing decision should reflect this risk. Similarly,
Menon and Williams (2001) note that a litigation risk measure (leverage) is
often included in the audit pricing models. Thus, various risk measures are
used as control variables for audit risk in the audit pricing models.2 The
finance literature (see, e.g., Hamada, 1972; Lev, 1974; Gahlon & Gentry,
1982) shows, however, that the firm-specific risk is a function of three di-
mensions of risk, which are the financial leverage, operating leverage and
business risk of a firm. Consequently, according to the finance literature
all of these risk dimensions should be taken into account in audit pricing
decisions.
The purpose of this chapter is to investigate the impact of the three
dimensions of risk, i.e. the financial risk, operating leverage and business
risk, on the audit fee determination. Since the risk of a firm consists of these
dimensions, the auditor’s cost function should include these factors. Con-
sequently, the auditor’s pricing decision should reflect all these dimensions
of firm-specific risk. It is therefore hypothesized that audit fees are related to
these three dimensions of risk, audit complexity and, as suggested by Gul
(1999) and Gul and Tsui (2001), to a set of control variables based on the
agency theory. While all the dimensions of risk are expected to affect the
audit pricing decisions, the different dimensions, i.e. business risk, operating
leverage and financial leverage may not, on the other hand, be equally
important for the auditor’s pricing decision. To empirically investigate these
issues, the determination of audit fees is investigated using a large sample
from the U.K. audit market.
This chapter contributes to the body of audit pricing literature (for
a review see, Cobbin, 2002) by investigating the impact of the three di-
mensions of the firm-specific risk, i.e. the financial risk, operating lever-
age and business risk, on the audit fee determination. While various risk
measures are typically used as control variables in the audit pricing-
models, the finance theory suggests that the firm-specific risk is a func-
tion of the risk dimensions investigated in this study. Consequently, all
of these risk dimensions should be taken into account in audit pricing
decisions.
The results of the study have an important implication for auditing
companies. Since the auditing business has grown increasingly complex
at both the national and international levels, auditors need better tools
for assessing audit risks. Consequently, a better understanding of the role
of risk in audit pricing is likely to lead to more accurate audit pricing
decisions.
JUSSI NIKKINEN AND PETRI SAHLSTROM142

IMPACT OF RISK ON AUDIT PRICING
Auditing is a business in which the final income of an audit project is
unknown since an auditor faces the possibility that the financial statements
contain undetected material misstatements, which may be observed after an
audit report has been published. Such a revelation may result in loss of
auditor reputation, loss of the client or in the worst case in costly litigation.
As a consequence, the auditor’s cost function consists of two components,
which are the amount of work hours used and the expected future loss (see
Simunic & Stein, 1987). The client’s risk affects both of these components.
The expected future loss increases as the probability of bankruptcy increas-
es, since the probability that the firm will be re-audited and misstatements
revealed is higher in a case of bankruptcy. Moreover, to avoid litigations in
a case of bankruptcy, it can be expected that auditors will increase their
effort to detect misstatements for firms with a high probability of bank-
ruptcy. The auditors should take this into account when pricing their serv-
ices. As a result, a positive relationship should pertain between audit fees
and client’s risk. The previous empirical evidence supports this argument
(see, e.g., Simunic & Stein, 1987; Cobbin, 2002 for a review).
The theoretical framework for the use of firm characteristics in the risk
measurement is based on studies according to which certain firm-specific
characteristics are connected to risk. Hamada (1972), Lev (1974), and
Gahlon and Gentry (1982), among others, show that the firm risk is a
positive function of the financial leverage, operating leverage and business
risk of a firm. Since the audit fee is a positive function of risk, it should be
positively related to these risk dimensions. Therefore, it can be hypothesized
that positive relationships pertain between audit fees and financial leverage,
operating leverage and business risk of a firm. If these hypotheses are con-
firmed, it implies that all of these risk dimensions should be used in the
modeling of the audit pricing.
While the dimensions of risk are hypothesized to have an impact on audit
fees, several other factors affecting the audit fees have to be taken into
account in the model construction. Firm size and the complexity of the
auditing process are the most important among these factors (see, e.g.,
Bamber, Bamber, & Schoderbek, 1993). The size of the client has a positive
impact on the auditing fees. The complexity of the auditing process increases
the level of auditor effort, thereby raising the auditing fee.
Moreover, according to agency theory, audit fees represent monitoring
cost, as proposed by Jensen and Meckling (1976) and therefore factors
affecting the agency costs should be taken into account, as suggested by Gul
Risk in Audit Pricing: The Role of Firm-Specific Dimensions of Risk 143

and Tsui (2001). Jensen (1986) suggests that the agency costs are lower for
firms with high levels of management ownership since managers’ interests
are more likely to be similar with those of shareholders when they own a
larger proportion of the shares. Consequently, it can be hypothesized that
monitoring costs, including audit fees, will be higher for firms with lower
manager ownership as argued by Agrawal and Jayaraman (1994). More-
over, based on the theory of Jensen and Meckling (1976); and Jensen (1986,
1989), the agency problem is more severe in firms with higher free cash flow
(FCF). The reason for this is the fact that if a firm has a large amount of
cash reserves then managers have more flexibility to choose where to use the
funds. To reduce this problem, owners use auditors to inspect managers’
behavior. Therefore, it can be hypothesized that there is a positive rela-
tionship between FCF and audit fees.
On the basis of the framework of risk dimensions, a positive relationship
should exist between the audit fee and the three dimensions of risk. More-
over, factors affecting the audit fees, i.e. firm size and the complexity of the
auditing process, and also the agency costs should be incorporated into a
model investigating the role of risk in audit pricing.
DATA
The hypotheses are tested using data from the U.K. The variables used are
retrieved from the publicly available Worldscope database. The sample
consists of all listed firms during the period 1992–2000. Firms belonging to
the financial services industry (SIC codes 6000–6999) are excluded from the
sample due to their unique characteristics.
The variables are defined as follows: Audit fee, the dependent variable,
is defined as a natural logarithm of audit fees (FEE). Debt to equity ratio is
used to measure financial leverage (FLEV). Operating leverage (OLEV) is
measured by the change in sales divided by the change in operating income.
This measure can be interpreted so that if all costs are variable then the
value of OLEV is one, and as the fraction of fixed costs increases, i.e.
operating leverage increases, so OLEV also increases. This definition is used
since it is impossible to measure the ratio of fixed costs to variable costs
using information from the financial statements. The problem of this meas-
ure is that it is not defined if the denominator is zero. Moreover, as the
denominator approaches zero, the variable approaches infinity. To avoid
these problems, an observation is omitted if the change in operating income
is zero and the natural logarithm of the variable is used in the analyses.
JUSSI NIKKINEN AND PETRI SAHLSTROM144

Business risk can be measured using the market beta when the other di-
mensions of risk, i.e. FLEV and OLEV, are included in the model as in our
case (see Kallunki, 1996). The beta is estimated using monthly stock and
FTSE 100 index returns over a 2-year period before the end of the fiscal year
applying the market model of Sharpe (1964).
On the basis of the earlier literature (see, e.g., Gul, 1999; O’Sullivan, 1999;
Gul & Tsui, 1997, 2001) the following control variables are used. FCF is a
measure of free cash flow and it is defined as free cash flow from operating
activities minus interest payments. The variable is deflated by the total assets
(see Lehn & Poulsen, 1989). The management ownership (MANA) is meas-
ured by the percentage of shares owned by insiders of the firm. Firm size
(SIZE) is measured by the natural logarithm of total assets and the com-
plexity of the auditing process (COMPLEX) is measured using the percent-
age of foreign sales to total sales. In addition to these variables, in the
robustness check QR, ROI and PBV are added in the model (see, e.g., Gul &
Tsui, 1997, 2001). QR is quick ratio, i.e. the ratio of current assets less
inventories to current liabilities. ROI is return on investments and PBV is
the market price to book value ratio. The beginning of year values are used
for the balance sheet items and market values in the variable construction.
Table 1 presents descriptive statistics of the sample used in the study with
and without outliers detected using the Weisberg (1985) test. At the 5%
significance level the test detects eight outliers.
METHODOLOGY
To investigate the importance of different dimensions of risk in audit pricing
the following regression equation is estimated:
FEEi;t ¼ a0 þX
99
k¼92
ak1Dyeark þ a2FLEVi;t þ a3OLEVi;t þ a4BRi;t
þ a5FCFi;t þ a6MANAi;t þ a7SIZEi;t þ a8COMPLEXi;t þ ei;t ð1Þ
where FEE is the logarithm of audit fee, Dyeark denotes a dummy variable
having a value of one at year k and otherwise zero, FLEV the financial
leverage, OLEV the operating leverage, BR the business risk, FCF the free
cash flow, MANA the percentage of shares own by insiders of the firm,
SIZE the logarithm of total assets, COMPLEX the percentage of foreign
sales to total sales, and i and t denote, respectively, firm and year.
Risk in Audit Pricing: The Role of Firm-Specific Dimensions of Risk 145

To avoid the dummy variable trap, no dummy variable is used for the
year 2000. The possibility of multicollinearity is detected using the variance
inflation factors (see, e.g., Judge, Hill, Griffiths, Lutkepohl, & Lee, 1988,
pp. 868–871). White’s test and the Breusch–Pagan test are performed. Based
on these tests, it is concluded that the error variances are heteroscedastic.
Consequently, the White (1980) heteroscedasticity consistent covariance
matrix is used.
Eq. (1) allows the intercepts to vary over years since according to Menon and
Williams (2001) audit fees have varied in the long run. However, the
F-test used to detect the equality of the coefficients of the dummy variables
indicates that they are not significantly different when this particular sample is
used (F ¼ 1:60; p ¼ 0:131). Therefore, Eq. (1) is re-estimated without the year
dummies as suggested, for example, by Baltagi (1995). These results are reported.
According to the theory outlined in the Section second, the audit fee
should be positively related to the dimensions of risk, i.e. the coefficients of
FLEV, OLEV, and BR should be positive. Based on the agency theory, the
coefficient of FCF should be positive and the coefficient of MANA negative.
Table 1. Descriptive Statistics.
Variable Raw Data Outliers Removed
Mean S. D. Mean S. D.
FEE 0.993 2.375 0.979 2.288
ASSETS 1.147 5.266 1.146 5.269
FLEV 0.568 0.759 0.568 0.759
OLEV 1.888 1.508 1.886 1.508
BR 0.704 0.808 0.704 0.808
FCF 0.034 0.968 0.033 0.968
MANA 0.250 0.203 0.249 0.203
COMPLEX 26.824 29.285 26.847 29.290
Number of observations 3,141 3,133
Notes:
Outliers are removed based on the Weisberg (1985) test.
FEE ¼ audit fee in millions.
ASSETS ¼ total assets in billions.
FLEV ¼ financial leverage.
OLEV ¼ operating leverage.
BR ¼ business risk, i.e. market beta.
FCF ¼ free cash flow divided by total assets.
MANA ¼ percentage of shares owned by insiders of the firm.
COMPLEX ¼ percentage of foreign sales to total sales.
JUSSI NIKKINEN AND PETRI SAHLSTROM146

In addition, the coefficients of control variables SIZE and COMPLEX are
expected to be positive.
The robustness of the results is examined in two ways. First, the Weisberg
(1985) test is used to identify the outliers in the data. After identification, the
outliers are removed and Eq. (1) is re-estimated. Second, three additional
control variables, which may also reflect risk, are included. These variables
are the QR measured as the ratio of current assets less inventories to current
liabilities, profit before interest and tax to total equity (ROI), and PBV.
Thus, the following regression model is estimated:
FEEi;t ¼ a1 þ a2FLEVi;t þ a3OLEVi;t þ a4BRi;t þ a5FCFi;t þ a6MANAi;t
þ a7SIZEi;t þ a8COMPLEXi;t þ a9QRi;t þ a10ROIi;t
þ a11PBVi;t þ e ð2Þ
The coefficients of QR and ROI should be negative and the coefficient of
PBV-positive.
RESULTS
Table 2 presents the results of explaining audit fees with the firm-specific
risk dimensions and control variables, i.e. the estimation results of Eq. (1).
The F-test for fixed effects ðp ¼ 0:13Þ indicates that intercepts are equal overtime and therefore the estimation is done without yearly dummies (see Bal-
tagi, 1995). The variance inflation factors (VIF) show that multicollinearity
does not cause problems (see, e.g., Judge, Hill, Griffiths, Lutkepohl, & Lee
1988, pp. 868–871). Consequently, FLEV, OLEV, and BR measure the in-
dividual components of risk.
The explanatory power of the model is rather high, 0.75. Regarding the
estimates of the risk measures, all coefficients have expected signs and they
are highly significant indicating that audit fees are positively related with
financial leverage, operating leverage and business risk of a firm. This result
implies that these risk measures capture different aspects of firm’s risk and
that these risk dimensions are taken into account in pricing of auditing
services. The coefficients of the control variables are also highly significant
having expected signs. This is in accordance with the previous literature
showing that the agency theory, firm size and complexity of auditing process
affect audit pricing.
To test the robustness of the results, the effect of possible outliers on the
results is investigated. Outliers are detected by using Weisberg’s (1985) test.
Risk in Audit Pricing: The Role of Firm-Specific Dimensions of Risk 147

The test detects eight outliers at the 5% level of significance. Moreover, the
effect of additional explanatory variables, suggested in the previous liter-
ature, on the results is investigated by adding QR, ROI and PBV as ex-
planatory variables in Eq. (2) (see, e.g., Simunic & Stein, 1987; Gul & Tsui,
1997, 2001). The estimation results after removing the possible outliers in-
dicate that the explanatory power is higher than with the outliers. However,
the coefficients are virtually unchanged. The results of the extended model
indicate that the additional explanatory variables are highly significant,
having the expected signs. Moreover, the results show that the coefficients of
risk dimensions are slightly lower in the extended model estimation. This
may be due to the fact that the additional variables measure, at least to some
extent, some risk characteristics of a firm and therefore, they affect the effect
of measures of FLEV, OLEV and BR of a firm even though the coefficients
remain highly significant. Generally, the results of the study support the
hypotheses Table 3.
Table 2. Different Components of Risk in Explaining Audit Fees.
Variable Measure Prediction Coefficient Prob. of t-stat.
Intercept ? �1.8986 0.000
FLEV Financial leverage + 0.1044 0.000
OLEV Operating leverage + 0.0321 0.000
BR Business risk + 0.0626 0.000
FCF Control variable + 0.3380 0.009
MANA Control variable � �0.3566 0.000
SIZE Control variable + 0.6067 0.000
COMPLEX Control variable + 0.0103 0.000
Number of observations 3,141
Adjusted R2 0.75
F-statistic 1,403.64
Prob. 0.000
Notes:
The White (1980) heteroscedasticity consistent covariance matrix is used.
Possibility of multicollinearity is detected using the variance inflation factors.
FEE ¼ audit fee in millions.
ASSETS ¼ total assets in billions.
FLEV ¼ financial leverage.
OLEV ¼ operating leverage.
BR ¼ business risk, i.e. market beta.
FCF ¼ free cash flow divided by total assets.
MANA ¼ percentage of shares owned by insiders of the firm.
COMPLEX ¼ percentage of foreign sales to total sales.
JUSSI NIKKINEN AND PETRI SAHLSTROM148

SUMMARY AND CONCLUSIONS
This chapter investigates the impact of the firm-specific dimensions of risk
on the audit fee determination. Since, according to the finance literature, the
risk of a firm consists of three dimensions, which are FLEV, OLEV and BR,
all these characteristics should be reflected in audit pricing. Thus, it is hy-
pothesized that audit fees are related to these three dimensions of risk, size,
Table 3. Robustness Check.
Variable Measure Prediction Outliers Removed Extended Model
Coeff. Prob. Coeff. Prob.
Intercept ? �1.8066 (0.000) �1.8486 (0.000)
FLEV Financial leverage + 0.1091 (0.000) 0.0727 (0.000)
OLEV Operating leverage + 0.0371 (0.000) 0.0301 (0.000)
BR Business risk + 0.0711 (0.000) 0.0515 (0.002)
FCF Control variable + 0.3274 (0.005) 0.3658 (0.015)
MANA Control variable � �0.3670 (0.000) �0.3469 (0.000)
SIZE Control variable + 0.5965 (0.000) 0.6063 (0.000)
COMPLEX Control variable + 0.0105 (0.000) 0.0105 (0.000)
QR Control variable � �0.0417 (0.000)
ROI Control variable � �0.1596 (0.019)
PBV Control variable + 0.0137 (0.000)
Number of observations 3133 3141
Adjusted R2 0.79 0.76
F-statistic 1,671.33 1,000.23
Prob. 0.000 0.000
Notes:
The White (1980) heteroscedasticity consistent covariance matrix is used.
Outliers are removed based on the Weisberg (1985) test.
FEE ¼ audit fee in millions.
ASSETS ¼ total assets in billions.
FLEV ¼ financial leverage.
OLEV ¼ operating leverage.
BR ¼ business risk, i.e. market beta.
FCF ¼ free cash flow divided by total assets.
MANA ¼ percentage of shares owned by insiders of the firm.
COMPLEX ¼ percentage of foreign sales to total sales.
QR ¼ quick ratio, i.e. ratio of current assets less inventories to current liabilities.
ROI ¼ return on investments, i.e. profit before interest and tax to total invested capital.
PBV ¼ market price to book value ratio.
Risk in Audit Pricing: The Role of Firm-Specific Dimensions of Risk 149

audit complexity and a set of the agency theory based control variables. To
empirically investigate these issues, the determination of audit fees is inves-
tigated using a large sample from the U.K. audit market. The results of the
study show that audit fees are positively related to FLEV, OLEV and BR of
a firm as hypothesized. Moreover, it is found that agency theory, firm size
and the complexity of auditing process explain audit fees. The result implies
that these risk dimensions capture different aspects of a firm’s risk and are
therefore taken into account in audit pricing.
NOTES
1. For example, Simunic and Stein (1987) report that the single most significantexplanatory variable was financial leverage.2. The existing audit pricing literature such as Simunic (1980), Palmrose (1986),
Francis and Simon (1987), Pong and Whittington (1994), Simon (1995), Collier andGregory (1996), Adams, Sherris, and Hossain (1997), Gul (1999), O’Sullivan (1999),Gul and Tsui (2001) and Menon and Williams (2001) has focused on an importantarea, namely the determination of audit fees, i.e. audit pricing.
ACKNOWLEDGMENTS
The authors gratefully acknowledge financial support from the Emil Aal-
tonen Foundation and the Ostrobothnia Chamber of Commerce foundation.
REFERENCES
Adams, M., Sherris, M., & Hossain, M. (1997). The determinants of external audit costs in the
New Zealand life insurance industry. Journal of International Management and Ac-
counting, 8, 69–86.
Agrawal, A., & Jayaraman, N. (1994). The dividend policies of all-equity firms: A direct test of
the free cash flow theory. Managerial and Decision Economics, 15, 139–148.
Baltagi, B. (1995). Econometric analysis of panel data. New York: Wiley.
Bamber, E. M., Bamber, L. S., & Schoderbek, M. P. (1993). Audit structure and other de-
terminants of audit report lag: An empirical analysis. Auditing: A Journal of Practice &
Theory, 12, 1–23.
Cobbin, P. E. (2002). International dimensions of the audit fee determinants literature. Inter-
national Journal of Auditing, 6, 53–77.
Collier, P., & Gregory, A. (1996). Audit committee effectiveness and the audit fee. European
Accounting Review, 5, 177–198.
JUSSI NIKKINEN AND PETRI SAHLSTROM150

Francis, J. R., & Simon, D. T. (1987). A test of audit pricing in the small-client segment of the
U.S. audit market. Accounting Review, 62, 145–157.
Gahlon, J. M., & Gentry, J. A. (1982). On the relationship between systematic risk and the
degrees of operating and financial leverage. Financial Management, 11, 15–23.
Gul, F. A. (1999). Audit prices, product differentiation and economic equilibrium. Auditing:
A Journal of Practice & Theory, 18, 90–100.
Gul, F. A., & Tsui, J. S. L. (1997). A test of the free cash flow and debt monitoring hyp-
otheses: Evidence from auditing pricing. Journal of Accounting and Economics, 24,
219–237.
Gul, F. A., & Tsui, J. S. L. (2001). Free cash flow, debt monitoring, and audit pricing: Further
evidence on the role of director equity ownership. Auditing: A Journal of Practice &
Theory, 20, 72–84.
Hamada, R. S. (1972). The effect of the firm’s capital structure on the market efficiency. Journal
of Finance, 27, 435–458.
Jensen, M. C., & Meckling, W. (1976). A theory of the firm: Managerial behavior, agency costs
and ownership structure. Journal of Financial Economics, 3, 305–360.
Jensen, M. C. (1986). Agency costs of free cash flow, corporate finance and takeovers. American
Economic Review, 76, 323–329.
Jensen, M. C. (1989). Eclipse of the public corporation. Harvard Business Review, 5, 61–74.
Judge, G., Hill, R. C., Griffiths, W. E., Lutkepohl, H., & Lee, T. C. (1988). Introduction to the
theory and practice of econometrics. New York: Wiley.
Kallunki, J. P. (1996). Stock returns and earnings announcements in Finland. European Ac-
counting Review, 5, 199–216.
Lehn, K., & Poulsen, A. (1989). Free cash flow and stockholder gains in going private trans-
actions. Journal of Finance, 44, 771–787.
Lev, B. (1974). On the association between operating leverage and risk. Journal of Financial and
Quantitative Analysis, 9, 627–641.
Menon, K., & Williams, D. D. (2001). Long-term trends in audit fees. Auditing: A Journal of
Practice & Theory, 20, 116–136.
O’Sullivan, N. (1999). Board characteristics and audit pricing post-Cadbury: A research note.
European Accounting Review, 8, 253–263.
Palmrose, Z. (1986). Audit fees and auditor size: Further evidence. Journal of Accounting
Research, 24, 97–110.
Pong, G. M., & Whittington, G. (1994). The determinants of audit fees: Some empirical models.
Journal of Business Finance and Accounting, 21, 1071–1095.
Sharpe, W. F. (1964). Capital asset prices: A theory of market equilibrium under conditions of
risk. Journal of Finance, 19, 425–442.
Simon, D. T. (1995). The market for audit services in South Africa. International Journal of
Accounting Education and Research, 30, 356–365.
Simunic, D. A. (1980). The pricing of audit services: Theory and evidence. Journal of Accounting
Research, 18, 161–190.
Simunic, D. A., & Stein, M. T. (1987). The impact of litigation risk on audit pricing: A review of
the economics and the evidence. Auditing: A Journal of Practice & Theory, 15, 120–134.
Weisberg, S. (1985). Applied linear regression. New York: Wiley.
White, H. (1980). A heteroscedasticity-consistent covariance matrix estimator and a direct test
for heteroscedasticity. Econometrica, 48, 817–838.
Risk in Audit Pricing: The Role of Firm-Specific Dimensions of Risk 151

This page intentionally left blank
152

IAS VERSUS U.S. GAAP: ASSESSING
THE QUALITY OF FINANCIAL
REPORTING IN SOUTH AFRICA,
THE UNITED KINGDOM, AND THE
UNITED STATES
Jenice Prather-Kinsey and Sandra Waller Shelton
ABSTRACT
In this study, we investigate whether financial reporting, using Interna-
tional Accounting Standards (IAS) results in quality disclosures, given
differences in institutional and market forces across legal jurisdictions.
This study contributes to the global accounting debate by utilizing U.S.-
based companies complying with U.S. Generally Accepted Accounting
Principles (U.S. GAAP) as a benchmark for measuring the quality of
IAS as applied by South Africa (S.A.) and United Kingdom (U.K.)
companies. Although South Africa, United Kingdom, and the United
States are common law countries with strong investor protection, South
Africa’s institutional factors and market forces vary from that of the U.K.
and the U.S. South Africa’s financial market is less developed than that of
the U.K. and the U.S. We compare the discretionary accruals of firms
complying with U.S. GAAP to the discretionary accruals of U.K.
and S.A. firms complying with IAS. This allows a comparison between
Advances in International Accounting
Advances in International Accounting, Volume 18, 153–168
Copyright r 2005 by Elsevier Ltd.
All rights of reproduction in any form reserved
ISSN: 0897-3660/doi:10.1016/S0897-3660(05)18008-8
153

companies (S.A. and U.K.) operating under different institutional factors
and market forces that have adopted IAS versus U.S. companies that
report under U.S. GAAP. Our sample, consisting of U.S., S.A., and U.K.
listed firms, contains 3,166 firm-year observations relating to the period
1999–2001. The results of our study indicate that S.A firms utilizing IAS
report absolute values of discretionary accruals that are significantly
greater than absolute values of discretionary accruals of U.S. firms uti-
lizing U.S. GAAP. In contrast, U.K. firms utilizing IAS report discre-
tionary accruals that are significantly less than the discretionary accruals
of companies in the United States reporting under U.S. GAAP. This study
contributes to the literature by providing evidence of the quality of fi-
nancial information prepared under IAS and its dependency on the in-
stitutional factors and market forces of a country.
INTRODUCTION
The purpose of this study is to examine whether financial reporting, using
International Accounting Standards (IAS) results in quality disclosures,
given differences in institutional factors and market forces.1 This study ex-
amines the quality of financial statements prepared in accordance with IAS
by concentrating on discretionary accruals as a measure of earnings man-
agement. In this study, earnings management is viewed as having an inverse
relationship to earnings quality (i.e. high earnings quality is synonymous
with low earnings management).
Recent interest in global accounting standards has resulted in consider-
able debate as to whether IAS results in high-quality financial reporting.
U.S. Generally Accepted Accounting Principles (U.S. GAAP) is frequently
viewed as the benchmark for high-quality global standards (Levitt, 1998;
McGregor, 1999). Moreover, the Financial Accounting Standards Board
(FASB) has published a comparison on the differences in U.S. GAAP and
IAS and finds significant differences between them. Prior studies examining
the quality of financial information prepared using IAS compared to U.S.
GAAP have presented mixed results (Leuz, 2003; Harris & Muller, 1999;
Ashbaugh & Olsson, 2002).
Ball, Robin, and Wu (2003) suggest that the global accounting debate
focuses too much on the choice of accounting standards and too little on
market forces and institutional factors. This study contributes to the global
accounting debate by utilizing U.S.-based companies complying with U.S.
JENICE PRATHER-KINSEY AND SANDRA WALLER SHELTON154

GAAP as a benchmark for measuring the quality of IAS as applied by
South Africa (S.A.) and United Kingdom (U.K.) companies. Although
South Africa, the United Kingdom, and the United States are common law
countries with strong investor protection, South Africa’s institutional fac-
tors and market forces vary from that of the U.K. and the U.S. For ex-
ample, South Africa’s financial market is less developed than that of the
U.K. and the U.S. Appiah-Kusi and Menyah (2003) find that investors are
less informed as a result of inadequate disclosures and the existence of
insider trading in the South African market. Furthermore, the inefficiency of
the South African market is reflected in the fact that stock market prices do
not adjust rapidly to the arrival of new information, hence, future prices can
be predicted from lagged prices. There is also less credible firm-specific
information available to individuals for the pricing of individual stocks.
Given these differences in institutional and market forces for South Af-
rica, versus the U.K. and the U.S., management’s incentives to engage in
earnings management may outweigh the costs. Ball, Kothari and Robin
(2000) argue that when the costs of complying with IAS are viewed as
exceeding the costs of non-compliance, substantial non-compliance will oc-
cur. In our study, earnings management (quality) is determined by exam-
ining discretionary accruals for U.S., S.A., and U.K.-based firms. We
compare the discretionary accruals of firms complying with U.S. GAAP to
the discretionary accruals of U.K. and S.A. firms complying with IAS. This
allows a comparison between companies operating under different institu-
tional factors and market forces that have adopted IAS versus companies
that report under U.S. GAAP.
The results of our study indicate that S.A. firms utilizing IAS report ab-
solute values of discretionary accruals are significantly greater than absolute
values of discretionary accruals of U.S. firms utilizing U.S. GAAP. In con-
trast, U.K. firms utilizing IAS report discretionary accruals that are signif-
icantly less than the discretionary accruals of companies in the United States
reporting under U.S. GAAP. This study contributes to the literature by pro-
viding evidence of the quality of financial information prepared under IAS
and its dependency on the institutional factors and market forces of a country.
LITERATURE AND HYPOTHESES
Prior market-based comparison studies examining the quality of financial
information prepared under IAS with financial information prepared under
U.S. GAAP have presented mixed results. Harris and Muller (1999) find
IAS Versus U.S. GAAP 155

that U.S. GAAP earnings reconciliation adjustment is value-relevant and
that U.S. GAAP amounts are valued differently for market value and return
models than IAS amounts. Similarly, Ashbaugh and Olsson (2002) in an
examination of non-U.S./non-U.K. firms find that the earnings capitaliza-
tion model is the dominant accounting-based valuation model when cross-
listed firms report under IAS. However, the residual income model is the
dominant accounting-based valuation model for cross-listed firms reporting
under U.S. GAAP. Leuz (2003) examined firms in Germany’s ‘‘New Mar-
ket’’ for growth firms, which are required to choose between IAS and U.S.
GAAP in preparing their financial statements. Leuz findings do not indicate
that U.S. GAAP is of higher quality than IAS. Differences in the bid-ask
spread and share turnover across IAS and U.S. GAAP firms are statistically
insignificant. Similarly, Leuz and Verrecchia (2000) find in a cross-sectional
analysis that firms which commit to either IAS or U.S. GAAP exhibit lower
percentage bid-ask spreads and higher share turnover than firms following
German GAAP.
Few studies have examined earnings management practices in non-U.S.
countries. Darrough, Pourjalali, and Saudagaran (1998) examined the
choices of accounting accruals using a large sample of Japanese companies.
The results of the study indicate that similar to managers of U.S. firms,
managers of Japanese companies chose income-increasing accounting ac-
cruals to increase their bonuses and to increase the amount of outside
funding. Management’s incentive to manage earnings may significantly af-
fect the quality of earnings in cross-listed firms reporting financial infor-
mation under IAS. Management has incentives to adjust accounting
earnings to maximize firm and/or manager wealth. The more the discretion
given to management in financial reports, the greater the opportunity for
more manipulated and thus less-quality reported financial disclosures.
Francis, Khurana, and Pereira (2003) in an examination of 31 countries
found that financial disclosures are more transparent and national account-
ing standards require timelier (accrual-based) reporting in countries with
stronger investor protection (common law countries). The authors address
the debate regarding international accounting standards by suggesting that
in the absence of a change in market forces and institutional factors, simply
transplanting accounting rules from one country to another is futile. Sim-
ilarly, Ball et al. (2003) debate that the global accounting debate focuses too
much on the choice of accounting standards and too little on market forces
and institutional factors. Although, Francis et al. (2003) found that com-
mon law countries have higher-quality accounting and auditing standards
and the enforcement of such standards through higher-quality auditing is
JENICE PRATHER-KINSEY AND SANDRA WALLER SHELTON156

more likely to exist than in civil law countries, differences existed in values
for variables within common law countries. Although, S.A., the U.K., and
the U.S. are common law countries with the strongest legal protection of
investors (compared to civil law countries), the development of the financial
market in South Africa is much less than that of the financial markets in the
U.K. and the U.S. Furthermore, Appiah-Kusi and Menyah (2003) in an
examination of return predictability in African markets conclude that the
South African market is inefficient; stock prices do not adjust rapidly to the
arrival of new information, hence, future prices can be predicted from
lagged prices.
Given the differences in institutional and market forces for South Africa,
versus the U.K. and the U.S., management’s incentives to engage in earn-
ings management in South Africa may outweigh the costs. Ball et al. (2000)
argue that when the costs of complying with IAS are viewed as exceeding the
costs of non-compliance, substantial non-compliance will occur. In this
study, earnings management (quality) is determined by examining discre-
tionary accruals for the U.S., S.A., and U.K.-based firms. We compare the
discretionary accruals of S.A. firms (IAS) and U.K. firms (IAS) with dis-
cretionary accruals of U.S. firms (U.S. GAAP). Based on these arguments
and results, we hypothesize as follows:
H1. S.A.-based firms report relatively higher discretionary accruals com-
pared to U.S. firms.
H2. U.K.-based firms report discretionary accruals that are not signif-
icantly different from that of U.S. firms.
This study examines the quality of financial statements under IAS by
comparing management’s use of discretionary accruals under IAS with
management’s use of discretionary accruals under U.S. GAAP, given dif-
ferences in institutional and market forces.
FINANCIAL REPORTING IN S.A. AND THE U.K.
We select S.A. and the U.K. to study because the former is an emerging
stock exchange that permits application of IAS to list, and the latter is a
developed stock exchange that permits application of IAS of its foreign
registrants to list. Some argue that application of GAAP may vary between
countries because of the varying business environments and literal trans-
lation of standards. For example, the types of business transactions of a
IAS Versus U.S. GAAP 157

developed country may be less susceptible to management’s discretionary
reporting than in a less-developed country (see Choi, Frost, & Meek, 2003).
The U.K. is an industrialized country where management is faced with
determining significant amounts of intangibles/amortization and deprecia-
tion of tangible assets. In S.A., a less-developed country, management may
be more concerned with managing its human capital as it represents the
greatest percentage of production/mining cost, which is not measured in the
financial reports. Hence, when discussing the quality of IAS, it seems rel-
evant to measure its quality across two levels of economic development.
Below we discuss the regulatory bodies and financial reporting requirements
in S.A. and the U.K.
The Johannesburg Stock Exchange (JSE), located in Johannesburg, S.A.,
became privately owned after the end of apartheid in 1995. The JSE is an
emerging stock exchange, the third largest emerging market. The Council of
the South Africa Institute of Chartered Accountants (SAICA) and the
Accounting Practices Board promulgate S.A. Accounting Standards. The
SAICA adopts IAS with occasional minor modifications, and listed com-
panies may follow S.A. GAAP or IAS. S.A. GAAP is almost identical to
IAS except that S.A. eliminates some of the alternative treatments permitted
by IAS. Hence, compliance with S.A. GAAP is compliance with IAS, but
compliance with IAS may not be in compliance with S.A. GAAP. The JSE
requires all listed firms to provide annual financial statements that are in
English, and audited by an independent accountant (McDonald & Prather-
Kinsey, 2002).
In contrast, the London Stock Exchange (LSE) is a developed stock
market. The Accounting Standards Board (ASB) promulgates U.K. ac-
counting standards. Like S.A. and the U.S., the ASB is an independent not-
for-profit regulatory body. The ASB statements of Standard Accounting
Practice and Financial Reporting Standards are very similar to IAS. In fact,
the LSE now allows foreign registrants to present their financial statements
in accordance with IAS (Larson & Kenny, 1994). Listed companies must
provide audited annual and half-year interim reports (Choi et al., 2002).
JSE, LSE, and U.S. stock exchanges are similar in that accounting stand-
ards are promulgated by the accountancy profession, and the accounting
regulatory structure is of British origin. Both the LSE and JSE may have
markets that respond less to financial disclosures than the U.S. (see Frost &
Pownall, 1994; Appiah-Kusi & Menyah, 2003). U.S. managers may manage
their discretionary accruals more than the U.K. and S.A. firms because of
the U.S. market’s sensitivity to disclosures. Hence, we use the U.S. as a
benchmark for measuring the quality of IAS reporting in S.A. and the U.K.
JENICE PRATHER-KINSEY AND SANDRA WALLER SHELTON158

RESEARCH METHODOLOGY
Research Design
Prior studies have documented discretionary accruals as a measure of earn-
ings management (Healy, 1985; DeAngelo, 1986; Jones, 1991; DeFond &
Jiambalvo, 1991; Dechow, Sloan, & Sweeney, 1995; Becker, DeFond,
Jiambalvo, & Subramanyam, 1998). Becker et al. (1998) examined the effect
of audit quality on earnings management by utilizing discretionary accruals
as a measure of earnings quality. This study measures earnings quality by
examining discretionary accruals for U.S. firms, S.A. firms, and U.K.-based
firms. We compare the discretionary accruals of firms complying with U.S.
GAAP and IAS. Discretionary accruals are estimated using a cross-sectional
version of a model developed in Jones (1991). Specifically, discretionary
accruals are estimated from the following model:
TAijt=Aijt�1 ¼ ajt½1=Aijt�1� þ b1jt½DREVijt=Aijt�1� þ b2jt½PPEijt=Aijt�1� þ eijt
(1)
where TAijt ¼ total accruals for sample firm i in industry j for year t;
Aijt�1 ¼ total assets for sample firm i in industry j for year t� 1;
DREVijt ¼ change in net revenues for sample firm i in industry j for year t;
PPEijt ¼ gross property plant and equipment for sample firm i in industry j
for year t;
eijt ¼ error term for sample firm i in industry j for year t.
Total accruals are measured using COMPUSTAT data and defined as
income before extraordinary items minus operating cash flows. Standard
Industrial Classification (SIC) codes are used to assess company industry.
As in Becker et al. (1998), Subramanyam (1996), and DeFond and Park
(1997), discretionary accruals are defined as the error term from the regres-
sion above.
Sample Selection
We selected firms for this study and obtained descriptive statistics based on
data for the years 1999, 2000, and 2001. The sample consists of 1,583 U.S.
firms complying with U.S. GAAP, 154 S.A. firms complying with IAS and
IAS Versus U.S. GAAP 159

1,429 U.K. firms complying with IAS for the years 1999, 2000, and 2001.
The S.A. and U.K. firms listed on the JSE and LSE, respectively, were
selected from Global Vantage. The U.S. firms were selected, without re-
placement, based on those with the closest sales and in the same industry
classification as the S.A. and U.K. sample. The 1,583 U.S.-based firms were
selected from COMPUSTAT.
Total accruals, measured using COMPUSTAT and Global Vantage data,
are defined as income before extraordinary items minus operating cash
flows. SIC codes are used to assess company industry. As in Becker et al.
(1998), Subramanyam (1996), and DeFond and Park (1997), discretionary
accruals are defined as the error term from the regression model (see re-
gression model (1)). The control variables include size (total assets), market
capitalization, country of domicile, size of the home equity market, and the
number of exchanges on which a company lists. We exclude multinationality
and leverage as control variables because prior research (Street & Nichols,
2002) has not found these variables useful in explaining the extent of ac-
counting disclosures.
Prior studies have found that compliance with IAS standards and type of
auditor influence the level of IAS compliance. This study controls for these
factors by including only companies whose financial reports are prepared
in compliance with IAS standards and are audited by Big 5 firms. Street,
Nichols, and Gray (2000) found that size of home equity market and
country of domicile may also affect the degree of compliance with IAS. We
control for size of home equity market and country of domicile by testing
each market, S.A., U.K., and U.S. separately.
Descriptive Statistics
Table 1 presents financial variables describing S.A. IAS, United Kingdom
IAS, and U.S. firms’ U.S. GAAP, respectively. Panels A, B, and C present
variables for S.A., U.K., and U.S. firms, respectively, with the results of
parametric and non-parametric tests comparing S.A. firms to U.S. firms,
U.K. firms, to U.S. firms, and both S.A. and U.K. firms to U.S. firms.
Specifically, assets, earnings, operating cash flows, and absolute value of
total accruals are not significantly different for S.A. firms and U.S. firms in
the sample. However, mean total accruals are significantly different between
S.A. and U.S. firms ðp ¼ 0:02Þ: Similarly, mean total accruals are signifi-
cantly different between U.K. firms and U.S. firms in the sample
ðp ¼ 0:000Þ: Furthermore assets, earnings, and operating cash flows are
JENICE PRATHER-KINSEY AND SANDRA WALLER SHELTON160

Table 1. Descriptive Statistics for 1999, 2000, 2001 – All Firm Years ðn ¼ 3;166Þ.
Variable Name Mean Median Standard
Deviation
t-Statistic
(p-value)
Z-Statistic
(p-value)
Panel A: South African Stock Exchange ðn ¼ 154Þ
Natural log of assets 6.234 6.226 1.242 0.507 0.952
Income before extraordinary items/total assets 0.136 0.084 0.273 0.100 0.219
Operating cash flows/total assets 0.134 0.115 0.145 0.265 0.113
Total liabilities/total assets 0.580 0.539 0.310 0.671 0.712
Total accruals/total assets �0.002 �0.040 0.274 0.020 0.019
Absolute value of total accruals/total assets 0.116 0.065 0.249 0.189 0.585
Panel B: London Stock Exchange ðn ¼ 1;429Þ
Natural log of assets 5.688 5.456 1.753 0.000 0.000
Income before extraordinary items/total assets 0.091 0.071 0.128 0.020 0.809
Operating cash flows/total assets 0.152 0.135 0.123 0.053 0.000
Total liabilities/total assets 0.632 0.585 0.349 0.093 0.000
Total accruals/total assets �0.062 �0.069 0.165 0.000 0.000
Absolute value of total accruals/total assets 0.096 0.077 0.147 0.357 0.000
Panel C: New York Stock Exchange ðn ¼ 1;583Þ
Natural log of assets 5.985 5.796 1.618 0.000 0.000
Income before extraordinary items/total assets 0.105 0.067 0.211 0.115 0.523
Operating cash flows/total assets 0.139 0.117 0.247 0.095 0.000
Total liabilities/total assets 0.605 0.546 0.440 0.131 0.000
Total accruals/total assets �0.033 �0.050 0.242 0.004 0.000
Absolute value of total accruals/total assets 0.101 0.065 0.223 0.626 0.000
Note: Tests are two-tailed. t-Statistics are from t-tests of the differences in the means and Wilcoxon Z-statistics are fromWilcoxon two-sample
tests.
IASVersu
sU.S.GAAP
161

significantly different between U.K. firms and U.S. firms. The median for
log of assets for U.S. firms is $5.8 million compared to $5.4 million for U.K.
firms and median cash flows are 11.7% of total assets for U.S. firms com-
pared to 13.5% of total assets for U.K. firms. In conclusion, Table 1 reports
differences between U.S. firms’ U.S. GAAP and South African firms’ and
United Kingdom firms’ IAS with respect to size and total accruals across the
three samples. Additionally, non-parametric tests indicate differences in
cash flows and absolute value of discretionary accruals. Therefore, in ad-
dition to a univariate test of our hypothesis, we also perform a multivariate
test that includes control variables of log of assets, operating cash flows, and
total accruals.
RESULTS
Univariate Results
Table 2 presents the univariate analysis of discretionary accruals. Mean and
median discretionary accruals and the absolute value of discretionary ac-
cruals are presented for the S.A., U.K., and U.S. firms in panels A, B, and
C, respectively. Panel D presents the differences from subtracting the means
for matched pair samples for S.A. and U.S. firms, U.K. and U.S. firms, and
U.K. and S.A. firms (combined) versus U.S. firms, along with the results of
t-tests of the differences between the groups. Panel A indicates that U.S.,
firms report mean (median) discretionary accruals of 0.2% (�0.9%) of total
assets. The t-tests indicate that the mean discretionary accrual is signifi-
cantly different from zero for U.S. firms in the sample. As indicated in panel
B, S.A. firms have mean (median) discretionary accruals of 2% (�2%) of
total assets. The mean central tendency measure is significantly different
from zero. Sections A–C indicate that the mean values of discretionary
accruals are largest among S.A. firms. As indicated in panel C, U.K. firms
have mean (median) discretionary accruals of –2.0% (�2.2%) of total as-
sets. The t-tests indicate that the mean central tendency is significantly neg-
ative. Panel D indicates that the difference in absolute value of discretionary
accruals for South African versus U.S. firms is statistically significant
ðp ¼ 0:031Þ: The absolute value of discretionary accruals is one way of
measuring management’s discretion in accounting choices that result in both
increases in income, as well as, decreases in income. Panels A–C indicate that
the mean values of absolute value of discretionary accruals are largest among
South African firms. This finding is consistent with managers of South
JENICE PRATHER-KINSEY AND SANDRA WALLER SHELTON162

African firms having greater flexibility in the choice of discretionary accru-
als. In contrast, panel D indicates that U.K. firms report discretionary ac-
cruals that are on average 2.2% of assets lower than the discretionary
accruals reported by U.S. firms. This difference is statistically significant
ðp ¼ 0:004Þ:
MULTIVARIATE RESULTS
A limitation of the univariate analysis is that it ignores a number of variables
that potentially confound the results. Accordingly, we conduct a multivariate
analysis that controls for differences across the sample groups that may
confound simple univariate comparisons. The descriptive data in Table 1
indicates differences in the size of firms across the three groups (U.S., U.K.,
Table 2. Discretionary Accruals for Sample Firms from South Africa,
United Kingdom, and United States during 1999, 2000, 2001.
Panel A: Observations from Firms on New York Stock Exchange ðn ¼ 1;583Þ
Mean Median p-value
Discretionary accruals 0.002 �0.009 0.000
Absolute value of discretionary accruals 0.088 0.048 0.000
Panel B: Observations from Firms on South African Stock Exchange ðn ¼ 154Þ
Mean Median p-value
Discretionary accruals 0.019 �0.017 0.024
Absolute value of discretionary accruals 0.108 0.055 0.000
Panel C: Observations from Firms on London Stock Exchange ðn ¼ 1;429Þ
Mean Median p-value
Discretionary accruals �0.020 �0.022 0.000
Absolute value of discretionary accruals 0.078 0.054 0.000
Panel D: Differences Across Samples (B�A) (C�A) (B+C)�A
Mean Mean Mean
(p-value) (p-value) (p-value)
Discretionary accruals 0.0269 �0.022 �0.015
0.248 0.004 0.045
Absolute value of discretionary accruals 0.0454 �0.009 �0.006
0.031 0.189 0.343
Note: In Panel A–C, p-values for means are from t-tests to measure central tendencies from
zero. Panel D represents the differences from subtracting the means for matched pair samples
for South African and U.S. firms, U.K. and U.S firms, U.K. and S.A. firms versus U.S. firms. In
Panel D, p-values for means are from t-tests.
IAS Versus U.S. GAAP 163

and S.A.). Therefore, we include log of assets to control for the potential
effects of size on the choice of discretionary accruals. Table 1 also indicates
differences in operating cash flows across the countries. Accordingly, oper-
ating cash flows are included in the multivariate regression. Table 1 indicates
differences in the total accruals across countries. Therefore, since total ac-
cruals differ across countries, and to control for the possibility that firms with
larger total accruals also have larger discretionary accruals, we include total
accruals as control variables in our multivariate analysis.
In the multivariate analysis, discretionary accruals are estimated as de-
scribed in Model 1 of the research design section. In the multivariate anal-
ysis, discretionary accruals are regressed on a dummy variable indicating
country type (U.S., U.K., or S.A.) and the control variables noted above.
The multivariate analysis is performed by estimating the coefficients in the
following regression model:
DAit ¼ b0 þ b1OCFit þ b2Assetsit þ b3ToAccrit þ b4NumExchsit
þb5SACtyIncit þ b6LCtyIncit þ b7ShareIncrit þ b8ShareDecrit þ eit ð2Þ
where DAit ¼ estimated discretionary accrual from regression model 1;
OCF ¼ operating cash flows;
Assets ¼ natural log of total assets;
ToAccr ¼ total accruals;
NumExchs ¼ number of stock exchanges on which a company lists;
SACtyInc ¼ country of location of listing equals 1 if it is S.A., 0 otherwise;
LCtyInc ¼ country of location of listing equals 1 if it is London, 0
otherwise;
ShareIncr ¼ dummy variable equal to 1 when there is a increase of o10%
of shares outstanding during the a year, 0 otherwise;
ShareDecr ¼ dummy variable equal to 1 when there is a decline of410% of
shares outstanding during the a year, 0 otherwise.
Table 3 presents the results of a multivariate analysis with the control
variables discussed earlier in this section. In Table 3, the coefficient on the
South African location dummy variable indicates that South African firms
report discretionary accruals that are higher than the U.S. and U.K. firms
by an average of 3.0% of assets. In Table 2, mean absolute value of dis-
cretionary accruals for South African firms exceeded those of U.S. firms by
4.5%. In Table 3, the coefficient on the United Kingdom location dummy
variable indicates that United Kingdom firms report discretionary accruals
that are lower than U.S. and South African firms by an average of 1.6% of
JENICE PRATHER-KINSEY AND SANDRA WALLER SHELTON164

total assets. This is consistent with Table 2 that indicates that mean dis-
cretionary accruals for U.K. firms are 2.2% less than those of U.S. firms.
Thus, the results of the multivariate analysis are consistent with those of the
univariate analysis.
The control variables, operating cash flow, total assets, and total accruals
in Table 3 are significantly associated with discretionary accruals. Discre-
tionary accruals are positively associated with operating cash flows and total
accruals. Discretionary accruals are negatively associated with total assets
(log of assets). Furthermore, discretionary accruals of firms that list on more
than one stock exchange are not significantly different than the discretion-
ary accruals of firms that only list on one stock exchange. The discretionary
accruals for firms with more than a 10% increase in the number of out-
standing shares during the year were 3.8% higher than the discretionary
accruals for firms with no increase in the number of shares outstanding.
SUMMARY AND CONCLUSIONS
This study is motivated by the global accounting debate about IAS and U.S.
GAAP. The debate focuses primarily on the quality of financial reporting
using IAS versus U.S. GAAP. There is little empirical evidence regarding
the affect of market forces and institutional factors on the quality of finan-
cial reporting. This study contributes to the global accounting debate by
utilizing U.S.-based companies complying with U.S. GAAP as a benchmark
for measuring the quality of IAS as applied by S.A. (South Africa) and U.K.
(United Kingdom) companies. Although, S.A., U.K., and U.S. are common
law countries with the strongest of legal protection for investors (compared
Table 3. OLS Regression of Discretionary Accruals on U.S., U.K., and
S.A. Firms and Control Variables.
Variable Pooled Estimate t-Statistic p-Value
Intercept 0.177 12.33 0.000
OCF 0.120 7.42 0.000
Assets �0.018 �8.31 0.000
ToAccr 0.000 7.51 0.000
NumExchs �0.007 �1.70 0.089
SACtyInc 0.031 1.28 0.040
LCtyInc �0.016 �2.54 0.011
ShareIncr 0.038 3.97 0.000
ShareDecr 0.013 0.72 0.471
IAS Versus U.S. GAAP 165

to civil law countries), the development of the financial market in South
Africa is much less than that of the financial markets in the U.K. and the
U.S. Earnings quality is determined by examining discretionary accruals for
the U.S. firms, S.A. firms, and U.K.-based firms. We compare the discre-
tionary accruals of firms complying with U.S. GAAP with the discretionary
accruals of firms complying with IAS, given differences in institutional fac-
tors and market forces.
The results of our study indicate that S.A. firms utilizing IAS report
absolute values of discretionary accruals that are significantly greater than
the absolute values of discretionary accruals of U.S. firms utilizing U.S.
GAAP. Given the institutional factors and market forces, evidenced by an
emerging market with market inefficiency and inadequate disclosure (Ap-
piah-Kusi & Menyah, 2003) in South Africa, management’s incentives to
engage in earnings management may outweigh the costs. In contrast, U.K.
firms utilizing IAS report discretionary accruals that are significantly less
than the discretionary accruals of companies in the United States reporting
under U.S. GAAP. These results imply that managers in the U.K. are more
conservative in reporting earnings than in the U.S. That is, the quality of
IAS is dependent on the institutional factors and market forces of a country.
In this study, we investigate whether the quality of financial statements
prepared in accordance with IAS are consistent with the quality of financial
statements prepared in accordance with U.S. GAAP. This study contributes
to the literature by providing evidence of the quality of financial information
prepared under IAS, and its dependency on the institutional factors and
market forces of a country.
NOTE
1. We realize that International Accounting Standards (IAS) are now referred toas International Financial Reporting Standards (IFRS). However, when we beganthis study the International Accounting Standards Board’s (IASB’s) pronounce-ments were referred to as IAS and when the core project standards, which are used inthis study, were completed, they were referred to as IAS.
REFERENCES
Appiah-Kusi, J., & Menyah, K. (2003). Return predictability in African stock markets. Review
of Financial Economics, 12, 247–270.
JENICE PRATHER-KINSEY AND SANDRA WALLER SHELTON166

Ashbaugh, H., & Olsson, P. (2002). An exploratory study of the valuation properties of cross-
listed firms’ IAS and U.S. GAAP earnings and book values. The Accounting Review,
77(January), 107–126.
Ball, R., Kothari, S., & Robin, A. (2000). The effect of international institutional factors on
properties of Accounting Earnings. Journal of Accounting and Economics, 29(February),
1–51.
Ball, R., Robin, A., & Wu, J. (2003). Incentives versus Standards: Properties of accounting
income in four Asian countries and implications for acceptance of IAS. Journal of
Accounting and Economics, 36, 235–270.
Becker, C., DeFond, M. L., Jiambalvo, J., & Subramanyam, K. R. (1998). The effect of audit
quality on earnings management. Contemporary Accounting Research, 15(1), 1–24.
Choi, F. D. S., Frost, C. A., & Meek, G. K. (2002). International Accounting (4th ed.). Upper
Saddle River, NJ: Prentice-Hall.
Darrough, M. N., Pourjalali, H., & Saudagaran, S. (1998). Earnings management in Japanese
companies. The International Journal of Accounting, 33(3), 313–334.
DeAngelo, L. (1986). Accounting numbers as market valuation substitutes: A study of man-
agement buyouts of public stockholders. Accounting Review, 61(July), 400–420.
Dechow, P., Sloan, R., & Sweeney, A. (1995). Detecting earnings management. Accounting
Review, 70(April), 193–225.
DeFond, M. L., & Jiambalvo, J. (1991). Incidence and circumstances of accounting errors.
Accounting Review, 66, 643–655.
DeFond, M. L., & Park, C. W. (1997). Smoothing income in anticipation of future earnings.
Journal of Accounting and Economics, 23, 115–140.
Francis, J., Khurana, I. K., & Pereira, R. (2003). The role of accounting and auditing in
corporate governance and the development of financial markets around the world.
Asia-Pacific Journal of Accounting & Economics, 10, 1–30.
Frost, C., & Pownall, G. (1994). A comparison of the stock price response to earnings
disclosures in the United States and the United Kingdom. Contemporary Accounting
Research, 11, 59–83.
Harris, M., & Muller, K. (1999). The market valuation of IAS versus U.S. GAAP accounting
measures using form 20-F reconciliations. Journal of Accounting and Economics, 26,
285–312.
Healy, P. M. (1985). The effect of bonus schemes on accounting decisions. Journal of
Accounting and Economics, 7(April), 85–107.
Jones, J. (1991). Earnings management during import relief investigations. Journal of Account-
ing Research, 29(Autumn), 193–228.
Larson, R. K., & Kenny, S. (1994). Raising capital overseas: International accounting stand-
ards may facilitate the process. The CPA Journal, 64, 64–67.
Leuz, C. (2003). IAS versus U.S. GAAP: Information asymmetry-bases evidence from
Germany’s New Market. Journal of Accounting Research, 41(June)(3), 445–473.
Leuz, C., & Verrecchia, R. (2000). The economic consequences of increased disclosure. Journal
of Accounting Research, 38(Suppl 2000), 91–124.
Levitt, A. (1998). The importance of high quality accounting standards. Accounting Horizons,
12(1), 79–82.
McDonald C., & Prather-Kinsey, J. (2002). The usefulness of developed country accounting
standards in emerging stock markets: South Africa and Mexico. Working paper,
University of Missouri.
IAS Versus U.S. GAAP 167

McGregor, W. (1999). An insider’s view of the current state and future direction of Interna-
tional Accounting Standards Setting. Accounting Horizons, 13(2), 159–168.
Street, D. L., & Nichols, N. B. (2002). LOB and geographic segment disclosures: An analysis of
the impact of IAS 14 revised. Journal of International Accounting, Auditing and Taxation,
11, 91–114.
Street, D. L., Nichols, N. B., & Gray, S. J. (2000). Assessing the acceptability of international
accounting standards in the US: An empirical study of the materiality of US GAAP
reconciliations by non-U.S. companies complying with IASC standards. The Interna-
tional Journal of Accounting, 9(1), 27–63.
Subramanyam, K. R. (1996). The pricing of discretionary accruals. Journal of Accounting and
Economics, 22, 249–282.
JENICE PRATHER-KINSEY AND SANDRA WALLER SHELTON168

USING ‘‘STATEMENT OF
INTERMEDIATE BALANCES’’ AS
TOOL FOR INTERNATIONAL
FINANCIAL STATEMENT
ANALYSIS IN AIRLINE INDUSTRY
C. Richard Baker, Yuan Ding and Herve Stolowy
ABSTRACT
Since September 11, 2001 and during the ensuing economic slowdown, a
number of airline companies have experienced significant financial dif-
ficulties, including bankruptcies and near bankruptcies. In an economic
setting where many airlines are struggling to achieve or maintain prof-
itability, it is important for accountants, auditors, and financial analysts
to be able to analyze the relative performance of such companies. In this
industry, income statements are normally prepared ‘‘by nature’’ rather
than ‘‘by function.’’ This differs from the usual presentation found in the
income statements of many companies around the world, in particular
most American companies. This paper demonstrates how to perform a
comparative financial statement analysis when an income statement is
prepared ‘‘by nature,’’ through application of a tool called the ‘‘Statement
Advances in International Accounting
Advances in International Accounting, Volume 18, 169–198
Copyright r 2005 by Elsevier Ltd.
All rights of reproduction in any form reserved
ISSN: 0897-3660/doi:10.1016/S0897-3660(05)18009-X
169

of Intermediate Balances.’’ This tool is illustrated using three companies
chosen from different continents: Southwest Airlines, a low cost U.S. air
carrier, Air France, the leader in Europe, and China Eastern Airlines, one
of the biggest Chinese air carriers.
INTRODUCTION
Income statements (also known as ‘‘statements of operations’’ or ‘‘profit
and loss accounts’’) can be presented in a manner that reflects two possible
classifications of expenses, that is: ‘‘by nature’’ or ‘‘by function.’’ In the first
case, expenses are organized into categories like purchases, salaries, depre-
ciation, rent, etc. In the second case, expenses are divided into ‘‘functions’’
like: selling and marketing, administration and general, research and de-
velopment, etc. By tradition, or following local regulations, different coun-
tries may be more comfortable or more familiar with one of these two
methods. For example, the ‘‘by function’’ form of presentation is well
known in North America, while the ‘‘by nature’’ presentation is practiced
in several European countries such as Italy, Spain, and France. In a par-
ticular country where one format is more practiced, the ‘‘alternative’’ format
may not be familiar to the ‘‘financial community’’ (not only to financial
analysts and investors, but also to academics and students). The main
objective of this paper is to present a tool, called the ‘‘Statement of Inter-
mediate Balances’’ (SIB), which is especially tailored to analyze an income
statement presented ‘‘by nature.’’ Despite a common belief that there is
essentially one format for the income statement, an analysis of financial
statements and annual reports on an international basis indicates that
income statements presented ‘‘by nature’’ are widespread and are found,
even in countries where the format ‘‘by function’’ is the general rule (or
practice).
The airline industry provides particular evidence of the usefulness of the
SIB because, in this sector, income statements are normally prepared ‘‘by
nature’’ rather than ‘‘by function.’’ In this paper, we will illustrate the use of
the SIB by studying three companies chosen from different continents:
Southwest Airlines Co. (‘‘Southwest’’ in the rest of the chapter), a low cost
U.S. air carrier, Air France, the leader in Europe (and now in the world,
after completion of the merger with KLM), and China Eastern Airlines
(‘‘China Eastern’’), one of the biggest Chinese air carriers.
C. RICHARD BAKER ET AL.170

INCOME STATEMENTS ‘‘BY NATURE’’ AND
‘‘BY FUNCTION’’
Presentation
An income statement is intended to report how a company’s financial and
operating performance was achieved during a particular period. Such state-
ments reflect the revenues and expenses of an enterprise during a period and
display the net income for the period. Net income is typically the remainder
after all expenses have been deducted from revenues and is a measure of the
wealth generated by an economic entity (i.e. the net increase to stockholders’
equity) during an accounting period.
An income statement can be organized in different ways with respect to its
format (e.g. horizontal vs. vertical format), its degree of fineness, and the
manner of classifying expenses (see Fig. 1).
Formats
An income statement includes a list of revenue and expense account bal-
ances, usually in aggregate form. The list of account balances can be pre-
sented as a continuous list (vertical format) or as two lists side by side
(horizontal format).
Degree of Fineness
Expenses in an income statement are usually grouped into homogeneous
categories and then subtracted step-by-step from revenues. With regard to
the degree of fineness, the choice is between a single- or a multiple-step
format.
Presentation of the income statement
Degree of
simplification
Single
step
Multiple
step
By nature (by
type of
expenditure)
Classification
of expenses
Format
Horizontal Vertical By function
(by type of
operation)
Fig. 1. Choices Regarding the Presentation of Income Statements.
Using ‘‘Statement of Intermediate Balances’’ 171

Single step. This is the simplest version for an income statement. All rev-
enues are grouped into one category and all expenses are grouped into
another category. Expenses are then subtracted from revenues. A variation
of this format can be seen, whereby all operating revenues are followed by
all operating expenses. This permits the determination of operating income.
Afterward, several sub levels of earnings may be presented (e.g. income
before income tax, net income). This type of format is still considered to be a
single-step format because the essential elements of the income statement
(i.e. operating revenues and operating expenses) are presented separately.
Multiple step. In a multiple-step format, the revenue and expense categories
are paired in a manner that highlights various sub components of net in-
come (e.g. gross profit, operating income, income from continuing opera-
tions). The multiple-step format is the most common format used in
business reporting because it is considered to be more informative than the
single-step approach (see for more details, Kieso, Weygandt, & Warfield,
2001, p. 132).
Classification of Expenses
The distinction between classifying expenses ‘‘by nature’’ or ‘‘by function’’ is
not addressed in U.S. GAAP (Generally Accepted Accounting Principles),
even though U.S. government regulations do address this distinction. The
International Accounting Standards Board (IASB) has specifically ad-
dressed the distinction between ‘‘by nature’’ and ‘‘by function’’ expense
classification, by stating that:
Expenses are subclassified to highlight components of financial performance that may
differ in terms of frequency, potential for gain or loss and predictability. This analysis is
provided in one of two forms [‘‘by nature’’ or ‘‘by function’’] (IASB, 2003, par. 90).
Classification by Function (or ‘‘Cost of Sales Method’’). This type of income
statement format classifies expenses according to their role in the determi-
nation of net income. Cost of goods sold, commercial, distribution, and
administrative expenses are common categories employed in the ‘‘by func-
tion’’ format (see Fig. 2).
Classification by Nature (or ‘‘Nature of Expenditure Method’’). In using the
‘‘by nature’’ format, expense accounts are combined in a way that reflects
their nature (e.g. purchases of raw materials, transportation costs, taxes
other than income tax, salaries and related costs, depreciation, etc.) (see
C. RICHARD BAKER ET AL.172

Fig. 2). This format is relatively easy to use, even for small enterprises
because no allocation or partitioning of expenses is required.
Choice of a Classification Approach
The multiple-step format, organized by function, is the most common for-
mat used by American companies (AICPA, 1999). In comparing the dif-
ferent approaches to income statement presentation, several remarks can be
made
� A preference for classification ‘‘by nature’’ may reflect the requirements of
governmental agencies that need such information to prepare national
income accounts (this is often the case in European countries). A ‘‘by
nature’’ presentation allows the calculation of the value added by an
enterprise to the overall economy of a country. The ‘‘value added’’ con-
cept is important for countries that have a value added tax system. In
essence, the value added concept1 measures the amount of value created
by a firm beyond what it acquired from outside the economic entity (see
Haller & Stolowy, 1998).� Preference for a ‘‘by function’’ presentation often reflects an emphasis on
the needs of capital markets. The ‘‘by function’’ format is the preferred
method in North America, and it is used by most firms listed on the New
York Stock Exchange.
The IASB has indicated that presentation of income statements ‘‘by
function’’ ‘‘provides more relevant information to users than the classifi-
cation of expenses by ‘‘nature’’ (IASB, 2003, par. 92). However, the IASB
also points out that: ‘‘allocating costs to functions may require arbitrary
allocations and involve considerable judgment.’’ Paragraph 94 of the same
standard recognizes that: ‘‘the choice between the function of expense
method and the nature of expense method depends on historical and in-
dustry factors and the nature of the entity’’ (IASB, 2003). The IASB states
Income Statement by Function
(Vertical Presentation)
Income Statement by Nature
(Vertical Presentation)
Net sales revenue Net sales
- Cost of goods sold (cost of sales) + Other operating revenues
= Gross margin - Cost of merchandise and raw materials sold and
consumed
- Commercial and distribution expenses - Labor and Personnel expenses
- Administrative expenses - Other operating expenses
- Other operating expenses - Depreciation expense
= Operating income = Operating income
Fig. 2. Function of Expense Versus Nature of Expense Presentations.
Using ‘‘Statement of Intermediate Balances’’ 173

that ‘‘each method of presentation has merit for different types of entities’’
(IASB, 2003, par. 94).
Compared to the classification ‘‘by function,’’ the format ‘‘by nature’’ is a
disaggregated format, with more items disclosed, and the related risk of
revealing potential inside information to competitors. The trade-offs be-
tween positive and negative aspects of disaggregation are an issue. However,
as the format of the income statement is highly standardized in the airline
industry (see below), competitors are on a more even playing field.
Reasons for Adoption of ‘‘By Nature’’ Format in Airline Industry
The search for explanations concerning the prevalence of the ‘‘by nature’’
format in the U.S. airline industry is difficult because the origin of this
format is not stated explicitly in companies’ annual reports. Some expla-
nations for the ‘‘by nature’’ format have been obtained by contacting the
investor relations departments at several U.S. airline companies and by
performing a search of regulations issued by the U.S. Department of
Transportation (DOT).
Airline accounting in the U.S. is determined in part by the Uniform
System of Accounts and Reports (USAR) issued by the U.S. DOT (DOT,
2002). Pursuant to DOT regulations: ‘‘all profit and loss elements are ac-
counted for within specific objective accounts, which are descriptive of both
basic areas of financial activity, or functional operation, and objective
served’’ (DOT, 2002, USAR, part 241, sections 1–3). The USAR envisions
two types of classification; one by function (or financial activity) and one by
nature (or objective). Section 7 of the USAR includes a ‘‘chart of profit and
loss accounts’’ employing an ‘‘objective classification of profit and loss
elements,’’ including:
� Transport revenues (passenger, mail, property, charter, other),� Transport-related revenues and expenses (in-flight sales, restaurant and
food service (ground), rents, limousine servicey),� Transport expenses (pilots and copilots, other flight personnel, mainte-
nance labory, traffic commissions, general services purchased, landing
fees, maintenance materials, passenger food expense, provisions for ob-
solescence and deteriorationy).
The USAR states that: ‘‘The profit and loss accounts are designed to
reflect, through natural groupings, the elements entering into the derivation
of income or loss’’ (our emphasis) (USAR, part 141, section 8). This
C. RICHARD BAKER ET AL.174

regulation provides some explanation of why U.S. airlines report their in-
come statement ‘‘by nature.’’ However, we have been unable to locate an
official explanation concerning why the ‘‘by nature’’ format has arisen in
the U.S. in the airline industry. We hypothesize that this choice was made
because the ‘‘by nature’’ format provides a higher degree of detail by
disclosing more expense items and is therefore more useful for decision
making.
In France, regulations relating to consolidated financial statements
(Anonymous, 1999, par. 410) allow companies to choose between the
‘‘by nature’’ and ‘‘by function’’ models. However, for non-consolidated fi-
nancial statements (all legal entities in France are required to prepare sep-
arate financial statements prepared in accordance with the General
Accounting Plan – ‘‘Plan Comptable General’’), the presentation ‘‘by na-
ture’’ is required, given the influence of the national income accounting in
France. The requirement of the ‘‘by nature’’ format for non-consolidated
financial statements may explain why this format is the most commonly
used in France for consolidated financial statements. In the case of Air
France, despite the choice mentioned above regarding consolidated financial
statements, the income statement is presented ‘‘by nature.’’ This might be
explained by the tradition in favor of this format and also by a sort of
mimetic behavior, given the fact that virtually all airline companies in the
world have adopted the ‘‘by nature’’ format for their income statements (see
below).
In China, after the accounting reforms of 1992, the income statement
format for all Chinese companies (whether listed or not) is very close to the
U.S. one, i.e. a multiple-step format organized ‘‘by function.’’ However,
companies with listed shares on exchanges outside of China are required to
prepare their financial statements in accordance with IASB, which, as men-
tioned above, authorize both formats. In the case of China Eastern Airlines,
the choice of ‘‘by nature’’ presentation for their expenses could also be a
mimetic practice in order to follow foreign competitors in the airline in-
dustry.
While our analysis of the financial statements of airline companies is not
comprehensive, if we exclude the three studied companies, we did find that
in the U.S., American Airlines, Continental Airlines, Delta Air Lines,
Northwest Airlines, and United Airlines have adopted the ‘‘by nature’’ for-
mat. In other countries, Air Canada, Japan Airlines, and LanChile, to
mention a few examples, also prepare their income statements ‘‘by nature.’’
This format is therefore the dominant practice in the air transport industry
on a worldwide basis.
Using ‘‘Statement of Intermediate Balances’’ 175

PRESENTATION OF STATEMENT OF
INTERMEDIATE BALANCES
Principles
When an income statement is presented ‘‘by nature,’’ it is often useful to
adjust the statement to highlight the key intermediate balances that deter-
mine the value creation process of the enterprise. In preparing a SIB,
the following balances can be highlighted: ‘‘commercial margin,’’ ‘‘value
added,’’ ‘‘gross operating income,’’ and Earnings from Operations Before
Interest, Taxes, Depreciation and Amortization ‘‘EBITDA.’’ Fig. 3 dem-
onstrates the structure of a SIB.
Essentially, the SIB dissects the income statement into meaningful blocks
of data to help the user understand and interpret the firm’s economic ac-
tivity. The intermediate balances can be presented in monetary terms, or as
percentage variations from one period to the next (trend analysis), or as
percentages of some relevant basis (common-size analysis). The SIB can be
particularly useful if a company has manufacturing operations combined
with merchandising (i.e. wholesale or retail) activities.
Definition of Terms
Commercial Margin
The commercial margin expresses the difference between the sales of mer-
chandise and the cost of merchandise sold.
Current Period Production
The company’s industrial output during the period is the total of production
sold plus the cost of self-produced fixed assets.
Value Added
The term ‘‘value added’’ is a concept used in National Income accounting. It
refers to the amount contributed by a particular enterprise to the national
wealth. Value added is defined as the increase in value resulting from the
enterprise’s activities over and above that of goods and services provided by
third parties and consumed by the firm. The concept is used in a number of
countries; especially Australia, France, Germany, South Africa, and the
United Kingdom (see Haller & Stolowy, 1998). Value added represents the
C. RICHARD BAKER ET AL.176

wealth created by the enterprise that will be distributed to various stake-
holders including employees, lenders, governments, and shareholders.
EBITDA or Gross Operating Income
The EBITDA or Gross Operating Income measures the wealth created by
the enterprise from its operations, independent of its financial income and
Sale of merchandise (goods purchased for resale)
- Cost of merchandise sold
= Commercial margin (margin on sale of
merchandise)
Sale of goods and/or services produced by the
business
+ Production capitalized (tangible and intangible
assets constructed for the firm itself)
= Total “production” for the period
- Cost of raw materials and other supplies consumed
- Other purchases and external expenses
- Other operating expenses
= Value added
Consumption of goods and
services from third parties
+ Operating subsidies
- Taxes and similar expenses (excluding income taxes)
- Wages and salaries
- Social security and other welfare allowances
= EBITDA or Gross operating income
- Depreciation and amortization expense
+ Other operating revenues (not included in sales)
- Other operating expenses (not included above)
= Operating income
+ Financial income
- Financial expense
= Operating net income/loss before taxes
± Gain/loss from sale of fixed
assets
- Asset writedowns
- Other unusual expenses
= Unusual income/loss
- Income taxes
- Cumulative effect of changes in accounting principles
- Preferred stock dividends
- Others
= Net income/loss after tax available to common
shareholders
Fig. 3. Structure of the Statement of Intermediate Balances.
Using ‘‘Statement of Intermediate Balances’’ 177

expenses, and charges for depreciation and amortization. This indicator
helps in evaluating the firm’s short-term ability to create wealth since it is
not affected by long-term strategic decisions regarding financing (i.e. capital
structure) and capital investment policies. The ratio of EBITDA to sales (or
accounting ‘‘production’’) is often considered to be a measure of the ‘‘busi-
ness profitability’’ of the firm, thereby allowing inter-company comparisons.
EBITDA is also considered to be a proxy for cash flow generated by op-
erations.
Operating Income
Operating income or profit represents the results of the firm’s normal and
current activity without taking into account financial and unusual elements.
Net Operating Income before Income Taxes
Operating net income before taxes indicates economic and financial per-
formance before consideration of unusual items and taxes.
Unusual Income (Loss)
Unusual income (loss) is the profit or loss from activities that are not related
to the firm’s usual operations. This ‘‘income’’ is shown as a separate item on
the SIB.
Net Income (Loss)
The last line of the SIB is the Net Income (Loss), which is self-explanatory.
This figure serves as a check on the equality between the adjusted SIB and
the original income statement.
Income Statement ‘‘By Nature’’ Versus ‘‘By Function’’
One of the features of income statements prepared ‘‘by nature’’ is that they
allow the calculation of intermediate balances before the net income figure. The
calculation of intermediate balances is a useful tool for financial statement
analysis, particularly for comparative analyses of company performance. When
an income statement is organized ‘‘by function,’’ the calculation of intermediate
balances such as commercial margin, value added, gross operating profit, and
operating income are often difficult to perform. However, in the ‘‘by function’’
income statement, some other useful intermediate balances may be reported,
such as: gross margin, operating income, etc. Consequently, neither format is
necessarily superior to the other, and nor the format provides a complete
C. RICHARD BAKER ET AL.178

understanding of the firm. One practical difficulty that arises in comparing
income statements ‘‘by nature’’ with income statements ‘‘by function’’ is that
the transformation of an income statement ‘‘by nature’’ to an income statement
‘‘by function’’ (and vice-versa) is a very difficult exercise because it requires
knowledge of information (concerning inventory, detail of personnel expenses,
etc.) that is typically not available to the financial analyst. In this context, one
of the primary purposes of this paper is to argue that, when an income state-
ment is presented ‘‘by nature,’’ users of financial statements need to be trained
to analyze this type of format because they will generally have less familiarity
with it and there may be no way to convert the ‘‘by nature’’ format to the more
familiar ‘‘by function’’ format. The preparation of a SIB can help analysts to
understand the utility of the income statement prepared ‘‘by nature.’’
APPLICATION OF THE STATEMENT OF
INTERMEDIATE BALANCES TO SOUTHWEST, AIR
FRANCE, AND CHINA EASTERN
In an economic setting where a number of airline companies have experi-
enced serious financial difficulties (e.g. in the U.S., Chapter 11 bankruptcy
for U.S. Airways on August 11, 2002; financial restructuring of Continental
Airlines in summer of 2002; Chapter 11 bankruptcy for United Airlines on
December 9, 2002), it is important to be able to analyze and measure the
relative performance of such companies. The following sections demonstrate
how to perform, in an international setting, a comparative financial state-
ment analysis when an income statement is prepared ‘‘by nature.’’ The three
companies studied in this case (Southwest, Air France, and China Eastern)
were chosen for the following reasons. First, they are based in three different
continents: North America, Europe, and Asia. Southwest is a U.S. based,
‘‘low-cost’’ carrier. Southwest experienced some financial difficulties after
September 11th, but generally remained profitable. Air France is currently
the largest airline in Continental Europe, and has become the largest airline
in the world after completion of its merger with the Dutch company KLM.
China Eastern is one of the largest Chinese air carriers.
Presentation of the Companies
The Management’s Discussion and Analysis of Financial Position and
Results of Operations (MD&A) in the annual report of United Airlines for
Using ‘‘Statement of Intermediate Balances’’ 179

the year 2001 summarized the state of the U.S. airline industry in particular,
and the situation of world airline industry, as follows:
Beginning in 2001, the weakening U.S. economy had a significant impact on the airline
industry as corporations reduced their business travel budgets and changed their travel
behavior. During the first six months of 2001, the industry began experiencing significant
revenue declines as a result of the decrease in business traffic (y), particularly in the
domestic markets. (y) United’s revenues (y) were significantly impacted by the events
of September 11 and the resulting reduction in the Company’s operations.’’
In light of the continuing problems in the airline industry, and to better
understand how the industry operates, we present financial statements pre-
pared by nature for Southwest, Air France, and China Eastern.
Southwest is a major U.S. domestic airline that primarily provides short-
haul, high frequency, point-to-point, low-fare service. Southwest carried
65.7 million passengers in 2003. Its fleet includes 388 aircraft at the end of
2003 (Southwest Air Lines Annual Report). By contrast, Air France is third
worldwide in terms of transportation of international passengers and first in
Europe in terms of traffic (before the merger with KLM). Air France carried
43.7 million passengers during fiscal 2003–2004. Its fleet included 372 air-
craft as of March 31, 2004 (Air France Annual Report). China Eastern was
established in the People’s Republic of China in 1995. It is headquartered in
Shanghai. Its shares are listed in Shanghai, Hong Kong, and New York. In
2003, China Eastern carried 12 million passengers. As at May 31, 2004, the
Group operated a fleet of 102 aircraft (China Eastern Airlines Annual Re-
port).
Appendix A contain the following:
� Consolidated Statements and statements of Income for the fiscal years
ended December 31, 2000 through December 31, 2003 for Southwest
(source: Annual Reports 2001, 2002, and 2003) (see Table A.1).� Consolidated Income Statement for the fiscal years ended March 31, 2001
through March 31, 2004 for Air France (source: Annual Reports
2001–2002, 2002–2003, and 2003–2004) (see Table A.2).� Consolidated Statements of Income for the fiscal years ended December
31, 2000 through December 31, 2003 for China Eastern (source: Annual
Reports 2001, 2002, and 2003) (see Table A.3).
These consolidated financial statements have been respectively prepared
in accordance with accounting principles generally accepted in the United
States (Southwest), in France (Air France) and with International Financial
Reporting Standards and the disclosure requirements of the Hong Kong
Companies Ordinance (China Eastern). For simplification purposes, the
C. RICHARD BAKER ET AL.180

term ‘‘income statement’’ is used to refer to the ‘‘consolidated statements of
income’’ or ‘‘consolidated income statements’’ of the three companies stud-
ied.
From the previous annual reports of the three companies, we extracted
the following comparative data:
Southwest Air France China Eastern
1999 1999–2000 1999
(in $m) (in hm) (in RMBm)
Passenger 4,563 8,377 8,031
Freight 103 1,240 1,730
Other 70 533 402
Maintenance 174
Total 4,736 10,324 10,163
In the Southwest 2001, 2002, and 2003 Annual reports, the following
additional information is provided:
� Agency commissions decreased primarily due to a change in the Com-
pany’s commission rate policy.� Depreciation expense increased due to the growth in the Company’s air-
craft fleet prior to September 11.� ‘‘Other operating expenses’’ increased until 2002 due to a significant in-
crease in passenger liability, aircraft hull, and third-party liability insur-
ance costs following the terrorist attacks.� In 2001, the ‘‘other gains/losses, net’’ include the Company’s share of
government grant funds under the Stabilization Act, arising from the
terrorist attacks. On April 16, 2003, as a result of the United States war
with Iraq, the Emergency Wartime Supplemental Appropriations Act
(Wartime Act) was signed into law. Among other items, the legislation
included a $2.3 billion government grant for airlines. Southwest received a
share of the grant during second quarter 2003. This amount is included in
‘‘Other (gains) losses’’ in the accompanying Consolidated Income State-
ment for 2003.
In Air France’s MD&A and notes to the financial statements for the year
ended March 31, 2004, the following information is also included:
Using ‘‘Statement of Intermediate Balances’’ 181

� Other operating revenues consist of the catering activities.� Other external expenses include namely insurance premiums, professional
fees, and aircraft engine rental costs.� In 2003–2004, other operating income and charges, net mainly represents
income linked to financial compensation on slot swaps at Heathrow air-
port.
From the China Eastern annual reports 2001, 2002, and 2003, we notice
some changes in the presentation of the ‘‘Other income, net’’ and ‘‘Other
operating income’’. The data disclosed in Table A.4 will allow restating
some elements of the income statement in order to ensure comparability
throughout the period (see Table A.4).
Additionally, the items ‘‘Aircraft depreciation and operating leases’’ and
‘‘Other depreciation and operating leases’’ mix depreciation and leases. In
order to separate these two expenses, we found the amount of operating
leases in the notes (see Table A.4).
Office and administration expenses mainly include training expenses, and
expenses relating to overseas sales. Other operating expenses include main-
tenance expenses of other fixed assets, computer and telecommunications
expenses, and other (unspecified) expenses. On December 31, 2002, the
Group’s fixed assets were revalued. The impact was charged to the income
statement under the caption ‘‘Revaluation deficit of fixed assets.’’
Analysis of Format of Income Statements
Southwest, Air France, and China Eastern all use the vertical format for
their income statements. Additionally, the first part of the income statement
(up to the point ‘‘operating income’’ for Southwest and Air France, and
‘‘operating profit’’ for China Eastern), follows the single-step format,
whereby operating expenses are subtracted from operating revenues. Fol-
lowing operating income, several sub-level earnings numbers are presented.
This format corresponds to the variation of the single-step format discussed
previously above.
More important, the three companies have clearly adopted the ‘‘by na-
ture’’ format. Interestingly, China Eastern had a real choice because it fol-
lows the International Financial Reporting Standards which allow both
formats. It appears likely that China Eastern adopted the format ‘‘by na-
ture’’ in order to be consistent with international reporting practices in the
airline industry.
C. RICHARD BAKER ET AL.182

Preparation of Statements of Intermediate Balances
Preliminary Indications
� The income statements for the three airline companies are presented ‘‘by
nature,’’ which is a necessary condition to the preparation of SIB.� In a SIB, percentage figures usually do not appear following the year to
which they relate because it is more important to have the percentages
figures adjacent to one another. This allows the analyst to compare the
evolution of the enterprise over the periods investigated. In practice, the
percentages are as important, if not more important, than the absolute
currency values.� Common-sized SIB offer the advantage of allowing comparisons to be
made between financial statements presented in different currencies, i.e.
U.S. dollars (Southwest), Euros (Air France), and Renminbi (China
Eastern).� Common-sized SIB offer the additional advantage of allowing compar-
isons to be made between periods of unequal length (which is not the case
here).� If there is a difference between companies in the treatment of certain
specific revenues or expenses, it is important to adjust these items so that
they are treated in the same manner. For instance, the operating leases are
included in China Eastern in the same caption with depreciation expenses.
With the help of the notes, this amount has been restated (see Table A.4
and below). In the same vein, the ‘‘Share in net income of equity affiliates’’
in Air France has been restated to be included in the financing section, to
be consistent with China Eastern and with the general definition of the
SIB.� The location of the sub-elements of the income statement can be different
in the SIB from the income statement itself. For example, in Southwest,
the ‘‘Other (gains) losses, net,’’ which primarily relates to a Government
grant, are treated as ‘‘unusual items’’ in the SIB.� In the income statement of Southwest, the ‘‘other expenses (income)’’ line
is presented with a sign opposite to that which would be considered to be a
normal presentation (i.e. plus for expenses and minus for income).� In the China Eastern SIB, the ‘‘Other income, net’’ and ‘‘Other operating
income’’ have been restated to ensure comparability throughout the pe-
riod (see Table A.4). Gain on disposal of aircraft and engines is reported
under unusual items. This treatment is consistent with the two other air-
lines where the gains from sale of fixed assets are shown as unusual items.
Using ‘‘Statement of Intermediate Balances’’ 183

� In the China Eastern SIB, the operating leases included in the items
‘‘Aircraft depreciation and operating leases’’ and ‘‘Other depreciation and
operating leases’’ (see Table A.4) have been separated and reported in the
consumption from third parties.� In the China Eastern SIB, because office and administration expenses
mainly include training expenses, and expenses relating to overseas sales,
they have been included in the ‘‘Consumption from third parties.’’� In the China Eastern SIB, other operating expenses include maintenance
expenses of other fixed assets, computer and telecommunications expens-
es, and other (unspecified) expenses. They fit well in the ‘‘Consumption
from third parties.’’� In the China Eastern SIB, the ‘‘Revaluation deficit of fixed assets’’ has
been considered as an unusual item.
Statement of Intermediate Balances
SIBs for Southwest (see Tables A.5 and A.6), Air France (see Tables A.7
and A.8), and China Eastern (see Tables A.9 and A.10), are presented
both in absolute currency terms and in percentage terms (i.e. common-
sized).
Comparative Analysis of Statements of Intermediate Balances
Revenues/Production2
Even though the common-sized SIBs are based on the principle of dividing
all other figures in the statement by the total production for the year, we
have added to the statement a line showing the change in revenues for each
year as compared with the previous year. It can be seen that before the
events of September 11, 2001, Southwest had the greatest growth in rev-
enues (+19.3% in 2000), ahead of Air France (+18.9%), and China East-
ern (+10.4%). After September 11th, the decrease in revenues was the
greatest for Southwest (�1.7%). In contrast, Air France realized an increase
(+2.0%) and China Eastern an even higher rise of 8.3%. In 2003, South-
west and China Eastern experienced an increase (7.5 and 9.2%, respectively)
while the other company suffered a decrease (�2.8% for Air France).
The activities of the three companies are relatively different: China East-
ern’s revenues are more diversified (less passenger oriented) than Air France
and significantly more diversified than Southwest. Seventy-two percent
(71.9%) of China Eastern’s revenues were derived from passengers versus
83.2% for Air France and 96.7% for Southwest in 2003.
C. RICHARD BAKER ET AL.184

Consumption from Third Parties
The ratio of Consumption from Third Parties to Total Production is lower for
Southwest (47.9% in 2003) than for Air France (54.7% in 2003) and in
particular as compared with China Eastern (72.5% in 2003). This ratio de-
creased for Air France and for Southwest in comparison with 2002 and 2001,
indicating an ability to pass on increased costs to airline passengers. Looking
at the breakdown of Consumption from Third Parties, we see that Fuel Cost
represents the greatest expense for each of the companies (except for ‘‘Other
Operating Expenses’’ for Southwest), especially for China Eastern. Fuel Cost
as a percent of Total Production decreased for Air France over the period but
increased for China Eastern from 2002 to 2003. This development can be
explained by a decrease in consumption of fuel and a decrease in the average
cost per gallon. For Southwest, the weight of fuel cost remained stable over
the period (�14%).
Southwest was able to reduce the impact from Consumption from Third
Parties because of a reduction in the amount of Commissions (i.e. fees paid
to travel agents) (from 2.8% in 2000 to 0.8% in 2003). (The Company
modified its system of paying commissions in 2001, which reduced this cost.)
China Eastern experienced an even greater reduction in Commissions (from
5.7% in 2000 to 3.3% in 2003). For Air France, commissions decreased
from 9.8% in 2000 to 8.5% in 2003. While Southwest was able to decrease
its Aircraft Rental cost (at 3.1% in 2003), China Eastern increased its cost
(from 6.9% in 2000 to 7.3% in 2003), and Air France faced a similar in-
crease (from 3.3% in 2000 to 3.7% in 2003).
China Eastern reports the highest take off and landing charges (15.8% in
2003, versus 14.0% in 2000), compared to Air France (7.4% in 2003) and
Southwest (6.3% in 2003).
We can also easily compare the maintenance costs expensed by the three
companies. China Eastern comes first with 9.3% in 2003 (increasing from
7.3% in 2000), before Southwest (7.2% in 2003, 6.7% in 2000) and Air
France (3.1% in 2003, 4.9% in 2000).
The composition of the category ‘‘Other operating expenses’’ or ‘‘Other’’
or ‘‘Other external expenses’’ may not be entirely comparable between the
companies. The annual report of Southwest provides little specific infor-
mation concerning the make up of Other Operating Expenses. The only
information provided is that the category includes insurance premiums
and advertising expenses. We learn that ‘‘Other operating expenses’’ in-
creased due to a significant increase in passenger liability, aircraft hull, and
third-party liability insurance costs following the terrorist attacks. For
Air France, ‘‘Other external expenses’’ include insurance premiums,
Using ‘‘Statement of Intermediate Balances’’ 185

professional fees, and aircraft engine rental costs. As regards China Eastern,
‘‘Other operating expenses’’ include maintenance expenses of other fixed
assets, computer and telecommunications expenses, and other (unspecified)
expenses. These fit well in the ‘‘Consumption from third parties’’.
In general, it can be seen that Southwest generally has a lower cost
structure than Air France and even lower than China Eastern. However, this
relationship deteriorated throughout the period until 2002, with an increase
in these costs for Southwest; while the other two companies were decreasing
their consumption from third parties (this is especially true for Air France).
The situation improved again for Southwest in 2003.
Value Added
While not widely used in North America, the Value Added figure shows the
extent to which an enterprise contributes to the national wealth of the
country (see Haller & Stolowy, 1998). The Value Added figure for South-
west declined sharply from 2000 to 2001 following the events of September
11th. This was because the cost of consumption from third parties increased
in relation to total production. This trend shows that Southwest has been
unable to pass along the increased cost to its customers. However, the sit-
uation improved for Southwest in 2003 and for Air France.
Gross Operating Income
The ratio of Salaries, Wages, and Benefits to Total Production for South-
west is generally much higher than for Air France and especially for China
Eastern (37.5% in 2003 versus 33.1% for Air France and 10.1% for China
Eastern). The increase recorded by Southwest was due in part to increased
security requirements following the events of September 11th. Consequent-
ly, this increase explains why Southwest recorded a decrease in its Gross
Operating Profit from 2000 (23%) to 2003 (14.6%). However, the Gross
Operating Profit of Southwest is still higher than that of Air France (10.7%
in 2003). China Eastern has by far the highest gross operating profit (17.3%
in 2003), due to its low level of salaries.
As discussed previously, Gross Operating Income reflects the return de-
rived from the core activities of the enterprise. The different Gross Oper-
ating Income figures indicate the relative performances of China Eastern
and Southwest. A negative gross operating income (i.e. a Gross Operating
Loss), which is not the case for any of our studied companies, is a sign of
financial distress.
C. RICHARD BAKER ET AL.186

Operating Income
For Air France and Southwest, Depreciation and Amortization expense
rose in 2003 in comparison with 2002, 2001, and 2000 because of the ac-
quisition of additional aircraft and ground equipment. The ratio of Depre-
ciation and Amortization to Total Production differs between the
companies: 6.5% for Southwest in 2003, 9.6% for Air France in 2003,
and 12.6% for China Eastern in 2003. The difference in the ratio of De-
preciation and Amortization expense to Total Production slightly magnifies
the gap between the Operating Income (Loss) of Southwest and China
Eastern versus Air France. Air France has a very low operating income
(‘‘Earnings from operations’’) (1.1% in 2003, compared to 2.9% in 2000).
Southwest posted very high but decreasing Operating income (8.1% in 2003,
18.1% in 2000). China Eastern has a decreasing operating income (1.8% in
2003).
Operating Net Income before Taxes
China Eastern’s ratio of Interest Expense (Net) to Total Production is the
highest in our sample (5% in 2003), but it decreased from 2000 (7.3%),
which is a good sign. China Eastern must have a high level (although de-
creasing) of outstanding debt. Southwest recorded an increase in the Interest
Expense ratio (from 1.2% in 2000 to 1.5% in 2003). Air France reports a
very low level of interest expense (net) (0.5% in 2003). However, the com-
parison between the three studied companies should be made with caution
as Southwest reports a gross interest expense when Air France and China
Eastern disclose a net amount.
After adjustments for Interest Expense and other items, the Operating
Net Income of Southwest remained positive in 2003 (7.6%) but decreasing
(as compared with 18% in 2000). Air France a low ratio (1% in 2003) and
China Eastern has a negative operating net income before taxes (�3.9% in
2003).
Unusual Income (Loss)
A special charge was recorded by Southwest in 2001 in relation to the
September 11 terrorist attacks and the resulting impact on the companies’
schedules and operations. However, the Company also received compen-
sation under the Airline Stabilization Act, which partially offset their losses.
The impact from unusual items was positive for Southwest (3.7% in 2001
and 4.4% in 2003). Air France also recorded a positive unusual item from
gains on the disposal of fixed assets. China Eastern, conversely, recorded a
loss on such items (�0.2% in 2003).
Using ‘‘Statement of Intermediate Balances’’ 187

Net Income (Loss)
Southwest had the highest positive Net Income number at 7.4% of its Total
Production in 2003. Air France disclosed a low net income percentage (0.8%
in 2003), while China Eastern faced a loss in 2003 (�6.6% of Total Pro-
duction).
Synthesis
The preparation of an SIB indicates that studying net income figures alone is
not sufficient. If we look at the Value Added, Southwest has the highest
amount. At the level of the gross Operating Income of the companies, it is
clear that the situation of China Eastern is the best. At the level of Operating
Income (Loss) before Taxes, the situation is once again better for Southwest.
The situation for Southwest remained satisfactory because of its generally
lower costs. However, it can be seen that there was deterioration even in
Southwest’s performance in 2002.
CONCLUSION
This chapter has demonstrated how to perform a comparative financial
statement analysis when an income statement is prepared ‘‘by nature,’’
through application of a tool called the ‘‘Statement of Intermediate Bal-
ances.’’ This tool has been illustrated using three airline companies: South-
west, Air France, and China Eastern. It is particularly useful in a
comparative and international setting. However, we should not forget that
when working with the airline industry, the investment community also uses
non-financial indicators (i.e. revenue passenger miles3 or kilometers, revenue
seat miles, passenger load factor, etc.) in addition to the information con-
tained in financial statements. This non-financial information is not specif-
ically dealt with in this chapter, but it can provide a useful complement to
the preparation of a SIB (see Liedtka, 2002; Riley, Pearson, & Trompeter,
2003). From another perspective, we should remember that the SIB can be
used outside the airline industry, if the income statement is reported by
nature.
NOTES
1. ‘‘Value added’’ should not be confused with ‘‘economic value added,’’ a termwhich is usually defined as operating income minus cost of capital employed.
C. RICHARD BAKER ET AL.188

2. All companies have no reselling activity. Consequently, there is no commercialmargin to compute.3. The term ‘‘revenue passenger mile’’ is defined as a mile flown on each flight
stage multiplied by the number of ‘‘revenue passengers’’ on that stage. A ‘‘revenuepassenger’’ is a person receiving air transportation from the air carrier for whichremuneration is received by the air carrier.
ACKNOWLEDGMENT
Yuan Ding would like to acknowledge the financial support of the Research
Center at the HEC School of Management (project A0306). Yuan Ding and
Herve Stolowy acknowledge the financial support of the Research Center in
Financial Information (HEC Foundation). Both are Members of the
GREGHEC, unite CNRS, FRE-2810.
REFERENCES
AICPA (1999). Accounting trends and techniques – 1999. New York: American Institute of
Certified Public Accountants.
Air France Annual Report. http://www.airfrance-finance.com.
China Eastern Airlines Annual Report. http://www.ce-air.com/cea/en_U.S./investor/report
DOT (2002). Uniform system of accounts and reports for large certificated air carriers. Wash-
ington, DC: Department of Transportation, http://www.bts.gov/lawlib/docs/Part241-
cy2000.pdf.
Haller, A., & Stolowy, H. (1998). Value added in financial accounting: A comparative study of
Germany and France. Advances in International Accounting, 11, 23–51.
IASB (2003). International accounting standard (IAS) No. 1: Presentation of financial statements
(revised). London: International Accounting Standards Board.
Kieso, D., Weygandt, J., & Warfield, T. (2001). Intermediate accounting (10th ed.). NY: Wiley.
Liedtka, S. L. (2002). The information content of nonfinancial performance measures in the
airline industry. Journal of Business Finance and Accounting, 29(7–8), 1105–1121.
Riley, R. A., Pearson, T. A., & Trompeter, G. (2003). The value relevance of non-financial
performance variables and accounting information: The case of the airline industry.
Journal of Accounting and Public Policy, 22(3), 231–254.
Southwest Air Lines Annual Report. http://www.southwest.com
Anonymous (1999). Regles et methodes relatives aux comptes consolides, arrete du 22 juin 1999
portant homologation du reglement 99-02 du 29 avril 1999 du comite de la reglementation
comptable (rules and methods relating to consolidated accounts – arrete of june 22, 1999,
approving the regulation No. 99-02 of april 29, 1999, of the accounting regulation com-
mittee). Paris: Accounting Regulation Committee.
Using ‘‘Statement of Intermediate Balances’’ 189

APPENDIX A
Consolidated income statements and statements of intermediate balances of
Southwest, Air France and China Eastern.
Table A.1. Southwest Airlines Consolidated Statements of Income for
Years ended December 31, 2003, 2002, 2001, and 2000.
(In Millions of U.S. $) 2003 2002 2001 2000
Operating revenues
Passenger 5,741 5,342 5,379 5,468
Freight 94 84 91 111
Other 102 96 85 71
Total operating revenues 5,937 5,522 5,555 5,650
Operating expenses
Salaries, wages, and benefits 2,224 1,992 1,856 1,684
Fuel and oil 830 762 771 805
Maintenance materials and
repairs
430 390 397 378
Agency commissions 48 55 103 160
Aircraft rentals 183 187 192 196
Landing fees and other rentals 372 345 311 265
Depreciation 384 356 318 281
Other operating expenses 983 1,017 976 860
Total operating expenses 5,454 5,104 4,924 4,629
Operating income 483 418 631 1,021
Other expenses (income)
Interest expense 91 106 70 70
Capitalized interest (33) (17) (21) (28)
Interest income (24) (37) (43) (40)
Other (gains) losses, net (259) (27) (203) 2
Total other expenses (income) (225) 25 (197) 4
Income before income taxes and
cumulative effect of change in
accounting principle
708 393 828 1,017
Provision for income taxes 266 152 317 392
Income before cumulative effect of
changes in accounting principles
442 241 511 625
Cumulative effect of changes in
accounting principles, Net of
income tax
0 0 0 (22)
Net income 442 241 511 603
Preferred stock dividends 0 0 0 0
Net income (loss) available to
common shareowners
442 241 511 603
C. RICHARD BAKER ET AL.190

Table A.2. Air France Consolidated Income Statements for Years
ended March 31, 2004, 2003, 2002, and 2001.
(In Millions of EUR) 2003–2004 2002–2003 2001–2002 2000–2001
Operating revenues
Passenger 10,260 10,527 10,378 10,022
Cargo 1,412 1,479 1,448 1,491
Maintenance 508 540 548 566
Other 157 141 154 201
Total operating revenues 12,337 12,687 12,528 12,280
Operating expenses
Aircraft fuel (1,302) (1,369) (1,443) (1,625)
Chartering costs (414) (415) (639) (741)
Aircraft operating lease costs (458) (522) (489) (410)
Landing fees and en route charges (913) (934) (882) (814)
Catering (296) (319) (329) (323)
Handling charges and other operating
costs
(756) (768) (747) (697)
Aircraft maintenance costs (381) (477) (652) (598)
Commercial and distribution costs (1,051) (1,157) (1,133) (1,199)
Other external expenses (1,183) (1,213) (1,152) (1,083)
Salaries and related costs (4,079) (3,856) (3,738) (3,436)
Taxes other than income tax (186) (187) (163) (154)
Total operating expenses (11,019) (11,217) (11,367) (11,080)
Gross operating result 1,318 1,470 1,161 1,200
Charge to depreciation/amortization,
net
(1,184) (1,195) (972) (915)
Charge to operating provisions, net (46) (115) (39) 62
Gain on disposal of flight equipment,
net
7 30 78 88
Other operating income and charges,
net
44 2 7 8
Operating income 139 192 235 443
Restructuring costs (22) (13) (11) (5)
Net financial charges (60) (85) (112) (137)
Gains on disposals of subsidiaries and
affiliates, net
5 4 24 96
Pretax income (loss) 62 98 136 397
Share in net income of equity affiliates 53 29 31 45
Amortization of goodwill (15) (16) (16) (62)
Income (loss) before income tax and
minority interests
100 111 151 380
Income tax (2) 13 5 45
Income (loss) before minority interests 98 124 156 425
Minority interests (5) (4) (3) (4)
Net income (loss) 93 120 153 421
Using ‘‘Statement of Intermediate Balances’’ 191

Table A.3. China Eastern Airlines Consolidated Statements of Income
for Years ended December 31, 2003, 2002, 2001, and 2000.
(In Millions of RMB) 2003 2002 2001 2000
Traffic revenues
Passenger 10,261 10,038 9,587 8,644
Cargo and mail 3,187 2,445 2,092 2,124
Other operating revenues 829 596 474 452
Turnover 14,277 13,079 12,153 11,220
Other operating income 2 226 128 0
Operating expenses
Wages, salaries, and benefits (1,449) (1,036) (773) (798)
Take off and landing charges (2,254) (1,988) (1,703) (1,572)
Aircraft fuel (3,045) (2,564) (2,613) (2,327)
Food and beverages (542) (606) (567) (499)
Aircraft depreciation and operating leases (2,851) (2,455) (2,404) (2,168)
Other depreciation and operating leases (495) (400) (358) (321)
Aircraft maintenance (1,329) (1,078) (967) (820)
Commissions (465) (380) (487) (645)
Office and administration (1,058) (1,044) (849) (724)
Revaluation deficit of fixed assets 0 (171) 0 0
Other (570) (520) (563) (568)
Total operating expenses (14,058) (12,242) (11,284) (10,442)
Operating profit 221 1,063 997 778
Finance costs, net (712) (731) (814) (814)
Exchange (loss)/gain, net (70) (38) 126 0
Other income, net 0 0 0 341
Share of results of associates before tax (29) (32) 5 0
Profit before taxation (590) 262 314 305
Taxation (247) (54) 261 (100)
Profit after taxation (837) 208 575 205
Minority interests (112) (122) (33) (29)
Profit attributable to shareholders (949) 86 542 176
C. RICHARD BAKER ET AL.192

Table A.4. China Eastern Airlines Additional Information for Years
ended December 31, 2003, 2002, 2001, and 2000.
2003 2002 2001 2000
Net exchange gain/(loss) 126 120
Gain on disposal of aircraft and engines 2 112
Rental income from operating subleases of aircraft 126 111
Other, net (5) (2)
Other income, net 249 341
Gain on disposal of aircraft and engines (29) 116 2
Rental income from operating subleases of aircraft 31 110 126
Other operating income 2 226 128
Operating lease rentals (aircraft) 1,048 1,026 925 769
Operating lease rentals (land and buildings) 46 99 90 83
Table A.5. Southwest Airlines Statement of Intermediate Balances
(in $ Millions).
For the Years Ended December 31 2003 2002 2001 2000
Passenger 5,741 5,342 5,379 5,468
Freight 94 84 91 111
Other 102 96 85 71
Total production for the period 5,937 5,522 5,555 5,650
Fuel and oil (830) (762) (771) (805)
Agency commissions (48) (55) (103) (160)
Landing fees and other rentals (372) (345) (311) (265)
Aircraft rentals (183) (187) (192) (196)
Maintenance materials and repairs (430) (390) (397) (378)
Other operating expenses (983) (1,017) (976) (860)
Consumption from third parties (2,846) (2,756) (2,750) (2,664)
Value added 3,091 2,766 2,805 2,986
Salaries, wages, and benefits (2,224) (1,992) (1,856) (1,684)
Gross operating income 867 774 949 1,302
Depreciation (384) (356) (318) (281)
Operating income 483 418 631 1,021
Interest expense (91) (106) (70) (70)
Capitalized interest 33 17 21 28
Interest income 24 37 43 40
Operating net income before taxes 449 366 625 1,019
Other (gains) losses, net 259 27 203 (2)
Unusual income 259 27 203 (2)
Provision for income taxes 266 152 317 392
Cumulative effect of changes in accounting
principles, net of income tax
0 0 0 (22)
Preferred stock dividends 0 0 0 0
Net income (loss) available to common shareowners 442 241 511 603
Using ‘‘Statement of Intermediate Balances’’ 193

Table A.6. Southwest Airlines Statement of Intermediate Balances
(in Percentage Terms).
For the Years Ended December 31 2003 2002 2001 2000
Passenger 96.7 96.7 96.8 96.8
Freight 1.6 1.5 1.6 2.0
Other 1.7 1.7 1.5 1.3
Total production for the period 100.0 100.0 100.0 100.0
Change in production 7.5 (0.6) (1.7) 19.3
Change in passenger revenues 7.5 (0.7) (1.6) 19.8
Change in cargo revenues 11.9 (7.7) (18.0) 7.8
Fuel and oil (14.0) (13.8) (13.9) (14.2)
Agency commissions (0.8) (1.0) (1.9) (2.8)
Landing fees and other rentals (6.3) (6.2) (5.6) (4.7)
Aircraft rentals (3.1) (3.4) (3.5) (3.5)
Maintenance materials and repairs (7.2) (7.1) (7.1) (6.7)
Other operating expenses (16.6) (18.4) (17.6) (15.2)
Consumption from third parties (47.9) (49.9) (49.5) (47.2)
Value added 52.1 50.1 50.5 52.8
Salaries, wages, and benefits (37.5) (36.1) (33.4) (29.8)
Gross operating income 14.6 14.0 17.1 23.0
Depreciation (6.5) (6.4) (5.7) (5.0)
Operating income 8.1 7.6 11.4 18.1
Interest expense (1.5) (1.9) (1.3) (1.2)
Capitalized interest 0.6 0.3 0.4 0.5
Interest income 0.4 0.7 0.8 0.7
Operating net income before taxes 7.6 6.6 11.3 18.0
Other (gains) losses, net 4.4 0.5 3.7 (0.0)
Unusual income 4.4 0.5 3.7 (0.0)
Provision for income taxes 4.5 2.8 5.7 6.9
Cumulative effect of changes in accounting
principles, Net of income tax
0.0 0.0 0.0 (0.4)
Preferred stock dividends 0.0 0.0 0.0 0.0
Net income (loss) available to common
shareowners
7.4 4.4 9.2 10.7
C. RICHARD BAKER ET AL.194

Table A.7. Air France Statement of Intermediate Balances
(in h Millions).
For the Years Ended March 31 2003–2004 2002–2003 2001–2002 2000–2001
Passenger 10,260 10,527 10,378 10,022
Cargo 1,412 1,479 1,448 1,491
Maintenance 508 540 548 566
Other 157 141 154 201
Total production for the period 12,337 12,687 12,528 12,280
Aircraft fuel (1,302) (1,369) (1,443) (1,625)
Chartering costs (414) (415) (639) (741)
Aircraft operating lease costs (458) (522) (489) (410)
Landing fees and en route
charges
(913) (934) (882) (814)
Catering (296) (319) (329) (323)
Handling charges and other
operating costs
(756) (768) (747) (697)
Aircraft maintenance costs (381) (477) (652) (598)
Commercial and distribution
costs
(1,051) (1,157) (1,133) (1,199)
Other external expenses (1,183) (1,213) (1,152) (1,083)
Consumption from third parties (6,754) (7,174) (7,466) (7,490)
Value added 5,583 5,513 5,062 4,790
Salaries and related costs (4,079) (3,856) (3,738) (3,436)
Taxes other than income tax (186) (187) (163) (154)
Gross operating income 1,318 1,470 1,161 1,200
Charge to depreciation/
amortization, net
(1,184) (1,195) (972) (915)
Charge to operating provisions,
net
(46) (115) (39) 62
Other operating income and
charges, net
44 2 7 8
Operating income 132 162 157 355
Net financial charges (60) (85) (112) (137)
Share in net income of equity
affiliates
53 29 31 45
Operating net income before taxes 125 106 76 263
Gain on disposal of flight
equipment, net
7 30 78 88
Restructuring costs (22) (13) (11) (5)
Gains on disposals of
subsidiaries and affiliates, net
5 4 24 96
Unusual income (10) 21 91 179
Amortization of goodwill (15) (16) (16) (62)
Income tax (2) 13 5 45
Minority interests (5) (4) (3) (4)
Net income (loss) 93 120 153 421
Using ‘‘Statement of Intermediate Balances’’ 195

Table A.8. Air France Statement of Intermediate Balances
(in Percentage Terms).
For the Years Ended March 31 2003–2004 2002–2003 2001–2002 2000–2001
Passenger 83.2 83.0 82.8 81.6
Cargo 11.4 11.7 11.6 12.1
Maintenance 4.1 4.3 4.4 4.6
Other 1.3 1.1 1.2 1.6
Total production for the period 100.0 100.0 100.0 100.0
Change in production (2.8) 1.3 2.0 18.9
Change in passenger revenues (2.5) 1.4 3.6 19.6
Change in cargo revenues (4.5) 2.1 (2.9) 20.2
Aircraft fuel (10.6) (10.8) (11.5) (13.2)
Chartering costs (3.4) (3.3) (5.1) (6.0)
Aircraft operating lease costs (3.7) (4.1) (3.9) (3.3)
Landing fees and en route charges (7.4) (7.4) (7.0) (6.6)
Catering (2.4) (2.5) (2.6) (2.6)
Handling charges and other
operating costs
(6.1) (6.1) (6.0) (5.7)
Aircraft maintenance costs (3.1) (3.8) (5.2) (4.9)
Commercial and distribution costs (8.5) (9.1) (9.0) (9.8)
Other external expenses (9.6) (9.6) (9.2) (8.8)
Consumption from third parties (54.7) (56.5) (59.6) (61.0)
Value added 45.3 43.5 40.4 39.0
Salaries and related costs (33.1) (30.4) (29.8) (28.0)
Taxes other than income tax (1.5) (1.5) (1.3) (1.3)
Gross operating income 10.7 11.6 9.3 9.8
Charge to depreciation/amortization,
net
(9.6) (9.4) (7.8) (7.5)
Charge to operating provisions, net (0.4) (0.9) (0.3) 0.5
Other operating income and charges,
net
0.4 0.0 0.1 0.1
Operating income 1.1 1.3 1.3 2.9
Net financial charges (0.5) (0.7) (0.9) (1.1)
Share in net income of equity affiliates 0.4 0.2 0.2 0.4
Operating net income before taxes 1.0 0.8 0.6 2.1
Gain on disposal of flight equipment,
net
0.1 0.2 0.6 0.7
Restructuring costs (0.2) (0.1) (0.1) (0.0)
Gains on disposals of subsidiaries and
affiliates, net
0.0 0.0 0.2 0.8
Unusual income (0.1) 0.2 0.7 1.5
Amortization of goodwill (0.1) (0.1) (0.1) (0.5)
Income tax (0.0) 0.1 0.0 0.4
Minority interests (0.0) (0.0) (0.0) (0.0)
Net income (loss) 0.8 0.9 1.2 3.4
C. RICHARD BAKER ET AL.196

Table A.9. China Eastern Statement of Intermediate Balances
(in RMB Millions).
For the Years Ended December 31 2003 2002 2001 2000
Passenger 10,261 1,0038 9,587 8,644
Cargo and mail 3,187 2,445 2,092 2,124
Other operating revenues 829 596 474 452
Total production for the period 14,277 13,079 12,153 11,220
Take off and landing charges (2,254) (1,988) (1,703) (1,572)
Aircraft fuel (3,045) (2,564) (2,613) (2,327)
Food and beverages (542) (606) (567) (499)
Aircraft maintenance (1,329) (1,078) (967) (820)
Commissions (465) (380) (487) (645)
Other (570) (520) (563) (568)
Operating lease rentals (aircraft) (1,048) (1,026) (925) (769)
Operating lease rentals (land and buildings) (46) (99) (90) (83)
Office and administration (1,058) (1,044) (849) (724)
Consumption from third parties (10,357) (9,305) (8,764) (8,007)
Value added 3,920 3,774 3,389 3,213
Wages, salaries, and benefits (1,449) (1,036) (773) (798)
Gross operating income 2,471 2,738 2,616 2,415
Rental income from operating subleases
of aircraft
31 110 126 111
Aircraft depreciation (1,803) (1,429) (1,479) (1,399)
Other depreciation (449) (301) (268) (238)
Operating income 250 1,118 995 889
Finance costs, net (712) (731) (814) (814)
Exchange (loss)/gain, net (70) (38) 126 120
Share of results of associates before tax (29) (32) 5 (2)
Operating net income before taxes (561) 317 312 193
Gain on disposal of aircraft and engines (29) 116 2 112
Revaluation deficit of fixed assets 0 (171) 0 0
Unusual income (29) (55) 2 112
Taxation (247) (54) 261 (100)
Minority interests (112) (122) (33) (29)
Profit attributable to shareholders (949) 86 542 176
Using ‘‘Statement of Intermediate Balances’’ 197

Table A.10. China Eastern Statement of Intermediate Balances
(in Percentage Terms).
For the Years Ended December 31 2003 2002 2001 2000
Passenger 71.9 76.7 78.9 77.0
Cargo and mail 22.3 18.7 17.2 18.9
Other operating revenues 5.8 4.6 3.9 4.0
Total production for the period 100.0 100.0 100.0 100.0
Change in production 9.2 7.6 8.3 10.4
Change in passenger revenues 2.2 4.7 10.9 7.6
Change in cargo revenues 30.3 16.9 (1.5) 22.8
Take off and landing charges (15.8) (15.2) (14.0) (14.0)
Aircraft fuel (21.3) (19.6) (21.5) (20.7)
Food and beverages (3.8) (4.6) (4.7) (4.4)
Aircraft maintenance (9.3) (8.2) (8.0) (7.3)
Commissions (3.3) (2.9) (4.0) (5.7)
Other (4.0) (4.0) (4.6) (5.1)
Operating lease rentals (aircraft) (7.3) (7.8) (7.6) (6.9)
Operating lease rentals (land and buildings) (0.3) (0.8) (0.7) (0.7)
Office and administration (7.4) (8.0) (7.0) (6.5)
Consumption from third parties (72.5) (71.1) (72.1) (71.4)
Value added 27.5 28.9 27.9 28.6
Wages, salaries, and benefits (10.1) (7.9) (6.4) (7.1)
Gross operating income 17.3 20.9 21.5 21.5
Rental income from operating subleases
of aircraft
0.2 0.8 1.0 1.0
Aircraft depreciation (12.6) (10.9) (12.2) (12.5)
Other depreciation (3.1) (2.3) (2.2) (2.1)
Operating income 1.8 8.5 8.2 7.9
Finance costs, net (5.0) (5.6) (6.7) (7.3)
Exchange (loss)/gain, net (0.5) (0.3) 1.0 1.1
Share of results of associates before tax (0.2) (0.2) 0.0 (0.0)
Operating net income before taxes (3.9) 2.4 2.6 1.7
Gain on disposal of aircraft and engines (0.2) 0.9 0.0 1.0
Revaluation deficit of fixed assets 0.0 (1.3) 0.0 0.0
Unusual income (0.2) (0.4) 0.0 1.0
Taxation (1.7) (0.4) 2.1 (0.9)
Minority interests (0.8) (0.9) (0.3) (0.3)
Profit attributable to shareholders (6.6) 0.7 4.5 1.6
C. RICHARD BAKER ET AL.198

TRANSFER PRICING PRACTICES
AND REGULATORY ACTIONS
IN THE U.S. AND U.K.:
A CROSS-COUNTRY COMPARISON
AND ANALYSIS
Rasoul H. Tondkar, Wendy W. Achilles and
Joyce van der Laan Smith
ABSTRACT
With the continued globalization of world markets, transfer pricing has
become one of the dominant sources of controversy in international tax-
ation. Cross-country differences in transfer pricing practices and regu-
lations present challenges to taxing authorities and multinational
enterprises (MEs). In the last two decades, tax authorities in the Unit-
ed States (U.S.) and other countries have brought major court cases
against MEs accused of underpayment of taxes through transfer pricing
practices. This paper discusses transfer pricing practices, regulatory
agencies, penalties related to violations, and proper documentation re-
quired in the U.S. and one of its major trading partners, the United
Kingdom (U.K.). The paper also examines the acceptable valuation
methods allowed as a surrogate for arm’s-length transactions as
Advances in International Accounting
Advances in International Accounting, Volume 18, 199–217
Copyright r 2005 by Elsevier Ltd.
All rights of reproduction in any form reserved
ISSN: 0897-3660/doi:10.1016/S0897-3660(05)18010-6
199

established by the country’s regulatory agency. Finally, the paper dis-
cusses the similarities and differences between the major court cases re-
lated to transfer pricing in the two countries.
INTRODUCTION
Transfer pricing has emerged as one of the dominant sources of controversy
in international taxation. Transfer pricing is the process by which a mul-
tinational enterprise (ME) calculates a price for goods and services that are
transferred to affiliated entities. These transfer prices impact the taxable
income reported in each country in which the ME operates. MEs wish to
minimize their tax burden and tax authorities wish to ensure that the tax
base of a ME is divided fairly. Thus, both tax authorities and MEs are
interested in the way in which a transfer price is determined.
Tax authorities view transfer pricing violations as a significant source of
lost revenue. The Internal Revenue Service (IRS) of the U.S. reported that in
1995, as a result of court cases involving transfer pricing violations, it re-
couped $1.64 billion. Similar actions netted $1.2 billion for the IRS in 1994.
In addition, for the 1996–1998 period ‘‘the ‘gross income gap’ in the United
States attributable to transfer pricing was in excess of U.S. $2.8 billion per
year’’ (Borkowski, 2001, p. 350). The U.S. is not the only country trying to
ensure that it receives its ‘‘fair share’’ of taxes paid by MEs (DeSouza, 1997).
Countries around the world are regulating transfer pricing activities and as a
result, several landmark court cases have emerged in this area.
MEs view transfer pricing as problematic given the potential effect of
differences in tax rates and transfer pricing policies on their reported profits.
Transfer pricing documentation requirements are also costly and time con-
suming for MEs because of differences in each country’s regulatory re-
quirements.
Transfer pricing issues are also costly and difficult for regulators because
of the lack of qualified personnel and resources. Oftentimes, the regulators
do not have the staff with the knowledge base necessary to audit large MEs’
transfer pricing practices. Additionally, the regulators may not have the
needed resources to contend in courts with the MEs accused of transfer
pricing violations. In many instances, the regulators are ‘‘outgunned’’ in
court cases because the MEs have more resources to spend on legal teams.
This paper examines the transfer pricing practices, regulatory policies,
and certain court cases involving transfer pricing violations in the U.S. and
the United Kingdom (U.K.). The U.K. is a major trading partner with the
RASOUL H. TONDKAR ET AL.200

U.S., representing over $33 billion in exports and over $40 billion in imports
in 2002 (U.S. Census Bureau). In addition, it is anticipated that the new
U.K./U.S. income tax treaty, effective March 3, 2003, will increase cross
border trade and investment, increasing the level of transfer pricing issues
within each country. The tax authorities within both countries use an arm’s-
length transaction as the standard for establishing transfer prices. However,
within the U.S., the regulations are more detailed providing specific rules for
determining the transfer price whereas in the U.K., the burden is on the
company to use a transfer price which meets the principle of an arm’s-length
transaction.
The court cases were selected based on their relevance to the transfer
pricing controversy within each country. The discussion of these cases in the
two countries address different issues on transfer pricing. Some of the cases
discussed provide background information that has led to the development
of current transfer pricing regulations, while others are more recent and
provide insight into the controversies between the taxpayer and the regu-
latory agency. This study should be of interest to companies engaged in
transfer pricing in the U.S. and the U.K., regulators in these countries, and
researchers interested in further examination of transfer pricing issues in the
above countries.
TRANSFER PRICING REGULATIONS AND
METHODS USED IN THE U.S.
Regulations
The IRS is the regulatory agency that sets transfer pricing rules in the U.S.
The guidelines are detailed in Section 482 of the Internal Revenue Code
(IRC). It states that intercompany transfer prices must be set at an arm’s-
length standard. The Treasury Regulations define ‘‘arm’s-length’’ as the
results of a transaction between controlled entities being similar to the re-
sults of uncontrolled corporations. To determine if its pricing strategy meets
the arm’s-length standard, the company must compare the prices charged to
affiliates with those charged to third parties. If the comparable prices are not
available, companies must compare their profits to profits earned by com-
parable third parties (DeSouza, 1997).
The transfer pricing regulations allow for flexibility in the utilization of
the transfer pricing methods. Section 482 of the regulations permits the
Transfer Pricing Practices 201

taxpayer to use any other reasonable pricing method, however, documen-
tation supporting the use of the alternative method is imperative.
As part of the transfer pricing regulations, Section 6662 was created to
encourage taxpayers, by threat of penalties, to provide the IRS with enough
information to determine if the taxpayer is meeting the Section 482 spec-
ifications. According to Section 6662, a penalty equal to 20% of the un-
derpayment in tax is levied if there is a substantial miscalculation in the
arm’s-length price of a transaction. If the company is grossly negligent, the
penalty is increased to 40% of the underpayment of tax. Treasury Regu-
lation Section 1.6662-6 details the transfer pricing penalty and documen-
tation requirements.
Section 6662 and Treasury Regulation Section 1.6662 specify the infor-
mation that needs to be made available for the IRS and identifies documents
the company should prepare to detail its transfer pricing policy. The fol-
lowing documentation is required for the U.S. companies:
� Business Overview� Organization Structure� Method Selected� Alternative Methods Rejected� Analyze Controlled Transaction� Identify Comparable Methods� Economic Analysis� Relevant Data Obtained after Year-End� Index (Deloitte & Touche, 2002)
Transfer Pricing Methods
The transfer pricing methods used in the U.S. for tangible properties are:
(1) comparable uncontrolled price (CUP), (2) resale price (RPM), (3) cost-
plus (CPLM), (4) comparable profits (CPM), (5) profit-split, and (6) other
reasonable methods. Under the transfer pricing regulations, no method is
preferred above other methods. The ‘‘best method’’ is the method ‘‘which is
the most reliable, with consideration given to the completeness and accuracy
of the data, the reality of the assumptions used, and the sensitivity of the
results to deficiencies in the data and assumptions employed’’ (Sherman &
McBride, 1995, p. 29).
The CUP method determines an arm’s-length price by comparing the
transfer price to prices charged to unrelated parties in similar transactions.
The CUP method can only be used if the transfer price is adjusted for the
RASOUL H. TONDKAR ET AL.202

differences between the intercompany transaction and the unrelated trans-
action with which it is being compared. The IRS deems the more differences
that exist between the two transactions, the more unreliable the CUP meth-
od becomes.
The RPM is most often used when there are no third party transactions to
compare the intercompany transaction. With RPM, ‘‘a transfer price is
computed by subtracting an appropriate gross profit from the resale price
charged by the controlled reseller to an unrelated third party’’ (Sherman &
McBride, 1995, p. 30). RPM focuses more on the functions performed by
the controlled and uncontrolled resellers than on the transaction itself.
The CPLM calculates the transfer price ‘‘by adding the profit (expressed
as a percentage of cost) that would be earned on the sale to an uncontrolled
party to the cost of producing the property’’ (Sherman & McBride, 1995,
p. 30). Parent and subsidiary groups use this method most often when a
subsidiary manufactures a product and sells it to the parent or another
affiliated company.
The CPM sets a transfer price by employing ‘‘profit measures (such as the
return on assets or operating income to sales) to determine a return that
would equal that realized by a comparable independent enterprise’’
(Borkowski, 2003, p. 30). The transfer pricing regulations state that CPM
is a ‘‘method of last resort’’ and cannot be used by the IRS to challenge
other methods.
The profit-split method includes two methods – the comparable profit-
split, and the residual profit-split. With the comparable profit-split, ‘‘a
profit-split is achieved based on the relative profits of uncontrolled taxpay-
ers engaged in transactions and functions similar to those of the controlled
taxpayer’’ (Kim, Swinnerton, & Ulferts, 1997, p. 20). The residual profit-
split requires a two-step process. In the first step, the ME evaluates the
functions of the parties involved in the controlled transaction and assigns a
fair value to each function based on the value that could be assigned in an
arm’s-length transaction. The second step requires allocating profit to the
company based on the value of each company’s input.
The methods prescribed by the IRS for pricing intangible transactions are
similar to the methods prescribed for tangible transactions. These methods
are: (1) comparable uncontrolled transaction (CUT), (2) CPM, (3) the profit-
split, and (4) any other reasonable method. The CUT method for intangibles
is basically the same as the CUP method for tangible property. The other
intangible methods, CPM and profit-split, are identical to the valuation
methods for tangible property (Sherman & McBride, 1995). The U.S. reg-
ulations, Section 482-4(a), also contain the commensurate-with-income
Transfer Pricing Practices 203

requirement, which require the value of the transferred intangible property to
be based on the income derived from that property. This requirement uses the
arm’s-length return concept versus arm’s-length price (Borkowski, 2001).
Advance pricing agreements (APAs) can be entered into between the tax-
payer and the IRS. The APA allows the taxpayer and the IRS to agree upon
a transfer pricing method. The APA alleviates the possibility of an IRS
challenge to the company’s transfer pricing method. The primary disadvan-
tages of an APA are the $5,000 filing fee, the required documentation, and
the uncertainty if the APA will be accepted in the other countries in which
the taxpayer operates. If there is a tax treaty between the U.S. and the foreign
countries, the ME can request the IRS to include the foreign countries’
transfer pricing rules as part of the agreement. The U.S./U.K. tax treaty
applies an arm’s-length standard that is consistent with the Organization of
Economic Cooperation and Development guidelines (discussed later).
TRANSFER PRICING REGULATIONS AND
METHODS USED IN THE U.K.
The main authority for transfer pricing regulation in the U.K. is the Inland
Revenue. The primary legislation that guides the Inland Revenue for tax-
ation is Section 770 (replaced Section 485), Schedule 28AA, and the Income
and Corporation Taxes Act of 1988 (Schon, 1997), and the Finance Act of
1998. The Inland Revenue issued the Inland Revenue Tax Bulletin 25, 38, 4,
and 46 to cover transfer pricing and the documentation requirements for
taxpayers. The U.K. transfer pricing regulations follow many of the reg-
ulations identified in the Organization for Economic Co-operation and De-
velopment (OECD) Guidelines.
The OECD consists of 30 member countries and is a ‘‘unique forum to
discuss, develop and refine economic and social policies. They compare ex-
periences, seek answers to common problems and work to co-ordinate do-
mestic and international policies to help members and non-members deal with
an increasingly globalized world’’ (OECD, 2003). The OECD also develops
international policies and recommendations on issues, such as transfer pric-
ing, where multilateral agreements are conducive to globalization.
The U.K. applies the arm’s-length standard outlined in the OECD
Guidelines. The OECD defines arm’s-length as the following:
conditions [that] are made or imposed between the two enterprises in their commercial or
financial relations which differ from those which would be made between independent
RASOUL H. TONDKAR ET AL.204

enterprises, then any profits which would, but for those conditions, have accrued to
one of the enterprises, but, by reasons of those conditions, have not so accrued,
may be included in the profits of that enterprise and taxed accordingly (OECD, 2001,
p. G-1).
Penalties are imposed for failure to comply with the transfer pricing rules
and the documentation requirements set forth by the Inland Revenue. Tax-
payers are expected to conduct a self-assessment (apply the arm’s-length
standard to transactions between related parties that appear in their annual
tax return) and if the filed tax return is fraudulent or negligent, the tax
penalty can be 100% of the unpaid tax. The absence of documentation will
constitute negligence; however, there is no penalty if the taxpayer has made
an ‘‘honest and reasonable’’ attempt to comply with the law and has ev-
idence to show that it has done so (Schwarz, 1999b).
As part of the self-assessment, documentation requirements exist to en-
sure a complete and accurate tax return. In practice, burden shifts to the
taxpayer to demonstrate reasonable pricing methods. This requirement is
effective for tax years beginning after July 1, 1998. The following is a list of
documentation requirements for the U.K. companies:
� Business Overview� Organization Structure� Method Selected� Analyze Control Transactions� Identify Comparable Methods� Conduct an Economic Analysis (Deloitte & Touche, 2002).
Transfer Pricing Methods
The methods outlined in the OECD Guidelines that are used by the U.K.
are: (1) the comparable uncontrolled price, (2) resale method, (3) cost-plus,
or (4) any other reasonable method. Since these methods are similar to the
U.S. methods, they are not discussed here. The U.K. applies the same
transfer pricing methods to both tangibles and intangibles, however, it does
not allow the commensurate-with-income approach. The Inland Revenue,
like the IRS, has not established an order of most to least preferable method
of transfer pricing. Many taxpayers believe the method preferred by the
Inland Revenue is the method that produces the best result for the U.K.
regulatory agency (Levey, Fox, Penney, Fairley & Palmer, 1994).
Transfer Pricing Practices 205

The Inland Revenue executes APAs for the U.K. and follows the OECD
Guidelines. The OECD Guidelines define an APA as:
an arrangement that determines, in advance of controlled transactions, an appropriate
set of criteria for the determination of the transfer pricing for those transactions over a
fixed period of time. An advance pricing agreement may be unilateral involving one tax
administration and a taxpayer or multilateral involving the agreement of two or more
tax administrations (OECD, 2001, p. G-1).
CASES
The following are discussions of cases involving civil action against a com-
pany for transfer pricing violations. A summary of the important aspects of
these cases is provided in the Appendix. The litigation in all of the cases
arose from disagreements between the company and the tax authority over
the calculation of an appropriate arm’s-length price. The cases were selected
based on their relevance to the transfer pricing controversy within the home
country of the company.
U.S. CASES
Section 482
The purpose of Section 482 is to allocate income to the appropriate taxpayer
in transactions between affiliated entities and to prevent tax avoidance. In
addition, this Section places controlled entities on a level playing field with
uncontrolled entities by attempting to compute true taxable income. Under
Section 482, the taxpayer chooses the valuation method that best approx-
imates an arm’s-length price. The following cases use Section 482 as the
basis for the calculation of an arm’s-length price for tangible and intangible
property.
Section 482: Tangible Property
Microsoft Corp. v. Commissioner. Microsoft Corporation (Microsoft), a
Washington-based company, owned Microsoft Puerto Rico (MS-Puerto
Rico), a Delaware-based corporation. MS-Puerto Rico manufactured soft-
ware diskettes and sold them to Microsoft to be packaged with other com-
ponents. MS-Puerto Rico elected to be treated as a U.S. possession and
reported its taxable income under the profit-split method. The IRS wanted
RASOUL H. TONDKAR ET AL.206

to recalculate Microsoft’s combined taxable income for taxable years ending
June 30, 1990 and 1991 using 936(h) of the IRC; however, Microsoft argued
that the IRS was barred by the statute of limitations from doing so. The IRS
contended that diskette duplication activities were not considered a man-
ufacturing activity under 936 and therefore, did not qualify for the profit-
split provisions. The IRS recalculated the price of the diskettes sold to
Microsoft under the transfer pricing rules of IRC Section 482.
In January 1996, Microsoft and the IRS agreed to extend the statute of
limitations related to the calculation of an arm’s-length price for the dis-
kettes for taxable years 1990 and 1991 until December 31, 1996. No mention
was made of the recalculation of combined taxable income, only the fact
that MS-Puerto Rico did not qualify for the profit-split provisions and a
new arm’s-length price would be calculated. This new price would have
substantially increased Microsoft’s taxable income as a result of the appli-
cation of Section 482. The IRS issued Microsoft a deficiency notice related
to the recalculation of combined taxable income. A deficiency notice is
issued when a difference exists between the tax liability reported on the
taxpayer’s tax return and the tax liability calculated by the tax authorities.
Microsoft argued the recalculation was not mentioned in the agreement to
extend the statute of limitations and thus time had expired. The United
States Tax Court agreed with Microsoft and ruled in their favor. This ruling
was a major victory for taxpayers because the Court limited the liability of
the taxpayer only to what is contained in the plain-language notice from the
IRS stating that any agreement between the taxpayer and the IRS must be
clearly explained in the notice.
National Semiconductor Corp. v. Commissioner. National Semiconductor
Corporation (NSC) manufactured semiconductors and allied products and
sold many of these products to its Asian subsidiary. The issue before the
Court was whether or not these sales were conducted as an arm’s-length
transaction under Section 482 of the transfer pricing rules. NSC used the
CUP method to calculate the price for the sales. The IRS claimed the cal-
culations did not represent an arm’s-length transaction and issued a defi-
ciency notice to that effect. The Court decided neither NSC nor the IRS
presented evidence of a true arm’s-length price and relied on the expert
testimony of several IRS witnesses, with modifications where it was shown
the witnesses had erred, to determine an adequate price. The Court deter-
mined the amount of income to be reallocated to NSC and entered the
amount as the judgment against NSC. This case showed the burden of proof
is on the taxpayer but also revealed the arm’s-length prices calculated by the
Transfer Pricing Practices 207

IRS had to be reasonable to be accepted by the Court. If the calculated price
of the IRS is not reasonable, the taxpayer only has to prove its transfer
pricing was arm’s-length. NSC did not prove this in this case.
Compaq Computer Corp. v. Commissioner. Compaq Computer Corporation
(Compaq), a Delaware corporation, has its primary business location in
Houston, Texas. Compaq is in the business of designing, manufacturing,
and selling personal computers. Compaq purchased circuit boards from its
Singapore subsidiary to be used in its personal computers. The IRS con-
tended that prices paid by Compaq to its Singapore subsidiary were not
arm’s-length and the price should be recomputed under the transfer pricing
rules of Section 482. Compaq claimed no other subcontractors were capable
of producing the circuit boards due to lack of capital-intensive equipment,
engineers, processes, and experience.
The IRS audited the tax returns of Compaq for fiscal year ended (FYE)
November 30, 1991 and 1992, and issued deficiency notices in the following
amount: FYE November 30, 1991: $42,422,470; FYE November 31, 1992:
$33,533,968 and Section 6662(a) penalty: $547,619. The Court decided that
the amount paid by Compaq for the printed circuit assemblies from the
Singapore subsidiary was arm’s-length under Section 482. Compaq used the
cost-plus method to compute the transfer price charged to the subsidiary
and the Court held ‘‘the subsidiary’s prices were closely related to the prices
paid to the unrelated contractors and could be adjusted to account for
physical differences, production times, payment terms, freight and duty
costs, setup and cancellation charges, inventory costs, and intangible costs.’’
The Tax Court described the IRS’ calculations as ‘‘arbitrary, capricious and
unreasonable based on unrealistic materials, labor and overhead markups.’’
The IRS lost the case because it failed to prove an alternative method
resulted in a more accurate calculation and the Court awarded Compaq a
favorable transfer pricing adjustment in the amount of $21 million. This
case was unusual in that it was a complete victory for the taxpayer. Gen-
erally, the Court does not grant a complete victory to the IRS, or the
taxpayer but rules somewhere in the middle.
Section 482: Intangible Property
BMC Software v. Commissioner. BMC Software, located in Houston, Texas,
designed and manufactured computer software products. BMC formed a
foreign subsidiary in Holland to distribute its products in Europe. BMC and
the subsidiary entered into a licensing agreement. The IRS alleged that
BMC did not recognize sufficient income in its FYE March 31, 1993 tax
RASOUL H. TONDKAR ET AL.208

return related to the licensing agreement due to BMC’s intercompany transfer
pricing policy. The IRS recalculated BMC’s tax liability and increased it by
$24,124,945. The main issue in this case was the intercompany valuation of
intangible transactions of BMC and the subsidiary. The core concept in this
case was IRC Sec. 482 and Treas. Reg. 1.481-1(b).
A central issue in the dispute was that the IRS wanted access to BMC’s
computer source code ‘‘alleging that it would help refine the calculation of
the maintenance fees that petitioner contended should be included in re-
spondent’s royalty base.’’ BMC responded that release of the source code
contained substantial business risk and the information was irrelevant to the
IRS’ case. The United States District Court agreed with BMC and the
motion to enforce the IRS summons was denied. The ruling in favor of
BMC enforced the concept that only relevant information needs to be dis-
closed to the IRS in relation to transfer pricing documentation.
The decision on the additional tax liability calculated by the IRS to BMC
is still outstanding. A decision is expected in the near future.
Seagate Technology v. Commissioner. Seagate Technology Inc. (Seagate), a
publicly traded company that manufactures hard disk drives for personal
computers, formed a 100%-owned subsidiary in Singapore to manufacture
parts for the disk drives. In 1984, the Singapore subsidiary began manu-
facturing completed hard disk drives. Seagate purchased component parts
and completed hard disk drives from the subsidiary for resale to third par-
ties. Seagate generally paid the subsidiary cost plus a markup of 25% for the
manufactured parts and completed disk drives. The subsidiary paid Seagate
a 1% royalty commission on ‘‘certain sales into the United States.’’ Seagate
and the subsidiary also had the following agreements: ‘‘the subsidiary
agreed to pay Seagate a commission of 5% on all of the subsidiary’s third
party sales, the subsidiary agreed to pay Seagate for certain costs in assisting
the subsidiary’s operations, the subsidiary agreed to pay for one-half of the
research and development cost Seagate incurred and identified as covered
under the cost-sharing agreement, and the subsidiary agreed to reimburse
Seagate for certain warranty costs incurred by Seagate’s repair centers.’’
Upon audit, the IRS reallocated income from the subsidiary to Seagate
using the transfer pricing rules of Section 482 because the IRS did not
believe the calculated price was arm’s-length. The Court decided that the
reallocation amount was unreasonable but did rule in favor of the IRS. The
Court also decided that the royalty rate of 1%, the 50% of research and
development cost, and the transfer price used by Seagate was not arm’s-
length. Additionally, the Court ruled that the definition of ‘‘sales into the
Transfer Pricing Practices 209

United States’’ was not reasonable, and Seagate was not permitted to offset
warranty payments. The original deficiency notice issued by the IRS in the
amount of $112.3 million was reduced to approximately $45 million. This
case is a prime example of the Court rendering a decision where neither
party obtains a complete victory.
The cases discussed above portray the transfer pricing controversy in the
United States. The primary issues in these cases were calculation of the
transfer prices (specifically the methods used to calculate the transfer price),
information that should be disclosed to the IRS, and the reliability of
agreements between the IRS and ME’s. Although this is not a comprehen-
sive list of U.S. cases, the cases are representative of the main transfer
pricing controversies facing entities doing business in the United States with
operations abroad.
U.K. CASES
The transfer pricing regulations have evolved over many years in the U.K.
and several landmark court cases have resulted from disputes in the transfer
pricing guidelines. Section 770 (and its predecessor Section 485) addressed
transfer pricing issues but did not define certain terms as ‘‘arm’s-length
standard’’ nor did it provide acceptable transfer pricing valuation methods;
however, these Sections did provide the groundwork for the current transfer
pricing regulations. Cases discussed in this section relate to the provisions of
Sections 485, and subsequently 770.
Section 485
Section 485 was issued under the Income and Corporations Tax Act of 1970.
This Section states that if entities are members of a controlled group, the
transaction price must be computed as if the entities are not affiliated in any
way. This Section is comparable to Section 482 of the U.S. IRC. Although
Section 485 was replaced by Section 770 of the Income and Corporation
Taxes Act of 1988 (TA 1988), most provisions of this Section are incor-
porated into Section 770. The cases under Section 485 took place before it
was incorporated into Section 770.
Beecham Group plc v. Inland Revenue Commissioners
The Inland Revenue issued Beecham Group plc (Beecham), a well-known
pharmaceutical company, an assessment notice for tax years 1977–1985 for
RASOUL H. TONDKAR ET AL.210

underpayment of taxes related to transfer pricing violations under Section
485 of the Income and Corporations Tax Act of 1970. In the assessment
notice, the Inland Revenue requested from Beecham information related to
the accounts of its Singapore subsidiary, Beecham Pharmaceuticals (Pte)
Ltd from March 31, 1977 until March 31, 1985. The Inland Revenue con-
tended that transactions occurred between Beecham and the Singapore
subsidiary during these periods that were not arm’s-length. The Inland
Revenue requested the information because it wanted to alter the original
assessment issued under Section 485 for the years 1977–1985.
Beecham filed a summons before the Court and argued that the original
assessment could not be altered. Beecham maintained that if a new assess-
ment was issued, it might contain some contested tax returns that were not
mentioned in the original assessment. According to Beecham, this should not
be allowed because the statute of limitations had expired for these tax filings.
The Inland Revenue, however, wanted to discard the original summons
and further maintained that the question of whether or not the Inland
Revenue could invoke Section 485 was an issue that should be heard before
the Special Commissioner and not the Court. The Court decided to hear the
matter and decided in favor of Beecham. Basically, this implies Beecham did
not have to gather extensive information that could be unnecessary and the
original deficiency issued by the Inland Revenue is still in effect.1
Section 770
Section 770 was issued under the TA 1988. It replaced Section 485 of the
Income and Corporations Tax Act of 1970 and contains many of the same
provisions as Section 482 of the U.S. IRC. One problem with Section 770 is
the missing definition of ‘‘arm’s-length transaction,’’ which leaves interpre-
tation in the hands of the taxpayer.
Waterloo plc and Others v. Inland Revenue Commissioners
Waterloo, the parent company for a multi-national group, is located in the
U.K. and the shares of the company are traded on the London Stock Ex-
change. Waterloo established a plan so that the trustees could obtain in-
terest-free loans to purchase stock, and stock options for the benefit of the
employees of Waterloo’s subsidiaries. The Inland Revenue stated that
Waterloo had ‘‘given business facilities to its subsidiary within Section 773 (4)
of the TA 1988 and that Section 770 (1), which provided, that where
business facilities were given at an undervalue then in computations for tax
Transfer Pricing Practices 211

purposes the like consequences would ensue as would have ensued if the
transaction had been at an arm’s-length price.’’2 Inland Revenue interpreted
the ‘‘business facilities’’ language of Section 770 to include interest-free loans.
Waterloo contended they could not compute an arm’s-length price but the
Court held that business facilities had been transferred and an arm’s-length
price could be calculated. Thus, the Court rendered a decision in favor of the
Inland Revenue. The decision confirms a broad interpretation of the term
‘‘business facilities’’ and expanded the scope of the U.K. transfer pricing
rules under Section 770 to include transactions that are conducted through
an independent third party.
Newidgets Manufacturing Ltd v. Jones (Inspector of Taxes)
Newidgets Manufacturing Ltd (NW) is a wholly owned subsidiary of Foreign
Parent 1 (FP1 – name specified in the court case). NW paid FP1 a royalty
(calculated as a percentage of the selling price of widgets sold by NW to third
parties) based on a manufacturing licensing agreement between the two par-
ties. The agreement stated that NW had ‘‘the exclusive right to manufacture
widgets in the British Isles, under technical information provided by FP1, and
the non-exclusive right to use the technical information in the manufacturing
of spare parts.’’ A copy of the licensing agreement was sent to Inland Revenue
for approval under Section 54 of the Taxes Management Act of 1970.
The Inland Revenue approved the agreement for FYE 1991 and 1992;
however, no decision was made for FYE 1993. Since NW did not hear from
the Inland Revenue concerning FYE 1993, the company assumed the royalty
calculations were acceptable and proceeded in that manner. The Inland Rev-
enue decided that the licensing agreement was not an arm’s-length transaction
under Section 770 and denied the calculation for FYE 1993. The Inland
Revenue then assessed an additional tax liability against NW that NW ap-
pealed. The Special Commissioner stated that the purpose of Section 54 was
to protect the taxpayer with an agreement that had been accepted by both
parties. The Court stated that NW had not presented misleading information
to Inland Revenue and Inland Revenue had agreed with the royalty calcu-
lation. Therefore, the agreement between NW and Inland Revenue was up-
held and the appeal by NW was allowed. This decision will give comfort to
taxpayers in that they have some protection from additional assessments
when an agreement has been reached based on factual information.
Rochester (U.K.) Ltd and another v. Pickin (Inspector of Taxes)
Rochester (U.K.) Ltd (Rochester), a wholly owned subsidiary of a Canadian
company, bought seeds from a Dutch supplier, an unrelated third party, for
RASOUL H. TONDKAR ET AL.212

the purpose of extracting oil. Several years passed and the Dutch supplier
sold the seeds to a Swiss company, which was affiliated with Rochester. The
Swiss company made arrangements for the extraction of the oil and then
supplied oil to Rochester and the Canadian parent.
Upon review of Rochester’s tax returns, the Inland Revenue stated that
the Swiss company entered into the transactions so that Rochester would
pay the Swiss company more than an arm’s-length price for the oil and
avoid paying U.K. taxes. The Inland Revenue also argued that the U.K.
company made payments to the Swiss company for medical research when
actually the Swiss Company rendered no services. An assessment notice was
issued to Rochester by the Inland Revenue under Section 770 for excess
amounts paid to the Swiss company for the oil ‘‘and for the payments
relating to medical [research] expense on the basis that they were not in-
curred wholly and exclusively for the purpose of the U.K. company’s trade
within TA 1988, S74 (1)(a). They were therefore not deductible and re-
mained profits of the U.K. company.’’
The Special Commissioner ruled in favor of Rochester stating that the
Inland Revenue had failed to prove negligence by Rochester and the pay-
ments made by Rochester to the Swiss Company were part of a commercial
arrangement. This case focused on the documentation and the facts of the
transactions. Since, Rochester had documented all transactions and calcu-
lated transfer prices within Section 770, the Inland Revenue could not prove
the company’s calculations were not arm’s-length.
The above mentioned cases highlight the main transfer pricing issues
facing companies in the U.K. The primary issues in these cases were the
calculation of the transfer prices and the reliability of agreements between
the taxpayer and the Inland Revenue. As with the U.S. cases, the list is not
all-inclusive but does emphasize the most prominent cases that have helped
shape U.K. transfer pricing legislation.
DISCUSSION AND CONCLUSION
With the continued globalization of world markets, transfer pricing has
become one of the dominant sources of controversy in international tax-
ation. Cross-country differences in transfer pricing practices and regulations
present challenges to taxing authorities and MEs. In the last two decades,
tax authorities in the U.S. and other countries have brought major court
cases against MEs accused of underpayment of taxes through transfer pric-
ing practices.
Transfer Pricing Practices 213

This paper discusses transfer pricing practices, regulatory agencies, pen-
alties related to violations, and proper documentation required in the U.S.
and the U.K. The paper also presents the acceptable valuation methods
allowed for arm’s-length transactions, as established by the country’s reg-
ulatory agency. Finally, the paper discusses major court cases related to
transfer pricing in the two countries; highlighting the similarities and dif-
ferences between the court cases in these countries.
The transfer pricing regulations in the countries have evolved in different
ways. Transfer pricing regulations in the U.S. are much more detailed
and rule based, as compared to the U.K., attempting to answer every
foreseeable issue. The current regulations were established much earlier than
that of their U.K. counterparts. The final U.S. regulations on transfer
pricing were issued in 1994; however, the IRS issued the arm’s-
length standard that is applied by the U.S. tax authorities in 1968. The
IRS applies this arm’s-length standard to all inbound and outbound busi-
ness transaction. These stringent tax laws issued by the IRS put extensive
pressure on the tax authorities in other countries to adopt similar transfer
pricing regulations to ensure MEs pay an appropriate amount of tax in their
country.
Compared to the U.S., the transfer pricing rules took longer to evolve in
the U.K. In addition, the U.K. guidelines, unlike the U.S. regulations, do
not require any specific method to be used to calculate the transfer price.
The Inland Revenue encourages MEs to use the best method for the cir-
cumstances of the transaction. However, the Inland Revenue prefers the
traditional methods as applied by OECD guidelines. The U.K. in its Treas-
ury explanatory notes of the Finance Act of 1998 adopted the definition of
the ‘‘arm’s-length standard’’ developed by the OECD in 1979, which is
consistent with the U.S. definition.
The transfer pricing documentation requirements within both countries
require a company to include the method selected, an analysis of the con-
trolled transactions, and to identify comparable methods. The U.S., as op-
posed to the U.K., also requires the documentation to include why
alternative methods were rejected.
There are also differences in the court cases from the two countries. In the
U.S., more cases reach the court system whereas, historically, in the U.K.
more cases are settled before reaching this stage. Also, in the U.S. court
cases the predominant issue was the transfer pricing method the company
used versus the method the IRS thought they should use. This difference in
the treatment of the court cases may be a result of the detailed regulations in
the U.S. versus the less detailed guidelines provided in the U.K.
RASOUL H. TONDKAR ET AL.214

As mentioned above, the U.S. regulations on transfer pricing methods are
much more detailed than the U.K. regulations. This finding is consistent
with the work of Bloom and Naciri (1989) who found that the U.K. tends to
place more emphasis on professional judgment and tradition as opposed to
the rulebook guidelines not uncommon in the U.S. They also found that in
the U.K. as compared to the U.S., more emphasis is placed on substance
over form.
This study should be of interest to companies engaged in transfer pricing
in the U.S. and the U.K., regulators in these countries, and researchers
interested in further examination of transfer pricing issues in the above
countries. We also believe that given the current debate occurring in the
U.S. on the issue of principles versus rules based accounting standards,
further research into the development of the transfer pricing regulations
may help us gain a better understanding of the major factors contributing to
a principles versus rules based approach to regulation.
NOTES
1. A deficiency notice is the amount by which the actual tax (as it should havebeen computed) exceeds the amount shown on the return, if any, plus any amountspreviously assessed as a deficiency and minus any rebates.2. Business facilities are transactions that occur in the normal course of business.
REFERENCES
Beecham Group plc v. Inland Revenue Commissioners, Chancery Division (1992). STC 935, 65
Tax Case 219, 6 November 1992.
Bloom, R., & Naciri, M. A. (1989). Accounting standard setting and culture: A comparative
analysis of the United States, Canada, England, West Germany, Australia, New Zea-
land, Sweden, Japan, and Switzerland. The International Journal of Accounting, 24,
70–97.
BMC Software v. Commissioner (1999). Docket No. 12731-98, United States Tax Court, 1999
U.S. Tax Ct. Lexis 1647, September 8, 1999, Filed.
Borkowski, S. (2001). Transfer pricing of intangible property: Harmony and discord across five
countries. The International Journal of Accounting, 36, 349–374.
Borkowski, S. (2003). Transfer pricing documentation and penalties: How much is enough?
International Tax Journal, 29(Spring), 1–32.
Compaq Computer Corp. v. Commissioner (1999). Docket No. 24238-96, United States Tax
Court, 113T.C. 363; 1999 U.S. Tax Ct. Lexis 52; 113T.C. No. 25, November 18, 1999,
Filed.
Transfer Pricing Practices 215

Deloitte & Touche. (2002). TransferPricing. www.corptax.com/www/TransferPricing.nsf/Doc-
uments/TransferPricing.
DeSouza, G. (1997). Functional analysis. Journal of International Taxation, 8(May), 223–228.
Levey, M., Fox, J., Penney, M., Fairley, J., & Palmer, S. (1994). Transfer pricing methods may
not be accepted in both the U.S. and the U.K.. Journal of International Taxation,
5(April), 153–159.
Kim, S., Swinnerton, E., & Ulferts, G. (1997). 1994 final transfer pricing regulations of the
United States. Multinational Business Review, 5(Spring), 17–25.
Microsoft Corp. v. Commissioner (2000). Docket No. 16878-96, United States Tax Court, 115
T.C. 228; 2000 U.S. Tax Ct. Lexis 63; 115 T.C. No. 17, September 15, 2000, Filed.
National Semiconductor Corp. v. Commissioner (1994). Docket Nos. 4754-89, 8031-90, United
States Tax Court, T.C. Memo 1994-195; 1994 Tax Ct. Memo Lexis 199; 67 T.C.M.
(CCH) 2849, May 2, 1994, As Corrected May 2, 1994.
Newidgets Manufacturing Ltd v. Jones (Inspector of Taxes) (1999). Special Commissioner’s
Decision, STC (SCD) 19S, 17 May 1999.
Organization for Economic Co-operation and Development (2001). Transfer pricing guidelines
for multinational enterprises and tax administrations.
Organization for Economic Co-operation and Development (2003). http://www.oecd.org/EN/
document/
Rochester (U.K.) Ltd and another v. Pickin (Inspector of Taxes) (1998). Special Commis-
sioner’s Decision, STC (SCD) 138, 7 May 1998.
Schon, R. (1997). U.K. transfer pricing: CFC rules will follow self-assessment framework.
Journal of International Taxation, 8(January), 46–47.
Schwarz, J. (1999b). Transfer litigation in the United Kingdom. TaxLine Annual Review (1999/
2000): Institute of chartered accountants for England & Wales.
Seagate Technology v. Commissioner (1994). Docket No. 11660-90, United States Tax Court,
102 T.C. 149; 1994 U.S. Tax Ct. Lexis 10; 102 T.C. No. 9, February 8, 1994, Filed.
Sherman, W., & McBride, J. (1995). International transfer pricing: Application and analysis.
The Ohio CPA Journal, 54(4), 29–35.
U.S. Census Bureau (2003). Foreign Trade Division, Data Dissemination Branch, Washington,
D.C. 20233.
Waterloo plc and Others v. Inland Revenue Commissioners (2002). Special Commissioner’s
Decision, STC (SCD) 95, 24 October 2001.
RASOUL H. TONDKAR ET AL.216

APPENDIX. SUMMARY OF CASES
Case Country Applicable Code
Section
Issues in the Case Outcome of the Case
Beecham Group U.K. 485 Underpayment of taxes based on
transfer price calculations
Finding in favor of
Beecham
BMC Software U.S. 482 Intangible Calculation of transfer price for
licensing agreement
Information that needs to be
disclosed to IRS
Ruling not issued for
deficiency notice
Finding in Favor of BMC
Software
Compaq Computer U.S. 482 Tangible Valuation method used to calculate
transfer price
Finding in favor of Compaq
Computer
Microsoft Corp. U.S. 482 Tangible Calculations of transfer price
Language of agreement between
IRS and taxpayer
Finding in favor of IRS but
for a reduced amount
Finding in favor of
Microsoft
National Semiconductor U.S. 482 Tangible Valuation method used to calculate
transfer price
Finding in favor of IRS but
for a reduced amount
Newidgets Mfg. Ltd U.K. 770 Language of agreement between
Inland Revenue and taxpayer
Finding in favor of
Newidgets on appeal
Rochester Ltd (U.K.) U.K. 770 Calculations of transfer price Finding in favor of
Rochester
Seagate Technology U.S. 482 Intangible Calculations of transfer price Finding in favor of IRS but
for a reduced amount
Waterloo plc U.K. 770 Expansion of definition of Business
Facility
Expansion of transfer pricing
regulations to transactions with
third-party intermediaries
Finding in favor of Inland
Revenue
Transfer
Pricin
gPractices
217

This page intentionally left blank
218

THE IMPACT OF SOCIAL AND
ECONOMIC DEVELOPMENT ON
CORPORATE SOCIAL AND
ENVIRONMENTAL DISCLOSURE IN
HONG KONG AND THE U.K.
Jason Zezheng Xiao, Simon S. Gao, Saeed Heravi and
Yuk C. Q. Cheung
ABSTRACT
This study compares corporate social and environmental disclosure
(CSED) in Hong Kong (HK) and the U.K. through a content analysis of
334 annual reports prepared by 69 listed companies over the period of
1993–1997. We find that U.K. and HK companies differed in the amount,
theme and location of CSED, and that there was an upward trend in the
amount of CSED in both U.K. and HK firms during the five-year period,
although U.K. firms increased more than HK firms. We argue that HK
and U.K.’s different stages of social and economic development, by cre-
ating differential pressures and demand for CSED and exposing compa-
nies to differential political costs and legitimacy threats, contributed
towards these differences in CSED.
Advances in International Accounting
Advances in International Accounting, Volume 18, 219–243
Copyright r 2005 by Elsevier Ltd.
All rights of reproduction in any form reserved
ISSN: 0897-3660/doi:10.1016/S0897-3660(05)18011-8
219

INTRODUCTION
This chapter argues that the stage of a nation’s social and economic de-
velopment is an important factor that affects corporate social and environ-
mental disclosure (CSED). Accounting reflects the information needs of
society and different social and economic environments create different in-
formation requirements (Burchell, Clubb, Hopwood, & Hughes, 1980).
Countries at different stages of social and economic development have dif-
ferent concerns and priorities (Mueller, 1968). Social and environmental
issues are of a greater concern to developed countries than to less developed
countries (LDCs) and the public and institutions in developed countries
generally have higher levels of awareness of such issues than their coun-
terparts in LDCs. Reflecting this difference, companies in developed coun-
tries face greater pressures from stakeholders for CSED than firms in LDCs.
Furthermore, countries in developed countries are more likely to introduce
mandatory CSED requirements than LDCs. Therefore, social and environ-
mental issues expose companies in developed countries, compared with
those in LDCs, to greater political costs, according to positive accounting
theory (Milne, 2002), and greater legitimacy threats by implication of le-
gitimacy theory (Deegan, 2002). Consequently, CSED in industrialized
world would be more extensive than that in LDCs.
We investigate the impact of the stage of social and economic development
on CSED by comparing CSED in corporate annual reports published by
HK and U.K. companies. These two countries are chosen for two reasons.
First, HK is a typical newly industrialized economy whereas the U.K. a typical
highly developed country. As a newly industrialized society, many aspects of
the HK economy remain developing, with such problems as increasing income
disparities and environmental degradation (Tang, 1998, 1999). Table 1 shows
that, in terms of GNP (GDP) per capita, HK lagged behind the U.K. until
1993. Even though HK matched the U.K. in economic terms in 1993, it was
still less developed than the U.K. as indicated by the social and economic
development indicators listed in Table 1. We stress that although HK currently
matches and even surpasses the U.K. in certain economic terms, the U.K.
became a developed country earlier than HK and the overall social and
economic development in the U.K. was more advanced than that in HK before
and during the period under examination in this study (1993–1997). In other
words, we consider not just current, but also historical, stages of social and
economic development. To the extent that the stages of social and economic
development affect CSED, we expect a higher level of CSED in the U.K. than
in HK.
JASON ZEZHENG XIAO ET AL.220

Table 1. Social and Economic Performance in HK and the U.K.
Social and Economic Indicators Year U.K. HK
GNP per capita (US$)a 1970 2,240 900
1975 3,900 2,180
1980 7,960 5,210
1985 8,470 6,080
1989 14,570 10,320
GDP per capita (US$)b 1990 16,948 13,110
1993 16,245 19,404
1995 18,991 22,372
1996 19,758 24,235
1997 21,921 26,567
Secondary school enrolment
(% of children in the age group)a1970 73 49
1975 83 49
1980 83 64
1985 84 72
1986 83 72
Enrolment in secondary education –
ranking of 125 countriesd1995 4 47
Literacy rate – ranking of 98 countriesd 1995 6 29
Public spending on education
as % of GNPb
1975 6.6 2.7
1980 5.6 2.5
1990 4.9 2.8
1993 5.4 2.8
TV (radio) receivers
(per 1,000 inhabitants)b1970 193 (623) 109 (170)
1975 359 (694) 190 (500)
1980 401 (941) 221 (506)
1985 433 (1,007) 234 (596)
1990 433 (1,390) 267 (666)
1995 446 (1,427) 307 (675)
1996 513 (1,438) 319 (676)
1997 521 (1,443) 321 (684)
Persons per hospital bedc 1970–1975 105 200
1980–1985 107 204
1988–1993 160 234
Persons per physicianc 1970–1975 809 1,500
1980–1985 613 1,211
1988–1993 N/A N/A
Persons per nursec 1970–1975 242 566
1980–1985 120 795
1988–1993 N/A N/A
Sources: aWorld Bank (1991). bUnited Nations (2000). cWorld Bank (1988, 1991, 1995). dWorld
Bank (http://wbln0018.worldbank.org/psd/).
The Impact of Social and Economic Development 221

Second, because HK had been under British colonial governance for 150
years before it was handed back to China as a ‘‘Special Administration
Region’’ on 1 July 1997, a comparison of HK and the U.K. allows us to
investigate the impact of different social and economic development stages
on CSED in the two countries while taking into consideration the influence
of colonization. One implication of colonization is that HK’s social and
economic systems tend to follow those of the U.K., thus suggesting that
CSED is similar between the U.K. and HK (Nobes, 1998).
Under the U.K. rule, HK’s legal, economic, education and accounting
systems generally followed those of the U.K. (Wallace & Naser, 1995). HK
companies ordinance tended to follow British company laws (Chan, 1988,
p. 199). The HK Stock Exchange was largely based on the system and
practice of its U.K. counterpart. Similarly, HK accounting and auditing
standards normally followed those of the U.K. The Hong Kong Society of
Accountants (HKSA) and the Association of Chartered Certified Account-
ants (ACCA) of the U.K. organized joint examinations in HK (Chan, 1988,
p. 199). These provide evidence of administrative and accounting knowledge
transfer from the U.K. to HK.
Despite this effect of colonization, however, the two countries have at-
tached different importance to CSED. While U.K. companies faced in-
creased pressures for CSED from the 1970s to the 1990s, external pressures
for HK firms were minimal during that period. In addition, the U.K. has
made some CSED mandatory since 1968 (Gray, Kouhy, & Lavers, 1995a),
whereas CSED was voluntary for HK firms before and during the period
under investigation in this study (Jaggi & Zhao, 1996; Ng, 2000).
This study contributes to the literature in two ways. First, it proposes and
empirically tests a social and economic development perspective on CSED.
As discussed later, several perspectives have been adopted in the CSED
literature to explain cross-country differences in CSED. However, these
perspectives do not formally recognize the impact of the stage of social and
economic development on CSED. Our results suggest that this appears to be
an important factor that should not be neglected. In addition, the adoption
of this perspective opens an avenue for the application of positive account-
ing theory, legitimacy theory, stakeholder theory, and political economy in
international comparative studies of CSED.
Our study also contributes to the literature by comparing CSED between
a developed country and a newly industrialized region. Prior research has
examined industrialized nations and newly developed countries separately
with a focus on the former. With rare exceptions such as Williams and Pei
(1999), little comparison of CSED practices between developed countries
JASON ZEZHENG XIAO ET AL.222

and newly industrialized country/region (such as HK) can be found in the
literature.
PRIOR STUDIES OF CSED
Many cross-country studies of CSED in Western countries have been un-
dertaken. For example, Adams, Hill, & Roberts (1998) analyze 150 annual
reports from France, Germany, The Netherlands, Sweden, Switzerland, and
the U.K. They find that company size, industrial grouping and country of
domicile influence corporate social reporting patterns and that the amount
and nature of information disclosed vary significantly across Europe. Gut-
hrie and Parker (1990), by assessing 147 company annual reports, find sig-
nificant differences between the U.K., the U.S. and Australia with respect to
the level, the theme, the method, and the location of the disclosure. How-
ever, such cross-country comparisons are predominately based on industri-
alized nations. In particular, prior research has made little effort to compare
CSED between industrialized nations and newly industrialized ones. A rare
exception is Williams and Pei (1999) who compare CSED on the Internet by
companies in Australian, HK, Singapore, and Malaysia.
Although no study has compared CSED in HK and the U.K., CSED in
both countries has been subject to separate academic research. The average
amount of the disclosure in the U.K. has increased from about one full page
during 1978–1987 to nearly five pages of which 1.53 pages accounted for
voluntary disclosures during 1988–1995 (Gray, Kouhy, & Lavers, 1995b;
Gray, Javad, Power, & Sinclair, 2001). By contrast, prior studies have found
a low level of CSED made by HK companies. Jaggi and Zhao (1996) report
that only 13 of 100 HK companies had been consistently disclosing envi-
ronmental information over the period of 1992–1994. Williams and Pei
(1999) find that a sample of HK listed company had, on average, only 10.53
lines of CSED in the 1995 annual reports. A recent study by Ng (2000)
discovers that only 9% of 200 HK listed companies reported environmental
information in the published accounts. As a newly developed economy,
there is a low level of environmental regulation and awareness in HK (Lynn,
1992; Ho, Ng, & Ng, 1994; Ng, 2000). Many HK business managers do not
support the view that stakeholders should have rights for environmental
information; some do not perceive disclosure of environmental information
to be their responsibility (Jaggi & Zhao, 1996). While these studies are
somewhat informative on the amount of, and trends in, CSED in each
country, they do not enable a direct comparison of these and other aspects
The Impact of Social and Economic Development 223

of CSED such as the location and themes of disclosure between the two
countries. These defects necessitate the current study.
The literature offers several perspectives on cross-country differences in
CSED. First, the cultural perspectives emphasize the influences of a coun-
try’s culture on CSED (e.g., Perera & Mathews, 1990; Williams, 1998).
Second, political perspectives attempt to explain the difference in CSED
between countries in the context of the social and political structure of the
countries and the agenda of political course within a particular society (e.g.,
Freedman & Stagliano, 1992; Adams et al., 1998; Williams, 1998). In ad-
dition, other arguments based on the development of the accounting system
and financial markets have also been suggested (Fekrat, Inclan, & Petroni,
1996). However, these perspectives do not formally recognize the influence
on CSED of different social and economic development stages.
Several theoretical frameworks have been adopted in the literature to
interpret CSED, including positive accounting theory (e.g., Watts &
Zimmerman, 1986; Milne, 2002), stakeholder theory (Ullmann, 1985; Robe-
rts, 1992), legitimacy theory (Patten, 1992; Neu, Warsame, & Pedwell,
1998), and political economy (Arnold, 1990; Tinker, Neimark, & Lehman,
1991). While all these approaches focus on the organizational–environmen-
tal nexus, only political economy theory considers the impact of social and
economic development on CSED. Political economy theory suggests that
the economic domain cannot be studied in isolation from the political, so-
cial, and institutional framework within which economic development takes
place and that social and political as well as economic factors affect CSED
(Gray et al., 1995b). Thus, companies produce information that serves cor-
porate political and ideological goals (Guthrie & Parker, 1990; Freedman &
Stagliano, 1992). However, these goals are shaped and constrained by the
social and economic development of a country where the company is based
or operates (Cooper & Sherer, 1984). Therefore, political economy theory
can be considered to provide a particular theoretical argument for our social
and economic development perspective. We show later in the chapter that
the above-mentioned other theories provide additional theoretical
arguments.
There is no single motivation for making CSED. Given the complexity of
CSED, it is extremely difficult (if it is not impossible) to explain the cross-
country variation in CSED from a single theoretical perspective (Gray et al.,
1995b). Thus, alternative perspectives might shed additional light on our
understanding of CSED. We argue that the difference in CSED between
countries can at least partially be attributed to their varied stages of social
and economic development.
JASON ZEZHENG XIAO ET AL.224

The financial reporting literature suggests that a country’s stage of devel-
opment is one of many environmental factors that affect corporate financial
disclosure (e.g., AAA, 1977; Mueller, 1968; Nobes, 1998; Salter, 1998). De-
velopment economists have strongly argued that the social and institutional
infrastructure (including the accounting system) in a country is dependent
upon economic development and industrialization (Adelman, 1995; Cypher
& James, 1997). Cooke and Wallace (1990) list the stage of economic de-
velopment as part of the internal environment affecting a country’s financial
disclosure regulation. Moreover, Wallace (1993) suggests that the need for
financial reporting increases as an economy becomes more developed.
THEORETICAL DEVELOPMENT AND HYPOTHESES
We argue that the stage of social and economic development is also an
important factor affecting CSED, as different stages of social and economic
development prompt different national concerns over social and environ-
mental issues and different types and levels of demand for social and en-
vironmental information. In developed countries, economies are well
developed. These countries have been through the stages of increasing the
standard of living by exhausting social and natural resources. People are less
concerned about their basic material needs, but more concerned about their
social and cultural needs and quality of life. They are more concerned about
equity, justice, and issues arising from polluted air, water, land, etc. People
are more aware of, and sensitive to, these social and environmental issues,
compared with citizens in developing or less developed countries.
By contrast, developing countries are still struggling to meet the basic
material needs of their people (Cypher & James, 1997). They have to destroy
natural resources to produce enough food and other materials to feed their
people. Their pressing priority is current productivity rather than long-term
social and economic consequences (Todaro, 1997). They also lack the re-
sources and regulations to protect natural resources from being destroyed or
lack the know-how to efficiently utilize resources. Many people in devel-
oping countries have to live with social injustice and a poor social welfare
system. In general, people lack awareness of the social and environmental
issues that are talked about in developed countries. As noted by Gray and
Kouhy (1993), a large majority of the populations of developing countries
live below a level of basic sustenance commensurate with human dignity. As
a result, accounting and reporting issues from the perspective of developing
countries themselves might seem relatively trivial compared to more
The Impact of Social and Economic Development 225

pressing matters. This argument can equally apply to the development of
CSED. In reality, a majority of enterprises in developing countries do not
have adequate (financial) accounting systems and there is usually no guid-
ance on how such systems can be developed and maintained (Wallace,
1993). Under these circumstances, it would be unrealistic to expect devel-
oping countries to have the same level of CSED as developed countries.
These different national concerns and priorities are reflected in public and
institutional pressures for corporate social and environmental accountability.
Organizations such as Greenpeace and Friends of the Earth have emerged
and been actively watching corporate social and environmental activities in
developed countries whereas similar organizations, if any, are likely to be
imported from developed countries and are less active in developing coun-
tries. Moreover, corporate social and environmental issues attract much
more press coverage in developed countries than in developing countries.
Finally, social and environmental activities and disclosures are more likely to
be subject to governmental regulation in developed countries than in devel-
oping countries. According to Gray et al. (1995b), between 1979 and 1991, the
total U.K. corporate social reporting rose by over four times, employee-related
disclosure fell from approximately 90% to about 78%, and community and
environmental reporting rose from about 10% to 32% of total disclosure. In
short, adopting the notions from positive accounting theory, legitimacy theory
and stakeholder theory, social and environmental issues potentially impose
higher ‘‘political costs’’ and a more stringent ‘‘social contract,’’ and create more
demanding stakeholders for companies in developed countries than for those in
developing countries (Milne, 2002; Deegan, 2002). As a result, companies in
advanced societies would have to make more CSED to alleviate political costs,
maintain the status of legitimacy and satisfy powerful stakeholders.
Between the two poles (developed and developing countries), there are
newly industrialized countries such as HK and Singapore. Although, they
may not be very different from those traditionally advanced countries in
economic terms, they have only begun to consider social and environment
issues. There is no legislation in these countries enforcing companies to
mandate CSED (Lynn, 1992; Tsang, 1998; Ng, 2000). The level of CSED in
these countries is thus generally low. However, as they move closer to tra-
ditionally developed countries, their concerns over these issues are increas-
ing. As a result, these countries (e.g., Singapore) have been experiencing a
trend of increased CSED over recent years (Tsang, 1998).
The U.K. and HK are illustrative of the above social and economic de-
velopment perspective on CSED. The U.K. is a traditionally developed
country while HK is a newly industrialized economy. The two economies
JASON ZEZHENG XIAO ET AL.226

have had quite different experiences in CSED. Since the late 1970s, U.K.
firms have been facing growing pressures from the public, European Union,
pressure groups, and professional bodies for social and environmental per-
formance and reporting (Gray et al., 1995b). Many efforts have been made
to encourage social and environmental reporting, for example, the ACCA’s
Environmental Reporting Award, the establishment of various social and
environment research/promotion bodies (e.g., the Institute of Social and
Ethical Accountability; the U.K. Social Investment Forum; the Green Al-
liance; and the Centre for Social and Environmental Accounting Research,
now based at the University of Glasgow). Influenced by European Union
social and environmental legislation, the U.K. has stipulated many acts
(such as the Environmental Protection Act 1990, the Environment Act 1995,
and the Pollution Prevention and Control Act 1999). The U.K. legislation
has also made it mandatory for companies to disclose many aspects of
corporate social and environmental activities. These include political and
charitable donations, information to trade unions, employment of disabled
persons, involvement of employees, health and safety at work, and air and
water pollution (Gray et al., 1995a).
By contrast, although Friends of the Earth established its offices in HK in
1983, it has made little fundamental difference on the way HK businesses
operate. Pollution, safety and many other social problems have accompa-
nied remarkable economic achievements in HK. The government only re-
cently realized the problems and introduced some environmental and social
related regulations such as waste disposal and employment related ordi-
nances. However, weak enforcement of environmental legislation has per-
mitted the existence of serious social and environmental problems. For
example, it is estimated that only half of HK’s daily sewage gets any
treatment before it flows into the sea, seriously polluting typhoon shelters
and Victoria Harbor (Wong & Tanner, 1997). In addition, unlike the U.K.,
HK had no mandatory regulatory requirements of CSED before and during
the study period (1993–1997) (Jaggi & Zhao, 1996; Ng, 2000). Taking into
consideration these and the additional rationale listed below, we expect that
differences in CSED will exist between the two countries in terms of the
trend, amount, theme, and location of CSED.
Trends in CSED
According to Wallace (1993, p. 131), the international accounting lit-
erature suggests that corporate reporting and its regulation in a country is
The Impact of Social and Economic Development 227

‘‘a response to both technological, economic and social change’’ and that
‘‘in the process of a country’s growth, the characteristics and functions of
reporting enterprises – and particularly of the needs of the different users,
preparers, auditors and regulators of corporate reports – are transformed.’’
Likewise, a country’s move towards a higher social and economic stage
leads to an increasing demand of stakeholders for corporate social and
environmental performance and reporting. This applies to both the U.K.,
which has been progressing towards a more advanced stage, and HK, which
is a newly industrialized economy. Consequently, it is expected that both
countries have experienced a trend of increased CSED over the period under
study. Furthermore, during the period under study, as HK and the U.K.
were at different levels of social and economic development and were under
different pressures for CSED, it is expected that the U.K. would experience
a greater increase in CSED than HK.
Indirect evidence seems to support such an expectation. Gray et al.
(1995b) find that the total CSED contained in annual reports increased by
four times in the U.K. between 1979 and 1991 (from just over one page to
nearly four and a half pages). By contrast, the available evidence shows that
the percentage of listed companies that disclosed information on corporate
environmental issues in annual reports increased from 1% in 1989 (Lynn,
1992) to 9% in 1998 (Ng, 2000). Although informative, these prior studies
do not facilitate a direct comparison of the trends in CSED in the two
countries (Fig. 1 shows the trend in CSED in both the U.K. and HK during
the period of 1993–1997).
Thus, we formulate and test the following hypothesis:
H1. U.K. companies increase CSED more than HK companies.
Amount of CSED
Compared with their U.K. counterparts, HK companies, regulators and the
public are less aware of and less concerned about social and environmental
issues (Lynn, 1992). Unlike the U.K., HK had no regulation that mandated
CSED before and during the period under our study (Jaggi & Zhao, 1996;
Ng, 2000). Anecdotal evidence as cited in the literature review section seems
to suggest that the level of CSED in the U.K. is higher than that in HK (see,
Gray et al., 2001; Williams & Pei, 1999; Ng, 2000). However, such anecdotal
evidence does not enable a direct comparison of the level of CSED in the
two countries as these prior studies are based on inconsistent samples, for
different time periods and without controlling for confounding factors (such
JASON ZEZHENG XIAO ET AL.228

as different company sizes between the two countries). This allows us to
frame and test our second hypothesis:
H2. The amount of CSED made by U.K. companies is greater than that
by HK companies.
Content Themes of CSED
An industry such as property whose activities modify or affect the environ-
ment may make more environmental disclosures than companies in other
industries as a result of greater public concern and legislation (Deegan &
Gordon, 1996; Hackston & Milne, 1996). By contrast, in the financial and
banking industry, as human resources are regarded as one of the most
important assets, companies tend to voluntarily disclose employee-related
issues to boost a good public image. In short, industries disclose different
information related to their different social and environmental responsibil-
ities and corporate strategies. Moreover, compared with those in newly
industrialized countries, the public and regulators in an advanced society
like the U.K. are interested in a broader spectrum of corporate social and
0
100
200
300
400
500
600
Year
Mea
n D
iscl
osu
re
Bank UK
Property UK
Utility UK
Total UK
Bank HK
Property HK
Utility HK
Total HK
93 94 96 9795
Fig. 1. CSED Trends in Hong Kong and the U.K.
The Impact of Social and Economic Development 229

environmental issues and thus expect the companies to disclose a wider
range of social and environmental information. In addition, companies in
countries at different stages of social and economic development may focus
on different issues. On the basis of this reasoning, we formulate the fol-
lowing hypothesis:
H3. There is a significant difference in the categories of disclosure made
by companies between the U.K. and HK.
Location of CSED
Prior studies find that investors see some sections of the annual report as
more important than other sections. For example, Lee and Tweedie (1976)
and Bartlett and Chandler (1997) find that the Chairman’s Statement was
perceived by British shareholders as the most important section in the an-
nual report, followed by Financial Statements, the Directors’ Report, Notes
to the Accounts, and the Auditor Report. Roberts (1990) argues that the
location of information may reflect the company’s attitudes towards envi-
ronmental and social issues as well as the reader’s perceptions of the im-
portance that the company attaches to these issues. Therefore, it is expected
that different companies place CSED in different parts of the annual re-
ports. As U.K. companies and the public are more sensitive to social and
environmental issues than HK companies, U.K. and HK companies may
select the location for CSED differently. Thus we test the following hy-
pothesis:
H4. There is a significant difference in the location of disclosure made by
companies between HK and the U.K.
RESEARCH METHODOLOGY
Research Design
To test H1, the CSED trends between U.K. and HK companies were com-
pared by testing the significance of the coefficient of the interaction between
year and country using the following regression model:
CSED ¼ b0 þ b2Countryþ b2Yearþ b3ðYear� CountryÞ (1)
where: CSED proxies for overall disclosures, disclosures by banking firms,
disclosures by property firms, disclosures by utility firms, disclosures on
JASON ZEZHENG XIAO ET AL.230

environment, disclosures on energy, disclosures on health and safety, dis-
closures on human resources, disclosures on community, or disclosures on
fairness.
Country is a dummy variable that was set at 1 for HK and 0 for the U.K.
Year is a proxy for the years under study with values ranging from 1 to 5
(representing 1993–1997).
Regression models were estimated for overall disclosures, disclosures by
individual industries and disclosures by individual themes respectively.
To test H2, H3, and H4, this study employs content analysis – the most
commonly used research method to assess an organization’s social and en-
vironmental disclosures (Milne & Adler, 1999). Weber (1990, p. 9) describes
content analysis as ‘‘a research method that uses a set of procedures to make
valid inferences from text.’’ It is an objective, systematic and quantitative
description of a text assuming that there is a relation between the frequency
of the linguistic units and the interest of the text producer (Holsti, 1969).
Despite its limitations as discussed in Milne and Adler (1999) and Unerman
(2000), it is particularly appropriate for our purposes because of its unob-
trusive nature in analyzing narratives and its ability to measure the implicit
importance attributed to an information category by the text (e.g., the an-
nual report) producer.
Content Themes
The identification and definition of CSED themes have always been
arbitrary. As noted by Gray et al. (1995a), there is no easy separation of
these themes as categories and subcategories vary from time to time. This
study considers six content themes, namely, environment, energy, health
and safety, human resources, community involvement, and fair business
practices. Table 2 provides the details of these categories and subcategories.
While these categories and subcategories have been broadly used in prior
studies, ‘‘Sport and Recreation,’’ and ‘‘Quality/ISO’’ are two new subcat-
egories which were not previously examined in the literature. Companies
start to consider their employees’ health as the direct cost arising from
employees’ sick leave and medical insurance is huge. Sport and recreation
activities organized by employers have become part of corporate culture.
Quality/ISO has also become a label for companies with quality service and
product. The International Organization for Standardization (ISO) has in-
troduced the ISO14001 series related to environmental management
standards.
The Impact of Social and Economic Development 231

Table 2. CSED Content Themes.
Content Themes Sub-Themes
1. Environment Pollution control (air, water, land, noise, and visual)
Prevention of environmental damage
Waste recycling
Conservation of natural resources
Research and development
Environmental audit
Environmental policy
Other environmental disclosure
2. Energy Conservation and energy saving
Development/exploration of new sources
Use of new sources
Other energy-related disclosure
3. Health and safety Health and safety at work
Customer safety
Product safety
Accidents rate
Compensation
Other health-related disclosure
4. Human resources Employee development/training programmes
Pay and benefits (profit-sharing scheme)
Pension scheme
Loan to employee
Employee share ownership scheme
Sport and recreation
Other employee related disclosure
5. Community involvement Charitable donation and service
Political donation and service
Social activity sponsorship
Other community activity disclosure
6. Fair business practices Employment of women (sexual equality)
Employment of minority (racial equality)
Employment of disabled people
Customer complaints
Legal proceedings, litigation and liabilities
Quality/ISO
Other fair business practice disclosure
JASON ZEZHENG XIAO ET AL.232

Measurement
Some previous studies measured CSED on a dichotomous basis of disclo-
sure or non-disclosure (e.g., Wiseman, 1982; Lynn, 1992). This measure-
ment fails to indicate the extent of the reporting entity’s involvement in
CSED. Alternative units of analysis in written communication tend to be
counts of words, sentences, lines, and pages. In addition, counts of sen-
tences, lines, and pages are also the most simple and convenient way,
which has been used, in previous studies. However, these three types of
counts have some limitations. For example, it is difficult to make a com-
parison between two annual reports if fonts, page margins, and compo-
nents (pictures and graphs) differ. Also, one sentence, line or page may
contain more than one category of information and the researcher may
have difficulty in deciding which category the sentence/line/page belongs
to. Word count is used in this study because words have the advantage of
lending themselves to more exclusive analysis. In addition to the number of
words, the location of a disclosure was extracted from the annual report to
test H4.Reliability
Two researchers in the U.K. and HK read the collected annual reports. To
check whether the two researchers could apply the rules and procedures
consistently, three other researchers reanalyzed a selection of 25 U.K. and
10 HK annual reports. The reliability test revealed the average variance was
0.98% for the U.K. annual reports and 0.68% for HK. As the location of an
annual report was easily identifiable, there was no mistake made. Only two
mistakes were made in classifying disclosures.
SAMPLE
The sample consisted of 33 HK firms from the top 100 listed companies in
the HK and 36 U.K. firms from the Financial Times 300 listed companies.
This study focussed on three sectors: property, banking, and utility. As
property companies account for a significant percentage of total market
capitalization in HK, they have a considerable impact on HK’s society and
environment. Banking is a service industry and its competitive advantage
depends on the quality of their employees, and thus, banks may be willing
to invest more in staff and disclose more on their human resource infor-
mation. Utilities were chosen because their activities are sensitive to the
The Impact of Social and Economic Development 233

environment. The initial sample consisted of all 38 companies in property,
banking, and utility in HK’s top 100 listed companies and all 46 U.K. listed
companies in these same industries from Financial Times top 300 compa-
nies. These companies were further screened according to four criteria. First,
companies with a merger, major acquisition or takeover during 1993–1997
that resulted in management restructuring were excluded because the new
management team might introduce a different policy in issuing their annual
reports. Second, companies that changed their accounting dates were ex-
cluded because two annual reports might be available for 1 year. Third,
companies with less than three annual reports were not included as the time
period was too short for a comparison. Finally, companies registered out-
side the U.K. and HK were not considered. This selection process provided
a final list of 33 HK companies with 154 annual reports and 36 U.K. com-
panies with 180 annual reports. Given the limited resources and availability
of HK annual reports, the annual reports for 5 years (1993–1997) were
sought for each company. The year 1997 was selected as the ending year of
the study period with a view to avoiding any external influences from
Mainland China on HK’s CSED after China took over the sovereignty of
HK in later 1997. All 180 U.K. annual reports were collected, whereas only
154 out of 165 HK annual reports were available (see Table 3). If a company
prepared a separate social and environmental report, the report was also
collected as part of the annual report.
FINDINGS AND DISCUSSIONS
Recent studies have found a positive relationship between company size and
the overall level of disclosure in a number of countries (e.g., Hackston
& Milne, 1996; Adams et al., 1998; Gray et al., 2001). This is because larger
companies are usually exposed to greater public scrutiny and under more
Table 3. The Sample.
Sectors U.K. Companies HK Companies Total
No. Reports No. Reports No. Reports
Banking 12 60 10 47 22 107
Property 14 70 17 78 31 148
Utility 10 50 6 29 16 79
Total 36 180 33 154 69 334
JASON ZEZHENG XIAO ET AL.234

pressure to communicate their social and environmental information. It is
also argued that management will not disclose social and environmental
information when the expected cost exceeds the benefit. A larger company
usually has more resources available to cover the costs. In this study we
found a strong association, significant at 0.01, between size and the amount
of disclosure in both the U.K. and HK with the Pearson correlation co-
efficients being 0.532 for the U.K. and 0.548 for HK. This size effect was
controlled for in testing Hypotheses 2, 3, and 4 using one-way analysis of
variance (ANOVA). That is, company size was used as a covariate in the
analysis. Company size was measured by turnover for utility and property,
and interest received and receivable for banks for all purposes of the paper
unless otherwise stated. Alternatively, we also measured company size by
total assets.
Table 4 indicates the trends in CSED in the U.K. and HK for the period
1993–1997. In this table, positive numbers for ‘‘Year�Country’’ indicate
greater CSED in HK than in the U.K. and negative numbers indicate greater
CSED in the U.K. than in HK. As Table 4 indicates, the increase in overall
CSED was significantly greater in the U.K., which supports H1. U.K. com-
panies also had a significantly larger trend of disclosure of information on
utility, environment, and human resources. These results are consistent with
Table 4. Disclosure Trends in the U.K. and HK
(Based on Word Count).
Year�Country F-Ratio Adj. R2
Total �41.95�� 51.02�� 0.09
Industry
Bank �43.96 14.76�� 0.08
Property �17.72 18.57�� 0.07
Utility �77.72 13.99�� 0.10
Themes
Environment �36.26�� 7.31�� 0.07
Energy �8.22 3.71�� 0.03
Health �2.55 12.53�� 0.12
Humanity �218.92�� 172.98�� 0.67
Community �25.40 9.08�� 0.09
Fairness 39.66�� 25.39�� 0.23
Notes: Positive numbers for ‘‘Year�Country’’ indicate greater CSED in HK than in the U.K.
and negative numbers indicate greater CSED in the U.K. than in HK. These results are pro-
duced after controlling for company size that is measured by turnover for utility and property
firms and interest received and receivable for banks. Using total assets as a proxy for company
size does not significantly alter these results. ��Significant at the 0.01 level.
The Impact of Social and Economic Development 235

the predictions of the social and economic development perspective. How-
ever, HK companies increased more significantly in the disclosure of fair-
ness than U.K. companies. This is because the focus of CSED in the U.K.
shifted from fairness disclosure at the end of the 1970s and 1980s towards
mainly on community and environmental disclosure in the early 1990s
(Gray et al., 1995b, p. 62). This shift reflected U.K.’s advance to a higher
level of social and economic development. In the 1970s and early 1980s, the
social focus of the economy was mainly in the area of employment (includ-
ing related issues such as equal opportunity, pension rights, and trade un-
ion). In the 1990s, the social concerns ranged from environmental problems
to social inclusion, citizens charters, community supports and sponsorship,
and staff training. By contrast, in the early 1990s, HK just began to develop
CSED and its central social and economic issues related to employment,
consumerism and social democratic transition (specifically the preparation
of the handover to China). As a result, the public were mainly interested in
issues relating to fairness such as equal opportunity in employment, cus-
tomers rights, and quality of products and services. By contrast, HK was
relatively late in addressing environmental issues compared with the U.K.
and other Western economies (Jaggi & Zhao, 1996).
Table 5 shows that the total CSED by U.K. companies was greater than
that by HK companies. This was also the case for the banking and property
industries. Moreover, when total assets were controlled for as an alternative
proxy for company size, then there was also a difference in the utility sector
with the F-value being 11.00 significant at 0.01. Thus, there is strong ev-
idence to support H2. As company size was controlled for in the statistical
test, this difference should not be regarded as being caused by the differences
in size between HK and U.K. companies. Instead, the difference supports
our argument that different stages of social and economic development
result in different amounts of CSED in the two countries. For example, the
difference was partly caused by the mandatory nature of some CSED in the
U.K. Gray et al. (2001) report that 1.10 out of the 4.89 pages of CSED made
by U.K. companies during 1988 and 1995 fell into the category of man-
datory disclosures. Taking the regulation of CSED as a characteristic of
social and economic development, this chapter does not formally distinguish
between mandatory and voluntary CSED.
As shown in Table 6, U.K. companies disclosed more than HK companies
in the categories of health and safety and human resources. However, no
difference was found in the amount of disclosures concerning environment,
energy, community, and fairness between the two countries. However, when
total assets were controlled for as an alternative proxy for company size,
JASON ZEZHENG XIAO ET AL.236

then there was also a significant difference in the theme of environment with
the F-value being 5.38 significant at 0.05. The results partially confirmed H3
that, due to different stages of social and economic development, U.K. and
HK companies focussed on different social and environmental issues. In
particular, over the period under study, HK showed great interest in fairness
while the U.K. moved on to deal with other pressing issues such as envi-
ronmental problems, social inclusion, and human resources. This probably
contributed towards narrowing the gap in the disclosure of information on
fairness issues while enlarging the gulf in the disclosure of information on
issues relating to the environment and human resources.
Table 5. The Amount of Disclosure in the U.K. and HK
(Based on Word Count).
Industry U.K. HK F-value
Mean S.D. Mean S.D.
Total 7,415 3,978 2,080 1,492 30.08��
Bank 8,644 3,241 1,819 935 16.01��
Property 4,672 2,994 1,725 1,573 15.44��
Utility 9,779 3,977 3,349 1,580 4.20
Note: These results are produced after controlling for company size that is measured by turn-
over for utility and property firms and interest received and receivable for banks. ��Significant
at the 0.01 level.
Table 6. Theme-Based Disclosure in the U.K. and HK
(Based on Word Count).
Theme U.K. HK F-value
Mean S.D. Mean S.D.
Environment 603 1,097 153 351 3.78
Energy 80 235 0 0 2.86
Health 204 283 17 64 9.50��
Human resources 5,581 2,712 1,298 828 53.5��
Community 595 768 228 388 1.07
Fairness 353 318 383 319 2.22
Note: These results are produced after controlling for company size that is measured by turn-
over for utility and property firms and interest received and receivable for banks. ��Significant
at the 0.01 level.
The Impact of Social and Economic Development 237

From Table 7, it can be seen that no or little CSED was included in the
Mission Statement, the Auditors’ Report, and Financial Statements by ei-
ther U.K. or HK companies. This might be because, technically, these sec-
tions of the annual report are probably less suitable for disclosing CSED;
the Mission Statement is normally fairly short whereas the Financial State-
ments and the Auditors’ Report are driven by accounting standards and
auditing standards that focus on the financial results and conditions of the
company, rather than on social and environmental issues.
In the other sections of the annual report where CSED was found, how-
ever, U.K. and HK companies placed an emphasis on different locations.
The amount of CSED by U.K. companies declined in the following order:
Notes to the Accounts, Separate Section or Report, Directors’ Report, Op-
erations Review, and Chairman’s Statement. By contrast, the amount of
CSED by HK companies followed a different pattern (in order of declined
importance): Operations Review, Notes to the Accounts, Directors’ Re-
port, and then Chairman’s Statement. Table 7 shows that U.K. companies
disclosed more social and environmental information in a Separate Section
or Report, the Directors’ Report, and Notes to the Accounts than HK firms.
These differences were statistically significant. These results can be inter-
preted as U.K. companies in general attaching more importance to CSED
than HK companies, especially if a separate section in the annual report or a
Table 7. The Location of Disclosure in the U.K. and HK
(Based on Word Count).
Location U.K. HK F-value
Mean S.D. Mean S.D.
Mission statement 2 13 29 105 1.84
Chairman’s statement 165 223 241 214 1.00
Separate section/report 2,228 2,314 27 87 19.6��
Operations review 922 1,636 679 1,128 0.07
Directors’ report 1,515 1,124 303 300 25.8��
Audit report 0 0 0 0 –
Financial statements 0 0 2 13 0.86
Notes to the accounts 2,583 1,283 536 471 59.3��
Note: These results are produced after controlling for company size that is measured by turn-
over for utility and property firms and interest received and receivable for banks. ��Significant
at the 0.01 level.
JASON ZEZHENG XIAO ET AL.238

separate social and environmental report signifies more perceived impor-
tance of CSED. Thus, there is evidence to support H4.
CONCLUSIONS
This study compared CSED in HK and the U.K. by analyzing 334 annual
reports from 69 companies over the period of 1993–1997. It found that,
despite the colonial impact, U.K. firms made significantly more CSED than
their HK counterparts. The difference existed for all three industries (bank-
ing, property, and utility) and for the themes of health and safety, human
resources, and environment, but not for the themes of energy, community
and fairness. During the five-year period studied, there was an upward trend
in the amount of CSED in both the U.K. and HK, although U.K. firms
increased more than HK firms did. Moreover, U.K. companies made more
CSED in a separate section of the annual report or a separate social and
environmental report, the Directors’ Report and Notes to the Accounts
than HK firms. These results were obtained after controlling for company
size because there appeared to be a strong association between company size
and the amount of disclosure in both countries. This size effect is consistent
with the findings of prior studies (e.g., Adams et al., 1998; Gray et al., 2001).
These findings reflect a higher level of public awareness of social and
environmental issues and greater public, institutional and regulatory pres-
sures and demand for CSED in the U.K. than in HK. They also suggest that
social and environmental issues represent greater political costs and legit-
imacy threats for U.K. companies than for HK firms. Moreover, the results
indicate that CSED was perceived as more important by U.K. firms than
by HK firms. Our findings generally support the argument that social and
economic development is an important cause for the difference in CSED
between the two countries. They are also consistent with the key notions
of positive accounting theory, stakeholder theory, and legitimacy theory,
suggesting that these theories can be adopted in comparative studies of
social and environmental reporting under the social and economic devel-
opment perspective.
Although making two important contributions as noted in the introduc-
tion, the limitations of this study should be noted. The results would have
been more inclusive if a longer time period and more industries had been
examined. In addition, this study has only considered annual reports. We
did not consider other media because the annual report is the most
important and statutory document for corporate communications (Gray
The Impact of Social and Economic Development 239

et al., 1995a). This focus is in line with the vast bulk of the CSED literature.
We did not expand the scope to CSED on the Internet for two reasons.
First, the findings would be contaminated by the uneven usage of the In-
ternet between HK and the U.K. during the period of study since the per-
centage of the largest 30 companies without a website in the mid-1999 was
37% and 3% in HK and the U.K. respectively (Lymer, Debreceny, Gray, &
Rahman, 1999). Second, Internet-based corporate disclosures are largely a
copy of hardcopy disclosure (Lymer et al., 1999).
Moreover, other factors may also contribute towards the difference in the
CSED between the U.K. and HK. Potential factors include the role of
government and culture. Future research would benefit from using samples
involving more sectors and covering more companies, distinguishing man-
datory from voluntary disclosures, considering additional determinants of
CSED and other media used by companies to disclose social and environ-
mental information.
ACKNOWLEDGEMENT
The authors thank the editor, Sonja Gallhofer, Wan-Ying Hill, Zhijun Lin,
and the participants of Napier University Accounting Research Seminar
Series on 25 October 1999 and the 12th Asian Pacific Conference on In-
ternational Accounting Issues for comments on earlier drafts. Jason Xiao
acknowledges financial support provided by the Chinese Accounting, Fi-
nance and Business Research Unit at Cardiff University. The authors thank
He Yang’s research assistance.
REFERENCES
AAA (American Accounting Association). (1977). Report of the committee on international
accounting operations and education, 1975–1976. The Accounting Review, 52(Suppl.),
65–132.
Adams, C. A., Hill, W. Y., & Roberts, C. B. (1998). Corporate social reporting practices in
Western Europe: Legitimating corporate behaviour? British Accounting Review, 30, 1–21.
Adelman, I. (1995). Institutions and development strategies. VT: Edward Elgar Publishing
Company.
Arnold, P. J. (1990). The state and political theory in corporate social disclosure research:
A response to Guthrie and Parker. Advances in Public Interest Accounting, 4, 144–181.
Bartlett, S. A., & Chandler, R. A. (1997). The corporate report and the private shareholder: Lee
and Tweedie twenty years on. British Accounting Review, 29, 245–261.
JASON ZEZHENG XIAO ET AL.240

Burchell, S., Clubb, C., Hopwood, A., & Hughes, J. (1980). The roles of accounting in or-
ganizations and society. Accounting, Organizations and Society, 5, 5–27.
Chan, A. M. Y. (1988). The speculative accounting systems in Hong Kong: Understanding
Hong Kong’s accounting reality. In: V. K. Zimmerman (Ed.), Recent accounting and
economic developments in the far east (pp. 197–218). Champaign, IL: Centre for Inter-
national Education and Research in Accounting, University of Illinois.
Cooke, T. E., & Wallace, R. S. O. (1990). Financial disclosure regulation and its environment:
A review and further analysis. Journal of Accounting and Public Policy, 9, 79–110.
Cooper, D., & Sherer, M. (1984). The value of corporate accounting reports: Arguments for a
political economy of accounting. Accounting, Organizations and Society, 9, 207–232.
Cypher, J. M., & James, L. D. (1997). The process of economic development. New York: Rout-
ledge.
Deegan, C. (2002). The legitimising effect of social and environmental disclosures – a theoretical
foundation. Accounting, Auditing, and Accountability Journal, 15(3), 282–311.
Deegan, C., & Gordon, B. (1996). A study of environmental disclosure practices of Australian
corporations. Accounting and Business Research, 26, 187–199.
Fekrat, M. A., Inclan, C., & Petroni, D. (1996). Corporate environmental disclosures: Com-
petitive disclosure hypothesis using 1991 annual report data. The International Journal of
Accounting, 31, 175–195.
Freedman, M., & Stagliano, A. J. (1992). European unification, accounting harmonization, and
social disclosures. The International Journal of Accounting, 27, 112–122.
Gray, R., & Kouhy, R. (1993). Accounting for the environment and sustainability in lesser-
developed countries: An exploratory note. Research in Third World Accounting, 2, 387–
399.
Gray, R. H., Javad, M., Power, D. M., & Sinclair, C. D. (2001). Social and environmental
disclosure and corporate characteristics: A research note and extension. Journal of
Business Finance and Accounting, 28, 327–356.
Gray, R. H., Kouhy, R., & Lavers, S. (1995a). Methodological themes: Constructing a research
database for social and environmental reporting by UK companies. Accounting, Auditing
and Accountability Journal, 8, 78–101.
Gray, R. H., Kouhy, R., & Lavers, S. (1995b). Corporate social and environmental reporting:
A review of the literature and a longitudinal study of UK disclosure. Accounting, Au-
diting and Accountability Journal, 8, 47–77.
Guthrie, J., & Parker, L. D. (1990). Corporate social disclosure practice: A comparative in-
ternational analysis. Advances in Public Interest Accounting, 3, 159–176.
Hackston, D., & Milne, M. (1996). Some determinants of social and environmental disclosures
in New Zealand. Accounting, Auditing and Accountability Journal, 9, 77–108.
Ho, S., Ng, P., & Ng, A. (1994). A study of environmental reporting in Hong Kong.Hong Kong
Accountant, 5, 62–65.
Holsti, O. R. (1969). Content analysis for the social sciences and humanities. New York: Addi-
son-Wesley.
Jaggi, B., & Zhao, R. (1996). Environmental performance and reporting: Perceptions of man-
agers and accounting professionals in Hong Kong. The International Journal of Ac-
counting, 31, 333–346.
Lee, T. A., & Tweedie, D. P. (1976). The private shareholder: His sources of financial infor-
mation and his understanding of reporting practices. Accounting and Business Research,
6(Autumn), 304–314.
The Impact of Social and Economic Development 241

Lymer, A., Debreceny, R., Gray, G. L., & Rahman, A. (1999). Business reporting on the
internet. London: IASC.
Lynn, M. (1992). A note on corporate social disclosure in Hong Kong. British Accounting
Review, 24, 105–110.
Milne, M. J. (2002). Positive accounting theory, political costs and social disclosure analysis:
A critical look. Critical Perspectives on Accounting, 13, 369–395.
Milne, M. J., & Adler, R. W. (1999). Exploring the reliability of social and environmental
disclosures content analysis. Accounting, Auditing and Accountability Journal, 12,
237–256.
Mueller, G. (1968). Accounting practices generally accepted in the United States versus those
generally accepted elsewhere. The International Journal of Accounting, 3(2), 91–103.
Neu, D., Warsame, H., & Pedwell, K. (1998). Managing public impressions: Environmental
disclosures in annual reports. Accounting, Organizations and Society, 23, 265–282.
Ng, A. Y. (2000). Going green: More cause than concern. Australian CPA, 70, 64–69.
Nobes, C. (1998). Towards a general model of the reasons for international differences in
financial reporting. Abacus, 34, 162–187.
Patten, D. M. (1992). Intra industry environmental disclosures in response to the Alaskan oil
spill: A note on legitimacy theory. Accounting, Organizations and Society, 17, 471–475.
Perera, M. H. B., & Mathews, M. R. (1990). The cultural relativity of accounting and
international patterns of social accounting. Advances in International Accounting,
3, 215–251.
Roberts, C. B. (1990). Environmental disclosures in corporate annual reports in Western Eu-
rope. In: D. L. Owen (Ed.), Green reporting: Accountancy and the challenge of the nineties
(pp. 139–165). London: Chapman & Hall.
Roberts, R. W. (1992). Determinants of corporate social responsibility disclosure: An appli-
cation of stakeholder theory. Accounting, Organizations and Society, 17, 595–612.
Salter, S. B. (1998). Corporate financial disclosure in emerging markets: Does economic de-
velopment matter? The International Journal of Accounting, 33, 211–234.
Tang, K-L. (1998). East Asian newly industrializing countries: Economic growth and quality of
life. Social Indicators Research, 43, 69–96.
Tang, K-L. (1999). Planning for the unknown: Social policy-making in Hong Kong 1990–1997.
International Journal of Sociology and Social Policy, 19, 27–56.
Tinker, A. M., Neimark, M., & Lehman, C. (1991). Falling down the hole in the middle of the
road: Political quietism in corporate social reporting. Accounting, Auditing and Ac-
countability Journal, 4, 28–54.
Todaro, M. (1997). Economic development. MA: Addison-Wesley.
Tsang, E. W. K. (1998). A longitudinal study of corporate social reporting in Singapore: The
case of the banking, food and beverages and hotel industries. Accounting, Auditing and
Accountability Journal, 11, 624–635.
Ullmann, A. A. (1985). Data in search of a theory: A critical examination of the relationships
among social performance, social disclosure, and economic performance of US firms.
Academy of Management Review, 10, 540–557.
Unerman, J. (2000). Methodological issues: Reflections on quantification in corporate social
reporting content analysis. Accounting, Auditing and Accountability Journal, 13, 667–681.
United Nations. (2000). Statistical year book. New York: UN.
Wallace, R. S. O. (1993). Development of accounting standards for developing and newly
industrialized countries. Research in Third World Accounting, 2, 121–165.
JASON ZEZHENG XIAO ET AL.242

Wallace, R. S. O., & Naser, K. (1995). Firm specific determinants of the comprehensives of
mandatory disclosure in the corporate annual reports of firms listed on the stock ex-
change of Hong Kong. Journal of Accounting and Public Policy, 14, 311–368.
Watts, R. L., & Zimmerman, J. L. (1986). Positive accounting theory. London: Prentice-Hall.
Weber, R. D. (1990). Basic content analysis. Beverly Hills, CA: Sage.
Williams, S. L. M. (1998). Voluntary environmental and social accounting disclosure practices in
the Asia–Pacific region. Unpublished doctoral thesis, Murdoch University, Australia.
Williams, S. L. M., & Pei, C. A. H. W. (1999). Corporate social disclosures by listed companies
on their web sites: An international comparison. The International Journal of Accounting,
34, 389–419.
Wiseman, J. (1982). An evaluation of environmental disclosures made in corporate annual
reports. Accounting, Organizations and Society, 7, 53–63.
Wong, A. Y-S., & Tanner, P. A. (1997). Monitoring environmental pollution in Hong Kong:
Trends and prospects. Trends in Analytical Chemistry, 16, 180–190.
World Bank. (1988, 1991, 1995). Social indicators of development. London: Johns Hopkins
University Press.
World Bank. (1991). World tables 1991, a World Bank publications. London: Johns Hopkins
University Press.
The Impact of Social and Economic Development 243

This page intentionally left blank
244

COMPLIANCE WITH MANDATORY
DISCLOSURE REQUIREMENTS
BY NEW ZEALAND
LISTED COMPANIES
Joanna Yeoh
ABSTRACT
Annual reports are a primary medium in which listed companies commu-
nicate with the public. In New Zealand, legislation, along with other
reinforcing features, regulates the information disclosures found in com-
panies’ annual report. However, the existence of a regulatory framework
does not guarantee its compliance. This paper reports a descriptive study
of the compliance behaviour of New Zealand registered companies listed
on the New Zealand Stock Exchange (NZX) with regard to required
disclosures in their annual reports over a 3-year period, 1996–1998.
Compliance with reporting requirement is measured by using a research-
er-created disclosure index consisting of 495 mandated information items.
The sample consists of 49 companies spanning the 1996–1998 period. The
overall results show a high degree of corporate compliance with the fi-
nancial reporting requirements. However, the compliance rate is higher
with respect to the Statements of Standard Accounting Practices
(SSAPs) than to both the Financial Reporting Standards (FRSs), and
Advances in International Accounting
Advances in International Accounting, Volume 18, 245–262
Copyright r 2005 by Elsevier Ltd.
All rights of reproduction in any form reserved
ISSN: 0897-3660/doi:10.1016/S0897-3660(05)18012-X
245

listing rules of the stock market. This is a cause for concern, as the
SSAPs will eventually be replaced by FRSs.
INTRODUCTION
This paper reports the results of an empirical study assessing the degree of
compliance with annual report mandatory disclosure requirements by New
Zealand (NZ)-registered companies listed on the New Zealand Stock
Exchange (NZX) over a 3-year period (1996–1998). The results indicate a
high degree of compliance with mandatory disclosure requirements. The
results are consistent with prior literature (see Adhikari & Tondkar, 1992;
Riahi-Belkaoui, 1995) that listed companies in developed markets tend to
comply more with mandatory disclosure requirements than their listed
counterparts in developing markets.
Although prior studies (McNally, Eng, & Hasseldine, 1982; Hossian,
Perera, & Rahman, 1995) have reported instances where accounting infor-
mation have voluntarily been disclosed in annual reports of NZ companies,
several other studies have documented noncompliance with certain individual
accounting standards (see Ryan, 1994). For example, Tower, Gnosh, Rah-
man, Tan, and Cuthberston (1990) found that the non-compliance rate with
accounting standard on depreciation (SSAP-3) was between 32% and 48%.
While the degree of compliance with individual financial accounting standards
in NZ has previously been examined for pre-Financial Reporting Act (FRA)
periods, no study has focused on the degree of compliance with FRSs after the
enactment of the FRA. Also, no study, in the context of NZ, has focused on
the accounting information required to be disclosed in corporate annual re-
ports in its entirety. This study, therefore, fills the void in the literature by
assessing the degree of compliance with statutory and regulatory financial
reporting requirements by companies listed on the NZX for post-FRA period
(1996–1998). Studies of this genre provide useful and timely information for
standard setters to isolate those standards with low compliance.1
FINANCIAL REPORTING FRAMEWORK
NZ lies in the southern Pacific Ocean about 1,600 km east of Australia. It
consists of two large islands (the North and South islands), and a number of
smaller islands. Its total land area is 268,021 sq. km, comparable to the size
JOANNA YEOH246

of the United Kingdom. However, it is considerably less populated. As of
early 2002, its total population was approximately 3.8 million. Eighty per-
cent of the population consists of people of European origin, and 15% of
the Maori race. The country also has many other minorities, including those
of Polynesian and Chinese descent. It was formerly a British colony, but is
now a self-governing democratic nation within the British Commonwealth.
It is rich in natural resources, and is economically dependent on exports of
agricultural commodities such as dairy produce, meat, forestry products,
and fish. Its major export trading partners are Australia, Japan, and the
United States (U.S.).
The financial reporting practices of companies in NZ are regulated by
both the Companies Act 1993 and the FRA. However, whereas the Com-
panies Act prescribes the administrative (and certain content) requirements,
the FRA establishes the overall regulatory framework for financial report-
ing in the country. Further, while the Companies Act applies to all com-
panies, the FRA applies to all companies and all issuers.2 The Companies
Act requires directors of companies to maintain accurate accounting
records, which can be adequately explained. It also requires all companies to
prepare an annual report, which must include all contents prescribed under
section 211 of the Act. The prescribed contents include financial statements,
an audit report, and additional information regarding accounting policies,
directors, employees, and donations. The prescribed additional information
can be excluded with shareholders’ consent. Financial statements consist of
balance sheet, profit and loss statement, statement of cash flows, and ac-
companying notes as defined by section 8 of the FRA.
The requirements for an audit are set out in both the Companies Act and
the FRA. The Companies Act requires all companies to appoint an external
auditor except for non-issuer companies with unanimous shareholder ap-
proval to waive this requirement. The FRA requires the financial statements
of all issuers to be audited. Implicitly, non-issuer entities are subject to
statutory audit requirements.
Evolving from the British tradition of self-regulation, the accountancy
profession in NZ, the Institute of Chartered Accountants of New Zealand
(ICANZ), is influential in the financial reporting practices of companies in
the country. Although the ICANZ has no exclusive right to develop FRSs in
the country, it has been the sole developer of Accounting Standards Review
Board (ASRB) approved standards. The ASRB-approved FRSs have legal
endorsement under the FRA. Apart from developing FRSs, it monitors
their compliance through its members serving in the capacity either as re-
porting accountants, auditors, or directors.
Compliance with Mandatory Disclosure Requirements 247

The FRA requires financial statements of all reporting entities to show a
‘‘true and fair view’’ in addition to meeting generally accepted accounting
practice (GAAP). Compliance with GAAP would usually be sufficient to
enable financial statements to show a ‘‘true and fair view’’. However, when
this is not the case, section 11 of the FRA requires additional information to
be provided to achieve a ‘‘true and fair view’’. Section 3 of the FRA defines
GAAP as compliance with any applicable FRSs, and where no applicable
FRS exists, appropriate accounting policies having authoritative support.3
Under the FRA, a failure to comply with an applicable FRS is punishable
by a maximum fine of NZ$100,000 per director. However, the FRA does not
prescribe any penalty for failing to comply with appropriate accounting pol-
icies having authoritative support. Westwood (2000) points out that, in prac-
tice, the Registrar of Companies may invoke an alternative penalty for failure
to comply with authoritative support by using the FRA section 18 filing
requirement in conjunction with section 16(2). The section 16(2) requires
external auditors to report any breach of GAAP to the Registrar of Com-
panies, who in turn, must report the breach to the ASRB and the Securities
Commission. During 1995/96, for example, the Securities Commission en-
quired into aspects of financial statements of 29 listed companies, and re-
viewed 138 financial statements referred to it by the Registrar of Companies
because their audit reports were qualified (Securities Commission, 1996).
In addition to the reporting requirements of the Companies Act and the
FRA, listed companies are obliged to conform with the NZX’s continuous
periodic reporting requirements. The NZX has a market surveillance panel
responsible for the creation and enforcement of its rules, with power to
censure and suspend a company’s shares from trading in the market.
RESEARCH DESIGN AND METHODOLOGY
Sample Selection
The sample consists of NZ-registered non-financial companies that were
listed on the NZX during 1996–1998. Only NZ-registered companies were
chosen because foreign-registered companies do not have to comply with
NZ GAAP. The companies selected were from those NZ-registered com-
panies listed on the NZX, and whose annual reports were available for each
of the 3 years. The final sample consists of 49 companies per year. The
yearly sample represents approximately 39 percent of the NZ-registered
companies listed on the NZX as at the end of each year examined.
JOANNA YEOH248

Therefore, the results of this paper can be generalised to the population of
NZ-registered non-financial companies listed on the NZX.
Measuring Disclosure Compliance Level
A disclosure-measuring template was developed and used to capture the
mandatory disclosure compliance level (DCL) for each company in the
sample. The disclosure template is similar to the one used by Owusu-Ansah
and Yeoh (2002). The disclosure-measuring template consists of all infor-
mation items required to be disclosed in an annual report of a NZX-listed
company. The information items are compiled from the Companies Act
1993, promulgations of the professional accounting body (FRSs and
SSAPs), and the NZX listing rules.
An applicable mandated information item is scored one when disclosed in
an annual report of a sample company, and zero otherwise. A problem with
scoring disclosures in annual reports is whether or not an undisclosed in-
formation item is applicable to a sample company. Several measures em-
ployed in prior literature to minimise the impact of this problem were
adopted here. First, following Cooke (1989), the annual reports were thor-
oughly read before they were scored so as to ascertain if undisclosed in-
formation items were indeed inapplicable to the companies. Second,
applicability of any information item was confirmed by reviewing preced-
ing and succeeding years’ annual reports as NZ companies are required to
disclose comparative figures for each financial statement item. This proce-
dure is consistent with Owusu-Ansah (2000). Third, the applicability of
some items was determined by logical reasoning (Owusu-Ansah, 2000). For
example, it is logical to expect a company to disclose its accounting policy
for inventory valuation, if it owns some kind of inventory.
Another problem with the disclosure index methodology is that some of
the information items in the index may not be applicable to all sample
companies. Following prior studies, a relative score was computed for each
company. The relative score is the ratio of what a company disclosed in its
annual report to what it is expected to disclose under the regulatory regime
in each year investigated. Because the constituents of the disclosure index
are mandated information items, the relative score obtained by a company is
interpreted as its DCL, derived by using the following formula:
DCLijt ¼
Pmjt
i¼1 d ijtPnjt
i¼1 d ijt
(1)
Compliance with Mandatory Disclosure Requirements 249

where
dijt ¼ disclosure value of information item i applicable to j sample com-
pany in year t, taking a value of one, if company j discloses it, or zero, if it
does not, mjt ¼ number of mandated information items applicable to the
sample company j that it actually disclosed in year t, njt ¼ the number of
mandated information items applicable to sample company j, which are
expected to be disclosed by company j in year t.
To ensure that the DCL for each company reflects its true disclosure
compliance behaviour, the reliability of the disclosure-measuring template
was evaluated. To do this, annual reports of 20 sample companies were
randomly selected and given to an independent person to re-score. A cor-
relation analysis was done on the scores obtained by this person, and those
by the present investigator. The results of this analysis indicate that there
was no significant bias introduced by the scorers, and that the DCL for each
company is reliable.
RESULTS AND DISCUSSION
As panel A of Table 1 indicates, there was a high degree of compliance with
mandatory disclosure requirements by the companies in the sample in each
of the years investigated. The DCLs cluster together in the upper end of the
fourth quartile. They range from a minimum compliance level of 84.1% to a
maximum level of 99.5% (see panel B of Table 1). A closer inspection of
panel A of Table 1 reveals that the number of companies disclosing less than
90% of the applicable mandated information items declined over time.
The number of companies whose compliance rate was between 90% and
100% of statutory and regulatory disclosure requirements consistently in-
creased over time from 84% in 1996 to 98% in 1998. This upward trend in
the degree of compliance with disclosure requirements could be due to the
regulatory agency having proved that it is not a big lion without teeth. The
upward trend in compliance level could also be due to increasing economies
of scale. Thus, the marginal cost of complying with more disclosure re-
quirements by the sample companies declines over time.
While Table 1 summarizes the overall compliance level with mandatory
disclosure requirements in the country, a more detailed item-by-item com-
parison between actual compliance level and corresponding disclosure re-
quirements would be insightful. Hence, such a comparative analysis was
done, and is reported in Tables 2–4.
JOANNA YEOH250

Table 2 is a detailed item-by-item comparison of the actual compliance
level and corresponding disclosure requirements of FRSs, Table 3 is a
detailed item-by-item comparison of the actual compliance level and cor-
responding disclosure requirements of SSAPs, and Table 4 is a detailed
item-by-item comparison of the actual compliance level and corresponding
disclosure requirements of the NZX.
The figures in the column headed ‘‘Applicable (Not Applicable)’’ repre-
sent the number of sample companies, on the basis of their annual reports,
that are (are not) to disclose the information items under the regulatory
regime that prevailed in each year. Because disclosure requirements can be
complied with at varying levels, sample companies obliged to comply with a
particular requirement (column 1) have been categorised into two: (i) those
fully complying with all sub-items (figures in columns 2c, 3c and 4c), and (ii)
those not complying with at least one of the sub-items (figures in parentheses
in columns 2c, 3c and 4c).
Table 1. Yearly Descriptive Statistics of Disclosure Compliance
Behaviour of Companies.
Panel A: Mandatory Disclosure Compliance Level
Disclosure Compliance Level (%) Companies
1996 1997 1998
No. % No. % No. %
Between 95 and 100 25 51.02 20 40.82 23 46.94
Between 90 and 94 18 36.73 24 48.98 25 51.02
Between 85 and 89 6 12.24 5 10.20 1 2.04
Between 80 and 84 0 0.00 0 0.00 0 0.00
Between 75 and 79 0 0.00 0 0.00 0 0.00
Less than 75 0 0.00 0 0.00 0 0.00
Total 49 100.00 49 100.00 49 100.00
Panel B: Summary Statistics
1996 1997 1998
Mean (%) 93.9 94.3 94.5
Minimum (%) 85.1 85.3 88.6
Maximum (%) 99.4 99.3 99.4
Compliance with Mandatory Disclosure Requirements 251

Table 2. Item-by-Item Comparison of Actual Disclosure Against Disclosure Requirements: Financial
Reporting Standards.
Applicability of Disclosure Items
1996 (n ¼ 49) 1997 (n ¼ 49) 1998 (n ¼ 49)
(1) (2a) (2b) (3a) (3b) (4a) (4b)
Sources of mandatory
disclosure
requirements/
mandated disclosure
items (sub-items not
shown)
Applicable (not
applicable)
Complying
(not complying)
Applicable (not
applicable)
Complying
(not complying)
Applicable (not
applicable)
Complying
(not complying)
Financial Reporting
Standards
No. % No. % Rank No. % No. % Rank No. % No. % Rank
FRS-01 Accounting
policies
49 (0) 100 47 (2) 96 3 49 (0) 98 48 (1) 98 1� 48 (0) 100 45 (3) 94 4
FRS-02 Presentation 49 (0) 100 45 (4) 92 6 49 (0) 98 45 (4) 92 3 48 (0) 100 44 (4) 92 6
FRS-04 Inventories 47 (2) 96 45 (2) 96 3 44 (5) 88 38 (6) 87 6 38 (10) 79 36 (2) 95 3
FRS-05 Events
occurring after
balance date
29 (20) 59 22 (7) 76 12 35 (14) 70 29 (6) 83 8 5 (43) 10 2 (3) 40 16
FRS-07 Extraordinary
items & fundamental
errors
20 (29) 41 20 (0) 100 1� 22 (27) 44 19 (3) 86 7 1 (47) 2 0 (1) 0 20��
FRS-09 Disclosure
of information
30 (19) 61 11 (19) 37 21 20 (29) 40 6 (14) 33 26 48 (0) 100 15 (33) 31 17
FRS-10 Cash flows 48 (1) 98 32 (16) 67 15 46 (3) 92 28 (18) 60 20 47 (1) 98 36 (11) 77 11
FRS-13 Research and
development
25 (24) 51 18 (7) 72 13 34 (15) 68 26 (8) 76 13 18 (30) 38 12 (6) 67 14
JOANNA
YEOH
252

FRS-14 Construction
contracts
23 (26) 47 19 (4) 83 9 30 (19) 60 26 (4) 87 6 0 (48) 0 0 (0) .
FRS-19 Goods and
services tax
9 (40) 18 6 (3) 67 15 10 (39) 20 6 (4) 64 16 2 (46) 4 2 (0) 100 1�
FRS-20 Dividend
election plans
23 (26) 47 14 (9) 58 18 23 (26) 46 18 (5) 79 11 1 (47) 2 1 (0) 100 1�
FRS-26 Debt
defeasance
24 (25) 49 15 (9) 63 17 28 (21) 56 20 (8) 72 14 2 (46) 4 2 (0) 100 1�
FRS-27 Right of
set-off
10 (39) 20 3 (7) 30 22 11 (38) 22 2 (9) 25 27 0 (48) 0 0 (0) .
FRS-29 Prospective
financial
information
3 (46) 6 3 (0) 100 1� 2 (47) 4 1 (1) 67 15 1 (47) 2 1 (0) 100 1�
FRS-30 Share
ownership
arrangements
30 (19) 61 16 (14) 53 19 34 (15) 68 21 (13) 63 17 10 (38) 21 3 (7) 30 18
FRS-31 Financial
instruments
28 (21) 57 7 (21) 25 23 20 (29) 40 7 (13) 33 26 45 (3) 94 7 (38) 16 19
FRS-32
Superannuation
schemes
13 (36) 27 3 (10) 23 24 8 (41) 16 0 (8) 11 28�� 6 (42) 13 3 (3) 50 15
Mean compliance level 67 66 66
Overall compliance
level
80 70 77
�Denotes full compliance with requirements.��Denotes total failure to comply with requirements.
Complia
nce
with
Mandatory
Disclo
sure
Requirem
ents
253

Table 3. Item-by-Item Comparison of Actual Disclosure Against Disclosure Requirements: Statements of
Standard Accounting Practices.
Applicability of Disclosure Items
1996 (n ¼ 49) 1997 (n ¼ 49) 1998 (n ¼ 49)
(1) (2a) (2b) (3a) (3b) (4a) (4b)
Sources of mandatory
disclosure
requirements/
mandated disclosure
items (sub-items not
shown)
Applicable (not
applicable)
Complying
(not complying)
Applicable (not
applicable)
Complying
(not complying)
Applicable (not
applicable)
Complying
(not complying)
Statements of Standard
Accounting Practice
No. % No. % Rank No. % No. % Rank No. % No. % Rank
SSAP-03 Depreciation 48 (1) 98 46 (2) 94 4 49 (0) 98 48 (1) 98 1� 47 (1) 98 47 (0) 100 1�
SSAP-08 Group
accounting
32 (17) 65 20 (12) 63 17 28 (21) 56 13 (15) 48 25 42 (6) 88 34 (8) 81 10
SSAP-12 Income tax 48 (1) 98 30 (18) 63 17 48 (1) 96 23 (25) 49 23 47 (1) 98 39 (8) 83 9
SSAP-15
Contingencies
29 (20) 59 27 (2) 93 5 23 (26) 46 21 (2) 91 4 44 (4) 92 44 (0) 100 1�
SSAP-17 Investment
properties
13 (36) 27 11 (2) 85 8 8 (41) 16 5 (3) 63 17 14 (34) 29 13 (1) 93 5
SSAP-18 Leases and
hire purchases
44 (5) 90 34 (10) 77 11 38 (11) 76 35 (3) 92 3 39 (9) 81 37 (2) 95 3
JOANNA
YEOH
254

SSAP-21 Foreign
currency
21 (28) 43 21 (0) 100 1� 16 (33) 32 14 (2) 88 5 39 (9) 81 36 (3) 92 6
SSAP-22 Related
parties
26 (23) 53 24 (2) 92 6 22 (27) 44 13 (9) 61 19 41 (7) 85 36 (5) 88 8
SSAP-23 Segments 45 (4) 92 37 (8) 82 10 38 (11) 76 29 (9) 77 12 47 (1) 98 36 (11) 77 11
SSAP-25 Joint
ventures and
partnerships
27 (22) 55 17 (10) 63 17 32 (17) 64 17 (15) 55 21 10 (38) 21 0 (10) 0 20
SSAP-28 Fixed assets 31 (18) 63 22 (9) 71 14 21 (28) 42 13 (8) 64 16 47 (1) 98 35 (12) 74 13
Mean compliance level 80 71 80
Overall compliance
level
76 70 77
�Denotes full compliance with requirements.
Complia
nce
with
Mandatory
Disclo
sure
Requirem
ents
255

Table 4. Item-by-Item Comparison of Actual Disclosure Against Disclosure Requirements: NZX Listing
Requirements.
Applicability of Disclosure Items
1996 (n ¼ 49) 1997 (n ¼ 49) 1998 (n ¼ 49)
(1) (2a) (2b) (3a) (3b) (4a) (4b)
Sources of mandatory
disclosure
requirements/
mandated disclosure
items (sub-items not
shown)
Applicable (not
applicable)
Complying
(not complying)
Applicable (not
applicable)
Complying
(not complying)
Applicable (not
applicable)
Complying
(not complying)
NZX listing
requirements
No. % No. % Rank No. % No. % Rank No. % No. % Rank
Sec 10 Signing financial
statements
49 (0) 100 48 (1) 98 2 49 (0) 98 47 (2) 96 2 48 (0) 100 48 (0) 100 1�
Sec 26 Substantial
security holders
46 (3) 94 31 (15) 66 16 47 (2) 94 24 (23) 52 22 46 (2) 96 45 (1) 98 2
Sec 8.4.2 Sec 8.4.2
Principal security
and directors
48 (1) 98 47 (1) 98 2 48 (1) 96 39 (9) 82 9 47 (1) 98 42 (5) 89 7
Sec 8.5.3 Reporting
period changes
23 (26) 47 20 (3) 87 7 29 (20) 58 22 (7) 77 12 2 (46) 4 2 (0) 100 1�
JOANNA
YEOH
256

Sec 3.3.4 Alternate
directors
6 (43) 12 3 (3) 50 20 5 (44) 10 3 (2) 67 15 8 (40) 17 7 (1) 88 8
Sec 10.5.4 Appointed
directors
3 (46) 6 3 (0) 100 1� 4 (45) 8 3 (1) 80 10 2 (46) 4 1 (1) 50 15
Sec 8.3.2 & 8.4.3 Audit
committee existence
49 (0) 100 29 (20) 58 18 49 (0) 98 30 (19) 62 18 48 (0) 100 36 (12) 75 12
Mean compliance level 80 74 86
Overall mean
compliance level
76 70 77
�Denotes full compliance with requirements.
Complia
nce
with
Mandatory
Disclo
sure
Requirem
ents
257

Several inferences can be drawn from Tables 2–4. First, the sample com-
panies fully complied with certain mandated disclosure requirements at least
once during the 3-year period studied. These requirements are: SSAP-3
(Accounting for Depreciation), SSAP-15 (Contingencies), SSAP-21 (Foreign
Currency Translations), FRS-1 (Disclosure of Accounting Policies), FRS-19
(Goods and Services Tax), FRS-20 (Dividend Election Plans), FRS-26 (Debt
Defeasance), FRS-27 (Extraordinary Items and Fundamental Errors), FRS-
29 (Prospective Financial Information), SEC 8.5.3 (Reporting Period Chang-
es), SEC 10 (Signing Financial Statements), and SEC 10.5.4 (Appointed
Directors).4
The full compliance with these disclosure requirements, ranked first in
Table 2, might be due to three factors. First, the compliance with these
requirements may not give away proprietary information to competitors,
which can be detrimental to the compliant companies. Second, certain dis-
closure requirements such as FRS-27 (Extraordinary Items and Fundamental
Errors) attract regulatory scrutiny as they are generally abused by the man-
agement. Hence, full compliance minimizes potential political cost. Finally,
the relatively low cost of producing and disseminating certain disclosure
requirements such as SEC 10 (Signing Financial Statements), SEC 10.5.4
(Appointed Directors), SEC 8.5.3 (Reporting Period Changes), FRS-19 (Good
and Services Tax), and FRS-20 (Dividend Election Plans).
The high compliance rate for FRS-29 (Prospective Financial Information)
is surprising because disclosure of such information can invite possible legal
suits. Perhaps, what might have motivated such high compliance with this
requirement is that NZ’s environment is relatively less litigious than the U.S.
A second inference that can be drawn from Table 2 is that certain dis-
closure requirements were moderately complied with (between 60% and
99%) by the sample companies. These requirements constitute about
59% of all those disclosure items, from the three regulatory sources in each
of the years investigated, that the companies were required to comply with.
The requirements that were moderately complied with by the companies
include FRS-13 (Research and Development), SSAP-17 (Investment Proper-
ties and Properties Intended for Sale), SSAP-18 (Accounting for Leases and
Hire Purchase Contracts), SSAP-23 (Accounting for Segments), and a NZX
Listing rule (Section 8.4.2: Principal Security Holders and Directors’
Shareholding).5
The third inference is that about a quarter of all the disclosure require-
ments were poorly complied with by the companies. Those that were lowly
complied with at least two out of the 3 years investigated include SSAP-8
(Group Accounting), FRS-9 (Information to be Disclosed in Financial
JOANNA YEOH258

Statements), FRS-31 (Disclosure of Information About Financial Instru-
ments), and FRS-32 (Financial Reporting by Superannuation Schemes).
Plausible reasons for the low compliance are cost and complexity of some of
these requirements. For example, FRS-31 (Disclosure of Information about
Financial Instruments) addresses controversial issues, which though referred
as a FRS, is yet to be approved by the ASRB (which has authoritative
support of the accounting profession).
Fourth, it can be discerned from Table 2 that the listing requirements of
the NZX has the highest mean compliance rate, followed by the SSAPs and
then by the FRSs.6 There are two plausible reasons accounting for this
phenomena. First, the NZX’s market surveillance panel monitors compli-
ance with its requirements more rigorously than the Securities Commission,
the Registrar of Companies, and the ICANZ. Second, cost of complying
with the NZX listing rules is relatively lower than the cost of complying with
SSAPs and FRSs.
Also, Table 2 indicates that the companies consistently complied more
with SSAPs than FRSs over the period investigated. The mean compliance
rate for SSAPs ranges from 53% (in 1996) to 80% (in 1998). In contrast, the
mean compliance rate for FRSs ranges from 40% (in 1996) to 66% (in
1998). The differences in the compliance rates between SSAPs and FRSs
may be due to three factors. First, because the SSAPs have relatively been in
existence for years, the companies have acquired experience in their appli-
cations. Thus, this is a learning curve effect. Second, the FRSs are more
costly to comply with than the SSAPs. Third, some of the FRSs cover recent
and controversial issues, thus non-compliance may indicate the preparers
disagreement with the views of ASRB.
CONCLUSION
This study investigates the mandatory disclosure compliance levels by NZ-
registered companies listed on the NZX over a 3-year period. The results
show a high rate of compliance with mandatory disclosure requirements by
these companies over the period investigated. However, the mean compli-
ance rate with NZX listing rules was higher, followed by that for SSAPs,
and then, the FRSs.
Like all studies, the present study has several weaknesses, which should be
taken into consideration in interpreting the results. First, information items
in the disclosure index were treated equally in terms of their information
content for methodological convenience. Second, the study examined
Compliance with Mandatory Disclosure Requirements 259

information required to be disclosed in corporate annual reports – one of
the media by which companies communicate with the public. Third, the
assumption that increases in the quantity of disclosure improves the quality
of information is questionable. Research shows that more information does
not necessarily mean quality information (Hirshleifer, 1971; Baiman, 1975).
Despite the weaknesses above, the study suggests several lines of future
inquiries. First, a research that would survey preparers of corporate annual
report in NZ to elicit their reasons for not complying with certain man-
datory disclosure requirements is needed. Second, for public policy pur-
poses, a further study would be needed to identify those companies that
failed to comply with mandatory disclosure requirements. Finally, future
studies could attach weights to the disclosure items to portray their relative
importance.
NOTES
1. Westwood (2000) attributes low compliance with accounting standards to theirlow quality, which in turn, is a consequence of standard setting process being reactiverather than proactive. He states that low-quality accounting standards may becaused by lack of precision in prescribed accounting treatments due to the existenceof optional treatments, inconsistencies between required treatments, and/or lack ofcoverage (due to limitations in the scope of a standard’s subject matter or because astandard does not exist in respect of a particular subject).2. Section 4 of the FRA defines an issuer as: (i) an entity which has allocated
securities to the public by way of a registered prospectus; (ii) an entity which hassecurities quoted on the NZX; (iii) a life insurance company that has issued any lifeinsurance policy according to an offer of securities to the public; (iv) a unit trust inwhich securities have been allocated according to an offer of securities to the public;and (v) a registered bank that has allocated securities to the public. Essentially, anissuer is any party that has made a public issue of debt or equity securities (Westwood,2000). Issuers include companies, building societies, industrial and provident societies,friendly societies, credit unions, and incorporated societies, as well as unincorporatedbodies, trusts or organizations and individuals (Deegan & Samkin, 2001).3. According to Westwood (2000), appropriate accounting policies having au-
thoritative support essentially refer to sources of accounting guidance which areappropriate to the circumstances of the entity reporting and that have authoritywithin the accounting profession in NZ.4. The high compliance rate for SSAP-3 is consistent with the results reported by
Ritchie (1994).5. There is a major improvement in the compliance rate for SSAP-18 as compared
to Davy’s (1994) results.6. Also, a one-way ANOVA test suggests that there is a significant difference
between the overall mean compliance rate between the NZX listing rules, SSAPs, andFRSs at the 0.01 level.
JOANNA YEOH260

ACKNOWLEDGEMENTS
I appreciate the research grant provided by the University of Canterbury,
New Zealand. I thank Selena Robb, James Arbuthnott, and Dylan Fit-
zgerald for their assistance in data collection, and Grace Ooi and Warwick
Anderson for their editorial comments. I also thank the staff at Macmillan
Brown library of the University of Canterbury for tracing the annual reports
of the sample companies in the library’s special collection on New Zealand
and the Pacific Islands. I am grateful to Stephen Owusu-Ansah for his
insightful comments on earlier drafts of this paper. The views expressed in
this article (chapter) are those of the author and do not necessarily reflect
the views of the Institute of Chartered Accountants of New Zealand.
REFERENCES
Adhikari, A., & Tondkar, R. (1992). Environmental factors influencing accounting disclosure
requirements of global stock exchanges. Journal of International Financial Management
and Accounting, 4(2), 76–105.
Baiman, S. (1975). The evaluation and choice of internal information systems within a mul-
tiperson world. Journal of Accounting Research, 13(1), 1–15.
Cooke, T. E. (1989). Disclosure in the corporate annual reports of Swedish companies.
Accounting and Business Research, 19(74), 113–124.
Davy, A. (1994). SSAP-18: Accounting for leases and hire purchase contracts. In: J. B. Ryan
(Ed.), New Zealand company financial reporting 1994. Auckland, New Zealand: Premier
Print Series.
Deegan, C., & Samkin, G. (2001). New Zealand financial accounting. Auckland, New Zealand:
McGraw-Hill Book Company.
Hirshleifer, J. (1971). The private and social value of information and the reward of incentive
activity. The American Economic Review, 61(4), 561–574.
Hossian, M., Perera, M. H. B., & Rahman, A. R. (1995). Voluntary disclosure in the annual
reports of New Zealand companies. Journal of International Financial Management and
Accounting, 6(1), 69–85.
McNally, G. M., Eng, L. H., & Hasseldine, C. R. (1982). Corporate financial reporting in New
Zealand: An analysis of user preferences, corporate characteristics and disclosure prac-
tices for discretionary information. Accounting and Business Research, 13(49), 11–20.
Owusu-Ansah, S. (2000). Noncompliance with corporate annual report disclosure requirements
in Zimbabwe. In: R. S. O. Wallace, J. M. Samuels, R. J. Briston & S. M. Saudagaran
(Eds), Research in accounting in emerging economies 4 (pp. 289–305). London, England
and Greenwich, CT: JAI Press.
Owusu-Ansah, S., & Yeoh, J. (2002). The impact of Financial Reporting Act on corporate
disclosure practices in New Zealand. In: Proceedings of the 14th Asian-Pacific conference
on international accounting issues (Nov 23–26), Los Angeles.
Riahi-Belkaoui, A. (1995). Accounting information adequacy and macroeconomic determi-
nants of economic growth. Advances in International Accounting, 8, 67–77.
Compliance with Mandatory Disclosure Requirements 261

Ritchie, K. A. (1994). SSAP-3: Accounting for depreciation. In: J. B. Ryan (Ed.), New Zealand
company financial reporting 1994. Auckland, New Zealand: Premier Print Series.
Ryan, J. B. (1994). New Zealand company financial reporting 1994. Auckland, New Zealand:
Premier Print Services.
Securities Commission [New Zealand]. (1996). Securities Commission’s 1996 Annual Report.
Tower, G. D., Gnosh, M., Rahman, A. R., Tan, L. M., & Cuthberston, J. (1990). SSAP-3:
Depreciation of fixed assets and measurement of fixed assets. In: J. B. Ryan (Ed.), New
Zealand company financial reporting 1989. Levin, New Zealand: Kerslake, Billens and
Humphrey.
Westwood, M. (2000). Financial accounting in New Zealand (4th ed.). Auckland, New Zealand:
Pearson Education.
JOANNA YEOH262