Advanced techniques for nanocharacterization of polymeric coating surfaces
10
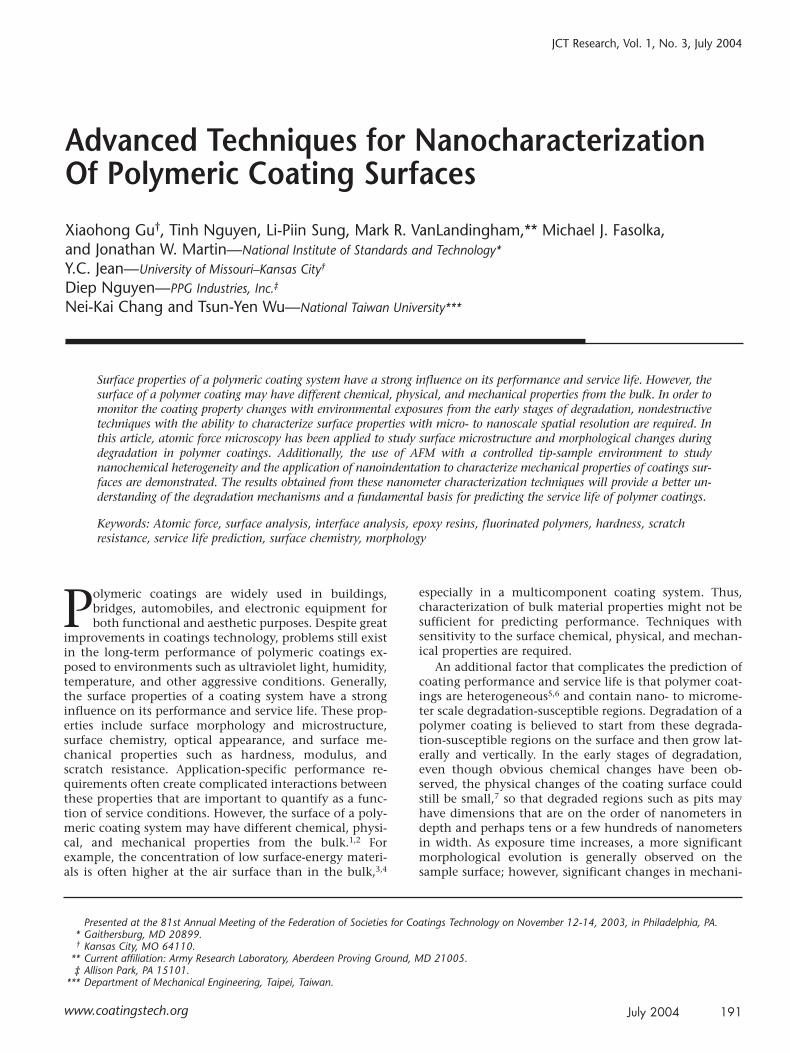
www.coatingstech.org Advanced Techniques for Nanocharacterization Of Polymeric Coating Surfaces Xiaohong Gu † , Tinh Nguyen, Li-Piin Sung, Mark R. VanLandingham,** Michael J. Fasolka, and Jonathan W. Martin—National Institute of Standards and Technology* Y.C. Jean—University of Missouri–Kansas City † Diep Nguyen—PPG Industries, Inc. ‡ Nei-Kai Chang and Tsun-Yen Wu—National Taiwan University*** Presented at the 81st Annual Meeting of the Federation of Societies for Coatings Technology on November 12-14, 2003, in Philadelphia, PA. * Gaithersburg, MD 20899. † Kansas City, MO 64110. ** Current affiliation: Army Research Laboratory, Aberdeen Proving Ground, MD 21005. ‡ Allison Park, PA 15101. *** Department of Mechanical Engineering, Taipei, Taiwan. Surface properties of a polymeric coating system have a strong influence on its performance and service life. However, the surface of a polymer coating may have different chemical, physical, and mechanical properties from the bulk. In order to monitor the coating property changes with environmental exposures from the early stages of degradation, nondestructive techniques with the ability to characterize surface properties with micro- to nanoscale spatial resolution are required. In this article, atomic force microscopy has been applied to study surface microstructure and morphological changes during degradation in polymer coatings. Additionally, the use of AFM with a controlled tip-sample environment to study nanochemical heterogeneity and the application of nanoindentation to characterize mechanical properties of coatings sur- faces are demonstrated. The results obtained from these nanometer characterization techniques will provide a better un- derstanding of the degradation mechanisms and a fundamental basis for predicting the service life of polymer coatings. Keywords: Atomic force, surface analysis, interface analysis, epoxy resins, fluorinated polymers, hardness, scratch resistance, service life prediction, surface chemistry, morphology July 2004 191 JCT Research, Vol. 1, No. 3, July 2004 P olymeric coatings are widely used in buildings, bridges, automobiles, and electronic equipment for both functional and aesthetic purposes. Despite great improvements in coatings technology, problems still exist in the long-term performance of polymeric coatings ex- posed to environments such as ultraviolet light, humidity, temperature, and other aggressive conditions. Generally, the surface properties of a coating system have a strong influence on its performance and service life. These prop- erties include surface morphology and microstructure, surface chemistry, optical appearance, and surface me- chanical properties such as hardness, modulus, and scratch resistance. Application-specific performance re- quirements often create complicated interactions between these properties that are important to quantify as a func- tion of service conditions. However, the surface of a poly- meric coating system may have different chemical, physi- cal, and mechanical properties from the bulk. 1,2 For example, the concentration of low surface-energy materi- als is often higher at the air surface than in the bulk, 3,4 especially in a multicomponent coating system. Thus, characterization of bulk material properties might not be sufficient for predicting performance. Techniques with sensitivity to the surface chemical, physical, and mechan- ical properties are required. An additional factor that complicates the prediction of coating performance and service life is that polymer coat- ings are heterogeneous 5,6 and contain nano- to microme- ter scale degradation-susceptible regions. Degradation of a polymer coating is believed to start from these degrada- tion-susceptible regions on the surface and then grow lat- erally and vertically. In the early stages of degradation, even though obvious chemical changes have been ob- served, the physical changes of the coating surface could still be small, 7 so that degraded regions such as pits may have dimensions that are on the order of nanometers in depth and perhaps tens or a few hundreds of nanometers in width. As exposure time increases, a more significant morphological evolution is generally observed on the sample surface; however, significant changes in mechani-
-
Upload
independent -
Category
Documents
-
view
0 -
download
0
Transcript of Advanced techniques for nanocharacterization of polymeric coating surfaces
www.coatingstech.org
Advanced Techniques for Nanocharacterization Of Polymeric Coating Surfaces
Xiaohong Gu†, Tinh Nguyen, Li-Piin Sung, Mark R. VanLandingham,** Michael J. Fasolka, and Jonathan W. Martin—National Institute of Standards and Technology*Y.C. Jean—University of Missouri–Kansas City†
Diep Nguyen—PPG Industries, Inc.‡
Nei-Kai Chang and Tsun-Yen Wu—National Taiwan University***
Presented at the 81st Annual Meeting of the Federation of Societies for Coatings Technology on November 12-14, 2003, in Philadelphia, PA.* Gaithersburg, MD 20899.† Kansas City, MO 64110.
** Current affiliation: Army Research Laboratory, Aberdeen Proving Ground, MD 21005.‡ Allison Park, PA 15101.
*** Department of Mechanical Engineering, Taipei, Taiwan.
Surface properties of a polymeric coating system have a strong influence on its performance and service life. However, thesurface of a polymer coating may have different chemical, physical, and mechanical properties from the bulk. In order tomonitor the coating property changes with environmental exposures from the early stages of degradation, nondestructivetechniques with the ability to characterize surface properties with micro- to nanoscale spatial resolution are required. Inthis article, atomic force microscopy has been applied to study surface microstructure and morphological changes duringdegradation in polymer coatings. Additionally, the use of AFM with a controlled tip-sample environment to studynanochemical heterogeneity and the application of nanoindentation to characterize mechanical properties of coatings sur-faces are demonstrated. The results obtained from these nanometer characterization techniques will provide a better un-derstanding of the degradation mechanisms and a fundamental basis for predicting the service life of polymer coatings.
Keywords: Atomic force, surface analysis, interface analysis, epoxy resins, fluorinated polymers, hardness, scratch resistance, service life prediction, surface chemistry, morphology
July 2004 191
JCT Research, Vol. 1, No. 3, July 2004
Polymeric coatings are widely used in buildings,bridges, automobiles, and electronic equipment forboth functional and aesthetic purposes. Despite great
improvements in coatings technology, problems still existin the long-term performance of polymeric coatings ex-posed to environments such as ultraviolet light, humidity,temperature, and other aggressive conditions. Generally,the surface properties of a coating system have a strong influence on its performance and service life. These prop-erties include surface morphology and microstructure,surface chemistry, optical appearance, and surface me-chanical properties such as hardness, modulus, andscratch resistance. Application-specific performance re-quirements often create complicated interactions betweenthese properties that are important to quantify as a func-tion of service conditions. However, the surface of a poly-meric coating system may have different chemical, physi-cal, and mechanical properties from the bulk.1,2 Forexample, the concentration of low surface-energy materi-als is often higher at the air surface than in the bulk,3,4
especially in a multicomponent coating system. Thus,characterization of bulk material properties might not besufficient for predicting performance. Techniques withsensitivity to the surface chemical, physical, and mechan-ical properties are required.
An additional factor that complicates the prediction ofcoating performance and service life is that polymer coat-ings are heterogeneous5,6 and contain nano- to microme-ter scale degradation-susceptible regions. Degradation of apolymer coating is believed to start from these degrada-tion-susceptible regions on the surface and then grow lat-erally and vertically. In the early stages of degradation,even though obvious chemical changes have been ob-served, the physical changes of the coating surface couldstill be small,7 so that degraded regions such as pits mayhave dimensions that are on the order of nanometers indepth and perhaps tens or a few hundreds of nanometersin width. As exposure time increases, a more significantmorphological evolution is generally observed on thesample surface; however, significant changes in mechani-

cal performance or appearance may not be detected usingconventional testing until the degradation has progressedto an advanced state.8 In order to monitor the coatingproperty changes with exposure from the early stages ofdegradation, nondestructive techniques with the ability tocharacterize surface properties with micro- to nanoscalespatial or depth resolution are required. Information ob-tained from such characterization can then be used to pro-vide a more complete understanding of degradationmechanisms, providing a fundamental basis for predictingthe service life of polymer coatings.
Tapping mode atomic force microscopy (AFM) hasemerged as a powerful technique to provide direct spatialmapping of surface topography and surface heterogeneity
with nanometer resolution. Phase contrast in tappingmode AFM often reflects differences in the properties ofindividual components of heterogeneous materials, and isuseful for compositional mapping in polymer blends,copolymers, and coatings.9-15 Additionally, force curves intapping mode AFM have also been explored to provide lo-cal mechanical property information in multicomponentmaterials.16 A combination of phase imaging and forcecurve measurement can allow the heterogeneous regionsin polymer systems to be identified. Development ofchemical modification of AFM probes has demonstratedthat chemical sensitivity of AFM can be enhanced byfunctionalizing tips with specific chemical species17,18 orby elevating the humidity of the tip-sample environ-ment.19,20 This capability allows AFM to be used to imagesurface morphology and surface heterogeneity based onlocal chemical interactions, making the linkage betweenphysical properties and chemical properties possible at mi-cro- to nanometer scales.
Nanoindentation has been increasingly used to charac-terize the mechanical response of polymer materials.8,21-23
This technique is characterized relative to traditional in-dentation techniques by the small radius of the indenta-tion probes, the continuous and simultaneous measure-ment of forces and displacements, the extremely highforce and displacement resolutions, and the large rangesof applied forces and displacements. These capabilities al-low for the study of a variety of materials with microme-ter and submicrometer scale resolution, both in lateral di-mension and in penetration depth. The addition ofdynamic oscillation superposed over a quasi-static loadinghistory allows for the characterization of mechanicalproperties as a function of penetration depth as opposedto a single measurement from the quasi-static loading his-tory. The dynamic capability can also be used to measuremechanical storage and loss and other time-dependent be-havior of polymers, such as creep and stress relaxation.Lateral motion and lateral force measurement capabilitieshave also been developed to extend the nanoindentationinstrument to surface tribological studies, such as scratchresistance of coatings.
In this article, AFM and nanoindentation techniquesare applied to study surface microstructure, properties,and degradation of polymer coatings. Tapping mode AFM
X. Gu et al.
JCT Research192 July 2004
Figure 1—AFM height images (left) and phase images (right) ofepoxy coatings applied on silicon substrates: (A) E1000, surface;(B) E1000, interface; (C) E2575, surface; (D) E2575, interface.Scan size is 1 × 1 µm. Contrast variations from white to blackare 10 nm for the height images and 90° for the phase images.
Figure 2—AFM height image (left) and phase image (right) of ul-tramicrotomed fractured surface of epoxy E1000 bulk specimen.Scan size is 500 × 500 nm. Contrast variations from white to blackare 10 nm for the height images and 30° for the phase images.
A
B
C
D
is used to investigate changes in surface microstructure asa function of exposure. Additionally, the use of AFM witha controlled tip-sample environment to image chemicalheterogeneity in coating surfaces and the application ofnanoindentation to studies of surface mechanical proper-ties, such as modulus, hardness, and scratch resistance aredemonstrated.
EXPERIMENTAL PROCEDURES*
Materials and Sample Preparation
The surfaces and interfaces of several polymer filmsamples were studied as a function of exposure to a partic-ular environment. Epoxy samples were prepared using ahighly pure diglycidyl ether of bisphenol A (DGEBA) withan epoxy equivalent of 172 g/equiv. The curing agentsused were mixtures of 1,3-bis(aminomethyl)-cyclohexane(BAC) and cyclohexylmethylamine (CMA). Samples offour different crosslinked epoxies were prepared with sto-ichiometric blends of DGEBA with appropriate aminemixtures. The molar ratios for BAC and CMA were 100/0,75/25, 50/50, and 25/75 for samples identified as E1000,E7525, E5050, and E2575, respectively. Films with an ap-proximate thickness of 300 µm were prepared in a CO2-free and H2O-free glove box by a drawdown technique. Allsamples were cured at room temperature for 24–48 hr, fol-lowed by post-curing at 130°C for two hours. The coatedfilms were removed from the silicon substrates by coolingin liquid nitrogen, followed by peeling with tweezers. Thefilm side in contact with the silicon substrate is the inter-face side, while the side exposed to air is the surface side.Surface morphology and surface mechanical properties ofepoxy samples were studied by AFM, nanoindentation,and other techniques during exposure to outdoor envi-ronments in the Washington D.C. area.
Blend films of poly(vinylidene fluoride) (PVDF) and acopolymer of poly(methyl methacrylate) (PMMA) andpoly(ethyl acrylate) (PEA) were prepared by mixing a PVDF-isophorone suspension with solutions of PMMA–co–PEA intoluene. The mass ratios between PVDF and PMMA–co–PEAwere 70/30, 60/40, 50/50, and 30/70. The mixtures werecast on glass plates by drawdown to provide a 75–µm thickfilm. After heating at 246°C for 10 min in an air-circulatedoven, coated glass plates were removed from the oven andslowly cooled to ambient temperature (24°C). After beingimmersed in boiling water for 10 min, the films were read-ily peeled from the glass plates. Again, the film side exposedto the air during film formation is the surface side and theside in contact with the glass substrate is the interface side.Surface and interface morphology was characterized byAFM before and after exposure to UV light at 50°C and 9%relative humidity (RH) for seven months. The radiationsource of UV light was supplied by a 1000 W xenon arc so-lar simulator, which provided infrared-free, near ambient
temperature (24°C) radiation with wavelengths between275 and 800 nm.
Polyester-free films with an approximate thickness of670 µm were studied using AFM as a function of exposureto a 3 mol/l NaOH solution. The samples were prepared bymixing 100 parts of an isophthalate ester resin and twoparts of methyl ketone peroxide catalyst. The mixture wasthen molded between two sealed acrylic plates. Then thesamples were cured in ambient condition overnight fol-lowed by post-curing at 150°C for two hours in an oven.
Two types of chemically heterogeneous polymer sam-ples were studied using AFM with an environmentalchamber. The first sample was a block polymer of poly-styrene-b-polyethylene (PS–b–PEO). The bulk specimen ofPS–b–PEO was annealed at 180°C and then fractured un-der liquid nitrogen. The fractured surface was examinedusing AFM in tapping mode under different RH levels. Asecond polymer specimen was a bilayer of PS and poly(acrylic acid) (PAA). The PS-PAA sample was prepared by
Nanocharacterization of Polymeric Coating Surfaces
www.coatingstech.org July 2004 193
*Certain commercial products or equipment are identified so as tospecify adequately the experimental procedure. In no case does suchidentification imply recommendation or endorsement by NIST, nor doesit imply that it is necessarily the best available for the purpose.
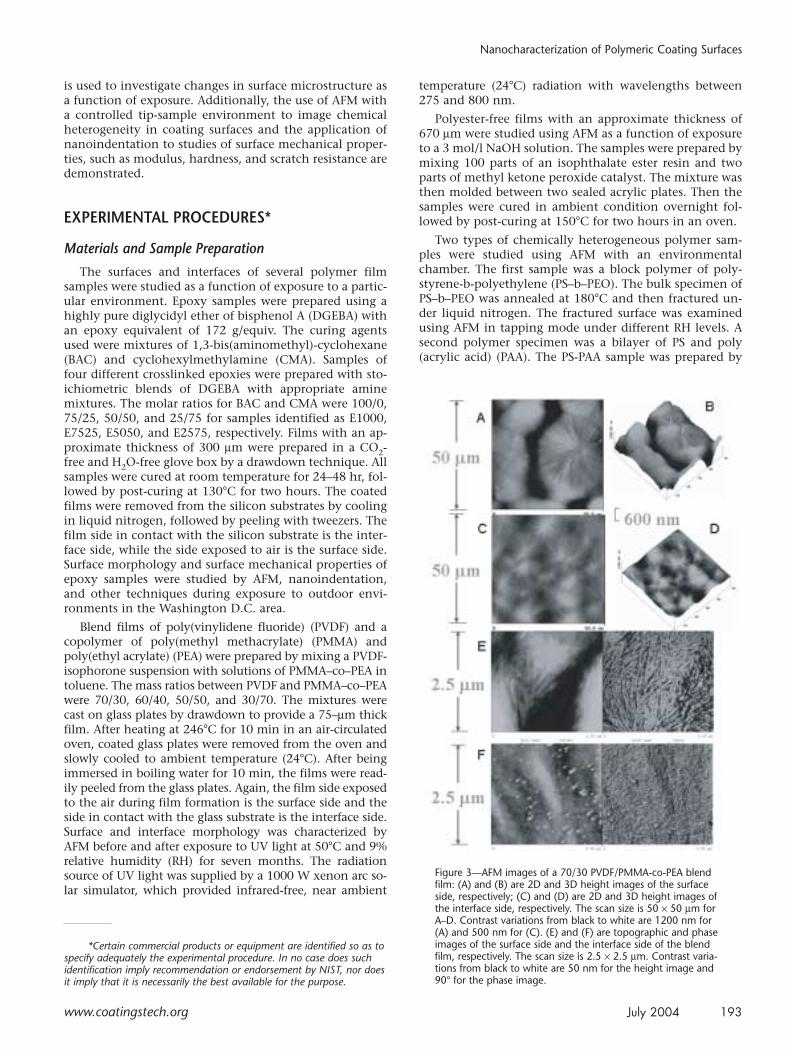
Figure 3—AFM images of a 70/30 PVDF/PMMA-co-PEA blendfilm: (A) and (B) are 2D and 3D height images of the surfaceside, respectively; (C) and (D) are 2D and 3D height images ofthe interface side, respectively. The scan size is 50 × 50 µm forA–D. Contrast variations from black to white are 1200 nm for(A) and 500 nm for (C). (E) and (F) are topographic and phaseimages of the surface side and the interface side of the blendfilm, respectively. The scan size is 2.5 × 2.5 µm. Contrast varia-tions from black to white are 50 nm for the height image and90° for the phase image.

spin casting a PS solution in toluene onto the silicon sub-strate, and then a solution of PAA in water was spuncastonto the PS layer. Due to the low surface energy of PS, thePAA dewetted over the PS layer thus forming viscous fin-gering patterns.24
PMMA and the high crystalline polypropylene (PP)that were studied using instrumented indentation andscratch testing were commercial products. Other materialsand their preparation procedures and degradation condi-tions will be described individually in the article.
Atomic Force Microscopy
Tapping mode AFM was used to characterize the epoxy,PVDF/PMMA-co-PEA, and polyester films as a function ofexposure to various environments. A Digitial InstrumentsDimension 3100 AFM with a NanoScope 3a controller(Veeco Metrology) was operated in tapping mode underambient conditions. Additionally, PS–b–PEO and PS–PAAsamples were studied with the same AFM but used a smallvolume environmental chamber to control the RH of theimaging environment over a range of nominally 0–95%RH.20 Commercial silicon microcantilever probes wereused that had manufacturer’s values of probe tip radiusand probe spring constant in the ranges of 5–10 nm and20–100 N/m, respectively. Topographic and phase imageswere obtained simultaneously using a resonance frequencyof approximately 300 kHz for the probe oscillation and afree-oscillation amplitude of 60 ± 5 nm. A set-point ratio(rsp) in the range of 0.70–0.90 was used. To obtain the me-chanical response of different domains in some of thefilms, force curves were performed utilizing the same typeof silicon cantilever described previously. While more in-
depth analysis of the force curves can be used to measurerelative modulus values, the identity of mechanically dif-ferent regions can be inferred simply from the slope andshape of the repulsive or contact portion of the forcecurve.16
Nanoindentation and Scratch Testing
Nanoindentation was performed using NanoindenterXP and Nanoindenter DCM (MTS System, Inc). Thenanoindenter was operated using the continuous stiffnessmethod with a Berkovich indenter. The tip shape of theindenter was directly imaged with AFM.25 Ten to 20 in-dents were made on each sample, from which averages ofmodulus and hardness were calculated. The scratch testson E1000, PMMA, and high crystalline PP were performedusing the Nanoindenter XP with a 1–µm-radius 90°-coni-cal diamond tip by constant-load and progressive-loadscratch test methods. Scratch velocity was held constantthrough each scratch test and could be set from 0.05 µm/sto 2.5 mm/s. The scratch deformation patterns were ex-amined by laser scanning confocal microscopy.
RESULTS
Imaging Surface Microstructure of Coatings with AFM
The advantage of tapping mode AFM for studying coat-ing surface microstructure is its ability to provide directspatial mapping of surface topography and surface hetero-geneity with nanometer resolution. Surface topographicmaps are generated through signal feedback in which thetapping amplitude is maintained at a constant. Anychanges in the oscillation phase can be used to providephase contrast, which often reflects the different mechan-ical, chemical, and/or adhesive properties of the differentphases or components of heterogeneous materials, thusmapping heterogeneity.
Examples of the use of topographic (height) and phasecontrast images to study the microstructure of surface andinterface sides of two different crosslinked epoxies areshown in Figure 1. For both the highly crosslinked E1000(Mc = 364 ± 16 g/mol) sample and the lower crosslinkedE2575 (Mc = 1950 ± 188 g/mol) sample, the height andphase images of the interface side exhibit more contrast ascompared to those of the surface side. The interface side isconsiderably rougher than the surface side, showing well-defined nodular structures. It should be mentioned that thesilicon surface is essentially smooth and featureless, as ob-served in AFM images with the same magnification.
The two-phase microstructure, consisting of a light ma-trix and relatively dark interstitial regions, indicates thatthe interface side of epoxy is heterogeneous. This mi-crostructure is similar to that obtained from the ultrami-crotomed fractured surface of an E1000 bulk sample,shown in Figure 2; though the nodules of the bulk sampleare slightly smaller and not as organized as those on theinterface side (see Figure 1B). Such a heterogeneous struc-ture is confirmed further with the microstructure of thedegraded sample, which will be shown later. In contrast,the surface sides appear homogeneous with smooth to-
X. Gu et al.
JCT Research194 July 2004
Figure 4—AFM height (left) and phase (right) images of the 50/50PVDF/PMMA-co-PEA blend film: (a) Surface; the scan size is 2.5 ×2.5 µm; contrast variations from black to white are 50 nm for theheight image and 25° for the phase image; (b) Interface; the scansize is 7.5 × 7.5 µm; contrast variations from black to white are 50nm for the height image and 30° for the phase image.
A
B

pography and little phase contrast. Such morphologicaldifferences between the surface and interface or the bulkhave also been observed for acrylic melamine and otherepoxies in our laboratory.26 Further, one can find that thecrosslink density has an obvious influence on the mi-crostructure of the interface, though no significant effectson the surface. The size of the bright nodules in the phaseimage of the interface is larger for the lower crosslinkedE2575 sample compared to the highly crosslinked E1000sample, while the surface sides for both are featureless.We believe that such differences are due to the surface en-richment of the low surface energy species at the air-filmsurface and to the preferential absorption and interactionof high polarity materials in the interface region. The po-larity results obtained from our contact angle measure-ments have provided evidence for such a hypothesis. Foreach epoxy, the polarity of the interface is higher thanthat of the surface, indicating that the air surface of thesetypes of coatings could be dominated by a thin layer oflower surface energy materials or groups. Additionally,the surface polarity appears independent of network vari-
ation while the interface polarity increases with decreas-ing crosslinking.27
For a multicomponent polymer coating system, such asPVDF/PMMA–co–PEA blends, the morphological differencebetween the surface side and the interface side is signifi-cant. AFM images provide not only morphological informa-tion but also reveal the fine microstructure of the PVDFcrystallites. In Figure 3, two-dimensional (A,C) and three-di-mensional (B,D) AFM topographic images are shown of thesurface and the interface of a 70/30 PVDF/PMMA–co–PEAblend film at a scan size of 50 × 50 µm. The spherulites atthe surface and the interface differ significantly in theirsizes, shapes, and distribution density. The large and circu-lar crystallites in A and B almost cover the surface com-pletely, while the crystallites at the interface are looselypacked and less impinged. The interface is also smootherthan the surface due to the smaller diameter of the crystallites.
At a smaller scan size of 2.5 µm (Figures 3E and 3F), thelamellar structure is clearly observed in the spherulites atthe surface side. On the other hand, at the interface side,particles are observed on the spherulites or aggregate in
Nanocharacterization of Polymeric Coating Surfaces
www.coatingstech.org July 2004 195
Figure 5—Monitoring pit evolution by AFM for a clear acrylic-urethane coating exposed to a xenon arc lamp for 6160 hr at 50°C/70% RH; (A)2D image with a line crossing two pits, (B) 3D image, (C) profile corresponding to line in (A) showing pit width and depth, and (D) depth anddiameter of the large pit as function of exposure time.
C D
A B
-356
-156
4
4
nm
0 25 50 75 100µm
0
4
8
12
16
2
0H
ole
Dia
met
er (
µm)
0 34 55 76 104 133Exposure Time (days)
500
400
300
200
100
0
Hol
e D
epth
(nm
)
the boundaries between crystallites. We believe thatthese particles are mainly PMMA–co–PEA, because theseamorphous materials tend to be rejected into the inter-lamellae regions or the fronts of the spherulites duringPVDF crystallization.28,29 The above observations indicatethat the composition, the crystallinity, and/or the crys-tallization kinetics might be different between the sur-face and the interface of the blend film. Attenuated totalreflection Fourier-transform infrared (ATR-FTIR) spectraand surface free energy results have confirmed that theair surface of the blend film is enriched with the low sur-face-free energy PVDF, and the interface side containsmore polar acrylic copolymers.30 With increasingPMMA–co–PEA in the blend, the morphological and mi-crostructural differences are more evident between thetwo sides, as shown in Figure 4. The surface of the 50/50PVDF/PMMA–co–PEA blend film is mostly covered withspherulites, but the interface side consists of many holessurrounded by smooth areas. Similarly, it has beendemonstrated using ATR-FTIR and other techniques thatPVDF enriches the air surface of the film, while the amor-phous PMMA–co–PEA component dominates the poly-mer/substrate interface. Such morphological and compo-sitional differences are believed to strongly affect theperformances of these coating systems.
Monitoring Surface Degradation Using AFM
One particular advantage to using AFM for studyingthe degradation of polymer coatings is its capability to im-age the surface change of the same location of coatings asa function of exposure with nanometer resolution. Oneexample is using AFM to monitor the formation and evo-lution of pits on the surface of an acrylic-urethane coatingfilm with exposure to a xenon arc lamp at 70% RH and50°C (Figure 5). The sample was approximately 10-µmthick and was applied onto a CaF2 substrate by spin-coat-ing. At the early stage of degradation, the highlighted pitis only a few nanometers deep and wide. With the in-crease of the exposure time, the pit depth has a nearly lin-ear increase, up to 400 nm, while the pit diameter enlargesrapidly at first up to 15 µm and then slows down. Suchquantitative data is not only useful for kinetic studies ofthe degradation but also allows the influence of the pitson the change of the surface appearance, such as glossloss, to be assessed.
X. Gu et al.
JCT Research196 July 2004
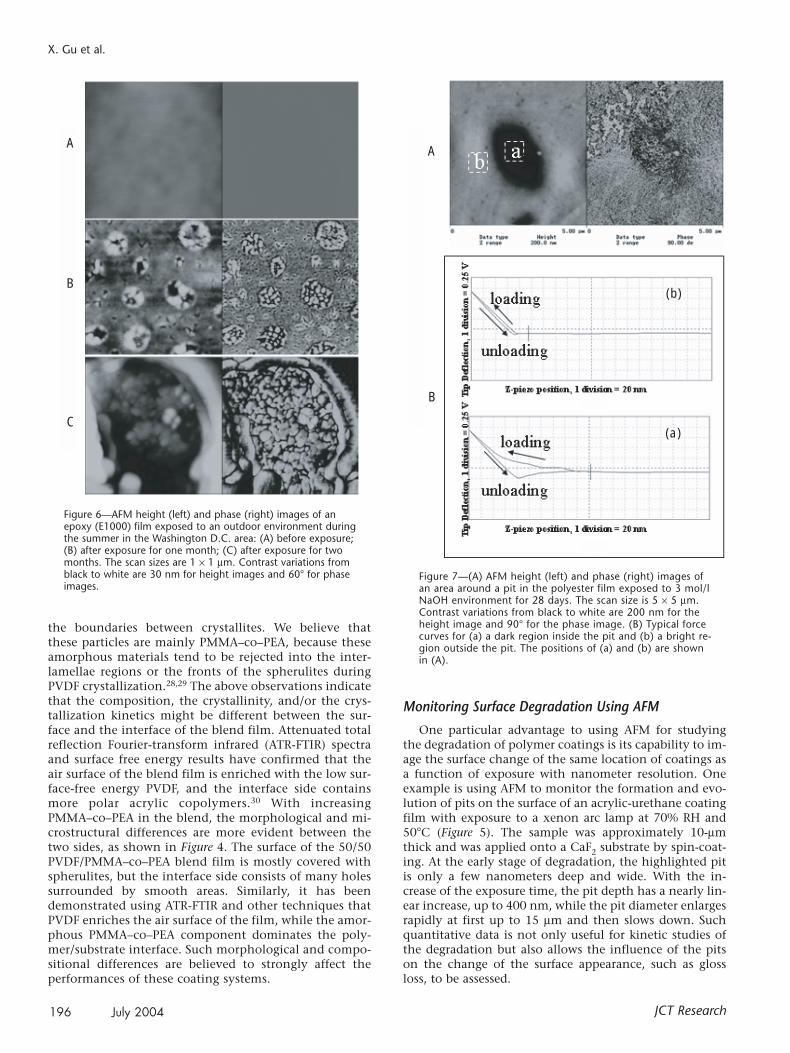
Figure 7—(A) AFM height (left) and phase (right) images ofan area around a pit in the polyester film exposed to 3 mol/lNaOH environment for 28 days. The scan size is 5 × 5 µm.Contrast variations from black to white are 200 nm for theheight image and 90° for the phase image. (B) Typical forcecurves for (a) a dark region inside the pit and (b) a bright re-gion outside the pit. The positions of (a) and (b) are shownin (A).
Figure 6—AFM height (left) and phase (right) images of anepoxy (E1000) film exposed to an outdoor environment duringthe summer in the Washington D.C. area: (A) before exposure;(B) after exposure for one month; (C) after exposure for twomonths. The scan sizes are 1 × 1 µm. Contrast variations fromblack to white are 30 nm for height images and 60° for phaseimages.
A
B
C
A
B
(b)
(a)

The phase images in tapping mode AFM can providevaluable information on surface microstructure changes,which are not visible in topographic images. This capabil-ity particularly benefits the characterization of the de-graded coating surface that is rough and pitted. In Figure6, the surface microstructure of an epoxy (E1000) film isshown before and after exposure to outdoor conditions inthe Washington D.C. area during summer. Initially, thesurface of the fresh epoxy film is smooth and there are novisible features in the phase image. After one month of ex-posure, pitting is observed. The diameters of the pits rangefrom a few nanometers to hundreds of nanometers, butthe depths are only a few nanometers. The phase imagesclearly show two phase heterogeneous structures withbright nodules, especially inside the pits. While these nod-ules are similar to those observed on the interface side andthe bulk of the E1000 film (Figures 1B and 2), they aremore irregular in their sizes and shapes. The nodules in-side the pits appear larger than those in the relativelysmooth area. Our extensive AFM results of degradedepoxy samples indicate that the heterogeneous structureof this type of epoxy coating is not limited at the film/sub-strate interface but also through the bulk of the sample.The surface rearrangement or/and degradation is believedto occur when the sample is exposed to the environment.The low surface-free energy layer on the top of the filmprobably is degraded or rearranged, exposing the bulk mi-crostructure of the epoxy films shown in Figure 2. Aftertwo months of exposure (Figure 6C), the surface becomesrougher, and the larger pits appear. When a pit is closelyexamined, irregular nodular structure is observed. Somenodules are as large as a hundred nanometers. This infor-mation can only be revealed clearly by the phase images,not by topographic images.
Another advantage of using tapping mode AFM for thestudy of coating degradation is its capability of generatingforce curves while the sample is being imaged. In this op-eration, the AFM probe tip is first lowered into contactwith the sample, then indented into the surface, and fi-nally lifted off the sample surface. Concurrently, a meas-
urement of the probe tip deflection as a function of thevertical displacement of the piezo scanner is produced. Aplot of this tip deflection signal is called a force-displace-ment curve or force curve. Generally, the mechanicallydifferent regions can be identified from the slope andshape of the repulsive or contact portion of the forcecurves obtained by the appropriate probe tips. Because thedegraded sample surfaces are often highly heterogeneousat a submicron scale, force curve can be combined withphase imaging to determine mechanical, viscoelastic,and/or adhesive differences between the different regionsof the coating surfaces. In this article, we demonstrate theuse of this technique for obtaining heterogeneity informa-tion in degraded polyester films.
Our previous study has shown that the base-catalyzedhydrolysis of polyester is a heterogeneous process, involv-ing the formation of pits that increase in number and sizewith exposure time.15 In Figure 7, AFM images of an areaaround a pit are shown along with the force curves of theregions inside and outside the pit for a polyester film ex-posed to 3 mol/l NaOH solution for 28 days. The phasecontrast appears darker inside the pit with respect to thesurrounding areas. However, large patches with brighterphase contrast also appear in the area above and to the leftof the pit. Compared to the regular nodular structures ofthe unexposed polyester (not shown here), the phase im-age in Figure 7A indicates that the microstructure of theexposed polyester has substantially changed and the pit-ted region has different mechanical and/or chemical prop-erties from the unpitted area. Although absolute values forthe elasticity and the adhesion force are still difficult toobtain, the mechanical behavior in the different regionsof the same sample can be compared from the AFM forcecurves. The characteristics of the force curve in the unpit-ted region (portion (b) of Figure 7B) shows that the mate-rials in this region are stiff and hard for the utilized tip topenetrate. For the area inside the pit, however, a greaterpull-off force and a larger hysteresis between the loadingand unloading curves are observed of Figure 7B (a). Theforce curve in Figure 7B (a) shows that the AFM tip initially
Nanocharacterization of Polymeric Coating Surfaces
www.coatingstech.org July 2004 197
Figure 8—AFM images of the fractured surface of PS-b-PEO bulkspecimen at different RHs. The scan size is 3 × 3 µm, and con-trast variations from black to white are 150 nm for the heightimage (left) and 90° for the phase image (right).
Figure 9—AFM images at different RH levels of PS-PAA dewet-ting patterns. The scan size is 5 × 5 µm, and contrast variationsfrom black to white are 150 nm for the height image (left) and90° for the phase image (right).
X. Gu et al.
JCT Research198 July 2004
penetrates into the sample for about 100 nm, and then itbegins to encounter a stiffer material that makes it hard topenetrate further. The results suggested that, in the darkphased region inside the pit, a compliant layer might coverthe rigid materials of the polyester. It is believed that somedegraded products are in this layer, and they seem moreadhesive or plastic than those undegraded materials in theunpitted region. In combination with force curves, there-fore, the phase images can provide more detailed informa-tion on the heterogeneity of the coating degradation.
Characterizing Surface Chemical Heterogeneity ofPolymer Coatings with AFM
The ability to probe chemical heterogeneity withnanometer scale resolution is essential to developing amolecular-level understanding of a variety of phenomenaoccurring at coating surfaces, such as adhesion, friction,and degradation. However, the ability to identify and mapthe surface chemical heterogeneity has remained an unful-filled opportunity in the field of AFM. Phase imaging intapping mode AFM can provide important information forthe surface heterogeneity from the differences in energydissipation of the different domains; however, it is hard todifferentiate the contributions of their mechanical andchemical properties. Chemical force microscopy(CFM)17,18 is a successful technique to enhance the chem-ical sensitivity of AFM through modification of the AFMtip with controlled functional groups. The key to the suc-cess of this technique is ensuring that interactions be-
tween the modified tip and the sample surface are domi-nated by the chemical species on the surface of the tip andthe sample surface studied. Because capillary forces result-ing from the adsorption of ambient water onto the samplesurface are usually one to two orders of magnitude higherthan specific chemical interactions, CFM has usually beenconducted in liquid instead of air to eliminate capillary ef-fects. Most CFM research has been performed on pat-terned self-assembled monolayers (SAM), where the hy-drophilic and hydrophobic domains are well defined andwell organized. For real world materials, such as polymerblends and coatings, solvent is not a desirable medium be-cause it can cause irreversible changes to the sample.
Recently, a well controlled humidity system has beendeveloped to enhance the sensitivity of AFM in character-izing surface chemical heterogeneity. The relative humid-ity in the sample-tip environmental chamber can be con-trolled from nearly 0 up to 95% RH at room temperature.Our results have shown that the image contrast betweenhydrophilic and hydrophobic regions of a surface is sub-stantially increased in elevated relative humidity environ-ments.19 One example is illustrated in Figure 8 for a modelcoating system—a block copolymer of polystyrene-b-poly-ethylene (PS–b–PEO)—in which images are shown for sim-ilar locations on the fractured surface of the PS–b–PEOsample at different RHs. Compared to that at lower hu-midity (40% RH), the phase image at a higher humidity(93% RH) exhibits a dramatic increase in the phase con-trast between different domains, and a large area of dark-phased domains is observed. The light regions in thephase image are believed to be PS regions, which is the hy-drophobic component. The dark domains are believed tobe the highly hydrophilic and water soluble PEO regions.At high humidity, these regions are swollen and surface re-arrangement has taken place. These results indicate thatthe PEO domains are softened at the elevated humidity,and the interactions between the tip and PEO domains areenhanced by the adsorbed moisture. Thus, the surface re-gions with different chemical properties can be distin-guished by AFM phase imaging. Similar results are ob-served in Figure 9 for a bilayer film of polystyrene andpoly(acrylic acid) (PS–PAA), where the flat region outsidethe fingering pattern is the hydrophilic PAA layer, and thelower flat area inside the pattern was the hydrophobic PS-rich region.24 Studies are underway on use of chemicallymodified tips combined with the humidity chamber forchemical imaging of polymeric coatings.
Characterizing Nanomechanical Properties withNanoindentation
Mechanical behaviors such as elastic modulus and hard-ness can be obtained by AFM through multiple individualforce-displacement curves. However, quantitive analyses ofAFM data are complicated by the uncertainties relating theprobe spring constant and tip geometry, hysteresis andcreep of the piezoelectric scanners, and instrument compli-ance and system electronics corrections.21,31 Instrumentedindentation or nanoindentation can overcome some ofthese problems. Recent developments in adding dynamicaloscillation for improved sensitivity to the penetrationdepth, and a higher level of test automation and data ac-
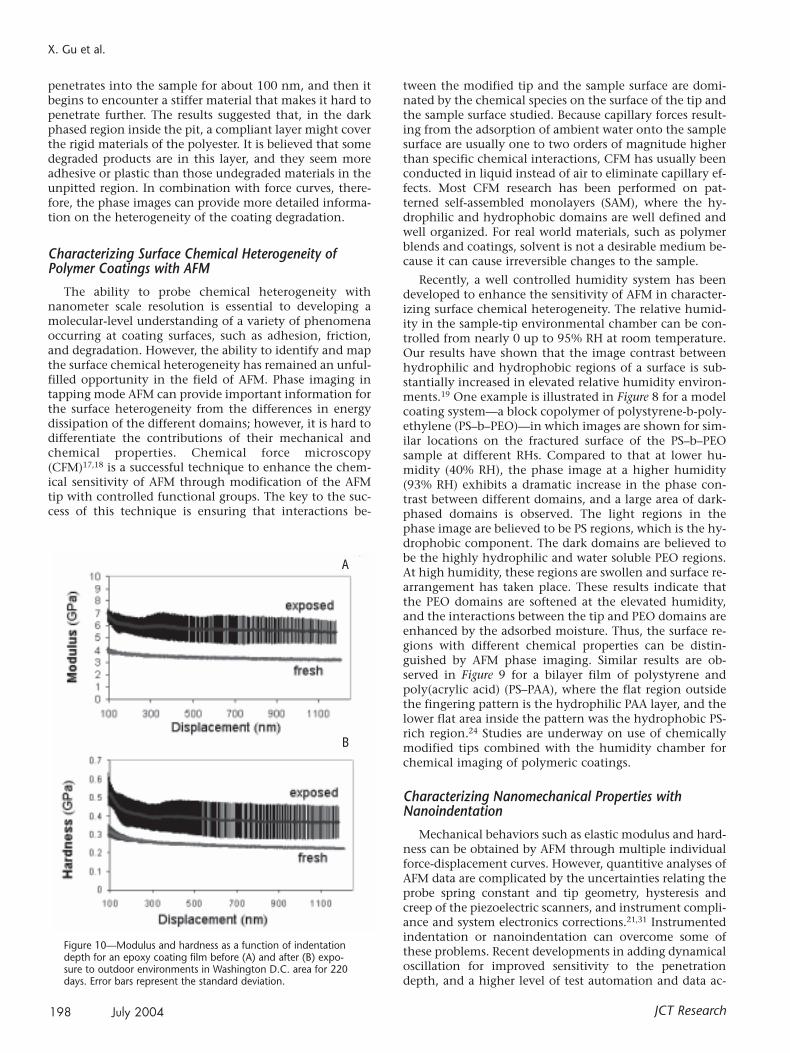
Figure 10—Modulus and hardness as a function of indentationdepth for an epoxy coating film before (A) and after (B) expo-sure to outdoor environments in Washington D.C. area for 220days. Error bars represent the standard deviation.
A
B

Nanocharacterization of Polymeric Coating Surfaces
www.coatingstech.org July 2004 199
quisition have increased the application of nanoindenta-tion for studying the mechanical properties of polymercoatings.21,22 Figure 10 shows the evolution of modulus andhardness versus indentation depth for an epoxy (E1000)coating film before and after exposure to outdoor environ-ments in the Washington D.C. area for 220 days. Each datapoint is the mean with error bars representing the standarddeviation calculated from 10 indents at different locations.Significant increases in both modulus and hardness areclearly observed for the exposed sample over the wholerange of indentation depth even though the standard de-viations of modulus and hardness of the exposed sampleare large. Our extensive FTIR studies7 have shown thatphotodegradation of the epoxy coating involves reactionssuch as oxidation, chain scission, and crosslinking. Thesechemical reactions may cause the observed mechanicalchanges of the film, at least for the near-surface region. Thecorresponding AFM study revealed that pits, cracks, abla-tion, degraded products, and dust particles dramatically in-crease the roughness of the sample surface. The increasedroughness and the nonuniform morphology could be areason for the large standard deviations observed in mod-ulus and hardness of the exposed samples. However, themechanical heterogeneity in different regions of the de-graded sample surface could possibly be another reason.The sensitivity to the heterogeneity of the different regionsis affected by the indenter geometry and contact area. TheBerkovich indentation tip used in this study has a radius ofcurvature of approximately 100 nm, and thus, might bemore sensitive to local mechanical variations. Regardless,the results have clearly demonstrated the effects of thephotodegradation on the surface mechanical properties ofthe epoxy coating.
The nanoindentation instrument has also been widelyused to study the scratch and mar resistance of polymercoatings. Three main types of scratch damage are nor-mally identified: elastic-plastic deformation, regularlyfractured scratches, and irregularly fractured scratches.23
Transitions between these types of scratch damage withincreasing load have been used to define so-called criticalload (Lc) values.23,32 Additionally, the characteristics of theresidual deformation pattern, particularly the shape of theruptures at loads above Lc can provide additional informa-tion on the material behavior.32 However, Lc is stronglydependent on indenter geometry and other test parame-ters, leading to poor reproducibility and misleading re-sults. Time-dependent properties of a coating surface,such as viscoplastic deformation and viscoelastic relax-ation, can also be obtained by the examination of thescratch width resulting from the various scratch velocitiesat a constant load and the measurement of the residualscratch depth after a specific period of time, respectively.The capability of lateral force measurement of the nanoin-dentation instrument also allows for the determination offriction force and friction coefficient. In Figure 11, laserscanning confocal microscopy images of the fracture pat-terns are shown for three different materials: an amine-cured epoxy, PMMA, and high crystalline PP. The moduliof these three samples obtained from nanoindentationtests are 3.17 ± 0.22 GPa for epoxy, 5.11 ± 0.08 GPa forPMMA, and 2.04 ± 0.04 GPa for PP. The scratch tests wereperformed using an increasing load from 0–18 mN at a
Figure 11—Laser scanning confocal micrographs of the scratchdeformation for three different materials: epoxy, PMMA, and PP.The progressive-load scratch test was performed using a dia-mond tip with a 1-µm tip radius and a 90° cone angle. Thescratch speed was 250 µm/sec.
constant scratch velocity of 250 µm/sec using a rounded90° conic indenter with a tip radius of approximately 1µm. As can be seen, the characteristics of the three defor-mation patterns are substantially different. An irregularfractured pattern is shown in epoxy, a concave deforma-tion pattern is observed in PMMA, and a convex deforma-tion in PP.32 Among the three materials, epoxy and PMMAare relatively brittle and PP is more compliant. The abilityof the thermoset epoxy to deform under tensile or shear-ing stresses is limited by its crosslinked structure com-pared to the two thermoplastic polymers. Also, epoxy iscompletely amorphous, while PMMA may perhaps havelow levels of crystallinity and PP has a much higher levelof crystallinity. These differences in structure and proper-ties likely affect the observed differences in scratch dam-age. Because the scratch morphology and the scratch re-sistance affect the appearance performance of coatings,developing an improved understanding of the relation-ships between scratch mechanisms and the material struc-ture and properties will facilitate material selection andperformance improvement.
CONCLUSIONS
The application of tapping mode AFM to studies of sur-face microstructure and degradation of polymer coatingshas been demonstrated. The results have shown that tap-ping mode AFM is a powerful technique for coating charac-terization that can provide direct spatial mapping of surfacetopography along with nanoscale microstructural informa-tion that reflects the property differences of heterogeneouscoating materials. An environmental chamber was used tocontrol the relative humidity of the imaging environment,resulting in enhanced sensitivity of tapping mode AFM onvarious chemical properties. Thus, the surface chemical het-erogeneity of polymers can be distinguished by AFM whenthe tip and sample environment is controlled using high
X. Gu et al.
JCT Research200 July 2004
humidity. The application of nanoindentation to studiesof surface mechanical properties, such as modulus, hard-ness, and scratch resistance of coating materials has alsobeen shown. The results indicate that nanoindentation isan important tool for studying surface mechanicalchanges of coatings during degradation. The capability tocapture the mechanical properties as a function of inden-tation depth with nanometer scale resolution in depthprovides valuable information about the process of coat-ing degradation. The additional scratch capability of thenanoindentation device allows for studies on surface me-chanical properties related to appearance. It is believedthat the characterization of coating surface with thesenanoscale techniques would provide a better understand-ing of degradation mechanisms, thus improving the serv-ice life performance of polymer coatings.
References(1) Thomas, H.R. and Omalley, J.J., “Surface Studies on Multicomponent
Polymer Systems by X-Ray Photoelectron-Spectroscopy-Polystyrene-Poly(ethylene oxide) Diblock Copolymers,” Macromolecules, 12, 323-329 (1979).
(2) Lee, W.K., Cho, W.J., Ha, C.S., Takahara, A., and Kajiyama, T.,“Surface Enrichment of The Solution-Cast Poly(methylmethacrylate) Poly(vinyl acetate) Blends,” Polymer, 36, 1229-1234 (1995).
(3) Ebbens, S.J. and Badyal, J.P.S., “Surface Enrichment ofFluorochemical-Doped Polypropylene Films,” Langmuir, 17,4050-4055 (2001).
(4) Chen, X., McGurk, S.L., Davies, M.C., Roberts, C.J., Shakesheff,K.M., Tendler, S.J., and Williams, P.M., “Chemical andMorphological Analysis of Surface Enrichment in aBiodegradable Polymer Blend by Phase-Detection ImagingAtomic Force Microscopy,” Macromolecules, 31, 2278-2283(1998).
(5) Bascom,W.D., J. Adhesion, 2, 168 (1970). (6) Corti, H., Fernandez-Prini, R., and Gomez, D., “Protective
Organic Coatings-Membrane-Properties and Performance,” Prog.Org. Coat., 10, 5-33 (1982).
(7) Gu, X., Nguyen, T., and Martin, J.W. (unpublished results).(8) Delobelle, P., Guillot, L., Dubois, C., Perreux, D., and Monney, L.,
“Photo-Oxidation Effects on Mechanical Properties of EpoxyMatrixes: Young’s Modulus and Hardness Analyses By Nano-in-dentation,” Polym. Degrad. Stab., 77, 465-475 (2002).
(9) Cleveland, J.P., Anczykowski, B., Schmid, A.E., and Elings, V.B.,“Energy Dissipation in Tapping-Mode Atomic ForceMicroscopy,” Appl. Phys. Lett. 72, 2613-2615 (1998).
(10) Magonov, S.N. and Reneker, D.H., “Characterization of PolymerSurfaces with Atomic Force Microscopy,” Annu. Rev. Mater. Sci.,27, 175-222 (1997).
(11) Magonov, S.N., Elings V., and Whangbo, M.H., “Phase Imagingand Stiffness in Tapping-Mode Atomic Force Microscopy,” Surf.Sci., 375, L385-L391 (1997).
(12) Bar, G., Thomann Y., and Whangbo, M.H., “Characterization ofMorphologies and Nanostructures of Blends of Poly(styrene)Block-Poly(ethane–co–but–1–ene)–Block-Poly(styrene) withIsotactic and Atactic Polypropylenes by Tapping-Mode AtomicForce Microscopy,” Langmuir, 14, 1219-1226 (1998).
(13) Raghavan, D., Gu, X., Nguyen, T., VanLandingham, M.R., andKarim, A., “Mapping Polymer Heterogeneity Using Atomic ForceMicroscopy Phase Imaging and Nanoscale Indentation,”Macromolecules, 33, 2573-2583 (2000).
(14) Raghavan, D., Gu, X., Nguyen, T., and Vanlandingham, M.R.,“Characterization of Chemical Heteogeneity in Polymer SystemUsing Hydrolysis and Tapping-Mode Atomic Force Microscopy,”J. Polym. Sci. Polym. Phys., 39, 1460-1470 (2001).
(15) Gu, X., Raghavan, D., Nguyen, T., and VanLandingham, M.R.,“Characterization of Polyester Degradation Using Tapping ModeAtomic Force Microscopy: Exposure to Alkaline Solution atRoom Temperature,” Polym. Degrad. Stab., 74, 139-149 (2001).
(16) Bar, G., Thomann, Y., Brandsch, R., and Cantow, H.-J., “Factorsaffecting the Height and Phase Images in Tapping Mode AtomicForce Microscopy. Study of Phase-Separated Polymer Blends ofPoly(ethane-co-styene) and Poly(2,6-dimethyl-1,4-phenyleneOxide),” Langmuir, 13, 3807 (1997).
(17) Frisbie, C.D., Rozsnyai, L.F., Noy, A., Wrighton, M.S., and Lieber,C.M., “Functional-Group Imaging by Chemical ForceMicroscopy,” Science, 265, 2071-2074 (1994).
(18) Noy, A., Vezenov, D.V., and Lieber, C.M., “Chemical ForceMicroscopy,” Annu. Rev. Mater. Sci. 27, 381-421 (1997).
(19) Martin, J.W., Embree E., and VanLandingham M.R., U.S. Patent,U.S. 6.490.913 B1 (2002).
(20) Gu, X., VanLandingham, M.R., Fasolka, M., Martin, J.W., Jean,Y.C., and Nguyen, T., “Enhancing Sensitivity of Atomic ForceMicroscopy for Characterizing Surface Chmical Heterogeneity,”in the Proc. 26th Adhesion Society Meeting, 185-187, 2003.
(21) Chong K.P., VanLandingham M.R., and Sung L., “Advances inMaterials and Mechanics,” in the Proc. International Conferenceon Advances in Building Technology, 3-16, 2002.
(22) VanLandingham, M.R., Chang, N.K., White, C.C., and ChangS.H., “Viscoelastic Characterization of Polymers UsingInstrumented Indentation-I. Quasi-static Testing,” J. Mat. Res.,submitted for publication (2003).
(23) Jardret, V., Lucas, B.N., and Oliver, W., “Scratch Durability ofAutomotive Clear Coatings: A Quantitative, Reliable and RobustMethodology,” JOURNAL OF COATINGS TECHNOLOGY, 72, No. 907, 79(2000).
(24) Gu, X., Raghavan, D., Douglas, J., and Karim, A., “Hole-GrowthInstability in the Dewetting of Unstable Viscous Polymer Films,”J. Polym. Sci. Polym. Phys. 40, 2825-2832 (2002).
(25) VanLandingham, M.R., Camara, R., and Villarrubia J.S.,“Measuring Tip Shape for Instrumented Indentation UsingAtomic Force Microscopy,” J. Mat. Res., submitted for publication(2003).
(26) Nguyen, T., Gu, X., VanLandingham, M.R., Giraud, M., Dutruc-Rosset, R., Ryntz, R., and Nguyen, D., “Characterization ofCoating System Interphases with Phase Imaging AFM,” in theProc. Adhesion Society Meeting, 68-70, 2001.
(27) Gu, X., Raghavan, D., Ho, D.L., Sung, L., VanLandingham, M.R.,and Nguyen, T., “Nanocharacterization of Surface and Interfaceof Different Epoxy Networks,” Mat. Res. Symp. Proc., 710,DD10.9.1-DD10.9.6 (2001).
(28) Kalivianakis, P. and Jungickel, B.J., “Crystallization-InducedComposition Inhomogeneities in PVDF/PMMA Blends,” J.Polym. Sci. Polym. Phys., 36, 2923-2930 (1998).
(29) Briber, R.M. and Khoury, F., “The Phase Diagram andMorphology of Blends of Poly(vinylidene fluoride) andPoly(ethyl acrylate),” Polymer, 28, 38-42 (1987).
(30) Gu, X., Sung, L., Ho, D.L., Michaels, C.A., Nguyen, D., Jean, Y.C.,and Nguyen, T., “Surface and Interface Properties of PVDF/AcrylicCopolymer Blends Before and After UV Exposure,” in the Proc.International Coating Technology Conference, 2002.
(31) VanLandingham, M.R., Villarrubia J.S., Guthrie, W.F., andMeyers, G.F., “Nanoindentation of Polymers: An Overview,”Macromolecules Symposia, 167, 15-43 (2001).
(32) Krupicka, A., Johansson, M., and Hult, A., “Mechanical SurfaceCharacterization: A Promising Procedure to Screen OrganicCoatings,” JOURNAL OF COATINGS TECHNOLOGY, 75, No. 939, 19(2003).