Adenylation-dependent conformation and unfolding pathways of the NAD+-dependent DNA ligase from the...
16
Biophysical Journal Volume 86 February 2004 1089–1104 1089 Adenylation-Dependent Conformation and Unfolding Pathways of the NAD 1 -Dependent DNA Ligase from the Thermophile Thermus scotoductus Daphne ´ Georlette,* , ** Vinciane Blaise,* Fabrice Bouillenne, y Benjamin Damien, z Sigridur H. Thorbjarnardo ´ ttir, § Eric Depiereux, z Charles Gerday,* Vladimir N. Uversky, {k and Georges Feller* *Laboratory of Biochemistry, Institute of Chemistry B6, University of Lie ` ge, B-4000 Lie ` ge, Belgium; y Laboratoire d’Enzymologie et Centre d’Inge ´nierie des Prote ´ines, Institute of Chemistry B6, University of Lie `ge, B-4000 Lie ` ge, Belgium; z Unite ´ de Biologie Mole ´ culaire, De ´ partement de Biologie, Faculte ´ s Universitaires Notre-Dame de la Paix, B-5000 Namur, Belgium; § Laboratory of Molecular Genetics, Institute of Biology, University of Iceland, Grensasvegur 12, IS-108 Reykjavik, Iceland; { Institute for Biological Instrumentation, Russian Academy of Sciences, Pushchino, Moscow Region 142290, Russia; k Department of Chemistry and Biochemistry, University of California, Santa Cruz, California 95064; and **Department of Molecular and Cell Biology, University of California, Berkeley, California 94720-3204 ABSTRACT In the last few years, an increased attention has been focused on NAD 1 -dependent DNA ligases. This is mostly due to their potential use as antibiotic targets, because effective inhibition of these essential enzymes would result in the death of the bacterium. However, development of an efficient drug requires that the conformational modifications involved in the catalysis of NAD 1 -dependent DNA ligases are understood. From this perspective, we have investigated the conformational changes occurring in the thermophilic Thermus scotoductus NAD 1 -DNA ligase upon adenylation, as well as the effect of cofactor binding on protein resistance to thermal and chemical (guanidine hydrochloride) denaturation. Our results indicate that cofactor binding induces conformational rearrangement within the active site and promotes a compaction of the enzyme. These data support an induced ‘‘open-closure’’ process upon adenylation, leading to the formation of the catalytically active enzyme that is able to bind DNA. These conformational changes are likely to be associated with the protein function, preventing the formation of nonproductive complexes between deadenylated ligases and DNA. In addition, enzyme adenylation significantly increases resistance of the protein to thermal denaturation and GdmCl-induced unfolding, establishing a thermodynamic link between ligand binding and increased conformational stability. Finally, chemical unfolding of deadenylated and adenylated enzyme is accompanied by accumulation of at least two equilibrium intermediates, the molten globule and premolten globule states. Maximal populations of these intermediates are shifted toward higher GdmCl concentrations in the case of the adenylated ligase. These data provide further insights into the properties of partially folded intermediates. INTRODUCTION DNA ligases are ubiquitous enzymes required for important cellular processes such as DNA replication, DNA recombi- nation, and DNA repair, in all three kingdoms of life (Lehman, 1974). They are divided into two broad classes, those requiring NAD 1 as cofactor and those requiring ATP (Lehman, 1974). Regardless of their energy source, they catalyze the sealing of 59-phosphate and 39-hydroxyl termini at nicks in duplex DNA by means of three distinct catalytic events (Lehman, 1974). The first involves activation of the ligase through the formation of a covalent adenylated intermediate by transfer of the adenyl group of NAD 1 or ATP to the e-NH 2 of a conserved lysine residue in the DNA ligase. In the second step, the AMP moiety is transferred from the ligase to the 59-phosphate group at the single-strand break site, creating a new pyrophosphate bond. Finally, DNA ligase catalyzes the DNA ligation step with loss of free AMP. NAD 1 -dependent ligases are of fairly uniform size (;70 kDa) and display extensive amino acid sequence conserva- tion throughout the entire protein. They are composed of four discrete domains (Doherty and Suh, 2000; Lee et al., 2000). Domain 1 comprises the subdomain 1a, required for ligase adenylation (Sriskanda and Shuman, 2002) and the sub- domain 1b, called ‘‘Adenylation domain,’’ containing the lysine residue implicated in enzyme adenylation. The domain 2 is called ‘‘Oligomer-Binding (OB) fold domain.’’ The domain 3 contains a zinc finger (subdomain 3a) and a HhH (Helix-hairpin-Helix) (subdomain 3b) subdomains, whereas the domain 4 consists of a ‘‘BRCT domain’’ (BRCA-carboxy-terminal-related domain). ATP-dependent ligases are more diverse in size but share a common ligase domain (formed by domains 1 and 2) called ‘‘catalytic core.’’ This domain comprises six conserved sequence motifs, I, III, IIIa, IV, V-VI, that define a family of related nucleotidyl- transferases including mRNA capping enzymes as well as RNA- and tRNA-ligases (Hakansson et al., 1997). Some ATP ligases are possibly flanked by additional domains that are likely to be implicated in the enzyme specialization, targeting the various ATP DNA ligases to different pathways in DNA repair and replication (for review, see Martin and Submitted July 9, 2003, and accepted for publication September 22, 2003. Address reprint requests to Georges Feller, Laboratory of Biochemistry, Institute of Chemistry B6, University of Lie `ge, B-4000 Lie `ge, Belgium. Tel.: 132-4-366-33-43; Fax: 132-4-366-33-64; E-mail: [email protected]. Abbreviations used: AEW, average emission wavelength; ANS, 8-anilino- 1-naphtalene sulfonic acid; GdmCl, guanidine hydrochloride; FI, fluores- cence intensity; FPLC, fast protein liquid chromatography; NAD 1 , nicotinamide adenine dinucleotide; NMN, nicotinamide mononucleotide; MG, molten globule; PMG, premolten globule; SEC, size exclusion chromatography; Tslig, Thermus scotoductus DNA ligase. Ó 2004 by the Biophysical Society 0006-3495/04/02/1089/16 $2.00
-
Upload
independent -
Category
Documents
-
view
2 -
download
0
Transcript of Adenylation-dependent conformation and unfolding pathways of the NAD+-dependent DNA ligase from the...
Biophysical Journal Volume 86 February 2004 1089–1104 1089
Adenylation-Dependent Conformation and Unfolding Pathwaysof the NAD1-Dependent DNA Ligase from the ThermophileThermus scotoductus
Daphne Georlette,*,** Vinciane Blaise,* Fabrice Bouillenne,y Benjamin Damien,z Sigridur H. Thorbjarnardottir,§
Eric Depiereux,z Charles Gerday,* Vladimir N. Uversky,{k and Georges Feller**Laboratory of Biochemistry, Institute of Chemistry B6, University of Liege, B-4000 Liege, Belgium; yLaboratoire d’Enzymologie etCentre d’Ingenierie des Proteines, Institute of Chemistry B6, University of Liege, B-4000 Liege, Belgium; zUnite de Biologie Moleculaire,Departement de Biologie, Facultes Universitaires Notre-Dame de la Paix, B-5000 Namur, Belgium; §Laboratory of Molecular Genetics,Institute of Biology, University of Iceland, Grensasvegur 12, IS-108 Reykjavik, Iceland; {Institute for Biological Instrumentation, RussianAcademy of Sciences, Pushchino, Moscow Region 142290, Russia; kDepartment of Chemistry and Biochemistry, University of California,Santa Cruz, California 95064; and **Department of Molecular and Cell Biology, University of California, Berkeley, California 94720-3204
ABSTRACT In the last few years, an increased attention has been focused on NAD1-dependent DNA ligases. This is mostlydue to their potential use as antibiotic targets, because effective inhibition of these essential enzymes would result in the deathof the bacterium. However, development of an efficient drug requires that the conformational modifications involved in thecatalysis of NAD1-dependent DNA ligases are understood. From this perspective, we have investigated the conformationalchanges occurring in the thermophilic Thermus scotoductus NAD1-DNA ligase upon adenylation, as well as the effect ofcofactor binding on protein resistance to thermal and chemical (guanidine hydrochloride) denaturation. Our results indicate thatcofactor binding induces conformational rearrangement within the active site and promotes a compaction of the enzyme. Thesedata support an induced ‘‘open-closure’’ process upon adenylation, leading to the formation of the catalytically active enzymethat is able to bind DNA. These conformational changes are likely to be associated with the protein function, preventing theformation of nonproductive complexes between deadenylated ligases and DNA. In addition, enzyme adenylation significantlyincreases resistance of the protein to thermal denaturation and GdmCl-induced unfolding, establishing a thermodynamic linkbetween ligand binding and increased conformational stability. Finally, chemical unfolding of deadenylated and adenylatedenzyme is accompanied by accumulation of at least two equilibrium intermediates, the molten globule and premolten globulestates. Maximal populations of these intermediates are shifted toward higher GdmCl concentrations in the case of theadenylated ligase. These data provide further insights into the properties of partially folded intermediates.
INTRODUCTION
DNA ligases are ubiquitous enzymes required for important
cellular processes such as DNA replication, DNA recombi-
nation, and DNA repair, in all three kingdoms of life
(Lehman, 1974). They are divided into two broad classes,
those requiring NAD1 as cofactor and those requiring ATP
(Lehman, 1974). Regardless of their energy source, they
catalyze the sealing of 59-phosphate and 39-hydroxyl termini
at nicks in duplex DNA by means of three distinct catalytic
events (Lehman, 1974). The first involves activation of the
ligase through the formation of a covalent adenylated
intermediate by transfer of the adenyl group of NAD1 or
ATP to the e-NH2 of a conserved lysine residue in the DNA
ligase. In the second step, the AMP moiety is transferred
from the ligase to the 59-phosphate group at the single-strand
break site, creating a new pyrophosphate bond. Finally,
DNA ligase catalyzes the DNA ligation step with loss of free
AMP.
NAD1-dependent ligases are of fairly uniform size (;70
kDa) and display extensive amino acid sequence conserva-
tion throughout the entire protein. They are composed of four
discrete domains (Doherty and Suh, 2000; Lee et al., 2000).
Domain 1 comprises the subdomain 1a, required for ligase
adenylation (Sriskanda and Shuman, 2002) and the sub-
domain 1b, called ‘‘Adenylation domain,’’ containing the
lysine residue implicated in enzyme adenylation. The
domain 2 is called ‘‘Oligomer-Binding (OB) fold domain.’’
The domain 3 contains a zinc finger (subdomain 3a) and
a HhH (Helix-hairpin-Helix) (subdomain 3b) subdomains,
whereas the domain 4 consists of a ‘‘BRCT domain’’
(BRCA-carboxy-terminal-related domain). ATP-dependent
ligases are more diverse in size but share a common ligase
domain (formed by domains 1 and 2) called ‘‘catalytic core.’’
This domain comprises six conserved sequence motifs, I, III,
IIIa, IV, V-VI, that define a family of related nucleotidyl-
transferases including mRNA capping enzymes as well as
RNA- and tRNA-ligases (Hakansson et al., 1997). Some
ATP ligases are possibly flanked by additional domains that
are likely to be implicated in the enzyme specialization,
targeting the various ATP DNA ligases to different pathways
in DNA repair and replication (for review, see Martin and
Submitted July 9, 2003, and accepted for publication September 22, 2003.
Address reprint requests to Georges Feller, Laboratory of Biochemistry,
Institute of Chemistry B6, University of Liege, B-4000 Liege, Belgium.
Tel.: 132-4-366-33-43; Fax: 132-4-366-33-64; E-mail: [email protected].
Abbreviations used: AEW, average emission wavelength; ANS, 8-anilino-
1-naphtalene sulfonic acid; GdmCl, guanidine hydrochloride; FI, fluores-
cence intensity; FPLC, fast protein liquid chromatography; NAD1,
nicotinamide adenine dinucleotide; NMN, nicotinamide mononucleotide;
MG, molten globule; PMG, premolten globule; SEC, size exclusion
chromatography; Tslig, Thermus scotoductus DNA ligase.
� 2004 by the Biophysical Society
0006-3495/04/02/1089/16 $2.00
MacNeill (2002); Timson et al. (2000)). Although there is
a scant amino acid sequence similarity between NAD1- and
ATP- DNA ligases, the tertiary structures of the catalytic
cores are quite well conserved (Doherty and Suh, 2000;
Singleton et al., 1999; Timson et al., 2000) and the adenylate
binding pocket of NAD1 ligases is composed of the same six
nucleotidyl transferase motifs described originally in the
ATP-dependent enzymes (Aravind and Koonin, 1999). The
conservation and similarity of these structural features
strongly suggest that the two types of ligases have evolved
from a common ancestor and are likely to have a similar
catalytic mechanism. The divergence may have largely
arisen from the need to accommodate different nucleotide
cofactors (Aravind and Koonin, 1999).
Nick recognition requires ligases to be adenylated at the
lysine residue located within the active site (Shuman, 1995).
In fact, molecular modeling studies of T7 DNA ligase
suggest that dsDNA binds predominantly in a positively
charged interdomain cleft, between domain 1 and 2 (Doherty
and Dafforn, 2000). Upon adenylation, the DNA binding
domain 2, rotates around and exposes the DNA-binding face
toward the active site (closed conformation), allowing DNA
to bind. In the deadenylated enzyme, the proposed DNA-
binding face is rotated away from the active site cleft (open
conformation). Therefore, adenylation would act as a con-
formational switch, facilitating rotation of the DNA-binding
surface of the OB fold toward the active site cleft. In this
view, only adenylated ligase can bind to nicked DNA,
preventing the formation of nonproductive ligase-DNA
complexes. Interestingly, two crystal structures of PBCV-1
mRNA capping enzyme have provided conclusive evidence
for such open-closed conformational switch during the
guanylylation reaction (Hakansson et al., 1997), which is
equivalent to the adenylation reaction catalyzed by DNA
ligases (Shuman and Schwer, 1995). This involves a 13-A
movement of the C-terminal OB domain 2 toward domain 1.
Such conformational modification has also been proposed
for the Thermus filiformis NAD1-DNA ligase (Lee et al.,
2000). In this case, domain 4 (BRCT domain) is very mobile
in the open conformation but its mobility is restricted in the
closed conformation, allowing a contact with domain 1a,
which leads to an active toroidal conformation (Lee et al.,
2000). Thus, despite their different amino acid sequences
and specificities, all these enzymes are likely to undergo
major domain rearrangements upon cofactor binding.
To date, NAD1-dependent DNA ligases have been
predominantly isolated from eubacteria (Wilkinson et al.,
2001). For that reason, they constitute an attractive target for
broad-spectrum antibiotic therapy predicated on blocking the
reaction of DNA ligase with NAD1, leading to an inactive
enzyme and thus growth arrest of the eubacterium. The drug-
binding site would ideally be unique to, and conserved
among, NAD1-DNA ligases but absent from ATP-de-
pendent ligases and other essential NAD1-requiring en-
zymes. This strategy implies that: i), the conformational
modifications involved in the catalysis of NAD1-dependent
DNA ligases are understood and ii), the structural compo-
nents of NAD1-ligases interacting specifically with NAD1
are known. A recent study, in which the role of domain Ia of
Escherichia coli DNA ligase was investigated, has provided
major advances toward the elucidation of this later issue
(Sriskanda and Shuman, 2002). This domain, essential for
the reaction with NAD1 and unique to NAD1-dependent
ligases, contains several conserved residues likely interact-
ing with the nicotinamide mononucleotide (NMN) moiety of
the NAD1 substrate. Because this domain is well conserved
among all NAD1-ligases, it is expected that the role of
domain Ia is common to all of them. To characterize the
structural changes occurring upon adenylation, we have
investigated the unfolding pathways of the deadenylated and
adenylated Thermus scotoductus DNA ligase (Tslig). Thisenzyme possesses all the conserved motifs common to
NAD1-dependent ligases and shows similar overall catalytic
properties to other NAD1-dependent DNA ligases (Thorb-
jarnardottir et al., 1995). In this paper, we show that cofactor
binding induces conformational changes within the active
site of Tslig, suggesting an open-closure mechanism upon
adenylation. In addition, we provide strong evidences that
cofactor binding also induces increased resistance to thermal
and chemical denaturation. Finally, the results of chemical
denaturation analysis indicate that the unfolding is a complex
sequential process and goes through at least two intermedi-
ates, the molten globule and pre-molten globule states.
MATERIALS AND METHODS
Chemicals and enzymes
3-(1-pyridinio)-1-propane sulfonate and acrylamide were from Fluka
(Buchs, Switzerland) b-NAD1, b-NMN, and 8-anilino-1-naphtalene
sulfonic acid (ANS) were from Sigma-Aldrich NV/SA (St. Louis, MS).
Guanidine Hydrochloride (GdmCl, ultra pure) was from ICN Biomedicals
Inc. (Irvine, CA). Hi-Trap Heparin, MonoQ HR 5/5, Superdex 200 HR 10/
30, and fast protein liquid chromatography (FPLC) systems were from
Pharmacia LKB Biotechnology (Stockholm, Sweden). Water used for the
experiments was purified over a Milli-Q water purification system from
Millipore (Billerica, MA), and all solutions were filtered through 0.22 mm
filters before use. Plasmid encoding T. scotoductus NAD1-DNA ligase
(Tslig) was a kind gift from Z. O. Jonsson and G. Eggertsson (Reykjavik,
Iceland) (Thorbjarnardottir et al., 1995).
Three-dimensional modeling
The target sequence for modeling is the NAD1-dependent DNA ligase from
T. scotoductus. The modeling, minimizations, and molecular dynamics were
done using the molecular operating environment (MOE) program (Chemical
Computing Group, Montreal, Canada). Optimal multiple sequence align-
ment was performed using the Match-Box program (Depiereux et al., 1997).
The first step was a Protein Data Bank search using the target sequence to
find the templates with the highest homology. Originally, a fast scan was
performed using the Fasta methodology (Pearson, 1996). An expectation
value (E-Value) was determined for each sequence. Then, the list was
reduced using thresholds of the E-value (E-Value Cutoff and E-Value
Accept). Only E-Values lower than E-Value Cutoff and with Z-score higherthan 7 were accepted.
1090 Georlette et al.
Biophysical Journal 86(2) 1089–1104
The best template found for T. scotoductus was 1DGS.A, the
homologous NAD1-DNA-ligase of Thermus filiformis (expected value:
7.2 10�259), which does not contain a C-terminal BRCT domain (Lee et al.,
2000). The five best templates were then aligned using the Match-Box
software and evaluated using secondary structure prediction algorithm. The
alignment was then introduced into the modeling process. Thus, 1DGS.A
was used as a template for the modeling. The modeling program was
configured to include outgaps and to build 10 intermediate models using
a Boltzmann-weighted randomized modeling procedure adapted from Levitt
(1992), combined with specialized logic for the proper handling of insertions
and deletions (Fechteler et al., 1995), minimize them, and select the best
intermediate. The final model is the one that scored best according to the
packing quality function. The obtained model was then thoroughly
minimized, using steepest gradient algorithm for 100 iterations, followed
by the conjugate gradient algorithms for another 100 iterations, to end with
the truncated Newton algorithm until the root-mean-square gradient went
under 0.01.
The obtained model was then reviewed following the experimental data
for the homologous proteins, and using MOE’s stereochemical quality
evaluation tools to confirm that the model’s stereochemistry is reasonably
consistent with the typical values found in crystal structures.
At this step a molecular dynamics was done using Molarity, Volume,
Temperature thermodynamic ensemble (number of particles, volume, and
temperature are fixed). The equilibrium temperature chosen was 3548K,
known as the optimal temperature of T. scotoductus. The heating,
equilibrium, and cooling cycles were held for 1000 iterations each. The
most stable conformation was chosen as a final model.
Protein purification
The recombinant wild-type T. scotoductus NAD1-DNA ligase (Tslig) was
overexpressed as previously described (Thorbjarnardottir et al., 1995),
except that the growth was performed in TB medium (12 g/l tryptone, 24 g/l
yeast extract, 4 ml/l glycerol, 12.54 g/l K2HPO4, 2.32 g/l KH2PO4 pH 7)
containing 100 mg/ml ampicillin. Tslig DNA ligase was purified by two
successive heatings (658C and 808C), followed by Hi-Trap Heparin and
MonoQ HR chromatographic steps. Protein concentration was determined
with the Coomassie protein assay reagent (Pierce, Rockford, IL), using BSA
as standard. The final yield was ;55 mg of protein per liter of culture. N-
terminal sequencing confirmed the integrity of the recombinant protein. As
previously reported in literature for NAD1-dependent DNA ligases (Barany
and Gelfand, 1991; Brannigan et al., 1999; Georlette et al., 2000; Ishino
et al., 1986; Kaczorowski and Szybalski, 1996; Modrich et al., 1973;
Panasenko et al., 1978; Singleton et al., 1999; Takahashi and Uchida, 1986;
Zimmerman and Pheiffer, 1983), the native recombinant enzyme is
produced in an adenylated form: DSC, fluorescence, and circular dichroism
profiles of the native and adenylated Tslig (after incubation with NAD1) are
superimposable.
Deadenylation/adenylation of Tslig
Tslig stock solution was either deadenylated or adenylated according to
Timson (Timson and Wigley, 1999) by adding excess of b-NMN or
b-NAD1, respectively. The ratio [NMN/NAD1]/[Tslig] was ;80. Dead-
enylated/adenylated mixtures were then heated at 658C for 30 min and then
cooled rapidly on ice. When required, protein solutions were dialyzed
against appropriate buffer before experiments.
Differential scanning calorimetry
Measurements were performed using a MicroCal MCS-DSC instrument at
a scan rate of 60 K/h and under 2 atm nitrogen pressure. Samples (;4 mg/
ml) were dialyzed overnight against 30 mMMOPS, 50 mMKCl, pH 7.6. To
decrease aggregation, a nondetergent sulphobetaine (3-(1-pyridinio)-
1-propane sulfonate) was added before differential scanning calorimetry
(DSC) experiment (Goldberg et al., 1995), to a final concentration of 0.75M.
Thermograms were analyzed according to a non-two-state model in which
Tm, DHcal, and DHeff of individual transitions are fitted independently using
the MicroCal Origin software (version 2.9). The magnitude and source of the
errors in the Tm and enthalpies values have been discussed elsewhere
(Matouschek et al., 1994). All scans were found to be irreversible under the
experimental conditions used for these studies.
GdmCl-induced unfolding transitions
Tslig deadenylated/adenylated samples were incubated overnight at 258C in
the presence of various concentrations of guanidine hydrochloride (GdmCl).
Unfolding curves were determined by monitoring the intrinsic fluorescence
emission or circular dichroism (CD) at 258C. The pH was checked to ensure
a constant value throughout the whole transition, and the denaturant
concentration was determined from refractive index measurements (Pace,
1986), using a R5000 hand refractometer from Atago (Tokyo, Japan).
Fluorescence measurements
Both intrinsic and ANS fluorescence emission spectra were recorded on an
Aminco SLM 8100 spectrofluorimeter. Excitation and emission slit widths
were 2 and 4 nm, respectively, and the scan speed was 350 nm/min. Cuvettes
with 1-cm pathlength were used. Intrinsic fluorescence measurements were
performed using a protein concentration of 25 mg/ml (0.33 mM), with
excitation at 280 nm, and emission spectra recorded from 300 to 440 nm.
The buffer used was 20 mM phosphate sodium, 50 mM NaCl, pH 7.6, in the
presence of desired GdmCl concentrations. With all samples, fluorescence
spectra were corrected for the background fluorescence of the solution
(buffer1 denaturant). Two fluorescence parameters have been considered in
this work: the fluorescence intensity at single excitation and emission
wavelengths and the average emission wavelength (AEW). The AEW values
were computed according to the following equation (Royer et al., 1993),
AEW ¼+lN
i¼l1
ðFi 3 liÞ
+lN
i¼l1
ðFiÞ; (1)
where F is the fluorescence intensity and l the wavelength. The AEW values
were calculated between 300 and 440 nm.
ANS fluorescence measurements were performed with the samples used
for intrinsic fluorescence measurements, with excitation at 390 nm, and
emission spectra recorded from 420 to 600 nm. The fluorescence spectra
were corrected for the background fluorescence of ANS. The ratio [ANS]/
[Tslig] was ;250 (e350nm ¼ 4950 M�1 cm�1 for ANS).
Circular dichroism measurements
Circular dichroism (CD) spectra were recorded at 258C using a CD6 Jobin
Yvon spectropolarimeter under constant nitrogen flow. In the far ultraviolet
(UV) region, spectra were recorded in a 0.1-cm cell at protein concentrations
of ;0.25 mg/ml whereas in the near UV region, a 1.0-cm cell was used for
protein concentrations of ;1 mg/ml. The buffer used was 20 mM sodium
phosphate, 50 mM NaCl, pH 7.6, in the presence of desired GdmCl
concentrations. Spectra were acquired at a scan speed of 20 nm/min, with a 2-
nm bandwidth and a 1-s integration time. Spectra were averaged over five
scans and corrected for the buffer signal. Raw data were expressed in terms
of the mean residue ellipticity [u] using the known mature adenylated Tslig
sequence (MW ¼ 76855 Da) for calculation of the mean residue weight.
GdmCl unfolding curves of adenylated Tslig were recorded at 222 and
280 nm, using a 2-nm bandwidth. At all denaturant concentrations, at least
30 data points were acquired over 1 min (2-s integration time), and averaged.
Unfolding Pathways of a NAD1-DNA Ligase 1091
Biophysical Journal 86(2) 1089–1104
The resulting values were corrected for the contribution of the solvent. An
estimate of the helical content ( fH) of Tslig has been obtained from the
following equation (Chen et al., 1972),
½u�222 ¼ ð�303003 fHÞ � 2340; (2)
where [u]222 is the mean residue ellipticity (deg cm2 dmol�1) at 222 nm.
Data analysis
The transition curves obtained by fluorescence spectroscopy and CD were
analyzed using Eqs. 3 and 4, assuming a two- (N$U, where N is the native
state and U is the fully unfolded state) or three-state model (N$I$U, where
I is the thermodynamically stable intermediate) for the unfolding reaction.
For N$U transition (Pace, 1990),
yobs ¼fðyN1p3 ½D�Þ1ðyU1q3 ½D�Þexp½a�g=ð11exp½a�Þ;(3)
where
a ¼ ð�DGðH2OÞ 1m3 ½D�Þ=RT;and where yobs is the measured variable parameter at a given denaturant
concentration, whereas yN and yU represent the values of this parameter for
the native and denatured states, respectively. DG(H2O) is the difference in
free energy between folded and unfolded conformations under physiological
concentrations and m is a measure of the dependence of the free energy on
the denaturant concentration [D]; p and q are the slopes of the pre- and post-
unfolding baselines, respectively, R is the gas constant and T is the absolute
temperature. The midpoint of the denaturation curve ([U]/[N] ¼ 1) is given
by Cm ¼ DG(H2O)/m. For N$I$U process (Vanhove et al., 1997),
yobs ¼ fðyN 1 p3 ½D�Þ1 y1exp½a�1 yUexp½a�exp½b�g=ð11 exp½a�1 exp½a�exp½b�Þ; (4)
where
a ¼ ð�DGN�IðH2OÞ1mN�I 3 ½D�Þ=RT and
b ¼ ð�DGI�UðH2OÞ1mI�U 3 ½D�Þ=RT;and where DGN-I(H2O) and DGI-U(H2O) are the differences in free energy
between I and N and between U and I, respectively, in the absence of
denaturant, and mN-I and mI-U are the slopes of the transitions.
Analysis of circular dichroism data using the‘‘phase diagram’’ method
The ‘‘phase diagram’’ method analysis of spectroscopic data is extremely
sensitive for the detection of intermediate states (Burstein, 1976; Bush-
marina et al., 2001; Kuznetsova et al., 2002; Munishkina et al., 2003;
Permyakov et al., 1980; Uversky et al., 2003). Although this method was
developed for the analysis of fluorescence data (Burstein, 1976), it can be
used with any spectroscopic technique. The essence of this method is to
build up the diagram of Il1 vs. Il2, where Il1 and Il2 are the spectral intensity
values measured at wavelengths l1 and l2 under different experimental
conditions for a protein undergoing structural transformations. The
relationship between Il1 and Il2 is described in the following equation,
Iðl1Þ ¼ a1 ðb3 Iðl2ÞÞ: (5)
The calculations allowing the determination of such equation, as well as
the composition of a and b can be found elsewhere (Kuznetsova et al.,
2002; Uversky et al., 2003). As a rule, l1 and l2 are arbitrary wavelengths
of the spectrum, but in practice, such diagrams will be more informative if
l1 and l2 will be on different slopes of the spectrum. If the wavelengths
are from one slope or near the maximum, some transitions may remain
undetected.
Size exclusion chromatography
Hydrodynamic dimensions (Stokes radius, RS) of deadenylated and
adenylated Tslig in different conformational states were measured by gel
filtration. Size exclusion chromatography (SEC) was performed on the
Superdex 200 H/R 10/30 prepacked FPLC column calibrated according to
(Uversky, 1993). Protein (;0.25 mg/ml) containing the required concen-
trations of GdmCl was loaded onto the column equilibrated with the same
buffer. The elution was carried out isocratically at a flow rate of 1.0–0.5 ml/
min and monitored by the absorbance at 280 nm. All measurements were
made at 258C. Molecular Stokes radii (RS) were estimated from elution
volume Vel measured according to the following equation,
RS ¼ð1000=VelÞ � 42:44
0:9114: (6)
The accuracy of determination of RS by this equation is ;95%. Relative
areas of chromatographic peaks were estimated from the elution profiles by
their deconvolution using LabCalc. The accuracy of such deconvolution was
;90%. Stages of unfolding of Tslig were determined as follows (Uversky
and Ptitsyn, 1994, 1996),
fLC ¼ SLC=ðSC 1 SLCÞ; (7)
where fLC represents the fraction of molecules that undergoes the transition
from a compact (C) to a less compact state and is determined from relative
areas (S) of corresponding FPLC peaks
fU ¼ fLC½ðhVel
LCi � Vel
PMGÞ=ðVel
U � Vel
PMG�; (8)
where fU represents the fraction of unfolded molecules, and where hVelLCi,
VelPMG, andV
elU are the average elution volume of less compact molecules, the
elution volume of molecules in the premolten globule state, and the elution
volume of molecules in the unfolded state, respectively.
fN ¼ 1� fD
fMG ¼ fD � fLC
fPMG ¼ fLC � fU (9)
where fN, fMG, fPMG, and fU are the fraction of molecules in native, molten-
globule, premolten globule, and unfolded states, respectively.
Stern-Volmer quenching
The conformational state of enzymes was further characterized by
acrylamide-induced fluorescence quenching. Samples were prepared in 20
mM sodium phosphate buffer, 50 mM NaCl, pH 7.6, and the protein
concentrations were adjusted to provide an optical density at the excitation
wavelength \0.1. Aliquots of a 1.2-M acrylamide stock solution were
consecutively added to 1 ml protein solution to increase acrylamide
concentration by ;5 mM steps. Experiments were performed using
excitation at 295 nm with fluorescence emission set at 333 nm (excitation
and emission slit widths were 1 and 4, respectively) and the fluorescence
intensities were recorded for 30 s. Experiments were performed in triplicate.
The data were corrected for the dilution effects and for the absorptive
screening caused by acrylamide (e295nm ¼ 0.25 M�1 cm�1 for acrylamide).
Quenching data were plotted as the ratio of fluorescence in the absence of
quencher (F0) to the intensity in the presence of quencher (F) against
quencher concentration. The resulting data were fit to dynamic parameters
according to the Stern-Volmer equation (Lakowicz, 1983),
F0=F ¼ 11 ðKSV 3 ½Q�Þ; (10)
1092 Georlette et al.
Biophysical Journal 86(2) 1089–1104
where KSV is the Stern-Volmer quenching constant and [Q] the quencher
concentration.
RESULTS AND DISCUSSION
Molecular model of adenylated Tslig
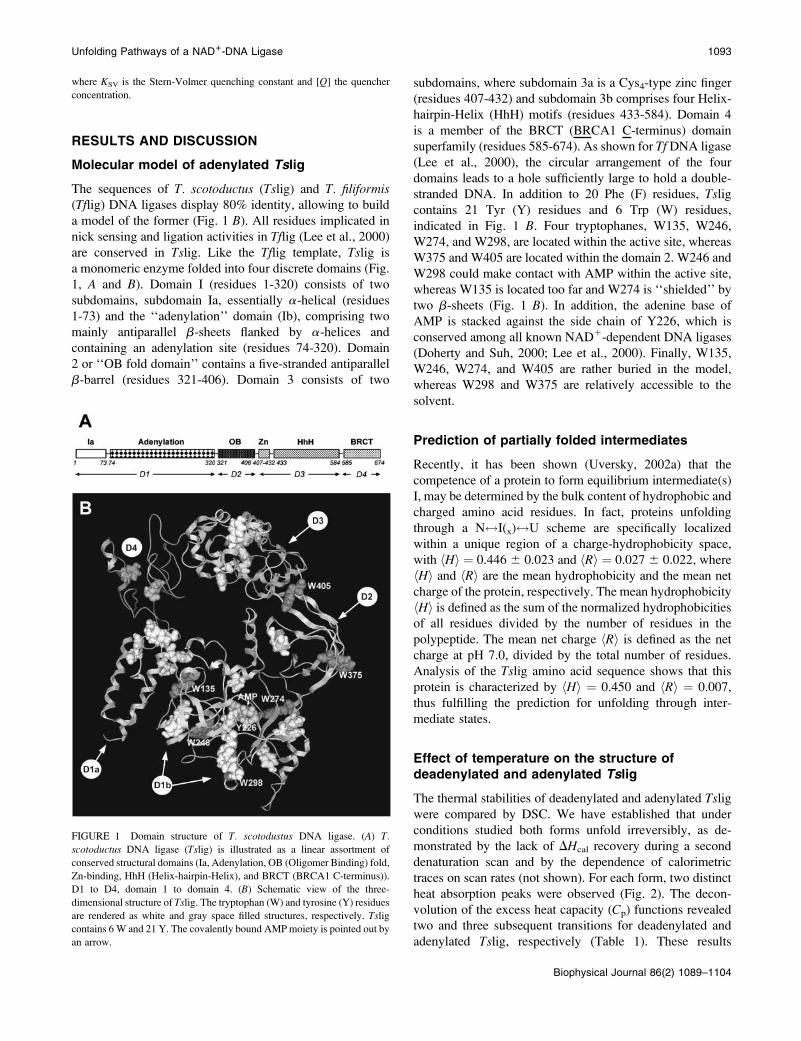
The sequences of T. scotoductus (Tslig) and T. filiformis(Tflig) DNA ligases display 80% identity, allowing to build
a model of the former (Fig. 1 B). All residues implicated in
nick sensing and ligation activities in Tflig (Lee et al., 2000)
are conserved in Tslig. Like the Tflig template, Tslig is
a monomeric enzyme folded into four discrete domains (Fig.
1, A and B). Domain I (residues 1-320) consists of two
subdomains, subdomain Ia, essentially a-helical (residues
1-73) and the ‘‘adenylation’’ domain (Ib), comprising two
mainly antiparallel b-sheets flanked by a-helices and
containing an adenylation site (residues 74-320). Domain
2 or ‘‘OB fold domain’’ contains a five-stranded antiparallel
b-barrel (residues 321-406). Domain 3 consists of two
subdomains, where subdomain 3a is a Cys4-type zinc finger
(residues 407-432) and subdomain 3b comprises four Helix-
hairpin-Helix (HhH) motifs (residues 433-584). Domain 4
is a member of the BRCT (BRCA1 C-terminus) domain
superfamily (residues 585-674). As shown for TfDNA ligase
(Lee et al., 2000), the circular arrangement of the four
domains leads to a hole sufficiently large to hold a double-
stranded DNA. In addition to 20 Phe (F) residues, Tsligcontains 21 Tyr (Y) residues and 6 Trp (W) residues,
indicated in Fig. 1 B. Four tryptophanes, W135, W246,
W274, and W298, are located within the active site, whereas
W375 and W405 are located within the domain 2. W246 and
W298 could make contact with AMP within the active site,
whereas W135 is located too far and W274 is ‘‘shielded’’ by
two b-sheets (Fig. 1 B). In addition, the adenine base of
AMP is stacked against the side chain of Y226, which is
conserved among all known NAD1-dependent DNA ligases
(Doherty and Suh, 2000; Lee et al., 2000). Finally, W135,
W246, W274, and W405 are rather buried in the model,
whereas W298 and W375 are relatively accessible to the
solvent.
Prediction of partially folded intermediates
Recently, it has been shown (Uversky, 2002a) that the
competence of a protein to form equilibrium intermediate(s)
I, may be determined by the bulk content of hydrophobic and
charged amino acid residues. In fact, proteins unfolding
through a N$I(x)$U scheme are specifically localized
within a unique region of a charge-hydrophobicity space,
with hHi ¼ 0.446 6 0.023 and hRi ¼ 0.027 6 0.022, where
hHi and hRi are the mean hydrophobicity and the mean net
charge of the protein, respectively. The mean hydrophobicity
hHi is defined as the sum of the normalized hydrophobicities
of all residues divided by the number of residues in the
polypeptide. The mean net charge hRi is defined as the net
charge at pH 7.0, divided by the total number of residues.
Analysis of the Tslig amino acid sequence shows that this
protein is characterized by hHi ¼ 0.450 and hRi ¼ 0.007,
thus fulfilling the prediction for unfolding through inter-
mediate states.
Effect of temperature on the structure ofdeadenylated and adenylated Tslig
The thermal stabilities of deadenylated and adenylated Tsligwere compared by DSC. We have established that under
conditions studied both forms unfold irreversibly, as de-
monstrated by the lack of DHcal recovery during a second
denaturation scan and by the dependence of calorimetric
traces on scan rates (not shown). For each form, two distinct
heat absorption peaks were observed (Fig. 2). The decon-
volution of the excess heat capacity (Cp) functions revealed
two and three subsequent transitions for deadenylated and
adenylated Tslig, respectively (Table 1). These results
FIGURE 1 Domain structure of T. scotodustus DNA ligase. (A) T.
scotoductus DNA ligase (Tslig) is illustrated as a linear assortment of
conserved structural domains (Ia, Adenylation, OB (Oligomer Binding) fold,
Zn-binding, HhH (Helix-hairpin-Helix), and BRCT (BRCA1 C-terminus)).
D1 to D4, domain 1 to domain 4. (B) Schematic view of the three-
dimensional structure of Tslig. The tryptophan (W) and tyrosine (Y) residues
are rendered as white and gray space filled structures, respectively. Tsligcontains 6 W and 21 Y. The covalently bound AMPmoiety is pointed out by
an arrow.
Unfolding Pathways of a NAD1-DNA Ligase 1093
Biophysical Journal 86(2) 1089–1104
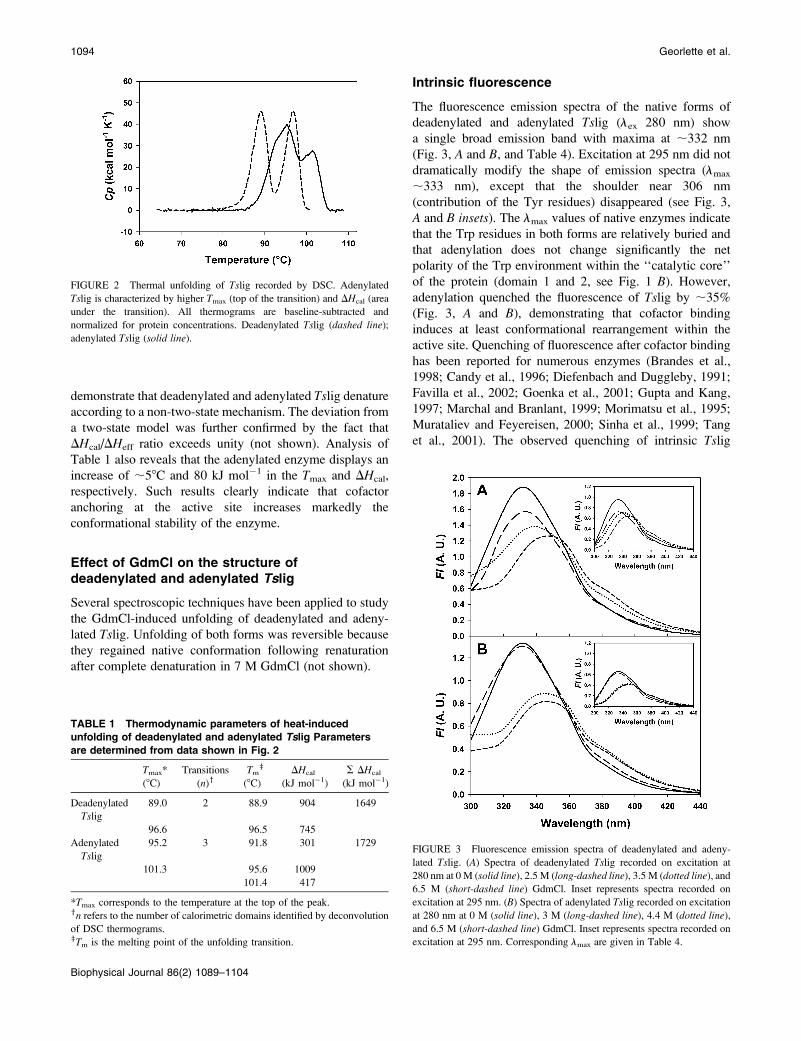
demonstrate that deadenylated and adenylated Tslig denatureaccording to a non-two-state mechanism. The deviation from
a two-state model was further confirmed by the fact that
DHcal/DHeff ratio exceeds unity (not shown). Analysis of
Table 1 also reveals that the adenylated enzyme displays an
increase of ;58C and 80 kJ mol�1 in the Tmax and DHcal,
respectively. Such results clearly indicate that cofactor
anchoring at the active site increases markedly the
conformational stability of the enzyme.
Effect of GdmCl on the structure ofdeadenylated and adenylated Tslig
Several spectroscopic techniques have been applied to study
the GdmCl-induced unfolding of deadenylated and adeny-
lated Tslig. Unfolding of both forms was reversible because
they regained native conformation following renaturation
after complete denaturation in 7 M GdmCl (not shown).
Intrinsic fluorescence
The fluorescence emission spectra of the native forms of
deadenylated and adenylated Tslig (lex 280 nm) show
a single broad emission band with maxima at ;332 nm
(Fig. 3, A and B, and Table 4). Excitation at 295 nm did not
dramatically modify the shape of emission spectra (lmax
;333 nm), except that the shoulder near 306 nm
(contribution of the Tyr residues) disappeared (see Fig. 3,
A and B insets). The lmax values of native enzymes indicate
that the Trp residues in both forms are relatively buried and
that adenylation does not change significantly the net
polarity of the Trp environment within the ‘‘catalytic core’’
of the protein (domain 1 and 2, see Fig. 1 B). However,adenylation quenched the fluorescence of Tslig by ;35%
(Fig. 3, A and B), demonstrating that cofactor binding
induces at least conformational rearrangement within the
active site. Quenching of fluorescence after cofactor binding
has been reported for numerous enzymes (Brandes et al.,
1998; Candy et al., 1996; Diefenbach and Duggleby, 1991;
Favilla et al., 2002; Goenka et al., 2001; Gupta and Kang,
1997; Marchal and Branlant, 1999; Morimatsu et al., 1995;
Murataliev and Feyereisen, 2000; Sinha et al., 1999; Tang
et al., 2001). The observed quenching of intrinsic Tslig
FIGURE 2 Thermal unfolding of Tslig recorded by DSC. Adenylated
Tslig is characterized by higher Tmax (top of the transition) and DHcal (area
under the transition). All thermograms are baseline-subtracted and
normalized for protein concentrations. Deadenylated Tslig (dashed line);
adenylated Tslig (solid line).
TABLE 1 Thermodynamic parameters of heat-induced
unfolding of deadenylated and adenylated Tslig Parameters
are determined from data shown in Fig. 2
Tmax*
(8C)
Transitions
(n)yTm
z
(8C)
DHcal
(kJ mol�1)
S DHcal
(kJ mol�1)
Deadenylated
Tslig89.0 2 88.9 904 1649
96.6 96.5 745
Adenylated
Tslig
95.2 3 91.8 301 1729
101.3 95.6 1009
101.4 417
*Tmax corresponds to the temperature at the top of the peak.yn refers to the number of calorimetric domains identified by deconvolution
of DSC thermograms.zTm is the melting point of the unfolding transition.
FIGURE 3 Fluorescence emission spectra of deadenylated and adeny-
lated Tslig. (A) Spectra of deadenylated Tslig recorded on excitation at
280 nm at 0 M (solid line), 2.5 M (long-dashed line), 3.5 M (dotted line), and6.5 M (short-dashed line) GdmCl. Inset represents spectra recorded on
excitation at 295 nm. (B) Spectra of adenylated Tslig recorded on excitation
at 280 nm at 0 M (solid line), 3 M (long-dashed line), 4.4 M (dotted line),
and 6.5 M (short-dashed line) GdmCl. Inset represents spectra recorded on
excitation at 295 nm. Corresponding lmax are given in Table 4.
1094 Georlette et al.
Biophysical Journal 86(2) 1089–1104
fluorescence is likely due to an interaction of AMP with
Y226 (the nucleotide is stacked against the side chain of
Y226) and/or W246 and W298 (see also ‘‘Molecular model
of adenylated Tslig’’). In 6.5 M GdmCl, the wavelength of
maximal emission is shifted to ;347 nm (lex 280 nm) for
both forms, indicating that they converge to an unfolded
form exhibiting the same emissive properties with increased
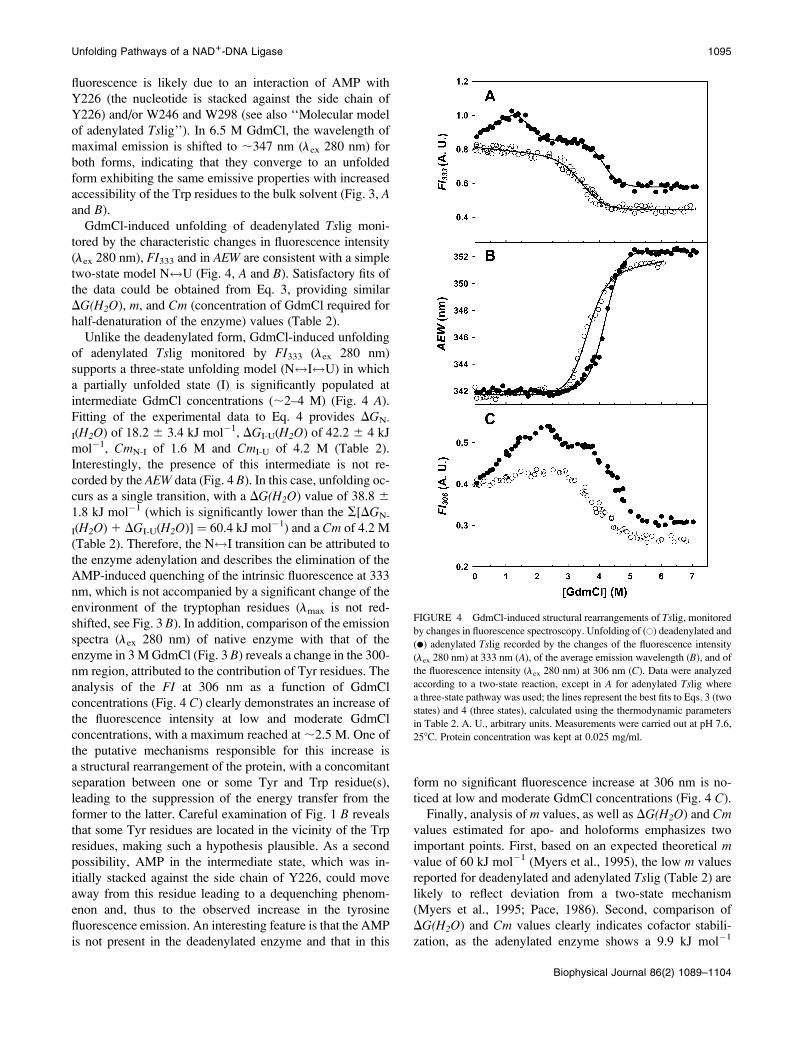
accessibility of the Trp residues to the bulk solvent (Fig. 3, Aand B).GdmCl-induced unfolding of deadenylated Tslig moni-
tored by the characteristic changes in fluorescence intensity
(lex 280 nm), FI333 and in AEW are consistent with a simple
two-state model N$U (Fig. 4, A and B). Satisfactory fits of
the data could be obtained from Eq. 3, providing similar
DG(H2O), m, and Cm (concentration of GdmCl required for
half-denaturation of the enzyme) values (Table 2).
Unlike the deadenylated form, GdmCl-induced unfolding
of adenylated Tslig monitored by FI333 (lex 280 nm)
supports a three-state unfolding model (N$I$U) in which
a partially unfolded state (I) is significantly populated at
intermediate GdmCl concentrations (;2–4 M) (Fig. 4 A).Fitting of the experimental data to Eq. 4 provides DGN-
I(H2O) of 18.2 6 3.4 kJ mol�1, DGI-U(H2O) of 42.2 6 4 kJ
mol�1, CmN-I of 1.6 M and CmI-U of 4.2 M (Table 2).
Interestingly, the presence of this intermediate is not re-
corded by the AEW data (Fig. 4 B). In this case, unfolding oc-curs as a single transition, with a DG(H2O) value of 38.8 6
1.8 kJ mol�1 (which is significantly lower than the S[DGN-
I(H2O)1 DGI-U(H2O)] ¼ 60.4 kJ mol�1) and a Cm of 4.2 M
(Table 2). Therefore, the N$I transition can be attributed to
the enzyme adenylation and describes the elimination of the
AMP-induced quenching of the intrinsic fluorescence at 333
nm, which is not accompanied by a significant change of the
environment of the tryptophan residues (lmax is not red-
shifted, see Fig. 3 B). In addition, comparison of the emission
spectra (lex 280 nm) of native enzyme with that of the
enzyme in 3MGdmCl (Fig. 3 B) reveals a change in the 300-nm region, attributed to the contribution of Tyr residues. The
analysis of the FI at 306 nm as a function of GdmCl
concentrations (Fig. 4 C) clearly demonstrates an increase of
the fluorescence intensity at low and moderate GdmCl
concentrations, with a maximum reached at;2.5 M. One of
the putative mechanisms responsible for this increase is
a structural rearrangement of the protein, with a concomitant
separation between one or some Tyr and Trp residue(s),
leading to the suppression of the energy transfer from the
former to the latter. Careful examination of Fig. 1 B reveals
that some Tyr residues are located in the vicinity of the Trp
residues, making such a hypothesis plausible. As a second
possibility, AMP in the intermediate state, which was in-
itially stacked against the side chain of Y226, could move
away from this residue leading to a dequenching phenom-
enon and, thus to the observed increase in the tyrosine
fluorescence emission. An interesting feature is that the AMP
is not present in the deadenylated enzyme and that in this
form no significant fluorescence increase at 306 nm is no-
ticed at low and moderate GdmCl concentrations (Fig. 4 C).Finally, analysis of m values, as well as DG(H2O) and Cm
values estimated for apo- and holoforms emphasizes two
important points. First, based on an expected theoretical mvalue of 60 kJ mol�1 (Myers et al., 1995), the low m values
reported for deadenylated and adenylated Tslig (Table 2) are
likely to reflect deviation from a two-state mechanism
(Myers et al., 1995; Pace, 1986). Second, comparison of
DG(H2O) and Cm values clearly indicates cofactor stabili-
zation, as the adenylated enzyme shows a 9.9 kJ mol�1
FIGURE 4 GdmCl-induced structural rearrangements of Tslig, monitored
by changes in fluorescence spectroscopy. Unfolding of (�) deadenylated and
(d) adenylated Tslig recorded by the changes of the fluorescence intensity
(lex 280 nm) at 333 nm (A), of the average emission wavelength (B), and ofthe fluorescence intensity (lex 280 nm) at 306 nm (C). Data were analyzed
according to a two-state reaction, except in A for adenylated Tslig where
a three-state pathway was used; the lines represent the best fits to Eqs. 3 (two
states) and 4 (three states), calculated using the thermodynamic parameters
in Table 2. A. U., arbitrary units. Measurements were carried out at pH 7.6,
258C. Protein concentration was kept at 0.025 mg/ml.
Unfolding Pathways of a NAD1-DNA Ligase 1095
Biophysical Journal 86(2) 1089–1104
increase in the stabilization energy and a 0.7 M increase in
Cm values (Table 2).
ANS fluorescence
Changes in ANS fluorescence are frequently used to detect
accumulation of nonnative partially folded intermediates in
globular proteins (Ptitsyn, 1995; Semisotnov et al., 1991).
Such intermediates are characterized by the presence of
solvent-exposed hydrophobic clusters, resulting in a pro-
nounced blue shift of the fluorescence emission maximum
(;525–480 nm) and a considerable enhancement of ANS
fluorescence intensity at;480 nm (Semisotnov et al., 1991).
With native deadenylated and adenylated Tslig, no binding
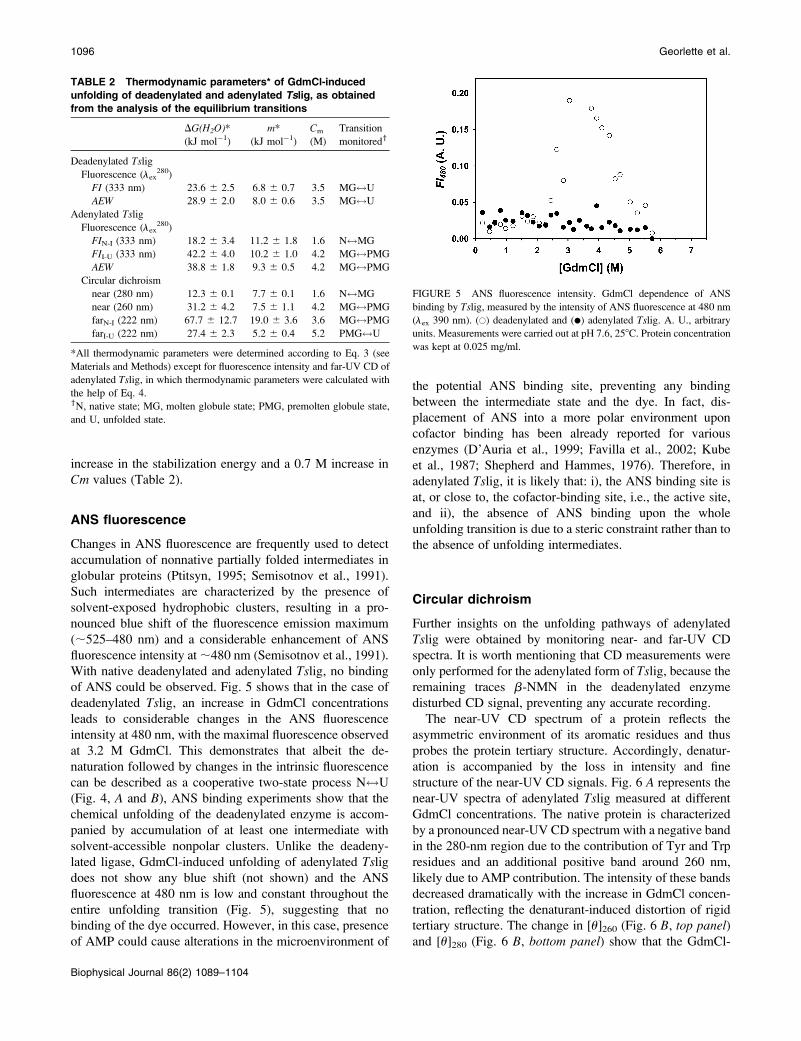
of ANS could be observed. Fig. 5 shows that in the case of
deadenylated Tslig, an increase in GdmCl concentrations
leads to considerable changes in the ANS fluorescence
intensity at 480 nm, with the maximal fluorescence observed
at 3.2 M GdmCl. This demonstrates that albeit the de-
naturation followed by changes in the intrinsic fluorescence
can be described as a cooperative two-state process N$U
(Fig. 4, A and B), ANS binding experiments show that the
chemical unfolding of the deadenylated enzyme is accom-
panied by accumulation of at least one intermediate with
solvent-accessible nonpolar clusters. Unlike the deadeny-
lated ligase, GdmCl-induced unfolding of adenylated Tsligdoes not show any blue shift (not shown) and the ANS
fluorescence at 480 nm is low and constant throughout the
entire unfolding transition (Fig. 5), suggesting that no
binding of the dye occurred. However, in this case, presence
of AMP could cause alterations in the microenvironment of
the potential ANS binding site, preventing any binding
between the intermediate state and the dye. In fact, dis-
placement of ANS into a more polar environment upon
cofactor binding has been already reported for various
enzymes (D’Auria et al., 1999; Favilla et al., 2002; Kube
et al., 1987; Shepherd and Hammes, 1976). Therefore, in
adenylated Tslig, it is likely that: i), the ANS binding site is
at, or close to, the cofactor-binding site, i.e., the active site,
and ii), the absence of ANS binding upon the whole
unfolding transition is due to a steric constraint rather than to
the absence of unfolding intermediates.
Circular dichroism
Further insights on the unfolding pathways of adenylated
Tslig were obtained by monitoring near- and far-UV CD
spectra. It is worth mentioning that CD measurements were
only performed for the adenylated form of Tslig, because theremaining traces b-NMN in the deadenylated enzyme
disturbed CD signal, preventing any accurate recording.
The near-UV CD spectrum of a protein reflects the
asymmetric environment of its aromatic residues and thus
probes the protein tertiary structure. Accordingly, denatur-
ation is accompanied by the loss in intensity and fine
structure of the near-UV CD signals. Fig. 6 A represents the
near-UV spectra of adenylated Tslig measured at different
GdmCl concentrations. The native protein is characterized
by a pronounced near-UV CD spectrum with a negative band
in the 280-nm region due to the contribution of Tyr and Trp
residues and an additional positive band around 260 nm,
likely due to AMP contribution. The intensity of these bands
decreased dramatically with the increase in GdmCl concen-
tration, reflecting the denaturant-induced distortion of rigid
tertiary structure. The change in [u]260 (Fig. 6 B, top panel)and [u]280 (Fig. 6 B, bottom panel) show that the GdmCl-
FIGURE 5 ANS fluorescence intensity. GdmCl dependence of ANS
binding by Tslig, measured by the intensity of ANS fluorescence at 480 nm
(lex 390 nm). (�) deadenylated and (d) adenylated Tslig. A. U., arbitraryunits. Measurements were carried out at pH 7.6, 258C. Protein concentration
was kept at 0.025 mg/ml.
TABLE 2 Thermodynamic parameters* of GdmCl-induced
unfolding of deadenylated and adenylated Tslig, as obtained
from the analysis of the equilibrium transitions
DG(H2O)*
(kJ mol�1)
m*
(kJ mol�1)
Cm
(M)
Transition
monitoredy
Deadenylated Tslig
Fluorescence (lex280)
FI (333 nm) 23.6 6 2.5 6.8 6 0.7 3.5 MG$U
AEW 28.9 6 2.0 8.0 6 0.6 3.5 MG$U
Adenylated Tslig
Fluorescence (lex280)
FIN-I (333 nm) 18.2 6 3.4 11.2 6 1.8 1.6 N$MG
FII-U (333 nm) 42.2 6 4.0 10.2 6 1.0 4.2 MG$PMG
AEW 38.8 6 1.8 9.3 6 0.5 4.2 MG$PMG
Circular dichroism
near (280 nm) 12.3 6 0.1 7.7 6 0.1 1.6 N$MG
near (260 nm) 31.2 6 4.2 7.5 6 1.1 4.2 MG$PMG
farN-I (222 nm) 67.7 6 12.7 19.0 6 3.6 3.6 MG$PMG
farI-U (222 nm) 27.4 6 2.3 5.2 6 0.4 5.2 PMG$U
*All thermodynamic parameters were determined according to Eq. 3 (see
Materials and Methods) except for fluorescence intensity and far-UV CD of
adenylated Tslig, in which thermodynamic parameters were calculated with
the help of Eq. 4.yN, native state; MG, molten globule state; PMG, premolten globule state,
and U, unfolded state.
1096 Georlette et al.
Biophysical Journal 86(2) 1089–1104
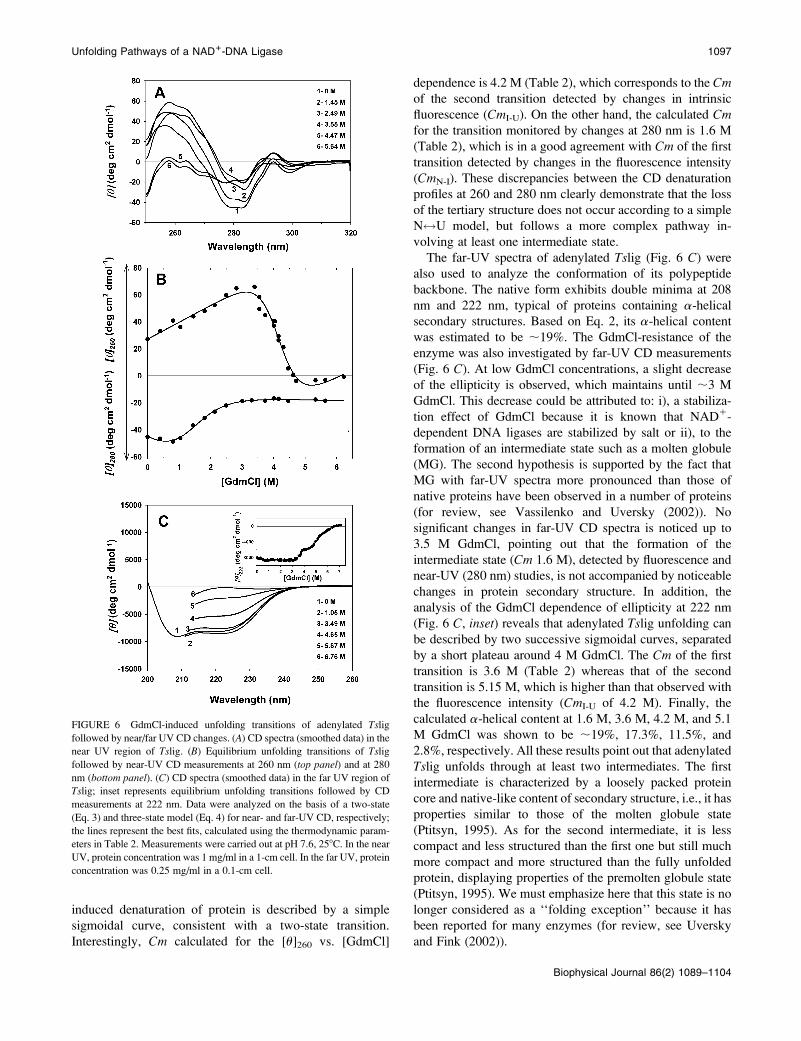
induced denaturation of protein is described by a simple
sigmoidal curve, consistent with a two-state transition.
Interestingly, Cm calculated for the [u]260 vs. [GdmCl]
dependence is 4.2 M (Table 2), which corresponds to the Cmof the second transition detected by changes in intrinsic
fluorescence (CmI-U). On the other hand, the calculated Cmfor the transition monitored by changes at 280 nm is 1.6 M
(Table 2), which is in a good agreement with Cm of the first
transition detected by changes in the fluorescence intensity
(CmN-I). These discrepancies between the CD denaturation
profiles at 260 and 280 nm clearly demonstrate that the loss
of the tertiary structure does not occur according to a simple
N$U model, but follows a more complex pathway in-
volving at least one intermediate state.
The far-UV spectra of adenylated Tslig (Fig. 6 C) werealso used to analyze the conformation of its polypeptide
backbone. The native form exhibits double minima at 208
nm and 222 nm, typical of proteins containing a-helical
secondary structures. Based on Eq. 2, its a-helical content
was estimated to be ;19%. The GdmCl-resistance of the
enzyme was also investigated by far-UV CD measurements
(Fig. 6 C). At low GdmCl concentrations, a slight decrease
of the ellipticity is observed, which maintains until ;3 M
GdmCl. This decrease could be attributed to: i), a stabiliza-
tion effect of GdmCl because it is known that NAD1-
dependent DNA ligases are stabilized by salt or ii), to the
formation of an intermediate state such as a molten globule
(MG). The second hypothesis is supported by the fact that
MG with far-UV spectra more pronounced than those of
native proteins have been observed in a number of proteins
(for review, see Vassilenko and Uversky (2002)). No
significant changes in far-UV CD spectra is noticed up to
3.5 M GdmCl, pointing out that the formation of the
intermediate state (Cm 1.6 M), detected by fluorescence and
near-UV (280 nm) studies, is not accompanied by noticeable
changes in protein secondary structure. In addition, the
analysis of the GdmCl dependence of ellipticity at 222 nm
(Fig. 6 C, inset) reveals that adenylated Tslig unfolding can
be described by two successive sigmoidal curves, separated
by a short plateau around 4 M GdmCl. The Cm of the first
transition is 3.6 M (Table 2) whereas that of the second
transition is 5.15 M, which is higher than that observed with
the fluorescence intensity (CmI-U of 4.2 M). Finally, the
calculated a-helical content at 1.6 M, 3.6 M, 4.2 M, and 5.1
M GdmCl was shown to be ;19%, 17.3%, 11.5%, and
2.8%, respectively. All these results point out that adenylated
Tslig unfolds through at least two intermediates. The first
intermediate is characterized by a loosely packed protein
core and native-like content of secondary structure, i.e., it has
properties similar to those of the molten globule state
(Ptitsyn, 1995). As for the second intermediate, it is less
compact and less structured than the first one but still much
more compact and more structured than the fully unfolded
protein, displaying properties of the premolten globule state
(Ptitsyn, 1995). We must emphasize here that this state is no
longer considered as a ‘‘folding exception’’ because it has
been reported for many enzymes (for review, see Uversky
and Fink (2002)).
FIGURE 6 GdmCl-induced unfolding transitions of adenylated Tslig
followed by near/far UV CD changes. (A) CD spectra (smoothed data) in the
near UV region of Tslig. (B) Equilibrium unfolding transitions of Tslig
followed by near-UV CD measurements at 260 nm (top panel) and at 280
nm (bottom panel). (C) CD spectra (smoothed data) in the far UV region of
Tslig; inset represents equilibrium unfolding transitions followed by CD
measurements at 222 nm. Data were analyzed on the basis of a two-state
(Eq. 3) and three-state model (Eq. 4) for near- and far-UV CD, respectively;
the lines represent the best fits, calculated using the thermodynamic param-
eters in Table 2. Measurements were carried out at pH 7.6, 258C. In the near
UV, protein concentration was 1 mg/ml in a 1-cm cell. In the far UV, protein
concentration was 0.25 mg/ml in a 0.1-cm cell.
Unfolding Pathways of a NAD1-DNA Ligase 1097
Biophysical Journal 86(2) 1089–1104
‘‘Phase diagram’’ analysis of circulardichroism data
Representation of CD data in a form of ‘‘phase diagrams’’
(see Materials and Methods) provided an additional support
to the idea that GdmCl-induced unfolding of adenylated Tsligis an exceptionally complex process. Application of this
method to protein unfolding predicts that the dependence of
I(l1)¼ f(I(l2)) will be linear if changes in the protein envi-
ronment lead to all-or-none transition between two different
conformations. On the other hand, nonlinearity of this
function reflects the sequential character of structural trans-
formations.Moreover, each linear portion of the I(l1)¼ f(I(l2))dependence will describe an individual all-or-none transition.
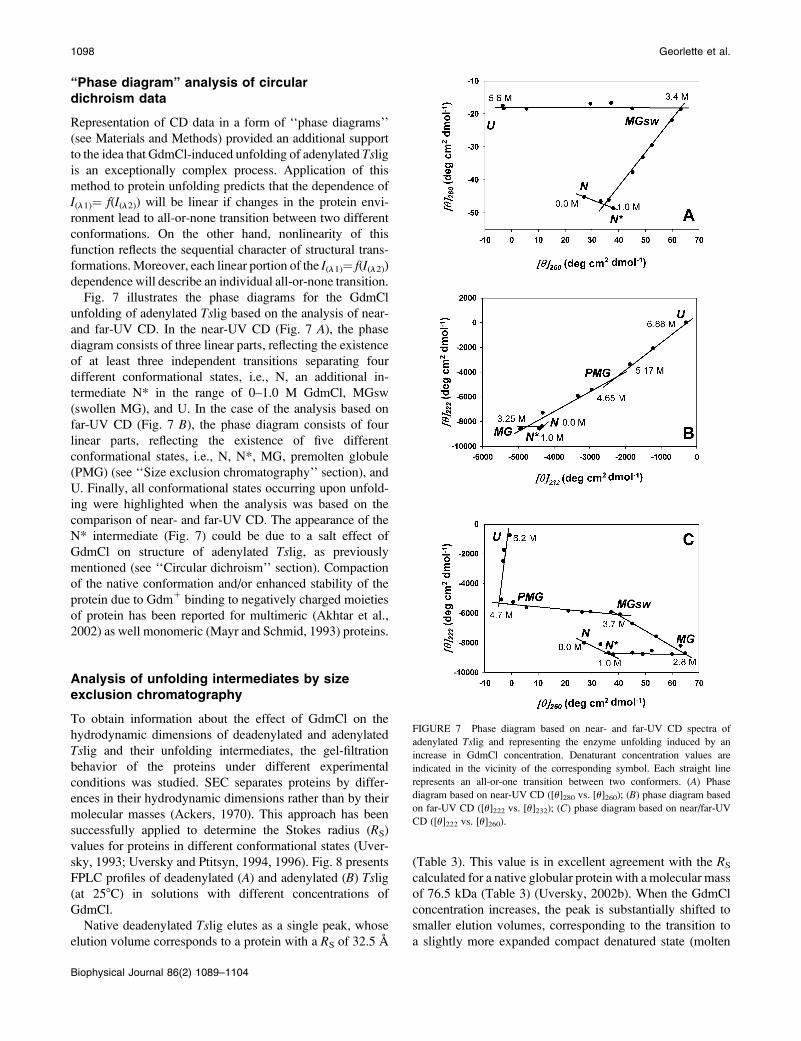
Fig. 7 illustrates the phase diagrams for the GdmCl
unfolding of adenylated Tslig based on the analysis of near-
and far-UV CD. In the near-UV CD (Fig. 7 A), the phase
diagram consists of three linear parts, reflecting the existence
of at least three independent transitions separating four
different conformational states, i.e., N, an additional in-
termediate N* in the range of 0–1.0 M GdmCl, MGsw
(swollen MG), and U. In the case of the analysis based on
far-UV CD (Fig. 7 B), the phase diagram consists of four
linear parts, reflecting the existence of five different
conformational states, i.e., N, N*, MG, premolten globule
(PMG) (see ‘‘Size exclusion chromatography’’ section), and
U. Finally, all conformational states occurring upon unfold-
ing were highlighted when the analysis was based on the
comparison of near- and far-UV CD. The appearance of the
N* intermediate (Fig. 7) could be due to a salt effect of
GdmCl on structure of adenylated Tslig, as previously
mentioned (see ‘‘Circular dichroism’’ section). Compaction
of the native conformation and/or enhanced stability of the
protein due to Gdm1 binding to negatively charged moieties
of protein has been reported for multimeric (Akhtar et al.,
2002) as well monomeric (Mayr and Schmid, 1993) proteins.
Analysis of unfolding intermediates by sizeexclusion chromatography
To obtain information about the effect of GdmCl on the
hydrodynamic dimensions of deadenylated and adenylated
Tslig and their unfolding intermediates, the gel-filtration
behavior of the proteins under different experimental
conditions was studied. SEC separates proteins by differ-
ences in their hydrodynamic dimensions rather than by their
molecular masses (Ackers, 1970). This approach has been
successfully applied to determine the Stokes radius (RS)
values for proteins in different conformational states (Uver-
sky, 1993; Uversky and Ptitsyn, 1994, 1996). Fig. 8 presents
FPLC profiles of deadenylated (A) and adenylated (B) Tslig(at 258C) in solutions with different concentrations of
GdmCl.
Native deadenylated Tslig elutes as a single peak, whose
elution volume corresponds to a protein with a RS of 32.5 A
(Table 3). This value is in excellent agreement with the RS
calculated for a native globular protein with a molecular mass
of 76.5 kDa (Table 3) (Uversky, 2002b). When the GdmCl
concentration increases, the peak is substantially shifted to
smaller elution volumes, corresponding to the transition to
a slightly more expanded compact denatured state (molten
FIGURE 7 Phase diagram based on near- and far-UV CD spectra of
adenylated Tslig and representing the enzyme unfolding induced by an
increase in GdmCl concentration. Denaturant concentration values are
indicated in the vicinity of the corresponding symbol. Each straight line
represents an all-or-one transition between two conformers. (A) Phase
diagram based on near-UV CD ([u]280 vs. [u]260); (B) phase diagram based
on far-UV CD ([u]222 vs. [u]232); (C) phase diagram based on near/far-UV
CD ([u]222 vs. [u]260).
1098 Georlette et al.
Biophysical Journal 86(2) 1089–1104
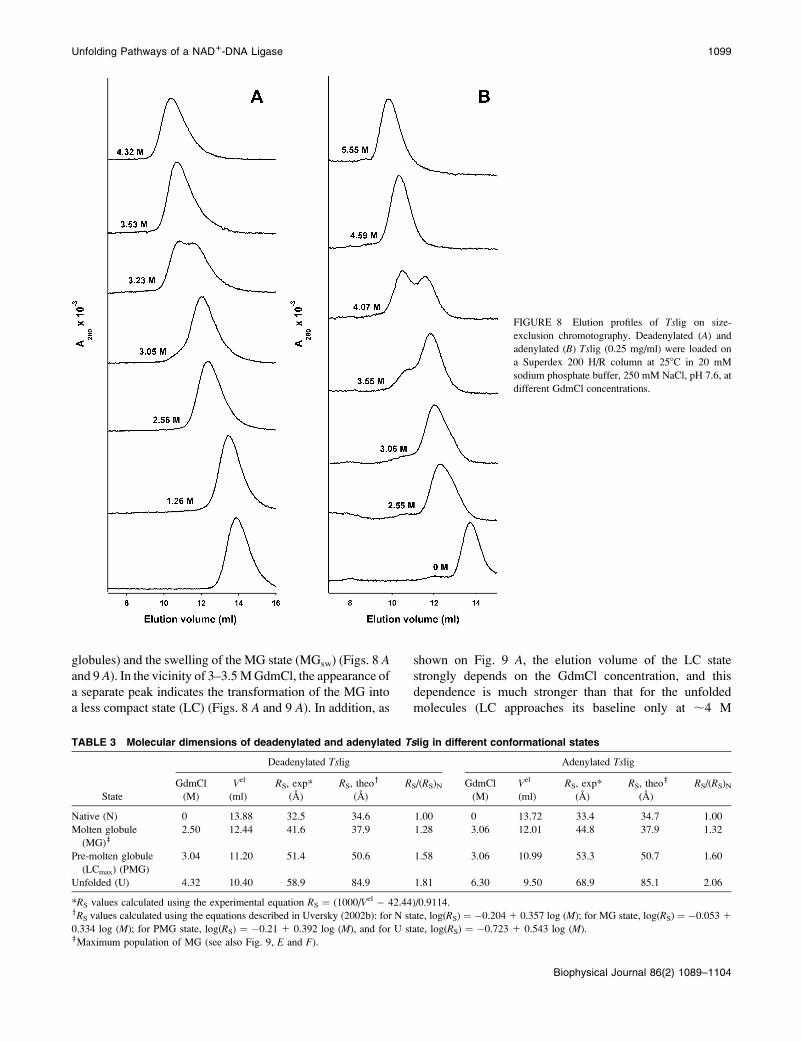
globules) and the swelling of the MG state (MGsw) (Figs. 8 Aand 9 A). In the vicinity of 3–3.5MGdmCl, the appearance of
a separate peak indicates the transformation of the MG into
a less compact state (LC) (Figs. 8 A and 9 A). In addition, as
shown on Fig. 9 A, the elution volume of the LC state
strongly depends on the GdmCl concentration, and this
dependence is much stronger than that for the unfolded
molecules (LC approaches its baseline only at ;4 M
FIGURE 8 Elution profiles of Tslig on size-
exclusion chromotography. Deadenylated (A) and
adenylated (B) Tslig (0.25 mg/ml) were loaded on
a Superdex 200 H/R column at 258C in 20 mM
sodium phosphate buffer, 250 mM NaCl, pH 7.6, at
different GdmCl concentrations.
TABLE 3 Molecular dimensions of deadenylated and adenylated Tslig in different conformational states
Deadenylated Tslig Adenylated Tslig
State
GdmCl
(M)
Vel
(ml)
RS, exp*
(A)
RS, theoy
(A)
RS/(RS)N GdmCl
(M)
Vel
(ml)
RS, exp*
(A)
RS, theoz
(A)
RS/(RS)N
Native (N) 0 13.88 32.5 34.6 1.00 0 13.72 33.4 34.7 1.00
Molten globule
(MG)z2.50 12.44 41.6 37.9 1.28 3.06 12.01 44.8 37.9 1.32
Pre-molten globule
(LCmax) (PMG)
3.04 11.20 51.4 50.6 1.58 3.06 10.99 53.3 50.7 1.60
Unfolded (U) 4.32 10.40 58.9 84.9 1.81 6.30 9.50 68.9 85.1 2.06
*RS values calculated using the experimental equation RS ¼ (1000/Vel � 42.44)/0.9114.yRS values calculated using the equations described in Uversky (2002b): for N state, log(RS) ¼ �0.204 1 0.357 log (M); for MG state, log(RS) ¼ �0.053 1
0.334 log (M); for PMG state, log(RS) ¼ �0.21 1 0.392 log (M), and for U state, log(RS) ¼ �0.723 1 0.543 log (M).zMaximum population of MG (see also Fig. 9, E and F).
Unfolding Pathways of a NAD1-DNA Ligase 1099
Biophysical Journal 86(2) 1089–1104
GdmCl). Concerning the native adenylated Tslig, it also
elutes as a single peak (Fig. 8 B), whose elution volume
corresponds to a protein with RS of 33.4 A (Table 3). In the
presence of denaturant, the elution profiles of the adenylated
enzyme (Figs. 8 B and 9 B) display the same trends as that of
the deadenylated protein, except that changes in elution
profile occur at higher GdmCl concentrations, reflecting
cofactor-induced stabilization of the enzyme.
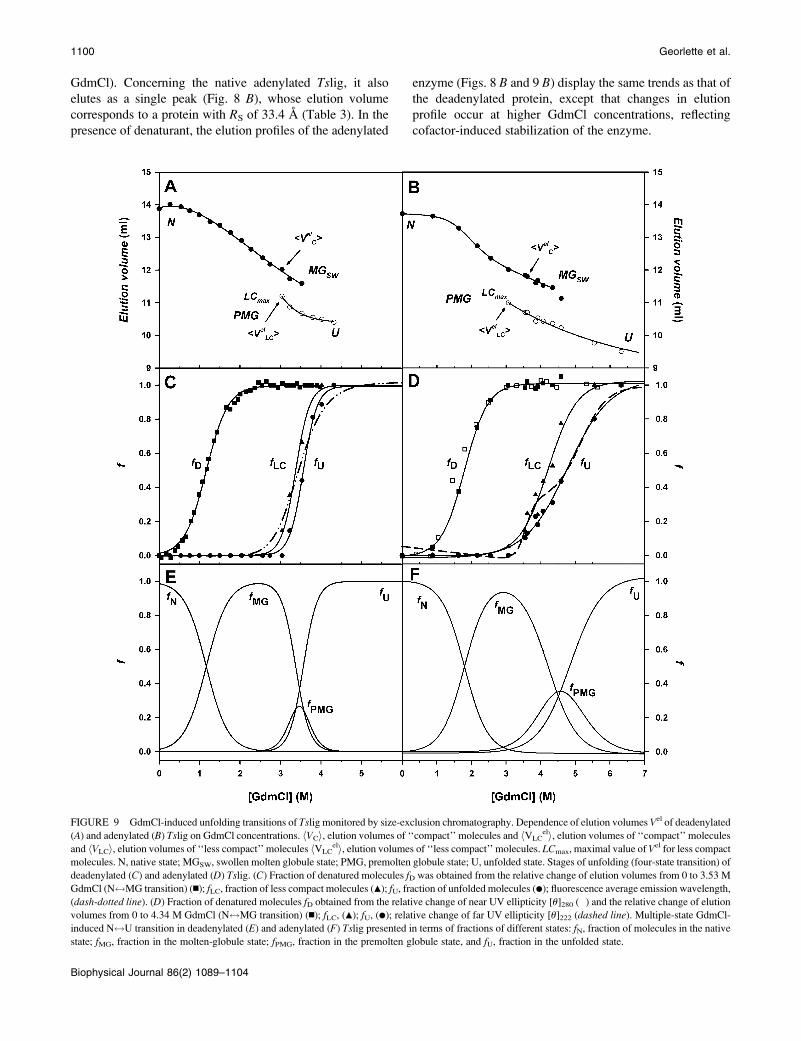
FIGURE 9 GdmCl-induced unfolding transitions of Tslig monitored by size-exclusion chromatography. Dependence of elution volumes Vel of deadenylated
(A) and adenylated (B) Tslig on GdmCl concentrations. hVCi, elution volumes of ‘‘compact’’ molecules and hVLCeli, elution volumes of ‘‘compact’’ molecules
and hVLCi, elution volumes of ‘‘less compact’’ molecules hVLCeli, elution volumes of ‘‘less compact’’ molecules. LCmax, maximal value of Vel for less compact
molecules. N, native state; MGSW, swollen molten globule state; PMG, premolten globule state; U, unfolded state. Stages of unfolding (four-state transition) of
deadenylated (C) and adenylated (D) Tslig. (C) Fraction of denatured molecules fD was obtained from the relative change of elution volumes from 0 to 3.53 M
GdmCl (N$MG transition) (n); fLC, fraction of less compact molecules (m); fU, fraction of unfolded molecules (d); fluorescence average emission wavelength,
(dash-dotted line). (D) Fraction of denatured molecules fD obtained from the relative change of near UV ellipticity [u]280 (�) and the relative change of elution
volumes from 0 to 4.34 M GdmCl (N$MG transition) (n); fLC, (m); fU, (d); relative change of far UV ellipticity [u]222 (dashed line). Multiple-state GdmCl-
induced N$U transition in deadenylated (E) and adenylated (F) Tslig presented in terms of fractions of different states: fN, fraction of molecules in the native
state; fMG, fraction in the molten-globule state; fPMG, fraction in the premolten globule state, and fU, fraction in the unfolded state.
1100 Georlette et al.
Biophysical Journal 86(2) 1089–1104
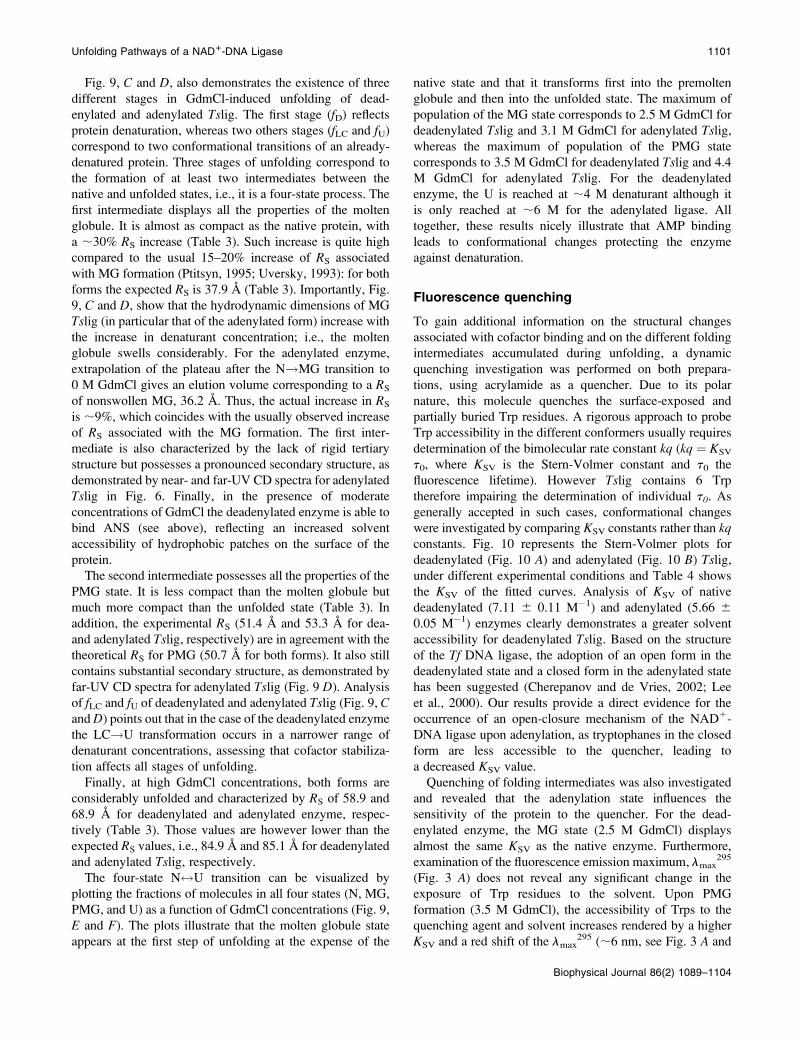
Fig. 9, C and D, also demonstrates the existence of three
different stages in GdmCl-induced unfolding of dead-
enylated and adenylated Tslig. The first stage (fD) reflectsprotein denaturation, whereas two others stages (fLC and fU)correspond to two conformational transitions of an already-
denatured protein. Three stages of unfolding correspond to
the formation of at least two intermediates between the
native and unfolded states, i.e., it is a four-state process. The
first intermediate displays all the properties of the molten
globule. It is almost as compact as the native protein, with
a ;30% RS increase (Table 3). Such increase is quite high
compared to the usual 15–20% increase of RS associated
with MG formation (Ptitsyn, 1995; Uversky, 1993): for both
forms the expected RS is 37.9 A (Table 3). Importantly, Fig.
9, C and D, show that the hydrodynamic dimensions of MG
Tslig (in particular that of the adenylated form) increase with
the increase in denaturant concentration; i.e., the molten
globule swells considerably. For the adenylated enzyme,
extrapolation of the plateau after the N!MG transition to
0 M GdmCl gives an elution volume corresponding to a RS
of nonswollen MG, 36.2 A. Thus, the actual increase in RS
is ;9%, which coincides with the usually observed increase
of RS associated with the MG formation. The first inter-
mediate is also characterized by the lack of rigid tertiary
structure but possesses a pronounced secondary structure, as
demonstrated by near- and far-UV CD spectra for adenylated
Tslig in Fig. 6. Finally, in the presence of moderate
concentrations of GdmCl the deadenylated enzyme is able to
bind ANS (see above), reflecting an increased solvent
accessibility of hydrophobic patches on the surface of the
protein.
The second intermediate possesses all the properties of the
PMG state. It is less compact than the molten globule but
much more compact than the unfolded state (Table 3). In
addition, the experimental RS (51.4 A and 53.3 A for dea-
and adenylated Tslig, respectively) are in agreement with the
theoretical RS for PMG (50.7 A for both forms). It also still
contains substantial secondary structure, as demonstrated by
far-UV CD spectra for adenylated Tslig (Fig. 9 D). Analysisof fLC and fU of deadenylated and adenylated Tslig (Fig. 9, CandD) points out that in the case of the deadenylated enzyme
the LC!U transformation occurs in a narrower range of
denaturant concentrations, assessing that cofactor stabiliza-
tion affects all stages of unfolding.
Finally, at high GdmCl concentrations, both forms are
considerably unfolded and characterized by RS of 58.9 and
68.9 A for deadenylated and adenylated enzyme, respec-
tively (Table 3). Those values are however lower than the
expected RS values, i.e., 84.9 A and 85.1 A for deadenylated
and adenylated Tslig, respectively.The four-state N$U transition can be visualized by
plotting the fractions of molecules in all four states (N, MG,
PMG, and U) as a function of GdmCl concentrations (Fig. 9,
E and F). The plots illustrate that the molten globule state
appears at the first step of unfolding at the expense of the
native state and that it transforms first into the premolten
globule and then into the unfolded state. The maximum of
population of the MG state corresponds to 2.5 M GdmCl for
deadenylated Tslig and 3.1 M GdmCl for adenylated Tslig,whereas the maximum of population of the PMG state
corresponds to 3.5 M GdmCl for deadenylated Tslig and 4.4
M GdmCl for adenylated Tslig. For the deadenylated
enzyme, the U is reached at ;4 M denaturant although it
is only reached at ;6 M for the adenylated ligase. All
together, these results nicely illustrate that AMP binding
leads to conformational changes protecting the enzyme
against denaturation.
Fluorescence quenching
To gain additional information on the structural changes
associated with cofactor binding and on the different folding
intermediates accumulated during unfolding, a dynamic
quenching investigation was performed on both prepara-
tions, using acrylamide as a quencher. Due to its polar
nature, this molecule quenches the surface-exposed and
partially buried Trp residues. A rigorous approach to probe
Trp accessibility in the different conformers usually requires
determination of the bimolecular rate constant kq (kq ¼ KSV
t0, where KSV is the Stern-Volmer constant and t0 the
fluorescence lifetime). However Tslig contains 6 Trp
therefore impairing the determination of individual t0. As
generally accepted in such cases, conformational changes
were investigated by comparing KSV constants rather than kqconstants. Fig. 10 represents the Stern-Volmer plots for
deadenylated (Fig. 10 A) and adenylated (Fig. 10 B) Tslig,under different experimental conditions and Table 4 shows
the KSV of the fitted curves. Analysis of KSV of native
deadenylated (7.11 6 0.11 M�1) and adenylated (5.66 6
0.05 M�1) enzymes clearly demonstrates a greater solvent
accessibility for deadenylated Tslig. Based on the structure
of the Tf DNA ligase, the adoption of an open form in the
deadenylated state and a closed form in the adenylated state
has been suggested (Cherepanov and de Vries, 2002; Lee
et al., 2000). Our results provide a direct evidence for the
occurrence of an open-closure mechanism of the NAD1-
DNA ligase upon adenylation, as tryptophanes in the closed
form are less accessible to the quencher, leading to
a decreased KSV value.
Quenching of folding intermediates was also investigated
and revealed that the adenylation state influences the
sensitivity of the protein to the quencher. For the dead-
enylated enzyme, the MG state (2.5 M GdmCl) displays
almost the same KSV as the native enzyme. Furthermore,
examination of the fluorescence emission maximum, lmax295
(Fig. 3 A) does not reveal any significant change in the
exposure of Trp residues to the solvent. Upon PMG
formation (3.5 M GdmCl), the accessibility of Trps to the
quenching agent and solvent increases rendered by a higher
KSV and a red shift of the lmax295 (;6 nm, see Fig. 3 A and
Unfolding Pathways of a NAD1-DNA Ligase 1101
Biophysical Journal 86(2) 1089–1104
Table 4). Finally, the KSV of the U state (6.5 M GdmCl) was
close to that of the PMG, whereas the lmax295 still increased
(350 nm), reflecting the full exposure of Trp residues at high
denaturant concentrations. Interestingly, the MG state of the
adenylated enzyme (3.06 M GdmCl) shows a slightly
decreased KSV compared to the native protein (Fig. 10 B).The main cause for this result cannot be explained by
a significant burial of the Trp residues in a hydrophobic
environment because no major blue shift of the fluorescence
emission maximum, lmax295 was observed (Fig. 3 B and
Table 4). In contrast, the PMG state of the adenylated Tslig(4.4 M GdmCl) is characterized by an increased KSV
compared to the deadenylated enzyme and comparable to
that of the unfolded state (Table 4). These results suggest that
Trp residues in those forms are substantially solvated and
accessible to the quencher molecules. This conclusion was
further confirmed by the analysis of the position of maximal
fluorescence, lmax295 (Fig. 3 B and Table 4), which
demonstrates concomitant changes in the exposure of Trps
to solvent. Thus, the results of quenching experiments
indicate that the Trp residues in the MG states of apo- and
holoenzymes are in the same global environment as those of
the native enzyme. On the other hand, in the PMG state Trp
residues are significantly exposed to the solvent, suggesting
more pronounced conformational changes than in the case of
the MG.
CONCLUSION
In this report, we provide new insights into the conforma-
tional changes occurring upon adenylation of NAD1-
dependent DNA ligases. Although previous works had
suggested such changes (Cherepanov and de Vries, 2002;
Doherty and Suh, 2000; Lee et al., 2000), our biophysical
analyses on the deadenylated and adenylated Tslig firmly
demonstrate that the transformation of the cofactor-free
enzyme into its catalytically active form causes a conforma-
tional rearrangement within its active site accompanied by
the compaction of the enzyme. These results support an
‘‘open-closure’’ induced-mechanism avoiding the formation
of nonproductive ligase-DNA complexes. Mutational studies
performed on aromatic residues located within the active site
will be instrumental in the identification of the amino acid(s)
involved in the conformational changes associated with
adenylation.
The structural modifications occurring upon adenylation
have also profound effects on the conformational stability of
the enzyme. Upon adenylation, the conformational stability
of the DNA ligase significantly increases, as demonstrated
by differential scanning microcalorimetry and guanidine
hydrochloride denaturation. Cofactor molecules have long
been known to stabilize enzymes specifically by stabilizing
their active site. Our results obviously indicate that this
observation is also valid for Tslig, establishing a thermody-
namic link between cofactor binding and conformational
stability. Furthermore, the effect of DNA binding on the
conformational stability of the enzyme is expected to give
supplementary information on the substrate-induced modu-
lation of enzyme stability.
To gain information about the deadenylated and adeny-
lated conformers, the unfolding pathways of deadenylated
and adenylated Tslig have been followed by a combination
of different biophysical methods. The GdmCl-induced equi-
FIGURE 10 Trp fluorescence quenching by acrylamide. Quenching
experiments of deadenylated (A) and adenylated (B) Tslig were conducted
as described under ‘‘Experimental Procedures.’’ (A) Fluorescence intensity
of deadenylated Tslig (lex 295 nm, lem 333 nm) at 0 M (1), 2.5 M (2), 3.5 M
(3), and 6.5 M GdmCl (4). (B) Fluorescence intensity of adenylated Tslig
recorded at 0 M (1), 3.06 M (2), 4.4 M (3), and 6.5 M (4) GdmCl. The
quenching constant KSV values corresponding to the plot slope (Eq. 10) are
given in Table 4.
TABLE 4 Stern-Volmer quenching constants (KSV) and lmax
(nm) obtained for deadenylated and adenylated Tslig under
different GdmCl concentrations
GdmCl
(M)
Deadenylated Tslig Adenylated Tslig
KSV (M�1)* ylmax280 zlmax
295 KSV (M�1)* ylmax280 zlmax
295
0 7.11 6 0.11 332.2 333.0 5.66 6 0.05 332.0 333.6
2.5 7.28 6 0.10 333.6 333.6
3.0 5.29 6 0.02 332.0 332.9
3.5 8.66 6 0.12 338.2 339.9
4.4 7.87 6 0.07 344.0 348.3
6.5 8.53 6 0.08 347.0 350.0 7.81 6 0.08 346.0 350.0
*The Stern-Volmer quenching constants were obtained from the slopes of
the lines for the plots of F0/F ¼ 1 1 (KSV 3 [Q]).yThe excitation wavelength was 280 nm.zThe excitation wavelength was 295nm.
1102 Georlette et al.
Biophysical Journal 86(2) 1089–1104
librium unfolding of both forms can be described by a four-
state transition model, N$MG$PMG$U, shifted toward
higher GdmCl concentrations in the case of adenylated
enzyme.
We thank N. Gerardin and R. Marchand for their skillful technical
assistance. We also thank F. Biemar, C. Houssier, A. Matagne, A. R.
Merrill, and M. Vanhove for helpful assistance and discussions.
This work was supported by the European Union (Grant CT970131), the
Region Wallonne (Grants Bioval 981/3860, Bioval 981/3848, Initiative
114705), the Fonds National de la Recherche Scientifique Belgium (Grant
2.4515.00), and the Institut Polaire Francais. The purchase of the Jasco 810
equipment was supported in part by a grant from the Fonds de la Recherche
Fondamentale et Collective (contract 2.4545.01).
REFERENCES
Ackers, G. K. 1970. Analytical gel chromatography of proteins. Adv.Protein Chem. 24:343–446.
Akhtar, M. S., A. Ahmad, and V. Bhakuni. 2002. Guanidinium chloride-and urea-induced unfolding of the dimeric enzyme glucose oxidase.Biochemistry. 41:3819–3827.
Aravind, L., and E. V. Koonin. 1999. Gleaning non-trivial structural,functional and evolutionary information about proteins by iterativedatabase searches. J. Mol. Biol. 287:1023–1040.
Barany, F., and D. H. Gelfand. 1991. Cloning, overexpression andnucleotide sequence of a thermostable DNA ligase-encoding gene. Gene.109:1–11.
Chen, Y. H., J. T. Yang, and H. M. Martinez. 1972. Determination of thesecondary structures of proteins by circular dichroism and opticalrotatory dispersion. Biochemistry. 11:4120–4131.
Brandes, H. K., F. W. Larimer, T. Y. Lu, J. Dey, and F. C. Hartman. 1998.Roles and microenvironments of tryptophanyl residues of spinachphosphoribulokinase. Arch. Biochem. Biophys. 352:130–136.
Brannigan, J. A., S. R. Ashford, A. J. Doherty, D. J. Timson, and D. B.Wigley. 1999. Nucleotide sequence, heterologous expression and novelpurification of DNA ligase from Bacillus stearothermophilus1. Biochim.Biophys. Acta. 1432:413–418.
Burstein, E. A. 1976. Intrinsic Protein Fluorescence: Origin andApplications. Series Biophysics, Vol. 7, Viniiti, Moscow .
Bushmarina, N. A., I. M. Kuznetsova, A. G. Biktashev, K. K. Turoverov,and V. N. Uversky. 2001. Partially folded conformations in the foldingpathway of bovine carbonic anhydrase II: a fluorescence spectroscopicanalysis. Chembiochem. 2:813–821.
Candy, J. M., J. Koga, P. F. Nixon, and R. G. Duggleby. 1996. The role ofresidues glutamate-50 and phenylalanine-496 in Zymomonas mobilispyruvate decarboxylase. Biochem. J. 315:745–751.
Cherepanov, A. V., and S. de Vries. 2002. Dynamic mechanism of nickrecognition by DNA ligase. Eur. J. Biochem. 269:5993–5999.
D’Auria, S., P. Herman, M. Rossi, and J. R. Lakowicz. 1999. Thefluorescence emission of the apo-glucose oxidase from Aspergillus nigeras probe to estimate glucose concentrations. Biochem. Biophys. Res.Commun. 263:550–553.
Depiereux, E., G. Baudoux, P. Briffeuil, I. Reginster, X. De Bolle, C.Vinals, and E. Feytmans. 1997. Match-Box_server: a multiple sequencealignment tool placing emphasis on reliability. Comput. Appl. Biosci.13:249–256.
Diefenbach, R. J., and R. G. Duggleby. 1991. Pyruvate decarboxylasefrom Zymomonas mobilis. Structure and re-activation of apoenzyme bythe cofactors thiamin diphosphate and magnesium ion. Biochem. J. 276:439–445.
Doherty, A. J., and T. R. Dafforn. 2000. Nick recognition by DNA ligases.J. Mol. Biol. 296:43–56.
Doherty, A. J., and S. W. Suh. 2000. Structural and mechanisticconservation in DNA ligases. Nucleic Acids Res. 28:4051–4058.
Favilla, R., M. Goldoni, A. Mazzini, P. Di Muro, B. Salvato, and M.Beltramini. 2002. Guanidinium chloride induced unfolding of a hemocy-anin subunit from Carcinus aestuarii. I. Apo form. Biochim. Biophys.Acta. 1597:42–50.
Fechteler, T., U. Dengler, and D. Schomburg. 1995. Prediction of proteinthree-dimensional structures in insertion and deletion regions: a procedurefor searching data bases of representative protein fragments usinggeometric scoring criteria. J. Mol. Biol. 253:114–131.
Georlette, D., Z. O. Jonsson, F. Van Petegem, J. Chessa, J. Van Beeumen,U. Hubscher, and C. Gerday. 2000. A DNA ligase from the psychrophilePseudoalteromonas haloplanktis gives insights into the adaptation ofproteins to low temperatures. Eur. J. Biochem. 267:3502–3512.
Goenka, S., B. Raman, T. Ramakrishna, and C. M. Rao. 2001. Unfoldingand refolding of a quinone oxidoreductase: a-crystallin, a molecularchaperone, assists its reactivation. Biochem. J. 359:547–556.
Goldberg, M. E., N. Expert-Bezancon, L. Vuillard, and T. Rabilloud. 1995.Non-detergent sulphobetaines: a new class of molecules that facilitatein vitro protein renaturation. Fold. Des. 1:21–27.
Gupta, G. S., and B. P. Kang. 1997. LDH-C4-substrate binary complexesstudied by intrinsic fluorescence method. Indian J. Biochem. Biophys.34:307–312.
Hakansson, K., A. J. Doherty, S. Shuman, and D. B. Wigley. 1997. X-raycrystallography reveals a large conformational change during guanyltransfer by mRNA capping enzymes. Cell. 89:545–553.
Ishino, Y., H. Shinagawa, K. Makino, S. Tsunasawa, F. Sakiyama, andA. Nakata. 1986. Nucleotide sequence of the lig gene and primary struc-ture of DNA ligase of Escherichia coli. Mol. Gen. Genet. 204:1–7.
Kaczorowski, T., and W. Szybalski. 1996. Co-operativity of hexamerligation. Gene. 179:189–193.
Kube, D., T. V. Esakova, M. V. Ivanov, A. I. Gromov, and N. K.Nagradova. 1987. Detection of ligand-induced conformation changesin lactate dehydrogenase by using fluorescent probes. Biokhimiia. 52:179–187.
Kuznetsova, I. M., O. V. Stepanenko, K. K. Turoverov, L. Zhu, J. M. Zhou,A. L. Fink, and V. N. Uversky. 2002. Unraveling multistate unfolding ofrabbit muscle creatine kinase. Biochim. Biophys. Acta. 1596:138–155.
Lakowicz, J. 1983. Fluorescence quenching. In Principles of FluorescenceSpectroscopy. J. R. Lakowicz, editor. Plenum Press, New York. 257–301.
Lee, J. Y., C. Chang, H. K. Song, J. Moon, J. K. Yang, H. K. Kim, S. T.Kwon, and S. W. Suh. 2000. Crystal structure of NAD1-dependent DNAligase: modular architecture and functional implications. EMBO J.19:1119–1129.
Lehman, I. R. 1974. DNA ligase: structure, mechanism, and function.Science. 186:790–797.
Levitt, M. 1992. Accurate modeling of protein conformation by automaticsegment matching. J. Mol. Biol. 226:507–533.
Marchal, S., and G. Branlant. 1999. Evidence for the chemical activation ofessential cys-302 upon cofactor binding to nonphosphorylating glycer-aldehyde 3-phosphate dehydrogenase from Streptococcus mutans. Bio-chemistry. 38:12950–12958.
Martin, I. V., and S. A. MacNeill. 2002. ATP-dependent DNA ligases.Genome Biol. 3:3005.1–3005.7.
Matouschek, A., J. M. Matthews, C. M. Johnson, and A. R. Fersht. 1994.Extrapolation to water of kinetic and equilibrium data for the unfoldingof barnase in urea solutions. Protein Eng. 7:1089–1095.
Mayr, L. M., and F. X. Schmid. 1993. Stabilization of a protein byguanidinium chloride. Biochemistry. 32:7994–7998.
Modrich, P., Y. Anraku, and I. R. Lehman. 1973. Deoxyribonucleic acidligase. Isolation and physical characterization of the homogeneousenzyme from Escherichia coli. J. Biol. Chem. 248:7495–7501.
Morimatsu, K., T. Horii, and M. Takahashi. 1995. Interaction of Tyr103and Tyr264 of the RecA protein with DNA and nucleotide cofactors.
Unfolding Pathways of a NAD1-DNA Ligase 1103
Biophysical Journal 86(2) 1089–1104
Fluorescence study of engineered proteins. Eur. J. Biochem. 228:779–785.
Munishkina, L. A., C. Phelan, V. N. Uversky, and A. L. Fink. 2003.Conformational behavior and aggregation of a-synuclein in organicsolvents: modeling the effects of membranes. Biochemistry. 42:2720–2730.
Murataliev, M. B., and R. Feyereisen. 2000. Functional interactions incytochrome P450BM3. Evidence that NADP(H) binding controls redoxpotentials of the flavin cofactors. Biochemistry. 39:12699–12707.
Myers, J. K., C. N. Pace, and J. M. Scholtz. 1995. Denaturant m values andheat capacity changes: relation to changes in accessible surface areas ofprotein unfolding. Protein Sci. 4:2138–2148.
Pace, C. N. 1986. Determination and analysis of urea and guanidinehydrochloride denaturation curves. Methods Enzymol. 131:266–280.
Pace, C. N. 1990. Measuring and increasing protein stability. TrendsBiotechnol. 8:93–98.
Panasenko, S. M., R. J. Alazard, and I. R. Lehman. 1978. A simple, three-step procedure for the large scale purification of DNA ligase froma hybrid lambda lysogen constructed in vitro. J. Biol. Chem.253:4590–4592.
Pearson, W. R. 1996. Effective protein sequence comparison. MethodsEnzymol. 266:227–258.
Permyakov, E. A., V. V. Yarmolenko, V. I. Emelyanenko, E. A. Burstein,J. Closset, and C. Gerday. 1980. Fluorescence studies of the calciumbinding to whiting ( Gadus merlangus) parvalbumin. Eur. J. Biochem.109:307–315.
Ptitsyn, O. B. 1995. Molten globule and protein folding. Adv. ProteinChem. 47:83–229.
Royer, C. A., C. J. Mann, and C. R. Matthews. 1993. Resolution of thefluorescence equilibrium unfolding profile of trp aporepressor usingsingle tryptophan mutants. Protein Sci. 2:1844–1852.
Semisotnov, G. V., N. A. Rodionova, O. I. Razgulyaev, V. N. Uversky,A. F. Gripas, and R. I. Gilmanshin. 1991. Study of the ‘‘molten globule’’intermediate state in protein folding by a hydrophobic fluorescent probe.Biopolymers. 31:119–128.
Shepherd, G. B., and G. G. Hammes. 1976. Fluorescence energy transfermeasurements between ligand binding sites of the pyruvate dehydroge-nase multienzyme complex. Biochemistry. 15:311–317.
Shuman, S. 1995. Vaccinia virus DNA ligase: specificity, fidelity, andinhibition. Biochemistry. 34:16138–16147.
Shuman, S., and B. Schwer. 1995. RNA capping enzyme and DNA ligase:a superfamily of covalent nucleotidyl transferases. Mol. Microbiol.17:405–410.
Singleton, M. R., K. Hakansson, D. J. Timson, and D. B. Wigley. 1999.Structure of the adenylation domain of an NAD1-dependent DNA ligase.Structure. 7:35–42.
Sinha, K. M., M. Ghosh, I. Das, and A. K. Datta. 1999. Molecular cloningand expression of adenosine kinase from Leishmania donovani:identification of unconventional P-loop motif. Biochem. J. 339:667–673.
Sriskanda, V., and S. Shuman. 2002. Conserved residues in domain Ia arerequired for the reaction of Escherichia coli DNA ligase with NAD1.J. Biol. Chem. 277:9695–9700.
Takahashi, M., and T. Uchida. 1986. Thermophilic HB8 DNA ligase:effects of polyethylene glycols and polyamines on blunt-end ligation ofDNA. J. Biochem. 100:123–131.
Tang, C. K., C. E. Jeffers, J. C. Nichols, and S. C. Tu. 2001. Flavinspecificity and subunit interaction of Vibrio fischeri general NAD(P)H-flavin oxidoreductase FRG/FRase I. Arch. Biochem. Biophys. 392:110–116.
Thorbjarnardottir, S. H., Z. O. Jonsson, O. S. Andresson, J. K. Kristjansson,G. Eggertsson, and A. Palsdottir. 1995. Cloning and sequence analysis ofthe DNA ligase-encoding gene of Rhodothermus marinus, and over-production, purification and characterization of two thermophilic DNAligases. Gene. 161:1–6.
Timson, D. J., M. R. Singleton, and D. B. Wigley. 2000. DNA ligases inthe repair and replication of DNA. Mutat. Res. 460:301–318.
Timson, D. J., and D. B. Wigley. 1999. Functional domains of an NAD1-dependent DNA ligase. J. Mol. Biol. 285:73–83.
Uversky, V. N. 1993. Use of fast protein size-exclusion liquidchromatography to study the unfolding of proteins which denaturethrough the molten globule. Biochemistry. 32:13288–13298.
Uversky, V. N. 2002a. Cracking the folding code. Why do some proteinsadopt partially folded conformations, whereas other don’t? FEBS Lett.514:181–183.
Uversky, V. N. 2002b. What does it mean to be natively unfolded? Eur.J. Biochem. 269:2–12.
Uversky, V. N., and A. L. Fink. 2002. The chicken-egg scenario of proteinfolding revisited. FEBS Lett. 515:79–83.
Uversky, V. N., L. N. Garriques, I. S. Millett, S. Frokjaer, J. Brange,S. Doniach, and A. L. Fink.2003. Prediction of the association stateof insulin using spectral parameters. J. Pharm. Sci. 92:847–858.
Uversky, V. N., and O. B. Ptitsyn. 1994. Partly folded state, a newequilibrium state of protein molecules: four-state guanidinium chloride-induced unfolding of b-lactamase at low temperature. Biochemistry.33:2782–2791.
Uversky, V. N., and O. B. Ptitsyn. 1996. Further evidence on theequilibrium ‘‘pre-molten globule state’’: four-state guanidinium chloride-induced unfolding of carbonic anhydrase B at low temperature. J. Mol.Biol. 255:215–228.
Vanhove, M., G. Guillaume, P. Ledent, J. H. Richards, R. H. Pain, andJ. M. Frere. 1997. Kinetic and thermodynamic consequences ofthe removal of the Cys-77-Cys-123 disulphide bond for the folding ofTEM-1 b-lactamase. Biochem. J. 321:413–417.
Vassilenko, K. S., and V. N. Uversky. 2002. Native-like secondarystructure of molten globules. Biochim. Biophys. Acta. 1594:168–177.
Wilkinson, A., J. Day, and R. Bowater. 2001. Bacterial DNA ligases. Mol.Microbiol. 40:1241–1248.
Zimmerman, S. B., and B. H. Pheiffer. 1983. Macromolecular crowdingallows blunt-end ligation by DNA ligases from rat liver or Escherichiacoli. Proc. Natl. Acad. Sci. USA. 80:5852–5856.
1104 Georlette et al.
Biophysical Journal 86(2) 1089–1104