Adaptive evolution of cone opsin genes in two colorful cyprinids
10
Adaptive evolution of cone opsin genes in two colorful cyprinids, Opsariichthys pachycephalus and Candidia barbatus Feng Yu Wang a , Wen Sung Chung b , Hong Young Yan b , Chyng Shyan Tzeng a, * a Institute of Bioinformatics and Structural Biology, National Tsing-Hua University, No. 101, Section 2, Guangfu Road, Hsinchu City 300, Taiwan b Institute of Cellular & Organismic Biology, Academia Sinica, No. 128, Section 2, Academia Road, Nankang, Taipei 115, Taiwan article info Article history: Received 22 February 2008 Received in revised form 17 April 2008 Keywords: Spectral shift Nuptial coloration k max Reflectance spectra Opsin gene abstract Opsariichthys pachycephalus and Candidia barbatus are two phylogenetically related freshwater cyprinids that both exhibit colorful, yet quite different nuptial coloration. This study was designed to test the hypothesis that differences in nuptial coloration between two species could reflect differences in color perception ability and the opsin genes that coded for it. Genes encoding the visual pigments of these two species were cloned and sequenced, k max of cone photoreceptors and the reflectance spectra of their body coloration were measured to test the hypothesis. The 14-nm spectral shift between green-light-sen- sitive photoreceptors of these two cyprinids is found to correlate well with differences in their reflective spectra. The spectral shift could result from differential expression of opsin genes and the interactive effects of the amino acid replacements in various minor sites. These results support our hypothesis that nuptial coloration is tied to color perception ability and opsin genes. Ó 2008 Elsevier Ltd. All rights reserved. 1. Introduction The photic environments of aquatic environments are very di- verse, ranging from total darkness in the deep sea to the full bright- ness at the surface of a clear, shallow stream. Visual abilities of fishes are influenced by ecological photo-environments (Bow- maker, 1995). For example, in deep sea fishes, the spectral sensitiv- ities of rod visual pigments shift to around 480 nm in order to match with the wavelength of the downwelling light (Hunt, Dulai, Partridge, Cottrill, & Bowmaker, 2001; Partridge, Arche, & Lythgoe, 1988). In Lake Baikal (located in Russia, the deepest lake in the world), the cottoid fishes there alter their spectral sensitivities of cone and rod photoreceptors to match with the shorter wavelength of ambient, deepwater light (Cowing, Poopalasundaram, Wilkie, Bowmaker, & Hunt, 2002; Hunt, Fitzgibbon, Slobodyyanyuk, & Bowmaker, 1996). Color vision of vertebrates is known to be modulated by four paralogous pigments expressed in cone photoreceptor cells. These four pigments are encoded by short-wavelength-sensitive type 1 (SWS1), short-wavelength-sensitive type 2 (SWS2), rhodopsin-like (RH2), and middle and long wavelength-sensitive (M/LWS) opsin genes, respectively (Ebrey & Koutalos, 2001; Yokoyama, 2000; Yokoyama & Yokoyama, 1996). These visual pigments are com- posed of a light-sensitive chromophore, either 11-cis-retinal or 3- dehydroretinal, which is bound to opsin proteins. The wavelength of maximum absorbance (defined as the k max ) of a visual pigment is determined by the interactions between the chromophore and the amino acid residues of the opsin protein (Nathans, 1990a, 1990b; Sakmar, Franke, & Khorana, 1989; Sakmar, Menon, Marin, & Awad, 2002; Yokoyama, 2002; Zhukovsky & Oprian, 1989). Several mechanisms have been demonstrated to be responsible for the tuning of the spectral sensitivity of photoreceptors in verte- brates. First, the spectral sensitivity can be modulated by differen- tial expression of opsin genes (Carleton & Kocher, 2001; Parry et al., 2005). For instance, cichlid fishes are known to have five cone op- sin genes, SWS1, SWS2A, SWS2B, Rh2, and LWS, among species. The planktivore, Metriaclima zebra, expresses SWS1, SWS2, and Rh2, while the piscivore, Dimidiochromis compressiceps, expresses a different subset of opsins, SWS2A, Rh2, and LWS (Carleton & Ko- cher, 2001). Such differences in expressions of opsin genes lead to variations of color vision ability among cichlid fishes. Second, depending on whether the chromophore is derived from either vitamin A1 or A2, the k max of the visual pigment changes accordingly. The visual pigment binding to A1-derived chromophore (11-cis-retinal) shows relatively shorter k max than the pigment binding to A2-derived chromophore (3-dehydroreti- nal) (Yokoyama & Yokoyama, 1996). Fishes that live in turbid envi- ronments usually utilize A2 or A1–A2 mixed chromophore in their visual pigment (Bowmaker, 1995). In cyprinids, A2-derived chro- mophore is dominate in goldfish (Carassius auratus), while A1 is used in zebrafish (Danio rerio)(Nawrocki, Bremiller, Streisinger, & Kapla, 1985; Palacios, Varela, Srivastava, & Goldsmith, 1998). These observed differences correspond well to the environmental differ- ences of their habitats (Carleton, Parry, Bowmaker, Hunt, & See- hausen, 2005). 0042-6989/$ - see front matter Ó 2008 Elsevier Ltd. All rights reserved. doi:10.1016/j.visres.2008.04.026 * Corresponding author. Fax: +886 3 5715934. E-mail address: [email protected] (C.S. Tzeng). Vision Research 48 (2008) 1695–1704 Contents lists available at ScienceDirect Vision Research journal homepage: www.elsevier.com/locate/visres
Transcript of Adaptive evolution of cone opsin genes in two colorful cyprinids

Vision Research 48 (2008) 1695–1704
Contents lists available at ScienceDirect
Vision Research
journal homepage: www.elsevier .com/locate /v isres
Adaptive evolution of cone opsin genes in two colorful cyprinids, Opsariichthyspachycephalus and Candidia barbatus
Feng Yu Wang a, Wen Sung Chung b, Hong Young Yan b, Chyng Shyan Tzeng a,*
a Institute of Bioinformatics and Structural Biology, National Tsing-Hua University, No. 101, Section 2, Guangfu Road, Hsinchu City 300, Taiwanb Institute of Cellular & Organismic Biology, Academia Sinica, No. 128, Section 2, Academia Road, Nankang, Taipei 115, Taiwan
a r t i c l e i n f o
Article history:Received 22 February 2008Received in revised form 17 April 2008
Keywords:Spectral shiftNuptial colorationkmax
Reflectance spectraOpsin gene
0042-6989/$ - see front matter � 2008 Elsevier Ltd. Adoi:10.1016/j.visres.2008.04.026
* Corresponding author. Fax: +886 3 5715934.E-mail address: [email protected] (C.S. Tzeng)
a b s t r a c t
Opsariichthys pachycephalus and Candidia barbatus are two phylogenetically related freshwater cyprinidsthat both exhibit colorful, yet quite different nuptial coloration. This study was designed to test thehypothesis that differences in nuptial coloration between two species could reflect differences in colorperception ability and the opsin genes that coded for it. Genes encoding the visual pigments of thesetwo species were cloned and sequenced, kmax of cone photoreceptors and the reflectance spectra of theirbody coloration were measured to test the hypothesis. The 14-nm spectral shift between green-light-sen-sitive photoreceptors of these two cyprinids is found to correlate well with differences in their reflectivespectra. The spectral shift could result from differential expression of opsin genes and the interactiveeffects of the amino acid replacements in various minor sites. These results support our hypothesis thatnuptial coloration is tied to color perception ability and opsin genes.
� 2008 Elsevier Ltd. All rights reserved.
1. Introduction
The photic environments of aquatic environments are very di-verse, ranging from total darkness in the deep sea to the full bright-ness at the surface of a clear, shallow stream. Visual abilities offishes are influenced by ecological photo-environments (Bow-maker, 1995). For example, in deep sea fishes, the spectral sensitiv-ities of rod visual pigments shift to around 480 nm in order tomatch with the wavelength of the downwelling light (Hunt, Dulai,Partridge, Cottrill, & Bowmaker, 2001; Partridge, Arche, & Lythgoe,1988). In Lake Baikal (located in Russia, the deepest lake in theworld), the cottoid fishes there alter their spectral sensitivities ofcone and rod photoreceptors to match with the shorter wavelengthof ambient, deepwater light (Cowing, Poopalasundaram, Wilkie,Bowmaker, & Hunt, 2002; Hunt, Fitzgibbon, Slobodyyanyuk, &Bowmaker, 1996).
Color vision of vertebrates is known to be modulated by fourparalogous pigments expressed in cone photoreceptor cells. Thesefour pigments are encoded by short-wavelength-sensitive type 1(SWS1), short-wavelength-sensitive type 2 (SWS2), rhodopsin-like(RH2), and middle and long wavelength-sensitive (M/LWS) opsingenes, respectively (Ebrey & Koutalos, 2001; Yokoyama, 2000;Yokoyama & Yokoyama, 1996). These visual pigments are com-posed of a light-sensitive chromophore, either 11-cis-retinal or 3-dehydroretinal, which is bound to opsin proteins. The wavelengthof maximum absorbance (defined as the kmax) of a visual pigment
ll rights reserved.
.
is determined by the interactions between the chromophore andthe amino acid residues of the opsin protein (Nathans, 1990a,1990b; Sakmar, Franke, & Khorana, 1989; Sakmar, Menon, Marin,& Awad, 2002; Yokoyama, 2002; Zhukovsky & Oprian, 1989).
Several mechanisms have been demonstrated to be responsiblefor the tuning of the spectral sensitivity of photoreceptors in verte-brates. First, the spectral sensitivity can be modulated by differen-tial expression of opsin genes (Carleton & Kocher, 2001; Parry et al.,2005). For instance, cichlid fishes are known to have five cone op-sin genes, SWS1, SWS2A, SWS2B, Rh2, and LWS, among species.The planktivore, Metriaclima zebra, expresses SWS1, SWS2, andRh2, while the piscivore, Dimidiochromis compressiceps, expressesa different subset of opsins, SWS2A, Rh2, and LWS (Carleton & Ko-cher, 2001). Such differences in expressions of opsin genes lead tovariations of color vision ability among cichlid fishes.
Second, depending on whether the chromophore is derivedfrom either vitamin A1 or A2, the kmax of the visual pigmentchanges accordingly. The visual pigment binding to A1-derivedchromophore (11-cis-retinal) shows relatively shorter kmax thanthe pigment binding to A2-derived chromophore (3-dehydroreti-nal) (Yokoyama & Yokoyama, 1996). Fishes that live in turbid envi-ronments usually utilize A2 or A1–A2 mixed chromophore in theirvisual pigment (Bowmaker, 1995). In cyprinids, A2-derived chro-mophore is dominate in goldfish (Carassius auratus), while A1 isused in zebrafish (Danio rerio) (Nawrocki, Bremiller, Streisinger, &Kapla, 1985; Palacios, Varela, Srivastava, & Goldsmith, 1998). Theseobserved differences correspond well to the environmental differ-ences of their habitats (Carleton, Parry, Bowmaker, Hunt, & See-hausen, 2005).

Table 1Primer sequences used in the visual genes amplification and sequencing reactions
Opsin PCR primer (50 to 30)
SWS1_F ATGGACGCGTGGGCCGTTCAGTTCGSWS1_R CAGAGAAGTTGTAAATGTGGTGTGGSWS2_F GGTGTTwCAGCATTCTCGGTGGSWS2_R TTCACTGCCAGCAGAGTGGTTCTGTCRh2_F GGCACTGAGGGAAACAACTTCTACATCRh2_R GAACATAATCyGTGArAGkTTGACAAGRh2-1_F GGCAGAACCATGGmArTTyAAGGCRh2-1_R CACCTCTGTTTTGCTTGTTGAmACTGAGLWS_F GGGCTATACAACAACCCCAAAAATGLWS_R CCTGGCTCAGGATCCTTGCTCTGAG
Sequencing primer (50 to 30)
O_SWS1_F2 GGAGCCGTGGCGTTCACCTGGGO_SWS1_R2 CTGCAACGGCACGCAGGGCTCO_SWS2_F2 GGGGTGACAGCATGTAAAATTGAGGGO_SWS2_R2 GAATCTGCTTGAGCTTTGGCTGCO_Rh2_F2 GGGCTTCATGGCCACACTTGGAGGO_Rh2_R2 GCAGCAACAGTGGCATAAGGGGO_LWS_F2 GGGAGAGATGGGTGGTCGTCTGCO_LWS_R2 CCCCAGCAAACACAGTAGGCCAGGTA-Fa CAAGGCGATTAAGTTGGGTATA-Ra GGAATTGTGAGCGGATAACA
a TA-F and TA-R are the primers of T-vector (Yeasten Biotech, Taipei, Taiwan).
1696 F.Y. Wang et al. / Vision Research 48 (2008) 1695–1704
Finally, amino acid substitutions of opsin genes can lead to thespectral shift of visual pigments (Takahashi & Ebrey, 2003; Takah-ashi & Yokoyama, 2005; Takenaka & Yokoyama, 2007; Yokoyama,2002). Based on the analysis of the three-dimensional crystalstructure of bovine rhodopsin, there are 27 amino acids locatedwithin 4.5 Å from 11-cis-retinal forming the chromophore bind-ing pocket (Palczewski et al., 2000). Up to now, it is known thatamino acid changes at 26 sites are involved in the spectral tuningof visual pigments in vertebrates (Yokoyama, Takenaka, & Blow,2007).
Adaptive evolution of opsin genes is quite common in fishes.Many studies have shown that adaptive evolution of opsin genesis correlated with the photic environments inhabited by fishes(Cowing et al., 2002; Spady et al., 2005; Yokoyama, Zhang, Radlw-immer, & Blow, 1999). Sexual selection was also reported to play arole in the evolution of visual genes of fishes, such as guppy (Poe-cilia reticulata) and cichlids (Cichlidae) (Hoffmann et al., 2007; Par-ry et al., 2005). The cases in cichlids and guppy point to thepossibility that differentiation of visual system may play an impor-tant role in the evolution of nuptial coloration.
Cyprinidae is the largest fish family, with the majority of speciesinhabiting freshwater environments, with few exceptions residingin some salty inland lakes (Nelson, 1994). The habitats of cyprinidsare divergent, ranging from pond to lake, tributary to mainstream,and therefore its photo-environments ranging from pristine andclear to highly turbid-water bodies. Despite such high speciesdiversity and wide distribution, studies on visual genes of cypri-nids are rather limited, with only three species, i.e., zebrafish, gold-fish, and common carp (Cyprinus carpio) have been characterizedso far (Chinen, Hamaoka, Yamada, & Kawamura, 2003; Johnsonet al., 1993; Tsai, Shih, Kuo, & Li, 1994). The molecular spectral tun-ing and the vision–environment relationship have been reportedonly for zebrafish and goldfish (Chinen, Matsumoto, & Kawamura,2005b).
Most cyprinid species lack colorful patterns on their body, butsome species of specific genera and subfamilies, such as membersof genus Opsariichthys and subfamily Acheilognathinae, have adultmales that possess brilliant nuptial coloration. The Opsariichthine,including genera Candidia, Opsariichthys, Parazacco, and Zacco, are agroup of cyprinids with sexual dimorphism (Chen, 1982; Wang,Wang, Du, & Lee, 2007). Among them, Opsariichthys pachycephalusand Candidia barbatus are two freshwater cyprinids exhibiting col-orful nuptial coloration during mating season, and distributedsympatrically in Taiwan (Tzeng, 1986). O. pachycephalus is an ende-mic cyprinid inhabiting middle and lower reaches of the rivers inTaiwan. During breeding season, mature males express markedsexual dimorphism and brilliant nuptial coloration with bluishgreen cross stripes on the body and pinkish red coloring in pector-al- and ventral-fins, as well as in lower cheeks (Chen & Chang,2005; Shen et al., 1993). C. barbatus is a widely distributed cyprinidthat can be found in wide range of habitats ranging from high alti-tude to lowland waters. During breeding season, adult males exhi-bit orange–red coloration on their pectoral-fins and lower cheeks(Chen & Chang, 2005; Shen et al., 1993). Both O. pachycephalusand C. barbatus are predators that feed on large invertebrates andsmall fishes, and both species live in very similar environments,that is, clear streams with high oxygen content and pristine waterquality. These two cyprinids, which use similar ecological habits,yet exhibit unique nuptial colorations, are suitable study animalsto investigate the relationship between the evolution of color vi-sion and nuptial coloration. In essence, the purpose of this studywas to test the hypothesis that there exists a relationship betweendifferences in nuptial coloration and its visual system between thetwo cyprinids.
In order to test the hypothesis, a three-prong approach wasused. First, we used a reflective photometer to measure and quan-
tify the color spectra emitted by the male fish body with nuptialcolor. Second, we used a microspectrophotometer (MSP) to mea-sure the kmax of cone photoreceptors of both species. Thirdly, wecloned and sequenced the visual pigment genes from these twocyprinids. With this integrated method, it allows us to understandthe evolutionary processes involved between visual genes andmale nuptial coloration of O. pachycephalus and C. barbatus.
2. Materials and methods
2.1. Study subjects
Individuals of C. barbatus and O. pachycephalus were collected in Houlong River,which is located at northwest of Taiwan, and the fish were shipped to a holdingfacility at the National Tsing-Hua University. Three adult individuals of each specieswere used for opsin genes cDNA cloning and sequencing, and 4–5 individuals wereused for microspectrophotometry and reflectance spectra measurements.
2.2. cDNA synthesis and PCR amplification of opsin genes
Total RNA was extracted from freshly dissected retina using a Qiagen RNeasyMini Kit (Valencia, USA). Single stranded cDNA was synthesized using an oligo(dT)primer and SuperScript II Reverse Transcriptase (Invitrogen, Carlsbad, California,USA).
The complete open reading frames (ORFs) of four classes of cone opsins wereamplified from the retinal cDNA. Primer pairs designed using conserved regionsof the opsin genes of zebrafish, goldfish, and common carp were applied in theamplification of opsin genes of the two cyprinids (Table 1). Rh2-F/R and Rh2-1F/Rare two primer sets designed for the amplification of Rh2 genes based on the diver-gence of the Rh2 sequences. Three primer sets were applied in the amplification ofother opsin genes. The PCR solution contained 1 ll cDNA, 2 ll 5� buffer A (5 mMMg2+), 8 ll 5� buffer B (10 mM Mg2+), 0.5 ll (5 mM) of each primer, 1 ll Elongase(Invitrogen) add to 50 ll of ddH2O. Reactions were conducted on a Takara PCR Ther-mal Cycler (Otsu, Shia, Japan) with denaturation at 94 �C for 40 s, annealing at 55 �Cfor 40 s, extension at 68 �C for 1 min 30 s for 35 cycles, and final extension at 68 �Cfor 10 min.
2.3. Cloning and sequencing
PCR products of five cone opsins were cloned individually into T-vectors usingyT&A cloning kit (Yeasten Biotech, Taipei, Taiwan) and then sequenced, respec-tively. The primers used for sequencing reaction were shown in Table 1. Sequencingreactions were carried out by dye terminator cycle sequencing method followingthe manufacturer’s protocol (Applied Biosystems, Foster City, USA). All sequenceswere determined in both directions by an ABI-3100 automatic DNA sequencer (Ap-plied Biosystems). Five to fifteen clones of each opsin gene were sequenced to ruleout the artificial errors.

F.Y. Wang et al. / Vision Research 48 (2008) 1695–1704 1697
2.4. Sequence analysis
Alignments of the LWS, RH2, SWS2, and SWS1 genes were carried out usingtheir predicted amino acid sequences with CLUSTAL W (Thompson, Higgins, & Gib-son, 1994) computer software, and their nucleotides sequences were aligned inaccordance with the amino acid alignments. The best-fit model of nucleotide evo-lution was determined by hierarchical likelihood ratio tests (LRT) implemented inModel Test (Posada & Crandall, 1998). The PAUP 4.0* (Swofford, 2000) was usedto construct neighbor-joining phylogenetic trees (Saitou & Nei, 1987) applyingML distances from the best-fit model. The nucleotide sequences of the LWS, RH2,SWS2, and SWS1 genes were retrieved from GenBank database, and the accessionnumbers were shown in Table 2.
Substitution sites identified from amino acid alignments of opsin genes werenumbered according to bovine rhodopsin (Palczewski et al., 2000).
2.5. Microspectrophotometry
Test subjects were dark-adapted for at least 2 h before the eyes were enucleatedunder dim red light. The retinas were removed with the aid of a night vision goggle,and the tissues were immediately immersed in chilled phosphate buffered salinecontaining 6% sucrose (Sigma, USA). The retina was cut into small pieces and placedon a cover glass and then sandwiched by a small glass cover slip sealed with siliconegrease. The preparation was placed on the microspectrophotometer (MSP) stage.Absorption spectra of individual photoreceptors were determined by the com-puter-controlled modified single-beam MSP which had been previously described(Loew, 1994). Selected absorbance curves and the kmax of a photoreceptor were ob-tained by a programed statistical method described in Loew (1994). The kmax of thenormalized visual pigment absorbance spectrum was acquired using the method ofMansfield as presented by MacNichil (1986). The templates used followed those ofLipetz and Cronin (1988). A decision as to which fitted best was made by visualexamination. The best visual fit usually was the template fit with the lowest stan-dard deviation (SD). If the SD of kmax was smaller than 7.5 nm, then the spectrumwas considered valid and stored into the computer (Sillman, Carver, & Loew,1999; Sillman, Johnson, & Loew, 2001). This process was repeated for each photo-receptor examined by the MSP. After the kmax values of each photoreceptor were
Table 2Species and visual genes analyzed in this study
Species Visual gene Symbol Source
Opsariichthys pachycephalus SWS1 OpaS1 EU410468h
SWS2 OpaS2 EU410467h
RH2 OpaRh2A EU410463h
OpaRh2B EU410464h
OpaRh2C EU410465h
LWS OpaL EU410466h
Candidia barbatus SWS1 CbaS1 EU410458h
SWS2 CbaS2 EU410459h
RH2 CbaRh2A EU410460h
CbaRh2B EU410461h
LWS CbaL EU410457h
Carassius auratus SWS1 CauS1 D85863*
SWS2 CauS2 L11864*
RH2 CauRh21 L11865*
CauRh22 L11866*
LWS CauL L11867*
Cyprinus carpio SWS1 CcaS1 AB113669*
SWS2 CcaS2 AB113668*
RH2 CcaRh21 AB110602*
CcaRh22 AB110603*
LWS CcaL AB055656*
Danio rerio SWS1 DreS1 AB087810*
SWS2 DreS2 AB087809*
RH2 DreRh21 AB087805*
DreRh22 AB087806*
DreRh23 AB087807*
DreRh24 AB087808*
LWS DreL1 AB087803*
DreL2 AB087804*
Oncorhynchus keta SWS1 OkeS1 AY214143*
SWS2 OkeS2 AY214144*
RH2 OkeRh2 AY214142*
LWS OkeL AY214140*
h and * indicate that the sequences are either obtained in this study (h) or down-loaded (*) from the GenBank database, respectively.
averaged, a final estimate of mean kmax ± SD was obtained. Numbers of differentclasses of cone and rod photoreceptors used for MSP measurements varied (see Ta-ble 4 for details).
2.6. Characterization of body coloration
The reflectance spectra (wavelength range: 400–700 nm) of the studied sub-jects were measured using a USB 2000 spectrometer attached to a PC running OOD-Base32 software (Ocean Optics, Dunedin, Florida, USA). The spectrometer wascalibrated against a diffuse reflectance standard WS-1 (Ocean Optics) before reflec-tion measurement. A sensor connected to a fiber optic probe, which was attached tothe USB 2000 spectrometer, was placed close to the fish at a 45� angle so that thesensor sampled reflected light from the specific colored region and the data werestored in the computer via spectrometer. Each measurement was an average of3–10 samples of the same colored zone on the fish. The spectrum of body colorcan be described ether as step-like shapes (e.g., orange–red, color 1, Fig. 1D) orpeak-like shapes (e.g., blue, color 4, Fig. 1B, (Chittka & Menzel, 1992)). The wave-length of a step-shaped color can be expressed as the wavelength correspondingto the 50% reflection point (R50) in the step (the half-way point from top to bottomof the step). This is similar to the 50% transmission (T50) used to quantify ocularmedia (Douglas & McGuigan, 1989; Losey, 2003; Siebeck & Marshall, 2001). Peakswere quantified simply as the wavelength of highest reflection.
3. Results
3.1. Nucleotide and amino acid sequences of two colorful cyprinids
Cone opsin cDNAs were isolated and sequenced from two cyp-rinids in this study. Six O. pachycephalus opsin genes (denoted asOpaSWS1, SWS2, Rh2A, Rh2B, Rh2C, and LWS) and five C. barbatusgenes (denoted as CbaSWS1, SWS2, Rh2A, Rh2B, and LWS) wereidentified (Table 2). The sequences of cone opsin genes of threecyprinids (zebra fish, goldfish, and common carp) were down-loaded from the NCBI database for comparison. The neighbor-join-ing tree of cyprinid opsin genes was constructed usingOncorhynchus keta as an out-group species (Fig. 2).
3.1.1. SWS1 geneSWS1 gene was cloned and sequenced from the two cyprinids,
and only one locus was identified in each species. The size ofSWS1 gene is 1011 bp in length. The amino acid sequences of thesetwo cyprinids show 98% of shared identity. Seven amino acid sub-stitutions were found between the two species. Among the sevensubstitutions, only one (M154I) is located in the transmembranedomain 4. This substitution has never been reported to affect kmax
(Yokoyama et al., 2007).Amino acids 52, 86, 93, 114, and 118 of SWS1 gene, which have
been shown to play an important role for spectral tuning of SWS1gene (Takahashi & Yokoyama, 2005), could also be involved in spec-tral tuning in these two cyprinids. In fact, amino acid 52, 86, and 93are conserved across cyprinids. Amino acid 86 is critical for the per-ception of UV- or violet-sensitive visual ability. Phenylalanine (Phe)was found present at this site (Yokoyama, 2000) upon comparing allteleosts, amphibian, reptilian, and mammalian UVS pigment se-quences. All cyprinids in Table 3 possess a UVS SWS1 gene sincePhe86 was present in both colorful cyprinids. This observationwas consistent with the results of MSP study (details later).
Red-shift of SWS1 resulting from amino acid substitutions,A114S and S118T, was reported in common carp (Takahashi &Yokoyama, 2005). Comparison of the SWS1 genes between thetwo cyprinids and goldfish indicates that the S118A mutationmight also cause red-shift of SWS1 in cyprinids (Table 3).
Fig. 2A shows the phylogenetic tree of cyprinid SWS1 genes. Thetree topology of SWS1 gene is different from the phylogenetic treeof Cyprinidae based on nuclear recombination activating gene(Wang, Li, & He, 2007). For example, zebrafish is clustered withthe two cyprinids in the SWS1 tree. However, in the tree of theCyprinidae, it is located close to the common ancestor (Wang, Li,et al., 2007).

Fig. 1. Fish body coloration plotted as percent reflectance spectra. The number in the photographs corresponds to the numbered reflection curves for the fish. (A and B)Opsarrichthys pachycephalus. (C and D) Candidia barbatus. Curves 1–5 indicate the reflectance spectra of the pectoral-fin, cheek, body side, dorsal side of body and anal-fin ofthe two cyprinids, respectively. Low reflectance of the dorsal side, cheek and anal-fin are common characteristics of both cyprinids. The R50 value of reflectance spectra of thepectoral-fin (curve 1) is similar between the two cyprinids (550 nm for O. pachycephalus and 584 nm for C. barbatus). The significant differences between the reflectancespectra of body side (curve 3) are observed between two cyprinids. The reflectance spectrum of bluish green stripes of O. pachycephalus on body side is 495 nm, but no coloredstripes could be found in C. barbatus.
1698 F.Y. Wang et al. / Vision Research 48 (2008) 1695–1704
3.1.2. SWS2 geneA single copy of SWS2 gene, with 1074 bp in length, is identified
in each cyprinid examined. The amino acid sequences show 97.4%shared identity (or 16 amino acid substitutions) between the twospecies. Five of the 16 substitutions, namely A60V, S118T, L155I,A272S, and S282A, are located in transmembrane domain. Onlyone of these sites, amino acid 118, has been reported to alter thekmax of opsin gene (Cowing, Poopalasundaram, Wilkie, Robinson,et al., 2002; Janz & Farrens, 2001; Nagata, Oura, Terakita, Kandori,& Shichida, 2002; Wilkie et al., 2000).
Comparison of the SWS2 genes between the two studied cypri-nids and the turbid habitat-dwelling goldfish and carp indicatesthat 17 amino acid sites in transmembrane domain were corre-lated to clear and turbid environmental species, respectively. Onlyfour of these sites, amino acids 94, 116, 117, and 295, have beenreported to modulate the kmax of SWS2 gene (Table 3) (Chinenet al., 2005b).
Fig. 2B is the phylogenetic tree of cyprinid SWS2 genes. Notethat the tree topology here is different from that of the SWS1 treeas stated above but is similar to the phylogenetic tree of Cyprinidae(Wang, Li, et al., 2007).
3.1.3. Rh2 geneTwo and three Rh2 genes are identified and designated as CbaR-
h2A/2B and OpaRh2A/2B/2C for C. barbatus and O. pachycephalus,respectively. CbaRh2A and Rh2B, with 11 amino acid substitutions,may be classified into two alleles or isoforms. On the other hand,OpaRh2A and 2B show 22 substitutions, whereas 61 substitutionsare found between OpaRh2C and 2A/2B (Fig. 3).
Glutamine/glutamic acid substitution at site 122 (Q122E) wasreported to cause 15 nm red-shift in Rh2 gene of zebrafish (Chi-nen, Matsumoto, & Kawamura, 2005a). In addition, four otheramino acid replacements, T97A, E122Q, M207L, and A292S,caused significant kmax-shift of Rh2 gene (Takenaka & Yokoyama,2007). In O. pachycephalus, Q122 is identified in Rh2A and Rh2C,while E122 is found in Rh2B. In C. barbatus, both Rh2 genes(Rh2A and Rh2B) contain E122, whereas Q122 can only be foundin zebrafish and O. pachycephalus in cyprinids (Table 3). Mean-
while, C97 is found in OpaRh2A and the Rh21/2 genes of zebra-fish, while A97 is found in the Rh2 genes of the other species(Table 3). Finally, sites 207 (Met) and 292 (Ala) are conservedin all studied cyprinids.
Upon comparing duplicated Rh2 genes of cyprinids, two sites intransmembrane domain could be correlated to the photic environ-ments and yet have not been reported to be responsible for spec-tral tuning of Rh2 genes yet (Takenaka & Yokoyama, 2007;Yokoyama et al., 2007).
Fig. 2C shows the phylogenetic tree of cyprinids Rh2 genes. Thetree can be divided into two major groups: Group I, (DreRh21(OpaRh2C, DreRh22)), and Group II, ((DreRh23, DreRh24)(((CcaRh21, CauRh21), (CcaRh22, CauRh22)), ((OpaRh2A,OpaRh2B), (CbaRh2A, CbaRh2B)))). There are three major notableevents. First, gene duplication events occurred independently sev-eral times in cyprinids. Second, the duplication of Rh2A and Rh2Boccurred after the appearances of O. pachycephalus and C. barbatus.Gene duplication occurred first for Rh21 and Rh22 genes of gold-fish and carp. Finally, the E122Q substitution occurred repeatedlyin cyprinids.
3.1.4. LWS geneOnly one LWS gene (1074 bp) is identified in each minnow. The
amino acid sequences show 98% shared identity, which is higherthan that observed for other cyprinid opsin genes.
It has been shown that amino acids 164, 181, 261, 269, and 392of LWS, which corresponded to sites 180, 197, 277, 285, and 308 ofhuman red- and green-opsin, are important for spectral tuning(known as the ‘‘Five Site Rule”; Yokoyama & Radlwimmer, 1998).The five sites are conserved across cyprinids, except at sites 180and 197 in zebrafish (Table 3). Nevertheless, eight amino acid sub-stitutions are identified between the two cyprinids, and only one(V320I) is located in the transmembrane domain.
Comparison of the LWS genes of cyprinids has shown that eightamino acid sites in the transmembrane domain could be correlatedto the inference of adapting to photic environments. None of thesesites have been reported to modulate the kmax of LWS gene (Yokoy-ama & Radlwimmer, 1998; Yokoyama et al., 2007).
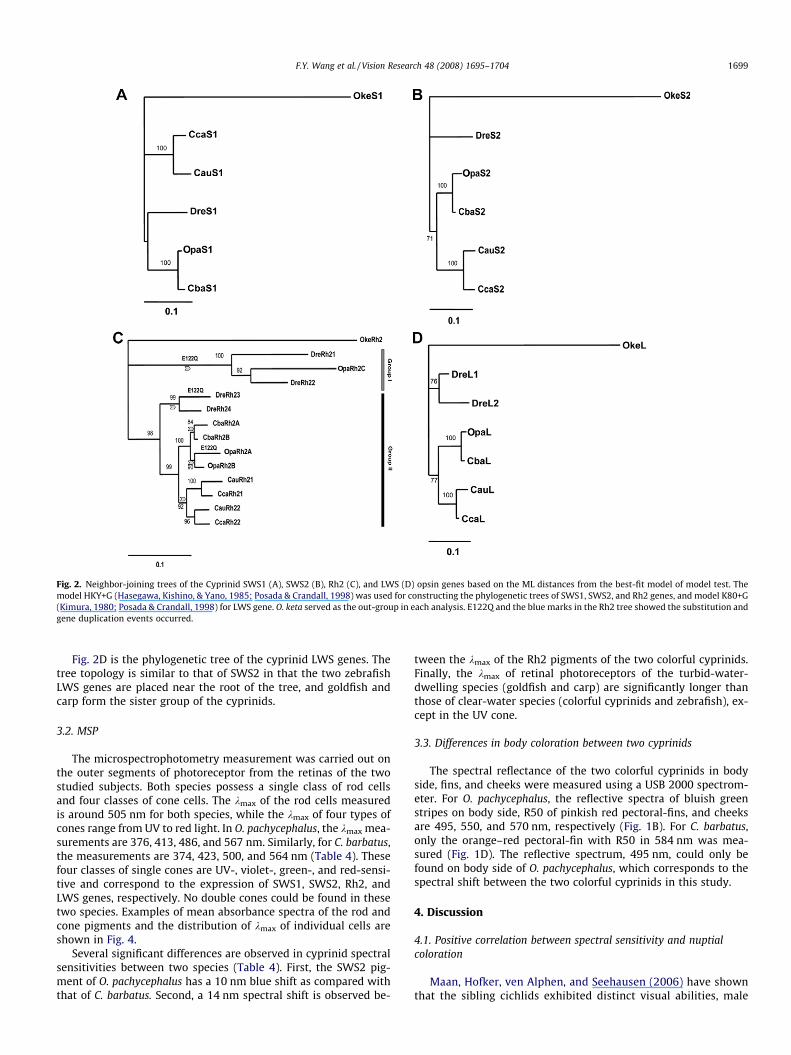
Fig. 2. Neighbor-joining trees of the Cyprinid SWS1 (A), SWS2 (B), Rh2 (C), and LWS (D) opsin genes based on the ML distances from the best-fit model of model test. Themodel HKY+G (Hasegawa, Kishino, & Yano, 1985; Posada & Crandall, 1998) was used for constructing the phylogenetic trees of SWS1, SWS2, and Rh2 genes, and model K80+G(Kimura, 1980; Posada & Crandall, 1998) for LWS gene. O. keta served as the out-group in each analysis. E122Q and the blue marks in the Rh2 tree showed the substitution andgene duplication events occurred.
F.Y. Wang et al. / Vision Research 48 (2008) 1695–1704 1699
Fig. 2D is the phylogenetic tree of the cyprinid LWS genes. Thetree topology is similar to that of SWS2 in that the two zebrafishLWS genes are placed near the root of the tree, and goldfish andcarp form the sister group of the cyprinids.
3.2. MSP
The microspectrophotometry measurement was carried out onthe outer segments of photoreceptor from the retinas of the twostudied subjects. Both species possess a single class of rod cellsand four classes of cone cells. The kmax of the rod cells measuredis around 505 nm for both species, while the kmax of four types ofcones range from UV to red light. In O. pachycephalus, the kmax mea-surements are 376, 413, 486, and 567 nm. Similarly, for C. barbatus,the measurements are 374, 423, 500, and 564 nm (Table 4). Thesefour classes of single cones are UV-, violet-, green-, and red-sensi-tive and correspond to the expression of SWS1, SWS2, Rh2, andLWS genes, respectively. No double cones could be found in thesetwo species. Examples of mean absorbance spectra of the rod andcone pigments and the distribution of kmax of individual cells areshown in Fig. 4.
Several significant differences are observed in cyprinid spectralsensitivities between two species (Table 4). First, the SWS2 pig-ment of O. pachycephalus has a 10 nm blue shift as compared withthat of C. barbatus. Second, a 14 nm spectral shift is observed be-
tween the kmax of the Rh2 pigments of the two colorful cyprinids.Finally, the kmax of retinal photoreceptors of the turbid-water-dwelling species (goldfish and carp) are significantly longer thanthose of clear-water species (colorful cyprinids and zebrafish), ex-cept in the UV cone.
3.3. Differences in body coloration between two cyprinids
The spectral reflectance of the two colorful cyprinids in bodyside, fins, and cheeks were measured using a USB 2000 spectrom-eter. For O. pachycephalus, the reflective spectra of bluish greenstripes on body side, R50 of pinkish red pectoral-fins, and cheeksare 495, 550, and 570 nm, respectively (Fig. 1B). For C. barbatus,only the orange–red pectoral-fin with R50 in 584 nm was mea-sured (Fig. 1D). The reflective spectrum, 495 nm, could only befound on body side of O. pachycephalus, which corresponds to thespectral shift between the two colorful cyprinids in this study.
4. Discussion
4.1. Positive correlation between spectral sensitivity and nuptialcoloration
Maan, Hofker, ven Alphen, and Seehausen (2006) have shownthat the sibling cichlids exhibited distinct visual abilities, male

Tabl
e3
Com
pari
sons
ofop
sin
sequ
ence
sof
cypr
inid
s
Spec
ies
UV
sen
siti
ve(S
WS1
)B
lue
sen
siti
ve(S
WS2
)R
edse
nsi
tive
(LW
S)G
reen
sen
siti
ve(R
h2)
MSP
k max
A.A
.sit
esM
SPk m
axA
.A.s
ites
MSP
k max
A.A
.sit
esM
SPk m
axA
.A.s
ites
5286
9311
411
894
116
117
118
295
164
181
261
269
292
Loci
9712
220
729
2C
onse
nsu
sT
FQ
AS
AT
ST
CS
HY
TA
TE
MA
O.p
achy
ceph
alus
376
..
..
A41
3.
..
S.
567
..
..
.48
6R
h2_
A.
Q.
.R
h2_
B.
..
.R
h2_
CC
Q.
.C.
barb
atus
373
..
..
A42
3.
..
..
564
..
..
.50
0R
h2_
A.
..
.R
h2_
B.
..
.C.
aura
tus
365
..
..
.44
7S
LA
.S
623
..
..
.53
7R
h2_
1.
..
.R
h2_
2.
..
.C.
carp
io37
7.5
..
.S
.45
8S
LA
.S
600
..
..
.53
2R
h2_
1.
..
.R
h2_
2.
..
.D
.rer
io36
2.
..
..
417
..
..
.55
6A
..
..
466.
5aR
h2_
1C
Q.
.47
5.7a
Rh
2_2
CQ
..
A.
F.
.48
8aR
h2_
3.
Q.
.50
4.9a
Rh
2_4
..
..
Sequ
ence
sar
eco
mpa
red
toth
eco
nse
nsu
sse
quen
cew
ith
sim
ilar
iden
tity
indi
cate
dby
ado
t.Si
tes
are
nu
mbe
red
acco
rdin
gto
bovi
ne
rhod
opsi
n.k m
axfr
omM
SP(i
nn
m)
are
list
edfo
rth
ose
gen
esth
atar
eex
pres
sed
incy
prin
ids.
The
k max
ofR
h2
gen
eco
uld
resu
ltfr
omth
eex
pres
sion
ofon
eof
the
mu
lti-
loci
,sin
cem
ult
i-lo
ciw
ere
fou
ndin
Rh
2ge
nes
.a
The
Rh
2ge
nes
wer
eex
pres
sed
and
mea
sure
dby
Ch
inen
etal
.(20
03).
1700 F.Y. Wang et al. / Vision Research 48 (2008) 1695–1704
colors, and female mating preferences differed in behavioral re-sponses to color stimuli outside the mate choice context. Thisbehavioral difference may play an important role in evolutionof male nuptial coloration. Wang, Liu, and Fang (1995) haveshown that the adult males of O. pachycephalus displayed theircolor patterns to threaten competitors, dashing aggressivelyand fighting with each other. Only the winner followed the fe-male and mated. According to our observations in the field, C.barbatus also showed similar mating behaviors during theirbreeding season. The mating behaviors indicated that the nuptialcoloration of the two cyprinids could be affected by sexualselection.
The MSP and reflectance spectra data in this study show thatthe visual sensitivity correlates closely with color patterns be-tween two vividly colored cyprinids. The reflective spectra,495 nm, could only be measured on the bluish green pattern ofO. pachycephalus, which corresponds to the kmax of green-sensitivephotoreceptors. Small shifts (4 nm) in kmax could cause significantdifferences in photoreceptor responses and play an important rolein visual perception and mate choice (Carleton et al., 2005). At thepresent study, the 10 and 14 nm shift in kmax of blue- and green-sensitive photoreceptors could lead to conspicuous differences inphotoreceptor responses resulted from their unique nuptial color-ation. The aforementioned arguments point to the possibility thatdifferentiation of spectral sensitivities and unique nuptial colora-tion of these two vivid cyprinids might have coevolved throughsexual selection.
4.2. Molecular mechanisms of the spectral shift between the twocyprinids
Significant spectral shifts of SWS2 and Rh2 were observed be-tween the two cyprinids. On the contrary, the spectral shifts ofSWS1 and LWS were not significant, since the differences weresmaller than stander error (Table 4). The spectral shift observedbetween the two cyprinids could result either from replacementsof amino acids or differential expression of opsin genes. Otherthan mutation in the retinal-binding pocket, accumulation ofthe complex interactive substitutions, located distantly to thepocket, could also change the kmax of opsin genes (Chinen et al.,2005a, b; Takenaka & Yokoyama, 2007).
In SWS2 gene, a 10 nm spectral shift was characterized betweenthe two cyprinids, but only one out of 16 amino acid substitutionsites (site 118) was found in the retinal-binding pocket. S118Thas been reported to cause 2 nm red-shift in SWS1 gene of clawedfrog (Xenopus laevis) (Takahashi & Yokoyama, 2005). It could alsoinduce red-shift between SWS2 genes of the two cyprinids.S118T and the accumulation of the interactive effects of other sub-stitutions might result in 10 nm kmax-shift of SWS2 opsin genes be-tween the two cyprinids.
In Rh2 genes, two and three clones were identified from C. barb-atus and O. pachycephalus, respectively. Chinen et al. (2005a) ex-pressed four duplicated Rh2 genes, and the kmax of theseduplicates, 467, 476, 488, and 505 nm, were measured in vitrousing 11-cis-retinal. The kmax 480 nm measured by MSP was foundto correspond to the expression of Rh22 in zebrafish. The threeduplicated Rh2 genes of O. pachycephalus, OpaRh2A, 2B and 2C,shared sequence similarity at tuning sites to Rh23, Rh24, andRh22 gene of zebrafish, respectively. Like zebrafish, kmax of theseduplicates of O. pachycephalus may differ. The kmax 486 nm of pho-toreceptor of O. pachycephalus might result from the expression ofRh2C gene, which used glutamine at site 122. Both Rh2 duplicatesof C. barbatus, which possessed glutamic acid at site 122, werehomogeneous at tuning sites to Rh24 gene of zebrafish and Rh2genes of goldfish. Like goldfish (Johnson et al., 1993), the kmax ofthe Rh2 genes of C. barbatus could differ. The kmax 500 nm of Rh2

Fig. 3. Amino acid sequences alignment of duplicated Rh2 genes of C. barbatus and O. pachycephalus. Opa2Rh2A indicated the alternative form of Rh2A gene of O.pachycephalus (Accession No.: EU410462). The dashes and dots in the figure indicate the deletions and identical amino acids in sequence alignments.
Table 4The kmax for rod and cone cells from cyprinids measured by the MSP
Species Rod (rhodopsin) UV single cone (SWS1) Blue single cone (SWS2) Green single cone (Rh2) Red single cone (LWS)
Opsariichthys pachycephalus N = 4* 505 ± 7.3(41) 376 ± 6.8(3) 413 ± 5.5(12) 486 ± 9.9(21) 567 ± 8.3(19)Candidia barbatus N = 5* 504 ± 8.4(31) 374 ± 7.6(5) 423 ± 5.1(11) 500 ± 8.7(16) 564 ± 4.2(8)Carassius auratus 492e 365c 447c 537c 623c
Cyprinus carpio 499f 377.5d 458d 532d 600d
Danio rerio 501a 362b 417a 480a 556a
All values are expressed in nanometers (nm) and where appropriate with nm ± SD. Numbers in parentheses indicate the number of the photoreceptor cells measured. Thethird and forth rows indicate the cyprinid species that inhabit turbid environment and other rows indicate the cyprinid species that inhabit clear environment.
* N indicates the number of the specimens examined.a Measured by Nawrocki et al. (1985).b Measured by Robinson, Schmitt, Hárosi, Reece, and Dowling (1993).c Measured by Palacios et al. (1998).d Measured by Hawryshyn and Harosi (1991).e Measured by Johnson et al. (1993).f Measured by Crescitelli and Dartnall (1954).
F.Y. Wang et al. / Vision Research 48 (2008) 1695–1704 1701
genes of C. barbatus could have achieved by the expression of oneof the Rh2 duplicates.
The 14 nm spectral shift between the green-sensitive photore-ceptors of the two cyprinids was consistent with the effect of theQ122E substitution of Rh2 gene in coelacanth and zebrafish (Chi-nen et al., 2005a; Yokoyama et al., 1999). The difference ofgreen-light sensitivities could be induced by expressing differentRh2 gene with either Q122 exhibition or not.
4.3. Opsin gene polymorphism of the two cyprinids
Opsin gene polymorphism within and between populations areobserved in guppy and cichlids, and could be a factor for sexualselection in them (Hoffmann et al., 2007; Parry et al., 2005). In thisstudy, two and three clones of Rh2 genes were identified from reti-nal cDNA of C. barbatus and O. pachycephalus, respectively. Sequencepolymorphism of these duplicates was found within species. A 11amino acid substitution between CbaRh2A and Rh2B, 22 amino acidsubstitutions between allele OpaRh2A and 2B, and 61 amino acidsubstitutions between OpaRh2A and 2C were identified, respec-tively. In O. pachycephalus, OpaRh2A allele from one of the threespecimens exhibited a divergent sequence when compared to the
other two specimens (denoted as Opa2Rh2A in Fig. 3), whileOpaRh2B and C alleles shared sequence homologous in all speci-mens. The existence of an alternative OpaRh2A allele indicates thatmore Rh2 alleles could be discovered and the allelic polymorphismof Rh2A may exist within O. pachycephalus populations. In C. barba-tus, CbaRh2B allele could not be isolated from the PCR product fortwo out of the three specimens, while CbaRh2A was found in allspecimens. The failure in isolating CbaRh2B could result from thedifferentiation of opsin gene expression or the allelic divergencewithin population. Therefore, a hypothesis could be proposed here,polymorphisms of Rh2 alleles could exist within and between O.pachycephalus and C. barbatus, while O. pachycephalus presentshigher divergence. Since only three specimens were examined inthis study, therefore, a survey of Rh2 alleles at population levelshould be proceeded in the future to test this hypothesis.
4.4. Opsin gene evolution in Cyprinidae
Opsin gene duplication is quite common in teleosts, such asSWS2 and Rh2 in cichlids, Rh2 in pufferfish (Takifugu rubripes),SWS2, LWS, and Rh2 in medaka (Oryzias latipes), SWS1 and Rh2in ayu (Plecoglossus altivelis), Rh2 in goldfish and carp, and LWS

Fig. 4. Mean absorbance spectra of rods and cones from O. pachycephalus. (A) Rods. (B) SWS1 cones. (C) SWS2 cones. (D) Rh2 cones. (E) LWS cones. Brown lines: beforebleaching; gray lines: after light-bleaching. The bleaching experiments were conducted as part of standard MSP protocol to ensure the cones or rods measured werefunctional. (F) Distribution histograms of kmax of individual photoreceptor cells. Filled bars are cone cells.
1702 F.Y. Wang et al. / Vision Research 48 (2008) 1695–1704
and Rh2 in zebrafish (Chinen et al., 2003; Johnson et al., 1993; Mat-sumoto, Fukamachi, Mitani, & Kawamura, 2006; Minamoto & Shi-mizu, 2005; Neafsey & Hartl, 2005; Parry et al., 2005).
Rh2 gene duplication took place independently several timesand was shown to have evolved independently in cyprinids andcichlids. In cichlids, two major groups, Acanthoptrygii-Rh2A andB, existed and Acanthoptrygii-Rh2A could be divided into group2Aa and 2Ab (Parry et al., 2005). The Rh2 gene of these threegroups of cichlids possessed different kmax values, and the geneduplication events occurred before the appearance of the generaof cichlids in group Acanthoptrygii-Rh2A.
In cyprinids, gene duplication occurred before the appearance ofcyprinids and could be divided into groups I and II (Fig. 2C). The Rh2duplicates of group I were lost in goldfish, carp and C. barbatus duringthe evolution of cyprinids. On the contrary, the Rh2 duplicates ofgroup II were kept in all cyprinids. Losing Rh2 duplicate of group Iin C. barbatus may be a factor that enables the ancestors of thesetwo colorful cyprinids to gain different visual ability and resultedin the division of genus Opsariichthys and Candidia. Contrary to theduplication events of Rh2Aa/b of cichlids, duplication of Rh2A andRh2B in Rh2 group II of cyprinids occurred later than the appearanceof O. pachycephalus and C. barbatus.
4.5. Molecular mechanisms of the spectral shift resulting fromadapting different photic environments in Cyprinidae
Significant differences of the kmax of blue-, green- and red-sen-sitive photoreceptors were found between the clear (the two color-ful cyprinids and zebrafish) and the turbid habitat-dwellingcyprinids (goldfish and carp). These differences could result fromadapting to the distinct photic environments in which they reside(Table 4). The clear habitat-dwelling cyprinids inhabit the environ-
ment which is dominated by short-wavelength background spectra(Chen & Chang, 2005) and their photoreceptors possessed shorterkmax. The turbid habitat-dwelling cyprinids live in turbid environ-ment, where the short-wavelength light was absorbed easily byparticulates (Roesler, 1998), and therefore possess the photorecep-tors with longer wavelengths. The mechanisms of the spectral shiftbetween the clear and turbid habitat-dwelling cyprinids could becaused by the differences of chromophore usage and the aminoacid substitutions, which were shown by Chinen et al. (2005b) be-tween the SWS2 genes of zebrafish and goldfish.
For SWS2, Rh2, and LWS genes, the substitutions of well knowntuning sites of these genes fail to explain the spectral shift resultedfrom the adaptation to distinct photic environments. This failurecould be explained from three possibilities. First, the differentchromophores were used. Second, the other amino acids substitu-tions, which could be correlated to adapting to different photicenvironments, in the transmembrane domain could also alter thekmax of opsin genes of cyprinids. Finally, the effect of amino acidsubstitution is heavily dependent on the background amino acidsequences of different species (Chinen et al., 2005b).
To date, the known molecular mechanisms of the spectral tun-ing of opsin genes (Yokoyama et al., 2007) cannot explain the spec-tral shift observed between clear- and turbid-water-dwellingcyprinids. The mechanisms of spectral tuning of the opsin genesare still ambiguous in cyprinids. Additional mutagenesis experi-ments should be conducted to investigate the spectral tuning sitesthat are influenced by the photic environments in Cyprinidae.
5. Conclusion
In this study, the relationship between differences in nuptialcoloration and its visual system between O. pachycephalus and

F.Y. Wang et al. / Vision Research 48 (2008) 1695–1704 1703
C. barbatus was investigated through comparing with their opsingenes, kmax of cone photoreceptors and body colors. Differentia-tion of spectral sensitivities and unique nuptial coloration ofthese two colorful cyprinids might have coevolved through sex-ual selection. The spectral shift between these two cyprinidscould result from differential expression of opsin genes andaccumulation of the interactive effects of the amino acid replace-ments in various minor sites. In the future, quantitative PCR andSouthern blotting within populations should be used test thehypothesis that the allelic polymorphism of opsin genes existin the two cyprinids. Visual systems from additional speciesshall be examined to reconstruct the evolutionary histories of vi-sual genes in Opsariichthine. The experiments of mating behav-ior of C. barbatus and the other species should be conducted toinvestigate the relationship between male coloration and thesexual selection in Opsariichthine. Through this integrated ap-proach, the mechanism of coevolution among visual system,male coloration, and sexual selection in cyprinids could becomprehended.
Acknowledgments
This work was supported by grants from the National ScienceCouncil of Taiwan (NSC 94-2313-B-001-010; 95-2313-B-001-024;96-2313-B-001-006) to H.Y.Y. and (NSC93-2313-B-007-003; 94-2311-B-007-014; 95-2621-B-007-002-MY2; 96-2422-H-007-001)to C.S.T.
References
Bowmaker, J. K. (1995). The visual pigments of fish. Progress in Retinal and EyeResearch, 15, 1–31.
Carleton, K. L., & Kocher, T. D. (2001). Cone opsin genes of African cichlid fishes:Tuning spectral sensitivity by differential gene expression. Molecular Biologyand Evolution, 18, 1540–1550.
Carleton, K. L., Parry, J. W. L., Bowmaker, J. K., Hunt, D. M., & Seehausen, O. (2005).Colour vision and speciation in Lake Victoria cichlids of the genus Pundamilia.Molecular Ecology, 14, 4341–4353.
Chen, Y. Y. (1982). A review of Opsariichthine cyprinid fishes. Oceanologia etLimnologia Sinica, 13, 293–299.
Chen, I. S., & Chang, Y. C. (2005). A photographic guide to the Inland-water fishesTaiwan. Keelung, Taiwan: The Sueichan Press. p. 284 (in Chinese).
Chinen, A., Hamaoka, T., Yamada, Y., & Kawamura, S. (2003). Gene duplication andspectral diversification of cone visual pigments of zebrafish. Genetics, 163,663–675.
Chinen, A., Matsumoto, Y., & Kawamura, S. (2005a). Reconstitution of ancestralgreen visual pigments of zebrafish and molecular mechanism of their spectraldifferentiation. Molecular Biology and Evolution, 22, 1001–1010.
Chinen, A., Matsumoto, Y., & Kawamura, S. (2005b). Spectral differentiation ofblue opsins between phylogenetically close but ecologically distantgoldfish and zebrafish. The Journal of Biological Chemistry, 280, 9460–9466.
Chittka, L., & Menzel, R. (1992). The evolutionary adaptation of flower colours andthe insect pollinators’ colour vision. Journal of Comparative Physiology A, Sensory,Neural and Behavioral Physiology, 171, 171–181.
Cowing, J. A., Poopalasundaram, S., Wilkie, S. E., Bowmaker, J. K., & Hunt, D. M.(2002). Spectral tuning and evolution of short wave-sensitive cone pigments incottoid fish from Lake Baikal. Biochemistry, 41, 6019–6025.
Cowing, J. A., Poopalasundaram, S., Wilkie, S. E., Robinson, P. R., Bowmaker, J. K., &Hunt, D. M. (2002). The molecular mechanism for the spectral shifts betweenvertebrate ultraviolet- and violet-sensitive cone visual pigments. BiochemicalSociety, 367, 129–135.
Crescitelli, F., & Dartnall, H. J. A. (1954). A photosensitive pigment of the carp retina.Journal of Physiology, 125, 607–627.
Douglas, R. H., & McGuigan, C. M. (1989). The spectral transmission of freshwaterteleost ocular media—An interspecific comparison and a guide to potentialultraviolet sensitivity. Vision Research, 29, 871–879.
Ebrey, T., & Koutalos, Y. (2001). Vertebrate photoreceptors. Progress in Retinal andEye Research, 20, 49–94.
Hasegawa, M., Kishino, H., & Yano, T. (1985). Dating of the human-ape splitting by amolecular clock of mitochondrial DNA. Journal of Molecular Evolution, 22,160–174.
Hawryshyn, C. W., & Harosi, F. I. (1991). Ultraviolet photoreception in carp:Microspectrophotometry and behaviorally determined action spectra. VisionResearch, 31, 567–576.
Hoffmann, M., Tripathi, N., Henz, S. R., Lindholm, A. K., Weigel, D., Breden, F.,et al. (2007). Opsin gene duplication and diversification in the guppy, amodel for sexual selection. Proceedings of the Royal Society B, 274, 33–42.
Hunt, D. M., Dulai, K. S., Partridge, J. C., Cottrill, P., & Bowmaker, J. K. (2001). Themolecular basis for spectral tuning of rod visual pigments in deep-sea fish. TheJournal of Experimental Biology, 204, 3333–3344.
Hunt, D. M., Fitzgibbon, J., Slobodyyanyuk, S. J., & Bowmaker, J. K. (1996). Spectraltuning and molecular evolution of rod visual pigments in the species flock ofcottoid fish in Lake Baikal. Vision Research, 36, 1217–1224.
Janz, J. M., & Farrens, D. L. (2001). Engineering a functional blue-wavelength-shiftedrhodopsin mutant. Biochemistry, 40, 7219–7227.
Johnson, R. L., Grant, K. B., Zankel, T. C., Boehm, M. F., Merbs, S. L., Nathans, J., et al.(1993). Cloning and expression of goldfish opsin sequences. Biochemistry, 32,208–214.
Kimura, M. (1980). A simple method for estimating evolutionary rates of basesubstitutions through comparative studies of nucleotide sequences. Journal ofMolecular Evolution, 16, 111–120.
Lipetz, L. E., & Cronin, T. W. (1988). Application of an invariant spectral form to thevisual pigments of crustaceans-implications regarding the binding of thechromophore. Vision Research, 28, 1083–1093.
Loew, E. R. (1994). A third, ultraviolet-sensitive, visual pigment in the today-gecko(Gekko gekko). Vision Research, 34, 1427–1431.
Losey, G. S. (2003). Crypsis and communication functions of UV–visible colorationin two coral reef damselfish, Dascyllus aruanus and D. reticulates. AnimalBehaviour, 66, 299–307.
Maan, M. E., Hofker, K. D., ven Alphen, J. J. M., & Seehausen, O. (2006). Sensory drivein cichlid speciation. The American Naturalist, 167, 947–954.
MacNichil, E. F. J. (1986). A unifying presentation of photopigment spectra. VisionResearch, 26, 1543–1556.
Matsumoto, Y., Fukamachi, S., Mitani, H., & Kawamura, S. (2006). Functionalcharacterization of visual opsin repertoire in Medaka (Oryzias latipes). Gene, 371,268–278.
Minamoto, T., & Shimizu, I. (2005). Molecular cloning of cone opsin genes and theirexpression in the retina of a smelt, Ayu (Plecoglossus altivelis, Teleostei).Comparative Biochemistry and Physiology. Part B, Biochemistry & MolecularBiology, 140, 197–205.
Nagata, T., Oura, T., Terakita, A., Kandori, H., & Shichida, Y. (2002). Isomer-specificinteraction of the retinal chromophore with threonine-118 in rhodopsin.Journal of Physical Chemistry A, 106, 1969–1975.
Nathans, J. (1990a). Determinants of visual pigment absorbance identification of theretinylidene Schiff’s base counterion in bovine rhodopsin. Biochemistry, 29,9746–9752.
Nathans, J. (1990b). Determinants of visual pigment absorbance role of chargedamino acids in the putative transmembrane segments. Biochemistry, 29,937–942.
Nawrocki, L., Bremiller, R., Streisinger, G., & Kapla, M. (1985). Larval and adult visualpigments of the zebrafish, Brachydanio rerio. Vision Research, 25, 1569–1576.
Neafsey, D. E., & Hartl, D. L. (2005). Convergent loss of an anciently duplicated,functionally divergent RH2 opsin gene in the fugu and Tetraodon pufferfishlineages. Gene, 350, 161–171.
Nelson, J. S. (1994). Fishes of the world. New York: John Wiley & Sons, Inc. p. 630.Palacios, A. G., Varela, F. J., Srivastava, R., & Goldsmith, T. H. (1998). Spectral
sensitivity of cones in the goldfish, Carassius auratus. Vision Research, 38,2135–2146.
Palczewski, K., Kumasaka, T., Hori, T., Behnke, C. A., Motoshima, H., Fox, B. A., et al.(2000). Crystal structure of rhodopsin: A G protein-coupled receptor. Science,289, 739–745.
Parry, J. W. L., Carleton, K. L., Spady, T., Carboo, A., Hunt, D. M., & Bowmaker, J. K.(2005). Mix and match color vision: Tuning spectral sensitivity by differentialopsin gene expression in Lake Malawi cichlids. Current Biology, 15, 1734–1739.
Partridge, J. C., Arche, S. N., & Lythgoe, J. N. (1988). Visual pigments in the individualrods of deep-sea fishes. Journal of Comparative Physiology A, Sensory, Neural andBehavioral Physiology, 162, 543–550.
Posada, D., & Crandall, K. A. (1998). Modeltest: Testing the model of DNAsubstitution. Bioinformatics, 14, 817–818.
Robinson, J., Schmitt, E. A., Hárosi, F. I., Reece, R. J., & Dowling, J. E. (1993). Zebrafishultraviolet visual pigment: Absorption spectrum, sequence, and localization.Proceedings of the National Academy of Sciences of the United States of America, 90,6009–6012.
Roesler, C. S. (1998). Theoretical and experimental approaches to improve theaccuracy of particulate absorption coefficients derived from the quantitativefilter technique. Limnology and Oceanography, 43, 1649–1660.
Saitou, L., & Nei, M. (1987). The neighbor-joining method: A new method forreconstructing phylogenetic trees. Molecular Biology and Evolution, 4,406–425.
Sakmar, T. P., Franke, R. R., & Khorana, H. G. (1989). Glutamic acid-113 serves asthe retinylidene Schiff base counterion in bovine rhodopsin. Proceedings ofthe National Academy of Sciences of the United States of America, 86,8309–8313.
Sakmar, T. P., Menon, S. T., Marin, E. P., & Awad, E. S. (2002). Rhodopsin: Insightsfrom recent structural studies. Annual Review of Biophysics and BiomolecularStructure, 31, 443–484.
Shen, S. C., Lee, S. C., Shao, K. T., Mok, H. K., Chen, C. T., & Chen, C. H. (1993). Fishes ofTaiwan. Taipei, Taiwan: National Taiwan University. p. 960 (in Chinese).
Siebeck, U. E., & Marshall, N. J. (2001). Ocular media transmission of coral reef fish—Can coral reef fish see ultraviolet light? Vision Research, 41, 133–149.
Sillman, A. J., Carver, J. K., & Loew, E. R. (1999). The photoreceptors and visualpigments in the retina of a boid snake, the ball python (Python regius). TheJournal of Experimental Biology, 202, 1931–1938.

1704 F.Y. Wang et al. / Vision Research 48 (2008) 1695–1704
Sillman, A. J., Johnson, J. L., & Loew, E. R. (2001). Retinal photoreceptors and visualpigments in Boa constrictor imperator. The Journal of Experimental Zoology, 290,259–365.
Spady, T. C., Seehausen, O., Loew, E. R., Jordan, R. C., Kocher, T. D., & Carleton, K. L.(2005). Adaptive molecular evolution in the opsin genes of rapidly speciatingcichlid species. Molecular Biology and Evolution, 22, 1412–1422.
Swofford, D. L. (2000). PAUP*. Phylogenetic analysis using parsimony (*and othermethods). Sunderland, Massachusetts: Sinauer Associates.
Takahashi, Y., & Ebrey, T. G. (2003). Molecular basis of spectral tuning in the newtshort wavelength sensitive visual pigment. Biochemistry, 42, 6025–6034.
Takahashi, Y., & Yokoyama, S. (2005). Genetic basis of spectral tuning in the violet-sensitive visual pigment of African clawed frog, Xenopus laevis. Genetics, 171,1153–1160.
Takenaka, N., & Yokoyama, S. (2007). Mechanisms of spectral tuning in the RH2pigments of Tokay gecko and American chameleon. Gene, 399, 26–32.
Thompson, J. D., Higgins, D. G., & Gibson, T. J. (1994). CLUSTAL W: Improving thesensitivity of progressive multiple sequence alignment through sequenceweighting, position-specific gap penalties and weight matrix choice. NucleicAcids Research, 22, 4673–4680.
Tsai, H. J., Shih, S. R., Kuo, C. M., & Li, L. K. (1994). Molecular cloning of common carp(Cyprinus carpio) rhodopsin cDNA. Comparative Biochemistry and Physiology. PartB, Biochemistry & Molecular Biology, 109, 81–88.
Tzeng, C. S. (1986). Distribution of the freshwater fishes of Taiwan. Journal of TaiwanMuseum, 39, 127–146.
Wang, X. H., Li, C. F., & He, S. P. (2007). Molecular evidence for the monophyly ofEast Asian groups of Cyprinidae (Teleostei: Cypriniformes) derived from thenuclear recombination activating gene 2 sequences. Molecular Phylogenetics andEvolution, 42, 157–170.
Wang, J. T., Liu, M. C., & Fang, L. S. (1995). The reproductive biology of an endemiccyprinid, Zacco pachycephalus, in Taiwan. Environmental Biology of Fishes, 43,135–143.
Wang, H. Y., Wang, C. F., Du, S. Y., & Lee, S. C. (2007). New insights on molecularsystematics of opsariichthines based on cytochrome b sequencing. Journal ofFish Biology, 71, 18–32.
Wilkie, S. E., Robinson, P. R., Cronin, T. W., Poopalasundaram, S., Bowmaker, J. K., &Hunt, D. M. (2000). Spectral tuning of avian violet- and ultraviolet-sensitivevisual pigments. Biochemistry, 39, 7895–7901.
Yokoyama, S. (2000). Molecular evolution of vertebrate visual pigments. Progress inRetinal and Eye Research, 9, 385–419.
Yokoyama, S. (2002). Molecular evolution of color vision in vertebrates. Gene, 300,68–79.
Yokoyama, S., & Radlwimmer, F. B. (1998). The ‘‘Five-Sites” rule and the evolution ofred and green color vision in mammals. Molecular Biology and Evolution, 15,560–567.
Yokoyama, S., Takenaka, N., & Blow, N. (2007). A novel spectral tuning in the shortwavelength-sensitive (SWS1 and SWS2) pigments of bluefin killifish (Lucaniagoodei). Gene, 396, 196–202.
Yokoyama, S., & Yokoyama, R. (1996). Adaptive evolution of photoreceptors andvisual pigments in vertebrates. Annual Review of Ecology and Systematics, 27,543–567.
Yokoyama, S., Zhang, H., Radlwimmer, F. B., & Blow, N. S. (1999). Adaptive evolutionof color vision of the Comoran coelacanth (Latimeria chalumnae). Proceedings ofthe National Academy of Sciences of the United States of America, 96, 6279–6284.
Zhukovsky, E. A., & Oprian, D. D. (1989). Effect of carboxylic acid side chains on theabsorption maximum of visual pigments. Science, 246, 928–930.