Lateral inhibitory networks: Synchrony, edge enhancement, and noise reduction

Kaufman et al. BMC Biology 2014, 12:83http://www.biomedcentral.com/1741-7007/12/83
RESEARCH ARTICLE Open Access
Adaptation to prolonged neuromodulation incortical cultures: an invariable return to networksynchronyMaya Kaufman*, Sebastian Reinartz and Noam E Ziv
Abstract
Background: Prolonged neuromodulatory regimes, such as those critically involved in promoting arousal andsuppressing sleep-associated synchronous activity patterns, might be expected to trigger adaptation processes and,consequently, a decline in neuromodulator-driven effects. This possibility, however, has rarely been addressed.
Results: Using networks of cultured cortical neurons, acetylcholine microinjections and a novel closed-loop‘synchrony-clamp’ system, we found that acetylcholine pulses strongly suppressed network synchrony. Over thecourse of many hours, however, synchrony invariably reemerged, even when feedback was used to compensate fordeclining cholinergic efficacy. Network synchrony also reemerged following its initial suppression by noradrenaline,but this did not occlude the suppression of synchrony or its gradual reemergence following subsequent cholinergicinput. Importantly, cholinergic efficacy could be restored and preserved over extended time scales by periodicallywithdrawing cholinergic input.
Conclusions: These findings indicate that the capacity of neuromodulators to suppress network synchrony isconstrained by slow-acting, reactive processes. A multiplicity of neuromodulators and ultimately neuromodulatorwithdrawal periods might thus be necessary to cope with an inevitable reemergence of network synchrony.
Keywords: Neuromodulators, Synchrony, Acetylcholine, Closed-loop, Adaptation, Cultured neuronal networks,Multielectrode arrays
BackgroundNeuronal networks are strongly influenced by neuromo-dulatory systems; consequently, the properties and dynam-ics of particular networks can vary enormously dependingon the levels, timing and composition of neuromodulatoryinfluences [1]. While such influences often vary on shorttime scales, neurons are also influenced by changes inneuromodulatory input over relatively long time scales. Inmany biological systems, prolonged exposure to agonistsis associated with adaptation to those substances or theireffects. Neurons, in particular, are known to adapt or reacthomeostatically to changes in their input levels or in theirmilieu (reviewed in [2-4]; see also [5,6]), raising the possi-bility that prolonged neuromodulation will be associatedwith some recovery of the affected properties. At present,
* Correspondence: [email protected] of Physiology and Biophysics and Rappaport Institute, TechnionFaculty of Medicine, and Network Biology Research Laboratories, Lorry LokeyCenter for Life Sciences & Engineering, Fishbach Building, Haifa 32000, Israel
© 2014 Kaufman et al.; licensee BioMed CentrCommons Attribution License (http://creativecreproduction in any medium, provided the orDedication waiver (http://creativecommons.orunless otherwise stated.
however, the question of adaptive or homeostatic reactivityto long-term neuromodulation has rarely been addressed.Some of the most important long-term neuromodula-
tory processes in the mammalian brain are those thatregulate a striking form of cortical synchrony known as‘slow oscillations’, ‘slow wave’ or ‘slow rhythmic’ activity.This activity pattern is characterized by transitions be-tween periods of neuronal discharges (‘on’ periods) andperiods of near-complete quiescence (‘off ’ periods) whichoccur in remarkably synchronous fashion in large corticaldomains. Macroscopically, these synchronous transitionsappear in electroencephalogram (EEG) recordings as lowfrequency, high amplitude waves (for example, [7-15];reviewed in [16]). At the single neuron level, these transi-tions typically coincide with transitions between relativelydepolarized membrane potentials (‘up’ states), which areoften accompanied by action potential firing and stronghyperpolarizations (‘down’ states) during which neuronsare silent. Following the lead of Harris and Thiele [17] we
al Ltd. This is an Open Access article distributed under the terms of the Creativeommons.org/licenses/by/4.0), which permits unrestricted use, distribution, andiginal work is properly credited. The Creative Commons Public Domaing/publicdomain/zero/1.0/) applies to the data made available in this article,

Kaufman et al. BMC Biology 2014, 12:83 Page 2 of 22http://www.biomedcentral.com/1741-7007/12/83
will refer to these network-wide, synchronous transitionsbetween ‘on’ and ‘off ’ periods as ‘synchrony’. Note that inthis context synchrony does not refer to the degree towhich multiple neurons fire action potentials simultan-eously at millisecond time precision.In the intact brain, synchrony as defined above is
strongly regulated by brainstem and basal forebrain norad-renergic and cholinergic neurons which project to wide-spread cortical regions [16,18-20]. The activation of theseneuromodulatory systems strongly suppresses networksynchrony and promotes asynchronous activity patternstypical of aroused and attentive behavioral states. In con-trast, reduced activity of these systems, which occursmainly during periods of NREM (non rapid eye move-ment) sleep, is associated with the prominent appearanceof network synchrony as defined above. Importantly, how-ever, neither these forms of network synchrony nor theirmodulation by acetylcholine (ACh) and noradrenaline(NA) are limited to the intact cortex, as similar activitypatterns occur in brain slabs [21], acute and organotypiccortical preparations (for example, [22-26]) and even innetworks of dissociated cortical neurons (for example,[27-37]; reviewed in [38]).Where networks of dissociated cortical neurons in cul-
ture are concerned, synchrony takes the form of network-wide bursting activity which lasts for several hundreds ofmilliseconds, separated by longer periods (1 to 10 seconds)of near-complete quiescence or sparse, asynchronousaction potentials [27-37]. These network-wide bursts areless frequent and more stereotyped as compared to thoseobserved in the intact brain, which might be expectedgiven the smaller size and lower connection density ofthese networks as well as the lack of reentrant pathways[21,39-41]). Moreover, it has been suggested that the de-gree of synchrony in these and other in vitro preparationsis exacerbated by various homeostatic responses to de-afferentation, resulting in activity forms that share somesimilarities with seizure-related paroxysmal activity (asindicated by in vivo deafferentation studies [42,43]). Yet,while the forms of synchrony observed in vitro differ inmany respects from those associated with low arousallevels in the intact brain, their underlying biophysicalmechanisms share important similarities. Both in vivo[10,15,17,21,44] and in vitro [27,33,34,37,45-47] experi-ments, as well as modeling studies [21,39,40,48,49], indi-cate that these forms of synchrony are not imposed bysome external circuitry, global inhibition or pacemakercells, but probably arise from the interplay of spontaneoussynaptic activity, nonlinear neuronal recruitment cascades,refractoriness and network wide synaptic depression(summarized in [17]), effectively giving rise to a defaultactivity mode, as it has been referred to [35,36] (see also[39]). Furthermore, and in full concordance with theiractivities in vivo [44,50-61], cholinergic and adrenergic
agonists suppress network synchrony in cell culture andslice preparations, shifting spontaneous activity away fromthis ‘default’ mode towards desynchronized, tonic firingmodes [35,36,62-65]. Thus, while synchrony in networksof cultured cortical neurons does not fully replicate theforms of synchrony related to low neuromodulatory tonein the intact brain, the similarities in underlying mecha-nisms and the comparable effects of neuromodulationsuggest that this preparation is a useful model system forstudying relationships between prolonged neuromodula-tion and network synchrony.As mentioned above, the tendency of neurons and
neuronal networks to adapt or react homeostaticallyraises the possibility that prolonged neuromodulationwill be associated with some reactive adaptation overlong time scales. Indeed, in a prior study [35] we foundthat the chronic, prolonged (many hour) exposure ofnetworks of cultured cortical neurons to a cholinergicagonist is associated with the gradual growth of excita-tory synapses and, intriguingly, to the gradual reemer-gence of synchrony (see also [36]). If neuronal networksadapt to neuromodulatory input, it might be asked howthe necessity to suppress network synchrony is ultim-ately addressed, in particular given that this activity formseems to be incompatible with attentive states andarousal [66,67]. Conceivably, the contradiction betweenthis necessity and diminishing neuromodulator efficacymight have been resolved by adjusting neuromodulatoryinput to match instantaneous neuromodulator efficacy.Alternatively, this contradiction might have been allevi-ated by the existence of multiple neuromodulatory sys-tems [18] that exert similar effects but employ differentcellular mechanisms. If, however, neither of these routesresolve the need to suppress synchrony, periodic neuro-modulator withdrawal periods (such as those whichoccur during NREM sleep periods) might be ultimatelyrequired. To date, however, none of these possibilitieshave been explored or addressed experimentally.Here we used a system based on networks of cultured
cortical neurons, ACh microinjections and a novel closed-loop ‘synchrony-clamp’ to address these questions. Specif-ically, we examined the capacity of both fixed andfeedback-based adjusted cholinergic input to suppress net-work synchrony continually as defined above. We thenexamined the ability of multiple neuromodulators to sup-press network synchrony continually. Finally we examinedthe possibility that cholinergic neuromodulatory efficacymight be preserved on extended time scales by periodic-ally withdrawing cholinergic input.
ResultsRational and experimental approachTo examine relationships between prolonged cholinergic in-put and network synchrony we developed an experimental

Kaufman et al. BMC Biology 2014, 12:83 Page 3 of 22http://www.biomedcentral.com/1741-7007/12/83
system which allowed us to tightly control and manipulatecholinergic input, measure its effects on network activityand synchrony, and assay changes in its capacity to suppresssynchrony, with the latter serving as a measure of adaptiveor homeostatic reactions occurring in the same networks.This system, shown schematically in Figure 1, is based onprimary cultures of dissociated rat cortical neurons growingon substrate integrated multielectrode arrays (MEAs), amicroinjection system used to apply minute ACh solutionvolumes in the form of brief pulses, and a controller used toapply ACh at fixed intervals (open-loop experiments) or atintervals modified online as required to ‘clamp’ synchronyat fixed, low levels (closed-loop experiments). To terminateACh signaling after each application and avoid ACh buildupin the media, acetylcholine esterase (AChE) was added tothe network cell culture media (and perfusion system), as-suring continuous and efficient ACh enzymatic breakdown[68]. ACh injections were delivered via a needle immersedin the culture media, hovering about 1 mm above the neur-onal network (Figure 1a, item 6), whereas a slow continuousmixing system was used to accelerate the dilution and dis-tribution of the applied ACh and facilitate its subsequentenzymatic breakdown (Figure 1a, item 7). In addition, thesystem also included provisions for optimal environmentalconditions (a slow perfusion system, a stream of a sterilegas mixture and heating devices, Figure 1a, items 3 to 5),providing a stable environment of 37°C, 5% CO2 and one totwo media replacements/day, resulting in experimentswhich were effectively open-ended [69].
Pulsed ACh applications effectively suppress networksynchrony, but synchrony eventually reemergesUnder baseline conditions, and in agreement with manyreports [27,30-36,70], spontaneous activity in the corticalnetworks used here occurs as periods of synchronous,network-wide bursting activity which lasts for severalhundreds of milliseconds, separated by longer periods(1 to 10 seconds) of near-complete quiescence orsparse, asynchronous action potentials (Figure 2a). Asmentioned in the introduction, these network activitypatterns share many similarities with the forms ofsynchrony observed in vivo under regimes of low neuro-modulatory levels. As shown in Figure 2b, this similarityalso extends to the single neuron level: intracellularwhole-cell recordings from individual neurons (six neuronsin three networks) performed concomitantly with extracel-lular recordings from the 59 electrodes of the MEAs in-variably showed that periods of network-wide burstingactivity were tightly correlated with neuronal membranepotential depolarizations, often accompanied by the firingof action potentials, whereas network quiescence periodswere associated with deep and constant membrane hyper-polarizations (Figure 2a,b). Closer examination (Figure 2d)revealed that these depolarizations and hyperpolarizations
exhibited a marked resemblance to ‘up’ and ‘down’ statesrecorded in vivo (compare, for example, with [71]), as didtheir tight temporal correlation with network ‘on’ and ‘off ’periods (Figure 2c), although their occurrence was less fre-quent (see Background).Our first goal was to examine how the forms of net-
work synchrony described above are affected by cholin-ergic input delivered at a fixed rate. To that end, weperformed the following experiments: cortical networksgrowing on MEA dishes (maintained in culture for atleast 17 days) were mounted on the MEA headstageand provided with optimal environmental conditionsas described above. After several preparatory phases(Figure 1c, phases I-IV; see Additional file 1: Figure S1and Methods), including the activation of the slow con-tinuous mixing system mentioned above (Figure 1a, item7), the experiments were started by initiating automatedACh applications at fixed intervals (Figure 1c, phase V),that is, in an ‘open-loop’ regime as illustrated in Figure 1b.ACh applications consisted of minute volumes (1 μl) ofconcentrated ACh solution (20 mM) briefly injected atfive minute intervals into the media bathing the corticalnetworks, which, as mentioned above, contained AChEand was continually mixed. Ignoring ACh breakdown, asingle, well-mixed ACh application would be expected toelevate ACh concentration to a final value of 10 μM. Theparticular experimental profile used here was chosen afteran extensive series of preliminary experiments in whichwe explored a wide range of ACh concentrations and ap-plication rates, settling on this regime as a compromisebetween the desire to mimic physiological profiles of cho-linergic neuromodulation and the constraints imposed bythe finite volumes of the injection syringe and MEA dish,mixing rates, synchrony stability and the time course ofsynchrony recovery.One fixed input rate experiment is shown in Figure 3a,b.
As shown here, prior to ACh applications synchrony levelswere high and quite stable (see also Additional file 1:Figure S1 and Additional file 2: Figure S2). The initiationof ACh applications (starting exactly five minutes after thebeginning of the recording phase shown) had major effectson the characteristics of spontaneous activity, the mostobvious being the replacement of stereotyped, network-wide alternating periods of activity and silence with muchmore diverse activity forms (compare the raster plots ofFigure 2a with Figure 3a and Additional file 1: Figure S1and Additional file 3: Figure S3). These ranged from nearcontinuous tonic firing, through intermittent tonic firing,through sporadic firing to near silence. Importantly, andin excellent agreement with prior in vitro [35,62-65] andin vivo [50,57,61] studies, the network-wide synchrony ofneural activity was strongly reduced. To quantify the ef-fects of ACh on network synchrony we developed a robustmeasure that was termed the ‘Sync Ratio’ which ranges

2
3
4
5
6
7
9
1
1. Network of cortical neurons growing on MEA dish2. MEA headstage 3. Ultraslow peristaltic perfusion system4. Reservoir containing cell culture medium + AChE
5. Airflow regulator (5% CO2, 95% air mixture)6. ACh injection system (Ultra MicroPump)7. Continuous mixing system8. Closed loop controller (Simulink xPC target)9. User interface computer (Windows, Matlab)
Cortical network on MEA
Calculate
Sync Ratio + ErrorPI controller:
Calculate IAI
Application
system
59 Channel
Data acquisition ,
Spike detection &
Data storage
Predetermined
Application Times
Application
systemOpen Loop
Closed Loop
a
b
I II III IV V
Mixing(12-24 h)
AChEadded
Needle insertion
ACh applicationsSlow perfusion (24-72 h)
c
8
Figure 1 (See legend on next page.)
Kaufman et al. BMC Biology 2014, 12:83 Page 4 of 22http://www.biomedcentral.com/1741-7007/12/83
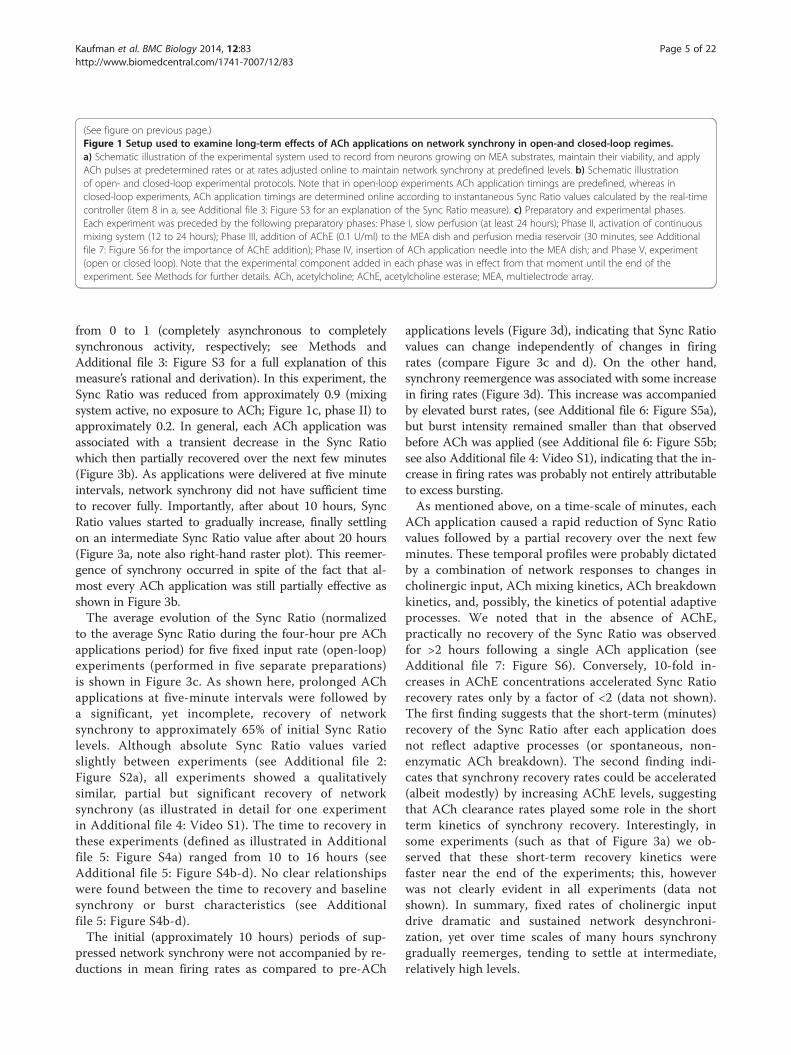
(See figure on previous page.)Figure 1 Setup used to examine long-term effects of ACh applications on network synchrony in open-and closed-loop regimes.a) Schematic illustration of the experimental system used to record from neurons growing on MEA substrates, maintain their viability, and applyACh pulses at predetermined rates or at rates adjusted online to maintain network synchrony at predefined levels. b) Schematic illustrationof open- and closed-loop experimental protocols. Note that in open-loop experiments ACh application timings are predefined, whereas inclosed-loop experiments, ACh application timings are determined online according to instantaneous Sync Ratio values calculated by the real-timecontroller (item 8 in a, see Additional file 3: Figure S3 for an explanation of the Sync Ratio measure). c) Preparatory and experimental phases.Each experiment was preceded by the following preparatory phases: Phase I, slow perfusion (at least 24 hours); Phase II, activation of continuousmixing system (12 to 24 hours); Phase III, addition of AChE (0.1 U/ml) to the MEA dish and perfusion media reservoir (30 minutes, see Additionalfile 7: Figure S6 for the importance of AChE addition); Phase IV, insertion of ACh application needle into the MEA dish; and Phase V, experiment(open or closed loop). Note that the experimental component added in each phase was in effect from that moment until the end of theexperiment. See Methods for further details. ACh, acetylcholine; AChE, acetylcholine esterase; MEA, multielectrode array.
Kaufman et al. BMC Biology 2014, 12:83 Page 5 of 22http://www.biomedcentral.com/1741-7007/12/83
from 0 to 1 (completely asynchronous to completelysynchronous activity, respectively; see Methods andAdditional file 3: Figure S3 for a full explanation of thismeasure’s rational and derivation). In this experiment, theSync Ratio was reduced from approximately 0.9 (mixingsystem active, no exposure to ACh; Figure 1c, phase II) toapproximately 0.2. In general, each ACh application wasassociated with a transient decrease in the Sync Ratiowhich then partially recovered over the next few minutes(Figure 3b). As applications were delivered at five minuteintervals, network synchrony did not have sufficient timeto recover fully. Importantly, after about 10 hours, SyncRatio values started to gradually increase, finally settlingon an intermediate Sync Ratio value after about 20 hours(Figure 3a, note also right-hand raster plot). This reemer-gence of synchrony occurred in spite of the fact that al-most every ACh application was still partially effective asshown in Figure 3b.The average evolution of the Sync Ratio (normalized
to the average Sync Ratio during the four-hour pre AChapplications period) for five fixed input rate (open-loop)experiments (performed in five separate preparations)is shown in Figure 3c. As shown here, prolonged AChapplications at five-minute intervals were followed bya significant, yet incomplete, recovery of networksynchrony to approximately 65% of initial Sync Ratiolevels. Although absolute Sync Ratio values variedslightly between experiments (see Additional file 2:Figure S2a), all experiments showed a qualitativelysimilar, partial but significant recovery of networksynchrony (as illustrated in detail for one experimentin Additional file 4: Video S1). The time to recovery inthese experiments (defined as illustrated in Additionalfile 5: Figure S4a) ranged from 10 to 16 hours (seeAdditional file 5: Figure S4b-d). No clear relationshipswere found between the time to recovery and baselinesynchrony or burst characteristics (see Additionalfile 5: Figure S4b-d).The initial (approximately 10 hours) periods of sup-
pressed network synchrony were not accompanied by re-ductions in mean firing rates as compared to pre-ACh
applications levels (Figure 3d), indicating that Sync Ratiovalues can change independently of changes in firingrates (compare Figure 3c and d). On the other hand,synchrony reemergence was associated with some increasein firing rates (Figure 3d). This increase was accompaniedby elevated burst rates, (see Additional file 6: Figure S5a),but burst intensity remained smaller than that observedbefore ACh was applied (see Additional file 6: Figure S5b;see also Additional file 4: Video S1), indicating that the in-crease in firing rates was probably not entirely attributableto excess bursting.As mentioned above, on a time-scale of minutes, each
ACh application caused a rapid reduction of Sync Ratiovalues followed by a partial recovery over the next fewminutes. These temporal profiles were probably dictatedby a combination of network responses to changes incholinergic input, ACh mixing kinetics, ACh breakdownkinetics, and, possibly, the kinetics of potential adaptiveprocesses. We noted that in the absence of AChE,practically no recovery of the Sync Ratio was observedfor >2 hours following a single ACh application (seeAdditional file 7: Figure S6). Conversely, 10-fold in-creases in AChE concentrations accelerated Sync Ratiorecovery rates only by a factor of <2 (data not shown).The first finding suggests that the short-term (minutes)recovery of the Sync Ratio after each application doesnot reflect adaptive processes (or spontaneous, non-enzymatic ACh breakdown). The second finding indi-cates that synchrony recovery rates could be accelerated(albeit modestly) by increasing AChE levels, suggestingthat ACh clearance rates played some role in the shortterm kinetics of synchrony recovery. Interestingly, insome experiments (such as that of Figure 3a) we ob-served that these short-term recovery kinetics werefaster near the end of the experiments; this, howeverwas not clearly evident in all experiments (data notshown). In summary, fixed rates of cholinergic inputdrive dramatic and sustained network desynchroni-zation, yet over time scales of many hours synchronygradually reemerges, tending to settle at intermediate,relatively high levels.
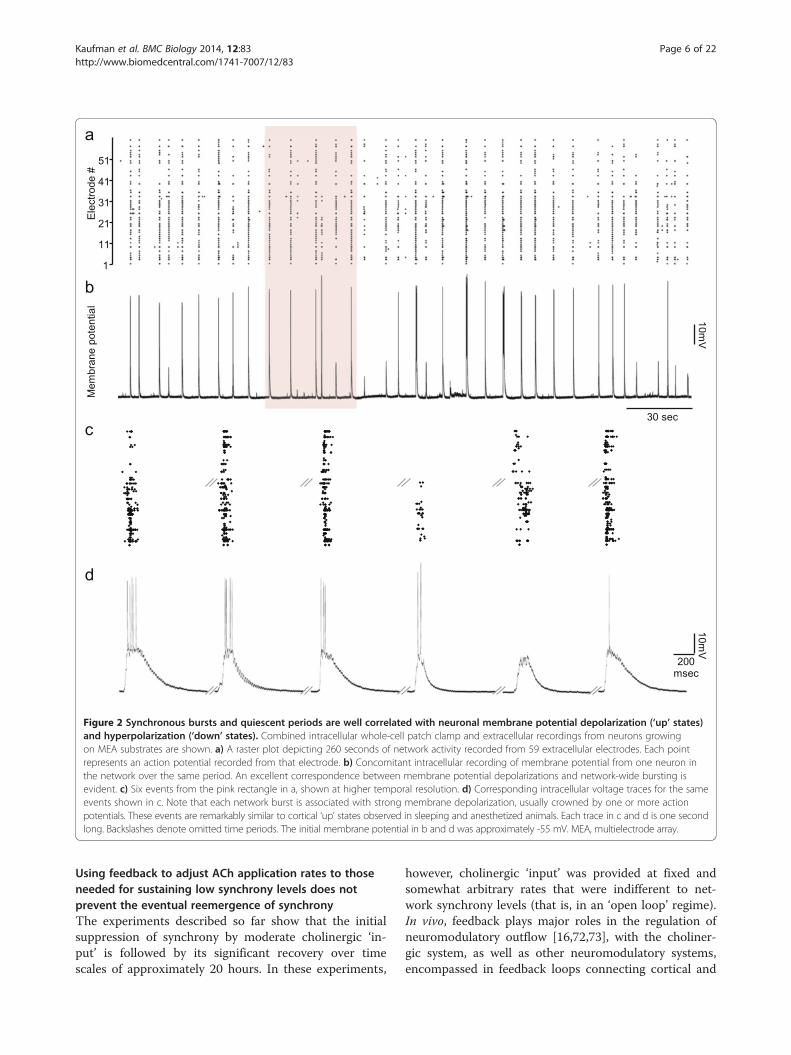
Figure 2 Synchronous bursts and quiescent periods are well correlated with neuronal membrane potential depolarization (‘up’ states)and hyperpolarization (‘down’ states). Combined intracellular whole-cell patch clamp and extracellular recordings from neurons growingon MEA substrates are shown. a) A raster plot depicting 260 seconds of network activity recorded from 59 extracellular electrodes. Each pointrepresents an action potential recorded from that electrode. b) Concomitant intracellular recording of membrane potential from one neuron inthe network over the same period. An excellent correspondence between membrane potential depolarizations and network-wide bursting isevident. c) Six events from the pink rectangle in a, shown at higher temporal resolution. d) Corresponding intracellular voltage traces for the sameevents shown in c. Note that each network burst is associated with strong membrane depolarization, usually crowned by one or more actionpotentials. These events are remarkably similar to cortical ‘up’ states observed in sleeping and anesthetized animals. Each trace in c and d is one secondlong. Backslashes denote omitted time periods. The initial membrane potential in b and d was approximately -55 mV. MEA, multielectrode array.
Kaufman et al. BMC Biology 2014, 12:83 Page 6 of 22http://www.biomedcentral.com/1741-7007/12/83
Using feedback to adjust ACh application rates to thoseneeded for sustaining low synchrony levels does notprevent the eventual reemergence of synchronyThe experiments described so far show that the initialsuppression of synchrony by moderate cholinergic ‘in-put’ is followed by its significant recovery over timescales of approximately 20 hours. In these experiments,
however, cholinergic ‘input’ was provided at fixed andsomewhat arbitrary rates that were indifferent to net-work synchrony levels (that is, in an ‘open loop’ regime).In vivo, feedback plays major roles in the regulation ofneuromodulatory outflow [16,72,73], with the choliner-gic system, as well as other neuromodulatory systems,encompassed in feedback loops connecting cortical and

Figure 3 Synchronous activity reemerges following semi-phasic, periodic ACh applications. a) Sync Ratio over time in one experiment (grey;same data after smoothing with a five-point kernel is shown in black), performed in an open-loop regime. ACh pulses were delivered once every fiveminutes, starting at t =5 minutes. Note the high values of the Sync Ratio in the period preceding ACh applications (initial conditions, obtained duringthe period defined as phase II in Figure 1c; see also Additional file 1: Figure S1) and the huge reduction in Sync Ratio values once ACh applicationswere initiated. Insets: examples of one-minute raster plots from early (left) and late (right) stages of the experiment. b) Enlarged one-hour sections ofthe plot shown in a from early (left) and late (right) stages of the experiment. Red arrows denote application times. c) Changes in Sync Ratio overtime in five separate experiments similar to the experiment shown in a. For each experiment, Sync Ratio values, averaged over 30 minutes, werenormalized to the average Sync Ratio measured during the 4 hour period preceding ACh application (initial conditions). Average ± SEM for fiveexperiments. d) Total firing rates measured from all electrodes, averaged over 30 minute intervals, normalized for each experiment to the average firingrate measured during the 4 hour period preceding ACh application (Initial conditions). Note that the initiation of ACh applications was not associatedwith changes in overall firing rates. Average ± SEM for five experiments. ACh, acetylcholine; SEM, standard error of the mean.
Kaufman et al. BMC Biology 2014, 12:83 Page 7 of 22http://www.biomedcentral.com/1741-7007/12/83

Kaufman et al. BMC Biology 2014, 12:83 Page 8 of 22http://www.biomedcentral.com/1741-7007/12/83
subcortical regions (findings predicted as early as 1955[74]). Would the experimental introduction of feedback,serving to adjust cholinergic input rates to instantaneoussynchrony levels, allow cholinergic neuromodulation tomaintain network synchrony at low levels for very long,perhaps indefinite periods?To examine this possibility, we constructed a ‘syn-
chrony clamp’ system – a closed-loop controller whichestimated synchrony levels in real time and used theseestimates to apply ACh at rates required to maintainnetwork synchrony at low predefined levels. In addition,and in analogy to voltage clamp experiments, in whichthe output current is used to measure changes in mem-brane conductance [75], the output of this controllerallowed us to gauge changes in cholinergic efficacy. Putdifferently, the controller output, in the form of inter ap-plication intervals (IAI, the time intervals between con-secutive ACh applications) provided a measure of thedegree to which adaptation to cholinergic input had oc-curred, with increasingly shorter IAIs indicative of in-creasingly greater adaptation.The system we used for this purpose was based on
the ‘neuronal response clamp’ developed by Maromand colleagues [76-79]. This system was composed of a‘bare-bones’ personal computer running a real time ap-plication (Figure 1a, item 8) which collected data fromthe 59 MEA channels and calculated the momentarySync Ratio value (see Methods for further details). Asoftware implementation of a proportional integral (PI)controller compared the calculated Sync Ratio values topredefined, desired Sync Ratio values and used the dif-ference, that is, the error, to adjust the time interval tothe next ACh application (as illustrated in Figure 1b).Experiments were set up as described above for open
loop experiments (Figure 1c, phases I-IV). Here, how-ever, instead of applying ACh at fixed intervals, instant-aneous IAI values were calculated online once everyminute and ACh applications were delivered automa-tically at these calculated time intervals. Figure 4a,bshows one such experiment in detail, in which the SyncRatio ‘clamp value’ was set to 0.05, reflecting the fullydesynchronized state observed in some open-loop exper-iments. Activating the closed-loop controller reducedthe Sync Ratio from 0.7 to slightly under 0.05 (note thatas ACh applications started a few minutes into the ex-periments, initial Sync Ratio values are observable onlyat the very beginning of the traces). This led to an initialundershoot of Sync Ratio values which was followed bya gradual adjustment (increase) of IAI values, as shownby the orange line in this figure, until a reasonable clampof Sync Ratio values was attained after several hours(note that the controller settings were aimed at minimizingfluctuations around the clamp value). During this period,the IAI values required to maintain this low synchrony
level hovered around 12 to 13 minutes (Figure 4a). Afterabout 10 hours, however, the IAIs required to sustain thissynchrony level started to decrease gradually, ultimatelyflooring at 15-second intervals (the minimum IAI allowedby the controller). In spite of this 50-fold increase in AChapplication rates, synchrony reemerged, escaping theclamp, with Sync Ratio values partially decreasing againonly after substantial ACh buildup, caused by the rapidapplication rates. Qualitatively identical results wereobtained in three additional closed-loop experiments(Figure 4c). Closer examination revealed that the time fromclamp initiation to eventual collapse back to synchronousactivity modes varied from one experiment to the other,ranging from about 6 to about 22 hours, probably reflect-ing differences in the adaptation rates of different networksas well as other factors related to network to network vari-ability. Here too, no clear relationships were foundbetween the time to collapse (defined as illustrated inAdditional file 5: Figure S4e) and baseline networksynchrony or burst characteristics (see Additional file 5:Figure Sf-h). Moreover, using IAI values as readouts ofadaptation to cholinergic input, we noted that the adapta-tion process, manifested as decreasing IAI values, couldstart within a few hours of ACh applications, a fact notimmediately apparent in open-loop experiments. Interest-ingly, firing rates in these experiments remained relativelystable and similar to pre-clamp values until the networksescaped the clamp, during which transient increases inspike rates, associated with volleys of synchronous bursts,were observed (see Additional file 8: Figure S7; Additionalfile 9: Video S2).These experiments thus show that even when feedback
is used to continually adjust cholinergic input to ratesneeded for sustaining low desynchronized states, syn-chrony ultimately reemerges.
Noradrenergic-induced suppression and reemergence ofnetwork synchrony does not occlude subsequentcholinergic-induced synchrony suppressionConceptually, the capacity to suppress network syn-chrony in the face of gradual adaptation to neuromodu-latory input might be preserved by the activation ofother modulatory pathways that exert similar effects butemploy different mechanisms. In vivo, NA is highly in-strumental in promoting brain activity patterns associ-ated with aroused states [20,44]. Does NA also suppressnetwork synchrony in a manner similar to the activitiesof ACh? Do cortical networks adapt to this neuromodu-lator as well? If they do, does this adaptation occlude thecapacity of cholinergic neuromodulation to suppress net-work synchrony?To examine these questions we exposed networks of
cortical neurons growing on MEA substrates to NAand followed the immediate and long-term effects of

Figure 4 Using feedback to adjust cholinergic input allows clamping of network synchrony at low levels, but not indefinitely. a) Oneclosed-loop experiment. Network activity was clamped to a desynchronized activity state (Sync Ratio =0.05). The Sync Ratio, calculated online, isshown as a grey line (corresponding to the left vertical y-axis) and after smoothing with a five-point kernel (black). The inter application interval(IAI), calculated online is shown as an orange line (corresponding to the right vertical y-axis). Each red dot denotes a single ACh application, andthe actual time difference from the previous application. The Sync Ratio value preceding the first ACh application is indicated as a dashed grayline. b) Enlarged one-hour sections of the plot in a, from early (left) and late (right) stages of the experiment. Red arrows denote application times.c) Three additional closed-loop experiments, in which the Sync Ratio was clamped to 0.05. Firing rates for each of the closed-loop experimentsare shown in Additional file 8: Figure S7. ACh, acetylcholine.
Kaufman et al. BMC Biology 2014, 12:83 Page 9 of 22http://www.biomedcentral.com/1741-7007/12/83

Kaufman et al. BMC Biology 2014, 12:83 Page 10 of 22http://www.biomedcentral.com/1741-7007/12/83
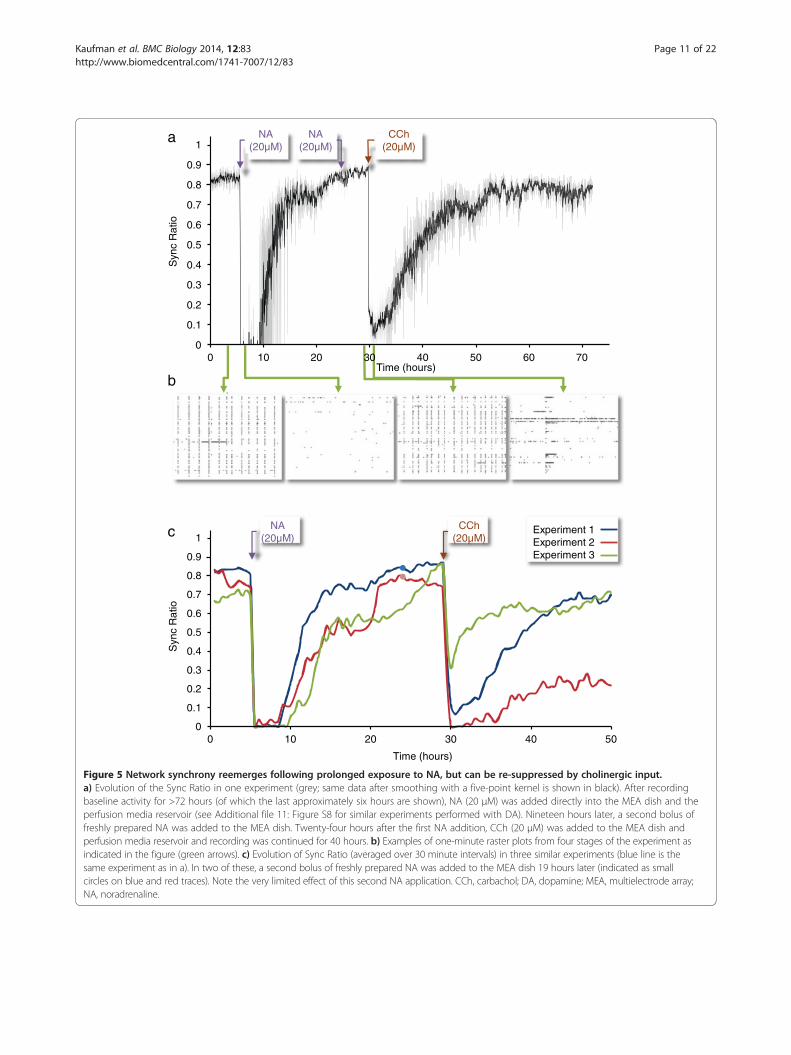
this manipulation on network synchrony. As shown inFigure 5a,b and Additional file 10: Video S3, the additionof NA (20 μM [36,65]) to the MEA dish (and perfusionmedia) resulted in an immediate reduction in networksynchrony which was reflected in drastically reducedSync Ratio values. Unlike ACh, however, the suppressionof network synchrony was also accompanied by an im-mediate and significant reduction in total firing rates(data not shown), in excellent agreement with a recentin vivo study concerning NA, cortical synchrony andfiring rates [61]. Reduced Sync Ratio values did notseem to stem from the reduction in firing rates, as thismeasure is mostly independent of such influences (seeabove, Additional file 10: Video S3, and another exampleof such independency below). Interestingly, over thenext 10 hours, synchrony (as well as total firing rates)returned to pre-NA application levels. Addition of a sec-ond bolus of freshly prepared NA to the MEA dish 19hours after the first exposure had only minor effects onthe Sync Ratio (and on total firing rates), indicating thatthe recovery of network synchrony was not due to NAbreakdown (Figure 5a). The addition of carbachol (CCh;20 μM) - a non-hydrolyzable analog of ACh - to thesame network 24 hours after the first NA application re-sulted in a dramatic reduction in network synchrony. Asbefore, however, synchrony reemerged over the next 10to 15 hours (Figure 5a,b; Additional file 10: Video S3).The evolution of the Sync Ratio in three separate ex-
periments is shown in Figure 5c. The effects of NA andCCh in all experiments were qualitatively very similar,and collectively demonstrate that: 1) NA strongly sup-presses network synchrony; 2) prolonged exposure toNA is associated with adaptive or homeostatic processesthat restore network synchrony; 3) the capacity ofcholinergic neuromodulation to suppress network syn-chrony is not occluded by prior adaptation to noradren-ergic modulation; and 4) synchrony recovers in thepresence of both NA and CCh.We also examined adaptation to a third neuromodula-
tor, dopamine (DA). Unlike ACh and NA, however,relationships between dopaminergic tone, networksynchrony and arousal levels are less clear and evensomewhat controversial [80-82]. In agreement with thisambiguity, we found, in three separate experiments, thatSync Ratio values were only slightly reduced by singleDA applications (500 nM; Additional file 11: Figure S8a;Additional file 12: Video S4). Conversely, firing rates (seeAdditional file 11: Figure S8b) and burst rates (data notshown) were reduced substantially (see also Additionalfile 12: Video S4), in agreement with the recent report thatDA reduces ‘up’ state prevalence in acute cortical prepara-tions [82]. Interestingly, Sync Ratio values, and most not-ably, network activity levels, gradually recovered over thecourse of the next approximately 5 and >10 hours,
respectively. These experiments indicate that changes infiring rates induced by various neuromodulators are notnecessarily associated with changes in network synchronyand highlight the specific effects of ACh and NA in thisrespect. They also indicate that prolonged exposure to athird neuromodulator – DA – is also followed by adaptiveor reactive processes which occur over many hours, in linewith our observations for ACh and NA.
Periodic ‘withdrawal’ periods restore the capacity of AChapplications to suppress network synchrony in ensuingperiodsAs mentioned in the introduction, timed cholinergicwithdrawal periods (such as those which occur duringNREM sleep periods) might ultimately be required topreserve cholinergic efficacy over extended time scales.In the setting of our experimental system, this predictsthat withdrawal periods introduced into our experimen-tal protocols will restore the capacity of ACh to suppressnetwork synchrony in subsequent periods.To test this prediction, we performed experiments that
included three closed-loop epochs, during which net-work synchrony was ‘clamped’ at low Sync Ratio values,separated by periods during which no ACh was applied(‘withdrawal’ periods). The duration of these periods waschosen to be 12 hours, to mirror the times at whichsynchrony often started to reemerge following prolongedcholinergic input (Figure 3). As shown in Figure 6a,multiple closed-loop epochs were qualitatively similar tothe closed-loop experiments described above. In particu-lar, as in the aforementioned experiments, the demandto maintain synchrony at low predetermined levels wasassociated with gradual and very significant decreasesin IAIs over time. During ‘withdrawal’ periods, syn-chrony returned almost immediately to the high levelstypical of unperturbed networks, as manifested by SyncRatio values that were similar or even exceeded initialvalues. Notably, ACh applications delivered after ‘with-drawal’ periods were highly effective in desynchronizingnetwork activity. Moreover, gauging the degree ofadaptation from the IAIs needed to clamp network syn-chrony at the beginning of the second and third closed-loop epochs and comparing these to IAI values at theend of the preceding epochs, indicated that cholinergicefficacy had recovered and that the degree of adaptationto cholinergic input was low.In the experiment presented in Figure 6a, the ‘with-
drawal’ phase of each epoch was started when the AChapplication syringe was depleted. Accordingly, the appli-cation syringe had to be refilled between epochs, aprocess that was associated with a small leak of AChinto the culture media (Figure 6a). Moreover, the dur-ation of the closed-loop epochs in this experiment be-came gradually shorter, reflecting a diminished capability
0
0.1
0.2
0.3
0.4
0.5
0.6
0.7
0.8
0.9
1
0 10 20 30 40 50
Time (hours)
Syn
c R
atio
NA (20µM)
CCh (20µM)
0
0.1
0.2
0.3
0.4
0.5
0.6
0.7
0.8
0.9
1
0 10 20 30 40 50 60 70 Time (hours)
Syn
c R
atio
NA (20µM)
CCh (20µM)
NA (20µM)
a
c
b
Experiment 1 Experiment 2 Experiment 3
Figure 5 Network synchrony reemerges following prolonged exposure to NA, but can be re-suppressed by cholinergic input.a) Evolution of the Sync Ratio in one experiment (grey; same data after smoothing with a five-point kernel is shown in black). After recordingbaseline activity for >72 hours (of which the last approximately six hours are shown), NA (20 μM) was added directly into the MEA dish and theperfusion media reservoir (see Additional file 11: Figure S8 for similar experiments performed with DA). Nineteen hours later, a second bolus offreshly prepared NA was added to the MEA dish. Twenty-four hours after the first NA addition, CCh (20 μM) was added to the MEA dish andperfusion media reservoir and recording was continued for 40 hours. b) Examples of one-minute raster plots from four stages of the experiment asindicated in the figure (green arrows). c) Evolution of Sync Ratio (averaged over 30 minute intervals) in three similar experiments (blue line is thesame experiment as in a). In two of these, a second bolus of freshly prepared NA was added to the MEA dish 19 hours later (indicated as smallcircles on blue and red traces). Note the very limited effect of this second NA application. CCh, carbachol; DA, dopamine; MEA, multielectrode array;NA, noradrenaline.
Kaufman et al. BMC Biology 2014, 12:83 Page 11 of 22http://www.biomedcentral.com/1741-7007/12/83

Figure 6 Withdrawal of cholinergic input for defined periods restores its capacity to suppress network synchrony in subsequentperiods. Three multiple epoch experiments are shown using the same notations as in Figure 4. Network activity was clamped to a desynchronizedactivity level (Sync Ratio = 0.05 for a, b and 0.1 and 0.15 for c). Following the depletion of the ACh in the application syringe (a) or the onlinecalculation of four consecutive IAI values <1.5 minutes (b,c), cholinergic input was removed for 12 hours. After these periods, new closed-loop epochswere initiated, using the same experimental parameters. In the first experiment (a), the syringe was refilled with freshly prepared ACh as indicated inthe figure, resulting in some leakage of ACh from the open end of the application needle, and a transient desynchronization of network activity. Inthe other two experiments (b,c) the syringe was not refilled, and the same ACh, prepared at the beginning of the experiment, was used for the entireduration of the experiments. Firing rates for each of the multi-epoch experiments are shown in Additional file 13: Figure S9. ACh, acetylcholine.
Kaufman et al. BMC Biology 2014, 12:83 Page 12 of 22http://www.biomedcentral.com/1741-7007/12/83
Kaufman et al. BMC Biology 2014, 12:83 Page 13 of 22http://www.biomedcentral.com/1741-7007/12/83
to sustain the network in a desynchronized state. Wewondered if this might stem from somewhat extremedemands for low synchrony levels and the consequential,excessive perhaps, cholinergic ‘input’. In subsequentexperiments we, therefore, terminated the closed-loopepochs and started the ‘withdrawal’ periods when theIAIs became shorter than 1.5 minutes. This also had theadditional benefit of eliminating the need to refill theapplication syringe between epochs. As shown inFigure 6b,c, the changes in the durations of the closed-loop periods were indeed less systematic. Importantly,however, the general outcome of all experiments was thesame: clamping synchrony at low levels was invariablyfollowed by drastic reductions in cholinergic efficacy,whereas cholinergic ‘withdrawal’ was followed by thepractically complete recovery of cholinergic efficacy.These experiments also clearly establish that the reduc-tion in cholinergic efficacy was not due to ACh break-down in the application system, as the same AChsolution was used for the entire duration of these exper-iments. Interestingly, proactively removing the clampbefore escape occurred also precluded the volleys ofsynchronous bursts such events were associated with(as described above) and resulted in much more moder-ate changes in firing rates over these long durations (seeAdditional file 13: Figure S9).In summary, these experiments demonstrate that with-
drawing cholinergic input can restore the capacity of AChto suppress network synchrony in subsequent periods.
DiscussionHere we studied adaptation to prolonged neuromodula-tory input in networks of cultured cortical neurons. Wefound that brief ACh applications strongly desynchro-nized spontaneous network activity, but repeated appli-cations were followed by a gradual recovery of networksynchrony. Introducing feedback to adjust cholinergicinput levels to waning cholinergic efficacy failed to pre-vent the reemergence of synchrony even when ACh ap-plication rates increased fifty-fold. We then showed thatthe suppression of network synchrony by a second neu-romodulator - NA - was also followed by the gradual re-emergence of synchrony. Importantly, this adaptation tocontinual NA presence did not occlude the subsequentsuppression of network synchrony by a cholinergicagonist, yet synchrony ultimately reemerged in the pres-ence of both substances. Finally, we showed that thecapacity of cholinergic input to suppress network syn-chrony could be restored by periodically withdrawingcholinergic input. These findings indicate that prolongedcholinergic (and noradrenergic) input induce slow-actingreactive processes that reduce their efficacy and ultimatelynegate their capacity to suppress network synchrony.
Adaptation to prolonged neuromodulation: an inevitablereturn to network synchrony?As mentioned in the introduction, neurons and neuronalnetworks tend to adapt or react homeostatically tochanges in input levels or in their milieu [2-6]. Our find-ings that networks react or adapt to prolonged neuromo-dulatory input are in line with this well establishedphenomenon. As neuromodulators affect an enormousnumber of processes, including attention, arousal, motorfunction, mood, reward, as well as numerous cellular andmolecular processes, adaptive or homeostatic reactions toneuromodulation might be of interest outside the contextof network synchrony. Within this limited context, how-ever, the relentless reemergence of synchrony raises inter-esting questions that touch on the very nature of thiswidespread phenomenon. It might be asked why networkactivity consistently falls into this pattern in the absence ofneuromodulatory influences, or conversely, falls back intothese patterns following prolonged neuromodulatory input.Starting with the latter, prolonged activation of a particu-
lar neuromodulatory pathway might be associated with re-ceptor desensitization, that is, changes in the propertiesand/or numbers of receptors to that neuromodulator.Thus, for example, it is well established that prolonged ex-posure to cholinergic agonists is associated with the intern-alization and, ultimately, down-regulation (degradationand/or reduced synthesis) of muscarinic receptors, whichseem to be the major mediators of cholinergic-driven net-work desynchronization [16,18,57,62] (in particular M1 re-ceptors [65,83]). Where examined, however, internalizationwas observed to occur rapidly, with membrane receptorlevels plateauing within minutes or at most one to threehours following chronic exposure to muscarinic agonists[84-86]. These kinetics seem to be too fast to explain theslow time course of adaptation observed here, a mismatchwhich also applies to the kinetics of nicotinic receptordesensitization [87]. On the other hand, the slow timecourse is in better agreement with agonist-driven receptordown-regulation, which has been previously reported tooccur over many hours [85]. Yet it also should be notedthat this apparently simple explanation is not likely to ac-count for the nearly complete loss of cholinergic efficacy inour experiments. It has been previously shown that evenafter continual exposure of cultured cortical neurons toCCh for seven days, the amount of M1 muscarinic recep-tors accessible to an extracellular fluorescent probe was stillapproximately 50% of nominal levels [88], indicating that asubstantial number of receptors were still present even afterthis long exposure. In line with this report, we previouslyfound that an abrupt pharmacological blockade of choliner-gic receptors after nine hours of continuous CCh exposureresulted in an immediate recovery of network synchrony[35], indicating that even after nine hours, receptors werestill present and effective.

Kaufman et al. BMC Biology 2014, 12:83 Page 14 of 22http://www.biomedcentral.com/1741-7007/12/83
An alternative, although not mutually exclusive, possibil-ity is that moving networks away from synchronous activ-ity modes is followed by additional reactive processesacting at molecular, cellular and network levels that indi-vidually or collectively result in gravitation back towardthis mode. Why this gravitation would occur is not entirelyclear (see [89] for one substantiated hypothesis) but it doesseem to occur also outside the setting of cell culture. Thus,for example, it has recently been shown [90] that in theintact cat brain, suppression of cortical synchrony bythalamic inactivation is followed by cortical synchronyreemergence over time scales remarkably similar to thosereported here (12 to 30 hours). In fact, it was concludedthat any factor leading to a reduction of synchrony triggersplastic changes that reinstate it. Consequently, and ifsynchrony represents a strong attractor as prior studiessuggest [39,49], escaping it might depend on finely tunedcombinations of multiple factors, such as neuronal mem-brane potential, excitability, probability of neurotransmit-ter release and synaptic depression. All these (and others)have been previously shown to be affected by (cholinergic)neuromodulation in complex and intricate manners[26,40,55,57,62,65,83,91-95] which differ from one celltype to another [96]. Consequently, the (homeostatic) re-covery [25,38] of one or more of these finely tuned factors,in one or more neuronal types, might move the systemback into a parameter space within which synchronynaturally emerges [49]. In line with this possibility, we ob-served that recovery from prolonged neuromodulatory in-put was often associated with changes in global networkactivity levels, burst rates and burst intensities (Figure 3,Additional file 6: Figure S5; see also [35,36]). We have pre-viously shown that synchrony reemergence is preceded byexcitatory synapse enlargement [35] (see also [97,98]), andthus prolonged neuromodulation seems to drive reactivechanges in both neuronal excitability and synaptic proper-ties. Interestingly, it has recently been shown [36] that aneuromodulator cocktail including CCh, NA, serotonin,histamine, dopamine and orexin applied to cortical net-works similar to those used here, both suppresses networksynchrony and drives widespread changes in gene expres-sion, which do not fully revert even when synchrony spon-taneously reemerges. These experimental observations,along with the emergence of synchrony in so many differ-ent conditions (prenatal and postnatal development[99,100], NREM sleep, anesthesia), systems (acute, organo-typic and cell culture preparations [22-25,27-38,89]) andmodeling studies [39,40,48,49] support the possibility thatthe parameter space for synchrony emergence is quitelarge, and that avoiding its emergence might be somethingof a balancing act.In summary, regardless of the exact nature of the adap-
tive processes that follow prolonged neuromodulation –changes in receptor properties, receptor abundance,
neuronal excitability or network level effects – it seemsthat the capacity of neuromodulators to suppress syn-chrony indefinitely might be rather limited.
Studying adaptation to neuromodulation in culturedcortical networks – confounds and advantagesThe reactions to prolonged neuromodulation were studiedhere in networks of cultured rat cortical neurons exposedto experimental manipulations that do not fully capturemany physiological aspects of (prolonged) neuromodula-tion. While the advantages offered by this model systemare substantial (see below), it should also be acknowledgedthat reduced systems, including the system used here, havecertain shortcomings that warrant discussion.One concern relates to the spatiotemporal structure of
cholinergic input used here. Neurons in vivo experiencecholinergic levels that vary according to the discharge pat-terns of cholinergic neurons, resulting in both phasic andtonic modes of innervation [101,102]. The phasic modeconsists of fast transients of high ACh concentrations,spanning a time scale of seconds and even subseconds[101]. Recent studies suggest that responses to cholinergicinnervation can be sensitive to precise (subsecond) timingof cholinergic neuron activity ([91,103] and referencestherein). In contrast, the regime of cholinergic input in theexperiments described here resembled a combination ofphasic and tonic modes, with cholinergic concentrationsvarying more than a hundredfold, but over time scales ofmany seconds and minutes. Thus, we cannot exclude thepossibility that some of our findings were affected by theslow kinetics of cholinergic input and breakdown or bythe spatial properties of this input which, if anything, re-sembled ‘volume’ (extrasynaptic) transmission more than‘wired’ innervation by cholinergic synapses [101]. In thisrespect, however, it is worth mentioning that phasic andtonic modes of innervation have been suggested to co-exist and play complementary roles, for example in foster-ing cue detection and general alertness [102]. Moreover,considering that basal forebrain cholinergic neurons tendto discharge at approximately 7 Hz rhythmic bursts [104],that brief stimulation of these neurons induces corticaldesynchronizations that persist for up to 20 seconds [57],and that the kinetics of neuronal muscarinic ACh recep-tors are rather slow [105], changes in cholinergic tone oc-curring over many second time scales are probably ofsignificant physiological importance.A second issue concerns the time course of adaptation
to cholinergic input and the duration of ‘withdrawal’ pe-riods described here. We found that the general timescale of synchrony reemergence in our experiments(many hours) was comparable with the time scales ofcircadian synchrony modulation in vivo. However, be-yond this general similarity, the actual time scales shouldnot be taken too literally; beyond the obvious fact that

Kaufman et al. BMC Biology 2014, 12:83 Page 15 of 22http://www.biomedcentral.com/1741-7007/12/83
these were measured in a reduced system, the level ofcholinergic input the neuronal networks were exposedto here was somewhat arbitrary, and it is not clear howthese relate to cumulative cholinergic exposure or itsfine temporal structure in vivo. Along the same line, inour experiments, cholinergic ‘withdrawal’ periods werechosen to be 12 hours. The introduction of these with-drawal periods was inspired by the low neuromodulatorylevels occurring during NREM sleep periods. Physiolo-gically, however, NREM periods are separated by shortREM periods characterized by especially high cholinergictone and desynchronized cortical activity [18,106]. Inhumans, each cycle of NREM and REM sleep lasts ap-proximately 1.5 hours, suggesting that the restoration ofefficacy, at least in the case of cholinergic innervation,might occur over shorter time scales. Indeed, in threeexperiments in which a single ACh application was ad-ministered approximately two hours after the end of aclosed-loop epoch, effective desynchronization was ob-served (data not shown). Yet there were also indicationsthat recovery from adaptation might occur over multipletime scales – for example, in the experiment shown inFigure 6a, closed-loop epochs tended to become pro-gressively shorter, which might be taken to indicate thata slow component of the adaptation process persists forlonger periods (akin, perhaps, to the ‘sleep debt’ that fol-lows prolonged sleep deprivation).While the reduced system used here has shortcomings,
it also has important advantages in the context of thequestions addressed here. Specifically, the experimentsdescribed above require full control over the inputs ofthe preparations to rule out the possibility that the re-emergence of synchrony was imposed by externalsources. Thus, for example, it is conceptually difficult toimagine how one could perform the same experimentsin vivo, isolating the monitored networks from the influ-ences of external excitatory and inhibitory sources, circa-dian systems and additional neuromodulators. Even ifone could selectively stimulate cholinergic [50] or norad-renergic [51] neurons for prolonged periods, it would beimpossible to unequivocally attribute the reemergence ofsynchrony to adaptation to these neuromodulatory sub-stances and rule out the possibility that these activitypatterns, which typically coincide with inattentive orsleep states [13,107], were imposed by other systems.Thus, at present, the reduced system used here pro-
vides unique opportunities to examine these questionsin an isolated, well-controlled fashion, with good accessto network activity properties and the possibility to useadvanced closed-loop techniques to expose and recordadaptation kinetics. Interestingly, a very recent in vivostudy further supports the utility of this reduced systemto study these questions. In this study [61] it was shownthat whereas both the cholinergic agonist CCh and NA
abolish synchronous slow oscillations in the intact ratbarrel cortex, the effects on spontaneous firing ratesdiffered: as in our own findings, CCh had practically noeffect on firing rates whereas NA significantly sup-pressed these. It thus seems that in spite of differencesin network organization, neuronal makeup and maturity,the relationships between network activity characteristicsand neuromodulation are largely preserved in thisreduced system.
ConclusionsWhat might be the general implications of our findings?Limitations of the system used here notwithstanding, thefindings seem to tie together four themes, namely syn-chrony, neuromodulation, homeostasis and sleep, in amanner that is rather unconventional yet potentiallyimportant. As mentioned in the introduction and in thediscussion above, the widespread occurrence of syn-chrony in many conditions and systems would seem tosuggest that it constitutes a ‘default’ activity mode andthat some active process might be required to move net-works out of it. In fact, as early as 1949, Hebb [108] pos-tulated that this form of synchrony, which ‘appears atbirth in the large slow waves of the infant’s electro-encephalogram and in the sleep or coma of older sub-jects’ represents an ‘intrinsic organization of corticalactivity’, which needs to be ‘interrupted’ as a ‘precondi-tion of the normal adult waking behavior’ (a conclusionechoed in recent studies documenting tight temporal re-lationships between synchrony emergence and loss ofconsciousness [66,67]). It has been suggested that inputfrom external sources serves in this function and, thus,hypersynchrony in reduced systems (such as cell culture)might reflect the lack of such input [70]. Indeed, previ-ous studies have shown that random stimulation pat-terns whose intensity is continuously adjusted in aclosed loop manner can transform synchronous activityinto more asynchronous firing patterns [70] and that thisstrategy can maintain such patterns for six hours [109].However, in more physiological settings, sensory inputper se does not always seem to be sufficient (for ex-ample, [110,111]). On the other hand, the indispensablerole of central neuromodulatory systems in ‘interrupting’these forms of synchrony has been firmly establishedby numerous studies [44,50,51,53-60,112], beginning withthe pioneering work of Morruzi and Magoun [52]. Giventhe findings described here, as well as the well-establishedtendency of neurons and neuronal networks to react oradapt to prolonged perturbations, it might be expectedthat the efficacy of neuromodulator-based ‘interruptions’might diminish with time. In line with this expectation, aprogressive reemergence of synchrony has been reportedin sleep-deprived but behaviorally awake rats which

Kaufman et al. BMC Biology 2014, 12:83 Page 16 of 22http://www.biomedcentral.com/1741-7007/12/83
continue to interact with their environments [13,107] (seealso [113]).In spite of the many intriguing parallels between neu-
romodulation, cortical synchrony, sleep and arousal onthe one hand, and the findings described here, on theother, the applicability of our findings to the intact or-ganism remains speculative. Yet, the many similaritieswith the underlying biophysics of network synchronyin vivo, as well as the similar initial reactions to the neu-romodulators studied here indicate that the long-termreactions to these neuromodulators and the reemergenceof synchrony these entail might also apply to the intactbrain. If this parallelism is extended, our findings mightalso imply that even with the additional degrees offreedom provided by multiple, partially redundant neu-romodulatory systems [18], ‘withdrawal’ periods mightultimately be essential for restoring neuromodulator effi-cacy and, in particular, their ability to counter the ten-dencies of synchrony to emerge. We hypothesize thatthis withdrawal is best achieved during tightly controlledsleep periods, which are thus viewed as an unavoidableprice of prolonged neuromodulator-driven arousal.
MethodsPrimary cultures of dissociated cortical neuronsPrimary cultures of rat cortical neurons were preparedas described previously [69] using a protocol approvedby the Technion committee for the supervision of ani-mal experiments. Briefly, cortices of one- to two-day-oldSprague-Dawley rats were dissected, dissociated by tryp-sin treatment followed by trituration using a siliconizedPasteur pipette. A total of 1 to 1.5*106 cells were thenplated on thin glass MEA dishes (MultiChannelSystems(MCS), Reutlingen, Germany) whose surface had beenpre-treated with polyethylenimine (Sigma, St. Louis, MO,USA) to facilitate cell adherence. Cells were initially grownin media containing minimal essential medium (MEM,Sigma), 25 mg/L insulin (Sigma), 20 mM glucose (Sigma),2 mM L-glutamine (Sigma), 5 μg/ml gentamycin sulfate(Sigma) and 10% NuSerum (Becton Dickinson Labware,Bedford, MA, USA). The preparation was then transferredto a humidified tissue culture incubator and maintainedat 37°C in a gas mixture of 5% CO2, 95% air. Half thevolume of the culture medium was replaced four timesa week with feeding media similar to the media de-scribed above but devoid of NuSerum, containing alower L-glutamine concentration (0.5 mM) and 2% B-27supplement (Invitrogen, San Diego, CA, USA).
Electrophysiological recordingsThe thin glass MEA dishes used here contained 59, 30 μmdiameter electrodes arranged in an 8 x 8 array, spaced 200μm apart. The flat, round electrodes are made of titaniumnitride, whereas the tracks and contact pads are made of
transparent indium tin oxide. A submerged platinum wireloop connected to a custom designed cap covering theMEA dish (see below) was used as a common reference.Electrophysiological extracellular recordings from MEA
dishes were performed using a commercial 60-channelheadstage (inverted MEA-1060-BC, MCS) with a gain of53x and frequency limits of 0.02 to 8,500 Hz. This signalwas further filtered with frequency limits of 150 to 3,000Hz and amplified (20x) using a filter/amplifier (FA60S-BC,MCS), and then digitized (PD2-MF-64-3 M/12H, UEI,Walpole, MA, USA) at 16 KSamples/second per chan-nel. All data were stored as threshold crossing eventswith the threshold determined according to one to twoseconds of pre-experiment analog voltage recordings,and calculated separately per channel as (mean - 9 xSTD) of the voltage trace. Data were then analyzed off-line (in open-loop experiments) using custom writtenscripts in Matlab (MathWorks, Natick, MA, USA) oronline (in closed-loop experiments) as explained below.Combined intracellular whole-cell patch clamp and
extracellular recordings from the MEA dish were per-formed by modifying a MEA recording setup mounted onan inverted microscope to allow for access to the networkwith a micromanipulator. Additionally, an intracellular re-cording amplifier (Axoclamp-700B, Molecular Devices,Sunnyvale, CA, USA) was added, from which all data werestreamed to a free channel of the MEA recording system,guaranteeing perfect synchronization of extracellular andintracellular recordings. In some combined recordings ex-periments the culture medium of cortical preparationsgrowing on MEA dishes at 25 to 29 Days in vitro (DIV)was gently replaced by Tyrode’s physiological solution(NaCl 119 mM, KCl 2.5 mM, MgCl2 2 mM, HEPES 25mM, CaCl2 2 mM and glucose 30 mM, pH 7.4) whereasin others, the original media was not replaced. Large,presumably-pyramidal cells were visualized with bright-field optics using a 40×, 1.3 N.A. Fluar objective. Whole-cell patch-clamp recordings were made at 28°C from thecells soma (n = 6 neurons, 3 networks). Recording pipettes(4 to 9 MΩ) were pulled from filament-containing boro-silicate glass capillaries (World Precision Instruments,(WPI) Sarasota, FL, USA) and filled with a solution at pH7.2 containing: K-gluconate 115 mM, KCl 20 mM, HEPES10 mM, Mg-ATP 2 mM, Na2-ATP 2 mM, GTP 0.3 mMand Na2-phosphocreatine 10 mM [114]. Intracellular volt-age recordings (current-clamp mode) were pre-amplified(10x), bridge-balanced and then further amplified (5x) andlow-pass filtered at 10 KHz with MCP-Plus variable gainfilter amplifiers (Alpha Omega, Nazareth, Israel). Extracel-lular recordings were performed using a commercial 60-channel headstage/amplifier (Inverted MEA1060, MCS)with a gain of 1,024x and frequency limits of 1 to 5,000Hz. The headstage/amplifier was connected to a bank of64 variable gain filter amplifiers (MCP-Plus, Alpha

Kaufman et al. BMC Biology 2014, 12:83 Page 17 of 22http://www.biomedcentral.com/1741-7007/12/83
Omega), with frequency limits set to 400 to 4,000 Hz,and the gain set to 10x. Data were digitized (16 bit,+/- 5 V voltage range) by two parallel 5200a/526 A/Dboards (Microstar Laboratories, Bellevue, WA, USA) at 12/24 KSamples/second (extracellular/intracellular) per chan-nel. Data acquisition was performed using AlphaMap(Alpha-Omega, Nazareth, Israel) and exported to MATLABfor analysis. For extracellular recordings, threshold crossingevents were detected offline with the threshold set individu-ally per channel to (mean - 7 x STD) of the voltage trace.
Long-term MEA recordingsMEA dishes were covered with a custom designed capcontaining inlet and outlet ports for perfusion mediaand air mixtures, a reference ground electrode and a re-movable rubber connector used to stabilize the micro-injection application needle (see below). The MEA dishwas continuously perfused with feeding media (describedabove) at a rate of 2.5 ml/day by means of a custom builtperfusion system based on an ultra-slow flow peristalticpump (Instech Laboratories Inc., Plymouth Meeting, PA,USA) using an imbalanced set of silicone tubes. Thetubes were connected to the dish through the appropri-ate ports in the custom designed cap. A sterile mixtureof 95% air/5% CO2 was continuously streamed into thedish at very low rates through a third port with flowrates regulated by a high precision flow meter (GilmontInstruments, Barrington, IL, USA). The base of theheadstage/amplifier was heated to 37°C using resistiveelements, a temperature sensor and a controller.
Pharmacological manipulationsACh and AChE (Sigma-Aldrich, Rehovot, Israel) were ap-plied to the culture media using a custom built applicationsystem (see section below). AChE (from Electrophoruselectricus, electric eel) was added both to the MEA dishand to the perfusion media to a final concentration of 0.1U/ml, while ACh was added only to the MEA dish. TheACh concentration in the application syringe was 20 mM,with each application of 1 μl diluted by a factor of approxi-mately 1:2000, resulting in a calculated final concentrationof 10 μM in the dish (ignoring breakdown by AChE). Cal-culations based on manufacturer-provided data on en-zyme activity suggest that 0.1 U/ml AChE can hydrolyze asingle application of 10 μM ACh within approximately 5.7seconds, yet this was obviously a coarse estimation, nottaking into account our specific experimental conditions.NA,CCh and DA (Sigma-Aldrich) were each applied to
the culture media by diluting them into 100 μL of mediumdrawn from the MEA dish. The mixture was subsequentlyreturned to the dish and mixed gently. Applications to thedish were complemented by simultaneous addition to theperfusion media to a final concentration of 20 μM (NAand CCh) and 500 nM (DA).
Application and mixing systemACh applications were performed using an automatedapplication system composed of a syringe (500 μl, Hamilton,Bonaduz, Switzerland, model 750 for ACh) mounted on ahigh-precision pump (UltraMicroPump III, WPI) controlledby an automated controller (Micro4, WPI). The syringewas connected to the MEA dish by a narrow tube, at theend of which was a needle, inserted and stabilized by arubber connector placed within the custom built cap ofthe MEA. The open end of this needle was immersed inthe culture media, hovering about 1 mm above the neur-onal network.A continuous mixing system was used to facilitate the
spread of ACh in the culture media and its subsequentbreakdown by AChE. This system was constructed as aflywheel-crankshaft system using a small electric motorand a metal strip, which was connected to the piston ofa 1 ml syringe (Hamilton, model 1001). This syringe wasconnected by silicon tubing to a narrow glass tubeimmersed within the culture media and facing the MEAdish sidewalls, so that the media flow would be directedaway from the neuronal networks. After many prelimin-ary experiments to determine the effects of the systemon baseline network activity and neuronal vitality, wesettled on mixing volumes of 200 μl at rates of 10 vol-umes/minute. Control experiments using a concentrateddye (sulfoRhodamine B, 330 uM) revealed that theserates resulted in dye dispersal within 60 to 120 seconds(data not shown).
Experimental procedureEach open- or closed-loop experiment was preceded bythe following preparatory phases: after at least 24 hoursof slow perfusion (Figure 1c, Phase I), the continuousmixing system was activated (Figure 1c, Phase II). Theactivation of the mixing system was followed by someadditional inter-burst firing recorded from a few elec-trodes, the extent of which varied somewhat amongdifferent preparations, resulting, sometimes, in slightdecreases in Sync Ratio values (see Additional file 1:Figure S1, second raster from top, for an example of apreparation in which these effects were most apparent).Twelve to twenty-four hours after activating the mixingsystem, AChE (0.1 U/ml) was added directly to the cul-ture medium in the MEA dish and to the perfusionmedium reservoir and activity was recorded for at least30 minutes (Figure 1c, Phase III). AChE addition had noapparent effect on network activity or synchrony levels(Additional file 1: Figure S1, third raster from top). Atthis point, the syringe containing the ACh solution wasmounted on the syringe pump and the application nee-dle was inserted into the MEA dish (Figure 1c, PhaseIV). Following these phases, experiments were started by

Kaufman et al. BMC Biology 2014, 12:83 Page 18 of 22http://www.biomedcentral.com/1741-7007/12/83
initiating automated ACh applications in either an open-or closed-loop regime (Figure 1c, phase V).
Real-time systemOpen- and closed-loop experiments were performed usinga real-time system (although only closed-loop experimentsrequired the real-time component). The real-time systemwas composed of a bare-bones personal computer runninga real time application over Simulink’s xPC target (Math-works). The application was composed of modular unitsdesigned to perform different parts of the experimentalprotocol in real time. These included the detection ofthreshold crossing events, the quantification of networksynchrony, an implementation of a PI controller (in closed-loop experiments, see below) and the execution of AChapplications through commands issued to the microappli-cation system at predefined/calculated (open/closed-loop)times. In addition, this computer periodically streamed therecorded data, as well as information on network syn-chrony and ACh application times, to a second computer(running Mathworks Matlab and Microsoft Windows)which served as a host for user interface and data storage.
Feedback loop and the PI controllerClosed-loop experiments were executed by a Simulinkimplementation of a feedback loop in the real-time com-puter. This loop included the following steps:
1. Network activity was continuously sampled from the60 electrodes.
2. Once a minute, a single value of the network synchronymeasure, Sync Ratio (see below), was calculated andsubtracted from a predetermined set point, the clampvalue, to produce the error (Eq. 1).
3. The error was used by the PI controller (Eq. 2) tocalculate the IAI.
4. The IAI value was added to the previous applicationtime to produce the next ACh application time. TheSync Ratio, error value and IAI were updated everyone minute, resulting in the online tuning of the nextapplication time: if the calculated IAI value increased,the next application time was delayed to reflect thenew IAI value. Conversely, if the IAI value decreased,the next application time was moved backwards (ifthis resulted in an application time that had alreadyelapsed, the application was performed immediately).
5. When the application time was reached, a commandwas sent to the application system controller, and theACh syringe applied 1 μl to the dish.
en ¼ SyncRatio�−SyncRation ð1Þ
In single-epoch closed-loop experiments, this loop wasexecuted until the ACh application syringe was depleted.
In multi-epoch experiments, a 12 hour ‘withdrawal’period commenced when the ACh application syringewas depleted (first experiment, Figure 6a) or when theIAI value was <1.5 minute in four consecutive minutes(two additional experiments, Figure 6b,c). After this‘withdrawal’ period, a new closed-loop phase was started,then another ‘withdrawal’ and so on.The PI controller was realized using a Simulink imple-
mentation. As mentioned above, the input to the con-troller was the error signal (en), which was used tocalculate IAIn according to the following equation:
IAIn ¼ IAIBaseline þ gP⋅en þ gI ⋅Xn
i¼1ei
� �� gconvert
ð2Þ
where gP, gI are the proportional and integral gain pa-rameters which were set to 1 and 0.2, respectively, in allexperiments. gconvert is simply a conversion gain into rele-vant units of IAI (minutes) for the sake of convenience.IAIbaseline is the baseline interval between ACh application,which was set to different values (ranging from 5 to 8.5minutes) in different experiments, determined arbitrarilyor according to a few test applications performed prior tothe closed-loop phase in some experiments. This valueaffected only the beginning of the closed-loop phase (in-deed, we found an undershoot of the Sync Ratio in allexperiments), as the integral component of the controllercorrects for this initial bias over time.
Data analysis - quantifying network synchronyTo quantify the effects of neuromodulation over time, anaccurate and reliable measure of network synchrony wasneeded. Although we and others [36] have previously usedthe Burstiness Index (BI) developed by Wagenaar and co-workers [70] for this purpose, in the course of preliminaryexperiments we found that this measure can misrepresentthe degree of network synchrony under some circum-stances. For example, reductions in overall network activ-ity levels during periods of clearly asynchronous activity,often lead to spuriously higher BI values. Conversely, sig-nificant increases in burst rates, which often followed pro-longed elevations of cholinergic tone, were oftenassociated with reduced BI values. We, therefore, deviseda different measure, which we termed the Sync Ratio. TheSync Ratio measure robustly distinguishes between syn-chronous and asynchronous activity modes (see Additionalfile 3: Figure S3) and was, therefore, used in all experi-ments. The premise of this measure is that synchrony, bydefinition, implies that many neurons across the networkare approximately simultaneously active. Therefore, themeasure is based on the number of active electrodes withina short (10 mseconds) time bin, instead of focusing on

Kaufman et al. BMC Biology 2014, 12:83 Page 19 of 22http://www.biomedcentral.com/1741-7007/12/83
the temporal structure of action potentials recorded fromsingle electrodes.The Sync Ratio measure was calculated for one minute
(or 0.5 hour in Figure 5c and Additional file 3: Figure S3d,and ten minute in Additional file 8: Figure S7, Additionalfile 11: Figure S8 and Additional file 13: Figure S9) timeintervals by: 1) counting the number of active electrodes(that is, the number of electrodes from which an actionpotential was recorded at least once within that bin) inconsecutive 10 msecond bins; 2) summing the activeelectrode counts in bins in which this count exceeded athreshold (above which activity was considered to be syn-chronous); and 3) dividing this sum by the sum of all ac-tive electrode counts in the one minute interval, to givethe Sync Ratio:
SyncRatio ¼X
active electode counts > thð ÞXTotal active electode countsð Þ ð3Þ
The threshold for the Sync Ratio was defined as thenumber of electrodes per bin for which the probabilityof exceeding it by chance was <0.0001 had activity inthe network occurred randomly and independently ateach electrode. This was calculated by: (1) calculatingthe average spike rate per electrode during a half hourinterval prior to ACh applications; (2) using the averagespike rates to create a surrogate data spike train for eachelectrode according to a Poisson distribution; (3) calcu-lating the active electrode per bin (10 mseconds) countsfor the surrogate data; (4) determining the thresholdfor which the Sync Ratio would be <0.0001 for thesurrogate data.Burst detection was performed for one minute time in-
tervals (as previously described [33]) with the followingchanges: detection was defined when activity crossed athreshold of N number of action potentials recordedthroughout the electrode array within a T millisecondtime bin, with N and T defined as 40% of active elec-trodes and 10 mseconds, respectively. Moreover, theburst starting point and termination were defined whenactivity crossed 10% of the threshold defined above, anda refractory period of 80 mseconds was applied to burstdetection analysis (no burst detection for 80 msecondsfollowing previous detection). Burst rates and burst in-tensity were averaged over one minute time intervals,defined as the number of bursts per second and theaverage number of action potentials within a burst,respectively.All data were exported to Matlab and analyzed using
custom written scripts. Final graphs were prepared usingMicrosoft Excel. All final figures were prepared usingMicrosoft PowerPoint.
Additional files
Additional file 1: Figure S1. Changes in network activity characteristicsduring preparatory phases. Example of network activity characteristicsduring each of the preparatory phases described in Figure 1c, illustratedby representative one-minute raster plots of activity recorded from allelectrodes in this particular network, and the Sync Ratio values obtainedduring these periods. In most experiments, these preparatory phases hadonly minimal effects on network synchrony, but in some experiments(as in the one shown here), activation of the mixing system (Phase II)induced some asynchronous firing, resulting in some reduction of SyncRatio values. Consequently, Sync Ratio values measured during this phasewere considered to represent pre-ACh application Sync Ratio values.
Additional file 2: Figure S2. Baseline network activity characteristicsare stable. a) Sync Ratio, b) burst rate and c) burst intensity measured forthe five networks of Figure 3 during 12 hour periods at the beginning ofthese experiments (Phase I in Figure 1c). Note the relative stability ofthese measures in all networks. See Methods for further details on burstdetection.
Additional file 3: Figure S3. The Sync Ratio as a measure of networksynchrony. The premise of this measure is that synchrony, by definition,implies that many neurons across the network are almost simultaneouslyactive. Therefore, the measure is based on the number of electrodesconcomitantly active within a small time window. a) One-minuteraster plots of network activity recordings in normal medium (left) andcarbachol (CCh; right) showing distinctly different activity patterns. Innormal media, activity in all electrodes is highly synchronous, whereas inCCh, activity is much more tonic and asynchronous. Time is given inminutes from the beginning of recording. b) Enlarged portions (4.8seconds) from each trace in a. c) Active electrode per bin counts (bin =10 mseconds) over 4.8 seconds from each trace shown in b. The dashedline depicts the threshold defined for the Sync Ratio calculation (th =7),clearly discriminating between synchronous events and desynchronizedfiring. Sync Ratio values denoted were calculated over the 4.8 seconddata traces. The inset in the left panel shows two synchronous eventsat a higher magnification, with suprathreshold bins highlighted in red.d) Network synchrony estimated by two measures - Burstiness Index(BI, calculated according to Wagenaar and colleagues [70], with someadjustments of parameters as previously described [35]) and Sync Ratio,calculated at half-hour intervals for previously published experiments [35]in which CCh was used to elevate cholinergic tone. Both measures showthe same trends; however, the Sync Ratio, as opposed to the BI, is lessaffected by increased burst rates near the end of the experiment andfully recovers to pre-CCh levels.
Additional file 4: Video S1. Effects of ACh applications on networkactivity in one open-loop experiment. In this video, each frame shows aone-minute raster plot of activity measured from the MEA 59 electrodes.Each dot represents an action potential. ACh was applied at five minuteintervals. The first five minutes preceding the first ACh application aredisplayed slowly to provide a better impression of basal network synchrony.Activity between hours 3 and 10 (180 to 600 minutes) was edited out tokeep the file size within reasonable limits. Note the dramatic change inactivity patterns induced by ACh, and the gradual reappearance ofsynchrony as manifested by vertical ‘lines’ in the raster plots.
Additional file 5: Figure S4. Synchrony reemergence time is mostlyindependent of network baseline activity characteristics. a) Illustration ofthe procedure used to determine the Time to Recovery in the open loopexperiments of Figure 3. To that end, Sync ratio values determined atone-minute intervals were smoothed with a five point kernel and thetime at which the Sync Ratio exceeded the half recovery point, definedas ≡ min _ val +0.5 ⋅ (max _ val ‐ min _ val) was obtained. No obviousrelationships were detected between the Time to Recovery and b) burstrates; c) burst intensities; and d) Sync Ratio values measured during 12hour baseline recording periods (phase I in Figure 1c) in all open loopexperiments of Figure 3. e) Illustration of the procedure used todetermine the Time to Collapse in the closed-loop experiments ofFigure 4. To that end, the time, in each experiment, at which the interapplication interval (IAI) first reached 0.25 minutes was obtained. No
Kaufman et al. BMC Biology 2014, 12:83 Page 20 of 22http://www.biomedcentral.com/1741-7007/12/83
obvious relationships were observed between the Time to Collapse andf) burst rates; g) burst intensities; and h) Sync Ratio values measuredduring 12 hour baseline recording periods (phase I in Figure 1c) in allclosed-loop experiments of Figure 4. AP, Action Potentials.
Additional file 6: Figure S5. Changes in burst rates and burstintensities following prolonged ACh applications. a) For each open loopexperiment of Figure 3, burst rate values, averaged over 30 minutes, werenormalized to the average burst rates measured during 12 hour baselinerecording periods (phase I in Figure 1c). Left – baseline periods. Right – openloop ACh application periods (phase V in Figure 1c). b) A similar analysis forburst duration. Averages ± SEM for five experiments. See Methods for furtherdetails on burst detection.
Additional file 7: Figure S6. The presence of AChE is required forphasic-like cholinergic input. The Sync Ratio is depicted over timefollowing a single application of ACh at t =0 with no AChE applied (red)or with AChE in the media (blue; average of two repeats. This AChEconcentration (0.1 U/ml) was used in all experiments.
Additional file 8: Figure S7. Comparisons of firing rates and Sync Ratiovalues in closed-loop experiments. Sync Ratio (blue) and firing rate (red)values, both averaged over 10 minute bins, are shown for each closed-loopexperiment shown in Figure 4. In all experiments Sync Ratio values weresignificantly lower than pre-clamp values, while firing rates were notsignificantly altered or changed only slowly after the initiation of the clamp(blue and red dashed lines, accordingly). The escape from the clamp wasassociated with temporary increases in firing rates due to transient periodsof volleys of synchronous bursts that were associated with this escapeafter which firing rates tended to subside while synchrony graduallyapproached pre-clamp levels (see also Additional file 9: Video S2). AP,Action Potentials.
Additional file 9: Video S2. Effects of ACh applications on networkactivity in one closed-loop experiment. Each frame is an activity rasterplot as explained in Additional file 4: Video S1. The first minute precedingthe first ACh application is displayed slowly to provide a better impressionof basal network synchrony. Activity between hours 3.5 and 8 (210 to 480minutes) was edited out to keep the file size within reasonable limits. Notethe sudden emergence of synchrony near the end of the experiments asthe network escaped the clamp. Same experiment as in Figure 4c (middlepanel) and Additional file 8: Figure S7 (third panel from top).
Additional file 10: Video S3. Effects of NA and CCh on networkactivity in one experiment. Each frame is an activity raster plot asexplained in Additional file 4: Video S1. Activity between hours 13.2 and22.0, 31.7 and 38, and 40.8 and 47.6 (789 to 1,322; 1,905 to 2,282; 2,449 to2,856 minutes) was edited out. Same experiment as shown in Figure 5a,and c (blue line).
Additional file 11: Figure S8. Dopamine effects on network synchronyand firing rates in networks of cultured cortical neurons. After recordingbaseline activity for at least 72 hours (of which the last 25 hours areshown), DA (500nM) was added directly into the MEA dishes and theperfusion media reservoirs. The figures show the evolution of the SyncRatio (a) and normalized firing rates (b) in these experiments, averagedover 10 minute periods. Note the very limited effect of DA on the SyncRatio, and the more pronounced effect on firing rates. Note also that theSync Ratio recovered to pre-application levels faster than firing ratesdid. Averages ± SEM for three separate experiments. AP, ActionPotentials.
Additional file 12: Video S4. Effects of DA on network activity in oneexperiment. Each frame is an activity raster plot as explained in Additionalfile 4: Video S1. Activity between hours 26.5 and 31.6 (1,590 to 1,898minutes) was edited out. Note that DA had no clear effects on networksynchrony (compare with Additional files 4, 9 and 10: Videos S1-S3).
Additional file 13: Figure S9. Firing rates and the Sync Ratio inmulti-epoch experiments. Sync Ratio (blue) and firing rate (red) values,both averaged over 10 minute bins, are shown for each multi-epochexperiment shown in Figure 6. Periods in which the synchrony clampwas in effect are shown as thick orange lines. Note that firing rates andSync Ratio values do not co-vary consistently. AP, Action Potentials.
AbbreviationsACh: acetylcholine; AChE: acetylcholine esterase; CCh: carbachol;DA: dopamine; EEG: electroencephalogram; IAI: inter application intervals;MEA: multielectrode array; NA: noradrenaline; NREM: non rapid eyemovement; PI: proportional integral.
Competing interestsThe authors declare that they have no competing interests.
Authors’ contributionsMK conceived the project, performed the experiments, developed analyticaltools, analyzed the data and wrote the manuscript. SR performedexperiments. NEZ conceived the project, developed analytical tools, analyzedthe data and wrote the manuscript. All authors read and approved the finalmanuscript.
AcknowledgementsWe are grateful to Larisa Goldfeld, Leonid Odessky and Vladimir Lyakhov fortheir invaluable technical assistance and to Shimon Marom, Omri Barak,Naama Brenner, Ron Meir, Erez Braun and additional members of theNetwork Biology Research laboratories, in particular Hanna Keren, RomanDvorkin and Liran Hazan for their help, insights and discussions. This workwas supported by grants from the Israel Science Foundation (1780/07; 1038/09) and the German Research Foundation (SFB 1089). The funders had norole in study design, data collection and analysis, decision to publish, orpreparation of the manuscript.
Received: 15 May 2014 Accepted: 29 September 2014
References1. Marder E: Neuromodulation of neuronal circuits: back to the future.
Neuron 2012, 76:1–11.2. Marder E, Goaillard JM: Variability, compensation and homeostasis in
neuron and network function. Nat Rev Neurosci 2006, 7:563–574.3. Maffei A, Fontanini A: Network homeostasis: a matter of coordination.
Curr Opin Neurobiol 2009, 19:168–173.4. Turrigiano G: Too many cooks? Intrinsic and synaptic homeostatic
mechanisms in cortical circuit refinement. Annu Rev Neurosci 2011,34:89–103.
5. Keck T, Keller GB, Jacobsen RI, Eysel UT, Bonhoeffer T, Hübener M: Synapticscaling and homeostatic plasticity in the mouse visual cortex in vivo.Neuron 2013, 80:327–334.
6. Hengen KB, Lambo ME, Van Hooser SD, Katz DB, Turrigiano GG: Firing ratehomeostasis in visual cortex of freely behaving rodents. Neuron 2013,80:335–342.
7. Steriade M, Nuñez A, Amzica F: A novel slow (<1 Hz) oscillation ofneocortical neurons in vivo: depolarizing and hyperpolarizingcomponents. J Neurosci 1993, 13:3252–3265.
8. Steriade M, Timofeev I, Grenier F: Natural waking and sleep states: a viewfrom inside neocortical neurons. J Neurophysiol 2001, 85:1969–1985.
9. Destexhe A, Contreras D, Steriade M: Spatiotemporal analysis of local fieldpotentials and unit discharges in cat cerebral cortex during natural wakeand sleep states. J Neurosci 1999, 19:4595–4608.
10. Timofeev I, Grenier F, Steriade M: Disfacilitation and active inhibition inthe neocortex during the natural sleep-wake cycle: an intracellular study.Proc Natl Acad Sci U S A 2001, 98:1924–1929.
11. Amzica F, Steriade M: The functional significance of K-complexes. SleepMed Rev 2002, 6:139–149.
12. Volgushev M, Chauvette S, Mukovski M, Timofeev I: Precise long-rangesynchronization of activity and silence in neocortical neurons duringslow-wave oscillations. J Neurosci 2006, 26:5665–5672.
13. Vyazovskiy VV, Olcese U, Lazimy YM, Faraguna U, Esser SK, Williams JC,Cirelli C, Tononi G: Cortical firing and sleep homeostasis. Neuron 2009,63:865–878.
14. Cash SS, Halgren E, Dehghani N, Rossetti AO, Thesen T, Wang C, Devinsky O,Kuzniecky R, Doyle W, Madsen JR, Bromfield E, Eross L, Halász P, Karmos G,Csercsa R, Wittner L, Ulbert I: The human K-complex represents anisolated cortical down-state. Science 2009, 324:1084–1087.

Kaufman et al. BMC Biology 2014, 12:83 Page 21 of 22http://www.biomedcentral.com/1741-7007/12/83
15. Chauvette S, Volgushev M, Timofeev I: Origin of active states in localneocortical networks during slow sleep oscillation. Cereb Cortex 2010,20:2660–2674.
16. Lee SH, Dan Y: Neuromodulation of brain states. Neuron 2012, 76:209–222.17. Harris KD, Thiele A: Cortical state and attention. Nat Rev Neurosci 2011,
12:509–523.18. Jones BE: From waking to sleeping: neuronal and chemical substrates.
Trends Pharmacol Sci 2005, 26:578–586.19. Platt B, Riedel G: The cholinergic system, EEG and sleep. Behav Brain Res
2011, 221:499–504.20. Berridge CW, Schmeichel BE, España RA: Noradrenergic modulation of
wakefulness/arousal. Sleep Med Rev 2012, 16:187–197.21. Timofeev I, Grenier F, Bazhenov M, Sejnowski TJ, Steriade M: Origin of slow
cortical oscillations in deafferented cortical slabs. Cereb Cortex 2000,10:1185–1199.
22. Sanchez-Vives MV, McCormick DA: Cellular and network mechanisms ofrhythmic recurrent activity in neocortex. Nat Neurosci 2000, 3:1027–1034.
23. Beggs JM, Plenz D: Neuronal avalanches in neocortical circuits. J Neurosci2003, 23:11167–11177.
24. Baker RE, Corner MA, van Pelt J: Spontaneous neuronal discharge patternsin developing organotypic mega-co-cultures of neonatal rat cerebralcortex. Brain Res 2006, 1101:29–35.
25. Johnson HA, Buonomano DV: Development and plasticity of spontaneousactivity and Up states in cortical organotypic slices. J Neurosci 2007,27:5915–5925.
26. Wester JC, Contreras D: Differential modulation of spontaneous andevoked thalamocortical network activity by acetylcholine level in vitro.J Neurosci 2013, 33:17951–17966.
27. Maeda E, Robinson HP, Kawana A: The mechanisms of generation andpropagation of synchronized bursting in developing networks of corticalneurons. J Neurosci 1995, 15:6834–6845.
28. Kamioka H, Maeda E, Jimbo Y, Robinson HP, Kawana A: Spontaneousperiodic synchronized bursting during formation of mature patterns ofconnections in cortical cultures. Neurosci Lett 1996, 206:109–112.
29. Canepari M, Bove M, Maeda E, Cappello M, Kawana A: Experimentalanalysis of neuronal dynamics in cultured cortical networks andtransitions between different patterns of activity. Biol Cybern 1997,77:153–162.
30. Segev R, Benveniste M, Hulata E, Cohen N, Palevski A, Kapon E, Shapira Y,Ben-Jacob E: Long term behavior of lithographically prepared in vitroneuronal networks. Phys Rev Lett 2002, 88:118102.
31. van Pelt J, Wolters PS, Corner MA, Rutten WL, Ramakers GJ: Long-termcharacterization of firing dynamics of spontaneous bursts in culturedneural networks. IEEE Trans Biomed Eng 2004, 51:2051–2062.
32. Wagenaar DA, Pine J, Potter SM: An extremely rich repertoire of burstingpatterns during the development of cortical cultures. BMC Neurosci 2006, 7:11.
33. Eytan D, Marom S: Dynamics and effective topology underlying synchronizationin networks of cortical neurons. J Neurosci 2006, 26:8465–8476.
34. Gullo F, Mazzetti S, Maffezzoli A, Dossi E, Lecchi M, Amadeo A, Krajewski J,Wanke E: Orchestration of “presto” and “largo” synchrony in up-downactivity of cortical networks. Front Neural Circuits 2010, 4:11.
35. Kaufman M, Corner MA, Ziv NE: Long-term relationships betweencholinergic tone, synchronous bursting and synaptic remodeling.PLoS One 2012, 7:e40980.
36. Hinard V, Mikhail C, Pradervand S, Curie T, Houtkooper RH, Auwerx J,Franken P, Tafti M: Key electrophysiological, molecular, and metabolicsignatures of sleep and wakefulness revealed in primary corticalcultures. J Neurosci 2012, 32:12506–12517.
37. Orlandi JG, Soriano J, Alvarez-Lacalle E, Teller S, Casademunt J: Noise focusingand the emergence of coherent activity in neuronal cultures. Nat Phys 2013,9:582–590.
38. Corner MA, Baker RE, van Pelt J: Physiological consequences of selectivesuppression of synaptic transmission in developing cerebral corticalnetworks in vitro: differential effects on intrinsically generated bioelectricdischarges in a living ‘model’ system for slow-wave sleep activity.Neurosci Biobehav Rev 2008, 32:1569–1600.
39. Holcman D, Tsodyks M: The emergence of Up and Down states in corticalnetworks. PLoS Comput Biol 2006, 2:e23.
40. Bazhenov M, Timofeev I, Steriade M, Sejnowski TJ: Model ofthalamocortical slow-wave sleep oscillations and transitions to activatedstates. J Neurosci 2002, 22:8691–8704.
41. Ivenshitz M, Segal M: Neuronal density determines network connectivityand spontaneous activity in cultured hippocampus. J Neurophysiol 2010,104:1052–1060.
42. Nita DA, Cissé Y, Timofeev I, Steriade M: Increased propensity to seizures afterchronic cortical deafferentation in vivo. J Neurophysiol 2006, 95:902–913.
43. Fröhlich F, Bazhenov M, Sejnowski TJ: Pathological effect of homeostaticsynaptic scaling on network dynamics in diseases of the cortex.J Neurosci 2008, 28:1709–1720.
44. Constantinople CM, Bruno RM: Effects and mechanisms of wakefulness onlocal cortical networks. Neuron 2011, 69:1061–1068.
45. Robinson HP, Kawahara M, Jimbo Y, Torimitsu K, Kuroda Y, Kawana A:Periodic synchronized bursting and intracellular calcium transientselicited by low magnesium in cultured cortical neurons. J Neurophysiol1993, 70:1606–1616.
46. Cohen E, Ivenshitz M, Amor-Baroukh V, Greenberger V, Segal M: Determinantsof spontaneous activity in networks of cultured hippocampus. Brain Res2008, 1235:21–30.
47. Cohen D, Segal M: Network bursts in hippocampal microcultures areterminated by exhaustion of vesicle pools. J Neurophysiol 2011,106:2314–2321.
48. Hill S, Tononi G: Modeling sleep and wakefulness in the thalamocorticalsystem. J Neurophysiol 2005, 93:1671–1698.
49. Mark S, Tsodyks M: Population spikes in cortical networks during differentfunctional states. Front Comput Neurosci 2012, 6:43.
50. Kalmbach A, Hedrick T, Waters J: Selective optogenetic stimulation ofcholinergic axons in neocortex. J Neurophysiol 2012, 107:2008–2019.
51. Carter ME, Yizhar O, Chikahisa S, Nguyen H, Adamantidis A, Nishino S,Deisseroth K, de Lecea L: Tuning arousal with optogenetic modulation oflocus coeruleus neurons. Nat Neurosci 2010, 13:1526–1533.
52. Moruzzi G, Magoun HW: Brain stem reticular formation and activation ofthe EEG. Electroencephalogr Clin Neurophysiol 1949, 1:455–473.
53. Szerb JC: Cortical acetylcholine release and electroencephalographicarousal. J Physiol 1967, 192:329–343.
54. Steriade M, Curro Dossi R, Nuñez A: Network modulation of a slowintrinsic oscillation of cat thalamocortical neurons implicated in sleepdelta waves: cortically induced synchronization and brainstemcholinergic suppression. J Neurosci 1991, 11:3200–3217.
55. Steriade M, Amzica F, Nuñez A: Cholinergic and noradrenergic modulationof the slow (approximately 0.3 Hz) oscillation in neocortical cells.J Neurophysiol 1993, 70:1385–1400.
56. Berridge CW, Foote SL: Effects of locus coeruleus activation onelectroencephalographic activity in neocortex and hippocampus.J Neurosci 1991, 11:3135–3145.
57. Metherate R, Cox CL, Ashe JH: Cellular bases of neocortical activation:modulation of neural oscillations by the nucleus basalis andendogenous acetylcholine. J Neurosci 1992, 12:4701–4711.
58. Berridge CW, España RA: Synergistic sedative effects of noradrenergic alpha(1)- and beta-receptor blockade on forebrain electroencephalographic andbehavioral indices. Neuroscience 2000, 99:495–505.
59. Dringenberg HC, Olmstead MC: Integrated contributions of basalforebrain and thalamus to neocortical activation elicited bypedunculopontine tegmental stimulation in urethane-anesthetized rats.Neuroscience 2003, 119:839–853.
60. Rudolph M, Pelletier JG, Paré D, Destexhe A: Characterization of synapticconductances and integrative properties during electrically inducedEEG-activated states in neocortical neurons in vivo. J Neurophysiol 2005,94:2805–2821.
61. Castro-Alamancos MA, Gulati T: Neuromodulators produce distinctactivated states in neocortex. J Neurosci 2014, 34:12353–12367.
62. Tateno T, Jimbo Y, Robinson HPC: Spatio-temporal cholinergic modulationin cultured networks of rat cortical neurons: spontaneous activity.Neuroscience 2005, 134:425–437.
63. Chiappalone M, Vato A, Berdondini L, Koudelka-Hep M, Martinoia S: Networkdynamics and synchronous activity in cultured cortical neurons. Int J NeuralSyst 2007, 17:87–103.
64. Pasquale V, Massobrio P, Bologna LL, Chiappalone M, Martinoia S: Self-organizationand neuronal avalanches in networks of dissociated cortical neurons.Neuroscience 2008, 153:1354–1369.
65. Schmidt SL, Chew EY, Bennett DV, Hammad MA, Fröhlich F: Differential effectsof cholinergic and noradrenergic neuromodulation on spontaneous corticalnetwork dynamics. Neuropharmacology 2013, 72:259–273.
Kaufman et al. BMC Biology 2014, 12:83 Page 22 of 22http://www.biomedcentral.com/1741-7007/12/83
66. Lewis LD, Weiner VS, Mukamel EA, Donoghue JA, Eskandar EN, Madsen JR,Anderson WS, Hochberg LR, Cash SS, Brown EN, Purdon PL: Rapidfragmentation of neuronal networks at the onset of propofol-inducedunconsciousness. Proc Natl Acad Sci U S A 2012, 109:E3377–E3386.
67. Mukamel EA, Pirondini E, Babadi B, Wong KF, Pierce ET, Harrell PG, Walsh JL,Salazar-Gomez AF, Cash SS, Eskandar EN, Weiner VS, Brown EN, Purdon PL:A transition in brain state during propofol-induced unconsciousness.J Neurosci 2014, 34:839–845.
68. Soreq H, Seidman S: Acetylcholinesterase-new roles for an old actor.Nat Rev Neurosci 2001, 2:294–302.
69. Minerbi A, Kahana R, Goldfeld L, Kaufman M, Marom S, Ziv NE: Long-termrelationships between synaptic tenacity, synaptic remodeling, andnetwork activity. PLoS Biol 2009, 7:e1000136.
70. Wagenaar DA, Madhavan R, Pine J, Potter SM: Controlling bursting incortical cultures with closed-loop multi-electrode stimulation. J Neurosci2005, 25:680–688.
71. Contreras D, Steriade M: Cellular basis of EEG slow rhythms: a study ofdynamic corticothalamic relationships. J Neurosci 1995, 15:604–622.
72. Golmayo L, Nuñez A, Zaborszky L: Electrophysiological evidence for theexistence of a posterior cortical-prefrontal-basal forebrain circuitry inmodulating sensory responses in visual and somatosensory rat corticalareas. Neuroscience 2003, 119:597–609.
73. Briand LA, Gritton H, Howe WM, Young DA, Sarter M: Modulators inconcert for cognition: modulator interactions in the prefrontal cortex.Prog Neurobiol 2007, 83:69–91.
74. Hebb DO: Drives and the C.N.S. (conceptual nervous system). Psychol Rev1955, 62:243–254.
75. Hodgkin AL, Huxley AF, Katz B: Measurement of current-voltage relationsin the membrane of the giant axon of Loligo. J Physiol 1952, 116:424–448.
76. Zrenner C, Eytan D, Wallach A, Their P, Marom S: A generic framework forreal-time multi-channel neuronal signal analysis, telemetry control, andsub-millisecond latency feedback generation. Front Neurosci 2010, 4:173.
77. Wallach A, Eytan D, Gal A, Zrenner C, Marom S: Neuronal response clamp.Front Neuroeng 2011, 4:3.
78. Wallach A, Marom S: Interactions between network synchrony and thedynamics of neuronal threshold. J Neurophysiol 2012, 107:2926–2936.
79. Wallach A: The response clamp: functional characterization of neuralsystems using closed-loop control. Front Neural Circuits 2013, 7:5.
80. Miller JD, Farber J, Gatz P, Roffwarg H, German DC: Activity ofmesencephalic dopamine and non-dopamine neurons across stages ofsleep and waking in the rat. Brain Res 1983, 273:133–141.
81. Lena I, Parrot S, Deschaux O, Muffat-Joly S, Sauvinet V, Renaud B, Suaud-Chagny MF, Gottesmann C: Variations in extracellular levels of dopamine,noradrenaline, glutamate, and aspartate across the sleep–wake cycle inthe medial prefrontal cortex and nucleus accumbens of freely movingrats. J Neurosci Res 2005, 81:891–899.
82. Mayne EW, Craig MT, McBain CJ, Paulsen O: Dopamine suppressespersistent network activity via D1-like dopamine receptors in rat medialentorhinal cortex. Eur J Neurosci 2013, 37:1242–1247.
83. Gulledge AT, Bucci DJ, Zhang SS, Matsui M, Yeh HH: M1 receptors mediatecholinergic modulation of excitability in neocortical pyramidal neurons.J Neurosci 2009, 29:9888–9902.
84. Klein WL, Nathanson N, Nirenberg M: Muscarinic acetylcholine receptorregulation by accelerated rate of receptor loss. Biochem Biophys ResCommun 1979, 90:506–512.
85. Maloteaux JM, Hermans E: Agonist-induced muscarinic cholinergicreceptor internalization, recycling and degradation in cultured neuronalcells. Cellular mechanisms and role in desensitization. Biochem Pharmacol1994, 47:77–88.
86. Thangaraju A, Sawyer GW: Comparison of the kinetics and extent ofmuscarinic M1-M5 receptor internalization, recycling and downregulationin Chinese hamster ovary cells. Eur J Pharmacol 2011, 650:534–543.
87. Giniatullin R, Nistri A, Yakel JL: Desensitization of nicotinic ACh receptors:shaping cholinergic signaling. Trends Neurosci 2005, 28:371–378.
88. Wang Y, Gu Q, Mao F, Haugland RP, Cynader MS: Activity-dependentexpression and distribution of M1 muscarinic ACh receptors in visualcortex neuronal cultures. J Neurosci 1994, 14:4147–4158.
89. Stewart CV, Plenz D: Homeostasis of neuronal avalanches during postnatalcortex development in vitro. J Neurosci Methods 2008, 169:405–416.
90. Lemieux M, Chen JY, Lonjers P, Bazhenov M, Timofeev I: The impact ofcortical deafferentation on the neocortical slow oscillation. J Neurosci2014, 34:5689–5703.
91. Sun YG, Pita-Almenar JD, Wu CS, Renger JJ, Uebele VN, Lu HC, Beierlein M:Biphasic cholinergic synaptic transmission controls action potential activityin thalamic reticular nucleus neurons. J Neurosci 2013, 33:2048–2059.
92. Tsodyks MV, Markram H: The neural code between neocortical pyramidalneurons depends on neurotransmitter release probability. Proc Natl AcadSci U S A 1997, 94:719–723.
93. McCormick DA: Actions of acetylcholine in the cerebral cortex andthalamus and implications for function. Prog Brain Res 1993, 98:303–308.
94. Wu LG, Saggau P: Presynaptic inhibition of elicited neurotransmitterrelease. Trends Neurosci 1997, 20:204–212.
95. Giessel AJ, Sabatini BL: M1 muscarinic receptors boost synaptic potentialsand calcium influx in dendritic spines by inhibiting postsynaptic SKchannels. Neuron 2010, 68:936–947.
96. Alitto HJ, Dan Y: Cell-type-specific modulation of neocortical activity bybasal forebrain input. Front Syst Neurosci 2013, 6:79.
97. Oda A, Yamagata K, Nakagomi S, Uejima H, Wiriyasermkul P, Ohgaki R,Nagamori S, Kanai Y, Tanaka H: Nicotine induces dendritic spineremodeling in cultured hippocampal neurons. J Neurochem 2014,128:246–255.
98. Halff AW, Gómez-Varela D, John D, Berg DK: A novel mechanism fornicotinic potentiation of glutamatergic synapses. J Neurosci 2014,34:2051–2064.
99. Blankenship AG, Feller MB: Mechanisms underlying spontaneous patternedactivity in developing neural circuits. Nat Rev Neurosci 2010, 11:18–29.
100. Khazipov R, Luhmann HJ: Early patterns of electrical activity in thedeveloping cerebral cortex of humans and rodents. Trends Neurosci 2006,29:414–418.
101. Sarter M, Parikh V, Howe WM: Phasic acetylcholine release and the volumetransmission hypothesis: time to move on. Nat Rev Neurosci 2009, 10:383–390.
102. Hasselmo ME, Sarter M: Modes and models of forebrain cholinergicneuromodulation of cognition. Neuropsychopharmacology 2011, 36:52–73.
103. Gu Z, Yakel JL: Timing-dependent septal cholinergic induction ofdynamic hippocampal synaptic plasticity. Neuron 2011, 71:155–165.
104. Lee MG, Hassani OK, Alonso A, Jones BE: Cholinergic basal forebrainneurons burst with theta during waking and paradoxical sleep.J Neurosci 2005, 25:4365–4369.
105. McCormick DA, Prince DA: Actions of acetylcholine in the guinea-pigand cat medial and lateral geniculate nuclei, in vitro. J Physiol 1987,392:147–165.
106. Marrosu F, Portas C, Mascia MS, Casu MA, Fà M, Giagheddu M, Imperato A,Gessa GL: Microdialysis measurement of cortical and hippocampalacetylcholine release during sleep-wake cycle in freely moving cats.Brain Res 1995, 671:329–332.
107. Vyazovskiy VV, Olcese U, Hanlon EC, Nir Y, Cirelli C, Tononi G: Local sleep inawake rats. Nature 2011, 472:443–447.
108. Hebb DO: The Organization of Behavior. New York: John Wiley & Sons; 1949.109. Newman JP, Zeller-Townson R, Fong MF, Arcot Desai S, Gross RE, Potter SM:
Closed-loop, multichannel experimentation using the open-source Neu-roRighter Electrophysiology Platform. Front Neural Circuits 2013, 6:98.
110. Poulet JF, Petersen CC: Internal brain state regulates membrane potentialsynchrony in barrel cortex of behaving mice. Nature 2008, 454:881–885.
111. Poulet JF, Fernandez LM, Crochet S, Petersen CC: Thalamic control ofcortical states. Nat Neurosci 2012, 15:370–372.
112. Berridge CW, Abercrombie ED: Relationship between locus coeruleusdischarge rates and rates of norepinephrine release within neocortex asassessed by in vivo microdialysis. Neuroscience 1999, 93:1263–1270.
113. Meisel C, Olbrich E, Shriki O, Achermann P: Fading signatures of criticalbrain dynamics during sustained wakefulness in humans. J Neurosci 2013,33:17363–17372.
114. Polsky A, Mel B, Schiller J: Encoding and decoding bursts by NMDA spikesin basal dendrites of layer 5 pyramidal neurons. J Neurosci 2009,29:11891–11903.
doi:10.1186/s12915-014-0083-3Cite this article as: Kaufman et al.: Adaptation to prolongedneuromodulation in cortical cultures: an invariable return to networksynchrony. BMC Biology 2014 12:83.
Copyright © 2022 FDOKUMEN