Simultaneous deactivation of FAK and Src improves ... - Nature
Upload
independentCategory
view
1download
0
SYSTEMS NEUROSCIENCEORIGINAL RESEARCH ARTICLE
published: 06 August 2014doi: 10.3389/fnsys.2014.00134
rTMS neuromodulation improves electrocortical functionalmeasures of information processing and behavioralresponses in autismEstate M. Sokhadze1*, Ayman S. El-Baz2, Lonnie L. Sears3, Ioan Opris4 and Manuel F. Casanova1
1 Department of Psychiatry and Behavioral Sciences, University of Louisville, Louisville, KY, USA2 Department of Bioengineering, University of Louisville, Louisville, KY, USA3 Department of Pediatrics, University of Louisville, Louisville, KY, USA4 Department of Physiology and Pharmacology, Wake Forest University, Winston-Salem, NC, USA
Edited by:Mikhail Lebedev, Duke University,USA
Reviewed by:Yoshio Sakurai, Kyoto University,JapanNivaldo Antonio Portela DeVasconcelos, Champalimaud Centrefor the Unknown, PortugalIgnacio Obeso, CNRS UMR 5229,France
*Correspondence:Estate M. Sokhadze, Department ofPsychiatry and Behavioral Sciences,University of Louisville, 401 EChestnut St #600, Louisville,KY 40202, USAe-mail: [email protected]
Objectives: Reports in autism spectrum disorders (ASD) of a minicolumnopathy withconsequent deficits of lateral inhibition help explain observed behavioral and executivedysfunctions. We propose that neuromodulation based on low frequency repetitiveTranscranial Magnetic Stimulation (rTMS) will enhance lateral inhibition through activationof inhibitory double bouquet interneurons and will be accompanied by improvements inthe prefrontal executive functions. In addition we proposed that rTMS will improve corticalexcitation/inhibition ratio and result in changes manifested in event-related potential (ERP)recorded during cognitive tests.
Materials and Methods: Along with traditional clinical behavioral evaluations the currentstudy used ERPs in a visual oddball task with illusory figures. We compared clinical,behavioral and electrocortical outcomes in two groups of children with autism (TMS, wait-list group). We predicted that 18 session long course in autistic patients will have betterbehavioral and ERP outcomes as compared to age- and IQ-matched WTL group. We used18 sessions of 1 Hz rTMS applied over the dorso-lateral prefrontal cortex in 27 individualswith ASD diagnosis. The WTL group was comprised of 27 age-matched subjects withASD tested twice. Both TMS and WTL groups were assessed at the baseline and aftercompletion of 18 weekly sessions of rTMS (or wait period) using clinical behavioralquestionnaires and during performance on visual oddball task with Kanizsa illusory figures.
Results: Post-TMS evaluations showed decreased irritability and hyperactivity on theAberrant Behavior Checklist (ABC), and decreased stereotypic behaviors on the RepetitiveBehavior Scale (RBS-R). Following rTMS course we found decreased amplitude andprolonged latency in the frontal and fronto-central N100, N200 and P300 (P3a) ERPs tonon-targets in active TMS treatment group. TMS resulted in increase of P2d (P2a totargets minus P2a to non-targets) amplitude. These ERP changes along with increasedcentro-parietal P100 and P300 (P3b) to targets are indicative of more efficient processingof information post-TMS treatment. Another important finding was decrease of the latencyand increase of negativity of error-related negativity (ERN) during commission errorsthat may reflect improvement in error monitoring and correction function. Enhancedinformation processing was also manifested in lower error rate. In addition we calculatednormative post-error treaction time (RT) slowing response in both groups and foundthat rTMS treatment was accompanied by post-error RT slowing and higher accuracyof responses, whereas the WTL group kept on showing typical for ASD post-error RTspeeding and higher commission and omission error rates.
Conclusion: Results from our study indicate that rTMS improves executive functioningin ASD as evidenced by normalization of ERP responses and behavioral reactions (RT,accuracy) during executive function test, and also by improvements in clinical evaluations.
Keywords: TMS, autism, ERP, motor response time, behavioral performance
Frontiers in Systems Neuroscience www.frontiersin.org August 2014 | Volume 8 | Article 134 | 1
Sokhadze et al. TMS improves behavior and ERP in autism
INTRODUCTIONAutism Spectrum Disorders (ASD) are featured by severe deficitsin social communication, social interaction, and restricted,repetitive patterns of behaviors, interests and activities (APA,2013). Additionally, autistic individuals usually present excessivereactions to the sensory environment such as aversive reactionsto visual, auditory, and tactile stimuli. These perception andsensory reactivity abnormalities are found in majority of subjectswith ASD affecting their ability to effectively process information(Gomes et al., 2008). In a series of electrophysiological studiesconducted by our group we explored specifics of event-relatedpotential (i.e., ERP) reflecting information processing duringperformance on reaction time (RT) tasks in children with ASD(Sokhadze et al., 2009a, 2012b, 2013a; Baruth et al., 2010c;Casanova et al., 2012) Our studies were aimed to explore themanifestations of the impaired functional connectivity, exces-sive cortical excitation/inhibition ratio, and deficient executivefunctioning in ASD by analyzing behavioral performance onattention tasks with dense-array ERP recording. Analysis of ERPcomponents is one of the most informative dynamic meth-ods of investigation and monitoring of information processingstages in the human brain due to the high temporal resolu-tion of this technique. Amplitude and latency of ERP wavesat selected topographies reflect both early sensory perceptionprocesses and higher-level processing including attention, corticalinhibition, memory update, as well as other cognitive activityprocesses (Polich, 2007). ERPs provide both a method of study-ing chronometry of information processing stages and a toolby which to assess the neurobiology of cognitive dysfunctionspresent in this neurodevelopmental disorder. ERP is a very usefultechnique to characterize time course and amplitude of corticalresponses to stimulation (Jeste and Nelson, 2009). Generally,early exogenous ERPs are believed to reflect sensory processingof a stimulus attributes (Coles and Rugg, 1995; Herrmann andKnight, 2001; Eichele et al., 2005; Folstein et al., 2008), whereaslate endogenous ERPs are thought to reflect higher level cogni-tive processes such as attention, memory trace update, percep-tual closure, etc. (Pritchard, 1981; Picton, 1992; Polich, 2003,2007).
One of our first studies investigated ERPs that index selec-tive attention processes in a visual novelty oddball task inchildren with autism and an age-matched group of typicallydeveloping children (Sokhadze et al., 2010a). The ASD grouphad excessive magnitude to task-irrelevant visual cues as com-pared to typically developing children and evidenced a lackof visual target discrimination. In a follow-up investigationwe found augmented early cortical responses to novel dis-tracters along with lower accuracy of motor response (MR)in a three-stimuli oddball task with illusory Kanizsa figures(Sokhadze et al., 2013a). We concluded that cortical responsesto visual stimulation in autism might be indiscriminative dur-ing visual tasks negatively affecting selective attention. Largemagnitude of electrocortical activity in response to sensorystimulation may be due to an increased ratio between excita-tion and inhibition in the cortex of individuals with autism(Casanova et al., 2002a,b; Rubenstein and Merzenich, 2003;Casanova, 2005, 2007). Impaired habituation and normative
adaptation to repeated stimuli can be considered as an inhibitorydeficit manifested in typical symptoms of autism such as stereo-typy, sensory hypersensitivity, deficient social interaction skills,etc.
One of contemporary models of autism, so called “mini-columnar theory of autism” (Casanova et al., 2003, 2006a,b;Casanova, 2005, 2007) is based on neuropathological findings inour laboratory. Autism in this model is associated with corticalneurodevelopmental abnormalities. In brief, the reduced neu-ropil space (periphery of the minicolumn) reported in autismis the compartment where lateral inhibition sharpens the bor-ders of minicolumns and increases their definition (Favorovand Kelly, 1994a,b; DeFelipe, 1999, 2004). The primary sourceof for this inhibitory effect may be derived from axon bun-dles of double-bouquet cells (Favorov and Kelly, 1994a). Theaxons of double bouquet cells arrange themselves in essen-tially repeatable patterns varying between 15 and 30 µm wide,depending on the cortical area examined (DeFelipe, 1999).Increases in numbers and types of inhibitory interneurons, asseen in the smaller minicolumns of autistic patients, resultin greater diversity and more nuanced modulation of mini-columns. Double-bouquet cells in the peripheral neuropil spaceof minicolumns provide a “vertical stream of negative inhibition”(Mountcastle, 2003) surrounding the minicolumnar core. OtherGABAergic cells in the minicolumn, having collateral projec-tions extending hundreds of microns tangentially, provide lateralinhibition of surrounding minicolumns on a macrocolumnarscale.
The value of each minicolumn’s output is insulated to a greateror lesser degree from the activity of its neighbors by GABAergicinhibition in its peripheral neuropil space. This allows for grada-tions in amplitude of excitatory activity across a minicolumnarfield. Rubenstein and Merzenich (2003) have posited that reduc-tions in GABAergic inhibitory activity may explain some symp-tomatology of autism, including increased incidence of seizuresand auditory-tactile hypersensitivity (see also Casanova et al.,2003, 2006a,b). Oblak et al. (2010) found decreased GABA recep-tors in the cingulate cortex and fusiform gyrus in autism. Theseresults may explain some symptomatology of autism, includingincreased incidence of seizures and sensory (e.g., auditory, tactile)hypersensitivity (Casanova et al., 2003).
This hypothesis is consistent with findings of reduced mini-columnar peripheral neuropil space in the neocortex of autisticsrelative to controls (Casanova et al., 2002a,b,d). In this model,a reduction in the peripheral neuropil space would result insmaller minicolumns which would coalesce into discrete, isolatedislands of coordinated excitatory activity. There are considerableconsequences resulting from the significant reduction of neu-ropil in minicolumns in autism. Reduced surround inhibitionmay result in an increase in the ratio of cortical excitationto inhibition and excessive amplification of sensory responsesreported by autistic individuals. Several important functions ofthe prefrontal cortex, for instance executive functions mightbe affected ability of individuals with autism focus on task-relevant targets without being distracted by task-irrelevant cues(Gray et al., 2003; Folstein et al., 2008; Matzel and Kolata,2010). There are several reviews describing consequences of
Frontiers in Systems Neuroscience www.frontiersin.org August 2014 | Volume 8 | Article 134 | 2
Sokhadze et al. TMS improves behavior and ERP in autism
increased excitation-to-inhibition (E/I) ratio both in humansand in animal models (Rubenstein and Merzenich, 2003; Renartet al., 2010; Harris and Thiele, 2011; Pinto et al., 2013). Deficitswithin the inhibitory elements that surround the cell minicol-umn suggest a mechanistic explanation to the I/E imbalance inautism (Casanova et al., 2003). Oscillations and synchronizationof pyramidal cells in and across minicolumns are maintainedby networks of inhibitory GABAergic interneurons. Local I/Einteractions shape neuronal representations of sensory, motorand cognitive variables, and produce local electroencephalo-graphic (EEG) gamma oscillations. The I/E bias caused byfaulty pyramidal cell-interneuronal diads provides a receptivescenario to induced gamma frequency and ERP abnormalities inautism.
TMS offers a noninvasive method for altering excitability ofthe neural circuits and for inducing a functional reorganization ofthe cortex. We reported positive effects of repetitive transcranialmagnetic stimulation (rTMS) in ASD in our pilot studies usingshorter (6–12 sessions) rTMS course (Sokhadze et al., 2009b,2010a, 2012a; Baruth et al., 2010a,b, 2011; Casanova et al., 2012).TMS-based neuromodulation exerts effects on cortical excitability(Maeda et al., 2000; Pascual-Leone et al., 2000, 2002; Frye et al.,2008; Baruth et al., 2010b; Enticott et al., 2010; Sokhadze et al.,2012a; Oberman et al., 2013). It is proposed that that low-frequency (i.e., “slow”’) rTMS (≤1 Hz) has inhibitory effects onstimulated cortex (Maeda et al., 2000), whereas high-frequencyrTMS (>1 Hz, e.g., 5 Hz, 10 Hz etc.) increases excitability of stim-ulated cortex (Pascual-Leone et al., 1994, 2000, 2002; Daskalakiset al., 2002; Schutter, 2009; Wassermann and Zimmermann, 2012;Oberman et al., 2013). Probably the effect of low frequency rTMSare mediated through increases in the activation of inhibitoryneurons (Hoffman and Cavus, 2002; Wagner et al., 2009). Wepropose that inhibitory cells such as basket and chandelier inter-neurons, whose projections keep no constant relation to thesurface of the cortex, of the double-bouquet neurons are ori-ented in more geometrically exact manner and are located atthe periphery of the minicolumn and therefore they are moreappropriate candidate for induction by a TMS applied parallelto cortex. Low frequency rTMS in autism, may lower the corticalexcitation/inhibition ratio, so called E/I ratio index.
In this study we were interested in how rTMS treatment affectsspecific ERP components known to index processes in sensorycortex, association cortical areas, and areas related to higherlevel cognitive activity. As it was mentioned above, the exoge-nous ERPs reflect early-stage, modality-specific, while endoge-nous ones reflect modality non-specific associative higher orderprocessing of stimuli within the context of the task (Näätänenet al., 1978; Luck et al., 1990; Coles and Rugg, 1995; Hillyard andAnnlo-Vento, 1998). Posterior visual P100 are generated withinthe fusiform gyrus with contribution from parieto-occipital andoccipital cortices (Yamazaki et al., 2000). Frontal N100 ERP waveoccurs within a similar time window and probably originates frommore anterior frontal dipole generators (Clark et al., 1994).
The fronto-central P300 (so called P3a) reflects frontal lobeactivity (Friedman et al., 1993) and in a visual oddball task withdistracters is interpreted as an attentional “orienting”, whereascentro-parietal and parietal P300 (P3b) is believed to reflect
sustain attention and other higher level processes. This cognitiveERP component has multiple dipole sources (Townsend et al.,2001).
Negative N200 component is recorded in visual tasksover centro-parietal cortex around 200–300 ms post-stimulus(Näätänen et al., 1978, 1993) and reflects processes of stimuluscategorization, perceptual closure and attention focusing sig-naling that a perceptual representation has been formed (Pottset al., 2004). A frontal positivity with a peak within (P2a, 180–320 ms post-stimulus) over inferior prefrontal recording sites isselectively responsive to the evaluation of the task relevance ofpresented stimuli, and originates from the orbito-frontal cortex(Potts et al., 1996, 1998, 2008). This frontal component may indextask-relevant features of the stimulus (Kenemans et al., 1993). Thefronto-central N200 according to some researchers (West, 2003;Donkers and van Boxtel, 2004; West et al., 2004) is thought tooriginate from the anterior cingulate cortex (ACC) and prefrontalsources and may reflect processes related to potential responseconflict detection in a RT tasks and/or cortical inhibition ofinappropriate MR. All ERP components have certain variability,but specific ERP measures selected for this study (frontal N100,N200 and P300, and parietal P100, N200 and P300) are lessaffected by variability in visual tasks and are relevant to thestudy goal.
We proposed that after 18 sessions of 1 Hz rTMS—administered to the dorso-lateral prefrontal cortices (DLPFC)participants with autism would demonstrate normalization ofelectrocortical indices of attention both at the early (P100, N100,100–200 ms post-stimulus) and the late (i.e., P200, N200, P300,200–600 ms) stages of sensory and cognitive processing and showimprovements in MT accuracy. Mainly, we expected lower mag-nitude and longer latencies to visual targets (i.e., better stimulusdiscrimination), and attenuated reactivity to non-target illusoryfigures and other non-target cues. Other anticipated improve-ments were expected to be found in outcomes of social andbehavioral functioning questionnaire and surveys. The hypothesisin this study proposed that low-frequency rTMS (i.e., inhibitory)would exert its effects through increased cortical inhibitory tone(i.e., lower E/I ratio) in the DLPFC with subsequent improve-ment in performance in the visual attention task. In addition weexpected improvements in clinical social and behavioral evalua-tion outcomes.
METHODSParticipants with ASD (age range 9–21 years) were recruitedthrough the University of Louisville Weisskopf Child EvaluationCenter (WCEC). Diagnosis was made according to the Diag-nostic and Statistical Manual of Mental Disorders (DSM-IV-TR)(APA, 2000) and further ascertained with the Autism Diagnos-tic Interview—Revised (ADI-R; Le Couteur et al., 2003). Theyalso had a medical evaluation by a developmental pediatrician.All subjects had normal hearing based on past hearing screens.Participants with a history of seizure disorder, significant hear-ing or visual impairment, a brain abnormality conclusive fromimaging studies or an identified genetic disorder were excluded.Fifty participants were high-functioning persons with autismdiagnosis and four had Asperger Syndrome. All had full-scale IQ
Frontiers in Systems Neuroscience www.frontiersin.org August 2014 | Volume 8 | Article 134 | 3
Sokhadze et al. TMS improves behavior and ERP in autism
>80 assessed using the Wechsler Intelligence Scale for Children,Fourth Edition (WISC-IV; Wechsler, 2003) or (for adolescents)the Wechsler Abbreviated Scale of Intelligence (WASI; Wechsler,1999).
We enrolled 54 autistic patients, 44 males and 10 females,with a mean age of 14.5 ± 2.9 years. Twenty-seven of them wereassigned to active 1.0 Hz TMS treatment (TMS group), while 27were assigned to the WTL group. Mean age of subjects in the TMSgroup was 14.8 ± 3.2 years, and 14.1 ± 2.6 years in the WTLgroup. There was not a significant difference in either age or full-scale IQ between the TMS and WTL groups.
The study complied with all relevant national regulationsand institutional policies and has been approved by the localInstitutional Review Board (IRB). Participating subjects andtheir parents (or legal guardians) were provided with full infor-mation about the study including the purpose, requirements,responsibilities, reimbursement, risks, benefits, alternatives, androle of the local IRB. The subjects were reimbursed only forparticipation in two ERP tests ($25/per test). The consent andassent forms approved by the IRB were reviewed and explainedto all subjects who expressed interest to participate. All ques-tions were answered before consent signature was requested.If the individual agreed to participate, both she/he and par-ent/guardian signed and dated the consent or assent form andreceived a copy countersigned by the investigator who obtainedconsent.
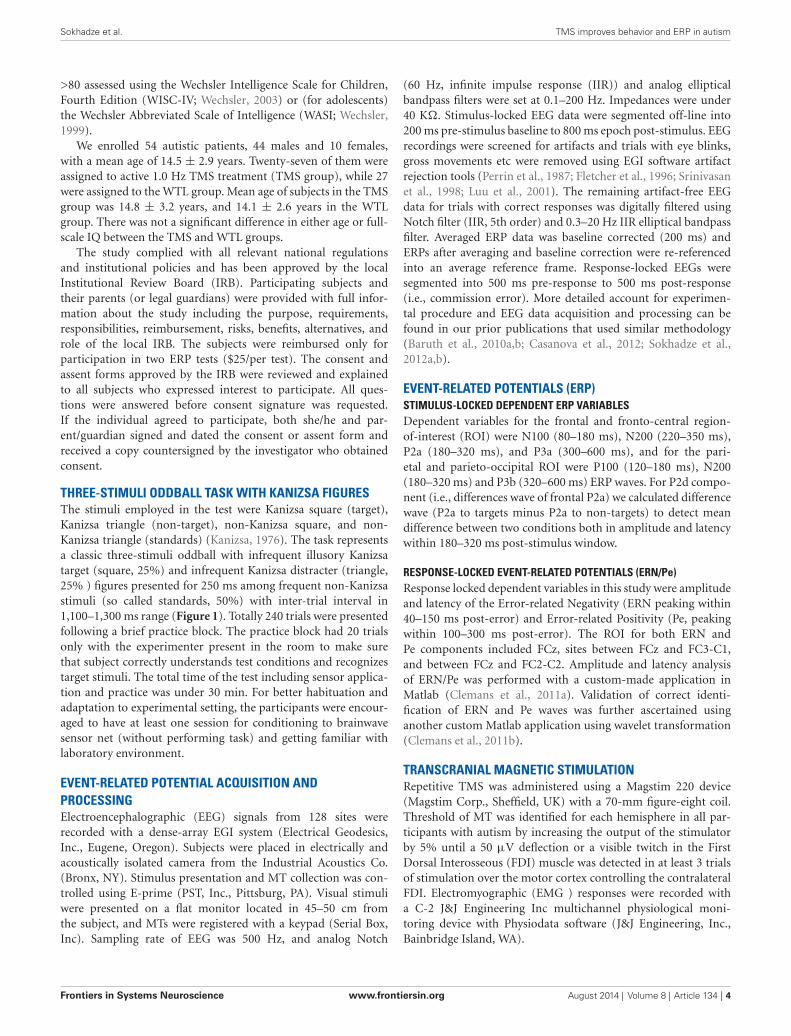
THREE-STIMULI ODDBALL TASK WITH KANIZSA FIGURESThe stimuli employed in the test were Kanizsa square (target),Kanizsa triangle (non-target), non-Kanizsa square, and non-Kanizsa triangle (standards) (Kanizsa, 1976). The task representsa classic three-stimuli oddball with infrequent illusory Kanizsatarget (square, 25%) and infrequent Kanizsa distracter (triangle,25% ) figures presented for 250 ms among frequent non-Kanizsastimuli (so called standards, 50%) with inter-trial interval in1,100–1,300 ms range (Figure 1). Totally 240 trials were presentedfollowing a brief practice block. The practice block had 20 trialsonly with the experimenter present in the room to make surethat subject correctly understands test conditions and recognizestarget stimuli. The total time of the test including sensor applica-tion and practice was under 30 min. For better habituation andadaptation to experimental setting, the participants were encour-aged to have at least one session for conditioning to brainwavesensor net (without performing task) and getting familiar withlaboratory environment.
EVENT-RELATED POTENTIAL ACQUISITION ANDPROCESSINGElectroencephalographic (EEG) signals from 128 sites wererecorded with a dense-array EGI system (Electrical Geodesics,Inc., Eugene, Oregon). Subjects were placed in electrically andacoustically isolated camera from the Industrial Acoustics Co.(Bronx, NY). Stimulus presentation and MT collection was con-trolled using E-prime (PST, Inc., Pittsburg, PA). Visual stimuliwere presented on a flat monitor located in 45–50 cm fromthe subject, and MTs were registered with a keypad (Serial Box,Inc). Sampling rate of EEG was 500 Hz, and analog Notch
(60 Hz, infinite impulse response (IIR)) and analog ellipticalbandpass filters were set at 0.1–200 Hz. Impedances were under40 KΩ. Stimulus-locked EEG data were segmented off-line into200 ms pre-stimulus baseline to 800 ms epoch post-stimulus. EEGrecordings were screened for artifacts and trials with eye blinks,gross movements etc were removed using EGI software artifactrejection tools (Perrin et al., 1987; Fletcher et al., 1996; Srinivasanet al., 1998; Luu et al., 2001). The remaining artifact-free EEGdata for trials with correct responses was digitally filtered usingNotch filter (IIR, 5th order) and 0.3–20 Hz IIR elliptical bandpassfilter. Averaged ERP data was baseline corrected (200 ms) andERPs after averaging and baseline correction were re-referencedinto an average reference frame. Response-locked EEGs weresegmented into 500 ms pre-response to 500 ms post-response(i.e., commission error). More detailed account for experimen-tal procedure and EEG data acquisition and processing can befound in our prior publications that used similar methodology(Baruth et al., 2010a,b; Casanova et al., 2012; Sokhadze et al.,2012a,b).
EVENT-RELATED POTENTIALS (ERP)STIMULUS-LOCKED DEPENDENT ERP VARIABLESDependent variables for the frontal and fronto-central region-of-interest (ROI) were N100 (80–180 ms), N200 (220–350 ms),P2a (180–320 ms), and P3a (300–600 ms), and for the pari-etal and parieto-occipital ROI were P100 (120–180 ms), N200(180–320 ms) and P3b (320–600 ms) ERP waves. For P2d compo-nent (i.e., differences wave of frontal P2a) we calculated differencewave (P2a to targets minus P2a to non-targets) to detect meandifference between two conditions both in amplitude and latencywithin 180–320 ms post-stimulus window.
RESPONSE-LOCKED EVENT-RELATED POTENTIALS (ERN/Pe)Response locked dependent variables in this study were amplitudeand latency of the Error-related Negativity (ERN peaking within40–150 ms post-error) and Error-related Positivity (Pe, peakingwithin 100–300 ms post-error). The ROI for both ERN andPe components included FCz, sites between FCz and FC3-C1,and between FCz and FC2-C2. Amplitude and latency analysisof ERN/Pe was performed with a custom-made application inMatlab (Clemans et al., 2011a). Validation of correct identi-fication of ERN and Pe waves was further ascertained usinganother custom Matlab application using wavelet transformation(Clemans et al., 2011b).
TRANSCRANIAL MAGNETIC STIMULATIONRepetitive TMS was administered using a Magstim 220 device(Magstim Corp., Sheffield, UK) with a 70-mm figure-eight coil.Threshold of MT was identified for each hemisphere in all par-ticipants with autism by increasing the output of the stimulatorby 5% until a 50 µV deflection or a visible twitch in the FirstDorsal Interosseous (FDI) muscle was detected in at least 3 trialsof stimulation over the motor cortex controlling the contralateralFDI. Electromyographic (EMG ) responses were recorded witha C-2 J&J Engineering Inc multichannel physiological moni-toring device with Physiodata software (J&J Engineering, Inc.,Bainbridge Island, WA).
Frontiers in Systems Neuroscience www.frontiersin.org August 2014 | Volume 8 | Article 134 | 4
Sokhadze et al. TMS improves behavior and ERP in autism
FIGURE 1 | Three-stimuli category visual oddball task with Kanizsaillusory figures. The stimulus types are: Kanizsa square (target, 25%),Kanizsa triangle (25%), non-Kanizsa square, and non-Kanizsa triangle.The non-target Kanizsa triangle is introduced to differentiate processing
of Kanizsa figures and targets. The stimuli consist of either three orfour inducer disks, which are considered the shape feature, and theyeither constitute an illusory figure (square, triangle) or not (collinearityfeature).
The rTMS was administered weekly for 18 weeks with the1st six treatments were over the left DLPFC, while the next sixwere over the right DLPFC, whereas remaining six treatmentswere done bilaterally over the DLFC (evenly at the left and rightDLPFC). The DLPFC site for magnetic stimulation was foundby placing the TMS coil 5 cm anterior, and in a parasagitalplane, to the site of maximal FDI response. A swimming capwas used to make the TMS coil positioning easier. TMS wasadministered at 1.0 Hz frequency and 90% MT. There were totalof 180 pulses per day session with nine trains with 20 pulses each.There were 20–30 s between the train intervals used. Decision toselect 90% of the MT was based on the prior publications whererTMS was used for the stimulation of DLPFC in various neuro-and psychiatric disorders (reviewed in Pascual-Leone et al., 2000;Wassermann and Lisanby, 2001; Daskalakis et al., 2002; Gershonet al., 2003; Loo and Mitchell, 2005; Greenberg, 2007; Obermanet al., 2013).
CLINICAL SOCIAL AND BEHAVIORAL EVALUATIONOUTCOMESFor the evaluation of social and behavioral functioning weutilized caregiver reports and clinician ratings of improve-ment. Every participant was evaluated before TMS courseand within 2 weeks following TMS treatment. AberrantBehavior Checklist (ABC; Aman and Singh, 1994; Aman,2004) is a clinician administered rating scale to assess Irri-tability, Lethargy/Social Withdrawal, Stereotypy, Hyperactivity,and Inappropriate Speech based on parent/caregiver report.Social Responsiveness Scale (SRS). Repetitive Behavior Scale—Revised (RBS-R; Bodfish et al., 1999) is a caregiver completed
rating scale assessing stereotyped, self-injurious, compulsive,ritualistic, sameness, and restricted range (Bodfish et al.,2000).
STATISTICAL ANALYSISThe primary model for statistical analyses of subject-averagedERP and MT data was the two factor repeated measure ANOVA.Dependent ERP variables were amplitude and latency of ERP atpre-determined ROIs. The within-participant factors were fol-lowings: Stimulus (Kanizsa target, Standard, Kanizsa Non-target),Hemisphere (Left, Right), and Time (Baseline, Post-treatment).The between-subject factor was Group (TMS, WTL). Post hocanalyses were conducted where appropriate. RT, error rate (com-mission, omission and total error rate), were analyzed usingTime and Group factor. For clinical behavioral rating scores aTreatment (pre-vs. post-TMS/or waiting period) ANOVA wascompleted to determine changes associated with active stimula-tion and WTL conditions. Histograms with normal distributioncurves along with skewness and kurtosis data were obtainedfor each dependent variables to determine normality of dis-tribution and appropriateness of data for ANOVA and t-tests.For more reliable determination of normality of distributionresidual plots (i.e., normal probability plot, histogram, vs. fitsand order) were created using Minitab statistical package toindicate that treatment with ANOVA is justified. All dependentvariables in the study had normal distribution. Greenhouse-Geisser corrected p-values were employed where appropriate inall ANOVAs. A priori hypotheses were tested with the Student’st-tests for two groups with equal variance. Confidence intervals(95% of mean, 95% CI) were calculated for each ERP data sets
Frontiers in Systems Neuroscience www.frontiersin.org August 2014 | Volume 8 | Article 134 | 5
Sokhadze et al. TMS improves behavior and ERP in autism
entered for t-tests. For the estimation of the effect size andpower (Murphy and Myors, 2004) we used Partial Eta Squared(η2) and observed power computed using α = 0.05. SPSS 19.0and Sigma Stat 3.1 statistical packages were used for analysis ofdata.
RESULTSBEHAVIORAL RESPONSES (REACTION TIME AND ACCURACY,POST-ERROR RT)Reaction Time (RT)Effects of TMS on RT to targets were not significant. Comparisonof RT to targets yielded no Time X Group effects.
AccuracyCommission and omission errors analysis yielded a significantbetween-group difference in the commission error percentage,F(1,52) = 4.32, p = 0.042. T-test showed significant decrease ofcommission error rate in the TMS group (mean decrease −6.38 ±
2.54%, 95% CI from −11.61 to −1.15%, t(26) = 2.50, p = 0.019).We could not find between group differences in omission errorrate. Total error rate (% errors) change also showed decrease onlyin TMS group (−7.47 ± 2.82%, 95% CI from −13.26 to −1.67%,t(26)=2.64, p = 0.013).
Post-error RTMain effect of Time (Pre, Post) on normative post-error RT slow-ing was highly significant (F(1,50)=15,14, p = 0.001, η2 = 0.134,observed power = 0.795 at alpha (α) = 0.05).
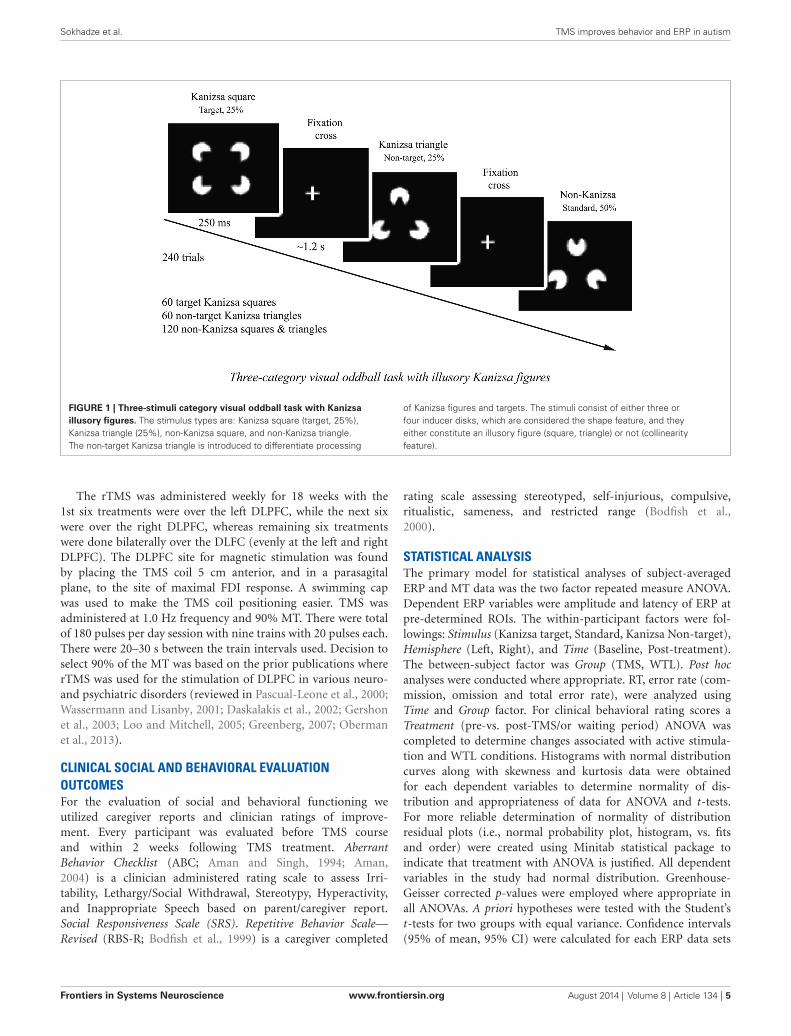
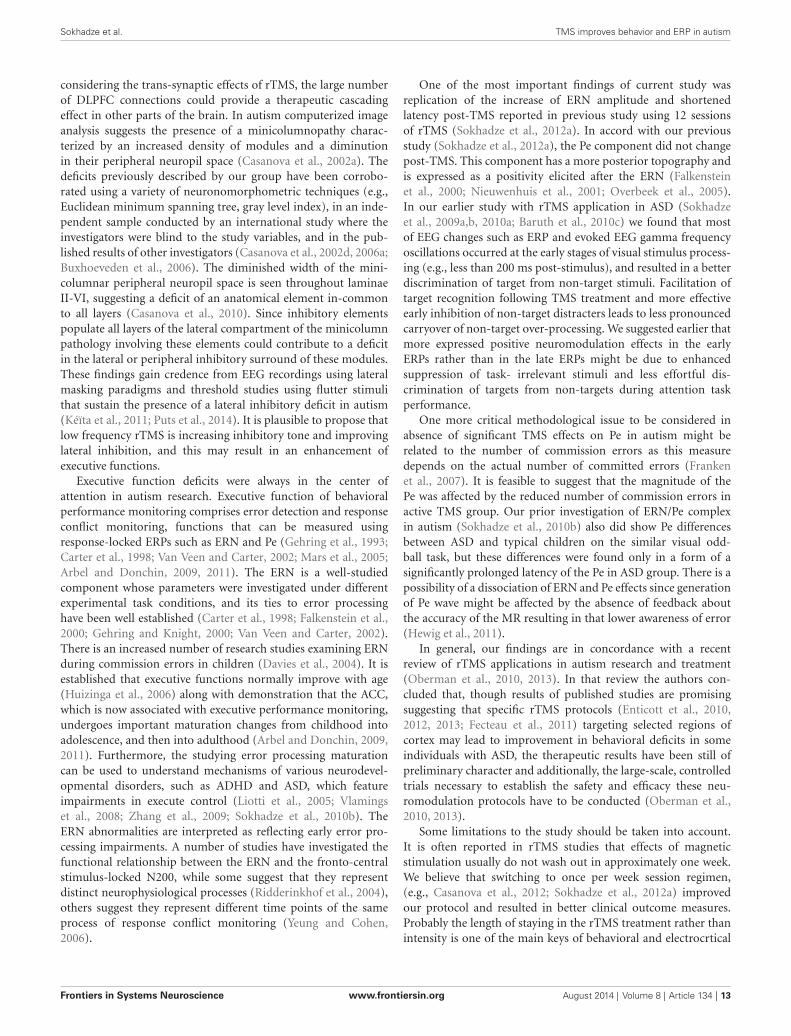
Repeated measure ANOVA of post-error RT slowing revealedthat TMS and WTL group differences on post-error RT changeswere also statistically significant, i.e., Time X Group interaction,F(1,52) = 8.05, p = 0.006, η2 = 0.134, observed power = 0.795.The TMS group showed post-error RT increase with significantpositive change in post-error RT. This change was computed aspost TMS post-error RT change minus pre-treatment post-errorRT change (49.9 ± 55.4 ms, 95% CI from 26.42 to 69.41 ms,t(26) = 4.57, p < 0.001). Figure 2 shows that at the baseline bothin WTL and TMS groups post-error RT was negative (mean post-error speeding was −23.1 ± 34.7 ms and not different betweengroups at pre-treatment stage), while in the TMS group post-errorRT became positive (i.e., showed normative slowing), whereas itremained negative in the WTL group.
PARIETAL AND PARIETO-OCCIPITAL ERP COMPONENTSP100TMS course had main effects on P100 component’s both ampli-tude (F(1,52) = 4.78, p = 0.033) and latency (F(1,52) = 15.00,p = 0.001). Response of this parietal and parieto-occipital P100component (positive peak within 130–160 ms post-stimulus)to targets showed post-treatment between group difference inamplitude (2.25 ± 2.93 µV, with 95% CI from 1.14 to 3.37µV, in TMS vs. 4.37 ± 3.89 µV, 95% CI from 2.83 to 5.91µV, in WTL, F(1,52) = 5.31, p = 0.025) and latency (153.3 ±
43.99 ms, 95% CI from 136 to 170 ms in TMS vs. 128 ±
18.42 ms, 95% CI from 121 to 135 ms in WTL, F(1,52) = 7.54,p = 0.008). Group differences in response to Kanizsa tar-gets and non-targets were more expressed in the latency of
FIGURE 2 | Post-error reaction time (RT) changes in TMS and wait-listgroups at the baseline and at the second test. Time X Group effect ishighly significant (F = 8.05, p = 0.006). At the baseline both groups showedpost-error RT speeding, while post-TMS post-error RT became positive.Change of the post-error RT in TMS group was significant (t = 4.57, p <0.001).
the P100 (F(1,52) = 4.91, p = 0.011). The Stimulus (Stan-dard, Non-target Kanizsa, Target Kanizsa) X Time (Pre, Post)X Group (TMS, WTL) effect was significant (F(2,52) = 4.34,p = 0.015), and this effect was even more powerful for stan-dard vs. target stimuli comparison (F(1,52) = 7.92, p = 0.007,η2 = 0.128, observed power = 0.789). The effect can bedescribed as a reduced latency to non-targets and increasedlatency to target stimuli post-TMS but not after wait period.There were no hemispheric differences observed for P100component.
N200There were no group differences in amplitude of the parietal N200component. Latency of N200 to targets showed post-treatmentbetween group difference in latency to targets (238.72 ± 58.58 ms,95% CI from 215 to 261 ms, in TMS vs. 201.35 ± 24.27 ms, 95%CI from 191 to 210 ms, in WTL group, F(1,52) = 9.34, p = 0.004)and non-target illusory Kanizsa figures (242.31 ± 62.42 ms,95% CI from 217 to 267 ms, in TMS vs. 208.27 ± 24.92 ms,95% CI from 198 to 218 ms, in WTL group, F(1,52) = 6.92,p = 0.011). ANOVA analysis of the latency of parietal N200 totarget and non-target Kanizsa stimuli showed a Stimulus (Target,Non-target) X Time (Pre, Post) X Group (TMS, WTL) interaction,F(2,52) = 3.69, p = 0.032. The effect was expressed as increasedlatency for non-target stimuli in the TMS group post-treatment.There were observed other interactions as well, for instancehemispheric one, as the effect was featured by more delayedlatency at the right hemisphere in the TMS group (F(1,52) = 7.15,p = 0.01, η2 = 0.121, power = 0.747). Other notable interactionwas significant Time X Group effect, F(1,52) = 4.60, p = 0.037,η2 = 0.08, observed power = 0.558, with TMS showing moreprolonged N200 latency to non-target Kanizsa stimuli. Post hoc
Frontiers in Systems Neuroscience www.frontiersin.org August 2014 | Volume 8 | Article 134 | 6
Sokhadze et al. TMS improves behavior and ERP in autism
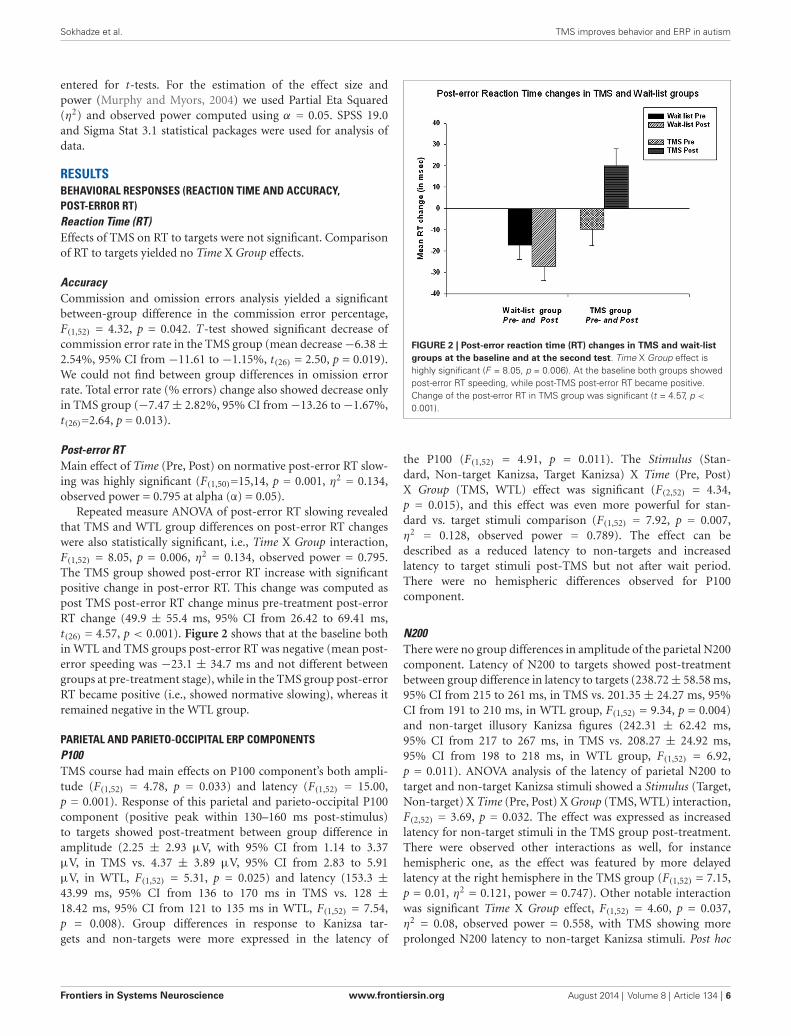
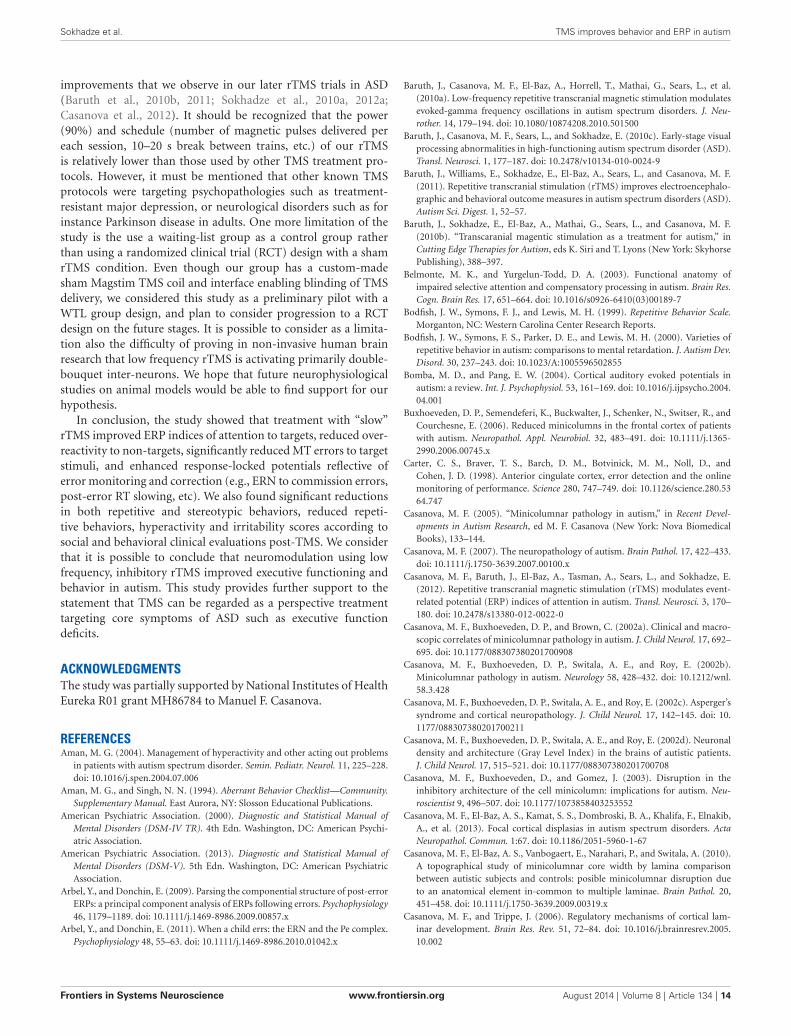
tests showed that in the active treatment group latency increased(e.g., to non-targets, bilaterally 24.2 ± 11.8 ms, 95% CI from3.7 to 51.0 ms, t(26) = 2.37, p = 0.025) along with attenuatedamplitude (−1.39 ± 3.26µV, 95% CI from −2.63 to −0.15 µV,t(26) = 2.30, p = 0.029), while changes of latency and amplitudeof N200 in the WTL group were not significant (see Figure 3).
P300 (P3b)We found between group differences in P3b amplitude that wereexpressed as more attenuated component post-treatment in TMSas compared to WTL group only to non-Kanisza standards (2.69± 2.96 µV, 95% CI from 0.88 to 3.61 µV, in TMS vs. 5.09± 3.98 µV, 95% CI from 3.21 to 6.14 µV, in WTL, F(1,52) = 5.25,p = 0.026). We found no interactions of P3b amplitude using inANOVA Stimulus, Hemisphere, Time, and Group factors. Stimulus(Target, Non-target Kanisza, Standard) factor had a main effect
on latency of P3b (F(2,53) = 11.59, p < 0.001). The latency ofP3b showed significant effects of Time factor on each stimuli:latency of P3b to targets, 364.15 ± 63.08 ms, 95% CI from 340to 380 ms, in TMS vs. 326.13 ± 28.27 ms, 95% CI from 314 to337 ms, in WTL, F(1,52) = 8.16, p = 0.006; non-target Kanizsa,356.68 ± 67.26 ms, 95% CI from 333 to 384 ms, in TMS vs. 322.93± 21.55 ms, 95% CI from 314 to 331 ms, in WTL, F(1,52) = 6.94,p = 0.011; and standards, 354.89 ± 64.68 ms, 95% CI from330 to 379 ms, in TMS vs. 323.54 ± 20.68 ms, 95% CI from315 to 331 ms, in WTL, (F(1,52) = 5.25, p = 0.026). Repeatedmeasure ANOVA analysis of the P3b latency also indicated asignificant between groups differences for all types of illusoryfigures, for example, increased P3b latency as a result of rTMS(Time × Group interaction, F(1,52) = 4.32, p = 0.044), that can bedescribed as a longer post-treatment latency in TMS, shorter inWTL group.
FIGURE 3 | Parietal ERPs (P1, P3, P7 sites according to 10–10 International System) to target and non-target Kanizsa figures in TMS and wait-listgroups (N = 27/per group) before and after treatment (TMS/or wait-period).
Frontiers in Systems Neuroscience www.frontiersin.org August 2014 | Volume 8 | Article 134 | 7
Sokhadze et al. TMS improves behavior and ERP in autism
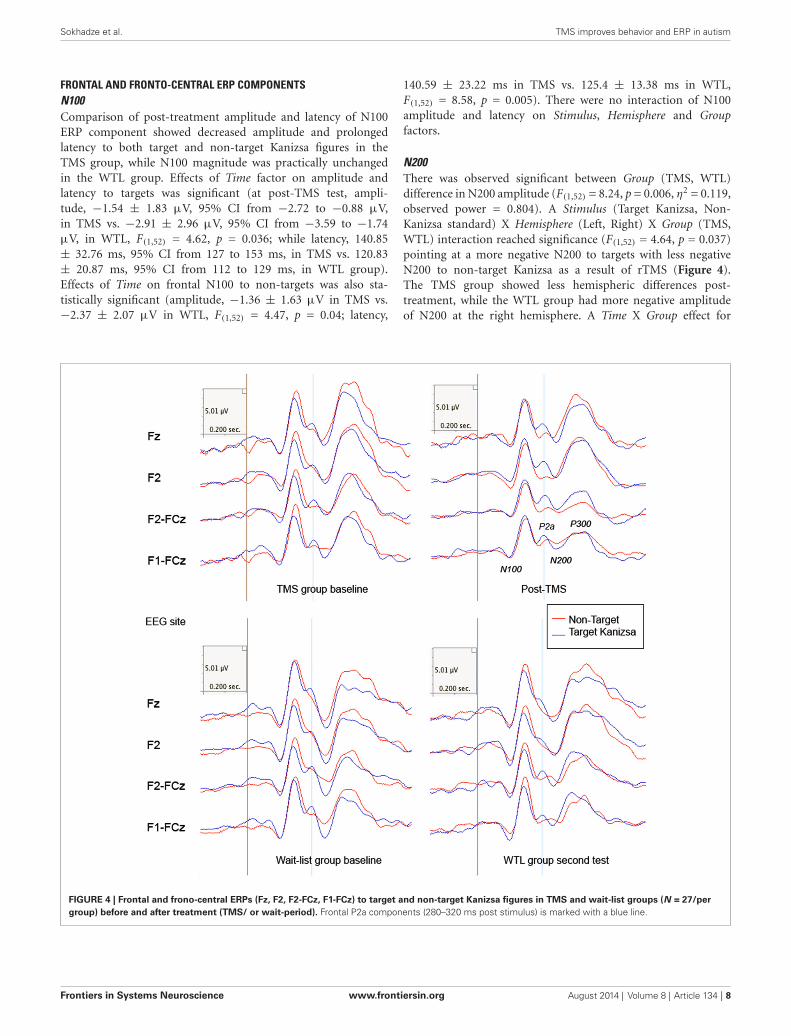
FRONTAL AND FRONTO-CENTRAL ERP COMPONENTSN100Comparison of post-treatment amplitude and latency of N100ERP component showed decreased amplitude and prolongedlatency to both target and non-target Kanizsa figures in theTMS group, while N100 magnitude was practically unchangedin the WTL group. Effects of Time factor on amplitude andlatency to targets was significant (at post-TMS test, ampli-tude, −1.54 ± 1.83 µV, 95% CI from −2.72 to −0.88 µV,in TMS vs. −2.91 ± 2.96 µV, 95% CI from −3.59 to −1.74µV, in WTL, F(1,52) = 4.62, p = 0.036; while latency, 140.85± 32.76 ms, 95% CI from 127 to 153 ms, in TMS vs. 120.83± 20.87 ms, 95% CI from 112 to 129 ms, in WTL group).Effects of Time on frontal N100 to non-targets was also sta-tistically significant (amplitude, −1.36 ± 1.63 µV in TMS vs.−2.37 ± 2.07 µV in WTL, F(1,52) = 4.47, p = 0.04; latency,
140.59 ± 23.22 ms in TMS vs. 125.4 ± 13.38 ms in WTL,F(1,52) = 8.58, p = 0.005). There were no interaction of N100amplitude and latency on Stimulus, Hemisphere and Groupfactors.
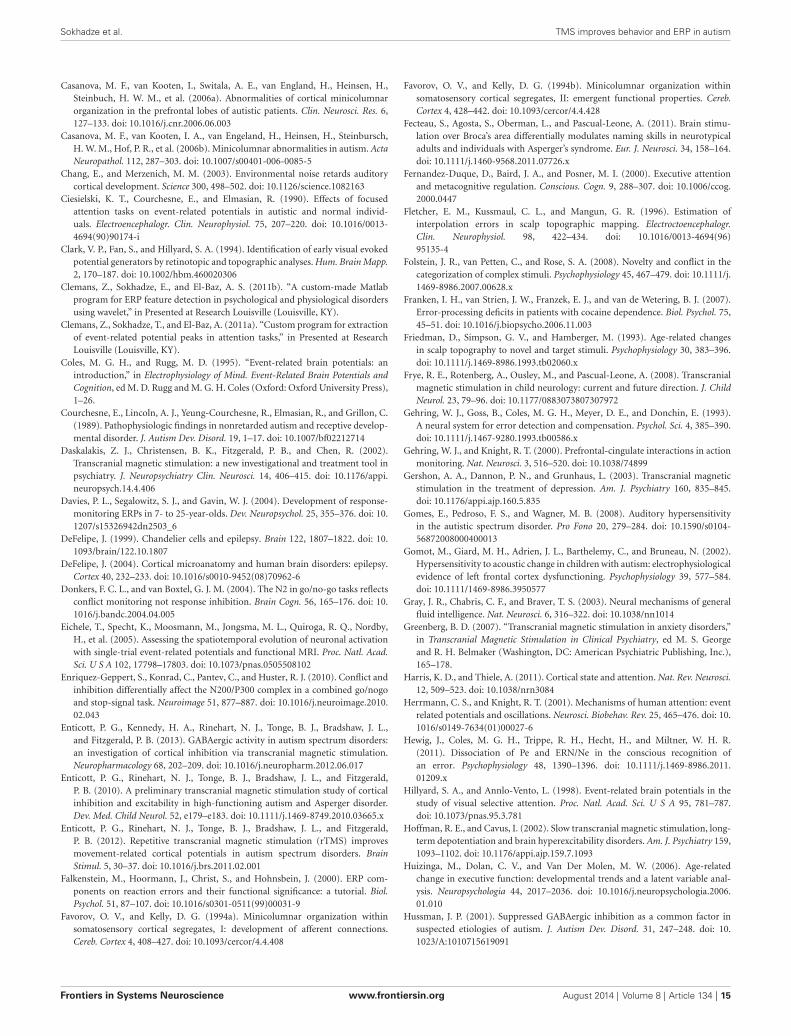
N200There was observed significant between Group (TMS, WTL)difference in N200 amplitude (F(1,52) = 8.24, p = 0.006, η2 = 0.119,observed power = 0.804). A Stimulus (Target Kanizsa, Non-Kanizsa standard) X Hemisphere (Left, Right) X Group (TMS,WTL) interaction reached significance (F(1,52) = 4.64, p = 0.037)pointing at a more negative N200 to targets with less negativeN200 to non-target Kanizsa as a result of rTMS (Figure 4).The TMS group showed less hemispheric differences post-treatment, while the WTL group had more negative amplitudeof N200 at the right hemisphere. A Time X Group effect for
FIGURE 4 | Frontal and frono-central ERPs (Fz, F2, F2-FCz, F1-FCz) to target and non-target Kanizsa figures in TMS and wait-list groups (N = 27/pergroup) before and after treatment (TMS/ or wait-period). Frontal P2a components (280–320 ms post stimulus) is marked with a blue line.
Frontiers in Systems Neuroscience www.frontiersin.org August 2014 | Volume 8 | Article 134 | 8
Sokhadze et al. TMS improves behavior and ERP in autism
the latency of N200 was significant (F(1,52) = 7.26, p = 0.009,η2 = 0.119, observed power = 0.754), yielding longed latencyto targets post-TMS. Additionally, post hoc analysis using t-test showed that N200 latency became statistically more pro-longed to target stimuli in TMS group across both hemispheres(13.31 ± 34.03 ms, 95% CI from 26.2 to 0.36 ms, t(26) = 2.10,p = 0.044).
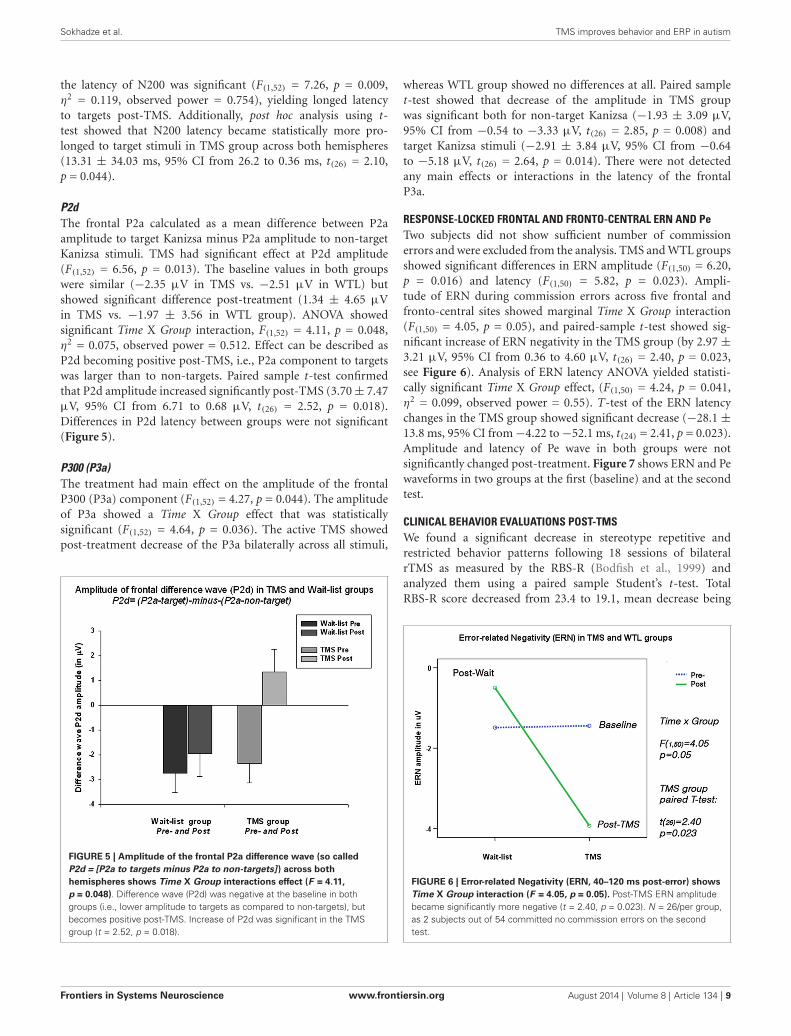
P2dThe frontal P2a calculated as a mean difference between P2aamplitude to target Kanizsa minus P2a amplitude to non-targetKanizsa stimuli. TMS had significant effect at P2d amplitude(F(1,52) = 6.56, p = 0.013). The baseline values in both groupswere similar (−2.35 µV in TMS vs. −2.51 µV in WTL) butshowed significant difference post-treatment (1.34 ± 4.65 µVin TMS vs. −1.97 ± 3.56 in WTL group). ANOVA showedsignificant Time X Group interaction, F(1,52) = 4.11, p = 0.048,η2 = 0.075, observed power = 0.512. Effect can be described asP2d becoming positive post-TMS, i.e., P2a component to targetswas larger than to non-targets. Paired sample t-test confirmedthat P2d amplitude increased significantly post-TMS (3.70 ± 7.47µV, 95% CI from 6.71 to 0.68 µV, t(26) = 2.52, p = 0.018).Differences in P2d latency between groups were not significant(Figure 5).
P300 (P3a)The treatment had main effect on the amplitude of the frontalP300 (P3a) component (F(1,52) = 4.27, p = 0.044). The amplitudeof P3a showed a Time X Group effect that was statisticallysignificant (F(1,52) = 4.64, p = 0.036). The active TMS showedpost-treatment decrease of the P3a bilaterally across all stimuli,
FIGURE 5 | Amplitude of the frontal P2a difference wave (so calledP2d = [P2a to targets minus P2a to non-targets] ) across bothhemispheres shows Time X Group interactions effect (F = 4.11,p = 0.048). Difference wave (P2d) was negative at the baseline in bothgroups (i.e., lower amplitude to targets as compared to non-targets), butbecomes positive post-TMS. Increase of P2d was significant in the TMSgroup (t = 2.52, p = 0.018).
whereas WTL group showed no differences at all. Paired samplet-test showed that decrease of the amplitude in TMS groupwas significant both for non-target Kanizsa (−1.93 ± 3.09 µV,95% CI from −0.54 to −3.33 µV, t(26) = 2.85, p = 0.008) andtarget Kanizsa stimuli (−2.91 ± 3.84 µV, 95% CI from −0.64to −5.18 µV, t(26) = 2.64, p = 0.014). There were not detectedany main effects or interactions in the latency of the frontalP3a.
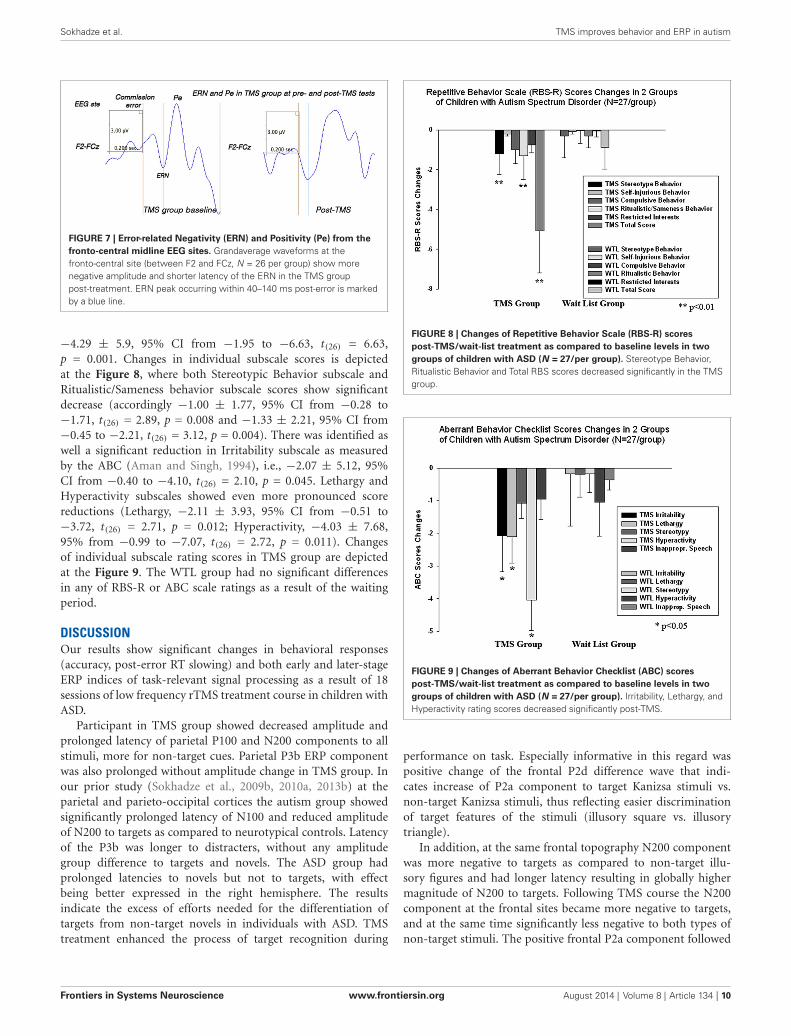
RESPONSE-LOCKED FRONTAL AND FRONTO-CENTRAL ERN AND PeTwo subjects did not show sufficient number of commissionerrors and were excluded from the analysis. TMS and WTL groupsshowed significant differences in ERN amplitude (F(1,50) = 6.20,p = 0.016) and latency (F(1,50) = 5.82, p = 0.023). Ampli-tude of ERN during commission errors across five frontal andfronto-central sites showed marginal Time X Group interaction(F(1,50) = 4.05, p = 0.05), and paired-sample t-test showed sig-nificant increase of ERN negativity in the TMS group (by 2.97 ±
3.21 µV, 95% CI from 0.36 to 4.60 µV, t(26) = 2.40, p = 0.023,see Figure 6). Analysis of ERN latency ANOVA yielded statisti-cally significant Time X Group effect, (F(1,50) = 4.24, p = 0.041,η2 = 0.099, observed power = 0.55). T-test of the ERN latencychanges in the TMS group showed significant decrease (−28.1 ±
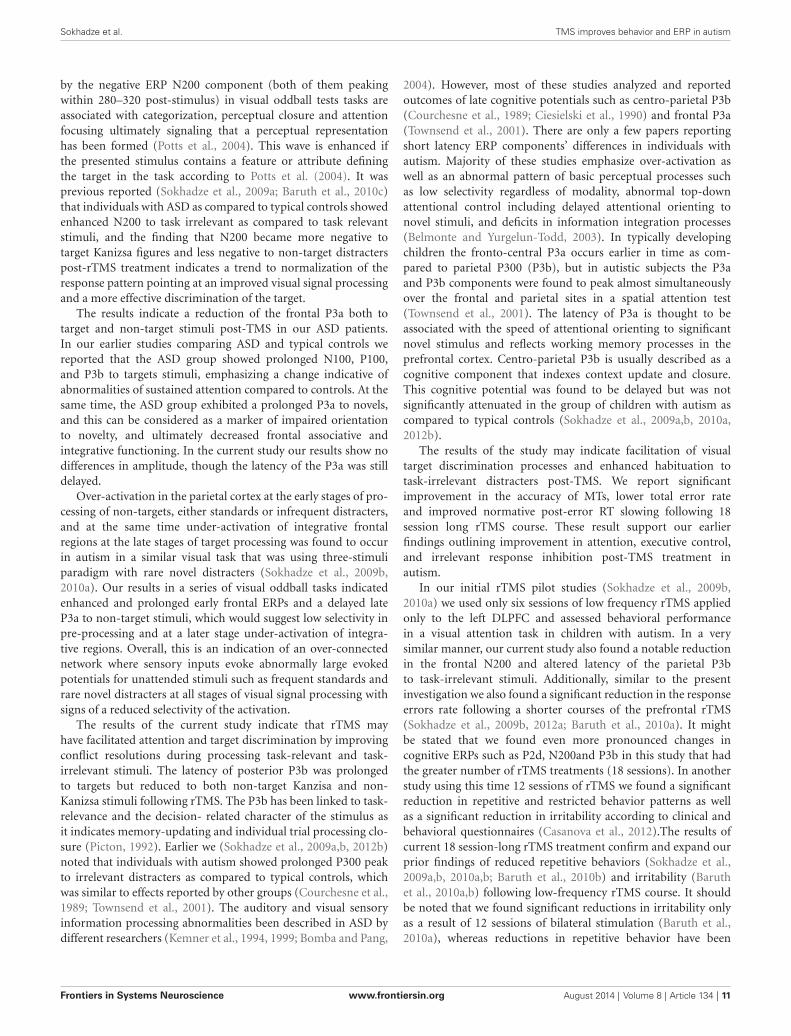
13.8 ms, 95% CI from −4.22 to −52.1 ms, t(24) = 2.41, p = 0.023).Amplitude and latency of Pe wave in both groups were notsignificantly changed post-treatment. Figure 7 shows ERN and Pewaveforms in two groups at the first (baseline) and at the secondtest.
CLINICAL BEHAVIOR EVALUATIONS POST-TMSWe found a significant decrease in stereotype repetitive andrestricted behavior patterns following 18 sessions of bilateralrTMS as measured by the RBS-R (Bodfish et al., 1999) andanalyzed them using a paired sample Student’s t-test. TotalRBS-R score decreased from 23.4 to 19.1, mean decrease being
FIGURE 6 | Error-related Negativity (ERN, 40–120 ms post-error) showsTime X Group interaction (F = 4.05, p = 0.05). Post-TMS ERN amplitudebecame significantly more negative (t = 2.40, p = 0.023). N = 26/per group,as 2 subjects out of 54 committed no commission errors on the secondtest.
Frontiers in Systems Neuroscience www.frontiersin.org August 2014 | Volume 8 | Article 134 | 9
Sokhadze et al. TMS improves behavior and ERP in autism
FIGURE 7 | Error-related Negativity (ERN) and Positivity (Pe) from thefronto-central midline EEG sites. Grandaverage waveforms at thefronto-central site (between F2 and FCz, N = 26 per group) show morenegative amplitude and shorter latency of the ERN in the TMS grouppost-treatment. ERN peak occurring within 40–140 ms post-error is markedby a blue line.
−4.29 ± 5.9, 95% CI from −1.95 to −6.63, t(26) = 6.63,p = 0.001. Changes in individual subscale scores is depictedat the Figure 8, where both Stereotypic Behavior subscale andRitualistic/Sameness behavior subscale scores show significantdecrease (accordingly −1.00 ± 1.77, 95% CI from −0.28 to−1.71, t(26) = 2.89, p = 0.008 and −1.33 ± 2.21, 95% CI from−0.45 to −2.21, t(26) = 3.12, p = 0.004). There was identified aswell a significant reduction in Irritability subscale as measuredby the ABC (Aman and Singh, 1994), i.e., −2.07 ± 5.12, 95%CI from −0.40 to −4.10, t(26) = 2.10, p = 0.045. Lethargy andHyperactivity subscales showed even more pronounced scorereductions (Lethargy, −2.11 ± 3.93, 95% CI from −0.51 to−3.72, t(26) = 2.71, p = 0.012; Hyperactivity, −4.03 ± 7.68,95% from −0.99 to −7.07, t(26) = 2.72, p = 0.011). Changesof individual subscale rating scores in TMS group are depictedat the Figure 9. The WTL group had no significant differencesin any of RBS-R or ABC scale ratings as a result of the waitingperiod.
DISCUSSIONOur results show significant changes in behavioral responses(accuracy, post-error RT slowing) and both early and later-stageERP indices of task-relevant signal processing as a result of 18sessions of low frequency rTMS treatment course in children withASD.
Participant in TMS group showed decreased amplitude andprolonged latency of parietal P100 and N200 components to allstimuli, more for non-target cues. Parietal P3b ERP componentwas also prolonged without amplitude change in TMS group. Inour prior study (Sokhadze et al., 2009b, 2010a, 2013b) at theparietal and parieto-occipital cortices the autism group showedsignificantly prolonged latency of N100 and reduced amplitudeof N200 to targets as compared to neurotypical controls. Latencyof the P3b was longer to distracters, without any amplitudegroup difference to targets and novels. The ASD group hadprolonged latencies to novels but not to targets, with effectbeing better expressed in the right hemisphere. The resultsindicate the excess of efforts needed for the differentiation oftargets from non-target novels in individuals with ASD. TMStreatment enhanced the process of target recognition during
FIGURE 8 | Changes of Repetitive Behavior Scale (RBS-R) scorespost-TMS/wait-list treatment as compared to baseline levels in twogroups of children with ASD (N = 27/per group). Stereotype Behavior,Ritualistic Behavior and Total RBS scores decreased significantly in the TMSgroup.
FIGURE 9 | Changes of Aberrant Behavior Checklist (ABC) scorespost-TMS/wait-list treatment as compared to baseline levels in twogroups of children with ASD (N = 27/per group). Irritability, Lethargy, andHyperactivity rating scores decreased significantly post-TMS.
performance on task. Especially informative in this regard waspositive change of the frontal P2d difference wave that indi-cates increase of P2a component to target Kanizsa stimuli vs.non-target Kanizsa stimuli, thus reflecting easier discriminationof target features of the stimuli (illusory square vs. illusorytriangle).
In addition, at the same frontal topography N200 componentwas more negative to targets as compared to non-target illu-sory figures and had longer latency resulting in globally highermagnitude of N200 to targets. Following TMS course the N200component at the frontal sites became more negative to targets,and at the same time significantly less negative to both types ofnon-target stimuli. The positive frontal P2a component followed
Frontiers in Systems Neuroscience www.frontiersin.org August 2014 | Volume 8 | Article 134 | 10
Sokhadze et al. TMS improves behavior and ERP in autism
by the negative ERP N200 component (both of them peakingwithin 280–320 post-stimulus) in visual oddball tests tasks areassociated with categorization, perceptual closure and attentionfocusing ultimately signaling that a perceptual representationhas been formed (Potts et al., 2004). This wave is enhanced ifthe presented stimulus contains a feature or attribute definingthe target in the task according to Potts et al. (2004). It wasprevious reported (Sokhadze et al., 2009a; Baruth et al., 2010c)that individuals with ASD as compared to typical controls showedenhanced N200 to task irrelevant as compared to task relevantstimuli, and the finding that N200 became more negative totarget Kanizsa figures and less negative to non-target distracterspost-rTMS treatment indicates a trend to normalization of theresponse pattern pointing at an improved visual signal processingand a more effective discrimination of the target.
The results indicate a reduction of the frontal P3a both totarget and non-target stimuli post-TMS in our ASD patients.In our earlier studies comparing ASD and typical controls wereported that the ASD group showed prolonged N100, P100,and P3b to targets stimuli, emphasizing a change indicative ofabnormalities of sustained attention compared to controls. At thesame time, the ASD group exhibited a prolonged P3a to novels,and this can be considered as a marker of impaired orientationto novelty, and ultimately decreased frontal associative andintegrative functioning. In the current study our results show nodifferences in amplitude, though the latency of the P3a was stilldelayed.
Over-activation in the parietal cortex at the early stages of pro-cessing of non-targets, either standards or infrequent distracters,and at the same time under-activation of integrative frontalregions at the late stages of target processing was found to occurin autism in a similar visual task that was using three-stimuliparadigm with rare novel distracters (Sokhadze et al., 2009b,2010a). Our results in a series of visual oddball tasks indicatedenhanced and prolonged early frontal ERPs and a delayed lateP3a to non-target stimuli, which would suggest low selectivity inpre-processing and at a later stage under-activation of integra-tive regions. Overall, this is an indication of an over-connectednetwork where sensory inputs evoke abnormally large evokedpotentials for unattended stimuli such as frequent standards andrare novel distracters at all stages of visual signal processing withsigns of a reduced selectivity of the activation.
The results of the current study indicate that rTMS mayhave facilitated attention and target discrimination by improvingconflict resolutions during processing task-relevant and task-irrelevant stimuli. The latency of posterior P3b was prolongedto targets but reduced to both non-target Kanzisa and non-Kanizsa stimuli following rTMS. The P3b has been linked to task-relevance and the decision- related character of the stimulus asit indicates memory-updating and individual trial processing clo-sure (Picton, 1992). Earlier we (Sokhadze et al., 2009a,b, 2012b)noted that individuals with autism showed prolonged P300 peakto irrelevant distracters as compared to typical controls, whichwas similar to effects reported by other groups (Courchesne et al.,1989; Townsend et al., 2001). The auditory and visual sensoryinformation processing abnormalities been described in ASD bydifferent researchers (Kemner et al., 1994, 1999; Bomba and Pang,
2004). However, most of these studies analyzed and reportedoutcomes of late cognitive potentials such as centro-parietal P3b(Courchesne et al., 1989; Ciesielski et al., 1990) and frontal P3a(Townsend et al., 2001). There are only a few papers reportingshort latency ERP components’ differences in individuals withautism. Majority of these studies emphasize over-activation aswell as an abnormal pattern of basic perceptual processes suchas low selectivity regardless of modality, abnormal top-downattentional control including delayed attentional orienting tonovel stimuli, and deficits in information integration processes(Belmonte and Yurgelun-Todd, 2003). In typically developingchildren the fronto-central P3a occurs earlier in time as com-pared to parietal P300 (P3b), but in autistic subjects the P3aand P3b components were found to peak almost simultaneouslyover the frontal and parietal sites in a spatial attention test(Townsend et al., 2001). The latency of P3a is thought to beassociated with the speed of attentional orienting to significantnovel stimulus and reflects working memory processes in theprefrontal cortex. Centro-parietal P3b is usually described as acognitive component that indexes context update and closure.This cognitive potential was found to be delayed but was notsignificantly attenuated in the group of children with autism ascompared to typical controls (Sokhadze et al., 2009a,b, 2010a,2012b).
The results of the study may indicate facilitation of visualtarget discrimination processes and enhanced habituation totask-irrelevant distracters post-TMS. We report significantimprovement in the accuracy of MTs, lower total error rateand improved normative post-error RT slowing following 18session long rTMS course. These result support our earlierfindings outlining improvement in attention, executive control,and irrelevant response inhibition post-TMS treatment inautism.
In our initial rTMS pilot studies (Sokhadze et al., 2009b,2010a) we used only six sessions of low frequency rTMS appliedonly to the left DLPFC and assessed behavioral performancein a visual attention task in children with autism. In a verysimilar manner, our current study also found a notable reductionin the frontal N200 and altered latency of the parietal P3bto task-irrelevant stimuli. Additionally, similar to the presentinvestigation we also found a significant reduction in the responseerrors rate following a shorter courses of the prefrontal rTMS(Sokhadze et al., 2009b, 2012a; Baruth et al., 2010a). It mightbe stated that we found even more pronounced changes incognitive ERPs such as P2d, N200and P3b in this study that hadthe greater number of rTMS treatments (18 sessions). In anotherstudy using this time 12 sessions of rTMS we found a significantreduction in repetitive and restricted behavior patterns as wellas a significant reduction in irritability according to clinical andbehavioral questionnaires (Casanova et al., 2012).The results ofcurrent 18 session-long rTMS treatment confirm and expand ourprior findings of reduced repetitive behaviors (Sokhadze et al.,2009a,b, 2010a,b; Baruth et al., 2010b) and irritability (Baruthet al., 2010a,b) following low-frequency rTMS course. It shouldbe noted that we found significant reductions in irritability onlyas a result of 12 sessions of bilateral stimulation (Baruth et al.,2010a), whereas reductions in repetitive behavior have been
Frontiers in Systems Neuroscience www.frontiersin.org August 2014 | Volume 8 | Article 134 | 11
Sokhadze et al. TMS improves behavior and ERP in autism
significant after six sessions of stimulation to the left DLPFC(Sokhadze et al., 2009b, 2010a).
It was a very reasonable decision to select DLPFC as a sitefor rTMS stimulation. The DLPFC processes components ofworking memory, decision making process, and regulates theability to focus attention on task-relevant goals while inhibitingresponses to distracters (Gray et al., 2003; Enriquez-Geppert et al.,2010; Matzel and Kolata, 2010). Suggested disruption in the ratiobetween cortical excitation and inhibition especially within theprefrontal cortex in individuals with autism (Casanova et al.,2002a, 2006a,b) was confirmed in individuals with Asperger syn-drome (Casanova et al., 2002c). Reduced cortical inhibitory toneand an increased E/I ratio could adversely affect patterns of corti-cal activation, possibly resulting in isolated islands of coordinatedexcitatory activity and in a high comorbidity rate of ASD andepilepsy (Tuchman and Rapin, 1997). We believe that a courseof 18 neuromodulatory sessions of low frequency rTMS mayrestore the cortical E/I balance by selective activation of double-bouquet cells at the periphery of cortical minicolumns (Casanovaet al., 2006a,b; Casanova, 2007). It was shown that minicolumnarabnormalities in autism are most significant within the prefrontalcortex, more specifically, the DLPFC and the ACC (Fernandez-Duque et al., 2000; Mesulam, 2000; Casanova et al., 2002b,2006a,b).
Rubenstein and Merzenich (2003) put forward a hypothesisthat at some forms of autism could be caused by a disproportion-ate high level of excitation (E) or disproportionately weak inhi-bition (I) resulting in a high E/I ratio. Cortical circuits with suchenhanced E/I level are proposed to be featured by poor functionaldifferentiation which may lead to broad-ranging abnormalities inperception, memory and cognition, and motor control. Amongother defects, individuals with autism have well known perceptualprocessing abnormalities, including a hypersensitivity to audi-tory, visual and tactile stimulation (Gomot et al., 2002; Plaistedet al., 2003). Studies of perceptual systems in animal modelsmay provide useful insights into mechanisms underlying sensorydisturbances in autism. In particular, investigations of auditorydevelopment in rats using modulated noise manipulation showedthat the representation of sound inputs in the cortex remainspoorly differentiated when the cortex is undergoing develop-ment under very poor signal-to-noise conditions (Chang andMerzenich, 2003). The E/I balance in the cortex is controlled bythe relative numbers and functional activity of glutamatergic andGABA-ergic neurons. Neurodevelopmental abnormalities maylead to increased number, morphology or functional balance ofexcitatory vs. inhibitory neurons and can lead to a hyper-excitablestate typical for autism. Excessive noise in cortical structuresprocessing information also negatively affects development ofnormally differentiated representations. Relatively undifferenti-ated representations of orienting signals or significant stimuliwould result in larger and less selective response. Such over-representation by non-differentiated responses could account forthe strong aversive reactions to auditory, tactile and visual stimulithat are common in autism.
Casanova et al. (2003) study indicated that minicolumns inthe brains of individuals with autism are narrow and have alteredinternal organization. More specifically, their minicolumns have
less peripheral neuropil space, which is the conduit for inhibitorylocal circuit projections. A defect in these GABAergic interneu-rons may correlate with the increased E/I balance and prevalenceof seizures among autistic patients. The authors concluded thatGABAergic interneurons are vital for sensory signal process-ing (e.g., filtering capacity, proper signal discrimination, etc.),thus providing a putative correlate to autistic symptomatol-ogy. As it was noted in a recent review on use of TMS inASD (Oberman et al., 2013), TMS could be particularly infor-mative in detecting abnormalities in E/I ratios in ASD giventheoretical studies regarding role of GABAergic interneurons inautism etiology (Hussman, 2001) and specifically role of highE/I balance in autism (Casanova et al., 2003; Rubenstein andMerzenich, 2003). Our current study is supportive of idea thatrTMS is capable to improve E/I ratio as manifested in electrocor-tical responses to sensory stimulus processing in visual selectiveattention test.
This TMS study was guided by the “minicolumnar” theory ofautism. The hierarchical basis of the modular organization of thecerebral cortex is well recognized in the literature. The cerebralcortex originates during brain development as germinal cells fromthe ventricular and later on the subventricular zones divide asym-metrically and the resulting neuroblasts migrate towards the pialsurface (for review see Casanova and Trippe, 2006). The migrat-ing neuroblasts split the preplate to form the incipient cortexwherein arriving cells acquire an orderly inside-out configurationby using either somal translocation or radial glia projections as ascaffold (Marín-Padilla, 1998). The resulting vertical arrangementof cells within this dynamic system serves as an attractor forsatellite interneurons to populate its peripheral neuropil space.Radially migrating neurons provide for future pyramidal cellswhile those that follow a tangential path, primarily from theganglionic eminences, are destined to be interneurons. Differenttypes of interneurons form dyadic units with pyramidal cells andthe resulting ensemble of cells, along with their afferent/efferentprojections, constitute information processing units better knownas minicolumns (Marin-Padilla, 2010). Recent studies indicatethat higher cognitive functions including our executive functionsderive from the workings of these modules or minicolumns(Opris et al., 2013).
Topographical studies of minicolumnar morphometry in ASDhave shown the greatest deviance from neurotypicals within theprefrontal cortex (Casanova et al., 2002d, 2006a, 2010). Someinvestigators have explained this fact as resulting from the pro-longed maturation time of this structure which thus provides alarger time window of opportunity for exogenous factors to alterits development (Opris and Casanova, 2014). Within the rostralbrain region abnormalities within the DLPFC could serve as apathological correlate to observed executive function deficits inautism (Opris and Casanova, 2014). Given the vertical orientationof inhibitory elements within the periphery of the minicolumns(e.g., double bouquet cells) it has been proposed that rTMS inASD could preferentially help build the inhibitory surround ofthese modular structures. Since the dorsolateral prefrontal cortexhas been a source of significant minicolumnopathy in publishedpostmortem studies it could be viewed as a target for stimula-tion using rTMS (Casanova et al., 2002b, 2012). Furthermore,
Frontiers in Systems Neuroscience www.frontiersin.org August 2014 | Volume 8 | Article 134 | 12
Sokhadze et al. TMS improves behavior and ERP in autism
considering the trans-synaptic effects of rTMS, the large numberof DLPFC connections could provide a therapeutic cascadingeffect in other parts of the brain. In autism computerized imageanalysis suggests the presence of a minicolumnopathy charac-terized by an increased density of modules and a diminutionin their peripheral neuropil space (Casanova et al., 2002a). Thedeficits previously described by our group have been corrobo-rated using a variety of neuronomorphometric techniques (e.g.,Euclidean minimum spanning tree, gray level index), in an inde-pendent sample conducted by an international study where theinvestigators were blind to the study variables, and in the pub-lished results of other investigators (Casanova et al., 2002d, 2006a;Buxhoeveden et al., 2006). The diminished width of the mini-columnar peripheral neuropil space is seen throughout laminaeII-VI, suggesting a deficit of an anatomical element in-commonto all layers (Casanova et al., 2010). Since inhibitory elementspopulate all layers of the lateral compartment of the minicolumnpathology involving these elements could contribute to a deficitin the lateral or peripheral inhibitory surround of these modules.These findings gain credence from EEG recordings using lateralmasking paradigms and threshold studies using flutter stimulithat sustain the presence of a lateral inhibitory deficit in autism(Kéïta et al., 2011; Puts et al., 2014). It is plausible to propose thatlow frequency rTMS is increasing inhibitory tone and improvinglateral inhibition, and this may result in an enhancement ofexecutive functions.
Executive function deficits were always in the center ofattention in autism research. Executive function of behavioralperformance monitoring comprises error detection and responseconflict monitoring, functions that can be measured usingresponse-locked ERPs such as ERN and Pe (Gehring et al., 1993;Carter et al., 1998; Van Veen and Carter, 2002; Mars et al., 2005;Arbel and Donchin, 2009, 2011). The ERN is a well-studiedcomponent whose parameters were investigated under differentexperimental task conditions, and its ties to error processinghave been well established (Carter et al., 1998; Falkenstein et al.,2000; Gehring and Knight, 2000; Van Veen and Carter, 2002).There is an increased number of research studies examining ERNduring commission errors in children (Davies et al., 2004). It isestablished that executive functions normally improve with age(Huizinga et al., 2006) along with demonstration that the ACC,which is now associated with executive performance monitoring,undergoes important maturation changes from childhood intoadolescence, and then into adulthood (Arbel and Donchin, 2009,2011). Furthermore, the studying error processing maturationcan be used to understand mechanisms of various neurodevel-opmental disorders, such as ADHD and ASD, which featureimpairments in execute control (Liotti et al., 2005; Vlamingset al., 2008; Zhang et al., 2009; Sokhadze et al., 2010b). TheERN abnormalities are interpreted as reflecting early error pro-cessing impairments. A number of studies have investigated thefunctional relationship between the ERN and the fronto-centralstimulus-locked N200, while some suggest that they representdistinct neurophysiological processes (Ridderinkhof et al., 2004),others suggest they represent different time points of the sameprocess of response conflict monitoring (Yeung and Cohen,2006).
One of the most important findings of current study wasreplication of the increase of ERN amplitude and shortenedlatency post-TMS reported in previous study using 12 sessionsof rTMS (Sokhadze et al., 2012a). In accord with our previousstudy (Sokhadze et al., 2012a), the Pe component did not changepost-TMS. This component has a more posterior topography andis expressed as a positivity elicited after the ERN (Falkensteinet al., 2000; Nieuwenhuis et al., 2001; Overbeek et al., 2005).In our earlier study with rTMS application in ASD (Sokhadzeet al., 2009a,b, 2010a; Baruth et al., 2010c) we found that mostof EEG changes such as ERP and evoked EEG gamma frequencyoscillations occurred at the early stages of visual stimulus process-ing (e.g., less than 200 ms post-stimulus), and resulted in a betterdiscrimination of target from non-target stimuli. Facilitation oftarget recognition following TMS treatment and more effectiveearly inhibition of non-target distracters leads to less pronouncedcarryover of non-target over-processing. We suggested earlier thatmore expressed positive neuromodulation effects in the earlyERPs rather than in the late ERPs might be due to enhancedsuppression of task- irrelevant stimuli and less effortful dis-crimination of targets from non-targets during attention taskperformance.
One more critical methodological issue to be considered inabsence of significant TMS effects on Pe in autism might berelated to the number of commission errors as this measuredepends on the actual number of committed errors (Frankenet al., 2007). It is feasible to suggest that the magnitude of thePe was affected by the reduced number of commission errors inactive TMS group. Our prior investigation of ERN/Pe complexin autism (Sokhadze et al., 2010b) also did show Pe differencesbetween ASD and typical children on the similar visual odd-ball task, but these differences were found only in a form of asignificantly prolonged latency of the Pe in ASD group. There is apossibility of a dissociation of ERN and Pe effects since generationof Pe wave might be affected by the absence of feedback aboutthe accuracy of the MR resulting in that lower awareness of error(Hewig et al., 2011).
In general, our findings are in concordance with a recentreview of rTMS applications in autism research and treatment(Oberman et al., 2010, 2013). In that review the authors con-cluded that, though results of published studies are promisingsuggesting that specific rTMS protocols (Enticott et al., 2010,2012, 2013; Fecteau et al., 2011) targeting selected regions ofcortex may lead to improvement in behavioral deficits in someindividuals with ASD, the therapeutic results have been still ofpreliminary character and additionally, the large-scale, controlledtrials necessary to establish the safety and efficacy these neu-romodulation protocols have to be conducted (Oberman et al.,2010, 2013).
Some limitations to the study should be taken into account.It is often reported in rTMS studies that effects of magneticstimulation usually do not wash out in approximately one week.We believe that switching to once per week session regimen,(e.g., Casanova et al., 2012; Sokhadze et al., 2012a) improvedour protocol and resulted in better clinical outcome measures.Probably the length of staying in the rTMS treatment rather thanintensity is one of the main keys of behavioral and electrocrtical
Frontiers in Systems Neuroscience www.frontiersin.org August 2014 | Volume 8 | Article 134 | 13
Sokhadze et al. TMS improves behavior and ERP in autism
improvements that we observe in our later rTMS trials in ASD(Baruth et al., 2010b, 2011; Sokhadze et al., 2010a, 2012a;Casanova et al., 2012). It should be recognized that the power(90%) and schedule (number of magnetic pulses delivered pereach session, 10–20 s break between trains, etc.) of our rTMSis relatively lower than those used by other TMS treatment pro-tocols. However, it must be mentioned that other known TMSprotocols were targeting psychopathologies such as treatment-resistant major depression, or neurological disorders such as forinstance Parkinson disease in adults. One more limitation of thestudy is the use a waiting-list group as a control group ratherthan using a randomized clinical trial (RCT) design with a shamrTMS condition. Even though our group has a custom-madesham Magstim TMS coil and interface enabling blinding of TMSdelivery, we considered this study as a preliminary pilot with aWTL group design, and plan to consider progression to a RCTdesign on the future stages. It is possible to consider as a limita-tion also the difficulty of proving in non-invasive human brainresearch that low frequency rTMS is activating primarily double-bouquet inter-neurons. We hope that future neurophysiologicalstudies on animal models would be able to find support for ourhypothesis.
In conclusion, the study showed that treatment with “slow”rTMS improved ERP indices of attention to targets, reduced over-reactivity to non-targets, significantly reduced MT errors to targetstimuli, and enhanced response-locked potentials reflective oferror monitoring and correction (e.g., ERN to commission errors,post-error RT slowing, etc). We also found significant reductionsin both repetitive and stereotypic behaviors, reduced repeti-tive behaviors, hyperactivity and irritability scores according tosocial and behavioral clinical evaluations post-TMS. We considerthat it is possible to conclude that neuromodulation using lowfrequency, inhibitory rTMS improved executive functioning andbehavior in autism. This study provides further support to thestatement that TMS can be regarded as a perspective treatmenttargeting core symptoms of ASD such as executive functiondeficits.
ACKNOWLEDGMENTSThe study was partially supported by National Institutes of HealthEureka R01 grant MH86784 to Manuel F. Casanova.
REFERENCESAman, M. G. (2004). Management of hyperactivity and other acting out problems
in patients with autism spectrum disorder. Semin. Pediatr. Neurol. 11, 225–228.doi: 10.1016/j.spen.2004.07.006
Aman, M. G., and Singh, N. N. (1994). Aberrant Behavior Checklist—Community.Supplementary Manual. East Aurora, NY: Slosson Educational Publications.
American Psychiatric Association. (2000). Diagnostic and Statistical Manual ofMental Disorders (DSM-IV TR). 4th Edn. Washington, DC: American Psychi-atric Association.
American Psychiatric Association. (2013). Diagnostic and Statistical Manual ofMental Disorders (DSM-V). 5th Edn. Washington, DC: American PsychiatricAssociation.
Arbel, Y., and Donchin, E. (2009). Parsing the componential structure of post-errorERPs: a principal component analysis of ERPs following errors. Psychophysiology46, 1179–1189. doi: 10.1111/j.1469-8986.2009.00857.x
Arbel, Y., and Donchin, E. (2011). When a child errs: the ERN and the Pe complex.Psychophysiology 48, 55–63. doi: 10.1111/j.1469-8986.2010.01042.x
Baruth, J., Casanova, M. F., El-Baz, A., Horrell, T., Mathai, G., Sears, L., et al.(2010a). Low-frequency repetitive transcranial magnetic stimulation modulatesevoked-gamma frequency oscillations in autism spectrum disorders. J. Neu-rother. 14, 179–194. doi: 10.1080/10874208.2010.501500
Baruth, J., Casanova, M. F., Sears, L., and Sokhadze, E. (2010c). Early-stage visualprocessing abnormalities in high-functioning autism spectrum disorder (ASD).Transl. Neurosci. 1, 177–187. doi: 10.2478/v10134-010-0024-9
Baruth, J., Williams, E., Sokhadze, E., El-Baz, A., Sears, L., and Casanova, M. F.(2011). Repetitive transcranial stimulation (rTMS) improves electroencephalo-graphic and behavioral outcome measures in autism spectrum disorders (ASD).Autism Sci. Digest. 1, 52–57.
Baruth, J., Sokhadze, E., El-Baz, A., Mathai, G., Sears, L., and Casanova, M. F.(2010b). “Transcaranial magentic stimulation as a treatment for autism,” inCutting Edge Therapies for Autism, eds K. Siri and T. Lyons (New York: SkyhorsePublishing), 388–397.
Belmonte, M. K., and Yurgelun-Todd, D. A. (2003). Functional anatomy ofimpaired selective attention and compensatory processing in autism. Brain Res.Cogn. Brain Res. 17, 651–664. doi: 10.1016/s0926-6410(03)00189-7
Bodfish, J. W., Symons, F. J., and Lewis, M. H. (1999). Repetitive Behavior Scale.Morganton, NC: Western Carolina Center Research Reports.
Bodfish, J. W., Symons, F. S., Parker, D. E., and Lewis, M. H. (2000). Varieties ofrepetitive behavior in autism: comparisons to mental retardation. J. Autism Dev.Disord. 30, 237–243. doi: 10.1023/A:1005596502855
Bomba, M. D., and Pang, E. W. (2004). Cortical auditory evoked potentials inautism: a review. Int. J. Psychophysiol. 53, 161–169. doi: 10.1016/j.ijpsycho.2004.04.001
Buxhoeveden, D. P., Semendeferi, K., Buckwalter, J., Schenker, N., Switser, R., andCourchesne, E. (2006). Reduced minicolumns in the frontal cortex of patientswith autism. Neuropathol. Appl. Neurobiol. 32, 483–491. doi: 10.1111/j.1365-2990.2006.00745.x
Carter, C. S., Braver, T. S., Barch, D. M., Botvinick, M. M., Noll, D., andCohen, J. D. (1998). Anterior cingulate cortex, error detection and the onlinemonitoring of performance. Science 280, 747–749. doi: 10.1126/science.280.5364.747
Casanova, M. F. (2005). “Minicolumnar pathology in autism,” in Recent Devel-opments in Autism Research, ed M. F. Casanova (New York: Nova BiomedicalBooks), 133–144.
Casanova, M. F. (2007). The neuropathology of autism. Brain Pathol. 17, 422–433.doi: 10.1111/j.1750-3639.2007.00100.x
Casanova, M. F., Baruth, J., El-Baz, A., Tasman, A., Sears, L., and Sokhadze, E.(2012). Repetitive transcranial magnetic stimulation (rTMS) modulates event-related potential (ERP) indices of attention in autism. Transl. Neurosci. 3, 170–180. doi: 10.2478/s13380-012-0022-0
Casanova, M. F., Buxhoeveden, D. P., and Brown, C. (2002a). Clinical and macro-scopic correlates of minicolumnar pathology in autism. J. Child Neurol. 17, 692–695. doi: 10.1177/088307380201700908
Casanova, M. F., Buxhoeveden, D. P., Switala, A. E., and Roy, E. (2002b).Minicolumnar pathology in autism. Neurology 58, 428–432. doi: 10.1212/wnl.58.3.428
Casanova, M. F., Buxhoeveden, D. P., Switala, A. E., and Roy, E. (2002c). Asperger’ssyndrome and cortical neuropathology. J. Child Neurol. 17, 142–145. doi: 10.1177/088307380201700211
Casanova, M. F., Buxhoeveden, D. P., Switala, A. E., and Roy, E. (2002d). Neuronaldensity and architecture (Gray Level Index) in the brains of autistic patients.J. Child Neurol. 17, 515–521. doi: 10.1177/088307380201700708
Casanova, M. F., Buxhoeveden, D., and Gomez, J. (2003). Disruption in theinhibitory architecture of the cell minicolumn: implications for autism. Neu-roscientist 9, 496–507. doi: 10.1177/1073858403253552
Casanova, M. F., El-Baz, A. S., Kamat, S. S., Dombroski, B. A., Khalifa, F., Elnakib,A., et al. (2013). Focal cortical displasias in autism spectrum disorders. ActaNeuropathol. Commun. 1:67. doi: 10.1186/2051-5960-1-67
Casanova, M. F., El-Baz, A. S., Vanbogaert, E., Narahari, P., and Switala, A. (2010).A topographical study of minicolumnar core width by lamina comparisonbetween autistic subjects and controls: posible minicolumnar disruption dueto an anatomical element in-common to multiple laminae. Brain Pathol. 20,451–458. doi: 10.1111/j.1750-3639.2009.00319.x
Casanova, M. F., and Trippe, J. (2006). Regulatory mechanisms of cortical lam-inar development. Brain Res. Rev. 51, 72–84. doi: 10.1016/j.brainresrev.2005.10.002
Frontiers in Systems Neuroscience www.frontiersin.org August 2014 | Volume 8 | Article 134 | 14
Sokhadze et al. TMS improves behavior and ERP in autism
Casanova, M. F., van Kooten, I., Switala, A. E., van England, H., Heinsen, H.,Steinbuch, H. W. M., et al. (2006a). Abnormalities of cortical minicolumnarorganization in the prefrontal lobes of autistic patients. Clin. Neurosci. Res. 6,127–133. doi: 10.1016/j.cnr.2006.06.003
Casanova, M. F., van Kooten, I. A., van Engeland, H., Heinsen, H., Steinbursch,H. W. M., Hof, P. R., et al. (2006b). Minicolumnar abnormalities in autism. ActaNeuropathol. 112, 287–303. doi: 10.1007/s00401-006-0085-5
Chang, E., and Merzenich, M. M. (2003). Environmental noise retards auditorycortical development. Science 300, 498–502. doi: 10.1126/science.1082163
Ciesielski, K. T., Courchesne, E., and Elmasian, R. (1990). Effects of focusedattention tasks on event-related potentials in autistic and normal individ-uals. Electroencephalogr. Clin. Neurophysiol. 75, 207–220. doi: 10.1016/0013-4694(90)90174-i
Clark, V. P., Fan, S., and Hillyard, S. A. (1994). Identification of early visual evokedpotential generators by retinotopic and topographic analyses. Hum. Brain Mapp.2, 170–187. doi: 10.1002/hbm.460020306
Clemans, Z., Sokhadze, E., and El-Baz, A. S. (2011b). “A custom-made Matlabprogram for ERP feature detection in psychological and physiological disordersusing wavelet,” in Presented at Research Louisville (Louisville, KY).
Clemans, Z., Sokhadze, T., and El-Baz, A. (2011a). “Custom program for extractionof event-related potential peaks in attention tasks,” in Presented at ResearchLouisville (Louisville, KY).
Coles, M. G. H., and Rugg, M. D. (1995). “Event-related brain potentials: anintroduction,” in Electrophysiology of Mind. Event-Related Brain Potentials andCognition, ed M. D. Rugg and M. G. H. Coles (Oxford: Oxford University Press),1–26.
Courchesne, E., Lincoln, A. J., Yeung-Courchesne, R., Elmasian, R., and Grillon, C.(1989). Pathophysiologic findings in nonretarded autism and receptive develop-mental disorder. J. Autism Dev. Disord. 19, 1–17. doi: 10.1007/bf02212714
Daskalakis, Z. J., Christensen, B. K., Fitzgerald, P. B., and Chen, R. (2002).Transcranial magnetic stimulation: a new investigational and treatment tool inpsychiatry. J. Neuropsychiatry Clin. Neurosci. 14, 406–415. doi: 10.1176/appi.neuropsych.14.4.406
Davies, P. L., Segalowitz, S. J., and Gavin, W. J. (2004). Development of response-monitoring ERPs in 7- to 25-year-olds. Dev. Neuropsychol. 25, 355–376. doi: 10.1207/s15326942dn2503_6
DeFelipe, J. (1999). Chandelier cells and epilepsy. Brain 122, 1807–1822. doi: 10.1093/brain/122.10.1807
DeFelipe, J. (2004). Cortical microanatomy and human brain disorders: epilepsy.Cortex 40, 232–233. doi: 10.1016/s0010-9452(08)70962-6
Donkers, F. C. L., and van Boxtel, G. J. M. (2004). The N2 in go/no-go tasks reflectsconflict monitoring not response inhibition. Brain Cogn. 56, 165–176. doi: 10.1016/j.bandc.2004.04.005
Eichele, T., Specht, K., Moosmann, M., Jongsma, M. L., Quiroga, R. Q., Nordby,H., et al. (2005). Assessing the spatiotemporal evolution of neuronal activationwith single-trial event-related potentials and functional MRI. Proc. Natl. Acad.Sci. U S A 102, 17798–17803. doi: 10.1073/pnas.0505508102
Enriquez-Geppert, S., Konrad, C., Pantev, C., and Huster, R. J. (2010). Conflict andinhibition differentially affect the N200/P300 complex in a combined go/nogoand stop-signal task. Neuroimage 51, 877–887. doi: 10.1016/j.neuroimage.2010.02.043
Enticott, P. G., Kennedy, H. A., Rinehart, N. J., Tonge, B. J., Bradshaw, J. L.,and Fitzgerald, P. B. (2013). GABAergic activity in autism spectrum disorders:an investigation of cortical inhibition via transcranial magnetic stimulation.Neuropharmacology 68, 202–209. doi: 10.1016/j.neuropharm.2012.06.017
Enticott, P. G., Rinehart, N. J., Tonge, B. J., Bradshaw, J. L., and Fitzgerald,P. B. (2010). A preliminary transcranial magnetic stimulation study of corticalinhibition and excitability in high-functioning autism and Asperger disorder.Dev. Med. Child Neurol. 52, e179–e183. doi: 10.1111/j.1469-8749.2010.03665.x
Enticott, P. G., Rinehart, N. J., Tonge, B. J., Bradshaw, J. L., and Fitzgerald,P. B. (2012). Repetitive transcranial magnetic stimulation (rTMS) improvesmovement-related cortical potentials in autism spectrum disorders. BrainStimul. 5, 30–37. doi: 10.1016/j.brs.2011.02.001
Falkenstein, M., Hoormann, J., Christ, S., and Hohnsbein, J. (2000). ERP com-ponents on reaction errors and their functional significance: a tutorial. Biol.Psychol. 51, 87–107. doi: 10.1016/s0301-0511(99)00031-9
Favorov, O. V., and Kelly, D. G. (1994a). Minicolumnar organization withinsomatosensory cortical segregates, I: development of afferent connections.Cereb. Cortex 4, 408–427. doi: 10.1093/cercor/4.4.408
Favorov, O. V., and Kelly, D. G. (1994b). Minicolumnar organization withinsomatosensory cortical segregates, II: emergent functional properties. Cereb.Cortex 4, 428–442. doi: 10.1093/cercor/4.4.428
Fecteau, S., Agosta, S., Oberman, L., and Pascual-Leone, A. (2011). Brain stimu-lation over Broca’s area differentially modulates naming skills in neurotypicaladults and individuals with Asperger’s syndrome. Eur. J. Neurosci. 34, 158–164.doi: 10.1111/j.1460-9568.2011.07726.x
Fernandez-Duque, D., Baird, J. A., and Posner, M. I. (2000). Executive attentionand metacognitive regulation. Conscious. Cogn. 9, 288–307. doi: 10.1006/ccog.2000.0447
Fletcher, E. M., Kussmaul, C. L., and Mangun, G. R. (1996). Estimation ofinterpolation errors in scalp topographic mapping. Electroctoencephalogr.Clin. Neurophysiol. 98, 422–434. doi: 10.1016/0013-4694(96)95135-4
Folstein, J. R., van Petten, C., and Rose, S. A. (2008). Novelty and conflict in thecategorization of complex stimuli. Psychophysiology 45, 467–479. doi: 10.1111/j.1469-8986.2007.00628.x
Franken, I. H., van Strien, J. W., Franzek, E. J., and van de Wetering, B. J. (2007).Error-processing deficits in patients with cocaine dependence. Biol. Psychol. 75,45–51. doi: 10.1016/j.biopsycho.2006.11.003
Friedman, D., Simpson, G. V., and Hamberger, M. (1993). Age-related changesin scalp topography to novel and target stimuli. Psychophysiology 30, 383–396.doi: 10.1111/j.1469-8986.1993.tb02060.x
Frye, R. E., Rotenberg, A., Ousley, M., and Pascual-Leone, A. (2008). Transcranialmagnetic stimulation in child neurology: current and future direction. J. ChildNeurol. 23, 79–96. doi: 10.1177/0883073807307972
Gehring, W. J., Goss, B., Coles, M. G. H., Meyer, D. E., and Donchin, E. (1993).A neural system for error detection and compensation. Psychol. Sci. 4, 385–390.doi: 10.1111/j.1467-9280.1993.tb00586.x
Gehring, W. J., and Knight, R. T. (2000). Prefrontal-cingulate interactions in actionmonitoring. Nat. Neurosci. 3, 516–520. doi: 10.1038/74899
Gershon, A. A., Dannon, P. N., and Grunhaus, L. (2003). Transcranial magneticstimulation in the treatment of depression. Am. J. Psychiatry 160, 835–845.doi: 10.1176/appi.ajp.160.5.835
Gomes, E., Pedroso, F. S., and Wagner, M. B. (2008). Auditory hypersensitivityin the autistic spectrum disorder. Pro Fono 20, 279–284. doi: 10.1590/s0104-56872008000400013
Gomot, M., Giard, M. H., Adrien, J. L., Barthelemy, C., and Bruneau, N. (2002).Hypersensitivity to acoustic change in children with autism: electrophysiologicalevidence of left frontal cortex dysfunctioning. Psychophysiology 39, 577–584.doi: 10.1111/1469-8986.3950577
Gray, J. R., Chabris, C. F., and Braver, T. S. (2003). Neural mechanisms of generalfluid intelligence. Nat. Neurosci. 6, 316–322. doi: 10.1038/nn1014
Greenberg, B. D. (2007). “Transcranial magnetic stimulation in anxiety disorders,”in Transcranial Magnetic Stimulation in Clinical Psychiatry, ed M. S. Georgeand R. H. Belmaker (Washington, DC: American Psychiatric Publishing, Inc.),165–178.
Harris, K. D., and Thiele, A. (2011). Cortical state and attention. Nat. Rev. Neurosci.12, 509–523. doi: 10.1038/nrn3084
Herrmann, C. S., and Knight, R. T. (2001). Mechanisms of human attention: eventrelated potentials and oscillations. Neurosci. Biobehav. Rev. 25, 465–476. doi: 10.1016/s0149-7634(01)00027-6
Hewig, J., Coles, M. G. H., Trippe, R. H., Hecht, H., and Miltner, W. H. R.(2011). Dissociation of Pe and ERN/Ne in the conscious recognition ofan error. Psychophysiology 48, 1390–1396. doi: 10.1111/j.1469-8986.2011.01209.x
Hillyard, S. A., and Annlo-Vento, L. (1998). Event-related brain potentials in thestudy of visual selective attention. Proc. Natl. Acad. Sci. U S A 95, 781–787.doi: 10.1073/pnas.95.3.781
Hoffman, R. E., and Cavus, I. (2002). Slow transcranial magnetic stimulation, long-term depotentiation and brain hyperexcitability disorders. Am. J. Psychiatry 159,1093–1102. doi: 10.1176/appi.ajp.159.7.1093
Huizinga, M., Dolan, C. V., and Van Der Molen, M. W. (2006). Age-relatedchange in executive function: developmental trends and a latent variable anal-ysis. Neuropsychologia 44, 2017–2036. doi: 10.1016/j.neuropsychologia.2006.01.010
Hussman, J. P. (2001). Suppressed GABAergic inhibition as a common factor insuspected etiologies of autism. J. Autism Dev. Disord. 31, 247–248. doi: 10.1023/A:1010715619091
Frontiers in Systems Neuroscience www.frontiersin.org August 2014 | Volume 8 | Article 134 | 15
Sokhadze et al. TMS improves behavior and ERP in autism
Jeste, S. S., and Nelson, C. A. 3rd. (2009). Event related potentials in the understand-ing of autism spectrum disorders: an analytical review. J. Autism Dev. Disord. 39,495–510. doi: 10.1007/s10803-008-0652-9
Kanizsa, G. (1976). Subjective contours. Sci. Am. 235, 48–52. doi: 10.1038/scientificamerican0476-48
Kéïta, L., Mottron, L., Dawson, M., and Bertone, A. (2011). Atypical lateralconnectivity: a neural basis for altered visuospatial processing in autism. Biol.Psychiatry 70, 806–811. doi: 10.1016/j.biopsych.2011.07.031
Kemner, C., van der Gaag, R. J., Verbaten, M., and van Engeland, H. (1999).ERP differences among subtypes of pervasive developmental disorders. Biol.Psychiatry 46, 781–789. doi: 10.1016/s0006-3223(99)00003-7
Kemner, C., Verbaten, M. N., Cuperus, J. M., Camfferman, G., and Van Engeland,H. (1994). Visual and somatosensory event-related brain potentials in autisticchildren and three different control groups. Electroencephalogr. Clin. Neurophys-iol. 92, 225–237. doi: 10.1016/0168-5597(94)90066-3
Kenemans, J. L., Kok, A., and Smulders, F. T. (1993). Event-related potentials toconjunctions of spatial frequency and orientation as a function of stimulusparameters and response requirements. Electroencephalogr. Clin. Neurophysiol.88, 51–63. doi: 10.1016/0168-5597(93)90028-n
Le Couteur, A., Lord, C., and Rutter, M. (2003). The Autism Diagnostic Interview—Revised (ADI-R). Los Angeles, CA: Western Psychological Services.
Liotti, M., Pliszka, S., Perez, R., Kothmann, D., and Woldorff, M. (2005). Abnormalbrain activity related to performance monitoring and error detection in childrenwith ADHD. Cortex 41, 377–388. doi: 10.1016/s0010-9452(08)70274-0
Loo, C. K., and Mitchell, P. B. (2005). A review of the efficacy of transcranialmagnetic stimulation (TMS) treatment for depression and current and futurestrategies to optimize efficacy. J. Affect. Disord. 88, 255–267. doi: 10.1016/j.jad.2005.08.001
Luck, S. J., Heinze, H. J., Mangun, G. R., and Hillyard, S. A. (1990). Visual event-related potentials index focused attention within bilateral stimulus arrays. ii.Functional dissociation of P1 and N1 components. Electroencephalogr. Clin.Neurophysiol. 75, 528–542. doi: 10.1016/0013-4694(90)90139-b
Luu, P., Tucker, D. M., Englander, R., Lockfeld, A., Lutsep, H., and Oken, B. (2001).Localizing acute stroke-related EEC changes: assessing the effects of spatialundersampling. J. Clin. Neurophysiol. 18, 302–317. doi: 10.1097/00004691-200107000-00002
Maeda, F., Keenan, J. P., Tormos, J. M., Topka, H., and Pascual-Leone, A.(2000). Modulation of corticospinal excitability by repetitive transcranialmagnetic stimulation. Clin. Neurophysiol. 111, 800–805. doi: 10.1016/s1388-2457(99)00323-5
Marín-Padilla, M. (1998). Cajal-Retzius cells and the development of the neocortex.Trends Neurosci. 21, 64–71. doi: 10.1016/s0166-2236(97)01164-8
Marin-Padilla, M. (2010). The Human Brain: Prenatal Development and Structure.New York: Springer.
Mars, R. B., Coles, M. G. H., Grol, M. J., Holroyd, C. B., Nieuwenhuis, S., Hulstijn,W., et al. (2005). Neural dynamics of error processing in medial frontal cortex.Neuroimage 28, 1007–1013. doi: 10.1016/j.neuroimage.2005.06.041
Matzel, L. D., and Kolata, S. (2010). Selective attention, working memory andanimal intelligence. Neurosci. Biobehav. Rev. 34, 23–30. doi: 10.1016/j.neubiorev.2009.07.002
Mesulam, M. M. (2000). “Behavioral neuroanatomy: large-networks, associationcortex, frontal syndromes, the limbic system and hemispheric specializations,”in Principles of Behavioral and Cognitive Neurology, ed M. M. Mesulam 2nd Edn.(New York: Oxford University Press), 1–120.
Mountcastle, V. B. (2003). Introduction. Computation in cortical columns. Cereb.Cortex 13, 2–4.
Murphy, K. R., and Myors, B. (2004). Statistical Power Analysis. A Simple andGeneral Model for Traditional and Modern Hypothesis Tests. 2nd Edn. Mahwah,NJ: Lawrence Erlbaum Associates.
Näätänen, R., Gaillard, A. W. K., and Mäntysalo, S. (1978). Early selective atten-tion effect on evoked potential reinterpreted. Acta Psychol.(Amst) 42, 313–329.doi: 10.1016/0001-6918(78)90006-9
Näätänen, R., Schröge, E., Karakas, S., Tervaniemi, M., and Paavilainen, P. (1993).Development of a memory trace for a complex sound in the human brain.Neuroreport 4, 503–506. doi: 10.1097/00001756-199305000-00010
Nieuwenhuis, S., Ridderinkhof, K. R., Blom, J., Band, G. P., and Kok, A. (2001).Error-related brain potentials are differentially related to awareness of responseerrors: evidence from an antisaccade task. Psychophysiology 38, 752–760. doi: 10.1111/1469-8986.3850752
Oberman, L., Ifert-Miller, F., Najib, U., Bashir, S., Woollacott, I., Gonzalez-Heydrich, J., et al. (2010). Transcranial magnetic stimulation provides means toassess cortical plasticity and excitability in humans with fragile X syndrome andautism spectrum disorder. Front. Sys. Neurosci. 2:26. doi: 10.3389/fnsyn.2010.00026
Oberman, L., Rotenberg, A., and Pascual-Leone, A. (2013). Use of transcranialmagnetic stimulation in autism spectrum disorders. J. Autism Dev. Disord.doi: 10.1007/s10803-013-1960-2. [Epub ahead of print].
Oblak, A. L., Gibbs, T. T., and Blatt, G. L. (2010). Decreased GABA(B) receptorsin the cingulate cortex and fusiform gyrus in autism. J. Neurochem. 114,1414–1423. doi: 10.1111/j.1471-4159.2010.06858.x
Opris, I., and Casanova, M. F. (2014). Prefrontal cortical minicolumn: from exec-utive control to disrupted cognitive processing. Brain 137, 1863–1875. doi: 10.1093/brain/awt359
Opris, I., Santos, L., Gerhardt, G. A., Song, D., Berger, T. W., Hampson, R. E., et al.(2013). Prefrontal cortical microcircuits bind perception to executive control.Sci. Rep. 3:2285. doi: 10.1038/srep02285
Overbeek, T. J. M., Nieuwenhuis, S., and Ridderinkhof, K. R. (2005). Dissocia-ble components of error processing. J. Psychophysiol. 19, 319–329. doi: 10.1027/0269-8803.19.4.319
Pascual-Leone, A., Davey, N. J., Rothwell, J., Wasserman, E. M., and Puri, B. K.(2002). Handbook of Transcranial Magnetic Stimulation. New York: OxfordUniversity Press.
Pascual-Leone, A., Valls-Sole, J., Wasserman, E. M., and Hallett, M. (1994).Responses to rapid-rate transcranial magnetic stimulation of the human cortex.Brain 117, 847–858. doi: 10.1093/brain/117.4.847
Pascual-Leone, A., Walsh, V., and Rothwell, J. (2000). Transcranial magneticstimulation in cognitive neuroscience—virtual lesion, chronometry and func-tional connectivity. Curr. Opin. Neurobiol. 10, 232–237. doi: 10.1016/s0959-4388(00)00081-7
Perrin, E., Pernier, J., Bertrand, O., Giard, M., and Echallier, J. F. (1987). Mappingof scalp potentials by surface spline interpolation. Electroencephalogr. Clin.Neurophysiol. 66, 75–81. doi: 10.1016/0013-4694(87)90141-6
Picton, T. W. (1992). The P300 wave of the human event-related potential. J. Clin.Neurophysiol. 9, 456–479. doi: 10.1097/00004691-199210000-00002
Pinto, L., Goard, M. J., Estandian, D., Xu, M., Kwan, A. C., Lee, S. H., et al. (2013).Fast modulation of visual perception by basal forebrain cholinergic neurons.Nat. Neurosci. 16, 1857–1863. doi: 10.1038/nn.3552
Plaisted, K., Saksida, L., Alcantara, J., and Weisblatt, E. (2003). Towards an under-standing of the mechanisms of weak central coherence effects: experiments invisual configural learning and auditory perception. Philos. Trans. R. Soc. Lond. BBiol. Sci. 358, 375–386. doi: 10.1098/rstb.2002.1211
Polich, J. (2003). “Theoretical overview of P3a and P3b,” in Detection of Change.Event-Related Potential and fMRI Findings, ed J. Polich (Boston: Kluwer Aca-demic Press), 83–98.
Polich, J. (2007). Updating P300: an integrative theory of P3a and P3b. J. Clin.Neurophysiol. 118, 2128–2148. doi: 10.1016/j.clinph.2007.04.019
Potts, G. F., Dien, J., Harty-Speiser, A., McDougl, L. M., and Tucker, D. M. (1998).Dense sensor array topography of the event-related potential to task-relevantauditory stimuli. Electroencephalogr. Clin. Neurophysiol. 106, 444–456. doi: 10.1016/s0013-4694(97)00160-0
Potts, G. F., Liotti, M., Tucker, D. M., and Posner, M. I. (1996). Frontal andinferior temporal cortical activity in visual target detection: evidence fromhigh spatially sampled event-related potentials. Brain Topogr. 9, 3–14. doi: 10.1007/bf01191637
Potts, G. F., Patel, S. H., and Azzam, P. N. (2004). Impact of instructed relevance onthe visual ERP. Int. J. Psychophysiol. 52, 197–209. doi: 10.1016/j.ijpsycho.2003.10.005
Potts, G. F., Wood, S. M., Kothmann, D., and Martin, L. E. (2008). Parallelperceptual enhancement and hierarchic relevance evaluation in an audio-visualconjunction task. Brain Res. 1236, 126–139. doi: 10.1016/j.brainres.2008.07.104
Pritchard, W. S. (1981). Psychophysiology of P300. Psychol. Bull. 89, 506–540.doi: 10.1037/0033-2909.89.3.506
Puts, N. A., Wodka, E. L., Tommerdahl, M., Mostofsky, S. H., and Edden, R. A.(2014). Impaired tactile processing in children with autism spectrum disorder.J. Neurophysiol. 111, 1803–1811. doi: 10.1152/jn.00890.2013
Renart, A., de la Rocha, J., Bartho, P., Hollender, L., Parga, N., Reyes, A., et al.(2010). The asynchronous state in cortical circuits. Science 327, 587–590. doi: 10.1126/science.1179850
Frontiers in Systems Neuroscience www.frontiersin.org August 2014 | Volume 8 | Article 134 | 16
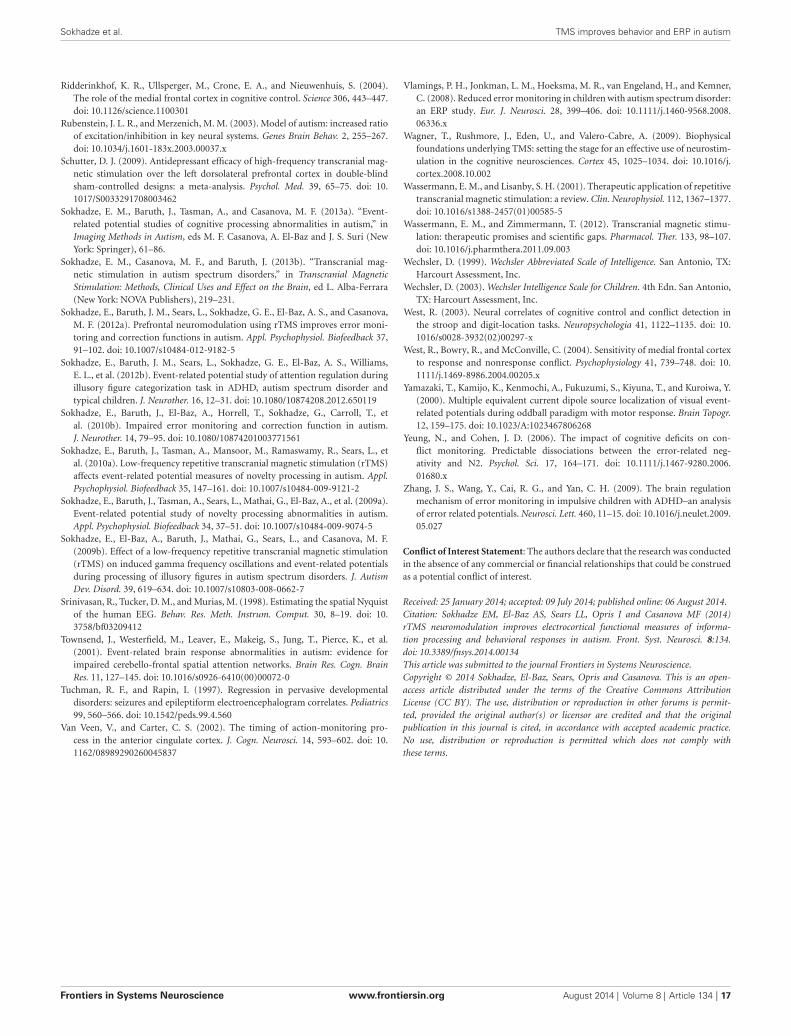
Sokhadze et al. TMS improves behavior and ERP in autism
Ridderinkhof, K. R., Ullsperger, M., Crone, E. A., and Nieuwenhuis, S. (2004).The role of the medial frontal cortex in cognitive control. Science 306, 443–447.doi: 10.1126/science.1100301
Rubenstein, J. L. R., and Merzenich, M. M. (2003). Model of autism: increased ratioof excitation/inhibition in key neural systems. Genes Brain Behav. 2, 255–267.doi: 10.1034/j.1601-183x.2003.00037.x
Schutter, D. J. (2009). Antidepressant efficacy of high-frequency transcranial mag-netic stimulation over the left dorsolateral prefrontal cortex in double-blindsham-controlled designs: a meta-analysis. Psychol. Med. 39, 65–75. doi: 10.1017/S0033291708003462
Sokhadze, E. M., Baruth, J., Tasman, A., and Casanova, M. F. (2013a). “Event-related potential studies of cognitive processing abnormalities in autism,” inImaging Methods in Autism, eds M. F. Casanova, A. El-Baz and J. S. Suri (NewYork: Springer), 61–86.
Sokhadze, E. M., Casanova, M. F., and Baruth, J. (2013b). “Transcranial mag-netic stimulation in autism spectrum disorders,” in Transcranial MagneticStimulation: Methods, Clinical Uses and Effect on the Brain, ed L. Alba-Ferrara(New York: NOVA Publishers), 219–231.
Sokhadze, E., Baruth, J. M., Sears, L., Sokhadze, G. E., El-Baz, A. S., and Casanova,M. F. (2012a). Prefrontal neuromodulation using rTMS improves error moni-toring and correction functions in autism. Appl. Psychophysiol. Biofeedback 37,91–102. doi: 10.1007/s10484-012-9182-5
Sokhadze, E., Baruth, J. M., Sears, L., Sokhadze, G. E., El-Baz, A. S., Williams,E. L., et al. (2012b). Event-related potential study of attention regulation duringillusory figure categorization task in ADHD, autism spectrum disorder andtypical children. J. Neurother. 16, 12–31. doi: 10.1080/10874208.2012.650119
Sokhadze, E., Baruth, J., El-Baz, A., Horrell, T., Sokhadze, G., Carroll, T., etal. (2010b). Impaired error monitoring and correction function in autism.J. Neurother. 14, 79–95. doi: 10.1080/10874201003771561
Sokhadze, E., Baruth, J., Tasman, A., Mansoor, M., Ramaswamy, R., Sears, L., etal. (2010a). Low-frequency repetitive transcranial magnetic stimulation (rTMS)affects event-related potential measures of novelty processing in autism. Appl.Psychophysiol. Biofeedback 35, 147–161. doi: 10.1007/s10484-009-9121-2
Sokhadze, E., Baruth, J., Tasman, A., Sears, L., Mathai, G., El-Baz, A., et al. (2009a).Event-related potential study of novelty processing abnormalities in autism.Appl. Psychophysiol. Biofeedback 34, 37–51. doi: 10.1007/s10484-009-9074-5
Sokhadze, E., El-Baz, A., Baruth, J., Mathai, G., Sears, L., and Casanova, M. F.(2009b). Effect of a low-frequency repetitive transcranial magnetic stimulation(rTMS) on induced gamma frequency oscillations and event-related potentialsduring processing of illusory figures in autism spectrum disorders. J. AutismDev. Disord. 39, 619–634. doi: 10.1007/s10803-008-0662-7
Srinivasan, R., Tucker, D. M., and Murias, M. (1998). Estimating the spatial Nyquistof the human EEG. Behav. Res. Meth. Instrum. Comput. 30, 8–19. doi: 10.3758/bf03209412
Townsend, J., Westerfield, M., Leaver, E., Makeig, S., Jung, T., Pierce, K., et al.(2001). Event-related brain response abnormalities in autism: evidence forimpaired cerebello-frontal spatial attention networks. Brain Res. Cogn. BrainRes. 11, 127–145. doi: 10.1016/s0926-6410(00)00072-0
Tuchman, R. F., and Rapin, I. (1997). Regression in pervasive developmentaldisorders: seizures and epileptiform electroencephalogram correlates. Pediatrics99, 560–566. doi: 10.1542/peds.99.4.560
Van Veen, V., and Carter, C. S. (2002). The timing of action-monitoring pro-cess in the anterior cingulate cortex. J. Cogn. Neurosci. 14, 593–602. doi: 10.1162/08989290260045837
Vlamings, P. H., Jonkman, L. M., Hoeksma, M. R., van Engeland, H., and Kemner,C. (2008). Reduced error monitoring in children with autism spectrum disorder:an ERP study. Eur. J. Neurosci. 28, 399–406. doi: 10.1111/j.1460-9568.2008.06336.x
Wagner, T., Rushmore, J., Eden, U., and Valero-Cabre, A. (2009). Biophysicalfoundations underlying TMS: setting the stage for an effective use of neurostim-ulation in the cognitive neurosciences. Cortex 45, 1025–1034. doi: 10.1016/j.cortex.2008.10.002
Wassermann, E. M., and Lisanby, S. H. (2001). Therapeutic application of repetitivetranscranial magnetic stimulation: a review. Clin. Neurophysiol. 112, 1367–1377.doi: 10.1016/s1388-2457(01)00585-5
Wassermann, E. M., and Zimmermann, T. (2012). Transcranial magnetic stimu-lation: therapeutic promises and scientific gaps. Pharmacol. Ther. 133, 98–107.doi: 10.1016/j.pharmthera.2011.09.003
Wechsler, D. (1999). Wechsler Abbreviated Scale of Intelligence. San Antonio, TX:Harcourt Assessment, Inc.
Wechsler, D. (2003). Wechsler Intelligence Scale for Children. 4th Edn. San Antonio,TX: Harcourt Assessment, Inc.
West, R. (2003). Neural correlates of cognitive control and conflict detection inthe stroop and digit-location tasks. Neuropsychologia 41, 1122–1135. doi: 10.1016/s0028-3932(02)00297-x
West, R., Bowry, R., and McConville, C. (2004). Sensitivity of medial frontal cortexto response and nonresponse conflict. Psychophysiology 41, 739–748. doi: 10.1111/j.1469-8986.2004.00205.x
Yamazaki, T., Kamijo, K., Kenmochi, A., Fukuzumi, S., Kiyuna, T., and Kuroiwa, Y.(2000). Multiple equivalent current dipole source localization of visual event-related potentials during oddball paradigm with motor response. Brain Topogr.12, 159–175. doi: 10.1023/A:1023467806268
Yeung, N., and Cohen, J. D. (2006). The impact of cognitive deficits on con-flict monitoring. Predictable dissociations between the error-related neg-ativity and N2. Psychol. Sci. 17, 164–171. doi: 10.1111/j.1467-9280.2006.01680.x
Zhang, J. S., Wang, Y., Cai, R. G., and Yan, C. H. (2009). The brain regulationmechanism of error monitoring in impulsive children with ADHD–an analysisof error related potentials. Neurosci. Lett. 460, 11–15. doi: 10.1016/j.neulet.2009.05.027
Conflict of Interest Statement: The authors declare that the research was conductedin the absence of any commercial or financial relationships that could be construedas a potential conflict of interest.
Received: 25 January 2014; accepted: 09 July 2014; published online: 06 August 2014.Citation: Sokhadze EM, El-Baz AS, Sears LL, Opris I and Casanova MF (2014)rTMS neuromodulation improves electrocortical functional measures of informa-tion processing and behavioral responses in autism. Front. Syst. Neurosci. 8:134.doi: 10.3389/fnsys.2014.00134This article was submitted to the journal Frontiers in Systems Neuroscience.Copyright © 2014 Sokhadze, El-Baz, Sears, Opris and Casanova. This is an open-access article distributed under the terms of the Creative Commons AttributionLicense (CC BY). The use, distribution or reproduction in other forums is permit-ted, provided the original author(s) or licensor are credited and that the originalpublication in this journal is cited, in accordance with accepted academic practice.No use, distribution or reproduction is permitted which does not comply withthese terms.
Frontiers in Systems Neuroscience www.frontiersin.org August 2014 | Volume 8 | Article 134 | 17
Copyright © 2022 FDOKUMEN