Acute Doxorubicin Toxicity Differentially Alters Cytochrome P450 Expression and Arachidonic Acid...
11
Acute Doxorubicin Toxicity Differentially Alters Cytochrome P450 Expression and Arachidonic Acid Metabolism in Rat Kidney and Liver Beshay N. M. Zordoky, Anwar Anwar-Mohamed, Mona E. Aboutabl, and Ayman O. S. El-Kadi Faculty of Pharmacy and Pharmaceutical Sciences, University of Alberta, Edmonton, Alberta, Canada Received February 25, 2011; accepted May 13, 2011 ABSTRACT: The use of doxorubicin (DOX) is limited by significant cardiotoxic- ity, nephrotoxicity, and hepatotoxicity. We have previously shown that DOX cardiotoxicity induces several cardiac cytochrome P450 (P450) enzymes with subsequent alteration in P450-mediated ara- chidonic acid metabolism. Therefore, in the current study, we investigated the effect of acute DOX toxicity on P450 expression and arachidonic acid metabolism in the kidney and liver of male Sprague-Dawley rats. Acute DOX toxicity was induced by a single intraperitoneal injection (15 mg/kg) of the drug. After 6 and 24 h, the kidneys and livers were harvested, and several P450 gene and protein expressions were determined by real-time polymerase chain reaction and Western blot analyses, respectively. Kidney and liver microsomal protein from control or DOX-treated rats was incubated with arachidonic acid, and its metabolites were deter- mined by liquid chromatography-electron spray ionization-mass spectrometry. Our results showed that acute DOX toxicity caused an induction of CYP1B1 and CYP4A enzymes and an inhibition of CYP2B1 and CYP2C11 in both the kidney and liver. CYP2E1 was induced and soluble epoxide hydrolase (sEH) was inhibited in the kidney only. In addition, DOX toxicity caused a significant increase in epoxyeicosatrienoic acids formation in the kidney and a signif- icant increase in 20-hydroxyeicosatetraenoic acid formation in both the kidney and the liver. In conclusion, acute DOX toxicity alters the expression of several P450 and sEH enzymes in an organ-specific manner. These changes can be attributed to DOX- induced inflammation and resulted in altered P450-mediated ara- chidonic acid metabolism. Introduction Doxorubicin (DOX) is a potent anthracycline antineoplastic drug used to treat a wide variety of malignancies. However, the clinical use of this agent is limited by a significant dose-dependent car- diotoxicity, which may progress to end-stage heart failure (Outo- muro et al., 2007). In addition to DOX-induced cardiotoxicity, it also causes nephrotoxicity and hepatotoxicity (Injac et al., 2008; Bulucu et al., 2009). DOX-induced nephrotoxicity causes in- creased capillary permeability and glomerular atrophy (Injac et al., 2008). Although the exact mechanism of DOX-induced nephrotox- icity has not been fully elucidated, it is thought to be mediated through DOX-induced oxidative damage (Liu et al., 2007). Like- wise, DOX-induced hepatotoxicity is generally mediated through the generation of free radicals (Bulucu et al., 2009). In addition to oxidative damage, DOX toxicity has been shown to induce inflam- matory changes in the heart, kidney, and liver tissues of DOX- administered rats (Deepa and Varalakshmi, 2005). We have shown previously that DOX-induced cardiotoxicity in- duces soluble epoxide hydrolase (sEH) and several cytochrome P450 (P450) enzymes in the heart of male Sprague-Dawley (SD) rats as well as in the heart-derived H9c2 cells with subsequent alteration of P450-mediated arachidonic acid metabolism (Zordoky and El-Kadi, 2008; Zordoky et al., 2010). In addition, it has been recently reported that DOX activates the aryl hydrocarbon receptor (AhR) with subse- quent induction of CYP1A1 (Volkova et al., 2011). On the other hand, administration of DOX to rats and mice has been shown to decrease the catalytic activity of several hepatic P450 enzymes, although it does not cause mechanism-based inactivation of these enzymes (Di Re et al., 1999). Therefore, the effect of DOX on P450 enzymes seems to be tissue- and enzyme-specific. P450 enzymes play an important role in arachidonic acid metabo- lism in addition to the cyclooxygenase and the lipoxygenase pathways (Roman, 2002). Although the role of P450-derived arachidonic acid metabolites in the cardiovascular physiology and pathophysiology This work was supported by the Canadian Institutes of Health Research [Grant 106665]; Alberta Innovates–Health Solutions (to B.N.M.Z.); Alberta Innovates– Technology Futures (to A.A.-M.); and the Egyptian government (to M.E.A.). Article, publication date, and citation information can be found at http://dmd.aspetjournals.org. doi:10.1124/dmd.111.039123. ABBREVIATIONS: DOX, doxorubicin; sEH, soluble epoxide hydrolase; P450, cytochrome P450; SD, Sprague-Dawley; Ahr, aryl hydrocarbon receptor; EET, epoxyeicosatrienoic acid; HETE, hydroxyeicosatetraenoic acid; DHET, dihydroxyeicosatrienoic acid; PCR, polymerase chain reaction; LC-ESI-MS, liquid chromatographic-electron spray ionization-mass spectrometry; HPLC, high-performance liquid chromatography; PAGE, polyacrylamide gel electrophoresis; DAN, 2,3-diaminonaphthalene; IL-6, interleukin-6; iNOS, inducible nitric-oxide synthase; TNF, tumor necrosis factor-. 0090-9556/11/3908-1440–1450$25.00 DRUG METABOLISM AND DISPOSITION Vol. 39, No. 8 Copyright © 2011 by The American Society for Pharmacology and Experimental Therapeutics 39123/3703880 DMD 39:1440–1450, 2011 Printed in U.S.A. 1440 at University of Alberta on January 23, 2013 dmd.aspetjournals.org Downloaded from
Transcript of Acute Doxorubicin Toxicity Differentially Alters Cytochrome P450 Expression and Arachidonic Acid...

Acute Doxorubicin Toxicity Differentially Alters Cytochrome P450Expression and Arachidonic Acid Metabolism in Rat Kidney
and Liver
Beshay N. M. Zordoky, Anwar Anwar-Mohamed, Mona E. Aboutabl,and Ayman O. S. El-Kadi
Faculty of Pharmacy and Pharmaceutical Sciences, University of Alberta, Edmonton, Alberta, Canada
Received February 25, 2011; accepted May 13, 2011
ABSTRACT:
The use of doxorubicin (DOX) is limited by significant cardiotoxic-ity, nephrotoxicity, and hepatotoxicity. We have previously shownthat DOX cardiotoxicity induces several cardiac cytochrome P450(P450) enzymes with subsequent alteration in P450-mediated ara-chidonic acid metabolism. Therefore, in the current study, weinvestigated the effect of acute DOX toxicity on P450 expressionand arachidonic acid metabolism in the kidney and liver of maleSprague-Dawley rats. Acute DOX toxicity was induced by a singleintraperitoneal injection (15 mg/kg) of the drug. After 6 and 24 h,the kidneys and livers were harvested, and several P450 gene andprotein expressions were determined by real-time polymerasechain reaction and Western blot analyses, respectively. Kidney andliver microsomal protein from control or DOX-treated rats wasincubated with arachidonic acid, and its metabolites were deter-
mined by liquid chromatography-electron spray ionization-massspectrometry. Our results showed that acute DOX toxicity causedan induction of CYP1B1 and CYP4A enzymes and an inhibition ofCYP2B1 and CYP2C11 in both the kidney and liver. CYP2E1 wasinduced and soluble epoxide hydrolase (sEH) was inhibited in thekidney only. In addition, DOX toxicity caused a significant increasein epoxyeicosatrienoic acids formation in the kidney and a signif-icant increase in 20-hydroxyeicosatetraenoic acid formation inboth the kidney and the liver. In conclusion, acute DOX toxicityalters the expression of several P450 and sEH enzymes in anorgan-specific manner. These changes can be attributed to DOX-induced inflammation and resulted in altered P450-mediated ara-chidonic acid metabolism.
Introduction
Doxorubicin (DOX) is a potent anthracycline antineoplastic drugused to treat a wide variety of malignancies. However, the clinicaluse of this agent is limited by a significant dose-dependent car-diotoxicity, which may progress to end-stage heart failure (Outo-muro et al., 2007). In addition to DOX-induced cardiotoxicity, italso causes nephrotoxicity and hepatotoxicity (Injac et al., 2008;Bulucu et al., 2009). DOX-induced nephrotoxicity causes in-creased capillary permeability and glomerular atrophy (Injac et al.,2008). Although the exact mechanism of DOX-induced nephrotox-icity has not been fully elucidated, it is thought to be mediatedthrough DOX-induced oxidative damage (Liu et al., 2007). Like-wise, DOX-induced hepatotoxicity is generally mediated throughthe generation of free radicals (Bulucu et al., 2009). In addition to
oxidative damage, DOX toxicity has been shown to induce inflam-matory changes in the heart, kidney, and liver tissues of DOX-administered rats (Deepa and Varalakshmi, 2005).
We have shown previously that DOX-induced cardiotoxicity in-duces soluble epoxide hydrolase (sEH) and several cytochrome P450(P450) enzymes in the heart of male Sprague-Dawley (SD) rats aswell as in the heart-derived H9c2 cells with subsequent alteration ofP450-mediated arachidonic acid metabolism (Zordoky and El-Kadi,2008; Zordoky et al., 2010). In addition, it has been recently reportedthat DOX activates the aryl hydrocarbon receptor (AhR) with subse-quent induction of CYP1A1 (Volkova et al., 2011). On the other hand,administration of DOX to rats and mice has been shown to decreasethe catalytic activity of several hepatic P450 enzymes, although itdoes not cause mechanism-based inactivation of these enzymes (DiRe et al., 1999). Therefore, the effect of DOX on P450 enzymes seemsto be tissue- and enzyme-specific.
P450 enzymes play an important role in arachidonic acid metabo-lism in addition to the cyclooxygenase and the lipoxygenase pathways(Roman, 2002). Although the role of P450-derived arachidonic acidmetabolites in the cardiovascular physiology and pathophysiology
This work was supported by the Canadian Institutes of Health Research [Grant106665]; Alberta Innovates–Health Solutions (to B.N.M.Z.); Alberta Innovates–Technology Futures (to A.A.-M.); and the Egyptian government (to M.E.A.).
Article, publication date, and citation information can be found athttp://dmd.aspetjournals.org.
doi:10.1124/dmd.111.039123.
ABBREVIATIONS: DOX, doxorubicin; sEH, soluble epoxide hydrolase; P450, cytochrome P450; SD, Sprague-Dawley; Ahr, aryl hydrocarbonreceptor; EET, epoxyeicosatrienoic acid; HETE, hydroxyeicosatetraenoic acid; DHET, dihydroxyeicosatrienoic acid; PCR, polymerase chainreaction; LC-ESI-MS, liquid chromatographic-electron spray ionization-mass spectrometry; HPLC, high-performance liquid chromatography;PAGE, polyacrylamide gel electrophoresis; DAN, 2,3-diaminonaphthalene; IL-6, interleukin-6; iNOS, inducible nitric-oxide synthase; TNF�, tumornecrosis factor-�.
0090-9556/11/3908-1440–1450$25.00DRUG METABOLISM AND DISPOSITION Vol. 39, No. 8Copyright © 2011 by The American Society for Pharmacology and Experimental Therapeutics 39123/3703880DMD 39:1440–1450, 2011 Printed in U.S.A.
1440
at University of A
lberta on January 23, 2013dm
d.aspetjournals.orgD
ownloaded from

grabbed the major scientific attention (Elbekai and El-Kadi, 2006),their roles in the kidney and liver cannot be ignored. Renal and hepaticP450 epoxygenases metabolize arachidonic acid to different epoxyei-cosatrienoic acid (EET) regioisomers, whereas P450 hydroxylasesmetabolize it to hydroxyeicosatetraenoic acids (HETEs) (Roman,2002; Sacerdoti et al., 2003). Furthermore, sEH enzyme, which cat-alyzes the conversion of EETs to the less biologically active dihy-droxyeicosatrienoic acids (DHETs), is also abundantly expressed inthe kidney and liver in both human and experimental animals (Enay-etallah et al., 2004; Zordoky et al., 2008).
Several investigators have addressed the role of P450-derived ara-chidonic acid metabolites in renal and hepatic function (Maier andRoman, 2001; Sacerdoti et al., 2003). In general, it has been shownthat EETs dilate the preglomerular arterioles, whereas 20-HETE elic-its a vasoconstricting effect in these blood vessels (Zhao and Imig,2003). However, both EETs and 20-HETE have a diuretic effectthrough inhibition of sodium reabsorption in the proximal tubule(Moreno et al., 2001). Nevertheless, little information is known aboutthe role of these eicosanoids in the liver (Sacerdoti et al., 2003). Incontrast to the kidney, 11,12-EET has been shown to have a vaso-constrictive effect on the portosinusoidal circulation in rat, whereas20-HETE showed a weaker vasoconstricting effect that was cycloox-ygenase-dependent (Sacerdoti et al., 2003). In addition, EETs wereshown to be involved in vasopressin-induced glycogenolysis in rathepatocytes (Yoshida et al., 1990).
Several studies have reported the modulation of renal and he-patic P450-mediated arachidonic acid metabolism in several patho-physiological and experimental conditions, most notably fasting,increased dietary �-linolenic acid, and inflammation (Qu et al.,1998; Yu et al., 2006; Anwar-Mohamed et al., 2010; Theken et al.,2011). However, there is little information about the effect of DOXtoxicity on the expression of P450 enzymes in the kidney and liver.Therefore, in the present study, we investigated the effect of acuteDOX toxicity on the expression of renal and hepatic P450 and sEHenzymes. In addition, we attempted to explore the mechanism bywhich acute DOX toxicity could alter P450 expression. Finally, weevaluated the effect of DOX toxicity on P450-mediated arachi-donic acid metabolism.
Materials and Methods
Materials. The High-Capacity cDNA Reverse Transcription Kit, SYBRGreen SuperMix, and 96-well optical reaction plates with optical adhesivefilms were purchased from Applied Biosystems (Foster City, CA). Real-timePCR primers were synthesized by Integrated DNA Technologies Inc. (Cor-alville, IA) according to previously published sequences. Arachidonic acid,4-hydroxybenzophenone, and DOX were purchased from Sigma-Aldrich (St.Louis, MO). Arachidonic acid metabolite standards 5,6-EET, 8,9-EET, 11,12-EET, 14,15-EET, 5,6-DHET, 8,9-DHET, 11,12-DHET, 14,15-DHET, and20-HETE were obtained from Cayman Chemical (Ann Arbor, MI). Reagentsused for liquid chromatographic-electron spray ionization-mass spectrometry(LC-ESI-MS) were HPLC-grade. Acetonitrile and water (HPLC-grade) werepurchased from EM Scientific (Gibbstown, NJ). Acrylamide, N�,N�-bis-meth-ylene-acrylamide, ammonium persulfate, �-mercaptoethanol, glycine, nitrocel-lulose membrane (0.45 �m), and N,N,N�,N�-tetramethylethylenediamine werepurchased from Bio-Rad Laboratories (Hercules, CA). ChemiluminescenceWestern blotting detection reagents were purchased from GE Healthcare(Little Chalfont, Buckinghamshire, UK). CYP1B1 rabbit polyclonal primaryantibody was purchased from BD Gentest (Woburn, MA). CYP2J and sEHprimary antibodies were obtained as generous gifts from Dr. Darryl Zeldin(National Institute of Environmental Health Sciences, National Institutes ofHealth, Research Triangle Park, NC) and Dr. Bruce Hammock (Department ofEntomology, University of California, Davis, CA), respectively. Other primaryand secondary antibodies were purchased from Santa Cruz Biotechnology, Inc.
(Santa Cruz, CA). Other chemicals were purchased from Thermo FisherScientific (Waltham, MA).
Animals. All experimental procedures involving animals were approved bythe University of Alberta Health Sciences Animal Policy and Welfare Com-mittee. Male SD rats weighing 250 to 300 g were obtained from Charles RiverCanada (St. Constant, QC, Canada). Animals were treated intraperitoneallywith a single 15 mg/kg dose of DOX (n � 12). Weight-matched controlsreceived the same volume of normal saline (n � 12). Animals were euthanizedunder isoflurane anesthesia at 6 and 24 h after the treatment. All animals wereallowed free access to food and water throughout the treatment period. Theamount of food consumed by each animal was recorded, and the animals wereweighed before and 24 h after DOX administration. The kidneys and liverswere excised, immediately frozen in liquid nitrogen, and stored at �80°C untilanalysis.
RNA Extraction and cDNA Synthesis. Total RNA from the frozen tissueswas isolated using TRIzol reagent (Invitrogen, Carlsbad, CA) according to themanufacturer’s instructions and quantified by measuring the absorbance at 260nm. RNA quality was determined by measuring the 260:280 ratio. Thereafter,first-strand cDNA synthesis was performed by using the High-Capacity cDNAReverse Transcription Kit according to the manufacturer’s instructions. Inbrief, 1.5 �g of total RNA from each sample was added to a mix of 2.0 �l of10� reverse transcriptase buffer, 0.8 �l of 25� dNTP mix (100 mM), 2.0 �lof 10� reverse transcriptase random primers, 1.0 �l of MultiScribe reversetranscriptase, and 3.2 �l of nuclease-free water. The final reaction mix waskept at 25°C for 10 min, heated to 37°C for 120 min, heated for 85°C for 5 s,and finally cooled to 4°C.
Quantification by Real-Time PCR. Quantitative analysis of specificmRNA expression was performed with real-time PCR, by subjecting theresulting cDNA to PCR amplification using 96-well optical reaction plates inthe ABI Prism 7500 System (Applied Biosystems). The 25-�l reaction mixcontained 0.1 �l of 10 �M forward primer and 0.1 �l of 10 �M reverse primer,12.5 �l of SYBR Green Universal MasterMix, 11.05 �l of nuclease-free water,and 1.25 �l of cDNA sample. The primers used in the current study werechosen from previously published studies (Anwar-Mohamed et al., 2010) andare listed in Table 1. No-template controls were incorporated onto the sameplate to test for the contamination of any assay reagents. An optical adhesivecover was used to seal the plate; thereafter, thermocycling conditions wereinitiated at 95°C for 10 min, followed by 40 PCR cycles of denaturation at95°C for 15 s and annealing/extension at 60°C for 1 min. Dissociation curveswere performed by the end of each cycle to confirm the specificity of theprimers and the purity of the final PCR product.
Real-Time PCR Data Analysis. The real-time PCR data were analyzedusing the relative gene expression method as described in Applied BiosystemsUser Bulletin No. 2. In brief, the data are presented as the fold change in geneexpression normalized to the endogenous reference gene (�-actin) and relativeto the untreated control of the same time point.
Microsomal Protein Preparation and Western Blot Analysis. Micro-somal protein was prepared from kidney and liver tissues as described previ-ously (Aboutabl et al., 2009). In brief, kidney and liver tissues were washed inice-cold KCl (1.15% w/v), cut into pieces, and homogenized separately in coldsucrose solution (1 g of tissue in 5 ml of 0.25 M sucrose). Microsomal proteinfrom the homogenized tissues was separated by differential ultracentrifugation.The final microsomal pellet was reconstituted in cold sucrose and stored at�80°C. The kidney and liver microsomal protein concentration was deter-mined by the method of Lowry et al. (1951) using bovine serum albumin as astandard. Western blot analysis was performed according to a method de-scribed previously (Gharavi and El-Kadi, 2005). In brief, 2.5 to 40 �g ofkidney and liver microsomal protein from each treatment group was separatedby 10% SDS-polyacrylamide gel (PAGE) and then electrophoretically trans-ferred to nitrocellulose membrane. Protein blots were then blocked overnightat 4°C in blocking solution containing 0.15 M sodium chloride, 3 mMpotassium chloride, 25 mM Tris base (Tris-buffered saline), 5% skim milk, 2%bovine serum albumin, and 0.5% Tween 20. After blocking, the blots wereincubated with a primary polyclonal rabbit anti-rat CYP1B1, mouse anti-ratCYP2B1, rabbit anti-rat CYP2C11, rabbit anti-rat CYP2E1, rabbit anti-mouseCYP2J, mouse anti-rat CYP4A, rabbit anti-mouse sEH, and rabbit anti-ratactin for 2 h. Incubation with a peroxidase-conjugated goat anti-rabbit IgGsecondary antibody for CYP1B1, CYP2C11, CYP2E1, CYP2J, sEH, and actin
1441EFFECT OF DOXORUBICIN ON CYTOCHROME P450 EXPRESSION
at University of A
lberta on January 23, 2013dm
d.aspetjournals.orgD
ownloaded from
or goat anti-mouse IgG secondary antibody for CYP2B1 and CYP4A wasperformed for 1 h at room temperature. The bands were visualized using theenhanced chemiluminescence method according to the manufacturer’s instruc-tions (GE Healthcare). The intensity of the protein bands was quantified,relative to the signals obtained for actin, using ImageJ software (NationalInstitutes of Health, Bethesda, MD, http://rsb.info.nih.gov/ij).
Microsomal Incubation and Separation of Different Arachidonic AcidMetabolites by LC-ESI-MS. Kidney and liver microsomes (1 mg of protein/ml) were incubated in the incubation buffer (5 mM magnesium chloridehexahydrate dissolved in 0.5 M potassium phosphate buffer, pH � 7.4) at 37°Cin a shaking water bath (50 rpm). A pre-equilibration period of 5 min wasperformed. The reaction was initiated by the addition of 1 mM NADPH.Arachidonic acid was added to a final concentration of 50 �M and incubatedfor 30 min. The reaction was terminated by the addition of 600 �l of ice-coldacetonitrile followed by the internal standard, 4-hydroxybenzophenone. Ara-chidonic acid metabolites were extracted by 1 ml of ethyl acetate twice anddried using a speed vacuum (Thermo Fisher Scientific). Kidney and liver tissueconcentrations of arachidonic acid metabolites were determined according to apreviously published method (Poloyac et al., 2004) with some modifications.In brief, kidney or liver tissues (1 g) were homogenized in the incubationbuffer and centrifuged at 10,000g for 30 min. After the addition of acetonitrile,the supernatant was extracted twice with 1 ml of ethyl acetate and dried usinga speed vacuum (Thermo Fisher Scientific).
Extracted arachidonic acid metabolites were analyzed using the LC-ESI-MS(Micromass ZQ 4000 spectrometer; Waters, Milford, MA) method as de-scribed previously (Aboutabl et al., 2009). In brief, the mass spectrometer wasoperated in negative ionization mode with single ion recorder acquisition. Thenebulizer gas was acquired from an in-house high-purity nitrogen source. Thesource temperature was set at 150°C, and the voltages of the capillary andthe cone were 3.51 kV and 25 V, respectively. The samples (10 �l) wereseparated on a reverse-phase C18 column (Kromasil, 250 � 3.2 mm) using alinear gradient mobile phase system with a mobile phase of water-acetonitrilewith 0.005% acetic acid at a flow rate of 0.2 ml/min. The mobile phase systemstarted at 60% acetonitrile, linearly increased to 80% acetonitrile in 30 min,increased to 100% acetonitrile in 5 min, and held for 5 min.
Nitrite Assay. Nitrites were measured in serum samples of control and 24-hDOX-treated rats as described previously (Nussler et al., 2006). In brief, 200�M working nitrite standard was prepared from a 2.0 mM sodium nitrite stocksolution in endotoxin-free deionized water and stored at 4°C until use. Aworking 2,3-diaminonaphthalene (DAN) solution of 50 �g/ml was prepared bydiluting a 20 mg/ml stock solution with 0.62 N HCl. All assays were conductedin 96-well plates, with each condition performed in quadruplet. In each well,20 �l of standard or sample was added to 80 �l of deionized water. Then, 10�l of working DAN solution was added to each well. The plate was allowedto sit in the dark at room temperature for 10 min. Using the same timing andsequence as for the additions of DAN, 20 �l of 2.8 N NaOH was added to eachwell, and the plate was gently shaken. The plate then was incubated in the dark
for 1 min, after which it was read in a fluorescence plate reader with anexcitation of 360 nm and an emission of 430 nm.
Statistical Analysis. Data are presented as the mean � S.E. Control and24-h treatment measurements were compared using Student’s t test, whereascontrol and treatment measurements at 6 and 24 h were compared usingone-way analysis of variance followed by a Student-Newman-Keuls post hoctest. A result was considered statistically significant when P � 0.05.
Results
Effect of DOX Treatment on Food Intake and Animal BodyWeight. Taking into account the possible effect of fasting on P450expression, we investigated the effect of DOX treatment on the foodintake and animal body weight. The food intake in DOX-treatedanimals was significantly reduced by almost 50% from the control. Inaddition, DOX-treated animals lost an average of 5% body weightcompared with the controls.
Effect of DOX Treatment on P450 Gene Expression. To examinethe effect of DOX treatment on the renal and hepatic expression ofseveral P450 genes, total RNA was extracted from the kidney andliver of both control and DOX-treated rats. Thereafter, the expressionof different genes was measured using reverse transcription followedby real-time PCR.
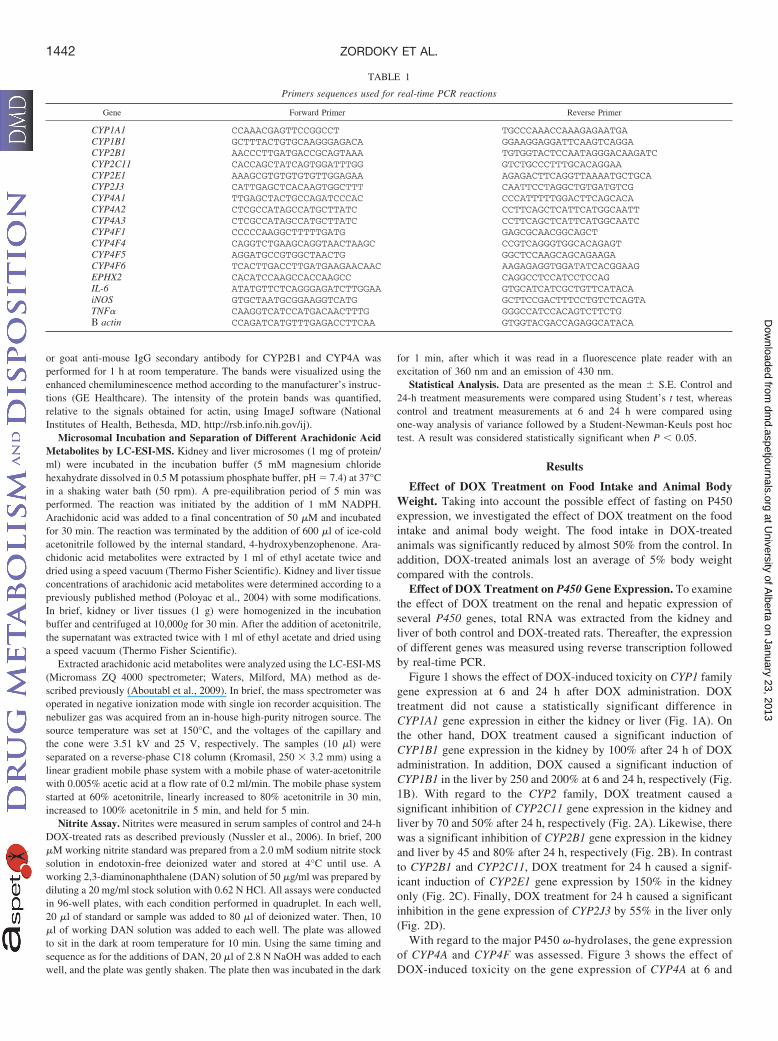
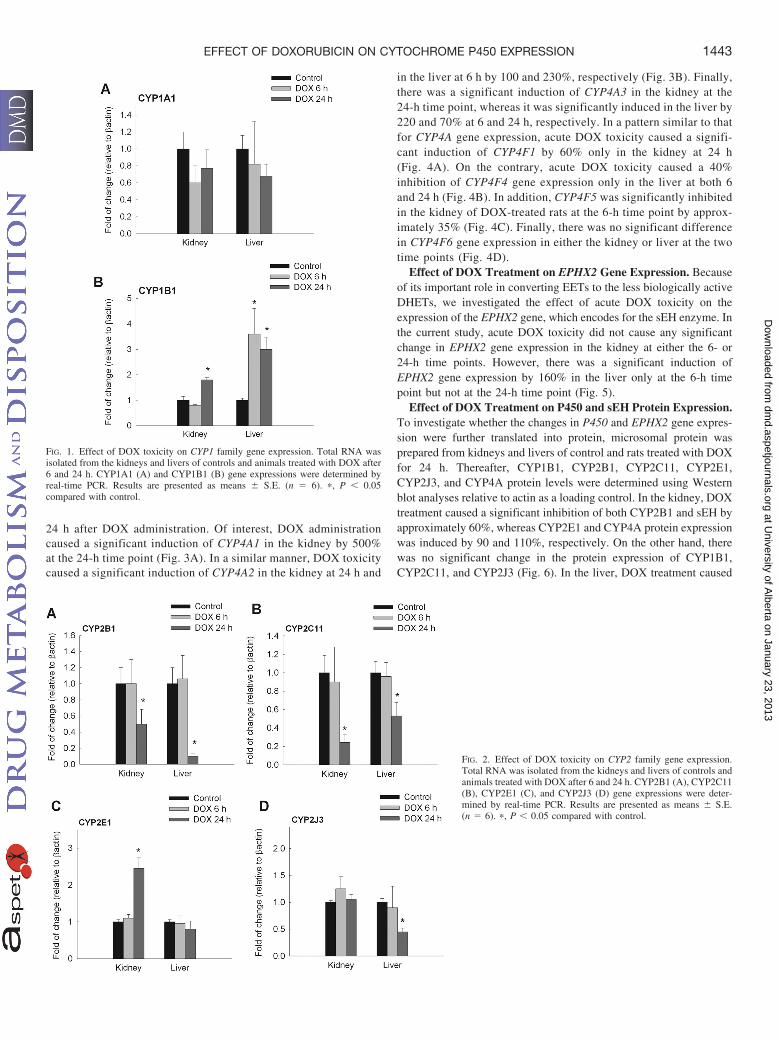
Figure 1 shows the effect of DOX-induced toxicity on CYP1 familygene expression at 6 and 24 h after DOX administration. DOXtreatment did not cause a statistically significant difference inCYP1A1 gene expression in either the kidney or liver (Fig. 1A). Onthe other hand, DOX treatment caused a significant induction ofCYP1B1 gene expression in the kidney by 100% after 24 h of DOXadministration. In addition, DOX caused a significant induction ofCYP1B1 in the liver by 250 and 200% at 6 and 24 h, respectively (Fig.1B). With regard to the CYP2 family, DOX treatment caused asignificant inhibition of CYP2C11 gene expression in the kidney andliver by 70 and 50% after 24 h, respectively (Fig. 2A). Likewise, therewas a significant inhibition of CYP2B1 gene expression in the kidneyand liver by 45 and 80% after 24 h, respectively (Fig. 2B). In contrastto CYP2B1 and CYP2C11, DOX treatment for 24 h caused a signif-icant induction of CYP2E1 gene expression by 150% in the kidneyonly (Fig. 2C). Finally, DOX treatment for 24 h caused a significantinhibition in the gene expression of CYP2J3 by 55% in the liver only(Fig. 2D).
With regard to the major P450 �-hydrolases, the gene expressionof CYP4A and CYP4F was assessed. Figure 3 shows the effect ofDOX-induced toxicity on the gene expression of CYP4A at 6 and
TABLE 1
Primers sequences used for real-time PCR reactions
Gene Forward Primer Reverse Primer
CYP1A1 CCAAACGAGTTCCGGCCT TGCCCAAACCAAAGAGAATGACYP1B1 GCTTTACTGTGCAAGGGAGACA GGAAGGAGGATTCAAGTCAGGACYP2B1 AACCCTTGATGACCGCAGTAAA TGTGGTACTCCAATAGGGACAAGATCCYP2C11 CACCAGCTATCAGTGGATTTGG GTCTGCCCTTTGCACAGGAACYP2E1 AAAGCGTGTGTGTGTTGGAGAA AGAGACTTCAGGTTAAAATGCTGCACYP2J3 CATTGAGCTCACAAGTGGCTTT CAATTCCTAGGCTGTGATGTCGCYP4A1 TTGAGCTACTGCCAGATCCCAC CCCATTTTTGGACTTCAGCACACYP4A2 CTCGCCATAGCCATGCTTATC CCTTCAGCTCATTCATGGCAATTCYP4A3 CTCGCCATAGCCATGCTTATC CCTTCAGCTCATTCATGGCAATCCYP4F1 CCCCCAAGGCTTTTTGATG GAGCGCAACGGCAGCTCYP4F4 CAGGTCTGAAGCAGGTAACTAAGC CCGTCAGGGTGGCACAGAGTCYP4F5 AGGATGCCGTGGCTAACTG GGCTCCAAGCAGCAGAAGACYP4F6 TCACTTGACCTTGATGAAGAACAAC AAGAGAGGTGGATATCACGGAAGEPHX2 CACATCCAAGCCACCAAGCC CAGGCCTCCATCCTCCAGIL-6 ATATGTTCTCAGGGAGATCTTGGAA GTGCATCATCGCTGTTCATACAiNOS GTGCTAATGCGGAAGGTCATG GCTTCCGACTTTCCTGTCTCAGTATNF� CAAGGTCATCCATGACAACTTTG GGGCCATCCACAGTCTTCTG� actin CCAGATCATGTTTGAGACCTTCAA GTGGTACGACCAGAGGCATACA
1442 ZORDOKY ET AL.
at University of A
lberta on January 23, 2013dm
d.aspetjournals.orgD
ownloaded from
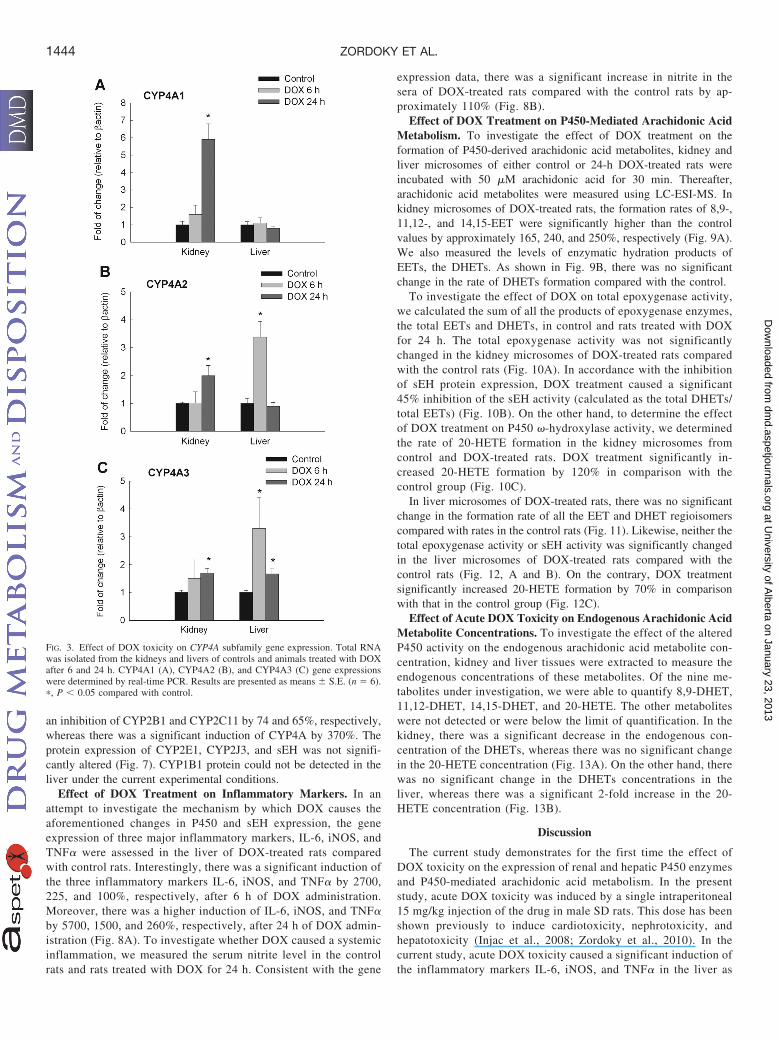
24 h after DOX administration. Of interest, DOX administrationcaused a significant induction of CYP4A1 in the kidney by 500%at the 24-h time point (Fig. 3A). In a similar manner, DOX toxicitycaused a significant induction of CYP4A2 in the kidney at 24 h and
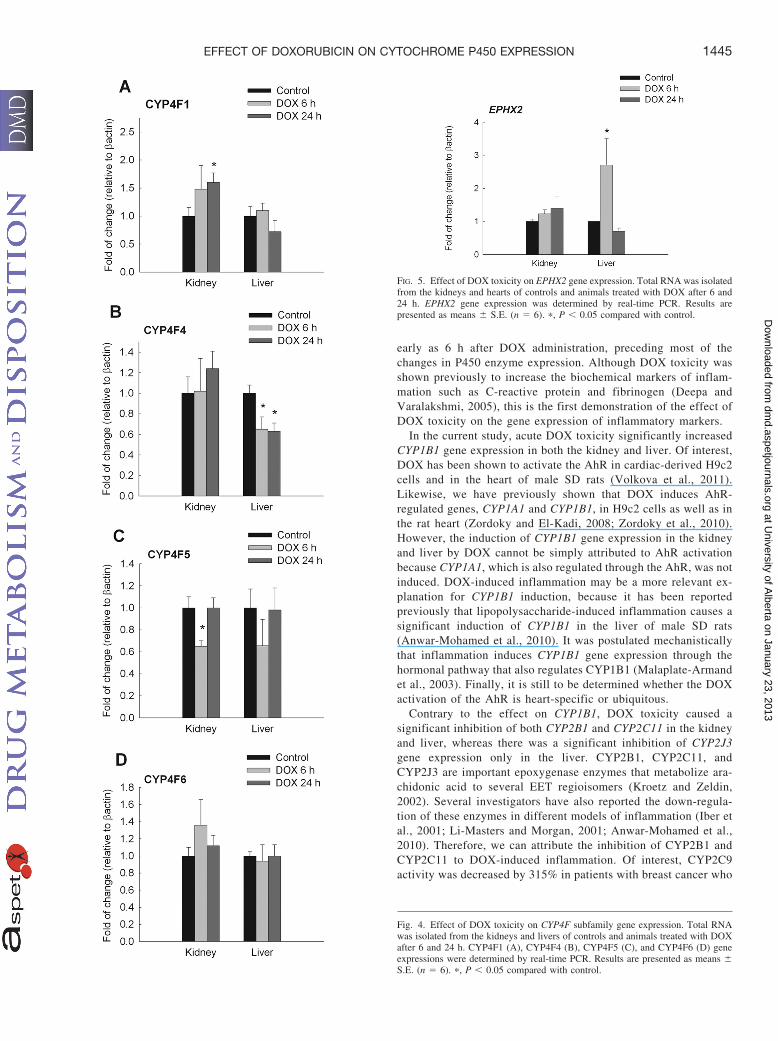
in the liver at 6 h by 100 and 230%, respectively (Fig. 3B). Finally,there was a significant induction of CYP4A3 in the kidney at the24-h time point, whereas it was significantly induced in the liver by220 and 70% at 6 and 24 h, respectively. In a pattern similar to thatfor CYP4A gene expression, acute DOX toxicity caused a signifi-cant induction of CYP4F1 by 60% only in the kidney at 24 h(Fig. 4A). On the contrary, acute DOX toxicity caused a 40%inhibition of CYP4F4 gene expression only in the liver at both 6and 24 h (Fig. 4B). In addition, CYP4F5 was significantly inhibitedin the kidney of DOX-treated rats at the 6-h time point by approx-imately 35% (Fig. 4C). Finally, there was no significant differencein CYP4F6 gene expression in either the kidney or liver at the twotime points (Fig. 4D).
Effect of DOX Treatment on EPHX2 Gene Expression. Becauseof its important role in converting EETs to the less biologically activeDHETs, we investigated the effect of acute DOX toxicity on theexpression of the EPHX2 gene, which encodes for the sEH enzyme. Inthe current study, acute DOX toxicity did not cause any significantchange in EPHX2 gene expression in the kidney at either the 6- or24-h time points. However, there was a significant induction ofEPHX2 gene expression by 160% in the liver only at the 6-h timepoint but not at the 24-h time point (Fig. 5).
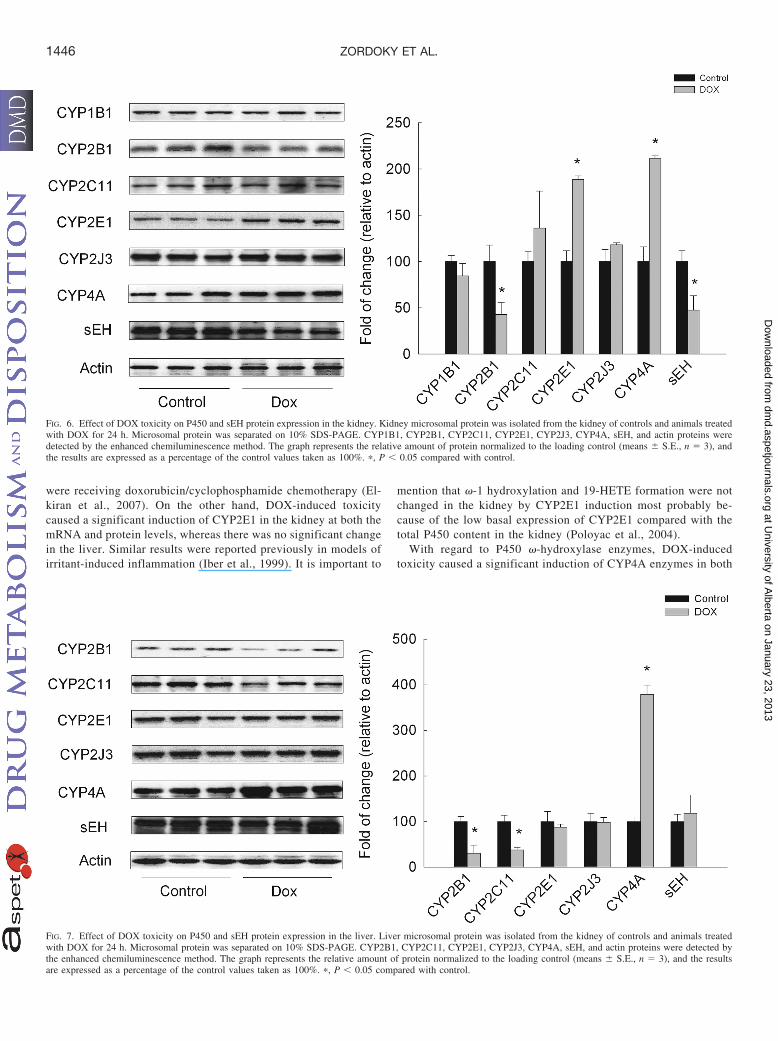
Effect of DOX Treatment on P450 and sEH Protein Expression.To investigate whether the changes in P450 and EPHX2 gene expres-sion were further translated into protein, microsomal protein wasprepared from kidneys and livers of control and rats treated with DOXfor 24 h. Thereafter, CYP1B1, CYP2B1, CYP2C11, CYP2E1,CYP2J3, and CYP4A protein levels were determined using Westernblot analyses relative to actin as a loading control. In the kidney, DOXtreatment caused a significant inhibition of both CYP2B1 and sEH byapproximately 60%, whereas CYP2E1 and CYP4A protein expressionwas induced by 90 and 110%, respectively. On the other hand, therewas no significant change in the protein expression of CYP1B1,CYP2C11, and CYP2J3 (Fig. 6). In the liver, DOX treatment caused
FIG. 1. Effect of DOX toxicity on CYP1 family gene expression. Total RNA wasisolated from the kidneys and livers of controls and animals treated with DOX after6 and 24 h. CYP1A1 (A) and CYP1B1 (B) gene expressions were determined byreal-time PCR. Results are presented as means � S.E. (n � 6). �, P � 0.05compared with control.
FIG. 2. Effect of DOX toxicity on CYP2 family gene expression.Total RNA was isolated from the kidneys and livers of controls andanimals treated with DOX after 6 and 24 h. CYP2B1 (A), CYP2C11(B), CYP2E1 (C), and CYP2J3 (D) gene expressions were deter-mined by real-time PCR. Results are presented as means � S.E.(n � 6). �, P � 0.05 compared with control.
1443EFFECT OF DOXORUBICIN ON CYTOCHROME P450 EXPRESSION
at University of A
lberta on January 23, 2013dm
d.aspetjournals.orgD
ownloaded from
an inhibition of CYP2B1 and CYP2C11 by 74 and 65%, respectively,whereas there was a significant induction of CYP4A by 370%. Theprotein expression of CYP2E1, CYP2J3, and sEH was not signifi-cantly altered (Fig. 7). CYP1B1 protein could not be detected in theliver under the current experimental conditions.
Effect of DOX Treatment on Inflammatory Markers. In anattempt to investigate the mechanism by which DOX causes theaforementioned changes in P450 and sEH expression, the geneexpression of three major inflammatory markers, IL-6, iNOS, andTNF� were assessed in the liver of DOX-treated rats comparedwith control rats. Interestingly, there was a significant induction ofthe three inflammatory markers IL-6, iNOS, and TNF� by 2700,225, and 100%, respectively, after 6 h of DOX administration.Moreover, there was a higher induction of IL-6, iNOS, and TNF�by 5700, 1500, and 260%, respectively, after 24 h of DOX admin-istration (Fig. 8A). To investigate whether DOX caused a systemicinflammation, we measured the serum nitrite level in the controlrats and rats treated with DOX for 24 h. Consistent with the gene
expression data, there was a significant increase in nitrite in thesera of DOX-treated rats compared with the control rats by ap-proximately 110% (Fig. 8B).
Effect of DOX Treatment on P450-Mediated Arachidonic AcidMetabolism. To investigate the effect of DOX treatment on theformation of P450-derived arachidonic acid metabolites, kidney andliver microsomes of either control or 24-h DOX-treated rats wereincubated with 50 �M arachidonic acid for 30 min. Thereafter,arachidonic acid metabolites were measured using LC-ESI-MS. Inkidney microsomes of DOX-treated rats, the formation rates of 8,9-,11,12-, and 14,15-EET were significantly higher than the controlvalues by approximately 165, 240, and 250%, respectively (Fig. 9A).We also measured the levels of enzymatic hydration products ofEETs, the DHETs. As shown in Fig. 9B, there was no significantchange in the rate of DHETs formation compared with the control.
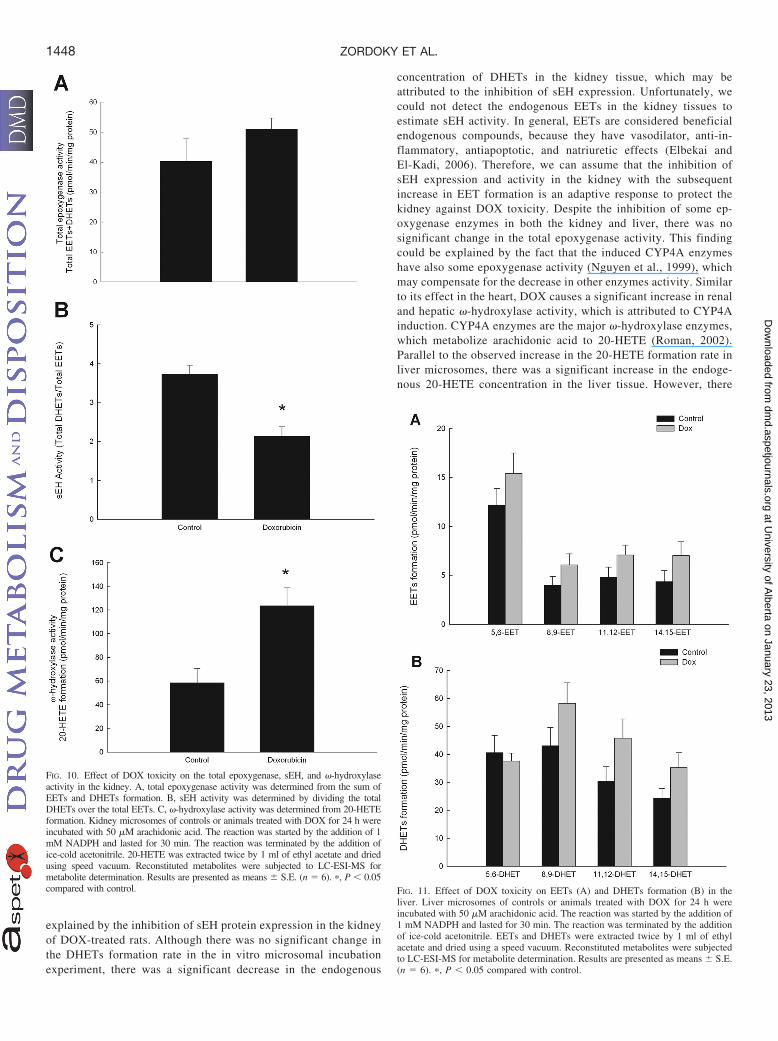
To investigate the effect of DOX on total epoxygenase activity,we calculated the sum of all the products of epoxygenase enzymes,the total EETs and DHETs, in control and rats treated with DOXfor 24 h. The total epoxygenase activity was not significantlychanged in the kidney microsomes of DOX-treated rats comparedwith the control rats (Fig. 10A). In accordance with the inhibitionof sEH protein expression, DOX treatment caused a significant45% inhibition of the sEH activity (calculated as the total DHETs/total EETs) (Fig. 10B). On the other hand, to determine the effectof DOX treatment on P450 �-hydroxylase activity, we determinedthe rate of 20-HETE formation in the kidney microsomes fromcontrol and DOX-treated rats. DOX treatment significantly in-creased 20-HETE formation by 120% in comparison with thecontrol group (Fig. 10C).
In liver microsomes of DOX-treated rats, there was no significantchange in the formation rate of all the EET and DHET regioisomerscompared with rates in the control rats (Fig. 11). Likewise, neither thetotal epoxygenase activity or sEH activity was significantly changedin the liver microsomes of DOX-treated rats compared with thecontrol rats (Fig. 12, A and B). On the contrary, DOX treatmentsignificantly increased 20-HETE formation by 70% in comparisonwith that in the control group (Fig. 12C).
Effect of Acute DOX Toxicity on Endogenous Arachidonic AcidMetabolite Concentrations. To investigate the effect of the alteredP450 activity on the endogenous arachidonic acid metabolite con-centration, kidney and liver tissues were extracted to measure theendogenous concentrations of these metabolites. Of the nine me-tabolites under investigation, we were able to quantify 8,9-DHET,11,12-DHET, 14,15-DHET, and 20-HETE. The other metaboliteswere not detected or were below the limit of quantification. In thekidney, there was a significant decrease in the endogenous con-centration of the DHETs, whereas there was no significant changein the 20-HETE concentration (Fig. 13A). On the other hand, therewas no significant change in the DHETs concentrations in theliver, whereas there was a significant 2-fold increase in the 20-HETE concentration (Fig. 13B).
Discussion
The current study demonstrates for the first time the effect ofDOX toxicity on the expression of renal and hepatic P450 enzymesand P450-mediated arachidonic acid metabolism. In the presentstudy, acute DOX toxicity was induced by a single intraperitoneal15 mg/kg injection of the drug in male SD rats. This dose has beenshown previously to induce cardiotoxicity, nephrotoxicity, andhepatotoxicity (Injac et al., 2008; Zordoky et al., 2010). In thecurrent study, acute DOX toxicity caused a significant induction ofthe inflammatory markers IL-6, iNOS, and TNF� in the liver as
FIG. 3. Effect of DOX toxicity on CYP4A subfamily gene expression. Total RNAwas isolated from the kidneys and livers of controls and animals treated with DOXafter 6 and 24 h. CYP4A1 (A), CYP4A2 (B), and CYP4A3 (C) gene expressionswere determined by real-time PCR. Results are presented as means � S.E. (n � 6).�, P � 0.05 compared with control.
1444 ZORDOKY ET AL.
at University of A
lberta on January 23, 2013dm
d.aspetjournals.orgD
ownloaded from
early as 6 h after DOX administration, preceding most of thechanges in P450 enzyme expression. Although DOX toxicity wasshown previously to increase the biochemical markers of inflam-mation such as C-reactive protein and fibrinogen (Deepa andVaralakshmi, 2005), this is the first demonstration of the effect ofDOX toxicity on the gene expression of inflammatory markers.
In the current study, acute DOX toxicity significantly increasedCYP1B1 gene expression in both the kidney and liver. Of interest,DOX has been shown to activate the AhR in cardiac-derived H9c2cells and in the heart of male SD rats (Volkova et al., 2011).Likewise, we have previously shown that DOX induces AhR-regulated genes, CYP1A1 and CYP1B1, in H9c2 cells as well as inthe rat heart (Zordoky and El-Kadi, 2008; Zordoky et al., 2010).However, the induction of CYP1B1 gene expression in the kidneyand liver by DOX cannot be simply attributed to AhR activationbecause CYP1A1, which is also regulated through the AhR, was notinduced. DOX-induced inflammation may be a more relevant ex-planation for CYP1B1 induction, because it has been reportedpreviously that lipopolysaccharide-induced inflammation causes asignificant induction of CYP1B1 in the liver of male SD rats(Anwar-Mohamed et al., 2010). It was postulated mechanisticallythat inflammation induces CYP1B1 gene expression through thehormonal pathway that also regulates CYP1B1 (Malaplate-Armandet al., 2003). Finally, it is still to be determined whether the DOXactivation of the AhR is heart-specific or ubiquitous.
Contrary to the effect on CYP1B1, DOX toxicity caused asignificant inhibition of both CYP2B1 and CYP2C11 in the kidneyand liver, whereas there was a significant inhibition of CYP2J3gene expression only in the liver. CYP2B1, CYP2C11, andCYP2J3 are important epoxygenase enzymes that metabolize ara-chidonic acid to several EET regioisomers (Kroetz and Zeldin,2002). Several investigators have also reported the down-regula-tion of these enzymes in different models of inflammation (Iber etal., 2001; Li-Masters and Morgan, 2001; Anwar-Mohamed et al.,2010). Therefore, we can attribute the inhibition of CYP2B1 andCYP2C11 to DOX-induced inflammation. Of interest, CYP2C9activity was decreased by 315% in patients with breast cancer who
Fig. 4. Effect of DOX toxicity on CYP4F subfamily gene expression. Total RNAwas isolated from the kidneys and livers of controls and animals treated with DOXafter 6 and 24 h. CYP4F1 (A), CYP4F4 (B), CYP4F5 (C), and CYP4F6 (D) geneexpressions were determined by real-time PCR. Results are presented as means �S.E. (n � 6). �, P � 0.05 compared with control.
FIG. 5. Effect of DOX toxicity on EPHX2 gene expression. Total RNA was isolatedfrom the kidneys and hearts of controls and animals treated with DOX after 6 and24 h. EPHX2 gene expression was determined by real-time PCR. Results arepresented as means � S.E. (n � 6). �, P � 0.05 compared with control.
1445EFFECT OF DOXORUBICIN ON CYTOCHROME P450 EXPRESSION
at University of A
lberta on January 23, 2013dm
d.aspetjournals.orgD
ownloaded from
were receiving doxorubicin/cyclophosphamide chemotherapy (El-kiran et al., 2007). On the other hand, DOX-induced toxicitycaused a significant induction of CYP2E1 in the kidney at both themRNA and protein levels, whereas there was no significant changein the liver. Similar results were reported previously in models ofirritant-induced inflammation (Iber et al., 1999). It is important to
mention that �-1 hydroxylation and 19-HETE formation were notchanged in the kidney by CYP2E1 induction most probably be-cause of the low basal expression of CYP2E1 compared with thetotal P450 content in the kidney (Poloyac et al., 2004).
With regard to P450 �-hydroxylase enzymes, DOX-inducedtoxicity caused a significant induction of CYP4A enzymes in both
FIG. 7. Effect of DOX toxicity on P450 and sEH protein expression in the liver. Liver microsomal protein was isolated from the kidney of controls and animals treatedwith DOX for 24 h. Microsomal protein was separated on 10% SDS-PAGE. CYP2B1, CYP2C11, CYP2E1, CYP2J3, CYP4A, sEH, and actin proteins were detected bythe enhanced chemiluminescence method. The graph represents the relative amount of protein normalized to the loading control (means � S.E., n � 3), and the resultsare expressed as a percentage of the control values taken as 100%. �, P � 0.05 compared with control.
FIG. 6. Effect of DOX toxicity on P450 and sEH protein expression in the kidney. Kidney microsomal protein was isolated from the kidney of controls and animals treatedwith DOX for 24 h. Microsomal protein was separated on 10% SDS-PAGE. CYP1B1, CYP2B1, CYP2C11, CYP2E1, CYP2J3, CYP4A, sEH, and actin proteins weredetected by the enhanced chemiluminescence method. The graph represents the relative amount of protein normalized to the loading control (means � S.E., n � 3), andthe results are expressed as a percentage of the control values taken as 100%. �, P � 0.05 compared with control.
1446 ZORDOKY ET AL.
at University of A
lberta on January 23, 2013dm
d.aspetjournals.orgD
ownloaded from

the kidney and the liver of male SD rats. In agreement with theseresults, we have previously shown that DOX-induced cardiotoxic-ity causes significant induction of CYP4A enzymes in the heart ofmale SD rats (Zordoky et al., 2010). In addition, we and otherinvestigators have also demonstrated that CYP4A enzymes areinduced in the kidney and liver in several models of inflammation(Mitchell et al., 2001; Anwar-Mohamed et al., 2010; Theken et al.,2011). Moreover, it is well established that fasting can induceCYP4A enzymes (Kroetz et al., 1998). Therefore, CYP4A induc-tion seems to be mediated, at least in part, by DOX-inducedinflammation and/or a reduction in food consumption. Neverthe-less, the increased 20-HETE formation may worsen the inflamma-tory condition by activating nuclear factor-�B and increasing thegeneration of inflammatory cytokines in a positive feedback circuit(Ishizuka et al., 2008). Contrary to the effect on CYP4A enzymes,the effect of DOX on CYP4F enzymes was isoform-specific. DOXcaused a significant induction of CYP4F1 in the kidney and aninhibition of CYP4F4 and CYP4F5 in the liver and kidney, respec-tively, whereas there was no change in CYP4F6 expression in thekidney and liver. Both CYP4F1 and CYP4F4 have been shown tobe inhibited in a rat model of lipopolysaccharide-induced inflam-mation (Anwar-Mohamed et al., 2010). Therefore, the observed
effect of DOX toxicity on CYP4F gene expression is less likely tobe attributed to DOX-induced inflammation.
We have reported previously that DOX induces sEH in H9c2cells and the rat heart (Zordoky et al., 2010). Therefore, it wasimportant to investigate the effect of DOX on the expression ofsEH in organs other than the heart to examine whether sEHinduction is heart-specific or not. In the present study, DOX causeda significant induction of EPHX2 gene only in the liver after 6 h ofDOX administration; however, there was no change in sEH proteinexpression in the liver. In the kidney, there was a significantinhibition of sEH protein expression through a post-transcriptionalmechanism, because DOX did not change EPHX2 gene expression.These results demonstrate that the DOX effect on sEH is tissue-specificand DOX-induced sEH protein expression and activity is specific to theheart, which further confirms its role in DOX-specific cardiotoxicity.
In the current study, our results show that DOX administrationcaused a significant increase in the 8,9-, 11,12-, and 14,15-EETformation in the kidney, although it did not change the totalepoxygenase activity. Therefore, the increase in EETs formationcan be attributed to the inhibition of sEH activity, which in turn is
FIG. 9. Effect of DOX toxicity on EETs (A) and DHETs formation (B) in thekidney. Kidney microsomes of controls or animals treated with DOX for 24 h wereincubated with 50 �M arachidonic acid. The reaction was started by the addition of1 mM NADPH and lasted for 30 min. The reaction was terminated by the additionof ice-cold acetonitrile. EETs and DHETs were extracted twice by 1 ml of ethylacetate and dried using a speed vacuum. Reconstituted metabolites were subjectedto LC-ESI-MS for metabolite determination. Results are presented as means � S.E.(n � 6). �, P � 0.05 compared with control.
FIG. 8. Effect of DOX toxicity on inflammatory markers gene expression (A) andserum nitrite level (B). A, total RNA was isolated from the livers of controls andanimals treated with DOX after 6 and 24 h. IL-6, iNOS, and TNF� gene expressionswere determined by real-time PCR. B, the nitrite level was determined in the seraof controls and animals treated with DOX for 24 h as described under Materials andMethods. Results are presented as means � S.E. (n � 6). �, P � 0.05 compared withcontrol.
1447EFFECT OF DOXORUBICIN ON CYTOCHROME P450 EXPRESSION
at University of A
lberta on January 23, 2013dm
d.aspetjournals.orgD
ownloaded from
explained by the inhibition of sEH protein expression in the kidneyof DOX-treated rats. Although there was no significant change inthe DHETs formation rate in the in vitro microsomal incubationexperiment, there was a significant decrease in the endogenous
concentration of DHETs in the kidney tissue, which may beattributed to the inhibition of sEH expression. Unfortunately, wecould not detect the endogenous EETs in the kidney tissues toestimate sEH activity. In general, EETs are considered beneficialendogenous compounds, because they have vasodilator, anti-in-flammatory, antiapoptotic, and natriuretic effects (Elbekai andEl-Kadi, 2006). Therefore, we can assume that the inhibition ofsEH expression and activity in the kidney with the subsequentincrease in EET formation is an adaptive response to protect thekidney against DOX toxicity. Despite the inhibition of some ep-oxygenase enzymes in both the kidney and liver, there was nosignificant change in the total epoxygenase activity. This findingcould be explained by the fact that the induced CYP4A enzymeshave also some epoxygenase activity (Nguyen et al., 1999), whichmay compensate for the decrease in other enzymes activity. Similarto its effect in the heart, DOX causes a significant increase in renaland hepatic �-hydroxylase activity, which is attributed to CYP4Ainduction. CYP4A enzymes are the major �-hydroxylase enzymes,which metabolize arachidonic acid to 20-HETE (Roman, 2002).Parallel to the observed increase in the 20-HETE formation rate inliver microsomes, there was a significant increase in the endoge-nous 20-HETE concentration in the liver tissue. However, there
FIG. 11. Effect of DOX toxicity on EETs (A) and DHETs formation (B) in theliver. Liver microsomes of controls or animals treated with DOX for 24 h wereincubated with 50 �M arachidonic acid. The reaction was started by the addition of1 mM NADPH and lasted for 30 min. The reaction was terminated by the additionof ice-cold acetonitrile. EETs and DHETs were extracted twice by 1 ml of ethylacetate and dried using a speed vacuum. Reconstituted metabolites were subjectedto LC-ESI-MS for metabolite determination. Results are presented as means � S.E.(n � 6). �, P � 0.05 compared with control.
FIG. 10. Effect of DOX toxicity on the total epoxygenase, sEH, and �-hydroxylaseactivity in the kidney. A, total epoxygenase activity was determined from the sum ofEETs and DHETs formation. B, sEH activity was determined by dividing the totalDHETs over the total EETs. C, �-hydroxylase activity was determined from 20-HETEformation. Kidney microsomes of controls or animals treated with DOX for 24 h wereincubated with 50 �M arachidonic acid. The reaction was started by the addition of 1mM NADPH and lasted for 30 min. The reaction was terminated by the addition ofice-cold acetonitrile. 20-HETE was extracted twice by 1 ml of ethyl acetate and driedusing speed vacuum. Reconstituted metabolites were subjected to LC-ESI-MS formetabolite determination. Results are presented as means � S.E. (n � 6). �, P � 0.05compared with control.
1448 ZORDOKY ET AL.
at University of A
lberta on January 23, 2013dm
d.aspetjournals.orgD
ownloaded from

was no change in the endogenous 20-HETE concentration in thekidney tissue despite the increased 20-HETE formation rate in thekidney microsomes. This discrepancy could be attributed to an
altered availability of the free arachidonic acid substrate in thekidney tissue, competition from other enzymatic pathways, and/oraltered secondary metabolism of the 20-HETE formed. Of interest,20-HETE has been shown to mediate cytotoxicity and apoptosis inischemic kidney epithelial cells, and its inhibition protects thekidney from ischemia/reperfusion injury (Nilakantan et al., 2008;Hoff et al., 2011). Therefore, we can conclude that the induction ofCYP4A enzymes with the subsequent increase in 20-HETE forma-tion is a maladaptive response to DOX toxicity that will partici-pate, at least in part, in the deterioration of the renal and hepaticfunction.
In conclusion, acute DOX toxicity alters the expression ofseveral P450 and sEH enzymes in an organ-specific manner. Al-though the exact mechanism has not yet been fully elucidated,DOX-induced inflammation contributes, at least in part, to thealteration of P450 enzymes by DOX. The changes in P450 and sEHexpression resulted in altered arachidonic acid metabolism as20-HETE formation was increased in both the kidney and the liver,whereas EETs formation was increased only in the kidney. If wetake into account the physiological functions of these metabolites,the increase in the EET and 20-HETE formation can be consideredan adaptive and a maladaptive response, respectively.
FIG. 13. Effect of acute DOX toxicity on endogenous arachidonic acid metabolitesconcentrations in the kidney (A) and liver (B). After homogenization and centrif-ugation, endogenous arachidonic acid metabolites were extracted twice from kidneyand liver tissues by 1 ml of ethyl acetate and dried using a speed vacuum.Reconstituted metabolites were subjected to LC-ESI-MS for metabolite determina-tion. Results are presented as means � S.E. (n � 6). �, P � 0.05 compared withcontrol.
FIG. 12. Effect of DOX toxicity on the total epoxygenase, sEH, and �-hydroxylase activityin the liver. A, total epoxygenase activity was determined from the sum of EETs and DHETsformation. B, sEH activity was determined by dividing the total DHETs over the total EETs.C, �-hydroxylase activity was determined from the 20-HETE formation. Liver microsomesof controls or animals treated with DOX for 24 h were incubated with 50 �M arachidonicacid. The reaction was started by the addition of 1 mM NADPH and lasted for 30 min. Thereaction was terminated by the addition of ice-cold acetonitrile. 20-HETE was extractedtwice by 1 ml of ethyl acetate and dried using a speed vacuum. Reconstituted metaboliteswere subjected to LC-ESI-MS for metabolite determination. Results are presented asmeans � S.E. (n � 6). �, P � 0.05 compared with control.
1449EFFECT OF DOXORUBICIN ON CYTOCHROME P450 EXPRESSION
at University of A
lberta on January 23, 2013dm
d.aspetjournals.orgD
ownloaded from
Acknowledgments
We are grateful to Dr. Vishwa Somayaji for his excellent technical assistancewith liquid chromatography-electron spray ionization-mass spectrometry.
Authorship Contributions
Participated in research design: Zordoky and El-Kadi.Conducted experiments: Zordoky, Anwar-Mohamed, and Aboutabl.Performed data analysis: Zordoky and Anwar-Mohamed.Wrote or contributed to the writing of the manuscript: Zordoky and El-
Kadi.
References
Aboutabl ME, Zordoky BN, and El-Kadi AO (2009) 3-Methylcholanthrene and benzo(a)pyrenemodulate cardiac cytochrome P450 gene expression and arachidonic acid metabolism in maleSprague Dawley rats. Br J Pharmacol 158:1808–1819.
Anwar-mohamed A, Zordoky BN, Aboutabl ME, and El-Kadi AO (2010) Alteration of cardiaccytochrome P450-mediated arachidonic acid metabolism in response to lipopolysaccharide-induced acute systemic inflammation. Pharmacol Res 61:410–418.
Bulucu F, Ocal R, Karadurmus N, Sahin M, Kenar L, Aydin A, Oktenli C, Koc B, Inal V,Yamanel L, et al. (2009) Effects of N-acetylcysteine, deferoxamine and selenium on doxoru-bicin-induced hepatotoxicity. Biol Trace Elem Res 132:184–196.
Deepa PR and Varalakshmi P (2005) Biochemical evaluation of the inflammatory changes incardiac, hepatic and renal tissues of Adriamycin-administered rats and the modulatory role ofexogenous heparin-derivative treatment. Chem Biol Interact 156:93–100.
Di Re J, Lee C, and Riddick DS (1999) Lack of mechanism-based inactivation of rat hepaticmicrosomal cytochromes P450 by doxorubicin. Can J Physiol Pharmacol 77:589–597.
Elbekai RH and El-Kadi AO (2006) Cytochrome P450 enzymes: central players in cardiovas-cular health and disease. Pharmacol Ther 112:564–587.
Elkiran T, Harputluoglu H, Yasar U, Babaoglu MO, Dincel AK, Altundag K, Ozisik Y, Guler N,and Bozkurt A (2007) Differential alteration of drug-metabolizing enzyme activities aftercyclophosphamide/Adriamycin administration in breast cancer patients. Methods Find ExpClin Pharmacol 29:27–32.
Enayetallah AE, French RA, Thibodeau MS, and Grant DF (2004) Distribution of solubleepoxide hydrolase and of cytochrome P450 2C8, 2C9, and 2J2 in human tissues. J HistochemCytochem 52:447–454.
Gharavi N and El-Kadi AO (2005) tert-Butylhydroquinone is a novel aryl hydrocarbon receptorligand. Drug Metab Dispos 33:365–372.
Hoff U, Lukitsch I, Chaykovska L, Ladwig M, Arnold C, Manthati VL, Fuller TF, Schneider W,Gollasch M, Muller DN, et al. (2011) Inhibition of 20-HETE synthesis and action protects thekidney from ischemia/reperfusion injury. Kidney Int 79:57–65.
Iber H, Li-Masters T, Chen Q, Yu S, and Morgan ET (2001) Regulation of hepatic cytochromeP450 2C11 via cAMP: implications for down-regulation in diabetes, fasting, and inflamma-tion. J Pharmacol Exp Ther 297:174–180.
Iber H, Sewer MB, Barclay TB, Mitchell SR, Li T, and Morgan ET (1999) Modulation of drugmetabolism in infectious and inflammatory diseases. Drug Metab Rev 31:29–41.
Injac R, Boskovic M, Perse M, Koprivec-Furlan E, Cerar A, Djordjevic A, and Strukelj B (2008)Acute doxorubicin nephrotoxicity in rats with malignant neoplasm can be successfully treatedwith fullerenol C60(OH)24 via suppression of oxidative stress. Pharmacol Rep 60:742–749.
Ishizuka T, Cheng J, Singh H, Vitto MD, Manthati VL, Falck JR, and Laniado-Schwartzman M(2008) 20-Hydroxyeicosatetraenoic acid stimulates nuclear factor-�B activation and the pro-duction of inflammatory cytokines in human endothelial cells. J Pharmacol Exp Ther 324:103–110.
Kroetz DL, Yook P, Costet P, Bianchi P, and Pineau T (1998) Peroxisome proliferator-activatedreceptor � controls the hepatic CYP4A induction adaptive response to starvation and diabetes.J Biol Chem 273:31581–31589.
Kroetz DL and Zeldin DC (2002) Cytochrome P450 pathways of arachidonic acid metabolism.Curr Opin Lipidol 13:273–283.
Li-Masters T and Morgan ET (2001) Effects of bacterial lipopolysaccharide on phenobarbital-induced CYP2B expression in mice. Drug Metab Dispos 29:252–257.
Liu LL, Li QX, Xia L, Li J, and Shao L (2007) Differential effects of dihydropyridine calciumantagonists on doxorubicin-induced nephrotoxicity in rats. Toxicology 231:81–90.
Lowry OH, Rosebrough NJ, Farr AL, and Randall RJ (1951) Protein measurement with the Folinphenol reagent. J Biol Chem 193:265–275.
Maier KG and Roman RJ (2001) Cytochrome P450 metabolites of arachidonic acid in the controlof renal function. Curr Opin Nephrol Hypertens 10:81–87.
Malaplate-Armand C, Ferrari L, Masson C, Siest G, and Batt AM (2003) Astroglial CYP1B1up-regulation in inflammatory/oxidative toxic conditions: IL-1� effect and protection byN-acetylcysteine. Toxicol Lett 138:243–251.
Mitchell SR, Sewer MB, Kardar SS, and Morgan ET (2001) Characterization of CYP4Ainduction in rat liver by inflammatory stimuli: dependence on sex, strain, and inflammation-evoked hypophagia. Drug Metab Dispos 29:17–22.
Moreno C, Maier KG, Hoagland KM, Yu M, and Roman RJ (2001) Abnormal pressure-natriuresis in hypertension: role of cytochrome P450 metabolites of arachidonic acid. Am JHypertens 14:90S–97S.
Nguyen X, Wang MH, Reddy KM, Falck JR, and Schwartzman ML (1999) Kinetic profile of therat CYP4A isoforms: arachidonic acid metabolism and isoform-specific inhibitors. Am JPhysiol 276:R1691–R1700.
Nilakantan V, Maenpaa C, Jia G, Roman RJ, and Park F (2008) 20-HETE-mediated cytotoxicityand apoptosis in ischemic kidney epithelial cells. Am J Physiol Renal Physiol 294:F562–F570.
Nussler AK, Glanemann M, Schirmeier A, Liu L, and Nussler NC (2006) Fluorometric mea-surement of nitrite/nitrate by 2,3-diaminonaphthalene. Nat Protoc 1:2223–2226.
Outomuro D, Grana DR, Azzato F, and Milei J (2007) Adriamycin-induced myocardial toxicity:new solutions for an old problem? Int J Cardiol 117:6–15.
Poloyac SM, Tortorici MA, Przychodzin DI, Reynolds RB, Xie W, Frye RF, and Zemaitis MA(2004) The effect of isoniazid on CYP2E1- and CYP4A-mediated hydroxylation of arachi-donic acid in the rat liver and kidney. Drug Metab Dispos 32:727–733.
Qu W, Rippe RA, Ma J, Scarborough P, Biagini C, Fiedorek FT, Travlos GS, Parker C, andZeldin DC (1998) Nutritional status modulates rat liver cytochrome P450 arachidonic acidmetabolism. Mol Pharmacol 54:504–513.
Roman RJ (2002) P-450 metabolites of arachidonic acid in the control of cardiovascular function.Physiol Rev 82:131–185.
Sacerdoti D, Gatta A, and McGiff JC (2003) Role of cytochrome P450-dependent arachidonicacid metabolites in liver physiology and pathophysiology. Prostaglandins Other Lipid Mediat72:51–71.
Theken KN, Deng Y, Kannon MA, Miller TM, Poloyac SM, and Lee CR (2011) Activation ofthe acute inflammatory response alters cytochrome P450 expression and eicosanoid metabo-lism. Drug Metab Dispos 39:22–29.
Volkova M, Palmeri M, Russell KS, and Russell RR (2011) Activation of the aryl hydrocarbonreceptor by doxorubicin mediates cytoprotective effects in the heart. Cardiovasc Res 90:305–314.
Yoshida S, Hirai A, Tamura Y, and Yoshida S (1990) Possible involvement of arachidonic acidmetabolites of cytochrome P450 monooxygenase pathway in vasopressin-stimulated glyco-genolysis in isolated rat hepatocytes. Arch Biochem Biophys 280:346–351.
Yu Z, Ng VY, Su P, Engler MM, Engler MB, Huang Y, Lin E, and Kroetz DL (2006) Inductionof renal cytochrome P450 arachidonic acid epoxygenase activity by dietary �-linolenic acid.J Pharmacol Exp Ther 317:732–738.
Zhao X and Imig JD (2003) Kidney CYP450 enzymes: biological actions beyond drug metab-olism. Curr Drug Metab 4:73–84.
Zordoky BN, Aboutabl ME, and El-Kadi AO (2008) Modulation of cytochrome P450 geneexpression and arachidonic acid metabolism during isoproterenol-induced cardiac hypertrophyin rats. Drug Metab Dispos 36:2277–2286.
Zordoky BN, Anwar-Mohamed A, Aboutabl ME, and El-Kadi AO (2010) Acute doxorubicincardiotoxicity alters cardiac cytochrome P450 expression and arachidonic acid metabolism inrats. Toxicol Appl Pharmacol 242:38–46.
Zordoky BN and El-Kadi AO (2008) Induction of several cytochrome P450 genes by doxoru-bicin in H9c2 cells. Vascul Pharmacol 49:166–172.
Address correspondence to: Dr. Ayman O. S. El-Kadi, Faculty of Pharmacyand Pharmaceutical Sciences, 3126 Dentistry/Pharmacy Centre, University ofAlberta, Edmonton, AB, Canada T6G 2N8. E-mail: [email protected]
1450 ZORDOKY ET AL.
at University of A
lberta on January 23, 2013dm
d.aspetjournals.orgD
ownloaded from