Activation of a Novel Calcineurin-mediated Insulin-like Growth Factor1 Receptor Pathway, Altered...
12
and Narayan G. Avadhani Manti Guha, Satish Srinivasan, Gopa Biswas Mitochondrial Respiratory Stress Cell Invasion in Cells Subjected to Pathway, Altered Metabolism, and Tumor Insulin-like Growth Factor-1 Receptor Activation of a Novel Calcineurin-mediated Metabolism and Bioenergetics: doi: 10.1074/jbc.M611693200 originally published online March 13, 2007 2007, 282:14536-14546. J. Biol. Chem. 10.1074/jbc.M611693200 Access the most updated version of this article at doi: . JBC Affinity Sites Find articles, minireviews, Reflections and Classics on similar topics on the Alerts: When a correction for this article is posted • When this article is cited • to choose from all of JBC's e-mail alerts Click here http://www.jbc.org/content/282/19/14536.full.html#ref-list-1 This article cites 58 references, 27 of which can be accessed free at at University of Pennsylvania Library on October 15, 2014 http://www.jbc.org/ Downloaded from at University of Pennsylvania Library on October 15, 2014 http://www.jbc.org/ Downloaded from
-
Upload
independent -
Category
Documents
-
view
3 -
download
0
Transcript of Activation of a Novel Calcineurin-mediated Insulin-like Growth Factor1 Receptor Pathway, Altered...

and Narayan G. AvadhaniManti Guha, Satish Srinivasan, Gopa Biswas Mitochondrial Respiratory StressCell Invasion in Cells Subjected to Pathway, Altered Metabolism, and TumorInsulin-like Growth Factor-1 Receptor Activation of a Novel Calcineurin-mediatedMetabolism and Bioenergetics:
doi: 10.1074/jbc.M611693200 originally published online March 13, 20072007, 282:14536-14546.J. Biol. Chem.
10.1074/jbc.M611693200Access the most updated version of this article at doi:
.JBC Affinity SitesFind articles, minireviews, Reflections and Classics on similar topics on the
Alerts:
When a correction for this article is posted•
When this article is cited•
to choose from all of JBC's e-mail alertsClick here
http://www.jbc.org/content/282/19/14536.full.html#ref-list-1
This article cites 58 references, 27 of which can be accessed free at
at University of Pennsylvania L
ibrary on October 15, 2014
http://ww
w.jbc.org/
Dow
nloaded from
at University of Pennsylvania L
ibrary on October 15, 2014
http://ww
w.jbc.org/
Dow
nloaded from
Activation of a Novel Calcineurin-mediated Insulin-likeGrowth Factor-1 Receptor Pathway, Altered Metabolism,and Tumor Cell Invasion in Cells Subjected toMitochondrial Respiratory Stress*
Received for publication, December 21, 2006, and in revised form, March 1, 2007 Published, JBC Papers in Press, March 13, 2007, DOI 10.1074/jbc.M611693200
Manti Guha, Satish Srinivasan, Gopa Biswas, and Narayan G. Avadhani1
From the Department of Animal Biology and the Mari Lowe Center for Comparative Oncology, School of Veterinary Medicine,University of Pennsylvania, Philadelphia, Pennsylvania 19104
We have previously shown that disruption of mitochondrialmembrane potential by depletion of mitochondrial DNA(mtDNA) or treatment with a mitochondrial ionophore, car-bonyl cyanide m-chlorophenylhydrazone, initiates a stress sig-naling, which causes resistance to apoptosis, and induces inva-sive behavior in C2C12 myocytes and A549 cells. In the presentstudy we show that calcineurin (Cn), activated as part of thisstress signaling, plays an important role in increased glucoseuptake and glycolysis. Here we report that, although both insu-lin and insulin-like growth factor-1 receptor levels (IR andIGF1R, respectively) are increased in response tomitochondrialstress, autophosphorylation of IGF1R was selectively increasedsuggesting a shift in receptor pathways. Using an approach withFK506, an inhibitor of Cn, and mRNA silencing by small inter-ference RNA we show that mitochondrial stress-activated Cn iscritical for increased GLUT 4 and IGF1R expression and activa-tion. The importance of the IGF1R pathway in cell survivalunder mitochondrial stress is demonstrated by increased apo-ptosis either by IGF1R mRNA silencing or by treatment withIGF1R inhibitors (AG1024 and picropodophyllin). This studydescribes a novel mechanism of mitochondrial stress-inducedmetabolic shift involving Cn with implications in resistance toapoptosis and tumor proliferation.
Mitochondria play important roles in energy production, cellmetabolism, and both integration and execution of apoptoticsignals. Dysfunctional mitochondria in mammalian cells trig-ger a stress signaling (1–3) analogous to the mitochondrial ret-rograde signaling pathway described in �° yeast cells (4). A dis-tinct difference between the yeast and mammalian cell systemsis the involvement of RTG signaling pathway in the former, asagainst a retrograde Ca2� signaling cascade in the latter (5). Inboth C2C12 myocytes, and A549 lung carcinoma cells, disrup-tion ofmitochondrialmembrane potential (��m) either due to
mitochondrial genetic stress (partial depletion of mtDNA) ortreatmentwithmitochondrial ionophore, CCCP,2 caused a sus-tained increase in cytosolic free Ca2 and activation of Ca2�-sensitive factors, calcineurin (Cn), NFAT, C/EBP� (1, 2, 6), anda novel I�B�-dependent NF�B pathway (7). In 143B osteosar-coma and other cells, mitochondrial stress resulting frommtDNA depletion or protein misfolding caused activation ofCREB, and a C/EBP family factor CHOPS, respectively (8, 9).Indeed these same transcription factors have been implicatedin the regulation of a number of nuclear marker genes thatrespond to mitochondrial respiratory stress signaling in differ-ent cells (10, 11).Currently there is increasing evidence that mtDNA content
directly reflects on themetabolic state of cells (11–13). Some ofthe �° cells, lacking mtDNA, exhibit slow growth and highersensitivity to apoptotic stimuli (14, 15). In contrast, mtDNAdepletion induced cell proliferation and resistance to apoptosisin C2C12 and A549 cells (1, 6), 143B osteosarcoma cells (16),and SK-Hep1 cells (17). Similarly, a cybrid cell line carryingmutations in mtDNA-encoded ATPase6 gene exhibitedincreased tumorigenicity and reduced apoptosis (18, 19), indi-cating a role for mtDNA mutations in tumor progression. Anincreasing number of recent studies shows that proliferatingtumors in both human patients and animal models containmutated or deleted mtDNA and/or dysfunctional mitochon-dria (19–21). In mtDNA-depleted C2C12 and A549 cells,increased resistance to apoptosis was associated with higherexpression of Bcl2 and/or increased phosphorylation of Bid,Bad, and Bax (22). Rapidly growing tumors meet their meta-bolic demand by increased expression of genes encoding glu-cose transporters and glycolytic enzymes (23). In the presentstudy we investigated the mechanism of cell proliferation andinduced glycolysis in C2C12 cells subjected to mitochondrialrespiratory stress. Our results show that selective inhibition ofIR autophosphorylation and Cn-dependent activation of theIGF1R pathway is the basis for increased glucose utilization and
* This work was supported by National Institutes of Health Grant CA-22762.The costs of publication of this article were defrayed in part by the pay-ment of page charges. This article must therefore be hereby marked“advertisement” in accordance with 18 U.S.C. Section 1734 solely to indi-cate this fact.
1 To whom correspondence should be addressed: Dept. of Animal Biology,School of Veterinary Medicine, University of Pennsylvania, 3800 Spruce St.,Philadelphia, PA 19104. Tel.: 215-898-8819; Fax: 215-573-6651; E-mail:[email protected].
2 The abbreviations used are: CCCP, carbonyl cyanide m-chlorophenylhydra-zone; mtDNA, mitochondrial DNA; Cn, calcineurin; IR, insulin receptor;IGF1R, insulin-like growth factor-1 receptor; GLUT 4, glucose transporter 4;PPP, picropodophyllin; 2-DOG, 2-deoxyglucose; PBS, phosphate-bufferedsaline; FBS, fetal bovine serum; CREB, cAMP-response element-bindingprotein; C/EBP, CAAT/enhancer-binding protein; siRNA, small interferenceRNA; AMPK, AMP kinase; CnA�, calcineurin A�; AICAR, 5-aminoimidazole-4-carboxamide-1-�-D-ribofuranoside.
THE JOURNAL OF BIOLOGICAL CHEMISTRY VOL. 282, NO. 19, pp. 14536 –14546, May 11, 2007© 2007 by The American Society for Biochemistry and Molecular Biology, Inc. Printed in the U.S.A.
14536 JOURNAL OF BIOLOGICAL CHEMISTRY VOLUME 282 • NUMBER 19 • MAY 11, 2007
at University of Pennsylvania L
ibrary on October 15, 2014
http://ww
w.jbc.org/
Dow
nloaded from
cell proliferation. Interestingly, mitochondrial stress-inducedmetabolic change appears to be an important survival factor inthese cells, because blocking the IGF1R function causedincreased cell death. Results also show that elevated GLUT 4and IGF1R levels are directly related to increased Cn activity,which is an essential component of the mitochondria-to-nu-cleus stress signaling pathway.
EXPERIMENTAL PROCEDURES
Cell Lines and Culture Conditions—Murine C2C12 skeletalmyoblasts (ATCC CRL1772), human pulmonary carcinomaA549 cells (ATTC CCL 185), mouse fibroblasts NIH 3T3(ATCC CRL-1658), and rat H9C2 cardiac myocytes (ATCCCRL 1446) were grown in Dulbecco’s modified Eagle’s medium(Life Technology Inc.) supplemented with 10% FBS and 0.1%gentamycin. In some specified experiments charcoal-treatedFBS was used. Depletion of mtDNA was carried out by EtBrtreatment (100 ng/ml, for 30 passages) as described before (2).Selected clones containing�20%mtDNAcontentswere grownin presence of 1 mM sodium pyruvate and 50 �g/ml uridine.Reverted cells representmtDNA-depleted cells (with 85%DNAdepleted) grown for 30 cycles in the absence of EtBr until themtDNAcontent reached 80%of control cells. ThemtDNAcon-tents were estimated by Southern hybridization using a DNAprobe from cytochrome oxidase I � II coding region asdescribed before (2).Calcineurin A�, IGF1R, and IRmRNAKnockdown by siRNA—
Predesigned siRNAs formouse CnA� (ID #292199), IGF1R (ID#159115), and IR (ID #67808) and negative controls (scrambledsiRNA) were purchased from Ambion Inc. (Austin, TX). Con-trol andmtDNA-depleted cells (104 cells/well) were transfectedwith pre-annealed double-stranded siRNAs at a final concen-tration of 30 nM by the method of reverse transfection. Tran-sient transfections were carried out in triplicate using siPORTNeoFX reagent (Ambion Inc). RNA was isolated 48 h aftertransfections using TRIzol reagent (Invitrogen), and the level ofsilencing of CnA�, IGF1R, and IR mRNA was quantitated byreal-time PCR as described later in this section.Transfection with IGF1R cDNA—MtDNA-depleted cells
were transfected with human IGF1R cDNA, kindly provided byDr. Renato Baserga (Thomas JeffersonUniversity, Philadelphia,PA) (24) using FuGENE 6 by a standard method describedbefore (1).Uptake of 2-Deoxyglucose—Glucose uptake was measured as
described previously (25). Briefly, 106 cells grown in 6-wellplates were serum-starved for 6 h, and incubated in the pres-ence or absence of indicated levels of insulin for 30 min in glu-cose-free medium. 1 �Ci of 2-[3H]DOG (1 mCi/0.1 mmol,American Radiolabeled Chemicals, St. Louis, MO) was addedto each well containing 2 ml of medium and incubated for anadditional 15 min. The transport was terminated by washingcells rapidly three times with ice-cold PBS and lysed in 1 NNaOH. Aliquots of the lysates were counted in liquid scintilla-tion counter (Beckman Instruments, Fullerton, CA).Measurement of Cellular ATP Levels—Total cellular ATP
levels were determined by bioluminescence using ATP-biolu-minescent somatic cell assay kit (Sigma) as described before (6).Briefly, 106 cells were lysed using the “somatic cell releasing
reagent,” which caused the release of cellular ATP by alteringmembrane permeability. ATP-dependent formation of lightwas measured in a Chameleon Multilabel Microplate Reader(Bioscan Inc., Washington, D. C.) with appropriate ATP stand-ards. In these experiments, cells were treated with 25�MCCCPand/or 25 �M oligomycin for 1 h.Measurement of Hexokinase, Phosphofructokinase, and Pyru-
vate Kinase Activities—Hexokinase assay was carried out asdescribed byMiccoli et al. (26). Glucose 6-phosphate producedin the hexokinase reactionwas coupled to glucose-6-phosphatedehydrogenase. The reaction was started by the addition of 50�g of the cell lysate, and the rate of NADPH production wasmeasured by the increase in absorbance at 340 nm for 20min ina Cary Varian spectrophotometer. Phosphofructokinase activ-ity was measured spectrophotometrically by coupling theenzyme with aldolase, triosephosphate isomerase, and glycer-aldehyde-3-phosphate dehydrogenase as described before (27).The reaction was started by the addition of 50 �g of the celllysate, and the rate of NADHmetabolized over a time of 20minwas measured by the decrease in absorbance at 340 nm. Pyru-vate kinase reaction was coupled to lactate dehydrogenase, andthe activity wasmeasured by the oxidation of NADH at 340 nmfor 20min as described before (28). The reaction was started bythe addition of 0.15 mM phosphoenolpyruvate and 50 �g of thecell lysate.Calcineurin Activity Assay—Calcineurin activity was assayed
according toAntoni et al. (29)with the followingmodifications.Total serine/threonine phosphatase activity was first deter-mined by incubating cell lysate (2 �g) from untreated, AICAR(2 mM, 2 h)-treated, and FK506 (10 nM, 30 min)-treated cellswith threonine phosphopeptide (Upstate, Cat. no. 12-219) in afinal volume of 25 �l for 20 min at 30 °C in 50 �M Tris-Cl, pH7.0, 0.1 mM CaCl2. The phosphate released was quantitated byincubating with 100 �l of malachite green and measuring theabsorbance at 660 nm after 15 min. In parallel, control incuba-tions containing phosphatase inhibitor mix I (NaF, 5 mM; oka-daic acid, 500 nM; orthovanadate, 100 �M; FK506, 1 nM; calycu-lin, 0.1 �M; and cyclosporine A, 100 �M) and phosphataseinhibitors mix II (FK506, 1 nM; calyculin, 0.1 �M; and cyclospo-rine A, 100 �M) were also carried out. Nonspecific phosphataseactivity under these conditions was subtracted from total ser-ine/threonine phosphatase activity referred to as correctedactivity. Calcineurin activity was calculated by subtracting theactivity obtained from incubation with phosphatase inhibitormix II from the corrected activity.Immunoprecipitation and Receptor Autophosphorylation—
Plasma membrane fractions from control and mtDNA-depletedC2C12 cells were isolated as described (30). Autophosphoryla-tion of the IR and IGF1R in the plasmamembrane fractions wascarried out at 37 °C in the presence of 10 mM MnCl2,[�-32P]ATP (0.2 mM and 2–15 cpm/fmol), 0.1 �M insulin for 30min. The reaction was terminated by adding 15 mM EDTA.The autophosphorylated receptors (100 �g of plasma mem-brane protein) were immunoprecipitated overnight at 4 °Cwith the IR or IGF1R� antibody (2 �g/ml). The immune com-plexes were collected on Protein A-agarose beads (Sigma) andwashed extensively with PBS. The immunoprecipitates were
Mitochondrial Stress-induced IGF1R Activation
MAY 11, 2007 • VOLUME 282 • NUMBER 19 JOURNAL OF BIOLOGICAL CHEMISTRY 14537
at University of Pennsylvania L
ibrary on October 15, 2014
http://ww
w.jbc.org/
Dow
nloaded from

extracted from the beads with 2� Laemmli buffer devoid of�-mercaptoethanol at 95 °C for 5 min for further analysis.Immunoblot Analysis—The protein contents were estimated
by the Lowry method (31). Cytosolic, nuclear, and plasmamembrane proteins (30 �g) solubilized in Laemmli samplebuffer were resolved by electrophoresis on 10 or 12% SDS-poly-acrylamide gels (32) and subjected to immunoblot analysis. Theimmunoblots were developed using SuperSignal West Femtomaximum sensitivity substrate (Pierce). In each case, blots pre-sented here are a representative of two to three independentexperiments.Plasma Membrane Lawn Assay—The level of plasma mem-
brane GLUT 4 was determined using the plasma membranelawn assay as described earlier (33). Cells grown on poly-L-ly-sine-coated coverslipswere treatedwith orwithout insulin (100nM for 30min). The coverslipswere rinsed in PBS and subjectedto hypotonic shock with three washes (10 s each) in membranebuffer (70mMKCl, 5mMMgCl2, 3mMEGTA, 1mMdithiothre-itol, 30 mM HEPES, pH 7.2). The coverslips were submerged inmembrane buffer and sonicated using a Probe sonicator, togenerate a lawn of plasma membrane fragments that remainedattached to the coverslip. The fragments were then immunola-beled with anti-GLUT 4 polyclonal antibody (1:100, U.S. Bio-logicals, Swampscott, MA) and Alexa 488 goat anti-rabbit sec-ondary antibody (Molecular Probes, 1:300). The membranefragments were viewed through an immunofluorescencemicroscope. At least six fields were examined within any oneexperiment for each condition.mRNAQuantitation by Real-time PCR—Total RNAwas iso-
lated using TRIzol reagent as per the supplier’s protocol(Invitrogen). cDNA was generated from 5 �g of RNA using thecDNA Archive kit from Applied Biosystems (Foster City, CA),and 50 ng of this cDNA was used as template per reaction.Relative quantification of GLUT 4, IGF1R, and IR mRNA byreal-time PCR was done using a TaqMan assay probe (AppliedBiosystems), and CnA� mRNA was quantified using SYBRGreen (Applied Biosystems) in an ABI PRISM 7300 sequencedetection system (Applied Biosystems). Data were normalizedto 18 S RNA (for TaqMan assay) and �-actin contents (forSYBR Green) as endogenous controls.Annexin V Assay—The assay for cells undergoing apoptosis
was performed using a Nexin Kit (Guava Technologies, Hay-ward, CA) according to the manufacturer’s suggested protocol.Cells (106 each) treated without or with inhibitors (Genistein,0.1 mg/ml; AG1024, 10 �M; and PPP, 2.5 �M) for 2 h werewashedwith 1ml of 1�NexinBuffer (GuavaTechnologies) andresuspended in the same buffer. After labeling with AnnexinV-PE, the percentage of apoptotic cells was quantified using thePersonal Cytometer (Guava Technologies). In the case of thesiRNA experiments, cells were harvested 48 h after the siRNAtransfections and counted as described above.Matrigel Invasion Assay—The in vitro invasion assays were
carried out as described previously (34). The Matrigel invasionchambers were prepared at 1:2 dilution of Matrigel (BD Bio-sciences, Belford, MA) as described before (1). Equal numbersof viable cells (4� 104) were seeded on top of theMatrigel layer.After incubation for 24 h at 37 °C, non-invading cells in theMatrigel layer were quantitatively removed, and the micro-
porous membrane containing invaded cells was stained andviewed under a Olympus BX 61 bright field microscope asdescribed before (22). At least six fields were examined withinany one experiment for each condition.Statistical Analysis—Data on enzyme activity, glucose
uptake, mRNA quantitation, and immunoblot analysis havebeen presented as means � S.D. of three to five independentmeasurements. Differences between paired variables weredetermined using two-way analysis of variance. p values �0.05were considered statistically significant, and p values �0.001were highly significant.
RESULTS
Increased Glucose Uptake by mtDNA-depleted Cells—Ini-tially, we evaluated glucose uptake by control and mtDNA-de-pleted C2C12 cells containing 20% of control cell mtDNA con-tent, and reverted cells with mtDNA content restored to �80%of control cells (Fig. 1A, left panel). Fig. 1A (right panel) shows
FIGURE 1. Increased uptake of deoxyglucose by C2C12 cells subjected topartial mtDNA depletion. A, mitochondrial DNA contents of control,mtDNA-depleted, and reverted cells. Total cell DNA (0.5 �g each), digestedwith BglII, was subjected to Southern blot hybridization using a 32P-labeledmtDNA probe (cytochrome oxidase subunits I plus II coding region ofmtDNA). In the right panel, 10 ng of DNA was used as template for amplifyingthe nuclear DNA-encoded Cox IVil amplicon. B–D, 2-DOG uptake by control,mtDNA-depleted, and reverted cells. Sub-confluent cells were washed withPBS and incubated for 30 min at 37 °C in transport buffer containing theindicated concentrations of insulin (B), 10 nM FK506 (C), and 25 �M CCCP (D).Cells were incubated at 37 °C for 30 min with 1 �Ci of 2-[3H]DOG (1 mCi/0.1mmol), and the uptake was measured as described under “Experimental Pro-cedures.” Nonspecific background counts with heat-killed cells were sub-tracted from experimental values. Averages � S.E. of three independentestimates (each taken in triplicate) are presented. In B the difference inglucose uptake between control and mtDNA-depleted cells is indicated:**, p � 0.001. Statistical differences between mtDNA-depleted cells with-out added insulin and with added 1 �M insulin are indicated: *, p � 0.05. Incontrol and reverted cells, the values with added insulin (*) compared withor without added insulin show a significance of p � 0.05. In C and D: *, p �0.05; **, p � 0.001.
Mitochondrial Stress-induced IGF1R Activation
14538 JOURNAL OF BIOLOGICAL CHEMISTRY VOLUME 282 • NUMBER 19 • MAY 11, 2007
at University of Pennsylvania L
ibrary on October 15, 2014
http://ww
w.jbc.org/
Dow
nloaded from

the relative levels of nuclear DNA as assessed by the cyto-chrome c oxidase IVil amplicons using 10 ng of genomic DNAtemplate in each case. Aliquots of cells from the same parentstock culture as shown in Fig. 1A were used to ascertain uni-form cellular mtDNA contents in all experiments reportedherein.We studied the uptake of 2-DOG in the three cell types under
uninduced and insulin stimulation, with insulin concentrationsranging from 0 to 1 �M (Fig. 1B). The mtDNA-depleted cellsshowed �2-fold higher glucose uptake in the absence of addedinsulin (basal) compared with control cells (p � 0.001). Thereverted cells showed glucose uptake closer to the control cells.With added 0.1 �M insulin, the mtDNA-depleted cells showednearly 2-fold higher glucose uptake than control cells. With 0.5�M and 1 �M insulin, the increase was only 60 and 40%, respec-tively, suggesting a saturating effect. Results also showed that allthree cell lines take up higher 2-DOG in response to increasinglevels of insulin, although the increase was markedly apparentin control and reverted cells (p � 0.05), but less apparent inmtDNA-depleted cells. The glucose uptake in mtDNA-de-pleted cells with added 1 �M insulin as compared with no insu-lin controls was also significant (p � 0.05). Although notshown, a similar pattern of 3-O-methyl-D-glucose uptake wasobserved confirming altered transport.The mitochondrial stress-induced signaling in different cell
lines involves activation of Cn and its related factors (2, 5). Fig.1C shows that FK506, an inhibitor of Cn, inhibited glucoseuptake by control and reverted cells only marginally (15 and20%, respectively), but to a markedly higher extent of 70% inmtDNA-depleted cells (p � 0.001). These results suggested therole of Cn in glucose uptake. A reduced glucose uptake byreverted cells also suggested a direct link between mitochon-drial genetic stress and glucose uptake.Previously we proposed that disruption of ��m by CCCP
treatment also activates themitochondrial stress signaling sim-ilar tomtDNA depletion (2). In accordance with these observa-tions, CCCP treatment indeed caused�2.5-fold higher glucoseuptake by C2C12 cells, which was further increased by�40% inresponse to added insulin (Fig. 1D). These results further sup-port the role of mitochondrial stress in inducing cellular glu-cose uptake.The predominant isoforms of glucose transporters in skeletal
muscle cells are GLUT 4 and GLUT 1 (35). There was no dif-ference in the levels of GLUT 1 between control and mtDNA-depleted cells (data not shown). In keeping with the results ofglucose uptake, immunoblot in Fig. 2A shows that mtDNA-depleted cells contain �2-fold higher GLUT 4 protein as com-paredwith control cells, which is in accordancewith 3- to 4-foldhigher mRNA level (Fig. 2B). GLUT 4 protein (Fig. 2A) andmRNA (Fig. 2B) levels in reverted cells were markedly lowerthan that of mtDNA-depleted cells and closer to that of controlcells. These results show that increased GLUT 4 expression isdirectly related tomitochondrial stress. GLUT 4mRNA level inmtDNA-depleted cells, but not in control cells, was sensitive toAG1024, an inhibitor of IGF1R. Although not shown, PPP, amore specific inhibitor of IGF1R (36, 37) also decreased GLUT4 protein levels inmtDNA-depleted cells. These results suggestthat increasedGLUT4 expression in response tomitochondrial
stress may be related to stress-mediated activation of IGF1Rpathway. In keeping with increased glucose uptake (Fig. 1D),addition ofCCCP increased the level ofGLUT4 in control cells.Additionally, FK506 added to mtDNA-depleted cells resultedin amarked reduction of bothGLUT 4 protein andmRNA level(Fig. 2, A and B) further suggesting the role of Cn pathway inincreased glucose uptake.Relative contributions of IGF1R and Cn activation on GLUT
4 expression was further investigated by overexpression ofIGF1R in mtDNA-depleted cells treated with Cn inhibitorFK506. As seen from Fig. 2C, FK506 treatment caused a 60%reduction of GLUT 4 mRNA in mock transfected mtDNA-de-pleted cells. Transfection of mtDNA-depleted cells with IGF1RcDNA caused a near 2-fold increase in GLUT 4 mRNA level,which was reduced to near basal level by FK506. These resultssuggest that IGF1R and Cn pathways may cooperatively inducethe expression of GLUT 4 mRNA. The results also show thatGLUT 4 protein and mRNA contents were increased by 2.5- to4.0-fold in mtDNA-depleted cells that returned close to thecontrol cell level in reverted cells.We carried out the lawn assay for determining the level of
GLUT4 protein in the plasmamembrane compartment of con-trol and mtDNA-depleted cells. Fig. 2D shows that the basallevel of GLUT 4 in the plasmamembrane fractionwas higher in
FIGURE 2. Increased GLUT 4 protein and mRNA levels in mtDNA-depletedC2C12 cells. A, C2C12 cells were treated with AG1024 (10 �M, 2 h), CCCP (25�M, 2 h), or FK506 (10 nM, 2 h) as indicated. Plasma membrane fractions (30 �geach) were subjected to immunoblot analysis, and the blot was co-developedwith antibody to GLUT 4 (1:1000 dilution) and Na�/K�-ATPase (1:1000 dilu-tion). The latter was used as a loading control. B, RT-PCR analysis of total RNA(50 ng each of RT product) from control, mtDNA-depleted, and revertedC2C12 cells. The values represent average � S.E. of three independent assays.*, p � 0.05; **, p � 0.001. C, real-time PCR analysis of total RNA (50 ng each ofRT product) from mtDNA-depleted C2C12 cells. Cells were transfected with 2�g of IGF1R cDNA for 48 h, and total RNA was isolated. Real-time PCR analysisof GLUT 4 mRNA was done using a TaqMan probe as described under “Exper-imental Procedures.” *, p � 0.05; **, p � 0.001. D, lawn assay for GLUT 4contents of plasma membrane fractions from control and mtDNA-depletedcells before or after treatment with insulin (100 nM, 30 min). Details of immu-noblot analysis, real-time PCR, and the lawn assay are as described under“Experimental Procedures.”
Mitochondrial Stress-induced IGF1R Activation
MAY 11, 2007 • VOLUME 282 • NUMBER 19 JOURNAL OF BIOLOGICAL CHEMISTRY 14539
at University of Pennsylvania L
ibrary on October 15, 2014
http://ww
w.jbc.org/
Dow
nloaded from

mtDNA-depleted cells as comparedwith control cells. Further-more, insulin treatment increased the plasma membrane con-tents of GLUT 4 in both cell types. These results are consistentwith GLUT4 mRNA and protein levels in mtDNA-depletedcells.Increased Expression ofGLUT4and IGF1RmRNAs andActi-
vation of IGF1 Receptor in mtDNA-depleted Cells—IR andIGF1R both activate GLUT 4 and glucose uptake in C2C12cells. To gain insight into the mechanism of increased glucoseuptake and induced expression of GLUT 4 inmtDNA-depletedcells, we studied the effects of specific inhibitors of receptorpathways that regulate glucose uptake. Fig. 3A shows that bothwortmannin and LY294002, general inhibitors of the phospha-tidylinositol 3-kinase pathway (38, 39), inhibited glucoseuptake both in control and mtDNA-depleted cells by �70–85%. Genistein, a known inhibitor of IR (40) inhibited glucoseuptake by �30% in control cells and by 15% in mtDNA-de-pleted cells. AG1024, which inhibits IGF1Rmore preferentiallyat the concentration used (10 �M), had no significant effect onglucose uptake in control cells, whereas it inhibited glucoseuptake by nearly 85% inmtDNA-depleted cells (Fig. 3A). PPP, aspecific inhibitor of IGF1R (36, 37), is known to specificallyinhibit the phosphorylation of Tyr1136, which is critical for theactivation of IGF1 receptor, but has no effect on IR activation(41). PPP inhibited glucose uptake to �46% in control cells and88% in mtDNA-depleted cells. The differential effects of theseinhibitors suggest that insulin receptor plays amore prominentrole in glucose uptake in control cells, whereas IGF1R plays amore prominent role in mtDNA-depleted cells.We then evaluated IR and IGF1R levels and their autophos-
phorylation in these cells. The immunoblot in Fig. 3B showsthat the IR level was increased by �1.5-fold in mtDNA-de-pleted cells, whichwas back to near control cell level in revertedcells. Treatment with FK506 had no significant effect on IRprotein level in control and reverted cells, whereas it inhibitedthe level by �50% in mtDNA-depleted cells. The autoradio-gram in Fig. 3C shows the level of autophosphorylation of IR incontrol, depleted, and reverted cells. Results show high levels ofautophosphorylation in control and reverted cells but a mark-edly lower level inmtDNA-depleted cells. These levels were notsignificantly affected by FK506, suggesting marked differencesin the level of IR activation in control and mtDNA-depletedcells.The immunoblot in Fig. 3D shows that the IGF1R level in
mtDNA-depleted cells is�4.5-fold higher than in control cells.Reverted cells, on the other hand, contained a IGF1R levelcloser to the control cells. CCCP treatment in control cellsinduced the IGF1R level by�3-fold. The level of IGF1R proteininmtDNA-depleted cells was reduced by treatmentwith FK506suggesting a possible role of Cn in increased expression ortranslocation of receptor protein. The autoradiogram in Fig. 3Eshows that the receptor is autophosphorylated at low levels incontrol and reverted cells, which is not significantly affected byFK506. In mtDNA-depleted cells, however, the level of auto-phosphorylation was markedly higher (�6-fold) and was sensi-tive to FK506. Consistent with the IGF1R protein levels in dif-ferent cell types, real-time PCR data in Fig. 3F shows that theIGF1R mRNA level was increased 7-fold in mtDNA-depleted
cells, and the level returned to near control cell level in revertedcells. The results collectively suggest that increased glucoseuptake inmtDNA-depleted cells was probably due to increasedexpression and/or increased autophosphorylation of IGF1receptor. Measurement of IGF1 in culture medium showed a
FIGURE 3. Activation of IGF1R and inactivation of IR in mtDNA-depletedC2C12 cells. A, effects of receptor inhibitors wortmannin (0.1 �M), LY294002(50 �M), genistein (0.1 mg/ml), AG1024 (10 �M), and PPP (2.5 �M) on 2-DOGuptake in control, mtDNA-depleted, and reverted cells. Treatments were car-ried out for 2 h. Details of 2-DOG uptake are as described in Fig. 1. Shown arethe differences between control (basal) and mtDNA-depleted cells (**, p �0.001) and between mtDNA-depleted cells with and without added genistein(*, p � 0.05). Shown also are the levels of inhibition in mtDNA-depleted cellswith added wortmannin, LY294002, AG1024, and PPP compared with noinhibitor control (**, p � 0.001). B, basal plasma membrane levels of IR� incontrol, mtDNA-depleted, and reverted cells treated with or without of FK506(10 nM, 2 h). Cell fractions (30 �g each) were subjected to immunoblot anal-ysis with antibody to IR� as described under “Experimental Procedures.” Theblot was co-developed with Na�/K�-ATPase antibody to assess equal proteinloading levels. C, levels of basal IR� autophosphorylation. Autophosphoryla-tion was carried out in plasma membranes of cells treated with or withoutFK506 as described under “Experimental Procedures.” An autoradiogram ofgels showing 32P-labeled IR� is presented. D, immunoblot analysis of plasmamembranes with IGF1R antibody following treatment with or without FK506.The blots were co-developed with antibody to Na�/K�-ATPase to assessloading levels. E, autoradiograms of gels showing 32P-labeled IGF1R proteinare presented. Levels of IGF1R autophosphorylation in cells treated with orwithout FK506. Details of treatment are as in C. F, IGF1R mRNA levels werequantified by real-time PCR in control, mtDNA-depleted, and reverted C2C12cells as described under “Experimental Procedures.” In some cases cellswere treated with FK506 (10 nM) for 30 min before isolating total RNA.*, p � 0.05; **, p � 0.001. G, autophosphorylation of IGF1R (upper panel)and IR (lower panel) in cells grown in charcoal-treated serum as describedunder “Experimental Procedures.” In B–E and G, values of relative bandintensities presented in parentheses represent averages of two to threeindependent blots.
Mitochondrial Stress-induced IGF1R Activation
14540 JOURNAL OF BIOLOGICAL CHEMISTRY VOLUME 282 • NUMBER 19 • MAY 11, 2007
at University of Pennsylvania L
ibrary on October 15, 2014
http://ww
w.jbc.org/
Dow
nloaded from
small increase in IGF1 level in mtDNA-depleted cells (�75ng/ml) compared with control cells (�50 ng/ml). To evaluate ifthemarked difference in the receptor autophosphorylationwasdue to extracellular or intracellular factors, we cultured the cellsinmedium containing charcoal pre-adsorbed FBS. As shown inFig. 3G, the IGF1R autophosphorylation was �3-fold higher inmtDNA-depleted cells and only marginally higher in controlcells grown in charcoal-treated FBS. Similarly, the level of IRautophosphorylation was reduced marginally in mtDNA-de-pleted cells in comparison to control cells.Possible Role of AMPK in Increased Glucose Uptake in
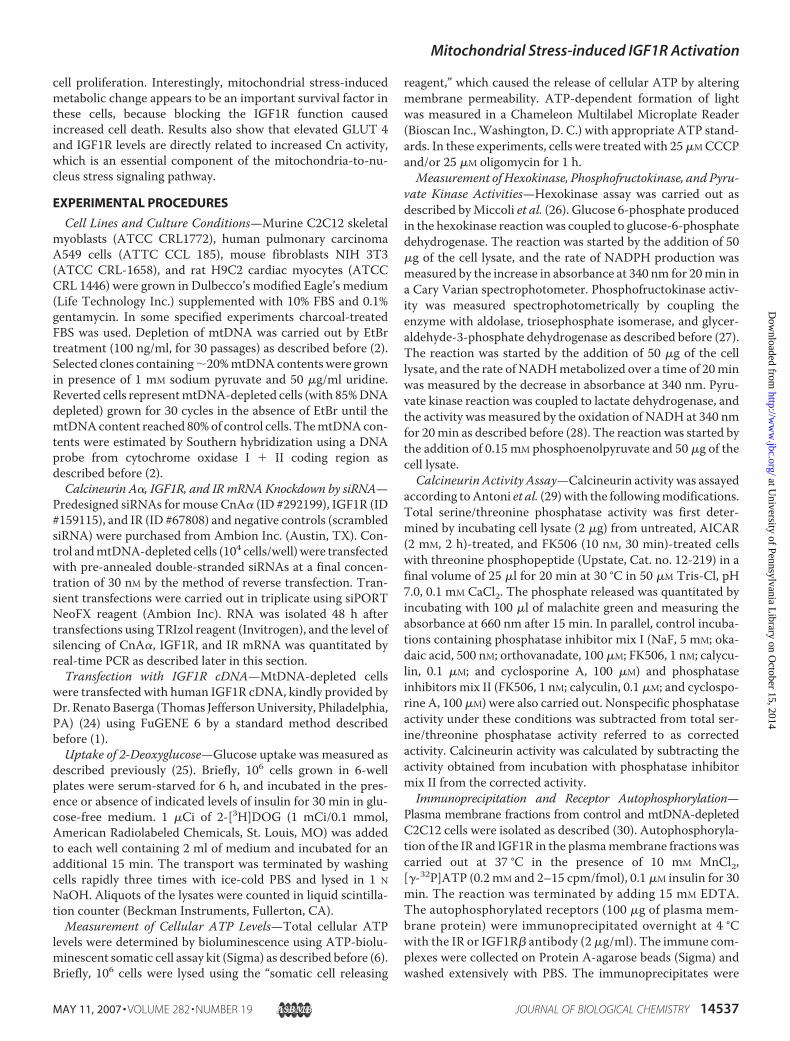
mtDNA-depleted Cells—5AMP-activated protein kinase isknown to play an important role in insulin signaling, glucoseuptake, and energy homeostasis (42). Recently AMPK has alsobeen implicated to be involved in PGC1�-mediated mitochon-drial biogenesis (43). For these reasons we assessed the role ofAMPK in the respiratory stress-mediated activation of Cn andglucose uptake in mtDNA-depleted C2C12 cells. We evaluatedthe effects of AICAR, a well known activator of AMPK (42), andFK506, an inhibitor of Cn, on the calcineurin activity in cellextracts. As shown in Fig. 4A AICAR had no effect on the Cnactivity in mtDNA-depleted cells, whereas FK506 inhibited theactivity. As seen from Fig. 4B, AICARmarginally increased glu-cose uptake by mtDNA-depleted cells. Similarly, AICAR wasable to partially restore FK506-mediated inhibition of glucoseuptake. These results suggest that, although AMPK is activatedin response to respiratory stress, it does not have a role inincreased Cn activity in mtDNA-depleted cells. Additionally,the contribution of AMPK to increased glucose uptake inmtDNA-depleted cells appears to be only marginal. Theseresults also suggest that the two pathways may not be depend-ent on each other.Activation of IGF1R and Glucose Uptake Is a General Phe-
nomenon in Cells Subjected to Mitochondrial RespiratoryStress—The generality of increased glucose uptake and ele-vated levels of GLUT 4 and IGF1RmRNAobserved inmtDNA-depleted C2C12 cells was investigated using three other celllines. For this purpose we chose mtDNA-depleted A549 cells(6) and H9C2 cardiomyocytes, both of which are transformedcells and also non-transformed 3T3 cells, all of which express
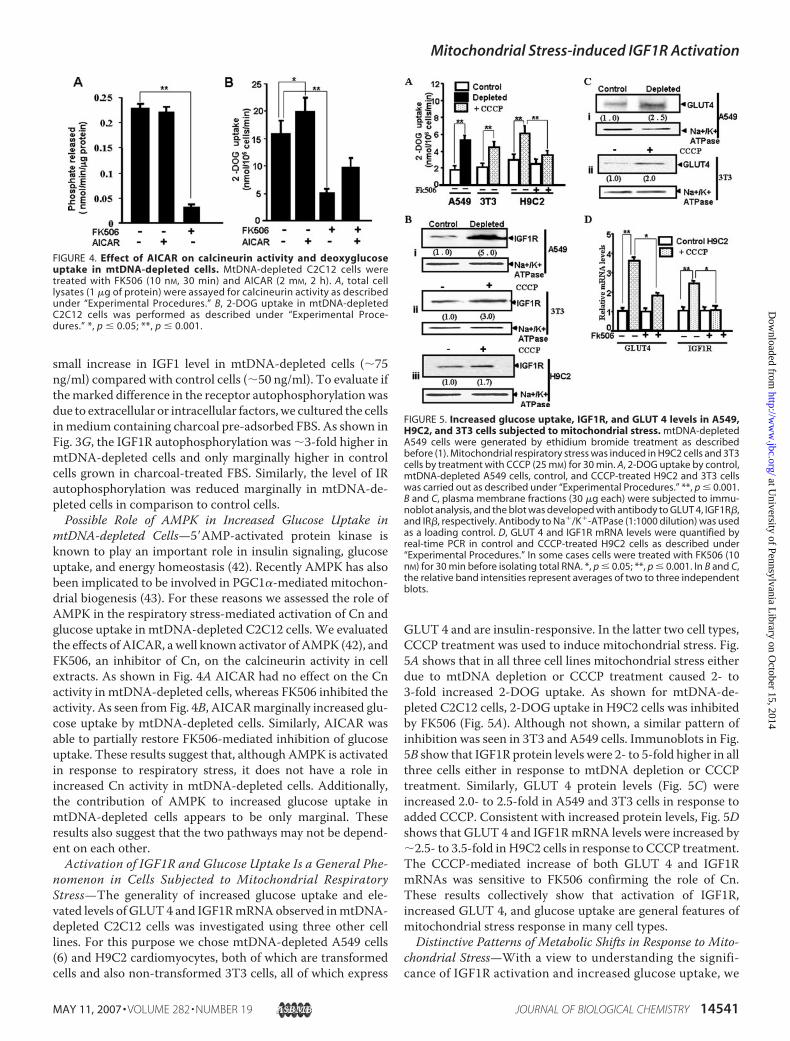
GLUT 4 and are insulin-responsive. In the latter two cell types,CCCP treatment was used to induce mitochondrial stress. Fig.5A shows that in all three cell lines mitochondrial stress eitherdue to mtDNA depletion or CCCP treatment caused 2- to3-fold increased 2-DOG uptake. As shown for mtDNA-de-pleted C2C12 cells, 2-DOG uptake in H9C2 cells was inhibitedby FK506 (Fig. 5A). Although not shown, a similar pattern ofinhibition was seen in 3T3 and A549 cells. Immunoblots in Fig.5B show that IGF1R protein levels were 2- to 5-fold higher in allthree cells either in response to mtDNA depletion or CCCPtreatment. Similarly, GLUT 4 protein levels (Fig. 5C) wereincreased 2.0- to 2.5-fold in A549 and 3T3 cells in response toadded CCCP. Consistent with increased protein levels, Fig. 5Dshows that GLUT 4 and IGF1RmRNA levels were increased by�2.5- to 3.5-fold in H9C2 cells in response to CCCP treatment.The CCCP-mediated increase of both GLUT 4 and IGF1RmRNAs was sensitive to FK506 confirming the role of Cn.These results collectively show that activation of IGF1R,increased GLUT 4, and glucose uptake are general features ofmitochondrial stress response in many cell types.Distinctive Patterns of Metabolic Shifts in Response to Mito-
chondrial Stress—With a view to understanding the signifi-cance of IGF1R activation and increased glucose uptake, we
FIGURE 4. Effect of AICAR on calcineurin activity and deoxyglucoseuptake in mtDNA-depleted cells. MtDNA-depleted C2C12 cells weretreated with FK506 (10 nM, 30 min) and AICAR (2 mM, 2 h). A, total celllysates (1 �g of protein) were assayed for calcineurin activity as describedunder “Experimental Procedures.” B, 2-DOG uptake in mtDNA-depletedC2C12 cells was performed as described under “Experimental Proce-dures.” *, p � 0.05; **, p � 0.001.
FIGURE 5. Increased glucose uptake, IGF1R, and GLUT 4 levels in A549,H9C2, and 3T3 cells subjected to mitochondrial stress. mtDNA-depletedA549 cells were generated by ethidium bromide treatment as describedbefore (1). Mitochondrial respiratory stress was induced in H9C2 cells and 3T3cells by treatment with CCCP (25 mM) for 30 min. A, 2-DOG uptake by control,mtDNA-depleted A549 cells, control, and CCCP-treated H9C2 and 3T3 cellswas carried out as described under “Experimental Procedures.” **, p � 0.001.B and C, plasma membrane fractions (30 �g each) were subjected to immu-noblot analysis, and the blot was developed with antibody to GLUT 4, IGF1R�,and IR�, respectively. Antibody to Na�/K�-ATPase (1:1000 dilution) was usedas a loading control. D, GLUT 4 and IGF1R mRNA levels were quantified byreal-time PCR in control and CCCP-treated H9C2 cells as described under“Experimental Procedures.” In some cases cells were treated with FK506 (10nM) for 30 min before isolating total RNA. *, p � 0.05; **, p � 0.001. In B and C,the relative band intensities represent averages of two to three independentblots.
Mitochondrial Stress-induced IGF1R Activation
MAY 11, 2007 • VOLUME 282 • NUMBER 19 JOURNAL OF BIOLOGICAL CHEMISTRY 14541
at University of Pennsylvania L
ibrary on October 15, 2014
http://ww
w.jbc.org/
Dow
nloaded from

assayed the levels of the three irreversible and regulatedsteps of glycolysis. Table 1 shows that the hexokinase, phos-phofructokinase, and pyruvate kinase activities wereincreased 5- to 28-fold in mtDNA-depleted C2C12 and A549cells, except that the unit increase of PFK in mtDNA-de-pleted A549 cells was only marginal. The activities of theseenzymes were also increased 2.5- to 4.5-fold in CCCP-treated 3T3 cells. The level of increase in CCCP-treatedH9C2 cells was significantly lower. In particular, the PKactivity was marginally reduced, which is not statisticallysignificant. Although the reason for this difference remainsunknown, it may be related to cell-specific differences in theinducibility of glycolytic pathways. Consistent with inducedglycolytic pathways, results in Table 2 show that the levels ofoligomycin-insensitive ATP synthesis is increased nearly2-fold in cells subjected to mitochondrial genetic (mtDNA-depleted) and metabolic (CCCP-treated) stress. Theseresults collectively show that mitochondrial respiratorystress induces a shift in cellular metabolic pattern.Effects of CalcineurinA�mRNASilencing onGLUT4, IGF1R,
and IR mRNA Levels—To confirm the role of increased Cnactivity on increased steady-state GLUT 4 and IGF1R mRNAlevels in cells subjected to mitochondrial stress, we used ansiRNA approach to knock down CnA� mRNA in C2C12 cells.Fig. 6A shows that transient expression of siRNA reduced
CnA� mRNA levels by �60% in control cells and nearly 80% inmtDNA-depleted cells compared with mock transfections.Results in Fig. 6 (B and C) show that Cn mRNA silencing incontrol cells did not have a significant effect on either IGF1R orGLUT 4 mRNA levels. However, in mtDNA-depleted cells, CnmRNA silencing had a profound effect, because both IGF1Rand GLUT 4 mRNA levels were reduced by 75–85%. Further,Fig. 6D shows that Cn mRNA silencing had only a marginaleffect on IR mRNA levels. These results provide confirmatoryevidence that Cn and its target factors are involved in the reg-ulation of IGF1R and GLUT 4 genes. Results also suggest that,in control cells, basal levels of expression of these two genes arenot regulated by Cn.
FIGURE 6. Effects of calcineurin A� mRNA silencing in mtDNA-depletedcells. Control and mtDNA-depleted cells were transfected either with specificsiRNA or scrambled siRNA (control) constructs as described under “Experi-mental Procedures.” A, CnA� mRNA levels; B, IGF1R mRNA levels in trans-fected cells quantitated by real-time PCR using TaqMan probe. C, GLUT 4mRNA levels in the transfected cells quantitated by TaqMan assay. D, IR mRNAlevels in transfected cells quantitated by real-time PCR using TaqMan assay.**, p � 0.001.
TABLE 1Mitochondrial respiratory stress increases activity of glycolytic enzymesThe values shown represent themean� S.D. from three independent assays. Statistical analyseswere done between control and depleted or control andCCCP-treated cells.
Enzymes
Cell lines, specific activitiesC2C12 A549 3T3 H9C2
Control Depleted Control Depleted Control Control plusCCCP Control Control
plus CCCPenzyme units/mg protein
Hexokinasea 35 � 1.75 160 � 10b 4.8 � 0.3 9.6 � 0.6b 27 � 1.3 143 � 5.2c 28 � 1.3 51 � 1.7bPhosphofructokinased 10.6 � 0.4 288 � 9.3c 3.2 � 0.1 3.5 � 0.14e 8 � 0.2 34 � 1.3b 4.2 � 0.15 5.1 � 0.17bPyruvate kinasef 65.6 � 4.2 616.1 � 20.5c 11.9 � 3.7 57.55 � 9.4e 108.8 � 3.75 258.8 � 9.24b 15.4 � 1.57 10.8 � 0.45
a One unit will phosphorylate 1.0 �mol of D-glucose min1 at pH 7.6 at 25 °C.b p � 0.005.c p � 0.001.dOne unit will convert 1.0 �mol of fructose 6-phosphate min1.e p � 0.05.f One unit will convert 1.0 �mol of phosphoenolpyruvate min1.
TABLE 2Oligomycin-sensitive and -insensitive ATP levels undermitochondrial respiratory stressATP levels were measured using the Somatic cell assay kit (Sigma) as describedunder “Experimental Procedures.” Oligomycin (25 �M) treatment was carried outfor 1 h. Values shown are mean � S.D. of three independent assays. Statisticalanalyses were done between the following sets: 1) control (oligomycin) and con-trol (�oligomycin); 2) control (oligomycin) and depleted (oligomycin); and 3)depleted (oligomycin) and depleted (�oligomycin).
Cell typeATP produced
�oligomycin �oligomycin�mol/106 cells
C2C12 Control 4.54 � 0.13 1.19 � 0.04aDepleted 2.03 � 0.06a 2.00 � 0.06a
A549 Control 2.04 � 0.08 0.67 � 0.02aDepleted 1.9 � 0.07a 1.7 � 0.06b
3T3 Control 5.35 � 0.19 1.63 � 0.05aControl plus CCCP 4.5 � 0.15b 2.6 � 0.09a
H9C2 Control 3.97 � 0.13 1.8 � 0.06aControl plus CCCP 3.8 � 0.14b 2.5 � 0.12a
a p � 0.001.b p � 0.05.
Mitochondrial Stress-induced IGF1R Activation
14542 JOURNAL OF BIOLOGICAL CHEMISTRY VOLUME 282 • NUMBER 19 • MAY 11, 2007
at University of Pennsylvania L
ibrary on October 15, 2014
http://ww
w.jbc.org/
Dow
nloaded from

IGF1R Inactivation Induces Apoptosis and Inhibits InvasiveProperty of mtDNA-depleted C2C12 Cells—Previously weshowed that mitochondrial stress in otherwise non-tumori-genic C2C12 cells renders them highly invasive (2, 6). Here weascertained the role of IGF1R activation on increased glucosetransport and invasive property of cells bymRNA silencing. Fig.7A shows that transfection with siRNA constructs reduced IRand IGF1R mRNA contents in mtDNA-depleted C2C12 cellsby 80 and 60%, respectively, of mock transfected cells (p �0.001). As shown in Fig. 7B, in control cells IR mRNA silencingreduced 2-DOG uptake by �50%, but IGF1R mRNA silencing
had only a marginal effect. InmtDNA-depleted cells, IR mRNAsilencing reduced 2-DOG uptakeonly marginally (�20%), whereasIGF1R mRNA silencing was moreeffective by inhibiting 2-DOGuptake by �60% (p � 0.001). Thislevel of inhibition was consistentwith the level of mRNA silencing(see Fig. 7A). As seen from Fig. 7C,both IR and IGF1RmRNA silencingin control cells marginally affectedGLUT 4 mRNA levels. In mtDNA-depleted cells, IR mRNA silencingreduced GLUT 4 mRNA levels by�20%. IGF1R mRNA silencing inmtDNA-depleted cells, however,had a profound effect in that GLUT4 mRNA levels were reduced by�75%. These results show thatIGF1R activation as part of mito-chondrial respiratory stress plays adirect role in increased GLUT 4mRNA and increased glucoseuptake.Because IGF1R activation is asso-
ciated with tumorigenic property ofcells, we tested the effects of mRNAsilencing on in vitro invasive prop-erty and rate of apoptosis. Fig. 7Dshows that IR mRNA silencing hadno significant effect on the ability ofmtDNA-depleted cells to invadethrough the Matrigel membrane,whereas IGF1R mRNA silencingreduced the number of invadingcells by �85%. An opposite effectwas observed on the propensity ofcells to undergo apoptosis. Thenumber of cells undergoing apopto-sis was measured using the Nexinassay, which utilizes annexin V-PEto detect phosphatidylserine on theplasma membrane signifying apop-totic cells. The Nexin assay in Fig.7E showed only a marginal increasein apoptosis by IR mRNA silencing,
whereas IGF1R mRNA silencing caused a vastly increased 50%apoptosis.We also assessed the effects of known inhibitors of IGF1R on
the invasive property and rate of apoptosis on control,mtDNA-depleted, and reverted C2C12 cells. The cell distribution pat-tern in Fig. 8A and the quantitation in Fig. 8B show that control,depleted, and reverted cells contained only 8–10% apoptoticcells. Treatment with AG1024 and PPP, specific inhibitors ofIGF1R, however induced apoptosis inmtDNA-depleted cells to�28% and 40%, respectively (p � 0.001), whereas these agentshad no significant effect on control cells. In reverted cells the
FIGURE 7. Effects of IR and IGF1R mRNA silencing in mtDNA-depleted cells. Control and mtDNA-depleted C2C12 cells were transfected either with scrambled siRNA (control) or IR- and IGF1R-specificsiRNA constructs as described under “Experimental Procedures.” A, IR and IGF1R mRNA levels determinedby real-time PCR. B, 2-DOG uptake in control, mtDNA-depleted, and mRNA-silenced cells. C, GLUT 4 mRNAlevels in control, mtDNA-depleted, and mRNA-silenced cells. D, Matrigel invasion assay with mtDNA-depleted cells transfected with mock (negative control) siRNA, IR siRNA, and IGF1R siRNA. E, Nexin assayfor measuring apoptosis in mtDNA-depleted cells. Panels on the left show the cell flow cytometry pattern,and the graph on the right shows the percent apoptotic cells quantified from three independent cellsorting measurements. **, p � 0.001.
Mitochondrial Stress-induced IGF1R Activation
MAY 11, 2007 • VOLUME 282 • NUMBER 19 JOURNAL OF BIOLOGICAL CHEMISTRY 14543
at University of Pennsylvania L
ibrary on October 15, 2014
http://ww
w.jbc.org/
Dow
nloaded from
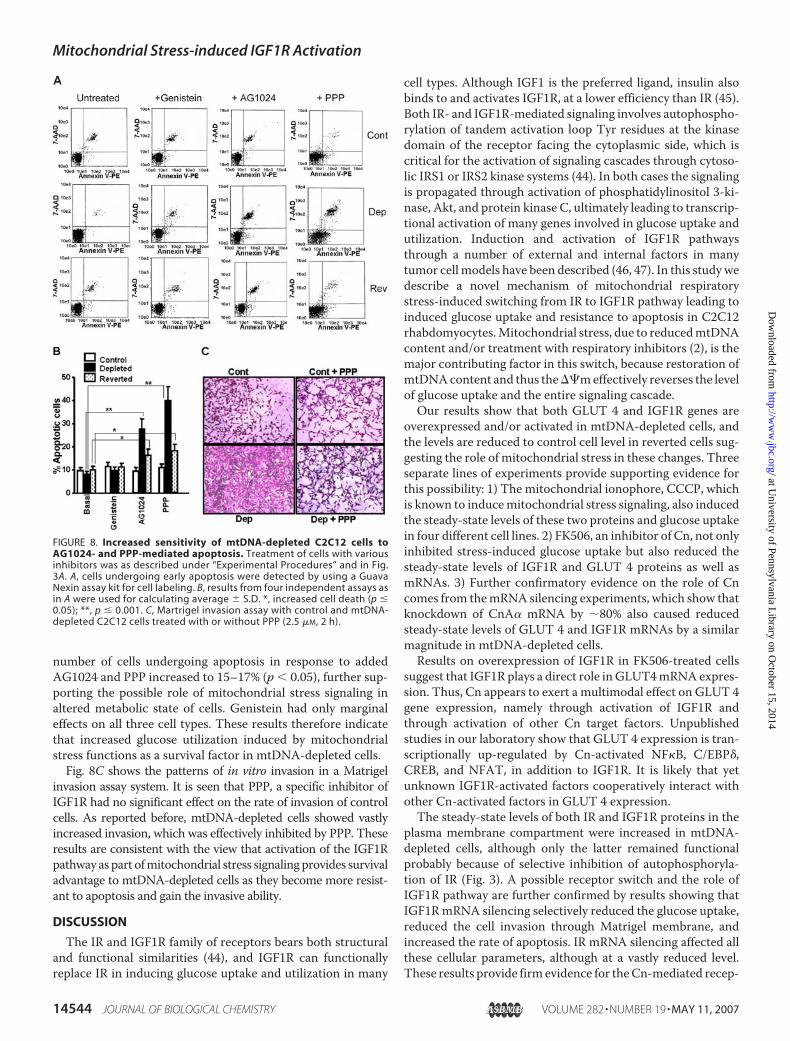
number of cells undergoing apoptosis in response to addedAG1024 and PPP increased to 15–17% (p � 0.05), further sup-porting the possible role of mitochondrial stress signaling inaltered metabolic state of cells. Genistein had only marginaleffects on all three cell types. These results therefore indicatethat increased glucose utilization induced by mitochondrialstress functions as a survival factor in mtDNA-depleted cells.Fig. 8C shows the patterns of in vitro invasion in a Matrigel
invasion assay system. It is seen that PPP, a specific inhibitor ofIGF1R had no significant effect on the rate of invasion of controlcells. As reported before, mtDNA-depleted cells showed vastlyincreased invasion, which was effectively inhibited by PPP. Theseresults are consistent with the view that activation of the IGF1Rpathway as part ofmitochondrial stress signalingprovides survivaladvantage to mtDNA-depleted cells as they become more resist-ant to apoptosis and gain the invasive ability.
DISCUSSION
The IR and IGF1R family of receptors bears both structuraland functional similarities (44), and IGF1R can functionallyreplace IR in inducing glucose uptake and utilization in many
cell types. Although IGF1 is the preferred ligand, insulin alsobinds to and activates IGF1R, at a lower efficiency than IR (45).Both IR- and IGF1R-mediated signaling involves autophospho-rylation of tandem activation loop Tyr residues at the kinasedomain of the receptor facing the cytoplasmic side, which iscritical for the activation of signaling cascades through cytoso-lic IRS1 or IRS2 kinase systems (44). In both cases the signalingis propagated through activation of phosphatidylinositol 3-ki-nase, Akt, and protein kinase C, ultimately leading to transcrip-tional activation of many genes involved in glucose uptake andutilization. Induction and activation of IGF1R pathwaysthrough a number of external and internal factors in manytumor cell models have been described (46, 47). In this studywedescribe a novel mechanism of mitochondrial respiratorystress-induced switching from IR to IGF1R pathway leading toinduced glucose uptake and resistance to apoptosis in C2C12rhabdomyocytes.Mitochondrial stress, due to reducedmtDNAcontent and/or treatment with respiratory inhibitors (2), is themajor contributing factor in this switch, because restoration ofmtDNAcontent and thus the��meffectively reverses the levelof glucose uptake and the entire signaling cascade.Our results show that both GLUT 4 and IGF1R genes are
overexpressed and/or activated in mtDNA-depleted cells, andthe levels are reduced to control cell level in reverted cells sug-gesting the role of mitochondrial stress in these changes. Threeseparate lines of experiments provide supporting evidence forthis possibility: 1) The mitochondrial ionophore, CCCP, whichis known to inducemitochondrial stress signaling, also inducedthe steady-state levels of these two proteins and glucose uptakein four different cell lines. 2) FK506, an inhibitor of Cn, not onlyinhibited stress-induced glucose uptake but also reduced thesteady-state levels of IGF1R and GLUT 4 proteins as well asmRNAs. 3) Further confirmatory evidence on the role of Cncomes from themRNA silencing experiments, which show thatknockdown of CnA� mRNA by �80% also caused reducedsteady-state levels of GLUT 4 and IGF1R mRNAs by a similarmagnitude in mtDNA-depleted cells.Results on overexpression of IGF1R in FK506-treated cells
suggest that IGF1R plays a direct role inGLUT4mRNAexpres-sion. Thus, Cn appears to exert a multimodal effect on GLUT 4gene expression, namely through activation of IGF1R andthrough activation of other Cn target factors. Unpublishedstudies in our laboratory show that GLUT 4 expression is tran-scriptionally up-regulated by Cn-activated NF�B, C/EBP�,CREB, and NFAT, in addition to IGF1R. It is likely that yetunknown IGF1R-activated factors cooperatively interact withother Cn-activated factors in GLUT 4 expression.The steady-state levels of both IR and IGF1R proteins in the
plasma membrane compartment were increased in mtDNA-depleted cells, although only the latter remained functionalprobably because of selective inhibition of autophosphoryla-tion of IR (Fig. 3). A possible receptor switch and the role ofIGF1R pathway are further confirmed by results showing thatIGF1RmRNA silencing selectively reduced the glucose uptake,reduced the cell invasion through Matrigel membrane, andincreased the rate of apoptosis. IR mRNA silencing affected allthese cellular parameters, although at a vastly reduced level.These results provide firm evidence for theCn-mediated recep-
FIGURE 8. Increased sensitivity of mtDNA-depleted C2C12 cells toAG1024- and PPP-mediated apoptosis. Treatment of cells with variousinhibitors was as described under “Experimental Procedures” and in Fig.3A. A, cells undergoing early apoptosis were detected by using a GuavaNexin assay kit for cell labeling. B, results from four independent assays asin A were used for calculating average � S.D. *, increased cell death (p �0.05); **, p � 0.001. C, Martrigel invasion assay with control and mtDNA-depleted C2C12 cells treated with or without PPP (2.5 �M, 2 h).
Mitochondrial Stress-induced IGF1R Activation
14544 JOURNAL OF BIOLOGICAL CHEMISTRY VOLUME 282 • NUMBER 19 • MAY 11, 2007
at University of Pennsylvania L
ibrary on October 15, 2014
http://ww
w.jbc.org/
Dow
nloaded from

tor switch for the observed invasive behavior and resistance toapoptosis in mtDNA-depleted cells. The molecular basis ofpreferentially higher autophosphorylation of IGF1R currentlyremains unclear. Preliminary results, however, suggest thatincreased PTP1B activity and possible post-translational mod-ification of this enzyme in mtDNA-depleted cells may beresponsible for this selectivity.Consistent with the observed receptor switch, cells subjected
to mitochondrial stress also show a distinct metabolic shift. Anincreasing number of studies suggest that mitochondrial muta-tions and/or dysfunction are closely associatedwith awide vari-ety of neuromuscular, retinal degenerative disease, diabetes,ischemic injury, cancer, and aging (19, 48, 49). In a large major-ity of these cases, the heteroplasmic nature of mutations withan age-dependent increase in the ratio of mutated to wild-typemtDNA is implicated as an important factor. In this regard,partial mtDNA depletion used in this study reflects the steadydecline of functional mtDNA levels in many diseases (50). Therespiratory stress-induced metabolic shift with induced glycol-ysis is not restricted to eithermtDNAdepletion or C2C12 cells.We show that mitochondrial stress induced either by mtDNAdepletion in A549 cells or disruption of ��m by CCCP treat-ment in H9C2 cardiomyocytes and 3T3 fibroblasts causesincreased IGF1R activity, increased GLUT 4 mRNA levels, andinduced glucose uptake. The relative increase in activities ofdifferent glycolytic enzymes in the four cell types varied mark-edly suggesting cell-specific effects. Further, although the pre-cise molecular mechanism of this increase remains unclear,unpublished results with hexokinase promoter suggests tran-scriptional activation as the main factor. Additionally, the levelof oligomycin-insensitive ATP synthesis, which probablyreflects the contribution of the glycolytic pathway, is increased�2-fold in all cases, confirming the metabolic switch. Based onthese observations we propose that stress-mediated activationof the IGF1R pathway is closely linked to the higher resistanceto apoptosis and invasive properties of mtDNA-depletedC2C12 and A549 cells.As proposed by Warburg (51), the capacity to sustain high
rates of glycolysis under aerobic conditions appears to be animportant feature of rapidly growing tumors. The Warburgeffect has been observed inmany solid tumors, and accordinglyincreased expression of genes encoding glucose transportergenes and glycolytic enzymes has been suggested as the basis foran altered metabolic profile of tumor cells (52). Other studiesshow that the high metabolic activity of tumor cells is associ-ated with activation of Akt, an Ser/Thr kinase (53, 54). Akt hasbeen shown to induce anabolic metabolism and suppress apo-ptosis bymultiplemechanisms (55), thus providing amolecularbasis for an altered metabolic state of proliferating tumors.Warburg also predicted that impaired mitochondrial oxidativefunction may be a factor in increased glucose utilization oftumor cells. Our results show that mtDNA depletion and othertypes of mitochondrial respiratory dysfunction induce stresssignaling, which culminates in altered glucose uptake andmetabolism. In this regard our results provide a potentialmech-anistic explanation for the Warburg hypothesis.Cn is known to play critical roles in many physiological pro-
cesses, including T-cell differentiation, myogenesis, switch of
muscle fiber types, and muscle contraction/glucose homeosta-sis (56–58). Here we show that mitochondrial respiratorystress-activated Cn plays a direct role in the altered meta-bolic property of tumor cells through an induced IGF1Rpathway and increased expression of GLUT 4. In summary,we describe a novel Cn-mediated IGF1R activation pathwaythat is likely to play an important role in tumor progressionand tumor invasion.
Acknowledgments—We are thankful to the members of the Avadhanilaboratory for useful discussions and suggestions. We are also thank-ful to Drs. Morris J. Birnbaum and Kendra Bence for their usefulcomments and suggestions on the manuscript. We also thankDr. Renato Baserga for providing the IGF1R expression cDNAconstruct.
REFERENCES1. Amuthan, G., Biswas, G., Zhang, S. Y., Klein-Szanto, A., Vijayasarathy, C.,
and Avadhani, N. G. (2001) EMBO J. 20, 1910–19202. Biswas, G., Adebanjo, O. A., Freedman, B. D., Anandatheerthavarada,
H. K., Vijayasarathy, C., Zaidi, M., Kotlikoff, M., and Avadhani, N. G.(1999) EMBO J. 18, 522–533
3. van Waveren, C., Sun, Y., Cheung, H. S., and Moraes, C. T. (2006) Carci-nogenesis 27, 409–418
4. Parikh, V. S., Morgan, M. M., Scott, R., Clements, L. S., and Butow, R. A.(1987) Science 235, 576–580
5. Butow, R. A., and Avadhani, N. G. (2004)Mol. Cell 14, 1–156. Amuthan, G., Biswas, G., Ananadatheerthavarada, H. K., Vijayasarathy,
C., Shephard, H.M., andAvadhani, N. G. (2002)Oncogene 21, 7839–78497. Biswas, G., Anandatheerthavarada, H. K., Zaidi, M., and Avadhani, N. G.
(2003) J. Cell Biol. 161, 507–5198. Arnould, T., Vankoningsloo, S., Renard, P., Houbion, A., Ninane, N.,
Demazy, C., Remacle, J., and Raes, M. (2002) EMBO J. 21, 53–639. Zhao, Q., Wang, J., Levichkin, I. V., Stasinopoulos, S., Ryan, M. T., and
Hoogenraad, N. J. (2002) EMBO J. 21, 4411–441910. Biswas, G., Guha, M., and Avadhani, N. G. (2005) Gene (Amst.) 354,
132–13911. Singh, K. K., Kulawiec,M., Still, I., Desouki,M.M., Geradts, J., andMatsui,
S. (2005) Gene (Amst.) 354, 140–14612. Meierhofer, D.,Mayr, J. A., Foetschl, U., Berger, A., Fink, K., Schmeller, N.,
Hacker, G. W., Hauser-Kronberger, C., Kofler, B., and Sperl, W. (2004)Carcinogenesis 25, 1005–1010
13. Saada, A., Shaag, A., and Elpeleg, O. (2003)Mol. Genet. Metab. 79, 1–514. Liu, C. Y., Lee, C. F., Hong, C. H., and Wei, Y. H. (2004) Ann. N. Y. Acad.
Sci. 1011, 133–14515. Wang, J., Silva, J. P., Gustafsson, C. M., Rustin, P., and Larsson, N. G.
(2001) Proc. Natl. Acad. Sci. U. S. A. 98, 4038–404316. Dey, R., and Moraes, C. T. (2000) J. Biol. Chem. 275, 7087–709417. Kim, J. Y., Kim, Y. H., Chang, I., Kim, S., Pak, Y. K., Oh, B. H., Yagita, H.,
Jung, Y. K., Oh, Y. J., and Lee, M. S. (2002) Oncogene 21, 3139–314818. Petros, J. A., Baumann, A. K., Ruiz-Pesini, E., Amin,M. B., Sun, C. Q., Hall,
J., Lim, S., Issa, M.M., Flanders,W. D., Hosseini, S. H., Marshall, F. F., andWallace, D. C. (2005) Proc. Natl. Acad. Sci. U. S. A. 102, 719–724
19. Shidara, Y., Yamagata, K., Kanamori, T., Nakano, K., Kwong, J. Q., Man-fredi, G., Oda, H., and Ohta, S. (2005) Cancer Res. 65, 1655–1663
20. Cottrell, D. A., Blakely, E. L., Johnson, M. A., Borthwick, G. M., Ince, P. I.,and Turnbull, D. M. (2001) Novartis Found. Symp. 235, 234–243
21. Parrella, P., Xiao, Y., Fliss, M., Sanchez-Cespedes, M., Mazzarelli, P.,Rinaldi, M., Nicol, T., Gabrielson, E., Cuomo, C., Cohen, D., Pandit, S.,Spencer, M., Rabitti, C., Fazio, V.M., and Sidransky, D. (2001)Cancer Res.61, 7623–7626
22. Biswas, G., Anandatheerthavarada, H. K., and Avadhani, N. G. (2005)CellDeath Differ. 12, 266–278
23. Mazurek, S., and Eigenbrodt, E. (2003) Anticancer Res. 23, 1149–1154
Mitochondrial Stress-induced IGF1R Activation
MAY 11, 2007 • VOLUME 282 • NUMBER 19 JOURNAL OF BIOLOGICAL CHEMISTRY 14545
at University of Pennsylvania L
ibrary on October 15, 2014
http://ww
w.jbc.org/
Dow
nloaded from
24. Pietrzkowski, Z., Lammers, R., Carpenter, G., Soderquist, A. M., Limardo,M., Philiphs, P. D., and Baserga, R. (1992)Cell Growth&Differ. 3, 199–205
25. Frevert, E. U., and Kahn, B. B. (1997)Mol. Cell. Biol. 17, 190–19826. Miccoli, L., Oudard, S., Sureau, F., Poirson, F., Dutrillaux, B., and Poupon,
M. F. (1996) Biochem. J. 313, 957–96227. Liu, Y. Q., Tornheim, K., and Leahy, J. L. (1998) J. Clin. Invest. 101,
1870–187528. Devin, A., Nogueira, V., Leverve, X., Guerin, B., and Rigoulet, M. (2001)
Eur. J. Biochem. 268, 3943–394929. Antony, F. A., Shipston, M. J., and Smith, S. M. (1993) Biochem. Biophys.
Res. Commun. 194, 226–23330. Nishimura, H., Saltis, J., Habberfield, A. D., Garty, N. B., Greenberg, A. S.,
Cushman, S. W., Londos, C., and Simpson, I. A. (1991) Proc. Natl. Acad.Sci. U. S. A. 88, 11500–11504
31. Lowry, O. H., Rosebrough, N. J., Farr, A. L., and Randall, R. J. (1951) J. Biol.Chem. 193, 265–275
32. Laemmli, U. K. (1970) Nature 227, 680–68533. MaCaulay, S. L., Stoichevska, V., Grusovin, J., Gough, K. H., Castelli, L. A.,
and Ward, C. W. (2003) Biochem. J. 376, 123–13434. Yagel, S., Warner, A. H., Nellans, H. N., Lala, P. K., Waghorne, C., and
Denhardt, D. T. (1989) Cancer Res. 49, 3553–355735. Watson, R. T., and Pessin, J. E. (2001) Recent Prog. Horm. Res. 56,
175–19436. Girnita, A., All-Ericsson, C., Economou, M. A., Astrom, K., Axelson, M.,
Seregard, S., Larsson, O., and Girnita, L. (2006) Clin. Cancer Res. 12,1383–1391
37. Stromberg, T., Ekman, S., Girnita, L., Dimberg, L. Y., Larsson, O., Axelson,M., Lennartsson, J., Hellman, U., Carlson, K., Osterborg, A.,Vanderkerken, K., Nilsson, K., and Jernberg-Wiklund, H. (2006) Blood107, 669–678
38. Hu, Y., Yao, J., Liu, Z., Liu, X., Fu, H., and Ye, K. (2005) EMBO J. 24,3543–3554
39. Walker, E. H., Pacold, M. E., Perisic, O., Stephens, L., Hawkins, P. T.,Wymann, M. P., and Williams, R. L. (2000)Mol. Cell 6, 909–919
40. Smith, R.M., Tiesinga, J. J., Shah,N., Smith, J. A., and Jarett, L. (1993)Arch.Biochem. Biophys. 300, 238–246
41. Vasilcanu, D., Girnita, A., Girnita, L., Vasilcanu, R., Axelson,M., and Lars-son, O. (2004) Oncogene 23, 7854–7862
42. Jenssen, N., Pold, R., Buhl, E. S., Jensen, L. S., Schmitz, O., and Lund, S.(2003) J. Appl. Physiol. 94, 1373–1379
43. Zong, H., Ren, J.M., Young, L. H., Pypaert,M.,Mu, J., Birnbaum,M. J., andShulman, G. I. (2002) Proc. Natl. Acad. Sci. U. S. A. 99, 15983–15987
44. Lee, J., and Pilch, P. F. (1994) Am. J. Physiol. 266, C319–C33445. Shefi-Friedman, L.,Wertheimer, E., Shen, S., Bak, A., Accili, D., and Samp-
son, S. R. (2001) Am. J. Physiol. 281, E16–E2446. Larsson, O., Girnita, A., andGirnita, L. (2005) Br. J. Cancer 92, 2097–210147. Peruzzi, F., Prisco, M., Dews, M., Salomoni, P., Grassilli, E., Romano, G.,
Calabretta, B., and Baserga, R. (1999)Mol. Cell. Biol. 19, 7203–721548. Loeb, L. A., Wallace, D. C., andMartin, G. M. (2005) Proc. Natl. Acad. Sci.
U. S. A. 102, 18769–1877049. Park, S. Y., Choi, B., Cheon, H., Pak, Y. K., Kulawiec, M., Singh, K. K., and
Lee, M. S. (2004) Biochem. Biophys. Res. Commun. 325, 1399–140550. Zeviani, M., and Antozzi, C. (1997)Mol. Hum. Reprod. 3, 133–14851. Warburg, O. (1956) Science 123, 309–31452. Semenza, G. L., Artemov, D., Bedi, A., Bhujwalla, Z., Chiles, K., Feldser, D.,
Laughner, E., Ravi, R., Simons, J., Taghavi, P., and Zhong, H. (2001) No-vartis Found. Symp. 240, 251–260
53. Bae, S. S., Cho, H., Mu, J., and Birnbaum, M. J. (2003) J. Biol. Chem. 278,49530–49536
54. Buzzai,M., Bauer, D. E., Jones, R. G., Deberardinis, R. J., Hatzivassiliou, G.,Elstrom, R. L., and Thompson, C. B. (2005) Oncogene 24, 4165–4173
55. Whiteman, E. L., Cho, H., and Birnbaum, M. J. (2002) Trends Endocr.Metab. 13, 444–451
56. Ryder, J. W., Long, Y. C., Nilsson, E., Mahlapuu, M., and Zierath, J. R.(2005) J. Physiol. 567, 379–386
57. Clipstone, N. A., and Crabtree, G. R. (1992) Nature 357, 695–69758. Molkentin, J. D., Lu, J. R., Antos, C. L., Markham, B., Richardson, J., Rob-
bins, J., Grant, S. R., and Olson, E. N. (1998) Cell 93, 215–228
Mitochondrial Stress-induced IGF1R Activation
14546 JOURNAL OF BIOLOGICAL CHEMISTRY VOLUME 282 • NUMBER 19 • MAY 11, 2007
at University of Pennsylvania L
ibrary on October 15, 2014
http://ww
w.jbc.org/
Dow
nloaded from