Acoustic devices for particle and cell manipulation and sensing
33
Sensors 2014, 14, 14806-14838; doi:10.3390/s140814806 sensors ISSN 1424-8220 www.mdpi.com/journal/sensors Article Acoustic Devices for Particle and Cell Manipulation and Sensing Yongqiang Qiu 1 , Han Wang 1 , Christine E. M. Demore 1 , David A. Hughes 2 , Peter Glynne-Jones 3 , Sylvia Gebhardt 4 , Aleksandrs Bolhovitins 1 , Romans Poltarjonoks 1 , Kees Weijer 5 , Andreas Schönecker 4 , Martyn Hill 3 and Sandy Cochran 1, * 1 Institute for Medical Science and Technology, University of Dundee, 1 Wurzburg Loan, Dundee DD2 1FD, UK; E-Mails: [email protected] (Y.Q.); [email protected] (H.W.); [email protected] (C.E.M.D.); [email protected] (A.B.); [email protected] (R.P.) 2 School of Engineering and Computing, University of the West of Scotland, Paisley, PA1 2BE, UK; E-Mail: [email protected] 3 Faculty of Engineering and the Environment, University of Southampton, Southampton, SO17 1BJ, UK; E-Mails: [email protected] (P.G.-J.); [email protected] (M.H.) 4 Smart Materials and Systems, Fraunhofer Institute for Ceramic Technology and Systems, Winterbergstrasse 28, 01277 Dresden, Germany; E-Mails: [email protected] (S.G.); [email protected] (A.S.) 5 Cell and Developmental Biology, College of Life Sciences, University of Dundee, Dundee, DD1 4HN, UK; E-Mail: [email protected] * Author to whom correspondence should be addressed; E-Mail: [email protected]; Tel.: +44-1382-386-991; Fax: +44-1382-386-588. Received: 15 June 2014; in revised form: 2 August 2014 / Accepted: 7 August 2014 / Published: 13 August 2014 Abstract: An emerging demand for the precise manipulation of cells and particles for applications in cell biology and analytical chemistry has driven rapid development of ultrasonic manipulation technology. Compared to the other manipulation technologies, such as magnetic tweezing, dielectrophoresis and optical tweezing, ultrasonic manipulation has shown potential in a variety of applications, with its advantages of versatile, inexpensive and easy integration into microfluidic systems, maintenance of cell viability, and generation of sufficient forces to handle particles, cells and their agglomerates. This article briefly reviews current practice and reports our development of various ultrasonic standing wave manipulation devices, including simple devices integrated with high frequency (>20 MHz) ultrasonic transducers for the investigation of biological cells and OPEN ACCESS
-
Upload
independent -
Category
Documents
-
view
5 -
download
0
Transcript of Acoustic devices for particle and cell manipulation and sensing
Sensors 2014, 14, 14806-14838; doi:10.3390/s140814806
sensors ISSN 1424-8220
www.mdpi.com/journal/sensors
Article
Acoustic Devices for Particle and Cell Manipulation and Sensing
Yongqiang Qiu 1, Han Wang
1, Christine E. M. Demore
1, David A. Hughes
2,
Peter Glynne-Jones 3, Sylvia Gebhardt
4, Aleksandrs Bolhovitins
1, Romans Poltarjonoks
1,
Kees Weijer 5, Andreas Schönecker
4, Martyn Hill
3 and Sandy Cochran
1,*
1 Institute for Medical Science and Technology, University of Dundee, 1 Wurzburg Loan,
Dundee DD2 1FD, UK; E-Mails: [email protected] (Y.Q.); [email protected] (H.W.);
[email protected] (C.E.M.D.); [email protected] (A.B.);
[email protected] (R.P.) 2 School of Engineering and Computing, University of the West of Scotland, Paisley, PA1 2BE, UK;
E-Mail: [email protected] 3 Faculty of Engineering and the Environment, University of Southampton, Southampton,
SO17 1BJ, UK; E-Mails: [email protected] (P.G.-J.); [email protected] (M.H.) 4 Smart Materials and Systems, Fraunhofer Institute for Ceramic Technology and Systems,
Winterbergstrasse 28, 01277 Dresden, Germany;
E-Mails: [email protected] (S.G.); [email protected] (A.S.) 5 Cell and Developmental Biology, College of Life Sciences, University of Dundee, Dundee,
DD1 4HN, UK; E-Mail: [email protected]
* Author to whom correspondence should be addressed; E-Mail: [email protected];
Tel.: +44-1382-386-991; Fax: +44-1382-386-588.
Received: 15 June 2014; in revised form: 2 August 2014 / Accepted: 7 August 2014 /
Published: 13 August 2014
Abstract: An emerging demand for the precise manipulation of cells and particles for
applications in cell biology and analytical chemistry has driven rapid development of
ultrasonic manipulation technology. Compared to the other manipulation technologies,
such as magnetic tweezing, dielectrophoresis and optical tweezing, ultrasonic manipulation
has shown potential in a variety of applications, with its advantages of versatile,
inexpensive and easy integration into microfluidic systems, maintenance of cell viability,
and generation of sufficient forces to handle particles, cells and their agglomerates. This
article briefly reviews current practice and reports our development of various ultrasonic
standing wave manipulation devices, including simple devices integrated with high
frequency (>20 MHz) ultrasonic transducers for the investigation of biological cells and
OPEN ACCESS
Sensors 2014, 14 14807
complex ultrasonic transducer array systems to explore the feasibility of electronically
controlled 2-D and 3-D manipulation. Piezoelectric and passive materials, fabrication
techniques, characterization methods and possible applications are discussed. The behavior
and performance of the devices have been investigated and predicted with computer
simulations, and verified experimentally. Issues met during development are highlighted
and discussed. To assist long term practical adoption, approaches to low-cost, wafer level
batch-production and commercialization potential are also addressed.
Keywords: ultrasonic manipulation; high frequency; array; piezocrystals; screen-printing
1. Introduction
In recent decades, precise control of bioparticles, biomolecules and biological cells has become
increasingly important in life sciences and medicine, with applications emerging in fields such as
biochemical analysis, cell separation and sorting, study of cell mechanisms, and tissue engineering.
Following this demand, particle manipulation technologies have been developing actively.
One existing approach is to utilize contact-mediated forces applied to targets directly by mechanical
tools, e.g., micropipettes [1], atomic force microscopes [2] and micro-grippers [3]. However, direct
mechanical intervention can cause problems with mechanical damage to the fragile structure of cells or
tissues, and difficulty in handling large numbers of targets. Contactless micromanipulation techniques,
such as magnetic tweezing (MT) [4], dielectrophoresis (DEP) [5], optical tweezing (OT) [6], and
ultrasonic manipulation (USM) [7] therefore have significant advantages, creating moderate forces to
drive particles towards equilibrium states at local potential energy minima without any direct, physical
contact. Besides individual manipulation techniques, attention has also been given to combining
multiple contactless techniques in single systems, taking advantage of the particular properties of
each technique, e.g., integrating USM and DEP [8], and USM and OT [9,10] to achieve precise
manipulation of individual cells whilst simultaneously maintaining high throughput.
Generally, all the contactless micromanipulation techniques provide relatively high ability to select
specific types of particles as the forces they generate depend strongly on the mechanical properties of
the particles and surrounding media, i.e., magnetic susceptibilities in MT, dielectric constants in DEP,
refractive indices in OT, and densities and compressibilities in USM. Table 1 outlines qualitatively the
capabilities of the contactless micromanipulation techniques, in terms of particle sizes and numbers
that can be handled, the typical range of forces that can be produced or measured, preparation of
particles such as labelling or seeding required before operation, particle contrast, range of acceptable
media, spatial precision, range of the operation field, biocompatibility and system integration.
One critical requirement of MT is that the particle should have either an induced or permanent
magnetization. Only two types of cells are naturally magnetic, i.e., red blood cells and magnetotactic
bacteria [11]. Therefore, other cells have to be labelled or seeded externally or internally with
paramagnetic [12] or magnetic particles [13]. Hence, magnetic tweezers are usually used for
manipulation of non-biological objects.
Sensors 2014, 14 14808
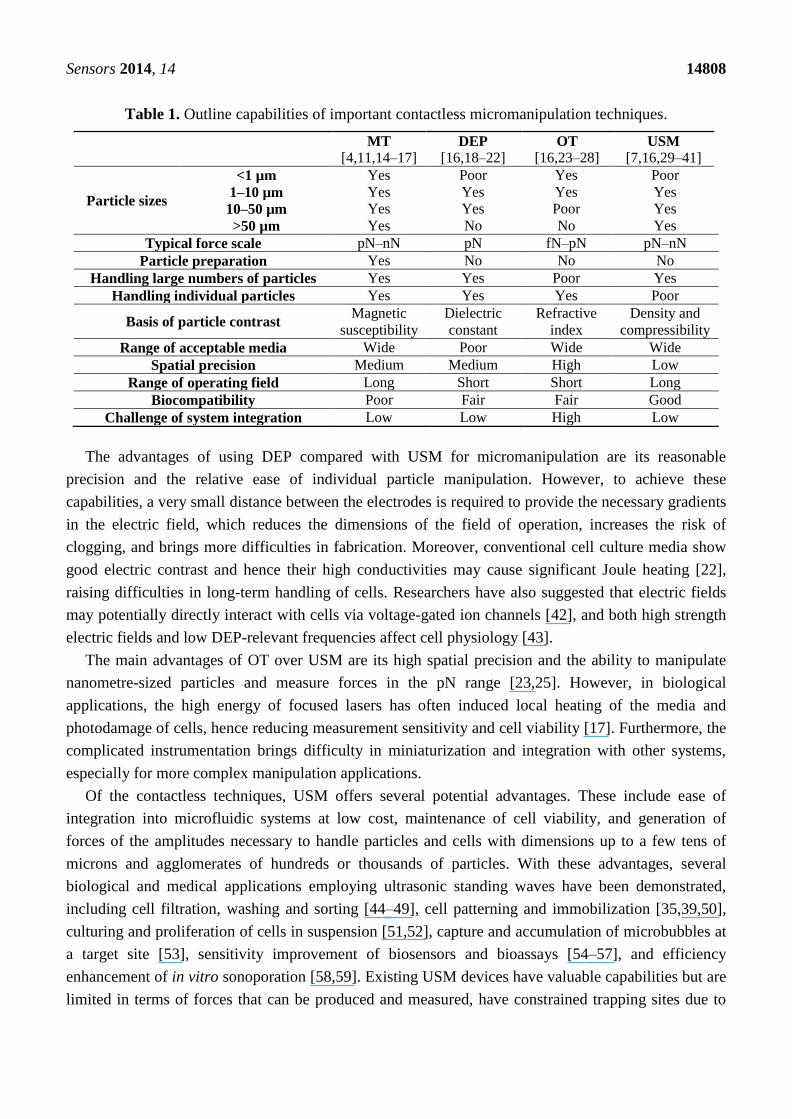
Table 1. Outline capabilities of important contactless micromanipulation techniques.
MT
[4,11,14–17] DEP
[16,18–22] OT
[16,23–28] USM
[7,16,29–41]
Particle sizes
<1 µm Yes Poor Yes Poor
1–10 µm Yes Yes Yes Yes
10–50 µm Yes Yes Poor Yes
>50 µm Yes No No Yes
Typical force scale pN–nN pN fN–pN pN–nN
Particle preparation Yes No No No
Handling large numbers of particles Yes Yes Poor Yes
Handling individual particles Yes Yes Yes Poor
Basis of particle contrast Magnetic
susceptibility
Dielectric
constant
Refractive
index
Density and
compressibility
Range of acceptable media Wide Poor Wide Wide
Spatial precision Medium Medium High Low
Range of operating field Long Short Short Long
Biocompatibility Poor Fair Fair Good
Challenge of system integration Low Low High Low
The advantages of using DEP compared with USM for micromanipulation are its reasonable
precision and the relative ease of individual particle manipulation. However, to achieve these
capabilities, a very small distance between the electrodes is required to provide the necessary gradients
in the electric field, which reduces the dimensions of the field of operation, increases the risk of
clogging, and brings more difficulties in fabrication. Moreover, conventional cell culture media show
good electric contrast and hence their high conductivities may cause significant Joule heating [22],
raising difficulties in long-term handling of cells. Researchers have also suggested that electric fields
may potentially directly interact with cells via voltage-gated ion channels [42], and both high strength
electric fields and low DEP-relevant frequencies affect cell physiology [43].
The main advantages of OT over USM are its high spatial precision and the ability to manipulate
nanometre-sized particles and measure forces in the pN range [23,25]. However, in biological
applications, the high energy of focused lasers has often induced local heating of the media and
photodamage of cells, hence reducing measurement sensitivity and cell viability [17]. Furthermore, the
complicated instrumentation brings difficulty in miniaturization and integration with other systems,
especially for more complex manipulation applications.
Of the contactless techniques, USM offers several potential advantages. These include ease of
integration into microfluidic systems at low cost, maintenance of cell viability, and generation of
forces of the amplitudes necessary to handle particles and cells with dimensions up to a few tens of
microns and agglomerates of hundreds or thousands of particles. With these advantages, several
biological and medical applications employing ultrasonic standing waves have been demonstrated,
including cell filtration, washing and sorting [44–49], cell patterning and immobilization [35,39,50],
culturing and proliferation of cells in suspension [51,52], capture and accumulation of microbubbles at
a target site [53], sensitivity improvement of biosensors and bioassays [54–57], and efficiency
enhancement of in vitro sonoporation [58,59]. Existing USM devices have valuable capabilities but are
limited in terms of forces that can be produced and measured, have constrained trapping sites due to
Sensors 2014, 14 14809
enclosure resonances and device geometries, and involve fabrication complexity which negatively
affects progress towards mass production and commercialization.
The limitations that have been outlined have motived the research reported here. Firstly, two
approaches to increase the force amplitude have been investigated with the aim of exploring the
feasibility of cell biology applications studies of cell motility, by: (1) increasing the operating
frequencies of the devices and (2) increasing the acoustic pressure gradients. Secondly, the integration
of ultrasonic transducer arrays in USM devices has been investigated with the aim of overcoming the
reliance on device resonance limitations imposed by geometry and to open avenues to extend precise
manipulation to multiple dimensions. Finally, several well established fabrication techniques from
other domains of technology have been explored with the aim to reduce the manufacturing
complexities of ultrasonic manipulation devices to move towards mass production. In this paper, all
reported USM devices and the related discussion are those in which the nodal planes are parallel to the
piezoelectric transducer [60,61], rather than surface acoustic wave (SAW) based devices and other
configurations which can excite other resonances.
2. Theory
Small particles suspended in standing acoustic wave fields experience non-zero time averaged
forces produced by gradients in the energy densities in the field and scattering of the field from the
particles [16]. In the acoustics literature, the phenomenon has been referred to as acoustic “radiation
pressure” [62,63] or “radiation force” [64], although it is closely analogous to the “gradient force”
discussed in the OT community [6]. In this paper, in line with acoustics usage, we refer to these forces
as radiation forces. Figure 1 shows two main kinds of acoustic radiation forces set up in an ultrasound
(US) standing wave (USW) field in a multilayer planar resonator [60,61]: primary radiation force
(FPRF) and secondary radiation force (FSRF).
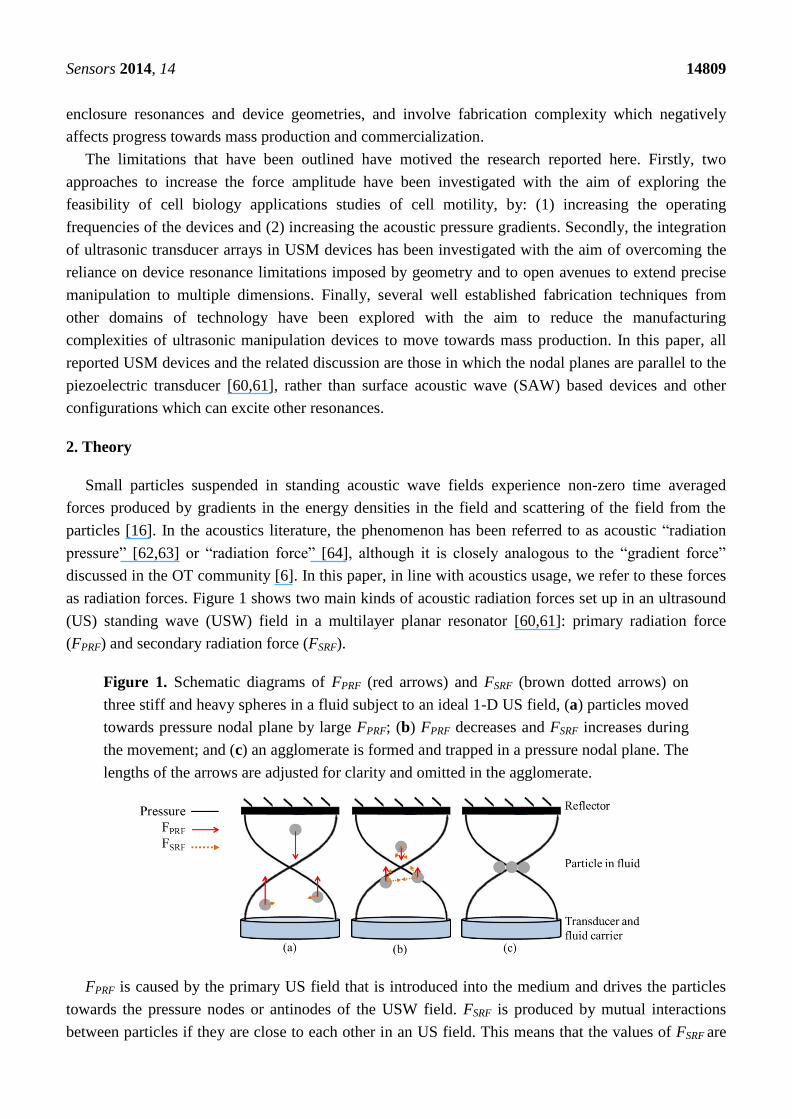
Figure 1. Schematic diagrams of FPRF (red arrows) and FSRF (brown dotted arrows) on
three stiff and heavy spheres in a fluid subject to an ideal 1-D US field, (a) particles moved
towards pressure nodal plane by large FPRF; (b) FPRF decreases and FSRF increases during
the movement; and (c) an agglomerate is formed and trapped in a pressure nodal plane. The
lengths of the arrows are adjusted for clarity and omitted in the agglomerate.
FPRF is caused by the primary US field that is introduced into the medium and drives the particles
towards the pressure nodes or antinodes of the USW field. FSRF is produced by mutual interactions
between particles if they are close to each other in an US field. This means that the values of FSRF are
Sensors 2014, 14 14810
often much smaller than those of FPRF [48]. The amplitudes of FPRF acting on small objects in an
acoustic field have been explored extensively in the literature [62,63,65]. King first provided an
expression for acoustic radiation force on a small, rigid, incompressible spherical object in an ideal
(inviscid) fluid, where the wavelength of the acoustic wave is much larger than the radius of the
object [62]. Yosioka and Kawasima expanded King’s theory to compressible objects and expressed
time-averaged radiation force on a sphere in a plane USW field with acoustic energy density, Eac, and
acoustic contrast factor, Ф, as [63]:
34 sin(2 ) acF ka kx E (1)
2
24ac
f f
pE
c
(2)
2( )
3
2 3
s s fs
s f f
(3)
where a is the radius of the sphere; p is the acoustic pressure amplitude; and ρ, c and β are the mass
density, speed of sound, and compressibility of the fluid and the sphere, indicated by subscripts f and s
respectively, The relationship of these three parameters is 21 ( c ) .
Later, the theory of Yosioka and Kawasima was generalized to the case of arbitrary acoustic fields
by Gor’kov [65], expressing the time-averaged force as a function of the gradients of the kinetic
energy density, kinE , and potential energy density, potE , of the acoustic field:
23
2
3( )41
3 2
s f f f
kin pot
s f s s
caF E E
c
(4)
kinE and potE are related to the acoustic velocity, u, and acoustic pressure field, p, by [34]:
21
2kin fE u (5)
2
2
1
2pot
f f
E pc
(6)
The theoretical developments of King, Yosioka and Kawasima, and Gor’kov still underpin new
developments in USM.
3. Design and Modelling
3.1. Materials
3.1.1. Piezoelectric Materials
Although piezoelectric ultrasonic transducers can use many different piezoelectric materials as their
active elements, e.g., piezoceramics, conventional and high performance relaxor-based piezocrystals,
piezocomposites and piezopolymers [66], the basic specifications of multilayer resonator type USM
Sensors 2014, 14 14811
devices and their applications restrict the selection of the piezoelectric materials in practice as listed in
Table 2.
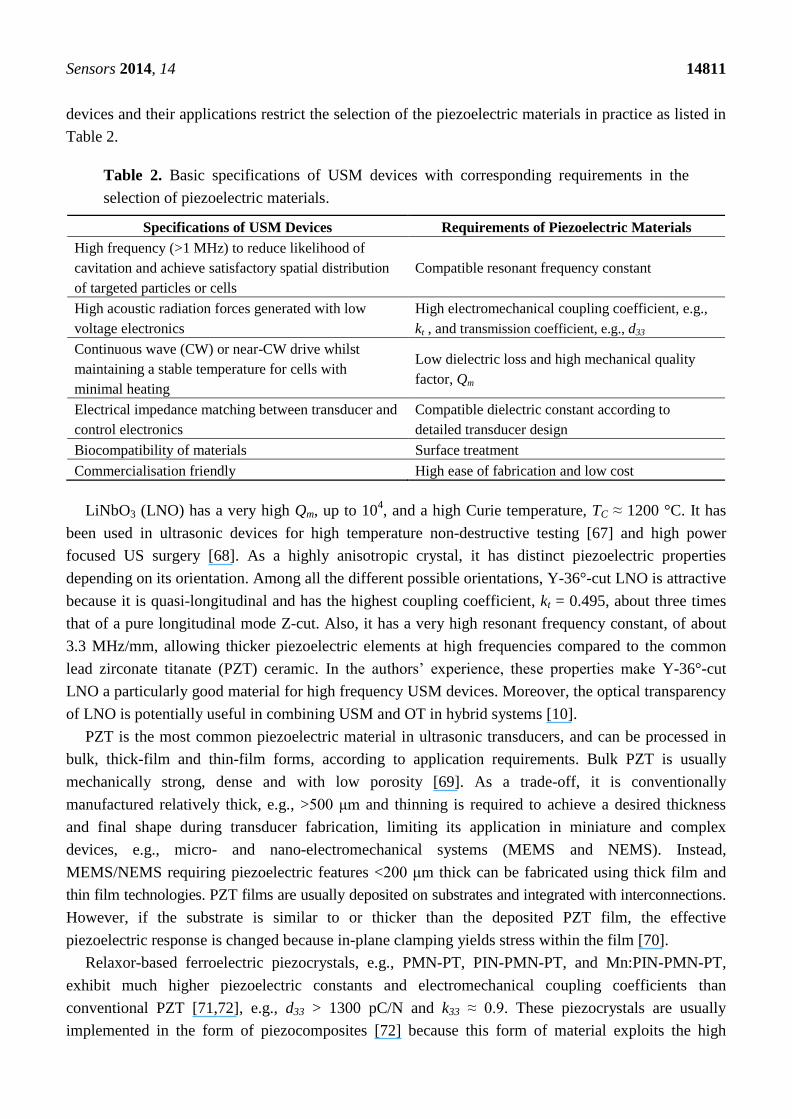
Table 2. Basic specifications of USM devices with corresponding requirements in the
selection of piezoelectric materials.
Specifications of USM Devices Requirements of Piezoelectric Materials
High frequency (>1 MHz) to reduce likelihood of
cavitation and achieve satisfactory spatial distribution
of targeted particles or cells
Compatible resonant frequency constant
High acoustic radiation forces generated with low
voltage electronics
High electromechanical coupling coefficient, e.g.,
kt , and transmission coefficient, e.g., d33
Continuous wave (CW) or near-CW drive whilst
maintaining a stable temperature for cells with
minimal heating
Low dielectric loss and high mechanical quality
factor, Qm
Electrical impedance matching between transducer and
control electronics
Compatible dielectric constant according to
detailed transducer design
Biocompatibility of materials Surface treatment
Commercialisation friendly High ease of fabrication and low cost
LiNbO3 (LNO) has a very high Qm, up to 104, and a high Curie temperature, TC ≈ 1200 °C. It has
been used in ultrasonic devices for high temperature non-destructive testing [67] and high power
focused US surgery [68]. As a highly anisotropic crystal, it has distinct piezoelectric properties
depending on its orientation. Among all the different possible orientations, Y-36°-cut LNO is attractive
because it is quasi-longitudinal and has the highest coupling coefficient, kt = 0.495, about three times
that of a pure longitudinal mode Z-cut. Also, it has a very high resonant frequency constant, of about
3.3 MHz/mm, allowing thicker piezoelectric elements at high frequencies compared to the common
lead zirconate titanate (PZT) ceramic. In the authors’ experience, these properties make Y-36°-cut
LNO a particularly good material for high frequency USM devices. Moreover, the optical transparency
of LNO is potentially useful in combining USM and OT in hybrid systems [10].
PZT is the most common piezoelectric material in ultrasonic transducers, and can be processed in
bulk, thick-film and thin-film forms, according to application requirements. Bulk PZT is usually
mechanically strong, dense and with low porosity [69]. As a trade-off, it is conventionally
manufactured relatively thick, e.g., >500 μm and thinning is required to achieve a desired thickness
and final shape during transducer fabrication, limiting its application in miniature and complex
devices, e.g., micro- and nano-electromechanical systems (MEMS and NEMS). Instead,
MEMS/NEMS requiring piezoelectric features <200 μm thick can be fabricated using thick film and
thin film technologies. PZT films are usually deposited on substrates and integrated with interconnections.
However, if the substrate is similar to or thicker than the deposited PZT film, the effective
piezoelectric response is changed because in-plane clamping yields stress within the film [70].
Relaxor-based ferroelectric piezocrystals, e.g., PMN-PT, PIN-PMN-PT, and Mn:PIN-PMN-PT,
exhibit much higher piezoelectric constants and electromechanical coupling coefficients than
conventional PZT [71,72], e.g., d33 > 1300 pC/N and k33 ≈ 0.9. These piezocrystals are usually
implemented in the form of piezocomposites [72] because this form of material exploits the high
Sensors 2014, 14 14812
values of d33 and k33, allowing for the fact that kt ≈ 0.5 is similar to that of conventional piezoceramics.
Piezocomposites provide a method to further tailor the physical, mechanical and piezoelectric
properties of bulk piezoelectric materials by combining them with polymers. In addition, the lossy
polymer matrix suppresses ringing and most lateral resonances, leading to higher sensitivity and larger
bandwidth in ultrasonic devices [73,74].
3.1.2. Passive Materials
Passive materials also play important roles in multilayer resonator type USM devices, e.g., as
acoustic matching and physical support layers, and in forming resonant structures, e.g., carrier and
reflector (Figure 1). Matching layers are not always used in the ultrasonic transducers of USM devices
because other layers, e.g., US couplant and fluid carrier, are used to couple the piezoelectric material to
the working volume, and because their creation adds needlessly to the complexity of device
fabrication. Air backing is used for most multilayer USM devices to maximize energy output at the
transducer front face [75]. However, as high frequency devices generally have thin piezoelectric
elements, physical support layers are required, e.g., a low acoustic impedance (low Zac) backing.
The material considerations for reflectors in USM devices include dimensional stability and smooth
surfaces. High Zac compared to the value for the fluid in the working volume (Zac ≈ 1.5 MRayl) is
typically used in USM designs. When handling biological cells, the biocompatibility of the material is
important if the cells are in direct contact. For carriers and spacers used for constructing fluid
chambers and channels, formability and machinability are important concerns; thus materials with
acoustic impedances close to water can also be used, e.g., polydimethylsiloxane (PDMS) and
polymethyl-methacrylate (PMMA). Besides these common materials, machinable glass ceramic,
Macor (Corning, NY, USA) may also be a good choice for carrier, spacer and reflector, because it has
similar chemical and acoustical properties to glass, plus good machinability to allow desired
thicknesses and complex shaping [76]. Researchers have also demonstrated the feasibility of glass
capillaries in USM devices, with advantages in terms of disposability, sterility, simplicity of use and
good resonant characteristics [75]. Nevertheless, care must be taken as dimensional variations can lead
to small changes in resonant frequency which interact badly with the high Qm of many USM devices.
3.2. Devices for Generation of Large Acoustic Forces
According to Equation (1), two effective means to increase the amplitude of FPRF on particles in
fluid are to increase the wave number, k, and the acoustic pressure, p. Therefore high frequency
ultrasound (HFUS) transducers are preferred to reduce the wavelength and increase the wave number.
This can also lead to USWs with small wavelength, thus generating multiple trapping lines even in a
small chamber but allowing high precision manipulation. In the same vein, utilization of HFUS
(>20 MHz) in SAW based manipulation devices has already been extensively explored for focusing
and separation of micron- and nanometer-sized particles [38–40,77]. Moreover, mixing of
nanometer-sized particles in nanoliter droplets with SAW based devices of frequencies in GHz range
has also been demonstrated [78]. Straightforward ways to increase the acoustic pressure are to increase
the electrical input power to the transducer and to use focused US transducers. Increasing input power,
Sensors 2014, 14 14813
however, differentially increases the risk of streaming and of heating. Here, two relevant transducer
configurations are reported, planar and curved ultrasonic resonators.
3.2.1. Planar Ultrasonic Resonator
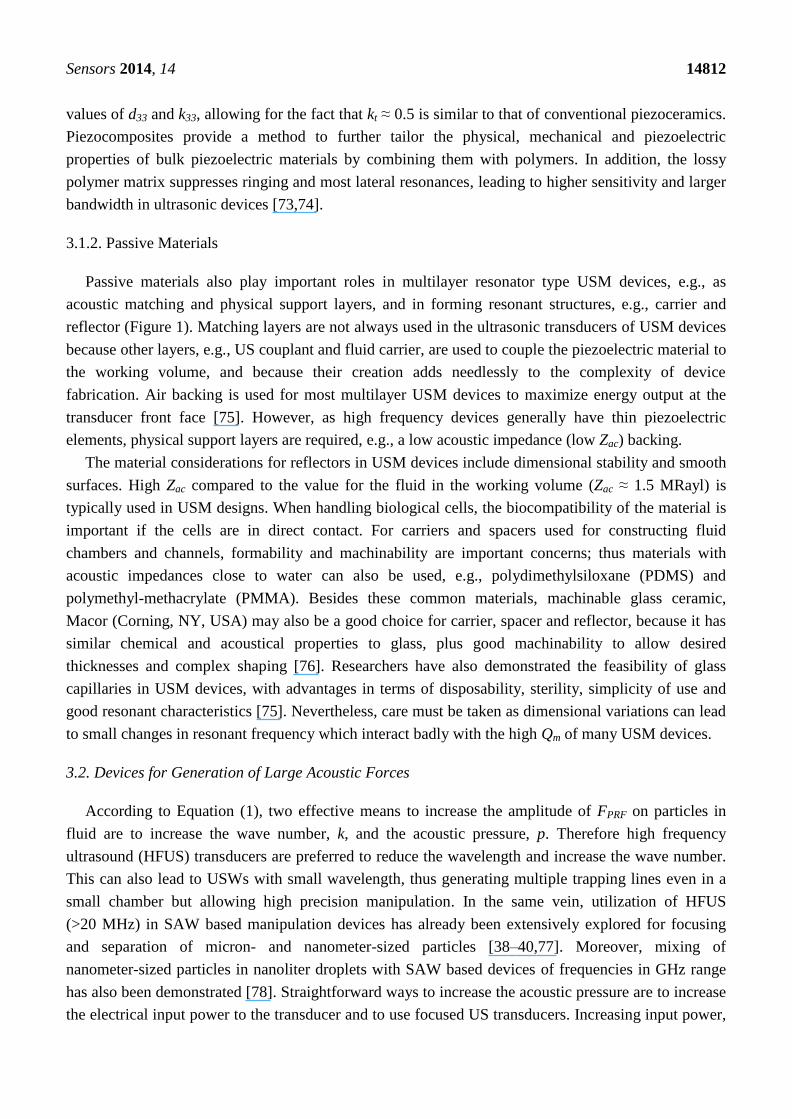
The planar US resonator, Figure 2a, comprises a Y-36°-cut LNO HFUS transducer of frequency,
f ≈ 23.8 MHz and a disposable glass capillary (W5010, VitroCom, Mountain Lakes, NJ, USA) with
targeted particles or cells inside. The capillary has channel dimensions 100 µm × 2 mm and wall
thickness ~100 µm. A 2-D model of the device was created for finite element analysis (FEA) using the
PZFlex code (Weidlinger Associates Ltd., Glasgow, UK), as shown in Figure 2b. In PZFlex,
piezoelectric materials are defined by the complete elasto-electric matrix. However, the lack of data for
Y-36°-cut LNO brings difficulties; therefore a PZ26 transducer with the same resonant frequency was
substituted to predict the device behavior before manufacture. The passive materials were assigned
properties already defined within PZFlex libraries.
Figure 2. (a) Schematic diagram of the planar ultrasonic resonator; and (b) PZFlex model
of the resonator with assigned materials and boundary conditions.
The capillary was coupled to the transducer with 30 µm thick couplant, required to avoid air in the
practical device configuration. The couplant thickness was estimated experimentally and three types
were modeled, i.e., medical US couplant (Zac ≈ 1.5 MRayl), NDT gel (Zac ≈ 3.69 MRayl) and a dummy
couplant (Zdummy ≈ 19 MRayl, calculated by 26dummy pz glassZ Z Z ). Symmetry boundary conditions
were assigned to reduce the size of the model and runtime. The model was driven with one sinusoidal
cycle at twice the maximum frequency of interest. The mesh size of the model was set to λw/20, where
λw is the wavelength in water at the frequency of interest. The runtime allowed the US to make
10 round trips across the water channel. After coupling to the capillary, with medical US couplant, the
electrical impedance and pressure response spectra of the transducer were extracted. The frequencies at
which peak pressure responses occurred were selected to observe the pressure and velocity fields.
Sensors 2014, 14 14814
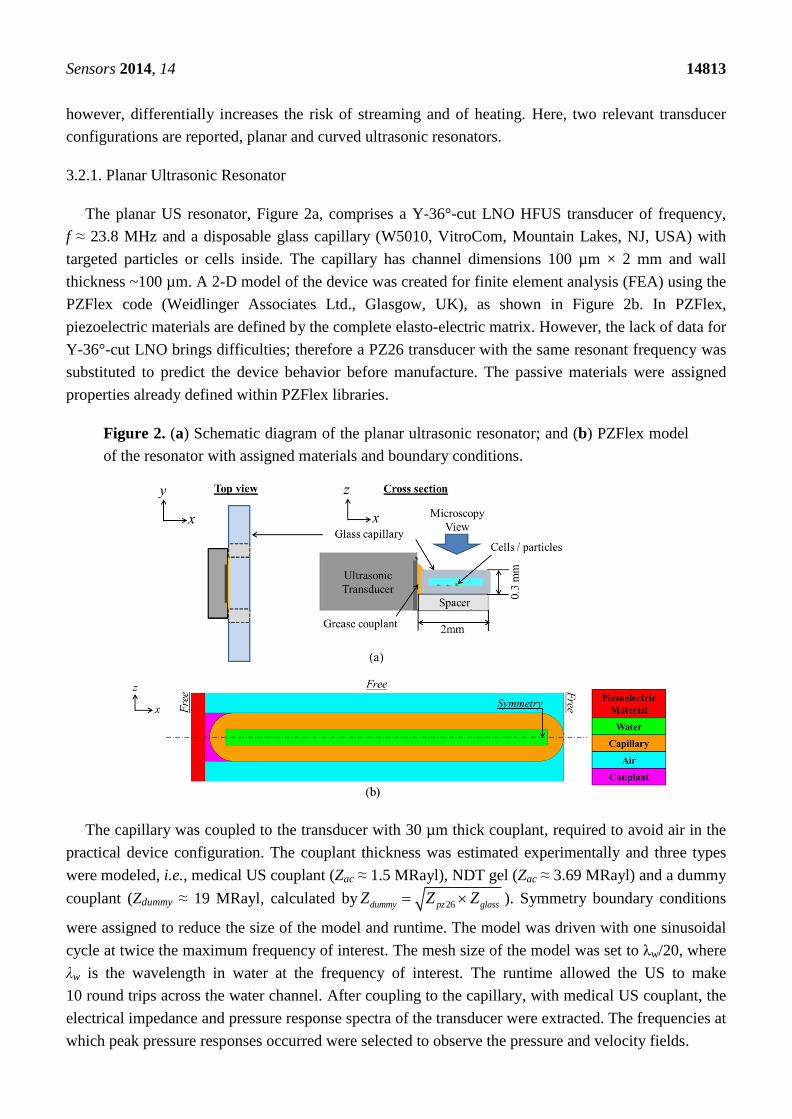
Figure 3 shows two typical USW patterns, i.e., pressure and velocity mode-shapes, formed at
different frequencies, due to the dominant effects of capillary geometry on the resonant modes.
Pattern A occurs when a USW or quasi-USW is formed parallel to both X and Z axes at
f = 22.67 MHz, Figure 3a. Pattern B occurs when a USW or quasi-USW is formed parallel to the X
axis only, at f = 23.46 MHz, Figure 3b. Similar mode-shapes were also obtained with NDT gel and
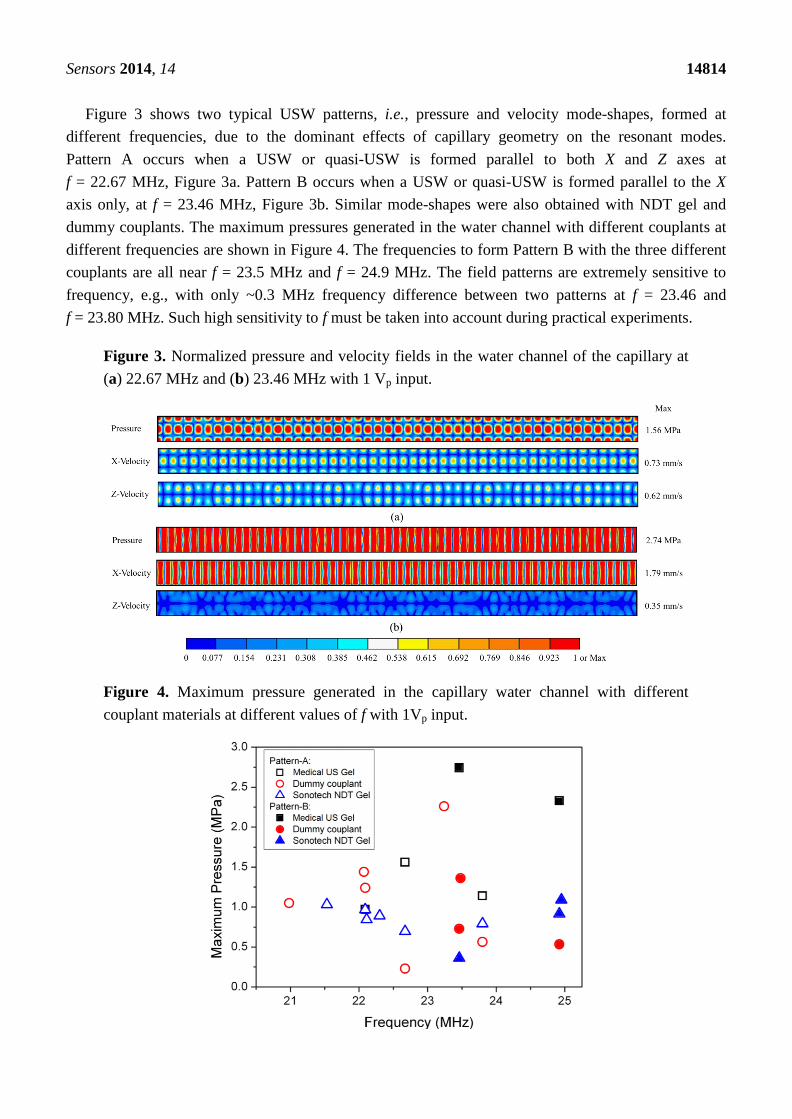
dummy couplants. The maximum pressures generated in the water channel with different couplants at
different frequencies are shown in Figure 4. The frequencies to form Pattern B with the three different
couplants are all near f = 23.5 MHz and f = 24.9 MHz. The field patterns are extremely sensitive to
frequency, e.g., with only ~0.3 MHz frequency difference between two patterns at f = 23.46 and
f = 23.80 MHz. Such high sensitivity to f must be taken into account during practical experiments.
Figure 3. Normalized pressure and velocity fields in the water channel of the capillary at
(a) 22.67 MHz and (b) 23.46 MHz with 1 Vp input.
Figure 4. Maximum pressure generated in the capillary water channel with different
couplant materials at different values of f with 1Vp input.
Sensors 2014, 14 14815
US transmission and reflection at media interfaces strongly depend on the values of Zac for the
media. Thus, the pressure amplitude with NDT gel and the dummy couplant should be larger than with
medical US couplant. However, this is not evident in Figure 4. The reasons are thought to be (1) the
non-optimized thickness of the coupling layers; (2) the rounded side-wall of the glass capillary; and (3)
the frequency sensitivity of the peak pressure making it easy to miss the highest response because of
the quantized frequency step, Δf, in FEA. In any case, the pressure responses in the water channel at
the selected frequencies are still relatively high, >0.25 MPa/Vp.
3.2.2. Curved Ultrasonic Resonator
Focused ultrasound trapping has been demonstrated in the literature [35], however, the work used
ultrahigh frequencies, e.g., 200 MHz, thus λw ≈ a, giving rise to gradient-forces across small objects
analogous to the physics of OT. Particle and cell trapping have also been demonstrated by creating an
energy potential well with the counter-propagating US beams transmitted from two collimated focused
US transducers, and the movement of the trapping site has been realized by tuning the frequency and
location of one of the focused transducers [32]. Similarly to this setup, USM devices with annular
chambers created by multiple of counter-propagating transducers demonstrated much more control
dexterity of the trapping sites by tuning the phase of these transducers [33,41]. For the curved US
resonator reported here, Figure 5a, FPRF was generated in an US field where λw >> a, using a curved
PZ26 transducer to transmit a focused US beam towards a glass reflector, thus forming a quasi-USW.
By moving the position of the curved US transducer laterally from the position-fixed reflector, the
trapping site can be moved simultaneously. As PZ26 is a hard piezoceramic, the transducer can be
driven at harmonics as well as the fundamental frequency.
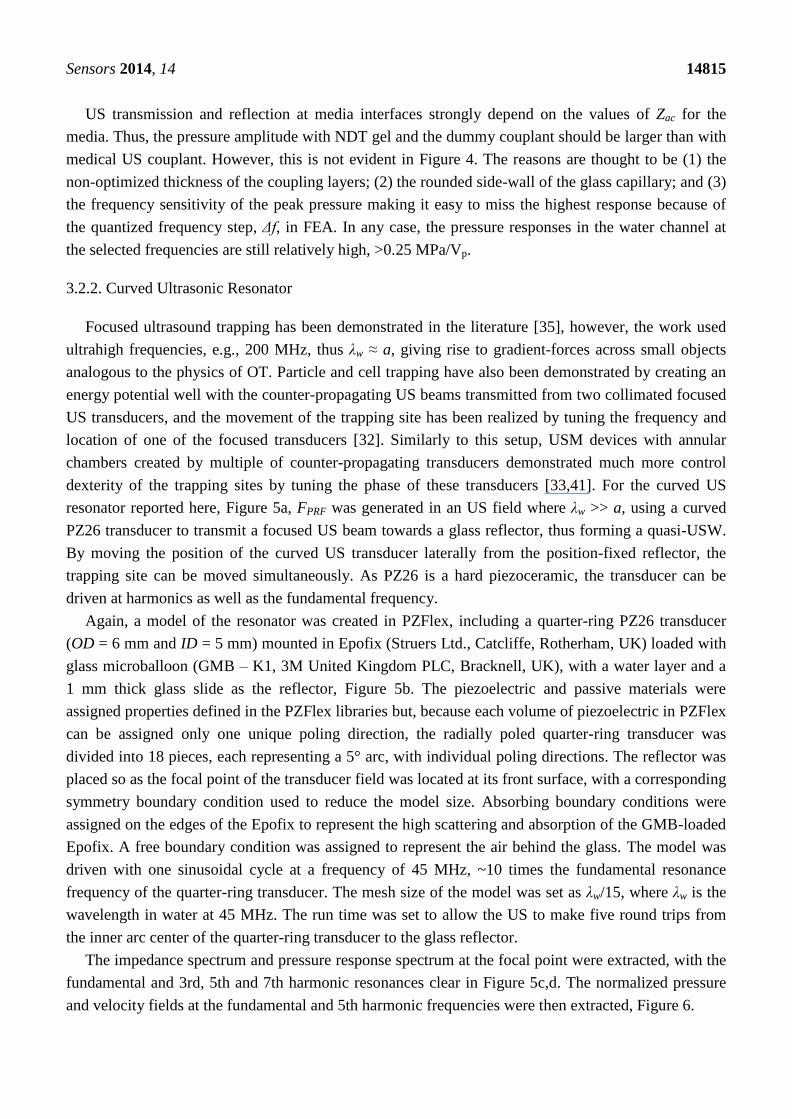
Again, a model of the resonator was created in PZFlex, including a quarter-ring PZ26 transducer
(OD = 6 mm and ID = 5 mm) mounted in Epofix (Struers Ltd., Catcliffe, Rotherham, UK) loaded with
glass microballoon (GMB – K1, 3M United Kingdom PLC, Bracknell, UK), with a water layer and a
1 mm thick glass slide as the reflector, Figure 5b. The piezoelectric and passive materials were
assigned properties defined in the PZFlex libraries but, because each volume of piezoelectric in PZFlex
can be assigned only one unique poling direction, the radially poled quarter-ring transducer was
divided into 18 pieces, each representing a 5° arc, with individual poling directions. The reflector was
placed so as the focal point of the transducer field was located at its front surface, with a corresponding
symmetry boundary condition used to reduce the model size. Absorbing boundary conditions were
assigned on the edges of the Epofix to represent the high scattering and absorption of the GMB-loaded
Epofix. A free boundary condition was assigned to represent the air behind the glass. The model was
driven with one sinusoidal cycle at a frequency of 45 MHz, ~10 times the fundamental resonance
frequency of the quarter-ring transducer. The mesh size of the model was set as λw/15, where λw is the
wavelength in water at 45 MHz. The run time was set to allow the US to make five round trips from
the inner arc center of the quarter-ring transducer to the glass reflector.
The impedance spectrum and pressure response spectrum at the focal point were extracted, with the
fundamental and 3rd, 5th and 7th harmonic resonances clear in Figure 5c,d. The normalized pressure
and velocity fields at the fundamental and 5th harmonic frequencies were then extracted, Figure 6.
Sensors 2014, 14 14816
Figure 5. (a) Schematic diagram of the curved ultrasonic resonator; (b) PZFlex model with
assigned materials and boundary conditions; (c) impedance spectrum of the resonator; and
(d) acoustic pressure response spectrum at the focal point of the transducer.
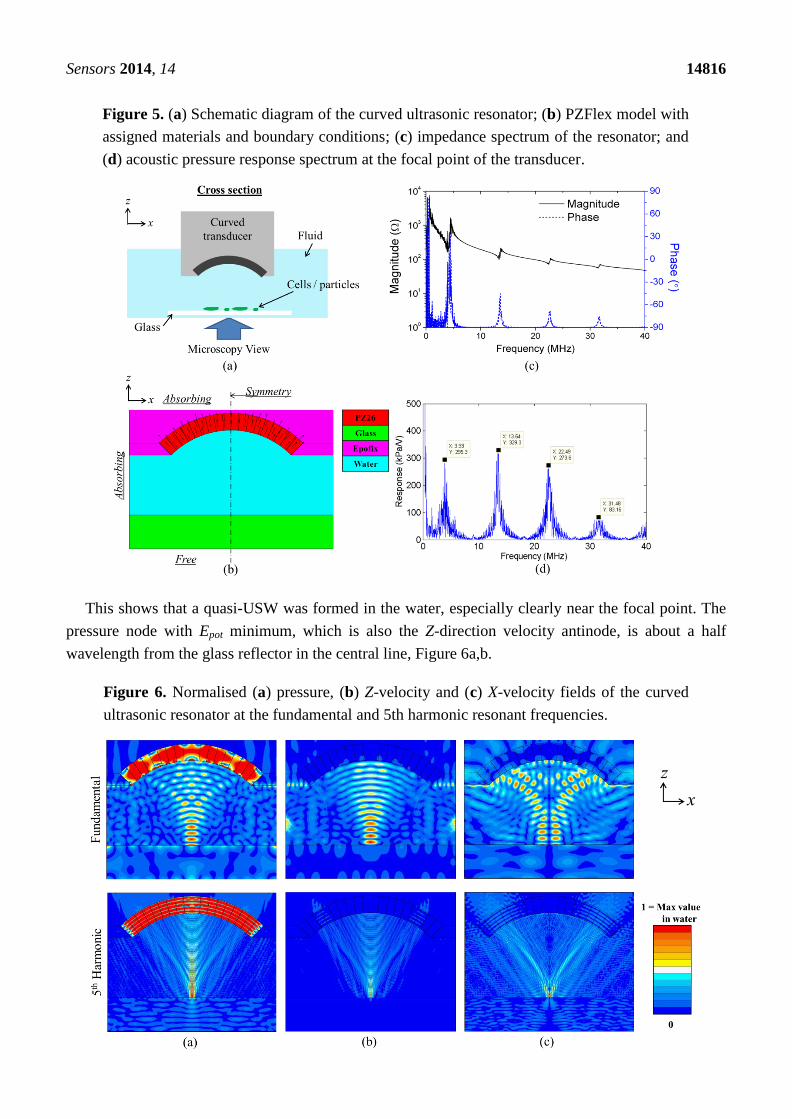
This shows that a quasi-USW was formed in the water, especially clearly near the focal point. The
pressure node with Epot minimum, which is also the Z-direction velocity antinode, is about a half
wavelength from the glass reflector in the central line, Figure 6a,b.
Figure 6. Normalised (a) pressure, (b) Z-velocity and (c) X-velocity fields of the curved
ultrasonic resonator at the fundamental and 5th harmonic resonant frequencies.
Sensors 2014, 14 14817
Therefore, FPRF will arise on particles already near the middle of the glass slide. Depending on the
relationship between FPRF and the buoyancy and gravity forces, the particles can potentially be lifted
and gathered at the Epot minimum (pressure node) and Ekin maximum (Z-velocity anti-node).
The trapped particles can then be moved by moving the transducer laterally as demonstrated in
literature [32,35]. Because of the transducer geometry, a non-uniform X-direction velocity field is also
generated, Figure 6c, located away from the central line at the boundary between the reflector and the
water, with a maximum amplitude about a quarter of the maximum amplitude of the Z-velocity. This
makes it possible that particles at some positions will be pushed away from the central line towards the
X-direction velocity anti-nodes.
3.3. Devices for Precise Manipulation in Multiple Dimensions
In general, precise control over particle position with US has been limited by enclosure resonances
and hence the geometry of USM devices [34]. Although efforts have been made to overcome this, most
are limited to controlling the particle only in the direction of wave propagation or by mechanically
moving the US source [35,79–81]. However, a practical USM field always has variations in directions
normal to wave propagation, which generate FPRF to drive particles towards particular points laterally in
the nodal and antinodal planes. By utilizing the variations in Ekin energy density, particle trapping at
particular locations within the nodal and antinodal planes has been demonstrated [82–84], however, most
of them are lack of control flexibility limited by the use of single US transducer. Thus, with
controllable variation of an US field created with US transducer arrays, precise lateral control and
better control flexibility can be realized, as shown schematically in Figure 7.
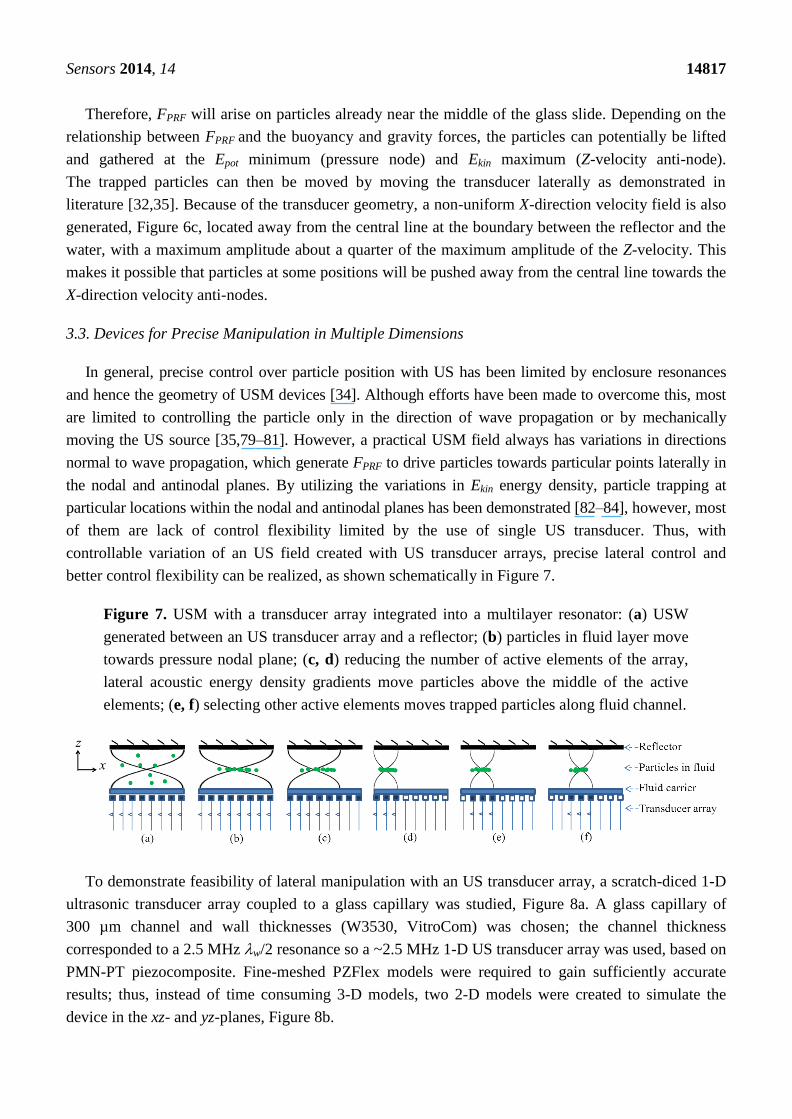
Figure 7. USM with a transducer array integrated into a multilayer resonator: (a) USW
generated between an US transducer array and a reflector; (b) particles in fluid layer move
towards pressure nodal plane; (c, d) reducing the number of active elements of the array,
lateral acoustic energy density gradients move particles above the middle of the active
elements; (e, f) selecting other active elements moves trapped particles along fluid channel.
To demonstrate feasibility of lateral manipulation with an US transducer array, a scratch-diced 1-D
ultrasonic transducer array coupled to a glass capillary was studied, Figure 8a. A glass capillary of
300 µm channel and wall thicknesses (W3530, VitroCom) was chosen; the channel thickness
corresponded to a 2.5 MHz w/2 resonance so a ~2.5 MHz 1-D US transducer array was used, based on
PMN-PT piezocomposite. Fine-meshed PZFlex models were required to gain sufficiently accurate
results; thus, instead of time consuming 3-D models, two 2-D models were created to simulate the
device in the xz- and yz-planes, Figure 8b.
Sensors 2014, 14 14818
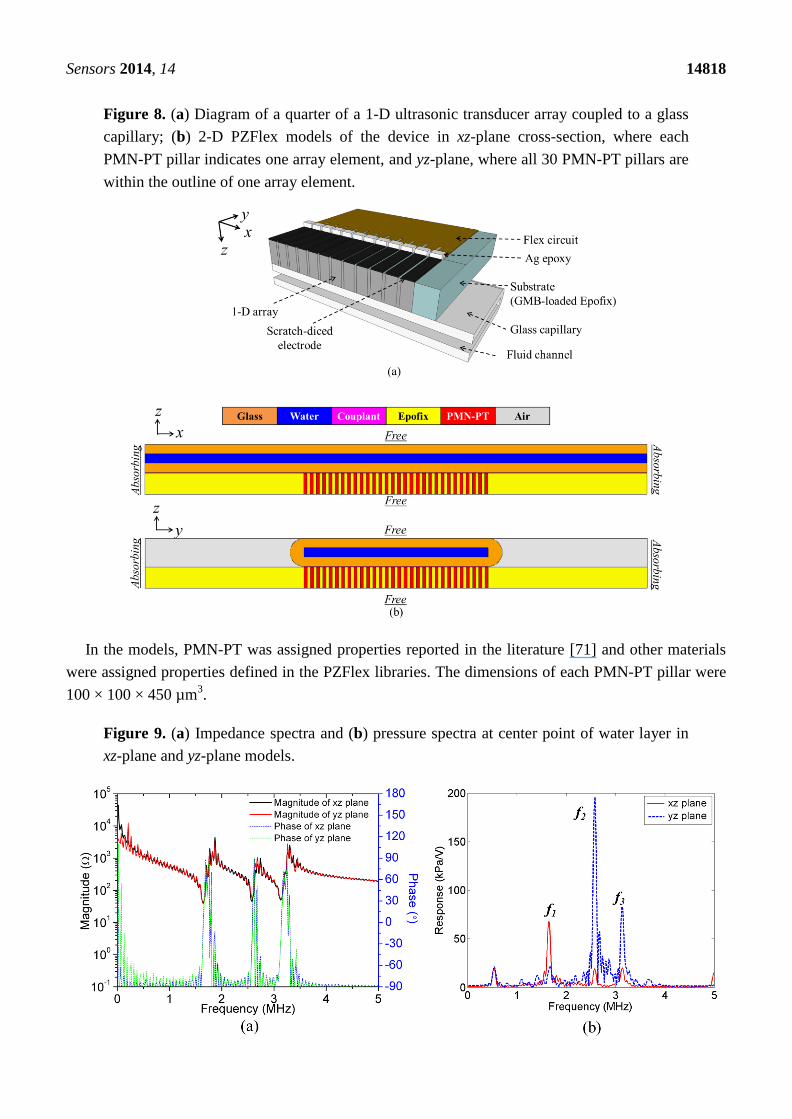
Figure 8. (a) Diagram of a quarter of a 1-D ultrasonic transducer array coupled to a glass
capillary; (b) 2-D PZFlex models of the device in xz-plane cross-section, where each
PMN-PT pillar indicates one array element, and yz-plane, where all 30 PMN-PT pillars are
within the outline of one array element.
In the models, PMN-PT was assigned properties reported in the literature [71] and other materials
were assigned properties defined in the PZFlex libraries. The dimensions of each PMN-PT pillar were
100 × 100 × 450 µm3.
Figure 9. (a) Impedance spectra and (b) pressure spectra at center point of water layer in
xz-plane and yz-plane models.
Sensors 2014, 14 14819
Couplant gel 25 µm thick was included between the transducer array and the capillary. A mesh size
of 6.25 µm was used for the water and couplant layers and 25 µm for other materials. The model was
driven with one sinusoidal cycle at f = 5 MHz, approximately twice the frequency of interest. Runtime
was set to be sufficient for the US to make 10 round trips across the whole capillary. The impedance
spectra and the pressure spectrum at the center of the water layer are shown in Figure 9. Three high
pressure peaks are evident at f1 = 1.64 MHz, f2 = 2.58 MHz and f3 = 3.14 MHz in Figure 9b. These
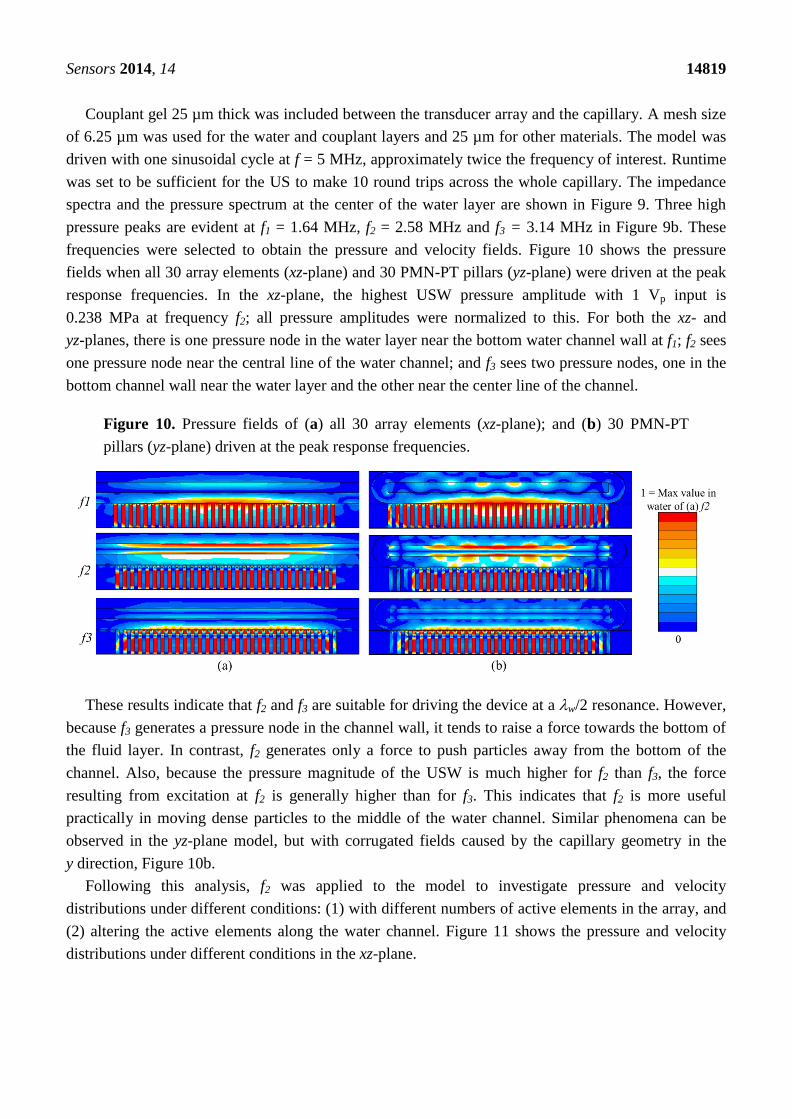
frequencies were selected to obtain the pressure and velocity fields. Figure 10 shows the pressure
fields when all 30 array elements (xz-plane) and 30 PMN-PT pillars (yz-plane) were driven at the peak
response frequencies. In the xz-plane, the highest USW pressure amplitude with 1 Vp input is
0.238 MPa at frequency f2; all pressure amplitudes were normalized to this. For both the xz- and
yz-planes, there is one pressure node in the water layer near the bottom water channel wall at f1; f2 sees
one pressure node near the central line of the water channel; and f3 sees two pressure nodes, one in the
bottom channel wall near the water layer and the other near the center line of the channel.
Figure 10. Pressure fields of (a) all 30 array elements (xz-plane); and (b) 30 PMN-PT
pillars (yz-plane) driven at the peak response frequencies.
These results indicate that f2 and f3 are suitable for driving the device at a w/2 resonance. However,
because f3 generates a pressure node in the channel wall, it tends to raise a force towards the bottom of
the fluid layer. In contrast, f2 generates only a force to push particles away from the bottom of the
channel. Also, because the pressure magnitude of the USW is much higher for f2 than f3, the force
resulting from excitation at f2 is generally higher than for f3. This indicates that f2 is more useful
practically in moving dense particles to the middle of the water channel. Similar phenomena can be
observed in the yz-plane model, but with corrugated fields caused by the capillary geometry in the
y direction, Figure 10b.
Following this analysis, f2 was applied to the model to investigate pressure and velocity
distributions under different conditions: (1) with different numbers of active elements in the array, and
(2) altering the active elements along the water channel. Figure 11 shows the pressure and velocity
distributions under different conditions in the xz-plane.
Sensors 2014, 14 14820
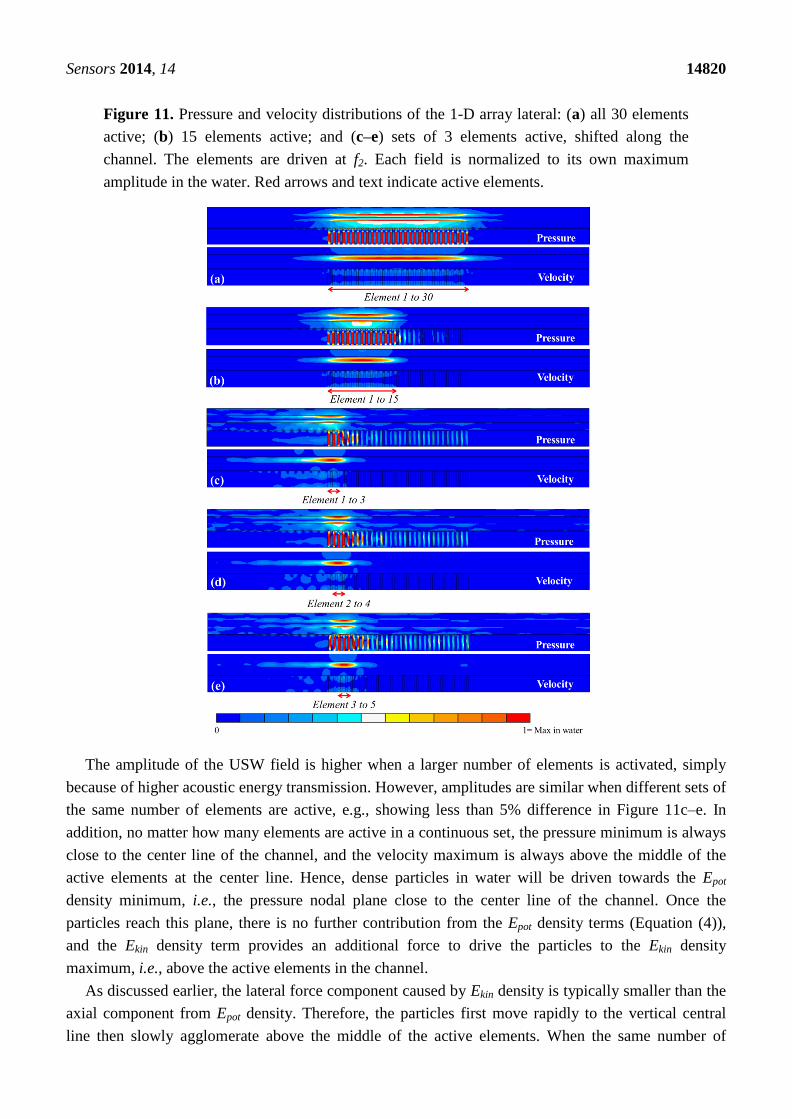
Figure 11. Pressure and velocity distributions of the 1-D array lateral: (a) all 30 elements
active; (b) 15 elements active; and (c–e) sets of 3 elements active, shifted along the
channel. The elements are driven at f2. Each field is normalized to its own maximum
amplitude in the water. Red arrows and text indicate active elements.
The amplitude of the USW field is higher when a larger number of elements is activated, simply
because of higher acoustic energy transmission. However, amplitudes are similar when different sets of
the same number of elements are active, e.g., showing less than 5% difference in Figure 11c–e. In
addition, no matter how many elements are active in a continuous set, the pressure minimum is always
close to the center line of the channel, and the velocity maximum is always above the middle of the
active elements at the center line. Hence, dense particles in water will be driven towards the Epot
density minimum, i.e., the pressure nodal plane close to the center line of the channel. Once the
particles reach this plane, there is no further contribution from the Epot density terms (Equation (4)),
and the Ekin density term provides an additional force to drive the particles to the Ekin density
maximum, i.e., above the active elements in the channel.
As discussed earlier, the lateral force component caused by Ekin density is typically smaller than the
axial component from Epot density. Therefore, the particles first move rapidly to the vertical central
line then slowly agglomerate above the middle of the active elements. When the same number of
Sensors 2014, 14 14821
active elements is shifted along the channel, the change in the position of the Ekin density maximum
leads to the trapping site moving along the center line of the channel, as shown in Figure 11c,d.
3.4. Devices towards Mass Production
Depending on the desired thickness of the PZT film, a number of fabrication techniques are
available. The modified sol-gel method [85] and hydrothermal deposition [86] have been used for
thicknesses of 10–30 µm. Aerosol deposition can achieve uniquely high density films, theoretically
>95%, with thickness range 1–100 µm [87]. Screen-printing [88] can achieve a large thickness range,
typically 10–150 µm. The modified sol-gel process overcomes the thickness limitation of the
conventional sol-gel process by incorporating ceramic powder into the chemical solution, thus
producing thick films at a relatively low sintering temperature, around 700 °C.
The hydrothermal method is able to make piezoelectric monocrystalline and polycrystalline films
on a large area at <200 °C [89]. Aerosol deposition has been reported to achieve dense, crack-free
ceramic films based on the impact and consolidation phenomenon of ceramic particles at room
temperature with a high deposition rate. Patterning can be achieved by successive lift-off process [90].
Compared with other fabrication techniques, screen-printing is a relatively simple way to fabricate
patterned films with reasonable quality and excellent reproducibility. Hence, creation of a 2-D matrix
ultrasonic transducer array manipulator, Figure 12a, based on thick film screen printing was used to
demonstrate the reduction in fabrication complexity, for translation towards mass production.
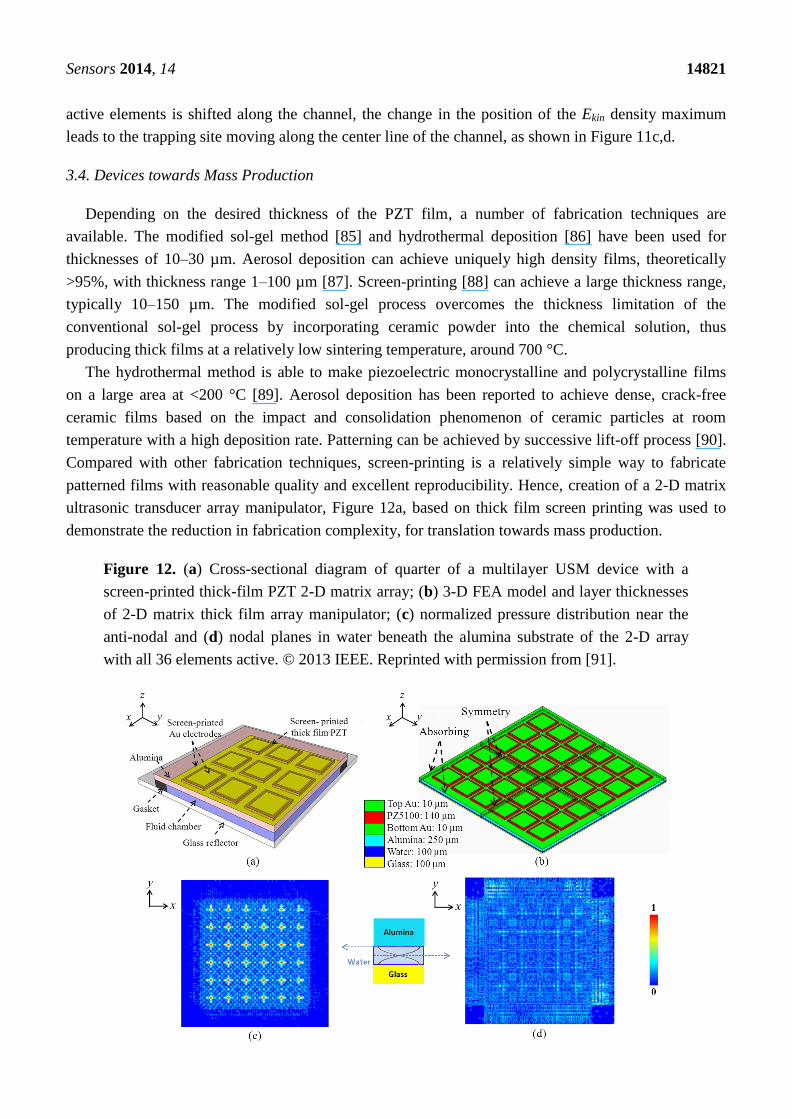
Figure 12. (a) Cross-sectional diagram of quarter of a multilayer USM device with a
screen-printed thick-film PZT 2-D matrix array; (b) 3-D FEA model and layer thicknesses
of 2-D matrix thick film array manipulator; (c) normalized pressure distribution near the
anti-nodal and (d) nodal planes in water beneath the alumina substrate of the 2-D array
with all 36 elements active. © 2013 IEEE. Reprinted with permission from [91].
Sensors 2014, 14 14822
A 3-D FEA model was created with 100 µm water thickness, Figure 12b. The element pitch in both
dimensions was 2.3 mm and the element dimensions were 2 × 2 mm2, with top electrodes of
1.7 × 1.7 mm2. As the PZT is built up layer-by-layer in screen printing, the PZT structures have
rounded edges. Hence, the dimension of the top electrode on each PZT element was 0.3 mm smaller.
The dimensions were also optimized to obtain an electrical impedance magnitude of ~50 Ω at the
fundamental resonance, f ≈ 7.5 MHz for ease of electrical impedance matching. The FEA mesh size
was ~λw/20 in the z-direction and ~λw/5 in the x- and y-directions, because of their larger dimensions.
The model was excited by a short pulse and oscillation was allowed to decay completely. The mode
shape was calculated at the frequency of maximum response. Normalized pressure distributions near
the anti-nodal and nodal planes in the water are shown in Figure 12c,d. The width at half the pressure
amplitude maximum is approximately 0.4 mm. Because of the lack of overlap of energy gradients
because of the larger lateral element dimensions, this design is unable to transport particle
agglomerates by switching active array elements as in the 1-D device; an array with a smaller pitch and
element size would be required to realize such lateral transportation.
4. Experimental Results and Discussion
4.1. Planar Ultrasonic Resonator
A 23.3 MHz ultrasonic transducer was fabricated from a 3-inch Y-36°-cut LNO wafer (Roditi
International Corporation Ltd, London, UK) with GMB-loaded Epofix as backing using a fabrication
process reported elsewhere [76], but was further lapped to obtain a height of 1.1 mm in the elevation
direction of the transducer.
Two Macor spacers were lapped to a thickness of 0.4 mm and used to lift the capillary into the
plane of the transducer. A glass capillary of 0.1 × 2 mm2 channel dimension and 0.1 mm wall
thickness (W5010, VitroCom) was coupled to the LNO transducer front face with US couplant, as
shown in Figure 13a. The impedance spectrum of the transducer was measured in air, and compared to
the modelled results of a LNO element of the same dimensions in the practical transducer using
one-dimensional model (ODM [92]), as shown in Figure 13b. The experimental result suggests slightly
higher damping and a slightly lower resonant frequency because of the GMB-loaded Epofix mounting
on the LNO element.
An experiment was performed with beads to evaluate the performance before cell experiments.
A mixture of Ø10 μm fluorescent polystyrene beads (Polysciences Inc., Warrington, PA, USA) in
degassed water (bead concentration ~1.5 × 10⁶ particles/mL) was drawn into the capillary by “capillary
action”. The motion of the beads was recorded with an epi-fluorescence microscope. The operating
frequency of the device was switched between two resonant frequencies, 24.96 MHz and 27.00 MHz,
thus rearranging the trapped beads after each switch. Two different couplants with low (Zac ≈ 1.5 MRayl)
and high (Zac ≈ 3 MRayl) acoustic impedances were used. The maximum acoustic radiation forces on
the beads were estimated from the viscous drag forces calculated from measured velocities [34] at
different input voltages, Figure 14. Input voltage was limited to 5 Vpp because strong streaming effects
were found at higher amplitudes.
Sensors 2014, 14 14823
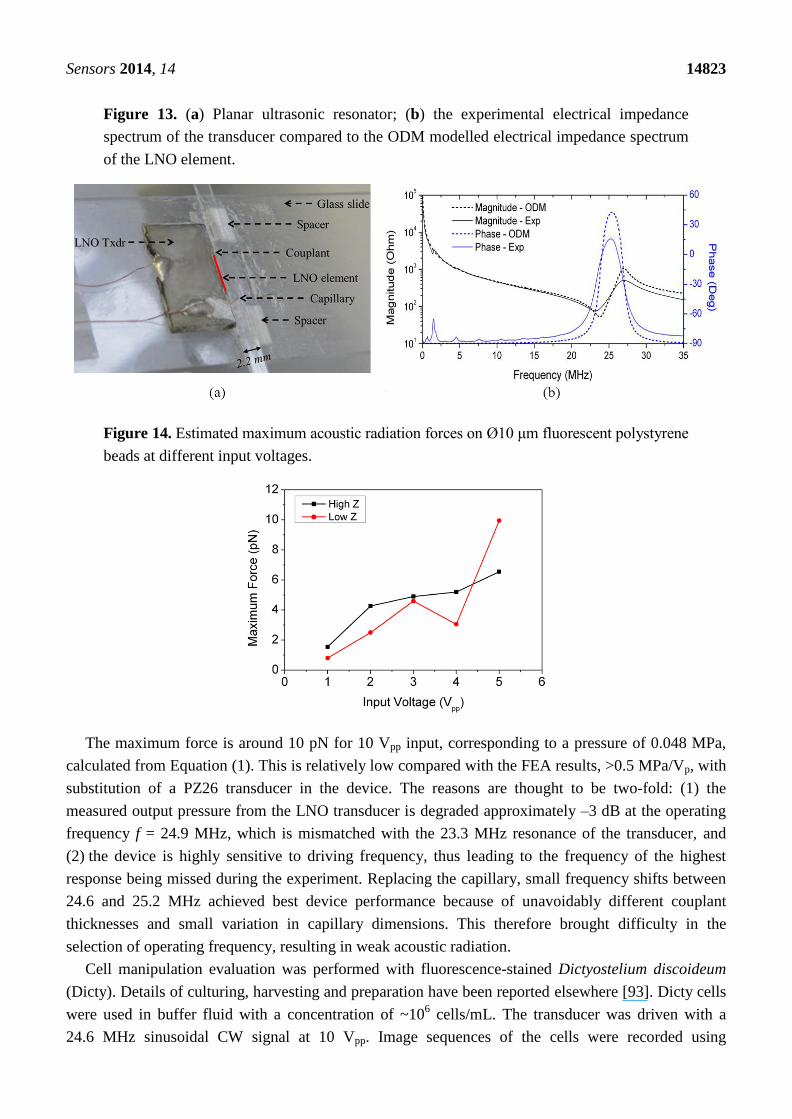
Figure 13. (a) Planar ultrasonic resonator; (b) the experimental electrical impedance
spectrum of the transducer compared to the ODM modelled electrical impedance spectrum
of the LNO element.
Figure 14. Estimated maximum acoustic radiation forces on Ø10 μm fluorescent polystyrene
beads at different input voltages.
The maximum force is around 10 pN for 10 Vpp input, corresponding to a pressure of 0.048 MPa,
calculated from Equation (1). This is relatively low compared with the FEA results, >0.5 MPa/Vp, with
substitution of a PZ26 transducer in the device. The reasons are thought to be two-fold: (1) the
measured output pressure from the LNO transducer is degraded approximately –3 dB at the operating
frequency f = 24.9 MHz, which is mismatched with the 23.3 MHz resonance of the transducer, and
(2) the device is highly sensitive to driving frequency, thus leading to the frequency of the highest
response being missed during the experiment. Replacing the capillary, small frequency shifts between
24.6 and 25.2 MHz achieved best device performance because of unavoidably different couplant
thicknesses and small variation in capillary dimensions. This therefore brought difficulty in the
selection of operating frequency, resulting in weak acoustic radiation.
Cell manipulation evaluation was performed with fluorescence-stained Dictyostelium discoideum
(Dicty). Details of culturing, harvesting and preparation have been reported elsewhere [93]. Dicty cells
were used in buffer fluid with a concentration of ~106 cells/mL. The transducer was driven with a
24.6 MHz sinusoidal CW signal at 10 Vpp. Image sequences of the cells were recorded using
Sensors 2014, 14 14824
Micro-Manager (Vale Lab, UCSF, San Francisco, CA, USA) microscopy software with and without
the presence of USWs across the capillary, for 30 min each. Dicty cell motion was tracked and plotted
as polar plots, with the starting point of each cell track shifted to a common origin [93].
In the absence of USWs, cells moved fully randomly, producing tracks migrating away from the
origin approximately uniformly in all directions. In the presence of USWs, the polar plot exhibited a
slight bias along the pressure nodal lines, perpendicular to the direction of US propagation. Given the
noted weak acoustic radiation, it is expected that more substantial effects may be realized by further
optimization of the device design, particularly through automatic frequency tracking, which may allow
cell motility forces to be evaluated, e.g., on the nN-scale required to influence adherent migration.
4.2. Curved Ultrasonic Resonators
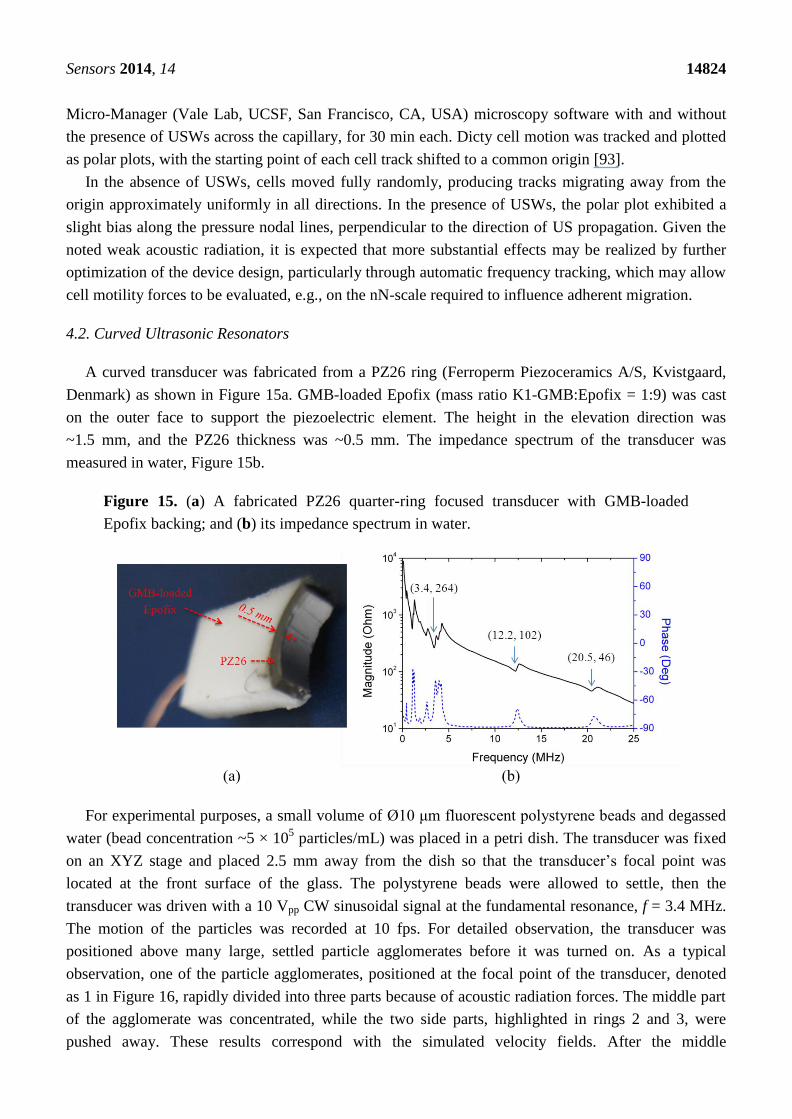
A curved transducer was fabricated from a PZ26 ring (Ferroperm Piezoceramics A/S, Kvistgaard,
Denmark) as shown in Figure 15a. GMB-loaded Epofix (mass ratio K1-GMB:Epofix = 1:9) was cast
on the outer face to support the piezoelectric element. The height in the elevation direction was
~1.5 mm, and the PZ26 thickness was ~0.5 mm. The impedance spectrum of the transducer was
measured in water, Figure 15b.
Figure 15. (a) A fabricated PZ26 quarter-ring focused transducer with GMB-loaded
Epofix backing; and (b) its impedance spectrum in water.
For experimental purposes, a small volume of Ø10 μm fluorescent polystyrene beads and degassed
water (bead concentration ~5 × 10⁵ particles/mL) was placed in a petri dish. The transducer was fixed
on an XYZ stage and placed 2.5 mm away from the dish so that the transducer’s focal point was
located at the front surface of the glass. The polystyrene beads were allowed to settle, then the
transducer was driven with a 10 Vpp CW sinusoidal signal at the fundamental resonance, f = 3.4 MHz.
The motion of the particles was recorded at 10 fps. For detailed observation, the transducer was
positioned above many large, settled particle agglomerates before it was turned on. As a typical
observation, one of the particle agglomerates, positioned at the focal point of the transducer, denoted
as 1 in Figure 16, rapidly divided into three parts because of acoustic radiation forces. The middle part
of the agglomerate was concentrated, while the two side parts, highlighted in rings 2 and 3, were
pushed away. These results correspond with the simulated velocity fields. After the middle
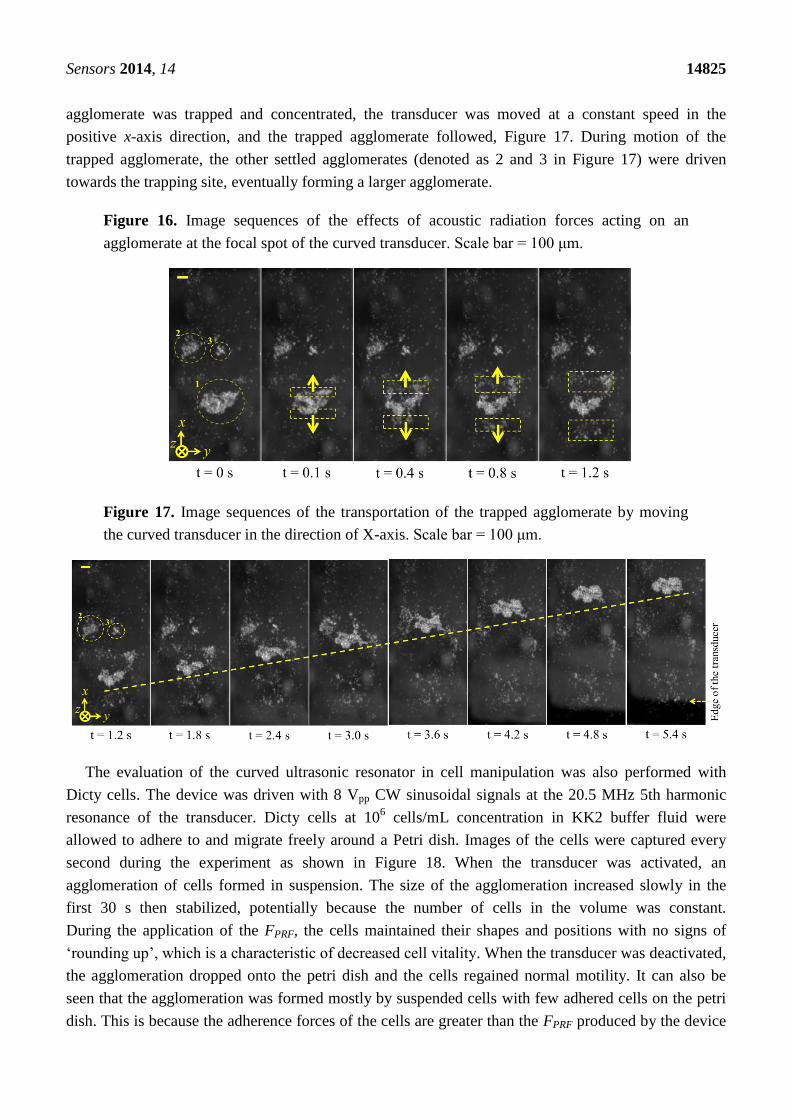
Sensors 2014, 14 14825
agglomerate was trapped and concentrated, the transducer was moved at a constant speed in the
positive x-axis direction, and the trapped agglomerate followed, Figure 17. During motion of the
trapped agglomerate, the other settled agglomerates (denoted as 2 and 3 in Figure 17) were driven
towards the trapping site, eventually forming a larger agglomerate.
Figure 16. Image sequences of the effects of acoustic radiation forces acting on an
agglomerate at the focal spot of the curved transducer. Scale bar = 100 μm.
Figure 17. Image sequences of the transportation of the trapped agglomerate by moving
the curved transducer in the direction of X-axis. Scale bar = 100 μm.
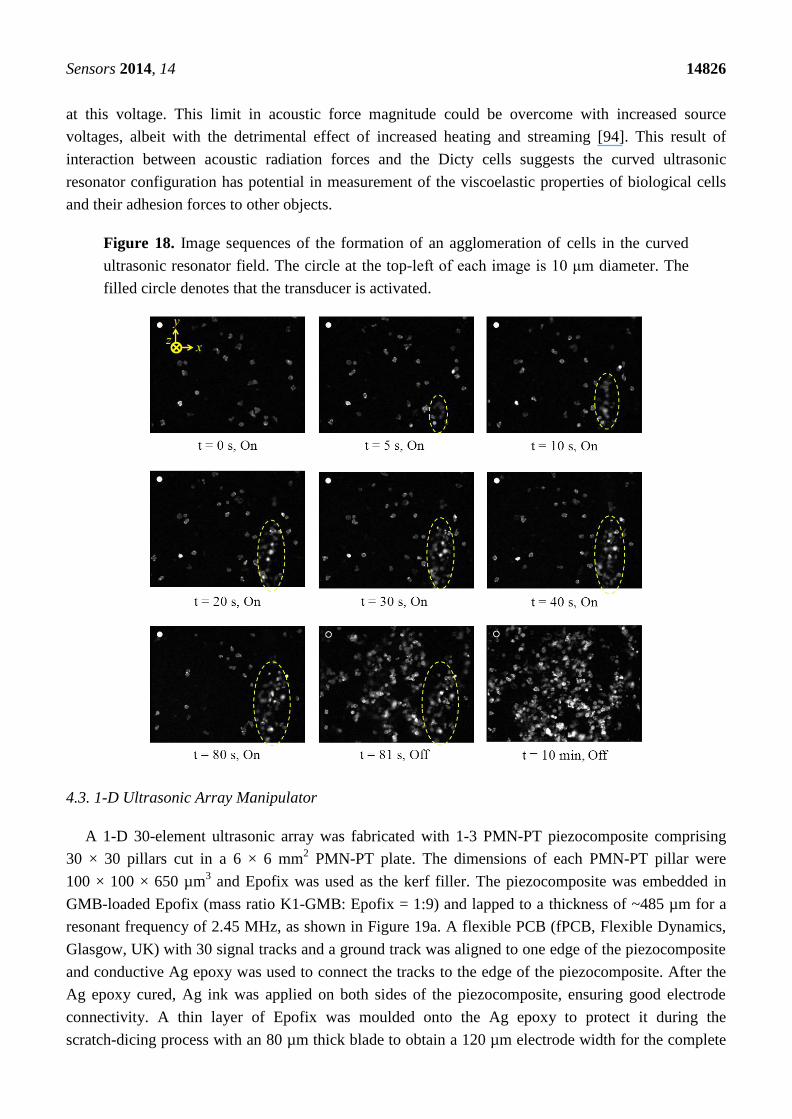
The evaluation of the curved ultrasonic resonator in cell manipulation was also performed with
Dicty cells. The device was driven with 8 Vpp CW sinusoidal signals at the 20.5 MHz 5th harmonic
resonance of the transducer. Dicty cells at 106 cells/mL concentration in KK2 buffer fluid were
allowed to adhere to and migrate freely around a Petri dish. Images of the cells were captured every
second during the experiment as shown in Figure 18. When the transducer was activated, an
agglomeration of cells formed in suspension. The size of the agglomeration increased slowly in the
first 30 s then stabilized, potentially because the number of cells in the volume was constant.
During the application of the FPRF, the cells maintained their shapes and positions with no signs of
‘rounding up’, which is a characteristic of decreased cell vitality. When the transducer was deactivated,
the agglomeration dropped onto the petri dish and the cells regained normal motility. It can also be
seen that the agglomeration was formed mostly by suspended cells with few adhered cells on the petri
dish. This is because the adherence forces of the cells are greater than the FPRF produced by the device
Sensors 2014, 14 14826
at this voltage. This limit in acoustic force magnitude could be overcome with increased source
voltages, albeit with the detrimental effect of increased heating and streaming [94]. This result of
interaction between acoustic radiation forces and the Dicty cells suggests the curved ultrasonic
resonator configuration has potential in measurement of the viscoelastic properties of biological cells
and their adhesion forces to other objects.
Figure 18. Image sequences of the formation of an agglomeration of cells in the curved
ultrasonic resonator field. The circle at the top-left of each image is 10 μm diameter. The
filled circle denotes that the transducer is activated.
4.3. 1-D Ultrasonic Array Manipulator
A 1-D 30-element ultrasonic array was fabricated with 1-3 PMN-PT piezocomposite comprising
30 × 30 pillars cut in a 6 × 6 mm2 PMN-PT plate. The dimensions of each PMN-PT pillar were
100 × 100 × 650 µm3 and Epofix was used as the kerf filler. The piezocomposite was embedded in
GMB-loaded Epofix (mass ratio K1-GMB: Epofix = 1:9) and lapped to a thickness of ~485 µm for a
resonant frequency of 2.45 MHz, as shown in Figure 19a. A flexible PCB (fPCB, Flexible Dynamics,
Glasgow, UK) with 30 signal tracks and a ground track was aligned to one edge of the piezocomposite
and conductive Ag epoxy was used to connect the tracks to the edge of the piezocomposite. After the
Ag epoxy cured, Ag ink was applied on both sides of the piezocomposite, ensuring good electrode
connectivity. A thin layer of Epofix was moulded onto the Ag epoxy to protect it during the
scratch-dicing process with an 80 µm thick blade to obtain a 120 µm electrode width for the complete
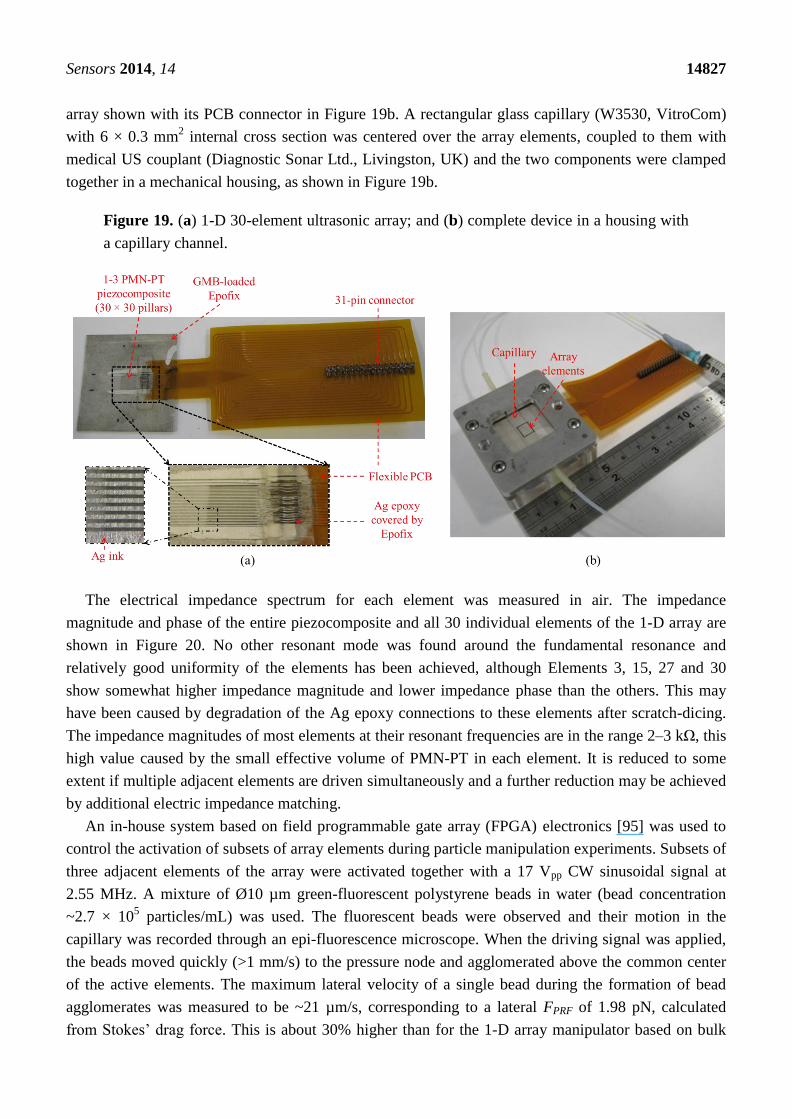
Sensors 2014, 14 14827
array shown with its PCB connector in Figure 19b. A rectangular glass capillary (W3530, VitroCom)
with 6 × 0.3 mm2 internal cross section was centered over the array elements, coupled to them with
medical US couplant (Diagnostic Sonar Ltd., Livingston, UK) and the two components were clamped
together in a mechanical housing, as shown in Figure 19b.
Figure 19. (a) 1-D 30-element ultrasonic array; and (b) complete device in a housing with
a capillary channel.
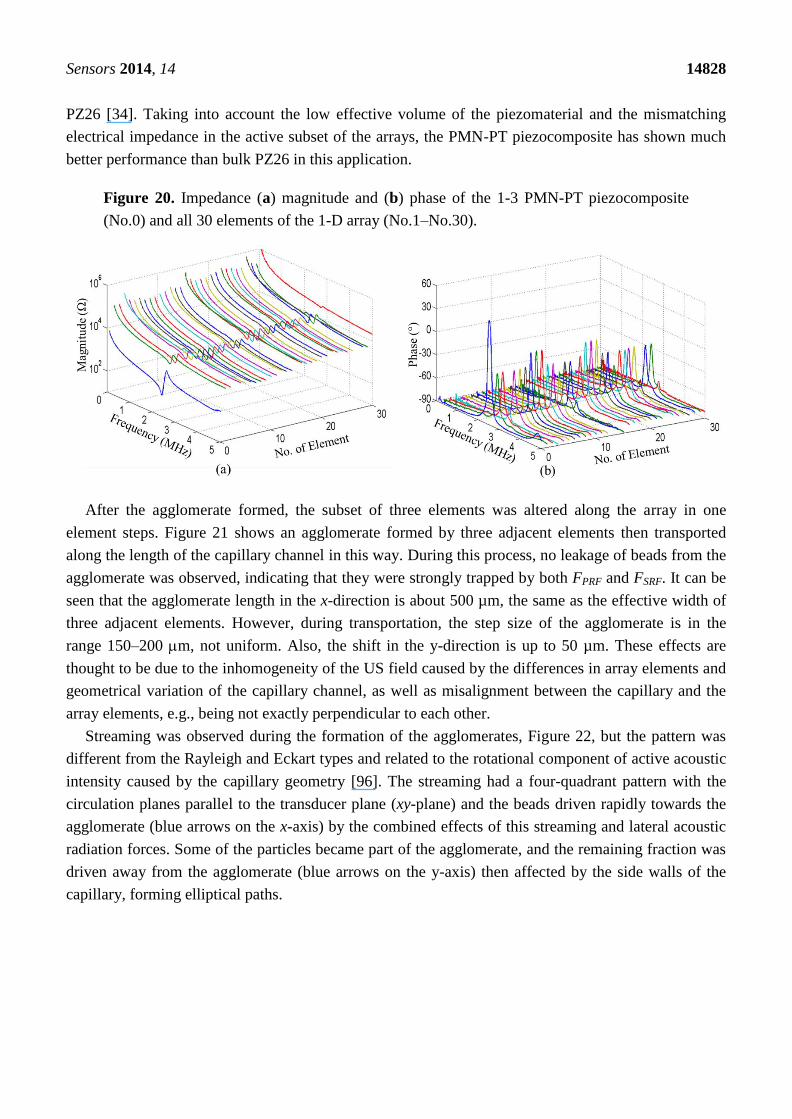
The electrical impedance spectrum for each element was measured in air. The impedance
magnitude and phase of the entire piezocomposite and all 30 individual elements of the 1-D array are
shown in Figure 20. No other resonant mode was found around the fundamental resonance and
relatively good uniformity of the elements has been achieved, although Elements 3, 15, 27 and 30
show somewhat higher impedance magnitude and lower impedance phase than the others. This may
have been caused by degradation of the Ag epoxy connections to these elements after scratch-dicing.
The impedance magnitudes of most elements at their resonant frequencies are in the range 2–3 kΩ, this
high value caused by the small effective volume of PMN-PT in each element. It is reduced to some
extent if multiple adjacent elements are driven simultaneously and a further reduction may be achieved
by additional electric impedance matching.
An in-house system based on field programmable gate array (FPGA) electronics [95] was used to
control the activation of subsets of array elements during particle manipulation experiments. Subsets of
three adjacent elements of the array were activated together with a 17 Vpp CW sinusoidal signal at
2.55 MHz. A mixture of Ø10 µm green-fluorescent polystyrene beads in water (bead concentration
~2.7 × 10⁵ particles/mL) was used. The fluorescent beads were observed and their motion in the
capillary was recorded through an epi-fluorescence microscope. When the driving signal was applied,
the beads moved quickly (>1 mm/s) to the pressure node and agglomerated above the common center
of the active elements. The maximum lateral velocity of a single bead during the formation of bead
agglomerates was measured to be ~21 µm/s, corresponding to a lateral FPRF of 1.98 pN, calculated
from Stokes’ drag force. This is about 30% higher than for the 1-D array manipulator based on bulk
Sensors 2014, 14 14828
PZ26 [34]. Taking into account the low effective volume of the piezomaterial and the mismatching
electrical impedance in the active subset of the arrays, the PMN-PT piezocomposite has shown much
better performance than bulk PZ26 in this application.
Figure 20. Impedance (a) magnitude and (b) phase of the 1-3 PMN-PT piezocomposite
(No.0) and all 30 elements of the 1-D array (No.1–No.30).
After the agglomerate formed, the subset of three elements was altered along the array in one
element steps. Figure 21 shows an agglomerate formed by three adjacent elements then transported
along the length of the capillary channel in this way. During this process, no leakage of beads from the
agglomerate was observed, indicating that they were strongly trapped by both FPRF and FSRF. It can be
seen that the agglomerate length in the x-direction is about 500 µm, the same as the effective width of
three adjacent elements. However, during transportation, the step size of the agglomerate is in the
range 150–200 m, not uniform. Also, the shift in the y-direction is up to 50 µm. These effects are
thought to be due to the inhomogeneity of the US field caused by the differences in array elements and
geometrical variation of the capillary channel, as well as misalignment between the capillary and the
array elements, e.g., being not exactly perpendicular to each other.
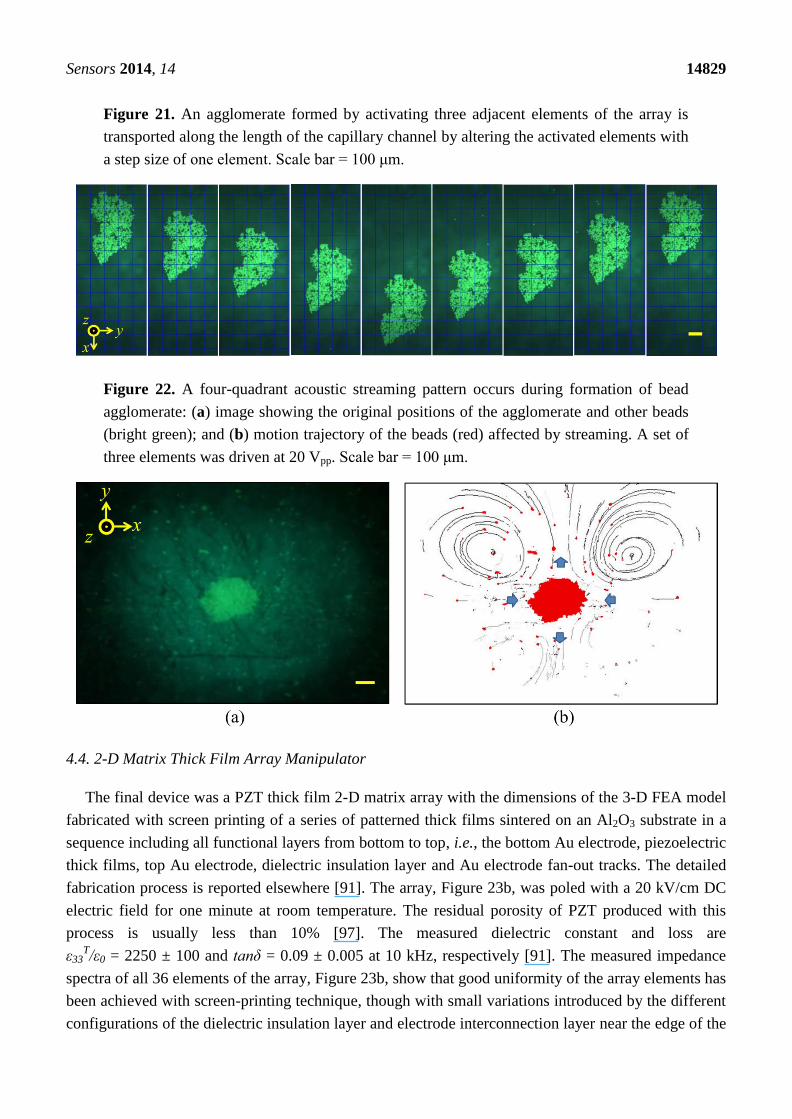
Streaming was observed during the formation of the agglomerates, Figure 22, but the pattern was
different from the Rayleigh and Eckart types and related to the rotational component of active acoustic
intensity caused by the capillary geometry [96]. The streaming had a four-quadrant pattern with the
circulation planes parallel to the transducer plane (xy-plane) and the beads driven rapidly towards the
agglomerate (blue arrows on the x-axis) by the combined effects of this streaming and lateral acoustic
radiation forces. Some of the particles became part of the agglomerate, and the remaining fraction was
driven away from the agglomerate (blue arrows on the y-axis) then affected by the side walls of the
capillary, forming elliptical paths.
Sensors 2014, 14 14829
Figure 21. An agglomerate formed by activating three adjacent elements of the array is
transported along the length of the capillary channel by altering the activated elements with
a step size of one element. Scale bar = 100 μm.
Figure 22. A four-quadrant acoustic streaming pattern occurs during formation of bead
agglomerate: (a) image showing the original positions of the agglomerate and other beads
(bright green); and (b) motion trajectory of the beads (red) affected by streaming. A set of
three elements was driven at 20 Vpp. Scale bar = 100 μm.
4.4. 2-D Matrix Thick Film Array Manipulator
The final device was a PZT thick film 2-D matrix array with the dimensions of the 3-D FEA model
fabricated with screen printing of a series of patterned thick films sintered on an Al2O3 substrate in a
sequence including all functional layers from bottom to top, i.e., the bottom Au electrode, piezoelectric
thick films, top Au electrode, dielectric insulation layer and Au electrode fan-out tracks. The detailed
fabrication process is reported elsewhere [91]. The array, Figure 23b, was poled with a 20 kV/cm DC
electric field for one minute at room temperature. The residual porosity of PZT produced with this
process is usually less than 10% [97]. The measured dielectric constant and loss are
ε33T/ε0 = 2250 ± 100 and tanδ = 0.09 ± 0.005 at 10 kHz, respectively [91]. The measured impedance
spectra of all 36 elements of the array, Figure 23b, show that good uniformity of the array elements has
been achieved with screen-printing technique, though with small variations introduced by the different
configurations of the dielectric insulation layer and electrode interconnection layer near the edge of the
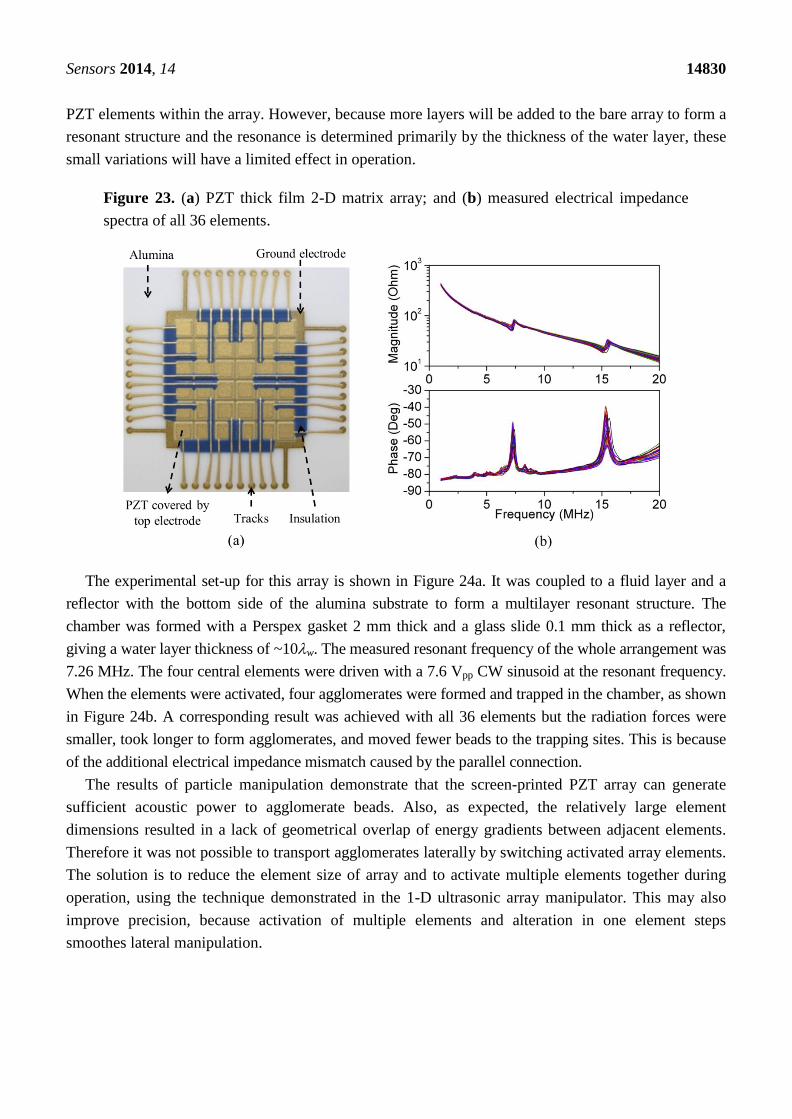
Sensors 2014, 14 14830
PZT elements within the array. However, because more layers will be added to the bare array to form a
resonant structure and the resonance is determined primarily by the thickness of the water layer, these
small variations will have a limited effect in operation.
Figure 23. (a) PZT thick film 2-D matrix array; and (b) measured electrical impedance
spectra of all 36 elements.
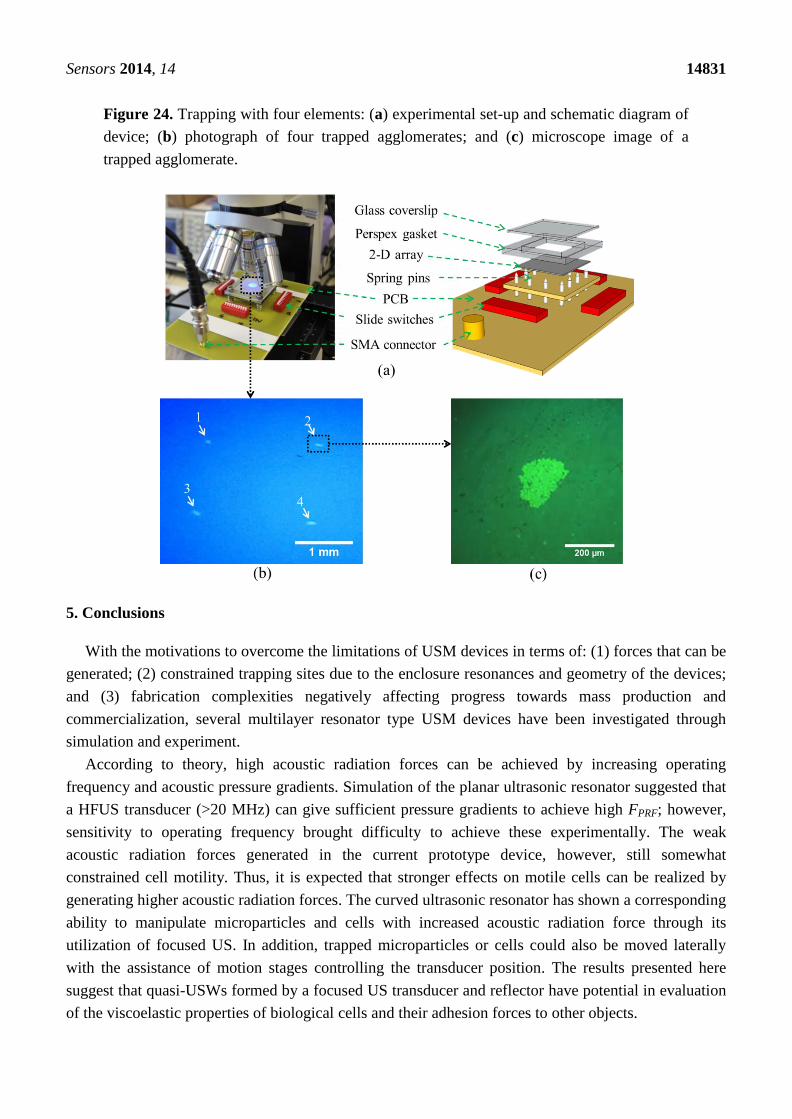
The experimental set-up for this array is shown in Figure 24a. It was coupled to a fluid layer and a
reflector with the bottom side of the alumina substrate to form a multilayer resonant structure. The
chamber was formed with a Perspex gasket 2 mm thick and a glass slide 0.1 mm thick as a reflector,
giving a water layer thickness of ~10w. The measured resonant frequency of the whole arrangement was
7.26 MHz. The four central elements were driven with a 7.6 Vpp CW sinusoid at the resonant frequency.
When the elements were activated, four agglomerates were formed and trapped in the chamber, as shown
in Figure 24b. A corresponding result was achieved with all 36 elements but the radiation forces were
smaller, took longer to form agglomerates, and moved fewer beads to the trapping sites. This is because
of the additional electrical impedance mismatch caused by the parallel connection.
The results of particle manipulation demonstrate that the screen-printed PZT array can generate
sufficient acoustic power to agglomerate beads. Also, as expected, the relatively large element
dimensions resulted in a lack of geometrical overlap of energy gradients between adjacent elements.
Therefore it was not possible to transport agglomerates laterally by switching activated array elements.
The solution is to reduce the element size of array and to activate multiple elements together during
operation, using the technique demonstrated in the 1-D ultrasonic array manipulator. This may also
improve precision, because activation of multiple elements and alteration in one element steps
smoothes lateral manipulation.
Sensors 2014, 14 14831
Figure 24. Trapping with four elements: (a) experimental set-up and schematic diagram of
device; (b) photograph of four trapped agglomerates; and (c) microscope image of a
trapped agglomerate.
5. Conclusions
With the motivations to overcome the limitations of USM devices in terms of: (1) forces that can be
generated; (2) constrained trapping sites due to the enclosure resonances and geometry of the devices;
and (3) fabrication complexities negatively affecting progress towards mass production and
commercialization, several multilayer resonator type USM devices have been investigated through
simulation and experiment.
According to theory, high acoustic radiation forces can be achieved by increasing operating
frequency and acoustic pressure gradients. Simulation of the planar ultrasonic resonator suggested that
a HFUS transducer (>20 MHz) can give sufficient pressure gradients to achieve high FPRF; however,
sensitivity to operating frequency brought difficulty to achieve these experimentally. The weak
acoustic radiation forces generated in the current prototype device, however, still somewhat
constrained cell motility. Thus, it is expected that stronger effects on motile cells can be realized by
generating higher acoustic radiation forces. The curved ultrasonic resonator has shown a corresponding
ability to manipulate microparticles and cells with increased acoustic radiation force through its
utilization of focused US. In addition, trapped microparticles or cells could also be moved laterally
with the assistance of motion stages controlling the transducer position. The results presented here
suggest that quasi-USWs formed by a focused US transducer and reflector have potential in evaluation
of the viscoelastic properties of biological cells and their adhesion forces to other objects.
Sensors 2014, 14 14832
The feasibility of precise lateral control of microparticles in a microfluidic channel has been
demonstrated with US transducer arrays integrated into multilayer resonators. Thereby, the restriction
that conventional USM devices can manipulate particles only in the direction of wave propagation has
been overcome with controllable variation of acoustic energy distributions created by the transducer
array. In this concept, 2-D (vertical and lateral) particle manipulation has been realized with a 1-D
transducer array integrated into a multilayer resonator operating at ~2.5 MHz; potentially 3-D (vertical,
lateral and orthogonal) particle manipulation can be realized with a 2-D matrix array integrated into a
multilayer resonator. Moreover, the use of 1-3 PMN-PT piezocomposite has given much better
performance than conventional bulk PZT devices.
The development of the 2-D matrix thick film array manipulator has taken advantage of the
relatively simple fabrication and interconnection strategy offered by screen-printing. Experimental
results show good uniformity and acceptable film quality and performance have been achieved.
Furthermore, the excellent reproducibility of screen-printing gives a potential for bulk production of
disposable devices, benefiting the commercialization of Sonotweezers® for life sciences applications.
Acknowledgments
This work was funded by the UK Engineering and Physical Sciences Research Council through the
Electronic Sonotweezers programme. The authors thank Sonotweezers partners at the Universities of
Bristol and Glasgow and industrial collaborators for their assistance in this research, Weidlinger
Associates Inc for a PZFlex research license, and Mike MacDonald, University of Dundee, for helpful
comments on the manuscript.
Author Contributions
YQ contributed to the design, modelling, fabrication, characterization and experimental evaluation
of the reported devices, and took leadership of manuscript preparation; HW and RP developed
electronic control units and HW contributed to the experimental evaluation of 1-D and 2-D array
devices; CD contributed to the design of 1-D array and 2-D array devices; DH contributed to the
design, modelling and biological experiments of planar and curved US resonators, and he and KW
contributed to experimental analysis; PG and MH contributed to the design and experimental
evaluation of the 1-D array device; AS and SG developed screen-printed PZT structures, and SG
contributed to fabrication and characterization of 2-D array devices; AB was involved in experimental
evaluation of 2-D array devices; SG and AB were responsible for the fabrication of the thick-film
devices and were involved in their testing. SC coordinated the research and took leadership in
manuscript review. MH, DH, HW, KW, PG, AS and SG reviewed and modified the manuscript.
Conflicts of Interest
The authors declare no conflict of interest.
Sensors 2014, 14 14833
References
1. Mitchison, J.; Swann, M. The mechanical properties of the cell surface I. The cell elastimeter.
J. Exp. Biol. 1954, 31, 443–460.
2. Ramachandran, T.; Baur, C.; Bugacov, A.; Madhukar, A.; Koel, B.E.; Requicha, A.; Gazen, C.
Direct and controlled manipulation of nanometer-sized particles using the non-contact atomic
force microscope. Nanotechnology 1998, 9, 237–245.
3. Menciassi, A.; Scalari, G.; Eisinberg, A. An instrumented probe for mechanical characterization
of soft tissues. Biomed. Microdevices 2001, 3, 149–156.
4. Pamme, N. Magnetism and microfluidics. Lab Chip 2006, 6, 24–38.
5. Reichle, C.; Müller, T.; Schnelle, T.; Fuhr, G. Electro-rotation in octopole micro cages. J. Phys. D.
Appl. Phys. 1999, 32, 2128–2135.
6. Ashkin, A.; Dziedzic, J.M.; Bjorkholm, J.E.; Chu, S. Observation of a single-beam gradient-force
optical trap for dielectric particles. Opt. Lett. 1986, 11, 288–290.
7. Coakley, W.T.; Bardsley, D.W.; Grundy, M.A.; Zamani, F.; Clarke, D.J. Cell manipulation in
ultrasonic standing wave fields. J. Chem. Technol. Biotechnol. 1989, 44, 43–62.
8. Wiklund, M.; Günther, C.; Lemor, R.; Jäger, M.; Fuhr, G.; Hertz, H.M. Ultrasonic standing wave
manipulation technology integrated into a dielectrophoretic chip. Lab Chip 2006, 6, 1537–1544.
9. Thalhammer, G.; Steiger, R.; Meinschad, M.; Hill, M.; Bernet, S.; Ritsch-Marte, M. Combined
acoustic and optical trapping. Biomed. Opt. Express 2011, 2, 2859–2870.
10. Brodie, G.; Qiu, Y.; Cochran, S.; Spalding, G.; Macdonald, M. Optically transparent piezoelectric
transducer for ultrasonic particle manipulation. IEEE Trans. Ultrason. Ferroelectr. Freq. Control
2014, 61, 389–391.
11. Safarík, I.; Safaríková, M. Use of magnetic techniques for the isolation of cells. J. Chromatogr. B.
Biomed. Sci. Appl. 1999, 722, 33–53.
12. Zborowski, M.; Malchesky, P.S.; Jan, T.-F.; Hall, G.S. Quantitative separation of bacteria in
saline solution using lanthanide Er(III) and a magnetic field. J. Gen. Microbiol. 1992, 138, 63–68.
13. Wilhelm, C.; Gazeau, F.; Roger, J.; Pons, J.; Bacri, J. Interaction of anionic superparamagnetic
nanoparticles with cells: Kinetic analyses of membrane adsorption and subsequent internalization.
Langmuir 2002, 8148–8155.
14. Chiou, C.-H.; Huang, Y.-Y.; Chiang, M.-H.; Lee, H.-H.; Lee, G.-B. New magnetic tweezers for
investigation of the mechanical properties of single DNA molecules. Nanotechnology 2006, 17,
1217–1224.
15. Gosse, C.; Croquette, V. Magnetic tweezers: Micromanipulation and force measurement at the
molecular level. Biophys. J. 2002, 82, 3314–3329.
16. Nilsson, J.; Evander, M.; Hammarström, B.; Laurell, T. Review of cell and particle trapping in
microfluidic systems. Anal. Chim. Acta 2009, 649, 141–157.
17. Neuman, K.C.; Nagy, A. Single-molecule force spectroscopy: Optical tweezers, magnetic
tweezers and atomic force microscopy. Nat. Methods 2008, 5, 491–505.
18. Pethig, R. Review article-dielectrophoresis: Status of the theory, technology, and applications.
Biomicrofluidics 2010, 4, 1–35.
Sensors 2014, 14 14834
19. Cheng, I.-F.; Froude, V.E.; Zhu, Y.; Chang, H.-C.; Chang, H.-C. A continuous high-throughput
bioparticle sorter based on 3D traveling-wave dielectrophoresis. Lab Chip 2009, 9, 3193–3201.
20. Jones, T.B.; Wang, K.L.; Yao, D.J. Frequency-dependent electromechanics of aqueous liquids:
electrowetting and dielectrophoresis. Langmuir 2004, 20, 2813–2818.
21. Sung, K.E.; Burns, M.A. Optimization of dielectrophoretic DNA stretching in microfabricated
devices. Anal. Chem. 2006, 78, 2939–2947.
22. Duschl, C.; Geggier, P.; Jager, M.; Stelzle, M.; Muller, T.; Schnelle, T.; Fuhr, G.R. Versatile
Chip-Based Tools for the Controlled Manipulation of Microparticles in Biology Using High
Frequency Electromagnetic Fields. In Lab-on-Chips for Cellomics, Micro and Nanotechnologies
for Life Science; Andersson, H., van der Berg, A., Eds.; Kluwer Academic Publishers: Dordrecht,
The Netherlands, 2004; pp. 83–122.
23. Molloy, J.E.; Padgett, M.J. Lights, action: Optical tweezers. Contemp. Phys. 2002, 43, 241–258.
24. Moffitt, J.R.; Chemla, Y.R.; Smith, S.B.; Bustamante, C. Recent advances in optical tweezers.
Annu. Rev. Biochem. 2008, 77, 205–228.
25. Neuman, K.; Block, S. Optical trapping. Rev. Sci. Instrum. 2004, 75, 2787–2809.
26. MacDonald, M.; Spalding, G.; Dholakia, K. Microfluidic sorting in an optical lattice. Nature 2003,
426, 421–424.
27. Pauzauskie, P.J.; Radenovic, A.; Trepagnier, E.; Shroff, H.; Yang, P.; Liphardt, J. Optical
trapping and integration of semiconductor nanowire assemblies in water. Nat. Mater. 2006, 5,
97–101.
28. Wang, K.; Schonbrun, E.; Steinvurzel, P.; Crozier, K.B. Trapping and rotating nanoparticles using
a plasmonic nano-tweezer with an integrated heat sink. Nat. Commun. 2011, 2, 469.
29. Sarvazyan, A.P.; Rudenko, O.V.; Nyborg, W.L. Biomedical applications of radiation force of
ultrasound: Historical roots and physical basis. Ultrasound Med. Biol. 2010, 36, 1379–1394.
30. Friend, J.; Yeo, L.Y. Microscale acoustofluidics: Microfluidics driven via acoustics and
ultrasonics. Rev. Mod. Phys. 2011, 83, 647–704.
31. Mulvana, H.; Cochran, S.; Hill, M. Ultrasound assisted particle and cell manipulation on-chip.
Adv. Drug Deliv. Rev. 2013, 65, 1–11.
32. Wu, J. Acoustical tweezers. J. Acoust. Soc. Am. 1991, 89, 2140.
33. Courtney, C.R.P.; Drinkwater, B.W.; Demore, C.E.M.; Cochran, S.; Grinenko, A.; Wilcox, P.D.
Dexterous manipulation of microparticles using Bessel-function acoustic pressure fields.
Appl. Phys. Lett. 2013, 102, 123508.
34. Glynne-Jones, P.; Demore, C.; Ye, C.; Qiu, Y.; Cochran, S.; Hill, M. Array-controlled ultrasonic
manipulation of particles in planar acoustic resonator. IEEE Trans. Ultrason. Ferroelectr. Freq.
Control 2012, 59, 1258–1266.
35. Lee, J.; Lee, C.; Kim, H.H.; Jakob, A.; Lemor, R.; Teh, S.-Y.; Lee, A.; Shung, K.K. Targeted cell
immobilization by ultrasound microbeam. Biotechnol. Bioeng. 2011, 108, 1643–1650.
36. Démoré, C.E.M.; Dahl, P.M.; Yang, Z.; Glynne-Jones, P.; Melzer, A.; Cochran, S.;
MacDonald, M.P.; Spalding, G.C. Acoustic Tractor Beam. Phys. Rev. Lett. 2014, 112, 174302.
37. Demore, C.E.M.; Yang, Z.; Volovick, A.; Cochran, S.; MacDonald, M.P.; Spalding, G.C.
Mechanical Evidence of the Orbital Angular Momentum to Energy Ratio of Vortex Beams.
Phys. Rev. Lett. 2012, 108, 194301.
Sensors 2014, 14 14835
38. Shi, J.; Mao, X.; Ahmed, D.; Colletti, A.; Huang, T.J. Focusing microparticles in a microfluidic
channel with standing surface acoustic waves (SSAW). Lab Chip 2008, 8, 221–223.
39. Shi, J.; Ahmed, D.; Mao, X.; Lin, S.-C.S.; Lawit, A.; Huang, T.J. Acoustic tweezers: Patterning
cells and microparticles using standing surface acoustic waves (SSAW). Lab Chip 2009, 9,
2890–2895.
40. Lin, S.-C.S.; Mao, X.; Huang, T.J. Surface acoustic wave (SAW) acoustophoresis: Now and
beyond. Lab Chip 2012, 2766–2770.
41. Courtney, C.R.P.; Demore, C.E.M.; Wu, H.; Grinenko, A.; Wilcox, P.D.; Cochran, S.;
Drinkwater, B.W. Independent trapping and manipulation of microparticles using dexterous
acoustic tweezers. Appl. Phys. Lett. 2014, 104, 154103.
42. Marszalek, P.; Liu, D.S.; Tsong, T.Y. Schwan equation and transmembrane potential induced by
alternating electric field. Biophys. J. 1990, 58, 1053–1058.
43. Desai, S.P.; Voldman, J. Measuring the impact of dielectrophoresis on cell physiology using
a high-content screening platform. In Proceedings of the Micro Total Analysis Systems ’08,
San Diego, CA, USA, 12–16 October 2008; pp. 1308–1310.
44. Cousins, C.M.; Holownia, P.; Hawkes, J.J.; Limaye, M.S.; Price, C.P.; Keay, P.J.; Coakley, W.T.
Plasma preparation from whole blood using ultrasound. Ultrasound Med. Biol. 2000, 26, 881–888.
45. González, I.; Fernández, L.J.; Gómez, T.E.; Berganzo, J.; Soto, J.L.; Carrato, A. A polymeric chip
for micromanipulation and particle sorting by ultrasounds based on a multilayer configuration.
Sens. Actuators B Chem. 2010, 144, 310–317.
46. Harris, N.R.; Hill, M.; Beeby, S.; Shen, Y.; White, N.M.; Hawkes, J.J.; Coakley, W.T. A silicon
microfluidic ultrasonic separator. Sens. Actuators B Chem. 2003, 95, 425–434.
47. Petersson, F.; Nilsson, A.; Holm, C.; Jonsson, H.; Laurell, T. Continuous separation of lipid
particles from erythrocytes by means of laminar flow and acoustic standing wave forces.
Lab Chip 2005, 5, 20–22.
48. Laurell, T.; Petersson, F.; Nilsson, A. Chip integrated strategies for acoustic separation and
manipulation of cells and particles. Chem. Soc. Rev. 2007, 36, 492–506.
49. Hawkes, J.J.; Barber, R.W.; Emerson, D.R.; Coakley, W.T. Continuous cell washing and mixing
driven by an ultrasound standing wave within a microfluidic channel. Lab Chip 2004, 4, 446–452.
50. Bernassau, A.L.; Gesellchen, F.; Macpherson, P.G.A.; Riehle, M.; Cumming, D.R.S. Direct
patterning of mammalian cells in an ultrasonic heptagon stencil. Biomed. Microdevices 2012, 14,
559–564.
51. Bazou, D.; Coakley, W.T.; Hayes, A.J.; Jackson, S.K. Long-term viability and proliferation of
alginate-encapsulated 3-D HepG2 aggregates formed in an ultrasound trap. Toxicol. In Vitro 2008,
22, 1321–1331.
52. Hultström, J.; Manneberg, O.; Dopf, K.; Hertz, H.M.; Brismar, H.; Wiklund, M.; Hultstrom, J.
Proliferation and viability of adherent cells manipulated by standing-wave ultrasound in a
microfluidic chip. Ultrasound Med. Biol. 2007, 33, 145–151.
53. Raiton, B.; McLaughlan, J.R.; Harput, S.; Smith, P.R.; Cowell, D.M.J.; Freear, S. The capture of
flowing microbubbles with an ultrasonic tap using acoustic radiation force. Appl. Phys. Lett. 2012,
101, 044102.
Sensors 2014, 14 14836
54. Glynne-Jones, P.; Boltryk, R.J.; Hill, M.; Zhang, F.; Dong, L.; Wilkinson, J.S.; Brown, T.;
Melvin, T.; Harris, N.R. Multi-modal particle manipulator to enhance bead-based bioassays.
Ultrasonics 2010, 50, 235–239.
55. Wiklund, M.; Radel, S.; Hawkes, J.J. Acoustofluidics 21: Ultrasound-enhanced immunoassays
and particle sensors. Lab Chip 2013, 13, 25–39.
56. Hawkes, J.J.; Long, M.J.; Coakley, W.T.; McDonnell, M.B. Ultrasonic deposition of cells on a
surface. Biosens. Bioelectron. 2004, 19, 1021–1028.
57. Martin, S.P.; Townsend, R.J.; Kuznetsova, L.A.; Borthwick, K.A.J.; Hill, M.; McDonnell, M.B.;
Coakley, W.T. Spore and micro-particle capture on an immunosensor surface in an ultrasound
standing wave system. Biosens. Bioelectron. 2005, 21, 758–767.
58. Kinoshita, M.; Hynynen, K. Key factors that affect sonoporation efficiency in in vitro settings: the
importance of standing wave in sonoporation. Biochem. Biophys. Res. Commun. 2007, 359, 860–865.
59. Khanna, S.; Hudson, B.; Pepper, C.J.; Amso, N.N.; Coakley, W.T. Fluorescein isothiocynate-dextran
uptake by chinese hamster ovary cells in a 1.5 MHz ultrasonic standing wave in the presence of
contrast agent. Ultrasound Med. Biol. 2006, 32, 289–295.
60. Glynne-Jones, P.; Boltryk, R.J.; Hill, M. Acoustofluidics 9: Modelling and applications of planar
resonant devices for acoustic particle manipulation. Lab Chip 2012, 1417–1426.
61. Hawkes, J.J.; Radel, S. Acoustofluidics 22: Multi-wavelength resonators, applications and
considerations. Lab Chip 2013, 13, 610–627.
62. King, L.V. On the Acoustic Radiation Pressure on Spheres. Proc. R. Soc. A Math. Phys. Eng. Sci.
1934, 147, 212–240.
63. Yosioka, K.; Kawasima, Y. Acoustic radiation pressure on a compressible sphere. Acustica 1955,
5, 167–173.
64. Hasegawa, T. Acoustic-Radiation Force on a Solid Elastic Sphere. J. Acoust. Soc. Am. 1969,
46, 1139.
65. Gor’kov, L. On the forces acting on a small particle in an acoustic field in an ideal fluid. Sov.
Phys.-Dokl. 1962, 6, 773–775.
66. Cochran, S. Piezoelectricity and Basic Configurations for Piezoelectric Ultrasonic Transducers.
In Ultrasonic Transducers; Nakamura, K., Ed.; Woodhead Publishing Limited: Philadelphia, PA,
USA, 2012; pp. 3–35.
67. Schmarje, N.; Kirk, K.J.; Cochran, S. 1-3 Connectivity Lithium Niobate Composites for High
Temperature Operation. Ultrasonics 2007, 47, 15–22.
68. Kotopoulis, S.; Wang, H.; Cochran, S.; Postema, M. Lithium niobate transducers for MRI-guided
ultrasonic microsurgery. IEEE Trans. Ultrason. Ferroelectr. Freq. Control 2011, 58, 1570–1576.
69. Jaffe, B.; Cook, W.R.; Jaffe, H.L. Piezoelectric Ceramics; Cook, W.R., Jaffe, H.L., Eds.;
Academic Press: Waltham, MA, USA, 1971; pp. 1–317.
70. Trolier-McKinstry, S.; Muralt, P. Thin Film Piezoelectrics for MEMS. J. Electroceramics 2004,
12, 7–17.
71. Qiu, Z.; Sadiq, M.; Demore, C.; Parker, M.; Marin, P.; Mayne, K.; Cochran, S. Characterization
of piezocrystals for practical configurations with temperature- and pressure-dependent electrical
impedance spectroscopy. IEEE Trans. Ultrason. Ferroelectr. Freq. Control 2011, 58, 1793–803.
Sensors 2014, 14 14837
72. Zhang, S.; Li, F. High performance ferroelectric relaxor-PbTiO3 single crystals: Status and
perspective. J. Appl. Phys. 2012, 111, 031301.
73. Cochran, S.; Abrar, A.; Kirk, K.J.; Button, T.W.; Meggs, C.; Porch, N. Net-shape ceramic
processing as a route to ultrafine scale 1-3 connectivity piezoelectric ceramic-polymer composite
transducers. IEEE Ultrason. Symp. 2004, 2004, 1682–1685.
74. Smith, W.A.; Auld, B.A. Modeling 1-3 composite piezoelectrics: Thickness-mode oscillations.
IEEE Trans. Ultrason. Ferroelectr. Freq. Control 1991, 38, 40–47.
75. Hammarström, B.; Evander, M.; Barbeau, H.; Bruzelius, M.; Larsson, J.; Laurell, T.; Nilsson, J.
Non-contact acoustic cell trapping in disposable glass capillaries. Lab Chip 2010, 10, 2251–2257.
76. Qiu, Y.; Demore, C.; Sharma, S. Multi-wavelength Ultrasonic Standing Wave Device for
Non-Invasive Cell Manipulation and Characterisation. In Proceedings of the 2011 IEEE
International Ultrasonics Symposium, Orlando, FL, USA, 18–21 October 2011; pp. 188–191.
77. Collins, D.J.; Alan, T.; Neild, A. Particle separation using virtual deterministic lateral
displacement (vDLD). Lab Chip 2014, 14, 1595–1603.
78. Shilton, R.J.; Travagliati, M.; Beltram, F.; Cecchini, M. Nanoliter-Droplet Acoustic Streaming via
Ultra High Frequency Surface Acoustic Waves. Adv. Mater. 2014, 26, 1–6.
79. Manneberg, O.; Vanherberghen, B.; Onfelt, B.; Wiklund, M. Flow-free transport of cells in
microchannels by frequency-modulated ultrasound. Lab Chip 2009, 9, 833–837.
80. Glynne-Jones, P.; Boltryk, R.J.; Harris, N.R.; Cranny, A.W.J.; Hill, M. Mode-switching: A new
technique for electronically varying the agglomeration position in an acoustic particle manipulator.
Ultrasonics 2010, 50, 68–75.
81. Haake, A.; Neild, A.; Radziwill, G.; Dual, J. Positioning, displacement, and localization of cells
using ultrasonic forces. Biotechnol. Bioeng. 2005, 92, 8–14.
82. Townsend, R.J.; Hill, M.; Harris, N.R.; White, N.M. Investigation of two-dimensional acoustic
resonant modes in a particle separator. Ultrasonics 2006, 4, e467– e471.
83. Lilliehorn, T.; Simu, U.; Nilsson, M.; Almqvist, M.; Stepinski, T.; Laurell, T.; Nilsson, J.;
Johansson, S. Trapping of microparticles in the near field of an ultrasonic transducer. Ultrasonics
2005, 43, 293–303.
84. Rogers, P.; Gralinski, I.; Galtry, C.; Neild, A. Selective particle and cell clustering at air–liquid
interfaces within ultrasonic microfluidic systems. Microfluid. Nanofluidics 2012, 14, 469–477.
85. Wu, D.-W.; Zhou, Q.; Geng, X.; Liu, C.-G.; Djuth, F.; Shung, K.K. Very high frequency (beyond
100 MHz) PZT kerfless linear arrays. IEEE Trans. Ultrason. Ferroelectr. Freq. Control 2009, 56,
2304–2310.
86. Zhu, B.; Chan, N.Y.; Dai, J.; Shung, K.K.; Takeuchi, S.; Zhou, Q. New fabrication of
high-frequency (100-MHz) ultrasound PZT film kerfless linear array. IEEE Trans. Ultrason.
Ferroelectr. Freq. Control 2013, 60, 854–857.
87. Zhou, Q.; Lau, S.; Wu, D.; Shung, K.K. Piezoelectric films for high frequency ultrasonic
transducers in biomedical applications. Prog. Mater. Sci. 2011, 56, 139–174.
88. Gebhardt, S.; Ernst, D.; Bramlage, B.; Flössel, M.; Schönecker, A. Integrated Piezoelectrics for
Smart Microsystems - A Teamwork of Substrate and Piezo. Adv. Sci. Technol. 2012, 77, 1–10.
89. Euphrasie, S.; Daviero-Minaud, S.; Pernod, P. Lead zirconate titanate (PZT) films deposited by a
hydrothermal method. Solid State Sci. 2003, 5, 1499–1504.
Sensors 2014, 14 14838
90. Akedo, J.; Park, J.; Tsuda, H. Fine patterning of ceramic thick layer on aerosol deposition by
lift-off process using photoresist. J. Electroceramics 2007, 22, 319–326.
91. Qiu, Y.; Wang, H.; Bolhovitins, A.; Cochran, S.; Gebhardt, S.; Schönecker, A. Thick Film PZT
Transducer Arrays for Particle Manipulation. In Proceedings of the 2013 Joint UFFC, EFTF and
PFM Symposium, Prague, Czech Republic, 21–25 July 2013; pp. 1911–1914.
92. Abrar, A.; Cochran, S. Mathematical optimization of multilayer piezoelectric devices with
nonuniform layers by simulated annealing. IEEE Trans. Ultrason. Ferroelectr. Freq. Control
2007, 54, 1920–1929.
93. Hughes, D.A.; Weijer, C.J.; Qiu, Y.; Demore, C.; Cochran, S. Investigating the motility of
Dictyostelium discodeum using high frequency ultrasound as a method of manipulation.
In Proceedings of the 2012 IEEE International Ultrasonics Symposium, Dresden, Germany, 7–10
October 2012; pp. 2002–2005.
94. Wiklund, M. Acoustofluidics 12: Biocompatibility and cell viability in microfluidic acoustic
resonators. Lab Chip 2012, 12, 2018–2028.
95. Wang, H.; Qiu, Y.; Demore, C.; Cochran, S.; Glynne-Jones, P.; Hill, M. Particle manipulation in a
microfluidic channel with an electronically controlled linear piezoelectric array. In Proceedings of
the 2012 IEEE International Ultrasonics Symposium, Dresden, Germany, 7–10 October 2012;
pp. 1998–2001.
96. Lei, J.; Glynne-Jones, P.; Hill, M. Acoustic streaming in the transducer plane in ultrasonic particle
manipulation devices. Lab Chip 2013, 13, 2133–2143.
97. Ernst, D.; Bramlage, B.; Gebhardt, S.; Schonecker, A.; Pabst, O.; Schreiner, H.-J. Enhanced large
signal performance of PZT thick film actuators for active micro-optics. In Proceedings of 2013
Joint IEEE International Symposium on Applications of Ferroelectric and Workshop on
Piezoresponse Force Microscopy (ISAF/PFM), Prague, Czech Republic,21–25 July 2013; pp. 5–8.
© 2014 by the authors; licensee MDPI, Basel, Switzerland. This article is an open access article
distributed under the terms and conditions of the Creative Commons Attribution license
(http://creativecommons.org/licenses/by/3.0/).