ABSTRACT PENBROOKE, TERESA L. Local Parks and ...
422
ABSTRACT PENBROOKE, TERESA L. Local Parks and Recreation Agencies Use of Systems Thinking to Address Preventive Public Health Factors. (Under the direction of Dr. Michael B. Edwards). Many leaders believe that local communities should play a role in preventive health. Within the United States (U.S.), some form of governmental agency typically manages local public facilities, spaces, lands, and recreation programs. These departments are usually identified as parks and recreation (P&R) or some similar variation. Public health (PH) evidence has increasingly pointed to local P&R agencies as a critical setting for promoting health. Addressing desired PH outcomes is a growing focus for P&R agencies, but many have limited resources or strategies on which to base their actions. However, the research base is also growing. The global research question has shifted from asking IF P&R agencies can positively affect PH factors, to HOW they can best do so with limited resources. This dissertation research featured a mixed-methods approach including a thematic literature review, exploration through a three-stage Delphi panel study with 17 P&R agency Key Informants, and a case study of two larger P&R agencies to deepen findings and identify strategies for local P&R agencies. This study was iterative, with each stage informed through review with all Informants. To help with potential limitations of the research methods and/or possible constraints due to personal experience and affiliations, a focus was maintained on transparency, continued search for the evidence-base, and asking, “what is missing?” The study first explored preventive health factors modified by P&R. The research investigated the theoretical basis of systems theory and potential systems thinking approach applications for local P&R agencies. Systems theory has been used previously in business and PH applications to describe concepts of how various components, actors, factors, and
-
Upload
khangminh22 -
Category
Documents
-
view
1 -
download
0
Transcript of ABSTRACT PENBROOKE, TERESA L. Local Parks and ...
ABSTRACT
PENBROOKE, TERESA L. Local Parks and Recreation Agencies Use of Systems Thinking to Address Preventive Public Health Factors. (Under the direction of Dr. Michael B. Edwards).
Many leaders believe that local communities should play a role in preventive health.
Within the United States (U.S.), some form of governmental agency typically manages local
public facilities, spaces, lands, and recreation programs. These departments are usually
identified as parks and recreation (P&R) or some similar variation. Public health (PH)
evidence has increasingly pointed to local P&R agencies as a critical setting for promoting
health. Addressing desired PH outcomes is a growing focus for P&R agencies, but many
have limited resources or strategies on which to base their actions. However, the research
base is also growing. The global research question has shifted from asking IF P&R agencies
can positively affect PH factors, to HOW they can best do so with limited resources.
This dissertation research featured a mixed-methods approach including a thematic
literature review, exploration through a three-stage Delphi panel study with 17 P&R agency
Key Informants, and a case study of two larger P&R agencies to deepen findings and identify
strategies for local P&R agencies. This study was iterative, with each stage informed through
review with all Informants. To help with potential limitations of the research methods and/or
possible constraints due to personal experience and affiliations, a focus was maintained on
transparency, continued search for the evidence-base, and asking, “what is missing?”
The study first explored preventive health factors modified by P&R. The research
investigated the theoretical basis of systems theory and potential systems thinking approach
applications for local P&R agencies. Systems theory has been used previously in business
and PH applications to describe concepts of how various components, actors, factors, and
processes within a given system work together, and to help identify barriers, gaps, and
opportunities for improved effectiveness.
Results indicate that the primary modifiable PH factors for P&R include increased
physical activity, improved nutrition, enhanced safety or perception of safety, increased
social and parental engagement, improved transportation and access to locations (especially
nature), and cessation or reduced overconsumption of tobacco and alcohol. However,
community-specific data on many of these various health factors are not yet readily available
to public agencies. The continuing challenge at the local P&R management level is knowing
the priority of the factors for a specific agency and/or partners to address.
This study furthered the theoretical knowledge base for both research and practice
through summary of the primary factors, interactions, initiatives, and potential strategies for
P&R agencies to address to facilitate change. The research examined how agencies may use
a systems thinking approach to prioritize. Results indicate that it is critical within the system
to focus on leadership to create a strong organizational culture of PH from P&R; a cultural
ethic of inclusion and equity; allocation of staff and financial resources; equitable access to
assets and programs; collaboration; utilization of crime prevention and design strategies;
increased health promotions; and centralized tracking of feasible measures. Conclusions
include an adapted framework for a community systems thinking approach related to
addressing the factors. There is also a need for better dissemination of research, evidence-
based tools, and established methods. A conceptual framework is suggested to further
address the gaps in knowledge transferal between P&R research and practice realms.

Local Parks and Recreation Agencies Use of Systems Thinking to Address Preventive Public Health Factors
byTeresa L. Penbrooke
A dissertation submitted to the Graduate Faculty of North Carolina State University
in partial fulfillment of the requirements for the degree of
Doctor of Philosophy
Parks, Recreation, and Tourism Management
Raleigh, North Carolina
2017
APPROVED BY:
_______________________________ _______________________________ Michael B. Edwards Jason N. Bocarro Committee Chair
_______________________________ _______________________________ Karla A. Henderson J. Aaron Hipp

© Copyright 2017 Teresa L. Penbrooke
All Rights Reserved

ii
DEDICATION
This dissertation is dedicated to the memory of my mother, Nancy L. Stolzenburg,
who forever instilled in me my love for acquiring knowledge, patience for exploring the
blessing and the curse of my unending curiosity, and the unshakeable belief that women can
do anything we set our minds to.

iii
BIOGRAPHY
Teresa Penbrooke was born in Lincoln, Nebraska, USA, in 1963, and moved with her
parents and younger sister to Denver, Colorado in 1966. Her parents amicably divorced in
1970, and she was raised through her school years by her mother in Westminster, CO.
Growing up, life was full of camping trips, lake outings, neighborhood walks, and swimming
in the local pools. A recreation center and library were built a block away when she was ten,
giving her safe havens to spend ample out of school time exploring both her love of water
and of books full of knowledge. Her mother, Nancy Stolzenburg, a self-made serial
entrepreneur, worked double shifts in a variety of businesses to support her daughters.
When she was 13, she was brought into her Mom’s deli restaurant to help out, and
learned to prep, cook, and cashier, and how to treat customers well. By 16, after school and
weekend time was spent running two of Mom’s restaurants, handling the inventories and
ordering, keeping the books, and hiring and training staff when Mom was busy. Her first
paying jobs outside of Mom’s businesses were as a clerk in a music store, and then as a
lifeguard at Waterworld for Hyland Hills Parks and Recreation District, CO, the first summer
it opened in 1979. At the time, it was the largest local government-run waterpark in the U.S.
After high school, Teresa moved far away (11 miles NW) over the hill to the strange land of
Boulder, CO, to start as a psychology major at the University of Colorado. In the first year
and a half, Teresa became aware that clinical psychology was not the way to go for her as a
career, and the call of the outdoors, friends, water, and playing USVBA doubles volleyball
tournaments led her away from school. For nine years in her twenties, she enjoyed life as a
“Boulder hippie chick”, and fell in love with the lifestyle of running large group kayaking
and rafting river trips. To earn income, she worked various restaurant management jobs,
iv
trained as a chiropractic and wellness center assistant, and led logistics and outdoor
recreation programs for the City of Boulder Adventure Program.
In 1990, she decided that the professional field of public parks and recreation (P&R)
was a calling, as helping people be active, fit, and happy seemed to be the way to go. She
applied back to the University of Colorado in the Parks and Recreation Program which was
then housed through the Business School. After acceptance and as she enrolled for Spring of
1991, the program was cut by the University. As she was already living near campus and
married, and had shifted life to go back to school full-time, Teresa enrolled in Kinesiology to
enhance her fitness, wellness, nutrition, and athletic training knowledge.
The last year of her undergraduate studies, she was offered a study abroad program in
Guadalajara to deepen her Spanish skills. Just before going to Mexico for five months, she
found she was pregnant, so that Spring she enjoyed the doting of Senoras and concentration
on language classes before her son, Caylon, was born in July 1992. That Fall, Caylon mostly
slept while she finished coursework and wrote her Honor’s Thesis, The effects of
ephedrine/caffeine compounds on the resting metabolic rate of two groups of women with
distinct body fat distribution patterns. This thesis garnered magna cum laude honors during
graduation in December 1993, and a Rocky Mountain Region 1993 Graduate Research
Award for Medicine and Science in Sports and Exercise from the American College of
Sports Medicine.
After graduation, Teresa’s first full-time position in public P&R was for the City of
Broomfield, CO (back in middle America, 9 miles east of Boulder) in 1993 as a recreation
programmer and leader for Seniors, Fitness & Wellness, Special Events, Facilities, and Trips.
As she began to better understand the local government systems, she yearned for more

v
education and responsibilities. Her marriage deteriorated as her professional drive
heightened, and following a divorce in 1995, she was a single mother with sole custody of
her son. She took a higher paying recreation coordinator position with North Jeffco P&R
District (now Apex District) in Arvada, CO. She learned that to move to a director-level
position for these public agencies, she would benefit from a Masters Degree, so enrolled at
the University of Phoenix, Denver, nighttime Masters Program while working and raising her
son. She completed many “hands-on” marketing, management, and research projects focused
on P&R agencies, gradually adding similar responsibilities at North Jeffco, and then
graduated with a Master of Arts in Organization Management (MAOM) in December 1998.
After achieving her MAOM, Teresa continued working on planning projects within
that agency and began applying for director positions at other agencies. She was on the
planning team conducting pricing and staffing studies to build the Apex Community Center,
still the largest public center west of the Mississippi at 160,000 SF, and enjoyed working
with the architects. After coming in “#2” from a series of interviews for director positions,
frustrations led to more soul searching and she realized that she really was a “planning,
organizational management, and research geek” at heart. Within a week, fate brought her a
part-time consulting project to conduct a study for the City of Boulder P&R Department, and
within a few months, she was making more consulting on the side than she was with North
Jeffco.
In 1999, she took the leap and started a sole-proprietor consulting firm called Flow
Consulting. Within a couple of years, she brought on a partner, changed the firm name to an
S-Corp LLC called GreenPlay, LLC, found an office, and hired staff to keep up with the
demand. Since that time, GreenPlay has conducted studies and consulting projects for over

vi
450 agencies in the U.S. and a few internationally. Teresa remains as CEO, with 18 staff
working on approximately 35 community projects each month around the country. Over the
years, Teresa expanded her work as a requested educator and speaker on various recreation
and management topics, and contributed to research and testing on several practitioner-based
management innovations in the field, such as component-based method (CBM) geo-spatial
system inventories and enhanced level of service analyses, the Pyramid Methodology for
determining appropriate cost recovery, and the Public Sector Services Assessment for
identifying community-specific key core agency services.
In 2008, both her business partner and GreenPlay’s accountant noted that over half of
Teresa’s time was being spent on non-profit research and teaching activities. Teresa realized
that she would not want to stop this type of work. With a group of like-minded other
consultants and practitioners, GreenPlay sponsored the formation of a national 501(c)(3) not-
for-profit organization called GP RED (www.gpred.org), for trans-disciplinary Research,
Education, and Development (RED) for health, land, and recreation management agencies,
and the associations, academics, and consultants that serve them. Teresa became the
Secretary of the governing Operating Board, and part-time faculty and researcher. In 2010,
Teresa began working on contract through GreenPlay with Dr. David M. Compton, Chair of
the P&R and Physical Education Department at Indiana University, and other faculty to
create the Healthy Communities Surveillance and Management Toolkit, geared to help public
parks and recreation better address increasing physical activity and reducing obesity. When
Dr. Compton retired from IU in 2012, this work moved under the GP RED research
umbrella, with Teresa becoming Director of GP RED’s Healthy Communities Research
vii
Group, and Dr. Compton came on as a part-time member of the GP RED National Advisory
Board, faculty, and research associate.
While presenting multiple sessions at the World Leisure Organization’s Biennial
Congress in Rimini, Italy in 2012, Teresa met with Dr. Karla Henderson, then Professor in
the Department of Parks, Recreation, and Tourism Management at North Carolina State
University, to discuss her work. Dr. Henderson invited Teresa to come present at a brown
bag seminar for the Health and Wellbeing Research Circle for the Department. While
visiting, Teresa was offered a funded PhD program and a Research Assistantship. Part of the
goals for Teresa with this program was to be able to increase her academic knowledge and
credibility, to work further on this healthy communities work, and to help update the parks
and recreation planning and management curriculum from a practitioner standpoint.
Teresa had remarried in 2010 to Kurt Cashman and her son Caylon had finished his
own Bachelors of Science in Geology, Philosophy, and Business, and GreenPlay has
continued to grow with great guidance from her business partner and staff. With these
evolutions came some freedom and support that allowed Teresa to begin her PhD program at
NC State in January 2014. The following dissertation is the current culmination of her studies
and contributions in this realm. She hopes you find this work as meaningful as she does, and
that her passion shines through the research and intended rigor in her continued personal goal
to help communities thrive.

viii
ACKNOWLEDGMENTS
As an older “non-traditional” student, this part of the path of my life would certainly
not be possible without strong support from many loved ones, friends, and mentors. There
are literally hundreds of contributors who have helped me get to this point with this “silly
PhD thing”, so I hope I am not leaving out anyone important (you would know who you are!)
as I thank some of the many key contributors.
First of all, thank you to my husband, Kurt Cashman, for putting up with my need to
disrupt our Colorado home and our life for me to move away do this. Your daily phone calls
of support and ongoing strong “base” means more to me than you will ever know. I just hope
my crazy love for NC infects you too, and as we keep the fires burning in CO, we can
someday slow down a bit and really enjoy some more beautiful time to just BE together. I am
also thankful that you’ve helped keep our family, Caylon, Jordan, and Connor, strong,
connected, happy, healthy, and productive during my time away, and our extended CO and
NE family network connected. I love you, and this one is really for the CashPen team!
Next, I must thank Chris Dropinski, my long-time GreenPlay business partner (or my
“business wife”, as we have still been together for my longest partnered relationship!). I
know you’ve had to shoulder a lot of the load for our firm while I was off gallivanting with
this academic, research, and teaching stuff, but as always, even though you and I sometimes
have different methods to get there, I know our goals and our passions for helping
communities thrive are the same. I hope to bring even more help to you now as we continue
forward. I could not be here without you, and all of our great, smart, passionate, and
supportive members of the GreenPlay and GP RED teams.

ix
For my day to day friends and loved ones, Robby, Linda, Ozlem, Nancy, Raj, and all
my other beach-loving, music-playing, hiking, teaching, seeking, and fellow grad school
geeks, you have supported me during light and dark hours, sometimes almost frantic stress,
health issues, and provided much needed breaks for music, outdoor adventures, good food,
venting, dog love, and all sorts of laughter. I treasure you deeply.
Now, for my professional and academic mentors who have paved the way… Thank
you to Dr. Karla Henderson for bringing me into this program, and for being there
throughout this crazy ride. Dr. Mike Edwards, you are the best Advisor I could have worked
with. I have been continually amazed how intelligent, knowledgeable, and insightful you are.
You have consistently guided me in all aspects, in such a talented and sometimes subtle way
that I often never knew I was “being guided” along the way until later. I have loved getting to
know you, your lovely wife Melissa, and the girls. My success is yours too!
Drs. David Compton, Jason Bocarro (see, spelled it right!), Myron Floyd, Aaron
Hipp, Nancy Wells, Carla Barbieri, Erin Seekamp, Yu-Fai Leung, and Vanessa Urch
Druskat, along with Chris Cares, Robin Moore, and Leon Younger, thank you for mentorship
and helping me know that our field is full of brilliant people trying to do the next right thing.
I would also like to acknowledge the many agency professionals who volunteered
many hours to assist with this work, especially John Henderson and Christine Lafontant, the
lead case study Key Informants, along with the Delphi Key Informants and stakeholders. In
addition, thank you to Zaarnaz Bashir, former manager of Health and Wellness Division
from the National Recreation and Park Association, for helping to identify Key Informants.
I could truly not be here without all of you, and so many other friends, family, and
colleagues. Now, let’s just go do some more good work and have some fun!
x
TABLE OF CONTENTS
LIST OF TABLES ............................................................................................................... xiv
LIST OF FIGURES ...............................................................................................................xv
LIST OF ABBREVIATIONS AND TERMS ................................................................... xvii
CHAPTER 1 – INTRODUCTION .........................................................................................1Background ................................................................................................................1
The Role of Parks and Recreation .........................................................................1Gaps in Current Research ......................................................................................4
Systems Theory as the Theoretical Basis ..................................................................5Purpose .......................................................................................................................7
Primary Research Question ....................................................................................8Secondary Research Questions ..............................................................................8
Significance ...............................................................................................................9Chapter Summary ....................................................................................................10
CHAPTER 2 – LITERATURE REVIEW ...........................................................................11Literature Review Methodology and Potential Process Sources .............................11
Search Terms .......................................................................................................12Selection Criteria .................................................................................................13Content Analysis ..................................................................................................13
Gaps in the Research - Identifying Relevant Modifiable Health Factors for P&R .16Identified Preventive Health Factors Addressed by P&R ....................................17Physical Activity ..................................................................................................18
Activities, programs, and screen time ..............................................................21Nutrition and Food Availability ...........................................................................23
Obesity .............................................................................................................24Body Mass Index (BMI) ..................................................................................27
Transportation and Access ...................................................................................28Safety and Perceptions of Safety .........................................................................31Social Components and Parental Engagement.....................................................32Access to Nature and Health ................................................................................33Tobacco Cessation ...............................................................................................37Reduction of Excessive Alcohol Consumption ...................................................39
Gaps in the Existing Theoretical Basis – Systems Theory for P&R .......................41Systems Theory Approach and Systems Thinking ..............................................41Social Ecological Model (SEM) and Theory .......................................................45Exploring further the Role of Local Parks and Recreation Agency Systems ......47Limitations of Community Systems Approaches ................................................50Conceptual Framework - Knowledge to Action Flow .........................................53
The Knowledge to Action (K2A) Framework .................................................54

xi
Potential Strategies - Relevant Organizational Elements and Campaigns ..............56Organizational Culture & Seeking of National Recognitions ..............................56Addressing Social Equity in Communities ..........................................................59Preventive Public Health Systems Planning ........................................................62
Health impact assessments (HIAs) ..................................................................63Logic models ....................................................................................................67
P&R Systems Planning ........................................................................................69P&R needs assessments ...................................................................................73
Organizational Partnerships .................................................................................74National Initiatives Related to the Health Factors ...............................................79
Park prescriptions and/or prescriptions for play ..............................................80The Role of Allocating Resources and Return on Investment .............................80
Potential Community-Specific Strategies and Data Collection Tools .....................81Measuring Physical Activity and Other Factors ..................................................81
Observational tools and methods for assessing PA .........................................83Site audit tools for PA ...................................................................................84Direct site observation ...................................................................................84Wearable physical activity sensors with GPS ...............................................85Webcams and crowdsourcing ........................................................................86Doubly labeled water .....................................................................................86Limitations of using Observational Tools .....................................................86
Spatial Analysis Tools for Assessment of Spaces and Programs ........................87ParkIndex. ......................................................................................................88Park Metrics (formerly called PRORAGIS) ..................................................88Component-Based Methodology (CBM) Level of Service Analysis ............90GRASP®Active.............................................................................................90
Suggested Methods for Linking Health to Park and Trail Planning ....................92Self-Reported Data Tools ....................................................................................93
Multi-Attribute Utilities Technique (MAUT). ..............................................94Photovoice .....................................................................................................95
Methods and Strategies for a Potential Focus on Youth ..........................................96Environmental Perception and Attitude Surveys .............................................98
Other youth community-specific surveys and constraints ...........................102Summary of the Literature Review ........................................................................102
Summary of Key Theoretical Findings ..............................................................103Summary of Key Modifiable Factors ................................................................104Summary of Key Strategies to Address the Factors ..........................................105
CHAPTER 3 - METHODOLOGY.....................................................................................107Overall Research Approach ...................................................................................107Delphi Study ..........................................................................................................108
Procedures for Delphi Panel ..............................................................................109Basecamp Study Management Site ....................................................................111Delphi Panel Round #1 ......................................................................................112Delphi Panel Round #2 ......................................................................................113Delphi Panel Round #3 ......................................................................................114

xii
Case Study .............................................................................................................115Data Gathering from the Case Study .................................................................116Case Study Analysis ..........................................................................................119
Final Analysis and Compilation ............................................................................122Circular Iterative Analysis .................................................................................122Key Themes Analysis Matrix ............................................................................124
Trustworthiness and Credibility .............................................................................125
CHAPTER 4 - ANALYSIS AND RESULTS.....................................................................129Delphi Panel Results and Analysis ........................................................................129
Key Informants ..................................................................................................130Agency Demographics, Geographic Distribution, and National Recognitions .131Agency Summary Descriptions and Resources Provided ..................................133Summary of Informant Resources Provided ......................................................133
Results from Delphi Group Discussion #1 ............................................................137Results from Questionnaire #1 ..............................................................................139
Key Informant Roles and Background ..............................................................139Ranked Priority of Health Factors .....................................................................141Perceived Effectiveness of Strategies to Address Health Factors ......................142Outcomes Assessment .......................................................................................144Staff Time and Resources Allocated ..................................................................145
Results from Delphi Focus Group #2 ....................................................................146Results from Questionnaire #2 ..............................................................................147
Ranking of Participation with National Initiatives ............................................149Ranked Strategies to Address Specific Factors..................................................150
Results from Delphi Group #3 ...............................................................................151Case Study Results and Analysis ...........................................................................154
Case Study Demographics .................................................................................155Population and population density .................................................................156Race / ethnicity. .............................................................................................157Familial and income indicators ......................................................................157Health behavior indicators .............................................................................157
Summary of Prince George’s County, MD Specific Case Findings ..................158PGC Organizational Strategies to address the Factors ..................................162
Summary of San Diego County, CA Primary Case Findings ............................164SDC Organizational Strategies to address the Factors ..................................166
Comparative Analysis of Case Study Agencies and Theoretical Basis .............170Key Themes Analysis Matrix ............................................................................173
CHAPTER 5 – DISCUSSION AND CONCLUSIONS ....................................................176The Potentially Modifiable Health Factors ............................................................178
Theoretical Basis – Systems Theory and Systems Thinking .............................184The role of organizational culture ..................................................................186The role of national initiatives in addressing health factors. .........................187
Strategies and Methods Effectively in Use by P&R agencies ...........................189System-wide planning tools and methods for P&R .......................................190
xiii
Site-specific analysis and observational tools ................................................191Policy and practice guidelines creation ..........................................................191Emerging methods. ........................................................................................192
Funding and Resources ......................................................................................193Addressing the Gaps using a Knowledge to Action Framework Application ...194
Limitations of this Research ..................................................................................199Going forward – Implications for Future Research and Practice ..........................202
Gathering Local Community Data to Prioritize .................................................204Specific Implications for Research ....................................................................205Specific Implications for Applications to Practice ............................................206
Application of PH practices to P&R ..............................................................207Creating a toolkit approach to address the health factors. .............................211Creation of a national repository of P&R agency examples ..........................212
REFERENCES .....................................................................................................................213
APPENDICES ......................................................................................................................262
xiv
LIST OF TABLES
Table 1. Relevant Identified National Initiatives .....................................................................80
Table 2. Identified Prescriptions for Parks Programs .............................................................80
Table 3. Key Informants .........................................................................................................130
Table 4. Key Informant Agencies, Populations, and National Recognition Status ...............131
Table 5. Resource Documents Provided by Informants.........................................................134
Table 6. Types of Resource Documents Provided by Agencies .............................................136
Table 7. Top 20 Word Frequencies for Agency Strengths .....................................................138
Table 8. Role of Informant at Agency ....................................................................................140
Table 9. Relative Priority of Health Factors by Key Informants ...........................................141
Table 10. Percent Rating of Informant Perceived Effectiveness of Methods ........................143
Table 11. Number of Full-time Staff Equivalents (FTEs) Assigned.......................................145
Table 12. Key Informant Thoughts on Review of Questionnaire #1 Summary ......................148
Table 13. National initiatives - Agencies Currently Active ...................................................149
Table 14. Case Study Populations Comparison ....................................................................156
Table 15. Case Study Percentage of Age Groupings .............................................................156
Table 16. Race / Ethnicity of Case Study Agencies Compared to State and U.S. ..................157
Table 17. Case Study Familial and Income Indicators..........................................................157
Table 18. Comparison of Health Indicators from Community Commons .............................158
Table 19. Delphi Panel Factor Rating - Descriptive Statistics .............................................178
Table 20. Similarities and Differences between HIAs and P&R Planning ............................208

xv
LIST OF FIGURES
Figure 1. Process for the thematic literature review ................................................................13
Figure 2. Ecologic model - Built environment to PA, diet, and body weight .........................25
Figure 3. Example of a systems thinking model for P&R for community health ...................45
Figure 4. Social ecological model as applied to health ...........................................................47
Figure 5. SEM showing local community services. ................................................................48
Figure 6. P&R role in improving health ..................................................................................50
Figure 7. Adapted Knowledge to Action (K2A) Framework from CDC and NAA ...............55
Figure 8. Basic logic model format (adapted by author) .........................................................68
Figure 9. Community needs assessment and engagement tools ..............................................74
Figure 10. YANS variables ...................................................................................................101
Figure 11. Systematic assessment thematic categories .........................................................106
Figure 12. Delphi and case study process and timeline .........................................................111
Figure 13. Screen capture of www.Basecamp.com resource portal, 12/24/16 ......................112
Figure 14. Circular and iterative dissertation analysis model ...............................................123
Figure 15: Map of Key Informant agencies ..........................................................................133
Figure 16. Key Informants time in field of P&R ...................................................................141
Figure 17. Do Key Informant agencies measure outcomes? .................................................144
Figure 18. Percent of Key Informant time spent on health factors .......................................145
Figure 19. Overall priority ranking of effectiveness of strategies .........................................151
Figure 20. Prince George’s County regional context ............................................................159
Figure 21. Rating of methods to address health factors – Prince George’s County ..............163
Figure 22. Regional context of San Diego County, CA ........................................................165

xvi
Figure 23. Rating of methods to address health factors – San Diego County .......................166
Figure 24. San Diego County LiveWell health indicators ....................................................168
Figure 25. Key Themes Analysis Matrix of data resources and onclusions. ........................175
Figure 26. System model for P&R agencies in preventive community PH ..........................185
Figure 27. System interaction of academic and P&R practice realms ..................................194
Figure 28. Knowledge to Action (K2A) Framework applied to P&R ..................................196

xvii
LIST OF ABBREVIATIONS AND TERMS
CBM LOS – Component-based method (CBM) for inventory and level of service analysis.
Looks at parks systems as components using digital geo-spatial analysis with GIS
rather than just standard park classifications or capacity-based (x/per 1,000) analysis.
CDC – Centers for Disease Control and Prevention, a Federal Agency.
CPTED – Crime Prevention through Environmental Design - Internationally accepted and
recommended practices for design and planning to enhance facilities and spaces for
increased safety and perception of safety. See http://www.cpted.net/.
Factors – Used in this research as an “umbrella term” for variables in PH research with
various actions. May include determinants, correlates, causal variables, mediators,
moderators, and confounders.
GIS – Geo-spatial information systems. Typically includes software that analyzes and creates
maps for geographic locations and other spatial elements.
GP RED – National 501(c)(3) not-for profit organization co-founded by this dissertation
researcher and others. Mission is to provide Research, Education, and Development
for health, recreation, and land management agencies. Primary goal is to help fill the
educational and translational research gaps for professionals in academics and
practice, and the associations that serve them. See www.gpred.org.
HEPA – Healthy Eating and Physical Activity. HEPA guidelines have been created by the
National Afterschool Association (NAA, 2015) and have been adopted by the NRPA
as recommended guidelines for P&R agencies.
IRB – Institutional Review Board - a type of committee used in research in the United States
that has been formally designated to approve, monitor, and review behavioral and

xviii
biomedical research involving humans. IRB fosters compliance with federal
regulations and an organization’s institutional policy. All protocols for this research
have been approved by the NC State IRB.
Key Informants – In this study, P&R practice “topic experts” were identified from P&R
agencies across the country. 17 of these practice topic experts became the Key
Informants as representatives of their agencies in this study.
LTPA – Leisure time physical activity.
NRPA – National Recreation and Park Association – the only U.S. national organization with
membership, education, and resources for P&R professionals. See www.nrpa.org.
Most states in the U.S. also have their own state association.
PA – Physical activity.
P&R – Parks and recreation agencies, and the field and profession that serves them and their
communities.
PH – Public health agencies, and the field and profession that serves them and their
communities.
OST – Out of school time.
ROI – Return on Investment. This typically includes quantifying the financial return of an
investment or subsidy.
SRTP – Safe Route to Play (GP RED) or Parks (NRPA).
SRTS – Safe Routes to School.
SEM – Social Ecological Model
SES – Socio-economic status
WHO – World Health Organization

1
CHAPTER 1 – INTRODUCTION
“Science is an organized form of wonder. Every scientific study comes out of a
wondering. You see something in the field, and ask, ‘What’s going on? Why is that
happening?’ Then you figure out how to answer that question, very rarely with 100
percent certainty, but with the minimum amount of uncertainty that you can get”.
– Eva Saulitis (Byl, 2017, p. 8)
Background
Standardized effective strategies for improving community health have long been
elusive as a major public health issue (Huang, Drewnowski, Kumanyika, & Glass, 2009). On
a national and global level, the U.S. Centers for Disease Control and Prevention (CDC, 2016)
and the World Health Organization (WHO, 2011) are just a few of the organizations that
have said that communities and partners within those communities should address preventive
health factors. However, those agencies fall short on specific recommendations for how a
community overall should do so.
The Role of Parks and Recreation
In most communities in the U.S., the public places where leisure activities occur
include lands and assets such as natural areas, parks, playgrounds, greenways, trails, sports
fields, bodies of water, and recreation facilities. These assets and related programs and
services are usually managed at a local level in a geographically defined town, township,
city, special district, or county, within a local governmental unit or department. The
department is typically called parks and recreation (P&R), or something similar, and they
address the management of community parks and recreation services through agency actions
2
(Edwards, Jilcott, Floyd, & Moore, 2011; Godbey, Caldwell, Floyd, & Payne, 2005;
Moiseichik, 2010, Vick, 2007). The unit of analysis for this study is the local parks and
recreation agency (including county, city, town, and district levels). County-level analysis
often includes an overlay function with municipalities, or may be appropriate as a stand-
alone jurisdiction for smaller or rural counties that have fewer smaller units within them
(Edwards, Jilcott, Floyd, & Moore, 2011; Shores & West, 2010; Singh, Siahpush, & Kogan,
2010).
Approaches to affect change in community systems need to concentrate on
mechanisms for strengthening the abilities of individuals within systems, including their
social networks, organizations, resources, gaps, and policies within the community to
collectively address common problems (Casey, Eime, Payne, & Harvey, 2009; McLeroy,
Kegler, Steckler, Burdine, & Wisotsky, 1994). Public health (PH) evidence has increasingly
pointed to these P&R agencies as being one of the critical settings for potentially promoting
health in communities. Addressing desired PH outcomes and addressing health equity issues
among diverse populations has become a growing focus for many P&R agencies (Active
Living Research, 2016; Cerin & Leslie, 2008; Cohen, McKenzie, Sehgal, & Lurie, 2007;
Ding, Sallis, Kerr, Lee, & Rosenberg, 2011; Edwards, Jilcott, Floyd, & Moore, 2011; Epstein
et al., 2012; Merriam, Bality, Stein, & Boehner, 2017; Schultz et al., 2015; Sallis & Spoon,
2015). There is also a need to address the community availability of schools for public use,
and encouragement of out of school time (OST) or leisure-time activities (Bocarro, Kanters,
Casper, & Forrester, 2008; Edwards, Jilcott, Floyd, & Moore, 2011; NIOST, 2015; Tebes et
al., 2007; Thaw et al., 2014).

3
Research has repeatedly shown that amenities and programs offered by P&R can help
increase health promoting activities, such as increasing physical activity (PA) (Gardsjord,
Tveit & Nordh, 2014; Godbey & Mowen, 2010; Kaczynski & Henderson, 2007; Kanters,
Bocarro, Filardo, Edwards, McKenzie, & Floyd, 2014; Layton, 2016a; Schultz et al., 2016;
Shores & West, 2010). The role of P&R agencies is not typically clearly identified in PH or
other community systems literature, but responsibilities are often shown as a subset of public
safety or related to schools. Actions by local policymakers to increase P&R parks and
facilities location, access, and attractiveness, especially to underserved populations may be
effective ways to promote health promoting activity (Babey, Wolstein, Krumholz, Robertson,
& Diamant, 2013). Addressing these issues is a growing focus for P&R agencies, but many
do not have access to an available applicable evidence base, tools, or methodologies to
effectively do so (Burns, 2016; Compton, Kim., & Damask, 2013; Godbey & Mowen, 2010).
They need not only the evidence base for what to address and why (which is now available
from the research realm), but understanding of HOW to do so within their specific type of
organizational and community system.
Over the past several years, there has been an increase of evidence connecting public
parks, programs, and trails to active living behaviors (e.g., Floyd et al., 2011; Sallis, Floyd,
Rodriquez, & Saelens, 2011; Veitch, Ball, Crawford, Abbott, & Salmon, 2012; Wolf &
Wohlfart, 2014). As concern has grown over the rise of health epidemics related to sedentary
lifestyles, the opportunities have pointed towards promoting P&R as cost-effective places
and services for encouraging healthier community behaviors. A recent national study
indicated that in the U.S., local public P&R agencies serve more than 70% of community
members, and over 80% agree that P&R provide benefits (Mowen, Graefe, Barrett, &

4
Godbey, 2015). P&R agencies facilitate health promoting activities on a local community
level primarily though two distinctive characteristics - low-cost access and widespread
availability (Bedimo-Rung, Mowen, & Cohen, 2005; Chiesura, 2004; Kaczynski, Potwarka,
& Saelens, 2008; Mowen, Kaczynski, & Cohen, 2008).
Gaps in Current Research
PH research has been somewhat disparate in terms of the level of intervention, the
role of P&R in PH, and the role of specific strategies or site-specific park characteristics
(Babey, Wolstein, Krumholz, Robertson, & Diamant, 2013; Sallis et al., 2014). Current
approaches (including lack of strategic systematic approaches) and resource limitations limit
the effectiveness of P&R agencies to effectively determine priorities, resulting in reactive
rather than proactive actions (Burns, 2016; Compton et al., 2011). There is a need to
synthesize the research and focus on specific leverage points that create gaps for P&R. The
issue may go beyond methodological limitations for measurement, and may lead to a need to
evaluate applications in community practice. Given the large number of potential programs
and interventions to choose from, and the constant limits on available financial resources,
local P&R administrators are challenged to identify the most appropriate interventions for
their specific community (Burns, 2016; Compton et al., 2011; Godbey & Mowen, 2010).
Another continuing challenge at the local community level is knowing which
preventive PH factors are of the highest priority for a specific local P&R agency to address.
This study seeks to identify and explore the key potential factors that P&R agencies may be
intentionally addressing and/or affecting in their communities. For purposes of this
dissertation, all types of preventive PH variables (e.g., determinants, correlates, causal
variables, mediators, moderators, and confounders) including their various potential actions,

5
will be included using the umbrella term of factors, as this study is not concerned with
validating the action of the variables themselves, but focused on thematic analysis of how
strategies can be used by local P&R agencies to prioritize and address them.
The federal government, academicians, and non-profit organizations (e.g., Centers for
Disease Control [CDC], 2016; Designed to Move, 2012; Let’s Move, 2016; NRPA, 2016a)
regularly promote many national level programs and campaigns. Most national programs and
campaigns for health interventions focus on programs and strategies for individual or
interpersonal change. Although P&R agencies often offer programs that address these levels
of change, by the nature of their governmental structure and funding mechanisms, they are
often focused on community/societal-level interventions and evaluation. (CDC, 2014b;
Godbey & Mowen, 2010; Let’s Move, 2014).
Gaps also exist related to organizational impacts and strategies. There are a variety of
national, local governmental, and foundation-sponsored initiatives working to identify factors
and components within varieties of levels of the SEM (e.g., Active Living Research, 2016;
CDC-SEM, 2016; Healthy People 2020; Khan et al., 2009). Researchers have been looking
for indicators and assessment tools that move beyond the assessment of individual health or
factors, such as PA occurring at a single site or its components, to a larger community level
assessment of how to improve these factors in a community as a whole (Compton & Kim,
2013; Edwards. 2009; Ross, Young, Sturts, & Franzidis, 2013, Sallis et al., 2015; Young,
Ross, Kim, & Sturts, 2013).
Systems Theory as the Theoretical Basis
Addressing PH factors at a local community level is complex. The global PH field,
which has been reasonably dominated by linear models of planning, is witnessing increased

6
interest in using non-linear processes, based on systems theory and the resultant systems
thinking to address interventions (Sarriot & Kouletio, 2015; Stroh, 2015). Seminal works
were based on Von Bertalanffy’s systems theory work (1968). The various fields of
environmental sociology, social ecology, public health, planning, business, and related
disciplines have been integrating systems thinking based on systems theory related to
studying ecology and human well-being (Arai & Pedlar, 1997; De Savigny & Adam, 2009;
Lieschow et al., 2008; Stroh, 2015). This theory appears to be applicable to this topic area for
P&R. Although the terms are often used interchangeably in the literature, for this
dissertation, the term systems theory is used to explore the conceptual and theoretical basis
for how a specific community system works relative to P&R addressing identified preventive
health factors. Systems thinking is used to discuss the process that allows for stakeholders
within a given system to have a shared agenda, or basis for application of the theory at work
within that system.
Varying other related theories from P&R research and PH realms were explored in
the literature. For example, Bauman, Sallis, Dzewaltowski, & Owen (2002) examined a
variety of variables associated with various theories and frameworks (e.g., the health belief
model, the trans-theoretical model, the theory of planned behavior, and social cognitive
theory) for consistent evidence of association with physical activity (PA). Golden & Earp
(2012) contributed a strong focus on the social ecological model (SEM) to describe the
interactive characteristics of individuals and environments that underlie health outcomes to
guide PH practice within a community system.
Attention to systems thinking appears to be evolving in the P&R realm. Floyd et al.
(2011) discussed elements of the SEM and related theory to describe how individual, park,
7
and neighborhood environmental variables and characteristics may influence children’s park-
based activities. Godbey & Mowen (2010) discussed various related theoretical elements
(although not directly calling them out as theory-based) common to SEM related to provision
of individual, familial, community, and societal benefits and investments in P&R. They
invoked systems theory, social exchange theory, and the theory of change elements for
discussing concepts related to behavioral programs and assets, transactional partnerships, and
community systems planning. These are just a few of the examples of the vast application of
theoretical bases conceptualized to try and address PH factors in local communities.
The local community system (and the P&R agency system that serves it) operates
with many organizational elements and partners. Many relationships and interactions occur at
all levels. A systems thinking approach and integration with SEM applications can help
inform the analysis of these systems at various levels of the SEM within a community.
System approaches help to empower the individuals, families, and communities to develop
and implement appropriate local strategies in order to alleviate health problems (Arai &
Pedlar, 1997; De Savigny & Adam, 2009; Golden & Earp, 2012). Design of community
environmental assets, strategic creation of programs, as well as the creation of goals and
strategies related to determining access to resources, such as safe PA facilities, may facilitate
the improvement of outcomes related to health (Henderson & Ainsworth, 2003; Kuo, 2013;
Sallis et al., 2015).
Purpose
The primary purpose of this dissertation is to attempt to better understand HOW local
P&R agencies (the unit of analysis) can and are addressing key health factors as preventive
PH providers, through systematic approaches to prioritize addressing health outcomes with
8
limited resources. A goal for this dissertation research is to advance the knowledge base
around this specific topic area, and to advance theory around that topic that can be
generalizable within the field. As such, extensive research will be conducted to identify and
confirm the appropriate theoretical basis that is applicable to this topic, along with
identifying the existing gaps and areas for advancement.
This study will identify the key modifiable health factors, along with perceived
effective and strategic methods local P&R agencies are using to prioritize and address
factors. After the initial literature review, the research will explore and expand upon the
theoretical basis through elements of systems theory and the resultant system thinking
impacts on local P&R agencies (the unit of analysis). Addressing all levels of a community
system may require more complex and adaptations of concepts and methods directly for P&R
management strategies and evaluaton practices. The following research questions will guide
this study:
Primary Research Question
Using systems theory and resultant systems thinking, a comprehensive thematic
literature review, a Delphi panel study of key informants, case study methodologies, and
cumulative analysis using a Key Issues Analysis Matrix, this dissertation seeks to answer the
following primary research question:
Q. How do parks and recreation (P&R) agencies address prioritizing modifiable key health
factors?
Secondary Research Questions
SRQ1: What have relevant research literature and data identified as the key modifiable
factors for preventive PH through local P&R systems?

9
SRQ2: Using Delphi study methodology, what do P&R professionals see as the key
strategies in systematic prioritization of modifiable health factors?
SRQ3: Using case study methodology, how are two agencies addressing prioritizing
modifiable key health factors in their communities?
Significance
This work is significant in that it seeks to identify what we can learn by systematic
methods, and how might this improve our understanding for effective P&R administration
and management. Prior literature suggests that P&R agencies provide preventive PH benefits
(e.g., Active Living Research, 2016; Cerin & Leslie, 2008; Cohen, McKenzie, Sehgal, &
Lurie, 2007; Ding, Sallis, Kerr, Lee, & Rosenberg, 2011; Godbey & Mowen, 2010; Edwards,
Jilcott, Floyd, & Moore, 2011; Epstein et al., 2012; Floyd et al., 2011; Sallis & Spoon, 2015).
However, there is little research related to the efficacy of systematic methods for P&R
agencies to prioritize their interventions and offerings given limited resources (Burns, 2016;
Compton et al., 2011; Crompton, 1999; Godbey & Mowen, 2010).
The primary audience for this research is intended to be both academic researchers
and professional practitioners. This research seeks to identify, analyze, confirm, and then
disseminate knowledge related to the theoretical basis, potential methods and strategies,
implications for future research, and potential applications to practice to help communities
address preventive health through P&R agencies. All research will include attention to both
research and practice limitations and implications. An overarching goal for significance is to
identify the factors that are evidence-based from a trans-disciplinary approach, and potential
methodologies for identifying community specific interventions based on those factors, along

10
with how they can be implemented or managed by P&R agencies as preventive public health
providers within the community.
In addition, a secondary system, related to but separate from the local community
system, may prove to be relevant. This research will explore system interplay between the
academic/research realms and the P&R practitioner realms. The Delphi and case study will
be used to explore that although there may be adequate and innovative research conducted
and available from the academic research realm, there may also be a strong gap in how this
knowledge base is reaching the practitioner realm. The system of interest is the process for
how the information flows, is translated, and informs implementation – the transfer of
knowledge. There is likely a gap between the evolving and emerging needs of the
practitioners and the focus and funding for research in the research realm.
Chapter Summary
This study has been designed to establish a systems theory approach to help
researchers and practitioners better understand key factors related to preventive PH that may
be effectively addressed, modified, and/or managed by local P&R agencies. The research
will look to identify management practices, current national movements and potential
interventions, and strategies that are successfully being used by local P&R agencies to
achieve desired outcomes. The following chapters more fully explore the theoretical basis,
literature, methods and strategies used to gather data, a discussion of the results, and
conclusions, with strong consideration for future research implications and application to
practice.

11
CHAPTER 2 – LITERATURE REVIEW
Literature Review Methodology and Potential Process Sources
SRQ1 asked: What have relevant research literature and data identified as the key
modifiable factors for preventive public health through local P&R systems? To answer this
question, a comprehensive exploratory and integrative review of articles and publications
from various PH, P&R, and planning disciplines was conducted to survey themes related to
the primary factors for preventive PH, which may be modifiable by P&R. An electronic
search was made to identify relevant articles published up until February 2017.
Literature was identified by use of the search terms as shown in the following section
to search select databases and online libraries: CAB Abstracts, CAB Archive, PubMed,
ProQuest Health Management, & Sport Discus, along with waterfall-style continued
exploration of articles from the gray literature recommended by respected colleagues, from
relevant conference attendances, and from related websites and social media (e.g., ALR,
CDC, Google Scholar searches, ResearchGate, Facebook, and Twitter announcements from
relevant organizations working in this realm). Searches were limited to identifying
publications since 1980 (as typically it is more difficult to find digital collections prior to this
date), except for additional articles recommended by experts in the field, and/or seminal
works cited for theoretical basis. Quality of materials was explored for sources through an
examination of methods cited, authors and author affiliations, subsequent citations in
academic journals, and impact documentations. As this review was a thematic exploration of
factors, along with strategies being used to address factors by public P&R agencies,
published gray literature (i.e., non-academic sources such as association briefs, websites, and
webinars) were included for methods and process that may not have yet had full academic

12
and peer reviewed validation. Many of these were identified by the Delphi panel as being
used by practitioners with effective applications (e.g., component-based inventories, some
youth survey instruments, and program based management matrices). It may be important to
note that the line between peer-reviewed and gray literature is rapidly lessening, as some
strong scientifically focused organizations (e.g., the American Public Health Association, the
Aspen Institute, Active Living Research, CDC, and WHO) are often now self-publishing
online rather than relying solely on inclusion in peer-reviewed journals. This makes it
difficult at times to distinguish between the two.
Focus was not on evaluating the validity, credibility, or reliability of the individual
studies or articles themselves, but instead on identification of common emerging themes
relative to theories used as a basis, the potentially modifiable PH factors from P&R, and
strategies used to address the factors by P&R.
Search Terms
There was an initial search of literature relative to various theoretical bases and
potentially modifiable health factors. Because this was an iterative process, as new themes
emerged and were identified as important to the work from the Delphi panel, additional
searches were conducted to deepen and inform the research. Throughout the process, the
following search terms were included at various times and in various combinations:
Activity, After School, Determinants, Engagement, Factors, Health, Health Impact
Assessments, Indicators, Knowledge-to-Action Framework, Leisure Management,
Logic Models, Matrices, Metrics, Nature, Nature Dosage (Dosing), Nutrition,
Obesity, Out of School Time (OST), Parks, Physical, Planning, Recreation, Rural,

13
Safety, Public, Social Ecological Model (SEM), Sports, Systems Theory, Systems
Thinking, Tobacco, Trails, Transportation, Urban, and Youth Activities.
Selection Criteria
The literature review narrowed focus on an attempt to reach saturation on the
evidence related to key theories, key factors, and key methodologies or strategies used by
researchers or P&R agencies to address the factors. Excluded from the review were articles
not in English, and studies focused only on in-school or private sector activities (unless the
focus was on a methodology). Over 1,100 potentially relevant sources were reviewed. In the
end, 357 reference sources were included. Figure 1 depicts the review process.
Figure 1. Process for the thematic literature review
Content Analysis
This thematic literature review included both integrative and interpretive methods. In
the literature on methods for research synthesis, a distinction was made between integrative
and interpretive reviews. Integrative reviews may be more suitable for quantitative studies

14
where findings are aggregated or pooled using techniques such as statistical meta-analysis.
Interpretive reviews may be more suitable for qualitative studies, where the aim for synthesis
is to achieve a higher-order interpretation through understanding how individual studies
included in the synthesis connect and interact (Oliver, Harden, & Rees, 2005). Many reviews
show both integrative and interpretive characteristics whether they are dealing with
qualitative studies, quantitative studies or both.
For this review, I used primarily an interpretive approach when synthesizing thematic
content from qualitative studies, and an integrative approach to synthesizing from
quantitative studies. The strength of an integrative review is that the methodology helps draw
conclusions about the current state of knowledge amongst diverse studies (Bocarro,
Greenwood, & Henderson, 2008; Torraco, 2005). Thematic integrative and interpretive
reviews may not employ summary or quantitative statistics, as sample sizes cannot be pooled
due to the heterogeneity of studies and samples (Crawford & Johnson, 2011). Combined
integrative/interpretive thematic reviews are capable of presenting varied perspectives and a
depth and breadth of evidence without over-emphasizing studies within empirically based
research hierarchies (Oliver, Harden, & Rees, 2005). A critique of these types of studies from
the perspective of health reveals that despite exhaustive searching, the available studies
typically only provide evidence about the views of particular categories. The evidence is
therefore always partial and evolving (Baxter, Killoran, Kelly, & Goyder, 2010; Oliver et al.,
2005).
This review attempted to serve as a cross section of scholarly activity to identify key
relevant themes. A key goal of this research was to help provide insight into ways future
research may augment the field’s knowledge base (Hodge, Bocarro, Henderson, Zabriskie,
15
Parcel, & Kanters, 2015). For this review, articles were identified that include relevant data
on an intervention or strategies related to the search words and criteria. A summary of key
words and thematic summary textual paragraphs were compiled documenting the outcomes,
goals, and intervention strategies. The information was organized and presented based on
how key factors and/or strategies to address those factors have been conceptualized.
An overview of the key theoretical basis, factors, systematic process strategies, and
observational tools from the literature was provided as an initial basis for the remaining parts
of the study. The literature review included a summary of relevant themes, key factors,
identified strategies and methods, and was organized based on how key factors and/or
methods have been conceptualized. The factors were purposefully not listed in any
prioritized order, as the findings indicated that they may have different priority order in
different communities. It is important to note that this research focused on how agencies can
use a systematic approach to prioritize the factors for their own specific community. This
review was focused on identifying key common themes, tools, and methods related to the
factors that can be potentially modified by P&R agencies, but not concerned with verifying
specific validity or results of the studies themselves. This review is comprehensive but not
exhaustive, with a goal of reaching saturation in theme identification, not systematic or
quantitative analysis.
Using the Delphi study and case study methods (including questionnaires, focus
groups, and interviews) described in the following chapters, potential systematic process
methods for community-specific prioritization were reviewed and discussed through an
iterative exploration for applicability, relevance, feasibility, and priority for implementation
for use in a local P&R setting. The following sections introduce and outline the key health

16
factors relevant theories and identified from the literature that may be modifiable by P&R
agencies, with an initial focus on middle school youth. In addition, background was provided
not only on the factors themselves, but also on various tools, methods, and processes that are
being used to identify outcomes from the factors (with a focus on identifying those factors
that evidence indicates may be modifiable by P&R). As they vary in content, application, and
priority in any given community, they are also presented in no particular order.
Gaps in the Research - Identifying Relevant Modifiable Health Factors for P&R
A primary goal of this study was to identify from the literature and through the
Delphi panel, which preventive PH factors may be most modifiable by P&R agencies. The
following sections include a thematic overview of that ongoing research and the factors and
potential strategies to address them through P&R, as identified to date.
A key guiding summary included a review by Richter et al. (2000) of 16 studies and a
case study that yielded a wide variety of environmental, individual, community, and
partnership-related contributing factors for youth PA and nutrition. These were each related
to four variables; a) practices of retailers, b) policies and practices in the home, c) availability
and use of recreation opportunities, and d) community-wide health interventions (including
school practices). After a review of additional literature, Compton, Kim, and Damask (2010)
found that the preliminary contributing factors for improving health primarily through
increasing physical activity and reducing obesity in youth appear to primarily include five
factors; nutritional habits and availability, participation in active programs, social and
parental engagement, transportation and access to sites, and perceptions of safety. The
additional research for this dissertation worked to confirm those findings through the
prioritization and questionnaires from the Delphi panel, and also to add a newer emphasis on

17
the potential health cognitive, physical, and psychological benefits of access to nature, along
with other elements such as public policies around tobacco cessation and alcohol
overconsumption.
All of these studies indicate that the interaction of factors is complex and varies
among communities. Each included suggestions that additional research needs to be
conducted to help identify how local public P&R systems can and should best approach these
factors to focus their resources to improve health in their community. However, a gap exists
in identifying and addressing which of these factors can actually be managed or modified by
P&R agencies, as some factors (such as immunizations or contraception) are beyond their
purview (Burns, 2016; Compton, Kim, & Damask, 2010).
Identified Preventive Health Factors Addressed by P&R
Although the PH realm is concerned with all forms of health and disease (e.g.;
immunizations, pre-natal care, infectious diseases, outbreaks of insect-borne disease, etc.),
this study focused on identifying and summarizing the preventive PH factors that can
specifically be modified by P&R agencies. These factors included variations of indicators,
determinants, correlates, causal variables, modifiers, indicators, and/or confounders
(Bauman, Sallis, Dzewaltowski, & Owen, 2002; Sallis & Hovell, 1990; SCIMPH, 2013,
Tremblay et al., 2011; United Nations [UN] 2030 Agenda, 2016). The purpose of this study
was not to further validate the specific action of P&R agencies, or on the factors themselves
beyond those identified in the literature, but to identify how processes and strategies are
being used to determine prioritization methods and outcomes related to the factors by P&R
agencies. This study was also not designed to address communicable or other diseases such
18
as environmentally-caused illness, sexually-transmitted diseases, or other allopathic health
needs that are often addressed in the PH and medical realms.
The primary factors that were identified as modifiable by P&R from the literature
and from the results of this study appear to be (purposefully in no particular order): ability to
do physical activity (PA), availability of good nutrition, access to programs and facilities
(including transportation and/or cost), safety and/or perception of safety, social engagement
(parental and/or peer), tobacco cessation and excessive alcohol consumption, and benefits
(physical and mental) that come from access to nature. All of these, along with processes to
address them for potential positive outcomes, are explored more fully in the following
sections, from both the literature and analysis of practice applications through the Delphi
panel and case study.
Physical Activity
The majority of the current research related to potentially modifying health through
P&R is around measuring physical activity (PA) and/or obesity. PA is a key factor (along
with nutrition discussed later) as a determinant of whether someone is of normal weight or
obese, along with effects on overall health (CDC, 2016; Kumanyika et al., 2008; Popkin,
2008; Sallis et al., 2015). Often research related to P&R activities and/or out of school (OST)
time refers to leisure time PA (LTPA) to indicate time relationship and differentiate it from
in-school PA.
Two federal sources outline objectives and strategies for increasing PA at a local
level. One is the Healthy People 2020 (2016), through the U.S. Office of Disease Prevention
and Health Promotion, and the other is the Centers for Disease Control reports and webpages
(CDC, 2014b) based heavily on work by Khan et al. (2009). The CDC uses data from the

19
National Survey of Children’s Health (NSCH), a national and state-representative, random-
digit–dialed, cross-sectional telephone survey of approximately 45,000 households that have
adolescents, ages 10 – 17. In the 2011-2012 NCSH, overall, 65% of U.S. adolescents were
found to live in neighborhoods supportive of physical activity, defined as neighborhoods that
are perceived as safe and have sidewalks or walking paths and parks, playgrounds, or
recreation centers (Watson, Harris, Carlson, Dorn, & Fulton, 2016). In this nationwide study
the primary outcome measure, a neighborhood supportive of physical activity, was a
composite measure derived from individual features related to perceived neighborhood
safety; availability of sidewalks or walking paths; and the availability of parks, playgrounds,
or recreation centers (National Physical Activity Plan Alliance [NPAPA], 2016; Watson et
al., 2016). These general measures are related to ten identified indicators they have related to
physical activity in children and youth: (1) overall physical activity; (2) sedentary behaviors;
(3) active transportation; (4) organized sport participation; (5) active play; (6) health-related
fitness; (7) family and peers; (8) school; (9) community and the built environment; and (10)
government strategies and investments (NPAPA, 2016). Another strong source of current
research related to PA is provided by Active Living Research, funded by the Robert Wood
Johnson Foundation (Active Living Research, 2016).
Many national level programs and campaigns are set forth each day from the federal
government, academicians, and non-profit organizations to address contributing factors for
increasing PA and the resultant benefits of doing so (e.g., CDC, 2015; Designed to Move,
2012; Let’s Move, 2016; Sallis et al., 2016). However, community-specific youth data on
measurements such as levels of obesity and participation in PA are not readily available to
practitioners (Brenner et al., 2013; CDC, 2014b). Agencies often have limited information

20
from which to inform the implementation of programs and development of appropriate
resources to address health issues in their communities. All of these national-level research
organizations look at local systems for potential interventions, and they recommend many
programs, site enhancements, and individual methods for increasing PA.
Public parks facilitate PA on a community level primarily through two distinctive
characteristics - low-cost access and widespread availability (Bedimo-Rung et al., 2005;
Chiesura, 2004; Kaczynski, Potwarka, & Saelens, 2008; Mowen, Kaczynski, & Cohen,
2008). Empirical evidence has demonstrated that people who reside in communities with
safe, active transit to parks and recreation facilities are more likely to be physically active
than their counterparts. Although these findings are encouraging, most neighborhoods are not
appropriately connected to parks via pedestrian paths. This presents difficulty for people to
easily access parks without motorized transportation, such as youth and older adults. People
are more likely to walk to parks if their communities are better connected to parks by active
transit routes (NRPA, 2014).
To increase the participation in PA, especially sustained PA, interventions require a
fair understanding and consideration of the influences of these behaviors. A systematic
review found benefits effecting overweight/obesity, blood pressure, bone strength, aerobic
fitness, strength and endurance, depression, anxiety, and several measures of self-concept
among children and youth engaging in PA (Janssen & LeBlanc, 2010). A 2007 study which
synthesized results of 28 random control trials of potential PA interventions with youth
showed that a decisive role for the compulsory provision of aerobic PA has been
demonstrated as effective (Connelly, Duaso, & Butler, 2007). That study also suggested that
additional research was still needed to identify how such activity can be sustained and

21
transformed into a personally chosen behavior by those youth over their life course and
during LTPA. A limitation of this study was that out of 28 studies they could identify on this
subject, only four included ages above ten. PA during adolescence is one of the best
predictors of adult physical activity, and evidence has shown that promoting and establishing
lifestyles that incorporate physical activity among children is often more effective and easier
than promoting physical activity among adults (Kushi et al., 2006).
Activities, programs, and screen time. Changes in culture and technology have
affected patterns and trends in energy imbalance, leading to lower levels of PA overall
through shifts in stages of eating, drinking and activity (Popkin, 2008; Ng & Popkin, 2012).
These shifts have been occurring since Paleolithic times, but they appear to have increased in
varying degrees in different regions of the world in the past century (Ng & Popkin, 2012).
Researchers have promoted offering organized youth programs offered during
adolescents’ out-of-school time (OST) as an ideal setting for increasing youth PA and
healthy eating (Edwards, Kanters, & Bocarro, 2014; Zarrett & Bell, 2014). When youth are
home alone, they typically spend excessive time in sedentary activities (watching television
or on computers) and have extended opportunities for snacking (Frank, Andresen, & Schmid,
2004; Fredricks & Eccles, 2006; Zarrett & Bell, 2014). Research indicates that individual
entertainment, passive screen time, and social media are increasing, and increased screen
time is typically related to increased body mass (Grøntved & Hu, 2011; Larson, Green, &
Cordell, 2010; Stamatakis et al., 2015; Tremblay et al., 2011; Wethington, Pan, & Sherry,
2013). Some studies have suggested that the type of sedentary behavior, such as screen time,
might be more important than overall sedentary time in relation to youth health (Larson,
Green, & Cordell, 2011; Stamatakis, et al., 2015). It has proven difficult to isolate the
22
independent effects of PA and screen-based sedentary behavior on negative health outcomes
due to differences in study samples, and methodologies between studies. To address screen
time, there has to be attractive and accessible options available, along with education
regarding the dangers of prolonged sedentary screen time (Larson, et al., 2011; Stamatakis et
al., 2015; Wethington, Pan, & Sherry, 2013).
P&R professionals have worked to validate the important contributions of access to
public green space to healthy lifestyles, (Kellert, 2005). Analysis of a national study, the
National Kids Survey, conducted by the USDA Forest Service using a random phone survey
of 1,450 U.S. households with children from 2007-2009, found gender differences for
reasons that youth do not spend more time outdoors (Cordell, Betz, Green, & Dunleavy,
2010; Larson, Green, & Cordell, 2011). Interest in music, art, reading, and similar activities
was the reason given by highest percentage of girls (64 percent) for not spending more time
outdoors. For boys, it was video games and watching DVDs and television (54 percent). In
addition, not having neighborhood access to outdoor areas, not having a friend to go with,
and not having transportation were reasons given more frequently by girls for not spending
more time outdoors, whereas not feeling safe was more often given as a reason by boys.
Sports, which are typically perceived to be inherently (but not always) active, and
other organized afterschool programs (e.g., P&R programs, community clubs, and faith-
based organizations) which often feature physical recreation as one part of the curriculum,
represent a relatively healthy environment compared to alternative OST arrangements (e.g.,
being home alone). The effectiveness of these activities depends upon a variety of
community-specific programmatic and contextual factors (Edwards, Kanters, & Bocarro,
2014; Jones, Edwards, Bocarro, Bunds, & Smith, 2017). Some studies have suggested that
23
organized sports fail to meet suggested guidelines for physical activity (Leek et al., 2010).
However, there are conflicting studies. Specifically, where some research has shown youth
engage in more moderate-to-vigorous physical activity on participation days than non-sports
days (Wickel & Eisenmann, 2007), other research has shown youth spend 43% of sports
practice inactive and fewer than one-fourth of youth obtain the recommended 60 min. of
moderate-to-vigorous activity during practice (Bocarro, Kanters, Edwards, Casper, &
McKenzie, 2014; Katzmarzyk, Walker, & Malina, 2001; Zarrett & Kelly, 2014). Despite
these limitations, sports are frequently regarded as a potentially effective mechanism to
promote positive youth development, increase PA, and as a way to increase health (Bocarro,
Kanters, Edwards, Casper, & McKenzie, 2014; Leek et al., 2010). The research is clear that
P&R has a strong role in providing activities, programs, and spaces that can increase PA.
Nutrition and Food Availability
Although it has not typically been seen as a primary focus of P&R agencies, nutrition
is a key factor for health, especially resultant effects on obesity and body mass (DeMattia &
Denny, 2008; Ferder, Ferder, & Inserra, 2010; Papas et al., 2007). Nutrition is often
considered personal choice, however there are a number of local level community system
factors that can be addressed to address nutrition. Availability of foods, minerals, vitamins,
and water can be addressed through zoning and public services, and awareness and culture
can be impacted by meal planning education, economic interventions, and food safety
preparation methods (DeMattia & Denney, 2008; Glanz & Sallis, 2006). Disparities in access
to healthy foods have been identified, particularly in the United States (Morland & Evenson,
2009).
24
The role of P&R agencies in community nutrition availability and education has not
been clearly defined. Some options may include educational after-school classes and camps,
food policy for all P&R programs and vending, and providing spaces to increase availability
of fresh foods, such as community gardens and farmers’ markets. Many cities such as
Chicago, Seattle, New York, and several of the Delphi panel agencies in this study have
adopted citywide healthy vending policies. Although there are some indications of success,
the evidence highlighting the effectiveness of such policies in altering the food and beverage
environment in community P&R settings is minimal at this point (Narain, Mata, & Flores.
2016).
Obesity. Obesity is not a primary focus for many P&R agencies, and it is also a
complex topic to address. Obesity often is an outcome used as a measurement related to
health and often viewed as a subset of the PA and nutrition equations, as it is related to
energy consumption, expenditure, and resultant energy balance (Papas et al. 2007). The
literature indicates that obesity is increasingly a topic for community attempts at systematic
intervention, and it is often seen as one of the greatest health threats currently facing the
United States. Obesity contributes significantly to a variety of serious diseases including
heart disease, diabetes, stroke, and certain cancers, as well as poor general health and
premature death (CDC, 2014b; Finkelstein, Trogdon, Cohen, & Dietz, 2009; Sallis et al.,
2014; Wetmore & Mokdad, 2012). Equity in communities also has a role in obesity, as the
prevalence of obesity is typically lower in areas that have supermarkets and higher in area
with only small grocery stores or fast food restaurants. Studies show that types of food stores
and restaurants influence food choices and, subsequently, diet-related health outcomes
(Morland & Evenson, 2009).

25
Although there are signs of potential improvements in some populations in the U.S.,
such as early childhood (Ogden et al., 2016), obesity among older youth remains a very
serious problem (CDC, 2016). Various intake habits specifically influence obesity. For
example, research findings support the importance of promoting regular breakfast
consumption among adolescents, as typically breakfast-eating frequency declines through
adolescence and has been inversely associated with body weight in cross-sectional studies,
(Bruening, Larson, Story, Neumark-Sztainer, & Hannan, 2011). In addition, research has
indicated a potential correlation drinking between sugar-sweetened beverages, eating meals
at home with family or in other settings, and other factors around consumption and youth
obesity (Cordain et al., 2005). Papas, Alberg, Ewing, Helzlsouer, Gary, and Klassen (2007)
built upon several previous studies to portray the effects of the built local environment on
body mass as shown in the following model in Figure 2.
Figure 2. Ecologic model - Built environment to PA, diet, and body weight (Adapted from Papas et al., 2007)

26
Although there may be some recent leveling off of rates of obesity in U.S., over the
past four decades, the prevalence of obesity has more than tripled for youth aged 6-11 years
and more than doubled for youth aged 12-19 years (CDC, 2014b, Ogden et al., 2016). If
youth become overweight, there is a high likelihood they will remain so as adults. Research
shows that the current generation of youth are the first that will most likely have a shorter
lifespan than their parents primarily due to the effects of being overweight or obese
(Compton & Kim, 2013; Olshansky, 2005). As stated by Compton and Kim (2013),
In 2007, about one-third of 10-to-17-year-olds were overweight…50% of obese
children and 80% of obese adolescents remain obese as adults. If kids have two obese
parents, they have an 80% chance of being obese themselves. That’s important to
understand because as more obese adults become parents, it creates a reinforcing loop
and there will be more obese children. (p.1)
When this pattern continues into adulthood, as it often does, it can lead to an
unprecedented rate of premature death and disability, diminished workplace productivity, and
staggering financial repercussions for families, insurers, health care providers and society. In
the short-term, poor nutrition and sedentary lifestyles cause serious health issues, lower self-
esteem, may lead to social and psychological problems, and contribute to poor academic
performance (Fletcher, 2010).
Current high prevalence of childhood obesity has been shown to be related to a low
level of PA and an abundance of sedentary pastimes in youth (Tremblay et al., 2011). In a
systematic literature review, Van der Horst, Paw, Twisk, and Van Mechelsen (2007) found
that for adolescents (age range 13 - 18), positive associations with physical activity were
found for gender (male), parental education, attitude, self-efficacy, goal orientation/
27
motivation, physical education/school sports, family influences, and friend support. Ethnicity
(Caucasian), socioeconomic status, and parental education were found to be inversely
associated with adolescent sedentary behaviors. As discussed in previous sections, as
community level P&R agencies can effect PA and nutrition, they can have a resultant effect
on obesity within the community overall.
Body Mass Index (BMI). To measure levels of body size relative to weight or
obesity, typically a measurement of Body Mass Index (BMI) is used. Relative to this study,
the inclusion of BMI as a relevant potential measurement tool related to the nutrition and PA
factors is appropriate. Although this type of measurement can be difficult to measure
accurately (see later sections on community measurement tools), it is a commonly accepted
quantitative tool that help agencies track and measure their progress for these factors in a
community realm.
Limitations exist related to using BMI as a measurement tool. It is not always an
accurate predictor of body fat percentage in some portions of certain ethnic groups and
especially elite athletes with high muscle to fat ratios), but it remains a common and accepted
measure of body weight status form most populations (CDC, 2014b), and continues to be the
best available mechanism available for assessing overall body mass in large study
populations. The national categories for weight classifications typically include categories
(underweight; healthy weight; overweight; and obese) as established by the CDC (2014).
BMI can be is calculated from height and weight using the using the standard BMI
percentage calculation of: weight (lb) / [height (in)]2 x 703 = BMI (CDC, 2014b). BMI is
calculated the same way for youth and adults. However, standard youth classification charts
indicate slightly different ranges for normal, overweight, and obesity for youth to

28
accommodate the variability of younger bodies. Sample BMI charts are available online from
the CDC (2014).
Transportation and Access
In many communities, addressing health factors from a systems standpoint is not an
issue of simply whether or not they have enough parks, trails, recreation centers, or programs
to help improve health. It may be an issue that people do not have the ability to get to these
types of amenities. This is especially true for those who cannot or do not drive (youth and
older adults), or those with lower incomes that cannot afford traditional transportation
options. Amenities may be too far away to walk, there may be barriers such as major roads
and highways or waterways, or there may not be adequate alternative transportation.
Addressing community transportation and access to amenities can be a key issue or barrier
when addressing preventive health factors. This can be a just physical amenities or systems
layout issue, or it can also be cultural in nature.
In the U.S. cultural shifts in many communities, such as pride in not having to walk
or not having to use public transportation (sometimes viewed as “dirty”), have led to many
feeling that “having to walk” is beneath them (Popkin, 2008). This is especially true for
lower income populations who view upward mobility as freedom to escape PA and show
others they are not in poverty. This is keenly correlated to some of the disparities of socio-
economic status (SES) discussed in later sections.
Results across the various studies have shown that participation in PA is positively
associated with publicly provided recreational infrastructure (access to recreational facilities
and schools) and transport infrastructure (presence of sidewalks and controlled intersections,
access to destinations and public transportation). At the same time, transport infrastructure

29
(number of roads to cross and traffic density/speed) and local conditions (crime, area
deprivation) are negatively associated with participation in PA (Davison and Lawson, 2006;
McGrath, Hopkins, & Hinckson, 2015). Quite often, the intended changes in community
infrastructure designed to make a community feel safer or quieter, such as the use of cul-de-
sac patterns for street layouts, have had the unintended effect of reinforcing sedentary
behaviors and creating barriers to walking and biking for residents (Lewyn, 2016). For
example, only 18% of neighborhoods in American metropolitan areas are considered
walkable using www.walkscore.com. Even in some of the most transit-oriented metropolitan
areas, many neighborhoods are not very walkable. The most walkable region in the U.S. is
considered to be New York City, where 52% of neighborhoods are walkable. However,
almost 80% of suburban neighborhoods are not (Lewyn, 2016). In rural communities, the
distance is often just too far.
Locals P&R systems can address the physical layout, walkability, cultural education,
and the policy sides of these changing patterns related to transportation, by improving access
to safe trails and sidewalks, along with working with local transportation departments to
enhance availability, timeliness, and cleanliness of public transportation, and removing
barriers to access. This may also have important benefits for pollution control and climate
change concerns as well as increasing community expended PA (Ng & Poplin, 2012; Sallis et
al., 2006). Recent focus on alternative transportation planning show slight increases in
alternative travel modes in the U.S., but this rate of change needs to occur faster than
currently projected. The rates need to continue towards the examples of European countries,
such as the Netherlands and Denmark in order to have positive impacts on health (Pucher,
Buehler, Bassett, & Danneberg, 2010).
30
How people use their time and how they use transportation are related, and these can
be contributing factors to preventive health. Much of this aspect is also cultural or related to
socio-economic status (SES). A major component of this transition has been the shift in all
domains of activity and inactivity patterns and energy expenditure. Daily expenditure of time
for various activities has been examined by researchers in the public health and
epidemiological realms by using the sleep, leisure, occupation, transportation, home-based
activities (SLOTH) model (Ng & Popkin, 2012; Pratt, Macera, Sallis, O’Donnell, & Frank,
2004), which incorporates the time and activity domains of sleep, leisure, occupation,
transportation, and home-based activities. Some key factors are the industrialization of work
and home, better availability of food and easier preparation, and availability of local public
water, leading to lower levels of simple subsistence activities, but a primary factor is that as
car ownership has increased, the distance walked per year has declined for both adults and
youth (Ng & Popkin, 2012).
All of these aspects can be systematically measured and examined using current
inventory and level of service analyses methods (Layton, 2016; Penbrooke, Compton,
Peterson, Layton, Kim, & Moyers, 2014). Improving cultural views around daily PA and
transportation options for local community residents use requires integrated policies that
include different but complementary interventions and integrated infrastructure provisions.
Policy actions, such as requiring enhanced bike/pedestrian plans, along with addressing
constraints such as perceived and real barriers to walking, can be good steps to systematically
help increase access to amenities that increase PA and enhance the other health factors in
local communities (Epstein et al., 1995; Giles-Corti et al., 2005; GP RED – SRTP, 2016;
NRPA, 2016; U.S. Department of Health & Human Services, 2015). P&R may not have the
31
primary responsibility for transportation and access, but they certainly need to be at the table
for these discussions, as transportation and access can have strong implications for the
effectiveness of P&R preventive health strategies. P&R also typically manages and maintains
off-street and loop trails, bikeways, and greenways in most communities.
Safety and Perceptions of Safety
The perception of a community or local environment as unsafe may lead to a
reduction in participation in activities over time. This effect can be through perceptions or
realities of crime or other unsanctioned behaviors, or related to traffic and transportation. For
example, one barrier to activity participation may be the safety or perception of safety around
how youth get to an activity location (Carver, Timperio, & Crawford, 2008; Friedan & Dietz,
2010).
Related to personal safety, research has shown that unsupervised OST is associated
with various negative youth outcomes. Juvenile crime rates and other non-sanctioned
behaviors occur most frequently between 3 and 6 p.m. in the afternoon, just after students are
released from school and when they have nothing to do (Kremer, Maynard, Polanin, Vaughn,
& Sarteschi, 2014; Newman, Fox, Flynn, & Christeson, 2000). Many studies suggest that
during this time period, youth are most likely to become victims of crime, engage in
destructive behaviors (graffiti, vandalism), be in or cause car accidents, and engage in risky
behaviors, such as smoking, alcohol abuse, drugs, and sexual intercourse (Jacobs, Vernon, &
Eccles, 2004; NIOST, 2015; Tebes et al., 2007).
In a study of more than 20,000 6th-8th grade students within 47 Massachusetts
middle schools, researchers found that the presence of recreation spaces may be less
influential on individual middle school youth PA compared to the safety of the spaces (Walls

32
et al.. 2012). The researchers also indicated that future studies are needed to examine safety
concerns related to PA in P&R areas. There is evidence to suggest that community-based
OST programs, such as those often offered by P&R and other providers, can provide
alternative positive activities that can help improve safety and health of youth (Godbey &
Mowen, 2010; Kremer et al., 2014; NIOST, 2015). Although actual crime rates have not
been strongly correlated with PA, fear of crime or perception of safety has been shown to be
related to lower PA and outdoor recreation (Shinew, Stodolska, Roman, & Yahner, 2013).
Recommendations to address these issues typically include creating positive
activation strategies, such as increasing programming, increasing police and adult presence in
parks and other recreation and trails areas, along with positive messaging and creation of a
safe culture. Safe spaces and asset design can be enhanced through including attention to
Crime Prevention through Environmental Design (CPTED) principles (Armitage, 2014).
Moreover, efforts must be made to reduce any gang problems. It is key to work closely with
public safety officials to establish a strong positive community environment (Newman, Fox,
Flynn, & Christeson, 2000).
Social Components and Parental Engagement
Research has indicated that the role of parents, including monitoring, negotiating of
unsupervised time, and establishment parental trust, is correlated with establishing desired
behaviors (Borawski, Ievers-Landis, Lovegreen, & Trapl, 2003). Although peer behavior
typically becomes more important with age, the role of modeling and support by parents and
guardians are still key determinants for PA behaviors by youth (Haines, 2007; Lederer, King,
Sovinski, & Kim, 2015; Puhl, 2010). In addition, it is important to monitor the amount of
bullying in recreation, parks, schools and the community. Often overweight and obese youth

33
are more likely to be the victims and perpetrators of bullying behaviors than their normal-
weight peers. Strategies to address this component can include training and program
elements to incorporate identifying and working through these types of behaviors in all
situations (Janssen, Craig, Boyce, & Pickett, 2004). Education and modeling related to
family rules can greatly impact youth health factors related to eating habits, sedentary
behaviors, and weight status (Lederer, King, Sovinski, & Kim, 2015).
Access to Nature and Health
Claims have long been made of the health-promoting effects of contact with nature,
but these claims have only recently been subjected to rigorous scientific testing. Research has
evaluated the role of the natural environment on physical health factors related to the effect
of being in nature or greenspace. A strong body of evidence is now available, and various
recommendations have been made using language and phrases such as treating “nature-
deficit disorder” (Charles & Louv, 2009; Louv, 2005), forest bathing and nature therapy (Lee
et al., 2012) and healing through “eco-therapy” (Delamont, 2016; Shanahan, 2015). As P&R
agencies manage public parks, forests, and other types of greenspaces on a local level, this
evidence related to the role they play is increasing in importance.
An array of studies ranging from rigorous experiments to large-scale epidemiological
work have tied nature to health for other outcomes ranging from childhood obesity, to
immune functioning, and rates of physician-diagnosed disease in adults, to longevity in older
adults, and strong effects on stress reduction, cognitive functioning, and mental health. For
example, Lovasi, Quinn, Neckerman, Perzanowski, and Rundle (2008) found that a higher
number of street trees were associated with a lower prevalence of early childhood asthma.
Also, a study of almost 250,000 Medicare beneficiaries in Florida found that enhancing

34
greenness or vegetative presence may be effective in promoting health in older populations,
particularly in poor neighborhoods, potentially due to increased time outdoors, physical,
activity, and/or stress mitigation (Brown et al., 2016).
A substantial body of work has examined the contributions of provisioning,
regulatory, and maintenance ecosystem services to urban health. For example, it has been
shown that urban green space can regulate air and water pollution, mitigate urban heat effects
and enhance access to nutritious fruits and vegetables (Jennings, Larson, & Jun, 2016). It has
been suggested that decreased nature experience may help to explain the link between
urbanization and mental illness. This suggestion is supported by a growing body of
correlational and experimental evidence (Charles & Louv, 2009; Lee et al., 2012). There is
also evidence that in rural settings, levels of nearby nature can moderate the impact of
stressful life events on the psychological well-being of children (Wells, 2013; Wells &
Evans, 2003).
Mental health is significantly related to access to nature and greenspace (Alcock et
al., 2014; Bratman et al., 2015; Lederbogen et al., 2011; Lee et al., 2012; Wells, 2000). More
than 50% of people in the world now live in urban areas, and by 2050, this proportion will be
70% (Lederbogen et al., 2011). Urbanization has been associated with increased levels of
mental illness, but until recently it has not been yet clear why. (Alcock, White, Wheeler,
Fleming, & Depledge, 2014; Bratman, Hamilton, Hahn, Daily, & Gross, 2015; Lederbogen et
al., 2011; Wells & Rollings, 2012). Residential distance from parks has an impact, with the
highest positive impacts on residents within short walking distance from a park, and the
number of visits and physical activity minutes are significantly and independently related to
distance (Sturm & Cohen, 2014).

35
Mental health policy has traditionally focused on individually-centered interventions.
Just as health policy for preventable chronic illnesses has shifted attention to modifiable
environmental determinants, population mental health may benefit substantially from
systematic environmental interventions (Bratman et al., 2015; Lederbogen et al., 2011; Lee et
al., 2012; Louv, 2005; Sturm & Cohen, 2014; Wells, 2000). Research has increasingly
focused on the cognitive or attentional benefits of nature experiences. As noted by Wells
(2000),
A pattern seems to emerge from the literature. The pattern suggests that a child living
in a place with more nature, with more restorative resources is likely to benefit with
respect to his or her cognitive functioning or attentional capacity. (p. 5)
A substantial body of literature regarding adults that suggests that exposure to the
natural environment, directly or through one’s window view, is psychologically, cognitively,
and/or physically beneficial (Ulrich, 1979; Ulrich, 1993; Wells, 2000; Wells & Donofrio,
2011). Moreover, evidence has accumulated to begin to answer questions about the dosage of
nature needed to promote health (Bratman, Hamilton, Hahn, & Daily, & Gross, 2015; Kuo,
2010; Kuo, 2013; Kuo & Taylor, 2004; Shanahan, Fuller, Bush, Lin, & Gaston, 2015; Wells,
2000; Wells & Rollings, 2012). The evidence to date suggests that total exposure is
important. All forms and quantities of exposure to greenspace appear to be helpful (Kuo,
2013).
Recent research indicates that access to and views of water, now referred to bluespace
in literature, may have an even greater effect on reducing psychological distress (Nichols,
2014; Nutsford, Pearson, Kingham, & Reistma, 2016). Bluespace typically includes
waterbodies (e.g. lakes, oceans, and rivers), and secondarily may include larger pools, and

36
rarely includes smaller human-made features such as water fountains or sculptures. Nichols
(2014) has compiled an extensive list of references related to the benefits of access to and
from water, and refers to the mental and psychological benefits as Blue Mind. This area of
research is newer but growing.
One mechanism of these benefits from nature might be the impact of nature exposure
on rumination, a pattern of self-referential thought that is associated with heightened risk for
depression and other mental illnesses. Evidence has shown that in healthy participants that a
brief nature experience, such as a 45 to 90 minute walk in a natural setting, decreases both
self-reported rumination and other negative pre-frontal brain activities, whereas a walk in an
urban setting may not (Bratman, Hamilton, Hahn, & Daily, 2015). There may be a pathway
by which nature experience improves mental well-being and evidence now suggests that
accessible natural areas within urban contexts may be a critical resource for mental health in
our rapidly urbanizing world (Bratman, Hamilton, Hahn, & Daily, 2015; Kuo, 2015;
Lederbrogen et al., 2011; Lee et al., 2012; Wells & Evans, 2003).
From these insights into access to nature and appropriate dosages, recommendations
have been suggested by researchers for addressing nature deficits at the population level.
These include: add green everyday places and views; bring green spaces closer; bring green
activities and events closer; make spaces and programs fit nearby users; make green spaces
serve multiple activities and uses; support longer visits; reconsider barriers to use; help
people start green or blue activities; and help people continue these activities (Kuo, 2013;
Sturm & Cohen, 2014). However, conflicting studies have indicated that effects may not only
be related to the distance to greenspace and bluespace but may also be related to finer
qualitative aspects (Delamont, 2016; Layton, 2016b; Nichols, 2014; Saw, Lim, & Currasco,
37
2015). Although parks planners and researchers are used to assessing quantity of available
land and water, proximity and accessibility, a measure of the quality of the space is often
left out of the picture, in part because it is difficult to measure objectively, and because
how it factors into larger urban questions is not well understood (Layton, 2016b; Saw,
Lim, & Currasco, 2015).
Some findings suggest that poorly planned parks have the capacity to actually
worsen the mental health outcomes in some places, effectively doing the opposite of one
of their intended functions (Delamont, 2016; Saw, Lim, & Carrasco, 2015). The reason
may be that in neighborhoods facing larger social issues like drug usage and crime, parks
can simply serve as a place for these things to occur. However, that does not appear to be
an argument against building parks and greenspaces in low-income neighborhoods. It just
needs to be done in a way that is aware of the issues in the community and includes safe
design aspects (Delamont, 2016, GP RED – SRTP, 2016; Rosenthal et al., 2009; Shinew,
Stodolska, Roman, & Yahner, 2013; Walls et al., 2012; Wells, Evans, & Yang, 2010).
This section has provided just a brief overview of the benefits of nature and
greenspace to health. An additional extensive annotated bibliography can be found
through the Children and Nature Network (www.childrenandnature.org/research).
Tobacco Cessation
Although it is not currently widely represented in the literature, or typically thought
of as a primary role for P&R agencies, some research suggests that P&R agencies may be
able to play a positive role in addressing smoking prevention and cessation, especially among
youth. In the United States, more than 600 municipalities have smoke-free parks, and more
than 100 have smoke-free beaches (Leung et al., 2013). The National Recreation and Park
38
Association (NRPA) released typical objectives for an outdoor smoke-free policy that
include protecting against secondhand smoke, supporting a normative message that smoking
is harmful, motivating smokers to quit, and mitigating tobacco-related sanitation costs
(Leung et al., 2013). The position statement (NRPA – Tobacco, 2016b) includes:
Attitudes and opinions about the consumption of tobacco have shifted in recent
decades, and scientific research has repeatedly confirmed the danger of tobacco use.
As park and recreation agencies seek to improve public health, protect the
environment, and uphold public trust, prohibiting the use or consumption of tobacco
at our ball fields, recreation centers, parks, splash pads and walking trails will go a
long way towards encouraging healthier lifestyles among the families and
communities we serve. The benefits of a tobacco prohibition include:
Healthier recreational environments that promote physical activity, encourage
personal development, and minimize exposure to tobacco use and secondhand
smoke.
Less tobacco use and initiation among child and adult visitors at park and
recreation facilities.
More public awareness about the dangers of tobacco use and secondhand
smoke exposure.
Better health equity and fewer health disparities among visitors to park and
recreation facilities.
Cleaner parks that contribute to a high quality recreation experience because
they are free of tobacco, secondhand smoke and cigarette butts.

39
Fewer carcinogens, toxic metals and poisonous gases from secondhand smoke
and tobacco products that impact human health, worsen air quality and impair
physical activity necessary to fully enjoy park and recreation facilities.
Fresher air, smoke-free facilities and better respiratory health for all visitors to
park and recreation facilities.
Reduction of Excessive Alcohol Consumption
This factor was not identified until later in the iterative literature research (it came up
during the last stages of the Delphi panel and case study). P&R, as front-line elements of the
local community system, may have a strong role around culture, availability, and educations
around reduction of overconsumption of alcohol. Although it may be a controversial topic
and research is limited at this time for providing specific evidence for P&R, informants noted
that public P&R agencies are seeing an increased demand for alcohol sales at public events.
Historically, many agencies have had policies that did not allow for alcohol due primarily to
the known health impacts, and/or have other types of alcohol provision practices.
The literature indicates that in the U.S., alcohol consumption increased 7% from 2001
to 2013 (Dawson, Goldstein, Saha, & Grant, 2015). Dawson et al. found that during this
period, the prevalence of drinking, volume of intake, frequency of drinking and prevalence of
monthly heavy episodic drinking increased overall. The proportion of past-year drinkers
among U.S. adults 18 and older rose from 61 to 66%, and mean volume of ethanol
consumption increased by 26%. The increases were greater for women overall, and the
increase in drinking prevalence was magnified among all race-ethnic minorities, whereas the
increase in monthly heavy drinking was magnified only among Blacks (all relative to
Whites).

40
In 2014, Stahre, Roeber, Kanny, Brewer, and Zhang examined how excessive alcohol
consumption is a leading cause of poor health and mortality in the U.S. They found that
among working age adults, 10% of all deaths were alcohol related, with an annual average of
an annual average of 87,798 in 2010, and stated that they believed this average number and
years of life lost was underestimated. Stahre et al. supported community policies
recommended by the CDC to reduce local community consumption, such as increasing prices
through taxes, increasing vendor liability, and reducing availability. Findings indicate the
need for continued systematic and expanded efforts to prevent chronic and episodic heavy
alcohol consumption in communities. Given the across-the-board increases in alcohol
consumption in recent years, policy efforts that address drinking at the community
population level are supported (Dawson et al., 2015; Stahre et al., 2014).
This health factor may be best addressed by P&R agencies through proactive policies
and awareness campaigns. One such campaign that has reported success is the “That Guy”
campaign, created and implemented to help reduce military alcohol consumption by the U.S.
Department of Defense (www.thatguy.com). The campaign states up front that That Guy is,
“Anyone (yes, ladies, you too!) who, after drinking excessive amounts of alcohol, loses
control of self or situation with humiliating or compromising results.” This is to help better
create a culture of responsible consumption. In addition, if a P&R agency is committed to
improving preventive public health, review of alcohol policies and vending for events,
concerts, farmer’s markets, sponsorship sales, and programs may lead to better alignment of
practices with those goals.

41
Gaps in the Existing Theoretical Basis – Systems Theory for P&R
A goal of this dissertation was to improve the knowledge base around improving PH
in a local community through P&R by addressing the identified factors. In doing so, it was
necessary to gain a greater understanding of the complex adaptive systems and organizational
elements involved in both causing and solving public health problems (Leischow et al.,
2008). Because of the complex system of nutrition, physical activity, and various levels of
other individual, intrapersonal, community, and societal factors that affect health, the
literature indicated that researchers likely need to use a systems-oriented approach and
related theory to address the multiple factors and levels of factors related to health (Compton
& Kim, 2013; Huang, Drewnoski, Kumanyika, & Glass, 2009; Jennings, Larson, & Jun,
2016; Lieschow & Milstein, 2006). For issues as complex as trying to position P&R agencies
as preventive PH providers, a systems approach can help organize and prioritize
interventions for those agencies. The following sections focus on the key theoretical basis
and related approaches, along with identified preventive factors, organizational elements,
potential strategies, and outcomes assessment related to improving health in a community.
Systems Theory Approach and Systems Thinking
Community management activities, such as P&R administration, are complex
activities. Many elements are involved, so at times it seems almost impossible to describe
development in a clear and organized manner. Although it is indeed a very complex field,
there is a theoretical basis which can be used to identify many of the components and
processes involved in this work. This way of organizing information has been called systems
theory. General system theory, which was initially conceptualized by Ludwig von
Bertalanffy (1968), provided an analytical framework which can be used to describe some of

42
the many factors involved in community development and management. This theory has
evolved and been adapted for many business and organizational management aspects
(Stermann, 2000). In recent years it has been applied to health systems (e.g., De Savigny &
Adam, 2009; Leischow & Milstein, 2006; Leischow et al., 2008; Mabry, Marcus, Clark,
Leischow, & Mendez, 2010; Papas et al., 2007; Sarriot & Kouletio, 2015; Trochim, Cabrera,
Milstein, Gallagher, & Leischow, 2006).
Some of the concerns in community development, such as assessing power and
influence, resource allocation, understanding the dynamics of inter-group relationships, and
considering the changes involved in planning development activities, can be understood and
described using systems theory. Terms such as systems and sub-systems, closed and open
systems, system boundaries, the transfer of energy or influence across boundaries, feedback
and system balance (or homeostasis) can be used to clarify what sometimes seems to be a
bewildering array of information involved in community development work (Sarriot &
Kouletio, 2015). A community system is based on the interaction of a variety of variables in
drivers, attitudes, access, awareness, need, available resources, and delivery structures
(Stermann, 2000).
Varieties of national and regional level governmentally sponsored initiatives are
working to identify the ever changing factors and components within systems approaches to
preventive PH. Instead of focusing on developing single programs or sites to address specific
health issues, community-based preventive approaches need to concentrate on mechanisms
for strengthening the abilities of individuals, social networks, organizations, and policies
within the community to collectively address common problems (Casey, Eime, Payne, &
Harvey, 2009; Frumkin & Eysenbach, 2003; Khan et al., 2009; McLeroy, Kegler, Steckler,

43
Burdine, & Wisotsky, 1994; Umstattd Meyer et al. 2016). A systems approach helps to
empower the individuals and communities to develop and implement appropriate local
strategies to alleviating health problems (Arai & Pedlar, 1997).
The various fields of environmental sociology, social ecology, public health,
planning, and related disciplines have been integrating systems thinking. This term is often
used synonymously for analysis using systems theory in the literature, as related to ecology
and human well-being. However, systems thinking is approached differently from different
disciplines, and it can be more accurately described in social science application as the
common approach that allows for stakeholders within a given system to have a shared
agenda, or basis for application of the theory at work within that system (Stroh, 2015).
Related to P&R, the systems terminology has been often used in the literature to refer
to ecosystems. This type of language often used by U.S Federal agencies like the
Environmental Protection Agency (EPA, 2014), and the Centers for Disease Control (CDC,
2016). In this research it was helpful to explore the example of the frameworks of ecosystems
in general as a basis. Ecosystems are the life-sustaining benefits we receive from nature.
These ecosystem services provide components that are important to environmental and
human health and well-being (Jennings, Larson, & Jun, 2016; U.S. EPA, 2014). Components
of ecosystem services that contribute to health include clean and adequate water, food,
recreation, cultural and aesthetic amenities, contributions to climate stability, habitat and
biodiversity, and clean air. Interactions take place on multiple scales (e.g., physical sites, air
and watersheds, and regional influences) and settings (e.g., rural, urban, suburban) and at
municipal, state, and regional levels.

44
Local community levels can fit into overall systems to address PH factors at a local
level. Environmental assets (components of a system) and programs may facilitate the
performance of health enhancing activities. An example is the creation of goals and strategies
related to determining access to resources such as safe exercise facilities, nature, trails, and
safe streets (Frumkin & Eysenbach, 2003; Henderson & Ainsworth, 2003). The design of
neighborhoods and communities is also important. Compton and Kim (2013) introduced the
use of STELLA® Modeling software to depict how P&R agencies may address creating a
healthy community for ages 10-14 using systems thinking. Figure 3 depicts an example from
Compton & Kim for such a system thinking model, with the adjacent text stating,
The model is very complex and can be huge…STELLA® has made it easy to break
the model into five modules that are consistent across public entities but unique in
how they work together. Different agencies or organizations can tailor the model to
reflect their use of funds, staff deployment, specific policies, or other variables.
Modeling how money is used for…programs, funding sources and capital investment,
populations of ages 10 – 14 year olds, engagement in physical activity, and health
care costs, the modules work together to form a surveillance and management system
for a healthy community.

45
Figure 3. Example of a systems thinking model for P&R addressing community health (Compton & Kim, 2013) used with permission.
Social Ecological Model (SEM) and Theory
Relative to health findings in the literature, another type of system approach
framework that is often used by the PH realm and increasingly in P&R research is the Social
Ecological Model and its related theoretical basis. Services, environmental assets, and
facilities typically need to be addressed within a systemic context of causes, effects, extent,
prevention, and/or reduction of factors at a variety of socio-ecological levels (Casey, Eime,
Payne, & Harvey, 2009; Golden & Earp, 2012; Hipp, Adlakha, & Chockalingam, 2013;
Jennings, Larson, & Jun, 2016 ).
The Social Ecological Model (SEM) and the related ecological systems theories have
their roots in a simple framework that understands behavior as a function of both individual
factors and the environments in which individuals live. Building on the work of Urie
46
Brofenbrenner (1977), who had previously articulated a multilevel framework, McLeroy,
Bibeau, Steckler, and Glanz (1988) offered five levels of influence specific to health
behavior: intrapersonal factors, interpersonal processes and primary groups, institutional
factors, community factors, and public policy. Social ecological models have since been used
by many researchers to recognize individuals as embedded within larger social systems and
describe the interactive characteristics of individuals and environments that underlie health
outcomes (Golden & Earp, 2012; Hipp, Adlakha, & Chockalingam, 2013; Sallis, Owen, &
Fisher, 2008; Stokols, 1992). An application of the SEM is built on the assumption that
health behaviors, such as PA, are driven by factors unique and internal to individuals, social
and interpersonal interactions, and broader environmental characteristics. As individuals, we
have internal characteristics that influence, and are in turn, influenced by our environment –
social, physical, economic and political. Our individual beliefs and the environment in which
decisions are made can both directly affect behavior, which in turn will impact health. When
we engage in certain behaviors, our experiences influence our beliefs about them, and
sometimes impact the environments in which we live. Figure 4 provides an example of a
SEM as applied to PH.

47
Figure 4. Social ecological model as applied to health (Golden & Earp, 2015, personal communication, used with permission)
Exploring further the Role of Local Parks and Recreation Agency Systems
Design of local environments at a community level on the SEM have been shown to
have the potential to contribute substantially to health, especially through physical activity
(Sallis et al., 2006; Sallis et al., 2015) as shown on Figure 5. There has been an increase of
evidence connecting public parks and trails to active living behaviors at a community level
(e.g., Cohen et al., 2013; Hitchings, 2013; Veitch, Ball, Crawford, Abbott, & Salmon, 2012;
Wolf & Wohlfart, 2014). The literature has provided evidence that access to and use of
public P&R amenities and programs can help improve health outcomes (Godbey & Mowen,
2010; Kaczynski & Henderson, 2008; Kanters, Bocarro, Edwards, & Floyd, 2014; Shores &
West, 2010), primarily through access to activities, programs, and locations. As concern has
grown over the rise of health epidemics related to sedentary lifestyles, the promotion of
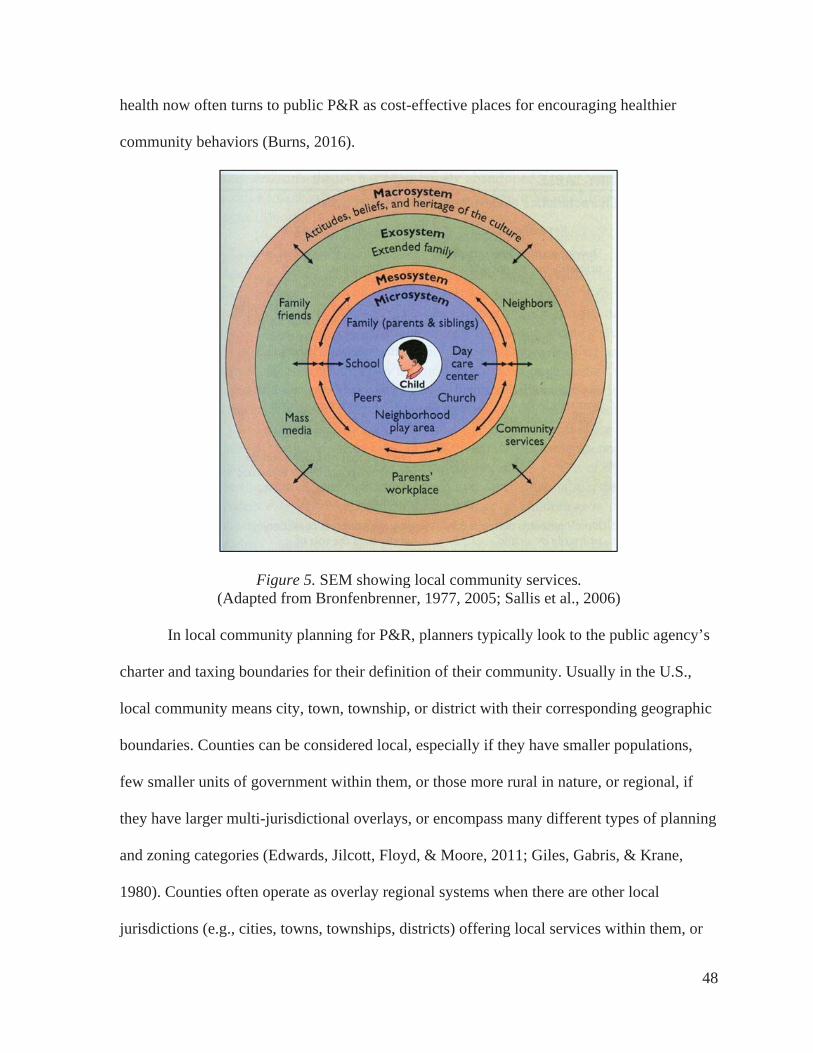
48
health now often turns to public P&R as cost-effective places for encouraging healthier
community behaviors (Burns, 2016).
Figure 5. SEM showing local community services.(Adapted from Bronfenbrenner, 1977, 2005; Sallis et al., 2006)
In local community planning for P&R, planners typically look to the public agency’s
charter and taxing boundaries for their definition of their community. Usually in the U.S.,
local community means city, town, township, or district with their corresponding geographic
boundaries. Counties can be considered local, especially if they have smaller populations,
few smaller units of government within them, or those more rural in nature, or regional, if
they have larger multi-jurisdictional overlays, or encompass many different types of planning
and zoning categories (Edwards, Jilcott, Floyd, & Moore, 2011; Giles, Gabris, & Krane,
1980). Counties often operate as overlay regional systems when there are other local
jurisdictions (e.g., cities, towns, townships, districts) offering local services within them, or

49
they may be the primary governing local jurisdiction for smaller counties with few towns or
other services in very rural or undeveloped areas.
However they are governed or their jurisdictions, there has been substantial research
and measurement of perceived or real benefits from site-specific design attributes, or
participation and use of specific local community public spaces such as parks, trails, and
facilities (Bedimo-Rung, Mowen, & Cohen, 2005; Chiesura, 2004; Kaczynski, Potwarka, &
Saelens, 2008; Mowen et al., 2008). Some of these programs, spaces, and education may be
offered through the schools (Bocarro, Kanters, Cerin, Floyd, Casper, Suau, & McKenzie,
2012; Casper, Bocarro, Kanters, & Floyd, 2011; Kanters, Bocarro, Filardo, Edwards,
McKenzie, & Floyd, 2014). Others are offered through public P&R agencies, alternative for
profit and non-profit providers, and faith-based organizations (Bedimo-Rung, Mowen, &
Cohen, 2005; Burns, 2016; Penbrooke, Compton, Peterson, Layton, Kim, & Moyers, 2014).
The proportion of who is providing these services varies in each community.
An element of note is that the purview of typical offerings by local P&R agencies
have not been specified directly by many systems thinking researchers, but typically are
generally covered under the factors listed under national/regional, community/local,
work/school/home, and individual factors. Although leisure activities and spaces are
identified, the role of P&R agencies is often not directly identified, but assumed to be part of
what is shown as a subset of Public Safety and potentially related to Schools. Given the large
number of programs and interventions to choose from, and the constant limits on available
financial resources, local public administrators (specifically P&R departments) are
challenged to identify the most appropriate interventions for their community (Godbey &
Mowen, 2010).

50
Most national programs and campaigns to improve health factors focus on individual
or interpersonal change, however P&R agencies, by their governmental structure and funding
mechanisms, are often focused on community/societal-level interventions and evaluation.
(CDC, 2016; Godbey & Mowen, 2010; Let’s Move, 2014). Components of the local P&R
system that provide health benefits are also varied (Powell, Slater, Chaloupka, & Harper,
2006; Penbrooke & Layton, 2007). Nutritional availability, familial environment and culture,
adequate medical care, social and security, and transportation all play a strong role. However,
typically access to various types of spaces to be active are needed, such as parks, recreation
facilities, trails, programs, and other providers (e.g., private, non-profit, faith-based
organization). I created Figure 6 to depict the roles of these various components of P&R
within a systems thinking approach.
Figure 6. P&R role in improving health
Limitations of Community Systems Approaches
Challenges and gaps remain in this P&R system approach. One limitation to local
P&R services is lack of or inequitable distribution of resources. If there is an overlay system

51
situation, there may be gaps or duplications in service provision with other governmental or
alternative providers (Burns, 2016; Edwards, et al., 2011; Penbrooke & Layton, 2007). Most
of the research on P&R participation and spaces has been done at a specific site level, and not
at a holistic community systems level of analysis of factors related to health (Compton &
Kim, 2013; Huang, Drewnowski, Kumanyika, & Glass, 2009). A large amount of research
has been done using quantitative methods to examine proximity and specific site attributes,
with less attention given to further qualitative aspects related to site use. (McCormack, Rock,
Toohey, & Hignell, 2010). This appears to be changing. A mixed-methods approach is likely
needed to garner a comprehensive assessment in any given community system to identify
which components are priorities and may yield the greatest return on investment (Creswell,
2013; Cyr, 2016; Roe, Aspinall, & Ward Thompson, 2016).
In recent years, various agencies and researchers have been trying to harness
systematic approaches in the literature to improving community-health level outcomes,
especially for improving physical activity and/or reducing obesity (e.g., ALR, 2016; CDC,
2016; Khan et al., 2009; Umstaddt Meyer et al., 2016). The challenges and limitations now
lie within the implementation and measurement (Burns, 2016; Khan et al., 2009; Umstaddt
Meyer et al., 2016). Khan et al. (2009) noted seven such limitations in their comprehensive
report for the CDC on Common Community Measures for Obesity Prevention (COCOMO)
(CDC, 2016; Umstaddt Meyer et al., 2016).
1. Recommended community strategies are usually based on available evidence,
expert opinion, and transparent documentation. However, typically the suggested
measurements have not been validated in practice.

52
2. To allow local governments to collect data, the suggested measurements typically
assess only one aspect or dimension of a more complex environmental or policy
strategy. Single indicators usually are inadequate for achieving in-depth
community-wide assessment of complex strategies, but they can be appropriate
tools to assess local government's attention.
3. Typically by design, proposed measurements for public systems are confined to
those that are under the authority of local governments, without including the
important role that schools, private, and non-profit collaborators play within that
system.
4. Many of the recommended strategies or suggested measurements have more
relevance to urban and suburban communities than to rural communities that
typically have limited transit systems, sidewalks, and/or local government
facilities. Many of the measurements require GIS capability; this technology
might not yet be available in certain rural communities.
5. Many suggested measurements require specific quantitation (e.g., the number of
full-service grocery stores per 10,000 residents for nutritional analysis). Currently,
no established standards exist by which communities can assess and compare
their performance on these measures. As was learned from the NRPA creation of
guidelines for park level of service analysis in the 1980s (Lancaster, 1983), data
collected from local governments reporting on these measurements can lead to the
inadvertent emergence of perception of a recommended standard rather than a
comparative benchmarking number (Penbrooke & Layton, 2007).

53
6. Many proposed policy-level measurements have their own limitations. For
example, although some measurements have been developed in consideration of
local governments, a number of policies might be established at the state or
federal level.
7. Policy measurements may not be sensitive to change or variability over time. For
example, after a community has implemented a desired policy, several years may
be needed before any verifiable change can be detected, quantified, and reported.
Knowing that a policy exists does not reveal the extent to which that policy is actually
implemented or enforced, if at all. Although implementation of and adherence to policies are
critical to their impact, measuring the implementation of policies requires a level of
assessment that might not be generally feasible for most local governments. Despite these
limitations, attention to policy and/or systems analysis can serve as a catalyst for discussion
and consideration with community members, staff, and elected governing officials.
Conceptual Framework - Knowledge to Action Flow
Research has indicated that when knowledge flow is effective, system performance
and systems level change is possible (Lieschow et al., 2008; Stermann, 2000; Trochim,
Cabrera, Milstein, Gallagher, & Leischow, 2006). Related to but separate from local
community systems thinking approaches, the PH literature indicates that since the early
2000’s, PH researchers have been exploring various frameworks to apply to the translation of
scientific knowledge into action to improve the public’s health (Graham et al., 2006; Wilson,
Brady, & Lesesne, 2011). The National Institute of Health (NIH) has tested and suggested a
variety of approaches to create and implement transdisciplinary-systems principles and
methods for the discovery, development, and delivery of PH program and policy

54
interventions within a research-to-practice paradigm (Lieschow et al., 2008; Mabry, Marcus,
Clark, Leischow, & Mendez, 2010). This work has identified four priority areas that together
serve as a synergistic foundation for understanding and improving the PH from a systems
perspective.
1. Managing systems knowledge - The management and transfer of shared
knowledge for interaction between stakeholders in a systems environment.
2. The power of transdisciplinary and multidisciplinary systems networks -
Networks are the backbone of a system that links diverse stakeholder individuals
and groups.
3. Methods for analyzing complex systems - There is strong promise in a variety of
systems approaches, including formal system-dynamics modeling techniques and
group processes that harness the problem-solving capabilities of multiple
stakeholders.
4. Systems organizing - Methods of organization can be seen as as a continuum from
formal organization in the traditional sense to self-organizing partnerships or
collaborations.
The Knowledge to Action (K2A) Framework. Based on a variety of systems
research adapted to the PH realm, the Centers for Disease Control has adopted the
Knowledge to Action Framework (K2A) to conceptualize work across disciplines and content
areas (CDC, 2014a). This organizing framework helps to depict the high-level processes
necessary to move from discovery into action through translation of evidence-based
programs, practices, or policies. The CDC K2A Framework as shown in Figure 7 identifies
three phases (research, translation, and institutionalization) and the decision points,
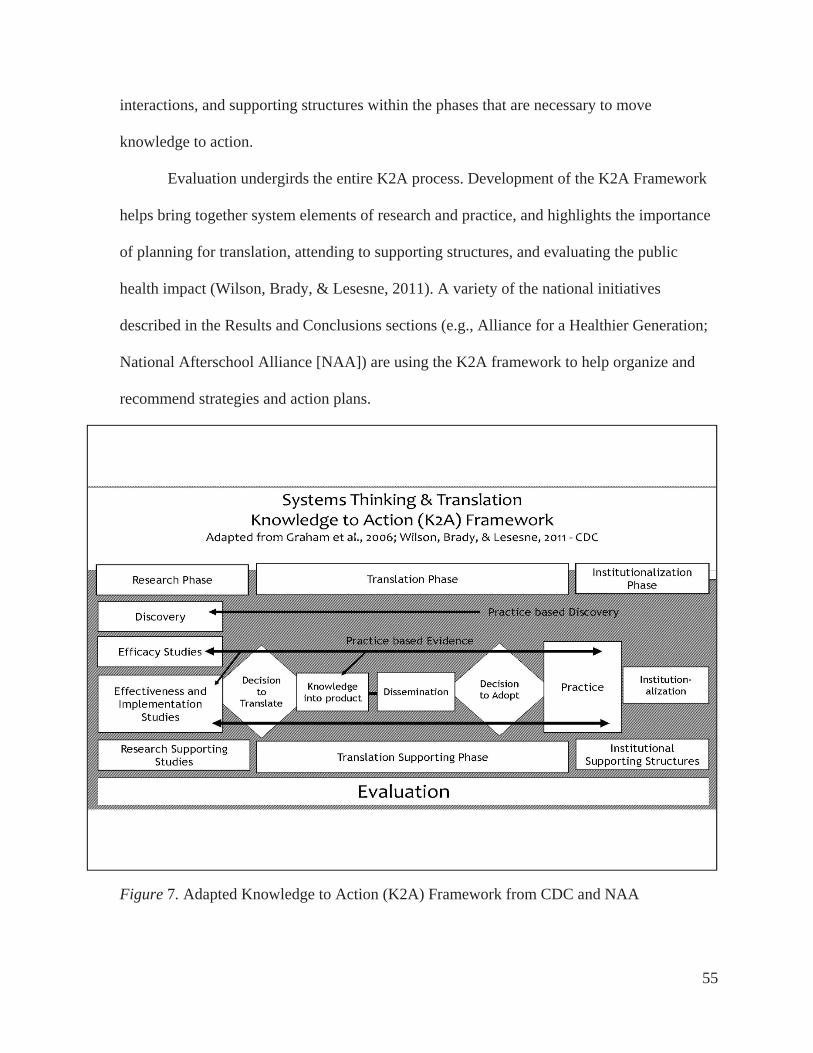
55
interactions, and supporting structures within the phases that are necessary to move
knowledge to action.
Evaluation undergirds the entire K2A process. Development of the K2A Framework
helps bring together system elements of research and practice, and highlights the importance
of planning for translation, attending to supporting structures, and evaluating the public
health impact (Wilson, Brady, & Lesesne, 2011). A variety of the national initiatives
described in the Results and Conclusions sections (e.g., Alliance for a Healthier Generation;
National Afterschool Alliance [NAA]) are using the K2A framework to help organize and
recommend strategies and action plans.
Figure 7. Adapted Knowledge to Action (K2A) Framework from CDC and NAA
56
Potential Strategies - Relevant Organizational Elements and Campaigns
Related to addressing the factors, and as sub-elements of the system and systems
thinking approach, the literature identifies a variety of organizational, management, and
planning aspects, along with national initiatives that are being utilized to help address the
health factors by P&R agencies. The Delphi panel identified that organizational culture was
one of the key elements relative to success and prioritization for the health factors, especially
having strong leadership that had made the decision to address the factors, and carried that
decision forth, with a strong organizational vision. In addition, various national recognitions
and accreditation, although not seen as always necessary, were seen by the Informants as
indicators that an agency’s leadership is paying attention to best practices in planning for
P&R. This was sometimes expressed as a constraint for smaller agencies who may not have
the internal resources to pursue recognitions. These next sections include primary themes
from the literature that help to inform the potential strategies, tools, and other considerations
for potential application in practice to address the factors.
Organizational Culture & Seeking of National Recognitions
It appears that organizational culture is a key element determining whether or not a
P&R agency addressed preventive health factors, especially at a systems level. Across the
U.S., more than 9,000 local P&R departments and organizations manage more than 108,000
public park facilities and 65,000 indoor facilities (Godbey & Mowen, 2010; Penbrooke,
2009). These organizations address the health factors in different ways (and some not directly
at all). A lot of how or if they focus on these various areas depends on organizational culture,
leadership, resources, and history.

57
Literature on organizational culture of P&R agencies is somewhat sparse, but in the
field of P&R some researchers are trying to recognize best practices and create systems that
identify and teach them. Some literature has attempted to correlate organizational culture
with the attempts to seek accreditation and other national recognitions (Farland, 2010). In the
U.S. there are two identified nationally recognition programs for P&R agencies, and these are
both administered by committees facilitated by the National Recreation and Park Association
(NRPA - www.nrpa.org). The first is the Gold Medal Award
(http://www.nrpa.org/goldmedal/), which honors agencies that “demonstrate excellence in
long-range planning, resource management, and innovative approaches to delivering superb
park and recreation services with fiscally sound business practices”. The second is
accreditation by the by the Commission for Accreditation of Parks and Recreation
Administration (CAPRA - http://www.nrpa.org/certification/ accreditation/CAPRA).
CAPRA is the only national U.S. accrediting organization for public P&R agencies, but only
a small portion of U.S. organizations participate. In 2009, 77 agencies were accredited
(Farland, 2010), and in 2014, 138 were accredited agencies (CAPRA, 2014). In 2016 the
CAPRA website indicated 151 agencies participating. This number indicates strong growth,
but this current number still represents less than 3% of the roughly 9,000 local P&R agencies
in the U.S.
Literature is limited on effectiveness of these recognitions on organizational culture
but some researchers have attempted to discern their value, especially related to
organizational effectiveness (Farland, 2010; Sandberg; 2004; Vick, 2007). Farland (2010)
completed a comprehensive literature review on the topic, and examined the potential
relationship of culture to performance and attitudinal attributes. He found that the earliest

58
literature on organizational culture was created starting in the 1970’s and has continued since
for other related disciplines. In this research, Farland found “no known studies which identify
and compare the organizational culture differences for municipal parks and recreation
agencies in the United States” (p. 4). Part of his research examined demographic and
organizational administrative benchmarking information such as community population,
budgets, number of full-time personnel, and whether they were accredited. Farland’s study
looked at the comparison of results between accredited CAPRA agencies and agencies not
accredited. CAPRA’s requirements for providing 140 Standards of Evidence were updated in
2014 with a stronger focus on systematic evaluation, management, and planning best
practices (CAPRA, 2014).
Farland’s work delved more deeply into organizational differences. He received
responses from 37 accredited agencies and 59 non-accredited agencies, and he looked at the
differences for various indicators of organizational focus, such as whether they were more
achievement externally within the community, or focused more on supporting their internal
team. According to Harrison and Stokes (1992), achievement orientation is the most aligned
orientation, as it focuses more on the agency’s mission, goals, and objectives. An
achievement oriented workplace is also more inclined to work toward common goals and
mission, have higher employee morale, and a team orientation in all aspects.
The key finding from Farland’s study was that for agencies who were accredited, the
leading indicator was that they were primarily achievement focused in their cultural
orientation. Agencies who were not accredited displayed the Support focus as their leading
indicator. The support orientation creates an environment more focused on shared values and
work ethics, and the workplace supports the organization with a focus on socialization and

59
support (Farland, 2010; Harris & Stokes, 2002). CAPRA accredited agencies reported that
their primary reasons for accreditation were to meet and validate a set of best practices and to
meet a higher level of professional standards. Non-accredited agencies reported that the lack
of financial resources and constraints for time to complete the process were the reasons for
not taking part (Farland, 2010).
The literature appears to support that having an external focus on mission and goals
for the community overall may provide stronger alignment for an organization than agencies
that are more internally focused on staffing and constraints. This does not necessarily mean
that going through the CAPRA process should be required or in itself makes an agency
better, but it may be that going through the formal steps required to improve management
and planning practices for things like CAPRA or applying for NRPA Gold Medal Awards
may help agencies become better aligned to achieve desired outcomes (Farland, 2010).
Even though organizational culture appears to be an important part of effective
dimensions for assessment and planning, there are other factors beyond organizational
culture that may affect the performance of agencies (Vick, 2007). Many of the CAPRA
standards require other systematic planning and assessment tools, and studies have shown
that systematic approaches typically are more effective from both a time and financial
performance aspects (Jervis, 1997). Organizations that utilize similar systematic approaches
to address the health factors may be more likely to have stronger success and outcomes.
Addressing Social Equity in Communities
Factors related to social equity are important for addressing health at a P&R systems
level. Access to P&R locations and programs is not always equal or equitable in communities
(Rigolon, 2016). Often differences exist based on socio-economic status (SES), nature of the
60
community density (rural vs. developing or sub-urban, vs. urban), and race/ethnicity. For
example, studies have shown that lower-SES and high-minority neighborhoods may have
reduced access to facilities, which in turn may be associated with decreased PA and
increased levels of obesity. Inequality in availability of facilities may contribute to ethnic and
SES disparities in PA, and overweight patterns, and resultant overall health (Gordon-Larsen,
Nelson, Page, & Popkin, 2006; Rigolon, 2016).
In addressing health factors in any local community, it is important to reduce
disparities based on race, ethnicity, gender, and socio-economic status (SES) (Singh,
Siahpush, & Kogan, 2010). Researchers have found that the disparities in access to recreation
resources are an environmental justice concern and should be a high priority for public health
research and policy (Edwards, Jilcott, Floyd, & Moore, 2011). Greater availability of outdoor
play and/or sports areas and parks have been associated with higher levels of youth PA
(Slater et al., 2010). However, perceived environmental barriers, such as lack of access to
these types of settings, have been associated with lower income neighborhoods.
Although results from the 2003–2004 through 2011–2012 National Health and
Nutrition Examination Surveys (NHANES) suggest that obesity rates in youth overall may
have stabilized (Ogden, Carroll, Kit, & Flegal, 2014), the most recent prevalence estimates
indicate that racial/ethnic and sex disparities are evident (Barr-Anderson, Singleton,
Cotwright, Floyd, & Affuso, 2014). Many studies have also demonstrated a positive
association between high-SES and low minority areas and recreational resources (e.g., Floyd,
2007; Jennings & Gaither, 2015; Jennings, Larson, & Jun, 2016; Gordon-Larsen, Nelson,
Page, & Popkin, 2006; Powell, Slater, Chaloupka, & Harper, 2006; Rigalon, 2016; Slater et
al., 2010; Wolch, 2014).

61
Inequities in distribution of P&R resources may be a significant environmental justice
issue (Cutts, Darby, Boone, & Brewis, 2009; Rigalon, 2016). Specifically, ethnicity and
gender have been investigated by many researchers as potential predictors of PA and
correlates of obesity (e.g., Gordon-Larsen, McMurray, & Popkin, 1999; TFAH, 2015). As
there are a variety of nutritional and cultural factors that affect obesity, biological
explanations seem unlikely taken on their own (Richmond, Hayward, Gahagan, Field, &
Heisler, 2006). Ethnic minorities generally engage in less physical activity overall and for the
most part, females tend to partake in less physical activity than their male counterparts, with
ethnicity again being a differentiating variable (TFAH, 2015).
Opportunities to make healthy choices in where people live, learn, work and play all
contribute to the rates of obesity being higher for Black, Latino and American Indian/Native
American adults and children than for Whites (TFAH, 2015). Black, Latino, and American
Indian/Native American communities experience higher rates of hunger and food insecurity,
limited access to safe places to be physically active and targeted marketing of less nutritious
foods (Beam, Ramirez, & Gallion, 2013; Indian Health Service, 2016; TFAH 2015).
Research has shown that children in low socioeconomic communities often depend more on
after-school programs to provide their PA than those in more affluent neighborhoods (Hynes
& Sanders, 2011). Low-income and African-American children, populations with the highest
risk of inactivity-related health conditions, have been found to be twice as likely to attend
after-school programs as higher income and white children (Hynes & Sanders, 2011).
Overweight and obesity rates are higher, start at earlier ages and increase faster among Black
and Latino children than among White children (TFAH, 2015). In addition, individuals with
lower income and/or education levels are disproportionately more likely to be obese (TFAH,

62
2015). Researchers have also found that from a systems standpoint, neighborhood social
conditions and parental education in the U.S all significantly affect youth obesity levels
(Kumanyika et al., 2008; Singh, Siahpush, & Kogan, 2010). In 2010, children of parents with
less than 12 years of education had an obesity rate 3.1 times higher (30.4 percent) than those
whose parents have a college degree (9.5 percent).
Preventive Public Health Systems Planning
Related to the theoretical basis of systems thinking, and the complexities of
addressing the interwoven effects of and on the health factors, it was important to explore the
current state of preventive PH systems planning and an element for applicable themes
relative to P&R. It is known in the PH and medical realms that most chronic health problems
(e.g., heart disease, obesity, Type II diabetes, and certain cancers) are at least mostly
preventable through diet and lifestyle interventions (Katz, 2009; Schroeder, 2007). The
approaches to effectively intervene include educational, behavioral, and structural
mechanisms at all levels of the SEM, however translating these findings into practice in a
community has been hampered by insufficient funding and difficulty reaching those persons
in greatest need. (Blankenship, Friedman, Dworkin, & Mantell, 2006; Katz, 2009).
Like any positivistic research, PH policy has historically been built upon creating
summaries of information collated through systematic reviews of the literature (Higgins &
Green, 2011). The research and application to PH practice is evolving. As Baxter, Killoran,
Kelly, and Goyder (2010) surmised from their review of historical approaches to PH
planning:
Conventional systematic reviews have been criticized on a number of grounds: that
they provide a lack of context for social interventions; that they are of limited use to

63
policymakers, practitioners, and other groups due to the lack of studies available; they
exclude important work; and that they lack consideration of feasibility and
implementation. (p. 5)
Systematic approaches and frameworks however have been identified for application
to address these types of preventive PH challenges, and the sections following outline some
of the primary methods being used by in the PH realm that could be better applied to P&R
applications.
Health impact assessments (HIAs). HIAs were created in the PH realm to provide a
systematic planning process that brings together scientific data, health expertise, and
stakeholder input to identify the potential and often overlooked positive and negative effects
on public health of proposed laws, regulations, projects, policies, and programs (APA,
2016a; Lock, 1999). They were defined internationally in the 1990’s by the World Health
Organization (WHO, 1999) with the initial purpose to:
Inform and influence decision makers.
Place public health on the agenda.
Promote cross-sector working.
Reduce conflict between stakeholders.
Help address inequalities in health.
They have been gaining national attention in the planning and PH realms in the U.S.
since the early 2000’s. HIAs are designed to provide pragmatic, evidence-based
recommendations about how to reduce risks, promote benefits, and monitor the health effects
of the implemented decision and have been used to inform decision-making in a range of

64
sectors, including planning, agriculture, criminal justice, economic policy, transportation, and
housing (Pew, 2016).
Research is mounting on the best methods and efficacy of HIAs. The American
Planning Association (APA, 2016) conducted a study to identify every known HIA
conducted in the U.S. between 2004–2014 for a planning-related policy or project, and
analyzed them by planning topic, type, date, decision level, and location. The number of
planning HIAs conducted and identified by the APA increased from one in 2004 to a peak of
29 per year in 2012 and 23 in 2014 (APA, 2016a). It appears that this number is expanding
rapidly and in recent decades, several factors have contributed to the increasing use of health
impact assessments (HIA) in the United States (Cowling, Lindberg, Dannenberg, Neff, &
Pollack, 2017; Dannenberg, 2016). As of March, 23, 2017, the Pew Charitable Trusts
maintained an online national list of 417 different types of HIAs with clickable links,
accessible at:http://www.pewtrusts.org/en/multimedia/data-visualizations/2015/hia-map.
Some U.S. universities are now implementing academic curriculum and/or
certification programs around HIAs. For example, Cornell University, Rutgers University,
the University of California – Los Angeles, and the University of North Carolina now have
courses specifically designed around how to do HIAs as part of healthy communities
planning. Rutgers now offers certification in HIA Planning,
(http://www.cpe.rutgers.edu/courses/current/ep0704ha.html), and UCLA maintains a broad
database of trainings, methods, templates, and resources on these topics (www.hiaguide.org).
Starting in Spring 2017, Cornell University offers a full semester mixed undergrad/grad
course on HIA Planning through the Environmental Sociology Department (personal
communication from Nancy M. Wells, PhD). An online search identifies a variety of

65
examples, including free webinars and outlines offered to help practitioners and researchers
understand how best apply them to various situations.
HIAs address a variety of types of system planning, such as comprehensive plans,
corridor plans, and functional plans, along with policy applications (APA, 2016a; Cowling et
al., 2017). In a study conducted by the American Planning Association (APA, 2016a), a little
more than one-fifth of the plans addressed policies, such as zoning and development
regulations and new utility fees. One-tenth of the planning HIAs addressed projects such as
the development of a new community facility. HIAs are designed to be flexible, with the
range of reflecting the comprehensive nature of planning as a discipline and the many ways
in which to address human health through planning. The HIAs issues studied by APA
encompassed 14 broad topic areas, with more than half of the planning HIAs focused on land
use, varying geographic scales, and different health conditions or outcomes. HIAs are
intended to each be unique, reflecting the circumstances, location, and way the HIA was
conducted, in addition to potential for their impact (APA, 2016b). Recently, these types of
studies have been adapted to parks planning assessments along with food/nutrition policies
and plan by professional planners and researchers (CDC, 2016; Cowling et al., 2017; Epstein
et al., 2012).
The steps for HIAs are somewhat similar to steps for general system site and master
planning projects, but are focused on health impacts and outcomes with an added emphasis
on evaluation at the end (something that public P&R agencies generally have not funded in
overall system planning). The six steps vary in title and adaptation depending on author or
researcher, but generally include something similar to:
1. Screening - Determine whether an HIA will add value.

66
2. Scoping - Develop a plan for the HIA.
3. Assessment - Identify current and predicted health impacts.
4. Recommendations - Identify actions that protect health.
5. Reporting - Communicate findings.
6. Evaluation - Monitor impacts.
One of the major criticisms of HIAs has been that methods of collecting and
analyzing evidence may not be sufficiently rigorous to withstand scrutiny and challenge
(Lock, 1999). Newer methods may address this criticism, but a range of data sources
including economic, epidemiological, quantitative, and qualitative information should be
routinely taken into account. Often the most useful information is not routinely collected. As
noted by Lock (1999),
Seldom is there going to be the time or money available for collection of primary
data. Although it may be preferable for decision makers to have a quantitative
measure of health impact, the limitations of qualitative estimates may have to be
accepted as the best evidence available. This may limit the strength of the
recommendations an assessment can make both in terms of the certainty and size of
an impact. (p. 1397)
In addition, all HIAs contain elements of uncertainty (Mesa-Friasa, Chalabia, Vannib,
& Foss, 2013). However, in a systematic review of peer-reviewed HIA studies, Mesa et al.
(2013) found that out of 51 articles reviewed, only 19 of the articles used uncertainty
quantification methods. Their conclusions were that the typical expectations for quantitative
expectations for HIAs were not applicable due to the complex nature and confounding
elements of the studies, and that future research should attempt to broaden the way

67
uncertainty is taken into account in HIAs. In addition, although evaluation is listed as a
primary last step, in practice, this step is still often not addressed effectively in practice
settings.
Despite the challenges, HIAs may have strong application to addressing P&R system
planning, especially related to the preventive health factors. Recently the CDC issued a
manual titled Parks, Trails, and Health Workbook - A Tool for Planners, Parks & Recreation
Professionals, and Health Practitioners (CDC, 2016) that includes an overview and an
appendix dedicated to applying HIA methods to parks and related systems. Additional recent
reviews have suggested practices that can improve the efficacy and application in practice
(Cowling et al., 2017; Hirono et al., 2017) . Hirono et al. (2017) suggested that incorporating
peer review in HIAs may be an additional strategy that can help to improve the quality and
usefulness of HIAs. The researchers suggested that there be process, technical, general, and
political peer-review included throughout the stages of the HIA. A remaining challenge is to
identify appropriate “peers” and resources to conduct the reviews at these stages.
Logic models. Another aspect of PH planning becoming more frequent in use is the
process of creating a logic model. (Baxter, Killoran, Kelly, & Goyder, 2007; Goldsmith,
Bankhead, & Austoker, 2007; Kaplan & Garrett, 2005; Kellogg Foundation, 2004). Logic
models can be a useful way of examining the complexity of relationships between factors and
outcomes, and of highlighting potential areas for interventions and further research or action.
The use of techniques from primary qualitative research may also be helpful in synthesizing
diverse document types (Kellogg Foundation, 2004). Because they are more graphic in nature
than standard textual plans, they require systematic thinking and planning to better describe
programs of action. The visual representation of a plan in a logic model format is flexible,

68
points out areas of strength and/or weakness, and allows stakeholders to run through many
possible scenarios to find the best outcomes for that situation. In a logic model, approaches
can be adjusted and change courses as program plans are developed. Ongoing assessment,
evaluation, review, and corrections can produce better program design through a strategic
systematic approach (Kellogg, 2004).
In recent years, many funders have begun to require that community-based initiatives
develop logic models as part of their grant applications and for ongoing monitoring and
reporting. At the same time, program evaluators are increasingly using logic models to
identify and measure expected results (Kaplan & Garrett, 2005). As shown in Figure 8 as an
presentation graphic I adapted, basic logic models typically include identification of
objectives, along with steps to monitor, manage, and report program outcomes throughout
development and implementation.
Figure 8. Basic logic model format (adapted by author)

69
For implementation in practice, these can be created through the use of tables,
spreadsheets, or with graphic software. Limitations of logic models often lie in the initial
assumptions. As detailed by Kaplan and Garrett (2005) from their extensive review, often
when funders require the development of a program logic model, the emphasis is on setting
goals for activities and expected outcomes. Although articulating the underlying rationale for
a program is critical to its success, it is frequently a later assumed activity, and one that is
never quite completed. The discussion of program assumptions seems to be the place where
there is the biggest disconnect between planners/evaluators and program
managers/implementers. Often managers are willing and able to layout activities and
expected outputs, but the time-consuming process of articulating and assessing the strength
of assumptions through a literature review or discussion with experts can feel like a
distraction or waste of time (Renger & Titcomb, 2002). This seems to be especially true in
the realm of P&R practice, where gathering evidence-based research by public practitioners
on the job is rarely funded or rewarded. However, despite the limitations, application of this
type of logic model framework may enhance the collaborative planning capabilities and
funding success for P&R agencies, through inviting a systematic approach of addressing each
element of the system to identify gaps, limitations, and opportunities.
P&R Systems Planning
Related to systems thinking, examining systematic assessment and planning for
addressing health factors by P&R requires first exploring the parent discipline of professional
planning and its relationship with P&R planning. However, as concluded by Lewis (2008)
when she edited a guide to parks system planning, From Recreation to Re-Creation: New
Directions in Parks and Open Space Systems Planning for the American Planning

70
Association, a wealth of information exists about how to design specific sites such as parks,
and how to create, implement, and measure recreational programming. The challenge
remains in that specific guidance on how to plan for management of overall public parks and
recreation systems is not widely available. Lewis stated, “Planners know planning. Parks
professionals know parks” (p. vi). In response, she gathered resources to create that guide to
serve as a reference manual by planners for planners. The guide, published in 2008, was one
of the most current resources found on system planning for P&R, but did not focus on
evidence-based P&R outcomes, and was primarily written for landscape architects and
planners, not P&R administrators.
A community system is based on the interaction of a variety of variables in drivers,
attitudes, access, awareness, need, available resources, and organizational delivery structures
(Stermann, 2000). In order to determine best course of action, a management and planning
framework needs to identify objectives and indicators, monitor those indicators, and
implement management practices to address them (Jaakson, 1985; Lewis, 2008). Published
literature shows the development of conceptual and management system frameworks for a
variety of specific P&R assessment situations besides but sometimes related to addressing
these health factors, such as carrying capacity (Manning, 2007; Manning, 2014; Whittaker et
al., 2011), social norms theory (Heywood, 2011), limits of acceptable change (LAC)
(Stankey, Cole, Lucas, Petersen, & Fris, 1985; Stankey, McCool, Clark, & Brown, 1999), the
Recreation Opportunity Spectrum (ROS) (Driver & Brown, 1978; Stankey et al., 1999;
Wilhelm Stanis et al., 2009), Recreation Experience Preferences (REP) scales (Manfredo,
Driver & Tarrant, 1996), sustainable tourism and ecotourism frameworks (Buckley, 2009;
Honey, 2008; Nyaupane & Andereck, 2008), level of service analysis tools (Layton, 2016b;
71
Lewis, 2008; Penbrooke, 2007; Penbrooke & Layton, 2007), adaptive management (Stankey,
Clark, & Borman, 2005; Stankey, McCool, Clark, & Brown, 1999), social and environmental
justice (Floyd, 1999; Floyd, 2007; Gramann & Allison, 1999), and general sustainability
frameworks (McCool & Stankey, 2004).
Many of these frameworks have been derived for addressing natural resource
planning at a federal level or for academic theoretical research, with little translation to
practical local level P&R planning and assessment application, and not focused on planning
for modifying health factors. However, both the ROS and LAC frameworks represent
examples of the social reform aspects of planning (Stankey et al., 2005) that have been
somewhat adapted for application to P&R in the public sector as related to equity. Most of
the instruments, however, are limited because they are too simplistic to account for high
complexity, ambiguity, and uncertainty that occurs in P&R systems planning (Stankey et al.,
1999).
Little additional current information was available in the literature on systems or
strategic system planning specifically for P&R. The most comprehensive current book in this
area, Management of Parks and Recreation Agencies, is a detailed tome of suggested P&R
management practices published by the NRPA (Moiseichik, 2010), and is the basis for
CAPRA standards for agency accreditation. It includes 681 pages, with 14 pages on strategic
system planning for P&R agencies. An additional resource that covers this material is a text
called Leisure Services Management (Hurd, Barcelona, & Meldrum, 2008). This text focuses
on an introduction to competency-based management theory for leisure management
providers, and includes a brief overview of planning practices for public P&R agencies.
Although one of the more currently used resources in overall P&R administration, this text

72
was published prior to broad adoption of some of the current planning methodologies in use
nationally that rely on new technologies such as Geographic Information Systems (GIS), new
software, and enhanced spatial analysis tools, and the current focus on integration of health
factors. Another available resource is a book chapter on general P&R department
management in a general local government management text (Vick, 2007). Other
publications attempt to address overall systems management for P&R and some of these are
similar to the frameworks presented for HIAs from the PH realm discussed in other sections.
In the 1970’s some federal level P&R planning units began using the Social Learning
Model approach for systems planning (Stankey et al., 1999). This was based on incorporation
of broad traditions from planning stemming from philosophical pragmatism with a core of
purposeful action. The Social Learning Model may translate into the current need for
application of community-specific planning at all levels, including a balanced management
approach for health. The Social Learning Model also lends itself to the five common steps for
any decision making or research process (including planning for agencies). This structure is
similar to the steps presented for HIA’s, and also looks like a standard positivistic outline for
research (Henderson & Bialeschki, 2010; Hurd, Barcelona, & Meldrum, 2008; Lewis, 2008).
Summarized, these typical steps include:
1. Identify and define the problem or project
2. Identify stakeholders or resources for data and information gathering
3. Identify needs or results
4. conduct analysis to present findings and draft recommendations
5. Conclusion or Implementation
73
If application to P&R practice is included in the process, a sixth step would be
evaluation and monitoring (Hurd et al., 2008). Including triangulation in the data collection
may also be beneficial (Yoder, McKinney, Wicks, & Espeseth, 1995). Systematic assessment
of the health factors within P&R has been suggested as a preferred mechanism to address
improved health within a community (Compton et al., 2011; Penbrooke et al., 2014; Saelens,
Sallis, Black, & Chen, 2003).
P&R needs assessments. One of the key elements of effective P&R community
systems engagement is knowing the community and what they want (Barth, 2008; Henderson
& Bialeschki, 2010; Hurd, Barcelona, & Meldrum, 2008; Moiseichik, 2010). After more than
17 years of personal professional experience overseeing over 450 community-specific
research, information gathering and engagement processes, I have compiled and adapted a
list of the most common effective methods to train staff and to provide in educational
settings.
For public agencies, a mixed methods approach is necessary to accurately determine
needs. Typically a needs assessment process includes qualitative and quantitative methods,
such as key stakeholder interviews, focus groups, open public meetings, and random
surveying of residents of the community, at a minimum. Agencies that systematically use
these types of tools at least every five years typically have been shown to have more effective
internal and external relationships, better implementation of plans, and increased decision-
maker buy-in (Barth, 2008). For this dissertation research, the Delphi panel data gathering
process included exploration of whether the informant agencies had actively included
community needs assessments relative to the identified health factors.

74
Figure 9 provides a graphic GreenPlay uses (I am CEO and Founder of this firm) to
explain the wide variety of tools available.
Figure 9. Community needs assessment and engagement tools
Organizational Partnerships
The role of partnerships has been discussed in the literature as an important element
in promoting awareness and use of P&R services for PA and health (Bocarro et al., 2009;
Henderson & Bialeschki, 2005; Henderson et al., 2001; Mowen, Payne, Orsega-Smith, &
Godbey, 2009; Spangler & Caldwell, 2007). Addressing health factors in a local agency P&R
system requires coordination and collaboration with a variety of partners. PH and P&R
agencies have not always seen each other as a major partner, but that may be changing
(Bocarro et al., 2009; Mowen, Barrett, Graefe, Kraschnewski & Sciamanna, 2017).

75
The roots of the recreation profession stem from social, environmental, and health
concerns of the 19th and 20th Centuries (Cross, 1990). More recently however, advocates
from the P&R profession have sought a greater voice in the PH agenda. These efforts,
combined with a renewed interest in the role of the built environment in shaping health, have
resulted in a growing acceptance of P&R as a legitimate health partner (Godbey, Caldwell,
Floyd, & Payne., 2005; Sallis, Linton, & Kraft, 2005). However, barriers to health
partnership participation remain, and there is a continued need to communicate the
contributions of P&R agencies to a wide variety of other organizations (e.g., public health,
transportation, design realms, community development, and faith-based organizations). The
widespread adoption of partnerships has been instigated by diminished public resources,
combined with a need to serve an increasingly diverse constituency (Mowen et al., 2009).
This requires organizations to pool resources and leverage strengths to provide community
services more effectively. There has also been a heightened awareness that pervasive social
concerns (e.g., youth delinquency, obesity, environmental degradation) cannot be effectively
tackled by one single organization, discipline, or level of governance (Henderson et al., 2001;
Mowen & Kerstetter, 2006).
Partnerships allow organizations to stretch existing staff, facilities, equipment, and
finances to provide enhanced programs or to be more inclusive in their services. In addition
to leveraging resources, partnership participation can increase organizational visibility and
credibility, reduce service duplication, and create opportunities for professional growth
across organizational staff (Yoder & Ham, 2005). According to the literature, trust and
relationship building, accommodating diverse values, having a broad strategic vision,
network brokering, negotiation, cross-organizational communications, collaborative

76
leadership styles, conflict resolution, and flexibility comprise the skill set required to
successfully manage partnerships (Crompton, 1997; Frisby, Thibault, & Kikulis, 2004;
Mayo, 1997). However, many organizations lack the basic capacities required to successfully
do so, in part because professional development and educational programs have not kept pace
with changing job demands (Razani et al., 2016; Yoder & Ham, 2005).
Based on the organizational dynamics referred to most often by agency managers and
staff as contributing to under-managed partnerships, two main themes which are typically
identified as related to partnerships are managerial structures and processes (Frisby et al.,
2004; Razani et al., 2016). Three subthemes that reflect how managerial structures contribute
to under-managed partnerships include:
a lack of planning and policy guidelines
unclear roles and reporting channels
insufficient human resources
Beyond that, sub-themes related to inadequate managerial processes for partnerships
have been uncovered and reported in previous studies (Frisby et al., 2004), including:
insufficient training
insufficient time devoted to partnerships
difficulties negotiating competing values
a lack of communication and consultation
poor coordination among parties
insufficient supervision
a lack of evaluation
a lack of strategies for retaining and terminating partnerships

77
A variety of studies examining collaborative partnerships within the P&R field have
found a large discrepancy between support for collaborative partnerships and the actual
collaborative efforts that are taking place (Barcelona & Bocarro, 2004; Bocarro et al., 2009;
Payne, Zimmerman, Mowen, Orsega-Smith, & Godbey; 2013; Selin & Chavez, 1995; Uhlik,
1995). This suggests that P&R practitioners may conceptually recognize the promise of
collaboration and partnerships, but may also lack the knowledge, motivation, skills, or
resources to initiate and maintain these collaborative efforts.
Mowen et al. (2009) conducted a nationwide survey of park and recreation agencies
to document health partnership practices, characteristics, and effectiveness. Results indicated
that a large number of park and recreation organizations (88%) had participated in at least
one health partnership, with some participating in several at a time. Larger organizations
(with larger budgets and larger populations served) were more likely to participate in health
partnerships. Among those agencies who did not participate in health partnerships, lack of
resources to initiate the partnership was seen as a key barrier to participation. Schools and
public health agencies were frequently cited as partners and physical activity promotion,
obesity prevention, and general wellness were the core issues partnership issues addressed.
Organizations with physical activity partnerships typically emphasized programmatic and
environmental approaches. Key contributions from the health partnerships were creating
facilities and providing greater access to the public. Respondents felt that visibility, meeting
the mission statement, and image were important partnership benefits and perceived their
partnerships as being somewhat or very effective. A more detailed study of 216 North
Carolina municipal and county public park and recreation agencies by Bruton et al. (2011)
indicated that about a third of the departments participated in formal partnerships with health

78
departments to promote physical activity. Over half of the departments participated in formal
partnerships with other community organizations. Less than half of the departments
participated in formal partnerships with schools. Departments that served larger populations
and had larger operating budgets were more likely to engage in partnerships with county
health departments. Certification of agency leadership played a role in these findings, as the
certification status of directors (whether they were Certified Parks and Recreation
Professionals - CPRPs) was positively associated with engaging in a partnership with other
organizations. Departments that focused their efforts on minorities and obesity among teens
were more likely to engage in partnerships with school systems and other community
organizations. Departments that focused effort upon individuals with disabilities were more
likely to engage in partnerships with YMCAs. The study also suggested that departments
who serve smaller populations may need assistance in identifying partners and sustaining
partnerships.
An additional nationwide study of P&R practitioners by Payne et al. (2013), also
identified that larger communities are significantly more likely to recognize the need for and
have more experience with partnerships for health related work than smaller communities.
Very small and large communities partner significantly more often with senior services,
nonprofit health promotion agencies, and public health agencies than small and medium
ones. Large and small communities appear to be significantly more likely than very small
and medium communities to agree that their decision making in partnerships is inclusive, and
that they have clearly defined goals and objectives.
The literature indicates that large communities are significantly more likely than very
small communities to report that their partnerships help to leverage resources, make policy

79
changes, meet their mission statement, and link to funding opportunities, but the outcomes of
partnerships, even for smaller agencies, can be beneficial. A variety of challenges,
constraints, and benefits emerge from initiating and maintaining partnerships, but they are
often key to leveraging scarce resources to provide greater services for the public.
National Initiatives Related to the Health Factors
Related to partnerships and other organizational strategies to address the health
factors, the literature review and intentional web searches indicate that there are literally
hundreds of initiatives related to addressing the health factors that have been and are being
implemented around the U.S. Currently many national level programs and campaigns set
forth as suggestions to address many of the health factors each month from the federal
government, academicians, the private sector, and non-profit organizations (CDC, 2016;
Designed to Move, 2012; Let’s Move, 2016).
This thematic literature review initially identified many of these initiatives, and this
list was expanded as the Delphi panel informed the process. As they appear to provide some
effective campaigns and methods, the research included a web search to identify national
initiatives that may be providing impact for P&R agencies. From the Delphi panel, literature,
and the web search, 31 national initiatives were identified that appear to offer at least some
assistance relative to tools, strategies, and/or collaborations for P&R agencies to address the
factors. Table 1 indicates the name of the included initiatives. The initiatives are briefly
described in Appendix A using language from the sources. Results from Questionnaire #2
included the findings from the agencies as to whether are using these initiatives.
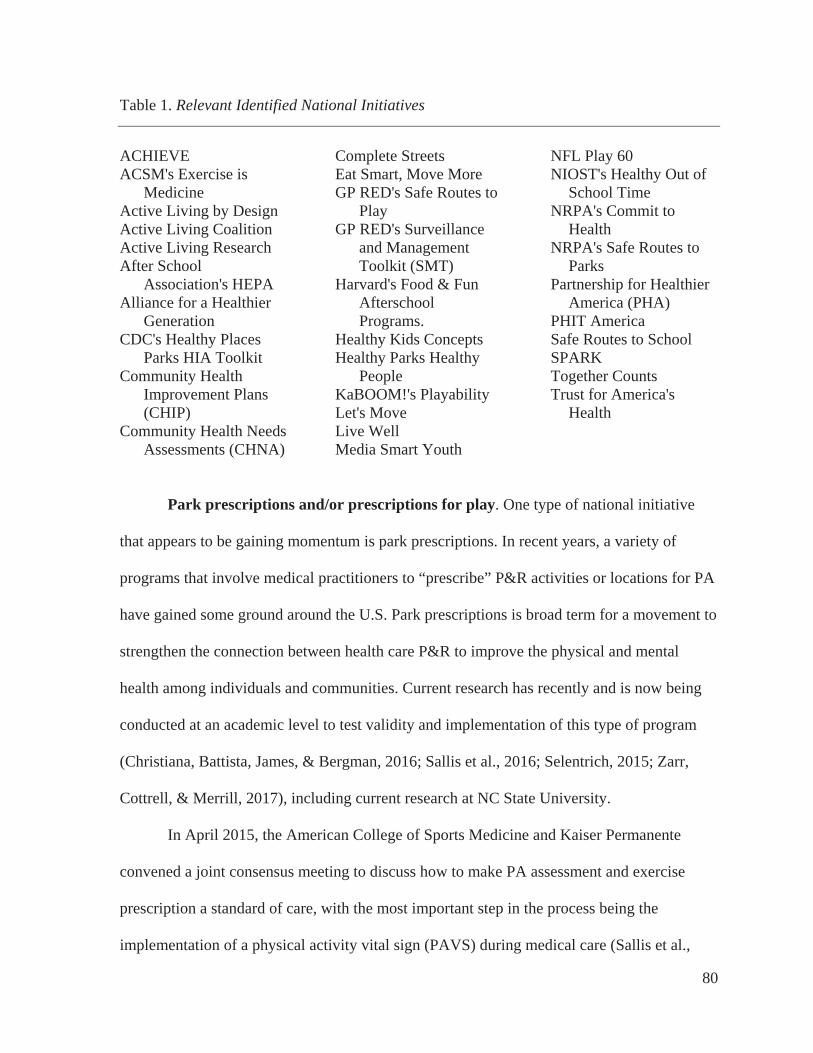
80
Table 1. Relevant Identified National Initiatives
ACHIEVEACSM's Exercise is
MedicineActive Living by Design Active Living Coalition Active Living Research After School
Association's HEPA Alliance for a Healthier
GenerationCDC's Healthy Places
Parks HIA Toolkit Community Health
Improvement Plans (CHIP)
Community Health Needs Assessments (CHNA)
Complete Streets Eat Smart, Move More GP RED's Safe Routes to
PlayGP RED's Surveillance
and Management Toolkit (SMT)
Harvard's Food & Fun AfterschoolPrograms.
Healthy Kids Concepts Healthy Parks Healthy
PeopleKaBOOM!'s Playability Let's Move Live Well Media Smart Youth
NFL Play 60 NIOST's Healthy Out of
School Time NRPA's Commit to
HealthNRPA's Safe Routes to
ParksPartnership for Healthier
America (PHA) PHIT America Safe Routes to School SPARKTogether Counts Trust for America's
Health
Park prescriptions and/or prescriptions for play. One type of national initiative
that appears to be gaining momentum is park prescriptions. In recent years, a variety of
programs that involve medical practitioners to “prescribe” P&R activities or locations for PA
have gained some ground around the U.S. Park prescriptions is broad term for a movement to
strengthen the connection between health care P&R to improve the physical and mental
health among individuals and communities. Current research has recently and is now being
conducted at an academic level to test validity and implementation of this type of program
(Christiana, Battista, James, & Bergman, 2016; Sallis et al., 2016; Selentrich, 2015; Zarr,
Cottrell, & Merrill, 2017), including current research at NC State University.
In April 2015, the American College of Sports Medicine and Kaiser Permanente
convened a joint consensus meeting to discuss how to make PA assessment and exercise
prescription a standard of care, with the most important step in the process being the
implementation of a physical activity vital sign (PAVS) during medical care (Sallis et al.,
79
2016). This would allow for baseline and ongoing evaluation of PA through a medical office,
and would also allow for measurement of success of any prescriptions of exercise. This
would promote strong potential partnerships with between the medical community and P&R,
helping to further position P&R as a preventive PH provider. Previously, most information
on Park prescriptions was available only from a practitioner and/or association organizational
level (ALR, 2016; NRPA, 2016). This type of partnered campaign can open doors to connect
with doctors/physicians and even school nurses who can prescribe children that are
overweight, obese, diabetic, asthmatic etc. to get out and go play. Typical goals include:
Connect children with nature and basic play for health benefits
Create champions: build capacity among pediatric health care providers to be
leaders in prescribing nature and recreational play
Refer families to a park or nature center within economically,
racially/ethically, and culturally diverse communities
Park prescriptions offer an alternative to treating or preventing health problems that
focuses less on traditional medicine and more on connecting with parks and nature to
increase levels of physical activity and reduce levels of stress. The movement has quickly
grown from concept into a period of rapid implementation with programs being developed
across the country (ALR, 2016; Sallis et al., 2016; Zarr, Cottrell, & Merrill, 2017). The
number of programs likely will continue to evolve, but some of these similar programs noted
in 2016 are included in Table 2.

80
Table 2. Identified Prescriptions for Parks Programs
Name Website Docs in the park http://bcrp.baltimorecity.gov/Recreation/SpecialPrograms/Do
csinthePark.aspx Exercise is Medicine http://www.exerciseismedicine.org/Rx: Play http://www.oregon.gov/oprd/PLANS/pages/planning_rx_pla
y_medical_admin.aspx Park Rx http://www.parkrx.org/ Walk with a Doc www.walkwithadoc.org
The Role of Allocating Resources and Return on Investment
Related to systems planning, the role of allocation of funding and resources to address
the health factors appears to be a primary organizational element, with strong impact on
potential effectiveness. No community public agency has unlimited funding, and public
agency decision makers must make tough decisions related to allocation of staffing resources
and investment of public tax dollars, especially as related to P&R services (Burns, 2016;
Godbey & Mowen, 2010; Moiseichik, 2010). Cost-effectiveness and cost-benefit studies
have demonstrated the ability of PA interventions to offer ‘‘good value for money,’’ but most
of these studies have focused on interventions at the individual or patient group level (disease
prevention, secondary prevention) (Laine et al., 2014). Studies of the cost-effectiveness of
PA interventions at the local population level are relatively few (Laine et al. found ten studies
through a systematic review). However, if an intervention can change the amount of PA in a
population, it also may change health care costs incurred by individuals, local communities,
and the nation as a whole (Laine et al., 2014; Roux et al., 2008). One purpose for this current
research is to identify factors that may influence resource allocation and potential resultant
return on investment related to prioritizing those factors for interventions at the local level.

81
Potential Community-Specific Strategies and Data Collection Tools
The previous sections focused on literature around the health factors, theoretical
basis, and contributing organizational elements. The following sections focus on strategies
that may be used to measure or address the health factors in local community systems.
Measuring Physical Activity and Other Factors
As PA has been the primary traditional factor overtly addressed by P&R agencies,
there is more literature available on how to measure and address PA than the other factors.
However many measurement techniques could be modified to be used as strategies to
measure the other factors. Each method or strategy for PA assessment has their own
limitations and opportunities (Kaczyinski & Henderson, 2007; Saint-Maurice & Welk, 2014).
The complex nature of activities makes it difficult to accurately measure all of its aspects and
assess the impact on outcome parameters, such as energy expenditure. Different
measurement techniques available can be grouped into five categories: behavioral
observation, self-report (questionnaires and activity diaries), physiological markers (heart
rate, body temperature, ventilation), wearable motion sensors (pedometers, accelerometers),
and indirect calorimetry (Hipp, Adlakha, Eyler, Chang, & Pless; 2013; Plasqui & Westerterp,
2007; Schutz, Weinsier, & Hunter, 2001).
Most studies on parks, PA, and health outcomes primarily use the individual as the
unit of analysis. Only a few studies have examined outdoor recreation opportunities and PA
at macro-level scales, such as across counties or metropolitan areas (Edwards et al., 2011,
Rosenberger et al., 2009). Literature indicates that there are methods and researchers have
measured actual activity within specific site contexts. For example, recent research has
shown that adolescents were more likely to engage in PA and achieved their highest PA

82
levels when using built environments located outdoors (Oreskovic et al., 2015). Babey, Tan,
Wolstein, and Diamant (2015) found that in California, 71% of adolescents reported being
physically active the last time they visited a park, older adolescents and females were less
likely to be physically active in parks, and adolescents with a park within walking distance of
home and those with a safe park nearby were more likely to be physically active during a
park visit. A 2015 systematic review and meta-analysis of 23 studies showed that in studies
that located youth PA with GPS, walking to school produced small increases in activity
compared with transport by car or bus, and greater proportions of activity took place in
streets and urban venues (40-80%) than in green spaces (20-50%) (McGrath, Hopkins, &
Hinckson, 2015).
Ideally, PA should be assessed during daily life, over periods long enough to be
representative of the habitual activity level and with minimal discomfort to the subject.
Furthermore, it is important to identify PA patterns (frequency, duration, intensity) as well as
activity-related energy expenditure (AEE) (Sallis et al., 2016). The limitations concerning the
accurate measurement of PA are often amplified in young people due to the cognitive,
physiological, and biomechanical changes that occur during natural growth, as well as the
challenges brought from youth having different types of patterns of PA compared with adults
(Corder, Ekelund, Steele, Wareham, & Brage, 2008).
Validity is a measure of how well the research actually represents the true construct
of interest (Remler & Van Ryzin, 2015). A variety of validity measures and definitions exist,
but primarily they are related to measuring that the research has 1) Face validity – does the
measure get at what we really want to measure?; 2) Content validity – Does the measure
include all dimensions of the construct?; and 3) Criterion validity – does the empirically

83
measure the concurrent findings of other research and/or have predictive capabilities?
(Remler & Van Ryzin, 2015). Kelly, Fitzsimons, & Baker (2016) presented an argument that
validity alone is not sufficient when studying PA and sedentary behaviors, as these are multi-
dimensional constructs that are multi-faceted. They can be described by multiple domains,
dimensions, and correlates or determinants that require context of not only a single outcome,
and to compare results to such type of an analysis can lead to an incorrect perception of the
strengths and weaknesses of different methods and a false hierarchy of measures. They
suggest a framework approach to PA research is necessary that includes attention to multiple
domains, dimensions, correlates and determinants. This includes duration, frequency,
intensity, and type of PA, along with where, when, why, and with whom it is occurring.
Collecting data on PA can be achieved through a variety of methods. A researcher
may use self-report methods (individuals subjectively report their activities) and
observational methods (the activity is objectively observed from an outside researcher or
instrument). The goal of these measurements are to get at the truth of what is really
occurring. Benefits, trade-offs, and limitations are common to all methods (Sallis & Saelens,
2000).
Observational tools and methods for assessing PA. According to Sallis (2009), the
optimal measurement of PA underlies all of the major elements of the evidence base for, and
the practice of, health promotion. Accurate physical activity measurement is important for
informing overall health promotion efforts (Bauman, Phongsavan, Schoeppe, & Owen,
2006). The following list provides an overview of primary observational tools. This list is not
exhaustive, but provides an overview of themes emerging from the literature related to the
common methods that can be used related to assessing PA in P&R systems.
84
Site audit tools for PA. Many site audit tools attempt to objectively assess the
environment as it relates to PA (Schultz et al., 2016). It is important to note that this current
study is not designed to validate the accuracy of the vast array of physical activity
measurement tools, especially those that are only suited for site specific or individual
application. Rather, this study aims to identify which tools are emerging as potentially best
suited for application in a P&R local community system setting at low cost, with efficiency,
and easy adoption for assessment of larger populations.
There has been an increase of measurement of benefits for PA from observational site
specific design attributes, or participation (use of) public spaces such as parks, trails, and
facilities (Bedimo-Rung, Mowen, & Cohen, 2005; Chiesura, 2004; Kaczynski, Potwarka, &
Saelens, 2008; Kaczynski, Wilhelm Stanis, & Besenyi, 2012). Satellite imagery is now being
used to identify components in mapping and to measure “greenness”, tree canopy, and water
coverage (Brown et al., 2016; Layton, 2016b).
Direct site observation. Beyond simple site assessment, there are many methods for
direct observation of PA on specific sites. For example, Behavior Mapping may be useful for
auditing to provide snapshots in time to evaluate how specific spaces are being used for
behaviors (NLI, 2016). This can help in analyzing transportation patterns, facilities, or park
sites. Site specific audit tools can help evaluate the levels of PA from sites and programs.
(Cohen et al., 2011; McKenzie, Cohen, Sehgal, Williamson, & Golinelli, 2006). They can be
useful for site specific PA analysis and pre-post audits if changes are recommended for sites,
but as of yet, are not as applicable to full community systems analysis.

85
In addition to those described previously, many other site-specific technical tools
have been developed to measure physical activity in parks. Most have been developed since
2000. Some published approaches include:
BRAT-DO (Bedimo-Rung, et al., 2006)
EAPRS - Environmental Assessment of Public Recreation Spaces (Saelens,
Sallis, Black, & Chen, 2003; Kaczynski & Havitz, 2009)
PARA – Physical Activity Resource Assessment Instrument (Lee et al., 2012).
POST - Quality of Public Open Space Tool (Leslie, Cerin, & Kremer, 2011)
SOPARC, SOPLAY, SOFIT, and ISOPARC (Bocarro et al., 2009, Floyd et
al., 2011, IPARC, 2012, McKenzie et al., 2006,).
CPAT – Community Park Audit Tool (BEACH Lab, 2015).
Wearable physical activity sensors with GPS. Initial motion sensors included basic
pedometers and accelerometers. New technology has enhanced the opportunities to measure
individual motion-based PA (Tremblay et al., 2011). Devices such as accelerometers,
pedometers, and Geographic Positioning System (GPS) enhanced wrist watches (e.g., FitBit
& Garmin wristbands) can allow researchers to track the complete whereabouts and 24-hour
activity levels of participants (Evenson, Wen, Hillier, & Cohen, 2013). There may be cost
limitations (someone must buy the device for each wearer) and potential privacy concerns,
but data are now be being collected and may be potentially available from the larger
manufacturers. Previous research has indicated that seven days of data are sufficient for
analysis, as this includes both weekdays and weekends (Trost, Pate, Freedson, Sallis &
Taylor, 2000).

86
Webcams and crowdsourcing. New technology has also enabled tracking of PA
through the use of webcams in public places, and crowdsourced reporting and analysis.
Although they have a variety of uses, these tools can be helpful for identifying traffic patterns
and physical activity through unobtrusive observation, and may allow for use of big data
through public webcams in some communities (Hipp, Adlakha, Eyler, Chang, & Pless,
2013). These may be primarily observational, or include self-reported data and reporting,
depending on the usage. Crowdsourcing has also become a popular tools for having the
public identify issues that they have observed in their communities. This can include creating
open public reporting sites such as MySidewalk (www.mysidewalk.com) and free satellite
imaging (e.g., Google Earth, Community Commons).
Doubly labeled water. The typically referenced “gold standard” for assessing and
observing PA is through use of doubly labeled water, where metabolic by-products of
individuals are analyzed to determine energy expenditure (Kelly, Fitzsimons, & Baker,
2016).
Limitations of using Observational Tools. Although it is considered the most accurate
method, there are strong limitations to the doubly labeled method for use in larger
populations and system-wide studies in terms of cost, technology, clinical needs, and
compliance (Kelly, Fitzsimons, & Baker, 2016; Plasqui & Westerterp, 2007). Observing data
with the other proven protocols is typically more expensive, as trained observers must be
available to collect the data. Using technology to observe PA may remove the issue of
observer reliability and self-report bias, but still leads to some challenges. The validity of
accelerometers and pedometry for tracking PA has long been validated. However, there are
still limitations related to assumptions that must be made and decisions for compliance by the

87
participant. There is an increased cost, and for youth, some parents and teachers feel these
methods may be invasive. It is difficult to do a full-system wide analysis with these types of
measures. To do an accurate full system-wide assessment observation of physical activity, all
sites within the system would need to be observed.
Spatial Analysis Tools for Assessment of Spaces and Programs
Various researchers have been looking for assessment tools that move beyond the
direct and observational assessment of physical activity related to an individual park and/or
its components, to a larger community-wide assessment of those and other factors and
components to evaluate how they are providing a level of service for health for the
community as a whole (Compton & Kim, 2013). Geographic Information Systems (GIS)
allow for spatial analysis so researchers and planners can efficiently display a variety of past,
current, and potential future spatial conditions and situations that enable the researcher to
determine trends and consider prospective geographic and locational scenarios (Aytur, Jones,
Stransky & Evenson, 2014; Betts & Penbrooke, 2007; Chancellor & Cole, 2008; Layton,
2016b; Penbrooke & Layton, 2007). As related to the PH factors, units of participation, the
locations of spaces, proximity analysis for assets and food availability, and transportation
options that can influence activities can be digitized, analyzed, and graphically portrayed
(mapped).
Through the improvements in GIS since the late 1990s, creation of a detailed
community-wide database has become somewhat more manageable for decision-making, but
it is still relatively new and many communities do not yet have this level of detail. Many are
now using GIS for point, polygon (parcel), and linear basis. Even Google Maps provides this
type of detail for most U.S. communities. However, the ability to add qualitative and

88
components for quantitative analysis for a full community has only recently become possible
(Aytur, Jones, Stransky & Evenson, 2014; Chancellor & Cole, 2008; Penbrooke & Layton,
2007). Researchers are now more often gathering this information for community-wide P&R
system decision making, often using the following tools and methods which appear to useful
for this type of research.
ParkIndex. Kaczynski et al. (2016) summarized and addressed a measurement system
that is based on the idea that access to and use of parks are associated with diverse
environmental, economic, social, psychological, and physical health benefits. They described
that despite enthusiasm among researchers and planners in several fields (e.g., urban
planning, parks and recreation, public health), it remains unclear which park metrics correlate
with park use and how best to combine diverse indicators into a strong measure of park
access and exposure. These researchers stated that a lack of comprehensive and standardized
metrics for measuring park exposure limits park-related research and health promotion
efforts. They developed an empirically derived and spatially represented index of park access
(called ParkIndex) to allow researchers, planners and citizens to evaluate the potential for
park use for a given area. Results from Kansas City, Missouri, showed that two park
summary variables — the number of parks and the average park quality index within one
mile — were positively associated with park use. ParkIndex could provide standardized
metrics of park access that combine elements of both park availability and quality, and they
can be represented spatially.
Park Metrics (formerly called PRORAGIS). This voluntary submittal online system
created by the National Park and Recreation Association (NRPA) looked at an inventory of
some attributes of a parks and recreation system to attempt to create a nationwide

89
benchmarking tool for communities. In the 1980’s, NRPA published the Recreation, Park
and Open Space Standards and Guidelines to address appropriated Levels of Service (LOS)
and to assist agencies in the planning and development of park and recreation facilities
(Lancaster, 1983). Although these guidelines are still widely used by earlier-trained
professionals, NRPA no longer considers their use a best practice for agency management
and planning. Applying a “one size fits all” approach to address the needs of widely varying
communities does not provide accurate guidance for parks and recreation planners
(Penbrooke & Layton, 2007). Instead, NRPA advocates the use of comparative
benchmarking. Researchers for NRPA have created the Park Metrics tool, (formerly called
Parks and Recreation Operating Ratio and GIS or PRORAGIS™) system as a tool to collect
and analyze data about parks and recreation agencies across the country
(http://www.nrpa.org/publications-research/parkmetrics/). The goal was to allow users to
compare themselves to other departments that they identify as similar to themselves –
whether similar in geography, climate, size, or number of total employees. Members of
NRPA have free access to this tool. Limitations of this tool are that data are self-reported by
agencies using a variety of inventory and level of service tools, with varying degrees of
sophistication. A cursory review of available data indicates current various deficiencies in
accuracy and the number of communities participating. This may be addressed as agency use
of standardized GIS and digital level of service tools grow. The other limitation is that the
original PRORAGIS dataset intentionally did not include a qualitative analysis of
components of a community’s system, but simply quantitative and locational attributes,
typically parcel-based. It does not include a walkability analysis. As the submittals are
voluntary from agencies using different collection systems and formats for attributes,

90
accuracy was proving difficult to achieve. In late 2016, NRPA discontinued the use of the
geo-spatial elements, but continued focus on the quantitative capacity-based benchmarking
capabilities of this online national tool, with a goal of creating a more reliable system (Kevin
Roth, NRPA Vice President of Research, personal communication, Nov. 11, 2016).
Component-Based Methodology (CBM) Level of Service Analysis. This digitally-
based inventory and level of service (LOS) system was created by practitioners and
consultants in the field in the 2000’s to address the community-specific deficiencies that
were not addressed through the previous standard NRPA LOS capacity-based practices. It
includes point, parcel, and linear GIS basis for location, accessibility, walkability, along with
qualitative functionality assessment for selected attributes for a full system of all relevant
components owned and managed by a community (Penbrooke & Layton, 2007). This system
has been utilized by more than 100 communities nationwide, and some national and trade
associations have acknowledged its applicability and success in practice (e.g., American
Planning Association and NRPA). NRPA used it for a national inventory analysis of youth
football fields and it was considered during the formulation of attributes and standard for
PRORAGIS in 2008-2009, but it was considered too sophisticated at that time by NRPA for
broad use by most public agencies. Peer-reviewed academic validation and publication are in
process (Layton, 2016b).
GRASP®Active. The spatial analysis of provision of urban greenspace system such as
parks and facilities is one way to address PH, but reliable guidelines and policies for
greenspace provision require the availability of sound measurements of greenspace
effectiveness in order to achieve predictable outcomes. The effectiveness of exposure to
greenspace as a treatment for health disorders appears to be a function of three factors: a) the

91
frequency of exposure; b) the duration of exposure, and c) the intensity of the exposure (Kuo,
2013; Shanahan, Fuller, Bush, Lin, & Gaston, 2015; Shanahan et al., 2016; Wells, 2014). For
parks, greenways, and other greenspace features, this translates into how often one visits
(frequency), how long they stay (duration), and the quantity of the visit (intensity). A
measurement that encapsulates characteristics that contribute to visiting more often, staying
longer, and enjoying a richer experience is useful for determining the “dosage” that a
particular greenspace location or feature provides.
An additional recent geo-spatial analysis measure, which has been an off-shoot of one
professional consulting firm’s proprietary version of CBM LOS analysis, called GRASP®
(www.dcla.net), has shown promise in the professional P&R planning realm for addressing
quality and dosage. It is called GRASP®Active. This measurement tool was developed for
use in assessing the potential for a park system and the features within it to generate physical
activity within the surrounding community. GRASP®Active merges CBM LOS for
assessment of greenspace features (Penbrooke & Layton, 2007) with empirically derived
evidence on health benefits (Shanahan et al., 2015; Shanahan et al., 2016) and active energy
expenditure data developed by NCSU (Floyd et al., 2015) to evaluate the propensity of
greenspace to generate physical activity. The resulting composite indicator (described in
detail in Layton, 2016b) combines the quantity, distribution, functionality, and energy
expenditure associated with park components with the quality of the overall park setting. The
measure can be thought of as the potential “dosage” of physical activity associated with
exposure to the park system and elements within it. Although GRASP®Active has been
focused on aspects of greenspace related to physical activity, a similar approach could be
92
used to develop indicators of greenspace strength related to other domains of health,
including social, ecosystem, and economic outcomes.
Suggested Measures and Methods for Linking Health to Park and Trail Planning
Based upon information collected from an NCSU research project (Schultz et al.,
2016), the Centers for Disease Control and National Park Service staff identified eight useful
measures for linking public health goals to park and trail system planning (Merriam, Bality,
Stein, & Boehner, 2017). These measures were vetted with park and recreation professionals,
public health practitioners, and academic researchers. The suggested measures are:
Proximity – Percentage of the population (city/county/state/national) living within a
half mile of a public park or trail corridor boundary.
Walking access – Percentage of the population (city/county) with less than a half-mile
walk route to a public park or trail entrance.
Park connectivity – The ratio of the number of people with less than a half-mile walk
route to a public park or trail entrance to the number of people living within a half
mile of that specific park or trail corridor boundary.
Land area – Percentage of land area designated as public parks or trails.
Physical activity – Percentage of users engaged in sedentary, moderate, or vigorous
physical activity at a specific facility area.
Visitation – Annual number of visits to a specific facility area.
Frequency – Average number of visits to a specific facility area by an individual
during a period of time.
Duration – Average time spent at a specific facility area by an individual.

93
Self-Reported Data Tools
Gathering self-reported data related to the health factors through interviews,
questionnaires, and other hardcopy or online mechanisms can provide an easy and relatively
low-cost way to collect large amounts of data (Sallis & Saelens, 2000). Online surveying has
enhanced the ability to get information from large populations at low cost (Flick, 2014).
Objective observed data are typically more valid (if the tools are well-designed, reliable, and
protocols are followed), and self-reported data sometimes have poor validity, as the subjects
may have memory-related, emotional, or psychological reasons for providing responses that
are not accurate. They may simply not recall the information, or may want to present the
actual activities differently than is empirically true for social reasons (Pate et al., 2002;
Remler & Van Ryzin, 2015; Sallis & Saelens, 2000).
Although research indicates many instances of using self-report instruments for PA
research (e.g., GP RED – SMT, 2016; Saint-Maurice & Welk, 2014), most studies using self-
reports do not provide accurate estimates of the absolute amount of PA, so when absolute
amounts need to be estimated, objective measures should be used. Few self-report measures
have been developed for or validated in distinct demographic, ethnic, or cultural groups
(Sallis & Saelens, 2000). When used in combination with objective measures, the most
effective role of self-reports may be to assess the context and type of physical activities.
However, given cost and resource limitations, especially when looking at system-
wide PA, self-report mechanisms may be an effective way to gather large amounts of data.
There is power in gathering data from large populations that help limit the challenges of
small groups for self-report (Flick, 2014; Remler & Van Rzyin, 2015). Multiple self-report
physical activity measures are available, with adequate reliability, content validity, and
94
relative criterion validity that can be used with youth, adults, and older adults. There is still a
need to improve the utility of self-report instruments that can be more effectively deployed in
a cost effective way (Bauman, Phongsavan, Schoeppe, & Owen, 2006; Pate et al., 2002).
Strong protocols, pilot testing of instruments, and testing relative to observed measures can
help improve validity, but for the highest level of accuracy, they should be used as part of a
mixed-methods approach, analyzed in a framework that considers full community context. A
couple of the more innovative current methods for strategically gathering and organizing
self-reported data and input follow.
Multi-Attribute Utilities Technique (MAUT). The Multi-Attribute Utility Technique
(MAUT) is a nominal group technique that has been used for gathering organized self-report
data. This method also facilitates PH decision making among diverse groups of stakeholders
using identified relevant factors and indicators for the subject at hand by other (Chapman,
1999; Zachry, Woodie, & Skrepnek, 2002). Compton, Kim, and Damask (2012) adapted the
technique to help community coalitions rank priorities of factors and indicators for P&R
agencies, with a focus on five of the potentially modifiable health factors (PA, nutrition,
transportation, social engagement, and safety) and various methods/indicators identified from
the literature for addressing those factors. The method was pilot tested with South Bend,
Indiana in 2012 with their Active Youth Initiative. Kim prepared ranking and calculation
sheets for onsite usage, and performed a Mann-Whitney U-test (Siegel & Castellan, 1988) to
examine if there was a significant mean difference in the perception of importance between
groups. Since that time, the MAUT has been utilized with two additional community
coalitions who were addressing positioning of P&R agencies as preventive public health
providers (Liberty, MO, and Arlington Heights, IL). These agencies have representatives on

95
the Delphi panel. As the Delphi panel Key Informants have used this method, examples were
provided of MAUT results used in community process in the study repository, and are
available in publicly released documents available at http://www.gpred.org/initiatives/
healthy-communities-research-group/. The MAUT process includes a multi-stage rating by a
group of onsite informants, with discussion and information exchange within the middle of
the process to inform and engage informants of differing backgrounds. A quantitative scoring
of coefficients is calculated and provided in real time for review and on-site validation. Most
of the methods initially ranked Questionnaire #1 for the Delphi panel were based on the
identified factors and indicators from the adapted MAUT process (Compton, Kim, &
Damask, 2012). A full overview of the process, factors, and indicators measured is available
in the community reports at http://www.gpred.org/initiatives/healthy-communities-research-
group/.
Photovoice. Often it is important to use other means beyond oral or textual data
collection, especially given populations with lower cognitive or developmental capabilities,
or language barriers. Photovoice is a self-reporting engagement and onsite surveying process
through which people can identify, represent, and enhance their community using a
photographic technique (Wang & Burris, 1997). Photovoice provides a photo documentation
observational method that can be used to train people to observe and document their
priorities, perceptions of safety concerns, and barrier analysis, even without verbal or textual
input (Henderson & Heath, 2015; Strack, Magill, & McDonagh, 2004; Wang, & Burris,
1998). It can be used for documenting walking and biking with photos and text to show
decision makers how the youth or those without strong language skills perceive in their
world.

96
Photovoice has three primary goals: 1) to promote critical dialogue and knowledge
about important issues through large and small group discussion of photographs 2) to enable
people to record and reflect their community's strengths and concerns through visual means
rather than just textually or orally, and 3) to help share that information with policymakers
(Strack, Magill, & McDonagh, 2004; Wang & Burris, 1997). This tool has been used by a
variety of researchers to enable youth and/or non-English speaking participants to graphically
record examples of their thoughts and recommendations, and could be one viable tool for
community specific youth research (Henderson & Heath, 2015; IPHI, 2015).
Although some may argue that this self-report tool may not be as valid and reliable as
observational methods, with the advent of digital photography and cell phones with cameras,
the decreased costs and ease of use is making this method more achievable for larger systems
analysis. The photos tend to be more reliable indicators than verbal data provided. This has
proven to be helpful as a health promotion strategy and increasing of awareness of barriers to
decision makers through youth engagement (IPHI, 2015). This technique can be considered a
component of Participatory Action Research (PAR), and includes image-based analysis. It
has been growing in usage, particularly related research and planning for community health
(Henderson & Heath, 2015). A related observational tool growing in use by researchers, but
not fully described here or yet in use by practitioner agencies, is the use of big data visual
photo gathering and analysis through community-installed cameras.
Methods and Strategies for a Potential Focus on Youth
In the literature, research has shown that the interventions often need to start with
youth (Beyer, Heller, Bizub, Kistner, Szabl Shawgo, & Zetts, 2015; Shannon, 2006). Early
adolescents (ages 12–14) may be an ideal group to examine more closely. They are typically

97
cognitively and developmentally ready for more involvement, autonomy, and responsibility;
hence, parental guidance, supervision, and authority wanes as peers assume more influence,
presenting increased opportunities and pressure to experiment with risky behaviors
(Steinberg, 1999). Recent literature lends support to the fact that some psychosocial factors
such as self-efficacy and physical competence may be solid anchor points upon which to
improve the participation of youth in voluntary activity (Frazier et al., 2015). The facilitated
development of motor skills may also be a good means for enhancing the self-image of obese
children (Guinhouya, 2012). Therefore, community interventions to increase physical activity
and/or reduce obesity may also need to include focus on improving these personal
dimensions around which physiological and environmental factors might revolve. Some
health factors in youth may lead to lifelong impacts if not addressed early. For example,
obese and overweight children and adolescents not only experience the physical
consequences of obesity, they often also suffer from higher levels of depression, lower self-
esteem, social isolation, more bullying, and a poorer quality of life in comparison to their
peers that may carry on into adulthood (Hills, Andersen, & Byrne, 2011; Janssen, Craig,
Boyce, & Pickett, 2004; Strong et al., 2005).
As one of the challenges for P&R agencies is in determining community specific
information from the youth themselves, one form of collecting self-reported data is the
surveying the youth within a given community. Much of research is focused on national,
state, or county level (Slater et al., 2010). In recent years, there have a been a variety of
youth-specific surveys or evaluation scales that attempt to garner evidence on knowledge,
awareness, participation, and/or skills related to youth and the identified health factors on a
community specific level. The purpose of the review of these types of tools in this study is
98
not to validate or recommend a specific survey tool, but to identify some of the more
common examples from the literature that are or could be used in a P&R setting to garner
usable youth information from a specific community. PhotoVoice was listed a previous
section, and that method can also be effective. Additional methods are listed below in no
particular order.
Environmental Perception and Attitude Surveys. Research has consistently shown
that children’s outdoor experiences affect conservation values, stewardship behaviors, and
participation in outdoor activities later in life (Wells & Lekies, 2006). There have been a
variety of survey tools that have been created to use for gathering information on youth
perception of the environment. Tools such that measure children’s attitudes may help
forecast a child’s willingness to engage in pro-environmental behaviors and activities as an
adult (Larson, Green, & Castleberry, 2011; Wells & Evans, 2003).
One example of a youth survey tool is the Children’s Environmental Perception Scale
(CEPS), created by the University of Georgia researchers as a survey instrument to assess the
environmental attitudes and awareness of children from different ages (6 to 13-yearolds) and
ethnic groups (Larson, Green, & Castleberry, 2011). Eco-affinity and eco-awareness emerged
from preliminary mixed-methods pilot studies as two distinct components of environmental
orientations to be measured. This simplified evaluation tool may help educators and
researchers examine the ways children perceive the natural world. It may also help to identify
cognitive and affective aspects of existing environmental education programs that need
improvement.
Additional similar environmental survey instruments have been utilized and
published. The Environmental (2-MEV) Scale questionnaire was developed in Europe to

99
measure adolescents’ attitudes and gauge the effectiveness of educational programs, forming
the basis for the theory of ecological attitudes (Johnson & Manoli, 2011). The 2-MEV Scale
was modified for use with 9 to 12 year old children in the United States. Some other cited
earlier instruments include The Children’s Attitudes Toward the Environment Scale (CATES)
(Musser & Malkus, 1994), the Children’s Environmental Attitude and Knowledge Scale
(CHEAKS) (Leeming, Dwyer, & Bracken, 1995) and the New Ecological Paradigm (NEP)
Scale for Children (Manoli, Johnson, & Dunlap, 2007). Other often cited surveys include:
The youth-focused Neighborhood Environment Walkability Scale (NEWS-Y)
provides a survey assessing physical activity in various locations (Rosenberg et al., 2009).
The surveys have been tested for validity for adolescents regarding perceived land use mix-
diversity, recreation facility availability, pedestrian/automobile, traffic safety, crime safety,
aesthetics, walking/cycling facilities, street connectivity, land use mix-access, and residential
density. The NEWS-Y has acceptable reliability when conducted by trained researchers and
subscales were significantly correlated with specific types of youth PA. The NEWS-Y can be
used to examine neighborhood environment correlates of youth PA.
The Youth Activities and Nutrition Survey (YANS) was designed as an online in
middle-school survey specifically to help identify and address health factors that could be
modifiable by P&R agencies (Kim, Jordan, Compton, & Penbrooke, 2015). It has been pilot
tested, conducted, and considered effective and reliable in practice in three different U.S.
communities (including two of the Delphi panel agencies) but has not, as of yet, been fully
tested for reliability or validity through a peer-reviewed process.
Researchers from Indiana University, East Carolina University, and GP RED initially
created the YANS. It is now owned and licensed by GP RED’s Healthy Communities

100
Research Group (www.GPRED.org). The survey was created as part of a larger Surveillance
and Management Toolkit (SMT) focused on exploring five primary LTPA and obesity
factors: nutritional habits, physical activity participation, transportation and access, perceived
safety, and parental/cultural engagement, as part of an overall ecological systems approach
(Compton & Kim, 2013; Compton, Kim, & Damask, 2012; Compton et al., 2011).
To date the YANS has provided results from an online middle school youth survey
from three communities (Liberty, MO, n=2,502; Arlington Heights, IL, n=1,425; and Halifax
County, NC, n=551) for a total of N = 4,478. Known limitations have been found for using
self-reported data from middle schools students, especially in terms of recall and honesty,
and the use of self-reported height and weight to calculate BMI. However, with the power of
almost 4,500 responses collected for the YANS from these three communities, it appears this
may be a potentially important data source and potential tools for collecting youth-focused
community-specific recalled data with relatively low cost and time investment. Community
demographics were provided as study background. The online survey consists of 23 question
blocks with variables as shown Figure 10. The survey was conducted during school time
(average completion time was 18 minutes) using computers in schools, monitored by school
representatives. A protocol and training was provided to schools for testing and approved by
the Institutional Review Boards of both NCSU and East Carolina University.

101
Figure 10. YANS variables
Question Topics Exploratory Variables Variable context
BMI Height (in.) / Weight (lb.) To calculate BMI (primary dependent variable)
Age Year and Month Born To calculate cohorts/ageGender Male or FemaleGrade 6th, 7th, or 8th
Race/ethnicityAfrican American, Asian,
Latino/Hispanic, Native American, White, Mixed
role of race/ethnicity
Types of Food for Breakfast & # of times eaten in past week didn't eat, cold, fast, hot, etc.
descriptions of types of meals provided
Where and # times ate breakfast home, school, restaurant, elswhere
Where and # times ate lunch home, school, restaurant, elswhereWhere and # times ate dinner home, school, restaurant, elswhere
Types of Food for dinner & # of times eaten
didn't eat, cold, fast, hot, etc. descriptions of types of meals provided
Dinner environment home, family, friends, aloneTypes of Food and # times eaten
per weekfresh fruit, vegetables, fast food, sugar-
sweetend beverages, milk, etc.descriptions of types of meals
provided
OST Activities hang out, park, sports, youth groups, outdoor, other
types of activities participated
Hours participated OST activities hours per OST activity matrix with hours selectionorganized sports participation and
agesage of specific sports participation (17
options + other)ages of participation (age of drop-
out)hours non-PA activities - weekday
vs. weekendacademic, TV, computer, video games choices of activity with matix for
hours weekday and weekend
#Friends participated #Friends per OST activity matrix with # friendsreasons participated in OST
activitiesfriends, fun, skills, stress release,
physical, parental, etc. (14 options)choices of reasons for participating
reasons don't participate in OST activities
$$, permission, no interest, time, lack of friends, skills, health
choices of reasons for not
Parental engagement and habits nutritional habits, PA habits, TV habits, encouragement, etc.
agree or disagree with 13 statements regarding parents
Transport to school walk, bike, driven, busTransport to OST activities walk, bike, driven, bus
Note, variables are organized into 23 question blocks, with some including multiple questions.Source: Youth Activities and Nutrition Survey (YANS) , © GP RED 2013, www.gpred.org
YANS Questions - Variables and Context
Social and Parental Engagement
Activities - Out of School Time (OST)
Transportation
Demographics
Nutrition
102
Other youth community-specific surveys and constraints. Reimers, Mess, Bucksch,
Jekauc, and Woll (2013) conducted a systematic review to identify reliable and valid
questionnaires for assessing neighborhood environmental attributes in the context of physical
activity behaviors in youth. Current gaps and best practice models in instrumentation and
their evaluation were discussed. They identified 13 questionnaires on attributes of the
neighborhood environment, with seven of them conducted in the U.S. They were examining
strengths and weaknesses of methods primarily. They recommended that cross-culturally
adapted questionnaires be used, with promotion of high-quality studies focused on
standardized measurement properties. They indicated that measurement models should be
specified to ensure that appropriate methods for youth-appropriate psychometric testing are
applied in all studies.
Sampling procedures can cause challenges when based on school clusters or
convenience samples, which might lead to clustered samples within similar neighborhood
environments. In addition, convenience samples might not cover the entire target
populations. However, youth specific surveying, in general, may be an efficient and feasible
way to identify youth perceptions and activities within communities. As always, the larger
the sample size, the more likely the results will be representative.
Summary of the Literature Review
This thematic literature review was initiated originally just to identify the modifiable
health factors that can be addressed by P&R agencies. As the review continued, the research
uncovered a variety of topics around systems theory, followed by organizational elements,
methods, and strategies that appear to be important and relevant to P&R agencies. As new
ideas emerged from the Delphi panel and case study, additional review and research was

103
conducted. The findings on factors and strategies have purposefully not been presented in
any priority order; however, as the review progressed the literature was analyzed in
conjunction with the Delphi panel and case study priorities and input, key themes began to
emerge. It became clear that to address the health factors from a basis of systems theory, I
needed to include focus on three strong categories. These are 1) the theory itself (systems
theory or systems thinking, and related theories) and how that may apply to P&R agencies, 2)
the actual factors themselves, and 3) potential strategies and prioritization tools that can be
used by P&R agencies to systematically address those factors.
Summary of Key Theoretical Findings
Systems theory posits that all components of the system are important (Shermann,
2000). Any deficit or gap can be present and can impose a challenge or constrain on the rest
of the system. Related to P&R addressing modifiable PH factors, there are various systems
interacting to potentially modify individual level health through P&R in a community. There
is the overall community-level PH system. The local community includes additional actors
beyond PH such as hospitals, schools, public safety, planning, transportation, private and
non-profit alternative providers, and other governmental or community departments or
agencies. The P&R agency system (the unit of analysis for this study) is just one actor within
this overall system. P&R is the primary actor of concern in this study, along with the
educational and research system that trains staff and provides knowledge (and/or transfer of
knowledge) to the P&R agency. The ongoing need for knowledge transfer between research
and practice realms continued to emerge as a guiding constraint or opportunity (depending on
the agency) within the community system. The Delphi panel and case study helped to
identify which strategies agencies can use, given where they are in their current knowledge

104
base of the theories, evidence, and methods, decisions to adopt knowledge or create action,
and their available resources, tools, and determined strategies.
Summary of Key Modifiable Factors
The research seems to illustrate a complex web of potential factors and tools. The
primary factors from the literature were identified under themed categories of: assessing
physical activity, nutrition, safety, transportation and access, parental/social engagement,
access to nature, tobacco and alcohol use reduction, and the elements that measure or impact
these factors. Each factor can be explored more deeply with a variety of sub-elements, and
many are inter-related. Additional examples abound in the literature of the benefits of
addressing these factors through P&R strategies. For example, it has been found that youth
who reduce their overall television watching and videogame playing have shown weight loss
as one result (Robinson, 1999). It has also been found that simply spending more time
outdoors is correlated with increased activity (Pate et al., 2003) and reduction of stress, ADD,
and ADHD (Kuo, 2010; Kuo; 2014, Kuo & Taylor, 2004). Finally, community-based
interventions have proven to be an effective promotion of physical activity and weight
management. These programs were most effective when focusing on decreasing sedentary
behaviors and increasing motivation for activity (Epstein et al., 1995; Pate et al., 2003). The
factors are often interrelated. For example, studies have found that focusing on diet
(promoting healthy foods and balanced nutrition) as well as limiting sedentary activities
(such as television viewing) can be linked to healthy weight loss and increase in PA (Epstein
et al.,1995).
These findings from the literature substantiate that the efforts to create a community
specific framework of improvements and interventions through P&R promote interplay of

105
the key factors. It is important to remember that the focus of this dissertation research was
not on further validation of these factors themselves, but rather on further identifying the
potential methods, tools, and processes that P&R agencies are using to systematically address
these potentially modifiable factors for positive outcomes. From this literature review, efforts
moved forward to identifying and exploring examples of how some P&R agencies are trying
to effectively do so.
Summary of Key Strategies to Address the Factors
After an iterative review of the literature, guided and modified by the Delphi panel
and case study, the key strategies identified for addressing the factors were grouped under the
following thematic categories of coding:
Agency Organization and Culture
Community Engagement and Partnering
Governing Policies, Laws, and Procedures
Inventory and Assessment of Assets and Affordances (Programs and Services)
Financial Analysis and Resource Allocation
Figure 11 provides a schematic I adapted to identify and organize these thematic
categories and sub-elements for further review and use. These categories of strategies were
further explored in Delphi panel and case study research. A primary finding is that although a
global systematic approach may be desirable, each community is different. The priority of
factor importance and strategies need to be community specific, and determined through
systems analysis, planning, and evaluation.

106
Figure 11. Systematic assessment thematic categories
107
CHAPTER 3 - METHODOLOGY
Overall Research Approach
This study focused on answering the primary and secondary research questions
related to identifying factors and methods for intervention by P&R agencies to address
preventive PH factors in their communities. The unit of analysis was case-level, for this study
is about local P&R agency systems. The research included a mixed-methods approach
(Babbie, 2016; Brennan Ramirez et al., 2006; Flick, 2014; Yin, 2015; Young et al. 2013), and
primarily used inductive methodologies to identify, code, analyze, categorize, refine, and
validate emerging theoretical and thematic categories (Charmaz, 2006; Flick, 2014; Strauss
& Corbin, 1998; Yin, 2015). NC State’s Institutional Review Board (IRB) for the Protection
of Human Subjects in Research approved all methods used in this study. The use of extended
contacts, repeated observations, continuous observations, corroboration, and triangulation of
data sources and techniques helped to increase the internal validity (Flick 2014; Henderson,
2006).
The following process methods were used to address the research questions – an
integrative thematic literature review (as summarized in Chapter 2), a Delphi panel of Key
Informants (knowledgeable participants representing a local P&R agency), and a detailed
case study of two agencies whose representatives also participated as a Key Informant for the
Delphi panel. Focus on detail was greater for the case study agencies, and they were analyzed
comparatively to the other methods. The analysis of case study elements became more
deductive, guided by the categories to specifically explore application of agency resources
and decision making for prioritization (Yin, 2015). The following sections describe the
detailed processes for the Delphi and case study methods.

108
Delphi Study
After the initial thematic literature review was conducted and analyzed, a Delphi
study methodology was used to explore and answer the secondary research question - SRQ2:
Using Delphi study methodology, what do P&R professionals see as the key strategies in
systematic prioritization of modifiable health factors?
The initial literature review informed the study through initial identification of
theoretical basis and conceptual framework for addressing the research questions, modifiable
health factors from the literature, and identification of initial potential strategies and methods
for addressing those factors. Standard Delphi methods were used for further identifying
expert consensus on suggested research and practice applications through reiteration and
discussions.
The Delphi method uses a process of having an expert panel of Key Informants to
formulate solutions to problems through several cycles of revision based on each other's
feedback. Ideally, the end result provided a better solution than any of the experts could have
arrived at individually (Landeta, 2006, Young et al., 2013). Other fields such as medicine,
nursing, public policy, business, public health, and social work, have effectively used Delphi
approaches (Maxey & Kezar, 2015), but in P&R related research, use of this technique is
relatively new (Barth & Carr, 2014; Young et al., 2013). The Delphi method has proven to be
a well-suited as a research tool when there is incomplete knowledge about a problem or
phenomenon. Delphi studies typically includes two to four rounds of information gathering,
and previous published studies have included between 4 and 171 experts (Barth & Carr,
2014; Skulmoski, Hartman, & Krahn, 2007).

109
For this study, a panel of 17 Key Informants representing local P&R agencies were
identified to use the Delphi method to create a summary of suggested process methods for
P&R agencies to address identifying priorities for the factors and interventions. The process
was designed to provide input validity through reiteration. This helped identify processes
used in the field, further gaps, and limitation in research. At times, as additional factors or
strategies arose from the Delphi panel or case study, I conducted an additional literature
review on those factors and included that evidence in the summarized literature review.
The Delphi technique has long been supported in the literature as a consensus-
building tool based upon the collective opinion of knowledgeable experts (Hsu & Sandford
2007; Skulmoski, Hartman, & Krahn, 2007; Young et al., 2014). The primary weakness of
using the Delphi method included the inherent nature of using subjective judgment of the
experts selected (Green et al., 2007). The panel members were carefully selected according to
specific criteria, and they were provided with and asked to review large amounts of
information from the literature which helped to reduce misinformation on the topic, but they
may not be fully representative of the field as a whole.
Procedures for Delphi Panel
To identify Key Informants, I first reviewed a list of P&R practitioners I had
personally compiled since 2010 who had been conference attendees for sessions related to
P&R healthy communities topics, and who had indicated interest in participating in future
research. In addition, I conducted a national search of P&R agency websites including
keywords of “parks and recreation” and “healthy communities”, and gathered
recommendations from a representative of Health and Wellness division of the National
Recreation and Park Association. Eighty-eight potential Key Informants representing local
110
P&R agencies were invited through an IRB-approved form (Appendix B - Invitation to
Participate and Appendix C. Informed Consent Form) to participate by email. Criteria for
invitation to participate included:
Must have been a mid to senior-level practitioner at a local P&R Agency with at least
three years’ experience in the field (to help ensure familiarity with the agency).
Must have represented an agency that claims interest in addressing and/or improving
outcomes for at least one of the key factors identified from literature through P&R
agency actions.
The agency had to claim to be trying to assign at least some staff resources, trying to
convene stakeholders, collecting data, and /or attempting to identify measurable
outcomes related to the factors.
Seventeen informants (19% of those invited) indicated eligibility, availability, and
full commitment to participate in the Delphi panel. The rest invited either did not respond
(about one third), emails bounced (four), and the remainder responded with a statement
related to not having time to participate. No one invited indicated an opinion that this work
was not important, and quite a few who declined requested to receive copies of the full study
once completed.
The Key Informants indicated in the initial stages that they did not have a strong
understanding of the theory basis behind this research. However, this method was used
primarily to introduce them to systems theory, and to gain opinion and consensus for the
factors, methods, and strategies statements that are provided in the results and conclusions.
Figure 12 provides a graphic overview of the Delphi and case study process.

111
Figure 12. Delphi and case study process and timeline
Basecamp Study Management Site
I established an online group portal through Basecamp (www.Basecamp.com) to
allow for sharing of resources and organized project contacts for all panel participants. As
shown in representative Figure 13, a folder was created for each agency participating in the
Delphi panel, and the Key Informants were asked to upload any pertinent agency summary
documents, demographics, and policies, guidelines, planning documents, grant materials, or
reports related to the health factors. All of the agencies contributed resources to the
Basecamp folders, which led to sharing of 98 resource documents.

112
Figure 13. Screen capture of www.Basecamp.com resource portal, 12/24/16
Delphi Panel Round #1
The first round of the Delphi panel study included an overview of the initial literature
review and the Delphi questionnaires, introduced through a web-based recorded conference
call, labeled Delphi Group #1, using www.anymeeting.com. Semi-structured questions were
included (See Appendix D – Delphi Group Protocol) with a focus on agency strengths and
known constraints relative to addressing the potentially modifiable health factors. A
PowerPoint summary presentation for Focus Group #1 was provided (Appendix F – Delphi
Group #1 Presentation) to give the Key Informants a summary of the literature review on the
initial theoretical basis, research questions, and the potentially modifiable health factors
identified from the literature. The online meeting was recorded verbatim and then transcribed
for analysis.
After the Delphi Group #1, the first questionnaire was administered online through a
link to Qualtrics (see Appendix I – Questionnaire #1 Protocol & Appendix J – Questionnaire
#1). Each preliminary factor was rated by the panel using Likert scales and open ended

113
responses, denoting Informant’s choices of perceived priority and/or importance when
applied to P&R process and practice. Round #1, Delphi Group #1 and Questionnaire #1
focused on:
Confirming knowledge and perceived applicability for modification of the health
factors from the literature that P&R agencies may be addressing
Practices for how these agencies are addressing these factors
These agencies’ approaches to prioritizing factors within a local setting
Agency strengths for the approaches in terms of success and why
Perceptions for how P&R can best build capacity to address these health factors
Questions were included to help determine which types of data are collected by the
agency relative to the primary factors, perceived measureable outcomes, and gaps identified
and to identify if they did not have this information, could not collect it for some reason, or
are using other methods for analysis.
Delphi Panel Round #2
After I compiled summary responses and analysis from Round #1 into a second
PowerPoint presentation (see Appendix G – Delphi Group #2 Presentation) and it was
reviewed by the dissertation committee, a Delphi Group #2 online conference call was
scheduled through a Doodle Poll of informants. This Delphi Group #2 introduced the Round
#1 summary, invited deepening comments and suggestions, and was also recorded verbatim
for later transcription and thematic analysis. Questionnaire #2 was introduced to deepen
responses on the key factors and to further identify and refine the list of factors and process
criteria as well as to develop a consensus by the Delphi panel. The second refinement and
ranking online Questionnaire #2 was then created using Qualtrics to prioritize their

114
perception of process, identified and prioritized relevant national initiatives, and potential
achievable outcomes (see Appendix K – Questionnaire #2 Protocol & Appendix L –
Questionnaire #2).
Both questionnaires included sections for open-ended responses to help identify any
missing strategies, interventions, data collection techniques, and outcomes that the Key
Informants reported related to these factors, along with questioning their ease of survey
completion. Results from Questionnaire #2 were exported to Microsoft Excel and each
question analyzed using the XLMiner Statistical Analysis Toolpack for descriptive analysis
and prioritization.
Delphi Panel Round #3
After completion of Questionnaire #2 and the thematic summary analysis of the
transcription for Delphi Group #2, I compiled the results into a presentation for Delphi Group
#3 (See Appendix H – Delphi Group Presentation #3) . These were provided back to the Key
Informants to review results. For Delphi Group #3, the Key Informant panel was asked to
review the Literature Review and summary slides of the results in the presentation, provide
validation and review, and submit new potential strategies through an additional focus group
call with all of the Key Informants to deepen the findings and consensus, in line with
common focus group methods (Babbie, 2014; Cyr, 2016; Yin, 2013). The primary objective
of the Delphi Group #3 online call was to share draft results and generate conversations that
helped further explore and uncover individual opinions regarding these issues. They also
helped to reveal group consensus, where it exists, on the issues at hand. As in the literature
for this method, the potential for data collection had emerged from the range of experiences
and perspectives that these focused conversations uncovered (Cyr, 2016).

115
The Key Informants made new suggestions based on positive or negative feedback
from within their professional experiences. The submission of the summarized methods,
tools, and draft key conclusions were reviewed and prioritized through the second online
questionnaire and discussed three or more times to arrive at consensus of accuracy of the
results from the Key Informants.
Case Study
Concurrently with the Delphi study, an inductive qualitative case study of two
purposively selected P&R agencies was conducted with focus on the following topic to
address SRQ3: How are two agencies addressing and prioritizing modifiable key health
factors in their communities?
The case study research design model for this study was informed by previous similar
but different studies and reported methods (e.g., Brennen Ramirez et al., 2006; Compton et
al., 2011; Ross et al., 2013; Yin, 2013; Young et al., 2013). The literature indicated that case
studies can be most effective when they are methodologically-based to include collection of a
variety of informing types of data to capture the process and factors in a detailed way through
narrative interviews, focus groups, ethnography, and review of relevant secondary data. Case
studies are not restricted due to intended comparability, and they are able to fully enhance the
potential of the other methods used (Flick, 2014, Yin, 2013). Limitations to case studies can
arise if only one case is used to generalize. To address that limitation and further enhance
findings from this study, the process included identifying and analyzing two community
systems within context of other methods.
I selected the case study approach, as this was foremost an exploratory study to
identify the “how and why” aspects related to how agencies can address the factors in a

116
systematic way in their given situation (Cyr, 2016; Yin, 2013; Young et al., 2014). This case
study was an adapted iterative process gathering data that was combined with various other
methodologies (e.g., the literature review, agency resource analysis, and Delphi study) to
focus on potential systematic processes and strategies that these agencies are using, and may
be useful as a model for other P&R agency research and application.
The two case study agency Key Informants who agreed to participate in this research
represented Prince Georges County, MD, and San Diego County, CA. Although they have
slightly different organizational structures and community demographics, both are award-
winning larger agencies focused on providing P&R related activities, programs, and assets
within their communities. Both case informants also served on the Delphi study panel.
These agencies were identified for this research as they:
had an identified interest in the research questions
indicated that they were willing to participate and will provide a representative for
both the case study and Delphi study processes for the study time period
indicated that they had been dedicating some staff resources towards addressing at
least three of the key factors, with some focus for middle school youth
reported they were currently attempting to use some sort of systematic approach
to addressing the key modifiable factors for youth
indicated they were currently achieving positive outcomes related to the research
questions
Data Gathering from the Case Study
The case study format included explorations of factors addressed, interventions,
methods, policies, and identified outcomes, from the literature and use methodologies and for

117
additional qualitative analysis until saturation was reached (Charmaz, 2006; Flick, 2014;
Glaser & Strauss, 1967; Strauss & Corbin, 1998; Yin, 2013). Primary data collection
consisted of initial in-depth semi-structured interviews with the primary case Key Informant
and detailed review of resources provided by the case Key Informant, followed by a
supplemental presentation to help deepen understanding, a Focus Group, and/or interviews
with additional agency-selected key stakeholders to review and to refine the identified
themes for application to practice. The following summary steps were taken for the case
study process:
A. Both representatives attended Delphi Group #1 as an introduction to the overall
research. An agenda and comments were provided. Both representatives had
access to all agenda, compiled data, and summary notes as created. Information
from the dissertation research questions, the literature review, and the Delphi
Study were provided in advance. Both agencies provided resource documents
such as reports, plans, policies, grant applications, and guidelines uploaded to the
Basecamp online study files open for review by both me and all other study
Informants. Both case study Informants participated in all three Delphi Panel
Groups, #1, #2, & #3.
B. Case data was compiled for each of the two agencies through detailed review of
the resources submitted by the Key Informants for the Delphi Resources on
Basecamp. In addition, general demographics and health behavior indicators were
compiled from www.communitycommons.org.

118
C. Individual semi-structured interviews with the identified Key Informants from
each of the agencies were conducted and recorded verbatim using a semi-
structured format as shown in Appendix D (Babbie 2016; Flick, 2014; Yin, 2013).
D. Key Stakeholders Focus Group and Interviews - Following the interviews and
Delphi Group #2, a snowball sampling of additional representatives was
conducted within each agency to identify key additional stakeholders (key
employees, volunteers, community partners, etc., from each agency). A summary
presentation and semi-structured questions were developed based on the results
from the Delphi Panel #3 presentation (see Appendix H) and the agency resource
review, and asked related to processes and strategies used, goals and objectives
related to the identified factors, and methods for determining outcomes.
Deepening of understanding was pursued in areas of additional interest or
findings. The case study Key Informants also participated in review of their own
results and results overall through Delphi Group #3. The case study focus groups
were conducted using simple semi-structured presentation and question formation
to further identify summary themes (Cyr, 2016; Goulding, 1999; Yin, 2013).
E. The Key Informants reviewed and provided feedback to confirm findings (Cyr,
2016; Goulding, 1999; Yin, 2013). All comments were recorded verbatim and
transcribed, and then later thematically summarized and reviewed again by the
participants to confirm accuracy in capture during and after the calls. The final
summary themes and analysis were again submitted back to the Key Informants
for review and their perception of accuracy before integration into the
Dissertation.

119
All web-based conference calls were summarized in real time and recorded verbatim
for later transcription. Summaries and transcriptions were reviewed in detail, coded for
thematic analysis through both frequency and node aspects related to the emerging categories
of theoretical basis application and concepts, modifiable factors, and potential strategies to
address the factors. This was done to try and understand the agency’s process, and summary
results were provided back to all Informants for validation review. A summary of collected
case agency data was compiled and sent back to the representatives to check for accuracy of
findings. Representative statistics were summarized for quantitative data, and summary text
identifying emerging themes, limitations, and gaps was compiled and presented.
Case Study Analysis
Data from the two agencies were analyzed independently and comparatively to look
for themes related to addressing the health factors. The research data were used in
conjunction with interview and final focus group data to provide construct validity through
continually watching for triangulation among differing data sources, differing perspectives
on the same data set, and the use of various methods (Yin, 2015). For example, emerging
themes were compared within the agency from the Delphi transcripts, the questionnaires, the
interview transcripts, and the focus group, in addition to between agencies through
comparison. The results and data from each stage were analyzed using grounded theory
approaches advocated by Babbie (2016), Corbin and Strauss (2008), and Flick (2014). Stated
briefly, grounded theory approaches follow many of the processes of grounded theory, and
involve analyzing data for concepts through coding, comparison, and creating memos and
diagrams. Corbin and Strauss emphasized that an open code should not merely be a summary
of a particular portion of one’s data, but rather it should be a tool for thinking conceptually.

120
They delineated two different comparisons, constant comparison in which I compared result
to result within the data, and theoretical comparison in which I compared incidents in the
data to findings or results within my own experience or knowledge. Comparisons like this
can be used to help researchers “move more quickly from the level of description to one of
abstraction” (p. 77).
The creation of researcher memos, figures, charts, tables, and diagrams and the
resultant PowerPoint presentations for each round of the Delphi process also helped inform
this analysis. The transcribed interviews, focus groups, and questionnaires were analyzed
independently and then relative to each other and the results of the Delphi panel overall. Prior
to the coding for themes, the first step was microscopic examination of the data (Henderson,
2006). During this step, I reviewed the data line-by-line in relation to researcher memos to
better understand the perspective of informants and context of the data. This allowed for the
identification of in vivo concepts to inform coding and iterative thematic summarizations.
During the coding process, the data were categorized, organized, and sorted (Corbin &
Strauss, 2014). Open coding of the data allowed common words and phrases to be analyzed
to lead to primary categories of themes. Next, data were axially and then selectively coded, to
refine the categories into like topics. Lastly, the data were process and outcome coded to
identify key themes over time (Corbin & Straus, 2014; Yin 2015). As referenced by Corbin
and Strauss as typical process, the memos and diagrams evolved over the course of the study,
becoming more theoretical in nature over time. The concepts ranged from lower level
concrete ideas to the higher level abstract conceptualizations needed to build theory and
overall themes for conclusions.

121
As an aid to building theory, Corbin and Strauss advocated for deciding upon central
categories or themes that serve as a unifying explanatory concept. They stated that the
explanatory nature of themes distinguishes descriptive studies from ones that build theory.
For this project, the health factors and the initiatives and methods identified in the literature
review continually guided the thematic organization and classifications, but the inclusion of
those initiatives and methods evolved and were deepened when new themes emerged. During
open coding, I reviewed the data word by word and line by line and attached thematic codes
to the data that related instances in the text to the concepts or categories (Grbich, 2007). This
process was iterative and results from each transcription and questionnaire were read and
reviewed multiple times. In addition, coded sections of text were reviewed together during
the analysis process and discussed with the informants at each stage. Examining coded text
together often resulted in further memos and additional questions for the next round of the
Delphi panel and case study interviews, and generally prompted review of previous themes
and interviews. The iterative process and continual input from the informants helped assess
whether that particular code or theme was widespread throughout the data or limited to
particular individuals/agencies.
Notes and summary memos were continually made during the data collection and
coding process to develop the emerging themes in the results for discussion and conclusions,
and were also further reviewed to help understand theoretical relationships between concepts.
The independently coded interview data from the two case agencies were cross-analyzed to
help draw conclusions, relative to the results of the Delphi Study. These patterns were also
analyzed to determine if there were different stakeholder perceptions of strategy feasibility
that may be achieved that were not in the initial factors and literature identification.

122
Final Analysis and Compilation
The reiteration of identified important key themes from the data continued until
saturation was achieved (Flick, 2014; Glaser & Strauss, 1967; Yin, 2015). At each step,
themes related to the identified factors from the literature and data collected, with alignment
for potential modifiability by P&R agencies, were addressed and refined. The analysis
included all four types of typical general case study strategies (Flick, 2014; Yin, 2013):
1) The identification of initial modifiable factors came from the literature.
2) Working data from the “ground up.” – Review of secondary data and focus
groups continually elicited new data for consideration.
3) Developing a case description – each case (the two agencies) were included along
with a description and analysis.
4) Examining plausible rival explanations. – Data were examined for potential
alternate findings, along with continual asking of “what are we missing?”
Circular Iterative Analysis
Analytic strategies included both real-time and summary review for pattern matching,
explanation building through an iterative process. Figure 14 provides the model for the
circular analysis process I used for validation and refinement (adapted from Flick, 2014; Yin,
2015).
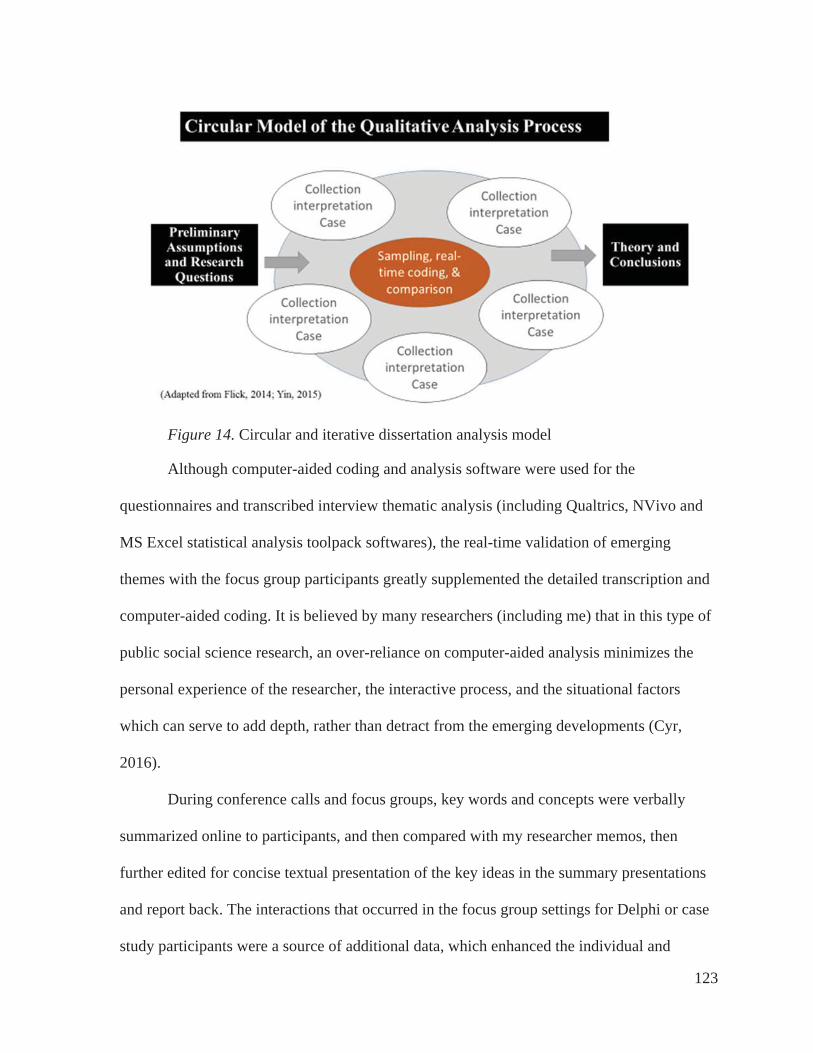
123
Figure 14. Circular and iterative dissertation analysis model
Although computer-aided coding and analysis software were used for the
questionnaires and transcribed interview thematic analysis (including Qualtrics, NVivo and
MS Excel statistical analysis toolpack softwares), the real-time validation of emerging
themes with the focus group participants greatly supplemented the detailed transcription and
computer-aided coding. It is believed by many researchers (including me) that in this type of
public social science research, an over-reliance on computer-aided analysis minimizes the
personal experience of the researcher, the interactive process, and the situational factors
which can serve to add depth, rather than detract from the emerging developments (Cyr,
2016).
During conference calls and focus groups, key words and concepts were verbally
summarized online to participants, and then compared with my researcher memos, then
further edited for concise textual presentation of the key ideas in the summary presentations
and report back. The interactions that occurred in the focus group settings for Delphi or case
study participants were a source of additional data, which enhanced the individual and
124
overall group unit of analysis. The interactive unit of analysis involved close attention to the
back and forth that occurred between participants. As also identified by Cyr (2016), this
interaction allowed answers to build and evolve, educating the Delphi panel Key Informants
in the process, and uncovering nuances and complexities that may not otherwise be
anticipated. This helped to identify areas of consensus or disagreement, as all Informants
became more aware of the modifiable factors, methods being used by other agencies to
address them, and potential outcomes.
In a second later process stage I incorporated my researcher memos, an organizing
key themes listing, and interpretation of the key ideas to deduce the concepts and look further
at theoretical meaning and summary themes. At this stage the concepts were sufficiently
developed to incorporate the compatible literature and other research tools in order to
demonstrate the ‘fit’, relationship and, where applicable, the extension of that literature
through these research findings. The third stage presented the key ideas, uniting and
integrating the concepts into categories within the specific context of the overall research and
presented them back to the Key Informants and the dissertation committee for additional
validation and review.
Key Themes Analysis Matrix
To finalize the overall assessment and check comparison of the many data sources, I
addressed the iterative assessment through a Framework Method (Gale, Heath, Cameron,
Rashid, & Redwood, 2013; Ritchie & Lewis, 2003) to compile a Key Themes Analysis
Matrix in MS Excel, using a three-point color-coded scale (low, mid, and high priority). The
row sections were summarized under factors, strategies, and outcomes, and the column
headings included the source of the ratings: literature review, resource documents, Delphi

125
panel (Questionnaire #1, Questionnaire #2, and focus groups), case study (Informant
interviews, additional stakeholder interview, and final case study focus groups), along with a
column for my researcher opinion and summary ratings.
Trustworthiness and Credibility
The study was designed to apply a systematic mixed-methods approach to a complex
case-based research problem. However, as with all qualitative studies, limitations exist which
have been acknowledged and addressed to enhance trustworthiness and credibility of the
study. Many steps were taken to ensure trustworthiness. The selection of two case study
agencies with similar characteristics helped with dependability because it allowed for easier
comparison between the two park units. Notes and memos were taken to help develop
emerging themes. During the rounds and coding process, I shared summaries with members
of the dissertation committee after each round to review as a way to enhance trustworthiness.
The review invited discussion on the process, the codes, and the emerging themes. Direct
quotes and thick descriptions were also used to support the themes that emerge from the data.
The key themes and conclusions were reviewed by the informants prior to finalization.
However, as with all research, there are limitations. First is the challenge of
researcher bias. I have been involved with similar research since 1999, and may have brought
a limited purview or natural bias in some areas. In addition, I am the CEO and Founder of a
national P&R consulting firm, GreenPlay, LLC (www.greenplayllc.com), which has
completed over 450 local community P&R planning and research projects around the U.S. I
am also the Director of the Healthy Communities Research Group and co-founder of GP
RED, a national 501(c)(3) non-profit research, education, and development organization
which works with recreation, health, and land management agencies. In addition, I have

126
personally previously worked in some planning, project management, or program employee
and/or contractor capacity for five of the seventeen informant agencies, including Arlington
Heights Parks District, IL; Broomfield, CO; Liberty, MO; Prince George’s County, MD; and
South Bend, IN. I have working knowledge of and/or professional relationships with most all
of the other informant agencies listed. GreenPlay and GP RED collaboratively maintain a
national list of current contacts and/or have done projects with over 8,000 professionals,
representing local governmental agencies, associations, universities, and vendors in this
realm, so past relationships, communications, and/or direct contact was likely and
unavoidable.
I fully acknowledge that researcher bias can interfere if care is not taken to use the
group as an inductive process (letting themes emerge) rather than leading the participants to
pre-determined themes (Yin, 2015). Although an initial thematic literature was conducted,
there was a trade-off between bringing a lot of prior theorizing to the theme-identification
effort, and looking at the data with openness to new information from the Informants. Prior
theorizing could have inhibited the forming of fresh ideas and new connections (Charmaz,
2006), but I took great care to approach the data and results with an open mind, looking for
the new themes or ideas. By examining the data relative to themes, I tried to be transparent in
all communications, and looked not to find only what was previously assumed or
experienced. Assiduous theory avoidance of prior evidence, on the other hand, could have
brought the risk of not making the connection between data and important research questions
(Flick, 2014; Ryan & Bernard, 2003; Yin, 2015). Constant review, reiterations, informant
back-checking, and sharing of all data compiled was an important part of the research to try
and help limit bias.

127
Limitations of the focus group methodologies were acknowledged and care taken at
each stage with attention, as literature has shown that there can be over-reliance of emergent
themes and concepts if there is not broad representation of the general study population in
attendance. There was also a danger of placing too much emphasis on early identification of
codes (themes) as the exclusive feature of the process, without explaining how the identified
key themes relate to each other (Cyr, 2016; Glaser, 1992; Strauss & Corbin, 1990).
It was important to recognize that the Delphi study and case study focus groups and
interviews were each just one a separate but important related method in a well-rounded
mixed-methods approach (also including quantitative and descriptive questionnaires and
separate informant resource analysis). They quickly helped identify key themes and allow for
deepening of understanding and interpretation, but cannot be necessarily interpreted as an
exhaustive account of all themes or concepts that are important for all P&R agencies. Further
validation of the importance of the key themes through other mixed-methods research tools
was an important consideration for overall context and accuracy (Yin, 2013). In addition, the
Delphi panel of 17 Key Informants included the two case study informants, and was
purposefully small in order to be manageable within this study timeframe and methods. All
informants were already identified as interested in this topic through selection criteria, and
may not be representative of all P&R agencies. Care was taken to also look for missing
information whenever possible. A “scrutiny-based approach” was used in reverse, in addition
to typical theme identification techniques (Ryan & Bernard, 2003). In addition to asking,
“What is here?” the process included asking all involved continually and at each stage,
“What is missing?”

128
Care was also taken related to the potential for the Delphi panel and case study
participants’ reflexivity and/or bias in presentation of their data and observations. These
representatives all work directly on these topics, and naturally want their agency to be
presented “in the best light”. Presentations, focus group facilitation, questionnaire creation,
and reviews included focus on findings for potential methods, strategies, and process
applications, rather than implying positive or negative judgments about data and resources
presented by each agency. The analysis focused on systematic process and applicability of
methods, rather than analysis of actual data presented. To help with these limitations and
potential trustworthiness issues, reiterative review by the full Key Informant panel and
dissertation committee was invited to suggest additional data for consideration at all points of
the study. Transparency was a goal through ongoing open presentation of all summary data,
with the expectation that this collaborative approach with many experienced minds could
effectively help get to the crux of the answers for this research.

129
CHAPTER 4 - ANALYSIS AND RESULTS
This dissertation is comprised of the results from three primary research components.
The summary of the comprehensive integrative thematic literature review included
identification of key factors that may be modifiable through P&R, theoretical basis, and an
overview of related organizational elements and strategy themes that have emerged. This
chapter focuses on the analysis and results of my original research, which included the
Delphi panel study with 17 Key Informants to help validate and further deepen information
relative to how local government P&R agencies are addressing those factors, and a
concurrent case study of two agencies (who also participated in the Delphi panel) to deepen
exploration to identify the “how and why” aspects related to how resourced and motivated
agencies may address the factors in a systematic way in their given situation. All of the
presentations provided and these research methods were couched under a broader basis of
systems theory, looking at how these agencies can potentially adapt, identify, and promote
change within their own community system to address the modifiable health factors. The
aggregated summary results and analysis of these Delphi study and case study methods were
explored relative to systems theory and systems thinking.
Delphi Panel Results and Analysis
The Delphi panel, including the two case study Key Informants, provided a variety of
strategies for data gathering from this study, including three Delphi Panel Group Discussions,
agency provided resources, input through online questionnaires, ranking of priorities, and
review of findings. The following sections provide a summary of results from each stages of
the research.
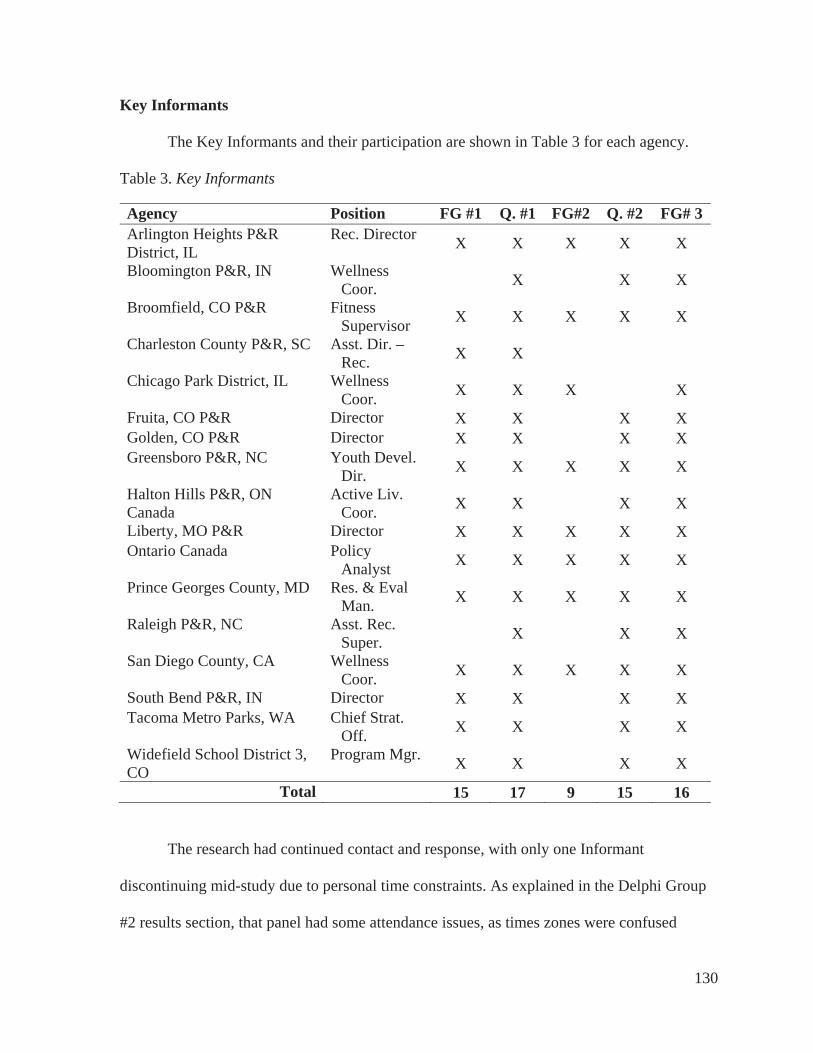
130
Key Informants
The Key Informants and their participation are shown in Table 3 for each agency.
Table 3. Key Informants
Agency Position FG #1 Q. #1 FG#2 Q. #2 FG# 3 Arlington Heights P&R District, IL
Rec. Director X X X X X
Bloomington P&R, IN Wellness Coor. X X X
Broomfield, CO P&R Fitness Supervisor X X X X X
Charleston County P&R, SC Asst. Dir. – Rec. X X
Chicago Park District, IL Wellness Coor. X X X X
Fruita, CO P&R Director X X X X Golden, CO P&R Director X X X X Greensboro P&R, NC Youth Devel.
Dir. X X X X X
Halton Hills P&R, ON Canada
Active Liv. Coor. X X X X
Liberty, MO P&R Director X X X X X Ontario Canada Policy
Analyst X X X X X
Prince Georges County, MD Res. & Eval Man. X X X X X
Raleigh P&R, NC Asst. Rec. Super. X X X
San Diego County, CA Wellness Coor. X X X X X
South Bend P&R, IN Director X X X X Tacoma Metro Parks, WA Chief Strat.
Off. X X X X
Widefield School District 3, CO
Program Mgr. X X X X
Total 15 17 9 15 16
The research had continued contact and response, with only one Informant
discontinuing mid-study due to personal time constraints. As explained in the Delphi Group
#2 results section, that panel had some attendance issues, as times zones were confused

131
through the Anymeeting.com software. All informants received the presentation and follow
up by email.
Agency Demographics, Geographic Distribution, and National Recognitions
The Delphi panel Key Informants were purposefully invited to represent a wide
variety of populations served and geographic locations as summarized in Table 4.
Table 4. Key Informant Agencies, Populations, and National Recognition Status
AgencyPopulation
2015Gold
Medal CAPRA Fruita, CO P&R 12,646 Golden, CO P&R 18,867 X X Liberty, MO P&R 29,149 Widefield School District 3, CO 51,281 Broomfield, CO P&R 55,889 Halton Hills P&R, ON Canada 56,809 Arlington Heights P&R District, IL 76,024 X Bloomington P&R, IN 80,405 X X South Bend P&R, IN 101,168 X Tacoma Metro Parks, Tacoma, WA 198,397 XGreensboro P&R, NC 269,666 X X Charleston County P&R, SC 350,209 XRaleigh P&R, NC 423,179 X Prince Georges County, MD 909,535 X X Chicago Park District, IL 2,695,598 X X San Diego County, CA 3,095,313 X Ontario, Canada 12,651,795 Total 8 8
CAPRA – Accredited by the Council on Accreditation of P&R Agencies Gold Medal – Recipient of NRPA Gold Medal national award
Although this study is focused on U.S. P&R agencies, two agencies from Canada
(one small community and one province-wide ministry) were included, as these agencies in
Ontario have been recommend by other Key Informants as having been thought leaders in
addressing these health factors through intersection of public health and P&R. Some other
agencies in Australia and New Zealand also were early adopters for addressing these issues,

132
but due to the needs for real-time collaboration for the Delphi Groups, the agencies in
Canada had an easier time participating and contributing their resources, thoughts, and
review. Results indicated that the two Canadian agencies had similar resources and
challenges to the U.S. agencies, but had more federal and provincial support funding due to
the socialized nature of health care in Canada. However, resources provided were helpful to
the other Key Informants and on the higher end of sophistication and evidence-base relative
to the smaller agencies in the study. They were somewhat similar to those provided by the
larger case study informants who had been addressing these factors for a similar length of
time.
National recognitions, such as Gold Medal Award status and CAPRA accreditation,
were identified as informative organizational elements, relative to potential links to
organizational culture and effectiveness. Detailed correlational analysis was not conducted as
to relationship of effectiveness to these recognitions (this could be indicated for additional
future research), but the themes identified within the Delphi groups, case focus groups, and
interviews indicated that those agencies who had the strong system planning focus (as
required by the recognitions) tended to have stronger buy-in from their decision makers.
A map of the Key Informant geographic distribution is included in Figure 15. Even
with a limited number of 17 Informants, there was broad cross-country and agency type
representation.

133
Figure 15: Map of Key Informant agencies
Agency Summary Descriptions and Resources Provided
The following section provides a brief description of key findings from the Delphi
panel agency backgrounds and the resources they provided for the study. Full Delphi
methodology was provided in Chapter 3, and agency more detailed agency descriptions are
provided in Appendix E. Delphi Panel Descriptions. In reviewing these data from a systems
theory lens, categories for themes emerged from review of the agency descriptions, websites,
and verbatim transcripts relative to the factors they addressed and the strategies they used.
Summary of Informant Resources Provided
As indicated in the Delphi agency descriptions, Informants were asked if they had any
types of plans, policies, reports, assessments, or other documents from their agency they felt
were related to addressing, management, or evaluation of any of the health factors presented
from the introduction to the study in Focus Group #1. All Key Informants were asked to
upload any such resources to their own folder created in Basecamp for the study. This created
a repository of 98 resources provided by and for the Delphi panel. Although all indicated

134
interest in addressing the factors, these agencies represent a wide variety of expertise and
sophistication in trying to do so. Some have been only recently trying to address them, and
just learning about this topic. Others (such as the agencies from Ontario, Canada, and San
Diego, CA), have been working to systematically address the factors for over 30 years. Table
5 provides a list of documents, and perhaps more helpful, the next Table 6 classifies the type
of document provided by each agency.
Table 5. Resource Documents Provided by Informants
Agency Resources Provided in Basecamp
Arlington Heights P&R District, IL
AHPD HCRG Year One Report; AHPD YANS Report, 2015; AHPD Year Two Logic Model
Bloomington P&R, IN
BLPRD Community Survey Report Final; 2015 Bloomington Parks and Recreation Annual Report; Bloomington Parks Recreation Master Plan 2016 - 2020;
Broomfield, CO P&R CCOB - Healthy Vending Policy
Charleston County P&R, SC
CCPRC P&R Master Plan, ACSM Exercise is Medicine
Chicago Park District, IL
CPD Healthy Vending Policy; CPD 2012 Strategic Plan - Exec. Summary; CPD - 2012 Strategic Plan; CPD 2014 Strategic Plan Update
Fruita, CO P&R Have P&R MP, but does not address health factors; Recreation Center feasibility Study
Golden, CO P&R GRASP®Active Slide, Golden P&R Master Plan
Greensboro P&R, NC Greensboro P&R Fighting Hunger Article, Fresh Food Access Plan, Community Garden Plan, Prescriptions for Play, Renaissance Food Coop Flyer
Halton Hills P&R, ON Canada
Town of Halton Hills Active Living Strategy (2016)
Liberty, MO P&R Liberty Demographic Report; Liberty Year One HCRG Report; YANS Liberty 2015 Report; Liberty HCRG & LCHAT Year Three Report; Liberty Vending Policy
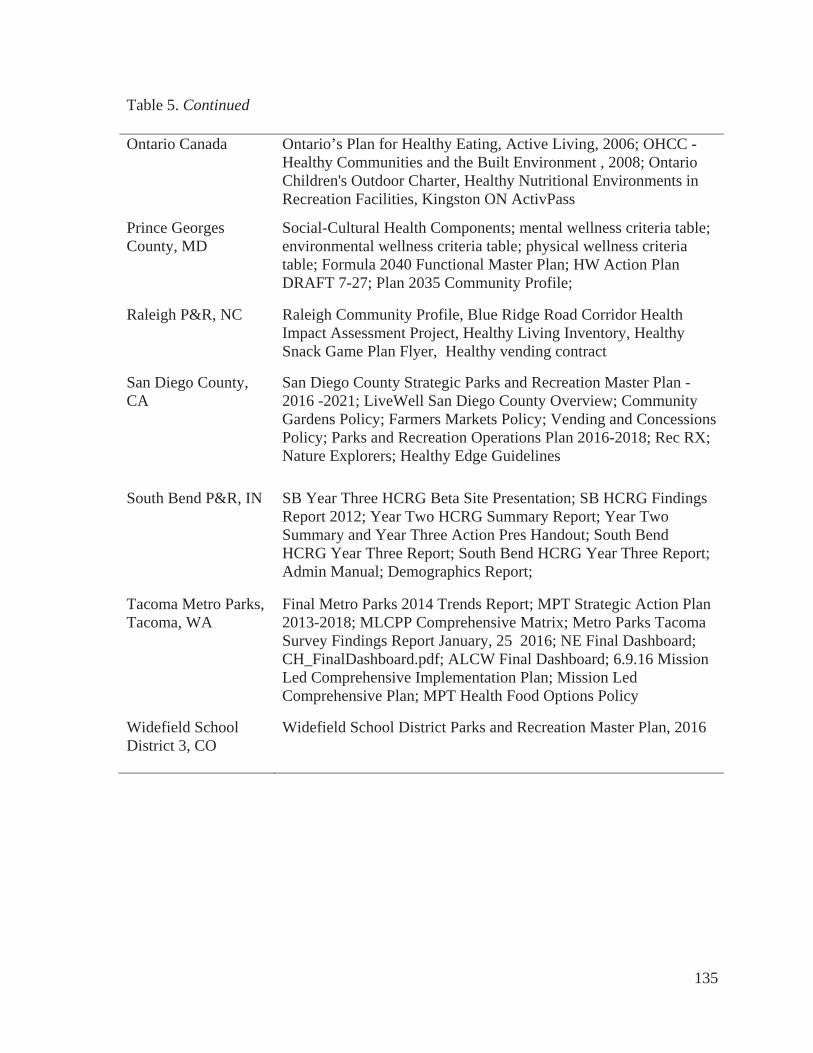
135
Table 5. Continued
Ontario Canada Ontario’s Plan for Healthy Eating, Active Living, 2006; OHCC - Healthy Communities and the Built Environment , 2008; Ontario Children's Outdoor Charter, Healthy Nutritional Environments in Recreation Facilities, Kingston ON ActivPass
Prince Georges County, MD
Social-Cultural Health Components; mental wellness criteria table; environmental wellness criteria table; physical wellness criteria table; Formula 2040 Functional Master Plan; HW Action Plan DRAFT 7-27; Plan 2035 Community Profile;
Raleigh P&R, NC Raleigh Community Profile, Blue Ridge Road Corridor Health Impact Assessment Project, Healthy Living Inventory, Healthy Snack Game Plan Flyer, Healthy vending contract
San Diego County, CA
San Diego County Strategic Parks and Recreation Master Plan - 2016 -2021; LiveWell San Diego County Overview; Community Gardens Policy; Farmers Markets Policy; Vending and Concessions Policy; Parks and Recreation Operations Plan 2016-2018; Rec RX; Nature Explorers; Healthy Edge Guidelines
South Bend P&R, IN SB Year Three HCRG Beta Site Presentation; SB HCRG Findings Report 2012; Year Two HCRG Summary Report; Year Two Summary and Year Three Action Pres Handout; South Bend HCRG Year Three Report; South Bend HCRG Year Three Report; Admin Manual; Demographics Report;
Tacoma Metro Parks, Tacoma, WA
Final Metro Parks 2014 Trends Report; MPT Strategic Action Plan 2013-2018; MLCPP Comprehensive Matrix; Metro Parks Tacoma Survey Findings Report January, 25 2016; NE Final Dashboard; CH_FinalDashboard.pdf; ALCW Final Dashboard; 6.9.16 Mission Led Comprehensive Implementation Plan; Mission Led Comprehensive Plan; MPT Health Food Options Policy
Widefield School District 3, CO
Widefield School District Parks and Recreation Master Plan, 2016
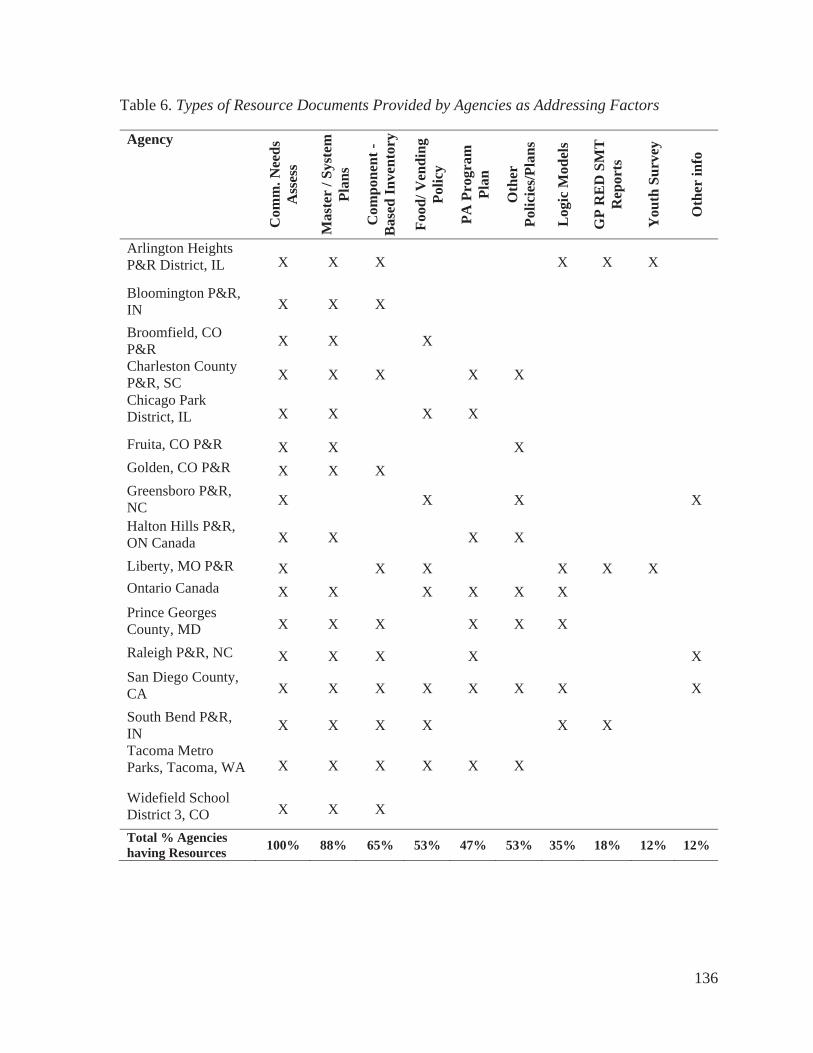
136
Table 6. Types of Resource Documents Provided by Agencies as Addressing Factors
Agency
Com
m. N
eeds
A
sses
s
Mas
ter
/ Sys
tem
Pl
ans
Com
pone
nt -
Bas
ed In
vent
ory
Food
/ Ven
ding
Po
licy
PA P
rogr
am
Plan
Oth
erPo
licie
s/Pl
ans
Log
ic M
odel
s
GP
RE
D S
MT
R
epor
ts
You
th S
urve
y
Oth
er in
fo
Arlington Heights P&R District, IL X X X X X X
Bloomington P&R, IN X X X
Broomfield, CO P&R X X X
Charleston County P&R, SC X X X X X
Chicago Park District, IL X X X X
Fruita, CO P&R X X X
Golden, CO P&R X X X
Greensboro P&R, NC X X X X
Halton Hills P&R, ON Canada X X X X
Liberty, MO P&R X X X X X X Ontario Canada X X X X X X
Prince Georges County, MD X X X X X X
Raleigh P&R, NC X X X X XSan Diego County, CA X X X X X X X X
South Bend P&R, IN X X X X X X
Tacoma Metro Parks, Tacoma, WA X X X X X X
Widefield School District 3, CO X X X
Total % Agencies having Resources 100% 88% 65% 53% 47% 53% 35% 18% 12% 12%

137
The majority of these Key Informant agencies (88%) have system-wide community
plans and all of them conduct needs assessments of their communities that have at least some
mention or attempt to focus on addressing health factors. 65 percent have a completed a
component-based method (CBM) inventory in GIS.
Popular specific policies and program specific plans include healthy food/vending
policies (53%), physical activity plans (47%), and other types of program plans (53%). A
lower number of PH-specific planning methods have been used, including creation of logic
models (35%), or use of the Surveillance and Management Toolkit™ (SMT) - 18%). 12%
have included youth specific surveying tools. This research did not identify the other specific
plans, and some agencies are using additional strategies, such as working from checklists
from the national initiatives. All Delphi agencies expressed gratitude at being able to review
the plans and policies provided by the other agencies.
Results from Delphi Group Discussion #1
On October 18, 2016, all Delphi panel Key Informants (including the two case study
informants) participated in an online recorded meeting with me using www.anymeeting.com,
following the approved focus group protocol described in Chapter 3 - Methods, and using
Delphi Group Presentation #1 included in Appendix F. The first portion of the meeting
included an introduction to the project and an overview of the primary health factors from the
literature. The Informants were then asked to describe their agency’s primary strengths and
constraints as related to addressing the potentially modifiable health factors. The responses
were recorded and transcribed verbatim. Text of the transcriptions were reviewed for
thematic elements through repeated commonality highlighting, and also using coding, nodes,
and frequency queries using NVIVO 10 for Windows. Table 7 provides the top 20 word

138
frequencies in response to the question, “What are the strengths that you see for your agency
in terms of how you’re addressing these health factors?”
Table 7. Top 20 Word Frequencies for Agency Strengths
Focus Group #1 - Strengths Top 20 Priority Word Frequencies
WordFrequency
CountWeighted
Percentage (%) health 32 1.25
community 31 1.21
parks 30 1.18
programs 27 1.05
people 23 0.90
vending 21 0.82
healthy 18 0.70
working 16 0.63
policy 14 0.55
system 14 0.55
food 13 0.51
data 11 0.43
change 11 0.43
process 11 0.43
recreation 11 0.43
agencies 10 0.39
outcomes 9 0.35
resources 9 0.35
communities 8 0.31
partnerships 8 0.31
The Informants were focused on strengths related to how they are addressing health
through the community’s P&R actions through parks, programs, and various types of policies
139
and planning methods. Further thematic analysis of summary content identified the key
strengths and constraints perceived by the Informants to be:
Key Strengths
Healthy vending policies
Community coalitions and partnerships
Programs to increase participation
Resources / staffing for larger agencies
Key Constraints
Availability of resources & staffing (especially smaller agencies)
Evidence-based evaluation tools and outcome measurements
Results from Questionnaire #1
All seventeen Delphi panel agencies (including the case study agencies) completed
Questionnaire #1 through a link to a Qualtrics online survey. Aggregate analysis of the
answers was conducted using the Qualtrics report features and Microsoft Excel 2013, with
the add-in of the XLMiner Statistical Analysis Toolpack. The questionnaire included agency
identifiers such as agency names, contact information, and name of Informant. The questions
then delved into experience of Informants, preliminary ranking of priority of health factors
for their agencies, their current perceptions of effectiveness of methods currently used, and
about outcomes measurement.
Key Informant Roles and Background
Question 5 asked about their role in their organization. As Table 8 summarizes, the
majority of informants are Directors or Senior Managers, with others as Supervisors,
Assistant Directors, and two informants with titles specific to work related around the health

140
factors (these were both from larger agencies). As a whole, Informants indicated that unless
the agency was large and could afford to hire specialty staff, if attention was being paid to
policies, planning, and partnerships aligning with addressing the health factors, it needed to
come from upper level staff.
Table 8. Role of Informant at Agency
Q5 - Title / Role at Agency % Count
Director/Senior Manager 44% 8 Supervisor level (staff supervision, may be
more than one program area) 33% 6
Assistant Director/Assistant Manager 11% 2
Coordinator/Programmer 6% 1
Instructor 0% 0
Volunteer 0% 0 Other: 11% 2
Wellness Manager 6% 1 Policy Advisor 6% 1
Key Informants were queried as to their length of time in the field as a way to
indicate experience with P&R (ergo, accumulated knowledge of how this research may affect
or be being addressed by their P&R agency). As one of the criteria for involvement in this
research was at least three years in the field, all Informants but one had at least three years,
with the majority having extensive experience (greater than 10 or 20 years). The one
exception was the Executive Director for South Bend Parks and Recreation, as he had
actually worked for the City of South Bend for many years as an Economic Development
Director before he was recently moved to the position when the previous P&R Director
retired. The agency and the prior Director had been a strong proponent of this type of work
related to the health factors for his agency. An exception was made since this agency met all

141
other criteria, the Director working with staff had ample dedicated resources to share, and so
was deemed appropriate for inclusion. Figure 16 visually graphs this experience.
Figure 16. Key Informants time in field of P&R
Ranked Priority of Health Factors
The Key Informants were asked to rank the health factors identified from the
literature on a 1 to 5 scale, with 1 as most important for their agency to address. Results are
shown in Table 9.
Table 9. Relative Priority of Health Factors by Key Informants
Priority of Factors 1st 2nd 3rd 4th 5th 6th 7th 8th Physical Activity 71% 18% 12% 0% 0% 0% 0% 0% Safety or Perception of Safety 20% 20% 7% 20% 0% 13% 13% 7% Nutrition / Food Availability 6% 6% 25% 31% 13% 6% 6% 6% Transportation / Access 0% 7% 13% 0% 7% 60% 7% 7% Social/Peer Engagement 0% 38% 13% 19% 25% 0% 6% 0% Parental Engage. / Education 0% 7% 27% 7% 33% 20% 7% 0% Other Factors 0% 20% 0% 20% 60% 0% 0% 0%
0%
5%
10%
15%
20%
25%
30%
35%
40%
45%
Less than 1 year 1 to less than 3years
3 to less than 5years
5 to less than 10years
10 to less than20 years
More than 20years
Key Informants Time in Field

142
The first priority for these Informants is PA. This is not surprising, as the primary role
of many agencies is creating places and programs for people to move. Safety is also a higher
priority (1st or second by 40% of informants), but not by all agencies, in fact, both of the
larger Case Study agencies ranked Safety as the highest priority. After that, the priorities
become less clear, and conclusions less obvious. They vary by agency and community
system. Other factors were also reported but were deemed lower priority. These additional
factors were provided through open-ended responses that included Tobacco Cessation, Team
Building Skills, Stress Management, and Access to Nature, with each answer receiving one
response.
Perceived Effectiveness of Strategies to Address Health Factors
The next set of questions explored the Key Informants’ perception of effectiveness of
a variety of tools, strategies, methods, and initiative steps from the literature to address the
primary health factors. Results from these agencies indicate that creating programs and
community coalitions specifically to address the health factors are deemed the most effective
methods. Hiring specific staff resources and pursing grant funding were also indicated as
effective, but substantial numbers of agencies have not used these methods. When asked
during the subsequent Focus Group as to why they have not used these methods, a typical
answer was that resources are generally not available, especially in smaller communities.
Table 10 provides a summary of Informant-perceived effectiveness of methods.
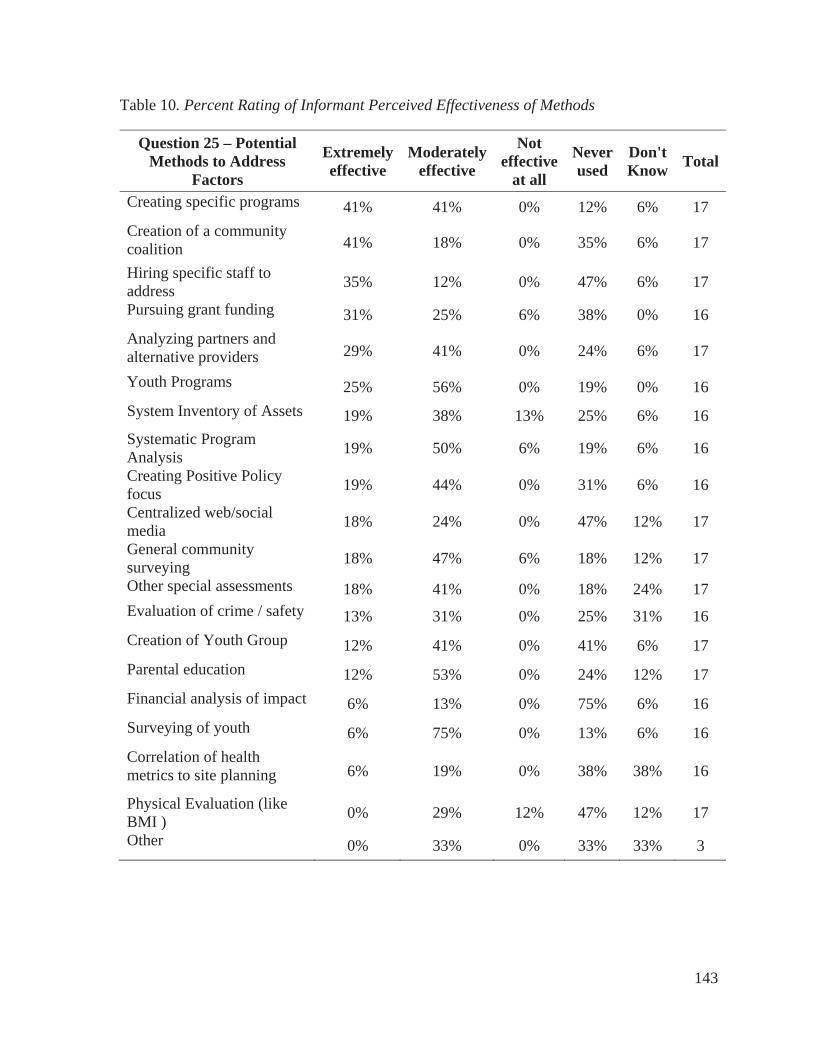
143
Table 10. Percent Rating of Informant Perceived Effectiveness of Methods
Question 25 – Potential Methods to Address
Factors
Extremelyeffective
Moderately effective
Noteffective
at all
Neverused
Don'tKnow Total
Creating specific programs 41% 41% 0% 12% 6% 17 Creation of a community coalition 41% 18% 0% 35% 6% 17
Hiring specific staff to address 35% 12% 0% 47% 6% 17
Pursuing grant funding 31% 25% 6% 38% 0% 16 Analyzing partners and alternative providers 29% 41% 0% 24% 6% 17
Youth Programs 25% 56% 0% 19% 0% 16 System Inventory of Assets 19% 38% 13% 25% 6% 16 Systematic Program Analysis 19% 50% 6% 19% 6% 16
Creating Positive Policy focus 19% 44% 0% 31% 6% 16
Centralized web/social media 18% 24% 0% 47% 12% 17
General community surveying 18% 47% 6% 18% 12% 17
Other special assessments 18% 41% 0% 18% 24% 17 Evaluation of crime / safety 13% 31% 0% 25% 31% 16 Creation of Youth Group 12% 41% 0% 41% 6% 17 Parental education 12% 53% 0% 24% 12% 17 Financial analysis of impact 6% 13% 0% 75% 6% 16 Surveying of youth 6% 75% 0% 13% 6% 16 Correlation of health metrics to site planning 6% 19% 0% 38% 38% 16
Physical Evaluation (like BMI ) 0% 29% 12% 47% 12% 17
Other 0% 33% 0% 33% 33% 3

144
Outcomes Assessment
The Informants were asked if they measure outcomes related to the primary health
factors. Figure 17 provides the results in graphic form.
Figure 17. Do Key Informant agencies measure outcomes?
Informants indicated that 13% said yes or maybe, and 69% said no. Of those who said
yes, 67% measured outcomes for PA, and 33% measure outcomes for nutrition, with the
following verbatim open-ended responses:
For the Exercise is Medicine Programs, we conduct an initial pre-engagement
assessment, then conduct regular assessments at three month intervals. Each
assessment consists of individual physical tests to gauge advancement or decline.
We measure BMI before and after program, self-reporting of weight, heart rate, &
diets.
We have a comprehensive evaluation strategy in place to monitor the outcomes of the
Town's Active Living Strategy.
We mostly track attendance numbers, but not factors such as BMI or behavior
change.
02468
1012
Yes Maybe No
Q22 - Do you assess or evaluate any specific outcomes for any of the health
factors?
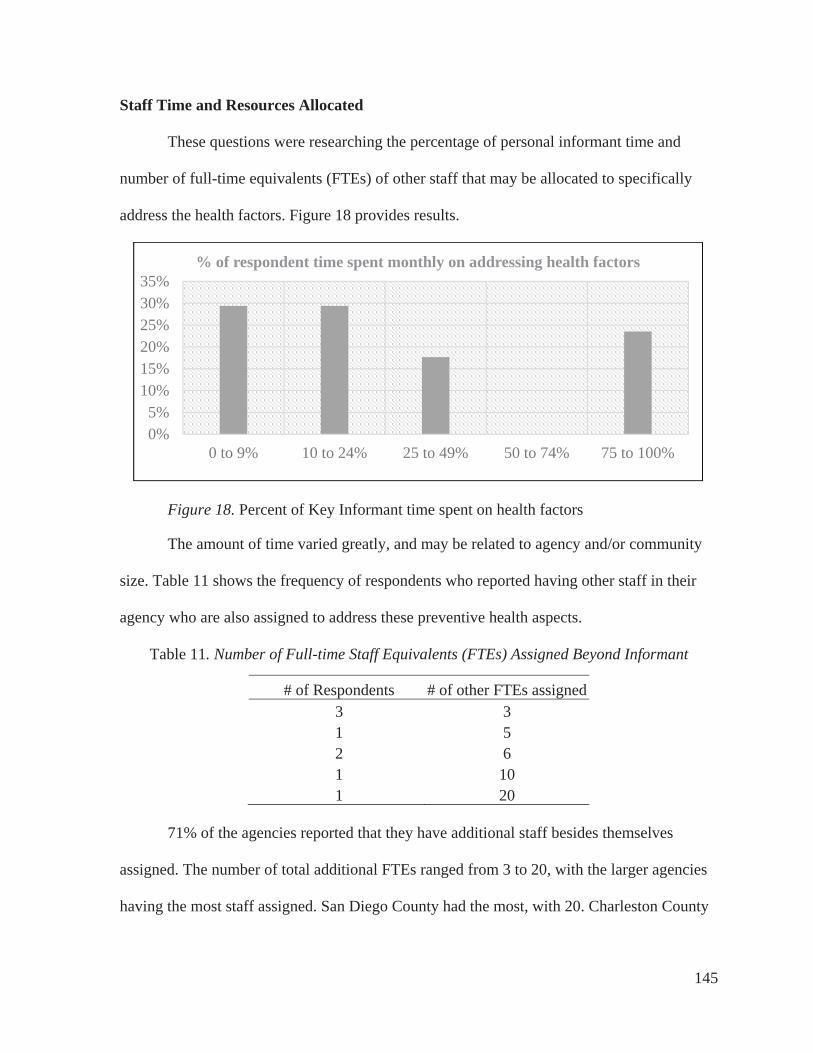
145
Staff Time and Resources Allocated
These questions were researching the percentage of personal informant time and
number of full-time equivalents (FTEs) of other staff that may be allocated to specifically
address the health factors. Figure 18 provides results.
Figure 18. Percent of Key Informant time spent on health factors
The amount of time varied greatly, and may be related to agency and/or community
size. Table 11 shows the frequency of respondents who reported having other staff in their
agency who are also assigned to address these preventive health aspects.
Table 11. Number of Full-time Staff Equivalents (FTEs) Assigned Beyond Informant
# of Respondents # of other FTEs assigned 3 3 1 5 2 6 1 10 1 20
71% of the agencies reported that they have additional staff besides themselves
assigned. The number of total additional FTEs ranged from 3 to 20, with the larger agencies
having the most staff assigned. San Diego County had the most, with 20. Charleston County
0%5%
10%15%20%25%30%35%
0 to 9% 10 to 24% 25 to 49% 50 to 74% 75 to 100%
% of respondent time spent monthly on addressing health factors

146
reported 10, Chicago Park District and Halton Hills both reported 6, Metro Parks Tacoma
with 5, Prince George’s County with three, and the others were lower.
Results from Delphi Focus Group #2
Delphi Panel Group #2 was conducted on November 30, 2016. Nine Informants
participated in an online recorded meeting with me using www.anymeeting.com, following
the approved Focus Group Protocol (Appendix G). Unfortunately, seven of the informants
were unavailable at the later time. To help remedy this error, Special emails and Basecamp
notifications were sent after the meeting summarizing the questions and asking for necessary
clarifications and input, pointing to results thus far including in the Delphi Group
Presentation #2, and a special question block was added to Questionnaire #2 to address input
that was requested during the Delphi Group #2. The Delphi Group #2 online meeting was
facilitated with the focus on presenting the results from Questionnaire #2, along with follow
up questions related to confirmation of the information presented thus far. Consensus was
obtained that the information appeared to be correct and useful. Informants reported finding
strong value in the creation of the Basecamp repository for resources. Several suggested that
they be organized by type rather than just by agency (a matrix was created for this purpose in
results for Questionnaire #2), and several stated that this was a key benefit to participating in
this Delphi Panel.

147
Results from Questionnaire #2
Of the Delphi Panel Key Informants, 15 of the 17 (88%) took the second
questionnaire through Qualtrics. To begin, as a follow up from Delphi Group #2, the
Informants were asked an open ended question about whether they were surprised by or not
surprised by the summary of information from Questionnaire #1 presented in Delphi Group
#2 presentation. This was coded into categories based on surprised, not surprised, and key
observations about the factors as summarized in Table 12 on the following page. As
expected, there were sometimes differing thoughts on the same topic.

148
Table 12. Key Informant Thoughts on Review of Questionnaire #1 Summary
Surprised by Not surprised by Observations partnerships were so low rang true glad to see creation of coalitions
safety did not rank higher rank order safety is a fundamental human need, want matrix of resource
materials
safety ranked so high information is consistent difficult to measure change in short period
lack of outreach to public all seems valid 70% of agencies do not
measure outcomes related to health
no surprises what programs are being implemented around safety?
lack of data collected by some agencies seems spot on work would not be possible
without partnerships impressed by # of resources some
departments have it’s the same for others
data presented were clear and certainly validated our current
position as a department policy templates not
available no surprises want to know who measures what
social media may be a motivator presentation on target all seems to ring true
no surprises effectiveness of methods are valid
importance of collaboration
would spend more time on data and analysis if we had the
resources
all seems valid we are more data driven on
economics and financial implications versus health factors we think we as P&R professionals know what to do without going to
the public larger communities benefit from
stronger policy direction evidence suggests that information
based campaigns do not lead to behavior change
looking forward to more information from resources

149
Ranking of Participation with National Initiatives
To deepen into exploring awareness and participation in national initiatives, a list of
the 31 national initiatives which appeared to be relevant to P&R and their efforts to address
the modifiable health factors that were identified from literature web searches, and the
resources provided by the Delphi Panel were compiled for the survey. A complete table
showing all agencies and initiative participation past and present is included in Appendix A –
National Initiatives and Agencies Active with Them. Initiatives with the Delphi agencies
responding that they are currently active with them are shown in Table 13:
Table 13. National initiatives - Agencies Currently Active
National Organization %
ActiveSafe Routes to School 53% Community Health Needs Assessments 42% Let's Move 38% NRPA's Safe Routes to Parks 36% NRPA's Commit to Health 36% Community Health Improvement Plans 33% Complete Streets 33% After School Association's - HEPA 27% Live Well 25% KaBOOM!'s Playability 23% Alliance for a Healthier Generation 20% Active Living Research 18% GP RED's SMT 18% GP RED's Safe Routes to Play 18% SPARK 15% NIOST's Healthy Out of School Time 11% ACHIEVE 10% Active Living Coalition 10% CDC's Healthy Places Parks HIA Toolkit 10% Eat Smart, Move More 9% Healthy Parks Healthy People 9% NFL Play 60 8% Healthy Kids Concepts 8%

150
The respondents were then asked for an open-ended response on which initiatives
have been most helpful to their agency and why. The comments all included verbatim in
Appendix A. Several indicated that they would like see these initiatives, especially NRPA,
GP RED's SMT, CHNA, CHIP, Public Health Institute, National Leadership Academy for
the Public's Health, CDC, and Robert Wood Johnson Foundation work and energy harnessed
into one giant movement.
Ranked Strategies to Address Specific Factors
Building upon the preliminary ranking of potentially modifiable health factors
identified in Questionnaire #1, the next series of question blocks included perceived ranking
of priorities of effectiveness of various identified methods and strategies to address specific
health factors. The lists of strategies were culled from the literature, with a focused
adaptation of those utilized in previous multi-attribute utilities technique (MAUT) studies,
created by Compton, Kim, and Damask (2012) in previous research. Additional strategies
were added from literature and early Delphi Panel findings in this study, and each question
block included an answer for other, with additional room for comments. All of the methods
and strategies for addressing health factors were compared relative to priority in effectiveness
overall by the Informants. Detailed analysis was conducted for each factor separately, and
then aggregated in summary format. The descriptions of strategies and methods have been
shortened here for readability, but are included in full in Appendix L – Questionnaire
#2.Those strategies that received greater than 40% rating as Priority #1 for effectiveness in
addressing the health factors are depicted in Figure 19.

151
Figure 19. Overall priority ranking of effectiveness of strategies to address health factors
Results from Delphi Group #3
Delphi panel Group #3 was conducted on January 6, 2017. Sixteen Informants
participated in an online recorded meeting with me, using www.anymeeting.com, following
the approved Focus Group Protocol described in Chapter 3 - Methods, using Delphi Group
Presentation #3 included in Appendix H. The purpose of this final panel meeting was to
provide an overview of preliminary summary results thus far, with a focus on results from
Round #2 that had not yet been presented, along with questions related to obtaining
consensus on the results and preliminary conclusions. Informants were led through the slides
in Delphi panel Group #3 and asked to provide any comments or corrections. A couple of
0% 10% 20% 30% 40% 50% 60% 70% 80%
Assets for PA
Tobacco Cessation Policies / Education
Increase community gardens
Staff training for social inclusion
Establish standards for staff supervision…
Train specific staff to address planning
Provide access to nature
Safety inspection & risk management
Strategically implement CPTED principles
Create positive social peer atmosphere
Collaboration to promote PA
Enact policies about healthy food
Create org. culture of social inclusion
Summary of Priority Methods to Effectively Address Health Factors Overall
( Ranked #1 by > 40% of Informants)

152
adjustments were suggested and made to the various participation points summary, and a
couple of Informants updated their national initiatives participation. The chart of total
resources available from Informants was discussed, and one Informant added an additional
vending policy. The chart included in Appendix A of which agencies are or have been active
with national initiatives was seen as a great help, because now they could contact each other
about participation or questions about the national initiatives. Comments were made that the
collection of resources and access to examples of what other agencies were doing was one of
the best parts of participation for the informants. Several Informants indicated that they had
not been previously aware of the breadth of work other agencies were doing.
An additional common theme that emerged was the identified need for an ongoing
national repository for available evidence-based research for practitioners, along with
examples of how other agencies are addressing the factors through plans, policies, templates,
and logic models (similar to what was made available to these Informants through their
participation in the Basecamp site). One representative comment that garnered agreement
was:
There are a number of agencies that are looking at health and how parks and
recreation can play a role in the health system, and they really are struggling to try to
figure out how to do it. They feel as though there's not one place to go for all the
information. Where can you just go and get evidence-based practices? And they're
just not sure where to find it because it seems like there's so many different places to
go.
The Informants indicated consensus that there are just not enough data or tracking
mechanisms in place to really have a specific focus on youth at this time. They were
153
surprised that so much literature and research was available, but none had the capability yet
of fully tracking middle school age participation separately, and only three had been able to
work with schools to do youth-specific self-report surveying. The conclusion from the group
was that they know more detailed tracking and evaluation is needed, but current software
system reporting functions do not allow for that type of detail easily in practice.
In review of the other factors suggested, consensus indicated that the factors
identified seemed accurate. In addition, access to nature and tobacco cessation were added as
two key factors that may be modifiable by P&R, but the two other identified factors, stress
management and development of teambuilding skills should be classified more as potential
outcomes from addressing several of the other factors. At the end, the question was again
asked, “What is missing?” The common theme was identified that given current knowledge
bases of all the different types of agencies and level of knowledge of the Informants,
saturation had been achieved through this work. A representative summary comment was:
When I looked at your summary slides about going forward, implications for research
and practice, I thought that was a fantastic summary. And a lot of those things really
resonate with me particularly from just going through the process of developing our
active living strategy. I think there's a real strong focus now on research-based
initiatives and we're being asked to verify that there are positive outcomes associated
with the different activities that we planned. And I also think that we are being called
upon more and more to evaluate what we are actually doing. And that is a challenge.
So I was somewhat, as others have said, relieved to see that we're not the only
recreation and parks department that struggles with that. This whole thing is
definitely in need of a strategic systems approach. That summary conclusions slide

154
really resonates with me. I think the thing that we have to look forward to in the
future is how we bridge the gap between research and the practitioners. We really
look forward to an opportunity to see simplified templates in terms of how we can
effectively implement some of these strategies that others have either tried or are
trying. I'm also really interested in the park prescriptions and working with local
health providers and the insurance industry. But, at any rate, it’s been really good to
be able to see what other folks have been doing. And our agency is looking forward
to participating more on a national scale to help forward this issue.
Based on review of comments and results, it is clear that the Key Informants found
their participation in this research to be beneficial. Most of them were surprised by the large
amount of research that is available in the literature, found benefit from the national
repository of sample documents and policies on Basecamp, and agreed that additional
systematic approaches to addressing the factors and learning more from the research realm
would be valuable. The perceived limitations around using a systems approach to address the
key preventive health factors were all about not having enough resources to do so, needing
more time, money, or staff.
Case Study Results and Analysis
Two local government county-level Departments of P&R (DPR) were selected for
more detailed level case study analysis, Prince George’s County DPR (PGC), is part of the
Maryland National Parks and Planning Commission, and the key Informant was John
Henderson, Research and Evaluation Manager. San Diego County (SDC), California was
represented by Key Informant Christine Lafontant, Region Manager. The reason for selection
of county-level agencies was that data are typically available for comparison at a county

155
level, and these selected agencies are large enough to have dedicated staff and other
resources available to address the health factors. Both of these agencies are Gold Medal
Award Winners from the National Recreation and Park Association. The Gold Medal Award
honors communities throughout the United States that demonstrate excellence in long-range
planning, resource management, and innovative approaches to delivering superb park and
recreation services with fiscally sound business practices (NRPA, 2016). Both are included in
the 152 agencies currently accredited through the Commission for Accreditation of Park and
Recreation Agencies (CAPRA), which accredits P&R agencies for excellence in operation
and service (NRPA, 2016).
The two selected agencies are located on opposite coasts of the U.S. Both have urban,
suburban, and more rural areas within the counties, and both are larger agencies with
dedicated resources towards attempting to define, address, and measure some outcomes
relative to the health factors that are potentially modifiable through community P&R. Both
have indicated that they have some resources focused on programming and spaces for youth,
but like the other Key Informants, neither have strong tracking and evaluation practices in
place at this time to separately evaluate the youth components in most cases.
The results from the case analysis are outlined on the following pages with an initial
section on demographics and various county-wide indicators for both agencies, followed by
more detailed analysis of methods, processes, resources, and outcomes addressed from each
County.
Case Study Demographics
All demographics have been compiled from the free U.S dataset of the Community
Commons Community Health Needs Assessment tools (www.communitycommons.org),

156
which is primarily sourced from US Census Bureau, American Community Survey, 2010-14,
along with other sources for specific indicators. Note that these final population numbers
may differ slightly in this section from those seen elsewhere in resources for this study that
have come directly from the agencies, as they may be sourced from varying years. This tool
was funded on a federal level to help enable non-profit health care systems to comply with
the Affordable Care Act, and provides a convenient, reliable free portal for demographics and
some health indicators down to a county level.
Population and population density. Although both case study agencies are large
coastal counties on opposite sides of the U.S., PGC has fewer total people but is more
densely populated per square mile, as shown in Table 14.
Table 14. Case Study Populations Comparison
Report Area TotalPopulation
Total Land Area
(Square Miles)
PopulationDensity
(Per Square Mile) Prince George’s County, MD 909,535 482.71 1,832.91 San Diego County, CA 3,095,313 4,206.67 756.69 United States 314,107,083 3,531,932.26 88.93
As indicated in Table 15, the percentage of age groupings for both Counties are
similar, and both have higher percentages of young adults as compared to the general U.S.
population.
Table 15. Case Study Percentage of Age Groupings
Report Area Age 0-4
Age5-17
Age18-24
Age25-34
Age35-44
Age45-54
Age55-64
Age65+
Prince George’s County, MD
6.73% 16.36% 11.28% 14.89% 13.92% 14.71% 11.79% 10.31%
San Diego County, CA
6.57% 16.27% 11.56% 15.68% 13.34% 13.46% 11.11% 12.01%
United States 6.36% 17.13% 9.96% 13.47% 12.96% 14.09% 12.29% 13.75%
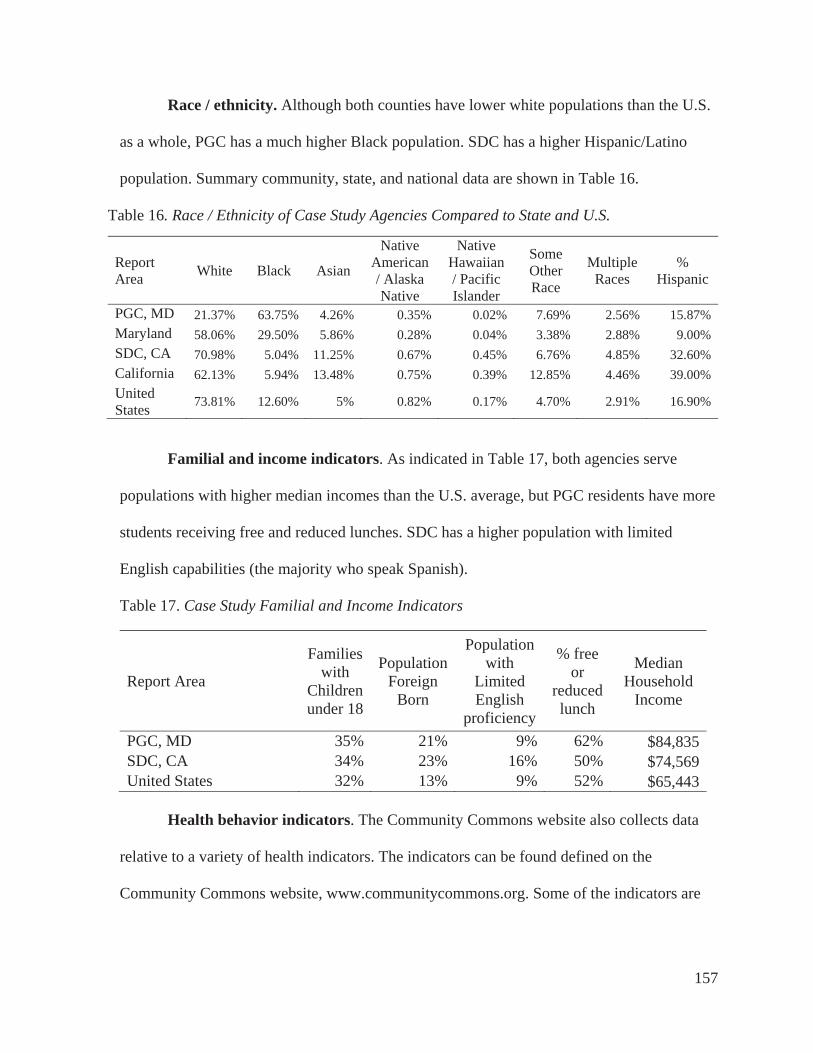
157
Race / ethnicity. Although both counties have lower white populations than the U.S.
as a whole, PGC has a much higher Black population. SDC has a higher Hispanic/Latino
population. Summary community, state, and national data are shown in Table 16.
Table 16. Race / Ethnicity of Case Study Agencies Compared to State and U.S.
ReportArea White Black Asian
NativeAmerican / Alaska Native
NativeHawaiian/ Pacific Islander
SomeOtherRace
MultipleRaces
%Hispanic
PGC, MD 21.37% 63.75% 4.26% 0.35% 0.02% 7.69% 2.56% 15.87% Maryland 58.06% 29.50% 5.86% 0.28% 0.04% 3.38% 2.88% 9.00% SDC, CA 70.98% 5.04% 11.25% 0.67% 0.45% 6.76% 4.85% 32.60% California 62.13% 5.94% 13.48% 0.75% 0.39% 12.85% 4.46% 39.00% UnitedStates 73.81% 12.60% 5% 0.82% 0.17% 4.70% 2.91% 16.90%
Familial and income indicators. As indicated in Table 17, both agencies serve
populations with higher median incomes than the U.S. average, but PGC residents have more
students receiving free and reduced lunches. SDC has a higher population with limited
English capabilities (the majority who speak Spanish).
Table 17. Case Study Familial and Income Indicators
Report Area
Families with
Childrenunder 18
PopulationForeign
Born
Populationwith
Limited English
proficiency
% free or
reducedlunch
MedianHousehold
Income
PGC, MD 35% 21% 9% 62% $84,835SDC, CA 34% 23% 16% 50% $74,569 United States 32% 13% 9% 52% $65,443
Health behavior indicators. The Community Commons website also collects data
relative to a variety of health indicators. The indicators can be found defined on the
Community Commons website, www.communitycommons.org. Some of the indicators are

158
listed in Table 18 as collected related to the factors identified as being potentially modifiable
by P&R.
Table 18. Comparison of Health Indicators from Community Commons
ReportArea
Foodinsecurity
rate
%withLowfood
access
%Adultswith no LTPA
%adultswho
walk or bike to work
%adults
usepublictransit
Adults% lack social
support
RecFac.
Access/ 100K
%AdultsObese -
BMI>30
PGC, MD 16% 28% 23% 2% 17% 23% 8% 33% SDC, CA 13% 16% 16% 4% 3% 23% 12% 19% U. S. 15% 24% 22% 3% 5% 21% 10% 28%
SDC has a much lower percentage of adults who are obese (BMI > than 30) and
higher access to recreation facilities. PGC has a much higher percentage of adults who live in
food deserts (areas of low food access), higher percentage of obesity, and also more adults
who use public transportation to get to work (a benefit of high population density).
Summary of Prince George’s County, MD Specific Case Findings
In Prince George’s County (PGC), MD, the operation of the entire County public
recreation program is managed by the Maryland-National Capital Park and Planning
Commission (M-NCPPC), which is a bi-county agency, created by the General Assembly of
Maryland in 1927. The Commission’s geographic authority extends to the great majority of
Montgomery and Prince George’s Counties. Along with operating the P&R functions for
PGC, the Commission has two other major functions, the preparation, and adoption of the
approved General Plan for PGC for the physical development of the Maryland Washington
Regional District, and the acquisition, development, operation, and maintenance of a public
park system in Montgomery County. For purposes of this study, the focus is on PGC’s
system only. The Commission operates in each County through a Planning Board appointed

159
by and responsible to the County government. All local plans, recommendations,
administration of subdivision regulations, and general administration of parks are
responsibilities of the Planning Boards.
PGC consists of 498 square miles (approximately 320,000 acres). It is bounded by
District of Columbia to the west. PGC is located within the Washington metropolitan area,
which is home to 5.6 million residents. The region’s diverse economy is fueled by federal
spending that has weathered recent recessions and nurtured growing research, commerce,
information, and technology sectors. PGC has 27 incorporated municipalities. Figure 20
depicts regional context.
Figure 20. Prince George’s County regional context

160
PGC is linked to the nation’s capital by a dense transit and road network and it is an
important part of the Washington, D.C.’s, robust regional economy. The County’s P&R
functions are led by the M-NCPPC Department of Parks and Recreation (DPR). PGC DPR is
nationally recognized for outstanding efforts in program design and development by
organizations such as the National Recreation and Park Association (NRPA), the Council on
Accreditation for Parks and Recreation Agencies (CAPRA), and the Maryland Recreation
and Parks Association (MRPA). M-NCPPC is one of the 152 agencies that are nationally
accredited by CAPRA and is the only agency to have been awarded six national gold medals
for excellence in park and recreation management.
For this agency, the key findings were that it is a large agency that is trying to address
evaluation and outcomes, with staff assigned that are specifically trained in PH and
systematic assessment and evaluation, but they have indicated, that they have still felt like
they are “making it up” as they go along. The PGC DPR is governed by their Commission, in
conjunction with the County Council, managed by assigned staff in alignment with the
Formula 2040: Functional Master Plan for Parks, Recreation and Open Space, an agency-
wide visioning and strategic plan. The agency is somewhat unique in that this system
planning effort purposefully incorporated and identified many elements that are relevant and
important to this dissertation study, and was specifically framed around three goals; health
and wellness, connectivity, and economic development.
The Formula 2040 plan include an action plan to address findings, including over 100
objectives and hundreds of action steps, many of which are related to the health factors in
this study. In the plan, there were basically two objectives that pertain to health and wellness.
First is the objective of partnering with others to reduce the overall adult obesity rate in the

161
County by 10%, and the second is the objective of making sure that 75% of PGC DPR
programs have health and wellness components. As a result of this plan’s goals,
approximately three staff full-time equivalent (FTE) resources were assigned to specifically
address health and wellness goals for the agency. In addition, a comprehensive topic-specific
Health and Wellness Action Plan 2016-2020 has been drafted to guide implementation of the
health and wellness objectives. In the plan a variety of matrices were developed to
specifically address various factors such as: social-cultural health components; mental
wellness criteria table; environmental wellness criteria table; physical wellness criteria. As
these matrices are the first of this type related to application to P&R practice identified by
this research, they are included in Appendix M – PGC Wellness Criteria Tables.
To accomplish their goals, the PGC Wellness action plan focuses on six thematic
areas: Signature Programs; Standards, Guidelines, and Policies; Partnerships, Sponsorships,
and Grants; Facilities; Marketing; and Staff Training. The plan includes desired outcomes
and outlines specific steps to achieve those outcomes. This plan includes logic model type
outlines for social engagement, mental, environmental, and physical wellness goals. Overall,
the action plan was designed to align the Department with national public health movements.
The plan is detailed, and describes that the PGC DPR is committed to being a leader in
addressing the health and wellness needs of PGC residents.
In addition to the Wellness Plan, the PGC DPR has recently decided to participate in
the Parks Rx Program (see http://www.parkrx.org) developed by the National Park Service
and pilot tested in DC with Dr. Robert Zarr and Anne O’Neill (Zarr, Cottrell, & Merrill,
2017). This work includes analysis and tracking of a list of 45 component fields for
evaluation. The system has been designed to track which park locations are prescribed, how
162
many visits the patients make, what they do during their visit, and the duration of visits.
Although results from use of this system are forthcoming later in 2017 and therefore not
available for this study, the design of this system appears to provide an opportunity to
develop a protocol to monitor and evaluate benefits.
Key themes emerged from the interviews with the informants interviewed for this
research, and the themes were later confirmed with them for perceived accuracy. The
informants indicated that they have been targeting incorporating health and wellness goals
into their P&R functions since 2009. Although all factors are important to them, their highest
priority factor is safety and perception of safety. The second was physical activity. Third was
parental engagement and education. Fourth was nutrition. Fifth was social and peer
engagement, and sixth was transportation and access. Social Capital is also important as an
aspect being explored in collaboration with the University of Maryland.
PGC Organizational Strategies to address the Factors. PGC has many
organizational elements in place, and they are addressing most of the health factors. The
County utilizes systems planning methods and needs assessments that address the health
factors, along with a component-based inventory and LOS. However, there is a need for
greater system-wide awareness and collaboration. Creating the Health and Wellness Action
Plan was difficult for PGC. So far it has resulted in being more of an internal plan, but is a
work in progress based on identifying the program components and elements. A primary
challenge is the fact that the agency is “huge” and there are several divisions devoted just to
programming. It is difficult to share information, and there is little in place in terms of formal
tracking of the desired outcomes. Related to evaluating physical assets, the Informants
indicated that simply due to the longitudinal nature of this type of evaluation, it has been
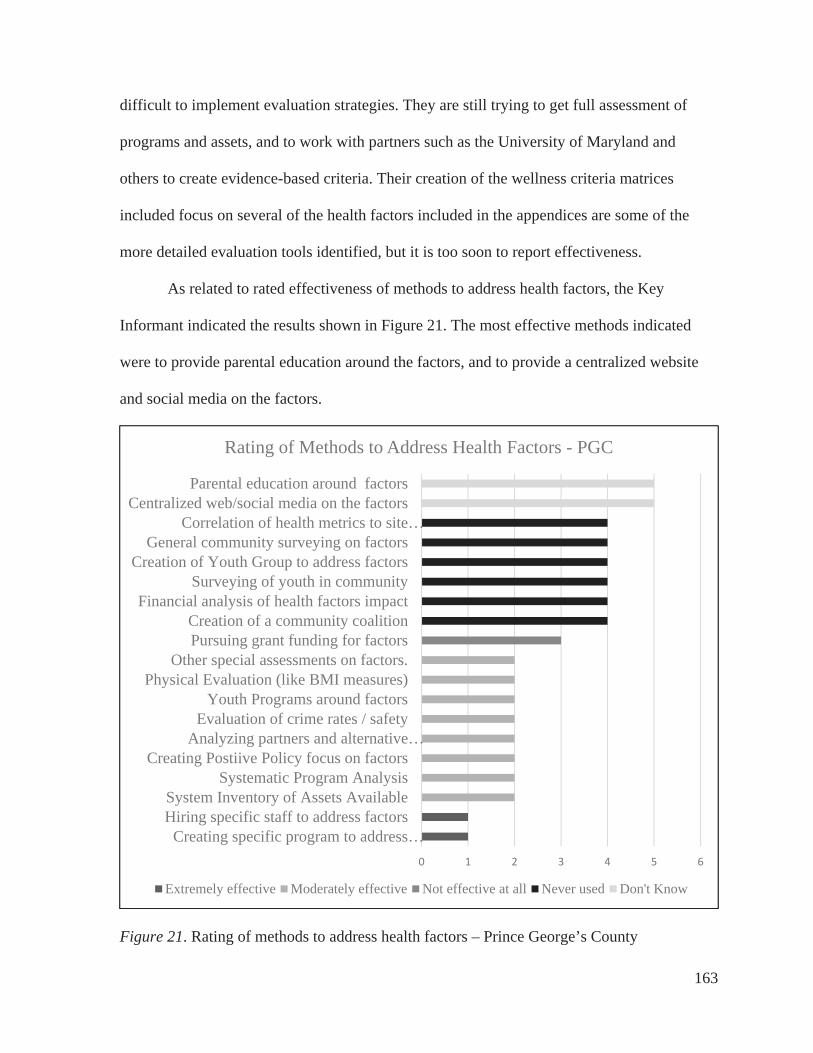
163
difficult to implement evaluation strategies. They are still trying to get full assessment of
programs and assets, and to work with partners such as the University of Maryland and
others to create evidence-based criteria. Their creation of the wellness criteria matrices
included focus on several of the health factors included in the appendices are some of the
more detailed evaluation tools identified, but it is too soon to report effectiveness.
As related to rated effectiveness of methods to address health factors, the Key
Informant indicated the results shown in Figure 21. The most effective methods indicated
were to provide parental education around the factors, and to provide a centralized website
and social media on the factors.
Figure 21. Rating of methods to address health factors – Prince George’s County
0 1 2 3 4 5 6
Creating specific program to address…Hiring specific staff to address factorsSystem Inventory of Assets Available
Systematic Program AnalysisCreating Postiive Policy focus on factors
Analyzing partners and alternative…Evaluation of crime rates / safety
Youth Programs around factorsPhysical Evaluation (like BMI measures)
Other special assessments on factors.Pursuing grant funding for factorsCreation of a community coalition
Financial analysis of health factors impactSurveying of youth in community
Creation of Youth Group to address factorsGeneral community surveying on factors
Correlation of health metrics to site…Centralized web/social media on the factors
Parental education around factors
Rating of Methods to Address Health Factors - PGC
Extremely effective Moderately effective Not effective at all Never used Don't Know

164
The agency’s leadership and system planning does generally support this work, and
ongoing focus appears to be intended. Agency strengths were indicated as having significant
resources to address these issues, and having a strong guiding system plan that includes focus
on the strategies and desired outcomes. Challenges continue to be that they have “a sluggish
and inefficient bureaucracy that frustrates innovation”, along with few current partnerships,
and proven metrics and methods for evaluation. PGC is likely one of the key leading
agencies in the country to watch over next few years, as they continue to attempt to address
the factors with emerging methods and utilize evaluation to measure effectiveness in the
P&R realm.
Summary of San Diego County, CA Primary Case Findings
The San Diego County (SDC) Department of Parks and Recreation (DPR) strives to
enhance the quality of life for more than three million county residents and visitors of all
ages. SDC DPR promotes health and wellness, safe communities, and civic pride through
thousands of programs system-wide, including events and activities, recreation centers and
state-of-the-art sports complexes. The County’s Gold Medal award-winning park system
includes 36 local and 19 regional parks, 8 camping parks, more than 360 miles of trails,
fishing lakes, ecological preserves, botanic gardens, and open space preserves. SDC DPR
operates and manages more than 48,000 acres of parkland and 11 historic park sites. Park
facilities are managed to enrich the lives of all patrons. To help ensure these services are
provided to millions of visitors each year, the SDC DPR manages a budget of over $38
million per year. The agency has also achieved accreditation from CAPRA. Regional context
is shown in Figure 22.

165
Figure 22. Regional context of San Diego County, CA
Key findings from SDC DPR indicate that it is a very large county system that has
directly been trying to address health factors through P&R for almost thirty years. The
Informants indicated that the priority order for SDC for addressing the factors were, 1) Safety
or Perception of Safety, 2) Social and Parental Engagement, and 3) PA. The SDC DPR has
developed relationships with a variety of partners, including a university and several non-
profit organizations that are specifically interested in addressing these health factors and
others.
The SDC DPR is a strong proponent of systemwide planning, and has created a
culture of including health in all planning documents and evaluation. The County utilizes
systems planning methods and needs assessments that address the health factors, along with a
component-based inventory and LOS. The Department is guided by the 2016-2021 Parks
and Recreation Strategic Master Plan, which includes health as one of the four key
components of the Strategic Vision for the agency. In addition, a more detailed SDC DPR
Operations Plan 2016-2018 calls out four specific strategic initiatives related to addressing
the health factors. These include Healthy Families, Safe Communities, Sustainable
Environments, and Operational Excellence.

166
SDC Organizational Strategies to address the Factors
SDC places emphasis on systemwide organizational and strategic planning. The
Informant provided many resource documents on the Basecamp site. These included not only
the general systems plan, needs assessments, and strategic plans, but also a variety of polices
and practice guideline documents for the addressing the various factors themselves.
Related to evaluating outcomes, SDC DPR tracks attendance numbers, but does not
evaluate specific individual measures, such as BMI or behavior change. As related to rated
effectiveness of methods to address health factors, the SDC indicated a different priority
order than the other case study or the aggregate from the Delphi panel for addressing the
factors, as shown in Figure 23. The most effective methods indicated for SDC were to pursue
grant funding and to create positive policies to address the factors.
Figure 23. Rating of methods and strategies to address health factors – San Diego County
0 0.5 1 1.5 2 2.5 3 3.5
Financial analysis of health factors impactHiring specific staff to address factors
Physical Evaluation (like BMI measures)Creation of a community coalitionSurveying of youth in community
Creation of Youth Group to address factorsCreating specific program to address factorsCentralized web/social media on the factors
Analyzing partners and alternative providers General community surveying on factors
Evaluation of crime rates / safetyParental education around factors
Youth Programs around factors Other special assessments on factors
Correlation of health metrics to site planningCreating Positive Policy focus on factors
Pursuing grant funding for factors
Effectiveness of Methods to Address Health Factors - SDC
Never Used Moderately Effective Effective

167
Information and documents were provided related to the agencies strategies and
practices for promoting nature access for youth, managing community gardens, farmers
markets, and nutrition, including vetted vending and concessions policies. SDC has
collaborated with the City Project and The San Diego Foundation to create a Parks for
Everyone – Green Access for San Diego County report to gain a better understanding of the
state of green access in the San Diego region. This report provided geographic, demographic,
and economic data to map and assess the overall accessibility of the region’s green space, as
well as to examine the equity of green access by analyzing whether certain groups of people,
based on income level, race/ethnicity, have access to these resources. Complementing the
SDC DPR systemwide plans, the maps in Parks for Everyone plot green space in relation to
population with a goal of improving health and equity.
SDC provided materials for this study from their partnership with LiveWell San Diego
County. The agency has an active regional coalition and plan that works with DPR annual
reports, created by SDC DPR and other county departments, to highlight success stories of
internal and external organizations and recognized partners who are making positive changes.
These reports are available on the Live Well San Diego website at
LiveWellSD.org/about/live-well-san-diego-materials/. This website also includes resources
to promote community involvement, identified best practice tools for organizations and
partners, and information about the Live Well San Diego Indicators, designed to measure the
region’s collective progress. The Top Ten Live Well San Diego Indicators were identified
under five themes to capture the overall well-being of residents in the County. These
indicators are part of a framework to allow the County to connect a wide array of programs
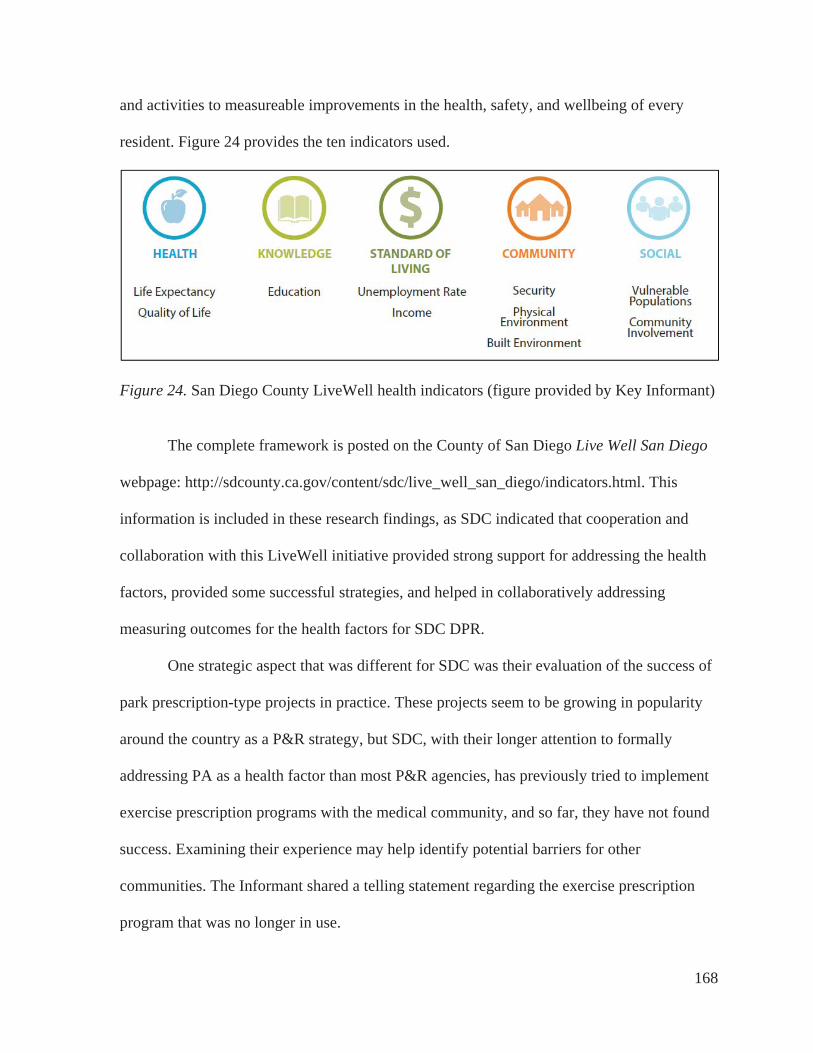
168
and activities to measureable improvements in the health, safety, and wellbeing of every
resident. Figure 24 provides the ten indicators used.
Figure 24. San Diego County LiveWell health indicators (figure provided by Key Informant)
The complete framework is posted on the County of San Diego Live Well San Diego
webpage: http://sdcounty.ca.gov/content/sdc/live_well_san_diego/indicators.html. This
information is included in these research findings, as SDC indicated that cooperation and
collaboration with this LiveWell initiative provided strong support for addressing the health
factors, provided some successful strategies, and helped in collaboratively addressing
measuring outcomes for the health factors for SDC DPR.
One strategic aspect that was different for SDC was their evaluation of the success of
park prescription-type projects in practice. These projects seem to be growing in popularity
around the country as a P&R strategy, but SDC, with their longer attention to formally
addressing PA as a health factor than most P&R agencies, has previously tried to implement
exercise prescription programs with the medical community, and so far, they have not found
success. Examining their experience may help identify potential barriers for other
communities. The Informant shared a telling statement regarding the exercise prescription
program that was no longer in use.

169
It was grant funded, and we had one year funding. It was a pilot. I’ve done it twice in
two different communities, and I just can’t figure out how to make it more successful.
There’s something missing from giving that type of program to people. We’re saying
basically, you can come sign up for any of our classes for $5. Like that’s the co-pay
and your kid could take this class, and yet it just wasn’t getting people to sign up. We
had to think about this quickly, and we did this $5 co-pay to create some kind of
ownership, right? To them it’s like, oh that was free, I don’t have to go. That wasn’t
really the intent. We really wanted people to attend. Maybe it wasn’t a matter if people
can. If it was $1, I don’t know if that would have made a difference. Talking to the
doctors or nurses, it was just like, sometimes these people just don’t have $5 for the co-
pay for their medicine, or they don’t even fill up the prescription that we gave them for
medicines to make them better. There’s a lot more barriers than we’re thinking of.
The Informant indicated that without additional funding and individual support for
participants, a simple prescription program is not likely to lead to adherence.
In terms of success in addressing the factors, SDC indicated strengths in the fact that
the County of San Diego as a whole (system) is addressing health and wellness. This agency
likely has some of the most experience in the U.S. in terms of integrating PH practices with
P&R, and regularly creates policies and templates for evaluation. They provided many
resources for the Basecamp site that other Delphi Informants found of value. Primary
challenges or constraints were identified as having a large and diverse region, having
challenges in obtaining and tracking meaningful data and comparisons that truly
demonstrates the effects of SDC’s programs and policies, and obtaining funding for specific
programs. The SDC case results indicate that even with all their work for almost 30 years,

170
there is much to do, especially in terms of assuring equity across the system, and
measurement of outcomes for evaluation.
Comparative Analysis of Case Study Agencies and Theoretical Basis
Comparison of the two agencies identifies a variety of key findings, similarities, and
differences that helped to inform the study conclusions. These also helped inform the study
results as a whole, along with how they do and do not align with and inform the systems
theory and systems thinking basis. A primary finding is that both of the case agencies have
been able to assign resources to specifically address at all of the identified modifiable health
factors. Both are larger agencies that have more resources assigned than the other Informant
agencies, but as they are larger, they have more difficulty in centralized tracking of
information. Both agencies agree that tracking information specific to youth is a challenge, as
many of the registration and participation tracking mechanisms do not specifically report or
track by age cohorts. Both agencies indicated that safety and perception of safety, PA, and
social/parental engagement are the top three health factors they need to address.
Transportation is also often a challenge, especially for lower income areas.
Both case agencies indicated a dedicated focus on creating equity across the system,
and addressing under-resourced populations. The Key Informants and additional stakeholders
for these larger agencies indicated that they had a harder time tracking down information, as
it was likely that others are working on various topics. Both Key Informants indicated that
taking the questionnaires was somewhat difficult for them, not because they did not
understand the questionnaires or background, but because others in the organization needed
to be consulted to gain the prioritization and initiative participation data. In addition, both
indicated that they work with many partners, have areas of their communities that are under-

171
resources (equity issues), and their key priority factor is a focus on safety and/or perception
of safety. Both agencies indicate that they have participated in a variety of national and
regional initiatives and grants, but their participation efforts differ. More partners and more
areas to serve mean for both agencies that they are often in the role of “high level upstream
focus” as organizer and policy maker, more than an operational implementer of the
programs, at least at the higher position level of these participating informants.
Both case agencies have systemwide plans in place that rely upon regularly scheduled
full community needs assessments. Both agencies have adopted using a component-based
method (CBM) inventory and level of service analysis process, using GIS to analyze and
manage their systems. Both specifically call out health and wellbeing as primary goal, with
stated objectives and support from senior leadership. Both agencies indicate that measuring
outcomes beyond participation and locations has been difficult, and neither claim to have a
strong method for measuring the specifics of the desired outcomes. Both agencies appear to
place a higher priority on the use of and perceived effectiveness of the system-wide methods,
strategies, and potential outcomes than the general Delphi panel overall.
The primary differences of the case agencies had to do with systemwide
implementation strategies, including length of time addressing the initiatives, current
initiatives participation, and ranked priority of effectiveness of methods used. SDC has been
specifically addressing most of these factors for almost 30 years, and has had existing
relationships and partnerships with the local universities, LiveWell San Diego, and other
partners. PGC is relatively new in having a specific focus on the health factors, mostly since
2010, and there is no countywide established partnership or coalition yet established. They
have just created the extensive Health and Wellness Plan in 2017. There is not yet a full

172
cultural acceptance of this work’s focus across the large PGC agency, but the Informants
hope that it will continue to grow in the coming years.
As is likely true for all agencies, the priority ranking of perceived effectiveness of
strategies and methods is perhaps an effect of the difference of length of time and allocations
of resources within the agency for specifically addressing the factors. PGC had hired a
dedicated “Research and Evaluation Manager” that was tasked with helping to organize the
organization’s approach and evaluation of potential outcomes. PGC had participated in ten
national initiatives in recent years related to these factors, and was still active in five of them.
SDC reported having twenty FTEs of staff allocated to help address the factors, and had
participated in eight national initiatives, but was currently active only with Let’s Move. A
telling statement from the SDC Key informant was:
We’ve had a lot of grants, but grants end, and then the program ends. A lot depends
on where the money is coming from. We’ve shifted our focus some from going after
grants for programs to now a bigger focus on changing policy longer term and
working with others. Health is now part of everything that we do, but now we work
with various groups and neighborhood to help them offer the programs they want for
their part of the community, more than us offering something across the County.
PGC was still identifying which programs they offer internally and/or by partners,
which partners are addressing which health factors, and which they may want to pick up or
add internally. Grant funding for PGC has been seen as a tool to help offer programs in more
areas. With their new plans, the broad goal stated “at least 75% of the programs include a
health or wellness component.” They had set up matrices to help measure outcomes in a
specific way.

173
One key difference between the case agencies was in the perspective of the potential
effectiveness of parks prescription programs. SDC had been a pilot for two of these types of
programs, and had determined that they were not very effective for reaching participants
overall. This was mostly due to resulting non-compliance from the participants and the large
amount of resources needed to run the program. In addition, the SCD agency included the
finding that if Park prescription programs were to continue, there would need to be dedicated
funding for internal staff to help act as a liaison with the medical community. PGC, being
relatively newer to this realm, reported high hopes for park prescription programs, and were
just starting a formal relationship with Dr. Robert Zarr to fully implement them. Additional
research is happening right now in this realm, and further research is indicated on this topic.
The comparative analysis of the case agencies with the Delphi panel overall in
relationship to the systems theory theoretical basis highlighted key themes that merited
further exploration for conclusions that were initiated through the creation of a Key Themes
Analysis Matrix framework.
Key Themes Analysis Matrix
In addition to establishing a theoretical basis, this research encompassed reviewing a
large amount of literature, factors, methods and strategies, and a variety of potential
outcomes. To help organize this vast amount of data, I utilized iterative assessment with a
Framework Method to review the many sources of data and results, and then compiled a Key
Themes Analysis Matrix in MS Excel, using a 3-point color-coded scale (low, mid, and high
priority). This type of framework method has been used since the 1980s to analyze
organizational management goals and outcomes in the social science realm (Ritchie & Lewis,
2003). I have used it before successfully on other community planning projects that require

174
analysis of large amounts of diverse data. Other researchers have also found it to be helpful
for organizing multi-disciplinary and qualitative health research (Gale, Heath, Cameron,
Rashid, & Redwood, 2013). The feedback from the Informants review indicated it was
effective method for organizing and articulating the large number of categories and themes
related to the variety of factors, methods, strategies, and potential outcomes for this project.
The Key Themes Analysis Matrix lists the key findings on the left hand column for
the health factors, priority strategies for addressing them, along with key identified desired
outcomes for P&R agencies. Columns indicate the results from the research methods used,
showing priority and comments. To determine priority, key themes were culled from the data
from all research methods. Results from each method were evaluated to determine whether a
factor, strategy or method, or desired organizational systemwide outcome was identified.
Identified items were then rated as a low, mid, or high priority for P&R agencies to address.
Results, as shown in Figure 25 on the following page, indicate and confirm the eight
primary modifiable factors. Fifteen primary strategies for addressing the strategies were
identified and ranked by reviewing the aggregated qualitative and quantitative results from
each method. Five primary desired organizational outcomes were shared across the study. In
addition, I added a column of my own personal opinion of priority based on my professional
research and practitioner experience with these topics, and then a final column based on an
aggregate summary ranking, along with a short comment. All themes, selected priority levels,
and researcher comments were vetted with all of the Informants in Stage 3 of the Delphi
panel. All Informants indicated agreement with the aggregated findings and all priority
rankings. These rankings were then used as the primary basis for the formation of
conclusions, implications, and recommendations.

175
Figure 25. Key Themes Analysis Matrix of data resources and emerging conclusions.
Key ThemesEmerging Theory, Process, and
Conclusions
Rating Scale1 - low priority2 - mid level3 - key issue/priority Emerging Themes Li
tera
ture
Rev
iew
Age
ncy
Res
ourc
es
Que
stio
nnai
re #
1
Que
stio
nnai
re #
2
Del
phi F
ocus
Gro
ups
Indi
vidu
al In
terv
iew
s
Sta
keho
lder
Inte
rvie
ws
Focu
s G
roup
Dis
cuss
ion
Res
earc
her
Opi
nion
Sum
mar
y R
atin
g
Comments: Each Agency is different and priorities will vary - Need to
evaluate in each community to proritize.
Modifiable P&R FactorsPhysical Activity Programs, policies, strong evidence.Safety Cannot participate if don't feel safe.Nutrition Strong evidence & policies. Access to Nature Dosing Growing rapidly in evidenceTransportation / Access P&R needs to be at the planning table.Social Engagement Need culture of inclusion at all levels.Parental Engagement Perceived as difficult to address.Tobacco Cessation Most agencies are tobacco-free.
Create strong org health culture Must have buy-in at all levels.Create strong external health culture of inclusion and equity
Equity is key. Need focus on under-resourced community segments.
Collaborate with partners Necessary but difficult.Utilize CPTED in planning Becoming common practice.Centralized agency tracking of metrics and standards
Need dissemination of process and tools.
Increase promotions on health Need resources and dissemination of campaign examples.
Use evidence-based tools to address health factors
Evidence based tools are available but not readily known or used by P&R.
Conduct master planning / needs assessment
Need system planning that includes health factors
Enact policies on all factors Need guidelines or recommendations for other agencies also.
Educational programs on factors Debate on need for policy vs. program focus. May be community specific.
Analyze CBM for level of service Emerging tool. Disseminate. Add AEE evidence to CBM Emerging tool with new evidence base.Track youth metrics separately Emerging tools - need dissemination.
Align with national initiativesGood but many and they change rapidly. Need to see which sustain.
Add Park / Rec Rx programEmerging tool. Becoming popular now, but efficacy not yet fully assessed.
Improved health for all factors Overall goal.
Standards for measurement Woefully needed, but fairly non-existent.
Increased operational funding Resources needed at all levels.Increased staffing Staffing can be partnered.
Increased grant funding specific to factors
Grants end. Helpful for capital improvements and pilots, but can be challenging for ongoing programming.
Top five desired outcomes achieved for or by addressing health factors
Suggested Primary Strategies for P&R to Address Health Factors
Case StudyDelphi Study

176
CHAPTER 5 – DISCUSSION AND CONCLUSIONS
As discussed in previous chapters, this study explored the primary research question
of how parks and recreation (P&R) agencies address prioritizing modifiable key health
factors. In addition, the research has addressed secondary questions on first identifying and
confirming the specific factors, how these Case Study and Delphi Key Informant agencies
are trying to successfully address them, and suggested potential methods and strategies for
use in further research and application to practice.
The following sections summarize and integrate the findings from the literature
review, the Delphi Panel, and the Case Study to discuss and identify conclusions for: 1) the
identified potentially modifiable health factors, 2), the role of the community system and the
basis of systems theory for this work, along with related relevant national initiatives and
organizational strategies, and 3) the process of translating evidence to implementation. This
chapter identifies and discusses the key findings from this research and the summary results
from the Key Themes Analysis Matrix. The results influenced and supported the conclusions
and implications for the application of systems theory and resultant systems thinking for
P&R agencies. I conclude by suggesting next steps for research and practice, including
application of an adapted Knowledge to Action (K2A) Framework for P&R research and for
agencies in their local systems. This conceptual framework may help in discussing and
addressing the gaps of knowledge, research, theory, and evidence for P&R. In addition, I
summarize a suggested systematic toolkit approach for identifying and addressing the factors
within a community-specific P&R system setting.
The reasoning behind the selection of the Delphi panel and case study research
strategies was primarily to identify any additional themes or strategies that were not already

177
available in the literature, and to use the full Delphi panel to confirm and help prioritize
strategies identified. The Delphi panel was crucial in identifying national initiatives and
confirming all findings through the three-stage process. An added benefit was that the Key
Informants served to educate and inform each other. Resources were submitted by the
agencies and aggregated into a common online Basecamp (www.basecamp.com) repository.
Feedback from the Delphi Panel Group Discussion in Stage 3 was overwhelmingly positive
in terms of all Informants final perceptions of this research. The feedback from the
Informants as to how the factors and strategies are or are not working in a systems context
was invaluable.
The case study served its purpose in providing detail relative to the challenges of
addressing strategies, evaluation practices, and outcomes. Although the results from the case
study were not very different overall from the results of data from the Delphi panel, a
primary conclusion was solidified that all communities are different, have different priorities,
and are at different stages, and levels of challenge in addressing these factors. Even with two
somewhat similar agencies serving large demographically-diverse populations on opposite
coasts of the U.S., their strategic organizational focus is somewhat different. This appears to
be a function of lifecycle stage of the research and resource availability within these agencies
(the longer the effort has been occurring, the more the effort appears to be focused on policy
rather than pure program delivery). This appears to be an important element influencing how
the local system overall may function, along with the level of interest in evaluation.
Integration of the case study results served to deepen and enrich the conclusions related to
the application of the theoretical basis and recommendations, and provided additional
resources, feedback, and validation of the findings.

178
An overview of the identified health factors, suggested strategies, limitations, and
implications for research and practice applications follow. Analysis led to implications for
suggested additional research for the academic realm, and practice applications to address the
factors in local communities.
The Potentially Modifiable Health Factors
As indicated on the Key Themes Analysis Matrix, and fully referenced in the
literature review, common themes emerged relative to the health factors that are potentially
modifiable by P&R agencies. The additional research for this dissertation through the Delphi
Panel and Case Study confirmed those findings. The list is not exhaustive, and some agencies
may address other preventive health factors. A key conclusion from all methods is that
priority order for attention to the factors is community-specific, and depends on needs,
situational climate, and resources available in a given community. Table 19 indicates the
identified descriptive statistics for the priority factors on an 8 point scale (1 is highest) in
order from all Delphi Informant responses.
Table 19. Delphi Panel Factor Rating - Descriptive Statistics N Minimum Maximum Mean SD
Physical Activity 18 1.00 3.00 1.41 0.69Social/Peer Engagement 17 2.00 7.00 3.56 1.50Safety/Perception of Safety 17 1.00 8.00 3.88 2.26Nutrition / Food Availability 17 1.00 8.00 4.13 1.73Other Factors 6 2.00 5.00 4.20 1.17Parental Engage/ Education 16 2.00 7.00 4.53 1.41Transportation / Access 16 2.00 8.00 5.47 1.54
When data were aggregated from all Delphi Informants, PA was identified the highest
priority factor for all agencies seventeen agencies overall. All of the Informants had some
type of plan or programs in place related to PA. It is a common program area for P&R

179
agencies, who have long addressed providing locations and programs for sports, fitness, and
individual activities that promote physical activity. Evidence is mounting for the role of the
individual elements beyond simple access and proximity to sites that affect PA. These
include documented relationships between PA and social support, nutritional habits, parental
engagement, screen time (time spent watching television or sedentary at computers, which
may displace time that could be devoted to PA), transportation availability, access to natural
environments, cost, perceptions of safety, and other factors that may be at play (Cohen et al.,
2006; Drenowatz et al., 2010; Hitchings, 2013; Sallis et al., 2015).
Although the analysis of the literature and volume of availability indicates that PA is
the most studied factor for P&R, both case study agencies indicated that it was not their
highest priority. PA was second behind safety and perception of safety for Prince George’s
County, and third behind safety and parental/social engagement for San Diego County. This
may partially be a function of looking specifically at larger countywide communities for the
case study. However, analysis of additional resources provide from other Delphi Informants
who have used a multi-attribute utilities technique process in their communities to prioritize
addressing health factors, along with detailed analysis of the individual Informant priorities,
indicated that the priority order of factors varies by community. These results warrant further
research into the other factors within a systems context.
As for the other factors, the evidence suggests that efforts to improve health factors
may be affected by increasing or decreasing peer-to-peer and parental engagement of others
in participation and policies. Informant responses confirmed that for youth, parental
engagement and modeling is more important than simple statements telling youth to be
healthier. If the parents are not themselves modeling healthy actions, youth may not either.

180
However, when peers adopt healthy practices, others tend to do so. For all ages and actors
within the system, teambuilding through sports and other programs, and creating social
engagement and bonds can work to improve health. Therefore, it is important to focus not
only on the individual, personal levels of education and change, but also on the intrapersonal,
familial, community, and societal levels.
The results indicate that people will not participate or allow their family and friends
to participate if they do not feel safe. Although safety and perception of safety are actually
two different but related factors, it is important to address both actual safety through
examining actual crime rates and spatial safety, and also to address emotional, cognitive, and
psychological perception of safety. Depending on the community, one or the other may be
more important as a priority to address, but in the mind of an individual in the community,
perception is reality. The literature indicates that national initiatives such as Crime
Prevention through Environmental Design (CPTED) can reduce actual crime and increase
perception of safety. The findings indicate that working with public safety officers (police) as
partners can be one effective strategy to address this factor. If crime rates or other safety
issues are actually low, but perception of safety is negative, attention may need to be focused
on educational /marketing campaigns that address the false perceptions, such as promoting
actual safety records and methods that are in place.
Although nutrition is not always thought of as a primary factor under the purview of
P&R agencies, the evidence is clear that local public agencies can help improve nutritional
intake and quality in communities. Some examples provided by the Informants were creation
of nutritional policies for program areas, creation of community gardens, summer and
breakfast feeding programs, and facilitation of farmers’ markets. The Informants confirmed

181
that nutrition can be a priority factor for P&R, especially in communities with disparities in
food availability. The indicators and strategies include promoting sound policies both within
the agency and within the overall community system. These may include vending policies,
policies around agency programming, recommendation of policies to other community
partners, such as schools, faith based organizations, and non-profit associations. In addition,
the research indicates that P&R agencies can affect positive nutritional change through
enabling provision of healthy food and education through healthy food option availability,
farmer’s markets, and community gardens. Nationally accepted guidelines are available for
describing what healthy means for these access points (e.g., NAA HEPA Standards, 2015).
Several of the Key Informants provided nutrition related policies, such as policies for internal
vending, internal programming food provision, and suggested policies for other community
partners (such as alternative providers, schools, and faith-based organizations) that provide
related public programming and spaces.
The literature is clear that a person cannot derive health benefits from a place or
program in their community if they are not able to get to it (or at least see it, in the case of
access to nature). The evidence is clear that having adequate access combined with education
can help increase PA in a community. However, some studies have questioned these “build it
and they will move” lines of research. Several studies have suggested that access to
recreational facilities and parks is less of a barrier to PA than other individual factors, such as
socio-economic status (SES), perceptions of safety, self-efficacy and individual thought
patterns (e.g. Cerin & Leslie, 2008; Cohen et al., 2013; Veitch et al., 2012). Promoting
zoning and health policies that encourage the design and regular use of P&R managed spaces
may also offer a promising opportunity for increasing PA. Although not direct health factors
182
per se, availability of transportation options and accessible locations are key to participation
and use of community amenities. P&R agencies may not always think of themselves as
transportation providers, but they must be part of the system to ensure that users can access
the assets and offerings.
The literature shows that proximity to quality P&R amenities increases utilization.
New geo-spatial methods have been created that can help determine preferred location and
minimize barriers. It is important to recognize that when focusing on age groups such youth
and seniors who don’t drive, additional focus needs to be on provision of safe transportation
alternatives, whether it is by car, bus, bike, or other popular alternative means (e.g.,
skateboarding, scooters). Bike lanes and off-street trails increase utilization and access. There
are effective nationally endorsed strategies (e.g. Complete Streets or 8:80 strategies) that can
be adopted to help improve local practices. Findings indicate that P&R agencies need to
actively participate in transportation planning if they want to modify the other health factors
within a systemwide context.
Delphi Informants suggested additional factors for inclusion after the initial literature
search. Although not widely represented in the literature relative to P&R, some research and
findings from the Delphi panel suggests that P&R agencies may be able to play a positive
role in addressing smoking prevention and cessation, especially among youth. In the United
States, more than 600 municipalities now have smoke-free parks, and more than 100 have
smoke-free beaches (NRPA – Tobacco, 2016b). After additional factors were added in Stage
2, addressing tobacco ranked second in terms of other factors to address, and in the top
fifteen strategies that received greater than 40% rating of first priority to address from all
Key Informants. Both case study Key Informants and others during Stage 3 mentioned that

183
their agencies were already under a smoke free or tobacco free policy. The verbal consensus
from Informants was that since addressing tobacco is typically a community-wide policy for
public facilities, they did not usually need a specific separate policy for P&R, unless the
community overall did not have one in place. Informants added some resources for tobacco
to the Basecamp repository.
Similarly, alcohol reduction in communities was also a factor suggested late in review
of the research, so some additional research was added to the literature review. However, this
factor was not separately included in the rankings or Key Themes Analysis Matrix. The
literature indicates that on a global scale, reduction of alcohol consumption in communities is
warranted as a preventive public health goal. P&R agencies often offer alcohol to the public
through programs and special events. These agencies may be able to play an important front
line role in education, especially for youth.
There may be additional related health factors for P&R to address in their community
systems. These may include addressing overall stress management, water quality,
environmental degradation, and climate change, which all may have a direct or indirect effect
on preventive health, especially if they are not already being addressed by other actors in the
community at large. The research is steadily evolving from trying to determine whether P&R
agencies can positively modify these health factors, to trying to determine how best to do so
given limited resources within the larger community system.

184
Theoretical Basis – Systems Theory and Systems Thinking
The research from identifying and confirming the priority health factors expanded to
analysis of the existing literature on systems theory and systems thinking, along with how
this theoretical basis can be applied to P&R agencies for addressing the health factors in local
communities. The literature review introduced the existing systems theory evidence, then
introduced a theoretical model for the interplay of a community system with various socio-
ecological levels, with P&R as a primary actor to help address the identified health factors.
After integrating the findings from the Delphi panel and case study, conclusions indicate that
applying this theory and creating a resultant culture of collaborative systems-wide thinking
provides a basis for application to how P&R agencies can address preventive PH factors in
their specific communities through both research and practice.
The mechanism for how an agency can address the factors in their community
appears to be ingrained in having established emphasis on consensual and adopted
systemwide needs assessments and plans that identify the priority of factors and specific
strategies for that specific agency. A summary system model is reproduced in Figure 26,
indicating the key factors and actors within the community system. P&R can be a leading
partner within this system, and through strategic leadership, can influence how all factors and
actors are connected for the overall desired systems outcome of improving preventive
community health factors. A key element is that P&R can take leadership and facilitate
working with the other actors and partners, such as the local community medical, schools,
public works, transportation, and public safety agencies to effectively address the other
strategies that may be implemented to address the factors.

185
Figure 26. System model for P&R agencies as a partner in preventive community PH
The literature indicated that applying and facilitating a systems thinking approach
(through convening and partnering with all stakeholders in the system) can lead to
minimization of duplications of service and gaps in service provision, along with building
trust and agency effectiveness, improved collaboration, a common agenda and goals, shared
measurement and evaluation of outcomes, and improved continuous communications (Stroh,
2015). In this study, the Informants repeatedly suggested and confirmed this type of need for
and application of systems thinking for P&R.
Findings from the Informants confirmed that systematic assessment of the health
factors within P&R appears to be one way to address improved health within a community.
The research indicates that P&R has a default stronghold as manager of the majority of
public spaces and programs where health-promoting strategies can occur in a community.
However, instead of simply focusing on developing single programs or policies to address
specific health issues, communities need community-specific preventive approaches and

186
consensual plans to concentrate on mechanisms for strengthening the abilities of individuals,
social networks, and organizations to collectively address their common problems. This
approach helps to empower the individuals and organizations within those communities to
develop and implement appropriate local strategies to alleviating health problems.
One mechanism to increase and promote the use of P&R as preventive PH providers
within a system approach is to examine factors that facilitate as well as constrain visitor use
and activities, and address those factors. The systematic assessment for communities
evaluating these special topic areas related to health also can use steps for decision making
and planning. It does appear to be important to conduct regular system-wide plans, needs
assessments, program analyses, and inventories and levels of service analyses, as discussed
in later sections as potential organizational strategies.
Challenges and limitations lie within the implementation and measurement of
interactions within the system, especially for complex factors and a multi-level system like
P&R. It is important to note that P&R is neither the only actor, nor maybe even the leading
actor in this system. To be successful, a systems thinking approach indicates that all agencies
need to understand that their P&R system is part of a larger community system. The actors
within the system need to collaborate with other providers in the community to affect change.
The role of organizational culture. When trying to measure the benefits and
outcomes for management of P&R agencies related to the health factors, the culture of the
organization appears to be very important, and can influence the management and
performance of that organization and the influence upon the community system overall.
Some organizations pay close attention to planning and assessment, and some do not. The
results from the Informants indicate that having leadership with a vision and mission that

187
includes addressing preventive health is key for potential effectiveness in addressing the
factors. Evidence indicates that strong and knowledgeable leadership of the P&R agency is
crucial to promoting both internal and external focus on these health factors (Ross, Young,
Sturts, & Fran, 2013). From that leadership, factors can be addressed through identified and
prioritized strategies.
The study indicates that having a comprehensive system-wide plan in place (e.g., a
departmental system-wide P&R master plan) is key to gaining organizational buy-in and
consensus of decision makers. Paying attention to the elements required for accreditation,
and/or items valued for national recognition (e.g., CAPRA or Gold Medal awards), attention
to creating an internal achievement focused culture, along with attention to community needs
assessment and engagement, all appear to be related to success in positioning agencies to be
able to address health factors (Bruton et al., 2011; Burns, 2016; Hurd, Barcelona, &
Meldrum, 2008; Jaakson, 1985).
The role of national initiatives in addressing health factors. With the
organizational system framework, the research indicates that alignment with other local,
regional, and national initiatives is key to gaining resources within the system. The literature
and input from the Informants covered a variety of initiatives at all levels of the socio-
ecological spectrum that have or are being created and directed towards addressing the
identified health factors. It became clear when coding for themes through the various
methods that involvement or alignment with national initiatives may impact an agency’s
ability to systematically effect positive outcomes. Attention to national initiatives was not an
intentional inclusion in the initial literature review or in Round 1 of the Delphi Panel, but

188
they kept arising through input and discussions. It became apparent that additional research
into the available initiatives was warranted, so it was conducted.
Although many of the Delphi Informants are involved with various local or regional
initiatives, for purposes of this study the review was limited to identifying established
national initiatives related to addressing one or more of the health factors in communities.
From the literature and the web search, 31 national initiatives were identified that appear to
offer at least some assistance relative to tools, methods, and/or collaborations for P&R
agencies to address the factors. Most agencies are working with data and suggested practices
from national level agencies, such as information from the national Safe Routes to Schools
initiative, Community Health Needs Assessments, information from the Centers for Disease
Control and Prevention, and information available around addressing the health factors from
national non-profit organizations such as NRPA, GP RED, and the Active Living Research
group. The identified national initiatives were further explored in Stages 2 and 3 of the
Delphi panel. Participation in national and regional initiatives appear to have an important
influence in whether or not a P&R agency feels they have a good chance of gaining funding,
resources, and collaborations to become effective. All Informants indicated that they were or
had participated in at least some of the national initiatives identified in the literature review
and ranked by the Informants in the Delphi study.
Pursuing national recognitions may also be important to secure resources and
recognition within the local system. Informants indicated involvement in national
recognitions, such as the NRPA Gold Medal Awards and CAPRA Accreditation process as
being key mechanisms for recognition at the community level. Achieving these types of
recognitions can help enhance credibility, decision maker awareness, visibility, and

189
partnership opportunities within the local community system, and also may increase the
opportunities for transfer of knowledge through national educational offerings, association
gatherings, and opportunities for connections.
During the following later deepening discussions, both within the Delphi Panel, and
in the Case Study focus group and interviews, conclusions were made that even though the
national initiatives were helpful, the challenge for agencies was primarily around whether or
not there was funding available to implement the suggested methods or mechanisms, or
continue with the initiative. The typical reason that an agency had been previously but was
no longer was active with an initiative was typically that the initiative was funded by a grant,
and the grant had ended. Sometimes, some of the goals of the initiative were continued, but
typically, when the funding resource ended, the focus ended on those goals. This may be
especially troubling for agencies in the coming years. Under the Obama administration in the
U.S., strong focus and funding at a federal level was made available or required preventive
health. With the election of a new national administration in 2016, indications have been that
there may be some desire to discontinue certain types of programs at a federal level. This
may mean that these national initiatives might go away and these resources may end.
Strategies and Methods Effectively in Use by P&R agencies
Systems theory and resultant systems thinking indicates that a system works best to
address health factors if factors, actors, and strategies within the system are in alignment to
achieve common goals and desired outcomes (Sarriot & Kouletio, 2015; Scaccia et al.,
2015). Analysis of the themes which emerged from the literature review, the data from the
Key Informants, and the resultant the Key Themes Analysis Matrix identified a variety of
systems approaches, site analysis tools, and other strategies relative to the theoretical basis
190
that appear to be relevant for application to P&R agencies. The primary tools and methods
identified through iterative coding and thematic exploration include the following primary
strategies for addressing the factors within a local system.
System-wide planning tools and methods for P&R. The review revealed that P&R
agencies are using systems planning and management tools such as community master and
comprehensive planning, community-wide needs assessment, and system-wide geo-spatial
inventory and analysis. P&R systems are often engaged in a form of social exchanges across
their specific system to negotiate the negotiations and exchanges within the community with
a goal for the greater good. This negotiation includes collaboration of different stakeholders
and the different skills they bring to the table. The literature identifies the importance of
identifying and convening stakeholders within the system as part of a mixed-method
approach for systems analysis. Key systems analysis tools and strategies were identified for
P&R, such as:
Departmental master and strategic plans that identify the needs and plans for
addressing the health factors as part of overall agency planning.
Community-wide needs assessments including questions related to the health
factors to gather qualitative input from demographically representative groups and
key stakeholders, including focus groups, public meetings, individual interviews,
staff input, user and/or intercept surveys, and youth-specific surveying tools, and
quantitative input from statistically-valid random surveys of residents for
validation and prioritization.
Geo-spatially component-based methods (CBM) for inventory and level of
service (LOS) analyses that include not only capacity, parcel-based, and asset

191
locations, but also component-based location, quality, and access analysis. New
tools are also capable of integrating evidence-based PA energy expenditures
analysis, sub-area demographics, and density analysis within the quantitative
dataset. Although there are no national studies of P&R agencies for comparison,
my professional experience with over 450 communities leads me to believe that
these numbers are higher than average for typical agencies overall. This may
indicate that agencies focusing on health are more focused on consensual system
planning than agencies who are not addressing health factors, and could be an
implication for future research.
Site-specific analysis and observational tools. The literature review identified
advances in the availability, validity, and reliability of site-specific analysis tools, with
potential to helping evaluate outcomes, especially in pre- and post- evaluation of sites or
projects. These can include site specific land/asset surveying, observational behavior and
activity analysis tools (e.g., SOPARC, C-PAT, Behavior Mapping, webcam sourcing), direct
measured analysis tools (e.g., wearable trackers; doubly labeled water, BMI measurements,
participation tracking), and self-reported data. The directly measured data are the most
reliable, but also typically the most expensive and sometime intrusive to obtain. These type
of strategies were indicated by the Informants as lower priority for practitioners in practice
due to cost and resource limitations.
Policy and practice guidelines creation. A body of the literature was interested in
the creation and effect of specific policies, practices, and programs or educational campaigns.
Analysis of resources (funding, capital, and staffing) dedicated to the efforts appear to be
correlated with effective modification of health factors. The questionnaires and focus group

192
dialogues identified themes relative to the various types of policies that are common or
lacking for the agencies. The types of policies available and provided were identified and
classified through the Basecamp resources analysis and the questionnaires during Round #2
of the Delphi panel, and analysis of the case study. The most common policies and guidelines
available from the study included vending/food provision policies and physical activity
specific program plans. However, policies related to smoking cessation, partnerships, and
asset planning/design were also deemed as helpful.
Emerging methods. The key themes analysis identified a variety of emerging
methods and strategies that P&R agencies are using in practice that have not yet been fully
validated in peer-reviewed in research literature. These include advances in geo-spatial
analysis, such as the component-based method (CBM) for inventory and level of service
analysis for P&R, which has been used by 65% of the Key Informant agencies and is now
being used in practice by most of the major professional P&R planning firms in the U.S.
However, these methods are not yet being taught in university curricula. In practice, some
firms and larger agencies are now incorporating evidence-based active energy expenditures,
programming locations, qualitative analysis, and assets management fields into the analysis.
These new methods may help address the discrepancies in the literature relative to qualitative
analysis of parks and greenspace that affect utilization and satisfaction, beyond the
quantitative and spatial analyses related to proximity and capacity. These methods may also
provide a focus for future integration into digitized systemwide datasets for parks
prescription programs.
In addition, other tools are being created in practice on an almost daily basis.
Resources provided by Informants included innovative matrices for evaluation, programming
193
templates, and various policies that may or may not be evidence-based or tested. There is
work for researchers to stay current and help validate emerging tools that are being used in
practice, and to share and help disseminate those that are effective.
Funding and Resources
A common theme emerged that a primary constraint to system effectiveness is having
sufficient funding and allocation of staff to address these factors. Funding is in short supply
for all of the P&R agencies. Even the agencies who have more staff reported needing more
funding to implement the programs or more spaces for activity and programs to occur. The
focus on preventive health as a goal has been at least anecdotally known by most P&R
professionals since the field emerged, but the quantification of return on investment (ROI)
for these types of allocations has been minimal. However, the literature indicates that there
are now peer-reviewed methods to do undertake calculations. P&R agencies would be well
served if they can apply quantification of benefits for goals. Site specific goals in particular
can be quantified through pre- and post-studies using health impact assessment techniques to
indicate their contribution to the overall system. Newer literature identifies the costs per
components of a P&R system, and allows for alignment of component planning with
assessment of predicted energy expenditures (Floyd et al., 2015). This can allow an agency
or researchers to project how changes may occur for specific capital investments. Integration
with the medical realm allows for real evaluation of health improvements through ongoing
tracking through tools utilized in P&R prescriptions programs. As these programs evolve and
the software is modified to allow for better integration and analysis, P&R agencies will be
better able to track, evaluate, and convey the ROI for their systems and projects to decision
makers. As stated in the summary conclusions from Cohen et al. (2016),

194
The current investment in urban parks across the U.S. is relatively small, considering
the potential benefits they may yield in health. Physical inactivity contributes to a
high proportion of chronic diseases and is directly responsible for 11% of all deaths.
Yet, among the 100 largest U.S. cities, the average annual per capita expenditure for
parks in 2013 was just $73 (range, $9–$247), less than 0.8% of the $9,146 per capita
expenditure on health care in the same year. Neighborhood parks are challenged by
being financed at the local level. (p. 7)
Addressing the Gaps using a Knowledge to Action Framework Application
This research indicates that even though much of the evidence is available to
researchers in the academic and PH realms, it is unfortunately slow in translation and
dissemination to the practice realm. As one Informant in the case study who has a Master’s
Degree in PH and now works in P&R administration indicated, “There’s at least a 10-year
lapse in theory and the updates to trends and research.” The Informant also indicated
agreement with the finding that P&R does not yet include strong focus on evaluation, as
recommended in the research realm, and that researchers are slow to validate the emerging
tools that come from the practice realm. Figure 27 reproduced here highlights the interaction
that needs to happen between the two realms within this knowledge exchange system.
Figure 27. System interaction of academic and P&R practice realms
Academic & Research realm
P&R Practice Realm

195
In reviewing and presenting the results and conclusions, it became more evident that
there is a large gap in knowledge translation that is affecting the ability of P&R agencies to
address the PH factors. There is strong knowledge and evidence available related to the PH
factors at the research level, but it is not yet being effectively conveyed and/or utilized in the
practice realm. This situation is not unique to P&R, and other fields have a similar challenge
in addressing the transfer of knowledge between the education/research realms and the
worksite/practice realms (Eraut, 2009).
In analyzing the relationships to the other emerging themes and data from this study’s
various research methods, it became apparent that there is a strong need for application and
conveyance of this type of conceptual framework to try to help bridge this knowledge gap
between the academic PH and P&R research realms and the P&R practice realms. The
exchange must be oriented toward outcomes that can be achieved through interactions with
other individuals or groups. The exchange must seek to adapt means to further achieve these
ends.
In reviewing concepts related to more effective knowledge transfer in a related
setting, this research identified the CDC’s Knowledge to Action (K2A) Framework,
presented in the literature as a potential conceptual mechanism to translate the research on
PH to action (CDC, 2014a). I present an adapted K2A framework to apply systems thinking
for P&R in Figure 28.
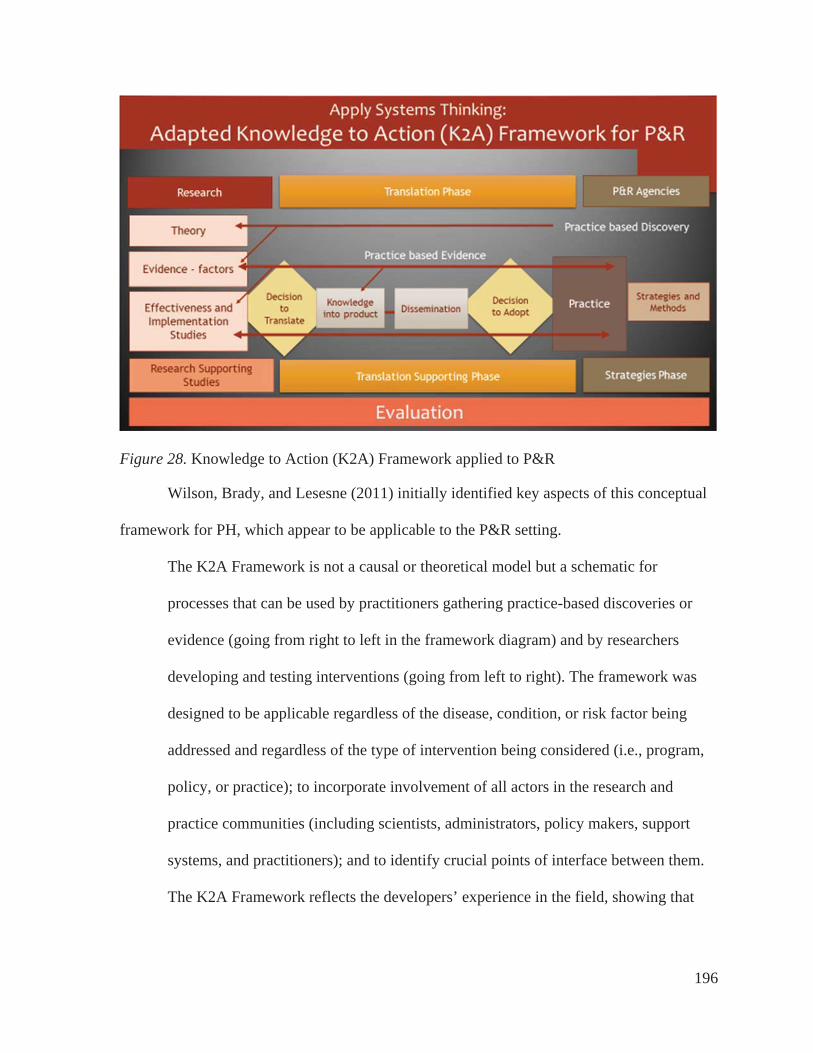
196
Figure 28. Knowledge to Action (K2A) Framework applied to P&R
Wilson, Brady, and Lesesne (2011) initially identified key aspects of this conceptual
framework for PH, which appear to be applicable to the P&R setting.
The K2A Framework is not a causal or theoretical model but a schematic for
processes that can be used by practitioners gathering practice-based discoveries or
evidence (going from right to left in the framework diagram) and by researchers
developing and testing interventions (going from left to right). The framework was
designed to be applicable regardless of the disease, condition, or risk factor being
addressed and regardless of the type of intervention being considered (i.e., program,
policy, or practice); to incorporate involvement of all actors in the research and
practice communities (including scientists, administrators, policy makers, support
systems, and practitioners); and to identify crucial points of interface between them.
The K2A Framework reflects the developers’ experience in the field, showing that

197
public health practitioners and practitioner-generated innovations are needed for
effective translation. (p.2)
In terms of application, this K2A framework indicates that P&R agencies need to
have access to the research knowledge base that is available from the academic and PH
realms. This could include promoting better access to the published peer reviewed research
findings (often hid behind a journal paywall), and a focus on pulling out the relevant
implications for practice settings into more easily digestible layperson’s research briefs.
Targeting research presentations to professional member associations such as NRPA and
state-level P&R associations should recognized as a more highly valued continuing
educational function in university evaluation criteria, rather than designated as a “service”
activity.
As P&R agencies work with partners in the community, such as hospitals or medical
partners, non-profits, PH, schools, transportation, and others, the knowledge/evidence-base,
and resultant feasible/desired outcomes for each stakeholder must be clearly identified and
addressed. One example of how this may help came from the following example identified
during the Informant research. A Key Informant identified that despite conducting a needs
assessment and internal P&R systems analysis that they had done relative to their assets,
programs, and participation to increase PA and reduce obesity in their community, during
their project, a partnering hospital pulled additional funding. The hospital representative
stated that it was because the P&R agency did not make the direct link (knowledge
identification) as to how increases in PA and better nutrition would help with the hospital’s
stated goal in their Community Health Needs Assessment to reduce Type II diabetes.
Although this link may seem obvious to most PH researchers, the lack of articulation of the

198
research evidence base by the P&R agency, as to how they were specifically going to help
collect and evaluate the evidence for the hospital, caused a knowledge gap and reduced
funding. The P&R agency explanation likely came too late in the conversations, or was
wrapped up in programming language, rather than terms of ROI or other specific evaluations
of physical health outcomes that the hospital needed to justify funding. This is just one
example, but clear partnership facilitation and mutual goal setting can be facilitated through
the application of knowledge translation and planning tools like logic models and HIA
formats up front in conversations, which may be beneficial for setting, measuring, and
achieving joint outcomes in a practice setting. However, if researchers cannot effectively
provide dissemination of the evidence and education for the P&R practitioners, the research
cannot be used in practice.
The goal of this K2A framework is to outline how information (theory, evidence, and
methods) must flow (be translated) from the left side (researchers) to the right side
(practitioners) in order to be used in the P&R setting. During the translation supporting
phase, these include the organizational strategies chosen (e.g., addressing organizational
culture, increased resource allocation through staffing or funding, or strategically increasing
access to assets or programs), and the attention by organizational leadership on decision to
adopt the research for practice application. There also needs to be a concurrent flow of
information (emerging practices and tools) from P&R practitioners back to the researchers
for validation and implications for future research. This could be better facilitated through
inviting practitioners to present to researchers on a regularly scheduled basis to discuss their
needs, newly created practice-identified strategies or methods, and joint validation and
dissemination of the effectiveness and evaluation.

199
Limitations of this Research
Using a mixed-methods approach with a focus on qualitative analysis and input from
17 local public P&R agencies (including the two case study agencies) can provide strong
results for theoretical and practical conclusions, but cannot necessarily be considered
representative of the P&R realm as a whole. However, they do provide a good start. These
agencies were specifically selected due to their indicated interest in this topic. The Key
Informants all have at least some personal and professional inclinations towards addressing
the focus areas. Although the thematic literature review is more generalizable, the findings
from the Delphi panel and case study are presented as possible best practices for identifying
potential methods, strategies, and outcomes measurement. At least a few other larger P&R
agencies have been identified as having some focus on addressing these factors (e.g., Miami,
San Francisco, Seattle), which were not available for participation in this study. They or
others may have created additional varying methods and strategies not yet identified here.
In addition, although efforts were made to approach this from an inductive and
transparent process, I have been actively working in this realm for over 30 years, and
obviously bring some researcher bias to the study. A goal was to continually address all
results with the Informants and dissertation committee for iterative review and confirmation,
and to continually ask, “What is missing?”
The application of systems thinking and theory to the P&R realm, and the conceptual
framework presented, are new to P&R related research. This is primarily a qualitative
analysis, and my conclusions are based on iterative revisions, coding, and categorization of
the themes, factors, and strategies. However, it is likely with the complex nature of this work
that there are still more missing elements and ideas. There are many implications for future

200
research, and this knowledge base will surely continue to evolve as researchers and
practitioners become more focused in this realm.
Part of this research was to examine if information is available, meaningful, and
useful for the agencies. Relative to this, the informants were asked their perceptions of how
hard or easy it was for them to take the survey. Informants were asked at both Stage 2 and
Stage 3 in the study if they found it easy to answer the questionnaires. Almost half (n = 8) of
the Informants on both questionnaires answered that it was extremely or somewhat easy to
take the survey. Open-ended comments indicated three common reasons for difficulty in
taking the questionnaires, 1) In larger agencies, others had the information, 2) They had not
tracked this type of information before or they had no centralized tracking mechanism, and 3)
They had not spent time thinking about these factors in this way before.
Agencies often have limited information from which to inform the implementation of
programs and development of appropriate resources to address PH issues in their
communities. As an example, initially this dissertation research was focused on factors
affecting youth but evolved to focus more generally on all age groups. In the early stages,
this research study included a specific focus on identifying the research related to middle-
school aged youth within the literature. The literature suggests that effective interventions
often need to start with youth (Beyer et al., 2015; Shannon, 2006). Research has shown that
PA during childhood and adolescence is one of the best predictors of adult PA, and evidence
has shown that promoting and establishing lifestyles that incorporate physical activity among
children is often more effective and easier than promoting physical activity among adults,
and can provide life-long benefits (Janssen & LeBlanc, 2010; Kuo, 2010; Kuo, 2013; Kushi
et al., 2006). However, as found in this study and in the literature, currently local community-

201
specific youth data on these various health factors are not readily available to practitioners
(Brenner et al., 2013; CDC-YRBSS, 2015). Due largely to the need for appropriate youth
research protections and difficulty in accessing youth directly, the majority of this
information is collected for adults (Beyer et al., 2015; Shannon, 2006).
During the first stage of this study results from the P&R agencies who practice in this
realm indicated that the agencies involved do not readily have the resources and data
available from their registration systems or evaluations to focus specific research separately
on middle school youth at this time. Therefore, that specific youth cohort focus was
discontinued after Stage 1 of the Delphi panel. This could be an area of interest for additional
focus for research and practitioner data collection in the future.
From a systems analysis standpoint, one challenge identified related to the addressing
the modifiable factors is the tendency for both P&R agencies and academic institutions to try
to separate the various program areas and assets into different divisions or departments. For
example, many agencies and universities promote sports management as if it is an entirely
different discipline than natural resource conservation and trails management. Yes, there are
obvious operational and technical management differences, but from a preventive PH
systems standpoint, both of these often-siloed categories are simply separate program areas
that can facilitate PA, social and parental engagement, and/or stress management, among
other benefits. Attention to safety and access/transportation to these amenities and
components all require systemwide community infrastructure that is subject to resource
constraints. The separate divisions often do not easily share knowledge or data across or even
within the departments or agencies, leading to an additional constraint within the system.

202
All programs areas are typically managed in the public realm by a P&R agency in the
local community, unless they are operating at a full revenue-producing capacity without
regard to services to under-resourced populations, which can facilitate private sector
involvement. This research has identified the complexity and current limitations of
evaluating categories of public services that are often treated as differing elements within an
academic or local community system.
Going forward – Implications for Future Research and Practice
When asked during the later stages of this research by a dissertation committee
member, “What have we learned from this that we didn’t know already?” I had to think long
and hard about that. On one hand, when evaluated from a purely academic basis of the
research indicated and methods used, a conclusion could be that most of the evidence was
available in the academic peer-reviewed realm, and most of the conclusions in this study
were at least suspected by my academic committee members who regularly work in this
research realm. This study is likely the first to summarize that evidence around preventive
health application for P&R. However, the big “AHA” was that although the many of the
researchers know and have ready access to most of this information, it has NOT been readily
disseminated to or adopted by P&R practice agencies. Much of this information was new to
the majority of the Delphi Informants, even as all of them have indicated interest, experience,
and focus in this realm for their agencies. This led to integration of the suggested conceptual
K2A framework for transfer of knowledge between research and practice.
There are several larger and more sophisticated agencies in the U.S. who are using
many of the methods and strategies identified. Some are starting to measure outcomes using
tools created primarily through PH research, especially related to participation and physical

203
activity. However, although they may be connected to PH or research partners, these
agencies each report that they are usually still “making it up” when it comes to what to do
with that information in practice. Some agencies are more advanced than others, and the
smaller agencies just entering this arena do not know where or how to get information on
best practices. NRPA just adopted Health and Wellness as a “pillar” of focus in 2013, and
their relatively recently created division and staff for this pillar are trying to figure it out.
There are no national “standards” or guidelines for how to do this work. Prior to this
research, there was currently no national repository of sample policies, guidelines, or
templates, or textbooks compiled on this topic. Although some universities are moving
towards aligning P&R with PH (e.g., Indiana University – Bloomington; Pennsylvania State
University - University Park; San Jose State University, CA; and North Carolina State
University - Raleigh), there is still no accepted overall “program” or “certification” that
teaches P&R administrators how to effectively address these PH topics.
To my knowledge, this is the first comprehensive study that explores a summary of
modifiable health factors that may be addressed by local P&R agencies in the U.S., along
with potential strategies for addressing outcomes for those agencies. This is also the first
known study that included a Delphi panel of Key Informants from seventeen P&R agencies,
with a focus on methods on identifying consensus on the resources they have available to
address these factors, methods being used, and outcomes being evaluated. Some researchers
and some of these Key Informants have conducted individual analysis to identify examples
of resources and practices, but this is the first compilation and analysis of these themes
conducted in an organized way on a larger group of agencies with this direct focus. Using

204
systems theory as a guiding basis, and facilitating a systems thinking approach, appears to
have strong merit going forward.
Gathering Local Community Data to Prioritize
A challenge remains in that effective models and frameworks for systematic
approaches related to preventive PH factors and outcomes have not been readily available to
practitioners (Brener et al., 2013; Burns, 2016; CDC, 2014b). Organizational elements and
culture have been shown to play a strong role in how communities address the factors. Some
of the more important organizational elements were explored in the literature and from the
Delphi and case studies.
Local agencies often have limited information from which to inform or prioritize the
implementation of programs and development of appropriate resources to address health
issues in their communities, and the priorities are often different in different communities.
This research identified community-specific measuring tools and methods. Addressing
methods to gather information, foster community engagement, form partnerships, and
prioritize interventions that leverage P&R likely require a framework and systematic
approach (Burns, 2016; Huang et al., 2009; Sallis et al., 2015; Young et al., 2013). Although
the actions taken should be community specific, there are common strategies that can help
build capacity to address the health factors.
The methods and strategies that need to be used are completely dependent upon
community-specific needs, resources, and funding. These elements are typically different in
each community. The focus appears to be on a need for systematic assessment per
community to determine their needs, rather than just adopting any one of the broad national
programmatic elements and initiatives as a leading method. That being said, this work has

205
compiled an extensive review of the literature on the health factors, national initiatives,
methods and strategies to address those factors, and potential outcomes that may be adopted
as objectives for local P&R agencies. Key identified themes and methods appear to suggest
in summary that P&R agencies should systematically assess, analyze, document, and
evaluate the priority of the key health factors within their own community to help position
P&R as an effective preventive community public health provider.
Specific Implications for Research
As I am sure is true for most researchers, a primary goal for my research was to help
move the knowledge base on this topic forward. However, there are many elements of this
study that identified additional implications for future research.
A primary area appears to be further development and validation of systems theory
and systems thinking modeling applications for P&R. This may include examining questions
such as how can P&R agencies adapt system modeling technology, such as modeling
software and network analysis tools, to examine priority strategies to address preventive
health factors. There is also need to continue to bolster and convey the research on all of the
identified specific health factors, especially related to the impact from various strategies.
This study has identified gaps in knowledge and qualitative data related to the role of
strategies to address organizational culture, resource allocation, and funding. However,
additional research is needed to confirm the impacts of these strategies, along with confirmed
mechanisms for evaluation, particularly within the context of feasibility for a community
system. There is support indicated for researchers to evaluate and make available valid and
credible tools, templates, and evidence-based instruments that can be used at a systems level
to allow for community-specific information gathering and evaluation. This includes the need
206
for validated component-based inventory and level of service analysis methods (like
ParkIndex and/or GRASPActive). There are also varieties of widely adopted practitioner-
developed cost recovery and resource allocation methods (such as the Pyramid Methodology
and the Public Sector Services Assessment) that may have an influence on prioritization of
addressing the health factors. These methods have not been tested for efficacy, reliability, or
validity in a peer-reviewed realm. Additional research on these methods could help answer
long-standing questions about the impacts of funding mechanisms, strategic analysis of
equity issues, and the role of partnerships in a system context.
In addition, there needs to be additional research on best application of the existing
research tools and methods to a practice realm. Additional future research could include
using the K2A framework concepts and accepted research methods to encourage overall
systems thinking approaches to 1) disseminate this current academic research and expanded
knowledge base into peer-reviewed articles for and with other researchers; 2) translate this
research to practice language, and disseminate and teach to practitioner audiences; 3) identify
additional practices that would benefit from more rigorous academic and research review;
and 4) create valid consensus on improved methods and strategies for P&R field overall.
Specific Implications for Applications to Practice
The research indicates that P&R agencies could benefit by adopting a systems
thinking approach to addressing the health factors in their communities. This includes
incorporating common PH and research practices when planning, but perhaps more
importantly, they need to adopt an organizational culture that allows for regular funding for
and analysis of evaluation of the methods on a regular basis. Doing so can help make “the
207
right thing, the easy thing” for community residents on a daily basis, so desired change can
occur across all levels of the SEM.
As identified in this study, there are several measurement and analysis instruments in
use by agencies that could be adopted for broader use in the practitioner realm. There are
accepted methods for component-based method (CBM) inventory and level of service
analysis that are currently in use by professional planning firms; quality and recommended
dosages of nature exposures now being explored in the biomedical and environmental
sociology fields and many agencies provided program and financial evaluation templates. An
opportunity exists to adapt the health and wellness criteria that have been created in the field
by some of participating agencies (e.g., the Prince George’s County DPR matrices uploaded
into the Basecamp repository and provided in Appendix M).
It is important to acknowledge that outcome effects from some of the policy resources
have not been fully vetted by researchers. Often practitioners and consultants have created
methods, templates, and policies in response to an immediate need, without full benefit of
access to the research that has been done. They are “creating tools on the fly”, without
considering the vast amount of related research available. As the Delphi panel and case study
informants indicated, these practice field-created methods and tools may be achieving the
goals for which they are intended, but validation needs to occur. Alignment and connection
of the research base and these used methods should be an ongoing goal for agencies and
researchers.
Application of PH practices to P&R. The literature indicates an evolution in that
integration of some PH practices and methods that have been used for interventions on other
health factors and in other situations may be beneficial for application to P&R practice. Two

208
PH methods that appear most applicable for use are the integration of health impact
assessment (HIA) methods, and adoption of logic models for program and grant planning.
Applying strategic health impact assessment (HIA) methods from the PH realm for
assessing health impacts appears to be gaining use in application to P&R agencies, especially
in planning for projects or policies with an identified health focus. These steps are somewhat
similar to steps for any overall planning project, but focused on the specific site or project.
The key difference between HIAs and typical P&R planning processes is the addition of a
sixth step in the HIA for evaluation. Table 20 indicates representative corresponding steps for
each process.
Table 20. Similarities and Differences between HIAs and P&R Planning
Step # Typical PH HIA Steps Typical P&R Planning Steps
1 Screening Project Kick-Off 2 Scoping Information Gathering 3 Assessment Findings Analysis 4 Recommendations Recommendations 5 Reporting Project presentations & approvals 6 Evaluation
The results indicate that a challenge exists in that most P&R public agency decision
makers do not yet readily see the benefit of investing the resources in Step 6 – Evaluation,
indicated for HIAs. It is true that this is still a challenge for PH agencies, even if they want to
include a greater focus on evaluation of outcomes from the outset. The key appears to be
finding measurable outcomes and setting up internal tool and methods that can measure those
outcomes in the practice setting so that the process is not so onerous. Researchers tend to be
more precise and want more data for evaluation than P&R practitioners are able to easily
collect, given limited staffing, time allocation, and financial resources.
209
As described and referenced in the literature review, the PH realm often also uses a
logic model format to identify and graphically portray goals, objectives, time frame, and
evaluation methods for interventions. This usually is created using a SMART format
(specific, measurable, actionable, realistic, and timely). P&R agency system wide planning
may include an action plan that is similar (typically with goals and objectives, timing,
responsibility, and funding impacts) and may incorporate a SMART focus, but again, the
focus on evaluation is typically not included or scheduled. Results from the study,
specifically from the case study informants, indicate that use of logic model formats for P&R
are growing, specifically when applying for grant funding from those used to dealing in the
PH realm. Although not yet adopted by these P&R Informants, additional PH frameworks
could also be beneficial if adopted in practice. P&R agencies would do well to adopt these
common PH practices when planning, but more importantly, they need to adopt a culture that
allows for regular funding for and analysis of evaluation of the methods on a regular basis.
Doing so can help make the right thing, the easy thing for community residents on a daily
basis, so change can occur across all levels of the SEM.
Going forward, the practice realm would benefit from adopting additional research
methods that can be translated and disseminated to allow P&R agencies identify and evaluate
data relative specifically to the specific demographics they serve. As discussed previously,
the Informants were not currently able to analyze or report participation data to address
specific demographic elements, such as youth. In evaluation of the methods used by some of
the agencies who have been more focused on these factors, findings indicated three primary
strategies that appear to be effective in providing stronger data and metrics for decision
making and outcomes achievement related to addressing preventive health.

210
1. Tracking information by age group in registration and participation records - Most
agencies are now using registration software and online registration, but the
reports provided within these software packages do not usually easily allow for
data evaluation for these age groups separately. Of those agencies who have used
an organized toolkit or template for addressing the health factors, one of the
biggest challenges was gathering data for youth specifically.
2. Conducting system-wide youth specific surveying or data collection methods –
Although data are often available through national surveys done in schools for
high school students, it does not easily translate to community specific data for
younger students. It would be ideal to have observational or directly recorded data
from many of the available research tools, as that can be more reliable. However,
several of the agencies reported that using youth specific self-reported surveys
have helped them better address the youth needs in their community. Results
indicate that this typically needs to be done in partnership with schools to have
access to a broad representation of the youth in the community. The literature
includes a variety of surveys that may be useful, but more research is needed to
assess best standardization, implementation, and validity of these instruments for
use in practice.
3. Convening a youth-specific task force or committee – Several of the Key
Informants reported that creating and facilitating a youth specific task force
(include youth themselves) has been an effective strategy for addressing the
factors as related to youth in communities.

211
Creating a toolkit approach to address the community-specific health factors.
The literature and several Informants identified that an apparently effective organizational
strategy for application of this knowledge base to practice within a local community can
include creating and disseminating some sort of toolkit approach, outlining data collection
methods and strategies to systematically address modifying the health factors. Summary
steps for this type of approach in practice may include:
Convening community stakeholders and champions – including identifying
leadership to gather and engage representatives of residents (all demographics),
partners, and alternative providers for all areas of the community to ensure
equitable services.
Creating a basis for focus, such as a warrant for agency action – Identifying why,
for whom (audience), desired impact, and messaging to the community and
stakeholders. This warrant for action is related to improving the organizational
culture and creating a shared agenda with collaborating stakeholders.
Documenting current programming, inventories, and outcomes – Implementing
emerging practices such as using programming analysis templates, component-
based GIS inventories and LOS analysis, and evaluation matrices to identify
specific asset, program, and active energy expenditures by neighborhood.
Enacting policies, methods, programs, and guidelines to help – this likely will
include partnering on many aspects for the benefit for the community, and using
PH, design, and planning principles (e.g., HIAs, logic models, CPTED principles,
and policies).

212
Identifying and obtaining fiscal resources - this may include identifying
sustainable resources for capital and/or operational funding for places, programs,
and staff, along with tracking allocation of these resources for evaluation and to
show ROI.
Aligning more effectively with available research – This may include dedicating
resources toward identifying PH needs and other research, along with attention to
telling the story through focused evaluation, documented outcomes, and
dissemination/sharing of effective practices, including methods from the PH
realm.
Creation of a national repository of P&R agency examples. Informants reported
finding strong value in the compilation of the Basecamp repository of resources. These
included sample policy documents, system plans, program plans for various factors, and
some specific planning documents around addressing the factors through P&R. In total, 98
documents were uploaded, and all Informants indicated in Stage 3 of the Delphi panel that
they had reviewed the various documents. Several suggested that they be organized by type
rather than just by agency (a matrix was created for this purpose, shown in results for
Questionnaire #2), and several stated that this was a key benefit to their participation in this
dissertation research. It is my intent to continue to facilitate availability of this national
repository for interested agency representatives and researchers in the future, through a GP
RED funded Basecamp portal.
A final goal is that this dissertation is that it is just a start for continued research and
systematic applications to practice to continue to help our communities thrive, through
positioning P&R agencies as evidence-based preventive public health providers.
213
REFERENCES
Active Living Research. (2016). Tools and resources, retrieved from:
http://activelivingresearch.org/toolsandresources/all.
APA - American Planning Association. (2016a). The state of health impact assessment in
planning. July. Retrieved 9-18-2016 from https://planning-org-uploaded-
media.s3.amazonaws.com/document/State-of-Health-Impact-Assessment-in-
Planning.pdf.
Alcock, I., White, M. P., Wheeler, B. W., Fleming, L. E., & Depledge, M. H. (2014).
Longitudinal effects on mental health of moving to greener and less green urban
areas. Environmental Science & Technology, 48(2), 1247–1255.
https://doi.org/10.1021/es403688w
APA - American Planning Association. (2016b). Health impact assessment can inform
planning to promote public health. Research Brief. August. Retrieved 9-18-2016
from https://planning-org-uploaded-media.s3.amazonaws.com/document/Health-
Impact-Assessment-Can-Inform.pdf.
Arai, S. M., & Pedlar, A. M. (1997). Building communities through leisure: Citizen
participation in a healthy communities initiative. Journal of Leisure Research, 29(2),
167-182.
Armitage, R. (2014). Crime prevention through environmental design. In: Encyclopedia of
Criminology and Criminal Justice. Springer, London. ISBN 9781461456919.
Aytur, S. A., Jones, S. A., Stransky, M., & Evenson, K. R. (2014). Measuring physical
activity in outdoor community recreational environments: Implications for research,
214
policy, and practice. Current Cardiovascular Risk Reports, 9(1), 1–13.
http://doi.org/10.1007/s12170-014-0423-4.
Babbie, E. (2016). The practice of social research, Fourteenth Edition, Cengage Learning,
Boston.
Babey, S. H., Wolstein, J., Krumholz, S., Robertson, B., & Diamant, A. L. (2013). Physical
activity, park access and park use among California adolescents. eScholarship.
Retrieved from http://escholarship.org/uc/item/5xp775t6.
Barcelona, R.J., & Bocarro, J.N. (2004). The nature and extent of collaboration between park
and recreation agencies and higher education institutions. Journal of Park and
Recreation Administration. 22(4) 3 - 24.
Barr-Anderson, D. J., Singleton, C., Cotwright, C. J., Floyd, M. F., & Affuso, O. (2014).
Outside-of-school time obesity prevention and treatment interventions in African
American youth. Obesity Reviews, 15, 26–45. http://doi.org/10.1111/obr.12204
Barth, D. (2008). How do you effectively assess a community’s need for parks and open
space? In M. Lewis (Ed.). From recreation to re-creation: new directions in parks
and open space planning, (pp. 52-56). American Planning Association. Chicago, IL,
Barth, D., & Carr, M. (2014). Using a Delphi method to develop criteria for high
performance public spaces that contribute to community sustainability. Landscape
Research Record, 2, 132-137.
Bauman, A. E., Sallis, J. F., Dzewaltowski, D. A., & Owen, N. (2002). Toward a better
understanding of the influences on physical activity: The role of determinants,
correlates, causal variables, mediators, moderators, and confounders. American

215
Journal of Preventive Medicine, 23(2, Supplement 1), 5–14.
http://doi.org/10.1016/S0749-3797 (02)00469-5.
Baxter, S., Killoran, A., Kelly, M., & Goyder, E. (2010). Synthesizing diverse evidence: the
use of primary qualitative data analysis methods and logic models in public health
reviews. Public Health. 2(24) 96-106.
BEACH Lab - Built Environment and Community Health Laboratory. (2015). Electronic
community park audit tool (eCPAT) project. http://beachlab.sc.edu/.
Beam, C., Ramirez, A., & Gallion, K. (2013). Competitive foods and beverages among
Latino students. Salud America! The Robert Wood Johnson Foundation Research
Network to Prevent Obesity Among Latino Children, Research Brief. May.
https://salud-america.org/sites/salud-america.
Bedimo-Rung, A. L., Gustat, J., Tompkins, B. J., Rice, J., & Thomson, J. (2006).
Development of a direct observation instrument to measure environmental
characteristics of parks for physical activity. Journal of Physical Activity & Health, 3,
S176–S189.
Bedimo-Rung, A.L., Mowen, A.J., & Cohen, D.A. (2005). The significance of parks to
physical activity and public health: A conceptual model. American Journal of
Preventive Medicine, 28(S2), 159-168.
Bergeron, K. Lévesque, L. (2014). Designing active communities: A coordinated action
framework for planners and public health professionals. Journal of Physical Activity
and Health, 11, 1041-1051.

216
Betts, D., & Penbrooke, T. (2007). Quality asset management = quality results. Presentation
at the annual meeting of the National Recreation and Parks Association, Indianapolis,
IN. September.
Beyer, K.M.M., Heller, E.F., Bizub, J.M., Kistner, A.J., Szabo, A., Shawgo, E.E., & Zetts,
C.J. (2015). More than a pretty place: Assessing the impact of environmental
education on children’s knowledge and attitudes about outdoor play in nature.
International Journal of Environmental Research and Public Health, 12, 2054-2070.
Blankenship, K.M., Friedman, S.F., Dworkin, S., & Mantell, J.E. (2006). Structural
interventions: concepts, challenges and opportunities for research. Journal of Urban
Health, 83(1), 59-72.
Bocarro, J. N., Casper, J., Henderson, K. A., Floyd, M. F., Moore, R., Kanters, M. A., …
Edwards, M. B. (2009). Physical Activity Promotion in North Carolina: Perceptions
of Public Park and Recreation Directors. Journal of Park & Recreation
Administration, 27(1), 1–16.
Bocarro, J. N., Greenwood, P. B., & Henderson, K. A. (2008). An integrative review of
youth development research in selected United States recreation journals. Journal of
Park and Recreation Administration, 26(2), 4–27.
Bocarro, J.N., Kanters, M. A., Casper, J., & Forrester, S. (2008). School physical education,
extracurricular sports, and lifelong active living. Journal of Teaching in Physical
Education, 27, 155–166.
Bocarro, J. N., Kanters, M. A., Cerin, E., Floyd, M. F., Casper, J. M., Suau, L. J., &
McKenzie, T. L. (2012). School sport policy and school-based physical activity

217
environments and their association with observed physical activity in middle school
children. Health & Place, 18(1), 31–38.
Bocarro, J. N., Kanters, M. A., Edwards, M. B., Casper, J. M., & McKenzie, T. L. (2014).
Prioritizing School Intramural and Interscholastic Programs Based on Observed
Physical Activity. American Journal of Health Promotion, 28(3), S65–S71.
https://doi.org/10.4278/ajhp.130430-QUAN-205
Borawski, E. A., Ievers-Landis, C. E., Lovegreen, L. D., & Trapl, E. S. (2003). Parental
monitoring, negotiated unsupervised time, and parental trust: the role of perceived
parenting practices in adolescent health risk behaviors. Journal of Adolescent Health,
33(2), 60–70. https://doi.org/10.1016/S1054-139X(03)00100-9
Bratman, G.N., Hamilton, J.P., Hahn, K.S., Daily, G.C.; & Gross, J.J. (2015). Nature
experience reduces rumination and subgenual prefrontal cortex activation.
Proceedings of the National Academy of Sciences, 112(28), 8567-8572.
Brener, N. D., Eaton, D. K., Kann, L. K., McManus, T. S., Lee, S. M., Scanlon, K. S., …
O’Toole, T. P. (2013). Behaviors related to physical activity and nutrition among U.S.
high school students. Journal of Adolescent Health, 53(4), 539–546.
Brennan Ramirez, L. K., Hoehner, C. M., Brownson, R. C., Cook, R., Orleans, C. T.,
Hollander, M., … Wilkinson, W. (2006). Indicators of Activity-Friendly
Communities: An Evidence-Based Consensus Process. American Journal of
Preventive Medicine, 31(6), 515–524. http://doi.org/10.1016/j.amepre.2006.07.026.
Bronfenbrenner, U. (1977). Toward an experimental ecology of human development.
American Psychologist, 32(7), 513-531.
218
Bronfenbrenner, U. (2005). Making human beings human: Bioecological perspectives on
human development. Thousand Oaks, CA: Sage Publications.
Brown, S.C., Lombard, J., Wang, K., Byrne, M.M., Toro, M., Plater-Zyberk, E., Feaster,
D.J., Kardys, J. Nardi, M.I., Perez-Gomez, G., Pantin, H.M, Szapocznik, J. (2016).
Neighborhood greenness and chronic health conditions in medicare beneficiaries.
American Journal of Preventive Medicine, 51(1), 78–89.
Bruening, M., Larson, N., Story, M., Neumark-Sztainer, D., & Hannan, P. (2011). Predictors
of adolescent breakfast consumption: Longitudinal findings from Project EAT.
Journal of Nutrition Education and Behavior, 43(5), 390–395.
http://doi.org/10.1016/j.jneb.2011.02.016.
Bruton, C. M., Floyd, M. F., Bocarro, J. N., Henderson, K. A., Casper, J. M., & Kanters, M.
A. (2011). Physical activity and health partnerships among park and recreation
departments in North Carolina. Journal of Park & Recreation Administration, 29(2),
55–68.
Buckley, R. (2009). Ecotourism principles and practices, Cambridge University Press,
Cambridge.
Burns, J. (Ed.) (2016). Executive summary and data - Summary brainstorming session,
Proceedings from February 12, 2016, National Symposium - Parks and Recreation in
Public Health. Indiana University.
Byl, C. (2017). Every reason to stay – Eva Saulitis’s life with whales. The Sun. 493, 6-13.
CAPRA (Commission for Accreditation of Park and Recreation Agencies), (2014). Self-
assessment report and visitation report, (5th ed.). www.NRPA.org/CAPRA.
219
Carver, A., Timperio, A. & Crawford, D. (2008). Playing it safe: The influence of
neighborhood safety on children's physical activity—A review. Health & Place,
14(2): 217-227.
Casey, M.M., Eime, R.M., Payne, W.R., & Harvey, J.T. (2009). Using a socioecological
approach to examine participation in sport and physical activity among rural
adolescent girls. Qualitative Health Research, 19, 881–893.
CDC - Centers for Disease Control and Prevention. (2015). Overweight and obesity,
Available at http://www.cdc.gov/obesity. Accessed April 28, 2015.
CDC - Centers for Disease Control and Prevention. (2014a). Applying the Knowledge to
Action (K2A) Framework: Questions to Guide Planning. Atlanta, GA: Centers for
Disease Control and Prevention, US Department of Health and Human Services.
Retrieved from http://intranet.cdc.gov/nccdphp/home/WGOT/tools/index.html.
CDC - Centers for Disease Control and Prevention. (2014b). State indicator report on
physical activity. Atlanta, GA: U.S. Department of Health and Human Services.
http://www.cdc.gov/obesity/.
CDC - Centers for Disease Control and Prevention. (2016). Resources and Publications.
Division of Nutrition, Physical Activity, and Obesity. Retrieved from
https://www.cdc.gov/nccdphp/dnpao/division-information/publications/index.htm.
CDC–SEM: Centers for Disease Control and Prevention. (2016). The social-ecological
model: a framework for prevention.
http://www.cdc.gov/ViolencePrevention/overview/social-ecologicalmodel.html.
CDC – YRBSS: Centers for Disease Control and Prevention. (2015). Youth risk behavior
surveillance system. Retrieved from https://www.cdc.gov/healthyyouth/data/yrbs/.

220
Cerin, E., & Leslie. E. (2008). How socio-economic status contributes to participation in
leisure-time physical activity. Social Science & Medicine, 66(12), 2596-2609.
Chancellor, C., & Cole, S. (2008). Using geographic information system to visualize travel
patterns and market research data. Journal of Travel & Tourism Marketing, 25(3-4),
341–354. http://doi.org/10.1080/10548400802508440.
Chapman, G. (1999). A multi-attribute model of prostate cancer patient’s preference for
health states. Quality of Life Research, 8(3), 171-180.
Charles, C., & Louv, R. (2009). Children’s nature deficit: What we know – and don’t know.
Children & Nature Network, Accessed at www.childrenandnature.org, 4/13/15.
Chiesura, A. (2004). The role of urban parks for the sustainable city. Landscape and Urban
Planning, 68(1), 129-138.
Christiana, R. W., Battista, R. A., James, J. J., & Bergman, S. M. (2016). Pediatrician
Prescriptions for Outdoor Physical Activity among Children: A Pilot Study.
Preventive Medicine Reports, 5, 100-105.
Cohen, D.A., Ashwood, J.S., Scott, M.M., Overton, A., Evenson, K.R.; Staten, L.K., Porter,
D., McKenzie, T.L., & Catellier, D. (2006). Public parks and physical activity among
adolescent girls. Pediatrics, 118(5), e1381-e1389.
Cohen, D.A., Han, B., Nagel, C.J., Harnik, P., McKenzie, T.L., Evenson, K.R., Marsh, T.,
Williamson, S., Vaughan, C., & Katta, S. (2016). The first national study of
neighborhood parks implications for physical activity. American Journal of
Preventive Medicine, 12(2), 289-295.
http://dx.doi.org/10.1016/j.amepre.2016.03.021.

221
Cohen, D. A., Lapham, S., Evenson, K. R., Williamson, S., Golinelli, D., Ward, P., &
McKenzie, T. L. (2013). Use of neighbourhood parks: does socio-economic status
matter? A four-city study. Public Health, 127(4), 325-332.
Cohen, D.A., McKenzie T.L., Sehgal, A., & Lurie, N. (2007). Contribution of public parks to
physical activity. American Journal of Public Health, 97, 509–514.
Compton, D.M., & Kim, K. (2013). Getting kids off the couch and into healthy communities:
modeling recreation programs with STELLA, The Connector: ISEE Systems, Fall,
http://www.iseesystems.com/community/connector.
Compton, D.M., Kim. K., & Damask, D., (2012). MAUT analysis of factors and indicators,
Appendix A, South Bend, Indiana Parks and Recreation Department, Healthy
Communities Research Group Surveillance and Management Toolkit, Year Two
Report, GP RED, 2012, Available at http://www.gpred.org/initiatives/healthy-
communities-research-group/.
Compton, D. M., Muehlenbein, M., Ona, F., Ross, C., Mowatt, R., Kim, K., & Penbrooke, T.
(2011). Communities surveillance and management: An ecological model to increase
youth participation in physical activity in Sentinel Indiana Public Park and Recreation
Agencies, 2011 Community Advisory Council (CAC) Forum, Indianapolis, IN, March
11, 2011.
Connelly, J. B., Duaso, M. J., & Butler, G. (2007). A systematic review of controlled trials of
interventions to prevent childhood obesity and overweight: A realistic synthesis of the
evidence. Public Health, 121(7), 510–517. http://doi.org/10.1016/j.puhe.2006.11.015
Corbin, J. M., & Strauss, A. L. (2008). Basics of qualitative research: Techniques and
procedures for developing grounded theory. Los Angeles, CA: Sage Publications.

222
Cordain, L., Eaton, S. B., Sebastian, A., Mann, N., Lindeberg, S., Watkins, B. A., & Brand-
Miller, J. (2005). Origins and evolution of the Western diet: health implications for
the 21st century. American Journal of Clinical Nutrition, 81(2), 341–354.
Corder, K., Ekelund, U., Steele, R.M., Wareham, N.J., & Brage, S. (2008). Assessment of
physical activity in youth. Journal of Applied Physiology, September 105(3):977–87.
http://jap.physiology.org.prox.lib.ncsu.edu/cgi/pmidlookup?view=long&pmid=18635
88.
Cordell, H.K., Betz, C.J., Green, G.T., & Dunleavy, P.G., (2010). National kids survey part
V: Kids outdoors summary - A recreation research report in the IRIS series.
https://www.srs.fs.usda.gov/trends/pdf-iris/IRISnks8.pdf.
Cowling, K., Lindberg, R., Dannenberg, A. L., Neff, R. A., & Pollack, K. M. (2017). Review
of health impact assessments informing agriculture, food, and nutrition policies,
programs, and projects in the United States. Journal of Agriculture, Food Systems,
and Community Development, 7(3), 139–157.
https://doi.org/10.5304/jafscd.2017.073.009
Crawford, C., & Johnson, J.A. (2011). Frequently asked questions about evidence reviews.
Kaiser Permanente SCAL Regional Nursing Research Program, accessed September
15, 2015.
Creswell, J. W. (2013). Research design: Qualitative, quantitative, and mixed methods
approaches. Los Angeles, CA: Sage Publications.
Crompton, J.L. (1997). Partnering with business: what’s in it for them? Journal of Park and
Recreation Administration, 15(4), 38–60.
223
Crompton, J.L. (1999). Financing and acquiring parks, recreation and open space resource,
Champaign, IL: Human Kinetics.
Cross, G. (1990). A social history of leisure since 1600. State College, PA: Venture
Publishing.
Cutts, B. B., Darby, K. J., Boone, C. G., & Brewis, A. (2009). City structure, obesity, and
environmental justice: an integrated analysis of physical and social barriers to
walkable streets and park access. Social Science & Medicine, 69(9), 1314–1322.
Cyr, J. (2016). The Pitfalls and Promise of Focus Groups as a Data Collection Method.
Sociological Methods & Research, 45(2), 231–259.
http://doi.org/10.1177/0049124115570065
Dannenberg, A.L. (2016). A brief history of health impact assessment in the United States.
Chronicles of Health Impact Assessment, 1(1). https://doi.org/10.18060/21348
Davison, K. K., & Lawson, C. T. (2006). Do attributes in the physical environment influence
children’s physical activity? A review of the literature. International Journal of
Behavioral Nutrition and Physical Activity, 3, 19. http://doi.org/10.1186/1479-5868-
3-19
Dawson, D. A., Goldstein, R. B., Saha, T. D., & Grant, B. F. (2015). Changes in alcohol
consumption: United States, 2001–2002 to 2012–2013. Drug and Alcohol
Dependence, 148, 56–61. https://doi.org/10.1016/j.drugalcdep.2014.12.016
Delamont, K. (2016). Why park designers need to think more about mental health. The
Atlantic Citylab, Accessed online: http://www.citylab.com/design/2016.

224
DeMattia, L., & Denney, S.L. (2008). Childhood obesity prevention: Successful community-
based efforts. The ANNALS of the American Academy of Political and Social Science,
615(1), 83-99.
De Savigny, D. & Adam, T. (Eds.). (2009). Systems thinking for health systems
strengthening. World Health Organization Publishing. Retrieved from:
http://www.who.int/alliance-hpsr/resources/9789241563895/en/.
Designed to Move. (2012). The economic costs of physical activity; A physical activity action
agenda. Nike, Inc., Available at www.designedtomove.org, Accessed on April 15,
2014.
Ding, D., Sallis, J. F., Kerr, J., Lee, S., & Rosenberg, D. E. (2011). Neighborhood
environment and physical activity among youth: A review. American Journal of
Preventive Medicine, 41(4), 442–455. http://doi.org/10.1016/j.amepre.2011.06.036.
Drenowatz, C., Eisenmann, J.C., Pfeiffer, K.A., Welk, G., Heelan, K., Gentile, D., Walsh, D.,
(2010). Influence of socio-economic status on habitual physical activity and sedentary
behavior in 8- to 11-year old children. BMC Public Health, 10:214.
Driver, B., & Brown, P. (1978). The opportunity spectrum concept in outdoor recreation
supply inventories: A rationale, Proceedings of the integrated renewable resource
inventories workshop, USDA Forest Service general technical report RM-55, pp. 73–
84.
Edwards, M. B. (2009). Place disparities in supportive environments for extracurricular
physical activity in North Carolina middle schools. (Unpublished doctoral
dissertation). North Carolina State University, Raleigh, NC.

225
Edwards, M. B., Bocarro, J. N., & Kanters, M. A. (2013). Place disparities in supportive
environments for extracurricular physical activity in North Carolina middle schools.
Youth & Society, 45(2), 265–285. https://doi.org/10.1177/0044118X11416677
Edwards, M. B., Kanters, M. A., & Bocarro, J. N. (2014). Peer reviewed: Policy changes to
implement intramural sports in North Carolina Middle Schools: Simulated effects on
sports participation rates and physical activity intensity, 2008–2009. Preventing
Chronic Disease, 11. https://doi.org/10.5888/pcd11.130195
Edwards, M. B., Jilcott, S. B., Floyd, M. F., & Moore, J. B. (2011). County-level disparities
in access to recreational resources and associations with adult obesity. Journal of
Park and Recreation Administration, 29(2), 39-54.
Emerson, R.M. (1976). Social exchange theory. Annual Review of Sociology, 2(1), 335–362.
https://doi.org/10.1146/annurev.so.02.080176.002003.
EPA - Environmental Protection Agency (2016). Ecosystem services. Retrieved from
https://www.epa.gov/eco-research/ecosystem-services.
Epstein, L., Raja, S., Daniel, T.O., Paluch, R.A., Wilfley, D.E., Saelens, B.E., & Roemmich,
J.N. (2012). The built environment moderates effects of family based childhood
obesity treatment over two years. Annals of Behavioral Medicine, 44(2), 248-258.
Epstein, L.H., Valoski, A.M., Vara, L.S., McCurly, J., Wisniewski, L., Kalarchian, M.A.,
Klein, K.R., & Shrager, L.R. (1995). Effects of decreasing sedentary behavior and
increasing activity on weight change in obese children. Health Psychology, 14, 109-
115.

226
Eraut, M. (2009). Transfer of knowledge between education and workplace settings. In H.
Daniels, H. Lauder, J. Porter (Eds.), Knowledge, values and educational policy: A
critical perspective. London: Routledge.
Evenson, K.R., Wen, F., Hillier, A., & Cohen, D.A., (2013). Assessing the contribution of
parks to physical activity using global positioning system and accelerometry.
Medicine and Science in Sports and Exercise, 45, 1981–1987.
Farland, J.E. (2010). A comparative study of the organizational culture of CAPRA Accredited
and non-accredited municipal parks and recreation agencies. (Unpublished doctoral
dissertation) University of Iowa. Iowa City, IA.
Ferder, L., Ferder, M. D., & Inserra, F. (2010). The role of high-fructose corn syrup in
metabolic syndrome and hypertension. Current Hypertension Reports, 12(2), 105–
112.
Finkelstein, E.A., Trogdon, J.G., Cohen, J.W., Dietz, W. (2009). Annual medical spending
attributable to obesity: Payer- and service-specific estimates. Health Affairs, 28(5),
w822-831.
Fletcher, A. J. (2010). Afterschool programs: Taking advantage of an unprecedented
opportunity to combat child obesity. Weight Management Matters, 8(1). Retrieved
from wmdpg.org/wp-content/uploads/2010/11/Summer101.pdf.
Flick, U. (2014). An Introduction to Qualitative Research (5th Ed.). Thousand Oaks, CA:
Sage.
Floyd, M. (1999). Race, ethnicity and use of the National Park System, Social Science
Research Review, 1(2), 1–23.

227
Floyd, M.F. (2007). Research on race and ethnicity in leisure: Anticipating the fourth wave.
Leisure/Loisir, 31(1), 245-254.
Floyd, M. F., Bocarro, J. N., Smith, W. R., Baran, P. K., Moore, R. C., Cosco, N. G., … &
Fang, K. S. (2011). Park-based physical activity among children and adolescents.
American Journal of Preventive Medicine, 41(3), 258–265.
Floyd, M.F., Bocarro, J.N., & Thompson, T. (2008). Research on race and ethnicity in leisure
studies: A review of five major journals. Journal of Leisure Research, 40(1): 1–22.
Floyd, M., Suau, L.J., Layton, R., Maddock, J.E., & Bitsura-Meszaros, K. (2015). Cost
analysis for improving park facilities to promote park-based physical activity. North
Carolina Cooperative Extension.
Frank, L., Andresen, M., & Schmid, T. (2004). Obesity relationships with community design,
physical activity, and time spent in cars. American Journal of Preventive Medicine,
27, 87–96.
Frazier, S. L., Dinizulu, S. M., Rusch, D., Boustani, M. M., Mehta, T. G., & Reitz, K. (2015).
Building resilience after school for early adolescents in urban poverty: open trial of
Leaders @ Play. Administration and Policy in Mental Health and Mental Health
Services Research, 42(6), 723–736.
Fredricks, J. A., & Eccles, J. S. (2006). Extracurricular involvement and adolescent
adjustment: impact of duration, number of activities, and breadth of participation.
Applied Developmental Science, 10, 132–146.
Frisby, W., Thiibault, L., & Kikulis, L. (2004). The organizational dynamics of under
managed partnerships in leisure service departments. Leisure Studies, 23(2), 109–126.
https://doi.org/10.1080/0261436042000224482.
228
Frumkin, H., & Eysenbach, M.E. (2003). How cities use parks to improve public health -
City parks forum briefing papers #7. American Planning Association. Available at:
https://planning-org-uploaded- media.s3.amazonaws.com/legacy_resources/cityparks/
briefingpapers/pdf/physicalactivity.pdf.
Gale, N. K., Heath, G., Cameron, E., Rashid, S., & Redwood, S. (2013). Using the
framework method for the analysis of qualitative data in multi-disciplinary health
research. BMC Medical Research Methodology, 13, 117.
https://doi.org/10.1186/1471-2288-13-117.
Gardsjord, H. S., Tveit, M. S., & Nordh, H. (2014). Promoting youth’s physical activity
through park design: Linking theory and practice in a public health perspective.
Landscape Research, 39(1), 70–81. http://doi.org/10.1080/01426397.2013.793764
Giles-Corti, B., Broomhall, M.H., Knuiman, M., Collins, C., Douglas, K., Ng, K., Lange, A.,
& Donovan, R.J. (2005). Increasing walking: How important is distance to,
attractiveness, and size of public open space? American Journal of Preventive
Medicine, 28(2S2), 169-176.
Glanz, K., & Sallis, J.F. (2006). The role of built environments in physical activity, eating,
and obesity in childhood. The Future of Children, 16, 89.
Glaser, B., & Strauss, A. (1967). The Discovery of Grounded Theory. Chicago: Aldine.
Godbey, G. C., Caldwell, L. L., Floyd, M., & Payne, L. L. (2005). Contributions of leisure
studies and recreation and park management research to the active living agenda.
American Journal of Preventive Medicine, 28, S150-158.
229
Godbey, G. & Mowen, A. (2010). The benefits of physical activity provided by park and
recreation services: The scientific evidence. NRPA Publications Research Brief,
Ashburn, VA.
Golden, S.A. & Earp, J.L. (2012). Social ecological approaches to individuals and their
contexts: Twenty years of health education & behavior health promotion
interventions, Health Education & Behavior, 39(3) 364–372.
Goldsmith, M., Bankhead, C., & Austoker, J. (2007). Synthesising quantitative and
qualitative research in evidence-based patient information. Journal of Epidemiology
and Community Health. 61, 262-270.
Gordon-Larsen, P., Nelson, M. C., Page, P., & Popkin, B. M. (2006). Inequality in the built
environment underlies key health disparities in physical activity and obesity.
Pediatrics, 117, 417-424.
GP RED - SMT. (2016). Healthy Communities Research Group (HCRG), Surveillance and
Management Toolkit. GP RED. Available at http://gpred.org/healthy-communities-
research-group.
GP RED - SRTP. (2016). Safe Routes to Play in action. GP RED.
http://www.gpred.org/initiatives/safe-routes-to-play/.
Graham, I. D., Logan, J., Harrison, M. B., Straus, S. E., Tetroe, J., Caswell, W., & Robinson,
N. (2006). Lost in knowledge translation: Time for a map? Journal of Continuing
Education in the Health Professions, 26(1), 13–24. https://doi.org/10.1002/chp.47.
Gramann, J. H., & Allison, M. T. (1999). Ethnicity, race, and leisure. In E. L. Jackson & T.
L. Burton (Eds.), Leisure studies: Prospects for the twenty-first century. (pp. 283-
295). State College, PA: Venture Publishing, Inc.

230
Grbich, C. (2007). Qualitative data analysis: An introduction. London: Sage Publications.
Grøntved A., & Hu, F.B. (2011). Television viewing and risk of Type 2 diabetes,
cardiovascular disease, and all-cause mortality. Journal of the American Medical
Association, 305(23), 2448–55.
Guinhouya, B. C. (2012). Physical activity in the prevention of childhood obesity. Pediatric
and Perinatal Epidemiology, 26, 438–447. Doi: 10.1111/j.1365-3016.2012.01269.x.
Haines, J., Neumark-Sztainer, D., Wall, M., & Story, M. (2007). Personal, behavioral, and
environmental risk and protective factors for adolescent overweight. Obesity, 15(11),
2748-2760.
Harrison, R., & Stokes, H. (1992). Diagnosing organizational culture. San Francisco, CA:
Jossey-Bass/Pfeiffer.
Healthy People 2020. (2016). Leading health indicators. https://www.healthypeople.gov/.
Henderson, K.A. (2006). Data analysis and interpretation in Dimensions of choice:
Qualitative approaches to parks, recreation, tourism, sport, and leisure research,
(2nd Ed.). Edmonton, Alberta, Canada: Venture Publishing.
Henderson, K. A., & Ainsworth, B. E. (2003). A synthesis of perceptions about physical
activity among older African American and American Indian women. American
Journal of Public Health, 93(2), 313–317. http://doi.org/10.2105/AJPH.93.2.313.
Henderson, K.A., & Bialeschki, M.D. (2005). Leisure and active lifestyles: Research
reflections. Leisure Sciences, 27(5), 355–365.
Henderson, K. A., & Bialeschki, M. D. (2010). Evaluating leisure services (3rd Ed.). State
College, PA: Venture Publishing, Inc.
231
Henderson, K.A. & Heath, C. (2015). Using image-based participatory action research to
improve community health: Photovoice. GP RED Research Briefs. #4 July, available
at http://www.gpred.org/research-briefs/#brief-4.
Henderson, K. A., Neff, L. J., Sharpe, P. A., Greaney, M. L., Royce, S. W., & Ainsworth, B.
E. (2001). “It takes a village” to promote physical activity: The potential for public
park and recreation departments. Journal of Park and Recreation Administration,
19(1), 23-41.
Heywood, J. L. (2011). Institutional norms and evaluative standards for parks and recreation
resources research, planning, and management. Leisure Sciences, 33(5), 441–449.
Higgins, J.P.T., & Green, S. (2011). Cochrane handbook for systematic reviews of
interventions, Version 5.1.0. The Cochrane Collaboration. Available at
www.handbook.cochrane.org.
Hills, A. P., Andersen, L. B., & Byrne, N. M. (2011). Physical activity and obesity in
children. British Journal of Sports Medicine, 45(11), 866–870.
http://doi.org/10.1136/bjsports-2011-090199
Hipp, J. A., Adlakha, D., & Chockalingam, R. (2013). Social ecological constraints to park
use in communities with proximate park access. LARNet - The Cyber Journal of
Applied Leisure and Recreation Research, 16(4), 23-36.
Hipp, J.A., Adlakha, D., Eyler, A.A., Chang, B., & Pless, R., (2013). Emerging technologies:
webcams and crowd-sourcing to identify active transportation. American Journal of
Preventive Medicine, 44(1), 96-97.
232
Hirono, K. T., Raab, K., Wendel, A., Choi, T., Yuen, T., Schuchter, J., & Fulk, F. (2017).
The challenges and opportunities of peer review in health impact assessment.
Chronicles of Health Impact Assessment, 2(1), 37–48.
Hitchings, R. (2013). Studying the preoccupations that prevent people from going into green
space. Landscape and Urban Planning, 118, 98–102.
Hodge, C., Bocarro, J. N., Henderson, K. A., Zabriskie, R., Parcel, T. L., & Kanters, M. A.
(2015). Family leisure: an integrative review of research from select journals. Journal
of Leisure Research, 47(5), 577–600.
Honey, M. (2008). Ecotourism and sustainable development, 2nd ed. Washington, DC:
Island Press.
Huang, T. T., Drewnowski, A., Kumanyika S. K., & Glass, T. A. (2009). A systems-oriented
multilevel framework for addressing obesity in the 21st century. Preventing Chronic
Disease, 6(3). http://www.cdc.gov/pcd/issues/2009/jul/09_0013.htm.
Hunter, R. F., Christian, H., Veitch, J., Astell-Burt, T., Hipp, J. A., & Schipperijn, J. (2015).
The impact of interventions to promote physical activity in urban green space: A
systematic review and recommendations for future research. Social Science &
Medicine, 124, 246–256. http://doi.org/10.1016/j.socscimed.2014.11.051
Hurd, A., Barcelona, R.J. & Meldrum, J. (2008). Leisure services management. Champaign,
IL: Human Kinetics.
Hynes, K., & Sanders F. (2011). Diverging experiences during Out-of-School Time: the race
gap in exposure to after-school programs. Journal of Negro Education, 80(4), 464–
476.

233
Indian Health Service. (2016). Trends and Impacts. Indian Health Service - The Federal
Health Program for American Indians and Alaska Natives.
https://www.ihs.gov/healthyweight/trends/.
IOM - Institute of Medicine. (2005). Committee on prevention of obesity in children and
youth. Preventing childhood obesity: Health in the Balance. Washington, DC.
IPARC – Investigating places for active recreation in communities (2012). North Carolina
State University, Systematic Assessment Tools. Available at:
cnr.ncsu.edu/iparc/resources, Accessed on April 12, 2014.
IPHI - Institute for Public Health Innovation. (2015). Safe routes to play. Transforming
Prince George’s County Communities through Health in All Policies. www.iphi.org.
Jackson, R. (1985). The municipal parks and recreation master plan: process, product, and
philosophy. Leisure Studies, 4(3), 275–291.
Jacobs, J. E., Vernon, M. K., & Eccles, J. S. (2004). Relations between social self-
perceptions, time use, and prosocial or problem behaviors: Adolescent transitions.
Journal of Adolescent Research, 19(1), 45-62.
Janssen, I. Craig, W.M., Boyce, W.F., & Pickett, W. (2004). Associations between
overweight and obesity with bullying behaviors in school-aged children. Pediatrics,
113(5) 1187-1194.
Janssen, I., & LeBlanc, A.G. (2010). Systematic review of the health benefits of physical
activity and fitness in school-aged children and youth. International Journal of
Behavioral Nutrition and Physical Activity, 7, 1–16.
234
Jennings, V., & Gaither, C.J. (2014). Approaching environmental health disparities and green
spaces: An ecosystem services perspective. International Journal of Environmental
Research and Public Health, 12, 1952-1968.
Jennings, V., Larson, L., & Yun, J. (2016). Advancing sustainability through urban green
space: Cultural ecosystem services, equity, and social determinants of health.
International Journal of Environmental Research and Public Health, 13(2), 196.
https://doi.org/10.3390/ijerph13020196.
Jilcott, S., Ammerman A., Sommers, J., & Glasgow, R.E. (2007). Applying the RE-AIM
framework to assess the public health impact of policy change. Annals of Behavioral
Medicine, 34(2), 105-114.
Johnson, B., & Manoli, C.C. (2011). The 2-MEV Scale in the United States: A measure of
children's environmental attitudes based on the theory of ecological attitude. The
Journal of Environmental Education, 42(2), 84-97.
Jones, G.J, Edwards, M.B., Bocarro, J.N, Bunds K.S, & Smith, J.W. (2017): An integrative
review of sport-based youth development literature, Sport in Society, 20(1), 161-179.
Kaczynski, A. T., & Havitz, M. E. (2009). Examining the relationship between proximal park
features and residents’ physical activity in neighborhood parks. Journal of Park &
Recreation Administration, 27(3), 42–58.
Kaczynski, A.T., & Henderson, K.A. (2007). Environmental correlates of physical activity:
A review of evidence about parks and recreation. Leisure Sciences, 29, 315-354.

235
Kaczynski A.T., & Henderson K.A. (2008). Parks and recreation Settings and active living:
A review of associations with physical activity function and intensity. Journal of
Physical Activity & Health, 5(4), 619-632.
Kaczynski, A., Potwarka, L., & Saelens, B. (2008). Association of park size, distance, and
features with physical activity in neighborhood parks. American Journal of Public
Health, 98(8), 1451–1456. doi: 10.2105/AJPH.2007.129064.
Kaczynski, A.T., Schipperijn, J., Hipp, J.A., Besenyi, G.M., Wilhelm Stanis, S.A., Hughey,
S. M. & Wilcox, S. (2016). ParkIndex: Development of a standardized metric of park
access for research and planning. Preventive Medicine, 87, 110–114.
https://doi.org/10.1016/j.ypmed.2016.02.012
Kaczynski, A.T., Wilhelm Stanis, S.A., & Besenyi, G.M. (2012). Development and testing of
a community stakeholder park audit tool. American Journal of Preventive Medicine,
42(3), 242-249.
Kanters, M. A., Bocarro, J. N., Filardo, M., Edwards, M. B., McKenzie, T. L., & Floyd, M.
F. (2014). Shared use of school facilities with community organizations and
afterschool physical activity program participation: A cost-benefit assessment.
Journal of School Health, 84(5), 302–309. http://doi.org/10.1111/josh.12148.
Kaplan, S. A., & Garrett, K. E. (2005). The use of logic models by community-based
initiatives. Evaluation and Program Planning, 28(2), 167–172. Retrieved from:
https://doi.org/10.1016/j.evalprogplan.2004.09.002.
Katz, M.H. (2009). Structural interventions for addressing chronic health problems. Journal
of the American Medical Association, 302, 6.

236
Katzmarzyk, P. T., Walker, P., & Malina, R. M. (2001). A time-motion study of organized
youth sports. Journal of Human Movement Studies, 40, 325–334.
Kellert, S. R. (2005). Nature and childhood development. In S. R. Kellert (Ed.), Building for
life: Designing and Understanding the human-nature connection, (pp. 63-89).
Washington, DC: Island Press.
Kellogg Foundation. (2004). Logic model development guide. W.K. Kellogg Foundation.
Battle Creek, Michigan. https://www.wkkf.org/resource-
directory/resource/2006/02/wk-kellogg-foundation-logic-model-development-guide.
Kelly, P., Fitzsimons, C., & Baker, G. (2016). Should we reframe how we think about
physical activity and sedentary behaviour measurement? Validity and reliability
reconsidered. International Journal of Behavioral Nutrition and Physical Activity, 13,
32. http://doi.org/10.1186/s12966-016-0351-4.
Khan, L.K., Sobush, K., Keener, D., Goodman, K., Lowry, A., Kakietek, J., & Zaro, S.
(2009). Recommended community strategies and measurements to prevent obesity in
the United States. Centers for Disease Control and Prevention (CDC) - MWR
Recommendations Report. 58 (RR-7, RR07):1–26.
www.cdc.gov/mmwr/preview/mmwrhtml/rr5807a1.htm.
Kim, K., Jordan, D., Compton, D., & Penbrooke, T. (2015). Youth activities and nutrition
survey (YANS) - Analysis & findings report, Liberty, MO, Louisville, CO: GP RED.
http://www.gpred.org/wp-content/uploads/2016/08/YANS-2015-MASTER-Final-
Dec-2015.pdf.
Kremer, K. P., Maynard, B. R., Polanin, J. R., Vaughn, M. G., & Sarteschi, C. M. (2014).
Effects of after-school programs with at-risk youth on attendance and externalizing

237
behaviors: A systematic review and meta-analysis. Journal of Youth and Adolescence,
44(3), 616–636. http://doi.org/10.1007/s10964-014-0226-4
Kumanyika, S. K., Obarzanek, E., Stettler, N., Bell, R., Field, A. E., Fortmann, S. P., …
Hong, Y. (2008). Population-based prevention of obesity: The need for
comprehensive promotion of healthful eating, physical activity, and energy balance:
A scientific statement from American Heart Association Council on Epidemiology
and Prevention, Interdisciplinary Committee for Prevention (Formerly the Expert
Panel on Population and Prevention Science). Circulation, 118(4), 428–464.
http://doi.org/10.1161/CIRCULATIONAHA.108.189702.
Kuo, F.E. (2010). Parks and other green environments: Essential components of a healthy
human habitat. Ashburn, VA: National Recreation and Park Association.
Kuo, F. E. (2013). Nature-deficit disorder: evidence, dosage, and treatment. Journal of Policy
Research in Tourism, Leisure and Events, 5(2), 172–186.
http://doi.org/10.1080/19407963.2013.793520.
Kuo, F.E. & Taylor, A.F. (2004). A potential natural treatment for attention-
deficit/hyperactivity disorder: evidence from a national study. American Journal of
Public Health, 94(9), 1580-1586.
Kushi, L. H., Byers, T., Doyle, C., Bandera, E. V., McCullough, M., Gansler, T., Andrews,
K.S., & Thun, M. J. (2006). American Cancer Society guidelines on nutrition and
physical activity for cancer prevention: Reducing the risk of cancer with healthy food
choices and physical activity. CA: A Cancer Journal for Clinicians, 56(5), 254–281.
http://doi.org/10.3322/canjclin.56.5.254

238
Laine, J., Kuvaja-Köllner, V., Pietilä, E., Koivuneva, M., Valtonen, H., & Kankaanpää, E.
(2014). Cost-effectiveness of population-level physical activity interventions: A
systematic review. American Journal of Health Promotion, 29(2), 71–80.
http://doi.org/10.4278/ajhp.131210-LIT-622
Lancaster, R. (1983). Recreation, park, and open space standards and guidelines, Ashburn,
VA: NRPA Publications.
Lantz, P. M., & Pritchard, A. (2010). Socioeconomic indicators that matter for population
health. Preventing Chronic Disease. 7(4), 1-7.
Larson, L.R., Green, G.T., & Castleberry, S.B. (2011). Construction and validation of an
instrument to measure environmental orientations in a diverse group of children.
Environment and Behavior, 43(1) 72–89.
Larson, L.R., Green, G.T., & Cordell, H.K. (2011). Children’s time outdoors: Results and
implications of the National Kids Survey. Journal of Parks and Recreation
Administration. 29(2), 1-20.
Layton, R.D. (2016a). Potential public health performance metrics for parks and greenspace
assessments. Manuscript in review. Personal Communication.
Layton, R.D. (2016b). What really matters? The role of environmental characteristics of
nearby greenspace in opinions of park system adequacy and predicting visits to
parks. (Unpublished Doctoral Dissertation). North Carolina State University, Raleigh,
NC.
Lederbogen, F., Kirsch, P., Haddad, L., Streit, F., Tost, H., Schuch, P., … Meyer-
Lindenberg, A. (2011). City living and urban upbringing affect neural social stress

239
processing in humans. Nature, 474(7352), 498–501.
https://doi.org/10.1038/nature10190.
Lederer, A. M., King, M. H., Sovinski, D., & Kim, N. (2015). The impact of family rules on
children’s eating habits, sedentary behaviors, and weight status. Childhood Obesity,
11(4), 421-429.
Lee, J., Li., Q., Tyrväinen, L., Tsunetsugu, Y. Park, B., Kagawa, T., & Miyazaki, Y. (2012).
Nature therapy and preventive medicine, public health - Social and behavioral
health. Prof Jay Maddock (Ed.), ISBN: 978-953-51-0620-3, InTech, Available from:
http://www.intechopen.com/books/public-health-social-and-behavioral-health/nature-
therapy-and-preventivemedicine.
Lee, I., Shironoma, E., Lobelo, P., Puska, P., Blair, S., & Katzmarzyk, P. (2012). Effect of
physical inactivity on major non-communicable diseases worldwide: an analysis of
burden of disease and life expectancy. The Lancet for the Lance Physical Activity
Series Working Group. 380(9838), 219-229.
Leek, D., Carlson, J. A., Cain, K. L., Henrichon, S., Rosenberg, D., & Patrick, K. (2010).
Physical activity during youth sports practices. Archives of Pediatrics and Adolescent
Medicine, 165(4), 294–299.
Leeming, F. C., Dwyer, W. O., & Bracken, B. A. (1995). Children’s environmental attitude
and knowledge scale: Construction and validation. The Journal of Environmental
Education, 26(3), 22–33.
Leslie, E., Cerin, E., & Kremer, P. (2011). Perceived neighborhood environment and park
use as mediators of the effect of area socio-economic status on walking behaviors,
Journal of Physical Activity & Health, 7(6), 802-810.
240
Let’s Move. (2016). Learn the facts, http://www.letsmove.gov/learn-facts/epidemic-
childhood-obesity.
Leung, R., Mallya, G., Dean, L. T., Rizvi, A., Dignam, L., & Schwarz, D. F. (2013).
Instituting a smoke-free policy for city recreation centers and playgrounds,
Philadelphia, Pennsylvania, 2010. Preventing Chronic Disease, 10(7), E116–E116.
Lewis, M. L. (Gen. Ed.) (2008). From recreation to re-creation: New directions in parks and
open space systems planning (No. 551). Chicago, IL: American Planning Association.
Lewyn, M.E. (2016). How to make suburbia less sprawling. Real Estate Law Journal, 45(1),
115 – 127. Available at: http://works.bepress.com/lewyn/111/.
Lock, K. (1999). Health impact assessments. British Medical Journal, 320, 1395–8.
Louv, R. (2005). Last child in the woods. Saving our children from nature-deficit disorder.
Chapel Hill, NC: Algonquin Books.
Lovasi, G. S., Quinn, J. W., Neckerman, K. M., Perzanowski, M. S., & Rundle, A. (2008).
Children living in areas with more street trees have lower prevalence of asthma.
Journal of Epidemiology & Community Health, 62(7), 647–659.
Mabry, P. L., Marcus, S. E., Clark, P. I., Leischow, S. J., & Méndez, D. (2010). Systems
science: a revolution in public health policy research. American Journal of Public
Health, 100(7), 1161–1163. https://doi.org/10.2105/AJPH.2010.198176.
Manfredo, M. J., Driver, B. L., & Tarrant, M. A. (1996). Measuring leisure motivation: A
meta-analysis of the recreation experience preference scales. Journal of Leisure
Research, 28(3), 188–213.
Manning, R. (2007). Parks and carrying capacity: Commons without tragedy, Washington,
DC: Island Press.

241
Manning, R.E. (2014). Research to guide management of outdoor recreation and tourism in
parks and protected areas. Koedoe, 56(2), 1–7.
Manoli, C., Johnson, B., & Dunlap, R. E. (2007). Assessing children’s environmental
worldviews: Modifying and validating the New Ecological Paradigm Scale for use
with children. Journal of Environmental Education, 38, 3-13.
Maxey, D., & Kezar, A. (2016). Leveraging the Delphi technique to enrich knowledge and
engage educational policy problems. Educational Policy, 30(7), 1042–1070.
https://doi.org/10.1177/0895904815586856.
Mayo, M. (1997). Partnerships for regeneration and community development, Critical Social
Policy, 17, 3–26.
McCool, S. F., & Stankey, G. H. (2004). Indicators of sustainability: challenges and
opportunities at the interface of science and policy. Environmental Management,
33(3), 294–305.
McCormack, G.R., Rock, M., Toohey, A.M., & Hignell, D. (2010). Characteristics of urban
parks associated with park use and physical activity: a review of qualitative research.
Health and Place, 16, 712-726.
McGrath, L. J., Hopkins, W. G., & Hinckson, E. A. (2015). Associations of objectively
measured built-environment attributes with youth moderate-vigorous physical
activity: a systematic review and meta-analysis. Sports Medicine, 45(6), 841–865.
McKenzie, T.L., Cohen D.A., Sehgal, A., Williamson, S., Golinelli, D. (2006). System for
observing play and recreation in communities (SOPARC): reliability and feasibility
measures. Journal of Physical Activity and Health, 3(S1):S208 –22.

242
McLeroy, K. R., Bibeau, D., Steckler, A., & Glanz, K. (1988). An ecological perspective on
health promotion programs. Health Education Quarterly, 15, 351-377.
McLeroy, K. R., Kegler, M. C., Steckler, A., Burdine, J. N., & Wisotsky, M. (1994).
Editorial: Community coalitions for health promotion: Summary and further
reflections. Health Education Research, 9(1), 1-11.
Merriam, D. Bality, A. Stein, J. Boehmer, T. (2017) Improving public health through public
parks and trails: Eight common measures. Summary report. US Department of
Health and Human Services, Centers for Disease Control and Prevention and US
Department of the Interior, National Park Service. Retrieved from
http://go.nps.gov/improving_public_health
Mesa-Friasa, M., Chalabia, Z., Vannib, T. & Foss, A.M. (2013). Uncertainty in
environmental health impact assessment: Quantitative methods and perspectives.
International Journal of Environmental Health Research, 23(1), 16–30.
Moiseichik, M. (2010). Management of parks and recreation agencies (3rd Ed.). Ashburn,
VA: National Recreation and Park Association.
Moore J.B. (2008). The built environment and physical activity: influencing physical activity
through healthy design. Journal of Public Health and Management Practices, 14,
209–10.
Moore, J. B., Jilcott, S. B., Shores, K. A., Evenson, K. R., Brownson, R. C., & Novick, L. F.
(2010). A qualitative examination of perceived barriers and facilitators of physical
activity for urban and rural youth. Health Education Research, 25(2), 355–367.
https://doi.org/10.1093/her/cyq004.
243
Morland, K. B., & Evenson, K. R. (2009). Obesity prevalence and the local food
environment. Health & Place, 15(2), 491–495.
http://doi.org/10.1016/j.healthplace.2008.09.004
Mowen, A.J., Graefe, A.R., Barrett, A.G. & Godbey, G.C. (2015). Americans’ use and
perceptions of local recreation and park services: A nationwide reassessment. NRPA
Publications. Available at: http://www.nrpa.org/uploadedFiles/nrpa.org/Publications_
and_Research/Research/Park-Perception-Study-NRPA-Full-Report.pdf.
Mowen, A., Kaczynski, A., & Cohen, D. (2008). The potential of parks and recreation in
addressing physical activity and fitness. President's Council on Physical Fitness and
Sports, 9(1), 1.
Mowen, A. J., & Kerstetter, D. L. (2006). Introductory comments to the special issue on
partnerships: Partnership advances and challenges facing the park and recreation
profession. Journal of Park and Recreation Administration, 24(1), 1-6.
Mowen, A. J., Payne, L. L., Orsega-Smith, E., & Godbey, G. C. (2009). Assessing the health
partnership practices of park and recreation agencies: Findings and implications from
a national survey. Journal of Park and Recreation Administration, 27(3), 116–131.
Musser, L. M., & Malkus, A. J. (1994). The children’s attitudes toward the environment
scale. The Journal of Environmental Education, 25(3), 22–26.
NAA - National Afterschool Association (2015). Healthy eating physical activity standards
(HEPA). Retrieved from http://naaweb.org/resources.
Narain, K., Mata, A., & Flores, J. (2016). Nutrition policy decreases sugar-sweetened
beverages in municipal parks: Lessons learned from Carson, California. Journal of
Public Health Management and Practice. 22(4), 392–394.

244
Newman, S. A., Fox, J.A., Flynn, E.A., & Christeson, W. (2000). America’s after-school
choice: The prime time for juvenile crime, or youth enrichment and achievement.
Retrieved from https://eric-ed-gov.prox.lib.ncsu.edu/?id=ED445823.
Ng, S.W., & Popkin, B.M. (2012). Time use and physical activity: a shift away from
movement across the globe. Obesity Reviews. 13(8), 659–680, doi: 10.1111/j.1467-
789X.2011.00982.x.
Nichols, W.J. (2014). Blue mind – The surprising science that shows how being near, in, on,
or under water can make you happier, healthier, more connected, and better at what
you do. New York, NY: Back Bay Books: Little, Brown, and Company.
NIOST - National Institute on Out-of-School Time. (2015). A youth development approach
to evaluation: critical participatory action research. Afterschool Matters. Retrieved
March 30, 2016, from http://www.niost.org/Afterschool-Matters-Fall-2015/a-youth-
development-approach-to-evaluation-critical-participatory-action-research.
NLI - Natural Learning Initiative. (2016). Protocols for behavior mapping.
http://www.naturalearning.org.
NPAPA - National Physical Activity Plan Alliance. (2016). National physical activity plan.
Retrieved from http://www.physicalactivityplan.org/index.html.
NRPA – SRTP - National Recreation and Park Association. (2014). Safe Routes to Parks:
Improving access to parks through walkability. Ashburn, VA: NRPA Publications.
NRPA - National Recreation and Parks Association (2016a). Improving the health of
communities for all people through parks, recreation and conservation. Accessed
through: www.nrpa.org.
245
NRPA – National Recreation and Park Association. (2016b). Tobacco position statement.
http://www.nrpa.org/our-work/three-pillars/tobacco-consumption-in-
parks/#.WFlrkNN-x_k.email.
NRPA – National Recreation and Park Association. (2016c). Walking initiatives.
http://www.nrpa.org/Grants-and-Partners/Recreation-and-Health/Walking-Initiatives/.
Nutsford, D., Pearson, A.L., Kingham, S., & Reistma, F., (2016). Residential exposure to
visible blue space (but not green space) associated with lower psychological distress
in a capital city. Health & Place, 39, 70-78.
http://dx.doi.org/10.1016/j.healthplace.2016.03.002
Nyaupane, G.P. & Andereck, K.L. (2008). Understanding travel constraints: Application and
extension of a leisure constraints model. Journal of Travel Research, 46(4):433-439.
Ogden, C.L, Carroll, M.D. Kit, B.K., & Flegal, K.M. (2014). Prevalence of childhood and
adult obesity in the United States, 2011-2012. Journal of the American Medical
Association. 311(8), 806-814.
Ogden, C. L., Carroll, M. D., Lawman, H. G., Fryar, C. D., Kruszon-Moran, D., Kit, B. K., &
Flegal, K. M. (2016). Trends in obesity prevalence among children and adolescents in
the United States, 1988-1994 through 2013-2014. Journal of American Medical
Association, 315(21), 2292–2299. https://doi.org/10.1001/jama.2016.6361
Olshansky S.J., Passaro, D.J., Hershow, R.C., Layden, J.; Carnes, B.A., Brody, J., ... Ludwig.
D.S. (2005). A potential decline in life expectancy in the United States in the 21st
century. New England Journal of Medicine, 352, 1138-1145.
Oliver, S., Harden, A., & Rees, R. (2005). An emerging framework for including different
types of evidence in systematic reviews for public policy. Evaluation, 11, 428- 446.

246
Oreskovic, N. M., Perrin, J. M., Robinson, A. I., Locascio, J. J., Blossom, J., Chen, M. L., …
Goodman, E. (2015). Adolescents’ use of the built environment for physical activity.
BMC Public Health, 15(251).
Papas, M. A., Alberg, A. J., Ewing, R., Helzlsouer, K. J., Gary, T. L., & Klassen, A. C.
(2007). The built environment and obesity. Epidemiologic Reviews, 29(1), 129–143.
Pate, R. R., Freedson, P. S., Sallis, J. F., Taylor, W. C., Sirard, J., Trost, S. G., & Dowda, M.
(2002). Compliance with physical activity guidelines: Prevalence in a population of
children and youth. Annals of Epidemiology, 12(5), 303–308.
http://doi.org/10.1016/S1047-2797(01)00263-0
Payne, L. L., Zimmermann J.A., Mowen, A.J., Orsega-Smith, E., & Godbey, G.C. (2013).
Community size as a factor in health partnerships in community parks and recreation,
2007. Preventing Chronic Disease, 10. https://doi.org/10.5888/pcd10.120238.
Penbrooke, T.L. (2007). Analyzing your level of service, Parks & Recreation, 42(10), 18-19.
Penbrooke, T.L. (2009). Landmark study provides findings on national survey of park
agencies and youth football. Parks & Recreation, 44(7), 48–52.
Penbrooke, T. L., Compton, D. M., Petersen, D., Layton, R., Kim, K., & Moyers, M. (2014).
Year three report - South Bend, IN, Healthy Communities Research Group
Surveillance and Management Toolkit project. Louisville, CO: GP RED. Retrieved
from http://www.gpred.org/initiatives/healthy-communities-research-group/
Penbrooke, T.L., & Layton, R. (2007). Replacing conventional park level of service (LOS)
analysis with the composite values approach. American Planning Association
Essential Symposium. Retrieved from:
http://www.planning.org/practicingplanner/print/2007/fall/values.htm?print=true

247
Pew Charitable Trusts. (2016). Health impact assessment can inform planning to promote
public health - Process offers opportunities for collaboration among planners and
public health professionals. A brief. Pew Health Impact Project and the American
Planning Association. August. http://www.pewtrusts.org/en/research-and-
analysis/issue-briefs/2016/08/health-impact-assessment-can-inform-planning-to-
promote-public-health.
Plasqui, G., & Westerterp, K. R. (2007). Physical activity assessment with accelerometers:
An evaluation against doubly labeled water. Obesity, 15(10), 2371–9.
http://doi.org/http://dx.doi.org.prox.lib.ncsu.edu/10.1038/oby.2007.281.
Popkin B. M. (2008). The world is fat – The fads, trends, policies, and products that are
fattening the human race. New York: Avery-Penguin Group.
Powell, L. M., Slater, S., Chaloupka, F. J., & Harper, D. (2006). Availability of physical
activity--related facilities and neighborhood demographic and socioeconomic
characteristics: A national study. American Journal of Public Health, 96(9), 1676-
1680.
Pratt, M., Macera, C.A., Sallis, J.F., O’Donnell, M., & Frank, L.D. (2004). Economic
interventions to promote physical activity: Application of the SLOTH model.
American Journal of Preventive Medicine, 27, 136–145.
Pucher, J., Buehler, R., Bassett, D.R., & Dannenberg, A.L. (2010). Walking and cycling to
health: a comparative analysis of city, state, and international data. American Journal
of Public Health, 100, 1986–1992.
Puhl, R. (2010). Obesity stigma: Important considerations for public health. American
Journal of Public Health, 100(6), 1019-1028

248
Razani, N. Stookey, J. Brainin-Rodriguez, L., Roberts, N.S., Rutherford, G.W., & Chan, C.
(2016). Surmounting barriers to public health/park agency partnerships: Insights from
a county public health department. Journal of Park and Recreation Administration,
34(1), 53–67. http://dx.doi.org/10.18666/JPRA-2016-V34-I1-6800.
Reimers, A. K., Mess, F., Bucksch, J., Jekauc, D., & Woll, A. (2013). Systematic review on
measurement properties of questionnaires assessing the neighbourhood environment
in the context of youth physical activity behaviour. BMC Public Health, 13, 461.
http://doi.org/10.1186/1471-2458-13-461.
Remler, D.K., & Van Rzyin, G.G. (2015). Research methods in practice: Strategies for
description and causation. Thousand Oaks, CA: Sage Publications.
Renger, R., & Titcomb, A. (2002). A three-step approach to teaching logic models. American
Journal of Evaluation, 23(4), 493–503.
Richmond, T. K., Hayward, R. A., Gahagan, S., Field, A. E., & Heisler, M. (2006). Can
school income and racial/ethnic composition explain the racial/ethnic disparity in
adolescent physical activity participation? Pediatrics, 117(6), 2158-2166.
Richter, K. P., Harris, K. J., Paine-Andrews, A., Fawcett, S. B., Schmid, T. L., Lankenau, B.
H., & Johnston, J. (2000). Measuring the health environment for physical activity and
nutrition among youth: A review of the literature and applications for community
initiatives. Preventive Medicine, 31(2), S98–S111.
http://doi.org/10.1006/pmed.1999.0541
Rigolon, A. (2016). A complex landscape of inequity in access to urban parks: A literature
review. Landscape and Urban Planning, 153, 160–169.
https://doi.org/10.1016/j.landurbplan.2016.05.017.

249
Ritchie, J., & Lewis, J. (2003). Qualitative research practice: a guide for social science
students and researchers. London: Sage Publishing.
Robinson, T.N. (1999). Reducing children’s television viewing to prevent obesity: A
randomized controlled trial. Journal of the American Medical Association, 282, 1561-
1567.
Roe, J., Aspinall, P., and Ward Thompson, C. (2016). Understanding relationships between
health, ethnicity, place and the role of urban green space in deprived urban
communities, International Journal of Environmental Research and Public Health,
13(7):681.
Rosenberger, D., Ding, D., Sallis, J. F., Kerr, J., Norman, G. J., Durant, N., … Saelens, B. E.
(2009). Neighborhood environment walkability scale for youth (NEWS-Y):
Reliability and relationship with physical activity. Preventive Medicine, 49(2–3),
213–218. http://doi.org/10.1016/j.ypmed.2009.07.011
Ross, C. M., Young, S. J., Sturts, J. R., & Franzidis, A. F. (2013). A Delphi study identifying
indicators and criteria for physically active communities for youth 10-14 years old.
LARNet: The Cyber Journal of Applied Leisure and Recreation Research, 16(1), 1-
11.
Roux, L., Pratt, M., Tengs, T. O., Yore, M. M., Yanagawa, T. L., Van Den Bos, J., …
Buchner, D. M. (2008). Cost effectiveness of community-based physical activity
interventions. American Journal of Preventive Medicine, 35(6), 578–588.
http://doi.org/10.1016/.
Ryan, G. W., & Bernard, H. R. (2003). Techniques to identify themes. Field Methods, 15(1),
85–109. http://doi.org/10.1177/1525822X02239569.

250
Saelens, B.E., Frank, L.D., Auffrey, C., Whitaker, R.C., Burdette, H.L., & Colabianchi, N.
(2006). Measuring physical environments of parks and playgrounds: EARPS
instrument development and inter-rater reliability. Journal of Physical Activity &
Health, 3(1), S190-S207.
Saelens, B. E., Sallis, J. F., Black, J. B., & Chen, D. (2003). Neighborhood-based differences
in physical activity: an environment scale evaluation. American Journal of Public
Health, 93(9), 1552–1558.
Saint-Maurice, P. F., & Welk, G. J. (2014). Web-based assessments of physical activity in
youth: Considerations for design and scale calibration. Journal of Medical Internet
Research, 16(12). http://doi.org/10.2196/jmir.3626.
Sallis, J. F., Cerin, E., Conway, T. L., Adams, M. A., Frank, L. D., Pratt, M., … Owen, N.
(2016). Physical activity in relation to urban environments in 14 cities worldwide: a
cross-sectional study. The Lancet, 387(10034):2207-17.
http://doi.org/10.1016/S0140-6736(15)01284-2
Sallis, J. F., Cervero, R. B., Ascher, W., Henderson, K. A., Kraft, M. K., & Kerr, J. (2006).
An ecological approach to creating active living communities. Annual Review of
Public Health, 27, 297–322.
Sallis, J. F., Cutter, C. L., Lou, D., Spoon, C., Wilson, A. L., Ding, D., & Orleans, C. T.
(2014). Active Living Research: creating and using evidence to support childhood
obesity prevention. American Journal of Preventive Medicine, 46(2), 195–207.
Sallis, J.F., Floyd, M.F., Rodriguez, D.A., & Saelens, B. (2012). Role of built environments
in physical activity, obesity, and cardiovascular disease. Circulation, 125, 729-737.

251
Sallis, J.F., & Hovell, M.F. (1990). Determinants of exercise behavior. In J. O. Holloszy &
K. B. Pandolf (Eds.), Exercise and Sport Sciences Reviews (pp. 307-330). Baltimore,
MD: Williams & Wilkins.
Sallis, J.F., Linton, L. & Kraft. M.K. (2005). The first active living research conference.
Growth of a transdisciplinary field. American Journal of Preventive Medicine, 28, 93-
95.
Sallis, R.E., Matuszak, J.M., Baggish, A.L., Franklin, B., Chodzko-Zajko, W., Fletcher, B. . .
. Williams, J., (2016). Call to action on making physical activity assessment and
prescription a medical standard of care. Current Sports Medicine Reports, 15(3), 207–
214.
Sallis, J. F., & Saelens, B. E. (2000). Assessment of physical activity by self-report: Status,
limitations, and future directions. Research Quarterly for Exercise and Sport,
71(sup2), 1–14. http://doi.org/10.1080/02701367.2000.11082780.
Sallis, J.F., & Spoon, C. (2015). Making the case for designing active cities (Technical
report). Active Living Research. Revised version: February.
Sallis, J.F., Spoon, C., Cavill, N., Engelberg, J., Gebel, K., Lou, D., Parker, M., Thornton,
C.M., Wilson, A., Cutter, C.L., & Ding, D. (2015). Making the case for designing
active cities. San Diego, CA: Active Living Research.
http://activelivingresearch.org/making-case-designing-active-cities.
Sandberg, J. (2004). Accreditation agents. Parks & Recreation, 39(8), 66–68.
Sarriot, D., & Kouletio, M. (2015). Community health systems as complex adaptive systems:
Ontology and praxis lessons from an urban health experience with demonstrated

252
sustainability. Systemic Practice and Action Research. 28, 255–272, DOI
10.1007/s11213-014-9329-9.
Saw, L.E., Lim, F.K.S. &, Carrasco, L.R. (2015). The relationship between natural park
usage and happiness does not hold in a tropical city-state. PLoS ONE, 10(7):
e0133781. doi:10.1371/journal.pone.0133781.
Scaccia, J. P., Cook, B. S., Lamont, A., Wandersman, A., Castellow, J., Katz, J., & Beidas,
R. S. (2015). A Practical Implementation Science Heuristic for Organizational
Readiness: R = Mc2. Journal of Community Psychology, 43(4), 484–501.
https://doi.org/10.1002/jcop.21698
Schroeder, S.A. (2007). We can do better—improving the health of the American people.
New England Journal of Medicine, 357(12), 1221-1228.
Schultz, C.L., Layton, R., Edwards, M.B., Bocarro, J.N., Moore, R.L., Tepperberg, S. Bality,
A. & Floyd, M.F. (2016). Potential measures for linking park and trail systems to
public health. Journal of Park and Recreation Administration, 34(1), 4-23.
Schutz, Y., Weinsier, R.L., & Hunter, G.R. (2001). Assessment of free living physical
activity in humans: an overview of currently available and proposed new measures.
Obesity Research, 9, 368–79.
SCIMPH - South Carolina Institute of Medicine and Public Health. (2013). A health impact
assessment (HIA) of park, trail, and green space planning in the west side of
Greenville, South Carolina. http://imph.org/health-impacts-proposed-west-side-
development-highlighted-report-2/.
Shanahan, D.F., Fuller, R.A., Bush, R., Lin, B.B., & Gaston, K.J. (2015). The health benefits
of urban nature: how much do we need? BioScience Advance Access. April. 1-10.

253
Shanahan, D.F., Bush, R., Gaston, K.J., Lin, B.B., Dean, J., Barber, E., & Fuller, R.A.
(2016). Health benefits from nature experiences depend on dose. Nature.com
Scientific Reports, 6(28551), 1-10.
Shannon, C.S. (2006). Parents’ messages about the role of extracurricular and unstructured
leisure activities: Adolescents’ perceptions. Journal of Leisure Research, 38(3), 398-
420.
Shinew, K. J., Stodolska, M., Roman, C. G., & Yahner, J. (2013). Crime, physical activity
and outdoor recreation among Latino adolescents in Chicago. Preventive Medicine,
57(5), 541–544. http://doi.org/10.1016/j.ypmed.2013.07.008.
Shores, K. A., & West, S. T. (2010). Rural and urban park visits and park-based physical
activity. Preventive Medicine, 50, S13–S17.
http://doi.org/10.1016/j.ypmed.2009.07.023.
Siegel, S., & Castellan, N. J. (1988). Nonparametric statistics for the behavioural sciences.
New York: McGraw-Hill.
Singh, G.K., Siahpush, M., & Kogan, M.D. (2010). Neighborhood socioeconomic
conditions, built environments, and childhood obesity. Health Affairs, 29(3), 503-512.
Skulmoski, G.J., Hartman, F.T., & Kraun, J., (2007). The Delphi method for graduate
research. Journal of Information Technology Education, 6, 1-21.
Slater, S. J., Ewing, R., Powell, L. M., Chaloupka, F. J., Johnston, L. D., & O’Malley, P. M.
(2010). The association between community physical activity settings and youth
physical activity, obesity, and body mass index. Journal of Adolescent Health, 47(5),
496–503. http://doi.org/10.1016/j.jadohealth.2010.03.017.

254
Spangler, K. J., & Caldwell, L. L. (2007). The implications of public policy related to parks,
recreation, and public health: A focus on physical activity. Journal of Physical
Activity & Health, 4(1), 64-71.
Stahre, M., Roeber, J., Kanny, D., Brewer, R. D., & Zhang, X. (2014). Contribution of
excessive alcohol consumption to deaths and years of potential life lost in the United
States. Preventing Chronic Disease, 11. https://doi.org/10.5888/pcd11.130293
Stamatakis, E., Rogers, K., Ding, D., Berrigan, D., Chau, J., Hamer, M., & Bauman, A.
(2015). All-cause mortality effects of replacing sedentary time with physical activity
and sleeping using an isotemporal substitution model: a prospective study of 201,129
mid-aged and older adults. International Journal of Behavioral Nutrition and
Physical Activity.
Stankey, G. H., Cole, D. N., Lucas, R. C., Petersen, M. E., & Frissell, S. S. (1985). The limits
of acceptable change (LAC) system for wilderness planning. General Technical
Report, Intermountain Forest and Range Experiment Station, USDA Forest Service,
(INT-176), 37–37.
Stankey, G., Clark, R. & Bormann, B. (2005), Adaptive management of natural resources:
Theory, concepts and management institutions. USDA Forest Service general
technical report PNW-GTR-654.
Stankey, G. H., McCool, S. F., Clark, R. N., & Brown, P. J., (1999). Institutional and
organizational challenges to managing natural resources for recreation: A social
learning model, In E. L. Jackson & T. L. Burton (Eds.), Leisure studies: Prospects for
the twenty-first century (pp. 283-295). State College, PA: Venture Publishing, Inc.
255
Stermann, J.D. (2000). Business dynamics: systems thinking and modeling for a complex
world. Boston, MA: Irwin McGraw-Hill.
Strack, R. W., Magill, C., & McDonagh, K. (2004). Engaging youth through photovoice.
Health Promotion Practice, 5(1), 49–58. http://doi.org/10.1177/1524839903258015
Strauss, A., & Corbin, J. (1998). Basics of qualitative research: Grounded theory procedures
and techniques. 2nd ed. Newbury Park, CA: Sage.
Stokols, D. (1992). Establishing and maintaining healthy environments - toward a social
ecology of health promotion, American Psychologist. January, 47(1), 6-22.
Stroh, D.P. (2015). Systems thinking for social change: A practical guide to solving complex
problems, avoiding unintended consequences, and achieving lasting results. White
River Junction, VT: Chelsea Green Publishing.
Strong, W. B., Malina, R. M., Blimkie, C. J. R., Daniels, S. R., Dishman, R. K., Gutin, B., …
Trudeau, F. (2005). Evidence based physical activity for school-age youth. The
Journal of Pediatrics, 146(6), 732–737. http://doi.org/10.1016/j.jpeds.2005.01.055.
Sturm, R., & Cohen, D. (2014). Proximity to urban parks and mental health. The Journal of
Mental Health Policy and Economics, 17(1), 19–24.
Tebes, J. K., Feinn, R., Vanderploeg, J. J., Chinman, M. J., Shepard, J., Brabham, T., …
Connell, C. (2007). Impact of a positive youth development program in urban after-
school settings on the prevention of adolescent substance use. Journal of Adolescent
Health, 41(3), 239–247. http://doi.org/10.1016/j.jadohealth.2007.02.016.
TFAH - Trust for America’s Health. (2015). The state of obesity 2015 - Trust for America’s
Health. http://healthyamericans.org/reports/stateofobesity2015/.

256
Thaw, J.M., Villa, M., Reitman, D., DeLucia, C., Gonzalez, J., Hanson, K.L. (2014).
Evidence-based fitness promotion in an afterschool setting: Implementation fidelity
and its policy implications. New Directions For Youth Development, 143, 101-131.
Wiley Periodicals, Inc. www.wileyonlinelibrary.com. DOI: 10.1002/yd.20106.
Torraco, R. J. (2005). Writing integrative literature reviews: Guidelines and examples.
Human Resource Development Review. 4(3), 356-367.
Tremblay, M.S., LeBlanc, A.G., Kho, M.E., Saunders, T.J., Larouche, R., Colley, R.C.,
Goldfield, G., & Gorber, S.C. (2011), Systematic review of sedentary behaviour and
health indicators in school-aged children and youth. International Journal of
Behavioral Nutritional and Physical Activity, 8, 98.
Trost, S. G., Pate, R.R., Freedson, P.S., Sallis, J.F., & Taylor, W.C. (2000). Using objective
physical activity measures with youth: How many days of monitoring are needed?
Medicine, Science, and Sports Exercise, 32(2), 426–431.
Ulrich, R.S. (1979). Visual landscapes and psychological wellbeing. Landscape Research.
4(1), 17-23.
Ulrich, R.S., Simons, R.F., Losito, B.D., Florito, E., Miles, M.A., & Zelson, M. (1991).
Stress recovery during exposure to natural and urban environments. Journal of
Environmental Psychology, 11, 211 - 230.
Umstattd Meyer, M.R., Perry, C.K., Sumrall, J.C., Patterson, M.S., Walsh, S.M.,
Clendennen, S.C., Hooker, S.P., & Evenson, K.R. (2016). Physical activity–related
policy and environmental strategies to prevent obesity in rural communities: A
systematic review of the literature, 2002–2013. Preventing Chronic Disease, 13,
150406, DOI: http://dx.doi.org/10.5888/pcd13.150406.

257
UN 2030 Agenda. (2016). Sustainable development goals and 2030 indicators. United
Nations. Retrieved 9/2/16 from http://www.un.org/sustainabledevelopment/.
U.S. Department of Health & Human Services. (2015). Step it up! The surgeon general’s call
to action to promote walking and walkable communities. Washington, DC. Retrieved
from http://www.surgeongeneral.gov/library/calls/walking-and-walkable-
communities/call-to-action-walking-and-walkable-communites.pdf
Van Der Horst, K., Paw, M. J. C. A., Twisk, J. W. R., & Van Mechelen, W. (2007). A brief
review on correlates of physical activity and sedentariness in youth. Medicine &
Science in Sports & Exercise, 39(8), 1241–1250.
http://doi.org/10.1249/mss.0b013e318059bf35.
Veitch, J., Ball, K., Crawford, D., Abbott, G. R., & Salmon, J. (2012). Park improvements
and park activity: A natural experiment. American Journal of Preventive Medicine,
42(6), 616-619.
Vick, C. G. (2007). Public Parks and Recreation. In C .W. Stenberg & S.A. Austin, (Eds.),
Managing Local Government Services: A Practical Guide, p. 235. Washington DC:
International City and County Management Association.
von Bertalanffy, L. (1968). General System Theory. New York: George Brazilier.
Wang. C., & Burris, M.A. (1997). Photovoice: Concept, methodology, and use for
participatory needs assessment. Health Education & Behavior, 24(3), 369-387.
Walls, C. E., Richmond, T. K., Blood, E. A., Austin, S. B., Greaney, M. L., Spadano-
Gasbarro, J., … Peterson, K. E. (2012). The influence of school neighborhood safety
and parks and recreation resources on middle school students’ physical activity levels.
Journal of Adolescent Health, 50(2), S37–S37.

258
Watson, K. B., Harris, C. D., Carlson, S. A., Dorn, J. M., & Fulton, J. E. (2016). Disparities
in adolescents’ residence in neighborhoods supportive of physical activity - United
States, 2011-2012. Morbidity and Mortality Weekly Report, 65(23), 598–601.
Wells, N.M. (2000). At home with nature effects of “greenness” on children’s cognitive
functioning. Environment and Behavior. 32(6), 775-795.
Wells, N.M. (2013). The role of nature in children's resilience: cognitive and social
processes. In: K. Tidball & M. Krasny (Eds.) Greening in the Red Zone. (pp. 95-109).
New York City, NY: Springer Publications.
Wells, N.M. & Donofrio, G.A. (2011). Urban planning, the natural environment, and public
health. In: J.O. Nriagu (Ed.) Encyclopedia of Environmental Health. (pp. 565-575).
Burlington, MA: Elsevier.
Wells, N. M., & Evans, G. W. (2003). Nearby nature. Environment and Behavior, 35(3),
311–330.
Wells, N. M., Evans, G., & Yang, Y. (2010). Environments and health: Planning decisions as
public health decisions. Journal of Architectural and Planning Research, 27(2), 124-
143.
Wells, N. M., & Lekies, K. S. (2006). Nature and the life course: Pathways from childhood
nature experiences to adult environmentalism. Children, Youth and Environments, 16,
1-24.
Wells, N.M. & Rollings K.A. (2012). The natural environment: Influences on human health
and function. In S. Clayton (Ed.) The Handbook on Environmental and Conservation
Psychology. (pp. 509-523). Cary, NC: Oxford University Press.

259
Wethington, H., Pan, L., & Sherry, B. (2013). The association of screen time, television in
the bedroom, and obesity among school aged youth: 2007 National Survey of
Children’s Health. Journal of School Health, 83(8), 573-581.
Wetmore, C. M., & Mokdad, A. H. (2012). In denial: misperceptions of weight change
among adults in the United States. Preventive Medicine, 55(2), 93–100.
Whittaker, D., Shelby, B., Manning, R., Cole, D. & Haas, G. (2011). Capacity reconsidered:
Finding consensus and clarifying differences, Journal of Park and Recreation
Administration, 29(1), 1–20.
Wickel, E. E., & Eisenmann, J. C. (2007). Contribution of youth sport to total daily physical
activity among 6- to 12-yr-old boys. Medicine & Science in Sports & Exercise, 39(9),
1493–1500.
Wilhelm Stanis, S. A., Schneider, I. E., Shinew, K. J., Chavez, D. J., & Vogel, M. C. (2009).
Physical activity and the recreation opportunity spectrum: Differences in important
site attributes and perceived constraints. Journal of Park & Recreation
Administration, 27(4), 73-91.
Wilson, K.M., Brady, T.J., & Lesesne, C., on behalf of the CDC-NCCDPHP Work Group on
Translation. (2011). An organizing framework for translation in public health: the
Knowledge to Action Framework. Preventing Chronic Disease, 8(2), A46.
http://www.cdc.gov/pcd/issues/2011/mar/10_0012.htm. Accessed 2-15-17.
WHO - World Health Organization. (2009). Systems thinking for health systems
strengthening. World Health Organization Publishing. Retrieved from:
http://www.who.int/alliance-hpsr/resources/9789241563895/en/.

260
World Health Organization (WHO). (2011). Rio political declaration on social determinants
of health. World Conference on Social Determinants of Health. Rio de Janeiro,
Brazil. 19–21 October 2011. Available: http://www.who.int/sdhconference/en/.
Wolch, J. R., Byrne, J., & Newell, J. P. (2014). Urban green space, public health, and
environmental justice: The challenge of making cities “just green enough.”
Landscape and Urban Planning, 125, 234–244.
https://doi.org/10.1016/j.landurbplan.2014.01.017
Wolf, I. D., & Wohlfart, T. (2014). Walking, hiking and running in parks: A
multidisciplinary assessment of health and well-being benefits. Landscape and Urban
Planning, 130, 89-103.
Yin, R. K. (2013). Case study research: Design and methods (5th Ed.). London: Sage
Publishing.
Yin, R. K. (2015). Qualitative research from start to finish (2nd Ed). New York City, NY:
Guilford Press.
Yoder, D. G., & Ham L. L. (2005). Partnerships. In B. van der Smissen, M. Moiseichik, &
Hartenburg, V. J. (Eds.), Management of park and recreation Agencies (2nd Ed.),
(pp. 85-101). Ashburn, VA: The National Recreation & Park Association.
Yoder, D. G., McKinney, W., Wicks, B., & Espeseth, R. (1995). Theory and application of
triangulation to public park and recreation planning. Journal of Park and Recreation
Administration, 13(3). 26-40.
Young, S. J., Ross, C. M., Kim, K., & Sturts, J. R. (2013). Engaging youth in physical
activity: indicators of a physically active friendly community. Child Indicators
Research, 7(1), 41–55. http://doi.org/10.1007/s12187-013-9199-1.

261
Zachry, I., Woodie, M., & Skrepnek, G. (2002). Applying multi-attribute utility technology
to the formulary evaluation process. Formulary, 37(4), 199.
Zarr, R., Cottrell, L., & Merrill, C. (2017). Park Prescription (DC Park Rx): A new strategy
to combat chronic disease in children. Journal of Physical Activity and Health, 14(1),
1-2.
Zarrett, N., & Bell, B. A. (2014). The effects of out-of-school time on changes in youth risk
of obesity across the adolescent years. Journal of Adolescence, 37(1), 85–96.
http://doi.org/10.1016/j.adolescence.2013.11.001.

262
APPENDICES

Appendix A - National Initiatives and Agencies Active with Them
Penbrooke Delphi Study - Results from Questionnaire #2, October 2016
To deepen into exploring awareness and participation in national initiatives, a list of
the 31 national initiatives which appeared to be relevant to P&R agencies and their efforts to
address the modifiable health factors that were identified from literature web searches, and
the resources provided by the Delphi Panel were compiled for the survey. The following
table includes percentage of the full list of similar initiatives in which Delphi Panel agencies
who took Questionnaire #2 (n=15) reported they are or have participated, and after the open
ended comments, descriptions of the initiatives are provided in tabular summary form.
National Initiatives and Percentage of Agencies Active with Them
National Organization %
ActiveNot now but YES in past NO
Safe Routes to School 53% 13% 33%Community Health Needs Assessments 42% 0% 58%Let's Move 38% 8% 54%NRPA's Safe Routes to Parks 36% 0% 64%NRPA's Commit to Health 36% 0% 64%Community Health Improvement Plans 33% 8% 58% Complete Streets 33% 8% 58% After School Association's – HEPA 27% 0% 73% Live Well 25% 8% 67% KaBOOM!'s Playability 23% 23% 54% Alliance for a Healthier Generation 20% 0% 80% Active Living Research 18% 9% 73% GP RED's SMT 18% 9% 73% GP RED's Safe Routes to Play 18% 9% 73% SPARK 15% 15% 69%NIOST's Healthy Out of School Time 11% 0% 89% ACHIEVE 10% 20% 70%Active Living Coalition 10% 10% 80% CDC's Healthy Places Parks HIA Toolkit 10% 10% 80% Eat Smart, Move More 9% 9% 82% Healthy Parks Healthy People 9% 9% 82% NFL Play 60 8% 15% 77%
263
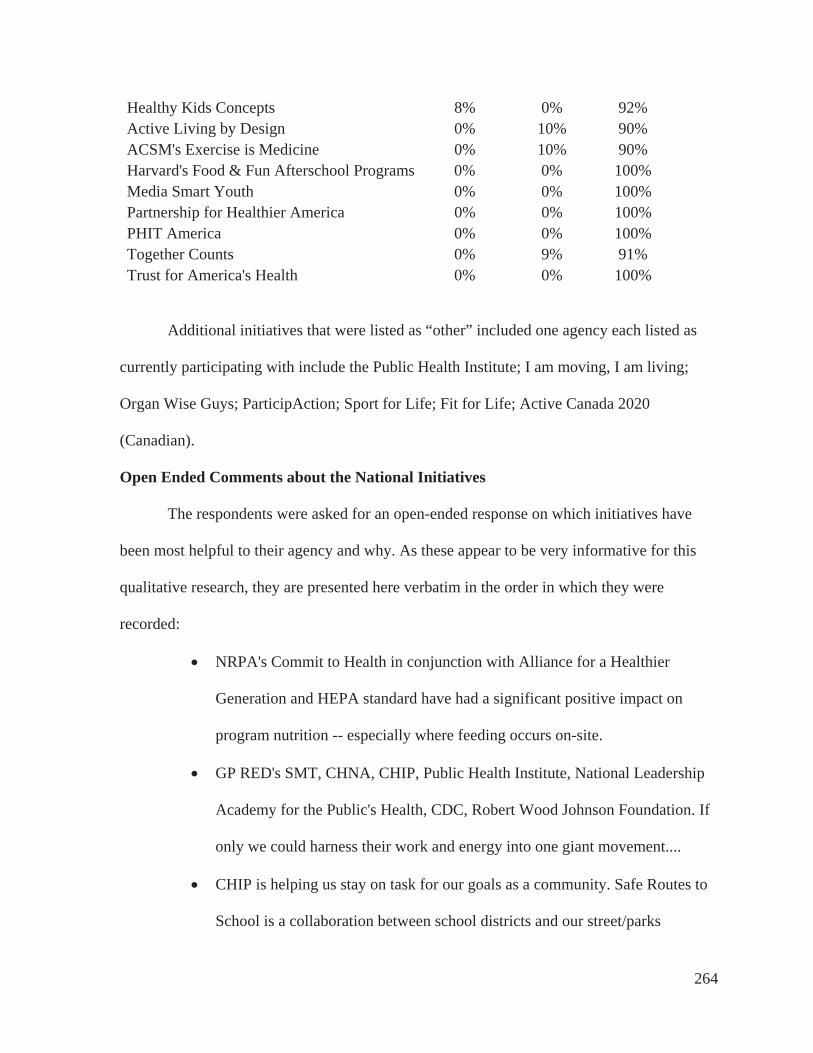
Healthy Kids Concepts 8% 0% 92% Active Living by Design 0% 10% 90% ACSM's Exercise is Medicine 0% 10% 90%Harvard's Food & Fun Afterschool Programs 0% 0% 100% Media Smart Youth 0% 0% 100% Partnership for Healthier America 0% 0% 100% PHIT America 0% 0% 100% Together Counts 0% 9% 91% Trust for America's Health 0% 0% 100%
Additional initiatives that were listed as “other” included one agency each listed as
currently participating with include the Public Health Institute; I am moving, I am living;
Organ Wise Guys; ParticipAction; Sport for Life; Fit for Life; Active Canada 2020
(Canadian).
Open Ended Comments about the National Initiatives
The respondents were asked for an open-ended response on which initiatives have
been most helpful to their agency and why. As these appear to be very informative for this
qualitative research, they are presented here verbatim in the order in which they were
recorded:
NRPA's Commit to Health in conjunction with Alliance for a Healthier
Generation and HEPA standard have had a significant positive impact on
program nutrition -- especially where feeding occurs on-site.
GP RED's SMT, CHNA, CHIP, Public Health Institute, National Leadership
Academy for the Public's Health, CDC, Robert Wood Johnson Foundation. If
only we could harness their work and energy into one giant movement....
CHIP is helping us stay on task for our goals as a community. Safe Routes to
School is a collaboration between school districts and our street/parks
264

department which helps open doors for future projects. I am moving, I am
living is for child care aged children to help promote healthy living at the very
early stages.
We have developed new partnerships and programming centered around our
involvement with GP RED and the NRPA and IPRA health initiatives.
Looking at this list was a huge awakening for me to realize that we do not
participate in any of these initiatives other than the Community Health
Assessment and Organ Wise Guys, which only some of our staff are still
using. Thank you for sharing this, because I will be sharing this with my staff
for us to start researching and finding ways for us to start implementing more
of these.
KaBoom's Playful City USA program has been beneficial for connecting our
organization to others on a National level. Being actively involved in this
program also opens the door to more opportunities for grants and similar
opportunities. ACHIEVE and the Active Living Coalition also help to create a
supportive environment for cross sector work within our diverse community.
We have gone "all in" on the complete streets concept throughout the entire
city. Some of our most significant community investments ($20 million +)
over the past two years have been in this arena. We were the first city in
Indiana to reach gold medals in all five Lets Move! categories. We were also
the first beta site for the GP RED Healthy Communities Surveillance and
Management Toolkit.
265

The County of San Diego was very involved in Let's Move and became the
first Let's Move County. Health and Human Agency does all the reporting.
Complete Streets is championed by our Public Works Department.
LiveWell Colorado provided us some direction and programs for our
community to potentially participate in. We directed community members to
the county programs, etc. LiveWell program is no longer funded or active in
Mesa County, Colorado Safe Routes to Schools was impactful in that we have
had some walkability analysis done. This has allowed us to look at crosswalk
locations, sidewalk-ability, etc. and has translated into some funding to make
improvements. I will say we would think twice about participating in grant
funding from Safe Routes in the future due to the construction and reporting
requirements imposed on the project.
KaBoom, NFL Play 60, Eat Smart Move more, all these agencies have been
great partners in providing curriculum and funding for programs.
The Canadian Framework for Recreation in Canada 2015 is a strategic
document that is particularly supportive of physical activity (including active
transportation and active school travel) and the importance of providing
access to nature.
Some of the initiatives developed by ParticipAction are engaging and easily
incorporated into community programming. Initiatives need to be linked
within a larger plan in order to make them sustainable, otherwise they are
simply a special event that comes and goes.
266

Appendix A Relevant Identified National InitiativesInitiative Brief description and websiteACHIEVE ACHIEVE strives to bring together local leaders who have the drive and
ability to make Policy, Systems, and Environmental changes that willimprove the health and wellness of their communities. http://www.achievecommunities.org/
ACSM's Exercise is Medicine Exercise is Medicine®, a global health initiative managed by the American College of Sports Medicine (ACSM), encourages primary care physicians and other health care providers to include exercise when designing treatment plans for patients. Along with the National Physical Activity Plan, Exercise is Medicine strives to make physical activity a “vital sign” that is routinely assessed at every patient interaction with a health care provider. http://www.acsm.org/about-acsm/initiatives/eim
Active Living by Design Active Living By Design partners with nonprofits, local leaders and funders to create healthy communities by making streets safer, bringing healthy foods to stores, and build parks, playgrounds and other active spaces for children and adults. http://activelivingbydesign.org/
Active Living Coalition ALC is a network of individuals and organizations whose mission is to work together to promote a healthy lifestyle to those who live, work, and visit Monroe County through events, programs, and policies. http://www.activelivingcoalition.org/
Active Living Research Active Living Research translates and disseminates evidence to advocates, policy-makers and practitioners aimed at preventing childhood obesity and promoting active communities. http://activelivingresearch.org/
After School Association's HEPA
The Afterschool Association hosts the National Institute on Out of School Time and the Health Out of School Time Coalition that has created Healthy Eating Physical Activity Standards. These standards have also been adopted by NRPA for their health initiatives. http://www.niost.org/HOST-Site
Alliance for a Healthier Generation
The Alliance for a Healthier Generation is a catalyst for children’s health, working with schools, companies, community organizations, healthcare professionals and families to transform the conditions and systems that lead to healthier kids. https://www.healthiergeneration.org
CDC's Healthy Places Parks HIA Toolkit
The CDC produces a variety of tools for HIAs and other assessments, such as Parks, Trails and Health: A Tool for Planners, Parks & Recreational Professionals, and Health Practitioner. https://www.cdc.gov/healthyplaces/healthtopics/parks_resources.htm
Community Health Improvement Plans (CHIP)
A community health improvement plan is a long-term, systematic effort to address public health problems in a community. The plan is based on the results of community health assessment activities, and is part of a community health improvement process. They are happening in all states, but one example and tools are available at http://www.health.state.mn.us/divs/opi/pm/lphap/chip/.
Community Health Needs Assessments (CHNA)
A CHNA is required as part of the Affordable Care Act, and is intended to be community-wide. This assessment and formal report should be in alignment with the federal IRS Community Benefit reporting requirements that affect all state licensed 501(c)(3) hospitals. Examples from Kaiser Permanente for various communities are available at: https://share.kaiserpermanente.org/article/community-health-needs-assessments/
267

Complete Streets Complete Streets is an initiative to create streets for everyone. They are designed and operated to enable safe access for all users, including pedestrians, bicyclists, motorists and transit riders of all ages and abilities. Complete Streets make it easy to cross the street, walk to shops, and bicycle to work. https://smartgrowthamerica.org
Eat Smart, Move More This is intended as a statewide resource for tips and information to help people eat smart and move more everyday. It is active in several states and features a variety of tools to address workplace, personal tools, obesity, and diabetes prevention. . Here is the NC example: http://www.eatsmartmovemorenc.com/index.html
GP RED's Safe Routes to Play Safe Routes to Play (SRTP) is a child-centered transportation planning process which helps communities assess the potential to create non- motorized connectivity between neighborhoods and parks, playgrounds, trails, and natural areas for children and their families. http://www.gpred.org/initiatives/safe-routes-to-play/
GP RED's Surveillance and Management Toolkit (SMT)
The SMT is an initiative of the GP RED Healthy Communities Research Group (HCRG) to help parks, recreation, public health, and related departments and organizations use a Systems Thinking Approach to assess, analyze, document, and evaluate key elements related to the repositioning of parks and recreation agencies as a primary provider of activities that impact public health in communities. http://www.gpred.org/initiatives/healthy-communities-research-group/
Harvard's Food & Fun Afterschool Programs.
Food & Fun After School© is a curriculum designed to develop healthy habits out of school time. Eleven teaching units help programs infuse healthy snacks and recipes, physically active games, and creative learning activities into regular program schedules. http://www.foodandfun.org/?p=about
Healthy Kids Concepts This initiative is committed to taking action in the fight against childhood obesity in California and nationwide. Healthy Kids Concepts is resolved to create a movement where healthy eating, exercise and fun becomes the norm in the daily lives of our children. http://www.healthykidsconcepts.org/home.html
Healthy Parks Healthy People Healthy Parks Healthy People is a global movement that harnesses the power of parks and public lands in contributing to a healthy civil society. The idea originated with Parks Victoria, Australia, and was brought to global prominence at the 1st Healthy Parks Healthy People Congress in April, 2010. https://www.nps.gov/public_health/hp/hphp.htm
KaBOOM!'s Playability This initiative was designed as a solution to ensure that all kids, especially the 16 million living in poverty in America, can get the balanced and active play they need to thrive. https://kaboom.org/playability
Let's Move Let’s Move! was launched by the First Lady, Michelle Obama, dedicated to solving the challenge of childhood obesity within a generation, so that children born today will grow up healthier and able to pursue their dreams. Let's Move! is about putting children on the path to a healthy future, giving parents helpful information. fostering environments that support healthy choices, providing healthier foods in schools, ensuring that every family has access to healthy, affordable food, and, helping kids become more physically active. http://www.letsmove.gov/
Live Well LiveWell has been used as a name for a variety of statewide and county nonprofit organizations committed to preventing and reducing the barriers to healthy eating and active living. Each organization has a somewhat different mandate and available tools. An example from Colorado is
268
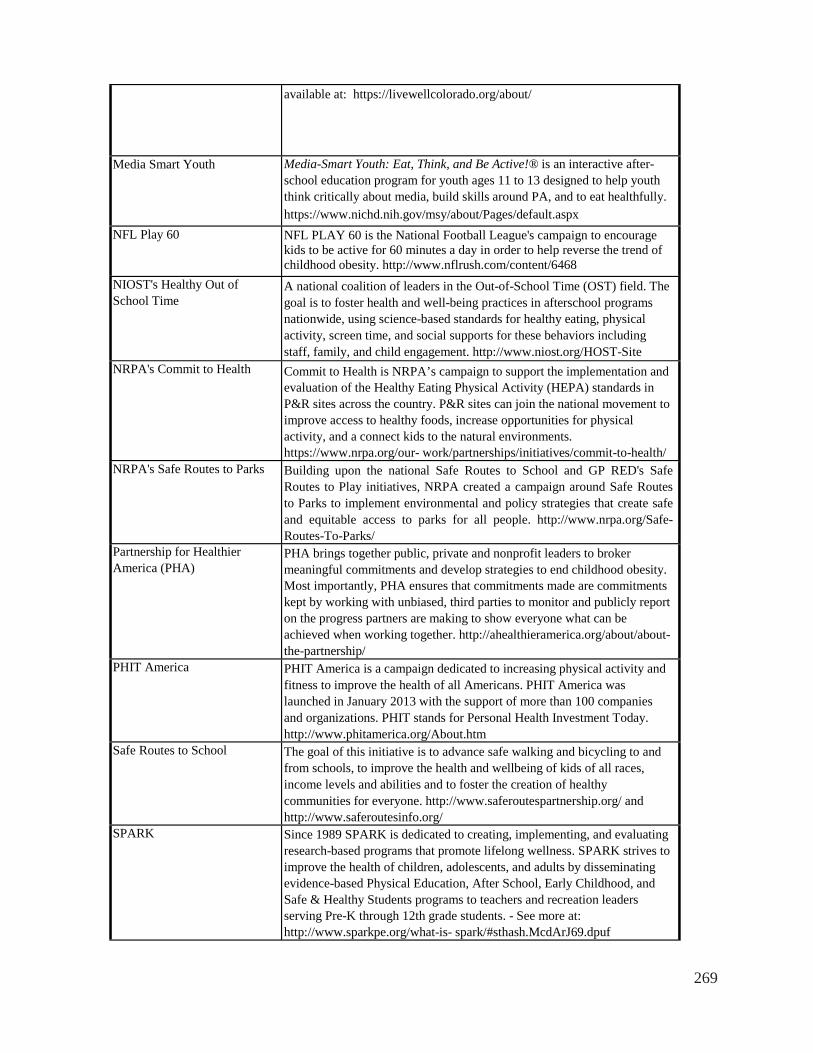
available at: https://livewellcolorado.org/about/
Media Smart Youth Media-Smart Youth: Eat, Think, and Be Active!® is an interactive after-school education program for youth ages 11 to 13 designed to help youth think critically about media, build skills around PA, and to eat healthfully. https://www.nichd.nih.gov/msy/about/Pages/default.aspx
NFL Play 60 NFL PLAY 60 is the National Football League's campaign to encourage kids to be active for 60 minutes a day in order to help reverse the trend of childhood obesity. http://www.nflrush.com/content/6468
NIOST's Healthy Out of School Time
A national coalition of leaders in the Out-of-School Time (OST) field. The goal is to foster health and well-being practices in afterschool programs nationwide, using science-based standards for healthy eating, physical activity, screen time, and social supports for these behaviors including staff, family, and child engagement. http://www.niost.org/HOST-Site
NRPA's Commit to Health Commit to Health is NRPA’s campaign to support the implementation and evaluation of the Healthy Eating Physical Activity (HEPA) standards in P&R sites across the country. P&R sites can join the national movement to improve access to healthy foods, increase opportunities for physical activity, and a connect kids to the natural environments. https://www.nrpa.org/our- work/partnerships/initiatives/commit-to-health/
NRPA's Safe Routes to Parks Building upon the national Safe Routes to School and GP RED's Safe Routes to Play initiatives, NRPA created a campaign around Safe Routes to Parks to implement environmental and policy strategies that create safe and equitable access to parks for all people. http://www.nrpa.org/Safe-Routes-To-Parks/
Partnership for Healthier America (PHA)
PHA brings together public, private and nonprofit leaders to broker meaningful commitments and develop strategies to end childhood obesity. Most importantly, PHA ensures that commitments made are commitments kept by working with unbiased, third parties to monitor and publicly report on the progress partners are making to show everyone what can be achieved when working together. http://ahealthieramerica.org/about/about-the-partnership/
PHIT America PHIT America is a campaign dedicated to increasing physical activity and fitness to improve the health of all Americans. PHIT America was launched in January 2013 with the support of more than 100 companies and organizations. PHIT stands for Personal Health Investment Today. http://www.phitamerica.org/About.htm
Safe Routes to School The goal of this initiative is to advance safe walking and bicycling to and from schools, to improve the health and wellbeing of kids of all races, income levels and abilities and to foster the creation of healthy communities for everyone. http://www.saferoutespartnership.org/ and http://www.saferoutesinfo.org/
SPARK Since 1989 SPARK is dedicated to creating, implementing, and evaluating research-based programs that promote lifelong wellness. SPARK strives to improve the health of children, adolescents, and adults by disseminating evidence-based Physical Education, After School, Early Childhood, and Safe & Healthy Students programs to teachers and recreation leaders serving Pre-K through 12th grade students. - See more at: http://www.sparkpe.org/what-is- spark/#sthash.McdArJ69.dpuf
269

Together Counts Together Counts™ is a nationwide program inspiring active and healthy living. Together Counts was started by The Healthy Weight Commitment Foundation, a broad-based not-for- profit organization whose mission is to help reduce obesity, especially childhood obesity, by encouraging positive and permanent lifestyle changes among school-aged children and their families. http://www.togethercounts.com/about
Trust for America's Health Trust for America's Health (TFAH) is a non-profit, non-partisan organization dedicated to saving lives by protecting the health of every community and working to make disease prevention a national priority. TFAH believes that preventing disease and stopping epidemics everyday requires a strong, effective, and responsive public health system. http://healthyamericans.org/about/
270

Agency
ArlingtonHeights PD, IL
Bloomington,IN
Broomfield,CO Fruita, CO
Greensboro,NC
HaltonHills, ON
Liberty,MO
Ontario,CAMinistry
PrinceGeorge'sCounty, MD
Raleigh,NC
San Diego County,CA
SouthBend, IN
Tacoma - Metro Parks, WA
WidefieldSD, CO
ACHIEVE YES Past PastACSM's Exercise is Medicine PastActive Living by Design PastActive Living Coalition YES PastActive Living Research YES YES PastAfter School Association's HEPA YES YES YESAlliance for a Healthier Generation YES YESCDC's Healthy Places Parks HIA Toolkit YES Past
Community Health Improvement Plans (CHIP) YES YES YES YES PastCommunity Health Needs Assessments (CHNA) YES YES YES YES YESComplete Streets YES Past YES YESEat Smart, Move More Past YESGP RED's Safe Routes to Play YES YES Past
GP RED's Surveillance and Management Toolkit (SMT) YES YES YESHarvard's Food & Fun Afterschool ProgramsHealthy Kids Concepts YESHealthy Parks Healthy People YES PastKaBOOM!'s Playability YES YES Past YES PastLet's Move YES YES YES Past YES YESLive Well YES Past YESMedia Smart YouthNFL Play 60 YES Past PastNIOST's Healthy Out of School Time YESNRPA's Commit to Health YES YES YESNRPA's Safe Routes to Parks YES YES YES YESPartnership for Healthier AmericaPHIT AmericaSafe Routes to School YES YES Past YES YES YES Past YES YESSPARK YES Past YES PastTogether Counts PastTrust for America's HealthOther YES YES YES YES
Appendix A: Penbrooke Study - National Intitiatives and Agencies Active with them (N = 15 Agencies Responding)
271

Appendix B - Invitation to Participate
Penbrooke Delphi Study and Case Study Overview Positioning local parks and recreation agencies as preventive public health providers Sent by email to identified potential agency participants Dear Agency Representative- Key Informant,
Attached is an updated overview version of an invitation to participate in a Delphi Panel and/or Case Study that is part of my dissertation research. Please let me know if you are willing to participate as a “key informant” in this study, I’m recruiting additional communities (up to 18). Your participation is completely voluntary. You will not receive compensation for participating in this study. This study is not designed to evaluate validity or measure benefits of outcomes from your work on these factors, but focused to assess and detail the current processes, tools, time allocation, and methods your agency is using to identify and address the key factors.
Participation in this Delphi Study will consist of: 1. Review of provided literature summary related to health factors that may be modifiable by
local P&R agencies for middle school youth, and your related materials (approx.. 1-3 hours)2. Participation in a group web-based conference call (Oct) to explain the project and answer
questions (1.5 hours)3. Answer an online questionnaire regarding data that is available to you, factors you are
addressing, outcomes you are measuring, and process for prioritization (Oct) – (1 hour)4. Participate in a web-based conference call focus group for review of summary analysis of
the collected questionnaires and info from all Key Informants (Nov) – (1.5 hours)5. Answer a second online questionnaire to help prioritize results for feasibility of process for
local P&R agencies (Nov) – (1 hour)6. Participate in a third email-based review of results and provide feedback and any other
suggestions (Dec). – (approx. 2-3 hours), including evaluation of this study.7. You will receive copies of all results and full dissertation when ready.
Total time commitment for Delphi Study = about 10 – 12 hours over approximately four months.
Case Study: Two agencies will be selected for a more detailed Case Study analysis (in addition to participating in the Delphi Study) that will include additional collection of detail on agency process data, along with semi-structured individual interviews and an additional focus group including up to five additional agency representatives and stakeholders for your agency. If you are selected for potential Case Study involvement, you and these stakeholders will be also be asked to consent to these additional activities. Total time commitment for Case Studies = approximately 20 hours over five months.
272

Please confirm your desire to participate by email, and let me know if you have any questions or suggestions. I will be in touch to move forward.
Thank you,
Teresa Penbrooke, MAOM, CPRE Direct (mobile): 303-870-3884 Email: [email protected] PhD Candidate and Research Assistant North Carolina State University – Department of Parks, Recreation, and Tourism Management http://cnr.ncsu.edu/prtm
273

APPENDIX C - North Carolina State University INFORMED CONSENT FORM for RESEARCH
Delphi and Case Study - Positioning local parks and recreation agencies as preventive public health providers What are some general things you should know about research studies?You are being asked to take part in a research study. Your participation in this study is voluntary. You have the right to be a part of this study, to choose not to participate or to stop participating at any time without penalty. The purpose of research studies is to gain a better understanding of a certain topic or issue. You are not guaranteed any personal benefits from being in a study. Research studies also may pose risks to those that participate. In this consent form you will find specific details about the research in which you are being asked toparticipate. If you do not understand something in this form it is your right to ask the researcher for clarificationor more information. A copy of this consent form will be provided to you. If at any time you have questions about your participation, do not hesitate to contact the researcher(s) namedabove.
What is the purpose of this study?The purpose of this study is to investigate the systematic processes used by local government parks and recreation agencies that may be related to addressing and positioning their agency as public health providers for key health factors such as nutrition, physical activity, transportation, perception of safety, parental and social engagement, and others, along with any outcomes identified and measured.
What will happen if you take part in the study?If you agree to participate in this study, you will be asked to review a summary of literature provided on this topic, and then participate in two online questionnaires, and one to two semi-structured interviews and/or focus groups lasting approximately 30-60 minutes each. Questions will be developed related to the process and methods your agency uses to address the health factors, along with time spent by you and other employees, tools, and outcomes that have been evaluated. Case Study participants will provide additional agency- specific materials and participate in more detailed review of findings and focus groups.
RisksThere are minimal risks or discomforts of the procedures to be used in the study.
BenefitsThe primary benefit is increased knowledge of potential process improvements and benefits of positioning P&R agencies as public health providers. All participants will receive copies of all results, analysis, and potential managerial implications they can use for individual knowledge increase and/or process improvements for the public good.
ConfidentialityThe information in the study records will be kept confidential to the extent necessary and allowed by law. Data will be stored securely in a password protected computer file. Participant names may be listed in the study as a participant, but most personal statements and contributions will be summarized. Individual quotes may be used if they add value to the results. Participants are representatives of public agencies and all emails and records may be open to public “sunshine laws. Confidentiality can’t be guaranteed for focus group or case study participants, and it is understood that info shared in the focus group may be shared outside the group for professional use.
274

CompensationYou will not receive anything for participating except for a summary of the analysis and findings.
What if you have questions about this study?If you have questions at any time about the study or the procedures, you may contact the researcher, Teresa L. Penbrooke, at Box 8004, 3033A Biltmore Hall, North Carolina State University, Raleigh 27695, or (303) 870-3884 or email [email protected].
What if you have questions about your rights as a research participant?If you feel you have not been treated according to the descriptions in this form, or your rights as a participant in
research have been violated during the course of this project, you may contact Deb Paxton, Regulatory Compliance Administrator, Box 7514, NCSU Campus (919/515-4514).
Consent To Participate“I have read and understand the above information. I have received a copy of this form. I agree to participate in this study with the understanding that I may choose not to participate or to stop participating at any time without penalty or loss of benefits to which I am otherwise entitled.”
Subject's signature Date Investigator's signature Date 9/19/2016
275

APPENDIX D - FOCUS GROUP PROTOCOL
Positioning local parks and recreation agencies as preventive public health providers
Teresa L. Penbrooke, CPRP, MAOM, PhD Candidate, NSCU
Focus Groups Protocol
For this Study, three focus groups will be conducted for the Delphi Study and Case
Study participants (one to introduce the research and process and collect initial thoughts on
the topic, and one to validate and discuss the initial findings of the questionnaire, and one to
review and discuss the findings after questionnaire #2). In addition, for the Case Study, one
additional focus group for each of the Case Study agencies will be held to involve additional
agency representative and key stakeholders for additional deepening and suggestions for that
specific agency) for a total of five recorded and transcribed focus groups.
The two Case Study representatives will participate in the first two Delphi Study
focus groups simultaneously for efficiency and knowledge transfer among participants, but
data from the other tools (the online questionnaires and case study data process collection
tools identification and the final three focus groups) will be kept separate for analysis
between the two study groups. All focus groups and interviews will be conducted using an
online approach through group video conferencing and recording using
www.anymeeting.com and recorded for verbatim transcription.
276

Scripts for Each Focus Group
Focus Group # 1 – Introduction to Study and Health Factors
(includes Delphi Study Participants, including the two Case Study Informants)
This will using a simple semi-structured question formation combined with a grounded
theory inductive approach to identify summary themes. The focus group will be prepared for
and facilitated by a trained researcher. The script will include
Introduction to the research. Participants, and research questions
Introduction and brief summary of the background and literature on the Key
modifiable Health Factors as provided in the literature (nutrition, physical activity,
transportation, social and parental engagement, and perception of safety.
SWOT (Strengths, Weaknesses, Opportunities, & Threats) questions will be asked
related to participants’ involvements and process for addressing these health factors at
a local government P&R level.
Q. 1 – What are the strengths you see in how your agency addresses these healthfactors?
Q.2 - What are the primary weaknesses or external challenges (threats) your agency
faces in trying to address these health factors?
Q.3. What are the opportunities you see for your agency in going forward?
Q.4. What types of process and/or systematic planning tools is your agency using to
address these factors?
Q.5. – What types of positive outcomes is your agency achieving in this area ofwork?
277

Focus Group #2 – Delphi and Case Study Participants – Prioritization of Factors
Review of results from the completed online questionnaire #1.
Facilitated discussion and deepening questions related to the findings thus far
Q.1. – Do the summary results presented ring true for your agency?
Q.2 . Based on the responses, are there any additional factors you are
addressing?
Q.3. – Based on the responses, are there any additional processes you are
using to evaluate and measure?
Q.4. – Based on the responses, are there any additional outcomes to share?Introduction to Questionnaire #2 – Prioritization of factors & processes for feasibility.
Focus Group #3 – Validation of Results and Feedback on Prioritization and
Implementation
(For the Delphi Study and Case Study Informants)– Agenda and Script:
o Review of the results of Questionnaire #2 on Prioritization
o Facilitated discussion on any identified additional process ramifications for
agencies and feasibility of process for best potential implementation.
Q.1. – What is your feedback on the results of Questionnaire #2?
Any other considerations you would like to share at this time?
278

Focus Groups #4 and #5 (for the two separate case study agencies and key stakeholders)
For the Case Study, an additional separate Focus Group each (#4 and #5) will
expand participation to additional staff and stakeholders working around the topic
for their agencies. Each of the two Case Study agencies will be asked to invite up to
5 key stakeholders to discuss process effectiveness, potential improvements, and
feasibility of implementation and outcomes.
The agenda and script will be:
o An introduction to the study and findings from Questionnaire #2 overall
o An introduction to findings specific to their agency case.
o Deepening questions for each of those two agencies.
Q.1 – How can the process and outcomes for these factors beimproved?
Q.2 – How does the agency’s process affect the partnerrelationships?
Q.3 – What are barriers to evaluation and outcomes for your specific
agency?
279

Appendix E. Delphi Panel Descriptions
This appendix includes a full description of each agency, with the exception of the
two case study agencies, Prince George’s County, MD, and San Diego County, CA, which
are more fully described in following the Case Study sections in Chapter 4. It is important to
note that with the data collected and interest of the informants, each of these Delphi agencies
could have been its own informative case study. However, key summary findings relative to
this study have been aggregated except for the two case study agencies. All agencies were
offered the opportunity to review this information for validity prior to final submittal. This
summary descriptive section focuses on agency overview, demographics, indications of note,
and relevant information from the resource documents provided. Information obtained from
the questionnaires and additional results for the case study agencies are in included in later
sections on those topics.
Arlington Heights Park District, IL – Key Informant: Brian Meyer
This 16.2-square mile Parks and Recreation District is located in northern Cook
County and southern Lake County, IL, 27 miles northwest of downtown Chicago. The
District serves most of Arlington Heights and small portions of Palatine, Mt. Prospect,
Prospect Heights, Rolling Meadows, and Lake County. Arlington Heights population was 72,
287 in 2015. Median age is 44 (higher than the U.S. average of 35) and household median
house household income is over $77,000 per year, significantly higher that the U.S. average
of $51,939. It’s the third largest suburb in Cook County, the eighth largest suburb in the
Chicago Metropolitan area, and the twelfth largest community in the State of Illinois. The
white population is majority but trending slightly downward from 88.5% to a predicted 86%
in 2020. Brian Meyer, Director of Recreation, was the Key Informant for this project.
280
Arlington Heights began to specifically address the health factors when the informant,
Brian Meyer, attended a conference session on healthy communities through P&R at an
NRPA conference, I taught in 2013. After working to obtain funding and partnerships to
move forward, the APHD contracted with GP RED to become a beta site for a two year
project (2015-2016) to utilize the Surveillance and Management Toolkit (GP RED - SMT,
2016). This project was in alignment with the 2014 Arlington Height Park District
Comprehensive Plan, which included a variety of goals and tasks related to this work. The
following goals and objectives are directly tied to this project:
Goal 2.2: Provide quality recreational programs and services which meet the
needs of all age groups, and promote a healthy lifestyle in the community.
Specific Tasks from the Comprehensive Plan Goal 2.2:
o Coordinate with all community partners to implement the agreement with
GP RED Healthy Communities Research Group (HCRG) SMT Project.
o Offer five new health and wellness programs yearly for youth ages 6-12.
Since that inception, the District compiled a coalition of nine community agencies
(e.g. hospitals, schools, the Village of Arlington Heights, etc.) to create the Arlington Heights
Health Action Alliance. The toolkit included many of the other methods identified and
described elsewhere in this research, including a component-based inventory and level of
service analysis, system-wide program analysis, creation of a youth focus group, a Youth
Activities and Nutrition Survey (YANS), and use of a multi-attribute utilities technique
(MAUT - facilitated by Dr. David Compton) to determine priority factors for AHPD (see
Figure 13).
281

Figure 1. Key Modifiable Factors by P&R in Arlington Heights, IL, 2015
As can be noted from the figure, in Arlington Heights, the key stakeholder
participants in the MAUT determined that the highest ranking priority for addressing by
AHPD would be nutrition, just slightly ahead of PA. This tool was put in context with the
other methods used to create a overall action plan for the next year that was then
implemented. To date, AHPD reports that the following outcomes have been achieved:
1. Strong increased partnerships for Arlington Heights Health Action Alliance
(AHHAA).
2. Helped to “create a buzz” among the partners including brand identity and tag line.
3. A complete component-based digital inventory and level of service analysis was
completed for all facilities, parks, trails, and programs.
4. The Youth Focus Group & YANS gave youth a voice and compiled youth
information.
5. Relevant trends, demographics, financial, and key management aspects were
compiled.
6. Various Program & participation enhancements were achieved:
0.260.23
0.15
0.24
0.12
0%
5%
10%
15%
20%
25%
30%
Nutritionregimen
Socialinteraction
Transportationservices
Physicalactivity
Safety
MAUT Results: Key Modifiable Factors by P&R in Arlington Heights, IL, 2015
282

a. AHPD developed sponsorships with Northwest Community Healthcare.
b. A Fit Kids series of classes was started, geared toward kids between the ages of 4-
12.
c. Incorporated healthy snacks into preschool program.
d. The AHPD incorporated pickle ball lines into the gym at Pioneer Park for all
ages.
e. The Youth Nutrition program was offered to approximately 900 students.
f. The APHD aligned with schools for bussing & additional locations.
In addition, in late 2016, AHPD worked with the GP RED HCRG and Design
Concepts to update their component-based inventory and level of service to include active
energy expenditures per component based on the recent work by Layton (2016), and Floyd,
Suau, Layton, Maddock, and Bistura-Meszaros (2015) on creating the evidence base and
methods for this new type of analysis. AHPD is the second agency in the country (Golden,
CO, another informant agency, was the first) to address this type of analysis. Publications of
the AHPD work are forthcoming.
The resources provided for this research in Basecamp included the AHPD HCRG
SMT Year One Report, 2015; AHPD YANS Report, 2015; and the AHPD Year Two Logic
Model. The agency recently had funding discontinued for this work, and while there is a
desire, there are not current resources allocated to ongoing evaluation or tracking of future
outcomes in this arena.
Bloomington, IN Parks and Recreation Department
Bloomington is a mid-size community in south central, Indiana, with a population of
80,405 (approximately 83% white), with a median income of $50,054. The City is home to
283

Indiana University – Bloomington (IU). Allison Miller, Wellness Coordinator, was the Key
Informant for this project.
The P&R department (BLPRD) has a long history of collaboration IU and the Eppley
Institute. In recent years, IU moved its P&R departmental function under the School of
Health, and these agencies have been actively working together. In relation to paying
attention to modifiable health factors, Bloomington was the initial Alpha Site for IU’s
Healthy Communities Surveillance and Management Toolkit (SMT), under the direction of
Dr. David M. Compton. (Compton et al. 2010). Bloomington participates in the CDC’s
ACHIEVE program through a grant funded application. (Bloomington-Monroe ACHIEVE,
2016) and CHANGE, a community assessment tool developed by the CDC's Healthy
Communities Program work. Bloomington / Monroe County was selected as an ACHIEVE
Community because of its rich collaborations and strong leadership conducted an annual
health and wellness assessment of the County community for three years in response to grant
requirements, and was designed to identify community assets and potential areas for
improvement in the area of health and wellness.
In addition to BLPRD, there are a variety of community organizations involved in
ACHIEVE, including Indiana State Department of Health, hospitals, Indiana University,
schools, Monroe County YMCA, and the local Active Living Coalition. Annual Community
Goals and Objectives of this work include focus on nutrition & PA:
Collaboration with restaurants, health centers, fitness centers, and other community
organizations and businesses to promote the benefits of the trails to the community.
Addition of signage and infrastructure to the trails to promote fitness and healthy
eating
284

Creation of an awareness campaign that showcases how the trail system connects and
the community and connects all the elements of a healthy, active lifestyle.
The agency provided resources in Basecamp primarily focused on using needs
assessments and system planning to address the health factors. The system master plan has
included component-based inventory and level of services analysis. Documents provided
include: BLPRD Community Survey Report Final; 2015 Bloomington Parks and Recreation
Annual Report; and Bloomington Parks Recreation Master Plan 2016 – 2020. Summary
reports or evaluation of specific outcomes were not readily available.
Broomfield, CO – Key Informant: Veronica Mueller
The City and County of Broomfield is a consolidated city and county just north of
Denver, CO, with a 2015 population of 55,889, which include 86% white population. Median
household income is $80,430. Recreation services are a separate department. Veronica
Mueller, Fitness Supervisor, was the Key Informant. While Fitness has long been a division
in Broomfield, specific agency-wide focus on these issues as health factors is relatively new.
The informant reported that the Broomfield Health initiative and coalition started in 2008 and
has been slowly progressing with a primary focus on coalition building and vending policies:
“So it’s definitely pulling down all the silos in our community as far as making sure
that we all know what our partners are doing, and what the community’s doing, and a
bigger picture just outside of parks and rec as far addressing every issue for a healthy
eating, active living initiative that we have. We had changed out all of the vending in
recreation, in our public vending, to the healthy options that were recommended
through a study through health and human services. So that was big step to change
out the vending in the building. It hasn’t been greatly received, but they’re going to
285

have to adjust because it’s all we have now. It’s healthy food in the vending machine,
so that’s very good.”
The agency is tracking pre and post sales outcomes from the vending change, but
results were not yet available. In addition to providing resources such as examples of the
vending policy and a nutritional campaign example, the Department recently created and
provided a copy of their Public Health Improvement Plan, Action Plan for Obesity
Prevention. This plan includes the following goals with more detailed objectives and action
plan tasks, include quantitative measurement goals, with a planned evaluation in 2018:
Goal 1: increase community outreach and public awareness related to obesity
prevention
Goal 2: improve nutrition and physical activity among the Broomfield
residents.
Goal 3: enhance worksite wellness programs in Broomfield.
Goal 4: enhance health and human service clients' knowledge and awareness
of wellness.
The agency also utilizes a system wide master plan and needs assessment completed
in 2005, but their inventory is park classifications-based rather than using a digital
component-based method. The informant indicated she is looking forward to future evidence-
based future planning with hopes that health goals will continue to be more integrated into
overall departmental goals.
Charleston County, SC – Key Informant: John Massey
Charleston County, SC P&R offerings are handled by special district established in
1968 called the Charleston County Park and Recreation Commission (CCPRC), which
286

overlays the County but is not funded or managed by the County. The District serves a large,
diverse population, numbering 350,209 in 2015, with 69% white and 29% black residents.
Overall median income for the County was $53,437, but there are pockets of very high and
very low income areas. The agency manages over 11,000 acres of parks and hundreds of
programs. This is a coastal county, with many beach access points, but also a focus on
programming across the County. John Massey, Assistant Director for Recreation Programs,
was the Key Informant.
Addressing equity is a key goal, and transportation to facilities and park spaces are an
issue, especially in rural and under-resourced areas of the County. The CCPRC has a full
system comprehensive master plan called “Parks for Tomorrow”, completed in 2012 and
available at https://ccprc.com/1207/Comprehensive-Plans, including a detailed needs
assessment and the use of component-based method for inventory and level of service
analysis. Specific analyses were created to address transportation and health.
Guiding principles were included that address these themes:
Parks and recreation opportunities are provided to promote healthy active
lifestyles and connect people to nature.
Provide park facilities within a 15-minute drive time or less to every resident
Core values were identified, including the following two related health factors:
Health & Wellness - Providing and promoting healthy lifestyle opportunities
Building a Legacy - Maintaining a vision for the future while sustaining a
healthy park system
As they have been noted as a larger agency reporting success in addressing the health
factors, this Informant was initially invited to be part of the case study. The informant
287
discontinued participation about half way through the project, but was offered an opportunity
to participate in each stage. Because an initial individual interview was initially conducted,
additional detailed results were identified relative to their methods for addressing the health
factors. As they added substantial deepening information to the thematic analysis, those
findings are summarized here.
A large focus of the programming for CCPRC has emerged to include alignment and
implementation of the national initiative ACSM Exercise is Medicine program. The Informant
indicated how this works:
“Well, for the Exercise is Medicine program, we start with when an individual
goes to physicians. We have a relationship with a physician liaison through the
network at the local hospital. They describe our program (CCPRC) as being a
location for Exercise is Medicine saying this is could be appropriate for
individuals that have chronic conditions like COPD, metabolic syndrome and
things like that. So yeah, physicians are welcome to recommend people in our
program if they think they’d be appropriate. When the recommendations come
in, the referral, we contact the client and basically say, ‘Let’s talk for a minute
about what your health and whether or not you might be appropriate for our
program’ ”.
The CCPRC has several staff who are specifically assigned to act as the liaisons for
incoming patients who have been referred, and to help direct them to appropriate P&R
programs and locations. They recommend participation goals and try to measure PA
outcomes, such as:
288

“We utilize an initial assessment. We put them into the program. They’ll then
start taking a class usually two times a week, one hour or class two times a
week. And then, three months after that, we’ll conduct that same assessment to
see whether or not they have improved on any of those measures, and then do
it like that every three months thereafter.”
The agency can access the online assessments when desired, however, the informant
indicated that currently they are primarily only evaluating participation numbers and
attendance. They would like to expand that evaluation process:
“We are attempting to establish an IT (information technology) component to
allow us to engage individuals to measure their involvement in our programs
across the session interactively, but that’s not coming online. We don’t have a
working program yet, but we’re working with a consultant trying to get one.”
Chicago Park District, IL – Key Informant: Colleen Lammel
Chicago Park District is a very large P&R district serving 2,695,598 residents in and
around the City of Chicago, IL. Colleen Lammel was the Key Informant. The geographic
area and demographics are diverse with a variety of income levels (median income overall
was $63,153), with race/ethnicity breakdown including 44% white, 32% black, 28%
Latino/Hispanic, and 13% other races. The District is guided by and operates from a strategic
plan that incorporates a variety of programmatic goals, including a primary core value of
“Children First”, with a strong focus on health and the benefits P&R provide to youth. The
following statement from the system-wide 2014 Chicago Park District Strategic Plan,
provided as a resource on Basecamp for this project and available online at:
289

http://www.chicagoparkdistrict.com/about-us/strategic-plan/, highlights the focus on efforts
related to addressing the identified health factors:
“Studies have proven that spending time outside makes children healthier, is
predictive of higher levels of physical activity, lowers levels of obesity, reduces
stress, and even improves a child’s ability to concentrate. The science confirms what
we already know: that our parks and programs make children’s lives better. These
benefits are real. We see it every day in the parks. We see it in the children that
participate in our programs. We find it in the adults that grew up going to the parks
and now bring their own children. But that’s not every child. And we need every
child in Chicago to play in the parks.” (p.10).
The primary goals through the plan and vision for the agency are around equity,
increased participation, and programming, including goals such as these to:
Expand early childhood fitness programs
Increase youth sports participation by 25 percent
The District has implemented a specific Wellness Department tasked with overseeing
the achievement of this vision and the goals. The system-wide planning efforts include
master planning and needs assessment with similar focus. The District has utilized park
classifications/capacity based inventory and LOS methods, not component-based methods. In
the focus groups, the informant indicated that the biggest recent area of focus, strengths, and
challenges have been around the creation and implementation of vending and food
purchasing policies. Policies were enacted, and then revenues fell substantially. Policies were
updated, and additional language enacted specifically around beverages. Policies around
concessions were changed. Staff from the Wellness Department are tasked with overseeing
290

and managing the adherence and revisions of the policies. The informant specifically noted
challenges around implementation:
“We changed our whole purchasing policy. Everything has to go through the Wellness
Department approval system. We just have to stamp and sign them, but with 256 staffed
parks, and 580 total parks, it deals with too much manpower.”
The informant provided full copies of the Strategic Plans and the Vending Policy to
share for this research on Basecamp.
Fruita, CO – Key Informant: Ture Nycum
On the opposite end of the agency spectrum from Chicago, Fruita is a small town in
western Colorado, along I-70 bordering of Utah. Ture Nycum, Director of Parks and
Recreation, was the Key Informant. Population of Fruita was 12,646 in 2015. The
demographic racial background is 90% white. While the agency is small and resources very
limited, the drive and energy of staff to address the themes related to the health factors is
high. With just a few full-time staff they have built and operate the Fruita Community Center
– a 55,000 sq. ft. facility complete with indoor and outdoor swimming pools, gymnasium,
fitness area, senior center, meeting rooms and the Fruita Branch of Mesa County Public
Library. They coordinate many youth to senior programs to actively engage participants. In
addition, they host and permit over 40 community events and festivals, including Mike the
Headless Chicken Festival, Thursday Night Concerts, Sweetheart Run and Health Expo, and
more.
The agency does have a system-wide master plan, primarily focused on parks, open
space, and trails, with a park classification system inventory. The agency did conduct a needs
assessment when planning for their new community center (included in the resources on
291
Basecamp) and expressed interest in participating in the study to reflect the challenges that
remain for very small communities. There are not any current plans in place for specifically
addressing the health factors, but the mission for the agency includes the statement that they
want to “enhance the quality of lives for residents and visitors on social, mental, and physical
levels. The agency has been active with Safe Routes to School grants and a CO chapter of
LiveWell, but time and limited staffing preclude much ability to align with other national
initiatives. The informant stated during Focus groups that much of this information was new,
and he wasn’t exactly sure how to address these factors, but the motivation is there. He
stated,
“We’re a smaller community. We’re not like Chicago or other communities like that.
We probably think of it more in terms of hands on approach, where we offer the
programs and we do staff community programs. We support environmental well-
being and access to care, so we’re trying provide some of that information. We may
want to access more funding, so we can then provide some more programs…
Community policies, decisions and discussions like you are talking about, we haven’t
really been able to put on to paper.”
Golden, CO – Key Informant: Rod Tarullo
The City of Golden, CO is a small town located west of Denver, nestled up against
the foothills of the Rockies. Golden Parks and Recreation Department oversees 565 acres of
parks and open space over 25 different sites, and 24 miles of trails, in addition to a broad
variety of recreation programs and numerous facilities. The Key Informant for this project
was Rod Tarullo, Director of Parks and Recreation. Total population in 2015 was 18,867,
with racial demographics of 90% white. Median income per household was $53,896.
292

While the agency is smaller, the leadership has been focused on pursuing strong
national recognitions and alignment with national initiatives. The agency is both CAPRA
certified and a Gold Medal Award winner. They clearly recognize the need to align with
addressing the health factors. Rather than simply update their previous capacity-style level of
service analysis, when addressing their 2016 Golden Parks and Recreation Master Plan
Update, they took an enhanced approach. In an effort to begin to equate parks and park
access to physical activity active energy expenditures and public health. Working with
GreenPlay and Design Concepts, Golden undertook detailed analysis that combined the
component-based methodology with the latest research in performance metrics and public
health indicators. This methodology and analysis built upon an exploratory study conducted
in Cary, North Carolina by Layton (2016) and Floyd et al. (2015). In addition, the master
plan called out health as a key focus area throughout. In terms of strengths of this approach,
the Informant stated,
“One of the pieces that’s pretty important to us is to try to add the health element. Often,
we’ve seen in regards to levels of service that a lot of citizens give input, and the things
that go into parks are primarily based on popularity. We’re really trying to connect the
dots to be able to show the health value that’s related to different amenities and
components and their location within our system.”
Greensboro, NC – Key Informant: Michelle Gill-Moffat
Greensboro is the third largest city in North Carolina, located in the central region of
the state. Population in 2015 was 269,666, and racial demographics include a diverse
community of the majority of 48% white and 40% black. Median household income is below
the national average at $41,518. The Key Informant for this research was Michelle Gill-
293
Moffat, Youth Development Director, who indicated interest after agency leadership
identified that they City is interested in trying to actively address the health factors through
P&R. While many program are offered in other areas by the Department of P&R, initial
focus has been primarily on addressing nutrition. As explained by the Informant:
“A couple of years ago Greensboro was identified as one of the top food deserts in the
country, and so a lot of effort from our department, as well as the City and the
County, has been put into how can we help fix this. One of things that we have put
some effort into internally is creating a community food taskforce, which one of our
staff members oversees. That helps bring together people that are interested in ending
that stigma of being a food desert and helping with food insecurities. They oversee
them, they bring together community partners. One of things that we do with that is
we offer food through one of our community partners at our afterschool programs
through one of the nonprofits. One of our youth councils this summer held a service
learning program that focused on learning about food deserts and insecurities. We
spend a fair amount of time talking with our youth in our programs about what it
means to not know where you next meal is coming from.”
Additional efforts are focused on transportation planning to get participants to
programs, and also to help get transportation to and from food sources. The agency does not
yet have a system wide master plan, full needs assessment, or digital inventory and level of
service analysis, but they are planned to be completed in the near future. Resources provided
on Basecamp included a Greensboro P&R Fighting Hunger Article, Fresh Food Access Plan,
Community Garden Plan, Prescriptions for Play, and a sample Renaissance Food Coop Flyer.
294
Halton Hills, Ontario, Canada – Key Informant: Margaret Taylor
Halton Hills was suggested for inclusion by other Delphi Panel informants as an
agency in Canada that is strategically addressing health factors through parks and recreation.
Population in 2015 was 56,809. The median household income (after-taxes) in Halton Hills is
$80,266, a lot higher than the national average at $54,089. The population is 94% white. The
Key Informant for this project was Margaret Taylor, Recreation Coordinator, hired
specifically to address process, partnerships, community engagement, development of key
goals and actions, along with evaluation, for a variety of program areas, including health
factors.
Halton Hills has written and adopted an Active Living Strategy intended to “support,
engage, and foster an active, healthy Town of Halton Hills community, where the healthy
choices are the easy choices at work, home and play”. The Active Living Strategy outlines
actions aimed at promoting a healthier community through physical activity over the next
five-years, considering the unique demographics and features of Halton Hills. The Active
Living Strategy was a collaborative effort based on principles of Active Living by Design
(www.activelivingbydesign.org) and guided by a committee comprised of Town of Halton
Hills staff, representatives from community-based organizations with expertise from varying
backgrounds, Council representation and community members at large. The resource
provided in Basecamp was the Active Living Strategy.
Liberty, MO – Key Informant: Janet Bartnik
Liberty is a small to mid-size community north of Kansas City in Missouri.
Population was 29,149 in 2015, with 91% being white. Median income per household was
295

$65,106. The Key Informant for this research was Janet Bartnik, Director of Parks and
Recreation.
Liberty began addressing the health factors with a strong focus through P&R when
they became a Beta Site for the GP RED Healthy Communities Research Group (HCRG)
Surveillance and Management Toolkit (SMT) in 2013 as part of a three year project. All
background documents and reports for the project are available at
http://www.gpred.org/initiatives/healthy-communities-research-group/. A summarized case
study research brief of this work is available at http://www.gpred.org/wp-
content/uploads/2017/01/GP-RED10-Collaborative-Initiatives-January-2017.pdf.
Janet led in creating a community coalition with the Clay County Public Health
Department, hospitals, schools, and various other partners, called the L-CHAT. A community
needs assessment, component-based inventory and level of service analysis, and
financial/programmatic assessments were completed. Data gathering included using the
multi-attributed utilities technique (MAUT for identifying consensus on priority of health
factors to address. See Figure 14. For Liberty, the key stakeholders within P&R identified
that PA was the most important factor to address, but interestingly, when community partners
were added, it was nutrition. Additionally, graphic analysis was conducted for transportation
and proximity, barriers analysis, walkability, and comparisons of program vs. assets
availability.
296

Figure 2. Liberty, MO MAUT priorities, both within P&R (LPRD) and with partners (LCOM)
A Youth Activities and Nutrition Survey (YANS) was pilot tested and used with
schools to measure youth self-report of youth activities and information around the health
factors. Goals were set for each year’s action plan using a logic model format. Summary
outcomes measured and achieved included:
• Increased partnerships with County Health, Schools, and Hospitals.
• Stakeholder identification and new programs.
• Full assets and program location inventory, with focus on connectivity.
• Helped create new HCRG Youth and Nutrition Survey (YANS) (created with East
Carolina University)
• Hired a full-time Fitness and Wellness Coordinator
While Liberty does not yet have a full system-wide master plan, this work provided
needs assessment, policy applications, logic models, program planning templates, and other
tools for system planning. Resources provided on Basecamp include all of the reports, along
with a copy of the vending policy.
Nutritionregimen
Socialinteraction
Transportation services
Physicalactivity Safety
LPRD 23.9% 17.6% 17.7% 26.4% 14.4%LCOM 26.9% 22.4% 17.8% 19.9% 13.0%
10.0%15.0%20.0%25.0%30.0%
297

Ontario, Canada – Ministry of Health Promotion, Sport, and Tourism – Key Informant:
Carol Ointment.
While different from the other Delphi Study key informants, this provincial agency
was included due to evidence of strong early implementation of process, methods,
community engagement, partnerships and evaluation across sectors, including recognizing
the importance of parks, recreation, and trails across the province. Population in the province
in 2011 was 12,651,795. The majority of the population is are of English or other European
descent with 25.9 percent of the population consisted of visible minorities (defined by the
Canadian government as "persons, other than aboriginal peoples, who are non-Caucasian in
race or non-white in colour) and 2.4% are aboriginals (Statistics Canada, 2016).
The Ministry focuses on land-use planning. Key informant Carol Oitment is involved
with inter-ministerial government committees in relation to legislation pieces. This position
provides an opportunity to influence the inclusion of active transportation, trails and green
spaces.
In 1992, an Ontario Healthy Communities Coalition (OHCC) was established in 1992
to support local and regional groups, coalitions and networks that are working on healthy
community initiatives in Ontario. Their mission was to work with diverse communities of
Ontario to strengthen their social, environmental and economic well-being by working in
partnership with community organizations and individuals on projects related to developing
healthy communities. The initial project consisted of eight components:
1) Literature Review
2) Environmental Scan
3) Indicators of Promising Practices and Case Studies
298

4) 15-20 Community Workshops
5) 5 Regional Forums
6) Publication
7) Project Evaluation
8) Follow-up Support
That work continues through support from over 40 collaborating organizations (Carol
Oitment is one representative). The outcomes have primarily identified that it is NOT the
responsibility of ONE organization’s specific mandate, but that this work on health factors is
an area that organizations work on together to achieve their overall mandate.
The Ministry continues in engaging in a strategic planning process working with
many other agencies. This includes engaging in discussion with key stakeholders on the next
phases and the role for environmental supports and policy within this program. The built
environment, nutrition, and promotion of physical activity continues to be important
components in Ontario’s Action plan for Healthy Eating and Active Living (Ontario HEAL,
2006). As the Informant indicated in a Delphi group discussion,
“I think our greatest strength has been that collaboration that I hear over and over. We
had a real bonus moment when our sport and recreation unit within the ministry was
with the Ministry of Health Promotions for a period of time. We’re now back with
Tourism and Culture, but that was a real boon to us when we were with the health
community. They’ve really raised our profile and they have become much more active
during research since. Their ‘a-ha moment’ working with us was to see all the benefits
that could be gained by working with parks and recreation. I don’t think that’s been
well appreciated, and it certainly has been changing over the last many years.”
299

Resources provided for this work on Basecamp include Ontario’s Plan for Healthy
Eating, Active Living, 2006; OHCC - Healthy Communities and the Built Environment,
2008; Ontario Children's Outdoor Charter; Healthy Nutritional Environments in Recreation
Facilities; and an overview of Kingston, ON ActivPass program.
Raleigh, NC – Key Informant: Chris Frelke
Raleigh is the capital of North Carolina, with a population of 451,066 in 2015. The
racial make-up is diverse, with 57% white, 29% black, and 11% Latino. Median household
income was $54,581. P&R functions are managed by the Department of Parks, Recreation,
and Cultural Resources. Chris Frelke, Assistant Superintendent, participated as the Key
Informant.
Raleigh’s P&R are guided by a System Plan, created in 2013 in alignment with the
City’s comprehensive plan, available at
https://www.raleighnc.gov/parks/content/PRecDesignDevelop/
Articles/2012PRSystemPlan.html. The vision stated at the beginning of the plan includes that
it is, “a system that addresses the needs of all and fosters a community of creativity,
engagement, healthy lifestyles, and welcoming neighborhoods. A full needs assessment and
modified component-based inventory and level of service analysis was conducted. Relative
to the health factors, sub-systems are identified, with the category of Programs and Services
having the following relevant stated goals:
Goal 1: The City of Raleigh will provide opportunities for every resident to maintain
a healthy lifestyle.
Goal 2: The City of Raleigh will improve outreach and foster a welcoming multi-
cultural environment.
300

Goal 3: The City of Raleigh will identify and eliminate barriers to participation in
parks, recreation and cultural programs for preschool, youth and teens of all
abilities throughout the city.
Goal 4: The City of Raleigh will provide inclusive and independent spaces, facilities
and programs that are accessible to all residents regardless of ability and age.
The informant indicated that the Department regularly utilizes health impact
assessment processes for site-specific planning projects, and has implemented policies
around healthy living, including a vending policy, a program inventory template that
identifies health impact goals of programs, and guidelines for food within programs.
However, challenges remain in trying to identify appropriate standards and measuring
outcomes, and there is much work to be done. Examples of each of these resources were
uploaded into Basecamp.
South Bend, IN – Key Informant: Aaron Perri
South Bend is a city in northern central Indiana, about 1.5 hours east of Chicago.
Population in 2015 was 101,168. The City has some diversity, with 60% white, 26% black,
and 12% Latino populations. Median income is lower than the national average at $34,656,
and the City has pockets of neighborhoods with very low incomes. The Key Informant for
South Bend was Aaron Perri, Executive Director of South Bend Parks and Recreation
Department (SBPRD). Perri was new in this position with the Department (coming from the
Department of Economic Development in the City when the previous Executive Director
retired). This agency however has been strongly focused on addressing health factors through
P&R since the prior Director began work as the second Beta Site for GP RED’s HCRG SMT
project.
301
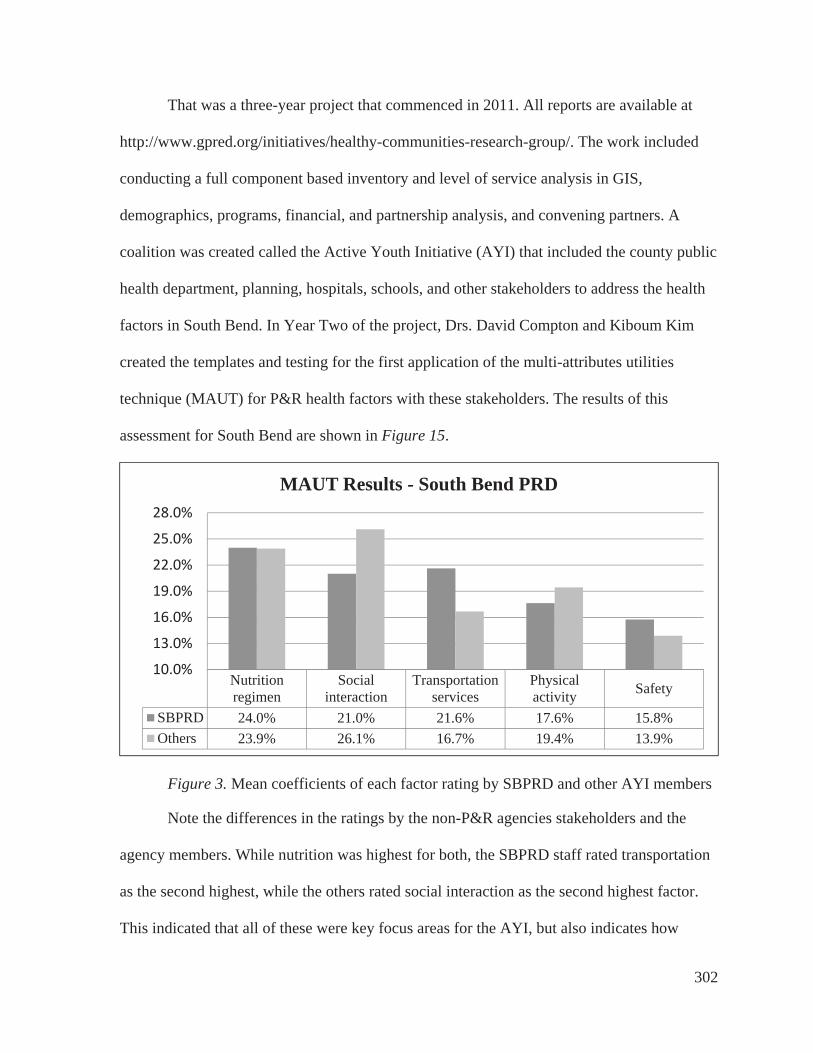
That was a three-year project that commenced in 2011. All reports are available at
http://www.gpred.org/initiatives/healthy-communities-research-group/. The work included
conducting a full component based inventory and level of service analysis in GIS,
demographics, programs, financial, and partnership analysis, and convening partners. A
coalition was created called the Active Youth Initiative (AYI) that included the county public
health department, planning, hospitals, schools, and other stakeholders to address the health
factors in South Bend. In Year Two of the project, Drs. David Compton and Kiboum Kim
created the templates and testing for the first application of the multi-attributes utilities
technique (MAUT) for P&R health factors with these stakeholders. The results of this
assessment for South Bend are shown in Figure 15.
Figure 3. Mean coefficients of each factor rating by SBPRD and other AYI members
Note the differences in the ratings by the non-P&R agencies stakeholders and the
agency members. While nutrition was highest for both, the SBPRD staff rated transportation
as the second highest, while the others rated social interaction as the second highest factor.
This indicated that all of these were key focus areas for the AYI, but also indicates how
Nutritionregimen
Socialinteraction
Transportationservices
Physicalactivity Safety
SBPRD 24.0% 21.0% 21.6% 17.6% 15.8%Others 23.9% 26.1% 16.7% 19.4% 13.9%
10.0%
13.0%
16.0%
19.0%
22.0%
25.0%
28.0%
MAUT Results - South Bend PRD
302
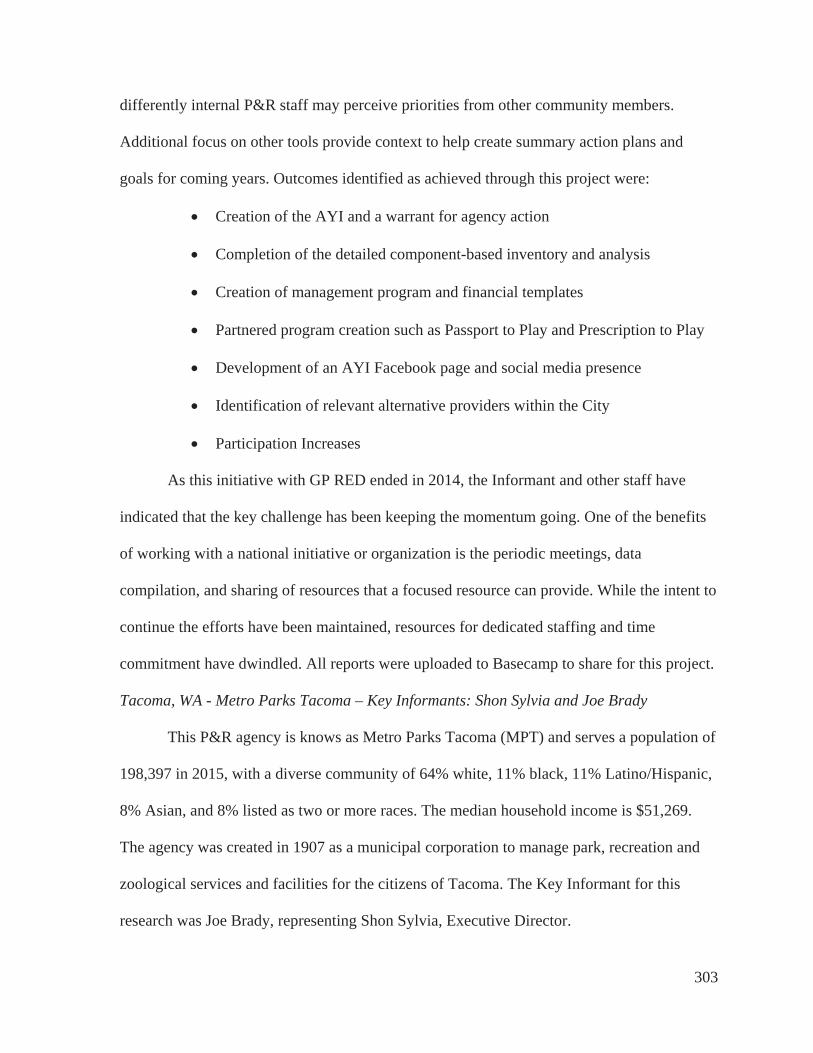
differently internal P&R staff may perceive priorities from other community members.
Additional focus on other tools provide context to help create summary action plans and
goals for coming years. Outcomes identified as achieved through this project were:
Creation of the AYI and a warrant for agency action
Completion of the detailed component-based inventory and analysis
Creation of management program and financial templates
Partnered program creation such as Passport to Play and Prescription to Play
Development of an AYI Facebook page and social media presence
Identification of relevant alternative providers within the City
Participation Increases
As this initiative with GP RED ended in 2014, the Informant and other staff have
indicated that the key challenge has been keeping the momentum going. One of the benefits
of working with a national initiative or organization is the periodic meetings, data
compilation, and sharing of resources that a focused resource can provide. While the intent to
continue the efforts have been maintained, resources for dedicated staffing and time
commitment have dwindled. All reports were uploaded to Basecamp to share for this project.
Tacoma, WA - Metro Parks Tacoma – Key Informants: Shon Sylvia and Joe Brady
This P&R agency is knows as Metro Parks Tacoma (MPT) and serves a population of
198,397 in 2015, with a diverse community of 64% white, 11% black, 11% Latino/Hispanic,
8% Asian, and 8% listed as two or more races. The median household income is $51,269.
The agency was created in 1907 as a municipal corporation to manage park, recreation and
zoological services and facilities for the citizens of Tacoma. The Key Informant for this
research was Joe Brady, representing Shon Sylvia, Executive Director.
303

Every six years, MPT establishes program priorities for future improvements of
services provided to the community through creation of a Mission-Led Comprehensive
Program Plan (MLCPP). There are three primary program areas, Active and Community
Wellness, Nature and Environment, and Culture and Heritage. Most relevant to this research
on the health factors is the focus for the Active and Community Wellness program areas.
This plan includes community-wide needs assessment, component-based inventory and LOS
analysis, an implementation plan, creation of a matrix related to identifying program tracking
measures, and “dashboards” for each geographic sub-area of the community, which is a
graphic summary with a map and charts to identify participation, program vs. unmet needs,
and a summary of needs and challenges. The matrix is an internal program management tool
focused primarily on identifying location (sub-area of city), delivery methods, participation,
audience, cancellation rates, and cost recovery expectations, along with types of evaluation
methods used. Figure 16 provides a summary of the “evaluation tactics” identified and
tracked.
Figure 4. Summary of evaluation tactics tracked by MPT (used with permission)
The agency also is guided by a Strategic Plan, which includes goals, objectives, and
performance measures. The first goal is most relevant for this research and includes:
Goal 1: Foster active lifestyles to support a healthy community.
Objectives
1.1 Provide infrastructure to encourage active living and community wellness.
Participant to Staff Ratio
Participant Retention Rate
Participant Satisfaction
Level
Marketing Effectiveness
Achievement of Outcomes
PART 6: EVALUATIONEvaluation Tactics Used
304

1.2 Embrace a holistic approach to community wellness.
1.3 Promote healthy lifestyles through diverse programming.
Performance Measures
P1.1 - % of respondents satisfied with the condition, quantity and distribution of
parks and facilities, and the quality and variety of programs supporting a healthy
lifestyle.
P1.2 - % of respondents using MPT parks and facilities, and agreeing that MPT
facilities and activities allow them or their family to enjoy a more active life.
Resources provided to Basecamp by MPT include these reports, along with other
sample policies and guidelines including: Final Metro Parks 2014 Trend Report; M PT
Strategic Action Plan 2013-2018; MLCPP Comprehensive Matrix; Metro Parks Tacoma
Survey Findings Report 2016; NE Final Dashboard; CH Final Dashboard.pdf; ALCW Final
Dashboard; 6.9.16 Mission Led Comprehensive Implementation Plan; Mission Led
Comprehensive Program Plan; MPT Health Food Options Policy. While this agency has
created innovative methods for evaluation and tracking, the Informant indicated that most of
that work is still focused on participation or self-reported satisfaction related elements.
Additional evidence-based standards around addressing specific health factors are desired.
Widefield School District, CO – Key Informant: Tamara Moore
Widefield Security is the largest unincorporated community located on the southern
end of Colorado Springs and north of the Town of Fountain in Colorado. It sits just below
Pikes Peak and near the foot of Cheyenne Mountain. Widefield Security is strategically
located off of I 25 and is approximately 80 miles south of the state capital of Denver.
Historically an agricultural area, it has become a bedroom community with 35 percent of the
305

District students having military families. Four military installations are located in the
Colorado Springs area. There are no malls or big businesses in the Widefield Security area,
and the largest employer is the School District.
There is no town hall or similar organizational structure to service the needs of the
community. The Board of Education functions to provide many services beyond education.
Widefield School District #3 (WSD3) has the distinction of being the only school district in
the state and one of few in the U.S. that owns and operates a P&R Department. This
department is called the Widefield Community Center. Population in 2015 was 51,281, The
white population is trending downward from 72.9 percent in 2010 to a predicted 69.2 percent
in 2020. Black population is 10.4%, and Hispanic/Latino is 18% and growing. Median
household income was $58,066 in 2015. The Key Informant for this agency was Tamara
Moore, Program Manager for P&R.
This agency was invited to participate in this research specifically to provide input
from a different type of small organization, and their perceptions relative to the health
factors, methods, and potential outcomes that could be measured by P&R. While the
agency’s resources have been very limited, Executive Director Ben Valdez, had attended
several healthy communities focused conference presentations and contacted me directly to
discuss new and best practices for incorporating health. An agency master plan was
completed in 2016, and included a full community-wide needs assessment, random
statistically-valid survey, health trends analysis, component-based inventory and level of
service analysis, identification of underserved populations, and results related to potential
funding mechanisms. Top focus areas identified relate to the health factors, including a need
306

for more social engagement opportunities (special events), space for PA (a new recreation
center), focus on youth, and a need for more standards for evaluation.
Currently this agency had no additional resources to provide to Basecamp beyond a
copy of their system wide P&R Master Plan, but the Informant enthusiastically participated
in focus groups and questionnaires. Her input and participation helped to deepen conclusions
relative to the challenges that smaller P&R organizations with limited resources face in
trying to address the health factors. Key statements when asked about agency strengths
included:
“Boy, I feel like we have more challenges than strengths. Our strengths are probably
just connected to the school district, because we’re owned and operated by them. We
can partner on things, whether that’s them running a program or us running a
program, or us supporting them financially…We’re more program-based and activity-
based. Those are our strengths.”
307

Appendix F - Delphi Presentation #1
Focus Group #1Positioning local parks and recreation agencies
as preventive public health providers for middle-school aged youth:
a Delphi study and case study approach
Teresa L. Penbrooke, PhD Candidate, CPRE Advisor: Michael B. Edwards, PhD
Committee: Jason Bocarro, PhD; Aaron Hipp, PhD; & Karla Henderson, PhD
October 11, 2016
Background and Purpose
Growing evidence that Parks & Recreation (P&R) agencies can help to improve Public Health (PH) through:• Increasing physical activity and reducing obesity• Providing psychological and physical benefits from nature• Facilitating social benefits from community gatherings and services• Addressing health equity issues among diverse populations
Burns, 2016; Godbey & Mowen, 2010; Kuo, 2013; Sallis, Floyd, Rodriquez, & Saelens, 2012; Slater, Ewing, Powell, Chaloupka, Johnston, & O’Malley, 2010; Young, Ross, Kim, & Sturts, 2013
308

Appendix F - Delphi Presentation #1
Background and Purpose
The global research question is shifting from one of asking IF P&R agencies can
positively affect PH factors, to HOW they can best do so with limited
resources and prioritization needs.
Background and Purpose
• Public Health (PH) interventions usually include identifying and systematicallyaddressing determinants at various social-ecological levels (Dunton et al, 2009;
Golden & Earp, 2008).
• PH field-specific research has been somewhat disparate in terms of the levelof needed interventions, the role of P&R in PH, and the role site-specificcharacteristics (Babey et al, 2013; Dunton et al, 2009; Golden & Earp, 2008; Sallis et al 2014).
• Many national health intervention programs and campaigns focus onindividual/interpersonal change. (CDC, 2016; Let’s Move, 2014).
• Community-specific youth data on various health factors are not readilyavailable to local P&R practitioners (Brenner et al, 2013; Compton et al, 2011; CDC-YRBSS,2014; Young, Ross, Kim, & Sturts, 2013).
309
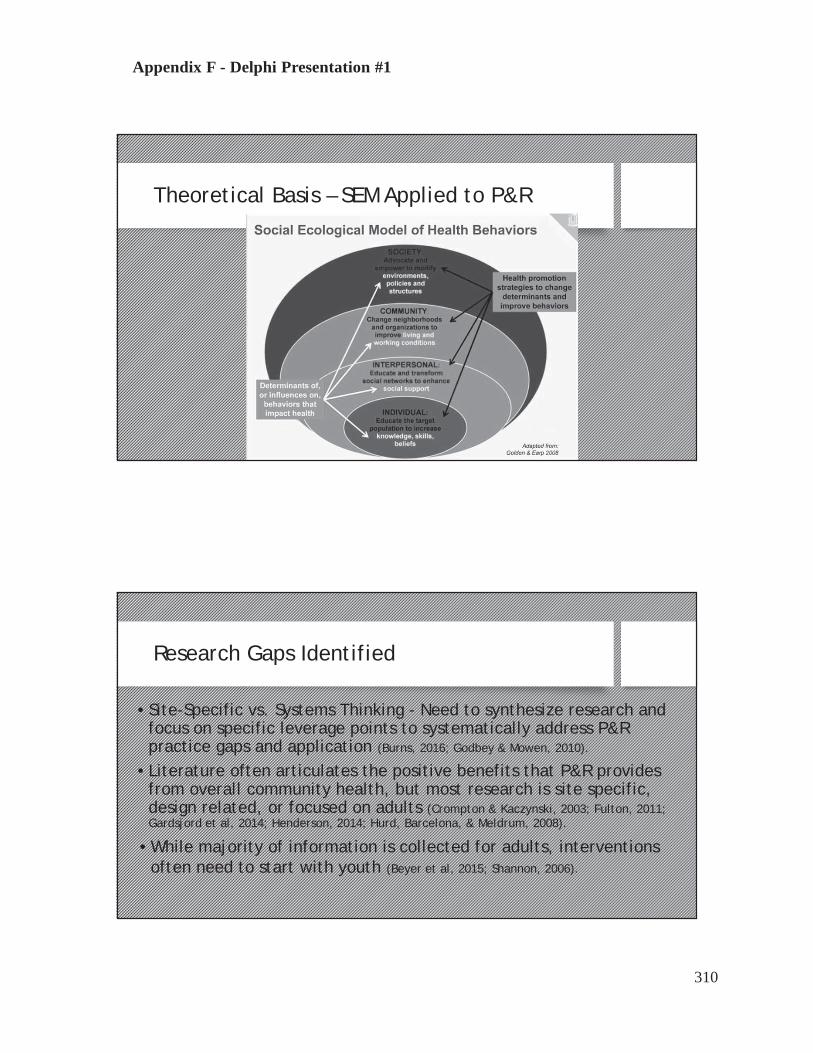
Appendix F - Delphi Presentation #1
Theoretical Basis – SEM Applied to P&R
Research Gaps Identified
• Site-Specific vs. Systems Thinking - Need to synthesize research andfocus on specific leverage points to systematically address P&Rpractice gaps and application (Burns, 2016; Godbey & Mowen, 2010).
• Literature often articulates the positive benefits that P&R providesfrom overall community health, but most research is site specific,design related, or focused on adults (Crompton & Kaczynski, 2003; Fulton, 2011;Gardsjord et al, 2014; Henderson, 2014; Hurd, Barcelona, & Meldrum, 2008).
• While majority of information is collected for adults, interventionsoften need to start with youth (Beyer et al, 2015; Shannon, 2006).
310

Appendix F - Delphi Presentation #1
Primary Research Question
How do parks and recreation (P&R) agencies address prioritizing modifiable key health factors for middle school aged youth?
MethodologyLiterature Review
• What has relevant research literature and data identified as the keymodifiable factors for preventative public health in middle-school youththrough local P&R systems?
Thematic review of articles and publications from various PH, P&R, and planning disciplines will be conducted to survey primary key factors for preventative public health for youth that may be modifiable by P&R
1
311

Appendix F - Delphi Presentation #1
MethodologyDelphi Study
• What do P&R professionals see as the key processes in systematicprioritization of modifiable health factors for middle-school youth?
Standard Delphi methods will be used for further identifying expert consensus on suggested research and practice applications through reiteration and discussions.
2
Delphi Study
A general process of having an expert panel to help formulate solutions to problems through several cycles of revision based on each other's feedback. Ideally, the end result is a better solution than any of the experts could have arrived at individually. (Landeta, 2006, Young et al, 2013).
• Key Informants representing local P&R agencies. – YOU!• To address identifying priorities for the factors and interventions
and provide validity through reiteration.• Will also help identify further gaps and limitation in research.
2
312

Appendix F - Delphi Presentation #1
Delphi Study Process1) Jul – Sep 2016 – Initial DataFormulate questions, issues to
explore, and identify Informants
• Identify Key Informants• Provide Research Questions, Literature, and Project Purpose
2) October 2016 – DataProvide initial literature
summary and gather more data
• Provide summary factors identified – Focus Group #1• Questionnaire #1 on Key Processes and Prioritization• Discuss data availability and Limitations
3) November 2016Analyze, refine questions,
and identify new issues
• Expert panel to review summary analysis to date• Questionnaire #2– Refinement of Process Priority• Focus Group #2 – Iterative discussions and validation -
challenges and potential outcomes/application
4) Jan 2017Draft review and
Analysis
• Focus Group #3 - review• Review of draft results and conclusions
(Adapted from Barth & Carr, 2014; Flick, 2014; Young et al, 2014)Iterations until saturation achieved
Inductiveprocess
Q2. What do P&R professionals see as the key processes insystematic prioritization of modifiable health factors with a focuson middle school youth?
MethodologyCase Study – Two Case Study Agencies
• Prince Georges County, MD and Charleston County, SC.
• Slightly different organizational structures and communitydemographics.
• The agencies claim to be assigning at least some staffresources, trying to convene stakeholders, collecting data, andattempting to identify measurable outcomes related to thefactors.
3
313
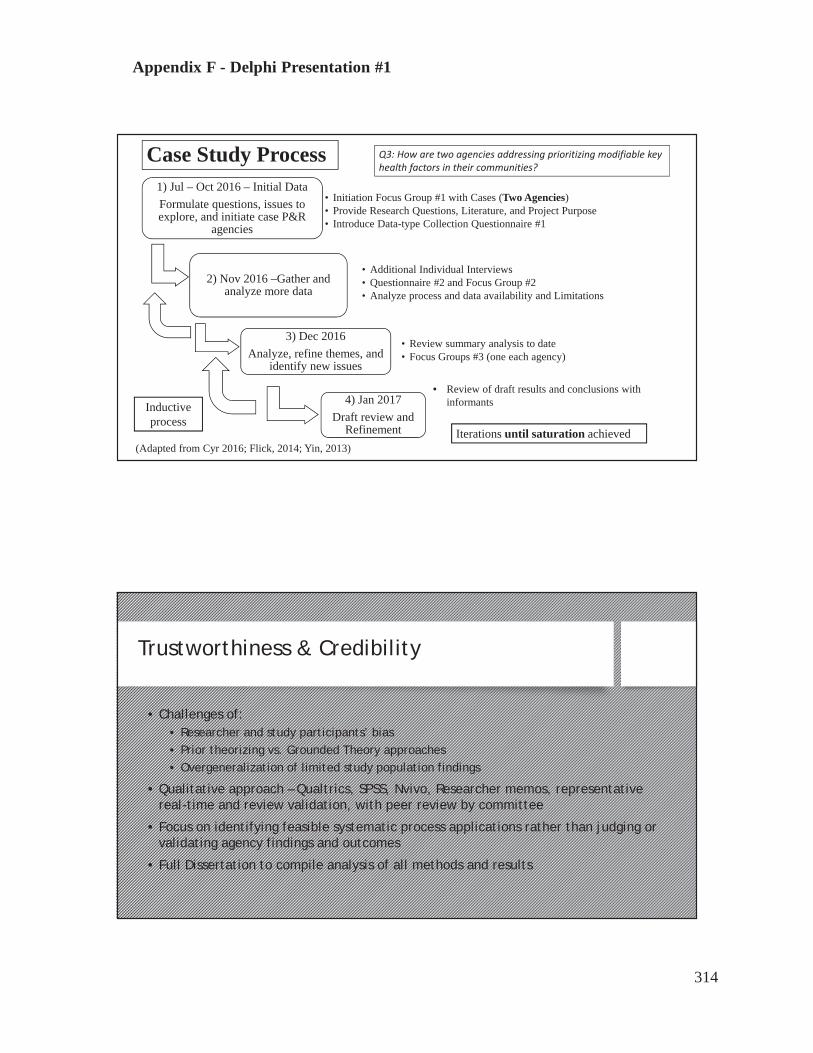
Appendix F - Delphi Presentation #1
Case Study Process1) Jul – Oct 2016 – Initial DataFormulate questions, issues to explore, and initiate case P&R
agencies
• Initiation Focus Group #1 with Cases (Two Agencies)• Provide Research Questions, Literature, and Project Purpose• Introduce Data-type Collection Questionnaire #1
2) Nov 2016 –Gather andanalyze more data
• Additional Individual Interviews• Questionnaire #2 and Focus Group #2• Analyze process and data availability and Limitations
3) Dec 2016Analyze, refine themes, and
identify new issues
• Review summary analysis to date• Focus Groups #3 (one each agency)
4) Jan 2017Draft review and
Refinement
• Review of draft results and conclusions withinformants
(Adapted from Cyr 2016; Flick, 2014; Yin, 2013)Iterations until saturation achieved
Inductiveprocess
Q3: How are two agencies addressing prioritizing modifiable keyhealth factors in their communities?
Trustworthiness & Credibility
• Challenges of:• Researcher and study participants’ bias• Prior theorizing vs. Grounded Theory approaches• Overgeneralization of limited study population findings
• Qualitative approach – Qualtrics, SPSS, Nvivo, Researcher memos, representativereal-time and review validation, with peer review by committee
• Focus on identifying feasible systematic process applications rather than judging orvalidating agency findings and outcomes
• Full Dissertation to compile analysis of all methods and results
314
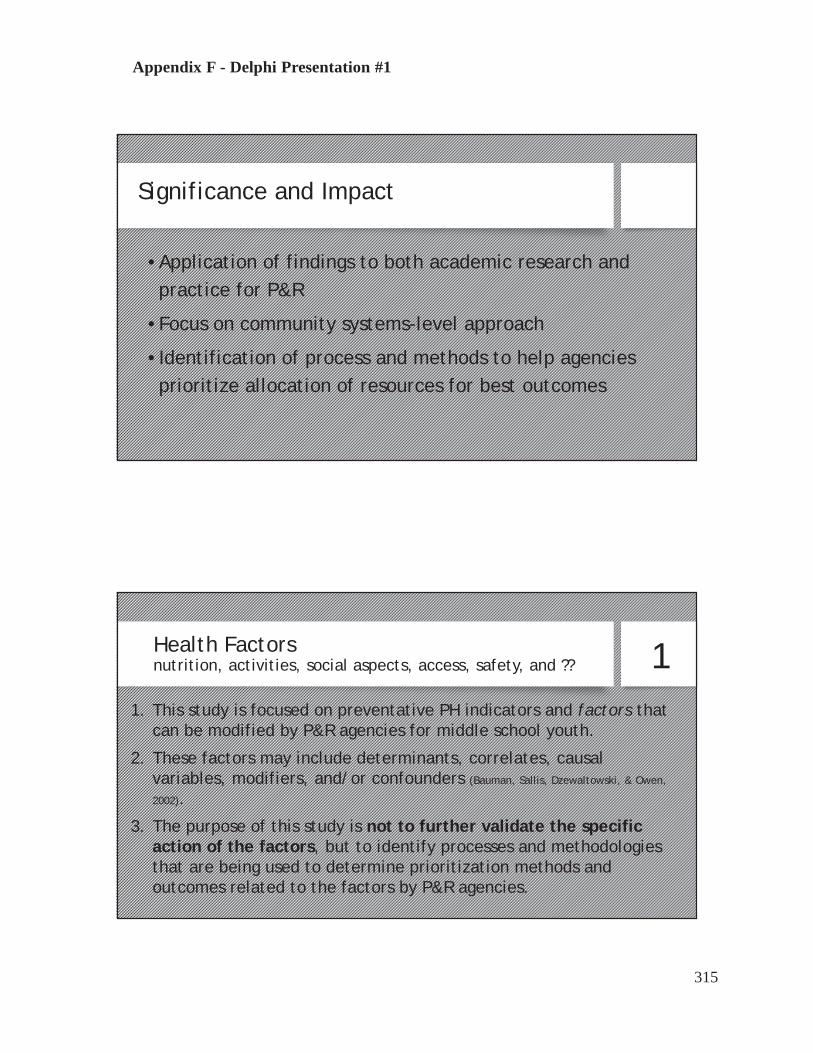
Appendix F - Delphi Presentation #1
Significance and Impact
• Application of findings to both academic research andpractice for P&R
• Focus on community systems-level approach
• Identification of process and methods to help agenciesprioritize allocation of resources for best outcomes
Health Factorsnutrition, activities, social aspects, access, safety, and ??
1. This study is focused on preventative PH indicators and factors thatcan be modified by P&R agencies for middle school youth.
2. These factors may include determinants, correlates, causalvariables, modifiers, and/or confounders (Bauman, Sallis, Dzewaltowski, & Owen,
2002).
3. The purpose of this study is not to further validate the specificaction of the factors, but to identify processes and methodologiesthat are being used to determine prioritization methods andoutcomes related to the factors by P&R agencies.
1
315

Appendix F - Delphi Presentation #1
Key Factors Examples of agency methods to address
Nutrition
Policies on availability of healthy foodInformation, education and trainingHealthy food/drink optionsCollaboration with local restaurantsCommunity gardens / farmers markets
Social interaction
Efforts to prevent bullying and hazingNon-competitive organized activity optionsEstablish practices of social inclusivenessPromote positive social environmentParental Engagement strategies
Transportation / Access to services
Accessibility of public transportationCost of servicesConvenienceConsumer knowledge of public transportation servicesUtilization rates
Physical activity
Inventory & quality of natural and built assetsVaried physical demands of programs/services/sitesAvailability of assets/programsApplication of evidence based practices by staffPromotion of increased physical capacity/Prescriptions
Safety/Perception of Safety
Crime rate at or near assets/programsParent/children perception of safety level
Prevention practices of service providers / CPTED
Safety inspection & risk management / public safetyStaff supervision & surveillance efforts
AND??? Smoking policies, etc.
Examples of potentiallymodifiablehealthfactors and methods to address
Introducing Data Collection & Sharing
Questionnaire #1• Basecamp for review and uploading• Qualtrics Questionnaire #1 link will be sent• Please complete by 10/21
File Sharing - Agency Process Reporting & Outcomes• Upload any agency info and examples into Basecamp – your file!• Agency Demographics - jurisdiction, summary of services www.communitycommons.org• Feel free to review other files for ideas / examples• Make comments / questions / connect
StartRecording
316

Appendix F - Delphi Presentation #1
Initial Questions Today
Q. 1 – What are the strengths you see in how your agency addressesthese health factors?
Q.2 - What are the primary weaknesses or external challenges(threats) your agency faces in trying to address these health factors?
Q.3. What are the opportunities you see for your agency in goingforward?
Q.4. What types of process and/or systematic planning tools is youragency using to address these factors?
Q.5. – What types of positive outcomes is your agency achieving in thisarea of work?
Next Steps
Questions or Suggestions?Thank YOU for your support!
317
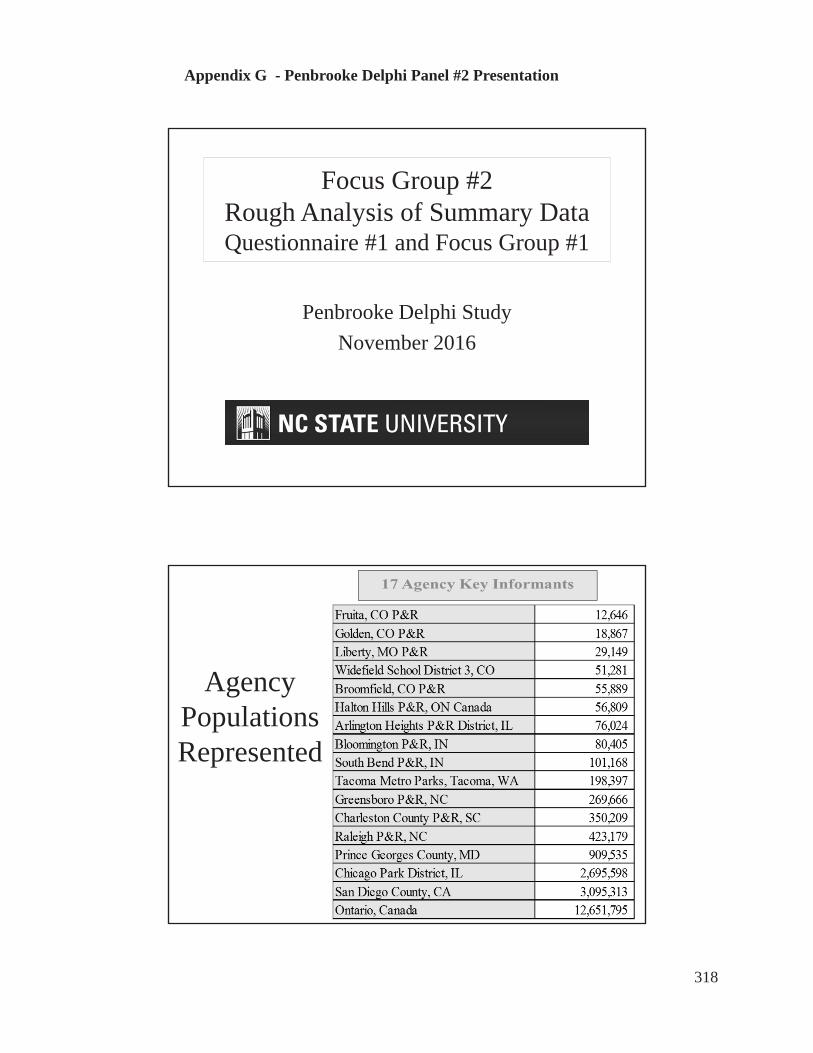
Appendix G - Penbrooke Delphi Panel #2 Presentation
Focus Group #2Rough Analysis of Summary Data Questionnaire #1 and Focus Group #1
Penbrooke Delphi StudyNovember 2016
AgencyPopulationsRepresented
318

Appendix G - Penbrooke Delphi Panel #2 Presentation
Geographic Distribution in U.S. (+ 2 from Ontario, Canada)
Round #1Focus Group
• Intro to Project• 13 Key informants
participated in FocusGroup, and 17 in Q. #1
• Overview of HealthFactors from literature
• Questions on strengthsand constraints, alongwith goals for project
Agency FG #1 Q. #1Liberty, MO P&R XRaleigh P&R, NC XGreensboro P&R, NC X XPrince Georges County, MD X XSan Diego County, CA X XChicago Park District, IL X XCharleston County P&R, SC XArlington Heights P&R District, IL X XBloomington P&R, IN XWidefield School District 3, CO X XBroomfield, CO P&R X XFruita, CO P&R X XOntario Canada X XSouth Bend P&R, IN X XMetro Parks, Tacoma, WA X XGolden, CO P&R X XHalton Hills P&R, ON Canada X X
13 17
319

Appendix G - Penbrooke Delphi Panel #2 Presentation
Focus Group #1 - StrengthsTop 20 Priority Word Frequencies
Word Frequency Count
Weighted Percentage (%)
health 32 1.25community 31 1.21parks 30 1.18programs 27 1.05people 23 0.90vending 21 0.82healthy 18 0.70working 16 0.63policy 14 0.55system 14 0.55food 13 0.51data 11 0.43change 11 0.43process 11 0.43recreation 11 0.43agencies 10 0.39outcomes 9 0.35resources 9 0.35communities 8 0.31partnerships 8 0.31
Question:What are the strengths that you see for your agency in terms of how you’re addressing these health factors?
Analyzed using coding, nodes, and frequency queries using NVIVO 10 for Windows.
Analysis
Focus Group - Analysis of Summary Content
Key StrengthsHealthy Vending Policies
Community coalitions and partnershipsPrograms to increase participation
Resources / staffing for larger agenciesKey Constraints
Availability of Resources & Staffing (especially smaller agencies)
Evidence-Based Evaluation Tools and Outcome measurements
320

Appendix G - Penbrooke Delphi Panel #2 Presentation
Round #1Questionnaire• 17 agencies
completed• Agency info• Experience of
Informants• Ranking of priority
of health factors• Effectiveness of
methods currently used
• Outcomes
Agency FG #1 Q. #1Liberty, MO P&R XRaleigh P&R, NC XGreensboro P&R, NC X XPrince Georges County, MD X XSan Diego County, CA X XChicago Park District, IL X XCharleston County P&R, SC XArlington Heights P&R District, IL X XBloomington P&R, IN XWidefield School District 3, CO X XBroomfield, CO P&R X XFruita, CO P&R X XOntario Canada X XSouth Bend P&R, IN X XMetro Parks, Tacoma, WA X XGolden, CO P&R X XHalton Hills P&R, ON Canada X X
13 17
Q5 - Title / Role at Agency % Count
Director/Senior Manager 44% 8
Assistant Director/Assistant Manager 11% 2
Supervisor level (staff supervision, may be more than one program area)
33% 6
Coordinator/Programmer 6% 1
Instructor 0% 0
Volunteer 0% 0
Other: 11% 2
Wellness Manager 6% 1
Policy Advisor 6% 1
321

Appendix G - Penbrooke Delphi Panel #2 Presentation
0%5%
10%15%20%25%30%35%40%45%
Lessthan 1year
1 to lessthan 3years
3 to lessthan 5years
5 to lessthan 10years
10 to lessthan 20years
Morethan 20years
Key Informants Time in Field
Q. 9 - Ranked Priority ofHealth Factors
Priority of Factors 1st 2nd 3rd 4th 5th 6th 7th 8thPhysical Activity 71% 18% 12% 0% 0% 0% 0% 0%Safety or Perception of Safety 20% 20% 7% 20% 0% 13% 13% 7%Nutrition / Food Availability 6% 6% 25% 31% 13% 6% 6% 6%Transportation / Access 0% 7% 13% 0% 7% 60% 7% 7%Social/PeerEngagement 0% 38% 13% 19% 25% 0% 6% 0%Parental Engagement / Education 0% 7% 27% 7% 33% 20% 7% 0%Other Factors 0% 20% 0% 20% 60% 0% 0% 0%
322
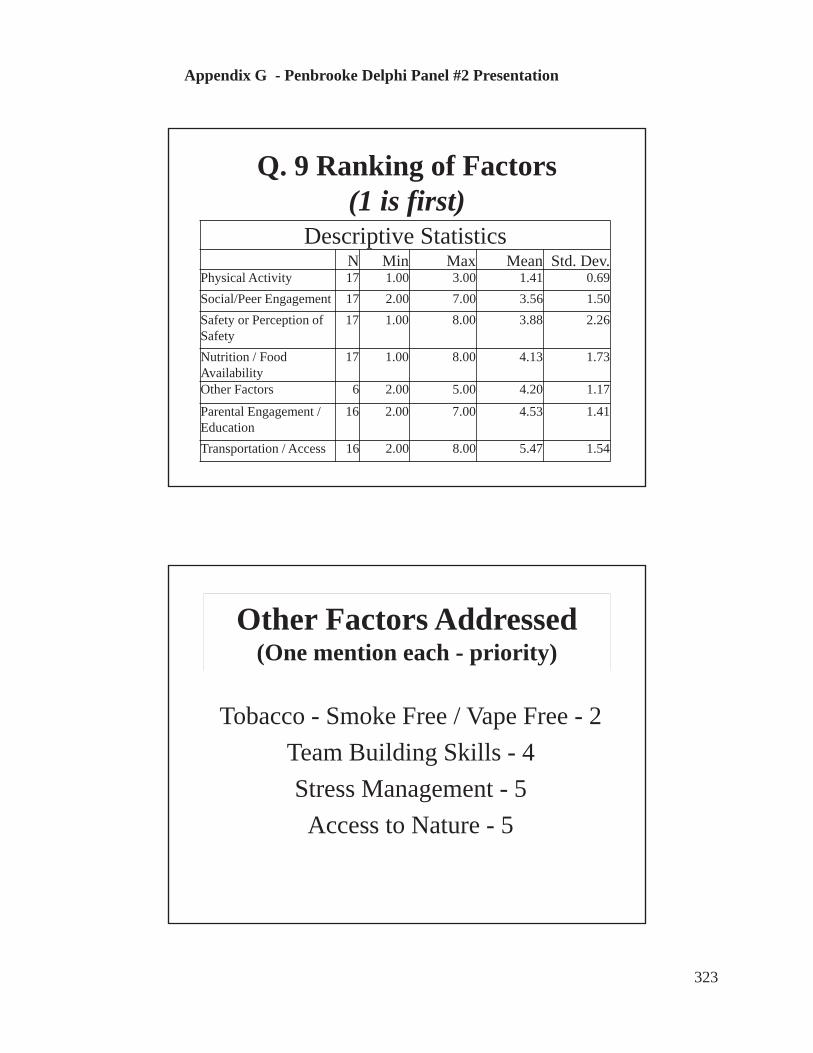
Appendix G - Penbrooke Delphi Panel #2 Presentation
Q. 9 Ranking of Factors(1 is first)
Descriptive StatisticsN Min Max Mean Std. Dev.
Physical Activity 17 1.00 3.00 1.41 0.69Social/Peer Engagement 17 2.00 7.00 3.56 1.50Safety or Perception of Safety
17 1.00 8.00 3.88 2.26
Nutrition / Food Availability
17 1.00 8.00 4.13 1.73
Other Factors 6 2.00 5.00 4.20 1.17
Parental Engagement / Education
16 2.00 7.00 4.53 1.41
Transportation / Access 16 2.00 8.00 5.47 1.54
Other Factors Addressed(One mention each - priority)
Tobacco - Smoke Free / Vape Free - 2Team Building Skills - 4Stress Management - 5
Access to Nature - 5
323

Appendix G - Penbrooke Delphi Panel #2 Presentation
Question 25 – Effectiveness of Potential Methods to Address Factors
Extremely effective
Moderatelyeffective
Not effective
at allNever used
Don't Know Total
Creation of a community coalition 41% 18% 0% 35% 6% 17Creating specific program to address factors 41% 41% 0% 12% 6% 17Hiring specific staff to address factors 35% 12% 0% 47% 6% 17Pursuing grant funding for factors 31% 25% 6% 38% 0% 16Analyzing partners and alternative providers 29% 41% 0% 24% 6% 17Youth Programs around factors 25% 56% 0% 19% 0% 16
System Inventory of Assets Available 19% 38% 13% 25% 6% 16Systematic Program Analysis 19% 50% 6% 19% 6% 16Creating Positive Policy focus on factors 19% 44% 0% 31% 6% 16Centralized web/social media on the factors 18% 24% 0% 47% 12% 17General community surveying on factors 18% 47% 6% 18% 12% 17Other special assessments on factors (walkability, food availability, etc.) 18% 41% 0% 18% 24% 17Evaluation of crime rates / safety 13% 31% 0% 25% 31% 16Creation of Youth Group to address factors 12% 41% 0% 41% 6% 17Parental education around factors 12% 53% 0% 24% 12% 17Financial analysis of health factors impact 6% 13% 0% 75% 6% 16Surveying of youth in community 6% 75% 0% 13% 6% 16Correlation of health metrics to site planning 6% 19% 0% 38% 38% 16Physical Evaluation (like BMI measures) 0% 29% 12% 47% 12% 17Other 0% 33% 0% 33% 33% 3
0% 200% 400% 600% 800% 1000% 1200% 1400% 1600% 1800%
OtherFinancial analysis of health factors impact
Surveying of youth in communityCorrelation of health metrics to site planning
Creation of Youth Group to address factorsParental education around factorsEvaluation of crime rates / safety
Centralized web/social media on the factorsGeneral community surveying on factors
Other special assessments on factors (walkability,…System Inventory of Assets Available
Systematic Program AnalysisCreating Postiive Policy focus on factors
Youth Programs around factorsAnalyzing partners and alternative providers
Pursuing grant funding for factorsHiring specific staff to address factors
Creation of a community coalitionCreating specific program to address factors
Question 25 - Potential Methods to Address Factors
Effectiveness of Potential Methods to Address Factors
Most effective to least effective, then Never Used or DKOther (1) = MVPA- SO PLAY study
324

Appendix G - Penbrooke Delphi Panel #2 Presentation
Outcomes Assessed
0
2
4
6
8
10
12
Yes Maybe No
Q22 - Do you assess or evaluate any specific outcomes for any of the health factors?
69%
13%13%
Outcomes Assessment Methods
“We have a comprehensive evaluation strategy in place to monitor the outcomes of the Town's Active Living Strategy.”“We mostly track attendance numbers, but not factors such as BMI or behavior change.”
“For the Exercise is Medicine Programs, we conduct an initial pre-engagement assessment, then conduct regular assessments at three month intervals. Each assessment consists of individual physical tests to gauge advancement or decline.”“We measure BMI before and after program, self-reporting of weight, heart rate, diets, etc.”
YES MAYBE
Outcomes Measured for %
Nutrition 33%
Physical Activity 67%
325

Appendix G - Penbrooke Delphi Panel #2 Presentation
0%
5%
10%
15%
20%
25%
30%
35%
0 to 9% 10 to 24% 25 to 49% 50 to 74% 75 to 100%
% of respondent time spent monthly on addressing health factors
0% 20% 40% 60% 80%
No
Yes
Are other staff assigned to address health factors?
71%# of
Respondents
# of other FTEs
assigned3 31 52 61 101 208
29%
326

Appendix G - Penbrooke Delphi Panel #2 Presentation
Q33 - How difficult was it for you to complete this survey?
Answer % Count
Extremely easy 12% 2
Somewhat easy 35% 6
Neither easy nor difficult 6% 1
Somewhat difficult 41% 7
Extremely difficult 6% 1
Total 100% 17
Review of Resources on Basecamp
Example from Ontario, Canada Healthy Eating and Active Living, 2006
327
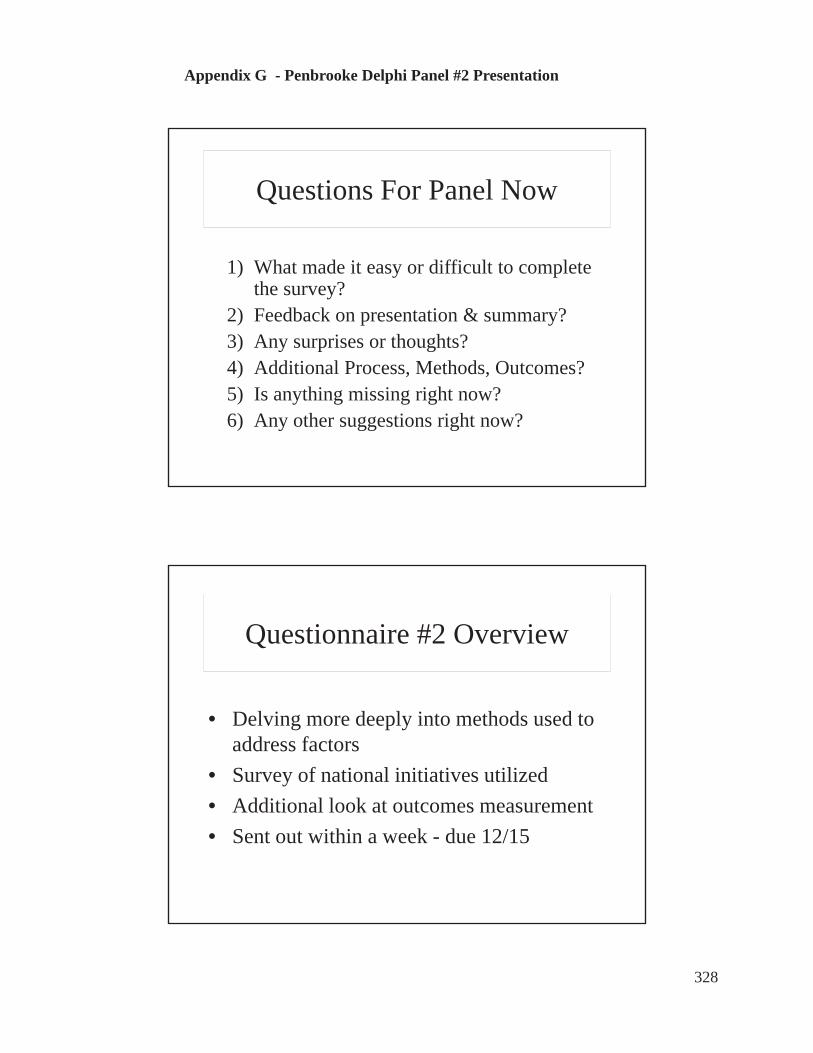
Appendix G - Penbrooke Delphi Panel #2 Presentation
Questions For Panel Now
1) What made it easy or difficult to completethe survey?
2) Feedback on presentation & summary?3) Any surprises or thoughts?4) Additional Process, Methods, Outcomes?5) Is anything missing right now?6) Any other suggestions right now?
Questionnaire #2 Overview
• Delving more deeply into methods used toaddress factors
• Survey of national initiatives utilized• Additional look at outcomes measurement• Sent out within a week - due 12/15
328

Appendix G - Penbrooke Delphi Panel #2 Presentation
Next Steps
• Please complete Questionnaire #2 by 12/15• Continue to upload and review resources• Focus Group #3 – second week of January
– review of draft summaries
THANK YOU!!
329

Appendix H – Penbrooke Delphi Panel Presentation #3
Focus Group #3 Positioning local parks and recreation agencies
as preventive public health providers, with a focus on middle-school aged youth:
a Delphi study and case study approach
Teresa L. Penbrooke, PhD Candidate, CPRE Advisor: Michael B. Edwards, PhD
Committee: Jason Bocarro, PhD; Aaron Hipp, PhD; & Karla Henderson, PhD
February 2017
Background and Purpose
Growing evidence that Parks & Recreation (P&R) agencies can help to improve Public Health (PH) through:• Increasing physical activity and reducing obesity• Providing psychological and physical benefits from nature• Facilitating social benefits from community gatherings and services• Addressing health equity issues among diverse populations
Burns, 2016; Godbey & Mowen, 2010; Kuo, 2013; Sallis, Floyd, Rodriquez, & Saelens, 2012; Slater, Ewing, Powell, Chaloupka, Johnston, & O’Malley, 2010; Wells, 2013; Young, Ross, Kim, & Sturts, 2013
330

Appendix H – Penbrooke Delphi Panel Presentation #3
Background and Purpose
The global research question is shifting from one of asking IF P&R agencies can
positively affect PH factors, to HOW they can best do so with limited
resources and prioritization needs.
Background and Purpose
• Public Health (PH) interventions usually includeidentifying and systematically addressing determinants atvarious social-ecological levels (Dunton et al, 2009; Golden & Earp, 2008).
• PH field-specific research has been somewhat disparate interms of the level of needed interventions, the role ofP&R in PH, and the role site-specific characteristics (Babey etal, 2013; Dunton et al, 2009; Golden & Earp, 2008; Sallis et al 2014).
• Many national health intervention programs andcampaigns focus on individual/interpersonal change. (CDC, 2016; Let’s Move, 2014).
• Community-specific youth data on various health factorsare not readily available to local P&R practitioners (Brenner et al, 2013; Compton et al, 2011; CDC-YRBSS, 2014; Young, Ross, Kim, & Sturts, 2013).
331

Appendix H – Penbrooke Delphi Panel Presentation #3
Research Gaps Identified
• Site-Specific vs. Systems Thinking - Need to synthesize researchand focus on specific leverage points to systematically address P&Rpractice gaps and application (Burns, 2016; Godbey & Mowen, 2010).
• Literature often articulates the positive benefits that P&R providesfrom overall community health, but most research is site specific,design related, or focused on adults (Crompton & Kaczynski, 2003; Fulton,2011; Gardsjord et al, 2014; Henderson, 2014; Hurd, Barcelona, & Meldrum, 2008).
• While majority of information is collected for adults, interventionsoften need to start with youth (Beyer et al, 2015; Shannon, 2006).
Significance and Impact
• Application of findings to both academic research andpractice for P&R
• Focus on community systems-level approach
• Identification of process and methods to help agenciesprioritize allocation of resources for best outcomes
332
Appendix H – Penbrooke Delphi Panel Presentation #3
Primary Research Question
How do parks and recreation (P&R) agencies address prioritizing modifiable key health factors, with a focus on middle school aged youth?
Methodology & Results Literature Review
• What has relevant research literature and data identified asthe key modifiable factors for preventative public health inmiddle-school youth through local P&R systems?
Thematic review of articles and publications from various PH, P&R, and planning disciplines conducted to survey primary key factors and preventive public tools used by local P&R agencies for addressing those health factors.
1
333

Appendix H – Penbrooke Delphi Panel Presentation #3
Theoretical Basis – SEM Applied to P&R
Flora / Fauna
Wellbeing&
ReducedStress
Community Spaces
Public Spaces Open Spaces
Ecosystems ApproachTheorized relationships between access to public
spaces and wellness
Attention restoration and biophilia
Physical activity and social support
Adapted from Kuo, 2015; Saw, Lim, & Carrasco, 2015; Sturm & Cohen, 2014
334

Appendix H – Penbrooke Delphi Panel Presentation #3
Local Community SystemGovernment, Public Safety, Public Works & Transportation
Park & Recreation and Alternative Providers
NutritionalAvailability and
Culture
Family, Home,Work, SocialSupport,Security &
Transportation
IndividualConstitution &
BasicPreferencesMedical Care
RecreationServicesCognitive,
Social, Physical,and SpiritualActivities &Education
AssetsPublic Parks,Trails, andFacilities
Other Providers
Parks and Recreation Systems Approachto Improving Public Health
1• Screening - Determine whether an
HIA will add value
2• Scoping - Develop a plan for the
HIA
3• Assessment - Identify current and
predicted health impacts
4• Recommendations - Identify
actions that protect health
5• Reporting - Communicate
findings
6• Evaluation - Monitor impacts
Comparison Steps of Systematic PlanningHealth Impact Assessments Vs P&R System Planning
1• Project Kick-Off
2• Information Gathering
3• Findings Analysis
4• Recommendations
5• Project presentations & approvals
335

Appendix H – Penbrooke Delphi Panel Presentation #3
Trustworthiness & Credibility
• Challenges of:• Researcher and study participants’ bias
• Prior theorizing vs. grounded theory approaches
• Overgeneralization of limited study population findings with small sample size
• Qualitative approach – Qualtrics, SPSS, Nvivo, Researcher memos, representative real-time and review validation, with peer review by committee
• Focus on identifying feasible systematic process applications rather than judging orvalidating agency-specific findings and outcomes
• Full dissertation includes all methods and results from each
Identifying Modifiable Health Factors for P&Rnutrition, activities, social aspects, access, safety, and ??
1. Focused on preventative PH indicators and factors that can bemodified by P&R agencies.
2. Factors may include determinants, correlates, causal variables,modifiers, and/or confounders (Bauman, Sallis, Dzewaltowski, & Owen, 2002).
3. The purpose of this study was not to further validate the specificaction of the factors, but to identify processes and methodologiesthat are being used to determine prioritization methods andoutcomes related to the factors by P&R agencies.
1
336

Appendix H – Penbrooke Delphi Panel Presentation #3
Study Process – Literature Review, Delphi Panel, and Case Study
Jan – Sep 2016 – Initial DataFormulate questions, issues to
explore, and identify Informants
• Research Questions and ProjectPurpose – Proposal defense
• Identify Key Informants• Initial Literature Review & IRB
Approval
1) October 2016 – DataProvide initial literature
summary and gather more data
• Summary health factors identified – Focus Group #1• Questionnaire #1 - Key Processes and Prioritization• Initial interviews with Case Study Informants• Discussed data availability and limitations
3) Nov - Dec 2016Analyze, refine questions,
and identify any new issues
• Focus Group #2 – Iterative discussions and validation:challenges and potential outcomes/application
• Questionnaire #2 – Refinement of Process Priority• Review summary analysis to date and refine
4) Jan – Feb 2017Draft review and Analysis
• Focus Group #3 and Case Study Focus Groups / Interviews
• Review and validation of draft results
(Adapted from Barth & Carr, 2014; Flick, 2014; Yin, 2015; Young et al., 2014) Iterations until saturation achieved
Inductive & Deductive process
Delphi Study – 3 Stage Process
A general process of having an expert panel to help formulate solutions to problems through several cycles of revision based on each other's feedback. Ideally, the end result is a better solution than any of the experts could have arrived at individually. (Landeta, 2006, Young et al, 2013).
• Key Informants representing local P&R agencies.• Addressed identifying priorities for the factors and
interventions and provided validity through reiteration.• Helped identify further gaps and limitation in research.
2
337

Appendix H – Penbrooke Delphi Panel Presentation #3
AgencyPopulationsRepresented& National
Recognitions
Agency Population 2015 Gold Medal CAPRAFruita, CO P&R 12,646 Golden, CO P&R 18,867 X X Liberty, MO P&R 29,149 Widefield School District 3, CO 51,281 Broomfield, CO P&R 55,889 Halton Hills P&R, ON Canada 56,809 Arlington Heights P&R District, IL 76,024 X Bloomington P&R, IN 80,405 X X South Bend P&R, IN 101,168 X Tacoma Metro Parks, Tacoma, WA 198,397 XGreensboro P&R, NC 269,666 X X Charleston County P&R, SC 350,209 X Raleigh P&R, NC 423,179 X Prince Georges County, MD 909,535 X X Chicago Park District, IL 2,695,598 X X San Diego County, CA 3,095,313 X Ontario, Canada 12,651,795
Totals 21,075,930 8 8
Geographic Distribution in U.S.(+ 2 from Ontario, Canada)
338

Appendix H – Penbrooke Delphi Panel Presentation #3
Agency Informant FG #1 Q. #1 FG#2 Q. #2 FG#3Arlington Heights P&R District, IL Brian Myer X X XBloomington P&R, IN Allison Miller X X XBroomfield, CO P&R Veronica Mueller X X X X XCharleston County P&R, SC John Massey X X X XChicago Park District, IL Colleen Lammel X X X X XFruita, CO P&R Ture Nycum X X X XGolden, CO P&R Rod Tarullo XGreensboro P&R, NC Michelle Gill-
MoffatX X X X X
Halton Hills P&R, ON Canada Margaret Taylor X X X XLiberty, MO P&R Janet Bartnik X X X X XOntario Canada Carol Ointment X X X X XPrince Georges County, MD John Henderson X X X X XRaleigh P&R, NC Chris Frelke X X XSan Diego County, CA Christine
LafontantX x X X X
South Bend P&R, IN Aaron Perri X X X XTacoma Metro Parks, Tacoma, WA Shon Sylvia (Joe
Brady)X X X X
Widefield School District 3, CO Tamara Moore X X X X XTotal 14 17 7 15
MethodologyCase Study – Two Case Study Agencies
• Prince Georges County, MD and San Diego County, CA
• Slightly different organizational structures and communitydemographics.
• The agencies claim to be assigning at least some staffresources, trying to convene stakeholders, collecting data,and attempting to identify measurable outcomes related tothe factors.
3
339

Appendix H – Penbrooke Delphi Panel Presentation #3
Focus Group #1 – All InformantsIntroduction of Data Collection & Sharing
IntroductionQ.1 – What are the strengths you see in how your agency addresses these health
factors?Q.2 - What are the primary challenges or constraints your agency faces in trying to
address these health factors?
File Sharing - Agency Process Reporting & Outcomes• Agency info and examples uploaded into Basecamp• Agency Demographics - jurisdiction, summary of services
www.communitycommons.org• Review other files for ideas / examples• Comments / questions / connections
Questionnaire #1 – Link Provided
Agency Resources shared on Basecamp
Needs Assess
SystemPlans
Component Based
Inventory
Food/VendingPolicy
PAProgram Plan
Other Policies/
Plans
Logic Models
GP RED SMT
Reports
Youth Survey
Other info
Arlington Heights PRD, IL X X X X X X
Bloomington P&R, IN X X X
Broomfield, CO P&R X X
Charleston County P&R, SC X X X X X
Chicago PD, IL X X X X
Fruita, CO P&R X X
Golden, CO P&R X X X
Greensboro P&R, NC X X X X
Halton Hills P&R, ON Canada X X X X
Liberty, MO P&R X X X X X
Ontario Canada X X X X X X
Prince Georges County, MD X X X X X X
Raleigh P&R, NC X X X X X X
San Diego County, CA X X X X X X X X
South Bend P&R, IN X X X X X X
Metro Parks, Tacoma, WA X X X X X XWidefield School District 3, CO X X X
Total provided resources 88% 88% 65% 47% 41% 47% 35% 18% 12% 18%
340

Appendix H – Penbrooke Delphi Panel Presentation #3
Focus Group #1 - StrengthsTop 20 Priority Word Frequencies
Word Frequency Count
Weighted Percentage (%)
health 32 1.25community 31 1.21parks 30 1.18programs 27 1.05people 23 0.90vending 21 0.82healthy 18 0.70working 16 0.63policy 14 0.55system 14 0.55food 13 0.51data 11 0.43change 11 0.43process 11 0.43recreation 11 0.43agencies 10 0.39outcomes 9 0.35resources 9 0.35communities 8 0.31partnerships 8 0.31
Question:What are the strengths that you see for your agency in terms of how you’re addressing these health factors?
Analyzed using coding, nodes, and frequency queries using NVIVO 10 for Windows.
Analysis
Focus Group - Analysis of Summary Content
Key StrengthsHealthy Vending Policies
Community coalitions and partnershipsPrograms to increase participation
Resources / staffing for larger agenciesKey Constraints
Availability of Resources & Staffing (especially smaller agencies)
Evidence-Based Evaluation Tools and Outcome measurements
341

Appendix H – Penbrooke Delphi Panel Presentation #3
Round #1Questionnaire
• 17 agenciescompleted
• Agency info• Experience of
Informants• Ranking of priority
of health factors• Effectiveness of
methods currently used
• Outcomes
Agency FG #1 Q. #1Liberty, MO P&R XRaleigh P&R, NC X
Greensboro P&R, NC X XPrince Georges County, MD X XSan Diego County, CA X X
Chicago Park District, IL X XCharleston County P&R, SC XArlington Heights P&R District, IL X XBloomington P&R, IN XWidefield School District 3, CO X XBroomfield, CO P&R X XFruita, CO P&R X XOntario Canada X XSouth Bend P&R, IN X XMetro Parks, Tacoma, WA X XGolden, CO P&R X XHalton Hills P&R, ON Canada X X
13 17
Q5 - Title / Role at Agency % Count
Director/Senior Manager 44% 8
Assistant Director/Assistant Manager 11% 2
Supervisor level (staff supervision, may be more than one program area)
33% 6
Coordinator/Programmer 6% 1
Instructor 0% 0
Volunteer 0% 0
Other: 11% 2
Wellness Manager 6% 1
Policy Advisor 6% 1
Round #1Questionnaire
N = 17
BackgroundExperience
Initial Factors Ranking
Current Methods effectiveness
342
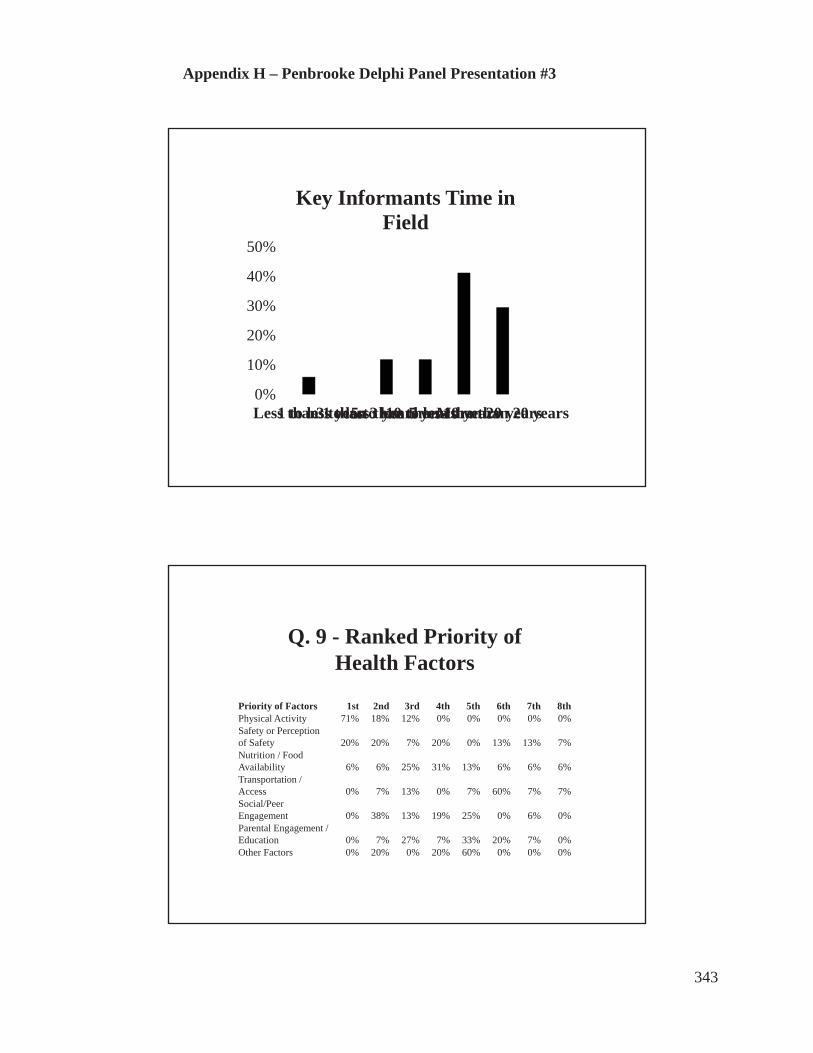
Appendix H – Penbrooke Delphi Panel Presentation #3
0%
10%
20%
30%
40%
50%
Less than 1 year1 to less than 3 years3 to less than 5 years5 to less than 10 years10 to less than 20 yearsMore than 20 years
Key Informants Time in Field
Q. 9 - Ranked Priority ofHealth Factors
Priority of Factors 1st 2nd 3rd 4th 5th 6th 7th 8thPhysical Activity 71% 18% 12% 0% 0% 0% 0% 0%Safety or Perception of Safety 20% 20% 7% 20% 0% 13% 13% 7%Nutrition / Food Availability 6% 6% 25% 31% 13% 6% 6% 6%Transportation / Access 0% 7% 13% 0% 7% 60% 7% 7%Social/Peer Engagement 0% 38% 13% 19% 25% 0% 6% 0%Parental Engagement / Education 0% 7% 27% 7% 33% 20% 7% 0%Other Factors 0% 20% 0% 20% 60% 0% 0% 0%
343

Appendix H – Penbrooke Delphi Panel Presentation #3
Q. 9 Ranking of Factors(1 is first)
Descriptive StatisticsN Min Max Mean Std. Dev.
Physical Activity 17 1.00 3.00 1.41 0.69Social/Peer Engagement 17 2.00 7.00 3.56 1.50Safety or Perception of Safety
17 1.00 8.00 3.88 2.26
Nutrition / Food Availability
17 1.00 8.00 4.13 1.73
Other Factors 6 2.00 5.00 4.20 1.17
Parental Engagement / Education
16 2.00 7.00 4.53 1.41
Transportation / Access 16 2.00 8.00 5.47 1.54
Other Factors Addressed(One mention each - priority)
Tobacco - Smoke Free / Vape Free - 2Team Building Skills - 4Stress Management - 5
Access to Nature - 5
344
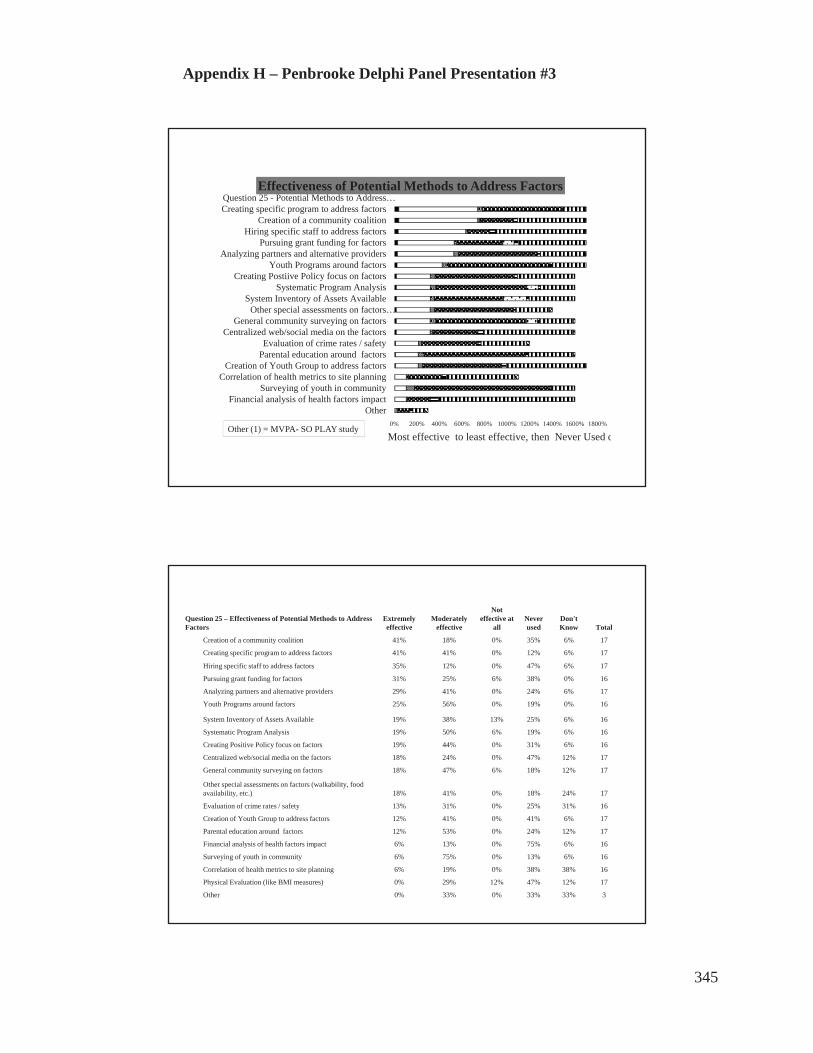
Appendix H – Penbrooke Delphi Panel Presentation #3
0% 200% 400% 600% 800% 1000% 1200% 1400% 1600% 1800%
OtherFinancial analysis of health factors impact
Surveying of youth in communityCorrelation of health metrics to site planning
Creation of Youth Group to address factorsParental education around factorsEvaluation of crime rates / safety
Centralized web/social media on the factorsGeneral community surveying on factors
Other special assessments on factors…System Inventory of Assets Available
Systematic Program AnalysisCreating Postiive Policy focus on factors
Youth Programs around factorsAnalyzing partners and alternative providers
Pursuing grant funding for factorsHiring specific staff to address factors
Creation of a community coalitionCreating specific program to address factorsQuestion 25 - Potential Methods to Address…
Effectiveness of Potential Methods to Address Factors
Most effective to least effective, then Never Used oOther (1) = MVPA- SO PLAY study
Question 25 – Effectiveness of Potential Methods to Address Factors
Extremely effective
Moderately effective
Not effective at
allNever used
Don't Know Total
Creation of a community coalition 41% 18% 0% 35% 6% 17
Creating specific program to address factors 41% 41% 0% 12% 6% 17
Hiring specific staff to address factors 35% 12% 0% 47% 6% 17
Pursuing grant funding for factors 31% 25% 6% 38% 0% 16
Analyzing partners and alternative providers 29% 41% 0% 24% 6% 17
Youth Programs around factors 25% 56% 0% 19% 0% 16
System Inventory of Assets Available 19% 38% 13% 25% 6% 16
Systematic Program Analysis 19% 50% 6% 19% 6% 16
Creating Positive Policy focus on factors 19% 44% 0% 31% 6% 16
Centralized web/social media on the factors 18% 24% 0% 47% 12% 17
General community surveying on factors 18% 47% 6% 18% 12% 17
Other special assessments on factors (walkability, food availability, etc.) 18% 41% 0% 18% 24% 17
Evaluation of crime rates / safety 13% 31% 0% 25% 31% 16
Creation of Youth Group to address factors 12% 41% 0% 41% 6% 17
Parental education around factors 12% 53% 0% 24% 12% 17
Financial analysis of health factors impact 6% 13% 0% 75% 6% 16
Surveying of youth in community 6% 75% 0% 13% 6% 16
Correlation of health metrics to site planning 6% 19% 0% 38% 38% 16
Physical Evaluation (like BMI measures) 0% 29% 12% 47% 12% 17
Other 0% 33% 0% 33% 33% 3
345

Appendix H – Penbrooke Delphi Panel Presentation #3
Outcomes Assessed
0
5
10
15
Yes Maybe No
Q22 - Do you assess or evaluate any specific outcomes for any of
the health factors? 69%
13%13%
Outcomes Assessment Methods
“We have a comprehensive evaluation strategy in place to monitor the outcomes of the Town's Active Living Strategy.”“We mostly track attendance numbers, but not factors such as BMI or behavior change.”
“For the Exercise is Medicine Programs, we conduct an initial pre-engagement assessment, then conduct regular assessments at three month intervals. Each assessment consists of individual physical tests to gauge advancement or decline.”“We measure BMI before and after program, self-reporting of weight, heart rate, diets, etc.”
YES MAYBE
Outcomes Measured for %
Nutrition 33%
Physical Activity 67%
346
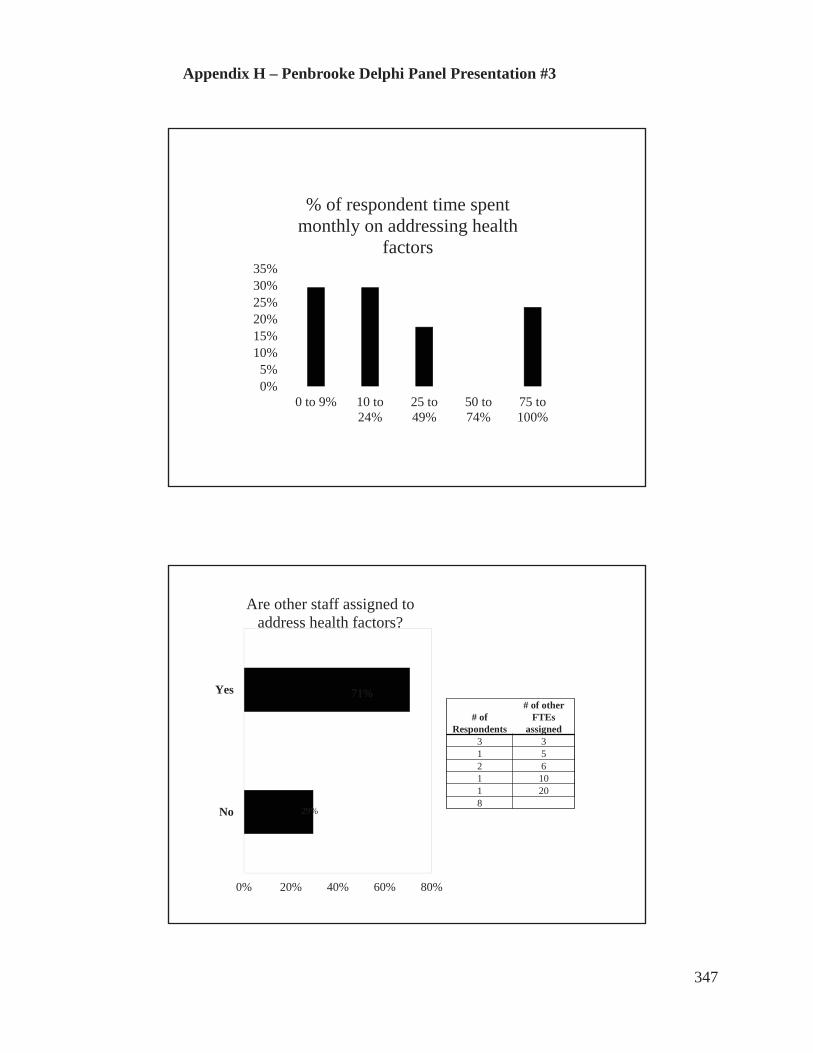
Appendix H – Penbrooke Delphi Panel Presentation #3
0%5%
10%15%20%25%30%35%
0 to 9% 10 to24%
25 to49%
50 to74%
75 to100%
% of respondent time spent monthly on addressing health
factors
0% 20% 40% 60% 80%
No
Yes
Are other staff assigned to address health factors?
71%
# of Respondents
# of other FTEs
assigned3 31 52 61 101 208
29%
347

Appendix H – Penbrooke Delphi Panel Presentation #3
Q33 - How difficult was it for you to complete this survey?
Answer % Count
Extremely easy 12% 2
Somewhat easy 35% 6
Neither easy nor difficult 6% 1
Somewhat difficult 41% 7
Extremely difficult 6% 1
Total 17
Questionnaire #2 – Delving more deeply into Initiatives,Factors, and Methods
31NationalInitiative
sIdentified
348

Appendix H – Penbrooke Delphi Panel Presentation #3
0% 10% 20% 30% 40% 50% 60%
Active Living by Design
Together Counts
Healthy Kids Concepts
Healthy Parks Healthy People
Active Living Coalition
NIOST's Healthy Out of School Time
Active Living Research
GP RED's Safe Routes to Play
KaBOOM!'s Playability
After School Association's - HEPA
Complete Streets
NRPA's Commit to Health
Community Health Needs Assessments…
National Initiatives – Are you active with them?
Not now but YES in past
Activenow in
23 out of the 31
nationalinitiativesidentified
Prince George’s County - National Initiatives Active with them now or in past Have heard of them
ACHIEVE Past YesACSM's Exercise is Medicine YesAfter School Association's HEPA YES YesAlliance for a Healthier Generation YES YesCommunity Health Improvement Plans (CHIP) YES YesCommunity Health Needs Assessments (CHNA)
Yes
Complete Streets YesGP RED's Safe Routes to Play Past YesHealthy Parks Healthy People YesLet's Move Past YesNFL Play 60 Past YesNIOST's Healthy Out of School Time YES YesNRPA's Commit to Health YES YesNRPA's Safe Routes to Parks YesSafe Routes to School YesSPARK Past YesActive Ever 10 16Active Now 5
349

Appendix H – Penbrooke Delphi Panel Presentation #3
San Diego County - National Initiatives Active now or in the Past Heard of them
ACSM's Exercise is Medicine YesActive Living by Design Past YesActive Living Research Past YesAlliance for a Healthier Generation YesCommunity Health Improvement Plans (CHIP) Past YesCommunity Health Needs Assessments (CHNA) YesComplete Streets YesGP RED's Safe Routes to Play YesHealthy Parks Healthy People YesKaBOOM!'s Playability Past YesLet's Move YES YesNFL Play 60 Past YesNRPA's Commit to Health YesNRPA's Safe Routes to Parks YesPartnership for Healthier America YesSafe Routes to School Past YesSPARK Past YesActive Ever 8 18Active Now 1
0% 20% 40% 60% 80% 100% 120%
Create a Park Rx ProgramApply evidence-based standards…
Assess programs and assetsQuality of programs for PA
Offer varied physical demandsStaff training on PA
Programs for PAPromotion to increase PA
Assets for PACollaboration to promote PA
Informant Ranked Priority of Methods to Address PA
High Priority Mod High Neutral Mod Low Low Priority
350
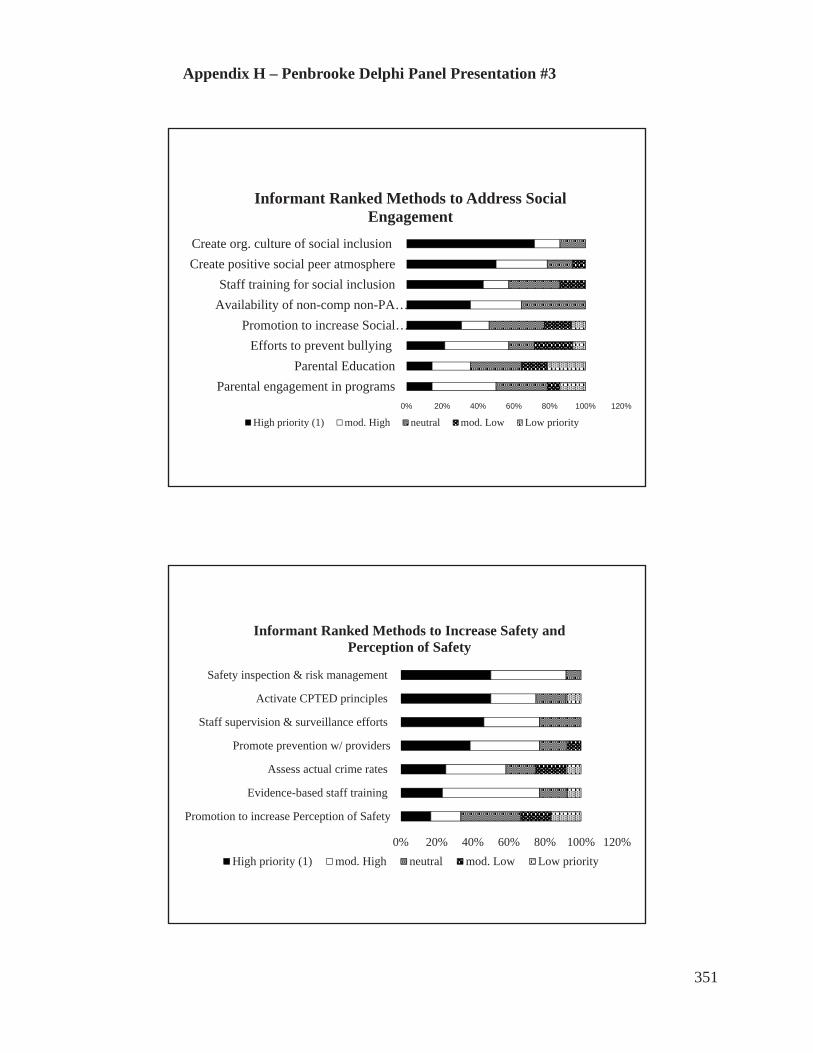
Appendix H – Penbrooke Delphi Panel Presentation #3
0% 20% 40% 60% 80% 100% 120%
Parental engagement in programsParental Education
Efforts to prevent bullyingPromotion to increase Social…
Availability of non-comp non-PA…Staff training for social inclusion
Create positive social peer atmosphereCreate org. culture of social inclusion
Informant Ranked Methods to Address Social Engagement
High priority (1) mod. High neutral mod. Low Low priority
0% 20% 40% 60% 80% 100% 120%
Promotion to increase Perception of Safety
Evidence-based staff training
Assess actual crime rates
Promote prevention w/ providers
Staff supervision & surveillance efforts
Activate CPTED principles
Safety inspection & risk management
Informant Ranked Methods to Increase Safety and Perception of Safety
High priority (1) mod. High neutral mod. Low Low priority
351

Appendix H – Penbrooke Delphi Panel Presentation #3
0% 20% 40% 60% 80% 100% 120%
Collab. with local restaurants / stores
Increase programming for parents
Promotion on benefits - healthy eating
Collab. with schools /providers policy
Staff training on nutrition
Programs around healthy eating
Promote community availability of…
Increase community gardens
Enact policies about healthy food
Informant Ranked Methods to Improve Nutrition
High priority (1) mod. High neutral mod. Low Low priority
0% 20% 40% 60% 80% 100% 120%
Collab. with schools, businesses, to…
Monitor utilization rates of transport
Promote knowledge of alternative transport
Convenience - Synchronize programs
Address availability of public transport
Promote Complete Streets policies
Assess walkability with geo-spatial analysis
Train specific staff to address planning
Informant Ranked Methods to Address Transportation and Access
High priority (1) mod. High neutral mod. Low Low priority
352

Appendix H – Penbrooke Delphi Panel Presentation #3
0% 20% 40% 60% 80% 100%
Stress Management Programs
Development of Team BuildingSkills
Tobacco Cessation Policies /Education
Providing access to nature
Informant Priority Ranking of Other Factors to Address
High priority (1) mod. High neutral mod. Low Low priority
0% 10% 20% 30% 40% 50% 60% 70% 80%
Assets for PATobacco Cessation Policies /…Increase community gardens
Staff training for social inclusionEstablish standards for staff…
Train specific staff to address planningProvide access to nature
Safety inspection & risk management Strategically implement CPTED…
Create positive social peer atmosphereCollaboration to promote PA
Enact policies about healthy foodCreate org. culture of social inclusion
Summary of Priority Methods to Address Health Factors Overall ( Ranked #1 by > 40%)
353

Appendix H – Penbrooke Delphi Panel Presentation #3
0
1
2
3
4
5 Prince George’s County – Rating Effectiveness of Methods
Extremely effective Moderately effective Not effective at all Never used
0
1
2
3
4 San Diego County Rating Effectiveness of Methods
Effective Moderately Effective Never Used
354

Appendix H – Penbrooke Delphi Panel Presentation #3
0% 10% 20% 30% 40% 50%
Extremely easy
Somewhat easy
Neither easy nor difficult
Somewhat difficult
Extremely difficult
Rating the Difficulty of Taking Questionnaire #2
Common Reasons for Citedfor Difficulty in Taking theQuestionnaires
• In larger agencies, othershad the information
• Hadn’t tracked this typeof information or nocentralized tracking
• Hadn’t spent timethinking about thesefactors in this way before
Round #3 – Review and Validation
• Additional informant interviews and focus groups foreach of the case study agencies to deepen
• Additional Round #3 Focus Group for all Informants
• Review of findings and materials
• Dissemination of full draft chapters for review by all
355

Appendix H – Penbrooke Delphi Panel Presentation #3
Additional Findings from the Case Study
• Larger agencies have more resources assigned, but moredifficulty in centralized tracking of information
• More time and resources promote more focus on “high levelupstream” policy rather than on specific programs or assets
• Equity is crucial - Under-resourced segments and youth requiredifferent methods and need more support
• More partners means P&R is often coordinator rather than doer• Outcomes beyond participation are still very difficult to measure• Grant funding ends – programs go away• Each community is different – methods must be customized
Key Conclusions of Research
• Strong evidence exists for basis of research – growing daily
• Top Modifiable Health Factors for P&R vary by community but are:• Physical Activity• Nutrition• Safety and Perception of Safety• Parental and Social Engagement• Transportation and Access• Access to Nature and Greenspace• Tobacco Cessation
356

Appendix H – Penbrooke Delphi Panel Presentation #3
Lessons from Public Health Realm
• P&R does not need to “make up” their own methodsbut application to practice may be different
• Utilize HIAs and Logic Model formats, especially forfunding and planning applications
• Incorporate evaluation steps in planning and tracking• Collaboration is key, but community leadership and
policy is crucial
Key Conclusions
• Not enough data currently collected for focus on middle-school youth by agencies – need instruments and methods
• Organizational culture is key to effectiveness – must havetop level buy in and incorporation of health into allmessaging
• Assignment of resources matters – staffing gets it done
• Creation of community collaboration is crucial
• Good sample policies and guidelines are available from earlyadopting agencies and appear to be working (need furthermeasurement of outcomes)
357

Appendix H – Penbrooke Delphi Panel Presentation #3
Going Forward:Implications for Research and Practice
• Disseminate and translate current research to practice• More research and publications needed for systems planning for local P&R• Need tools, templates, and evidence based instruments on systems level• P&R needs to better connect with public health, schools, medical,
transportation, safety, and other providers• Create valid consensus on standards for P&R field overall (e.g., response
times, quality of exposures, and dosages)• Share and disseminate successful policies and plans• Focus on highlighting importance for sustainable funding (return on
investment and evaluation of outcomes) by P&R
Next Steps
Questions or Suggestions?
Thank YOU for your support!
358
APPENDIX I - Draft Key Delphi Study Informant Online Questionnaires Protocol
Penbrooke Dissertation:
1) Questionnaire #1 will be drafted online as follows in Qualtrics – not yet formatted.
Introduction Page
Thank you for agreeing to participate in this Delphi Study. The following
questionnaire will ask you a variety of questions related to your role, your agency, the
processes you use for decision making, the data you collect, and the outcomes that you are
evaluating related to health factors that may be modifiable at a local parks and recreation
level, related mostly to middle school youth. You have separately been provided a
literature summary covering the key identified factors (nutrition, physical activity,
transportation and access, perceptions of safety, social and parental engagement, etc.).
This questionnaire will likely take about 15 minutes to complete, and you can
continue where you left off if interrupted, if you save each page. Please finish the survey
by XX. You will receive a summary of the results. Thank you!
1. What is your Name and Agency?
First, Last, Certifications/post-nominal designationsAgencyTitleMailing address –Street/City/State/Zip EmailPhone
2. What is your Primary Level of position at your agency?
Director/Senior ManagerAssistant Director/Assistant ManagerSupervisor level (includes staff supervision, may be more than oneprogram area) Coordinator/Programmer (program/division/operationallevel)Instructor
359
VolunteerOther:
3. How long have you been in your current position with your agency?
Less than 1 year1 to less than 3 years3 to less than 5 years5 to less than 10 years10 to less than 20 years. More than 20 years
4. How long have you been in the field of professional local government parksand recreation management?
Less than 1 year1 to less than 3 years3 to less than 5 years5 to less than 10 years10 to less than 20 years. More than 20 years
5. Which of the following potentially modifiable health factors does youragency try to address through parks and recreation programs, planning,partnerships and/or other methods? (check all that apply)
NutritionPhysical ActivityTransportationSocial/Peer EngagementParental EngagementPerception of SafetyOther:
6. What percentage of your time during an average monthly workload do youspend focused on addressing all of these health and wellness factors for youragency?
0 – 9%10 – 24%25 - 49%50 – 74%75-100%
360

7. Are other staff assigned/funded to work specifically on these factors for youragency?
If so, please list:# of staff from your agency funded for this workEstimated total hours worked in an average month by other staff in totalon these factors for your agency
8. Of that time spent in an average month, how much time of time from allagency staff do you estimate is spent specifically addressing any of the factorsfor middle-school aged youth?
0 – 9%10 – 24%25 - 49%50 – 74%75 - 100%
9. Of the health factors that your agency tries to address, how do you do so?(write in answer for each:
NutritionPhysical ActivityTransportationSocial/Peer EngagementParental EngagementPerception of SafetyOther:
10. Do you assess or evaluate outcomes for any of the health factors?
Yes No
11. If yes, what types of tools or process do you use to evaluate them? (write inanswer for each):
NutritionPhysical ActivityTransportationSocial/Peer EngagementParental EngagementPerception of SafetyOther:
361

12. In the last year, have you documented any measurable outcomes for thefactors?
Yes No
13. If yes, what outcomes did you document? (write in any answersfor each)?
NutritionPhysical ActivityTransportationSocial/Peer EngagementParental EngagementPerception of SafetyOther:
14. How hard or easy was this survey to complete? 1 = very hard, 5 = very easy1 2 3 4 5
15. Do you have any other thoughts to share related to this study at this time?
Questions will be limited to 15 – 20 to promote compliance and completion. Names of informants will be identified in the study but answers will be aggregated to minimize specific agency identification or judgement of specific agencies in analysis. Specific positive innovations or outcomes may be highlighted by identifiers to provide credit to those agencies.
A second Questionnaire #2 will be created to include ranking/prioritization of factors and processes listed through Questionnaire. #1 (related specifically to Q.5) along with collecting additional open ended comments on challenges/opportunities for process/outcome evaluation. See Questionnaire #2 Protocol.
4) All Key Informants will receive and review summary results and any inaccuracies will benoted.
Case Study participants will participate in Quest. #1 and #2 also, and results will be analyzed both together and separately in subsequent focus groups for additional deepening of results.
362

Q1 Introduction Thank you for agreeing to participate in this Delphi Study. The following questionnaire will ask you a variety of questions related to your role, your agency, the processes you use for decision making, the data you collect, and the outcomes that you are evaluating related to health factors that may be modifiable at a local parks and recreation level, related mostly to middle school youth. You have separately been provided a literature summary presentation covering the key identified factors (nutrition, physical activity, transportation and access, perceptions of safety, social and parental engagement, etc.). This questionnaire will likely take about 15 to 25 minutes to complete, and you can continue where you left off if interrupted, if you save each page. Please finish the survey by October 21st. You will receive a summary of the results prior to the next Focus Group #2. Thank you!
Q2 First Name
Q3 Last Name
Q4 Agency Name
Q5 Title / Role Director/Senior Manager (1)Assistant Director/Assistant Manager (2)Supervisor level (includes staff supervision, may be more than one program area) (3)Coordinator/Programmer (program/division/operational level) (4)Instructor (5)Volunteer (6)Other: (7) ____________________
Q8 Agency Address: Street (1) City (2) State/Country (3) Postal Code (4) Phone Number (5) Email Address (6)
Q10 How long have you been in your current position with your agency? Less than 1 year (1)1 to less than 3 years (2)3 to less than 5 years (3)5 to less than 10 years (4)10 to less than 20 years (5)More than 20 years (6)
363

Q12 How long have you been in the field of professional local government parks and recreation management?
Less than 1 year (1) 1 to less than 3 years (2) 3 to less than 5 years (3) 5 to less than 10 years (4) 10 to less than 20 years (5) More than 20 years (6)
Q9 Which of the following potentially modifiable health factors does your agency try to address for Middle School youth (ages 10 - 15) through parks and recreation programs, planning, partnerships and/or other methods? Check all that apply and rank them in the order of current highest priority for you. 1 is the highest priority, and 8 being you do not address at all. ______ Nutrition / Food Availability (1) ______ Physical Activity (2) ______ Transportation / Access (3) ______ Social/Peer Engagement (4) ______ Parental Engagement / Education (5) ______ Safety or Perception of Safety (6) ______ Other Factor? (7) ______ Other Factor? (8)
Q13 If you address Nutrition / Food Availability through your work, please describe and provide examples of how your agency addresses this factor through methods, process, programs, collection of data, evaluation, and/or outcomes that are addressed. If you do not address this factor at all, please answer NA.
Q14 If you address Physical Activity through your work, please describe and provide examples of how your agency addresses this factor through methods, process, programs, collection of data, evaluation, and/or outcomes that are addressed. If you do not address this factor at all, please answer NA.
Q18 If you address Transportation / Access through your work, please describe and provide examples of how your agency addresses this factor through methods, process, programs, collection of data, evaluation, and/or outcomes that are addressed. If you do not address this factor at all, please answer NA.
Q19 If you address Social Peer to Peer Engagement through your work, please describe and provide examples of how your agency addresses this factor through methods, process, programs, collection of data, evaluation, and/or outcomes that are addressed. If you do not address this factor at all, please answer NA.
Q20 If you address Parental Engagement / Education through your work, please describe and provide examples of how your agency addresses this factor through methods, process,
364

programs, collection of data, evaluation, and/or outcomes that are addressed. If you do not address this factor at all, please answer NA.
Q21 If you address any other potentially modifiable health factor through your work, please describe and provide examples of how your agency addresses this factor through methods, process, programs, collection of data, evaluation, and/or outcomes that are addressed. If you do not address any other factors at all, please answer NA.
Q22 Do you assess or evaluate any specific outcomes for any of the health factors from the last question?
Yes (1) Maybe (please explain) (2) ____________________ No (3)
Answer If Do you assess or evaluate specific outcomes for any of the health factors from the last question? Yes Is Selected Q24 If you assess or evaluate specific outcomes, which outcomes are you trying to measure? Select the factor(s) and write in a brief description of the measured outcome and any other info that seems relevant to you.
Nutrition / Food Availability (1)Physical Activity (2)Transportation / Access (3)Social/Peer Engagement (4)Parental Engagement / Education (5)Safety or Perception of Safety (6)Other Factor? (7) ____________________Types of tools used for outcomes assessment (8) ____________________
365

Q25 The following list includes just some of the methods and tools identified from the literature that are being used to systematically address modifiable health factors through public parks and recreation. Please check any of the tools/methods that your agency has used in the last five years. (note, BMI means Body Mass Index , i.e.; do you measure specific individual physical characteristics?)
Extremely effective (78)
Moderatelyeffective (79)
Not effective at all (80)
Never used (81)
Don't Know (82)
SystemInventory of
AssetsAvailable (1) SystematicProgram
Analysis (2) Creation of a communitycoalition (3)
Financialanalysis of
health factors impact (4) CreatingPostiive
Policy focus on factors (5) Surveying of
youth in community
(6)Creation of
Youth Group to address factors (7) Creatingspecific
program to address
factors (8) Centralizedweb/social
media on the factors (9)
Hiringspecific staff to address factors (10)
366
Analyzingpartners and alternative
providers (11) Pursuing
grant funding for factors
(12)General
communitysurveying on factors (13)
Evaluation of crime rates / safety (14) Parental
educationaround
factors (15) Youth
Programsaround
factors (16) Physical
Evaluation(like BMI
measures)(17)
Other special assessments
on factors (walkability,
foodavailabiity,etc.) (18)
Correlation of health
metrics to site planning (19)
Other (20) Other (21)
367

Q26 What percentage of your time during an average monthly workload do YOU spend focused on addressing all of these health and wellness factors for your agency?
0 – 9% (1) 10 – 24% (2) 25 - 49% (3) 50 – 74% (4) 75 - 100% (5)
Q28 Are other staff assigned/funded to work specifically on these factors for your agency? No other staff are assigned or funded specifically for addressing these factors (1) Yes, - Number of staff that are assigned (2) ____________________ Yes - Estimate the TOTAL number of hours from other staff (not you) that are allocated on
an average monthly basis for your agency to specifically addressing these factors (Note to calculate: Full time is typically 160 hours per month) (3) ____________________
I don't know or other (explain) (4) ____________________
Q29 The Focus Group #1 Presentation included a variety of questions, some of which are not already covered in the previous questions here. Due to time constraints, we were not able to completely delve deeply into the responses. If you were not able to attend, or have additional answers to the following questions, essay response space is provided. Feel free to elaborate as much as you think will be helpful for this study and your peer Key Informants. Thank you for your attention to this!
Q30 What are the strengths you see in how your agency addresses the health factors?
Q31 What are the primary weaknesses (internal to your agency) or external challenges (threats) your agency faces in trying to address these health factors?
Q32 What are the opportunities you see for your agency in going forward related to systematic processes for addressing these factors?
Q33 How difficult was it for you to complete this survey? Extremely easy (1) Somewhat easy (2) Neither easy nor difficult (3) Somewhat difficult (4) Extremely difficult (5)
Q34 Is there anything else we should consider around this research or questions you have at this time?
368

APPENDIX K – QUESTIONNAIRE #2 PROTOCOL
Questionnaire #2 – Penbrooke - Delphi Panel and Case Study #1)
Questions: Prioritization of process/application for Health Factors in Your Community
For the following potentially modifiable health factors identified in the literature, please rank from 1 to 5 (1 is most important, 5 is least important) for your agency to address for your community:
Factor Operating Definition Likert Scale
I. Nutritionregimen
A balanced intake of food that is comprised of various solids, liquids, fresh and prepared foods that provide the necessary daily nutrients for an active lifestyle and is culturally relevant.
1 2 3 4 5
II. Social /Parentalinteraction
Positive social relations with peers & adults in various settings. Engaging in social discourse. Developing and maintaining friendships with others.
1 2 3 4 5
III. Transportation services
Various modes of transportation of individuals or groups including vehicles offered by public, private or family members. Primarily used for getting youth to and from a program, event or activity.
1 2 3 4 5
IV. Physicalactivity
The array of opportunities in a community that require physical skills and capacities (e.g.) balance, strength, flexibility, etc.), and often specific venues in which to engage during free or discretionary time.
1 2 3 4 5
V. SafetyPerception of safety to participate in programs, activities, events, places, spaces (indoors or outdoors) that are not likely to cause avoidable harm, personal injury, or perceived threat of same.
1 2 3 4 5
VI. Other Write in any other health factor and then rank: 1 2 3 4 5
369
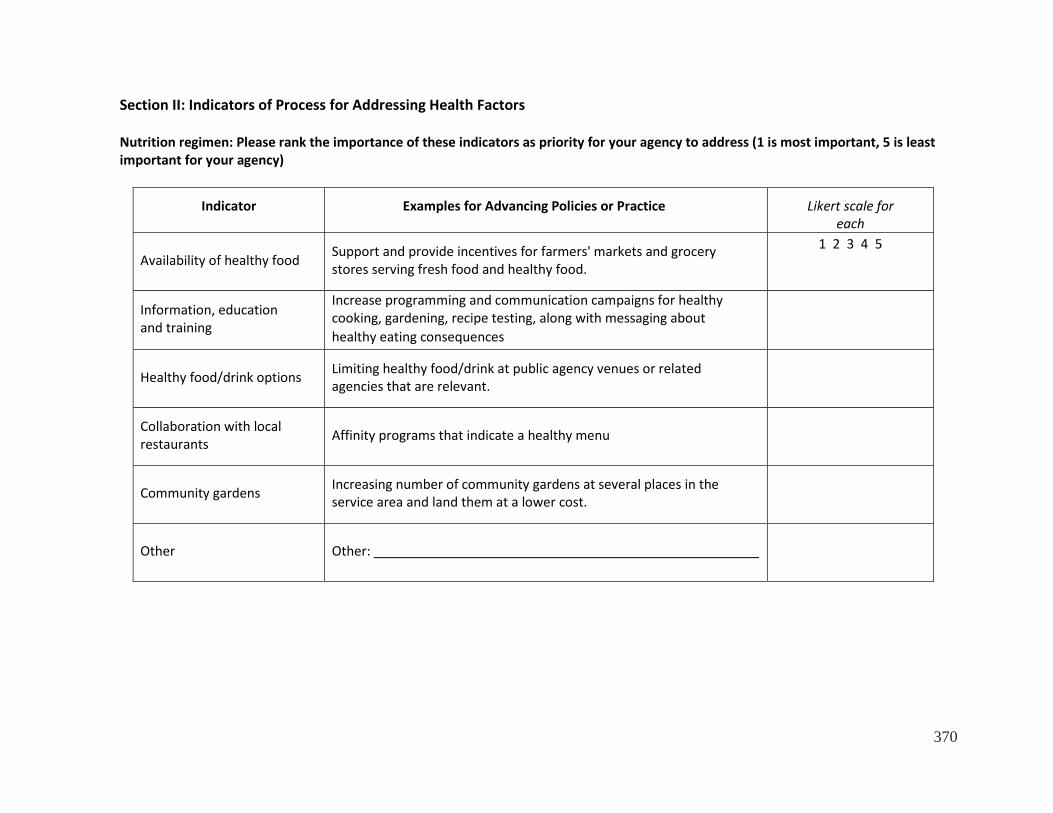
Section II: Indicators of Process for Addressing Health Factors
Nutrition regimen: Please rank the importance of these indicators as priority for your agency to address (1 is most important, 5 is least important for your agency)
Indicator Examples for Advancing Policies or Practice Likert scale for each
Availability of healthy food Support and provide incentives for farmers' markets and grocery stores serving fresh food and healthy food.
1 2 3 4 5
Information, education and training
Increase programming and communication campaigns for healthy cooking, gardening, recipe testing, along with messaging about healthy eating consequences
Healthy food/drink options Limiting healthy food/drink at public agency venues or related agencies that are relevant.
Collaboration with local restaurants Affinity programs that indicate a healthy menu
Community gardens Increasing number of community gardens at several places in the service area and land them at a lower cost.
Other Other:
370

II. Social Interaction and Engagement: Please rank the importance of these indicators as priority for your agency to address (1 ismost important, 5 is least important for your agency)
Indicator Examples for Advancing Policies or Process Likert scale for each
Efforts to prevent bullying and hazing
Establish programs, campaigns, etc. for those who are ostracized or socially isolated, and those who engage in bullying behaviors.
1 2 3 4 5
Non-competitive non- physical organized activity options
Encourage more youth to participate in non-competitive, non- physical activities to increase retention in programs/activities.
Establish practices of social inclusiveness
Emphasize the virtue of friendships, teamwork, and a sense of belonging in the every program
Positive social environment
Create positive atmosphere where all youth are welcomed, valorized and respected; Establish a strong policy strictly prohibiting bullying or hazing behaviors.
Parental engagement programs/services
Offering programs, services and activities focused on increasing parental engagement and/or education.
Other Other:
371

II. Transportation/Access to ServicesPlease rank the importance of these indicators as priority for your agency to address (1 is most important, 5 is leastimportant for your agency)
Indicator Examples of Strategies for Advancing Policies & Practice Likert scale for each
Addressing accessibility, availability, and Interconnectivity of public transportation
Transportation in communities is multi-modal and requires close access, available when most needed, synchronized with programs, services and operating hours, and account for interconnectivity across the community at large.
1 2 3 4 5
Collaboration Collaboration with schools, local businesses, and other agencies when utilizing public modes of transportation to and from agency facilities & programs
Convenience Synchronization programs, events, services, activities of the agency with other youth services
Consumer knowledge of public transportation services
Information and training strategies to increase the level of awareness of public transportation to and from facilities, programs, events, services, activities
Utilization rates Monitor utilization rates by type of customer, location, mode of transportation, frequency, time/day, etc.
Other Strategies Other:
372

III. Physical ActivityPlease rank the importance of these indicators as priority for your agency to address (1 is most important, 5 is leastimportant for your agency)
Indicator Examples of Strategies for Advancing Policies and Practice Likert scale for each
Quality of natural and built assets
Strategically increase the number of amenities, type, and invest more financial resources for maintenance
1 2 3 4 5
Varied physical demands of programs/services
Utilize analysis to examine the level of required physical skills in programs, events, activities, sport types by age, gender, etc. to sustained engagement across the lifespan
Availability of assets/programs
Using GIS to document the location and operating hours/days of all natural and built assets programs, services, activities, events by age, program type, etc.
Application of evidence based standards, practices by staff
Using national, state and other physical fitness standards seek to increase the physical capacity of each individual in community. Review and implement evidence based practices to increase physical capacity (aerobic, strength, flexibility, balance, etc.).
Marketing and promotion of increased physical capacity
Utilize varying modes of increasing physical activity through collaboration, partnerships, sponsorships, campaigns to increase awareness of the vital role in personal and public health
Other Strategies: Other:
373

IV. Safety and Perception of SafetyPlease rank the importance of these indicators as priority for your agency to address (1 is most important, 5 is leastimportant for your agency)
Indicator Examples of Strategies for Advancing Policies and Practice Likert scale for each
Assess crime rate at or near assets/programs
Collaborate with law enforcement to reduce crimes in areas managed by P & R. Install surveillance cameras, Hire police or security officers, CPTED principles or positive activation.
1 2 3 4 5
Parent/children perception of safety level
Make streetlights brighter, more people on trails, speed bumps near P&R buildings and pedestrian walkways.
Prevention practices of direct and affiliated service providers
Staff training and communications for accident/injury free environment and safety education for participants
Safety inspection & risk management
Conduct frequent and regular inspections to assure safe operations at facilities (built or natural) and in programs/events/services.
Staff supervision & surveillance efforts
Establish standards for supervision & surveillance at all sponsored programs, events, activities as well as managed assets.
Other Strategies Other:
374

Q1 Welcome to Questionnaire #2 for our Delphi Panel! As discussed during the Focus Group #2 presentation, for this questionnaire, you have been asked to review the material presented in Focus Groups #1 & #2, and the resources in the Basecamp files to help us "deepen" the findings and explore certain aspects of this research. This survey is not optimal for small screen mobile viewing, so a computer monitor or larger tablet is advised. This questionnaire is longer and will require deeper thought, but please complete as best possible, as it is the last big gathering of information from you directly (beyond your review input in Focus Group #3 and our review of your resources submitted) for this research study. Part of the goal of a Delphi Panel with Key Informants is for us all to learn from and deepen our understanding through this three-stage process. You can leave the survey and come back to complete, if needed. Just use the same computer on which you've started. Email with any questions. Thanks in advance for your attention and efforts!
Q4 What is your last name?
Q5 What is your agency name?
Q2 Were you able to participate in Focus Group #2? YesNo
Q3 Have you been able to review the data provided from the first stage of the Delphi Panel from the presentation for Focus Group #2? If not, you may want to take the time do do so now at: https://3.basecamp.com/3541923/buckets/1528344/uploads/306434665
YesSomewhat or mostlyNo
Q6 The next section asks questions that were asked towards the end of Focus Group #2. Due to time mix-ups, some people were unable to participate (sorry for the mix-up!). If you DID NOT participate in Focus Group #2 for whatever reason, please answer the following two question blocks as best you can. If you DID participate, feel free to elaborate here, or if you said all you had to say, simply skip through these next two question blocks without additional answering.
Q7 What made it easy or difficult for you to answer Questionnaire #1?
Q8 What did you think of the summary of information presented in Focus #2? Were there any surprises? Did it make you think of any additional methods, tools, outcomes or resources you would add now? What do you think of the rank order of the data presented in the graphs? Do they ring true to you based on your experience? Any additional thoughts or suggestions? Please write as much detail as you think will help inform the study.
375

Q9 Participation or Benefit from National Initiatives Which national or international programs / initiatives related to the addressing the primary potentially modifiable Health Factors identified through Questionnaire #1 (nutrition, physical activity, safety, transportation, parental and social engagement, mental health such as access to nature and/or stress management, tobacco cessation, etc.), especially as related to middle school youth, are you familiar with? Does your agency currently participate in their initiatives (or have in the past)? Any comments?
Are you Active with them? Are you familiar with them?
Anyadditional
comments?
YES Not now but YES in past NO Yes No Comments
ACHIEVE Active Living
Coalition Active Living by
DesignACSM’s Exercise is
MedicineActive Living
ResearchAfter School
Association’s – Healthy Eating
Physical Activity Standards (HEPA)
Alliance for a Healthier
GenerationCDC's Healthy
Places Parks HIA Toolkit
Community Health Improvement Plans
(CHIP) Community Health
NeedsAssessments
(CHNA) Complete Streets Eat Smart, Move
More GP RED’s
Surveillance and Management Toolkit (SMT)
376

GP RED’s Safe Routes to Play
Harvard’s Food & Fun Afterschool
Programs Healthy Kids
ConceptsHealthy Parks
Healthy People KaBOOM!’sPlayabilityLet’s Move Live Well
Media Smart Youth NIOST’s Healthy
Out of School Time NFL Play 60
NRPA’s Commit to Health
NRPA’s Safe Routes to Parks Partnership for
Healthier America PHIT America Safe Routes to
SchoolSPARK
Together Counts Trust for America’s
HealthOther
Q10 Of the national initiatives and programs listed, which have been the most effective or helpful for your agency and why? Anything else you care to comment on about these national initiatives?
377
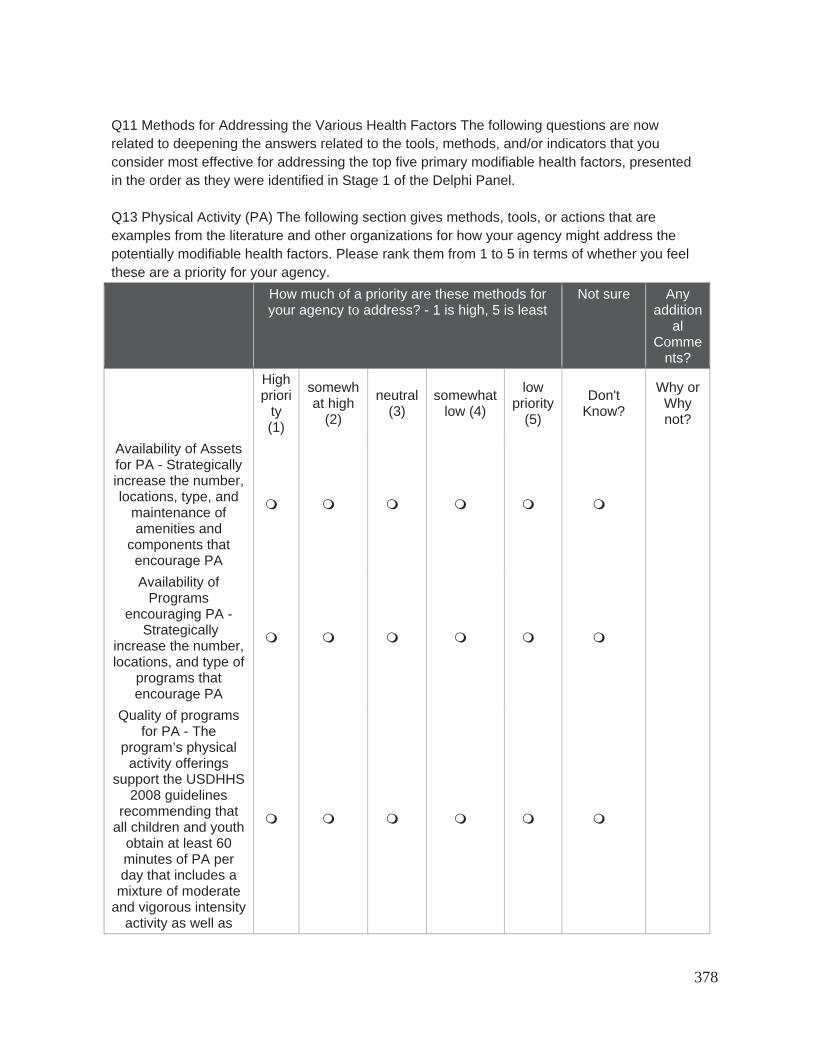
Q11 Methods for Addressing the Various Health Factors The following questions are now related to deepening the answers related to the tools, methods, and/or indicators that you consider most effective for addressing the top five primary modifiable health factors, presented in the order as they were identified in Stage 1 of the Delphi Panel.
Q13 Physical Activity (PA) The following section gives methods, tools, or actions that are examples from the literature and other organizations for how your agency might address the potentially modifiable health factors. Please rank them from 1 to 5 in terms of whether you feel these are a priority for your agency.
How much of a priority are these methods for your agency to address? - 1 is high, 5 is least
Not sure Anyaddition
alComme
nts?Highpriori
ty(1)
somewhat high
(2)
neutral(3)
somewhatlow (4)
lowpriority
(5)
Don'tKnow?
Why or Whynot?
Availability of Assets for PA - Strategically increase the number, locations, type, and
maintenance of amenities and
components that encourage PA Availability of
Programsencouraging PA -
Strategically increase the number, locations, and type of
programs that encourage PA
Quality of programs for PA - The
program’s physical activity offerings
support the USDHHS 2008 guidelines
recommending that all children and youth
obtain at least 60 minutes of PA per day that includes a
mixture of moderate and vigorous intensity
activity as well as
378

bone and muscle strengthening
activities. Offer varied physical
demands of programs/services - Utilize analysis to
examine the level of required physical skills in programs, events, activities,
sport types by age, gender, etc. to
sustainedengagement across
the lifespan Staff training - Specific staff
participate in learning about physical activity using
effective training models and using
content that is evidence-based.
Monitor and assess programs and assets
- Document thelocation, hours/days,
and use of natural and built assets
programs, services, activities, events by age, program type,
etc. Application of
evidence based standards to increase
individual physical capacity - Using
national, state, and other physical fitness standards to seek to increase the physical
capacity (aerobic, strength, flexibility, balance, reduced
weight, etc.) of individuals in
379

community.Collaboration with
other organizations - Offer or advertise
programs that promote PA
managed by others beyond those the
agency can provide. Create a Park
Prescription (Park Rx) Program - Work
with healthcare organizations and
physicians to enable them to “prescribe” agency programs or assets that enhance
PA.Marketing and
promotion to increase PA - Utilize varying
campaigns to increase PA through increased awareness
of the vital role in personal and public
health (signage, messaging,
wayfinding kiosks, etc.)
Other
380

Q16 Social - Peer and Parental Engagement -The following section gives methods, tools, or actions that are examples from the literature and other organizations for how your agency might address the potentially modifiable health factors. Please rank them from 1 to 5 in terms of whether you feel these are a priority for your agency.
How much of a priority are these methods for your agency to address? - 1 is high, 5 is least
Notsure
AnyadditionalComment
s?High
priority(1)
somewhat high
(2)
neutral (3)
somewhat low
(4)
lowpriority
(5)
Don'tKnow
?
Why or Why not?
Organizational culture of social inclusion -
Organization and staff create a social
environment (including positive relationships among staff, youth,
families and community) that
encourages all ages and abilities to enjoy
and participate. Availability of non-competitive non-
physical organized activity options -
Encourage youth to participate in non-competitive, non-
physical activities to increase participation
and retention in programs.
Efforts to prevent bullying and hazing - Establish programs, campaigns, etc. for
those who feel ostracized or socially isolated, and those
who engage in bullying behaviors.
Staff training - Specific staff participate in
learning about methods for social
inclusion using
381
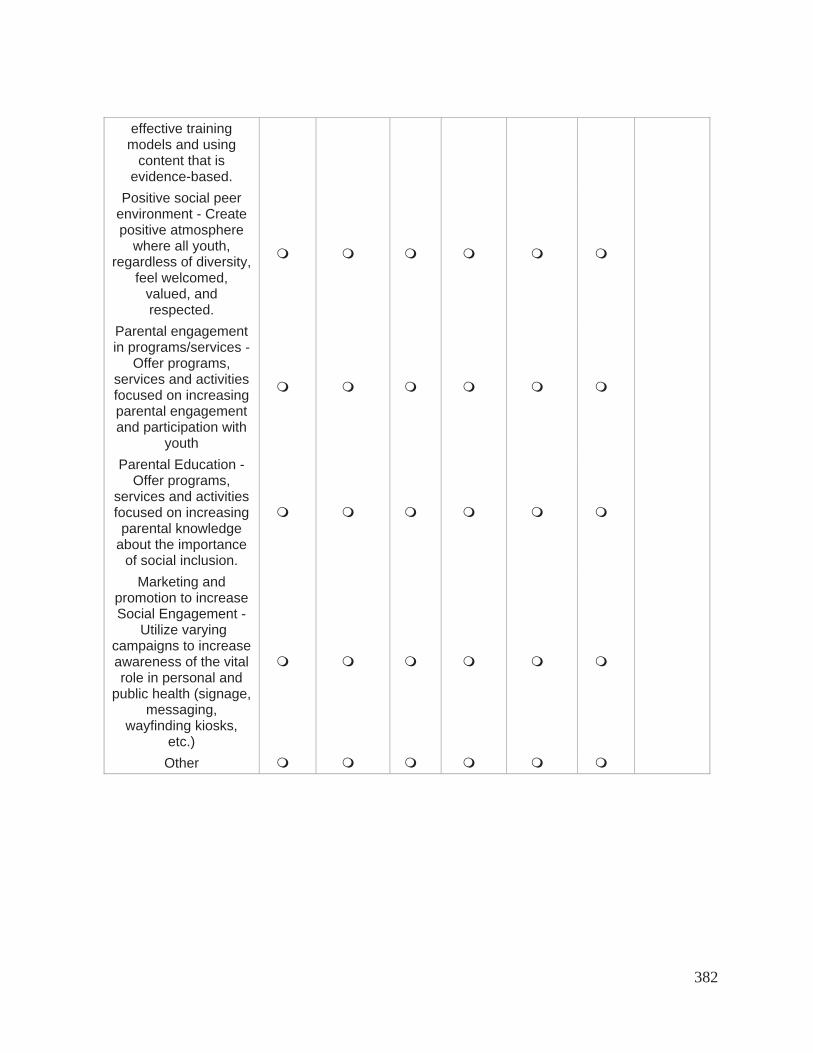
effective training models and using
content that is evidence-based.
Positive social peer environment - Create positive atmosphere
where all youth, regardless of diversity,
feel welcomed, valued, and respected.
Parental engagement in programs/services -
Offer programs, services and activities focused on increasing parental engagement and participation with
youthParental Education -
Offer programs, services and activities focused on increasing parental knowledge
about the importance of social inclusion.
Marketing and promotion to increase Social Engagement -
Utilize varying campaigns to increase awareness of the vital role in personal and
public health (signage, messaging,
wayfinding kiosks, etc.)Other
382

Q17 Safety and / or Perception of Safety -The following section gives methods, tools, or actions that are examples from the literature and other organizations for how your agency might address the potentially modifiable health factors. Please rank them from 1 to 5 in terms of whether you feel these are a priority for your agency.
How much of a priority are these methods for your agency to address? - 1 is high, 5 is least
notsure
Anyadditional
Comments?High
priority(1)
somewhathigh (2)
neutral(3)
somewhatlow (4)
lowpriority
(5)
Don'tKnow?
Why or Why not?
Assess actual crime rates at or
near assets / programs -
Collaborate with law
enforcement to measure and reduce crimes
in areas managed by P
& R.Activate crime
preventionmeasures -
Strategically implement
CPTEDprinciples and
positiveactivation, such
as installing surveillance
cameras, hiring police or
security officers, make brighter
lighting,activating more people on trails, installing speed
bumps near P&R buildings and pedestrian walkways, etc.
Promotepreventionpractices of
383

direct and affiliated service providers - Staff and volunteer training and
communicationsfor accident /
injury free environment and safety
education for participants.
Staff training - Specific staff participate in
learning about methods for increasing
safety using effective
training models and using
content that is evidence-
based. Safety
inspection & risk
management - Conduct
frequent and regular
inspections to assure safe
operations at facilities (built or natural) and in
programs / events / services.
Staffsupervision & surveillance
efforts - Establish
standards for supervision & surveillance at all sponsored
384

programs,events,
activities as well as managed
assets. Marketing and promotion to
increasePerception of
Safety - Utilize varying
campaigns to increase
perceivedsafety and
safety practices. Other
385

Q18 Nutrition The following section gives methods, tools, or actions that are examples from the literature and other organizations for how your agency might address the potentially modifiable health factors. Please rank them from 1 to 5 in terms of whether you feel these are a priority for your agency.
How much of a priority are these methods for your agency to address? - 1 is high, 5 is least
notsure
Anyadditional
Comments?High
priority(1)
somewhathigh (2)
neutral(3)
somewhatlow (4)
lowpriority
(5)
Don'tKnow?
Why or Why not?
Communityavailability of healthy food - Support and
provide incentives for farmers'
markets, grocery stores serving
healthy food, or other ways to
make healthy food available.
Policies around agency availability of healthy food - Enact policy and guidelines around food for programs
and healthy vending for onsite sales/concessions. Programs around healthy eating - youth - Increase programming for healthy cooking, gardening, recipe
testing, and/or nutrition for youth Programs around healthy eating –
parents - Increase programming for healthy cooking, gardening, recipe
testing, and/or nutrition for
parents.
386

Marketing & Communication -
Provide an educational
campaign on the benefits of healthy eating (signage, messaging, etc.)
Collaboration with local restaurants
or stores - Promote affinity programs that
indicate healthier items.
Collaboration with schools and other
providers - Recommend policy and/or
provide resources for other providers
around nutrition Community
gardens - Increase the number of
communitygardens in the
service area and land and provide
them at a low cost.
Staff resources focused on
nutrition - Provide staff trained in healthy eating
practices. Other
387

Q19 Transportation/Access to Services - The following section gives methods, tools, or actions that are examples from the literature and other organizations for how your agency might address the potentially modifiable health factors. Please rank them from 1 to 5 in terms of whether you feel these are a priority for your agency.
How much of a priority are these methods for your agency to address? - 1 is high, 5 is least
notsure
Anyadditional
Comments?High
priority(1)
somewhathigh (2)
neutral(3)
somewhatlow (4)
lowpriority
(5)
Don'tKnow?
Why or Why not?
Addressaccessibility,
availability, and Interconnectivity
of public transportation - Transportation in communities is multi-modal and provides close access,
available when most needed, synchronized
with programs, services and
operating hours, and account for interconnectivity
across the community at
large.Collaboration - Collaborate with schools,
localbusinesses, and other agencies
to provide public modes of transportation to
and from agency facilities
& programs. Convenience - Synchronize
programs,events, and
388
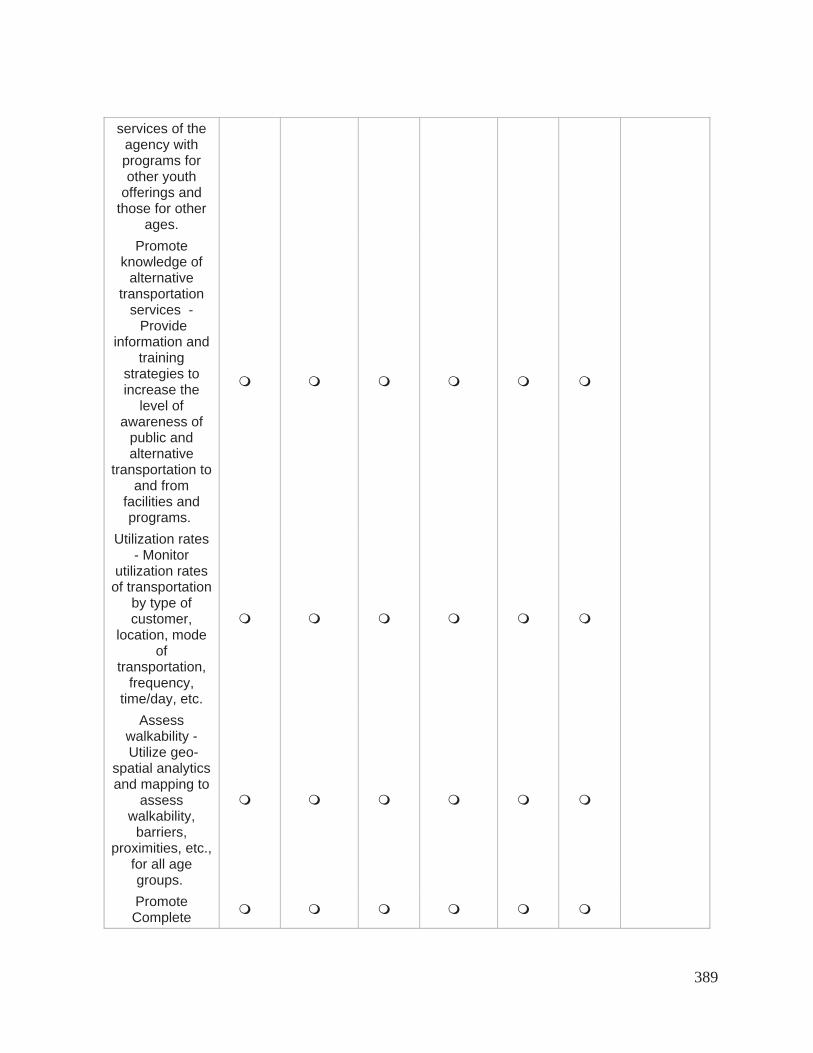
services of the agency with programs for other youth
offerings and those for other
ages. Promote
knowledge of alternative
transportation services - Provide
information and training
strategies to increase the
level of awareness of
public and alternative
transportation to and from
facilities and programs.
Utilization rates - Monitor
utilization rates of transportation
by type of customer,
location, mode of
transportation, frequency,
time/day, etc. Assess
walkability - Utilize geo-
spatial analytics and mapping to
assesswalkability,
barriers,proximities, etc.,
for all age groups.PromoteComplete
389

Streets - Adopt policies and
designguidelines to encourage“Complete
Streets”adaptations for
multi-modaltransportation
planning.Staff training -
Assign and train specific staff to
address and collaborate on transportation
and trails planning.
Other
390

Q21 Other Health Factors -The following section gives methods, tools, or actions that were added by Key Informants on Questionnaire #1. Please rank them from 1 to 5 in terms of whether you feel these are a priority for your agency.
How much of a priority are these methods for your agency to address? - 1 is high, 5 is least
not sure Anyadditional
Comments?High
priority(1)
somewhathigh (2)
neutral(3)
somewhatlow (4)
lowpriority
(5)
Don'tKnow?
Why or Why not?
StressManagement
Programs Tobacco
Cessation - Smoke-
Free/VapeFree
Policies,Ordinances
and/orEducation
Development of Team Building
SkillsProvidingaccess to
natureAny Others
Q25 Any other additional thoughts or suggestions for us to consider going forward into Stage 3 of the Delphi Panel?
Q23 How difficult was it for you to complete this survey? Extremely easy Somewhat easy Neither easy nor difficult Somewhat difficult Extremely difficult
Q24 Why was it easy or difficult for you to complete this survey?
391

Be More Active Choose Sound Nutrition Manage Risk Factors and Treat Diseases
Avoid Risky Behaviors Safety
Knowledge health benefitsassociated withphysical activitythe varying types andintensity of physicalactivitybasic fitness principles
food groupsportion sizesnutritional content offood
where to accessresourceshealth literacy
physical andpsychological effectsof drugs and alcohol
water safetysigns and symptoms ofphysical distress
Skills instruction inindividual and teamsportsinstruction in other
activities thatincorporate physicalactivityinjury prevention
determining one’s ownnutrition intake andnutritional needspreparing a healthymealcalculating portionsizes
administering medicalself- carepersonal hygienepractices
coping skills (drugrefusal, emotionalregulation, andrelaxation)decision-making skills
rescue skillsCPR/First Aid
Attitudes adopting a positiveattitude towardsfitness and exercise
adopting a positiveattitude andappreciation towardssound nutrition
adopting a positiveattitude towardsincorporatingprotective behaviors
increased self-efficacy increased self-efficacy
Behaviors changes in frequencyand duration ofphysical activitychanges in overalllevel of leisure timephysical activity
incorporating morehealthy mealsincreasing the varietyof healthy foodsconsumed, based onnutritional needs
increased personalresponsibility and carefor minor illnesses
making lower-riskdecisionsmore readily identifiesrisk and avoids it
more likely to assesssituations andactivities for safetyconcerns
Conditions improvements inoverall fitness levelsachieving ormaintaining a healthyweight status
improvements innutrition intakeachieving or
maintaining a healthyweight status
lowered risk of chronicdiseases and ailments
achieving ormaintaining a healthyrelationship withsubstances
more adeptlymaintains situationalawarenessmore readilyrecognizes emergencyconditions andresulting problems andimplements action tosolve problems
392

Knowledge: The fact or condition of knowing something with familiarity gained through experience or association Skill: The ability to use one’s knowledge effectively and readily in execution or performance Attitude: a mental position with regard to or feeling or emotion toward a fact or state Behavior: the way something moves, functions, or reacts Condition: a state of being Social Capital: the networks of relationships among people who live and work in a particular society, enabling that society to function effectively
Social Capital increased collectiveefficacy amongresidents to improveaccess to resourcesfor physical activityand to encourage andsupport continuedparticipationspreading of healthynorms
increased collectiveefficacy amongresidents to improveaccess to resourcesfor healthy eating andto encourage andsupport healthy eatinghabitsspreading of healthynorms
increased collectiveefficacy amongresidents to improveaccess to accuratehealth informationspreading of healthynorms
increased collectiveefficacy amongresidents to improveaccess to resourcesfor avoiding drugs andalcoholspreading of healthynorms
increased collectiveefficacy amongresidents to emphasizeknowledge and skillsof life-savingtechniques
393

Mental health is a state of well-being in which an individual realizes his or her own abilities, can cope with the normal stresses of life, can work productively and is able to make a contribution to his or her community (World Health Organization).
Emotional Intelligence: The ability to know, understand, and manage your emotions Knowledge: The fact or condition of knowing something with familiarity gained through experience or association Skill: The ability to use one’s knowledge effectively and readily in execution or performance Attitude: a mental position with regard to or feeling or emotion toward a fact or state Behavior: the way something moves, functions, or reacts Condition: a state of being Social Capital: the networks of relationships among people who live and work in a particular society, enabling that society to function effectively
Build Self-Esteem and Confidence Cope with Stress and Emotions Knowledge emotional awareness
self-affirmation words
emotional awareness
mental health literacy
awareness of how to seek help and treatmentSkills decision-making skills
inner conflict management skills
coping skills
stress management and relaxation techniques
Attitudes increased self-efficacy enhanced help-seeking efficacy
Behaviors utilizing more positive self-talk
taking more initiative and measured risks
utilizing more relaxation techniques
Conditions increased self-confidence and assertiveness lowered levels of stress
increased emotional intelligence
Social Capital increased collective efficacy among residents tocreate an environment that fosters a sense ofencouragement
increased collective efficacy among residents tocreate a positive, safe environment that fosters asense of inclusion, identity, and connectedness
reduction of stigma
394

Environmental Stewardship Benefits of Nature Outdoor Education Knowledge Conservation and Sustainability
Benefits of reducing, reusing, recycling Hazards to the environment Water quality Natural area and land management Climate change Soil erosion
Benefits of spending time in nature Healing effects of nature Mind-body connection to nature
Common plant and animal species and habitats Natural resources and landmarks (i.e., wetlands, meadows, Chesapeake Bay, etc.) Natural outdoor hazards Environmental cycles
Skills Reduce waste Recycle Create recyclable DIY projects Compost Tree planting Reduce pollutants and emissions Reduce water use Erosion control River clean-up Test water quality Agricultural practices Land management Best practices
Recognize positive effects of exercising outdoors Recognize the benefits of natural remedies Master outdoor relaxation techniques
Care for plants and animals Locate natural resources Identify common animals and plants Identify environmental threats
Attitudes Adopt a positive attitude towards conserving electricity, heat, light, and water Adopt a positive attitude towards reducing waste Adopt positive attitudes against littering Appreciation for water safety Develop ownership of local animal/plant community Empower advocates of the environment
Greater appreciation for spending time in nature Greater appreciation for being holistically healthy Adopting positive attitudes towards healing properties of natural products/remedies Adopt a healthy curiosity of nature Sense of place
A positive attitude towards the value of environmental education A positive attitude towards natural history A positive attitude towards animal preservation and protection Greater appreciation for outdoor activities such as: gardening, camping, nature walk, bird watching Positive attitude towards natural beautification Decrease fear of nature
Behaviors Increase the conservation of energy and natural resources
Increase time outdoors Increase exercise in nature
Positive interactions with different plant and animal species
395

Environmental Wellness: involves leading a lifestyle that is respectful of and in harmony with your environment. (Environmental Wellness, n.d.)
Knowledge: The fact or condition of knowing something with familiarity gained through experience or association Skill: The ability to use one’s knowledge effectively and readily in execution or performance Attitude: a mental position with regard to or feeling or emotion toward a fact or state Behavior: the way something moves, functions, or reacts Condition: a state of being Social Capital: the networks of relationships among people who live and work in a particular society, enabling that society to function effectively
Stewardship: The activity or job of protecting and being responsible for something. Pollutants: unwanted chemicals or other materials found in the air, at high enough concentrations to endanger the environment and people’s health. (B.C Air Quality, n.d.) Emission: discharges of a pollutant from a particular source (e.g., a factory) or group of sources (e.g., vehicles) into the air. (B.C Air Quality, n.d.)
Volunteer time to environmental stewardship projects (i.e., tree planting, trash pick-up, etc.) Reduce littering Increase in recycling habits and purchasing recycled goods Practice habits that lessen pollution Increase sustainable practices at home and in the community Increase water recreation
Explore natural products/remedies Increase contact with nature
Increase engagements with nature Direct experience in nature Service learning outdoors Visiting local landmarks
Conditions Increase protection of natural resources Decrease waste Increase energy savings
Increase appreciation for natural resources Increase outdoor interaction
Increase value for an outdoor learning environment Increase respect for natural resources and landmarks
Social Capital Increase collective efficacy among residents to improve environmental health
Collective respect for the environment and appreciation of nature
Increase public engagement about environmental and education topics Increase collective efficacy among residents to increase resident interaction outdoors
396

Herbal medicine: the art or practice of using herbs and herbal preparations to maintain health and to prevent, alleviate, or cure disease (Merriam-Webster, n.d.)Ethics: rules of behavior based on ideas about what is morally good or bad (Merriam-Webster, n.d.) Recreation: something people do to relax and have fun (Merriam-Webster, n.d.) Holistic: relating to or concerned with complete systems rather than with individual parts (Merriam-Webster, n.d.)Public Engagement: describes the myriad of ways in which the activity and benefits of higher education and research can be shared with the public (NCCPE, n.d) Service Learning: Combining learning goals and community service in ways that can enhance both student growth and the common good (Center for TeachingVanderbilt University, n.d)
Resources
B.C. Air Quality. (n.d.). Retrieved October 11, 2016, fromhttp://www.bcairquality.ca/101/pollutantsemissions.html
Environmental Wellness. (n.d.). Retrieved October 13, 2016, from http://wellness.illinois.edu/dimensions/environmental.html
Live Life Well.co - LifestyleConcept.org - UHWLC.com. (n.d.). Live Life Well - Be Happy & Healthy – Unique Health Wellness and Lifestyle Concepts. Retrieved October 11, 2016, from http://livelifewell.co/category/wellness/index_wellness_arti.php?ARTIwellness_ID= 5
Ochel, E. (n.d.). 62 Beneficial Effects of Nature for Healing and Evolution of Mind, Body & Spirit. Retrieved October 11, 2016, from http://www.evolvingbeings.com/post/beneficial-effects-of-nature-for-healing-evolution-of-mind-body-spirit
Social Wellness. (n.d.). Retrieved October 11, 2016, from http://wellness.illinois.edu/dimensions/social.html
University of California, Riverside. (n.d.). Retrieved October 11, 2016, from https://wellness.ucr.edu/environmental_wellness.html
Wellness Services. (n.d.). Retrieved October 11, 2016, from https://shcs.ucdavis.edu/wellness/environmental
397

Build Relationships Contributing to Community Respecting Differences Knowledge Healthy vs. unhealthy relationships
Communication styles Self-awareness and understanding of how to connect with others
Societal pressures Progressive thinking Leadership styles
Culture of others History of another community Self-assessment
Skills Develop and maintain friendships and social networks Seeking opportunities to connect with others Conflict management/resolution
Societal norms Adapting to change Team-building skills Goal setting and prioritization skills Decision making skills
Cross-cultural skills Identification of preconceived notions, bias and stereotypes Cultural competency
Attitudes Belief in a social support system Adopting a positive attitudes towards increasing communication skills Adopting a positive attitude towards gaining the skills to better manage conflict Appreciation for meeting new people
Adopting a positive attitude towards inspiring others Adopting a positive attitude towards working as a team Increased openness to criticism
Belief that those who differ can live in harmony Increased empathy Appreciating the value of inclusion
Behaviors Active listening Make new friends/keep ties with existing friends Networking Try new hobbies Join an organization or group discussion
Increased use of active listening skills Instilling innovative ideas Utilizing more communication skills Incorporating multiple perspectives into decisions
Explore diversity by interacting with people of other cultures, backgrounds, and beliefs Visiting new communities that differ from your own Join an organization or group discussion about diversity/cultural topics Educate others about personal identity
Conditions Increase resiliency Healthy attachments Greater ties with the community Less social isolation
Increased self-confidence when engaging with others and in decision making Increased sense of belonging
Decrease in racial tension Reducing hate crimes Reduction in bias
398

Social/Cultural Wellness: The ability to perform social roles effectively, build meaningful relationships, and show respect to other people, backgrounds, and cultures.
Knowledge: The fact or condition of knowing something with familiarity gained through experience or association Skill: The ability to use one’s knowledge effectively and readily in execution or performance Attitude: a mental position with regard to or feeling or emotion toward a fact or state Behavior: the way something moves, functions, or reacts Condition: a state of being Social Capital: the networks of relationships among people who live and work in a particular society, enabling that society to function effectively
Assertive: Disposed to or characterized by bold or confident statements and behavior. (Merriam-Webster) Cultural Competency: the self-awareness, cultural humility, and the commitment to understanding and embracing culture as central to effective practice. (Social Workers, 2003). Progressive: favoring or advocating progress, change, improvement, or reform, as opposed to wishing to maintain things as they are (Diectionary.com, n.d.) Cross Cultural skills: The skills and techniques that demonstrate an understanding of and respect for the importance of culture in practice, policy, and research. (Social Workers, 2003)Self-assessment: the act or process of judging one’s own achievements or progress (Merriam-Webster)
Social Capital Building healthy ties with your community Increase collaborations to build social support groups
Establishing social norms for interactions Increased desire for input from varying perspectives for community decisions
Ways to recognize and celebrate diversity
399