ABSTRACT DAMSCHEN, ELLEN INGMAN. Plant community ...
138
ABSTRACT DAMSCHEN, ELLEN INGMAN. Plant community response to landscape connectivity and patch shape. (Under the direction of Nick Haddad and Jim Gilliam.) Land transformation is the single most important factor promoting the global loss of terrestrial biological diversity. Remaining habitat fragments contain more edges, less interior habitat, and are more isolated from other habitat fragments, all of which decrease rates of colonization following local extinctions, reduce reproductive rates and gene flow between populations, and ultimately lead to species extinctions. The best approach to prevent species loss, therefore, is to preserve greater areas of habitat. In many cases, however, habitat has already been fragmented and strategies are needed to configure and manage the remaining land. Land managers often create reserve networks that incorporate the use of landscape corridors, linear strips of habitat connecting isolated patches, to reduce species loss by increasing colonizations and decreasing extinctions. Most empirical tests of corridors have been limited to individuals and populations, leaving corridor effects on diversity largely unknown, especially at large spatial scales. Additionally, only a handful of studies have examined corridor effects on plants, which may be especially sensitive to the abiotic changes resulting from alterations in patch shape due to dispersal limitation. Using one of the best-replicated, large-scale habitat fragmentation experiments, I tested explicitly for corridor effects on plant community diversity and composition by examining the established plant community and the soil seedbank. My experimental design distinguished among the three possible ways corridors can affect between-patch processes: by acting as a movement conduit between connected patches (“connectivity effects”), by increasing area alone (“area effects”), and by intercepting organisms moving across the
-
Upload
khangminh22 -
Category
Documents
-
view
1 -
download
0
Transcript of ABSTRACT DAMSCHEN, ELLEN INGMAN. Plant community ...

ABSTRACT
DAMSCHEN, ELLEN INGMAN. Plant community response to landscape connectivity and patch shape. (Under the direction of Nick Haddad and Jim Gilliam.)
Land transformation is the single most important factor promoting the global loss of
terrestrial biological diversity. Remaining habitat fragments contain more edges, less interior
habitat, and are more isolated from other habitat fragments, all of which decrease rates of
colonization following local extinctions, reduce reproductive rates and gene flow between
populations, and ultimately lead to species extinctions. The best approach to prevent species
loss, therefore, is to preserve greater areas of habitat. In many cases, however, habitat has
already been fragmented and strategies are needed to configure and manage the remaining
land. Land managers often create reserve networks that incorporate the use of landscape
corridors, linear strips of habitat connecting isolated patches, to reduce species loss by
increasing colonizations and decreasing extinctions. Most empirical tests of corridors have
been limited to individuals and populations, leaving corridor effects on diversity largely
unknown, especially at large spatial scales. Additionally, only a handful of studies have
examined corridor effects on plants, which may be especially sensitive to the abiotic changes
resulting from alterations in patch shape due to dispersal limitation.
Using one of the best-replicated, large-scale habitat fragmentation experiments, I tested
explicitly for corridor effects on plant community diversity and composition by examining
the established plant community and the soil seedbank. My experimental design
distinguished among the three possible ways corridors can affect between-patch processes:
by acting as a movement conduit between connected patches (“connectivity effects”), by
increasing area alone (“area effects”), and by intercepting organisms moving across the

landscape and filtering them into connected patches (“drift-fence effects”). Additionally, I
tested for the importance of within-patch edge effects because corridors increase the amount
of edge relative to core habitat in a given patch. I provide evidence that corridors increase
plant diversity through a combination of connectivity, drift-fence, and edge effects that can
be largely predicted from plant dispersal modes. Biotically dispersed plant species (e.g., by
birds and mammals) were most affected by connectivity effects, while passively-dispersed
species (e.g., by wind or gravity) were most affected by drift-fence effects. Resource
managers should consider these differential responses relative to their conservation goals for
particular species or communities.
In a related experiment, I tested for effects of habitat edges on plant performance, which
are known to have impacts on abiotic conditions and biotic interactions. Edge effects have
been especially well documented for forest-dwelling species along edges created by clearing
or disturbing the surrounding habitat, but edge effects for historically open-habitat species
along edges of forests have been virtually ignored. This is the case for many native
herbaceous species in the southeastern United States that once existed in historically open
longleaf pine forests but are now restricted to openings in modern densely planted pine
forests. I tested empirically for edge effects of open habitat species by planting nine species
of native longleaf pine forest herbs (three grasses, two asters, and four legumes) in equal
densities at six distances (0, 6, 12, 25, 50, and 100 m) from an edge of a dense forest into an
adjacent opening. I measured plant growth and flowering as well as available light and soil
conditions. Using multivariate analysis of variance (MANOVA), I determined that plant
growth and flowering were both significantly affected by the distance to the open habitat
edge. Responses for individual species differed, in that some species performed best near the

edge while others performed worst. Incident photosynthetically active radiation, soil
moisture, and competitive interactions with other study species are likely responsible for the
observed tradeoffs in performance. Resource managers should consider thinning the
overstory of longleaf pine forests, establishing uneven age distributions within pine stands,
and initiating regular low-intensity understory burns for the conservation of these understory
species.

PLANT COMMUNITY RESPONSE TO LANDSCAPE CONNECTIVY AND PATCH SHAPE
by ELLEN INGMAN DAMSCHEN
A dissertation submitted to the Graduate Faculty of North Carolina State University in partial fulfillment of the requirements of the
Degree of Doctor of Philosophy
ZOOLOGY
Raleigh
2005
APPROVED BY:
__________________________ _________________________ Dr. George R. Hess Dr. Thomas R. Wentworth
__________________________ _________________________
Dr. Nicholas M. Haddad Dr. James F. Gilliam
Co-chair of Advisory Committee Co-chair of Advisory Committe

ii
DEDICATION
To my grandparents, Dona and Emery Damschen and Eleanor and Boyd Ingman, my parents,
Janie and Dan Damschen, and to John for always believing in me

iii
BIOGRAPHY
I grew-up outside of the Twin Cities in Hopkins, Minnesota. I am the oldest daughter of
Janie and Dan Damschen and have one younger brother, Aren. For as long as I can
remember, my family has gone to lakes in northern Minnesota and to the north shore of Lake
Superior to camp, hike, fish, and find solitude. My parents also took Aren and me on long
roadtrips each summer, allowing us to see much of the United States. These experiences
fostered an appreciation of natural systems and instilled curiosity for how they function.
It was not until after college graduation, however, that I decided to pursue a career in
ecology. A passion for music led me to pursue a Bachelor of Arts degree at Luther College
in Decorah, Iowa where I double majored in flute performance and communication. Two
years after graduating, however, I decided to change my vocation and returned to
undergraduate studies at the University of Minnesota-Twin Cities. I also obtained an
ecological research internship at Cedar Creek Natural History Area in East Bethel,
Minnesota. Working at Cedar Creek was one of the most formative experiences in my life
because I was able to interact with prominent ecologists, gain field experience, and it is
where I met my Ph.D. advisor, Dr. Nick Haddad.
I moved to Raleigh, North Carolina in the fall of 2000 to become Dr. Haddad’s first Ph.D.
student at North Carolina State University. I have had the pleasure to interact with an
incredible group of graduate students and faculty members at NC State. In addition, I have
had the opportunity to spend much of my time in New Ellenton, South Carolina and at the
Savannah River Site while completing my field research. The individuals I met and worked
with in South Carolina made my dissertation experience truly memorable.

iv
ACKNOWLEDGEMENTS
Over the past five years, I have had the privilege of meeting and interacting with many
people who have facilitated the completion of my dissertation and given me great happiness
along the way. Thank you to all of you.
My interest in ecology as a career did not begin in earnest until two years after I graduated
from college. I took an introductory biology course at Luther College in 1999, where I met
Dr. Tom Cottrell, who gave me inspiration and confidence to pursue ecology in the first
place. I also received a great deal of support and encouragement from Jyoti Grewal, who
helped me successfully obtain an internship at Cedar Creek Natural History Area. My
experience at Cedar Creek was one of the most formative experiences in my life and has had
a major impact on my research interests and it is where I met my current Ph.D. advisor, Dr.
Nick Haddad. Thanks to Jenny Goth and Wendy Bengston, Nick Haddad, and Cini Brown
for your leadership and to the many Cedar Creek interns for inspiring me to become an
ecologist.
My dissertation research took place near Aiken, South Carolina at the Savannah River
Site. I spent several years living in New Ellenton, South Carolina, a small southern town that
became home because of the hospitality of our landlords, Robert and Thelma Kirby. I will
always have fond memories of times at 307 Smith Avenue. My work at the U.S. Forest
Service could not have taken place without the help of many people. Thanks to John Blake,
Ed Olson, and Kim Hale for your leadership and the support you have given our project.
Don Imm made much of my work possible, both logistically and financially, and always
made life at the Forest Service more enjoyable. Thanks to Pat Wright for making sure we
always had running vehicles; Jamie Scott for expert knowledge on site preparation, herbicide,

v
and cold storage facilities; and to Ron Mosely and Bob Morgan for the use of the large trucks
when we needed them. Tremendous thanks to the fire crew for maintaining our sites,
especially to Paul Linse, Chris Hobson, Jarvis Brown, Jason Demas, Mark Frizell, Iola
Hallock, Tim Kolnik, Bobby Phillips, Travis McCollough, Kaye Mills, Jason Rose, and
Diana Johnston, for their dedication to the corridor project. The SRWC crew, including
Dave Coyle (a.k.a., “Solver of All Problems”), Mark Coleman, Christy Prenger, and Tucker
Slack always made life enjoyable and provided a wealth of mental and physical resources.
While at North Carolina State, I had the great fortune of becoming friends with a
wonderful group of graduate students. Salinda Daley, my six-foot tall kindred spirit, could
not have been a better roommate and friend. Thank you for the support you gave to me over
my entire dissertation experience. Kristen Rosenfeld, the other half of my brain, has made
my graduate school experience so much more meaningful and has provided sanity during the
times I needed it most. Kristen, thank you for your support, laughter, trust, and confidence.
You will make it difficult for future collaborators to meet my expectations and I could not
ask for a better friend. Thank you to both you and David for all your hospitality and
logistical support over the last two years. Thank you to Jessica and Matt Thompson, Mandy
and Dave Hewitt, Larissa Bailey, Kate Semsar, Dave Davenport, Becky Bartel, Sunny
Snider, and Alesia Read for exciting and fun times over the last five years. Thanks to the
Haddad Lab past and present: Becky Bartel, Jory Brinkerhoff, Brian Hudgens, Daniel
Kuefler, Allison Leidner, and Aimee Weldon. Special thanks to Becky Bartel and Kristen
Rosenfeld for research support and camaraderie during my last two years.
I came to North Carolina State because I wanted to work with Nick Haddad, a new faculty
member whose research on corridors not only tested ecological theory but also provided

vi
information for land management and reserve design. Nick, I could not have had a better
dissertation advisor. You have supported me intellectually and financially, helped be to
become a better ecologist and teacher, provided guidance and sound advice, and most
importantly, you have given me confidence to be an ecologist. I have learned from you to
never “discount my future” too much, that I will “always have more good opportunities than
I have the time for”, and to always remain optimistic. Thank you for everything.
I could not have grown-up with a better family and I am so very grateful for the
tremendous encouragement and support I have gotten. To my brother, Aren, thank you for
your continuous support of what I do. My aunt and uncle, Lorie and Tom Stemig, your
constancy and belief in who I am has given me confidence and allowed me to achieve more
than I thought was possible. To my cousin (i.e., “sister”), Holley Gullickson, and to Shawn,
Joshua, and Tyler, I am so glad to have you as a part of my life. You remind me what is truly
important. I am especially thankful for the lessons my grandparents have taught me: my
Grandma Ingman taught me that nature was exciting and interesting; my Grandpa Ingman
taught me that good story telling and a dry sense of humor can make life a lot more
interesting; my Grandpa Damschen taught me that a positive attitude and endearing spirit can
give you the power to change the world; and my Grandma Damschen gave me ultimate
freedom by always believing I was innately perfect. To my parents, Janie and Dan
Damschen, none of this could have been possible without you: the curiosity you instilled in
me about the natural world, the constant belief that I could do anything, the financial support
when I needed it, and the incredible and constant emotional support that I get each day. I am
truly lucky to have parents that are not only mentors, but also my best friends.

vii
And finally, to John; you have been with me for the whole experience and I don’t know
how I would have completed this enormous task without you by my side. Much has changed
since the early days of changing tires, rebar races, and thermarest furniture, but your
inquisitive spirit, your dedication and hard work, your humorous outlook on life, and your
honorable principles have consistently made my life so much more meaningful. You have
given me strength when I needed it most, challenged me when you knew I could do more,
and always loved me nonetheless. For your tireless patience, support, and love - thank you.

viii
TABLE OF CONTENTS
Page
LIST OF FIGURES x LIST OF TABLES xi CHAPTER 1: HOW CORRIDORS INCREASE PLANT DIVERSITY 1 Abstract 1 Introduction 2 Habitat fragmentation, corridors, and biodiversity 2 Corridor effects and plants 4 Predictions 8 Secondary hypotheses 9 Methods 9 Study site 9 Presence/absence surveys 11 Permanent plot surveys 12 Supplemental edge study 13
Plant species identification 13 Soil moisture 15 Data analysis 16 Total species richness 16 Species richness by dispersal mode 17 Within- and between-patch effects on species richness, evenness, and similarity 18 Supplemental edge study 19 Occurances of rare and common species by patch type 20 Results 20 Total species richness 20 Species richness by dispersal mode 21 Within- and between-patch effects on species richness, evenness, and similarity 22 Supplemental edge study 23 Occurances of rare and common species by patch type 23 Discussion 24
Separating drift-fence and edge effects 25 Applicability of island biogeography 26 Generality of observed patterns 27
Conservation implications and recommendations for future work 28 Acknowledgements 29 Literature cited 31

ix
CHAPTER 2: HABITAT FRAGMENTATION AFFECTS A SEEDBANK 59 Abstract 59
Introduction 60 Fragmentation impacts and seedbanks 60 Methods 62 Study site 62 Seedbank sampling 63 Seedling monitoring 65
Standing vegetation survey 67 Data analysis 67 Results 69 Discussion 70
Fragmentation and the seedbank 71 Relationship between the seedbank and the established plant community 73
Conservation implications 73 Acknowledgements 74 Literature cited 76 CHAPTER 3: EDGE EFFECS ON LONGLEAF PINE SAVANNAH HERBS…………..87 Abstract 87 Introduction 88 Fragmentation and edge effects in open habitats 88 Herbaceous plants in longleaf pine forests 89 Study goals 89 Methods 90 Study site 90 Species and planting methods 91 Plot sampling 93 Environmnetal variables 93 Data analysis 94 Results 95 Discussion 97
Ascribed mechanisms 97 Relationship to historical diversity patterns and conservation 99 Future work 100
Acknowledgements 101 Literature cited 102 APPENDICES Appendix A: Vascular plant taxa found in established plant community surveys
from 2001-2003 125 Appendix B: Vascular plant taxa found in seedbank study 134

x
LIST OF TABLES
Page Table 1.1 Predictions for plant community response to corridors 42 Table 1.2 Results from repeated measures ANOVA for total species richness in the
central 100 x 100 m of each patch 43 Table 1.3 Results from repeated measures ANOVA for total species richness by
dispersal mode in the central 100 x 100 m of each patch 44 Table 1.4 Results from repeated measures ANOVA for species richness in the whole
patch 45 Table 1.5 Results from repeated measures ANOVA for species richness by dispersal
mode in the whole patch 47 Table 1.6 Results from repeated measures ANOVA for total species richness of all
species in Poaceae, Cyperaceae, Juncaceae, and Asteraceae in the whole patch 49
Table 1.7 Chi-square analyses of species traits by patch type for rare and intermediate
species 50 Table 2.1 Results from ANOVA for total number of individuals and species richness
in seedbank 81 Table 3.1 Names and characteristics for the nine species used in the edge study 118 Table 3.2 Standardized canonical coefficients from MANOVA analyses for plant
growth and flower production 119

xi
LIST OF FIGURES Page Figure 1.1 The proportion of corridor studies that have focused on: a) animals vs.
plants, and b) individual- or population-level processes vs. multiple-species or community processes 51
Figure 1.2 Experimental landscape located at the Savannah River Site near
Aiken, SC 52 Figure 1.3 Patch and plot design 53 Figure 1.4 Species richness measured by 544 permanent plots in edge and center plot
locations only during July-August 2000 54 Figure 1.5 Species richness measured from patch-level presence/absence suveys (a, c, e)
and a cumulative list of species from permanent plots (b, d, f) for the whole patch 55
Figure 1.6 Species richness measured from patch-level presence/absence suveys (a, c, e)
and a cumulative list of species from permanent plots (b, d, f) for the central 100 x 100 m of each patch 56
Figure 1.7 Species richness measured from patch-level presence/absence surveys of
graminoids and asters in the fall of 2002 57 Figure 1.8 The proportion of total patches (40) occupied by each species found in
presence/absence surveys from 2001-2003 58 Figure 2.1 Conceptual diagram showing how the spatial configuration of habitat can
affect processes that determine seedbank composition 82 Figure 2.2 Study design for seedbank study in an experimental landscape at the
Savannah River Site, South Carolina 83 Figure 2.3 The percentage of unique and overlapping species between the seedbank and
standing vegetation 84 Figure 2.4 NMS ordination of the seedbank and established vegetative community in
2001, 2002, and 2003 85 Figure 2.5 Species richness and total number of individuals in the seedbank of patch
types and locations 86 Figure 3.1 Historical extent of longleaf pine forest 120

xii
Figure 3.2 Location of edge study sites at the Savannah River Site near Aiken, SC 121 Figure 3.3 Plot layout at each site 122 Figure 3.4 Mean light availability and temperature for each distance category 123 Figure 3.5 Mean plant growth and flowering for nine study species 124

CHAPTER 1: HOW CORRIDORS INCREASE PLANT DIVERSITY
A paper to be submitted to Ecology
Ellen I. Damschen and Nick M. Haddad
Abstract
Corridors are a popular reserve design tool used extensively to preserve biodiversity.
Land managers often create reserve networks that incorporate the use of landscape corridors,
linear strips of habitat connecting isolated patches, to reduce species loss. However, corridor
use is controversial and most empirical tests of corridors have been limited to individuals and
populations. In addition, only a handful of studies have examined corridor effects on plants,
which may be especially sensitive to the abiotic changes resulting from alterations in patch
shape. Using the best-replicated, large-scale habitat fragmentation experiment, we
distinguished among the three possible ways corridors can affect between-patch processes:
by acting as a movement conduit between connected patches (“connectivity effects”), by
increasing area alone (“area effects”), and by intercepting organisms moving across the
landscape and filtering them into connected patches (“drift-fence effects”). We provide
evidence that corridors increase plant species richness through multiple mechanisms:
biotically dispersed plant species respond to the connectivity effects corridors provide, while
abiotically dispersed plant species respond to drift-fence effects. Within-patch edge effects
alone did not account for the increase in diversity. Additionally, corridors increased the
probability of dispersal and pollination events for rare and intermediately common species.

2
Introduction
Habitat fragmentation, corridors, and biodiversity
Landscape corridors were originally proposed as a reserve design tool to preserve
biodiversity by connecting two isolated habitat patches with a thin linear strip of habitat
(Diamond 1975). Corridors are based on two of the most fundamental theories in
conservation biology, island biogeography and metapopulation theory, which gives them
intuitive appeal and has led to their widespread use in reserve design (Mann and Plummer
1993, Mann and Plummer 1995). Despite the common use of corridors, however, empirical
tests of corridor effects are generally lacking and the efficacy of corridors has remained
controversial (Noss 1987, Simberloff 1987, Hobbs 1992, Simberloff et al. 1992, Rosenberg
et al. 1997, Beier and Noss 1998, Haddad et al. 2000). Empirical evidence for corridor
effects comes mainly from studies of individuals and populations (Figure 1.1) and shows that
corridors can increase movement rates (Haas 1995, Sutcliffe and Thomas 1996, Gonzalez et
al. 1998, Haddad 1999a, Haddad et al. 2003), population sizes (Fahrig and Merriam 1985,
Haddad and Baum 1999), and rates of gene flow (Aars and Ims 1999, Hale et al. 2001)
between the patches they connect. However, studies have also shown that corridors can have
neutral (Rosenberg et al. 1998, Haddad and Baum 1999, Danielson and Hubbard 2000) or
even negative effects for some species, through processes such as disease transmission or
predation (Hess 1994, Burkey 1997, Orrock et al. 2003, Orrock and Damschen 2005, Weldon
and Haddad 2005). These studies show that corridor effects can be species and life-stage
specific, making ultimate outcomes for community composition unclear.
Only a handful of studies have examined corridor effects on biodiversity (MacClintock et
al. 1977, Schmiegelow et al. 1997, Gilbert et al. 1998, Gonzalez et al. 1998, Collinge 2000,

3
Hoyle and Gilbert 2004, Rantalainen et al. 2004a, Rantalainen et al. 2004b, Rantalainen et al.
2005). Studies of this type are difficult to implement because they require specific spatial
configurations of habitat, posing logistical and ethical challenges, especially for
experimentally controlled and replicated designs.
The first evidence of corridor effects on diversity was provided by MacClintock et al.
(1977), who found that bird species richness was higher in a single forest fragment as a result
of supplementation from other forested habitat through a corridor. This study, however, was
observational and unreplicated. Schmeigelow et al. (1997) also examined how patch size
and connectivity affected avian species richness and found weak effects of corridors, but
higher diversity in the smallest of their patches. This was likely because the corridors in their
study were wider than the smallest patches, making it impossible to separate corridor effects
from the increased patch area associated with corridors. In addition, their study was
conducted over a short time span and patches were non-randomly located so that connected
patches were always adjacent to riparian areas. In an experimental grassland system,
Collinge (2000) also found weak corridor effects on insect diversity. While this study was
well controlled and replicated, the authors attributed the weak corridor effects they observed
to a lack of contrast between the patch habitat and surrounding matrix and to the high
dispersal ability of many insects relative to the size and isolation of patches.
Experimental microcosm studies provide the most conclusive support for theoretical
predictions of corridor effects on diversity (Gilbert et al. 1998, Gonzalez et al. 1998,
Gonzalez and Chaneton 2002, Rantalainen et al. 2004a, Rantalainen et al. 2004b, Rantalainen
et al. 2005). Moss patches connected by a corridor had higher levels of microarthropod
diversity and slower extinction rates (Gilbert et al. 1998, Gonzalez et al. 1998, Gonzalez and

4
Chaneton 2002). However, a recent study in this same microecosystem found no evidence
that corridors slowed the rate of extinction or increased species richness (Hoyle and Gilbert
2004), likely because of temporal changes in weather relative to their previous studies. A
recent series of small-scale experiments using soil decomposer organisms as a model system
(Rantalainen et al. 2004a, Rantalainen et al. 2004b, Rantalainen et al. 2005) found that
corridors increased the species richness of soil fungi in the patches they connected and that
that corridors also sometimes increased the abundance of enchytraeid worms, the species
richness of bacteria (dispersed by enchytraeid worms), and the number of microarthropod
taxa. These relatively small-scale studies provide rigorous tests of corridor effects on
diversity, but their applicability to larger spatial and temporal scales is unknown. Here, we
present results from the first large-scale experimental test of corridors on plant community
diversity in a well-replicated landscape that has a high degree of contrast and controls for
area effects.
Corridor effects and plants
Studies of corridor effects have almost exclusively used animal study organisms. Less
than 10% of all corridor studies have explicitly examined effects of corridors on plant species
(Figure 1.1, ISI Web of Science search, March 22, 2005). There are several additional
studies examining the effects of other “corridor-like” habitats, such as hedgerows,
windbreaks, roads, riparian areas, and right-of-ways on plants (Metzger et al. 1997, Corbit et
al. 1999, Harvey 2000, McCollin et al. 2000, Honnay et al. 2001, Tikka et al. 2001, Watkins
et al. 2003), but these studies only consider processes within these linear habitat types and
not within or between two connected habitat patches.

5
There are six empirical studies that examine corridor effects on plants within and between
patches. Kirchner et al. (2003) found that the presence and number of corridors in a naturally
patchy wetland system could explain, in part, the number of ponds colonized by a rare
wetland plant, Ranunculus nodiflorus, as a result of increased seed dispersal. The remaining
five studies of corridor effects for upland terrestrial plants all come from the experimental
system that is the focus of this study (see Methods for study site description), which have
shown that corridors can increase positive effects such as pollination and dispersal
(Tewksbury et al. 2002, Haddad et al. 2003, Townsend and Levey 2005) and negative effects
such as increased predation rates (Orrock et al. 2003, Orrock and Damschen 2005),
suggesting that corridor responses for plants can be species and life-stage specific.
Past research (Haddad and Baum 1999, Danielson and Hubbard 2000, Tewksbury et al.
2002, Orrock et al. 2003, Fried and Levey, Orrock and Damschen 2005) has led to three main
hypotheses for how corridors affect between-patch processes. First, and most commonly,
corridors are thought of as movement conduits facilitating the dispersal and movement rates
of organisms between the patches they connect (“connectivity effects”). Second, by
increasing the total habitat area of connected patches, corridors could operate through “area
effects”. Third, corridors could operate through “drift-fence effects”, where organisms are
filtered from the surrounding matrix into connected patches (defined by Anderson and
Danielson (1997) and Haddad and Baum (1999)); corridors might increase this probability
because of their expanse across the landscape. Additionally, while corridors have
theoretically been considered as a way to alter between-patch processes, they also have the
potential to change within-patch dynamics for plants and animals. As two long linear edges,
corridors can affect local abiotic conditions at edges, which may have large consequences for

6
relatively sessile organisms like plants. Other studies have shown that edge effects can lead
to changes in plant survivorship, reproduction, and composition (e.g., Murcia 1995, Fox et al.
1997, Didham and Lawton 1999, Restrepo and Vargas 1999, Euskirchen et al. 2001, Bruna
2002, Benitez-Malvido and Martinez-Ramos 2003, Ries et al. 2004). Thus, between-patch
corridor effects must be separated from within-patch edge effects.
Theoretically, corridors are predicted to increase species diversity by reducing between-
patch isolation, increasing colonization rates, and decreasing extinctions (e.g., through rescue
effects, Brown and Kodric-Brown 1977). Colonization rates are tightly linked to dispersal
ability, which has been correlated with seed dispersal mode for plants (Westoby et al. 1996,
Yao et al. 1999, Dupré and Ehrlén 2002). Therefore, testing for effects of corridors on plants
with similar dispersal modes may be especially useful for making predictions for corridor
responses. The theoretical importance of colonization for corridor effects makes this
interaction most important for testing predictions of corridor effects on plant diversity and is
our primary focus for testing how corridors function.
We considered evidence from previous studies on dispersal to generate our primary
predictions for plant community response to corridors. The role that corridors play in
promoting connectivity is clearest for animal-dispersed plants. The dispersal of biotically
dispersed plant species is dependent on the movement behavior and gut retention time of the
animals that disperse their seeds (Murray 1988, Clench and Mathias 1992, Jordano 1995,
Levey et al. 2005). In the same experimental landscape used here, bird-dispersed seeds had
higher deposition rates in connected patches than either of the unconnected patch types
(Tewksbury et al. 2002). Other studies have also found that patch isolation and small habitat
size had a greater impact on species with larger and fewer seeds that are dispersed by animals
7
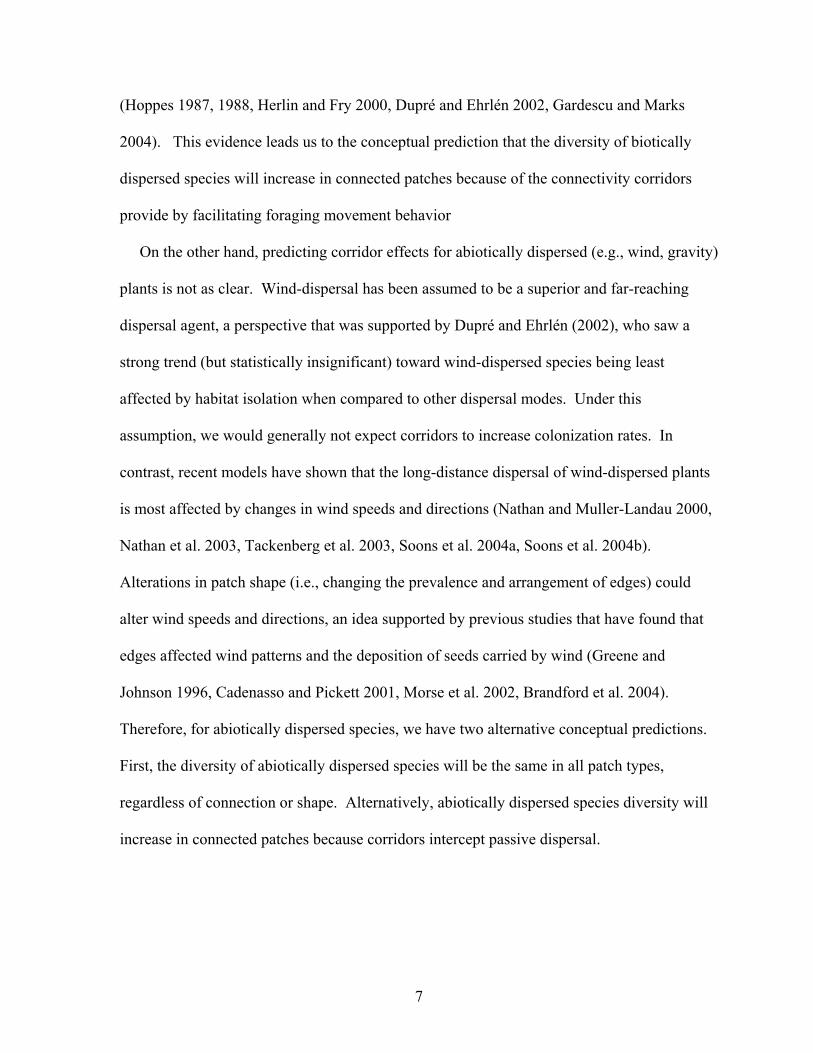
(Hoppes 1987, 1988, Herlin and Fry 2000, Dupré and Ehrlén 2002, Gardescu and Marks
2004). This evidence leads us to the conceptual prediction that the diversity of biotically
dispersed species will increase in connected patches because of the connectivity corridors
provide by facilitating foraging movement behavior
On the other hand, predicting corridor effects for abiotically dispersed (e.g., wind, gravity)
plants is not as clear. Wind-dispersal has been assumed to be a superior and far-reaching
dispersal agent, a perspective that was supported by Dupré and Ehrlén (2002), who saw a
strong trend (but statistically insignificant) toward wind-dispersed species being least
affected by habitat isolation when compared to other dispersal modes. Under this
assumption, we would generally not expect corridors to increase colonization rates. In
contrast, recent models have shown that the long-distance dispersal of wind-dispersed plants
is most affected by changes in wind speeds and directions (Nathan and Muller-Landau 2000,
Nathan et al. 2003, Tackenberg et al. 2003, Soons et al. 2004a, Soons et al. 2004b).
Alterations in patch shape (i.e., changing the prevalence and arrangement of edges) could
alter wind speeds and directions, an idea supported by previous studies that have found that
edges affected wind patterns and the deposition of seeds carried by wind (Greene and
Johnson 1996, Cadenasso and Pickett 2001, Morse et al. 2002, Brandford et al. 2004).
Therefore, for abiotically dispersed species, we have two alternative conceptual predictions.
First, the diversity of abiotically dispersed species will be the same in all patch types,
regardless of connection or shape. Alternatively, abiotically dispersed species diversity will
increase in connected patches because corridors intercept passive dispersal.

8
Predictions
We use a well-replicated experimental landscape (see Figures 2 and 3 and Methods for
study description) to test several predictions for corridor effects on plant species diversity
(Table 1.1). If corridors function through connectivity effects, diversity should be higher in
connected patches than in unconnected patches of any shape (Table 1.1). If corridors instead
operate by increasing area (“area effects”), then connected and unconnected patches with the
same area and any shape should be equally diverse. If corridors function through “drift-fence
effects”, then diversity in both connected and unconnected patches with the same shape and
landscape expanse (high edge-to-area ratios) should be equal, but greater than in patches of
equal area and less expanse (lower edge-to-area ratios) and within-patch effects should not be
responsible for this difference. Finally, if within-patch edge effects are driving diversity
patterns, two conditions must be met: 1) patches with the highest edge-to-area ratios should
have much higher or lower diversity than patches with the lowest edge-to-area ratios
(connected or unconnected); and 2) within individual patches, diversity should increase or
decrease and/or composition should change with distance from the edge (Table 1.1).
Our predictions for the relative importance of each of these between-patch corridor effects
are dependent on plant dispersal mode. For biotically dispersed species, we predict corridors
will operate via connectivity effects, resulting in higher diversity in connected patches than in
all unconnected patch types (Table 1.1). For abiotically dispersed species, however, we
predict that corridors will either: 1) have no impact on diversity, or 2) will operate by altering
patch shape, with higher diversity in connected and winged patches than in rectangular
patches as a result of between-patch edge effects. Because edges have often been found to

9
alter resources and/or habitat heterogeneity, within-patch edge effects are predicted to affect
all types of plant species (Weathers et al. 2001, Ries et al. 2004).
Secondary hypotheses
While our strongest predictions are based on dispersal mode, corridors may also may have
other effects through alterations of other interactions such as pollination, herbivory, and seed
predation. Furthermore, it is possible that corridors affect common and rare species
differently. We secondarily focus on testing for the strength of corridor effects as a function
of species rarity. Some species will occur nearly everywhere, others will be intermediately
common, and some will be quite rare across the 40 patches that we examine. Because
species that occur ubiquitously across all patches are likely the least dispersal-limited and
therefore the least likely to respond to corridors, we expect corridors to most strongly affect
those species with intermediate or rare frequencies of occurrence. Furthermore, examining
the life history traits of such species might provide additional insight as to what other life
history traits might predict corridor response.
Methods
Study site
In collaboration with the USDA Forest Service at the Savannah River Site (SRS) near
Aiken, South Carolina, we created large-scale experimental landscapes during the winter of
1999-2000. The SRS, a National Environmental Research Park (NERP), is operated by the
U.S. Department of Energy and occupies nearly 78,000 ha of land in west central South
Carolina (Workman and McLeod 1990). Like many other pine forests in the southeastern
10
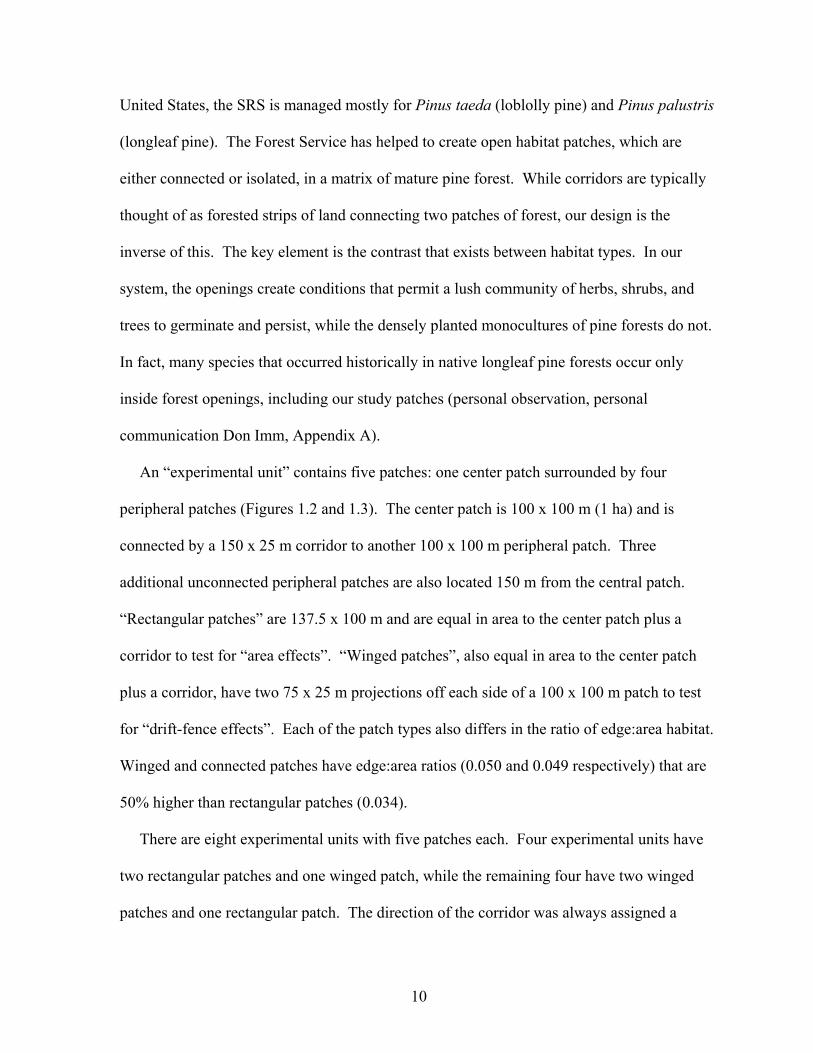
United States, the SRS is managed mostly for Pinus taeda (loblolly pine) and Pinus palustris
(longleaf pine). The Forest Service has helped to create open habitat patches, which are
either connected or isolated, in a matrix of mature pine forest. While corridors are typically
thought of as forested strips of land connecting two patches of forest, our design is the
inverse of this. The key element is the contrast that exists between habitat types. In our
system, the openings create conditions that permit a lush community of herbs, shrubs, and
trees to germinate and persist, while the densely planted monocultures of pine forests do not.
In fact, many species that occurred historically in native longleaf pine forests occur only
inside forest openings, including our study patches (personal observation, personal
communication Don Imm, Appendix A).
An “experimental unit” contains five patches: one center patch surrounded by four
peripheral patches (Figures 1.2 and 1.3). The center patch is 100 x 100 m (1 ha) and is
connected by a 150 x 25 m corridor to another 100 x 100 m peripheral patch. Three
additional unconnected peripheral patches are also located 150 m from the central patch.
“Rectangular patches” are 137.5 x 100 m and are equal in area to the center patch plus a
corridor to test for “area effects”. “Winged patches”, also equal in area to the center patch
plus a corridor, have two 75 x 25 m projections off each side of a 100 x 100 m patch to test
for “drift-fence effects”. Each of the patch types also differs in the ratio of edge:area habitat.
Winged and connected patches have edge:area ratios (0.050 and 0.049 respectively) that are
50% higher than rectangular patches (0.034).
There are eight experimental units with five patches each. Four experimental units have
two rectangular patches and one winged patch, while the remaining four have two winged
patches and one rectangular patch. The direction of the corridor was always assigned a

11
random cardinal direction and the position of each patch type was assigned randomly. Patch
and corridor areas were chosen because the dimensions fall within the range of typical Forest
Service management units and because the entire patch and corridor areas are not shaded by
trees along patch edges, which alone could impact plant community composition.
Presence/absence surveys
We recorded the presence or absence of all plant species in each patch, which included the
central 100 x 100m patch area plus the area of a corridor, two wings, or the additional area in
the rectangle. Surveys took place during 15 May – 30 June in 2001, 2002, and 2003. An
established grid system of 10’ tall PVC poles allowed us to determine our location within
12.5m at any point in the patch. We started in a random corner of the patch and walked back
and forth within 12.5m wide sections, visually covering the entire area of the patch. All new
species were recorded, effectively censusing the presence of all plant species in the patch.
Separate surveys were conducted for the central 100 x 100 m area of each patch and for the
“other” areas (e.g., the corridor, wings, or extra area in the rectangle; see Figure 1.3) so that
species richness could be quantified for both this central area or for the whole patch.
From 17 September – 29 October 2002, we also conducted the survey described above for
only species in Poaceae, Cyperaceae, Juncaceae, and Asteraceae. We did this because
species in these families comprise a large proportion of the total species pool in the
Southeastern United States as well as in our experimental sites (Appendix A). Most of these
species, however, flower and fruit during the late summer and early fall (Radford et al. 1964,
Weakley 2005). Detectability of these species may be higher when they are in bloom or
going to seed, so we conducted a separate survey to account for this possible bias.

12
Permanent plot surveys
Plant species richness and abundance were measured within permanently established
nested plots in each patch (Figure 1.3). The size and number of plots was modeled after
another study on successional dynamics in a system similar to ours (Phillips and Shure
1990). Each center patch contained 24 plots and each peripheral patch contained 34 plots,
for a total of 1280 plots. We distributed plots in three locations within each patch: 1) 12
plots within the center 50 x 50 m of each patch (center plots), 2) 12 plots within 12.5 m from
the edge of a patch (edge plots), and 3) 10 plots in each peripheral patch located in other
areas (corridor, wings, or rectangles, depending on patch type). Plots were apportioned this
way to determine how responses to connectivity and patch shape are affected by habitat
edges.
Surveys took place during the height of plant production from 15 July – 20 August 2000-
2003. Nested plots were used to sample in a way that accommodated plant species with
different vegetative habits. Three plots of different sizes were layered concentrically around
a permanent stake: Herbs (herbaceous species, 1 – 30 cm tall) were surveyed in 1 x 1 m
plots, shrubs (woody species > 30 cm tall and < 2.5 cm dbh) in 3 x 3 m plots, and trees
(woody species > 2.5 cm dbh) in 10 x 10 m plots (Figure 1.3). In 2000, plots were
permanently established and 544 plots were sampled in a pilot survey by counting the
number of stems of each species. From 2001-2003, all 1280 plots were surveyed and species
were assigned to one of ten classes of percent cover after Peet et al. (1998): 0-0.01%, 0.01-
1%, 1-2%, 2-5%, 5-10%, 10-25%, 25-50%, 50-75%, 75-95%, >95%, which allowed for
13
consistency among multiple observers. We used the median value of each cover class in
abundance analyses as recommended by Peet et al. (1998).
Supplemental edge survey
Other studies of edge effects have shown varying distances of edge responses into a
clearing from a surrounding pine forest. In addition to shading, root competition is thought
to be one of the most important for limiting herbaceous species abundances and diversity
(Brockway and Outcalt 1998, Harrington et al. 2003, see Chapter 3). These studies have
observed areas where the herbaceous understory is severely reduced or eliminated up to 18 m
away from a mature pine. While the comparisons of our permanent edge and center plots are
well within this observed 18 m edge effect (and should therefore capture any edge response),
we supplemented these analyses with another edge study in 2005. Using only rectangular
patches in six experimental units, four identical transects were used to record the presence or
absence of all species. Transects were 100 m long and 2 m wide. Two were located directly
against the forest-clearing border and two were evenly spaced along the central 12.5 m of the
patch. A list of all species was created for each transect.
Plant species identification
All plants were identified using the nomenclature of Radford et al. (1964). For the genera
Chamaecrista, Dichanthelium, and Panicum, however, it was necessary to use updated
nomenclature (Weakley 2005). A list of all plant species identified in our study is included
in Appendix A. All unknown species were identified from samples and photographs taken in
the field, compared with specimens at the North Carolina State University Herbarium, and

14
verified with regional botanical experts (pers. comm. T. Wentworth, J. Stucky, B. Miley, and
A. Krings). If we were still unable to identify plant species (less than 3% of all species could
not be identified), they were removed from all datasets prior to analyses. Fourteen species
could not be identified to species, however, these unknown species were able to be
recognized consistently as unique in the field. These species were given unique names as
unknown species (Appendix A) and retained in the datset.
In a few cases two or more species were lumped into a single group for analyses because
they could not be differentiated in the field. Species groups that were combined were: 1)
Centrosema virginianum and Clitoria mariana, and 2) Cyperus retrorsus and another
unknown Cyperus spp. Also, because Dichanthelium spp. are notoriously difficult to
distinguish in the field, all questionable individuals of Dichanthelium spp. were categorized
with four easily recognizable species (listed in Appendix A) based on size and morphology.
Analyses were conducted without removing or lumping species, confirming that these
changes did not alter the direction or significance of our results.
Plant species were categorized by dispersal mode by searching regional flora and guides
(Radford et al. 1964, Miller and Miller 1999, Weakley 2005), conducting a primary literature
search for each species (ISI Web of Science and Biological Abstracts), and searching for
each species in three plant databases: 1) USDA PLANTS Database (USDA 2004), 2)
NatureServe Explorer (NatureServe 2005), and 3) The Illinois Plant Network (Iverson et al.
1999). If species dispersal modes could not be found using these methods (~25%), they were
deduced from seed morphology and congener comparisons. All species could be classified
with reasonable certainty.
Species were divided into two categories based on dispersal mode: 1) biotically dispersed

15
species as those actively dispersed through the ingestion of fruits or seeds by birds or
mammals, and 2) abiotically dispersed species as those dispersed passively by wind, gravity,
or explosive seed capsules (e.g., some pods in Fabaceae). Species were not broken into more
specific dispersal modes (e.g., bird, mammal, wind, gravity, etc.) because the number of
species within subgroups became too small to analyze separately. There were eight species
dispersed by adhesion to animals that were eliminated from analyses because these seeds
readily attached themselves to observers in our system, possibly altering dispersal pathways.
Soil Moisture
Soil moisture holding capacity has been found to be a strong predictor of plant species
richness in southeastern pine forests (Kirkman et al. 2001) and at the Savannah River Site
(Bryan Foster pers. comm.). Soil moisture holding capacity was measured at each permanent
plot using the methods of Salter and Williams (1967). Eight 2.5 x 15 cm soil cores were
taken along the perimeter of each 1 x 1 m vegetation plot. The cores from each plot were
homogenized and placed in soil tins that were 5 cm tall and 6.5 cm in diameter. In the
bottom of each tin, we drilled fifteen 1 mm diameter holes and lined the tin with a piece of
filter paper before filling it with soil. All tins were placed in a shallow pan of water, allowed
to saturate for 24 hours, and then placed on a wire rack until they stopped dripping. All
saturated tins were weighed and subsequently placed in a drying oven at 105° C until they
reached constant mass and then weighed again. The percent soil moisture by weight was
calculated for each sample as: {% soil moisture by weight = [(wet weight – dry weight) *
100%] / dry weight}. Estimating soil moisture in this way provides an estimate for how
much water the soil could potentially hold over long time periods rather than discrete time

16
periods that can be biased by weather events and climatic conditions. At large experimental
scales (over 25 km between some sites in our system), this method allows for the feasible
estimation of soil moisture holding ability with a limited number of observers. Averages of
the soil moisture by weight for all plots in each patch were used as covariates in analyses.
This is an appropriate covariate because estimates were obtained for how much water the soil
could potentially hold rather than over discrete time intervals, which would have possibly
been influenced by our treatment effect (patch type).
Data analysis
Total species richness
To test our predictions about how corridors affect species diversity, we used species
richness (the cumulative count of all species in each patch) as our response variable. We
calculated species richness separately from each of our two survey types: 1) presence-
absence, and 2) a cumulative list from all permanent plots within a patch. To test for corridor
effects on groups of species that vary with dispersal mode, we also subdivided total richness
into groups of species with biotic or abiotic dispersal and analyzed these groups separately.
All response variables were checked for normality and homogeneity of variances prior to
conducting analyses.
The center patch in each experimental unit was removed from analyses so that
comparisons were always made between patches of equal area. In addition, the two duplicate
patch types (winged or rectangle) in each experimental unit were averaged prior to analyses
so as not to not inflate degrees of freedom. We conducted each analysis twice, first using the
entire area of each patch (dark and light gray in Figure 1.3), and second, using only the

17
central 100 x 100m area of each patch (dark gray only in Figure 1.3). We did this to assess
the relative importance of additional areas (i.e., the corridors, extra area in rectangles, or the
wings) in contributing to the patterns we observed.
Species richness was used as a response variable in a repeated measures randomized block
design ANOVA with year as the repeated measure, each of the eight experimental units as
blocks, patch type (connected, rectangular or winged) as a treatment effect, and the natural
log of soil moisture by weight as a covariate. We also tested for an interaction between year
and patch type. We used a mixed model design with block as a random effect and year,
patch type, and the year by patch type interaction as fixed effects. When overall F-values for
patch type were significant, we used two planned linear contrasts to test our hypotheses about
corridor functioning (Table 1.1) by 1) comparing connected to winged and rectangular
patches, and 2) comparing both winged and connected patches to rectangular patches. The
Dunn-Šidák procedure was used to adjust the alpha level according to the number of post-hoc
comparisons (α’ = 1 - (1 - α) 1/k for k comparisons, Sokal and Rohlf (1995)).
Species richness by dispersal mode
Species were divided into two groups, those with passive vs. active dispersal modes, and
analyzed in the same way as described above. Because empirical results from our study sites
have demonstrated that there is greater deposition of bird-dispersed seeds in connected
patches vs. either rectangle or winged unconnected patches (Tewksbury et al. 2002, Haddad
et al. 2003, Levey et al. 2005) and models have been able to predict landscape seed dispersal
patterns from local movement behaviors of birds (Levey et al. 2005), we use a one-tailed test
for the specific linear contrast testing if corridors act through between-patch connectivity

18
effects for biotically dispersed species to test this clear directional prediction. All other
analyses use two-tailed tests. All of the above analyses were conducted using SAS v. 8.02.
Within- and between-patch effects on species richness, evenness, and similarity
We determined the impact of within-patch edge effects on diversity and evenness by
calculating species richness and evenness for each 1 x 1 m plot using Williams’s evenness
index (Williams 1964), measured as [ (1 / D) / S ] where D = ∑ (the proportion of individuals
in the ith species)2 and S is the number of species in the sample. Williams’s evenness index is
a robust measure of evenness that is independent from species richness (Smith and Wilson
1996). We used the PC-Ord Software System (McCune and Mefford 1999) to calculate D
and S prior to determining William’s index. Plots were compared between three locations:
edges, centers, and other areas depending on the patch type (i.e., either corridors, wings, or
rectangles; see Figure 1.3 for plot locations). To analyze these response variables, we used a
mixed model repeated measured randomized block design with year as the unit of replication,
the experimental site as the block (a random effect), patch type as a treatment effect (fixed
effect), plot location nested within patch type (fixed effect), and the natural log of soil
moisture as a covariate. Species richness was natural log transformed and William’s
evenness index was square root transformed prior to analyses to improve normality and the
homogeneity of variances.
To examine if patch type affects the similarity between plots from different locations, we
conducted a Multivariate Analysis of Variance (MANOVA) using the 2003 permanent plot
data. MANOVA allows for multiple response variables to be examined, especially if they
are not independent from one another (i.e., between-plot similarity measures use data from

19
the same plot locations). We measured the similarity between plots at different locations
(edge, center, other) to see if there were gross differences in the composition of these
locations. Two similarity measures were used: Bray-Curtis, which incorporates species
abundances, and Sorensen’s, which is based on presence-absence data. We generated
similarity values between each plot and every other plot within and between locations using
EstimateS software (Colwell 2005). We averaged the similarity values obtained from all
pairwise comparisons of plots between groups (edge to center, edge to other, and center to
other) and used these three means as multiple response variables in the MANOVA. We
included experimental unit and patch type as independent variables, and the variance in soil
moisture at the patch level as a covariate.
Supplemental edge survey
We determined the impact of patch edges by conducting two analyses. First, species
richness was used as a response variable in a mixed model ANOVA. Experimental unit was
used as a random block effect and transect location as a fixed treatment effect. We utilized a
repeated measures analysis to account for the multiple transects within each patch. Second,
we calculated the species similarity using the number of overlapping species between each
transect and its same location as well as between the opposite location (center-center, center-
edge, edge-edge). Since there were four possible center-edge comparisons, we used the
average of the four comparisons in our analyses. We used a mixed model ANOVA with the
number of overlapping species as the response variable, experimental site as a random
blocking factor, and the type of comparison (center-center, center-edge, edge-edge) as a fixed

20
independent variable. All response variables were checked for normality and homogeneity
of variances.
Occurrences of rare and common species by patch type
For each species, we calculated the proportion of all patches (40 total) it occupied from
2001-2003 during our presence-absence surveys. We then created a list of all species, rank-
ordered by the frequency of patches each species occupied (from 40/40 to 1/40 patches). We
conducted chi-square analyses for four groups of species to determine if species rarity was
related to increased frequencies in connected, winged, or rectangular patches. The first chi-
square analysis used species that occur in 75% or more of the patches, the second used those
in 50-74% of the patches, the third included species occurring in 25-49% of the patches, and
the fourth used species in 24% or less of the patches. For those groups that occurred more
often than expected in any patch type, we subsequently examined the frequency of species
with different dispersal and pollination modes, again using chi-square analyses. In addition
to dispersal, we examined pollination because it is essential for sexual reproduction to occur
and pollination modes can be easily assigned to species.
Results
Total species richness
During a pilot study in 2000 (see Permanent Plot Surveys for methods), no difference in
overall species richness was found between any patch type (Tables 1.2 and 1.3, Figure 1.4),
suggesting that the patterns we see later in the study are a result of our experimental
manipulations. A total of 285 species were identified from 2001 until 2003 in all survey

21
types (Appendix A). Experimental units differed in their species richness and composition,
however, since we included this as a random effect, we do not report means or significance
values. The fact that different sites (experimental units) varied in their diversity and
composition strengthens our finding since our treatment effects were still strongly significant
after accounting for these site-to-site differences in our statistical model.
In the whole patch, total species richness in presence-absence surveys differed
significantly by patch type with greater richness in winged and connected patches than in
rectangular patches (Table 1.4, Figure 1.4). There were also significant year effects (Table
1.4), but there was no interaction between year and patch type. Species richness from the
central 100 x 100 m of each patch did not significantly differ (Table 1.2), but the trends were
in the same direction as analyses of the whole patch (Figure 1.5). Likewise, patch species
richness measured from the accumulation of all species recorded in permanent plots resulted
in non-significant, but similar directional trends (Figures 1.5 and 1.6).
Species richness by dispersal mode
Our pilot study in 2000 also showed no difference in species richness of abiotically
dispersed species or biotically dispersed species as a function of patch type, again indicating
that the results we observed were due to our experimental manipulation. When species
richness from 2001-2003 was subdivided into abiotic and biotic dispersal modes, two unique
patterns emerged. When the whole patch was analyzed, abiotically dispersed species had
consistently higher species richness in connected and winged patches than in rectangular
patches (Table 1.5, Figure 1.5c). Our survey of species in Poaceae, Juncaceae, Cyperaceae,
and Asteraceae in the fall of 2002 confirms these same trends (Table 1.6, Figure 1.7a). For

22
biotically dispersed species, richness was lower in rectangular patches than in the other two
patch types, but was also significantly higher in connected patches than winged patches
(Table 1.5, Figure 1.5e). Species richness from the central 100 x 100 m area of each patch
did not significantly differ (Table 1.3), but the trends were in the same direction (Figure
1.6d). Our survey of species in Poaceae, Juncaceae, Cyperaceae, and Asteraceae in the late
summer-fall of 2002 also shows a trend for increased species richness of abiotically
dispersed species in connected and winged patches vs. rectangular patches, but in this case,
the pattern was only significant when analyzing the central 100 x 100 m area of each patch
(Table 1.6, Figure 1.7).
When analyses were conducted using patch species richness from a cumulative list of
species from permanent plots, there was no significant difference between patch types for
total richness or for either dispersal mode group (either for the whole patch or for the central
100 x 100 m). However, the directional trends were consistent with the patch-wide presence-
absence survey (Tables 1.4 and 1.5, Figures 1.5b, 1.5d, 1.5f and 1.6b, 1.6d, 1.6f)
corroborating the patterns we found.
Within- and between-patch effects on species richness, evenness, and similarity
Mean species richness per meter2 was 11.47 ± 1.063 in 2001, 12.16 ± 1.06 in 2002, and
15.10 ± 1.06 in 2003. Species richness/m2 did not differ by patch type (F = 1.112, 17.2, p
=0.3526 and F = 1.602, 14.7, p = 0.2348 respectively) or plot location (F = 0.626, 33.4, p =
0.7106 and F = 0.626, 45.6, p = 0.7105 respectively), but did differ by year
(p ≤ 0.0001), with communities increasing in species richness each year. Species evenness
measured by William’s index did not differ by year, patch type, or plot location (p > 0.05).

23
The average similarity in composition between plots located in different groups (edge,
center, other) was not affected by patch type when measured using either Bray-Curtis
(Pillai’s trace, F = 0.956, 38, p = 0.4694) or Sorensen (Pillai’s trace, F = 1.526, 38, p = 0.1991)
similarity measures. Pairwise similarities between any two plots always differed in
composition, however, the similarity between plots within the same location (e.g., all center
plots) and plots between different locations (e.g., between edge and center plots) were the
same (Bray-Curtis ~0.23, Sorensen ~0.39). This indicates that from one 1 x 1 m plot to the
next, there is always some amount of compositional dissimilarity, but this difference does not
change because of specific locations or patch types.
Supplemental edge study
Species richness did not differ between edge and center locations (37.49 species at
centers, 34.08 at edges, F = 4.681, 3.61, p = 0.1039). In addition, the number of overlapping
species also did not differ between location types (22.00 overlapping species between center
locations, 18.83 between edge locations, and 19.04 between edge and center locations; F =
1.262,10, p = 0.3256). This pattern did not change when other similarity measures, such as the
Sorensen or Jaccard Indices, were used.
Occurrences of rare and common species by patch type
Chi-square analyses revealed that the species with “rare to intermediate” occupancy
frequencies (49% or less of all patches; Figure 1.8) had the strongest influence on increased
species richness in connected and winged patches vs. rectangular patches (χ2 = 23.72, p <
0.0001), while “common” species (50% or greater of patches; Figure 1.8) did not show a

24
significant influence (χ2 = 2.00, p = 0.3687). Two life history traits, dispersal mode and
pollination mode, were significantly different between rare and intermediately distributed
species (χ2 = 23.72, p < 0.0001 and χ2 = 5.3703, p < 0.0205 for dispersal and pollination
modes respectively), while no difference existed for common species. We subsequently
evaluated the frequency of species with different dispersal (bird, mammal, ballistic, gravity,
and wind) and pollination (insect, wind) modes in each patch type (Table 1.7) and found that
rare and intermediate species with ballistic, gravity, and wind dispersal as well as species
pollinated by insects (vs. wind), were more likely to be found in connected and winged
patches. Some combinations of these traits could also be analyzed together (e.g., gravity
dispersed and insect pollinated species), which indicated that insect pollination is important
for generating responses in gravity and wind-dispersed species.
Finally, we examined the importance of within-patch edge effects for these species by
assessing the distribution of rare and intermediate species in permanent plot locations. We
used a chi-square analysis to compare the frequency of species occurrences at edge, center,
and other plots and determined that these species did not occur in any plot type more than in
the others, corroborating our previous findings. In other words, within-patch edge effects do
not seem to driving the distribution of intermediate and rare species occurrences.
Discussion
Corridors increased plant species richness through both connectivity and patch shape
effects. The degree to which each of these effects increased species richness was related to
dispersal modes. Actively-dispersed species responded to corridors mainly through
connectivity effects and less so to patch shape effects, while passively-dispersed species

25
responded mainly to patch shape effects. Plant community evenness and composition were
unaffected by corridors or patch shape. The higher species richness in connected and winged
patches can be explained by the increased presence of species with rare and intermediate
patch occupancy frequencies, suggesting that corridors operate by increasing the probability
of uncommon events that lead to greater colonization or persistence and that there may be
specific life history traits or interactions that are more or less affected by corridors.
Separating drift-fence and edge effects
We did not detect effects of edges on species richness, evenness, or similarity in either our
permanent plots or in our supplemental edge study. Rare and intermediately common species
were equally common in all plot types (edge plot frequencies = center plot frequencies),
suggesting that the increased amount of edge in connected and winged patches is not driving
the increase in diversity that we observe. This was surprising, given that other studies have
found strong impacts of edges on community composition of plants (e.g., Murcia 1995, Fox
et al. 1997, Didham and Lawton 1999, Restrepo and Vargas 1999, Euskirchen et al. 2001,
Bruna 2002, Benitez-Malvido and Martinez-Ramos 2003, Ries et al. 2004, Chapter 3) and
other species (Davies et al. 2001). Nearly all of these studies, however, have been performed
in late-successional environments such as tropical forests. In early-successional
environments like ours, effects of edges on individual species may be diluted at the
community level due to the relatively strong influences of environmental heterogeneity,
historical influences, and species interactions. Another study of edge effects across clearcuts
in red and jack pine forests corroborates our findings (Euskirchen et al. 2001). The latter
study also did not detect consistent shifts in species richness, evenness, or similarity between

26
edge and core habitat locations within clearcuts (Euskirchen et al. 2001). In light of the
findings of these other studies, the fact that we detect corridor and patch shape effects above
this “ecological noise” makes our seemingly small total effect sizes quite large in
comparison.
The lack of a discernable edge effect suggests that the increased species richness in
winged patches is not because of dissimilarity in plant communities at edges and center
locations within the patch. It also suggests that “drift-fence effects” may be operating. This
could be due to increased colonization probabilities caused by changes in wind dynamics at
edges. If edges increase wind turbulence, an important factor for dispersal of wind-dispersed
plants (Soons et al. 2004a, Soons et al. 2004b), then patches that have more edge could more
effectively redistribute seeds from plants within the patch. This could increase species
diversity by increasing the proportion of seeds that remain in a patch that would otherwise be
lost to the surrounding landscape matrix.
Applicability of island biogeography
The idea of corridors initially arose from applying island biogeography to terrestrial
landscapes, and these theoretical underpinnings have given corridor implementation intuitive
appeal and led to their widespread use. However, many empirical studies have found
evidence that runs contrary to theory (e.g., Jules et al. 1999, Holl and Crone 2004), casting
doubt on the ability of island biogeography to be applied in terrestrial settings. The results
from our study suggest that applied island biogeography indeed operates in terrestrial
systems, but that it works in conjunction with, and is often weaker than, within- and between-
patch environmental heterogeneity. Moreover, the relative strength of applied biogeography

27
relative to environmental processes can depend on the organism of interest and may be
largely predictable by life history traits. For plants in our study system, the effects of applied
island biogeography were relatively strong for biotically dispersed species when compared to
abiotically dispersed species. It is possible that the degree to which island biogeography can
be applied to any particular organism depends on its dispersal mode in conjunction with the
scale of the landscape and the quality and degree of contrast between the habitat of interest
and the surrounding matrix. Theoretical predictions of applied biogeography may be met for
species that can actively direct their dispersal through a landscape via behavioral choices.
But, species that are dispersed passively through a landscape are subject to the speed and
direction of winds or currents and any landscape feature (i.e., patch shape) that alters these
conditions may be more important than connectivity effects per se. Additionally, life stage
specific processes may be differentially affected, making some life history traits or species
interactions more or less limiting. The frequency of rare and intermediate species with
abiotic dispersal not only is limited by dispersal, but also pollination. Other studies in our
system have also suggested that traits such as seed size can differentially impact predation
rates in different patch types (Orrock and Damschen 2005). Further studies are needed to
assess the relative importance of each of these processes for specific species groups.
Generality of observed patterns
Our experimental design uses openings within managed pine plantation created by cutting
and burning. Early colonists in disturbance-generated openings in the southeastern United
States are often considered to be widespread generalists and “good colonizers” and are
therefore assumed to be less affected by habitat isolation. If this assumption is true, we

28
provide a conservative test of the effects of corridors. That is, if corridors can impact species
that are generally not considered to be dispersal limited, then they may have greater impacts
on those species that are less mobile, especially over long time periods. Additionally, most
of the species found in our study sites are native to the region (Appendix A) and over half of
the species are native to longleaf pine forests, a threatened ecosystem once covering the
coastal plain of the southeastern United States (Frost 1993, Smith et al. 2000). As early-
successional communities, our experimental patches may be much closer to historical
environmental conditions of longleaf pine forests, which had low tree densities, high light
penetration, and open understories (Frost 1993, Smith et al. 2000). The planted pine
plantations surrounding our experimental patches, on the other hand, do not allow for many
of the species dependent on these historical conditions to germinate or persist due mainly to
increased root competition with mature trees (Brockway and Outcalt 1998, Battaglia et al.
2003, Chapter 3, Harrington et al. 2003). For these reasons, it is likely that the results we
observe from 285 species in our experimental landscapes are generally applicable to other
systems, especially those dependent on open habitats such as longleaf pine forest, tallgrass
prairie, or oak savanna. Our results for abiotically dispersed species may also have
implications that extend beyond terrestrial environments to marine systems, where a large
proportion of organisms also experience passive dispersal and where alterations of currents
and flow could occur with changes in the spatial configuration of habitat.
Conservation implications and recommendations for future work
As reserve designs are considered for particular habitats or species, the life history
characteristics of individual species as well as the types of traits commonly found in general

29
community types need to be considered carefully in conjunction with any proposed reserve
design.
While we have primarily shown that dispersal and pollination modes can be useful
categories for understanding the ways corridors function, there are many other traits that
could be affected by corridors. Such traits may be more important for individual species or
at specific successional stages (i.e., dispersal traits initially important after a disturbance, but
competitive and reproductive traits later becoming more important). For example, other
studies have shown that seed predation is affected by corridors and patch shape (Orrock et al.
2003, Orrock and Damschen 2005), so advantages in dispersal could be outweighed by losses
due to predation. Thus far, studies have either considered specific mechanisms individually
(e.g., Haddad 1999b, Haddad and Baum 1999, Haddad 2000, Tewksbury et al. 2002, Orrock
et al. 2003, Orrock and Damschen 2005, Townsend and Levey 2005, Levey et al. In Review)
or have examined general patterns in community composition (described here).
Additionally, most studies span only a few years, making it difficult to understand the
relative importance of specific mechanisms, like dispersal, pollination, or predation,
temporally over the course of succession. Future research should experimentally test for the
relative importance of specific mechanisms (e.g., dispersal, species interactions, local
environment, etc.) to community diversity and composition over longer time periods.
Acknowledgements
This work was made possible by funding from NSF DEB-9907365, the D.O.E. –Savannah
River Operations Office through the Forest Service Savannah River under the Interagency
Agreement DE-1A09-76SR00056 (a National Environmental Research Park), Sigma Xi, and

30
North Carolina State University. We are especially thankful for the leadership provided by
John Blake and Ed Olson and the quality assistance of Kim Hale at the Forest Service
Savannah River. Thank you to the members of The Corridor Project for your insight and
support: Jory Brinkerhoff, Brent Danielson, Doug Levey, John Orrock, Sarah Sargent, Josh
Tewksbury, Patricia Townsend, and Aimee Weldon. Tremendous thanks to the support of
John Orrock and many outstanding field technicians: Justin Cooper, Julie Davis, Dominique
Donato, Jennifer Freeman, Sarah Gabris, Bethany Honeyager, Daniel Kuefler, Elizabeth
Long, Jenny Mayer, and Sara Woolard. We are also most grateful for support and site
maintenance provided by Dave Coyle, Chris Hobson, Dan Shea, Kim Hale, Iola Hallock,
Steve Polk, Tim Kolnik, Kaye Mills, Travis McCollough, Bob Morgan, Ron Mosely, Jarvis
Brown, Diana Johnston, Bobby Phillips, Jamie Scott, Tim Travis, Nick Vines, Pat Wright,
and the Savannah River Forest Service Fire Crew. Thanks to Don Imm, Alexander Krings,
Brett Miley, Jon Stucky, Tom Wentworth, and the North Carolina State Herbarium for
assistance with specimen identification and to Jonathan Levine for providing logistical
support to EID during the writing process. Thank you to John Orrock, Mark Vellend, Kevin
Gross, members of the Haddad Lab, and the Terrestrial Plant Ecology Seminar at UCSB for
your most helpful suggestions and statistical guidance. The manuscript benefited from the
helpful comments of John Orrock, Jim Gilliam, George Hess, Kristen Rosenfeld, Tom Rufty,
Mark Vellend, and Tom Wentworth

31
Literature Cited
Aars, J., and R. A. Ims. 1999. The effect of habitat corridors on rates of transfer and
interbreeding between vole demes. Ecology 80:1648-1655.
Anderson, G. S., and B. J. Danielson. 1997. The effects of landscape composition and
physiognomy on metapopulation size: the role of corridors. Landscape Ecology
12:261-271.
Battaglia, M. A., R. J. Mitchell, P. P. Mou, and S. D. Pecot. 2003. Light transmittance
estimates in a longleaf pine woodland. Forest Science 49:752-762.
Beier, P., and R. F. Noss. 1998. Do habitat corridors really provide connectivity?
Conservation Biology 12:1241-1252.
Benitez-Malvido, J., and M. Martinez-Ramos. 2003. Influence of edge exposure on tree
seedling species recruitment in tropical rain forest fragments. Biotropica 35:530-541.
Brandford, D., D. Fowler, and M. V. Moghaddam. 2004. Study of aerosol deposition at a
wind exposed forest edge using Pb-210 and Cs-137 soil inventories. Water, Air and
Soil Pollution 157:107-116.
Brockway, D. G., and K. W. Outcalt. 1998. Gap-phase regeneration in longleaf pine
wiregrass ecosystems. Forest Ecology and Management 106:125-139.
Brown, J. H., and A. Kodric-Brown. 1977. Turnover rates in insular biogeography: effect of
immigration on extinction. Ecology 58:445-449.
Bruna, E. M. 2002. Effects of forest fragmentation on Heliconia acuminata seedling
recruitment in central Amazonia. Oecologia 132:235-243.
Burkey, T. V. 1997. Metapopulation extinction in fragmented landscapes: Using bacteria and
protozoa communities as model ecosystems. American Naturalist 150:568-591.

32
Cadenasso, M. L., and S. T. A. Pickett. 2001. Effect of edge structure on the flux of species
into forest interiors. Conservation Biology 15:91-97.
Clench, M. H., and J. R. Mathias. 1992. Intestinal Transit - How Can It Be Delayed Long
Enough for Birds to Act as Long-Distance Dispersal Agents. Auk 109:933-936.
Collinge, S. K. 2000. Effects of grassland fragmentation on insect species loss, colonization,
and movement patterns. Ecology 81:2211-2226.
Colwell, R. K. 2005. EstimateS: Statistical estimation of species richness and shared species
from samples. Version 7.5. User's guide and application published at
http://purl.oclc.org/estimates.
Corbit, M., P. L. Marks, and S. Gardescu. 1999. Hedgerows as habitat corridors for forest
herbs in central New York, USA. Journal of Ecology 87:220-232.
Danielson, B. J., and M. W. Hubbard. 2000. The influence of corridors on the movement
behavior of individual Peromyscus polionotus in experimental landscapes. Landscape
Ecology 15:323-331.
Davies, K. F., B. A. Melbourne, and C. R. Margules. 2001. Effects of within- and between-
patch processes on community dynamics in a fragmentation experiment. Ecology
82:1830-1846.
Diamond, J. M. 1975. The island dilemma: lessons of modern biogeographic studies for the
design of natural preserves. Biological Conservation 7:129-146.
Didham, R. K., and J. H. Lawton. 1999. Edge structure determines the magnitude of changes
in microclimate and vegetation structure in tropical forest fragments. Biotropica
31:17-30.
33
Dupré, C., and J. Ehrlén. 2002. Habitat configuration, species traits and plant distributions.
Journal of Ecology 90:796-805.
Euskirchen, E. S., J. Q. Chen, and R. C. Bi. 2001. Effects of edges on plant communities in a
managed landscape in northern Wisconsin. Forest Ecology and Management 148:93-
108.
Fahrig, L., and G. Merriam. 1985. Habitat Patch Connectivity and Population Survival.
Ecology 66:1762-1768.
Fox, B. J., J. E. Taylor, M. D. Fox, and C. Williams. 1997. Vegetation changes across edges
of rainforest remnants. Biological Conservation 82:1-13.
Fried, J. H., and D. J. Levey. 2005. Habitat corridors function as drift-fences and movement
conduits for dispersing flies. Oecologia.
Frost, C. C. 1993. Four centuries of changing landscape patterns in the longleaf pine
ecosystem. Pages 17-43 in S. M. Hermann, editor. Proceedings of the Tall Timbers
Fire Ecology Conference, No. 18, Tall Timbers Research Station, Tallahassee, FL.
Gardescu, S., and P. L. Marks. 2004. Colonization of old fields by trees vs. shrubs: seed
dispersal and seedling establishment. Journal of the Torrey Botanical Society 131:53-
68.
Gilbert, F., A. Gonzalez, and I. Evans-Freke. 1998. Corridors maintain species richness in the
fragmented landscapes of a microecosystem. Proceedings of the Royal Society of
London Series B-Biological Sciences 265:577-582.
Gonzalez, A., and E. J. Chaneton. 2002. Heterotroph species extinction, abundance and
biomass dynamics in an experimentally fragmented microecosystem. Journal of
Animal Ecology 71:594-602.
34
Gonzalez, A., J. H. Lawton, F. S. Gilbert, T. M. Blackburn, and I. Evans-Freke. 1998.
Metapopulation dynamics, abundance, and distribution in a microecosystem. Science
281:2045-2047.
Greene, D. F., and E. A. Johnson. 1996. Wind dispersal of seeds from a forest into a clearing.
Ecology 77:595-609.
Haas, C. A. 1995. Dispersal and use of corridors by birds in wooded patches on an
agricultural landscape. Conservation Biology 9:845-854.
Haddad, N. M. 1999a. Corridor and distance effects on interpatch movements: a landscape
experiment with butterflies. Ecological Applications 9:612-622.
Haddad, N. M. 1999b. Corridor use predicted from behaviors at habitat boundaries. The
American Naturalist 153:215-227.
Haddad, N. M. 2000. Corridor length and patch colonization by a butterfly, Junonia coenia.
Conservation Biology 14:738-745.
Haddad, N. M., and K. A. Baum. 1999. An experimental test of corridor effects on butterfly
densities. Ecological Applications 9.
Haddad, N. M., D. R. Bowne, A. Cunningham, B. J. Danielson, D. J. Levey, S. Sargent, and
T. Spira. 2003. Corridor use by diverse taxa. Ecology 84:609-615.
Haddad, N. M., D. K. Rosenberg, and B. R. Noon. 2000. On experimentation and the study
of corridors: Response to Beier and Noss. Conservation Biology 14:1543-1545.
Hale, M. L., P. W. W. Lurz, M. D. F. Shirley, S. Rushton, R. M. Fuller, and K. Wolff. 2001.
Impact of landscape management on the genetic structure of red squirrel populations.
Science 293:2246-2248.
35
Harrington, T. B., C. M. Dagley, and M. B. Edwards. 2003. Above- and belowground
competition from longleaf pine plantations limits performance of reintroduced
herbaceous species. Forest Science 49:681-695.
Harvey, C. A. 2000. Windbreaks enhance seed dispersal into agricultural landscapes in
Monteverde, Costa Rica. Ecological Applications 10:155-173.
Herlin, I. L. S., and G. L. A. Fry. 2000. Dispersal of woody plants in forest edges and
hedgerows in a Southern Swedish agricultural area: the role of site and landscape
structure. Landscape Ecology 15:229-242.
Hess, G. R. 1994. Conservation Corridors and Contagious-Disease - a Cautionary Note.
Conservation Biology 8:256-262.
Hobbs, R. J. 1992. The role of corridors in conservation: solution or bandwagon? Trends in
Ecology and Evolution 7:389-392.
Holl, K. D., and E. E. Crone. 2004. Applicability of landscape and island biogeography
theory to restoration of riparian understorey plants. Journal of Applied Ecology
41:922-933.
Honnay, O., W. Verhaeghe, and M. Hermy. 2001. Plant community assembly along dendritic
networks of small forest streams. Ecology 82:1691-1702.
Hoppes, W. G. 1987. Pre-Foraging and Post-Foraging Movements of Frugivorous Birds in an
Eastern Deciduous Forest Woodland, USA. Oikos 49:281-290.
Hoppes, W. G. 1988. Seedfall Pattern of Several Species of Bird-Dispersed Plants in an
Illinois Woodland. Ecology 69:320-329.
Hoyle, M., and F. Gilbert. 2004. Species richness of moss landscapes unaffected by short-
term fragmentation. Oikos 105:359-367.

36
Iverson, L. R., D. Ketzner, and J. Karnes. 1999. Illinois Plant Information Network. Database
at http://www.fs.fed.us/ne/delaware/ilpin/ilpin.html. in. Illinois Natural History
Survey and USDA Forest Service.
Jordano, P. 1995. Angiosperm Fleshy Fruits and Seed Dispersers - a Comparative-Analysis
of Adaptation and Constraints in Plant-Animal Interactions. American Naturalist
145:163-191.
Jules, E. S., E. J. Frost, L. S. Mills, and D. A. Tallmon. 1999. Ecological consequences of
forest fragmentation in the Klamath region. Natural Areas Journal 19:368-378.
Kirchner, F., J. B. Ferdy, C. Andalo, B. Colas, and J. Moret. 2003. Role of corridors in plant
dispersal: an example with the endangered Ranunculus nodiflorus. Conservation
Biology 17:401-410.
Kirkman, L. K., R. J. Mitchell, R. C. Helton, and M. B. Drew. 2001. Productivity and species
richness across an environmental graident in a fire-dependent ecosystem. American
Journal of Botany 88:2119-2128.
Levey, D. J., B. M. Bolker, J. J. Tewksbury, S. Sargent, and N. M. Haddad. 2005. Bird
foraging behaviors scale up to predict corridor effects on seed dispersal. Science
309:146-148.
MacClintock, L., R. F. Whitcomb, and B. L. Whitcomb. 1977. Evidence for the value of
corridors and minimization of isolation in preservation of biotic diversity. American
Birds 31:6-13.
Mann, C. C., and M. L. Plummer. 1993. The high cost of biodiversity. Science 260:1868-
1871.

37
Mann, C. C., and M. L. Plummer. 1995. Are wildlife corridors the right path? Science
270:1428-1439.
McCollin, D., J. I. Jackson, R. G. H. Bunce, C. J. Barr, and R. Stuart. 2000. Hedgerows as
habitat for woodland plants. Journal of Environmental Management 60:77-90.
McCune, B., and M. J. Mefford. 1999. PC-ORD: Multivariate Analysis of Ecological Data.
Version 4.14.
Metzger, J. P., L. C. Bernacci, and R. Goldenberg. 1997. Pattern of tree species diversity in
riparian forest fragments of different widths (SE Brazil). Plant Ecology 133:135-152.
Miller, J. H., and K. V. Miller. 1999. Forest plants of the southeast and their wildlife uses.
Southern Weed Society and Craftmaster Printers, Inc., Auburn, Alabama.
Morse, A. P., B. A. Gardiner, and B. J. Marshall. 2002. Mechanisms controlling turbulence
development across a forest edge. Boundary-Layer Meterology 103:227-251.
Murcia, C. 1995. Edge effects in fragmented forests: implications for conservation. Trends in
Ecology and Evolution 10:58-62.
Murray, K. G. 1988. Avian Seed Dispersal of 3 Neotropical Gap-Dependent Plants.
Ecological Monographs 58:271-298.
Nathan, R., and H. C. Muller-Landau. 2000. Spatial patterns of seed dispersal, their
determinants and consequences for recruitment. Trends in Ecology and Evolution
15:278-285.
Nathan, R., G. Perry, J. T. Cronin, A. E. Strand, and M. L. Cain. 2003. Methods for
estimating long-distance dispersal. Oikos 103:261-273.
NatureServe. 2005. NatureServe Explorer Version 4.2. in.

38
Noss, R. F. 1987. Corridors in real landscapes: a reply to Simberloff and Cox. Conservation
Biology 1:159-164.
Orrock, J. L., and E. I. Damschen. 2005. Corridors cause differential seed predation.
Ecological Applications In press.
Orrock, J. L., B. J. Danielson, M. J. Burns, and D. J. Levey. 2003. Spatial ecology of
predator-prey interactions: corridors and patch shape influence seed predation.
Ecology 84:2589-2599.
Peet, R. K., T. R. Wentworth, and P. S. White. 1998. A flexible, multipurpose method for
recording vegetation composition and structure. Castanea 63:262-274.
Phillips, D. L., and D. J. Shure. 1990. Patch-size effects on early succession in southern
Appalachian forests. Ecology 71:204-212.
Radford, A. E., H. E. Ahles, and C. R. Bell. 1964. Manual of the vascular flora of the
Carolinas. The University of North Carolina Press, Chapel Hill, NC.
Rantalainen, M. L., H. Fritze, J. Haimi, O. Kiikkila, T. Pennanen, and H. Setala. 2004a. Do
enchytraeid worms and habitat corridors facilitate the colonisation of habitat patches
by soil microbes? Biology and Fertility of Soils 39:200-208.
Rantalainen, M. L., H. Fritze, J. Haimi, T. Pennanen, and H. Setala. 2005. Colonisation of
newly established habitats by soil decomposer organisms: the effect of habitat
corridors in relation to colonisation distance and habitat size. Applied Soil Ecology
28:67-77.
Rantalainen, M. L., J. Haimi, and H. Setala. 2004b. Testing the usefulness of habitat
corridors in mitigating the negative effects of fragmentation: the soil faunal
community as a model system. Applied Soil Ecology 25:267-274.

39
Restrepo, C., and A. Vargas. 1999. Seeds and seedlings of two neotropical montane
understory shrubs respond differently to anthropogenic edges and treefall gaps.
Oecologia 119:419-426.
Ries, L., R. J. Fletcher, J. Battin, and T. D. Sisk. 2004. Ecological responses to habitat edges:
mechanisms, models, and variability explained. Annual Review of Ecology Evolution
and Systematics 35:491-522.
Rosenberg, D. K., B. R. Noon, J. W. Megahan, and E. C. Meslow. 1998. Compensatory
behavior of Ensatina eschscholtzii in biological corridors: a field experiment.
Canadian Journal of Zoology-Revue Canadienne De Zoologie 76:117-133.
Rosenberg, D. K., B. R. Noon, and E. C. Meslow. 1997. Biological corridors: form, function,
efficacy. Bioscience 47:677-687.
Salter, P. J., and J. B. Williams. 1967. Influence of Texture on Moisture Characteristics of
Soils .4. A Method of Estimating Available-Water Capacities of Profiles in Field.
Journal of Soil Science 18:174-&.
Schmiegelow, F. K. A., C. S. Machtans, and S. J. Hannon. 1997. Are boreal birds resilient to
forest fragmentation? An experimental study of short-term community responses.
Ecology 78:1914-1932.
Simberloff, D., and J. Cox. 1987. Consequences and costs of conservation corridors.
Conservation Biology 1:63-71.
Simberloff, D., J. A. Farr, J. Cox, and D. W. Mehlman. 1992. Movement corridors:
conservation bargains or poor investments? Conservation Biology 6:493-504.
Smith, B., and J. B. Wilson. 1996. A consumer's guide to evenness indices. Oikos 76:70-82.

40
Smith, G. C., M. W. Patterson, and H. R. Trendell. 2000. The demise of the longleaf-pine
ecosystem. Southeastern geographer XXXX:75-92.
Soons, M. B., G. W. Heil, R. Nathan, and G. G. Katul. 2004a. Determinants of long-distance
seed dispersal by wind in grasslands. Ecology 85:3056-3068.
Soons, M. B., R. Nathan, and G. G. Katul. 2004b. Human effects on long-distance wind
dispersal and colonization by grassland plants. Ecology 85:3069-3079.
Sutcliffe, O. L., and C. D. Thomas. 1996. Open corridors appear to facilitate dispersal by
ringlet butterflies (Aphantopus hyperantus) between woodland clearings.
Conservation Biology 10:1359-1365.
Tackenberg, O., P. Poschlod, and S. Kahmen. 2003. Dandelion seed dispersal: The horizontal
wind speed does not matter for long-distance dispersal - it is updraft! Plant Biology
5:451-454.
Tewksbury, J. J., D. J. Levey, N. M. Haddad, S. Sargent, J. L. Orrock, A. Weldon, B. J.
Danielson, J. Brinkerhoff, E. I. Damschen, and P. Townsend. 2002. Corridors affect
plants, animals, and their interactions in fragmented landscapes. Proceedings of the
National Academy of Sciences USA 99:12923-12926.
Tikka, P. M., H. Hogmander, and P. S. Koski. 2001. Road and railway verges serve as
dispersal corridors for grassland plants. Landscape Ecology 16:659-666.
Townsend, P. A., and D. J. Levey. 2005. An experimental test of whether habitat corridors
affect pollen transfer. Ecology In Press.
USDA, N. 2004. The PLANTS Database, Version 3.5 (http://plants.usda.gov). in, National
Plant Data Center, Baton Rouge, LA 70874-4490 USA.

41
Watkins, R. Z., J. Q. Chen, J. Pickens, and K. D. Brosofske. 2003. Effects of forest roads on
understory plants in a managed hardwood landscape. Conservation Biology 17:411-
419.
Weakley, A. S. 2005. Flora of the Carolinas, Virginia, and Georgia. University of North
Carolina Press, Chapel Hill.
Weathers, K. C., M. L. Cadensasso, and S. T. A. Pickett. 2001. Forest edges as nutrient and
pollutant concentrations: potential synergisms between fragmentation, forest
canopies, and the atmosphere. Conservation Biology 15:1506-1514.
Westoby, M., M. Leishman, and J. Lord. 1996. Comparative ecology of seed size and
dispersal. Philosophical Transactions of the Royal Society of London Series B-
Biological Sciences 351:1309-1317.
Williams, C. B. 1964. Patterns in the balance of nature. Academic Press, London.
Workman, S. W., and K. W. McLeod. 1990. Vegetation of the Savannah River Site: Major
Community Types. Savannah River Site National Environmental Research Park
Program, Aiken, South Carolina.
Yao, J., R. D. Holt, P. M. Rich, and W. S. Marshall. 1999. Woody plant colonization in an
experimentally fragmented landscape. Ecography 22:715-728.

42
Table 1.1. Predictions for how plant community diversity will respond to corridors. “Connected” = connected patch type, “Winged” = winged patch type, and “Rectangular”= rectangular patch type. Within- or
between-patch
process
Corridor effect
type Experimental prediction
Species predicted to exhibit
this response
Between-patch Connectivity effect Connected > (Winged =
Rectangular)
Biotically dispersed species
Between-patch Drift-fence effect (Connected = Winged) >
Rectangular, no within-patch
effects
Abiotically dispersed species
Within-patch Area effect Connected = Rectangular =
Winged
All species
Within-patch Edge effects (Connected = Winged) >
Rectangular, patch edges > patch
centers, and/or edges dissimilar
from centers
All species

43
Table 1.2. Results from repeated measures ANOVA for total species richness in the central 100 x 100 m of each patch. Results are shown for species richness estimates from each survey type (presence-absence and permanent plots) separately. Factors for 2000 include patch type (connected, unconnected winged, unconnected rectangular) and the natural log of log soil moisture by weight. Factors for 2001-2003 include year (2001, 2002, 2003), patch type (connected, unconnected winged, unconnected rectangular), an interaction between year and patch type, and the natural log of soil moisture by weight for each patch. Numerator and denominator degrees of freedom are listed as subscripts for each F-value. Presence absence surveys were not conducted in 2000.
2000 2001-2003
F p F p
Presence-Absence Surveys
Source of Variance
Year n.a. n.a. 27.822, 42 < 0.0001
Patch type n.a. n.a. 1.382, 13.2 0.2852
Year*Patch type n.a. n.a. 0.914, 42 0.4685
Soil moisture n.a. n.a. 2.271, 15.4 0.1524
Planned linear contrasts
Connected > (Rectangular = Winged) n.a. n.a. 1.621, 13.2 0.2244
(Connected = Winged) > Rectangular n.a. n.a. 1.211, 13.2 0.3977
Permanent Plot Data
Source of Variance
Year n.a. n.a. 23.012, 40.6 < 0.0001
Patch type 0.522, 13 0.6040 0.472, 13.8 0.6329
Year* Patch type n.a. n.a. 1.104, 40.6 0.3685
Soil moisture 0.291, 13 0.6001 2.261, 15.1 0.1531
Planned linear contrasts
Connected > (Rectangular = Winged) 0.031, 13 0.8722 0.161, 13.8 0.6915
(Connected = Winged) > Rectangular 1.031, 13 0.3288 0.761, 13.8 0.3977

44
Table 1.3. Results from repeated measures ANOVA for species richness by dispersal mode (abiotic and biotic) in the central 100 x 100 m of each patch. Results are shown for species richness estimates from each survey type (presence-absence and permanent plots) separately. Factors for 2000 include patch type (connected, unconnected winged, unconnected rectangular) and log soil moisture. Factors for 2001-2003 include year (2001, 2002, 2003), patch type (connected, unconnected winged, unconnected rectangular), an interaction between year and patch type, and the log soil moisture by weight for each patch. Numerator and denominator degrees of freedom are listed as subscripts for each F-value. Presence absence surveys were not conducted in 2000.
2000 2001-2003
F p F p
Presence-Absence Surveys – Biotically Dispersed
Source of Variance
Year n.a. n.a. 7.412, 42 0.0018
Patch type n.a. n.a. 2.392, 20 0.1177
Year*Patch type n.a. n.a. 0.304, 42 0.8771
Soil moisture n.a. n.a. 0.051, 20 0.8256
Planned linear contrasts
Connected > (Rectangular = Winged) n.a. n.a. 4.271, 20 0.0520
(Connected = Winged) > Rectangular n.a. n.a. 0.561, 20 0.4619
Permanent Plot Data – Biotically Dispersed
Source of Variance
Year n.a. n.a. 3.132, 40.6 0.0545
Patch type 1.662, 13 0.2272 1.302, 13.4 0.3046
Year* Patch type n.a. n.a. 1.664, 40.6 0.1788
Soil moisture 4.091, 13 0.0641 4.541, 18.5 0.0469
Planned linear contrasts
Connected > (Rectangular = Winged) 1.851, 13 0.1967 2.471, 13.5 0.1391
(Connected = Winged) > Rectangular 1.391, 13 0.2591 0.161, 13.4 0.6979

45
Presence-Absence Surveys – Abiotically Dispersed
Source of Variance
Year n.a. n.a. 32.732, 21 <0.0001
Patch type n.a. n.a. 1.082, 12.5 0.3697
Year*Patch type n.a. n.a. 0.984, 21 0.4389
Soil moisture n.a. n.a. 8.551, 13.8 0.0112
Planned linear contrasts
Connected > (Rectangular = Winged) n.a. n.a. 0.601, 12.5 0.4536
(Connected = Winged) > Rectangular n.a. n.a. 1.591, 12.4 0.2309
Permanent Plot Data – Abiotically Dispersed
Source of Variance
Year n.a. n.a. 18.012,
40.8
<0.0001
Patch type 0.552, 13 0.5876 1.102, 14.3 0.3593
Year* Patch type n.a. n.a. 0.754, 40.8 0.5665
Soil moisture 0.031, 13 0.8582 0.731, 15.9 0.4052
Planned linear contrasts
Connected > (Rectangular = Winged) 0.611, 13 0.4494 1.471, 14.3 0.2457
(Connected = Winged) > Rectangular 0.531, 13 0.4815 0.681, 14.3 0.4230
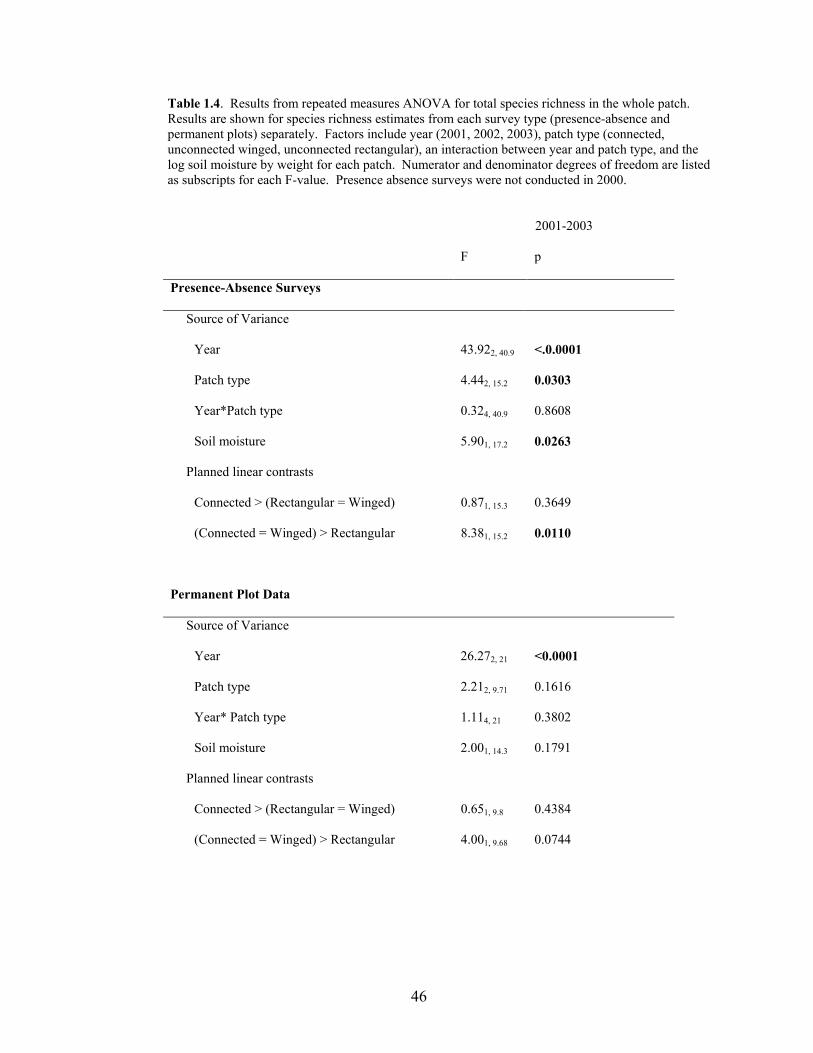
46
Table 1.4. Results from repeated measures ANOVA for total species richness in the whole patch. Results are shown for species richness estimates from each survey type (presence-absence and permanent plots) separately. Factors include year (2001, 2002, 2003), patch type (connected, unconnected winged, unconnected rectangular), an interaction between year and patch type, and the log soil moisture by weight for each patch. Numerator and denominator degrees of freedom are listed as subscripts for each F-value. Presence absence surveys were not conducted in 2000. 2001-2003
F p
Presence-Absence Surveys
Source of Variance
Year 43.922, 40.9 <.0.0001
Patch type 4.442, 15.2 0.0303
Year*Patch type 0.324, 40.9 0.8608
Soil moisture 5.901, 17.2 0.0263
Planned linear contrasts
Connected > (Rectangular = Winged) 0.871, 15.3 0.3649
(Connected = Winged) > Rectangular 8.381, 15.2 0.0110
Permanent Plot Data
Source of Variance
Year 26.272, 21 <0.0001
Patch type 2.212, 9.71 0.1616
Year* Patch type 1.114, 21 0.3802
Soil moisture 2.001, 14.3 0.1791
Planned linear contrasts
Connected > (Rectangular = Winged) 0.651, 9.8 0.4384
(Connected = Winged) > Rectangular 4.001, 9.68 0.0744

47
Table 1.5. Results from repeated measures ANOVA for species richness by dispersal mode (abiotic or biotic) in the whole patch. Results are shown for species richness estimates from each survey type (presence-absence and permanent plots) separately. Factors include year (2001, 2002, 2003), patch type (connected, unconnected winged, unconnected rectangular), an interaction between year and patch type, and the log soil moisture by weight for each patch. Numerator and denominator degrees of freedom are listed as subscripts for each F-value. Presence absence surveys were not conducted in 2000.
2001-2003
F p
Presence-Absence Surveys – Biotically Dispersed
Source of Variance
Year 2.862, 42 0.0687
Patch type 3.442, 20 0.0521
Year*Patch type 0.294, 42 0.8808
Soil moisture 0.591, 20 0.4506
Planned linear contrasts
Connected > (Rectangular = Winged) 2.981, 20 0.0498
(Connected = Winged) > Rectangular 4.251, 20 0.0526
Permanent Plot Data – Biotically Dispersed
Source of Variance
Year 8.622, 42 0.5684
Patch type 0.592, 13.7 0.5684
Year* Patch type 0.874, 42 0.4871
Soil moisture 2.771, 20 0.1116
Planned linear contrasts
Connected > (Rectangular = Winged) 0.791, 13.8 0.3879
(Connected = Winged) > Rectangular 0.451, 13.6 0.5132

48
Presence-Absence Surveys – Abiotically Dispersed
Source of Variance
Year 61.862, 40.5 <0.0001
Patch type 5.152, 15 0.0199
Year*Patch type 0.364, 40.5 0.8358
Soil moisture 6.301, 16.3 0.0229
Planned linear contrasts
Connected > (Rectangular = Winged) 0.241, 15 0.6330
(Connected = Winged) > Rectangular 10.241, 15 0.0060
Permanent Plot Data – Abiotically Dispersed
Source of Variance
Year 17.542, 41.7 <0.0001
Patch type 2.232, 15.8 0.1406
Year* Patch type 0.374, 41.7 0.8295
Soil moisture 1.051, 18 0.3194
Planned linear contrasts
Connected > (Rectangular = Winged) 1.581, 15.9 0.2275
(Connected = Winged) > Rectangular 2.531, 15.8 0.1318

49
Table 1.6. Results from repeated measures ANOVA for total species richness of all species in Poaceae, Juncaceae, Cyperaceae, and Asteraceae in the whole patch. Species richness was estimated from a survey in the fall of 2002. Factors include patch type (connected, unconnected winged, unconnected rectangular) and the log soil moisture by weight for each patch. Numerator and denominator degrees of freedom are listed as subscripts for each F-value.
2002 Fall Survey of Species in Poaceae, Juncaceae, Cyperaceae, and
Asteraceae
F p
Whole Patch
Source of Variance
Patch type 1.932, 13 0.1848
Soil moisture 4.031, 13 0.6600
Planned linear contrasts
Connected > (Rectangular = Winged) 0.001, 13 0.9447
(Connected = Winged) > Rectangular 3.811, 13 0.1729
Central 100 x 100 m Area
Source of Variance
Patch type 3.812, 13 0.0498
Soil moisture 2.891, 13 0.1130
Planned linear contrasts
Connected > (Rectangular = Winged) 1.641, 13 0.2224
(Connected = Winged) > Rectangular 6.151, 13 0.0276
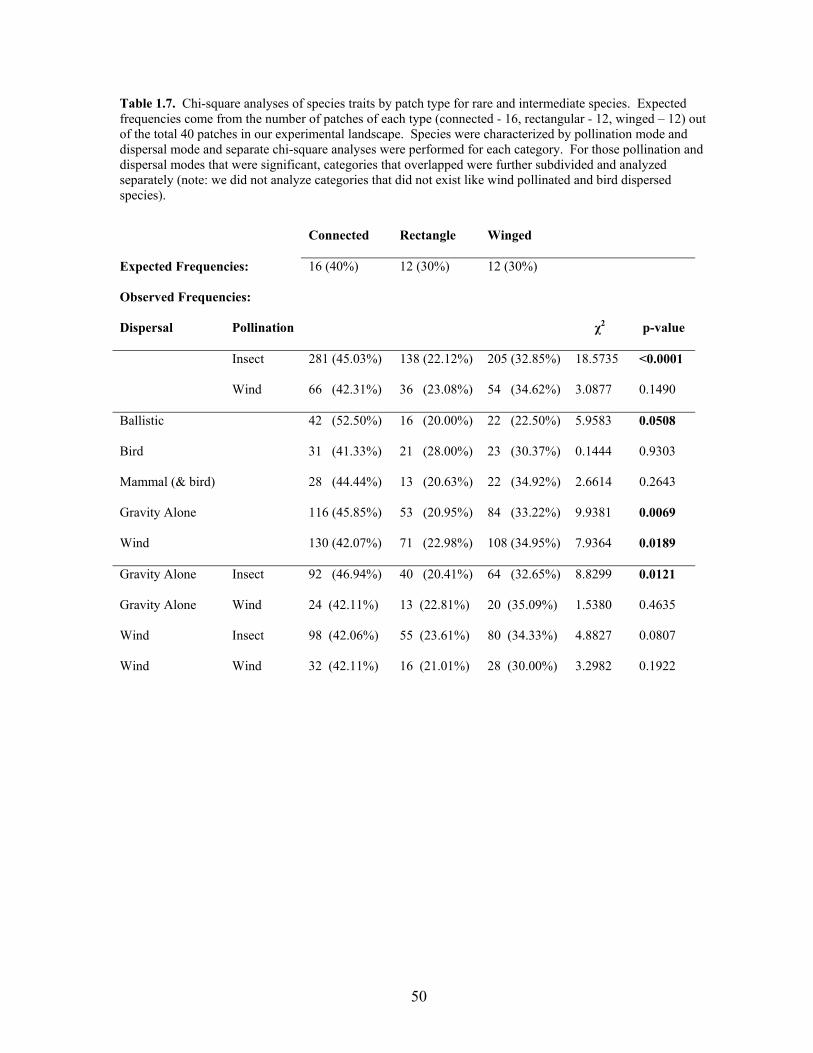
50
Table 1.7. Chi-square analyses of species traits by patch type for rare and intermediate species. Expected frequencies come from the number of patches of each type (connected - 16, rectangular - 12, winged – 12) out of the total 40 patches in our experimental landscape. Species were characterized by pollination mode and dispersal mode and separate chi-square analyses were performed for each category. For those pollination and dispersal modes that were significant, categories that overlapped were further subdivided and analyzed separately (note: we did not analyze categories that did not exist like wind pollinated and bird dispersed species). Connected Rectangle Winged
Expected Frequencies: 16 (40%) 12 (30%) 12 (30%)
Observed Frequencies:
Dispersal Pollination χ2 p-value
Insect 281 (45.03%) 138 (22.12%) 205 (32.85%) 18.5735 <0.0001
Wind 66 (42.31%) 36 (23.08%) 54 (34.62%) 3.0877 0.1490
Ballistic 42 (52.50%) 16 (20.00%) 22 (22.50%) 5.9583 0.0508
Bird 31 (41.33%) 21 (28.00%) 23 (30.37%) 0.1444 0.9303
Mammal (& bird) 28 (44.44%) 13 (20.63%) 22 (34.92%) 2.6614 0.2643
Gravity Alone 116 (45.85%) 53 (20.95%) 84 (33.22%) 9.9381 0.0069
Wind 130 (42.07%) 71 (22.98%) 108 (34.95%) 7.9364 0.0189
Gravity Alone Insect 92 (46.94%) 40 (20.41%) 64 (32.65%) 8.8299 0.0121
Gravity Alone Wind 24 (42.11%) 13 (22.81%) 20 (35.09%) 1.5380 0.4635
Wind Insect 98 (42.06%) 55 (23.61%) 80 (34.33%) 4.8827 0.0807
Wind Wind 32 (42.11%) 16 (21.01%) 28 (30.00%) 3.2982 0.1922
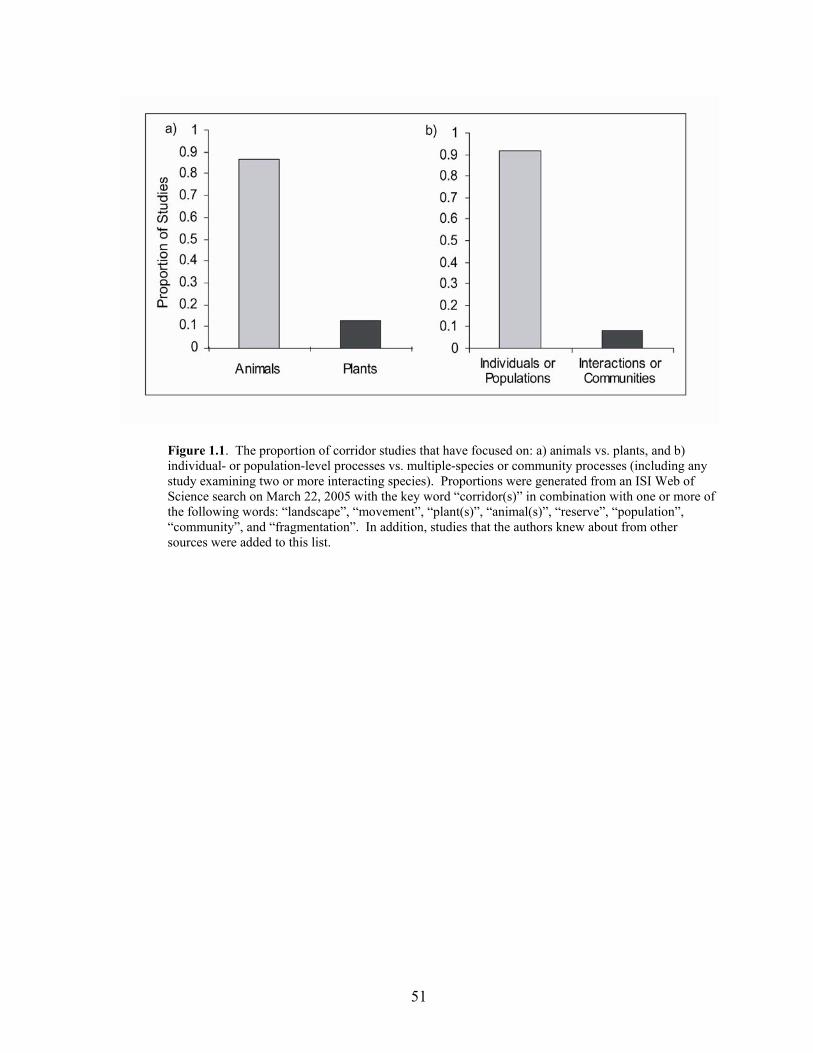
51
Figure 1.1. The proportion of corridor studies that have focused on: a) animals vs. plants, and b) individual- or population-level processes vs. multiple-species or community processes (including any study examining two or more interacting species). Proportions were generated from an ISI Web of Science search on March 22, 2005 with the key word “corridor(s)” in combination with one or more of the following words: “landscape”, “movement”, “plant(s)”, “animal(s)”, “reserve”, “population”, “community”, and “fragmentation”. In addition, studies that the authors knew about from other sources were added to this list.

52
Figure 1.2. Experimental landscape located at the Savannah River Site near Aiken, SC. Eight experimental units each contain a system of five connected and unconnected patches. Center patches are 100 x 100 m and connected to a patch of equal size by a 150 x 25 m corridor. Three unconnected patches are either “rectangular” to test for “area effects” or “winged” to test for “drift-fence effects” and alterations of edge:area ratios.

53
Figure 1.3. Patch and plot design. The center patch (shown in white) was never included in analyses, while light gray areas were included only in analyses of the central 100 x 100 m area of each patch, and both light and dark gray areas were included for whole patch analyses. The black squares represent one nested plot with a 1 x 1 m, 3 x 3 m, and 10 x 10 m plot sampling herbs, shrubs, and trees, respectively. Plots are located in “edges”, “centers” and in three additional areas: “corridors”, “wings”, and “rectangles”.

54
Figure 1.4. Species richness measured by 544 permanent plots in edge and center plot locations only during July-August 2000. Species richness for connected, unconnected rectangular, and unconnected winged patches is shown from a) the total plant community, b) abiotically dispersed species, and c) biotically dispersed species. Error bars indicate standard errors and corresponding F and p-values are in Tables 1.2 and 1.3.
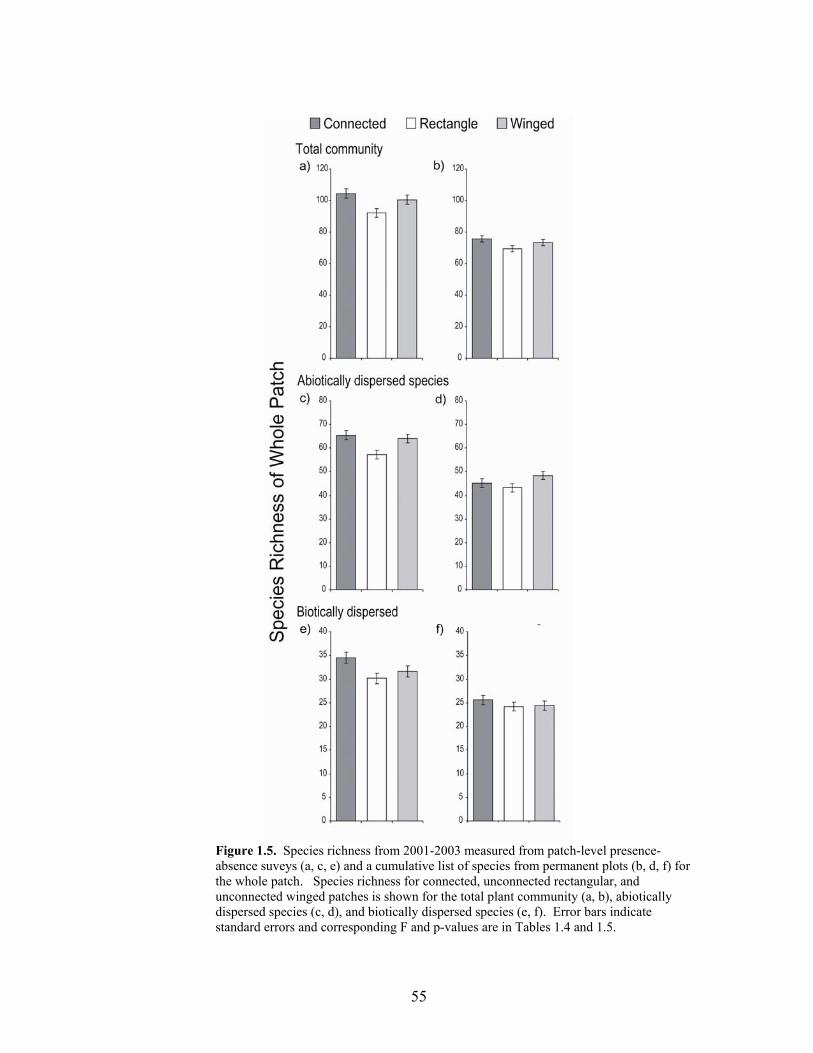
55
Figure 1.5. Species richness from 2001-2003 measured from patch-level presence-absence suveys (a, c, e) and a cumulative list of species from permanent plots (b, d, f) for the whole patch. Species richness for connected, unconnected rectangular, and unconnected winged patches is shown for the total plant community (a, b), abiotically dispersed species (c, d), and biotically dispersed species (e, f). Error bars indicate standard errors and corresponding F and p-values are in Tables 1.4 and 1.5.

56
Figure 1.6. Species richness from 2001-2003 measured from patch-level presence-absence surveys (a, c, e) and a cumulative list of species from permanent plots (b, d, f) for the central 100 x 100 m of each patch. Species richness for connected, unconnected rectangular, and unconnected winged patches is shown for the total plant community (a, b), abiotically dispersed species (c, d), and biotically dispersed species (e, f). Error bars indicate standard errors and corresponding F and p-values are in Tables 1.2 and 1.3.

57
Figure 1.7. Species richness measured from patch-level presence-absence surveys of species in Poaceae, Juncaceae, Cyperaceae, and Asteraceae in the fall of 2002. Species richness for connected, unconnected rectangular, and unconnected winged patches is shown from a) the whole patch, b) the central 100 x 100 m of each patch. Error bars indicate standard errors and corresponding F and p-values are in Tables 1.6.
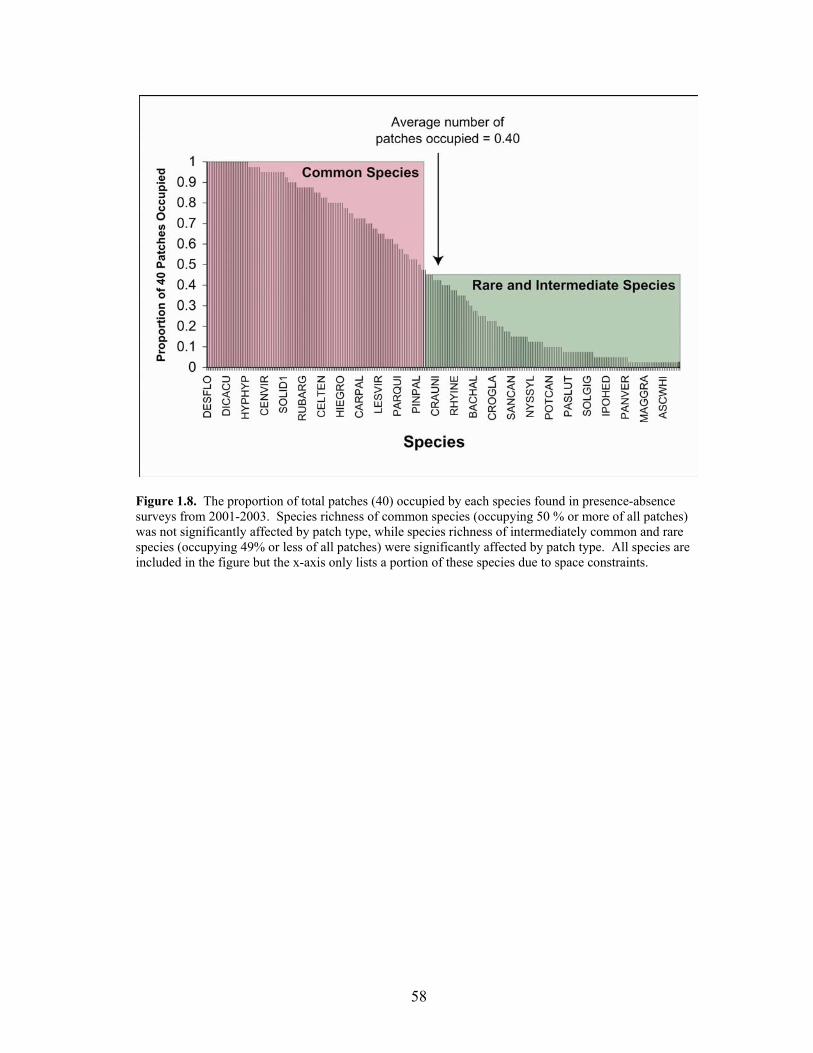
58
Figure 1.8. The proportion of total patches (40) occupied by each species found in presence-absence surveys from 2001-2003. Species richness of common species (occupying 50 % or more of all patches) was not significantly affected by patch type, while species richness of intermediately common and rare species (occupying 49% or less of all patches) were significantly affected by patch type. All species are included in the figure but the x-axis only lists a portion of these species due to space constraints.

59
CHAPTER 2: HABITAT CONFIGURATION AFFECTS A SEEDBANK
A paper to be submitted to Journal of Ecology
Ellen I. Damschen, Kristen M. Rosenfeld, Nick M. Haddad, and Thomas R. Wentworth
Abstract
Seedbanks can make large contributions to the composition of standing plant
communities, especially following disturbance. The spatial configuration of a landscape may
affect processes that add or remove seeds from the seedbank, such as dispersal, germination
conditions, or seed predation. In a large-scale habitat fragmentation experiment, we
evaluated the influence of corridors and patch shape on the seedbank. These landscapes were
created by clearing and burning, and the resulting early-successional community grew and
dispersed seeds over the next four growing seasons. During the fourth growing season, we
sampled the soil seedbank to assess whether the experimental configuration of habitat had
altered the density and diversity of seeds in the soil. The soil seedbank was most similar to
the plant community established following disturbance and progressively became more
dissimilar over time. Corridors and patch shape did not affect seed density or diversity, but
the edges of all patch types had significantly fewer species of seeds than the centers. Of the
species that were only present at edges or centers of patches, but not both, wind and gravity
dispersed species were more likely to be at patch centers than at patch edges. These changes
in seedbank composition are likely due to the combined influence of several edge effects on
seed dispersal, predation, and germination requirements.

60
Introduction
Fragmentation impacts and seedbanks
Plant community composition can be affected substantially by inputs from the seedbank
(the pool of germinable seeds laying dormant in the soil), which can be especially strong
under particular climatic conditions or after disturbance events (e.g., Kalamees and Zobel
1997, 1998, Bossuyt et al. 2002, Kalamees and Zobel 2002). Propagules enter the seedbank
through dispersal and exit through germination or mortality via seed senescence or seed
predation (Figure 2.1).
One factor that may have important effects on seedbanks, but has received little attention,
is habitat fragmentation. Habitat loss and alteration is one of the biggest contributors to the
endangerment of species across the globe (Wilcove 1998, Yiming and Wilcove 2005).
Among other effects, habitat fragmentation has been shown to influence critical plant-animal
interactions such as pollination and seed dispersal (Rathcke and Jules 1993, Aizen and
Feinsinger 1994, Tewksbury et al. 2002, Townsend and Levey 2005), as well as negative
interactions such as seed predation (Orrock et al. 2003, Chacoff et al. 2004, Orrock and
Damschen 2005). Because propagule inputs, survivorship, and seedling emergence from the
seedbank depend on processes that are known to be affected by spatial alterations of habitat
(Figure 2.1), the composition of the seedbank may be altered in fragmented landscapes.
In this study, we tested for the effects of two habitat characteristics that are altered by
fragmentation: patch shape and connectivity. We specifically test for the effects of corridors,
thin strips of habitat connecting two otherwise isolated habitat patches, on the density and
diversity of seeds in a seedbank. Corridors can operate through three main between-patch
processes (see Chapter 1 for further description): First, corridors can act through

61
“connectivity effects”, where they serve to increase movement rates between the patches they
connect. Second, corridors can operate solely by increasing habitat area (“area effects”).
And, finally, they can operate through “drift-fence effects” (after Haddad and Baum 1999) by
filtering organisms moving through the surrounding landscape into a connected patch simply
because of the expanse of the corridor in the landscape, intercepting dispersing organisms
and directing them into a connected patch. Additionally, corridors can alter within-patch
processes by changing the prevalence of local edge effects because corridors are two long,
linear edges. Increased edge-to-area ratios are a major result of habitat fragmentation, which
can have dramatic consequences for the distribution and abundance of organisms due to
shifts in habitat types and available resources at ecotones (reviewed in Ries et al. 2004, Ries
and Sisk 2004).
At the Savannah River Site, near Aiken, South Carolina, we have worked with the U.S.
Forest Service to create experimental landscapes to test for the effects of habitat
fragmentation on plant communities through alterations to connectivity and patch shape (see
Methods for study site description). These sites were created by harvesting and burning
(typical forest management practice in this region) and allowed to undergo succession for
four growing seasons. During this time, the herbaceous understory grew, reproduced, and
dispersed propagules under our imposed spatial landscape. We have evidence that spatial
processes in this landscape altered the three main factors that could affect seedbank
composition, including seed dispersal (Tewksbury et al. 2002), local microsite conditions
(Orrock unpublished data), and seed mortality by predation (Orrock et al. 2003, Orrock and
Damschen 2005). The deposition of bird-dispersed seeds was greater in connected patches
than in any other unconnected patch type (Tewksbury et al. 2002), and edge effects and patch

62
shape affected both rodent and arthropod seed predation rates (Orrock et al. 2003, Orrock and
Damschen 2005). Other studies have shown that seedbanks can differ across habitat edges
(Dougall and Dodd 1997, Cubina and Aide 2001, Lamb and Mallik 2003, Landenberger and
McGraw 2004, Devlaeminck et al. 2005) and that dispersal can be an important determinant
of seedbank composition (Cubina and Aide 2001, Landenberger and McGraw 2004).
We predicted that the seedbank community would differ by patch type (i.e., connected,
winged, or rectangular) and by its proximity to a patch edge. However, while we have
learned much about how space influences the processes that contribute to the seedbank
composition in our landscape, directional predictions for seedbank community response are
not clear because the relative strength of each of these forces for population and community
dynamics is unknown. Here, we tested for the effects of patch shape and within-patch
location (edge, center, “other”; Figure 2.2) on the density and diversity of the seedbank and
evaluated the importance of dispersal, microsite limitation, seed predation, and senescence in
light of our findings. We also hypothesized that the seedbank community would be most
similar in composition to the established plant community established in the first year after
our sites were cleared and burned and would become progressively increasingly dissimilar
from the established growing plant community in subsequent years.
Methods
Study site
Our study took place at the Savannah River Site near Aiken, South Carolina, a National
Environmental Research Park (NERP). The Savannah River Site lies in the Upper Coastal
Plain Physiographic Province and is characterized by sandy, well-drained soils. The U.S.
63
Forest Service manages the SRS for Pinus taeda (loblolly pine) and Pinus palustris (longleaf
pine) (Workman and McLeod 1990). In the winter of 1999-2000, the Forest Service helped
to create a large-scale experimental landscape consisting of open habitat patches within a
surrounding matrix of mature pine forest (Figure 2.2). The landscape consisted of 8
experimental units made up of 5 patches each. One central 100 x 100 m (1 ha) patch was
surrounded by four 150 m peripheral patches (Figure 2.2). A 150 x 25 m corridor connected
the central patch to a single peripheral patch while the other three peripheral patches were
unconnected (Figure 2.2). The cardinal direction of the corridor was randomized to adjust
for plants or animals that exhibit daily or seasonal directionality in their movement.
Connectivity effects were tested using the connected patches, while the two unique
unconnected patch shapes allowed us to test for the other possible corridor functions.
“Rectangular” patches tested for area effects by adding the area equivalent to a corridor to
100 x 100 m patch but not providing a connection. “Winged” patches have two 75 x 25 m
projections off either patch side to test for the impacts of corridors as drift-fences. These
changes in patch shape may alter within-patch processes through local edge effects, or they
may affect between-patch processes by filtering dispersing individuals into patches because
of their expanse across the landscape. Four of the experimental units had one rectangular and
two winged patches and the other four experimental units had two rectangular and one
winged patch.
Seed Bank Sampling
In 2003, 3.5 years after patch creation, we collected soil seedbank samples from the 1280
permanent 1 x 1 m plots used to sample the standing vegetation (described below, Figure 2.2)

64
using a modified version of Gross’s (1990) “germination following cold-stratification seed
bank estimation method.” From 16 – 29 June 2003, eight soil cores (15 cm deep and 2.5 cm
in diameter) were extracted at every 0.5 m around the perimeter of each 1 x 1 m plot (Figure
2.2). The litter layer was brushed away prior to taking each core. The eight cores were
combined and homogenized into one sample per plot and then cold stratified for 6 weeks at
2.2 - 3.3o C. Other studies have found that a greater number of combined small samples are
more appropriate than a small number of large samples for estimating the composition of the
seedbank, which is subject to small scale heterogeneity (e.g., Benoit et al. 1989, Cohen et al.
2004)
From 15 September – 30 November 2003, samples were allowed to germinate under
greenhouse conditions at North Carolina State University, Raleigh, NC. 27.94 x 44.88 cm
plastic trays with several small drainage holes were filled 2.54 cm deep with Metro Mix 360
sterile potting medium and separated into thirds using plastic dividers. Each sample was
spread across the sterile potting mix in one section of a divided tray, resulting in a sample
layer approximately 1.5 - 2.5 cm deep on top of the sterile soil medium. Samples were
randomly assigned to trays and tables within three greenhouses. To control for possible seed
contaminants present in greenhouses, eleven trays were randomly placed throughout the
greenhouses and filled only with sterile soil. Only one species, Erigeron canadensis,
emerged in trays close to an intake fan in one greenhouse, so this species was removed from
data collected from all trays within 5 m of this fan (this species did not emerge in any other
control tray that was farther than 1.5 m from the fan, so this contamination distance is
conservative). Because E. canadensis was a species commonly found in the established plant
community, we did not want to eliminate the species from the dataset, because most

65
individuals were not likely to be contaminants.
All trays were watered gently until the soil was saturated. Watering took place one to two
times per day to keep the soil consistently moist for the duration of the experiment. We
fertilized all trays once a month for two reasons: 1) some seeds may require fertilization for
germination (Baskin and Baskin 1998), and 2) to assure the survivorship of seedlings
growing in trays awaiting identification (see monitoring methods below). We fertilized all
trays with a solution of 0.25 teaspoon of Peters 20 : 20 : 20 (N : P2O5 : K2O) fertilizer per
gallon of water on 9 September and again on 8 October 2003. Similarly, to promote the
germination of seeds beneath the soil surface, we disturbed each sample once from 29 - 31
September 2003 by gently turning-over the soil with a clean plastic fork, taking care not to
combine the soil sample with the underlying sterile potting mix or to disturb already growing
seedlings. While it is possible that germination requirements for all species were met, our
method mimics natural field conditions by providing high light and moisture conditions for
seed germination and is a common method used in other seedbank studies (Thompson and
Grime 1979, Gross 1990).
Seedling monitoring
Seedling monitoring began on 26 September 2003 and continued weekly until 30
November - 3 December 2003. All seedlings were identified to species, counted, and then
removed from the trays. If we were unable to identify a seedling, it was counted and marked
with a unique combination of colored straight pins until identification was possible. If a
species began to flower and was still unidentified, it was removed and pressed for later
identification. Those seedlings that had not flowered and were still unidentified at the
66
conclusion of the experiment were transplanted to larger pots and allowed to mature until 15
August 2004, when all seedlings were identified or pressed. If a germinant died before
identification was possible, it was recorded as emerging, but was not included in any
analyses. Analyses were also performed that included dead individuals, but doing so did not
alter the direction or significance of our findings.
We followed the nomenclature of Radford et al. (1964) except for the genera
Chamaecrista and Gnapthalium, where the updated nomenclature of Weakley (2005) was
used. A complete species list can be found in Appendix B. Because grasses in the genus
Dichanthelium are notoriously difficult to identify, we classified all Dichanthelium spp.
individuals into three groups based on size. All Rubus spp. were also grouped together as
one species because identification was dependent upon reproductive parts and none of these
individuals ever flowered. Similarly, we lumped both Andropogon ternarius and A.
virginicus into one species. All species were matched to specimens at the North Carolina
State University Herbarium and verified by regional experts (pers. comm. J. Stucky, and A.
Krings). We could not identify eleven species to genus or species, but recognized them as
unique. These species were given a unique identifying name for use in analyses (see
Appendix B).
Dispersal modes and other life history traits were determined by conducting primary
literature searches, searching the USDA PLANTS Database (USDA 2004), NatureServe
Explorer (NatureServe 2005), and The Illinois Plant Network (Iverson et al. 1999), and using
local flora and regional plant guides (Radford et al. 1964, Miller and Miller 1999, Weakley
2005). For less than 25% of the species, the primary dispersal mode was not indicated in
these sources, so a best guess was made based on field observations of morphological traits

67
and comparisons with congeners. We were able to categorize all known species by dispersal
mode with reasonable certainty.
Standing Vegetation Survey
At each of the 1280 plots where we sampled the seedbank, we also surveyed the
established plant community from 2001-2003 (Figure 2.2). Plots were a nested design, in
which three concentric plot sizes were used to accommodate plant species with different
vegetative habits: 1 x 1 m for herbs, 3 x 3 m for shrubs, and 10 x 10 for trees. Here, we
compare the seedbank community to species found in the 1 x 1 m plots only, which included
all species less than 30 cm tall (both woody and herbaceous). Surveys took place during the
height of plant production from 15 July – 20 August 2001-2003. All species were recorded
and assigned one of ten percentage cover classes following the methods of Peet et al. (1998):
0-0.01%, 0.01-1%, 1-2%, 2-5%, 5-10%, 10-25%, 25-50%, 50-75%, 75-95%, >95%, which
allows for consistency among multiple observers. The median value of each cover class was
used for analyses as recommended by Peet et al. (1998).
Data analysis
We used a mixed model randomized block design to analyze two separate response
variables: the density of individuals and the number of species (species richness) that
emerged from each plot. Both of these variables were square-root transformed to improve
normality by using X′ = X1/2 + (X+1)1/2 prior to analysis (Zar 1999). Random variables
included the experimental site the sample came from and the greenhouse a sample
germinated in, as well as the interactions between greenhouse and site, greenhouse and patch

68
type, and greenhouse by plot location within a patch. Fixed variables included patch type
and plot location (edge, center, other; Figure 2.2) nested within patch type. The natural log
of soil moisture by weight (see Chapter 1 for methods) and the natural log of the nearest
distance to a heater in the greenhouse were included as covariates.
To assess the degree of similarity in seedbank composition between plots in different
locations within a patch (i.e., edges, centers, and other), we calculated pairwise similarity
distances between each plot and all other plots using Bray-Curtis and Sorensen distance
measures calculated with EstimateS software (Colwell 2005). The Bray-Curtis similarity
measure is based on species abundances while the Sorensen similarity measure is based on
presence-absence data and therefore more heavily weights rare species. We averaged the
pairwise similarity values for all comparison types (center and edge, edge and other, center
and other) for each similarity measure (Bray-Curtis and then Sorenson). These distance
comparisons were used as response variables in a Multivariate Analysis of Variance
(MANOVA) with experimental unit and patch type as independent variables and the variance
in soil moisture in each patch included as a covariate. Bray-Curtis similarity measures were
natural log transformed and Sorensen similarity values were square-root transformed to
improve normality and homogeneity of variances.
To assess the similarity of the seedbank and standing vegetative communities from 2001-
2003, we ordinated species presence-absence data for each species occurring in any survey
type (seedbank, standing vegetation 2001-2003). We used non-metric multidimensional
scaling (NMS) as recommended by McCune and Grace (2002) using the PC-Ord Software
System (McCune and Mefford 1999) with the default settings (Kruskal 1964, McCune and
Mefford 1999). We utilized the Sorensen distance measure with 3 axes and the ordination

69
was rotated with varimax rotation so that the first axis accounted for the majority of the
solution.
We also examined the frequency of species occurrences in each patch type and location
and whether specific species life history traits were associated with the observed patterns.
Four life history traits were assigned to each species: dispersal mode (bird, ballistic, gravity,
mammal, or wind), pollination mode (insect or wind), life cycle (annual or perennial), and
habit (herb, shrub, tree, or vine). Traits were assigned by searching regional flora and guides
(Radford et al. 1964, Miller and Miller 1999, Weakley 2005), conducting a primary literature
search for each species (ISI Web of Science and Biological Abstracts), and searching for
each species in three plant databases: 1) USDA PLANTS Database (USDA 2004), 2)
NatureServe Explorer (NatureServe 2005), and 3) The Illinois Plant Network (Iverson et al.
1999). If we could not determine species life history characteristics using these methods
(~25%), we deduced them from plant morphology and congener comparisons. We classified
all species with reasonable certainty. Chi-square analyses were used to test the relative
frequency of species with the four life history traits between edge and center plot locations.
Results
A total of 9029 individuals and 76 species were found in the germinable soil seedbank
(Appendix B). On average, there were 2.82 ± 0.10 individuals and 2.49 ± 0.04 species per
sample (588.72 cm3). Of all species found in either the seedbank the established plant
community from 2001-2003, or both, 3% were unique to the seedbank, 39% were shared, and
58% were unique to the established community (Figure 2.3). Ordination revealed that the
seedbank community was most similar to the community established in 2001, one year after

70
the initial disturbance, and became progressively more dissimilar over time (Figure 2.4).
This is evident in the ordination plot, where the clustering of plots in any given year moves
progressively away from the initial year after disturbance (years are different symbols).
There were differences between experimental units in the diversity and composition of
seeds, however, we do not report means or significance values since the experimental unit
was included as a random effect in our statistical model. There was no effect of patch type or
location on the density of seeds in the seedbank (Table 2.1, Figure 2.5). Species richness was
also unaffected by patch type, but location had a significant effect (Table 2.1). Linear
contrasts revealed that patch centers had more species than either edges or other areas
(corridors, wings, rectangles) within each patch type (Table 2.1, Figure 2.5). Location-to-
location similarities analyzed with MANOVA were not affected by patch type using either
Bray-Curtis (Pillai’s trace F = 0.462,21, p = 0.6401) or Sorensen measures (Pillai’s trace F =
0.822,21, p = 0.4536). Chi-square analyses indicated that of species that only occur in one
location (either edges or centers, but not both), wind- or gravity-dispersed species are more
likely to occur at centers than at edges (14 species at center, 3 species at the edge, χ2 = 7.12,
df = 1, p = 0.0076). All other dispersal modes, pollination modes, life cycles, and habits did
not differ between edges and center locations.
Discussion
Seedbanks in our study system were more species rich at centers of patches than edges or
other locations, but were not affected by patch type. The density of seeds in the seedbank
was also unaffected by patch type or location and there was no effect of patch type on the
similarity of the seedbank community between different locations. The composition of the

71
seedbank was most similar to the established plant community that initially arose after the
sites were created via disturbance and then became progressively more dissimilar over time.
Fragmentation and the seedbank
The increased species richness of seeds at patch centers suggests that multiple processes
are at work. Below, we consider the evidence for each of the three possible mechanisms
driving our observed response: seed dispersal, seed predation, and microsite limitation. Seed
dispersal could have led to the increased species richness we saw at patch centers because
centers capture greater proportions of seed rain when compared to edges. However, we did
not observe an increase in seed density, which would also be expected to increase if seed rain
alone were driving the pattern. Small mammal and arthropod seed predators have been
shown to forage more intensively at patch centers in our experimental landscape (Orrock et
al. 2003, Orrock and Damschen 2005). Small mammals avoid edges, which are perceived as
places of high predation risk, while arthropods are more active in locations with greater solar
load (also away from edges). There could be an interaction between increased dispersal and
seed predation, nullifying an effect of increased seed rain via seed predation. Furthermore,
seed predators could preferentially forage on common species, making it more likely that
rarer species persist and emerge. Alternatively, arthropod seed predators are known to
disperse and cache seeds without consuming them (Christian and Stanton 2004). If ants are
bringing greater numbers of seeds to patch centers, they could increase the probability of
unique species in the seedbank at patch centers. Finally, microsite conditions could reduce or
enhance the persistence of seeds within the seedbank. Other studies have documented shifts
in light, temperature, soil moisture, and root production along gap and clearing edges in

72
longleaf pine forests (Brockway and Outcalt 1998, Harrington et al. 2003, Chapter 3). If
such changes affect seed survival, microsite conditions could affect seedbank composition.
Future studies should explicitly control each of these factors by using a combination of seed
additions (dispersal), seed predator exclosures (predation), and abiotic manipulations of
shading and soil moisture (microsite).
Our results could be influenced by the depth of the soil cores that we used to sample the
seedbank (15 cm). We used this depth because there have been few studies of seedbanks in
the southeastern United States (but see Cohen et al. 2004) and 15 cm was a conservative limit
for the range of seedbank depths sampled in other studies (Moles and Drake 1999, Cubina
and Aide 2001, Cohen et al. 2004, Decocq et al. 2004). It is possible that the persistent
seedbank, which we would not expect to be affected by the spatial configuration of the
landscape over the past four years, overwhelmed any effect we may have seen in the transient
seedbank in the uppermost soil depths. If this is the case, we may only be detecting the
strongest trends, which are the resulting changes in seedbank species richness as a result of
edge effects. If seedbanks are affected by edges, we would expect that changes in the
amount and configuration of edges would lead to patch-level consequences. It may be that
these effects have not had enough time to accumulate. Because the early-successional
species we observed are dependent on natural (fire for longleaf pine forest species) and
human disturbances (clearing and burning in forest management) for reproduction and
dispersal, additional disturbance events might be needed before patch-level responses are
able to be detected.

73
Relationship between the seedbank and established plant community
The established vegetative community in this experimental landscape has become more
diverse in connected and winged patches vs. rectangular over time (Chapter 1). One of the
main hypotheses we tested was the effect of increased edge-to-area ratios in connected
patches (since corridors are effectively two long, linear edges) leading to the increases in
diversity we observed. We found no difference, however, in established plant species
richness, evenness, or composition between locations within a patch (edge, center, other) for
the established plant community. This discrepancy between observing edge effects in the
seedbank but not in the established plant community suggests several possible mechanisms
are at work, which would be worth exploring in the future. First, differential abiotic factors
at edges and centers that are present in the field (but not in the greenhouse) could cause
differential germination patterns that essentially nullify any compositional differences in the
seedbank as species germinate. Second, species interactions in more mature life stages could
eliminate any initial edge effect. And finally, site history (i.e., present community
composition, disturbance, land use, etc.) may be more important in determining the
composition of the standing community by limiting the number or type of seedlings that
emerge.
Conservation implications
Longleaf pine forests were historically the dominant community type across the
southeastern United States (Frost 1993, Smith et al. 2000). These forests extended across a
moisture gradient, with more mesic forests defined as savannas and more xeric forests
defined as sandhill or scrub communities. These forests are some of the most species rich

74
ecosystems in North America and harbor many rare and threatened species (Frost 1993,
Smith et al. 2000). Today, less than 3% of longleaf pine forest remains (Frost 1993,
Schwartz 1994, Smith et al. 2000) and there are active restoration efforts underway to restore
habitat for many of the critical plant species found in these forests. Our study suggests that
native longleaf pine species are infrequent members of the seedbank community (Appendix
B) and that seed additions may be necessary when trying to restore longleaf pine habitats.
Our results are contrary to those of Cohen et al. (2004), who compared the seedbanks of
disturbed and undisturbed native longleaf pine savannas and found that over half of the
species in the seedbank of highly disturbed former longleaf pine sites were indicative of
native longleaf pine communities. Both of our studies occurred in disturbed sites that have
undergone similar forest management strategies (including the use of mechanical clearing,
herbicide, and burning), soil cores were taken at similar depths (10 cm and 15 cm), and we
both used similar seedling emergence methods. The major difference between our studies
was that Cohen et al. sampled forests occurring in the more mesic end of the soil moisture
gradient for longleaf pine communities, while we sampled communities at the more xeric
end. The differences we found in overall composition suggest that the usefulness of
seedbanks as a restoration tool in longleaf pine forests may depend on hydrological gradients.
Acknowledgements
This work was made possible by funding from NSF DEB-9907365, the D.O.E. –Savannah
River Operations Office through the Forest Service Savannah River under the Interagency
Agreement DE-1A09-76SR00056 (a National Environmental Research Park), Sigma Xi, and
North Carolina State University. We are especially thankful for the leadership provided by

75
John Blake and Ed Olson at the Forest Service Savannah River. Thanks to Julie Davis,
Jennifer Freeman, and Bethany Honeyager for your patience, persistence, and tenacity while
collecting copious quantities of dirt. Thank you to John Orrock for your continued support
and helpful advice throughout the completion of this project. Jamie Scott provided
refrigeration space for the cold stratification process and Ron Mosely and Aimee Weldon
assisted in transporting the samples to NCSU. Vann Covington, George Kennedy, and Fred
Gould provided greenhouse space and logistical support. Thanks to Nate Bacheler, Becky
Bartel, Salinda Daley, Julie Davis, Jennifer Freeman, Faith Inman, Christy Prenger, Wayne
Rostant, and Sunny Snider for help with greenhouse planting, watering, and sampling.
Alexander Krings, Jon Stucky, and the North Carolina State Herbarium provided tremendous
assistance with specimen identification. Thanks to Marcia Gumpertz and Kevin Gross for
statistical advice. The intellectual and logistical support provided to E.I.D. by Jonathan
Levine during manuscript preparation is greatly appreciated. The manuscript benefited from
the helpful comments of Jim Gilliam, George Hess, John Orrock, and Tom Rufty.
76
Literature Cited Aizen, M. A., and P. Feinsinger. 1994. Forest fragmentation, pollination, and plant
reproduction in a chaco dry forest, Argentina. Ecology 75:330-351.
Baskin, C. C., and J. M. Baskin. 1998. Seeds: Ecology, Biogeography, Evolution of
Dormancy and Germination. Academic Press, New York.
Benoit, D. L., N. C. Kenkel, and P. B. Cavers. 1989. Factors influencing the precision of soil
seed bank estimates. Canadian Journal of Botany-Revue Canadienne De Botanique
67:2833-2840.
Bossuyt, B., M. Heyn, and M. Hermy. 2002. Seed bank and vegetation composition of forest
stands of varying age in central Belgium: consequences for regeneration of ancient
forest vegetation. Plant Ecology 162:33-48.
Brockway, D. G., and K. W. Outcalt. 1998. Gap-phase regeneration in longleaf pine
wiregrass ecosystems. Forest Ecology and Management 106:125-139.
Chacoff, N. P., J. M. Morales, and M. D. Vaquera. 2004. Effects of fragmentation on amount
of aborted and predated seed in the Chaco Serrano Argentina. Biotropica 36:109-117.
Christian, C. E., and M. L. Stanton. 2004. Cryptic consequences of a dispersal mutualism:
Seed burial, elaiosome removal, and seed-bank dynamics. Ecology 85:1101-1110.
Cohen, S., R. Braham, and F. Sanchez. 2004. Seed bank viability in disturbed longleaf pine
sites. Restoration Ecology 12:503-515.
Colwell, R. K. 2005. EstimateS: Statistical estimation of species richness and shared species
from samples. Version 7.5. User's guide and application published at
http://purl.oclc.org/estimates.

77
Cubina, A., and T. M. Aide. 2001. The effect of distance from forest edge on seed rain and
soil seed bank in a tropical pasture. Biotropica 33:260-267.
Decocq, G., B. Valentin, B. Toussaint, R. Hendoux, R. Saguez, and J. Bardat. 2004. Soil seed
bank composition and diversity in a managed temperate deciduous forest.
Biodiversity and Conservation 13:2485-2509.
Devlaeminck, R., B. Bossuyt, and M. Hermy. 2005. Inflow of seeds through the forest edge:
evidence from seed bank and vegetation patterns. Plant Ecology 176:1-17.
Dougall, T. A. G., and J. C. Dodd. 1997. A study of species richness and diversity in seed
banks and its use for the environmental mitigation of a proposed holiday village
development in a coniferized woodland in south east England. Biodiversity and
Conservation 6:1413-1428.
Frost, C. C. 1993. Four centuries of changing landscape patterns in the longleaf pine
ecosystem. Pages 17-43 in S. M. Hermann, editor. Proceedings of the Tall Timbers
Fire Ecology Conference, No. 18, Tall Timbers Research Station, Tallahassee, FL.
Gross, K. L. 1990. A comparison of methods for estimating seed numbers in the soil. Journal
of Ecology 78:1079-1093.
Haddad, N. M., and K. A. Baum. 1999. An experimental test of corridor effects on butterfly
densities. Ecological Applications 9:623-633.
Harrington, T. B., C. M. Dagley, and M. B. Edwards. 2003. Above- and belowground
competition from longleaf pine plantations limits performance of reintroduced
herbaceous species. Forest Science 49:681-695.

78
Iverson, L. R., D. Ketzner, and J. Karnes. 1999. Illinois Plant Information Network. Database
at http://www.fs.fed.us/ne/delaware/ilpin/ilpin.html. in. Illinois Natural History
Survey and USDA Forest Service.
Kalamees, R., and M. Zobel. 1997. The seed bank in an Estonian calcareous grassland:
Comparison of different successional stages. Folia Geobotanica & Phytotaxonomica
32:1-14.
Kalamees, R., and M. Zobel. 1998. Soil seed bank composition in different successional
stages of a species rich wooded meadow in Laelatu, western Estonia. Acta
Oecologica-International Journal of Ecology 19:175-180.
Kalamees, R., and M. Zobel. 2002. The role of the seed bank in gap regeneration in a
calcareous grassland community. Ecology 83:1017-1025.
Kruskal, J. B. 1964. Nonmetric multidimensional scaling: a numerical method.
Psychometrika 29:115-129.
Lamb, E. G., and A. U. Mallik. 2003. Plant species traits across a riparian-zone/forest
ecotone. Journal of Vegetation Science 14:853-858.
Landenberger, R. E., and J. B. McGraw. 2004. Seed-bank characteristics in mixed-
mesophytic forest clearcuts and edges: Does "edge effect" extend to the seed bank?
Canadian Journal of Botany-Revue Canadienne De Botanique 82:992-1000.
McCune, B., and J. B. Grace. 2002. Analysis of Ecological Communities. MjM Software
Design, Gleneden Beach, OR.
McCune, B., and M. J. Mefford. 1999. PC-ORD: Multivariate Analysis of Ecological Data.
Version 4.14.

79
Miller, J. H., and K. V. Miller. 1999. Forest plants of the southeast and their wildlife uses.
Southern Weed Society and Craftmaster Printers, Inc., Auburn, Alabama.
Moles, A. T., and D. R. Drake. 1999. Potential contributions of the seed rain and seed bank
to regeneration of native forest under plantation pine in New Zealand. New Zealand
Journal of Botany 37:83-93.
NatureServe. 2005. NatureServe Explorer Version 4.2. in.
Orrock, J. L., and E. I. Damschen. 2005. Corridors cause differential seed predation.
Ecological Applications In press.
Orrock, J. L., B. J. Danielson, M. J. Burns, and D. J. Levey. 2003. Spatial ecology of
predator-prey interactions: corridors and patch shape influence seed predation.
Ecology 84:2589-2599.
Peet, R. K., T. R. Wentworth, and P. S. White. 1998. A flexible, multipurpose method for
recording vegetation composition and structure. Castanea 63:262-274.
Radford, A. E., H. E. Ahles, and C. R. Bell. 1964. Manual of the vascular flora of the
Carolinas. The University of North Carolina Press, Chapel Hill, NC.
Rathcke, B. J., and E. S. Jules. 1993. Habitat Fragmentation and Plant Pollinator Interactions.
Current Science 65:273-277.
Ries, L., R. J. Fletcher, J. Battin, and T. D. Sisk. 2004. Ecological responses to habitat edges:
mechanisms, models, and variability explained. Annual Review of Ecology Evolution
and Systematics 35:491-522.
Ries, L., and T. D. Sisk. 2004. A predictive model of edge effects. Ecology 85:2917-2926.
Schwartz, M. W. 1994. Natural distribution and abundance of forest species and communities
in northern Florida. Ecology 75:685-705.

80
Smith, G. C., M. W. Patterson, and H. R. Trendell. 2000. The demise of the longleaf-pine
ecosystem. Southeastern geographer XXXX:75-92.
Tewksbury, J. J., D. J. Levey, N. M. Haddad, S. Sargent, J. L. Orrock, A. Weldon, B. J.
Danielson, J. Brinkerhoff, E. I. Damschen, and P. Townsend. 2002. Corridors affect
plants, animals, and their interactions in fragmented landscapes. Proceedings of the
National Academy of Sciences USA 99:12923-12926.
Thompson, K., and J. P. Grime. 1979. Seasonal variation in the seed banks of herbaceous
species in ten contrasting habitats. Journal of Ecology 67:893-921.
Townsend, P. A., and D. J. Levey. 2005. An experimental test of whether habitat corridors
affect pollen transfer. Ecology In Press.
USDA, N. 2004. The PLANTS Database, Version 3.5 (http://plants.usda.gov). in, National
Plant Data Center, Baton Rouge, LA 70874-4490 USA.
Weakley, A. S. 2005. Flora of the Carolinas, Virginia, and Georgia. University of North
Carolina Press, Chapel Hill.
Wilcove, D. S., D. Rothstein, J. Dubow, A. Phillips, and E. Losos. 1998. Quantifying treats
to imperiled species in the United States. Bioscience 48:607-615.
Workman, S. W., and K. W. McLeod. 1990. Vegetation of the Savannah River Site: Major
Community Types. Savannah River Site National Environmental Research Park
Program, Aiken, South Carolina.
Yiming, L., and D. S. Wilcove. 2005. Threats to vertebrate species in China and the United
States. Bioscience 55:147-153.
Zar, J. H. 1999. Biostatistical Analysis, 4th edition. Prentice Hall, Upper Saddle River, NJ.

81
Table 2.1. Results from ANOVA for total number of individuals and species richness in seedbank (both square root transformed). Fixed effects included patch type (connected, unconnected winged, unconnected rectangular), location (center, edge, other) nested within patch type. We used covariates of the natural log of average soil moisture by weight for each patch and the natural log of the distance from a heater in the greenhouse. Random variables included the experimental site the sample came from and the greenhouse a sample germinated in, as well as the interactions between greenhouse and site, greenhouse and patch type, and greenhouse by plot location within a patch. Numerator and denominator degrees of freedom are listed as subscripts for each F-value.
F p
Number of Individuals / m2
Source of Variance
Patch type 0.962, 22.8 0.3977
Patch type (location) 1.336, 1044 0.2415
Soil moisture 6.631, 1071 0.0102
Distance from greenhouse heater 0.031, 981 0.8632
Linear Contrasts
C = E 2.271, 1044 0.1320
C = O 0.051, 1041 0.8209
E = O 1.481, 1042 0.2246
Species richness / m2
Source of Variance
Patch type 0.672, 22.6 0.5200
Patch type (location) 2.606, 1045 0.0165
Soil moisture 4.341, 1067 0.0374
Distance from greenhouse heater 1.911, 984 0.1673
Linear Contrasts
C = E 8.701, 1046 0.0033
C = O 3.811, 1044 0.0511
E = O 0.751, 1045 0.3874

82
Figure 2.1. Conceptual diagram showing how the spatial configuration of habitat can affect processes that determine seedbank composition.

83
Figure 2.2. Study design for seedbank study in an experimental landscape at the Savannah River Site, South Carolina. There are eight experimental units, three patch types (connected, winged, rectangular), and 34 plots in three locations (center, edge, and “other” – wings, corridor, or rectangle). Eight soil cores were taken around a 1x1m plot and homogenized for one seedbank sample per plot.

84
Figure 2.3. The percentage of unique and overlapping species between the seedbank and standing vegetation.

85
NMS of Seed Bank and Standing Vegetation 2001 - 2003
Axis 1
Axi
s 2
YEAR200120022003Seed bank
Figure 2.4. NMS ordination of the seedbank and established vegetative community in 2001, 2002, and 2003. The first two axes are shown and each point is coded by survey year or type.

86
Figure 2.5. Species richness and total number of individuals in the seedbank of patch types and locations. Both response variables were square root transformed by using X′ = X1/2 + (X+1)1/2 for analysis (Zar 1999). Error bars indicate standard errors and corresponding F and p-values can be found in Table 2.1.
a) b)

87
CHAPTER 3: EDGE EFFECTS ON LONGLEAF PINE FOREST HERBS
A paper to be submitted to Ecological Applications
Ellen I. Damschen, John L. Orrock, Sara O. Woolard, Elizabeth Y. Long,
Sarah H. Gabris, and Don Imm
Abstract
The increased prevalence of abrupt edges is a well-known consequence of habitat
fragmentation. Edge effects have been widely studied in forested habitats, but edge effects
for historically open habitats have been largely ignored. We examined the impact of an open
habitat and forest edge on nine species of native longleaf pine forest herbs and grasses. We
planted equal densities of seedlings of nine species in plots at six distances into an opening
(0, 6, 12, 25, 50, and 100 m) and monitored their performance. Photosynthetically active
radiation (PAR) and soil temperature decreased at 0 and 6 m into the opening, while soil
nutrients and texture did not vary with respect to distance from edge. Three edge responses
were observed: the largest species (Sorghastrum secundum Desmodium ciliare,
Schizachyrium scoparium, and Aristida longespica) had increased growth and flowering at 0
and 6 m, the smallest species (Galactia regularis and Baptisia lanceolata) had decreased
growth and flowering at 0 and 6 m, while two species (Carphephorous bellidifolius and
Dalea pinnata) showed relatively little response. Both abiotic conditions and biotic
interactions could be responsible for the observed tradeoffs in plant growth and flowering,
but further manipulative experiments will be needed to determine the importance of species
interactions in governing the community patterns we observed. Our results corroborate

88
findings from other studies by indicating that overstory thinning and the creation of multi-
generational stands may be necessary for the successful conservation and restoration of many
herbaceous species.
Introduction
Fragmentation and edge effects in open habitats
There are several well-known consequences of habitat loss and fragmentation, including
decreases in total habitat area, increases in habitat isolation, and increases in the prevalence
of edge habitat (Harrison and Bruna 1999, Fahrig 2003). This increased landscape
“edgyness” has led to a host of studies on edge effects, which have documented shifts in
abiotic conditions and species interactions at these ecotones (reviewed in Murcia 1995, Ries
et al. 2004).
Most edge studies have focused on forested habitats, while edges of historically open
habitats, such as prairie and savanna, have received little attention (Ries et al. 2004, Ries and
Sisk 2004). Both forested and open habitats have been fragmented by disturbance and
agriculture, but open habitats are also threatened by newly planted forests (e.g., Frost 1993,
Brockway and Lewis 2003, Harrington et al. 2003, Lett and Knapp 2005). In the
southeastern United States, these recently planted forests are characterized by dense pine
overstories, thick hardwood middlestories, and the increased presence of shade tolerant
species. These habitats result from typical forest management practices as well as the loss of
historical fire regimes (Frost 1993, Harrington et al. 2003).
Large areas of native open habitat have been lost because they are ideal lands for
agriculture and grazing. Today, only small remnants of once widespread open habitats

89
remain, including less than 1% of the tallgrass prairie (Samson and Knopf 1994) and less
than 3% of longleaf pine-dominated ecosystems (Frost 1993, Schwartz 1994, Smith et al.
2000, Figure 3.1). Many of the species associated with these native communities are now
relegated to old fields, forest gaps, and clearings where the environmental conditions most
closely resemble their original habitat.
Herbaceous plants in longleaf pine forests
Longleaf pine forests are among the most diverse plant communities in North America, in
some cases containing more than 40 species per square-meter (Frost 1993, Peet and Allard
1993, Smith et al. 2000). Historically, longleaf pine forests contained low densities of
patchily-distributed canopy trees (often below 50 stems / ha), an open understory, and were
maintained by frequent, low-intensity, surface fires (Frost 1993, Noel et al. 1998, Smith et al.
2000, Harrington et al. 2003). Current management of pine forests in the southeastern U.S.
typically includes longleaf, loblolly, or slash pine planted at high densities, where low light
levels, thick pine litter layers, and competition with overstory trees decrease the survivorship,
abundance, and diversity of herbaceous plants native to longleaf pine-dominated ecosystems
(Frost 1993, Means 1997, Brockway and Outcalt 1998, Harrington and Edwards 1999,
Harrington et al. 2003).
Study goals
Most edge studies are observational, in that they record the presence or state of naturally
occurring organisms along an edge gradient (Ries et al. 2004). Such studies are crucial for
understanding the effect of habitat edges on abiotic conditions and species interactions, but

90
lack controls over the abundances of the species they observe. Additionally, few edge
studies have used adequate replication over space or time to test for the consistency of
observed effects (Ries et al. 2004). We advanced the study of edge effects by experimentally
controlling the abundances of plants at consistent distances from each edge and replicating
our study across multiple locations. Our goals were to: 1) assess the effect of edges between
open habitats and forest on the growth and performance of several plant species, and to 2)
identify possible mechanisms underlying any observed edge effects.
Methods
Study site
To test for edge effects, we established five experimental sites (i.e., openings) at the
Savannah River Site (SRS), a National Environmental Research Park (NERP), near Aiken,
South Carolina (Figure 3.2). The landscape surrounding each site consists of mature longleaf
or loblolly pine stand and sites were created according to typical U.S. Forest Service
management protocols. In 1999, each site was created by harvesting pine trees. In 2003,
sites were prepared by the U.S. Forest Service using standard management protocols. From
13 May – 14 August 2003, they applied herbicide to eliminate woody vegetation resprouts
using a mix of Arsenal AC and Garlon 4 at a rate of 35 gal / acre. From 16 August – 28
September 2003, they burned all sites. All sites were subsequently planted with longleaf pine
(Pinus palustris) seedlings (except one site was planted with loblolly (Pinus taeda) as well)
from 1 January – 25 February 2004 at a density of ~700 seedlings / acre. While tree densities
were higher than historical longleaf pine forests in both the clearing and the forest, young
longleaf pine remain in a short-statured “grass stage” for 2-5 years before bolting into a small

91
tree. This maintained a large discrepancy between the forested habitat with large trees,
closed canopies, and mature root systems, and the open habitat with small seedlings,
immature root systems, and no canopy.
In May 2004, two 1 x 1 m plots were established at each of six distance categories (0, 6,
12, 25, 50, and 100 m) from the western opening-forest edge into the open site, for a total of
60 plots (Figure 3.3). We consistently used the same edge direction in order to control for
differences in edge effects due to cardinal direction. The western edge was chosen for two
reasons. First, it provides a more conservative test of edge effects by minimizing the contrast
in light and temperature along an edge (as opposed to north or south-facing edges). And
second, all sites also had western edges that met our selection criteria of being adjacent to
mature pine forest and being farther than 100 m from any other edge. The sites ranged in
total area from 16 to 25 hectares and differed in their shape. However, our plots were closer
to the western edge used for this study than to any other edge surrounding the clearing,
making these differences in shape and size negligible for our study goals.
Species and planting methods
During winter 2003, seedlings for nine species (Table 3.1) were propagated from seed
collected locally at the Savannah River Site using the methods developed by the U.S. Forest
Service (Marshall, In prep.). All are native to the understory of longleaf pine forest
communities. The species chosen still occur in the area, but were absent from the sites
chosen for our study. We used three species from the Poaceae (Aristida longespica,
Schizachyrium scoparium, and Sorghastrum secundum), four species from the Fabaceae
(Baptisia lanceolata, Dalea pinnata, Desmodium ciliare, and Galactia regularis), and two

92
species from the Asteraceae (Carphephorous bellidifolius and Liatris elegans) plant families.
All species are perennials except A. longespica, which is an annual. Our intention was to
plant Aristida beyrichiana (a native perennial grass); however, seeds from A. longespica (a
native annual grass) were inadvertently procured by seed collection volunteers and not
discovered until after seedling propagation.
Five individuals of each species were planted in each 1 x 1 m study plot from May 13-20,
2004. We established a 7 x 7 cell grid for each plot to ensure equal spacing of seedlings and
to allow us to generate a random planting order for each plot (Figure 3.3).
Since there were a total of 45 seedlings (9 species x 5 individuals each), but 49 possible grid
cells, four randomly chosen cells in each plot were left unplanted. To standardize the
planting procedure and facilitate accurate seedling placement, seedlings were planted using a
dibble bar that matched the size of the seedling container. Soil was gently back-filled around
each planted core. Plots were supplemented with water for the first 9 weeks of growth to
ensure the establishment of seedlings. Plots were watered for the first two days following
planting with 11.36 liters / plot each day (see rationale for amount below). After this time,
we watered plots only when the weekly average rainfall was not met (the average rainfall
from May-August at the Savannah River Site is 2.5 cm / week, unpublished weather station
data). Rain gauges at each site were checked twice each week and if 1.25 cm of rain was not
present in the gauge, plots were watered with 11.36 liters / plot (equivalent to the volume of
water during a 1.25 cm rainfall in a 1 m2 area). If this rainfall had been achieved, plots did
not receive any additional water. All watering ceased on August 12, 2004 after seedlings
were fully established. While we supplemented with water for seedling establishment,
evapotranspiration rates likely still differed as a function of edge, allowing for soil moisture

93
differences along the edge gradient. Plots were also weeded for the first nine weeks,
removing all non-focal species within each plot.
Plot sampling
Measurements were taken on 21-24 May, 6-9 August, and 2-8 October 2004. We
measured plant height at all time periods. When species began to flower, we counted the
number of flowers. The number of flowers was defined as the number of flowering heads for
the Asteraceae species, the number of flowering stems for the three grass species, and the
total linear length of flowering spikes for L. elegans because individual flowers for these
species were too small to count individually. Only one species, B. lanceolata, did not flower
or fruit during 2004, because it flowers in the spring. After the completion of our study, B.
lanceolata was observed in fruit in June 2005, so this species did flower in the spring one
year after planting. For each plot, values from the five individuals of each species were
averaged prior to analyses.
Environmental variables
We measured several abiotic variables at each plot. On 6 July 2004, the amount of
incident Photosynthetically Active Radiation (PAR) was recorded with a SunScan SS1 Delta-
T Devices Ltd. (Cambridge, UK) light meter from 10:30h - 14:30h. Two light readings were
taken for each plot and subsequently averaged. Soil temperature was recorded for every plot
using Onset Computer Corporation (Pocasset, MA) HOBO temperature loggers. Two
loggers were placed at every plot (one on the north and one on the south side of each plot) in
each site and recorded the soil temperature every five minutes from 08:30h – 16:30h. The

94
average daily soil temperature from the two loggers at each plot was used in analyses. Each
site was measured on a different day, but all plots within a site were measured concurrently
within a single day. Eight soil cores (2.5 cm diameter x 15 cm deep) were taken along the
border of each 1 x 1 m plot and homogenized. Soil samples from each plot were analyzed
for standard nutrient and textural content by Brookside Laboratories, Incorporated in New
Knoxville, Ohio using the Mehlich III extraction solution.
Data analysis
We first examined the affect of the edge gradient on several abiotic variables. Two
separate analyses were used for the abiotic variables because we expected that soil properties
would respond much more slowly (relative to the timeframe of our study) to edge effects
than light and temperature. Soil properties including soil exchange capacity (TEC), percent
organic matter, and estimated nitrogen release (ENR) were used as response variables in a
Multivariate Analysis of Variance (MANOVA). Independent variables included distance as
a discrete categorical treatment effect and site as a block effect. A second MANOVA was
performed with average daily soil temperature (C°) and incident Photosynthetically Active
Radiation (PAR) with the same independent variables. Soil temperature was natural log
transformed and incident PAR was square-root transformed to improve normality and
homogeneity of variances. Unplanned linear contrasts were used for each analysis to discern
how far the edge effect penetrated into the opening. The Dunn-Šidák procedure was used to
adjust the alpha level according to the number of post-hoc comparisons (α’ = 1 - (1 - α) 1/k for
k comparisons, Sokal and Rohlf (1995)).

95
The impact of edge distance on plant growth was determined by performing a MANOVA
with the difference in height between 21 May and 9 August 2004 for each of the nine species
as multiple response variables. Independent variables were distance and site, and post-hoc
linear contrasts were also employed as described above to understand how far the edge effect
penetrated. We used this same type of analysis described above for a separate analysis of the
number of flowers produced by each of the nine species. Flowers were counted at the peak
of flowering for each species, which occurred from 2-8 October for A. longespica, C.
bellidifolius, D. ciliare, D. pinnata, L. elegans, S. scoparium, and S. secundum and 9 August
for G. regularis. B. lanceolata was the only species not to flower, so it was not used in the
MANOVA for flower production. All analyses were conducted with SAS v. 8.02.
Results
Soil TEC, organic matter, and ENR did not change with distance from the edge (Pillai’s
trace, F = 1.2015, 150, p = 0.2750). Light and soil temperature, however, were significantly
affected by distance from the edge (Pillai’s trace, F = 1.5325, 250, p = 0.0240, Figure 3.4).
Means for light and temperature indicated that these abiotic factors were exhibiting relatively
shallow edge response, where only plots at 0 and 6 m differed from all remaining classes.
We used five post-hoc linear contrasts corrected with the Dunn-Šidák procedure (α’ =
0.0102) to compare the difference between the edge (0 m) and all other distance classes.
Zero meters was not different from the 6 m distance class (p = 0.0214), but was significantly
different from all other distance classes (p ≤ 0.0040 for comparing 0 m to 12 m, 25 m, 50 m
and 100 m).

96
Plant growth for the nine species, measured as the change in height over the growing
season from 21 May to 9 August, was significantly affected by distance from the edge
(Pillai’s trace, F = 1.54545, 230, p = 0.0434). Standardized canonical coefficients reported
from the MANOVA provide a comparison of the relative strength and correlation among
response variables (but not the specific direction of the response) across treatments (Scheiner
and Gurevitch 2001). Canonical coefficients for the nine plant species indicated that the
growth of S. secundum, D. ciliare, L. elegans, S. scoparium, and A. longespia responded to
distance similarly but in opposition to G. regularis and B. lanceolata, while C. bellidifolius
and D. pinnata showed relatively little response (Table 3.2, Figure 3.5). Species means show
that at 0 and 6 m, S. secundum D. ciliare, L. elegans, S. scoparium, and A. longespia all had
increased growth, while G. regularis and B. lanceolata had decreased growth compared to all
other distances (Figure 3.5).
The number of flowers was also significantly affected by distance from the edge (Pillai’s
trace, F = 1.7145, 235, p = 0.0079). Canonical coefficients for the eight species that flowered
during our study indicate that D. pinnata, G. regularis, and L. elegans responded similarly
and in opposition to A. longespica, D. ciliare, S. scoparium, and S. secundum, while C.
bellidifolius showed relatively little response in the number of flowers produced (Table 3.2,
Figure 3.5). Species means show that S. secundum had the greatest number of flowers at 0
m, while D. ciliare and S. scoparium had the greatest number of flowers at 6 m (Figure 3.5).
All other species that flowered showed an opposite pattern, having the fewest number of
flowers at 0 and 6 m (Figure 3.5).

97
Discussion
The nine study species showed two main responses to the distance of the opening edge.
The growth and flower production of the four largest species, the three grass species and D.
ciliare (a legume), increased within 0 – 6 m from the clearing edge. The remaining three
species of legumes and one of the two species in Asteraceae exhibited the opposite pattern
with either increased growth or flowering (or both) away from the edge. Only one species,
C. bellidifolius (an Asteraceae species), showed little response to the edge in either growth or
flowering.
Ascribed mechanisms
Other researchers have generally observed a decrease in herbaceous cover and diversity
up to 18 m from the base of mature pine trees (Brockway and Outcalt 1998, Harrington and
Edwards 1999, 2001, McGuire et al. 2001, Harrington et al. 2003). This pattern has been
ascribed primarily to increased root competition for soil moisture and nitrogen (Brockway
and Outcalt 1998, Harrington et al. 2003, Jones et al. 2003). Brockway and Outcalt (1998)
found that litterfall only increased 4 m inside forest gaps, canopy coverage up to 4 – 5 m, and
that there was no change in PAR as a function of edge. However, fine root production
increased within 12 – 16 m of surrounding mature pine trees and most closely matched the
observed edge effect distance for the herbaceous community (Brockway and Outcalt 1998).
Other studies have found similar edge effects. The distribution and abundance of legumes
in longleaf pine forests was positively correlated with soil moisture and negatively correlated
with pine basal area (Hainds et al. 1999). Jones et al. (2003) found that total soil moisture
and nitrogen mineralization rates decreased when the production of pine root mass increased.

98
They also found that when the number of gaps increased in a pine forest, the total production
of fine roots by non-pine species increased (Jones et al. 2003). When Harrington et al.
(2003) experimentally removed 50% of the pine tree cover, belowground competition for soil
water was reduced and the performance of understory herbs improved.
Given the findings of other studies, we propose that the increased performance of the
three grass species (especially S. secundum) and D. ciliare at 0 and 6 m from the forest edge
are likely due to species-specific responses to increased fine root mass closer to the opening-
forest edge. Because we did not find soil nitrogen content, organic matter, or exchange
capacity to be affected by our edge gradient, it is most probable that soil moisture was the
limiting resource driving the patterns we observed. This may be especially true for our sites,
which occur at the more xeric end of the longleaf pine moisture gradient.
Recent results from a study manipulating root competition, litterfall, and stand density in
longleaf pine forests predicted that belowground competition would be most limiting for the
herbaceous understory when the overstory was relatively open, while aboveground
competition would be most limiting with dense overstories and middlestories (Harrington et
al. 2003). Our results confirm their predictions in that the three largest species performed
best near the forest edge, where belowground competition was most severe and where
aboveground competition likely led to their superior performance. It is probable that these
species, in turn, limited the others via competition, but future work will be needed to separate
these biotic interactions from abiotic factors.

99
Relationship to historical diversity patterns and conservation
Old-growth longleaf pine forests have been shown to have lower densities of overstory
pine trees (often less than 50 stems/ha) with very patchy distributions, as well as smaller
numbers of hardwoods than second-growth longleaf pine stands (Noel et al. 1998, Harrington
et al. 2003). The death of older, larger trees in old-growth stands creates openings within the
forest that promote juvenile longleaf recruitment, a characteristic that has been lost in`
second-growth forests (Noel et al. 1998).
Our study provides additional evidence that the uniform spacing and size of trees in
modern forests may limit species richness in longleaf pine forests (Oliver and Larson 1996,
Harrington et al. 2003). Patchy distributions of overstory trees likely result in greater
variability in soil moisture availability and competitive relationships, which could lead to
high levels of diversity at intermediate scales. Our study provides evidence that high
densities of trees in forest plantations will favor the performance of species that are superior
aboveground competitors, reducing overall understory diversity. Our findings support
others’ recommendations that the conservation and restoration of native longleaf pine forests
would benefit from thinning overstory trees and creating uneven size distributions of trees
that allow for open areas of recruitment (Noel et al. 1998, Harrington et al. 2003). Previous
researchers have suggested that canopy gaps larger than 0.1 ha may be necessary to allow for
understory restoration in young plantations, while mature pine stands may require gaps at
least 0.15 - 0.20 ha (Harrington et al. 2003). Furthermore, planting trees in clumped
distributions will increase the prevalence of larger gaps (Noel et al. 1998, Harrington et al.
2003).

100
Our study was conducted in a clearing created by typical forest management practices:
clearcutting, herbiciding, burning, and planting an even-aged pine stand. Clearings, like
those used in our study, are important refuges for species once associated with historical
longleaf pine forests. However, we do not advocate the use of large-scale and pervasive
clearcutting for conservation and restoration of these species. Land use history, including
agriculture and burning regimes, can have larger impacts on understory composition than
pine densities per se (Hedman et al. 2000). Forests regenerating from clearcuts have been
found to have higher percentages of woody cover, lower species richness, and more
predictable species composition (species evenness) than those that have only been thinned
(Brockway and Lewis 2003). Furthermore, Brockway and Lewis (2003) found that while
cover of grass species like S. scoparium and Andropogon spp. remained the same over time
in both clearcut and thinned habitats, the abundance of forbs decreased in the clearcut areas
while it did not in the thinned areas. The clearcuts used in our study are early in their
rotation, making the temperature, light, and soil moisture conditions more similar to those
found in at least portions of historical longleaf pine forests. Over time, however, these stands
may undergo succession and become less suitable habitat for native longleaf pine forest
species. Planting multi-generational stands at lower overall densities and maintaining regular
low-intensity burns will be key for the conservation of these species.
Future work
Our study is one of the first to document edge effects on experimentally established plant
communities in open habitats and to propose possible mechanisms behind these responses.
Future work should focus on manipulating soil moisture, nutrients and species interactions to

101
understand the mechanistic controls behind the patterns we observed. To determine the role
of competitive interactions, species should be planted in monoculture and in paired
combinations while soil moisture and nitrogen are manipulated in a factorial experiment.
Additionally, field studies over greater time periods will be important because some
interactions (i.e., the influence of nitrogen-fixing legumes) and successional processes may
become increasingly important over time.
Acknowledgements
This work was made possible by funding from the D.O.E. – Savannah River Operations
Office through the Forest Service Savannah River (a National Environmental Research Park)
and North Carolina State University. We are especially thankful for the leadership and
support provided by John Blake, Don Imm, and Ed Olson at the Forest Service Savannah
River and to Nick Haddad at North Carolina State University. Tremendous thanks go to
Doug Marshall for producing the seedlings and for the field support and advice. Field
assistance was provided by Becky Bartel-Sexton, Allison Leidner, and Kristen Rosenfeld.
Thanks to Jamie Scott, Andrew Freeman, Bob Morgan, and Ron Mosely for logistical
support. The manuscript benefited from the helpful comments of Nick Haddad, Becky
Bartel, Jim Gilliam, George Hess, Kristen Rosenfeld, and Tom Wentworth.

102
Literature Cited
Brockway, D. G., and C. E. Lewis. 2003. Influence of deer, cattle grazing and timber harvest
on plant species diversity in a longleaf pine bluestem ecosystem. Forest Ecology and
Management 175:49-69.
Brockway, D. G., and K. W. Outcalt. 1998. Gap-phase regeneration in longleaf pine
wiregrass ecosystems. Forest Ecology and Management 106:125-139.
Fahrig, L. 2003. Effects of habitat fragmentation on biodiversity. Annual Review of Ecology
Evolution and Systematics 34:487-515.
Frost, C. C. 1993. Four centuries of changing landscape patterns in the longleaf pine
ecosystem. Pages 17-43 in S. M. Hermann, editor. Proceedings of the Tall Timbers
Fire Ecology Conference, No. 18, Tall Timbers Research Station, Tallahassee, FL.
Hainds, M. J., R. J. Mitchell, B. J. Palik, L. R. Boring, and D. H. Gjerstad. 1999. Distribution
of native legumes (Leguminoseae) in frequently burned longleaf pine (Pinaceae) -
wiregrass (Poaceae) ecosystems. American Journal of Botany 86:1606-1614.
Harrington, T. B., C. M. Dagley, and M. B. Edwards. 2003. Above- and belowground
competition from longleaf pine plantations limits performance of reintroduced
herbaceous species. Forest Science 49:681-695.
Harrington, T. B., and M. B. Edwards. 1999. Understory vegetation, resource availability,
and litterfall responses to pine thinning and woody vegetation control in longleaf pine
plantations. Canadian Journal of Botany-Revue Canadienne De Botanique 29:1055-
1064.
Harrington, T. B., and M. B. Edwards. 2001. Overstory and understory interactions in
longleaf pine plantations: Implications for community restoration. in K. J. e. al.,

103
editor. Proceedings of the Southern Forest Science Conference, USDA Forest Service
Southern Research Station, Asheville, NC.
Harrison, S., and E. Bruna. 1999. Habitat fragmentation and large-scale conservation: what
do we know for sure? Ecography 22:225-232.
Hedman, C. W., S. L. Grace, and S. E. King. 2000. Vegetation composition and structure of
southern coastal plain pine forests: an ecological comparison. Forest Ecology and
Management 134:233-247.
Jones, R. H., R. J. Mitchell, G. N. Stevens, and S. D. Pecot. 2003. Controls of fine root
dynamics across a gradient of gap sizes in a pine woodland. Oecologia 134:132-143.
Lett, M. S., and A. K. Knapp. 2005. Woody plant encroachment and removal in mesic
grassland: Production and composition responses of herbaceous vegetation. American
Midland Naturalist 153:217-231.
Marshall, D. J. In prep. A manual for producing contanerized seedlings of herbaceous species
from the Southeastern fire-maintained savannahs.
McGuire, J. P., R. J. Mitchell, E. B. Moser, S. D. Pecot, D. H. Gjerstad, and C. W. Hedman.
2001. Gaps in a gappy forest: Plant resources, longleaf pine regeneration, and
understory response to tree removal in longleaf pine savannas. Canadian Journal of
Forest Research-Revue Canadienne De Recherche Forestiere 31:765-778.
Means, D. B. 1997. Wiregrass restoration: Probable shading effects in a slash pine plantation.
Restoration Management Notes 15:52-55.
Murcia, C. 1995. Edge effects in fragmented forests: implications for conservation. Trends in
Ecology and Evolution 10:58-62.

104
Noel, J. M., W. J. Platt, and E. B. Moser. 1998. Structural characteristics of old- and second-
growth stands of longleaf pine (Pinus palustris) in the gulf coastal region of the
U.S.A. Conservation Biology 12:533.
Oliver, C. D., and B. C. Larson. 1996. Forest stand dynamics, Update edition. Wiley, New
York.
Peet, R. K., and D. J. Allard. 1993. Longleaf pine vegetation of the southern Atlantic and
eastern Gulf Coast regions: A preliminary classification. Pages 45-81 in S. M.
Hermann, editor. Proceedings of the Tall Timbers Fire Ecology Conference: The
longleaf pine ecosystem: Ecology, restoration, and management. Tall Timbers
Research Station, Tallahassee, FL.
Ries, L., R. J. Fletcher, J. Battin, and T. D. Sisk. 2004. Ecological responses to habitat edges:
mechanisms, models, and variability explained. Annual Review of Ecology Evolution
and Systematics 35:491-522.
Ries, L., and T. D. Sisk. 2004. A predictive model of edge effects. Ecology 85:2917-2926.
Samson, F., and F. Knopf. 1994. Prairie conservation in North America. Bioscience 44:418-
422.
Scheiner, S. M., and J. Gurevitch. 2001. Design and analysis of ecological experiments, 2nd
edition. Oxford University Press, New York.
Schwartz, M. W. 1994. Natural distribution and abundance of forest species and communities
in northern Florida. Ecology 75:685-705.
Smith, G. C., M. W. Patterson, and H. R. Trendell. 2000. The demise of the longleaf-pine
ecosystem. Southeastern geographer XXXX:75-92.

105
Sokal, R. R., and F. J. Rohlf. 1995. Biometry, 3rd edition. W.H. Freeman and Company,
New York.

106
Table 3.1. Names and characteristics for the nine species used in the edge study.
Species Family Common Name U.S. Nativity Duration
Aristida longespica Poir. Poaceae Slimspike threeawn Native Annual Baptisia lanceolata (Walter) Ell. Fabaceae Gopherweed Native Perennial Carphephorus bellidifolius (Michx.) Torr. & Gray Asteraceae Sandywoods chaffhead Native Perennial Dalea pinnata (J.F. Gmel.) Barneby var pinnata Fabaceae Summer farewell Native Perennial Desmodium ciliare (Muhl. Ex Willd.) DC. Fabaceae Hairy small-leaf ticktrefoil Native Perennial Galactia regularis (L.) BSP. Fabaceae Eastern milkpea Native Perennial Liatris elegans (Walt.) Michx. Asteraceae Pinkscale blazing star Native Perennial Schizachyrium scoparium (Michx.) Nash Poaceae Little bluestem Native Perennial Sorghastrum secundum (Ell.) Nash Poaceae Lopsided indiangrass Native Perennial

107
Table 3.2. Standardized canonical coefficients from MANOVA analyses for plant growth and flower production.
Standardized Canonical Coefficients
Species Plant Growth Flower Production Aristida longispica -0.2487 -0.3061 Baptisia lanceolata 0.3051 n.a. Carphephorous bellidifolius -0.0006 0.0993 Dalea pinnata -0.0387 0.4090 Desmodium ciliare -0.4670 -0.4708 Galactia regularis 0.7083 0.9707 Liatris elegans -0.3144 0.5077 Schizachyrium scoparium -0.2771 -0.1163 Sorghastrum secundum -0.7886 -0.6448

108
Figure 3.1. Historical extent of longleaf pine forest in relation to the study site location at The Savannah River Site, SC. Modified from Outcalt and Sheffield (1998).

109
Figure 3.2. Location of edge study sites at the Savannah River Site near Aiken, SC.

110
Figure 3.3. Plot layout at each site. Plots were placed at six distance categories away from the western edge of the clearing. All sites contained mature longleaf or loblolly pine forest on the western side of the edge and a recently planted clearing on the eastern side of the edge (all treated under the same management protocols for planting preparations and times). The black squares each represent one 1 x 1 m plot of experimental seedlings. Two plots at each distance category were randomly placed in four possible locations that were 25 m apart (potential locations indicated by horizontal lines). The planting arrangement for a 1 x 1 m plot is detailed in the circular inset. Seedlings were uniformly spaced in a 7 x7 grid. The black circles indicate four randomly chosen cells that were left blank. The species order and blank cells were randomly determined for each plot.

111
Figure 3.4. Mean light availability and temperature for each distance category. Light was measured as Photosynthetically Averaged Radiation (PAR) and was square root transformed. The average daily soil temperature was natural log transformed. Error bars represent 95% confidence intervals.

112
Figure 3.5. Mean plant growth and flowering for nine study species. The difference in plant height from 21 May to 9 August 2004 is shown as a solid line and refers to the left axis. The log of the number of flowers produced is indicated by the dotted line and refers to the right axis. Error bars represent 95% confidence limits. Error bars for the growth G. regularis are slightly offset to the right for visual clarity.

113
Appendix A. Plant species found in either presence-absence (P/A) or permanent plot surveys (Plots) in 2001, 2002, or 2003. Shown here are the unique species codes given to each species, what survey type the species was found in (an asterisk indicates that it was present), if the species is a monocot (M) or dicot (D), the family, genus, and specific epithet, the dispersal type (AD = adhesive, BL = ballistic, BD = bird, GR = gravity, MA = mammal, WI = wind), the dispersal type (A = abiotic, B = biotic), life cycle (A = annual, B = biennial, P = perennial, ABP = annual, biennial, or perennial), habit (F = forb, G = graminoid, R = fern, S= shrub, T = tree, TS = tree or shrub, V = vine), and origin (NV = native, ID = introduced, IV = invasive, EN = endemic). Life history information was found by using a primary literature search, searching three databases, and consulting regional guides and floras (see methods for details and citations). All plants were identified using the nomenclature of Radford et al. (1964) except the genera Chamaecrista, Dichanthelium, and Panicum, which follow the updated nomenclature of Weakley (2005).
Unique Code Plots P/A
Mono/Dicot Family Genus ssp.
Dispersal Type
Dispersal Mode Life Cycle Habit Origin
DYSOBL * * D Acanthaceae Dyschoriste oblongifolia BL P P F NV ACERUB * * D Aceraceae Acer rubrum WI P P T NV RHUCOP * * D Anacardiaceae Rhus copallina BD A P TS NV RHUTOX * * D Anacardiaceae Rhus toxicodendron BD A P S NV SANCAN * D Apiaceae Sanicula canadensis AD A B F NV APOCAN * D Apocynaceae Apocynum cannabinum WI P P F NV ILEGLA * D Aquifoliaceae Ilex glabra BD A P S NV ILECAS * D Aquifoliaceae Illex cassine var. cassine BD A P TS NV ILEOPA * * D Aquifoliaceae Illex opaca BD A P T NV ILEVOM * D Aquilifoliaceae Ilex vomitoria BD A P TS NV ARASPI * * D Araliaceae Aralia spinosa BD A P TS NV ASCAMP * * D Asclepiadaceae Asclepias amplexicaulis WI P P F NV ASCTUB * * D Asclepiadaceae Asclepias tuberosa WI P P F NV ASCVIR * D Asclepiadaceae Asclepias viridiflora WI P P F AMBART * * D Asteraceae Ambrosia artemisiifolia WI P A F NV ASTCON * * D Asteraceae Aster concolor WI P P F ASTDUM * * D Asteraceae Aster dumosa WI P P F NV ASTPAT * * D Asteraceae Aster patens WI P P F NV ASTTOR * D Asteraceae Aster tortifolius WI P P F ASTUND * * D Asteraceae Aster undulatus WI P P F BACHAL * * D Asteraceae Baccharis halimifolia WI P P F NV BERPUM * * D Asteraceae Berlandiera purnila WI P P F Unknown 1 * * D Asteraceae Carduus unknown WI P A F CARBEL * D Asteraceae Carphephorus bellidifolius WI P P F CIRREP * * D Asteraceae Cirsium repandum WI P P F NV, ~EN

114
CORMAJ * * D Asteraceae Coreopsis major WI P P F NV CRODIV * * D Asteraceae Croptilion divaricatum WI P A F NV ELETOM * * D Asteraceae Elephantopus tomentosus WI P P F NV EREHIE * * D Asteraceae Erechtites hieracifolis WI P A F NV ERICAN * * D Asteraceae Erigeron canadensis WI P A F ERISTR * * D Asteraceae Erigeron strigosus WI P ABP F NV EUPCAP * * D Asteraceae Eupatorium capillifolium WI P A F NV EUPCOM * * D Asteraceae Eupatorium compositifolium WI P P F NV EUPCUN * * D Asteraceae Eupatorium cuneifolium WI P P F EUPHYS * D Asteraceae Eupatorium hyssopifolium WI P P F EUPROT * * D Asteraceae Eupatorium rotundifolium WI P P F EUPSER * * D Asteraceae Eupatorium serotinum WI P P F NV GNAOBT * * D Asteraceae Gnapthalium obtusifolium WI P ABP F NV GNAPUR * * D Asteraceae Gnapthalium purpureum WI P ABP F NV HELAMA * D Asteraceae Helenium amarum WI P A F NV HELDIV * * D Asteraceae Helianthus divaricatus WI P P F HELAMP * D Asteraceae Heliotropium amplexicaule WI P P F HETGOS * * D Asteraceae Heterotheca gossypinus WI P P F HETSUB * D Asteraceae Heterotheca subaxillaris WI P ABP F NV HIEGRO * * D Asteraceae Hieracium gronovii WI P P F NV HYMSCA * * D Asteraceae Hymenopappus scabiosaeus WI P P F IVAMIC * D Asteraceae Iva microcephala WI P A F LACCAN * * D Asteraceae Lactuca canadensis WI P B F NV LACGRA * * D Asteraceae Lactuca graminifolia WI P B F NV LIAELE * * D Asteraceae Liatris elegans WI P P F NV LIAGRA * D Asteraceae Liatris graminifolia WI P P F NV LIASEC * * D Asteraceae Liatris secunda WI P P F NV LIASPI * * D Asteraceae Liatris spicata WI P P F LIASQU * D Asteraceae Liatris squarrosa WI P P F NV LIATEN * * D Asteraceae Liatris tenuifolia WI P P F NV PITGRA * * D Asteraceae Pityopsis graminifolia WI P P F NV RUDHIR * D Asteraceae Rudbeckia hirta WI P ABP F NV Unknown 2 * * D Asteraceae Senecio unknown WI P P F SILCOM * * D Asteraceae Silphium compositum var. compositum WI P P F NV SILDEN * * D Asteraceae Silphium dentatum WI P P F

115
SOLALT * * D Asteraceae Solidago altissima WI P P F SOLGIG * * D Asteraceae Solidago gigantea WI P P F SOLMIC * * D Asteraceae Solidago microcephela WI P P F NV SOLODO * * D Asteraceae Solidago odora WI P P F NV SOLPET * D Asteraceae Solidago petiolaris WI P P F SOLRUG * D Asteraceae Solidago rugosa WI P P F SOLSTR * D Asteraceae Solidago stricta WI P P F SOLTOR * * D Asteraceae Solidago tortifolia WI P P F Unknown 3 * * D Asteraceae Solidago unknown WI P P F Unknown 4 * D Asteraceae Unknown unknown WI P P F Unknown 5 * D Asteraceae Unknown unknown WI P A F Unknown 6 * D Asteraceae Unknown unknown WI P P F Unknown 7 * D Asteraceae Unknown unknown WI P P F Unknown 8 * D Asteraceae Unknown unknown WI P A F Unknown 9 * * D Asteraceae Unknown unknown WI P P F VERANG * * D Asteraceae Veronia angustifolia WI P P F CAMRAD * * D Bignoniaceae Campsis radicans WI P P V NV CATSPE * D Bignoniaceae Catalpa speciosa WI P P T NV LITCAR * * D Boraginaceae Lithospermum carolinense GR P P F NV OPUCOM * * D Cactaceae Opuntia compressa BD, MA A P C NV SPEPER * * D Campanulaceae Specularia perfoliata GR P A F NV LONJAP * * D Caprifoliaceae Lonicera japonica BD A P V ID, IV VIBPRU * D Caprifoliaceae Viburnum prunifolium BD A P S STISET * * D Caryophyllaceae Stipulicida setacea GR P A F HELCAN * * D Cistaceae Helianthemum canadense GR P P F HELROS * * D Cistaceae Helianthemum rosmarinifolium GR P P F NV LECLEG * D Cistaceae Lechea leggettii GR P P F LECVIL * * D Cistaceae Lechea villosa GR P P F NV BONPAT * * D Convoluvulaceae Bonamia patens GR P P V IPOHED * * D Convolvulaceae Ipomea heduraceae GR P A V ID IPOPAN * * D Convolvulaceaea Ipomoea pandurata GR P P V NV CORFLO * * D Cornaceae Cornus florida BD, MA A P T NV LECTEN * * D Costaceae Lechea tenuifolia GR P P F NV CHIMAC * D Ericaceae Chimaphila maculata GR P P F LYOLIG * D Ericaceae Lyonia ligustrina BD A P S NV

116
VACARB * * D Ericaceae Vaccineum arboreum BD A P TS NV VACCOR * * D Ericaceae Vaccineum corymbosum BD A P S VACELL * D Ericaceae Vaccineum ellottii BD A P S VACSTA * * D Ericaceae Vaccineum stamineum BD, MA A P S NV ACAGRA * * D Euphorbiaceae Acalypha gracilens GR P A F NV CNISTI * * D Euphorbiaceae Cnidoscolus stimulosus GR P P TS NV CROGLA * * D Euphorbiaceae Croton glandulosus GR P A F NV EUPCOR * * D Euphorbiaceae Euphorbia corollata GR P P F NV EUPIPE * * D Euphorbiaceae Euphorbia ipecacuahae GR P P F STISYL * * D Euphorbiaceae Stillingia sylvatica GR P P F NV TRAURE * * D Euphorbiaceae Tragia urens GR P P F NV TRAURT * * D Euphorbiaceae Tragia urticifolia GR P P F NV ALBJUL * D Fabaceae Albizia julibrissin GR P P T ARAHYP * D Fabaceae Arachis hypogaea GR P A F BAPALB * D Fabaceae Baptisia alba BL P P F BAPPER * * D Fabaceae Baptisia perfoliata BL P P F BAPTIN * * D Fabaceae Baptisia tinctoria BL P P F NV CASOBT * D Fabaceae Cassia obtusifolia BL P A F NV, ID CENVIR * * D Fabaceae Centrosema virginianum GR P P V NV CHAFAS * * D Fabaceae Chamaecrista fasiculata BL P A F NV
CHANIC * * D Fabaceae Chamaecrista nictitatans ssp. nictans var. nictitans BL P A F NV
CLIMAR * * D Fabaceae Clitoria mariana GR P P V NV CROANG * * D Fabaceae Crotalaria angulata BL P ABP F CROSPE * * D Fabaceae Crotalaria spectabilis BL P A F ID DESFLO * * D Fabaceae Desmodium floridanum AD A P F DESMAR * * D Fabaceae Desmodium marilandicum AD A P F NV DESPAN * * D Fabaceae Desmodium paniculatum var. paniculatum AD A P F NV DESSTR * * D Fabaceae Desmodium strictum AD A P F NV DESTOR * * D Fabaceae Desmodium tortuosum AD A A F GALVOL * * D Fabaceae Galactia volubilis GR P P V NV INDCAR * * D Fabaceae Indigofera caroliniana BL P P S NV LESBIC * * D Fabaceae Lespedeza bicolor GR P P S ID, IV LESCUN * * D Fabaceae Lespedeza cuneata GR P P F ID LESHIR * * D Fabaceae Lespedeza hirta GR P P F NV

117
LESREP * * D Fabaceae Lespedeza repens GR P P F NV LESSTR * * D Fabaceae Lespedeza striata GR P A F ID LESSTU * * D Fabaceae Lespedeza stuevei GR P P F NV LESVIR * * D Fabaceae Lespedeza virginica GR P P F NV LUPDIF * * D Fabaceae Lupine diffusus BL P P F PETPIN * D Fabaceae Petalostemum pinnata GR P P F PHASIN * D Fabaceae Phaseolus sinnatus GR P P V RHYDIF * * D Fabaceae Rhyncosia difformis GR P P F NV RHYTOM * D Fabaceae Rhyncosia tomentosa BL P P F NV RHYREN * * D Fabaceae Rynchosia reniformus BL P P F NV SCHMIC * * D Fabaceae Schrankia microphylla AD A P V NV STYBIF * * D Fabaceae Stylosanthes biflora GR P P F NV TEPFLO * * D Fabaceae Tephrosia florida BL P P F NV Unknown 10 * D Fabaceae Unknown Unkonwn BL P P F WISFRU * D Fabaceae Wisteria fructescens BL P P V NV CASPUM * D Fagaceae Castanea pumilla MA A P S QUEALB * D Fagaceae Quercus alba MA A P TS NV QUEFAL * * D Fagaceae Quercus falcata MA A P T NV QUEINC * * D Fagaceae Quercus incana MA A P TS NV QUELAE * * D Fagaceae Quercus laevis MA A P T NV QUELAU * * D Fagaceae Quercus laurifolia MA A P T NV QUEMAG * * D Fagaceae Quercus margaretta MA A P T QUEMAR * * D Fagaceae Quercus marilandica MA A P T NV QUENIG * * D Fagaceae Quercus nigra MA A P T NV QUESTE * * D Fagaceae Quercus stellata MA A P T NV QUEVEL * * D Fagaceae Quercus velutina MA A P T QUEVIR * * D Fagaceae Quercus virginiana MA A P T NV SABDIF * D Gentianaceae Sabatia difformis GR P P F Unknown 11 * D Geraniaceae Geranium Unknown GR P P F LIQSTY * * D Hamamelidaceae Liquidambar styraciflua GR P P T NV HYPGEN * * D Hypericaceae Hypericum gentianoides GR P A F NV HYPHYP * * D Hypericaceae Hypericum hypercoides WI P P S NV CARALB * * D Juglandaceae Carya alba MA A P T CARPAL * * D Juglandaceae Carya pallida MA A P T NV PRUVUL * D Lamiaceae Prunella vulgaris var. lanceola GR P P F NV

118
SALAZE * * D Lamiaceae Salvia azurea GR P ABP F PERBOR * * D Lauraceae Persea borbonia BD A P T NV SASALB * * D Lauraceae Sassafras albidum BD A P T NV LINSTR * D Linaceae Linum striatum GR P A F LINUSI * * D Linaceae Linum usitatissimum GR P A F ID GELSEM * * D Logainiaceae Gelsemium sempervirens GR P P V NV POLPRO * * D Loganiaceae Polypremum procumbens GR P P F NV LIRTUL * * D Magnoliaceae Liriodendron tulipifera WI P P T NV MAGGRA * D Magnoliaceae Magnolia grandiflora GR P P T SIDRHO * D Malvaceae Sida rhombifolia GR P A F RHEMAR * D Melastomataceae Rhexia mariana GR P P F NV MELAZE * * D Meliaceae Melia azedarach GR P P T ID MORRUB * D Moraceae Morus rubra BD A P T NV MYRCER * * D Myricaceae Myrica cerifera BD A P T NV NYSSYL * D Nyssaceae Nyssa sylvatica BD A P T LIGSIN * * D Oleaceae Ligustrum sinense BD A P TS ID OSMAME * D Oleaceae Osmanthus americana BD A P T NV GAUFIL * * D Ongraceae Gaura filipes Spach. GR P P F NV OENBIE * * D Ongraceae Oenethera biennis BL P ABP F NV OSMCIN * D Osmundaceae Osmunda cinnamomea WI P P R OXASTR * * D Oxalidaceae Oxalis stricta BL P P F NV PASINC * * D Passifloraceae Passiflora incarnata MA A P V NV PASLUT * * D Passifloraceae Passiflora lutea BD, MA A P V NV PHYAME * * D Phytolaccaceae Phytolacca americana BD A P F NV PINPAL * * D Pinaceae Pinus palustris WI P P T NV PINTAE * * D Pinaceae Pinus taeda WI P P T ID PLAOCC * * D Platanaceae Platanus occidentalis GR P P T NV CHEAMB * * D Polygonaceae Chenopodium ambrosioides GR P ABP F ID ERITOM * * D Polygonaceae Eriogonum tomentosum GR P P F POLAME * * D Polygonaceae Polygonella americuana WI P P F RUMHAS * * D Polygonaceae Rumex hastatulus WI P P F NV BERSCA * * D Rhamnaceae Berchemia scandens BD, MA A P V NV CEAAME * * D Rhamnaceae Ceanothus americanus BL P P S NV AGRPAR * D Rosaceae Agrimonia parviflora GR P P F CRAFLA * * D Rosaceae Crataegus flava BD, MA A P TS NV

119
CRAUNI * * D Rosaceae Crataegus uniflora BD, MA A P S NV MALANG * * D Rosaceae Malus angustifolia BD, MA A P TS NV POTCAN * * D Rosaceae Potentilla canadensis BD, MA A P V NV PRUANG * * D Rosaceae Prunus angustifolia BD, MA A P TS NV PRUCAR * * D Rosaceae Prunus caroliniana BD A P TS NV PRUSER * * D Rosaceae Prunus serotina BD A P T NV RUBARG * * D Rosaceae Rubus argutus BD, MA A P S NV RUBCUN * * D Rosaceae Rubus cunefolia BD, MA A P S NV RUBFLA * * D Rosaceae Rubus flagellaris BD, MA A P V NV SORARB * D Rosaceae Sorbus arbutifolia BD, MA A P S DIOTER * * D Rubiaceae Diodia teres GR P A F NV GALTIN * * D Rubiaceae Galium tinctorium GR P P F NV RICSCA * * D Rubiaceae Richardia scabra GR P A F NR DIOVIR * * D Sapotaceae Diospyros virginiana BD, MA A P T NV AGAFAS * * D Scrophulariaceae Agalinis fasciculata GR P A F NV AURPEC * * D Scrophulariaceae Aureolaria pectinata GR P A F LINCAN * * D Scrophulariaceae Linaria canadensis GR P B F NV, NR PENAUS * * D Scrophulariaceae Penstemon australis GR P P F NV AILALT * D Simaroubaceae Ailanthus altissima WI P P T DATSTR * D Solanaceae Datura stramonium GR P A F ID PHYHET * * D Solanaceae Physalis heterophylla MA A P F NV SOLAME * D Solanaceae Solanum americanum BD A ABP F NV SOLCAR * * D Solanaceae Solanum carolinense BD, MA A P F NV PIRCAR * * D Turneraceae Piriqueta cistoides ssp. caroliniana GR P ABP S NV CELTEN * * D Ulmaceae Celtis tenuifolia BD, MA A P TS NV ULMALA * * D Ulmaceae Ulmus alata WI P P T NV Unknown 12 * D Unknown Unknown unknown GR P P F CALAME * * D Verbenaceae Callicarpa americana BD A P S NV VERSCA * D Verbenaceae Verbena scabra GR P P F Unkonwn 13 * * D Violaceae Viola unknown GR P ABP F NV AMPARB * * D Vitaceae Ampelopsis arborea BD, MA A P V NV PARQUI * * D Vitaceae Parthenocissus quinquefolia BD A P V NV VITAES * * D Vitaceae Vitis aestivalis BD A P V NV VITROT * * D Vitaceae Vitis rotundifolia BD A P V NV POLACR * F Aspidiaceae Polystichum acrostichoides WI P P F

120
ASPPLA * F Aspleniaceae Asplenium platyneuron WI P P R NV PTEAQU * * F Pteridaceae Pteridium aquilinum WI P P F NV COMERE * * M Commelinaceae Commelina erecta GR P ABP F ID, NV TRAROS * M Commelinaceae Tradescantia rosea GR P P F BULCIL * * M Cyperaceae Bulbostylis ciliatifolia GR P A G CARALA * * M Cyperaceae Carex alata GR P P G CYPALA * M Cyperaceae Cyperus alata GR P P G CYPFIL * * M Cyperaceae Cyperus filiculmis GR P P G CYPRET * * M Cyperaceae Cyperus retrorsus GR P A G NV RHYGRA * M Cyperaceae Rhyncospora grayi GR P P G NV RHYINE * * M Cyperaceae Rhyncospora inexpansa WI P P G NV SCICYP * M Cyperaceae Scirpus cyperinus WI P P G NV SCLCIL * * M Cyperaceae Scleria ciliata WI P P G JUNDIC * * M Juncaceae Juncus dichotomous GR P P F ASPOFF * * M Liliaceae Asparagus officinalis BD A P F ID SMIBON * * M Liliaceae Smilax bona-nox BD A P V NV SMIGLA * * M Liliaceae Smilax glauca BD A P V NV SMIROT * * M Liliaceae Smilax rotundifolia BD A P V NV SMISMA * * M Liliaceae Smilax smallii BD A P V NV YUCFIL * * M Liliaceae Yucca filamentosa GR P P U NV ALLCAN * M Lilliaceae Allium canadense var. canadense GR P P F ANDSPP * * M Poaceae Andropogon ternarius and virginicus WI P P G NV ARIPUR * * M Poaceae Aristida purpurascens var. tenuispica WI P P G NV ARITUB * * M Poaceae Aristida tuberculosa WI P A G NV Unknown 14 * * M Poaceae Aristida unknown WI P ABP G ARUGIG * * M Poaceae Arundinaria gigantea WI P P G NV CENSPI * * M Poaceae Cenchrus spinifex AD A A F CYNDAC * * M Poaceae Cynodon dactylon GR P P G ID DANSER * * M Poaceae Danthonia sericea WI P P G DICACU + + M Poaceae Dichanthelium acuminatum var. acuminatum GR P P G NV DICCOM + + M Poaceae Dichanthelium commutatum GR P P G NV DICLEU + + M Poaceae Dichanthelium leucothrix GR P P G NV DICVOL + + M Poaceae Dichanthelium volubis GR P P G NV DIGCOG * * M Poaceae Digitaria cognata GR P A G ERACAP * * M Poaceae Eragrostis capillaris WI P A G NV

121
ERAMEX * * M Poaceae Eragrostis mexicana WI P A G EREOPH * * M Poaceae Eremochloa ophiuroides WI P P G GYMAMB * * M Poaceae Gymnopogon ambiguus GR P P G NV MUHEXP * * M Poaceae Muhlenbergia expansa WI P P G PANANC * * M Poaceae Panicum anceps var. anceps WI P P G NV PANVER * * M Poaceae Panicum verrucosum WI P A G NV PASBOS * * M Poaceae Paspalum bosicanum GR P A G PASFLO * * M Poaceae Paspalum floridanum GR P P G NV PASLAE * * M Poaceae Paspalum laeve GR P P G NV SACBRE * * M Poaceae Saccharum brevibarbe WI P P G NV SETGLA * M Poaceae Setaria glauca WI P A G NR SORNUT * M Poaceae Sorghastrum nutans WI P P G NV STIAVE * M Poaceae Stipa avenaceae WI P P G

122
Appendix B. Vascular plant taxa recorded in the seedbank from experimental sites at the Savannah River Site near Aiken, South Carolina. We utilized the nomenclature of Radford (1964) except for the genera Chamaecrista and Gnapthalium, where the updated nomenclature of Weakley (2005) was used.
Unique Code
Mono- or Dicot Family Genus Species
Dispersal Type
Dispersal Mode
Life Cycle Habit Origin
ACAGRA D Euphorbiaceae Acalypha gracilens GR A A F NV ANDSPP M Poaceae Andropogon ternarius and virginicus WI A P G NV ARITUB M Poaceae Aristida tuberculosa WI A A G NV BACHAL D Asteraceae Baccharis halimifolia WI A P F NV BULCIL M Cyperaceae Bulbostylis ciliatifolia GR A A G CALAME D Verbenaceae Callicarpa americana BI B P S NV CENSPI M Poaceae Cenchrus spinifex AD B A F CHAFAS D Fabaceae Chamaecrista fasiculata BA A A F NV
CHANIC D Fabaceae Chamaecrista nictitatans ssp. nictans var. nictitans BA A A F NV
CHEAMB D Polygonaceae Chenopodium ambrosioides GR A ABP F ID CYPFIL M Cyperaceae Cyperus filiculmis GR A P G CYPHAS M Cyperaceae Cyperus haspan GR A P G CYPRET M Cyperaceae Cyperus retrorsus GR A A G NV DICLAR M Poaceae Dichanthelium large spp. GR A P G NV DICMED M Poaceae Dichanthelium medium spp. GR A P G NV DICSMA M Poaceae Dichanthelium small spp. GR A P G NV DIGCOG M Poaceae Digitaria cognata GR A A G DIGFIL M Poaceae Digitaria filiformis GR A A G NV
DIGISC M Poaceae Digitaria ischaemum var. Ischaemum GR A A G
DIOTER D Rubiaceae Diodia teres GR A A F NV ERACAP M Poaceae Eragrostis capillaris WI A A G NV EREHIE D Asteraceae Erechtites hieracifolis WI A A F NV EREOPH M Poaceae Eremochloa ophiuroides WI A P G ERICAN D Asteraceae Erigeron canadensis WI A A F ERISTR D Asteraceae Erigeron strigosus WI A ABP F NV EUPCAP D Asteraceae Eupatorium capillifolium WI A A F NV EUPCOM D Asteraceae Eupatorium compositifolium WI A P F NV GELSEM D Logainiaceae Gelsemium sempervirens GR A P V NV GNAOBT D Asteraceae Gnapthalium obtusifolium WI A ABP F NV GNAPRF D Asteraceae Gnapthalium purpureum var. falcata WI A ABP F GNAPRS D Asteraceae Gnapthalium purpureum var. spa WI A ABP F HYPGEN D Hypericaceae Hypericum gentianoides GR A A F NV HYPHYP D Hypericaceae Hypericum hypercoides WI A P S NV IVAMIC D Asteraceae Iva microcephala WI A A F JUNDIC M Juncaceae Juncus dichotomous GR A P F LECVIL D Cistaceae Lechea villosa GR A P F NV LESCUN D Fabaceae Lespedeza cuneata GR A P F ID LESSTR D Fabaceae Lespedeza striata GR A A F ID LINCAN D Scrophulariaceae Linaria canadensis GR A B F NV LINUSI D Linaceae Linum usitatissimum GR A A F ID MOLVER D Aizoaceae Mollugo verticillata GR A A F ID NICTAB D Solanaceae Nicotiana tabacum GR A F OENBIE D Ongraceae Oenethera biennis BA A ABP F NV OPUCOM D Cactaceae Opuntia compressa BM B P C NV OXASTR D Oxalidaceae Oxalis stricta BA A P F NV
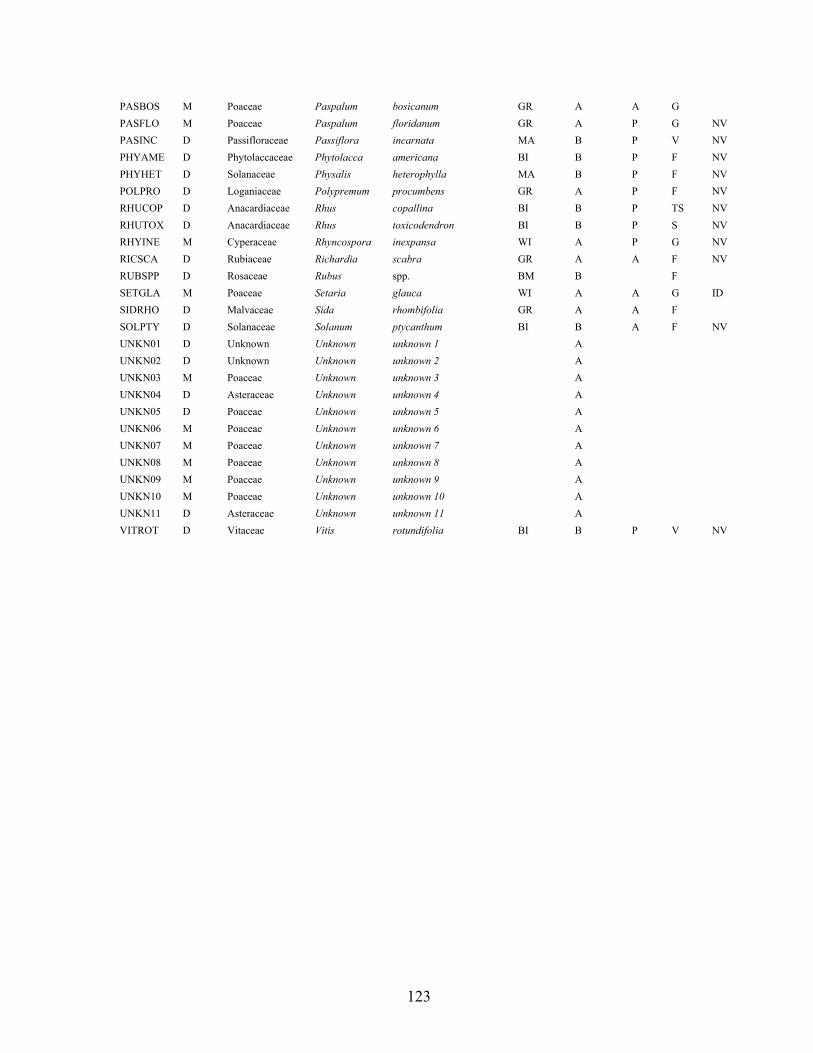
123
PASBOS M Poaceae Paspalum bosicanum GR A A G PASFLO M Poaceae Paspalum floridanum GR A P G NV PASINC D Passifloraceae Passiflora incarnata MA B P V NV PHYAME D Phytolaccaceae Phytolacca americana BI B P F NV PHYHET D Solanaceae Physalis heterophylla MA B P F NV POLPRO D Loganiaceae Polypremum procumbens GR A P F NV RHUCOP D Anacardiaceae Rhus copallina BI B P TS NV RHUTOX D Anacardiaceae Rhus toxicodendron BI B P S NV RHYINE M Cyperaceae Rhyncospora inexpansa WI A P G NV RICSCA D Rubiaceae Richardia scabra GR A A F NV RUBSPP D Rosaceae Rubus spp. BM B F SETGLA M Poaceae Setaria glauca WI A A G ID SIDRHO D Malvaceae Sida rhombifolia GR A A F SOLPTY D Solanaceae Solanum ptycanthum BI B A F NV UNKN01 D Unknown Unknown unknown 1 A UNKN02 D Unknown Unknown unknown 2 A UNKN03 M Poaceae Unknown unknown 3 A UNKN04 D Asteraceae Unknown unknown 4 A UNKN05 D Poaceae Unknown unknown 5 A UNKN06 M Poaceae Unknown unknown 6 A UNKN07 M Poaceae Unknown unknown 7 A UNKN08 M Poaceae Unknown unknown 8 A UNKN09 M Poaceae Unknown unknown 9 A UNKN10 M Poaceae Unknown unknown 10 A UNKN11 D Asteraceae Unknown unknown 11 A VITROT D Vitaceae Vitis rotundifolia BI B P V NV