Abstract book - Alps-Adria Scientific Workshop
174
of the 17 th Alps-Adria Scientific Workshop 9 th - 14 th April 2018, Hnanice, Czech Republic Abstract book
-
Upload
khangminh22 -
Category
Documents
-
view
2 -
download
0
Transcript of Abstract book - Alps-Adria Scientific Workshop

of the 17th Alps-Adria Scientific Workshop 9th - 14th April 2018, Hnanice, Czech Republic
Abstract book


The Conference organized by theHungarian Academy of Sciences
Soil Science, Water Management and Crop Production CommitteePlant Protection Committee
Published by Szent István Egyetemi Kiadó Nonprofit Kft.HU-2100 Gödöllő, Páter Károly utca 1.
Online ISBN 978-963-269-734-5
Gödöllő, Hungary2018
Abstract book17th Alps-Adria Scientific Workshop
9th - 14th April 2018, Hnanice, Czech Republic
Edited byZoltán KENDE
Co-EditorsCsaba BÁLINTViola KUNOS

Table of ContentsPreface Zoltán GYŐRI . . . . . . . . . . . . . . . . . . . . . . . . . . . . . . . . . . . . . . . . . . . . . . . . . . . . . . . . . . . . . . 10
Mycotoxins in the food chainMelinda KOVÁCS – András SZABÓ – Judit SZABÓ-FODOR . . . . . . . . . . . . . . . . . . . . 12
Food safety in the crop productionZoltán GYŐRI . . . . . . . . . . . . . . . . . . . . . . . . . . . . . . . . . . . . . . . . . . . . . . . . . . . . . . . . . . . . . . 14
Food security and sustainability – a crop production assessment Márton JOLÁNKAI – Zsolt SZENTPÉTERY – Katalin M. KASSAI . . . . . . . . . . . . . . . 16
Insects as alternative food for humans in futureStepan KUBIK . . . . . . . . . . . . . . . . . . . . . . . . . . . . . . . . . . . . . . . . . . . . . . . . . . . . . . . . . . . . . . 18
Growth and quality of sunflower subjected to climate changePhilippe GRIEU . . . . . . . . . . . . . . . . . . . . . . . . . . . . . . . . . . . . . . . . . . . . . . . . . . . . . . . . . . . . 20
To eat or not to eat: Is the consumption of seafood safe?József LEHEL – Katalin LÁNYI – Péter LACZAY – András BARTHA – Péter BUDAI . . . . . . . . . . . . . . . . . . . . . . . . . . . . . . . . . . . . . . . . . . . . . . . . . . . . . . . . . . . . . . . 22
Basic cooking characteristics of different accessions of a hungarian rice variety collectionÁrpád SZÉKELY – Tímea SZALÓKI – Mihály JANCSÓ . . . . . . . . . . . . . . . . . . . . . . . . . 24
Effect of xylo-oligosaccharides a new non-digestible oligosaccharide on fruit productsPéter PENKSZA – Beatrix SZABÓ-NÓTIN – Mónika STÉGER-MÁTÉ – Réka JUHÁSZ . . . . . . . . . . . . . . . . . . . . . . . . . . . . . . . . . . . . . . . . . . . . . . . . . . . . . . . . . . . . . . 26
Monitoring the sensorial e-nose based and color properties of chicken meat containing different concentration of Allyl-isothiocyanate (AITC) during chilling and freezing storageKhabat N. HUSSEIN – László FRIEDRICH – Richard PINTER – Adrien TÓTH – Istvan DALMADI . . . . . . . . . . . . . . . . . . . . . . . . . . . . . . . . . . . . . . . . . . . . . . . . . . . . . . . . . . . 28
The effect of the blanching time and the nitrite curing salt for the colour of edible mealworm Richard PINTER – Khabat N. HUSSEIN – Laszló FRIEDRICH – Orsolya PINTER-NAGY – Klára PÁSZTOR-HUSZÁR . . . . . . . . . . . . . . . . . . . . . . . . . . . . . . . . . . . . . . . . . . 30
Investigations on the effect of T-2 toxin on chicken liver cells with comet assayRubina Tünde SZABÓ – Mária KOVÁCS-WEBER – Ákos HORVÁTH – Miklós MÉZES – Balázs KOVÁCS . . . . . . . . . . . . . . . . . . . . . . . . . . . . . . . . . . . . . . . . . . . . 32
Antioxidant-activity and carbohydrate profile of ciders available in Hungarian retailDániel KOREN – Zsolt HATVANY – Beáta HEGYESNÉ VECSERI – Gabriella KUN-FARKAS . . . . . . . . . . . . . . . . . . . . . . . . . . . . . . . . . . . . . . . . . . . . . . . . . . . . 34

Current situation in agriculture of AzerbaijanMaralkhanim JAMALOVA . . . . . . . . . . . . . . . . . . . . . . . . . . . . . . . . . . . . . . . . . . . . . . . . . . . 36
Moderation of distance in perception of the affective image of a rural tourist destinationNesrine KHAZAMI – Zoltan LAKNER . . . . . . . . . . . . . . . . . . . . . . . . . . . . . . . . . . . . . . . . 38
Cooperation – for sustainable economyIstván TAKÁCS – Katalin TAKÁCS-GYÖRGY . . . . . . . . . . . . . . . . . . . . . . . . . . . . . . . . . 40
Hungary’s nutrition and health in European comparisonCsaba BÁLINT – Zsuzsanna SÓFALVY . . . . . . . . . . . . . . . . . . . . . . . . . . . . . . . . . . . . . . . . 42
Applying of remote sensing in weed survey by different camerasÉva LEHOCZKY – Péter RICZU – Nikolett MAZSU – Viktória DELLASZÉGA-LÁBAS – János TAMÁS . . . . . . . . . . . . . . . . . . . . . . . . . . . . . . . . . . . . . . . . . . . . . . . . . . . . . . . . . . . . . 44
Effects of fungicides on key plant physiological parameters of Zea mays L. and on changes in superoxide-dismutase (SOD) and lipid-peroxidase (LP) activityÁrpád ILLÉS– Zoltán GYŐRI– Antal NAGY– Péter SIPOS– Brigitta TÓTH . . . . . . . . 46
The impact of crop rotation on photosynthetic parameters nutrition quality, and yield of maize (Zea mays L)Mahama SALIFU – Lajos Fülöp DÓKA . . . . . . . . . . . . . . . . . . . . . . . . . . . . . . . . . . . . . . . . 48
Effect of bean rust (Uromyces appendiculatus (Pers.) Strauss) on physiological characteristics, superoxide-dismutase and lipid-peroxidase activities of common bean (Phaseolus vulgaris L.)Csaba BOJTOR–Zoltán GYŐRI – Péter SIPOS–László RADÓCZ– Brigitta TÓTH . . . . . . . . . . . . . . . . . . . . . . . . . . . . . . . . . . . . . . . . . . . . . . . . . . . . . . . . . . . . . . . . . . . .50
Model study to investigate the toxic interaction between chlorpyriphos containing insecticide and lead acetate on chicken embryosGéza SZEMERÉDY–Gergő SOMODY–László MAJOR –József LEHEL – Péter BUDAI . . . . . . . . . . . . . . . . . . . . . . . . . . . . . . . . . . . . . . . . . . . . . . . . . . . . . . . . . . . . . . . 52
Effect of the production year and soil temperature on the green spear yield of asparagus (Asparagus officinalis L.) Zsuzsa ERDŐS – László ZSOMBIK . . . . . . . . . . . . . . . . . . . . . . . . . . . . . . . . . . . . . . . . . . . 54
Cold tolerance evaluation of rice (Oryza sativa L.) genotypes at the germination – and the seedling stageTímea SZALÓKI – Mihály JANCSÓ – Árpád SZÉKELY – Beáta VITÁNYI . . . . . . 56
Effect of critical agrotechnical factors on the yield and physiological parameters of sunflower (Helianthus annuus L.)András SZABÓ – Lajos Fülöp DÓKA – Éva SZABÓ . . . . . . . . . . . . . . . . . . . . . . . . . . . . 58
Analysis of the interactions between the yield-influencing factors in maize during three different cropyears Fülöp Lajos DÓKA – Éva SZABÓ – András SZABÓ . . . . . . . . . . . . . . . . . . . . . . . . . . . . . 60

Using multiple plant sensors to characterise the development of maize (Zea Mays L.) in field experimentPéter RAGÁN – Dénes SULYOK – János NAGY – Endre HARSÁNYI – Tamás RÁTONYI . . . . . . . . . . . . . . . . . . . . . . . . . . . . . . . . . . . . . . . . . . . . . . . . . . . . . . . . . . . 62
Analysis of maize hybrid yields in a long-term field experimentÁgnes TÖRŐ – Zoltán BALLA – Endre HARSÁNYI – Tamás RÁTONYI . . . . . . . . . . 64
Genetic and phenotypic variability of seed germination in barley cultivars (Hordeum vulgare L.) Desimir KNEZEVIC – Danijela KONDIC – Adriana RADOSAVAC – Sretenka SRDIC – Vlado KOVACEVIC . . . . . . . . . . . . . . . . . . . . . . . . . . . . . . . . . . . . . . . . . . . . . . . . . . . . . . . . . 66
Variability of seed number and seed mass per spike in wheat (Triticum aestivum L.)Desimir KNEZEVIC – Veselinka ZECEVIC – Dusan UROSEVIC – Mirela MATKOVIC – Danica MICANOVIC . . . . . . . . . . . . . . . . . . . . . . . . . . . . . . . . . . . . . . . . . . . . . . . . . . . . . . . . 68
Examination of the starch content of maize hybrids based on long-term field experiment resultsKarina Bianka BODNÁR – Zoltán BALLA – János NAGY . . . . . . . . . . . . . . . . . . . . . . . 70
The appearance of taxonomical distance among winter cereal species along the spring to early summer SPAD valuesÁkos TARNAWA – Laura CZERŐDINÉ KEMPF – Ferenc NYÁRAI-HORVÁTH – András MÁTÉ – Zsolt SZENTPÉTERY . . . . . . . . . . . . . . . . . . . . . . . . . . . . . . . . . . . . . . . . 72
Performance of industrial hemp varieties and hybrids in HungaryLaura CZERŐDINÉ KEMPF – Ákos TARNAWA – Zuzana FINTA . . . . . . . . . . . . . . . . 74
Design of water management and technical erosion control measures in a specific area of interestJaroslav ANTAL – Elena KONDRLOVÁ . . . . . . . . . . . . . . . . . . . . . . . . . . . . . . . . . . . . . . 76
Water supply in the soil aeration zone in Zahorska LowlandPeter STRADIOT – Stefan REHAK . . . . . . . . . . . . . . . . . . . . . . . . . . . . . . . . . . . . . . . . . . . . 78
The annual amount of dew determined by weighing lysimetersKrisztina CZELLÉR – József ZSEMBELI – Lúcia SINKA . . . . . . . . . . . . . . . . . . . . . . . . 80
Effect of extreme water loads on the penetration resistance of the soil surfaceJózsef ZSEMBELI – Pál Máté NAGY – Géza TUBA . . . . . . . . . . . . . . . . . . . . . . . . . . . . . 82
The changes of water balance components in SlovakiaMarcel GARAJ – Pavla PEKÁROVÁ – Pavol MIKLÁNEK – Ján PEKÁR . . . . . . . . . . 84
Reaction of the daily discharge to snow melt in the basinDana HALMOVA – Pavla PEKÁROVÁ – Veronika BACOVA MITKOVA – Pavol MIKLÁNEK . . . . . . . . . . . . . . . . . . . . . . . . . . . . . . . . . . . . . . . . . . . . . . . . . . . . . . . . . . 86
Metal leaching in geothermal systemsMáté OSVALD – János SZANYI – Tamás MEDGYES – Balázs KÓBOR – Balázs KOVÁCS . . . . . . . . . . . . . . . . . . . . . . . . . . . . . . . . . . . . . . . . . . . . . . . . . . . . . . . . . . . . 88
The conceptual framework for a user-friendly process-driven irrigation system (PDIS)Tomáš ORFÁNUS – Gábor MILICS – Viliam NAGY . . . . . . . . . . . . . . . . . . . . . . . . . . . . 90
Effect of plough pan and sunflower roots on soil water storage in intensively agriculturally used soil Viliam NAGY – Peter ŠURDA – Tomáš ORFÁNUS – Ľubomír LICHNER – Gábor MILICS . . . . . . . . . . . . . . . . . . . . . . . . . . . . . . . . . . . . . . . . . . . . . . . . . . . . . . . . . . . . . 92
The impact of river stage and conductance parameter on the seepage volume between river and aquiferPetr DUŠEK – Yvetta VELÍSKOVÁ . . . . . . . . . . . . . . . . . . . . . . . . . . . . . . . . . . . . . . . . . . . 94
Chemical composition of the leachate from lysimeter-grown short-rotation willow coppice in relation to irrigation water qualityÁgnes KUN – Mária B. ONCSIK – Károly BARTA . . . . . . . . . . . . . . . . . . . . . . . . . . . . . . 96
Comparison of hydraulic conductivity of bed silts in Komárňanský channel - Žitný ostrovRenáta DULOVIČOVÁ – Yvetta VELÍSKOVÁ – Radoslav SCHŰGERL . . . . . . . . . . 98
Applicability of inland excess water hazard mapsCsaba BOZÁN – Norbert TÚRI – György KEREZSI – János KÖRÖSPARTI . . . . . . . 100
Advantages of rational control of soil moisture regime to prevent and mitigate the adverse effects of climate change in Békés countyNorbert TÚRI – János KÖRÖSPARTI – György KEREZSI – Csaba BOZÁN . . . . . . . 102
Effect of drought stress on the relative water content and canopy temperature of rice cultivars Mihály JANCSÓ – Árpád SZÉKELY – Tímea SZALÓKI . . . . . . . . . . . . . . . . . . . . . . . . 104
Testing the applicability of biodegradable superabsorbent polymers for crop productionZoltán KENDE – Márta BIRKÁS . . . . . . . . . . . . . . . . . . . . . . . . . . . . . . . . . . . . . . . . . . . . . 106
Bentonite-digestate mixture as a new product: Its effect on plant germination and soil nutrient statusMarianna MAKÁDI – Bente FOEREID – Emilio ALVARENGA – Tamás SZEGI – Zsolt ESZES . . . . . . . . . . . . . . . . . . . . . . . . . . . . . . . . . . . . . . . . . . . . . . . . . . . . . . . . . . . . . . . 108
Relationship between the microbial activity and land use on typical sandy soil of the Nyírség regionIbolya DEMETER – Marianna MAKÁDI – Tibor ARANYOS – Attila TOMÓCSIK – Katalin POSTA . . . . . . . . . . . . . . . . . . . . . . . . . . . . . . . . . . . . . . . . . . . . . . . . . . . . . . . . . . . . . 110
Glomalin gene as molecular marker for functional diversity of arbuscular mycorrhizal fungi in the soilFranco MAGURNO – Monika RAJTOR – Erica LUMINI – Katalin POSTA – Zofia PIOTROWSKA-SEGET . . . . . . . . . . . . . . . . . . . . . . . . . . . . . . . . . . . . . . . . . . . . . . . 112
Analysis of Soil Organic Material in UV-Vis SpectrumAndrás SEBŐK – Imre CZINKOTA – Balázs NYIRI – Gabriella BOSNYÁKOVICS – Miklós GULYÁS . . . . . . . . . . . . . . . . . . . . . . . . . . . . . . . . . . . . . . . . . . . . . . . . . . . . . . . . . . . 114

Changing of some characteristics and the CO2 production of a sandy soil by application of mineral grist treatmentsMagdolna TÁLLAI – Imre VÁGÓ – Zsolt SÁNDOR – János KÁTAI . . . . . . . . . . . . . 116
Effects of nutrient supply on soil respiration in a long-term experimentJózsef Tibor ARANYOS – Ibolya DEMETER – István HENZSEL . . . . . . . . . . . . . . . . 118
Do vascular plant biomass and biodiversity stimulate soil enzymes activity on post–mining waste heaps?Wojciech BIERZA – Agnieszka KOMPAŁĄ-BĄBA – Agnieszka BŁOŃSKA – Edyta SIERKA – Gabriela WOŹNIAK . . . . . . . . . . . . . . . . . . . . . . . . . . . . . . . . . . . . . . . . 120
The effects of tillage practices on earthworm population in winter oat (Avena sativa L.) Igor DEKEMATI – Márta BIRKÁS . . . . . . . . . . . . . . . . . . . . . . . . . . . . . . . . . . . . . . . . . . . 122
How do NDVI patches reflect soil properties?Csaba CENTERI – Izabella OLÁH – Zsófia DOBÓ – Boglárka KELLER – Renáta HOLLÓ-CSEH . . . . . . . . . . . . . . . . . . . . . . . . . . . . . . . . . . . . . . . . . . . . . . . . . . . . . . 124
Trend in consumption of industrial and organic fertilizers in Slovakia (potential source of surface water pollution) Cyril SIMAN – Yvetta VELÍSKOVÁ . . . . . . . . . . . . . . . . . . . . . . . . . . . . . . . . . . . . . . . . . 126
The effects of N fertilization on soybean (Glycine max (L.) Merr.) yield and quality under different drought stress levelsOqba BASAL – András SZABÓ . . . . . . . . . . . . . . . . . . . . . . . . . . . . . . . . . . . . . . . . . . . . . . 128
Investigation of mineral content of Jubilejnaja 50 (Winter wheat - Triticum aestivum L.) in different cropping years, in Hungary Diána UNGAI – Béla KOVÁCS – Zoltán GYŐRI . . . . . . . . . . . . . . . . . . . . . . . . . . . . . . 130
Green manures as specific issues in crop productionÁgnes FEKETE – Péter PEPÓ . . . . . . . . . . . . . . . . . . . . . . . . . . . . . . . . . . . . . . . . . . . . . . . . 132
The changes of the purple coneflower’s (Echinacea purpurea L.) herba and radix drug yield under different fertilization settingsJudit Éva LELESZ – József CSAJBÓK . . . . . . . . . . . . . . . . . . . . . . . . . . . . . . . . . . . . . . . . 134
Long-term sewage sludge compost application on sandy soilAttila TOMÓCSIK – Viktória OROSZ – György FÜLEKY – József MÉSZÁROS – Tibor ARANYOS . . . . . . . . . . . . . . . . . . . . . . . . . . . . . . . . . . . . . . . . . . . . . . . . . . . . . . . . . . . 136
Rapid biotest for fertilizer’s effectsBoglárka Anna DÁLNOKI – András SEBŐK – János GRÓSZ – Gabriella RÉTHÁTI – László TOLNER . . . . . . . . . . . . . . . . . . . . . . . . . . . . . . . . . . . . . . . . . . . . . . . . . . . . . . . . . . . . 138
Impacts of different fertilization methods on the yield and N-, S-uptake of spring wheat (Triticum aestivum L.)Evelin Kármen JUHÁSZ – Áron BÉNI – Mihály OROSZ-TÓTH – Andrea BALLÁNÉ KOVÁCS . . . . . . . . . . . . . . . . . . . . . . . . . . . . . . . . . . . . . . . . . . . . . . . . 140
Uptake, translocation and influence of selenium on rutin content in Fagopyrum esculentumJiri TUMA – Lenka TUMOVA – Matej SEMERAK – Adela STARMANOVA . . . . . 142

Impact of nitrogen topdressing on the quality and quantity parameters of yield and grain protein of wheat (Triticum aestivum L.) Adnan ESER . . . . . . . . . . . . . . . . . . . . . . . . . . . . . . . . . . . . . . . . . . . . . . . . . . . . . . . . . . . . . . . 144
Trend in consumption of industrial and organic fertilizers in Slovakia (potential source of surface water pollution) Cyril SIMAN – Yvetta VELÍSKOVÁ . . . . . . . . . . . . . . . . . . . . . . . . . . . . . . . . . . . . . . . . . 146
Results of N supply and plant protection testing experiment on winter barley varieties József CSAJBÓK – Erika KUTASY . . . . . . . . . . . . . . . . . . . . . . . . . . . . . . . . . . . . . . . . . . 148
Investigation on the growth of microalgae affected by biomass ash extract treatmentGyörgy FEKETE – László ALEKSZA – Péter KÖLES – János GRÓSZ – Boglárka Anna DÁLNOKI . . . . . . . . . . . . . . . . . . . . . . . . . . . . . . . . . . . . . . . . . . . . . . . . . . . 150
Biodiversity of arbuscular mycorrhizal fungi (AMF) in the environment contaminated with toxic organic pollutantsMonika RAJTOR – Franco MAGURNO – Zofia PIOTROWSKA-SEGET . . . . . . . . 152
Adaptation possibilities to climate change with green infrastructure in urban environmentEdit HOYK . . . . . . . . . . . . . . . . . . . . . . . . . . . . . . . . . . . . . . . . . . . . . . . . . . . . . . . . . . . . . . . . 154
“Miletin pheasantry” Nature reserve (East Bohemia, Czech Republic): vegetation surveyMilan SKALICKY – Vaclav HEJNAK – Jan KUBES . . . . . . . . . . . . . . . . . . . . . . . . . . . . 156
Evaluation of potentially toxic elements mobilityViera KOVÁČOVÁ . . . . . . . . . . . . . . . . . . . . . . . . . . . . . . . . . . . . . . . . . . . . . . . . . . . . . . . . . 158
A cost-effective arsenic removal methodImre SZATMÁRI – József ZSEMBELI – Prasanna SAXENA – Júlia TÜDŐSNÉ BUDAI – Károly ANTAL . . . . . . . . . . . . . . . . . . . . . . . . . . . . . . . . . . . . . . . . . . . . . . . . . . . . . . . . . . . . . 160
Rapid biotest method in precision agricultureMiklós GULYÁS – László TOLNER – György FEKETE – Rita ERDŐSI – Imre CZINKOTA . . . . . . . . . . . . . . . . . . . . . . . . . . . . . . . . . . . . . . . . . . . . . . . . . . . . . . . . . . . 162
Factors important for biomass production of selected vascular plant species occurring on post-mining waste heapsEdyta SIERKA – Agnieszka BŁOŃSKA – Agnieszka KOMPAŁA-BĄBA – Wojciech BIERZA – Gabriela WOŹNIAK . . . . . . . . . . . . . . . . . . . . . . . . . . . . . . . . . . . . . 164
Estimation of nitrogen mobility effectiveness in maize genotypes Attila SIMKÓ – Szilvia VERES . . . . . . . . . . . . . . . . . . . . . . . . . . . . . . . . . . . . . . . . . . . . . . . . 166
INDEX . . . . . . . . . . . . . . . . . . . . . . . . . . . . . . . . . . . . . . . . . . . . . . . . . . . . . . . . . . . . . . . . . . . 169

Abstract Book – 17th Alps-Adria Scientific Workshop
10
Preface
Human history is accompanied by the collection, production and processing of plant parts that are suitable for human consumption. We can follow this process while investigating pictorial and written sources, which can provide useful knowledge for people today. Since the beginning of human history, the provision of food supply in adequate amount to the population was a key issue both in peace and wartime. Quantity has always been a priority, but beside the nutritional-physiological properties it was essential to have safe food without damaging consumers’ health. There have often been attempts to poison drinking water, one of the most important resources of existence, trying to prevent entire armies from functioning.
In a world that is constantly changing, the changes in society and the economy shape the production and utilization food and industrial crops in agriculture. We have to insert the expectation into this changing scene to meet the needs of our age.
During the production of food we have to face new challenges as the result of natural and anthropogenic influences. Considering the time passed since the Second World War, today in developed countries there is an emphasis on food safety, with food that cannot harm people’s health in addition to food security. Besides, there is an increasing consumer preference for food that is the most beneficial to human health. In this process we have to pay increasing attention to let a producer-processor-distributional centralization develop in our days. It might risk consumers’ health especially in expanding urban areas. So much so, that it can be a continent-wide problem. There were several examples of this effect in the last decades of the past century since salmonella epidemic, BSE and certain plant protecting chemicals occurred as well as natural toxins of fungi caused or may have caused damage to consumers in some highly industrialized countries. These phenomena lead professionals in the USA and the EU to the realization that a new strategy is needed in which the „from farm to table” principle is central. According to this, food safety should cover materials used in agriculture, primary agricultural production, food production and retail as well.
The implementation of this principle requires us to develop a new approach because there is a need to have a regulation and administration during the manufacturing of plant products, based on which their manufacturing process, movement, storage, processing and transportation can be determined „from farm to the table”. This is completed by risk analysis and risk assessment which involves providing risk communication to consumers in a clear and understandable way as it is necessary in order to detect diseases immediately and inform consumers in time.
Based on these principles food safety system includes „good agricultural practices” in the processing of plant products. It is later completed by good production, hygienic practices and the adherence to regulation in the catering industry as well. The HACCP system is built on these principles and the ISO 22000 is a new regulation of the whole system.
This scientific community laid an emphasis on publishing and disseminating information about experimental result of the connection between agronomy and product quality. As a result we have every reason to believe to have an exchange of information in the issues specific of this professional field and provide progressive knowledge for participants.

Hnanice, Czech Republic – 09-14. April, 2018
11
We hope to address the challenge the world is facing, namely how to provide the growing world population of 10 billion in the future in terms of reliable food security and efficient food safety.
This conference is organized under the auspices of two scientific committees of the Hungarian Academy of Sciences. The workshop is dedicated to the Alps-Adria movement providing a bridge to science, technology and people of the region. The aim of the scientific workshop is to open a forum for the discussion of research results related to anthropogenic factors in the field of agro-environment and in the agro-food chain.
The venue of the scientific workshop is the resort and conference centre located in the town of Hnanice in Czech Republic near the magnificent Thayatal National Park environment, the traditional Czech hospitality may contribute to the success of the conference.
Hnanice, April 2018
Zoltán GYŐRI

Abstract Book – 17th Alps-Adria Scientific Workshop
12
Mycotoxins in the food chainMelinda KOVÁCS1,2 – András SZABÓ1 – Judit SZABÓ-FODOR2
1: Kaposvár University, Faculty of Agricultural and Environmental Sciences & 7400 Kaposvár, Guba S. u. 40. Hungary; E-mail: [email protected]
2: MTA-KE Mycotoxins in the Food Chain Research Group & Kaposvár, Guba S. u. 40. Hungary; E-mail: [email protected]
Keywords: mycotoxins, occurrence, climate change, interaction
Introduction
Mycotoxins are fungal secondary metabolites that cause disease (mycotoxicosis) in animals and humans. They are introduced into the organism usually with feed and food, but, they can be absorbed through the skin, or inhaled them. Mycotoxins are found all around the world as natural contaminants. They pose risk for human and animal health (so they are of feed and food safety concern) and serious economic losses.
Materials and methods
This review gives a summary of the occurrence of the most important mycotoxins in Europe, the predicted effect of climate change on their production and the problem of the co-occurrence of these toxins causing multitoxic effects.
Results and discussion
The analyses of global mycotoxin occurrence is of particular interest because it helps to identify areas of high risk and study the effect of Climatic Change. The BIOMIN Mycotoxin Survey is the longest running survey using advanced analytic tools. At the latest survey over 33000 analyses were conducted on 8452 finished feed and raw commodity samples sourced from 63 countries from January to June 2017. In Central Europe the most prevalent mycotoxin is DON, followed by zearalenone and fumonisins, however T-2 is also often contaminant (Table 1).Table 1: Occurrence (%) of mycotoxins in Central Europe
Mycotoxin 2015 2016 2017Deoxynivalenol 84 84 84Zearalenone 75 66 72Fumonisin 52 46 48T-2 toxin 57 32 37Ochratoxin A 13 11 15Aflatoxin 2 11 19
According to the prediction of several competent organisations, a global warming is taking place. Climate change may affect all ecological factors important in the mycotoxin problem (moisture content, temperature, substrate, migration of insects etc.) so will influence directly or indirectly mould growth and toxin production. Predicted results of climate change are: (1) shift in contamination pattern; (2) changes in the level of mycotoxin production; (3) the biggest problem is expected by the predicted increase in aflatoxin production and the increase in the size of areas affected; (4) effect of CC on biosynthetic pathways.

Hnanice, Czech Republic – 09-14. April, 2018
13
Several surveys indicate that humans and animals are generally exposed to more than one mycotoxin (Gerding et al., 2014; Kovalsky et al., 2016). The toxicity of combinations of mycotoxins cannot always be predicted based on their individual toxicities, because individual effects may be influenced by interactions, like antagonism, synergism or additive effects (Grenier & Oswald, 2011). On the other hand, risk assessment studies are usually based on the toxicity and occurrence data of individual mycotoxins. It is very important to have reliable data regarding co-occurrence of toxins in order to make a better risk assessment, established maximum levels and guideline values. That was the reason why we started with a series of experiments examining interactions between different Fusarium mycotoxins, some of the results are summarized in Table 2. Table 2: Interaction between mycotoxins tested in vivo
Applied combination F+T2 F+DZ F+D+ZDose 10 and 2 mg/kg feed 5, 1 and 0.25 mg/kg feed 5, 1 and 0.5 mg/kg feedSource of the toxin fungal culture fungal culture pure toxinTest animal growing rabbit adult male rabbit ratParameters testedbody weight, feed intake antagonism antagonism antagonismAST no no additiveGSH, GPx antagonism antagonismGPx synergismMDA synergism antagonism nogenotoxicity antagonism antagonism no
F: fumonisin, T2: T-2 toxin, D: deoxynivalenol, Z: zearalenone
Conclusions
The multidisciplinary nature of the mycotoxin problem and the importance of collaboration have to be highlighted.
Acknowledgement
The work was supported by the GINOP-2.3.2-15-2016-00046 and EFOP-3.6.3-VEKOP-16-2017-00008 projects.
References Kovalsky, P., Kos, G., Nahrer, K., Schwab, C., Jenkins, T., Schatzmayr, G., Sulyok, M., Krska, R. (2016): Co-
occurrence of regulated, masked and emerging mycotoxins and secondary metabolites in finished feed and maize – an extensive survey. Toxins. 8:363. DOI:10.3390/toxins8120363
Gerding, J., Cramer, B., Humpf H.U. (2014): Determination of mycotoxin exposure in Germany using an LC-MS/MS multibiomarker approach. Molecular Nutrition and Food Research. 2014. 58: 2358–2368.
Grenier, B., Oswald, I.P. (2011): Mycotoxin co-contamination of food and feed: meta-analysis of publications describing toxicological interactions. World Mycotoxin Journal. 4:3: 285-313.

Abstract Book – 17th Alps-Adria Scientific Workshop
14
Food safety in the crop productionZoltán GYŐRIUniversity of Debrecen, Institute of Nutrition; E-mail: [email protected]
Keywords: food safety, food supply chain, chemical pollutants
Introduction
Supplying people with the adequate amount of food was one of the most important issues both in peace and in wartime during history. Securing water resources was a priority in addition to providing access to food and feed supplies. Food production and storage hygiene were taken seriously in all periods and the violations of safety regulations were punished. Social and economic changes raised food supply issues as a consequence the increasing importance of food safety.
Discussion
The processes mentioned above have largely changed due to different factors. The most important factors among them are the ones related to food production, processing, transportation, distribution and sale. This is especially valid in terms of developed countries since worldwide integration started from them, which put the emphasis on the global market instead of separated national markets. As a result of these processes we need to be familiar with the definition of food and to food quality, which means the consumption of food that poses no threat to human health. There might be difference in nutritional quality of food products but they cannot contain any material hazardous to health. This guideline is important because according to researches 70 % of the contaminants get into the organization through food.
Table 1: Changes in social demands from 1945 until the present day (Flachowsky et al., 2004.)
1945-60 1980-1990 2000-
consumer I am hungry. Is there something to eat?
I’d like to eat
s something! What do we have?
How safe is my food?
policy
FOOD SECURITY
securing food supply
manufacturing enough food
FOOD QUALITY
educing surpluses in the EU
FOOD SAFETY
risk assessment
agri-food research
RESEARCH ON
increasing agricultural production
using all resources
RESEARCH ON
product quality
process quality
RESEARCH ON
safety
sustainability of agriculture
After realizing the significance of these processes new publications and action plans were created from a new perspective by different countries and organizations. One publication of note is the Food Safety from Farm to Table: a New Strategy for the 21th Century published

Hnanice, Czech Republic – 09-14. April, 2018
15
in the USA in 1997 (IMNRC, 1997). Another example of this trend was provided in the EU in 2000 in the White Paper on Food Safety and the organization of the European Food Safety Authority (European Commission, 2000) and the World Health Organization’s Global Strategy for Food Safety 2002: Safe Food for Better Health (WHO, 2002). These actions were approached from a global, complex perspective which covers the food lifecycle from the farm to the table in addition to being consumer-centered. The White Papers of the European Union was based on a common approach to fulfilling the present-day requirements in the framework of the “from farm to the table” concept (Raspor, 2008).
It was also highlighted that feed and food producers are also responsible primarily for food safety but we have to consider the responsibility of consumers as well who are at the other end of the food supply chain (storage, processing, and kitchen technology). This shows the demand for a complete monitoring process in the food chain. Hazards represent a large group of the possible contamination sources and today we have to talk about physical, chemical and biological hazards in terms of food. This means that food safety have to cover the materials used in agriculture, primary agricultural production, food production and marketing too (Molnár, 2002).In this presentation I am going to publish data about the condition of the soil-plant system based on the processing of the measurement (ICP-OES, ICP-MS, GC, GC-MS) results. This includes potentially toxic elements and organic micro pollutants (pesticide remains and other compounds).
Conclusions
These efforts are present in Hungary as well. Based on these guidelines the New National Food Safety Program was created with priorities including: a complex approach to food safety, enhancing microbiological and chemical food safety (NFCSO, 2013). These efforts can be successful if there will be a progress in the field of education as well. It is recommended to involve new fields into researches and the application of the network science.
ReferencesEuropean Commission (2000): White Paper on Food Safety. http://eur-lex.europa.eu/legal-content/EN/
TXT/?uri=LEGISSUM:l32041 accessed on: 23/11/2017.Flachowsky G., Schulz E., Dänicke S. (2004): Demands on a “Positive List”of feedstuffs from the point of view
of animal nutrition. Landbauforschung Völkenrode Sonderheft 271. 1.-10.Institute of Medicine and National Research Council (1997): Ensuring Safe Food: From Production to
Consumption. National Academies Press (US)., Washington (DC), USAMolnár P. (2002): Az élelmiszerbiztonság aktuális kérdései az európai szabályozás tükrében. Élelmiszervizsgálati
Közlemények, 48, 8-40.National Food Chain Safety Office (NFCSO) (2013): Strategy on National Food Chain Safety 2013 – 2022.
https://elelmiszerlanc.kormany.hu/download/ 4/39 /70000 /%C3%89LBS%204_1_20130711.pdf accessed on: 23/11/2017
Raspor, P. (2008): Total food chain safety: How good practices can contribute? Trends in Food Science and Technolnology. 19. 405-412.
World Health Organization (2002): Global Strategy for Food Safety 2002: Safe Food for Better Health. http://apps.who.int/iris/bitstream/10665/42559/1/9241545747.pdf accessed on: 23/11/2017.

Abstract Book – 17th Alps-Adria Scientific Workshop
16
Food security and sustainability – a crop production assessment Márton JOLÁNKAI – Zsolt SZENTPÉTERY – Katalin M. KASSAI Szent István University, Crop Production Institute. 2100 Gödöllő, Páter Károly utca 1. Hungary. E-mail: jolankai.
Keywords: food security, sustainability, alimentation, climatic constrains
Introduction
The increasing population of the world may induce various problems. There are two major fields; food security and adequate fresh water supply, which are predominant for all Global economic structures. On the other hand all activities implemented in favour of meeting the demand of the population, increase the ecological footprint and may risk sustainability of both mankind and its environment. The present study deals with an assessment of future trends on the basis of the present state of alimentation.
Agriculture has a basic role in providing food for the human race. All sort of activities of that are in relation with the environment and at the same time they are driven by economic and social aspects. Sustainable agriculture can only be implemented if agricultural production can be run in an environment which is socially bearable, and economically viable. The scheme has to take into consideration that the society has to be equitable economically continuously. Whenever any of these interrelations cannot be manifested, the whole system may turn to be non-sustainable, or inefficient regarding food security.
Materials and methods
The study has been focusing on three aspects of sustainability: economic growth, environmental protection and social equality. In the evaluation assessment public databases and statistics of the United Nations, within that the FAO (FAO 2017) have been used.
Figure 1: Alimentation of the world (Source: FAO 2017)
Results and discussion
Sustainable agriculture integrates three main goals; environmental health, economic profitability, and social and economic equity. A variety of philosophies, policies and practices have contributed to these goals. People in many different capacities, from farmers to consumers, have shared this vision and contributed to it. Despite the diversity

Hnanice, Czech Republic – 09-14. April, 2018
17
of people and perspectives, the following themes commonly weave through definitions of sustainable agriculture. Sustainability rests on the principle that we have to meet the needs of the present without compromising the ability of future generations to meet their own needs. Therefore, stewardship of both natural and human resources is of prime importance. Stewardship of human resources includes consideration of social responsibilities such as working and living conditions of labourers, the needs of rural communities, and consumer health and safety both in the present and the future. Stewardship of land and natural resources involves maintaining or enhancing this vital resource base for the long term.
A system perspective is essential to understanding sustainability. A systems approach provides tools to explore the interconnections between agronomic and other aspects of our environment. A systems approach also implies interdisciplinary efforts in research and education.
Conclusions
For a sustainable agricultural production, apart from theoretical and practical knowledge and the necessary technical support for its implementation, quality of human resources are to be considered as an essential basis. Nowadays green movements often do more harm to environment than any other people involved in regular activities of agriculture. Politicians speak of agriculture, as if it was some kind of hobby farming. Actually, it is an economic necessity in most countries. Green movements often manipulate the public with arguments of no scientific value. Agriculture and environment are bound together. There are several problems in their inter-relation however these problems should never be placed in the field of politics.
Acknowledgement
The paper presents research results obtained from researches supported by TÁMOP, NVKP and VKSZ funds of the Government of Hungary.
References FAO (2017): FAO Statistics. http://faostat.fao.org/en/site/default.aspxGold, M. (2009): What is sustainable agriculture? United States Department of Agriculture, Alternative Farming
Systems Information Center. Washington DCJolánkai M. (2016): From soil to food. Növénytermelés. 65. Suppl.. 9-10. pp. DOI:10.12666/Novenyterm.65.2016.
SupplJolánkai M., Máté A., Nyárai H. F. (2002): Endeavour in crop science. In: Proceedings of the Alps-Adria
Scientific Workshop. Ed: Gyuricza Cs. Akaprint. Opatija. 15-21 pp.Ross P. R, Tóth E., Sófalvy Zs. (2009): Nutritional impacts on angiological state. Cereal Research
Communications. 37. Suppl. 635-638. DOI: 10.1556/CRC.37.2009.Suppl.1

Abstract Book – 17th Alps-Adria Scientific Workshop
18
Insects as alternative food for humans in futureStepan KUBIKCzech University of Life Sciences Prague; Fac. of Agrobiology, Food and Natural Resources, Dept. of Zoology
and Fisheries, Kamycka 129, 16500 Prague, Czech Republic; E-mail: [email protected]
Keywords: entomophagy, insect, breeding, consummation, nutritional value
Abstract
As documented in bibliography, there is eaten more than 1400 insects species all over the world, whence the major part of them are situated in the tropical and subtropical area. Entomophagy is a common part of aborigine´s culture and recently it brings oneself to people´s attention also in Europe, particularly due to media. Insects are increasingly considered for another benefit they offer – as a source of animal protein. As a source of animal protein, insects require ten times less space than cows. This could be a solution not just for producing meat for human consumption; insect protein could also, for example, replace fishmeal in animal feed. Edible insects contain high quality protein, vitamins and amino acids for humans. Insects have a high food conversion rate, e.g. crickets need six times less feed than cattle, four times less than sheep, and twice less than pigs and broiler chickens to produce the same amount of protein. Besides, they emit less greenhouse gases and ammonia than conventional livestock. Insects can be grown on organic waste. Therefore, insects are a potential source for conventional production of protein for direct human consumption.
Figure 1: Crickets with onion, garlic and tomatoes

Hnanice, Czech Republic – 09-14. April, 2018
19
Figure 2: Curry from larvae of Tenebrio molitor
Figure 3: Cookies with larvae of Zophobas in tomato-garlic sauce
Acknowledgement
Supported by the Ministry of Education, Youth and Sports of the Czech Republic, Project “S grant of MSMT CR”.

Abstract Book – 17th Alps-Adria Scientific Workshop
20
Growth and quality of sunflower subjected to climate changePhilippe GRIEU AGIR, Université de Toulouse, INRA, Castanet-Tolosan, France; E-mail: [email protected]
Keywords: climate change, drought, sunflower
Introduction
France is the first sunflower producer in the European Union with 1.64 million tons of seeds in 2010. About 80% of the French sunflower seeds production goes for domestic uses (Labalette & Raoul, 2012). Despite sunflower hectares (ha) have largely decreased during the last 20 years because of an insufficient profitability, real increases in planting have been observed since 2008 due to the Common Agriculture Policy evolution and of higher selling prices for oil crops (Jouffret et al., 2012). From 2007, sunflower cultivation increased by 35 % in France to reach 695,000 ha in 2010 (735,000 ha in 2011) mainly due to good prices and to a more favourable European agricultural policy (Labalette & Raoul, 2012).
According to research of CETIOM, sunflower cultivation has a benefit over the last 25 years, is a real genetic progress. Through a series of tests divided into the main areas of production, it has increased 0.5 q/ha per year, or 1.3% annually. However, the gap between the potential yield and the yield in culture remains important due to some limiting factors in relation with climate change, such as water supply, date of sowing, and fungi of Phoma.
Labalette et al., (2012) reported that particularly for oleic sunflower from these countries have quite doubled in five years, from around 500000 to 950000 ha. Further, the oleic types are mostly introduced in the South-Western Europe and in Hungary where their proportion reach around 30 % of the total sunflower acreage meanwhile the eastern countries starts only cultivating such types (1% of the total surfaces).
In France, the main limiting factor in the context of climate change is drought. For agronomist, a drought is defined as any lack of water which the crops could not able to express their performance and yield in favorable conditions, or which may affect the quality of the harvested products (Ludlow & Muchow, 1990). A tolerant plant in this case is the plant that is able to produce an output (plant production or yield) as high as possible in a given drought scenario (Zhu, 2002; Alqudah et al., 2011). Drought is characterized by its intensity, dynamics (suddenly or gradually implemented), duration and time of occurrence relative to the crop cycle. These preliminary remarks have a consequence: it is very difficult experimentally to identify specific characteristics of drought which agronomist faces (Chaves et al., 2003).
Genotypes subjected to the same water deficit do not perceive the stress in the same way. A wide range of mechanisms has been summarized by Tardieu et al., (2007). In addition, a significant genotypic variability is associated with these mechanisms in many crops, especially in sunflower species.
We used sunflower recombinant inbred lines (RILs) as a crop model for quantitative trait loci (QTL) mapping. This crop is often reported as being drought-tolerant (Merrien et al., 1981; Connor & Hall, 1997), but this tolerance varies with the cultivar. That is why we study the plant-water relation traits, and the seed quality traits of sunflower subjected to

Hnanice, Czech Republic – 09-14. April, 2018
21
drought by analyzing its variability and mapping the genomic regions that are responsible for those traits through QTL analysis. QTL analysis provides the opportunity to compare whether different traits have a common genetic basis (Tanksley, 1993; Lynch & Walsh, 1998). Besides, an understanding of the sources of genetic variation and physiological mechanisms involved facilitates the development of an appropriate strategy to breed drought-tolerant cultivars (Sinclair, 2011).
ReferencesAlqudah A. M., Samarah N. H., Mullen R. E. (2011): Drought stress effect on crop pollination, seed set, yield
and quality, in Alternative Farming Systems, Biotechnology, Drought Stress and Ecological Fertilisation, ed Lichtfouse E., editor. (Springer), 193–213.
Connor, D., and A. Hall, (1997): Sunflower physiology. In: A. A. Schneiter (ed.), Sunflower Technology and Production, 67-113. Agronomy Monograph. No. 35. ASA-CSSA- SSSA, Madison.
Chaves, M. M., Maroco, J. P., Pereira, J. S. (2003): Understanding plant responses to drought from genes to the whole plants. Funct. Plant Biol. 30, 239-264.
Jouffret, P., Labalette, F. , Lecomte, V. , Nolot, J. M. (2012): Sunflower crop management in the new agronomic, environmental, social and societal context: challenges for a sustainable production in France. In: Proceeding of 18th International Sunflower Conference, Mar del Plata & Balcarce – Argentina.
Labalette, F.; Raoul, Y. (2012): Current Uses of the French Sunflower Production. In Proceedings of the 18th International Sunflower Conference, Mar del Plata, Argentina, Februrary 27–March 1, 2012
Ludlow MM, Muchow R.C. (1990): A critical evaluation of traits for improving crop yields in water-limited environments. Advances in Agronomy 43, 107-153.
Merrien, A., Blanchet, R., Gelfi, N., Laurent, J. (1981): Relationships between water supply, leaf area development and survival, and production in sunflower (Helianthus annuus L.). Agronomie. 1, 917-922.
Tanksley, S. D., (1993): Mapping polygenes. Annu. Rev. Genet. 27: 205-233.Tardieu, F., Cruiziat, P., Durand, J. L., Triboi, E., Zivy, M. (2007): ESCo: sécheresse et agriculture, 242-257.Zhu, Q. (2002): Salt and drought stress signal transduction in plants. Annu. Rev. Plant. Biol. 53, 247–273.

Abstract Book – 17th Alps-Adria Scientific Workshop
22
To eat or not to eat: Is the consumption of seafood safe?József LEHEL1 – Katalin LÁNYI1 – Péter LACZAY1 – András BARTHA2 – Péter BUDAI3 1: University of Veterinary Medicine, Department of Food Hygiene, H-1078 Budapest, István u. 2.; E-mail:
[email protected] 2: University of Veterinary Medicine, Department of Animal Hygiene, Herd Health and Veterinary Ethology,
H-1078 Budapest, István u. 2.; E-mail: [email protected]: University of Pannonia, Georgikon Faculty, Institute of Plant Protection, H-8360 Keszthely Deák F. u. 16.;
E-mail: [email protected]
Keywords: seafood, environmental contaminants, food safety
Introduction
Nowadays, the accumulation of heavy metals is very important from point of view of the health care of the consumers because of their environmental contamination effect and accumulation property. Biomonitoring using various mollusc species as bioindicator organisms is widely used in many countries, and is an important task to prevent the hazard and risks to consumers, and for monitoring of environment (Cantillo, 1998; Claisse, 1989; Hendozko et al., 2010; O’Connor, 1998; Sukasem & Tabucanon, 1993). The different heavy metals are found in the environment as natural components, however, they can contaminate the foods of animal origin and consequently can enter into the consumers due to anthropogenic activities. Marine fish and cephalopods are frequently consumed because of excellent dietetic properties, more advantageous and healthy components. However, the consumption of them with above the average can pose food toxicological risk due to the accumulation of heavy metals in the edible tissues of these species.
Materials and methods
Samples of live bivalve molluscs were collected weekly up to 20 weeks from a fishery market including Black mussel (Mytilus galloprovincialis), Blue mussel (Mytilus edule), Vongole (Venerupis philippinarum) and Amanda cockle (Glycymeris glycymeris), Pacific oyster (Crassostrea gigas), Portuguese oysters (Crassostrea angulata), and European squid (Loligo vulgaris). The aquatic molluscs were originated from Denmark, Italy, Spain (shellfish), France (oysters) and Argentina (squids). The heavy metal (arsenic, cadmium, lead, mercury) contents of the samples were measured by Inductively Coupled Plasma Optical Emission Spectrometer (ICP-OES) analysis after preparation of samples. The results of metal concentrations were analyzed statistically by one-way ANOVA method. The dietary weekly or monthly exposures were calculated based on the detected amounts of the heavy metals and they were compared to the recommended provisional tolerable weekly or monthly intakes set by the World Health Organization (WHO) (JECFA-776, 1989; JECFA-959, 2011; JECFA-960, 2011).
Results and discussion
Detected amount of heavy metals was below the maximum concentration based on the legal regulations (Commission Regulation, 2006). However, the arsenic content of shellfish (3.01±1.46 mg/kg wet weight=w.w.) was significantly higher (p<0.001) compared to oysters (2.88±1.12 mg/kg w.w.) and squids (1.28±0.52 mg/kg w.w.). The mercury concentration was below the limit of detection (0.5 mg/kg) in every sample, and

Hnanice, Czech Republic – 09-14. April, 2018
23
there was no statistical significance in case of cadmium level (p=0.351).
The provisional tolerable weekly intake (PTWI) of arsenic including organic and inorganic derivatives was twice to 4.7 times higher than the previously regulated limit (15 µg/kg) in every case (JECFA-776, 1989; JECFA-959, 2011). However, this metal does not pose any risk to the consumers because the majority of it is found as less dangerous organic forms in these species. The provisional tolerable monthly intake (PTMI) of cadmium (25 µg/kg) was 1.04 times higher in oysters (26.1 µg/kg) and 1.12 times higher in squids (28 µg/kg) according to the mean data (JECFA-960, 2011). In the case of lead the PTWI values were below the acceptable level (25 µg/kg) in all investigated samples based on the average concentrations (JECFA-960, 2011). However, 2.6-4.8% of the samples were above the recommended PTWI.
Conclusions
Based on the measured concentrations of the heavy metal content (cadmium, lead, mercury) shellfish, oysters and squids are not objectionable. They are fit for human consumption, however, the prolonged ingestion (monthly or even lifelong) of oysters and squids can contribute to cadmium burden of the consumers.
Acknowledgement
The Project is supported by the grant No. EFOP-3.6.2-16-2017-00012 of the European Union and co-financed by the European Social Fund. Presenting this research was supported by 12190-4/2017/FEKUTSTRAT grant of the Hungarian Ministry of Human Capacities and by the Society of Hungarian Toxicologist.
ReferencesCantillo, A. Y. (1998): Comparison of results of mussel watch programs of the United States and France with
worldwide mussel watch studies. Mar ine Pollution Bulletin. 36: 712-717. DOI: https://doi.org/10.1016/S0025-326X(98)00049-6
Claisse, D. (1989): Chemical contamination of French coasts: the results of a ten years mussel watch. Marine Pollution Bulletin. 20: 523-528. DOI: https://doi.org/10.1016/0025-326X(89)90141-0
Commission Regulation (2006): Commission regulation (EC) No 1881/2006 setting maximum levels for certain contaminants in foodstuffs. Official Journal of the European Union L 364/5-24. DOI: https://doi.org/10.1533/9781855736320.3.279
Hendozko, E., Szefer, P., Warzocha, J. (2010): Heavy metals in Macoma balthica and extractable metals in sediments from the southern Baltic Sea. Ecotoxicological Environmental Safe. 73: 152–163. DOI: https://doi.org/10.1016/j.ecoenv.2009.09.006
JECFA-776 (1989): Evaluation of certain food additives and contaminants, 33rd Report of Joint FAO/WHO Expert Committee on Food Additives, Technical report series 776. Geneva
JECFA-959 (2011): Evaluation of certain food additives and contaminants, 72nd Report of Joint FAO/WHO Expert Committee on Food Additives, Technical report series 959. Geneva
JECFA-960 (2011): Evaluation of certain food additives and contaminants, 73rd Report of Joint FAO/WHO Expert Committee on Food Additives, Technical report series 960. Geneva
O’Connor, T. P. (1998): Mussel watch results from 1986 to 1996. Marine Pollution Bulletin. 37: 14-19. DOI: https://doi.org/10.1016/S0025-326X(98)00126-X
Sukasem, P., Tabucanon, M. S. (1993): Monitoring heavy metals in the Gulf of Thailand using mussel watch approach. Science Total Environment. 139-140: 297-305. DOI: https://doi.org/10.1016/0048-9697(93)90029-6

Abstract Book – 17th Alps-Adria Scientific Workshop
24
Basic cooking characteristics of different accessions of a hungarian rice variety collectionÁrpád SZÉKELY – Tímea SZALÓKI – Mihály JANCSÓNational Agricultural Research and Innovation Centre, Research Department of Irrigation and Water Management
(NAIK ÖVKI), Anna-liget 8, Szarvas H-5540, Hungary; E-mail: [email protected]
Keywords: rice, KOH index, alkali spreading value, gelatinization temperature
Introduction
Cooking and eating characteristics of rice are determined by the properties of the starch that is the main part of milled grains (Graham 2002.) The gelatinization temperature (GT) is one of the three most important traits that are related to these qualities (Little et al., 1958). GT is a physical trait responsible for the time and for the temperature of cooking at which starch irreversibly loses its crystalline order as well as for the water-absorbing capacity during this process (Sabouri 2009). Not only genetic background but also environmental conditions, such as temperature during ripening influence GT: for instance high ambient temperature results higher GT of starch (de la Cruz et al., 1989). Our aim was to determine GT of 106 accessions from the NAIK ÖVKI varieties collection to promote breeding of high quality rice in Hungary.
Materials and methods
Samples (3 g) of rough rice were dehulled by a Satake THU Laboratory Husker followed by the polishing phase in a Satake TM05 Test Mill. GT was estimated by the extent of alkali spreading and clearing of polished rice (KOH index) soaked in 1.7 % KOH at 30 °C for 23 hours (Little et al., 1958). The degree of spreading was observed using a seven-point scale as follows: 1 - grain not affected; 2 - grain swollen; 3 - grain swollen, collar incomplete and narrow; 4 - grain swollen, collar complete and wide; 5 - grain split or segmented, collar complete and wide; 6 - grain dispersed, merging with collar; and 7 - grain completely dispersed and intermingled.
Alkali spreading value (ASV) corresponds to GT as follows:• 1-2: high (74.5 - 80 °C)• 3: high intermediate (not precisely determined)• 4-5: intermediate (70 - 74 °C)• 6-7: low (< 70°C)
Results and discussion
ASV was ranged from 2 to 7 of the tested varieties. The highest ASV (7) was found in two genotypes and the lowest (2) in 29 different varieties.
Our results showed that 42.45 % of the examined varieties had low, 50.94 % of the entries had intermediate and high intermediate, and only 6.60 % of the genotypes showed high ASV (Figure 1). The mean ASV was 3.4 in average of genotypes. ASV shows good correspondence to GT. Therefore, if we know GT traits, we can conclude amylose content (Jennings et al., 1979). Varieties characterised by high GT, generally have low amylose content. All varieties that have an intermediate GT are either intermediate or high in amylose content, but they were never analysed with low amylose content (Graham 2002.)

Hnanice, Czech Republic – 09-14. April, 2018
25
Conclusions
For successful breeding, a genetically diverse population is required with detailed information about different quantitative and qualitative traits. Since GT is also affected by the ambient temperature, it is necessary to check varieties in different countries and climatic zones. In temperate countries like Hungary, data published from tropical regions cannot be used directly. Our results highlighted the importance of these tests on each variety to obtain relevant information for breeding processes, because there are so many differences such as environmental conditions, preferences of producers and consumers.
Acknowledgement
The Hungarian Ministry of Agriculture supported the project under the “Improvement of the abiotic stress tolerance of Hungarian rice varieties” programs (FM OD002, FM O15540).
References de la Cruz, N., Kumar, I., Kaushik, R.P., Khush, G. S. (1989): Effect of temperature during grain development
on stability of cooking quality component in rice. Jpn. J. Breed. 39:299-306. DOI: https://doi.org/10.1270/jsbbs1951.39.299
Graham, R. (2002): A Proposal for IRRI to Establish a Grain Quality and Nutrition Research Center. IRRI Discussion Paper Series No. 44. Los Baños (Philippines): International Rice Research Institute. 15 p.
Jennings, P.R., Coffman, W.R., Kauffman, H. E. (1979): Grain quality. In: Rice improvement. Los Baños (Philippines): International Rice Research Institute. pp.101-120.
Sabouri, H. (2009): QTL detection of rice grain quality traits by microsatellite markers using an indica rice (Oryza sativa L.) combination. J. Genetics. 88: 1. 81-85. DOI: https://doi.org/10.1007/s12041-009-0011-4
Figure 1: The relative occurrence of different GT and ASV characteristics in the rice variety collection

Abstract Book – 17th Alps-Adria Scientific Workshop
26
Effect of xylo-oligosaccharides a new non-digestible oligosaccharide on fruit productsPéter PENKSZA1 – Beatrix SZABÓ-NÓTIN1 – Mónika STÉGER-MÁTÉ1 – Réka JUHÁSZ2
1Department of Food Preservation, Szent István University, Villányi str. 29.-43. 1118 Budapest, Hungary; E-mail: [email protected]
2Department of Dietetics and Nutrition Sciences, Semmelweis University, 17 Vas str. Budapest, Hungary; E-mail: [email protected]
Keywords: Xylo-oligosaccharides (XOS), oscillatory rheological methods, gelatin, functional food
IntroductionAs a result of the growth in the demand for quality and healthy food, functional food has emerged as a new product category that is becoming increasingly popular worldwide. Functional foods have positive health effects on the human body. These fruit-based, plant-fiber-enriched products can play a prominent role against the chronic non-infectious diseases due to low-nutrition, e.g. abnormal obesity, colorectal cancer and cardiovascular diseases. Due to their beneficial properties, non-digestible oligosaccharides, like the Xylo-oligosaccharides (XOS) produced from lignocellulosic enzymes, can be important components of the fiber-enriched formulations. XOS are oligomers of two to ten β-1, 4-linked xylose monomers. Longlive XOS is made of corncob (Zea mays subsp mays) by hydrolysis process using xylanase enzyme (EC 3.2.1.8.) isolated from Trichoderma reesi. XOS are non-digestible oligosaccharides (NDOs) since β(1–4) bonds between xylose monomer units are not degraged by human digestive enzymes. XOS can be characterized as prebiotics due to their ability to stimulate the growth of intestinal Bifidobacteria as proved by in vitro and human tests. These oligosaccharides are stable at temperatures up to 100°C and over a wide pH range of 2.5–8.0 therefore in the garlic pH too XOS are non-digestible, non-cariogenic prebiotics: stimulate bacterial growth and fermentation and improve intestinal mineral absorption and also possess antioxidant effect is a novel food ingredient currently licensed in Europe. In our research, we investigated how XOS behaves in fruit jellies. How it affected the rheological, color, sensory properties and antioxidant capacity during a storage experiment. MaterialsIn our present work, XOS were added into fruit gels at 1, 3 and 5 (m/m%). XOS70P a powder with 70% XOS content were used in samples. Xylo-oligosaccharides were produced in Shangdong Longlive Ltd., China and provided by Longlive Europe Food Division Ltd., Budapest, Hungary. Sour cherry and pineapple were selected as fruits and gelatin for texture modifier
MethodsThere were 8 weeks of storage experiment, during oscillatory measurements were carried out using a Physica MCR51 rheometer for amplitude swirling, performed in oscillation mode. Rheograms of gels (starage modulus [Pa] and loss modulus [Pa] in function of shear rate [1/s] ) was measured by oscillatory technique using a Physica MCR 51 rheometer (Anton-Paar Hungary Ltd., Veszprém, Hungary). Oscillation tests were performed with a plate and plate (PP50/S: plate measuring bob 50 mm in diameter and P-PTD200 plate) measuring system using 2 mm gap size. The amplitude sweep method was performed at 4°C, at constant angular frequency (10 rad s-1), increasing strain logarithmically from 0.01 to 200% during 150 secs. and recording a measuring point at each 5 seconds. The

Hnanice, Czech Republic – 09-14. April, 2018
27
analysis of the stock profile was performed with the LFRA Texture Analyzer (Brookfield) instrument. The data capture and analysis were made using TexturePro Lite v1.1 Build 4 software, which represents load as a function of time. The color values were captured in the CIELAB system. The organoleptic properties were evaluated by a sensory panel consisting of 20 trained panelists using a10-point scoring system. Colour, odour, taste, fruit taste and texture properties: homogeneity, creaminess, agglomeration of XOS containing gels were compared to the control sample. Full-polyphenol content, antioxidant capacity based on FRAP and total anthocyanin content measurements were performed in the sour cherry sample with copynaptation. Overall acceptance of gels was evaluated by ranking the samples according to personal preference. Statistical evaluation of data: student’s t-test to compare control sample and the gels with XOS addition. 95% confident interval, using Microsoft Excel 2010 software.
Results and discussionDuring the 8-week study series, the analysis of the stock profile and the reograms determined by the amplitude swelling method showed the same tendency. It was observed from the reograms that due to the low initial pH values of the sour cherry concentrate, sour cherry gel structure was developed slower than the ideal gel structure. For both samples, it can be said that the strongest and most stable gels were seen on the 4th week ( Figure 1.). The color changing manifested mainly in the pineapple gel, where strong yellowing and lightening was observed. The sour cherry grew slightly brighter at the end of the storage experiment. The XOS dosage resulted in sweeter feelings in the samples, and the fruity taste, smell and color grew stronger than in the control sample.
Conclusions
During storage, the samples remained solid throughout, did not drain, their color was unchanged and no more syneresis was observed. Overall, the prebiotic-enriched gelatin-based fruit jellies were well preserved. XOS were suitable for prebiotic and fiber-based fruit products as it had not compromised the physical chemical parameters of the products. Furthermore this prebiotics were able to improve the sensory properties hence these could be helpful to prevent the obesity.Acknowledgement Authors greatfully acknowledge to Doctoral
School of Food Sciences for supporting, to Longlive Europe Food Division Ltd for providing testing materials for the experiments.
References Vázquez, M. J., Alonso, J. L., Domínguez, H., Parajó, J. C.. (2000): Xylo-oligosaccharides: Manufacture and
applications. Trends in Food Science and Technology (11), pp. 387-393. Carvalho, A. F. A., Oliva-Neto P., de Almeida, P. Z., da Silva, J. B., Escaramboni, B. Pastore, G. M. (2015):
Screening of xylanolytic Aspergillus fumigatus for prebiotic xylooligosaccharide production using bagasse. Food Technology and Biotechnology (53), pp. 428-435.
Courtin, C. M., Swennen, K., Verjans, P., Delcour, J.A. (2009): Heat and pH stability of prebiotic arabinoxylooligosaccharides, xylooligosaccharides and fructooligosaccharides. Food Chemistry (112), pp. 831-837.
Figure 1: Hardness of the pineapple and sour cherry gels during the storage; Footnote: grey: pineapple gel hardness values; black: sour cherry gel hardness values

Abstract Book – 17th Alps-Adria Scientific Workshop
28
Monitoring the sensorial e-nose based and color properties of chicken meat containing different concentration of Allyl-isothiocyanate (AITC) during chilling and freezing storageKhabat N. HUSSEIN – László FRIEDRICH – Richard PINTER – Adrien TÓTH – Istvan DALMADISzent Istvan University-Faculty of Food Science; Department of Refrigeration and Livestock Products’
Technology, Budapest, Hungary. E.mail: [email protected]
Keywords: chicken meat, Allyl-isothiocyanate, e-nose, color, refrigeration-freezing storage
Introduction
Allyl isothiocyanate (AITC), is one of many natural non-phenolic volatile sulphur compounds that are found in the seeds, stem, leaves, and roots of cruciferous plants (Brassicaceae family), other plants such as; horseradish, cabbage, wasabi, brussels sprouts, broccoli, cauliflower, kohlrabi, rutabaga, watercress, and papaya also contain AITC. It is legalized to be applied as food additives and GRAS flavoring agent in different food systems including frozen or chilled meat products. Additionally, it possesses antioxidant, anticarcinogenic and antimicrobial characteristics that inhibit a range of pathogens at low concentrations. Meat and meat products are perishable by nature it is prone to quality deterioration, which affects quality characteristics and can lead to undesirable reactions that deteriorate flavor, odor, color, sensory, and textural properties of meat products (Lucera et al., 2012). Therefore, if the meat and meat products not preserved and handled properly it could be a common vehicle for foodborne diseases and compromises the nutritional quality. Eventually, influencing product acceptance by consumers and potential public health issues, causing food insecurity and economic loss. The consequences of organoleptic changes that affecting on meat can be limited or inhibited using natural additives consequently extending the shelf-life and improving product quality.
Materials and methods
Fresh or chicken breast meat 24 hours’ post-mortem were obtained from a local slaughterhouse (Budapest, Hungary) and transported to laboratories (faculty of food science - SZIU). The meat then was cuts and minced (free from bone, connective tissue, skin and visible fat), homogenized and divided into samples of four groups. Control (sunflower oil only) and three treatments were mixed with 100, 200 and 300ppm AITC and 5% oil. The samples then placed in polyethylene bags packaged and stored at 2 ± 0.5 °C for up to 20 days and -18°C for 34 weeks. The samples were then taken at different time intervals for different analysis. The color: L* (lightness), a* (+a, red; –a, green), and b* (+b, yellow; –b, blue) were measured at five different points using a Konica Minolta CR-400 colorimeter, following the CIELAB scoring system. Sensorial properties (E-Nose) headspace analysis of refrigerated meat samples were performed by an NST3320 type electronic nose (Applied Sensor A.G., Sweden).
Results and discussion
The results from the color show that the L*values of all treated samples; 100, 200 and 300ppm were significantly increased at the end of the storage period compared to untreated

Hnanice, Czech Republic – 09-14. April, 2018
29
meat in accordance to the results by Shin et al., (2010). The a* value shows that the redness of the meat was increased significantly in control and samples containing 100ppm. The b* values with high level of AITC showed significant increasing in the yellowness of the meat (Figure 1). For the e-nose data the canonical discriminant model was applied. The separation was based on the storage time. On the 0 day, and the day 20 samples. Interesting results can be noticed regarding the concentrations, the two low concentration groups have a different direction than the two other groups (Figure 2).
Conclusions
The application of various concentrations of AITC into the chicken breast had shown a significant effect on increasing L* value controlling a* value, increasing b*value, and increasing the smell detection by an electrical nose was the most highlighted efficiency of AITC.The effect more pronounced with a higher level of AITC 200 ppm and 300 ppm.
Acknowledgement
The authors would like to thank laboratory technicians and thank the Doctoral School of Food Sciences (SZIU) for their support.
ReferencesLucera, A., Costa, C., Conte, A., & Del Nobile, M. A. (2012): Food applications of natural antimicrobial
compounds. Frontiers in Microbiology, 3: (287), pp. 1-13.Shin, J., Harte, B., Ryser, E. and Selke, S. (2010): Active Packaging of Fresh Chicken Breast, with Allyl
Isothiocyanate (AITC) in Combination with Modified Atmosphere Packaging (MAP) to Control the Growth of Pathogens. Journal of Food Science, 75: M65–M71. doi:10.1111/j.1750-3841.2009.01465x.
Figure 1: The influence of different levels of AITC on; A: lightness (L*) B: redness (a*) and C: yellowness (b*) value of fresh chicken meat. a,b,cMeans in same row with different superscript are significantly different regarding the days of storage (p˂0.05).
Figure 2: Effect of different concentrations of AITC on smell detected by electronic nose in fresh chicken breast meat.

Abstract Book – 17th Alps-Adria Scientific Workshop
30
The effect of the blanching time and the nitrite curing salt for the colour of edible mealworm Richard PINTER – Khabat N. HUSSEIN – Laszló FRIEDRICH – Orsolya PINTER-NAGY – Klára PÁSZTOR-HUSZÁR Szent István University, Faculty of Foodscience, Department of Refrigeration and Livestock Products’
Technology, H-1118 Budapest, Ménesi út 43–45; E-mail: [email protected]
Keywords: edible insect, mealworm, colour, blanching
Introduction
Food industry need to find and use new and more environment-friendly nutrient sources in the cause of sustainable development. Use of insects as feed and food could be a great opportunity to spear the environment (FAO, 2013). The consuming of insects is heavily influenced by cultural and religious practices. In many regions of the world the insects are consumed as the part of the normal diet, however, in most Western countries people view it with disgust (Hartmann, et al., 2015). The great potentials of the insects are in the favorable breeding compared to the traditional livestock farming and the beneficial nutritional properties (van Huis, 2013). Due to researches in the theme, food safety issues appear to be solving (EFSA, 2015). The main applied technology in the insect processing is the heat treatment. This research shows the effect of the different time of blanching process for the colour change of mealworm (Tenebrio molitor).
Materials and methods
Tenebrio molitor were breed in the department used plastic container. The forage was wheat bran and regularly changed apple slices. The length of the selected larvae were between 2 to 2.5 cm. The larvae were separated and flushed to clean the dirt and dust. The temperature of the steam space was 99.5 °C during the blanching process. The blanching times were 0, 30, 60 sec; the amount of the added nitrite curing salt (99.5% NaCL + 0.5% NaNO2) was 0, 1, 2 %. To prepare the samples there were use 50.0 g larvae in all cases. The blanched larvae were cool with icy water after the heat treatment. The pre-prepared samples were grinded with a Bosch MSM2650B blender in 2 minutes. The colour binding additive were added to the samples right before the grinding process. The CIELab colour characteristics were monitored with Minolta CR-400 system (Konica Minolta, Japan). The surfaces of the samples were investigated once per minutes during a 30 min period.
Results and discussion
The colour characteristics (L*, a*, b*) shows conspicuous difference between the raw samples compared the blanched ones. The changes of lightness variable (L*) during the measurement shows the blanched samples were lighter colour compared the raw samples. The higher blanching time not indicates lightness decrease. The nitrite curing salts cause a slight difference (Figure 1.).
Conclusions
For that purpose, to develop insect based food products for the Western countries people, the effect of heat treatments and additives have to define. This study indicates the heating

Hnanice, Czech Republic – 09-14. April, 2018
31
has high efficiency for the stabilization of colour and increase the lightness of the mealworm larvae. The nitrite curing salt has a slight effect for the change of colour.
Acknowledgement
This study in part of a Ph.D. project was supported by the Doctoral School of Food Sciences (SZIU).
References EFSA (2015): Insects as food and feed: what are the risks? doi:10.2903/j.efsa.2015.4257FAO (2013): Edible insects: future prospects for food and feed security. ISBN 978-92-5-107595-1Hartmann, C., Shi, J., Giusto, A., & Siegrist, M. (2015): The psychology of eating insects: A cross-cultural
comparison between Germany and China. Food Quality and Preference, 44, 148–156. http://doi.org/10.1016/j.foodqual.2015.04.013
van Huis, A. (2013): Potential of Insects as Food and Feed in Assuring Food Security. Annual Review of Entomology, 58 (1). https://doi.org/10.1146/annurev-ento-120811-153704
Figure 1: Changes of the lightness variable depends on blanching time and different added nitrite curing salt

Abstract Book – 17th Alps-Adria Scientific Workshop
32
Investigations on the effect of T-2 toxin on chicken liver cells with comet assayRubina Tünde SZABÓ1* – Mária KOVÁCS-WEBER1* – Ákos HORVÁTH3 – Miklós MÉZES2 – Balázs KOVÁCS3
1: Institute of Animal Husbandry, Faculty of Agricultural and Environmental Sciences (FAES), Szent István University (SZIU), Pater Karoly str. 1, H-2100 Gödöllő, Hungary. E-mail: [email protected]
2: Department of Nutrition, Institute of Basic Animal Science, FAES, SZIU, Pater Karoly str. 1, H-2100 Gödöllő, Hungary. E-mail: [email protected]
3: Department of Aquaculture, Institute of Aquaculture and Environmental Safety, FAES, SZIU, Pater Karoly str. 1., H-2100 Gödöllő, Hungary . E-mail: [email protected]
*Those authors contributed equally to this work.
Keywords: T-2 toxin, DNA damage, comet assay, chicken
Introduction
T-2 toxin, and its main metabolite HT-2 toxin belong to the A-type trichothecene mycotoxins (Shokri et al., 2000), and it is known to be the most toxic in this group. These toxins inhibit protein- and indirectly DNA- and RNA-synthesis (Escrivá et al., 2015). However, their genotoxic nature and the process of DNA damage is not yet fully understood (Horvatovich et al., 2013). Results of Sokolovic et al (2007) showed the possibility of the single- or double-strand breaks of DNA as an effect of the T-2 toxin. DNA damage can be measured in a simple and sensitive way with comet assay (Augustyniak et al., 2014). It is suitable for quantitative measurements of direct DNA damage, and analysis of single- or double-strand DNA breaks or indirectly, oxidative DNA damage (Dhawan et al., 2009). According to our best knowledge, comet assay has not been previously used to analyse the effect of T-2 toxin in chicken liver cells. The aim of present study was to verify, whether the comet assay can be utilised for investigating the DNA damaging effect of T-2 toxin in the liver of broiler chickens, and comparison of the results generated by the software CometScore and by visual evaluation.
Materials and methods
A total of 20 Cobb 540 cockerels were investigated in four groups (Table 1). Table 1 The experimental groups and the measured mycotoxin contents
Mycotoxin content of the feedExperimental group T-2 toxin (mg/kg) HT-2 toxin (mg/kg)Control (C) - -Eg1 0.127±0.330 0.088±0.023Eg2 0.235±0.550 0.149±0.010Eg3 0.989±0.168 0.57±0.061
The experiment lasted for 14 days and it was started at 14 days of age. Chickens were exterminated by cervical dislocation and liver samples were collected post-mortem, after autopsy. The comet assay was performed under alkaline conditions according to Devaux et al., (1997) with some modifications. At least 150 cells of each control and treated groups were analysed. The level of the DNA damage was evaluated by CometScore software (TriTek) and by visual analysis (0-4 scale). The data were analysed using one-way ANOVA test with Tukey post-hoc tests.

Hnanice, Czech Republic – 09-14. April, 2018
33
Results and discussion
T-2/HT-2 toxin treatment there was some significant (p= <0.001) changes in the DNA fragmentation (Table 2). In case of the CometScore, there was a significant difference between the C and the C+, Eg1 and Eg2 groups. However, there was no significant difference between C and Eg3 groups. Comparably, the visual evaluation showed significant differences between the C and the C+ and all of the three toxin-treated groups.Table 2:Results of the comet assay parameter (DNA % in the tail) and the visual evaluation
DNA % in the tail (%) Visual evaluation (point)Experimental group Mean S.D. Mean S.D.Control (C) 0.0001a 0.0002 0.13a 0.3Positive control (C+) 0.946b 1.591 3.67b 0.7Eg1 4.319b 5.396 3.5b 0.8Eg2 1.142b 1.194 3.1b 0.9Eg3 0.445 1.709 3.6b 0.8
a,b: different superscript letters in the same column means significant difference (P < 0.05)
In the Eg3 group, the expected damage could not be displayed by using the CometScore software, because the comets had only tails, thus the nuclei were completely fragmented. Therefore, the evaluation was compromised. Results of the visual evaluation were more identical. Our results with these two different methods are comparable to those of previous research (Rezar et al., 2007, Hafner et al., 2012).
Conclusions
The comet assay is a simple and frequently used method but practical details may influence the results and compromise evaluation. If DNA damage is extensive, software evaluation will not be accurate, therefore visual evaluation can be used as a suitable supplementary method. According to the results of the present study, comet assay can be recommended for studying DNA damage even in the liver of poultry. Otherwise our data proved that T-2/HT-2 toxins have measurable DNA damaging effect.
Acknowledgement
The experiments supported by the NTP-SZKOLL-17-0065 project, the EFOP-3.6.3-VEKOP-16-2017-00008 project and was co-financed by the European Union and the European Social Fund.
ReferencesDhawan A., Bajpayee M., Parmar D. (2009): Comet assay: a reliable tool for the assessment of DNA damage in
different models Cell Biology Toxicology 25. 5–32. DOI: https://doi.org/10.1007/s10565-008-9072-zEscrivá L., Font G., Manyes L. (2015) In vivo toxicity studies of fusarium mycotoxins in the last decade: A
review. Food and Chemical Toxicology, 78: 185-206. DOI: https://doi.org/10.1016/j.fct.2015.02.005Horvatovich K., Hafner D., Bodnár Zs, Berta G., Hancz Cs., Dutton M., Kovács M. (2013): Dose-related
genotoxic effect of T-2 toxin measured by comet assay using peripheral blood mononuclear cells of healthy pigs Acta Veterinaria Hungarica 61 (2), 175–186. DOI: https://doi.org/10.1556/AVet.2013.010
Kent C. R., Eady J. J., Ross G. M., Steel G. G. (1995): The comet moment as a measure of DNA damage in the comet assay International Journal of Radiation Biology 67(6):655-60.
Shokri F., Heidari M., Gharagozloo S., Ghazi-Khansari M. (2000): In vitro inhibitory effects of antioxidants on cytotoxicity of T-2 toxin Toxicology 146, 171–176. DOI: https://doi.org/10.1016/S0300-483X(00)00172-4
Sokolovic M., Garaj-Vrhovac V., Ramic S., Šimpraga B. (2007): Chicken nucleated blood cells as a cellular model for genotoxicity testing using the comet assay. Food and Chemical Toxicology 45 (2007) 2165–2170. DOI: https://doi.org/10.1016/j.fct.2007.05.013

Abstract Book – 17th Alps-Adria Scientific Workshop
34
Antioxidant-activity and carbohydrate profile of ciders available in Hungarian retailDániel KOREN1 – Zsolt HATVANY2 – Beáta HEGYESNÉ VECSERI1 – Gabriella KUN-FARKAS1 1: Department of Brewing and Distilling, Faculty of Food Science, Szent István University, 45 Ménesi street,
H-1118, Budapest, Hungary; *E-mail: [email protected]: Inspection Department for Vine and Fruit Propagating Material, Directorate of Plant Production and
Horticulture, National Food Chain Safety Office, 4 Kitaibel Pál street, H-1024, Budapest, Hungary
Keywords: cider, antioxidant-activity, carbohydrates, extract-content
Introduction
Ciders are alcoholic beverages made from apple. They have low alcohol content (4-9 V/V%), and refreshing carbon-dioxide content like beer, but fermented with yeast used for wine making, therefore they have sensory attributes similar to wines. There is limited information available about their health promoting components. Some scientific studies are published about the impact of technological steps on antioxidant-activity and phenolic content during production (Budak, 2015), and some about the final products (Kowalczyk, 2015; Lobo, 2009), but there is no information about ciders available in Hungarian retail. There are different types of products available on the market made from different types of apples with the use of different ingredients like sugar, flavourants and additives. Among them we can find dry, semi-dry, semi-sweet and sweet ones but their exact sugar content and composition is not known. Related to the above mentioned we aimed to study the antioxidant-activity and carbohydrate profile of ciders available in Hungarian retail.
Materials
11 ciders were involved in the study, which are available in Hungarian commercial trade. Among them two are produced in a Hungarian small-scale cider producing plant, four samples are from the UK, one sample is from France. Four products are distributed worldwide by three multi-national brewing companies.
Methods
Antioxidant-activity was determined by the five most commonly used assays: TPC, FRAP, DPPH, CUPRAC, ABTS.Carbohydrates were measured by HPLC/RI using acetonitrile and water as eluent and Waters Spherisorb NH2 column. Real extract content was determined by an Anton Paar DMA 4500 density meter.
Results and discussion
In case of antioxidant-activity there are magnitude differences between the samples. Two semi-sweet English ciders (sample No. 3 and 11) have approximately two times higher values in case of most assays (TPC: 59.8-65.7 mg/100cm3 GAE, FRAP: 2067.7-2113.3 mg/100cm3 TE, ABTS: 412.5-515.1 mg/100cm3 TE, DPPH: 112.9-120.8 I%, CUPRAC: 2742.6-2763.0 mg/100cm3 TE) compared to the rest of the samples. The dry French cider (No. 4) has outstanding antioxidant-activity (TPC: 144.8 mg/100cm3 GAE, FRAP: 4415.2

Hnanice, Czech Republic – 09-14. April, 2018
35
mg/100cm3 TE, ABTS: 1051.5 mg/100cm3 TE, DPPH: 539.9 I%, CUPRAC: 7310.0 mg/100cm3 TE). This is partially maybe due to the different apple cultivar used to produce these ciders (Sanoner, 1999).
The carbohydrate content correlates well with the real extract content. The real extract content varies between 2.58 and 10.83 m/m%. The products that contain sugar added after fermentation have higher fructose, glucose and sucrose content. On the label of sample No. 3 (semi-sweet made in the UK) added sugar is presented, however it does not contain sucrose. Maybe it is decomposed to fructose and glucose. Dry ones contain more fructose than glucose while sweet ones with added sugar have nearly the same amount of fructose and glucose except for No. 9 (sweet cider distributed by a multinational company) which has the most outstanding fructose level (84.2 g/l) but its glucose level is low (11.4 g/l). Furthermore, dry ones do not contain any sucrose while all the others do, except for No. 9.
Conclusions
Ciders can be a good source of antioxidants but there are magnitude differences between them in this respect as well as in the case of their carbohydrate content. It is not possible to predict their antioxidant properties based on their ingredients, but from the viewpoint of health it is better if we choose cider with the most organic composition.
Acknowledgement
I would like to say special thanks to Csaba Orbán who is not among us anymore and without whom this research could not have been carried out.
ReferencesLobo, A. P., García, Y. D., Sánchez, J. M., Madrera, R. R., & Valles, B. S. (2009): Phenolic and antioxidant
composition of cider. Journal of food composition and analysis, 22: 7. 644-648. DOI: https://doi.org/10.1016/j.jfca.2009.03.008
Sanoner, P., Guyot, S., Marnet, N., Molle, D., & Drilleau, J. F. (1999): Polyphenol profiles of French cider apple varieties (Malus domestica sp.). Journal of Agricultural and Food Chemistry, 47: 12. 4847-4853. DOI: https://doi.org/10.1021/jf990563y
Budak, N. H., Ozçelik, F., & Güzel-Seydim, Z. B. (2015): Antioxidant activity and phenolic content of apple cider. Turkish Journal of Agriculture-Food Science and Technology, 3: 6. 356-360. DOI: https://doi.org/10.24925/turjaf.v3i6.356-360.265
Kowalczyk, A., Ruszkiewicz, M., & Biskup, I. (2015): Total phenolic content and antioxidant capacity of polish apple ciders. Indian journal of pharmaceutical sciences, 77: 5. 637. DOI: https://doi.org/10.4103/0250-474x.169024

Abstract Book – 17th Alps-Adria Scientific Workshop
36
Current situation in agriculture of AzerbaijanMaralkhanim JAMALOVASzent Istvan University, Páter Károly street 1, 2100 Gödöllő, Hungary; E-mail: [email protected]
Keywords: agriculture, farmers, Azerbaijan, agricultural enterprises, consumption
Introduction
Besides consideration of the economic system of the country, agriculture is one of the most important fields of each country. From one side to have successful agriculture means to produce enough products for the nation, which is useful for citizens and government. From the other side, the country does not depend on foreign suppliers and provide citizens with domestically produced food.
Brief historical information about development and changes in the world economy can create a clear picture. Everyone knows that industrial revolution began from England in the 18th century. Moreover, the reason for the revolution was increased amount of agricultural output which decreased labor force in the middle of eighteen century (Allen, 1999; Nurkse, 1966). From the middle of 20th-century debates about the role of structural transformation increased. Role of agricultural and Industrial sectors widely analyzed during this period (Johnston & Mellor, 1961; Jorgenson, 1961; Lewis, 1954; Ranis & Fei, 1961).
From 1920 Azerbaijan was part of Soviet Union around 70 years. Second World War destroyed economy of the country which included in it with more “allies and adversaries” (Gatrell & Harrison, 1993). For a long time under Khrushchev and Brezhnev priorities of Soviet economy was building “exceedingly powerful military force” (Rowen, 1984). By contrast, Soviet GNP is increased over this period. Different sectors of economy of member countries developed under governance of Soviet regime under influence of the Soviet ideology (Bornstein, 1966). After the collapse of USSR, not only number of manufactured products decreased, but also general economic system changed. Dissolution characterizes with increasing crime, unemployment, corruption, at the same time life expectancy and income decrease, which means economic and political crisis among Post Soviet countries (Brainerd, 2001).
Materials and methods
Methodology of this paper include quantitative approach by analyzing secondary data and comparison with some numbers after independence with Soviet Union time data. Data about GDP by sectors and share of the people employed in each sector of economy create clear picture about economic development of country. Generally, data between 2001-2016 compared with 1985, 1990 and 1991. Considering economic instability in 1990 and 1991 it is better to analyze difference of economic indicators in 1985 (Gorbachev era) and 2000 (independence and stable economic development).
Results and discussion
Comparison of the structure of employment in Azerbaijan SSR and independent Azerbaijan Republic shows that more people are employed in agricultural field. At the end of 1980s

Hnanice, Czech Republic – 09-14. April, 2018
37
overall around 33% of economic active individuals work in this sector. By contrast from 2000 to 2016 percentage of agricultural jobs is fluctuating between 36 and 39%. It can be explained by the freedom in decision making and income or work conditions. Information of Azerbaijan Statistic Committee between 2000 and 2016 shows that in gross output of agriculture private owners has much bigger share than agricultural enterprises. Farmers or private owners are free to choose seeds, harvest it and sell agricultural products. Interestingly number of livestock and plant growing farmers is 5 times more that enterprises in same field. After independence, even amount of sown area increased. It is the result of privatization and personal interest of each farmer to earn more money. By contrast interest of the persons or companies did not change. Cereals and dried pulses areas and fodder crop areas are leading. Just agricultural enterprises shifted to private owners or farmers. Industrial crops were the third in the consideration of sown area till proclaiming independence. Sadly, nowadays farmers are not so interested in them. Main animal production decreased after gaining independence. Economy need almost 15 years to achieve the same level of egg production whenever production of milk increased over the shown period. Amount of produced slaughtered meat is also higher than numbers in Soviet period. Amount of produced wool and honey is growing up. While 600 ton of honey produced in 2000, 2700 tons of honey produced in 2016. Azerbaijan farmers produced 16.700 tons of wool produced which is higher than highest number during Soviet governance. (Maximal number was 11700 tons in 1988.)
Conclusions Consideration of war situation with Armenia increment importance of agriculture for Azerbaijan. Nowadays, independence create positive basis for agricultural development. Development of science and technology can be one of the main reasons of agricultural development and more gross production in comparison with Soviet period. A lot of technological innovation increase productivity and as result gross product of agriculture. But also, direct government support, subsidies, leasing of agricultural equipment’s and breeding animals oriented to increase development speed of agricultural field.
ReferencesAllen, R. C. (1999). Tracking the agricultural revolution in England. The Economic History Review, 52(2), 209-
235. DOI: https://doi.org/10.1111/1468-0289.00123 Awokuse, T. O. (2009). Does agriculture really matter for economic growth in developing countries? Paper
presented at the 2009 Annual Meeting, July 26-28, 2009, Milwaukee, Wisconsin. DOI:https://doi.org/10.1111/cjag.12038
Bornstein, M. (1966). Ideology and the Soviet Economy. Soviet Studies, 18(1), 74-80. DIO:https://doi.org/10.1080/09668136608410514
Brainerd, E. (2001). Economic reform and mortality in the former Soviet Union: a study of the suicide epidemic in the 1990s. European economic review, 45(4-6), 1007-1019. DOI:https://doi.org/10.1016/s0014-2921(01)00108-8
Byerlee, D., De Janvry, A., & Sadoulet, E. (2009). Agriculture for development: Toward a new paradigm. Annu. Rev. Resour. Econ., 1(1), 15-31. DOI:https://doi.org/10.1146/annurev.resource.050708.144239
Gatrell, P., & Harrison, M. (1993). The Russian and Soviet Economies in Two World Wars: A Comparative View. The Economic History Review, 46(3), 425-452. DOI: https://doi.org/10.1111/j.1468-0289.1993.tb01343.x
Johnston, B. F., & Mellor, J. W. (1961). The role of agriculture in economic development. The American Economic Review, 51(4), 566-593. DOI: https://doi.org/10.1257/000282802320189177

Abstract Book – 17th Alps-Adria Scientific Workshop
38
Moderation of distance in perception of the affective image of a rural tourist destinationNesrine KHAZAMI1 – Zoltan LAKNER2
1: Phd student (Szent Istvan University, Godollo): [email protected]: Professor (Szent Istvan University, Godollo): [email protected]
Keywords: Distance; rural tourism; perceived affective image; revisit; motivation.
Introduction
Geographical proximity seems to be one of the decisive factors in the decisions of diaspora communities because of travel costs (Esiyok, Çakar, & Kurtulmu, 2017). Distance to a destination can play a dual role. At first, it can be a determinant for some holiday options. The latter presents a pull factor (Gallarza and Gil, 2006, Nicolau & Mas, 2006). Tourists choose more distant destinations according to their desires and their availability of time. However, the distance of a holiday destination is a key variable in the relationship between the level of tourist’s satisfaction and the motive for making the trip. In a second step, the distance of a destination is a clearly decisive variable in the holiday decision process (Nyaupane et al, 2003). In this context, it is appropriate to study the effect of distance as an important moderating variable in the choice of a tourist destination and its intention to be satisfied towards one destination to another.
Materials and methods
To test the conceptual model of our research, we conducted a quantitative study via a questionnaire which was created and administered online through Google Drive. The corresponding link has been administered on several web platforms such as travel agency communities and groups related to different tourist destinations. The different respondents have a common interest that is related to the travel and discoveries. During this period, 400 respondents responded to our survey, of which 80% are women with high education levels. 85.9% of the respondents are between 25 and 45 years old.
Results and discussion
The results of this study highlight the strong influence of these dimensions on the destination image and consequently on the satisfaction of tourists who intend to reach rural areas for entertainment. In this case, the search for relaxation, discovery and enriching the knowledge have reached important values, where their coefficients are higher than the identified sporting dimension. The results also show that the affective image of the destination acts positively and significantly on the satisfaction towards a destination which confirms the affirmations of Agapito et al., (2013). So, this study found that the affective image, including items such as pleasant, fun, sense of escape and sense of discovery, has a direct explanatory power on the satisfaction and intention of revisiting towards a tourist destination. This article has also highlighted the moderating effect of distance. It showed that this concept could significantly moderate the relationship between travel history and affective image and the satisfaction and intention of revisit. However, when the distance is high, the tourist’s feelings and emotions towards a given destination are important to create a favorable image towards a destination. In addition, the distance of

Hnanice, Czech Republic – 09-14. April, 2018
39
a destination influences motivations and quality of service to build an affective image towards a destination, and consequently its level of satisfaction.
Conclusion
This research leads us to two contributions. On the theoretical side, it contributes to existing research into consumer behaviour by studying a model that has not been tested in previous tourism research. It has proven that the motivation to travel and the rural destination image are important determinants of satisfaction and intention to revisit a rural tourist destination. Therefore, a relevant marketing action must come from a development and a prospective study. Thus, on one hand, modelling the behaviour of the tourist by integrating the motivational variables of travel and the quality of service is fundamental. On the other hand, a marketing approach more coherent with the current context and with the specificities of the tourist offer appropriate to each destination. In addition, this study also provides additional insights into the moderating role of distance on the relationship between travel and the destination affective image, satisfaction, and intention to revisit, a relationship that had not been addressed in previous work. From a managerial point of view, the analysis of proposed relationships allows vacation destination managers to specify their product and to know the reasons why customers opt for their offer and not for competitors. This helps them develop strong and long-term marketing strategies to stay competitive in a market characterized by increased competition.
ReferencesAgapito, D., Mendes, J. & Valle, P. (2013): Exploring the conceptualization of the sensory dimension of tourist
experiences. Journal of Destination Marketing and Management, 2(2), 62- 73. https://doi.org/10.1016/j.jdmm.2013.03.001
Esiyok, B., Çakar, M., & Kurtulmu, F. (2017): The effect of cultural distance on medical tourism. Journal of Destination Marketing & Management, 6, 66–75. https://doi.org/10.1016/j.jdmm.2016.03.001
Gallarza , M., & Saura , I. (2006): Value dimensions, perceived value, satisfaction and loyalty: An investigation of university students’ travel behavior. Tourism Management, 27, 437-452. https://doi.org/10.1016/j.tourman.2004.12.002
Graillot, L. (2005): Réalités (ou apparences?) de l’hperréalité : une application au cas du tourisme de loisirs. Recherche et Applications en Marketing, 20(1), 43- 64. https://doi.org/10.1177/076737010502000103
Nicolau, J., & Mas , F. (2006): The influence of distance and prices on the choice of tourist destinations: The moderating role of motivations. Tourism Management, 27, 982-996. https://doi.org/10.1016/j.tourman.2005.09.009
Nyaupane, G., Graefe, A., & Burns, R. (2003): Does distance matter? Differences in characteristics, behaviors, and attitudes of visitors based on travel distance. Proceedings of 2003 Northeastern Recreation Research Symposium, 74-81. https://doi.org/10.1080/10548400802508457

Abstract Book – 17th Alps-Adria Scientific Workshop
40
Cooperation – for sustainable economyIstván TAKÁCS – Katalin TAKÁCS-GYÖRGYÓbuda University, Keleti Faculty of Business and Management & H-1084 Budapest, Tavaszmező utca 17.
address; E-mail: [email protected]; [email protected]
Keywords: moral economy, changes of values, coopetition
Introduction
Sustainable economy includes viable, developing agriculture, with competitive farms. One of the key driving forces of this development is the farmer itself. Cooperation, sharing the resources helps to meet the requirements of sustainable economy. It should be based on a certain degree of intensity and technology of production matched with a form of farming technology that is appropriate for the environment. There were some Hungarian experiments on trust, level and willingness on cooperation carried out among Hungarian farmers. (Baranyai – Szabó, 2017). Fukuyama (2007) and Sedlacek (2012) – besides other behavioral economists – highlighted the importance of learning the new principles of economic cooperation.
Materials and methods
Based on content analysis a summarization is given in this paper on trust and cooperation. The paper focuses on our former researches where the level of cooperation, attitudes and willingness to cooperate were examined among Hungarian farmers in the last decade. (Takács, 2012; Takács-György – Takács, 2016)
Results and discussion
One of the most important questions of human history and economy is: to cooperate or not to cooperate, to share the information, the resources, the property or not to share them with others (actors, neighbours, competitors). Trust is a fundamental requirement of cooperation. This can be examined based on the game theory. New principles of economic cooperation were introduced into existence in last decades. (Fukuyama, 2007; Sedlacek, 2012). One of the most famous followers of moral economics – Richard Thaler, who got the Nobel Memorial Prize in Economic Sciences in 2017 – predicted, that Homo economics will evolve into Homo sapiens in the close future without any changes in our life. One reason is, that the building of rational, unemotional agents – based on the existing decision-making models, is easier than take into consideration the individual behaviour, the emotional questions that are characteristic for individuals. (Thaler, 2000). He states that the assumption that the behaviour of many actors in economy is like they were Homo economicus over the long pull is not valid. The economic and social benefits or losses should be anticipated, the factors affect the individual utility functions (advantages), determined by the personal preferences (subjective), yields and the social transaction costs appeal the decision maker. The theory of transaction costs of cooperative behavior shows that due to the information asymmetry between the participants and the

Hnanice, Czech Republic – 09-14. April, 2018
41
lack of confidence, higher is the individual – and social – costs than the reasonable level is. Cooperation should give higher collective result as the optimum of the transaction. The base of cooperation is moral economy instead of benefit economy. (Thaler, 2017) Cooperation, based on a rational (efficient) resource use meets with the new concept: the ‘de-growth’ theory. Due to the limitation here, we mention the restructuring (adaption of social relations to changing values); re-evaluation (going back to public service, the transmission of knowledge, frankness and mutual trust, the respects for human rights, nature and society); redistribution (of access of resources) and somehow relocalization. (Latouche, 2011 p. 51) Cooperation requires changes in moral values, higher attention on effective resource use (cost efficiency appears here), on ecologic, economic and social sustainability as well. Also, the ‘Think global – Act local’ philosophy is match to relocalize principle. Unfortunately, low level of willingness to cooperate is characteristic among horizontal participants, in Hungary, too. The farmers are unwilling to work in common machine use forms or share the access for their surplus capacity. (Wilson, 2000; Andersson et al., 2005; Takács, 2012; Baranyai – Szabó, 2017)
Conclusions
The role of cooperation, to share of resources, strengthen the market position with concentrated products is important element of the nowadays agriculture, farming. Sustainable economy – to be successful – requires strategic thinking from agricultural SMEs, they have to give appropriate answers to the changes, to give good answer to the question: „What kind of business model we need?” The answer is cooperation in a competing environment.
ReferencesAndersson, H., Larsen, K., Lagerkvist, C.J., Andersson, C., Blad, F., Samuelsson, J., Skargren, P. (2005): Farm
Cooperation to Improve Sustainability. Ambio. 34(4/5), MAT 21 / Food 21 - A Sustainable Food Chain. pp. 383-387.
Baranyai, Zs., Szabó, G. G. (2017): A termelői szövetkezés-együttműködés gazdasági-társadalmi feltételei és akadályai a magyar mezőgazdaságban. Agroinform Kiadó. Budapest.359 p.
Fukuyama. F: (2007): Bizalom - A társadalmi erények és a jólét megteremtése. Európa Könyvkiadó. 616 p.Latouche, S. (2011): A nemnövekedés diszkrét bája. Szombathely. Savaria University Press. 138 p.Mawapanga, M.N.; Debertin, D.L. Choosing between alternative farming systems: An application of the analytic
hierarchy process. Rev. Agric. Econ. 1996, 18, 385-401.Sedlaček, T. (2012): A jó és a rossz közgazdaságtana. HVG Kiadó. 400 p.Takács I. (2012): Games of farmers – to cooperate or not? Annals of the Polish Association of Agricultural and
Agribusiness Economists. 14:(6) pp. 260-266.Takács-György, K., Takács I. (2016): Some ideas about site specific crop production and theory of degrowth.
Növénytermelés. 65:(2016. Suppl) pp. 67-70.Thaler, R. H. (2010): From Homo Economicus to Homo Sapiens. Journal of Economic Perspectives—Volume
14(1) pp. 133–141Thaler, R. H. (2016): Rendbontó A viselkedési közgazdaságtan térnyerése. HVG Kiadó. Budapest. pp. 500.Wilson, P.N. (2000). Social capital, trust, and the agribusiness economics. Journal of Agricultural and Resource
Economics, 25 (1): pp. 1-13.

Abstract Book – 17th Alps-Adria Scientific Workshop
42
Hungary’s nutrition and health in European comparison
Csaba BÁLINT1 – Zsuzsanna SÓFALVY2
1: Szent István University, Gödöllő, Hungary; E-mail: [email protected]: Railway Health Care Company, Budapest, Hungary; E-mail: [email protected]
Keywords: health, nutrition, obesity, chronic diseases, Hungary
Introduction
Healthy diet contains the right amount of nutrients which are important for our body: proteins, fats, carbohydrates, vitamins, minerals and trace elements, which are provided by the regular, varied consumption of foods and drinks in an appropriate quantity and proportion. Energy intake has to adapt to our age, gender, body-mass index and the level of physical activity. Proper diet reduces the risk of cardiovascular diseases, diabetes and certain types of cancer (Rodler et al., 2004).
Materials and methods
In our study we reviewed the databases of FAO, Eurostat and Hungarian Central Statistical Office (HCSO) concerning the interrelations between food supply, nutrition and health status. We calculated the structure of energy intake by using the average of the 2004-2015 time series for all indicators.
Results and discussion
Hungary’s recent development in health was strongly influenced by the 2004 accession to the European Union. Life expectancy at birth of Hungarian men was 3.6 years longer in 2014 than in 2005, the 6.7 years negative difference with the EU at the time of accession had been reduced to 5.6 years by 2014, and the males’ initial 8.5 years difference with Hungarian women decreased to 6.7 years. Women in Hungary lived 2.2 years longer in 2014 than in 2005. Healthy life years grew by 6.7 years in case of males and 6.5 years for females between 2005 and 2014, but the gender difference is only 1.9 years for the advantage of women in 2014 which means that women live longer but not in a good health. On average of the 2005-2015 period, 40% of women reported any long standing chronic illness or longstanding health problem, which is higher by 6.55 percentage points than men’s proportion. The indicator for the total population was 31.2% in the EU on the above-mentioned time series, while in Hungary it was 37%, and decreasing only slightly and in a fluctuating way (Source: ECHI data tool). Death rate due to chronic diseases was 2.3 times higher in case of Hungarian males than the EU average for the 2010-2014 years (the same ratio was 1.9 for females), but it is considerable that the value of indicator declined by 15.8% in case of men (and by 7.3% in case of women) between 2010 and 2014 (Source: Eurostat). Chronic illnesses are strongly related to dietary habits, among other lifestyle-related factors like physical activity, alcohol and tobacco consumption etc. (NEFI, 2016).
Based on the 2003 Joint WHO/FAO Expert Consultation’s population nutrient intake goals for balanced diet, total energy supply is recommended to be provided to the proportion of

Hnanice, Czech Republic – 09-14. April, 2018
43
15-30% by fats, 55-75% by carbohydrates and 10-15% by proteins. 1 gram of fat contains 9.3 kcal (38.9 kJ), while carbohydrate and protein both contain 4.1 kcal (17.1 kJ) per g. In Hungary, the daily available amount of energy was 13 018 kJ per capita on average of the 2004-2015 period. Based on the FAO set of food security indicators, the energy supply adequacy is below the EU-28 level for the 2004-2016 years, and is in decreasing trend, so the energy intake is closer to the required level (but still higher than it by 21%). Between 2004 and 2015, the average daily protein supply per person was 98.58 g, 369 g/day was the carbohydrate supply, and 139.63 g of fat was available on a daily basis. The annual changes in the nutrient structure – which hereby are not examined – can be explained by the time-varying consumption of food products, which is influenced by versatile underlying socio-economic effects.
On average of the 2004-2015 time period, 1685.63 kJ of daily energy was provided by proteins, 6309.9 kJ by carbohydrates and 5431.74 kJ by fats. It means that only the share of protein’s energy provision was fulfilling the FAO/WHO goals, because it represented 12.55% which falls into the expected interval between 10 and 15%. Carbohydrates’ contribution to energy supply remained under the desired level (min. 55%), with the share of only 46.99%. Concluding from that, the consumption of fat exceeded the recommended level (max. 30%) with the value of 40.45%. For the measurement of nutritional status, Body Mass Index is defined as the weight in kilograms divided by the square of the height in metres (kg/m2). The normal range of BMI is 18.5-24.99 kg/m2, below this interval we can talk about underweight, above there is overweight. According to the data of Eurostat, in 2014, 53.9% of the Hungarian population belongs to the overweight range, while the EU average is 50.2%. Women and elderly people are more concerned by obesity (Erdei et al., 2017), which is consistent with their longer life expectancy but less healthy lifetime in the percentage of it, so their exposure to living with chronic diseases is more significant.
Conclusions
In Hungary, the structure of dietary energy supply is not adequate because of the predominance of fats and the backwardness of carbohydrates. The prevalence of obesity and health disorders originating from these factors worsen Hungary’s position in the European comparison. In terms of chronic morbidity and mortality, there are remarkable differences between men and women.
ReferencesErdei, G., Kovács, V. A., Bakacs, M., Martos, É. (2017): Hungarian Diet and Nutritional Status Survey
2014. I. Nutritional status of the Hungarian adult population. Orv. Hetil., 2017, 158(14), 533–540. https://doi.org/10.1556/OH.2012.29375
Rodler, I. (edit.) (2004): Táplálkozási ajánlások a magyarországi felnőtt lakosság számára. Országos Egészségfejlesztési Intézet, Budapest 5 p.
World Health Organization (2003): Diet, nutrition and the prevention of chronic diseases - Report of a Joint WHO/FAO Expert Consultation. WHO Technical Report Series 916 p. 56
Varsányi, P., Vitrai, J. (2016): Egészségjelentés 2016 – Információk a népegészségügyi beavatkozások célterületeinek azonosításához a nem fertőző betegségek és az egészségmagatartási mutatók elemzése alapján. Nemzeti Egészségfejlesztési Intézet, Budapest

Abstract Book – 17th Alps-Adria Scientific Workshop
44
Applying of remote sensing in weed survey by different camerasÉva LEHOCZKY1,2 – Péter RICZU3 – Nikolett MAZSU1 – Viktória DELLASZÉGA-LÁBAS1 – János TAMÁS3
1: Institute for Soil Science and Agricultural Chemistry, Centre for Agricultural Research, Hungarian Academy of Sciences; 1022 Budapest, Herman Ottó u. 15., Hungary E-mail: [email protected]
2: Institute of Agricultural Sciences and Environmental Management, Faculty of Agricultural Sciences and Rural Development, Eszterházy Károly University; 3200 Gyöngyös, Mátrai út 36., Hungary
3: Institute of Water and Environmental Management, Faculty of Agricultural and Food Sciences and Environmental Management, University of Debrecen; 4032 Debrecen, Böszörményi u. 138., Hungary
Keywords: weed detection, multispectral camera, long-term fertilization, maize
Introduction
Maize is one of the most important crop in the word, as food and forage point of view as well. Today, production area is more than 180 million hectare and production quantity exceeds 1 billion tons per year (FAOSTAT, 2017). The optimal grow and development of plants is necessary to well supplied with water, nutrient and light in appropriate time. Weeds compete with cultivated plants for these factors, thus weeds strongly influence the successfulness of crop production (Lehoczky et al., 2016). Traditional and modern methods are available to detect weed patches on the field. Traditional weed-scouting techniques are time-consuming, difficult and not so effective (Wiles et al., 1993). The visual, estimation based methods do not cause disturbance but less accurate in contrast to the counting and measuring. In the most cases, in order to determine weed patches, scout the weed species, the selection of representative sampling areas is performed through examination of large areas, for both methods. Remote sensing techniques are ideal for fast, effective surveying of weeds on larger area (Riczu et al., 2015; Zheng et al., 2017). Nowadays, remote sensing with high spectral resolution can provide to discriminate weeds from each other (Pantazi et al., 2016). Analysing the spectral characteristics of vegetation in different phenological stages and the effect of nutrient treatments were examined in our research. Henceforth, development of weeds and maize were monitored by remote sensing instruments.
Materials and methods
The investigation was carried out near Nagyhörcsök, Hungary (N46°51’54”, E18°36’28,8”) in a long-term fertilization experiment, which was set up in 2003. Weed survey was proceeded on herbicide-free, weedy plots of five treatments (control, PK, NK, NP, NPK) in six replications, on 3th June 2014 five weeks after maize sowing (BBCH 12-14). The annual fertilizer doses used were as follows: N: 150 kg N ∙ ha-1, P: 100 kg P2O5 ∙ ha-1, K: 100 kg K2O ∙ ha-1. In order to imaging weed survey, Tetracam ADC broadband multispectral camera and Panasonic DMC-TZ40 digital camera were used. Tetracam ADC measures the reflectance values of the canopy of weeds and maize in green (520-600 nm), red (620-750 nm) and infrared (750-950 nm) bands. Using the bands, NDVI vegetation index was calculated by PixelWrench2 software. Used Panasonic DMC-TZ40 digital camera is also a multispectral camera with visible bands (blue, green, red). Based on the high resolution camera images, canopy coverage was calculated on each replication plots in IDRISI Taiga software environment. The composition of the weed flora, weed density, dominance of the weed species and biomass weight of weeds, weedy maize and weed free maize were studied, too.

Hnanice, Czech Republic – 09-14. April, 2018
45
Results and discussion
On the herbicide-free plots occurred 19 weed species. Ambrosia artemisiifolia L. and Sorghum halepense (L.) Pers were the dominant species in the control, PK and NK treatments, Chenopodium album L. and Datura stramonium L. on the NP and NPK plots. Weed density varied between 72 – 127 plant∙m-2. Processing the digital camera images, separation of weeds and maize was carried out. It was successful, because the maize and weed canopies were not overlapped. Vegetation activity was monitored by Tetracam ADC multispectral camera. Calculated NDVI values represent vigour status of each plot. In order to analyse the effect of treatments, NDVI values of replication were averaged. Based on the results, lowest NDVI values were at control plots (0.40) and the highest was in NPK treatment (0.52). Compared NDVI values with the canopy coverage, a close positive linear correlation (r=0.8437) was detected. Independently from the treatments, average vegetation activity was calculated form NDVI data in the weed-maize mixed plots. Thus, the main phenological stages of maize plots in weedy periods were quantified. These results are useful in the planning of precision irrigation too.
Conclusions
The effect of nutrient supply was proved in the weed flora composition, in weed density and in the biomass production of weeds and maize. Spectral remote sensing technique can ideal tool for determining vegetation activity in maize without weed control. Based on the vigour status of plants, high precision sensors can distinguish differences between nutrient treatments. One of the most important result of our investigation is that multispectral camera and normal camera data was correlated. Using the equation of the linear trend line, widely used NDVI values can estimate based on the calculated canopy coverage data from traditional digital photos.
Acknowledgements
The research was supported by Hungarian Scientific Research Fund (OTKA), Project No. K 105789. The first author’s research was supported by the grant EFOP-3.6.1-16-2016-00001
References FAOSTAT (2017): Food and agriculture organization of the United Nations for a world without hunger. http://
www.fao.org/faostat/en/#data/QC. Lehoczky, É., Kamuti, M., Mazsu, N., Sándor, R. (2016): Changes to soil water content and biomass yield under
combined maize and maize-weed vegetation with different fertilization treatments in loam soil. Journal of Hydrology and Hydromechanics 64: 2. 150-159.
Pantazi, X.E., Moshou, D., Bravo, C. (2016): Active learning system for weed species recognition based on hyperspectral sensing. Biosystems Engineering. 146: 193-202.
Riczu, P., Nagy, A., Tamás, J., Lehoczky, É. (2015): Precision weed detection using terrestrial laser scanning techniques. Communications in Soil Science and Plant Analysis. 46: Supp. 1. 309-316.
Wiles, L.J., Gold, H.J., Wilkerson, G. G. (1993): Modeling the uncertainty of weed density estimates to improve post-emergence herbicide control decisions, Weed Research, 33: 241-252.
Zheng Y., Zhu, Q., Huang, M., Guo, Y., Qin, J. (2017): Maize and weed classification using color indices with support vector data description in outdoor fields. Computers and Electronics in Agriculture. 141: 215-222.

Abstract Book – 17th Alps-Adria Scientific Workshop
46
Effects of fungicides on key plant physiological parameters of Zea mays L. and on changes in superoxide-dismutase (SOD) and lipid-peroxidase (LP) activityÁrpád ILLÉS1– Zoltán GYŐRI1– Antal NAGY2– Péter SIPOS1– Brigitta TÓTH1,3
1: Institute of Nutrition, University of Debrecen, 1 Egyetem Square, 4032 Debrecen, Hungary2: Institute of Plant Protection, Faculty of Agricultural and Food Sciences and Environmental Management,
University of Debrecen, 138 Böszörményi St, 4032 Debrecen, Hungary3:Institute of Plant Sciences, Faculty of Natural and Agricultural Sciences, University of the Free State, PO Box
339, Bloemfontein 9300, Republic of South Africa. E-mail: [email protected]
Keywords: chlorophyll, defence mechanism, enzymes activity, fungicides, maize
Introduction
Although new active ingredients in pesticides are continuously being developed little is known about their effects. Pesticides modify enzyme activity including lipid peroxidation, protein, sucroses and DNA oxidation processes (Jablonska, 2017). Although, fungicides fulfill a significant role in the activation of particular defensive responses of plants, limited scientific results area available to indicate whether these substances have little or any effect on key steps of phenolic and oxidative processes (Garcia et al, 2003). The general aim of this study was to justify the effect of fungicides on main plant physiological parameters. More specifically, the researchers aimed to prove that there is an effect of fungicides on enzymes activity of crop, such as the level of reactive oxygen species (ROS) and whether fungicides have an effect on chlorophyll content.
Materials and methods
The test plant was Zea mays L. cv. Dessert R78. The effect of two fungicides Amistar (azoxystrobin and cyproconazole) and Quilt Xcel (azoxystrobin and propiconazole) was examined during the field experiment. The relative chlorophyll content, the concentration of chlorophyll-a,b and carotenoids, and the activity of SOD and LP, respectively, were measured. The plant samples were taken after treatment at 7 and 14 days, respectively.
Results and discussion
When plants were treated with fungicides, the reduction in relative chlorophyll content was observed (Table 1). The reduction was the same with both fungicides and both sampling dates. In addition, there were significant changes in the quantity of photosynthetic pigments (results are not shown). Furthermore, the concentration of chlorophyll-a significantly decreased by 28% at Amistar. This reduction was noted as 44% in the case of chlorophyll-b and 12% in carotenoids, after treatment at 7 days respectively. Table 1: Effect of fungicides on the relative chlorophyll content (SPAD unit) in Zea mays after 7 and 14 days of treatments
Treatment after 7 days after 14 daysControl 38,95±3,20 43,19±3,45Amistar 29,52±2,95*** 33,02±3,94***Quilt Xcel 29,87±3,79*** 33,54±5,68***N=75 ±S.D., Significant difference compared to the control: ***p<0,001.

Hnanice, Czech Republic – 09-14. April, 2018
47
Some researchers found a connection between fungicides and SOD. Zhang et al (2010) measured increased SOD activity in wheat after fungicides treatment. However, during this experiment no significant difference in SOD activity was noted.
Nevertheless, due to the Amistar fungicide treatment, no fungicide induced change in superoxide-dismutase activity was detected one week after the treatment. SOD activity increased at a non-significant level two weeks after the treatment while Quilt Xcel fungicide treatments decreased SOD activity.
The activity of LP did not change after 14 days of both fungicides treatments, while it was significantly lower with Quilt Xcel after 7 days (results are not shown). Table 2: SOD activity (U g-1 FW) after 7 and 14 days of treatments
Treatment after 7 days after 14 days Control 0,10±0,02 0,08±0,03 Amistar 0,10±0,01 0,10±0,01 Quilt Xcel 0,10±0,00 0,06±0,00
Conclusions
This study was proven that the fungicides, Amistar and Quilt Xcel, had different effects on plant physiological parameters. These fungicides showed a negative effect on relative chlorophyll content and photosynthetic pigment concentration after treatment at 7 and 14 days respectively. However, no have negative effects on SOD activity were detected, which means fungicides did not have any effects on the defence mechanism of plant.
AcknowledgementSupported BY the ÚNKP-17-2 New National Excellence Program of the Ministry of Human Capacities
ReferencesGarcia C P., Rivero M R., Ruiz M J., Romero L. (2003): The Role of Fungicides in the Physiology of Higher
Plants: Implications for Defense Responses. The Botanical Review 69: 2.162-172.Jablonska T A. (2017): Pesticides as Inducers of Oxidative Stress, Reactive Oxygen Species 3: 8.96–110.Zhang Y., Zhang X., Chen J C., Zhou G M., Wang C H. (2010): Effects of fungicides JS399-19, azoxystrobin,
tebuconazloe, and carbendazim on the physiological and biochemical indices and grain yield of winter wheat. Pesticide Biochemistry and Physiology. 98.2. 151-157.

Abstract Book – 17th Alps-Adria Scientific Workshop
48
The impact of crop rotation on photosynthetic parameters nutrition quality, and yield of maize (Zea mays L)
Mahama SALIFU1 – Lajos Fülöp DÓKA2
1: Ph.D. Student, Institute of Crop Sciences, Faculty of Crop Production and Horticulture Science, University of Debrecen, H-4032 Debrecen, Böszörményi út 138, E-mail: [email protected]
2: Lecturer, Institute of Crop Sciences, Faculty of Crop Production and Horticulture Science, University of Debrecen, H-4032 Debrecen, Böszörményi út 138., E-mail: [email protected]
Keywords: maize, crop rotation, yield and nutrient quality
Introduction
Maize (Zea mays L.) is a highly productive crop under optimal environmental and crop management conditions and is a major cereal crop worldwide, serving as a major staple for both human consumption and animal feed. It has also become a key resource for indus-trial applications and bioenergy production. It is a versatile crop and ranks third following wheat and rice in world production as reported by Food and Agriculture Organization (FAO. 2002). Crop rotation represents a way of approach in crop production research that enables the available natural resources to be preserved in a more efficient utilized ways. In crop rotation experiments, a monoculture is usually compared to various crop sequences. The fact that in most cases the yields of the cultivated crops are higher in crop rotation, as compared with a monoculture under identical conditions, is explained by the rotation effect. This rotation effect has been demonstrated irrespective of the combination of crops in the rotation system. (Dolijanović et al., 2006; Riedell et al., 2009).
Materials and methods
This research was carried out in the Latokep Research site of the University of Debrecen in the cropping year of 2017. The experimental site is located at Hajdusag ridge, about 15 Km way from the city center of Debrecen and its geographical coordinates are 47o33’ N, 21o27’ E. The experiment was set up on a split-split-plot design in three replication. The research was carried out based on a one-factorial parameter thus, different cropping system treatment (Monoculture and Biculture) on a plot of land with plant density of (72,500/ha-1). The plots were fully-irrigated in the cropping system.
The factors that were considered in this study included, the nutrition quality of grains (protein, starch and moisture content) and yield kg/ha.
The objective of this study was to investigate the influence of different cropping systems: monoculture and biculture, (maize and wheat rotation) on the yield and nutrition quality of maize (Zea mays L).

Hnanice, Czech Republic – 09-14. April, 2018
49
Results and discussion
Table1: Effects of cropping system on grain nutrient quality and photosynthetic parameters
Treatments Spad Ndvi Lai Protein Starch Moisture Yield
Monoculture
Biculture
Cv (%)
50.93**
54.09
1.80
75.69
75.87
1.77
2.89**
2.47
0.28
8.52**
9.07
0.27
73.74*
75.04
0.41
17.31
17.76
0.54
4041.042*
6178.877
0.002*Correlation is significant at 0.05 level, ** correlation is significant at 0.01 level
In this study, analysis of data indicate that cropping system has a significant effect on the Spad, LAI, Protein, moisture content, and crop yield (Table1) The maximum yield and protein of maize was achieved as a result of crop rotation system being applied as Biculture had 6178.877kh/ha as against Monoculture 4041.042kg/ha yield in this research and this study concedes with (Riedell et al., 2009). (Table 1.)
Crop rotation provided higher yield as compared to monoculture because of the activities of residues remaining of the previous crop on the soil. (Silva et al., 2005), especially on lands where the system is already consolidated. A general impact of the cropping system reflected only on LAI, as shown in this study. The negative impact of cropping system on monoculture with significantly lowest yield and LAI was observed. (Table 1.) The influence of cropping systems on LAI had been also reported by (Wozniak, 2008). (Salem & Ali, 1979) also reported that, increases plant height and protein content of maize grain
Conclusions
From this study, it can be inferred from the obtained results that high yield and grain nutrient quality in maize is associated with cropping system. So yielding potential and grain nutritional quality in maize production can be associated with relatively high crop rotation and together with best agronomical practices such weed control and proper water management supply systems.
References Dolijanović, Ž., Kovačević, D., Oljača, S., Broćić, Z., & Simić, M. (2006): The yield grain of winter wheat and
maize in continuous cropping, two- and three-crop rotation. Journal of Scientific Agricultural Research, 67, 81-90.
FAO. (2002): Fertilizer and the future. IFA/FAO Agriculture Conference on Global food security and the role of Sustainability Fertilization. Rome, Italy. 16th-20th March, 2003, pp 1-2.in agroecosystem. J. Crop Prod. 4, 185-196.
Riedell, W.E., Pikul, J. L., Jaradat, A. A., & Schumacher, T. E. (2009): Crop rotation and nitrogen input effects on soil fertility, maize mineral nutrition, yield, and seed composition. Agronomy Journal, 101(4), 870-879.
Salem, S. A., Ali, A. E., (1979): Effect of nitrogen fertilizer levels and varieties on grain yield and some plant characters of maize (Zea mays L.). Field Crop Abstr. 33 (2), 1035 (Abstr. 9881).
Silva E. C., Ferreira S. M., Silva G. P., Assis R. L. & Guimarães G. L. (2005): Épocas e formas de aplicação de nitrogênio no milho sob plantio direto em solo de cerrado. Revista Brasileira de Ciência do Solo, 29:725-733.
Wozniak, A. (2008): Wpływ zrośnicowanego udziału pszenicy jarej w zmianowaniu na indeks powierzchni liści (LAI). Acta Agrophysica, 12(1), 269-276.

Abstract Book – 17th Alps-Adria Scientific Workshop
50
Effect of bean rust (Uromyces appendiculatus (Pers.) Strauss) on physiological characteristics, superoxide-dismutase and lipid-peroxidase activities of common bean (Phaseolus vulgaris L.)
Csaba BOJTOR1–Zoltán GYŐRI1 – Péter SIPOS1–László RADÓCZ2–Brigitta TÓTH1,3
1: Institute of Nutrition, University of Debrecen, 1 Egyetem Square, 4032 Debrecen, Hungary2: Institute of Plant Protection, Faculty of Agricultural and Food Sciences and Environmental Management,
University of Debrecen, 138 Böszörményi St, 4032 Debrecen, Hungary3: Institute of Plant Sciences, Faculty of Natural and Agricultural Sciences, University of the Free State, PO Box
339, Bloemfontein 9300, Republic of South Africa. E-mail: [email protected]
Keywords: bean rust, chlorophyll, common bean, lipid-peroxidase, superoxide-dismutase
Introduction
There are numerous stress factors which affect the development of plants. These factors can be divided into two categories namely biotic and abiotic. Various studies indicated that biotic stress factors, such as diverse pathogens, have an impact on the natural defense mechanism of plants (Barna et al., 2012; Shetty et al., 2008). Furthermore, Shetty et al., (2008) proved that various infections have an increasing effect on the amount of reactive oxygen species (ROS) in the tissues. The latter seemed to have an adverse effect on lipids, proteins and nucleic acids.
The main objective of this study was to prove that there exists a strong effect on reactive oxygen species level in host-parasitic relationship. Clarification of the role of the enzymes involved in the defense mechanism can significantly contribute to the breeding of plant varieties with a natural defense mechanism. Consequently, reducing the amount of chemicals used in food production.
Materials and methods
The effect of bean rust (Uromyces appendiculatus (Pers.) Strauss) was investigated. The relative chlorophyll content of the host plant (Phaseolus vulgaris L.), the amount of photosynthetic pigments, and the activity of superoxide dismutase (SOD) and lipid peroxidase (LP) were measured. The experiment was conducted in a humidity tent. Samples were taken 7 and 14 days after inoculation, respectively.
Results and discussion
Efficient organic matter accumulation is not possible without chlorophyll, which is the essential component of photosynthetic processes. Because of this, the changes in the relative chlorophyll content of the plants were measured after 7 and 14 days of inoculation, respectively. Table 1. shows the changes in the relative chlorophyll content of the plants. When bean plants were inoculated, the relative chlorophyll content was significantly lower in both samplings. After 7 days, the reduction was measured as 6 SPAD-Units, whilst 14 SPAD-Units were detected after 14 days.

Hnanice, Czech Republic – 09-14. April, 2018
51
Table 1: Changes in relative chlorophyll content with bean rust inoculation ( SPAD-Units)
1. sampling 2. samplingControl 43,96 ± 4,13 34,66 ± 7,02Bean rust inoculation 37,93 ± 6,06* 20,55 ± 8,07***
1. sampling: 1 week after inoculation, 2. sampling: 2 weeks after inoculation. N=10 ±S.D., Significant difference compared to control: *p<0,05, ***p<0,001.
As relative chlorophyll content is only a relative value, the amount of photosynthetic pigments (chlorophyll-a, chlorophyll-b, carotenoids) was also measured in the primary leaves. As shown in the Table 2., the amount of each measured photosynthetic pigment was significantly lower due to the rust infection. Table 2: Changes in the amount of photosynthetic pigments with bean rust inoculation (mg g-1)
1. samplingchlorophyll-a chlorophyll-b carotenoids
Control 9.12 ± 1.61 3.42 ± 0.58 6.88 ± 1.05Bean rust inoculation 6.16 ± 1.20* 2.24 ± 0.79* 4.52 ± 0.79*
2. samplingControl 5.57 ± 0.55 1.93 ± 0.48 4.41 ± 0.62Bean rust inoculation 2.23 ± 1.17** 0.83 ± 0.57* 2.65 ± 0.94**
1. sampling: 1 week after inoculation, 2. sampling: 2 weeks after inoculation. N=5 ±S.D., Significant difference compared to control: *p<0,05, **p<0,01.
At both sampling times, an increase was found in enzyme activity (both superoxide-dismutase and lipid-peroxidase) due to the bean rust infection. Notably, in several cases the differences were significant (results are not shown).
Conclusions
The results indicate that amount of time after inoculation primary effects the activity of superoxide dismutase and lipid peroxidase, and on the amount of photosynthetic pigments. The differences of data at the first and the second sampling can be explained by the evolution of the life cycle of pathogen.
AcknowledgementSUPPORTED BY THE ÚNKP-17-2 NEW NATIONAL EXCELLENCE PROGRAM OF THE
MINISTRY OF HUMAN CAPACITIES
References Barna, B., Fodor J., Harrach, B. D., Pogány, M., Király, Z. (2012): The Janus facet of reactive oxygen species
in resistance and susceptibility of plants to necrotrophic and biotrophic pathogens. Plant Physiology and Biochemistry 59, 37-43.
Shetty, N. P., Jorgensen, H. J. L., Jensen, J. D., Collinge, D. B., Shetty, H. S. (2008): Roles of reactive oxygen species in interactions between plants and pathogens. Eur. J. Plant. Pathol. 121, 267-280.

Abstract Book – 17th Alps-Adria Scientific Workshop
52
Model study to investigate the toxic interaction between chlorpyriphos containing insecticide and lead acetate on chicken embryos
Géza SZEMERÉDY1 –Gergő SOMODY1 –László MAJOR1 –József LEHEL2 –Péter BUDAI1 1: University of Pannonia, Georgikon Faculty, Institute of Plant Protection, H-8360 Keszthely Deák F. str. 16.
E-mail: [email protected]: University of Veterinary Medicine, Department of Food Hygiene, H-1078 Budapest, István str. 2.
E-mail: [email protected]
Keywords: chicken embryo, lead-acetate, interaction, combined toxic effects, insecticide
Introduction
The chemical plant protecting process is one of the most important polluting activities in the agricultural production. The ecosystem of a given habitat can be contaminated simultaneously by sprayed pesticides and other xenobiotics, e.g. heavy metals due to the agricultural activities during the plant protecting processes. Therefore, the chemical load can be occurred as a complex problem, so the combined toxic effect, i.e. toxic interaction of at least two substances can expected and the components can modify the effect of each other. Recently, the examination of the combination of heavy metals and other chemicals gained significant ground in both avian (Fejes et al., 2001; Kertész, 2001) and mammalian (Institóris et al., 2001; Pecze et al., 2001) toxicology research studies. Furthermore, the interaction effects are examined not only in the field of ecotoxicology, but also in all other areas that deal with health care and chemical safety issues (Oskarsson, 1983; Danielsson et al., 1984; Speijers & Speijers, 2004).
Materials and methods
Farm chicken eggs with good fertile potential (Goldavis Ltd., Hungary) were used in the experiment. The eggs based on their size and weight were divided into six homogenous groups (40 eggs in each), and were incubated in Ragus type table incubator (Vienna, Austria) ensuring the required temperature (37–38ºC), the relative humidity (65–70%) and the daily rotation.
The eggs were treated with a final volume of 0.1 ml solution or emulsion of the test items, directly into the air-chamber with a pipette on the first day of incubation. The egg-shell was bored through before the injection, and it was sealed with paraffin after treatment (Clegg, 1964). During the single and simultaneous administration lead acetate (Reanal-Ker Ltd., Budapest) with a concentration of 0.01% and 0.5% of Cyren EC chlorpyriphos containing insecticide (FMC-Agro Hungary Ltd., 360 g/l) corresponding to that used in plant protection practice were applied. The control group was treated with avian physiological saline solution (NaCl 0.75%). All eggs and embryos were examined and processed on day 19 of incubation. During the processing rate of embryo mortality, body mass of embryos and type of developmental anomalies were registered.

Hnanice, Czech Republic – 09-14. April, 2018
53
Results and discussion
The average body weight of the embryos was significantly lower as compared to the control group in all treated groups.
The single and simultaneous administration of the test items increase the mortality of embryos significantly as compared to the control.
Developmental abnormalities were sporadically observed due to the single and concomitant administration.
The results of the individual teratogenicity studies on lead acetate in chicken are in accordance with results of toxicity studies in other species. Depending on the dose, lead has embryotoxic potential and may cause developmental anomalies (Ferm & Carpenter, 1967; Várnagy & Budai, 1995).
Conclusions
Based on the results, there are presumably addition-type toxic interaction between lead acetate and Cyren EC insecticide, that highly reduce the viability of the embryos.
Acknowledgement
The publication is supported by the EFOP-3.6.3-VEKOP-16-2017-00008 project. The project is co-financed by the European Union and the European Social Fund.
References Danielsson, B.R.G., Oskarsson, A., Dencker, L. (1984): Placental transfer and fetal distribution of lead in mice
after treatment with dithiocarbamates. Arch. Toxicol. 55: 27-33. DOI: https://doi.org/10.1007/bf00316582 Fejes, S., Várnagy, L., Budai, P., Takács, I. (2001): A réz-szulfát és a BI 58 EC interakciós vizsgálata házityúk
embrión. TOX’2001 Konferencia. Eger. Absztraktok C2–4.Ferm, V.H., Carpenter, S.J. (1967): Teratogenic effect of cadmium and its inhibition by zinc. Nature. 216: 1123.
DOI: https://doi.org/10.1038/2161123a0 Institóris, L., Siroki, O., Dési, I. (2001): Kombinált cipermetrin Hg2+ és As3+ expozíció immuntoxikológiai
vizsgálata patkányon. TOX’2001 Konferencia. Eger. Absztraktok C1–2. DOI: https://doi.org/10.1016/s1567-5769(01)00029-7
Kertész, V. (2001): Nehézfémek és PAH-vegyületek embrionális fejlődésre gyakorolt hatása madarakon. Doktori (PhD) értekezés. SZIE MKK. Gödöllő.
Oskarsson, A. (1983): Redistribution and increased brain uptake of lead in rats after treatment with dethyldithiobarbamate. Arch. Toxicol. 6: 279-284. DOI: https://doi.org/10.1007/978-3-642-69083-9_52
Pecze, L., Papp, A., Nagymajtényi, L. (2001): Kombinált toxikus expozíció hatása az in vivo regisztrált hippokampális populációs spike-ra patkányban. TOX’2001 Konferencia. Eger. Absztraktok C1–4.
Speijers, G.J.A., Speijers, M.H.M. (2004): Combined toxic effects of mycotoxins. Toxicology Letters. 153: 91-98. DOI: https://doi.org/10.1016/j.toxlet.2004.04.046
Várnagy, L., Budai, P. (1995): Agrochemical hygiene. Mezőgazda Publishing, Budapest. 45., 50-52., 64-65., 70-83.

Abstract Book – 17th Alps-Adria Scientific Workshop
54
Effect of the production year and soil temperature on the green spear yield of asparagus (Asparagus officinalis L.) Zsuzsa ERDŐS – László ZSOMBIKUniversity of Debrecen, Institutes for Agricultural Research and Educational Farm Research Institutes
of Nyíregyháza H-4400 Nyíregyháza Westsik Vilmos str. 4-6. ; E-mail: [email protected]; [email protected]
Keywords: asparagus, spear yield, soil temperature, production year, heat unit
Introduction
Asparagus is one of the earliest harvestable vegetable crops. It is partly due to its earliness that it has special demands for soil, temperature and precipitation. Dean (1999) determined the heat threshold of growth of asparagus at 10 oC. Asparagus prefers temperate climatic conditions, its optimum root and shoot growth are realised between 18 and 29 ° C (Brenna, et al., 2011). In contrast, according to Dean (1999), heat threshold of growth of shoots is between 24.5 and 33 oC. In his studies, maximum spear growth was observed at 30 oC (0.51 cm/h growth). There was a close correlation between daily temperature and pear yield but no statistically confirmed correlation was established. Wilson et al., (1999) found that the heat threshold of asparagus growth was 7.1 oC based on the analysed data, but different heat threshold values were determined at each test sites. Based on studies carried out in the United States, a developmental heat threshold of 6.7 oC, while in Japan 4.8 oC was found with significant variety effect. Bouwkamp and McCully (1975) determined the heat threshold at 4.4 oC, while Blumenfield et al., (1961) set this value at 7.2 oC.
Materials and methods
The examinations have been carried out at the 2013 established asparagus plantation of the University of Debrecen Institutes for Agricultural Research and Educational Farm Research Institutes of Nyíregyháza. The analyses have been carried out with asparagus hybrids Cumulus, Vitalim and Grolim on 12 mezo-plots in 2016-2017. Meteoroligcal data was recorded with AgroSense meteorological station and its substations. A Soil temperature was measured at 20 cm depth. For the determination of effective heat unit the heat threshold values determined by Blumenfield et al., (1961) and Bouwkamp and McCully (1975).
Results and discussion
In my examinations, the Cumulus, Vitalim and Grolim asparagus hybrids have been harvested as green asparagus. In 2016, harvesting began on the 8th of April and ended until the 9th of May. In 2017, it took place between the 4th of April and the 5th of May. In both harvesting periods, 32 day harvest was analysed, where the analysed yield result was determined as classified weight. Parameters of the harvesting period are shown in Table 1.

Hnanice, Czech Republic – 09-14. April, 2018
55
Table 1: The main data of asparagus harvesting period (Nyíregyháza, 2016-2017)
Cumulus Vitalim Grolim
2016 2017 2016 2017 2016 2017Soil temperature reached 10 °C 2016.03.31 2017.03.28 2016.03.31 2017.03.28 2016.03.31 2017.03.28
Emergence of the first spear 2016.04.03 2017.04.01 2016.04.02 2017.04.02 2016.04.08 2017.04. 05
Plot yield
(kg/plot/harvest period)11.95 15.16 16.92 23.56 8.85 10.96
Effective heat unit calculations were carried out for the starting period of harvesting in terms of air and soil temperature.
Conclusions
Overall, it can be stated that soil temperature is one of the most important factors in terms of the emergence of asparagus spears and daily spear yield. It has been observed that in both years, the emergence of whistles is expected when the soil temperature is steadily around 10 °C. During the calculation of effective heat unit, it was found that in the case of the analysed hybrids and asuniting a heat threshold of 4.4 oC, the emergence of spears is expected upon reaching a heat unit of 61.5-66.5 °C for the Cumulus asparagus hybrid, 55.1-73.2 °C for Vitalim and 97.7-107.4 °C for Grolim. Asuniting a 7.2 °C asuniting heat threshold the emergence of spears is expected at 17.2-26.3 °C for Cumulus, 13.6-30.3 °C for Vitalim and 46.3-48.9 °C for Grolim. The best green asparagus yields of both 2016 and 2017 were observed in the case the Vitalim asparagus hybrid followed by Cumulus and Grolim hybrids. In terms of yields, a significant difference was found in the case Vitalim and Grolim hybrids.
Acknowledgement
Our analysis has been carried out in the scope of the „Supported by the ÚNKP-17-3 New National Excellence Program of the Ministry of Human Capacities” and „Supported by the NTP-EFÖ-P-15 Scholarships providing unique development of the Ministry of Human Capacities”.
References Blumefield, D. K., Meinken K. W., Le Compte S. B. (1961): A field study of asparagus growth. Proc. American
Society Horticultural Science. 77. 386-392.Bouwkamp, J. C., McCully, J. E. (1975): Effects of simulated and no-selective mechanical harvesting on spear
emergence of Asparagus officinalis L. Scienta Horticulturae 3. 2. 157-162. DOI: https://doi.org/10.1016/0304-4238(75)90022-9
Brenna, A., Michael, C., Steven, K., Richard, S., Timothy, H., Trevor, S. (2011): Asparagus production is California. UC Vegetable Research & Information Center. 1-6. ISBN-13: 978-1-60107-761-5
Dean, B. B. (1999): The effect of temperature on asparagus spear growth an correlation of heat units accumulated int he field with spear yield. Acta Horticulturae. 479. 289-296. DOI: 0.17660/ActaHortic.1999.479.40
Wilson, D. R., Cloughley, C. G., Sinton, S. M. (1999): Model of the influence of the temperature on the elongation rate of asparagus spears. Acta Horticulturae 479. 297-304. DOI: 10.17660/ActaHortic.1999.479.41

Abstract Book – 17th Alps-Adria Scientific Workshop
56
Cold tolerance evaluation of rice (Oryza sativa L.) genotypes at the germination – and the seedling stage
Tímea SZALÓKI1 – Mihály JANCSÓ1 – Árpád SZÉKELY1 – Beáta VITÁNYI2
1: National Agricultural Research and Innovation Centre, Research Department of Irrigation and Water Management (NAIK ÖVKI), Anna-liget 8, Szarvas H-5540, Hungary; [email protected]
2: National Agricultural Research and Innovation Centre, Agricultural Biotechnology Institute (NAIK MBK), Szent-Györgyi Albert 4, Gödöllő H-2100, Hungary; [email protected]
Keywords: rice, chilling stress, germination, seedling stage, cold tolerance
Introduction
Rice is one of the most important cereals worldwide. Most of the cultivars are sensitive to cold stress due to its tropical origin; therefore, low temperature is a major abiotic stress factor causing serious yield losses in temperate rice growing areas. Cold stress adversely affects the growth and the photosynthetic activity at all developmental stages (Cruz et al., 2013). In this study, we examined cold tolerance of 14 rice varieties during the early development to provide background information for further breeding processes.
Materials and methods
Germination stage: 14 rice varieties from the Hungarian Rice Breeding Program in the NAIK (Dunghan Shali, Risabell, Ringola, Sandora, Ábel, M 488, Janka, Dáma, Nembo, Sprint, Unggi 9, Irat109 and IE5593, Dular)re studied. Seeds were germinated in Petri dishes on wet filter papers (100 seeds/Petri dish, after 2 days pre-treatment at 50 °C to break dormancy) at 12 °C, at 15 °C and at 25 °C for 26, 16 and 6 days, respectively. Germinated seeds with coleoptiles reached 1 mm length were registered every 8 hours (12 °C) or every 6 hours (15 °C and control). Germination rate (GR), median germination time (E50), germination speed (R50) and the lag period were calculated.
Seedling stage: Based on the determined GR, D. Shali, Sandora (cold-tolerant), Janka (moderately tolerant) and M 488 (very sensitive) were selected for the experiment. Seedlings were grown hydroponically in Yoshida solution for 15 days (23-26 °C, 12h light). For cold stress, seedlings were placed into the incubator (4 °C ± 0.2 °C, 2 days). Recovery was at control conditions (23-26 °C) after 10 days. We determined fresh and dry weight (FW, DW) and plant height (PH) (10 plants/variety) 27 DAS. Differential rates (DR) were calculated (control/treatments). Chlorophyll (Chl) content was determined 15 DAS, 17 DAS and 27 DAS (extraction 80 % (v/v) acetone) according to a modified method of Sims and Gamon (2002). The Chl content was also estimated using Minolta SPAD-502 chlorophyll meter (5 reps) at the same days.
Results and discussion
Germination stage: Under chilling stress, all varieties showed lower GR, longer lag period, slower R50 and delayed E50 similarly to earlier works (Zhanbyrbayev et al., 2016). However, significant differences in cold tolerance were indicated. Based on GR values, the cold tolerance level was classified tolerant (T), moderately tolerant (MT), moderately sensitive (MS), sensitive (S) and supersensitive (SS) categories (Table 1).

Hnanice, Czech Republic – 09-14. April, 2018
57
Table 1: Classification of cold tolerance level of 14 rice varieties based on germination rate (GR)
Category GR (12 °C) GR (15 °C) Rice varietyTolerant (T) > 80 % > 80 % D. Shali, IE 5593, Sandora
Moderately tolerant (MT) 50-80 % > 80 % Dáma, Janka, Nembo, Risabell
Moderately sensitive (MS) < 50 % > 80 % Ábel, Ringola, Unggi 9Sensitive (S) < 50 % 50-80 % SprintSupersensitive (SS) < 50 % < 50 % Dular, Irat 109, M 488
Seedling stage: Negative effect of low temperature on biomass production and PH was described earlier (Ye et al., 2009). Our results showed that mean PH was reduced by 25.3 (D. Shali, M 488) - 38.4 % (Janka, Sandora) after the cold treatment. Interestingly, nearly the same DR was measured in M 488 and D. Shali, although they showed different cold sensitivity during germination. DR of shoot FW was 45.1 %, 39.6 %, 32.7 % and 14.5 % in D. Shali, M 488, Janka and Sandora, respectively. Although D. Shali and Sandora proved to be cold tolerant at germination, DR values of shoot FW were different. Significant decrease of root FW and DW was also observed in all varieties. Cold stress accompanied by oxidative stress result in reduced photosynthetic efficiency and decrease of Chl content (Cruz et al., 2013). The total Chl content in each variety was lower in treated seedlings than controls, although it was either decreased (D. Shali) or increased (Janka, M 488) during the recovery period. In Sandora the Chl content was not influenced significantly. SPAD values showed similar tendency except M 488.
Conclusions
We found that Sandora had high level of cold resistance, while Janka showed moderate cold tolerance and M 488 was cold sensitive during both studied developmental stages. Interestingly D. Shali, showed very good cold resistance at germination stage but it was sensitive at early seedling stage. The studied genotypes, which were identified cold tolerant are important for Rice Breeding Program: they could be used as genetic sources for improving cold tolerance of new rice varieties and for further genetic studies as well.
Acknowledgement
The Hungarian Ministry of Agriculture supported the project under the “Improvement of the abiotic stress tolerance of Hungarian rice varieties” program (FM OD002).
ReferencesCruz, R.P.D., Sperotto, R.A., Cargnelutti, D., Adamski, J.M., FreitasTerra, T., Fett, J.P. (2013): Avoiding
damage and achieving cold tolerance in rice plants. Food and Energy Security. 2: 2. 96-119. DOI: https://doi.org/10.1002/fes3.25
Sims, D.A., Gamon, J.A. (2002): Relationships between leaf pigment content and spectral reflectance across a wide range of species, leaf structures and developmental stages. Remote Sens. Environ. 81: 2. 337-354. DOI: https://doi.org/10.1016/s0034-4257(02)00010-x
Zhanbyrbayev, E.A., Rysbekova, A.B., Usenbekov, B.N., Kazkeev, D.T., Sartbayeva, I.A., Berkimbay, K.A., Sarsenbayev, B.A., Zelensky G.L. (2016): Screening Rice (Oryza sativa l.) Genetic Resources for Cold Tolerance at the Germination Stage. Biosci., Biotech. Res. Asia. 13: 4. 1969-1973. DOI: http://dx.doi.org/10.13005/bbra/2351
Ye, C., Fukai, S., Godwin, I., Reinke, R., Snell, P., Schiller, J., Basnayake, J. (2009): Cold tolerance in rice varieties at different growth stages. Crop Pasture Sci. 60: 4. 328-338. DOI: https://doi.org/10.1071/cp09006

Abstract Book – 17th Alps-Adria Scientific Workshop
58
Effect of critical agrotechnical factors on the yield and physiological parameters of sunflower (Helianthus annuus L.)
András SZABÓ1 – Lajos Fülöp DÓKA2 – Éva SZABÓ3
1: Lecturer, Debrecen University, 4032 Debrecen, Böszörményi út 138; [email protected]: Lecturer, Debrecen University, 4032 Debrecen, Böszörményi út 138; [email protected]: Assistant professor, Debrecen University, 4032 Debrecen, Böszörményi út 138; [email protected]
Keywords: sunflower, plant density, nutrient supply, fungicide treatment, physiological parameters
Introduction
Sunflower is one of the plants that, from plant protection point of view, are considered as sensitive. The primary problem is the fungal diseases (Diaporthe helianthi, Sclerotinia sclerotiorum, Phoma macdonaldi, Alternaria, etc.), that can cause significant damages in the stands, mainly in cold, wet weather. Agroclimatic factors had the most significant influence on crop yield, while the effect of the hybrid selection was moderate. The emergence and intensity of diseases is significantly influenced by the hybrid choice, as well as the agroclimatic factors in the crop year (temperature, distribution and amount of precipitation) (Branimir et al., 2008, Zsombik, 2008). The yield capacity of sunflower hybrids is highly influenced by agrotechnical and climatic factors in the crop years (for e.g. crop density, sowing time, etc.) (Borbélyné et al., 2007, Zsombik 2006, Dani – Pepó, 2005).
Materials and methods
The small-plot field experiment was carried out in the year 2015-2016 at the Látókép Research Site of the University of Debrecen CAS. The experimental soil is a lowland calcareous chernozem type with deep humus layer based on loess. Three hybrids were involved into the experiment: NK Neoma, NK Ferti and NK Alego. The effect of unilateral N, just as PK supply and harmonic NPK nutrient supply. Were investigated by different plant densities of 35000, 55000 and 75000 plants per hectare. The investigated agrotechnical factors have been evaluated in case of treatments without any fungicide plant protection (control treatment), just as of treatments with two-times fungicide application (in the plant development state of 8-10 leaves and flowering).
Results and discussion
According to the results of the crop year 2015 it can be stated that the Leaf area index, the different normalized vegetation index, and the yield amount result (5242 kg ha-1) of the experimental model treated with fungicides with balanced nutrient supply (NPK) was higher than those of other studied models. Changes in plant densities proved to be significant yield affecting factors. In the control treatment the highest LAI index, NDVI index and the highest yield amount was produced in case of the application of optimal plant density (55000 plants ha-1) in the NPK nutrient supply model. In the too dense, 75000 plants ha-1 population microclimatic conditions were favourable for the spread of fungal pathogens, thus lower yield amounts were produced in case of this high plant density, even in the balanced NPK nutrient supply treatment model (2332 kg ha-1). As an effect of fungicide application the density of sunflower populations could be effectively

Hnanice, Czech Republic – 09-14. April, 2018
59
increased. Due to the application of fungicide treatments yield amounts of hybrids were higher than 4500 kg ha-1 in all treatment combinations in the crop year 2015. Regarding the average of the studied hybrids the highest yield was measured in the populations with a density of 75000 plants ha-1 with balanced NPK supply in treatments with two-times fungicide application.
In the crop year of 2016 the yield amounts of the studied populations were lower than those measured in the crop year 2015 due to the unfavourable, wetter weather conditions. In treatment combinations not treated with fungicides in case of both unilateral N, PK-supply and balanced NPK-supply yield amounts were lower than 4250 kg ha-1. Yield amounts were lower than 4000 kg ha-1 in the control treatments with plant densities of 35000 plants ha-1 in case of all studied nutrient supply levels. The results of our study confirmed that adequate nutrient supply and fungicide treatments are determining factors in sunflower productivity, leaf area and assimilation ability (NDVI index). Regarding the nutrient supply levels of both unilateral N and PK supply, and balanced NPK supply as well, it can be stated that the results of the populations treated two-times with fungicides show significant LAI, NDVI and yield, increment in case of all three studied plant densities. Regarding the average of the studied sunflower hybrids the highest yield was measured in the treatment combination with balanced NPK-supply, treated two-times with fungicides. In case of the application of balanced NPK nutrient supply level and two-times fungicide application yield increment of the plant density 55000 plants ha-1 was over 500 kg ha-1, while in case of the density of 75000 plants ha-1 it was almost 1000 kg ha-1 higher in contrast to the control treatment.
Conclusions
Critical factors of sunflower production are sowing technology, harmonic nutrient supply and the adequate fungicide plant protection measurements. The results of the present experiment confirm the Leaf area, assimilation ability and the yield determining effect of nutrient supply and fungicide treatments in case of all three studied hybrids. The highest LAI, NDVI and yield amount was measured in the treatment models treated two-times with fungicide and fertilized with NPK substances in case of all three hybrids.
Acknowledgments
The publication is supported by the EFOP-3.6.3-VEKOP-16-2017-00008 project. The project is co-financed by the European Union and the European Social Fund.
ReferencesBranimir S., Jasenka C., Ruza P., Karolina V. (2008): Influence of climate conditions on grain yield and
appearance of white rot (sclerotinia sclerotiorum) in field experiments with sunflower hybrids. Cereal Research Communications. 36. 63-66.
Dani M. , Pepó P. (2005): The yield potential utilization of some sunflower hybrids in different cropyears. Cereal Research Communications 33. 1. 193-196.
Zsombik L. (2006): Effect of sowing time on the oil content of different sunflower hybrids. Cereal Research Communications, 34. 1. 725-728.
Zsombik L. (2008): Optimalization aspects for sowing time of sunflower (helianthus annuus L.) production. Cereal Research Communications 36. 3. 755-758.
Borbélyné Hunyadi É. – Csajbók J. –Lesznyák. M. (2007): Relations between the yield of sunflower and the characteristics of the cropyear. Cereal Research Communications. 35. 2. 285-289.

Abstract Book – 17th Alps-Adria Scientific Workshop
60
Analysis of the interactions between the yield-influencing factors in maize during three different cropyears Fülöp Lajos DÓKA1 – Éva SZABÓ2 – András SZABÓ3
University of Debrecen, Hungary Institute of Plant Sciences; E-mail: [email protected]; [email protected]; [email protected]
Keywords: maize, water deficit, irrigation, agrotechnical elements, yield
Introduction
The ’macroclimatic’ change which started several years ago has shifted also the climate of Hungary from the typical features of the continental climate. The future possibilities of crop production will probably be widened or limited by the level of adaptation to the changes in the climate. The weather phenomena of the past six years verify the forecasts. Not only the dry or wet periods are more frequent, but the probability of weather extremes and the strength of their effects are increasing even within a year or a vegetation period (Keszthelyi, 2005; Birkás, 2006; Láng et al., 2007; Polyák, 2008; Jolánkai & Birkás, 2009).
Materials and methods
The experiment was carried out within the confines of a polifactorial long-term field experiment set up at the Látókép Experimental Station of the University of Debrecen in the crop years of 2007., 2008 and 2009. In the experiment we have used 3 nutrient supply levels (control, N120P90K90, N240P180K180), two water supply levels (treatment Ö1 = without irrigation, treatment Ö2 =irrigated), plant densities of 60000 and 80000 plants ha-1 and three different crop rotation systems (mono-, bi- and triculture). Soil cultivation, plant protection and harvest measurements were the same in case of all treatments. The investigated maize hybrid was Reseda (PR37M81). In the irrigated treatments (Ö2) following water amounts were applied in the given times:Year 2007: 04. May – 50 mm water 23. May – 50 mm water 04. June – 50 mm water 30. June – 50 mm waterYear 2008 was favourable from the aspect of maize water supply; therefore there was non-need to apply any additional irrigation water in any treatment.Year 2009: 04. May – 50 mm water 23. May – 50 mm waterIn order to study the soil water management soil samples were taken 6 times during the vegetation from each 20 cm sub-layer of the upper 200 cm layer.
Results and discussion
The relationships between water deficiency values, yield, irrigation, fertrilization, precipitation before the season (October-March), precipitation during the season (April-September) and precipitation in June-July (a critical period for maize) were studied per year and per crop rotation using Pearson’s correlation. (Table 1).The correlation between fertilization and yield was medium and significant (0.422). The correlation between

Hnanice, Czech Republic – 09-14. April, 2018
61
plant density and yield were not significant in either year. Based on the results of the three years, it can be concluded that the period of June-July (when maize has the highest water requirements) has the strongest effect on yield and accordingly on water deficiency, at this time, temperature also has a great impact on yields in addition to water supply. A very strong significant correlation was found between precipitation in the period of June-July and yield in mono-, bi- and triculture (monoculture: 0.711, biculture 0.754 and triculture: 0.781).Table 1. Correlation coefficients between some agrotechnical elements, temperature, precipitation and yield (Debrecen, 2007-2008-2009)
Monoculture Biculture TricultureYear-yield 0.456** 0.540** 0.300**Nutrient-yield 0.350** 0.183 0.233*Water deficiency-yield -0.423** -0.668** -0.562**Plant density-yield -0.104 -0.041 -0.013Precipitation in June-July-yield 0.711** 0.754** 0.781**Precipitation in June-July –water deficiency -0.808** -0.810** -0.878**Precipitation in October-March-yield 0.749** 0.832** 0.685**Precipitation in October-March –water deficiency -0.529** -0.768** -0.506**Precipitation in April-September-yield 0.431** 0.427** 0.581**Precipitation in April-September –water deficiency -0.740** -0.558** -0.858**Heat sum in June-July-yield -0.782** -0.848** -0.788**Heat sum in June-July-water deficiency 0.723** 0.847** 0.751**
Numbers marked by (**) indicate a significant correlation at P=1 %
Conclusions
According our results the water stock of chernozem soil was determined primarily by crop rotation, which was modified by irrigation and fertilization. Plant density had the smallest impact on the water stock of the soil in maize production. Via the optimization of the agrotechnical elements (crop rotation, fertilization, irrigation, plant density), the maximum yield of maize varied between 9.6 and 13.9 t ha-1 in a small-plot long-term experiment on chernozem soil in the region of Hajdúság. Therefore, the harmonization of agrotechnical elements is essential for achieving high yields in the practice of production.
Acknowledgement
The work is supported by the EFOP-3.6.3-VEKOP-16-2017-00008 project. The project is co-financed by the European Union and the European Social Fund.
ReferencesBirkás, M. (2000): Környezetkímélő alkalmazkodó talajművelés. Akaprint Nyomdaipari Kft. 107.Jolánkai M. – Birkás M. (2009):Klímaváltozás és növénytermesztés. V. Növénytermesztési Tudományos Nap.
Növénytermesztés: Gazdálkodás – Klímaváltozás – Társadalom. Akadémiai Kiadó. 27-32.Keszthelyi, S. (2005):A 2004. év klimatikus tényezőinek hatása a kukorica fejlődésére, kártevőinek megjelenésére
és kártételére. Gyakorlati Agrofórum Extra 10. 2005. március. 3-7.)Láng, I., Csete L., Jolánkai M. (2007):A globális klímaváltozás: hazai hatások és válaszok. A VAHAVA jelentés.
Szaktudás Kiadó Ház, Budapest.Polyák, F. (2008):Az öntözés fontossága, szükségessége, gyakorlata. Agrárágazat. 9. 5. 74-76.

Abstract Book – 17th Alps-Adria Scientific Workshop
62
Using multiple plant sensors to characterise the development of maize (Zea Mays L.) in field experimentPéter RAGÁN1 – Dénes SULYOK2 – János NAGY1 – Endre HARSÁNYI1 – Tamás RÁTONYI1
1: Institute of Land Utilisation Technology and Regional Development, Faculty of Agricultural and Food Sciences and Environmental Management, University of Debrecen, H-4032 Debrecen, Böszörményi street. 138, E-mail: [email protected]
2: KITE Plc. & H-4181 Nádudvar, Bem József square 1; E-mail: [email protected]
Keywords: maize, SPAD value, NDVI index, leaf area index, field experiment
Introduction
In agriculture, decision-making requires a large amount of data (Milics, 2015). Remote sensing applications in precision agriculture began with sensors for soil organic matter and quickly diversified to include satellite aerial and hand held or tractor mounted sensors (Mulla, 2013). The GreenSeeker measurement developed by Stone et al., (2003) collecting the crop canopy reflectance at the red and near-infrared wave band with which normalised difference vegetation index was calculated to estimate the crop growth conditions, plant biomass and patterns of productivity. Leaf chlorophyll content measured with SPAD-502 portable chlorophyll meter measures “greenness” of the plants and assesses nitrogen requirement. This “greenness” and the connection amongst acetone extract chlorophyll contents measured in spectrophotometer were examined by Marquard and Tipton (1987), they established that there was a significant correlation amongst the measured values. The assimilating leaf area greatly influences dry matter accumulation in hybrids (Pető, 1993).
Materials and methods
In the course of the trial, sample areas have been assigned on 4 field plots of Balogh-Farm Tépe Ltd. on the basis of the productivity maps provided by KITE cPlc. Measurement points have been classified into three groups. A weak, a medium and a good productivity zone has been selected for examination on the A,C; and D plots, while on plot B a weak and a good productivity yield zone has been selected. At these measurement points SPAD, NDVI measurements were performed at 4 leaf, 10 leaf and silking stages of maize. Leaf area measurements were performed at 10 leaf stage and silking. Statistical analysis was performed by means of Rstudio. To analyse the connection of NDVI, SPAD, LAI, and NDVI variation coefficient values, a multilinear regression model was elaborated. The purpose of our investigations is the on-site validation of vegetation index measurements more and more frequently utilised in technical advisory systems and the determination of correlations amongst SPAD and LAI values and the NDVI values measured by GreenSeeker.
Results and discussion
The SPAD, LAI and NDVI variation coefficient values measured at two different dates had a significant influence on the NDVI values measured by the GreenSeeker sensor. Their combined effect is medium week (r=0.45), jointly they affected the measured NDVI values at 20.26% (Table 1)

Hnanice, Czech Republic – 09-14. April, 2018
63
Table 1: Effect of measured SPAD, LAI and variation coefficient data on the NDVI values measured by GreenSeeker sensor
Measured value Significance Correlation
SPAD 0.03504* r 0.4501
LAI 0.01546* r2 0.2026
CV NDVI 4.413*10-12*** r2% 20.26Significance codes: 0 ‘***’ 0.001 ‘**’ 0.01 ‘*’ 0.05 ‘.’ 0.1 ‘ ’ 1
Conclusions
SPAD and LAI values had a weak correlation with NDVI values. The reason for the weak correlation is that in the early stage of maize development, the NDVI measuring sensor detects a large area of soil beside the plant, which greatly influences the measured values. In addition, upon silking the scattered pollen covers the plant, affecting the correlation between the measured NDVI values and SPAD and LAI values. We have found that the time and circumstances of the measurement greatly influence the usability of NDVI values.
Acknowledgement
The research is supported by the project “Establishing a scale-independent complex precision consultancy system (GINOP-2.2.1-15-2016-00001)” The publication is supported by the EFOP-3.6.3-VEKOP-16-2017-00008 project. The project is co-financed by the European Union and the European Social Fund. The field trial and the analyses is supported by KITE cPlc.
ReferencesMarquard, R. D., Tipton J. L.: (1987): Realtionship between chlorophyll and an in situ method to estimate leaf
greennes. HortScience. 22: 1327Milics G.: (2015): Data collection methods for agricultural models [In: Neményi M., Nyéki A. (szerk) Proceedings
of the Workshop on „Impact of Climate Change on Agriculture”] Mosonmagyaróvár 2015. szeptember 24. ISBN 978-963-359-057-7
Mulla, D.J. (2013): Twenty five years of remote sensing in precision agriculture: Key advances and remaining knowledge gaps. Biosystems engineering. Vol 114, Issue 4. 358-371.
Pető M. (2013): A növényélettan alapjai. Akadémia Kiadó, Budapest. 178. ISBN: 9630575434Stone, M.L., Needham, D., Solie, J.B., (2003): Optical spectral reflectance sensor and controller. US. Pattent
6,596,996.

Abstract Book – 17th Alps-Adria Scientific Workshop
64
Analysis of maize hybrid yields in a long-term field experimentÁgnes TÖRŐ1 – Zoltán BALLA2 – Endre HARSÁNYI1 – Tamás RÁTONYI1
1: Institute of Land Utilisation Technology and Regional Development, Faculty of Agricultural and Food Sciences and Environmental Management, University of Debrecen, H-4032 Debrecen, Böszörményi út 138, E-mail: [email protected]
2: Bázismag Kft., Martonvásár, Hungary; 2462 Martonvásár-Erdőhát, Kúti András u. 21; E-mail: [email protected]
Keywords: maize hybrid, tillage system, agrotechnical factors
Introduction
Ecological, biological and agrotechnical factors jointly determine the success and efficiency of maize production. Fertilisation has a significant importance of all production technological elements affecting maize yield (Széll et al., 2005; Nagy, 2007). Fertilisation may contribute to reduce the quality and quantity disparities between various production sites as elicited by weather factors (Árendás, 2006). The tillage system needs to be adjusted, supplemented or reduced in accordance with the current soil type, soil conditions and the needs of the crop species and varieties, conforming to the peculiarities of the given crop year (Jóri, 2014). Soil preparation procedures can be divided to two groups of operation: primary tillage and spring seedbed preparation. Several researchers confirmed that there is a close correlation between tillage processes and the change of soil moisture (Gyuricza és Birkás, 2005). According to Surányi (1957), the water shortage of maize is especially a risk factor in dry crop years; therefore, the omission of spring polughing is necessary in order to guarantee that the water stock of the soil does not decrease significantly. However, Nagy (2012) recommended the use of spring ploughing as primary tillage in the case of favourable crop years. According to Birkás (2017), the unnecessary deepening effect of spring ploughing, the increased amount of soil compaction, moisture loss and unbalanced moisture usually make it an unfavourable operation.
Materials and methods
Examinations were performed on mid-heavy, calcareous chernozem soil on the Látókép Experiment Site (N 47°33’ E 21°27) of the Debrecen Study Farm and Land Research Institute of the Agricultural Research Institutes and Study Farm (AKIT) of the University of Debrecen. The long-term field experiment has a split-strip-plot design with the main plots representing tillage and irrigation treatments without replication. In the primary subplot, the maize hybrids have 70,000 and 50,000 pland density values, while fertiliser treatment in the secondary subplots is randomised in four replications. In our experiments, we only analysed the data of the non-irrigated experiment. Based on the results of small plot long-term field experiments, we have been looking for the effect of the three maize hybrids we have chosen per hectare and the change in soil cultivation, fertilisation and plant density per hectare starch yield.
Results and discussion
It was found that the average crop yield was the highest (9,49 t/ha) in the case of a plant density of 50 thousand plants per hectare and spring shallow tillage in the average of three years. Autumn ploughing (8.43 t/ha) resulted in a yield decrease of 1.06 t, while spring

Hnanice, Czech Republic – 09-14. April, 2018
65
ploughing (8.30 t/ha) led to a yield decrease of 1.19 t. The surplus yield achieved through the use of spring shallow tillage was achieved in the average of the three years in the case of unfavorable rainfall distribution, in addition to a soil cultivation process which has a favorable effect on water-preserving, soil water balance, and minimises the evaporation of ground water. In the case of dry crop year, it is recommended that spring shallow cultivation be used to maximize crop yield under non-irrigated conditions. In non-irrigated cultivation technologies, the crop year effect is the most significant in determining yields. Since it was able to surpass the effect of fertilisation, tillage and hybrid selection in dry years, it had the greated effect on yield. The highest yield was obtained in the case of spring shallow tillage, followed by autumn ploughing primary tillage and spring ploughing. In the case of 3 fertiliser treatments, the highest yield was obtained by applying the highest amount of nitrogen, which is consistent with the finding that the amount of nitrogen applied has the highest role in achieving maize yield surplus (Bocz, 1974; Berzsenyi, 2009). Soil tillage as an agrotechnical factor has a significant effect on maize yield in the case of 70 thousand plants per hectare. Averaged over the three examined years, the highest yield, which is significantly higher than the results of the other primary tillage methods, was achieved in the case of spring shallow tillage (9.56 t/ha). Yields achieved achieved by autumn plowing (8.49 t/ha) and spring plowing (8.37t/ha) were significantly lower. In addition to tillage, fertilisation is an important agrotechnical factor, which can affect yield under irrigated conditions, with 70 thousand plants per hectare. The obtained results of fertilisation effect show that elevated nitrogen doses maximise yield under non-irrigated circumstances.
Conclusions
The results of the maize yields showed that there were significant differences between the yields of the examined years, and in particular the yields achieved through the various tillage systems. On the basis of the tillage method results, it was found that the highest amount of yield was achieved by applying autumn ploughing at 70 thousand plants per hectare and spring shallow tillage at 50 thousand plants per hectare on mid-heavy calcareous chernozem soil in the case of non-irrigated conditions.
Acknowledgement
The work/publication is supported by the EFOP-3.6.3-VEKOP-16-2017-00008 project.
ReferencesÁrendás T. (2006): Növénytáplálás új szemlélettel. Agrofórum. 17. 12: 8–10.Berzsenyi Z. (2009): Új kihívások és módszerek a növénytermesztési kutatásban. Növénytermelés 58. 1:77-91.Birkás M. (2017): Földművelés és földhasználat. Mezőgazda Kiadó. Budapest. 120.Bocz E. (1974): A szántóföldi növények hazai trágyázásának irányelvei. Debrecen. 65–77.Gyuricza Cs., Birkás M. (2005): A talajnedvesség és a talajállapot összefüggései - Lehetőség az aszálykárcsökkentésére. Tanulmány a Corvinus Egyetem. Budapest. 29.Jóri L. (2014): Az őszi talajművelés feladatai és megvalósítási lehetőségei. Agrofórum. 2014. október.Nagy J. (szerk.) (2012): Versenyképes Kukoricatermesztés: A jövedelmezőség kulcstényezői a szántóföldi
gyakorlatban. Mezőgazda Kiadó. Budapest. 494.Surányi J. (1957): A kukorica és termesztése. Akadémia Kiadó. Budapest.

Abstract Book – 17th Alps-Adria Scientific Workshop
66
Genetic and phenotypic variability of seed germination in barley cultivars (Hordeum vulgare L.) Desimir KNEZEVIC1 – Danijela KONDIC2 – Adriana RADOSAVAC3– Sretenka SRDIC2 – Vlado KOVACEVIC4
1: University of Pristina, Faculty of Agriculture, Kosovska Mitrovica-Lesak, Kopaonicka bb.,38219 Lesak, Kosovo and Metohija, Serbia, [email protected]
2: University of Banja Luka, Faculty of Agriculture Banjaluka, Aveue Vojvode Petra Bojovića, 1A, 78000 Banjaluka, Republika Srpska, B& H; E-mail: [email protected] , [email protected]
3: University Business Academy in Novi Sad, Faculty of Applied Management, Economics and Finance in Belgrade, Jevrejska 24, 11000 Belgrade, Serbia; E-mail: [email protected]
4: University J. J. Strossmayer in Osijek, Faculty of Agriculture, Trg Sv. Trojstva 3, HR-31000 Osijek, Croatia, [email protected]
Keywords: barley, variability, seed germination, nitrogen dose
Introduction
Seed germination are critical stages of the plant life cycles, which influence on distribution of plants and abundance of plant in communities (Silveira et al., 2012). The growing of barley crops in different region environment can be associated with variations in seed germinability (Ranieri et al., 2012). Seed size is an important evolutionary trait that effects on plant reproduction of many plant species and which varies between plant species (Moles et al., 2006) as well between cultivars within one species (Paunovic et al, 2010). For production of vigorous quality seeds is necessary control of crops in each phase of plant growing up to harvesting and storing (Zečevič et al., 2006). The nitrogen nutrition has positive effect on barley yield and yield components (Madic et al., 2009; Knezevic et al., 2015). The aim of this work was to investigate the influence of increasing rates of N, applied during the growing season on the percentage of seed germination of four winter barley cultivars.
Materials and methods
The four winter barley cultivars (Jagodinac, Premium, NS 489 and NS 495), were used for investigation of seed germination during two year experiment which was performed in randomized block design on 5m2 plots and 4 replications under four different dose of mineral nutrition (control N0=0, N1=20, N2=40 and N3=60 kg ha-1). The values of temperature and precipitation were different between two years of experiment. The seed germination analysis conducted according to the rules of the ISTA (2010).
Results and discussion
The values of seed germination variate for investigated barley cultivar depends of year of investigation and variant of applied nitrogen during vegetative period of development. Table 1. Average values of seed germination of barley cultivars
Jagodinac Premium NS-589 NS-595 Average Total average2010/11-Total average/cultivar 93,44 92,16 93,65 93,38 93.162011/12-Total average/cultivar 94,70 96,64 95,68 95,78 95.7 94.43Two years average/cultivar 94.07 94.39 94.66 94.58

Hnanice, Czech Republic – 09-14. April, 2018
67
Obtained data indicate the percentage values of seed germination for analysed four barley cultivars were high significant different between first and second experimental years, as well between nutrition variant, which indicates that the weather conditions in the second year of investigation were more favourable and enabled more efficient nitrogen exploitation from soil, as well that dose of N 60kg ha-1 had the highest influence to increase value of seed germination. The significant differences among the investigated barley cultivars were established for the expressed average values of seed germination in the first and in the second year of investigation (tab. 1 and 2). Table 2. Components of phenotypic variance for germination of seed of barley cultivars
Source of variance
(DF) (MS) F-test LSD Comps of variance0.05 0.01 σ2 %
Repetitions (R) 3 0.618 2.5949 - - - -Genotypes (G) 3 1.090 4.5788** 0.5489 1.007 0.018 0,82Nitrogen (N) 3 29.488 123.8657** 0.5489 1.007 1.793 81,87Interaction (GxN) 9 0.803 3.3716** 0.7804 1.121 0.141 6,44Error 45 0.238 - - - 0.238 10,87Total 63 - - - - 2.190 100.00
Conclusions
According to values of seed germination were determined high significant differences among barley cultivars and established the influence of mineral N nutrition to the expression of this trait. The germination percentage can be used as markers that determine the tolerance capacity of barley plants to environmental stress and for prediction adaptability of cultivars during germination and early seedling growth.
Acknowledgement
This investigation supported by Ministry of Education, Science and Technology Development of Republic of Serbia, Project TR 31092
References ISTA Rules (2010): International Rules for Seed Testing. Int. Seed Testing Assoc., SwitzerlandKnezevic, D., Kondic, D., Srdić, S., Zečević, V., Atanasijevic, S. (2015): Variability of grain mass per spike in
winter barley cultivars (Hordeum vulgare L.) influenced by nitrogen nutrition. Növénytermelés 64: 47-50. Madic, M., Paunovic, A., Knezevic, D., Zecevic. V. (2009): Grain yield and yield components of two-row winter
barley cultivars and lines. Acta Agriculturae Serbica, 14(27):17-22. Moles, A. T., Westoby, M. (2006): Seed size and plant strategy across the whole life cycle. Oikos, 113:91-105. Paunovic, A., Madic, M., Knezevic, D., Jelic, M., Djalovic, I. (2010): The effect of N fertilization and sowing
density on the first-class grain contents in two-rowed spring barley. In Proceedings (ed. Z. Loncaric) 45th Croatian &5th Int. Symp. Agriculture, Opatija pp. 874-877.
Ranieri, B. D., Pezzini, F.F., Garcia, Q.S., Chautems. A., França, M.G.C. (2012): Testing the regeneration niche hypothesis with Gesneriaceae (tribe Sinningiae) in Brazil: Implications for the conservation of rare species. Austral. Ecology. 37:125-133.
Silveira, F.A.O., Negreiros, D., Araújo, L.M., Fernandes,G.W. (2012): Does seed germination contribute to ecological breadth and geographic range? A test with sympatric Diplusodon (Lythraceae) Species from rupestrian fields. Plant Species Biology. 27:170-173.
Zečević, V., Knežević, D., Mićanović, D., Urošević, D. (2006): Influence of seed maturity on early seedling vigor in wheat. Kragujevac J. Sci. 28(1): 165-171.

Abstract Book – 17th Alps-Adria Scientific Workshop
68
Variability of seed number and seed mass per spike in wheat (Triticum aestivum L.)Desimir KNEZEVIC1 – Veselinka ZECEVIC2 – Dusan UROSEVIC2 – Mirela MATKOVIC2 – Danica MICANOVIC3 1: University of Pristina, Faculty of Agriculture, Kosovska Mitrovica-Lesak, Kopaonicka bb.,38219 Lesak,
Kosovo and Metohija, Serbia, [email protected]: University Megatrend, Belgrade, Faculty of Biopharming Backa Topola, M. Tita 39, Serbia; [email protected],
[email protected] 3: Serbian Chamber of Commerce and Industry, Resavska15, Bеlgrade, Serbia; [email protected]
Keywords: wheat, variability, seed number, seed mass, environment, genotype
Introduction
The number of seed spike-1 and mass of seed spike-1 have significant positive contribution in forming of whole wheat yield (Shoran et al., 2000). Those two traits are in connection to other yield components (Haq et al., 2010; Dimitrijevic et al., 2011). The values of number of seed and mass of seed per spike are under control of genetic and environmental factors as well as interaction of genetic and environmental factors (Knežević et al., 2015). The optimal environmental condition (temperature and precipitation) are very important at each developmental stage of plants for achievement high value of number of seed and seed mass spike-1. High temperature shortens the seed filling period, and induces early maturity which causes seed shrinkage and low grain weight (Agoston and Pepo, 2005). Spike productivity is in direct correlation with the number of seed and seed mass spike-1 as well with total seed yield (Okuyama, 2005). The aim of this study was to evaluate the variability of seed number ad seed mass spike-1 in genetically divergent wheat cultivars grown in different environmental conditions
Materials and methods
The twenty genetically divergent winter wheat cultivars were used for study of number of seed and mass of seed spike-1 during two years (2015-2017). The experiment was performed in randomized block design in three replications on the field in Kraljevo, Serbia. The seeds of varieties were sown at the distance of 0.05m in rows of 1m length among which was the distance of 0.2m. For analysis of number of seed and mass of seed spike-1 were used 60 plants in full maturity stage (20 plants per replication). The significant differences between the average values were estimated by F-test values. The analysis of variance was performed according to a random block system with one factor.
Results and discussion
The number of seed spike-1 in first year of experiment varied in ratio of 47.62-75.40 with average value 67.29, while in second year varied from 60.82 to 77.80 with average value 60.65 seed. Mass of seed spike-1 in first year of experiment varied in interval of 2.63 g -3.537 g with mean value 3.15g, while in second year grain mass varied between 2.487g and 3.143 g with average value2.87g (tab. 1). The obtained results showed significant differences in the average values of number of seed and mass of seed spike-1 per year, that indicating diversity of studied cultivars. Similar results were reported in previous investigation (Knezevic et al., 2010; Knezevic et al., 2015).

Hnanice, Czech Republic – 09-14. April, 2018
69
Table 1. Variability of number of seed spike-1 and mass of seed spike-1
Number of kernels spike-1 Mass of seed spike-1 Cultivars First year Second year Average First year Second year AverageEvropa 90 68.15cde 72.77abc 70.46 2.907ghi 2.733bcde 2.82Dejana 66.62e 69.68bcd 68.15 3.037efgh 2.903abcde 2.97Sila 75.40ab 77.80a 76.60 3.220bcdef 2.943abc 3.08Omega 66.00ef 69.40bcde 67.70 3.323abcd 3.067ab 3.19Lasta 71.33bcd 71.67abc 71.50 3.353abcd 3.073ab 3.21Milica 76.98a 72.20abc 74.59 3.537a 3.063ab 3.30Partizanka 68.00cde 61.00fg 64.50 2.907ghi 2.517de 2.71Pobeda 73.33ab 63.67defg 68.50 3.493ab 2.677bcde 3.08Dična 72.33bc 78.00a 75.16 3.227bcdef 2.927abcd 3.08NSR-5 68.13de 67.05cdefg 67.59 3.270abcde 2.857abcde 3.06Alfa 64.00efg 69.33bcde 66.66 2.817hi 2.563cde 2.69Rodna 67.67de 67.67cdef 67.67 2.970fgh 2.763abcde 2.87Agrounija 64.47efg 68.93cde 66.70 3.043efgh 2.487e 2.76Zadruga 47.62i 60.82fg 54.22 2.637i 3.123a 2.88KG -75 54.77h 62.60efg 58.68 2.953fgh 3.143a 3.05Šumadinka 77.68a 73.55abc 75.61 3.403abc 2.897abcde 3.15Levčanka 72.23bc 76.08ab 74.15 3.207cdef 2.997ab 3.10Oplenka 68.35cde 67.73cdef 68.04 3.440abc 3.043ab 3.24Gruža 61.12g 67.47cdefg 64.29 3.087defgh 2.803abcde 2.94KG-56 61.65fg 60.65g 61.15 3.180cdefg 2.780abcde 2.98Average 67.29 68.90 - 3.15 2.87 -LSD (0.05) 4.356 6.991 - 0.2756 0.4186 -LSD (0.01) 5.955 9.556 - 0.3767 0.5722 -
Conclusions
The differences among wheat cultivars were significant for analyzed traits: number of seed spike-1 and mass of seed spike-1 in both year of investigation.
Acknowledgement
This study financed by Ministry of Education, Sci&Techn.of R.Serbia-Project TR31092
References Agoston, T., Pepo, P. (2005): Effects of genetic and ecological factors on yield formation in winter wheat
production. Cereal Research Communications, 33 (1):37- 40.Dimitrijević, M., Knežević, D., Petrović, S., Zečević V., Bošković J., Belić, M. Pejić, B., Banjac, B. (2011):
Stability of yield components in wheat (Triticum aestivum L.). Genetika, 43(1): 29-39. Haq, W., Munir, M., Akram, Z. (2010): Estimation of interrelationships among yield and yield related attributes
in wheat lines. Pak. J. Bot., 42(1):567-573.Knežević, D., Branković, G., Šurlan-Momirović, G., Stamenković, S., Knežević, J. (2010): Fenotipska
varijabilnost mase primarnog klasa pšenice Triticum aestivum L. Arhiv za polj. nauke, 71 (3): 255: 15-20.Knezevic, D., Radosavac, A., Zelenika, M., (2015): Variability of grain weight per spike of wheat grown in
different ecological conditions. Acta Agriculturae Serbica, Vol. XX, No. 39, 85-95Okuyama, L. A., Federizzi, L. C., Neto, J. F. B. (2005): Grain yield stability of wheat genotypes under irrigated
and non-irrigated conditions. Brazilian Archives of Biology and Technology, 48(5):697-704.Shoran J., Hariprasad, A.S., Lakshmi, K., Mani, V.P., Chauhan, V.S. (2000): Association and contribution of
yield attributed to seed yield in wheat under varying environments in North Western Hills. Ann. Agri. Res., 21: 274–278.

Abstract Book – 17th Alps-Adria Scientific Workshop
70
Examination of the starch content of maize hybrids based on long-term field experiment resultsKarina Bianka BODNÁR1 – Zoltán BALLA2 – János NAGY1 1: Kerpely Kálmán Doctoral School, University of Debrecen, Hungary; E-mail: [email protected]: Bázismag Kft., Martonvásár, Hungary; E-mail: [email protected]
Keywords: maize hybrids, long-term field experiment, starch content
Introduction
The quality properties of crop yields are determined primarily by genetic background which can be modified with crop production technology and site conditions (Jellum and Marion, 1966). Móroczné (2004) reported the following analytical results: carbohydrate: 70-72%, protein: 8-10%, oil: 4-5%, raw fibre: 3-3.5%, ash: 1.5-2%. Of nutritional values, protein and oil content affects quality the most.
Bocz (1976) concluded that fertilisers significantly affect the nutritional value of maize grain yield. The performed analyses also covered the proportions of the three macronutrients (NPK). It was concluded that nitrogen and phosphorus are the main factors which affect the nutritional value of the grain. Compared to the control, nitrogen alone was able to increase the crude protein content, but the combination with NPK resulted in the the highest amount of crude protein in the crop. This finding was later also shown by Ványiné et al., (2012). Nowadays, the recommendations of various breeding institutions offer maize hybrids containing even up to 70-75% starch. These hybrids are marked as HTF (High Total Fermentable).
In the research performed for the purpose of increasing the carbohydrate content of the maize grain, Sárvári and Boros (2011) concluded that the recommended NPK fertiliser ratio should result in starch increase and not protein increase in addition to proper yield. During the use of NPK fertilisers, increased potassium use resulted in increased carbohydrate development and increased starch yield. In maize growing for bioethanol production purposes, it is recommended to apply 80-90 kg/ha nitrogen, 70-80 kg/ha phosphorus and 120-130 kg/ha potassium active ingredient to achieve the highest starch yield.
Materials and methods
Examinations were performed on mid-heavy, calcareous chernozem soil on the Látókép Experiment Site of the University of Debrecen. The long-term field experiment has a split-split-plot design with the main plots representing tillage and irrigation treatments. In the primary subplot, the maize hybrids have 70,000 and 50,000 plant density values, while fertilizer treatment in the secondary subplots is randomized in four replications.
Duncan’s test was used to perform a mean value comparison of yield and starch yields (Huzsvai & Balogh, 2015).
Based on the results of small plot long-term field experiments, we have been mainly looking for the effect of production technological factors on maize hybrids’ grain and starch yield per hectare. Due to the comparability of the maize hybrids with different moisture content, the starch content of the different samples on the dry substance had to be

Hnanice, Czech Republic – 09-14. April, 2018
71
determined. This value is the relative starch content, which makes it possible to compare the sample of hybrids of different moisture content. The relative starch content can be calculated using the following equation: 100/(100-A)×B (A= momentary starch content obtained during the measurement, B= starch content of the sample of the given moisture content as measured by spectroscopy).
Results and discussion
Averaged over the examined years and applying 50 and 70 thousand plants per hectare, the highest starch yield was obtained in the case of applying N 240 kg / ha + P2O5 180 kg / ha + K2O 212 kg / ha. According to several scientists, nutrition, including nitrogen supply as an agrotechnical element, determines yield and, consequently, grain quality to the largest extent (Genter et al., 1956).
Conclusions
Among the nutritional values, the starch content of maize hybrids is an important factor in industrial processing, from which we can determine the yield per hectare in terms of crop yields. Bocz (1976) obtained the same data as, i.e., nitrogen and phosphorus are the main factors which affect the nutritional value of the grain. In the case of extremely dry crop years (2012, 2013), elevated amounts of nitrogen resulted in the highest amount of starch yield in the case of both plant density values (50 and 70 thousand plants/ha). However, the highest amount of starch yields we have achieved and the corresponding nitrogen fertiliser dose are largely different from that proposed by Sárvári and Boros (2011), i.e., 80–90 kg / ha nitrogen dose is required to achieve maximum starch yield.
Acknowledgement
The publication is supported by the GINOP-2.2.1-15-2016-00001 and the EFOP-3.6.3-VEKOP-16-2017-00008 projects. The project is co-financed by the European Union and the European Social Fund.
References Bocz E. (1976): Trágyázási útmutató. Mezőgazdasági Kiadó. Budapest. 257.Genter, C. G., Eheart, J. F., Linkous, W. N. (1956): Effect of location, hibrid, fertilizer and rate of planting on the
oil and protein content of corn grain. Agronomy Journal. 48: 63–67.Huzsvai L., Balogh P. (2015): Lineáris modellek az R-ben. Seneca Books. Debrecen. 109–124.Jellum, M. D., Marion, J. E. (1966): Factors affecting oil content and oil composition of corn (Zea mays L.) grain.
Crop Science. 6: 41–42.Móroczné Salamon K. (2004): Nemesítés speciális beltartalmi értékekre. [In: Sági F. (szerk.) A nyolcadik
évtizedben.] Gabonatermesztési Kutató Kht. Szeged. 180–181.Sárvári M., Boros B. (2011): A kálium műtrágyázás hatása a kukorica hibridek bioetanol produkciójára.
Növénytermelés. 60. 1: 7–25.Ványiné Széles, A., Tóth, B., Nagy, J. (2012): Effect of nitrogen doses on the chlorophyll concentration, yield
and protein content of different genotype maize hibrids in Hungary. Afr. J. f Agric. Res. 7. 16: 2546–2552.

Abstract Book – 17th Alps-Adria Scientific Workshop
72
The appearance of taxonomical distance among winter cereal species along the spring to early summer SPAD valuesÁkos TARNAWA1 – Laura CZERŐDINÉ KEMPF1 – Ferenc NYÁRAI-HORVÁTH1 – András MÁTÉ1 – Zsolt SZENTPÉTERY2
1: Institute of Crop Production, Szent István University, 2100 Gödöllő, Páter K. u. 1; E-mail: [email protected]
2: Faculty of Mechanical Engineering, Szent István University, 2100 Gödöllő, Páter K. u. 1
Keywords: cereal, SPAD value
Introduction
In Hungary, agricultural production has long been a major issue as almost half of the country’s land is arable. In Hungary, just as in the entire world, cereals represent the most plausible source of human alimentation, hence, for a very long time, winter cereals were the most commonly cultivated crop species. There exist numerous factors that have effect on yield (Tarnawa & Klupács, 2006; Horváth, 2014). The most critical technological points in winter cereal production are agrochemical applications, so that it is essential to reveal and study soundly their impacts (Birkás, 2006). The nitrogen regime of plants has high importance in photosynthetic activity. Strong connection could be found even visually between the colour of a crop plant and N supply. That colour, and in parallel the chlorophyll activity can be estimated in an objective way by SPAD analyzer that generates indices on N supply of plants on field. As it measures without destruction, it can be used in different phenological status (Ványiné, 2008). To be able to use the SPAD method for N supply estimation it is necessary to have points to accord. In former studies it was found that even between varieties there can be observed big differences in SPAD values. In this paper our aim is to make reference values for the most critical lifetime of several species and varieties of winter cereals.
Materials and methods
At the Gödöllő campus of Szent István University a set of winter cereals were sown on micro-plots (1 m2 each) for demonstrational purposes. Among these items any sort of winter cereals could be found. Four groups were made on them: 1 – Triticum aestivum; 2 – other Triticum; 3 – nude cereals but not Triticum; 4 – other cereals in glumous. In one of the most critical period, the late spring to early summer, chlorophyll activity was estimated by SPAD-502 PLUS analyzer in different phenological stages. On nine occasion the estimations were made. The SPAD values were measured on them regularly in 10 repetitions for each plot in each time. On the series the statistical analysis was performed by using the MS Excel program package.
Results and discussion
The analysis was made by group, and also with the averages of other groups as reference. In the first group the difference between them seems to be big, the shape of curves are similar; the place of local maximum and minimum point are together for most of them. In the second group, as that group comprises numerous varieties, lower differences can be found in value but bigger variation in the shape of curves. In third group, as the triticale

Hnanice, Czech Republic – 09-14. April, 2018
73
is closer to wheat, it can be noticed in the similarity to average curves of wheat groups. In the last group it can be seen well on figure 1 that the curves of the three barley varieties go similarly but the oat variety has a diverse performance. As an example, on figure 1 the averages of the measurements could be seen. The solid lines refer for each item but dashed lines are for average of a bigger group.
It can be stated that remarkable differences occurred between the averages. Also, the differences show close correlation with taxonomical distances of the species and varieties examined.
Conclusions
Evaluating the results obtained it can be concluded that it is necessary to have reference values not only for each species but for every variety. The differences in pattern of averages seem to be correlated with taxonomical distances of the varieties examined.
Acknowledgement
The authors are indebted regarding the financial support of VKSZ (VKSZ_12-1-2013-0034 - Agrárklíma.2).
ReferencesBirkás M., Dexter, A. R., Kalmár, T., Bottlik, L. (2006): Soil quality – soil condition – production stability.
Cereal Research Comm. 34. 1. 135-138. DOI: 10.1556/CRC.34.2006.1.34 Horváth Cs. (2014): Storage proteins in wheat (Triticum aestivum L.) and the ecological impacts affecting their
quality and quantity, with a focus on nitrogen supply. Columella - Journal of Agricultural and Environmental Sciences 1. 2. 57-75 pp.
Tarnawa Á., Klupács H. (2006): Element and energy transport model for an agricultural site. Cereal Research Communications. 34. 1. 85-89 pp.
Ványiné Széles A. (2008): SPAD érték és a kukorica (Zea Mays L.) termésmennyisége közötti összefüggés elemzése különböző tápanyag - és vízellátottsági szinten. PhD doktori értekezés, Debrecen, p. 111.
Figure 1. The average result for glumous cereals (group 4) with the combined average of Triticum aestivum varieties (group 1), Triticum varieties (group 2) and non-Triticum nude cereals (group 3)

Abstract Book – 17th Alps-Adria Scientific Workshop
74
Performance of industrial hemp varieties and hybrids in HungaryLaura CZERŐDINÉ KEMPF1 – Ákos TARNAWA1 – Zuzana FINTA2
1: Institute of Crop Production, Szent István University, 2100 Gödöllő, Páter K. u. 1; E-mail: [email protected]
2: Agromag Ltd., 3356 Kompolt, Fleischman u. 4.
Keywords: industrial hemp, Hungarian hemp varieties, Hungarian hemp hybrids, hemp breeding
Introduction
Hemp is the most important of our fibre crops under temperate climate, but the purpose of its cultivation extended in the last few years thanks to its highly valuable natural compounds. The varieties were grown for a long time in lack of systematic breeding work it has a number of unfavourable characteristics of wild plants until the breeding started in Hungary in the 1950’s. (Bredemann et al., 1956) One chemical constituents of Cannabis was undesirable used as a fibre crop.
Materials and methods
Several descriptions of varieties can be found in the literature. Most of them are not in the same structure, some of them is not up to date. Even it would be necessary to have the descriptions in a collection, completed with new varieties / hybrids. In that way, it would be easier to compare them from several points of views.
To make that comparative work, the following sources could be used: former monographies on hemp breeding and use, agrobotanical descriptions (eg. Magyarország Kultúrflórája) descriptions for marketing purposes, etc.
Results and discussion
The most practical way to collect them together is to create a table with the most important characteristics (Table 1.).Table 1.: The description of existing hemp varieties and hybrids in Hungary
name length of growing season (days) variety/hybrid sexual type tkw (g) typical performance
KC Zuzana 90 variety monoecious 15 excellent seed yieldFibrol 100 variety monoecious 13 high oil contentMonoica 110 variety monoecious 19 high seed yieldTiborszállási 110 variety dioecious 19-20 very fine fibresTisza 110 SC hybrid dioecious 18 very good stem production
Unico -B 110 SC hybrid dioecious 18-20 outstanding seed yield in F1 generation
Cannakomp 115 TC hybrid dioecious 18 excellent fine fibres
KC Dóra 120 variety monoecious 18 outstanding stem production
KC Virtus 120 SC hybrid dioecious 18-19 excellent fiber contentLipko 120 TC hybrid dioecious 17 very good seed yieldKompolti 130 variety dioecious 19-20 excellent stem yieldK o m p o l t i hibrid TC 135 TC hybrid dioecious 19 excellent stem yield, late
ripeningThe THC content of all items are below 0.2%.

Hnanice, Czech Republic – 09-14. April, 2018
75
As it can be seen in the table, the Hungarian varieties and hybrids can be used different purposes along their typical performance, like the following: seed production, fiber production, medical purposes, as energy crop and for many more.
Conclusions
The genetic background in hemp breeding is quite wild, that is the reason of plenty of varieties and hybrids. It also gives the opportunity to change them by breeding, creating new one with proper characteristic. In that way, the right variety could be found for each purpose or the combination of purposes as well.
Acknowledgement
The authors are indebted regarding the financial support of VKSZ (VKSZ_12-1-2013-0034 - Agrárklíma.2).
ReferencesBredemann, G., Schwanitz, Fr., von Sengbusch, R. (1956): Problems of modern hemp breeding, with particular
reference to the breeding of varieties of hemp containing little or no hashish. Hamburg. 31-35 (https://www.unodc.org/unodc/en/data-and-analysis/bulletin/bulletin_1956-01-01_3_page007.html#s0002)

Abstract Book – 17th Alps-Adria Scientific Workshop
76
Design of water management and technical erosion control measures in a specific area of interestJaroslav ANTAL – Elena KONDRLOVÁ Slovak University of Agriculture in Nitra, Horticulture and Landscape Engineering Faculty, Department of
Biometeorology and Hydrology, Hospodárska 7, 949 76 Nitra, Slovak Republic; E-mail: [email protected]
Keywords: land consolidation, water management practices, erosion control, design parameters, watershed
Introduction
Due to various reasons and causes, “specific” areas of interest are defined and delineated in the landscape. A very specific case of such areas in the Central European countries is the so-called area of land consolidation project (ALCP) (Muchová & Antal, 2013). Water and soil resources have an irreplaceable role in the agricultural land, and it is often necessary to address problems due to possible negative effects of water (flash floods, and floods, pollution of water resources, soil erosion etc.) also within the ALCP.
Materials and methods
Based on the theoretical analysis, three characteristic situations for localization of ALCP can be identified:
1. the border of ALCP is identical with the watershed divide (Figure 1a)2. the border of ALCP is located within the same watershed but is not is identical with the watershed divide (Figure 1b)3. the border of ALCP is part of several watersheds (Figure 1c)
Figure 1: Area of land consolidation project (ALCP) and positioning of its border within the landscape (Antal, Muchová, 2013, edited by authors)
For the design of water management practices and technical erosion control measures in a specific ALCP the following activities need to be carried out:
1. analysis of precipitation-runoff process2. analysis of soil erosion risk3. design and dimensioning of necessary water management and technical erosion control

Hnanice, Czech Republic – 09-14. April, 2018
77
practices, facilities and measures, including their localization (in ALCP)
Results and discussion
The aim of the precipitation-runoff analysis is, among other things, to determine (Antal et al., 2014):
• characteristics of design rainfall, e.g. the intensity and duration of the design rainfall, the depth, duration and intensity of snowfall,
• characteristics of surface runoff e.g. the start and end of surface runoff, velocity and volume of surface runoff, design discharge from the contributing area.
The analysis of soil erosion risk by water aims to, among other things (Antal, 2005):
• estimate the soil erosion risk by water erosion using the Universal Soil loss Equation - USLE (Wishmeier, Smith, 1978) and compare the estimated value with tolerable soil loss,
• to propose a corresponding erosion control measure to ensure a reduction of soil loss at least to a tolerable value if the estimated intensity of water erosion in the ALCP exceeds the tolerable value of water erosion intensity. In case of necessity of application of technical erosion control measures, also their location, dimensions and construction material should be specified.
Conclusions
The design of water management and erosion control measures in specific areas of interest cannot be executed without an analysis of the precipitation-runoff process and the erosion risk of this territory.
Acknowledgement
This study was supported by projects VEGA 1/0268/14 and KEGA 026SPU-4/2017.
References Antal, J. (2005). Protierózna ochrana pôdy. SPU v Nitre, Nitra.Antal, J., Bárek, V., Čimo, J., Halaj, P., Halászová, K., Horák, J., Igaz, D., Jurík, Ľ., Michová, Z., Novotná, B.,
Šinka, K. (2014). Hydrológia poľnohospodárskej krajiny. SPU v Nitre, Nitra.Muchová, Z., Antal, J. (2013). Pozemkové úpravy. SPU v Nitre, Nitra.Wishmeier, W.H., Smith, D.D. (1978). Predicting rainfall erosion losses - a guide to conservation planning.
Agriculture handbook. U. S. Department of Agriculture, Hyatsville.

Abstract Book – 17th Alps-Adria Scientific Workshop
78
Water supply in the soil aeration zone in Zahorska LowlandPeter STRADIOT – Stefan REHAK1: Water Research Institute, Nabr. arm. gen. L. Svobodu 5, 81249 Bratislava; E-mail: [email protected];
E-mail: [email protected]
Keywords: water supply, soil aeration zone, Daisy model
Introduction
The water supply in the soil aeration zone in Zahorska Lowland in the period January, 2000 - December, 2013 was evaluated in 15 localities by the model Daisy. This water was compared with calculated critical integral water supply based on the „wilting point“.
Materials and methods
There were 15 localities in Zahorska Lowland simulated on the DAISY model (horizon 0 - 100 cm divided to 10 cm sections. Model inputs include climatic data, data on soil and data on sow. The model outputs are average month integral soil water supply in the horizon 0–100 cm and they were compared with calculated critical integral water supply based on the hydrolimit „wilting point“ (volume moisture of soil samples at pF = 4,18).
Results and discussion
Light soils (probes PM1, PM4, PM5, PM10, PM11, PM13, PM14, PM15)The critical integral water supply in the Probe PM10 in the horizon 0 – 100 was 125,935 mm (89,8 % of the lowest integral water supply) in August 2012.
Figure 1: Probe PM 10 – Course of average month values of integral water supply Wp in 2012
Medium heavy soils (probes PM3, PM7, PM8, PM9) The critical integral water supply in the Probe PM8 in the horizon 0 – 100 was 317,150 mm (99,8 % of the lowest integral water supply) in August 2012.
Figure 2: Probe PM 8 – Course of average month values of integral water supply Wp in 2012

Hnanice, Czech Republic – 09-14. April, 2018
79
Heavy soils (probes PM2, PM6)The critical integral water supply in the Probe PM6 in the horizon 0 – 100 was 366,36 mm (101,4% of the lowest integral water supply) in August 2012.
Figure 3: PM 6 – Course of average month values of integral water supply Wp in 2012
Conclusions
The objective of the work was to analyse the water supply course in the soil aeration zone in Zahorska Lowland in the period 2000 – 2013. The simulated localities are placed in areas with different land use. In case of agricultural land there were considered 2 sowing courses (maize – maize – spring barley – alfalfa – alfalfa – alfalfa, and wheat – maize – maize – alfalfa – alfalfa). These sowing courses are both recommended by Pacific Consultants International in the JICA project Sustainable Development of Agriculture in the Zahorska Lowlands and Protection of Natural Resources and also correspond to sowing courses really used in given localities. There was used the model DAISY. The results of simulation were verified by comparing with measured values of soil moisture on the day of sample abstraction. Simulated average month integral water supply in soil was compared with critical integral water supply derived from measured hydrolimit „Wilting point“ for each locality. The water supply was the lowest in summer. Unpleasant situation occurred especially in case of medium heavy and heavy soils. In case of agricultural land, the influence of sowing course on water supply in the soil aeration zone was shown negligible.
Acknowledgement
This paper supported from the project APVV 14 0735 “New possibilities of use of drainage canal systems taking the biodiversity the protection and use of the landscape”
ReferencesAbrahamsen, P. (2008): https://code.google.com/p/daisy-model/downloads/detail?name=Hyd-parm-est.xlsHansen, S., Abrahamsen, P. (2011): General introduction to the application of the Daisy model, University of
Copenhagen, 28 p.Rehák, S., Jansky, L. (2001): Fyzika pôdy I (Soil Physics I) Basic physical properties od soil, Comenius
University Bratislava, 108 p., ISBN 80-2231544-3 Rehák, S., Jansky, L., Novakova, K. (2006): Fyzika pôdy II (Soil Physics II) Physical processes in soil, Comenius
University Bratislava, 116 p., ISBN 80-223-2032-3

Abstract Book – 17th Alps-Adria Scientific Workshop
80
The annual amount of dew determined by weighing lysimetersKrisztina CZELLÉR1 – József ZSEMBELI1 – Lúcia SINKA2
1: Research Institute of Karcag, Research Institutes for Agricultural Sciences and Educational Farm, University of Debrecen, H-5300 Karcag, Kisújszállási út 166; E-mail: [email protected]
2: Faculty of Agricultural and Food Sciences and Environmental Management, University of Debrecen, H-4032 Debrecen, Böszörményi út 138; E-mail: [email protected]
Keywords: dew, weighing lysimeter
Introduction
Dew denotes humidity condensing on plants, soil, or other surfaces near the ground. As a fraction of precipitation, dew is a component of the hydrological cycle (“non-rainfall water”). The actual amount of dew depends on meteorological and environmental conditions and surface properties (Agam & Berliner, 2006). Hence, a representative quantification requires that plants, leaves, or whole soil columns are placed on a balance with their surface at the same height and in the same surroundings as would occur naturally (Uclés et. al., 2014). Recent advances in lysimetry allow measuring water balance components – including precipitation and dew as a fraction of it – with high accuracy and high temporal resolution (Meissner et. al., 2007; Nolz et. al., 2014).
Materials and methods
In total, six weighing lysimeters exist at the Research Institute of Karcag RIEF University of Debrecen (RIK) with surface area of 1.7 m2 and depth of 1 m. This study focuses on the water balance of 2 weighing lysimeters (grass covered and bare soil) during the study period from 1st January 2016 to 31st December 2016. Measurement frequency was 30 minutes; accuracy of the weighing system is 0.1 kg (equivalent water height: 0.06 mm). The determination of the dewfall periods was done on the base of the weight data recorded by means of the weighing lysimeter system. Those periods were considered dewfall periods when positive weight changes were recorded by the lysimeters and at the same time neither natural precipitation nor irrigation occurred. The amount and duration of the natural precipitation data were determined on the base of the records of the meteorological station located in the territory of RIK.
Results and discussion
Analysing all the weighing data of our database we signed those periods when positive weight changes were characteristic regardless their extent. All these periods were compared to the precipitation data gained by means of the meteorological station and we determined such periods when positive weight changes are recorded by the lysimeters and at the same time, neither natural precipitation nor irrigation occurred. Due to oscillation of the weighing system, simple averaging methods are not sufficient to obtain an appropriate accuracy. In order to distinguish the true dewfall events from the oscillations filtering of the data is necessary. Therefore, we applied 30 minutes as the weight measurement frequency in order to exclude such positive weight changes that disappear soon assuming that the longer lasting positive changes are caused by dew falling.

Hnanice, Czech Republic – 09-14. April, 2018
81
By means of this dewfall identification method based on the filtering, we determined the daily amounts of dew fallen on the two lysimeters in the whole investigation period and calculated the monthly and total values (Fig. 1).
Figure 1: Monthly dew amounts on the lysimeters in 2016
According to our measurements, the annual amount of dew was 34.2 mm on the grass covered surface, while 39 mm on the bare soil surface in 2016. Our results are unique as they are the first in Hungary regarding the annual amount of dew determined on the base of measurements.
Conclusions
Precision weighing lysimeters are useful tools for the determination of the amount of dew if suitable data filtering is applied. We found similar annual amounts of dew generated on grass covered and bare soil surfaces, though some differences occurred in the period from July to September when the grass was irrigated.
Acknowledgement
This study was supported by the ÚNKP-17-2 New National Excellence Program of the Ministry of Human Capacities.
References Agam, N., Berliner, P.R. (2006): Dew formation and water vapor adsorption in semi-arid environments – a
review. Journal of Arid Environments 65: 4. 572–590. DOI: https://doi.org/10.1016/j.jaridenv.2005.09.004Meissner, R., Seeger, J., Rupp, H., Seyfarth, M., Borg, H. (2007): Measurement of dew, fog, and rime with a
high-precision gravitation lysimeter. Journal of Plant Nutrition and Soil Science 170. 335–344. DOI: http://dx.doi.org/10.1002/jpln.200625002
Nolz, R., Cepuder, P., Kammerer, G. (2014): Determining soil water-balance components using an irrigated grass lysimeter in NE Austria. Journal of Plant Nutrition and Soil Science 177. 237–244. DOI: http://dx.doi.org/10.1002/jpln.201300335
Uclés, O., Villagarcía, L., Moro, M.J., Canton, Y., Domingo, F. (2013): Role of dewfall in the water balance of a semiarid coastal steppe ecosystem. Hydrological Processes 28. 2271–2280. DOI: http://dx.doi.org/10.1002/hyp.9780

Abstract Book – 17th Alps-Adria Scientific Workshop
82
Effect of extreme water loads on the penetration resistance of the soil surfaceJózsef ZSEMBELI1 – Pál Máté NAGY2 – Géza TUBA1
1: Research Institute of Karcag, Research Institutes for Agricultural Sciences and Educational Farm, University of Debrecen, H-5300 Karcag, Kisújszállási út 166; E-mail: [email protected]
2: Faculty of Agricultural and Food Sciences and Environmental Management, University of Debrecen, H-4032 Debrecen, Böszörményi út 138; E-mail: [email protected]
Keywords: penetration resistance, soil degradation, soil compaction, irrigation
Introduction
Soil compaction is one of the most significant degradation processes that can hardly be parried. During this process, the volume and porosity of the soil are decreasing, the mechanical resistance is increasing, while the water- and air penetration capacity gets lower (Birkás, 1993; Hakansson & Voorhees, 1997; Várallyay, 1999). Approximately 35% of the soils in Hungary are highly susceptible for compaction either in the surface layer or in the deeper horizons (Várallyay, 2005). The most widely accepted method to examine soil compaction is the measurement of the penetration resistance of the soil (Freitag, 1971; Darózcy & Lelkes, 1999; Sinóros-Szabó & Szőllősi, 1999). For the examination of the compacted soil layer formed due to water logging, over irrigation or sudden heavy rainfall (the latter one is more and more frequent in Hungary) the generally used penetrometers are not suitable due to their size and measurement accuracy.
Materials and methods
Our examinations were carried out on a seedbed created in a meadow chernozem soil (vertisol) with high clay content and susceptible for cracking. The water input of 30 mm, which can occur as a natural precipitation too, was spread on the soil surface like sprinkle irrigation. We measured the penetration resistance of the soil with a specially developed micro-penetrometer that has been never used under filed conditions before. The probe of the device is operated by a small electric engine down to the depth of 100 mm. The sensor built in the cone of the probe detects the force required for the penetration into the soil with the sensitivity of 1 N in the measurement range of 0-100 N. During our measurements we used a probe ended in a cone with 60° angle and 8 mm diameter. Parallel to the penetration resistance measurements the soil moisture content was determined by means of a SMT-100 probe.
Results and discussion
Before the water input (irrigation) was applied, we measured the penetration resistance of the soil in order to have a control data and then the second measurement was carried out 1 hour after the irrigation. Further measurements followed the first two ones 1, 2, 3, and 4 days after the water input. Directly after the irrigation we could not get any data as the penetration resistance of the overwetted soil was under the measurement range of the penetrometer. After one day drying, the penetration resistance could be measured under the depth of 60 mm, but they were still lower than before irrigation. After three days of drying, the signs of sealing and crusting appeared in the upper soil layer of 0-40 mm showing higher penetration resistance values. As the probe penetrated through that

Hnanice, Czech Republic – 09-14. April, 2018
83
compacted layer, the measured values were again lower than before irrigation showing that the crusty surface layer impeded the drying process getting deeper. After four days of drying, the depth of the crusty layer did not increase, but became more compacted, and the soil moisture content decreased resulting in penetration resistance values higher than before irrigation (Figure 1).
Figure 1: Change of the penetration resistance and moisture content of the soil after a water input of 30 mm
The moisture content data represent very well the dynamics of the sudden wetting and drying of the soil. After four days of drying, the soil moisture content dropped back almost to the initial level measured before irrigation.
Conclusions
On the base of our measurements, we consider the micro-penetrometer we used suitable for the detection and quantification of soil compaction even in the soil layers very close to the surface. We established that sudden irrigation with high dose (simulating sudden heavy rainfalls) has considerable compacting effect on the soil; in the case of a soil status simulating seedbed conditions, soil compaction occurs close to the soil surface resulting in a crusty layer with measurably higher penetration resistance.
ReferencesBirkás, M. (1993): Talajművelés. In: Földműveléstan (szerk. Nyiri L.). Mezőgazda Kiadó, Budapest, 96-191.Daróczy, S., Lelkes, J. (1999): A szarvasi Penetronik talajvizsgáló nyomószonda alkalmazása. Gyakorlati
Agrofórum. 10.7. pp.16-18.Freitag, D. R. (1971): Methods of measuring soil compaction. In: Compaction of agricultural soils. Szerk.
Barnes, K. K. ASAE monograph. 47-103.Hakansson, L.; Voorhees, W. B. (1997): Soil compaction. In: Methods for assessment of soil degradation (Ed.
Lal, R., Blum, W. H., Valentine, C., Stewart, B. A. ) CRC Press. New York. 167-179.Sinóros-Szabó B., Szőllősi I. (1999): A 3T System alkalmazása és gyakorlati jelentősége. Gyakorlati
Agrofórum.10.7.1 pp.5-16.Várallyay, Gy. (1999): A talajfizika gyakorlati alkalmazásai a fenntartható talajhasználatban. Gyakorlati
Agrofórum 10. 7. 4-7.Várallyay, Gy. (2005): Talajvédelmi Stratégia az EU-ban és Magyarországon. Agrokémia és Talajtan, 54. (1-2)
pp. 203-216.

Abstract Book – 17th Alps-Adria Scientific Workshop
84
The changes of water balance components in Slovakia
Marcel GARAJ1 – Pavla PEKÁROVÁ1 – Pavol MIKLÁNEK1 – Ján PEKÁR2 1: Institute of Hydrology of Slovak Academy of Sciences; E-mail: [email protected]; [email protected] 2: Faculty of Mathematics, Physics and Informatics of Comenius University; E-mail: [email protected]
Keywords: water balance, climate change, runoff
Introduction
The assessment of the climate change impact on the runoff from the territory of Slovakia is frequently discussed (Kostka & Holko, 1996; Majerčáková et al., 2004; Szolgay et al., 2007). All climate change scenarios expect the increase in mean annual air temperature about 3°C for the territory of Slovakia to the year 2075. It is necessary to analyze carefully the development of particular elements of water balance if we are talking about impact of climate change on water resources. The air temperature at the Hurbanovo climatological station increased by 1°C in the period 1981–2010. The mean annual precipitation increased from 730 mm to 800 mm but the runoff coefficient decreased from 0.32 to 0.29. The water balance analysis suggests that despite the increased precipitation the runoff from the territory of Slovakia decreased.
Materials and methods
Slovak Hydro-Meteorological Institute (SHMI) provided all the time series. We had available time series of the mean annual areal precipitation amount [mm], the mean annual air temperature [°C] and the mean annual runoff volume [mm] for the period 1931–2016. The water balance is the difference between recharge and discharge and changes of water accumulation during period in particular water body. If we consider longer time series it can be describe as the balance between annual precipitation total, evapotranspiration and the mean annual runoff. For the future estimation of runoff development, we derived empirical equation:
Ra = 167.6 + 0.336 Pa – 17.39 Ta
Ra – mean annual runoff,Pa – mean annual precipitation amount,Ta – mean annual air temperature at the Hurbanovo station,
Results and discussion
As the result of our research we observe decreasing trend in runoff volume but increasing trend in areal precipitation amount. The air temperature at the Hurbanovo station increased by 0.3°C during the 50-years period 1931–1980. During the next 30-years 1981–2010 the air temperature increased by other 1°C. The balance evaporation did not change until 1981 and its value was about 495 mm. The balance evaporation then increased by 55 mm up to 550 mm until the year 2002 but runoff coefficient decreased.
The modelled values of runoff show a strong coincidence with real measured data (Fig.

Hnanice, Czech Republic – 09-14. April, 2018
85
1.). If precipitation 100 mm decrease then runoff decrease 33.6 mm. If mean annual air temperature increase by 1°C at the Hurbanovo, then evapotranspiration increase by 17.4 mm. Not only rising air temperature enhance evapotranspiration. Another reason is spreading vegetated area in Slovakia. The forest area has increased from 34% to 41% during last 100 years in the area of Slovakia.
Figure 1: The real measured and modelled values of the total runoff from the territory of Slovakia
Conclusions
In general, we are observing decreasing trend in the surface water storage. It is necessary to recalculate water balance not only for the whole Slovakia but also for particular hydrological regions and sub-catchments especially. It is possible to do it by runoff-balance models (BILAN, WatBal, Clirun, Sacramento, FRIEFR). Then we are able to identify the most vulnerable localities and find suitable mitigation and adaptation strategies.
Acknowledgement
This paper is the result of the project implementation ITMS 26240120004 Centre of excellence for integrated flood protection of land supported by the Research & Development Operational Programme funded by the ERDF and was supported by project VEGA 2/0009/15.
ReferencesKostka, Z., Holko. L., (1996): Estimation of Hydrological Balance Components at Variable Conditions of the
Mountainous Catchment. Proc. Ecohydrology of High Mountain Areas, ICIMOD, Kathmandu, 181–186.Majerčáková O., Faško P., Škoda P., Šťastný P., (2004): Porovnanie hydrologickej bilancie Slovenska za obdobia
1931–1980 a 1991–2001. Vodohosp. Spravodaj., 47, 2-3, 12–15.Szolgay, J., Hlavčová, K., Lapin, M., Parajka, J., Kohnová, S., (2007): Vplyv zmeny klímy na odtokový režim
na Slovensku. Key Publishing, 160 pp.

Abstract Book – 17th Alps-Adria Scientific Workshop
86
Reaction of the daily discharge to snow melt in the basinDana HALMOVA – Pavla PEKÁROVÁ – Veronika BACOVA MITKOVA – Pavol MIKLÁNEKInstitute of Hydrology SAS, Dubravska cesta 9, Bratislava, Slovakia, E-mail: [email protected]
Keywords: snow-melting, trend, pristine basin, trend analysis
Introduction
The analysis of climate variability impact on the hydrological system at regional scale have been received a great deal of attention over the past years, as many extreme events such as flood and drought have been happened in different parts of the world. According to IPCC 2007, statistical parameters of meteorological, hydrological and climatological characteristics show variability in time. This variability may be cyclical with the seasons, steadily (a trend), sudden jumps or some other established variations. The aim of the study was to evaluate the possible long-term trend changes of the date (Julian day) of beginning of the flow response to snowmelt in the Bela River basin for the period 1928–2014. As the critical value, we determined the flow of 2 m3s-1.
Materials and methods
From the year 1970 onwards, considerable literature concerning the trend detection techniques is available in environmental and hydrological field. Some of those studies are Sen’s nonparametric slope estimator, least squares linear regression for the detection of trends in time series of hydrological variables, work concerning the Spearman rank correlation test and seasonal Mann–Kendall test (Blahusiakova et al., 2016; Lettenmaier et al., 1994; Sonali et al., 2013; Şen, 2014). In this paper, we tried to confirm or reject the hypothesis about the earlier flow response to snowmelt during the spring season in the high mountain Bela River. The method is based on identification of the spring Julian day at which the discharge exceeds the critical value at the station. This day can be assigned as starting day of high discharge from snowmelt in the river basin upstream. For determining the Julian day we used daily discharge measured at Bela River at Podbanske gauge for the period of 1928–2014. As the critical value we determined the flow of 2 cubic meters per seconds (Fig. 1).
02468
101214161820
1/Jan 1/Apr 1/Jul 1/Oct
Qd
[m3 s
-1]
P10P50P90
Figure 1: Long term mean daily discharge (P50) and upper and lower decil (P90, P10), Bela River at Podbanske gauge, period 1928–2014.

Hnanice, Czech Republic – 09-14. April, 2018
87
a)
b) Figure 2: a) MK trend analysis of the flow response to snowmelt in the Bela River basin; b) Şen trend detection
test of the Julian day of the flow response to snowmelt, period 1928–2014.
Results and discussion
The long-term linear trend of the flow response beginning to snowmelt during the period 1928–2014 according to MK test illustrates Fig. 2a. Trend analysis shows no significant change in trend of Julian day of the flow response to snowmelt in the Bela River basin. Time series of Julian days of the flow response to snowmelt in two shorter periods was analysed according to Şen’s trend detection test. Figure 1b shows the scatter plot of Julian day of the flow response to snowmelt in the Bela River basin. We conclude that changes are not significant. Minor changes of Julian day of the flow response were recorded between days 98 to 110. The scatter plot shows a decreasing and subsequently increasing trend during these few days.
Conclusions
Our results of the comparison of both trend tests can be regarded as similar and now there is no statistically significant change in Julian day of flow response to snowmelt in the Bela River basin during the period 1929–2014, as well as shorter periods.
Acknowledgement This publication is the result of the project implementation ITMS 26240120004 Centre of excellence for integrated flood protection of land supported by the Research & Development Operational Programme funded by the ERDF and was supported by project VEGA 2/0009/15.
References Blahusiakova, A., Matouskova, A. (2016): Rainfall and runoff regime trends in mountain catchments (Case study
area: the upper Hron River basin, Slovakia). J.l of Hydrol. Hydromech. 63: 3. 183-192.IPCC Climate Change (2007): The Physical Science Basis. Contribution of Working Group I to the Fourth
Assessment Report of the Intergovernmental Panel on Climate Change Cambridge. Cambridge, New York: University Press, 996 p.
Lettenmaier, D.P, Wood, E.F., Wallis, J.R. (1994): Hydro-Climatological Trends in the Continental United States, 1948-1988. Journal of Climate. 7. 586-607.
Sonali, P., Nagesh Kumar, D. (2013): Review of trend detection methods and their application to detect temperature changes in India. Journal of Hydrology. 47: 6. 212-227.
Şen, Z. (2014): Trend identification simulation and application. Journal of Hydrologic Engineering. 19: 3. 635-642. http://dx.doi.org/10.1061/(ASCE)HE.1943-5584.0000811.

Abstract Book – 17th Alps-Adria Scientific Workshop
88
Metal leaching in geothermal systems
Máté OSVALD – János SZANYI – Tamás MEDGYES – Balázs KÓBOR – Balázs KOVÁCSUniversity of Szeged Department of Mineralogy, Geochemistry and Petrology: [email protected]
Keywords: geothermal energy, leaching, metal production
Introduction
The European Union has massive demand for clean and renewable energy, which is sustainable in a long term. At the same time, there is need for conventional resources (ores and metals) as well, however the mining industry has its limitations. To challenge this, the European Commission provided fund to develop a sustainable power plant with combined heat, power and metal extraction. By the end of the 42-month period, the concepts should be validated to TRL4 in a laboratory environment.
The “Combined Heat, Power and Metal extraction from ultra-deep ore bodies”; CHPM2030 project aims to develop a novel technological solution which helps to satisfy the European energy and strategic metal demand in a single interlinked process. There is not much knowledge about ultra-deep metallic mineralizations that could be converted into an “orebody EGS”, so we will investigate the characteristics of these bodies and their implications for EGS.
In the reservoir an injected fluid chemically reacts with the mineral formations and extracts some of the soluble ore, bringing it to the surface. In our study many different rocks were reacted at high temperature (250 °C) and high pressure (250 bar) with different leaching fluids in a custom build flow-through reactor.
Materials and methods
Developing a task-specific, high-pressure and high-temperature reactor designed and built to carry out flow-through measurements and to determine soluble ore-content. This equipment has been commissioned, and initial experiments have been conducted with a relatively simple aqueous fluid, providing information of flow rates and chemical composition (Figure 1). Future experiments will extend the range of fluid types.
Figure 1: Custom built flow-through leaching device developed by the authors

Hnanice, Czech Republic – 09-14. April, 2018
89
The flow-through pipe reactor is supported by a HPLC pump which can provide a flow rate of 0.1 ml/min to 5 ml/min, pressure up to 300 bar and heated by electric mantle heating which can hold temperature up to 300°C.
During each measurement, rock sample with the particle size of maximum 250 µm is put into the reactor and compacted with ultrasonic cleaner. After heating up a mild leaching fluid is flown through, which then reacts with the rock and collected at the end of the process.
Results and discussion
During each reaction, leachate is collected at least 3 times and analyzed with ICP-MS. Multiple sampling allows us to presume a trend in leaching efficiency over time. Figure 2 shows the results of 2 specific sample, which were reacted with deionized water at 200°C on 290 bar pressure. CHPM4 was a banded baritic lead ore from a metasomatic deposit hosted by limestone and CHPM12 represents a magnetite deposit enriched in sulphides, and with visible chalcopyrite on a macroscopic level.
In the future further experiments should be made to develop an optimal leaching fluid composition.
Acknowledgement
This project has received funding from the European Union’s Horizon 2020 research and innovation programme under grant agreement nº654100.
Figure 2: Element composition of the fluid (which reacted with the rock) samples. The axis is logarithmic and in PPB

Abstract Book – 17th Alps-Adria Scientific Workshop
90
The conceptual framework for a user-friendly process-driven irrigation system (PDIS)Tomáš ORFÁNUS1 – Gábor MILICS2 – Viliam NAGY1
1: Institute of Hydrology, Slovak Acadmy of Sciences, Dúbravská cesta 9, 841 04 Bratislava, Slovakia; E-mail: [email protected]
2:Department of Biosystems and Food Engineering, Faculty of Agricultural Sciences, Széchenyi István University; E-mail: [email protected]
Keywords: critical soil moisture, limited evapotranspiration, root-zone drainage
Introduction
Soil moisture (SM) varies in time and space. At the field scale, the central moments of SM variability follow the textural differences of the soil while in terms of characteristics of moisture variability other soil factors like soil structure, micro relief, preferred water flow paths, root system characteristics, rock content, etc. are determinant. The aim of this paper is to show how SM variability can indicate the critical stages of drying processes (root-zone drainage and evapotranspiration) and reveal the need for irrigation to be most effective.
Materials and methods
In Fig. 1, there is a scheme of particular procedures needed to evaluate the applicability and implementation of PDIS at the field-scale farmsteads. In fact, the extent of the farmstead area is not limited but pre-assumes the hydropedological similarity of the area, where the PDIS should be implemented. Hydropedological similarity of the agricultural land is usually conditioned by stacionarity and ergodicity in spatial variability of soil moisture and basic hydrophysical characteristics. The principle of PDIS system grounds in observation of root-zone moisture variability in space and time that is a result of wetting-drying processes. Drainage (as first important drying process) generally enhances the variability of soil moisture, since the relatively coarser-textured soil drains faster than the finer-textured soil. Atmospheric demand for evaporation usually has small spatial variation at field scale if landscape structures like shelter belts are not the constituents of the agricultural land (Orfanus & Eitzinger, 2010). Therefore, evaporation under wet conditions can only reduce mean soil moisture, but does not change its variability. However, after the soil moisture becomes lower than a threshold value (called limited availability point) the actual evapotranspiration becomes lower than potential one. Evapotranspiration starts to be selective, i.e. wetter parts of the field evaporate more water than drier parts, what results in smoothing of the spatial variability of soil moisture (Orfanus et al., 2016).
Results and discussion
PDIS has been successfully verified on the experimental field in Moravsky Sv. Ján village in western Slovakia. The soil moisture spatial variability varied according to active wetting/drying processes and position against the limited water availability point. Standard deviations ranged btw. 3.2 and 7.0 volumetric %.

Hnanice, Czech Republic – 09-14. April, 2018
91
Figure 1: The scheme of workflow for the implementation of PDIS in agricultural practice
Conclusions
The conceptual framework for a simple process-driven identification of irrigation timing and demand was presented. Currently there continues the system verification on the research experimental field in Mosonmagyaróvar in north-west Hungary.
Acknowledgement
This study was supported by the projects VEGA 2/0167/12 and 2/0152/15, and partially by the Research and Development Operational Programme, the project Excellence Centre of Integral Territory Flood Protection, code ITMS 26240120004, funded by the ERDF.
References Orfanus T, Eitzinger J. (2010:) Factors influencing the occurrence of water stress at field scale. Ecohydrology.
3:478–486.

Abstract Book – 17th Alps-Adria Scientific Workshop
92
Effect of plough pan and sunflower roots on soil water storage in intensively agriculturally used soil Viliam NAGY1 – Peter ŠURDA1 – Tomáš ORFÁNUS1 – Ľubomír LICHNER1 – Gábor MILICS2 1: Slovak Academy of Sciences, Institute of Hydrology; E-mail: [email protected] 2: Széchenyi University – University of Győr; E-mail: [email protected]
Keywords: soil compaction, plough pan, water flow, water storage capacity
Introduction
The negative consequences of intensively exploited agricultural systems include soil compaction from wheel traffic by heavy agricultural equipment. Compaction rearranges soil particles changing pore-size distribution and connectivity. It leads to a decrease in infiltration rates, saturated hydraulic conductivity, porosity and increase in bulk density. Soil compaction in the plant root zone can also result from the repeated ploughing at the same depth. Plough pan is a subsurface horizon having high bulk density and lower total porosity than the soil directly above or below it because of pressure applied by normal tillage operations, such as plough, disc, and other tillage implements. Tillage and traffic pans are serious problems, because it reduces the movement of water, air and growing of plant roots. The aim of this study was to investigate the impact of plough pan on water penetration depth and potential water storage in individual layers of sandy loam soil.
Materials and methods
Experimental site was located near Kalinkovo (48°3’53’’ N, 17°12’12’’ E) at the Danubian Lowland, southwestern Slovakia, represents intensively farmed land, where common sunflower (Helianthus annuus L.) was grown during our field campaign.
Light soil at the experimental site, evolved on fluvial deposits of Danube River, is classified as Calcaric Fluvisol (WRB, 2006) and has a sandy loam texture.
Three plots were demarcated at this site. Plot 1 was situated on the edge of field, where heavy agricultural equipment was turned. All properties at the plot 2 were measured in the intra-row position, and those at the plot 3 in the inter-row position.
Kopecký cylinders (100 cm3 steel cylinders) were pushed into the soil and the samples with 100 cm3 volume were taken from 7 depths up to 40cm. The field moist samples were then weighed in the laboratory, oven dried and weighed once more. Soil bulk density (g/cm3) was calculated as the ratio of the mass of oven-dried soil from the Kopecký cylinder and 100 cm3 volume of this cylinder.
Infiltration experiments were undertaken at three 100 cm × 100 cm plots. In each of these plots four steel access tubes with inner diameter of 43 mm and length of 2 m were inserted vertically into the holes made with an auger. The volumetric water content was measured in the depths of every 10 cm up to 100 cm for 60 seconds using the neutron moisture meter with Am-Be probe before and after application of water.

Hnanice, Czech Republic – 09-14. April, 2018
93
Fifty mm of water was applied manually with a watering can at a rate of about 2 mm min–1, and it took 50 minutes. Two hours after application, soil moisture was measured using the neutron moisture meter and the neutron counting rates, CR, were transformed to the volumetric water content.
Results and discussion
The impact of plough pan on water flow after application of 50 mm of water was evident at all 3 plots. Water penetrated to maximum depth of 30 cm at all three plots, increase in soil water content was measured to the depth of 20 cm only at plot 1, and to the depth of 30 cm at plots 2 and 3. The maximum increase in soil water storage was estimated at plot 2 and it was 12.82 mm, which means that the upper (0–30 cm) part of soil profile with sunflower roots retained 25.63% of applied water. At plot 3, representing the inter-row position of probes, the increase in soil water storage was 10.97 mm, which means that the upper (0–30 cm) part of soil profile retained 21.9% of applied water. At the extremely compacted plot 1, the increase in soil water storage was 3.73 mm only, which means that the upper (0–20 cm) part of soil profile retained 7.46% of applied water. In all cases, remaining water flowed out (drained) through the horizontal subsurface flow.
Figure 1: Increase in soil water storage at 3 experimental plots after application of 50 mm of water. Plot 1 was situated on the edge of field, where heavy agricultural equipment was turned, plot 2 were measured in the intra-row position, and plot 3 in the inter-row position.
Conclusions
Application of 50 mm of water resulted in water storage differences only to the penetration depth of 30 cm at all 3 plots. Soil water storage estimated at plot 2 in intra-row position was higher than the soil water storage estimated at plot 3 in inter-row position, and much higher than the soil water storage estimated at plot 1 where heavy agricultural equipment was turned.
Acknowledgement
This contribution was supported by the Scientific Grant Agency VEGA Project No. 2/0189/17, and Project APVV-15-0160. This publication is the result of the project implementation ITMS 26240120004 Centre of excellence for integrated flood protection of land supported by the Research & Development Operational Programme funded by the ERDF.

Abstract Book – 17th Alps-Adria Scientific Workshop
94
The impact of river stage and conductance parameter on the seepage volume between river and aquiferPetr DUŠEK – Yvetta VELÍSKOVÁInstitute of Hydrology SAS, Dúbravská cesta 9, 84101, Bratislava; E-mail: [email protected]; veliskova@
uh.savba.sk
Keywords: groundwater, surface water, numerical simulation, seepage, MODFLOW
Introduction
Heterogeneity of the river surroundings can have a significant impact on the interaction between river and aquifer (Brunner, et. al., 2010). Other important factor is the difference between the river and aquifer heads. The following results represent modeled scenarios in which the effects of environmental heterogeneity, namely the value of the saturated hydraulic conductivity of aquifer layer, are examined. The results of numerical simulation were compared to a one for homogeneous environment. Also, these scenarios investigate the influence of the river stage in relation to the level of the groundwater at the edge of the model and the influence of the MODFLOW seepage parameter - conductance.
Materials and methods
The coefficient of saturated hydraulic conductivity was considered by three values with a difference of one and two orders, namely 5 m.d-1, 50 m.d-1 and 500 m.d-1. The groundwater level at the edge of the theoretical model was 90 m for the boundary condition on the left, and the river stage on the right side of the model was 10 m, while the river stage in the flow was changed at intervals of 5 meters in the range of 10-30 meters. The ground plane of the simulated aquifer was 1000 x 1000 meters. The river sediment conductance was modelled for values of 5 m2.d-1.m-1, 50 m2.d-1.m-1 and 500 m2.d-1.m-1. The influence of conductance on seepage values for different heterogeneous environment configurations was investigated.
Results and discussion
The first simulated case describes a homogeneous environment. The model layers have the same constant value of the coefficient of saturated hydraulic conductivity. Increasing conductivity also increases the seepage between the river and the aquifer. The seepage values are negative as it is a flow from the aquifer into the river. The change of seepage will occur only when the riverbed permeability is higher. The seepage values have an increasing tendency for all cases, due to the increasing conductivity parameter (Fig. 1).
The simulations of influence of the river stage were conducted for the thickness of the middle layer of the aquifer of 10 meters. The seepage rates for the individual river stages were then compared to the equivalent homogeneous environment. With a saturated hydraulic conductivity of 50 m.d-1 of the middle layer of the aquifer, the seepage is 92.2% of the equivalent value at a height of 10 m and 89.7% of the river stage at 30 m. For a saturated hydraulic conductivity of 5 m.d-1 the seepage is 87.6% of the equivalent value at a level of 10 m and 86.9% of the equivalent value for a height of 30 m.

Hnanice, Czech Republic – 09-14. April, 2018
95
Figure 1: Comparison of the seepage volume – change of saturated hydraulic conductivity of the bottom model layer and the conductance parameter
Conclusions
The outputs of the numerical simulations showed that the highest sensitivity of modelled seepage on the change of saturated hydraulic conductivity occurred in the bottom layer of the aquifer. The same trend was present in the simulation of influence of the river stage, where the difference in seepage between homogeneous environment and less permeable layers were up to 74% for 50 m.d-1 (Fig. 2) and up to 80% for 5 m.d-1.
Figure 2: Comparison of seepage ratio for the selected saturated hydraulic conductivity in the middle and bottom layer of the aquifer
Acknowledgement
This paper was prepared with the support of the project No. VEGA 2/0058/15 and APVV – 14 – 0735. This publication is also the result of the project implementation ITMS 26240120004 Centre of excellence for integrated flood protection of land supported by the Research & Development Operational Programme funded by the ERDF.
ReferencesBrunner, P., Simmons, C. T., Cook, P. G. and Therrien, R. (2010): Modeling Surface Water-Groundwater Interaction
with MODFLOW: Some Considerations. Ground Water, 48: 174–180. doi:10.1111/j.1745-6584.2009.00644.

Abstract Book – 17th Alps-Adria Scientific Workshop
96
Chemical composition of the leachate from lysimeter-grown short-rotation willow coppice in relation to irrigation water qualityÁgnes KUN1 – Mária B. ONCSIK1 – Károly BARTA2
1: National Agricultural Research and Innovation Centre, Research Department of Irrigation and Water Management (NAIK ÖVKI), H-5540 Szarvas, Anna-liget 8., Hungary; E-mail: [email protected]
2: University of Szeged, Department of Physical Geography and Geoinformatics, H-6722 Szeged, Egyetem utca 2-6., Hungary; E-mail: [email protected]
Keywords: irrigation, nitrate leaching, saline water
Introduction
The reuse of treated wastewater for irrigation is a suitable practice to close the water cycle in the agro-industrial sector (Vergine et al., 2017). Inappropriate management of irrigation with wastewater can cause substantial risks to public health and the surrounding environment (Elgallal et al., 2017). Understanding the processes of nitrate leaching and introduction of deeper-rooted trees or other crops can minimise the ground water contamination (Khajanchi Lal et al., 2015). Aim of this study was to determine the impacts of the wastewater irrigation on the leachate chemical compositions.
Materials and methods
The experiment was conducted at NAIK ÖVKI in Szarvas, Hungary. The experiment was set up in the NAIK ÖVKI Lysimeter Station in 2014 in 64, 1 m3 vessels with two energy willow clones (no. 77, 82). In 2015 and 2016 same irrigation treatments and norms (15, 30 and 60 mm) were applied and same water sources were used for irrigation. First one originated from the Oxbow Lake of Körös River (KR) while the other one was a wastewater (WW) from an intensive African catfish farm. Beside the rainfed treatment, one WW based irrigation water type was used for irrigation which was diluted with KR water and added gypsum (Kun et al., 2017). The WW had high nitrogen content (~30 mg/l) which is favourable for the plants as nutrient. For this study leachate was collected in January and February in 2016 and 2017 than pH, specific electrical conductivity (EC), bicarbonate, sulphate, chloride, nitrate, phosphorous and cations (Ca2+, Mg2+, Na+, K+) parameters were analysed. Principal component analysis (PCA) was used to create groups from the parameters with same characteristics and to reduce the variables. After the PCA analyses of variance (ANOVA) was made with all components (5) to evaluate the impact of the irrigation water quality.
Results and discussion
According to the PCA results five components were separable which explains 98.17% of the total variance of the data (Table 1). The first principal component (C1) was strongly correlated with six of the original variables. The C1 increased with increasing Mg2+, Ca2+, EC, SO4
2-, Na+ and Cl-, these six parameters vary together. C1 determined the most important parameters which are responsible for the EC values.

Hnanice, Czech Republic – 09-14. April, 2018
97
Table 1. Five main components of the leachate parameters
ComponentsC1 C2 C3 C4 C5
pH -0.010 0.950 0.171 -0.009 0.223HCO3
- (mg/l) 0.512 0.670 -0.490 0.039 -0.051Cl- (mg/l) 0.787 0.070 -0.539 -0.110 0.136K+ (mg/l) 0.239 0.142 0.853 0.308 0.295EC (µS/cm) 0.948 0.141 -0.002 0.278 0.027NO3
- -N (mg/l) -0.027 -0.020 0.230 0.947 0.210Ca2+ (mg/l) 0.984 0.055 0.146 -0.013 0.029Mg2+ (mg/l) 0.988 0.132 0.033 -0.032 0.023Na+ (mg/l) 0.800 0.268 -0.320 0.406 0.048PO4
3- -P (mg/l) 0.109 0.191 0.161 0.211 0.937SO4
2- (mg/l) 0.936 -0.100 0.144 -0.208 0.151Principal Component Analyses, Varimax rotation with Kaiser normalisation
The C2 determined the alkalinity. The C3, C4, C5 individually represented macronutrients. According to the two-way ANOVA the irrigation water quality and quantity had impact only on the C1 and the C4. The WW having high nitrogen concentration led to significant higher nitrate concentration (20.7 mg/l nitrate-N) in the leachate than in case of KR (1.7 mg/l nitrate-N) and treated WW irrigation (1.6 mg/l nitrate-N). However the nitrate concentrations were in each treatment under the limit of Hungarian regulation (50 mg/l) except of the non-irrigated treatment (62.7 mg/l) due to the less N uptake than in the irrigated treatments. The EC of leachate from the treated WW treatment had significant higher value (~1900 µS/cm) than in the other treatments (~1000 µS/cm).
Conclusions
For the sustainable WW reuse in agriculture the nitrate concentration of the irrigation (waste)water needs to be considered to avoid the groundwater pollution because it has impact on the leachate water. However, according to our result 30 mg/l concentration of the WW did not led to remarkable nitrate leaching. The EC value of the leachate means that some soluble salt can leach from the root zone that could be favourable for the plants and the soil health.
Acknowledgement
The Ministry of Agriculture (OD001 project) funded our work. Authors thank to Csaba Bozán is responsible for this project.
ReferencesElgallal M., Fletcher L., Ewans B. (2016): Assessment of potential risks associated with chemicals in wastewater
used for irrigation in arid and semiarid zones: A review. Agricultural Water Management.177: 419-431. DOI: http://dx.doi.org/10.1016/j.agwat.2016.08.027
Khajanchi, L., Minhas, P.S., Yadav, R.K. (2015): Long-term impact of wastewater irrigation and nutrients II. Nutrients balance, nitrate leaching and soil properties under peri-urban cropping system. Agriculture Water Management 156: 110-117. https://doi.org/10.1016/j.agwat.2015.04.001
Kun Á., Bozán Cs., Barta K., Oncsik B. M. (2017): The effects of wastewater irrigation on the yield of energy willow and soil sodicity. Columella. 4: 1. 11-14. DOI: 10.18380/SZIE.COLUM.2017.4.1.suppl
Vergine, P., Salerno, C., Libutti, A., Beneduce, L., Gatta, G., Berardi, G., Pollice, A. (2017): Closing the water cycle in the agro-industrial sector by reusing treated wastewater for irrigation. Journal of Cleaner Production 164: 587-596. https://doi.org/10.1016/j.jclepro.2017.06.239

Abstract Book – 17th Alps-Adria Scientific Workshop
98
Comparison of hydraulic conductivity of bed silts in Komárňanský channel - Žitný ostrov
Renáta DULOVIČOVÁ – Yvetta VELÍSKOVÁ – Radoslav SCHŰGERLInstitute of Hydrology SAS & Dúbravská cesta 9, 841 04 Bratislava, Slovakia; E-mail: [email protected]
Keywords: bed silts, cross-section profile, granularity curve, disturbed and undisturbed samples, saturated hydraulic conductivity
Introduction
This contribution deals with evaluation of bed silts permeability on Komárňanský channel (KC), the biggest channel from channel network at Žitný ostrov (ŽO). The bed silts permeability in ŽO channel network significantly impacts on mutual interaction between channel network and groundwater at ŽO and is expressed by parameter their saturated hydraulic conductivity (SHC). The paper compares the values of bed silts SHC which were extracted from KC during period 2004 – 2016. The bed silts were extracted and obtained by two ways, as a disturbed samples (DS) and as an undisturbed samples (US). From DS on KC were obtained bed silts SHC calculated according to empirical formulas of Bayer-Schweiger and Špaček, the valid values of SHC - Kp reach from 1,917.10-06 – 6.094.10-05 m.s-1. From US of silts which were extracted along KC from top, middle and bottom layer of silts, were determined the values SHC - Kn by measurement in laboratory - by the laboratory falling head method. The acquired values Kn for KC reach from 4,721.10-07 – 1,255.10-05 m.s-1. The all results were demonstrated as tabular and graphically, too.
Materials and methods
The first measurements of silting up at ŽO channel network were performed in 1993, at first from the displaceable inflatable dinghy with special equipments – first by simple drill hole, then by echo-sounder Lowrance HDS-10 and EA400/SP. From 2004 we started measurements with the extraction of silts in single channel cross-section profiles. The methodology of silt thickness measurement was mentioned in e.g Dulovičová, Velísková, 2010, etc. The extraction of silt samples was performed by two sorts of equipment – by auger (as DS) and by beeker (as US, too), they are described in Dulovičová et al., 2016. The values of SHC from DS silts were calculated by empirical formulas coming out from granularity curves –Beyer-Schweiger (Mucha-Šestakov, 1987) and Špaček (Špaček, 1987). These formulas were used for assessment of SHC from DS - Kp. In 2014 – 2016 we were able to extract also some US of silts. These US were transposed from extracting cylinder of beeker to sampling tube and then were assessed the values of SHC by direct measurement in laboratory - there was used simplified equipment for measuring of SHC from US (methodology of measurement and calculation described e.g. Šurda et al., (2013); or Dulovičová, Velísková, Schűgerl, (2016).
Results and discussion
The graphical results from calculation and assessment of valid values of SHC for DS of silts for KC - Kp are left on Fig.1. According to equation for calculation of average SHC from US were determined the values Kn, the results are right on Fig. 1.

Hnanice, Czech Republic – 09-14. April, 2018
99
Conclusions
The bed silts were obtained by 2 ways, as DS and as US. The granularity analysis of its samples were made, extracted from top, middle and bottom layer of silts. On their base we calculated SHC values according to Bayer-Schweiger and Špaček formulas. The valid values Kp reached from 1,917.10-06 – 6.094.10-05 m.s-1. From US of silts were determined SHC values of silts Kn by the laboratory falling head method. The values of Kn reach from 4,721.10-07 – 1,255.10-05 m.s-1. Finally we compared SHC values of silts from DS and US. For DS SHC values run into order of magnitude 10-05 do 10-06 m.s-1. These results come from year 2004 and 2013. In 2016 for US these values run into order of magnitude 10-05 do 10-07 m.s-1, it shows that SHC values of silts from US in 2016 approximately tenfold decreased. We compared also SHC values from DS and US for single silt layers. In majority was validated the assumption of reduction of silts permeability in case of US because their SHC values were lower than the DS values. It was valid for top and bottom layer. Only in one case occurred that SHC values from DS were lower than the SHC values from US – in km 25 , resp. 25.8.
Acknowledgement
This work was supported by the contract VEGA-02/0058/15, APVV-14-0735 and the project implementation ITMS 26240120004 Centre of excellence for integrated flood protection of land supported by the Research & Development Operational Programme funded by the ERDF.
References Dulovičová, R., Velísková, Y. (2010): Aggradation of Irrigation Canal Network in Zitny Ostrov, Southern
Slovakia. In Journal of Irrigation and Drainage Engineering- ASCE, Vol. 136, No. 6, p. 421-428. (1.294 - IF2009). (2010 - Current Contents). ISSN 0733-9437.
Dulovičová R. a kol. (2016): Hydraulická vodivosť nánosov Chotárneho kanála na Žitnom ostrove, Acta Hydrologica Slovaca, Ročník 17, č. 2, 2016, 149 – 156
Mucha I., Šestakov V. M., (1987): Hydraulika podzemných vôd. Alfa, BratislavaŠpaček J. 1987. Stanovení koeficientu filtrace z totálních křivek zrnitosti. Meliorace, 23, č.1, s. 1-13Šurda, P., Štekauerová, V., Nagy, V. (2013): Variability of the saturated hydraulic conductivity of the individual
soil types in the area of the Hron catchment. In Nővénytermelés, vol. 62, supplement, p. 323-326, ISSN 0546-8191.
0.00E+005.00E-061.00E-051.50E-052.00E-052.50E-053.00E-053.50E-054.00E-054.50E-055.00E-055.50E-056.00E-056.50E-05
0 5 10 15 20 25 30
Komárňanský channel 2004-2013hydraulic conductivity Kp
for disturbed samples 2013 km 0.0 Sp_I mid1
2013 km 0.0 Sp_I mid2
2004 km 14.8 B_Schw top
2004 km 14.8 Sp_I bot
2004 km 25.8 Sp_I top
2004 km 25.8 Sp_I bot
2013 km 29.0 Sp_II bot1
2013 km 29.0 Sp_I bot2
0.00E+00
2.00E-06
4.00E-06
6.00E-06
8.00E-06
1.00E-05
1.20E-05
1.40E-05
1.60E-05
1.80E-05
2.00E-05
0.00 2.00 4.00 6.00 8.00 10.00 12.00 14.00 16.00 18.00 20.00 22.00 24.00 26.00 28.00
Komárňanský channel 2016hydraulic conductivity Knfor undisturbed samples
km 2.0 top
km 2.0 mid
km 2.0 bot
km 9.0 top
km 9.0 mid
km 9.0 bot
km 12.0 top
km 12.0 mid
km 12.0 bot
km 20.0 top
km 20.0 mid
km 20.0 bot
km 23.0 top
km 23.0 mid
km 23.0 bot
km 25.0 top
km 25.0 bot
km 28.0 top
km 28.0 mid
km 28.0 bot
Figure 1: Komárňanský channel – valid values of Kp from DS and Kn from US of silts in year 2004 - 2016

Abstract Book – 17th Alps-Adria Scientific Workshop
100
Applicability of inland excess water hazard mapsCsaba BOZÁN – Norbert TÚRI – György KEREZSI – János KÖRÖSPARTINational Agricultural Research and Innovation Centre, Research Department of Irrigation and Water Management
(NAIK ÖVKI), 5540 Szarvas, Anna-liget 8., Hungary; E-mail: [email protected]
Keywords: excess water, hazard mapping, complementary effects, applicability
Introduction
Excess water is a kind of temporary water inundation that occurs in flat lands due to the extreme precipitation, sudden snow melting and emerging groundwater level. Damage caused by excess waters can occur on about 1.8 million hectares in Hungary. Prevention of excess water damages has been carried out by various drainage and watercourse management activities. As a consequence, preventive management of land requires sufficient information on the spatial and temporal distribution of excess water. Mapping of excess water hazard is a great challenge since the formation of excess water inundation is a very complex process. The objective of this study was to compare three kinds of mapping methods with special emphasis on complementary effects.
Materials and methods
The Szamos-Kraszna interfluves study area is a 457 km2 large sub-catchment in north-eastern Hungary. After river regulations, excess waters became frequent. Motivations for the selection of the studied area selected were as follows: mostly used for agricultural production; poor vertical drainage of soil; different hazard maps are available. Three mapping methods and results were compared: (1) direct mapping based on in situ or remotely sensed observations; (2) synthetic mapping with regression analysis based on static and dynamic influential factors and water coverage data; (3) integrated hydrologic models to analyze the relation between spatially-temporally aggregated indicators of excess water and other hydrologic variables.
Results and discussion
(1) In Hungary the first attempts to map excess water hazard dates back to the early 1980s. National and regional overview maps were compiled mainly based on event frequency records (Pálfai 1982). With the appearance of publically available remote sensing data, and the development of image processing techniques, the in situ observations were complemented and excess water could be identified and classified in a more efficient and effective way. (2) GIS-based synthetic mapping is suitable for taking numerous influential factors into consideration. GIS allows for the exact evaluation of spatial distribution of the influential factors and the quantification of excess water, which occurs randomly, under different hydro-meteorological conditions (Bozán et al., 2017). (3) The integrated hydrologic models are the most capable to describe the spatial-temporal variations of excess water inundations. The applied models algorithmically coupled the dynamic simulation of 3D territorial (precipitation, evapotranspiration, runoff, and subsurface water movement in the unsaturated and saturated zone) and 1D instream hydrologic process (Koncsos 2011). To compare easily the above mentioned mapping methods, the advantages and disadvantages were collected in Table 1. The sensitivity of excess water hazard and risk

Hnanice, Czech Republic – 09-14. April, 2018
101
maps was shown in Figure 1. Table 1: Advantages and disadvantages of mapping methods
In situ or remotely sensed observations
Excess water hazard vulnerability map
Excess water risk map – integrated hydrologic model
advantages disadvantages advantages disadvantages advantages disadvantages
Computation process
it can be automated
experts required
it can be automated
spec. experts required
partly automated
spec. experts required
Calibration, validation
with in situ survey
limited access of data
large amount of data
limited possible robust method
Hazard calculation
- partly applicable
possible just quality calculation
possible just quantity calculation
Risk calculation
- partly applicable
possible partly applicable
scenario analysis
partly applicable
Water regulation
- take no notice of it
- take no notice of it
possible limited (land-use)
Applicability regional development
none cause and effect
local development
medium cause and effect
local development
high cause and effect
Figure 1: Compare to three methods of excess water hazard and risk mapping
Conclusions
(1) The former in situ observations were very limited because of subjectivity; meanwhile, at present, the remote sensing techniques have a limited revisiting time, which may result in inaccurate measurements of excess water. (2) There is a need for further improving and refining of vulnerability mapping with other influential factors (confined groundwater, anthropogenic factors etc.). (3) At present, the model has been only applied for a pilot area to study the process of excess water inundations. The country-scale model is still not available due to the lack of the specific high amount of real-time input data. As a consequence, all of the methods have disadvantages in addition to advantages, but it may be beneficial to make use of complementary effects.
ReferencesBozán, Cs., Körösparti, J., Andrási G., Túri, N., Pásztor, L. (2017): Inland excess water hazard on the flat lands
in Hungary Columella: Journal of Agricultural and Environmental Sciences, 4/1 (suppl.) (2017), 11-14 DOI: 10.18380/SZIE.COLUM.2017.4.1.suppl
Koncsos, L. (Ed.), (2011): Jövőképtől a vízkészlet kockázatig [From future plan to risk of water resources]. BMGE, Vízi Közmű és Környezetmérnöki Tanszék.
Pálfai, I., (1982): A belvízi veszélyeztetettség területi mutatója [Excess water hazard index], in: MHT III. Országos Vándorgyűlés. MHT, Debrecen, pp. 385-390.

Abstract Book – 17th Alps-Adria Scientific Workshop
102
Advantages of rational control of soil moisture regime to prevent and mitigate the adverse effects of climate change in Békés countyNorbert TÚRI – János KÖRÖSPARTI – György KEREZSI – Csaba BOZÁNNational Agricultural Research and Innovation Centre, Research Department of Irrigation and Water Management
(NAIK ÖVKI), H-5540 Szarvas, Anna-liget 8., Hungary; E-mail: [email protected]
Keywords: water resources management, extreme weather conditions, soil moisture regime, melioration
Introduction
Nowadays, due to the effects of climate change, the agriculture has new challenges to maintain the formerly usual quality and yield of different crops (Várallyay, 2007). Agricultural production has been exposed to many kinds of natural impacts so called stress factors (extreme weather conditions, droughts, excess water inundations, heavy surface runoff, extreme soil moisture regime, etc.), which could significantly determine the production technology. Unfortunately, climate change strongly influences the Carpathian Basin. In the last decades, the Hungarian climate zone has been obviously shifted to the dryer direction. The global warming is likely to have significant impacts on the hydrologic cycle, affecting water resources system, especially on the Great Hungarian Plain (Bartholy & Pongrácz, 2010). In Hungary there are so many detailed thematic action plans on national climate change response policies and measures. Nevertheless one of the main influenced sectors by the effects of climate change is the agricultural production. The main goal of this study, to draw attention a “forgotten” soil moisture regime control method, which could mitigate the adverse effects of climate change on the Hungarian arable lands, called melioration.
Materials and methods
The chosen study area was Békés County (563.000 ha) situated on the south part of the Great Hungarian Plain, because from the sixties to 1990 this area highlighted by melioration interventions. Békés County Directorate for Disaster Management to have raw data (map stock about the meliorated lands of the county) for GIS data generation performed data collection. Besides, prepared GIS data was compiled by NAIK ÖVKI for comparisons, for example: soil water regime layer (Agrotopo), Corine Land Cover layers (1990, 2000, 2006, 2012), drought risk zonal map layer (Pálfai’s Drought Index), relative excess water inundation frequency layers and drainage channels layers form National Water Management Directorate. The maps were compiled in Esri ArcMap 10.4.
Results and discussion
As our result shows, 65% (368.600 ha) of Békés County’s arable lands (447.500 ha) have extreme moisture regime of soils with unfavorable water management conditions, from which just only 9.4% (52.800 ha) was meliorated before. The Pálfai’s Drought Index (Pálfai 2004) shows that most of the county has been hazarded by drought (PAI = 8-10). According to the GIS comparisons, in the last decades the excess water appeared on the same areas (2000, 2003, 2006, 2010, 2011, and 2013) which influenced by very serious drought at the same year. The channel density at the areas with unfavorable soil moisture regime is four times higher (1.06 km/km2) than the one with favorable soil moisture regime

Hnanice, Czech Republic – 09-14. April, 2018
103
(0.32 km/km2). Unfortunately, there is not enough information about the effectiveness of melioration works, but the compiled map shows those meliorated areas which have been affected by excess water inundations, consequently 18.5% of all meliorated area does not operate in Békés County (9.800 ha), (Figure 1).
Figure 1. Meliorated works under excess water inundations
Conclusions
In this study, all the relevant water management related data of Békés County was collected and compared. Most part of the county has extreme soil moisture regime, which determines the actual agricultural production. Before the political changes, so many areas were meliorated to regulate the soil moisture regime. Based on a previously performed survey (Bozán et al., 2015), approximately 10% of the established meliorated works are out of order to some extent in Hungary. According to our current results it is higher volume (18.5%) in Békés County. For this reason it is highly recommended to start the reconstructions of meliorated works in strong connection with development of water regulation works and water preserved agricultural techniques. Without any changes, the functionality and capacity of the meliorated works will be from bad to worse to serve “Climate change” required water management methods sufficiently on agricultural lands.
Acknowledgement
The Ministry of Agriculture (O14230 Development of agricultural water management – irrigation and excess water management, rational land use) founded our work.
References Bartholy, J., Pongrácz, R., (2010): Analysis of precipitation conditions for the Carpathian Basin based on
extreme indices in the 20th century and climate simulations for 2050 and 2100. Phys. Chem. Earth 35, 43-51. DOI:10.1016/j.pce.2010.03.011
Bozán Cs., Körösparti J., Andrási G., Túri N., Valentinyi K., Fabó I., Fehér F. (2016): Meliorációs tervvel rendelkező területek felmérésének előkészítése - Megvalósíthatósági tanulmányterv [Survey of meliorated areas in Hungary – feasibility study]. Készült az Országos Vízügyi Főigazgatóság megbízásából. NAIK ÖVKI, Szarvas. 17-87.
Pálfai I. (2004): Belvizek és aszályok Magyarországon [Excess water inundations and droughts in Hungary]. Hidrológiai tanulmányok. Közlekedési Dokumentációs Kft. Budapest. 231-250; 339-409; II.sz melléklet. ISBN 963-552-382-3
Várallyay, Gy. (2007): A globális klímaváltozás: hazai hatások és válaszok (A VAHAVA Jelentés) [The global climate change: effects and answers in Hungary (The VAHAHA report)]. In.: Láng, I., Csete, L., Jolánkai, M. (Eds.). Agrokémia és Talajtan, 56(1): 199-202. DOI: 10.1556/Agrokem.56.2007.1.16
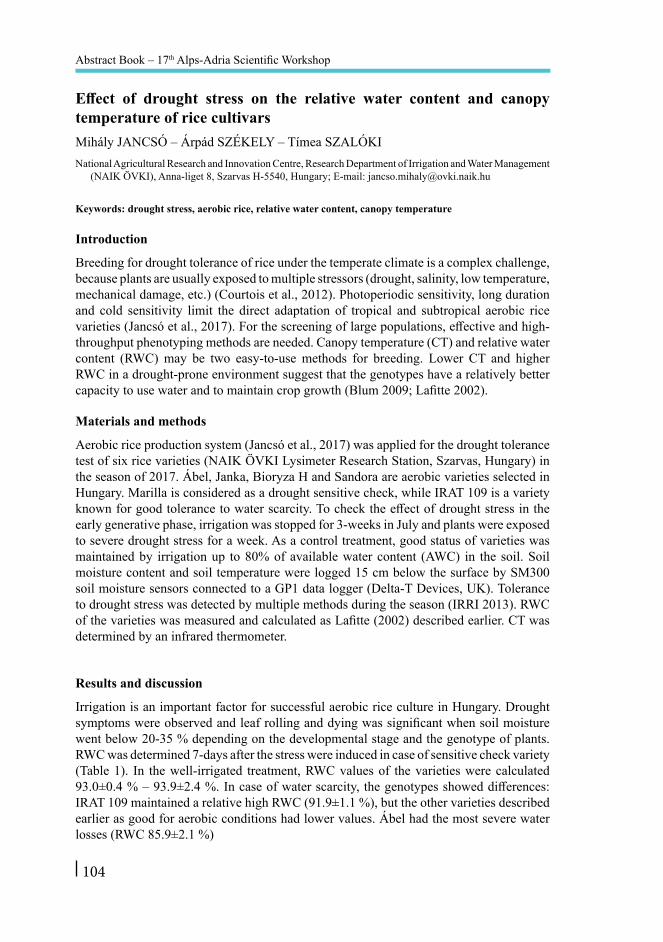
Abstract Book – 17th Alps-Adria Scientific Workshop
104
Effect of drought stress on the relative water content and canopy temperature of rice cultivars Mihály JANCSÓ – Árpád SZÉKELY – Tímea SZALÓKINational Agricultural Research and Innovation Centre, Research Department of Irrigation and Water Management
(NAIK ÖVKI), Anna-liget 8, Szarvas H-5540, Hungary; E-mail: [email protected]
Keywords: drought stress, aerobic rice, relative water content, canopy temperature
Introduction
Breeding for drought tolerance of rice under the temperate climate is a complex challenge, because plants are usually exposed to multiple stressors (drought, salinity, low temperature, mechanical damage, etc.) (Courtois et al., 2012). Photoperiodic sensitivity, long duration and cold sensitivity limit the direct adaptation of tropical and subtropical aerobic rice varieties (Jancsó et al., 2017). For the screening of large populations, effective and high-throughput phenotyping methods are needed. Canopy temperature (CT) and relative water content (RWC) may be two easy-to-use methods for breeding. Lower CT and higher RWC in a drought-prone environment suggest that the genotypes have a relatively better capacity to use water and to maintain crop growth (Blum 2009; Lafitte 2002).
Materials and methods
Aerobic rice production system (Jancsó et al., 2017) was applied for the drought tolerance test of six rice varieties (NAIK ÖVKI Lysimeter Research Station, Szarvas, Hungary) in the season of 2017. Ábel, Janka, Bioryza H and Sandora are aerobic varieties selected in Hungary. Marilla is considered as a drought sensitive check, while IRAT 109 is a variety known for good tolerance to water scarcity. To check the effect of drought stress in the early generative phase, irrigation was stopped for 3-weeks in July and plants were exposed to severe drought stress for a week. As a control treatment, good status of varieties was maintained by irrigation up to 80% of available water content (AWC) in the soil. Soil moisture content and soil temperature were logged 15 cm below the surface by SM300 soil moisture sensors connected to a GP1 data logger (Delta-T Devices, UK). Tolerance to drought stress was detected by multiple methods during the season (IRRI 2013). RWC of the varieties was measured and calculated as Lafitte (2002) described earlier. CT was determined by an infrared thermometer.
Results and discussion
Irrigation is an important factor for successful aerobic rice culture in Hungary. Drought symptoms were observed and leaf rolling and dying was significant when soil moisture went below 20-35 % depending on the developmental stage and the genotype of plants. RWC was determined 7-days after the stress were induced in case of sensitive check variety (Table 1). In the well-irrigated treatment, RWC values of the varieties were calculated 93.0±0.4 % – 93.9±2.4 %. In case of water scarcity, the genotypes showed differences: IRAT 109 maintained a relative high RWC (91.9±1.1 %), but the other varieties described earlier as good for aerobic conditions had lower values. Ábel had the most severe water losses (RWC 85.9±2.1 %)

Hnanice, Czech Republic – 09-14. April, 2018
105
Table 1: RWC of rice varieties in well-irrigated and in drought stressed conditions, 7 days after stress was induced (Szarvas, Hungary, 2017)
Name of varieties RWC, % – irrigated RWC, % – stressedÁbel 93.7±1.1 85.9±2.1Janka 93.2±1.1 86.7±1.5
Bioryza H 93.0±0.4 87.2±0.7Sandora 93.9±0.9 87.3±2.7Marilla 93.6±0.4 89.9±1.7
IRAT 109 93.9±2.4 91.9±1.1
The CT was measured in the warmest periods of the days in July. 7 days after stress was induced, the highest ambient temperature was observed as 33 °C and the soil surface exposed to direct sunlight was measured 57±1 °C. In that conditions, varieties in the well-irrigated treatment showed closely the same CTs (26-27 °C). In the drought affected plots, IRAT 109 maintained CT as it was observed in the control. Highest CT (34 °C) and severe leaf rolling were detected in Marilla.
Conclusions
In our experiment, RWC and CT were applied to determine the effect of drought stress for the crop growth. As earlier described (Blum 2009; Lafitte 2002), both are suitable to check the reactions of the genotypes, but based on our results and previous growth experiments (Jancsó et al., 2017), multiple methods need to be used during the season to get relevant information about the drought tolerance of rice genotypes under the temperate conditions.
Acknowledgement
The Hungarian Ministry of Agriculture supported the project under the “Improvement of the abiotic stress tolerance of Hungarian rice varieties” programs (FM OD002, FM O15540).
References Blum, A. (2009): Effective use of water (EUW) and not water-use efficiency (WUE) is the target of crop yield
improvement under drought stress. Field Crops Research, 112 : 119–123. DOI: https://doi.org/10.1016/j.fcr.2009.03.009
Courtois, B., Frouin J., Greco R., Bruschi G., Droc G,. Hamelin C., Ruiz M., Clément G., Evrard J, Coppenole S., Katsantonis D., Oliveira M., Negrão S., Matos C., Cavigiolo S., Lupotto E., Piffanelli P., Ahmadi N. (2012): Genetic Diversity and Population Structure in a European Collection of Rice. Crop Sci. 52: 1663–1675. DOI: https://doi.org/10.2135/cropsci2011.11.0588
IRRI (2013): Standard Evaluation System for Rice (5th edition). International Rice Research Institute, Manila, pp. 35-37.
Jancsó, M., Székely, Á., Szalóki, T., Lantos, Cs., Pauk, J. (2017): Performance of rice varieties under aerobic conditions in Hungary. Columella. 4: 1. 83-88. DOI: https://doi.org/10.18380/szie.colum.2017.4.1.suppl
Lafitte, R. (2002): Relationship between leaf relative water content during reproductive stage water deficit and grain formation in rice. Field Crops Research, 76(2–3), 165–174. DOI: http://dx.doi.org/10.1016/S0378-4290(02)00037-0

Abstract Book – 17th Alps-Adria Scientific Workshop
106
Testing the applicability of biodegradable superabsorbent polymers for crop productionZoltán KENDE – Márta BIRKÁSSzent István University, Crop Production Institue, H-2100 Gödöllő Páter Károly u. 1. E-mail: kende.zoltan@
mkk.szie.hu
Keywords: superabsorbent polymers, climate change, crop production, soil
Introduction
Several countries have inadequate water resources to serve their current urban and agricultural needs. The most astonishing situation established nowadays is in Cape Town, South Africa, where the government had to restrict the use of water. One of the main reasons why people are suffering from water scarcity now is the expansion of agriculture in the region to serve the needs of the population. Everyone underestimated the size of the water problem, thinking that the drought would only be temporary (Bosurgi, 2018). However, we do not experience yet a serious water scarcity in Europe nor in Hungary similar to that of South Africa but we can clearly see the negative effects of climate change because of the unusual precipitation distribution and the increasing number of drought periods. Drought stress is the most important factor limiting plant growth and usually farmers try to avoid that with adequate tillage methods with reduced surface disturbance (Botlik et al., 2014). One of the re-discovered methods for retaining water in soil is the use of superabsorbent materials that serve as a storage tank to prevent water loss and increase irrigation efficiency (Khodadadi et al., 2013).
Superabsorbent polymers (SAP or Hydrogel) are able to absorb large amounts of water (Esposito et al., 1996). Uses of SAPs in soil near the rhizosphere zone may create a water reserve (Han et al., 2010). Theoretically, their hydrophilic networks can absorb and retain 1000 times more water or solutions than their original weight (Sojka – Entry, 2000). Thus, the application of SAPs in soils could increase the water and nutrient holding capacities and, also to reduce water loss (Lentz et al., 1998). Unfortunately, most of the hydrogels on the market are acrylate-based products. They are produced by the polymerization of acrylic acid, acrylic esters, acrylamide and other unsaturated monomers. The carboxylic group along the polymer chain facilitates the absorption of water, while the presence of crosslinking in the chain prevents their complete solubilisation (Allcock et al., 1990). Thus, most of the products are not biodegradable and regarded as potential pollutants for the soil.
Also, SAPs are not used in agriculture only. Originally, they were invented for military use to handle haemostasis and for other human healthcare relations such as disposable diapers. Due to the increasing attention for environmental protection issues, biodegradable hydrogels deserve potential commercial applications in agriculture (Cannazza et al., 2014) furthermore because of the high environmental risk of hydrogels, since recently there has been a demand for biopolymers in every sector. Biopolymers are derived from feedstock, such as cellulose and starch. The advantages of these biopolymers compared to petroleum-based polymers are in their sustainability, biodegradation properties and non toxic base components. Biopolymers can be made from carboxymethyl cellulose (CMC), which has a naturally occurring polysaccharide cellulose base. CMC is made commercially by reacting chloroacetic acid with sodium cellulose in slurry with isopropanol and water (Weerawarna, 2009). Nowadays SAPs and biopolymers are in use mainly in agriculture and horticulture.

Hnanice, Czech Republic – 09-14. April, 2018
107
Use of hydrogels in crop production is in an experimental stage. There is extensive scientific research in the USA and China (Chen et al., 2017; Li et al., 2014). In Europe and in Hungary the number of publications and experiments with these materials are low.
Materials and methods
The main scope of this study was to determine germination capabilities of three different Hydrogels, which has usage authorization documentation in the European Union. For the germination experiments, we used 7.5 ml of distilled water and MV2500 FAO 290 maize seeds in petri dishes with 5 replications. pH and electric conductivity (EC) changes were tested in the over diluted extracts with Horiba LAQUAtwin measurement sticks.
Results and conclusions All of the three examined SAP materials are capable to help and maintain the maize seed germinations. The pH did not change in our experiments, however in some cases the hydrogels leached ions increasing the EC of the extracts. There is a need for more experiments in the future, mainly to determine the real biodegradability of the hydrogels.
Acknowledgement
Supported by the ÚNKP-17-3 New Natonal Excellence Program of the Ministry of Human Capacities.
References Allcock, H. R., Lampe, F. W. (1990): Contemporary Polymer Chemistry, 2.nd ed., Prentice-Hall, Inc., Engle-
wood Cliffs, New Jersey, USA. ISBN: 0131705490.Botlik M., Csorba Sz., Gyuricza Cs., Kende Z., Birkás M. (2014): Climate challenges and solutions in soil
tillage. Applied Ecology and Environmental Research 12:(1),13-23.Bosurgi, R. (2018): Water crisis in Cape Town: a failure in governance. Editorial. The Lancet Planetary Health.
Volume 2, Issue 3, p.95Cannazza, G., Cataldo, A., De Benedetto, E., Demitri, C., Madaghiele, M., Sannino, A. (2014): Experimental
Assessment of the Use of a Novel Superabsorbent polymer (SAP) for the Optimization ofWater Consumption in Agricultural Irrigation Process. Water, 6(7), 2056-2069.
Chen, X., Huang, L., Mao, X. Liao, Z., He Z. (2017): A Comparative Study of the Cellular Microscopic Characteristics and Mechanisms of Maize Seedling Damage from Superabsorbent Polymers. Pedosphere Volume 27, Issue 2 pp. 274-282.
Esposito F., Del Nobile A., Mensitieri G, Nicholais, L. (1996): Water Sorption in Cellulose-Based Hydrogels. J. Appl. Polymer. Sci., 60: 2403-2407.
Han, Y. G., Yang, P. L., Luo, Y. P., Ren, S. M., Zhang, L. X., Xu, L. (2010): Porosity change model for watered super absorbent polymer-treated soil. Environmental Earth Sciences, 61(6), 1197-1205
Khodadadi Dehkordi, D., Seyyedboveir, S. (2013): Evaluation of super AB A 200 Superabsorbent on water use efficiency and yield response factor of SCKaroun701 corn under deficit irrigation. Advances in Environmental Biology, 7, 4615- 4622.
Lentz, R. D., Sojka, R. E., Robbins, C. W. (1998): Reducing phosphorus losses from surface irrigated fields: emerging polyacrylamide technology. Journal of Environmental Quality, 27(2), 305-312.
Sojka, R. E., Entry, J. A. (2000): Influence of polyacrylamide application to soil on movement of microorganisms in runoff water. Environmental Pollution, 108(3), 405-412.
Weerawarna S. A. (2009): Method for Making Biodegradable Superabsorbent Particles. U.S. Patent 2009/0324731 A1, filed June 30, 2008, and issued December 31, 2009.
X. Li, X., He, J., Hughesc, M., Liu, Y, Zheng M. (2014): Effects of super-absorbent polymers on a soil–wheat (Triticum aestivum L.) system in the field. Applied Soil Ecology. Volume 73 pp. 58-63.

Abstract Book – 17th Alps-Adria Scientific Workshop
108
Bentonite-digestate mixture as a new product: Its effect on plant germination and soil nutrient statusMarianna MAKÁDI1 – Bente FOEREID2 – Emilio ALVARENGA2 – Tamás SZEGI3 – Zsolt ESZES4 1: University of Debrecen, Research Institute of Nyíregyháza, Westsik Vilmos u. 4-6, 4400 Nyíregyháza,
Hungary; E-mail: [email protected] 2: Norwegian Institute of Bioeconomy Research, Pb 115, 1431 Ås, Norway; E-mail: [email protected],
[email protected]: Szent István University, Department of Soil Science and Agrochemistry, Páter Károly u. 1, 2100 Gödöllő,
Hungary; E-mail: [email protected]: Inwatech Ltd., Németvölgyi út 114, 1124 Budapest, Hungary; E-mail: [email protected]
Keywords: digestate, minerals, nitrogen loss, nutrient source
Introduction
The area of sandy soils in Hungary covers 1.4 million hectares. This soil is characterised by low organic matter content, low nutrient retention and water holding capacity (Várallyay, 1984). An available source of both organic matter and nutrients is digestate, the organic residue from biogas production. The amount of liquid digestate is acting like a plant nutrition source but it can also cause environmental problems like nitrogen (N) volatilisation and leaching. Digestate has a high concentration of mineral N, almost exclusively ammonium (NH4
+) which sorption to soil or other mineral and natural porous materials could decrease losses of N from soil (Sun et al., 2015; Huang et al., 2017). Here we go a step further to mix bentonite with digestate before application, to retain N in the mixture. However, high concentrations of NH4
+ can inhibit plant germination. Therefore, the objectives of this work were to study i) the effects of different rate of mixtures on the plant germination, ii) the changes in plant biomass and, iii) the N, phosphorus (P) and carbon (C) content of plant and soil in the germination phase.
Materials and methods
Ground bentonite (Ø 0.005-10 mm) from the Pétervására, Hungary was used in the experiment. The ratio of bentonite and digestate were 1:3 and 1:9. The mixtures were dried at 50 oC for 1 hour and were stored in room temperature until water content reached 10% (m/m). For the germination test 300 g of soil from Arenosol (Nyíregyháza, Hungary) was used per each pot mixed with 0%, 1%, 2.5% and 5% of bentonite-digestate mixtures and digestate only with four replicates for each sampling time. Control pots were not treated. Mustard (Sinapis alba) was used as a test plant. Samples were taken on days 1, 2, 3, 5, 12. The available NH4-N, NO3-NO2-N and PO4-P content and total C and N content were measured in soil samples. For data elaboration, one-way ANOVA, Tukey’s test and Pearson’s correlation was applied (p<0.05).
Results and discussion
The first three days, the control treatment had the highest germination rate. Afterward the other treatments caught up to a similar rate, so that after day 7 no difference was found. However, because of the delay, plant biomass at the end of the experiment was

Hnanice, Czech Republic – 09-14. April, 2018
109
significantly smaller in the treatments with the highest doses of the mixtures than in those with smaller doses. The highest biomass was recorded in the 1% of 1:3 mixture and 2.5% of digestate treatments. The available N content of soil increased with doses applied as seen in Fig. 1.
Figure 1: Changes of NH4-N and NO3-NO2-N of treated soils on day 1 and 12 of the germination experiment. Different letters means significant difference of means (Tukey’s test, p<0.05)
The highest concentrations of mineral N were recorded in the 5% digestate treatment in days 1-5, while the treatments with the mixtures resulted in highest concentrations at the end. PO4-P concentration increased in soils treated with the mixtures, but was less affected by digestate treatments. Plant biomass N at the end of the experiment was moderately correlated with available N fractions of soil, and biomass C was positively correlated with NH4-N, total N and C content of soil.
Conclusions
In the first five days, the NH4-N content of soil was lower in mixtures than in digestate treatments. Therefore, the delay in germination in the treatment with highest application rates of mixtures could not be caused by NH4-N alone. Moreover, bentonite seems to have an inhibitory effect on germination by itself. However, this negative effect was only a delay; therefore its negative effects could be avoided by applying the mixtures some days before sowing. The level of available N and P in mixtures treatments were higher in the last days of the experiment, suggesting a better nutrient supply for the subsequent plant growth.
Acknowledgement
Thanks for the financial support of Norway Grant (HU09-0096-A2-2016).
References Huang, J., Kankanamge, N.R., Chow, C., Welsh, D. T., Li, T., Teasdale, P. R. (2017): Removing ammonium from
water and wastewater using cost-effective adsorbents: A review, Journal of Environmental Sciences. DOI: https://doi.org/10.1016/j.jes.2017.09.009
Sun, Z., Qu, X., Wang, G., Zheng, S., Frost, R.L. (2015): Removal characteristics of ammonium nitrogen from wastewater by modified Ca-bentonites. Applied Clay Science 107: 46–51. DOI: http://dx.doi.org/10.1016/j.clay.2015.02.003
Várallyay, Gy. (1984): Magyarországi homoktalajok vízgazdálkodási problémái. Agrokémia és Talajtan 33: 159-169. (In Hungarian).

Abstract Book – 17th Alps-Adria Scientific Workshop
110
Relationship between the microbial activity and land use on typical sandy soil of the Nyírség regionIbolya DEMETER1 – Marianna MAKÁDI1 – Tibor ARANYOS1 – Attila TOMÓCSIK1 – Katalin POSTA2
1: Research Institute of Nyíregyháza, Institutes for Agricultural Research and Educational Farm, University of Debrecen, 4400 Nyíregyháza, Hungary, Westsik Vilmos út 4-6.; E-mail: [email protected], [email protected], [email protected], [email protected]
2: Institute of Genetics, Microbiology and Biotechnology, Szent István University, 2100 Gödöllő, Hungary, Páter Károly út 1.; E-mail: [email protected]
Keywords: sandy soil, ecological management, conventional management, elevation position, seasonal changes
Introduction
The typical sandy soils in Nyírség region have acidic pH and low organic carbon content, so the fertility and microbial activity are relatively low. The recycling of plant residues can increase the organic carbon content of the soil offering more favourable conditions for the soil microbes (Prasad et al., 2016). Furthermore, the microbial activity and biodegradation show higher intensity in ecological than in conventional management system (Ge et al., 2013). In addition, changes of soil moisture and available organic substrates could influence the microbial activity (Martin-Lammerding et al., 2015). Moreover, the management systems (ecological, conventional) can influence on it. The objective of the present study was to compare the soil microbial activities found in ecological and conventional farming systems on a light textured soil in Hungary.
Materials and methods
The investigated areas located near to Nyíregyháza, Hungary. The main soil type in this region is acidic sandy soil (Arenosol). Ecological arable crop production has maintained since 1997 in the Research Institute of Nyíregyháza. In the ecological management farmyard and green manure and crop residues, while on the conventional land artificial fertilizers are used for nutrient supply. Soil samples were collected from the upper and lower part of the slopes in both sites, from the 0-30 cm and the 30-60 cm soil layers in spring and autumn, 2017. Samples were stored at -20 ˚C until the analysis. Invertase activity was investigated photometrically (Mikanová et al., 2001). Soil respiration was measured in situ by an LCi-SD infrared gas analyser (ADC Ltd). Soil moisture content was determined by gravimetric method. Statistical analyses were carried out with IBM SPSS Statistics 22.0 software package (IBM Inc., USA), at a significance level of 0.05.
Results and discussion
Generally, higher invertase activity was measured in the upper 30 cm soil layer, than in the lower ones. Differences were observed between the upper and the lower part of the slope, which was significant only in the upper 30 cm layer, during springtime. In case of management, the soil samples collected from the ecological site had higher enzyme activity, but the difference between the two sites was significant only in autumn. The recycled plant residues have found positive effect on essential substrates concentrations

Hnanice, Czech Republic – 09-14. April, 2018
111
of soil enzymes (Wick et al., 1998) which could result in higher enzyme activities in ecological site. Considering the seasonal dynamic, significant decrease in enzyme activity was observed from spring to autumn, which was significantly higher in the conventional management. The higher organic matter input by the recycled plant residues can buffering the negative environmental conditions in the ecological management.
Soil moisture content showed differences by topography, management and soil layer. We measured significantly higher soil moisture content (10.38-15.33 m/m %) in samples collected from the upper 30 cm soil depth in autumn. The soil moisture content had strong and significant relationship with the invertase activity (0,718; P < 0.01). However, negative correlation was observed (-0.409; P < 0.05) in springtime with lower soil moisture content (3.15-5.76 m/m %).
The soil respiration was significantly higher in the ecological than in conventional management, but the difference between the two reliefs was significant only in spring. Aerts and Toet (1997) also found negative effect of applied nitrogen fertilizer on the soil respiration.
Conclusions
Comparison of soil microbial activities detected in ecological and conventional farming systems was found that all parameters were affected by soil depth, topography, management and seasons. In general, the invertase enzyme activity and soil moisture content were higher in the ecological site. Furthermore, the soil respiration was more intensive in this site, too. Based on our results, the ecological management can buffering the negative environmental and human effects and resulted in favourable soil conditions to the microbes. These conditions resulted in higher microbial activity and increasing soil fertility of the investigated acidic sandy soil.
References Aerts R., Toet S. (1997): Nutritional controls on carbon dioxide and methane emission from carex-dominated
peat soils, Soil. Biol. Biochem., (29) 11, 1683-1690.Ge T., Chen X., Yuan H., Zhu B. Li, H., Peng P., Li K., Jones D. L., Wu J. (2013): Microbial biomass, activity,
and community structure in horticultural soils under conventional and organic management strategies. Eur. J. Soil Biol. 58, 122-128.
Martin-Lammerding, D., Navas, M., Mar Albarrán, M., Tenorio, J. L., Walter, I. (2015): Long term management systems under semiarid conditions: Influence on labile organic matter, β-glucosidase activity and microbial efficiency, App. Soil Ecol. 96, 296-305.
Mikanová O., Kubát J., Mikhailovskaya N., Vörös I., Bíró B. (2001): Influence of heavy metal pollution on some soil-biological parameters in the alluvium of the Litavka river. Rostlinná Výroba 47, 117-122.
Prasad J.V.N.S., Srinivasa Rao Ch., Srinivas K., Naga Jyothi Ch., Venkateswarlu B., Ramachandrappa B.K., Dhanapal G. N., Ravichandra K., Mishra P. K. (2016): Effect of ten years of reduced tillage and recycling of organic matter on crop yields, soil organic carbon and its fractions in Alfisols of semi arid tropics of southern India. Soil Till. Res. 156, 131–139.
Wick B., Khüne R., Vlek, P. (1998): Soil microbiological parameters as indicators of soil quality under improved fallow management system in South-Western Nigeria. Plant Soil. 202, 97–107.

Abstract Book – 17th Alps-Adria Scientific Workshop
112
Glomalin gene as molecular marker for functional diversity of arbuscular mycorrhizal fungi in the soilFranco MAGURNO1 – Monika RAJTOR2 – Erica LUMINI3 – Katalin POSTA4 – Zofia PIOTROWSKA-SEGET2
1: Department of Botany and Nature Protection; Faculty of Biology and Environmental Protection; University of Silesia in Katowice; Jagiellońska 28, 40-032 Katowice, Poland; E-mail: [email protected]
2: Department of Microbiology; Faculty of Biology and Environmental Protection; University of Silesia in Katowice; Jagiellońska 28, 40-032 Katowice, Poland.
3: Institute for Sustainable Plant Protection (IPSP-SS Turin); C.N.R; Viale P.A. Mattioli 25, 10125 Torino, Italy.4: Microbiology and Environmental Toxicology Research Group; Faculty of Agricultural And Environmental
Sciences; Szent István University; Páter Károly 1, 2100 Gödöllő, Hungary.
Keywords: glomalin, arbuscular mycorrhizal fungi, functional diversity
Introduction
Arbuscular mycorrhizal fungi (AMF) are ubiquitous plant symbionts playing an important role in terrestrial ecosystems functioning (Smith & Read, 1997). Among the ecological services provided, the process of soil aggregation is hypothesized to be partially mediated by glomalin (Wright et al., 1996), an immunoreactive glycoprotein released by AM fungi into soil during hyphal turnover and after the death of the fungus in the soil (Driver et al., 2005). The protein is characterized by abundant production, apparent recalcitrance and hydrophobic properties (Wright et al., 1996; Wright & Upadhyaya, 1996; Rillig & Mummey, 2006). Although glomalin has been identified as a putative homolog of heat shock protein (hsp) 60 (Gadkar & Rillig, 2006) related to a salinity stress response (Hammer & Rillig, 2011), the use of expressed fungal genes encoding glomalin as a marker for functional AMF diversity was never exploited. The present work describes the first attempt to characterize the glomalin gene in several AMF species, verify its reliability as gene marker for the identification and discrimination of AMF, and test the possibility to detect its expression in soil.
Materials and methods
The glomalin nucleotide sequence from Rhizophagus irregularis DAOM 197198 (DQ383981) was used to query the available transcriptome of Gigaspora margarita (Salvioli et al., 2016) to identify the putative homologue. Sequences were then aligned with MUSCLE with hsp60 coding sequences from the non-glomeromycotan fungi to verify the phylogenetic position of AMF sequences and to identify the conserved regions for intra-phylum primers design. Two couples of primers were designed and used in nested PCR on crude genomic DNA extracted from spores of 12 AMF isolates representing 12 different species (Funneliformis mosseae, F verruculosum, F geosporum, F caledonium, Rhizophagus clarus, Septoglomus constrictum, Gigaspora margarita, Gi rosea, Dentiscutata cerradensis, Acaulospora laevis, Diversispora trimurales, D varaderana), 7 genera and 4 families of the phylum Glomeromycotina. Sequences obtained were blasted versus R irregularis hsp60. Putative glomalin sequences were aligned with MUSCLE. jModelTest2 was used to predict the best substitution model to set in Bayesian analysis using MrBayes.

Hnanice, Czech Republic – 09-14. April, 2018
113
RNA was extracted from 2 gr of soil using the RNeasy PowerSoil Total RNA Kit (Mo Bio) and retrotranscripted with Maxima First Strand cDNA Synthesis Kit for RT-qPCR (Thermofisher). cDNA and RT- control were used as template in a nested PCR with the same primers and conditions for amplification from genomic DNA.
Results and discussion
A single sequence, putative homologue of glomalin gene, was found blasting R irregularis hsp60 versus Gi margarita transcriptome, with a percentage of identity of about 80%. The two couples of primers, designed on the most conserved parts of the gene, were successful in the amplification of the putative ortholog sequences, about 930-950 bp long, from the AMF isolates utilized. An intron (about 70-100 bp) was removed before proceeding with phylogenetic analysis. The Bayesian analysis produced a tree with a topology coherent with the one derived by ribosomal genes. The amplification using cDNA from soil resulted in a product of expected size, and no bands for the RT- control.
Conclusions
These results open a door on a new field of investigation for AMF, till now only theorized in several papers (van der Heijden et al., 2004). Once the range of glomalin sequences available will increase to cover all the taxonomic groups of Glomeromycotina phylum, it will be possible to investigate AMF communities not only at the phylotaxons present but also at the specific contribution of single taxa in the enrichment of glomalin in the soil.
References Driver, J. D., Holben, W. E., Rillig, M. C. (2005): Characterization of glomalin as a hyphal wall component of
arbuscular mycorrhizal fungi. Soil Biology and Biochemistry 37: 101–106. DOI: https://doi.org/10.1016/j.soilbio.2004.06.011
Gadkar, V., Rillig, M. C. (2006): The arbuscular mycorrhizal fungal protein glomalin is a putative homolog of heat shock protein 60. FEMS Microbiology Letters 263: 93–101. DOI: https://doi.org/10.1111/j.1574-6968.2006.00412.x
Hammer, E. C., Rillig, M. C. (2011): The Influence of Different Stresses on Glomalin Levels in an Arbuscular Mycorrhizal Fungus—Salinity Increases Glomalin Content. PLoS ONE 6(12): e28426. DOI: https://doi.org/10.1371/journal.pone.0028426
Rillig, M. C., Mummey, D. L. (2006): Mycorrhizas and soil structure. New Phytologist 171: 41–53. DOI: 10.1111/j.1469-8137.2006.01750.x
Salvioli, A., Ghignone, S., Novero, M., Navazio, L., Venice, F., Bagnaresi, P., et al., (2016): Symbiosis with an endobacterium increases the fitness of a mycorrhizal fungus, raising its bioenergetic potential. the ISME Journal. 10: 130–144. DOI: https://doi.org/10.1038/ismej.2015.91
Smith, S. E., Read, D. J. (1997): Mycorrhizal Symbiosis, 2nd edn. Academic Press, London, UK.van der Heijden MGA, Scheublin T. R., Brader A. 2004. Taxonomic and functional diversity in arbuscular
mycorrhizal fungi — Is there any relationship? New Phytologist 164: 201-204. DOI: https://doi.org/10.1111/j.1469-8137.2004.01205.x
Wright, S. F., Upadhyaya, A. (1996): Extraction of an abundant and unusual protein from soil and comparison with hyphal protein from arbuscular mycorrhizal fungi. Soil Science 161: 575–586.
Wright, S. F., Franke-Snyder, M., Morton, J. B., Upadhyaya, A. (1996): Time-course study and partial characterization of a protein on hyphae of arbuscular mycorrhizal fungi during active colonization of roots. Plant Soil 181: 193–203. DOI: https://doi.org/10.1007/BF00012053

Abstract Book – 17th Alps-Adria Scientific Workshop
114
Analysis of Soil Organic Material in UV-Vis SpectrumAndrás SEBŐK1 – Imre CZINKOTA1 – Balázs NYIRI2 – Gabriella BOSNYÁKOVICS1 – Miklós GULYÁS1 1: Szent István University, Gödöllő, Hungary; E-mail: [email protected]: Department of Radiology, University of Ottawa, Ottawa, Canada; E-mail: [email protected]
Keywords: SOM, humic acid, fulvo acid, UV-Vis spectrum
Introduction
The international community tries to take more effort year after year to protect and conservation the current resources across the globe. The climate change occurs some problem in the global systems that have effect on our soils also. The measurement of soil organic matter (especially of fulvic acid – FA and humic acid – HA) is a well-known process which develop continuously in the last hundred years. Some widely accepted methods are the E4/6 [465/665 nm] ratio or the E2/3 [250/365 nm] method. Both of them are depend on the spectral analysis of the extracted organic matter. The UV-Vis spectrum of these solutions form an exponential curve which has some chosen points between the 200-900 nm (depend on the method) and the ration of these points give the information of the distribution of the FA-HA materials (Wang & Hsich 2001, Chen et al., 2002). Many authors mention the problems that occur if aromatic organic molecules appear in the system. They could modify the results; give wrong information about the molecule distributions (Hayase & Tsubota 1985, Yan et al., 2012). To avoid the inaccurate, Yacobi et al., 2003 tried to linearize this exponential spectrum. Unfortunately, they noticed some problem during this linearization process. In our experiment we tried to find a solution to use the exponential curve as information not only the FA/Ha ratio but the whole size distribution in the samples we examined. This approach promises an easy and cheap method to assume the molecule distribution in the soils (also in any sample what contain organic matter in the liquid phase or has the ability to extract the organic content).
Materials and methods
The soil samples were chosen to represent different types, e. g. sandy soil (Nyírségi sand) or chernozem (Nagyhörcsök) or solonetz (Karcag) or acid forest soil (Vasmegyer). We also used Na-humate standard (by Sigma & Aldrich). These soils treated with extract liquid of: 0.5 M NaOH and 0.1 M Na4P2O7. 5.0 gram of soil added to 20 ml of extractor, and after 4 hours of shake they were centrifuged (10 mins on 5000 rpm) and filtered (MN 751 filter paper, Reanal) based on Stevenson, 1982. The prepared solid extractions were diluted to 10x, 20x with distillate water and measured on Jenway spectrometer between 400-900 nm. The exponential curves were analysed by the Origin 6.0 software.
Results and discussion
The spectral analysis results provided information to calculate the E4/6. Use these t1 number we can also calculate the E4/6 value. These values based on the t1 parameter of exponential curves (Table 2). The exponential equation is:

Hnanice, Czech Republic – 09-14. April, 2018
115
Table 1: Exponential parameters and the E4/6 results
Sample R2 A1 t1 465 nm 665 nm E4/6 Calculated E4/6
Karcag 0.99847 26.72 129.34 0.722 0.153 4.7 4.7Nyírségi sand 0.99856 12.37 127.47 0.323 0.072 4.5 4.8Nagyhörcsök 0.99894 29.55 133.80 0.922 0.201 4.6 4.5Vasmegyer 0.98717 37.09 143.23 1.574 0.320 4.9 4.0Na-Humate 0.99704 35.67 110.33 0.480 0.001 480 6.1
The results show that the E4/6 values could be calculated directly from the curves. In addition, the curve is less sensible for dilution or measurement error, compared to the original E4/6.
Conclusions
In the last decades, the computer science increased the possibility to calculate the parameters. According to this, the efforts toward the linearization are less important and the equation parameters could be used directly to compare and calculate the distributions between the forms of organic matters. We found, that the regular E4/6 method could give reliable results. However, if the whole spectrum was analyzed, the result is more accurate (because we have hundreds of points instead of the two points fitting). If we use the exponential approach the information that we can get from the parameters is more accurate compared the regular methods. The decreasing constant or half wavelength-value of these curves gives information about the distribution of different materials we want to measure (not only on certain wavelength) and helps to avoid the disturbing effect (like aromatic groups) in the samples. The dilution has effect to the samples, change the E4/6 numbers also. The parameters of exponential curves are less sensitive to this effect.
Acknowledgement
The research was „Supported by the UNKP-17-3-I/SZIE-38 New National Excellene Program of the Ministry of Human Capacities”.
ReferencesChen, J., Gu, B., LeBoeuf, E. J., Pan, H., Dai S. (2002): Spectroscopic characterization of the structural and
functional properties of natural organic matter fractions. Chemosphere. 48, 59-68.Hayase, K., Tsubota, H. (1985): Sedimentary humic acid and fulvic acid as fluorescent organic materials.
Geochimica et Cosmochimica Acta. 49: 159-163.Stevenson, F. J., (1982): Extraction, fractionation, and general chemical composition of soil organic matter. In:
Stevenson,F.J. (Ed.), Humus Chem.. Genesis, Composition, Reactions. John Wiley & Sons, N. Y. 26–54Wang, G. S., and Hsieh, S. (2001): Monitoring natural organic matter in water with scanning spectrophotometer.
Environment International. 26: 205-212.Yan, M., Korshin, G., Wang, D., Cai, Z. (2012): Characterization of dissolved organic matter using HPLC-SEC
with a multiple wavelength absorbance detector. Chemosphere. 87: 879-885.Yacobi, Y. Z., Alberts, J. J. Takács, M., McElvaine, M.. (2003): Adsorption spectroscopy of colored dissolved
organic carbon in Georgia (USA) rivers: the impact of molecular size distribution. J. Limnol. 62(1): 41-46.

Abstract Book – 17th Alps-Adria Scientific Workshop
116
Changing of some characteristics and the CO2 production of a sandy soil by application of mineral grist treatmentsMagdolna TÁLLAI – Imre VÁGÓ – Zsolt SÁNDOR – János KÁTAIUniversity of Debrecen, Faculty of Agricultural and Food Sciences and Environmental Management,
Institute of Agricultural Chemistry and Soil Science, Debrecen, Böszörményi Street 138. Hungary; E-mail: [email protected]
Keywords: alginate, perlite, physical, chemical, sand
Introduction
The using of natural substances, such as alginate and perlite for soil improvement was start to meet the requirements of sustainable production, and maintain the soil fertility.
Materials and methods
The effects of alginate and perlite minerals on a humus sandy soil type (Debrecen-Pallag-2017) were examine. Measured soil parameters were: the silt and clay content, some water-management features of soil (Filep, 1995), the pH [pH(H2O); pH(KCl)], (Buzás, 1988), the nitrate nitrogen-N (Felföldy, 1988), the AL-P2O5 and AL-K2O (Egnér et al., 1960), and soil respiration (Witkamp, 1966. cit. Szegi, 1979).
Results and discussion
The humus sandy soil was sand texture with low clay fraction. The water management parameters improved due to the treatments with higher dose of minerals (Table 1.).
Table 1: Effects of alginate and perlite on some soil physical features
Treatments Silt and clay (%)
Soil texture
Moisture content (m/m%)
Water permeability(ml sec-1)
Water-holding capacity (m/m%)
Control 10.00a*
sand
14.62a 9.82b 20.96aAlginate (5t ha-1) 10.50ab 17.61b 9.77b 21.83abAlginate (10t ha-1) 10.80bc 17.81b 9.37ab 23.20bcPerlite (5t ha-1) 11.50cd 20.37c 9.08ab 21.57abPerlite (10t ha-1) 11.80d 25.02d 8.18a 24.07c*One-way ANOVA Duncana-test (Significance level =,05) n=3
Minerals did not influence the soil pH significantly. From among the available nutrient content of the soils, the K-value increased in higher rate compared with control (Table2).
Table 2: Effects of alginate and perlite on some soil chemical features
Treatments pH(H2O) pH(HCl)Nitrate-N(mg kg-1)
AL-P2O5(mg kg-1)
AL-K2O(mg kg-1)
Control 5.60a 4.20a 23.90a 160.00a 98.00aAlginate (5t ha-1) 5.75a 4.60b 33.70bc 191.20b 123.00cAlginate (10t ha-1) 5.78a 4.62b 35.62c 194.60b 113.12bPerlite (5t ha-1) 5.70a 4.30a 29.16ab 191.00b 120.00bcPerlite (10t ha-1) 5.75a 4.35a 28.17ab 192.50b 132.62d

Hnanice, Czech Republic – 09-14. April, 2018
117
The soil respiration increased due to mineral treatments nearly the same rate, significantly on the effect of 10 t ha-1 perlite treatment (Figure 1.).
a
ab ab ab
b
15,0
15,5
16,0
16,5
17,0
control alginate (5 t ha-1) alginate (10 t ha-1) perlite (5 t ha-1) perlite (10 t ha-1)
CO2
prod
uctio
n (m
g 10
0g-1
10 d
ays-1
)
Treatments
Figure 1: Effect of alginate and perlite on the CO2-production of soil
Some Pearson-correlations were proven: between moisture content and CO2 (alginate: r = 0.615*; perlite: r = 0.768*); water-holding capacity and CO2 (alginate: r = 0.346*; perlite: r = 0.536*); NO3-N and CO2 (alginate: r = 0.308; perlite: r = 0.739*) (n=15).
Conclusions
The results have proven that the application of natural amendments can fit into the sustainable land use systems, especially into soils having low colloid content.
Acknowledgement
The work/publication was support by the EFOP-3.6.3.-VEKOP-16-2017-00008 project. The project is co-finance by the European Union at the European social fund.
ReferencesBuzás, I. (Ed.) (1988): Methods of soil and agricultural chemistry analyses 2. Physical-chemical and chemical
methods of soil analyses. (In Hungarian) Mezőgazdasági Kiadó. Bp. pp.90-93.Egner, H., Riehm, H. & Domingo, W. R. (1960): Untersuchungen über die chemische Bodenanalyse als
Grundlage für die Beurteilung des Nährstoffzustandes der Böden. Ann. 26. pp.199–215.Felföldy L. (1987): Biológiai vízminősítés. 4. kiadás Vízügyi Hidrológia, Vízgazdálkodási Intézet Budapest,
Vol. 16. pp.172-174.Filep Gy. (1995): Talajvizsgálatok. (jegyzet) Debreceni Agrártudományi Egyetem, pp.105-107. Kátai, J. (1992): Correlation among the physical, chemical characteristics and microbiological activities of some
soil types. In: Functioning and Dynamics of Perturbed Ecosystems. Eds. Bellan, D.- Bonin, G. – Emig, C. Lavoisier Publishing, Paris. pp.137-158.
Sorin P., Maria P., Elena M. D. (2014): Influence of using perlite and eco fertilizers for hydroponic cucumbers culture. Journal of Biotechnology. Vol. 185, Suppl.09. pp. 81.
Szegi J. (1979): Talajmikrobiológiai vizsgálati módszerek. Mezőgazdasági Kiadó, Budapest. pp. 250-256. Kátai J., Zsuposné O. Á., Sándor Zs., Tállai M., (2016): Ásványok hatása a homoktalajra. Magyar Mezőgazdaság.
71.évf. 40. pp. 28-30. Rinaudo, M, (2014): Biomaterials based on a natural polysaccharide: alginate. TIP Revista Especializada en
Ciencias Químico-Biológicas, 17(1):92-96.

Abstract Book – 17th Alps-Adria Scientific Workshop
118
Effects of nutrient supply on soil respiration in a long-term experimentJózsef Tibor ARANYOS – Ibolya DEMETER – István HENZSELUniversity of Debrecen Research Institute of Nyíregyháza; H-4400 Nyíregyháza Westsik Vilmos út 4-6E-mail: [email protected], [email protected], [email protected],
Keywords: long-term experiment, climate change, soil respiration, nutrient supply
Introduction
The possible solutions for mitigate climate change are important topics of research, industry and agriculture. In the last two centuries, the atmospheric carbon dioxide (CO2) concentration has significantly increased due to human activity. CO2 coming from agriculture is about 5% of the total CO2 emission (Gyuricza, 2004). The soil is one of the largest carbon reservoirs. Its respiration plays a large role in atmospheric CO2 concentration and global carbon cycle, as well (Reich & Schlesinger, 1992; Jensen et al., 1996; Hanson et al., 2000). It is expected that global warming will have an impact on soil respiration and has a positive feedback. So it is very important to understand soil respiration process and its rate across ecosystems. The nutrient supplying methods of agricultural lands have strong effect on soil, depending both on the soil type and on the duration of the treatment. The aim of our study was to determine the long-term effects of different fertilization methods on soil CO2 emission.
Materials and methods
The experiment was carried out in Westsik’s crop rotation at the city of Nyíregyháza (Hungary), which represents the typical farming systems of Eastern Hungarian Region. The experiment is appropriate for studying long-term effects of different fertilization methods (straw, farmyard, main and second crop green manure).In the crop rotation experiment rye and potato are grown at least once in every 3 years. Besides these two plants, legumes are grown in some crop rotations. Soil respiration was measured 2 times in 2016 in rye and on 1 occasion in 2017 in potato, in three replicates. We used LCi-SD portable device which measures the CO2concentration parallel with soil temperature. Statistical analysis of data was carried out using the one-way ANOVA test, the means were compared with Tukey’s test. In data evaluation, the soil and air temperature and the precipitation were also taken into consideration.
Results and discussion
Our results indicate that regular organic matter application had a positive effect on carbon dioxide emission of sandy soil (Figure 1.).In 2016, the intensity of soil respiration was the lowest in Rotations I-III. (control and lupine root manure treatment), and it was significantly higher in the other studied crop rotations. The highest soil respiration was measured in the manure+fertilizer crop rotations (Rotations X-XI.). In 2017, the results of soil respiration measurements in potato were similar to data obtained in 2016. Summarized the results, the organic matter treatments had a significant effect on carbon dioxide emission of soil, thereby the intensity of soil respiration increased. However, the different type of organic matter added to the soil resulted in different CO2 efflux of soil.

Hnanice, Czech Republic – 09-14. April, 2018
119
Figure 1: Changes in soil respiration by the effects of different nutrient supplies in July, 2016
Conclusions
The examination of different farming systems in long-term experiment is very important, because the changes in soil parameters are the result of a long-term process. In the crop rotations, in which the soil was treated by organic matters, the CO2 emission of soil was high. This could indicate greater microbial activity, which can result in high quantity of available nutrients for plants. The better nutrient supply resulted in higher crop yield indicating higher level of carbon sequestration in plants. In the future further tests and calculation of exact carbon balance are required for understanding soil respiration processes and decreasing the quantity of CO2 efflux from the soil of this experiment.
Acknowledgement
This research was realized in the frames of TÁMOP 4.2.4. A/2-11-1-2012-0001 ”National Excellence Program–Elaborating and operating an inland student and researcher personal support system convergence program”. The project was subsidized by the European Union and co-financed by the European Social Fund.
ReferencesGyuricza, Cs. (2004): Relationship between land use and greenhouse effect based on measured data. In: Soil
Management–Tillage effects–Soil water. (Eds.: Birkás, M. & Gyuricza, CS.) 47–60. Szent István University, Gödöllő.
Hanson, P.J., Edwards, N., Garten, C.T. & Andrews, J.A. (2000): Separating root and soil microbial contributions to soil respiration: A review of methods and observations. Biogeochemistry. 48: 115-146.
Jensen, L.S., Müller, T., Tate, K.R., Ross, D.J., Magid, J., Nielsen, N.E. (1996): Soil surface CO2 flux as an index of soil respiration in situ: a comparison of two chamber methods. Soil Biology & Biochemistry. 28: 1297-1306.
Reich J. W., & Schlesinger W. H. (1992): The global carbon-dioxide flux in soil respiration and its relationship to climate. Tellus. 44: 81-99.

Abstract Book – 17th Alps-Adria Scientific Workshop
120
Do vascular plant biomass and biodiversity stimulate soil enzymes activity on post–mining waste heaps?Wojciech BIERZA – Agnieszka KOMPAŁĄ-BĄBA – Agnieszka BŁOŃSKA – Edyta SIERKA – Gabriela WOŹNIAKDepartment of Botany and Nature Protection; Faculty of Biology and Environmental Protection; University of
Silesia in Katowice; Jagiellońska 28, 40-032 Katowice, Poland; E-mail: [email protected]
Keywords: soil enzymes, plant biomass, plant biodiversity, post-mining waste heaps
Introduction
Soil enzymes participate in releasing minerals to plants, detoxification of xenobiotics and decomposition of organic matter. Microorganisms are the main source of soil enzymes. However, the functional structure of microbial communities present in soil is frequently influenced by the most abundant plants (Waldrop et al., 2000). There is little data on the relationship between plants biomass and soil enzyme activity within spatial patches of spontaneously growing vegetation on post-mining waste dumps. The aims of this work was to investigate whether there is a relationship between the dominant species biomass and plants biodiversity in the studied patches of vegetation and selected soil enzymes.
Materials and methods
Studies were conducted on three post-mining waste heaps. In total, 45 vegetation patches (3 m diameter) with the following dominant species: Calamagrostis epigejos, Poa compressa and Daucus carota and 15 control patches without vegetation (all the plots were set up under the project InfoRevita TANGO ID: 268600 financed by NCBiR). In each patch soil was sampled in 3 points at a depth of 10 cm, sieved, and stored until analysis at 4°C. The activity of soil alkaline and acid phosphatases and dehydrogenase was determined according to Schinner et al., (1996) and urease activity according to Hoffmann & Teicher (1961). Diversity index’s, plants biomass, were determined for the studied patches. The analysis of variance with Welsh amendment and Tukey’s post hoc test and the regression analysis were applied. All statistical analysis were conducted with Statistica v.12 (StatSoft, Inc. 2014).
Results and discussion
The patches dominated by Calamagrostis epigejos were characterized by the highest biomass (56.982 g) and lowest diversity index (S-W = 1.495, p<0.05). Negative correlations between plant species diversity and biomass were also obtained in case of natural systems (Laskyi in. 2014). Activity of soil urease and dehydrogenase did not differ significantly among vegetated and control patches (Fig. 1). The highest activity of alkaline phosphatase was determined in soil from Calamagrostis epigejos patches, whereas the highest activity of soil acid phosphatase was observed in Poa compressa patches (Fig. 1). Regression models for dominant plants biomass and investigated soil enzymes as well as with H’ biodiversity index are presented in Table 1. A low percentage of the variance explained by most of the models may be due to the fact that activity of soil enzymes is more affected by soil substrate properties, than plant biomass and biodiversity.

Hnanice, Czech Republic – 09-14. April, 2018
121
Figure 1. Comparison of the activity of selected soil enzymes from vegetated and control patches. Results with the same letter do not differ statistically. A – alkaline phosphatase; B – acid phosphatase; C – urease; D – dehydrogenase.Table 1. Regression analysis for the investigated soil enzymes and dominant biomass as well as Shannon-Wiener biodiversity index.
Trait Equation of regression R2 p
Alkalinephosphatasey = 2.128407DOMINANT BIOMASS + 9.478136 ± 3.7934* 0.31 0.000y = 1.367837S-W INDEX + 9.499831 ± 3.8365* 0.28 0.000
Acidphosphatasey = 1.123928DOMINANT BIOMASS + 8.428461 ± 2.9198* 0.17 0.000y = 0.374222S-W INDEX + 9.400313 ± 3.1443 0.04 0.082
Ureasey = 0.14733DOMINANT BIOMASS - 2.24624 ± 0.71445* 0.06 0.044y = 0.05277S-W INDEX - 2.13355 ± 0.72450 0.02 0.282
Dehydrogenasey = 0.263771DOMINANT BIOMASS + 1.662671 ± 0.88967* 0.11 0.004y = 0.187117S-W INDEX+ 1.616791 ± 0.88308* 0.12 0.002
* ˗ statistically significant models; S-W Index – Shannon-Wiener Index
ConclusionsBoth plant biomass and diversity may affect, to some extent, the activity of soil enzymes on post–mining waste heaps, but there are factors (e.g. soil properties) that have a greater effect. Calamagrostis epigejos had the highest impact on the activity of soil enzymes.
ReferencesLasky, J. R., Uriarte, M., Boukili, V. K., Erickson, D. L., Kress, W. J., Chazdon, R. L. (2014): The relationship
between tree biodiversity and biomass dynamic changes with tropical forest succession. Ecology Letters. 17: 9. 1158–1167.DOI:10.1111/ele.12322
Waldrop, M. P, Balser, T. C., Firestone, M. K. (2000): Linking microbial community composition to function in a tropical soil. Soil Biology and Biochemistry. 32: 1837-1846. DOI: https://doi.org/10.1016/S0038-0717(00)00157-7
Schinner, F., Öhlinger, R., Kandeler, E., Margesin, R. (1996): Methods in Soil Biology. Springer-Verlag., Berlin, Heidelberg.
Hoffmann, G. G., Teicher, K. (1961): Ein kolorimetrisches Verfahren zur Bestimmung der Ureaseaktivität in Böden. Zeitschriftfür Pflanzenernährung.Düngung, Bodenkunde. 95: 1. 55-63.
DC
BA

Abstract Book – 17th Alps-Adria Scientific Workshop
122
The effects of tillage practices on earthworm population in winter oat (Avena sativa L.) Igor DEKEMATI – Márta BIRKÁSDepartment of Soil Management, Institute of Crop Production, Szent István University, Páter Károly u. 1.,
E-mail: [email protected]
Keywords: soil tillage, climate extreme, earthworm activity, winter oat
Introduction
The earthworm population is one of the most important biological factors of soil quality and fertility. Soil condition affects their activity, however soil tillage may deteriorate or improve the suitability of the habitat. In the last decades the conservation solution, compared to the conventional tillage has received more attention in the environmental aspect of sustainability and vulnerability focusing on climate change mitigation. One of the main aspects of conservation tillage is conserving and maintaining the biological life of the soil (Kalmár et al., 2007), reducing the production costs, preserving the water resources and protecting the soil environment (Birkás et al., 2004). Kladivko (2001) highlighted, that the earthworms are represented in a significant part of the macrofauna in different kind of soils, and that has a positive effect on maintaining or improving physical conditions of the soil such as tilth, aeration and water infiltration through their feeding, casting and burrowing activities.
Materials and methods
Earthworm distribution was investigated in a long-term experiment on a Endocalcic Chernozems (Loamic) (WRB 2015) at the Experimental and Training Farm of the Szent István University (47o68’N, 19o60’ E, 130 m a.s.l.) near the town of Hatvan, Hungary. The multi-year average of the precipitation in this region is 580 mm (308 mm fall in the growing season). Measurements of the earthworm population were conducted in the 2016 – 2017 growing season. The experiment was arranged in a randomised block design with four replicates, and the area of each plot is 2,340 m2 (13 m x 180 m). Six treatments were applied in the experiment which comprised deep tillage (≥ 0.30 m, made up of loosening (L), ploughing (P) and tine tillage (T), shallow tillage (≤ 0.22 m, made up of tine tillage (ST) and disking (D)) and soil disturbance along with direct drilling (DD). The number of earthworms consists of hand sorting from 25 x 25 cm soil cores dug to a depth of 25 – 30 cm with a spade in four replicates and data was calculated on square meters. Sampling were conducted before primary tillage on 28th October 2016, and during the winter oat (Avena sativa L.) growing season once a month and the last sampling was done on the day of the harvest on 12th, July 2017. The statistical analysis executed by Microsoft Office Excel software package.
Results and discussion
This paper discusses the effects of tillage treatments on earthworm number at different soil condition. As indicated in Table 1, higher earthworm population was observed in spring, while the lowest was found in summer, at harvest time.

Hnanice, Czech Republic – 09-14. April, 2018
123
Table 1: The earthworm’ counts (pcs/m2/0-30 cm) at different tillage treatments
Months L P T ST D DDOct., 2016 21 13 28 29 17 43Nov., 2016 8 0 10 11 3 18
March, 2017 45 6 36 60 24 51Apr., 2017 25 5 40 60 40 140May, 2017 25 10 15 15 15 10June, 2017 3 1 10 12 3 5July, 2017 0 0 0 1 0 1Average 18.1 5 19.8 26.8 14.6 38.3
The earthworm population was highest under direct drilling (DD) that is in the undisturbed soil and number of them was also favourable in soil tilled by tine (ST, T), in the carefully disturbed soil. Ploughed soil came as the last in the rank. It must be ploughed soil gave a particularly disadvantageous habitat when not even field residues were mixed into the soil than other tillage treatments during the season. The difference between earthworm population using different soil tillage could be proven statistically (P < 0,011643). Kladivko (2001) and Edwards and Lofty (1982) noted comparable results. According to variance analysis, we experienced a significant difference between the sampling times which could also be proven statistically (P < 5,89E -06).
Conclusions
Soil disturbance by tillage had remarkable impact on the earthworm population. It may outline that using soil conservation and environmental friendly tillage – that are direct drilling, tine tillage, soil loosening – could be produced not only soil quality maintaining circumstances, but creating a favourable habitat for earthworms in long-term. Soil tillage may rank by the level of the earthworm habitat in the future.
Acknowledgement
Research was supported by the AGRÁRKLÍMA.2 VKSZ_12-1-2013-0034 project
ReferencesBirkás, M., Jolánkai, M., Gyuricza C., Percze, A., (2004): Tillage effects on compaction, earthworms and other soil
quality indicators in Hungary. Soil and Tillage Research 78, pp. 185 – 196 DOI: 10.1016/j.still.2004.02.006 Kalmár, T., Birkás, M., Stingli, A., Bencsik, K., (2007): Tarlóművelési módszerek hatékonysága szélsőséges
idényekben, Növénytermelés, Különylenyomat, 56. 5 – 6. pp. 253 – 391 Kladivko, E. J., (2001): Tillage systems and soil ecology. Department of Agronomy, Purdue University, 1150
LILY, West Lafayette, IN 47907 – 1150, USA. DOI: https://doi.org/10.1016/S0167-1987(01)00179-9Edwards, C. A., Lofty, J. R., (1982): The effect of direct drilling and minimal cultivation on earthworm
populations, Rothamsted Experimental Station, Harpenden, Hertfordshire. Journal of Applied Ecology 19, pp. 723 – 734 DOI: 10.2307/2403277
IUSS Working Group, WRB 2015, World Reference base for Soil Resources, 2014, update 2015, FAO, Rome

Abstract Book – 17th Alps-Adria Scientific Workshop
124
How do NDVI patches reflect soil properties?Csaba CENTERI1 – Izabella OLÁH2,3 – Zsófia DOBÓ1 – Boglárka KELLER4 – Renáta HOLLÓ-CSEH3
1: Szent István University, Inst. of Nature Conservation and Landscape Management, Dept. of Nature Conservation and Landscape Ecology, 2100-Gödöllő, Páter K. u. 1., Hungary; E-mail: [email protected]
2: Szent István University, Inst. of Regional Economy and Rural Development, 2100-Gödöllő, Páter K. u. 1., Hungary; E-mail: [email protected]
3: TFSZ Zrt. 6000 Kecskemét, Petőfi S. u. 1/a., Hungary; E-mail: [email protected]: NAIK Agricultural- and Machinery Institute, Hungary
Keywords: soil-plant relations, remotely sensed data
Introduction
NDVI is a widely used index, there were 22000 hits even on Google Scholar (01/12/2017). However, when we search for NDVI and soil parameters, articles become scarce. Zeeshan et al., (2017) analysed the relation of macronutrients (NO3, P, K SO4, CaCO3) and found that soil macronutrients were correlated significantly positive with NDVI values of the examined study area. Whetton et al., (2017) found that K, P and total carbon had the largest contribution to NDVI.
Materials and methods
Several soil types and geographical locations were examined. The Börcs area is introduced here. Börcs is in North-Western Hungary, on a flat land, close to river courses. Five NDVI patches were chosen based on their areal distribution as follows: Group 1 (mix. of 0.65-0.76 and 0.76-0.88); Group 2 (0.65-0.76), Group 3 (0.42-0.53), Group 4 (0.76-0.88), Group 5: 0.53-0.65. There were five soil samples collected under each NDVI patch (Figure 1). There were only 4 NDVI patches with more than 1% cover of the total area but one extra was chosen according to its high visibility, thus high cover, the mixture of 0.65-0.76 and 0.76-0.88.
Figure 1: Soil sampling points on different NDVI patches
Statistical analyses were based on Kruskal-Wallis test, Levene’s test of equality and Kolmogorov-Smirnov test.

Hnanice, Czech Republic – 09-14. April, 2018
125
Results and discussion
We found significant differences between almost all soil parameters with an exception of Zn, where no differences were found (all values were below 4 ppm). The further statistical analyses allowed us to make distinction between groups. The most similar groups were Group 3 and 5 which is reasonable as they are close to one another, on a higher ground, with more sand and mainly the degree of their wind and water erosion is different (this is the only sloping part of the examined plot). In case of pH(H2O) and pH (KCl) Group 1,4,2 are different. In case of total salt 3<4 and 5<4 (p<0.05). In case of lime Group 1< Group 5 (p<0.01), Group 4< Group 5 (p<0.05). In case of humus Group 5 and Group 3 are similar while Group 2 and Group 4 are different, Group 1 is overlap between Group 2 and Group 4. In case of NO3-NO2-N Group1>Group5 (p<0.05), Group4>Group5 (p<0.01). In case of P2O5 Group1<Group3 (p<0.001) and Group1<Group5 (p<0.05). In case of K2O Group5<Group4,1,3 and Group2<Group3; Group2 overlaps with Group5,4,1 while Group2 and Group1 overlaps with Group2 and Group3. In case of Na Group2<Group4 (p<0.05). In case of Mg 1>5, 4>5(p<0.01). In case of SO4-S Group3>Group4 (p<0.05). In case of Mn Group1>Group 5, Group4>Group 5 (p<0.01).
Conclusions
We can conclude that NDVI and various soil parameters can correlate. It is mostly investigated in case of macro-elements but in the examined area it was true for Mn, Cu, SO4-S, Mg, Na as well. One important expertise is that Zn did not have significant differences because the Zn content was very little. Maybe if areas are rich in Zn, even this element is showing significant differences between NDVI patches. So, we can conclude that very low amount of nutrients in the soil makes it difficult to show differences between the patches with different NDVI values.
Acknowledgement
We thank E-NET Ltd. for the support of the research.
ReferencesWhetton, R., Zhao, Y., Shaddad, S. M., Mouazen, A. (2017): Nonlinear parametric modelling to study how soil
properties affect crop yields and NDVI. Computers and Electronics in Agriculture 138, 127-136.Zeeshan, M., Siddique, M.T., Ali, N.A., Farooq, M.S. (2017): Correlation of Spatial Variability of Soil
Macronutrients with Crop Performance by Using Satellite and Remote Sensing Indices for Site Specific Agriculture: Chakwal Region. J. Rice Res. 5: 2. pp. 9. DOI: 10.4172/2375-4338.1000182

Abstract Book – 17th Alps-Adria Scientific Workshop
126
Trend in consumption of industrial and organic fertilizers in Slovakia (potential source of surface water pollution)
Cyril SIMAN – Yvetta VELÍSKOVÁInstitute of hydrology Slovak Academy of sciences, Dubravska cesta 9, 841 04 Bratislava, Slovakia; E-mail:
[email protected], [email protected]
Keywords: source of pollution, industrial and organic fertilizers, surface streams
Introduction
Agriculture is one of the largest consumers of fresh surface water on Earth, using an average of 70% of all its resources (FAO, 1996). On the other side, it is a significant non-point source contributor to surface and groundwater pollution (Ignazi, 1996). Result of fertilizers application is decreasing water quality, and with that related environmental problem is mainly water eutrophication (SAZP, 2013).
The paper presents the summary of the consumption of industrial and organic fertilizers on the territory of Slovakia in the period 2006 – 2015. We identify areas with the highest as well as the lowest levels of fertilization within our territory during this period.
Materials and methods
The data of the consumption of fertilizers in the monitored area of the agricultural land for the individual districts of Slovakia during the period 2006 – 2015 was provided by the Central Agricultural Control and Testing Institute in Bratislava. Evaluation of fertilizer consumption was done by calculation of the average level of fertilization during the period 2005 - 2015. The input data was in kilograms per hectare (kg/ha).
Conclusions
During the evaluated period, the amount of organic fertilizers applied was from 3472,5 kg/ha (in 2015) to 3913,1 kg/ha (in 2007). In this group we observed just slight decrease in the level of fertilization. In the group of industrial fertilizers, a moderate increase in their consumption between 2005 and 2015 was observed, with the amount of industrial fertilizers applied increased by 20 kg/ha in the period 2010 – 2015. The most significant of industrial fertilizers were fertilizers based on nitrogen (fig. 1). From districts of Slovakia the highest consumption of industrial fertilizers in evaluated period was in southwest part in Slovakia. In some districts it was even more like 120 kg/ha. The highest value was calculated for the Sala district (152,7 kg/ha). In mountainous regions of Slovakia with less fertile soils the consumption of industrial fertilizers was in general in lower level. The lowest value was evaluated for the Kysucke Nove Mesto district.

Hnanice, Czech Republic – 09-14. April, 2018
127
Figure 1: Average consumption of organic and industrial fertilizers in Slovakia during period 2005 - 2015
Figure 2: Average consumption of industrial fertilizers in district of Slovakia during period 2005 - 2015
Acknowledgement
The chapter was created with support from VEGA project no. 1/0805/16. This contribution/publication is the result of the project implementation ITMS 26220120062 Centre of excellence for the Integrated River Basin Management in the Changing Environmental Conditions, supported by the Research & Development Operational Programme funded by the ERDF.
References FAO. (1996): Control of water pollution from agriculture. E.D. Ongley. FAO Irrigation and drainage Paper 55.
FAO, Rome, 1996. 111 s. ISBN 92-5-103875-9Ignazi, J. C. (1993): Prevention of Water Pollution by Agriculture and Related Activities. Proceedings of the
FAO Expert Consultation, Water Report 1, 247-261.SAZP. (2013): Agriculture and its impact on the environment in the Slovak Republic for the year 2011: Indicator
sector report. Banska Bystrica : Slovak Environmental Agency, 2011. 41 p.

Abstract Book – 17th Alps-Adria Scientific Workshop
128
The effects of N fertilization on soybean (Glycine max (L.) Merr.) yield and quality under different drought stress levelsOqba BASAL1 – András SZABÓ2
1: PhD Student/ Kerpely Kálmán Doctoral School, 4032 Debrecen, Böszörményi út 138; [email protected]: Lecturer, Debrecen University, 4032 Debrecen, Böszörményi út 138; [email protected]
Keywords: soybean, drought Stress, N fertilizer, yield, soybean quality
Introduction
Soybean (Glycine max (L.) Merr.) is a very important legume; its seeds have very high protein and oil concentrations compared to other legumes (Miransari, 2016). Drought stress negatively affects quantity (yield) and quality (seed content) of soybean (Vurukonda et al., 2016). As a legume, soybean is capable of nitrogen fixation, which is the most effective N source, whereas mineral N is not always necessary (Zapata et al., 1987), and has conflicting effects on the yield (Mendes et al., 2008; Kaschuk et al., 2016). The amount of N fertilization has a significant effect on the seed protein content, but is sometimes adversely correlated with seed grain yield and oil (Miransari, 2016).
Materials and methods
Two soybean genotypes, Boglár and Panonia Kincse, were grown in Debrecen University’s experimental site (Látókép) (N. latitude 47o 33’, E. longitude 21o 27’) in 2017. The soil type is calcareous chernozem. Three N fertilization rates (no N, 35 kg ha-1 N and 105 kg ha-1 N) under three different irrigation regimes (non-irrigated, half-irrigated and fully-irrigated) were applied with four replications. The statistical analysis was made using SPSS ver.22 software, and two-way ANOVA was used to compare the means and significances.
Results and discussionTable 1: yield (kg ha-1), protein and oil concentration (%) under different fertilization and irrigation regimes
Treatment Boglar Panonia Kincse Irrigation/Fertilization Yield Protein Oil Yield Protein Oil
IrrigationNon-Irrigated 3755.42b 35.63a 23.27b 4190.17a 37.51a 22.63a
Half-Irrigated 4749.92a 35.85ab 22.62a 4243.33a 37.68a 22.06ab
Fully-Irrigated 5046.08a 36.53b 22.54a 4580.42a 38.36a 21.60b
Fertilization
No N 4497.58a 35.38a 22.95a 4433.58a 36.67a 22.1335 kg ha-1 N 4584.83a 35.80a 22.87a 4251.58a 37.57a 21.98
105 kg ha-1 N 4469.00a 36.84b 22.61a 4328.75a 39.31b 22.18
the same letter indicates no significant differences in the same colomn within particular treatment.
For both genotypes, there was no significant effect of the combined effect (drought*fertilization) on any of the three studied traits. However, Irrigation had a significant effect on Boglár yield, as it decreased by 5.87 and 25.58% under half- and non-irrigated regimes, respectively, compared to control (fully-irrigated), whereas the effect was not significant for the genotype Panonia Kincse (Table 1). Bellaloui and Mengistu (2008) reported no significant differences in the yield of one of the studied genotypes, whereas it was significant for the another, suggesting that soybean genotype has a role in yield loss; similar results were reported by Heatherly et al., (1999). Irrigation had

Hnanice, Czech Republic – 09-14. April, 2018
129
also significant effects on oil concentration for both genotypes. Protein insignificantly decreased for Panonia Kincse under drought, whereas the decrease was significant for Boglár (Table 1). Medic and Atkinson (2014) concluded that the relationship between drought stress and soybean seed composition remains controversial; however, decreasing protein concentrations under drought stress were previously reported (Boydak et al., 2002; Carrera et al., 2009).
Fertilization had no significant effect on yield and oil concentration of both genotypes, however, the effect was significant on the protein concentration for both genotypes (Table 1). Miransari (2016) reported that N fertilization increased the protein concentration of soybean seeds by 27%. Under the fertilization rate of 105 kg ha-1 N, yield was lower than the no N treatment for both genotypes (Table 1); Miransari and Mackenzie (2015) previously concluded that high rates of N can negatively affect yield. MacKenzie and Kirby (1979) reported a linear yield response to N up to 60-90 kg N ha-1.
Conclusions
Drought stress decreases soybean yield; it also affects protein and oil concentrations. N fertilization is not always recommended for soybean, especially high rates, which has a negative influence on the yield; yet, N plays an important role in increasing protein concentration in the seeds.
ReferencesBellaloui, N., Mengistu, A. (2008): Seed composition is influenced by irrigation regimes and cultivar differences
in soybean. Irrig Sci. 26, 261–268.Boydak, E., Alpaslan, M., Hayta, M., Gercek, S., Simsek, M. (2002): Seed composition of soybeans grown in
the Harran region of Turkey as affected by row spacing and irrigation. J Agric Food Chem. 50, 4718–4720.Carrera, C., Martinez, M. J., Dardanelli, J., Balzarini, M. (2009): Water deficit effect on the relationship between
temperature during the seed fill period and soybean seed oil and protein concentrations. Crop Sci. 49, 990–998.
Heatherly, L. G., Blaine, A., Hodges, H. F., Wesley, R. A., Buehring, N. (1999): Variety selection, planting dates, row spacing, and seeding rate. Soybean production in the midsouth (41–47). CRC, New York.
Kaschuk, G., Nogueira, M. A., De Luca, M. J., Hungria, M. (2016): Response of determinate and indeterminate soybean cultivars to basal and topdressing N fertilization compared to sole inoculation with Bradyrhizobium. Field Crops Research 195 (2016) 21–27.
MacKenzie, A. F., Kirby, P. C. (1979): Effects of fertilizers and soil series on yields of corn, barley, wheat and soybeans. Soil Fertility Research at Macdonald College: a summary of 1968-1978. McGill University, Montreal, PQ.
Medic, J., Atkinson, C., Hurburgh, C. R. (2014): Current Knowledge in Soybean Composition. J. Am. Oil Chem. Soc. 91, 363–384.
Mendes, I. C., Reis-Junior, F. B., Hungria, M., Sousa, D. M. G., Campo, R. J. (2008): Adubac¸ ão nitrogenada suplementar tardia em soja cultivada em latossolos doCerrado. Pesq. Agropec. Bras. 43, 1053–1060.
Miransari, M. (2016): Soybean, Protein, and Oil Production Under Stress. Environmental Stresses in Soybean Production. Soybean Production Volume 2 (157-176). Nikki Levy, Chippenham.
Miransari, M., Mackenzie, A. (2015): Development of soil N testing for wheat production using soil residual mineral N. Journal of Plant Nutrition 38, 1995–2005.
Vurukonda S. Sh. K. P., Vardharajula, S., Shrivastava, M., Sk. Z, A. (2016): Enhancement of drought stress tolerance in crops by plant growth promoting rhizobacteria. Microbiological Research 184, 13–24.
Zapata, F., Danso, S. K. A., Hardarson, G., Fried, M. (1987): Time course of nitrogen fixation in field-grown soybean using nitrogen-15 methodology, Agron. J. 79: 172–176.

Abstract Book – 17th Alps-Adria Scientific Workshop
130
Investigation of mineral content of Jubilejnaja 50 (Winter wheat - Triticum aestivum L.) in different cropping years, in Hungary Diána UNGAI1 – Béla KOVÁCS1 – Zoltán GYŐRI2
1: University of Debrecen, Institute of Food Science H-4032 Böszörményi str. 138., Debrecen, Hungary; E-mail: [email protected]
2: University of Debrecen, Institute of Nutrition H-4032 Egyetem square 1., Debrecen, Hungary; E-mail: [email protected]
Keywords: winter wheat, mineral content
Introduction
The wheat growing area in Hungary changes from 1.0 to 1.2 million hectares. It is one of the three cereals cultivated in largest quantities. So it represent the main part of plant origin products. Wheat grain and the flour prepared from it play an important role to our daily nutrition because supplying the human population with minerals (McKevith et al., 2004; Zhao et al., 2009). Numerous researchers report data on the mineral content of winter wheat (Győri, 2002; Oury et al., 2006; Tóth et al., 2006; Zhao et al., 2009). Recently, this topic is key important, because the intensification of agricultural production pointed the view of micro- and macroelements (Burján & Győri, 2013; Győri, 2017). The element content is determined by genetically and environmental factors, but the technology of agriculture has an important role as well (Davis et al., 1984).
Materials and methods
Winter wheat samples originated from different experimental sites and various agrotechnical experiments, where fertilization and crop variety testing were conducted. These included different soil types and climatic conditions. The examined variety was Jubilejnaja 50. The measurements were performed using the inductive coupled plasma optical emission spectrometer (OPTIMA 3300 DV), after digestion with HNO3-H2O2 solution. Measurements were carried out by the University of Debrecen. The data refer to dry matter content.
Results and discussion
The macro- and microelement content of Jubilejnaja 50 variety are summarized in Table 1. Based on these, it can be stated that both in the 2003 and the 2004 years, notable standard deviation are observed for most of the examined macro- and microelements. Considering the relative standard deviation, it can be concluded that the highest values for the Zn (33.0 % in year 2003 and 22.1 % in year 2004) and Cu contents (23.6 % and 22.2 % in years 2003 and 2004) were obtained in both of the examined years, while the lowest relative standard deviation values were observed for Mg content (9.8 % and 8.6 % in years 2003 and 2004).

Hnanice, Czech Republic – 09-14. April, 2018
131
Table 1: The macro- and micro element content of winter wheat grain for Jubilejnaja 50 variety
P K Ca Mg Zn Mn Cu FeYear Research area g kg-1 mg kg-1
2003
Székkutas 2.7 2.9 422 935 17.6 31.8 3.2 41.2Kompolt 3.3 3.4 409 1062 36.0 18.2 3.8 50.5Tordas 2.6 2.9 520 891 15.0 35.0 3.5 50.2M.magyaróvár 3.5 3.8 456 1111 30.0 24.5 5.5 34.8Bóly 2.4 2.7 362 820 17.9 28.4 2.6 45.3Karcag 2.8 3.5 389 981 28.6 30.1 3.4 48.7Siófok 2.8 3.5 465 903 16.7 29.6 3.2 36.9Szeged 3.5 3.3 380 982 23.3 36.5 3.4 41.8Average 2.9 3.3 425.4 960.6 23.1 29.3 3.6 43.7Std. deviation 0.5 0.4 52.3 94.4 7.6 5.8 0.8 6.0Rel.deviation, % 15.5 11.9 12.3 9.8 33.0 19.9 23.6 13.7
2004
Röjtökmuzsaj 3.6 2.4 398 952 22.0 27.7 3.5 35.4Gyöngyös 4.7 3.4 441 1133 25.0 41.6 3.7 46.3Felsőszentiván 3.9 3.4 355 1043 14.8 31.6 4.4 35.1Mezőhegyes 3.3 2.8 360 934 18.5 39.9 3.7 38.1Dalmand 4.0 3.5 398 1066 28.3 41.7 3.9 51.8Abaújszántó 4.1 2.9 479 1018 26.6 33.8 3.9 49.6Bábolna 3.4 2.1 376 874 23.8 37.3 1.8 41.6Debrecen 3.5 2.5 621 1087 17.9 46.1 4.2 58.9Average 3.8 2.9 428.5 1013.4 22.1 37.5 3.6 44.6Std. deviation 0.5 0.5 88.2 86.9 4.7 6.1 0.8 8.5Rel. deviation, % 12.0 17.8 20.6 8.6 21.2 16.2 22.2 19.1
Conclusions Winter wheat and the flour prepared from it make up a considerable part of the daily diet, contributing greatly to supplying the human population with minerals. Nowadays, the question arises that how the intensification of agricultural production and the genetic features of the varieties affect the mineral composition. For reliable conclusions, we have to process data from several experimental sites and from different years.
References Burján, Z., Győri, Z. (2013): A termőhelyek hatása a búzaszem és a liszt ásványianyag és fehérjetartalmára.
AGROKÉMIA ÉS TALAJTAN 62:(2) 387-400.Davis, K. R., Peters, L. J., Cain, R. F., LeTorneau, D., McGinnis, J. (1984): Evaluation of the nutrient composition of wheat. III. Minerals. Cereal Foods World. 29. 246-248.Győri, Z. (2002): Tápanyaggazdálkodás és minőség. In: Győri, Z., Jávor, A. (eds.): Az agrokémia időszerű
kérdései. Debreceni Egyetem ATC, MTA Talajtani és Agrokémiai Bizottsága. Debrecen. 79-89.Győri, Z. (2017): Az őszi búza ásványianyag tartalmának értékelése az új vizsgálatok tükrében/
eredményeként, Evaluation of the mineral content of winter wheat in light of/as a result of the new studies. ÉLELMISZERVIZSGÁLATI KÖZLEMÉNYEK 63:(2) 1519-1534.
McKevith, B. (2004): Nutritional aspects of cereals. Nutrition Bulletin. 29. 111-142.Oury, F. X., Leenhardt, F., Rémésy, C., Chanliaud, E., Duperrier, B., Balfourier, F., Charmet, G. (2006): Genetic
variability and stability of grain magnesium, zinc and iron concentrations in bread wheat. European Journal of Agronomy. 25. 177-185.
Tóth, Á., Prokisch, J., Sipos, P., Széles, É., Mars, É., Győri, Z. (2006): Effects of particle sizes on the quality of winter wheat flour, with a special view to macro – and micro element concentration. Communications in Soil Science and plant analysis 37:(15-20) 2659-2672.
Zhao, F.J.,Shu,Y.H.,Dunham,S.J.,Rakszegi,M.,Bedo,Z.,McGrath,S.P.,Shewry, P.R.(2009):Variation in mineral micronutrient concentrations in grain of wheat lives of diverse origin. Journal of Cereal Science.49. 290-295.

Abstract Book – 17th Alps-Adria Scientific Workshop
132
Green manures as specific issues in crop productionÁgnes FEKETE – Péter PEPÓUniversity of Debrecen, Institute of Crop Science, Faculty of Agricultural and Food Sciences and Environmental
Management, 4032, Debrecen, Hungary, Böszörményi Str., 138; E-mail: [email protected]; [email protected]
Keywords: green manure, fertilization, yield, organic matter, alternative plant nutrition
Introduction
According to the data of KSH (Hungarian Central Statistical Office) sowing area of cereals in the crop year 2016 was over 2.56 million ha, on which winter wheat and maize were produced in a rate of around 50-50%. Regarding these data it is obvious that the domestic sowing structure has been simplified and become unilateral. This unfavourable crop rotation system causes several problems. The importance of other possibilities, alternatives for organic matter recovery have become enhanced. This is especially important from the aspect of sustainable plant production. There are several methods for the recovery of organic matter. One is if plant organic substances and by-products are tilled into the soil, the other is if different green manure crop species and/or their mixture are sown directly.
Materials and methods
Small plot field experiment has been set up at the Látókép Experimental Station of Plant Production of the Farm and Regional Research Institute of the University of Debrecen during the summer 2017. The experimental soil can be soil genetically classified as a calcareous chernozem soil. Fodder pea was sown on 21st July 2017, while the rapeseed hybrid Arkazo as green manure crop on the 8th August. Green manure plants were tilled into the soil on the 4th October. After that the main crop, the winter wheat variety MV Csillag was sown. The other studied main crop of our study, maize will be sown during the spring of 2018 as well. In the present experimental crop year plant development dynamics of both studied species, just as the time of the main phenological stages, agronomical parameters of populations and plant health conditions will be also monitored. In the vegetation period photosynthetic capacity, just as its dynamic change, leaf area duration and after the harvest yield of the two main crops, just as their most important quality parameters will be evaluated as well. The present study will cover the monitoring of changes in soil conditions too. These soil analyses include mainly the determination of soil organic substance stock and the quantity and quality of humus, just as further soil parameters.
Results and discussion
Several experiments proved the importance of green manure plants. Gyuricza (2014) stated according to their results, in case of phacelia plant, the stress-tolerance was significantly increased by N-application and its water-utilization was also improved. Furthermore, in case of examined plants (mustard, phacelia, oil radish) the green biomass amount was increased. Similar results was provided by Mikó (2004), the application of low amount 50 kg ha-1 results in the production of balanced green biomass amounts just as significant NPK-content in case of all three studied crops. Further results of the research work confirmed

Hnanice, Czech Republic – 09-14. April, 2018
133
that mustard, oil radish and the mixture of phacelia-mustard-oil radish, just as mustard-foil radish mixture had excellent weed control effect, their populations were completely free from weeds in all studied treatment combinations. The small-plot experimental results of Csavajda (2003) confirm that the biomass yield of green manure crops could be depending on the given crop year. Talgre et al., (2012) determined following results:, in all three studied crop years the red clover, just as alfalfa and hybrid alfalfa has effect on the yield amount of winter wheat.
Conclusions
Experiments proved that, the low nitrogen amounts can doubled the green biomass amount. The fertilization treatment improved the nitrogen uptake and the nutrition mobilization of the green manure crops. Furthermore there is significant correlation between the effect of green manure and the yield of the main crop. Due to the lack of fossil resources, the expensive measurements and the decreasing amount of manure the production of green manure crops will increase in the future and spread to further production sites and soils.
Acknowledgement
The work/publication is supported by the EFOP-3.6.3-VEKOP-16-2017-00008 project. The project is co-financed by the European Union and the European Social Fund.
ReferencesCsavajda É. (2003): A talajtermékenységet befolyásoló növények és növénytársítások termőképességének
vizsgálata. Veszprémi Egyetem. Növénytermesztési és Kertészeti Tudományok Doktori Iskola: 68-85.Gyuricza Cs. (2014): A talaj és környezetminőség javítása és fenntartása növénytermesztési módszerekkel. Szent
István Egyetem. Növénytudományok Doktori Iskola: 60-64.Mikó P. (2009): A zöldtrágyázás talaj állapotra és utónövényre gyakorolt hatásainak vizsgálata. Doktori
értekezés. Szent István Egyetem. Növénytudományi Doktori Iskola: 69-86.Talgre, L., Lauringson, E., Roostalu, H., Astover, A., Makke, A. (2012): Green manure as a nutrient source for
succeeding crops. Plant soil environ. 58. 6: 275-281.I.: https://www.ksh.hu/docs/hun/agrar/html/tabl1_4_1_1.html

Abstract Book – 17th Alps-Adria Scientific Workshop
134
The changes of the purple coneflower’s (Echinacea purpurea L.) herba and radix drug yield under different fertilization settingsJudit Éva LELESZ – József CSAJBÓK1: Institute of Crop Sciences, Faculty of Agricultural and Food Sciences and Environmental Management,
University of Debrecen, 138. Böszörményi road, Debrecen, 4032; E-mail: [email protected]; [email protected]
Keywords: medicinal plant, coneflower, drug, nutrient requirements
Introduction
The interest is growing after the medicinal plants’ using and production. There is a need of new investigations of nutrient supply that ensure profitable yields and quality. There are many uncertainties in the herbs specific nutrient requirements (Valkovszki, 2011). The purple coneflower found in the meadows and prairies of the USA (Meuninck, 2016). Three species known in medicine. It’s breeded variety in Hungary the „Indián”. The cultivation is 2-3, or 4 years long. Could be reproducible with sowing on place, division, or seedling. Its’ drug is the herba and the root (Bernáth et al., 2000). Echinacea purpurea L. has a limited salt tolerance, but it’s survival rate is the highest among the Echinacea species (Sabra et al., 2012). In India, the root used as an antivenin. In Italy the dried leafs hot water extract has taken orally for inflammations (Ross, 2001). In the USA the roots and flowers can be used as a snakebite treatment, the mashed plant was applied to wounds, and as a therapy for infections (Meuninck, 2016). Clinical research reports that a proprietary combination of a concentrated Echinacea herb and root extract is as effective as the conventional antiviral medicine used in the treatment of influenza (Raus et al., 2015). From the herba polysaccharide-phenolic-protein complex isolated, which is marked for cough supressing and bronchodilatory effects (Capek et al., 2015). The Echinacea complex has significant bronchodilatory and anti-inflammatory effects, what is similar to the classic synthetic drugs’ (Sutovska et al., 2015).
Materials and methods
The experiment took place in the experiment site of the University of Debrecen. Plot size was 8 m2 and plots were arranged in 4 replicates in randomized blocks, with 6 different fertilizer treatment levels, in 4 rows with 40 cm row space. The experimental place’s soil is chernozem. The forecrops were potato and sunflower. In 2014 the regular annual nutrient dosages were spread on. Sowing was 30th March in 2015 into seedling trays. The first plants were emerged 7th April. The planting was between 18th and 21st May. The first harvest of the herba was 4th July in 2016. The second harvest was 10th July in 2017. The fertilizer doses were from N 15 kg ha-1, P2O5 20 kg ha-1 and K2O 30 kg ha-1 to N 75 kg ha-1, P2O5 100 kg ha-1 and K2O 150 kg ha-1 in 5 levels with 15 kg ha-1 N, 20 kg ha-1 P2O5, and 30 kg ha-1 K2O steps.We measured the raw and the dry mass of the herba and the three years old roots, whose patterns we picked up 7th and 8th November in 2017. We dried the harvested herba under prenumbra for three weeks in 2016. In 2017 because of the rainy weather, we must use drying cabinet on 40 oC for 72 hours and the roots for 48 hours. During processing of the gained data, variance analysis were applied by using MS Excel 2010 and IBM SPSS 22.0 programmes.
Results and discussion
Figure 1 shows the quantity of the raw and the dry herba yield depending on the nutrient supply in 2016. The control setting exceeded all nutrient settings’ results. The mass of the herba reached

Hnanice, Czech Republic – 09-14. April, 2018
135
the minimum in the N60P80K120 setting. On Figure 2 can be observed the quantity of the raw and dry herba yield depending on the nutrient supply in 2017. The control setting reached the minimum in contrary to the year 2016. On Figure 3 the roots’ yield data fluctuations can be observed. There is a maximum in N75P100K150, and a minimum in N30P40K60 settings.Conclusions
Based on the data, every fertilization settings has a negative effect on the raw and the dry herba mass in 2016, and a positive in 2017. As for the roots’ yield fluctuations were observed. Until now we could not find an explanation for this phenomenons. The variance analysis of the data of the raw and dry herba and root mass did not show
significant differences between the plots with different fertilizer treatments. For the sake of clarity, more research work is needed to clear up the complex connections between quantity of the drugs’ mass, and the effect of the different nutrient settings.Acknowledgement
„ Supported BY the ÚNKP-17-….. New National Excellence Program of the Ministry of Human Capacities”
ReferencesBernáth J. (Szerk.) (2000): Gyógy- és aromanövények, Mezőgazda Kiadó, Budapest, http://dx.doi.org/10.1556/
tarskut.27.2009.2.8Capek P., Sutovská M., Kocmálová M., Franová S., Pawlaczyk I., Gancarz R. (2015): Chemical and
pharmacological profiles of the Echinacea complex, International Journal of Biological Macromolecules, 79. 388-391., https://doi.org/10.1016/j.ijbiomac.2015.05.010
Goodier J. (2016):Medicinal Plants of North America, 2nd Edition, Jim Meuninck FALCON GUIDES, Guilford, Connecticut, Helena, Montana, 40-41 ptp., https://doi.org/10.1108/rr-01-2017-0013
Raus K., Pleschka S., Klein P., Schoop R., Fisher P. (2015): Effect of an Echinacea-Based Hot Drink Versus Oseltamivir in Influenza Treatment: A Randoized, Double-Blind, Double-Dummy, Multicenter, Noninferiority Clinical Trial, Current Therapeutic Research 77 (2015) 66-72. , https://doi.org/10.1016/j.curtheres.2015.04.001
Ross I. A. (2001): Medicinal Plants of the World, Chemical Constituents, Traditional and Modern Medicinal Uses Volume 2, Springer Science+Business Media New York, https://doi.org/10.1007/978-1-59259-237-1
Sabra A., Daayf F., Remault S. (2012): Differential physiological and biochemical responses os three Echinacea species to salamity stress, Scientia Horticulturae, vol. 135., 23-31., https://doi.org/10.1016/j.scienta.2011.11.024
Sutovská M., Capek P., Kazimierová I., Pappová L., Josková M., Matulová M., Pawlaczyk I., Gancarz R. (2015): Echinacea complex – chemical view and anti-asthmatic profile, Journal of Ethnopharmacology vol. 175., 163-171.
Valkovszki N. J., Zámboriné Németh É. (2011): Effects of growing conditions on content and composition of the essential oil of annual caraway (Carum carviL. var.annua), Acta Alimentaria vol. 40 issue 2., 235-246.,
Figure 1-2: Quantity of the raw and dry drug yield depending on the nutrient supply (Debrecen, 2016&2017)
Figure 3: Quantity of the raw and dry root drug yield depending on the nutrient supply (Debrecen, 2017)

Abstract Book – 17th Alps-Adria Scientific Workshop
136
Long-term sewage sludge compost application on sandy soilAttila TOMÓCSIK1,2 – Viktória OROSZ1 – György FÜLEKY3 – József MÉSZÁROS4 –Tibor ARANYOS1 1: Research Institute of Nyíregyháza, University of Debrecen, Westsik Vilmos u. 4-6. H-440 Nyíregyháza, Hungary,
E-mail: [email protected]; [email protected]; [email protected]: Environmental Sciences PhD School, Szent István University, Páter Károly u. 1. H-2100 Gödöllő, Hungary3: Department of Soil Science and Agricultural Chemistry, Szent István University, Páter Károly u. 1. H-2100
Gödöllő, Hungary, E-mail: [email protected]: Nyírségvíz Closed Shareholder Group, Tó u. 5., H-4400 Nyíregyháza, Hungary, E-mail: [email protected]
Keywords: long-term experiment, sewage sludge compost, bentonite, crop yield
Introduction
Composting of sewage sludge is one of the most suitable solutions for managing and recycling such waste (Song and Lee, 2010). The application of sewage sludge composts (SSC) to agricultural soils has many advantages like providing nutrients to the soil (Chodak et al., 2001; Tejada et al., 2001), increasing the number of beneficial soil organisms (Herzel et al., 2016), improving soil physical (Aranyos et al., 2016) and microbiological properties (Makádi, 2010). However, the application of SSC could have some dangerous effects on the soil-plant system (Fytili & Zabaniotou, 2008). The aim of our work was to evaluate the possibility of SSC utilization in arable crop production. The objectives of this study were to analyse the relationship between the crop yield of test plants and basic soil chemical properties in the period of the 4th SSC treatment.
Materials and methods
The small-plot experiment with SSC was started in the spring of 2003. Soil type is acidic Arenosol at the Research Institute of Nyíregyháza, University of Debrecen, in the NE part of Hungary. The applied SSC contained 40% sewage sludge, 25% rye straw, 30% rhyolite and 5% bentonite. Four treatments in five blocks have been conducted, where the SSC was applied at a rate of 0, 9, 18 and 27 t/ha and then was ploughed into the soil. The treatments were repeated in 2006, 2009, 2012 and 2015. Test plants were maize (Zea mays L.’MV NK 333’), triticale (x Triticosecale Wittmack ‘Titán’) and green pea (Pisum sativum L. ‘Zita’). Plant samples were collected before harvesting. Composite soil samples were collected from 5 subsamples in each plot from 0-30 cm soil layer after harvesting of all test plants. Treatment effect was evaluated for each year separately by one-way ANOVA followed by Tukey’s test (p<0.05). Pearson’s correlation was applied to determine the relationships between crop yield of test plants and soil chemical properties.
Results and discussion
The yields of treated triticale were higher than the control ones in three years period (2013-2015) in all treatments. Moreover, the combination of SSC with fertilizers could increase the positive effects on crop yield of cereal crops (Jalilian, 2015). In case of maize, higher yield were measured in all treatments comparing to the control in 2013 and 2014. However, in the 3rd year after SSC application, no treatment effect was found. The yield of green pea was increased by SSC treatment in the years 2014 and 2015 while in the 1st year after the forth SSC application any effects were not recorded.

Hnanice, Czech Republic – 09-14. April, 2018
137
The long-term SSC application resulted in increase of soil pH and nutrient content. The changes of soil chemical properties effect on crop yield positive or negative ways. The phosphorus (P), potassium (K) and sodium (Na) content of 9 and 18 t/ha treatments positively correlated with triticale yield in 2013 (9 t/ha, r= 0.783, 0.574, 0.677; 18 t/ha, r= 0.679, 0.629, 0.536, respectively). Similar results were found between soil pH(KCl) and triticale yield in 9 t/ha treatment in the same year (r= 0.652). Contrarily, negative correlations were found between K and P content and the yield of maize but only in the 9 t/ha compost treated plot in 2014 (r= -0.580, -0.528, respectively). Also negative correlations were found among the pH(KCl) and the yield of green pea in 27 t/ha compost treated plot in 2015 (r= -0.745).
Conclusions
The SSC treatment generally has positive effects on cultivated plants but there are some differences in plants’ reactions and we found variations in time. Crop yields of triticale and maize were higher in the treated plots than in control one in 2013 and 2014. The SSC treatment resulted in positive yield responses of green pea in 2014 and 2015. SSC application had positive effects on soil chemical properties but more studies needed to screen the reactions of other plant species. These results could be used for planning more effective crop rotations based on SSC utilization as a plant nutrient supplying method.
Acknowledgement
„ Supported BY the ÚNKP-17-3 New National Excellence Program of the Ministry of Human Capacities”.
ReferencesAranyos T. J.; Tomócsik A., Makádi M., Mészáros J., Blaskó L. (2016): Changes in physical properties of sandy
soil after long-term compost treatment. International Agrophysics. 30. 269-274.Chodak, M., Borken, W., Ludwig, B., Beese, F., (2001): Effect of temperature on the mineralization of C and N
of fresh and mature compost in sandy material. J. Plant Nutr. Soil Sci. 164. 284–294.Fytili D., Zabaniotou A. (2008): Utilization of sewage sludge in EU application of old and new methods - A
review. Renewable and Sustainable Energy Reviews, Volume 12. 116-140.Herzel, H., Kruger, O., Herman, L., Adam, C. (2016): Sewage sludge ash – a promising secondary phosphorus
source for fertilizer production. Sci. Total Environ. 542. 1136–1143.Jalilian J. (2015): The effect of farm slope and application of different fertilizer sources on wheat on wheat yield.
Sixth International Scientific Agricultural Symposium “Agrosym 2015”. Bosnia and Herzegovina, Jahorina, 15-18 October 2015. Book of proceedings 209-213.
Makádi M. (2010): Microbiological properties of sandy soils in Nyírség Region (Hungary), affected by organic and inorganic additives. PhD Thesis; Gödöllő, Hungary. (In Hungarian).
Song, U., Lee, E. J. (2010): Environmental and economical assessment of sewage sludge compost application on soil and plants in a landfill. Resources, Conservation and Recycling 54. 1109–1116.
Tejada, M., Dobao, M.M., Benitez, C., Gonzalez, J.L. (2001): Study of composting of cotton residues. Biores. Technol. 79. 199–202.

Abstract Book – 17th Alps-Adria Scientific Workshop
138
Rapid biotest for fertilizer’s effectsBoglárka Anna DÁLNOKI1– András SEBŐK2 – János GRÓSZ2 – Gabriella RÉTHÁTI2 – László TOLNER2
1: NAIK – ÁTHK, Herceghalom, Hungary; E-mail: [email protected] 2: Szent István University, Gödöllő, Hungary; E-mail: [email protected]; [email protected].
hu; [email protected]; [email protected]
Keywords: rapid test, pot experiment, image analysing, orthogonal factor model,
Introduction
In precision agriculture there are several methods to describe an agricultural area, for example, yield mapping, remote sensing and local soil and plant analysis. Besides that, differences in the plant size are caused by several effects, therefore it is not easy to choose the right treating method. Generally applied fertilisers and organic fertilisers could improve yield and the organic matter content of soil, optimize the soil water management etc. To select the appropriate methods rapid biotesting is the simplest method to take advice for us.
Small pot experiment is a widespread method to estimate the soil treatment effects. After Chaminade works there were several experiments achieved, which involved the plants’ germination ability, growing data, height (length), root length etc (Chaminade 1960, Poorter et al., 2012, Szabó et al., 2012).
Effects of the treatments and these possible relations are established when the pot experiment is combined with the orthogonal factor model (Biczók et al., 1994).
Materials and methods
Our aim was to determine the NPK fertiliser effects on an assigned agricultural area with the rapid pot experiment. This method contains a 2m diameter ring, which turns around approximately 3 times per hour. On this ring there are 32 pots, which contain the treated soil and plants seeds. All the treated soil sets to 60% of water holding capacity. Above this ring there are plants’ growing lamps and a camera system, which takes pictures of every pot in every circle and controls the irrigation system. After 1-2 weeks of growing season, we collect the images and analyze them with an internally developed software. This program is counting the number of green pixels on the images. Base on this pixel values we could determine the growing curve. After the software calculates the growing data, we analyze the differences between the growing effect of the plants with a nonlinear function fitting, which does not have larger error than 0.5 %.
On the other hand, to optimize the treated factors we apply the orthogonal factor model, which has 2 different levels with N, P and K fertiliser and one center of the factor model, which contains 50% concentration all of the fertilisers. These treatments are shown in table 1 which is the data calculated from kg/ha.

Hnanice, Czech Republic – 09-14. April, 2018
139
Table 1: Calculated soil treatments with NPK fertiliser g/kg
1 2 3 4 5 6 7 8 9 10NH4NO3 332,4 0 332,4 0 332,4 0 332,4 0 332,4 332,4H3PO4 156 156 0 0 156 156 0 0 78 78KCl 179 179 179 179 0 0 0 0 89,5 89,5
After running the model we calculated the orthogonal factors and estimate the effects of the different soils and fertilisers.
Results and discussion
In each of the pots we calculate the green mass change over the time. Figure 1. presents the
different soil and treatments with a sigmoid function.:
Figure 1: The maximum of the green mass with sigmoid function.
On the factor model we calculate the following equation (p<10%):
Conclusions
In the rapid pot experiment, we could estimate the small differences of the treatments. The fertilised sample area has not significant differences. Besides N supply with the maximal K and P doses is not significantly larger but our treatments have negative effect to the seeds germination and plans growing. Furthermore, P and K fertilisers have not significantly effects, but the medium specialties of the area represent in this result. These results prove that the rapid biotest is appropriate for describe the different soil treatments effects.
ReferencesChaminade, R. (1960): Experimentation en petits vases de vegetation types d’essais pour tester l’efficacite des
engrais humiques. Annales Agronomiques, II: pp. 121-131.Poorter H., Bühler J., van Dusschoten D., Climent J., Postma J. A. (2012): Pot size matters: a meta-analysis
of the effects of rooting volume on plant growth. Functional Plant Biology 39, 839-850. DOI: https://doi.org/10.1071/FP12049
Szabó A, Balla-Kovács A., Jakab A., Bákonyi N., Vágó I. (2012): The effect of increasing compost doses on the changes of Ca- and Mg content of soil and indicator plant (Lolium perenne L.) in pot experiment. Oradea:2012
Biczók Gy., Tolner L., Simán Gy. (1994): Method for the determination of multivariate response functions. Bull. of the Univ. of Agric. Sci. Gödöllő.
100 150 200 250 300
0,0
0,1
0,2
0,3
0,4
0,5
0,6
0,7
0,8
Gree
n mas
s (g)
Time (h)
100 150 200 250 300
0,0
0,5
1,0
1,5
2,0
2,5
Gree
n mas
s (g)
Time (h)

Abstract Book – 17th Alps-Adria Scientific Workshop
140
Impacts of different fertilization methods on the yield and N-, S-uptake of spring wheat (Triticum aestivum L.)Evelin Kármen JUHÁSZ1 – Áron BÉNI2 – Mihály OROSZ-TÓTH3 – Andrea BALLÁNÉ KOVÁCS1
University of Debrecen, Faculty of Agricultural and Food Sciences and Environmental Management, Institute of Agricultural Chemistry and Soil Science, Debrecen, Böszörményi út 138. E-mail:[email protected], [email protected], [email protected], [email protected]
Keywords: starter fertilization, spring wheat, yield, N-, S-uptake
Introduction
Fertilizer application might be a critical practice in agricultural production systems. Fertilization is one of the greatest cost inputs in crop production. Taking nitrogen fertilizer as an example, in conventional fertilization management systems, N fertilizer is uniformly applied across a field (Zhang, 2015). Uniform N fertilizer rate across entire fields can result in over- and underapplications of N because crop responses to N fertilization are often variable within individual fields and plants in some parts of the field may need more N while plants in other parts may require less (Vetsch et al, 1995). Precision agriculture, as the name implies, is useful technology for growing and fertilizing crops more precisely or efficiently, thereby retaining water and nutrients in the root zone (Schumann, 2010). Placement of fertilizer in relation to the seed of most agronomic crops has been studied extensively (Ham et. al. 1973). Seed-placed starter fertilizer is an important planting practice for wheat. The primary objective of a starter fertilizer is to provide nutrients for early growth and promote root development. This improves winter survival and crop uniformity the following spring (Hall, 2013). In this study the effects of mineral fertilizers applied in different ways were investigated on the yield and nutrient uptake of spring wheat (Triticum aestivum L.). Materials and methods
The greenhouse pot experiment was set up with calcareous chernozem soil with spring wheat (Triticum aestivum L.) Some of the main parameters of the soil are pH (CaCl2) =7.2; Hu% =2.8; KA = 37.5; AL-P2O5 =394.1mg/kg; AL-K2O = 190.8mg/kg; AL-Ca = 5130mg/kg; AL-Mg =403.0mg/kg. To establish the experiment, 10 kg of air dry soil was measured into pots. The moisture content of soils was set up to 60% of the water holding capacity of the field. We had five treatments. The phosphorus and potassium need of wheat (as KH2PO4, KCl) was supplied uniformly in all pots. Nitrogen and sulphur were supplied as soil fertilizer (applied by two different ways as seed-placed (starter), and mixed into the soil) and were supplied as foliar fertilizer (starter+foliar, soil+foliar) at the stage of stem elongation In certain development stages at the beginning of stem elongation, at the heading, at the flowering stage plants height and weight were measured. After harvesting fresh and dry weight of the wheat straw and grain were determined. The nitrogen and sulphur content of straw and grain were measured by Elementar Vario EL type CNS analyzer.
Results and discussion
1. Nitrogen and sulphur content of spring wheat in stage of stem elongation, flowering and ripeningThe Table 1. shows the change of nitrogen and sulphur content of spring wheat at the stage of stem elongation, flowering and ripening.

Hnanice, Czech Republic – 09-14. April, 2018
141
Table 1: Nitrogen and sulphur content of spring wheat in different stage of development
TreatmentsSampling time
Stem elongation Flowering Ripening Grain Ripening StrawN% S% N% S% N% S% N% S%
control 4.020a 0.602a 1.281a 0.260a 2.115a 0.174a 0.328a 0.219astarter 4.588a 0.651a 1.358ab 0.333a 2.363ab 0.204ab 0.418bc 0.232ab
starter+foliar 4.605a 0.645a 1.416ab 0.334a 2.500b 0.230b 0.454c 0.247bsoil 4.142a 0.602a 1.316a 0.271a 2.287ab 0.213b 0.353ab 0.229ab
soil+foliar 4.379a 0.599a 1.495b 0.306a 2.251ab 0.226b 0.441c 0.240ab
At stem elongation stage the N- and S-uptake of plant was very intensive, then the N-and S-content of the aboveground biomass continuously decreased in time in all treatments. Comparing the values of different treatments at the stage of stem elongation, it can be said, that the nitrogen and sulphur content of plant did not differ significantly in all treatment, but due to starter treatments became a little bit higher. At stage of flowering all treatments increased the N-content, but a verifiable and significant growth was only measured at soil + foliar treatment. Foliar fertilization resulted a further increase of nitrogen content, either in case of starter or in case of soil treatments as well. The S-content did not alter significantly, but it can be seen, that all fertilizer application slightly improved the sulphur content of plant. At stage of ripening both the N-and S-content of the grain and straw were analyzed separately. The highest N-amount of grain was measured in starter+foliar treatment. In this case, the impact of starter treatment was also more favourable, then the other soil treatments. The starter+foliar treatment resulted the highest S content of grain as well. Comparing the nitrogen content of straw and grain, it can be said that the nitrogen content of straw was lower with 16-20% than the values of grain. This can be explained by the fact that a large part of the N content as protein is concentrated in the grain at the stage of ripening. The starter +foliar treatment resulted the highest N-and S-content of straw.
ConclusionsThe starter+foliar treatment resulted the highest N- and S-content of grain and of straw in the stage of ripening. So this was proved the most favourable treatment.
AcknowledgementsThe publication is supported by the EFOP-3.6.3- VEKOP-16- 2017-00008 project and the GINOP- 2.2.1-15- 2016-00001 projects. The project is co-financed by the European Union and the European Social Fund.
ReferencesHall, B. (2013): Starter fertilizer distribution on winter wheat as affected by rate of application, Crops & Soils
magazine, 2013, 46-6-2Ham, G. E., Nelson, W. W., Evans, S. D., Frazier, R. D. (1973): Influence of Fertilizer Placement on Yield
Response of Soybeans, Agronomy Journal, Vol. 65 No. 1, 81-84.Schumann A. W. (2010): Precise Placement and Variable Rate Fertilizer Application Technologies for
Horticultural Crops, HortTechnology February 2010 vol. 20 No. 1 34-40.Vetsch, J.A., Malzer, G. L., Robert, P. C., Huggins, D. R. (1995): Nitrogen Specific Management by Soil
Condition: Managing. Fertilizer Nitrogen in Corn, ASA Miscellaneous Publication, 465-473Zhang Q. (2015): Precision Agriculture Technology for Crop Farming, CRP Press, Taylor & Francis Group, Boca
Raton, London, New York.

Abstract Book – 17th Alps-Adria Scientific Workshop
142
Uptake, translocation and influence of selenium on rutin content in Fagopyrum esculentumJiri TUMA1 – Lenka TUMOVA2 – Matej SEMERAK1 – Adela STARMANOVA1 1: University of Hradec Kralove, Faculty of Science & Rokitanskeho 62, 500 03 Hradec Kralove, Czech republic;
E-mail: [email protected] 2: Charles University, Faculty of Pharmacy Hradec Kralove; Ak. Heyrovskeho 1203, 500 05 Hradec Kralove,
Czech republic; E-mail: [email protected]
Keywords: Fagopyrum esculentum, selenium, translocation, rutin
Introduction
Both seeds and other buckwheat tissues contain a large amount of nutritionally valuable components (proteins, antioxidants, trace elements, fibre). They are a source of selenium (Se), essential unsaturated fatty acids, and choline. Se is a beneficial element for human health; it strengthens the immune system in particular. Rutin can often be found with vitamin C; together, they act synergistically as antioxidants. It reduces the fragility of blood vessels and can be used for allergy, hemorrhoids and varicose veins treatment (Tumova et al., 2007).
The aim of this work was to determine how the Se soil fertilisation influences the Se content in various parts of the buckwheat plant, and also how it affects the production of the flavonoid rutin.
Materials and methods
In an outside pot experiment with Fagopyrum esculentum ‘Pyra’, the influence of graded Se dose in soil on the Se (in roots, stems, leaves, and flowers) and rutin (in stems and leaves) content was studied. Plastic pots were filled with 10 kg of dry soil (pH 6.8; element content: P 23.0, K 76.0, and Mg 20.3 mg/kg – Mehlich III leachate). Four variants (control and graded doses of 0.2, 2.0, and 10.0 mg Se / kg of soil) were set up in 3 replicates. Se was applied in the form of SeO2. One buckwheat seedling was planted in each experimental pot. During the vegetation season, the growth and the development of the plants, as well as their health state, were valorised. The harvest took place on the 16th July 2013 in the blooming phase. Flowers, leaves, stems, and roots were collected separately. In dry mass, the Se content was determined by the ICP-MS; for rutin determination, the HPLC was used. The results were statistically evaluated in the Statistika 12 programme; one-way ANOVA was followed by the Tukey test.
Results and discussion
Table 1: Selenium content in individual parts of Fagopyrum esculentum
Se dose[mg / kg] in soil
Se content [mg / kg DW] in plants ratioroots stems leaves flowers leaves/roots flowers/leaves
control 1.0a 1.0a 1.0a 1.0a 1.00 1.000.2 4.0ab 4.0b 4.0a 4.0ab 1.00 1.002.0 14.3b 8.0c 10.7a 8.7b 0.75 0.8110.0 47.0c 32.0d 97.5b 38.0c 2.07 0.39
DW = dry weight; 95% confidence interval was used for the significance testing

Hnanice, Czech Republic – 09-14. April, 2018
143
Higher Se dose (2 and 10 mg Se/kg) in soil manifested itself in significantly increased Se content in all of the observed parts of buckwheat plants (Table 1). The highest Se content was measured in leaves, followed by the amount in flowers. Similar results had been published by Jiang et al., (2015) and Golob et al., (2016). The translocation factors indicate that the increased Se transport into leaves (and subsequently generative organs, too) was mainly triggered by the largest dose of Se. This dose also resulted in the highest plant growth. Se toxic effects were not detected.
Figures 1 and 2 show the rutin content in stems and leaves; in leaves, it was several times higher than in stems. Se increased dose gave a significant rise to rutin content. The relationship between Se and rutin content is mentioned in Cuderman & Stibilj (2010).
Figures 1 and 2: Rutin content in stems and leaves (error bars indicate the standard error of the mean)
Conclusions
Soil fertilisation with 10 mg Se/kg resulted in higher Se content in all parts of the buckwheat plant, mainly in leaves and generative organs. It positively influenced the plant growth as well. Increased dose of Se also lead to higher rutin content. The buckwheat plant is a potential Se-enriched functional food with higher rutin, flavonoids and other phenolic compounds content.
Acknowledgement
This study was financially supported by Particular Research Program, University of Hradec Kralove, No. 2105/2017
ReferencesCuderman, P., Stibilj, V. (2010). Stability of Se species in plant extracts rich in phenolic substances. Analytical
and Bioanalytical Chemistry. 396: 4. 1433-1439. DOI: https://doi.org/10.1007/s00216-009-3324-5Golob, A., Germ, M., Kreft, I., Zelnik, I., Kristan, U., Stibilj, V. (2016). Selenium uptake and Se compounds in
Se-treated buckwheat. Acta Botanica Croatica. 75: 1. 17-24. DOI: https://doi.org/10.1515/botcro-2016-0016Jiang, Y., Zeng, Z.H., Bu, Y., Ren, C.Z., Li, J.Z., Han, J.J., Tao, C., Zhang, K., Wang, X.X., Lu, G.X., Li,
Y.J., Hu,Y.G. (2015). Effects of selenium fertilizer on grain yield, Se uptake and distribution in common buckwheat (Fagopyrum esculentum Moench). Plant Soil and Environment. 61: 8. 371-377. DOI: https://doi.org/10.17221/284/2015-PSE
Tumova, L., Pichova, M., Dusek, J. (2007): Fagopyrum esculentum in vitro. Ceska a Slovenska farmacie. 56: 3. 125-128.

Abstract Book – 17th Alps-Adria Scientific Workshop
144
Impact of nitrogen topdressing on the quality and quantity parameters of yield and grain protein of wheat (Triticum aestivum L.) Adnan ESERCrop Production Institute, Szent István University, 2100 Gödöllő, Páter Károly utca 1.E-mail: [email protected]
Keywords: grain protein, gluten, winter wheat, moisture, nitrogen
Introduction
There is more land planted to wheat in the world than any other crop. It provides 20 percent of the world’s caloric consumption and for the world’s poorest 50 percent, 20 percent of their protein consumption too (Washington Wheat Facts 2015/2016). The total global wheat output exceeded 749.3 million tons in 2016, according to FAOSTAT data (FAOSTAT 2017). The goal of wheat production is twofold; provide quantity and quality. Milling and baking quality of wheat are mainly determined by the genetic basis, however, it can be influenced by management techniques (Grimwade et al 1996; Pollhamer 1981; Pepó 2010; Vida et al., 1996).
Materials and methods
For long-term field trials high milling and baking quality winter wheat varieties Mv Karéj, Mv Nádor, Mv Krajcár, Mv Kolompos and Alföld (Triticum aestivum L.) were sown. The small plots trial with four replications run at Nagygombos, experimental field Crop Production Institute of Szent Istvan University, Hungary. The size of each plot is 10 m2. Soil type of the experimental field is chernozem (calciustoll). Annual precipitation of the experimental site belongs to the 550-600 mm belt of the Northern edges of the Hungarian Great Plain. Identical agronomic treatment applied to each plot. Supply of N fertiliser planned for single and divided doses. Applications of N topdressing will be done by 6 levels: 0, 80, 120, 160 kg/ha N in single supply and 80+40, 120+40 kg/ha N in two applications. After harvest, samples were analysed in the laboratory of Crop Production Institute of Szent Istvan University in the regard of hectolitre mass(kg/hl), thousand grain weight(g), baking quality, protein (%), moisture (%) and gluten (%).
Results and discussion
Experimental results showed that ascending doses of N application caused in yield increase regarding all varieties.
Tested wheat grain samples protein and gluten content indicate that N supply has high effect on examined varieties. Specially 80+40kg/h and 120+40kg/h divided applications were remarkable. Figure 1 data of protein performance in 2016. Figure 2 data of gluten performance in 2016.
Conclusions
The outcome of the experiment highlight that increasing levels of N supplement and ascending number of fertilizer distribution proved to have a positive effect on the grain protein amount and crop yield of winter wheat varieties. No significant effect has been found on moisture content

Hnanice, Czech Republic – 09-14. April, 2018
145
Acknowledgement
I am indebted regarding the all supports and efforts of my supervisor, Prof. Jolankai Marton and financial support of the Hungarian Government managed by Tempus Public Foundation.
References FAO (2017): Food and Agriculture Organization of the United Nations, Land Resources. FAOSTATS-Crops. http://faostat.fao.org/site/567/default.aspx#ancor.Grimwade B, Tatham AS, Freedman RB, Shewry PR, Napier JA. (1996): Comparison of the expression patterns
of wheat gluten proteins and proteins involved in the secretory pathway in developing caryopses of wheat. Plant Molecular Biology 30, 1067–1073. DOI: 10.1007/BF00020817
Pepó P. 2010: Adaptive capacity of wheat (Triticum aestivum L.) and maize (Zea mays L.) crop models to ecological conditions. Növénytermelés. 59. Suppl. 325-328.
Pollhamer. E. 1981: A búza és a liszt minősége. (Quality of wheat and flour). Mezőgazdasági Kiadó. Budapest.Shewry, P. R., & Halford, N. G. (2002): Cereal seed storage proteins: structures, properties and role in grain
utilization. Journal of Experimental Botany, 53(370), 947-958. doi:10.1093/jexbot/53.370.947Vida Gy., Bedő Z., Jolánkai M. (1996): Agronómiai kezeléskombinációk őszi búzafajták sütőipari minőségére
gyakorolt hatásának elemzése főkomponens-analízissel. Növénytermelés. 45. 5-6. 453-462.Washington Wheat Facts 2015/2016; http://wagrains.org/wp-content/uploads/2015/04/WGC-2016-
17WF4WebFinal.pdf
Figure1-2: Impact of N topdressing applications onwheat grain protein and gluten, 2016

Abstract Book – 17th Alps-Adria Scientific Workshop
146
Trend in consumption of industrial and organic fertilizers in Slovakia (potential source of surface water pollution) Cyril SIMAN – Yvetta VELÍSKOVÁInstitute of hydrology Slovak Academy of sciences, Dubravska cesta 9, 841 04 Bratislava, Slovakia; E-mail:
[email protected], [email protected]
Keywords: source of pollution, industrial and organic fertilizers, surface streams
Introduction
Agriculture is one of the largest consumers of fresh surface water on Earth, using an average of 70% of all its resources (FAO, 1996). On the other side, it is a significant non-point source contributor to surface and groundwater pollution (Ignazi, 1996). Result of fertilizers application is decreasing water quality, and with that related environmental problem is mainly water eutrophication (SAZP, 2013).
The paper presents the summary of the consumption of industrial and organic fertilizers on the territory of Slovakia in the period 2006 – 2015. We identify areas with the highest as well as the lowest levels of fertilization within our territory during this period.
Materials and methods
The data of the consumption of fertilizers in the monitored area of the agricultural land for the individual districts of Slovakia during the period 2006 – 2015 was provided by the Central Agricultural Control and Testing Institute in Bratislava. Evaluation of fertilizer consumption was done by calculation of the average level of fertilization during the period 2005 - 2015. The input data was in kilograms per hectare (kg/ha).
Conclusions
During the evaluated period, the amount of organic fertilizers applied was from 3472,5 kg/ha (in 2015) to 3913,1 kg/ha (in 2007). In this group we observed just slight decrease in the level of fertilization. In the group of industrial fertilizers, a moderate increase in their consumption between 2005 and 2015 was observed, with the amount of industrial fertilizers applied increased by 20 kg/ha in the period 2010 – 2015. The most significant of industrial fertilizers were fertilizers based on nitrogen (fig. 1). From districts of Slovakia the highest consumption of industrial fertilizers in evaluated period was in southwest part in Slovakia. In some districts it was even more like 120 kg/ha. The highest value was calculated for the Sala district (152,7 kg/ha). In mountainous regions of Slovakia with less fertile soils the consumption of industrial fertilizers was in general in lower level. The lowest value was evaluated for the Kysucke Nove Mesto district.

Hnanice, Czech Republic – 09-14. April, 2018
147
Figures 1-2: Average consumption of industrial fertilizers in district of Slovakia during period 2005 - 2015
Acknowledgement
The chapter was created with support from VEGA project no. 1/0805/16. This contribution/publication is the result of the project implementation ITMS 26220120062 Centre of excellence for the Integrated River Basin Management in the Changing Environmental Conditions, supported by the Research & Development Operational Programme funded by the ERDF.
References FAO. (1996): Control of water pollution from agriculture. E.D. Ongley. FAO Irrigation and drainage Paper 55.
FAO, Rome, 1996. 111 s. ISBN 92-5-103875-9Ignazi, J.C. (1993): Prevention of Water Pollution by Agriculture and Related Activities. Proceedings of the FAO
Expert Consultation, Water Report 1, 247-261.SAZP (2013): Agriculture and its impact on the environment in the Slovak Republic for the year 2011: Indicator
sector report. Banska Bystrica : Slovak Environmental Agency, 2011. 41 p.

Abstract Book – 17th Alps-Adria Scientific Workshop
148
Results of N supply and plant protection testing experiment on winter barley varieties József CSAJBÓK1 – Erika KUTASY2 Institute of Crop Sciences, Faculty of Agricultural and Food Sciences and Environmental Management, University
of Debrecen, H-4032 Debrecen, Böszörményi str. 138, E-mail: [email protected]; [email protected]
Keywords: winter barley, nitrogen, variety
Introduction
There are many papers published in effect of N supply on barley topic. Barley has strong root system, Drew (1975) wrote that lateral roots of barley grow into patches of high concentration of NO3- and NH4+. Siebrecht et al., (1995) stated in N-starved barley seedlings, supply of NO3 gave immediate uptake of it. Estimation of barley plant N concentration is possible using NIR reflectance of the leaf (Perry et al., 2012).
Materials and methods
The measurements were carried out in 2017 at the Látókép research site of the Debrecen University in small plot (18.4 m2) experiment with 3 repetitions. The soil of the area is calciferous chernozem with favourable water regime. Fertilization levels were: N93P45K51 and N153P45K51 kg ha-1, plant protection treatments were: average (fungicide: Tango Star 1.2 l ha-1), intensive (fungicide: Falcon Pro 1.0 l ha-1 + 2x Prosaro 1.0 l ha-1). The precipitation was 514.7 mm between 08 2016 to 06 2017. We measured the LAI, NDVI, SPAD values, plant height, lodging and yield. The tested varieties: SU Antonella, KH Malko, KH Korsó , KH Kárpátia, KH Viktor, KH Rudolf, KG Kunsági2, KG Puszta, KG Konta. We analyzed and evaluated the data of experimental results with the IBM SPSS 22.0 statistical software package using GLM model.
Results and discussion
The tested winter barley varieties gave high yield in 2017. The results show the nutrient supply caused significant differences in the yield of barley varieties while the crop protection levels only in KH Viktor and KH Rudolf resulted in significant difference. There were no significant differences in the leaf area index between the N-doses except KH Viktor. NDVI values differed statistically between the N levels and varieties, and in the higher N-doses plots, the barley had higher NDVI values. The highest NDVI value was measured in KH Rudolf with 135 kg ha-1 N+PK treatment. Crop protection intensity levels caused minor differences in any measured values in general. The reason probably is the good cropyear that was not favourable for fungal infections. The higher N level resulted in higher plants and serious lodging in some varieties SU Antonella (85%, 90.1 cm), KH Rudolf (22%, 78 cm), while the lower N showed 0-1% lodging and lower plants, but higher N doses did not cause higher plants in most of the varieties (KH Korsó, KH Kárpátia, KH Viktor, KH Rudolf, KG Kunsági2, KG Puszta, KG Konta).

Hnanice, Czech Republic – 09-14. April, 2018
149
Figure 1: Yield of winter barley varieties under different N-supply levels (Debrecen, 2017)
Figure 2: NDVI value of winter barley varieties under different N-supply levels (Debrecen, 2017)
Conclusions
N supply caused significant differences in the yield and NDVI value of winter barley varieties, but the different plant protection levels did not resulted in relevant differences probably due to the favourable cropyear. The N fertilization and plant height were not in close connection in most of the varieties.
Acknowledgement
The publication is supported by the EFOP-3.6.3-VEKOP-16-2017-00008 project. The project is co-financed by the European Union and the European Social Fund.
ReferencesDrew, M.C. (1975): Comparison of the effects of a localized supply of phosphate, nitrate, ammonium and
potassium on the growth of the seminal root system, and the shoot, in barley. New Phytol. 75:479–490.Perry, E. M., Fitzgerald, J. G. Nuttall, G. J., O’Leary, U. Schulthess, and A. Whitlock. (2012): Rapid estimation
of canopy nitrogen of cereal crops at paddock scale using a Canopy Chlorophyll Content Index. Field Crops Res. 134:158–164.
Siebrecht, S., G. Mäck, and R. Tischner (1995): Function and contribution of the root tip in the induction of NO3 − uptake along the barley root axis. J. Exp. Bot. 46:1669–1676.

Abstract Book – 17th Alps-Adria Scientific Workshop
150
Investigation on the growth of microalgae affected by biomass ash extract treatmentGyörgy FEKETE1 – László ALEKSZA1 – Péter KÖLES2 – János GRÓSZ1 – Boglárka Anna DÁLNOKI1
1: Szent István University, Gödöllő, Hungary; E-mail: [email protected]; [email protected]; [email protected]; [email protected]
2: Gazdász K+K Ltd., Gödöllő; E-mail: [email protected]
Keywords: microalgae, carbon dioxide, ash, biomass, pH
Introduction
Our research gives a new approach to carbon capture and storage (CCS) processes. The absorption of carbon dioxide (CO2) content of flue gases is a very effective method (efficiency >90%), while sorbents can be regenerated by heating and/or depressurization (Leung 2014). The novelty of our method arises from the involvement of biomass ash extract in the carbon binding process and the use of algae as a regenerative material.
Materials and methods
Carbon capturing medium was a 1 to 10 aqueous extract of biomass ash. Modelling flue gas washing was carried out by diffusing CO2 gas through the mixture which consisted of distilled water and a certain amount of the extraction. Diffusion in was stopped when pH reached level 6, where most of the carbon was in HCO3 (Chi et al., 2011). This step was followed by inoculation with algae. Our test organism was Chlorella vulgaris which was cultured according to the OECD recommendation (OECD 2006). The experiment investigated 5 different treatments (all in triplicates) where there was a blank with no carbon added, one where pH was set only by CO2 gas and the others contained 10, 25, and 50 % of ash extraction before the gas absorption. The optical density (OD) was obtained by measuring the absorbance of the suspension at 440 nm with a spectrophotometer. A calibration curve of cell dry weight against OD at 440 nm gave the result: biomass (mg)=ln(1-OD/3.29)/(-0,0022), R2=0.99. OD and pH were measured every 12 hours and the CO2 content of the suspensions was determined in the initial and the final stages by an increase in pressure of acidification. The experiment was terminated after 96 hours when the minimum treatment ran out of CO2.
Results and discussion
Best biomass production was detected in the 25% treatment (Figure 1/a) however, the growth curve showed a flattening by the end of the test period due to the CO2 loss. Meanwhile, samples with 50% treatment needed a longer adaptation time but they showed a rapid growth even on the fourth day. This trend correlates with the pH (Figure 1/b) which can be explained by the transformation of HCO3 into CO2 plus OH− during photosynthesis by cells with a high affinity for CO2 uptake (Shiraiwa et al., 1993).

Hnanice, Czech Republic – 09-14. April, 2018
151
Figure 1: (a) Biomass production, and (b) pH change during the four-day culture experiment
Figure 2 explains why growth in small samples stopped: they totally run out of carbon source. The levels of efficiency of CO2 removal in the four treated samples are the following: 100%, 89%, 46% and 29 %. This phenomenon also means that the experiment should be repeated with initial algae density, the orders of magnitude of which is higher than it is recommended by OECD.
Figure 2: Initial and final CO2 content of the suspensions in mmol/L
Conclusions
Algal CO2 uptake was significantly proven by different parameters in our results in all treated samples. It entails that algae can regenerate liquid CO2 sorbents, which can be recycled for carbon capturing. At the same time, it forms a biomass, which can be a valuable raw material of products in different segments of the industry.
References Chi, Z., O’Fallon, J. V., & Chen, S. (2011): Bicarbonate produced from carbon capture for algae culture. Trends
in biotechnology, 29(11), 537-541. Leung, D. Y., Caramanna, G., & Maroto-Valer, M. M. (2014): An overview of current status of carbon dioxide
capture and storage technologies. Renewable and Sustainable Energy Reviews, 39, 426-443.OECD (Organization for Economic Co-operation and Development) (2006): OECD Guideline for the testing of
chemical-Test No. 201: Freshwater Alga and Cyanobacteria, Growth Inhibition TestShiraiwa, Y., Goyal, A., & Tolbert, N. E. (1993): Alkalization of the medium by unicellular green algae during
uptake dissolved inorganic carbon. Plant and cell physiology, 34(5), 649-657.

Abstract Book – 17th Alps-Adria Scientific Workshop
152
Biodiversity of arbuscular mycorrhizal fungi (AMF) in the environment contaminated with toxic organic pollutants
Monika RAJTOR – Franco MAGURNO – Zofia PIOTROWSKA-SEGETDepartment of Microbiology, Faculty of Biology and Environmental Protection, University of Silesia,
Jagiellońska 28, 40-032 Katowice, Poland ; E-mail: [email protected]
Keywords: arbuscular mycorrhizal fungi, next generation sequencing, polynuclear aromatic hydrocarbons, phenol
Introduction
AMF form ubiquitous symbiotic association with the roots of 80-90% terrestrial plant species and greatly enhance plant growth by provision with nutrients (Smith & Read, 2008). AMF proved to be useful in agriculture and phytoremediation of lands contaminated with heavy metals. Recently, more attention has been paid to explore their potential in the enhancement of rhizodegradation of organic pollutants (Rajtor et al., 2016). This study was focused on the analysis of structure and biodiversity of AMF community in the environment contaminated with phenol and PAHs, in comparison to the non-polluted site.
Materials and methods
Rhizosphere soil and root samples from two plant species, Phragmites australis and Poa trivialis were collected from the area of Kalina Pound in Świętochłowice (Southern Poland), contaminated with wastes from the production of paints and varnishes, and from an uncontaminated control site (Kokotek Lake, Lubliniec, Southern Poland). Evaluation of mycorrhizal root colonization was performed according to a method of Trouvelout et al., (1986) and with qPCR using 18S rDNA-specific primers AMV 4.5NF-AMDGR (Sato et al., 2005). Quantification of AMF in soil was based on extrametrical hyphal length (Abbott and Robson, 1985), number of spores (Gerdemann and Nicolson, 1963; Daniels and Skipper, 1982) and the concentration of glomalin (Wright & Upadhyaya, 1998, Bradford et al., 1976) and 16:1ω5c fatty acids in soil (Frostegard et al., 1993; Olsson et al., 1997). The preliminary analysis of AMF biodiversity was performed with nested-PCR-DGGE method, using a fragment of 18S rDNA gene (Wang et al., 2015). Deep sequencing of AMF community based on 28S rDNA fragment was performed on MiSeq platform (Illumina). Sequences where processed using a customized Mothur pipeline followed by Evolutionary Placement Algorithm (EPA) species affiliation.
Results and discussion
Mycorrhizal root colonization, quantity of AMF in soil and their biodiversity were significantly lower in the contaminated site, when compared to the non-polluted one. The number of AMF sequences obtained from NGS of the contaminated soil was 67498 and 547966 from the uncontaminated soil. Totally, 241 OTUs where obtained, with 141 and 262 OTUs representing the contaminated soil uncontaminated soil, respectively. AMF communities inhabiting P. trivialis and P. australis rhizosphere in the area of Kalina Pound demonstrated high similarity and were dominated in 50% by Paraglomus laccatum. AMF communities from the control site were totally different from the Kalina AMF communities and where more diversified among the tested plants. P. trivialis rhizosphere was dominated by Dominikia sp. in 48% and Archaeospora sp. in 22% while P. australis by Archaeospora sp. in 62%.

Hnanice, Czech Republic – 09-14. April, 2018
153
Conclusions
Organic contaminants present in the soil had definitely a negative effect on AMF diversity and their symbiotic development, however they exert also a selective pressure promoting the growth of fungi which may potentially tolerate their presence in the habitat. These AMF strains will be further isolated and tested for they response to PAHs and phenol contamination.
ReferencesAbbott, L. K, Robson, A.D. (1985): Formation of external hyphae in soilby four species of vesicular-
arbuscular mycorrhizal fungi. New Phytologists. 99: 245-55. Bradford, M. M. (1976): A rapid and sensitive method for the quantitation of microgram quantities of protein
utilizing the principle of protein-dye binding. Analytical Biochemistry. 72: 248-54.Daniels, B. A., H. D. Skipper. (1982): Methods for the recovery and quantitative estimation of propagules
from soil, p. 29-35. In N. C. Schenck (ed.), Methods and principles of mycological research. The American Phytopathological Society, St. Paul., Minnesota.
Frostegard, A. Tunlid, A., Bååth, E. (1993): Phospholipid fatty acid composition, biomass, and activity of microbial communities from two soil types experimentally exposed to different heavy metals. Applied and Environmental Biology. 59: 3605-3617
Gerdemann, J. W., Nicolson, T.H. (1963): Spores of mycorrhizal Endogone species extracted from soil by wet sieving and decanting. Transactions of the British Mycological Society. 46: 235-244.
Olsson, P. A., Baath, E., Jakobsen, I. (1997): Phosphorus effects on the mycelium and storage structures of an arbuscular mycorrhizal fungus as studied in the soil and roots by analysis of fatty acid signatures. Applied and Environmental Biology. 63: 3531–3538.
Sato, K., Suyama, Y., Saito, M., Sugawara, K. (2005): A new primer for discrimination of arbuscular mycorrhizal fungi with polymerase chain reaction-denature gradient gel electrophoresis. Grassland Science. 51: 179–181.
Trouvelot, A., Kough, J. L., and Gianinazzi-Pearson, V. (1986): Mesure du taux de mycorhization VA d’un système radiculaire. Recherche de méthodes d’estimation ayant une signification fonctionnelle. In Physiological and genetical aspects of mycorrhizae. Proceedings of the 1st European Symposium on Mycorrhizae, Dijon, 1–5 July 1985. Edited by V. Gianinazzi-Pearson and S. Gianinazzi. Institut National de la Recherche Agronomique, Paris. pp. 217–221.
Wang, C., Zhenhong, G., Hang, C., Honghui, Z., Shenlei, F., Qing Y. (2015): Differences in arbuscular mycorrhizal fungal community composition in soils of three land use types in subtropical hilly area of Southern China. PLOS ONE. 10: 1-16.
Wright, S. F., Upadhyaya, A. (1996): Extraction of an abundant and unusual protein from soil and comparison with hyphal protein from arbuscular mycorrhizal fungi. Soil Science. 161: 575-586.

Abstract Book – 17th Alps-Adria Scientific Workshop
154
Adaptation possibilities to climate change with green infrastructure in urban environmentEdit HOYKHAS Centre for Economic and Regional Studies, Institute for Regional Studies. Kecskemét, Rákóczi út. 3. 6000;
E-mail: [email protected]
Keywords: climate change, adaptation, green infrastructure, Urban Heat Island (UHI)
Introduction
The attempts to reduce the negative effects of climate change in urban environment primarily focus on overheating protection and decrease of UHI effect primarily. Green infrastructure has a prominent role in this adaptation process. In this study, we present the microclimatic differences within a medium sized Hungarian city – Kecskemét –, which refer to UHI formation. We analyse green surfaces in the downtown, which have an important role in UHI effect reduction and overheating protection. As a conclusion, we make suggestions about green infrastructure as an adaptation tool.
Materials and methods
The preceding findings revealed that the UHI effect and its intra-urban variability are observable throughout the whole year, but the highest values can be measured in summer. International researches agree that in urban level, green infrastructure is one of the key tools in the mitigation of this phenomenon. Many measurements show the differences between green spaces and vegetation-free areas. In London, greenspace is reducing the UHI effect by 31% (Doick et al., 2014). Others found a strong correlation between topography and land-use and UHI intensity (Ketterer – Matzarakis 2014). According to Tsilini et al., (2015) urban gardens decreased the surface temperature by 10 °C compared to areas with no vegetation. The evaluation of cooling effects of gardens, street trees, green roofs etc. could also help understanding how green infrastructure can be integrated into urban environments (Feyisa et al., 2014). This includes that the cooling effect of urban trees is highly associated with sky view factor (Tan et al., 2016), which shows the importance of the canopy density.
In our research, we measured the urban climate with five Netatmo NRG01-WW weather stations in Kecskemét, which give us a climatic cross-section of the town. We analysed 10 August 2017 – 10 November 2017 period. The measured parameters were the following: temperature, precipitation, humidity and wind. Because green surfaces can play a significant role to reduce UHI effect, we made qualitative and quantitative survey about the green areas of Kecskemét downtown (size of green areas, number, type and health of the trees). We used Google Street View and a simplified version of EU method for health status classification, with three health classes (1 – good; 2 – medium; 3 – bad health condition).
Results and discussion
Differences in temperature manifested mainly in night cooling between city districts. We measured 1,5-2 °C differences between the densely built downtown measure point and the loosely built downtown edge or the intermediate measure points, with higher nightly

Hnanice, Czech Republic – 09-14. April, 2018
155
temperatures in the downtown. However, there is no significant difference in the daytime warming. In the precipitation, there may be a significant difference between the city centre and downtown edge (data can show almost 30 mm difference within one day).
Green areas of the downtown approx. 60 ha, which is about 30% of the investigated area. This value is relatively high, although it is important to consider that the size of the coherent green spaces has an important role in UHI effect reduction. In the downtown of Kecskemét the biggest coherent green area is about 5 ha. This extension can have a significant impact on the urban microclimate, but other green areas in the downtown are too small for a similar impact. Because of this, in case of the vegetation of the downtown, emphasis should be placed for shielding and decreasing of the daytime overheating. To achieve this we need healthy canopy with high density. A significant part of the woody vegetation surveyed by the city centre is in poor condition. Our results show that more than 50% of the trees are in medium or bad health condition (class 2 or 3). This indicates that bigger part of the trees can reach upper limit of their viability within 10-15 years.
Conclusions
Our temperature measurements indicate the presence of the Urban Heat Island phenomenon in Kecskemét. The differences in precipitation between different points of the city reflect the unpredictable rainfall patterns; within a distance of 1 km, there is a deviation of up to 30% in the rainfall. It confirms the necessity and urgency of urban rainfall management. The problems from abundant rainfall and lack of precipitation ameliorated with the help of this management, and it is easier to maintain green territories also. Our examination outlined that great emphasis should be placed to increase the extent of urban green spaces for which different elements of green infrastructure (green walls, green roofs) should be used. To achieve the best shading effect of the green areas, proper and continuous maintenance of the present vegetation is also important.
ReferencesDoick, K. J., Peace, A., Hutchings, T.R. (2014): The role of one large greenspace in mitigating London’s
nocturnal urban heat island. Science of the Total Environment. 493. 662–671. DOI: https://doi.org/10.1016/j.scitotenv.2014.06.048
Feyisa, G. L., Dons, K., Meilby, H. (2014): Efficiency of parks in mitigating urban heat island effect: An example from Addis Ababa. Landscape and Urban Planning. 123. 87-95. DOI: https://doi.org/10.1016/j.landurbplan.2013.12.008
Ketterer, C., Matzarakis, A. (2014): Human-biometeorological assessment of the urban heat island in a city with complex topography – The case of Stuttgart, Germany. Urban Climate. 10:3. 573-584. DOI: https://doi.org/10.1016/j.uclim.2014.01.003
Tan, Z., Ka-Lun Lau, K., Ng, E. (2016): Urban tree design approaches for mitigating daytime urban heat island effects in a high-density urban environment. Energy and Buildings. 114:15. 265-274. DOI: https://doi.org/10.1016/j.enbuild.2015.06.031
Tsilini, V., Papantoniou, S., Kolokotsa, DD., Maria, E.A. (2015): Urban gardens as a solution to energy poverty and urban heat island. Sustainable Cities and Society. 14. 323-333. DOI: https://doi.org/10.1016/j.scs.2014.08.006

Abstract Book – 17th Alps-Adria Scientific Workshop
156
“Miletin pheasantry” Nature reserve (East Bohemia, Czech Republic): vegetation surveyMilan SKALICKY – Vaclav HEJNAK – Jan KUBESCzech University of Life Sciences Prague; Fac. of Agrobiology, Food and Natural Resources, Dept. of Botany
and Plant Physiology, Kamycka 129, 16500 Prague, Czech Republic; E-mail: [email protected]
Keywords: wet meadows, management, endangered species
Introduction
There are currently about 820 nature reserves in the Czech Republic. The “Miletin Pheasantry” Nature Reserve has major significance as the preservation of natural ecosystem typical of “Podzvicinska” area and old ash-oakwood with rare pond, meadow fauna and rare flora. The area was declared a nature reserve in 1954. It is an extensive wet meadows and forest complex situated between the municipalities of “Miletin” and “Červená Třemešná” and occupies an area of 0.696 km2. The “Miletin Pheasantry” is the historical property of the small estate Miletin. Given the extensive use of the forest for pheasant keeping in the past have preserved floodplain forest and hornbeam relatively stable natural state.
Main objectives: Overall assessment of the vegetation in areas of the “Miletin Pheasantry” Nature Reserve. | Approximate site characteristics of certain areas using Ellenbergs’ indication values by particular species. This includes the relationships concerning light, temperature, continental characteristics, humidity, reactive and soil nitrogen. | The presence of protected and endangered species and invasive species has also been evaluated. | Finally, advisable management for the studied areas has been suggested.
Materials and methods
The studied area reaches N50°24’1’’ and E 15°39’41’’. The floristic part was chosen in the field by inventory methods (Danihelka et al., 2012) common in Central-European field botany (Fig. 1). Four localities were chosen: L1 – Alder carrs 50°24’3”N 15°39’35”E | L2 – Oak-hornbeam forests 50°24’8”N 15°39’38”E | L3 – Pond Povolír 50°24’6”N 15°39’40”E | L4 – Ash-alder alluvial forests 50°24’9”N 15°39’48”E. The phyto-sociological part was worked out with the help of the Zürich Montpellier School of Phytosociology and included analysis, synthesis and identifying vegetation. Twelve phyto-sociological relevés were taken (Rosenthal, 2003). We compared the results concerning the vegetation with previous surveys.
Results and discussion
In this area, more than 130 species were identified mainly in the wet meadows and ash-alder alluvial forests. There were 8 taxa of protected plants of various categories found (Grulich, 2012). Intermittently wet Molinia meadows (the alliance Phragmition communis, Molinion and Salicion cinereae), fragmentally calcareous fens (the alliance Caricion davallianae and associations Valeriano dioicae-Caricetum davallianae, Seslerietum uliginosae) occupied grasslands in nature reserve. The hardwood forest of lowland rivers (suballiance Ulmenion) with old oaks, ash-alder alluvial forest (association Pruno padi-Fraxinetum excelsioris) and hercynian oak-hornbeam forest (association Galio sylvatici-

Hnanice, Czech Republic – 09-14. April, 2018
157
Carpinetum betuli) with den oak trees and occurrence of typical species of herbaceous layer were determined during survey.
Figure 1: Aerial photo of the forests and wet meadows in “Miletin Pheasantry” Nature Reserve (old mixed ash oakwood and wet meadows - ponds Povolir and Bubnovka with adjacent wetlands; left) | Intermittently wet Molinia meadows on nutrient-poor soils that are wet but not flooded in spring and mesic in summer; in many stands the dominant species are the tussock-forming grasses Molinia arundinacea or M. caerulea (right).
Conclusions
During the vegetation period of 2014 - 2016, more than 130 vascular plant taxa were determined there. The authors found some severely endangered, endangered and rare species of the Czech Republic’s flora, the former include i.a. Carex davalliana, Platanthera bifolia, Carex otrubae, Cerastium lucorum, Galium boreale, Listera ovata and Primula veris. The occurrence of very well preserved and biologically valuable communities with dominant Carex davalliana and Sesleria uliginosa were confirmed there. The plant communities just mentioned are severely endangered by the expansion of Phragmites australis, as well as by the process of being overgrown with Arrhenatherum elatius and Impatiens parviflora.
Acknowledgement
Supported by the Ministry of Education, Youth and Sports of the Czech Republic, Project “S grant of MSMT CR”.
ReferencesDanihelka, J., Chrtek, J. Jr., Kaplan, Z. (2012): Checklist of vascular plants of the Czech Republic. Preslia. 84:
3. 647-811.Grulich, V. (2012): Red List of vascular plants of the Czech Republic: 3rd edition. Preslia. 84: 3. 631-645.Rosenthal, G. (2003): Selecting target species to evaluate the success of wet grassland restoration. Agriculture
Ecosystems & Environment. 98: 227-246. DOI: https://doi.org/10.1016/s0167-8809(03)00083-5

Abstract Book – 17th Alps-Adria Scientific Workshop
158
Evaluation of potentially toxic elements mobilityViera KOVÁČOVÁInstitute of Hydrology, Slovak Academy of Sciences, Dúbravská cesta 9, 841 04 Bratislava;
E-mail: [email protected]
Keywords: sorption, heavy metals, soil profile, soil solution
Introduction
Heavy metals like cadmium, lead, chromium, mercury and arsenic are the major toxic metals posing a threat to human health. Industrialization, urbanization and agricultural production have become permanent resources of extraneous chemicals in environment. The increase in agricultural production efficiency causes using of large quantities of chemical products in soils and water. Therefore, an attention should be paid to understanding the problems of detention of contaminants in soils and their penetration to water (Dulovičová et al., 2007, Yong et al., 1992). The fate of heavy metals in the environment is largely controlled by sorption reaction with soil colloids. The three main active soil colloidal constituents, clay minerals, metal oxides and organic matter are important sorbents of heavy metals owing primarilly to their cation-exchange capacity (CEC) and their ability to form inner-sphere complexes through surface reactive groups, such as carboxylic and hydroxyl groups (Basta et al., 1992). Accordingly, the studies of pollutants behavior in relation to soil type are of crucial importance for the prediction of the fate of contaminants and the selection of appropriate methods for soil rehabilitation (Čelková, 2016; Pokrovsky et al., 2012).
Materials and methods
Adsorption processes we can quantify by adsorption isotherms. The most frequent are used linear and nonlinear (Freundlich and Langmuir) isotherms. In linearised form is:
SF = KF (ce)1/n
(1)
eL
eLL cK
cQKS+
=1
max
(2)
The purpose of this research project was to measure Freundlich and Langmuir isotherm´s parameters for a range of soils and investigate any correlation between these parameters and characteristic parameters of the soils.
Results and discussion
Parameters of Freundlich and Langmuir isotherms were measured in laboratory batch experiments for 10 soils at environmentally relevant solute concentrations in approximately equal conditions (pH).

Hnanice, Czech Republic – 09-14. April, 2018
159
0
1
2
3
4
5
6
7
8
9
10
0 50 100 150 200 250 300
cr [mg/l]
S [m
g/1
g so
il]
L1 loam CdL2 loam CdSL1 sandy-loam CdSL2 sandy-loam CdL1 loam PbL2 loam PbSL1 sandy-loam PbSL2 sandy-loam Pb
Figure 1: Heavy metals adsorption isotherms for loamy soils L1, L2 and sandy-loamy soils SL1, SL2.Table 2: Freundlich parameters for heavy metals (Cd(II), Pb(II)) sorption by different soil types
soil Freundlich parameters (Cd) Freundlich parameters (Pb)KF 1/n R2 KF 1/n R2
m3.kg-1 - m3.kg-1 - 0,8778L1 43,3.10-3 0,75 0,923 841,7.10-3 1,97 0,875L2 24,3.10-3 0,68 0,918 754,2.10-3 1,92 0,7782SL1 15,6.10-3 0,94 0,903 352,0.10-3 1,45 0,791SL2 8,5.10-3 0,86 0,88 298,1.10-3 1,41 0,8778
where KF, 1/n – the parameters of Freundlich isotherm
Table 3: Langmuir parameters for heavy metals (Cd(II), Pb(II)) sorption by different soil types
Conclusions
The aims of this study were comprehensive evaluation and comparison of the capacities of soil horizons withstand pollution heavy metals and determination of the parameters of Freundlich and Langmuir isotherms mentioned above for ten relevant soil horizons.
Acknowledgement
This research was supported by project VEGA 2/0058/15 and project APVV-14-0735.
ReferencesBasta, N. T., Tabatabai, M.A. (1992): Metal Adsorption by Soils. Effect of cropping systems on adsorption
of metals by soils : I. Single-metal adsorption, Soil Sci., Vol. 158, no.2, 108-114. DOI: https://doi.org/10.1097/00010694-199202000-00004
Čelková, A. (2016): Individual and competitive adsorption of lead and cadmium and its impact on their transport. Acta Hydrologica Slovaca, 17, 2, 182-189. DOI: http://dx.doi.org/10.1007/3-540-26746-8_13
Dulovičová, R., Velísková, Y. (2007): Change of Žitný Ostrov channel network aggradation state. J. Hydrol. Hydromech., Vol. 55, No. 3, 185-198. DOI: http://dx.doi.org/10.18380/szie.colum.2015.1.73.
Pokrovsky, O. S., Probst, A., Leviel, E., Liao, B. (2012): Interactions berween cadmium and lead with acidic soil: Experimental evidence of similar adsorption patterns for a wide range of metal concentrations. J. of Hazardous Materials, Vol. 199-200, 2012, 358-366. DOI: https://doi.org/10.1016/j.jhazmat.2011.11.027
Yong, R. N., Mohamed, A.M.O., Warkentin, B.P. (1992): Principles of contaminant transport in soils. Elsevier Science Publishers B.V., Amsterdam, 1992, 327p. DOI: http://dx.doi.org/10.1201/b17405-11

Abstract Book – 17th Alps-Adria Scientific Workshop
160
A cost-effective arsenic removal methodImre SZATMÁRI1 – József ZSEMBELI1 – Prasanna SAXENA2 – Júlia TÜDŐSNÉ BUDAI1 – Károly ANTAL1
1: Karcag Research Institute, RIEF, University of Debrecen H-5300 Kisújszállási út 166., Karcag, Hungary; E-mail: [email protected]
2: Faculty of Agricultural and Food Sciences and Environmental Management, University of Debrecen, H-4032 Debrecen, Böszörményi út 138.
Keywords: arsenic removal, iron(III), decontamination, filtration
Introduction
Water is one of the most important conditions for life. 97% of the water-content of Earth is salt water in the form of oceans and seas, further 2% compose the ice covers and glaciers. Only the remaining 1% is represented in the forms of fresh water (rivers, lakes, groundwaters and as vapour in the atmosphere). 70% of the fresh water is used for food production. The quality of this water is crucial in the livestock production as a component of the human food chain. The presence of arsenic, among other pollutants, can be a serious problem in various parts of the world, including the Great Plains region of Hungary (Pál, 2002). Our goal was developing a cost-effective method for arsenic removal from groundwater.
Materials and methods
All chemicals were of analytical grade and used without further purification. All reactions were carried out in batch reactors in room temperature. Iron-hydroxide sol was made in situ from iron(III)-chloride in basic media using calcium-hydroxide. Deionised water, tap water and a mineral water were used as samples, which were previously determined to their exact chemical composition. Sand filters were used for the removal of arsenic-contained iron(III)-hydroxide precipitations from the solutions (Lihua et al., 2009). The arsenic concentration of the filtrate was determined by a Thermo Scientific iCE3000 series AA Spectrometer using GFAAS technique.
Results and discussion
We found out that the optimal pH is 9.0, which is the minimal pH-level, where the adsorption reached the maximum amount. We developed two ways for the removal of arsenic. In one case we set the iron concentration to 56 mg/L, then set the pH at 9.0 to form the iron(III)-hydroxide precipitation, at last the arsenic level was set to 300 µg/L (A method). In the other case the steps were applied in reverse order (B method). After the filtration, we measured the arsenic content of the filtrates, which were all below 10 µg/L. These results are demonstrated in Table 1.
The calculated removal efficiency, based on the analytical results was the same, which suggested that the sequence of the steps not influencing the removal process. These results are demonstrated on Figure 1.

Hnanice, Czech Republic – 09-14. April, 2018
161
Table 1: Efficiency of arsenic removal with different methods
Method Sample Initial As concentration (µg/L)
Final As concentration (µg/L)
Removal efficiency (%)
ADeionised water 300 38.1 87
Tapwater 300 4.5 98Mineral water 300 3.0 99
BDeionised water 300 21.3 93
Tapwater 300 3.8 99Mineral water 300 3.0 99
Figure 1: Efficiency of arsenic removal with different methods
Conclusions
Based on our observations, in alkaline media the iron(III)-hydroxide sol is a very effective decontaminating agent. Despite the initially high arsenic concentrations, the arsenic levels in the purified water meet the requirements of the European Union. The efficiency of arsenic removal is independent from the methods applied by us.
ReferencesLihua S., Ruiping L., Shengji X., Yanling Y., Guibai L. (2009): Enhanced As(III) removal with permanganate
oxidation, ferric chloride precipitation and sand filtration as pre-treatment of ultrafiltration. Desalination 243. 122-131.
Pál K. (2002): Arsenic in the environment, Environmental booklets, OMIKK: BUTE, Budapest.

Abstract Book – 17th Alps-Adria Scientific Workshop
162
Rapid biotest method in precision agricultureMiklós GULYÁS1 – László TOLNER1 – György FEKETE2 – Rita ERDŐSI2 – Imre CZINKOTA1
1: Szent István University, Gödöllő, Hungary; E-mail: [email protected]; [email protected]; [email protected]; [email protected]
2: Asseco Central Europe Hungary Zrt., Budapest, Hungary; E-mail: [email protected]
Keywords: rapid biotest, pot experiment, image analysing
Introduction
Precision agriculture is a new technology with a long history. The invariable question of the agriculture is how to maximize the physical and economic crop production by varying the input application according to soil types and crop performance. In the past the only one possibility was for the farmers to observe the spatial variability of soil properties and their effects on the development and production of crops and manage them based these differences. In precision agriculture there are several methods to get useable, high amount (BIG DATA) information.
Collecting this information is necessary to increase the yield, to decide the right treating method. There are many things which have an effect on the plant production and the plant growth. Generally applied fertilisers and organic fertilisers could improve yield and the organic matter content of soil, optimize the soil water management etc. The rapid biotest is the simplest method to take specific answer for our question.
Materials and methods
We developed a new plant experiment method, for the rapid and punctual measurement of the plant growing effect caused by plant nutrient, water management or other soil properties. The buildup of this instrument is very simple. There is a 2 m diameter ring which is moves continuously and slowly different soil sample. Type of the test plants depends on the target. Plant growing lamps are used over the pots, and an irrigating system is a part of the ring. The growing period is about 1-2 weeks. A camera system is used in on a fixed point to take photos from each pot in every circle. A computer collects and saves all the images for the pot analysis. For the image analysis we use an internally developed software, which is counting the number of green pixels on the image (Tolner et al., 2010). Based on the time-pixel function we can calculate the growing. Using this method, we can measure the differences between growing effect of plants and the measurement error is less than 0.5 %.
First, we must set out the same plant growing areas which are depending on the remote sensing, production maps or other method. Treatments based on the known average soil properties, and the treatment set up due to a factor plan. After that we collect soil samples, and add fertilizers or other materials and fill the pots with this mixture. After the measurement, and data-analysis we can calculate how to influence the investigated parameter to the plant production, and we can make the precision soil treatment plan.

Hnanice, Czech Republic – 09-14. April, 2018
163
Results and discussion
The usability of our method is moves on a wide range. It is proper to investigate different soil sample from management zones and different types of plants and amount of nutrients before the application
Conclusions
The preexperiment results prove that the rapid biotest is appropriate for describe the different soil treatments effects.
ReferencesTolner L. - Czinkota I. - Sándor G. - Tolner K. (2010): Testing the effect of redirected glycerol by-products on
the nutrition providing ability of the soil. In: Gilkes RJ, Prakongkep N, editors. Proceedings of the 19th World Congress of Soil Science; Soil Solutions for a Changing World; ISBN 978-0-646-53783-2; Published on DVD; http://www.iuss.org; Symposium 3.3.1; Integrated nutrient management; 2010 Aug 1-6. Brisbane, Australia: IUSS; 2010, pp.298-301.

Abstract Book – 17th Alps-Adria Scientific Workshop
164
Factors important for biomass production of selected vascular plant species occurring on post-mining waste heapsEdyta SIERKA – Agnieszka BŁOŃSKA – Agnieszka KOMPAŁA-BĄBA – Wojciech BIERZA – Gabriela WOŹNIAKDepartment of Botany and Nature Conservation, Faculty of Biology and Environmental Protection, University
of Silesia in Katowice, Poland; 28 Jagiellonska Str. 40-032 Katowice; E-mail: [email protected]
Keywords: biomass, biodiversity, habitat, post-mining waste heaps
Introduction
The relationship between biomass and different environmental factors is one of the most discussed scientific issue. It has been stated that biomass production depends on many habitat factors such as soil properties, plant growth rate and pest resistance. In natural systems biomass is negatively correlated with biodiversity (Tilman, 1988; Lasky, 2014). The data about relationship between plant biomass and biodiversity parameters within spatial patches of spontaneously growing vegetation on man-made habitats such as e.g. post-mining waste dumps, are very scarce. Biomass is understood as an organic substance that is produced as a result of the process of photosynthesis (Hu & Guo, 2013). This research is focused on finding out which habitat factors and biodiversity parameters influence the variety of biomass produced by selected species of vascular plants in spontaneously developed patches of vegetation on post-mining heaps?
Materials and methods
The above biomass of plants collected from the study plots of 0.25m2 area. The collected biomass was divided into individuals of the dominant species* and the individuals of the accompanying species. The following species were studied: Calamagrostis epigejos, Daucus carota, Phragmites australis, Poa compressa, Tussilago farfara. In the next step biomass samples were dried in 105oC and weight. The relationships between plant biomass and the number of species, percentage cover, enzymatic activity, humidity, water capacity, value of biodiversity indicators (Evennes, Shannon-Wiener (H ‘), Simpson (D)) were analyzed. Biodiversity indicators were calculated using the CANOCO 4.5.*The dominant species was the species that occupied the largest area in comparison to the rest of the species within the plot.
Results and discussion
It was found that dry biomass of dominant species is significantly different among the studied patches (Kruskal-Wallis test, X2 = 141.5, p<0,0001). The highest biomass was found in patches dominated by Phragmites australis, and the lowest in patches dominated by Poa compressa. Similar results have been obtained when the dry biomass was measured. The Spearman rank correlation showed that the dry biomass of the dominant species is negatively correlated with the values of the tested diversity indices: D, E, H (rs=-0.43, -0.53, -0.32, p<0,0001) and with soil moisture (rs=-0.14, p=0.01). The highest value for the species homogeneity index (E) was recorded in patches dominated by Daucus carota and Poa compressa (0.74 and 0.73), and lowest in patches dominated by: Calamagrostis epigeios and Tussilago farfara (0.60 and 0.64) respectively.

Hnanice, Czech Republic – 09-14. April, 2018
165
The highest value for the Shannon-Wiener (H) index was recorded in patches of Poa compressa (1.98) and Daucus carota (1.82), significantly less in Calamagrostis epigejos (1.43), and lowest in patches of Tussilago farfara (1.33). On average the highest number of accompanying species (N = 14) occurred in patches dominated by Poa compressa and Daucus carota (12) Calamagrostis epigejos (11) and lowest in patches with Tussilago farfara (8). The analyzes performed below have showed that the amount of dry biomass have been negatively related such biodiversity values like: D index (rs=-0,43), E index (r=-0,53), Shannon’ index: H=(rs=-0,43), (p<0,0001) (Picture 1.).
A B CFigure 1: Results relatioships: biodiversity indexes and dry biomass of choosen species. A. Simpson index (D), B. Evennes index (E), C. Shannon’ index: (H’).
Conclusions
Preliminary analyses revealed that on human transformed habitats such as the man-made post-mining waste sites biomass produced by selected dominant species is negatively related with biodiversity indexes of the studied patches. The results show also that biomass is higher when the habitat is dry. The results of researches might be use in reclamation practice.
Acknowledgement
The study was financed by The National Centre for Research and Development, TANGO1/268600/NCBR/2015 pt. “Geoinformatics tools a supporting system of coal mine heaps reclamation” InfoRevita
ReferencesHu, L.; Guo, Q. (2013): What does productivity really mean? Towards an integrative paradigm in the search for
biodiversity-productivity relationships. Not Bot Horti Agrobo. 41. 36-43.Lasky, J. R., Uriarte, M., Boukili, V. K., Erickson, D. L., Kress, W. J., Chazdon, R. L. (2014): The relationship
between tree biodiversity and biomass dynamic changes with tropical forest succession. Ecology letters. 17(9).1158–1167.
Tilman, D., Knops, J., Wedin, D., Reich, P., Ritchie, M., Siemann, E. (1997): The Influence of Functional Diversity and Composition on Ecosystem Processes. Science. 277.1300-1302.

Abstract Book – 17th Alps-Adria Scientific Workshop
166
Estimation of nitrogen mobility effectiveness in maize genotypesAttila SIMKÓ – Szilvia VERES University of Debrecen, Faculty of Agricultural and Food Sciences and Environmental Management,
Institute of Plant Sciences, Department of Agricultural Botany, Crop Physiology and Biotechnology; E-mail: [email protected]
Keywords: SPAD, Nitrogen, Maize
Introduction
Nitrogen (N) fertilizers had a great effect on the yield of crops. However, care must be taken about the determination of the dose of nitrogen fertilizers. Nitrogen supply modified water use at all irrigation levels (Pandey et al. 2000). The correlation between fertilization and grain yield was high at irrigated condition, but low was at non-irrigated conditions (Nagy 2010). The maize is one of the most sensitive crop for the nitrogen supply level. Nitrogen deficiency at the flowering stage is important because it effects the number of kernels (Uhart and Andrade 1995), and affects the stem elongation and the leaf area rate (Zhao et al. 2003) as well. McCullough et al. (1994) claimed that new maize hybrids are less sensitive for the nitrogen deficiency. The SPAD values can be used to the analyzation of photosynthetic pigments and total nitrogen content (Netto et al. 2005). Our goal was to estimate some maize genotypes nitrogen mobilization effectiveness and to determine the differences of this parameter between the genotypes at different nitrogen level with a non-destructive technique.
Materials and methods
In our experiment, four maize (Zea mays L.) genotypes (DK440, Occitan, P9903, Sushi) were examined in controlled conditions on a hydroponic system. Two treatments of nitrogen were applied: optimal nitrogen (N) supply and the quarter of it (1/4 N). The repetition was three per each treatment and four plants per treatments. For the estimation of nitrogen content from the relative chlorophyll content, we used a SPAD-502 (Minolta, Japan). Six measurements were done per leaf. The investigation was at V5 stage of plants on the first (youngest), second, third and fourth (oldest) leaves.
Results and discussion
The highest SPAD value was measured on the first leaf of Sushi genotype in the case of normal nitrogen treatment (Table 1). It was 50.6±0.43. The lowest was on the first leaf of P9903 genotype in the case of reduced nitrogen treatment. It was 20.7±1.91. In P9903 under ¼ nitrogen level the youngest leaf has higher SPAD value, than the oldest one by 16.3. In DK440 also under ¼ nitrogen level the youngest leaf has lower SPAD value, than the oldest one by 9.5. The experienced value can be an indicator of the ability of the genotypes for N mobilization. The mobilization of this nitrogen is influenced by the genotypes and the fertility of nitrogen (Ta and Weiland 1992). The remarkable higher SPAD value of youngest leaf, than oldest in P9903 can refer a good nutrient mobilization effectiveness. The reverse situation in DK440 can be an evidence of the less N mobilization rate. No pronounced differences were described in SPAD values in DK440 under different N amount application, it reveals less sensitivity for nitrogen deficiency. At the optimal

Hnanice, Czech Republic – 09-14. April, 2018
167
nitrogen dose all of the genotypes have lower SPAD values in youngest leaves, than older. The highest difference (19.3) was found in Sushi genotype, which means inefficient N mobilization skill.Table 1. The SPAD values on leaves (1st, 2nd, 3rd, 4th) per genotype (Sushi, DK440, Occitan, P9903) at different levels of nitrogen (1/4 N, 4/4 N), significant differences between 1st and 4th leaves within the treatments: p≤0.05*, p≤0.001***
1st 2nd 3rd 4th 1st 2nd 3rd 4th
1/4 N 4/4 N
DK440 45.5±2.8 40.2±2.1 38.3±1.06 36.0±1.64* 41.9±2.32 40.7±3.09 40.1±1.7 34.1±1.82
Occitan 36.1±2.63 39.4±0.84 39.6±0.17 38.2±1.93 42.1±2.2 42.7±1.25 41.8±1.48 34.3±0.76*
P9903 20.7±1.91 39.1±0.4 39.1±0.44 36.9±0.26*** 43.6±1.66 50.0±0.89 44.9±1.43 39.6±0.49
Sushi 42.8±0.61 43.5±0.66 41.2±0.75 36.3±1.31*** 50.6±0.43 46.0±1.35 43.1±1.51 31.3±1.5***
Conclusions
Significant differences were established between the maize genotypes nitrogen mobilization effectiveness, and there are differences between the genotypes sensitivity to the nitrogen deficiency.
Acknowledgement
The work/publication is supported by the EFOP-3.6.3- VEKOP-16- 2017-00008 project. The project is co-financed by the European Union and the European Social Fund and grant from “Establishing a scale-independent complex precision consultancy system” (GINOP-2.2.1-15-2016-00001) project.
References Mccullough, D.E., Mihajlovic, M., Aguilera, A., Tollenaar, M., Girardin, P. (1994): Influence of N supply on
development and dry matter accumulation of an old and a new maize hybrid. Canadian Journal of Plant Science. 74: 3. 471-477.
Nagy, J. (2010): Impact of fertilization and irrigation on the correlation between the soil plant analysis development value and yield of maize. Communications in Soil Science and Plant Analysis. 41: 11. 1293-1305.DOI: https://doi.org/10.1080/00103621003759304
Netto, A.T., Campostrini, E., de Oliveira, J.G., Bressan-Smith, R.E. (2005): Photosynthetic pigments, nitrogen, chlorophyll a fluorescence and SPAD-502 readings in coffee leaves. Scientia Horticulturae. 104: 2. 199-209. DOI: https://doi.org/10.1016/j.scienta.2004.08.013
Pandey, R.K., Maranville, J.W., Admou1, A. (2000): Deficit irrigation and nitrogen effects on maize in a Sahelian environment: I. Grain yield and yield components. Agricultural Water Management. 46:1. 1-13. DOI: https://doi.org/10.1016/S0378-3774(00)00073-1
Ta, C.T., Weiland, R.T. (1992): Nitrogen Partitioning in Maize during Ear Development. Crop Science. 32: 443-451.
Udo, E.F., Ajala, S.O., Olaniyan, A.B. (2017): Physiological and morphological changes associated with recurrent selection for low nitrogen tolerance in maize. Euphytica. 213: 7. 140.
Uhart, S.A., Andrade, F.H. (1995): Nitrogen Deficiency in Maize: II. Carbon-Nitrogen Interaction Effects on Kernel Number and Grain Yield. Crop Science. 35: 1384-1389
Zhao, D., Reddy, K.R., Kakani V.G., Read, J.J., Carter, G.A. (2003): Corn (Zea mays L.) growth, leaf pigment concentration, photosynthesis and leaf hyperspectral reflectance properties as affected by nitrogen supply. Plant and Soil. 257. 205–218.

Abstract Book – 17th Alps-Adria Scientific Workshop
168

Hnanice, Czech Republic – 09-14. April, 2018
169
AALEKSZA László 150ALVARENGA Emilio 108ANTAL Jaroslav 76ANTAL Károly 160ARANYOS Tibor 110, 118ASZTOR-HUSZAR Klára 30
BBACOVA MITKOVA Veronika 86BÁLINT Csaba 42BALLÁNÉ KOVÁCS Andrea 140BALLA Zoltán 64, 70BARTA Károly 96BASAL Oqba 128BÉNI Áron 140BIERZA Wojciech 120, 164BIRKÁS Márta 106, 122BŁOŃSKA Agnieszka 120, 164BODNÁR Karina Bianka 70BOJTOR Csaba 50BOSNYÁKOVICS Gabriella 114BOZÁN Csaba 100, 102BUDAI Péter 22, 52
CCENTERI Csaba 124CSAJBÓK József 134, 148CZELLÉR Krisztina 80CZERŐDINÉ KEMPF Laura 72, 74CZINKOTA Imre 114, 162
DDALMADI István 28DÁLNOKI Boglárka Anna 138, 150DEKEMATI Igor 122DELLASZÉGA-LÁBAS Viktória 44DEMETER Ibolya 110, 118DOBÓ Zsófia 124DÓKA Lajos Fülöp 48, 58DULOVIČOVÁ Renáta 98DUŠEK Petr 94
EERDŐSI Rita 162ERDŐS Zsuzsa 54ESER Adnan 144ESZES Zsolt 108
FFEKETE Ágnes 132FEKETE György 150, 162FINTA Zuzana 74FOEREID Bente 108FRIEDRICH László 28, 30FÜLEKY György 136
GGARAJ Marcel 84GRIEU Philippe 20GRÓSZ János 138, 150GULYÁS Miklós 114, 162GYŐRI Zoltán 10, 14, 46, 50, 130
HHALMOVA Dana 86HARSÁNYI Endre 62, 64HATVANY Zsolt 34HEGYESNÉ VECSERI Beáta 34HEJNAK Vaclav 156HENZSEL István 118HOLLÓ-CSEH Renáta 124HORVÁTH Ákos 32HOYK Edit 154HUSSEIN N. Khabat 28, 30
IILLÉS Árpád 46
J
JAMALOVA Maralkhanim 36JANCSÓ Mihály 24, 56, 104JOLÁNKAI Márton 16JUHÁSZ Evelin Kármen 140JUHÁSZ Réka 26
INDEX

Abstract Book – 17th Alps-Adria Scientific Workshop
170
KKASSAI M. Katalin 16KÁTAI János 116KELLER Boglárka 124KENDE Zoltán 106KEREZSI György 100, 102KHAZAMI Nesrine 38KNEZEVIC Desimir 66, 68KÓBOR Balázs 88KÖLES Péter 150KOMPAŁA-BĄBA Agnieszka 120, 164KONDIC Danijela 66KONDRLOVÁ Elena 76KOREN Dániel 34KÖRÖSPARTI János 100, 102KOVACEVIC Vlado 66KOVÁČOVÁ Viera 158KOVÁCS Balázs 32, 88KOVÁCS Béla 130KOVÁCS Melinda 12KOVÁCS-WEBER Mária 32KUBES Jan 156KUBIK Stepan 18KUN Ágnes 96KUN-FARKAS Gabriella 34KUTASY Erika 148
LLACZAY Péter 22LAKNER Zoltán 38LÁNYI Katalin 22LEHEL József 22, 52LEHOCZKY Éva 44LELESZ Judit Éva 134LICHNER Ľubomír 92LUMINI Erica 112
MMAGURNO Franco 152MAJOR László 52MAKÁDI Marianna 108, 110MÁTÉ András 72MATKOVIC Mirela 68MAZSU Nikolett 44MEDGYES Tamás 88MÉSZÁROS József 136
MÉZES Miklós 32MICANOVIC Danica 68MIKLÁNEK Pavol 84, 86MILICS Gábor 90, 92
NNAGY Antal 46NAGY János 62, 70NAGY Pál Máté 82NAGY Viliam 90, 92NYÁRAI-HORVÁTH Ferenc 72NYIRI Balázs 114
OOLÁH Izabella 124ONCSIK B. Mária 96ORFÁNUS Tomáš 90, 92OROSZ-TÓTH Mihály 140OROSZ Viktória 136OSVALD Máté 88
PPEKÁR Ján 84PEKÁROVÁ Pavla 84, 86PENKSZA Péter 26PEPÓ Péter 132PINTER-NAGY Orsolya 30PINTER Richard 28, 30PIOTROWSKA-SEGET Zofia 112, 152POSTA Katalin 110, 112
RRADÓCZ László 50RADOSAVAC Adriana 66RAGÁN Péter 62RAJTOR Monika 112, 152RÁTONYI Tamás 62, 64REHAK Stefan 78RÉTHÁTI Gabriella 138RICZU Péter 44
S
SALIFU Mahama 48SÁNDOR Zsolt 116SAXENA Prasanna 160

Hnanice, Czech Republic – 09-14. April, 2018
171
SCHŰGERL Radoslav 98SEBŐK András 114, 138SEMERAK Matej 142SIERKA Edyta 120, 164SIMAN Cyril 126, 146SIMKÓ Attila 166SINKA Lúcia 80SIPOS Péter 46, 50SKALICKY Milan 156SÓFALVY Zsuzsanna 42SOMODY Gergő 52SRDIC Sretenka 66STARMANOVA Adela 142STÉGER-MÁTÉ Mónika 26STRADIOT Peter 78SULYOK Dénes 62ŠURDA Peter 92SZABÓ András 12, 22, 58, 128SZABÓ Éva 58SZABÓ-FODOR Judit 12SZABÓ-NÓTIN Beatrix 26SZABÓ Rubina Tünde 32SZALÓKI Tímea 24, 56, 104SZANYI János 88SZATMÁRI Imre 160SZEGI Tamás 108SZÉKELY Árpád 24, 56, 104SZEMERÉDY Géza 52SZENTPÉTERY Zsolt 16, 72
TTAKÁCS-GYÖRGY Katalin 40TAKÁCS István 40
TÁLLAI Magdolna 116TAMÁS János 44TARNAWA Ákos 72, 74TOLNER László 138, 162TOMÓCSIK Attila 110, 136TÖRŐ Ágnes 64TÓTH Adrien 28TÓTH Brigitta 46, 50TUBA Géza 82TÜDŐSNÉ BUDAI Júlia 160TUMA Jiri 142TUMOVA Lenka 142TÚRI Norbert 100, 102
UUNGAI Diána 130UROSEVIC Dusan 68
VVÁGÓ Imre 116VELÍSKOVÁ Yvetta 94, 98, 126, 146VERES Szilvia 166VITÁNYI Beáta 56
WWOŹNIAK Gabriela 120, 164
ZZECEVIC Veselinka 68ZSEMBELI József 80, 82, 160ZSOMBIK László 54
Abstract Book – 17th Alps-Adria Scientific Workshop
172


Online ISBN 978-963-269-734-5