Abnormal Glucose Regulation Is Associated With Lipid-Rich Coronary Plaque
7
Abnormal Glucose Regulation Is Associated With Lipid-Rich Coronary Plaque Relationship to Insulin Resistance Tetsuya Amano, MD, PHD,* Tatsuaki Matsubara, MD, PHD,† Tadayuki Uetani, MD, PHD,* Michio Nanki, MD, PHD,* Nobuyuki Marui, MD, PHD,* Masataka Kato, MD,* Tomohiro Yoshida, MD,* Kosuke Arai, MD,* Kiminobu Yokoi, MD,* Hirohiko Ando, MD,* Soichiro Kumagai, MD,* Hideki Ishii, MD,‡ Hideo Izawa, MD, PHD,‡ Nigishi Hotta, MD, PHD,* Toyoaki Murohara, MD, PHD‡ Nagoya, Japan OBJECTIVES This study sought to determine lipid and fibrous volume of coronary atherosclerotic plaques in subjects with abnormal glucose regulation (AGR) by integrated backscatter (IB) intravascular ultrasound (IVUS) during percutaneous coronary intervention. BACKGROUND Abnormal glucose regulation, including impaired glucose regulation (IGR) and diabetes mellitus (DM), has emerged as an important determinant of cardiovascular risk. We hypothe- sized that AGR would be associated with coronary plaque instability. METHODS Conventional intravascular ultrasound and IB-IVUS using a 40-MHz (motorized pullback 1 mm/s) intravascular catheter was performed in 172 consecutive patients. The percentage of fibrous area and the percentage of lipid area were automatically calculated by IB-IVUS. Three-dimensional analysis of IB-IVUS images was performed to determine the percentage of lipid volume (%LV) and fibrous volume (%FV). Following the World Health Organization criteria, the subjects were classified into the DM group, the IGR group, and the normal glucose regulation group. The cutoff point for the lipid-rich plaque was defined as %LV 44% or %FV 52%, which was the 75th percentile of %LV or the 25th percentile of %FV in this study population. Insulin resistance (IR) was defined as the homeostasis model assessment of insulin resistance (HOMA-IR). RESULTS There were no significant differences in the baseline characteristics except for glucometabolic parameters. The conventional IVUS analysis indicated that the DM group had a significantly increased plaque volume (and percent plaque volume). In the IB-IVUS analysis, as compared with the normal glucose regulation group, the DM and the IGR groups showed a significant increase in %LV (36 14% and 37 13% vs. 29 14%, p 0.02) and a significant decrease in %FV (59 11% and 58 11% vs. 64 11%, p 0.03). The lipid-rich plaque rate was significantly associated with an increasing HOMA-IR in the tertile (p 0.008). On logistic regression analysis after adjusting for confounding and coronary risk factors, the DM group (odds ratio 3.52, 95% confidence interval 1.13 to 11.0, p 0.03) and the IGR group (odds ratio 3.92, 95% confidence interval 1.13 to 13.6, p 0.03) were significantly associated with the lipid-rich plaque. CONCLUSIONS Coronary lesions in patients with AGR are associated with more lipid-rich plaque content, which may be related to the increased IR in these patients. (J Am Coll Cardiol Img 2008;1: 39 – 45) © 2008 by the American College of Cardiology Foundation From the *Department of Cardiology, Chubu-Rosai Hospital, †Department of Internal Medicine, School of Dentistry, Aichi-Gakuin University, and the ‡Department of Cardiology, Nagoya University Graduate School of Medicine, Nagoya, Japan. Manuscript received August 30, 2007; revised manuscript received September 20, 2007, accepted September 24, 2007. JACC: CARDIOVASCULAR IMAGING VOL. 1, NO. 1, 2008 © 2008 BY THE AMERICAN COLLEGE OF CARDIOLOGY FOUNDATION ISSN 1936-878X/08/$34.00 PUBLISHED BY ELSEVIER DOI:10.1016/j.jcmg.2007.09.003
-
Upload
kokugakuin -
Category
Documents
-
view
1 -
download
0
Transcript of Abnormal Glucose Regulation Is Associated With Lipid-Rich Coronary Plaque

J A C C : C A R D I O V A S C U L A R I M A G I N G V O L . 1 , N O . 1 , 2 0 0 8
© 2 0 0 8 B Y T H E A M E R I C A N C O L L E G E O F C A R D I O L O G Y F O U N D A T I O N I S S N 1 9 3 6 - 8 7 8 X / 0 8 / $ 3 4 . 0 0
P U B L I S H E D B Y E L S E V I E R D O I : 1 0 . 1 0 1 6 / j . j c m g . 2 0 0 7 . 0 9 . 0 0 3
Abnormal Glucose Regulation Is AssociatedWith Lipid-Rich Coronary PlaqueRelationship to Insulin Resistance
Tetsuya Amano, MD, PHD,* Tatsuaki Matsubara, MD, PHD,† Tadayuki Uetani, MD, PHD,*Michio Nanki, MD, PHD,* Nobuyuki Marui, MD, PHD,* Masataka Kato, MD,*Tomohiro Yoshida, MD,* Kosuke Arai, MD,* Kiminobu Yokoi, MD,* Hirohiko Ando, MD,*Soichiro Kumagai, MD,* Hideki Ishii, MD,‡ Hideo Izawa, MD, PHD,‡Nigishi Hotta, MD, PHD,* Toyoaki Murohara, MD, PHD‡
Nagoya, Japan
O B J E C T I V E S This study sought to determine lipid and fibrous volume of coronary atherosclerotic
plaques in subjects with abnormal glucose regulation (AGR) by integrated backscatter (IB) intravascular
ultrasound (IVUS) during percutaneous coronary intervention.
B A C K G R O U N D Abnormal glucose regulation, including impaired glucose regulation (IGR) and
diabetes mellitus (DM), has emerged as an important determinant of cardiovascular risk. We hypothe-
sized that AGR would be associated with coronary plaque instability.
M E T H O D S Conventional intravascular ultrasound and IB-IVUS using a 40-MHz (motorized pullback 1
mm/s) intravascular catheter was performed in 172 consecutive patients. The percentage of fibrous area and
the percentage of lipid area were automatically calculated by IB-IVUS. Three-dimensional analysis of IB-IVUS
images was performed to determine the percentage of lipid volume (%LV) and fibrous volume (%FV). Following
the World Health Organization criteria, the subjects were classified into the DM group, the IGR group, and the
normal glucose regulation group. The cutoff point for the lipid-rich plaque was defined as %LV �44% or %FV
�52%, which was the 75th percentile of %LV or the 25th percentile of %FV in this study population. Insulin
resistance (IR) was defined as the homeostasis model assessment of insulin resistance (HOMA-IR).
R E S U L T S There were no significant differences in the baseline characteristics except for glucometabolic
parameters. The conventional IVUS analysis indicated that the DM group had a significantly increased plaque
volume (and percent plaque volume). In the IB-IVUS analysis, as compared with the normal glucose
regulation group, the DM and the IGR groups showed a significant increase in %LV (36 � 14% and 37 � 13%
vs. 29 � 14%, p � 0.02) and a significant decrease in %FV (59 � 11% and 58 � 11% vs. 64 � 11%, p � 0.03).
The lipid-rich plaque rate was significantly associated with an increasing HOMA-IR in the tertile (p � 0.008).
On logistic regression analysis after adjusting for confounding and coronary risk factors, the DM group (odds
ratio 3.52, 95% confidence interval 1.13 to 11.0, p � 0.03) and the IGR group (odds ratio 3.92, 95% confidence
interval 1.13 to 13.6, p � 0.03) were significantly associated with the lipid-rich plaque.
C O N C L U S I O N S Coronary lesions in patients with AGR are associated with more lipid-rich plaque
content, which may be related to the increased IR in these patients. (J Am Coll Cardiol Img 2008;1:
39–45) © 2008 by the American College of Cardiology Foundation
From the *Department of Cardiology, Chubu-Rosai Hospital, †Department of Internal Medicine, School of Dentistry,Aichi-Gakuin University, and the ‡Department of Cardiology, Nagoya University Graduate School of Medicine, Nagoya, Japan.
Manuscript received August 30, 2007; revised manuscript received September 20, 2007, accepted September 24, 2007.

Df(sshlc
pvftCiaipMg
caaGwHcooabcooO
O
��
��
(
ggrac[gscmsaDIpaa(tpPwSb2l
A
A
%
v
%
v
A
A
r
C
C
D
E
m
H
a
I
b
u
I
r
I
L
a
N
r
O
t
P
intervention
J A C C : C A R D I O V A S C U L A R I M A G I N G , V O L . 1 , N O . 1 , 2 0 0 8
J A N U A R Y 2 0 0 8 : 3 9 – 4 5
Amano et al.
Insulin Resistance and Plaque Component
40
iabetes mellitus (DM) is a well-known riskfactor for cardiovascular disease (CVD) (1–3). Recently, special emphasis has been given
to impaired glucose regulation (IGR) as a riskactor in patients with as well as without frank DM4,5). It has been proposed that macrovascular diseasetarts before the development of DM (6). Ultrasoundtudies measuring carotid intima-media thicknessave shown the relevance of abnormal glucose regu-
ation (AGR) in subclinical atherosclerosis and in-reased risk of CVD (7–9). Insulin resistance (IR),
which mainly accounts for AGR, has alsobeen shown to be related to adverse cardio-vascular risk (10–12). We recently reportedthat the metabolic syndrome, which is pre-dominantly based on IR and the cluster ofcomorbidities of AGR, is associated withthe lipid-rich plaque contributing to theincreasing risk of plaque vulnerability (13).Insulin resistance progressively increaseswhen passing from normal glucose regula-tion (NGR) through IGR to DM. Fewstudies, however, have assessed the relevantdetail of AGR or IR with coronary plaquemorphology.
See page 46
In the present study, we assessed thehypothesis that AGR would be associatedwith a high content of plaque lipid (por-tending possible plaque instability) usingthe integrated backscatter (IB) intravascu-lar ultrasound (IVUS) method to analyzecoronary tissue components (13–15).
M E T H O D S
Patients and study design. This study was aprospectively planned observational studyfor coronary lesions in patients with acutecoronary syndrome (ACS) or stable angina
ectoris who underwent percutaneous coronary inter-ention (PCI). Intravascular ultrasound was per-ormed before PCI in 172 consecutive patients be-ween September 2006 and June 2007.ardiovascular diagnoses. Acute coronary syndromencluded acute myocardial infarction and unstablengina pectoris. The diagnosis of acute myocardialnfarction was based on elevation of at least 1ositive biomarker (creatine kinase, creatine kinase-B, or troponin T), characteristic electrocardio-
s
ome
e
del
nce
al
ce
y
ram changes, and a history of prolonged acute m
hest pain. Unstable angina pectoris was defined asngina with a progressive crescendo pattern orngina that occurred at rest.lucometabolic parameters. Previously known DMas defined as a diagnosis based on the Worldealth Organization classification (16). The proto-
ol recommended that all patients without previ-usly diagnosed DM should undergo a standardral glucose tolerance test (OGTT, 75 g). Forcutely admitted patients, measurements of fastinglood glucose and insulin were to be taken in stableonditions before hospital discharge. Classificationf glucometabolic state in patients without previ-usly diagnosed DM was then made based onGTT in a stable condition as following:NGR � OGTT (0 min) �110 mg/dl andGTT (2 h) �140 mg/dlImpaired fasting glycemia � OGTT (0 min)110 mmol/l but �126 mg/dl and OGTT (2 h)140 mg/dlImpaired glucose tolerance � OGTT (0 min)126 mg/dl and OGTT (2 h) �140 mg/dl but200 mg/dlDM � OGTT (0 min) �126 mg/dl or OGTT
2 h) �200 mg/dlIn the text, IGR refers to both impaired fasting
lycemia and impaired glucose tolerance. Abnormallucose regulation includes IGR and DM. Insulinesistance was defined from the homeostasis modelssessment of insulin resistance (HOMA-IR) ac-ording to the following formula: HOMA-IR �fasting insulin concentration (�U/ml) · fastinglucose concentration (mg/dl)/405] (17). Variouserum markers, including IR, were measured byommercial radioimmunoassay kits and specific im-unoradiometric assay. For this purpose, blood
amples were collected from patients before PCIfter a 10- to 12-h overnight fast.efinitions of analysis segments and measurements ofVUS parameters. Quantitative coronary angiogra-hy analysis was conducted. Reference diameternd percentage diameter stenosis were measured by
validated automated edge-detection programCMS-MEDIS Medical Imaging System, Leiden,he Netherlands). Coronary lesions included theroximal and distal sites of the target lesions forCI. The mean length of the analyzed segmentas 37 mm (37 IB-IVUS images) per patient.evere coronary lesions that could not be crossedy the IVUS catheter were excluded. Conventional-dimensional (2D) images were quantified forumen cross-sectional area (LCSA), external elastic
B B R E V I A T I O N S
N D A C R O N YM S
FV � percentage of fibrou
olume
LV � percentage of lipid
olume
CS � acute coronary syndr
GR � abnormal glucose
egulation
SA � cross-sectional area
VD � cardiovascular diseas
M � diabetes mellitus
EM � external elastic
embrane
OMA-IR � homeostasis mo
ssessment of insulin resista
B-IVUS � integrated
ackscatter intravascular
ltrasound
GR � impaired glucose
egulation
R � insulin resistance
CSA � lumen cross-section
rea
GR � normal glucose
egulation
GTT � oral glucose toleran
est
CI � percutaneous coronar
embrane (EEM), cross-sectional area (CSA), and
pEIctPa((mw(puLtpa(tSfs(IsepdtTaalaatIafiue3tppcadp%c
Sf(CwpcwBplwp(gpp
J A C C : C A R D I O V A S C U L A R I M A G I N G , V O L . 1 , N O . 1 , 2 0 0 8
J A N U A R Y 2 0 0 8 : 3 9 – 4 5
Amano et al.
Insulin Resistance and Plaque Component
41
laque (P) � media (M) CSA (P � M CSA �EM CSA � LCSA) using the software of the
VUS system. An eccentricity index of P � M wasalculated by the formula of (maximum P � Mhickness � minimum P � M thickness)/maximum
� M thickness. A remodeling index was defineds a ratio of EEM CSA at the measured lesionminimum luminal site) to reference EEM CSAaverage of the proximal and distal reference seg-ents). The 2D analysis referred to the segmentith minimal luminal area. Three-dimensional
3D) analysis for conventional IVUS images waserformed to compute vessel volume, lumen vol-me, and plaque volume (sum of EEM CSA,CSA, and P � M CSA at 1-mm axial intervals for
he analysis segments). The IB-IVUS analysis waserformed as previously reported (13–15). In brief,personal computer equipped with custom software
IB-IVUS, YD Co., Nara, Japan) was connected tohe IVUS imaging system (Clear View, Bostoncientific, Natick, Massachusetts) to obtain radio-requency signal trigger output. Ultrasound back-cattered signals were acquired using a 40-MHzmotorized pullback 1 mm/s) mechanically rotatingVUS catheter, to be digitized and subjected topectral analysis. Integrated backscatter values forach tissue component were calculated as an averageower using a fast Fourier transform, measured inecibels, of the frequency component of backscat-ered signal from a small volume of tissue (13–15).he percentage of fibrous area (fibrous area/plaque
rea, %FA) and the percentage of lipid area (lipidrea/plaque area, %LA) were automatically calcu-ated by the IB-IVUS system (using commerciallyvailable software). The percentage of high signalrea (a part of the calcification on the inner surfacehat could be measured with the formula of IB-VUS/plaque area) was also calculated. The 3Dnalysis for IB-IVUS images was performed forbrous volume, lipid volume, and high signal vol-me (sum of fibrous, lipid, and high signal area inach CSA at 1-mm axis intervals for the average of7 IB-IVUS images per patient, respectively). Thenhe percentage of fibrous volume (fibrous volume/laque volume, %FV), lipid volume (lipid volume/laque volume, %LV) and high signal volume werealculated. The quantitative coronary angiographynd IVUS measurements were conducted indepen-ently by 2 physicians who were blinded to theatient’s clinical characteristics. The variability onLV and %FV determined by 2 physicians was
onsidered from 50 randomly selected records.
tatistical analyses. Statistical analysis was per-ormed using the SAS statistical software packageversion 8.02, SAS Institute Inc., Cary, Northarolina). Continuous and categorical variablesere expressed as mean � standard deviation androportions, respectively. Comparisons of variouslinical and IVUS parameters among the 3 groupsere evaluated using analysis of variance, and aonferroni test was performed for multiple com-arisons. We defined the cutoff point for the
ipid-rich plaque as %LV �44% or %FV �52%,hich was the 75th percentile of %LV or 25thercentile of %FV in the present study population13,18). Following this definition, multivariate lo-istic regression analysis was applied to study theredictors of the lipid-rich plaque by adjusting forredefined variables. All variables with a p value
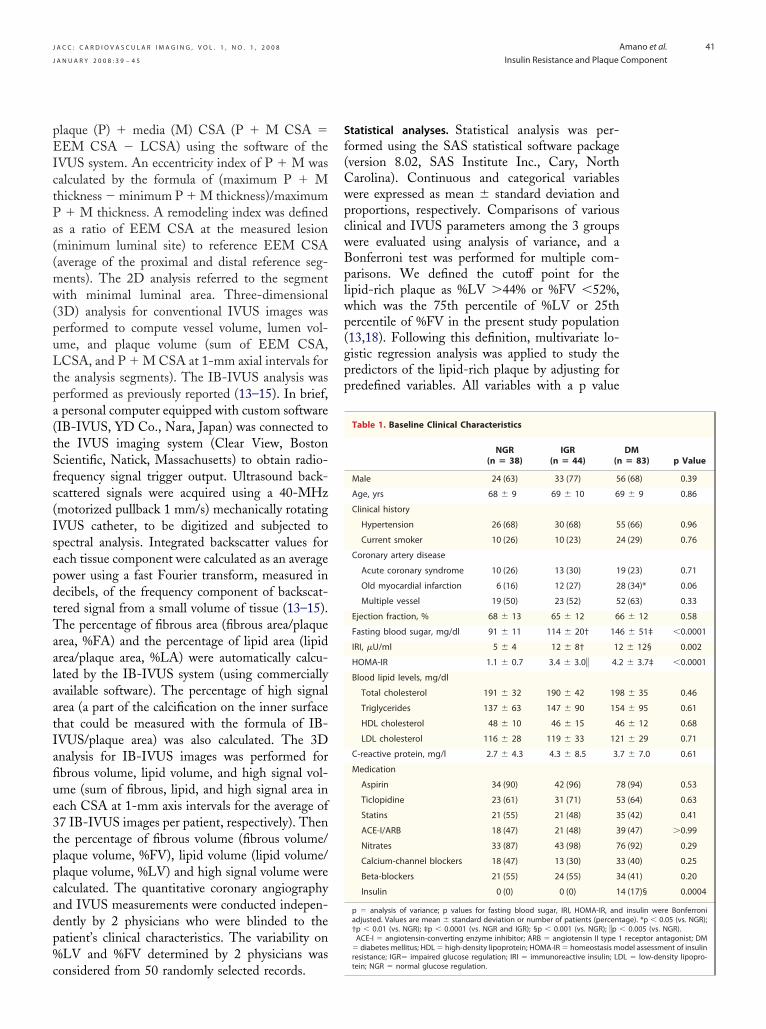
Table 1. Baseline Clinical Characteristics
NGR(n � 38)
IGR(n � 44) (n
Male 24 (63) 33 (77) 5
Age, yrs 68 � 9 69 � 10 6
Clinical history
Hypertension 26 (68) 30 (68) 5
Current smoker 10 (26) 10 (23) 2
Coronary artery disease
Acute coronary syndrome 10 (26) 13 (30) 1
Old myocardial infarction 6 (16) 12 (27) 2
Multiple vessel 19 (50) 23 (52) 5
Ejection fraction, % 68 � 13 65 � 12 6
Fasting blood sugar, mg/dl 91 � 11 114 � 20† 14
IRI, �U/ml 5 � 4 12 � 8† 12
HOMA-IR 1.1 � 0.7 3.4 � 3.0� 4.2
Blood lipid levels, mg/dl
Total cholesterol 191 � 32 190 � 42 19
Triglycerides 137 � 63 147 � 90 15
HDL cholesterol 48 � 10 46 � 15 4
LDL cholesterol 116 � 28 119 � 33 12
C-reactive protein, mg/l 2.7 � 4.3 4.3 � 8.5 3.
Medication
Aspirin 34 (90) 42 (96) 7
Ticlopidine 23 (61) 31 (71) 5
Statins 21 (55) 21 (48) 3
ACE-I/ARB 18 (47) 21 (48) 3
Nitrates 33 (87) 43 (98) 7
Calcium-channel blockers 18 (47) 13 (30) 3
Beta-blockers 21 (55) 24 (55) 3
Insulin 0 (0) 0 (0) 1
p � analysis of variance; p values for fasting blood sugar, IRI, HOMA-IR, andadjusted. Values are mean � standard deviation or number of patients (percent†p � 0.01 (vs. NGR); ‡p � 0.0001 (vs. NGR and IGR); §p � 0.001 (vs. NGR); �p �ACE-I � angiotensin-converting enzyme inhibitor; ARB � angiotensin II type 1
� diabetes mellitus; HDL � high-density lipoprotein; HOMA-IR � homeostasis mresistance; IGR� impaired glucose regulation; IRI � immunoreactive insulin; LD
DM� 83) p Value
6 (68) 0.39
9 � 9 0.86
5 (66) 0.96
4 (29) 0.76
9 (23) 0.71
8 (34)* 0.06
2 (63) 0.33
6 � 12 0.58
6 � 51‡ �0.0001
� 12§ 0.002
� 3.7‡ �0.0001
8 � 35 0.46
4 � 95 0.61
6 � 12 0.68
1 � 29 0.71
7 � 7.0 0.61
8 (94) 0.53
3 (64) 0.63
5 (42) 0.41
9 (47) �0.99
6 (92) 0.29
3 (40) 0.25
4 (41) 0.20
4 (17)§ 0.0004
insulin were Bonferroniage). *p � 0.05 (vs. NGR);0.005 (vs. NGR).receptor antagonist; DM
odel assessment of insulinL � low-density lipopro-
tein; NGR � normal glucose regulation.
�v�
R
SIdwNwawggapQIIe3l�gIti2d1d(ii
backscatter intravascular ultrasound.
Abbreviatio
J A C C : C A R D I O V A S C U L A R I M A G I N G , V O L . 1 , N O . 1 , 2 0 0 8
J A N U A R Y 2 0 0 8 : 3 9 – 4 5
Amano et al.
Insulin Resistance and Plaque Component
42
0.2 at univariate analysis and other confoundingariables were considered in the model. A p value0.05 was considered statistically significant.
E S U L T S
tudy populations and baseline characteristics. AnVUS was performed on 172 consecutive patientsuring the study period. Seven patients (3 patientsith DM, 2 patients with IGR, and 2 patients withGR) were excluded because the IVUS catheterould not cross or IB-IVUS data were not avail-
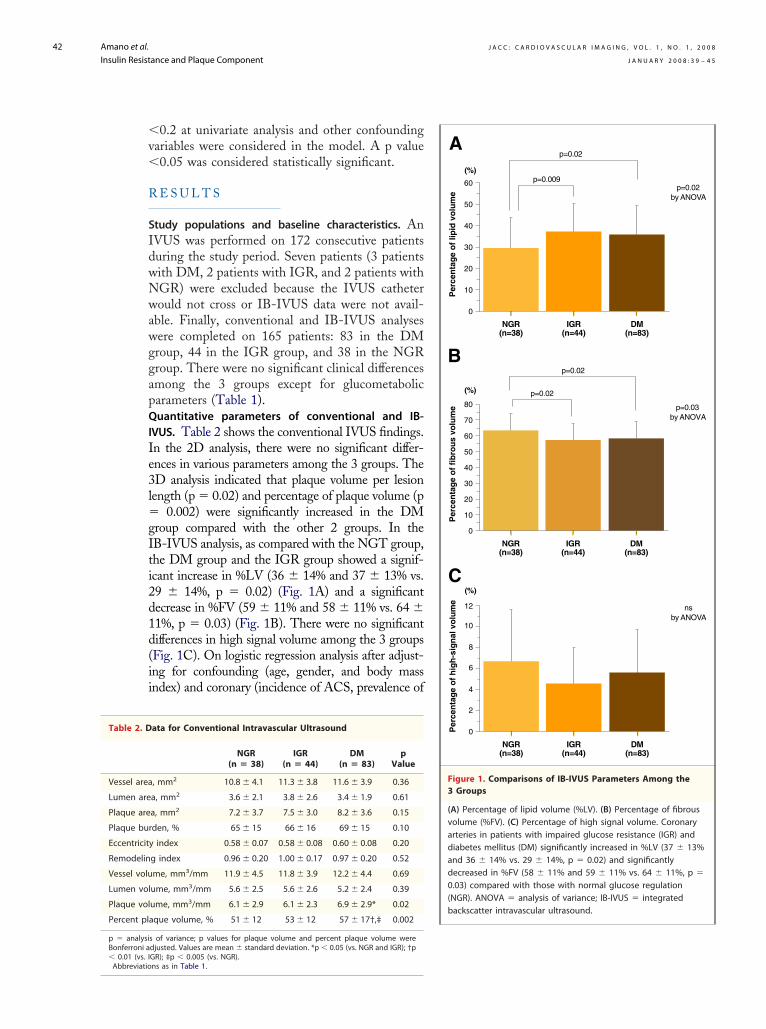
ble. Finally, conventional and IB-IVUS analysesere completed on 165 patients: 83 in the DMroup, 44 in the IGR group, and 38 in the NGRroup. There were no significant clinical differencesmong the 3 groups except for glucometabolicarameters (Table 1).uantitative parameters of conventional and IB-VUS. Table 2 shows the conventional IVUS findings.n the 2D analysis, there were no significant differ-nces in various parameters among the 3 groups. TheD analysis indicated that plaque volume per lesionength (p � 0.02) and percentage of plaque volume (p
0.002) were significantly increased in the DMroup compared with the other 2 groups. In theB-IVUS analysis, as compared with the NGT group,he DM group and the IGR group showed a signif-cant increase in %LV (36 � 14% and 37 � 13% vs.9 � 14%, p � 0.02) (Fig. 1A) and a significantecrease in %FV (59 � 11% and 58 � 11% vs. 64 �1%, p � 0.03) (Fig. 1B). There were no significantifferences in high signal volume among the 3 groupsFig. 1C). On logistic regression analysis after adjust-ng for confounding (age, gender, and body massndex) and coronary (incidence of ACS, prevalence of
ata for Conventional Intravascular Ultrasound
NGR(n � 38)
IGR(n � 44)
DM(n � 83)
pValue
, mm2 10.8 � 4.1 11.3 � 3.8 11.6 � 3.9 0.36
a, mm2 3.6 � 2.1 3.8 � 2.6 3.4 � 1.9 0.61
a, mm2 7.2 � 3.7 7.5 � 3.0 8.2 � 3.6 0.15
den, % 65 � 15 66 � 16 69 � 15 0.10
y index 0.58 � 0.07 0.58 � 0.08 0.60 � 0.08 0.20
g index 0.96 � 0.20 1.00 � 0.17 0.97 � 0.20 0.52
me, mm3/mm 11.9 � 4.5 11.8 � 3.9 12.2 � 4.4 0.69
ume, mm3/mm 5.6 � 2.5 5.6 � 2.6 5.2 � 2.4 0.39
ume, mm3/mm 6.1 � 2.9 6.1 � 2.3 6.9 � 2.9* 0.02
que volume, % 51 � 12 53 � 12 57 � 17†,‡ 0.002
s of variance; p values for plaque volume and percent plaque volume weredjusted. Values are mean � standard deviation. *p � 0.05 (vs. NGR and IGR); †pGR); ‡p � 0.005 (vs. NGR).
ns as in Table 1.0
10
20
30
40
50
60
Per
cen
tag
e o
f Iip
id v
olu
me
NGR(n=38)
(%)
IGR(n=44)
DM(n=83)
p=0.02by ANOVA
p=0.02
p=0.009
A
B
0
10
20
30
40
50
60
70
80
Per
cen
tag
e o
f fi
bro
us
volu
me
NGR(n=38)
(%)
IGR(n=44)
DM(n=83)
p=0.03by ANOVA
p=0.02
p=0.02
C
0
2
4
6
8
10
12
Per
cen
tag
e o
f h
igh
-sig
nal
vo
lum
e
NGR(n=38)
(%)
IGR(n=44)
DM(n=83)
nsby ANOVA
Figure 1. Comparisons of IB-IVUS Parameters Among the3 Groups
(A) Percentage of lipid volume (%LV). (B) Percentage of fibrousvolume (%FV). (C) Percentage of high signal volume. Coronaryarteries in patients with impaired glucose resistance (IGR) anddiabetes mellitus (DM) significantly increased in %LV (37 � 13%and 36 � 14% vs. 29 � 14%, p � 0.02) and significantlydecreased in %FV (58 � 11% and 59 � 11% vs. 64 � 11%, p �
0.03) compared with those with normal glucose regulation(NGR). ANOVA � analysis of variance; IB-IVUS � integrated
Table 2. D
Vessel area
Lumen are
Plaque are
Plaque bur
Eccentricit
Remodelin
Vessel volu
Lumen vol
Plaque vol
Percent pla
p � analysiBonferroni a� 0.01 (vs. I
htD13w(atrIlHirsm0
D
Ta%lftc
raAqtsoiIisct1fwpAd
ppir
aopcpriioptl
s
J A C C : C A R D I O V A S C U L A R I M A G I N G , V O L . 1 , N O . 1 , 2 0 0 8
J A N U A R Y 2 0 0 8 : 3 9 – 4 5
Amano et al.
Insulin Resistance and Plaque Component
43
ypertension, smoking status, elevated C-reactive pro-ein, and use of statin and insulin) risk factors, theM group (odds ratio 3.52, 95% confidence interval
.13 to 11.0, p � 0.03) and the IGR group (odds ratio
.92, 95% confidence interval 1.13 to 13.6, p � 0.03)ere significantly associated with the lipid-rich plaque
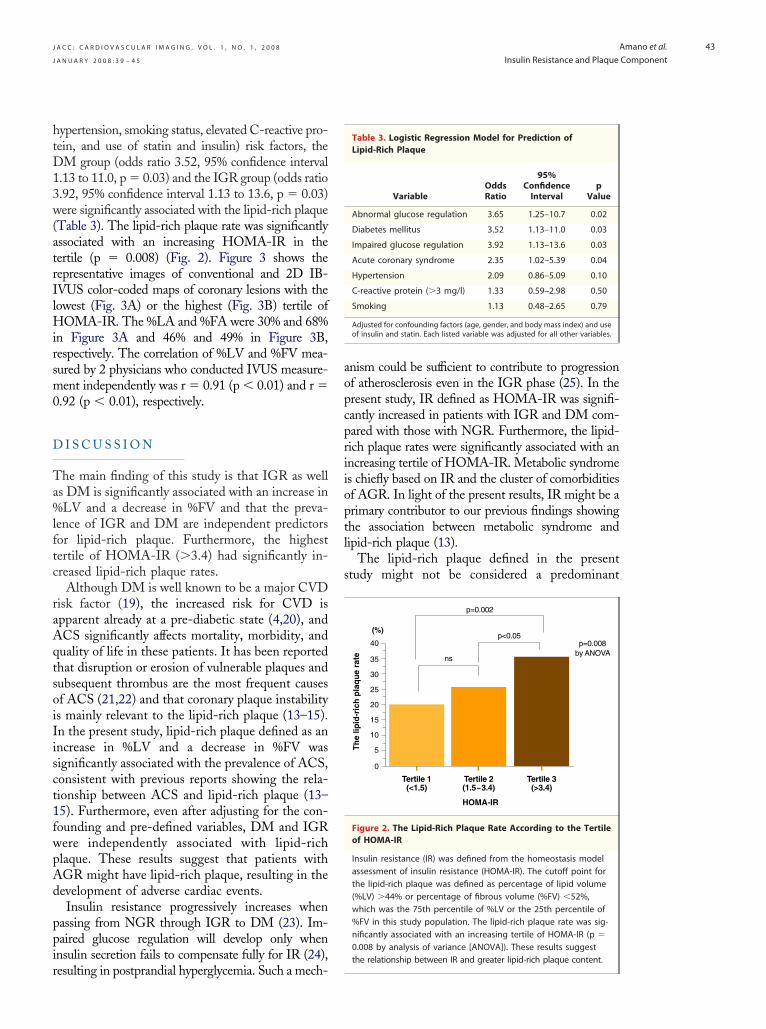
Table 3). The lipid-rich plaque rate was significantlyssociated with an increasing HOMA-IR in theertile (p � 0.008) (Fig. 2). Figure 3 shows theepresentative images of conventional and 2D IB-VUS color-coded maps of coronary lesions with theowest (Fig. 3A) or the highest (Fig. 3B) tertile of
OMA-IR. The %LA and %FA were 30% and 68%n Figure 3A and 46% and 49% in Figure 3B,espectively. The correlation of %LV and %FV mea-ured by 2 physicians who conducted IVUS measure-ent independently was r � 0.91 (p � 0.01) and r �
.92 (p � 0.01), respectively.
I S C U S S I O N
he main finding of this study is that IGR as wells DM is significantly associated with an increase inLV and a decrease in %FV and that the preva-
ence of IGR and DM are independent predictorsor lipid-rich plaque. Furthermore, the highestertile of HOMA-IR (�3.4) had significantly in-reased lipid-rich plaque rates.
Although DM is well known to be a major CVDisk factor (19), the increased risk for CVD ispparent already at a pre-diabetic state (4,20), andCS significantly affects mortality, morbidity, anduality of life in these patients. It has been reportedhat disruption or erosion of vulnerable plaques andubsequent thrombus are the most frequent causesf ACS (21,22) and that coronary plaque instabilitys mainly relevant to the lipid-rich plaque (13–15).n the present study, lipid-rich plaque defined as anncrease in %LV and a decrease in %FV wasignificantly associated with the prevalence of ACS,onsistent with previous reports showing the rela-ionship between ACS and lipid-rich plaque (13–5). Furthermore, even after adjusting for the con-ounding and pre-defined variables, DM and IGRere independently associated with lipid-richlaque. These results suggest that patients withGR might have lipid-rich plaque, resulting in theevelopment of adverse cardiac events.Insulin resistance progressively increases when
assing from NGR through IGR to DM (23). Im-aired glucose regulation will develop only whennsulin secretion fails to compensate fully for IR (24),
esulting in postprandial hyperglycemia. Such a mech-nism could be sufficient to contribute to progressionf atherosclerosis even in the IGR phase (25). In theresent study, IR defined as HOMA-IR was signifi-antly increased in patients with IGR and DM com-ared with those with NGR. Furthermore, the lipid-ich plaque rates were significantly associated with anncreasing tertile of HOMA-IR. Metabolic syndromes chiefly based on IR and the cluster of comorbiditiesf AGR. In light of the present results, IR might be arimary contributor to our previous findings showinghe association between metabolic syndrome andipid-rich plaque (13).
The lipid-rich plaque defined in the presenttudy might not be considered a predominant
0
5
10
15
20
25
30
35
40
Th
e Iip
id-r
ich
pla
qu
e ra
te
HOMA-IR
Tertile 1(<1.5)
Tertile 2(1.5~3.4)
Tertile 3(>3.4)
p=0.008by ANOVA
p=0.002
p<0.05
ns
(%)
Figure 2. The Lipid-Rich Plaque Rate According to the Tertileof HOMA-IR
Insulin resistance (IR) was defined from the homeostasis modelassessment of insulin resistance (HOMA-IR). The cutoff point forthe lipid-rich plaque was defined as percentage of lipid volume(%LV) �44% or percentage of fibrous volume (%FV) �52%,which was the 75th percentile of %LV or the 25th percentile of%FV in this study population. The lipid-rich plaque rate was sig-nificantly associated with an increasing tertile of HOMA-IR (p �
0.008 by analysis of variance [ANOVA]). These results suggest
Table 3. Logistic Regression Model for Prediction ofLipid-Rich Plaque
VariableOddsRatio
95%ConfidenceInterval
pValue
Abnormal glucose regulation 3.65 1.25–10.7 0.02
Diabetes mellitus 3.52 1.13–11.0 0.03
Impaired glucose regulation 3.92 1.13–13.6 0.03
Acute coronary syndrome 2.35 1.02–5.39 0.04
Hypertension 2.09 0.86–5.09 0.10
C-reactive protein (�3 mg/l) 1.33 0.59–2.98 0.50
Smoking 1.13 0.48–2.65 0.79
Adjusted for confounding factors (age, gender, and body mass index) and useof insulin and statin. Each listed variable was adjusted for all other variables.
the relationship between IR and greater lipid-rich plaque content.

medrwnsp
tdrmrunaiyparnptShtesps
C
IAmFir
RDK
R
J A C C : C A R D I O V A S C U L A R I M A G I N G , V O L . 1 , N O . 1 , 2 0 0 8
J A N U A R Y 2 0 0 8 : 3 9 – 4 5
Amano et al.
Insulin Resistance and Plaque Component
44
arker of plaque instability. With a slightly differ-nt methodology (virtual histology and IVUS ra-iofrequency analysis), another Japanese group (26)ecently showed that the amount of lipid contentas not higher and the amount of fibrotic tissue wasot lower in patients with ACS compared withtable patients. Although this report provides im-ortant insight into ruptured plaques, it focused on
Figure 3. Representative Images of Conventional and 2DIB-IVUS Color-Coded Maps of Coronary Artery Plaques
The percentage of lipid area (%LA) and the percentage offibrous area (%FA) were automatically calculated by IB-IVUS. The%LA and %FA were (top panels) 30% and 68% in patients withthe lowest tertile of the HOMA-IR, and (bottom panels) 46%and 49% in patients with the highest tertile of HOMA-IR. Blue �
lipid pool; green/yellow � fibrous lesion; red � high signallesion. 2D � 2-dimensional; other abbreviations as in Figures 1and 2.
MJ, et al. A prospective study of Med 2001;161:397
he minimal luminal site. There are scant IVUSata defining plaque instability before the occur-ence of rupture. Sano et al. (15) have shown theorphology of plaque instability before the occur-
ence of ACS. In that study of plaques before ACSsing IB-IVUS, the %LA was greater in the vul-erable plaque than in the stable plaque. However,higher lipid content did not necessarily translate
nto mote vulnerable plaques. Cap thickness (be-ond the resolution of IB-IVUS) is another majorlayer in the field. True plaque instability means anctive change from 1 point in time to another,esulting in plaque rupture. Therefore, a longitudi-al and prospective study is needed to assess therecise prognostic value of the lipid-rich plaque inhe development of future coronary events.tudy limitations. In the present study, although it isypothesized that lipid-rich plaques are those con-ributing to plaque instability, these data were notxamined. Taken together with other results, largertudies should confirm present findings before anyreventive or therapeutic implication could beuggested.
O N C L U S I O N S
n conclusion, coronary lesions in patients withGR are associated with lipid-rich plaque, whichay be related to the increased IR in these patients.urther study is needed to provide therapeutic
nformation on the need for any intervention toeduce IR even in the IGR state.
eprint requests and correspondence: Dr. Tetsuya Amano,epartment of Cardiology, Chubu-Rosai Hospital,ohmei 1-10-6, Minato-ku, Nagoya, 455-8530, Japan.
plaques after the occurrence of rupture measured at E-mail: [email protected].
E F E R E N C E S
1. Buse JB, Ginsberg HN, Bakris GL, etal. Primary prevention of cardiovascu-lar diseases in people with diabetesmellitus: a scientific statement fromthe American Heart Association andthe American Diabetes Association.Circulation 2007;115:114–26.
2. Stamler J, Vaccaro O, Neaton JD,Wentworth D. Diabetes, other riskfactors, and 12-yr cardiovascular mor-tality for men screened in the MultipleRisk Factor Intervention Trial. Dia-betes Care 1993;16:434–44.
3. Manson JE, Colditz GA, Stampfer
maturity-onset diabetes mellitus andrisk of coronary heart disease andstroke in women. Arch Intern Med1991;151:1141–7.
4. Coutinho M, Gerstein HC, Wang Y,Yusuf S. The relationship betweenglucose and incident cardiovascularevents: a meta regression analysis ofpublished data from 20 studies of95783 individuals followed for 12.4years. Diabetes Care 1999;22:233–40.
5. DECODE Study Group, the Euro-pean Diabetes Epidemiology Group.Glucose tolerance and cardiovascularmortality: comparison of fasting and2-hour diagnostic criteria. Arch Intern
–405.
6. Haffner SM, Stern MP, Hazuda HP,Mitchell BD, Patterson JK. Cardio-vascular risk factors in confirmed pre-diabetic individuals. JAMA 1990;263:2893–998.
7. Bonora E, Kiechl S, Oberhollenzer F,et al. Impaired glucose tolerance, typeII diabetes mellitus, and carotid ath-erosclerosis: prospective results fromthe Bruneck Study. Diabetologia2000;43:156–64.
8. O’Leary DH, Polak JF, Kronmal RA,et al. Distribution and correlates ofsonographically detected carotid arterydisease in the Cardiovascular HealthStudy: the CHS Collaborative Research
Group. Stroke 1992;23:1752–60.
1
1
1
1
1
2
2
2
2
2
2
J A C C : C A R D I O V A S C U L A R I M A G I N G , V O L . 1 , N O . 1 , 2 0 0 8
J A N U A R Y 2 0 0 8 : 3 9 – 4 5
Amano et al.
Insulin Resistance and Plaque Component
45
9. Hanefeld M, Koehler C, Schaper F, etal. Postprandial plasma glucose is anindependent risk factor for increasedcarotid intima-media thickness innon-diabetic individuals. Atheroscle-rosis 1999;144:229–35.
0. Tenerz Å, Norhammar A, Silveria A,et al. Diabetes, insulin resistance andthe metabolic syndrome in patientswith acute myocardial infarction with-out previously known diabetes. Diabe-tes Care 2003;26:2770–6.
1. Ruige JB, Assendelft WJJ, DekkerJM, et al. Insulin and risk of cardio-vascular disease: a meta-analysis. Cir-culation 1998;97:996–1001.
2. Fujiwara T, Saitoh S, Takagi S, et al.Development and progression of ath-erosclerotic disease in relation to insu-lin resistance and hyperinsulinemia.Hypertens Res 2005;28:665–70.
3. Amano T, Matsubara T, Uetani T, etal. Impact of metabolic syndrome ontissue characteristics of angiographi-cally mild to moderate coronary le-sions: integrated backscatter intravas-cular ultrasound study. J Am CollCardiol 2007,49:1149–56.
4. Kawasaki M, Takatsu H, Noda T, etal. In vivo quantitative tissue charac-terization of human coronary arteryplaques by use of integrated backscat-ter intravascular ultrasound and com-parison with angioscopic findings.
Circulation 2002;105:2487–92.15. Sano K, Kawasaki M, Ishihara Y, etal. Assessment of vulnerable plaquescausing acute coronary syndrome us-ing integrated backscatter intravascu-lar ultrasound. J Am Coll Cardiol2006;47:734–41.
16. Report of the WHO Consultation,Definition, Diagnosis and Classifica-tion of Diabetes Mellitus and ItsComplications. Part 1: Diagnosis andClassification of Diabetes Mellitus.Geneva: World Health Organization,Department of Non-communicableDisease Surveillance, 1999.
17. Matthews DR, Hosker JP, RudenskiAS, et al. Homeostasis model assess-ment: insulin resistance and beta-cellfunction from fasting plasma glucoseand insulin concentrations in man.Diabetologia 1985;28:412–9.
18. Honda O, Sugiyama S, Kugiyama K,et al. Echolucent carotid plaques pre-dict future coronary events in patientswith coronary artery disease. J AmColl Cardiol 2004;43:1177–84.
19. Haffner SM, Lehto S, Ronnemaa T,et al. Mortality from coronary heartdisease in subjects with type 2 diabetesand in non diabetic subjects with andwithout prior myocardial infarction.N Engl J Med 1998;339:229–34.
20. The DECODE Study Group on be-half of the European Diabetes Epide-miology Group. Is the current defini-
tion for diabetes relevant to mortalityrisk from all causes and cardiovascularand non-cardiovascular disease? Diabetes Care 2003;26:688–96.
1. Little WC, Constantinescu M, Apple-gate RJ, et al. Can coronary angiographypredict site of a subsequent myocardialinfarction in patients with mild-to-moderate coronary artery disease? Cir-culation 1988;78:1157–66.
2. Ambrose JA, Tannenbaum MA,Alexopoulos D, et al. Angiographicprogression of coronary artery diseaseand the development of myocardialinfarction. J Am Coll Cardiol 1988;12:56–62.
3. Tripathy D, Carlsson M, Almgren P,et al. Insulin secretion and insulinsensitivity in relation to glucose toler-ance: lessons from the Botnia study.Diabetes 2000;49:975–80.
4. Beck-Nielsen H, Groop LC. Meta-bolic and genetic characterization ofprediabetic states: sequence of eventsleading to non-insulin-dependent di-abetes mellitus. J Clin Invest 1994;94:1714–21.
5. Rossetti L, Giaccari A, DeFronzoRA. Glucose toxicity. Diabetes Care1990;13:610–30.
6. Surmely JF, Nasu K, Fujita H, et al.Coronary plaque composition of cul-prit/target lesions according to theclinical presentation: a virtual histol-ogy intravascular ultrasound analysis.
Eur Heart J 2006;27:2939–44.