Abnormal Choline Phospholipid Metabolism in Breast and Ovary Cancer:Molecular Bases for Noninvasive...
15
Current Medical Imaging Reviews, 2007, 3, 123-137 123 1573-4056/07 $50.00+.00 ©2007 Bentham Science Publishers Ltd. Abnormal Choline Phospholipid Metabolism in Breast and Ovary Cancer: Molecular Bases for Noninvasive Imaging Approaches Franca Podo 1,* , Francesco Sardanelli 2 , Egidio Iorio 1 , Rossella Canese 1 , Giulia Carpinelli 1 , Alfonso Fausto 2 and Silvana Canevari 3 1 Department of Cell Biology and Neurosciences, Istituto Superiore di Sanità, Roma, Italy, 2 University of Milan School of Medicine, Department of Medical and Surgical Sciences, Radiology Unit, IRCCS Policlinico San Donato, San Donato Milanese, Milano, Italy, 3 Department of Experimental Oncology and Laboratories, IRCCS Fondazione Istituto Nazionale Tumori, Milano, Italy Abstract: Elevated contents of choline phospholipid metabolites are typically detected by nuclear magnetic resonance spectroscopy (MRS) in human and animal tumors. An increase in the intensity of the 1 H-MRS profile of total choline- containing compounds (tCho, 3.2 ppm) is today considered as a common feature in different types of cancer, beyond their otherwise wide phenotypic variability. This finding fostered investigations on the molecular mechanisms underlying the observed spectral changes and on correlations between aberrant phospholipid metabolism and tumor progression. At the clinical level, efforts are addressed to evaluate effectiveness and potential use of in vivo localized MRS and choline-based positron emission tomography (Cho-PET) in cancer diagnosis. Aims of this article are: a) to overview recent advances in the identification of biochemical pathways responsible for the altered 1 H-MRS tCho profile in breast and ovary cancer cells, as a basis for interpreting in vivo MR spectra and enhanced uptake of radiolabeled choline in PET; b) to summarize recent developments of in vivo 1 H-MRS methods in breast cancer diagnosis; c) to discuss the potentialities of complementing current diagnostic modalities with noninvasive MRS and Cho-PET methods to monitor biochemical alterations associated with progression, relapse and therapy response in ovary cancer. Keywords: Breast cancer, ovary cancer, choline metabolism, phosphatidylcholine cycle, 1 H-MRS, PET. INTRODUCTION The characterization of abnormal choline phospholipid metabolism in tumors by magnetic resonance spectroscopy (MRS) [1-5] fostered novel investigations in cancer cell biology, allowed the identification of new fingerprints of tumor progression and promoted pilot studies on clinical MRS and choline-based positron emission tomography (Cho-PET) approaches in oncology. In particular, an increase in the 1 H-MRS resonance at 3.2 parts per million (ppm), arising from the trimethylammonium headgroups of the total pool of water-soluble choline-containing metabolites (tCho), has been reported as the most common feature in a large variety of cancers such as breast [6-8], prostate [9, 10] and colon carcinomas [11], bone and soft tissue malignant lesions [12] and high-grade neuroepithelial tumors [13]. More recently, we also focused attention on alterations of the tCho spectral profile in human epithelial ovarian cancer (EOC) cells [14, 15], an aspect which received only scarce attention in the past. Our studies showed that EOC cells represent a particularly suitable model to investigate the molecular bases of aberrant choline phospholipid meta- bolism associated with progression of tumors of epithelial origin [15]. By comprising contributions from different phospha- tidylcholine (PC) precursors and catabolites, such as phos- phocholine (PCho), glycerophosphocholine (GPC) and free choline (Cho), changes in the tCho spectral profile may *Address correspondence to this author at the Department of Cell Biology and Neurosciences, Istituto Superiore di Sanità, Viale Regina Elena 299, 00161 Rome, Italy; Tel +39 06 4990 2686; Fax +39 06 4938 7144; E-mail: [email protected] result from multiple alterations in the steady state levels and fluxes of metabolites in the PC-cycle [16]. A better elucidation of the molecular mechanisms res- ponsible for changes in the tCho resonance profile in tumor cells and tissues would pave the way to further developments in noninvasive imaging approaches for in vivo diagnosis and therapy response follow-up, and may also allow the identification of metabolic targets for newly designed, patient-tailored anti-tumor therapies [4, 5, 17]. This review will summarize the main results so far obtained on: a) characterization of abnormal concentrations of MRS-detectable PC metabolites in cells derived from human ovary and breast tumors, as compared to the respec- tive non-tumoral (normal or immortalized) epithelial cells; and b) activation of different PC-cycle enzymes likely involved in the tCho spectral alterations, as a basis for interpreting 1 H-MR spectra of cancer lesions in vivo. An overview will then be provided on clinical 1 H-MRS methods developed in breast cancer diagnosis and on the perspectives of further extending these approaches to ovary cancer. An outline will finally be provided on the perspectives of endeavors addressed to evaluate the effectiveness of Cho- PET approaches, especially in ovary cancer. BREAST AND OVARY CANCER: MAIN CLINICAL FEATURES AND CURRENT IMAGING METHODS Breast Cancer Female breast cancer is the second most common cancer in the world and the most common cancer among women, accounting for more than 400,000 cancer deaths per year. Although deaths for breast cancer are decreasing in many
-
Upload
independent -
Category
Documents
-
view
0 -
download
0
Transcript of Abnormal Choline Phospholipid Metabolism in Breast and Ovary Cancer:Molecular Bases for Noninvasive...

Current Medical Imaging Reviews, 2007, 3, 123-137 123
1573-4056/07 $50.00+.00 ©2007 Bentham Science Publishers Ltd.
Abnormal Choline Phospholipid Metabolism in Breast and Ovary Cancer: Molecular Bases for Noninvasive Imaging Approaches
Franca Podo1,*
, Francesco Sardanelli2, Egidio Iorio
1, Rossella Canese
1, Giulia Carpinelli
1, Alfonso
Fausto2 and Silvana Canevari
3
1Department of Cell Biology and Neurosciences, Istituto Superiore di Sanità, Roma, Italy,
2University of Milan School of
Medicine, Department of Medical and Surgical Sciences, Radiology Unit, IRCCS Policlinico San Donato, San Donato
Milanese, Milano, Italy, 3Department of Experimental Oncology and Laboratories, IRCCS Fondazione Istituto
Nazionale Tumori, Milano, Italy
Abstract: Elevated contents of choline phospholipid metabolites are typically detected by nuclear magnetic resonance
spectroscopy (MRS) in human and animal tumors. An increase in the intensity of the 1H-MRS profile of total choline-
containing compounds (tCho, 3.2 ppm) is today considered as a common feature in different types of cancer, beyond their
otherwise wide phenotypic variability. This finding fostered investigations on the molecular mechanisms underlying the
observed spectral changes and on correlations between aberrant phospholipid metabolism and tumor progression. At the
clinical level, efforts are addressed to evaluate effectiveness and potential use of in vivo localized MRS and choline-based
positron emission tomography (Cho-PET) in cancer diagnosis. Aims of this article are: a) to overview recent advances in
the identification of biochemical pathways responsible for the altered 1H-MRS tCho profile in breast and ovary cancer
cells, as a basis for interpreting in vivo MR spectra and enhanced uptake of radiolabeled choline in PET; b) to summarize
recent developments of in vivo1H-MRS methods in breast cancer diagnosis; c) to discuss the potentialities of
complementing current diagnostic modalities with noninvasive MRS and Cho-PET methods to monitor biochemical
alterations associated with progression, relapse and therapy response in ovary cancer.
Keywords: Breast cancer, ovary cancer, choline metabolism, phosphatidylcholine cycle, 1H-MRS, PET.
INTRODUCTION
The characterization of abnormal choline phospholipid metabolism in tumors by magnetic resonance spectroscopy (MRS) [1-5] fostered novel investigations in cancer cell biology, allowed the identification of new fingerprints of tumor progression and promoted pilot studies on clinical MRS and choline-based positron emission tomography (Cho-PET) approaches in oncology. In particular, an increase in the
1H-MRS resonance at 3.2 parts per million (ppm),
arising from the trimethylammonium headgroups of the total pool of water-soluble choline-containing metabolites (tCho), has been reported as the most common feature in a large variety of cancers such as breast [6-8], prostate [9, 10] and colon carcinomas [11], bone and soft tissue malignant lesions [12] and high-grade neuroepithelial tumors [13]. More recently, we also focused attention on alterations of the tCho spectral profile in human epithelial ovarian cancer (EOC) cells [14, 15], an aspect which received only scarce attention in the past. Our studies showed that EOC cells represent a particularly suitable model to investigate the molecular bases of aberrant choline phospholipid meta-bolism associated with progression of tumors of epithelial origin [15].
By comprising contributions from different phospha-tidylcholine (PC) precursors and catabolites, such as phos-phocholine (PCho), glycerophosphocholine (GPC) and free choline (Cho), changes in the tCho spectral profile may
*Address correspondence to this author at the Department of Cell Biology
and Neurosciences, Istituto Superiore di Sanità, Viale Regina Elena 299, 00161 Rome, Italy; Tel +39 06 4990 2686; Fax +39 06 4938 7144; E-mail:
result from multiple alterations in the steady state levels and fluxes of metabolites in the PC-cycle [16].
A better elucidation of the molecular mechanisms res-ponsible for changes in the tCho resonance profile in tumor cells and tissues would pave the way to further developments in noninvasive imaging approaches for in vivo diagnosis and therapy response follow-up, and may also allow the identification of metabolic targets for newly designed, patient-tailored anti-tumor therapies [4, 5, 17].
This review will summarize the main results so far obtained on: a) characterization of abnormal concentrations of MRS-detectable PC metabolites in cells derived from human ovary and breast tumors, as compared to the respec-tive non-tumoral (normal or immortalized) epithelial cells; and b) activation of different PC-cycle enzymes likely involved in the tCho spectral alterations, as a basis for interpreting
1H-MR spectra of cancer lesions in vivo. An
overview will then be provided on clinical 1H-MRS methods
developed in breast cancer diagnosis and on the perspectives of further extending these approaches to ovary cancer. An outline will finally be provided on the perspectives of endeavors addressed to evaluate the effectiveness of Cho-PET approaches, especially in ovary cancer.
BREAST AND OVARY CANCER: MAIN CLINICAL FEATURES AND CURRENT IMAGING METHODS
Breast Cancer
Female breast cancer is the second most common cancer in the world and the most common cancer among women, accounting for more than 400,000 cancer deaths per year. Although deaths for breast cancer are decreasing in many

124 Current Medical Imaging Reviews, 2007, Vol. 3, No. 2 Podo et al.
Western countries, breast cancer incidence rates are increasing in all regions of the world [18]. The large variation of breast cancer incidence among or within different regions may be attributed to genetic differences among populations and/or differences in lifestyle [19]. However, geographic disparities in breast cancer incidence and mortality are also related to differences in screening, chemoprevention, and treatment strategies in more-develo-ped, as compared with less-developed regions of the world.
Furthermore, it should be taken into account that breast cancer is a clinically heterogeneous disease, and existing histological classifications do not fully capture the varied clinical course of this disease. Recent molecular approaches indicated that breast cancer is not one disease but a collection of several biologically different diseases. There are large-scale molecular differences between estrogen receptor (ER)-positive and ER-negative cancers, that reach far beyond the presence or absence of estrogen receptors. HER-2-amplified cancers also have a very distinct gene expression signature that also extends to some cancers with no apparent HER-2 gene amplification. Further molecular categories are likely to exist in addition to and within these three most apparent molecular classes [20]. It might be useful to identify the various molecular classes because the different subsets may have a different natural history and clinical management.
Estimates from randomized clinical trials and population-based models from developed countries, such as United States and United Kingdom, indicate that early detection by screening mammography and improved treatment could result in reducing mortality rates by at least 30%. In this context, other imaging modalities could be of significant help in initial diagnosis, staging and monitoring of tumor response to treatment. For example, it should be noted that differential detection by screening mammography of ER-positive, more dormant tumors might yield an apparently higher incidence of tumors associated with more favorable survival; thus methods of functional imaging, able to identify more proliferating and aggressive tumors might be of help in programming alternative or more stringent treatment modalities. As a matter of fact, imaging beyond mammo-graphy seems recommended in the surveillance protocol of women with an increased lifetime risk of breast cancer [21-24]. Finally, early diagnosis of relapse and assessment of therapy response are vital, as they might ensure a prompt therapeutic intervention or change in treatment strategies; even in these cases a combination of functional and morphological imaging is expected to provide more sensitive and specific approaches.
Contrast-enhanced breast magnetic resonance imaging (MRI) is today the most sensitive morphological/functional technique for tumor detection and local staging of breast cancer. Breast tumors actually played an important role in the historical progress which led to the introduction of magnetic resonance imaging (MRI) in medicine. In the 1970s, when nuclear magnetic resonance rapidly converted into the most versatile imaging method, the possibility of differentiating malignant tumors from benign lesions or normal breast tissues, on the basis of relaxation times, appeared particularly promising [25]. However, when clini-
cal breast MRI was attempted in the early 1980s, expec-tations turned into rather disappointing results. In fact, classical proton density-, T1-, and T2-weighted sequences did not allow differentiation of malignant from benign tumors [26]. This scenario was dramatically changed in 1986, when Sylvia Heywang and coworkers published the first report on the use of Gd-DTPA as an intravenously administered paramagnetic contrast agent for the detection and characterization of breast tumors [27]. By exploiting the neoangiogenesis associated with tumor growth, dynamic contrast-enhanced (DCE) MRI opened an important avenue, complemented in the following years by the introduction of rapid spoiled gradient-echo sequences, dynamic acquisition and dedicated post-processing, up to the more recent approaches capable of combining high spatial with high temporal resolution [28, 29].
On the basis of these technical developments, breast MRI gained in the last decade a relevant clinical role for defined indications such as presurgical staging, diagnosis of local recurrence, evaluation of the effect of neoadjuvant chemo-therapy, search of occult primitive breast tumor in patients with metastases and surveillance of women at familial-genetic high risk of breast cancer. These results were due to a top level sensitivity (about 95% for invasive cancers) and to an increasing specificity, estimated to be at least 75-80% when morphologic and dynamic criteria are integrated in a unique evaluation system. The remaining gap between sensi-tivity and specificity is filled-in by second look ultrasound (US) examination and MRI-guided breast biopsy.
In the meanwhile, the introduction of in vivo localized MRS approaches opened the way to a powerful comple-mentation of the anatomical/physiopathological information provided by conventional imaging modalities, by adding metabolic information potentially useful to enhance diag-nostic accuracy and to offer noninvasive assessment of novel biomarkers of in vivo tumor progression [3, 4, 6, 17]. The additional information provided by MRS may therefore substantially contribute to improve pre-operative assessment of tumor aggressiveness and to monitor early tumor responsein vivo.
Early in vitro31
P-MRS studies demonstrated altered phospholipid metabolism in cancer cells, by detecting increased levels of phosphomonoesters such as PCho and phosphoethanolamine and, sometimes, also their phospho-diester analogues, GPC and glycerophosphoethanolamine [2, 3]. Despite an in vivo dependence of the
31P spectrum on
hormonal status [30], the results of 31
P-MRS for differen-tiating malignant from benign breast tumors were found inadequate for a clinical use [31]. On the contrary, in the last decade, many in vivo
1H-MRS studies based upon tCho
signal analysis in breast cancer lesions offered promising results with possible translation into clinical practice [32-35], as discussed in more detail in a following section. This perspective was also strengthened by the possibility to perform a
1H-MRS study as a final step after a regular breast
DCE-MRI examination.
In comparison with conventional imaging techniques such as computed tomography (CT), US and MRI, PET with fluoro-18 fluorodeoxyglucose (
18F-FDG), used as such or in
combination with CT (PET/CT), offers the advantage of a

Choline Metabolism in Breast and Ovary Cancer Imaging Current Medical Imaging Reviews, 2007, Vol. 3, No. 2 125
high sensitivity in detecting metabolic abnormalities of tumor lesions and contributes to breast cancer staging mainly in terms of identification of bone [36] and lymph node metastases.
Ovary Cancer
EOC has a relatively low incidence (approximately 1/100,000 new cases each year) in North America and in Europe and up to 10-fold lower incidence rates are observed in most parts of Africa and Eastern Asia; furthermore, within a particular country, incidence rates may differ among ethnic groups [37]. Despite the low incidence, epithelial ovarian cancer presents a high case-fatality ratio and is the most lethal gynecological malignancy in industrialized countries, with an overall 5-year survival still remaining at about 44% [38]. The unfavourable statistics in ovarian cancer patients reflects in part the poor understanding of the molecular pathogenesis and progression of this heterogeneous malig-nancy. Although much remains to be discovered, numerous gene alterations have been identified as associated to this disease [39, 40] and a model of development has been recently proposed [41]. Women with organ-confined tumors have an excellent prognosis, but the majority of early stage cancers is asymptomatic and more than two-thirds of patients are diagnosed with advanced disease. Initial surgery is almost always necessary in the management of suspected ovarian cancer for histological confirmation, staging and tumor debulking. Effective cytoreductive surgery at the time of diagnosis, achievable mainly in early-stage disease, has been correlated with improved survival. However, due to the difficulties in early diagnosis, the vast majority of EOC patients require adjuvant treatment in the attempt to eradicate residual disease. EOC is considered to be a chemosensitive tumor and the median overall survival significantly improved after the development of new therapeutic approaches. About two-thirds of EOC patients who receive highly active front-line chemotherapy enter clinical remission, but relapse occurs in the majority of advanced-stage patients even after complete response to initial treatments.
According to the Federation of Gynecologists and Obstetrics (FIGO), staging criteria in post-surgical treatment and follow-up, radiological tests such as US, CT or MRI should only be performed when clinical findings or a raise in serological tumor markers (CA-125) suggest a possible recurrence. However, due to the tumor location in the abdominal and pelvic peritoneum and the propensity for diffuse small-volume disease, recurrent EOCs are clinically detected and located in most patients when the lesions are larger than about 2 cm; alternatively, invasive procedures (second-look laparatomy) should be adopted [42]. The positive prognostic impact of early diagnosis of relapse (detection of small lesions less than 0.5 cm) as well as of the assessment of response at the end of treatment could be fully exploited only if noninvasive in vivo imaging techniques with high sensitivity and specificity are successfully applied.
The role of imaging is to detect and characterize adnexal masses as likely malignant, recognize unusual findings that may suggest a typical pathology, demonstrate metastases in order to prevent under-staging and detect a specific size of disease that may be unresectable [43]. A strategy for diagnosis of ovarian benign, borderline malignant and
malignant masses with MRI incorporates signal intensity characteristics into morphologic features [44].
A retrospective study showed that gadolinium-enhanced spoiled gradient-echo MRI depicted residual tumor in women with treated ovarian cancer with an accuracy, positive predictive value and negative predictive value that were comparable with those of laparotomy reassessment and superior to those of serum CA-125 values alone [45]. How-ever, the specificity of MRI of the pelvis may be substan-tially limited by the presence of post-surgical anatomical alterations. On the other hand,
18F-FDG-PET has been found
to be very sensitive in detecting recurrent or persistent ovarian cancer [46], while the combined functional-anatomic imaging given by PET/CT may substantially improve sensitivity and specificity of imaging studies [47, 48]. However, false-negative
18F-FDG PET imaging of tumors of
the reproductive tract or misinterpretation of metastatic involvement of lymph nodes may derive from artifacts associated with physiologic accumulation of the radiotracer in the urinary route [49]. These considerations suggest the interest of further investigating the potentialities of alter-native imaging approaches in ovarian cancer, such as in vivo-localized MRS and Cho-PET, especially for the discri-mination of scars from recurrent disease and evaluation of therapeutic response.
EVIDENCE AND MOLECULAR BASES OF ALTE-RED CHOLINE METABOLISM IN BREAST AND
OVARY CANCER CELLS
Abnormal Levels of Choline Metabolites
Quantitative high-resolution 1H-MRS analyses at high
field allowed us to measure a tCho content of 5.2 ± 2.4 nmol/10
6 cells (corresponding to a cellular average concen-
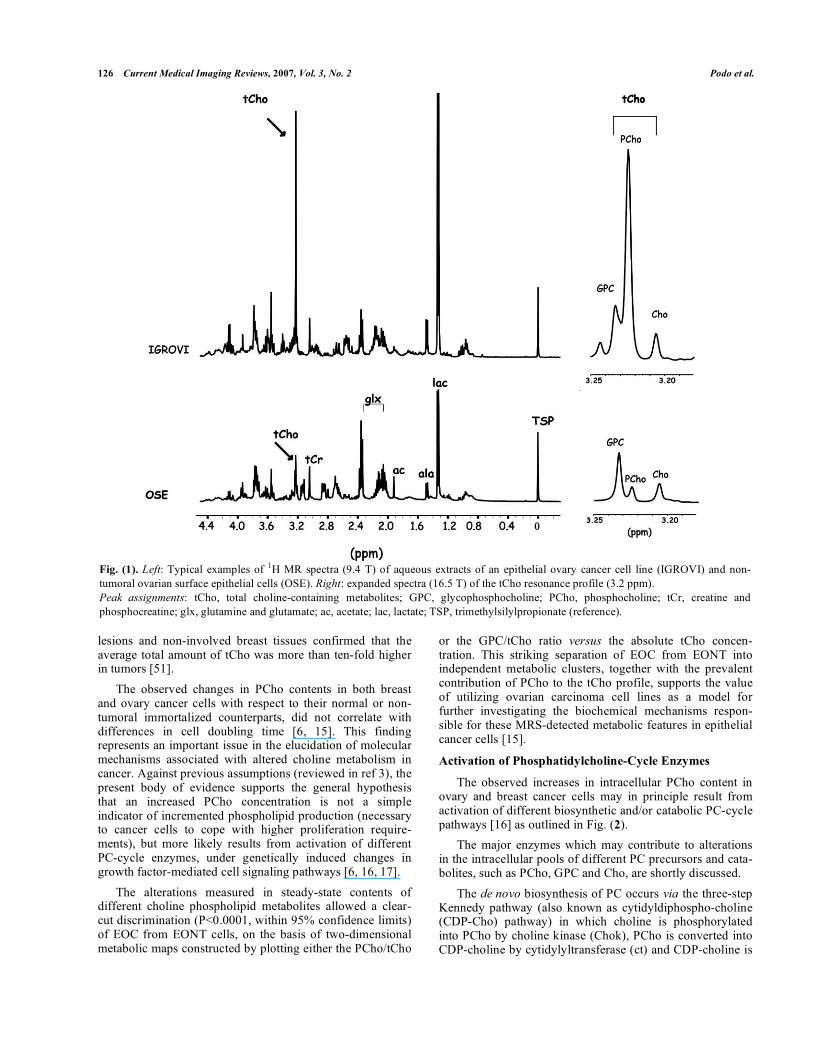
tration of about 2.0 mM) in aqueous extracts of normal ovary surface epithelial cells or their immortalized non-tumoral cell variants (EONT) [15]. With respect to this basal level, the tCho content measured in different EOC cell lines (SKOV3, OVCA432, CABA I, IGROV1, OVCAR3) reached much higher intracellular levels (4.0 to 7.0 mM). The most remarkable feature was a 3.0- to 8.0-fold increase in PCho in EOC with respect to EONT cells. Fig. (1) shows a typical example of increased intensity and altered composition of the tCho spectral profile in a EOC cell line as compared to normal cells. The average percent contribution of this metabolite to the overall tCho resonance profile increased from about 50% in EONT to 70-90% in EOC cells. In parallel, the GPC/PCho ratio underwent a ten-fold decrease (a phenomenon already reported for some oncogene-trans-formed and cancer cells, and known as the “GPC-to-PCho switch” [6, 50]).
Significant increases in tCho and PCho (P<0.05) have also been reported for tumorigenic, highly metastatic breast cancer cell lines (such as MDA-MB 435; MDA-MB 231) as compared to human mammary epithelial cells (HMEC) and their immortalized non-tumoral cell variants [6, 9]. In fact, the overall computed concentration of tCho increased from about 0.2 mM in HMEC to 2–4 mM in breast cancer cells, with an average PCho contribution of about 80% to the tCho spectral profile. It is worth noting that MRS analyses of aqueous extracts of samples isolated from breast cancer
126 Current Medical Imaging Reviews, 2007, Vol. 3, No. 2 Podo et al.
lesions and non-involved breast tissues confirmed that the average total amount of tCho was more than ten-fold higher in tumors [51].
The observed changes in PCho contents in both breast and ovary cancer cells with respect to their normal or non-tumoral immortalized counterparts, did not correlate with differences in cell doubling time [6, 15]. This finding represents an important issue in the elucidation of molecular mechanisms associated with altered choline metabolism in cancer. Against previous assumptions (reviewed in ref 3), the present body of evidence supports the general hypothesis that an increased PCho concentration is not a simple indicator of incremented phospholipid production (necessary to cancer cells to cope with higher proliferation require-ments), but more likely results from activation of different PC-cycle enzymes, under genetically induced changes in growth factor-mediated cell signaling pathways [6, 16, 17].
The alterations measured in steady-state contents of different choline phospholipid metabolites allowed a clear-cut discrimination (P<0.0001, within 95% confidence limits) of EOC from EONT cells, on the basis of two-dimensional metabolic maps constructed by plotting either the PCho/tCho
or the GPC/tCho ratio versus the absolute tCho concen-tration. This striking separation of EOC from EONT into independent metabolic clusters, together with the prevalent contribution of PCho to the tCho profile, supports the value of utilizing ovarian carcinoma cell lines as a model for further investigating the biochemical mechanisms respon-sible for these MRS-detected metabolic features in epithelial cancer cells [15].
Activation of Phosphatidylcholine-Cycle Enzymes
The observed increases in intracellular PCho content in ovary and breast cancer cells may in principle result from activation of different biosynthetic and/or catabolic PC-cycle pathways [16] as outlined in Fig. (2).
The major enzymes which may contribute to alterations in the intracellular pools of different PC precursors and cata-bolites, such as PCho, GPC and Cho, are shortly discussed.
The de novo biosynthesis of PC occurs via the three-step Kennedy pathway (also known as cytidyldiphospho-choline (CDP-Cho) pathway) in which choline is phosphorylated into PCho by choline kinase (Chok), PCho is converted into CDP-choline by cytidylyltransferase (ct) and CDP-choline is
Fig. (1). Left: Typical examples of1H MR spectra (9.4 T) of aqueous extracts of an epithelial ovary cancer cell line (IGROVI) and non-
tumoral ovarian surface epithelial cells (OSE). Right: expanded spectra (16.5 T) of the tCho resonance profile (3.2 ppm).
Peak assignments: tCho, total choline-containing metabolites; GPC, glycophosphocholine; PCho, phosphocholine; tCr, creatine and
phosphocreatine; glx, glutamine and glutamate; ac, acetate; lac, lactate; TSP, trimethylsilylpropionate (reference).

Choline Metabolism in Breast and Ovary Cancer Imaging Current Medical Imaging Reviews, 2007, Vol. 3, No. 2 127
incorporated into PC by choline phosphotranferase (pct) [52]. While ct mediates the rate-limiting step of the pathway, Chok acts as a regulatory enzyme for PC biosynthesis. As an example of Chok regulation, the intracellular activity rate measured for this enzyme in 3T3 fibroblasts (1.2 ± 0.2 nmol/10
6 cells·h) undergoes a 2- to 3-fold increase following
growth factor-induced cell stimulation [53] or H-rastransformation [54].
The Chok activity measured in our laboratory in EONT cells was only 0.6 ± 0.1 nmol/10
6 cells·h but increased 12- to 24-
fold (P< 0.001) in EOC cells [15].
The increases in Chok activity and PCho levels in EOC cells are in agreement with a substantial body of evidence reported in the literature on implications of this enzyme and its choline-containing product in human carcinogenesis. Elevated Chok activity has been reported in a variety of cancers, including lung, colon and prostate tumors [55] and in breast carcinomas [56]. Moreover, Chok activation has been found in about 40% of breast tumor tissues, in which it was associated with clinical indicators of increased malignancy, such as high histologic tumor grade and ER–negative status [56]. In addition, Chok overexpression/ activation has been shown to be a critical requirement for the proliferation of human mammary epithelial cells (HMEC) and for breast tumor progression [57], while a specific Chok inhibitor (MN58b) efficiently blocked receptor-induced proliferation of in vitro cultured breast tumor cells and inhibited their in vivo growth in animal models [57, 58]. In
general agreement with the reported overexpression and increased activity of Chok in malignant cells and tumors, RNA-interference-mediated Chok suppression in breast cancer cells induced cell differentiation and reduced in vitro cell proliferation [59].
In this context, the different rates of Chok activity measured in EOC and EONT cells warrant further investi-gations to elucidate to which extent activation of individual isoforms of this enzyme [60] may act as possible pharmaco-dynamic endpoints of new cancer therapies, either based upon specific Chok inhibition [61] or upon selective targe-ting against cell signaling pathways involved in Chok regulation.
An important implication of enhanced Chok activity in breast and ovary cancer cells is the expected increase in the phosphorylation of a radiolabeled choline tracer transported from the medium into intracellular compartments. In vitromeasurements on uptake of
14C-choline by ovary epithelial
cells [15] actually showed that the incorporation of this radiotracer into the cells was (within 1 hour) 5- to 15-fold higher in EOC than in EONT cells (P<0.0001). Recent analyses by Yoshimoto et al [62] showed 1.5- to 4.0-fold increases in the average [
14C]-Cho uptake by a wide variety
of cancer cells as compared to non-tumoral fibroblasts, with a radiolabel distribution mainly confined (within 45 min) to water-soluble choline metabolites. In fact,
14C-PC reached,
in this time window, levels lower than 5% of the total pool of
14C-labeled compounds. Moreover, [
14C]-Cho uptake
Fig. (2). Schematic representation of phosphatidylcholine (PC) de novo biosynthesis and catabolism. Metabolites: CDP-Cho, cytidine
diphosphate choline; Cho, choline; DAG, diacylglycerol; FFA, free fatty acid; G3P, sn-glycerol-3-phosphate; GPC, glycerophosphocholine;
LPA, lyso-phosphatidate; PA, phosphatidate; PCho, phosphocholine. Enzymes: Chok, choline kinase (EC 2.7.1.32); ct, cytidylyltransferase
(EC 2.7.7.15); lpl, lysophospholipase (EC 3.1.1.5); pct, phosphocholine transferase (EC 2.7.8.2); pd, glycerophosphocholine
phosphodiesterase (EC 3.1.4.2); plA2, phospholipase A2 (EC 3.1.1.4) and plA1, phospholipase A1 (EC 3.1.1.32); pla, phospholipase a; plc,
phospholipase C (EC 3.1.4.3); pld, phospholipase D (EC 3.1.4.4).

128 Current Medical Imaging Reviews, 2007, Vol. 3, No. 2 Podo et al.
correlated with Chok activity and with [3H]-thymidine
incorporation (a well known index of cell proliferation). Similar mechanisms and rates of radiolabeled choline uptake and accumulation into water-soluble PC precursors of tumor cells can be predicted to take place in
11C- or
18F-Cho PET
examinations [63, 64] of ovary cancer cells in vivo, and could form the basis for the prediction of differential standard uptake (SUV) ranges for normal and malignant tumor lesions, following a bolus administration of the radiotracer. It is worth emphasizing that, according to these in vitro uptake analyses [15, 62], the “metabolic window” of in vivo PET examinations is mainly confined to Cho transport and phosphorylation in the Kennedy pathway, the higher SUV values of radiolabeled Cho in tumors most likely reflecting increased cell proliferation.
On the other hand, regarding the biological meaning of MRS signal variations, multiple pathways may contribute to the enhanced PCho levels detected under the tCho profile of tumor cells. In fact, although Chok activation likely represents a key issue in the interpretation of abnormal PCho contents in EOC cells, no statistically significant correlation was found between Chok activity rates and PCho levels detected in the different EOC cell lines investigated [15]. This result suggests the interest of further investigating the role of both biosynthetic and catabolic PC-cycle pathways in PCho accumulation in cancer cells.
Three major catabolic pathways can contribute to the formation of a MRS-detected intracellular PCho pool: PC hydrolysis into PCho and diacylglycerol, mediated by a specific phospholipase C (PC-plc); combination of phos-pholipase D (pld)-mediated PC degradation into Cho and phosphatidate and further Cho phosphorylation by Chok into PCho; phosphodiesterase (pd)-mediated hydrolysis of GPC into Cho and glycerophosphate and subsequent Cho phos-phorylation [65]. The last reaction represents the terminal step of PC degradation along the deacylation pathway mediated by the combined action of phospholipases A2 and A1 and lysophospholipases (lpl).
Assays on PC catabolism carried out in our laboratory by measuring Cho formation in total cell lysates of EONT and EOC cells following addition of a monomeric, short-chain PC (1,2-dihexanoyl-sn-glycero-3-phosphocholine, C6PC) showed that PC-plc activity increased 9- to 15-fold in EOC cells, while pld was only activated about 2- to 3-fold in some, but not in all EOC cells and GPC-pd activity increased about 2- to 4-fold
(1,2). Furthermore, Western blotting and
confocal laser scanning microscopy experiments showed that PC-plc activation in EOC cells is associated with massive expression of this enzyme on the outer plasma membrane surface of EOC cell lines, as well as on that of cells isolated from patient ascitic exudates
(1).
The overall body of results overviewed in this section shows that both biosynthetic and catabolic PC-cycle
1Iorio E, Ricci A, Mezzanzanica D, Spadaro F, Ramoni C, Canese R, Rozera C, Spada
M, Belardelli F, D'Ascenzo S, Dolo V, Canevari S, Podo F. Choline phospholipid
metabolism in human ovarian tumor progression: a MRS study. In: Proceedings Intl
Soc Mag Reson Med 2006: 3181. 2Iorio E, Ricci A, Pisanu ME, Di Vito M, Canese R, Mezzanzanica D, Canevari S,
Podo F. Activation of PC cycle enzymes in human epithelial ovarian carcinoma cells.
Magn Reson Mat Phys Biol Med (MAGMA) 2006;19(Suppl 1):50.
pathways may contribute to the increased MRS-detected PCho levels in cancer cells, while increased radiolabeled Cho uptake in PET examinations is mainly due to Cho transport into the cell and subsequent phosphorylation in the Kennedy pathway.
1H MRS OF BREAST CANCER
Background
A number of in vivo localized 1H-MRS clinical studies
conducted in the last decade reported increases in the area of the tCho peak detected in primary breast tumors larger than 1 cm of diameter [66-82], supporting the proposal that this spectral parameter may represent a useful biomarker for noninvasively testing malignancy in breast lesions.
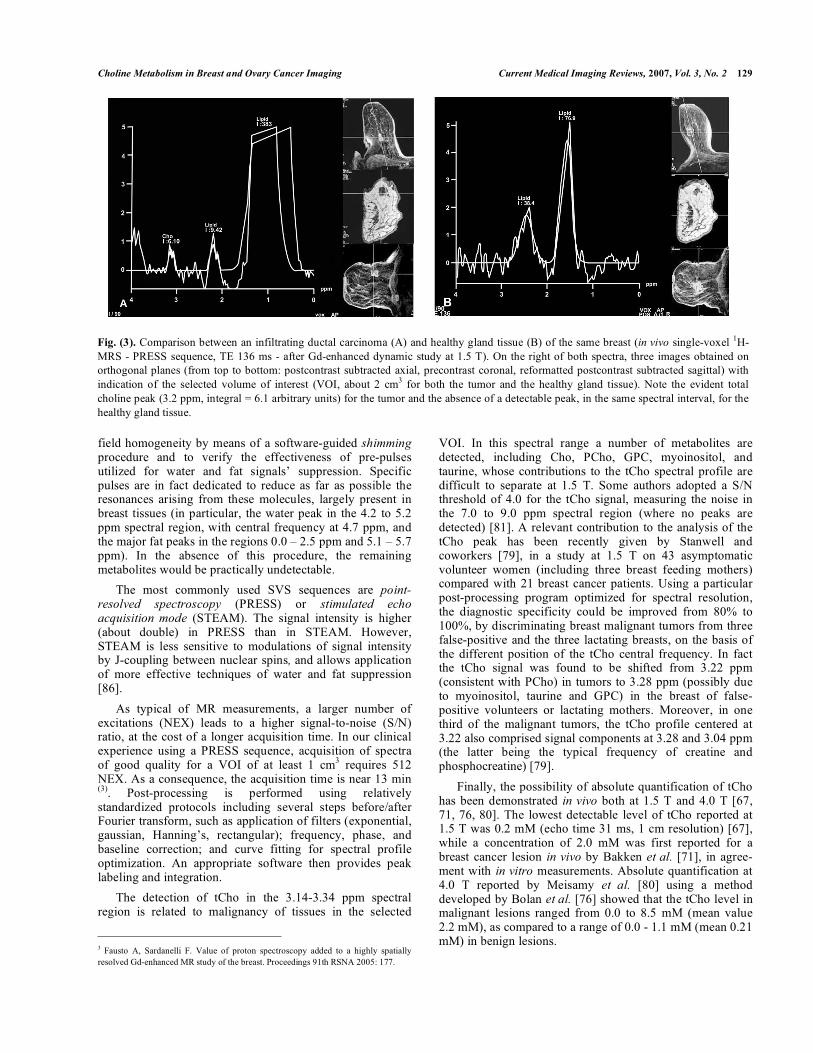
Fig. (3) shows an example of in vivo1H-MRS exami-
nation of an infiltrating ductal carcinoma compared with healthy gland tissue in the same breast.
When 1H-MRS was integrated in a complete imaging
protocol, it was reported to improve the specificity of breast MRI [77] and was suggested as a useful adjunct to MRI for reducing the number of lesions proposed for biopsy on the basis of MRI examinations alone [82]. Moreover, prelimi-nary results of an inter-observer performance study at 4.0 T [80] showed that addition of
1H-MRS to MRI significantly
improved the radiologist ability to distinguish benign from malignant breast lesions.
The potentiality of in vivo and in vitro MRS analyses in the evaluation of nodal status was investigated, with promising results, in patients with breast cancer, using choline metabolites as biomarkers for metastasis [83-85].
Furthermore, decreased levels of choline-containing metabolites were reported in tumors following response to neoadjuvant therapy [70].
Technical Aspects and Interpretation
The most commonly used 1H MRS approach in breast
cancer diagnosis and follow-up is single voxel spectroscopy (SVS). The application of multivoxel two-dimensional che-mical shift imaging (CSI) methods is still in a preliminary, although very promising phase [78, 81].
The SVS approach is based upon the acquisition of a single spectrum acquired from a single voxel corresponding to the volume of interest (VOI) positioned on the MRI-detected lesion, usually a contrast-enhancing mass. This VOI is spatially defined using images obtained or reconstructed along the three orthogonal planes. The VOI should exactly comprise the mass to be examined, limiting as much as possible contamination from surrounding tissues, particularly from fat. This method requires previous identification of the lesion by DCE-MRI and takes advantage of the lack of any significant relaxation effect induced by the paramagnetic agent on the
1H-MRS tCho signal [69], probably due to the
basically different location of choline metabolites (intra-cellular space) and Gd-chelates (vascular and extracellular space).
According to our in vivo experience using a 1.5 T unit (Sonata, Siemens, Erlangen, Germany), before applying a SVS
1H-MRS sequence, it is important to optimize the local
Choline Metabolism in Breast and Ovary Cancer Imaging Current Medical Imaging Reviews, 2007, Vol. 3, No. 2 129
field homogeneity by means of a software-guided shimmingprocedure and to verify the effectiveness of pre-pulses utilized for water and fat signals’ suppression. Specific pulses are in fact dedicated to reduce as far as possible the resonances arising from these molecules, largely present in breast tissues (in particular, the water peak in the 4.2 to 5.2 ppm spectral region, with central frequency at 4.7 ppm, and the major fat peaks in the regions 0.0 – 2.5 ppm and 5.1 – 5.7 ppm). In the absence of this procedure, the remaining metabolites would be practically undetectable.
The most commonly used SVS sequences are point-resolved spectroscopy (PRESS) or stimulated echo acquisition mode (STEAM). The signal intensity is higher (about double) in PRESS than in STEAM. However, STEAM is less sensitive to modulations of signal intensity by J-coupling between nuclear spins, and allows application of more effective techniques of water and fat suppression [86].
As typical of MR measurements, a larger number of excitations (NEX) leads to a higher signal-to-noise (S/N) ratio, at the cost of a longer acquisition time. In our clinical experience using a PRESS sequence, acquisition of spectra of good quality for a VOI of at least 1 cm
3 requires 512
NEX. As a consequence, the acquisition time is near 13 min (3)
. Post-processing is performed using relatively standardized protocols including several steps before/after Fourier transform, such as application of filters (exponential, gaussian, Hanning’s, rectangular); frequency, phase, and baseline correction; and curve fitting for spectral profile optimization. An appropriate software then provides peak labeling and integration.
The detection of tCho in the 3.14-3.34 ppm spectral region is related to malignancy of tissues in the selected
3 Fausto A, Sardanelli F. Value of proton spectroscopy added to a highly spatially
resolved Gd-enhanced MR study of the breast. Proceedings 91th RSNA 2005: 177.
VOI. In this spectral range a number of metabolites are detected, including Cho, PCho, GPC, myoinositol, and taurine, whose contributions to the tCho spectral profile are difficult to separate at 1.5 T. Some authors adopted a S/N threshold of 4.0 for the tCho signal, measuring the noise in the 7.0 to 9.0 ppm spectral region (where no peaks are detected) [81]. A relevant contribution to the analysis of the tCho peak has been recently given by Stanwell and coworkers [79], in a study at 1.5 T on 43 asymptomatic volunteer women (including three breast feeding mothers) compared with 21 breast cancer patients. Using a particular post-processing program optimized for spectral resolution, the diagnostic specificity could be improved from 80% to 100%, by discriminating breast malignant tumors from three false-positive and the three lactating breasts, on the basis of the different position of the tCho central frequency. In fact the tCho signal was found to be shifted from 3.22 ppm (consistent with PCho) in tumors to 3.28 ppm (possibly due to myoinositol, taurine and GPC) in the breast of false-positive volunteers or lactating mothers. Moreover, in one third of the malignant tumors, the tCho profile centered at 3.22 also comprised signal components at 3.28 and 3.04 ppm (the latter being the typical frequency of creatine and phosphocreatine) [79].
Finally, the possibility of absolute quantification of tCho has been demonstrated in vivo both at 1.5 T and 4.0 T [67, 71, 76, 80]. The lowest detectable level of tCho reported at 1.5 T was 0.2 mM (echo time 31 ms, 1 cm resolution) [67], while a concentration of 2.0 mM was first reported for a breast cancer lesion in vivo by Bakken et al. [71], in agree-ment with in vitro measurements. Absolute quantification at 4.0 T reported by Meisamy et al. [80] using a method developed by Bolan et al. [76] showed that the tCho level in malignant lesions ranged from 0.0 to 8.5 mM (mean value 2.2 mM), as compared to a range of 0.0 - 1.1 mM (mean 0.21 mM) in benign lesions.
Fig. (3). Comparison between an infiltrating ductal carcinoma (A) and healthy gland tissue (B) of the same breast (in vivo single-voxel 1H-
MRS - PRESS sequence, TE 136 ms - after Gd-enhanced dynamic study at 1.5 T). On the right of both spectra, three images obtained on
orthogonal planes (from top to bottom: postcontrast subtracted axial, precontrast coronal, reformatted postcontrast subtracted sagittal) with
indication of the selected volume of interest (VOI, about 2 cm3 for both the tumor and the healthy gland tissue). Note the evident total
choline peak (3.2 ppm, integral = 6.1 arbitrary units) for the tumor and the absence of a detectable peak, in the same spectral interval, for the
healthy gland tissue.
130 Current Medical Imaging Reviews, 2007, Vol. 3, No. 2 Podo et al.
More detailed information on the individual metabolites contributing to the in vivo tCho spectral profile (with evidence on the prevalence of the PCho component) could be obtained by ex vivo (or in vitro) high resolution
1H MRS
analyses of breast tumor specimens (or their aqueous extracts) [51, 87-89]. Among these approaches, the techni-que of high resolution magic angle spinning (HR MAS) is particularly powerful. In fact, it allows comparative exami-nation of the tCho spectral profile of a given cancer lesion invivo with that of its fine-needle or surgical biopsies analysed ex vivo at a resolution comparable to that of conventional
1H-
MRS analyses on cell extracts [90], whilst maintaining the possibility of further histological analysis of tissue samples [89]. The HR MAS approach is based on the application of a rapid spinning to an intact tissue sample around the so-called magic angle (54° 44’), whereby line broadening typical of semisolid or solid compartments is reduced to values comparable with that of slightly viscous liquids [91]. A combination of one- and two-dimensional HR MAS
1H MRS
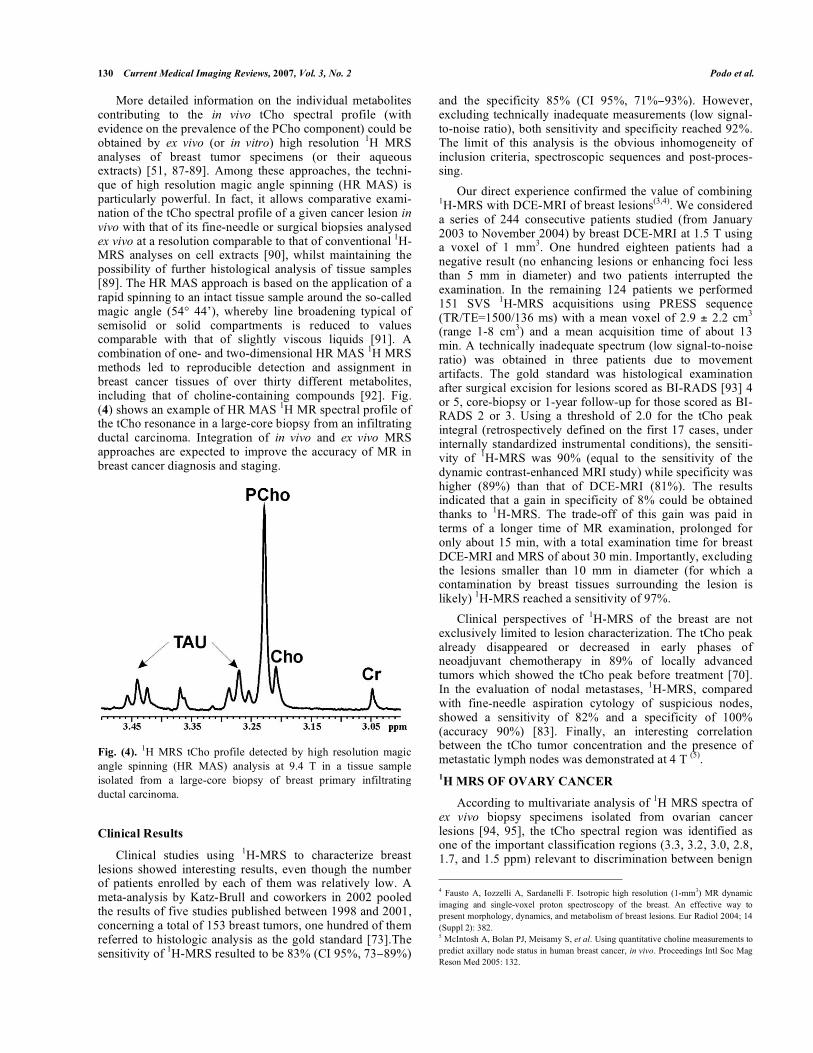
methods led to reproducible detection and assignment in breast cancer tissues of over thirty different metabolites, including that of choline-containing compounds [92]. Fig. (4) shows an example of HR MAS
1H MR spectral profile of
the tCho resonance in a large-core biopsy from an infiltrating ductal carcinoma. Integration of in vivo and ex vivo MRS approaches are expected to improve the accuracy of MR in breast cancer diagnosis and staging.
Fig. (4). 1H MRS tCho profile detected by high resolution magic
angle spinning (HR MAS) analysis at 9.4 T in a tissue sample
isolated from a large-core biopsy of breast primary infiltrating
ductal carcinoma.
Clinical Results
Clinical studies using 1H-MRS to characterize breast
lesions showed interesting results, even though the number of patients enrolled by each of them was relatively low. A meta-analysis by Katz-Brull and coworkers in 2002 pooled the results of five studies published between 1998 and 2001, concerning a total of 153 breast tumors, one hundred of them referred to histologic analysis as the gold standard [73].The sensitivity of
1H-MRS resulted to be 83% (CI 95%, 73 89%)
and the specificity 85% (CI 95%, 71% 93%). However, excluding technically inadequate measurements (low signal-to-noise ratio), both sensitivity and specificity reached 92%. The limit of this analysis is the obvious inhomogeneity of inclusion criteria, spectroscopic sequences and post-proces-sing.
Our direct experience confirmed the value of combining 1H-MRS with DCE-MRI of breast lesions
(3,4). We considered
a series of 244 consecutive patients studied (from January 2003 to November 2004) by breast DCE-MRI at 1.5 T using a voxel of 1 mm
3. One hundred eighteen patients had a
negative result (no enhancing lesions or enhancing foci less than 5 mm in diameter) and two patients interrupted the examination. In the remaining 124 patients we performed 151 SVS
1H-MRS acquisitions using PRESS sequence
(TR/TE=1500/136 ms) with a mean voxel of 2.9 ± 2.2 cm3
(range 1-8 cm3) and a mean acquisition time of about 13
min. A technically inadequate spectrum (low signal-to-noise ratio) was obtained in three patients due to movement artifacts. The gold standard was histological examination after surgical excision for lesions scored as BI-RADS [93] 4 or 5, core-biopsy or 1-year follow-up for those scored as BI-RADS 2 or 3. Using a threshold of 2.0 for the tCho peak integral (retrospectively defined on the first 17 cases, under internally standardized instrumental conditions), the sensiti-vity of
1H-MRS was 90% (equal to the sensitivity of the
dynamic contrast-enhanced MRI study) while specificity was higher (89%) than that of DCE-MRI (81%). The results indicated that a gain in specificity of 8% could be obtained thanks to
1H-MRS. The trade-off of this gain was paid in
terms of a longer time of MR examination, prolonged for only about 15 min, with a total examination time for breast DCE-MRI and MRS of about 30 min. Importantly, excluding the lesions smaller than 10 mm in diameter (for which a contamination by breast tissues surrounding the lesion is likely)
1H-MRS reached a sensitivity of 97%.
Clinical perspectives of 1H-MRS of the breast are not
exclusively limited to lesion characterization. The tCho peak already disappeared or decreased in early phases of neoadjuvant chemotherapy in 89% of locally advanced tumors which showed the tCho peak before treatment [70]. In the evaluation of nodal metastases,
1H-MRS, compared
with fine-needle aspiration cytology of suspicious nodes, showed a sensitivity of 82% and a specificity of 100% (accuracy 90%) [83]. Finally, an interesting correlation between the tCho tumor concentration and the presence of metastatic lymph nodes was demonstrated at 4 T
(5).
1H MRS OF OVARY CANCER
According to multivariate analysis of 1H MRS spectra of
ex vivo biopsy specimens isolated from ovarian cancer lesions [94, 95], the tCho spectral region was identified as one of the important classification regions (3.3, 3.2, 3.0, 2.8, 1.7, and 1.5 ppm) relevant to discrimination between benign
4 Fausto A, Iozzelli A, Sardanelli F. Isotropic high resolution (1-mm3) MR dynamic
imaging and single-voxel proton spectroscopy of the breast. An effective way to
present morphology, dynamics, and metabolism of breast lesions. Eur Radiol 2004; 14
(Suppl 2): 382. 5 McIntosh A, Bolan PJ, Meisamy S, et al. Using quantitative choline measurements to
predict axillary node status in human breast cancer, in vivo. Proceedings Intl Soc Mag
Reson Med 2005: 132.
Choline Metabolism in Breast and Ovary Cancer Imaging Current Medical Imaging Reviews, 2007, Vol. 3, No. 2 131
and malignant tissue samples. These findings suggested the interest of focussing on the identified spectral regions in future
1H MRS analyses of ovarian tumors in vivo. More-
over, significantly higher levels of choline metabolites (P = 0.0009) were found in malignant (mean value 42 mol/L; range 19-113 mol/L) than in benign cyst fluids (mean value 15 mol/L; range >2-163 mol/L) [96].
In vivo MRS is still at its infancy for ovarian cancer and, accordingly, few clinical reports are available from literature search. In two different studies, both evaluating a limited number of large lesions or tumors of the female pelvis, different metabolites (Cho, lactate, lipids and creatine) were measured by single-voxel proton MRS. The use of this approach showed significant differences in metabolites’ concentrations between benign and malignant ovarian tumors and pelvic abscesses. Interestingly, the tCho signal was found only in ovary carcinoma, suggesting a potential clinical application of this methodology [97, 98].
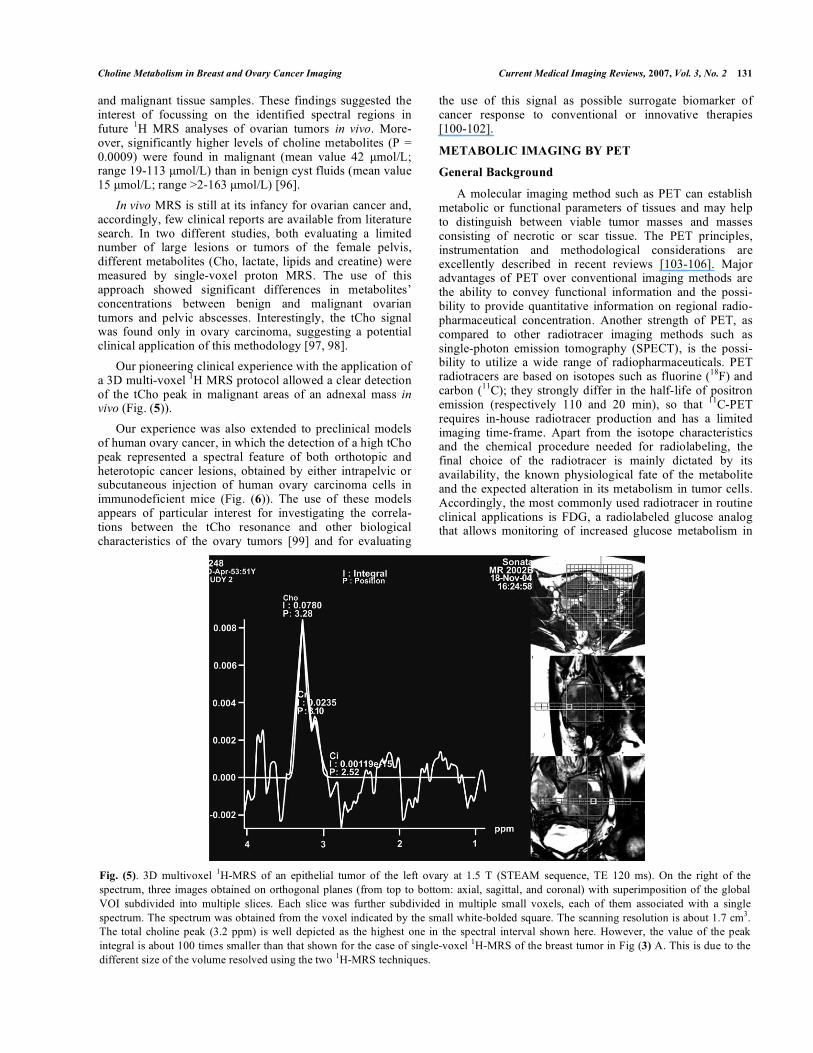
Our pioneering clinical experience with the application of a 3D multi-voxel
1H MRS protocol allowed a clear detection
of the tCho peak in malignant areas of an adnexal mass invivo (Fig. (5)).
Our experience was also extended to preclinical models of human ovary cancer, in which the detection of a high tCho peak represented a spectral feature of both orthotopic and heterotopic cancer lesions, obtained by either intrapelvic or subcutaneous injection of human ovary carcinoma cells in immunodeficient mice (Fig. (6)). The use of these models appears of particular interest for investigating the correla-tions between the tCho resonance and other biological characteristics of the ovary tumors [99] and for evaluating
the use of this signal as possible surrogate biomarker of cancer response to conventional or innovative therapies [100-102].
METABOLIC IMAGING BY PET
General Background
A molecular imaging method such as PET can establish metabolic or functional parameters of tissues and may help to distinguish between viable tumor masses and masses consisting of necrotic or scar tissue. The PET principles, instrumentation and methodological considerations are excellently described in recent reviews [103-106]. Major advantages of PET over conventional imaging methods are the ability to convey functional information and the possi-bility to provide quantitative information on regional radio-pharmaceutical concentration. Another strength of PET, as compared to other radiotracer imaging methods such as single-photon emission tomography (SPECT), is the possi-bility to utilize a wide range of radiopharmaceuticals. PET radiotracers are based on isotopes such as fluorine (
18F) and
carbon (11
C); they strongly differ in the half-life of positron emission (respectively 110 and 20 min), so that
11C-PET
requires in-house radiotracer production and has a limited imaging time-frame. Apart from the isotope characteristics and the chemical procedure needed for radiolabeling, the final choice of the radiotracer is mainly dictated by its availability, the known physiological fate of the metabolite and the expected alteration in its metabolism in tumor cells. Accordingly, the most commonly used radiotracer in routine clinical applications is FDG, a radiolabeled glucose analog that allows monitoring of increased glucose metabolism in
Fig. (5). 3D multivoxel 1H-MRS of an epithelial tumor of the left ovary at 1.5 T (STEAM sequence, TE 120 ms). On the right of the
spectrum, three images obtained on orthogonal planes (from top to bottom: axial, sagittal, and coronal) with superimposition of the global
VOI subdivided into multiple slices. Each slice was further subdivided in multiple small voxels, each of them associated with a single
spectrum. The spectrum was obtained from the voxel indicated by the small white-bolded square. The scanning resolution is about 1.7 cm3.
The total choline peak (3.2 ppm) is well depicted as the highest one in the spectral interval shown here. However, the value of the peak
integral is about 100 times smaller than that shown for the case of single-voxel 1H-MRS of the breast tumor in Fig (3) A. This is due to the
different size of the volume resolved using the two 1H-MRS techniques.

132 Current Medical Imaging Reviews, 2007, Vol. 3, No. 2 Podo et al.
body tissues in relation to the well known altered glycolysis of tumor cells. The biochemical behavior of FDG can be summarized as follow: it is transported into cells and phosphorylated by the same enzyme (hexokinase) acting on glucose but, unlike glucose, it cannot be further processed along the glycolytic pathway in most tissues, including tumors; therefore, phosphorylated FDG is metabolically trapped in the cell. However, the normal physiological uptake of FDG in certain tissues (as bowel) and its excretion through the renal system may alter the diagnostic accuracy of FDG-PET and limit the application of this method to malignancies in the abdomen and pelvis. Besides the general precautions adopted for PET imaging, specific patient prepa-ration procedures are therefore suggested for imaging these regions.
Other radiotracers, which characterize tumor biology on the basis of metabolic patterns different from glucose accumulation, are under active research. Table 1 summarizes their main features and applications for breast and/or ovary cancer imaging.
Although innovative tracers move slowly to the clinic, they present some important advantages as compared to FDG, because they are able to probe metabolic pathways more specifically connected with the disease of interest and,
accordingly, are expected to be more accurate in early diagnosis or in therapy response evaluation. Furthermore, in the vast majority, these radiotracers are not physiologically excreted through the kidneys and bladder and therefore appear more suited for evaluating a local disease in the pelvis.
Finally, in recent years, there has been an improvement in instrumentation [103-106] and recent studies have focused on the added value of the dual PET/CT modality. Fused PET and CT images provide oncologists with two pieces of critical information within a single session, i.e. both the extent of viable tumor and its exact location. Initial studies in patients with different tumor types have confirmed that PET/CT both in pretreatment planning and in follow-up evaluations has a significant impact on radiotherapy mana-gement in lung and in head and neck cancer. Evaluation of PET/CT for radiation treatment planning is still in its nascent stage, still lacking rigorous randomized trials, but the method certainly shows an early promise [109].
Clinical Applications to Breast and Ovary Cancer
As summarized in Table 1, FDG-PET has now entered the clinical practice and its use in breast cancer can be very helpful in many common situations. The major areas of
Fig. (6). Examples of MRI and 1H-MRS analyses (4.7 T) of intraperitoneal (ip) and subcutaneous (sc) xenografts of human ovary cancer
cells (OVCA432) in SCID mice. 1H MR images and spectra were obtained about 50 days after ip or sc injection of 10
6 cells. Transverse
images were obtained with a gradient echo technique (TR/TE=183/5.3 ms, = 20°, 15 contiguous slices, 1 mm thickness, FOV = 30 x 30
mm, matrix 128 x 128, corresponding to in plane resolution of 0.23 x 0.23 mm, 2 averages). 1H MR spectra were acquired from the voxels
indicated in the respective images, by using a PRESS sequence (TR/TE = 1500/23 ms, ROIs ranging from 8 to 40 l, number of averages
ranging from 256 to 1024) preceded by 3 CHESS pulses for water suppression.
Choline Metabolism in Breast and Ovary Cancer Imaging Current Medical Imaging Reviews, 2007, Vol. 3, No. 2 133
application and the limits of this method in initial diagnosis are excellently described in recent reviews [105, 108]. In summary, initial diagnosis of invasive breast cancer is possible with an overall specificity of 92%, but false-positives do occur in some benign inflammatory conditions and in fibroadenoma; the sensitivity varied in different studies between 84% and 93%. In addition, several studies have shown that the breast tumor size significantly affects FDG-PET scan results, the sensitivity for tumors smaller than 1 cm being 57%, as compared with 91% for tumors larger than 1 cm. Improvements in spatial resolution and scanner sensitivity are needed to increase the accuracy of diagnosis. The performance of FDG-PET imaging in breast cancer staging is different depending on the site of regional lymph nodes. The axillary lymph node involvement was initially detected with a 85-90% of sensitivity; however, in a more recent series of studies with a larger fraction of T1 primary tumors, a situation more similar to the typical screened populations, the sensitivity dropped to a level as low as 50%. In contrast to the mixed results of FDG-PET in axillary lymph node staging, PET resulted to be consistently useful in assessing disease spread to the internal mammary chain and mediastinal lymph nodes, which are important prognostic factors in patient management.
A review article suggests that PET, in its current format, cannot replace sentinel node biopsy but, due to its high specificity, may be useful in determining the extent of local and systemic disease [110]. Furthermore, an accurate meta-analysis estimated the pooled sensitivity, false positive rate, and the maximum joint sensitivity and specificity of the diagnostic performance of FDG-PET in the evaluation of breast cancer recurrence and metastases. The pooled sensi-
tivity was 90% (95% confidence interval 86.8-93.2) and the pooled false positive rate was 11% (95% confidence interval 7.8-14.6) after the exclusion of outliers, indicating that FDG-PET is a valuable tool for detecting breast cancer recurrence and metastases [111].
Finally, recent reports of PET or PET/CT imaging with less used or even new tracers indicate the possibility to open new avenues for future clinical usage at least in some specific areas, such as evaluation of bone metastases in patients with prostate and breast cancer by
18F-choline [36];
early identification of responders to chemotherapeutic treatments with
18F-FLT [105, 108, 112]; assessment of the
response to endocrine treatment by 18
F-FES [113]; and determination of the presence of cell-surface receptors suitable for following targeted therapies by engineered antibody fragments labeled with
64Cu or
124I [108]. However,
prospective studies with large patient groups will be essential to define the exact diagnostic role of these approaches in different clinical settings.
Following some pioneering studies in early 1990’s [114, 115] PET has also been more widely applied as imaging procedure for primary diagnosis and detection of ovary cancer recurrence [reviewed in 107, 116]. Although excretion through the urinary tract could limit
18F-FDG
application for detecting tumors in the pelvis, most of studies have been performed with this tracer. The major conclusions of recent reviews are that
18F-FDG-PET has limited value in
early diagnosis, while, due to its high sensitivity and specifi-city, can be useful in identifying patients with suspected recurrent tumor. In addition, in both the female and male reproductive tract, whole body imaging with FDG-PET is
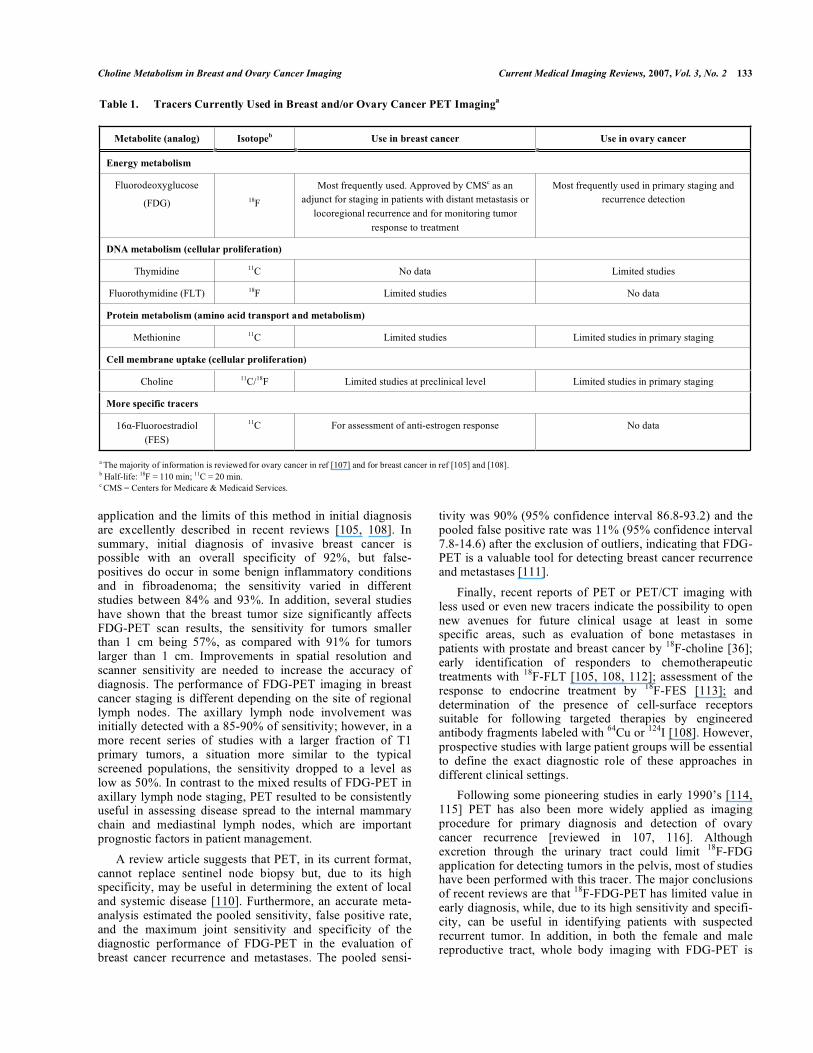
Table 1. Tracers Currently Used in Breast and/or Ovary Cancer PET Imaginga
Metabolite (analog) Isotopeb Use in breast cancer Use in ovary cancer
Energy metabolism
Fluorodeoxyglucose
(FDG) 18F
Most frequently used. Approved by CMSc as an
adjunct for staging in patients with distant metastasis or
locoregional recurrence and for monitoring tumor
response to treatment
Most frequently used in primary staging and
recurrence detection
DNA metabolism (cellular proliferation)
Thymidine 11C No data Limited studies
Fluorothymidine (FLT) 18F Limited studies No data
Protein metabolism (amino acid transport and metabolism)
Methionine 11C Limited studies Limited studies in primary staging
Cell membrane uptake (cellular proliferation)
Choline 11C/18F Limited studies at preclinical level Limited studies in primary staging
More specific tracers
16 -Fluoroestradiol
(FES)
11C For assessment of anti-estrogen response No data
a The majority of information is reviewed for ovary cancer in ref [107] and for breast cancer in ref [105] and [108]. b Half-life: 18F = 110 min; 11C = 20 min. c CMS = Centers for Medicare & Medicaid Services.

134 Current Medical Imaging Reviews, 2007, Vol. 3, No. 2 Podo et al.
capable of visualizing lymph-node and distant metastases before these changes become apparent on conventional cross-sectional imaging modalities [117].
Only few authors attempted ovary cancer PET imaging with alternative tracers, such as
11C-Methionine [115] and
11C-Choline [118]; the relative advantage of only minimal
radioactivity in the urinary tract and bladder was counter-balanced by a variable background activity in the intestine and the shorter time-frame for image acquisition due to the very short
11C half-life. Available studies are still limited by
the relatively low number of patients and wide confidence intervals of the analysis, thus no conclusion about suitability of different tracers could be drawn.
Despite the present limitations, due to the rapid progress in molecular imaging, the development of new tracers and the increased knowledge in tumor metabolism, PET, either alone or in combination with CT, is expected in the near future to enter the routine clinical practice for detecting ovarian cancer recurrence and early response to treatment. In this framework, Cho-PET may provide important contribu-tions, especially in view of the high level of uptake of radiolabeled choline in human ovary cancer cells [15].
CONCLUSIONS AND FUTURE DIRECTIONS
The continuous progress in characterizing features and mechanisms of altered choline metabolism in tumor cells may lead to improvements in the effectiveness of nonin-vasive imaging methods such as MRS and Cho-PET in cancer diagnosis and therapy response follow-up.
1H-MRS studies conducted on breast and ovary cancer
cells provided acquisition of an integrated set of information on altered choline metabolism during tumor progression. The tCho pool may reach in these cancer cells concentrations as high as 4 to 7 mM, PCho representing the most abundant component (80 ± 10%). Both biosynthetic and degradative PC-cycle enzymes likely contribute to the increased PCho levels.
1H-MRS of the breast is on the way of converting from a
role of a research tool to that of a possible clinical tool. Open problems are: i) sequence optimization, to obtain spectra with a good S/N ratio also for lesions less than 10 mm in diameter; ii) post-processing standardization with a higher spectral resolution within the tCho peak; iii) absolute quantification of tCho concentration in tumor tissues. Acquisition of metabolic maps of the breast using 3D multi-voxel MRS imaging approaches are expected to provide powerful means to integrate anatomical and biochemical information at the clinical level.
The new body of evidence specifically acquired on altered choline metabolism in ovary cancer cells warrants further efforts to elucidate the value of integrating the current imaging modalities with the metabolic information provided by
1H-MRS and Cho-PET approaches, to improve the strate-
gies of noninvasive diagnosis and therapy response follow-up.
ACKNOWLEDGEMENTS
The broad scope of this review has necessitated citation of only representative examples throughout. We apologize to
numerous investigators whose excellent work has not been cited.
Grants by a Special Project of the Italian Health Ministry (2001) and by Cassa di Risparmio delle Provincie Lombarde Foundation (CARIPLO) are gratefully acknowledged.
The Authors are indebted to Dr. Filippo Belardelli, Dr. Carmen Rozera, Mr. Massimo Spada and Mr. Massimo Giannini (Istituto Superiore di Sanità, Roma) and to Dr. Andrea Iozzelli (Unit of Radiology, IRCCS Policlinico San Donato Milanese) for collaboration in experimental and clinical examinations.
REFERENCES
[1] Negendank WG. Studies of human tumors by MRS: a review. NMR Biomed 1992; 5: 303-24.
[2] de Certaines JD, Larsen VA, Podo F, Carpinelli G, Briot O, Henriksen O. In vivo 31P MRS of experimental tumours. NMR
Biomed 1993; 6: 345-65. [3] Podo F. Tumour phospholipid metabolism. Review article. NMR
Biomed 1999; 12: 413-39. [4] Ackerstaff E, Glunde K, Bhujwalla ZW. Choline phospholipid
metabolism: a target in cancer cells? J Cell Biochem 2003; 90: 525-33.
[5] Glunde K, Ackerstaff E, Mori N, Jacobs MA, Bhujwalla ZM. Choline phospholipid metabolism in cancer: consequences for
molecular pharmaceutical interventions. Mol Pharm 2006; 3: 496-506.
[6] Aboagye EO, Bhujwalla ZM. Malignant transformation alters membrane choline phospholipid metabolism of human mammary
epithelial cells. Cancer Res 1999; 59: 80-4. [7] Katz-Brull R, Seger D, Rivenson-Segal D, Rushkin E, Degani H.
Metabolic markers of breast cancer: enhanced choline metabolism and reduced choline-ether-phospholipid synthesis. Cancer Res
2002; 62:1966-70. [8] Tse GM, Yeung DK, King AD, Cheung HS, Yang WT. In vivo
proton magnetic resonance spectroscopy of breast lesions: an update. Breast Cancer Res Treat 2006 Oct 19 [Epub ahead of print].
[9] Ackerstaff E, Pflug BR, Nelson JB, Bhujwalla ZM. Detection of increased choline compounds with proton nuclear magnetic
resonance spectroscopy subsequent to malignant transformation of human prostatic epithelial cells. Cancer Res 2001; 61: 3599-603.
[10] Chen AP, Cunningham CH, Kurhanewicz J, et al. High-resolution 3D MR spectroscopic imaging of the prostate at 3 T with the
MLEV-PRESS sequence. Magn Reson Imaging 2006; 24: 825-32. [11] Mori N, Delsite R, Natarajan K, Kulawiec M, Bhujwalla ZM, Singh
KK. Loss of p53 function in colon cancer cells results in increased phosphocholine and total choline. Mol Imaging 2004; 3: 319-23.
[12] Wang CK, Li CW, Hsieh TJ, Chien SH, Liu GC, Tsai KB. Characterization of bone and soft-tissue tumors with in vivo 1H MR
spectroscopy: initial results. Radiology 2004; 232: 599-605. [13] Stadlbauer A, Gruber S, Nimsky C, et al. Preoperative grading of
gliomas by using metabolite quantification with high-spatial-resolution proton MR spectroscopic imaging. Radiology 2006; 3:
958-69. [14] Ferretti A, D’Ascenzo S, Knijn A, Iorio E, Dolo V, Podo F.
Detection of polyol accumulation in a new ovarian carcinoma cell line, CABA 1: a 1H NMR study. Br J Cancer 2002; 86: 1180-87.
[15] Iorio E, Mezzanzanica D, Alberti P, et al. Alterations of choline phospholipid metabolism in ovarian tumor progression. Cancer Res
2005; 65: 9369-76. [16] Pelech SL, Vance DE. Signal transduction via phosphatidylcholine
cycles. Trends Biochem Sci 1989; 14: 28-30. [17] Glunde K, Serkova NJ. Therapeutic targets and biomarkers identi-
fiedin cancer choline phospholipid metabolism. Pharmacogenomics 2006; 7: 1109-23.
[18] http://www.imaginis.com/breasthealth/statistics.asp [19] Kamangar F, Dores GM, Anderson WF. Patterns of cancer
incidence, mortality, and prevalence across five continents: defining priorities to reduce cancer disparities in different geographic
regions of the world. J Clin Oncol 2006; 24: 2137-50.
Choline Metabolism in Breast and Ovary Cancer Imaging Current Medical Imaging Reviews, 2007, Vol. 3, No. 2 135
[20] Pusztai L, Mazouni C, Anderson K, Wu Y, Symmans WF.
Molecular classification of breast cancer: limitations and potential. Oncologist 2006; 11: 868-77.
[21] Kuhl CK, Kuhn W, Schild H. Management of women at high risk for breast cancer: new imaging beyond mammography. Breast
2005; 14: 480-6. [22] Leach MO, Boggis CR, Dixon AK, et al. Screening with magnetic
resonance imaging and mammography of a UK population at high familial risk of breast cancer: a prospective multicentre cohort study
(MARIBS). Lancet 2005; 365: 1769-78. [23] Sardanelli F, Podo F. D’Agnolo G, et al. Multicenter comparative
multimodality surveillance of women at genetic-familial high risk of breast cancer: Interim results. Radiology, (published online
before print January 23, 2007). [24] Sardanelli F, Podo F. Breast MR imaging in women at high-risk of
breast cancer. Is something changing in early breast cancer detection? Eur Radiol 2006 Sep 29 [Epub ahead of print]
[25] Koutcher JA, Goldsmith M, Damadian R. NMR in cancer. X. A malignancy index to discriminate normal and cancerous tissue.
Cancer 1978; 41: 174-82. [26] Heywang SH. Status of research in the field of diagnostic imaging
of the breast with particular reference to magnetic resonance tomography. Röntgenpraxis 1988; 41: 384-94.
[27] Heywang SH, Hahn D, Schmidt H, et al. MRI of the breast using gadolinium–DTPA. J Comput Assist Tomogr 1986; 10: 199-204.
[28] Vomweg TW, Buscema M, Kauczor HU, et al. Improved artificial neural networks in prediction of malignancy of lesions in contrast-
enhanced MR-mammography. Med Phys 2003; 30: 2350-9. [29] Kuhl CK, Schild HH, Morakkabati N. Dynamic bilateral contrast-
enhanced MR imaging of the breast: trade-off between spatial and temporal resolution. Radiology 2005; 236: 789-800.
[30] Payne GS, Dowsett M, Leach MO. Hormone–dependent metabolic changes in the normal breast monitored noninvasively by 31P
magnetic resonance (MR) spectroscopy. Breast 1994; 3: 20-3. [31] Park JM, Park JH. Human in-vivo 31P MR spectroscopy of benign
and malignant breast tumors. Korean J Radiol 2001; 2: 80-6. [32] Mountford CE, Doran S, Lean CL, Russell P. Proton MRS can
determine the pathology of human cancers with a high level of accuracy. Chem Rev 2004; 104: 3677-704.
[33] Pathak AP, Gimi B, Glunde K, Ackerstaff E, Artemov D, Bhujwalla ZM. Molecular and functional imaging of cancer:
advances in MRI and MRS. Methods Enzymol. 2004; 386: 3-60. [34] Gillies RJ, Morse DL. In vivo magnetic resonance spectroscopy in
cancer. Annu Rev Biomed Eng 2005; 7:287-326. [35] Tosi R and Tugnoli V Eds, Nuclear Magnetic Resonance
Spectroscopy in the study of neoplastic tissue. New York, Nova Science Publisher, Inc. 2005.
[36] Langsteger W, Heinisch M, Fogelman I. The role of fluorodeoxy-glucose, 18F-dihydroxyphenylalanine, 18F-choline and 18F-fluoride
in bone imaging with emphasis on prostate and breast. Sem Nucl Med 2006; 36: 73-92.
[37] Parkin DM, Whelan SL, Ferlay J, Teppo L, Thomas DB. Cancer incidence in five continents. VIII. Lyon (France): IARC Press;
2002. [38] Jemal A, Siegel R, Ward E, et al. Cancer statistics, 2006. CA
Cancer J Clin 2006; 56: 106-30. [39] Bell DA. Origins and molecular pathology of ovarian cancer.
Mod.Pathol 2005; 18 Suppl 2:S19-S32. [40] Canevari S, Gariboldi M, Reid JF, Bongarzone I, Pierotti MA.
Molecular predictors of response and outcome in ovarian cancer. Crit Rev Oncol Hematol 2006; 60: 19-37.
[41] Shih IeM, Kurman RJ. Ovarian tumorigenesis: a proposed model based on morphological and molecular genetic analysis. Am J
Pathol 2004; 164: 1511-8. [42] Classe JM, Fontanelli R, Bischof-Delaloye A, Chatal JF. Ovarian
cancer management. Practice guidelines for nuclear physicians. Q J Nucl Med Mol Imaging 2004; 48: 143-9.
[43] Coakley FV. Staging ovarian cancer: role of imaging. Radiol Clin North Am 2002; 40: 609-36.
[44] Imaoka I, Wada A, Kaji Y, et al. Developing an MR imaging strategy for diagnosis of ovarian masses. Radiographics 2006; 26:
1431-48. [45] Low RN, Duggan B, Barone RM, Saleh F, and Song SYT. Treated
ovarian cancer: MR imaging, laparotomy reassessment, and serum CA-125 values compared with clinical outcome at 1 year.
Radiology 2005; 235: 918-26.
[46] Delbeke D, Martin WH. Positron emission tomography imaging in
oncology. Radiol Clin North Am 2001; 39: 883-917. [47] Sironi S, Messa C, Mangili G, et al. Integrated FDG PET/CT in
patients with persistent ovarian cancer: correlation with histological findings. Radiology 2004; 433-40.
[48] Nanni C, Rubello D, Farsad M, et al. (18)F_FDG PET/CT in the evaluation of recurrent ovarian cancer: a prospective study on forty-
one patients. Eur J Surg Oncol 2005; 31: 792-7. [49] Reinhardt MJ, Matthiews A, Biersack HJ. PET-imaging in tumors
of the reproductive tract. Q J Nucl Med 2002; 46: 105-12. [50] Bhakoo KK, Williams SR, Florian CL, Land H, Noble MD.
Immortalization and transformation are associated with specific alterations in choline metabolism. Cancer Res 1996; 20: 4630-5.
[51] Gribbestad IS, Sitter B, Lundgren S, Krane J, Axelson D. Metabolite composition in breast tumors examined by proton
nuclear magnetic resonance spectroscopy. Anticancer Res 1999; 19: 1737-46.
[52] Vance JE and Vance DE. Phospholipid biosynthesis in mammalian cells. Biochem Cell Biol 2004; 82: 113-28.
[53] Warden CH, Friedkin M. Regulation of phosphatidylcholine biosynthesis by mitogenic growth factors. Biochim Biophys Acta
1984; 792: 270-80. [54] Macara IG. Elevated phosphocholine concentration in ras-
transformed NIH 3T3 cells arises from increased choline kinase activity, not from phosphatidylcholine breakdown Mol Cell Biol
1989; 9: 325-8. [55] Ramirez de Molina A, Rodriguez-Gonzalez A, Gutierrez R, et al.
Overexpression of choline kinase is a frequent feature in human tumor-derived cell lines and in lung, prostate, and colorectal human
cancers. Biochem Biophys Res Commun 2002; 296: 580-3. [56] Ramirez de Molina A, Gutierrez R, et al. Increased choline kinase
activity in human breast carcinomas: clinical evidence for a potential novel antitumor strategy. Oncogene 2002; 21: 4317-22.
[57] Al-Saffar NM, Troy H, Ramirez de Molina A, et al. Non invasive magnetic resonance spectroscopic pharmacodynamic markers of the
choline kinase inhibitor MN58b in human carcinoma models. Cancer Res 2006; 66: 427-34.
[58] Ramirez de Molina AR, Banez-Coronel M, Gutierrez R, et al.Choline kinase activation is a critical requirement for the
proliferation of primary human mammary epithelial cells and breast tumor progression. Cancer Res 2004; 64: 6732-9.
[59] Glunde K, Raman V, Mori N, Bhujwalla ZM. RNA interference-mediated choline kinase suppression in breast cancer cells induces
differentiation and reduces proliferation. Cancer Res 2005; 65: 11034-43.
[60] Aoyama C, Liao H, Ishidate K. Structure and function of choline kinase isoforms in mammalian cells. Progr Lipid Res 2004; 43:
266-81. [61] Lacal JC. Choline kinase: a novel target for antitumor drugs. IDrugs
2001; 4: 419-26. [62] Yoshimoto M, Waki A, Obata A, Furukawa T, Yonekura Y,
Fujibayashi Y. Radiolabeled choline as a proliferation marker: comparison with radiolabeled acetate. Nucl Med Biol 2004; 31:
859-65. [63] DeGrado TR, Baldwin SW, Wang S, et al. Synthesis and evaluation
of (18)F-labeled choline analogs as oncologic PET tracers. J Nucl Med 2001; 42: 1805-14.
[64] Hara T. 18F-Fluorocholine: a new oncologic PET tracer. J Nucl Med 2001; 42: 1815-17.
[65] Podo F, Carpinelli G, Ferretti A, Borghi P, Proietti E, Belardelli F. Activation of glycerophosphocholine phosphodiesterase in Friend
leukemia cells upon in vitro-induced erytroid differentiation.31P and 1H NMR studies. Israel J Chem 1992; 32: 47-54.
[66] Gribbestad IS, Singstad TE, Nilsen G, et al. In vivo 1H MRS of normal breast and breast tumors using a dedicated double breast
coil. J Magn Reson Imaging 1998; 8: 1191-7. [67] Roebuck JR, Cecil KM, Schnall MD, Lenkinski RE. Human breast
lesions: characterization with proton MR spectroscopy. Radiology 1998; 209: 269-75.
[68] Kvistad KA, Bakken IJ, Gribbestad IS, et al. Characterization of neoplastic and normal human breast tissues with in vivo 1H MR
spectroscopy. J Magn Reson Imaging 1999; 10: 159-64. [69] Yeung DK, Cheung HS, Tse GM. Human breast lesions:
characterization with contrast-enhanced in vivo proton MR spectroscopy - Initial results. Radiology 2001; 220: 40-6.
136 Current Medical Imaging Reviews, 2007, Vol. 3, No. 2 Podo et al.
[70] Jagannathan NR, Kumar M, Seenu V, et al. GK. Evaluation of total
choline from in-vivo volume localized proton MR spectroscopy and its response to neoadjuvant chemotherapy in locally advanced
breast cancer. Br J Cancer 2001; 84:1016-22. [71] Bakken IJ, Gribbestad IS. External standard method for the in vivo
quantification of choline-compounds in breast tumors by proton MR spectroscopy at 1.5 T. proton MR spectroscopy at 1.5 Tesla.
Magn Reson Med 2001; 46: 189-92. [72] Cecil KM, Schnall MD, Siegelman ES, Lenkinski RE. The
evaluation of human breast lesions with magnetic resonance imaging and proton magnetic resonance spectroscopy. Breast
Cancer Res Treat 2001; 68: 45-54. [73] Katz-Brull R, Lavin PT, Lenkinski RE. Clinical utility of proton
magnetic resonance spectroscopy in characterizing breast lesions. J Natl Cancer Inst 2002; 94: 1197-203.
[74] Tse GM, Cheung HS, Pang LM, et al. Characterization of lesions of breast with proton MR spectroscopy: comoparison of carcinomas,
benign lesions, and phyllodes tumors. AJR Am J Roentgenol 2003; 181: 1267-72.
[75] Kim JK, Park SH, Lee HM, et al. In vivo 1H-MRS evaluation of malignant and benign breast diseases. Breast 2003; 12: 179-82.
[76] Bolan PJ, Meisamy S, Baker EH, et al. In vivo quantification of choline compounds in the breast with 1H MR spectroscopy. Magn
Reson Imaging 2003; 50: 1134-43. [77] Huang W, Fisher PR, Dulaimy K, Tudorica LA, O’Hea B, Button
TM. Detection of breast malignancy: diagnostic MR protocol for improved specificity. Radiology 2004; 232: 585-91.
[78] Jacobs MA, Barker PB, Bottomley PA, Bhujwalla Z, Blumke DB. Proton MR spectroscopic imaging of human breast cancer: A
preliminary study. J Magn Reson Imaging 2004;19:68-75. [79] Stanwell P, Gluch L, Clark D, et al. Specificity of choline
metabolites for in vivo diagnosis of breast cancer using 1H MRS at 1.5 T. Eur Radiol 2005;15:1037-43.
[80] Meisamy S, Bolan PJ, Baker EH, et al. Adding in vivo quantitative 1H MR spectroscopy to improve diagnostic accuracy of breast MR
imaging: preliminary results of observer performance study at 4.0 T. Radiology 2005; 236:465-75.
[81] Jacobs MA, Barker PB, Argani P, Ouwerkerk R, Bhujwalla ZM, Bluemke DA. Combined dynamic contrast enhanced breast MR and
proton spectroscopic imaging: a feasibility study. J Magn Reson Imaging. 2005; 21:23-8.
[82] Bartella L, Morris EA, Dershaw DD, et al. Proton spectroscopy with choline peak as malignancy marker improves positive
predictive value for breast cancer diagnosis: Preliminary study. Radiology 2006; 239: .686-92.
[83] Yeung DK, Yang WT, Tse GM. Breast cancer: in vivo proton MR spectroscopy in the characterization of histopathologic subtypes and
preliminary observations in axillary node metastases. Radiology 2002; 225:190-7.
[84] Sharma U, Mehta A, Seenu V, Jagannathan NR. Biochemical characterization of metastatic lymph nodes of breast cancer patients
by in vitro 1H magnetic resonance spectroscopy: a pilot study. Magn Reson Imaging 2004; 22: 697-706.
[85] Seenu V, Pavan Kumar MNP, Sharma U, Gupta SD, Mehta SN, Jagannathan NR. Potential of magnetic resonance spectroscopy to
detect metastasis in axillary lymph nodes in breast cancer. Magn Reson Imaging 2005; 23:1005-10.
[86] Salibi N, Brown MA. Clinical MR spectroscopy. First principles. New York: Wiley-Liss, 1998: 75-80.
[87] Gribbestad IS, Peterson SB, Fjone HE, Kvinnsland S, Krane J. 1HNMR spectroscopic characterization of perchloric acid extracts
from breast carcinomas and non-involved breast tissue. NMR Biomed 1994; 7: 181-194.
[88] MacKinnon WB, Barry PA, Malycha PL, et al. Fine-needle biopsy specimens of benign breast lesions distinguished from invasive
cancer ex vivo with proton MR spectroscopy. Radiology 1997; 204: 661-6.
[89] Cheng LL, Chang IW, Smith BL, Gonzales RG. Evaluation of human breast ductal carcinoma with high-resolution magic-angle
spinning proton magnetic resonance spectroscopy. J Magn Reson 1998; 135: 194-202.
[90] Sitter B, Sonnewald U, Spraul M, Fj sne HE, Gribbestad IS. High-resolution magic angle spinning HR MAS of breast cancer tissue.
NMR Biomed 2002; 15: 327-37.
[91] Fitch WL, Detre G., Holmes CP, Shoolery JN, Keifer P. High
resolution 1H NMR in solid phase organic synthesis. J Org Chem 1994; 59: 7955-56.
[92] Bathen TF, Jensen LR, Sitter B, et al. MR-determined metabolic phenotype of breast cancer in prediction of lymphatic spread, grade,
and hormone status. Breast Cancer Res Treat 2006; Oct 24 [Epub ahead of print].
[93] American College of Radiology. Reporting system. In: Breast Imaging Reporting and data System (BI-RADS). 3rd ed. Reston,
VA: American College of Radiology, 1998. [94] Wallace JC, Raaphorst GP, Somorjai RL, et al. Classification of 1H
MR spectra of biopsies from untreated and recurrent ovarian cancer using linear discriminate analysis. Magn Reson Med 1997; 38: 569-
76. [95] Smith JC, Blandford DE. Diagnosis of cancer in humans by 1H
NMR of tissue biopsies. Biochem Cell Biol 1998; 76: 472-476. [96] Boss EA, Moolenaar SH, Massuger LF, et al. High-resolution
proton nuclear magnetic resonance spectroscopy of ovarian cyst fluid. NMR Biomed 2000;13: 297-305.
[97] Okada T, Harada M, Matsuzaki K, Nishitani H, Aono T. Evaluation of female intrapelvic tumors by clinical proton MR spectroscopy. J
Magn Reson Imaging 2001; 13: 912-7. [98] Hascalik S, Celik O, Sarac K, Meydanli MM, Alkan A, Mizrak B.
Metabolic changes in pelvic lesions: findings at proton MR spectroscopic imaging. Gynecol Obstet Invest. 2005; 60: 121-7.
[99] Rofstad EK, DeMuth P, Sutherland RM. 31P NMR spectroscopy measurements of human ovarian carcinoma xenografts:
relationships to tumor volume, growth rate, necrotic fraction and differentiation status. Radiother Oncol 1988; 12: 315-26.
[100] Klostergaard J, Auzenne E, Ghosh S, Farquhar D, Rivera B, Price RE. Magnetic resonance imaging-based prospective detection of
intraperitoneal human ovarian carcinoma xenografts treatment response. Int J Gynecol Cancer 2006; 16 Suppl 1:111-7.
[101] Han LY, Landen CN, Trevino JG, et al. Antiangiogenic and antitumor effects of SRC inhibition in ovarian carcinoma. Cancer
Res 2006; 66: 8633-9. [102] Kim KS, Sengupta S, Berk M, et al. Hypoxia Enhances
Lysophosphatidic Acid Responsiveness in ovarian cancer cells and lysophosphatidic acid induces ovarian tumor metastasis in vivo.
Cancer Res 2006; 66: 7983-90. [103] Kumar R, Nadig MR, Chauhan A. Positron emission tomography:
clinical applications in oncology. Part 1. Expert Rev Anticancer Ther 2005; 5: 1079-94.
[104] Kumar R, Chauhan A. Positron emission tomography: clinical applications in oncology. Part 2. Expert Rev Anticancer Ther
2006;6: 625-40. [105] Mankoff DA, Eubank WB. Current and future use of positron
emission tomography (PET) in breast cancer. J Mammary Gland Biol Neoplasia 2006; 11: 125-136.
[106] Jager PL, de Korte MA, Lub-de Hooge MN, et al. Molecular imaging: what can be used today. Cancer Imaging 2005; 5 Spec No
A: S27-32. [107] Kumar R, Chauhan A, Jana S, Dadparvar S. Positron emission
tomography in gynecological malignancies. Expert Rev Anticancer Ther 2006; 6:1033-44.
[108] Quon A, Gambhir SS. FDG-PET and beyond: molecular breast cancer imaging. J Clin Oncol 2005; 23: 1664-73.
[109] Messa C, Di Muzio N, Picchio M, Gilardi MC, Bettinardi V, Fazio F. PET/CT and radiotherapy. Q J Nucl Med Mol Imaging 2006; 50:
4-14. [110] Guller U, Nitzsche E, Moch H, Zuber M. Is positron emission
tomography an accurate non-invasive alternative to sentinel lymph node biopsy in breast cancer patients?. J Natl Cancer Inst 2003; 95:
1040-3. [111] Isasi CR, Moadel RM, Blaufox MD. A meta-analysis of FDG-PET
for the evaluation of breast cancer recurrence and metastases. Breast Cancer Res Treat 2005; 90: 105-12.
[112] Been LB, Elsinga PH, de Vries J, et al. Positron emission tomography in patients with breast cancer using 18F-3'-deoxy-3'-
fluoro-l-thymidine (18F-FLT)-a pilot study. Eur J Surg Oncol 2006; 32: 39-43.
[113] Linden HM, Stekhova SA, Link JM, et al. Quantitative fluoroestradiol positron emission tomography imaging predicts
response to endocrine treatment in breast cancer. J Clin Oncol 2006; 24: 2793-9.

Choline Metabolism in Breast and Ovary Cancer Imaging Current Medical Imaging Reviews, 2007, Vol. 3, No. 2 137
[114] Hubner KF, McDonald TW, Niethammer JG, Smith GT, Gould HR,
Buonocore E. Assessment of primary and metastatic ovarian cancer by positron emission tomography (PET) using 2-[18F]deoxyglucose
(2-[18F]FDG). Gynecol Oncol 1993; 51: 197-204. [115] Lapela M, Leskinen-Kallio S, Varpula M, et al. Metabolic imaging
of ovarian tumors with carbon-11-methionine: a PET study. J Nucl Med 1995; 36: 2196-200.
[116] Havrilesky LJ, Kulasingam SL, Matchar DB, Myers ER. FDG-PET
for management of cervical and ovarian cancer. Gynecol Oncol 2005; 97: 183-91.
[117] Reinhardt MJ, Matthies A, Biersack HJ. PET-imaging in tumors of the reproductive tract. Q J Nucl Med 2002; 46: 105-12.
[118] Torizuka T, Kanno T, Futatsubashi M, et al. Imaging of gynecologic tumors: comparison of 11C-choline PET with 18F-FDG
PET. J Nucl Med 2003; 44: 1051-6.
Received: December 26, 2006 Revised: February 19, 2007 Accepted: February 19, 2007


![Magnetic ionic plastic crystal: choline[FeCl4]](https://static.fdokumen.com/doc/165x107/634545c06cfb3d4064099b55/magnetic-ionic-plastic-crystal-cholinefecl4.jpg)