A trophic model for exploring possible ecosystem impacts of fishing in the Gulf of Paria, between...
16
Ecological Modelling 172 (2004) 307–322 A trophic model for exploring possible ecosystem impacts of fishing in the Gulf of Paria, between Venezuela and Trinidad Sherry Manickchand-Heileman a,∗ , Jeremy Mendoza-Hill b , Amoy Lum Kong c , Freddy Arocha b a United Nations Environment Programme, Division of Technology, Industry and Economics, Tour Mirabeau, 39-43 quai Andre Citroen, 75739 Paris Cedex 15, France b Instituto Oceanográfico de Venezuela, Universidad de Oriente, Apdo. 245, Cumana, Venezuela c Institute of Marine Affairs, Hilltop Lane, Chaguaramas, Trinidad and Tobago Abstract The Gulf of Paria is a semi-enclosed estuarine area between Trinidad and Venezuela. Fisheries for demersal and pelagic species are important, and shared by nationals from both countries. In this study, a trophic model is constructed, and several whole system statistics and network flow indices determined for this ecosystem. Possible impacts of trawling on the biomass of model components, through simulation of the effects of varying fishing mortality rate, were also explored. The model components consist of 15 fish groups, 5 invertebrate groups, seabirds, phytoplankton, detritus and discards. Results indicate that the food web is dominated by the detrital pathway, and that the export of detritus out of the system is significant. Mixed trophic impacts show that detritus and lower trophic levels have a significant positive impact on other groups, i.e. they exert bottom-up control of the food web. Mean transfer efficiency is 12.2%, Finn cycling index 7.2%, path length 6.2, omnivory index 0.2, and system ascendency and overhead 42 and 58%, respectively. Results suggest that, although the Gulf appears to be relatively mature, it may experience some degree of instability due to exploitation and the large seasonal variation in salinity, among other factors. Simulations of different fishing mortality rates show a strong impact on the biomass of system components. Increasing fishing mortality by 50% for 5 years resulted in a marked decrease in biomass of fish groups accompanied by an increase in that of invertebrates, notably penaeids and crabs. Fish biomass recovers after fishing pressure is relaxed, while that of crabs declined further. On the other hand, a reduced fishing mortality rate elicited the opposite response in system components, except for crab of which the biomass again declined significantly when that of fish increased. Biomass of groups at higher trophic levels obtained during trawl surveys conducted in 1945, before trawl fishing was introduced in the Gulf, were significantly higher than current biomass, except for carangids, penaeids, and possibly clupeoids. This may indicate a possible shift towards a system dominated by lower trophic levels. © 2003 Elsevier B.V. All rights reserved. Keywords: Ecopath with Ecosim; Ecosystem impact of fishing; Venezuela; Trinidad; Gulf of Paria Manuscript PFITEC-12 (EMECS 6) for Ecological Modelling, May 2003. ∗ Corresponding author. E-mail address: sh [email protected] (S. Manickchand-Heileman). 1. Introduction The Gulf of Paria is a shared body of water on the northeastern continental shelf of South America, between eastern Venezuela and the west coast of the island of Trinidad (Fig. 1). The Gulf is very produc- 0304-3800/$ – see front matter © 2003 Elsevier B.V. All rights reserved. doi:10.1016/j.ecolmodel.2003.09.013
Transcript of A trophic model for exploring possible ecosystem impacts of fishing in the Gulf of Paria, between...

Ecological Modelling 172 (2004) 307–322
A trophic model for exploring possible ecosystem impacts offishing in the Gulf of Paria, between Venezuela and Trinidad�
Sherry Manickchand-Heilemana,∗, Jeremy Mendoza-Hillb,Amoy Lum Kongc, Freddy Arochab
a United Nations Environment Programme, Division of Technology, Industry and Economics, Tour Mirabeau,39-43 quai Andre Citroen, 75739 Paris Cedex 15, France
b Instituto Oceanográfico de Venezuela, Universidad de Oriente, Apdo. 245, Cumana, Venezuelac Institute of Marine Affairs, Hilltop Lane, Chaguaramas, Trinidad and Tobago
Abstract
The Gulf of Paria is a semi-enclosed estuarine area between Trinidad and Venezuela. Fisheries for demersal and pelagicspecies are important, and shared by nationals from both countries. In this study, a trophic model is constructed, and severalwhole system statistics and network flow indices determined for this ecosystem. Possible impacts of trawling on the biomass ofmodel components, through simulation of the effects of varying fishing mortality rate, were also explored. The model componentsconsist of 15 fish groups, 5 invertebrate groups, seabirds, phytoplankton, detritus and discards. Results indicate that the foodweb is dominated by the detrital pathway, and that the export of detritus out of the system is significant. Mixed trophic impactsshow that detritus and lower trophic levels have a significant positive impact on other groups, i.e. they exert bottom-up controlof the food web. Mean transfer efficiency is 12.2%, Finn cycling index 7.2%, path length 6.2, omnivory index 0.2, and systemascendency and overhead 42 and 58%, respectively. Results suggest that, although the Gulf appears to be relatively mature, itmay experience some degree of instability due to exploitation and the large seasonal variation in salinity, among other factors.Simulations of different fishing mortality rates show a strong impact on the biomass of system components. Increasing fishingmortality by 50% for 5 years resulted in a marked decrease in biomass of fish groups accompanied by an increase in that ofinvertebrates, notably penaeids and crabs. Fish biomass recovers after fishing pressure is relaxed, while that of crabs declinedfurther. On the other hand, a reduced fishing mortality rate elicited the opposite response in system components, except for crabof which the biomass again declined significantly when that of fish increased. Biomass of groups at higher trophic levels obtainedduring trawl surveys conducted in 1945, before trawl fishing was introduced in the Gulf, were significantly higher than currentbiomass, except for carangids, penaeids, and possibly clupeoids. This may indicate a possible shift towards a system dominatedby lower trophic levels.© 2003 Elsevier B.V. All rights reserved.
Keywords:Ecopath with Ecosim; Ecosystem impact of fishing; Venezuela; Trinidad; Gulf of Paria
� Manuscript PFITEC-12 (EMECS 6) for Ecological Modelling,May 2003.
∗ Corresponding author.E-mail address:sh [email protected]
(S. Manickchand-Heileman).
1. Introduction
The Gulf of Paria is a shared body of water onthe northeastern continental shelf of South America,between eastern Venezuela and the west coast of theisland of Trinidad (Fig. 1). The Gulf is very produc-
0304-3800/$ – see front matter © 2003 Elsevier B.V. All rights reserved.doi:10.1016/j.ecolmodel.2003.09.013

308 S. Manickchand-Heileman et al. / Ecological Modelling 172 (2004) 307–322
Fig. 1. Study area, the Gulf of Paria.
tive and supports valuable fisheries in both countriesfor penaeid shrimps and demersal fish, as well as forsmall and medium-sized pelagic species. Commercialfishing for demersal species became established in thesecond half of the 20th century, with the major fish-ery being the trawl fishery for penaeid shrimps. Asis characteristic of tropical demersal shrimp fisheries,large quantities of bycatch consisting of juvenilesof commercially important finfish such as sciaenids,carangids and gerreids are caught, most of which isdiscarded at sea (Maharaj and Recksiek, 1991; Jobityet al., 1997; Marcano et al., 1997).
Over the last decade, landings and catch per unitof effort of shrimp and finfish from the Gulf havedeclined (Marcano et al., 1999; Novoa, 2000) and itis likely that the average size of individual fish landedhas decreased. Also, data presented by the Trinidadand TobagoFisheries Division in 1999on bycatch ofartisanal trawlers, and observations by the first author
suggest a marked increase in the abundance of portu-nid crabs. These trends suggest that trawling has hadan impact on the ecosystem, but there are no studiesto date to support this. The ecosystem impact of trawl-ing has been documented for other marine systems,for example, the Gulf of Thailand (Beddington, 1984;Christensen, 1998) and the Java Sea (Buchary, 1999).A decline in landings of targeted species, accom-panied by marked alterations in fish abundance andbody size, has already been demonstrated on othercontinental shelves subjected to long-term trawl-ing (Caveriviere, 1982; Longhurst and Pauly, 1987;Anthony, 1993).
The fisheries of the Gulf are not managed; althoughregulations exist (both in Trinidad and Venezuela),they are not properly implemented or enforced. Pre-vious studies in this area have consisted of fisheriessurveys (e.g.Whiteleather and Brown, 1945; Ginés,1972; Manickchand-Heileman and Julien-Flus, 1990;

S. Manickchand-Heileman et al. / Ecological Modelling 172 (2004) 307–322 309
Cervigón, 1991, 1993) or focused on individualspecies (Altuve et al., 1995, for the western Gulf;Sturm, 1974; Shim, 1981; Manickchand-Dass, 1987;Manickchand-Heileman and Kenny, 1990, for theeastern Gulf), as well as recent joint assessments ofthe shrimp resources (Alió et al., 1999a, 1999b). Todate, no studies have been conducted on species in-teractions or on the ecosystem effects of trawling inthe Gulf.
In this study, a mass-balance trophic model for theGulf is constructed and the possible impact of trawl-ing on its ecosystem explored, using the Ecopath withEcosim software (Walters et al., 1997).
2. Methods
2.1. Study area
The Gulf of Paria (Fig. 1) covers an area of7600 km2. Average depth of the Gulf and the southernchannel is approximately 30 m, while depths in thenorthern channel reach over 150 m. In general, bottomtopography is smooth and soft sediments predomi-nate, except in the north where hard substrates occur.The Gulf is a large estuarine area with high waterstratification, and has substantial seasonal variationsdue to river runoff and mixing by tides, currents andwind. The dry season lasts from November to Mayand the rainy season peaks in July–September.
The main riverine inputs are from the Orinoco andSan Juan rivers of South America, and the CaroniRiver of Trinidad. Surface water temperature in thedry season varies between 25.5 and 28◦C and surfacesalinity varies between 27 and 35. In the rainy season,surface water temperature is less variable ranging from28 to 29◦C and surface salinity ranges from close tozero to a maximum of 25 (Ginés, 1972; Novoa, 1998).
The Gulf is also subjected to land-based sourcesof pollutants from industrial and agricultural activitieson the eastern side (Trinidad), one of the more indus-trialized areas in the region (Boodoosingh, 1992). Inaddition, petroleum exploration and extraction in thewaters of the Gulf and in the Atlantic Ocean to thesouth, may also lead to impacts on the Gulf ecosys-tem. However, there is no concrete indication of ac-tual or potential effects of these activities on the Gulfecosystem.
2.2. The fisheries
The muddy substrate with its high detrital contentsupports a rich and diverse fauna of benthic inver-tebrates including penaeid shrimps, demersal teleostfishes and elasmobranchs. The major fisheries in theGulf include industrial and semi-industrial trawl fish-eries for penaeid shrimps and a multispecies mix ofdemersal fish, as well as artisanal fisheries for smalland medium-sized coastal pelagic fish.
In the western Gulf fishing has been practised by in-digenous peoples since pre-hispanic times. During thesecond half of the 20th century, particularly during thelast 30 years, fishing intensity increased considerably.By the mid-1970s, there were more than 100 trawlers,declining to around 70 boats in the late 1990s. An-nual landings of the commercial fleet peaked in theearly 1990s at around 9000 t. The main species cap-tured by this fleet are penaeid shrimp (especiallyPe-naeus notialis) and sciaenids (Micropogonias furnieri,Macrodon ancyclodonandCynoscionsp.).
The earliest statistical data available for thesmall-scale fishery in the western Gulf are for 1969(Marcano, 1977). By the mid-1990s the total num-ber of boats in this fleet had increased to around450 and landings exceeded 10,000 t. Both the num-ber of registered boats and landings have declined inrecent years. Fishing gears used by the small-scalefleet includes handlines, longlines, bottom and sur-face gillnets, and more recently small shrimp trawls.The main species captured are catfish (Arius sp.),sciaenids (M. furnieri, M. ancyclodonandCynoscionsp.), carangids (Caranx sp.), scombrids (Scombero-morus brasiliensisandS. cavalla), sharks (Rhizopri-onodon porosusandCarcharhinussp.) and snappers(Lutjanussp.).
On the eastern side of the Gulf, fishing was also tak-ing place at a subsistence level up until the second halfof the 20th century, when commercial trawling wasintroduced. Up until that time, fishing was conductedwith handlines and beach seines mainly for pelagicspecies such asS. brasiliensis, Caranxsp., and dem-ersal species such asM. furnieri andCynoscionsp. In1945, an experimental fishery survey revealed goodpotential for a demersal trawl fishery (Whiteleatherand Brown, 1945), following which rapid develop-ment of trawling took place. Historical information onthe development of trawling in the eastern Gulf is not

310 S. Manickchand-Heileman et al. / Ecological Modelling 172 (2004) 307–322
available, but as early as 1969 a total of 166 locallyregistered trawlers had been identified (Jordan, 1969).The main species exploited by this fleet are the penaeidshrimpsP. notialis, P. schmitti, P. subtilis and Xiphope-naeus kroyeri. The demersal trawl fishery consists ofan inshore artisanal fleet, an offshore semi-industrialfleet, both of which operate in the Gulf, and an offshoreindustrial fleet (Fisheries Division, Ministry of Agri-culture, Lands and Marine Resources, Trinidad andTobago, 1999). Available statistics show that landingsof penaeid shrimps ranged from 162 in 1962 to 321 tin 1997, with a peak of 630 t in 1970 (Annual Fish-eries Landing Statistics, Fisheries Division, Ministryof Agriculture, Lands and Marine Resources, Trinidadand Tobago, unpublished).
2.3. Analyses
A mass-balanced trophic model was constructedusing the Ecopath with Ecosim software, version4 (Walters et al., 1997; Christensen et al., 2000;Christensen and Walters, 2003). The model was firstconstructed using the Ecopath routine which uses aseries of simultaneous linear equations, one for eachspecies or group i, to quantify trophic flows amongtrophic groups (Christensen and Pauly, 1992a, 1992b).The basic equation is expressed as follows:
Production by (i)-all predation on (i)-non-predatorylosses of (i)-export of (i): 0, for all i. This can beexpressed as
Bi ·(
Pi
Bi
)· EEi −
n∑j=1
Bj
(Q
B
)j · DCji − EXi = 0,
whereBi is the biomass of group (i); Pi/Bi is the pro-duction/biomass ratio of (i), which is equal to the co-efficient of total mortalityZ under steady-state condi-tions (Allen, 1971); EEi is the ecotrophic efficiency,which is that part of production that goes to preda-tion, catches or exports out of the system;Bj is thebiomass of predator (j); Qj /Bj: consumption/biomassratio of predator (j); DCji: fraction of prey (i) in thediet of predator (j); EXi is export of group (i), which,in this study, consisted of fisheries catches. At leastthree of the parametersB, P/B, EE, andQ/B must beknown for each group, while the model estimates thefourth. In addition, diet compositions are required foreach living group in the model.
2.4. Model groups
Twenty-four ecological groups were defined basedon the most abundant families captured during re-search cruises in the Gulf, on economic importance,and abundance in the fish diets. The fish groups wereclupeoids (Clupeidae and Engraulidae), carangids,scombrids, flatfish, ariids, gerreids, trichiurids, lut-janids, serranids, haemulids, sharks, rays, other fish,M. furnieri and Cynoscionsp., which are the mostabundant demersal finfish species caught. Five in-vertebrate groups are included: penaeid shrimps,crabs (mainlyCallinectes sapidus), molluscs, het-erotrophic benthos and zooplankton. The other groupsare seabirds, phytoplankton, trawling discards andsediment detritus.
2.5. Parametrization
Biomass estimates of demersal fish, penaeids andcrabs were obtained from trawl surveys conducted onthe Trinidad side of the Gulf (Maharaj, 1989; Amos,1990) as well as from research cruises conducted bythe Norwegian research vessel “Dr. Fridtjof Nansen”in the area adjacent to the Gulf off the south coastof Trinidad (Institute of Marine Research, Bergen,1989). Biomass of detritus was calculated using theempirical formula ofPauly et al. (1993), relating detri-tal biomass to primary production and euphotic layerdepth, which were obtained fromMoigis and Bonilla(1985). Biomass of seabirds, pelagic fish groups,molluscs and benthos were calculated by the model.Biomass was expressed as t per km2 wet weight.
Production/biomass rates (Z) for fish groups forwhich biomass (B), catch (C) and natural mortality (M)were available were determined fromZ = C/B + M.For some fish groups estimates ofZ were avail-able from analysis of length-frequency distributions(Institute of Marine Affairs, Trinidad and Tobago,unpublished) while for othersZ were obtained fromanalysis of numbers-at-age (Sturm, 1974; Shim, 1981;Manickchand-Dass, 1987; Manickchand-Heilemanand Kenny, 1990). P/B ratios of invertebrates wereobtained from the literature for similar ecosys-tems (Arreguın-Sánchez et al., 1993; Manickchand-Heileman et al., 1998). Mean fish landings and dis-cards by group were provided by both Venezuela(Instituto Nacional de Investigaciones Agrıcolas,
S. Manickchand-Heileman et al. / Ecological Modelling 172 (2004) 307–322 311
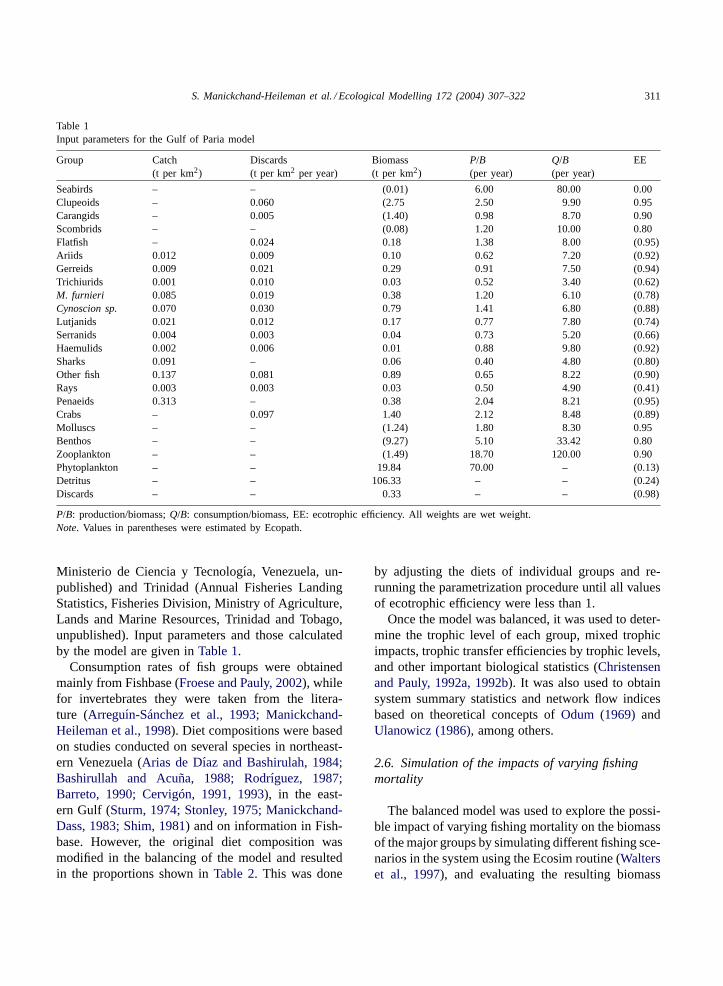
Table 1Input parameters for the Gulf of Paria model
Group Catch(t per km2)
Discards(t per km2 per year)
Biomass(t per km2)
P/B(per year)
Q/B(per year)
EE
Seabirds – – (0.01) 6.00 80.00 0.00Clupeoids – 0.060 (2.75 2.50 9.90 0.95Carangids – 0.005 (1.40) 0.98 8.70 0.90Scombrids – – (0.08) 1.20 10.00 0.80Flatfish – 0.024 0.18 1.38 8.00 (0.95)Ariids 0.012 0.009 0.10 0.62 7.20 (0.92)Gerreids 0.009 0.021 0.29 0.91 7.50 (0.94)Trichiurids 0.001 0.010 0.03 0.52 3.40 (0.62)M. furnieri 0.085 0.019 0.38 1.20 6.10 (0.78)Cynoscion sp. 0.070 0.030 0.79 1.41 6.80 (0.88)Lutjanids 0.021 0.012 0.17 0.77 7.80 (0.74)Serranids 0.004 0.003 0.04 0.73 5.20 (0.66)Haemulids 0.002 0.006 0.01 0.88 9.80 (0.92)Sharks 0.091 – 0.06 0.40 4.80 (0.80)Other fish 0.137 0.081 0.89 0.65 8.22 (0.90)Rays 0.003 0.003 0.03 0.50 4.90 (0.41)Penaeids 0.313 – 0.38 2.04 8.21 (0.95)Crabs – 0.097 1.40 2.12 8.48 (0.89)Molluscs – – (1.24) 1.80 8.30 0.95Benthos – – (9.27) 5.10 33.42 0.80Zooplankton – – (1.49) 18.70 120.00 0.90Phytoplankton – – 19.84 70.00 – (0.13)Detritus – – 106.33 – – (0.24)Discards – – 0.33 – – (0.98)
P/B: production/biomass;Q/B: consumption/biomass, EE: ecotrophic efficiency. All weights are wet weight.Note. Values in parentheses were estimated by Ecopath.
Ministerio de Ciencia y Tecnologıa, Venezuela, un-published) and Trinidad (Annual Fisheries LandingStatistics, Fisheries Division, Ministry of Agriculture,Lands and Marine Resources, Trinidad and Tobago,unpublished). Input parameters and those calculatedby the model are given inTable 1.
Consumption rates of fish groups were obtainedmainly from Fishbase (Froese and Pauly, 2002), whilefor invertebrates they were taken from the litera-ture (Arreguın-Sánchez et al., 1993; Manickchand-Heileman et al., 1998). Diet compositions were basedon studies conducted on several species in northeast-ern Venezuela (Arias de Dıaz and Bashirulah, 1984;Bashirullah and Acuña, 1988; Rodrıguez, 1987;Barreto, 1990; Cervigón, 1991, 1993), in the east-ern Gulf (Sturm, 1974; Stonley, 1975; Manickchand-Dass, 1983; Shim, 1981) and on information in Fish-base. However, the original diet composition wasmodified in the balancing of the model and resultedin the proportions shown inTable 2. This was done
by adjusting the diets of individual groups and re-running the parametrization procedure until all valuesof ecotrophic efficiency were less than 1.
Once the model was balanced, it was used to deter-mine the trophic level of each group, mixed trophicimpacts, trophic transfer efficiencies by trophic levels,and other important biological statistics (Christensenand Pauly, 1992a, 1992b). It was also used to obtainsystem summary statistics and network flow indicesbased on theoretical concepts ofOdum (1969)andUlanowicz (1986), among others.
2.6. Simulation of the impacts of varying fishingmortality
The balanced model was used to explore the possi-ble impact of varying fishing mortality on the biomassof the major groups by simulating different fishing sce-narios in the system using the Ecosim routine (Walterset al., 1997), and evaluating the resulting biomass

312S
.M
an
ickcha
nd
-He
ilem
an
et
al./E
colog
ical
Mo
de
lling
17
2(2
00
4)
30
7–
32
2
Table 2Diet composition matrix for the Gulf of Paria obtained following balancing of the model
Prey Predators
1 2 3 4 5 6 7 8 9 10 11 12 13 14 15 16 17 18 19 20 21
SeabirdsClupeoids 0.590 0.328 0.720 0.400 0.015 0.190 0.020 0.059 0.060 0.154 0.030Carangids 0.280 0.120 0.220 0.018 0.120 0.010 0.010 0.030 0.095 0.020Scombrids 0.100 0.010Flatfish 0.020 0.020 0.030 0.100 0.120Ariids 0.050 0.085Gerreids 0.010 0.010 0.010 0.005 0.100 0.100 0.100TrichiuridsM. furnieri 0.060 0.006 0.016Cynoscion sp. 0.020 0.010 0.007 0.100 0.010 0.109 0.028 0.015Lutjanids 0.010 0.080 0.030Serranids 0.002 0.010 0.010Haemulids 0.005 0.002SharksOther fish 0.010 0.020 0.020 0.010 0.006 0.020 0.060 0.010RaysPenaeids 0.002 0.010 0.010 0.020 0.010 0.020 0.010 0.001 0.020 0.001 0.020 0.005 0.080 0.020Crabs 0.040 0.050 0.110 0.080 0.120 0.150 0.050 0.150 0.030 0.130 0.050 0.100 0.250 0.010Molluscs 0.050 0.020 0.200 0.020 0.090 0.060 0.040 0.080 0.110 0.060Benthos 0.220 0.250 0.130 0.740 0.630 0.450 0.150 0.450 0.412 0.610 0.314 0.590 0.190 0.440 0.410 0.750 0.720 0.750Zooplankton 0.750 0.250 0.340 0.020 0.080 0.120Phytoplankton 0.010 0.010 1.000Detritus 0.020 0.090 0.150 0.210 0.100 0.150 0.050 0.060 0.030 0.050 0.160 0.150 0.250 0.180 0.240 1.000Discards 0.020 0.010 0.020 0.010 0.010 0.010 0.010

S. Manickchand-Heileman et al. / Ecological Modelling 172 (2004) 307–322 313
changes in the different groups. Ecosim is a time-dynamic simulation model that uses the linear equa-tions of steady-state Ecopath models, isolating thebiomass accumulation term and setting up a series ofdifferential equations of the form:
dBi
dt= gi
∑j
Cji −∑
j
Cij + Ii − (Mi + Fi + ei)Bi
where, dBi/dt represents the biomass growth rate,gi isthe net growth efficiency (production/consumption ra-tio), Cji is the total consumption rate of group (i), Cij
is the predation of all predators on group (i), Mi thenon-predation natural mortality rate,Fi is the fishingmortality rate,ei is emigration rate andIi is inmigra-tion rate.
This leads to predictions of how biomass developsover time as a consequence of changes in fishing pat-terns or in other ecosystem forcing functions. Ecosimrequires a vulnerability setting for all predator-prey in-teractions controlling the rates with which prey groupsare moving between a vulnerable state and one wherethey are not susceptible to predation by a given preda-tor. The default vulnerability setting corresponds tomixed top-down and bottom-up control (a setting of0.0 for bottom-up control, to 1 for top-down control).For the present simulations the default was used forall prey groups, apart from penaeids, crabs and ben-thos, for which the vulnerability setting was 0.9 fortop-down control.
Under each scenario, fishing mortality on thetrawler fleet, rather than on individual groups, waschanged. This was because trawling is relatively non-selective and it was not practical to adjust fishingeffort on individual groups. Each simulation was runfor 60 years. The three scenarios were exploratory andarbitrarily chosen, and did not reflect any intendedfisheries management plans or proposals:
Scenario 1: Relative fishing mortality rate was in-creased by 50% for 5 years (year 5 to year 10),then reduced to the original level for the remain-ing time period.
Scenario 2: Fishing mortality was gradually de-creased in the first 5 years to no fishing for thenext 55 years, until year 60.
Scenario 3: Fishing mortality was doubled for 10years, then returned to the original level for theremaining time period.
Biomass used in the model (current biomass) werecompared with those obtained during trawl surveysconducted in 1945 (Whiteleather and Brown, 1945),before the trawl fishery was introduced and becameestablished in the Gulf. The latter were calculated us-ing the swept area method.
3. Results
3.1. Trophic structure and flows
A balanced model was successfully constructed forthe Gulf of Paria ecosystem. In general, EE values arehigh for the fish groups, while they are low for phy-toplankton and detritus (Table 1). The low EE of phy-toplankton indicates that only a small proportion ofphytoplankton production is grazed in the water col-umn, with the rest going toward detritus. Similarly, thelow EE of detritus also indicates that a small fractionof detritus biomass is consumed, with the rest beingburied in the sediment or exported out of the system.
Ecopath also calculates the fractional trophic level(TL) for each group; this is a measure of the aver-age trophic level at which a group is receiving energy(Levine, 1980). The routine assigns a TL of 1 to pri-mary producers and detritus, and a TL of 1+(weightedaverage of the preys’ TL) to consumers, resulting inTLs which are not necessarily integers. The highestfractional trophic levels in the Gulf are occupied byseabirds, trichiurids, scombrids,Cynoscionsp., sharksand serranids, while flatfish and ariids occupy the low-est trophic levels among the fish groups (Table 3).
The entire system was aggregated into discretetrophic levelssensuLindeman (1942). This trophicaggregation routine also gives a breakdown of relativeflows by TL, and the transfer efficiency (TE) betweensuccessive TLs and for the system as a whole. TEis the fraction of the total food intake by a trophiclevel which is transferred to the next higher level.Results show the presence of 10 integer (discrete)TLs in the Gulf ecosystem. Since the magnitude offlows at trophic levels higher than the fourth is verylow, representing only a small fraction of the flowsassociated with the top predators, these higher levelswere omitted from further analyses.
The results of trophic aggregation were used toconstruct a Lindeman spine, which is a linear chain

314 S. Manickchand-Heileman et al. / Ecological Modelling 172 (2004) 307–322
Table 3Fractional trophic level for groups in the Gulf of Paria model
Group Trophic level
Seabirds 4.1Clupeoids 3.0Carangids 3.3Scombrids 3.9Flatfish 2.9Ariids 2.9Gerreids 3.0Trichiurids 3.8M. furnieri 3.2Cynoscionsp. 3.7Lutjanids 3.3Serranids 3.6Haemulids 3.2Sharks 3.7Other fish 3.1Rays 3.2Penaeids 2.8Crabs 2.9Molluscs 2.8Benthos 2.0Zooplankton 2.0Phytoplankton 1.0Discards 1.0Detritus 1.0
showing transfers through each discrete trophic level(Fig. 2). As already noted, trophic flow originatingfrom detritus to consumers is almost twice that orig-inating from primary producers, resulting in a detri-tivory:herbivory ratio of 1.7. Flows originating fromprimary producers and detritus were combined to ob-
I (PP)
II
12.9
III
18.3
0.60
12 IV
7.6
112
129
14 3
322 38 8
1179
365
I (D)
210 64
0.16 0.10
Fig. 2. Lindeman spine showing flows from each discrete trophic level, and transfer efficiency for each level.
tain TE by trophic levels. For the Gulf, highest TE isin level III, then declines in level IV (Fig. 2). The ge-ometric mean transfer efficiency for the system as awhole is 12.2%.
3.2. Mixed trophic impacts
Ecopath uses the Leontief matrix routine (Leontief,1951) to assess the direct and indirect impacts of achange in the biomass of each group on the othergroups (Christensen and Pauly, 1992a, 1992b). Re-sults of this routine illustrate the importance of detri-tus and lower trophic levels, particularly benthos, inthe Gulf ecosystem. These groups have the most pro-nounced positive impacts on other groups in the sys-tem, providing an important food source for the lattergroups. Detritus has a positive impact on almost allgroups, emphasizing the importance of detritus as thebase of the food web in the Gulf. Some fish groups(scombrids, ariids, gerreids, trichurids, serranids andhaemulids), as well as rays, have minimal or no im-pact on the other groups, due to their relatively lowbiomass and/or lowQ/B ratios. On the other hand,among the fish groupsCynoscionsp., carangids andclupeoids show both positive and negative impacts onthe highest number of groups in the system throughpredation or competition.
Mixed trophic impacts of the impact of the trawlerfleet indicate that increased fishing mortality will havea negative impact on trichiurids, serranids, haemulids,other fish, rays and shrimps. Discards appear to have

S. Manickchand-Heileman et al. / Ecological Modelling 172 (2004) 307–322 315
no positive impacts on the other groups, and thereforemay not be an important food source for consumers,despite the large quantities discarded.
3.3. Primary production required
The trawl fishery in the Gulf is equivalent to a preda-tor with a mean trophic level of 2.97, with almost 80%of the catch coming from trophic levels II and III. Pri-mary production required (PPR) for current total catchfrom the area is 28.3 t per km2, which is equivalentto about 2% of net primary production. For the eco-nomically important penaeid shrimp fishery, PPR forpresent harvest range is 8 t per km2 which is equiva-lent to 0.56% of net primary production.
3.4. Summary statistics and network flow indices
Ecopath computes a number of summary statisticswhich can be used to assess the maturity of the ecosys-tem (sensuOdum, 1969) and for comparisons amongecosystems. It also gives a number of network flowindices based on concepts developed by theoreticalecologists, notablyUlanowicz (1986). Some of thesesummary statistics and network flow indices for theGulf are given inTable 4.
Total system throughput, which describes the sizeof the system in terms of flow (Ulanowicz, 1986) is an
Table 4Summary statistics and network flow indices for the Gulf of Paria(flows in t per km2 per year)
Parameter Value
Sum of all consumption 576.6Sum of all respiratory flows 368.8Sum of all flows into detritus 1338.9Total system throughput 2285.0Sum of all production 1480.0Net primary production (PP) 1388.8Total PP/total respiration 3.8Net system production 1019.9Total primary production/total biomass 34.0Finn’s cycling index (%) 7.2Mean path length 6.2System transfer efficiency (%) 12.2Detritivory:herbivory 1.7Connectance index 0.3Omnivory index 0.2Ascendency (%) 41.7Overhead (%) 58.3
important parameter for comparison of flow networks.For the Gulf, total system throughput is 2285 t perkm2 per year, while net system production is 1020 tper km2 per year. The ratio between total primaryproduction (PP) and total respiration (R), consideredto be another important descriptor of system maturity(Odum, 1971), is 3.77 for the Gulf (Table 4).
The connectance index, which is the number of ac-tual links in relation to the number of possible linksin the food web (Gardner and Ashby, 1970), is alsocorrelated with system maturity since the food chainis expected to change from linear to weblike as thesystem matures (Odum, 1971). For the Gulf ecosys-tem, the connectance index is 0.31. However, since theinterpretation of connectance is ambiguous, the sys-tem omnivory index, which characterizes the extentto which the system displays weblike features, is sug-gested as an alternative (Christensen and Pauly, 1993),and is 0.20 for the Gulf (Table 4).
The fraction of an ecosystem’s throughput that is re-cycled, as quantified by the Finn’s cycling index, FCI(Finn, 1976), is also thought to be related to systemmaturity (Odum, 1969; Christensen and Pauly, 1993).Another system descriptor is path length, which is theaverage number of groups that a flow passes through(Finn, 1980), and which is also expected to increasewith system maturity. The FCI and mean path lengthfor the Gulf are 7.2% and 6.2, respectively (Table 4).
A measure of the average mutual information inthe system is the ascendency, which is derived frominformation theory (Ulanowicz, 1986; Ulanowicz andNorden, 1990). It is a measure of the network’s poten-tial for competitive advantage over other network con-figurations (Ulanowicz, 1986). The upper limit for theascendancy is the development capacity and the dif-ference between them is the system overhead, whichreflects the system’s strength in reserve to meet unex-pected perturbations (Ulanowicz, 1986). For the Gulf,ascendency is 2471 (42%), capacity is 5924 and over-head 3452 (58%) (Table 4).
3.5. Simulated impacts of fishing
Scenario 1: Fig. 3shows variation in the biomass ofsix model groups (crabs, penaeids,M. furnieri,Cynoscionsp., Lutjanids and sharks) when fish-ing mortality is increased by 50% for five years.

316 S. Manickchand-Heileman et al. / Ecological Modelling 172 (2004) 307–322
Fig. 3. Simulated changes in biomass of selected groups after an increase in fishing mortality by 50% for 5 years and return to originalfishing mortality for remainder of the simulation period.

S. Manickchand-Heileman et al. / Ecological Modelling 172 (2004) 307–322 317
Following the perturbation, a significant reduc-tion in biomass occurs for most fish groups,while biomass increases for crabs and penaeids.Biomass of M. furnieri first decreases, thenshows a small increase, followed by a greater in-crease after the perturbation ends. The biomassesof all the fish groups and penaeids rapidly re-cover and stabilize at higher levels, followingthe perturbation, but that of crabs decreases tovalues about 65% lower than the initial biomass.Notable is that the recovery of sharks is slowerthan that of the other fish groups. Reducing vul-nerability of peneaids and crabs to intermediatelevels causes a reduction of shrimp biomass dur-ing perturbation, while crab biomass increases.
Scenario 2: The biomasses of fish groups increasewhen fishing is reduced to zero for 5 years, thendecline and stabilize at higher levels than previ-ously existed (Fig. 4). Biomass of sharks showsa slower rate of increase, compared to that of theother fish groups. In contrast to the fish groups,biomass of crabs shows a rapid decline to zero byyear 10 when fishing is relaxed. The biomass ofshrimps also decreases but recovers to a higherlevel after fishing mortality is reduced. When vul-nerabilities of these two groups are set at inter-mediate levels, changes in biomass are also neg-ative but declines are not as significant
Scenario 3: A doubling of fishing effort resultedin chaotic fluctuations and reduction in thebiomasses of all demersal groups, except crabsand molluscs (figure not shown). The biomassof all demersal groups is significantly reducedin the first 5 years, while that of crabs increasessignificantly. Increases in biomass are observedfor seabirds, clupeoids and scombrids. Biomassrecoveries after the perturbation ends are slowerin this case, and may take more than two decadesfor certain species such as sharks.
The group biomasses used in the model were com-pared with those of similar groups obtained by trawlsurveys in 1945 byWhiteleather and Brown (1945).As expected, biomasses obtained in 1945, before trawlfishing was introduced in the Gulf, are higher thancurrent biomass, except for carangids and penaeids(Table 5). Although no catch data are available forclupeoids from these surveys, they were not reported
Table 5Biomass used in the model (Bmodel) compared with biomass from1945 (B1945), before the trawl fishery was established
Group Bmodel B1945
Clupeoid 2.75 –Carangid 1.39 0.08Flatfish 0.18 –Ariids 0.10 0.21Gerreids 0.29 0.61Trichiurids 0.03 –M. furnieri 0.38 0.85Cynoscionsp. 0.79 2.16Lutjanids 0.17 0.24Serranids 0.04 –Haemulids 0.01 0.02Sharks 0.06 0.52Other fish 0.89 3.86Rays 0.03 0.07Penaeids 0.38 0.25Crabs 1.40 –
Biomass in t per km2.
to be very abundant (Whiteleather and Brown, 1945),and might have had a lower biomass than obtained inthe present study.
4. Discussion
This study provides some useful insights into thetrophic structure and functioning of the Gulf of Paria.Results indicate that the ecosystem of the Gulf is inmany aspects similar to other continental shelf andestuarine ecosystems. Notable is the dominance ofthe detrital pathway over the grazing pathway. Graz-ing may not have a major effect in the Gulf, con-sidering the relatively shallow depth and high sea-sonal nutrient input into this ecosystem. In other es-tuarine environments grazing has been found to behighly variable and consumes from 2 to 45% of phyto-plankton standing crop (Day et al., 1989). The ineffi-cient grazing by herbivores has previously been shownfor several other marine ecosystems, for example, theGulf of Panama (Smayda, 1966), the northern Gulf ofMexico (Flint and Rabelais, 1981), the Sierra Leonecontinental shelf (Longhurst, 1983), the Texas shelf(Walsh, 1983), the shelf off northeastern Venezuela(Mendoza, 1993), and the southwestern Gulf of Mex-ico (Manickchand-Heileman et al., 1998). These stud-ies show that pelagic herbivory accounts for no more

318 S. Manickchand-Heileman et al. / Ecological Modelling 172 (2004) 307–322
Fig. 4. Simulated changes in biomass of selected groups after a gradual decrease in fishing rate during the first 5 years and return tooriginal fishing mortality for remainder of the simulation period.
than 10–20% of primary production, which is consis-tent with the findings in the present study.
The export of detritus out of the system, as ob-served in the Gulf, concurs with the finding ofWalsh(1981) and Longhurst (1983)that export of organiccarbon to the deep ocean is a general feature of conti-nental shelves. Export of detritus from the Gulf to theCaribbean Sea may be significant, considering the low
consumption of phytoplankton and detritus in the sys-tem, the large input from rivers and the flow of waterout of the Gulf in a northwesterly direction (Muller-Karger and Aparicio-Castro, 1994).
The food web of the Gulf is dominated by the detri-tal pathway as in many other estuarine systems (Dayet al., 1989), with benthic invertebrates playing a sig-nificant role in transferring energy from detritus to

S. Manickchand-Heileman et al. / Ecological Modelling 172 (2004) 307–322 319
higher trophic levels. Detritus and lower trophic lev-els have significant positive impacts on other groupsin the system, suggesting “bottom-up” control of thefood web.Odum (1969)suggested that as systems ma-ture they become more dependent on detritivory thanherbivory.
Analysis of mixed trophic impacts also shows theimportance of detritus and lower trophic levels as afood source in the system, and again illustrates theirrole in bottom-up control of the Gulf food web. In con-trast, fish groups showing negative trophic impacts onother groups through predation have potential for sig-nificant top-down control of the food web in this sys-tem. Increasing fishing mortality is expected to havea negative impact on penaeids, as well as on some ofthe fish groups, particularly sharks and rays. In theGulf, these two latter groups form a relatively largeproportion of trawl bycatch, and because of their lifehistory strategy, are highly susceptible to exploitation(Stevens et al., 2000).
The relatively high ecotrophic efficiencies suggestthat the system’s secondary production is efficientlyutilized by predators. The mean transfer efficiency forthis ecosystem is close to the value of 10% that is oftenassumed to exist in ecosystems (Lindeman, 1942), andwhich was shown to be a good estimate of the averagetransfer efficiency in aquatic ecosystems (Pauly andChristensen, 1995). The transfer efficiency obtained inthis study shows that the Gulf system is very efficientat transferring energy up the food chain, and may in-dicate a fair degree of stability in the ecosystem.
The primary production required (PPR) for totalharvest from the Gulf is lower than the average re-ported byPauly and Christensen (1995)for globalaquatic systems, and may reflect the dominance of thecatch for the Gulf by penaeid shrimps. The PPR forharvest of penaeid shrimps is lower than that for fishgroups, despite their higher landings, due to the lowerecological cost of harvesting at lower trophic levels(Jarre-Teichmann, 1998).
As previously mentioned, several ecosystem prop-erties that allow the determination of ecosystem matu-rity and stability are determined from the model. Ac-cording toOdum (1971)a PP/R ratio greater than 1 isexpected in the early developmental stages of anecosystem, while in mature systems, it should ap-proach 1. The PP/R ratio obtained in this study isslightly higher than 1, suggesting a system that may
still be maturing. However, the omission of bacteriafrom this model, and therefore lower total respiration,could account for the high value of PP/R obtained forthe Gulf.
Christensen and Pauly (1993)suggested that theFinn’s cycling index (FCI) should be related to systemoverhead by a parabolic relationship, which is relatedto maturity (sensuRutledge et al., 1976). Intermedi-ate values in this relationship were suggested as beingoptimal in terms of stability (Christensen and Pauly,1993). A value of 7.2% for the FCI and system over-head of 58.3% place the Gulf in the lower intermedi-ate range of this relationship, suggesting that it maypossess some degree of instability.
The connectance index and system omnivory indexare also correlated with system maturity since the foodchain is expected to change from linear to web-like asthe system matures (Odum, 1971). For the Gulf, thevalues of these indices are intermediate, suggestinga simplification of the food web, and consequently asystem that is not fully mature and stable.
Some degree of instability of the Gulf ecosystemmay be caused by its dependence on the seasonal in-put of nutrients from terrigenous sources, significantfluctuations in salinity and also by the effects of fish-ing. Furthermore, the Gulf is subjected to pollutionfrom land-based activities which may also result indisturbance of its ecosystem, although this has yet tobe substantiated by scientific studies.
Nevertheless, the relatively high system ascendencyand overhead for the Gulf would suggest that thissystem has a fairly high level of development, is re-silient and has strength in reserve (Ulanowicz, 1986).Mendoza (1993)obtained values of 39.6 and 60.4%for ascendency and overhead, respectively, for the up-welling area off northeastern Venezuela, showing thatthis system may have a higher resilience than the Gulf.
Attempts to rate the maturity of the Gulf ecosystemin comparison to other similar systems, according toChristensen (1995), shows that the Gulf is similar tothe Campeche Bank, Gulf of Mexico (Vega-Cendejaset al., 1993), the continental shelf off Yucatan in theGulf of Mexico (Arreguın-Sánchez et al., 1993), andthe South China Sea (Silvestre et al., 1993). Thesewere ranked in maturity between 29 and 36 out of the41 ecosystems (with ecosystem 41 showing highestmaturity), of Christensen (1995). On the other hand,the Gulf is not as stable and mature as the southwestern

320 S. Manickchand-Heileman et al. / Ecological Modelling 172 (2004) 307–322
Gulf of Mexico continental shelf which shows higherFCI, path length, connectance, and system overhead,and which was reported to be relatively mature andstable (Manickchand-Heileman et al., 1998).
Responses to the simulated increase in fishing effortwere as expected. During increased fishing in scenario1, the biomass of all fish groups initially declined,then recovered. On the other hand, penaeids and crabsincreased in abundance when predatory pressure wasreduced due to a reduction in the biomass of theirpredators. These results could indicate that apparentrecent increases in abundance of portunid crabs maybe trophically mediated by the effects of increasedfishing on their predators.
In scenario 2, under reduced fishing, the biomass offinfish increases initially, then decreases but to higherlevels than previously existed. Although the biomassof sharks recovered, the new level represented a sig-nificant reduction from the period of reduced fishing,possibly due to their lower P/B ratio, and life historystrategy. Again the biomass of crabs declined signif-icantly. Crabs are a significant proportion of the di-ets of demersal fish groups, and as demonstrated inthe different scenarios, increase in biomass of the lat-ter has significant impact on the biomass of crabs asa consequence of increased predation. Although themagnitude of this impact is related to the vulnerabilitysetting used, the same trends are always present.
Following the period of perturbation in both theabove scenarios, the biomass of penaeids recovered asdid the fish groups. It has been shown that penaeidsare able to withstand relatively high fishing pressure,as long as their predators (in this case the fish groups)are also harvested (Pauly, 1982).
Under less intense fishing increments, such as inscenario 1, the relatively fast recovery of the differentgroups indicates a certain degree of system resilience,as borne out by the network flow indices. However,under heavy fishing in scenario 3, the rapid decline inbiomass of most demersal groups to very low levels,except for crabs and molluscs, indicates that systemrecovery may be relatively slow following large, rapidperturbations, and may take more than two decadesfor some components to recover.
Current biomass used in the model are lower thanthose from 1945 for groups for which data is avail-able, except carangids and penaeids which showhigher abundances in 1945. This is consistent with
observations in ecosystems subjected to extended pe-riods of trawling, in which the community shifts toone dominated by lower trophic levels (Power andNewlands, 1999; Bianchi et al., 2000). Thus, a de-crease in the abundance of species at higher trophiclevels through trawling could have resulted in thisshift to a dominance of species of lower trophic levelsin the Gulf. However, these results are only prelim-inary and further studies are required to verify theimpacts of fishing in the Gulf ecosystem.
Acknowledgements
The authors wish to thank the Fisheries Division,Ministry of Agriculture, Lands and Marine Resourcesof Trinidad and Tobago, and Luis Marcano from theInstituto Nacional de Investigaciones Agrıcolas (Min-isterio de Ciencia y Tecnologıa, Venezuela) for provid-ing catch statistics and other information. Thanks arealso due to Villy Christensen and the European Unionfor the opportunity to participate in this Project, andthe anonymous reviewers whose suggestions helped toimprove this manuscript. This publication was partlyfunded by the European Commission’s INCO-DC pro-gram through contract no. ERBIC18CT97175.
References
Alió, J., Marcano, L., Costa, J., Altuve, D., Ehrhardt, N., 1999a.Evaluation of the white shrimp (Penaeus schmitti) stock withinthe Orinoco Delta and Gulf of Paria region. FAO Fish. Rep.600, 141–152.
Alió, J., Die, D., Ferreira, L., Goriesingh, K., Kuruvilla, S.,Maharaj, L., Marcano, L., Ramnarine, I., Richardson-Drakes,A., 1999b.Penaeus subtilisstock within the Orinoco and Gulfof Paria region. FAO Fish. Rep. 600, 153–167.
Allen, K.R., 1971. Relation between production and biomass. J.Fish. Res. Board Can. 28, 1573–1581.
Altuve, D.E., Alió, J.J., Marcano, L.A., 1995. Preliminary resultson the artisanal fishery of penaeid shrimps on the northwesterncoast of the Gulf of Paria. FAO Fish. Rep. 526, 179–184.
Amos, M., 1990. A study of Type II shrimp trawling in the Gulf ofParia. Advanced Diploma Project Report: Center for ResourceManagement and Environment Studies, The University of theWest Indies, Cave Hill Campus, Barbados, 56 pp.
Anthony, V.C., 1993. The state of groundfish resources off thenortheastern United States. Fisheries 18 (3), 12–17.
Arias de Dıaz, A., Bashirulah, A.K.M., 1984. Estudios del bagrecuinche, Cathorops spixii (Fam. Ariidae) en el Golfo de Cariaco,

S. Manickchand-Heileman et al. / Ecological Modelling 172 (2004) 307–322 321
Venezuela. I. Habitos alimenticios de juveniles., Bol. Inst.Oceanogr. Venezuela Univ.Oriente 26(1-2) (1984) 195–200.
Arreguın-Sánchez, F., Seijo, J.C., Valero-Pacheco, E., 1993. Anapplication of Ecopath II to the north continental shelfecosystem of Yucatan, Mexico. In: Christensen, V., Pauly,D. (Eds.), Trophic Models of Aquatic Ecosystems. ICLARMConference Proceedings, vol. 26, pp. 269–278, 390.
Barreto, M.A., 1990. Alimentacion, edad y crecimiento delchere-chere Haemulon steindachneri (Jordan - Gilbert, 1882)(Pisces:Haemulidae) de al costa norte del Estado Sucre yalrededores de las Islas de Margarita y los Testigos, Venezuela.Tesis Maestrıa en Ciencias Marinas, Instituto Oceanográfico deVenezuela, Universidad de Oriente, Cumaná, 100 pp.
Bashirullah, A.K.M., Acuña, A., 1988. Analisis del contenidoestomacal del carite pintado, Scomberomorus brasiliensisCollete, Russo y Zavala-Camins, 1978 en el oriente deVenezuela. Bol. Inst. Oceanogr. Venezuela Univ. Oriente27 (1/2), 117–122.
Beddington, J.R., 1984. The response of multispecies systemsto perturbations. In: May, R.M. (Ed.), Exploitation of MarineCommunities. Springer, Berlin, pp. 209–225.
Bianchi, G., Gislason, H., Graham, K., Hill, L., Jin, X., Koranteng,K., Manickchand-Heileman, S., Payá, I., Sainsbury, K., Sanchez,F., Zwanenburg, K., 2000. Impact of fishing on size compositionand diversity of demersal fish communities. ICES J. Mar. Sci.57, 558–571.
Boodoosingh, M., 1992. A review of possible impacts of humanactivities on fisheries in the coastal waters of Trinidad, withemphasis on the Gulf of Paria. Fisheries Division, Ministryof Agriculture, Land and Marine Resources, Port of Spain(Trinidad). Fisheries Occasional Paper, Series No. 2, 126 pp.
Buchary, E.A., 1999. Evaluating the effects of the 1990 trawl banin the Java Sea, Indonesia: an ecosystem-based approach. M.Sc.Thesis, University of British Columbia, Vancouver, Canada,134 pp.
Caveriviere, A., 1982. Les balistes des cotes africaines(Balistes carolinensis). Biologie, prolifération et possibilitésd’exploitation. Oceanol. Acta 5, 453–460.
Cervigón, F., 1991. Los Peces marinos de Venezuela. 2da. Edición.Volumen I. Fundación Cientıfica Los Roques, Caracas, 425 pp.
Cervigón, F., 1993. Los Peces marinos de Venezuela. 2da. Edición.Volumen II. Fundación Cientıfica Los Roques, Caracas, 497 pp.
Christensen, V., 1995. Ecosystem maturity-towards quantification.Ecol. Model. 77, 3–32.
Christensen, V., 1998. Fishery induced changes in a marineecosystem: insight from models of the Gulf of Thailand. J. FishBiol. 53 (Suppl. A), 128–142.
Christensen, V., Pauly, D., 1992a. A guide to the ECOPATH IIsoftware system (version 2.1). ICLARM Software 6, 72 pp.
Christensen, V., Pauly, D., 1992b. ECOPATH II-a softwarefor balancing steady-state ecosystem models and calculatingnetwork characteristics. Ecol. Model. 61, 169–185.
Christensen, V., Pauly, D., 1993. Flow characteristics ofaquatic ecosystems. In: Christensen, V., Pauly, D. (Eds.),Trophic Models of Aquatic Ecosystems. ICLARM ConferenceProceedings, vol. 26, pp. 338–352.
Christensen, V., Walters, C. J., Pauly, D., 2000. Ecopath withEcosim: a User’s Guide, October 2000 Edition. Fisheries
Centre, University of British Columbia, Vancouver, Canada andICLARM, Penang, Malaysia, 130 pp.
Christensen, V., Walters, C.J., 2003. Ecopath with Ecosim:methods, capabilities and limitations. Ecol. Model.
Day, Jr., J., Hall C., Kemp W., Yañez-Arancibia, A., 1989.Estuarine Ecology. Wiley, New York, 558 pp.
Finn, J.T., 1976. Measures of ecosystem structure and functionderived from analysis of flows. J. Theor. Biol. 56, 363–380.
Finn, J.T., 1980. Flow analysis of models of the Hubbard Brookecosystem. Ecology 6, 562–571.
Fisheries Division, 1999. National Report of Trinidad and Tobago.The shrimp and groundfish fisheries of Trinidad and Tobago,FAO Fish. Rep. 600, 51–83.
Flint, R.W., Rabelais, N.N., 1981. Ecosystem characteristics. In:R.W. Flint, N.N. Rabelais, (Eds.), Environmental Studies ofa Marine Ecosystem, South Texas Outer Continental Shelf.University of Texas Press, Austin, Texas, pp. 137–156.
Froese, R., Pauly, D. (Eds.), 2002. FishBase. World Wide Webelectronic publication.www.fishbase.org, September 2002.
Gardner, M.R., Ashby, W.R., 1970. Connectance of large,dynamical (cybernetic) systems. Nature 228, 784.
Ginés, H., 1972. Carta Pesquera de Venezuela. 1. Areas deNororiente y Guayanas. Monografıa no. 16. Fundación La Sallede Ciencias Naturales, Caracas, 328 pp.
Institute of Marine Research, Bergen, 1989. Surveys of the fishresources in the shelf areas between Suriname and Colombia,1988. Institute of Marine Research, Bergen, Norway, 139 pp.
Jarre-Teichmann, A., 1998. The potential role of mass balancemodels for the management of upwelling ecosystems. Ecol.Appl. 8 (1), S93–S103.
Jobity, A., Kuruvilla, R., Amos, M., Ferreira, L., 1997. Nationalreport on the shrimp and groundfish fisheries of Trinidad andTobago. FAO Fish. Rep. 544, 62–95.
Jordan, C.M., 1969. A survey of the shrimp industry ofTrinidad and Tobago. Ministry of Agriculture, Land and FoodProduction, Trinidad and Tobago, 8 pp.
Leontief, W.W. 1951. The Structure of the U.S. Economy, 2nded., Oxford University Press, New York.
Levine, S., 1980. Several measures of trophic structure applicableto complex food webs. J. Theor. Biol. 83, 195–207.
Lindeman, R.L., 1942. The trophic-dynamic aspect of ecology.Ecology 23, 399–418.
Longhurst, A.R., 1983. Benthic-pelagic coupling and export oforganic carbon from a tropical Atlantic continental shelf-SierraLeone. Estuar. Coast. Shelf Sci. 17, 261–285.
Longhurst, A.R., Pauly, D., 1987. Ecology of Tropical Oceans.Academic Press, San Diego, 407 pp.
Maharaj, V., 1989. The by-catch in the artisanal shrimp trawlfishery, Gulf of Paria, Trinidad. M.S. Thesis, University ofRhode Island, Kingston, R.I., 168 pp.
Maharaj, V., Recksiek, C., 1991. The by-catch from the artisanalshrimp trawl fishery, Gulf of Paria, Trinidad. Mar. Fish. Rev.53 (2), 1–15.
Manickchand-Dass, S. 1983. Some aspects of the biology of thelane snapperLutjanus synagris(Linnaeus, 1758) in Trinidad.Research Report. Institute of Marine Affairs, Trinidad andTobago, 27 pp.

322 S. Manickchand-Heileman et al. / Ecological Modelling 172 (2004) 307–322
Manickchand-Dass, S., 1987. Reproduction age and growth of theLane Snapper,Lutjanus synagris(Linnaeus) in Trinidad. WestIndies Bull. Mar. Sci. 40 (1), 22–27.
Manickchand-Heileman, S., Julien-Flus, M., 1990. Speciescomposition and seasonality of a coastal demersal fish stock inTrinidad, West Indies. Caribb. Mar. Stud. 1 (1), 11–21.
Manickchand-Heileman, S., Kenny, J.S., 1990. Reproduction, ageand growth of the whitemouth croakerMicropogonias furnieri(Desmarest 1823) in Trinidad waters. Fish. Bull. 88 (3), 523–529.
Manickchand-Heileman, S., Soto, L.A., Escobar, E., 1998. Apreliminary trophic model of the continental shelf, southwesternGulf of Mexico. Estuarine, Coastal Shelf Sci. 46 (6), 885–899.
Marcano, L.A., 1977. Análisis de las Pesquerıas de laZona Atlántica Venezolana. Thesis. Universidad Central deVenezuela, Caracas, 151 pp.
Marcano, L.A., Alió, J., Altuve, D., 1997. National report on theshrimp and groundfish fisheries of Venezuela. FAO Fish. Rep.544, 96–110.
Marcano, L.A., Alió, J., Altuve, D., 1999. National report ofVenezuela. Venezuelan shrimp fisheries in the Atlantic marginof Guiana. FAO Fish. Rep. 600, 85–98.
Mendoza, J.J., 1993. A preliminary biomass budget for thenortheastern Venezuela shelf ecosystem. In: Christensen, V.,Pauly, D. (Eds.), Trophic Models of Aquatic Ecosystems.ICLARM Conference Proceedings 26, pp. 285–297, 390.
Moigis, A.G., Bonilla, J., 1985. la productividad primaria delfitoplancton e hidrografıa del Golfo de Paria, Venezuela, durantela estación de lluvias. Bol. Inst. Oceanogr. Univ. Oriente24 (1/2), 163–175.
Muller-Karger, F., Aparicio-Castro, R., 1994. Mesoscale processesaffecting phytoplankton abundance in the southern CaribbeanSea. Continental Shelf Res. 14 (2), 199–221.
Novoa, D., 2000. La pesca en el golfo de Paria y delta del Orinococostero. Ed. Arte. Caracas, 140 pp.
Novoa, D., Mendoza, J., Marcano, L., Cárdenas, J., 1998. El AtlasPesquero Marıtimo de Venezuela. SARPA, Caracas, 197 pp.
Odum, E.P., 1969. The strategy of ecosystem development. Science164, 262–270.
Odum, E.P., 1971. Fundamentals of Ecology. Saunders,Philadelphia, 574 pp.
Pauly, D., 1982. A method to estimate the stock-recruitmentrelationship of shrimps. Trans. Am. Fish. Soc. 111, 13–20.
Pauly, D., Christensen, V., 1995. Primary production required tosustain global fisheries. Nature 374, 255–257.
Pauly, D., Soriano, M.L., Palomares, M.L., 1993. Improvedconstruction, parametrization and interpretation of steady-state ecosystem models. In: V. Christensen, D. Pauly, (Eds.),Trophic Models of Aquatic Ecosystems. ICLARM ConferenceProceedings vol. 26, pp. 1–13.
Power, M.D., Newlands, N., 1999. A report on historical human-induced changes in Newfoundland’s fisheries ecosystem. In:Ecosystem Approaches for Fisheries Management. University
of Alaska Sea Grant, AK-SG-99-01, Fairbanks, Alaska.pp. 391–404.
Rodrıguez, J., 1987. Determinación de edad y crecimiento delcataco Trachurus lathami Nichols, 1920 (Pisces: Carangidae) yla importancia del recurso en la pesquerıa de arrastre del áreade la Isla de Margarita y norte del Estado Sucre, Venezuela.M.Sc. Thesis, Universidad de Oriente, Cumaná, Venezuela, 95pp.
Rutledge, R.W., Bacore, B.L., Mulholland, R.J., 1976. Ecologicalstability: an information theory viewpoint. J. Theor. Biol. 57,355–371.
Shim, D.J., 1981. A contibution to the biology ofCynoscionjamaicensis (Pisces: Sciaenidae) in the coastal waters ofTrinidad. M.Phil. Thesis, University of the West Indies, St.Augustine, Trinidad and Tobago, 148 pp.
Silvestre, G., Selvanathan, S., Salleh, A.H.M. 1993. Preliminarytrophic model of the coastal fishery resources of BruneiDarussalam, South China Sea. In: Christensen, V., Pauly,D. (Eds.), Trophic Models of Aquatic Ecosystems. ICLARMConference Proceedings, vol. 26, pp. 300–306.
Smayda, T.J., 1966. A quantitative analysis of the phytoplanktonof the Gulf of Panama. Bull. Inter Am. Trop. Tuna Comm. 11,355–612.
Stevens, J.D., Bonfil, R., Dulvy, N.K., Walker, P.A., 2000.The effects of fishing on sharks, rays and chimaeras(chondrichthyans) and the implication for marine ecosystems.ICES J. Mar. Sci. 57, 476–494.
Stonley, J.M., 1975. A monograph of the crabs of Trinidad. M.Sc.Thesis. University of the West Indies, St. Augustine, Trinidad,402 pp.
Sturm, M.G. de L., 1974. Aspects of the biology of the Spanishmackerel,Scomberomorus maculatus(Mitchell), in Trinidad,West Indies. Ph.D. thesis. University of the West Indies, St.Augustine, Trinidad, 238 pp.
Ulanowicz, R.E., 1986. Growth and Development: EcosystemPhenomenology. Springer, New York, 203 pp.
Ulanowicz, R.E., Norden, J.S., 1990. Symmetrical overhead inflow and networks. Int. J. Systems Sci. 21 (2), 429–437.
Vega-Cendejas, M.E., Arreguın-Sánchez, F., Hernández, M., 1993.Trophic fluxes on the Campeche Bank, Mexico. In: Christensen,V., Pauly, D. (Eds.), Trophic Models of Aquatic Ecosystems.ICLARM Conference Proceedings, vol. 26, pp. 206–213.
Walters, C., Christensen, V., Pauly, D., 1997. Structuring dynamicmodels of exploited ecosystems from trophic mass-balanceassessments. Rev. Fish Biol. Fish 7, 139–172.
Walsh, J.J., 1981. A carbon budget for overfishing off Peru. Nature(London) 290, 300–304.
Walsh, J.J., 1983. Death in the sea: enigmatic phytoplankton losses.Prog. Oceanogr. 12 (1), 1–86.
Whiteleather, R.T., Brown, H.B., 1945. An experimental fisherysurvey in Trinidad, Tobago and British Guiana. Withrecommended improvements in methods and gear. Anglo-American Caribbean Commission, United States PrintingOffice, Washington, 130 pp.