Summary Report: National Forum on Migration & Development (Trinidad-Tobago)
Upload
independentCategory
view
3download
0

4
A NATURAL ORDER OF CULTURAL ADOPTION AND LOSS IN TRINIDAD
BY
F. T. CLOAK, JR.
WORKING PAPERS IN METHODOLOGY
No. 1
INSTITUTE FOR RESEARCH IN SOCIAL SCIENCE
Univers i ty of Nor th Carolina
Chap e l H i l l

Copyright by
Frank Theodore Cloak, Jr.
1966


St Vincent Calypso King Competition (Coke-oh-co)
by Lord Blakie
Last Calypso Season, Lord Blakie went St. Vincent
Last Calypso Season, Lord Blakie went St. Vincent So they had a competition
To crown "King Calypsonian"
When they crown the calypso king This is the song the fellow sing:
C h o r u s
Morning . . . cock ah crow, co-ke-oh-co, Morning .
. . cock ah crow, co-ke-oh-co,
Wake up girl and put on your frock, Wake up girl, you nah hear de cock, Wakeup
and come leh we go,
Morning . . . cock ah crow.
Is now ah start to grind, I was so sure that the crown was mine.
Ahsing like a lark,
They still give the crown to Lord Mauby-Bark.
Ahwatch the judge and ah shake my head,
So, a Vincentian girl turn round and said,
Youcould grind like a corn-mill
Nah for we prize . . . nah leaving here still.
Well friends, ah feel so funny
' Cause they didn't give the prize to Lord Blakie,
Ah say, "Well look at my cross, ah leave Trinidad and come quite
here to loss."
They make me feel so nice, they hand me a consolation prize,
Open the prize ah blow like a flute,
Is ah piece of fish, three pieces of breadfruit.
So ah turn to my girl-friend Verro and tell her "Darling let' s go"
She say Blakie wait a little longer
Let we see the prize you sing so hard for.
When she see it the girl start to laugh. Laugh till she burst she brassiere in half.
Friend, you couldn't believe all the time Ah was singing for a pitch-oil pan of chataigne.
(Runner-up for Road March, Trinidad Carnival, 1964)

v
FOREWORD FOR NON-ANTHROPOLOGISTS
While the primary purpose of this monograph is to contribute "to
the understanding of culture and how culture works" (p. 1), it appears
that the methods developed herein may have wider application in the
social and behavioral sciences.
The methods are designed for the discovery, establishment, and
analysis, respectively, of developmental sequences. In the study
reported here, I had data on the presence or absence of some 3,666
behavioral and artifactual features in 28 households in a village in
Trinidad. On the basis of general anthropological theory, I had reason
to believe
1. that at least some of these presences or absences resulted from
adoption or loss of the features through time;
2. that these adoptions and losses were causally related;
3. that, hence, they had occurred in a developmental sequence or
"natural order;" and
4. that the several households differed in the extent to which they had
passed through this sequence.
First, then, the method of discovery was applied to order the
households, from the one which had undergone the fewest adoptions and
losses to the one which had undergone the most.

vi
While this was being done, the order of adoption and loss of the
features was determined (pages 38-42, 57-63, 65-68, 136).
Secondly, the method of establishment was applied to the result of the
first process; an estimate was made of the probability of making, from
random data, an arrangement as orderly as the one constructed from the
empirical data (pages 42-45, 63-65, 68-80, 140-143),
Finally, the method of analysis was used to extract those features which
conformed most closely to 'the discovered order, so that these features,
and the relations between them, could be studied further (pages 136, 143-
164, 170-172) .
The methods, then, are perhaps most effectively used in situations
where the following conditions hold:
1. There is good reason to believe that one is dealing with
multiple examples of a developmental sequence, and one wishes to
discover, establish, and/or analyze that sequence.
2. One has only contemporary results of the sequences to work with;
i.e., the materials to be examined are not already chronologically ordered,
either relatively or absolutely. (Where the materials are already ordered,
the methods can be used, and the sequence thus produced checked against
the known chronological sequence.)
3. The materials are qualitative in form; i.e., they are concerned with
the presence or absence of specific features.
4. There is a considerable amount of information, on the order of

vii
30 (or more) sets of data (individual cases) with features numbering in the
hundreds or thousands.
5. It can be assumed that the sets of data, or the features, or both,
are either total populations or random samples thereof. When this cannot
be assumed, the methods of discovery and analysis can be applied, but the
method of establishment cannot. (Guttman's Coefficient of
Reproducibility [1944] might be applied instead.)
There are many problems in the various disciplines to which these
methods could be applied; they might be used, for example,
In archaeology, to establish a sequence of non-stratified sites, either
in cases where the amount of material is too limited for standard quantitative
seriation techniques or as a supplement to seriation.
— In economics, to establish a sequence of addition and subtraction of
various specifications in certain kinds of contracts.
— In epidemiology, to establish a developmental sequence for
certain conditions of health or disease, either in individuals or
families or in geographic areas.
—In history, to study mediaeval city charters.
— In political science, to study factors reported to be influencing voting
behavior in a survey of various precincts.
—In sociology, to study the evolution of street gangs or informal work
groups.
I hope, then, that the methods will be used by other social and

vii i
behavioral scientists; even more, I hope that they will be found useful
enough to stimulate efforts to improve them from their present weak and
inelegant state.
F. T. Cloak, Jr.
Chapel Hill, North Carolina
February 20, 1967

PREFACE
In July, 1958, when I had completed my first year of anthropology
courses, I took my family to Parker, Arizona, for six weeks' field work
on the Colorado River Indian Reservation. Professor Milton L. Barnett, who
had first encouraged me to take up anthropology, and who had arranged
the financing for that field trip, met us at Parker and showed us around
the reservation. Before he left he handed me
a copy of William H. Sewell' s "Scale for the Measurement of Socio-
economic Status of Oklahoma Farm Families," remarking that I might find
it useful.
Taking Mr. Barnett' s advice perhaps a little more literally than he
had intended, I proceeded to draw up a sample of Mojave and
Chemehuevi households and to interview them, using a modified Sewell
scale accompanied by a handful of questions concerning use of Indian
language, dress, and so forth. Then I brought the results home to
Madison and put them in a file for two years, getting them out from time
to time and trying to decide how to use them in an
M. A. thesis.
Meanwhile my course work continued; as one would expect, most of it
consisted of general anthropological training, but a few segments
ix

stand out as having influenced the peculiar direction of my thought within the
general framework of anthropology:
In 1958-59, in an archaeology course with David A. Baerreis, I
learned that "culture-trait" is not necessarily a dirty word, and first
began to realize that the culture-trait, if properly defined, might be the
empirical unit of culture and culture-change.
During the summer of 1959 I read and re-read Kroeber' s
Anthropology . Only now, as I read it yet again, do I realize how many
of the ideas I have about culture have been derived from that one book.
This work, for example, is in a very real sense simply an expansion of
and an attempt to use operationally a few of the ideas Kroeber saw so
clearly and explained so well.
Robert J. Miller, in a theory course, put me on to the concept of culture
as superorganic, as a causal force rather than as merely a descriptive
concept, and pointed me toward Leslie A. White' s The Science of Culture.
The result of this encounter was a real intellectual crisis for me. I soon
realized that while both White and his detractors were offering profound
insights into the nature of culture, they were unable to bring their
arguments to the point of empirical resolution. The reason for this seemed
to be a sometimes incredible naivete, on both sides, with respect to the logic
and nature of scientific method. It was mainly in order to find something to
resolve this controversy and thus reduce my intellectual tension that I
returned to the study of the

xi
logic of science, taking my Ph. D. minor under Haskell Fain of the De-
partment of Philosophy, University of Wisconsin.
Finally the bits and pieces garnered during these various intellectual
excursions began to fit into a sort of pattern, and I was able to turn my field
data into a master' s thesis. In it I demonstrated that among the Colorado River
Indians, the people who had lost the most aboriginal and early reservation
period culture were the people who had acquired the most modern day Anglo-
American culture (using the Sewell scale as a measure of the latter), and that
the specific data items for loss and for adoption could be ordered into a pair of
Guttman scales.
Soon after the master' s thesis was completed I began planning to
replicate it by a much more intensive study in Trinidad. I was intuitively aware
that the notion of a culture as an integrated system of some sort would
logically lead to the prediction of certain regularities in culture change, and I
was eager to try this idea out in the field. After a two- year wait I was able
to secure support for eighteen months' field work
in the form of a pre-doctoral training fellowship from the Social Science
Research Council.
I arrived in Trinidad with my family in August, 1963. After two months
in the St. James section of Port-of-Spain, the capital, we moved to Enterprise,
Chaguanas ward, where the field study was carried out, We returned to
Madison in March, 1965, and I spent six months there preparing the data for
computer processing and processing it, using the

xii
facilities of the University of Wisconsin Computing Center, funded by the
University of Wisconsin Faculty Research Committee (through my advisor,
Robert j. Miller). During that spring and summer I was supported for three
months by an extension of my S. S. R. C. fel lowship, and for one month by a
Graduate School summer fellowship. The writing of the monograph was done
during the academic year 1965-66, while teaching at the University of North
Carolina.
I should like to express my appreciation and gratitude to all the
individuals and institutions mentioned above, and also to John Gonsalves
and Horace Fifi, for helping us adapt to Port-of-Spain; to Henry Nebblett and
to Lionel E. Punnett and to Mrs. Ambrosine Walters, for continual help and
encouragement in Enterprise; to Edgar F. Borgatta and to Gene V. Glass for
suggestions which led to the method of data processing; to Joshua Chover
for explaining the facts of life about the current status of knowledge about
binary matrices; to Robert Schacht for his constructive suggestions while
programming; to the staff at the University of Wisconsin Computing Center
for many little courtesies and favors; to Joan Rubin for editorial
suggestions; and to Robb and Ouida Taylor for typing, etc.
My wife, Jane Cloak, should not be mentioned here. Her name should
appear on the title-page as co-author, not only because she did a
substantial part of the field work but also because she has listened

x i i i
creatively for nine years —to every idea that went into this effort and to a
great many more that were (fortunately) left out.
Finally, this book is dedicated to the people of Enterprise, collectively
and individually.
Chapel Hill, North Carolina
May 4, 1966

xiv
TABLE OF CONTENTS
CHAPTER Page
I . I N T R O D U C T I O N . 1
What this study claims to accomplish 2
Notes for Chapter I 5
I I . THEORY: A CULTURE AS A FUNCTIONALLY
INTEGRATED WHOLE . 7
A. The two concepts of "A Culture" 7
B. The general nature and the general empirical
consequents of the d-culture as a functionally
integrated whole (FIW) . ¹1
C. The language of description of x-cultures ¹7
D. The culture trait: the unit of x-cultural change 23
E. The Natural Order of Cultural Adoption and Loss: theoretical considerations . 26
F. The Natural Order of Cultural Adoption and Loss: empirical problems . 29
G. The household as the social unit . 33
H. Studying cultural change synchronically 36
I. Testing the hypothesis synchronically . 42
Notes for Chapter II . 46
III. METHOD: ARRANGING THE DATA AND TESTING
THE GENERAL HYPOTHESIS . . 57
A. Introduction 57
B. Processing the data-matrix: computer aspects 65
C. Evaluating the best possible matrix 68
Notes for Chapter III . 81

XV
CHAPTER Page
IV. A FIELD TEST OF THE HYPOTHESIS IN
ENTERPRISE, TRINIDAD. 86
A. Introduction 86
B. Social description and selection of the study population 87
C. Similar i t ies and differences among the ethnic categories in Enterprise . 95
1 . Occupat ions and employment 95
2 . Household compos i t ion 103
3 . Rel ig ious groupings . 107
4 . I n t e r -g r oup r e l a t i ons . ¹08
D. The sample of Vincentian households . ¹13
Notes for Chapter IV . 1¹9
V. FIELD WORK METHODS AND TECHNIQUES. ¹24
Notes for Chapter V . 138
VI. RESULTS . 140
Recapitulation. 164
Further Research ¹65
Note for Chapter VI 170
REFERENCES CITED 173
CULTURAL DATA . Supplement

F
xvi
LIST OF TABLES
TABLE Page
1. Summary of the Household Register 92
2. Rates of Employment by Ethnic Category 96
3. Frequency of Employment by Ethnic Category 97
4. Place of Employment by Ethnic Category' 98
5. Computation of Total Occupation Units with Kind Known 99
6. Types of Occupation-Units by Ethnic Category . 101
7. Composition of Households with Children, by
Ethnic Category. . 105
8. Composition of All Households, by Ethnic Category . 105
9. Summary of Life History Data of the Sample of
28 Vincentian Households 115
10. Selected Culture Traits, by Cutting-Point: An
Approximation of the Natural Order of Cultural Adoption and Loss 147

xvii
LIST OF FIGURES
FIGURE Page,
I . Sc he ma t i c d i a g r a m o f a cu l t u r a l cha nge . . . . . . . 25
I I . Di s t r i bu t i o n s a nd me a ns o f t wo s e t s o f h y po t he t i c a l va lues of UTOT 79
III. Random and empirical values of UTOT superimposed 141

xviii
. theory about human [cultural] evolution remains at a stage comparable to that in biology before the development of genetics.
— Margaret Mead (1958: 486)
Students of human life who pride themselves on being "scientific" and upon their rigor still tend, consciously or unconsciously, to hold the view of "science" set forth in Karl Pearson' s famous Grammar. In other words, they not only take physics as their model but specifically nineteenth-century physics. Here problems of measurable incidence and intensity predominate. Such problems also have their importance
in anthropology, but the most difficult and most essential questions about culture cannot be answered in these terms. As W. M. Wheeler is said to have remarked, "Form is the secretion of culture." Form is a matter of ordering, or arrangement, of emphasis. Measurement in and of itself will seldom provide a valid description of distinctive form. Exactly the same measurable entities may be present in precisely the same quantities, but if the sequences or arrangements of these entities differ, the configurations may have vastly different properties. Linguistics, which is, on the whole, the most rigorous and precise of the cultural sciences, has achieved its success much more by configurational analysis than by counting.
Kroeber and Kluckhohn (1952 : 161)
Perhaps a better way of putting the problem would be to say that as yet we have no full theory of culture. We have a fairly well - delineated concept, and it is possible to enumerate conceptual elements embraced within that master concept. But a concept, even an important one, does not constitute a theory. There is a theory of gravitation in which "gravity" is merely one term. Concepts have a way of corning to a dead end unless they are bound together in a testable theory. In anthropology at present we have plenty of definitions but too little theory.
Kroeber and Kluckhohn (1952 : 181)

CHAPTER 1
INTRODUCTION
In this monograph, I hope to make a contribution to the understanding
of culture and how culture works by showing, in part, what a culture is
and how it changes. I will not deal with broad, sweeping long term
changes in culture, but rather with very short, very slight changes in the
culture of one social group in fact, I intend to discover, and utilize,
the smallest empirical unit of cultural change. I further intend to show
that microchanges in culture can be studied synchronically, by comparing
the cultures of parallel subunits of
the social group being studied.
This study will, it is hoped, lead to an understanding of some of the
mechanisms by which culture changes at the microscopic level.
If this can be done, perhaps these mechanisms may, in turn, be useful in
explaining cultural change in the historical sense of the term, in the same
way that we can understand developments in the evolution of man through
concepts developed in short-term experimental studies of populations of fruit-
flies, English moths, and human beings in malarial regions.
¹

2
What This Study Claims to Accomplish
1. It develops a general hypothesis about culture that includes both
integration and change without sacrificing either. This has not been done
previously,'
2. It provides specific techniques for studying a culture as an integrated
changing thing. These techniques are completely straight--
forward. They are not confused by the use of terms denoting substantive
items of culture in theoretical statements or methodological instructions;
thus they are completely general. No one has heretofore spelled out a
complete methodology in such detail,
3. It can lead to a general theory of culture and culture change that
can be tested, anywhere culture exists, by using the techniques
mentioned above. No one has as yet written such a theory.2
4. This general theory, if supported by replication elsewhere, can
be refined, added to, improved, even completely rewritten, as a result of
the replicative study; but it will still be the same theory, In other
words, the theory will be corrigible not only as a whole but in detail.
Again, no one has as yet written such a theory.
5. In the process of developing procedures for validating the general
hypothesis, we present a new method for constructing Guttman-type scales.
With this method and a high-speed computer, we can

3
a. construct double scales as well as single scales; 1.
e., scales with a parallelogram as an ideal pattern as well as
scales with a triangle as an ideal pattern
b. construct scales from very large amounts of data, and
c, construct scales where the number of ' attributes' is many
times the number of ' individuals,' to use Guttman' s terms (1944).
6. We develop a new measure of the closeness of empirically derived
scales to the ideal pattern; this measure is adapted from Mann and
Whitney' s "U" (1947), Used in conjunction with the scaling process
mentioned in paragraph 5 above, the new measure is, in effect, an
expansion of "U" into two dimensions.
7. The problem of determining the probability of getting a certain
value of this new measure is explored, and a computer technique for
estimating this probability is offered, using Monte Carlo procedures, No
one has yet successfully presented a method for estimating the probability
of a Guttman-type scale.3
8. The field work technique developed for and used in this study is not new
or unique, having been used, for example, in the California Cultural Element
Surveys in the thirties, and more recently by
John M. Roberts (1951). It has, however, never before been

4
used to this extent and with this degree of precision in the study of a single
village or social group. I refer here to the use of interview schedules and
material culture checklists to gather comparative cultural data from parallel
subunits of a society,

NOTES FOR CHAPTER I
¹Kroeber and Kluckhohn touch on this problem when they say:
On the other hand, the inescapable fact of cultural relativism does not justify the conclusion that cultures are in all respects utterly disparate monads and hence strictly noncomparable entities, (Footnote: As a matter of fact, cultures may share a large body of their content through historical connection and provable derivation and yet have arrived at pretty diverse value systems. If we could recover enough ancient and lost evidence, it is expectable that we would be driven
to the admission that every culture shares some of its content, through derivation, with every other on earth. This historic interconnection leaves any monadal view or talk of the noncomparability of cultures without basis. Possessing coancestry, they must be comparable.) If this were literally true, a comparative science of culture would be ex hypothesi impossible. It is unfortunately the case that up to this point anthropology has not solved very satisfactorily the problem of describing cultures in such a way that objective comparison is possible. Most cultural monographs organize the data in terms of the categories of our own contemporary
Western culture: economics, technology, social organization, and the like. Such an ordering, of course, tears many of
the facts from their own actual context and loads the analysis. The implicit assumption is that our categories are "given"
by nature an assumption contradicted most emphatically by
these very investigations of different cultures. A smaller number of studies have attempted to present the information consistently in terms of the category system and whole way of thought of the culture being described. This approach obviously excludes the immediate possibility of a complete set of common terms for comparison. Such a system of comparable concepts and terms remains to be worked out, and will probably be established only gradually.
(1952: 175-6)
2It may be argued by some that such theories do exist, that hypotheses
have been offered, and tested, that explain and predict one cultural change
on the basis of another, and that these hypotheses do
5

6
reflect a developing agreement on the nature of culture and cultural change;
in other words, that there does indeed exist a theoretical framework, albeit a
rather implicit one.
I agree. But I feel that such hypotheses are concerned with what one
might call macro-change , that is, with large-scale changes of state (e.g.,
with jumps from one level of socio-economic integration to another, from
being a sedentary culture to being a horse-culture, from being apathetic to
being messianic). I submit that such macro-changes are the end product of
a series of minute changes occurring systematically through time and that
a global explanation of a macro-change fails completely to take this
sequence of micro-changes into account
The analogy to our growing awareness of the nature of biological
change is apparent; studies of macro-evolution have led merely to
descriptions of temporal sequences of forms, and such quasi-explanations
as "irreversibility of evolution," "trend toward increasing complexity," and
"increasing ability to capture and utilize energy from the environment"
Studies of micro-evolution, on the other hand, have led to, and been aided
by, explanations in terms of change in allelo-types of populations, natural
selection expressed mathematically, the notion of balanced polymorphism,
and other sophisticated concepts, See Kroeber and Kluckhohn 1952: 182.
Some archaeologists have also been working on micro-change. Compare
the following:
It would seem, therefore, that the types serve best for
reconstructing broad-scale historical relationships,
whereas the modes are more sensitive indicators of
changes in culture within small regions and over short
periods of time. (Rouse ¹939: 14¹)
3Professor Joshua Chover, Department of Mathematics, University of
Wisconsin: personal communication.

CHAPTER II
THEORY: A CULTURE AS A FUNCTIONALLY INTEGRATED WHOLE
A. The two concepts of "A Culture"
We open our discussion with an extensive quotation from Kluckhohn and
Kelly, to which we will refer repeatedly in the next few chapters:
". . . there are four variables in the determination of human action:
man' s biological equipment, his social environment, his physical
environment, and his culture. Let us designate those as a, b, c, and
d. But a given system of designs for l iving is clearly the product of a,
b, c, and d. In other words, it is quite clearly different from ' d' alone, so
let us call it ' x' . It would seem, then, that anthropologists have used
the same term ' culture' to cover both 'd' and 'x' . This is enough to
make a logician' s hair stand on end.
". . . Perhaps, in practice, the confusion has been mitigated by the
tendency to use ' culture' for the analytical abstraction ' d' and 'a
culture' for the generalizing abstraction ' x' . But it is all too true that
anthropologists and other scholars have frequently treated 'd' (the
explanatory concept) and 'x' (the descriptive concept) as synonyms or
equivalents. Having given a sound abstract description of 'group habits,'
the anthropologist then unthinkingly employs this (' x') a an
explanatory concept, forgetting that ' x' must be regarded as the joint
product of ' d' and three other determiners.
'' 'X' [sic] is much closer to observable 'reality' than ' d'
' D' is, if you will, only an hypothesis —though a highly useful
7

8
hypothesis. X' , however, is an abstract representation of central
tendencies in observed facts."
—Kluckhohn and Kelly ¹945, quoted in Kroeber and Kluckhohn 1952: 90. ¹
Since we are going to be talking exclusively of particular social
groups and their cultures, we will refer from here on to "the d-culture of
social group y," "the x-culture of social group y," "d-cultural change" (i.e.,
change in the d-culture), "x-cultural change," and so forth. In other
words, as far as we are concerned there is no such thing as "culture," but
only cultures , x- and d-
But we are interested not so much in what produces an x-culture, or
in how a d-culture controls, influences, or determines its x-culture; we
are more interested in how d-cultures (and x-cultures) change. For this
reason we are going to have to introduce some ideas and concepts
additional to those of Kluckhohn and Kelly.
a, b, and c (biological equipment, social environment, and physical
environment) are, from the point of view of d, all external factors; for the
present discussion we will treat them as being either constant or essentially
unpredictable, and lump them together under the term habitat. (In
justification of this, it might be pointed out that to Kluckhohn and Kelly, '
social environment' seems to refer to demography, not to the determinants
of social interaction-patterns, which they would include under ' d' .)

9
in addition, it we are to discuss d-cultural change, there is an
important factor not mentioned in the Kluckhohn and Kelly discussion.
This is the collection of behaviors and products of behaviors exhibited by
neighboring societies, which are available for borrowing by society y. This
will vary, of course, from place to place and from time to time, and
variation in it will be very important in determining changes in the d-
culture and the x-culture of society y. Let us refer to it as the cultural
environment of society y.
It goes almost without saying that it never happens that the entire
cultural environment is borrowable by a society, For one thing, the habitat
may be unsuitable for certain items. More important for this study, certain
items may not "fit in" with the d-culture of the society. In other words the
d-culture acts to control, selectively, diffusion or borrowing.? One way to
view the role of the d-culture, in fact, would be to see it as a filter, which
determines the content of the x-culture by controlling borrowing.
But the d-culture does not operate in a random, arbitrary fashion. Its
actions have a form, or pattern, underlying them.
Cultures are systems (that is, are organized) because the
variables are interdependent. All systems appear to acquire
certain properties that characterize the system qua system
rather than the sum of isolable elements. Among these
properties is that of directionality or "drift," There is a
momentum quality to cultural systems.
3 (Kroeber and Kluckhohn 1952: 189)

10
For the kind of systems d-cultures are, we are going to use the
term ' functionally integrated whole, abbreviated . This ex-
pression will be made more explicit in the next section. We are not going
to take this lastmentioned notion about culture as an assumption,
however; we will, rather, regard it as an hypothesis to be tested
experimentally.
We are not claiming, furthermore, that the d-culture is an
unchanging changer, that it has the character of, say, a genotype that
once established can be modified in its effects but not in its nature. A d-
culture is seen as more like an allelotype of a population, which is
modified by the process of the population' s adapting to its habitat. In
other words, we claim that when the x-culture is limited or modified by
habitat-factors, these limitations or modifications are "fed back" in some
fashion to the d-culture, and limit or modify it, thus altering its further
operation as a determiner of the x-culture.4
Finally, it would be well to make explicit two more basic assumptions,
which really need no defense: first, that individuals learn their culture
through precept or example, mainly from older members of their own social
groups (persistence) but also, occasionally, from members of other groups
(diffusion or borrowing); second, corollary to the first, that a d-culture can
properly be viewed as the social heritage or tradition of a social group.5

¹¹
B. The general nature and the general empirical consequents of the d -
culture as a functionally integrated whole (FIW)
We wil l put two main quest ions to ourselves: First , can we show by
empirical means that a culture is indeed an FIW —that is, not only that
certain broad features of an x -culture tend to vary together but that
integrat ion, l ike traditionality and learnibi l i ty, is an essential
characterist ic of a culture? Second, in the process of showing that a
culture is an FIW , can we use the empirical evidence to get some
indicat ion of what kind of an FIW a d-culture is, what some of the
mechanisms involved are; in other words, of how a d -culture, as an
FIW, works?
To answer these questions, we must find a mechanical procedure by
means of which we can feed in behavioral data from a culture - bearing
group (1, e., feed in the group° s x-culture or a sample of it), turn a
methodological crank, and be informed whether the d -culture of that
group is an FIW or not.
Then, if the procedure reveals that it is indeed an FIW, we want to be
able to arrange the data in such a way that we can examine it and get some
insights into the nature of that FIW, and thus of d -cultural FIWs in
general.
To begin with, let us assume, for purposes of exposition, that we know
that a d-culture is an FIW. (Later we will drop this assumption.) We will not
assume anything about the specific nature of cult ural FIWs,

12
We will not assume, for example, that the ecological or technical areas of
culture are central, or even that every culture has an ethos, or a focus, or a
set of themes or postulates, around which it is organized.
What, then, are the general, essential characteristics of an FIW, cultural or
otherwise?
1. An FIW is a piece of a universe. That is to say, the things which
go to make up an FIW are of a kind. For instance, a living animal is made
up of cells, a chemical formula is made up of valences, a genotype is
made up of alleles or of DNA molecules (but not both). We don' t know
what a d-culture is made up of, yet, but we can say that it is made up of
one kind of (cultural) things.
2. An FIW is a piece of a universe. In other words, not all of
the kind of d-cultural things mentioned above are in any single culture;
things can be added and subtracted.
3. A change in a part of an FIW causes a change in the whole.6 This is
the central defining statement of what an FIW is, and requires a good deal
of explication. It is not meant to be a trivial truth, a truth inherent in the
definition of the whole-part relation (as is, say, the truth that a change in
the number of shirts on a laundry list is a change in the list as a whole). It
is meant, rather, to be a factual statement of cause and effect involving, at
least, a difference in time between the first change and the second.

13
4. The preceding paragraph introduces the notion of "part of an FIW,"
but we lack any basis for distinguishing one part of a d-culture from
another (just as we lack knowledge of d-cultural things). We have noted,
however, that a change in a part is a change in the whole (by definition of
the whole-part relation), so we can rephrase paragraph 3 to read simply:
One change in an FIW causes another.
5. The statement is perhaps too strong, since it implies a continuous,
never-ending series of changes, given any change at all. To avoid such an
implication, we will rephrase the statement again: The changes in an FIW
are causally related.
6. The notion of ' cause' is not very clear, but we need not solve the
problem of its explication here. For our purposes, we can simply reinterpret
statement 5 thus: Antecedent changes in an FIW are sufficient conditions
for subsequent changes.
7. The epistemological import of 6 is: If we fully understood the
principles or rules governing the operation of a certain FIW; and if we knew
its history, i.e., the changes that have occurred in it up to the present
moment; then we could predict the next change that will occur in it (or that
there will be no further change). In other words, by knowing what has
happened in an FIW, we can in principle predict what will happen next,
8. Suppose that a certain FIW is in stasis. Then a change occurs

1 4
(whose cause, presumably, lies outside the FIW). From 7 it follows that
we can, in principle, predict a sequence of changes to follow.
All the above statements can be summarized into two:
1. An FIW is a piece of a universe.
2. If an FIW is in stasis, and a change occurs in it , subsequent
changes fall into a predictable (in principle) sequence.
We have now explicated the concept of a functionally integrated whole
(FIW), to the extent that we know the general rule of change in an FIW.
Let us reiterate that it is in the nature of an FIW that changes in it are
predictable in principle . What we mean by "in principle" is that if we had
sufficient theoretical knowledge of how FIWs work, and if we knew the
history of a given FIW, or perhaps its present state alone, we could,
without reference to anything outside the FIW, predict what is going to
happen to that FIW next; always provided that no event occurs outside the
FIW which influences its internal workings. 7
Now a thoroughgoing philosophical determinist will say that every
event is, in principle, predictable. In our terms, then, he is cl aiming that
the entire universe is a functionally integrated whole (FIW). The difference
between him and us is that he merely asserts his claim; we aim to subject
our claim to empirical test.
In order to make such an empirical test, we must find a way to

15
express changes in an FIW. This is essentially a problem of describing the FIW,
fully or partially, and then changing the description.
We do not know what the terms for describing a d-cultural FIW might
be, just as we don't know what the ' parts' are or what the 'things' are (see
above). We do know, however, that changes in Kluckhohn and Kelly' s d-
culture determine changes in x-culture. Thus we can use changes in x-
culture as indicators of changes in the d-cultural FIW and, hopefully, we can
study sequences of the former for clues as to sequences of the latter. 8
At this point we want to make another temporary assumption, in
order to make the implications of this relationship clear. We assume that
the d-culture is not only known to be an FIW, but that it is also
omnipotent and all-inclusive. That is, the d-culture and only the d-
culture controls x-cultural change.
Now we have the problem of describing changes in the x-culture.
Any description of a named thing can be said to consist of a
number of sentences joined by ' and' . The subject of every one of the
sentences is the name of the thing, in this case ' the x-culture of social
group y.' The predicate of each sentence consists of a term or phrase or
clause describing some characteristic or quality.
If we required a complete description of the thing we would be
obliged, obviously, to write all the descriptive sentences; the predicate of
the final sentence might be something like "nothing else." Or

16
else we could write every possible sentence, with the word ' not' in the
predicates of the sentences that were not applicable.
Fortunately, however, do do not have to perform this infinite, ex-
haustive, and Herculean task, as we only want to describe changes
in the thing. To do this we can simply write a certain sentence for a
certain time, and write the same sentence, but with the predicate
negated, for a certain subsequent time, thus:
John is not old at time i.
John is (not not) old at time i + 1 .
Thus we describe a change in John. For an x-culture:
The x-culture of y has characteristic z at time i .
The x-culture of y does not have characteristic z
at time i +1 .
Now if the "thing" in question is, as we are assuming for an x-culture,
determined in its changing by an omnipotent and all-inclusive FIW, it follows
from Summary Statement 2 (above, page ¹4) that if an x-culture is in stasis
and we write a description of a change in that x-culture, we could in principle
then proceed to write further descriptions of changes in that x-culture in the
correct sequence. The reason that we cannot do this at the present time is
not that culture change is inherently unpredictable but that we don' t
understand d-cultural FIWs (and how they control x-cultures) well enough.
Or we can forget about the d-culture and simply look at the x-culture through
time. Given our (temporary) assumptions, if we observe changes

17
in an x-culture, and describe them as they occur, we will have written them
in the correct sequence, the sequence determined by the FIW'; in other
words, we will have written the changes in the sequence we would have
written ante factum had we had sufficient knowledge both of the
determining d-culture and of how d-cultural FIWs work.
C. The language of description of x-cultures
We have said above that descriptions of changes consist of changes
of descriptions, by negating their predicates. (It can easily be shown -that
this statement holds for quantitative changes, i. e., changes along a
continuum, as well as for clearly qualitative changes.)
Descriptive statements about an x-culture are statements of
presences or absences of culture-traits , so descriptions of change in an
x-culture consist of time-tagged negatings of such statements. Culture
traits, in turn, are located by applying certain procedures to statements
inferred from observations of the behavior of members of the social group
whose x-culture is being described. These procedures are described as
follows:
The lowest-level descriptive term describes a behavior-element; a
behavior element consists of a stimulus-element and a response element.
Behavior-elements exist a priori in the lexicon of the observer. That is to
say, a field worker observes someone behaving and writes

18
down as simple and as extensive a description or what he has observed as
possible, This description will include notations of movements, gestures,
etc., and also verbatim quotations of the speech of the individual in
question and of others.9
In general, the report will consist of a description of the situation,
including what other people may have said or done, and of the action of the
person in question. The field worker will use his intuition to determine which
part of the total situation is stimulus for a particular response and which
part of the action is a response to a particular stimulus.
(This intuition will be derived from common sense, from study of the
field descriptions and analyses of other anthropologists, and from
specialized training in techniques of anthropological field research. It will
be refined and re-refined as observation and analysis proceed.)
The behavior-elements, then, are words and phrases used in these
reports of behaviors. They are very roughly analogous to phones,
symbolized in the International Phonetics Association alphabet, as used
by someone gathering textual materials for a later linguistic analysis.
When a body of such descriptive elements is in hand (and as it is
added to), one begins to analyze the body into behavior-types, A behavior-
type is, quite simply, an ordered set of behavior elements (first stimulus-
elements, then response-elements) that seem frequently

19
to occur together in that order. in other words, the ethnographer judges that
there exists a propensity in the society for (at least some) people to produce
a certain ordered set of response-elements when confronted with a certain
ordered set of stimulus-elements.10
In an ideally simple society, with a very small population and no
status-differences at all, a description of the x-culture would consist of
nothing more than a list of behavior-types, and a change in x-culture would
be expressed by negating a behavior-type predicate. To express an adoption,
for example:
S UBJECT PREDICATE TIME
-the x-culture of y does not include behavior-type w -at time i
the x-culture of y does include behavior-type w at time i + 1
If, however, a society does have more than one status, we have to
analyze a corpus of behavior-type descriptions further, utilizing behavior-
traits as the analytical unit. A behavior-trait is a predicate consisting of
a behavior-type plus a status-designator, for example:
STATUS DESIGNATOR
culture of y includes behavior-type w by young adult male at time i
More than one status-designator may be required; for example: . . .
behavior-type w by young adult male toward adolescent female

20
Statuses are discovered empirically by correlating behavior-type descriptions
with personal names or other individual-designators. If certain persons have
exhibited certain behavior-types while other per-
sons have not, one suspects a status-difference. If analysis shows
that there is a set of behavior-types associated with and only with one
group of persons, this set of behaviors defines a status. In all probability
the defining behavior-types will include a ready-made status-designator
in the indigenous language, e. g.
STATUS DESIGNATOR
when asked "Why don't you hunt?" Old Man says "I am an old man."
If no indigenous status-designator is forthcoming, the ethnographer will coin
one.¹¹
Finally, in a society with more than an absolutely rudimentary social
system, we will discover sets of behavior-traits which hold for pairs,
triplets, or quadruplets of statuses, e. g. , husband and wife, maternal
uncle and nephew, the various statuses involved in a puberty ceremony.
Such sets of behavior-traits define institutions. An institution is, in effect, a
set of statuses which occur together in space and time and are defined in
part by patterns of interaction among them.
The reader will no doubt have realized that these various "steps" in the
analytical description of an x-culture will not in actuality occur separately
and independently, but rather that, as one begins to suspect

21
the existence of an institution, one will postulate statuses and look for defining
behavior-types. He will then, of course, examine his
raw" observation data for overlooked similarities and differences in
behavior-element sets to conform to these rough hypotheses. The analogy
to linguistic analysis need not be labored. It is also obvious that what I
have attempted to do here is to provide a sort of rational reconstruction of
what ethnographic field workers have been doing all along as they " work
up" their data.
The next step in analysis is, however, novel. But before going on, we want to
deal with the problem of time and the problem of propensity both terms having
been used above without discussion of their meanings.
A behavior-trait is not, properly speaking, the response of a holder of a
certain status to a certain stimulus in a certain institutional context, but
rather a propensity for such a response. Now, we can state that so-and-so
has or hasn't such a propensity only if we see him holding that status and
presented with that stimulus in that institutional context. But the stimulus
may occur only at a certain time of the year or the institution may be
instituted only once every ten years or, for a long time, no individual may be
eligible to hold a certain status. In such cases the variation through time we
observe constitutes behavioral change but not cultural change. If we want to
observe cultural change we have to wait for the next year or the next time
the institution is instituted or for another person to grow into the status.

22
Only then can we negate the predicate and say that culture change has
occurred, because only then can we be sure that the old propensity is gone
or a new propensity is added.12 Regular time, as measured by clocks and
calendars, we will call here 'behavioral time.' The time measured by 'i' , ' i
+1' , etc., in one of our predicate-negations we will refer to as ' cultural
time.'
We are now going to observe x-cultural change under our tempo-
rarily assumed ideal conditions - i.e., assuming that d-culture is an FIW
and is omnipotent and all-inclusive. This assumption about d-culture, if
interpreted strictly, includes conditions that may seem quite surprising.
It is almost universally agreed that the vast majority of changes in any
human culture have been due to contacts with and borrowings from other
cultures. Thus, if the x-culture we are studying is to undergo much change
at all, it must have a cultural environment, that is a source of behaviors to
borrow. But, if that cultural environment is in any way limited, the d-
culture cannot be an omnipotent and all-inclusive determiner of x-cultural
change. So omnipotence and all-inclusiveness imply that the cultural
environment includes every pos-sible human behavior, so that any trait
that fits in can be borrowed. For similar reasons, d-cultural omnipotence
and all-inclusiveness also entail a universal habitat, one in which every
possible human behavior can be realized.

23
a The culture trait: the unit of x-cultural change
Assuming universal cultural environment and habitat and imagining
ourselves to be omniscient ethnographers, let us proceed with our cultural
analysis. First, we turn on the behavioral clock and get a complete behavior-
trait inventory for social group y. Call this inventory Inventory A. To have a
complete description of the x-culture of group y, we next write out a
complete inventory of behavior-traits not exhibited by group y, Inventory B.
We then advance the cultural clock one unit of cultural time, run the
behavioral clock through a complete cycle, and compare our inventories, time
i, with our inventories, time i + 1. Each behavior-trait predicate from
Inventory A which has been negated describes a culture trait which has been
lost. Each behavior-trait predicate from Inventory B which has been negated
describes a culture-trait which has been gained or adopted. The concept '
culture-trait' is thus defined, roughly speaking, as the empirical unit of
cultural change (i. e., the unit of x-cultural change). While such a conception
may be unusual, I believe it does no violence to common usage.
(Note that analytical feedback is again required; for example, what we
had thought was a behavior-trait may have been lost or adopted only in part,
in which case we must conclude that it was, at time i, actually two behavior-
traits highly correlated, and we must alter our original inventories
accordingly.

2 4
(in so doing, we are also solving what has been at t imes a vexed problem in
the study of diffusion; namely, the problem of reinterpre tation, of the borrowing
of form without the borrowing of function, and so forth. Our culture traits are
built up from behaviors, and expressed by verbs or verbals; they describe only
what people do (including their verbal deeds) and, ideally, everything they do. If
the form of a behavioral complex is borrowed, but not the function, this will be
reflected in the description of the borrowing. As a matter of fact, the function of
a trait can be discovered only by analysis of the institutional setting into which
it is borrowed and of its place in the sequence of borrowings.
(See, for instance, the example presented below, kissing at an office
party. One can see from this example that "the office party" would never be
the name of a trait; traits might be such things as drinking at an office party,
kissing at an office party, etc. , each further qualified by who does it and
under what specific conditions. The name of the trait does not in any way
imply its function, but only its form; i. e., the specific behavior in question.) 13
A schematic diagram of a description of a cultural change, then, might look
something like this:

2 5

26
Thus might an ethnologist studying American culture denote such a
change; to wit, the loss of a culture-trait. At some time between December
1964 and December 1965, the propensity of young adult males for kissing
young adult females under the mistletoe at office parties in late December has
been lost.
E. The Natural Order of Cultural Adoption and Loss: theoretical
considerations
And so we go on, advancing the cultural clock and cycling the behavioral
clock, listing the cultural traits and changes as they occur. When we have a
goodly list of such traits and changes, we can examine this list in an effort to
discover the mechanisms in the d-cultural FIW which caused the changes to
occur in that order. Since we know that all changes in the x-culture were
caused by the operation of the FIW, we can call the order represented by this
list a Natural Order of Cultural Adoption and Loss of the culture of group y .
Let us now relax our assumption of d-cultural omnipotence in a series of
steps and examine the consequences of each step in turn.
First, we will reduce the last-mentioned entailments of d-cultural
omnipotence, and let the cultural environment and habitat be limited; that is, not
every possible behavior-trait will be available for borrowing, nor will the habitat
permit the entire range of cultural expression. We will not, however, allow them
to change ; we will continue to hold cultural environment and habitat constant
through cultural time.

27
The consequence of this is that, while not every change that the d-culture
would determine can occur, any change that does in fact occur is determined
by a change in the d-culture and, as before, the d-culture' s being an FEW
guarantees us a Natural Order of Cultural Adoption and Loss, but with gaps.
(A corollary consequence may be that because certain changes cannot occur
when called for by the d-culture, the whole process may come to a halt. It
could be set in motion again only by a change in cultural environment or
habitat.)
Next, we give up d-cultural all-inclusiveness and allow normal variation
in cultural environment and habitat. Such changes are, of course, inherently
unpredictable; that is to say, no amount of knowledge of d-culture-as-FIW
would enable us to predict them. At the same time, any one of these
"external" changes can start a sequence of changes in the d-culture; such a
sequence would in turn produce a Natural Order of changes in the x-culture
until that order was upset by another "external" change. So we are
confronted, empirically, with a series of sequences of changes in the x-
culture; with fragments, as it were, of Natural Orders; but we can't really tell
when one Natural Order is broken or when the next Natural Order begins. We
have both gaps and foreign elements to contend with.
(We can, however, try to pick a society where drastic changes in cultural
environment and habitat are not apparent —where rapid acculturation isn't being
forced, for example, by political and/or

28
military means, or by recent contact with a society recognized as worthy, for
prestige or economic reasons, of intense emulation. Thus we can hope that
FIW-changes will be revealed in the x-culture in relatively extensive sequences
of Natural Order.)
At best, unfortunately, we will have some foreign elements, and such will
surely confuse us if we attempt to use this broken order to make inductions about
the nature of the d-cultural FIW.
We must solve this problem, then, of sorting out changes in the x-
culture due to changes in the d-culture, from changes in the x-culture due
to cultural-environmental and habitat changes.
We can do this if we make the following assumption: Changes in the
cultural environment and in the habitat are, in the main, unpredictable. What
we really mean by this is that changes in the cultural environment and the
habitat are determined by many different factors, simply related neither to each
other nor to the d-culture. Thus there appears to be no temporal pattern in the
behavior manifestations of these changes.
If we make this assumption, we can observe several social groups with
similar cultures, similar habitats, and similar cultural environments, in the
manner described above for studying a single group; i. e., we can replicate our
study. Barring radical change in the habitat or cultural environment of one or
more of these groups, we would end up with roughly similar sequences of
adoptions and losses

29
(predicate-negatings). Those adoptions and losses that were present in al l (or
most) lists, and in the same (or nearly the same) order, would be the ones
resulting from changes in the d-cultural FIW. Thus we could attempt to infer
the nature of the d-cultural changes from changes in x-culture. Of course, we
would still have discontinuities and gaps, which would make the task more
difficult.
At this point we can discard our last remaining temporary assumption, the
one we made first, namely that we know that a d-culture is an FIW. That is to
say that, instead of stating it as an assumption, we state it as an hypothesis.
It can now be seen that the very procedure which we have outlined above,
a procedure to investigate d-cultural change through its x-cultural effects,
actually is also a test of this hypothesis, for this reason:
The d-culture can be said to be an FIW only if similar x-cultures, under
the stated conditions, do indeed go through parallel sequences of adoptions
and losses; that is, only if the same Natural Order of Cultural Adoption and
Loss can be demonstrated to exist in several parallel social groups can we
assert that the x-culture of those groups is controlled by an FIW.
F. The Natural Order of Cultural Adoption and Loss: empirical problems At this
point it may be asked how we can locate parallel culture-bearing social groups
for this kind of comparative study. We want to

30
be able to do this a priori , that is before we begin describing x-cultures and x-
cultural changes. What criteria can we use to determine that two or more social
groups a) have similar cultures, and b) occupy similar cultural environments and
habitats?
To take the second part of the question first: The groups can be said to
occupy similar habitats and cultural environments if they occupy the same
habitats and cultural environments; 1. e., if they exist at the same place and
time. But, it may be asked, how can they occupy the same habitats and cultural
environments, when each will then be a part of the other' s habitat and cultural
environment? The answer is that we don' t need identical environments and
habitats, we need similar ones, and since the groups' x-cultures are to be similar
they will have similar effects on the habitats and environments of the others.
Then, too, it can be said that such effects of a group' s x-culture are part of its
own habitat and environment, so groups occupying the same place and time
really do have practically the same habitat and environment.
As for cultural similarity: Two groups are similar culturally if they are
daughter-groups of the same parent-group. This statement is true in the light of
the notion of a culture as a tradition, or social inheritance, of a people. It is our
intention to apply this parent-daughter analogy quite literally.
(To take a similar analogy, if a biological population splits up into two
groups we would expect the allelotypes of the two daughter

31
populations, one generation hence, to be about the same; and we would say the
daughter populations are racially similar, without having to describe their
allelotypes. Severe cases of genetic drift must, of course, be excepted.)
Of course, it is hardly likely that we can find in nature two daughter
societies of one parent society, still less a large enough number of societies to
replicate our experiment often enough to suit us. That is, it is hardly likely that
we will find several distinct, complete, whole societies only a generation or two
removed from the parent society and occupying the same habitat. Actually, total
distinctiveness is not only empirically a will o' the wisp, it is not theoretically
necessary. Diffusion between daughter societies need not be ruled out, since
each of the social units would, in the case of diffusion, be acting simply as a part
of the cultural environment of the others; and each' s d-culture would,
hypothetically, be controlling its own borrowing.
Likewise, it is not necessary that each of the social units be a complete
society, i. e., that it provide for all the biological, social, and cultural needs of
its members. For example, several bands of a single tribe would meet our
criteria well enough. Each band is a social unit, presumably being a sub-unit
of the tribe on an equal basis with every other band. Although a part of the
cultural life of the
people occurs in inter-band interactions, still a large part of it occurs strictly
intra-band, For example, day-to-day subsistence behavior,

32
behavior toward one s co-bandsmen and women, self-curing practices, and so
forth can be looked at from the perspective of each band separately.
Furthermore, much of general socialization and enculturation occurs at the
band level, so that many attitudes toward extra-band situations, along with
the behaviors expressive of these attitudes, are learned as part of band-
culture, not as part of tribe-culture. On the other hand, the practices learned
at tribal initiation rites cannot be considered as band-culture, although band-
cultural differences might help to explain differences in, say, the
interpretation an individual would give these practices.
So a series of bands might serve as daughter-societies, in a sense, with
their daughterhood being re-established in every generation by band exogamy
coupled with tribal endogamy. Assuming, then, that the bands are not ranked
or specialized within the tribe, that they occupy similar habitats, and that
they have the same degree of contact with the same alien peoples —to the
extent that we can assume all these things, to that extent we can expect each
band to go through precisely the same sequence of micro-changes in x-culture
if there is a d-culture and that d-culture is an FIW.14
To put the above in more specific, practical terms: if we have separate
ethnographers living with the several bands, and noting their cultural changes
over several years, we would expect to find similarities between their
sequences of cultural changes significantly

33
greater than chance alone would explain. If we so find, then we proceed to
claim that the differences in the sequences were due to such imponderables
as accident, habitat-differences, differences in alien cultures in contact and,
perhaps, minor differences in the nature of the d-cultural FIW due to earlier
accidents, habitat-differences, etc.
It should be noted at this point that on the one hand, we don' t claim
that the micro-changes will occur simultaneously; a certain change may
occur in one band a whole generation before it occurs in another. We argue
only that if a culture is an FIW, then if changes occur in a certain sequence
in one social unit they will occur in the same sequence in every other social
unit bearing that culture.
On the other hand, our basic hypothesis gives us no grounds for
predicting which of the social units will be farthest along in the sequence,
which the second, third, etc. Presumably this will be determined by extrinsic
factors —which is the first unit to be struck by an external change-causer: a
change in habitat due to drought, a change in cultural environment (and
habitat, perhaps) due to contact with Europeans, etc. Another factor might be
differences in intensity of contact with regularly-present aliens.15
G. The household as the social unit
It is only a short leap from bands of the same tribe as social units to households
of the same village as social units. Again, certain

34
behaviors occur only in a household context, and households are generally the
main enculturative milieux, so that differences in many basic attitudes may be
traced to differences in household cultures.16
Since households are generally even smaller than bands, however, they
are subject to an important kind of what might be called "cultural drift." If a "
normal" household for a given society includes occupiers of the statuses of,
say, Father and Husband, Mother and Wife, and Child, a household that
doesn't have bodies to occupy those statuses is going to be behaviorally
defective, not on cultural grounds but on habitat, in this case demographic,
grounds. Similarly, if the same person who is Father and Husband is
"normally" also Head of Household, but it happens that the wife' s mother is
present and is the owner of the homestead, the Head' s behavioral inventory
may be rendered defective; or, putting it another way, the roles of status Head
may be split among two people.
What we must try to do, then, is select households with similar
demographic characteristics for comparison. Ideally, they should not differ
in social class within the village, nor should they differ in occupational
specialty, particularly if available specialties include home industries
involving more than just the Head.
As for access to resources, i. e., differences in the physical part of
habitat, it should be possible to show that differential use of resources is due
to cultural preferences and not to extrinsic causes.

35
This may, of course, be extremely difficult to determine in an actual case.
It cannot be emphasized too strongly, however, that any errors we make in
determining similarity will have the effect of reducing the likelihood of getting a
Natural Order, not of increasing it , because differences in habitat, as we stated
on pages 8 and 28, are "essentially unpredictable" ; in other words, nothing we
do in selecting our households can lead to bogus confirmation of our
hypothesis, but only to mistaken rejection of it.
One way to improve the probability of getting similar cultures is to use
households that are linked by kinship ties --again, a literal use of the "daughter"
metaphor. If the ties of marriage and kinship are fairly close, the likelihood of
class differences between households is somewhat diminished, for instance.
So, now we can select a matched sample of households from a village,
assign a field worker to each, and note microchange over the years. If we get
similarity of sequences, we declare the basic hypothesis confirmed; we then
throw out or explain away the variations from the general pattern, write down
the general pattern, and begin to use it as a source of hunches for a general
theory of micro-cultural change. After several such studies, hopefully, we can
elevate the hunches that work out to the level of hypotheses, and subject each
to theoretical and empirical test.

36 H. Studying cultural change synchronically
Unfortunately, we are still talking in terms of ideal field situations; we have
not yet finished making concessions to the practical. We do not have many field
workers (we have two); we do not have a generation or two to work (we have
eighteen months). The first of these limitations means that we cannot observe
each member of every household under every relevant stimulus; instead, we
must simulate a series of relevant stimuli, and record simulated responses, and
also record artifactual responses such as house types and furnishings.
The second limitation is even more confining. Eighteen months is a
minimum of behavior-time; it cannot encompass more than an instant of
cultural time. This means, in the first place, that only a tiny bit of cultural
change could take place in any one household during the course of the study,
and such a change would be very difficult to separate from random variations
in responses. In the second place, the second limitation may well make inter-
household comparison impossible, since it could very well be the case that no
two households are within one and one-half years of each other in their
common culture-change sequence.
These limitations in time and personnel create a further difficulty; namely,
it is impossible to denote adequately the cultural environment, to list every
behavior-trait that might be observed, at one time or another, by members of
the households being studied. Indeed, it may

37
well be that to do this would be impossible even with unlimited time
and personnel, when dealing with a population that has access to mass-
media: books, newspapers, radio, motion pictures, and television.
In short, we cannot specify exactly either the base-line behavioral
inventory nor the sources available for borrowing. All we can do is
record some of the differences in behavioral inventory between house-
holds at one point in time. We cannot specify with certainty, on any
a priori basis, whether a difference with respect to any particular
trait is due to a gain by those who have the trait or a loss by those
who lack it.
Now, is it still possible, with all these limitations and difficulties,
to identify and specify a Natural Order of Cultural Adoption and Loss,
if there is one, and thus to confirm the general hypothesis that a
d-culture is a functionally integrated whole (FIW)?
Further, and more important, is it possible to invalidate that
hypothesis; i. e., is the general hypothesis corrigible in the light of
the limitations listed? The answer is yes, and the means of valida-
tion lies in the prediction of the pattern of distribution of the behavior-
traits throughout the households. The way this works is that each
household, if the hypothesis is correct and a Natural Order exists,
will be located by its most recent cultural change somewhere along
that Natural Order; thus there will be an ordered sequence of house-
holds ranging from the most progressive to the most conservative.
38
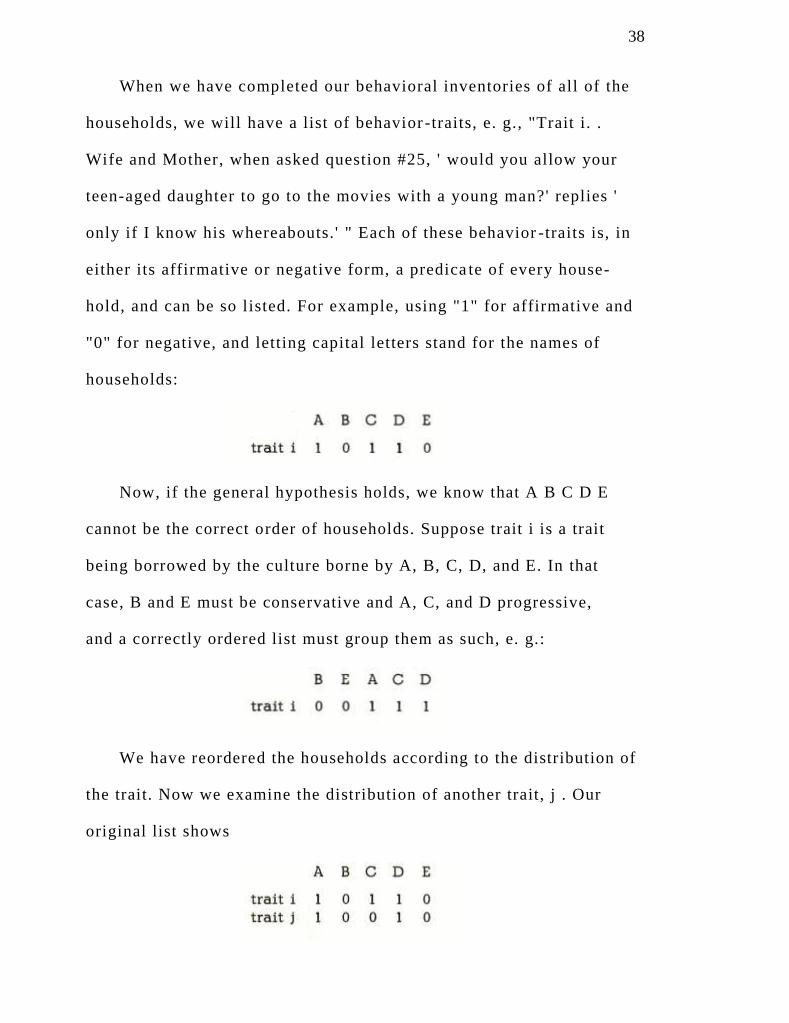
When we have completed our behavioral inventories of all of the
households, we will have a list of behavior -traits, e. g., "Trait i. .
Wife and Mother, when asked question #25, ' would you allow your
teen-aged daughter to go to the movies with a young man?' replies '
only if I know his whereabouts. ' " Each of these behavior -traits is, in
either its affirmative or negative form, a predica te of every house-
hold, and can be so listed. For example, using "1" for affirmative and
"0" for negative, and letting capital letters stand for the names of
households:
Now, if the general hypothesis holds, we know that A B C D E
cannot be the correct order of households. Suppose trait i is a trait
being borrowed by the culture borne by A, B, C, D, and E. In that
case, B and E must be conservative and A, C, and D progressive,
and a correctly ordered list must group them as such, e. g.:
We have reordered the households according to the distribution of
the trait. Now we examine the distribution of another trait, j . Our
original list shows

39 and our reordered list shows
Again, we see that the households are not in the correct order: households
A and C must be reordered
Suppose our next trai t , k, has distribution
which we now reorder as
Again, we must reorder and we can reorder, but this t ime we see that
if i and j are traits being borrowed, k must be a trait being lost:
If the general hypothesis were true and omnipotent , we would expect
that additional traits would allow us to improve our ordering of the
households, until we got a set of distributions something like this:

4 0
These dis t r ibut ions have one thing in common: under household
order EBCAD, in every one of them, e i ther a l l 1 ' s are before al l 0 ' s , or
a l l 1 ' s a re after a l l 0 ' s . Fur ther , of a l l the possible household orders ,
th is condi t ion obta ins only under E B C A D or i t s exact opposi te D A C
BE; any other household -order would cause 1 ' s and 0 ' s to be mixed
together for a t least one t ra i t (actual ly two t ra i t s) . D is e i ther the most
conservat ive household or the most progressive (we cannot te l l which on
the basis of the synchronic dis t r ibut ions a lone) , A the second most
conservat ive or progressive , and so on through E. 1 7
For purposes o f expos i t ion , le t us s t ipula te tha t D represent s the
p rogress ive end of the sca le . From th i s i t fo l lows tha t t r a i t s wi th 1 ' s
to the r igh t o f 0 ' s a re t ra i t s be ing bor rowed , and tha t t r a i t n , which i s
he ld by on ly the most p rogress ive househ old , i s the la te s t adopt ion .
S imi la r ly k , which i s he ld by on ly the conse rva t ive E , i s the ear l i e s t
loss . Likewise p , he ld by eve ryone bu t the conse rva t ive E , i s the
ear l i e s t adopt ion ; and so on . We can thus reorder the t ra i t s :

4 1
There, then, is our Natural Order of Cultural Adoption and Loss for
the culture borne by households A, B, C, D, and E
(At this point , it would be well to note that more than one behavior -
trait might have a given pattern of distribution over the households.
( It would also be well to state emphatically that nothing here im -
plies that culture change is a simple mat ter of the substi tution of one
culture-t rait for another. On the contrary: If two of the households
happened to be separated by just one moment of cul tural t ime, we
would find a difference between them of either an adopted trait or a
lost trai t , but not both. And i t is perfectly possible for several suc -
cessive moments of cultural t ime to be taken up by adoptions only or
by losses only.)
One point to be remembered here is that , whi le we can ' t know
which end of the sequence i s ear l ier , we can know the sequence. In

42
this example it is either the one shown above or its exact opposite, namely
and no other . In pract ice, de termining the di rect ion of change is easy,
using historica l mater ials, obvious l inguist ic borrowings, individuals '
recol lect ions of changes, etc .
So we have demonstrated that a synchronic study can be used to
identify and specify a Natural Order of Cultural Adoption and Loss.
I. Test ing the hypothesis synchronical ly
We now turn to the more important question of corrigibility; can the
hypothesis that x-cultural change will show a Natural Order of Cultural
Adoption and Loss, and thus the general hypothesis that a d-culture is an
FIW, be invalidated by synchronic methods?
For purposes of exposition, let us suppose that we are stil l
claiming that the general hypothesis is not only true but omnipotent. If
we make such a claim we can be easily conf uted empirically. Suppose,
for instance, that in our example above we found not only the eight
trait-distributions presented but also a ninth:

43
Put in with the other eight on the chart on page 40, it would appear thus:
Here is a distr ibution that cannot be reconciled for, i f we reorder the
households to sui t that distribution, some other trait or traits would show a
scrambled distr ibution. 1 8 Thus, we would have to admit that we have a
behavior-trait that is being borrowed or lost out of order. This means that
unpredictable changes are occurring in the x -culture; a certain change has
occurred which has been followed in some cases by this one, and in some
cases not . But we have shown that our gen eral hypothesis entails a
predictable Natural Order of change. Hence we must abandon our claim to
both truth and omnipotence. So, of course, we abandon the claim to
omnipotence and retain the claim to t ruth.
We might next swing to the opposite extreme and state that we will
continue to assert our hypothesis if we are able to find any order at all, in
other words we will abandon it only if the distributions of traits seem to
occur completely at random.
There are several cogent arguments against taking this stand; I will
mention two of them. First , if the effect of culture-as-FIW on culture
change is so weak that we have to be satisfied with bare detec tion of it , it
would seem a waste of t ime to pursue its study, since

44
there are so many other factors that are known to have relat ively strong
effects on culture change. It would be much more useful to turn our
attent ion to these more sal ient factors, and leave cultural integration to
the more poetically incl ined among us.
Secondly, there are many minor functional relat ionships among
different behaviors that have l i t t le or nothing to do with cul ture -as-FIW.
Some of these relat ionships are pret ty obvious: no one who lacks
electr ici ty wil l have an electr ic refrigerator, in al l probabil i ty; others
may be less obvious. But al l would tend to show up in an analysis l ike
that proposed and thus perhaps give a bogus indicat ion of order, or at
least woefully obscure the nature of a weak FIW-effect ; which, in turn,
would make inferences from the empirical order to the nature of the d -
cultural FIW extremely hazardous, to say the least .
Ergo, we must t ry to find a way of judging whether or not our
hypothesis is worth going on with, and we must look for i t between the
extremes of too difficult and too easy a test .
A midd le ground , here , r equ i res us to deve lop and u t i l i ze some
quant i ta t ive techniques . When we have our da ta a r rayed , we must
a r range i t i n to the bes t poss ible pa t t e rn . We must a r range our house -
ho lds in the way tha t yie lds the most be t t e r d i s t r ibut ions and the
fewes t worse di s t r ibu t ions , Then we must a sk, and answer , the ques t ion
"What i s the p robabi l i ty o f ge t t ing a pa t te rn th i s c lose to the idea l , o r
c lose r , by chance a lone?"

45
To do this, we will have to invent a measure of closeness to the ideal,
and then calculate the distribution of the values of that measure over all the
possible patterns, from the best to the worst. The probability -figure we seek
can then be found by dividing the number of closer and equally close patterns
by the total number of possible patterns.

NOTES FOR CHAPTER II
1Although he does not use the same terms, Rouse' s analysis of the various factors entering into an artisan' s behavior, and hence into
an artifact, parallels the Kluckhohn-Kelly analysis very closely:
To speak in physical terms, elements of cul ture are
analogous to forces which react upon the individual
art isan, causing him to behave in a certain way, i . e . , to
make art i facts of certain kinds. They are not the only
forces which react upon the art isan and affect his
procedure, however. Chance, peculiar elements of his
personali ty, di fferences in his innate abi l i ty, and
environment al l may have affected the art isan and
moulded his procedure. In fact , the procedure i tself may
be considered to have been an equil ibrium, in to which al l
these factors were able for a moment to enter . The
art i fact is the resul t , somewhat of a fixat ion, of the
equil ibrium. These relat ionships may be diagrammed as
fol lows:
2In view of the known eclect icism of cultures, the
problems inherent in a theory of diffusion are mainly
the mechanical ones of t ime, space, and means of
t ransport of materials or ideas. It is recognized that the
nature of the t rai ts and the att i tudes of the donor and
recipient groups also enter importantly.
46

47
into the successful t ransmission of cul tural elements,
(Rands and Riley 1958: 274)
Cf. also Eggan:
. . the larger organizations or configurations of culture
may well be limited to a considerable extent in terms of
types. We do know that these patterning s or organiza tions
have an important influence on innovation and bor rowing
and hence on cultural change. (Eggan 1955a: 493)
Social structures are no more subject to ready borrowing
than are linguist ic structures, whereas cultural elements,
l ike linguistic vocabulary, may be more easi ly taken over.
The pat terning or configurational aspects of culture may
offer parallel resistances to borrowing, as Benedict
has demonstrated. (Eggan 1955a: 493-4)
Murdock, and Eggan again, emphasize how a portion of the d-culture, namely
social structure, may resist, and thus influence selection in, borrowing:
A people borrows from i ts neighbors only what i ts cul tural
base is prepared to accept and, among such elements, only
what i ts members have reason to feel wil l sat isfy their wants
bet ter than exist ing pract ices, and, among such, only the
elements which actual ly prove, a fter t r ial , more sat isfying
under the environing condit ions. In actual fact , the presence
of other peoples with differing cultures in the vic ini ty is
reacted to as is any other aspect of the environment, as a
source to be select ively drawn upon for innovations which
may bring superior adaptat ion.
(Murdock 1960: 185)
Obviously borrowing has taken place on a large scale
throughout the Pueblos — and beyond as well — in terms
not only of technology and material culture but of ideas,
a tti tudes, and concepts as well . But in the field of social
structure as with l inguist ic structure the bor rowing of
pat terns of organizat ion is relat ively rare, except where
there is close and int imate contact accom panied by
intermarriage or bil ingualism. The borrowing of clan names
is possible , but the essentials of a clan system are difficul t
to grasp; matri local residence can be comprehended
readily, but the principl e of grouping on a

48
lineage basis is not easily formulated; kinship terms can
be borrowed, but the system of organization is
largely unconscious. (Eggan 1950: 319)
3This is, of course, a very common idea. Divers authors have offered
divers schemes for understanding the nature of the underlying patterns of
culture; e. g., Benedict' s and Mead' s "configuration," Opler's "themes,"
Hoebel' s "postulates" :
Nor are the basic postulates in a cul ture necessarily
perfect ly consistent among themselves. However, the
measure of consistency between basic postulates, and
between the postulates and the specific selected be havior
pat terns, will be the measure of integration of the
cul ture. Integration, i t is assumed, must be held above a
minimal level i f any society is to continue to function
effectively. Integrat ion is achieved by selec tion in
accordance with a body of basic postulates that are not
overly inconsistent with each ot her. Every society
maintains a social system.
As a result, the behavior of the individual members of
any society (or of subgroups within a society) reveal
considerable similarity in response to specific stimuli.
These frequently recurring patterns we call norms or
ways. (Hoebel 1954: 14)
Note also how Eggan contrasts social integration and cultural integration:
The concept of integration likewise has a somewhat different
meaning with reference to social structure and to culture.
Social structure may differ in terms of the number of
individuals bound together and in the character and complexity
of the ties uniting them with one another. Cultural integration,
on the other hand, refers to the degree to Which beliefs,
attitudes, and behavior patterns are mutually adjusted and form
a system without contradictions or loose ends. This process
takes place in the individual but may be generalized for the
group. Social integration and cultural integration not only are
measured by different criteria but can be measured
independently of
each other, (Eggan 1955a: 494)
See also the definitions of ' culture' and the following di scussion under
"Structural" in Kroeber and Kluckhohn (1952/63: 118-24); Kroeber' s

49
discussion of "Integration —Inherent or Induced" (1948: Section 122);
Oliver' s section on "Function and Structure" (1964: 41 -2); and Benedict' s
well-known Patterns of Culture (1934/46).
4Cf. Kroeber and Kluckhohn on Sapir:
As Sapir showed for language, there are "configurational
pressures" which bring about both parallel and differentiating
changes. Every particular cultural structure through its em phases,
its tendencies toward disequilibrium in certain sec tors, its lack of
development in particular areas, favors evolution in some
directions and not in others. And as Sapir further pointed out, "it is
more than doubtful if the gradual unfolding of social pa tterns tends
indefinitely to be controlled by function." (Kroeber and Kluckhohn
1952a: 183)
Hoebel makes this more explicit , in the framework of his "postulates":
Once a culture gets under way there are always some criteria
of choice that govern or influence selection. These criteria are
the broadly generalized propositions held by the members of a
society as to the nature of things and as to what is qualitatively
desirable and undesirable. We prefer to call these basic
propositions "postulates." [Others, Hoebel points out, call
them themes or values.]
New patterns are accepted, rejected, or modified with
reference to the basic postulates. New patterns may be
ideologically rejected as incompatible with the pre -existing
postulates, but once present they may persist though "officially"
banned, and in time may influence a change in the postulates
themselves so that ultimately their general acceptance becomes
possible. Or they may be found acceptable in terms of some of
their aspects and without awareness of the potential
implications of other aspects that are incompatible with existing
postulates. Then when such implications are finally realized, the
behavior may be so well established as to cause a modification
or even overthrow of the original postulate . (Hoebel 1954: 13)
5For the learnibility of culture, see the definitions in Kroeber and
Kluckhohn 1952/63, pp. 111-14; for the traditional nature of culture, see
the definitions on pp. 89-94.

50
6In other words, an FIW is a "K-Gestalt, a system of functional interdependence"
(Madden 1953: 561).
As we have seen, Koehler stresses interaction in the sense that
a change in one element causes alteration in all areas of a
system. This is essentially what is meant by saying that a K -
Gestalt is a system of functional interdependence.
(Madden 1953: 566)
7For example, a chemical reaction, as expressed in a formula, is an FIW.
Knowing the nature of electron bonds, etc., and knowing what elements have
been put into the reaction, in what order and under what conditions, the
chemist can predict the sequences of chemical changes that will occur;
provided that no events extraneous to that formula occur which affect the
course of the reaction. Such extraneous events could range from unsuspected
impurities in the input chemicals to, say, an earthquake destroying the
laboratory.
8This is not meant to imply that there is necessarily a one -to-one
relation between changes in the d -culture and changes in the x -culture. To
put that another way, i t does not necessarily fol low that the terms used to
describe changes in the d -culture will a ll be interpretable into terms
describing changes in the x -culture. To use a chemical metaphor, terms
such as "electron bonds," "atom," etc. , are not interpretable into terms
describing what the chemist sees when he looks into his test - tube or
measures the acidi ty of i ts content at different stages in an experiment.
9Gardin suggests essentially the same basis for working with the raw materials of
archaeology:
Archeological data can indeed best be described by varying
combinations of elementary terms to which unique and stable
meanings can be assigned. These meanings conform suffi ciently
to the pan-human universalities of sense perception so that —
with the aid of drawings — speakers of different languages will
nevertheless assign the same features to the
same categories. (Cardin 1958: 338-9)

51
10 When systematically gathered comparative data are being used,
this process is referred to as coding, Cf. Rouse' s procedure for coding
attributes into modes (1939: 26-27).
1 1Cf. Linton 1945: 55-82. Our analysis here has been inspired by
Linton' s discussion of status and role. We use ' status ' in precisely the
sense he uses it , and the set of behaviors d efining a status corresponds
closely to his notion of ' role. '
12For more on the problem of the logical status of propensity, see
Hempel' s discussion of the problem of disposition terms (1952: 24 -29).
13Cf. Kroeber and Kluckhohn' s discussion:
Uniformities. Most anthropologists would agree that no
constant elemental units like atoms, cells, or genes have as yet
been satisfactorily established within culture in general. Many
would insist that within one aspect of culture, namely
language, such constant elemental units have been isolated:
phonemes, and morphemes. It is arguable whether such units
are, in principle, discoverable in sectors of culture less
automatic than speech and less closely tied (in some ways) to
biological fact. We shall present both sides of this argument,
for on this one point we ourselves are not in complete
agreement.
One of us feels that it is highly unlikely that any such
constant elemental units will be discovered. Their place is on
lower, more basic levels of organization of phenomena. Here
and there suggestions have been ven tured that there are such
basic elements: the culture trait , for instance, or the small
community of face-to-face relations. But no such hints have
been systematically developed by their proponents, l et alone
accepted by others. Culture traits can obviously be divided
and subdivided and resubdivided at will, according to
occasion or need. Or, for that matter, they are often combined
into larger complexes which are still treatable, in ad hoc
situations, as unitary traits, and are in fact ordinarily
spoken of as traits in such situations. (1952: 162-3)

52
14This use of sub-units of a single society is clearly carrying Eggan' s
"Method of Controlled Comparison" to its logical conclusion:
My own preference is for the utilization of the comparative
method on a smaller scale and with as much control over the
frame of comparison as it is possible to secure. It has seemed
natural to utilize regions of relatively homogeneous culture or to
work within social or cultural types and further to control the
ecological factors so far as it is possible to do so. Above all, it is
important to control the historical framework within which
comparison takes place. While I share Radcliffe -Brown' s vision
of an ultimate science of society, I think that we first have to
cultivate more intensively what Merton has called the "middle
range" of theory, and I suggest the method of controlled
comparison as a convenient instrument for its exploration,
utilizing covariation and correlation and avoiding too great a
degree
of abstraction. (1955a: 499)
See also, of course, Eggan 1954.
15Before the present study was undertaken, a pilot analysis was
performed on the data from the California Cultural Element Survey of the
Northern Paiute, by Omer Stewart (193 -). The eleven bands of the Paiute
were found to serve quite well as social units for this kind of analysis.
16Cf. Levi-Strauss:
It seems that both the reality and the autonomy of the
concept of culture could better be validated if culture
were, from an operational point of view, treated in the
same way as the geneticist and demographer do for the
closely allied concept of "isolate." What is called a
"culture" is a fragment of humanity which, from the point
of view of the research at hand and of the scale on which
it is being carried out, presents, in relation to the rest of
humanity, significant discontinuities. If our aim is to
ascertain significant discontinuities between, let us say,
North America and Europe, then we are dealing with two
different cultures; but should we become concerned with
significant discontinuities between New York and
Chicago, we would be allowed to speak of these two
groups as different cultural

53
"units." Since these discontinuit ies can be reduced to
invariants, which is the goal of structural analysis, one
sees that culture may, at the same time, correspond to
an objective reality and be a function of the kind of re -
search undertaken. Accordingly, the same set of indi -
viduals may be considered to be parts of many different
cul tural contexts: universal , continental , nat ional , pro -
vincial , parochial , e tc . , as well as famil ial, professional ,
confessional , pol i t ica l , e tc , Thi s i s t rue a s a l imi t ; how -
ever, anthropologists usually reserve the term "culture" to
designate a group of discontinuities which has significance
on several of these levels at the same t ime. That i t can
never be valid for all levels does not prevent the concept
of "culture" from being as fundamental for the anthro -
pologist as that of "isolate" for the demographer.
(Levi-Strauss 1953: 535-6)
17In our claim #5 (pages 2-3 above) we mentioned that we would be
constructing a "Guttman-type" scale. If the i tems in the chart on
page 40 are reordered properly, a perfect Guttman scale appears, thus:
The reader is advised that the work leading up to this dissertation was
inspired, in part, by the idea of the Guttman scale. The writer' s M.A. thesis
(1961) included the use of the Guttman scale as a measure of "acculturation
status" ; but even then I realized the exciting possi bility that a Guttman
scale, applied to cultural materials, might be seen as a static representation
of culture change through time.
Robert L. Carneiro got the same idea at about the same time (personal
communication, 1962), and showed how Guttman scale technique could be
applied to the study of macro-cultural change; i. e.,

54
of cultural evolution in the historical sense (Carneiro 1962).
In 1963, Ward H. Goodenough published an article in which he
discussed and criticized Carneiro' s applications, suggesting that Guttman
analysis could be used to show whether there is, indeed, a single path of
cultural macroevolution, all other changes being essen tially random, or
whether the presence of non-scale types would reveal that there are several
paths. (At about that time I was working on Stewart ' s Paiute materials [see
above, footnote 15]. Using data of the Cultural Element Survey type strikes
me as being somewhere in between Carneiro' s interests and those of the
present study — perhaps we could refer to it as the study of mesoevolution.)
In the same article, Goodenough applied a scale to data co llected from a
single Trukese informant, as a device for ordering normative statements to
determine whether these lie along one or more dimensions. In this he follows
Pauline Mahar Kolenda' s study of ritual distance among castes in India (Mahar
1959, cited by Goodenough [1963: 243]). Both his and Mahar' s studies use the
method for the same purposes Guttman originally did (1944).
Paul Kay followed this lead in analyzing Tahitian consumer behavior
(1964), claiming as his contribution the rather nice distinction between
attitudinal (Goodenough) and behavioral (his own) data,
Meanwhile Carneiro has been working on carrying out his program of
studying macroevolution, with the help of a student (personal com -
munication); and James W. Bosch, a graduate student at Stanford University,
is independently replicating my 1961 study, using data he collected from
Navaho (personal communications, 1964-65).
The present work presents many striking contrasts to the work of others
(and my own earlier work) cited above. So many and so striking are these
contrasts, in fact, that I do not regard this work as "an ap plication of
Guttman scale analysis" at all. To use anthropological

55
terminology, the form of my ideal pattern is the same as that of a Guttm an
scale, but the function is quite different.
The Guttman scale was original ly designed, and has been used by al l the
above wri ters except Carneiro, to establish dimensions of em pirical
measurement. We ask, "Is ethnic prejudice a single dimension in Angl o-
American culture?" Then we apply Guttman techniques to several sets of
expressed att i tudes which we have decided, a priori , fall into the general
category of ethnic prejudice. (We ask a series of respond ents, "Would you
want a member of your family to marry an Ital ian? a Jew? a Negro? a Turk?"
; "Would you want an Ital ian [Jew, etc .] to move into your town? Your
neighborhood? Your block? Next door?" ; and so forth.) On the basis of the
scalability ("reproducibi li ty") of the data, we decide whether or n ot ethnic
prejudice is a single dimension, empirical ly. If i t is , we have a measure of
ethnic prejudice, and thus we can, for example, seek the causes of ethnic
prejudice, using scale scores as the dependent variable and such things as
income, education, rural-urban differences, etc. , as independent variables.
Because the data are selected, however, it is impossible to work out a
probability distribution for the measure used to decide whether a scale
actually exists or not; we can' t say, for example, "If t he answers to our
questions were unrelated, we would expect to get a scale with a Coefficient of
Reproducibility of .93 or better only 5% of the time"; in other words, we
cannot specify a confidence level for our statement that a single dimension,
ethnic prejudice, exists.
The present effort is not an attempt to develop a measure of any thing; it
is, rather, an attempt to test the general notion that a culture, any culture, is
in toto a functionally integrated whole. (Goodenough points out that
Carneiro' s work is an effort to test the general notion that cultural evolution
is unilineal [1963: 246] .) For this reason we do not have to select our data;
every culture-trait should scale, not just

56
those we have labelled ethnic prejudice' traits, or those we have labelled '
consumer traits, ' etc. While we cannot claim that we have been able to list
all the culture-traits (or to sample them), we are able to list several
thousand. Further, we do so without any preconceived notions of which
traits are being lost, which being gained, or in what order; our mechanical
procedure will sort these out as we go. Thus a probability distribution
exists, and we feel we can use random techniques to estimate where our
result lies in that distribution. From this estimation we can state our
confidence in our hypothesis in mathematical terms.
There are two less important differences between our method of analysis
and the standard Guttman method. First , we use a different measure of
"scalability"; this measure, based on the Mann -Whitney "U" (1947), is more
precise than Guttman' s Coefficient of Reproducibility, in that i t not only
counts errors, it weighs them. Second, we throw out all universal traits and
all traits not present in any household. Such traits are known a priori to be
errorless, and thus tend to make the data appear more scalable than it
actually is, whatever the measure.
So we must conclude that while the Guttman -scale form is present, the
function is very different; and that the methods introduced here are quite
different, both in general and in detail .
18As a matter of fact, no distributions other than the original eight can
be reconciled with them, and there are 2 n = 25 = 32 possible distributions,
where n = number of households.
In the actual study being reported here, there are 28 households. There
can thus be 2(n- 1)=2(27)=54 perfectly compatible distributions out of 2 n =
228 = approximately 268.5 million possible distributions.

CHAPTER III
METHOD: ARRANGING THE DATA AND
TESTING THE GENERAL HYPOTHESIS
A. Introduction
In this chapter we will discuss
1. the technique for processing the data to reveal the Natural
Order of Cultural Adoption and Loss, if i t exists, and
2. the technique for evaluating the processed data in order to
test the hypothesis that the Natural Order does indeed exist .
In the remainder of this s ection we will describe these two
techniques in genera l terms. Then, in the fol lowing two sect ions, we
wil l t reat each of them in detail , describing computer procedures and
giving stat is t ical rat ionales .
When the data have been gathered and have bee n coded in terms of
presences and absences of behavior - t rai ts ( IIC and IIH, above), they
must be processed in a computer to form a matrix as closely approxi -
mat ing the ideal pat tern ( II I , above) as possible .1
This matr ix wil l
be referred to from now on as "the best possible matrix."
We start with the raw data, arranged in the form of a binary matrix .
In this matrix the households are l isted across the top in some arbitrary
57

58
order (e.g., in alphabetical order by surname of husband -father), and the
behavior-traits are listed down the left -hand side in the order in which they
were elicited. In every cell in the matrix there is either a 1 or a 0 , denoting
whether or not the household represented by that vertical column exhibited
the trait represented by that horizontal row.
Transforming the original data-matrix into the best possible matrix is a
matter of rearranging the columns, i . e. , the households. If a Natural Order
of Cultural Adoption and Loss exists, each household will be located at a
certain point in that Natural Order; that is, it will have adopted and lost
traits up to a certain point in the order, and its next adoptions and/or losses
will be predictable, once the Natural Order is known. Thus the households
can be ranked, according to their position in the Natural Order, from the
most conservative (those which have undergone the fewest changes) through
the most progressive (those which have undergone the most changes).
Let us suppose for a moment that we are dealing only with traits
being adopted. In that case, determining the order of the households will
be quite easy —the household having the most adopted traits will be the
most progressive, that with the second most t raits the second most
progressive, etc. Next, let us suppose that we have two lists, one of traits
being adopted and one of traits being lost. Again, ranking the households
will be easy, but this time we count both the number of traits -being-
adopted which a household possesses and the number of traits -being-lost
which it lacks.

5 9
But now let us turn to the actual situation we will be confronted
with: we will have both traits being adopted and traits being lost, in a single
list; we won't know whether any given trait on that list is being adopted or
is being lost. Of course, if we had our households in the correct rank order,
we could easily determine the adoption-or-loss status of each trait: If a trait
predominated among households at the progressive end of the list we would
know that it is being adopted; if it predominated at the conservative end, we
would know that it is being lost. But of course we don't have the correct
rank order of households; that is what we are trying to determine. So we
appear to be in a circular impasse: We need to know the rank order of
households to establish the adoption-or-loss statuses of the traits, and we
need to know the adoption-or-loss statuses of the traits in order to establish
the rank order of the households.
We can break out of this impasse, and determine simultaneously both
the rank order of the households and the adoption -or-loss statuses of the
traits, by using what are known to computer scientists as iterative
procedures. We can start out with an arbitrary (e.g., alpha betical) ranking of
the households, and determine which traits would be traits being adopted,
and which would be traits being lost, if that were the correct ranking of
households.
Now we ask, given that assessment of the adoption-or-loss
statuses of the various traits, what is now the correct ranking of

6 0
households? That is, what household appears to have undergone the most
adoptions and losses, the second most, . . , the fewest? The answer to that
question, of course, is in the form of a new rank order of households.
We compare this new rank order with the previous one. If they are
different, we discard the old rank order, and tentatively adopt the new rank
order. Then, on the basis of this new rank order, we re -assess the adoption-
or-loss status of each trait and, again, determine a new tentative rank order
of households. And so we continue until we arrive at a tentative rank order
which coincides exactly with the previous -rank order. Then we stop. We
have now found the rank order of households, and the sorting of traits by
adoption-or-loss status, which yields the best possible matrix. We have done
so by using a set of mechanical procedures to detect a structure in our raw
data; this process is directly analogous to that used in factor analysis, latent
structure analysis, and cluster analysis.
At this point i t would be well to discuss more fully the idea of "best
possible matrix." We defined this expression above as the "matrix as
closely approximating the ideal pattern as possible." The ideal pattern, of
course, is one in which every single row has all i ts Ps at one end and all
i ts 0 's at the other end, with no interpenetration whatever. In our best
possible matrix there will be many rows wh ich are not perfect, i .e., which
have 1's and 0 's interpenetrating. An

61
imperfection, or error, in a row represents, e.g. , a case where a
household has adopted a trait out of order, say prematurely; the
farther out of order the adoption is, the more serious the error.
Let us imagine an imperfect row in a matrix . Obviously, we can
correct the errors in that row by reordering the columns. But that
means reordering the columns for al l the rows. If we have the best
possible matrix , reordering the columns will always produce more
(and/or more serious) errors than i t corrects. This is , in fact , an
operational definit ion of "best possible matrix ."
In our discussion of the use of i terative procedures to construct
the best possible matrix , we spoke as i f the procedures would ult i -
mately determine which traits were being adopted and which lost . This
is not exactly true. When the procedure is finished, the traits will have
been sorted into two groups, one of trai ts being borrowed and one of
traits being lost . But the problem is that the procedures will not tel l us
which group is which. By the same token, the households will be
correctly ordered, but the procedures will not tel l us which end of the
ranking represents the most conservative household and w hich the most
progressive. The reason for this is that we started with an arbitrary
ranking; if we had started with the same arbit rary ranking, but had
reversed i t , we would have ended up with the same final ranking, but
reversed; and, of course, the adopt ion-or-loss statuses of al l the traits
would have been reversed.

6 2
So we must use some means, extrinsic to the raw data and the
mechanical procedures described, to decide which end of the household
ranking is which. Suppose, to take an analogy, we were given a list of thirty
Americans, ranked according to their annual incomes, but we weren't told
which end of the list had the higher incomes. It would not be difficult for us
to make the determination by observing the dress and speech of a half dozen
individuals taken from opposite ends of the list.
Similarly, if our processed matrix really does represent a Natural Order
of Cultural Adoption and Loss through time, we should have no trouble
identifying the conservative and progressive ends o f our ranked order of
households. For instance, it will probably be observed that the rank -ordering
of the households correlates roughly with a ranking by age of husband -
father; in that case, the older households presumably are the more
conservative.2
Another way of solving this problem is to look at the patterns of
distribution of certain traits which are known historically to be being
adopted or lost by the community as a whole. It would be rather obvi ous
among American Indians, for example, that abilit y to speak the native
language is being lost and ability to speak English is being adopted.
If we want to anticipate the which -end-is-which problem and have an
excellent chance of solving it before we begin our iterative proce dures, we
can do so. Instead of using an arbitrary list of households

6 3
at the start, we can make up a ranking which we feel will approximate the
final ranking; for example, we could list the households in descending
order of age of husband-father, left to right. In all probability, then, the
final household ranking will put the most conservative household on the
left. Using a tentative ranking of this sort will have another advantage;
namely, it will reduce the number of iterations required, and thus will save
computer time.
When the data processing is completed, and we have the best possible
matrix our original data -matrix can be made to yield, we can examine each
row in order to determine its cutting-point. The cutting-point of a row is the
place where, as one reads across, 0's end and l 's begin, or vice -versa. In
cultural terms, the cutting-point separates the household which most
recently changed with respect to the trait in question from the household
which will be next to change. The posi tion of the cutting-point of a trait ,
then, enables us to determine the position of tha t trait in the Natural Order
of Cultural Adoption and Loss. Traits whose cutting -points are to the left of
i ts cutting-point are adopted or lost before it ; traits whose cutting -points are
to the right of i ts cutting-point are adopted or lost after i t . Thus to list the
traits in the order of their cutting-points is to list their Natural Order of
Cultural Adoption and Loss.
The next question to be dealt with is that of evaluating the best possible
matrix to determine whether it is close enough to perfection so

6 4
that we can conclude that a Natural Order exists and, thus, accept the
general hypothesis that the cultural change we are observing is under the
control of an FIW.
The problem and our attempted solution wil l be mentioned here only
briefly; we will go into greater detail in section C. In our best pos sible
matrix there wil l be a certain number of errors of varying degrees of
seriousness; that is to say, 1 's and 0 's will be out of place, i .e ., they will
interpenetrate in some of the rows. If we could calculate how many
matrices of the same general type as ours there are, and how many of those
matrices could be processed into matrices not less perfect than our best
possible matrix, we could divide the latter figure by the former and get an
answer in the form of a decimal fract ion be tween 0 and 1000. That fraction
would represent the probability of get ting a data matrix not less perfect
than ours by sheer chance — say by fl ipping a coin to determine the
contents of each cel l . If that probabil ity is low, we can conclude that we
have a Natural Order of Cultural Adoption and Loss, and accept the
hypothesis of an FIW.
Unfortunately, however, there is no method exist ing at present for
calculating the numerator of the probabil ity -fraction. For this reason, we
will resort to what computer scientists cal l "empirical techniques"; we
will generate a number of small matrices at random, process them, and
compare the results with those obtained by processing a sample of small
matrices drawn at random from our empirical matrix. From this

6 5
comparison we will be able to make a rough estimate of the probability we
seek.
B. Processing the data -matrix: computer aspects
In order to save computer time and attempt to insure that we will end
up with the progressives on the right (and the conservatives on the left), we
make up a tentative order of households, assigning the house hold we suspect
will be the most conservative the number 1 and giving successive numbers to
the second most conservative, etc . The n t h household, then, is our candidate
for most progressive.
The computer then examines the distribution of each of the m traits in
accordance with the initial ranking, and determines for each trait whether
that trait would be being lost or adopted, if the initial ranking of
households was correct.
The method we chose for doing this was to calculate a rank -biserial
correlation coefficient. 3 If the 1's and 0's in the row are balanced, or
distributed evenly over the ranked columns, there is no correlati on and the
value of the coefficient is at or near 0 . If the 1's tend to fall toward the
upper end of the ranking, this value will be a positive decimal fraction,
and if the 1's tend to fall among the lower -ranked columns, the value will
be a negative decimal fraction. Thus traits with negative coefficients are
deemed, tentatively, to be traits being lost, since they preponderate among
the more conservative

6 6
households, and, conversely, those with positive coefficients are
deemed, tentatively, to be traits being adopted.
The computer now tags each "negative trait," in order to remember
which they are, and then complements it — that is, it changes all the 1's in
that trait 's row to 0's and all the 0's to 1's. (What it has done, from the point
of view of culture, is this: It has changed the meaning of a '1'. A 1 formerly
marked the presence of a behavior -trait in a household; now it notes the fact
that that household has changed with respect to that trait — adopted it if it is
a trait being adopted, or lost it if it is a trait being lost.)
As a result of this complementing procedure, all the rows (except those
with a correlation coefficient of 0) now have 1's preponderating among the
higher ranking (more progressive) households. If our tenta tive order of
households happened to be the correct one, and if a per fect matrix were
possible with our data, each and every row would now have all its 1's on the
right and all its 0's on the left , with no interpenetration. Let us examine the
implications of this more fully.
There are some changes which have taken place in only one house hold;
a row representing such a change would have only one 1 in it . If we had the
correct order and perfect data, the 1 in every such row would now have to be
in column n. If a change has taken place in two households, the row
representing it would have it s two 1's in columns n and n -1. Likewise, a row
representing a change that had taken

6 7
place in all but one household would have its only 0 in column 1 . In fact,
column 1 would contain nothing but 0's and column n would contain
nothing but 1's (non-existent and universal traits are thrown out, because
they can throw no light on culture change).
Furthermore, in a correctly-ordered perfect matrix, as the ranks of the
households go from 1 to n, the number of 1's in the columns rep resenting
these households increases monotonically (going from 0 to m , the total
number of traits).
Similarly, in a correctly ordered imperfect matrix, the number of 1's in
the columns will increase monotonically (although it may neither begin at 0
nor reach m).
So the computer next counts the number of 1's in each column, and
compares the ranking determined by the resulting column-sums with the
original tentative ranking. If one or more households were not correct ly
ordered in the initial ranking, the column-sums will not increase
monotonically as we go from column 1 to column n ; one or more decreases
(drops) will be noted. In other words, the tentative initial ranking and the
ranking by column-sum will be different.
Noting this discrepancy, the computer proceeds to do two things.
First , i t reconciles the two rankings by generat ing a new tentative ranking
that parallels the column-sum ranking exactly. But this means that the
earlier assessment of t raits -being-gained and traits -being-lost will be upset,
a t least as fa r as some traits are concerned. So,

6 8
secondly, the computer recalculates each rank-biserial coefficient, tags each
negatively-correlated row again and complements it , and repeats its column -
sum check. And, of course, if the column -sum check again reveals a
discrepancy, it continues to repeat, getting a closer correspondence each
time, until the column-sum check reveals that the two rankings coincide. At
that point, since recalculating the coefficients would only produce the same
signs and values of them, the computer quits computing and prints out the
final, best, order of households. It also can be programmed to print out the
final best possible matrix, noting which traits are being lost and which
gained, and giving also the last rank-biserial correlation coefficient of each
row, as an indicator of which traits had a powerful influence in determining
the final order of households, and which a relatively weak influence. An other
useful bit of information that can be calculated and printed is the "cutting-
point" of each row; that is, the point at which, if the row were perfectly
correlated with the final rank-ordering, the 0's would leave off and the 1's
begin. In cultural terms, the cutting point denotes the line between the
household which most recently made the change and the household which we
would expect to make the change next.
C. Evaluating the best possible matrix
Now that we have organized our data into the best possible matrix, we
want to determine just how good it is. We ask, is this matrix close

69
enough to a perfec t pa t te rn to just i fy going on wi th our analysis? Does i t
support our cent ra l hypothesis , tha t an x -cul ture i s cont rol led, in part , by
a d-cul ture which i s an FIW? Put t ing i t another way: Can we re jec t the
nul l hypothesis tha t a matr ix th is good (or be t te r) could very wel l have
been const ructed by reordering a matr ix of l ' s and 0 's which was
or igina l ly genera ted by some random process?
Before we can even begin to answer this quest ion, we have to make
an assumption and devise a measure.
The assumption, necessary for any si tuation where an est imation of
probabil ity is to be attempted, is one of randomness. We have to be able to
state that there is no built - in bias in our select ion of data that would resul t
in an unjust ified appearance of a low probabil ity. (As far as the actual study
here reported is concerned, the households amounted to 28 out of the 31
households which met certain standards, none of them behavioral [see
below, p.113] in short pract ically a total sample. The stimuli for the
behavioral t rai ts were selected by various criteria , none of which had
anything to do with whether they appeared likely to yield a well - integrated
set of responses or not . The result ing responses were selected only from the
point of view of frequency, and even then only when necessary; e .g. , so as to
avoid having li teral ly hundreds of responses which occurred in only one of
the 28 households.
The measure i s UTOT. This i s derived from the U of Mann and
Whi tney (1947) which, l ike a rank -biserial coefficient , i s a measure of


71
Thus i t makes no difference to U that , in processing our matrix ,
we have complemented some of the rows ( i t does make a difference to
U, of course, that we have reordered the columns). In fact , we can
define U for our purposes as the number of t imes a 1 precedes a 0 in a
row after processing. And now we further define UTOT as the sum of
the U's of al l the rows or , p utt ing i t another way, as the total number
of t imes a 1 precedes a 0 in the enti re matr ix .
Before we leave U , one more thing should be pointed out; namely,
that if n1 or no is greater than 7, the dist ribution of U is essentially
normal (Mann and Whitney 1947:51). Its standard deviation can be
calculated and i ts probabil i ty can be figured by area -under-the-normal-
curve, without calculating i ts actual frequency-dist ribution.
To summarize: UTOT represents the number of t imes a 1 precedes
a 0 in the processed matrix. In a perfect matrix , no 1 precedes any 0 ,
so UTOT = 0. We cannot say, however, that in the worst possible
matrix al l the 1 's precede al l the 0 's , because this can never occur, due
to the automatic complementing of rows where 1 's predominate to th e
lef t .

7 2
lower value of UTOT
The outcome of all this is that first, we cannot specify what the
worst possible value of UTOT will be; second, we don't know how to
calculate the frequency distribution of the values of UTOT. These
drawbacks are caused by the fact that we don't start with some a priori
order of columns and simply calculate U for each row and add them up
to get UTOT; instead, we rearrange the columns to get the lowest pos -
sible value for UTOT .5
In effect , we play the rows against one another. If enough of the
rows "agree," more or less, upon an order, and the orders "proposed"
by the rest of the rows are more -or-less scattered, random, unable to
"agree" on an alternative order, then the rows that do have a "con -
sensus" will carry the day.6
Thus, we have loaded the dice in our favor
when we come to calculate how well we've done, and we must
somehow compensate for this loading to get an honest result .
The processing method is new and therefore, unfortunately, there
are no existing statistical gadgets for compensating for it; and this
writer has neither the time nor the training to try to develop a compen -
sator. Computer science, however, provides us with a way out. We can
use a Monte Carlo process7
to estimate the distribution of UTOT over
matrices which have certain character istics in common with our
empirical data matrix.
If we can use the Monte Carlo process in a straightforward manner,

7 3
we will first state the defining characterist ics of the matrix; then we
will use the computer to generate at random a few d ozen matrices with
those characterist ics , process each to get the best possible matrix , and
calculate the UTOT of each; and finally, by observing what pro portion
of the randomly obtained values of UTOT were equal to or less than the
UTOT of our empirical matrix , we will est imate the probabil i ty we
seek. The problem of choosing the defining characterist ics of the
universe is an interesting one and we wil l examine i t here.
We are trying to estimate the distribution of UTOT over a universe
of matrices, so we must define that universe before we sample i t . First,
of course, we l imit ourselves to binary matrices, those in which there
are two and only two possible occupants of ea ch cell , because UTOT
measures only such matrices. Secondly, we l imit ourselves to m x n
matrices, those with the same over --all dimensions as the empir ical
matrix; otherwise we would have to include all sorts of bizarre matrices,
e. g. , 1 X 1 , 1 X 00 , 00 X 00 , in our universe.
Although I don't know how to prove it, it doesn't seem to me that
leaving the bizarre matrices out will influence the shape of the distri -
bution of UTOT or the position of the empirical value in that distribu tion.
To put that another way, I don't see how we could, by adding or
subtracting columns or rows (households or traits), alter the probability of
the resulting value of UTOT
Going on, we remember that rows with only 0 's or only Ps must

7 4
be thrown out before processing. Hence these rows must be eliminated
before the dimensions are determined. So, as a third step in defining our
matrix-universe, we specify that every row must have at least one 1 and at
least one 0 in it .
Let us continue our examination of the rows. We note that in our
empirical matrix, before processing, there are so many rows with one 1 , so
many with two 1's , and so on. Let us refer to the number of 1's in a row as its
row-type. Again, the number of rows with each row-type seems to be
irrelevant to the probability of UTOT. Further, we have observed that the
distribution of U for a row depends not on how many
1's there are in that row, but on the ratio of 1's to 0's or vice-versa; that is,
the distribution of U for a row with n 1 = k is the same as for a row with no =
k. Since the processing of the matrix includes comple menting some of the
rows, i t would seem better to define rows in the unprocessed matrix in terms
not of the number of 1's , the row-type,
but in terms of the number of 1's or 0's , whichever is the smaller. Let us
call this characteristic the row-class of the row. Since complementing a row
does not change the value of U for that row, it does not change the value of
UTOT for the matrix that row is in. Thus, as a fourth step in defining our
universe of matrices, i t seems proper to limit it to matrices with not only
the same dimensions, but with the same number of rows of each row -class.
To summarize, then, we define our universe of matrices as all

7 5
those binary matrices which are the same as our empirical matrix
(before and after processing, since none of these characteristics
changes in the processing), with respect to
1. over-all dimensions, and
2. the number of rows of each row-class.8
We then, as stated above, generate a random sample of these
matrices, process them and get their respective UTOTs, and estimate the
probability of our empirical UTOT from the distribution of these
UTOT-values.
If our matrix is large, however, to generate and process the re -
quired 30 or so random matrices will take an inordinate amount of com -
puter time. (The matrix of the actual study [n = 28, m = 3666], even
with a fairly accurate initial ordering of the households, took more than
fourteen minutes just to process. Each random matrix would take longer
to process, because we would have to start with an arbitrary ordering of
columns. And it would require additional time to generate each matrix.)
So, instead of using the UTOT-value of the whole empirical matrix, and
generating full-sized matrices to match it, we will use a different
UTOT-measure and a sampling procedure.
A matrix can be sampled by taking a certain number of its columns
and a certain number of its rows. For example, we could sample a
matrix with dimensions mm = 6 x nn = 3 to get a matrix m = 3 x n = 2:

7 7
Our ideal would be to get the distribution of the mean -UTOTs-of-
sample-matrices of the universe of large matrices with the same
characteristics as our empirical matrix; i.e. , the universe we discussed
above (p, 73-7'5). But to do so we would have to generate all , or a
random sample, of the large matrices and then sample each of them, in
turn, to get an estimate of the mean-UTOT-of-sample-matrices of
each, and this would be nearly as burdensome as estimating the
distribution of UTOT in the first place.
But we observe that the random generating of a matrix, large or
small, boils down ultimately into a coin -flipping operation. We take
each row as a unit, and flip a coin for each cell: heads it 's a 1 , tails
it's a 0. After filling each cell in the row, we determine the class of
the row (counting the 1's or 0's , whichever is less). If our quota for
that class is unfilled, we then put the row into our matrix; if the quota
is full, we discard the row or save it for the next matrix. (Remember
again that we can complement rows without any effect on the results.)
Thus to generate a large matrix and then sample it is a very inef -
ficient way to get a small matrix; we can get precise ly the same results
just as well by generating a small matrix at random. Hence to estimate
the distribution of the mean-UTOT-of-sample-matrices of a sample of
randomly generated large matrices, we can simply generate at random a
number of such small matrices1 0 (with the same characteristics as the
sample-matrices drawn from the empirical matrix) and observe the

7 8
distribution of the UTOTs of these small matrices.
At this point we will have two sets of UTOT's of small matrices. First,
we have the UTOT's of small matrices drawn at random from our large
empirical matrix; we estimate the mean-UTOT-of-sample-matrices for the
empirical matrix to be the same as the mean UTOT of this ran dom sample.
Second, we have the UTOT's of small matrices constructed at random; i,
e., drawn at random from the entire universe of such small matrices. We
estimate the distribution of mean-UTOTs-of-sample-matrices for the whole
universe of large matrices to be the same as the distribution of this random
sample.
What experience we have with these distributions indicates that they
are roughly normal (Clark 1953:74-7). Thus, in the case where the general
hypothesis is to be confirmed, the distribution and means of the two sets of
UTOT's would appear something like Figure 2.
We are now confronted with the problem of interpreting these re sults.
Unfortunately, there are at present no conveniently available methods for
doing so (Joshua Chover, personal communication, 1965).
Besides simple inspection of the curved (or h istogrammed) distri-
butions, there is a rather rough-and-ready method of estimating our desired
probability. This is to assume that we have an accurate esti mate of the
mean-UTOT-of-sample-matrices of our empirical matrix; this is, of course,
derived from the random sample of sample-matrices

7 9
estimated mean UTOT of sample-matrices drawn from empirical
matrix
estimated mean of mean UTOT's of
sample-matrices
drawn from all
large matrices
Figure II. Distributions and means of two sets of hypothetical values of
UTOT
drawn from that empirical matrix. We then calculate the mean and
standard deviation of the UTOT's of the small matrices generated at
random. Then we ask how many standard deviations away from that mean
of mean- UTOT's our mean-UTOT is; from this figure, z , we read off the
area left under the normal curve (shaded area in diagram) from any
standard table, and this is our required probability, very roughly.
It is of the greatest importance that improved methods for evalu -
a ting processed matrices be devised. These methods could involve an
analyt ical method for est imating the distr ibution of UTOT, or empirical
methods better than those just described, or perhaps an entirely

8 0
different approach, using a measure oth er than UTOT. Until such
methods are available, however, we can work quite comfortably with
those outl ined here. If a great deal of subsequent analysis is to be
based on an acceptance of our general hypothesis, as i t is , we should
expect confirmation of that hypothesis to be unequivocal and obvious
by even the crudest methods.

NOTES FOR CHAPTER III
1The program used to reorder the data was writ ten for me by
Mr. Robert Schacht, an undergraduate student at the Universi ty of
Wisconsin.
2This presumption is based on the fact that the older persons wi l l
have been enculturated at an earl ier period, and wil l thus be more l ikely
to have learned behaviors now being lost , and less l ikely to have learned
behaviors now being adopted, than younger perso ns.
3The coefficient used was r r b developed by Gene V. Glass of the
Experimental Design Laboratory, Department of Educational
Psychology, Universi ty of Wisconsin (Glass 1965) . The formula for
rrb is:
4U and r r b are relatively straightforward functions of one another. 5I
don't know how to go about proving that the process of deter -
mining the final order of columns is at the same time a process for
ensuring the lowest possible value of UTOT . I think, however, t hat the
fol lowing observation gives strong intui tive support to that assert ion:
The quickest way to calcula te UTOT for a given processed em -
pirical matr ix E is this . Fi rst , calcula te the column -sums for the
81

82
ideal matrix I with the same row -=types as E. (By this we mean tha t
I has the same width [n] as E , that i t has the same number of rows
with n 1 = 1 as E , the same number of rows wi th n 1 = 2 as E , and so
for th up to the same number of rows with n 1 = n - 1. ) Arrange these
column-sums of I in a row, and place the analogous column -sums of E
two spaces beneath each. For example (n = 5, m = 15):
column-sums of I
(space)
(space)
column-sums of E
0
4
3
5
8
7
12
10
15
12
Star t a t the r ight . Subtract the column -sum of column n of E from tha t
of I , wri t ing th is f igure in the customary Place . Now move to column n -
1 (col . 4 in the example) and add the f igure just obtained to the column -
sum of I ; then subt rac t the column -sum of E as before . Repeat unt i l a l l
columns have been done . To continue the example:
column-sums of I 0 3 8 12 15
4 6 5 3
4 9 13 15 column-sums of E 4 5 7 10 12
0 4 6 5 3
Now add up the f igures in the bot tom row, the resul ts of the suc -
cessive subt ract ions. The resul t of this addit ion i s UTOT for
matrix E. ( In the example , UTOT = 18.)
It would seem then, that any other ordering of E would produce a
higher value of UTOT ; and, since the ordering of E was done in the
fi rst place by ranking the column-sums and UTOT is calculated by
means of the column-sums, it would seem that the column -reordering
method wil l always produce the lowest possible UTOT.
6It might be pointed out here that the rows don't carry equal voice in
this decision. The number of votes a row has depends, in effect , on the
relat ive number of 1 's and 0 's in i t . This i s because a row with only one
1 or 0 in i t has a maximum value of U when

weight in determining UTOT as has a row with n 1 = 1 or no = 1 .
This same relative weighting of rows applies in the ordering of the
columns by means of the process described above. When the column -
sums are being added up to check and alter the column order, a r ow
with n1 close to no can make differences, for better or worse, be tween
many more pairs of adjacent columns than can a row with only a few 1's
or a few 0's . That this same weighting applies in the column -ordering
process and in the calculation of UTOT should come as no surprise (see
Note 5).
7When a statistical procedure is so complicated that its properties cannot readily be discovered by analytic methods, empirical methods can be used. Random numbers are used to construct hypothetical data that conform with the statistical model. The statist ical procedure in question is applied to many sets of such data, to provide estimates of the reliability of the results. With a digital computer to do the routine labor, the procedure can be tested in many different situations to give a comprehensive pictu re of its properties.
Computations based on random numbers are called Monte Carlo computations, as a tribute to the patriarch of random processes, the roulette wheel. (Green 1963:155-156.)
8A digression: In theory, it would be possible to use empirical
computer procedures to figure the exact probability of our value of
UTOT . To do this, we would generate and evaluate not a random
sample of the universe of matrices with the same characteristics as
the empirical matrix, but the whole universe.

84
This i s a pract ica l impossibi l i ty, of course, because i f the matrix i s
of any s ize there are l i tera l ly bi l l ions of matrices with those char -
acterist ics. This number could be reduced somewhat i f we remember that
the posi t ioning of the rows is i r relevant; i .e . , i f two matrices have
identical rows they are the same matr ix . Since there are m! possible
arrangements of rows, we could reduce the s ize of the uni verse by tha t
factor; except that when two or more rows wi thin a matrix are identical
we would have to mult iply again by the number of possible
arrangements of those identical rows, since the identi ty of those
matrices has al ready been taken into account , so to speak.
While these observations are at present academic, they might be
useful later on to someone at tempting to develop, by analyt ical meth ods,
a way of calculating the distribution of UTOT .
9 I t would be wel l to have the cha rac te r i s t i c s o f the sample -
mat r i ces bear some proport iona l re l a t ion to those o f the em pir i ca l
mat r ix ; to take a me taphor , the smal l matr ix should be a s t ra t i f i ed
sample o f the l a rge mat r ix . Thi s can be done by es tabl i shing ana logues
be tween the row-classes o f the la rge matr ix and those o f the smal l
mat r i ces . ( In the p resen t s tudy, fo r exa mple , nn = 28 and n = 12 ; we
chose to make l arge -mat r ix row-classes 1 and 2 analo gous to smal l -
mat r ix row-class 1 ; 3 and 4 to 2; 5 and 6 to 3; 7 and 8 to 4 ; 9 , 10 ,
and 11 to 5; and 12 , 13 , and 14 to 6 . ) Then the number o f rows of
each row-c lass in the sample -matr ix i s made proport ional to the
number o f rows in the analogous row -class in the la rge mat r ix . ( In the
p resen t s tudy the ra t io was 1 /10 . )
1 0The techniques for drawing the two samples the sample of small
sample-matrices from the large empirical matrix and the sample of like
matrices from the whole universe of small matrices —will not be
discussed here. They are relatively straightforward computer

85
techniques involving, on the one hand, putt ing the empirical matrix into
storage, sampling the rows and columns at random, and processing the
result ing matrix and calculating UTOT ; and, on the other hand,
generating all the possible rows for a small matrix , ordering these
according to row-class, drawing the specified number of rows at
random from each class and processing and calculating.
CHAPTER IV
A FIELD TEST OF THE HYPOTHESIS IN ENTERPRISE, TRINIDAD
A. Introduction
In Chapter II we concluded that households in a single village
would be suitable social groups to compare for the purpose of de-
tecting a Natural Order of Cultural Adoption and Loss. Earlier in that
chapter we referred to the social group whose culture was under study
by the general term "social group y ," and invariably included it as
part of the subject in representative sentences of cultural description,
so: "the culture of social group y includes [predicate: behavior trait +
cultural time]."
The reader may legitimately inquire whether or not there is any -
thing to be said about social group y other than the totality of these
cultural predicates. Strictly speaking, the answer to this question is no;
that is to say, in order to detect and describe the Natural Order of
Cultural Adoption and Loss we can use only behavior traits. In other
words, we use as our realm of observation not social group y but the
x-culture of social group y.
On the other hand, when the time comes to try to understand the
Natural Order, that is, to construct an explanation of it in theoretical
86

87
terms, it will be very useful to know certain facts, not strictly cultural,
about the social group whose culture is under study. Who are they,
i.e., do they have an identity, a name? Where are they? Where did they
come from? What do they do for a living? How are they related to one
another? With bearers of what other cultures are they in contact? How
frequent and how intense is that contact?
Of course, none of these questions is entirely culture-free. What
people do for a living, to use the most obvious example, is partly de-
termined by what they know how to do and what they are willing to do,
as well as by factors external to their culture such as availability of
jobs of various kinds, availability of agricultural land and other capital
requirements, world economic conditions, and so forth. Similar
cultural factors are at work in the situations to which the other ques-
tions are directed. The point being made here is that these are
questions about the people, about their history, about external factors
that may be determining their cultural environment, their habitat, and
the rate of their cultural change. The purpose of this chapter, then, is
to describe the social and historical background of the households
selected for field study.
B. Social description and selection of the study population
The island of Trinidad, in the West Indies, was chosen as the
place to look for a site for this study. Trinidad was chosen because

88
of its well-known multi-cultural character, its social pluralism, and
because there appear to be no intense pressures for acculturation by
any of the socio-cultural groups which comprise its population
(Crowley 1957, Klass 1960). Specifically, I planned to use the methods
described in Chapter II to study acculturative change between
Trinidadian Creoles (i.e., Negroes), and Trinidadian Indians (the
descendants of indentured laborers brought from India). Since two
studies which had been recently made described the acculturation (or
lack thereof) of Trinidadian Indians toward Creole culture (Klass 1961,
Niehoff and Niehoff 1960), I planned to concentrate on the
acculturation of Creoles toward Indian culture. For this purpose I
looked for a predominantly Creole village in a predominantly Indian
area. The Director of Community Development advised me that County
Caroni, the "sugar belt" of Trinidad, had the highest proportion of
relatively unacculturated Indians in Trinidad. ' At his suggestion I
asked the County Caroni Community Development Officer to suggest a
predominantly Creole village, and thus I arrived in Enterprise,
Chaguanas Ward, County of Caroni.
My first contact in the village was the secretary of the Village
Council. He confirmed my information that the village was predomi-
nantly Creole. He also showed me where the Council considered the
boundaries of the village to be. On the basis of this information I
made a map of the village, showing every house.

89
Enterprise is by no means an isolated village. It is situated on the
Southern Main Road and thus, until a by-pass route (the Princess
Margaret Highway) was completed in 1953, all road traffic between Port-
of-Spain and San Fernando, the two largest cities of Trinidad, perforce
passed up or down the main street of the village. There has been
regular bus service through the village since the 1920's, and dozens of
route taxis ply the Southern Main Road. The taxi fare to "town" (Port-of-
Spain) is 35 ¢ W. I., about 21¢ U. S. The fare to Chaguanas, the
market-center three miles down the road from Enterprise, is 15¢ W. I.
These prices make it possible for any Enterprisean with a steady job to
commute to work in the city.
When the village map was complete, I went over it with a series of
informants, making up a household register. This household register shows,
for each household:
1. its location (address, keyed to a map)
2. the name of its head, if known2
3. its racial character (Negro, Indian, Mixed Negro-Indian,
etc.)
4. its composition (number of adults of each sex, older
children, school children, and infants)
5. length of time the household (or its members) has been in
Enterprise and/or its environs, and where the adults lived
previously
6. occupations and regularity of employment of adults and
older children.

90
Meanwhile, I began constructing a genealogical chart for the
village. I began with an old lady, a resident of the village all her life,
as Ego. When the limits of her considerable recollection and current
information were reached, I extended the chart by using her most
distant relatives3 as informants. In the course of the genealogical work
I was able to fill some of the gaps in the household register. The
genealogical chart and the household register were keyed to each
other.
At this point I began to realize that the nucleus of the village, the
"old livers," belong to a rather limited number of related family lines,
many of which were founded around the turn of the century by immi-
grants into Trinidad from the Lesser Antilles, principally from St.
Vincent.4
After the genealogical chart had been extended as far as possible, I
filled in the gaps in the household register by visiting the hundred-odd
Creole households on which information was lacking.5 These visits
turned up a half dozen or so additional fairly old Vincentian
households, unrelated to the others; but in the main they confirmed
that at least a third of the present Creole households are recent arrivals
in the area, and that Creole households outside the one large loose
genealogical network already mentioned are almost entirely unrelated to
each other. In other words, there is only one genealogical network in
the village of any size at all; it is a network of older families,

91
primarily; it contains about one third of the present Creole house-
holds (ca. 120); and the village's households of Vincentian extraction
are vastly over-represented in it.
In most cases, it appeared that the Creole newcomers were using
Enterprise as a dormitory, spending most of their waking hours else-
where; the refrain heard again and again was, "I doesn't belong to
here, you know." Many of the newcomers have fled the slummier sec-
tions and suburbs of Port-of-Spain, to build rough houses on cheaply
rented land well away from the main road and the village center (the
intersection of the Main Road and the railway line, see the map). Most
of them either are of Trinidadian grandparentage or else are very
recent immigrants from Grenada. There are also a few middle-class
Creoles who have built rather substantial houses in Enterprise simply
because they want to live in the country; in the United States we
would call them exurbanites. They, too, use Enterprise simply as a
dormitory.
When the procedures outlined above were completed, the household
register could be summarized as shown in Table 1.
The next task was to select the population of households for
study. The prime criterion for this selection was that the households
should be, as far as possible, bearers of the same cultural tradition.
First, then, I eliminated the non-Creole households from consider-
ation. Next, I eliminated the short-term residents; first, because

92
TABLE 1
Summary of the Household Register
Non-Creole Households:
Indian 141
Mixed Indian-Creole 21
Other ethnic categories 4
Total Non-Creole 166
Creole Households:
Short-term residents
(less than 10 years) 94
Long-term residents:
Non-Vincentian:
Trinidadian only 46
Other small island 48
(at least one adult of
at least 50% non- Vincentian small
island ancestry)
Total Non-Vincentian 94
Vincentian (at least one adult
of at least 50% Vincentian
a n c e s t r y ) 7 9
Total long-term residents 1 73
Total Creole known and classified 267
Creole, unclassified (provenance and/or
length of residence not ascertained) 97
Total Creole 364
GRAND TOTAL 530

93
they are of very heterogeneous origin, and second, because I felt that
they have not been in the area long enough to have developed any
definite observable patterns of adoption and loss with respect to the
local cultural environment.
Turning, then, to the long-term residents, I examined the
information I had on the households of Trinidadian ancestry (meaning
that neither adult had more than one grandparent from abroad). It
soon became apparent that while a dozen or so Trinidadian families
have deep roots in the village, the vast majority are first-generation
Enterpriseans, most of them included in the long-term resident
category solely because of the arbitrary 10-year cutoff point.
Furthermore, they or their immediate ancestors have lived in
practically every part of Trinidad, and thus can be supposed to have
been subject to a very heterogeneous set of cultural influences prior to
moving to the Enterprise area. Finally, very few of these households
are related to each other; when they are, it is almost always by a
distant affinal relationship established through one or more
Vincentian households, in the main genealogical network.
An examination of the information on the other-small-island households
showed almost exactly the same conditions existing as for the Trinidadian
households.
In the case of the Vincentian households, however, one can more
closely approximate the ideal of a single common cultural heritage.

94
First, every Vincentian household has, by definition, from one-fourth
to all of its immediate ancestors coming from the small island of St.
Vincent; further, almost all of them can trace their roots to one area
of St. Vincent, the vicinity of Georgetown. Second, many of the
Vincentian households are directly or indirectly related in the main
genealogical network, and when they are indirectly related it is usu-
ally through yet another Vincentian household. Third, even when a
Vincentian household is not related to the main Vincentian group,
they are generally in Enterprise because the main group is there; that
is, individuals, while still in St. Vincent, learned about Enterprise as
a place where many Vincentians lived, and came to Enterprise to be
with their own people.6 Fourth, and closely connected with the last
fact, the Enterprisean Vincentians, unlike many other-small-
islanders, came directly to Enterprise from St. Vincent, without
stopping for several years or for a generation in Port-of-Spain or its
suburbs. Fifth, some of the Vincentian households in the kinship
network have deep roots in the village, going back to 1898, when the
village had only five houses.
For all these reasons, then, I determined to make the Vincentian
households the subjects of my study.
For our convenience in the following sections, the household
register summary can now be restated thus:

95
Indian 141
Mixed Indian-Creole 21
Other ethnic 4
Non-Vincentian Creole 285
Vincentian Creole 79
Total 530
C. Similarities and differences among the ethnic categories in Enterprise
Continuing our description of the village and its population, we
will now discuss several aspects of ethnic differentiation, comparing
and contrasting the Indian, Non-Vincentian Creole, and Vincentian
groups or, more properly speaking, ethnic categories. We will also
characterize briefly the relations between these categories.
1. Occupations and employment
Table 2 indicates roughly the rates of employment of the three
ethnic categories.
For households for which employment information is available, then,
the frequency of total unemployment for the three categories is virtually
identical.
In many of the households there is more than one person employed;
indeed, some individuals have more than one occupation, often a full-
time and a part-time occupation. For this reason, we will not use the
household as the unit for the balance of our analysis of occupations and
employment; rather, we will speak of occupation-units. In other

96 TABLE 2
Rates of Employment by Ethnic Category
No. (%) No. (%) No. (%)
Someone in household employed 88 (79) 208 (78) 60 (78)
No one in household employed
(no occupation, unemployed,
or pensioned) 24 (21) 60 (22) 17 _(22)
Total households whose employ-
ment status is known 112 (100) 268 (100) 77 (100)
Households whose employment
status is unknown 29
17
2
Totals of households 141
285
79
words, if a Vincentian man is a full-time carpenter and he and his
family tend an extensive garden, we will count this as one Vincentian
building-trades unit and one Vincentian self-employed agriculture unit.
The rationale for doing this, besides its convenience, is that from the
cultural point of view we are looking at two sets of skills, attitudes,
willingnesses, etc., just as if these two sets resided in two different
men or in two different households; these are two things Vincentians
do, in spite of the fact that one Vincentian participates in both.
Taking up the matter of frequency of employment, then, we find the
pattern presented in Table 3.

97 TABLE 3
Frequency of Employment by Ethnic Category
No. (%) No. (%) No. (%)
Units of regular employment 85 (88) 178 (81) 73 (87)
Units of intermittent
employment 5 ( 6) 38 (17) 10 (12)
Units of seasonal
employment 6 ( 6) 5 ( 2) 1 ( 1)
Total units? 96 (100) 221 (100) 84 (100)
The variations among the ethnic categories do not appear
especially striking. The relatively high frequency of intermittent em-
ployment for non-Vincentian Creoles, and thus their relatively low
frequency of regular employment, is the only thing unusual. This is
probably largely a matter of the frequency of employment of self-
employed skilled tradesmen. It is very difficult to divide such people
into regular and intermittent.
Next we turn to place of employment. This is important to use be-
cause a man who works away from the village, especially if he works in
Port-of-Spain or San Fernando or in the oil areas, is actually spending
a major part of every day in a different cultural environment from

98
TABLE 4
Place of Employment by Ethnic Category
No. (%) No. (%) No. (%)
Local 22 (26) 26 (15) 17 (23)
Area 53 (62) 99 (56) 33 (45)
Elsewhere 10 (12) 53 (30) 23 (32)
Totals 85 (100) 178 (100) 73 (100)
that which we had anticipated. Table 4, above, concerns only units
of regular employment. "Local" refers to units of employment in
Enterprise and its immediate environs. "Area" refers to the space
within a radius of three miles of the village center, in effect em-
bracing work-places which can easily be reached on foot or by
bicycle; it also includes some units about which it was known only
that they are outside the village. "Elsewhere" means anywhere else
in Trinidad; the majority of these units are in Port-of-Spain or its
suburbs (11 - 19 miles), and most of the rest are in Couva (8 miles)
and points farther south (Point-a-Pierre, 15 miles, San Fernando, 18
miles).
The similarity in the frequency of Indian and Vincentian local

99
units, and the lower frequency for non-Vincentian Creole local units,
is perhaps a reflection of the fact that many of the former have been
in Enterprise and its environs for some time, while the latter includes
many newcomers. More significant as an indication of cultural dif -
ferences, however, is the disparity in frequency of "elsewhere" units
between the Indian category, on the one hand, and both Creole cate -
gories, on the other. This can be explained by the types of occupa-
tions Indians tend to have, as we shall see below.
TABLE 5
Computation of Total Occupation Units with Kind Known
Total occupation units 96 221 84
LESS units with kind of
work unknown 14 48 18
Total units with kind known 82 173 66
The tabulation in Table 5, above, presents the occupation-units of
the three ethnic categories according to type. Here we ignore the
frequency of employment, combining regular, intermittent, and seasonal

100
units. We will base our frequencies on the total number of units, for
each ethnic category, whose occupation can be typed; that is to say,
we will leave out those occupation units where we knew where the
person worked and/or how often he worked, but not what kind of work
he did. The figures in the last row of Table 5, then, are used as the
denominators in calculating the frequency of each type of occupation
for each ethnic category in Table 6. The reason that these frequencies
will total more than 100% is that some occupation-units fit into more
than one type; e.g., a taxi owner-driver unit will be included in both
the semi-skilled operative type and the medium-capitalization
business type. Types whose frequencies vary strikingly among ethnic
categories are marked with an asterisk (*), and some of these
variations will be discussed.
To summarize the subject of occupations and employment: we have
found that the Vincentian category is like the other two ethnic cate-
gories in percentage of households with someone employed, in regularity
of employment, and in frequency of certain types of occupation-units.
We have found that the Vincentian category differs from the non-
Vincentian Creole category but resembles the Indian category in its
relatively high frequency of local occupation-units and in its low
frequency of policeman-units. We have found that the Vincentian
category differs from the Indian category but resembles the non-
Vincentian Creole category in its high frequency of units of employment

101
No. Other sk i l led trades (butcher , shoemaker , jo iner , baker , auto mechanic , welder , ta i lor , dent is t , Calypsonian , b lack -smith, jockey, radio repair , wheelwright) 4
TOTAL SKILLED 5
(%) No. (%) No. (%)
(1) 33 (19) 13 (20)
(0) 9 ( 5) 1 ( 2)
(1)* 42 (24) 14 (21)
14 ( 8) 4 ( 6)
(6)* 56 (32) 18 (27)
(20)* 20 (12) 4 ( 6)*
( 0)* 15 ( 9) 5 ( 8)
(20) 35 (22) 9 (14)
0
0
3 0
15 3
(33)* 18 (10) 3 ( 5)
1. Skil led tradesmen
bui lding trades (esp. mason, carpenter), self-employed 1
building trades, other-employed 0
building trades, total 1
2. Semi-skilled operatives
motor vehicle drivers, tractor, etc.8 17
other 0
TOTAL SEMI-SKILLED 17
3. Unskilled labor
canal cleaning 3
field labor 9
other 15
TOTAL UNSKILLED 9 27
LABOR
TABLE 6
Types of Occupation — Units by Ethnic Category

4. Unskilled l ight work
l i teracy requ i red (esp . sa les )
l iteracy not required (e.g. watchman)
domestic service
TOTAL UNSKILLED LIGHT WORK
5. Other occupations (not totalled)
whi te co l l a r , t r a ined (esp . teachers )
re l i g ious spec ia l i s t
police
self-employed agriculture
6. Business:
amoun t o f cap i t a l i z a t ion
no or low (e.g. , "parlour," fish peddler)
medium (e.g., requiring shop or vehicle)
heavy (bakery, house rental, light mfg.)
TOTAL BUSINESS UNITS
7. Author i ty & respons ib i l i ty
supervisor level (incl. builders who employ others)
foreman level
TOTALS
1 0 2 Table 6 (continued)
No.
6
0
0
(%) No.
7
6
4
(%) No.
1
3
1
(%)
6 ( 7) 17 (10) 5 ( 8)
2 ( 2) 9 ( 5) 3 ( 5)
1 ( 1) 2 ( 1) 3 ( 5)
0 ( 0) 9 ( 5)* 1 ( 2)
6 ( 7) 12 ( 7) 11 (17)*
10 (12) 14 ( 8) 6 ( 9)
19 (23)* 15 ( 9) 3 ( 5)
1 ( 1) 2 ( 1) 3 ( 5)
30 (37)* 31 (18) 12 (18)
2 ( 2) 3 ( 2) 8 (12)*
1 ( 1) 8 ( 5) 3 ( 5)*
3 ( 4) 11 ( 6) 11 (17)*

103
outside the area, in its high frequency of skilled trade occupation-
units, in its low frequency of unskilled units, and in its relatively low
frequency of business units. Finally, we have found that the Vincen-
tian category differs from both of the other categories in its low fre-
quency of motor vehicle operator units, its high frequency of self-
employed agriculture units, and its high frequency of non-business
units requiring authority and responsibility.
It is clear that some of these similarities are closely related. The
fact that Indians tend to be laborers and businessmen would explain
why they have such a high frequency of local units, the frequency of
skilled units in the two Creole categories would explain their high
frequency of distant units, etc. Some of the differences in occupation
and employment reflect differing cultural preferences, and others re-
flect differences in the histories of migration of the three groups.
2. Household composition
Because of the interest in Caribbean family structures re-
cently displayed by some anthropologists,2 we will summarize here the
section of the household register dealing with the demographic compo-
sition of the households. In organizing the data for presentation, we
make a basic dichotomy between households with children and house-
holds without children. Without going into a lengthy rationale for this,
we will point out two things: First, the presence of children in

104
the world is more or less fortuitous. The problem that interests us as
anthropologists concerns differences in the arrangements made by
bearers of various cultures for the nurturing and enculturation of the
children; for this reason we should compare households that actually
have children. Second, we have in Enterprise many households of
adults living alone, or in the company of another adult of the same sex
(usually a relative), or in a non-mated relationship with an adult of the
opposite sex (e.g., a brother and sister or a young man looking after
his grandmother). The frequency of these "adults alone" households
varies among ethnic categories. But this variation reflects not
differences in nuclear family structure, as such, but rather differences
in the institutional modes for dealing with unmated adults, particu-
larly the aged: Do they live alone or do they retain (or acquire)
membership in the relatives', especially their children's, households?
First, then, we present the households with children (Table 7).
The most striking fact here is that the so-called matricentral or
matrifocal family (type c) is by no means modal among the Creole fam-
ilies in Enterprise. In fact its frequency for Vincentian households is
slightly lower than that for Indian households. The mode for all ethnic
categories is the "normal" family household, that with at least one
adult of each sex present.
Table 8 shows all households, giving frequencies for several types
of childless household.

Households with one or more children, and
a. one adult of each sex
b. as above wi th add i t iona l adu l t ( s ) 1 3
SUBTOTALS: "normal" family units
c. female adult(s) only
d. male adult(s) only
TOTALS: households wi th
ch i ldren)
No. (%) No. (%) No. (%) No.
66 (75) 119 (69) 44 (72) 14
4 ( 5) 9 ( 5) 8 (13) 0
70 (80) 128 (74) 52 (85) 14
15 (17) 42 (24) 8 (13) 1
3 ( 3) 3 ( 2) 1 ( 2) 0
88 (100) 173 (100) 61 (100) 15
sition is known No.
a. households with children (from Table 7) 88
b. households without children
couple only 19
couple + additional adult(s) 0
adults alone (not couple) 8
TOTALS 115
Households whose composition is unknown 26
GRAND TOTALS 141
(%) No. (%) No. (%) No.
(77) 173 (62) 61 (77) 15
(17) 51 (18) 5 ( 6) 3
( 0) 1 ( 0) 1 ( 1) 0
( 7) 54 (19) 12 (15) 3
(100) 279 (100) 79 (100) 21
6
0
0
285
79 21
1 0 5 TABLE 7
Composition of Households with Children, by Ethnic Category
TABLE 8
Composition of All Households, by Ethnic Category
All households whose compo-

106
There are two things which might be noted about the "couple
only" type. First, the frequency of this type in Indian households
seems high, as high as that for non-Vincentian Creole households. It
might possibly reflect a breaking down of the Indian extended or joint
family, reported by Klass (1961: 44-5, 131) and Niehoff and Niehoff
(1960: 101) to be still functioning strongly in "Amity" and in Penal. If
the Indian extended family were still strong in Enterprise, one would
expect the married son to stay with his parents at least until a child
was born to his wife.
Second, we observe that there are relatively few Vincentian house-
holds of the "couple only" type. This is perhaps because Vincentian
couples generally want, and are able, to acquire unofficial foster
children if they have none of their own.14 The wanting is undoubtedly
cultural, and may be shared with non-Vincentian Creoles; the ability is
probably a result of having access to kinsmen from whom to acquire
foster children.
The remaining point of note in the above table is that Indian
households are low in the "adults alone" type. This suggests that,
whether the Indian joint family is losing its force or not, it still has not
become the custom among Enterprisean Indians for unmated adults to
live alone.

107
3. Religious groupings
No formal census data were acquired on the subject of reli-
gion, so this section is based mainly on casual observation. In
general, then, it would appear that
— Indians are mainly Hindus, with a tiny minority of Muslins and a
slight minority of Christians. The frequency of actual practice is
high, as attested by the large number of Indian households dis-
playing prayer (puja) flags.
—Trinidadian Creoles are primarily Roman Catholic and Church of
England. A few are or have been active in the African Saints (so-called
"Shango") Cult.
—Non-Vincentian "small islanders" are mostly Church of England and
Wesleyan Methodist.
—Vincentian data are in the Supplement (Q. 075). See page 139. The
A. M. E. Church has a church in nearby Montrose, as has an
American Christian revivalist sect, whose local minister is an Indian
but whose congregation is predominantly Creole. In Enterprise proper
there are six Spiritual Baptist churches (one abandoned), one
Wesleyan church, and one Hindu shrine. There are Roman Catholic
and Anglican churches in Chaguanas (three miles south) and Cunupia
(three miles north). In Enterprise there are two small and
intermittently active "Shango" centers; there is an important center
just outside the village.

108
4. Inter-group relations
Attitudes of members of the Vincentian sample toward
various ethnic categories, including Vincentians, Indians, Trinidadian
Creoles, and other-small-islanders, are presented in detail in the
Supplement (Questions 023, 024, 028, 029, 033, 037, 048 -051, etc.).
The following remarks are based on observation (including participant-
observation) and informal interviews, and are intended simply to de-
lineate the social context of the attitudes.
As the map shows, there are sections of Enterprise which are pre-
dominantly Indian and sections which are predominantly Creole. (Of
the latter, there are sections which are predominantly Vincentian.)
There are, nevertheless, many cases of Indians and Creoles living side
by side. In such cases, it is my impression that ordinary neighborly
relations are carried on; that is to say, a given Creole household is as
likely to be on speaking terms with their Indian neighbors on one side
as with their Creole neighbors on the other. If they are on speaking
terms, their members will greet each other upon meeting for the first
time each day, there will be a certain amount of calling back and forth
between the women as they go about their daily tasks, and there will
be gossip at the property line or the water "pipe" (public hydrant) if
any topic of interest should come up. It is my impression that in such
gossip, public events will be dwelt upon and the private affairs of third
parties will be passed over quickly, in an effort to

109
avoid the charge of "talking other people business." Home visiting among
neighbors is not common, unless the neighbor happens to be a personal
friend as well.
These neighborly relations are very brittle, and may be broken off
upon the least real or imagined slight; frequently a failure to greet or
return a greeting is all that is required ("We doesn't speak, you know.")
Again, however, such ruptures are at least as likely to occur between
Creole neighbors as between Creole and Indian neighbors.
In more formal private situations, however, ethnic differentiation
is quite marked. One rarely sees Creoles at an Indian wedding or
Bhagwat (Hindu religious festival) except as onlookers. Likewise, one
sees only an occasional Indian at a Creole house-fete (private party),
christening, wedding party, or wake. At the latter, of course, Indian
neighbors and acquaintances may stop by to pay their respects, but
they are not likely to stay to sing or drink or play cards.
The above observations hold mainly for non-Creolized Indians. For
Indians of varying degrees of Creolization exceptions have to be made;
this suggests that absence of Indians from the lives of Creoles is a
voluntary thing on the part of the Indian rather than a rejection by the
Creole on racial grounds. For a striking example, we once attended a
christening party given by an Indian who had recently moved to
Enterprise from a suburb of Port-of-Spain. The parents regarded
themselves as Hindus, but had the child baptized Roman Catholic,

1 1 0
with Creole godparents, because they thought "it might help him in
school." Both Creoles and Indians attended the party at the parents'
house afterwards. One young Indian told me he was from St. fames,
Port-of-Spain: "I' m completely Creolized, man." At the same time,
Indian ladies were enjoying themselves beating a drum, singing Indian
songs, and dancing in the kitchen. My wife asked one lady where she'
d learned a certain step. She replied she' d learned it from watching
Indian movies in Chaguanas.
Along with an undetermined but certainly small number of house-
holds like this one, counted in the household register as "Indian," we
also have the 21 households listed as "Mixed Indian and Creole." That
such households exist is, of course, interesting. Whether they indicate
a trend toward social and cultural amalgamation or assimilation is
doubtful. In my opinion, these mixed households are simply
exceptional.
There is one other cross-ethnic situation that sometimes develops,
when an Indian or mixed Indian-Creole child or youth is adopted by a
Creole family. The result is that the child is considered a Creole and
will live his adult life with Creoles as a Creole. I know of no instances
of Creole or mixed children being adopted by un-Creolized Indians; I
would hazard the opinion that this would be unlikely, because Indians
are much more concerned with kin-relationships than are Creoles, and
would not want to raise and care for someone else' s

111
child. The general propensity for Creoles, particularly Vincentians, to adopt
children has already been invoked above as an explanation of the
infrequency of childless couples among them.
In spite of the exceptions noted, it can be stated that, in general,
an Indian-Creole dichotomy exists in the social structure of private life
in Enterprise, and it is strong. This dichotomy is carried over into
public life, as well. The Indians of the village seem to believe that the
Village Council, for example, is a closed corporation, in effect a private
club, run by Creoles. This seems to be true in spite of the fact that
Indians have been urged to attend the Council's meetings (at which any
villager may speak and vote), and in spite of the fact that one member
of each of two well-known Indian families has actually participated
actively in the Council's affairs, both having been elected to office. On
the other hand, the Enterprise Tenants' Association, whose sole
purpose is to resist the eviction of its members from certain lands in
the village, includes both Creoles and Indians as active members. Its
executive body is primarily Creole. The area chapter of another special-
purpose group, the Trinidad Islandwide Cane Farmers' Association, is
represented by a Creole, although the majority of the chapter members
are Indians. Again, the Agricultural Credit Societies, formed to take
advantage of a government loan program, are mixed in membership,
although usually one ethnic category or the other predominates. The
two sports clubs in the village, on the other

112
hand, are almost entirely Creole in membership, while there is a
cricket club in nearby Cunupia which is entirely Indian. The steel-
band is entirely Creole, while the Indian Orchestra is entirely Indian.
As far as relations between Vincentians and other Creoles are
concerned, it is probably safe to say that ancestry or immigrant status
is practically irrelevant. In fact, it was some weeks before I became
aware that the Vincentian group, as such, existed at all. We can say
that there is total social integration among the various groups making
up the Creole community. One does occasionally hear the stereotype
that "Bajan too intelligent" (i.e., natives of Barbados are tricky
businessmen), or the stereotype that Grenadians are clannish and
uncivilized, but I know of no stereotype applied to Vincentians qua
Vincentians. I have heard the Spiritual Baptists attacked as being a
group devoted more to their own advancement than to the common
weal, and of course most Baptists are Vincentians. This kind of attack
has to be understood in a certain light, however. Individuals in the
village seem prone to attack any group they see as organized —
Indians, the Village Council, the Baptists, etc. In fact, it almost seems
a general cultural trait in Creole Enterprise to view with suspicion any
organization or, for that matter, any individual, who shows many signs
of success.

113
D. The Sample of Vincentian Households
The criteria for selecting a sample of households as social sub-
units for comparative purposes have been spelled out in Chapter II
(pp. 34 - 35). We want households that contain persons occupying
each of a set of essential statuses (Husband-Father, Wife-Mother,
and Child), and that are not too different in social class or occupa-
tional specialty, All this is to make it more likely that we shall get
households of similar d-culture.
We have suggested that another way of increasing the likelihood of
getting households of similar d-culture is to use households that are
related. So in selecting the sample in Enterprise, I first turned to the
genealogical chart, and selected the households there that included a
mated couple and at least two children, and in which at least one of the
adults was of at least 50% Vincentian ancestry. When those ran out, I
chose the most Vincentian households outside the genealogical network
that met the composition-criterion, until I had a total sample of 31.
With the exception of a young couple who came directly from St.
Vincent to Enterprise seven years ago, all the households (or their adult
members separately) have been in the area ten years or more. The Wife -
Mother in one household died before she could be interviewed, and two
households were finally dropped from the sample when it became
apparent that it would be extremely difficult to interview the Husband-
Father successfully, Thus we interviewed and inventoried a total of 28
households,

114
The first step in the formal interviewing of the adults in each
household was the taking of a brief life history, being sure to
account for each year of the respondent's life.
Table 9 summarizes the life history data and some census data
on the 28 households, The households are listed in the order in
which they were arranged by the computer (operating on cultural
data alone, not using the life history data): The most conservative
households are on the left. (This same order will be followed in all
subsequent presentations of data.) In the L D. number, "M" refers to
the male head of the household (Husband-Father) and "F" refers to
the female head (Wife-Mother). "Freq." (frequency) refers to the
number of times the fact obtains in the sample of 28; each "X"
stands for a presence and "0" for an absence.
"CTGPT" (cutting point) is calculated (by hand) for a few life
history items that show striking agreement with the household
order, This figure represents the point in the household order where,
ideally, presences of the item end and absences begin, or vice versa,
A "C" or a "P" in the next column indicates whether presences of the
item occur at the conservative (left) or progressive (right) end of the
household spectrum, respectively, Consider, for example,
MLH00004. Here we see that the male heads of the most
conservative six households tend to have been born before 1900, but
the male heads of the other 22 households do not; hence CTGPT = 6.


1 1 7
Z indicates how closely the pattern of X's and 0's for the item corre-
sponds to the rank order of households. Z is a measure based on
Mann and Whitney's U, representing the distance between the actual
value of U and the mean value of U (U) , and expressing this distance
in standard deviations.15 The probability of U being that far or farther
from the mean can be determined from any table of areas under the
normal curve (two-tailed test). (For example, if Z = 1.96, the
probability is .05.) Some data which might have been included in
Table 9, such as religious associations and some employment infor-
mation, have been included instead with the cultural data in the
Supplement (see page 139).
When one looks over this life history material, so arrayed, two
facts stand out clearly. One is that the rank order of households is
correlated quite closely with the rank order by age of male head (and
female head as well), as we anticipated (p. 62) . The other is that the
households are a pretty heterogeneous lot, with respect to past
cultural influences and habitats, in spite of our efforts. At the time
the fieldwork was going on, it seemed that this was a good thing,
since it would ensure that the households would be broadly
scattered over the whole Natural Order; I feared too much sameness,
too many responses discarded because universal or non-existent. I
believe now I would have done better had I sought a group that was
more isolated and more inbred, biologically and culturally, than the

118
Enterprise Vincentians. I think there would still have been plenty of
variation; that a greater proportion of that variation would have
been due to differences in position along the Natural Order of
Cultural Adoption and Loss; and that thus a smaller proportion
would have been due to past and present differences in cultural
environment and habitat. All this is not to say that a Natural Order
could not be found in the Enterprise data; it could and it was. It
just wasn't as clear-cut as it might have been. My situation is
analogous to that of a chemist who finds that some of the chemicals
used in a critical experiment were not as pure as he had thought.
The experiment worked anyway, but the results aren't as close to
the predicted results as they would have been had the chemicals
been purer. Or so he likes to think.

NOTES FOR CHAPTER IV
1For a more detailed analysis of the distribution of ethnic groups, see
Augelli and Taylor 1960,
2These informants, all of them young Creole men, often knew the
occupant of a household only by some nickname. Only rarely could they
give both surname ("title") and Christian name ("name"). I found also a
certain reluctance on the part of many Creoles, older people especially, to
refer to neighbors and acquaintances by name. I am quite certain that this
had nothing to do with supernatural ideas of any kind, e.g., with the spirits
of the dead. I believe, rather, that it reflected an aversion to getting
involved in someone else's affairs, perhaps a fear of being accused of
gossiping (possibly with a latent fear of retaliation through sorcery). A
speaker would refer rather vaguely to "that girl livin' by the [railway] line,"
and only gradually would one become aware that the speaker knew the
person in question very well and certainly knew her name.
3In constructing the chart, I construed the term "relatives" in a very
broad sense indeed. Consanguineal links, of course, were included. Affinal
links were considered to be established not only by marriage, but also
merely by the fact that the man was known to recognize a child born by
the woman as his own.
40ne elderly informant described coming to Enterprise from St. Vincent
at the age of 12, after the island was devastated by the hurricane of 1898.
(Other Vincentians came after the eruption of Mt, Soufriere in 1902,) His
parents had come to take up a cocoa contract with the local estate; that is,
they were granted a number of acres of land and provided the cocoa-tree
seedlings which they were to plant and bring to fruition, a matter of three
119

120
years or so. When the trees bore, they were paid one shilling per tree;
meanwhile, they had land on which to grow a garden. They also could
find jobs on the estate, supervising the Indian laborers and performing
other responsible services. At the time this informant came to Enterprise
there were but five houses, all clustered near the railway crossing. All
were occupied by Creoles; the Indians were confined to barracks on the
estate, except for a few who had completed their indentures and elected
to remain in Trinidad.
It should be pointed out that no cocoa has been grown in the Enter-
prise area for some years. The lands have changed hands several times.
The village is now flanked along its entire western edge by the cane-
fields of a huge British sugar firm; the rest of the estate lands have been
sold off for residential use. As one informant put it, "Nothing grows in
Enterprise but house-grass." This is not, of course, strictly true; quite a
few people in Enterprise have vegetable gardens, and several grow cane
in small patches for sale to the British firm' s factory.
5Actually, there were about 200 such households. Information
already in the household register, however, showed that many of these
households were unsuitable for my research because of their composi -
tion; i. e., they did not include a male head, a female head, and two or
more children (see page 34). In addition, at several houses I was
unable to find anyone at home despite repeated visits, and there were
two outright refusals.
6The question of whether the Enterprise Vincentians have a
concept of group identity as such is interesting. As we shall see in the
cultural data, some of them definitely claim to prefer to deal with other
Vincentians, but most do not. A few even go the other way, saying they
want their child to work for a Trinidadian "as he [the child] is a
Trinidadian."
Several older people referred to St. Vincent as "my country," as

121
did some recent immigrants among the young. This most emphatically
does not mean, however, that they identify themselves with other Vin-
centians in Enterprise. On the contrary, in at least one case one gets
the distinct impression that the informant means to say "in my
country we didn't have to associate with the kind of Vincentian people
we have to associate with here." In short, some of the people feel that
they have been de-classed by coming to Trinidad; the discovery of this
fact, late in the field work, makes us question whether our sample of
households is as homogeneous with respect to social class as we had
assumed.
In any case, however, it is true that many Vincentians came to
Enterprise because other Vincentians —relatives, friends, or just ac-
quaintances were there. We have several personal accounts to
establish this.
7One is tempted to compare the three ethnic categories with respect
to number of occupation-units per household. This would not be correct,
however; our information being more complete on the Vincentian
households, they would of course appear to have a higher number of
units per household.
8The propensity of Indians for occupations involving motor-vehicle
driving has been noted by Niehoff and Niehoff (1960: 44, 46-48). The
attitude of many Vincentians is practically the opposite. (See Supple -
ment, Questions 017 and 019; see page 139.)
9Canal cleaning and field labor are listed separately because they
are regarded as especially undesirable by certain Vincentians (see
Supplement, Question 015). It is very likely that most of the units
where the kind of work is unknown are of the unskilled labor type. If
this is true, the numbers of unskilled labor units, with their
frequencies expressed as a percentage of all occupation units, known
and unknown, are as follows:

122
an
As above, the asterisk indicates a type whose frequency varies strikingly
among ethnic categories.
10A parlour is a small store, run by a woman or a retired man from
a little shed in front of the house. Small amounts of staple items, such
as ground provisions (root crops, obtained from the Chaguanas market
or locally grown), rice, salt fish, and perhaps cheese are sold, in
addition to candies, cigarettes, little cakes, and soft drinks. The latter
two items may be home-made or manufactured.
A shop is more often a full-time proposition, involving a building
constructed of hollow clay or concrete blocks, fully plastered, but still
situated in front of (perhaps attached to) the owner' s house. The selec-
tion of manufactured goods is greater, including clothing, cooking
utensils, dishes, etc. The main distinguishing feature, however, besides
size and volume of business, is that a shop has a license to sell rum
and beer.
11This section overlaps the preceding (business) section with respect
to but two units (one builder who has a small van, and one manu-
facturer who employs non-relatives). The relatively high frequency of
Vincentian units here may be traditional; that is, the ancestors of sev-
eral of the older Vincentian families had been supervisory personnel on
estates in St. Vincent, and several of them were founded by people who
had come to Trinidad for the express purpose of taking charge of
planting on cocoa estates in the Enterprise region.

123
12Keith F. Otterbein (1965) has recently reviewed the work done in this
area.
13It should be noted that in coding the data, we occasionally failed
to distinguish between types a and b; that is, sometimes a household
consisted, e. g., of an adult man, his wife, their child, the child' s
spouse, and the children of child and spouse. In such a case we put the
household in type a , although a case could be made for putting it in
type b. At any rate, using the subtotals for "normal" family units
eliminates this problem.
14For example, while we were in Enterprise one Vincentian lady in
her late seventies sent to relatives in St. Vincent for a child to mind.
She wanted the child to keep her and her enfeebled husband company.
The young mother in another Vincentian household remarked that she
had made babies for several of her childless sisters; the stepfather of
one of these children, at the child' s birthday party, told a gathering of
adult males how he had "begged and begged" for the child.
15For the method of calculating U and Z , see Mann and Whitney 1947,
pp. 51 and 55, respectively.

CHAPTER V
FIELD WORK METHODS AND TECHNIQUES
In the preceding chapter we have been preoccupied with presenting
certain facts about Enterprise and its inhabitants, especially its
Vincentian inhabitants. In doing so, we have made reference, from time
to time, to the means by which these facts were ascertained; in most
cases this has been by interviewing informants as to census data,
genealogical relationships, etc.
In this chapter we are going to outline briefly the general field
methods we used to gather material that would aid us in making up good
questions, and then discuss the preparation for, and conduct of, the
cultural interviews and inventories themselves.
One of the first problems encountered by any ethnographer is that of
fitting himself into the social structure of the people he is studying, in
other words, of establishing a status and exhibiting the appropriate role
behavior. Some anthropologists have been obliged to take on a status
already existing in the society under study; e. g., by being adopted into a
family as Eldest Son. This course has its advantages, in that opportunities
for participant-observation are maximized. On the other hand, it may be
difficult, if not impossible, to step back and observe without being
observed, to "become part of the woodwork," and it may
124

125
be difficult to observe events that holders of the assigned status do not
customarily observe.
In other cases, it may happen that there already exists a status for
non-members of the society into which a stranger may automatically be
put, and from which he may find it difficult to extricate himself fully.
To the people of Enterprise, there were several statuses into which
an anthropological field worker and his family might be put. The members
of the Village Council saw me in the role of White Well-wisher or Social
Worker. (In Trinidad, a Social Worker is not a government official but is
rather a private citizen who volunteers his time for community uplift
projects.) To them I was, initially at least, an honored and learned guest
whose advice was sought and who was expected to speak at meetings
urging the rank and file to cooperate with the Village Council and work on
community projects. '
As time went by, I tried to convert this status into that of Faithful
Ordinary Member of the council; that is, I made an effort to attend all
meetings, to do my bit on work projects, and to contribute my share
when subscriptions were taken. This status was not congenial to me,
and I soon found myself taking a more active role than proper for the
status — suggesting projects, helping to plan the remodeling of the
community center, drafting a new constitution, and so forth. When
elections were held, I had to decline firmly a nomination as general
secretary of the council; I accepted a place on the Executive Committee.

126
It soon became clear that, from the point of view of those familiar with
council affairs, I had found an acceptable social niche; I know this
because several times I was compared, not unfavorably, with certain
other outsiders who had lived in the village earlier and who had been
able and willing to assist the council.
It is my belief that my fitting into this status helped us enormously
in building and maintaining rapport with the village as a whole, or at least
with that portion of it that I wanted to learn from. As long as a person we
were meeting for the first time knew that I occupied this status, and that
we "gave everybody ' right' " (greeted everyone), we could count on a
cordial reception and remarkably cheerful endurance of our lengthy
interviews. This reception contrasts sharply with the various "White Man"
treatments I almost invariably received upon casual contact with people,
both Creole and Indian, who didn't know "who I was." I believe that if such
a high but neutral status can be found and adopted, the ethnographer is
far better off than if he develops very close friendships with a few
individuals but by so doing risks the enmity of others. I say this because
very often two households which were both very cordial to me were not on
speaking terms with each other.
The reader may have noted the lack of any statement about an
occupational status. The question of occupation did not come up as
frequently as one might think, perhaps because so many villagers worked
outside the village and perhaps because, for this and other reasons,

127
people are not defined by their occupations to the extent they are in U.S.
society. When the question did arise I answered truthfully, saying that I
was an anthropologist interested in the way people' s customs and ideas
changed when they lived close to people different from themselves. This
seemed to be an acceptable explanation, and no one ever demanded that
I go farther, except that middle-class people sometimes wanted to know
what was in it for me, who was paying me, and so forth. These people
were satisfied when told that I was working for an advanced degree and a
private foundation was supporting me; middle-class Trinidadians put a
very instrumental value on scholarship.
From the start, of course, the plan was to prepare for formal data-
gathering procedures —interviews and household inventories. The map-
making, genealogy-taking, and census-taking outlined in the previous
chapter were part of this preparation, as was the establishment of status
discussed above. While these tasks were being accomplished, and after they
were finished, my wife and I were gathering information and understanding
necessary for the formulation of meaningful questions and for the
intelligent interpretation of the responses. I used no special techniques for
this, nor did I seek out certain key informants or prepare specific questions
in advance. In other words, for this part of the field work I was learning to
be a participant and was acting as a relatively passive observer. At a Village
Council meeting I observed how others addressed the chair and then, when
it seemed appropriate for me to speak,

128
I used the same phrasing or modified it to suit myself, always, of
course, observing its effect. When someone called me into a rumshop to
have a drink, I observed how he and his companions went about
drinking, and then followed their lead. When I fell in with a lime (a
group of people, generally young males, lounging somewhere along the
main road and enjoying themselves by demonstrating the virtuosity of
Trinidadian English), I gave everybody "right," and sometimes stopped
to listen and perhaps chat briefly (unfortunately, it never seemed
appropriate for me to join in, perhaps because my status was too
similar to that of Elder).
One of the most important accomplishments of the early period was
becoming more-or-less attuned to Trinidadian speech. This speech is
distinct from the American varieties I am familiar with first, in the phonetic
values assigned to phonemes, second, in stress and intonation patterns,
and third, in semantics —in the meanings assigned to morphemes and in
idioms. I learned the speech well enough to be able to understand most
utterances directed at me, although I never reached the point where I could
understand every utterance in an overheard conversation. As for my own
utterances, I never consciously tried to adopt phonetic values or
stress/intonation patterns, except when I wanted to produce a comic ef fect.
On the other hand, I tried very hard to make the morphemic content as
idiomatic as possible without seeming to make fun.
To mention some more situations in which background information

129
was acquired: We were often invited to fete or to sup at people's houses,
where we learned about food and drink preferences and habits, varia-
tions in etiquette and seating, behavior expected of children, and,
through conversation, attitudes about sports, valued and disvalued per-
sonality traits, etc. On other occasions a private chat with a man or
woman would lead to his opening up and revealing attitudes which would
be, to say the least, embarrassing for him if bruited about the village. We
could then attempt to include a question in our schedule which might
elicit the same attitude, if it were present, in a respondent in the private
(or semi-private) interview.
One source of general information was the attending of various
religious ceremonies, especially those of the Spiritual Baptists and the
African Saints Cult people. After learning as much as possible about
the practices and beliefs of these people we could then plan to test our
respondents for the extent of their knowledge and possession of these
practices and beliefs. We also got (we think) a certain amount of insight
into the way Trinidadians and Vincentians, respectively, and Creoles in
general, look at the natural and supernatural worlds.
Since several informants were building tradesmen, and since quite
a few new houses were built in the village while we were there, I was
able to learn a great deal about methods, techniques, and materials of
building construction, both traditional and recently adopted. This
learning was facilitated by actual participation in the rebuilding of the

130
community center. Similar information was similarly acquired in the field
of automobile repair and maintenance.
Information of health, ethno-medicine, childbirth, and associated
attitudes was also gathered informally, much of it by my wife. Attitudes
toward doctors and hospitals became clearer as we carried sick and
injured people and expectant mothers to the district medical officer
and/or the government hospital in Port-of-Spain. And our
understanding of the relative position of Enterpriseans in the life of
Trinidad as a whole was enhanced by our own contacts with government
officials, doctors, educators, artists, folklorists, merchants, and others
in the more urbanized and more cosmopolitan strata of Trinidadian
society. Even a simple taxi-ride to town often provided a remarkable
amount of grist for our mill.
The result of all this preliminary informal spade-work was that the
time for constructing schedules for interviewing and inventorying seemed
to appoint itself. We began to list our ideas for questions on cards, each
with a more-or-less definite idea in mind —that is, an idea of what
responses might be expected to each question and what the cultural
significance of such response might be. These questions were supple-
mented by using ideas from Herskovits and Herskovits (1947). Since we
were still looking for Creole borrowing of Trinidadian Indian patterns,
Klass (1960) and Niehoff and Niehoff (1959) were used to augment ideas
gathered from Indian informants within and without the village.

131
At this point my emphasis shifted from concentration on the expected
responses taken singly to concern for producing a field-workable
schedule, that is, a schedule that would put questions in an order that
would seem natural to interviewer and respondent alike and thus would
be most likely to produce a steady flow of responses. I decided to begin by
censuring the household, if we had not already done so.
The schedules for the interviews proper were constructed using two
general guide-lines: First, the over-all trend would be from superficial,
relatively non-sensitive questions that called for a factual answer, to
deeper, more sensitive questions that called for the expression of an
inner state of some sort. (For example, each interview would begin with
a year-by-year life history and would end with a question calling for a
self-description and an evaluation of the respondent's life to date.3)
Second, within a block of questions on a single topic, we would move
from more open-ended, circumstantial questions to more forcing, hypo-
thetical questions, again working from "fact" questions to opinion
questions. The household inventory would follow a roughly similar set of
patterns, going from the yard to the sitting-room, to the kitchen, and
examining the bedrooms last of all.
The actual interviews and inventories followed the expected pattern to
a remarkable degree. Although the interviews were long and tiring (as long
as six hours), the data continued to come. Some people were bothered a
bit by the hypothetical questions, but this in itself is a datum;

132
similarly, some were embarrassed by questions testing their knowledge
of affairs on a larger scale than village life; still others were perhaps a
bit insulted by certain questions with respect to the supernatural; but
practically all came up with a thoughtful answer to every question, or,
when they lied, did so obviously and/or in ways that were clearly
culturally patterned. In short, most questions were, at least to some
extent, meaningful to the respondents. It would not add anything to
describe each interview in detail; we could make a few brief points,
however. Most interviews were conducted in the respondent' s home,
although a few were conducted in a sort of office at my house. The first
was a mistake; too often there were other people present, if not in the
very room then on the other side , of a thin partition. In more than
one case the Wife-Mother heard (and listened to) part of the Husband-Father'
s interview before being interviewed herself.4
Most of the interviews with Wife-Mother, done by my wife, were
accomplished at a single sitting; almost all the interviews with Husband-
Father required two meetings, and a handful extended to three or more.
In only one case of the latter was difficulty encountered in completing
the interview; this was finally overcome by sheer persistence (I waylaid
him at work).
The questions were typed on standard 5 X 8 cards, as many to a
card as it would hold, and the cards were punched for a small three-ring
binder, thus providing an easy way of carrying the questions and of

133
flipping through them as the interview proceeded. For each interview and
inventory a standard schoolchild' s "copybook" (like an extra-thick
bluebook) was prepared, with a copy of the census-data on the house-
hold pasted on it for quick reference at appropriate points in the ques-
tioning. As each question was asked, then, the interviewer would write
down its number in the copybook and then write down the response
verbatim (or as nearly verbatim as possible). The household inventories
were taken in much the same fashion.
As the interviewing got under way, some changes were made in
the questions, usually involving rewording the question; two or three
questions were dropped after the first couple of interviews. Some of
these changes are noted in the discussion of the questions and re-
sponses in the Supplement (see page 139).
When the 56 interviews and the 28 household inventories were
completed, we began coding the responses. In the case of the interviews,
we followed the paradigm outlined in Chapter II, in that a response was
seen as something characterizing a household, not an individual. Thus
the interviews with Husband-Father ("male interviews") were coded
separately from those with Wife-Mother ("female interviews").
The actual procedure of coding was something like this: First, all
the answer-books were opened to the responses to the same question.
Then, taking the booklets in alphabetical order, the responses in the
first book were entered on the code sheet and 1' s entered after them in

134
the first column, the column for that household. Then each of the other
books was taken in turn; when a response in it seemed to be the same
as one encountered before, a 1 was entered in the appropriate column
in the row already labelled with that response, When a novel response
was encountered, a new row was labelled and a 1 entered there. Each
response was assigned an eight-character ID number: three letters
designating the source of the response (e. g., MIN for male interview), a
three-digit number representing the question, and a two-digit number
representing the specific response.
Occasionally, in the course of coding we discovered gaps in our
data and, since we were still in the field, we were able to revisit the
respondent and fill the gaps. I feel that a more general benefit accrues
from doing the coding in the field; namely, the material is still fresh,
one' s "ear" for cultural nuances is more in tune, one' s own circum-
stances are more nearly the same as those of the respondents — in
short, the results of the coding will be more natural, more in accord
with the classifications actually pertinent to the culture-bearers them-
selves, than classifications devised later on from the bare descriptions
and quotations alone. There were real difficulties in coding, and it is
almost certain that responses were often miscoded; every time that
happens, of course, the Natural Order of Cultural Adoption and Loss is
further obscured. We utilized certain techniques to lessen this effect:
One technique was to look for certain striking phrases that were used

135
practically verbatim by several respondents. For example, while many
people said they grew, among other things, corn, peas, and cassava, a
certain number of women began their answer to the "what do you grow in
your garden?" question with "Corn, peas, cassava (falling intonation and
end-of-utterance juncture)"; then they went on to name other things. So
the "corn-peas-cassava formula" was coded as a single response,
additional to the separate mention of each of the three vegetables.
Another technique used to lessen the randomizing effects of mis-
coding was the use of the "recap" response; that is, several responses,
which might or might not have been coded separately, were recapitu-
lated as a single response.5 For an example, see the coded responses to
the question on carnival activities (Supplement, Question 070).
Back in the U. S., the code sheets were keypunched onto
Hollerith ("IBM") cards, one card for each response. The card showed
the ID number of the response, a brief (35 character) description of
the response, the frequency of the response, and its distribution of
presences and absences over the 28 households. These cards were
processed by means of the procedures explained in Chapter III. The
final result of processing was the production of a new deck of cards
containing the same information but with the households in rank
order of descending conservativeness, with X' s rather than 1' s
representing presences and with the following information also
punched into the card:

136
1. The cutting-point for the trait; that is, the best estimate of the
place in the household-order where presences of that trait end and
absences begin, or vice-versa. The computer determines the cutting-
point by finding the place which produces the fewest "errors", i. e., in
the case of a trait being adopted, the place that produces the lowest
total count of X' s to its left plus 0' s to its right.
2. An indicator of whether the trait is being adopted (A) or lost (L), if
either. If X' s and 0' s are perfectly balanced, or if the cutting point is
either before the most conservative household (CTGPT = 0) or after the
most progressive (CTGPT = 28), a 0 is entered in this column. In such
cases, the adoption-or-loss status of the trait simply cannot be
determined.
3. A figure, Z, representing the number of standard deviations,
away from the mean, of the value of U for that particular response.
This figure, when translated into a probability by the use of a table of
areas under the normal curve (two-tailed test), tells us how closely the
distribution of that response corresponds to the rank order of the
households, which rank order in turn has been determined by the
distributions of all the responses taken as a whole. We interpret the
probability associated with this figure, then, as an index of the relative
importance of that particular response in the determination of the final
matrix. A response whose distribution has a low probability of having
occurred by chance is one which interacted well with certain other

137
traits in determining the reordering of the columns. Therefore it seems
logical to presume that such a trait must be a good indicator of the
Natural Order of Cultural Adoption and Loss, and thus will be worthy of
study in any attempts we might make to develop insights into the nature
of the d-cultural
The information of these final data cards has been reproduced in
a Supplement to the present volume, together with the actual questions
and some explanatory materials pertinent to the individual
responses. This Supplement is available, in various forms, to
interested readers.6

NOTES FOR CHAPTER V
1The expected role, then, was very similar to that of an official of
the Community Development Department or other agency of the Central
Government —an official from Port-of-Spain, that is, not one of the
county officials. My impression is that high officials are thought to be
remote and powerful and just, but ill-informed about local problems;
county officials, on the other hand, are thought to be upwardly mobile
and hence are suspected of holding office merely to line their own
pockets. It is felt that only by appealing directly to Port-of-Spain can the
villagers get their share of government largesse and justice. (All financial
aid must come from the Central Government, since only the Central
Government has the power to tax.)
2I don' t mean to claim that adopting such a status would result in
such universally cordial relations for a local man; on the contrary, it was
a very common experience for me to hear someone I met on the road
"mauvais langue" my colleagues on the Village Council, many of whom
had done and were doing far more for the village than I.
3For women, it was discovered that life history was a sensitive
area, because of early sexual liaisons which commonly resulted in what
we came to know as "sociological parthenogenesis" —the birth of a child
who is raised by the girl' s mother, aunt, or grandmother. This causes
little embarrassment in Creole circles, but my wife soon found that the
"White Lady" was not expected to take such news calmly. Thereupon the
life history was shifted to the end of the interview, and the interview
opened with the gardening questions.
138

139
4An interesting methodological problem arises here: Given that we
want to present each respondent with the same stimuli under the
same conditions, but given that we want these stimuli to simulate
natural stimuli as closely as possible, which is better: to interview
every respondent in an identical but unfamiliar setting chosen by the
ethnographer, or to interview each in his own home, subject to all
sorts of stray and uncontrolled conditions, but in a sense the natural
setting for his cultural behavior? One possible way to escape this
dilemma would be to conduct the interview in an artificial environment
but one designed to concentrate the informant' s mind on a limited set
of culturally relevant stimuli, for instance by the use of slides, films,
recordings, etc., as well as the voice of the ethnographer.
5This would have an anti-random effect, however, only if an
ordering is possible on other grounds. If the "recap" is mistaken, it will
obscure the order just as any other "mistake" in coding or eliciting
responses.
6The Supplement consists of a six-page introduction, 80 pages of
computer-printed data (like that on pages 148-157, but arranged by
question-categories), and 60 pages of notes to the data, including the
questions verbatim.
The Supplement is available at cost in the following forms: (1)
on microfilm; (2) Xeroxed on 8½ x 11 sheets; (3) introduction and
notes, Xeroxed; data, on I. B. M. cards (two boxes). For information
and prices, write to the author, c/o Institute for Research in Social
Science, University of North Carolina, Chapel Hill, N. C. 27514 .

CHAPTER VI
RESULTS
After the households had been reordered, giving the processed
empirical matrix on cards (see pp. 135-137), the next step was to
evaluate the matrix according to the methods presented in Chapter III.
The characteristics of a sample-matrix were defined in such a way as
to make the sample-matrices stratified samples of large matrices (i.e.,
like the empirical matrix) (see note 9, Chapter III). Forty such sample-
matrices were drawn at random from the empirical matrix, processed,
and their values of UTOT calculated. Then 100 such sample-matrices
were constructed at random, processed, and their values of UTOT
calculated. The results of these two sets of operations are shown, in
the form of superimposed histograms, in Figure 3. Means were cal -
culated for each set of values of UTOT . The mean of the larger sample
(the constructed sample) was used to estimate the mean value of UTOT
of the universe of small matrices, and thus of the universe of samples
of small matrices drawn from the universe of large matrices (see
Chapter III). This mean value of UTOT was 2539, and its associated
standard deviation was 114.
What we are saying, then, is that if one generated a large number of
large matrices (i.e., those with the characteristics of our empirical
140


142
matrix) at random; then from each of these drew a sample of small
matrices at random; then calculated UTOT for each of the small
matrices; then averaged the UTOT's for all the small matrices drawn
from each large matrix; and then averaged the results from all the
large matrices; and if one did this several dozen times, then one
would find that the results clustered around the figure 2539, with a
standard deviation of 114.
The next question is, how does our empirical large matrix
compare with the universe of large matrices? We have a sample of 40
UTOT-values of small matrices drawn from the empirical matrix, and
the mean of these values is 2425. We use this value to estimate the
mean of the values of UTOT of all the sample matrices which could
be drawn from the empirical matrix. The difference between this
value and the expected value is 2539 -2425 = 114, which makes it, by
coincidence, exactly one standard deviation less than the expected
value. The probability of a value being one or more standard devia -
tions less than a mean value is .159 , or slightly less than 1/6.
Before making a final interpretation of this result, it is necessary
to enter a qualification. Late in the analysis, a re -examination of the
computer printouts from the operations generating and evaluating the
two sets of sample-matrices has revealed an apparent flaw in the logic
of processing. Because of this flaw, the computer seems to have
stopped processing a few of the sample-matrices before the lowest

143
possible value of UTOT for those matrices was achieved. This seems to
have occurred in the processing of both sets of sample matrices, so
that any errors may well have cancelled each other, but we cannot be
sure. Correction of the flaw is a simple matter, but reprocessing all the
data would be extremely expensive in both time and money.
With that caveat in mind, then, we can interpret our results as
follows: If we were making up large matrices by random processes, only
about 1/6 of them would be as orderable as the empirical matrix
consisting of the Enterprise data. Putting that another way, we can say
with about 84% confidence that the data reordering we have ac-
complished could have been accomplished only if there were a certain
factor or factors operating to give our data an innate orderability. We
have called that orderability-factor a Natural Order of Cultural Adop-
tion and Loss, and predicted its existence on the basis of a general
hypothesis that the constitution of an x-culture is, in part, determined
by a d-culture which is an FIW.
While the confidence level is not highly satisfactory, I feel that
we can regard our hypothesis as tentatively confirmed: there is a
Natural Order, and it is controlled by a d-cultural FIW. With the
hypothesis accepted, we can proceed to examine the data to find the
traits which best illustrate the Natural Order.
In selecting the portion of the data which we will regard as a first
approximation of the Natural Order of Cultural Adoption and Loss of the
144
Enterprise Vincentians (or, rather, that portion of the Natural Order
spanned by our sample in 1964), we utilized the following line of
reasoning:
Some behavior-traits have had more influence than others in re-
ordering the households. These traits have "cooperated," so to speak, and
the final rank order of households is the end result of their combined
influence. We assume that the reason these traits have combined to
produce that influence is that they, in turn, most closely reflect the
influence of the d-culture in controlling culture change.
To put that another way: We have accepted that the d-culture
exists and that it is an FIW. This FIW has had an important effect in
controlling the adoption and loss of behavior-traits by the Vincentian
households studied. There are also many other extrinsic factors at work,
however, which operate in an unpredictable fashion and thus introduce
a certain amount of indeterminacy into our observed results. But these
factors do not operate with the same strength on all behavior-traits.
Some traits are so strongly influenced by extrinsic factors that their
distributions, when compared with the rank order of households
determined by the Natural Order, approach randomness. On the other
hand, there are traits whose distributions conform very closely to the
rank order of households. This conformity is taken to be due to those
traits' being relatively free of extrinsic influences; in other words, to
their distributions' being controlled almost entirely by the d-cultural

145
FIW. If the d-culture were omnipotent, and we had made no mistakes
in data-collecting or in coding, all traits' distributions would correlate
perfectly with the rank-ordering of households. The well-conforming
traits, then, represent most closely the Natural Order of Cultural
Adoption and Loss that would stand revealed if the d-culture were
omnipotent, and can be taken as a first approximation to that
Natural Order. In so taking them, we are treating them as the empiri -
cal units of cultural change; i.e., as the culture-traits, properly
speaking (pp. 23-26).
To identify the culture-traits and arrive at a first approximation
to the Natural Order, we have recourse again to the Mann-Whitney U-
test (p. 69). We have utilized the fact that the distribution of U is
roughly normal, when n = 16 or more, to compute a value, for each
trait, of Z . Z represents the number of standard deviations the U-
value for that trait is from the mean of all possible U-values, i.e., from
complete randomness, and thus it can be used to calculate the proba-
bility that the degree of conformity of the behavior-trait in question is
due to chance alone.
To give us a convenient criterion, we have selected behavior-
traits whose probability of being as well ordered as they are by
chance alone is .05 or less, i.e., whose Z-value is 1.96 or higher, for
further analysis. (We recognize, of course, that about one in every
20 of the traits so included is included by chance.) These traits are

146
considered candidates, as it were, for the status of culture-trait.
Now we take the selected traits and arrange them for convenient
inspection as an approximation of the Natural Order of Cultural Adop-
tion and Loss by cutting-point in ascending order, by adoption-or-loss
status within the cutting point, and then in descending order of Z-value
-- and present them on the following pages (Table 10). If we could
assume that this group of traits did, in fact, exactly represent the
Natural Order, we could say that the adoption (A) or loss (L) of the
traits with cutting-point 1 was a necessary condition for the adoption
or loss of the traits with cutting-point 2 and all higher cutting-points,
and so forth. This is because ideally speaking there exists no household
which has undergone the changes at cutting-point 2 , but which hasn't
undergone the changes at cutting-point 1 .
To take a concrete example, using the first trait listed with cutting-
point 1 and the first with cutting-point 2: An Enterprise Vincentian
apparently has to lose the propensity to make odious comparisons
between Christianity and Indian religions before his wife can stop
believing that A. N. R. Robinson is the owner of Woodford Lodge Estate.
If this particular sequence seems hard to explain, it may be because
there is in fact no connection between the two traits; but it may be
because we don't know enough about how d-cultures in general, and
this d-culture in particular, operate.
We will shortly look at a few culture-traits, their cutting-points,

147
TABLE 10
Selected Culture Traits, by Cutting-Point:
An Approximation of the Natural Order
of Cultural Adoption and Loss


157

158
and their sequences. First, however, let us examine the selected list of traits,
the pro-tern Natural Order, to find general trends in Enterprise Vincentian
acculturation.
It is glaringly apparent, right away, that our original assumption,
that the Vincentian Creoles were adopting Indian culture, was totally
wrong. Knowledge of Hindi, for example, is lost at cutting-point 4.
(Hence forth, we will use the code of Table 10 for loss/adoption status
and cutting-point, e.g., "Knowledge of Hindi, 4L". The reader may wish
to refer to the Supplement for further information on specific traits.) It
appears that the conservatives look more favorably upon interaction
with Indians (prefer rent house to Indian, 2L), and have picked up a
few Indian culture traits that progressive people lack (M likes meat "a
little," 5L; doesn't like beef, 9L; likes Indian music; M , F would listen
to Indian music, 23L - 24L), but disapproves of some specifically
Indian values and practices, especially in the religious sphere (odious
comparison, 1L; disapproval of prayer flags, 2L). More progressive
people, on the other hand, are able and willing to express what we
might regard as ethnographic knowledge and attitudes concerning
Indian culture (prayer flags, 14A, 18A; has been to Ramdilla, 22A; B.
S. Maraj is head of Maha Sabha, 26A). In this respect it is interesting
to note that the most conservative ladies learned to make roti by
watching a hired Indian woman make it for them to serve at a Baptist
prayers (3L), while the most progressive ladies

159
learned it at home, from their mothers (26A). In other words, roti-
making as a specifically Indian trait is almost lost, but it is being
adopted by the most progressive Vincentians, now, as a general
Trinidadian trait. Far from having Vincentian Creoles adopting
Trinidadian Indian culture we see, rather, that we have Vincentian
Creoles losing what little Indian culture they picked up at an earlier
time as they adopt Trinidadian Creole culture, of which a small part,
in turn, is ultimately Indian in origin.1
An examination of Table 10 reveals that, while most of the adop-
tions and losses do indeed seem to represent cultural change, a few
seem to represent not culture change but change in age-status. The
most obvious and direct example is that some men at the
"conservative" end of the household-order regard themselves as retired
(6L). A set of such adoptions and losses occurs in the area of housing;
the most conservative families have not only the largest (3L) and
highest (4L) houses, they have the most modern and up-to-date houses
(walls of hollow clay block, 15L; walls plastered, 9L), while the most
progressive families still live in the old-fashioned tapia houses (25A). It
would appear that the older people have been saving their capital, in
money or in land, and have at last decided to spend it on building a
house in which to spend their declining years. The younger people, on
the other hand, are living in much older houses which they rent or
have purchased on rented land or which, in a few cases, they have
159

learned it at home, from their mothers (26A). In other words, roti-
making as a specifically Indian trait is almost lost, but it is being
adopted by the most progressive Vincentians, now, as a general
Trinidadian trait. Far from having Vincentian Creoles adopting
Trinidadian Indian culture we see, rather, that we have Vincentian
Creoles losing what little Indian culture they picked up at an earlier
time as they adopt Trinidadian Creole culture, of which a small part,
in turn, is ultimately Indian in origin.1
An examination of Table 10 reveals that, while most of the adop-
tions and losses do indeed seem to represent cultural change, a few
seem to represent not culture change but change in age-status. The
most obvious and direct example is that some men at the
"conservative" end of the household-order regard themselves as retired
(6L). A set of such adoptions and losses occurs in the area of housing;
the most conservative families have not only the largest (3L) and
highest (4L) houses, they have the most modern and up-to-date houses
(walls of hollow clay block, 15L; walls plastered, 9L), while the most
progressive families still live in the old-fashioned tapia houses (25A). It
would appear that the older people have been saving their capital, in
money or in land, and have at last decided to spend it on building a
house in which to spend their declining years. The younger people, on
the other hand, are living in much older houses which they rent or
have purchased on rented land or which, in a few cases, they have

160
built in the much cheaper old-fashioned way. This impression is borne
out by the data in the Supplement (answers to Questions 004 and
005), and by material in field notes.
In spite of the fact that they have smaller and less modern
houses, it is interesting to note that the younger, more progressive
women have made shift, if necessary, to have a kitchen fully inside
the house, in a separate room (18A), and that the most progressive of
these have arranged some built-in counter space (22A). By contrast,
several of the conservative women cook in dirt-floored detached or
semi-detached tapia sheds, even when a separate kitchen-wing is
available in their recently-built upstairs houses (see Supplement,
Question HH C01; see above, p. 139) .
In general, then, the pattern of the traits has the expected direc-
tion as long as we are dealing with features that are within the means
of everybody; but some modern conveniences, which everyone would
like to have, are out of reach of the more progressive but younger, and
hence poorer, families, and thus appear to contradict the general trend.
Such behavior-traits cannot be said to be culture-traits; they are being
adopted or lost not through cultural time but through behavioral time
(p. 22), in this case behavioral time whose period is the life-cycle. Since
age can generally be expected to correlate well with the rank order of
households produced by the Natural Order of Cultural Adoption and
Loss (p. 62), we must be prepared to encounter such life

161
cycle changes in future analyses of other x -cultures.
So much, then, for general trends revealed by scanning the Natural
Order. It had been my intention to attempt a complete analysis of the
pro tern Natural Order, a kind of circular process which would have
tentatively selected certain traits as bona fide culture -traits and
established their exact cutting points, then examined their sequence
(the tentative true Natural Order) in order to leap to the construction
of an elaborate theoretical model, representing the d-cultural FIW and
derivable from a limited set of theoretical hypotheses; this theoretical
model, in turn, would be predictive of a Natural Order of Cultural
Adoption and Loss which would then be compared to the existing
tentative true Natural Order. The process could be repeated until a
fairly close correspondence is reached. Then plans could be made for
testing this model, and thus the hypotheses, in a replication of the
present study.
Perhaps this can still be done, using the very pro tern Natural
Order we have here in Table 10. But the fact is that the task will be
laborious and time-consuming in the extreme. One must admit, sadly,
that a clear pattern does not leap out at one from the pages; several
hunches have been followed through without success, and analogies
which have occurred to the writer from which to build the theoretical
model have failed. This temporary failure is not, after all, unduly
surprising; if the underlying FIW worked according to our common

162
sense understanding, so that adoptions and losses followed one an-
other in a common-sense order, it would have been discovered long ago,
and would have been a rather uninteresting discovery at that. It would
have been as if the laws of chemical bond-formation had followed
common sense conceptions of what happens when different substances
are mixed together; Lavoisier, Priestly, and others would have had no
difficulty in discovering these laws, the theory of valence would never
have been invented, and our understanding of atomic physics would
have been to that extent impoverished.
So we will defer the attempt to make a complete theoretical
analysis, and simply call the reader's attention to a few features of
the Natural Order that are clearly revealed in the table.
The most striking feature occurs at cutting-point 13. Here we see
the loss of the propensity to give a response containing the words
"Baptist" or "Spiritual Baptist" to the question, "Do you belong to a
church or religious organization? What church or religious organiza-
tion?", and this loss is very definite (with Z - 3.72, p = .0002). If we
look back through the collections with lower cutting-points, we see the
loss of other Baptist traits (e.g., Baptist gift: is a Mother, 7L; if sudden
money would give a prayers, 7L; and a whole series at 4L). But 13 is
the point where self-identification as a Baptist is finally and
completely lost. At the same point, we find a series of responses being
adopted, responses indicating attitudes of acceptance of various

163
secular pleasures. It is as if the d-cultures of the first thirteen house-
holds contained a germ, a factor, expressed as self-identification-as-a-
Baptist, which inhibited, or otherwise prevented the expression of,
acceptance of cards, movies, rum, the idea that a wife might be
adulterous, and so forth. Or possibly it's the other way around:
Adoption of a "pleasure" factor has eliminated, or silenced the ex-
pression of, a "Baptist" factor. Again, at cutting-point 21 , we see the
adoption of another "pleasure" factor, this time a propensity for active
participation in Carnival. Perhaps this is associated with loss of the
perception of the environment as Baptist at the same point; but we
would have to recognize that, in that case, the Wife's loss of the latter
perception was accompanied by the Husband's adoption of the
former propensity.
To examine the situation from another point of view, let us follow
the career of a particular folk-belief, namely the belief that drinking
rum and eating fig (banana), simultaneously or successively, can
cause illness or death: First the ability to name specific varieties of
fig that are to be avoided is lost (3L). Then flat agreement with the
whole proposition is lost (9L); this is the most clear-cut shift (p =
.0004). Flat agreement is replaced immediately by the non-committal
"I hear (but never see)" (9A). Finally an open indication of disbelief
takes over (19A).
One has a definite impression of sequential turnings-on and

164
turnings-off of different propensities to respond to the rum-and-fig
question. Again, it is as if a certain behavior-determining factor is
present up to a point, and then is lost; or, conversely, that a factor
previously not possessed is acquired. If this notion is correct, then
such factors are the "things" of which a d-culture is made (p. 12).
Changes in the d-culture consist of acquisitions and losses of these
factors, and one gain or loss is causally related to a subsequent gain
or loss. Another way of putting that is that the presence or absence of
one factor or group of factors in the d-culture may determine whether
or not a certain other factor will be adopted or lost. What we must
work to discover now are the mechanisms by which such
determinations are made. This study has indicated that the
mechanisms exist and has provided a means for empirically testing
our ideas about these mechanisms as they evolve.
To recapitulate:
We have shown, in Chapter II, that if the widely-held view that a
culture is functionally integrated is true, we should be able to find a
certain pattern in the distributions of behaviors over various households
of a single social group. After specifying our method of analysis (Chapter
III), describing our field situation (Chapter IV) and method of eliciting
behavior (Chapter V and Supplement), we have shown that the predicted
pattern can indeed be discerned, with a 16% likelihood that we are wrong
(p. 142). We have next selected the traits most

165
representative of the discerned pattern (Table 10) as a first approxima-
tion to the predicted Natural Order of Cultural Adoption and Loss (and
have shown how this order can give us an over-all characterization of
culture change in Vincentian Enterprise [Note 1]). We have tried to
indicate how some of these culture-traits seem to reflect the presence
of discrete factors, presumably in the d-cultures of the households,
factors which are to culture-traits as Mendelian genes are to pheno-
typic biological traits. Finally, turning back to our original theoretical
discussion in Chapter II, we have raised the question of causal rela-
tions between the presences and absences of the various factors.
Answering this question will require the construction, and testing, of
an elaborate theoretical framework, and for that reason is deferred.
Further Research
The present study is by no means intended to be definitive. On the
contrary, it serves primarily to attest to the feasibility of a new
approach to the study of culture change, to outline the methodology of
the new approach, and to put forth some specific techniques. What is
suggested here, then, is that the present study can be regarded as a
pilot study for an extensive program, or perhaps a number of programs,
of research in culture change. Such continued research is required on
three levels: theoretical, methodological, and empirical.
As stated in the preceding section, theoretical research has been

166
deferred for this study. Perhaps the building of theory on the basis of
the method of analysis presented will have to wait for additional field
studies, so that we can look for cross-cultural similarities in Natural
Orders of Cultural Adoption and Loss. Perhaps, on the other hand, re-
analysis of existing data will prove theoretically fruitful as new
methodological techniques are devised.
Among the new methodological techniques required is an improve-
ment in the method of processing a matrix (Chapter III). As noted on
pp. 142-143, the existing method has an unfortunate habit of
stopping, occasionally, before its job is done. This habit can be
corrected by providing an instruction to the computer to re-shuffle the
households arbitrarily the first two or three times it stops and start re-
ordering again, making sure it arrives more than once at the one and
only rank order that produces the lowest possible value of UTOT.
As badly needed, and much more difficult to acquire, is an im-
proved technique for evaluating matrices once they are processed.
What is really required is a means of calculating the probability of
UTOT (or some other measure) based on theoretical knowledge of the
distribution of that measure for matrices of a specified size and shape.
Such a technique would make it possible to evaluate large matrices
directly, instead of having to sample them.
As these techniques are developed, they can be applied both to new
field data (if available) and to existing data. Besides simply

167
re-processing the existing raw data along the lines already followed,
certain other approaches to the existing data might be fruitful of
theoretical insight. For one, it may have been noticed by the reader that
certain responses are coded both for males and for females (see
Supplement). Those responses could be selected as a separate data set,
and a new analysis made using the 56 individuals, rather than the 28
households, as the subjects.
Another approach would involve "improving" the data. Once the raw
data has been processed and evaluated as it is, and it has been decided
to accept the existence of a Natural Order ; one can look among the
answers to a single question to see whether they might not be
combined. That is, two responses which were originally coded
separately might be re-coded as a single response, if that yields a
higher value of Z for the combined response than either gets separately.
The justification for this would be that the two different responses were
actually variants of the same response; i.e., a single underlying factor
controls both. Similarly, one could go back to the original data-books
and see whether some coded responses ought not to be broken down
into two or more separate responses; this would not be as fruitful as
the former procedure, however, because our rule while doing the
original coding was "when in doubt, code separately."
When the "improved (i.e., re-coded) data is processed, it should
produce a clearer-cut Natural Order and thus, hopefully, regularities

168
in relationships between the various adoptions and losses should be
more apparent, leading to an improved possibility of theoretical
insight.
Finally, more and better field studies are indicated. While the
basic field techniques outlined in Chapter V are sound, they certainly
can be refined.
The most important single improvement that should be made is
in the choice of a study population. Before commitment is made to a
particular village or other social group, an intensive study should be
made of the history of the people in an effort to ensure their cultural
homogeneity in terms of social class, for example. Unfortunately,
this can mean that weeks of work spent in taking a census and ob-
taining genealogies and life histories may end in one's deciding to do
one's study elsewhere. Furthermore, the village studied should be
more isolated than Enterprise, and thus less subject to differential
cultural influences on its members (i.e., differences in cultural
environment). On the other hand, the social unit studied must be,
like Enterprise, culturally stable and viable; it is difficult to specify
exactly how one determines this, but at any rate a society that is
undergoing extremely rapid change, which is being overwhelmed by
alien customs to the point where intergenerational communication is
jeopardized, must be avoided.
Another area in which improvement can be made over the present

169
study is in the pre-testing of the interview schedule. Before beginning
the actual survey, the schedule should be gone over with a good
informant, and he should be asked for his interpretation of each
question. If his interpretation doesn't match the ethnographer's, the
informant should be asked to help re-write the question. This will not
guarantee that every respondent will understand the question, but at
least one can be sure that every question will be meaningful to at least
some respondents, a condition that was reached in the Enterprise
study only after several interviews. Then, ideally, a few trial interviews
should be run, and perhaps re-run, to eliminate any remaining "bugs"
in the schedule; the results of these interviews would not be used in
the analysis.
Finally, it is the very strongly held opinion of the writer that future
studies must be carried out, as was this one, entirely by anthro-
pologists. This must include the actual interviewing. Rapport of the kind
that anthropologists seek as a matter of course is absolutely essential;
the relationship between interviewer and respondent must approximate
the traditional relationship between ethnographer and informant as
closely as possible. Only if he has carried out the interviews himself can
the anthropologist hope to code the responses properly, to understand
the pro tern Natural Order when the computer gives it to him, and, most
important of all, to build a fruitful theory of culture change from the
Natural Order of Cultural Adoption and Loss.

NOTE TO CHAPTER VI
If we examine the Order further, and augment this examination
with information from the life-history table (Table 9), from additional
cultural data in the Supplement, and from field notes, we may be able
to detect some additional over-all trends, such as those shown in the
table below, (The table shows changes along several dimensions of
culture in three stages. We do not mean to imply by the use of this
trichotomous form that our sample of households could be broken
down into three distinct cultural groups one having all the qualities in
the first column, another all those in the second, etc. In the first
place, most of the dimensions are continuous; the adjacent
descriptive categories intergrade gradually into one another. In the
second place, far more important, even where the lines between
adjacent categories are abrupt, they do not necessarily occur between
the same two households from one dimension to the next. The table is
presented, rather, as an example of a set of descriptive
generalizations that could be made about Enterprise Vincentian
acculturation, based primarily on a summary of the data
systematically produced by the computer. The reader is invited to
compare the summary with its immediate source, the pro-tem Natural
Order (Table 10), and to check their congruence for himself.)
170


REFERENCES CITED
Augelli, John P. , and Harry W. Taylor
1960 Race and population patterns in Trinidad. Annals of the
Association of American Geographers 50: 123-38.
Benedict, Ruth
1946 Patterns of culture. New York: Penguin Books.
Originally published by Houghton Mifflin.
Carneiro, Robert L.
1962 Scale analysis as an instrument for the study of cultural
evolution. Southwestern Journal of Anthropology 18:
149-69.
Clark, Charles E.
1953 An introduction to statistics. New York: John Wiley and
Sons.
Cloak, F. T. , Jr.
1961 An explication of ' acculturation' : the application of
some of Carl G. Hempel' s "fundamentals of concept
formation" to an anthropological problem. Unpublished
M. A. thesis, University of Wisconsin.
Crowley, Daniel J.
1957 Plural and differential acculturation in Trinidad. American
Anthropologist 59: 817-24.
Eggan, Fred
1950 Social organization of the Western Pueblos. Chicago:
University of Chicago Press.
1954 Social anthropology and the method of controlled com- parison. American Anthropologist 56: 743-63.
1955 Social anthropology of North American tribes, 2d. ed.,
Chicago: University of Chicago Press.
1955a Social anthropology: methods and results. In Eggan 1955:
485-551.
173

174
Feigl, Herbert, and May Brodbeck
1953 Readings in the philosophy of science. New York:
Appleton-Century-Crofts.
Gardin, Jean-Claude
1958 Four codes for the description of artifacts: an essay in
archeological technique and theory. American
Anthropologist 60: 335-57,
Glass, Gene V.
1965 Note on rank-biserial correlation. Occasional Paper No.
4, Laboratory of Experimental Design, Department of
Educational Psychology, University of Wisconsin
(mimeo)
Goodenough, Ward H.
1963 Some applications of Guttman scale analysis to ethnog-
raphy and culture theory. Southwestern Journal of
Anthropology 19: 235-50.
Green, Bert F. , Jr.
1963. Digital computers in research. New York: McGraw-Hill
Book Company.
Guttman, Louis
1944 A basis for scaling qualitative data. American Sociological
Review 9: 139-50.
1950 The basis for scalogram analysis. Chapter 3 of
Stouffer et al. 1950.
Hempel, Carl G.
1952 Fundamentals of concept formation in empirical science.
Vol. 2, No. 7 of the International Encyclopedia of Unified
Science. Chicago: University of Chicago Press.
1959 The logic of functional analysis. In Llewellyn Gross,
Symposium on sociological theory. Evanston, Illinois: Row,
Peterson and Company. 271-307.
Herskovits, M. J. , and F. S. Herskovits
1947 Trinidad village. New York: Alfred A. Knopf, Inc.
Hoebel, E. Adamson
1954 The law of primitive man, Cambridge: Harvard University
Press,

175
Kay, Paul
1964 A Guttman scale of Tahitian consumer behavior, South-
western Journal of Anthropology 20: 160-7.
Klass, Morton
1960 East and West Indian: cultural complexity in Trinidad. In
Rubin 1960: 855-61.
1961 East Indians in Trinidad: a study of cultural persistence. New
York: Columbia University Press.
Kluckhohn, Clyde, and William H. Kelly
1945 The concept of culture. (2 versions, one mimeographed,
one in R. M. Linton, The science of man in the world
crisis.)
Kroeber, A. L.
1948 Anthropology. New York: Harcourt Brace and World.
1952 The nature of culture. Chicago: University of Chicago
Press.
1953 Anthropology today. Chicago: University of Chicago Press.
Kroeber, A. L. , and Clyde Kluckhohn
1952 Culture: a critical review of concepts and definitions. Papers
of the Peabody Museum of American Archaeology and
Ethnology, Vol. 47, No. 1,
1952/63 Culture: a critical review of concepts and definitions. New
York: Random House (Vintage Books). Reprint of Kroeber
and Kluckhohn 1952.
Levi-Strauss, Claude
1953 Social structure. In Kroeber 1953: 524-53.
Linton, Ralph M.
1945 The cultural background of personality. New York:
Appleton-Century-Crofts, Inc.
Madden, Edward H.
1953 The philosophy of science in Gestalt theory. In Feigl and
Brodbeck 1953: 559-70.

176
Mahar, P. M.
1959 A multiple scaling technique for caste ranking, Man in India
39: 127-47.
Mann, H. B., and D. R. Whitney
1947 On a test of whether one of two random variables is
stochastically larger than the other. Annals of
Mathematical Statistics 18: 50-60.
Mead, Margaret
1958 Cultural determinants of behavior. In Rowe and Simpson
1958.
Murdock, George Peter
1960 Typology in the area of social organization. In Wallace (ed. )
1960: 183-8.
Niehoff, Arthur, and Juanita Niehoff.
1960 East Indians in the West Indies. Milwaukee: Milwaukee Public
Museum Publications in Anthropology, Number 6.
Oliver, Douglas L.
1964 Invitation to anthropology. Garden City: The Natural
History Press.
Otterbein, Keith F.
1965 Caribbean family organization: a comparative analysis,
American Anthropologist 67: 66-79.
Rands, Robert L. , and Carroll L. Riley
1958 Diffusion and discontinuous distribtion. American
Anthropologist 60: 274-97.
Roberts, John M.
1951 Three Navaho households: a comparative study in small
group culture. Papers of the Peabody Museum of
American Archaeology and Ethnology, Harvard University,
Vol. 40, No. 3.
Rouse, Irving
1939 Prehistory in Haiti: a study in method. Yale University
Publications in Anthropology, No. 21. New Haven: Yale
University Press.
Rowe, Anne, and George Gaylord Simpson
1958 Behavior and evolution. New Haven: Yale University
Press.

177
Rubin, Vera (ed. )
1960 Social and cultural pluralism in the Caribbean. Annals of
the New York Academy of Sciences, Vol. 83, Art. 5, pp. 761-
916.
Stewart, Omer C.
193- Culture element distributions: XIV: the Northern
Paiute. University of California Anthropological
Records, Vol. 4.
Stouffer, Samuel A. , et al.
1950 Measurement and prediction: Studies in social psychology in
World War II, vol. 4. Princeton, N. J. : Princeton University
Press.
Thomas, William L. , Jr.
1956 Current anthropology. Chicago: University of Chicago
Press.
Wallace, Anthony F. C. (ed. )
1960 Selected papers of the fifth international congress of
anthropological and ethnological sciences. Phila-
delphia: University of Pennsylvania Press.
Wallace, Anthony F. C. , and John Atkins
1960 The meaning of kinship terms. American Anthropologist 62:
58-80.

Copyright © 2022 FDOKUMEN