A Time\Dependent Probabilistic Seismic Hazard Model For The Central Apennines (Italy)
26
Effect of Time Dependence on Probabilistic Seismic-Hazard Maps and Deaggregation for the Central Apennines, Italy by A. Akinci, F. Galadini, D. Pantosti, M. Petersen, L. Malagnini, and D. Perkins Abstract We produce probabilistic seismic-hazard assessments for the central Apennines, Italy, using time-dependent models that are characterized using a Brown- ian passage time recurrence model. Using aperiodicity parameters, α of 0.3, 0.5, and 0.7, we examine the sensitivity of the probabilistic ground motion and its deaggrega- tion to these parameters. For the seismic source model we incorporate both smoothed historical seismicity over the area and geological information on faults. We use the maximum magnitude model for the fault sources together with a uniform proba- bility of rupture along the fault (floating fault model) to model fictitious faults to account for earthquakes that cannot be correlated with known geologic structural segmentation. We show maps for peak ground acceleration (PGA) and 1.0 Hz spectral accelera- tion (SA 1 ) on rock having 10% probability of exceedence in 50 yr. We produce maps to compare the separate contributions of smoothed seismicity and fault components. In addition we construct maps that show sensitivity of the hazard for different α pa- rameters and the Poisson model. For the Poisson model the addition of fault sources to the smoothed seismicity raises the hazard by 50% at locations where the smoothed seismicity contributes the highest hazard and up to 100% at locations where the hazard from smoothed seismic- ity is low. For the strongest aperiodicity parameter (smallest α), the hazard may further increase 60%–80% or more or may decrease by as much as 20% depending on the recency of the last event on the fault that dominates the hazard at a given site. In order to present the most likely earthquake magnitude and/or the most likely source-site distance for scenario studies, we deaggregate the seismic hazard for SA 1 and PGA for two important cities (Rome and L ’Aquila). For PGA both locations show the predominance of local sources having magnitudes of about 5.3 and 6.5, respec- tively. For SA 1 at a site in Rome, there is significant contribution from local smoothed seismicity and an additional contribution from the more distant Apennine faults hav- ing magnitude around 6.8. For L ’Aquila the predominant sources remain local. In order to show the variety of impact of different α values, we also obtained de- aggregations for another three sites. In general, as α decreases (periodicity increases), the deaggregation indicates that the hazard is highest near faults with the highest earth- quakes rates. This effect is strongest for the long-period (1 sec) ground motions. Introduction In recent years time-dependent earthquake recurrence models have been an important component of many proba- bilistic seismic-hazard analyses (PSHA; e.g., Working Group on California Earthquake Probabilities [WGCEP], 1995; Ku- mamoto, 1999; Cramer et al., 2000; Papaioannou and Papa- zachos, 2000; Frankel et al., 2002; Peruzza and Pace, 2002; WGCEP , 2003; Erdik et al., 2004; Pace et al., 2006; Petersen et al., 2007, 2008). There has been some debate on the rela- tive merits of Poissonian and nonPoissonian recurrence mod- els for use in building codes and earthquake insurance rates. However, the question of whether the time-dependent mod- els of seismic hazard provide sufficiently important infor- mation for public policy applications is still open. The focus of this article is to investigate the differences that these two different recurrence models make in the assessment of earthquake-induced ground-motion hazard. Deaggregations of the hazard indicate the earthquakes (magnitude, distances) that contribute most to the hazard at a site and are used to 585 Bulletin of the Seismological Society of America, Vol. 99, No. 2A, pp. 585–610, April 2009, doi: 10.1785/0120080053
Transcript of A Time\Dependent Probabilistic Seismic Hazard Model For The Central Apennines (Italy)
Effect of Time Dependence on Probabilistic Seismic-Hazard Maps
and Deaggregation for the Central Apennines, Italy
by A. Akinci, F. Galadini, D. Pantosti, M. Petersen, L. Malagnini, and D. Perkins
Abstract We produce probabilistic seismic-hazard assessments for the centralApennines, Italy, using time-dependent models that are characterized using a Brown-ian passage time recurrence model. Using aperiodicity parameters, α of 0.3, 0.5, and0.7, we examine the sensitivity of the probabilistic ground motion and its deaggrega-tion to these parameters. For the seismic source model we incorporate both smoothedhistorical seismicity over the area and geological information on faults. We use themaximum magnitude model for the fault sources together with a uniform proba-bility of rupture along the fault (floating fault model) to model fictitious faults toaccount for earthquakes that cannot be correlated with known geologic structuralsegmentation.
We show maps for peak ground acceleration (PGA) and 1.0 Hz spectral accelera-tion (SA1) on rock having 10% probability of exceedence in 50 yr. We produce mapsto compare the separate contributions of smoothed seismicity and fault components.In addition we construct maps that show sensitivity of the hazard for different α pa-rameters and the Poisson model.
For the Poisson model the addition of fault sources to the smoothed seismicityraises the hazard by 50% at locations where the smoothed seismicity contributes thehighest hazard and up to 100% at locations where the hazard from smoothed seismic-ity is low. For the strongest aperiodicity parameter (smallest α), the hazard may furtherincrease 60%–80% or more or may decrease by as much as 20% depending on therecency of the last event on the fault that dominates the hazard at a given site.
In order to present the most likely earthquake magnitude and/or the most likelysource-site distance for scenario studies, we deaggregate the seismic hazard for SA1
and PGA for two important cities (Rome and L’Aquila). For PGA both locations showthe predominance of local sources having magnitudes of about 5.3 and 6.5, respec-tively. For SA1 at a site in Rome, there is significant contribution from local smoothedseismicity and an additional contribution from the more distant Apennine faults hav-ing magnitude around 6.8. For L’Aquila the predominant sources remain local.
In order to show the variety of impact of different α values, we also obtained de-aggregations for another three sites. In general, as α decreases (periodicity increases),the deaggregation indicates that the hazard is highest near faults with the highest earth-quakes rates. This effect is strongest for the long-period (1 sec) ground motions.
Introduction
In recent years time-dependent earthquake recurrencemodels have been an important component of many proba-bilistic seismic-hazard analyses (PSHA; e.g., Working Groupon California Earthquake Probabilities [WGCEP], 1995; Ku-mamoto, 1999; Cramer et al., 2000; Papaioannou and Papa-zachos, 2000; Frankel et al., 2002; Peruzza and Pace, 2002;WGCEP, 2003; Erdik et al., 2004; Pace et al., 2006; Petersenet al., 2007, 2008). There has been some debate on the rela-tive merits of Poissonian and nonPoissonian recurrence mod-
els for use in building codes and earthquake insurance rates.However, the question of whether the time-dependent mod-els of seismic hazard provide sufficiently important infor-mation for public policy applications is still open. The focusof this article is to investigate the differences that thesetwo different recurrence models make in the assessment ofearthquake-induced ground-motion hazard. Deaggregationsof the hazard indicate the earthquakes (magnitude, distances)that contribute most to the hazard at a site and are used to
585
Bulletin of the Seismological Society of America, Vol. 99, No. 2A, pp. 585–610, April 2009, doi: 10.1785/0120080053
help define scenario earthquakes that can be used for publicpolicy planning. Because of the large amount of fault infor-mation that has recently become available for the centralApennines, we selected this area as a case study for devel-oping time-dependent hazard models. Historical and recentearthquake sequences in the central Apennines have raisedhazard awareness, and this, in turn, has motivated the iden-tification of several active faults and the estimation of seismicrates also for regions that have been silent during historicaltime (Barchi et al., 2000; Galadini and Galli, 2000; Valensiseand Pantosti, 2001).
We compiled geologic data describing the geometry andactivity (fault lengths, slip rates [SR], single-event displace-ments, and return times) for the major active faults andcombined these data with the historical seismicity to assessthe fault seismicity parameters. In order to express the timedependence of the seismic processes to predict the futureground motions that will occur across the region, we useda Brownian passage time (BPT) model characterized by amean recurrence, aperiodicity, or uncertainty in the recur-rence distribution and elapsed time since the last earthquake(Matthews et al., 2002). Although other parameters suchas static elastic fault interactions, visco-elastic stress-transfer,and dynamic stress changes from earthquakes on nearbyfaults will also influence the probabilities for earthquake oc-currence, in our study we consider only the influence of theelapsed time since the last earthquake.
Results for both BPT and Poisson models are presentedin terms of maps of PGA and 1.0 sec spectral response accel-eration (SA1) for 10% probability of exceedance in 50 yr.The general strategy used in our study is similar to that usedin the preparation of seismic-hazard maps for California, theUnited States (Petersen et al., 1996, Frankel et al., 2002;Petersen et al., 2008), and for the Marmara Region in Turkey(Erdik et al., 2004).
To determine the relative contribution from varioussources at L’Aquila and Rome, we deaggregated the seismichazard for SA1 and PGA following the approach described byHarmsen and Frankel (2001). These cities have been selectedbecause they are two of the most densely populated metro-politan areas in the region. They have a high concentration ofhistorical monuments and industrial facilities and high politi-cal, economic, and strategic relevance.
Pace et al., 2006 have also developed a PSHA for thesame area. However, our study differs from that one in manyrespects. The first difference is the use of the backgroundseismicity parameters and the seismic catalogs in the hazardcalculations. For example, we use historical catalogs, Work-ing Group Catalogo Parametrico dei Terremoti Italiani (CPTI,2004) and a constant b-value distribution for the backgroundseismicity hazard while Pace et al. (2006) use CatalogoStrumentale dei Terremoti Italiani (CSTI, 2001) instrumentalcatalogs with spatially variable b value. Another difference isthe geologic data for the fault sources as well as the earth-quake recurrence models. For example, we calculate the seis-mic hazard for the faults that have magnitudes greater than
5.9 while it isM >5:5 in their study. We associate an elapsedtime calculated from 500 A.D. as a conventional date for pre-vious rupture on faults that did not have a historical earth-quake and use time-dependent model to calculate the seismichazard for these faults. Instead, Pace et al., 2006 treated thosewith the time-independent model. For some specific faults(see following section), we use different magnitudes, SR, andelapsed time parameters. For this reason we provide a con-siderable amount of detail for our sources in this study. Thelast difference is time-dependent recurrence parameters fromobserved-recurrence times. In contrast, Pace et al. (2006) de-rived aperiodicity parameters from the statistics of alternativemethods of determining maximum magnitude,Mmax. We es-timated aperiodicity (α values) for three faults where the re-currence intervals were already available and used thesevalues as a guide for selecting the range of α values to beused in our sensitivity analysis. On the contrary, Pace et al.(2006) did not attempt a sensitivity analysis on α values.
Active Faults/Seismogenic Sourcesin the Central Apennines
Seismotectonic Framework
The central Apennines are characterized by extensionaltectonics since the Pliocene (e.g., Consiglio Nazionale delleRicerce [CNR]-Progetto Finalizzato Geodinamica [PFG]1987; Elter et al., 2003) with most of the active faults show-ing normal or normal-oblique movement. In this area themain active faults trend northwest–southeast and north-northwest–south-southeast parallel to the general physio-graphic features of the chain with only a few faults trendingwest-northwest–east-southeast (Fig. 1).
Faults showing evidence of late Pleistocene–Holoceneactivity are considered active in this work (e.g., Barchi et al.,2000; Galadini and Galli, 2000; Pantosti and Valensise,2001). The length of fault sections mapped at the surfaceranges between 5 and 20 km, with dips of 40°–60° usuallyto the west or southwest. These fault sections are frequentlyorganized in dextral stepover systems consisting of 3 to 5segments. The total length of these stepover fault systemsdoes not exceed 33 km (i.e., Fucino and Gran Sasso fault).
At a regional scale, fault systems and individual faultsare organized into larger fault sets that run almost parallel tothe Apennine chain axis (Fig. 1). The number of fault setsand their relevance to seismic hazard is still a matter of de-bate. Boncio et al. (2004a) define three fault sets but otherregional compilations (e.g., Galadini and Galli, 2000; Va-lensise and Pantosti, 2001; Basili et al., 2008) or specificfault case studies (e.g., D’Addezio et al., 2001) identify nomore than two active fault sets (Fig. 1). The debated set isrelated to faults located in the western sector of the study areabecause there is evidence for inactivity or very low activityalong these faults (Galadini and Messina, 2004). In thiswork, we adopted only two main active fault sets (A andB, Fig. 1) and introduced two of the faults (9 and 16) com-
586 A. Akinci, F. Galadini, D. Pantosti, M. Petersen, L. Malagnini, and D. Perkins
posing the third set of Boncio et al. (2004a) as secondarystructures with uncertain activity.
The Geometry and Kinematics of Faultsin the Apennines
The fault strike, location, length, and SR/recurrence in-terval derived from surface investigations for the two mainactive fault sets are considered representative of the seismo-
genic sources at depth. The geometries and source param-eters used in this model are mainly derived from the synthe-sis provided by Galadini and Galli (2000) and Valensise andPantosti (2001) integrated with recent geologic mapping (seeTable 1) with subsurface information, seismology, and geod-esy (e.g., Barchi et al., 2000; Salvi et al., 2000; Lundgrenand Stramondo, 2002; Mirabella and Pucci, 2002; Pizzi et al.,2002). Starting from the surficial and subsurficial fault geo-
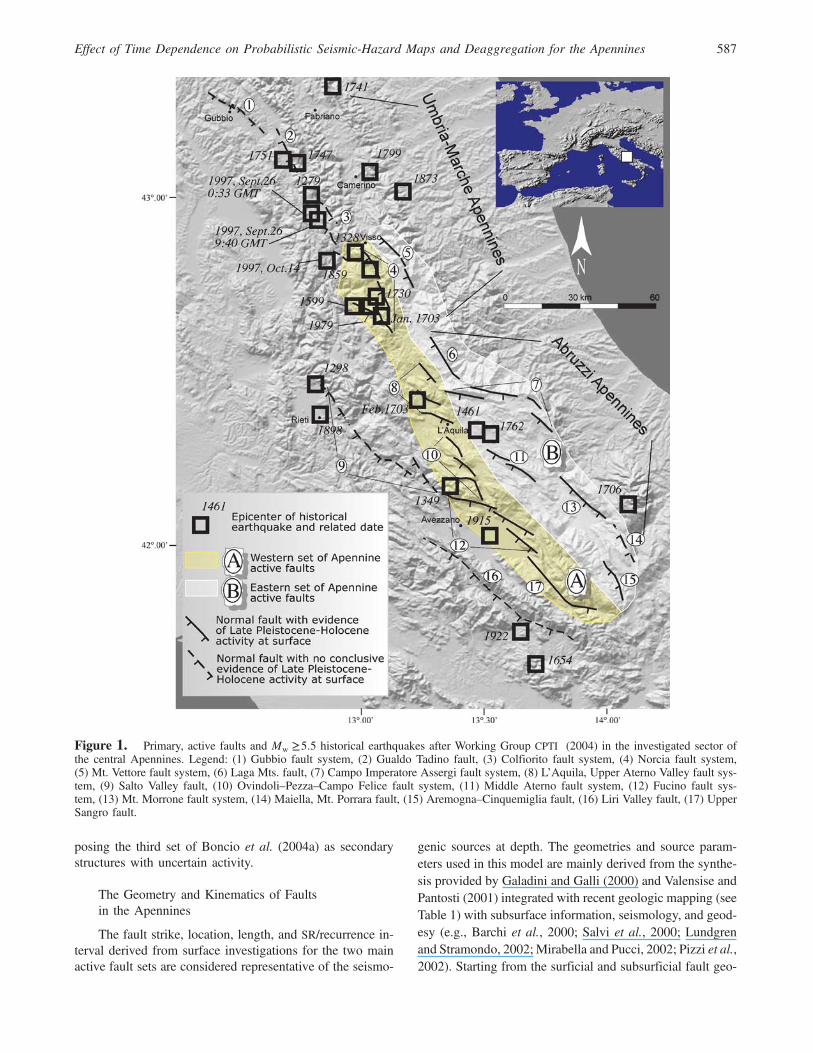
Figure 1. Primary, active faults and Mw ≥5:5 historical earthquakes after Working Group CPTI (2004) in the investigated sector ofthe central Apennines. Legend: (1) Gubbio fault system, (2) Gualdo Tadino fault, (3) Colfiorito fault system, (4) Norcia fault system,(5) Mt. Vettore fault system, (6) Laga Mts. fault, (7) Campo Imperatore Assergi fault system, (8) L’Aquila, Upper Aterno Valley fault sys-tem, (9) Salto Valley fault, (10) Ovindoli–Pezza–Campo Felice fault system, (11) Middle Aterno fault system, (12) Fucino fault sys-tem, (13) Mt. Morrone fault system, (14) Maiella, Mt. Porrara fault, (15) Aremogna–Cinquemiglia fault, (16) Liri Valley fault, (17) UpperSangro fault.
Effect of Time Dependence on Probabilistic Seismic-Hazard Maps and Deaggregation for the Apennines 587

metry derived from geological data, the source dimensions(Table 1) have been defined using the magnitude of the earth-quake associated with each fault (for the cases defined in Ta-ble 2). Therefore, source length and width are consistent withthe expected energy release.
Generally, SR have been geologically determined, thatis, by means of the displacement affecting dated quater-nary deposits and/or landforms or the displacement oflate Pleistocene–Holocene stratigraphic units observed intrenches excavated during paleoseismological investigations.
The Northern Sector
Although numerous studies were recently conductedin the study area (e.g., Barchi et al., 2000; Pucci et al.,2003), in the northern sector no conclusive evidence of latePleistocene–Holocene activity at the surface has been ob-tained. Moreover, no obvious evidence for recent faultingwas recognized in the area east of Gubbio (Fig. 1) eventhough this area experienced earthquakes withMw estimatedabout 6.0 (1741 and 1799; Fig. 1). In such cases, the sourceparameters for PSHA input (magnitude and source) were de-rived mainly from the damage distribution of the historicalearthquakes through the Boxer algorithm (Gasperini et al.,1999). This algorithm estimates magnitude by the macroseis-mic intensity reports and then estimates an axis by finding anorientation in which the near-field intensity appears to be
elongated. Then, given the magnitude and axis, the algorithmcan be used to create a box from which a magnitude can beestimated using length and width derived from empirical re-lations given by Wells and Coppersmith (1994).
Because of the lack of geological information to directlyderive the slip rate for some sources, we assume this can beconsidered similar to that of nearby sources for which the sliprate is available. For instance, the slip rate for the Colfioritofault system was defined by integrating 1997 coseismic geo-detic slip derived from geodetic and interferometric syntheticaperture radar (InSAR) modeling with historical information.In this case the coseismic slip is better known at depth that isan estimated 20–30 cm (Salvi et al., 2000; Lundgren andStramondo, 2002; De Martini et al., 2003) and can be trans-lated to 10–20 cm at the surface by using common elasticdislocation models. Assuming that the previous earthquakeon the same source occurred in 1279 (Galadini et al., 1999), amean-recurrence time of 700 yr is hypothesized. These es-timates yield a slip rate of ca. 0:15–0:28 mm=yr for the Col-fiorito source. For the sake of simplicity we adopt the meanvalue of 0:2 mm=yr.
On the hypothesis that the Gubbio fault system (Pucciet al., 2003) and Gualdo Tadino structures share a similartectonic setting and seismogenic behavior with the Colfioritosystem, we assumed that the slip rate of this latter sys-tem (0:2 mm=yr) is representative also for the Gubbio andGualdo structures. On the basis of displaced geomorphic fea-
Table 1Geometric Parameters of the Fault Segments in the Central Apennines
Number* Faults Slip Rates (mm=yr)† Width (km) Length (km) Mw Depth (km) Fault Dip (°)
1,2,3,4 Gubbio, G. Tadino, Colfiorito, Norcia (float fault) 0.20 15 139 5.9 8.0 �601 Gubbio 0.20 20 22 6.2 8.0 �402 Gualdo Tadino 0.20 15 16 6.3 13.0 �603 Colfiorito, Sellano 0.20 20 23 6.3 13.0 �404 Norcia 0.65 15 42 6.8 13.0 �405 Mt. Vettore 0.40 15 22 6.5 13.0 �606 Laga Mts. (Campotosto) 0.50 14 29 6.6 13.0 �657 Campo Imperatore Assergi 0.50 15 44 6.8 13.0 �658 L’Aquila 0.60 15 34 6.7 13.0 �609 Martani Mts. South, Salto– Velino Valleys (float fault) 0.10 14 47 6.0 13.0 �7010 Ovindoli–Pezza 0.65 15 23 6.5 13.0 �6011 Middle Aterno Valley 0.60 15 21 6.5 13.0 �6012 Fucino 0.65 17 56 7.0 13.0 �5013 Mt. Morrone 0.50 15 21 6.5 13.0 �6014 Maiella 0.60 15 28 6.6 13.0 �6015 Aremogna–Cinquemiglia 0.50 15 21 6.5 13.0 �6016 Liri Valley–Sora (float. fault) 0.20 15 62 6.2 13.0 �6017 Upper Sangro Valley 0.40 17 22 6.5 13.0 �5018 Poggio Picenze 0.60 13 11 6.0 13.0 �6019 Fabriano–Camerino (float fault) 0.10 15 51 5.9 13.0 �60
*Data from (1) Pucci et al. (2003). (2) Barchi et al. (2000). (3) Salvi et al. (2000); Lundgren and Stramondo (2002); Messina et al. (2002); Mirabellaand Pucci (2002); De Martini et al. (2003); Chiaraluce et al. (2005). (4) Blumetti (1995); Pizzi and Scisciani (2000); Galli et al. (2002). (5) Galadini andGalli (2003). (6) Galadini and Galli (2003); Boncio et al. (2004b). (7) Carraro and Giardino (1992); Giraudi and Frezzotti (1995); Galadini et al. (2003).(8) Galadini and Galli (2000); Moro et al. (2002). (9) Barchi et al. (2000). (10) Salvi and Nardi (1995); Pantosti et al. (1996); Salvi et al. (2003).(11) Galadini and Galli (2000). (12) Galadini and Galli (1999); Galadini and Messina (2001); Galli et al. (2002). (13) Cavinato and Miccadei (1995);Vittori et al. (1995); Gori et al. (2007). (14) Gasperini et al. (1999). (15) D'Addezio et al. (2001). (16) Barchi et al. (2000). (17) Galadini and Messina(1993); Galadini et al. (1998). (18) This article. (19) Barchi et al. (2000).
†Seismic behavior (SR, Mmax).
588 A. Akinci, F. Galadini, D. Pantosti, M. Petersen, L. Malagnini, and D. Perkins

tures, a minimum slip rate of 0:2 mm=yr was estimated alsofor the Norcia fault system (Blumetti, 1995) that is the sourceof historical Mw ≥6 earthquakes. On the basis of the systemlength, magnitude of last earthquake (1703, Mw 6.8), a sliprate of 0:65 mm=yr is proposed in the present work (4 inFig. 1 and Tables 1 and 2). Given the large uncertainty onthe seismic behavior of these structures, we also modeledthem as a floating rupture along the Gualdo, Gubbio, Col-fiorito, and Norcia faults. The slip rate applied to the floatingrupture was fixed at 0:2 mm=yr.
A slightly lower slip rate was attributed to the Fabriano–Camerino source (0:10 mm=yr, the minimum considered inthis study), which for the reasons given previously, is onlymodeled as a floating fault.
The Southern Sector
The amount of seismotectonic data increases signifi-cantly in the southern part of the target area. In this area most
of the faults composing the two parallel active fault sets(Fig. 1) were mapped and characterized using active tec-tonics, geomorphic, and paleoseismological investigationsinitiated by Bosi (1975) and further developed during thepast 30 yr (see Table 1 for references listed according tofault). For these faults we used the parameters directly ob-tained in these studies (see Table 1).
In fact, the available data indicate that in the southernsector none of the historical earthquakes that occurred duringapproximately the past 1000 yr can be associated with the sixseismogenic sources of the eastern fault set (i.e., numbers 5,6, 7, 11, 13, 15 in Fig. 1 and Tables 1 and 2) with only onefault of the western set (number 17 in Fig. 1 and Tables 1 and2). Thus, in such cases the elapsed time since the last earth-quake should exceed 1000 yr for any fault. On the basis ofpaleoseismological and archaeoseismological data, the av-erage recurrence times in the target area are inferred to belonger than 1000 years (e.g., Pantosti et al., 1996; Galadini
Table 2Time-Dependent Fault Segments with Their Rates and Probabilities for Poisson and Time-Dependent (BPT) and PSHA Models Together
with Their Elapsed Time Ratios* and Mean Recurrence Intervals†
Number Faults Previous Events Last EventsRecurrence Time,
T-bar Poisson Annual RateRenewal BPT, α � 0:5
50 yr probabilities T-lapse‡ Model
1,2,3,4 Gubbio, G. Tadino,Colfiorito, Norcia
1328, 1599,1730, 1747,1859, 1984,1997, 1979
1997 103 9:71 × 10�3 1:683 × 10�1 0.07 Float Fault
1 Gubbio - (§) 1348 7:42 × 10�4 7:36 × 10�2 1.12 Char. Model2 Gualdo Tadino 1751 1751 2215 4:51 × 10�4 1:52 × 10�6 0.10 Char. Model3 Colfiorito, Sellano 1279 1279 1160 8:62 × 10�4 5:84 × 10�2 0.62 Char. Model4 Norcia 1703 1703 1458 6:86 × 10�4 1:21 × 10�3 0.20 Char. Model5 Mt. Vettore - (§) 1627 6:15 × 10�4 5:69 × 10�2 0.92 Char. Model6 Laga Mts.
(Campotosto)- (§) 1442 6:93 × 10�4 6:75 × 10�2 1.04 Char. Model
7 Campo ImperatoreAssergi
- (§) 1789 5:59 × 10�4 4:895 × 10�2 0.84 Char. Model
8 L’Aquila 1703 1703 1369 7:30 × 10�4 2:04 × 10�3 0.22 Char. Model9 Martani Mts. South
Salto-VelinoValleys
1298, 1898 1898 573 1:75 × 10�3 4:29 × 10�3 0.18 Float Model
10 Ovindoli-Pezza (#) 1349(?) 941 1:06 × 10�3 8:0 × 10�2 0.70 Char. Model11 Middle Aterno Valley - (§) 1132 8:84 × 10�4 9:14 × 10�2 1.32 Char. Model12 Fucino (||) 1915 1910 5:24 × 10�4 4:9 × 10�14 0.04 Char. Model13 Mt. Morrone 125 125 1360 7:35 × 10�4 7:65 × 10�2 1.38 Char. Model14 Maiella 1706 1706 1160 8:62 × 10�4 5:73 × 10�3 0.47 Char. Model15 Aremogna-
Cinquemiglia- (§) 1381 7:24 × 10�4 7:18 × 10�2 1.09 Char. Model
16 Liri Valley–Sora 1654, 1922 1922 402 2:49 × 10�3 1:51 × 10�2 0.20 Float Fault17 Upper Sangro Valley - (§) 1429 7:0 × 10�4 6:84 × 10�2 1.05 Char. Model18 Poggio Picenze 1461, 1762 1762 405 3:53 × 10�3 1:62 × 10�1 0.60 Char. Model19 Fabrianese 1799, 1873,
17411873 343 2:92 × 10�3 1:06 × 10�1 0.38 Float Fault
*T-lapse/T-bar†T-bar‡Equals lapse time since the last earthquake§We assume activation on 500 A.D. for the Gubbio, Campo Imperatore Assergi, Mt. Vettore, Laga Mts. (Campotosto), Middle Aterno Valley, Mt. Morrone,
Sangro, and Aremogna–Cinquemiglia sources deriving from the mean of the time span 0–1000 A.D. (see Galadini and Galli, 2001, 2003; Galadiniet al., 2003).
||Paleoseismological earthquakes, 508–618 A.D., 1100–1600 B.C., 2200–3944 B.C., 400–5979 B.C., 5770–10,729 B.C., 10,053–10,729 B.C.#Paleoseismological earthquakes, 1300 A.D.–1690 B.C., 1420–5620 B.C., 5460–20,000 B.P.
Effect of Time Dependence on Probabilistic Seismic-Hazard Maps and Deaggregation for the Apennines 589
and Galli, 2000; D’Addezio et al., 2001; Galadini and Galli,2001). Because there is some evidence of large earthquakesfor a few of these sources in the preceding millennium, weassume the elapsed times for the sources to be on the order of1,000–2,000 yr. We set the occurrence of the last earthquakeon the sources that have not ruptured during the last 3,000 yrat 500 A.D., and we set the elapsed time at 1500 yr B.P. (Ta-ble 2). The choice of 500 A.D. is conventional; it is a fixeddate in order to emphasize these faults have not had an earth-quake in a long time. When we deal with periods preceding1000 A.D., knowledge on the historical earthquakes is sosparse that in many cases conventional dates have been at-tributed to the unknown events caused by well known seis-mogenic sources.
Conversely, for those faults that are less known we hadto infer parameters similarly to the methods used in thenorthern sector of the target area. These faults (i.e., the twolocated to the western part of this sector) are considered aspotentially responsible for earthquakes with Mw about 6 andare modeled as floating faults. A low slip rate (0:10 mm=yr,the minimum considered in this study) was assumed for theSalto-Rieti fault (number 9 in Fig. 1 and Tables 1 and 2),whereas a 0:20 mm=yr was inferred for the Liri Valley–Sorasource (number 16 in Fig. 1 and Tables 1 and 2).
Unresolved Issues and Adopted Choices
Two major unresolved issues are the association of his-torical damaging earthquakes with faults identified in thearea and the probable overestimation of some magnitudesestimated from historical data.
1706 Earthquake. The 1706 Mw 6.6 earthquake (Fig. 1) islocated in the southern part of the study. Different hypothesesare available for its association with identified faults (Melettiet al., 1988; Gasperini et al., 1999). Because the seismotec-tonic framework of the 1706 earthquake area is still unclear,in this work we adopt the magnitude and source size solutionderived from the Boxer program (Gasperini et al., 1999) andreported in Valensise and Pantosti (2001, number 14 in Fig. 1and Tables 1 and 2).
1654 Earthquake. The Sora area (southwest sector of thetarget area) was struck in 1654 by an Mw 6.2 earthquake(Fig. 1), but no conclusive data are available on the identi-fication of the responsible fault (e.g., Carrara et al., 1995).One possibility is that the earthquake magnitude has beenoverestimated and/or the event was produced by a blindsource. For this reason, we decided to include the 1654 earth-quake source in a floating rupture source. (number 16 inFig. 1 and Tables 1 and 2).
1461 and 1639 Earthquakes. Both the 1461 earthquakeand the 1639 earthquake sequences occurred near L’Aquila(see Fig. 1 for the location of the 1461 event, while the 1639earthquake epicenter [it is not in the map] was located about
30 km north of L’Aquila). Given the limited amount of his-torical information available and the fact these occurred asearthquake sequences, the revision of their CPTI (2004) mag-nitudes suggests that these are likely overestimates. For the1461 event, an Mw 6.5 is attributed by CPTI. However, be-cause it produced significant damage only in a small area ofthe Middle Aterno Valley and given the general tectonic set-ting of the area (Bosi and Bertini, 1970; Bertini and Bosi,1993), we forced the association of the 1461 earthquake seis-mogenic source to the northwest–southeast Poggio–Picenzestructure that is consistent with a Mw 6.0 earthquake (num-ber 18 in Fig. 1 and Tables 1 and 2).
Working Group CPTI (2004) attributes an Mw 6.3 to the1639 earthquake. However, this earthquake is also likely tobe a sequence of events (Camassi and Castelli, 2004). Thus,the CPTI (2004) magnitude is expected to be higher than thatof the separate earthquakes. In this case, we consider all ofthe earthquakes composing the 1639 sequence to be smallerthan Mw 5.9, and thus in our PSHA model, to belong to thebackground seismicity. Therefore, no individual source hasbeen imaged for these earthquakes.
1315 Earthquake. An Mw 6.0 earthquake is reported byWorking Group CPTI (2004) in 1315. However, the poorhistorical information available suggests that both the mag-nitude and location attributed to this event are too uncertainto associate this event to any defined seismogenic source.For this reason we do not include the 1315 event in ourfault model. Therefore, it also belongs to the backgroundseismicity.
PSHA Methodology and Models
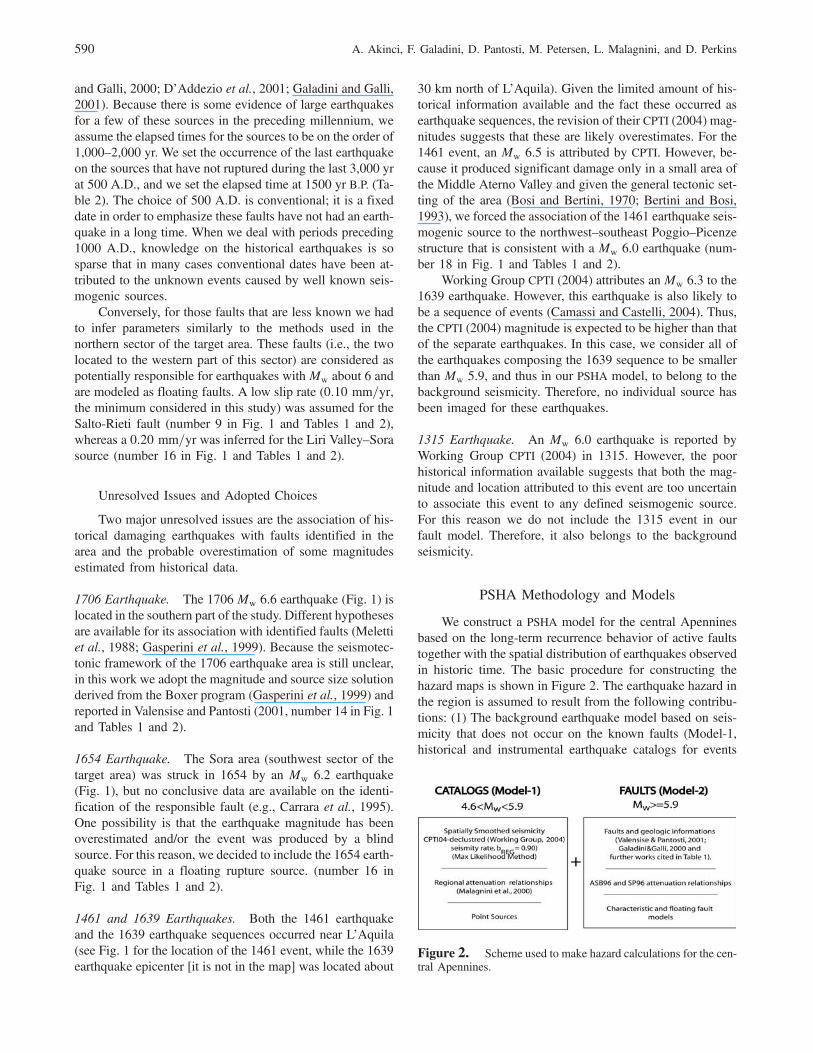
We construct a PSHA model for the central Apenninesbased on the long-term recurrence behavior of active faultstogether with the spatial distribution of earthquakes observedin historic time. The basic procedure for constructing thehazard maps is shown in Figure 2. The earthquake hazard inthe region is assumed to result from the following contribu-tions: (1) The background earthquake model based on seis-micity that does not occur on the known faults (Model-1,historical and instrumental earthquake catalogs for events
Figure 2. Scheme used to make hazard calculations for the cen-tral Apennines.
590 A. Akinci, F. Galadini, D. Pantosti, M. Petersen, L. Malagnini, and D. Perkins
4:6 ≤ Mw <5:9� and (2) The geologic data from individualfault segments for large earthquakes Mw ≥5:9 (Model-2).
Model-1: Historical Catalogs/Background Seismicity
In the background earthquake model spatially smoothedseismicity (Frankel, 1995; Frankel et al., 1996) accountsfor random earthquakes on unknown faults or on knownfaults for magnitudes below Mw 5.9. In its purest form, thesmoothed-seismicity method simply assumes that patterns ofhistorical earthquakes predict future activity, but it can easilybe supplemented by tectonic or geodetically based zones orother model elements if there is reason to suspect that seis-micity catalogs are insufficient.
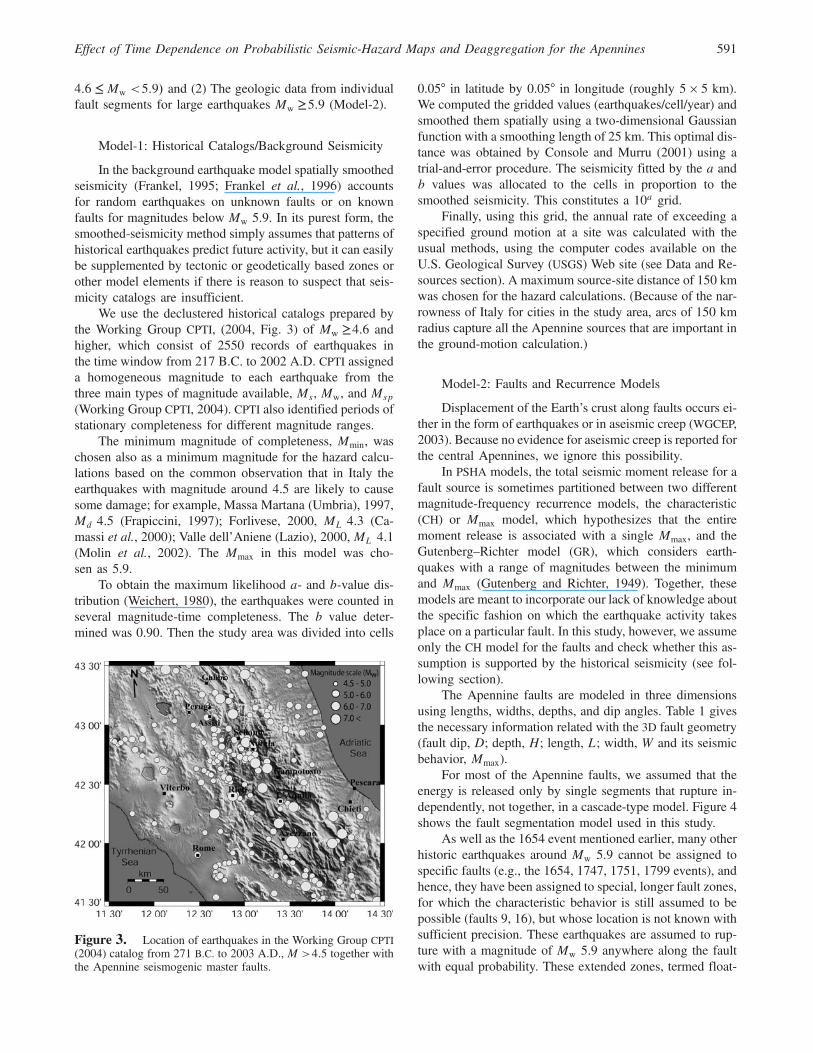
We use the declustered historical catalogs prepared bythe Working Group CPTI, (2004, Fig. 3) of Mw ≥4:6 andhigher, which consist of 2550 records of earthquakes inthe time window from 217 B.C. to 2002 A.D. CPTI assigneda homogeneous magnitude to each earthquake from thethree main types of magnitude available, Ms, Mw, and Msp
(Working Group CPTI, 2004). CPTI also identified periods ofstationary completeness for different magnitude ranges.
The minimum magnitude of completeness, Mmin, waschosen also as a minimum magnitude for the hazard calcu-lations based on the common observation that in Italy theearthquakes with magnitude around 4.5 are likely to causesome damage; for example, Massa Martana (Umbria), 1997,Md 4:5 (Frapiccini, 1997); Forlivese, 2000, ML 4:3 (Ca-massi et al., 2000); Valle dell’Aniene (Lazio), 2000, ML 4:1(Molin et al., 2002). The Mmax in this model was cho-sen as 5.9.
To obtain the maximum likelihood a- and b-value dis-tribution (Weichert, 1980), the earthquakes were counted inseveral magnitude-time completeness. The b value deter-mined was 0.90. Then the study area was divided into cells
0.05° in latitude by 0.05° in longitude (roughly 5 × 5 km).We computed the gridded values (earthquakes/cell/year) andsmoothed them spatially using a two-dimensional Gaussianfunction with a smoothing length of 25 km. This optimal dis-tance was obtained by Console and Murru (2001) using atrial-and-error procedure. The seismicity fitted by the a andb values was allocated to the cells in proportion to thesmoothed seismicity. This constitutes a 10a grid.
Finally, using this grid, the annual rate of exceeding aspecified ground motion at a site was calculated with theusual methods, using the computer codes available on theU.S. Geological Survey (USGS) Web site (see Data and Re-sources section). A maximum source-site distance of 150 kmwas chosen for the hazard calculations. (Because of the nar-rowness of Italy for cities in the study area, arcs of 150 kmradius capture all the Apennine sources that are important inthe ground-motion calculation.)
Model-2: Faults and Recurrence Models
Displacement of the Earth’s crust along faults occurs ei-ther in the form of earthquakes or in aseismic creep (WGCEP,2003). Because no evidence for aseismic creep is reported forthe central Apennines, we ignore this possibility.
In PSHA models, the total seismic moment release for afault source is sometimes partitioned between two differentmagnitude-frequency recurrence models, the characteristic(CH) or Mmax model, which hypothesizes that the entiremoment release is associated with a single Mmax, and theGutenberg–Richter model (GR), which considers earth-quakes with a range of magnitudes between the minimumand Mmax (Gutenberg and Richter, 1949). Together, thesemodels are meant to incorporate our lack of knowledge aboutthe specific fashion on which the earthquake activity takesplace on a particular fault. In this study, however, we assumeonly the CH model for the faults and check whether this as-sumption is supported by the historical seismicity (see fol-lowing section).
The Apennine faults are modeled in three dimensionsusing lengths, widths, depths, and dip angles. Table 1 givesthe necessary information related with the 3D fault geometry(fault dip, D; depth, H; length, L; width, W and its seismicbehavior, Mmax).
For most of the Apennine faults, we assumed that theenergy is released only by single segments that rupture in-dependently, not together, in a cascade-type model. Figure 4shows the fault segmentation model used in this study.
As well as the 1654 event mentioned earlier, many otherhistoric earthquakes around Mw 5.9 cannot be assigned tospecific faults (e.g., the 1654, 1747, 1751, 1799 events), andhence, they have been assigned to special, longer fault zones,for which the characteristic behavior is still assumed to bepossible (faults 9, 16), but whose location is not known withsufficient precision. These earthquakes are assumed to rup-ture with a magnitude of Mw 5.9 anywhere along the faultwith equal probability. These extended zones, termed float-
Figure 3. Location of earthquakes in the Working Group CPTI(2004) catalog from 271 B.C. to 2003 A.D., M >4:5 together withthe Apennine seismogenic master faults.
Effect of Time Dependence on Probabilistic Seismic-Hazard Maps and Deaggregation for the Apennines 591
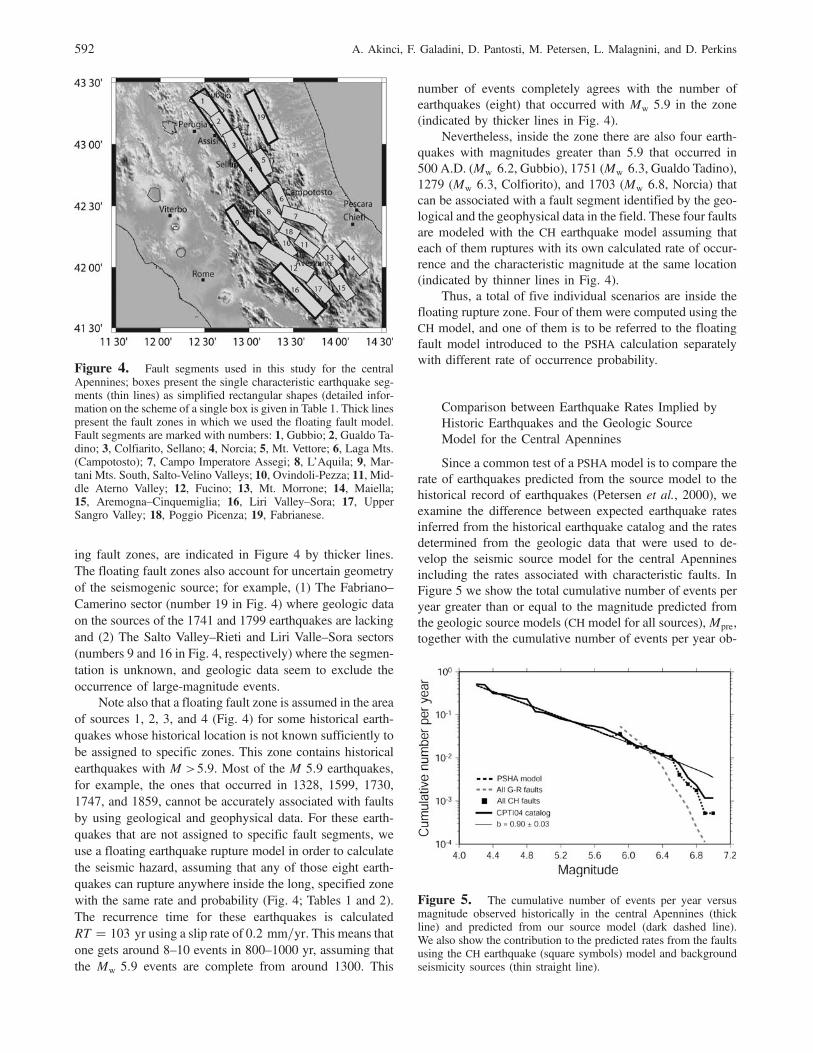
ing fault zones, are indicated in Figure 4 by thicker lines.The floating fault zones also account for uncertain geometryof the seismogenic source; for example, (1) The Fabriano–Camerino sector (number 19 in Fig. 4) where geologic dataon the sources of the 1741 and 1799 earthquakes are lackingand (2) The Salto Valley–Rieti and Liri Valle–Sora sectors(numbers 9 and 16 in Fig. 4, respectively) where the segmen-tation is unknown, and geologic data seem to exclude theoccurrence of large-magnitude events.
Note also that a floating fault zone is assumed in the areaof sources 1, 2, 3, and 4 (Fig. 4) for some historical earth-quakes whose historical location is not known sufficiently tobe assigned to specific zones. This zone contains historicalearthquakes with M >5:9. Most of the M 5:9 earthquakes,for example, the ones that occurred in 1328, 1599, 1730,1747, and 1859, cannot be accurately associated with faultsby using geological and geophysical data. For these earth-quakes that are not assigned to specific fault segments, weuse a floating earthquake rupture model in order to calculatethe seismic hazard, assuming that any of those eight earth-quakes can rupture anywhere inside the long, specified zonewith the same rate and probability (Fig. 4; Tables 1 and 2).The recurrence time for these earthquakes is calculatedRT � 103 yr using a slip rate of 0:2 mm=yr. This means thatone gets around 8–10 events in 800–1000 yr, assuming thatthe Mw 5:9 events are complete from around 1300. This
number of events completely agrees with the number ofearthquakes (eight) that occurred with Mw 5:9 in the zone(indicated by thicker lines in Fig. 4).
Nevertheless, inside the zone there are also four earth-quakes with magnitudes greater than 5.9 that occurred in500 A.D. (Mw 6:2, Gubbio), 1751 (Mw 6:3, Gualdo Tadino),1279 (Mw 6:3, Colfiorito), and 1703 (Mw 6:8, Norcia) thatcan be associated with a fault segment identified by the geo-logical and the geophysical data in the field. These four faultsare modeled with the CH earthquake model assuming thateach of them ruptures with its own calculated rate of occur-rence and the characteristic magnitude at the same location(indicated by thinner lines in Fig. 4).
Thus, a total of five individual scenarios are inside thefloating rupture zone. Four of them were computed using theCH model, and one of them is to be referred to the floatingfault model introduced to the PSHA calculation separatelywith different rate of occurrence probability.
Comparison between Earthquake Rates Implied byHistoric Earthquakes and the Geologic SourceModel for the Central Apennines
Since a common test of a PSHA model is to compare therate of earthquakes predicted from the source model to thehistorical record of earthquakes (Petersen et al., 2000), weexamine the difference between expected earthquake ratesinferred from the historical earthquake catalog and the ratesdetermined from the geologic data that were used to de-velop the seismic source model for the central Apenninesincluding the rates associated with characteristic faults. InFigure 5 we show the total cumulative number of events peryear greater than or equal to the magnitude predicted fromthe geologic source models (CH model for all sources),Mpre,together with the cumulative number of events per year ob-
Figure 4. Fault segments used in this study for the centralApennines; boxes present the single characteristic earthquake seg-ments (thin lines) as simplified rectangular shapes (detailed infor-mation on the scheme of a single box is given in Table 1. Thick linespresent the fault zones in which we used the floating fault model.Fault segments are marked with numbers: 1, Gubbio; 2, Gualdo Ta-dino; 3, Colfiarito, Sellano; 4, Norcia; 5, Mt. Vettore; 6, Laga Mts.(Campotosto); 7, Campo Imperatore Assegi; 8, L’Aquila; 9, Mar-tani Mts. South, Salto-Velino Valleys; 10, Ovindoli-Pezza; 11, Mid-dle Aterno Valley; 12, Fucino; 13, Mt. Morrone; 14, Maiella;15, Aremogna–Cinquemiglia; 16, Liri Valley–Sora; 17, UpperSangro Valley; 18, Poggio Picenza; 19, Fabrianese.
Figure 5. The cumulative number of events per year versusmagnitude observed historically in the central Apennines (thickline) and predicted from our source model (dark dashed line).We also show the contribution to the predicted rates from the faultsusing the CH earthquake (square symbols) model and backgroundseismicity sources (thin straight line).
592 A. Akinci, F. Galadini, D. Pantosti, M. Petersen, L. Malagnini, and D. Perkins
served historically from the seismicity catalog, CPTI, and thefinal PSHA model for the central Apennines.
The Working Group CPTI (2004) catalog tends to followa typical GR distribution, suggesting that the catalogs arecomplete for most of the range of magnitudes of interest.The thin straight line in Figure 5 indicates a GR model witha b value of 0.90. Note that our PSHA model rates and thehistorical seismicity rates are very similar for magnitudes be-low Mw 5.9 because one is derived from the other. Betweenmagnitudes Mw 5.9 and Mw 6.5, faults treated as character-istic fit the historic curve better than faults treated as GR.For greater magnitudes, both the historic rate and the faultrates drop below the straight line given by the b value, theCH model giving the better fit.
Ground-Motion Prediction Equations
Ground-motion prediction equations (GMPEs) havebeen developed by Ambraseys et al. (1996) for the Medi-terranean regions and by Sabetta and Pugliese (1996) forItaly through regressions of strong-motion data. Also, aset of empirical relationships is available for different geo-graphical regions of Italy. These relationships were derivedfrom the regional seismicity (weak- and strong-motion data-bases) containing thousands of waveforms recorded in areaswith homogeneous attenuation characteristics (Malagniniand Herrman, 2000; Malagnini et al., 2000, 2002; Bragatoand Slejko, 2005; Morasca et al., 2006). The new predic-tive ground-motion relationships recently developed byMalagnini et al. (2000) for the Apennines have been intro-duced into the hazard calculations together with the onesderived by Ambraseys et al. (1996) and Sabetta and Pug-liese (1996).
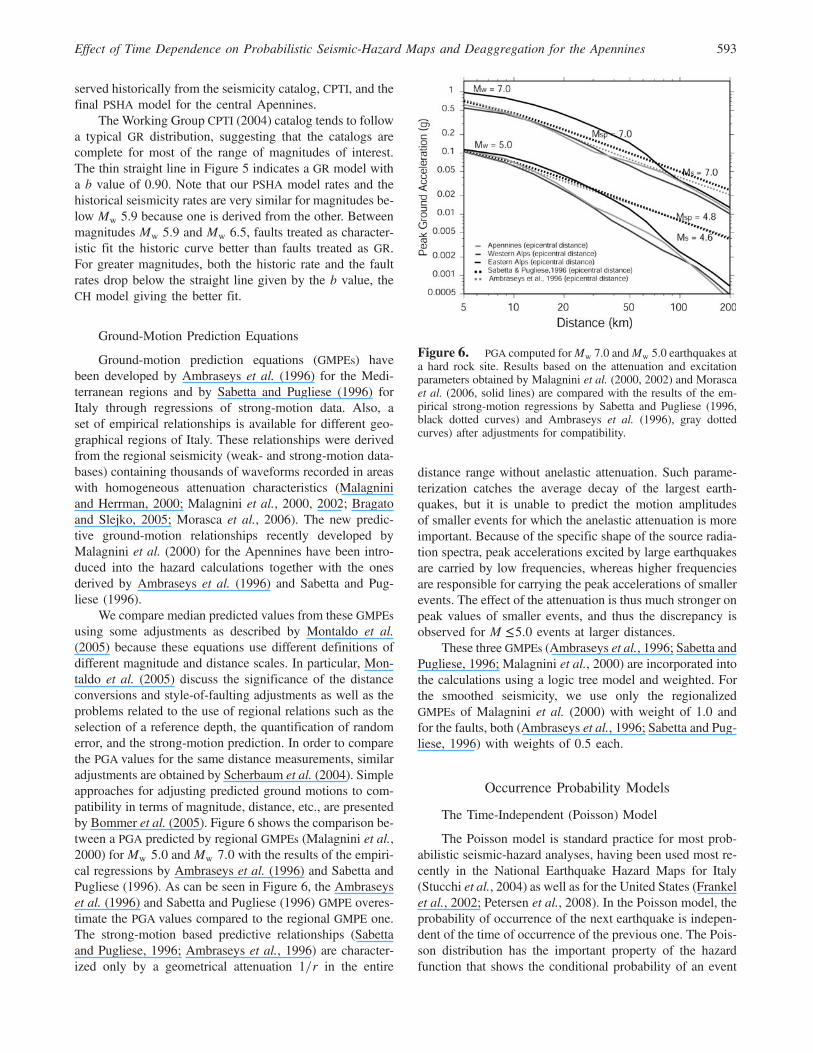
We compare median predicted values from these GMPEsusing some adjustments as described by Montaldo et al.(2005) because these equations use different definitions ofdifferent magnitude and distance scales. In particular, Mon-taldo et al. (2005) discuss the significance of the distanceconversions and style-of-faulting adjustments as well as theproblems related to the use of regional relations such as theselection of a reference depth, the quantification of randomerror, and the strong-motion prediction. In order to comparethe PGA values for the same distance measurements, similaradjustments are obtained by Scherbaum et al. (2004). Simpleapproaches for adjusting predicted ground motions to com-patibility in terms of magnitude, distance, etc., are presentedby Bommer et al. (2005). Figure 6 shows the comparison be-tween a PGA predicted by regional GMPEs (Malagnini et al.,2000) for Mw 5:0 and Mw 7:0 with the results of the empiri-cal regressions by Ambraseys et al. (1996) and Sabetta andPugliese (1996). As can be seen in Figure 6, the Ambraseyset al. (1996) and Sabetta and Pugliese (1996) GMPE overes-timate the PGA values compared to the regional GMPE one.The strong-motion based predictive relationships (Sabettaand Pugliese, 1996; Ambraseys et al., 1996) are character-ized only by a geometrical attenuation 1=r in the entire
distance range without anelastic attenuation. Such parame-terization catches the average decay of the largest earth-quakes, but it is unable to predict the motion amplitudesof smaller events for which the anelastic attenuation is moreimportant. Because of the specific shape of the source radia-tion spectra, peak accelerations excited by large earthquakesare carried by low frequencies, whereas higher frequenciesare responsible for carrying the peak accelerations of smallerevents. The effect of the attenuation is thus much stronger onpeak values of smaller events, and thus the discrepancy isobserved for M ≤5:0 events at larger distances.
These three GMPEs (Ambraseys et al., 1996; Sabetta andPugliese, 1996; Malagnini et al., 2000) are incorporated intothe calculations using a logic tree model and weighted. Forthe smoothed seismicity, we use only the regionalizedGMPEs of Malagnini et al. (2000) with weight of 1.0 andfor the faults, both (Ambraseys et al., 1996; Sabetta and Pug-liese, 1996) with weights of 0.5 each.
Occurrence Probability Models
The Time-Independent (Poisson) Model
The Poisson model is standard practice for most prob-abilistic seismic-hazard analyses, having been used most re-cently in the National Earthquake Hazard Maps for Italy(Stucchi et al., 2004) as well as for the United States (Frankelet al., 2002; Petersen et al., 2008). In the Poisson model, theprobability of occurrence of the next earthquake is indepen-dent of the time of occurrence of the previous one. The Pois-son distribution has the important property of the hazardfunction that shows the conditional probability of an event
Figure 6. PGA computed forMw 7.0 andMw 5.0 earthquakes ata hard rock site. Results based on the attenuation and excitationparameters obtained by Malagnini et al. (2000, 2002) and Morascaet al. (2006, solid lines) are compared with the results of the em-pirical strong-motion regressions by Sabetta and Pugliese (1996,black dotted curves) and Ambraseys et al. (1996), gray dottedcurves) after adjustments for compatibility.
Effect of Time Dependence on Probabilistic Seismic-Hazard Maps and Deaggregation for the Apennines 593
occurring, given that some interval has elapsed since the lasteven, is constant. Thus, it has no memory of the time of themost recent event. This assumption is reasonable when thehazard may depend on a number of different and independentsources. For sites near dominating faults, this assumption isquestionable: an earthquake is not just as likely to occur on afault segment one day after the most recent event as it is tooccur on a day 200 yr later.
Time-Dependent (Renewal) Model
In contrast to the Poisson model, a time-dependent re-newal process model is based on the assumption that afterone earthquake on a fault segment, another earthquake onthat segment is unlikely until sufficient time has elapsedto build sufficient stress for another rupture (Lindh, 1983;Sykes and Nishenko, 1984; Nishenko and Buland, 1987;Ellsworth, 1995; Ogata, 1999). Various statistical modelshave been proposed for the computation of the probabilitydensity function for earthquake recurrence, such as Gauss-ian, log-normal, Weibull, Gamma, and Brownian. In thisstudy we use the BPT probability model that is based ona simple physical model of the earthquake cycle. In theBPT model, the failure condition of the fault is describedby a state variable that rises from a ground state to the failurestate during the earthquake cycle (Kagan and Knopoff, 1987;Ellsworth et al., 1999; Matthews et al., 2002). This modelyields values that are very similar to the other time-dependentmodels except at elapsed times greater than the average re-currence interval.
The BPT model requires a minimum of two parametersas well as knowledge of the time of the most recent rupture.One parameter is the mean-recurrence interval, μ, and theother describes the variability of recurrence intervals andcan be related to the variance of the distribution. This varia-bility of recurrence intervals is described as the aperiodicity,α, which is related to the mean divided by the standarddeviation.
The probability density for the BPT model is given by
fBPT�t� ��������������������������μ=2πα2t3�
qexp���t � μ�2=2α2μt�;
where t is time. The behavior of a BPT model dependsstrongly on the value of α. For smaller values of α,fBPT�t� is more periodic, is strongly peaked, and remainsclose to zero longer. For larger values, the time in whichthe earthquake is very unlikely, the delay or dead time, be-comes shorter, and fBPT�t� becomes increasingly Poisson-like. The hazard function increases with decreasing valuesof α and becomes Poissonlike with increasing values thatapproach 1.0.
For the renewal model, the conditional probabilitiesfor each fault are calculated. These probabilities are saidto be conditional because they change as function of the timeelapsed since the last earthquake. The 50 yr conditional prob-abilities, thus calculated, are converted to effective Pois-
sonian annual probabilities by the use of following expres-sion: Reff � � ln�1 � Pcond�=T.
Aperiodicity Parameter
In the present study, we calculated aperiodicity pa-rameter, α, from four sequences of repeating earthquakesin the central Apennines using an approach given by Savage(1991). In order to do so, we have to have enough intereventtimes to calculate a robust estimate of α. Ellsworth et al.(1999) has shown that sequences of only two or three inter-vals between events will be of little use for estimation of α.By restricting the sequences to those that have at least threeand four closed intervals (i.e., five events), we found onlythree sequences out of all available in the Apennines suitablefor analysis. The α values are around 0.22 for the Fucino andthe Irpinia faults and around 0.50 for the Ovindoli–Pezzafault. Although the Iprinia fault is not listed in Tables 1and 2 and not shown in Figure 1, it locates just in the south-ern part of the studied area. Because it has similar faultingfeatures to the Fucino fault and has more than five datedpaleoseismologic events from data observed in trenchingstudies (Pantosti et al., 1993), we also used the Irpinia earth-quake sequence to determine the aperodicity parameter.
Of course, these values are very uncertain, having beencalculated from small samples, but their values serve to showthe comparison with values found elsewhere. Ellsworth et al.(1999) found from statistical tests that (1) The limited world-wide earthquake recurrence interval data have a model shapefactor (α value) of 0:46� 0:32, (2) The 35 recurrence inter-val sequences examined are compatible with a shape factorof 0.5, and (3) The 35 earthquake sequences had no system-atic differences when grouped by tectonic style. Because wedo not have experimental data of repeated earthquakes on theindividual faults, and/or actual data on which to estimateaperiodicity in the central Apennines are sparse, we usedthe average value of α, 0.5, as a central value for the restof the faults in the study region, and for a sensitivity studywe also used this value with plus or minus 0.2, that is, 0.7,0.5, and 0.3.
An illustration of how the α value affects time-dependent results is given in Figure 7 for the Aremogna–Cinquemiglia fault. For a time-dependent calculation, wepresent the time since the last earthquake as ratio of thattime divided by the mean-recurrence interval of the earth-quake (elapsed time ratio). For example, the current timeis presented by time since the last earthquake over mean-recurrence time of the earth �1506 yr=1381 yr� � 1:09 forthis fault. Generally, the conditional probability for α equalto 0.5 and 0.7 is closer to the fixed Poisson probability thanthe conditional probability for a α of 0.3. Also the condi-tional probability for a α equal to 0.7 and 0.5 rises abovethe Poisson probability level earlier in the recurrence cyclethan the conditional probability for a α of 0.3. In general, thesmaller the α, the nearer the rise in hazard above the Poissonlevel that the average recurrence time occurs.
594 A. Akinci, F. Galadini, D. Pantosti, M. Petersen, L. Malagnini, and D. Perkins

In Table 2, we give the recurrence rates at each fault cal-culated using both the Poisson and BPT recurrence model.Seven of the 20 faults in Table 2 do not have the elapsedtime, and the last earthquakes on these faults are assumedto have occurred in 500 A.D. (see Active Faults/SeismogenicSources in the Central Apennines section). For these sevenfaults the elapsed times exceed the average calculated recur-rence interval, and at the lowest α values, time-dependentprobabilities are still sensitive to the elapsed time.
Hazard Computation
For earthquakes having magnitudes less than Mw 5.9,the source model is that of the smoothed seismicity. Forearthquakes having magnitudesMw 5.9 or greater, the sourcemodel is that of the characteristic faults. The computer codesused to make the hazard maps are taken from the Web site ofthe USGS (see the Data and Resources section). The meth-odology used follows that used by the USGS in the prepara-tion of the U.S. national hazard maps. The codes used for thedeaggregation calculation are taken from S. Harmsen (per-sonal comm.) and modified for use in Italy.
Results
The Role of the Faults and theBackground Seismicity
Figures 8a and b show, respectively, the hazard maps ofmean PGA having 10% probability of exceedence in 50 yr onrock from Model-1 only, the background seismicity, andModel-2 only, the individual fault models. The map obtainedusing both models is shown in Figure 9d. The backgroundseismicity contributes significantly to the hazard in the cen-ter of the study area and in some cases even dominates the
contribution of the sources as we shall demonstrate in thedeaggregations.
The Effect of Aperiodicity Parameteron the Hazard Maps
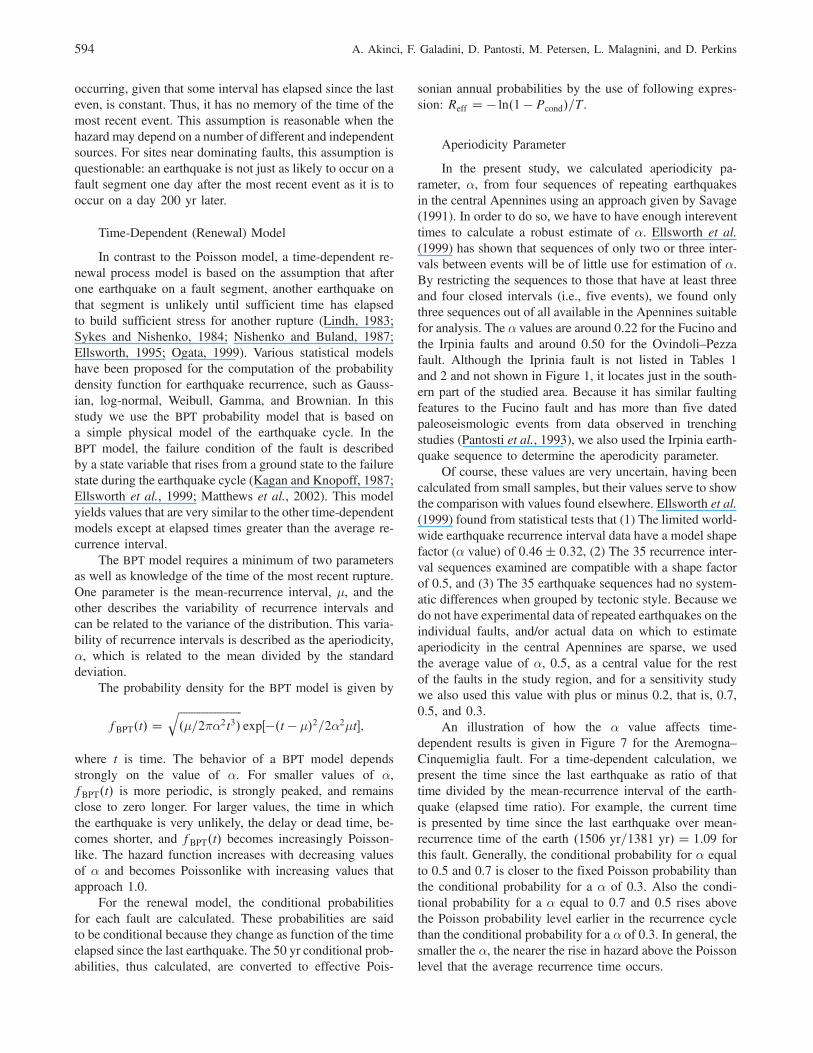
The results obtained for 10% probabilities of exceed-ence in 50 yr for PGA for the BPT (α � 0:3, 0.5, and 0.7)and Poisson models are presented in Figure 9a–d. The dif-ferences between Poisson and BPT hazard are striking. In thePoisson model the hazard is not sensitive to the recency ofrupture on the faults. Generally, but not always, time depen-dence raises the probabilities except for those faults that havehad earthquakes recently (e.g., the Fuciuno, 1915). For ex-ample, the maps for PGA show high probabilistic accelera-tions in the Sellano and Norcia areas, around 0.32 g for thePoisson model, while the ground motions are lower, around0.28 g for BPT model (α � 0:5) since the elapsed time fromthe last earthquake for floating fault 1 was short (7 yr after1997; see Table 2 and Fig. 9b). On the other hand, somesource faults for high BPT conditional probabilities producethe most hazardous sites (for example, numbers 11, 13, 15,and 17 of Table 2 and Fig. 4). For example PGA is ∼0:32 garound the city of L’Aquila for the time-independent model,while it increases nearly 60%–80%, up to 0.55 g, in the same
Figure 7. Graph showing 50 yr probability of the Aremogna–Cinquemiglia fault/earthquake occurrence as a function of elapsedtime ratio. Curves are for Poisson model and BPT model withindicated α values. The x-axis presents lapse time since the lastcharacteristic earthquake (T-lapse � 1506) as a ratio of the mean-recurrence interval (T-bar � 1381). The arrow indicates the 2006lapse time for this segment.
Figure 8. Maps of probabilistic PGA having 10% probability ofexceedance in 50 yr for Poisson model derived from (a) griddedseismicity and (b) faults only.
Effect of Time Dependence on Probabilistic Seismic-Hazard Maps and Deaggregation for the Apennines 595
site close to fault 11 for the time-dependent case (α � 0:3)and becomes the most hazardous city in the study area.
From Figure 6 and Table 2, it is possible to estimate theeffect of α on the hazard. In general, if the elapsed time isonly a small fraction of the average recurrence time, the con-tribution of the fault to the hazard map will be small. Also, ifthe elapsed time is near or greater than the average recurrencetime, the contribution of the fault to the hazard will increasewith decreasing α. At values of elapsed time near 60% of theaverage recurrence time, the probability of earthquake occur-rence can first increase and then decrease with decreasing α.When the steady contribution of the background seismicity isadded into the model, great complexity is possible for theeffect of decreasing α on the map values.
Just looking at sites near the center of each fault in Fig-ure 9a–d, we have seen all of the following behaviors withdecreasing α and suggest their likely causes in the follow-ing list.
1. Hazard increases continuously: one fault having elapsedtime greater than the average recurrence interval domi-nates at the site.
2. Hazard decreases and then levels off: the domination of afault having elapsed time shorter than average recurrence
interval decreases to the point where the background seis-micity dominates.
3. Hazard maintains a steady level: background seismicityalways dominates.
4. Hazard stays level and then increases: background seis-micity loses domination to a fault with elapsed timelonger than the average recurrence interval.
5. Hazard stays level and then decreases: a fault havingelapsed time shorter than average recurrence interval.
6. Hazard decreases and then increases: initially a fault hav-ing recurrence time shorter than the average recurrenceinterval dominates but then loses domination to anotherfault having elapsed time longer than average recurrenceinterval.
7. Hazard increases and then decreases: a dominating faulthas elapsed time near 0.6 times the average recurrencetime, a value where the probability of occurrence in-creases and then decreases as α goes from 0.7 to 0.5to 0.3.
Overall, the PSHA results that are based on the time-dependent model display the effects of the recency of faultrupture by drastically reduced hazard levels in the northernsector and by somewhat elevated hazard levels in the south-ern sector.
Figure 9. Maps of probabilistic PGA having 10% probability of exceedence in 50 years, derived from both gridded seismicity and faultsBPT renewal model using the (a) α � 0:3, (b) 0.5, (c) 0.7, and for (d) Poisson model.
596 A. Akinci, F. Galadini, D. Pantosti, M. Petersen, L. Malagnini, and D. Perkins

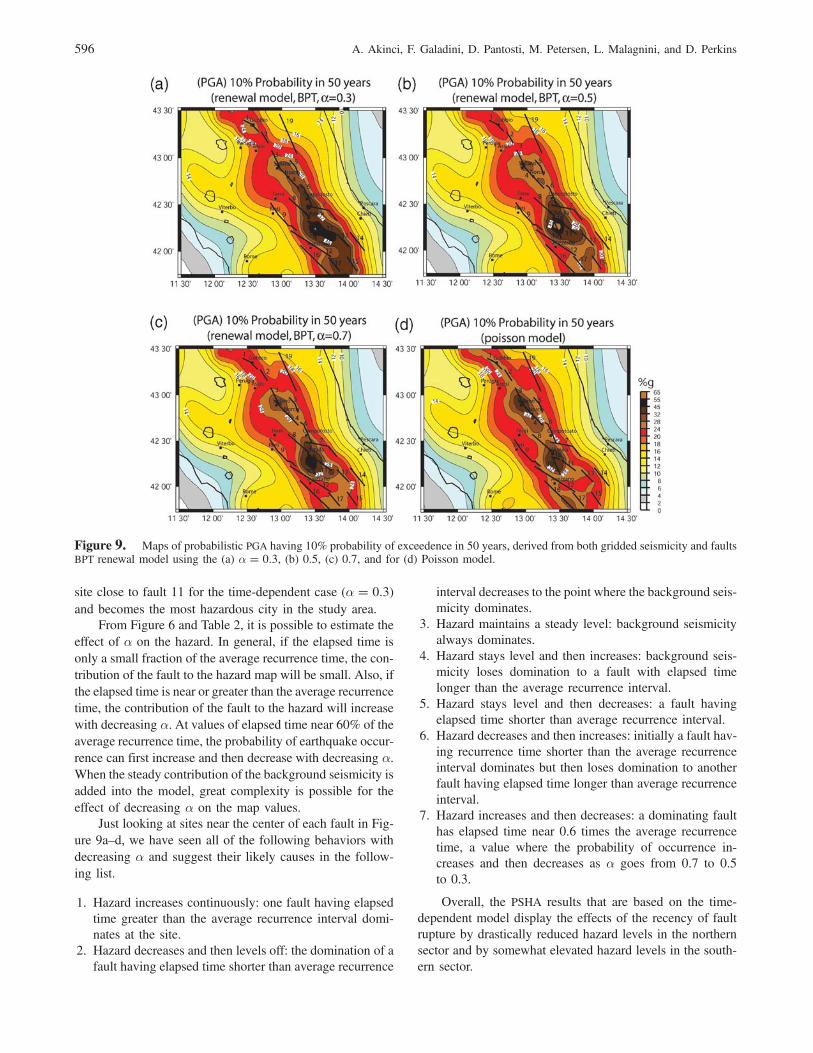
Figure 10a–f shows the ratios (time-dependent overPoisson) for PGA and SA1 hazard level of 10% exceedancein 50 yr where differences exceed 0.05 g using three sep-arate α parameters 0.3, 0.5, and 0.7. Notice that α parameterhas large influence on the results in each figure.
PGA estimates mostly increase with decreasing α at thesoutheastern part of the studied area including faults 7, 10,11, 13, 15, 17, and 18, which have long lapse time that is wellpast average recurrence time (elapsed time ratio ∼1:0). It de-creases along the central belt of the Apennines where thefaults have shorter lapse time of compared to its average re-currence time (fault 2, 4, 9, 12, and 16, elapsed time ratio∼0:0–0:2). In general, the choice of the α parameter createssmall areas where the change is greater than 10% whenα � 0:5 and 0.7, and large areas where change is greater than10% when α � 0:3 (Fig. 10a–f). An α of 0.5 and 0.7 showchanges less than 20%–25% in Figure 10b,c and 10e,f.Changes in the time-dependent maps both for PGA andSA1 reach up to 60%–80% compared to time independentfor α � 0:3 depending on the recency of the last event onthe fault that dominates at some sites (Figures 10a and d).From those figures, it is difficult to follow the details ofthe behavior of each fault as a function of elapsed time thatmay be observed in the deaggreation analysis (see follow-ing section).
Deaggregations
The process of deaggregation is that of the separation ofmagnitude and distance combinations that contribute to theexceedances of the map ground motion at a particular site.Deaggregation allows us to understand the magnitudes anddistances that contribute the most to the hazard at a specificsite and may help to select the design earthquake for suchsite. This information is often useful for engineering andplanning purposes (McGuire, 1995).
Deaggregation for Rome and L’Aquila. We first deaggre-gated the seismic hazard for PGA and SA1 at two sites inimportant urban areas, Rome and L’Aquila (Figs. 11a–d and12a–d). In this study, we used the geographic deaggregationmethod that separates the contributions into bins of location,magnitude, and ground-motion uncertainty (Bazzurro andCornell, 1999). We used equal area location bins with con-stant incremental radius and variable azimuthal angle (seeData and Resources section). In Figure 11a–d, 12a–d, andthe following map views of deaggregated hazard, we showthe geographic variation of hazard contribution both in termsof percent of the ground-motion exceedances (bar height)and average magnitude for the sources producing those ex-ceedances in that bin (bar color).
For the city of L’Aquila, one or two magnitude locationbins contribute over 50% of the ground-motion exceedancesrepresenting a single controlling source. Thus, the probabi-listic hazard of L’Aquila is controlled by large earthquakes
on faults located along the axis of the tectonic belt, and theL’Aquila fault contributes most to the PGA hazard.
For PGA with the Poisson model (Fig. 11a), faults 8(R ∼ 0:1 km), 10, and 18 (R ∼ 5 km) contribute equallyabout 20%–30 % of the ground-motion exceedances. Withthe BPT model (Fig 11b) for α � 0:5, the probabilisticground motion at L’Aquila increases from 0.36 (Poisson)to 0.42g (time-dependent). The contribution from fault 8 de-creases from 28% to 1% because the elapsed time is muchsmaller (elapsed time ratio � 0:22; see Table 2 and Fig. 7).
For SA1 with the Poisson model and the BPT model, thebehavior is essentially the same as for PGA.
In contrast to L’Aquila, for the city of Rome there is nosingle source that clearly dominates the seismic hazard. Bothin the Poisson and BPT model for PGA, background seismic-ity contributes around 95% to the exceedance of the mappedground motion (Figs. 12a and b).
For SA1 the hazard contribution from distant faults 7,10, and 12 (R ∼ 70–90 km) becomes important, and the con-tribution from the background seismicity decreases almost50% (Figs. 12c and d).
Paleoseismic evidence and seismic history suggest thatthe city of Rome has experienced considerable earthquakeground motion since its establishment more than 2000 yrago. Seismic hazards in Rome are mainly associated withtwo active seismogenic areas, the Alban Hills and the centralApennines regions, located about 20 km southeast and 80–100 km east of central Rome, respectively. Within the pastcentury, Mw 7.0 and Mw 5.3 earthquakes in the Apenninesand the Alban Hills, respectively, generated intensities upto 7 in the city (Tertulliani and Riguzzi, 1995). This is re-flected in the deaggregation results that show the PGAs tobe dominated by moderate-sized background earthquakes(Mw ∼ 5:3) at close distances (∼20 km; Figs. 12a and b),whereas the 1.0 sec spectral accelerations predicted for Romeare also due to large earthquakes (Mw ∼ 6:8–7:0) at distancesof around 80–100 km, (Figs. 12c and d).
Deaggregation at Sites Illustrating Special Behav-iors. Based on the hazard map behavior and knowledgeof which faults ought to show increasing, decreasing, ormore complex contribution to site hazard, and understandingthat the background seismicity can disguise this behavior inthe hazard maps, we selected three sites (A, B, and C) inwhich deaggregation shows the changing role of the faultand background sources as α gets smaller.
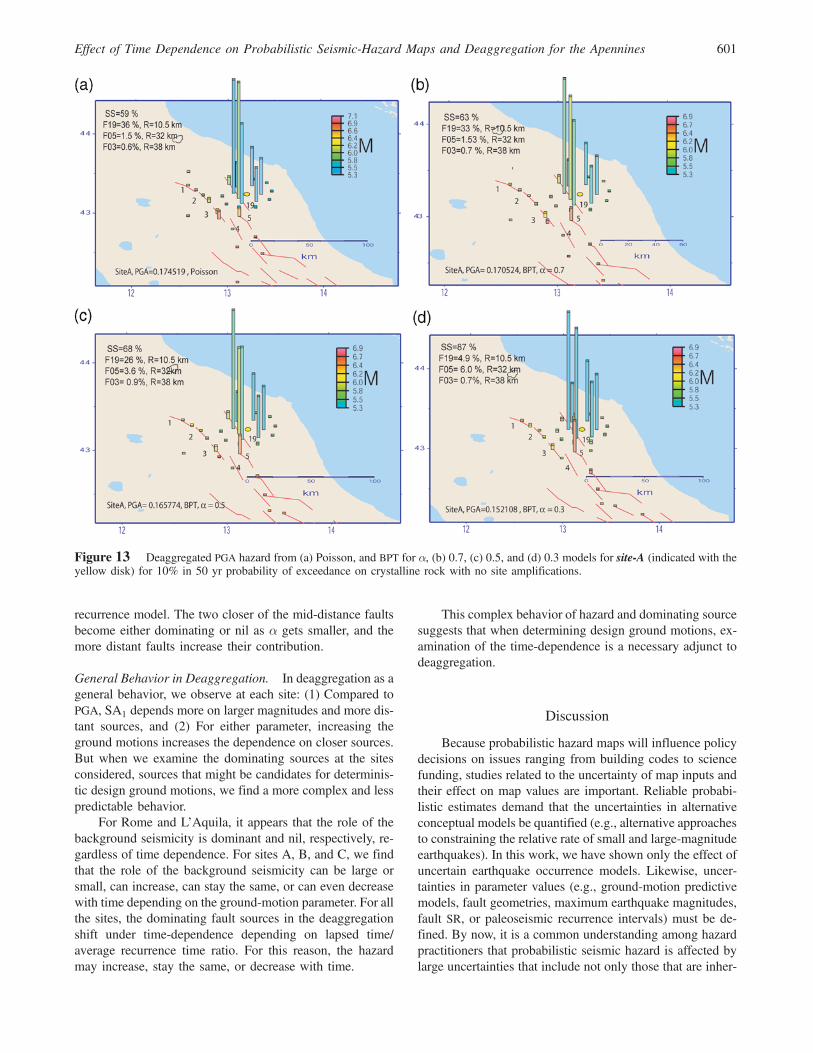
Site-A. For PGA with the Poisson model, the exceed-ance comes from fault 19 (R � 10 km), the closest fault, andfrom the background seismicity with contribution 59% and36%, respectively (Fig. 13a).
In the BPT model, maximum ground motion decreasesslightly from 0.17 to 0.15 g with decreasing α (Fig. 13b–d).The hazard contribution from fault 19 decreases with de-creasing α and its elapsed time ratio is equal to 0.38. The
Effect of Time Dependence on Probabilistic Seismic-Hazard Maps and Deaggregation for the Apennines 597
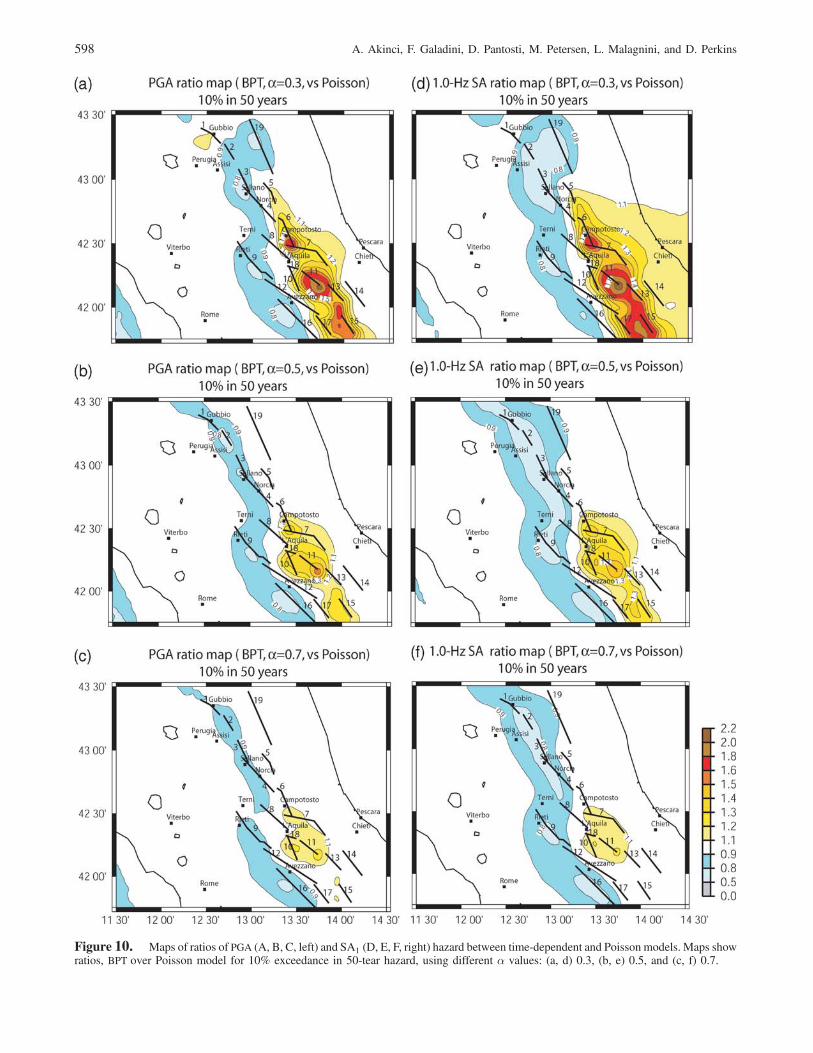
Figure 10. Maps of ratios of PGA (A, B, C, left) and SA1 (D, E, F, right) hazard between time-dependent and Poisson models. Maps showratios, BPT over Poisson model for 10% exceedance in 50-tear hazard, using different α values: (a, d) 0.3, (b, e) 0.5, and (c, f) 0.7.
598 A. Akinci, F. Galadini, D. Pantosti, M. Petersen, L. Malagnini, and D. Perkins

contribution from fault 5 (R � 32 km) increases slightlywhen α decreases.
For this site for PGA, we see that the contribution ofbackground seismicity is important both for the Poisson andthe BPT cases. The BPT model slightly increases the hazard,and the dominating fault loses only a little domination.
For SA1with the Poisson model, the deaggregation issimilar to that of PGA, but there is more contribution fromdistant faults 1, 2, 3, 5, 6, and 7 (Fig. 14a), a characteristic ofdeaggregations of longer-period ground motions. With theBPT model, the contribution from fault 19 decreases drasti-cally from 40% to 12% with decreasing α. Behavior of faults5 (R � 32 km), 6 (R � 62 km), and 7 (R � 86 km) is op-posite. Their contribution increases to a maximum of 23%,13%, and 7% with decreasing α, respectively because theirelapsed times are well past the average recurrence times(Fig. 14b–d). This is a consequence of our assumption thatwhen there is no known previous event, the date of the pre-vious event is taken to be 500 A.D. giving a lapse time ofmore than 1500 yr.
For site SA1 the background seismicity is important andbecomes more so with the BPT model. The BPT modelslightly decreases the hazard, and the dominating, closestfault loses its domination to more distant faults having largerlapse time.
Site-B. For PGA with the Poisson model (Fig. 15a),faults 11 (R � 8:1 km) and 10 (R � 6 km) contribute tothe hazard at site-A equally with around 27% of the exceed-ences, and source 12 (R � 12 km) and the background con-tribute about 13% each.
For PGAwith the BPT model, the hazard level increasesfrom 0.26 to 0.34 g as α decreases (Fig. 15b–d). The con-tribution from fault 11 increases with decreasing α andreaches 66%, owing to the fact that its elapsed time sincethe last earthquake is well past the average recurrence time.The contribution of the other faults decreases either some-what, as with fault 17, because of the moderate elapsed time,or completely as with fault 12 because it has had a recentevent. The contribution of background seismicity, alreadyminor, becomes much smaller.
Figure 11. Deaggregated seismic hazard from BPT (α � 0:5) and Poisson models for the city of L’Aquila (indicated with the yellowdisk) for 10% in 50 yr probability of exceedance on crystalline rock with no site amplifications: PGA (a, b, left) and SA1 (c, d, right). PGA andSA1 are 0.39–0.42 g (PGA) and 0.36–0.41 g (SA1) in L’Aquila, respectively. Here and figure 12, 13, 14, 15, 16, 17, and 18, the color of the barover each location indicates the average magnitude of all potential seismic sources at that location. The height of the bar is proportional to thehazards from all sources at the location. Red lines represent surface traces of the faults. Major faults are numbered and correspond to one asgiven in Tables 1 and 2. F09: Fault number 9, Fucino, as in Tables 1 and 2; Smoothed seismicity (SS).
Effect of Time Dependence on Probabilistic Seismic-Hazard Maps and Deaggregation for the Apennines 599

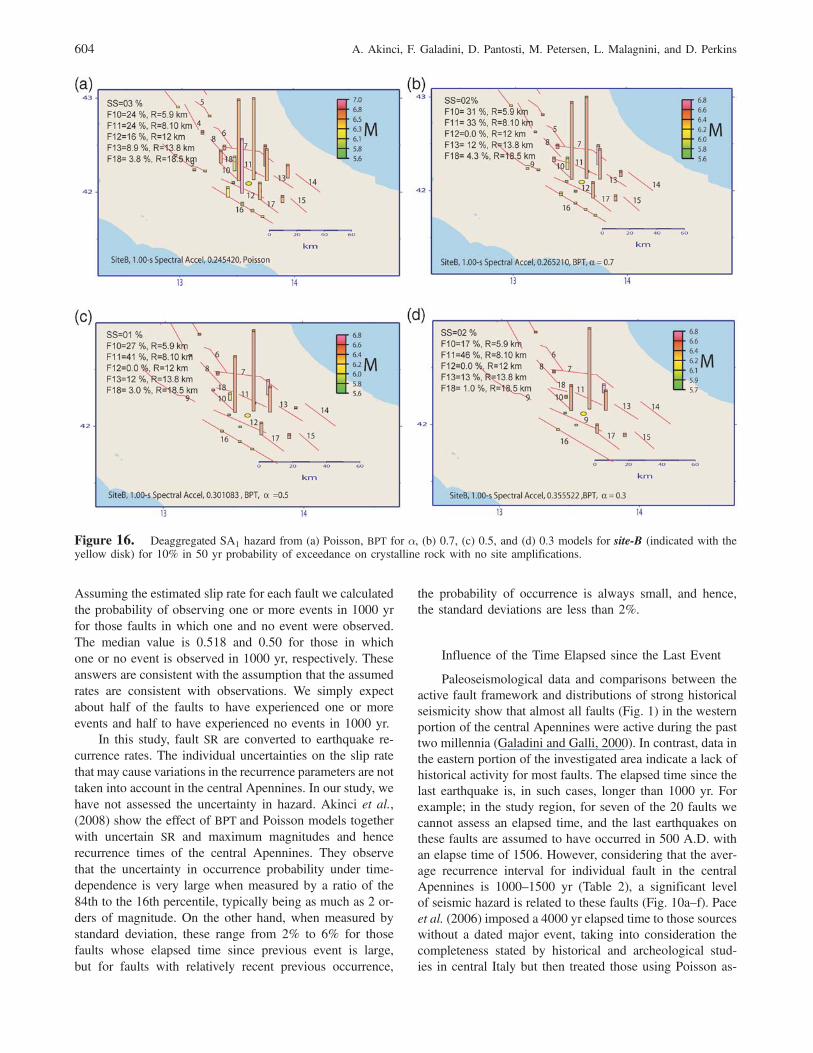
For SA1 with the Poisson model, we observe contribu-tions very similar to those of PGA but with slight contribu-tions from more distant fault (Fig. 16a).
For SA1 with the BPT model, the behavior is similar tothat of PGA except that the domination of fault 11 is not asgreat, and the more distant (R � 13:8 km) fault 13 providesa greater contribution.
For this site, time dependence greatly increases the haz-ard. In contrast to site-A, for this site the background seis-micity is not very important and becomes less important withdecreasing α. The nearest fault (10) becomes less important,and a slightly farther fault (11) becomes dominating, whilethe role of more distant fault (12) becomes negligible.
Site-C. For PGA with the Poisson model, backgroundseismicity contributes almost half the hazard, 44%, whilefaults at moderate distance contribute the rest (Fig. 17a). Theprimary fault contributions come from faults 7 and 14 at36 km distance with 12%–15% of the exceedance. Othercontributing faults are some that we saw contributing tosite-B. The probabilistic ground-motion level is relativelylow, which is why the more distant sources can equal thecontribution of the local seismicity.
For PGA with the BPT model, the hazard increases onlyslightly (Fig. 17b–d). The contribution of the backgroundseismicity decreases somewhat. Fault 14 loses all contribu-tion as α gets smaller owing to an elapsed time only abouthalf the average recurrence time. On the other hand, the per-centage contribution of faults 7, 11, and 13 almost doublesbecause their elapsed times are well past their average recur-rence time.
For SA1 the primary effect when applying the Poissonmodel is that the background seismicity has only a minorcontribution compared to the PGA case (Fig. 18a). The con-tribution of the mid-distant faults has increased because thelonger-period ground motion is dominated by their largermagnitudes.
For the BPT model, the hazard at SA1 increases about15% (Fig. 18b–d). The minor contribution of the backgroundseismicity stays constant while the role of the mid-distantfault is rather similar to the PGA case; fault 14 loses all con-tribution as α gets smaller while the percentage contributionof the other faults increases by 70% to 170%.
For this site, the role of the background seismicity de-pends on the ground-motion parameter—consistently impor-tant for PGA and consistently minor for SA1 regardless of
Figure 12. Deaggregated seismic hazard from BPT (α � 0:5) and Poisson models for the city of Rome (indicated with the yellow disk)for 10% in 50 yr probability of exceedance on crystalline rock with no site amplifications: PGA (a, b, left) and SA1 (c, d, right). PGA and SA1
are 0.14–0.13 g and 0.080–0.075 g in Rome, respectively.
600 A. Akinci, F. Galadini, D. Pantosti, M. Petersen, L. Malagnini, and D. Perkins
recurrence model. The two closer of the mid-distance faultsbecome either dominating or nil as α gets smaller, and themore distant faults increase their contribution.
General Behavior in Deaggregation. In deaggregation as ageneral behavior, we observe at each site: (1) Compared toPGA, SA1 depends more on larger magnitudes and more dis-tant sources, and (2) For either parameter, increasing theground motions increases the dependence on closer sources.But when we examine the dominating sources at the sitesconsidered, sources that might be candidates for determinis-tic design ground motions, we find a more complex and lesspredictable behavior.
For Rome and L’Aquila, it appears that the role of thebackground seismicity is dominant and nil, respectively, re-gardless of time dependence. For sites A, B, and C, we findthat the role of the background seismicity can be large orsmall, can increase, can stay the same, or can even decreasewith time depending on the ground-motion parameter. For allthe sites, the dominating fault sources in the deaggregationshift under time-dependence depending on lapsed time/average recurrence time ratio. For this reason, the hazardmay increase, stay the same, or decrease with time.
This complex behavior of hazard and dominating sourcesuggests that when determining design ground motions, ex-amination of the time-dependence is a necessary adjunct todeaggregation.
Discussion
Because probabilistic hazard maps will influence policydecisions on issues ranging from building codes to sciencefunding, studies related to the uncertainty of map inputs andtheir effect on map values are important. Reliable probabi-listic estimates demand that the uncertainties in alternativeconceptual models be quantified (e.g., alternative approachesto constraining the relative rate of small and large-magnitudeearthquakes). In this work, we have shown only the effect ofuncertain earthquake occurrence models. Likewise, uncer-tainties in parameter values (e.g., ground-motion predictivemodels, fault geometries, maximum earthquake magnitudes,fault SR, or paleoseismic recurrence intervals) must be de-fined. By now, it is a common understanding among hazardpractitioners that probabilistic seismic hazard is affected bylarge uncertainties that include not only those that are inher-
Figure 13 Deaggregated PGA hazard from (a) Poisson, and BPT for α, (b) 0.7, (c) 0.5, and (d) 0.3 models for site-A (indicated with theyellow disk) for 10% in 50 yr probability of exceedance on crystalline rock with no site amplifications.
Effect of Time Dependence on Probabilistic Seismic-Hazard Maps and Deaggregation for the Apennines 601

ent in the estimation of the input parameters but also thoseassociated with the adopted source and model (Cramer et al.,1996; Cramer, 2001; Beauval and Scotti, 2004; Bommeret al., 2005; Cao et al., 2005; Lombardi et al., 2005; Mor-gan et al., 2006; Akinci et al., 2007, 2008). In order to pro-vide a basis for assessing the uncertainty of the assessingpriorities for critical research needed to increase reliabilityof future assessments, future effort will be devoted to de-fining and quantifying uncertainties in these parameters ina separate study.
We also compare our time-independent and time-dependent hazard maps with those generated by Pace et al.(2006) in the same area. First of all, we observe several areaswith different hazard calculated following the smoothed-seismicity approach in two studies. Pace et al. (2006) calcu-late relatively high hazard with PGA around 0.2 g and 0.25 gin the areas, Lake Trasimeno (west of Perugia) and aroundthe town of Chieti, where there is neither present nor his-torical seismic activity observed and calculated lower haz-ard around the Lake Bolsena, Viterbo (see their study; Figs. 2and 10a) for which we observe the opposite feature inour study. This difference might be caused by the differentb values but especially by the different GMPEs used in both
studies. Pace et al. (2006) use spatially variable b-value dis-tribution while we use the constant one. This high hazardobserved in the Perugia and Chieti might be caused by un-stable b values calculated from an insufficient number ofearthquakes in their study. For the background seismicitybased hazard, they use the Ambraseys et al. (1996) ground-motion relationship that overestimates the PGA values com-pared to the one predicted by the regional ground-motionrelationship that is used in this study for smaller magnitudes(Akinci et al., 2004; Lombardi et al., 2005).
Differences between the time-independent hazard mapsgenerated by the two studies might be caused by the useof different fault databases, fault parameters, and recur-rence times. Moreover, differences between the two time-dependent hazard maps might be caused by the chosenelapsed time and α parameter. For example, we use differentα values of 0.3, 0.5, and 0.7 in the time-dependent occur-rence in order to explore its sensitivity to probabilisticground motion, whereas Pace et al. (2006) calculate the αvalues from the statistics of alternative methods rather thanfrom actual experienced recurrence times without using geo-logical evidence at each individual fault. We do not believethat this procedure is correct.
Figure 14. Deaggregated SA1 hazard from (a) Poisson, BPT for α, (b) 0.7, (c) 0.5, and (d) 0.3 models for site-A (indicated with theyellow disk) for 10% in 50 yr probability of exceedance on crystalline rock with no site amplifications.
602 A. Akinci, F. Galadini, D. Pantosti, M. Petersen, L. Malagnini, and D. Perkins
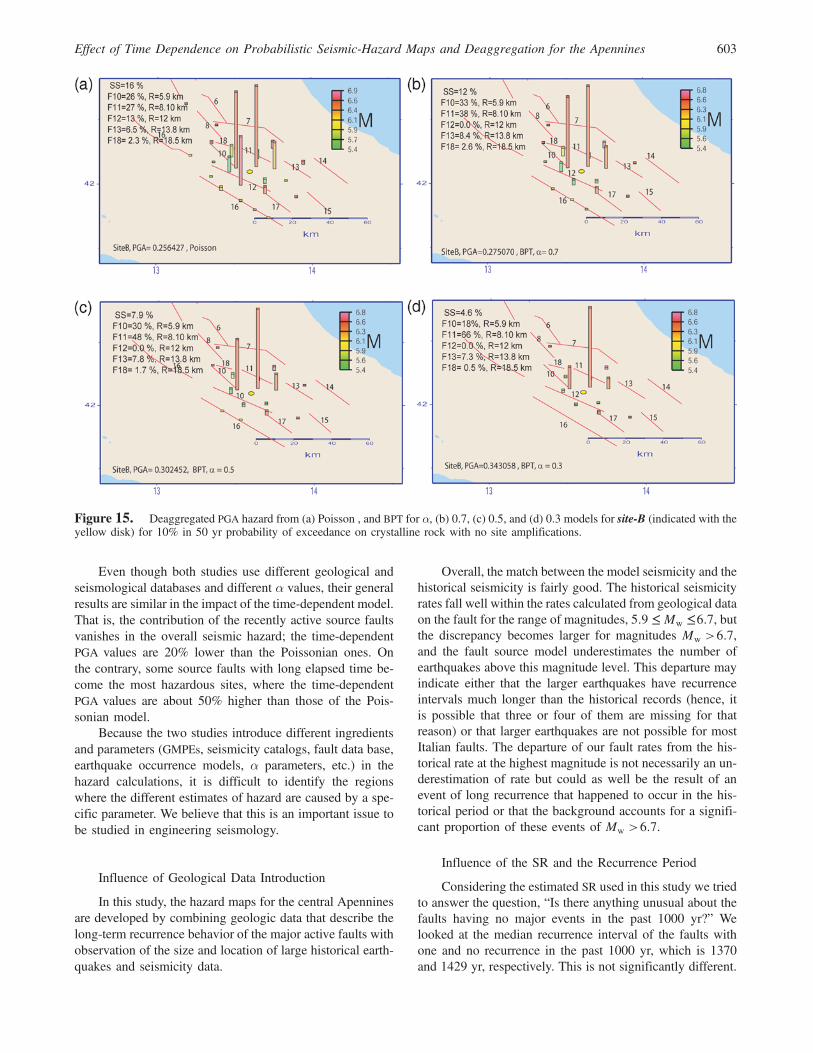
Even though both studies use different geological andseismological databases and different α values, their generalresults are similar in the impact of the time-dependent model.That is, the contribution of the recently active source faultsvanishes in the overall seismic hazard; the time-dependentPGA values are 20% lower than the Poissonian ones. Onthe contrary, some source faults with long elapsed time be-come the most hazardous sites, where the time-dependentPGA values are about 50% higher than those of the Pois-sonian model.
Because the two studies introduce different ingredientsand parameters (GMPEs, seismicity catalogs, fault data base,earthquake occurrence models, α parameters, etc.) in thehazard calculations, it is difficult to identify the regionswhere the different estimates of hazard are caused by a spe-cific parameter. We believe that this is an important issue tobe studied in engineering seismology.
Influence of Geological Data Introduction
In this study, the hazard maps for the central Apenninesare developed by combining geologic data that describe thelong-term recurrence behavior of the major active faults withobservation of the size and location of large historical earth-quakes and seismicity data.
Overall, the match between the model seismicity and thehistorical seismicity is fairly good. The historical seismicityrates fall well within the rates calculated from geological dataon the fault for the range of magnitudes, 5:9 ≤ Mw ≤6:7, butthe discrepancy becomes larger for magnitudes Mw >6:7,and the fault source model underestimates the number ofearthquakes above this magnitude level. This departure mayindicate either that the larger earthquakes have recurrenceintervals much longer than the historical records (hence, itis possible that three or four of them are missing for thatreason) or that larger earthquakes are not possible for mostItalian faults. The departure of our fault rates from the his-torical rate at the highest magnitude is not necessarily an un-derestimation of rate but could as well be the result of anevent of long recurrence that happened to occur in the his-torical period or that the background accounts for a signifi-cant proportion of these events of Mw >6:7.
Influence of the SR and the Recurrence Period
Considering the estimated SR used in this study we triedto answer the question, “Is there anything unusual about thefaults having no major events in the past 1000 yr?” Welooked at the median recurrence interval of the faults withone and no recurrence in the past 1000 yr, which is 1370and 1429 yr, respectively. This is not significantly different.
Figure 15. Deaggregated PGA hazard from (a) Poisson , and BPT for α, (b) 0.7, (c) 0.5, and (d) 0.3 models for site-B (indicated with theyellow disk) for 10% in 50 yr probability of exceedance on crystalline rock with no site amplifications.
Effect of Time Dependence on Probabilistic Seismic-Hazard Maps and Deaggregation for the Apennines 603
Assuming the estimated slip rate for each fault we calculatedthe probability of observing one or more events in 1000 yrfor those faults in which one and no event were observed.The median value is 0.518 and 0.50 for those in whichone or no event is observed in 1000 yr, respectively. Theseanswers are consistent with the assumption that the assumedrates are consistent with observations. We simply expectabout half of the faults to have experienced one or moreevents and half to have experienced no events in 1000 yr.
In this study, fault SR are converted to earthquake re-currence rates. The individual uncertainties on the slip ratethat may cause variations in the recurrence parameters are nottaken into account in the central Apennines. In our study, wehave not assessed the uncertainty in hazard. Akinci et al.,(2008) show the effect of BPT and Poisson models togetherwith uncertain SR and maximum magnitudes and hencerecurrence times of the central Apennines. They observethat the uncertainty in occurrence probability under time-dependence is very large when measured by a ratio of the84th to the 16th percentile, typically being as much as 2 or-ders of magnitude. On the other hand, when measured bystandard deviation, these range from 2% to 6% for thosefaults whose elapsed time since previous event is large,but for faults with relatively recent previous occurrence,
the probability of occurrence is always small, and hence,the standard deviations are less than 2%.
Influence of the Time Elapsed since the Last Event
Paleoseismological data and comparisons between theactive fault framework and distributions of strong historicalseismicity show that almost all faults (Fig. 1) in the westernportion of the central Apennines were active during the pasttwo millennia (Galadini and Galli, 2000). In contrast, data inthe eastern portion of the investigated area indicate a lack ofhistorical activity for most faults. The elapsed time since thelast earthquake is, in such cases, longer than 1000 yr. Forexample; in the study region, for seven of the 20 faults wecannot assess an elapsed time, and the last earthquakes onthese faults are assumed to have occurred in 500 A.D. withan elapse time of 1506. However, considering that the aver-age recurrence interval for individual fault in the centralApennines is 1000–1500 yr (Table 2), a significant levelof seismic hazard is related to these faults (Fig. 10a–f). Paceet al. (2006) imposed a 4000 yr elapsed time to those sourceswithout a dated major event, taking into consideration thecompleteness stated by historical and archeological stud-ies in central Italy but then treated those using Poisson as-
Figure 16. Deaggregated SA1 hazard from (a) Poisson, BPT for α, (b) 0.7, (c) 0.5, and (d) 0.3 models for site-B (indicated with theyellow disk) for 10% in 50 yr probability of exceedance on crystalline rock with no site amplifications.
604 A. Akinci, F. Galadini, D. Pantosti, M. Petersen, L. Malagnini, and D. Perkins
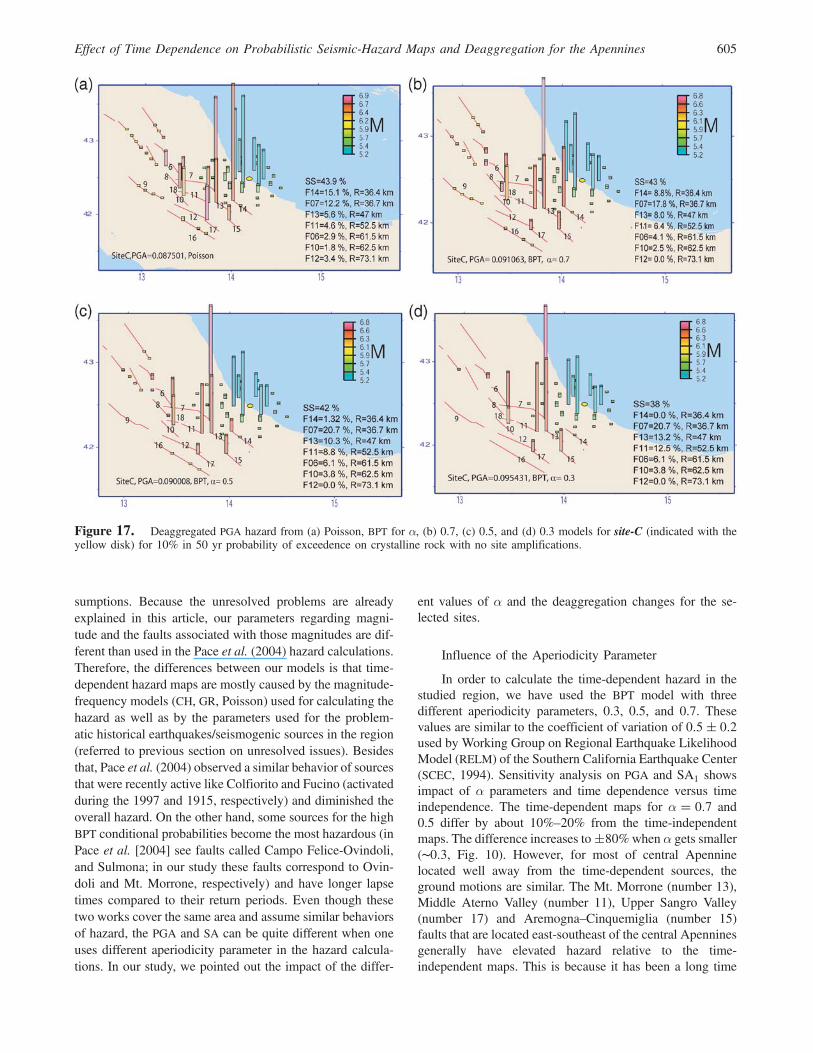
sumptions. Because the unresolved problems are alreadyexplained in this article, our parameters regarding magni-tude and the faults associated with those magnitudes are dif-ferent than used in the Pace et al. (2004) hazard calculations.Therefore, the differences between our models is that time-dependent hazard maps are mostly caused by the magnitude-frequency models (CH, GR, Poisson) used for calculating thehazard as well as by the parameters used for the problem-atic historical earthquakes/seismogenic sources in the region(referred to previous section on unresolved issues). Besidesthat, Pace et al. (2004) observed a similar behavior of sourcesthat were recently active like Colfiorito and Fucino (activatedduring the 1997 and 1915, respectively) and diminished theoverall hazard. On the other hand, some sources for the highBPT conditional probabilities become the most hazardous (inPace et al. [2004] see faults called Campo Felice-Ovindoli,and Sulmona; in our study these faults correspond to Ovin-doli and Mt. Morrone, respectively) and have longer lapsetimes compared to their return periods. Even though thesetwo works cover the same area and assume similar behaviorsof hazard, the PGA and SA can be quite different when oneuses different aperiodicity parameter in the hazard calcula-tions. In our study, we pointed out the impact of the differ-
ent values of α and the deaggregation changes for the se-lected sites.
Influence of the Aperiodicity Parameter
In order to calculate the time-dependent hazard in thestudied region, we have used the BPT model with threedifferent aperiodicity parameters, 0.3, 0.5, and 0.7. Thesevalues are similar to the coefficient of variation of 0:5� 0:2used by Working Group on Regional Earthquake LikelihoodModel (RELM) of the Southern California Earthquake Center(SCEC, 1994). Sensitivity analysis on PGA and SA1 showsimpact of α parameters and time dependence versus timeindependence. The time-dependent maps for α � 0:7 and0.5 differ by about 10%–20% from the time-independentmaps. The difference increases to�80%when α gets smaller(∼0:3, Fig. 10). However, for most of central Apenninelocated well away from the time-dependent sources, theground motions are similar. The Mt. Morrone (number 13),Middle Aterno Valley (number 11), Upper Sangro Valley(number 17) and Aremogna–Cinquemiglia (number 15)faults that are located east-southeast of the central Apenninesgenerally have elevated hazard relative to the time-independent maps. This is because it has been a long time
Figure 17. Deaggregated PGA hazard from (a) Poisson, BPT for α, (b) 0.7, (c) 0.5, and (d) 0.3 models for site-C (indicated with theyellow disk) for 10% in 50 yr probability of exceedence on crystalline rock with no site amplifications.
Effect of Time Dependence on Probabilistic Seismic-Hazard Maps and Deaggregation for the Apennines 605

since the last earthquake, about 1500 yr since the 500 A.D.assumed activation. All of these faults are late or close totheir seismic cycles. The Gualdo Tadino (number 2), Fucino(number 12), Norcia (number 4), Liri Valley–Sora (num-ber 16) faults, on the other hand, have time-dependent hazardthat is lower than the time-independent hazard due to the rel-atively short period since the last earthquake that places thesefaults in the first half of their seismic cycles.
Importance of Deaggregations
Seismic-hazard analyses for engineering purposes areusually conducted for particular sites rather than regions.Because of this, there has been a move to make hazard as-sessments as site specific and as fault specific as possible.Deaggregation plots can provide useful information on howthe typical size and distance of earthquakes making the larg-est contributions to the seismic hazard at a specific site variesboth with the probability level and with the spectral param-eter. Performing deaggregations at more than one period willhelp determine if one source dominates at all periods andclarify the need for one or more design earthquakes. This in-formation can also be used to generate the scenario earth-quakes and the corresponding time histories for dynamic
seismic design and retrofit for cities in the central Apennines,Italy (Olsen et al., 2006). These maps may assist in thedetermination of earthquake parameters (magnitude anddistance) that earthquake engineers use in their work inearthquake-resistant design and retrofitting. We also ob-served that larger, more distant earthquakes are more impor-tant contributors to the SA1 hazard than the PGA hazard. Thistypical behavior is seen in the deaggregation for the cities ofRome, L’Aquila, and the selected three sites. This is causedby the higher ratio of long-period to short-period energy ra-diated by larger earthquakes and to be lower rate of ampli-tude decay per unit distance for long-period waves.
Conclusions
We constructed a PSHA model for the central Apenninesbased on the long-term recurrence behavior of active faultstogether with the spatial distribution of earthquakes observedin historic time. In order to express the time dependence ofthe seismic processes to predict the future ground motions inthe region, we used a BPT model (Matthews et al., 2002). Wepresented the results for both BPT and Poisson models interms of maps of PGA and SA1 for 10% probability of ex-
Figure 18. Deaggregated SA1 hazard from (a) Poisson, BPT for α, (b) 0.7, (c) 0.5, and (d) 0.3 models for site-C (indicated with theyellow disk) for 10% in 50 yr probability of exceedence on crystalline rock with no site amplifications.
606 A. Akinci, F. Galadini, D. Pantosti, M. Petersen, L. Malagnini, and D. Perkins

ceedance in 50 yr. The maps show the highest levels of PGAand SA to occur along the axis of the tectonic belt both for thetime-dependent and the time-independent models. Time-dependent hazard is increased with respect to the resultsof the Poissonian source model, and the peaks appear to shiftto the east-southeast of the central Apennines. Using aperio-dicity parameter (α) of 0.3, 0.5, and 0.7, we examine thesensitivity of the probabilistic ground motion to these pa-rameters. PGA estimates mostly increase with decreasing αat the southeastern part of the studied area including thefaults 7, 10, 11, 13, 15, 17, and 18 that have long lapse timeswell past average recurrence time (elapsed time ratio ∼1:0).The hazard decreases along the central belt of the Apennineswhere the faults have shorter lapse of time compared to itsaverage recurrence time (faults 2, 4, 9, 12, and 16, elapsedtime ratio ∼0:0–0:2).
Because it is difficult to follow the details of the behav-ior of each fault as a function of elapsed time, we deaggre-gated the seismic hazard at some specific sites as a functionof α parameter. When we examined the dominating sourcesat the sites considered, sources that might be candidates fordeterministic design ground motions, we found quite com-plex and less predictable behavior. We observed at each sitecompared to PGA, SA1 depends more on larger magnitudesand more distant sources, and for either parameter, increasingthe ground motions increases the dependence on closersources. This complex behavior of hazard and dominatingsource means when determining design ground motions, ex-amination of the time dependence is a necessary adjunct todeaggregation.
The results of the present study clearly illustrate the in-fluence of active fault parameters to probabilistic seismic-hazard maps. However, the absolute ground-motion levelsobtained in this study should be considered with care sincethese are highly dependent of the assumptions made in thedifferent input models and the chosen attenuation relation.
In general, the time-dependent models may be appli-cable in a few areas because we know little about the re-currence rates for the majority of seismic sources in mostregions of the world. However, for the few faults for whichwe think we have adequate information on time-dependentbehavior, a time-dependent model may be better than a time-independent model at identifying the short-term risks foreconomic loss assessment.
Data and Resources
In this article we used declustered CPTI (2004) historicalcatalog prepared by the Working Group (http://emidius.mi.ingv.it/CPTI04, last accessed May 2007). Fault informationused for hazard calculations (Tables 1 and 2) came frommany published sources listed in the references. The annualrate of exceeding a specified ground motion at a site wascalculated using the computer codes available on the USGSWeb site (http://earthquake.usgs.gov/research/hazmaps/, last
accessed December 2008). Many of the plots are made usingthe Generic Mapping Tools version 4.2.1 (www.soest.hawaii.edu/gmt, last accessed December 2008; Wessel and Smith,1998) We used equal area location bins available on theUSGS Web site (http://eqint.cr.usgs.gov/deaggint/2002/index.php, last accessed May 2007, December 2006, and Decem-ber 2006, respectively).
Acknowledgments
The thoughtful reviews by Arthur D. Frankel and Steve Harmsen ofUnited States Geological Survey (USGS), Golden, Colorado, whom we wishto thank, strongly contributed to the clarity and the readability of this article.We would also thank Editor-in-Chief Andrew J. Michael, Mark W. Stirling,and an anonymous reviewer whose comments and suggestion improved themanuscript. During this work at the USGS in Golden, Colorado, A. Akinciand D. Perkins at Istituto Nazionale di Geofisica e Vulcanologia in Rome,Italy, were supported by grants from the Consiglio Nazionale delle Ricerceand Civil Protection Projects, (DPC-S2), 2004–2006.
References
Akinci, A., C. Mueller, L. Malagnini, and A. M. Lombardi (2004). A prob-abilistic seismic hazard assessment for the Alps and Apennines (Italy)using historical seismicity and new predictive ground-motion relation-ships, Boll. Geofis. Teor. Appl. 45, no. 4, 285–304.
Akinci, A., D. Perkins, and A. M. Lombardi (2007). A Monte Carlo ap-proach in estimating endogenous uncertainties for a seismic hazardassessment of the central Apennines, Italy, in Seism. Res. Lett., Seis-mological Society of America, Annual Meeting, 78, no. 2.
Akinci, A., D. Perkins, A. M. Lombardi, and R. Basili (2008). Uncertaintiesin the estimation of the probability of occurrence of strong earthquakesfrom individual seismological sources in the Apennines, Italy, J.Seism., doi 10.1007/s10950‑008‑9142‑y (in press).
Ambraseys, N. N., K. A. Simpson, and J. J. Bommer (1996). Prediction ofhorizontal response spectra in Europe, Earth. Eng. Struct. Dyn. 25,371–400.
Barchi, M., F. Galadini, G. Lavecchia, P. Messina, A. M. Michetti,L. Peruzza, A. Pizzi, E. Tondi, and E. Vittori (a cura di) (2000). Sintesidelle conoscenze sulle faglie attive in Italia centrale, CNR—GruppoNazionale per la Difesa dai Terremoti, 62 pp.
Basili, R., G. Valensise, P. Vannoli, P. Burrato, U. Fracassi, S. Mariano,M. M. Tiberti, and E. Boschi (2008). The database of individual seis-mogenic sources (DISS), version 3: summarizing 20 years of researchon Italy’s earthquake geology, Tectonophysics 453, no. 1–4, 20–4.
Bazzurro, P., and C. Cornell (1999). Disaggregation of seismic hazard, Bull.Seismol. Soc. Am. 89, 501–520.
Beauval, C., and O. Scotti (2004). Quantifying sensitivities of PSHA forFrance to earthquake catalog uncertainties, truncation of ground-motion variability, and magnitude limits, Bull. Seismol. Soc. Am. 94,1579–1594.
Bertini, T., and C. Bosi (1993). La tettonica quaternaria della conca di Fossa(L’Aquila), Il Quaternario 6, 293–314.
Blumetti, A. M. (1995). Neotectonic investigations and evidence of paleo-seismicity in the epicentral area of the January–February 1703, cen-tral Italy, earthquakes,, in L. Serva and D. B. Slemmons (Editors),Perspectives in Paleoseismology, Association of English Geologists,Spec. Publ., no. 6, 83–100.
Bommer, J. J., F. Scherbaum, H. Bungum, F. Cotton, F. Sabetta, and N. A.Abrahamson (2005). On the use of logic trees for ground-motion pre-diction equations in seismic-hazard analysis, Bull. Seismol. Soc. Am.95, 377–389.
Effect of Time Dependence on Probabilistic Seismic-Hazard Maps and Deaggregation for the Apennines 607

Boncio, P., G. Lavecchia, and B. Pace (2004). Defining a model of 3D seis-mogenic sources for seismic hazard assessment applications: the caseof central Apennines (Italy), J. Seism. 8, 407–425.
Boncio, P., G. Lavecchia, G. Milana, and B. Rozzi (2004). Seismogenesis incentral Apennines, Italy: an integrated analysis of minor earthquakesequences and structural data in the Amatrice-Campotosto area, Ann.Geophys. 47, 1723–1742.
Bosi, C. (1975). Osservazioni preliminari su faglie probabilmente attivenell'Appennino centrale, Boll. Soc. Geol. It. 94, 827–859.
Bosi, C., and T. Bertini (1970). Geologia della media valle dell’Aterno,Mem. Soc. Geol. It. 9, 719–777.
Bragato, L., and D. Slejko (2005). Empirical ground-motion attenuationrelations for the eastern Alps in the magnitude range 2.5–6.3, Bull.Seismol. Soc. Am. 95, no. 1, 252–276.
Camassi, R., and V. Castelli (2004). Looking for “new” earthquake data inthe 17th–18th century European “newssellers” network, J. Earthq.Eng. 8, 335–359.
Camassi, R., P. Galli, D. Molin, and A. Tertulliani (2000). Eventi sismicidel faentino forlivese dell’aprile-maggio 2000 e del Reggiano del18 giugno 2000, Rilievo macrosismico, Rapporto interno ING-SSN,Roma, 16 pp.
Cao, T., M. Petersen, and A. Frankel (2005). Model uncertainties of the 2002update of California seismic hazard maps, Bull. Seismol. Soc. Am. 95,2040–2057.
Carraro, F., and M. Giardino (1992). Geological evidence of recent faultevolution. Examples from Campo Imperatore (L’Aquila-central Apen-nines), Il Quaternario 5, 181–200.
Carrara, C., G. DaiPra, and C. Giraudi (1995). Lineamenti di tettonica plio-quaternaria dell’area, in Lazio Meridionale, Sintesi delle RicercheGeologiche Multidisciplinari, Dipartimento Ambiente, ENEA, Rome,151–155.
Cavinato, G. P., and E. Miccadei (1995). Sintesi preliminare delle caratter-istiche tettoniche e sedimentarie dei depositi quaternary della conca diSulmona (L’Aquila), Il Quaternario 8, 129–140.
Chiaraluce, L., M. Barchi, C. Collettini, F. Mirabella, and S. Pucci (2005).Connecting seismically active normal faults with quaternary geologi-cal structures in a complex extensional environment: the Colfiorito1997 case history (northern Apennines, Italy), Tectonics 24, TC1002,doi 10.1029/2004TC001627.
Consiglio Nazionale delle Ricerce (CNR)-Progetto Finalizzato Geodinamica(PFG) (1987). Neotectonic map of Italy, Quaderni de La RicercaScientifica, 114 pp.
Console, R., and M. Murru (2001). A simple and testable model forearthquake clustering, J. Geophy. Res. 106, no. B5, 8699–8711.
Cramer, C. H. (2001). A seismic hazard uncertainty analysis for the NewMadrid seismic zone, Eng. Geol. 62, 251–266.
Cramer, C. H., M. D. Petersen, T. Cao, T. R. Toppozada, and M.Reichle (2000). A Time-dependent probabilistic seismic-hazardmodel for California, Bull. Seismol. Soc. Am. 90, no. 1,1–21.
Cramer, C. H., M. D. Petersen, and M. S. Reichle (1996) A Monte Carloapproach in estimating uncertainty for a seismic hazard assessment ofLos Angeles, Ventura and Orange Counties, California, Bull. Seismol.Soc. Am. 86, no. 6, 1681–1691.
D’Addezio, G., G. Masana, and D. Pantosti (2001). The Holocene paleoseis-micity of the Aremogna-CinqueMiglia fault (central Italy), J. Seism. 5,181–205.
De Martini, P. M., N. A. Pino, G. Valensise, and S. Mazza (2003). Geodeticand seismologic evidence for slip variability along a blind normal faultin the Umbri-Marche 1997–1998 earthquakes (central Italy), Geophys.J. Int. 155, 819–829.
Ellsworth, W. L. (1995). Characteristic earthquakes and long-term earth-quake forecasts: implications of central California seismicity, in F. Y.Cheng and M. S. Sheu (Editors), Urban Disaster Mitigation: the Roleof Science and Technology, Elsevier, 1–14.
Ellsworth, W. L., M. V. Matthews, R. M. Nadeau, S. P. Nishenko, P. A.Reasenberg, and R. W. Simpson (1999). A physically-based earth-
quake recurrence model for estimation of long-term earthquake prob-abilities, U.S. Geol. Surv., Open-File Rept. 99–522, 23 pp.
Elter, P., M. Grasso, M. Parotto, and L. Vezzani (2003). Structural setting ofthe Apennine-Maghrebian thrust belt, Episodes 26, 205–211.
Erdik, M., M. Demircioglu, K. Sesetyan, E. Durukal, and B. Siyahi (2004).Earthquake hazard in Marmara region, Turkey, Soil Dyn. Earthq. Eng.24, 605–631.
Frankel, A. (1995). Mapping seismic hazard in the central and easternUnited States, Seism. Res. Lett. 66, no. 4, 8–21.
Frankel, A., C. Mueller, T. Barnhard, D. Perkins, E. V. Leyendecker,N. Dickman, S. Hanson, and M. Hooper (1996). National seismichazard maps: documentation June 1996, U.S. Geol. Surv. Open-FileRept. 96–532 100 pp.
Frankel, A. D., M. D. Petersen, C. S. Muller, K. M. Haller, R. L. Wheeler,E. V. Leyendecker, R. L. Wesson, S. C. Harmsen, C. H. Cramer,D. M. Perkins, and K. S. Rukstales (2002). Documentation for the2002 update of the national seismic hazard maps, U.S. Geol. Surv.Open-File Rept. 02–420, 33 pp.
Frapiccini, M., G. Monachesi, S. Del Mese, L. Giovani, A. Maramai, A.Tertulliani, and D. Molin (1997). Terremoto di Massa Martana del12 maggio 1997: Rilevamento macrosismico preliminare dell'areamaggiormente interessata, Rapporto Protezione Civile.
Galadini, F., and P. Galli (1999). The Holocene paleoearthquakes onthe 1915 Avezzano earthquake faults (central Italy): implicationsfor active tectonic in the central Apennines, Tectonophysics 308,143–170.
Galadini, F., and P. Galli (2000). Active tectonics in the central Apen-nines (Italy)-input data for seismic hazard assessment, Nat. Haz.22, 225–270.
Galadini, F., and P. Galli (2001). Archaeoseismology in Italy: case stud-ies and implications on long-term seismicity, J. Earthq. Eng. 5,35–68.
Galadini, F., and P. Galli (2003). Paleoseismology of silent faults in thecentral Apennines (Italy): the Mt. Vettore and Laga Mts. faults, Ann.Geophys. 46, 815–836.
Galadini, F., and P. Messina (1993). Characterization of the recent tectonicsof the upper Sangro river valley (Abruzzi Apennine, central Italy),Annali di Geofisica 36, no 1, 277–285.
Galadini, F., and P. Messina (2001). Plio-Quaternary changes of the normalfault architecture in the central Apennines (Italy), Geodinamica Acta14, 321–344.
Galadini, F., and P. Messina (2004). Early-middle Pleistocene eastwardmigration of the Abruzzi Apennine (central Italy) extensional domain,J. Geodyn. 37, 57–81.
Galadini, F., P. Galli, I. Leschiutta, G. Monachesi, and M. Stucchi (1999).Active tectonics and seismicity in the area of the 1997 earthquake se-quence in central Italy: a short review, J. Seism. 3, 167–175.
Galadini, F., P. Galli, andM. Moro (2003) Paleoseismology of silent faults inthe central Apennines (Italy): the Campo Imperatore fault (Gran SassoRange fault system), Ann. Geophys. 46, 793–813.
Galadini, F., C. Giraudi, and P. Messina (1998). Nuovi dati sulla tettonicatardopleistocenica dell’alta valle del Sangro: implicazioni sismotetto-niche, Il Quaternario 11, 347–356.
Galli, P., F. Galadini, M. Moro, and C. Giraudi (2002). New paleoseismo-logical data from the Gran Sasso d’Italia area (central Apennines),Geophys. Res. Lett. 29, no. 7, doi 10.1029/2001GL013292, 38.1–38.4.
Gasperini, P., F. Bernardini, G. Valensise, and E. Boschi (1999). Defin-ing seismogenic sources from historical earthquake felt reports, Bull.Seism. Soc. Am. 89, 94–110.
Giraudi, C., and M. Frezzotti (1995). Paleoseismicity in the Gran Sassomassif (Abruzzo, central Italy), Quaternary Int. 25, 81–93.
Gori, S., F. Dramis, F. Galadini, and P. Messina (2007). The use of geo-morphological markers in the footwall of active faults for kinematicevaluations: examples from the central Apennines, Boll. Soc. Geol.It. (Ital. J. Geosci.) 126, no. 2, 365–374.
Gutenberg, B., and C. F. Richter (1949). Seismicity of the Earth and Asso-ciated Phenomena, Princeton University Press, Princeton.
608 A. Akinci, F. Galadini, D. Pantosti, M. Petersen, L. Malagnini, and D. Perkins
Harmsen, S., and A. Frankel (2001). Geographic deaggregation of seismichazard in the United States, Bull. Seismol. Soc. Am. 91, no. 1, 7–24.
Kagan, Y. Y., and L. Knopoff (1987). Random stress and earthquake statis-tics; time dependence, Geophys. J. R. Astr. Soc. 88, 723–731.
Kumamoto, T. (1999). Seismic hazard maps of Japan and computationaldifferences in models and parameters, Geograph. Rev. Japan, SeriesB 72, no. 2, 135–161.
Lindh, A. G. (1983). Preliminary assessment of long-term probabilities forlarge earthquakes along selected segments of the San Andreas faultsystem in California, U.S. Geol. Surv. Open-File Rept. 83–63, 15 pp.
Lombardi, A. M., A. Akinci, L. Malagnini, and C. H. Mueller (2005). Un-certainty analysis for seismic hazard in northern and central Italy, Ann.Geophys. 48, 853–865.
Lundgren, P., and S. Stramondo (2002). Slip distribution of the 1997Umbria-Marche earthquake sequence: joint inversion of GPS andsynthetic aperture radar interferometry data, J. Geophys. Res. 107,no. B11, 2316, doi 10.1029/2000JB000103.
Malagnini, L., and R. B. Herrman (2000). Ground-motion scaling in the re-gion of the 1997 Umbria-Marche earthquake (Italy), Bull. Seismol.Soc. Am. 90, 1041–1051.
Malagnini, L., A. Akinci, R. B. Herrmann, N. A. Pino, and L. Scognamiglio(2002). Characteristics of the ground-motion in northeastern Italy,Bull. Seismol. Soc. Am. 92, 2186–2204.
Malagnini, L., R. B. Herrmann, and M. Di Bona (2000). Ground mo-tion scaling in the Apennines (Italy), Bull. Seismol. Soc. Am. 90,1062–1081.
Matthews, M. V., W. L. Ellsworth, and P. A. Reasenberg (2002). A Brown-ian model for recurrent earthquakes, Bull. Seismol. Soc. Am. 92,2233–2250.
McGuire, R. K. (1995). Probabilistic seismic hazard and design earthquakes:closing the loop, Bull. Seismol. Soc. Am. 85, no. 5, 1275–1284.
Meletti, M., E. Patacca, P. Scandone, and B. Figliuolo (1988). Il terremotodel 1456 e la sua interpretazione nel quadro sismotettonico dell’Ap-pennino meridionale, in a c. di B. Figliuolo, Il terremoto del 1456,Istituto Italiano di Studi filosofici, Storia e Scienza della Terra, Vol. 2,71–163.
Messina, P., F. Galadini, P. Galli, and A. Sposato (2002). Quaternary basinevolution and present tectonic regime in the area of the 1997–98Umbria-Marche seismic sequence (central Italy), Geomorphology 42,97–116.
Mirabella, F., and S. Pucci (2002). Integration of geological and geophysicaòdata along a section crossing the region of the 1997–98 Umbria-Marche earthquakes (Italy), Boll. Soc. Geol. It. 1, 891–900.
Molin, D., A. Rossi, A. Tertulliani, and V. e Verrubbi (2002). Studio dellasismicità dell’alto Bacin dell’Aniene (Appennino centrale—Italia) ecatalogo sismico di area, Quaderni di Geofisica 24, 19–21.
Montaldo, V., E. Faccioli, G. Zonno, A. Akinci, and L. Malagnini (2005).Ground-motion predictive relationships for the reference seismic haz-ard map of Italy, J. Seism. 9, 295–316.
Morasca, P., L. Malagnini, A. Akinci, D. Spallarossa, and R. B. Herrmann(2006). Ground-motion scaling in the western Alps, J. Seism. 10, no. 3,315–333.
Morgan, T. Page, and J. M. Carlson (2006). Methodologies for earthquakehazard assessment: model uncertainty and the WGCEP-2002 forecast,Bull. Seismol. Soc. Am. 96, 1624–1633.
Moro, M., V. Bosi, F. Galadini, P. Galli, B. Giaccio, P. Messina, and A.Sposato (2002). Analisi paleosismologiche lungo la faglia del M. Ma-rine (alta valle dell’Aterno): risultati preliminari, Il Quaternario 15,267–278.
Nishenko, S. P., and R. Buland (1987). A generic recurrence interval dis-tribution for earthquake forecasting, 77, 1382–1399.
Ogata, Y. (1999). Estimating the hazard of rupture using uncertain occur-rence times of Paleoearthquakes, J. Geophys. Res., B, Solid EarthPlanets 104, no. 8, 17,995–18,014.
Olsen, K. B., A. Akinci, A. Rovelli, F. Marra, and L. Malagnini (2006).3-D finite-difference modeling of earthquakes in the city of Rome,Italy, Bull. Seismol. Soc. Am. 96, no. 1, 133–146.
Pace, B., L. Perruzza, G. Lavecchia, and P. Bancio (2006). Layered seismo-genic source model and probabilistic seismic-hazard analyses in cen-tral Italy, Bull. Seismol. Soc. Am. 96, 107–132.
Pantosti, D., G. D’Addezio, and F. R. Cinti (1996). Paleoseismicity of theOvindoli-Pezza fault, central Apennines, Italy: a history including alarge, previously unrecorded earthquake in the Middle Ages (860–1300 A.D.), J. Geophys. Res. 101, 5937–5959.
Pantosti, D., D. P. Schwartz, and G. Valensise (1993). Paleoseismologyalong the 1980 surface rupture of the Irpinia fault: implications forearthquake recurrence in the southern Apennines, Italy, J. Geophys.Res. 98, 6561–6577.
Papaioannou, C., and C. Papazachos (2000). Time-independent and time-dependent seismic hazard in Greece based on seismogenic sources,Bull. Seismol. Soc. Am. 90, 22–33.
Peruzza, L., and B. Pace (2002). Sensitivity analysis for seismic source char-acteristics to probabilistic seismic hazard assessment in central Appen-nines (Abruzzo area), Bollettino di Geofisica Teorica ed Applicata 43,79–100.
Petersen, M. D., W. A. Bryant, C. H. Cramer, T. Cao, M. S. Reichle, A. D.Frankel, J. J. Lienkaemper, P. A. McCrory, and D. P. Schwartz (1996).Probabilistic seismic hazard assessment for the state of California,U. S. Geol. Surv. Open-File Report OFR 96-0706, 33 pp.
Petersen, M. D., T. Cao, K. W. Campbell, and A. D. Franke (2007). Time-independent and time-dependent seismic hazard assessment for thestate of California: Uniform California $arthquake rupture forecastmodel 1.0, Seism. Res. Lett. 78, no. 1 99–109.
Petersen, M. D., C. H. Cramer, M. S. Reichle, A. D. Frankel, and T. C.Hanks (2000). Discrepancy between earthquake rates implied by his-toric earthquakes and a consensus geologic source model for Califor-nia, Bull. Seismol. Soc. Am. 90, 1117–1132
Petersen, M. D., A. D. Frankel, S. C. Harmsen, C. S. Mueller, K. M.Haller, R. L. Wheeler, R. L. Wesson, Y. Zeng, O. S. Boyd, D. M. Per-kins, N. Luco, E. H. Field, C. J. Wills, and K. S. Ruksatles (2008).Documentation for the 2008 update of the United States nationalseismic hazard maps, U.S. Geol. Surv. Open-File Rept. 2008–1128,60 pp.
Pizzi, A., and S. Scisciani (2000). Methods for determining the Pleistocene-Holocene component of displacement on active faults reactivating pre-quaternary structures: examples from the central Apennines (Italy),J. Geodyn. 29, 445–457.
Pizzi, A., F. Calamita, M. Coltorti, and P. Pieruccini (2002). Quaternary nor-mal faults, intramontane basins and seismicity in the Umbria-Marche-Abruzzi Apennine ridge (Italy): contribution of neotectonic analysisto seismic hazard assessment, Boll. Soc. Geol. It., Spec. Publ., 1,923–929.
Pucci, S., P. M. De Martini, D. Pantosti, and G. Valensise (2003).Geomorphology of the Gubbio basin (central Italy): understandingthe active tectonics and earthquake potential, Ann. Geophys. 46,837–864.
Sabetta, F., and A. Pugliese (1996). Estimation of response spectraand simulation of non-stationary earthquake ground motions, Bull.Seismol. Soc. Am. 86, 337–352.
Salvi, S., and A. Nardi (1995). The Ovindoli fault: a segment of a longer,active fault-zone in central Abruzzi (Italy), in Perspectives in Paleo-seismology, L. Serva and D. B. Slemmons (Editors), Bull. Assoc. Eng.Geol., Spec. Publ., Vol. 6, 101–113.
Salvi, S., F. R. Cinti, L. Colini, G. D’Addezio, F. Doumaz, and E.Pettinelli (2003). Investigation of the active Celano-L’Aquila fault sys-tem, Abruzzi (central Appennines, Italy), with combined ground-penetrating radar and paleosismic trenching, Geophys. J. Int. 155,805–818.
Salvi, S., S. Stramondo, M. Cocco, M. Tesauro, I. Hunstad, M. Anzi dei,P. Brióle, P. Baldi, E. Sansosti, G. Fomaro, R. Lanari, F. Doumaz,A. Pesci, and A. Galvani (2000). Modeling coseismic displace-ments resulting from SAR interferometry and GPS measurementsduring the 1997 Umbria-Marche seismic sequence, J. Seism. 4,479–499.
Effect of Time Dependence on Probabilistic Seismic-Hazard Maps and Deaggregation for the Apennines 609
Savage, J. C. (1991). Criticism of some forecasts of the national earthquakeprediction council, Bull. Seismol. Soc. Am. 81, 862–881.
Southern California Earthquake Center (SCEC) Phase II, (1994). Seismichazards in southern California: probable earthquakes, 1994 to 2024(Phase II), SCEC Rept..
Scherbaum, F., J. Schmedes, and F. Cotton (2004). On the conversion ofsource-to-site, distance measures for extended earthquake source mod-els, Bull. Seismol. Soc. Am. 94, 1053–1069
Stucchi, M., A. Akinci, E. Faccioli, P. Gasperini, L. Malagnini, C. Meletti,V. Montaldo, and G. Valensise (2004). Mappa di Pericolosità sismicadel territorio Nazionale, http://zonesismiche.mi.ingv.it/documenti/rapporto_conclusivo.pdf (in Italian).
Sykes, L. R., and S. P. Nishenko (1984). Probabilities of occurrence of largeplate rupturing earthquakes for the San Andreas, San Jacinto, and Im-perial faults, California, J. Geophys. Res. 89, 5905–5927.
Tertulliani, A., and F. Riguzzi (1995). Earthquakes in Rome during the pastone hundred years, Ann. Geofis. 38, no. 5–6, 581–590.
Valensise, G. and D. Pantosti (Editors), (2001). Database of potentialsources for earthquakes larger than M 5.5 in Italy, version 2.0,Ann. Geofis. 44, 797–964.
Vittori, E., G. P. Cavinato, and E. Miccadei (1995). Active faulting alongthe northeastern edge of the Sulmona basin, central Apennines, Italy,in L. Serva and D. B. Slemmons (Editors), Perspectives in Paleoseis-mology, Ass. of Eng. Geologists, Spec. Publ., no. 6, 83–100.
Weichert, D. H. (1980). Estimation of the earthquake recurrence parame-ters for unequal observation periods for different magnitudes, Bull.Seismol. Soc. Am. 70, 1337–1346.
Wells, D., and K. J. Coppersmith (1994). New empirical relationshipsamong magnitude, rupture length, rupture width, rupture area and sur-face displacement, Bull. Seismol. Soc. Am. 84, 974–1002.
Wessel, P., and W. H. F. Smith (1998). New, improved version of the Ge-neric Mapping Tools released, in EOS Trans. American GeophysicalMonograph 79, 579.
Working Group on California Earthquake Probabilities (WGCEP) (1995).Seismic hazards in southern California: probable earthquakes, 1994to 2024, Bull. Seismol. Soc. Am. 85, 379–439.
Working Group on California Earthquake Probabilities (WGCEP) (2003).Earthquake Probabilities in the San Francisco Bay region: 2000 to2030, U.S. Geol. Surv. Circ. 1189.
Working Group Catalogo Strumentale dei Terremoti Italiani (CSTI) (2001).Catalogo Strumentale dei Terremoti Italiani dal 1981 al 1996, vers. 1.0,Gruppo Nazionale per la Difesa dai Terremoti (Editors), Istituto Na-zionale di Geofisica, Bologna, Italy.
Working Group Catalogo Parametrico dei Terremoti Italiani (CPTI) (2004).Catalogo Parametrico dei Terremoti Italiani, vers. 2004, Istituto Nazio-nale di Geofisica, Bologna, Italy.
Istituto Nazionale di Geofisica e VulcanologiaVia di Vigna Murata 60500143 Rome, [email protected]@[email protected]
(A.A., D.P., L.M.)
Istituto Nazionale di Geofisica e VulcanologiaSezione Milano-Pavia20133 Milano, [email protected]
(F.G.)
U. S. Geological SurveyMS 966, Box 25046Denver, Colorado [email protected]@usgs.gov
(M.P., D.P.)
Manuscript received 5 April 2008
610 A. Akinci, F. Galadini, D. Pantosti, M. Petersen, L. Malagnini, and D. Perkins