A thesis submitted in partial fulfillment of the ... - CGSpace
37
1 INVESTIGATION OF GARDENING, CULTIVATION AND GRAZING ON THE INTUNJAMBILI WETLAND By CHARLIE A.S A thesis submitted in partial fulfillment of the requirements for Bachelor of Science Honours Degree in Agriculture Department of Soil Science and Agricultural Engineering Faculty of Agriculture University of Zimbabwe May 2006 Approved by ………………………….. Mr. K. Motsi (Supervisor)
-
Upload
khangminh22 -
Category
Documents
-
view
0 -
download
0
Transcript of A thesis submitted in partial fulfillment of the ... - CGSpace

1
INVESTIGATION OF GARDENING, CULTIVATION AND GRAZING ON THE
INTUNJAMBILI WETLAND
By
CHARLIE A.S
A thesis submitted in partial fulfillment of the requirements for Bachelor of
Science Honours Degree in Agriculture
Department of Soil Science and Agricultural Engineering
Faculty of Agriculture
University of Zimbabwe
May 2006
Approved by
…………………………..
Mr. K. Motsi
(Supervisor)
2
Abstract ............................................................................................................................... 5
CHAPTER 1 ....................................................................................................................... 6
INTRODUCTION .............................................................................................................. 6
1.1 BACKGROUND ...................................................................................................... 6
1.1.1 Overview............................................................................................................ 6
1.1.2 Justification ........................................................................................................ 7
1.2 OBJECTIVES........................................................................................................... 8
1.3 HYPOTHESES......................................................................................................... 8
CHAPTER TWO ................................................................................................................ 9
LITERATURE REVIEW ................................................................................................... 9
2.1 Overview................................................................................................................... 9
2.2 DAMBO UTILISATION HISTORY ....................................................................... 9
2.2.1 Pre-colonial era .................................................................................................. 9
2.2.2 Colonial era...................................................................................................... 10
2.2.3 Post colonial era to present day ....................................................................... 10
2.3 HYDROLOGIC FUNCTION OF WETLANDS.................................................... 11
2.3.1 Wetland groundwater....................................................................................... 11
2.3.2 Factors affecting groundwater flow ................................................................. 12
Hydraulic Gradients .................................................................................................. 12
Porosity ..................................................................................................................... 13
Storage Coefficient ................................................................................................... 13
2.4 HYDROLOGIC AND HYDRAULIC PROCESSES............................................. 13
2.5 HYDROLOGIC AND HYDRAULIC PROCESSES............................................. 13
2.5.1 Precipitation ..................................................................................................... 13
2.5.2 Groundwater Discharge and Recharge ............................................................ 14
2.5.3 Shallow and Deep Groundwater Flow............................................................. 14
2.6 EFFECT SHALLOW WATER TABLE ON CROPPING..................................... 14
CHAPTER THREE .......................................................................................................... 15
METHODOLOGY ........................................................................................................... 15
3.1 Site description........................................................................................................ 15
3.2 Methodological steps .............................................................................................. 15
3.2.1 Baseline and exploratory surveys .................................................................... 15
3.2.2 Informal interviews.......................................................................................... 16
3.2.3 Formal interviews ............................................................................................ 16
3.2.4 Evaluation ........................................................................................................ 16
3.2.5 Technical Measurements ................................................................................. 16
3.2.5.1 Water table observation wells....................................................................... 16
3.2.5.2 Well structure................................................................................................ 17
3.2.5.3 Analysis of data................................................................................................. 17
CHAPTER FOUR............................................................................................................. 18
4.0 RESULTS AND DISCUSSION............................................................................. 18
4.1 Wetland use activities ............................................................................................. 18
4.1.1 Cultivation........................................................................................................ 18
4.1.2 Gardening......................................................................................................... 19
4.1.3 Grazing............................................................................................................. 20
4.2 ADVANTAGES AND CONSTRAINTS............................................................... 21

3
4.3 WATER TABLE READINGS ............................................................................... 23
5.0 DISCUSSIONS....................................................................................................... 26
5.1 CULTIVATION, GARDENING AND GRAZING............................................... 26
5.2 WATER TABLE READINGS ................................Error! Bookmark not defined.
5.3 CONCLUSIONS..................................................................................................... 27
CHAPTER SIX................................................................................................................. 28
6.0 RECOMMENDATIONS AND INTERVENTIONS ............................................. 28
6.1 Gardening................................................................................................................ 28
6.2 Cultivation............................................................................................................... 28
6.3 Grazing.................................................................................................................... 29
6.4 Tabular form of interventions ..................................Error! Bookmark not defined.
6.5 SUMMARY OF WETLAND MANAGEMENT REQUIREMENTS ................... 29
REFERENCES ............................................................................................................. 30
APPENDICES .............................................................................................................. 31
QUESTIONNAIRES .................................................................................................... 31

4
5
Abstract The research was carried out to assess the effects of the management practices on the
Intunjambili wetland during the 2005-2006 rainy season. After assessing the effects
interventions were supposed to be created that enable sustainable development of the
wetland to occur. Changes in the water regime were also to be investigated so as to
determine the characteristic fluctuations and effects of the fluctuations. The hypothesis
was that current management practices and methods were harmful and environmentally
damaging since the farmers were using unimproved traditional methods of management.
Baseline and exploratory surveys were first carried out to visually observe the practices in
use on the wetland. This was then followed by informal, then formal interviews to obtain
relevant data on the practiced methods. Water table elevations over the period of
investigation were obtained from observation wells situated on the wetland and implemented
for long term observation of the wetland. Cultivation was mainly carried out on the fields
using conventional tillage and some of the farmers used ridges and furrows. The maize crop
was somewhat stunted at the end of the season due to waterlogging. Broad belts broad
furrows were mainly used on the gardens by most of the farmers though some simply used
furrows for vegetable production. Some of the wetland vegetables showed signs of lack of
nutrients due to leaching and some had stunted growth due to excessive weeds on the
gardens, another sign of excess water (the excess water discouraged weeding). A lack of
aeration due to waterlogging also possibly caused some of the above effects. The pastoral
areas for grazing rather flourished during the period of investigation with no ill effects noted.
Water table elevations over the period of investigation were obtained from observation wells
situated on the wetland and implemented for long term observation of the wetland.
The water table levels for the period of study showed some fluctuations mostly due to
rainfall recharge and discharge due to well abstraction by the farmers. The water table
readings were not taken for a substantially long period to make any major conclusions
about the water regime since just one season was used for observations. At around March
30, 2006 the water table had started to fall. Immediate effects of waterlogging and rainfall
recharge were however evident by the end of the cropping period on the planted crop.
Statistical analysis of the water table fluctuations showed a similarity between the
behaviours of wells. From the ANOVA analysis at the 5% level of significance there was
no significant difference between the fluctuations of well 1 and well 2 though for well 2
and well 3 there was a significant difference. There was a significant difference between
the fluctuations of well 3 and well 4 at the 5% level of significance. There was a high
correlation between the fluctuations of well 1 and wells 2, 3 and 4 as can be shown from
the values of the Pearson correlation values and there was a low correlation between the
values of well 2 and well 4. It is suggested that the wetland farmers practice their tillage
activities using ridges and broad belts broad furrows, which maintain a high water table.
The wetland farmers should also practice most of their tillage activities at the upland also
to maintain a high water table.

6
CHAPTER 1
INTRODUCTION
1.1 BACKGROUND
1.1.1 Overview
The most predominantly used type of wetland ecosystem in Zimbabwe are dambos which
are low lying seasonally waterlogged treeless areas in the headwater regions of river
systems. There is approximately 1.28 million hectares of dambo in Zimbabwe of which 2,
5 % are found in communal areas. Dambo gardens are especially important during
drought years when dryland crops are poor, but wet conditions in dambos are still
adequate to yield reasonable harvests (Mazambani, 1982). According to Mharapara
(1995) nearly 20000 hectares of dambos were under informal tillage and were at a
capacity to be increased due to that farmer initiated tillage practices were and are cheaper
to develop than state supported schemes. Dambo catchments were thought to act as
hydrological reservoirs, storing water in the rainy season and releasing it through
evapotranspiration from the dambo surface and dry season stream flow and this was used
as a basis for legislative protection of wetland but has not been supported by more recent
hydrological investigations (Owen et al., 1995). Discouraged by colonial legislation
dambos have been developed entirely through local initiatives. There has been a
preoccupation with the hazards of soil erosion and drying out of dambos in Zimbabwe
(Jennings, 1923; Rattray et al; 1953) such that legal restrictions have prevented
realization of the potential of these seasonally waterlogged lands through various
prohibitive measures enshrined in the legislature. These laws were instituted in order to
protect dry season river flows and to reduce erosion and siltation. Current legislation, the
Zimbabwe Environmental Management Act (EMA) 2002 allows utilization of wetlands
only if authority has been granted by the Ministry of Environment and Tourism including

7
the Ministry of Water Resources. According to Mharapara (1995) farmers have however
developed a variety of land utilization systems and tillage practices according to their
needs. Cormack (1972) has argued that the dambo water should be put to more
productive use in growing crops or improved pastures within dambos, providing there is
no damage to soils or stream flow.
1.1.2 Justification
According to Mharapara (1995) the degradation of dambos, particularly in the communal
areas, continues unabated as the system is subjected to a variety of pressures and uses.
Wetland ecosystems are generally fragile and sensitive to use and any activities carried
out have to be sustainable hence there is a need to study the effects of different activities
such as gardening, grazing and cultivation so as to create appropriate interventions. In
recent years, dambos have been threatened by an extension of agriculture and
overgrazing, caused by a range of socio-economic pressures often linked to government
policies. In many areas, this has resulted in a lowering of the water table which has
resulted in soil erosion, a loss in organic matter and a reduction in local and downstream
water supplies. Those local communities who derive their livelihoods from dambos and
those downstream who rely on a constant supply of freshwater, have suffered as a
consequence. According to Mharapara (1995) dambos derive their potential from the high
moisture and organic content of the soil. The high moisture affects the wetland organic
content hence water balance on dambos needs to be adequately investigated together with
the practices. Care must be taken so as to avoid excess drainage and unhealthy practices
which can have a detrimental effect to the dambo ecosystem. Dambos can be a good
alternative to irrigation in that they are cheaper and require no special infrastructure or
complicated machinery and in addition dambo cultivation can be successfully integrated
with dryland farming hereby helping in hunger alleviation in communal areas. Since
water resources are more limited than land in Zimbabwe, proper water management
strategies are necessary to be part of a sustainable agricultural production system.
Legislation for the control and protection of dambos has proved to be a failure as dambos
in communal areas have been utilized and degraded due to population pressures and
overgrazing.

8
1.2 OBJECTIVES
Main objective
To observe the effects of present management practices on the wetland and to create
interventions which are soil and water conserving
Minor objectives
1. To identify the land use activities and management practices in use in the wet
season.
2. To determine changes in water table over time due to the current practices.
3. To develop interventions that aim at sustainable development on the wetland.
1.3 HYPOTHESES
The hypothesis is that current management practices and methods are harmful and
environmentally damaging and that changes occur on the water table that reflect
management practices.

9
CHAPTER TWO
LITERATURE REVIEW
2.1 Overview
Dambos referred to as seasonally waterlogged, predominantly grass covered shallow
depressions in the headwater zone of rivers. Dambos occur on the plains of eastern and
southern Africa. Because of the availability of soil moisture in dambos during dry
periods, these areas are important to local communities who use them for crop cultivation
and cattle grazing. In the dry season small-scale agriculture in dambos is practiced in the
form of maize and vegetable garden cultivation, based on indigenous water management
techniques. During the rainy season when most of the dambo remains flooded, rice can
also be grown. Each year, the decomposition of the grass and sedge dominated vegetation
leads to the build up of organic matter in the dambo soil - a valuable agricultural
resource.
Among the uses developed by traditional communities are as water sources for domestic use
and livestock grazing, cultivation of cereals or root crops in the wet season, cultivation of
vegetables in the dry season, gathering of wild fruits and medicines or a combination of these
(Mharapara ,1995). In communal areas gardens have been instituted on dambos by
communal farmers. Research carried out by Mharapara (1995) has shown that dambos are
adequately fertile such as to offer high output and returns should they be utilised to the full.
2.2 DAMBO UTILISATION HISTORY
Dambos have long been utilized in Zimbabwe since the early times. There have been rapid
developments however occurring in the last 100 years concerning dambo utilization. These
changes have involved population increases and widespread degradation of dambos including
the passing of legislation.
2.2.1 Pre-colonial era
According to Mharapara (1995) widespread cultivation of dambos took place in Zimbabwe
before the arrival of the Europeans and this is evidenced by folk stories and visible remains
of cultivation practices. Ridges and furrows provide ample evidence of cultivation on the
dambos by the black settlers and this practice has continued into the present day. The

10
traditional system of cultivation dominated in this pre-colonial era. Rice was for long a staple
food for the Mashona on the dambos on the swampy areas in eastern Zimbabwe and was the
main cereal crop though it was later abandoned in favour of the recently introduced maize
crop (E.R. Sawyer, 1909).
2.2.2 Colonial era
This era was characterised by the adoption of different agricultural technologies. According
to Mharapara (1995) when the European settlers arrived in Zimbabwe dambos had by then
been long utilized by the traditional farmers. On settling they immediately discouraged the
traditional farmers from farming since they perceived them as competition and had the
traditional farmers send to the reserves or Tribal Trust Lands. Environmental degradation
however occurred due to population pressures on these reserves from people and livestock.
On the other hand commercial farmers, on seeing the potential of dambos instituted fields on
these dambos for growing crops such as maize, wheat and tobacco. Since the crops do not
grow well under waterlogged conditions drainage ditches were dug to remove the excess
water. This then resulted in degradation in the form of gullying, silting and lowering of water
table. The then government then enacted prohibitive legislation on dambo utilisation namely
the Water act of 1927 and the Natural Resources act of 1941 (revised in 1952). These two
acts prohibited any cultivation along stream banks, in dambos and around the stream source
area.
2.2.3 Post colonial era to present day
The post colonial era has been characterised by land pressure on the former reserves as
well as the need to redress socio-economic imbalances created by the previous
administrators. During this era dambos had mainly been maintained as non arable land.
Two different scenarios have occurred during the post-colonial era. According to
Mharapara (1995) commercial farmers mainly maintained the dambos by engaging in
controlled grazing on the dambos. On these commercial farms there was little or no
cultivation and there were dams on these lands which maintained the water table. On the
communal areas however, there was heavy human and livestock pressures due to the
shortage of land. Poor conservation measures abounded and this led to degradation of the
dambos. There was, as a result of this some overgrazing, erosion and trampling as a

11
result. This then in part led to the enactment of new legislation (EMA) in 2002. There is
still, however, an extensive lack of understanding and appreciation of wetland values,
functions and products by planners and decision-makers and this has largely led to
irreversible damage to the wetland systems of Zimbabwe. A number of the threats and
issues stem from national problems of poverty, population pressure and uncoordinated
sectoral developments. More recently, the conservation and wise use of wetlands as
ecosystems has received increasing attention countrywide.
2.3 HYDROLOGIC FUNCTION OF WETLANDS
Wetland hydrologic functions are the roles that wetlands play in modifying or controlling
the quantity of water moving through a wetland. Some of the major hydrologic functions
of wetlands are as flood storage and stormflow modification, ground-water recharge and
discharge and alterations of precipitation and evaporation. An understanding of wetland
functions and the underlying chemical, physical, and biological processes supporting
these functions facilitates the management and protection of wetlands. The hydrologic
and water-quality functions of wetlands are controlled by landscape position, climate,
topographic location, presence or absence of vegetation, type of vegetation, type of soil
and water inflow and outflow from the wetland. Natural functions of wetlands can be
altered or impaired by human activity and management practices. Although slow
incremental changes in the natural landscape can lead to small changes in wetlands, the
accumulation of these small changes can permanently alter the wetland function
(Brinson, 1988).
2.3.1 Wetland groundwater
The hydrologic and hydraulic characteristics of a wetland influence all wetland functions
and affect its use. The processes by which water is introduced, temporarily stored, and
removed from a wetland are commonly known as the water budget. Water is introduced
to a wetland through direct precipitation, overland flow (or runoff), channel and overbank
flow and groundwater discharge. Temporary storage includes channel, overbank, basin,
and groundwater storage. Water is removed from the wetland through evaporation, plant
transpiration, channel and overland flow and groundwater recharge. To evaluate whether
groundwater is influenced by wetland functions, it is important to understand ground

12
water processes.
2.3.2 Factors affecting groundwater flow
Groundwater flow is influenced by a number of factors, including hydraulic gradients,
hydraulic conductivity, porosity, and storage coefficients.
Hydraulic
Gradients
The hydraulic gradient is the difference in piezometric head between two
locations divided by the distance between them. Generally, this is measured
by installing several wells, bore holes, or piezometers, and measuring the
head in each. For groundwater flows to or from the surface water, the
elevation of the surface water is the upper piezometric head.
Hydraulic
Conductivity
This is the ability of the soil to conduct water under hydraulic gradients. The
hydraulic conductivity or permeability depends on soil characteristics such
as type, size, shape, and packing. Hydraulic conductivity can be estimated in
a number of ways (Xiscoll 1986, Lamb and Whitman 1969). Local values of
hydraulic conductivity can be measured by performing a slug test in a well
location. Field-wide measurements can be determined from an aquifer
performance test, in which one well is pumped and the variation of the
piezometric head in nearby wells is observed over time (SCS 1992).

13
Porosity
Porosity is the fraction of a soil volume occupied by voids, and represents
the potential area through which water can flow. It is usually measured in the
laboratory from a soil sample, although knowledge of the soil type can give
a fair estimate of porosity. Together with the flow rate calculated from
Darcy’s Law (Freeze and Cherry 1979), the soil porosity can be used to
estimate groundwater travel times.
Storage
Coefficient
The storage coefficient is a measure of the amount of water stored in an
aquifer for a unit rise in the elevation of the piezometric head. For an
unconfined aquifer, the storage coefficient (or specific yield) determines the
rate of change in elevation of the water table. Values of this parameter can
be estimated, crudely, from knowledge of the soil material.
2.4 HYDROLOGIC AND HYDRAULIC PROCESSES
Some of the major hydrologic functions of wetlands are as flood storage and storm flow
modification, ground-water recharge and discharge and alterations of precipitation and
evaporation. Natural functions of wetlands can be altered or impaired by human activity.
Although slow incremental changes in the natural landscape can lead to small changes in
wetlands, the accumulation of these small changes can permanently alter the wetland
function (Brinson, 1988).
2.5 HYDROLOGIC AND HYDRAULIC PROCESSES
The primary hydrologic and hydraulic processes that influence wetland groundwater
interaction are precipitation, infiltration, groundwater discharge or recharge, shallow and
deep groundwater flow, groundwater pumping, and evaporation and transpiration.
2.5.1 Precipitation
Groundwater processes associated with wetlands result from local and regional
precipitation patterns. Precipitation can influence a wetland water budget directly through
rain within the wetland, or indirectly through inflows from upstream watersheds.

14
2.5.2 Groundwater Discharge and Recharge
Groundwater discharge occurs where the elevation of the water table exceeds that of the
surface water and recharge results when the opposite occurs. Estimates of the rate of
groundwater discharge or recharge can be obtained by applying Darcy’s Law. Wetlands
have been observed to change seasonally from discharge to recharge or flow-through
systems. As a result, it is important to examine the variability of wetland groundwater
characteristics.
2.5.3 Shallow and Deep Groundwater Flow
The interaction between the shallow groundwater zone and the underlying regional
groundwater system can influence the rate of shallow groundwater transport, and thus the
interaction with surface waters and wetlands. In some systems a confining layer exists
that decouples the shallow and deep groundwater zones. In these cases it is important that
local shallow-water well piezometric heads are used to assess wetland groundwater
function. The potential influence of the deep groundwater zone can be examined by
inspecting available information for evidence of confining material or other significant
changes in formation composition. This process can be further examined utilizing
measurements of head from shallow piezometers and deep wells to develop piezometric
contours of the system.
2.6 EFFECT SHALLOW WATER TABLE ON CROPPING
Plants have several requirements which need to be met if they are to be productive. The
hydrologic behaviour of the water table affects the plant characteristics in turn. Generally
water in the ground rises by capillary action and when it reaches o 1500mm below the
surface of the land the land is said to be waterlogged. When this happens the soil pores
within the root zone are filled with subsoil water. The air circulation within the root zone
is then totally stopped and the plants suffer as a result.
According to Basack (2003) the effects of waterlogging are:
1. Salinisation - when dissolved salts come to the surface by capillary action and
when they are deposited there, salinisation has occurred. The soil then becomes
alkaline and the alkalinity inhibits plant growth.

15
2. Lack of aeration - When this occurs, the anaerobic conditions cause bacteria and
micro-organisms to undergo minimum breakdown. Complex compounds are then
not broken down into simpler compounds which can then be uptaken by plants.
3. Temperature reduction - Low temperatures inhibit micro-organism effects and
behaviour.
4. Prevalence of disease – There is a multiplication of diseases when there are
excess water conditions.
5. Restricted root growth – excess water causes the prevalence of restricted root
growth.
CHAPTER THREE
METHODOLOGY
3.1 Site description
The Intunjambili wetland lies at about 42 kilometres from Bulawayo. This wetland area is
along Tuli, a tributary to the Limpopo River and covers an area of approximately 30hectares.
Soils are sandy, with some black clay and the slope is gentle. The wetland is located at
20º27ºS, 28º41ºE and is at 1500m above sea level. The area lies in region 4 which has low
annual rainfall (400 to 600mm per annum). There are several farmers situated on the
Intunjambili wetland who carry out various management practices. Several families are
settled on the wetland and these carry out grazing, cultivation and gardening on the wetland.
Maize cropping and vegetable gardening is carried out on some sections of the land and
gardens are the predominant activity on the wetland. The Intunjambili wetlands climate is
characterised by a very long and hot dry season.
3.2 Methodological steps
The methodological steps were as follows
3.2.1 Baseline and exploratory surveys
This involved initial inspection of the methods and practices being employed by the farmers.
It involved going throughout the wetland and observing what was being undertaken by the

16
wetland inhabitants and their daily activities especially before the current cropping season.
This data will serve as a benchmark for monitoring and evaluation.
3.2.2 Informal interviews
Interviews were carried out on the ordinary individual farmers on their practices, methods of
management and scope and intensity of their activities and the cropping habits. The
interviews mainly aimed at assessing the production practices including the specific crops
which are cultivated on the wetland. Some key participants were interviewed and differences
and similarities in their methods noted.
3.2.3 Formal interviews
This was done with the aid of two local males who accompanied the research party
throughout the wetland and helped in questioning the wetland inhabitants about their
methods. These males helped in translating the farmers’ responses during interviews helping
to overcome the language barrier by helping to communicate the questions to the wetland
inhabitants.
3.2.4 Evaluation
This involved evaluation during and after the cropping season to note the management
practices carried out by the farmers and the state of the crops at the end of the cropping
season.
3.2.5 Technical Measurements
3.2.5.1 Water table observation wells
Four wells were used and their water table levels continuously from around 23 December
to 31 March. Regular monitoring of the water table level from the surface was carried out
weekly and a tape measure was used to measure from the surface to the water table depth.
These wells were chosen because they were located on areas where the activities of
gardening, grazing and cultivation were being carried out in close proximity so as to
measure the water table at positions whereby the effects of the three activities were
greater more acute and more representative.

17
3.2.5.2 Well structure
Small diameter pipes were used which were vertically inserted into the ground. These
were used to determine the depth of the water table from the ground level. Since the
water table is close to the surface shallow observation wells were used.
The wells in use are composed of a PVC casing, a locking well plug, a curb box and a
PVC pipe. A locking well plug casing was set in around the above grade portion of a well
with a locking cap. A Curb box or manhole and cover flush with the pavement surface
were used to protect the well. A locking well plug or other appropriate seal was used to
insure that wells installed at ground level were watertight. A PVC pipe was used that
reached to about 1.5 to 2.5 meters below the ground.
3.2.5.3 Analysis of data
Data from questionnaires was analysed using the SPSS statistical package and data from the
wells was also analysed using the SPSS statistical package. An Analysis of Variance
(ANOVA) was carried out to determine if there were any significant differences between the
different water table elevations. A p value was then used to interpret the results at a 95%
confidence interval. The Pearson’s correlation was used to determine the correlation between
the values of the water table fluctuations. The short questionnaire was analysed using the
SPSS statistical package.

18
CHAPTER FOUR
4.0 RESULTS AND DISCUSSION
4.1 Wetland use activities
These were gardening, cultivation and grazing for the 2005-2006 cropping season.
4.1.1 Cultivation
The crop mainly grown on the plots was maize during the summer season. Each of the
plots was subdivided into maize fields and gardening. On each plot, shallow irrigation
wells were dug whereby the farmers access their water for irrigating their fields. A
cultivated field is shown in fig1.
Fig 1 Cultivated Fields
Maize cultivation took place on the dambos from around October 2005 to March 2006.
The wetland inhabitants left some of the land fallow for the duration of the cropping
season. There was no intercropping practiced. Most of the dryland dambo farmers
practiced conventional tillage for maize cropping. Only a small amount of the cultivated
land has ridges on contours or has any ridges at all. Some of the farmers had ridges and
furrows trending down the slope to facilitate drainage of excess water from the wetland.
19
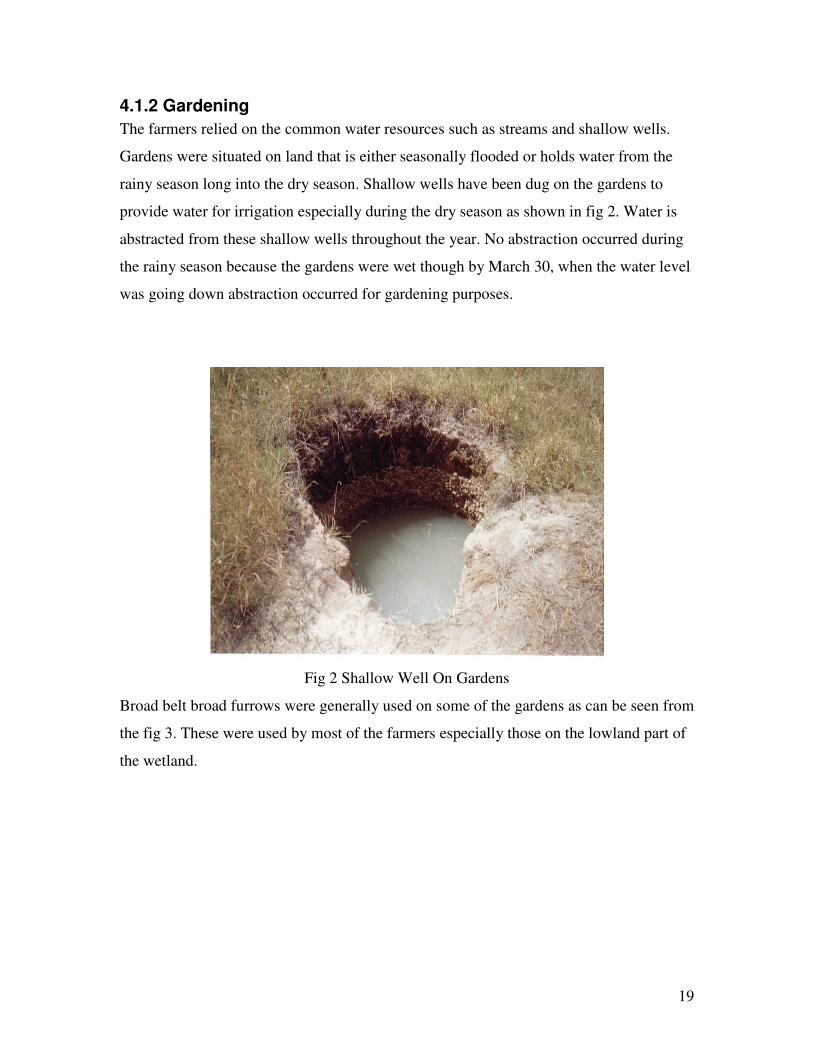
4.1.2 Gardening
The farmers relied on the common water resources such as streams and shallow wells.
Gardens were situated on land that is either seasonally flooded or holds water from the
rainy season long into the dry season. Shallow wells have been dug on the gardens to
provide water for irrigation especially during the dry season as shown in fig 2. Water is
abstracted from these shallow wells throughout the year. No abstraction occurred during
the rainy season because the gardens were wet though by March 30, when the water level
was going down abstraction occurred for gardening purposes.
Fig 2 Shallow Well On Gardens
Broad belt broad furrows were generally used on some of the gardens as can be seen from
the fig 3. These were used by most of the farmers especially those on the lowland part of
the wetland.

20
Fig 3 Broad Belts Broad Furrows On Dambo
4.1.3 Grazing
Grazing occurred throughout the wetland with the entire uncultivated dambo being used
as grazing lands. Grazing occurred alongside cultivation and gardening and even on the
marshy land. No rotational grazing took place on the dambos and there appeared to be no
fodder production done by the dambo farmers. No ill effects or overgrazing was observed
on the grazing pastures. Fig 4 shows some of the pastures.
Fig 4 Grazing Area As At 30 March

21
4.2 ADVANTAGES AND CONSTRAINTS
4.2.1 Gardening
Some of the farmers seemed to maintain broad furrows and ridges, which are a
recognized conservation practice that maintains a high water table, though there are some
minor signs of nutrient loss. The wetland however experienced an excess of water as can
be seen by the state of the choumolier at around 30 March as shown in fig 5. The
vegetable has some purple leaves, a possible sign of potassium deficiency caused by
excess water. The vegetables also experienced stunted growth and the prevalence of tiny
leaves which may also have been caused by a lack of aeration in addition to nutrient loss.
The gardens show some neglect as evidenced by the presence of the grass and weeds on
the gardens. This is because of the excess water that made weeding impossible.
4.2.2 Cultivation
Most of the farmers had ridges and furrows on their fields. In addition some of the
farmers had left some of their land fallow which are both good practices for conserving
soil and nutrients.
There was however excess water on the fields as can be seen from the state of the maize
crop. The maize crop appears to have experienced excess water as evidenced by stunted
characteristics of the maize, evidence of insufficient uptake of nutrients and a lack of
aeration, which may have been caused by excess water.
4.2.3 Grazing
There were no recognizable ill effects on the grazing pastures

22
Fig 5 State of Choumolier As At 30 March

23
Fig 6 Cultivated Fields As On 30 March
4.3 WATER TABLE READINGS
0
100
200
300
400
500
600
700
800
900
1 2 3 4 5 6 7 8 9 10 11 12 13 14 15
week number
wa
ter
tab
le e
lev
ati
on
well 1 well 2 well 3 well 4
The wells 1 and 2 were on elevation A on the lowland and the wells 3 and 4 were on

24
elevation B on the upland. Since the above levels were measured from the surface of the
ground to the surface of the water, peaks relate to a decline in the water table levels
whilst drops relate to a rise in the water table levels. Wells A and B were almost similar
in their variations over the cropping season as can be shown by the statistical analysis.
During the period of data collection for well 1 the water table value remained lower than
400mm for the whole period of data collection with the exception of week 3 where the
depth was 415m though the water table level did not go lower than 100mm. The water
table depth for well 2 did not go lower than 100mm nor did it go higher than 300mm for
well 2 for the whole period of data collection. For elevation B the variations are rather
different with well 3 experiencing higher water table levels than well 4 throughout the
entire period of data collection showing that the water table was lower. The trend
however is that of a continuous decrease in the value of the level of well 3 until about
week 11 showing that the water table level was increasing. From then on there is an
increase then a slight decrease in the values on the final week (week 15). The water table
elevations did not go lower than 600mm or higher than 805mm for the whole period of
data collection. Roughly the same variations are observed on the well 4 though some
spikes do occur on weeks 3, 6, 8, 12 and 14. The upward spikes and rises were due to
discharge due to rainfall. On week three there was a sudden peak possibly caused by
abstraction of water from the wells for gardening and also due to wetland discharge. It
can be observed that the rainfall intensity before the readings were taken (before week 1)
was much lower since the trends of the wells show a gradual decline meaning that there
was a gradual recharge of the water table. The low points on the graph were due to
rainfall recharge.
4.4 STATISTICAL ANALYSIS
Analysis of the data was done by the SPSS statistical package. One way ANOVA was
used and also Pearson’s correlation. Four water table observations were analysed for their
water table fluctuations over a period of 15 weeks.
From the ANOVA tables there was no significant difference between the means of the
fluctuations of well 1 and well 2, well1 and well 3 and well 1 and well 4 since p>0.05.
There was no significant difference between the means of well 2 and well 3 and well 2

25
and well 4 since also p>0.05. There was no significant difference between the means of
well 3 and well 4 since p>0.05.
There was a high correlation between the fluctuations of well 1 and wells 2, 3 and 4 as
can be shown from the values of the Pearson correlation values of 0.882, 0.630 and
0.720. There was a lower correlation between the values of well 2 and well 4 where the
Pearson value was 0.495.
26
CHAPTER FIVE
5.0 DISCUSSIONS
5.1 CULTIVATION, GARDENING AND GRAZING
The crops on the different gardening activities on the wetland showed an acute response
to variations in the wetland water table and also to the different activities being carried
out on the wetland. The cultivated fields where maize cropping was predominant
generally experienced low yields due to that most if not all of the plants experienced
stunted growth or premature maturation. The plants obviously suffered from an excess of
water during the rainy season due to their tillage practices namely conventional tillage
with minimal ridging. The waterlogged conditions on most of the fields caused adverse
effects to be experienced on the fields namely the leaching of nutrients and a lack of
aeration. The gardens experience the same problems whereby there was excess water
with an obvious adverse effect on the vegetables on the gardens and again leaching of
nutrients. Waterlogging especially on the non broad based gardens causes various
negative results on most of the plants (purplish leaves and stunted growth), drying up of
leaves and also the promotion of pests and diseases which led to drying out of leaves. The
excess water also discouraged weeding which caused the grass to flourish on the gardens,
again leading to stunted growth due to nutrient uptake by the grasses. The grazing areas
did not experience any noticeable adverse effects and they actually flourish during the
rainy season. From the water abstraction well on fig 2 it is evident that the water table
level had gone down considerably by 30 March. From the statistical analysis tables there
was no significant difference between the means of the fluctuations of well 1 and well 2,
well1 and well 3 and well 1 and well 4 since p>0.05. There was no significant difference
between the means of well 2 and well 3 and well 2 and well 4 since also p>0.05. There
was no significant difference between the means of well 3 and well 4 since p>0.05.
There was a high correlation between the fluctuations of well 1 and wells 2, 3 and 4. This
showed that the behaviour of the wells were similar on both the upland and the lowland
where recharge and discharge were concerned and the similarity on correlation show how
close the behaviour of the fluctuations were.

27
5.2 WATER TABLE READINGS
As can be seen from the abstraction water wells on fig 2 there was a lowering of the
water table at around March whereby recharge from the rains had ceased. The
fluctuations of the water table had a direct effect on the conditions on the wetland
surface, from water logging to dryness. The practices carried out by the farmers such as
conventional tillage, maize cropping non-ridged gardening were inadequate to cope with
the excess water which is experienced on the wetland. The water table levels for the
lowlands do not experience great variation from week 4 to week 15 though some spikes
due to rainfall discharge were evident.
5.3 CONCLUSIONS
The current dambo farming practices on the wetland require some improvement since it
is evident that the excess water experienced during the rainy season is affecting the
yields. There is however no noticeable adverse effects on the water table on the wetland
except for some normal fluctuations due to rain recharge. At around March 30, 2006 the
water table had started to fall. The effects of the rain were very marked on the water table
as can be seen from the graphs. The practices in place do little to help improve the output
in a sustaining manner. Tillage activities, which are in use, require improvement to
increase yields and to make the area more sustainable. Lack of adequate drainage has
resulted in waterlogging on the tillage fields and this has resulted in wasted effort by the
farmers. The same thing has occurred on the gardens where broad furrows were not being
used. Dambo farming on the wetland seems to require some changes and interventions so
as to enhance the output hence the adoption rate for the changes and interventions is of
great importance. The adoption rate for the technologies can however take some time
since the interventions may require some machinery and other expensive inputs. The
suggested interventions are in no way exhaustive since there may be more requirements
for wetland improvement, which have not currently been looked into.

28
CHAPTER SIX
6.0 RECOMMENDATIONS AND INTERVENTIONS
6.1 Gardening
Some of the farmers were using broad belts broad furrows on their gardens as shown
below.
Fig 7 Broad Belts Broad Furrows After Construction
Not all the farmers seem to be using broad belts in their gardens and this has led to a
gradual lowering of the water table hence the first suggested intervention is the adoption
of broad belts broad furrows on all the gardens which help to raise the level of the water
table. The excess water on the gardens as observed by the state of the vegetable leaves
necessitates the creation of drainage ditches to drain the excess water from the gardens
especially on the lowland parts of the wetland where excess water is a problem. There is
also evidence of fungi and pests as a result of the excess water.
6.2 Cultivation
Some conservation tillage practices such as contouring and the use of drainage ditches

29
will reduce the amount of excess water on the field at the same time reducing ponding,
which seems to be a problem where conventional tillage is practiced. The use of broad
belt broad furrows is a safe practice that has been confined to gardening though it can
also be used for cultivation so as to raise the water table in the wetland. It is advised that
cultivation be confined to the upper part of the dambo where water logging is not a
problem instead of the lowland. The institution of the rice crop on the wetland seems a
feasible option since rice does well on the excess water. Rice can be intercropped on the
wetland together with maize crop especially in the drainage ditches if drainage ditches
are instituted.
6.3 Grazing
Rotational grazing is advised since this may relieve pressure that may in the future occur
on the dambo pastures. Fodder production is also advised though there are no noticeable
adverse effects of the presence of pastures on the wetland.
6.4 SUMMARY OF WETLAND MANAGEMENT REQUIREMENTS
1. It is suggested that the wetland farmers practice their tillage activities using ridges
and broad belts broad furrows, which maintain a high water table. Subsurface
drainage is also advised to drain away excess water during the rainy season.
2. The wetland farmers should also practice their tillage activities at the upland.
3. Planting dates should be shifted so that the farmers plant earlier than their current
dates to avoid waterlogging.
4. To make maximum use of the fields or any drainage channels instituted,
intercropping with rice can prove to be beneficial within the channels or rice
cropping with no intercropping can be used.
5. The pastoral lands should be left untouched since they have always been used
without any adverse effects.

30
REFERENCES
Basack, N.N., 2003. Irrigation engineering, 4th
edition, Tata McGraw Hill Publishing,
New Dehli.
Bullock A and McCartney. M.P. 1998 Wetland and river flow interactions in
Zimbabwe.
Carter, V., and Novitzki, R. P. 1986. “Some comments on the relation between
groundwater and wetlands,” The ecology and management of wetlands;
Chow, V. T. 1964. Handbook of hydrology. McGraw-Hill, New York.
Christiansen, J. E. 1968. “Pan evaporation and evapotranspiration from climatic data,
Journal of the Irrigation and Drainage Division, ASCE, 263-265.
Cormack, J.M. 1972. Efficient utilisation of water through land management. Rhodesian
Agriculture Journal. 9(1):11-16.
Courier. Volume 1: Ecology of wetlands. D. D. Hook, et al., eds, Timber Press, Portland,
OR. 68-86.
Driscoll, F. G. 1986. Groundwater and wells, second edition, Johnson Filtration
Systems, Inc., St. Paul, MN.
Freeze, R. A., and Cherry, J. A. 1979. Groundwater. Prentice-Hall, Englewood Cliffs,
NJ.
Jennings, A.C. 1923. Erosion, especially surface washing in Southern Rhodesia. South
African Journal of Science. 20:204-207.
Kadlec, R. H., Williams, R. B., and Scheffe, R. D. 1986. “Wetland evapotranspiration
in temperate and arid climates. Timber Press, Portland.
Mazambani, D. 1982. Peri-urban cultivation within Greater Harare. Zimbabwe Science
News 16(6):134-138.
Mharapara, IM. 1994. A Fundamental Approach to Dambo Utilization.
Owen, R., K. Verbeek, J. Jackson, and T. Steenhuis 1995. Dambo Farming in

31
Zimbabwe: Water Management, Cropping and Soil Potentials for Smallholder Farming in
Wetlands. Conference Proceedings. University of Zimbabwe, CIIFAD.
Rattray, J.M. 1957. The grass and grass associations of Southern Rhodesia. Rhodesian.
Agricultural Journal. 54(3): 197-234.
Rattray, J.M. Cormack, R.M.M. and Staples, R.R. 1953. The vlei areas of S. Rhodesia
and their uses. Rhodesian Agricultural Journal. 50:465-483.
Scoones. I991. Wetlands in drylands: Key resources for agricultural and pastoral
production in Africa.
Whitlow J. R. 1984. A Survey of Dambos in Zimbabwe. Zimbabwe Agricultural Journal
81(4).
Whitlow J. R.1985. Dambos in Zimbabwe, A review. Zimbabwe Agricultural Journal
Winter, T. C. 1988. “A conceptual framework for assessing cumulative impacts on the
hydrology of non tidal wetlands,” Environmental Management 12(5), 605-620
APPENDICES
APPENDIX 4
QUESTIONNAIRES
1. What are the numbers of households using dambos?
2. When did you start growing crops on dambos?
1. 1 year ago 2. More than 1 year ago
3. How have you been watering your crops?
1. Using shallow wells 2. Not using shallow wells
4. What is the size of your garden?
5. How have the people used dambos?
1. as gardens and fields 2. As pastures
6. When was it used for crop production?
1. 1 year ago 2. More than 1 year ago
7. What are the problems faced?
1. Pests 2. Water logging 3. Lack of water
8. What technology is used?

32
9. At what time is the dambo used most and why?
1. Throughout the year 2. During the rainy season
10. When do you carry out various operations in the dambos?
1. Throughout the year 2. During the rainy season
11. How do you overcome waterlogging problems in gardens?
1. Tolerate them 2. No solutions 3. Furrows and ridges
12 How do you overcome waterlogging problems in fields?
1. Tolerate them 2. No solutions 3. Furrows and ridges
13. What are the existing cultural practices in terms of land preparation
1. No tillage 2. Cultivation then ridging 3. Cultivation then planting
14. What are the existing cultural practices in terms of planting?
15 What are the existing cultural practices in terms of irrigating?
1. Throughout year using shallow wells 2. No irrigating 3. Streams
16 What are the existing cultural practices in terms of weeding?
1. No weeding 2. Weed throughout year 3. Weed only when necessary
17 What are the existing cultural practices in terms of fertilizing?
1. No fertilizing 2. Fertilizing with manure 3. Adequate fertilizing
18 What are the existing cultural practices in terms of harvesting?
1. Hand harvesting 2. Harvesting with beasts
19 What are the existing cultural practices in terms of crop rotation?
1. No crop rotation 2. Adequate crop rotation
13. What methods are used to improve soil fertility?
1. None 2. Manure 3. Fertilizing. 4. Crop rotation
14. What are the problems associated with each crop?
1. Water logging 2. Pests 3. Inadequate nutrient
15. What animals are used for grazing?
1. Cattle 2. Goats
16. How are the dambos managed for fodder production?
1. No fodder 2. Fodder produced
17. How are the dambos managed for rotational grazing?
1. No rotational grazing 2. Rotational grazing

33
APPENDIX 1 ANALYSIS OF VARIANCE FOR WELL FLUCTUATIONS
ANOVA 1
Sum of
Squares
df Mean
Square
F Sig.
WELL2 Between
Groups
15473.733 9 1719.304 12.642 .006
Within
Groups
680.000 5 136.000
Total 16153.733 14
WELL3 Between
Groups
41593.333 9 4621.481 1.324 .397
Within
Groups
17450.000 5 3490.000
Total 59043.333 14
WELL4 Between
Groups
91414.433 9 10157.159 1.327 .396
Within
Groups
38262.500 5 7652.500
Total 129676.933 14
ANOVA 2
Sum of
Squares
df Mean
Square
F Sig.
WELL1 Between
Groups
52760.000 8 6595.000 13.045 .003
Within
Groups
3033.333 6 505.556
Total 55793.333 14
WELL3 Between
Groups
49230.833 8 6153.854 3.763 .062
Within
Groups
9812.500 6 1635.417
Total 59043.333 14
WELL4 Between
Groups
105281.100 8 13160.138 3.237 .085
Within
Groups
24395.833 6 4065.972
Total 129676.933 14
ANOVA 3
Sum of
Squares
df Mean
Square
F Sig.
WELL1 Between
Groups
55376.667 12 4614.722 22.151 .044
Within
Groups
416.667 2 208.333
Total 55793.333 14
WELL2 Between
Groups
16087.067 12 1340.589 40.218 .025
Within
Groups
66.667 2 33.333
Total 16153.733 14
WELL4 Between
Groups
108076.933 12 9006.411 .834 .665

34
Within
Groups
21600.000 2 10800.000
Total 129676.933 14
ANOVA 4
Sum of
Squares
df Mean
Square
F Sig.
WELL1 Between
Groups
54764.167 10 5476.417 21.285 .005
Within
Groups
1029.167 4 257.292
Total 55793.333 14
WELL2 Between
Groups
16024.567 10 1602.457 49.624 .001
Within
Groups
129.167 4 32.292
Total 16153.733 14
WELL3 Between
Groups
50443.333 10 5044.333 2.346 .213
Within
Groups
8600.000 4 2150.000
Total 59043.333 14
APPENDIX 2
4.4 Correlations
WELL1 WELL2 WELL3 WELL4
WELL 1 Pearson Correlation 1.000 .882 .630 .720
Sig. (2-tailed) .000 .012 .002
N 15 15 15 15
WELL 2 Pearson Correlation .882 1.000 .668 .495
Sig. (2-tailed) .000 .007 .061
N 15 15 15 15
WELL 3 Pearson Correlation .630 .668 1.000 .694
Sig. (2-tailed) .012 .007 .004
N 15 15 15 15
WELL 4 Pearson Correlation .720 .495 .694 1.000
Sig. (2-tailed) .002 .061 .004
N 15 15 15 15
Correlation is significant at the 0.01 level (2-tailed).
Correlation is significant at the 0.05 level (2-tailed).
APPENDIX 3 FREQUENCY DISTRIBUTION FOR QUESTIONNAIRES
WHENCROP
Frequency Percent Valid
Percent
Cumulative
Percent

35
Valid more than i
year ago
10 100.0 100.0 100.0
HOWWATER
Frequency Percent Valid
Percent
Cumulative
Percent
Valid using
shallow
wells
10 100.0 100.0 100.0
USEDAMBO
Frequency Percent Valid
Percent
Cumulative
Percent
Valid gardens and
fields
8 80.0 80.0 80.0
pastures 2 20.0 20.0 100.0
Total 10 100.0 100.0
WHENPROD
Frequency Percent Valid
Percent
Cumulative
Percent
Valid 1 year ago 3 30.0 30.0 30.0
more than 1
year ago
7 70.0 70.0 100.0
Total 10 100.0 100.0
PROBFAC
Frequency Percent Valid
Percent
Cumulative
Percent
Valid pests 1 10.0 10.0 10.0
waterlogging 9 90.0 90.0 100.0
Total 10 100.0 100.0
TIMEUSE
Frequency Percent Valid
Percent
Cumulative
Percent
Valid throughout
year
6 60.0 60.0 60.0
rainy season 4 40.0 40.0 100.0
Total 10 100.0 100.0
HOWATERL
Frequency Percent Valid
Percent
Cumulative
Percent
Valid tolerate 9 90.0 90.0 90.0
11.00 1 10.0 10.0 100.0
Total 10 100.0 100.0
CULLAND
Frequency Percent Valid
Percent
Cumulative
Percent
Valid cultivation
then ridging
3 30.0 30.0 30.0
cultivation
then
planting
7 70.0 70.0 100.0
Total 10 100.0 100.0
CULIRR
Frequency Percent Valid
Percent
Cumulative
Percent
Valid shallow
wells
6 60.0 60.0 60.0
streams 4 40.0 40.0 100.0

36
Total 10 100.0 100.0
CULWEED
Frequency Percent Valid
Percent
Cumulative
Percent
Valid throughout
year
8 80.0 80.0 80.0
when
necessary
2 20.0 20.0 100.0
Total 10 100.0 100.0
CULFERT
Frequency Percent Valid
Percent
Cumulative
Percent
Valid no
fertilizing
2 20.0 20.0 20.0
manure
fertilizing
8 80.0 80.0 100.0
Total 10 100.0 100.0
CULHARV
Frequency Percent Valid
Percent
Cumulative
Percent
Valid hand 8 80.0 80.0 80.0
beasts 2 20.0 20.0 100.0
Total 10 100.0 100.0
CULCROP
Frequency Percent Valid
Percent
Cumulative
Percent
Valid no crop
rotation
7 70.0 70.0 70.0
adequate
crop
rotation
3 30.0 30.0 100.0
Total 10 100.0 100.0
SOILLFER
Frequency Percent Valid
Percent
Cumulative
Percent
Valid manure 5 50.0 50.0 50.0
fertilizing 5 50.0 50.0 100.0
Total 10 100.0 100.0
PROBCRO
Frequency Percent Valid
Percent
Cumulative
Percent
Validwaterlogging 7 70.0 70.0 70.0
pests 3 30.0 30.0 100.0
Total 10 100.0 100.0
GRAZANI
Frequency Percent Valid
Percent
Cumulative
Percent
Valid cattle 10 100.0 100.0 100.0
FODDPR
Frequency Percent Valid
Percent
Cumulative
Percent
Valid no fodder 10 100.0 100.0 100.0
ROTATG
Frequency Percent Valid
Percent
Cumulative
Percent
Valid no 10 100.0 100.0 100.0

37
rotational
grazing