A Thesis Submitted in Partial Fulfillment of the Requirements ...
162
i A Thesis Submitted in Partial Fulfillment of the Requirements for the Degree of Master of Science in Microbiology Prince of Songkla University 2013 Copyright of Prince of Songkla University Kawitsara Borwornwiriyapan Screening of Soil Fungi from Plant Genetic Conservation Project Area, Rajjaprabha Dam, Suratthani Province which Produced Antimicrobial Substances i
-
Upload
khangminh22 -
Category
Documents
-
view
0 -
download
0
Transcript of A Thesis Submitted in Partial Fulfillment of the Requirements ...
i
A Thesis Submitted in Partial Fulfillment of the Requirements for the Degree of
Master of Science in Microbiology
Prince of Songkla University
2013
Copyright of Prince of Songkla University
Kawitsara Borwornwiriyapan
Screening of Soil Fungi from Plant Genetic Conservation Project Area,
Rajjaprabha Dam, Suratthani Province which Produced
Antimicrobial Substances
i
ii Thesis Title Screening of Soil Fungi from Plant Genetic
Conservation Project Area, Rajjaprabha Dam, Suratthani Province which Produced Antimicrobial Substances
Author Miss Kawitsara Borwornwiriyapan Major Program Master of Science in Microbiology Major Advisor: Examining Committee: ………………………………………… ..……………………………Chairperson (Assoc. Prof. Dr. Souwalak Phongpaichit) (Asst. Prof. Dr. Youwalak Dissara) Co-advisor: ...............................................................
(Assoc. Prof. Dr. Souwalak Phongpaichit)
………………………………………… ………………………………………… (Dr. Jariya Sakayaroj) (Dr. Jariya Sakayaroj)
………………………………………….. (Dr. Pawika Boonyapipat)
The Graduate School, Prince of Songkla University, has approved this thesis as partial fulfillment of the requirements for the Master of Science Degree in Microbiology.
………………………………….. (Assoc. Prof. Dr. Teerapol Srichana)
Dean of Graduate School

iii This is to certify that the work here submitted is the result of the candidate’s own investigations. Due acknowledgement has been made of any assistance received.
...………………………………Signature
(Assoc. Prof. Dr. Souwalak Phongpaichit) Major advisor
...………………………………Signature (Miss Kawitsara Borwornwiriyapan) Candidate
v
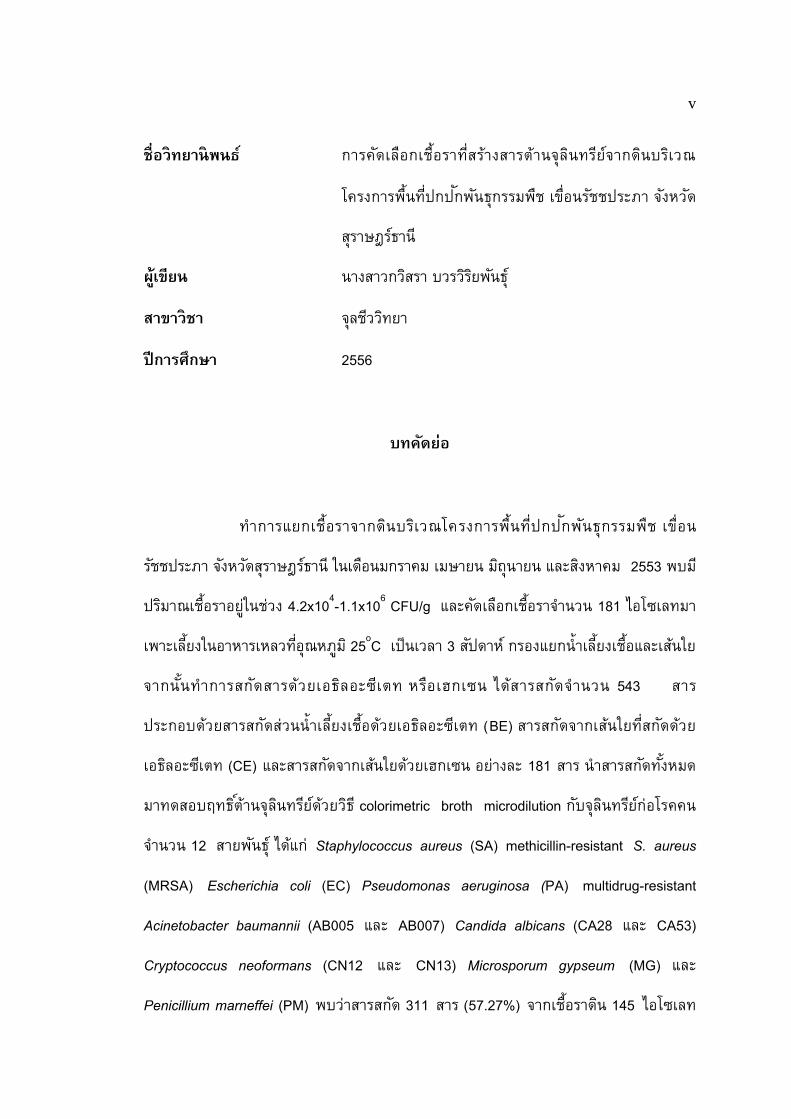
ชอวทยานพนธ การคดเลอกเชอราทสรางสารตานจลนทรยจากดนบรเวณ
โครงการพนทปกปกพนธกรรมพช เขอนรชชประภา จงหวด
สราษฎรธาน
ผเขยน นางสาวกวสรา บวรวรยพนธ
สาขาวชา จลชววทยา
ปการศกษา 2556
บทคดยอ
ท าการแยกเชอราจากดนบรเวณโครงการพนทปกปกพนธกรรมพช เขอน
รชชประภา จงหวดสราษฎรธาน ในเดอนมกราคม เมษายน มถนายน และสงหาคม 2553 พบม
ปรมาณเชอราอยในชวง 4.2x10⁴-1.1x10⁶ CFU/g และคดเลอกเชอราจ านวน 181 ไอโซเลทมา
เพาะเลยงในอาหารเหลวทอณหภม 25oC เปนเวลา 3 สปดาห กรองแยกน าเลยงเชอและเสนใย
จากนนท าการสกดสารดวยเอธลอะซเตท หรอเฮกเซน ไดสารสกดจ านวน 543 สาร
ประกอบดวยสารสกดสวนน าเลยงเชอดวยเอธลอะซเตท (BE) สารสกดจากเสนใยทสกดดวย
เอธลอะซเตท (CE) และสารสกดจากเสนใยดวยเฮกเซน อยางละ 181 สาร น าสารสกดทงหมด
มาทดสอบฤทธตานจลนทรยดวยวธ colorimetric broth microdilution กบจลนทรยกอโรคคน
จ านวน 12 สายพนธ ไดแก Staphylococcus aureus (SA) methicillin-resistant S. aureus
(MRSA) Escherichia coli (EC) Pseudomonas aeruginosa (PA) multidrug-resistant
Acinetobacter baumannii (AB005 และ AB007) Candida albicans (CA28 และ CA53)
Cryptococcus neoformans (CN12 และ CN13) Microsporum gypseum (MG) และ
Penicillium marneffei (PM) พบวาสารสกด 311 สาร (57.27%) จากเชอราดน 145 ไอโซเลท
vi
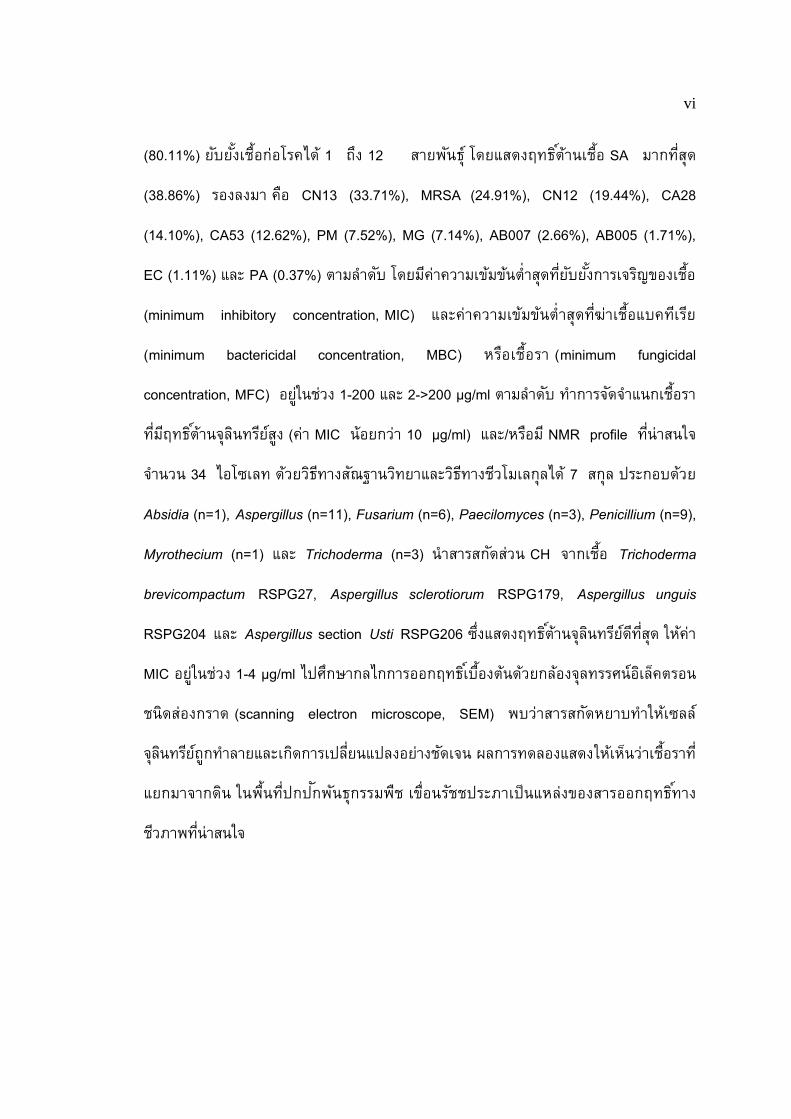
(80.11%) ยบยงเชอกอโรคได 1 ถง 12 สายพนธ โดยแสดงฤทธตานเชอ SA มากทสด
(38.86%) รองลงมา คอ CN13 (33.71%), MRSA (24.91%), CN12 (19.44%), CA28
(14.10%), CA53 (12.62%), PM (7.52%), MG (7.14%), AB007 (2.66%), AB005 (1.71%),
EC (1.11%) และ PA (0.37%) ตามล าดบ โดยมคาความเขมขนต าสดทยบยงการเจรญของเชอ
(minimum inhibitory concentration, MIC) และคาความเขมขนต าสดทฆาเชอแบคทเรย
(minimum bactericidal concentration, MBC) หรอเชอรา (minimum fungicidal
concentration, MFC) อยในชวง 1-200 และ 2->200 µg/ml ตามล าดบ ท าการจดจ าแนกเชอรา
ทมฤทธตานจลนทรยสง (คา MIC นอยกวา 10 µg/ml) และ/หรอม NMR profile ทนาสนใจ
จ านวน 34 ไอโซเลท ดวยวธทางสณฐานวทยาและวธทางชวโมเลกลได 7 สกล ประกอบดวย
Absidia (n=1), Aspergillus (n=11), Fusarium (n=6), Paecilomyces (n=3), Penicillium (n=9),
Myrothecium (n=1) และ Trichoderma (n=3) น าสารสกดสวน CH จากเชอ Trichoderma
brevicompactum RSPG27, Aspergillus sclerotiorum RSPG179, Aspergillus unguis
RSPG204 และ Aspergillus section Usti RSPG206 ซงแสดงฤทธตานจลนทรยดทสด ใหคา
MIC อยในชวง 1-4 µg/ml ไปศกษากลไกการออกฤทธเบองตนดวยกลองจลทรรศนอเลคตรอน
ชนดสองกราด (scanning electron microscope, SEM) พบวาสารสกดหยาบท าใหเซลล
จลนทรยถกท าลายและเกดการเปลยนแปลงอยางชดเจน ผลการทดลองแสดงใหเหนวาเชอราท
แยกมาจากดน ในพนทปกปกพนธกรรมพช เขอนรชชประภาเปนแหลงของสารออกฤทธทาง
ชวภาพทนาสนใจ
vii
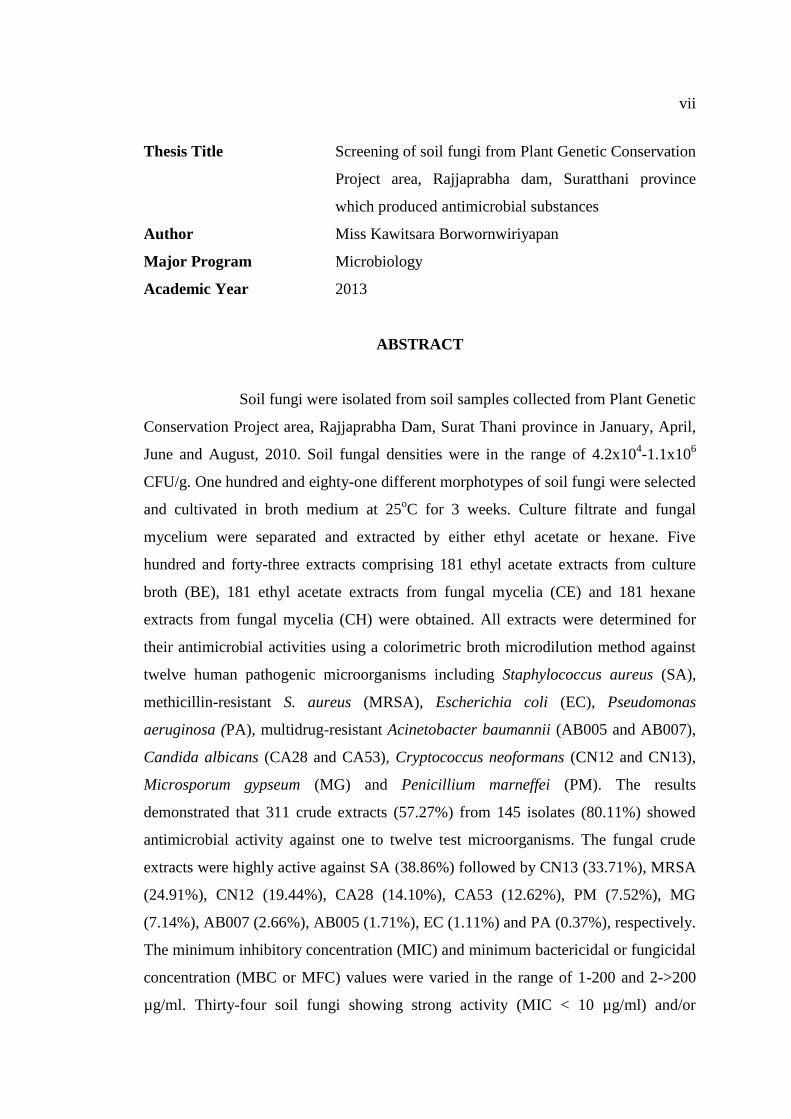
Thesis Title Screening of soil fungi from Plant Genetic Conservation
Project area, Rajjaprabha dam, Suratthani province
which produced antimicrobial substances
Author Miss Kawitsara Borwornwiriyapan
Major Program Microbiology
Academic Year 2013
ABSTRACT
Soil fungi were isolated from soil samples collected from Plant Genetic
Conservation Project area, Rajjaprabha Dam, Surat Thani province in January, April,
June and August, 2010. Soil fungal densities were in the range of 4.2x10⁴-1.1x10
6
CFU/g. One hundred and eighty-one different morphotypes of soil fungi were selected
and cultivated in broth medium at 25oC for 3 weeks. Culture filtrate and fungal
mycelium were separated and extracted by either ethyl acetate or hexane. Five
hundred and forty-three extracts comprising 181 ethyl acetate extracts from culture
broth (BE), 181 ethyl acetate extracts from fungal mycelia (CE) and 181 hexane
extracts from fungal mycelia (CH) were obtained. All extracts were determined for
their antimicrobial activities using a colorimetric broth microdilution method against
twelve human pathogenic microorganisms including Staphylococcus aureus (SA),
methicillin-resistant S. aureus (MRSA), Escherichia coli (EC), Pseudomonas
aeruginosa (PA), multidrug-resistant Acinetobacter baumannii (AB005 and AB007),
Candida albicans (CA28 and CA53), Cryptococcus neoformans (CN12 and CN13),
Microsporum gypseum (MG) and Penicillium marneffei (PM). The results
demonstrated that 311 crude extracts (57.27%) from 145 isolates (80.11%) showed
antimicrobial activity against one to twelve test microorganisms. The fungal crude
extracts were highly active against SA (38.86%) followed by CN13 (33.71%), MRSA
(24.91%), CN12 (19.44%), CA28 (14.10%), CA53 (12.62%), PM (7.52%), MG
(7.14%), AB007 (2.66%), AB005 (1.71%), EC (1.11%) and PA (0.37%), respectively.
The minimum inhibitory concentration (MIC) and minimum bactericidal or fungicidal
concentration (MBC or MFC) values were varied in the range of 1-200 and 2->200
µg/ml. Thirty-four soil fungi showing strong activity (MIC < 10 µg/ml) and/or
viii
interesting NMR profiles were identified based on morphological and molecular data
into 7 genera including Absidia (n=1), Aspergillus (n=11), Fusarium (n=6),
Paecilomyces (n=3), Penicillium (n=9), Myrothecium (n=1) and Trichoderma (n=3).
Cell hexane extracts from Trichoderma brevicompactum RSPG27, Aspergillus
sclerotiorum RSPG179, Aspergillus unguis RSPG204 and Aspergillus section Usti
RSPG206 were the most active extracts with MIC values of 1-4 g/ml. Electron
microscopic observation of the treated cells with these strongly active extracts showed
pronounced morphological changes consistent with cell damage. The results show
that soil fungi isolated from Plant Genetic Conservation Project area, Rajjaprabha
dam could be a potential source of antimicrobial substances.
xi
CONTENTS
Page
บทคดยอ v
ABSTRACT vii
ACKNOWLEDGEMENTS ix
CONTENTS xi
LIST OF TABLES xiii
LIST OF FIGURES xv
LIST OF ABBREVIATIONS AND SYMBOLS xix
CHAPTER 1 INTRODUCTION
1.1 Background and rationale 1
1.2 Reviews of the literature 2
1.3 Objectives of this study 29
CHAPTER 2 MATERIALS AND METHODS
2.1 Materials 30
2.2 Methods 35
CHAPTER 3 RESULTS
3.1 Number of isolated soil fungi 48
3.2 Fungal species identified by morphology 48
3.3 Antimicrobial activity of fungal crude extracts 52
3.4 Study on possible mechanisms of action of the active 66
crude extracts by scanning electron microscopy (SEM)
3.5 Identification of interesting soil fungi 69
CHAPTER 4 DISCUSSIONS
4.1 Number of isolated soil fungi 91
4.2 Fungal species identified by morphology 92
4.3 Antimicrobial activity of fungal crude extracts 93
4.4 Study on possible mechanisms of action of the active 96
crude extracts by scanning electron microscopy (SEM)
xii
CONTENTS (CONT.)
Page
4.5 Identification of interesting soil fungi 97
CHAPTER 5 CONCLUSIONS 112
REFERENCES 114
APPENDIX 139
VITAE 145
xiii
LIST OF TABLES
Table Page
1 Antimicrobial, antifungal, antiprotozoal and antiviral 8
substances produced by soil fungi
2 Anticancer or cytotoxic metabolites isolated from soil 11
fungi
3 Antioxidant potential of soil fungi 13
4 Examples of the PCR process inhibitors 14 5 Standard conditions for PCR amplification: concentration 20
of the different PCR components
6 Additive reagents used in PCR amplification 23
7 Universal and fungal specific primers used for DNA 43
amplification and DNA sequencing
8 PCR mixtures for DNA amplification 45
9 PCR profiles for DNA amplification 46
10 Number of fungal isolates and fungal density in soil samples 49
11 Number of fungal genera isolated from soil samples 50
12 Number of active crude extracts and soil fungi tested at 53
a concentration of 200 µg/ml
13 MIC and MBC or MFC ranges of active fungal crude 59
extracts against each test microorganism
14 Number of active fungal crude extracts against each test 62
microorganism at each MIC and MBC or MFC value
15 Potential crude extracts presenting strong activity 63
(MIC<10 µg/ml) or the best MIC against each test
microorganism
xiv
LIST OF TABLES (CONT.)
Table Page
16 Selected soil fungi presenting strong antimicrobial activity 70
and/or interesting NMR profile
17 Identification of selected soil fungi by morphological 111
and molecular characteristics
xv
LIST OF FIGURES
Figure Page
1 Example of wood-decay fungi 5
2 Nematode captured by the nematode-destroying fungus 5
3 Mycorrhizal fungus and plant roots 6
4 Photograph of lichens on the basalt 7
5 Schematic of the nuclear ribosomal DNA in fungi 15
6 Schematic of PCR amplification 19
7 Photograph of Plant Genetic Conservation Project area 28
under the Royal initiative of Her Royal Highness Princess
Maha Chakri Sirindhron at Rajjaprabha dam
8 Map of Rajjaprabha dam showing the five survey trails 30
9 Soil fungal colonies on rose-bengal chloramphenicol agar 36
10 Chemical extractions of secondary metabolites produced 37
by soil fungi
11 Universal and fungal specific primers map for small subunit 44
(SSU), internal transcribed spacer (ITS) and large subunit
(LSU) ribosomal DNA regions
12 Microscopic morphologies of representative isolated soil 51
fungi (40X)
13 Antimicrobial activity of fungal crude extracts and soil 54
fungi at a concentration of 200 µg/ml
14 Number of susceptible test microorganisms inhibited by 55
fungal crude extracts at a concentration of 200 µg/ml
15 Types of active crude extracts against test microorganisms 55
at a concentration of 200 µg/ml
16 Percentage of each type of active crude extracts against 57
each test microorganism at a concentration of 200 µg/ml
xvi
LIST OF FIGURES (CONT.)
Figure Page
17 Number of active crude extracts having strong, moderate 60
and weak activity against each test microorganism
18 Scanning electron micrographs of S. aureus ATCC 25923 67
(SA) after 24 hours of incubation at 35°C
19 Scanning electron micrographs of methicillin-resistant 67
S. aureus (MRSA) after 24 hours of incubation at 35°C
20 Scanning electron micrographs of C. albicans ATCC 90028 67
(CA28) after 24 hours of incubation at 35°C
21 Scanning electron micrographs of C. albicans NCPF 3153 68
(CA53) after 24 hours of incubation at 35°C
22 Scanning electron micrographs of C. neoformans ATCC 90112 68
(CN12) after 48 hours of incubation at 25°C
23 Scanning electron micrographs of C. neoformans ATCC 90113 68
(CN13) after 48 hours of incubation at 25°C
24 Scanning electron micrographs of P. marneffei clinical isolate 69
(PM) after 3 days of incubation at 25°C
25 Morphological characteristics of Absidia sp. RSPG214 72
26 Morphological characteristics of Aspergillus spp. 73
27 Morphological characteristics of Fusarium spp. 74
28 Morphological characteristics of Paecilomyces sp. RSPG52 75
29 Morphological characteristics of Penicillium spp. 76
30 Morphological characteristics of Trichoderma spp. 77
31 Morphological characteristics of unidentified fungi 78
xvii
LIST OF FIGURES (CONT.)
Figure Page
32 Phylogenetic tree of Aspergillus spp. based on 82
ITS1-5.8S-ITS2 sequences. The number of each branch
point represents percentage bootstrap support (≥50 %)
from Maximum Parsimony with 100 replications are shown
on the branch. P. griseofulvum JX231006 and P. citrinum
JQ647899 were used as outgroups. Length; 168 steps;
consistency index (CI); 0.8810; retention index (RI);
0.9903; homoplasy index (HI); 0.1190; rescaled consistency
index (RC); 0.8724.
33 Maximum parsimonious tree of Penicillium spp. based on 84
ITS1-5.8S-ITS2 sequences. The number on each branch
presents percentage of bootstrap values support (≥50 %)
with 100 replications. A. versicolor JX845289 and
Trichocoma paradox JF417485 were used as outgroups.
Length; 393 steps; consistency index (CI); 0.6947;
retention index (RI); 0.9620; homoplasy index (HI);
0.3053; rescaled consistency index (RC); 0.6683.
34 Phylogenetic tree based on ITS1-5.8S-ITS2 sequences of 88
soil fungi in order Hypocreales. The number on each branch
represents percentage of bootstrap values support (≥50 %)
with 100 replications. Bionectria lucifer AF210683 and
B. epichloe JN198444 were used as outgroups. Length;
389 steps; consistency index (CI); 0.8123; retention
index (RI); 0.9767; homoplasy index (HI); 0.1877;
rescaled consistency index (RC); 0.7934.
xviii
LIST OF FIGURES (CONT.)
Figure Page
35 Maximum parsimonious tree of RSPG214 based on 90
ITS1-5.8S-ITS2 sequences. The number on each branch
represents percentage of bootstrap values support (≥50 %)
with 1000 replications. Cunninghamella elegans FJ792589
and C. bertholletiae FJ345351 were used as outgroups.
Length; 1961 steps; consistency index (CI); 0.5502;
retention index (RI); 0.7267; homoplasy index (HI); 0.4498;
rescaled consistency index (RC); 0.3998.
36 Partial ITS rDNA sequences alignment of RSPG185 100
and closely related taxa. Distinct nucleotides of RSPG185
compared with other sequences are marked.
37 Partial ITS rDNA sequences alignment of RSPG99 103
and closely related taxa. Distinct nucleotides of RSPG99
compared with other sequences are marked.
38 Partial ITS rDNA sequences alignment of RSPG214 110
and closely related taxa
xix
LIST OF ABBREVIATIONS AND SYMBOLS
CFU = Colony forming unit
TFU = Total fungal unit
kg = Kilogram
g = Gram
mg = Milligram
µg = Microgram
ng = Nanogram
ml = Milliliter
µl = Microliter
cm = Centimeter
mm = Millimeter
M = Molar
mM = Millimolar
rpm = Round per minute
pH = Potential of hydrogen ion
GANA = Glucose ammonium nitrate agar
TSM = Trichoderma selective media
NMR = Nuclear magnetic resonance
1
CHAPTER 1
INTRODUCTION
1.1 Background and rationale
Antibiotic resistance is a type of drug resistance where a
microorganism is capable to survive exposure to an antibiotic. Nowadays, antibiotic
resistance has become an important problem in the public health system worldwide.
Infections caused by resistant microorganisms frequently fail to respond to
conventional treatment, resulting in prolonged illness and greater risk of death
(Odonkor and Addo, 2011). There is a need to find new antibiotics from various
sources and natural products, which are still a worth promise (Newman and Cragg,
2007).
Filamentous fungi are well-known as the major producers of diverse
bioactive natural products. Secondary metabolites produced by fungi usually exhibit
toxicity or inhibitory effects on other organisms. Therefore, many fungal secondary
metabolites have been developed for using in pharmaceutical, industry, agriculture
and environment (Shwab and Keller, 2008). In addition, most of these compounds
have been discovered from fungi inhabited in soil (Livermore, 2011).
Soil fungi play an important role in improving soil quality by recycling
of organic matter and aggregation (Morton, 2005). There are many reports on soil
fungi which produced bioactive substances. Cazar et al. (2005) extracted terreic acid
and butyrolactone I from Aspergillus terreus that is active against Erwinia
carotovora, a plant pathogenic bacterium. Xiao-Yan et al. (2006) found trichokonins
from Trichoderma koningii inhibit Gram-positive bacteria and plant pathogenic fungi.
Moreover, Petit et al. (2009) isolated Penicillium sp. producing a new compound
2
which has activities against Candida albicans, Listeria monocytogenes and Bacillus
cereus. Although many soil fungi have been exploited, the potential ones can still be
found from an undisturbed area. Thus, Rajjhaprabha Dam Plant Genetic Conservation
Project area under the Royal initiative of Her Royal Highness Princess Maha Chakri
Sirindhron or RSPG area is a good place to look for soil fungi producing interesting
antimicrobial substances.
1.2 Reviews of the literature
1.2.1 Soil in general (Subbarao, 1999)
Soil is the outer sheathing of the earth which comprises of loosely
arranged layers of inorganic and organic matter in different stages of organization. It
provides the physical support needed for the anchorage of the root system and serves
as the source of air, water and nutrients which are necessary for plant growth. Each
soil zone may contain various soil types and each type of soil is characterized by the
presence of different horizons. The formations of soil horizons rely on climate, living
organisms, parent rock material, topography and time.
1.2.2 Soil physicochemical environment (Standing and Killham, 2007)
1.2.2.1 Water
Water carries ions, nutrients, dissolved gases and heat, as well as
microorganisms. Soil water potential is the sum of matrix, osmotic and pressure
potentials, and is the key measure of the water activity in the soil.
1.2.2.2 Organic and inorganic matters
The reduced forms of inorganic chemicals such as Fe2+
, SO3-, S
0, NH4
+
and NO2- are served as the chemical energy of chemoautotrophs. Organic matter does
not provide only the energy source for heterotrophic soil microbes; it is also the main
source of nutrients, as most of the N, P and S.

3
1.2.2.3 Temperature
Soil temperature is an important factor of activity and distribution of
soil microorganisms. Temperature affects microbial physiology, nutrient, substrate
diffusion and water activity. In addition, temperature involves rates of physical,
chemical and physiological reactions in soil environment.
1.2.2.4 Light
Light stimulates plant seed germination, seedling establishment and
growth. It also directly affects the microbial distribution and activity near soil surface
or where light can reach and served as an energy source of photoautotrophic soil
microorganisms.
1.2.2.5 Soil atmosphere and redox potential
The characteristics of soil atmosphere are strongly correlated to soil
water regime. Soil water potential is critical to define the diffusive supply of oxygen.
Oxygen tends to display a gradient of concentration from the surface to the margin of
the rooting depth.
1.2.2.6 pH
Soil pH represents a major factor of microbial distribution and activity
in soil. The pH of the soil is the product of a number of determinants and processes.
First, it is evaluated by the parent material and the degree of mineral weathering since
formation. Second, the biological processes of soil microbes are able to change the
soil pH to varying degrees. Several soil microorganisms can tolerate pH condition that
is unsuitable for them. For example, various fungi isolated from acid forest soils are
not acidophiles but they are highly competitive under considerable acidity.
1.2.3 Soil microorganisms (Subbarao, 1999; Zuberer and Wollum II, 2005)
Soil organisms are both numerous and highly diverse. Several soil
organisms are small and can be seen by using the magnification. The microorganisms
inhabited in soil including bacteria, actinomycetes, fungi, algae, protozoa and virus
4
are mentioned as microflora. They are the key of the biological changes in this
environment (Takahashi et al., 2008).
The dominant microorganism in all soils is fungi. Fungi are an
abundant group in acid soil because acidic condition is not promoting the growth of
bacteria and actinomycetes. The most common fungus isolated from soil is the
mitosporic fungi. Yeasts can be found in soil but their numbers are low. In soil
ecosystem, fungi play a very important role in the recycling of important chemical
elements by degrading organic matter. Their hyphal networks grow through soils,
helping to bind soil particles into aggregates. Some of the fungi are capable to grow
symbiotically with plant roots resulting in increasing nutrient and water uptake.
However, fungi also have a dark site as pathogen to animals, plants and microbes.
Furthermore, they produce harmful metabolic byproducts known as mycotoxin
(Morton, 2005).
1.2.4 Groups and roles of soil fungi
Soil fungi can be classified into three groups as follows:
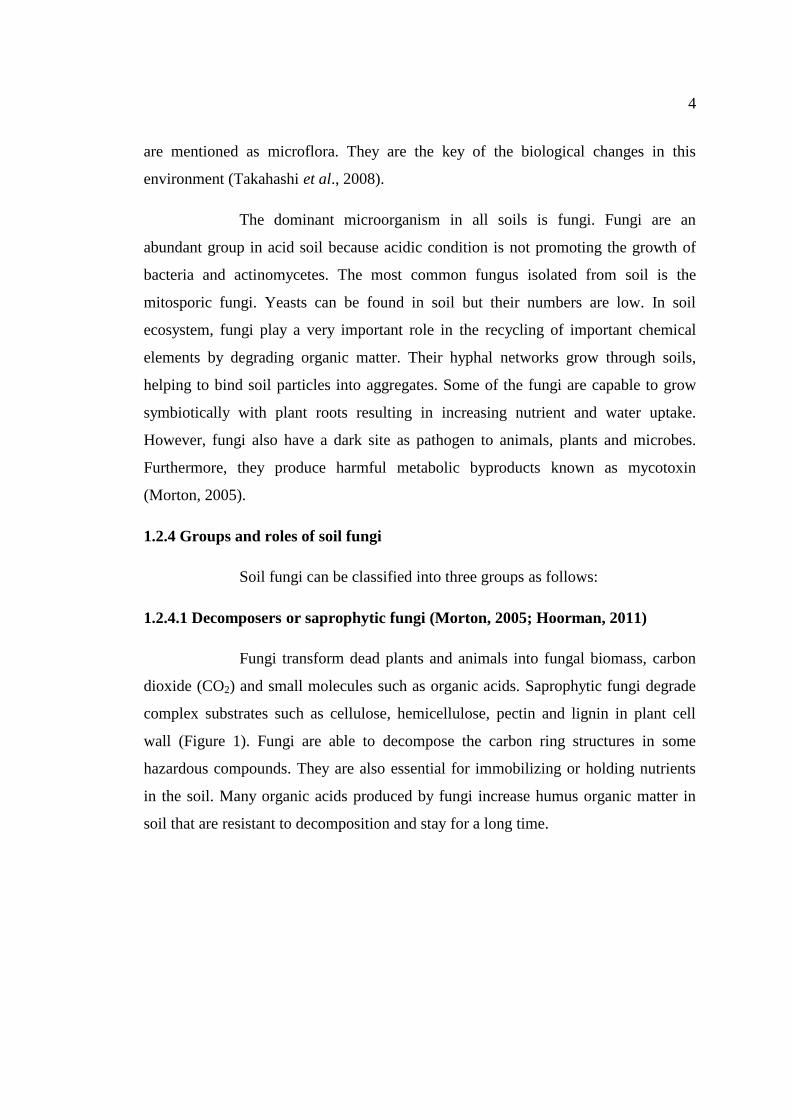
1.2.4.1 Decomposers or saprophytic fungi (Morton, 2005; Hoorman, 2011)
Fungi transform dead plants and animals into fungal biomass, carbon
dioxide (CO2) and small molecules such as organic acids. Saprophytic fungi degrade
complex substrates such as cellulose, hemicellulose, pectin and lignin in plant cell
wall (Figure 1). Fungi are able to decompose the carbon ring structures in some
hazardous compounds. They are also essential for immobilizing or holding nutrients
in the soil. Many organic acids produced by fungi increase humus organic matter in
soil that are resistant to decomposition and stay for a long time.
5
(A) (B)
Figure 1 An example of wood-decay fungi
(A) A closer view of brown-rooted wood
(B) Scanning electron micrograph of brown-rooted wood
Source: http://forestpathology.cfans.umn.edu/microbes.htm
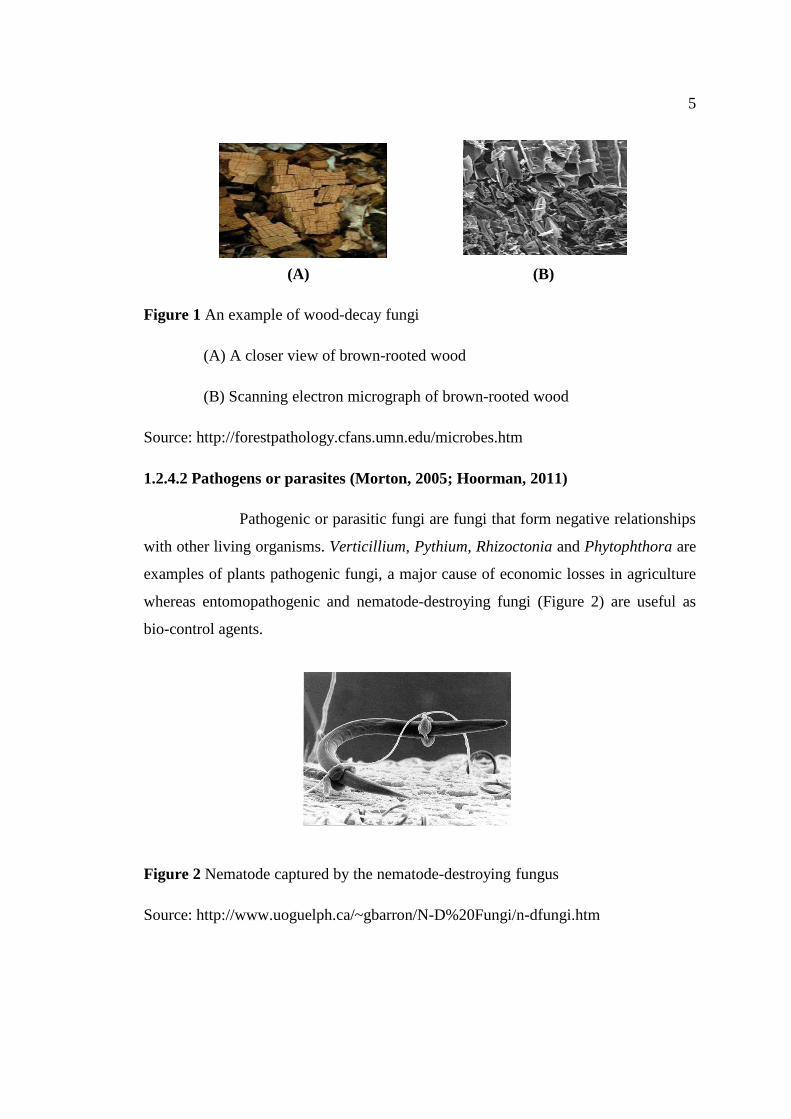
1.2.4.2 Pathogens or parasites (Morton, 2005; Hoorman, 2011)
Pathogenic or parasitic fungi are fungi that form negative relationships
with other living organisms. Verticillium, Pythium, Rhizoctonia and Phytophthora are
examples of plants pathogenic fungi, a major cause of economic losses in agriculture
whereas entomopathogenic and nematode-destroying fungi (Figure 2) are useful as
bio-control agents.
Figure 2 Nematode captured by the nematode-destroying fungus
Source: http://www.uoguelph.ca/~gbarron/N-D%20Fungi/n-dfungi.htm
6
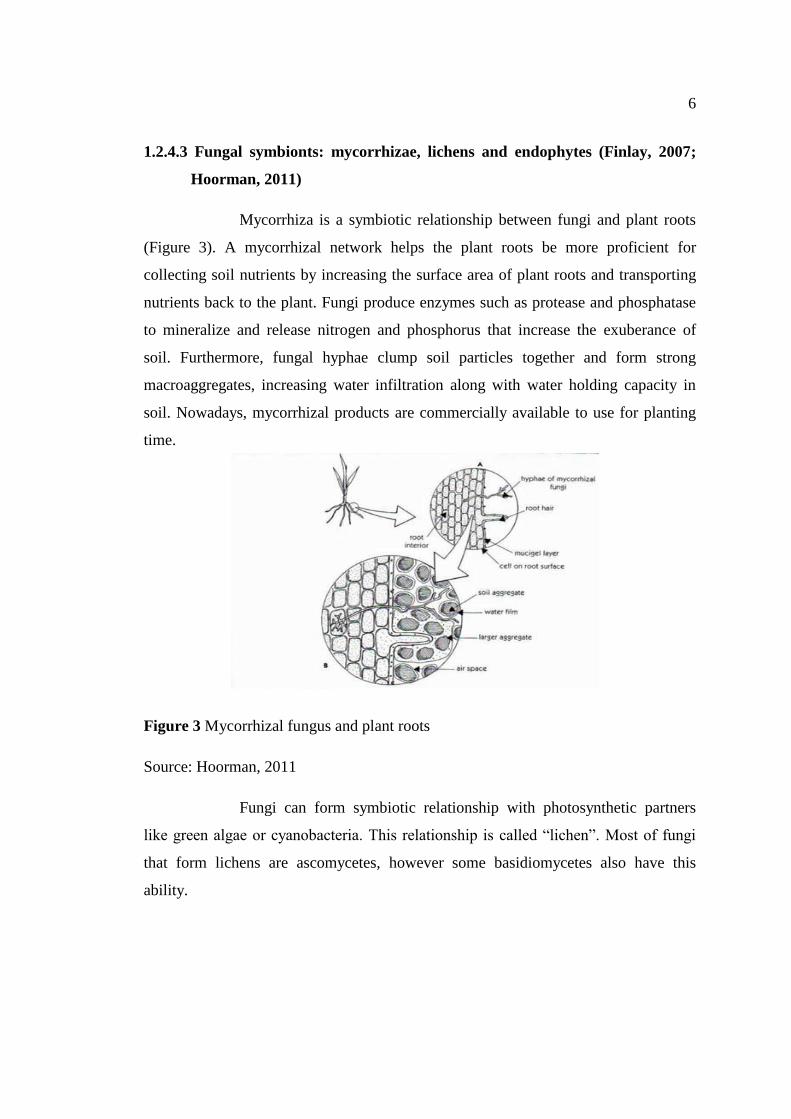
1.2.4.3 Fungal symbionts: mycorrhizae, lichens and endophytes (Finlay, 2007;
Hoorman, 2011)
Mycorrhiza is a symbiotic relationship between fungi and plant roots
(Figure 3). A mycorrhizal network helps the plant roots be more proficient for
collecting soil nutrients by increasing the surface area of plant roots and transporting
nutrients back to the plant. Fungi produce enzymes such as protease and phosphatase
to mineralize and release nitrogen and phosphorus that increase the exuberance of
soil. Furthermore, fungal hyphae clump soil particles together and form strong
macroaggregates, increasing water infiltration along with water holding capacity in
soil. Nowadays, mycorrhizal products are commercially available to use for planting
time.
Figure 3 Mycorrhizal fungus and plant roots
Source: Hoorman, 2011
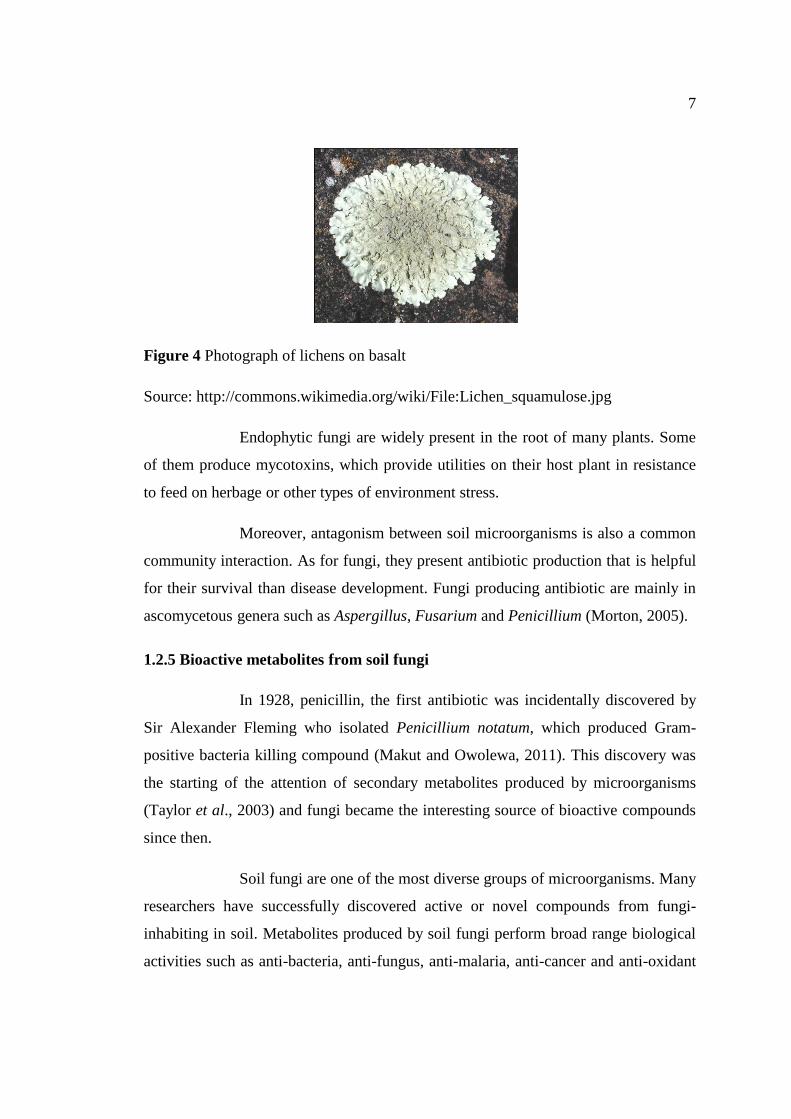
Fungi can form symbiotic relationship with photosynthetic partners
like green algae or cyanobacteria. This relationship is called “lichen”. Most of fungi
that form lichens are ascomycetes, however some basidiomycetes also have this
ability.
7
Figure 4 Photograph of lichens on basalt
Source: http://commons.wikimedia.org/wiki/File:Lichen_squamulose.jpg
Endophytic fungi are widely present in the root of many plants. Some
of them produce mycotoxins, which provide utilities on their host plant in resistance
to feed on herbage or other types of environment stress.
Moreover, antagonism between soil microorganisms is also a common
community interaction. As for fungi, they present antibiotic production that is helpful
for their survival than disease development. Fungi producing antibiotic are mainly in
ascomycetous genera such as Aspergillus, Fusarium and Penicillium (Morton, 2005).
1.2.5 Bioactive metabolites from soil fungi
In 1928, penicillin, the first antibiotic was incidentally discovered by
Sir Alexander Fleming who isolated Penicillium notatum, which produced Gram-
positive bacteria killing compound (Makut and Owolewa, 2011). This discovery was
the starting of the attention of secondary metabolites produced by microorganisms
(Taylor et al., 2003) and fungi became the interesting source of bioactive compounds
since then.
Soil fungi are one of the most diverse groups of microorganisms. Many
researchers have successfully discovered active or novel compounds from fungi-
inhabiting in soil. Metabolites produced by soil fungi perform broad range biological
activities such as anti-bacteria, anti-fungus, anti-malaria, anti-cancer and anti-oxidant
8
that are valuable for biotechnological applications (Petit et al., 2009; Antipova et al.,
2011).
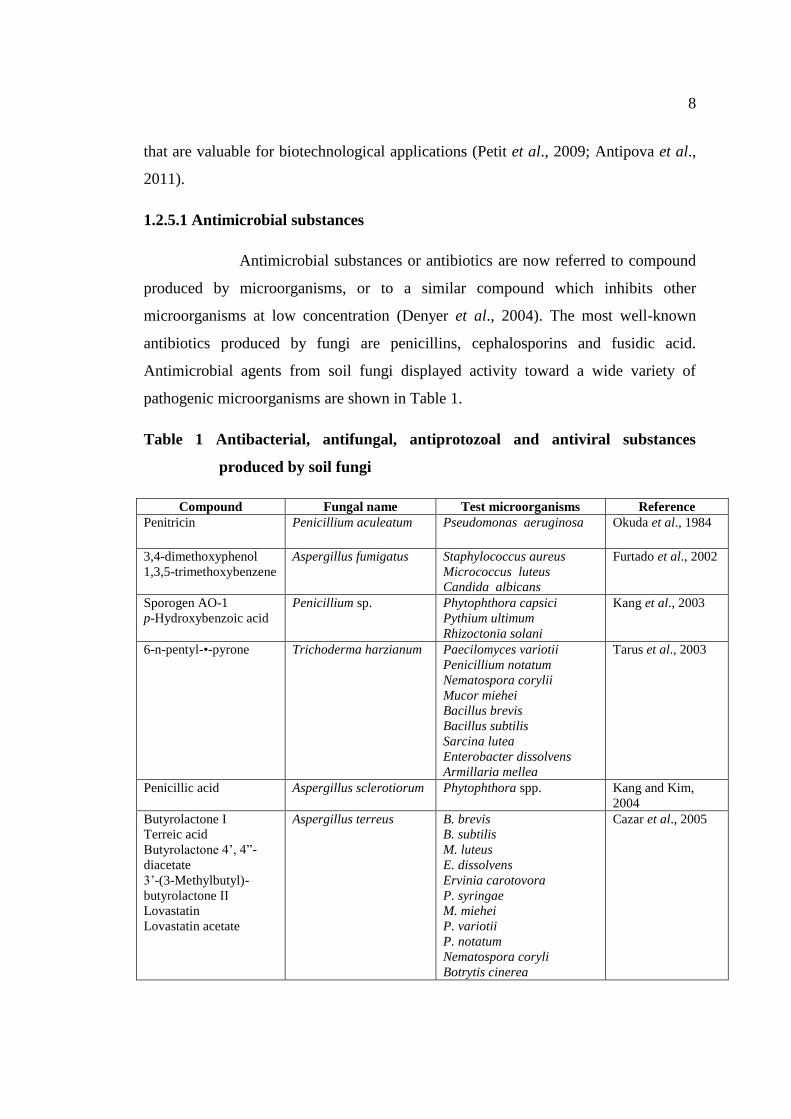
1.2.5.1 Antimicrobial substances
Antimicrobial substances or antibiotics are now referred to compound
produced by microorganisms, or to a similar compound which inhibits other
microorganisms at low concentration (Denyer et al., 2004). The most well-known
antibiotics produced by fungi are penicillins, cephalosporins and fusidic acid.
Antimicrobial agents from soil fungi displayed activity toward a wide variety of
pathogenic microorganisms are shown in Table 1.
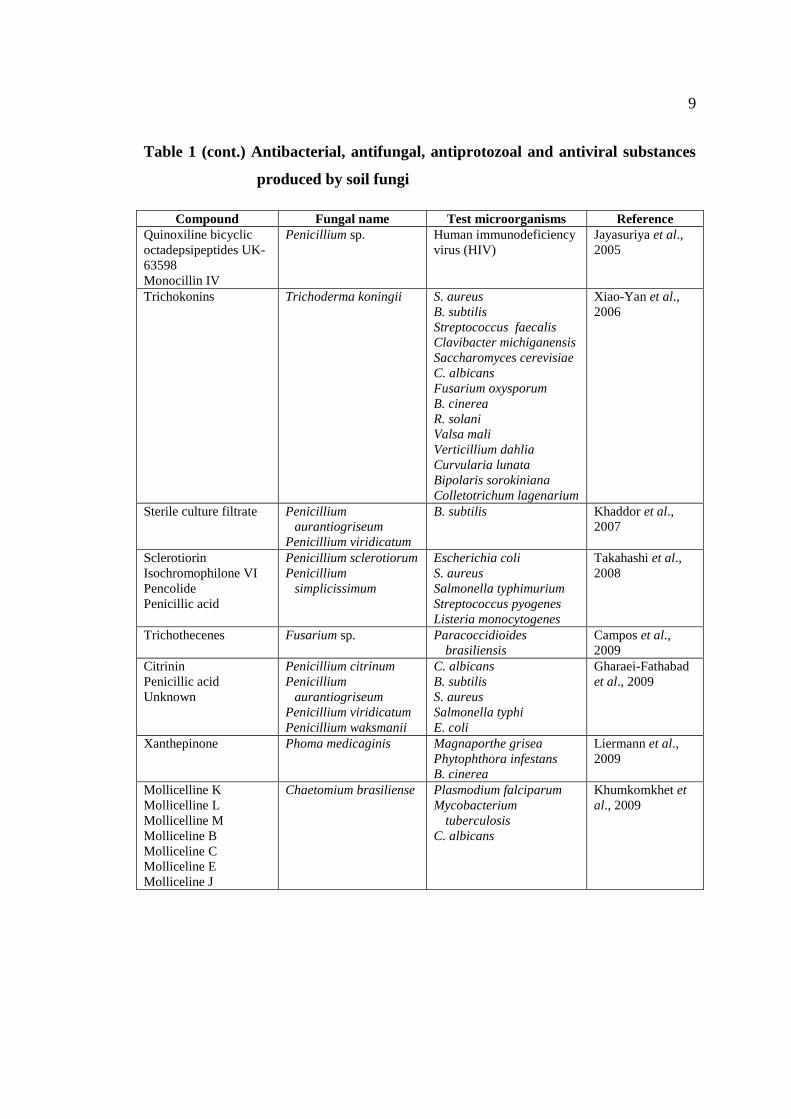
Table 1 Antibacterial, antifungal, antiprotozoal and antiviral substances
produced by soil fungi
Compound Fungal name Test microorganisms Reference
Penitricin Penicillium aculeatum Pseudomonas aeruginosa
Okuda et al., 1984
3,4-dimethoxyphenol
1,3,5-trimethoxybenzene
Aspergillus fumigatus Staphylococcus aureus
Micrococcus luteus
Candida albicans
Furtado et al., 2002
Sporogen AO-1
p-Hydroxybenzoic acid
Penicillium sp. Phytophthora capsici
Pythium ultimum
Rhizoctonia solani
Kang et al., 2003
6-n-pentyl-•-pyrone Trichoderma harzianum Paecilomyces variotii
Penicillium notatum
Nematospora corylii
Mucor miehei
Bacillus brevis
Bacillus subtilis
Sarcina lutea
Enterobacter dissolvens
Armillaria mellea
Tarus et al., 2003
Penicillic acid Aspergillus sclerotiorum Phytophthora spp. Kang and Kim,
2004
Butyrolactone I
Terreic acid
Butyrolactone 4’, 4”-
diacetate
3’-(3-Methylbutyl)-
butyrolactone II
Lovastatin
Lovastatin acetate
Aspergillus terreus B. brevis
B. subtilis
M. luteus
E. dissolvens
Ervinia carotovora
P. syringae
M. miehei
P. variotii
P. notatum
Nematospora coryli
Botrytis cinerea
Cazar et al., 2005
9
Table 1 (cont.) Antibacterial, antifungal, antiprotozoal and antiviral substances
produced by soil fungi
Compound Fungal name Test microorganisms Reference
Quinoxiline bicyclic
octadepsipeptides UK-
63598
Monocillin IV
Penicillium sp. Human immunodeficiency
virus (HIV)
Jayasuriya et al.,
2005
Trichokonins Trichoderma koningii S. aureus
B. subtilis
Streptococcus faecalis
Clavibacter michiganensis
Saccharomyces cerevisiae
C. albicans
Fusarium oxysporum
B. cinerea
R. solani
Valsa mali
Verticillium dahlia
Curvularia lunata
Bipolaris sorokiniana
Colletotrichum lagenarium
Xiao-Yan et al.,
2006
Sterile culture filtrate Penicillium
aurantiogriseum
Penicillium viridicatum
B. subtilis Khaddor et al.,
2007
Sclerotiorin
Isochromophilone VI
Pencolide
Penicillic acid
Penicillium sclerotiorum
Penicillium
simplicissimum
Escherichia coli
S. aureus
Salmonella typhimurium
Streptococcus pyogenes
Listeria monocytogenes
Takahashi et al.,
2008
Trichothecenes Fusarium sp. Paracoccidioides
brasiliensis
Campos et al.,
2009
Citrinin
Penicillic acid
Unknown
Penicillium citrinum
Penicillium
aurantiogriseum
Penicillium viridicatum
Penicillium waksmanii
C. albicans
B. subtilis
S. aureus
Salmonella typhi
E. coli
Gharaei-Fathabad
et al., 2009
Xanthepinone Phoma medicaginis Magnaporthe grisea
Phytophthora infestans
B. cinerea
Liermann et al.,
2009
Mollicelline K
Mollicelline L
Mollicelline M
Molliceline B
Molliceline C
Molliceline E
Molliceline J
Chaetomium brasiliense Plasmodium falciparum
Mycobacterium
tuberculosis
C. albicans
Khumkomkhet et
al., 2009
10
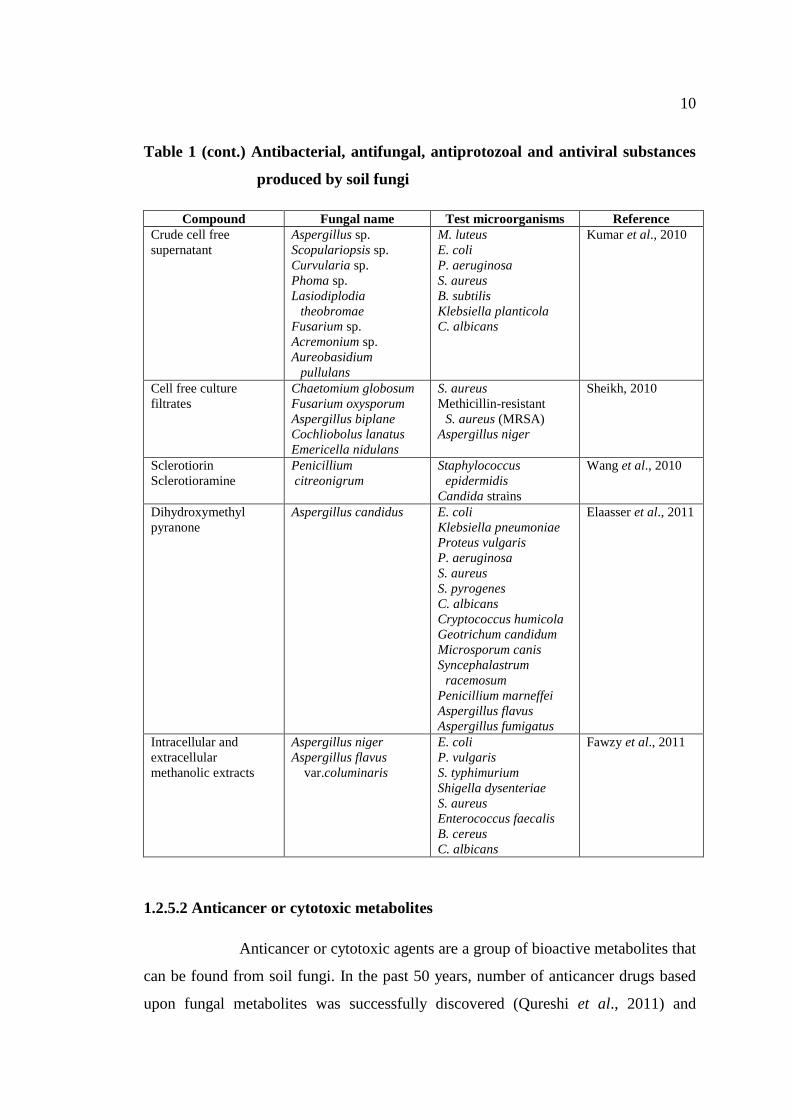
Table 1 (cont.) Antibacterial, antifungal, antiprotozoal and antiviral substances
produced by soil fungi
Compound Fungal name Test microorganisms Reference
Crude cell free
supernatant
Aspergillus sp.
Scopulariopsis sp.
Curvularia sp.
Phoma sp.
Lasiodiplodia
theobromae
Fusarium sp.
Acremonium sp.
Aureobasidium
pullulans
M. luteus
E. coli
P. aeruginosa
S. aureus
B. subtilis
Klebsiella planticola
C. albicans
Kumar et al., 2010
Cell free culture
filtrates
Chaetomium globosum
Fusarium oxysporum
Aspergillus biplane
Cochliobolus lanatus
Emericella nidulans
S. aureus
Methicillin-resistant
S. aureus (MRSA)
Aspergillus niger
Sheikh, 2010
Sclerotiorin
Sclerotioramine
Penicillium
citreonigrum
Staphylococcus
epidermidis
Candida strains
Wang et al., 2010
Dihydroxymethyl
pyranone
Aspergillus candidus E. coli
Klebsiella pneumoniae
Proteus vulgaris
P. aeruginosa
S. aureus
S. pyrogenes
C. albicans
Cryptococcus humicola
Geotrichum candidum
Microsporum canis
Syncephalastrum
racemosum
Penicillium marneffei
Aspergillus flavus
Aspergillus fumigatus
Elaasser et al., 2011
Intracellular and
extracellular
methanolic extracts
Aspergillus niger
Aspergillus flavus
var.columinaris
E. coli
P. vulgaris
S. typhimurium
Shigella dysenteriae
S. aureus
Enterococcus faecalis
B. cereus
C. albicans
Fawzy et al., 2011
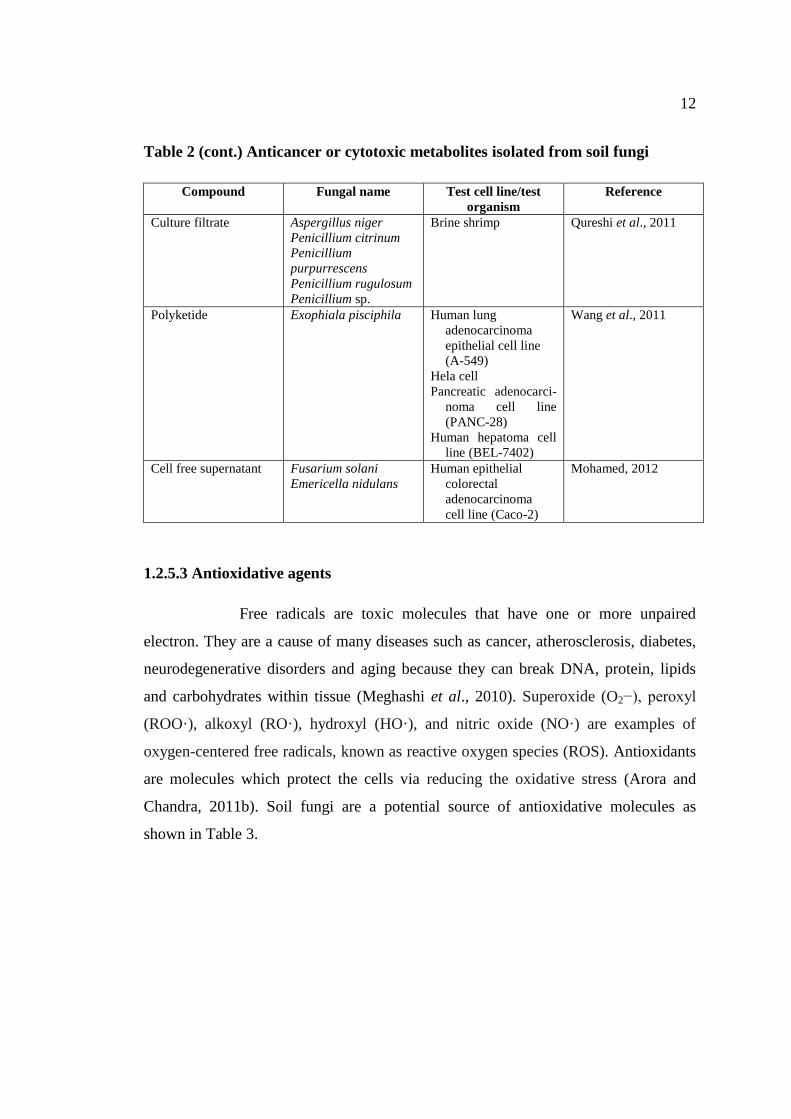
1.2.5.2 Anticancer or cytotoxic metabolites
Anticancer or cytotoxic agents are a group of bioactive metabolites that
can be found from soil fungi. In the past 50 years, number of anticancer drugs based
upon fungal metabolites was successfully discovered (Qureshi et al., 2011) and
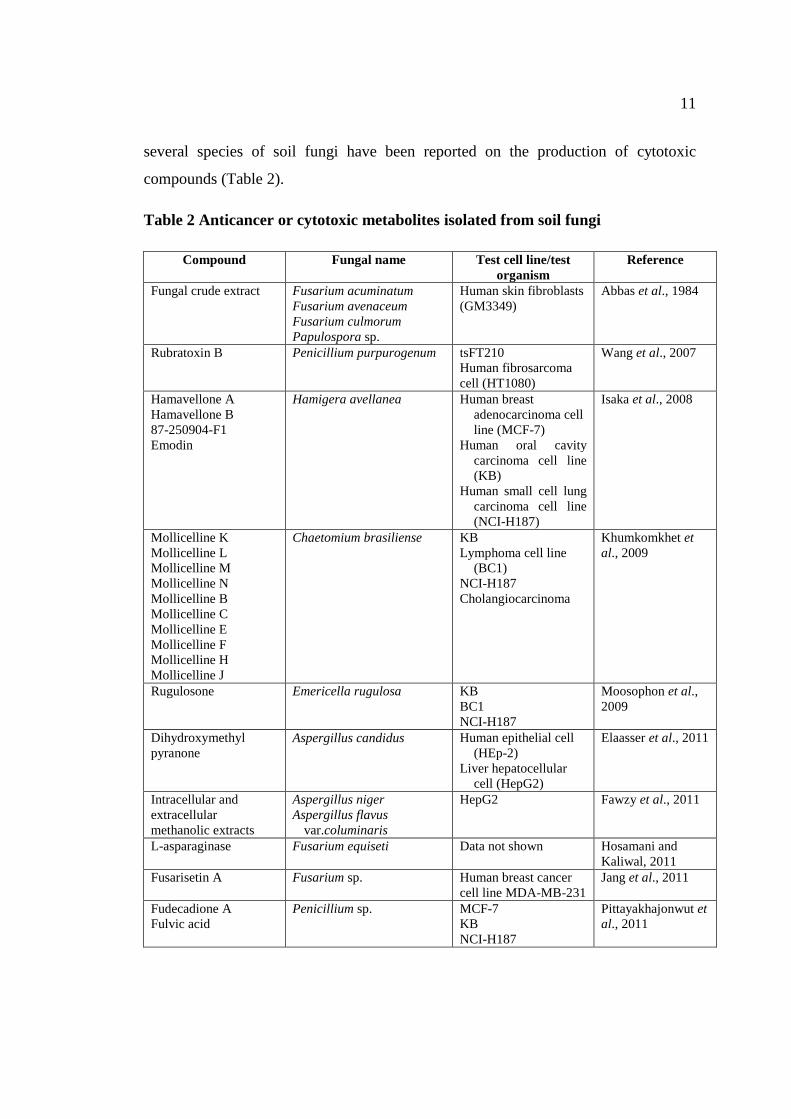
11
several species of soil fungi have been reported on the production of cytotoxic
compounds (Table 2).
Table 2 Anticancer or cytotoxic metabolites isolated from soil fungi
Compound Fungal name Test cell line/test
organism
Reference
Fungal crude extract Fusarium acuminatum
Fusarium avenaceum
Fusarium culmorum
Papulospora sp.
Human skin fibroblasts
(GM3349)
Abbas et al., 1984
Rubratoxin B Penicillium purpurogenum tsFT210
Human fibrosarcoma
cell (HT1080)
Wang et al., 2007
Hamavellone A
Hamavellone B
87-250904-F1
Emodin
Hamigera avellanea Human breast
adenocarcinoma cell
line (MCF-7)
Human oral cavity
carcinoma cell line
(KB)
Human small cell lung
carcinoma cell line
(NCI-H187)
Isaka et al., 2008
Mollicelline K
Mollicelline L
Mollicelline M
Mollicelline N
Mollicelline B
Mollicelline C
Mollicelline E
Mollicelline F
Mollicelline H
Mollicelline J
Chaetomium brasiliense KB
Lymphoma cell line
(BC1)
NCI-H187
Cholangiocarcinoma
Khumkomkhet et
al., 2009
Rugulosone Emericella rugulosa KB
BC1
NCI-H187
Moosophon et al.,
2009
Dihydroxymethyl
pyranone
Aspergillus candidus Human epithelial cell
(HEp-2)
Liver hepatocellular
cell (HepG2)
Elaasser et al., 2011
Intracellular and
extracellular
methanolic extracts
Aspergillus niger
Aspergillus flavus
var.columinaris
HepG2 Fawzy et al., 2011
L-asparaginase Fusarium equiseti Data not shown Hosamani and
Kaliwal, 2011
Fusarisetin A Fusarium sp. Human breast cancer
cell line MDA-MB-231
Jang et al., 2011
Fudecadione A
Fulvic acid
Penicillium sp. MCF-7
KB
NCI-H187
Pittayakhajonwut et
al., 2011
12
Table 2 (cont.) Anticancer or cytotoxic metabolites isolated from soil fungi
Compound Fungal name Test cell line/test
organism
Reference
Culture filtrate Aspergillus niger
Penicillium citrinum
Penicillium
purpurrescens
Penicillium rugulosum
Penicillium sp.
Brine shrimp Qureshi et al., 2011
Polyketide Exophiala pisciphila Human lung
adenocarcinoma
epithelial cell line
(A-549)
Hela cell
Pancreatic adenocarci-
noma cell line
(PANC-28)
Human hepatoma cell
line (BEL-7402)
Wang et al., 2011
Cell free supernatant Fusarium solani
Emericella nidulans
Human epithelial
colorectal
adenocarcinoma
cell line (Caco-2)
Mohamed, 2012
1.2.5.3 Antioxidative agents
Free radicals are toxic molecules that have one or more unpaired
electron. They are a cause of many diseases such as cancer, atherosclerosis, diabetes,
neurodegenerative disorders and aging because they can break DNA, protein, lipids
and carbohydrates within tissue (Meghashi et al., 2010). Superoxide (O2−), peroxyl
(ROO·), alkoxyl (RO·), hydroxyl (HO·), and nitric oxide (NO·) are examples of
oxygen-centered free radicals, known as reactive oxygen species (ROS). Antioxidants
are molecules which protect the cells via reducing the oxidative stress (Arora and
Chandra, 2011b). Soil fungi are a potential source of antioxidative molecules as
shown in Table 3.
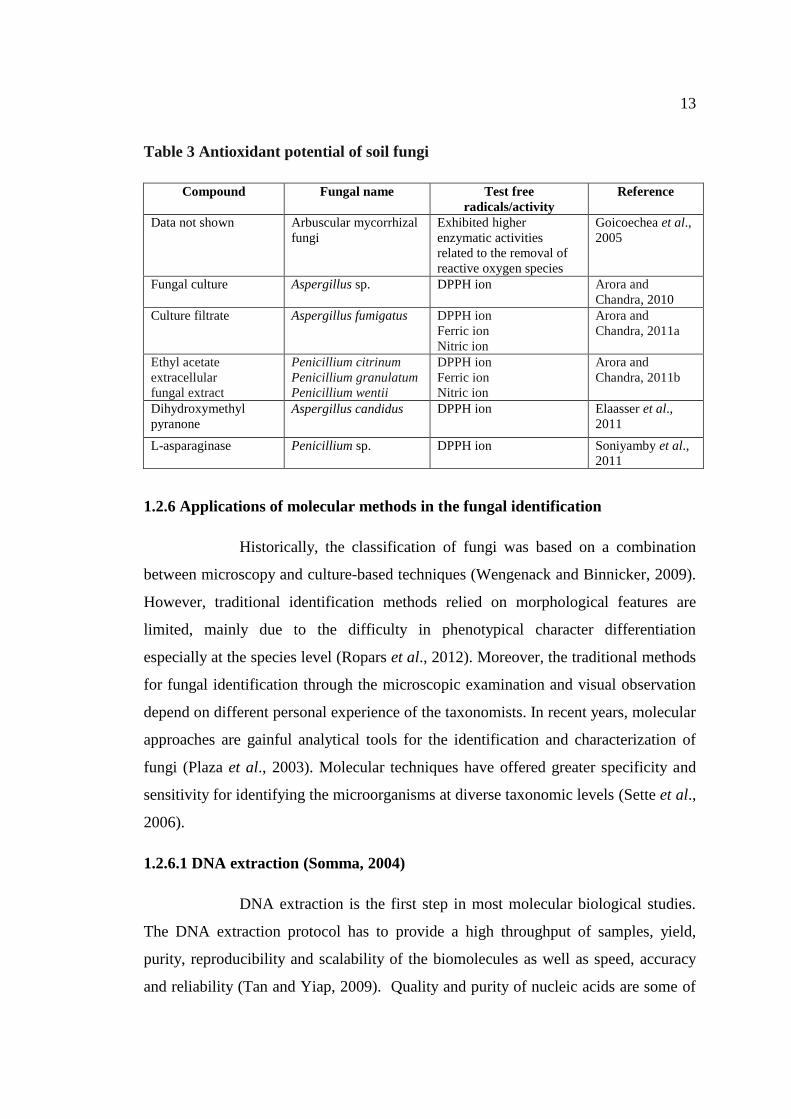
13
Table 3 Antioxidant potential of soil fungi
Compound Fungal name Test free
radicals/activity
Reference
Data not shown Arbuscular mycorrhizal
fungi
Exhibited higher
enzymatic activities
related to the removal of
reactive oxygen species
Goicoechea et al.,
2005
Fungal culture Aspergillus sp. DPPH ion Arora and
Chandra, 2010
Culture filtrate Aspergillus fumigatus DPPH ion
Ferric ion
Nitric ion
Arora and
Chandra, 2011a
Ethyl acetate
extracellular
fungal extract
Penicillium citrinum
Penicillium granulatum
Penicillium wentii
DPPH ion
Ferric ion
Nitric ion
Arora and
Chandra, 2011b
Dihydroxymethyl
pyranone
Aspergillus candidus DPPH ion Elaasser et al.,
2011
L-asparaginase Penicillium sp. DPPH ion Soniyamby et al.,
2011
1.2.6 Applications of molecular methods in the fungal identification
Historically, the classification of fungi was based on a combination
between microscopy and culture-based techniques (Wengenack and Binnicker, 2009).
However, traditional identification methods relied on morphological features are
limited, mainly due to the difficulty in phenotypical character differentiation
especially at the species level (Ropars et al., 2012). Moreover, the traditional methods
for fungal identification through the microscopic examination and visual observation
depend on different personal experience of the taxonomists. In recent years, molecular
approaches are gainful analytical tools for the identification and characterization of
fungi (Plaza et al., 2003). Molecular techniques have offered greater specificity and
sensitivity for identifying the microorganisms at diverse taxonomic levels (Sette et al.,
2006).
1.2.6.1 DNA extraction (Somma, 2004)
DNA extraction is the first step in most molecular biological studies.
The DNA extraction protocol has to provide a high throughput of samples, yield,
purity, reproducibility and scalability of the biomolecules as well as speed, accuracy
and reliability (Tan and Yiap, 2009). Quality and purity of nucleic acids are some of
14
the most critical factors for PCR analysis. Suitable extraction method should be
selected for obtaining highly purified nucleic acids free from contaminants. Examples
of contaminants that could affect PCR amplification are listed in Table 4. The DNA
extraction requires cell lysis, inactivation of cellular nucleases and separation of target
DNA from cell debris. The common lysis procedures comprise of the mechanical
disruption (e.g. grinding, hypotonic lysis), chemical treatment (e.g. detergent lysis,
chaotropic agents, thiol reduction) and enzymatic digestion (e.g. proteinase K).
Solvent extraction is used to remove contaminants from DNA. Phenol-chloroform is
frequently used for proteins eliminating. Isopropanol or ethanol is commonly used to
precipitate and concentrate nucleic acids. To heighten amount of target DNA, an inert
carrier (e.g. glycogen) can be added to the mixture for enhancing the efficiency of
precipitation. Other precipitation methods of nucleic acid consist of selective
precipitation by salting out or changes in pH.
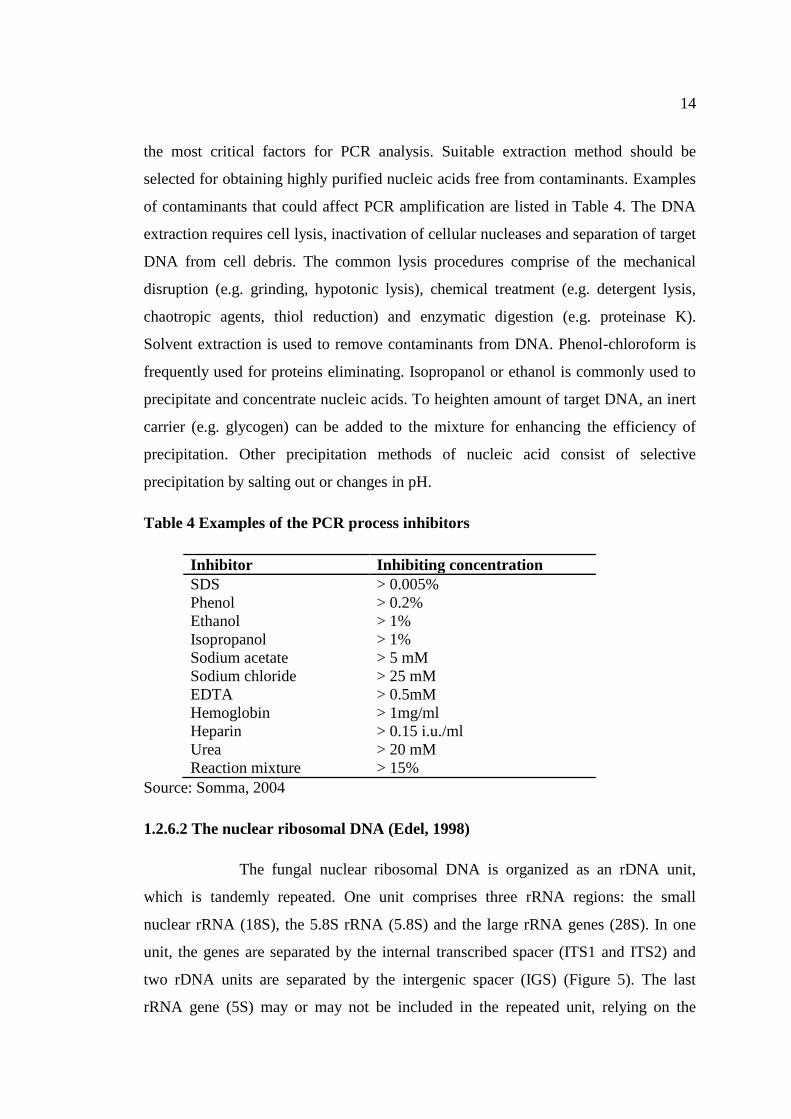
Table 4 Examples of the PCR process inhibitors
Inhibitor Inhibiting concentration
SDS
Phenol
Ethanol
Isopropanol
Sodium acetate
Sodium chloride
EDTA
Hemoglobin
Heparin
Urea
Reaction mixture
> 0.005%
> 0.2%
> 1%
> 1%
> 5 mM
> 25 mM
> 0.5mM
> 1mg/ml
> 0.15 i.u./ml
> 20 mM
> 15%
Source: Somma, 2004
1.2.6.2 The nuclear ribosomal DNA (Edel, 1998)
The fungal nuclear ribosomal DNA is organized as an rDNA unit,
which is tandemly repeated. One unit comprises three rRNA regions: the small
nuclear rRNA (18S), the 5.8S rRNA (5.8S) and the large rRNA genes (28S). In one
unit, the genes are separated by the internal transcribed spacer (ITS1 and ITS2) and
two rDNA units are separated by the intergenic spacer (IGS) (Figure 5). The last
rRNA gene (5S) may or may not be included in the repeated unit, relying on the
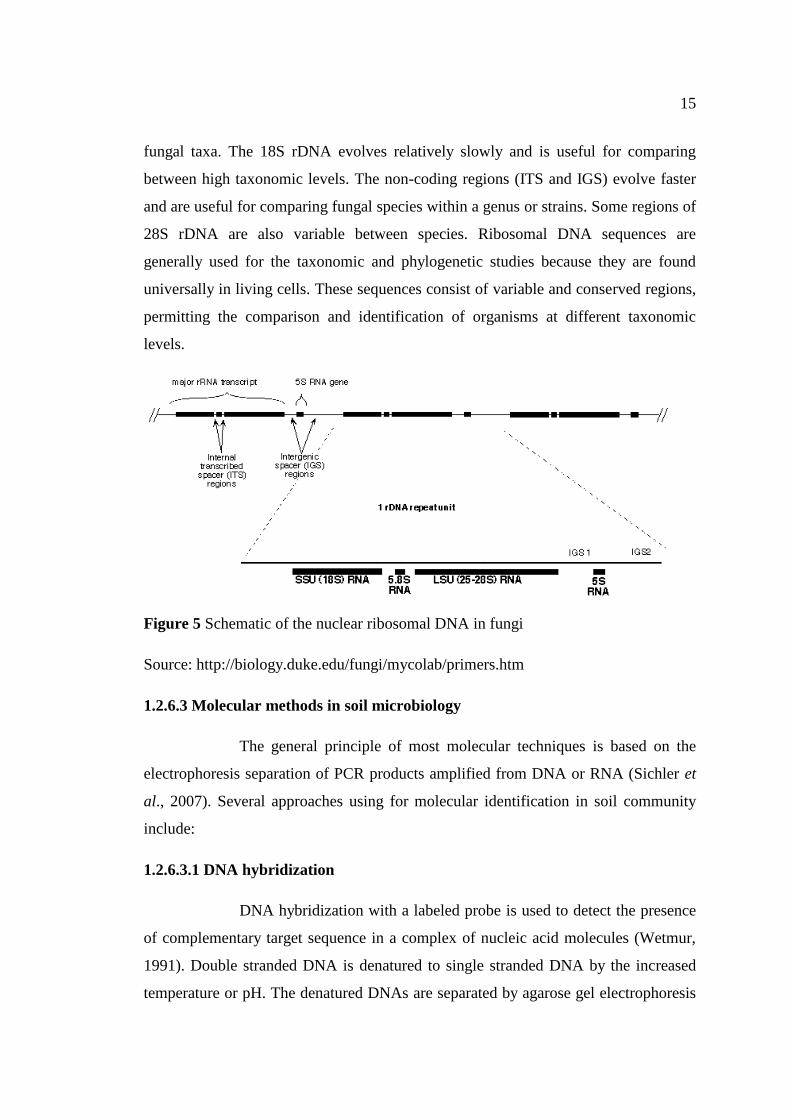
15
fungal taxa. The 18S rDNA evolves relatively slowly and is useful for comparing
between high taxonomic levels. The non-coding regions (ITS and IGS) evolve faster
and are useful for comparing fungal species within a genus or strains. Some regions of
28S rDNA are also variable between species. Ribosomal DNA sequences are
generally used for the taxonomic and phylogenetic studies because they are found
universally in living cells. These sequences consist of variable and conserved regions,
permitting the comparison and identification of organisms at different taxonomic
levels.
Figure 5 Schematic of the nuclear ribosomal DNA in fungi
Source: http://biology.duke.edu/fungi/mycolab/primers.htm
1.2.6.3 Molecular methods in soil microbiology
The general principle of most molecular techniques is based on the
electrophoresis separation of PCR products amplified from DNA or RNA (Sichler et
al., 2007). Several approaches using for molecular identification in soil community
include:
1.2.6.3.1 DNA hybridization
DNA hybridization with a labeled probe is used to detect the presence
of complementary target sequence in a complex of nucleic acid molecules (Wetmur,
1991). Double stranded DNA is denatured to single stranded DNA by the increased
temperature or pH. The denatured DNAs are separated by agarose gel electrophoresis
16
and transferred to either a nitrocellulose or nylon membrane. The membrane-bound
DNA is then hybridized with labeled probes homologous to target gene (Olive and
Bean, 1999).
1.2.6.3.2 Denaturing gradient gel electrophoresis (DGGE) and temperature
gradient gel electrophoresis (TGGE) (Sichler et al., 2007)
Principle of these techniques is the separation of DNA fragments
having the same length but different nucleotide sequence by electrophoresis in a
gradient of increasing denaturing strength, which is set up either via chemical
(denaturants e.g. urea and formamide-DGGE) or physical way (temperature-TGGE).
The fragments will move according to their melting behavior under the different
denaturing conditions. A fingerprint comprising of bands at different migration
distance will appear in the polyacrylamide gel.
1.2.6.3.3 Polymerase chain reaction (PCR) (Spiegelman et al., 2005)
PCR is a way to amplify nucleic acid from whole-cell extracts or total
community DNA from an environment sample. DNA is exposed to a thermostable
polymerase and provided repetitive cycles of template strand denaturation,
oligonucleotide primer annealing and polymerization of the template-primer duplex.
This process offered the exponential amplification of the template DNA. More details
of PCR are described in 1.2.6.4.
1.2.6.3.4 Restriction length polymorphism (RFLP) (Rasmussen, 2012)
The first step of this technique is amplification of an interesting gene.
The amplified fragments are then cut with restriction enzymes resulting in the
formation of restriction fragments of different sizes. An electrophoresis is used to
separate the treated DNA fragment.
1.2.6.3.5 Terminal restriction length polymorphism (T-RFLP) (Schütte et al.,
2008)
T-RFLP is also relied on PCR amplification of a target gene using
primers labeled with a fluorescent dye. The PCR product is digested with restriction
17
enzymes that have four base-pair recognition sizes. After the restriction reaction, the
mixture of fragments is separated by electrophoresis and determined the different
sizes of terminal fragments using an automated DNA sequencer.
1.2.6.3.6 Single-strand conformational polymorphism analysis (SSCP)
SSCP is a method to separate the same size of single-stranded DNA
(denatured double-stranded DNA) based on the different conformations formed which
depended on their sequences by non-denaturing polyacrylamide gel electrophoresis
(PAGE) (Sichler et al., 2007). The motility of DNA in a gel matrix is partially
determined by its shape (Spiegelman et al., 2005).
1.2.6.3.7 Ribosomal intergenic spacer analysis (RISA) (Spiegelman et al., 2005)
RISA is a PCR-based method that amplifies the prokaryotic ribosomal
intergenic spacer (IGS) region. The IGS region possesses a high degree of sequence
variability. This technique creates a community profile based on the species-specific
length polymorphisms in this region and can be used to distinguish between different
strains and closely-related species.
1.2.6.3.8 Pulse-field gel electrophoresis (PFGE) (Nassonova, 2008)
PFGE is a technique for separation of high molecular weight DNA
ranging from 10 kb to 10 Mb using agarose gel electrophoresis with an electric field
that alternates in two directions. This technique greatly promotes the structural and
functional analysis of genome in various organisms.
1.2.6.4 Polymerase chain reaction (PCR)
1.2.6.4.1 Overview of PCR methods (Edel, 1998)
The polymerase chain reaction (PCR) is a potent method with
widespread applications in the molecular biology. Since its development in 1985, the
specificity, sensitivity and speed of this technology have led to the development of
many methods for a broad range of molecular biological research areas. This reaction
permits in vitro amplification of specific DNA fragments from complex DNA
18
samples. Any nucleic acid sequence can be cloned, analysed or modified. Fungal
studies will continue to progress with PCR and new methods are regularly reported.
1.2.6.4.2 The standard principle of PCR (Edel, 1998)
The standard PCR method requires a DNA template containing the
target region and two oligonucleotide primers flanking this region. A thermostable
DNA polymerase (Taq polymerase) is used for the amplification. The PCR procedure
consists of three steps which are determined by temperature condition:
DNA denaturation: In this step, the hydrogen bonds between
complementary bases are broken down by high temperature (90-95°C). The double-
stranded DNA subsequently becomes single-stranded DNA.
DNA annealing: The reaction temperature is decreased to 50-65°C
allowing the target specific oligonucleotide primers anneal to the 5’end of the two
single-stranded templates.
DNA extension: The polymerase binds to the primer-template hybrid
and begins DNA formation at 72 °C.
This sequence of three steps corresponds to one cycle of PCR. In the
second cycle, the newly synthesized DNA strands are separated from the original
strands by the denaturation and each strand acts again as template in the next step.
Therefore, n cycles of PCR allow a 2n-fold amplification of the target DNA (Figure
6).

19
Figure 6 Schematic of PCR amplification
Source: http://www.accessexcellence.org/RC/VL/GG/polymerase.php
1.2.6.4.3 PCR reaction components and conditions
The template DNA, oligonucleotide primers, DNA polymerase and
deoxyribonucleotide triphosphates (dNTPs) are mixed in PCR buffer containing
magnesium ions (MgCl2). The final volume of the reaction mixture ranges from 25-
100 µl (Edel, 1998). Standard conditions for the concentration of the different
components are given in Table 5.
20
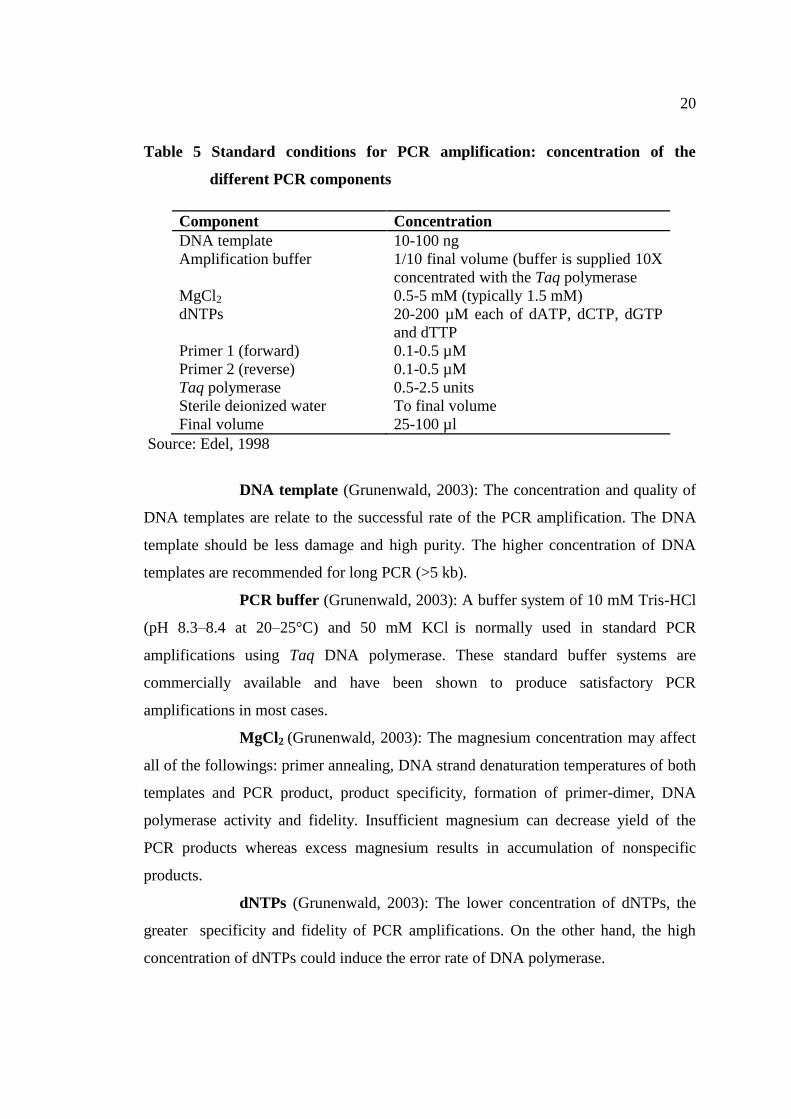
Table 5 Standard conditions for PCR amplification: concentration of the
different PCR components
Component Concentration
DNA template
Amplification buffer
MgCl2
dNTPs
Primer 1 (forward)
Primer 2 (reverse)
Taq polymerase
Sterile deionized water
Final volume
10-100 ng
1/10 final volume (buffer is supplied 10X
concentrated with the Taq polymerase
0.5-5 mM (typically 1.5 mM)
20-200 µM each of dATP, dCTP, dGTP
and dTTP
0.1-0.5 µM
0.1-0.5 µM
0.5-2.5 units
To final volume
25-100 µl
Source: Edel, 1998
DNA template (Grunenwald, 2003): The concentration and quality of
DNA templates are relate to the successful rate of the PCR amplification. The DNA
template should be less damage and high purity. The higher concentration of DNA
templates are recommended for long PCR (>5 kb).
PCR buffer (Grunenwald, 2003): A buffer system of 10 mM Tris-HCl
(pH 8.3–8.4 at 20–25°C) and 50 mM KCl is normally used in standard PCR
amplifications using Taq DNA polymerase. These standard buffer systems are
commercially available and have been shown to produce satisfactory PCR
amplifications in most cases.
MgCl2 (Grunenwald, 2003): The magnesium concentration may affect
all of the followings: primer annealing, DNA strand denaturation temperatures of both
templates and PCR product, product specificity, formation of primer-dimer, DNA
polymerase activity and fidelity. Insufficient magnesium can decrease yield of the
PCR products whereas excess magnesium results in accumulation of nonspecific
products.
dNTPs (Grunenwald, 2003): The lower concentration of dNTPs, the
greater specificity and fidelity of PCR amplifications. On the other hand, the high
concentration of dNTPs could induce the error rate of DNA polymerase.

21
Primer (Innis and Gelfand, 1990): High primer concentrations
promote mispriming and increase both of nonspecific products and primer-dimer,
while low concentration affects to the PCR yield.
DNA polymerase (Innis and Gelfand, 1990): The high concentration
of enzyme causes the accumulation of nonspecific products, whereas low
concentration could give an insufficient amount of desired PCR product.
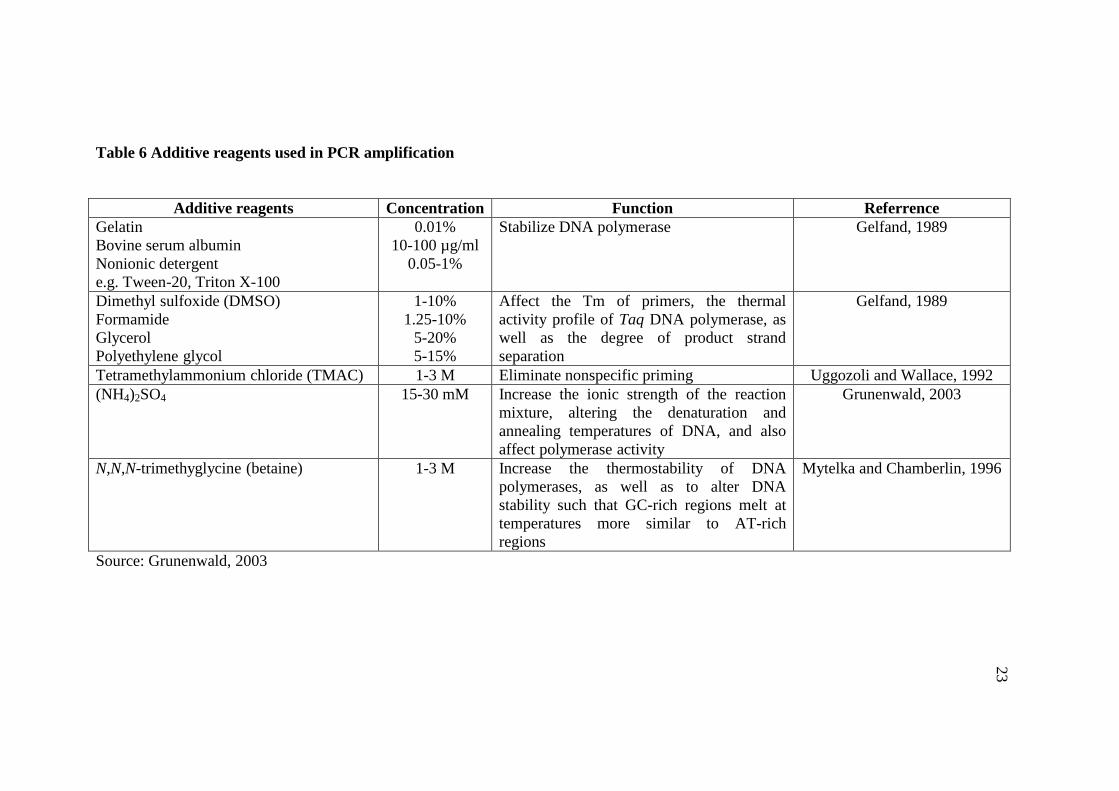
Additive reagents: Several additive reagents are added into the PCR
reaction to increase specificity and yield when all else fails (Roux, 1995; Lorenz,
2012). The list and function of the additive reagents frequently used for PCR are
shown in Table 6.
1.2.6.5 Basic methods for the detection of PCR products
1.2.6.5.1 Direct visualization using ethidium bromide (Jenkins, 1994)
The most common and easiest method used for detecting PCR is
ethidium bromide staining. Ethidium bromide is a fluorescent dye that intercalates
between the staked bases of DNA. DNA products are visualized and can be
photographed under UV light at 260 nm. Identification of the PCR product is based
on the occurrence of a DNA band of the prospective length. Sizing of the DNA bands
is achieved by running the PCR products compared with DNA markers. The major
disadvantage of ethidium bromide detection is the dye only detect bands that contain
~5 ng or more of DNA. Another disadvantage is this method can lead to faulty
interpretations if the nonspecific bands are excess or very close to the same size as the
desired DNA product due to all of the DNA products (both specific and nonspecific)
will be stained.
1.2.6.5.2 Incorporation of radioactive and nonradioactive labels (Jenkins, 1994)
Incorporation of specific labels is done with the radioactive or non-
radioactive labels directly added into the amplified products. Incorporation of specific
labels decreases the amount of one or more non-labeled deoxynucleotide
triphosphates (dNTPs) and increases a corresponding labeled dNTP. 32
P and 35
S are
usually used as radioactive labels, whereas biotin and digoxigenin are used as non-

22
radioactive labels. Detection of PCR products labeled with radioisotopes is achieved
by autoradiography on dried gels or membrane which the DNA products have been
transferred. The detection of PCR products labeled with biotin or dioxigenin requires
the transfer of the DNA products to membrane, then visualized by the treatment of the
membrane with a streptavidin-enzyme conjugate and a chromogen substrate
appropriate for the specific enzyme. The sensitivity of this method is greater than
ethidium bromide staining. They can detect bands that contain <1 ng of DNA. The
major disadvantage of this method is that the visualization of both specific and
nonspecific PCR products. The number of nonspecific bands can be seen greater than
ethidium bromide staining. However, direct labeling of PCR products is not generally
employed.
1.2.6.5.3 Detection of specific PCR products using a DNA probe (Jenkins, 1994)
The use of DNA probe is recommended for identification of a specific
PCR product. DNA probe hybridizes to a region of the DNA located internally
between the two PCR primers. Only the specific amplified product will be detected.
The DNA probe can be either labeled with radioisotopes or non-radioactive markers.
The use of labeled DNA probes increases sensitivity and accuracy over ethidium
bromide staining; thus they are widely used for the detection of PCR products.
23
Table 6 Additive reagents used in PCR amplification
Additive reagents Concentration Function Referrence
Gelatin
Bovine serum albumin
Nonionic detergent
e.g. Tween-20, Triton X-100
0.01%
10-100 µg/ml
0.05-1%
Stabilize DNA polymerase Gelfand, 1989
Dimethyl sulfoxide (DMSO)
Formamide
Glycerol
Polyethylene glycol
1-10%
1.25-10%
5-20%
5-15%
Affect the Tm of primers, the thermal
activity profile of Taq DNA polymerase, as
well as the degree of product strand
separation
Gelfand, 1989
Tetramethylammonium chloride (TMAC) 1-3 M Eliminate nonspecific priming Uggozoli and Wallace, 1992
(NH4)2SO4 15-30 mM Increase the ionic strength of the reaction
mixture, altering the denaturation and
annealing temperatures of DNA, and also
affect polymerase activity
Grunenwald, 2003
N,N,N-trimethyglycine (betaine) 1-3 M Increase the thermostability of DNA
polymerases, as well as to alter DNA
stability such that GC-rich regions melt at
temperatures more similar to AT-rich
regions
Mytelka and Chamberlin, 1996
Source: Grunenwald, 2003
23
24
1.2.7 Molecular phylogenetic analyses
1.2.7.1 DNA sequencing
DNA sequence analysis has become the most useful method for
inferring phylogenetic relationships between organisms. Bruns et al. (1990) explained
the benefits of DNA sequencing for phylogenetic analysis as “the large number of
characters compared can substantially increase the resolving power”. In general, the
DNA cloning and direct sequencing are employed for sequencing of PCR products.
Direct sequencing is widely used for the phylogenetic studies more than DNA cloning
because this technique generates consensus sequence of each nucleotide and
minimizes possible errors from misincorporation (Takamatsu, 1998).
1.2.7.2 DNA sequences alignment
The sequence alignment is a way of arranging the sequences of DNA
for identifying the similar region between the sequences. This step could show the
evolutionary relationships among the taxa (Mount, 2004). Alignment can be done
automatically through the softwares such as Clustal X/W and can be subsequently
refined manually.
1.2.7.3 Phylogenetic tree reconstruction
1.2.7.3.1 Method of analysis
1.2.7.3.1.1 Distance criterion (Harrison and Langdale, 2006)
Distance methods (e.g. neighbor-joining, UPGMA) construct trees by
calculating pairwise distances between sequences that are most similar. This method
considers the current states of characters without regarding to the evolutionary of
history. They are simplicity and speedy but only one tree is obtained. The distance
tree is not possible to examine conflicting tree topologies. Although, distance methods
are frequently useful for creating an initial tree, they should be used for final trees
with discretion.
25
Unweighted Pair-Group Method with Arithmetic Mean (UPGMA) (Hall, 2001)
UPGMA is an example of clustering method. The program searches
the pair of taxa with the fewest distance between them and sets the branching between
them as half of the distance. It then joins the two taxa into a cluster and redraws the
matrix with the distance from the cluster to each of the remaining taxa. Since the
cluster serves as a substitute for two taxa, the number of entries in the matrix is
reduced by one. That process is repeated on the new matrix and repeated until the
matrix contains a single entry. The set of matrices is then used to build up the tree by
starting at the root and moving out to the first two nodes represented by the last two
clusters.
Neighbor joining (Hall, 2001)
Neighbor joining (NJ) is similar to UPGMA in a distance matrix
manipulation but it directly calculates distances to internal nodes without creating
clusters. NJ uses net divergence of each taxon from all other taxa to calculate a
corrected distance matrix. NJ then finds the pair of taxa with the lowest corrected
distance and computes the distance from each of those taxa to the node that joins
them. A new matrix is then created in which the new node is substituted for those two
taxa. NJ does not assume that all taxa are equidistant from a root.
1.2.7.3.1.2 Character-based criterion
Maximum parsimony (Harrison and Langdale, 2006)
Maximum parsimony constructed trees based on assumption about
ancestral relationships as well as current data. Groups establish on the basis of shared
characters and the fewest mutations of characters are taken to be the most
parsimonious. With multiple characters, different groupings may be equally possible
or parsimonious, and thus multiple trees are generated. The exhaustive enumeration,
branch and bound or heuristic search are employed to find the most parsimonious tree
(MPTs). A majority rule consensus tree shows nodes that are stable in half to all of
the most parsimonious trees and the percentage of trees in which a given topology
exists is shown on the branches.
26
Maximum likelihood (Harrison and Langdale, 2006)
Maximum likelihood analysis calculates the probability of every
individual nucleotide substitution, giving a specific model of sequence evolution. The
analysis starts with a specified tree derived from the input dataset (for example a NJ
tree) and swaps the branches on the starting tree until the tree with the highest
likelihood score is obtained. This score is a function both of the tree topology and the
branch lengths (number of character state changes). Likelihood analysis allows an
absolute examination of the ascription made about sequence evolution but it is time-
consuming for constructing the tree.
1.2.7.3.2 Tree evaluation
Bootstrapping analysis (Brinkman and Leipe, 2001)
Bootstrapping analysis is performed to verify the support for the
branches of phylogenetic tree. Positions are re-sampled randomly from the alignment
to obtain multiple subsamples (bootstrap replicates) of the original alignment. The
results are exhibited as percentage of bootstrap support. Bootstrapping works with
distance, parsimony and likelihood methods.
Consistency index (CI) (Lipscomb, 1998)
Consistency index is a relative amount of homoplasy within the tree.
CI is calculated as the number of steps expected given the number of character states
in the data, divided by the actual number of steps multiplied by 100.
CI = total character state changes expected given the data set ×100
actual number of steps on the tree
Retention index (RI) (Lipscomb, 1998)
The retention index measures the amount of synapomorphy expected
from a data set that is retained as synapomorphy on a tree.
RI = maximum number of steps on tree - number of state changes on the tree × 100
maximum number of steps on tree - number of state changes in the data
27
Rescaled consistency index (RC) (Farris, 1989)
Rescaled consistency index observes homoplasy on scale from
minimum possible (0) to maximum possible homoplasy (1). The formula for RC is:
RC = CI × RI
Homoplasy index (HI) (Sang, 1995)
Homoplasy index describes the level of homoplasy of the characters.
The formula for HI is:
HI = 1 - CI
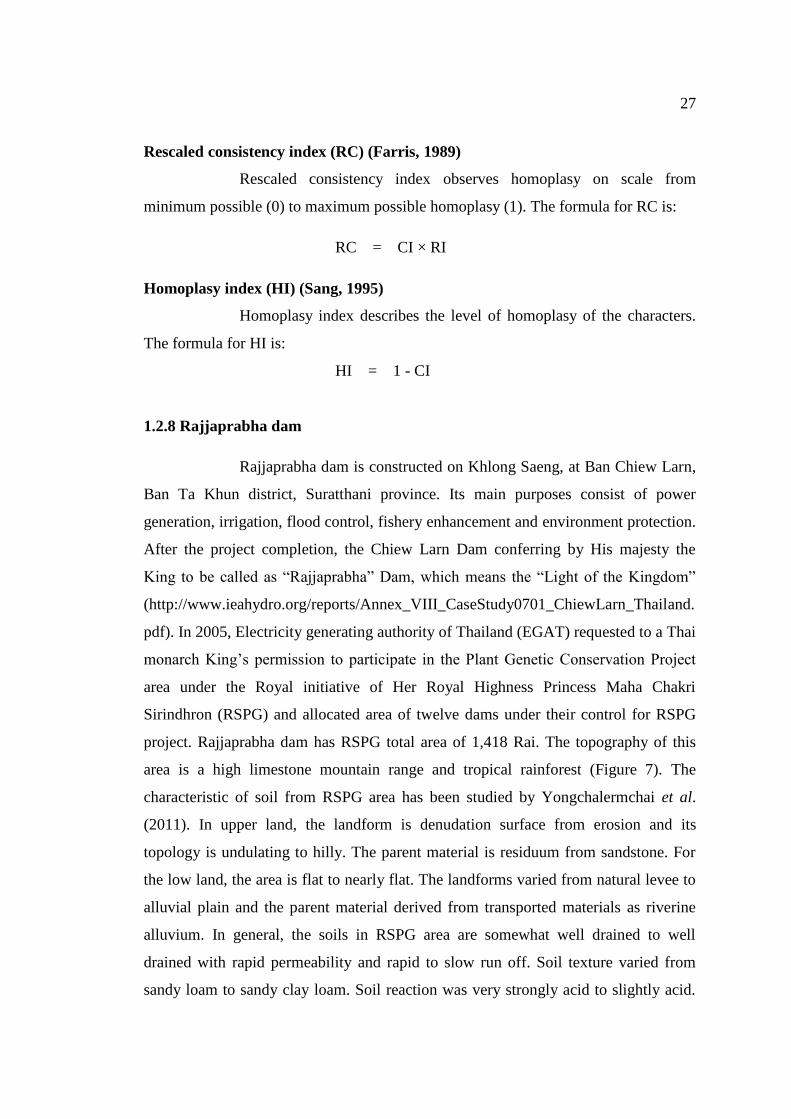
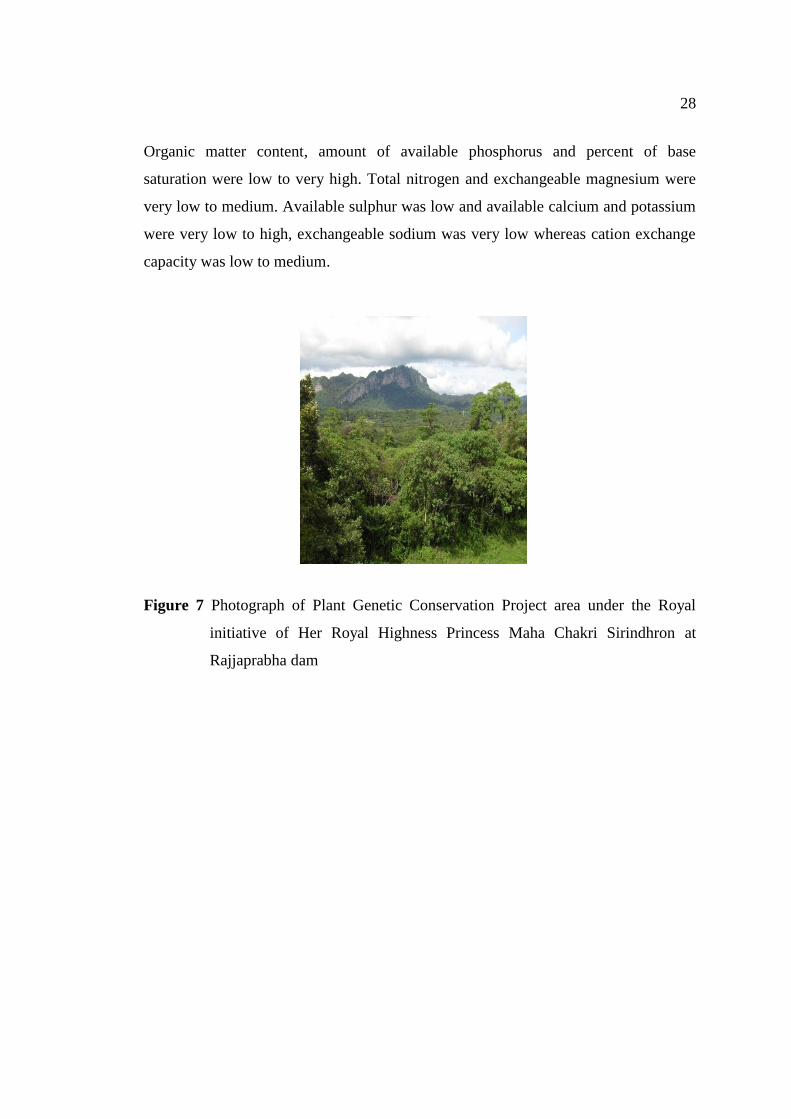
1.2.8 Rajjaprabha dam
Rajjaprabha dam is constructed on Khlong Saeng, at Ban Chiew Larn,
Ban Ta Khun district, Suratthani province. Its main purposes consist of power
generation, irrigation, flood control, fishery enhancement and environment protection.
After the project completion, the Chiew Larn Dam conferring by His majesty the
King to be called as “Rajjaprabha” Dam, which means the “Light of the Kingdom”
(http://www.ieahydro.org/reports/Annex_VIII_CaseStudy0701_ChiewLarn_Thailand.
pdf). In 2005, Electricity generating authority of Thailand (EGAT) requested to a Thai
monarch King’s permission to participate in the Plant Genetic Conservation Project
area under the Royal initiative of Her Royal Highness Princess Maha Chakri
Sirindhron (RSPG) and allocated area of twelve dams under their control for RSPG
project. Rajjaprabha dam has RSPG total area of 1,418 Rai. The topography of this
area is a high limestone mountain range and tropical rainforest (Figure 7). The
characteristic of soil from RSPG area has been studied by Yongchalermchai et al.
(2011). In upper land, the landform is denudation surface from erosion and its
topology is undulating to hilly. The parent material is residuum from sandstone. For
the low land, the area is flat to nearly flat. The landforms varied from natural levee to
alluvial plain and the parent material derived from transported materials as riverine
alluvium. In general, the soils in RSPG area are somewhat well drained to well
drained with rapid permeability and rapid to slow run off. Soil texture varied from
sandy loam to sandy clay loam. Soil reaction was very strongly acid to slightly acid.
28
Organic matter content, amount of available phosphorus and percent of base
saturation were low to very high. Total nitrogen and exchangeable magnesium were
very low to medium. Available sulphur was low and available calcium and potassium
were very low to high, exchangeable sodium was very low whereas cation exchange
capacity was low to medium.
Figure 7 Photograph of Plant Genetic Conservation Project area under the Royal
initiative of Her Royal Highness Princess Maha Chakri Sirindhron at
Rajjaprabha dam
29
1.3 Objectives of this study
1) To follow the objectives of Plant Genetic Conservation Project
Under the Royal Initiative of Her Royal Highness Princess Maha Chakri Sirindhorn
(RSPG)
2) To search for potential antimicrobial producing fungi in soils from
RSPG area.
30
CHAPTER 2
MATERIALS AND METHODS
2.1 Materials
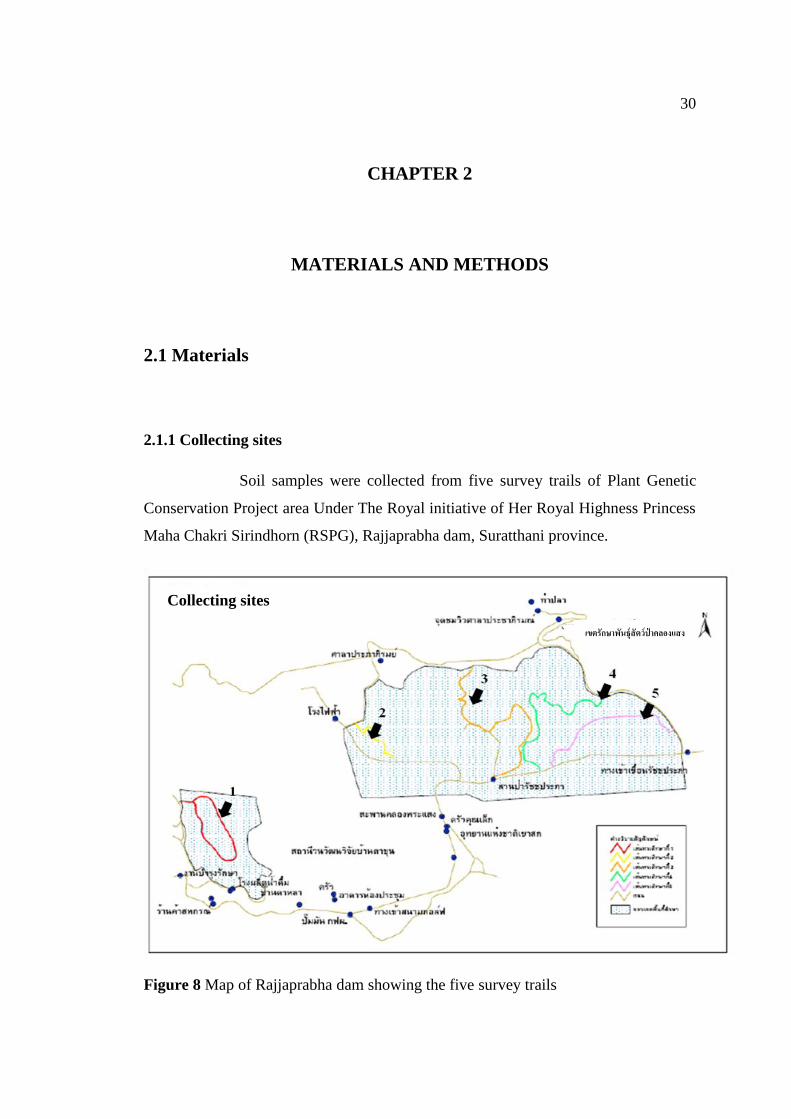
2.1.1 Collecting sites
Soil samples were collected from five survey trails of Plant Genetic
Conservation Project area Under The Royal initiative of Her Royal Highness Princess
Maha Chakri Sirindhorn (RSPG), Rajjaprabha dam, Suratthani province.
Figure 8 Map of Rajjaprabha dam showing the five survey trails
Collecting sites
เขตรกษาพนธสตวปาคลองแสง
31
2.1.2 Test microorganisms
Bacteria
- Staphylococcus aureus ATCC 25923 (SA)
- Methicillin-resistant Staphylococcus aureus SK1 clinical isolate (MRSA
SK-1)
- Escherichia coli ATCC 25922 (EC)
- Pseudomonas aeruginosa ATCC 27853 (PA)
- Multidrug-resistant Acinetobacter baumannii NPRC AB005 clinical
isolate (AB005)
- Multidrug-resistant Acinetobacter baumannii NPRC AB007 clinical
isolate (AB007)
Yeasts
- Candida albicans ATCC 90028 (CA28)
- Candida albicans NCPF 3153 (CA53)
- Cryptococcus neoformans ATCC 90112 (CN12), flucytosine-susceptible
strain
- Cryptococcus neoformans ATCC 90113 (CN13), flucytosine-resistant
strain
Filamentous fungi
- Microsporum gypseum SH-MU4 clinical isolate (MG)
- Penicillium marneffei clinical isolate (PM)
32
2.1.3 Chemicals
- Lacto phenol cotton blue
- Normal saline solution (0.85% NaCl) (Appendix)
- Ethanol (commercial grade)
- Glycerol (Fluka)
- McFarland Standard (Appendix)
- Dimethyl sulfoxide (DMSO) (Merck)
- D-glucose (BDH Prolabo)
- Phosphate buffer saline (PBS) pH 7 (Appendix)
- 1.8% resazurin (Appendix)
2.1.4 Media
- Rose-bengal chloramphenicol agar (RBC) (Merck)
- Potato dextrose agar (PDA) (Appendix)
- Potato dextrose broth (PDB) (Appendix)
- Mueller-Hinton broth (MHB) (Difco)
- Sabouraud dextrose agar (SDA) (Difco)
- Sabouraud dextrose broth (SDB) (Difco)
- Nutrient agar (NA) (Difco)
- Nutrient broth (NB) (Difco)
- Granulated agar (Difco)
33
2.1.5 Antibiotics
- Vancomycin (Sigma Chemical Co., USA)
- Gentamicin (NIDA Pharma Inc., Thailand)
- Amphotericin B (Bristol-Mayer Squibb Co., USA)
- Miconazole (Sigma Chemical Co., USA)
- Colistin (Atlantic Laboratories Co., Ltd Thailand)
2.1.6 Chemicals for molecular identification
- 0.5 M NaOH (Appendix)
- Tris-HCl pH 8 (Appendix)
- 50 mM MgCl2 (iNtRON Biotechnology, Inc.)
- 10x PCR buffer (iNtRON Biotechnology, Inc.)
- 10 mM dNTPs mix (iNtRON Biotechnology, Inc.)
- i-Taq DNA polymerase (iNtRON Biotechnology, Inc.)
- Nanopure water
- Agarose (Research organics)
- TAE buffer (Appendix)
(Tris Acetate EDTA buffer, pH 8)
- 6X Loading dye (Appendix)
- Lamda DNA/Eco911 (BstEII) Marker (Fermentas)
- Ethidium bromide (Fluka)
- Liquid N2
34
- CTAB lysis buffer (Appendix)
- 5 M NaCl (Appendix)
- Chloroform: Isoamyl alcohol (24:1)
- 7.5 M Ammonium acetate
- 70% ethanol
- DNeasy® Plant Mini Kit (Qiagen)
- NucleoSpin® Plant II (Machery-Nagel)
- 4 M N,N,N-trimethyglycine (betaine) (Sigma-Aldrich)
- Sea sand (Sigma-Aldrich)
2.1.7 Instruments
- Stereozoom microscope (Olympus SZ-PT)
- Light microscope (Olympus CX31)
- Hemacytometer
- Microtube (Eppendorf)
- Pipette tips (Axygen)
- Automatic pipette (Eppendorf)
- Multi channel automatic pipette (Eppendorf)
- Hot plate stirrer (Thermolyne)
- Biosafety cabinet class II
- Autoclave (Tomy)
- 25°C Incubator (Gallenkamp)
35
- 35°C Incubator (Brandt)
- Incubator shaker
- Hot air oven (Binder)
- Freezer -20°C (Sanyo)
- Freezer -80°C (New Brunswick Scientific)
- Electronic balance (Sartorius)
- PCR thermal cycler (Bio-Rad)
- Centrifuge (Eppendorf 5417R)
- Gel electrophoresis machine (Bio-Rad)
- Gel documentation (Model Syngene Gene Genius)
- Heat block (Labnet)
- Lyophilizer (LABCONCO)
2.2 Methods
2.2.1 Collection of soil fungi
Soil samples were collected four times in January, April, June and
August 2010 from five trails of RSPG areas, Rajjaprabha dam, Suratthani province,
five samples per trail per collection. A total of 100 soil samples were obtained. Each
soil sample was collected from 10-15 cm in depth from the soil surface. The samples
were kept in sterile plastic bag and brought back to the Mycology laboratory, Prince
of Songkla University for isolation.
36
2.2.2 Isolation and enumeration of soil fungi
Soil fungi were isolated from soil samples by the dilution plate
method. Each sample from the first collection was individually isolated. For the
second to forth collections, five samples in each trail were pooled as one sample. Each
10 g of soil sample was added to 90 ml sterile 0.85% NaCl solution (1:10 dilution).
The sample suspensions were shaken in incubator shaker at room temperature (RT)
for 10 minutes and left unshaken for 20 minutes. Then, 1 ml of the soil suspension
was serially diluted in 9 ml 0.85% NaCl from 10-2
-10-6
and spread on rose-bengal
chloramphenicol agar (RBC). Each dilution was spread in duplicate. Plates were
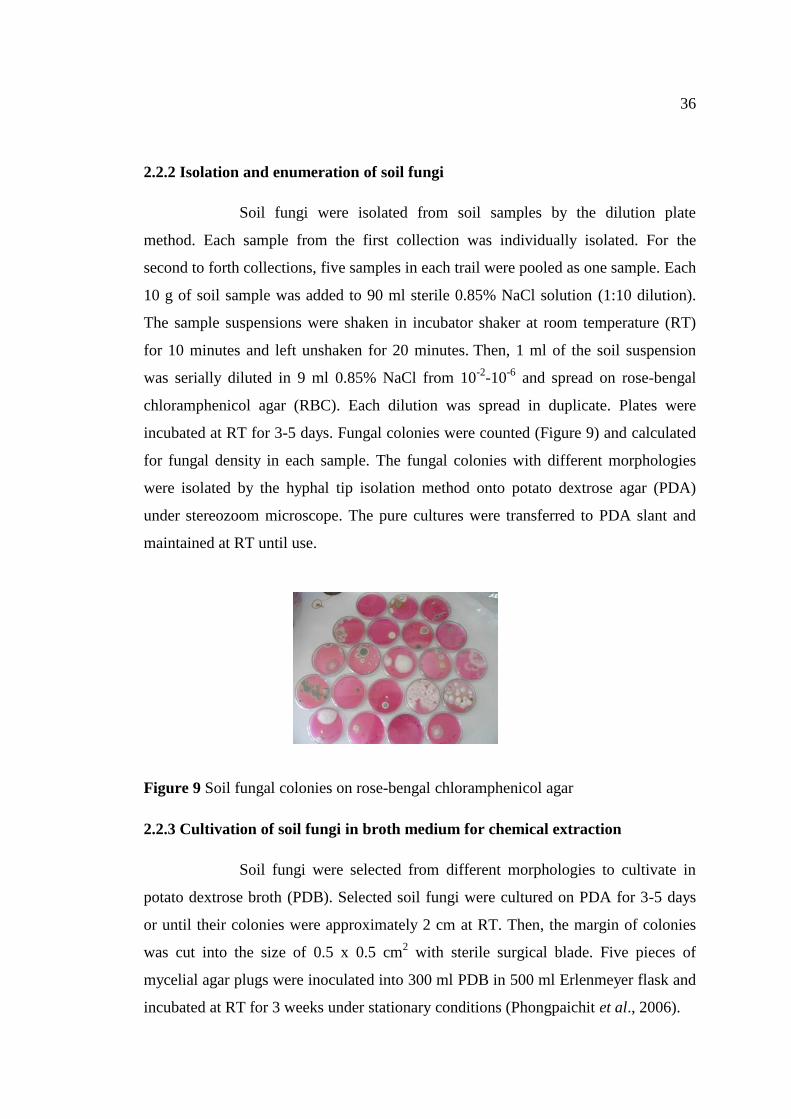
incubated at RT for 3-5 days. Fungal colonies were counted (Figure 9) and calculated
for fungal density in each sample. The fungal colonies with different morphologies
were isolated by the hyphal tip isolation method onto potato dextrose agar (PDA)
under stereozoom microscope. The pure cultures were transferred to PDA slant and
maintained at RT until use.
Figure 9 Soil fungal colonies on rose-bengal chloramphenicol agar
2.2.3 Cultivation of soil fungi in broth medium for chemical extraction
Soil fungi were selected from different morphologies to cultivate in
potato dextrose broth (PDB). Selected soil fungi were cultured on PDA for 3-5 days
or until their colonies were approximately 2 cm at RT. Then, the margin of colonies
was cut into the size of 0.5 x 0.5 cm2 with sterile surgical blade. Five pieces of
mycelial agar plugs were inoculated into 300 ml PDB in 500 ml Erlenmeyer flask and
incubated at RT for 3 weeks under stationary conditions (Phongpaichit et al., 2006).
37
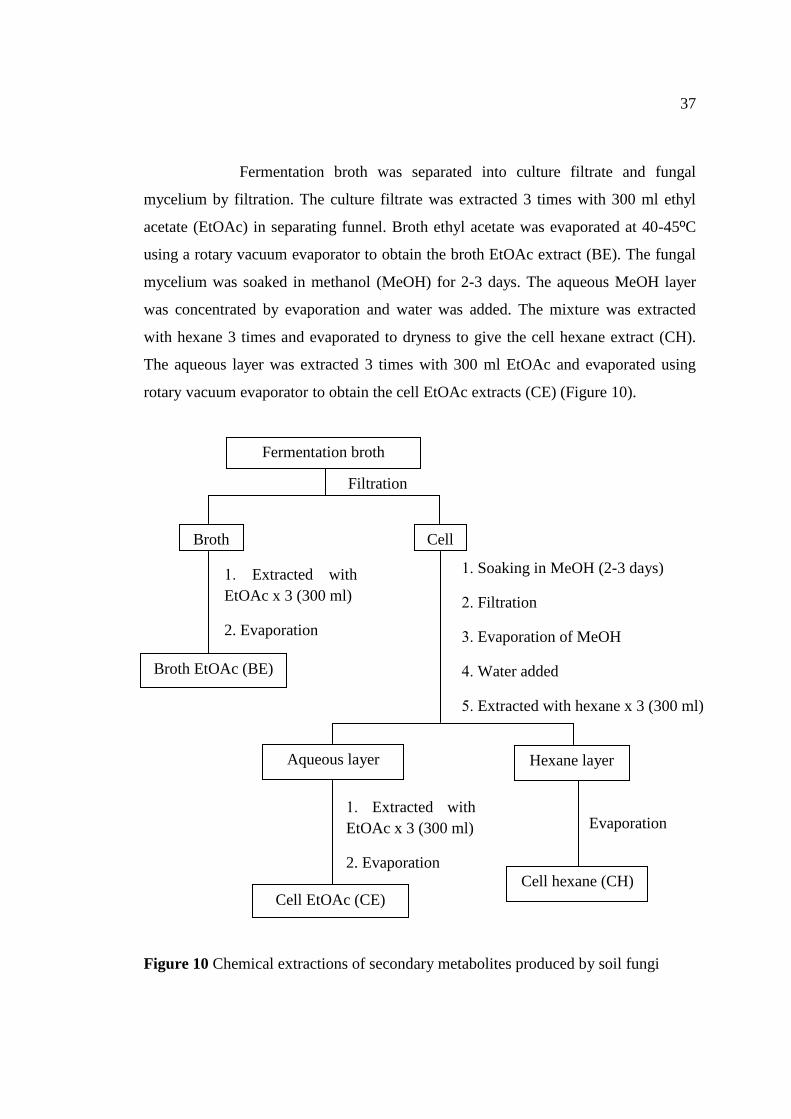
Fermentation broth was separated into culture filtrate and fungal
mycelium by filtration. The culture filtrate was extracted 3 times with 300 ml ethyl
acetate (EtOAc) in separating funnel. Broth ethyl acetate was evaporated at 40-45ºC
using a rotary vacuum evaporator to obtain the broth EtOAc extract (BE). The fungal
mycelium was soaked in methanol (MeOH) for 2-3 days. The aqueous MeOH layer
was concentrated by evaporation and water was added. The mixture was extracted
with hexane 3 times and evaporated to dryness to give the cell hexane extract (CH).
The aqueous layer was extracted 3 times with 300 ml EtOAc and evaporated using
rotary vacuum evaporator to obtain the cell EtOAc extracts (CE) (Figure 10).
Figure 10 Chemical extractions of secondary metabolites produced by soil fungi
Broth Cell
Broth EtOAc (BE)
Hexane layer Aqueous layer
Cell EtOAc (CE) Cell hexane (CH)
1. Soaking in MeOH (2-3 days)
2. Filtration
3. Evaporation of MeOH
4. Water added
5. Extracted with hexane x 3 (300 ml)
1. Extracted with
EtOAc x 3 (300 ml)
2. Evaporation
1. Extracted with
EtOAc x 3 (300 ml)
2. Evaporation
Evaporation
Filtration
Fermentation broth
38
2.2.4 Preliminary antimicrobial activity testing at a concentration of 200 µg/ml
2.2.4.1 Crude extract preparation
Crude extracts were dissolved in dimethyl sulfoxide (DMSO) to
prepare stock solutions (100 mg/ml) and kept at -20oC. Stock solutions were diluted
again with DMSO to obtain the concentration of 10 mg/ml and used as working
solution.
2.2.4.2 Standard drug preparation
Vancomycin, gentamicin and colistin were dissolved in sterile distilled
water (DW) to obtain stock solution of 16 mg/ml. Amphotericin B was dissolved in
sterile DW at 10 mg/ml. DMSO was used to prepare a stock solution of miconazole at
the concentration of 3.2 mg/ml.
2.2.4.3 Inoculum preparation
Bacteria were streaked on nutrient agar (NA) and incubated at 35°C for
18-24 hours. C. albicans and C. neoformans were cultured on Sabouraud dextrose
agar (SDA). C. albicans was incubated at 35°C, 18-24 hours while C. neoformans
was incubated at 25°C, 48 hours. Three to five single colonies were inoculated into
nutrient broth (NB) for bacteria and Sabouraud dextrose broth (SDB) for yeasts.
Bacterial and yeast inocula were then shaken at 150 rpm, 35°C in incubator shaker for
3-5 hours. After incubation, sterile normal saline (NSS) was used to adjust the
turbidity of inocula. Bacterial inocula were adjusted to 0.5 McFarland standard (MF)
and diluted 1:200 (~7.5×10⁵ CFU/ml) with Mueller-Hinton broth (MHB). Yeast
inocula were adjusted to 2.0 MF and diluted 1:20 (~3×10⁷) using SDB. Filamentous
fungi were grown on SDA at 25°C until they produced spore. Sterile glass beads were
added to fungal culture plate. Plates were shaken gently and 2 ml of sterile NSS were
added. Spore suspensions were adjusted to 8x10³
conidia/ml with SDB using
hemacytometer.
39
2.2.4.4 Antibacterial activity testing (modification of CLSI M07-A9, CLSI, 2012)
Crude extract working solutions (10 mg/ml) were diluted 1:25 with
MHB to obtain the concentration of 400 µg/ml. Triplicate 50 µl of crude extracts were
placed into sterile microtiter plates and 50 µl of bacterial inocula were added.
Therefore, the final concentrations of crude extracts were 200 µg/ml. Plates were
incubated at 35°C for 15 hours, and then 20 µl of 0.09% resazurin was added into
each well. Plates were further incubated for 3 hours at 35°C for complete incubation
(adapted from Sarker et al., 2007). Standard drugs were used as a positive control
including vancomycin (10 µg/ml) for S. aureus and MRSA, gentamicin (10 µg/ml) for
E. coli and P. aeruginosa and colistin (1,000 µg/ml) for A. baumannii.
2.2.4.5 Antifungal activity testing against yeasts (modification of Liu et al., 2007;
CLSI M27-A3, CLSI, 2008a)
The antifungal activities of crude extracts against yeasts were
investigated in a similar way to bacteria but SDB was used as culture medium. Tested
microtiter plates were incubated at 35°C, 15 hours for C. albicans and 25°C, 24 hours
for C. neoformans, and then 20 µl of 0.09% resazurin were added into each well.
Plates were examined after further incubation for 3 hours for C. albicans and 24 hours
for C. neoformans. Amphotericin B (10 µg/ml) was used as a positive control.
Interpretation: If a blue or purple color occurred indicating that crude
extract can inhibit the growth of test microorganisms (positive result). A pink or
colorless indicated that test microorganisms were survived or no inhibition (negative
result).
2.2.4.6 Antifungal activity testing against filamentous fungi (modification of CLSI
M38-A2, CLSI, 2008b)
Filamentous fungi were tested in a similar way to yeasts. Microtiter
plates were incubated at 25°C for 7 days. The growth of fungal mycelium was
observed everyday under stereo-zoom microscope. No growth of mycelium was
reported as a positive result.
40
Active crude extracts were further evaluated for their minimum
inhibitory concentrations (MICs), minimum bactericidal concentrations (MBCs) and
minimum fungicidal concentrations (MFCs).
2.2.5 Determination of MIC, MBC and MFC
The MICs of crude extracts were determined in a similar way to the
preliminary test but active crude extracts were diluted in triplicate using the serial
dilution method. The final concentrations of crude extracts were 0.25-128 µg/ml. The
lowest crude extracts concentration that inhibited the growth of tested microorganisms
was recorded as the MIC.
The streaking method was used to determine the MBCs and MFCs.
Wells of MIC and higher concentrations were streaked on NA for bacteria or SDA for
yeasts and filamentous fungi. The lowest concentration that killed tested
microorganisms was reported as the MBC or MFC.
The MICs values were categorized into 3 levels.
Strong activity : MIC < 8 µg/ml
Moderate activity : MIC = 16-64 µg/ml
Weak activity : MIC = 128-200 µg/ml
2.2.6 Study on the possible mechanisms of action of the strongly active fungal
crude extracts by scanning electron microscopy (SEM)
The strongly active crude extracts were selected to study the possible
mechanisms of action by SEM. Test microorganisms were streaked on NA for
bacteria or SDA for yeasts. Bacteria and C. albicans were incubated at 35°C for 18-24
hours. C. neoformans was incubated at 25°C for 48 hours. Three to five single
colonies were transferred to 100 ml of MHB (bacteria) or SDB (yeasts). Culture broth
was incubated at different times and temperatures depending on test microorganisms.
Culture broth was centrifuged at 5000 rpm, 5 minutes and supernatant was discarded.
Broth medium (10 ml) was added into a tube and mixed well. One ml of cells
suspension and 1 ml of crude extract at 8 times their MIC (8xMIC) in broth medium
41
were added to obtain the final concentrations of 4xMIC. After incubation, culture
broth was centrifuged at 5000 rpm for 5 minutes and washed 3 times with phosphate
buffer saline (PBS) pH 7.
Fungal mycelial plugs (1 x 1 cm2) from the margin of actively growing
colony were cut and added into 4xMIC crude extract in SDB. Cells were incubated 3
days at 25°C and washed with PBS pH 7.
Treated cells were kept at 4°C and sent to Scientific Equipment Center,
Prince of Songkla University for SEM study.
In the step of cell fixation, treated cells were fixed with 2.5%
glutaraldehyde in PBS for 1-2 hours. Cells were washed with PBS and immersed in
1% OsO4 for 1-2 hours. Cells were washed again with DW and dehydrated with
alcohol series (50%, 70%, 80%, 90% and 100%). Cells were dried by critical point
drying (CPD) method. Samples were mounted on a stub and gold-coated before
observation with SEM.
2.2.7 Identification of soil fungi
Soil fungi presenting strong antimicrobial activity or interesting NMR
profile were selected for identification.
2.2.7.1 Morphological identification
Macroscopic morphology
Soil fungi were cultured on PDA at RT for 3 weeks. The
morphological characters such as color of colony, growth rate, colonial morphology
and pigment production were observed and recorded. Isolates that do not produce any
reproductive structures after 1 month of incubation were recorded as mycelia sterilia
(Santos et al., 2013).

42
Microscopic morphology
Samples were stained with lactophenol cotton blue. Microscopic
characters including sporulation, conidial shape, type of mycelia and other important
characters were used for identification according to the keys e.g. Barnett and Hunter
(1998) and Samson et al. (2004).
2.2.7.2 Molecular identification
Selected soil fungi were grown in 50 ml PDB and incubated at RT for
3-7 days in shaking incubator. Fermentation broth was filtrated with sterile gauze and
mycelia were washed several times with sterile DW (~60°C). Fungal mycelia were
placed on sterile tissue towel to absorb water, and then freeze-dried using lyophilizer.
2.2.7.2.1 Genomic DNA extraction
CTAB method
Freeze-dried fungal mycelia were transferred to sterile mortar and
liquid nitrogen was added. Mycelia were ground into a fine powder and placed into
sterile 1.5 ml microtube. Five hundred µl of CTAB lysis buffer (O’Donnell et al.,
1997) was added, and then the microtube was incubated at 70°C for 45 minutes. 5M
NaCl (140 µl) and 10% CTAB (50 µl) were added and the microtube was incubated at
65°C for 10 minutes. The microtube was centrifuged at 12,000 rpm, 4°C for 20
minutes and the lysate was transferred to a new tube. An equal volume of chloroform:
isoamyl alcohol (24:1) was added and inverted gently, then centrifuged at 12,000 rpm,
4°C for 10 minutes. An aqueous phase (upper) was transferred to a new tube and an
equal volume of chloroform: isoamyl alcohol (24:1) was added and centrifuged at
12,000 rpm, 4°C for 10 minutes. Upper liquid phase was transferred to a new tube
after that a half volume of 7.5 M ammonium acetate and a half volume of cold
isopropanol were added. Mixture was kept at -20°C for at least 30 minutes and
centrifuged at a maximum speed (14,000 rpm), at 4°C for 10 minutes. DNA pellet
was washed twice with cold 75% ethanol and air dried. DNA pellet was resuspended
with 30-50 µl sterile nanopure water. The DNA was stored at 4°C or -20°C until used.
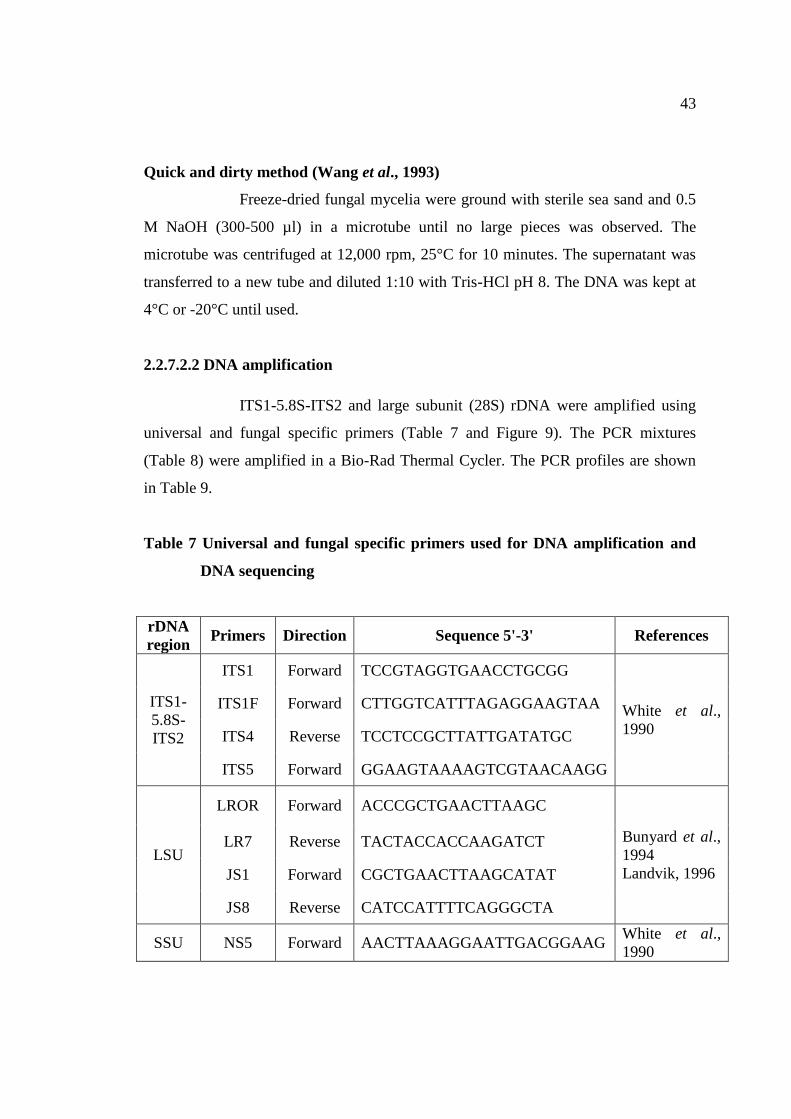
43
Quick and dirty method (Wang et al., 1993)
Freeze-dried fungal mycelia were ground with sterile sea sand and 0.5
M NaOH (300-500 µl) in a microtube until no large pieces was observed. The
microtube was centrifuged at 12,000 rpm, 25°C for 10 minutes. The supernatant was
transferred to a new tube and diluted 1:10 with Tris-HCl pH 8. The DNA was kept at
4°C or -20°C until used.
2.2.7.2.2 DNA amplification
ITS1-5.8S-ITS2 and large subunit (28S) rDNA were amplified using
universal and fungal specific primers (Table 7 and Figure 9). The PCR mixtures
(Table 8) were amplified in a Bio-Rad Thermal Cycler. The PCR profiles are shown
in Table 9.
Table 7 Universal and fungal specific primers used for DNA amplification and
DNA sequencing
rDNA
region Primers Direction Sequence 5'-3' References
ITS1-
5.8S-
ITS2
ITS1 Forward TCCGTAGGTGAACCTGCGG
White et al.,
1990
ITS1F Forward CTTGGTCATTTAGAGGAAGTAA
ITS4 Reverse TCCTCCGCTTATTGATATGC
ITS5 Forward GGAAGTAAAAGTCGTAACAAGG
LSU
LROR Forward ACCCGCTGAACTTAAGC
Bunyard et al.,
1994
Landvik, 1996
LR7 Reverse TACTACCACCAAGATCT
JS1 Forward CGCTGAACTTAAGCATAT
JS8 Reverse CATCCATTTTCAGGGCTA
SSU NS5 Forward AACTTAAAGGAATTGACGGAAG White et al.,
1990
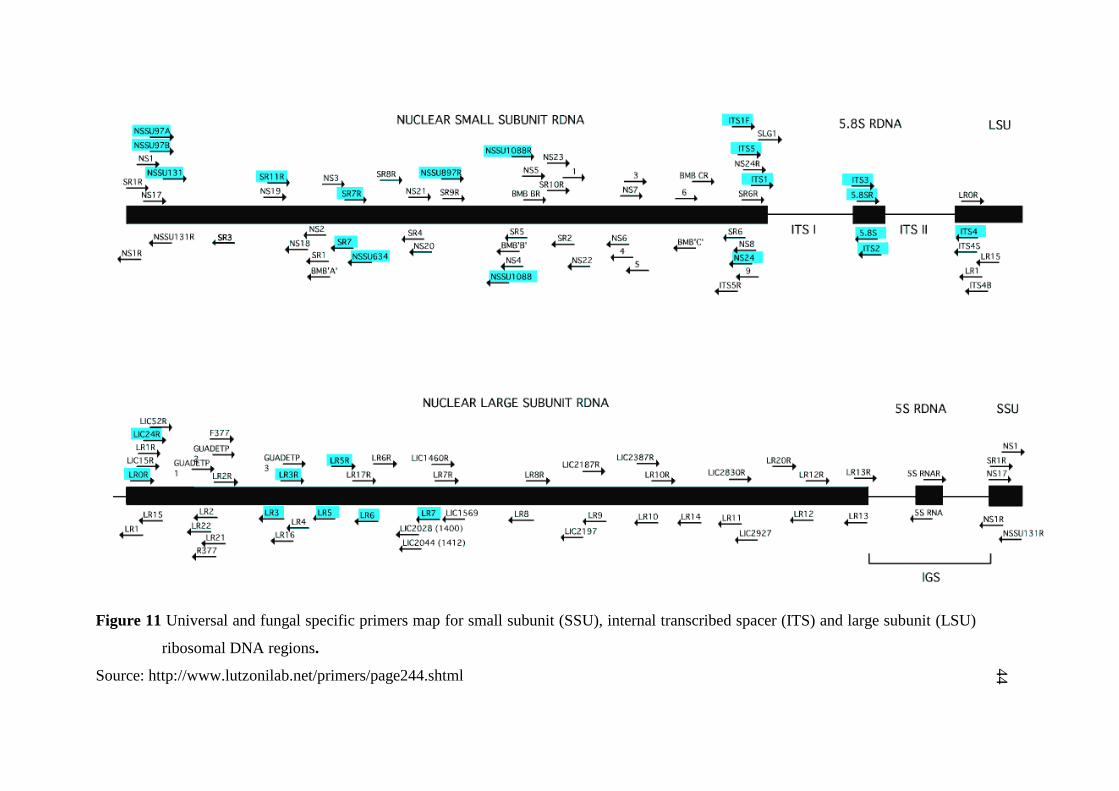
44
Figure 11 Universal and fungal specific primers map for small subunit (SSU), internal transcribed spacer (ITS) and large subunit (LSU)
ribosomal DNA regions.
Source: http://www.lutzonilab.net/primers/page244.shtml
44
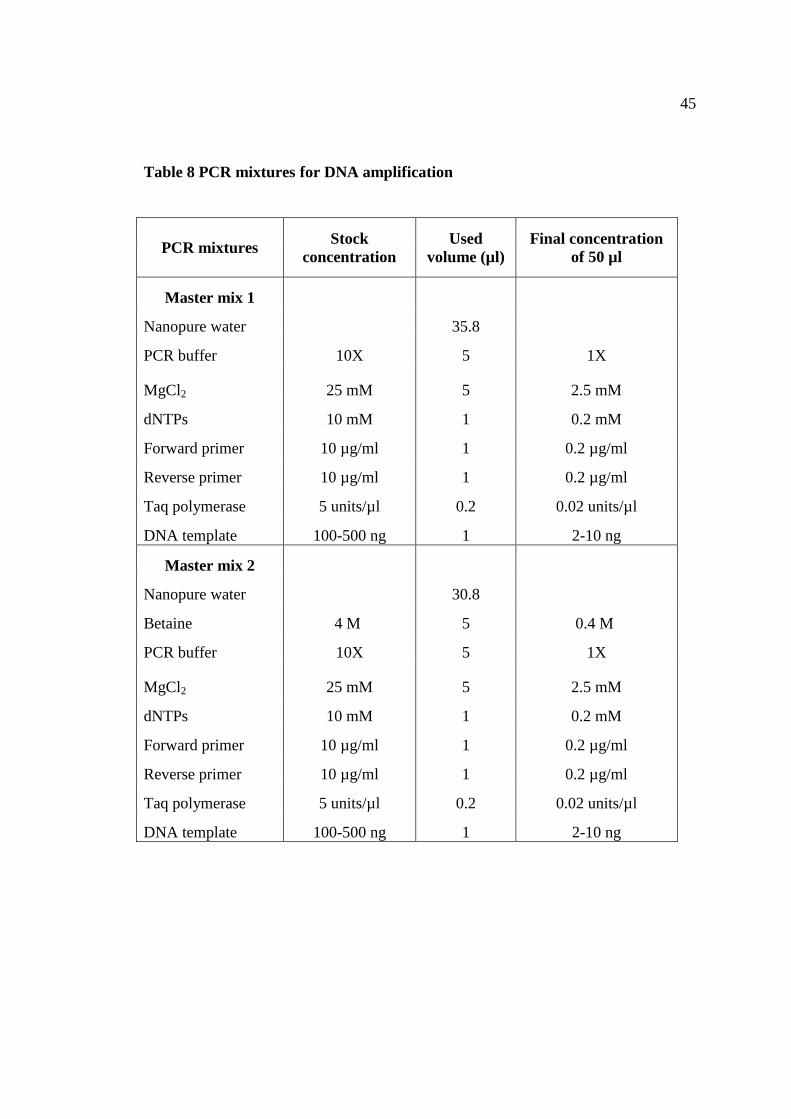
45
Table 8 PCR mixtures for DNA amplification
PCR mixtures Stock
concentration
Used
volume (µl)
Final concentration
of 50 µl
Master mix 1
Nanopure water 35.8
PCR buffer 10X 5 1X
MgCl2 25 mM 5 2.5 mM
dNTPs 10 mM 1 0.2 mM
Forward primer 10 µg/ml 1 0.2 µg/ml
Reverse primer 10 µg/ml 1 0.2 µg/ml
Taq polymerase 5 units/µl 0.2 0.02 units/µl
DNA template 100-500 ng 1 2-10 ng
Master mix 2
Nanopure water 30.8
Betaine 4 M 5 0.4 M
PCR buffer 10X 5 1X
MgCl2 25 mM 5 2.5 mM
dNTPs 10 mM 1 0.2 mM
Forward primer 10 µg/ml 1 0.2 µg/ml
Reverse primer 10 µg/ml 1 0.2 µg/ml
Taq polymerase 5 units/µl 0.2 0.02 units/µl
DNA template 100-500 ng 1 2-10 ng
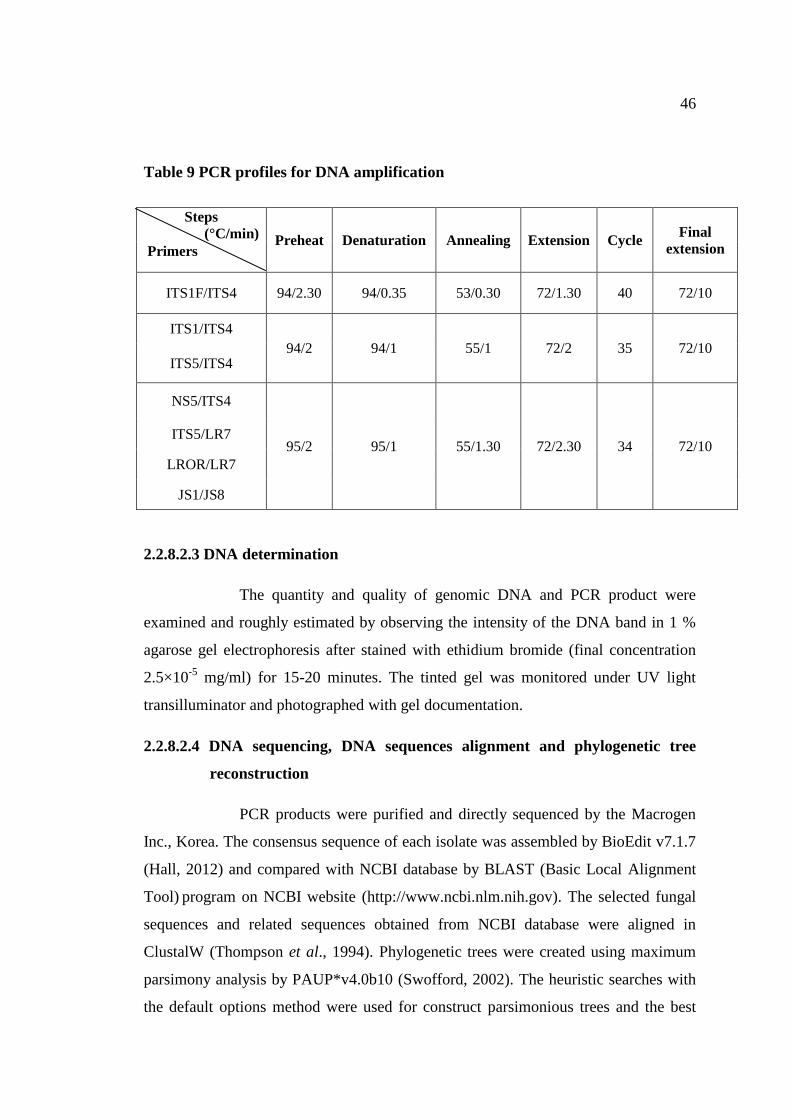
46
Table 9 PCR profiles for DNA amplification
2.2.8.2.3 DNA determination
The quantity and quality of genomic DNA and PCR product were
examined and roughly estimated by observing the intensity of the DNA band in 1 %
agarose gel electrophoresis after stained with ethidium bromide (final concentration
2.5×10⁻⁵
mg/ml) for 15-20 minutes. The tinted gel was monitored under UV light
transilluminator and photographed with gel documentation.
2.2.8.2.4 DNA sequencing, DNA sequences alignment and phylogenetic tree
reconstruction
PCR products were purified and directly sequenced by the Macrogen
Inc., Korea. The consensus sequence of each isolate was assembled by BioEdit v7.1.7
(Hall, 2012) and compared with NCBI database by BLAST (Basic Local Alignment
Tool) program on NCBI website (http://www.ncbi.nlm.nih.gov). The selected fungal
sequences and related sequences obtained from NCBI database were aligned in
ClustalW (Thompson et al., 1994). Phylogenetic trees were created using maximum
parsimony analysis by PAUP*v4.0b10 (Swofford, 2002). The heuristic searches with
the default options method were used for construct parsimonious trees and the best
Steps
(°C/min) Preheat Denaturation Annealing Extension Cycle
Final
extension Primers
ITS1F/ITS4 94/2.30 94/0.35 53/0.30 72/1.30 40 72/10
ITS1/ITS4
94/2 94/1 55/1 72/2 35 72/10 ITS5/ITS4
NS5/ITS4
95/2 95/1 55/1.30 72/2.30 34 72/10 ITS5/LR7
LROR/LR7
JS1/JS8
47
tree was estimated by the Kishino-Hasegawa (KH) test (Kishino and Hasegawa,
1989). The assessment of confidence for each clade was performed by bootstrapping
values with the default parameters. The fungal DNA sequences were submitted to
NCBI database.
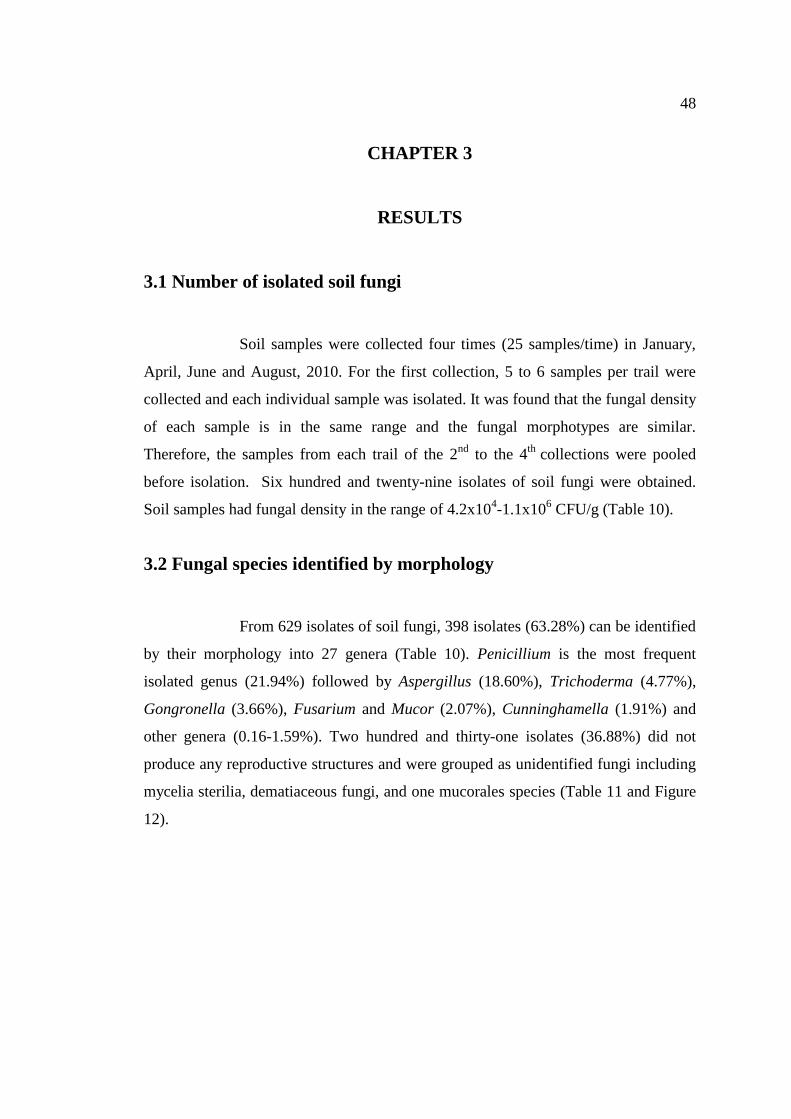
48
CHAPTER 3
RESULTS
3.1 Number of isolated soil fungi
Soil samples were collected four times (25 samples/time) in January,
April, June and August, 2010. For the first collection, 5 to 6 samples per trail were
collected and each individual sample was isolated. It was found that the fungal density
of each sample is in the same range and the fungal morphotypes are similar.
Therefore, the samples from each trail of the 2nd
to the 4th
collections were pooled
before isolation. Six hundred and twenty-nine isolates of soil fungi were obtained.
Soil samples had fungal density in the range of 4.2x10⁴-1.1x10
6 CFU/g (Table 10).
3.2 Fungal species identified by morphology
From 629 isolates of soil fungi, 398 isolates (63.28%) can be identified
by their morphology into 27 genera (Table 10). Penicillium is the most frequent
isolated genus (21.94%) followed by Aspergillus (18.60%), Trichoderma (4.77%),
Gongronella (3.66%), Fusarium and Mucor (2.07%), Cunninghamella (1.91%) and
other genera (0.16-1.59%). Two hundred and thirty-one isolates (36.88%) did not
produce any reproductive structures and were grouped as unidentified fungi including
mycelia sterilia, dematiaceous fungi, and one mucorales species (Table 11 and Figure
12).
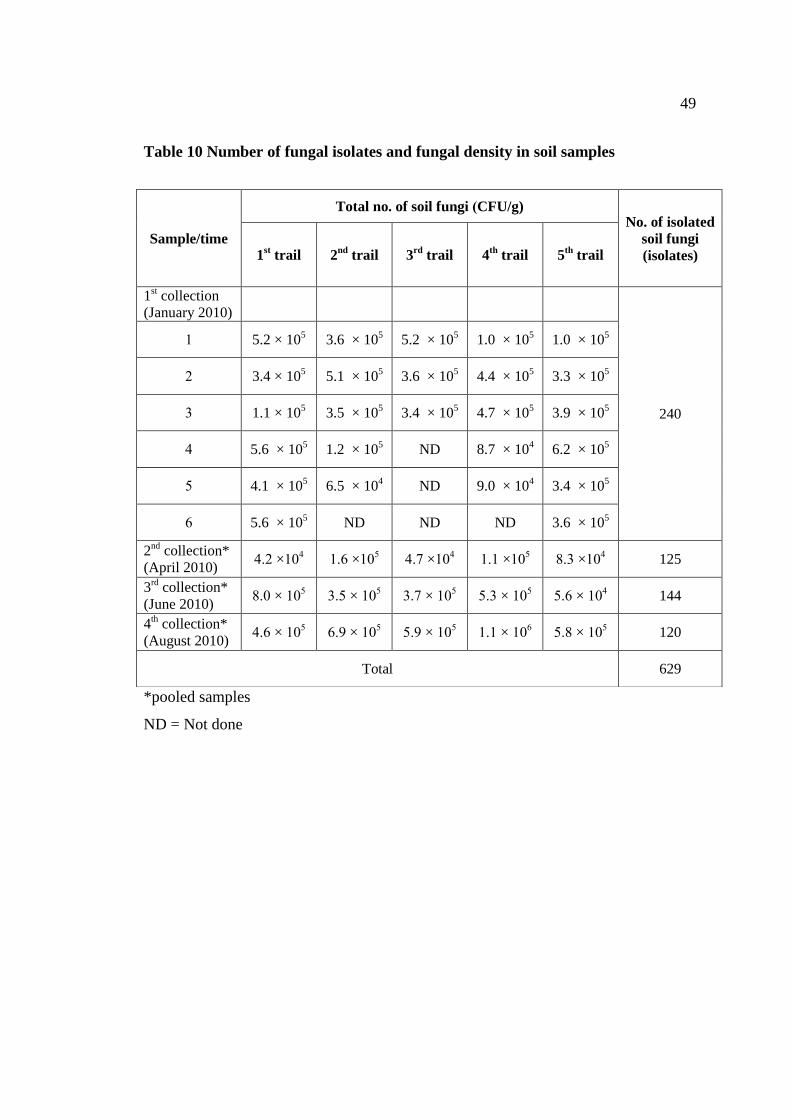
49
Table 10 Number of fungal isolates and fungal density in soil samples
*pooled samples
ND = Not done
Sample/time
Total no. of soil fungi (CFU/g) No. of isolated
soil fungi
(isolates) 1st trail 2
nd trail 3
rd trail 4
th trail 5
th trail
1st collection
(January 2010)
240
1 5.2 × 10⁵ 3.6 × 10
5 5.2 × 10
5 1.0 × 10
5 1.0 × 10
5
2 3.4 × 10⁵ 5.1 × 10
5 3.6 × 10
5 4.4 × 10
5 3.3 × 10
5
3 1.1 × 10⁵ 3.5 × 10
5 3.4 × 10
5 4.7 × 10
5 3.9 × 10
5
4 5.6 × 10⁵ 1.2 × 10
5 ND 8.7 × 10
4 6.2 × 10
5
5 4.1 × 10⁵ 6.5 × 10
4 ND 9.0 × 10
4 3.4 × 10
5
6 5.6 × 10⁵ ND ND ND 3.6 × 10
5
2nd
collection*
(April 2010) 4.2 ×10
4 1.6 ×10
5 4.7 ×10
4 1.1 ×10
5 8.3 ×10
4 125
3rd
collection*
(June 2010) 8.0 × 10
5 3.5 × 10
5 3.7 × 10
5 5.3 × 10
5 5.6 × 10
4 144
4th collection*
(August 2010) 4.6 × 10
5 6.9 × 10
5 5.9 × 10
5 1.1 × 10
6 5.8 × 10
5 120
Total 629
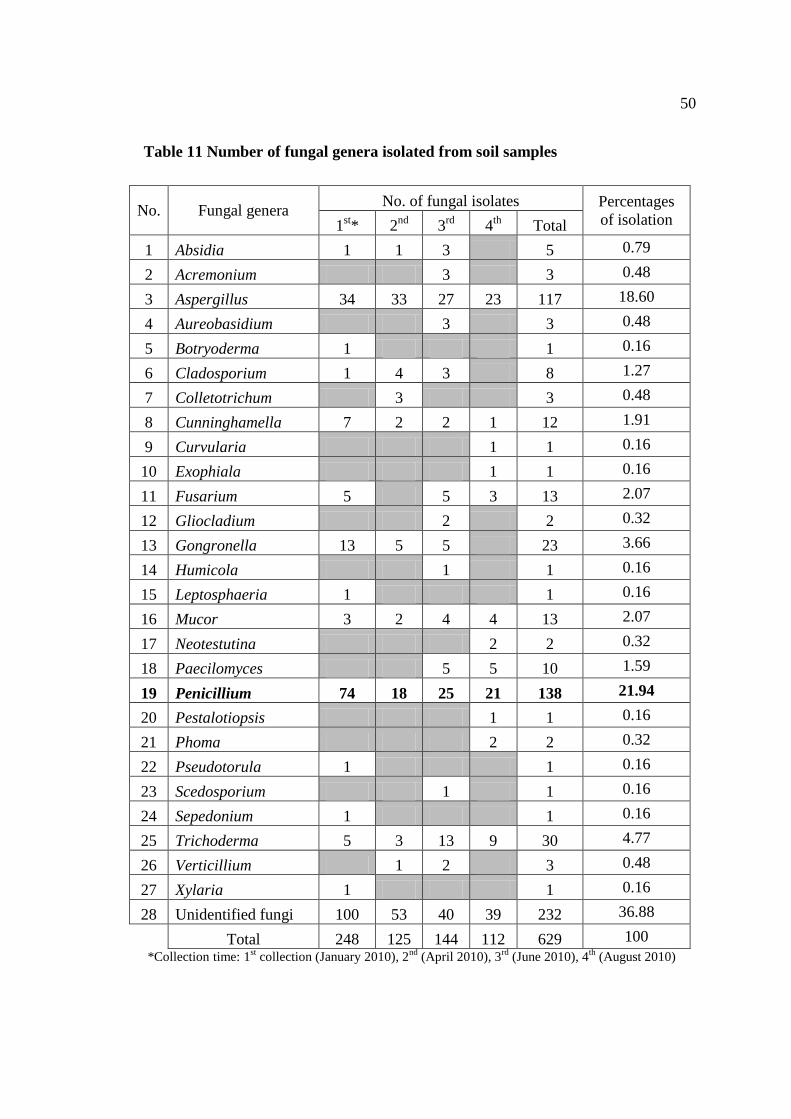
50
Table 11 Number of fungal genera isolated from soil samples
No. Fungal genera No. of fungal isolates Percentages
of isolation 1st* 2
nd 3
rd 4
th Total
1 Absidia 1 1 3 5 0.79
2 Acremonium 3 3 0.48
3 Aspergillus 34 33 27 23 117 18.60
4 Aureobasidium 3 3 0.48
5 Botryoderma 1 1 0.16
6 Cladosporium 1 4 3 8 1.27
7 Colletotrichum 3 3 0.48
8 Cunninghamella 7 2 2 1 12 1.91
9 Curvularia 1 1 0.16
10 Exophiala 1 1 0.16
11 Fusarium 5 5 3 13 2.07
12 Gliocladium 2 2 0.32
13 Gongronella 13 5 5 23 3.66
14 Humicola 1 1 0.16
15 Leptosphaeria 1 1 0.16
16 Mucor 3 2 4 4 13 2.07
17 Neotestutina 2 2 0.32
18 Paecilomyces 5 5 10 1.59
19 Penicillium 74 18 25 21 138 21.94
20 Pestalotiopsis 1 1 0.16
21 Phoma 2 2 0.32
22 Pseudotorula 1 1 0.16
23 Scedosporium 1 1 0.16
24 Sepedonium 1 1 0.16
25 Trichoderma 5 3 13 9 30 4.77
26 Verticillium 1 2 3 0.48
27 Xylaria 1 1 0.16
28 Unidentified fungi 100 53 40 39 232 36.88
Total 248 125 144 112 629 100
*Collection time: 1st collection (January 2010), 2
nd (April 2010), 3
rd (June 2010), 4
th (August 2010)
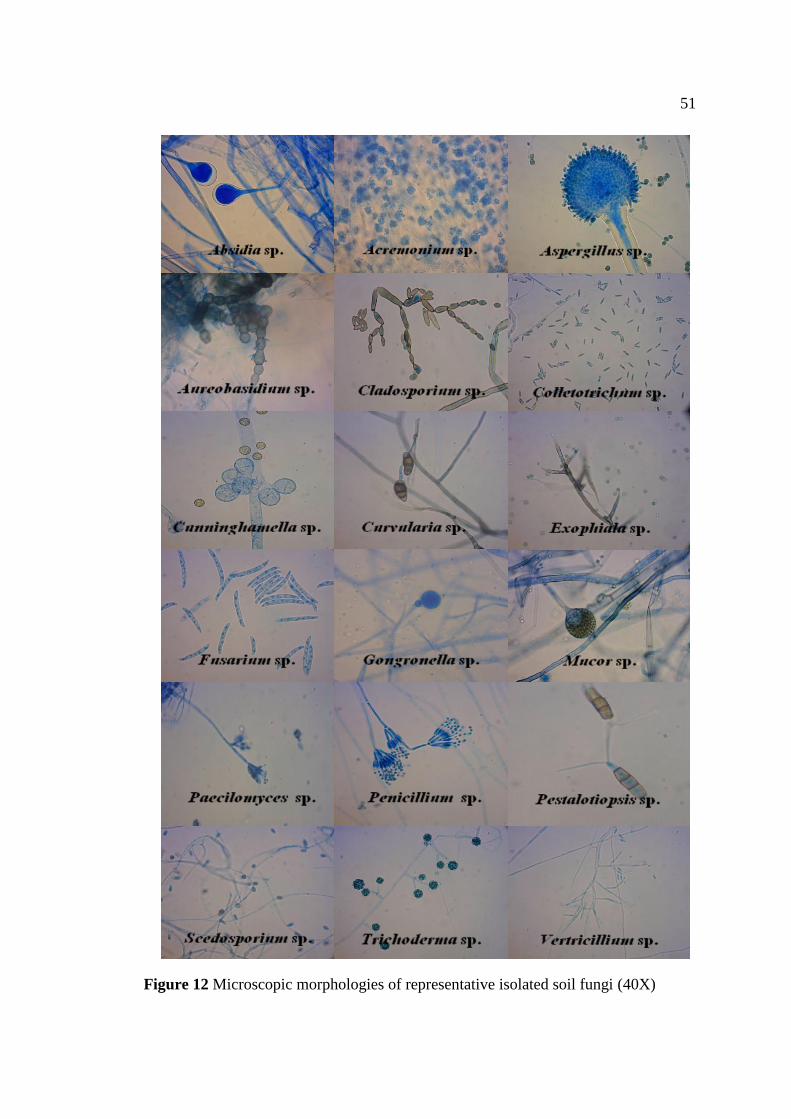
51
Figure 12 Microscopic morphologies of representative isolated soil fungi (40X)
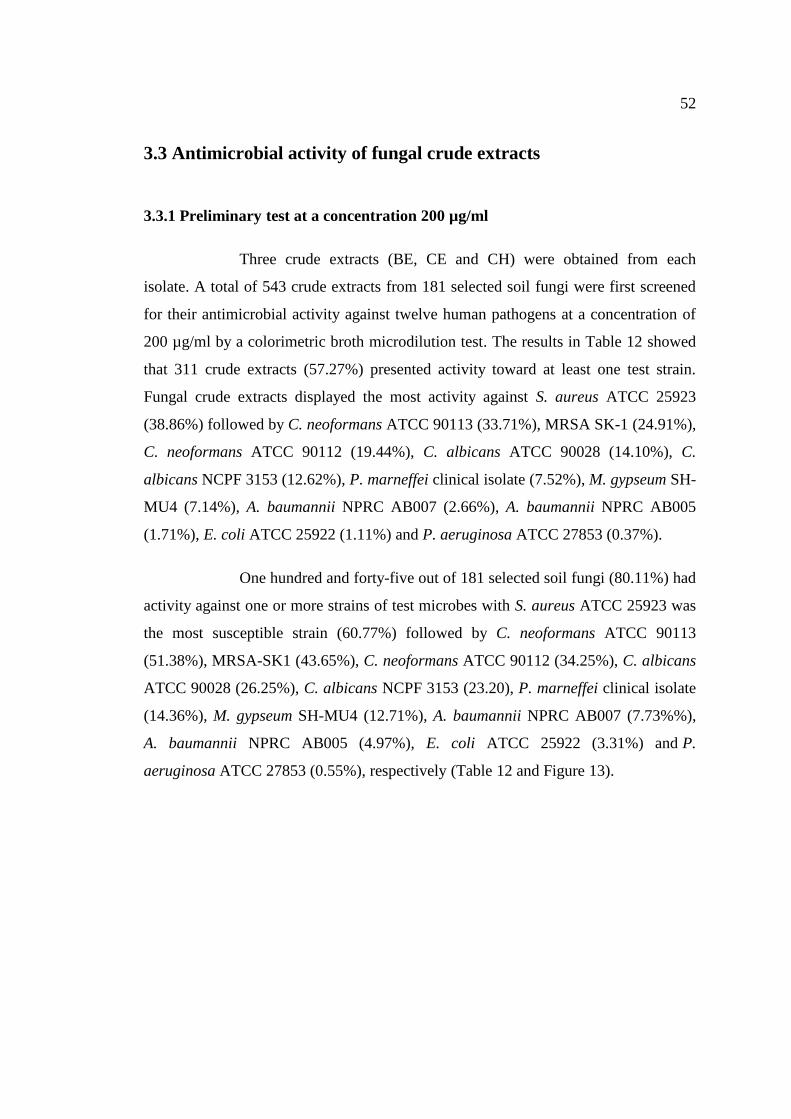
52
3.3 Antimicrobial activity of fungal crude extracts
3.3.1 Preliminary test at a concentration 200 µg/ml
Three crude extracts (BE, CE and CH) were obtained from each
isolate. A total of 543 crude extracts from 181 selected soil fungi were first screened
for their antimicrobial activity against twelve human pathogens at a concentration of
200 µg/ml by a colorimetric broth microdilution test. The results in Table 12 showed
that 311 crude extracts (57.27%) presented activity toward at least one test strain.
Fungal crude extracts displayed the most activity against S. aureus ATCC 25923
(38.86%) followed by C. neoformans ATCC 90113 (33.71%), MRSA SK-1 (24.91%),
C. neoformans ATCC 90112 (19.44%), C. albicans ATCC 90028 (14.10%), C.
albicans NCPF 3153 (12.62%), P. marneffei clinical isolate (7.52%), M. gypseum SH-
MU4 (7.14%), A. baumannii NPRC AB007 (2.66%), A. baumannii NPRC AB005
(1.71%), E. coli ATCC 25922 (1.11%) and P. aeruginosa ATCC 27853 (0.37%).
One hundred and forty-five out of 181 selected soil fungi (80.11%) had
activity against one or more strains of test microbes with S. aureus ATCC 25923 was
the most susceptible strain (60.77%) followed by C. neoformans ATCC 90113
(51.38%), MRSA-SK1 (43.65%), C. neoformans ATCC 90112 (34.25%), C. albicans
ATCC 90028 (26.25%), C. albicans NCPF 3153 (23.20), P. marneffei clinical isolate
(14.36%), M. gypseum SH-MU4 (12.71%), A. baumannii NPRC AB007 (7.73%%),
A. baumannii NPRC AB005 (4.97%), E. coli ATCC 25922 (3.31%) and P.
aeruginosa ATCC 27853 (0.55%), respectively (Table 12 and Figure 13).
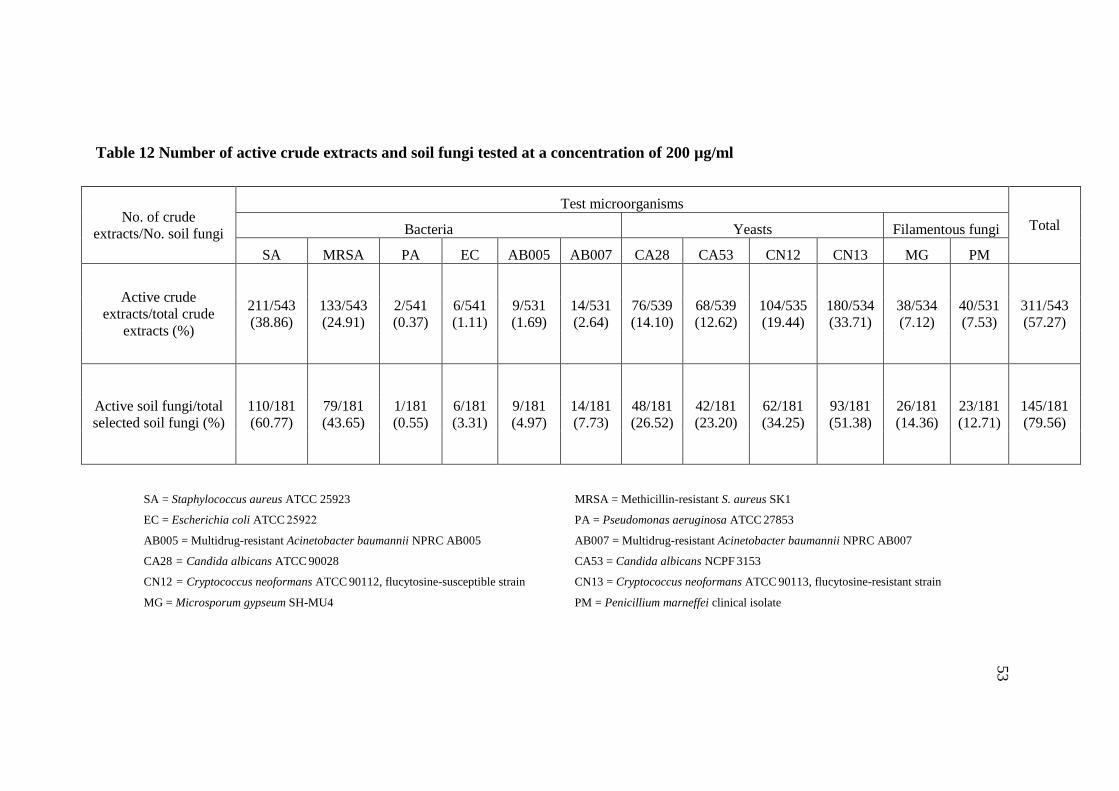
53
Table 12 Number of active crude extracts and soil fungi tested at a concentration of 200 µg/ml
No. of crude
extracts/No. soil fungi
Test microorganisms
Total Bacteria Yeasts Filamentous fungi
SA MRSA PA EC AB005 AB007 CA28 CA53 CN12 CN13 MG PM
Active crude
extracts/total crude
extracts (%)
211/543
(38.86)
133/543
(24.91)
2/541
(0.37)
6/541
(1.11)
9/531
(1.69)
14/531
(2.64)
76/539
(14.10)
68/539
(12.62)
104/535
(19.44)
180/534
(33.71)
38/534
(7.12)
40/531
(7.53)
311/543
(57.27)
Active soil fungi/total
selected soil fungi (%)
110/181
(60.77)
79/181
(43.65)
1/181
(0.55)
6/181
(3.31)
9/181
(4.97)
14/181
(7.73)
48/181
(26.52)
42/181
(23.20)
62/181
(34.25)
93/181
(51.38)
26/181
(14.36)
23/181
(12.71)
145/181
(79.56)
SA = Staphylococcus aureus ATCC 25923 MRSA = Methicillin-resistant S. aureus SK1
EC = Escherichia coli ATCC 25922 PA = Pseudomonas aeruginosa ATCC 27853
AB005 = Multidrug-resistant Acinetobacter baumannii NPRC AB005 AB007 = Multidrug-resistant Acinetobacter baumannii NPRC AB007
CA28 = Candida albicans ATCC 90028 CA53 = Candida albicans NCPF 3153
CN12 = Cryptococcus neoformans ATCC 90112, flucytosine-susceptible strain CN13 = Cryptococcus neoformans ATCC 90113, flucytosine-resistant strain
MG = Microsporum gypseum SH-MU4 PM = Penicillium marneffei clinical isolate
53
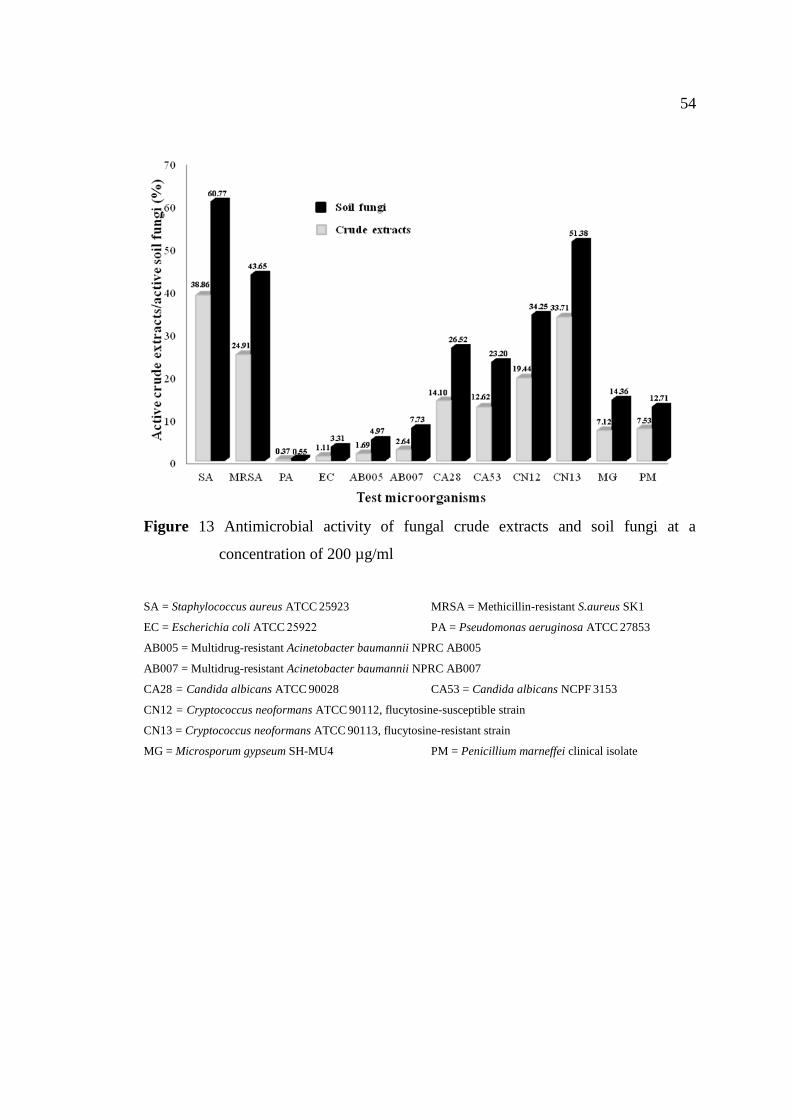
54
Figure 13 Antimicrobial activity of fungal crude extracts and soil fungi at a
concentration of 200 µg/ml
SA = Staphylococcus aureus ATCC 25923 MRSA = Methicillin-resistant S.aureus SK1
EC = Escherichia coli ATCC 25922 PA = Pseudomonas aeruginosa ATCC 27853
AB005 = Multidrug-resistant Acinetobacter baumannii NPRC AB005
AB007 = Multidrug-resistant Acinetobacter baumannii NPRC AB007
CA28 = Candida albicans ATCC 90028 CA53 = Candida albicans NCPF 3153
CN12 = Cryptococcus neoformans ATCC 90112, flucytosine-susceptible strain
CN13 = Cryptococcus neoformans ATCC 90113, flucytosine-resistant strain
MG = Microsporum gypseum SH-MU4 PM = Penicillium marneffei clinical isolate
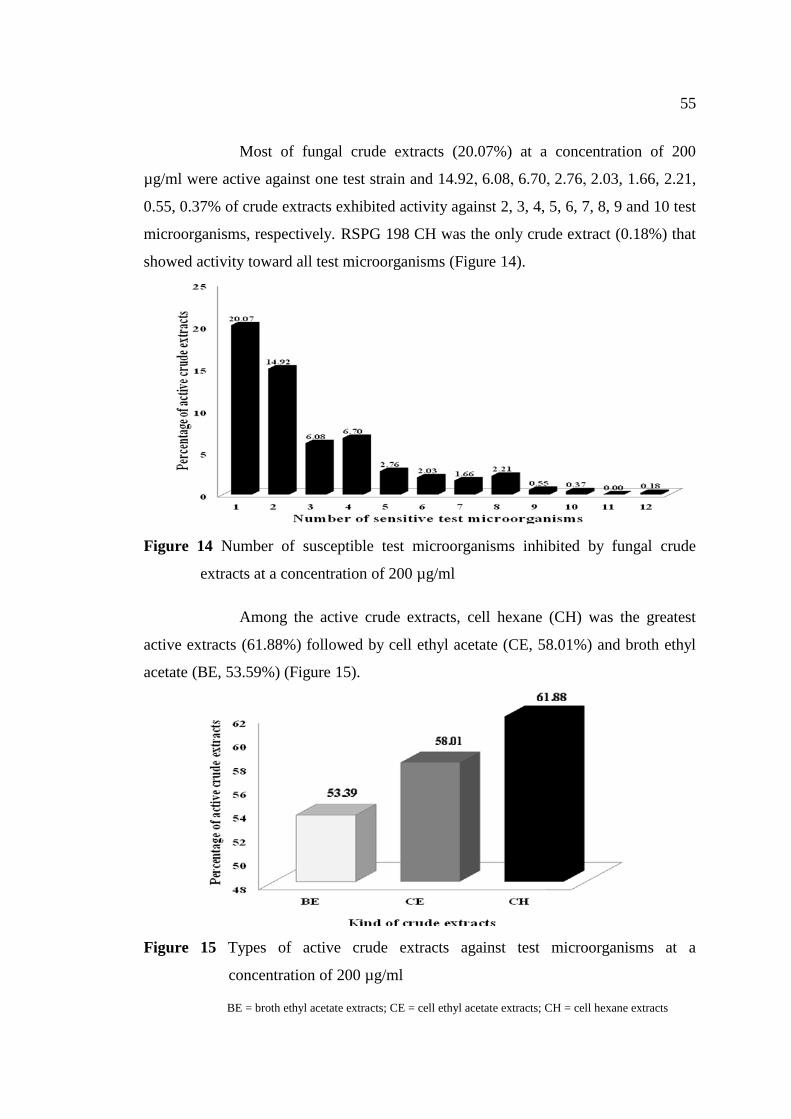
55
Most of fungal crude extracts (20.07%) at a concentration of 200
µg/ml were active against one test strain and 14.92, 6.08, 6.70, 2.76, 2.03, 1.66, 2.21,
0.55, 0.37% of crude extracts exhibited activity against 2, 3, 4, 5, 6, 7, 8, 9 and 10 test
microorganisms, respectively. RSPG 198 CH was the only crude extract (0.18%) that
showed activity toward all test microorganisms (Figure 14).
Figure 14 Number of susceptible test microorganisms inhibited by fungal crude
extracts at a concentration of 200 µg/ml
Among the active crude extracts, cell hexane (CH) was the greatest
active extracts (61.88%) followed by cell ethyl acetate (CE, 58.01%) and broth ethyl
acetate (BE, 53.59%) (Figure 15).
Figure 15 Types of active crude extracts against test microorganisms at a
concentration of 200 µg/ml
BE = broth ethyl acetate extracts; CE = cell ethyl acetate extracts; CH = cell hexane extracts
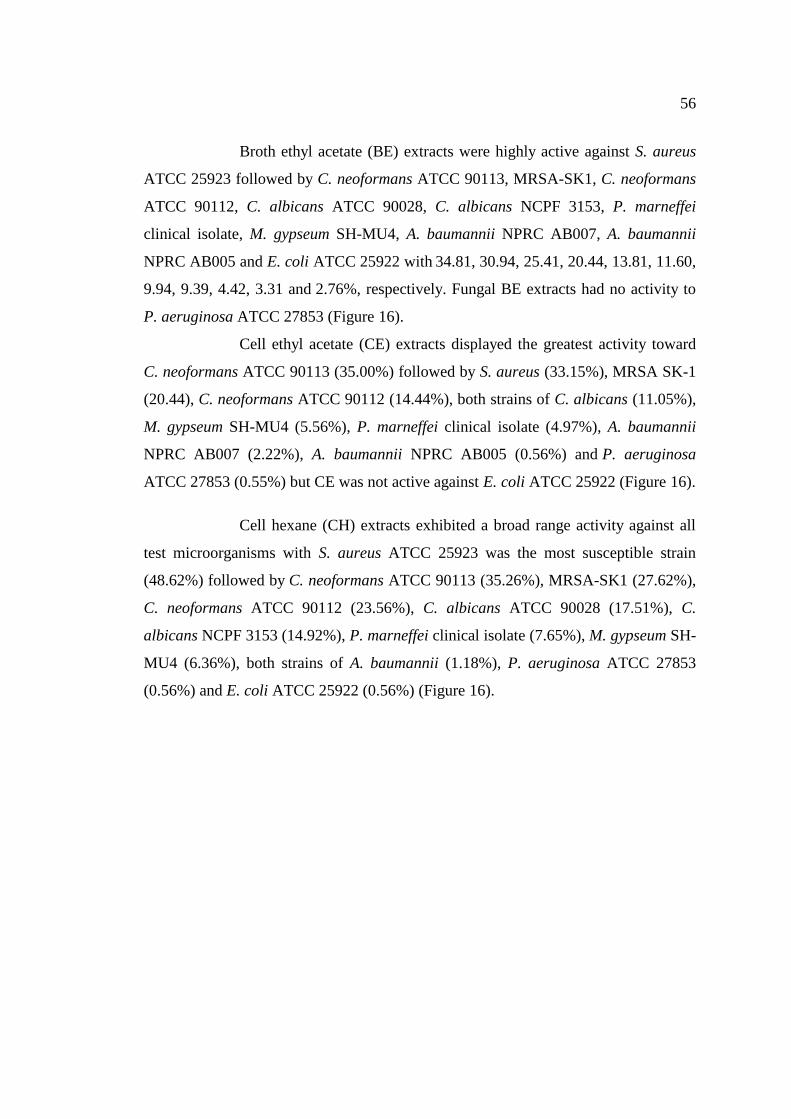
56
Broth ethyl acetate (BE) extracts were highly active against S. aureus
ATCC 25923 followed by C. neoformans ATCC 90113, MRSA-SK1, C. neoformans
ATCC 90112, C. albicans ATCC 90028, C. albicans NCPF 3153, P. marneffei
clinical isolate, M. gypseum SH-MU4, A. baumannii NPRC AB007, A. baumannii
NPRC AB005 and E. coli ATCC 25922 with 34.81, 30.94, 25.41, 20.44, 13.81, 11.60,
9.94, 9.39, 4.42, 3.31 and 2.76%, respectively. Fungal BE extracts had no activity to
P. aeruginosa ATCC 27853 (Figure 16).
Cell ethyl acetate (CE) extracts displayed the greatest activity toward
C. neoformans ATCC 90113 (35.00%) followed by S. aureus (33.15%), MRSA SK-1
(20.44), C. neoformans ATCC 90112 (14.44%), both strains of C. albicans (11.05%),
M. gypseum SH-MU4 (5.56%), P. marneffei clinical isolate (4.97%), A. baumannii
NPRC AB007 (2.22%), A. baumannii NPRC AB005 (0.56%) and P. aeruginosa
ATCC 27853 (0.55%) but CE was not active against E. coli ATCC 25922 (Figure 16).
Cell hexane (CH) extracts exhibited a broad range activity against all
test microorganisms with S. aureus ATCC 25923 was the most susceptible strain
(48.62%) followed by C. neoformans ATCC 90113 (35.26%), MRSA-SK1 (27.62%),
C. neoformans ATCC 90112 (23.56%), C. albicans ATCC 90028 (17.51%), C.
albicans NCPF 3153 (14.92%), P. marneffei clinical isolate (7.65%), M. gypseum SH-
MU4 (6.36%), both strains of A. baumannii (1.18%), P. aeruginosa ATCC 27853
(0.56%) and E. coli ATCC 25922 (0.56%) (Figure 16).
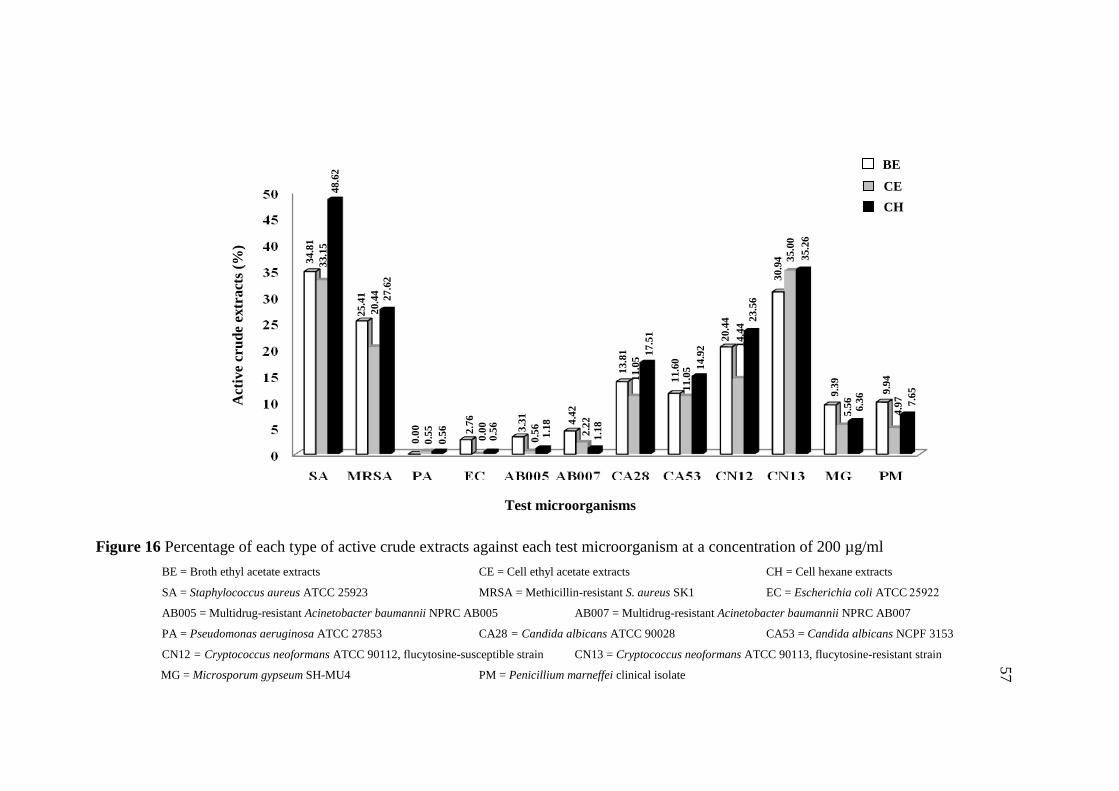
57
Figure 16 Percentage of each type of active crude extracts against each test microorganism at a concentration of 200 µg/ml
BE = Broth ethyl acetate extracts CE = Cell ethyl acetate extracts CH = Cell hexane extracts
SA = Staphylococcus aureus ATCC 25923 MRSA = Methicillin-resistant S. aureus SK1 EC = Escherichia coli ATCC 25922
AB005 = Multidrug-resistant Acinetobacter baumannii NPRC AB005 AB007 = Multidrug-resistant Acinetobacter baumannii NPRC AB007
PA = Pseudomonas aeruginosa ATCC 27853 CA28 = Candida albicans ATCC 90028 CA53 = Candida albicans NCPF 3153
CN12 = Cryptococcus neoformans ATCC 90112, flucytosine-susceptible strain CN13 = Cryptococcus neoformans ATCC 90113, flucytosine-resistant strain
MG = Microsporum gypseum SH-MU4 PM = Penicillium marneffei clinical isolate
Act
ive
cru
de
extr
act
s (%
)
Test microorganisms
BE
CE
CH
34.8
1
48.6
2
33.1
5
27.6
2
20.4
4
25.4
1
0.5
6
0.5
5
0.0
0
2.7
6
0.5
6
0.0
0
1.1
8
0.5
6
3.3
1
1.1
8
2.2
2
4.4
2
17.5
1
11.0
5
13.8
1
11.6
0
14.9
2
11.0
5
23.5
6
14.4
4
20.4
4
35.2
6
35.0
0
30.9
4
6.3
6
5.5
6 9
.39
7.6
5
4.9
7 9
.94
57
58
3.3.2 Determination of minimum inhibitory concentrations (MICs) and
minimum bactericidal concentrations (MBCs) or minimum fungicidal
concentrations (MFCs)
Active crude extracts from preliminary test were further examined for
their MICs by a colorimetric broth microdilution test. The results showed that the
MICs values varied among each test microorganism. The MIC values ranged from the
lowest to the highest concentrations were as follows: C. neoformans ATCC 90113 (1-
200 µg/ml); S. aureus ATCC 25923, MRSA SK-1 and both strains of C. albicans (2-
200 µg/ml); C. neoformans ATCC 90112 (4-200 µg/ml); P. marneffei clinical isolate
(16-200 µg/ml); M. gypseum SH-MU4 (32-200 µg/ml); P. aeruginosa ATCC 27853
and E. coli ATCC 25922 (128-200 µg/ml) and both strains of A. baumannii (200
µg/ml) (Table 13).
MBC and MFC values of crude extracts were in ranges of 2->200
µg/ml and 4->200 µg/ml, respectively. The lowest MBC/MFC was found against
MRSA (2 µg/ml) followed by C. neoformans ATCC 90113 (4 µg/ml); S. aureus
ATCC 25923, C. albicans NCPF 3153 and C. neoformans ATCC 90112 (8 µg/ml); C.
albicans ATCC 90028 and P. marneffei clinical isolate (16 µg/ml) and M. gypseum
(128 µg/ml). However, the active crude extracts had no bactericidal activity against
Gram-negative bacteria (MBC >200 µg/ml) (Table 13). The MIC values could be divided into 3 levels as strong activity (MIC
< 8 µg/ml), moderate activity (MIC = 16-64 µg/ml) and weak activity (MIC = 128-
200 µg/ml). Most fungal crude extracts exhibited weak activity followed by moderate
and strong activity. The strong activity was the highest against C. neoformans ATCC
90113 (23 extracts) followed by S. aureus ATCC 25923 (14 extracts), MRSA (12
extracts), C. neoformans ATCC 90112 (7 extracts), C. albicans NCPF 3153 (3
extracts) and C. albicans ATCC 90028 (2 extracts). None of the extracts showed
strong activity against filamentous fungi and Gram-negative bacteria (Figure 17).
59
Table 13 MIC and MBC or MFC ranges of active fungal crude extracts against each test microorganism
Test
Test microorganisms
Bacteria Yeasts Filamentous fungi
SA MRSA PA EC AB005 AB007 CA28 CA53 CN12 CN13 MG PM
MIC (µg/ml) 2-200 2-200 128-200 128-200 200 200 2-200 2-200 4-200 1-200 32-200 16-200
MBC/MFC (µg/ml) 8->200 2->200 >200 >200 >200 >200 16->200 8->200 8->200 4->200 128->200 16->200
Vancomycin (MIC/MBC) 0.5/1 1/2
Gentamicin (MIC/MBC) 0.25/2 0.5/1
Colistin (MIC/MBC) 80/160 80/80
Amphotericin B
(MIC/MFC) 0.125/0.25 0.125/0.5 0.125/0.125 0.125/0.25 1/2
Miconazole (MIC/MFC) 1/32
SA = Staphylococcus aureus ATCC 25923 MRSA = Methicillin-resistant S. aureus SK1
EC = Escherichia coli ATCC 25922 PA = Pseudomonas aeruginosa ATCC 27853
AB005 = Multidrug-resistant Acinetobacter baumannii NPRC AB005 AB007 = Multidrug-resistant Acinetobacter baumannii NPRC AB007
CA28 = Candida albicans ATCC 90028 CA53 = Candida albicans NCPF 3153
CN12 = Cryptococcus neoformans ATCC 90112, flucytosine-susceptible strain CN13 = Cryptococcus neoformans ATCC 90113, flycytosine-resistant strain
MG = Microsporum gypseum SH-MU4 PM = Penicillium marneffei clinical isolate
MIC = minimum inhibitory concentration (µg/ml) MBC = minimum bactericidal concentration (µg/ml)
MFC = minimum fungicidal concentration (µg/ml)
59
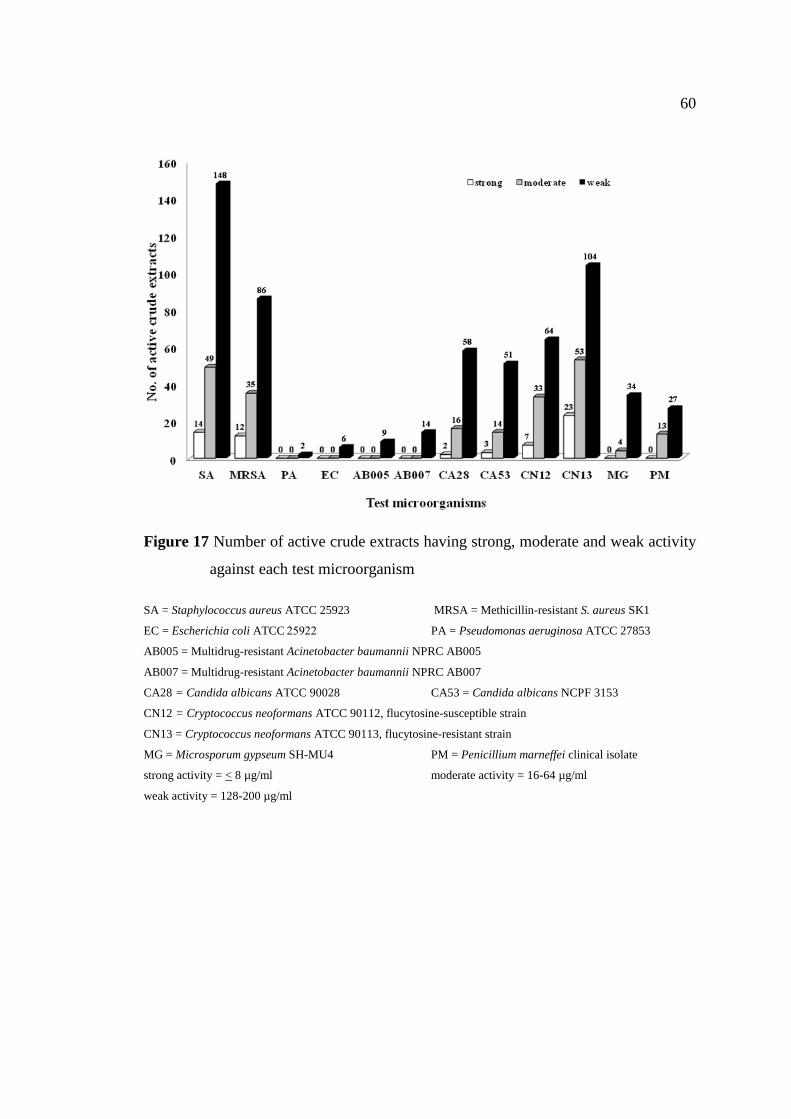
60
Figure 17 Number of active crude extracts having strong, moderate and weak activity
against each test microorganism
SA = Staphylococcus aureus ATCC 25923 MRSA = Methicillin-resistant S. aureus SK1
EC = Escherichia coli ATCC 25922 PA = Pseudomonas aeruginosa ATCC 27853
AB005 = Multidrug-resistant Acinetobacter baumannii NPRC AB005
AB007 = Multidrug-resistant Acinetobacter baumannii NPRC AB007
CA28 = Candida albicans ATCC 90028 CA53 = Candida albicans NCPF 3153
CN12 = Cryptococcus neoformans ATCC 90112, flucytosine-susceptible strain
CN13 = Cryptococcus neoformans ATCC 90113, flucytosine-resistant strain
MG = Microsporum gypseum SH-MU4 PM = Penicillium marneffei clinical isolate
strong activity = < 8 µg/ml moderate activity = 16-64 µg/ml
weak activity = 128-200 µg/ml
61
Antibacterial activity
Two hundred and twenty-three crude extracts revealed antibacterial
activity with MIC/MBC in ranges of 2-200/2->200 µg/ml. Strongly active extracts
were found against Gram-positive bacteria. RSPG 206 CH was the best crude extract
against S.aureus ATCC 25923 and MRSA SK-1 with MIC/MBC value of 2/8 and 2/2
µg/ml. For Gram-negative bacteria, fungal crude extracts showed only weak activity
with MIC/MBC values ranging from 128-200/>200 µg/ml. (Table 14 and 15).
Antifungal activity
Two hundred and eleven crude extracts had antifungal activity with
MIC/MFC values ranging from 1-200/4->200 µg/ml. The potential crude extracts
represented strong activity toward C. albicans and C. neoformans whereas only
moderate activity was found against M. gypseum and P. marneffei. RSPG 27 CH
presented the best activity toward C. albicans ATCC 90028 and C. albicans NCPF
3153 with MIC/MFC value of 2/32 and 2/64 µg/ml. RSPG 206 CH was the best crude
extract against C. neoformans ATCC 90112 with MIC/MFC equal to 4/8 µg/ml.
RSPG 179 CH exhibited the best anti-C. neoformans ATCC 90113 and anti-P.
marneffei activity with MIC/MFC value of 1/8 and 16/16 µg/ml. RSPG 199 CE
showed the best anti-M. gypseum activity with MIC/MFC equal to 32/>200 µg/ml.
(Table 14 and 15).
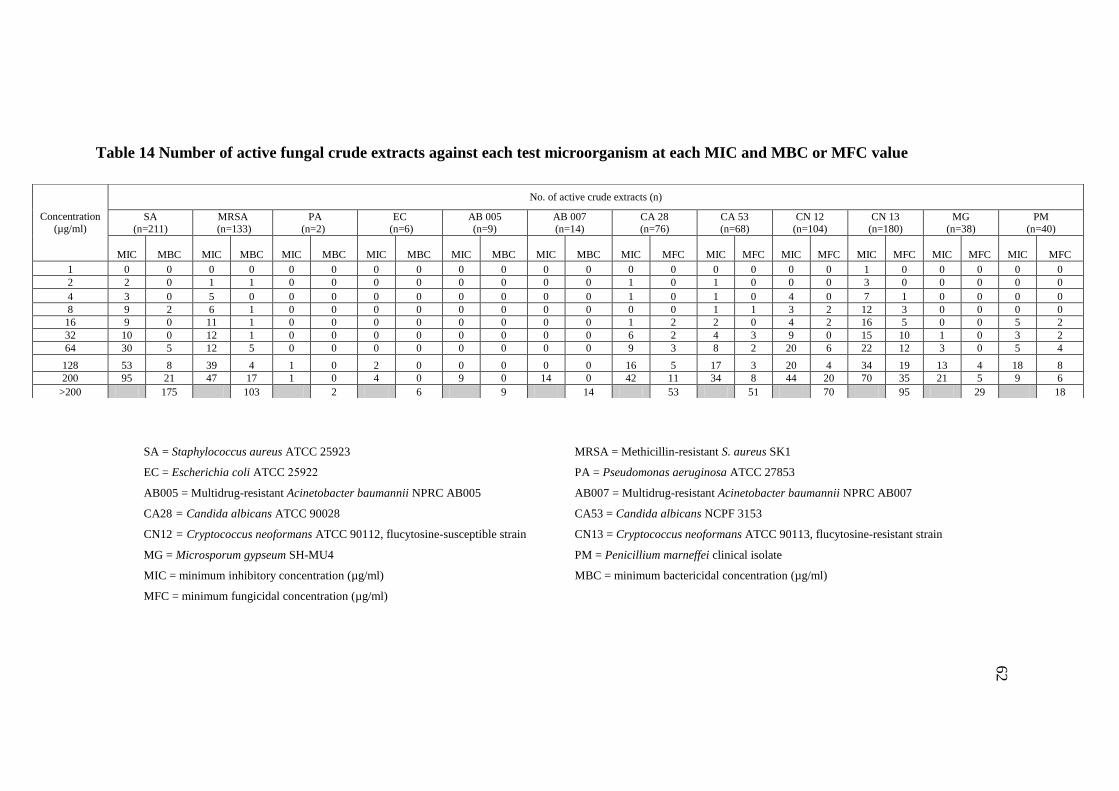
62
Table 14 Number of active fungal crude extracts against each test microorganism at each MIC and MBC or MFC value
SA = Staphylococcus aureus ATCC 25923 MRSA = Methicillin-resistant S. aureus SK1
EC = Escherichia coli ATCC 25922 PA = Pseudomonas aeruginosa ATCC 27853
AB005 = Multidrug-resistant Acinetobacter baumannii NPRC AB005 AB007 = Multidrug-resistant Acinetobacter baumannii NPRC AB007
CA28 = Candida albicans ATCC 90028 CA53 = Candida albicans NCPF 3153
CN12 = Cryptococcus neoformans ATCC 90112, flucytosine-susceptible strain CN13 = Cryptococcus neoformans ATCC 90113, flucytosine-resistant strain
MG = Microsporum gypseum SH-MU4 PM = Penicillium marneffei clinical isolate
MIC = minimum inhibitory concentration (µg/ml) MBC = minimum bactericidal concentration (µg/ml)
MFC = minimum fungicidal concentration (µg/ml)
Concentration
(µg/ml)
No. of active crude extracts (n)
SA (n=211)
MRSA (n=133)
PA (n=2)
EC (n=6)
AB 005 (n=9)
AB 007 (n=14)
CA 28 (n=76)
CA 53 (n=68)
CN 12 (n=104)
CN 13 (n=180)
MG (n=38)
PM (n=40)
MIC MBC MIC MBC MIC MBC MIC MBC MIC MBC MIC MBC MIC MFC MIC MFC MIC MFC MIC MFC MIC MFC MIC MFC
1 0 0 0 0 0 0 0 0 0 0 0 0 0 0 0 0 0 0 1 0 0 0 0 0
2 2 0 1 1 0 0 0 0 0 0 0 0 1 0 1 0 0 0 3 0 0 0 0 0
4 3 0 5 0 0 0 0 0 0 0 0 0 1 0 1 0 4 0 7 1 0 0 0 0
8 9 2 6 1 0 0 0 0 0 0 0 0 0 0 1 1 3 2 12 3 0 0 0 0
16 9 0 11 1 0 0 0 0 0 0 0 0 1 2 2 0 4 2 16 5 0 0 5 2
32 10 0 12 1 0 0 0 0 0 0 0 0 6 2 4 3 9 0 15 10 1 0 3 2
64 30 5 12 5 0 0 0 0 0 0 0 0 9 3 8 2 20 6 22 12 3 0 5 4
128 53 8 39 4 1 0 2 0 0 0 0 0 16 5 17 3 20 4 34 19 13 4 18 8
200 95 21 47 17 1 0 4 0 9 0 14 0 42 11 34 8 44 20 70 35 21 5 9 6
>200 175 103 2 6 9 14 53 51 70 95 29 18
62
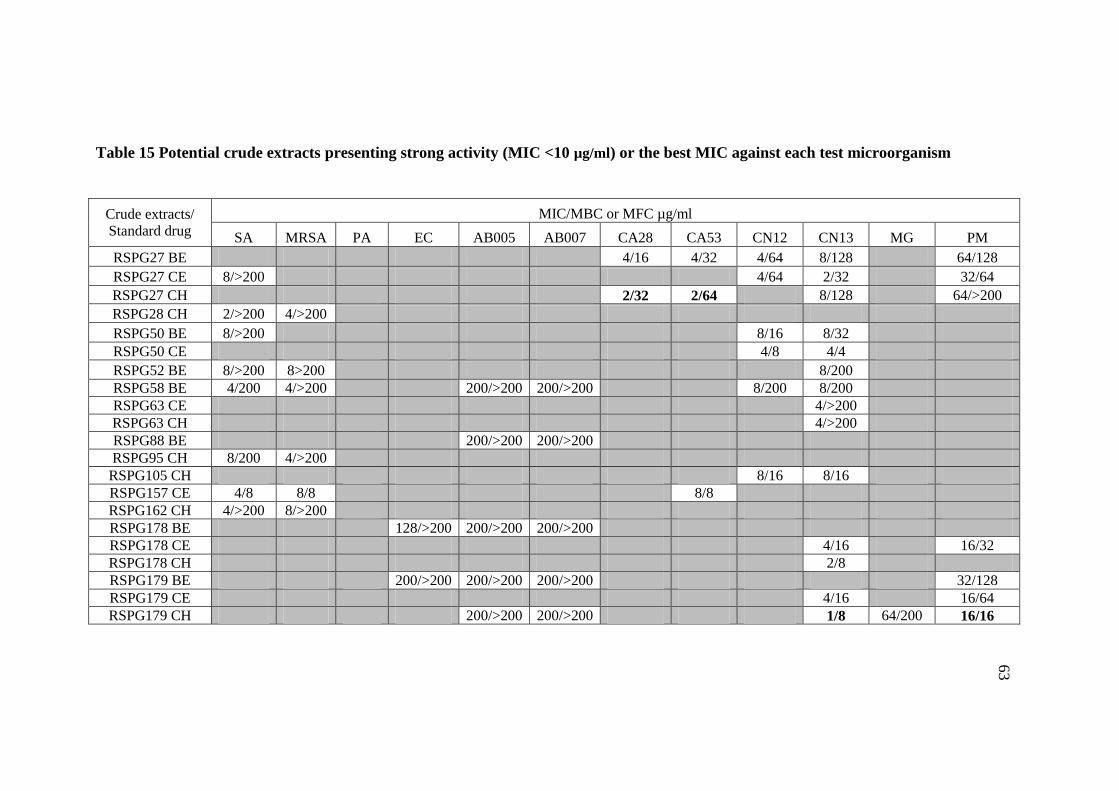
63
Table 15 Potential crude extracts presenting strong activity (MIC <10 µg/ml) or the best MIC against each test microorganism
Crude extracts/
Standard drug
MIC/MBC or MFC µg/ml
SA MRSA PA EC AB005 AB007 CA28 CA53 CN12 CN13 MG PM
RSPG27 BE 4/16 4/32 4/64 8/128 64/128
RSPG27 CE 8/>200 4/64 2/32 32/64
RSPG27 CH 2/32 2/64 8/128 64/>200
RSPG28 CH 2/>200 4/>200
RSPG50 BE 8/>200 8/16 8/32
RSPG50 CE 4/8 4/4
RSPG52 BE 8/>200 8>200 8/200
RSPG58 BE 4/200 4/>200 200/>200 200/>200 8/200 8/200
RSPG63 CE 4/>200
RSPG63 CH 4/>200
RSPG88 BE 200/>200 200/>200
RSPG95 CH 8/200 4/>200
RSPG105 CH 8/16 8/16
RSPG157 CE 4/8 8/8 8/8
RSPG162 CH 4/>200 8/>200
RSPG178 BE 128/>200 200/>200 200/>200
RSPG178 CE 4/16 16/32
RSPG178 CH 2/8
RSPG179 BE 200/>200 200/>200 200/>200 32/128
RSPG179 CE 4/16 16/64
RSPG179 CH 200/>200 200/>200 1/8 64/200 16/16
63
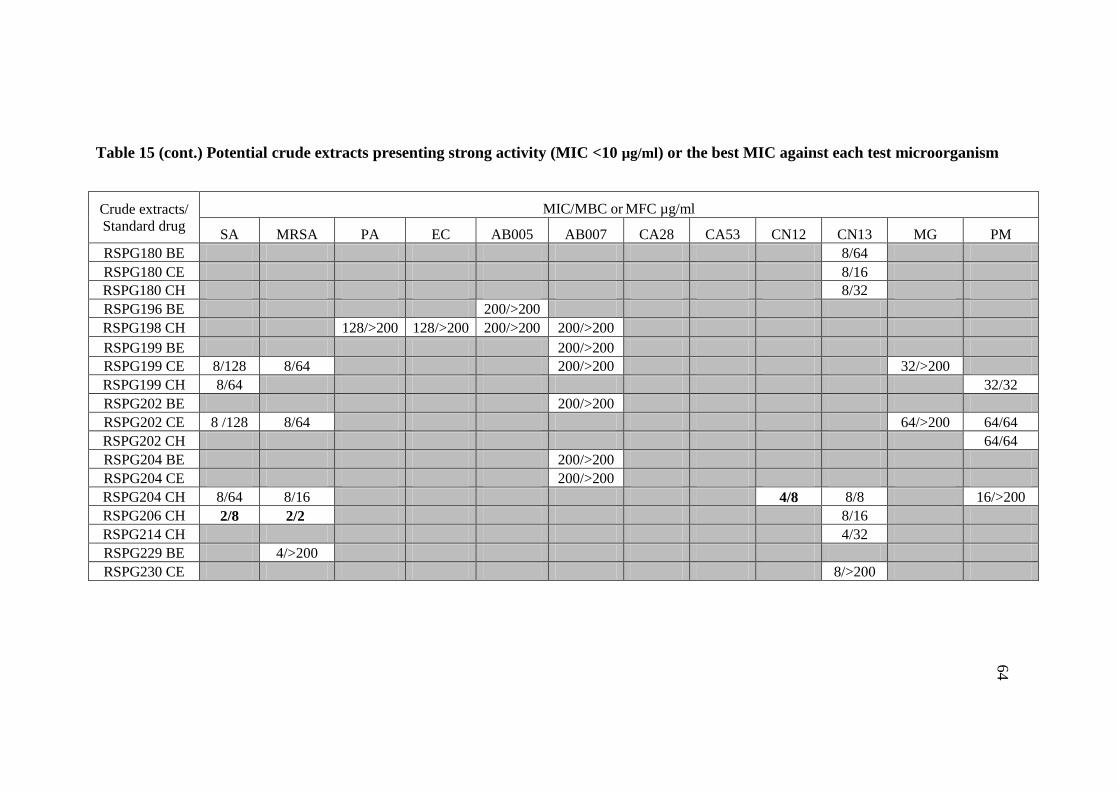
64
Table 15 (cont.) Potential crude extracts presenting strong activity (MIC <10 µg/ml) or the best MIC against each test microorganism
Crude extracts/
Standard drug
MIC/MBC or MFC µg/ml
SA MRSA PA EC AB005 AB007 CA28 CA53 CN12 CN13 MG PM
RSPG180 BE 8/64
RSPG180 CE 8/16
RSPG180 CH 8/32
RSPG196 BE 200/>200
RSPG198 CH 128/>200 128/>200 200/>200 200/>200
RSPG199 BE 200/>200
RSPG199 CE 8/128 8/64 200/>200 32/>200
RSPG199 CH 8/64 32/32
RSPG202 BE 200/>200
RSPG202 CE 8 /128 8/64 64/>200 64/64
RSPG202 CH 64/64
RSPG204 BE 200/>200
RSPG204 CE 200/>200
RSPG204 CH 8/64 8/16 4/8 8/8 16/>200
RSPG206 CH 2/8 2/2 8/16
RSPG214 CH 4/32
RSPG229 BE 4/>200
RSPG230 CE 8/>200
64
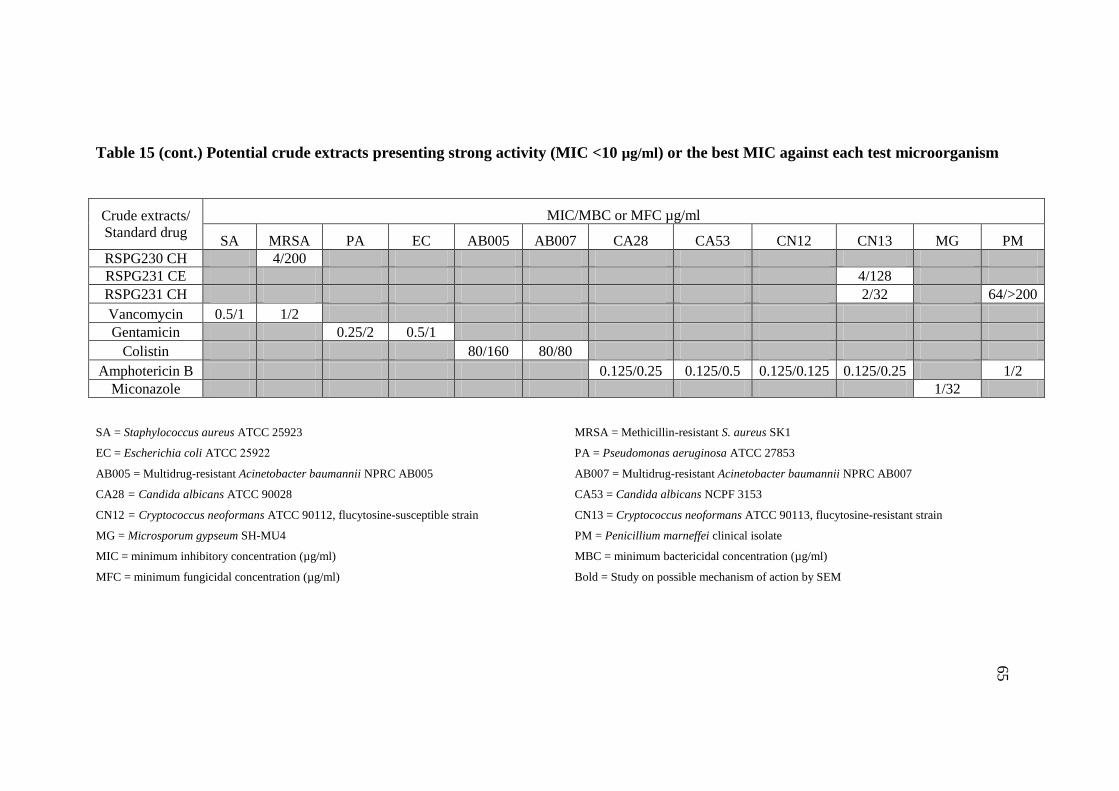
65
Table 15 (cont.) Potential crude extracts presenting strong activity (MIC <10 µg/ml) or the best MIC against each test microorganism
Crude extracts/
Standard drug
MIC/MBC or MFC µg/ml
SA MRSA PA EC AB005 AB007 CA28 CA53 CN12 CN13 MG PM
RSPG230 CH 4/200
RSPG231 CE 4/128
RSPG231 CH 2/32 64/>200
Vancomycin 0.5/1 1/2
Gentamicin 0.25/2 0.5/1
Colistin 80/160 80/80
Amphotericin B 0.125/0.25 0.125/0.5 0.125/0.125 0.125/0.25 1/2
Miconazole 1/32
SA = Staphylococcus aureus ATCC 25923 MRSA = Methicillin-resistant S. aureus SK1
EC = Escherichia coli ATCC 25922 PA = Pseudomonas aeruginosa ATCC 27853
AB005 = Multidrug-resistant Acinetobacter baumannii NPRC AB005 AB007 = Multidrug-resistant Acinetobacter baumannii NPRC AB007
CA28 = Candida albicans ATCC 90028 CA53 = Candida albicans NCPF 3153
CN12 = Cryptococcus neoformans ATCC 90112, flucytosine-susceptible strain CN13 = Cryptococcus neoformans ATCC 90113, flucytosine-resistant strain
MG = Microsporum gypseum SH-MU4 PM = Penicillium marneffei clinical isolate
MIC = minimum inhibitory concentration (µg/ml) MBC = minimum bactericidal concentration (µg/ml)
MFC = minimum fungicidal concentration (µg/ml) Bold = Study on possible mechanism of action by SEM
65
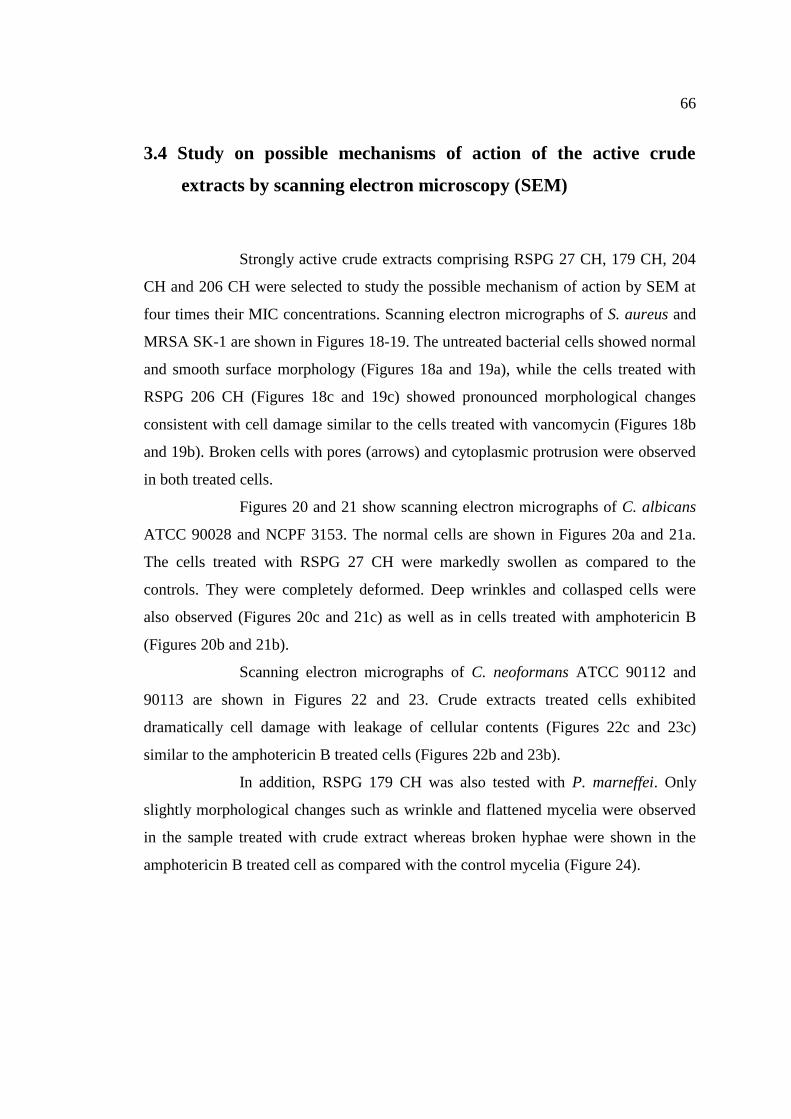
66
3.4 Study on possible mechanisms of action of the active crude
extracts by scanning electron microscopy (SEM)
Strongly active crude extracts comprising RSPG 27 CH, 179 CH, 204
CH and 206 CH were selected to study the possible mechanism of action by SEM at
four times their MIC concentrations. Scanning electron micrographs of S. aureus and
MRSA SK-1 are shown in Figures 18-19. The untreated bacterial cells showed normal
and smooth surface morphology (Figures 18a and 19a), while the cells treated with
RSPG 206 CH (Figures 18c and 19c) showed pronounced morphological changes
consistent with cell damage similar to the cells treated with vancomycin (Figures 18b
and 19b). Broken cells with pores (arrows) and cytoplasmic protrusion were observed
in both treated cells.
Figures 20 and 21 show scanning electron micrographs of C. albicans
ATCC 90028 and NCPF 3153. The normal cells are shown in Figures 20a and 21a.
The cells treated with RSPG 27 CH were markedly swollen as compared to the
controls. They were completely deformed. Deep wrinkles and collasped cells were
also observed (Figures 20c and 21c) as well as in cells treated with amphotericin B
(Figures 20b and 21b).
Scanning electron micrographs of C. neoformans ATCC 90112 and
90113 are shown in Figures 22 and 23. Crude extracts treated cells exhibited
dramatically cell damage with leakage of cellular contents (Figures 22c and 23c)
similar to the amphotericin B treated cells (Figures 22b and 23b).
In addition, RSPG 179 CH was also tested with P. marneffei. Only
slightly morphological changes such as wrinkle and flattened mycelia were observed
in the sample treated with crude extract whereas broken hyphae were shown in the
amphotericin B treated cell as compared with the control mycelia (Figure 24).
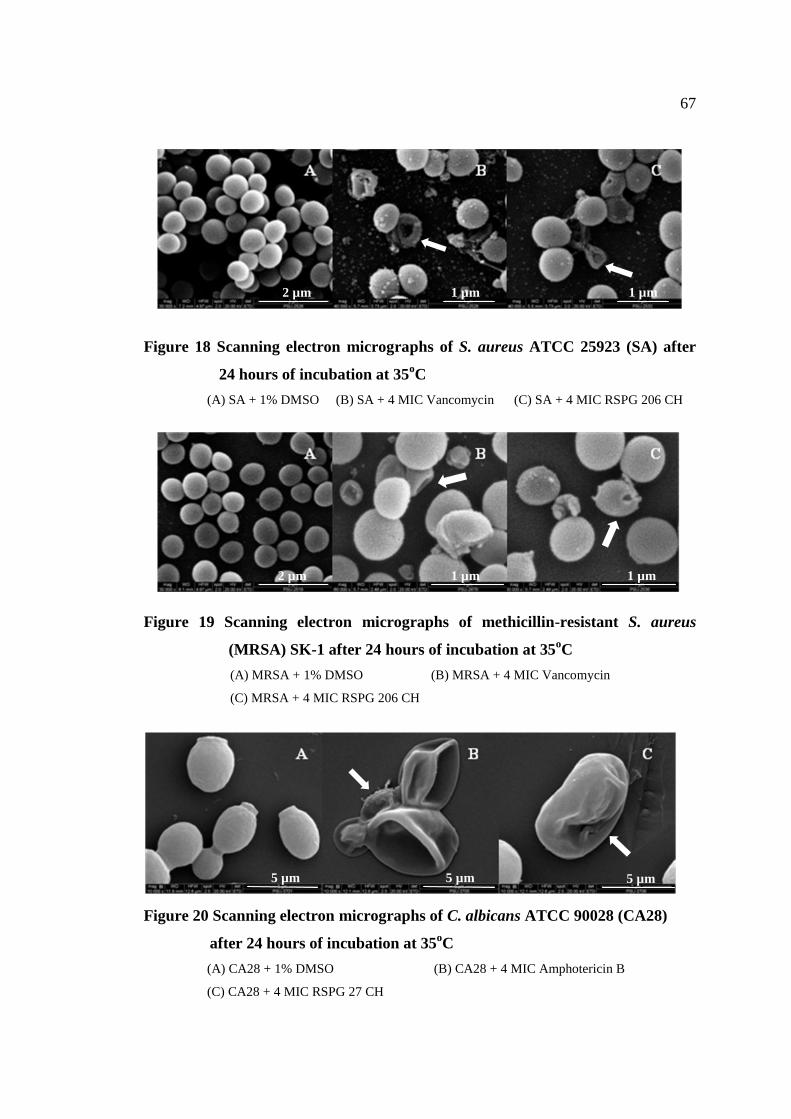
67
Figure 18 Scanning electron micrographs of S. aureus ATCC 25923 (SA) after
24 hours of incubation at 35oC
(A) SA + 1% DMSO (B) SA + 4 MIC Vancomycin (C) SA + 4 MIC RSPG 206 CH
Figure 19 Scanning electron micrographs of methicillin-resistant S. aureus
(MRSA) SK-1 after 24 hours of incubation at 35oC
(A) MRSA + 1% DMSO (B) MRSA + 4 MIC Vancomycin
(C) MRSA + 4 MIC RSPG 206 CH
Figure 20 Scanning electron micrographs of C. albicans ATCC 90028 (CA28)
after 24 hours of incubation at 35oC
(A) CA28 + 1% DMSO (B) CA28 + 4 MIC Amphotericin B
(C) CA28 + 4 MIC RSPG 27 CH
2 µm 1 µm 1 µm
2 µm 1 µm 1 µm
5 µm 5 µm 5 µm
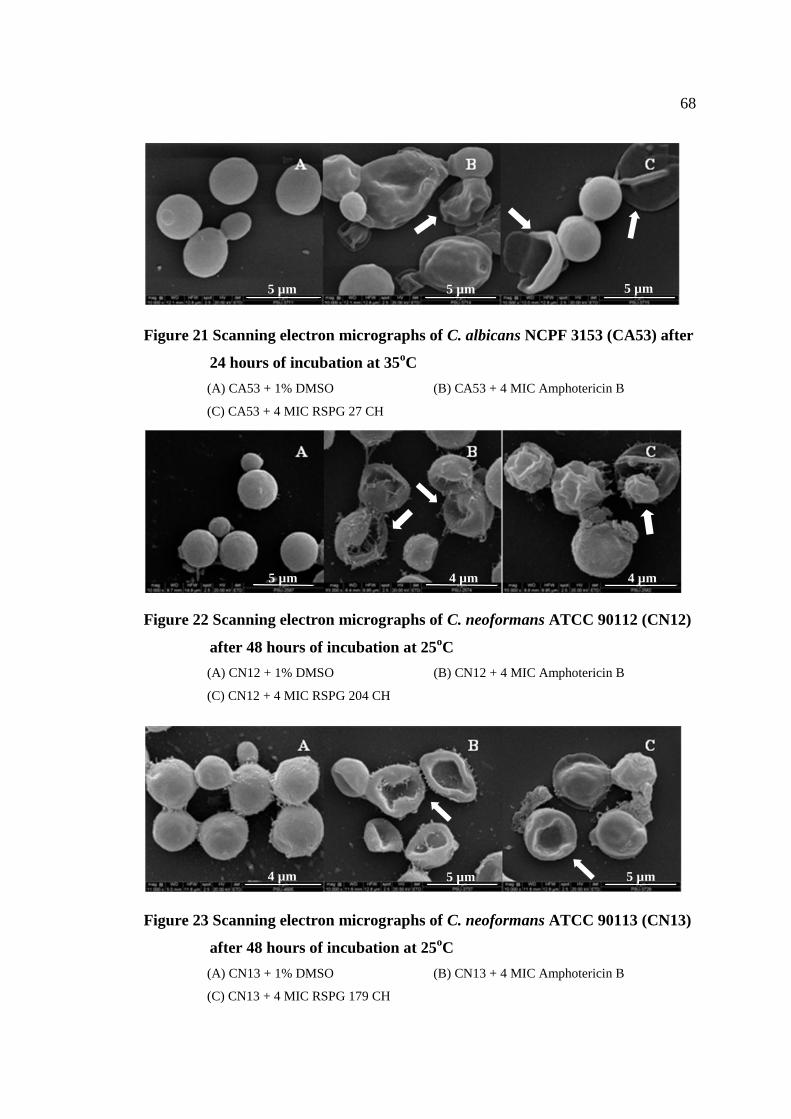
68
Figure 21 Scanning electron micrographs of C. albicans NCPF 3153 (CA53) after
24 hours of incubation at 35oC
(A) CA53 + 1% DMSO (B) CA53 + 4 MIC Amphotericin B
(C) CA53 + 4 MIC RSPG 27 CH
A B C
Figure 22 Scanning electron micrographs of C. neoformans ATCC 90112 (CN12)
after 48 hours of incubation at 25oC
(A) CN12 + 1% DMSO (B) CN12 + 4 MIC Amphotericin B
(C) CN12 + 4 MIC RSPG 204 CH
Figure 23 Scanning electron micrographs of C. neoformans ATCC 90113 (CN13)
after 48 hours of incubation at 25oC
(A) CN13 + 1% DMSO (B) CN13 + 4 MIC Amphotericin B
(C) CN13 + 4 MIC RSPG 179 CH
5 µm 5 µm 5 µm
5 µm 4 µm 4 µm
4 µm 5 µm 5 µm
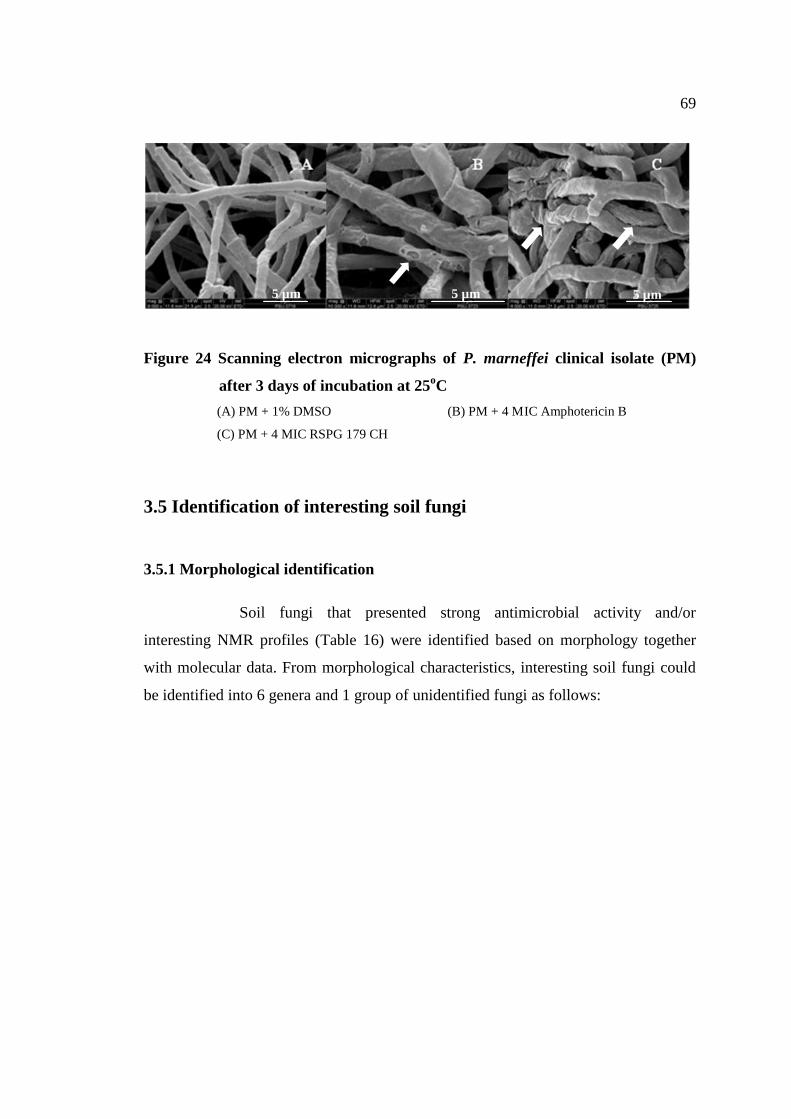
69
A B C
Figure 24 Scanning electron micrographs of P. marneffei clinical isolate (PM)
after 3 days of incubation at 25oC
(A) PM + 1% DMSO (B) PM + 4 MIC Amphotericin B
(C) PM + 4 MIC RSPG 179 CH
3.5 Identification of interesting soil fungi
3.5.1 Morphological identification
Soil fungi that presented strong antimicrobial activity and/or
interesting NMR profiles (Table 16) were identified based on morphology together
with molecular data. From morphological characteristics, interesting soil fungi could
be identified into 6 genera and 1 group of unidentified fungi as follows:
5 µm 5 µm 5 µm
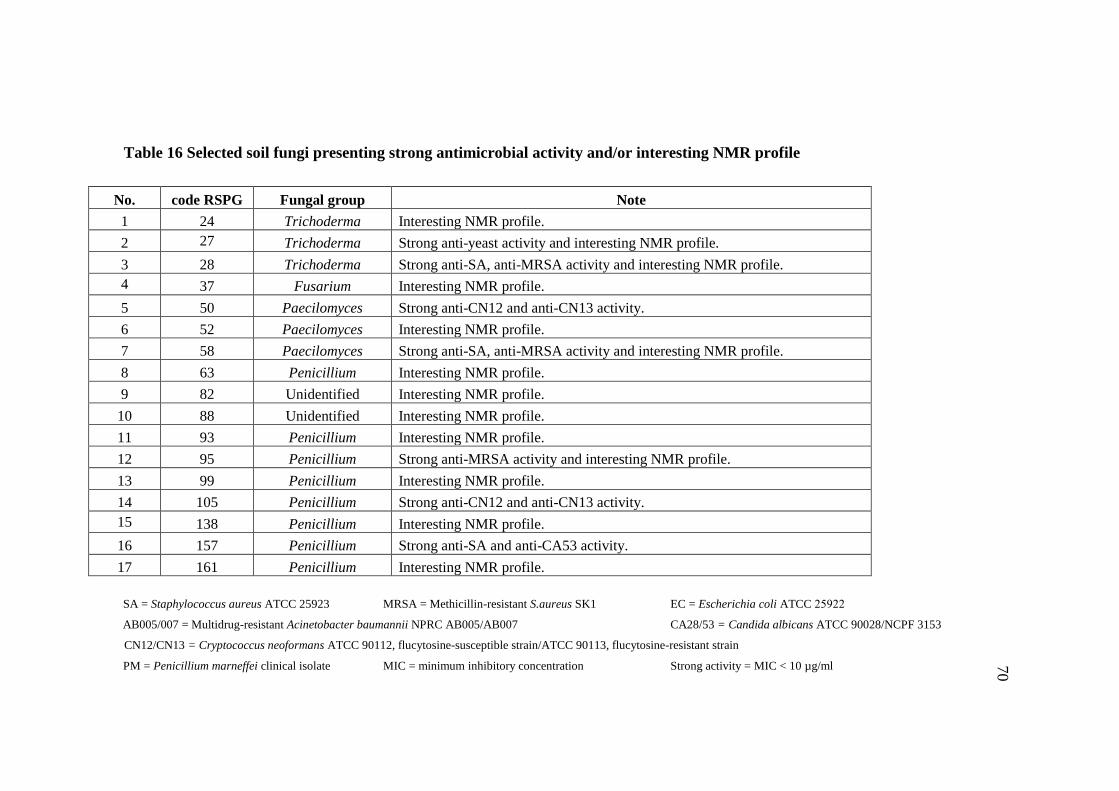
70
Table 16 Selected soil fungi presenting strong antimicrobial activity and/or interesting NMR profile
No. code RSPG Fungal group Note
1 24 Trichoderma Interesting NMR profile.
2 27 Trichoderma Strong anti-yeast activity and interesting NMR profile.
3 28 Trichoderma Strong anti-SA, anti-MRSA activity and interesting NMR profile.
4 37 Fusarium Interesting NMR profile.
5 50 Paecilomyces Strong anti-CN12 and anti-CN13 activity.
6 52 Paecilomyces Interesting NMR profile.
7 58 Paecilomyces Strong anti-SA, anti-MRSA activity and interesting NMR profile.
8 63 Penicillium Interesting NMR profile.
9 82 Unidentified Interesting NMR profile.
10 88 Unidentified Interesting NMR profile.
11 93 Penicillium Interesting NMR profile.
12 95 Penicillium Strong anti-MRSA activity and interesting NMR profile.
13 99 Penicillium Interesting NMR profile.
14 105 Penicillium Strong anti-CN12 and anti-CN13 activity.
15 138 Penicillium Interesting NMR profile.
16 157 Penicillium Strong anti-SA and anti-CA53 activity.
17 161 Penicillium Interesting NMR profile.
SA = Staphylococcus aureus ATCC 25923 MRSA = Methicillin-resistant S.aureus SK1 EC = Escherichia coli ATCC 25922
AB005/007 = Multidrug-resistant Acinetobacter baumannii NPRC AB005/AB007 CA28/53 = Candida albicans ATCC 90028/NCPF 3153
CN12/CN13 = Cryptococcus neoformans ATCC 90112, flucytosine-susceptible strain/ATCC 90113, flucytosine-resistant strain
PM = Penicillium marneffei clinical isolate MIC = minimum inhibitory concentration Strong activity = MIC < 10 µg/ml 70
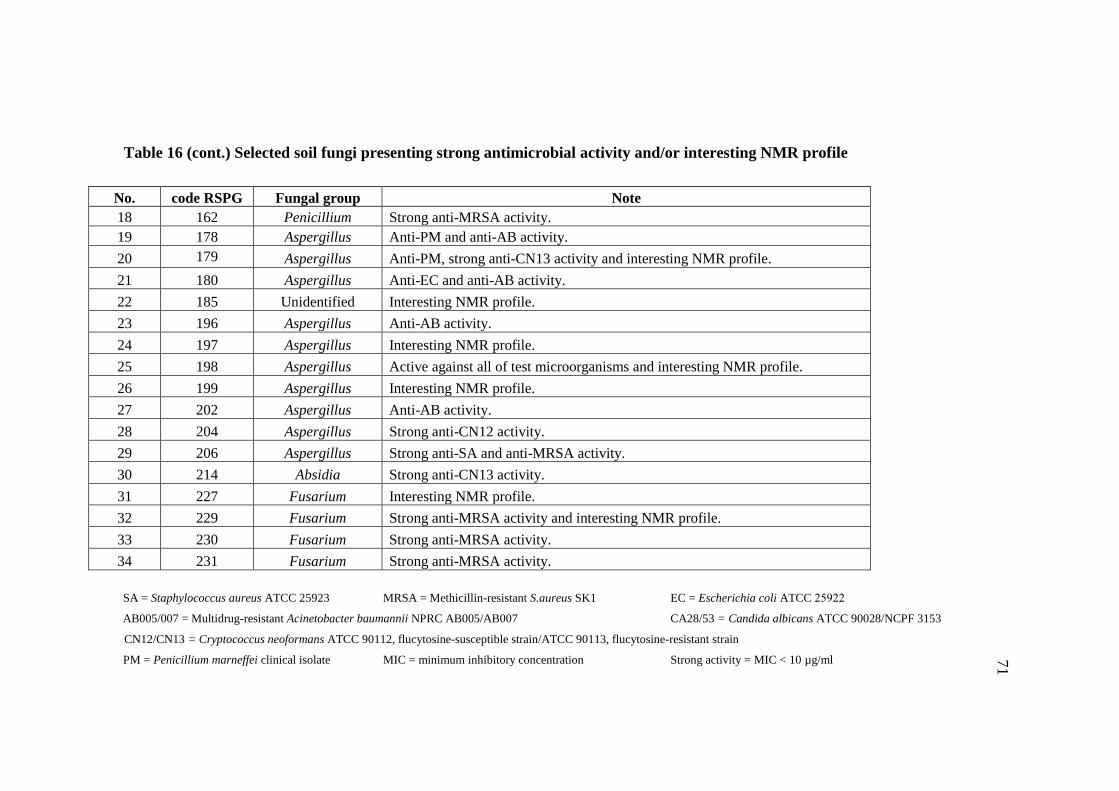
71
Table 16 (cont.) Selected soil fungi presenting strong antimicrobial activity and/or interesting NMR profile
No. code RSPG Fungal group Note
18 162 Penicillium Strong anti-MRSA activity.
19 178 Aspergillus Anti-PM and anti-AB activity.
20 179 Aspergillus Anti-PM, strong anti-CN13 activity and interesting NMR profile.
21 180 Aspergillus Anti-EC and anti-AB activity.
22 185 Unidentified Interesting NMR profile.
23 196 Aspergillus Anti-AB activity.
24 197 Aspergillus Interesting NMR profile.
25 198 Aspergillus Active against all of test microorganisms and interesting NMR profile.
26 199 Aspergillus Interesting NMR profile.
27 202 Aspergillus Anti-AB activity.
28 204 Aspergillus Strong anti-CN12 activity.
29 206 Aspergillus Strong anti-SA and anti-MRSA activity.
30 214 Absidia Strong anti-CN13 activity.
31 227 Fusarium Interesting NMR profile.
32 229 Fusarium Strong anti-MRSA activity and interesting NMR profile.
33 230 Fusarium Strong anti-MRSA activity.
34 231 Fusarium Strong anti-MRSA activity.
SA = Staphylococcus aureus ATCC 25923 MRSA = Methicillin-resistant S.aureus SK1 EC = Escherichia coli ATCC 25922
AB005/007 = Multidrug-resistant Acinetobacter baumannii NPRC AB005/AB007 CA28/53 = Candida albicans ATCC 90028/NCPF 3153
CN12/CN13 = Cryptococcus neoformans ATCC 90112, flucytosine-susceptible strain/ATCC 90113, flucytosine-resistant strain
PM = Penicillium marneffei clinical isolate MIC = minimum inhibitory concentration Strong activity = MIC < 10 µg/ml 71
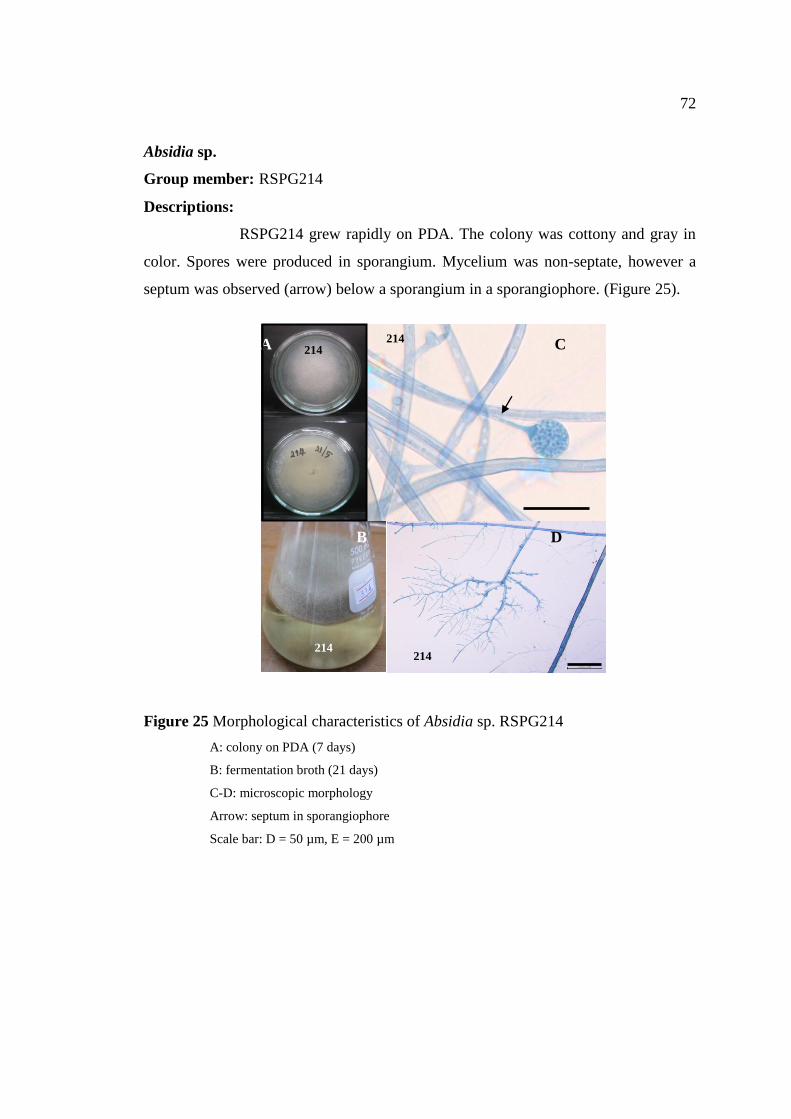
72
Absidia sp.
Group member: RSPG214
Descriptions:
RSPG214 grew rapidly on PDA. The colony was cottony and gray in
color. Spores were produced in sporangium. Mycelium was non-septate, however a
septum was observed (arrow) below a sporangium in a sporangiophore. (Figure 25).
A C
B D
Figure 25 Morphological characteristics of Absidia sp. RSPG214
A: colony on PDA (7 days)
B: fermentation broth (21 days)
C-D: microscopic morphology
Arrow: septum in sporangiophore
Scale bar: D = 50 µm, E = 200 µm
214
214 214
214
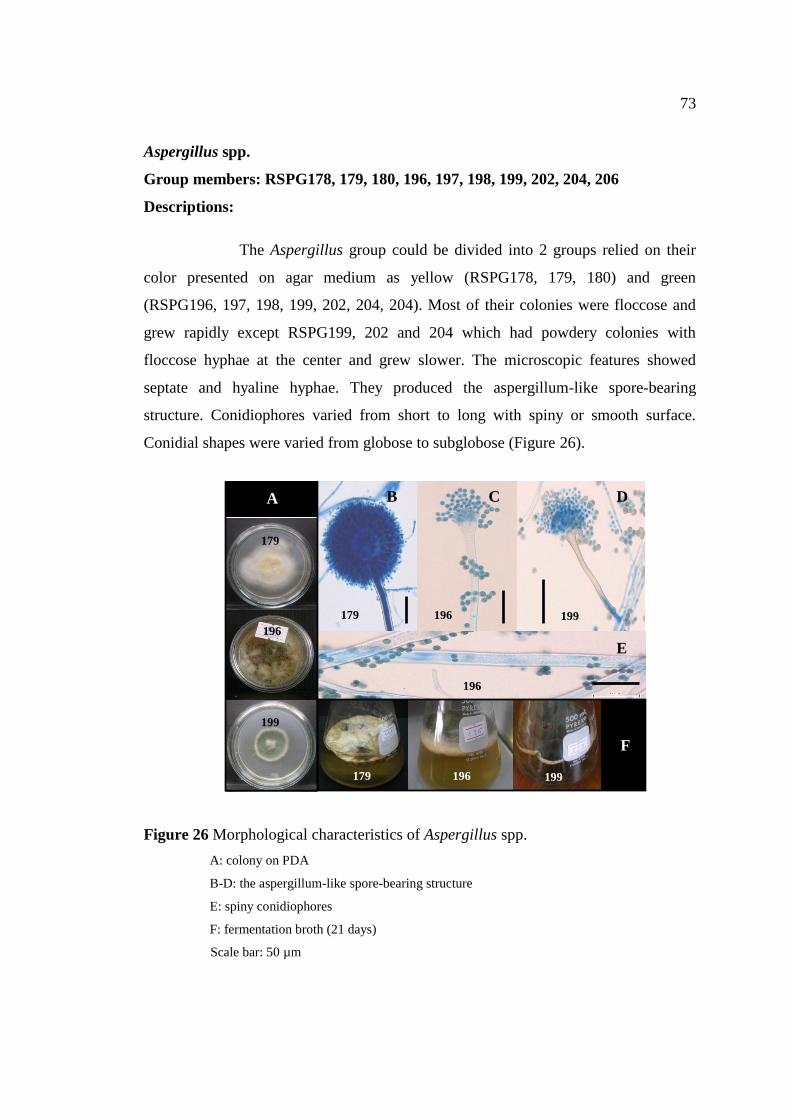
73
Aspergillus spp.
Group members: RSPG178, 179, 180, 196, 197, 198, 199, 202, 204, 206
Descriptions:
The Aspergillus group could be divided into 2 groups relied on their
color presented on agar medium as yellow (RSPG178, 179, 180) and green
(RSPG196, 197, 198, 199, 202, 204, 204). Most of their colonies were floccose and
grew rapidly except RSPG199, 202 and 204 which had powdery colonies with
floccose hyphae at the center and grew slower. The microscopic features showed
septate and hyaline hyphae. They produced the aspergillum-like spore-bearing
structure. Conidiophores varied from short to long with spiny or smooth surface.
Conidial shapes were varied from globose to subglobose (Figure 26).
Figure 26 Morphological characteristics of Aspergillus spp.
A: colony on PDA
B-D: the aspergillum-like spore-bearing structure
E: spiny conidiophores
F: fermentation broth (21 days)
Scale bar: 50 µm
B C D
E
179 196 199
196
199 196 179
F
A
179
196
199
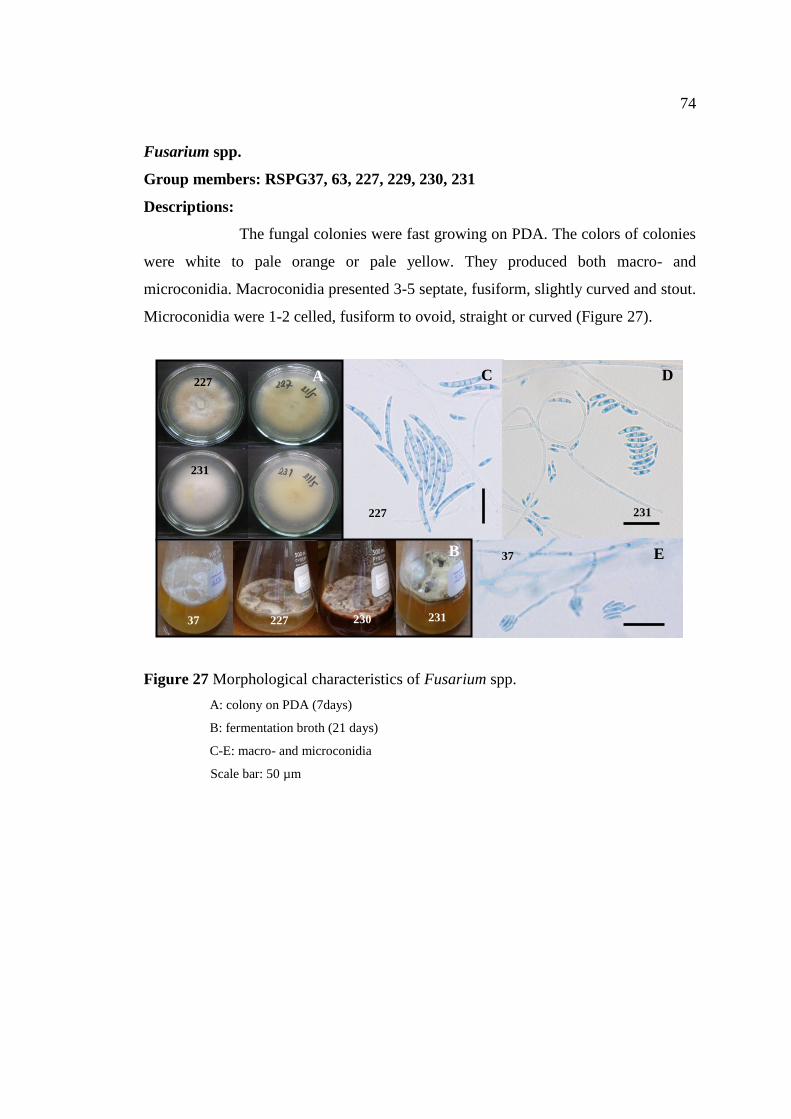
74
Fusarium spp.
Group members: RSPG37, 63, 227, 229, 230, 231
Descriptions:
The fungal colonies were fast growing on PDA. The colors of colonies
were white to pale orange or pale yellow. They produced both macro- and
microconidia. Macroconidia presented 3-5 septate, fusiform, slightly curved and stout.
Microconidia were 1-2 celled, fusiform to ovoid, straight or curved (Figure 27).
Figure 27 Morphological characteristics of Fusarium spp.
A: colony on PDA (7days)
B: fermentation broth (21 days)
C-E: macro- and microconidia
Scale bar: 50 µm
B
A C D
E
227
37
231
227
231
231 230 227 227 230 231 37
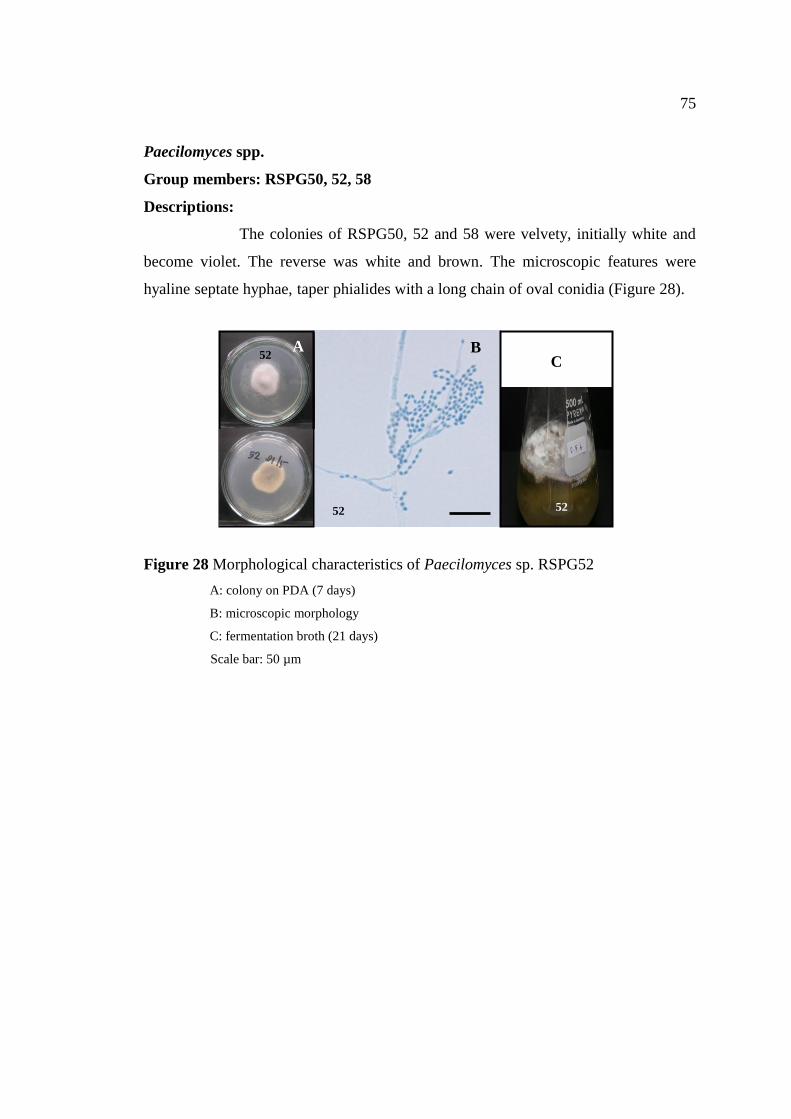
75
Paecilomyces spp.
Group members: RSPG50, 52, 58
Descriptions:
The colonies of RSPG50, 52 and 58 were velvety, initially white and
become violet. The reverse was white and brown. The microscopic features were
hyaline septate hyphae, taper phialides with a long chain of oval conidia (Figure 28).
Figure 28 Morphological characteristics of Paecilomyces sp. RSPG52
A: colony on PDA (7 days)
B: microscopic morphology
C: fermentation broth (21 days)
Scale bar: 50 µm
A B C
52
C
52
52
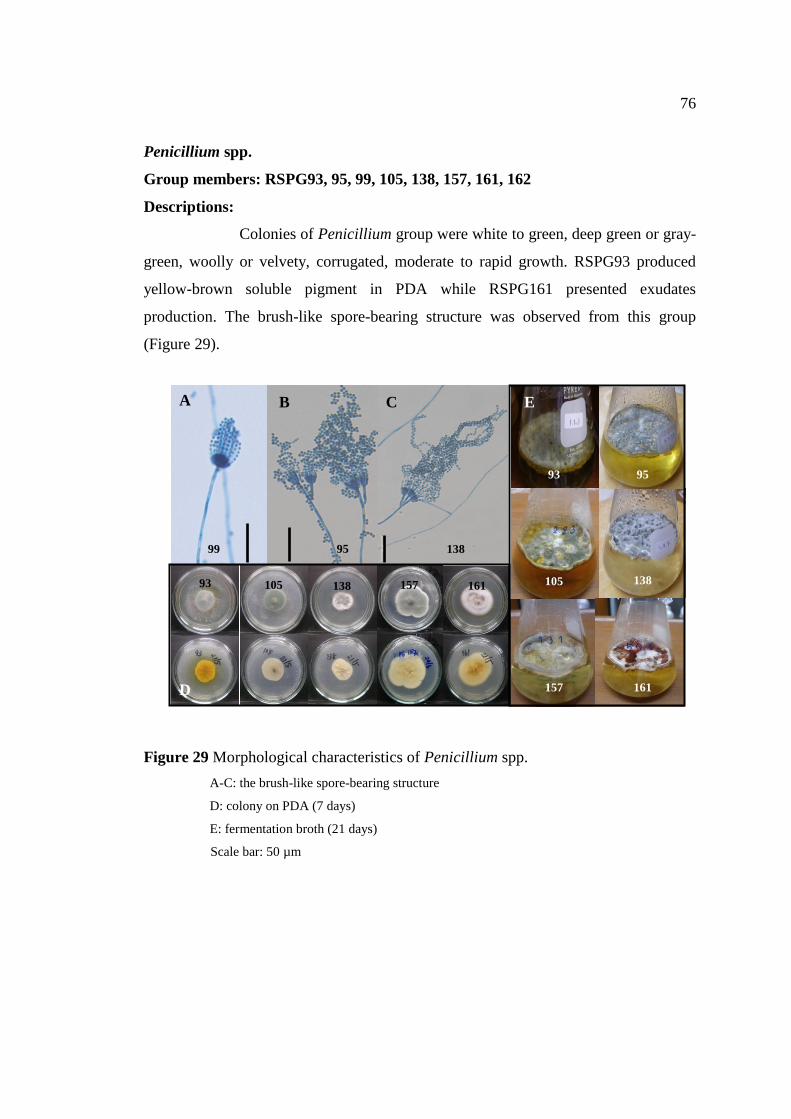
76
Penicillium spp.
Group members: RSPG93, 95, 99, 105, 138, 157, 161, 162
Descriptions:
Colonies of Penicillium group were white to green, deep green or gray-
green, woolly or velvety, corrugated, moderate to rapid growth. RSPG93 produced
yellow-brown soluble pigment in PDA while RSPG161 presented exudates
production. The brush-like spore-bearing structure was observed from this group
(Figure 29).
Figure 29 Morphological characteristics of Penicillium spp.
A-C: the brush-like spore-bearing structure
D: colony on PDA (7 days)
E: fermentation broth (21 days)
Scale bar: 50 µm
B A C
D
E
99 95 138
138 161 93 105 157
93 95
138 105
157 161
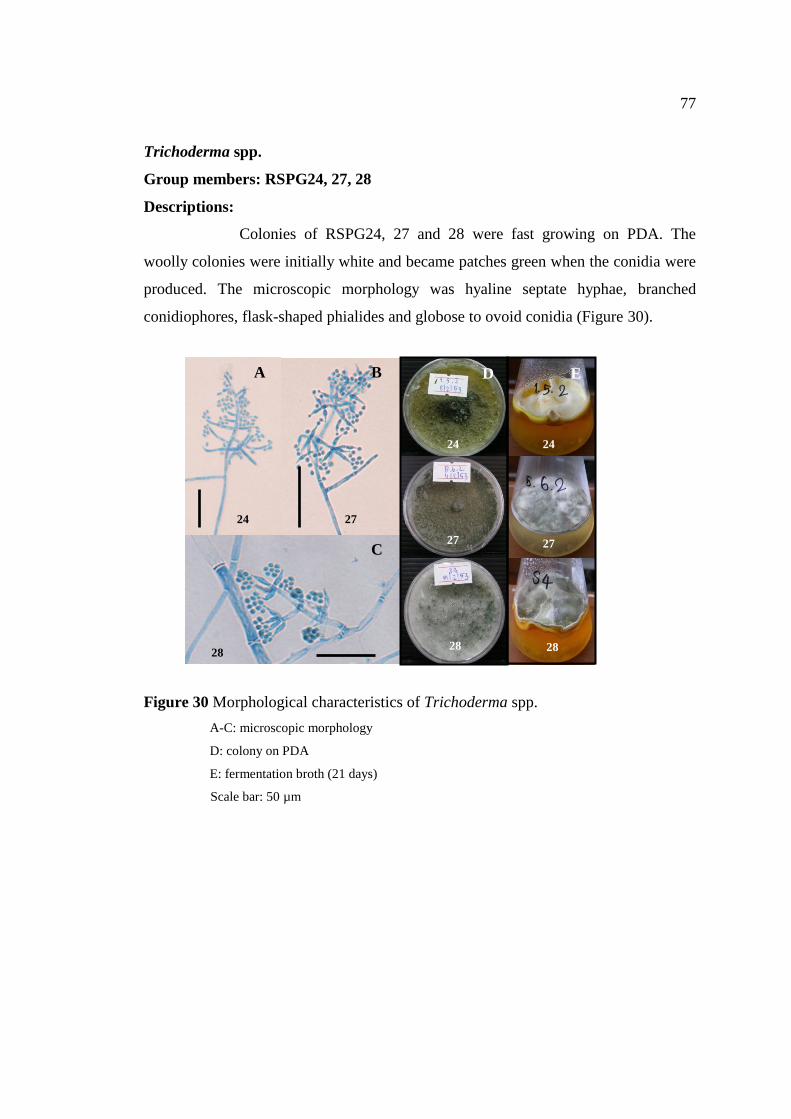
77
Trichoderma spp.
Group members: RSPG24, 27, 28
Descriptions:
Colonies of RSPG24, 27 and 28 were fast growing on PDA. The
woolly colonies were initially white and became patches green when the conidia were
produced. The microscopic morphology was hyaline septate hyphae, branched
conidiophores, flask-shaped phialides and globose to ovoid conidia (Figure 30).
Figure 30 Morphological characteristics of Trichoderma spp.
A-C: microscopic morphology
D: colony on PDA
E: fermentation broth (21 days)
Scale bar: 50 µm
A D
E C
B
24 27
28 28
24
27
28
27
24
E
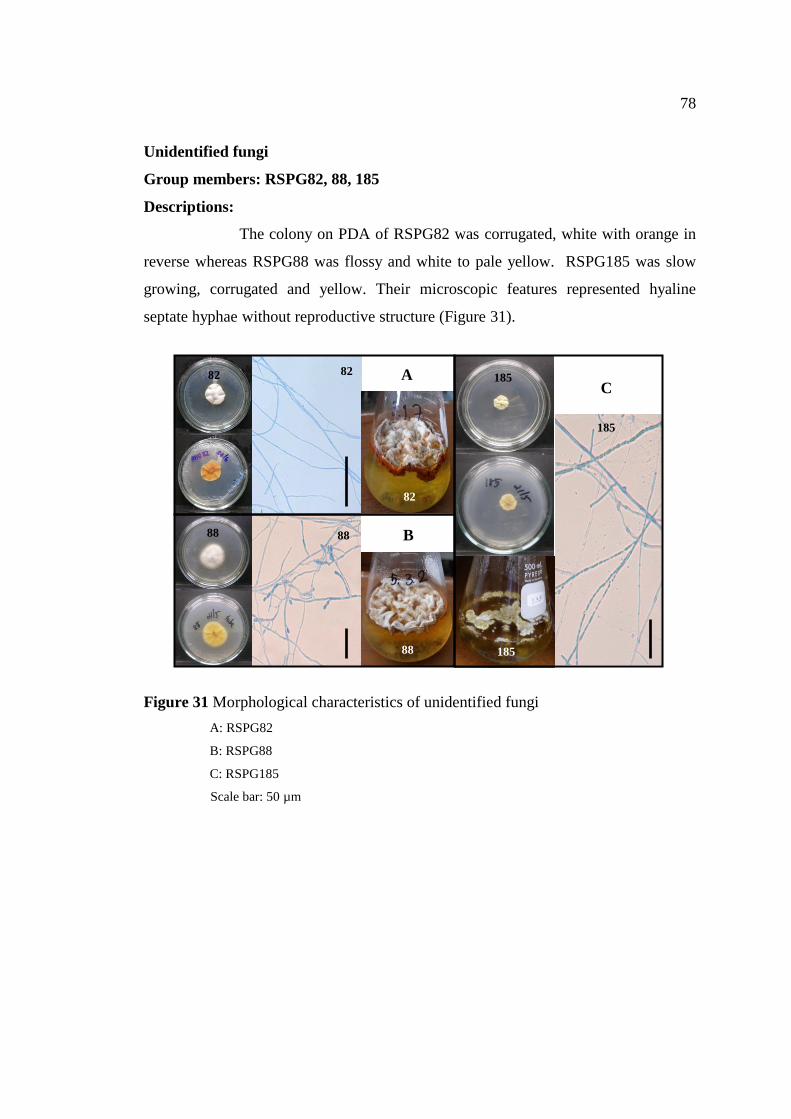
78
Unidentified fungi
Group members: RSPG82, 88, 185
Descriptions:
The colony on PDA of RSPG82 was corrugated, white with orange in
reverse whereas RSPG88 was flossy and white to pale yellow. RSPG185 was slow
growing, corrugated and yellow. Their microscopic features represented hyaline
septate hyphae without reproductive structure (Figure 31).
Figure 31 Morphological characteristics of unidentified fungi
A: RSPG82
B: RSPG88
C: RSPG185
Scale bar: 50 µm
A
B
C
82
88 185
88
82
185
88
82 185
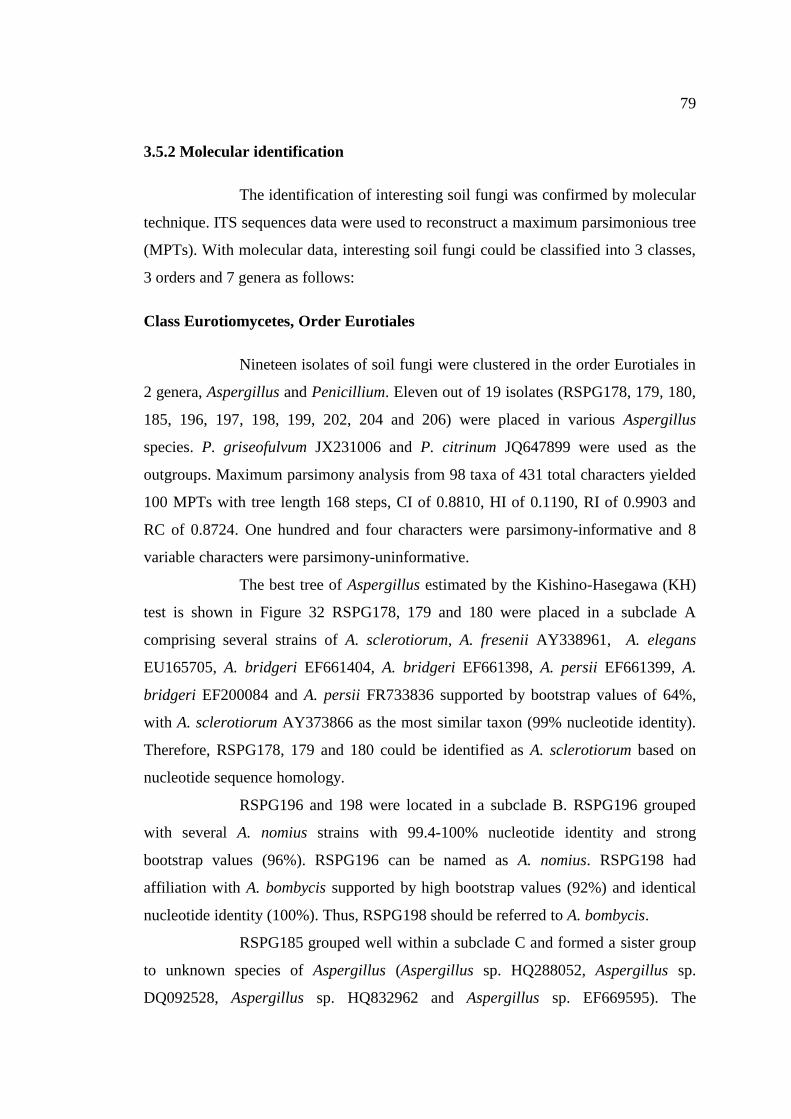
79
3.5.2 Molecular identification
The identification of interesting soil fungi was confirmed by molecular
technique. ITS sequences data were used to reconstruct a maximum parsimonious tree
(MPTs). With molecular data, interesting soil fungi could be classified into 3 classes,
3 orders and 7 genera as follows:
Class Eurotiomycetes, Order Eurotiales
Nineteen isolates of soil fungi were clustered in the order Eurotiales in
2 genera, Aspergillus and Penicillium. Eleven out of 19 isolates (RSPG178, 179, 180,
185, 196, 197, 198, 199, 202, 204 and 206) were placed in various Aspergillus
species. P. griseofulvum JX231006 and P. citrinum JQ647899 were used as the
outgroups. Maximum parsimony analysis from 98 taxa of 431 total characters yielded
100 MPTs with tree length 168 steps, CI of 0.8810, HI of 0.1190, RI of 0.9903 and
RC of 0.8724. One hundred and four characters were parsimony-informative and 8
variable characters were parsimony-uninformative.
The best tree of Aspergillus estimated by the Kishino-Hasegawa (KH)
test is shown in Figure 32 RSPG178, 179 and 180 were placed in a subclade A
comprising several strains of A. sclerotiorum, A. fresenii AY338961, A. elegans
EU165705, A. bridgeri EF661404, A. bridgeri EF661398, A. persii EF661399, A.
bridgeri EF200084 and A. persii FR733836 supported by bootstrap values of 64%,
with A. sclerotiorum AY373866 as the most similar taxon (99% nucleotide identity).
Therefore, RSPG178, 179 and 180 could be identified as A. sclerotiorum based on
nucleotide sequence homology.
RSPG196 and 198 were located in a subclade B. RSPG196 grouped
with several A. nomius strains with 99.4-100% nucleotide identity and strong
bootstrap values (96%). RSPG196 can be named as A. nomius. RSPG198 had
affiliation with A. bombycis supported by high bootstrap values (92%) and identical
nucleotide identity (100%). Thus, RSPG198 should be referred to A. bombycis.
RSPG185 grouped well within a subclade C and formed a sister group
to unknown species of Aspergillus (Aspergillus sp. HQ288052, Aspergillus sp.
DQ092528, Aspergillus sp. HQ832962 and Aspergillus sp. EF669595). The
80
nucleotide identities within the group were 95.7-96.5%. However, RSPG185 had no
closely related species with moderate bootstrap support (70%), therefore, it can only
be reffered to Aspergillus sp.
RSPG197 and 206 clustered within a subclade D consisting of four
species from Aspergillus section Usti including A. ustus, A. keveii, A. insuetus and A.
minutus (100% bootstrap support). The nucleotide identities within the group were
99.4-100%. The molecular data of ITS rDNA sequence revealed that RSPG197 and
206 belonged to Aspergillus section Usti.
Three soil fungal isolates, RSPG 199, 202 and 204 were closely related
and well placed in a subclade E containing several A. unguis strains (teleomorph:
Emericella unguis) and Aspergillus sp. HM589221 supported by high bootstrap
values and nucleotide identity of 100%. Therefore, RSPG199, 202 and 204 should be
named as A. unguis.
Eight isolates of soil fungi (RSPG82, 93, 95, 99, 105, 138, 161 and
162) were located in the genus Penicillium. Maximum parsimony analysis from 117
taxa of 473 total characters yielded 100 MPTs with tree length of 393 steps, CI of
0.6947, HI of 0.3053, RI of 0.9620 and RC of 0.6683. Fifty-five variable characters
were parsimony-uninformative and 139 characters were parsimony-informative.
A.versicolor JX845289 and Trichocoma paradox JF417485 were used as outgroups.
Figure 33 shows the best topology of Penicillium tree analysed by the
KH test. RSPG95, 138 and 162 were clustered in a subclade A. RSPG95 and 162
were closely related and formed a subgroup with various strains of P. citrinum with
100% nucleotide identity and 100% bootstrap values. Therefore, these two isolates
could be identified as P. citrinum. While RSPG138 formed a sister group to P.
roseopurpureum AF455437, P. roseopurpureum AF455492, P. rosepurpureum
GU723456 and P. copicola JN617685. This group was established by 60% bootstrap
support. The most closely related species of RSPG138 was P. copticola JN617685
with 99.5% nucleotide sequence identity. Thus, it could be identified as P. copticola.
RSPG99 grouped with several strains of Penicillium sp. in a subclade
B supported by moderate bootstrap support but without any closely associated taxa.
Its nucleotide identity with this grouping was relative low (78.0-80.6%). As the result
of ITS rDNA analysis, this isolate can only be referred to Penicillium sp.
81
RSPG82 was placed in a subclade C containing various P.
scelerotiorum strains supported by robust bootstrap values (100%) and nucleotide
identity of 99.5-100%. RSPG82 could be identified as P. sclerotiorum.
RSPG93 belonged to a subclade D including several strains of P.
herquei. Although the grouping was not supported by bootstrap analysis, the
nucleotide identities within the group were 99.7-100%. Therefore, RSPG93 should be
named as P. herquei.
RSPG161 was placed in a subclade E and formed a subgroup with
Penicillium sp. GU565135, Penicillium sp. JN545832 and P. pimiteouiense
GQ924903 supported by moderate bootstrap values (68%). RSPG161 had affinity
with Penicillium sp. GU565135 and P. pimiteouiense GQ924903 with 100%
nucleotide identity. RSPG161 could be referred to P. pimiteouiense.
Finally, RSPG105 grouped in a subclade F supported by bootstrap
value (100%). RSPG105 was closely related to P. aculeatum strains with 99.0-99.5%
nucleotide identity. ITS rDNA analysis suggested that it could be identified as P.
aculeatum.
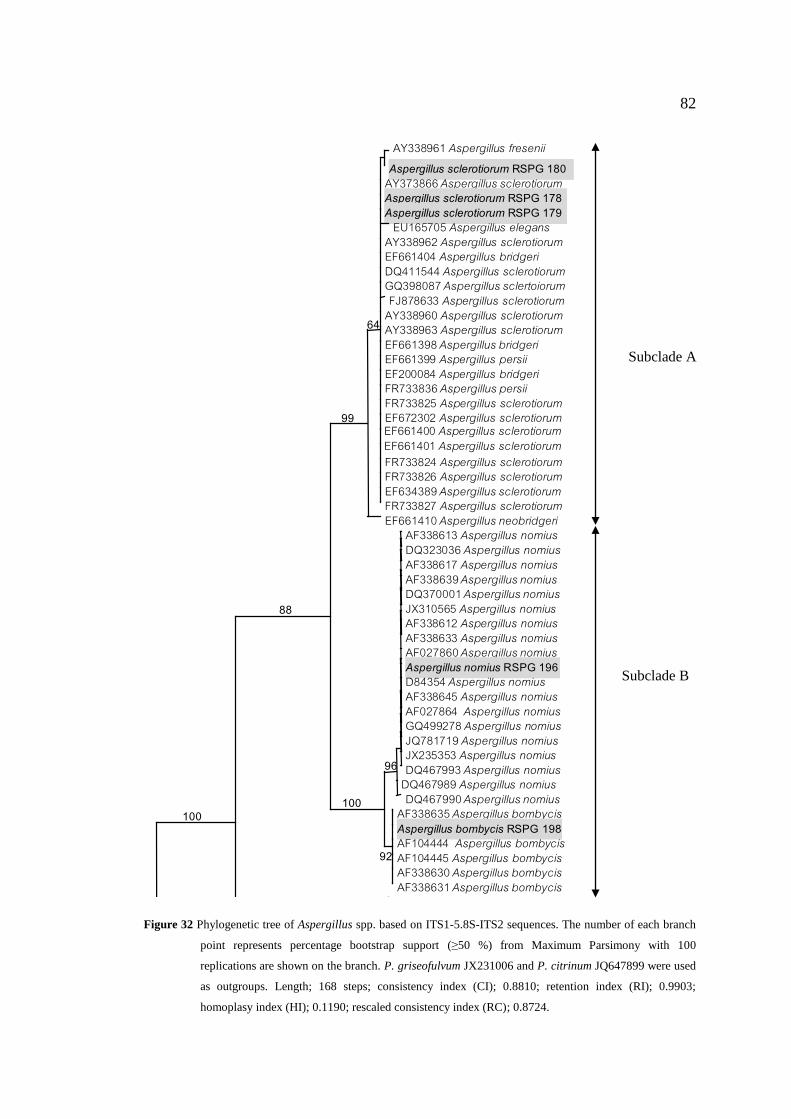
82
AY338961 Aspergillus freseniiAspergillus sclerotiorum RSPG 180
AY373866 Aspergillus sclerotiorumAspergillus sclerotiorum RSPG 178Aspergillus sclerotiorum RSPG 179
EU165705 Aspergillus elegansAY338962 Aspergillus sclerotiorumEF661404 Aspergillus bridgeriDQ411544 Aspergillus sclerotiorumGQ398087 Aspergillus sclertoiorumFJ878633 Aspergillus sclerotiorum
AY338960 Aspergillus sclerotiorumAY338963 Aspergillus sclerotiorumEF661398 Aspergillus bridgeriEF661399 Aspergillus persiiEF200084 Aspergillus bridgeriFR733836 Aspergillus persiiFR733825 Aspergillus sclerotiorumEF672302 Aspergillus sclerotiorumEF661400 Aspergillus sclerotiorumEF661401 Aspergillus sclerotiorumFR733824 Aspergillus sclerotiorumFR733826 Aspergillus sclerotiorumEF634389 Aspergillus sclerotiorumFR733827 Aspergillus sclerotiorumEF661410 Aspergillus neobridgeri
AF338613 Aspergillus nomiusDQ323036 Aspergillus nomiusAF338617 Aspergillus nomiusAF338639 Aspergillus nomiusDQ370001 Aspergillus nomiusJX310565 Aspergillus nomiusAF338612 Aspergillus nomiusAF338633 Aspergillus nomiusAF027860 Aspergillus nomiusAspergillus nomius RSPG 196D84354 Aspergillus nomiusAF338645 Aspergillus nomiusAF027864 Aspergillus nomiusGQ499278 Aspergillus nomiusJQ781719 Aspergillus nomiusJX235353 Aspergillus nomiusDQ467993 Aspergillus nomius
DQ467989 Aspergillus nomiusDQ467990 Aspergillus nomius
AF338635 Aspergillus bombycisAspergillus bombycis RSPG 198AF104444 Aspergillus bombycisAF104445 Aspergillus bombycisAF338630 Aspergillus bombycisAF338631 Aspergillus bombycis
AY373849 Aspergillus flavipes
64
99
88
100100
96
92
Figure 32 Phylogenetic tree of Aspergillus spp. based on ITS1-5.8S-ITS2 sequences. The number of each branch
point represents percentage bootstrap support (≥50 %) from Maximum Parsimony with 100
replications are shown on the branch. P. griseofulvum JX231006 and P. citrinum JQ647899 were used
as outgroups. Length; 168 steps; consistency index (CI); 0.8810; retention index (RI); 0.9903;
homoplasy index (HI); 0.1190; rescaled consistency index (RC); 0.8724.
Subclade A
Subclade B
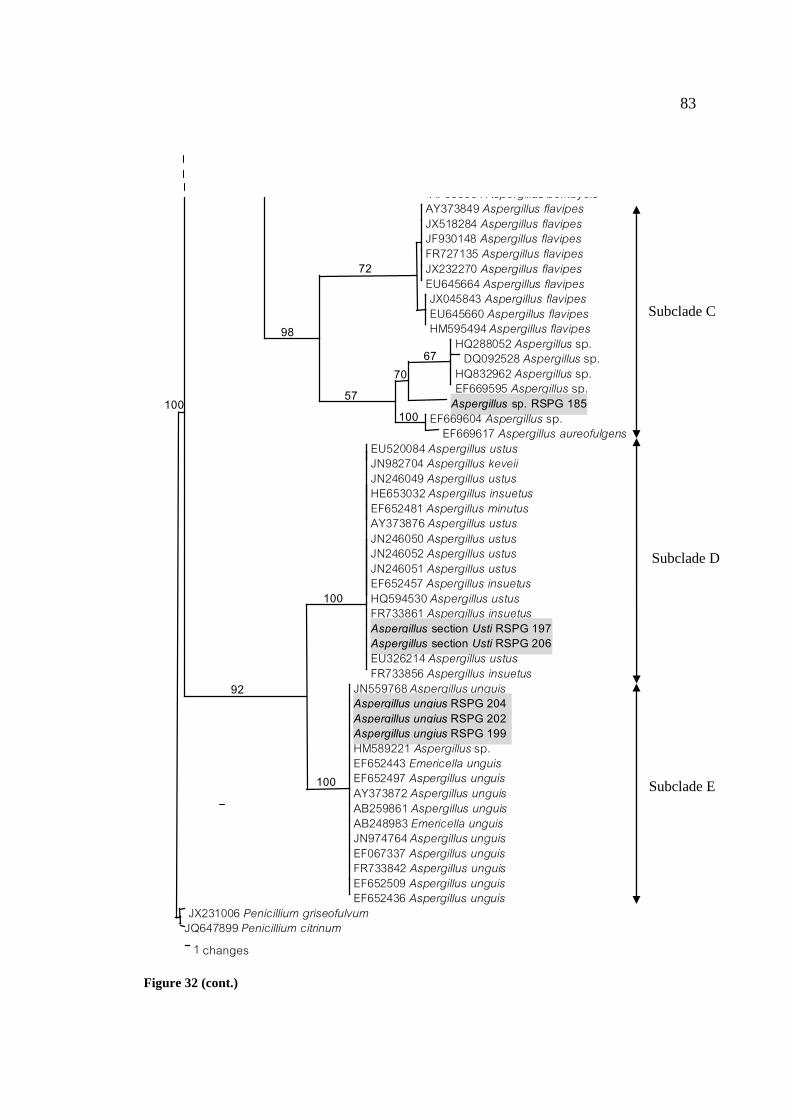
83
1
AF338631 Aspergillus bombycisAY373849 Aspergillus flavipesJX518284 Aspergillus flavipesJF930148 Aspergillus flavipes FR727135 Aspergillus flavipesJX232270 Aspergillus flavipesEU645664 Aspergillus flavipesJX045843 Aspergillus flavipesEU645660 Aspergillus flavipesHM595494 Aspergillus flavipes
HQ288052 Aspergillus sp.DQ092528 Aspergillus sp.
HQ832962 Aspergillus sp.EF669595 Aspergillus sp.
Aspergillus sp. RSPG 185EF669604 Aspergillus sp.
EF669617 Aspergillus aureofulgensEU520084 Aspergillus ustusJN982704 Aspergillus keveiiJN246049 Aspergillus ustusHE653032 Aspergillus insuetusEF652481 Aspergillus minutusAY373876 Aspergillus ustusJN246050 Aspergillus ustusJN246052 Aspergillus ustusJN246051 Aspergillus ustusEF652457 Aspergillus insuetusHQ594530 Aspergillus ustusFR733861 Aspergillus insuetusAspergillus section Usti RSPG 197Aspergillus section Usti RSPG 206EU326214 Aspergillus ustusFR733856 Aspergillus insuetus
JN559768 Aspergillus unguisAspergillus ungius RSPG 204Aspergillus ungius RSPG 202Aspergillus ungius RSPG 199HM589221 Aspergillus sp.EF652443 Emericella unguisEF652497 Aspergillus unguisAY373872 Aspergillus unguisAB259861 Aspergillus unguisAB248983 Emericella unguisJN974764 Aspergillus unguisEF067337 Aspergillus unguisFR733842 Aspergillus unguisEF652509 Aspergillus unguisEF652436 Aspergillus unguis
JX231006 Penicillium griseofulvumJQ647899 Penicillium citrinum
changes
100
98
72
5770
100
67
92
100
100
Figure 32 (cont.)
Subclade C
Subclade D
Subclade E

84
JN851046 Penicillium citrinumPenicillium citrinum RSPG 95Penicillium citrinum RSPG 162HM235992 Penicillium citrinumHQ232482 Penicillium citrinumHQ248193 Penicillium citrinumHQ671192 Penicillium citrinumGU565103 Penicillium citrinumHQ889713 Penicillium citrinumHM469428 Penicillium citrinumHQ596918 Penicillium citrinumJF793520 Penicillium citrinumJF266706 Penicillium citrinumJN226917 Penicillium citrinumJN226951 Penicillium citrinumJN226972 Penicillium citrinumJN601441 Penicillium citrinumJN850977 Penicillium citrinumJN851003 Penicillium citrinumJN851020 Penicillium citrinumJN851027 Penicillium citrinumJN851040 Penicillium citrinum
DQ682594 Penicillium steckiiJN157801 Eupenicillium sp.HQ832818 Penicillium sp.
HM469415 Penicillium steckiiHQ649852 Eupenicillium sp.HQ649854 Eupenicillium sp.HQ649853 Eupenicillium sp.
HM469404 Penicillium sumatrenseAF455437 Penicillium roseopurpureumAF455492 Penicillium roseopurpureum
GU723456 Penicillium roseopurpureumPenicillium copticola RSPG 138JN617685 Penicillium copticola
JN617686 Penicillium terrigenumEU833225 Penicillium roseopurpureumJN617684 Penicillium terrigenum
JN617690 Penicillium gallaicumJN617699 Penicillium euglaucum
JN617687 Penicillium paxilliJF439501 Penicillium sp.
EU142860 Penicillium sp.GU565147 Penicillium sp.HQ022493 Penicillium sp.JF439500 Penicillium sp.
Penicillium sp. RSPG 99JF439502 Penicillium sp.
JQ905772 Penicillium sp.HQ608078 Penicillium sp.GU981581 Eupenicillium zonatumHQ607882 Penicillium simplicissimum
EF564151 Penicillium sclerotiorum
100
62
51
60
81
100
56
53
88
96
61
Figure 33 Maximum parsimonious tree of Penicillium spp. based on ITS1-5.8S-ITS2 sequences. The number on
each branch presents percentage of bootstrap values support (≥50 %) with 100 replications. A.
versicolor JX845289 and Trichocoma paradox JF417485 were used as outgroups. Length; 393 steps;
consistency index (CI); 0.6947; retention index (RI); 0.9620; homoplasy index (HI); 0.3053; rescaled
consistency index (RC); 0.6683.
Subclade A
Subclade B
84
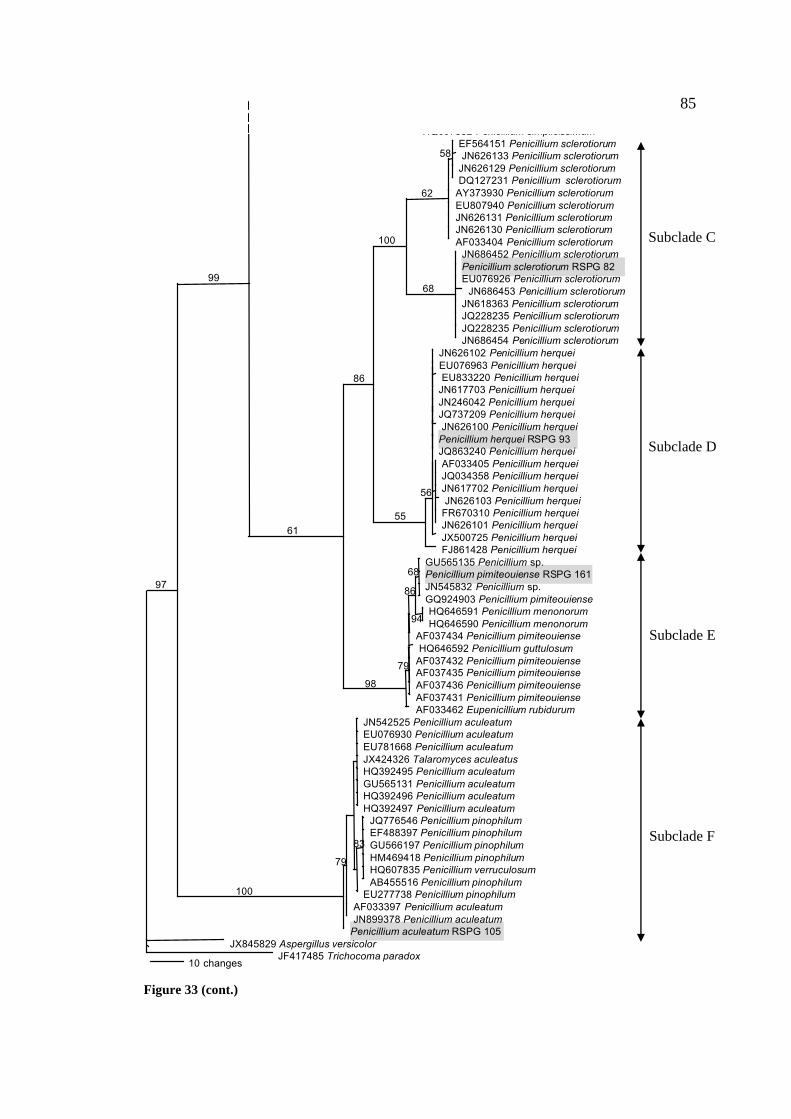
85
Penicillium aculeatum RSPG 105
Penicillium pimiteouiense RSPG 161
Penicillium herquei RSPG 93
Penicillium sclerotiorum RSPG 82
10 changes
HQ607882 Penicillium simplicissimumEF564151 Penicillium sclerotiorumJN626133 Penicillium sclerotiorumJN626129 Penicillium sclerotiorumDQ127231 Penicillium sclerotiorumAY373930 Penicillium sclerotiorumEU807940 Penicillium sclerotiorumJN626131 Penicillium sclerotiorumJN626130 Penicillium sclerotiorumAF033404 Penicillium sclerotiorumJN686452 Penicillium sclerotiorum
EU076926 Penicillium sclerotiorumJN686453 Penicillium sclerotiorum
JN618363 Penicillium sclerotiorumJQ228235 Penicillium sclerotiorumJQ228235 Penicillium sclerotiorumJN686454 Penicillium sclerotiorum
JN626102 Penicillium herqueiEU076963 Penicillium herqueiEU833220 Penicillium herqueiJN617703 Penicillium herqueiJN246042 Penicillium herqueiJQ737209 Penicillium herqueiJN626100 Penicillium herquei
JQ863240 Penicillium herqueiAF033405 Penicillium herqueiJQ034358 Penicillium herqueiJN617702 Penicillium herqueiJN626103 Penicillium herqueiFR670310 Penicillium herqueiJN626101 Penicillium herqueiJX500725 Penicillium herqueiFJ861428 Penicillium herquei
GU565135 Penicillium sp.
JN545832 Penicillium sp.GQ924903 Penicillium pimiteouienseHQ646591 Penicillium menonorumHQ646590 Penicillium menonorum
AF037434 Penicillium pimiteouienseHQ646592 Penicillium guttulosumAF037432 Penicillium pimiteouienseAF037435 Penicillium pimiteouienseAF037436 Penicillium pimiteouienseAF037431 Penicillium pimiteouienseAF033462 Eupenicillium rubidurum
JN542525 Penicillium aculeatumEU076930 Penicillium aculeatumEU781668 Penicillium aculeatumJX424326 Talaromyces aculeatusHQ392495 Penicillium aculeatumGU565131 Penicillium aculeatumHQ392496 Penicillium aculeatumHQ392497 Penicillium aculeatumJQ776546 Penicillium pinophilumEF488397 Penicillium pinophilumGU566197 Penicillium pinophilumHM469418 Penicillium pinophilumHQ607835 Penicillium verruculosumAB455516 Penicillium pinophilum
EU277738 Penicillium pinophilumAF033397 Penicillium aculeatumJN899378 Penicillium aculeatum
JX845829 Aspergillus versicolorJF417485 Trichocoma paradox
99
58
62
100
68
86
6155
56
976886
94
7998
8379
100
Figure 33 (cont.)
Subclade C
Subclade D
Subclade E
Subclade F
86
Class Sordariomycetes, Order Hypocreales
Thirteen fungal isolates were placed in the Order Hypocreales within
four genera Trichoderma, Paecilomyces, Myrothecium and Fusarium. Bionectria
lucifer AF210683 and B. epichloe JN198444 were used as outgroups. Maximum
parsimony analysis from 66 taxa of 563 total characters yielded 1000 MPTs with tree
length 389 steps, CI of 0.8123, HI of 0.1877, RI of 0.9767 and RC of 0.7934. Thirty-
nine variable characters were parsimony-uninformative and 182 characters were
parsimony-informative. The best tree estimated by the KH test is shown in Figure 34
The soil fungi RSPG24, 27 and 28 were located in subclade A.
RSPG24 had affiliation with T. reesei (teleomorph: Hypocrea jecorina) supported by
high bootstrap values and nucleotide identity of 100%. Therefore, RSPG24 should be
referred to T. reesei. RSPG27 was clustered with T. brevicompactum with 100%
bootstrap values and 100% nucleotide identity. Thus, this isolate was identified as T.
brevicompactum. RSPG28 was closely related to the sequences of Hypocrea lixii
(anamorph : T. harzianum) with bootstrap values and nucleotide identity of 100% and
99.8-100%, respectively. This fungus did not produce any ascospores, therefore,
RSPG28 should be name as T. harzianum.
Three soil fungal isolates, RSPG50, 52 and 58 grouped within subclade
B containing several Paecilomyces lilacinus strains including clinical isolate
Purpureocillium lilacinum with 99.5-100% nucleotide identity and 100% bootstrap
values. The ITS phylogeny supported the identification of RSPG50, 52 and 58 as P.
lilacinus.
RSPG88 was placed in subclade C with several M. roridum strains.
The nucleotide identities within the group were 98.3-99.7%. RSPG88 was referred to
M. roridum with 100% bootstrap support.
Six isolates of soil fungi (RSPG37, 63, 227, 229, 230 and 231) were
clustered in subclade D. RSPG37, 63, 227, 229 and 231 grouped with F. oxysporum
EU625403, Fusarium sp. EU750689, F. solani FJ719812, F. solani AM412643 and
F. solani AM 412603 supported by bootstrap values of 100%. RSPG37 and 229 were
grouping together and most related to F. solani AM412643 with 96.1-97.3% ITS
sequence identity thus, RSPG37 and 229 can be referred to F. solani. RSPG63, 227
87
and 231 were identical to F. solani FJ719812, Fusarium sp. EU750689 and F.
oxysporum EU625403 with 99.3-99.7% sequence identity. Considering the
morphology of RSPG63, 227 and 231, the colonies were white to pale orange or pale
yellow. Blue color was occurred on colony when cultured in PDB. Macroconidia were
slightly curved, stout and had 3-5 septate. Microconidia had 1-2 septa and large. Thus,
RSPG63, 227 and 231 should be named as F. solani (Nelson et al., 1983). While
RSPG230 were grouped with several strains of F. solani and Fusarium sp. EF687945
with 93% bootstrap support. Its ITS rDNA sequence was closely related to F. solani
AM412623 with 99.7% nucleotide identity. Therefore, RSPG230 was identified as
F. solani.

88
Fusarium solani RSPG 229
Fusarium solani RSPG 230
Fusarium solani RSPG 63Myrothecium roridum RSPG 88
Paecilomyces lilacinus RSPG 52
Paecilomyces lilacinus RSPG 50
Paecilomyces lilacinus RSPG 58
Trichoderma harzianum RSPG 28
Trichoderma reesei RSPG 24
Trichoderma brevicompactum RSPG 27
10 changes
DQ000635 Trichoderma brevicompactum
EF417484 Trichoderma brevicompactumHQ596986 Trichoderma brevicompactumFJ610290 Trichoderma brevicompactumFJ610289 Trichoderma brevicompactumFJ610288 Trichoderma brevicompactumFJ610287 Trichoderma brevicompactumEU330934 Trichoderma brevicompactumJQ979435 Trichoderma reesei
X93951 Hypocrea jecorinaZ31018 Hypocrea jecorinaAF510497 Hypocrea jecorinaEU280094 Hypocrea jecorinaEU280101 Hypocrea jecorinaJQ070073 Hypocrea jecorinaJQ040380 Hypocrea jecorina
AF443927 Hypocrea lixii
HQ608036 Hypocrea lixiiEF191308 Hypocrea lixiiJF923807 Hypocrea lixiiFR848364 Hypocrea lixiiAY605734 Hypocrea lixiiAY605745 Hypocrea lixiiHQ259985 Hypocrea lixii
AM158216 Paecilomyces lilacinusHQ842815 Purpureocillium lilacinumHQ842813 Purpureocillium lilacinumHQ842819 Purpureocillium lilacinumJF896086 Purpureocillium lilacinumHQ842814 Purpureocillium lilacinumFN598940 Paecilomyces lilacinusGU980019 Paecilomyces lilacinus
JF896085 Purpureocillium lilacinum
AY213667 Paecilomyces lilacinusGQ229080 Paecilomyces lilacinusFN995207 Paecilomyces lilacinus
FR822391 Paecilomyces lilacinusJF724150 Myrothecium roridumJF724156 Myrothecium roridumEF151002 Myrothecium roridumEU927366 Myrothecium roridumJF343832 Myrothecium roridum
GQ853401 Myrothecium roridum
Fusarium solani RSPG 231EU625403 Fusarium oxysporumEU750689 Fusarium sp.FJ719812 Fusarium solani
AM412643 Fusarium solaniAM412603 Fusarium solani
AM412623 Fusarium solani
JF827036 Fusarium solaniFJ459978 Fusarium solani
Fusarium solani RSPG 227
Fusarium solani RSPG 37
FJ224382 Fusarium solaniEF687945 Fusarium sp.
AF210683 Bionectria luciferJN198444 Bionectria epichloe
100
100
79
100
100
100
98
100
68
100
93
100
Figure 34 Phylogenetic tree based on ITS1-5.8S-ITS2 sequences of soil fungi in order Hypocreales. The number
on each branch represents percentage of bootstrap values support (≥50 %) with 100 replications.
Bionectria lucifer AF210683 and B. epichloe JN198444 were used as outgroups. Length; 389 steps;
consistency index (CI); 0.8123; retention index (RI); 0.9767; homoplasy index (HI); 0.1877; rescaled
consistency index (RC); 0.7934.
Subclade D
Subclade C
Subclade B
Subclade A
88

89
Class Zygomycetes, Order Mucorales
RSPG 214 was located in the Mucorales comprising several Absidia
species. Maximum parsimony analysis from 24 taxa of 767 total characters, with
Cunninghamella elegans FJ792589 and C. bertholletiae FJ345351 were used as
outgroups. The numbers of constant characters, parsimony-uninformative and
parsimony-informative characters were 242, 33 and 492, respectively. Four most
parsimonious trees were obtained from heuristic searches. The best tree calculated by
the KH maximum parsimony test is shown in Figure 35 with tree length of 1961 steps,
CI of 0.5502, RI of 0.7267 RC of 0.3998 and HI of 0.4498.
RSPG 214 had affiliation with A. repens, A. psychrophilia, A.
heterospora, A. anomala and A. spinosa, but no closely associated with other known
species from GenBank database. Its nucleotide identity in this grouping was relative
low (50.2-72.1%) with weak bootstrap support. Thus, RSPG 214 was identified to be
Absidia sp.
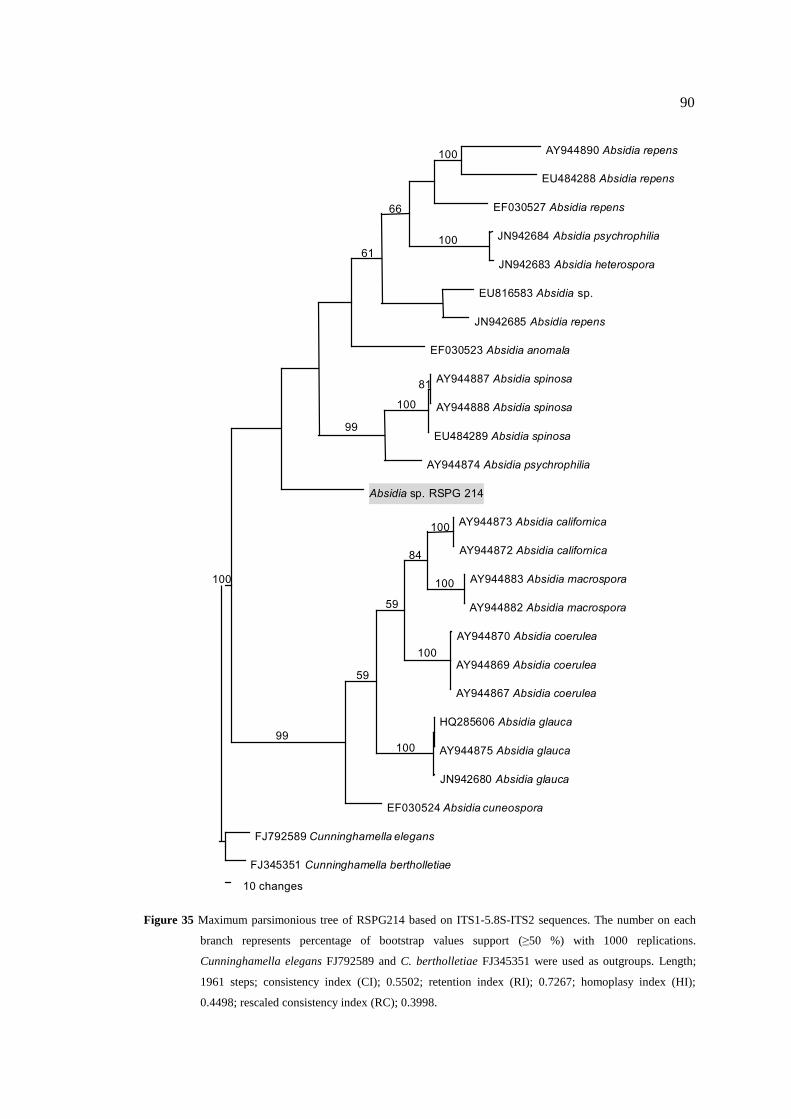
90
10 changes
AY944890 Absidia repens
EU484288 Absidia repens
EF030527 Absidia repens
JN942684 Absidia psychrophilia
JN942683 Absidia heterospora
EU816583 Absidia sp.
JN942685 Absidia repens
EF030523 Absidia anomala
AY944887 Absidia spinosa
AY944888 Absidia spinosa
EU484289 Absidia spinosa
AY944874 Absidia psychrophilia
Absidia sp. RSPG 214
AY944873 Absidia californica
AY944872 Absidia californica
AY944883 Absidia macrospora
AY944882 Absidia macrospora
AY944870 Absidia coerulea
AY944869 Absidia coerulea
AY944867 Absidia coerulea
HQ285606 Absidia glauca
AY944875 Absidia glauca
JN942680 Absidia glauca
EF030524 Absidia cuneospora
FJ792589 Cunninghamella elegans
FJ345351 Cunninghamella bertholletiae
100
61
66
100
81100
99
100
99
59
59
100
84
100
100
100
Figure 35 Maximum parsimonious tree of RSPG214 based on ITS1-5.8S-ITS2 sequences. The number on each
branch represents percentage of bootstrap values support (≥50 %) with 1000 replications.
Cunninghamella elegans FJ792589 and C. bertholletiae FJ345351 were used as outgroups. Length;
1961 steps; consistency index (CI); 0.5502; retention index (RI); 0.7267; homoplasy index (HI);
0.4498; rescaled consistency index (RC); 0.3998.
90
91
CHAPTER 4
DISCUSSIONS
4.1 Number of isolated soil fungi
Soil fungi were isolated from soil samples that collected in January,
April, June and August 2010 from Plant Genetic Conservation Project area,
Rajjaprabha dam, Suratthani province. The fungal density of soil samples were in the
ranges of 4.2×10⁴-1.1×10
6 CFU/g. The average fungal density from this study was in
the same range as in other studies. Chutia and Ahmed (2012) isolated soil fungi from
different virgin forest floor in India and reported mean of fungal population of
9.9×10⁴ CFU/g. Makut and Owolewa (2011) isolated antibiotic-producing soil fungi
from Nigeria and recorded the total fungal count as 1.6-4.7×10⁴ TFU/g. In Thailand,
Boonleang (1999) reported the fungal density of soil samples from Forest-Reviving as
the Royal Suggestions and Plant Germplasm Forest Project in Nakhon Ratchasima
province of 1.80×10⁴-1.09×10
5 CFU/g. Soil samples from RSPG area, Rajjaprabha
dam were very strongly acid to slightly acid soil with the pH value of 4.90-6.43
(Yongchalermchai et al., 2011) that encourage the population of fungi. Generally, the
numbers of fungi in soil were varied in range of 105-10
6/g of soil (Metting, 1993).
The lowest density of soil fungi was found in April, whereas the
highest density was found in August. Soil properties e.g. pH and moisture content
affect to a survival of fungi inhabiting in soil (Rohilla and Salar, 2012). Most of fungi
require high water availability for their growth (Levetin et al., 2001; Burge, 2006).
From the collection times in 2010, the highest average temperature and the lowest
average rainfall were presented in April (http://www.tmd.go.th/programs/uploads
/yearlySummary/T_weather2553.pdf). High temperatures and low rainfall decrease
92
water availability in soil and limit the fungal growth. Moreover, fungal hyphae and
conidia in soil are exposed to ultraviolet radiation which has effects on fungal
viability and spore germination (Levetin et al., 2001). Therefore, high moisture and
low temperature from rain in August are a suitable condition to promote the growth of
soil fungi.
4.2 Fungal species identified by morphology
Soil fungi were isolated by dilution plate method on RBC agar. This
medium was supplemented with chloramphenicol and rose bengal to prevent bacterial
growth. Rose bengal also slows down the growth of fungal colonies decreasing the
tendency of fast-growing fungi to spread quickly over the plate before slow-growing
fungi form colonies (Garrett, 1981). The isolated fungal species, Penicillium,
Aspergillus, Trichoderma, Gongronella, Fusarium, Mucor and Cunninghamella were
common genera found in soil samples. Dilution plate method usually employed to
isolate fungi which produce conidia (Rao, 1970) but this technique has some
disadvantages. Firstly, no single culture medium is suitable for isolation of all fungal
species. Thus, some species are not occurred because their population numbers are too
low or grow rather slowly when compared with the common species. The secondary
disadvantage is the original suspension of soil. Some of heavy fungal fragment and
spore fuse with heavier part of soil and are sunk to the bottom of the shaking vessel
before a sample has been pipetted off to make a dilution. So, this fungal group was
not appeared on the isolation medium (Garrett, 1981). Other techniques used for
isolation of soil fungi are Warcup soil plate, immersion plate and tube and baiting
technique. The Warcup soil plate allows the isolation of fungi that are not
representing with the dilution plate method and potential to isolate a wider range of
fungal species (Garrett, 1981). Immersion plate and tube employ to study the
microbes in a natural way in their habitats (Subbarao, 1999). Baiting technique is a
semiselective method used for isolation of various fungi such as Pythium,
Chaetomium, Rhizoctonia, dermatophytes and water fungi (Rao, 1970; Windham and
93
Lucas, 1987; Simpanya and Baxter, 1996; Deechouy, 2013). A sexual stage of fungi
has been obtained under controlled laboratory conditions for example Rodriguez and
Owen (1992) successfully induced the sexual stage of Colletotrichum musae by
controlling light and growth temperature.
From this study, Penicillium is the most frequent isolated genus
followed by Aspergillus. Deechouy (2013) also isolated soil fungi from RSPG area
and found that the most isolated genera from dilution plate method using GANA and
TSM were Penicillium followed by Aspergillus and Trichoderma. Chutia and Ahmed
(2012) also reported that Penicillium and Aspergillus were abundant species isolated
from virgin forest floor in India. These two genera can be found in all natures due to
their ability to adapt to different environments (Wahegaonkar et al., 2011).
4.3 Antimicrobial activity of fungal crude extracts
Soils are traditionally the major source of antibiotic and/or new
compound producing fungi. Antibiotics provided by fungi are currently used in
pharmaceuticals especially cephalosporin, fusidic acid and penicillin (Takahashi et
al., 2008; Gharaei-Fathabad et al., 2009; Petit et al., 2009; Makut and Owolewa,
2011). Several researches indicated that soil fungi served as a good source of
antimicrobial agents (Qureshi, 2003; Liermann et al., 2009; Kumar et al., 2010; Ali et
al., 2011; Senthilkumar et al., 2011).
In this study, antimicrobial activity of 181 soil fungi was evaluated
from their crude extracts toward 12 human pathogens comprising bacteria (6 strains),
yeasts (4 strains) and filamentous fungi (2 strains). Three hundred and eleven crude
extracts from 145 selected soil fungi exhibited antimicrobial activity against at least
one test strain. This result is similar to Mya (2011), Helen et al. (2012) and Jaiswal et
al. (2012) that isolated soil fungi from different places exhibited antimicrobial activity
against one or more test microorganisms.
94
Among the tested microorgnisms, Gram-positive bacteria (S. aureus
ATCC 25923 and MRSA SK-1) were more susceptible than Gram-negative bacteria
(A. baumannii AB007, A. baumannii AB005, E. coli ATCC 25922 and P. aeruginosa
ATCC 27853) and yeasts (C. neoformans and C. albicans) were more susceptible than
the filamentous fungi (P. marneffei and M. gypseum). Several studies also found the
less inhibition of Gram-negative bacteria by soil fungi (Corte et al., 2000; Makut and
Owolewa, 2011; Chutia and Ahmed, 2012) and by other natural products (Kelmanson
et al., 2000; Mahesh and Satish, 2008; Wagate et al., 2010). In Gram-negative
bacteria, their outer membrane displays an important role as a permeability barrier
that prevents exposure of susceptible sites to antimicrobial agents (Kaye et al., 2004).
On the other hand, Gharaei-Fathabad et al. (2009) reported that C. albicans was the
lowest susceptible strain when examined with fungal crude extracts dissolved in
chloroform and tested by disc diffusion method. The polarity of the compounds can
affect the diffusion of compounds onto the culture medium (Jiang, 2011). Different
solvents used to dissolve crude extracts and different techniques used to evaluate
activity may give different results of antimicrobial assay.
Even most of fungal crude extracts were active against only one test
strain (20.07%) but overall of antimicrobial activity testing showed that fungal crude
extracts were able to inhibit more than one test strain. RSPG 198 CH was the only
crude extract presented activity to all of the test microorganisms. The results indicated
that crude extracts from soil fungi had a wide range of antimicrobial activity. Many
investigators including Corte et al. (2000); Takahashi et al. (2008); Gharaei-Fathabad
et al. (2009); Petit et al. (2009); Makut and Owolewa (2011); Chutia and Amhed
(2012) also reported that soil fungi showed a broad antimicrobial spectrum against
various strains of test microorganisms.
Considering the type of crude extracts, cell hexane was the highest
active crude extracts (CH, 61.88%) followed by cell ethyl acetate (CE, 58.01%) and
broth ethyl acetate (BE, 53.59%). This could explain that active substances are
retained in fungal mycelium and contained cell-bound components. Active extracts
may have low polarity and are better dissolved in hexane than ethyl acetate (Buatong,
2011; Prapagdee et al., 2012). This work is correlated with Buatong et al. (2011) and
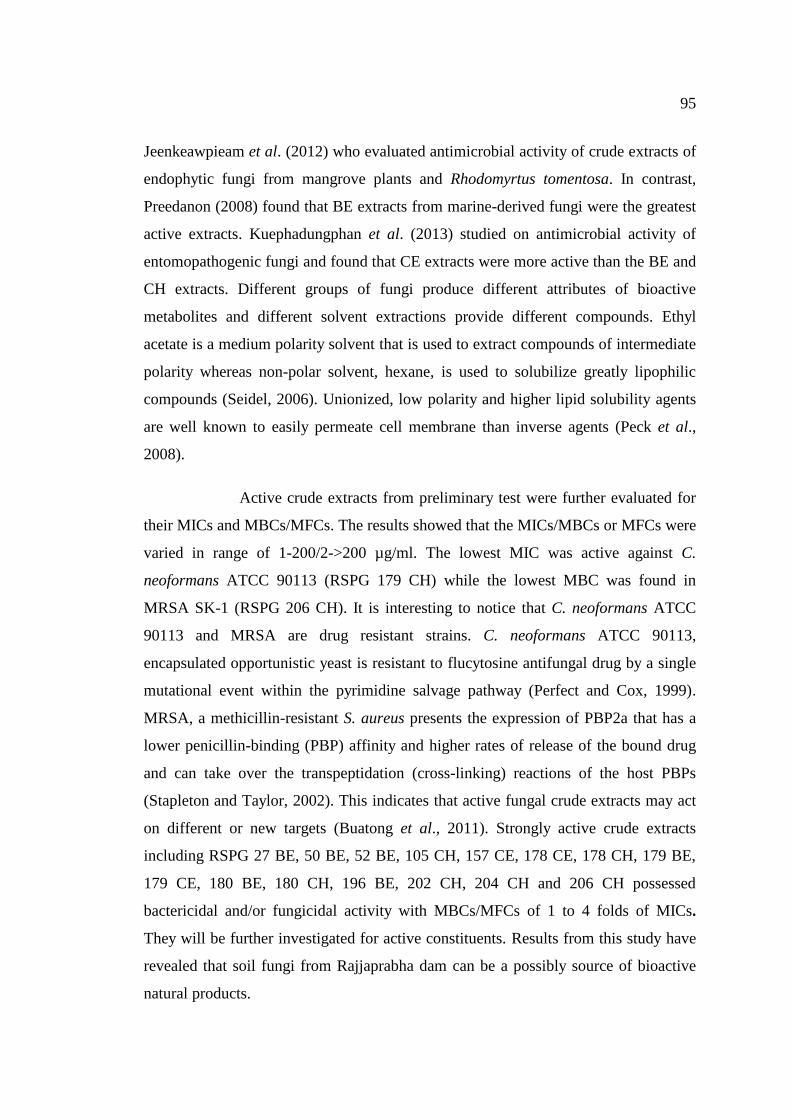
95
Jeenkeawpieam et al. (2012) who evaluated antimicrobial activity of crude extracts of
endophytic fungi from mangrove plants and Rhodomyrtus tomentosa. In contrast,
Preedanon (2008) found that BE extracts from marine-derived fungi were the greatest
active extracts. Kuephadungphan et al. (2013) studied on antimicrobial activity of
entomopathogenic fungi and found that CE extracts were more active than the BE and
CH extracts. Different groups of fungi produce different attributes of bioactive
metabolites and different solvent extractions provide different compounds. Ethyl
acetate is a medium polarity solvent that is used to extract compounds of intermediate
polarity whereas non-polar solvent, hexane, is used to solubilize greatly lipophilic
compounds (Seidel, 2006). Unionized, low polarity and higher lipid solubility agents
are well known to easily permeate cell membrane than inverse agents (Peck et al.,
2008).
Active crude extracts from preliminary test were further evaluated for
their MICs and MBCs/MFCs. The results showed that the MICs/MBCs or MFCs were
varied in range of 1-200/2->200 µg/ml. The lowest MIC was active against C.
neoformans ATCC 90113 (RSPG 179 CH) while the lowest MBC was found in
MRSA SK-1 (RSPG 206 CH). It is interesting to notice that C. neoformans ATCC
90113 and MRSA are drug resistant strains. C. neoformans ATCC 90113,
encapsulated opportunistic yeast is resistant to flucytosine antifungal drug by a single
mutational event within the pyrimidine salvage pathway (Perfect and Cox, 1999).
MRSA, a methicillin-resistant S. aureus presents the expression of PBP2a that has a
lower penicillin-binding (PBP) affinity and higher rates of release of the bound drug
and can take over the transpeptidation (cross-linking) reactions of the host PBPs
(Stapleton and Taylor, 2002). This indicates that active fungal crude extracts may act
on different or new targets (Buatong et al., 2011). Strongly active crude extracts
including RSPG 27 BE, 50 BE, 52 BE, 105 CH, 157 CE, 178 CE, 178 CH, 179 BE,
179 CE, 180 BE, 180 CH, 196 BE, 202 CH, 204 CH and 206 CH possessed
bactericidal and/or fungicidal activity with MBCs/MFCs of 1 to 4 folds of MICs.
They will be further investigated for active constituents. Results from this study have
revealed that soil fungi from Rajjaprabha dam can be a possibly source of bioactive
natural products.
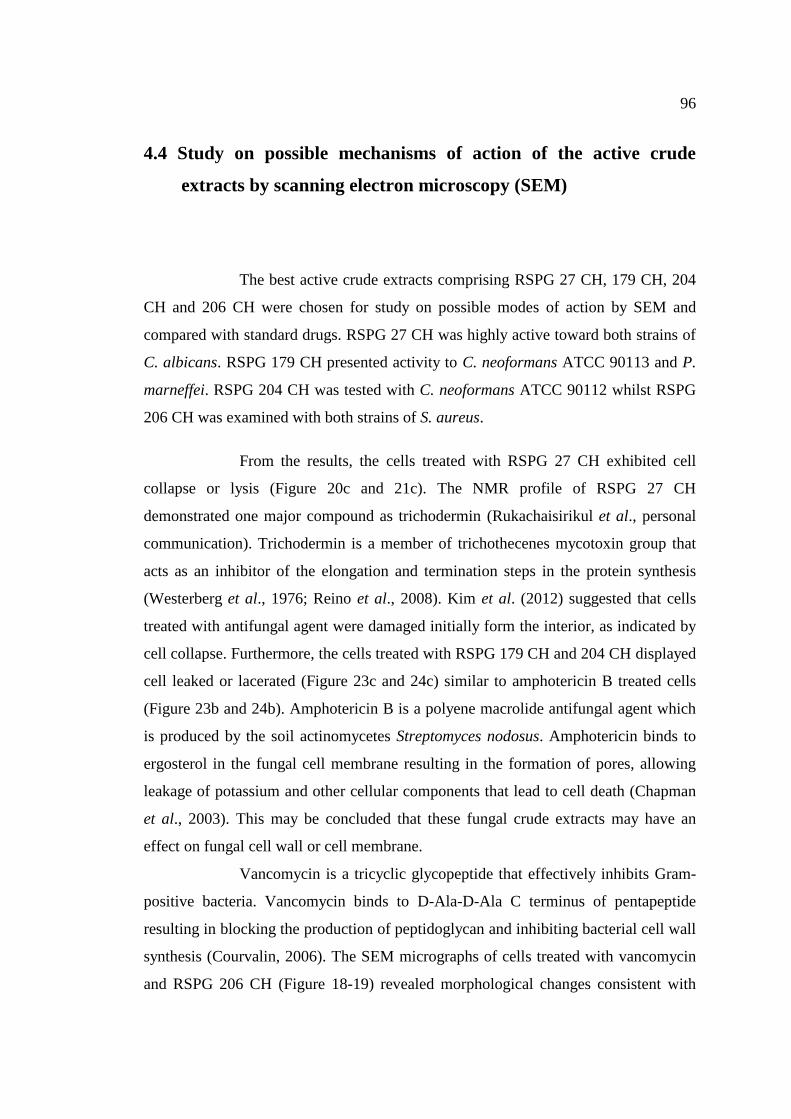
96
4.4 Study on possible mechanisms of action of the active crude
extracts by scanning electron microscopy (SEM)
The best active crude extracts comprising RSPG 27 CH, 179 CH, 204
CH and 206 CH were chosen for study on possible modes of action by SEM and
compared with standard drugs. RSPG 27 CH was highly active toward both strains of
C. albicans. RSPG 179 CH presented activity to C. neoformans ATCC 90113 and P.
marneffei. RSPG 204 CH was tested with C. neoformans ATCC 90112 whilst RSPG
206 CH was examined with both strains of S. aureus.
From the results, the cells treated with RSPG 27 CH exhibited cell
collapse or lysis (Figure 20c and 21c). The NMR profile of RSPG 27 CH
demonstrated one major compound as trichodermin (Rukachaisirikul et al., personal
communication). Trichodermin is a member of trichothecenes mycotoxin group that
acts as an inhibitor of the elongation and termination steps in the protein synthesis
(Westerberg et al., 1976; Reino et al., 2008). Kim et al. (2012) suggested that cells
treated with antifungal agent were damaged initially form the interior, as indicated by
cell collapse. Furthermore, the cells treated with RSPG 179 CH and 204 CH displayed
cell leaked or lacerated (Figure 23c and 24c) similar to amphotericin B treated cells
(Figure 23b and 24b). Amphotericin B is a polyene macrolide antifungal agent which
is produced by the soil actinomycetes Streptomyces nodosus. Amphotericin binds to
ergosterol in the fungal cell membrane resulting in the formation of pores, allowing
leakage of potassium and other cellular components that lead to cell death (Chapman
et al., 2003). This may be concluded that these fungal crude extracts may have an
effect on fungal cell wall or cell membrane.
Vancomycin is a tricyclic glycopeptide that effectively inhibits Gram-
positive bacteria. Vancomycin binds to D-Ala-D-Ala C terminus of pentapeptide
resulting in blocking the production of peptidoglycan and inhibiting bacterial cell wall
synthesis (Courvalin, 2006). The SEM micrographs of cells treated with vancomycin
and RSPG 206 CH (Figure 18-19) revealed morphological changes consistent with
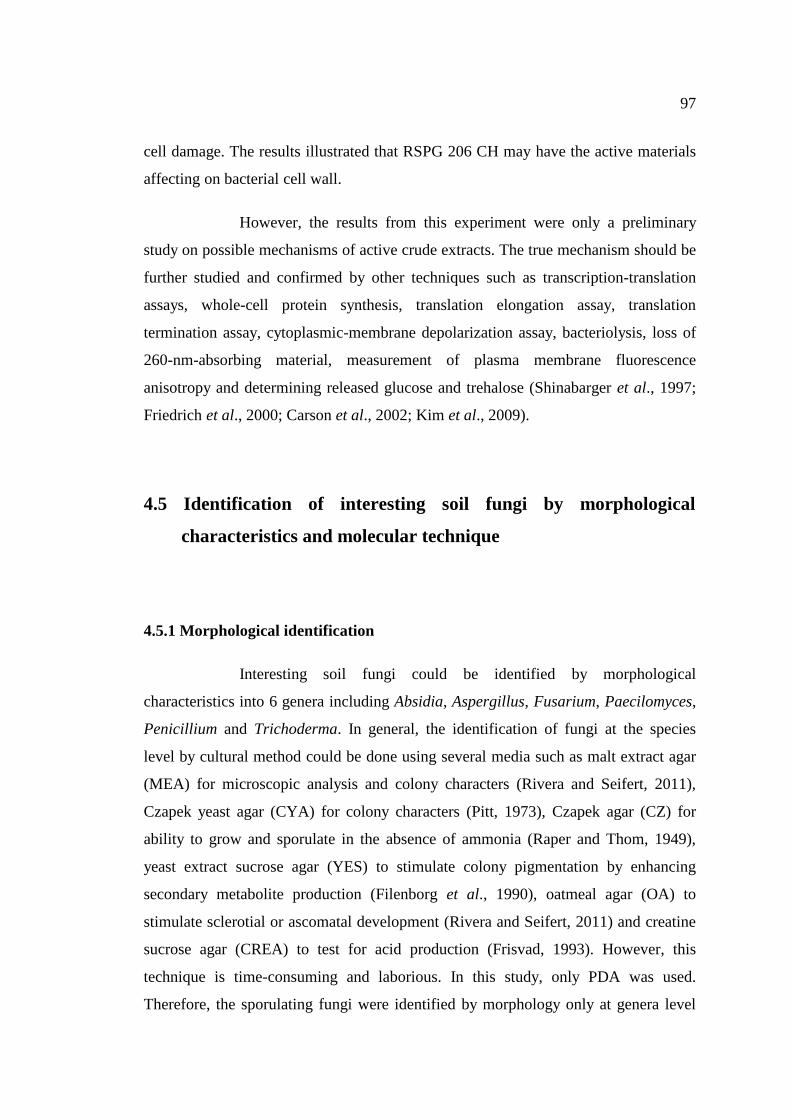
97
cell damage. The results illustrated that RSPG 206 CH may have the active materials
affecting on bacterial cell wall.
However, the results from this experiment were only a preliminary
study on possible mechanisms of active crude extracts. The true mechanism should be
further studied and confirmed by other techniques such as transcription-translation
assays, whole-cell protein synthesis, translation elongation assay, translation
termination assay, cytoplasmic-membrane depolarization assay, bacteriolysis, loss of
260-nm-absorbing material, measurement of plasma membrane fluorescence
anisotropy and determining released glucose and trehalose (Shinabarger et al., 1997;
Friedrich et al., 2000; Carson et al., 2002; Kim et al., 2009).
4.5 Identification of interesting soil fungi by morphological
characteristics and molecular technique
4.5.1 Morphological identification
Interesting soil fungi could be identified by morphological
characteristics into 6 genera including Absidia, Aspergillus, Fusarium, Paecilomyces,
Penicillium and Trichoderma. In general, the identification of fungi at the species
level by cultural method could be done using several media such as malt extract agar
(MEA) for microscopic analysis and colony characters (Rivera and Seifert, 2011),
Czapek yeast agar (CYA) for colony characters (Pitt, 1973), Czapek agar (CZ) for
ability to grow and sporulate in the absence of ammonia (Raper and Thom, 1949),
yeast extract sucrose agar (YES) to stimulate colony pigmentation by enhancing
secondary metabolite production (Filenborg et al., 1990), oatmeal agar (OA) to
stimulate sclerotial or ascomatal development (Rivera and Seifert, 2011) and creatine
sucrose agar (CREA) to test for acid production (Frisvad, 1993). However, this
technique is time-consuming and laborious. In this study, only PDA was used.
Therefore, the sporulating fungi were identified by morphology only at genera level
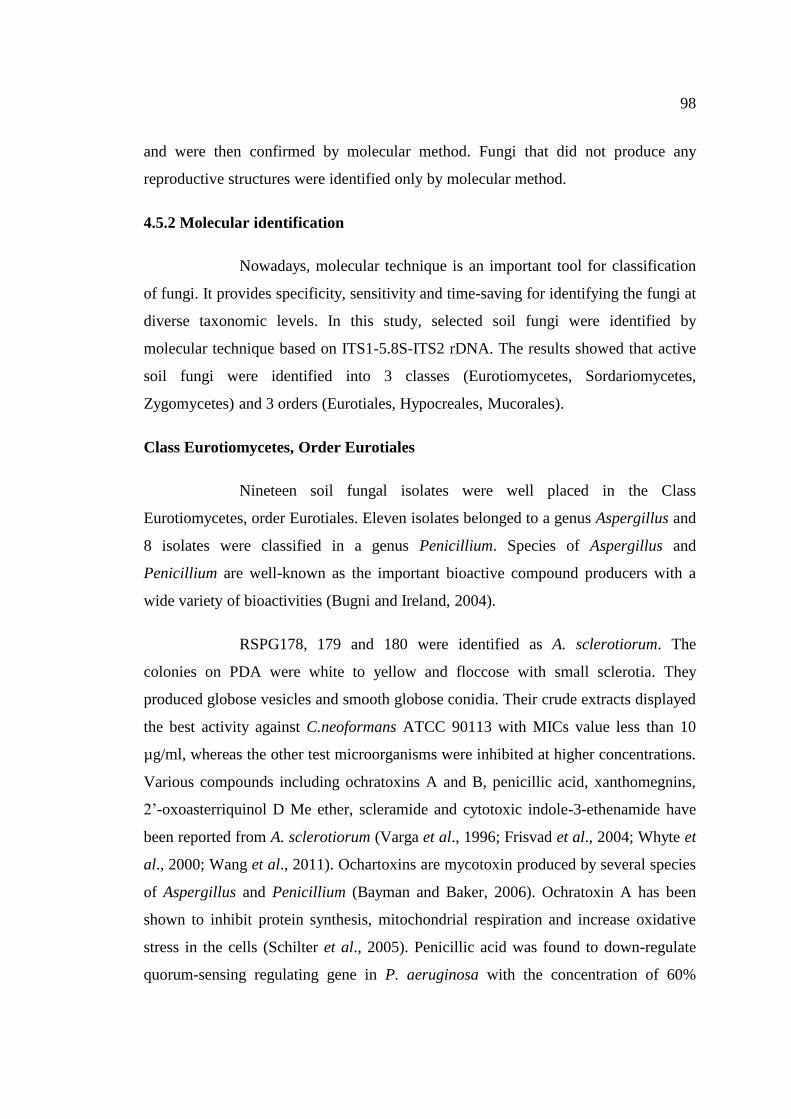
98
and were then confirmed by molecular method. Fungi that did not produce any
reproductive structures were identified only by molecular method.
4.5.2 Molecular identification
Nowadays, molecular technique is an important tool for classification
of fungi. It provides specificity, sensitivity and time-saving for identifying the fungi at
diverse taxonomic levels. In this study, selected soil fungi were identified by
molecular technique based on ITS1-5.8S-ITS2 rDNA. The results showed that active
soil fungi were identified into 3 classes (Eurotiomycetes, Sordariomycetes,
Zygomycetes) and 3 orders (Eurotiales, Hypocreales, Mucorales).
Class Eurotiomycetes, Order Eurotiales
Nineteen soil fungal isolates were well placed in the Class
Eurotiomycetes, order Eurotiales. Eleven isolates belonged to a genus Aspergillus and
8 isolates were classified in a genus Penicillium. Species of Aspergillus and
Penicillium are well-known as the important bioactive compound producers with a
wide variety of bioactivities (Bugni and Ireland, 2004).
RSPG178, 179 and 180 were identified as A. sclerotiorum. The
colonies on PDA were white to yellow and floccose with small sclerotia. They
produced globose vesicles and smooth globose conidia. Their crude extracts displayed
the best activity against C.neoformans ATCC 90113 with MICs value less than 10
µg/ml, whereas the other test microorganisms were inhibited at higher concentrations.
Various compounds including ochratoxins A and B, penicillic acid, xanthomegnins,
2’-oxoasterriquinol D Me ether, scleramide and cytotoxic indole-3-ethenamide have
been reported from A. sclerotiorum (Varga et al., 1996; Frisvad et al., 2004; Whyte et
al., 2000; Wang et al., 2011). Ochartoxins are mycotoxin produced by several species
of Aspergillus and Penicillium (Bayman and Baker, 2006). Ochratoxin A has been
shown to inhibit protein synthesis, mitochondrial respiration and increase oxidative
stress in the cells (Schilter et al., 2005). Penicillic acid was found to down-regulate
quorum-sensing regulating gene in P. aeruginosa with the concentration of 60%
99
(Liaqat et al., 2008). Xanthomegnin showed genotoxic activity and interrupted cell
respiration (Mori et al., 1984 and Kawai et al., 1976).
RSPG196 can be named as A. nomius. Most of related A. nomius
strains from the database were isolated from soil, silkworm excrement, arthropods and
subterranean termites (www.ncbi.nlm.nih.gov). The colony on PDA was white to
green, floccose and rapid growth. It presented globose to subglobose conidia and long
stipe. The broth ethyl acetate extract (BE) had mild activity to A. baumanii AB005.
The secondary metabolites of RSPG196 are being examined by Rukachaisirikul and
co-workers. Secondary metabolites produced by A. nomius including aflatoxin B and
G, n-butylhexadeconoate, 3-hydrobutylhexahydroxylpyrrolo- pyrazinedione and
cytotoxic antiinsectan aspernomine (Olsen et al., 2008; Staub et al., 1992;
Meenupriya and Thangaraj, 2012.). A. nomius exhibited a high variation of
morphology and hardly to discriminate from A. flavus (Zotti et al., 2011). Mycotic
keratitis, onychomycosis and pneumonia caused by A. nomius have been reported
(Manikandan et al., 2009; Zotti et al., 2011; Caira et al., 2012).
RSPG198 was identified as A. bombycis. The colony texture on PDA
was floccose, pale greenish-yellow in color and rapid growth. Its conidia were
globose with spinule. RSPG198 CH showed a broad range antimicrobial activity
against all test microorganisms (MICs value of 64-200 µg/ml) with interesting signal
of NMR profile (Rukachaisirikul et al., personal communication). A. bombysis
produced aflatoxin B and G in addition to kojic acid. Furthermore, this fungus can be
found in silkworm cultivation and may infect the wild silkmoth (Bombyx mandarina)
(Goto et al., 2003).
RSPG185 was referred to unidentified Aspergillus species based on
molecular identification. Most of related Aspergillus taxa from GenBank were
obtained from the marine habitat (www.ncbi.nlm.nih.gov). The colony of RSPG185
on PDA was yellow, white edge, rough and slow growth. The sequence alignment of
RSPG185 was distincted from other taxa in a subclade (Figure 36). The sequence
alignment of RSPG185 in position 3, 69 and 109 presented A, T and C, while other
taxa displayed G, C and A. Futhermore, in position 46, other taxa had the nucleotide
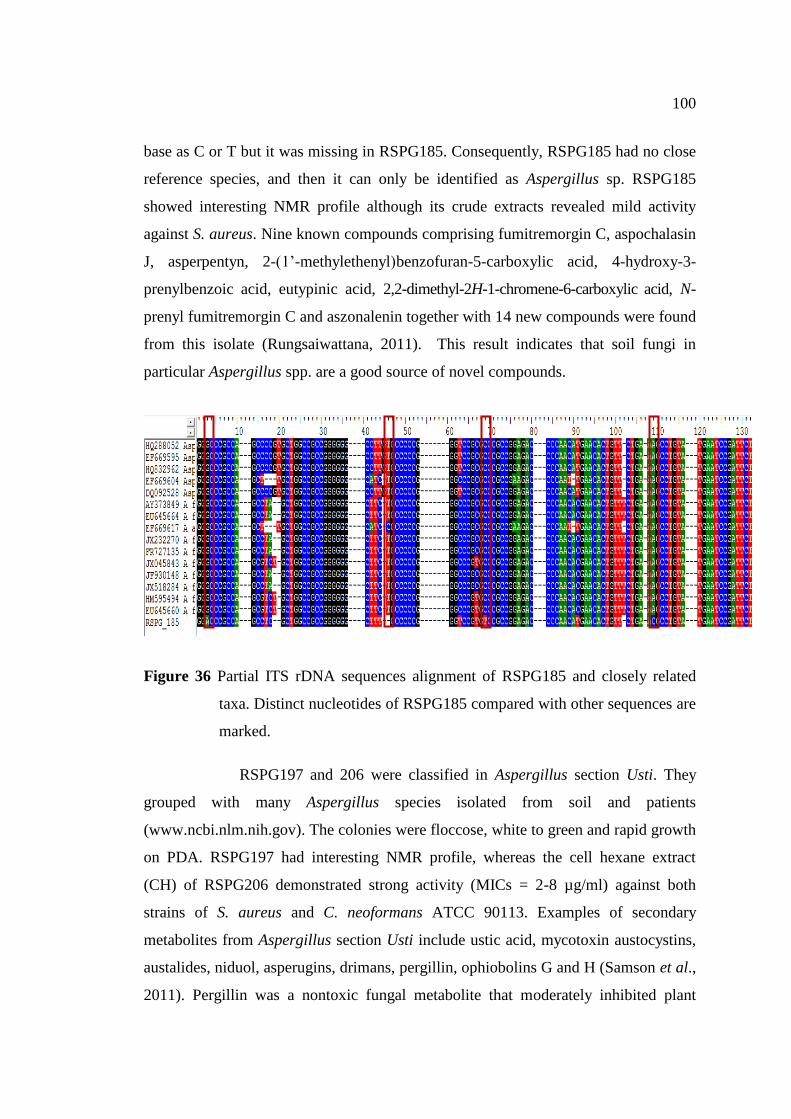
100
base as C or T but it was missing in RSPG185. Consequently, RSPG185 had no close
reference species, and then it can only be identified as Aspergillus sp. RSPG185
showed interesting NMR profile although its crude extracts revealed mild activity
against S. aureus. Nine known compounds comprising fumitremorgin C, aspochalasin
J, asperpentyn, 2-(1’-methylethenyl)benzofuran-5-carboxylic acid, 4-hydroxy-3-
prenylbenzoic acid, eutypinic acid, 2,2-dimethyl-2H-1-chromene-6-carboxylic acid, N-
prenyl fumitremorgin C and aszonalenin together with 14 new compounds were found
from this isolate (Rungsaiwattana, 2011). This result indicates that soil fungi in
particular Aspergillus spp. are a good source of novel compounds.
Figure 36 Partial ITS rDNA sequences alignment of RSPG185 and closely related
taxa. Distinct nucleotides of RSPG185 compared with other sequences are
marked.
RSPG197 and 206 were classified in Aspergillus section Usti. They
grouped with many Aspergillus species isolated from soil and patients
(www.ncbi.nlm.nih.gov). The colonies were floccose, white to green and rapid growth
on PDA. RSPG197 had interesting NMR profile, whereas the cell hexane extract
(CH) of RSPG206 demonstrated strong activity (MICs = 2-8 µg/ml) against both
strains of S. aureus and C. neoformans ATCC 90113. Examples of secondary
metabolites from Aspergillus section Usti include ustic acid, mycotoxin austocystins,
austalides, niduol, asperugins, drimans, pergillin, ophiobolins G and H (Samson et al.,
2011). Pergillin was a nontoxic fungal metabolite that moderately inhibited plant
101
growth (Cutler et al., 1980). Ophiobolins G and H inhibited the growth of B. subtilis
and ophiobolin H also induced hyperacusia in day-old chicks (Cutler et al., 1984).
RSPG 199, 202 and 204 can be named as A. unguis. Most of related A.
unguis strains from GenBank were reported from marine habitat, soil, patients and
PlaoYai (Croton oblongifolius) (www.ncbi.nlm.nih.gov). The colonies on PDA were
deep green, white margin, powdery, floccose hyphae at the center and moderate
growth. The microscopic features were short stipe and green conidia. RSPG199CE,
199CH, 202CE and 204CH displayed strong activity against both strains of S. aureus
and C. neoformans with MICs value of 4-8 µg/ml. Moreover, their crude extracts
inhibited A. baumannii AB007, C. albicans, M. gypseum and P. marneffei with MICs
value of 16-200 µg/ml. RSPG199 showed interesting NMR profile (Rukachaisirikul et
al., personal communication). Several secondary metabolites consist of phospholipase
A2 inhibitor folipastatin, antibacterial depside guisnol, 2-chlorounguinol, emeguisins
A C, 3-ethyl-5,7-dihydroxy-3,6-dimethylphthalide, nornidin, antibacterial depsidone
nidulin, unguinol, haiderin, rubinin, shirin and narsin were previously described from
A. unguis (Kamal et al., 1970; Turner and Aldridge, 1983; Kawahara et al., 1988a;
Kawahara et al., 1988b; Hamano et al., 1992; Nielsen et al., 1999).
RSPG95 and 162 had affiliation with P. citrinum. They grouped with
various P. citrinum strains found from gorgonian sea fans, germinated Aquilaria
crassna seed, agricultural soil, insect, oil palm, wood, orchid (Cymbidium insigne)
and liquor brewing environment (www.ncbi.nlm.nih.gov). The fungal colonies were
gray-green, velvety, moderate growth and cream to pale yellow in reverse on PDA.
The microscopic morphology showed 1 or 2-stage branched and green globose
conidia. The fungal crude extracts displayed antibacterial (Gram-positive bacteria)
and antifungal (C. neoformans) activity with MICs value of 4-200 µg/ml.
Hydroxyisovaleramide was the major compound reported from RSPG162
(Rukachaisirikul et al., personal communication) while the compounds from RSPG95
are being examined. There are many reports on secondary metabolites from P.
citrinum such as 5 new polyketides including coniochaetones C and D, (3R,4S)-6,8-
dihydroxy-1,1-dimethyl-3,4,5-trimethylisochroman, penicillanthranins A and B along
with 13 known compounds from sea fan-derived fungus P. citrinum (Khamthong et
102
al., 2012). Mazumder, et al. (2002) extracted mycotoxin citrinin from P. citrinum,
which was active against both Gram-positive and Gram-negative bacteria.
RSPG138 could be referred to P. copticola. The colony on PDA was
white to gray-green in the front, corrugated, moderate growth and white in reverse.
The crude extracts of RSPG138 were active against S. aureus, C. albicans ATCC
90028, both strains of C. neoformans and P. marneffeii with weak activity (128-200
µg/ml). Sporogen AO-1, petasol, 6-dehydropetasol, 7-hydroxypetasol, JBIR-27, (+)
phomenone and new compounds were reported from RSPG138 (Deangrot, personal
communication). Sporogen AO-1 represented antifunagal, anti-HIV and cytotoxic
activity (Kang et al., 2003; Jayasuriya et al., 2005; Yurchenko et al., 2013). (+)
Phomenone showed antimalarial activity with EC50 equal to 0.32 µg/ml (Kaur et al.,
2009).
RSPG99 was identified as Penicillium sp. Most of related Penicillium
species from GenBank were found mainly from Zijin mountain, China
(www.ncbi.nlm.nih.gov). The colony on PDA was white, velvety, moderate growth
and produced diffusible yellow pigment into the medium. The sequence alignment of
RSPG99 presented 37 nucleotide deletions and 20 bases that were different from other
taxa in a subclade (Figure 37). Thus, it had a long branch length and did not group
with any known species. RSPG99 crude extracts showed mild activity against Gram-
positive bacteria and C. neoformans ATCC 90113. Questinol, dihydrogeodin, 2-(3-
chloro-4-methyl--resorcyloyl)-5-hydroxy-m-anisic acid methyl ester, sulochrin,
methyl asterrate, asterric acid, asperpentyn, emodin, coniochaetone B, GKK1032B,
methyl dichloroasterrate, methyl 8-hydroxy-6-methyl-9-oxo-9H-xanthene-1-carboxylate
and 3 novel compounds were isolated from RSPG99 (Rukachaisirikul et al., personal
communication).
RSPG82 was referred to P. sclerotiorum. It grouped with several P.
sclerotiorum isolates found from soil and Japanese bamboo (Polygonum cuspidatum)
(www.ncbi.nlm.nih.gov). The colony on PDA was white, moderate growth and
orange in reverse. The broth ethyl acetate extract of RSPG82 displayed interesting
NMR profile (Rukachaisirikul et al., personal communication) with weak antifungal
activity against C. neoformans ATCC 90113 and M. gypseum. Sclerotiorin was a
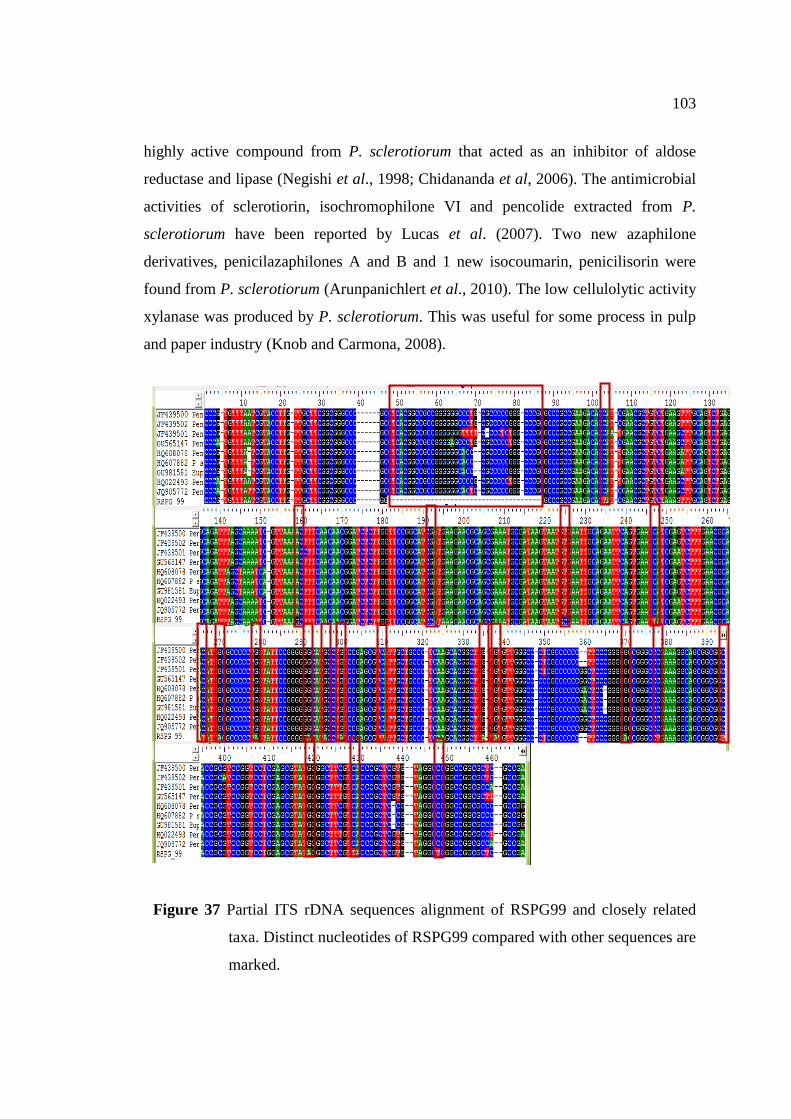
103
highly active compound from P. sclerotiorum that acted as an inhibitor of aldose
reductase and lipase (Negishi et al., 1998; Chidananda et al, 2006). The antimicrobial
activities of sclerotiorin, isochromophilone VI and pencolide extracted from P.
sclerotiorum have been reported by Lucas et al. (2007). Two new azaphilone
derivatives, penicilazaphilones A and B and 1 new isocoumarin, penicilisorin were
found from P. sclerotiorum (Arunpanichlert et al., 2010). The low cellulolytic activity
xylanase was produced by P. sclerotiorum. This was useful for some process in pulp
and paper industry (Knob and Carmona, 2008).
Figure 37 Partial ITS rDNA sequences alignment of RSPG99 and closely related
taxa. Distinct nucleotides of RSPG99 compared with other sequences are
marked.
104
RSPG93 had affiliation with P. herquei. The closest relatives of
RSPG93 were reported from pearl oyster (Pinctada martensii)
(www.ncbi.nlm.nih.gov). The colony was deep green, velvety and moderate growth.
It produced yellow-brown soluble pigment in PDA. The microscopic morphology
showed 2-stage branched conidiophores, smooth conidia and spiny stipe. The
compounds produced by RSPG93 were investigated by Rukachaisirikul et al. (data
not shown). RSPG93 crude extracts presented activity against Gram-positive
bacteria, C. neoformans and filamentous fungi with MICs value of 32-200 µg/ml.
According to Omura and co-workers (1979), an alkaloid named herquline has been
found from P. herquei. Herquline weakly inhibited blood platelet aggregation
induced by adenosine diphosphate, however the antimicrobial activity has not been
reported. The RSPG93 broth ethyl acetate extract (BE) displayed very good
antioxidant activity to superoxide anion with IC50 equal to 0.45 mg/ml (Hutadilok-
Towattana et al., personal communication). Morimoto et al. (1987) had pointed out
that an antioxidative compound, herqueinone derivative PHR was isolated from P.
herquei and had synergistic effect on tocopherol.
RSPG161 can be named as P. pimiteouiense. The closest relatives of
this isolate were reported from Thai medicinal plants and vineyard ecosystem
(www.ncbi.nlm.nih.gov). The colony on PDA was velvety, white to green with
exudate production. The reverse of colony was white. The microscopic features were
short stipe and rough conidia. RSPG161 crude extracts displayed anti-S. aureus (2
strains) and anti-yeast activity with MICs value of 32-200 µg/ml. Its NMR profile
showed interesting signal (Rukachaisirikul et al., personal communication). Peterson
et al. (1999) isolated P. pimiteouiense from polycystic kidney cell cultures but
ocharatoxin A, a cause of nephritis was not detected. The antimicrobial activity from
P. pimiteouiense has not been reported before.
RSPG105 was classified as P. aculeatum. The colonies grown on PDA
were deep green, white edge, powdery and white with brown in reverse. The
microscopic morphology presented 3-stage branched and smooth conidia. The
compounds produced by RSPG105 are under investigation. Its crude extracts
presented activity against Gram-positive bacteria, C. albicans ATCC 90028 and C.
105
neoformans with MICs value of 8-128 µg/ml. Okuda and co-workers (1984) found
the antibiotic penitricin from P. aculeatum. High amount of dextranase were
produced by this fungus (Prabhu, 1984). In addition, dextranase from P. aculaetum
could be used in co-immobilizates for the direct conversion of sucrose into isomalto-
oligosaccharides (Erhardt et al., 2008).
Class Sordariomycetes, Order Hypocreales
RSPG24, 27 and 28 were well placed in the genera
Hypocrea/Trichoderma reported from the GenBank database. Colonies of RSPG24,
27 and 28 were wooly and rapid growth on PDA. The colors of colonies were white
from the front and reverse except RSPG24, the reverse was yellow. The colonies
became patches green when they produced conidia. The microscopic morphology was
septate hyaline hyphae, branched conidiophores, flask-shaped phialides and green
conidia. Trichoderma species are widely distributed in all types of soil (Reino et al.,
2008). They were used as enzyme producer and biocontrol agent (Nielsen et al.,
2005). Several secondary metabolites from Trichoderma spp. have been reported
comprising anthraquinones, daucanes, simple pyrones, koninginins,
trichodermamides, viridians, viridiofungins, nitrogen heterocyclic compounds,
azaphilones, trichothecenes, bisorbicillinoids, statins, trichodenones and
cyclopentenone derivatives etc. (Reino et al., 2008).
RSPG24 was identified as T. reesei. Most of related
Hypocrea/Trichoderma species from the database were industrial and standard
(ATCC) strains (www.ncbi.nlm.nih.gov). The crude extracts of RSPG24 were active
against S. aureus, MRSA, C. albicans NCPF 3153, C. neoformans ATCC 90113 and
M. gypseum with moderate to weak activity (MIC16-200 µg/ml). The BE extract of
RSPG24 had good antioxidant activity against hydroxyl anion with IC50 value of 1.22
mg/ml (Hutadilok-Towattana et al., personal communication). RSPG24 produced
sorbicillin derivatives (3′-hydroxysorbicillin, 2’,3’-dihydrosorbicillin and sorbicillin),
phenol derivative (tyrosol) and trichoacorenol (Rungsaiwattana, 2011). Anti-C.
albicans and anti-A. fumigatus activity of 2’,3’-dihydrosorbicillin and sorbicillin have
106
been reported by Zhao et al. (2012). Tyrosol is an antioxidant that can protect cells
from oxidative damage (Giovannini et al., 1999).
RSPG27 was identified as T. brevicompactum. Most of related species
from GenBank were found mainly from banana roots (www.ncbi.nlm.nih.gov). Its
crude extracts were active against S. aureus, both strains of C. albicans and both
strains of C. neoformans with MICs value of 2-8 µg/ml. The growths of MRSA, M.
gymseum and P. marneffei were suppressed by RSPG27 crude extracts with MICs
value of 16-200 µg/ml. The main compound from RSPG27 was trichodermin
(Rukachaisirikul et al., personal communication), which had been reported to inhibit
elongation and termination step in protein synthesis (Westerberg et al., 1976).
Moreover, trichodermin had highly cytotoxic activity against human solid tumor cell
lines (Choi et al., 1996).
RSPG28 can be referred to T. harzianum. The crude extracts from
RSPG28 could inhibit both strains of S. aureus and C. neoformans with MICs value
of 2-128 µg/ml. Chromone derivative (5-hydroxy-3-hydroxymethyl-2-methyl-7-
methoxychromone), isocoumarin derivative (diaportinol) and epoxy--lactone
derivative (nafuredin) were isolated from RSPG28 (Satpradit, 2011). Liu et al. (2012)
extracted 5-hydroxy-3-hydroxymethyl-2-methyl-7-methoxychromone from marine-
derived fungus Hypocrea virens but its antimicrobial activity was not reported.
Nafuredin is a helminth-specific inhibitor of electron-transport enzyme, complex I,
which exhibits anthelmintic activity against nematode in sheep and pig (Shiomi et al.,
2001; Omura and Shiomi, 2007).
RSPG50, 52 and 58 were identified as P. lilacinus. Most of related
species from GenBank were reported from tropical Pacific Ocean, show cave,
metallic surface in a hydro-electric power station and patients
(www.ncbi.nlm.nih.gov). The colonies of these three isolates were velvety, initially
white and become violet. The reverse was white and brown. The microscopic features
were hyaline septate hyphae, taper phialides and form long chain of oval conidia.
Their crude extracts showed activities against 10 strains of tested microorganisms,
except for E. coli and P. aeruginosa, with MICs value in range of 4-200 µg/ml. P.
107
lilacinus was frequently isolated from terrestrial and marine environments as well as
from nematode eggs (Elbandy et al., 2009). It can cause severe mycoses in
immunocompromised patients and immunocompetent hosts (Carey et al., 2003;
Pastor and Guarro, 2006). The clinical strains have been named Purpureocillium
lilacinum (Luangsa-ard et al., 2011) while the environmental strains are identified as
P. lilacinus. Leucinostatin A, P168, kojic acid, phomaligol A and methylphomaligol
A have been reported from P. lilacinus. Leucinostatin A showed antitumor and
antimicrobial activities against Gram-positive bacteria and fungi (Mori et al., 1982).
P168 exhibited activity against filamentous fungi, yeasts and bacteria (Isogai et al.,
1981). Kojic acid, phomalogol A and methylphomaligol A had cytotoxic activity
against several human solid tumor cell lines (Elbandy et al., 2009).
RSPG88 was identified as M. roridum based on ITS rDNA sequence
analysis. It grouped with various species reported from GenBank database found from
cotton, melon, soybean, water hyacinth, Salvia spp. and Hemionitis arifolia
(www.ncbi.nlm.nih.gov). The colony of RSPG88 was flossy and white to pale yellow.
RSPG88 crude extracts showed activity against S. aureus, A. baumannii and yeasts
with the MIC values of 64-200 µg/ml. Isoepiepoformin was the major compound
isolated from RSPG88 (Rukachaisirikul et al., personal communication). M. roridum
is a soil fungus found worldwide (Fish et al., 2012). It has been reported as an
endophyte and plant pathogen (Worapong et al., 2009). M. roridum is able to produce
cellulase and xylanase enzymes in submerged cultures (Okunowo et al., 2010).
RSPG37, 63, 227, 229, 230 and 231 were classified as F. solani. The
closest relatives of our soil fungi were reported from mulberry, lettuce and cilantro
roots (www.ncbi.nlm.nih.gov). Colonies of the isolated fungal strains were white, pale
orange or pale yellow. Macroconidia had 3-5 septa, slightly curved and stout.
Microconidia were large and had 1-2 septa. Their crude extracts displayed active
activity against Gram-positive bacteria, yeasts and filamentous fungi with MIC values
of 2-200 µg/ml. Fusarpyrones A and B, two new pyrone derivatives, were isolated
from the soil fungus F. solani PSU-RSPG37 together with eight known compounds,
anhydrofusarubin, fusarubin, 5-hydroxy-8-methoxy-2,4-dimethylnaphtha[1,2,b]furan
-6,9-dione, 2,3-dihydro-5-hydroxy-8-methoxy-2,4-dimethyl naphtho[1,2,b]furan-6,9-
108
dione, javanicin, fusalanipyrone, p-hydroxyacetophenone, and tyrosol. Anhydro-
fusarubin, fusarubin, 5-hydroxy-8-methoxy-2,4-dimethyl naphtho[1,2,b]furan-6,9-
dione and javanicin displayed cytotoxic acivity to KB, MCF-7, NCH-137 and vero
cell line (Trisuwan et al., 2013).
Naphthoquinone derivatives (javanicin, 2,3-dihydro-5-hydroxy-8-
methoxy-2,4-dimethylnaphtho[1,2-b]furan-6,9-dione, and solaniol) and tyrosol were
isolated from RSPG229 (Rukachaisirikul et al., personal communication). Moreover,
RSPG227 also produced naphthoquinone derivative (javanicin) and phenol
derivatives (tyrosol, 4-hydroxyphenylacetic acid, monaspilosin and aspergillol B)
(Rukachaisirikul et al., personal communication). Kornsakulkarn et al. (2011) isolated
javanicin from an endophytic fungus Fusarium sp. that presented anti-C. albicans
activity with IC50 of 6.16 mg/ml. Salaniol was the member of trichothecenes
mycotoxin group which was produced by F. solani (Ishii et al., 1971).
Class Zygomycetes, Order Mucorales
RSPG214 was classified in the order Mucorales, Class Zygomycetes.
This fungus was shown to grow rapidly on PDA. The colony was cottony, gray in
color and had no pigment production. The microscopic morphology was shown to be
non-septate hyphae and sporangiospores produced in sporangium. Its ITS rDNA
sequence analysis of RSPG214 revealed that it grouped with several species of
Absidia but had no affinity with any known species. The alignment of this group
showed highly nucleotide variation between taxa (Figure 38) therefore RSPG214 can
only be referred to Absidia sp. The CH extract of RSPG214 had strong activity
against C. neoformans ATCC 90113 with MIC value of 4 µg/ml. A genus Absidia is
usually found as saprobe in soil and decaying organic matters (Ho et al., 2004;
Antoniadou, 2009). Moreover, it can be found to be human pathogen such as Absidia
corymbifera that caused zygomycosis in immunocompromised patients (Ribes et al.,
2000). Absidia spp. were applied in microbial biotransformation and enzyme
production. Villemain et al. (2006) used Absidia fusca to degrade two polycyclic
aromatic hydrocarbons (PAHs): anthracene and fluoranthene. Chen et al. (2012) used
A. corymbifera to transform 20(S)-protopanaxatriol and obtained novel compounds
109
which showed cytotoxic activity to human prostate tumor cell lines. A. corymbifera
DY-9 was isolated from soil in Korea and used as extracellular chitin deacetylase
producer which may be applied into the industrial production of chitosan and chitosan
oligomers (Zhao et al., 2010). Furthermore, Absidia coerulea was used to produce
hydrocortisone (anti-inflammatory drug) in moderate pressure bioconversion system
(Jia and Cui, 2009). Although there were many researches of Absidia sp. on
biotechnological aspects, however their antimicrobial metabolite applications have
not been reported.
Morphological identification was identified selected soil fungi into
only genus level whereas molecular technique could be identified fungi into genus
and species level. RSPG88 was classified as unidentified fungi by morphology
because it did not produced any reproductive structures but it can be named as
Myrothecium roridum via molecular data. In contrast, RSPG157 was not successfully
amplified in PCR reaction thus it was identified as Penicillium sp. by morphology.
Pallen et al. (1992) suggested that PCR failure may be result from defective PCR
reagents, mistakes in setting up the PCR, or presenting of inhibitory substances in the
sample.
In conclusion, the selected strains of soil fungi from this study were
identified based on morphology and molecular data into 7 genera, 16 species and 1
section (Table 17). Most of them were usually found from all kinds of environments.
Occasionally, they cause diseases to human, plant and animal. Their crude extracts
showed antimicrobial activities against several strains of test microorganisms,
especially Gram-positive bacteria and yeast C. neoformans. Additionally, our
interesting soil fungi produced a wide range of secondary metabolites both new and
known compounds that may be used in future application.
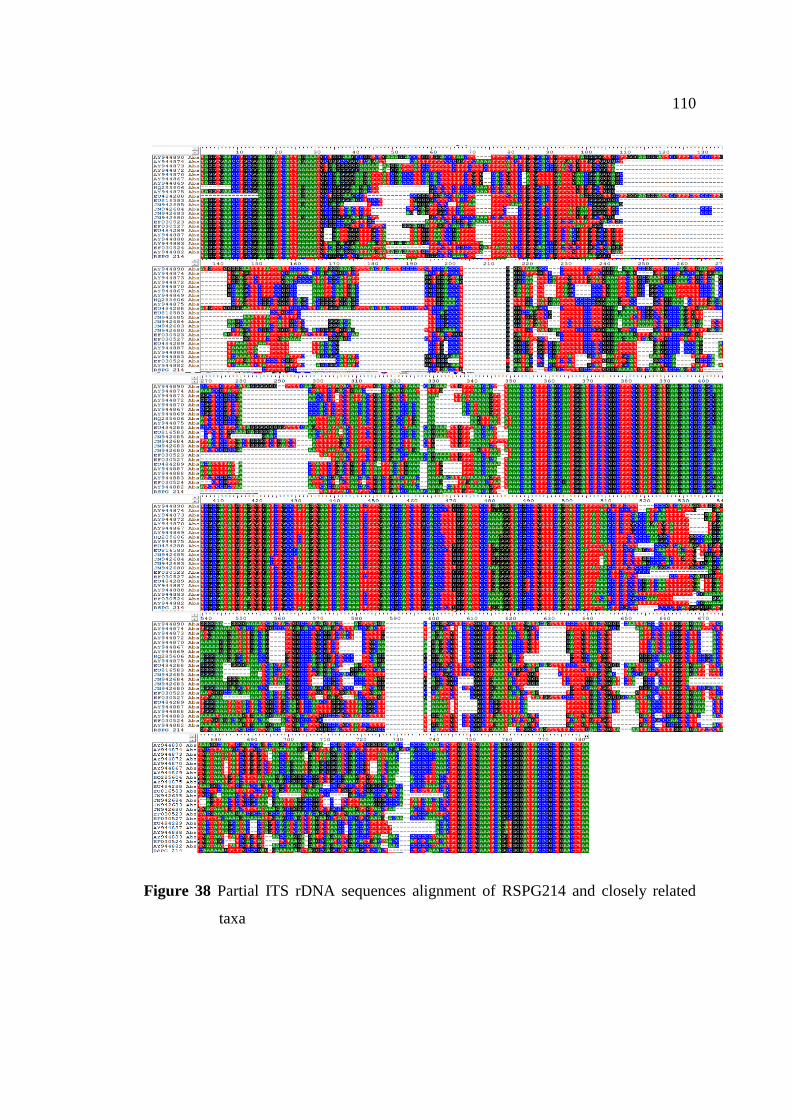
110
Figure 38 Partial ITS rDNA sequences alignment of RSPG214 and closely related
taxa
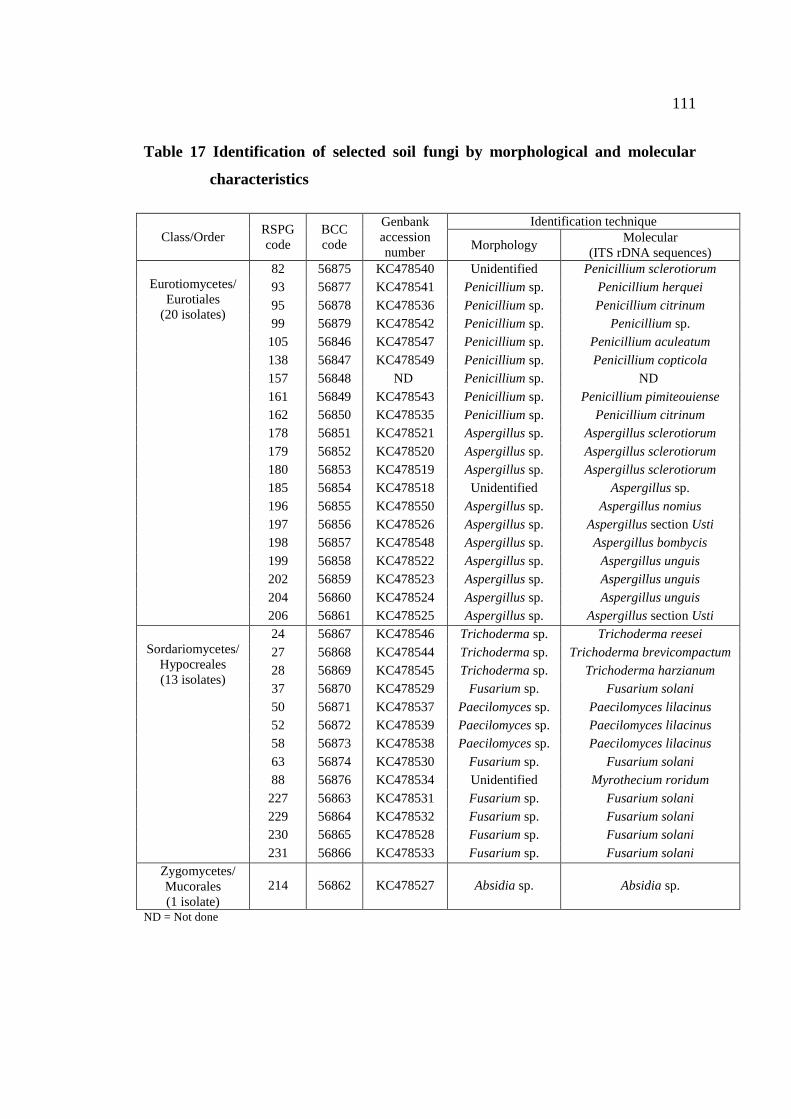
111
Table 17 Identification of selected soil fungi by morphological and molecular
characteristics
Class/Order RSPG
code
BCC
code
Genbank
accession
number
Identification technique
Morphology Molecular
(ITS rDNA sequences)
Eurotiomycetes/
Eurotiales
(20 isolates)
82 56875 KC478540 Unidentified Penicillium sclerotiorum
93 56877 KC478541 Penicillium sp. Penicillium herquei
95 56878 KC478536 Penicillium sp. Penicillium citrinum
99 56879 KC478542 Penicillium sp. Penicillium sp.
105 56846 KC478547 Penicillium sp. Penicillium aculeatum
138 56847 KC478549 Penicillium sp. Penicillium copticola
157 56848 ND Penicillium sp. ND
161 56849 KC478543 Penicillium sp. Penicillium pimiteouiense
162 56850 KC478535 Penicillium sp. Penicillium citrinum
178 56851 KC478521 Aspergillus sp. Aspergillus sclerotiorum
179 56852 KC478520 Aspergillus sp. Aspergillus sclerotiorum
180 56853 KC478519 Aspergillus sp. Aspergillus sclerotiorum
185 56854 KC478518 Unidentified Aspergillus sp.
196 56855 KC478550 Aspergillus sp. Aspergillus nomius
197 56856 KC478526 Aspergillus sp. Aspergillus section Usti
198 56857 KC478548 Aspergillus sp. Aspergillus bombycis
199 56858 KC478522 Aspergillus sp. Aspergillus unguis
202 56859 KC478523 Aspergillus sp. Aspergillus unguis
204 56860 KC478524 Aspergillus sp. Aspergillus unguis
206 56861 KC478525 Aspergillus sp. Aspergillus section Usti
Sordariomycetes/
Hypocreales
(13 isolates)
24 56867 KC478546 Trichoderma sp. Trichoderma reesei
27 56868 KC478544 Trichoderma sp. Trichoderma brevicompactum
28 56869 KC478545 Trichoderma sp. Trichoderma harzianum
37 56870 KC478529 Fusarium sp. Fusarium solani
50 56871 KC478537 Paecilomyces sp. Paecilomyces lilacinus
52 56872 KC478539 Paecilomyces sp. Paecilomyces lilacinus
58 56873 KC478538 Paecilomyces sp. Paecilomyces lilacinus
63 56874 KC478530 Fusarium sp. Fusarium solani
88 56876 KC478534 Unidentified Myrothecium roridum
227 56863 KC478531 Fusarium sp. Fusarium solani
229 56864 KC478532 Fusarium sp. Fusarium solani
230 56865 KC478528 Fusarium sp. Fusarium solani
231 56866 KC478533 Fusarium sp. Fusarium solani
Zygomycetes/
Mucorales
(1 isolate)
214 56862 KC478527 Absidia sp. Absidia sp.
ND = Not done
112
CHAPTER 5
CONCLUSIONS
A total of 629 isolates of soil fungi were isolated from 100 soil
samples collected from Plant Genetic Conservation Project area (RSPG) at
Rajjaprabha dam, Suratthani province in January, April, June and August, 2010. The
fungal density of soil samples were in the range of 4.2x10⁴-1.1x10
6 CFU/g. The
highest fungal density was found in August whereas the lowest was in April.
Three hundred and ninety-eight out of 629 isolates (63.26%) were
classified into 27 genera by their morphology with Penicillium was the most abundant
group (21.94%) followed by Aspergillus (18.60%), Trichoderma (4.77%),
Gongronella (3.66%), Fusarium and Mucor (2.07%), Cunninghamella (1.91%) and
other genera (0.16-1.59%).
Selected soil fungi (181 isolates) were cultivated in PDB for 3 weeks at
25°C and extracted via ethyl acetate or hexane to obtain broth ethyl acetate extracts
(BE), cell ethyl acetate extracts (CE) and cell hexane extracts (CH) from each isolate.
Fungal crude extracts were evaluated for their antimicrobial activity against 12 human
pathogens. The results showed that 311 crude extracts (57.27%) from 145 selected
isolates (80.11%) exhibited activity toward at least one test strain. Fungal crude
extracts showed the most activity against S. aureus ATCC 25923 followed by C.
neoformans ATCC 90113, MRSA SK-1, C. neoformans ATCC 90112, C. albicans
ATCC 90028, C. albicans NCPF 3153, P. marneffei clinical isolate, M. gypseum SH-
MU4, A. baumannii AB007, A. baumannii AB005, E. coli ATCC 25922 and P.
aeruginosa ATCC 27853. The MIC/MBC or MFC values were varied in range of 1-
200/2->200 µg/ml.
113
Strongly active crude extracts including RSPG27CH, 179CH, 204CH
and 206CH were further studied on the possible mode of action by SEM. The treated
cells showed pronounced morphological changes consistent with cell damage when
compared to untreated cells. The results illustrated that these fungal crude extracts
cause deformation of the test microorganisms. In RSPG27CH, trichodermin was a
major component and was known to act on fungal protein synthesis.
The identification of 34 isolates of interesting soil fungi was confirmed
by molecular technique based on ITS1-5.8S-ITS2 rDNA. They could be classified as
Absidia sp. (RSPG214), Aspergillus sp. (RSPG185), A. bombycis (RSPG198), A.
sclerotiorum (RSPG178, 179, 180), Aspergillus section Usti (RSPG197, 206), A.
unguis (RSPG199, 202, 204), F. solani (RSPG37, 63, 227, 229, 230, 231), M.
roridum (RSPG88), Paecilomyces lilacinus (RSPG50, 52, 58), Penicillium sp.
(RSPG99), P. aculeatum (RSPG105), P.citrinum (RSPG95, 162), P. copticola
(RSPG138), P. herquei (RSPG93), P. pimiteouiense (RSPG161), P. sclerotiorum
(RSPG82), T. brevicompactum (RSPG27), T. harzianum (RSPG28) and T. reesei
(RSPG24). The results form this study provided that soil fungi isolated from
Rajjaprabha dam are a good source for antimicrobial agents.
114
REFERENCES
Abbas, H. K., Mirocha, C. J. and Shier, W. T. 1984. Mycotoxin produced from fungi
isolated from foodstuffs and soil: comparison of toxicity in fibroblasts and rat
feeding tests. Applied and Environment Microbiology. 48: 654.
Ali, A., Haider, M. S., Khokhar, I., Bashir, U., Mushtaq, S. and Mukhtar, I. 2011.
Antibacterial activity of culture extracts of Penicillium species against soil-
borne bacteria. Mycopathologia. 9: 17-20.
Antoniadou, A. 2009. Outbreaks of zygomycosis in hospitals. Clinical Microbiology
and Infection. 15: 55-59.
Arora, D. S. and Chandra, P. 2010. Assay of antioxidant potential of two Aspergillus
isolates by different methods under various physio-chemical condition.
Brazilian Journal of Microbiology. 41: 765-777.
Arora, D. S. and Chandra, P. 2011a. Antioxidant activity of Aspergillus fumigatus.
International Scholarly Research Network Pharmacology. 2011: 1-11.
Arora, D. S. and Chandra, P. 2011b. In vitro antioxidant potential of some soil fungi:
screening of functional compounds and their purification from Penicillium
citrinum. Applied Biochemistry and Biotechnology. 165: 639-651.
Arunpanichlert, J., Rukachaisirikul, V., Sukpondma, Y., Phongpaichit, S., Tewtrakul,
S., Rungjindamai, N. and Sakayaroj, J. 2010. Azaphilone and isocoumarin
derivatives from the endophytic fungus Penicillium sclerotiorum PSU-A13.
Chemical and Pharmaceutical Bulletin. 58: 1033-1036.
Barnett, H.L. and Hunter, B.B. 1998. Illustrated genera of imperfect fungi. Prentice-
Hall, Inc.: USA.
Bayman, P. and Baker, J. L. 2006. Ochratoxins: A global perspective.
Mycopathologia. 162: 215-223.
115
Boonleang, S. 1999. Genetic diversity of cellulolytic microfungi in Forest-Reviving
as the Royal Suggestions and Plant Germplasm Forest Project in Nakhon
Ratchasima province. Master of Science Thesis, Chulalongkorn University,
Bangkok, Thailand.
Brinkman, F. S. L. and Leipe, D. D. 2001. Phylogenetic analysis. In: Bioinformatics:
A practice guide to the analysis of genes and proteins. 2nd
Ed. Baxevanis, A.
D. and Ouellette, B. F., Eds. John Wiley & Sons, Inc.: New Jersey.
Brun, T. D., Fogel, R. and Taylor, J. W. 1990. Amplification and sequencing of DNA
from fungal herbarium specimens. Mycologia. 82: 175-184.
Buatong, J., Phongpaichit, S., Rukachaisirikul, V. and Sakayaroj, J. 2011.
Antimicrobial activity of crude extracts from mangrove fungal endophytes.
World Journal of Microbiology and Biotechnology. 27: 3005-3008.
Bugni, T. M. and Ireland, C. M. 2004. Marine-derived fungi: a chemically and
biologically diverse group of microorganisms. Natural Product Reports. 21:
143-163.
Bunyard, B. A., Nicholson, M. S. and Royes, D. J. 1994. A systematic assessment of
Morchella with RFLP analysis of the 28S ribosomal RNA gene. Mycologia.
86: 762-772.
Burge, H. 2006. How does heat affect fungi?. The Environmental Reporter. 4: 1-3.
Caira, M., Posterara, B., Sanguinetti, M., Carolis, E., Leone, G. and Pagano, L. 2012.
First case of breakthrough pneumonia due to Aspergillus nomius in a patient
with acute myeloid leukemia. Medical Mycology. 50: 746-750.
Campos, F. F., Johann, S., Cota, B. B., Alves, T. M. A., Rosa, L. H., Caligiorne, R.
B., Cisalpino, P. S., Rosa, C. A. and Zani, C. L. 2009. Antifungal activity of
trichothecenes from Fusarium sp. against clinical isolates of Paracoccidioides
brasiliensis. Mycoses. 54: e122-129. doi: 10.1111/j.1439-0507.2009.01854.x.
116
Carey, J., D’Amico, R., Sutton, D. A. and Rinaldi, M. G. 2003. Paecilomyces
lilacinus vaginitis in an immunocompetent patient. Emerging Infectious
Diseases. 9: 1155-1158.
Carson, C. F., Mee, B. J. and Riley, T. V. 2002. Mechanism of action of Melaleuca
alternifolia (tea tree) oil on Staphylococcus aureus determined by time-kill,
lysis, leakage, and salt tolerance assays and electron microscopy.
Antimicrobial Agents and Chemotherapy. 46: 1914-1920.
Cazar, M.E., Schmeda-Hirschmann, G. and Astudillo, L. 2005. Antimicrobial
butyrolactone I derivatives from the Ecuadorian soil fungus Aspergillus
terreus Thorn. var terreus. World Journal of Microbiology and
Biotechnology. 21: 1067-1075.
Chapman, S. W., Cleary, J. D. and Rogers, P. D. 2003. Amphotericin B. In: Clinical
mycology. Dismukes, W. E., Pappas, P. G. and Sobel, J. D., Eds. Oxford
University Press, Inc.: New York., pp. 33-48.
Chen, G., Yang, X., Zhai, X. and Yang, M. 2013. Microbial transformation of 20(S)-
protopanaxatriol by Absidia corymbifera and their cytotoxic activities against
two human prostate cancer cell lines. Biotechnology Letters. 35: 91-95.
Chidananda, C., Rao, L. J. M. and Sattur, A. P. 2006. Sclerotiorin, from Penicillium
frequentans, a potent inhibitor of aldose reductase. Biotechnology Letters. 28:
1633-1636.
Choi, S. U., Choi, E. J., Kim, K. H., Kim, N. Y., Kwon, B. M., Kim, S. U., Bok, S.
H., Lee, S. Y. and Lee, C. O. 1996. Cytotoxicity of trichothecenes to human
solid tumor cells in vitro. Archives of Pharmacal Research. 19: 6-11.
Chutia, M. and Ahmed, G. U. 2012. Diversity, antimicrobial activities and associated
microbiota of soil Penicillia from virgin forest floor. Journal of Microbiology
Biotechnology and Food Sciences. 1: 1279-1294.
Clinical and Laboratory Standards Institute (CLSI). 2008a. Reference method for
broth dilution antifungal susceptibility testing of yeasts; approved standard-
117
third edition. CLSI document M27-A3. Clinical and Laboratory Standards
Institute: Wayne.
Clinical and Laboratory Standards Institute (CLSI). 2008b. Reference method for
broth dilution antifungal susceptibility testing of filamentous fungi; approved
standard. CLSI documents M38-A2. Clinical and Laboratory Standards
Institute: Wayne.
Clinical and Laboratory Standards Institute (CLSI). 2012. Methods for dilution
antimicrobial susceptibility tests for bacteria that grow aerobically; approved
standard. CLSI document M07-A9. Clinical and Laboratory Standards
Institute: Wayne.
Corte, A. M., Liotta, M., Venturi, C. B. and Calegari, L. 2000. Antibacterial activity
of Penicillium spp. strains isolated in extreme environments. Polar Biology.
23: 294-297.
Courvalin, P. 2006. Vancomycin resistance in Gram-positive cocci. Clinical
Infectious Diseases. 42: S25-34.
Culter, H. G., Crumley, F. G., Cox, R. H., Springer, J. P., Arrendale, R. F., Cole, R. J.
and Cole, P. D. 1984. Ophiobolins G and H: new fungal metabolites from a
novel source, Aspergillus ustus. Journal of Agriculture and Food Chemistry.
32: 778-782.
Cutler, H. G., Crumley, F. G., Springer, J. P., Cox, R. H., Cole, R. J., Dorner, J. W.
and Thean, J. E. 1980. Pergillin: a nontoxic fungal metabolite with moderate
plant growth inhibiting properties from Aspergillus ustus. Journal of
Agriculture and Food Chemistry. 28: 989-991.
Deechouy, S. 2013. Soil and leaf litter fungi in plant protected area at Ratchaprapa
dam, Suratthani province and their antagonistic activities against para rubbers
pathogens. Master of Science Thesis, Prince of Songkla University, Songkhla,
Thailand.
118
Denyer, S. P., Hodges, N. A. and German, S. P. 2004. Hugo and Russell’s
pharmaceutical microbiology. 7th
Ed. Blackwell Science: India.
Edel, V. 1998. Polymerase chain reaction in mycology: an overview. In: Application
of PCR in mycology. Bridge, P. D., Arora, D. K., Reddy, C. A. and Elander,
R. P., Eds. CABI Publishing: Oxon., pp. 1-20.
Elaasser, M. M., Abdel-Aziz, M. M. and El-Kassas, R. A. 2011. Antioxidant,
antimicrobial, antiviral and antitumor activities of pyranone derivative
obtained from Aspergillus candidus. Journal of Microbiology and
Biotechnology Research. 1: 5-17.
Elbandy, M., Shinde, P. B., Hong, J., Bae, K. S., Kim, M. A., Lee, S. M. and Jung, J.
H. 2009. α-Pyrones and yellow pigments from the sponge-derived fungus
Paecilomyces lilacinus. Bulletin of the Korean Chemical Society. 30: 188-192.
Erhardt, F. A., Stammen, S. and Jördening, H. J. 2008. Production, characterization
and (co-)immobilization of dextranase from Penicillium aculeatum.
Biotechnology Letters. 30: 1069-1073.
Farris, J. S. 1989. The retention index and the rescaled consistency index. Cladistics.
5: 417-419.
Fawzy, G. A., Al-Taweel, A. M. and Melake, N. A. 2011. In vitro antimicrobial and
anti-tumor activities of intracellular and extracellular extracts of Aspergillus
niger and Aspergillus flavus var. columinaris. Journal of Pharmaceutical
Sciences and Research. 3: 980-987.
Filtenborg, O., Frisvad, J. C. and Trane, U. 1990. The significance of yeast extract
composition of metabolite production in Penicillium. In: Modern concepts in
Penicillium and Aspergillus classification. Samson, R. A and Pitt, J. I., Eds.
Plenum Press: New York., pp. 433–441.
Finlay, R. D. 2007. The fungi in soil. In: Modern soil microbiology. 2nd
Ed. Elsas, J.
D. V., Jansson, J. K. and Trevors, J. T., Eds. CRC press: Boca Raton., pp. 107-
146.
119
Fish, W. W., Bruton, B. D. and Popham, T. W. 2012. Cucurbit host range of
Myrothecium roridum isolated from watermelon. American Journal of Plant
Sciences. 3: 353-359.
Friedrich, C. L., Moyles, D., Beveridge, T. J. and Hancock, R. E. W. 2000.
Antibacterial action of structurally diverse cationic peptides on Gram-positive
bacteria. Antimicrobial Agents and Chemotherapy. 44: 2086-2092.
Frisvad, J. C. 1993. Modifications on media based on creatine for use in Penicillium
and Aspergillus taxonomy. Letters in Applied Microbiology. 16: 154–157.
Frisvad, J. C., Frank, J. M., Houbraken, J. A. M. P., Kuijpers, A. F. A. and Samson,
R. A. 2004. New ochratoxin A producing species of Aspergillus section
Circumdati. Studies in Mycology. 50: 23-43.
Furtado, N. A. J. C., Said, S., Ito, I. Y. and Bastos, J. K. 2002. The antimicrobial
activity of Aspergillus fumigatus is enhanced by a pool of bacteria.
Microbiological Research. 157: 207-211.
Garrett, S. D. 1981. Soil fungi and soil fertility. 2nd
Ed. Pergamon Press: Great
Britain.
Gelfand, D. H. 1989. Taq DNA polymerase. In: PCR technology: principles and
applications for DNA amplification. Erlich, H. A., Ed. Stockton Press: New
York., pp. 17–22.
Gharaei-Fathabad, E., Tajick-Ghanbary, M. A. and Shahrokhi, N. 2009. Antimicrobial
properties of Penicillium species isolated from agriculture soils of Northern
Iran. Research Journal of Toxins. 1: 1-7.
Giovannini, C., Straface, E., Modesti, D., Coni, E., Cantafora, A., De Vincenzi, M.,
Molorni, W. and Masella, R. 1999. Tyrosol, the major olive oil biphenol,
protects against oxidized-LDL-induced injury in Caco-2 cells. The Journal of
Nutrition. 129: 1269-1277.
120
Goicoechea, N., Merino, S. and Sánchenz-Díaz, M. 2005. Arbuscular mycorrhizal
fungi can contribute to maintain antioxidant and carbon metabolism in nodules
of Anthyllis cytissoildes L. subjected to drought. Journal of Plant Physiology.
162: 27-35.
Goto, T., Wicklow, D. T., MaAlpin, C. E. and Peterson, S. W. 2003. Aspergillus
bombysis genotypes (RFLP) from silkworm cultivation. Mycoscience. 44:
209-215.
Grunenwald, H. 2003. Optimization of polymerase chain reactions. In: PCR
protocols. 2nd
Ed. Barnet, J. M. S. and Stirling, D., Eds. Human Press: New
Jersey., pp. 89-100.
Hall, B. G. 2001. Phylogenetic trees made easy: A How-To manual for molecular
biologists. Sinauer Associates, Inc.: Sunderland.
Hall, T. 2012. BioEdit V.7.1.7: A User-friendly biological sequence alignment editor
and analysis program for windows 95/98/NT/2000/XP/7. [Online]. Available
at http://www.mbio.ncsu.edu/BioEdit/bioedit.html. (accessed 12/12/2012).
Hamano, K., Okami, M. K., Hemmi, A., Sato, A., Hisamoto, M., Matsuda, K., Yoda,
K., Haruyama, H., Hosoya, T. and Tanzawa, K. 1992. Folipastatin, a new
depsidone compound from Aspergillus unguis as an inhibitor of phospholipase
A2. Taxonomy, fermentation, isolation, structure determination and biological
properties. The Journal of Antibiotics. 45: 1195-1201.
Harrison, C. J. and Langdale, J. A. 2006. A step by step guide to phylogeny
reconstruction. The Plant Journal. 45: 561-572.
Helen, P. A. M., Shiny, M., Ruskin, S., Sree, S. J. and Nizzy, A. M. 2012. Screening
of antibiotic producing fungi from soil. Journal of Environmental Science,
Computer Science and Technology. 1: 141-151.
Ho, H. M., Chuang, S. C. and Chen, S. J. 2004. Notes on zygomycetes of Taiwan
(IV): three Absidia species (Mucoraceae). Fungal Science. 19: 125-131.
121
Hoorman, J. J. 2011. The role of soil fungus. In: Fact Sheet Agriculture and Natural
Resources. The Ohio State University Extension: Ohio.
Hosamani, R. and Kaliwal, B. B. 2011. Isolation, molecular identification and
optimization of fermentation parameters for the production of L-asparaginase,
an anticancer agent by Fusarium equiseti. International Journal of
Microbiology Research. 3: 108-119.
Innis, M. A. and Gelfand, D. H. 1990. Optimization of PCRs. In: PCR protocols a
guide to methods and applications. Innis, M. A., Gelfand, D. H., Sninsky, J. J.
and White, T. J., Eds. Academic Press, Inc.: San Diego., pp. 3-12.
Isaka, M., Chinthanom, P., Veeranondha, S., Supothina, S. and Luangsa-ard, J. J.
2008. Novel cyclopropyl diketones and 14-membered macrolides from the soil
fungus Hamigera avellanea BCC 17816. Tetrahedron. 64: 11028-11033.
Ishii, K., Sakai, K., Ueno, Y., Tsunoda, H. and Enomoto, M. 1971. Solaniol, a toxic
metabolite of Fusarium solani. Applied Microbiology. 22: 718-720.
Isogai, A., Suzuki, A., Higashikawa, S., Kuyama, S. and Tamura, S. 1981. Isolation
and biological activity of a peptidal antibiotic P168. Agricultural Biology and
Chemistry. 45: 1023-1024.
Jaiswal, S., Saini, R., Sangani, S. R., Tiwari, S., Agrawal, M. and Agrawal, M. K.
2012. Antibacterial activity of five fungal strains isolated from a leguminous
soil field against nitrogen-fixing bacteria. Annals of Biological Research. 3:
2829-2837.
Jang, J. H., Asami, Y., Jang, J. P., Kim, S. O., Moon, D. O., Shin, K. S., Hashizume,
D., Muroi, M., Saito, T., Oh, H., Kim, B. Y., Osada, H. and Ahn, J. S. 2011.
Fusarisetin A, an acinar morphogenesis inhibitor from a soil fungus, Fusarium
sp. FN080326. Journal of the American Chemical Society. 133: 6865-6867.
Jayasuriya, H., Zink, D. L., Polishook, J. D., Bills, G. F., Dombrowski, A. W.,
Genilloud, O., Pelaez, F. F., Herranz, L., Quamina, D., Lingham, R. B.,
Danzeizen, R., Graham, P. L., Tomassini, J. E. and Singh, S. B. 2005.
122
Identification of diverse microbial metabolites as potent inhibitors of HIV-1
Tat transactivation. Chemistry and Biodiversity. 2: 112-122.
Jeenkeawpieam, J., Phongpaichit, S., Rukachaisirikul, V. and Sakayaroj, J. 2012.
Antifungal activity and molecular identification of endophytic fungi from the
angiosperm Rhodomyrtus tomentosa. African Journal of Biotechnology. 11:
14007-14016.
Jenkins, F. J. 1994. Basic methods for the detection of PCR products. Genome
Research. 3: s77-82.
Jia, S. R. and Cui, J. D. 2009. Production of hydrocortisone by Absidia coerulea in
moderate pressure bioconversion system. Korean Journal of Chemical
Engineering. 26: 1084-1089.
Jiang, L. 2011. Comparison of disk diffusion, agar dilution, and broth microdilution
for antimicrobial susceptibility testing of five chitosans. Master of Science
Thesis, Louisiana State University and Mechanical College, Louisiana, USA.
Kamal, A., Haider, Y., Qureshi, A. A and Khan, Y. A. 1970. Isolation and structures
of haiderin, rubinin, shirin and narsin metabolic products of Aspergillus unguis
Emile-Weil and Gaudin. Pakistan Journal of Science and Industrial Research.
13: 364-372.
Kang, J. G., Hur, J. H., Yun, B. S., Yoo, I. D. and Kang, K. Y. 2003. Antifungal
activity of sporogen AO-1 and p-hydroxybenzoic acid isolated from
Penicillium sp. AF5. Agriculture Chemistry and Biotechnology. 46: 33-37.
Kang, S. W. and Kim, S. W. 2004. New antifungal activity of penicillic acid against
Phytophthora species. Biotechnology Letters. 26: 695-698.
Kaur, K., Jain, M., Kaur, T. and Jain, R. 2009. Antimalarials from nature. Bioorganic
and Medicinal Chemistry. 17: 3229-3256.
Kawahara, N., Nakajima, S., Satoh, Y., Yamazaki, M. and Kawai, K. 1988a. Studies
on fungal products. XVIII.: Isolation and structures of a new fungal depsidone
123
related to nidulin and a new phthalide from Emericella unguis. Chemical and
Pharmaceutical Bulletin. 36: 1970-1975.
Kawahara, N., Nozawa, K., Nakajima, S., Kawai, K. and Yamazaki, M. 1988b.
Isolation and structures of novel fungal depsidones, emerguisins A, B, and C,
from Emericella unguis. Journal of the Chemical Society, Perkin Transactions
1: 2611-2614.
Kawai, K., Akita, T., Nishibe, S., Nozawa, Y., Ogihara, Y. and Ito, Y. Biochemical
studies of pigments from a pathogenic fungus Microsporum cookei. III.
Comparison of the effects of xanthomegnin and O-methylxanthomegnin on
the oxidative phosphorylation of rat liver mitochondria. Journal of
Biochemistry. 79: 145-152.
Kaye, K. S., Engemann, J. J., Fraimow, H. S. and Abrutyn, E. 2004. Pathogens
resistant to antimicrobial agents: epidemiology, molecular mechanisms, and
clinical management. Infectious Disease Clinics of North America. 18: 467-
511.
Kelmanson, J. E., Jäger, A. K. and Staden, J. V. 2000. Zulu medicinal plants with
antibacterial activity. Journal of Ethnopharmacology. 69: 241-246.
Khaddor, M., Saidi, R., Aidoun, A., Lamarti, A., Tantaoui-Elaraki, A., Ezziyyani, M.,
Castillo, M. E. C. and Badoc, A. 2007. Antibacterial effects and toxigenesis of
Penicillium aurantiogriseum and P.viridicatum. African Journal of
Biotechnology. 6: 2314-2318.
Khamthong, N., Rukachaisirikul, V., Phongpaichit, S., Preedanon, S. and Sakayaroj,
J. 2012. Bioactive polyketides from the sea fan-derived fungus Penicillium
citrinum PSU-F51. Tetrahedron. 68: 8245-8250.
Khumkomkhet, P., Kanokmedhakul, S., Kanokmedhakul, K., Hahnvajanawong, C.
and Soytong, K. 2009. Antimalarial and cytotoxic depsidones from the fungus
Chaetomium brasiliense. Journal of Natural Products. 72: 1487-1491.
124
Kim, K. J., Sung, W. S., Suh, B. K., Moon, S. K., Choi, J. S., Kim, J. G. and Lee, D.
G. 2009. Antifungal activity and mode of action of silver nano-particles on
Candida albicans. Biometals. 22: 235-242.
Kim, Y.S., Kim, K. S., Han, I., Kim, M. H., Jung, M. H. and Park, H. K. 2012.
Quantitative and qualitative analysis of the antifungal activity of allicin alone
and in combination with antifungal drugs. PLoS One. 7: e38242.
doi:10.1371/journal.pone.0038242.
Kishino, H. and Hasegawa, M. 1989. Evolution of the maximum likelihood estimate
of the evolutionary tree topologies from DNA sequence data, and the
branching order in hominoidea. Journal of Molecular Evolution. 29: 170-179.
Knob, A. and Carmona, E. C. 2008. Xylanase production by Penicillium sclerotiorum
and its characterization. World Applied Sciences Journal. 4: 277-283.
Kornsakulkarn, J., Dolsophon, K., Boonyuen, N., Boonruangprapa, T., Rachtawee, P.,
Prabpai, S., Kongsaeree, P. and Thongpanchang, C. 2011.
Dihydronaphthalenones from endophytic fungus Fusarium sp. BCC14842.
Tetrahedron. 67: 7540-7547.
Kuephadungphan, W., Phongpaichit, S., Luangsa-ard, J. J. and Rukachaisirikul, V.
2013. Antimicrobial activity of invertebrate-pathogenic fungi in the genera
Akanthomyces and Gibellula. Mycoscience. doi: 10.1016/j.myc.2013.06.007.
Kumar, C. G., Mongolla, P., Joseph, J., Nageswar, Y. V. D. and Kamal, A. 2010.
Antimicrobial activity from the extracts of fungal isolates of soil and dung
samples from Kaziranga national park, Assam, India. Journal of Medical
Mycology. 20: 283-289.
Landvik, S. 1996. Neolecta, a fruit-body-producing genus of the basal ascomycetes,
as shown by SSU and LSU rDNA sequences. Mycological Research. 100:
199-202.
125
Levetin, E., Shaughnessy, R., Rogers, C. A. and Sceir, R. 2001. Effectiveness of
germicidal UV radiation for reducing fungal contamination within air-
handling units. Applied and Environmental Microbiology. 67: 3712-3715.
Liaqat, I., Bachman, R. Th., Sabri, A. N., Edyvean, R. G. J. and Biggs, C. A. 2008.
Investigating the effect of patulin, penicillic acid and EDTA on biofilm
formation of isolates from dental unit water lines. Applied Microbiology and
Biotechnology. 81: 349-358.
Liermann, J. C., Kolshorn, H., Opatz, T., Thines, E. and Anke, H. 2009.
Xanthepinone, an antimicrobial polyketide from a soil fungus closely related
to Phoma medicaginis. Journal of Natural Products. 72: 1905-1907.
Lipscomb, D. 1998. Basics of cladistic analysis. George Washington University.:
Washington D.C.
Liu, M., Seidel, V., Katerere, D.R. and Gray, A.I. 2007. Colorimetric broth
microdilution method for the antifungal screening of plant extracts against
yeasts. Methods. 42: 325-329.
Liu, T., Li, Z., Wang, Y., Tian, L., Pei, Y. and Hua, H. 2012. Studies on the secondary
metabolites from the marine-derived fungus Hypocrea virens. Shenyang
Yaoke Daxue Xuebao. 29: 93-97.
Livermore, D. M. 2011. Discovery research: the scientific challenge of finding new
antibiotics. Journal of Antimicrobial Chemotherapy. 66: 1941-1944.
Lorenz, T. C. 2012. Polymerase chain reaction: basic protocol plus troubleshooting
and optimization stratrgies. Journal of Visualized Experiments. 63: 1-15.
Luangsa-ard, J., Houbraken, J., Doorn, T. V., Hong, S. B., Borman, A. M., Hywel-
Jones, N. L. and Samson, R. A. 2011. Purpureocillium, a new genus for the
medically important Paecilomyces lilacinus. Federation of European
Microbiological Societies. 321: 141-149.
126
Lucas, E. M. F., Castro, M. M. C. and Takahashi, J. A. 2007. Antimicrobial properties
of sclerotiorin, isochromophilone VI and pencolide, metabolites from a
Brazilian Cerrado isolate of Penicillium sclerotiorum Van Beyma. Brazlian
Journal of Microbiology. 38: 785-789.
Mahesh, B. and Satish, S. 2008. Antimicrobial activity of some important medicinal
plant against plant and human pathogens. World Journal of Agricultural
Sciences. 4: 839-843.
Makut, M. D. and Owolewa, O. A. 2011. Antibiotic-producing fungi present in the
soil environment of Keffi metropolis, Nasarawa state, Nigeria. Trakia Journal
of Science. 9: 33-39.
Manikandad, P., Varga, J., Kocsubé, S., Samson, R. A., Anita, R., Revathi, R., Dóczi,
I., Németh, T. M., Narendran, V., Vágvölgyi, C., manohara, C. and Kredics, L.
2009. Mycotic keratitis due to Aspergillus nomius. Journal of Clinical
Microbiology. 47: 3382-3385.
Mazumder, P. M., Mazumder, R., Mazumder, A. and Sasmal, D. S. 2002.
Antimicrobial activity of the mycotoxin citrinin obtained from the fungus
Penicillium citrinum. Ancient Science of Life. 3: 191-197.
Meenupriya, J. and Thangaraj, M. 2012. Bioprospecting of potent fungal strains from
marine sponge Hyatella cribriformis from Gulf of mannar coast. International
Conference on Bioscience, Biotechnology and Healthcare Sciences.
Singapore, December 14-15, 2012. pp. 72-75.
Meghashi, S., Kumar, H. V. and Gopal, S. 2010. Antioxidant properties of a novel
flavonoid from leaves of Leucas aspera. Food Chemistry. 122: 105-110.
Metting, F. B. 1993. Structure and physiological ecology of soil microbial
communities. In: Soil microbial ecology: applications innagricultural and
environmental management. Metting, F. B., Ed. Marcel Dekker, Inc.: New
York., pp. 3-25.
127
Mohamed, H. F. 2012. Molecular analysis and anticancer properties of two identified
isolates, Fusarium solani and Emericella nidulans isolated from Wady El-
Natron soil in Egypt against Caco-2 (ATCC) cell line. Asian Pacific Journal of
Tropical Biomedicine. 2: 863-869.
Moosophon, P., Kanokmedhakul, S., Kanokmedhakul, K. and Soytong, K. 2009.
Prenylxanthones and a bicycle[3.3.1]nona-2,6-diene derivative from the
fungus Emericella rugulosa. Journal of Natural Products. 72: 1442-1446.
Mori, H., Kawai, K., Ohbayashi, F., Kuniyasu, T., Yamazaki, M., Hamasaki, T. and
William, G. M. 1984. Genotoxicity of a variety of mycotoxin in the hepatocyte
primary culture/DNA repair test using rat and mouse hepatocytes. Cancer
Research. 44: 2918-2923.
Mori, Y., Tsuboi, M., Suzuki, M., Fukushima, K. and Arai, T. 1982. Isolation of
leucostatin A and one of its constituents the new amino acid, 4-methyl-6-(2-
oxobutyl)-2-piperidinecarboxylic acid, from Paecilomyces lilacinus A-267.
Journal of Antibiotics. 35: 543-544.
Morimoto, K., Yoshisawa, T., Ishikawa, Y. and Hamasaki, T. 1987. An antioxidative
metabolite of Penicillium herquei as a potent synergist for tocopherol. Journal
of Japan Oil Chemists’ Society. 36: 10-15.
Morton, J. B. 2005. Fungi. In: Principles and application of soil microbiology. 2nd
Ed.
Yarnell, D., Ed. Pearson Education Inc.: New Jersey., pp. 141-161.
Mount, D. M. 2004. Bioinformatics: sequence and genome analysis. 2nd
Ed. Cold
Spring Harbor Laboratory Press: New York.
Mya, Y. Y. 2011. Isolated soil fungi and their biological properties. Universities
Research Journal. 4: 113-121.
Mytelka, D. S. and Chamberlin, M. J. 1996. Analysis and suppression of DNA
polymerase pauses associated with a trinucleotide consensus. Nucleic Acids
Research. 24: 2774–2781.
128
Nassonova, E. S. 2008. Pulsed field gel electrophoresis: theory, instruments and
application. Cell and Tissue Biology. 2: 557-565.
Negishi, Y., Matsuo, N., Miyadera, K. and Tanishima, M. 1998. Lipase inhibitors
containing sclerotiorin. Jpn Patent. 98-376263. 2000: December 24.
Nelson, P. E., Toussoun, T. A. and Marasas, W. F. O. 1983. Fusarium species. An
illustrated manual for identification. Pennsylvania State University Press:
Pennsylvania.
Newman, D. J. and Cragg, G. M. 2007. Natural products as sources of new drugs over
the last 25 years. Journal of Natural Products. 7: 461-477.
Nielsen, J., Nielsen, P. H. and Frisvad, J. C. 1999. Fungal depside, guisinol, from a
marine derived strain of Emericella unguis. Phytochemistry. 50: 263-265.
Nielsen, K. F., Gräfenhan, T., Zafari, D. and Thrane, U. 2005. Trichothecene
production by Trichoderma brevicompactum. Journal of Agriculture and Food
Chemistry. 53: 8190-8196.
O’Donnell, K., Cigelink, E., Weber, N.S. and Trappe, J.M. 1997. Phylogenetic
relationship among ascomycetous truffles and the true and false morels
inferred from 18S and 28S ribosomal DNA sequence analysis. Mycologia. 89:
48-65.
Odonkor, S. T. and Addo, K. K. 2011. Bacteria resistance to antibiotics: Recent trends
and challenges. International Journal of Biological & Medical research. 2:
1204-1210.
Okuda, T., Yoneyama, Y. and Fujiwara, A. 1984. Penitricin, a new class of antibiotic
produced by Penicillium aculeatum I. Taxonomy of the producer strain and
fermentation. The Journal of Antibiotics. 37: 712-717.
Okunowo, W. O., Gbenle, G. O., Osuntoki, A. A., Adekunle, A. A. and Ojokuku, S.
A. 2010. Production of cellulytic and xylanolytic enzymes by a
phytopathogenic Myrothecium roridum and some avirulent fungal isolates
from water hyacinth. African Journal of Biotechnology. 9: 1074-1078.
129
Olive, D. M. and Bean, P. 1999. Principles and applications of methods for DNA-
based typing of microbial organisms. Journal of Clinical Microbiology. 37:
1661-1669.
Olsen, M., Johnsson, P., Möller, T., Paladino, R. and Lindblad, M. 2008. Aspergillus
nomius, an important aflatoxin producer in Brazil nuts?. World Mycotoxin
Journal. 1: 123-126.
Omura, S. and Shiomi, K. 2007. Discovery, chemistry, and chemical biology of
microbial product. Pure and Applied Chemistry. 79: 581-591.
Omura, S., Hirano, A., Iwai, Y. and Masuma, R. 1979. Herquline, a new alkaloid
produced by Penicillium herquei. Fermentation, isolation and properties. The
Journal of Antibiotics. 32: 786-790.
Pastor, F. J. and Guarro, J. 2006. Clinical manifestations, treatment and outcome of
Paecilomyces lilacinus infections. Clinical Microbiology and Infection. 12:
948-960.
Peck, T. E., Hill, S. and Williams, M. 2008. Pharmacology for anaesthesia and
intensive care. 3rd
. Cambridge University Press: Cambridge.
Perfect, J. R. and Cox, G. M. 1999. Drug resistance in Crytococcus neoformans. Drug
Resistance Updates. 2: 259-269.
Peterson, S. W., Corneli, S., Hjelle, J. T., Hjelle, M. A. M., Nowak, D. M. and
Bonneau, P. A. 1999. Penicillium pimiteouiense: a new species isolated from
polycystic kidney cell cultures. Mycologia. 91: 269-277.
Petit, P., Lucas, E.M.S., Abreu, L.M., Pfenning, L.H. and Takahashi, J.A. 2009.
Novel antimicrobial secondary metabolites from a Penicillium sp. isolated
from Brazilian cerrado soil. Electronic Journal of Biotechnology. 12: 1-9.
Phongpaichit, S., Rungjindamai, N., Rukachaisirikul, V. and Sakayaroj, J. 2006.
Antimicrobial activity in cultures of endophytic fungi isolated from Garcinia
species. Federation of European Microbiological Societies. 48: 367-372.
130
Pitt, J. I. 1973. An appraisal of identification methods for Penicillium species: novel
taxonomic criteria based on temperature and water relations. Mycologia. 65:
1135–1157.
Pittayakhajonwut, P., Dramae, A., Intaraudom, C., Boonyuen, N., Nithithanasilp, S.,
Rachatawee, P. and Laksanacharoen, P. 2011. Two new drimane
sesquiterpenes, fudecadiones A and B, from the soil fungus Penicillium sp.
BCC 17468. Planta Medica. 77: 74-76.
Plaza, G. A., Upchurch, R., Brigmon, R. L., Whitman, W. B. and Ulfig, K. 2003.
Rapid DNA extraction for screening soil filamentous fungi using PCR
amplification. Polish Journal of Environmental Studies. 13: 315-318.
Prahbu, M. K. A. 1984. Studies on dextranase from Penicillium aculeatum. Enzyme
and Microbial Technology. 6: 217-220.
Prapagdee, B., Tharasaithong, L., Nanthaphot, R. and Paisitwiroj, C. 2012. Efficacy
of crude extract of antifungal compounds produced from Bacillus subtilis on
prevention of anthracnose disease in Dendrobium orchid. EnvironmentAsia. 5:
32-38.
Preedanon, S. 2008. Screening and identification of sea fan-derived fungi that produce
antimicrobial substances. Master of Science Thesis, Prince of Songkla
University, Songkhla, Thailand.
Qureshi, S. A. 2003. Studies on antibiotics from soil fungi. Ph. D. Thesis, University
of Karachi, Karachi, Pakistan.
Qureshi, S. A., Hira, Sultana, V., Ara, J. and Ehteshamul-Haque, S. 2011. Cytotoxic
potential of fungi associated with rhizophere and rhizoplane of wild and
cultivated plants. Pakistan Journal of Botany. 43: 3025-3028.
Rao, P. R. 1970. Studies on soil fungi IV. A comparison of some techniques for
isolating soil fungi. Mycopathologia. 40: 299-304.
Raper, K. B. and Thom, C. 1949. A Manual of the Penicillia. Williams & Wilkins
Co.: Baltimore.
131
Rasmussen, H. B. 2012. Restriction fragment length polymorphism analysis of PCR-
amplified fragments (PCR-RFLP) and gel electrophoresis-Valuable tool for
genotyping and genetic fingerprinting. In: Gel electrophoresis-Principles and
basics. Magdeldin, S., Ed. InTech: Rijeka., pp. 315-334.
Reino, J. L., Guerrero, R. F., Galán, R. H. and Collado, I. G. 2008. Secondary
metabolites from species of the biocontrol agent Trichoderma. Phytochemistry
Reviews. 7: 89-123.
Ribes, J. A., Sams, C. L. V. and Baker, D. J. 2000. Zygomycetes in human disease.
Clinical Microbiology Reviews. 13: 236-301.
Rivera, K. G. and Seifert, K. A. 2011. A taxonomic and phylogenetic revision of the
Penicillium sclerotiorum complex. Studies in Mycology. 70: 139-158.
Rodriguez, R. J. and Owen, J. L. 1992. Isolation of Glomerella musae [teleomorph of
Colletotrichum musae (Berk. & Curt.) Arx.] and segregation analysis of
ascospore progeny. Experimental Mycology. 16: 291-301.
Rohilla, S. K. and Salar, R. K. 2012. Isolation and characterization of various fungal
strains from agriculture soil contaminated with pesticides. Research Journal of
Recent Science. 1: 297-303.
Ropars, J., Cruaud, C., Lacoste, S. and Dupont, J. 2012. A taxonomic and ecological
overview of cheese fungi. International Journal of Food Microbiology. 155:
199-210.
Roux, K. H. 1995. Optimization and troubleshooting in PCR. In: PCR primer a
laboratory manual. Dieffenbach, C. W. and Dveksler, G. S., Eds. Cold Spring
Harbor Laboratory Press.: New York., pp. 53-62.
Rungsaiwattana, N. 2011. Metabolites from the soil fungi: Aspergillus sp. PSU-
RSPG185 and Trichoderma sp. PSU-RSPG24. Master of Science, Prince of
Songkla University, Songkhla, Thailand.
132
Samson, R. A., Varga, J., Meijer, M. and Frisvad, J. C. 2011. New taxa in Aspergillus
section Usti. Studies in Mycology. 69: 81-97.
Samson, R.A., Hoekstra, E.S. and Frisvad, J.C. 2004. Introduction to food and
airborne fungi. An Institute of the Royal Netherland Academy of Arts and
Science: The Netherland.
Sang, T. 1995. New measurements of distribution of homoplasy and reliability of
parsimonious cladograms. Taxon. 44: 77-82.
Sarker, D. S., Nahar, L. and Kumarasamy, Y. 2007. Microtitre plate-based
antibacterial assay incorporating resazurin as an indicator of cell growth, and
its application in the in vitro antibacterial screening of phytochemicals.
Methods. 42: 321-324.
Satpradit, S. 2011. Metabolites from the soil fungi: Penicillium sp. PSU-RSPG99 and
Trichoderma sp. PSU-RSPG28. Master of Science, Prince of Songkla
University, Songkhla, Thailand.
Schilter, B., Marin-Kuan, M., Delatour, T., Nestler, S., Mantle, P. and Cavin, C. 2005.
Ochratoxin A: Potential epigenetic mechanisms of toxicity and
carcinogenicity. Food Additives and Contaminants. 1: 88-93.
Schütte, U. M. E., Abdo, Z., Bent, S. J., Shyu, C., Williams, C. J., Pierson, J. D. and
Forney, L. J. 2008. Advances in the use of terminal restriction fragment length
polymorphism (T-RFLP) analysis of 16S rRNA gene to characterize microbial
communities. Applied Microbiology and Biotechnology. 80: 365-380.
Seidel, V. 2006. Initial and bulk extraction. In: Natural products isolation. 2nd
Ed.
Sarker, S. D., Latif, Z. and Gray, A. I., Eds. Humana Press: New Jersey., pp.
27-46.
Senthilkumar, G., Madhanraj, P. and Panneerselvam, A. 2011. Studies on the
compounds and its antifungal potentiality of fungi isolated from paddy field
soils of Jenbagapuram village, Thanjavur district, and South India. Asian
Journal of Pharmaceutical Research. 1: 19-21.
133
Sette, L.D., Passarini, M.R.Z., Delarmelina, C., Salati, F. and Duarte, M.C.T. 2006.
Molecular characterization and antimicrobial activity of endophytic fungi from
coffee plants. World Journal of Microbiology and Biotechnology 22: 1185-
1195.
Sheikh, H. M. A. 2010. Antimicrobial activity of certain bacteria and fungi isolated
from soil mixed with human saliva against pathogenic microbes causing
dermatological diseases. Saudi Journal of Biological Sciences. 17: 331-339.
Shinabarger, D. L., Marotti, K. R., Murray, R. W., Lin, A. H., Melchior, E. P.,
Swaney, S. M., Dunyak, D. S., Demyan, W. F. and Buysse, J. M. 1997.
Mechanism of action of oxazolidinones: Effects of linezolid and eperezolid on
translation reactions. Antimicrobial Agents and Chemotherapy. 41: 2132-
2136.
Shiomi, K., Ui, H., Yuuichi, Y., Masuma, R., Namikoshi, M., Kita, K., Miyoshi, H.,
Harder, A. and Omura, S. 2001. Isolation, structure, and biological activity of
a new NADH-fumarate reductase inhibitor, nafuredin, produced by
Aspergillus niger. Tennen Yuki Kagobutsu Toronkai Koen Yoshishu. 43: 311-
316.
Shwab, E. K. and Keller, N. P. 2008. Regulation of secondary metabolite production
in filamentous ascomycetes. Mycological Research. 112: 225-230.
Sichler, M. O., Costa, R., Heuer, H. and Smalla, K. 2007. Molecular fingerprinting
techniques to analyze soil microbial communities. In: Modern soil
microbiology. 2nd
Ed. Elsas, J. D. V., Jansson, J. K. and Trevors, J. T., Eds.
CRC press: Boca Raton., pp. 355-386.
Simpanya, M. F. and Baxter, M. 1996. Isolation of fungi from soil using the keratin-
baiting technique. Mycopathologia. 136: 85-89.
Somma, M. 2004. The analysis of food samples for the presence of genetically
modified organisms; session 4 extraction and purification of DNA. World
Health Organization Regional Office for Europe: Copenhagen Ø.
134
Soniyamby, A. R., Lalitha, S., Praveesh, B. V. and Priyadarshini, V. 2011. Isolation,
production and anti-tumor activity of L-asparaginase of Penicillium sp.
International Journal of Microbiological Research. 2: 38-42.
Spiegelman, D., Whissell, G. and Greer, C. W. 2005. A survey of the methods for the
characterization of microbial consortia and communities. Canadian Journal of
Microbiology. 51: 355-386.
Standing, D. and Killham, K. 2007. The soil environment. In: Modern soil
microbiology. 2nd
Ed. Elsas, J. D. V., Jansson, J. K. and Trevors, J. T., Eds.
CRC press: Boca Raton., pp. 1-22.
Stapleton, P. D. and Taylor, P. W. 2002. Methicillin resistance in Staphylococcus
aureus: mechanisms and modulation. Science Progress. 85: 57-72.
Staub, G. M., Gloer, J. B., Wicklow, D. T. and Dowd, P. F. 1992. Aspernomine: a
cytotoxic antiinsectan metabolite with a novel ring system from the sclerotia
of Aspergillus nomius. Journal of the American Chemical Society. 114: 1015-
1017.
Subbarao, N. S. 1999. Soil microbiology. 4th
Ed. Science Publishers, Inc.: India.
Swofford, D. L. 2002. PAUP*: Phylogenetic Analysis Using Parsimony (*and other
methods) version 4.0b10. Sinauer Associates: Sunderland.
Takahashi, J.A., Monteiro de Castro, M.C., Souza, G.G., Lucas, E.M.F., Bracarense,
A.A.P., Abreu, L.M., Marriel, I.E., Oliveira, M.S., Floreano, M.B. and
Oliveira, T.S. 2008. Isolation and screening of fungal species isolated from
Brazilian cerrado soil for antibacterial activity against Escherichia coli,
Staphylococcus aureus, Salmonella typhimurium, Streptococcus pyogenes
and Listeria monocytogenes. Journal of Medical Mycology. 18: 198-204.
Takamatsu, S. 1998. PCR applications in fungal phylogeny. In: Application of PCR in
mycology. Bridge, P. D., Arora, D. K., Reddy, C. A. and Elander, R. P., Eds.
CABI Publishing: Oxon., pp. 125-152.
135
Tan, S. C. and Yiap, B. C. 2009. DNA, RNA, and protein extraction: the past and the
present. Journal of Biomedicine and Biotechnology. 2009: 1-10.
Tarus, P. K., Lang’at-Thoruwa, C. C., Wanyonyi, A. W. and Chhabra, S. C. 2003.
Bioactive metabolites from Trichoderma harzianum and Trichoderma
longibrachiatum. Bullentin of Chemical Society of Ethiopia. 17: 185-190.
Taylor, D. J., Green, D. P. O. and Stout, G. W. 2003. Biological science. 3rd
Ed.
Cambridge University Press: Cambridge.
Thompson, J. D., Higgins, D. G. and Gibson, T. J. 1994. ClustalW: Improving the
sensitivity of progressive multiple sequence alignment through sequence
weighting, position-specific gap penalties and weight matrix choice. Nucleic
Acids Research. 22: 4673-4680.
Trisuwan, K., Rukachaisirikul, V., Borwornwiriyapan, K., Phongpaichit, S. and
Sakayaroj, J. 2013. Pyrone derivatives from the soil fungus Fusarium solani
PSU-RSPG37. Phytochemistry Letters. 6: 495-497.
Turner, W. B. and Aldridge, D. C. 1983. Fungal metabolites II. Academic Press:
London.
Uggozoli, L. and Wallace, B. 1992. Application of an allele-specific polymerase
chain reaction to the direct determination of ABO blood group genotypes.
Genomics. 670–674.
Varga, J., Kevei, E., Rinyu, E., Téren, J. and Kozakiewicz, Z. 1996. Ochratoxin
production by Aspergillus species. Applied and Environmental Microbiology.
62: 4461-4464.
Villemain, D., Guiraud, P., Bordjiba, O. and Steiman, R. 2006. Biotransformation of
antracene and fluoranthene by Absidia fusca Linnemann. Electronic Journal of
Biotechnology. 9: 107-116.
Wagate C. G., Mbaria, J. M., Gakuya, D. W., Nanyingi, M. O., Kareru, P. G.,
Njuguna, A., Gitahi, N., Macharia, J. K. and Njonge, F. K. 2010. Screening of
136
some Kenyan medicinal plants for antimicrobial activity. Phytotherapy
Research. 24: 150-153.
Wahegaonkar, N., Salunkhe, S. M., Palsingankar, P. L. and Shinde, S. Y. 2011.
Diversity of fungi from soil of Aurangabad, M. S., India. Annals of Biological
Research. 2: 198-205.
Wang, C. C., Liu, H. Z., Liu, M., Zhang, Y. Y., Li, T. T. and Lin, X. K. 2011.
Cytotoxic metabolites from the soil-derived fungus Exophiala pisciphila.
Molecules. 16: 2796-2801.
Wang, H., Qi, M. and Cutler, A. J. 1993. A simple method for preparing plant
samples for PCR. Nucleic Acids Research. 21: 4153-4154.
Wang, H., Zheng, J. K., Qu, H. J., Liu, P. P., Wang, Y. and Zhu, W. M. 2011. A new
cytotoxic indole-3-ethenamide from the halotolerant fungus Aspergillus
sclerotiorum PT06-1. Journal of Antibiotics. 64: 679-681.
Wang, T., Zhang, Y., Wang, Y. and Pei, Y. 2007. Anti-tumor effects of rubratoxin B
on cell toxicity, inhibition of cell proliferation, cytotoxic activity and matrix
metalloproteinase-2,9. Toxicology in Vitro. 21:646-650.
Wang, X., Filho, J. G. S., Hoover, A. R., King, J. B., Ellis, T. K., Powell, D. R. and
Cichewicz, R. H. 2010. Chemical epigenetics alters the secondary metabolite
composition of guttate excreted by an atlantic-forest-soil-derived Penicillium
citreonigrum. Journal of Natural Products. 73: 942-948.
Wengenack, N. L. and Binnicker, M. J. 2009. Fungal molecular diagnosis. Clinics In
Chest Medicine. 30: 391-408.
Westerberg, U. B., Bolcsfoldi, G. and Eliasson, E. 1976. Control of transfer RNA
systhesis in the presence of inhibitors of protein synthesis. Biochimica et
Biophysica Acta. 447: 203-213.
137
Wetmur, J. G. 1991. DNA probes: applications of the principles of nucleic acid
hybridization. Critical Reviews in Biochemistry and Molecular Biology. 26:
227-259.
White, T. J., Bruns, T. Lee, S. and Taylor, J. W. 1990. Amplification and direct
sequencing of fungal ribosomal RNA genes for phylogenetics. In: PCR
protocols: A guide to methods and applications. Innis, M. A., Gelfand, J.,
Sninsky, J. and White, T. J., Eds. Academic Press, Inc., San Diego., pp 315-
322.
Whyte, A. C., Joshi, B. K., Gloer, J. B., Wicklow, D. T. and Dowd, P. F. 2000. New
cyclic peptide and bisindolyl benzenoid metabolites from the sclerotia of
Aspergillus sclerotiorum. Journal of Natural Products. 63: 1006-1009.
Windham, A. S. and Lucas, L. T. 1987. A qualitative baiting technique for selective
isolation of Rhizoctonia zeae from soil. Phytopathology. 77: 712-714.
Worapong, J., Sun, J. and Newcombe, G. 2009. First report of Myrothecium roridum
from a gymnosperm. North American Fungi. 4: 1-6.
Xiao-Yan, S., Qing-Tao, S., Shu-Tao, X., Xiu-Lan, C., Cai-Yun, S. and Yu-Zhong, Z.
2006. Broad-spectrum antimicrobial activity and high stability of
trichokonins from Trichoderma koningii SMF2 against plant pathogens.
Federation of European Microbiological Societies. 260: 119-125.
Yongchalermchai, C., Nilnond, C. and Pechkeo, S. 2011. A study of diversity of soils
and morphology with their chemical and physical properties. The complete
research report, Prince of Songkla University, Songkhla, Thailand.
Yurchenko, A. N., Smetanina, O. F., Kalinovskii, A. I., Kirichuk, N. N., Yurchenko,
E. A. and Afiyatullov, S. S. 2013. Biologically active metabolites of the
facultative marine fungus Penicillium citrinum. Chemistry of Natural
Compounds. 48: 996-998.
138
Zhao, R., Li, J., Peng, H., Li,Y., Wang, L. and Ye, B. 2012. Isolation and structure
elucidation of antibacterial metabolites from marine-derived Penicillium strain
XGH2321. Zhongguo Kangshengsu Zazhi. 37: 261-264.
Zhao, Y., Kim, Y. J., Oh, K. T., Nguyen, V.N. and Park, R. D. 2010. Production and
characterization of extracellular chitin deacetylase from Absidia corymbifera
DY-9. Journal of the Korean Society for Applied Biological Chemistry. 53:
119-126.
Zotti, M., Machetti, M., Persi, A., Barabino, G. and Parodi, A. 2011. Onychomycosis:
first case due to Aspergillus nomius. Acta Dermato Venereologica. 91: 591-
592.
Zuberer, D. A. and Wollum II, A. G. 2005. Introduction and historical perspective. In:
Principles and application of soil microbiology. 2nd
Ed. Yarnell, D., Ed.
Pearson Education, Inc.: New Jersey., 3-24.
http://biology.duke.edu/fungi/mycolab/primers.htm (accessed 23/06/2013).
http://commons.wikimedia.org/wiki/File:Lichen_squamulose.jpg
(accessed 22/06/2013)
http://forestpathology.cfans.umn.edu/microbes.htm (accessed 4/06/2013).
http://www.accessexcellence.org/RC/VL/GG/polymerase.php (accessed 21/06/2013).
http://www.ieahydro.org/reports/Annex_VIII_CaseStudy0701_ChiewLarn_Thailand.
pdf (accessed 24/06/2013).
http://www.lutzonilab.net/primers/page244.shtml (accessed 22/02/2013).
http://www.ncbi.nlm.nih.gov (accessed 12/12/2012).
http://www.tmd.go.th/programs/uploads/yearlySummary/T_weather2553.pdf
(accessed 13/12/2013).
http://www.uoguelph.ca/~gbarron/N-D%20Fungi/n-dfungi.htm (accessed 5/06/2013).
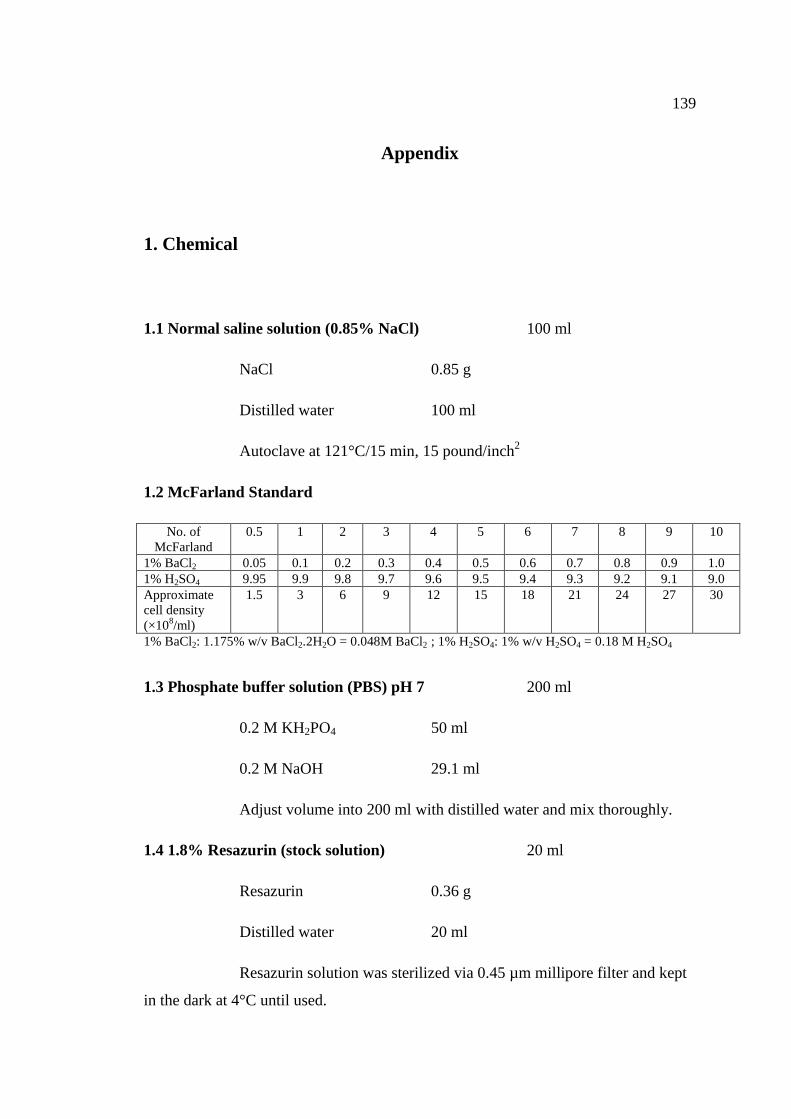
139
Appendix
1. Chemical
1.1 Normal saline solution (0.85% NaCl) 100 ml
NaCl 0.85 g
Distilled water 100 ml
Autoclave at 121°C/15 min, 15 pound/inch2
1.2 McFarland Standard
No. of
McFarland
0.5 1 2 3 4 5 6 7 8 9 10
1% BaCl2 0.05 0.1 0.2 0.3 0.4 0.5 0.6 0.7 0.8 0.9 1.0
1% H2SO4 9.95 9.9 9.8 9.7 9.6 9.5 9.4 9.3 9.2 9.1 9.0
Approximate
cell density
(×108/ml)
1.5 3 6 9 12 15 18 21 24 27 30
1% BaCl2: 1.175% w/v BaCl2.2H2O = 0.048M BaCl2 ; 1% H2SO4: 1% w/v H2SO4 = 0.18 M H2SO4
1.3 Phosphate buffer solution (PBS) pH 7 200 ml
0.2 M KH2PO4 50 ml
0.2 M NaOH 29.1 ml
Adjust volume into 200 ml with distilled water and mix thoroughly.
1.4 1.8% Resazurin (stock solution) 20 ml
Resazurin 0.36 g
Distilled water 20 ml
Resazurin solution was sterilized via 0.45 µm millipore filter and kept
in the dark at 4°C until used.
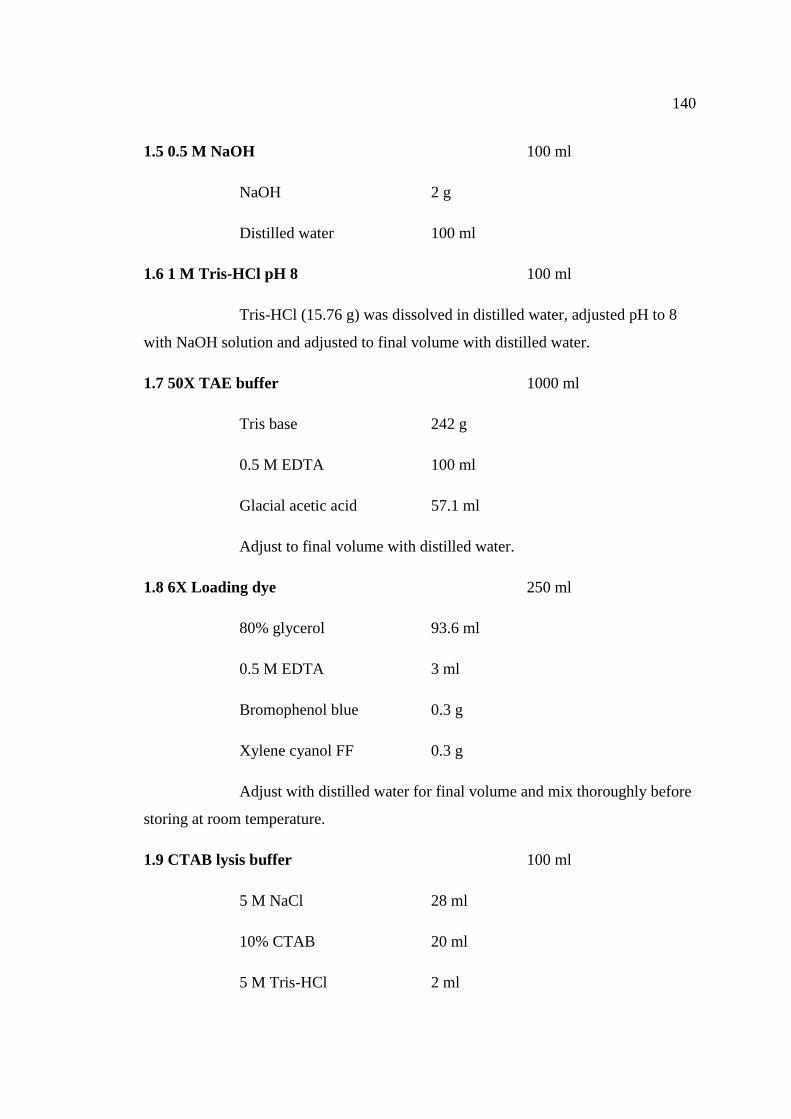
140
1.5 0.5 M NaOH 100 ml
NaOH 2 g
Distilled water 100 ml
1.6 1 M Tris-HCl pH 8 100 ml
Tris-HCl (15.76 g) was dissolved in distilled water, adjusted pH to 8
with NaOH solution and adjusted to final volume with distilled water.
1.7 50X TAE buffer 1000 ml
Tris base 242 g
0.5 M EDTA 100 ml
Glacial acetic acid 57.1 ml
Adjust to final volume with distilled water.
1.8 6X Loading dye 250 ml
80% glycerol 93.6 ml
0.5 M EDTA 3 ml
Bromophenol blue 0.3 g
Xylene cyanol FF 0.3 g
Adjust with distilled water for final volume and mix thoroughly before
storing at room temperature.
1.9 CTAB lysis buffer 100 ml
5 M NaCl 28 ml
10% CTAB 20 ml
5 M Tris-HCl 2 ml
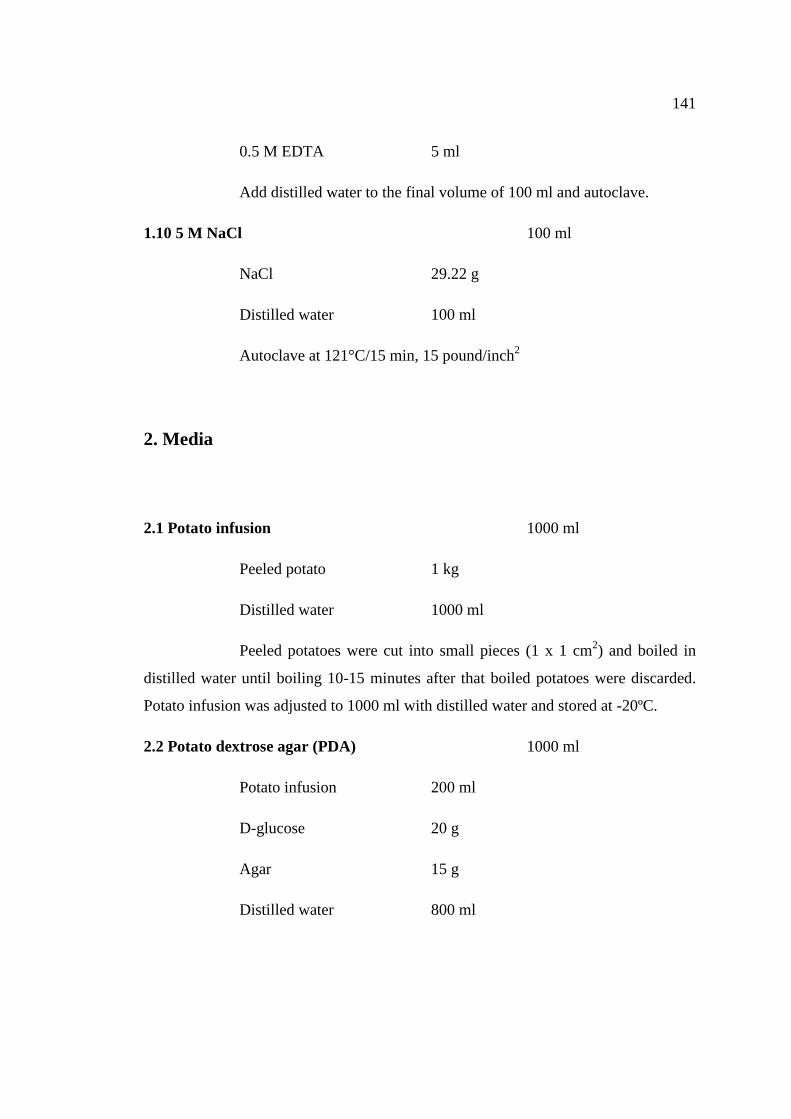
141
0.5 M EDTA 5 ml
Add distilled water to the final volume of 100 ml and autoclave.
1.10 5 M NaCl 100 ml
NaCl 29.22 g
Distilled water 100 ml
Autoclave at 121°C/15 min, 15 pound/inch2
2. Media
2.1 Potato infusion 1000 ml
Peeled potato 1 kg
Distilled water 1000 ml
Peeled potatoes were cut into small pieces (1 x 1 cm2) and boiled in
distilled water until boiling 10-15 minutes after that boiled potatoes were discarded.
Potato infusion was adjusted to 1000 ml with distilled water and stored at -20ºC.
2.2 Potato dextrose agar (PDA) 1000 ml
Potato infusion 200 ml
D-glucose 20 g
Agar 15 g
Distilled water 800 ml
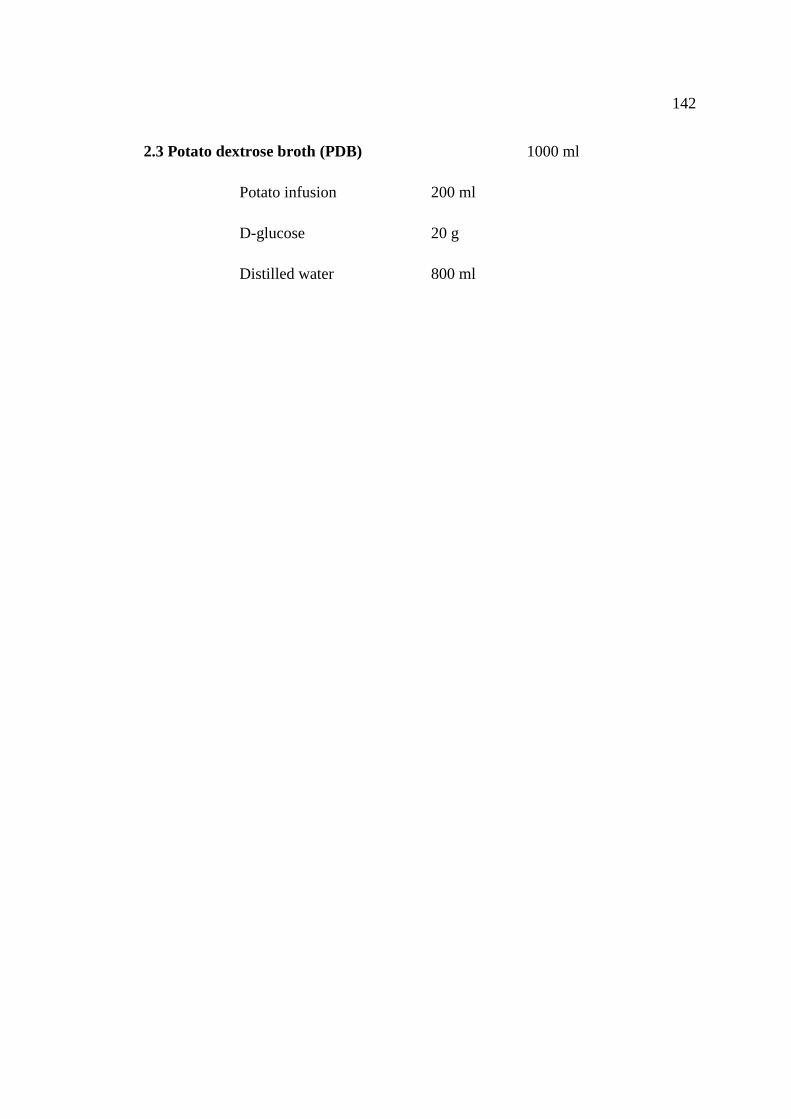
142
2.3 Potato dextrose broth (PDB) 1000 ml
Potato infusion 200 ml
D-glucose 20 g
Distilled water 800 ml
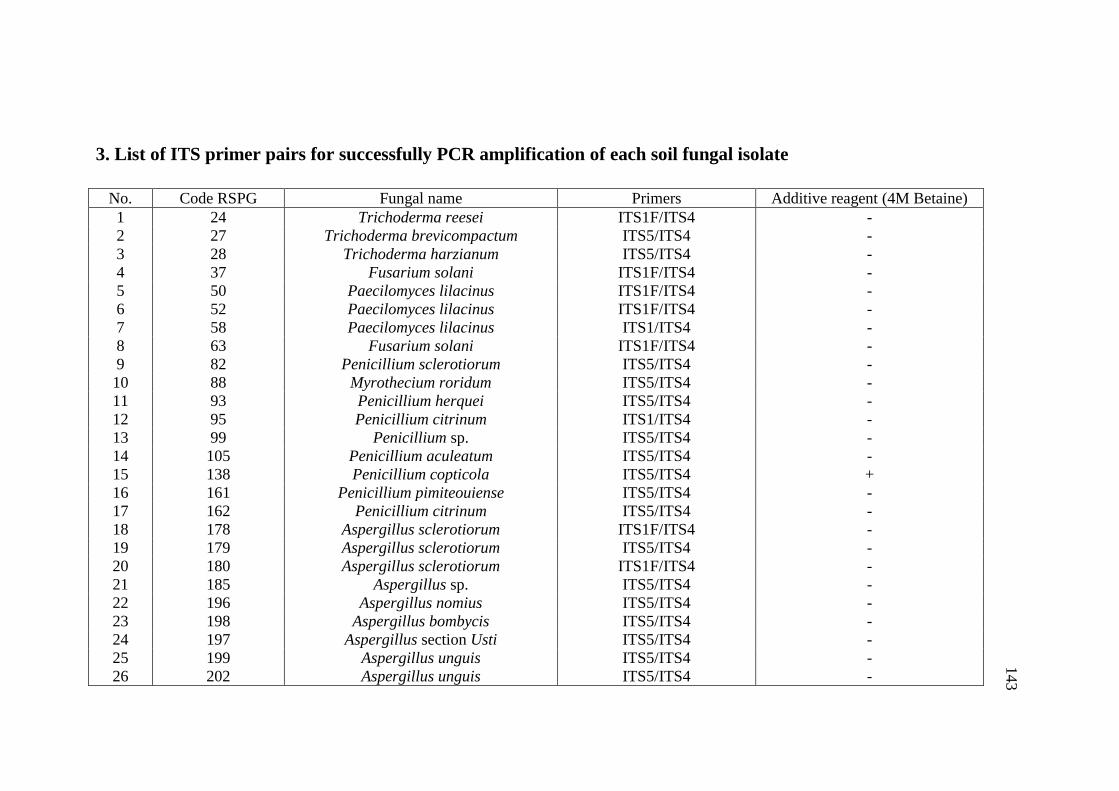
140
3. List of ITS primer pairs for successfully PCR amplification of each soil fungal isolate
No. Code RSPG Fungal name Primers Additive reagent (4M Betaine)
1 24 Trichoderma reesei ITS1F/ITS4 -
2 27 Trichoderma brevicompactum ITS5/ITS4 -
3 28 Trichoderma harzianum ITS5/ITS4 -
4 37 Fusarium solani ITS1F/ITS4 -
5 50 Paecilomyces lilacinus ITS1F/ITS4 -
6 52 Paecilomyces lilacinus ITS1F/ITS4 -
7 58 Paecilomyces lilacinus ITS1/ITS4 -
8 63 Fusarium solani ITS1F/ITS4 -
9 82 Penicillium sclerotiorum ITS5/ITS4 -
10 88 Myrothecium roridum ITS5/ITS4 -
11 93 Penicillium herquei ITS5/ITS4 -
12 95 Penicillium citrinum ITS1/ITS4 -
13 99 Penicillium sp. ITS5/ITS4 -
14 105 Penicillium aculeatum ITS5/ITS4 -
15 138 Penicillium copticola ITS5/ITS4 +
16 161 Penicillium pimiteouiense ITS5/ITS4 -
17 162 Penicillium citrinum ITS5/ITS4 -
18 178 Aspergillus sclerotiorum ITS1F/ITS4 -
19 179 Aspergillus sclerotiorum ITS5/ITS4 -
20 180 Aspergillus sclerotiorum ITS1F/ITS4 -
21 185 Aspergillus sp. ITS5/ITS4 -
22 196 Aspergillus nomius ITS5/ITS4 -
23 198 Aspergillus bombycis ITS5/ITS4 -
24 197 Aspergillus section Usti ITS5/ITS4 -
25 199 Aspergillus unguis ITS5/ITS4 -
26 202 Aspergillus unguis ITS5/ITS4 -
14
3
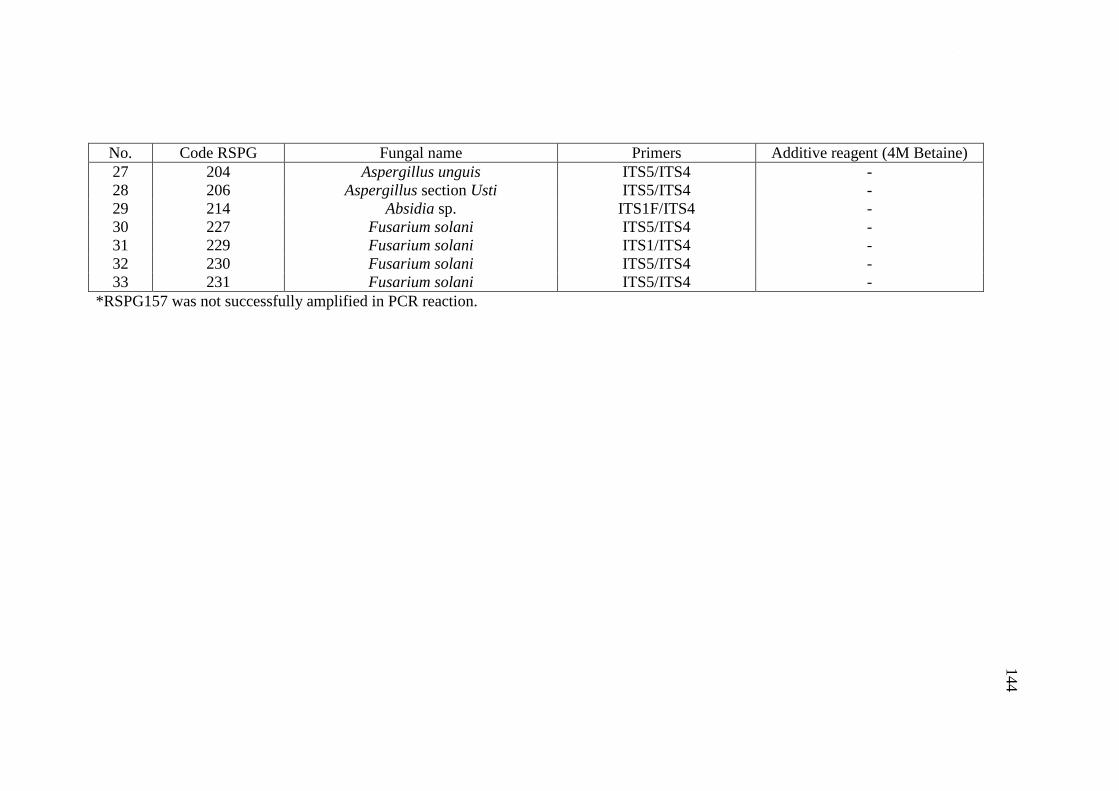
141
No. Code RSPG Fungal name Primers Additive reagent (4M Betaine)
27 204 Aspergillus unguis ITS5/ITS4 -
28 206 Aspergillus section Usti ITS5/ITS4 -
29 214 Absidia sp. ITS1F/ITS4 -
30 227 Fusarium solani ITS5/ITS4 -
31 229 Fusarium solani ITS1/ITS4 -
32 230 Fusarium solani ITS5/ITS4 -
33 231 Fusarium solani ITS5/ITS4 -
*RSPG157 was not successfully amplified in PCR reaction.
144
145
VITAE
Name Miss Kawitsara Borwornwiriyapan
Student ID 5410220004
Educational Attainment
Degree Name of Institution Year of Graduation
Bachelor of Science Prince of Songkla University 2006
(Microbiology)
Bachelor of Science Sukothai Thammathirat Open University 2012
(Marketing)
Scholarship Awards during Enrolment
- Centre of Excellence for Innovation in Chemistry (PERCH-CIC)
- Plant Genetic Conservation Project Under The Royal Initiative of Her Royal
Highness Princess Maha Chakri Sirindhorn (RSPG)
- Natural Products Research Center of Excellence (NPRC)
- Teacher Assistant (TA)
List of Publication and Proceeding
Borwornwiriyapan, K., Phongpaichit, S., Sakayaroj, J. and Rukachaisirikul, V. 2013.
Penicillium spp. isolated from soil from Surat Thani province and their
antimicrobial activity. The 1st Academic Science and Technology Conference
2013, 18th
March 2013, The Ambassador Hotel, Bangkok, Thailand.
Poster presentation
Borwornwiriyapan, K., Phongpaichit, S., Sakayaroj, J. and Rukachaisirikul, V. 2011.
Antimicrobial activity of Trichoderma spp. isolated from soils from Surat
Thani, Thailand. Asian Mycological Congress 2011 & the 12th
International
146
Marine and Freshwater Mycology Symposium, 7-11th
August 2011,
Convention Center, University of Incheon, Incheon, The Republic of Korea.
Borwornwiriyapan, K., Phongpaichit, S., Sakayaroj, J. and Rukachaisirikul, V. 2011.
Antimicrobial activity of Aspergillus spp. isolated from soils from Surat
Thani, Thailand. 1st International Congress on Natural Products, 17-18
th
October 2011, Khao Lak Emerald Beach Resort & Spa, Phang Nga, Thailand.
Borwornwiriyapan, K., Phongpaichit, S., Sakayaroj, J. and Rukachaisirikul, V. 2013.
Screening of soil fungi from Rajjaprabha dam, Surat Thani province which
produced antimicrobial substances. The International Congress for Innovation
in Chemistry (PERCH-CIC Congress VIII) “Chemistry for Creative
Economy”, 5-8th
May 2013, Jomtien Plam Beach Hotel & Resort Pattaya,
Chonburi, Thailand.
List of Awards
- The best poster presentation in major of Basic Science from the 1st Academic
Science and Technology Conference 2013
- Outstanding poster presentation in major of Innovation in Bioactive Natural
Products from the International Congress for Innovation in Chemistry
(PERCH-CIC Congress VIII)