
A Thesis Submitted in Partial Fulfillment of the requirements ...
183
DETERMINANTS OF THE LIKELIHOOD OF ADOPTION OF CONCENTRATED SOLAR POWER TECHNOLOGY BY TEA FACTORIES IN KENYA DAVID MUCHUNU MAGU A Thesis Submitted in Partial Fulfillment of the requirements for the Award of Doctor of Philosophy in Business Administration and Management in the School of Business Management and Economics of Dedan Kimathi University of Technology MARCH, 2019
-
Upload
khangminh22 -
Category
Documents
-
view
0 -
download
0
Transcript of A Thesis Submitted in Partial Fulfillment of the requirements ...

DETERMINANTS OF THE LIKELIHOOD OF ADOPTION OF
CONCENTRATED SOLAR POWER TECHNOLOGY BY TEA FACTORIES
IN KENYA
DAVID MUCHUNU MAGU
A Thesis Submitted in Partial Fulfillment of the requirements for the
Award of Doctor of Philosophy in Business Administration and
Management in the School of Business Management and Economics
of Dedan Kimathi University of Technology
MARCH, 2019

ii
DECLARATION
This thesis is my original work and has not been presented for the award of a degree in any
other University for examination.
Signature: ________________________ Date ____________________
David Muchunu Magu
B311-03-1569/2014
APPROVAL
This thesis has been submitted with our approval as University Supervisors
Signature: ________________________ Date ____________________
Dr. Lilian Mwenda, PhD.
School of Business Management and Economics
Dedan Kimathi University of Technology
Signature: ________________________ Date ____________________
Dr. David Kiragu, PhD.
School of Business Management and Economics
Dedan Kimathi University of Technology

iii
DEDICATION
I first dedicate this thesis to my late parents Mr. Ezekiel Magu Muchunu and Mrs. Ziporah
Wairimu Magu for all sacrifices they made to see me grow and prosper. This work is also
dedicated to my wife Njeri, my daughters Wairimu & Waithira, and my son Magu whose
substantial time and other resources were diverted for this study.

iv
ACKNOWLEDGEMENT
I am sincerely grateful to my supervisors Dr. Lilian Mwenda PhD and Dr. David Kiragu
PhD for their immense professional guidance, motivation and availability in my conduct of
this study. Their team support and encouragement was invaluable for the completion of this
thesis. I also wish to acknowledge Dedan Kimathi University of Technology for according
me the learning opportunity and sponsorship.

v
TABLE OF CONTENTS
DECLARATION ................................................................................................................. ii
DEDICATION .................................................................................................................... iii
ACKNOWLEDGEMENT ................................................................................................. iv
TABLE OF CONTENTS .................................................................................................... v
FIGURES….. .................................................................................................................... viii
ABREVIATIONS AND ACRONYMS ............................................................................. ix
ABSTRACT.. .................................................................................................................... xiii
CHAPTER ONE: INTRODUCTION ............................................................................... 1
1.1 Background of the Study............................................................................................. 1
1.2 Statement of the Problem. ......................................................................................... 16
1.3 Research Objectives. ................................................................................................. 18
1.4 Research Hypotheses ................................................................................................ 19
1.5 Significance of the Study. ......................................................................................... 20
1.6 Delimitations of the Study. ....................................................................................... 22
1.7 Limitations of the Study. ........................................................................................... 23
1.8 Assumptions of the Study ......................................................................................... 24
1.9 Definition of Terms ................................................................................................... 25
CHAPTER TWO: LITERATURE REVIEW ................................................................ 27
2.1 Introduction ............................................................................................................... 27
2.3 Empirical Literature Review ..................................................................................... 42
2.4 Critique of Literature ................................................................................................ 61
2.5 Conceptual Framework ............................................................................................. 65
2.6 Operational Framework ............................................................................................ 67
2.7 Hypotheses Development ......................................................................................... 68
2.8 Chapter Summary ..................................................................................................... 73
CHAPTER THREE: RESEARCH METHODOLOGY ............................................... 74
3.1 Introduction ............................................................................................................... 74
3.2 Research philosophy ................................................................................................. 74
3.3 Research Design ........................................................................................................ 75
3.4 Target Population ...................................................................................................... 77
3.5 Sampling and Sampling Procedure ........................................................................... 78

vi
3.6 Data Collection ......................................................................................................... 78
3.7 Pilot Study ................................................................................................................. 79
3.8 Measurement and Scaling Technique ....................................................................... 82
3.9 Data Analysis and Presentation ................................................................................. 84
3.10 Chapter Summary ................................................................................................... 93
CHAPTER FOUR: RESEARCH FINDINGS AND DISCUSSIONS .......................... 94
4.1 Introduction ............................................................................................................... 94
4.2 Response Rate ........................................................................................................... 94
4.3 Data on the Adoption of CSPT by Tea Factories ...................................................... 99
4.4 Attributes and Likelihood of CSPT Adoption ........................................................ 101
4.5 CSPT Awareness and CSPT Adoption ................................................................... 107
4.6 Organization Complexity and CSPT Adoption ...................................................... 114
4.7 Access to Finance and Likelihood of CSPT Adoption ........................................... 121
4.8 CSPT Standardization and Likelihood of CSPT Adoption ..................................... 127
4.9 Combined Influence of the Determinants of CSPT Adoption ................................ 132
4.10 Chapter Summary. ................................................................................................. xiii
CHAPTER FIVE:SUMMARY, CONCLUSIONS AND RECOMMENDATIONS .. xiv
5.1 Introduction .............................................................................................................. xiv
5.2 Summary .................................................................................................................. xiv
5.3 Conclusions .............................................................................................................. xix
5.4 Recommendations .................................................................................................... xxi
5.5 Areas for Further Research ..................................................................................... xxii
REFERENCES ............................................................................................................... xxiii
APPENDICES ................................................................................................................ xxxi
APPENDIX I: INTRODUCTION LETTER ............................................................... xxxi
APPENDIX II: FACTORY MANAGERS QUESTIONNAIRE ................................ xxxii
APPENDIX III: THE 66 TEA FACTORIES RUN BY KTDA BY REGION .............. xlii
APPENDIX IV: LETTER OF RESEARCH AUTHORIZATION ............................ xliii
APPENDIX V: RESEARCH PERMIT ...................................................................... xliv

vii
LIST OF TABLES
Table 3.1: CSPT Adoption Variables and their Measurement Scales ....................... 85
Table 4.1: Distribution of Factory Manager’s Age .................................................... 95
Table 4.2: Distribution of Factory Manager’s Experience......................................... 96
Table 4.3: Factory Sources of Heat Energy ............................................................... 96
Table 4.4: Challenges of Current Sources of Energy heat ......................................... 98
Table 4.5: Factories CSPT Adoption Stage ............................................................... 99
Table 4.6: Factory CSPT Adoption Status Skewness and Kurtosis ......................... 100
Table 4.6: Descriptive Statistics of CSPT attributes ................................................ 103
Table 4.7: Model CSPT adoption and CSPT attributes Statistics ............................ 104
Table 4.8: General Awareness of CSPT of Current Sources of Energy. ................. 108
Table 4.9: Awareness Creation Approaches ............................................................ 110
Table 4.10: Model CSPT adoption and CSPT Awareness Statistics ....................... 112
Table 4.11: Factory Managers Response on Factory’s Current Capacity Status ..... 115
Table 4.12: Factory Managers Responses on Technical Training Approaches ....... 117
Table 4.13: Technical Training Approaches and Adoption of CSPT ...................... 118
Table 4.14: Managers Responses on Access to Finance Statistics .......................... 122
Table 4.15: Access to Finance & Likelihood to Enhance Adoption of CSPT ......... 126
Table 4.16: Managers Responses on Standardization Elements Preferred .............. 128
Table 4.17: CSPT Standardization & Likelihood to Enhance Adoption of CSPT .. 129
Table 4.18: Combined Influence of the Determinants of Adoption of CSPT. ......... 132
Table 4.19: CSPT Adoption Model Parameters ....................................................... 134
Table 4.20: Determinants of the Adoption of CSPT ................................................ 138

viii
LIST OF FIGURES
Figure 2.1: The S Curve of Technology Diffusion .................................................... 35
Figure 2.2 Conceptual Framework ............................................................................. 65
Figure 2.3 Operational Framework ............................................................................ 68
Figure 4.1 Factory CSPT Adoption Status Q-Q Plot ............................................... 101
Figure 4.2 Revised Conceptual Framework ............................................................. 137

ix
ABREVIATIONS AND ACRONYMS
AC Absorption Capacity
ADB Asian Development Bank
ANOVA Analysis Of Variance
ASBE Association for Small Business & Entrepreneurship
CD Compact Disc
CHP Combined Heat and Power
CL Collateral
CO2 Carbon Dioxide
CRIG Cocoa Research Institute of Ghana
CSH Solar Concentrating Heat
CSP Concentrated Solar Power
CSPT Concentrated Solar Power Technology
CST Solar Concentrating Technology
DPR Detailed Project Report
DVD Digital Versatile Disc
EE Energy Efficiency
Energy4ALL Energy for All
ESTIF European Solar Thermal Industry Federation
ETC Evacuated Tube Collectors
ETSAP Energy Technology Systems Analysis Program
FAO Food and Agriculture Organization
FEP Formal Education Programs
FPC Flat-Plate Collectors
GBTs Green Building Technologies
GDP Gross Domestic Product
GEF Global Environment Facility
GG Grants from Government
GHG Green House Gases
GOK Government of Kenya
GW Gigawatts
IDC International Data Corporation
IEA International Energy Agency

x
IFEP Informal Education Programs
IISD International Institute for Sustainable Development
IPCC Intergovernmental Panel on Climate Change
IRENA International Renewable Energy Agency
ISC Insurance Schemes
ISO International Organization for Standardization
ITC International Trade Centre
JICA Japan International Cooperation Association
JKUAT Jomo Kenyatta University of Agriculture &Technology
JNNSM Jawaharlal Nehru National Solar Mission
KCAL Kilo Calories
KEBS Kenya Bureau of Standards
KEREA Kenya Renewable Energy Association
KM KEBS mark of Quality
KNBS Kenya National Bureau of Statistics
KTCO2 Kilotonnes Carbon Dioxide
KTDA Kenya Tea Development Agency
KW Kilowatt
KWH Kilowatt-Hour
MAG Magazines
MEDDESIRE Mediterranean Development of Support Schemes for Solar Initiatives
and Renewable Energies
MENA Middle East and North Africa
MLE Maximum Likelihood Estimation
MNRE Ministry of New and Renewable Energy
M.Techs Masters of Technology
MW Megawatts
NIC'S Newly Industrialized Countries
NISE National Initiative for Solar Energy
NP Newspapers
OECD Organization for Economic Co-Operation and Development
PhD Doctor of Philosophy
PLR Penalized Logistic Regression

xi
PMLE Penalized Maximum Likelihood Estimates
PNPCs Perceived New Product Characteristics
PPP Public Private Partnerships
PPR Public Presentations
PRC Peoples Republic of China
PV Photo Voltaic
RE Renewable Energy
RET Renewable Energy Technology
SBS Subsidies
SDGs Sustainable Development Goals
SEGS Solar Energy Generating Systems
SEIA Solar Energy Industries Association
SHS Solar Homes Systems
SMS Short Message Service
SPPU Savitribai Phule Pune University
TV Television
UK United Kingdom
UN United Nations
UNDP United Nations Development Programme
UNEP United Nations Environmental Programme
UNIDO United Nations Development Programme
US United States of America
USA United States of America
USD USA Dolar
VETIs Vocational Education Training Institutes
VC Venture Capital
WEF World Economic Forum.
Wts Watts
WRST World Renewable Spiritual Trust
WSP Workshops

xii

xiii
ABSTRACT
This study focused on the Kenyan tea industry which has been faced with the challenge of identifying a sustainable source of process heat energy. Sixty five of the factories managed by Kenya Tea Development Agency (KTDA) use fuel wood and minimal fuel oil for process heat generation. Both these sources are not sustainable due to their high costs, depletion and negative impact on the environment. This challenge threatens future survival of the industry, Kenya foreign exchange earnings and the livelihood of the 600,000 small scale tea farmers. One source of heat energy that has been recommended for the industry is the concentrated solar power technology (CSPT). This is a renewable energy source that can be used to replace about thirty per cent of the wood and oil sources. It would be cheaper, more environmental friendly and would greatly enhance the survival of the tea industry and by extension the livelihood of the farmers. However, despite its apparent benefits and promise, by 2013 the CSPT technology had not been adopted by any of the 66 tea companies under KTDA. The general objective of this study was to investigate the determinants of the likelihood for the adoption of Concentrated Solar Power technologies by the Kenyan tea factories run by KTDA. Specifically the study investigated the effect of the variables CSPT attributes, CSPT awareness, organization complexity, access to finance and standardization on the likelihood of the adoption of CSPT by tea factories managed by KTDA. The target population was all the sixty six factories managed by KTDA while the respondents were factory unit managers of the 66 tea factories.. The study was a cross-sectional survey taking a quantitative approach with descriptive and inferential statistical outcomes. This adoption study was anchored on the diffusion of Innovations theory. Other theories applied were UNESCO awareness raising model, the World Bank’s commercial financial instruments for renewable energy model, and the ISO guide on standardization. Data collection was done using a structured questionnaire which was piloted in four private tea factories to test its reliability and validity. The questionnaires were delivered and picked by the researcher and a 100% response rate was attained. A binary logistic regression model was used to analyse data, making use of IBM SPSS statistics version 23 and STATITICA version12 software to generate statistics that enabled hypothesis testing. Most of the managers (89%) were not aware of the concentrated solar power technology but all had the education level necessary for CSPT training. On testing the hypotheses, CSPT attributes, CSPT awareness, organizational technical capacity, and CSPT standardization were found to be statistically significant with a likelihood to influence the adoption of CSPT. CSPT attributes were found to be the most likely variable to influence adoption of CSPT by the tea factories, followed by CSPT awareness, CSPT standardization and organizational technical capacity respectively. Access to finance was not found to have a significant likelihood of influencing the adoption of CSPT. In conclusion there is minimal adoption of CSPT among tea factories managed by KTDA mainly due to lack of awareness of its existence and its benefits over wood and oil sources of heat energy. The managers and technicians in the factories have basic education but need specialized training on CSPT. Standards on the quality of the technology and its installation were also found to be key in minimizing uncertainty among the potential users and therefore enhance chances of adoption. The researcher recommends massive awareness creation campaigns on CSPT particularly through exhibitions, electronic publications, workshops, newspapers and brochures. Training courses in-house or abroad should be arranged for technical staff to enable them for CSPT adoption. There is also need to ensure CSPT products and the service providers are ascertained as to their adherence to quality standards and practices.

1
CHAPTER ONE
INTRODUCTION
1.1 Background of the Study
The Kenyan tea industry is faced with the challenge of identifying a sustainable source of
process heat energy (Rawlins & Ashcroft, 2013). Sixty five (65) of the 66 factories run by
Kenya Tea Development Agency (KTDA) use fuel wood and once in a while use fuel oil
(Kamau, Kiplagat & Mwenda, 2015). Both these sources are not sustainable due to their
high costs, depletion and negative impact on the environment. This challenge threatens
future survival of the industry and the livelihood of the 600,000 small scale tea farmers
whose 80% income is from tea. The industry is therefore in search of more sustainable
sources of heat energy. One of the heat energy sources recommended for the industry is
concentrated solar technology. The industry and the energy challenge it is facing is
discussed in the following sections.
1.1.1 The Tea Industry
Tea is currently grown in 35 countries in the world (Forum for the Future, 2015). The tea
industry is a key employer and generator of foreign exchange in the world, and more so in
the developing countries. There are several classes of people that are dependent on tea for
their livelihood. They start with tea farmers and tea pickers who get over 80% of their
incomes from tea. Others are traders and dealers engaged in the tea supply chain
worldwide, and lastly are the consumers who every day look up for a cup of tea to energize
their day. The industry, therefore, has tremendous impact on many people’s lives in the
world.

2
China is the biggest tea producer, followed by India, then Kenya and Sri Lanka, in that
order (Gunathilaka & Tularan, 2016). China contributes 28% of world tea production, India
25%, Kenya 9% and Sri Lanka at 8.5%. Other notable tea producing countries are Malawi,
Rwanda, Tanzania and Uganda, while minor producers include Nepal, Peru, Papua New
Guinea, Zimbabwe, Turkey, Vietnam, Indonesia, Argentina, and Bangladesh. The global
market for tea was estimated to be around USD 15.4 billion in 2013 in terms of production
value and USD 40.7 billion in terms of retail value. Beyond economic gains for the
producers, tea productions also deliver other important ecosystem services such as carbon
prevention, soil fertility protection and water conservation. Indeed, the survival and well-
being of many people in the world rely on tea as an antioxidant.
The tea supply chain is dominated by multinational companies (Groosman, 2011). About
80% of tea production in the world is sold by multinational organizations. Two major
organizations in the trade are Unilever and Tata Tea. Unilever controls about 12% of the
world production, while Tata has a 4% market share. Other multinationals in the tea
industry are Associated British Foods, Van Rees and James Finlay. Overall, only seven
organizations control over 85% of tea produced and consumed worldwide (Agritrade,
2012). Most of these organizations are multinational companies with operations covering
the entire tea supply chain. They grow tea in plantations, are packers and distributors of tea
in different parts of the world. Tea value addition is higher after primary production in the
farms. Blending is one of the operations that improves on tea value. Other such operations
are packing and branding. These later stages in the tea supply chain actually take up to 80%
of tea shelve price (Agritrade, 2012). These high value operations are mostly done in the
multinationals facilities in their home countries in Europe and other developed countries.

3
According to Food and Agriculture Organization (FAO) (2015), the margin between
processed packed tea prices and primary auction prices has been widening, implying that
the tea growers are not benefiting from the rising consumer market for processed tea
products. The main tea importers are seven countries. These are the Russian Federation, the
United Kingdom, Pakistan, United States of America, Iraq, Egypt and United Arab
Emirates.
Energy is a key input in tea processing (Kamau et al, 2015). Heat energy is used to remove
moisture from the green tea leafs. It is also used to further dry the fermented teas. On the
other hand electrical energy is used in almost all stages of tea processing operations.
Overall energy costs will comprise about thirty percent (30%) of the total costs of tea
processing (Baruah, Punja & Rao, 2012). Several activities require different types of energy
of varying intensity in tea processing. The key operations are withering, fermentation,
drying, sifting and packing. These operations make use of electrical, heat and human
energy. Over 80% of the energy requirement in tea processing is heat energy used to
remove moisture from tea leaves during withering and also drying (Baruah et al, 2012). To
make a kilogram of ready tea requires 3.5-6 kWh of heat energy, 0.21 - 0.5 kWh of
electrical energy plus 0.11 kWh of manpower. Further it requires about 32 kilo calories
(kcal) of energy for drying green tea leaves that will yield a teaspoon of tea. In the process
approximately 17 grams of carbon dioxide is emitted.
Tea in Kenya has been the country’s leading foreign exchange earner in the last ten years,
attaining export earnings of about Kshs 105 billion in 2013, an improvement over the Kshs
33 billion earnings in 2003 (Kenya National Bureau of Statistics (KNBS), 2015).

4
In 2014 tea exports generated 24% of Kenya’s foreign exchange earnings and the sector
employed 120,000 workers in addition to the 600,000 small holders who grow tea. Tea
production accounts for over 11 per cent of agriculture’s share of Kenya’s Gross Domestic
Product (GDP). Tea is also a catalyst for rural development as it is grown in 15 counties
across Kenya. The industry directly and indirectly is a source of livelihood for about five
million people in Kenya, making it one of the corner stones in economic well-being for
Kenyans. The Kenyan tea sub-sector is one of the industries in Kenya with a significant
need for process heat. Its energy requirement is in the temperature range of 60-80oC
(Rawlins & Ashcroft, 2013). The Kenya Tea Development Agency (KTDA) is mandated to
manage 55 Kenyan tea companies owned by small scale farmers. In 2011, thirty six (36) of
the companies run by KTDA complained of rising fuel costs as a key threat to their
organizations (Rawlins & Ashcroft, 2013). Almost all of the factories were using fuel wood
as their basic source of heat energy. However, wood supply was declining as trees and
forests got depleted. Prices of wood were also rising. This scenario triggered plans by thirty
four (34) of the companies to plan to plant their own trees. They identified eucalyptus trees
as a viable tree to be grown in plantations on the factories land as a self-reliant and
sustainable source of wood fuel. This was to be attained by the year 2015. This initiative
was, however, faced by the challenge of inadequate land for sustainable wood production
for the increasing demand of heat energy.
In the same period seventeen (17) factories were reported to be using fuel oil for heat
generation. These factories complained of rising oil prices, and were reported to have
decided to change from using fuel oil as their heat energy source (Rawlins & Ashcroft,
2013). Further, these factories were reported to have used 3.6 million litres of oil in 2011,
which resulted in carbon dioxide (CO2) emissions of about 14 kilo tonnes carbon dioxide

5
(ktCO2). The tea factories were reported to be the target of the sole supplier of small-scale
CSPT technology in Kenya, and the study by Carbon Trust suggested 1.1 million litres
(30%) of their fuel demand could be replaced and 4.3 ktCO2 carbon emissions averted by
use of CSPT.
1.1.2 Solar Energy Technology
Technological improvements, accompanied by a surging interest in use of green energy
technologies, have made solar energy technologies a prime focus area for renewable energy
development (Association for Small Business & Entrepreneurship (ASBE), 2009). The
escalation of global prices of sources of heat energy coupled with an emerging strong
interest in use of green and renewable technologies has instigated great focus on and growth
in solar energy technologies. The cost to produce solar energy has decreased by 70-80% in
recent years, (IISD, 2014). Although these improvements in cost are significant, some
barriers have been reported to hinder the solar technologies from attaining extensive
adoption. The barriers cited to hinder market penetration of the solar technologies include
lack of regulations on new renewable energy technologies, poor leadership, financing risks,
and high cost of financing.
There are two broad solar technology types: solar photovoltaic and solar thermal
technologies. Solar photovoltaic (PV) is a technology through which sun energy is
transformed to electrical energy (Bhutta, 2012). PV is used for domestic, commercial and
industrial purposes. In homes its used for lighting and for water heating, for example using
solar home systems (SHS) of about 2000 watts. In industries it is used for lighting and also
heating with solar power plants in the range of 10 kilowatts (kW) to 20 megawatts (MW).

6
On the other hand, solar thermal technology changes sun energy into heat energy. It is used
in commercial and industrial enterprises for water heating and steam generation for various
operations. Milk pasteurization and condensation is one common application of thermal
energy. Others are drying in tea factories and tanning in leather industries (Bhutta, 2012).
Solar heat technologies used in industrial processing are broadly classified into three
categories. These are solar air collectors, solar water systems, and solar concentrators (IEA-
ETSAP & IRENA, 2015). Solar air collectors are mostly used in the food industries for
drying and moisture reduction to avert food spoilage. Solar water systems are commonly
found in homes mostly used to heat water for bathing, swimming pools and cooking. Others
are installed on light industry’s rooftops for water heating and steam generation of up to
about 125oC. Examples of these solar water systems are flat-plate collectors (FPC) and
evacuated tube collectors (ETC). Solar concentrators use mirrors to concentrate sun rays to
generate heat. There are various types of concentrators such as the parabolic dish, the linear
parabolic trough and the linear Fresnel. The concentrators can produce process heat in
industries, as well as provide on-grid or off-grid electricity (Rawlins & Ashcroft, 2013).
Even though solar heat technologies have exhibited a strong technical potential, and high
promise for economic benefits for industry processes, their adoption has been very low
(IEA-ETSAP & IRENA, 2015). To achieve higher market penetration, some new initiatives
have been recommended. They include creating greater awareness of the existence of, and
benefits of, using solar heating technologies among industries and small and medium
enterprises (SMEs). Others are providing financing especially for covering the initial
acquisition costs, and supporting use of solar heat energy technologies as an alternative to
subsidizing use of fossil fuels by industries.

7
1.1.3 Concentrated Solar Power Technology (CSPT)
Concentrated Solar Power Technology (CSPT) facilities use mirrors to focus sunlight on a
receiver, which receives, transforms and transfers the sun energy to a heat transfer fluid
which in-turn supplies heat direct for application in a process (IEA-ETSAP & IRENA
2015). Large CSPT facilities are fitted with a heat storage system used for storage and
supply of heat or electricity at night or when weather is unfavourable. Four CSPT
technologies are commonly used across the world. These are Parabolic Trough technology,
Fresnel Reflector technology, Solar Tower technology and Solar Dish technology.
Modern CSPT originates from the times of Solar Energy Generating Systems (SEGS)
constituted in the Mojave desert in California in the 1980s (Hu and Wu, 2013). The US
dithered in supporting CSPT systems owing to declining fossil fuel prices. However,
around 2006 the market re-emerged in Spain and the United States. This was mainly
triggered by government initiatives such as feed-in tariffs in Spain, and policies requiring
industries to use some share of power from renewable energy technologies. These CSPT
installations were used mainly to fuel plants in remote facilities such as mines and cement
factories. They were also applied in homes for cooling and heating, and for producing
steam for oil recovery in the United State.
By the year 2010 global stock of CSPTs installed was about 1 GW capacity, while Projects
in development stage or under construction in various countries (including China, India,
Morocco, Spain and the United States) were expected to total 15 GW (OECD/IEA, 2010).
By 2013 attention was shifting from European and US projects to those in other emerging
countries. China has lead the way, by first announcing in 2011 a target of 1GW of CSPT
installation. This target was raised in 2012 to 3GW for CSPT installed by 2015. Further, the

8
country’s 12th five-year plan highly emphasized the great promise of CSPT, and as a result
further raised the installation target to 10GW of commercial scale activity by 2020. The
country’s target of a 3GW CSPT installed capacity by 2015 would exceed the entire world
cumulative installation of 2.5GW. This would effectively make China the world’s CSPT
leader, leading in energy cost reductions, and increased rate of diffusion of CSPT in the
world as a key substitute of nuclear and fossil sources of power.
Several newly industrializing countries have moved fast to embrace the CSPT. India has
made great efforts for a strong CSPT sector, utilizing the country’s good solar insolation
(Hu and Wu, 2013). Within the Jawaharlal Nehru National Solar Mission (JNNSM)
framework, India is expected to produce 10GW of grid-connected solar power from CSPT
by 2020. By 2013 India was the global leader in CSPT industrial applications having 70
installed systems out of the approximately 100 installed worldwide (Rawlins & Ashcroft,
2013). According to a study conducted by UNDP, about 50 of the 70 CSPT systems were
being used for steam generation for very high volume cooking in religious institutions. The
technology was also being applied in other industries including dairies, bakeries, and
laundries.
South Africa has also emerged as a major CSPT player. The country’s potential of CSPT
projects has been estimated at about 40GW by Eskom, the principal electricity generator in
that country. The country has a big project targeting to build a 5GW solar park in the
Northern Cape. The country has strategized for a 100-fold expansion in CSPT installations
in the next decade and a half, reaching 100 GW by 2025 (Hu and Wu, 2013). Other players
in CSPTs development are in the Middle East and North Africa (MENA) region. Saudi
Arabia has committed herself in major CSPT projects for up to 25GW, which are to be

9
launched over the 2013 to 2030 period. The Middle Eastern and Gulf states have also been
making moves in adoption of CSPT. They are doing so in an effort to complement their oil
resource and also minimize dependence on oil. Saudi Arabia has announced a massive 25
GW CSPTs installation goal by year 2030, and Qatar is targeting 1.8 GW of CSPT capacity
by 2020. In a study on renewable energy potential in the Middle East/North Africa region,
by the German Aerospace Center, it was reported that by the year 2050, CSPT technologies
will cater for about half of the region’s electrical requirements, with a total installed
capacity of 390 GW (OECD/IEA, 2010). Reports from Japan indicate that several Japanese
districts are commissioning concentrated solar thermal (CST) plants to replace nuclear
power plants.
According to literatures reviewed so far, there is no evidence of installed CSPT projects in
Kenya. As per a report on a study conducted in Kenya in 2013 by Carbon Trust found there
were two dealers in small-scale concentrated solar energy systems by 2013 (one
specializing in concentrated solar thermal systems, and another one specializing on
concentrated PV) in Kenya. However there was no evidence of any installed CSPT systems
for either industrial process heat generation or lighting. (Rawlins & Ashcroft, 2013). The
sole dealer of thermal CSPT systems was reported not to have been aware of any installed
CSPT system in Kenya and claimed to have put in a lot of effort trying to gain acceptance
of CSPT for industrial applications, with no success.
Considering the Kenya solar energy resource estimated at 4 to 6 kWh per square meter per
day of solar insolation, the CSPT has been cited as a viable and sustainable source of heat
energy for the country. A prototype parabolic trough solar concentrator for steam
production developed at Jomo Kenyatta University of Agriculture and Technology

10
(JKUAT) generated a maximum temperature of steam of 248.3oC while average
temperature of steam produced was 150oC (Kawira et al., 2012). These results obtained
show that production of power using the sun flux is a viable undertaking in Kenya. Moving
away from wood fuel and fuel oil to CSPT in industries could reduce carbon emissions and
deforestation.
The study conducted in Kenya in 2013 by Carbon Trust expressed the viability of CSPT in
Kenya (Rawlins & Ashcroft, 2013). This study particularly singled out the tea industry as a
high potential beneficiary of CSPT. It that found the tea factories could replace 30% of their
energy requirement by taking up CSPT. The study farther suggested the possibility of
Kenya deploying many and varied CSPT systems across the country’s industrial sectors.
Various industries were cited that would potentially benefit from application of CSPT.
These were salt processing industry, food and beverages industry, dairy industry, and
pharmaceutical and cosmetics industries. Others were the textile industry, commercial
laundries, and hotel and catering establishments. Another potential area of application of
CSPT for industrial heat in Kenya is in cooling using absorption chillers, which is required
in the cut flower sub-sector, in dairies and fish processing industries.
Energy is cited as one of the infrastructural enablers of the three “pillars” of Kenya
Vision 2030 (GOK, 2007). The vision targeted more use of renewable energy sources to
reduce over-reliance on hydroelectricity and by extension the frequency of power outages.
The adoption of CSPT by the tea factories fits well in this desired vision. Further it is an
initiative fitting the UN blue print Energy4ALL by 2030, in which one key strategy is
doubling of contribution of renewable energy in the energy matrix by 2030 (IISD, 2014).
Adoption of CSPT would also leverage the country on the path to attaining the recently

11
formulated sustainable development goals (SDGs). By securing the tea industry it would be
an effort in reduction of poverty by providing sustainable jobs in accordance to SDG
number one (UN, 2017). It would also be in line with SDG number two which emphasizes
promotion of sustainable agriculture and SDG number eight which promotes sustainable
economic growth, employment and decent work for all. Finally, adoption of CSPT will be
in the right direction of combating climate change and its impacts as stipulated in SDG
number thirteen.
1.1.4 Adoption of Technology Innovations
Many authors have defined or described technology innovation’s adoption. One of the
earliest definitions of technology adoption was contributed by Rogers in his book,
Diffusion of Innovations. He defined adoption as a decision to make full use of an
innovation as the best course of action available (Rogers, 2003). A similar perspective was
given in a report of a study by UNEP in 2012 on Overcoming Barriers to the Transfer and
Diffusion of Climate Technologies in which adoption was described as a process by which
a technology is selected for use by an individual, an organization or a society (Boldt et al,
2012). Thus, technology adoption comprises a process by which a new technology is taken
up or installed by an individual, institution, company, or any other entity.
Aggregate adoption is referred to as technology diffusion. Technology diffusion refers to a
process through which a new innovation spreads in a society, industry, or country. The
innovation is gradually adopted by more and more members of the society, industry, or
country (Shoeb, 2014). At any one time it is measured by the proportion of the potential
users who have actually adopted the new innovation. Diffusion is, therefore, aggregate
adoption. It is the aggregate process of product penetration. The extent to which

12
innovations and new technologies contribute to economic growth and welfare in an industry
or country is highly determined by the rate of diffusion of the innovations and technologies.
According to Everett M. Rogers (Rogers, 2003) adoption takes place at the end of the
innovation decision process. This is the process through which an individual, or any other
decision making unit, gathers knowledge of an innovation, forms an attitude towards the
innovation, makes a decision to adopt or reject the innovation, implements the new idea and
finally confirm of the decision. The innovation decision process stages are briefly discussed
next.
The first stage is knowledge stage. Adoption of a new innovation usually starts with
seeking for knowledge on the innovation. It's difficult for one to commit to an innovation
before knowing about the innovation. The potential adopter needs to know of the existence
of the innovation, how the innovation works and how best to use the innovation (Shoeb,
2014). This awareness of the innovation is mostly gotten through the media (television,
newspaper, radio), peers, colleagues or mentors. Next is the persuasion stage. Having
gotten knowledge of an innovation, a person becomes more conscious of the benefits of the
technology. Such a person develops interest in the technology and seeks farther information
on the technology, for example its cost, current users views, its features, and how it works.
It is at this stage that a person start considering self as a potential adopter of a technology
and earnest consideration of whether to adopt the technology or not begins.
The third stage is decision stage. The choice to adopt or not adopt a technology is arrived at
in this stage. The stage often involves comparing the benefits and costs of the innovation,
generally trading-off advantages and disadvantages. From the trade-off analysis the
decision to accept or reject a technology is made (Rogers, 2003). The decision stage is

13
followed by implementation stage. The implementation stage involves putting the
technology into use. During the stage the technology is assessed on whether it meets the
adopters’ expectations and more guidance on the technology is sought to maximize on the
utility of the technology. The final stage is confirmation stage. This stage is attained when
an innovation is integrated and made use of fully by an adopter. At this juncture the adopter
wants to affirm that the right innovation decision was made. Nevertheless, sometimes the
original decision to adopt a technology may be rescinded (reversal) if there is dissonance
about the innovation adoption decision. In this case the adopter decides to stop the usage of
the technology.
1.1.5 Factors Influencing Technology Adoption
Within the stages described above several factors could arise that are likely to affect the
adoption of an innovation by the potential adopter, thereby influencing a positive or
negative adoption decision. First Rogers identified awareness of an innovation as key to
innovation adoption (Sahin, 2006). Awareness of the features, advantages and
disadvantages of a new technology helps to reduce uncertainty of adopting the technology.
Rogers also identified five characteristics of innovations that may be used to minimize
uncertainty in an innovation, which in-turn improves the likelihood of adoption. These were
the innovation’s relative advantage, its compatibility with technology in use, its complexity,
its trialbility, and observability. Relative advantage refers to the extent to which an
innovation is seen as being better than the technology currently in use (Sahin, 2006).
Compatibility refers to the extent to which an innovation is seen to abide with the existing
values, past experiences, and the requirements of the potential adopters (Shoeb, 2014;
Sahin, 2006). Complexity, on the other hand, is about the extent to which an innovation is

14
considered as relatively difficult to comprehend or use. Rogers noted that complexity and
adoption have an inverse relationship. Trialbility is the degree to which an innovation may
be tried before or tested before adoption (Shoeb, 2014; Sahin, 2006). The more a new
technology is triable, the more likely it is to be adopted. Finally, Rogers explained
observability as the extent to which the outcomes of use of an innovation are visibly evident
to others. He explained that observability is strongly promoted by role modelling and peer
observations, which in-turn enhance chances of innovation adoption.
Rogers later identified organization structure characteristics as determinants of technology
innovations adoption. Specific characteristics identified were centralization, organization
complexity, formalization, interconnectedness and Organizational slack (Rogers, 2003).
Centralization is considered as the extent to which power and control in an organization are
concentrated in the hands of a few individuals. It has been negatively associated with
innovativeness. Complexity refers to the extent to which members of the organization are
perceived to possess a relatively high level of knowledge, skills and expertise, which in-
turn is measured in terms of members' spectrum of occupational specialties and their levels
of professionalism (Rogers, 2003). Complexity is said to enhance organizational members’
potential for conception and generation of innovations. Formalization is about the extent to
which the organization emphasizes adherence to rules and procedures in the various
functions and roles of the members. Formalization is said to hinder conception of
innovations by members of the organization, but may encourage implementation of
innovations.
Interconnectedness refers to the extent to which the various units of an organization are
linked by interpersonal networks (Rogers, 2003). New ideas easily permeate through

15
various sections and groups of an organization if the organization has considerable
interconnectedness, and interconnectedness is said to have a positive relationship with
organizational innovativeness. Finally, Organizational slack refers to the extent to which
there are uncommitted resources in an organization. The more uncommitted resources
available the more innovative an organization is likely to be.
Other factors likely to determine adoption of innovations have been identified. Access to
finance has been cited in many studies as a major determinant of technology adoption
decisions (Silva, 2014; Topo, Moretta, Glorioso & Pansini, 2014; Hedeina, Pohlb, Mansorc
& Genderen, 2015). Non availability of financial incentives, flexible funding mechanisms,
high costs of capital and risks associated with new technologies have been highlighted as
drawbacks to new technology adoption. Another factor cited to hinder adoption of new
technologies is poor quality technologies. Technologies that fail due to poor quality cause
market spoilage, creating negative attitudes in potential customers’ minds, and thereby
deter further adoption of the technology (IRENA, 2013).
In summary technology adoption refers to a decision by which a new technology is taken
up by members of a society, industry or country. However a number of factors may
influence the potential adopters in making the adoption decision. These include the
potential adopters’ awareness of the technology, attributes of the technology and
availability of financial resources. Others are assurance of technology quality and in the
case of organizations, the organization structure characteristics.

16
1.1.6 Technology Adoption and Business Growth
Ability to adopt new technologies has been in the past found to be vital for national
economic growth (Comin & Hobijn, 2008). For instance, rapid economic growth of Japan
after the second world war, and the Asian ‘tigers’ in the 1990s, has been attributed to their
quick adoption of new technologies such as internet and innovative steelmaking processes.
As with the case of nations, technological innovation has been associated with promotion of
organization competitiveness, access to new markets, attainment of cost advantages and
repositioning to go up the value chain (Han & Park, 2017; Kasim & Altinay, 2016;
Gajavelli, 2018). Adoption of cutting edge technologies ahead of competing organizations
is a mechanism used to quickly respond to changing environment and for attaining
competitiveness. It is a pre-requisite for successful modern manufacturing organizations
(Eeva et al, 2018). As organizations grow they need to enhance their innovative capabilities
to survive and accelerate growth.
1.2 Statement of the Problem
The Kenya tea industry plays a big role in economic development of the country and
contributes to rural industrialization. Tea export accounts for about 25% of Kenya’s total
agricultural export income of which 62% is contributed by the smallholder tea factories.
There are sixty six smallholder tea factories in Kenya managed by KTDA that contribute
4% of the Kenyan economy GDP. Statistics indicate that over 600,000 households in Kenya
rely on tea farming as their sole source of livelihood. It is farther estimated that about 10%
(4,000,000) of the Kenya population indirectly rely on the tea sector as a source of income.
These statistics point to the tea as a key commodity and foreign exchange earner in Kenya.

17
The annual returns to the farmers are estimated to be less than 10% of the proceeds per
kilogram of processed tea. One of the key contributors of low returns to the farmer is the
cost of energy. Cost of heat energy erodes the incomes of the small farmers, threatening the
sustainability of tea farming in Kenya. If this trend continues, the scenario threatens
achievement of the economic pillar of Kenya vision 2030, and SDG 1 on reduction of
poverty. The factories are faced with the challenge of identifying a sustainable source of
process heat energy. By 2013 thirty four (34) of the factories were reported to be using
wood fuel to produce process heat, with the average tea factory using 20,000 cubic meters
of firewood annually, which equals about 60,000 trees. The others were reported to be
using fuel oil to generate process heat and were reported to have used 3.6 million litres of
oil in 2011, which resulted in carbon dioxide emissions of approximately 14 ktCO2. Both
the wood and oil sources are not sustainable due to their high costs, depletion of natural
resources, their negative health effects and their negative impact on the environment. This
challenge threatens future survival of the tea industry, Kenya foreign exchange earnings
and the earnings and livelihood of the 600,000 small scale tea farmers, whose 80% income
is from tea.
A source of heat energy that has been recommended by sustainable energy experts for the
industry is the concentrated solar power technology (CSPT). It has been observed to replace
30% of factories thermal energy requirements. This source would be cheaper, more reliable,
more environmental friendly and would cut on factory costs which in-turn would result in
higher payouts to the farmers. These would secure survival of the Kenya tea industry and
by extension the livelihood of the farmers. It would also give the country a nudge in the
accomplishment of Sustainable Development Goals (SDGs) 1 and 2 that emphasize
minimization of poverty and supporting people-centred rural development. The initiative

18
would also be a promotion of access to sustainable and modern energy, as well as leverage
on the fight to combat climate change and its impacts as envisaged in SDGs 7 and 13.
However, despite the apparent benefits and promise of CSPT, by 2013 the technology had
not been adopted by any of the 66 tea factories under KTDA. Technology innovation
adoption theories suggest a number of factors that are likely to influence adoption of new
technologies. These are attributes of the innovation, awareness of the technology, access to
finances by potential adopters, technical capacity of the adopting organization and existence
of assuring standards of the innovation among other factors. This study sought to
investigate the factors that are likely to influence the adoption of this solar innovation by
the tea factories run by KTDA.
1.3 Research Objectives
This study was be guided by the following objectives.
1.3.1 General Objective
The general objective of this study was to investigate the determinants of the likelihood of
the adoption of Concentrated Solar Power Technologies (CSPT) by Kenyan tea factories
run by KTDA.
1.3.2 Specific Objectives
This study sought to achieve the following specific objectives:
i) To analyse the effect of CSPT attributes on likelihood of the adoption of CSPT by the
KTDA run tea factories in Kenya.
19
ii) To assess the effect of CSPT awareness on the likelihood of the adoption of CSPT by
the KTDA run tea factories in Kenya.
iii) To assess the effect of organization complexity on the likelihood of the adoption of
CSPT by the KTDA run tea factories in Kenya.
iv) To evaluate the effect of access to finance on the likelihood of the adoption of CSPT
by the KTDA run tea factories in Kenya.
v) To assess the effect of CSPT standardization on the likelihood of the adoption of
CSPT by the KTDA run tea factories in Kenya.
1.4 Research Hypotheses
This study was be guided by the following null hypotheses.
General Objective.
H06: The independent variables (CSPT attributes, CSPT awareness, Organizational
technical capacity, access to finance and CSPT standardization) do not have a
significant combined effect on the likelihood of the adoption of CSPT by the
KTDA run tea factories in Kenya.
Objective One
H01: There is no significant relationship between CSPT attributes and likelihood of
adoption of CSPT by the KTDA run tea factories in Kenya.
Objective Two
H02: There is no significant relationship between CSPT awareness and likelihood of
adoption of CSPT by the KTDA run tea factories in Kenya.

20
Objective Three
H03: There is no significant relationship between organization complexity and
likelihood of adoption of CSPT by the KTDA run tea factories in Kenya.
Objective Four
H04: There is no significant relationship between access to finance and likelihood of
adoption of CSPT by the KTDA run tea factories in Kenya.
Objective Five
H05: There is no significant relationship between CSPT standardization and
likelihood of adoption of CSPT technologies by the KTDA run tea factories in
Kenya.
1.5 Significance of the Study
This study sought to give an insight into the factors that affect the adoption of CSPT
technologies in the Kenya tea industry. Such insight would play a big role in informing the
managements of the tea factories on adoption possibilities of the technology that may in
turn help them in mitigation of ills emanating from conventional sources of energy such as
fuel oil and fuel wood. The results of this study are likely to have significant impact on
other stakeholders.
The factories that install CSPT factories based on the studies recommendations will attain
some level of the much desired cost reduction through lower factory energy bills. This is
likely to translate to higher profits for the factories and better returns for the shareholders.
Beyond cost reduction CSPT provides an energy source available twenty four hours a day.
This alleviates the current situation where the factories are faced by intermittent energy

21
supply occasioned by regular power outages. The CSPT will also see a reduction of air
pollution as CSPT replaces part of biomass and oil fuel sources. This will improve
international acceptance of the factory products on account of environmental conservation
and global warming control. Further use of the CSPT will mean less health hazard
challenge for employees thereby improving workers health, motivation and ultimately
productivity.
Beyond the tea sector, CSPT is a universal source of process heat that can be applied in
other industries in Kenya with heat requirements of maximum range of about 4000C. There
are many such industries in Kenya such as the dairy industry, breweries and cement plants
just to mention a few. Outcomes of this study will inform on approaches that enhance
adoption of CSPT and might enlighten the stakeholders in these other industries to adopt
this sustainable energy source. They will stand to gain the benefits of lower costs, less
pollution, and the environment conservation claim.
The tea farmers are likely to enjoy several benefits if CSPT is widely adopted by the tea
factories following the findings of this study. First it will improve the likelihood of the
survival of the industry and therefore secure their income source and livelihood. Beyond
this, the lower energy costs are likely to raise factory profits, which in-turn are likely to
translate into higher tea payments and dividends for the farmers. Less use of biomass will
help reduce deforestation, global warming and by extension improve regular and adequate
rainfall for the tea farms. This is likely to raise tea production and expected returns for the
farmer.

22
The study was also an attempt to bridge literature gap on diffusion of CSPT technology
especially in developing countries. Being a relatively new technology, hardly any
comprehensive literature has been put together on its status and potential in Kenya and
other developing countries. The study also brings together important facts, experiences and
insights about the promotion of this technology which will aid policy makers. Government,
development partners, and other policy makers will get important information that might
help improve policy formulations and implementations, in line with already set out
blueprints such as Kenya Vision 2030 and the UN Energy4ALL initiative. Kenya vision
2030 emphasizes exploitation of renewable sources of energy to power economic and
industrial growth in the country (GOK, 2007). Further, realization of adoption of CSPT by
tea factories as recommended by this study, will help the country make a move in the right
direction in attaining at least four of the global SDGs. It would help the country’s efforts in
reduction of poverty and promote rural development in line with SDG 1 and SDG 2. It will
also help in the promotion of use of sustainable and modern energy as well as minimize the
impact of climate change, in line with SDG 7 and SDG 13.
The study was an additional building block in CSPT and renewable energy literature for the
benefit of academia and researchers at large. It provides a platform for testing applicability
of adoption theories, and develops leads for future research in its recommendations.
1.6 Delimitations of the Study
This study focused on diffusion of CSPT technologies in the Kenyan tea industry but only
in factories operated under KTDA. This was because these tea factories had explicitly
expressed their interest to change their primary fuel source (Rawlins & Ashcroft, 2013).
The researcher, therefore, considered them to be in more dire need for interventions on the

23
energy challenge than the private operators. Further, due to their public nature the
researcher expected to access information more easily owing to the less bureaucratic and
secrecy issues. The respondents were factory unit managers. This is because they were
considered pivotal in decision making of past and future energy source choices of the
factories. They, therefore, were more likely to provide the necessary information for the
study than any other calibre in the factories.
1.7 Limitations of the Study
The 66 target factories of the study were spread out in 15 counties in Kenya. This is a vast
coverage for the study. The factories were also generally located in the highlands, way off
main transport routes. These factors caused logistical and financial challenges.
Beyond logistical challenges, the study was faced by data analysis limitations. The
dependent variable was the adoption of CSPT among tea factories run by KTDA in Kenya.
Adoption is a dichotomous concept, and results of observations of dichotomous values do
not have a linear relationship, and therefore inferential analysis of such data cannot be
subjected to linear regression. An analysis approach without the linearity assumptions had
to be identified. For this purpose logistic regression was selected for this study.
A further challenge of the study was that standard logistic regression was hard to apply in
the study. This was because the model assumes, among other things, a large data set and a
fair distribution of the two dichotomous categories. Adoption of CSPT by the tea factories
study had a population of 66 (considerably small population and data set) and produced a
rare data set. Rare event data consists of binary dependent variables with thousands of times

24
fewer ones (desired event) than zeros (undesired event) (Allison, 2012). Standard logistic
regression arrives at maximum likelihood estimates (MLE) of the relationship between the
dependent variable and the indicator variables. However, MLE algorithms analysis breaks
down when rare event data is run. Alternative logistic regression approach circumventing
the above problem had to be found, and penalized logistic regression was embraced.
Penalized logistic regression (PLR) is a variation of logistic regression developed to take
care of complications that arise when analysing complex data using standard logistic
regression and maximum likelihood estimation. It yields penalized maximum likelihood
estimates (PMLE) using algorithms such as Ridge, Lasso and Firth. Firth penalized logistic
regression model was selected for this study.
1.8 Assumptions of the Study
Assumptions are statements of what a researcher believe to be facts but may not verify
(Best & Khan, 2011). The first assumption of this study was that all the 66 tea factories
managed by KTDA are similar in their energy requirements and share the urge to find a
sustainable source of process heat. Secondly the researcher assumed the factory unit
managers capability to accurately review and project their factories process heat scenarios
in comparison with global benchmarks.

25
1.9 Definition of Terms
Concentrated Solar Power Technology
Concentrated solar power technology (CSPT) refers to equipment that use mirrors to
concentrate the energy from the sun to generate heat (thermal energy) (SEIA, 2014). CSPT
uses the solar resource to produce electricity or heat while generating very low levels of
greenhouse-gas emissions (IEA, 2010). Currently there are four main well established CSP
technologies, which are classified according to the way they focus the sun’s rays and the
technology utilised for the reception of the solar energy. These technologies are Linear
Fresnel Reflectors, Solar towers, Parabolic Troughs and Parabolic Dishes.
CSPT Awareness
Awareness creation is a means of making a group of people aware of something (ESTIF,
2012). In new products adoption schemes awareness is aimed to reduce uncertainty
potential adopters may have in new technology innovations. Potential adopters are made
aware of advantages and disadvantages of new innovations to prepare them for the
consequences of adoption of the innovations (Sahin, 2006).
Technology Adoption
This is a process by which a technology is selected for use by an individual, an organization
or a society (Boldt, J.et al, 2012). It has also been defined as the stage of selecting a
technology for use by an individual or an organization (Sharma & Mishra, 2014). It is a
process involving five stages. These are knowledge, persuasion, decision, implementation
and confirmation stages. In this study adoption of CSPT technology refers to whether a tea
factory has installed a CSPT technology or not.

26
Access to Finance
This refers to ability for raising or providing money or capital for realizing a project or
continuing an activity (IPCC, 2011). This could be from capital sources, credit or grants.
Organization Complexity
Organization complexity refers to the extent to which members of the organization are
perceived to possess a relatively high level of knowledge, skills and expertise, which in-
turn is measured in terms of members' spectrum of occupational specialties and their levels
of professionalism (Rogers, 2003). Complexity is said to enhance organizational members’
potential for conception and generation of innovations.
CSPT Standardization
Standardization involves developing and providing standards, and the dissemination of
information on various standards to stakeholders (ISO, 2013). The work of the standards is
to endorse that a product or service offered is fit for a said purpose, is safe and has value
(IRENA, 2013). An important aspect of this protection is the assurance that the product or
service delivers as promised, performs as per specifications, and is reliable, durable and
safe. CSPT Standardization variable in this study will be an investigation of the existence of
such standardization in the CSPT market.

27
CHAPTER TWO
LITERATURE REVIEW
2.1 Introduction
This chapter reviews literature of various scholars on adoption of new solar technologies
(particularly CSPT technologies) and its determinants. It starts with a discussion of the
independent variable, adoption of CSPT, followed by a review of theoretical and empirical
literatures. Then the conceptual and operational frameworks for this study are presented.
2.2 CSPT Adoption
As discussed in chapter one, CSPT technology has been applied for various purposes in the
past especially in America and Spain. Other countries have engaged in programmes to
benefit from this technology too. Of importance for this study is the application of the
technology in industrial processes as opposed to catering for energy needs of remote
locations as was common for most CSPT applications in the past. Evidence exist of such
initiatives in the last decade and several of them are discussed in this section.
One case is the UNDP/GEF project carried out in India (South) on energy conservation and
energy efficiency of tea factories. The project was implemented in the 2008-2011 with the
aim of reducing energy consumption for tea processing factories in south India and thereby
minimizing greenhouse gas (GHG) emissions (Ocampo & Maithel, 2012). A key aim of the
project was to come up with replicable strategies for sustainable energy innovations in tea
production in south India. Specific strategies laid out were awareness creation on renewable
technologies relevant to the tea industry and the profitability emanating from their adoption.
Other strategies were minimization of financial barriers that hinder investment in renewable
energy technologies, adoption of renewable energy equipment, and knowledge sharing and
replication.

28
On completion the project had created awareness among all 266 factories in the region on
renewable energy technologies and successfully introduced seven new renewable energy
technologies adopted by 114 factories (Ocampo & Maithel, 2012). These investments had
the impact of reducing carbon emissions by 277,255 tons annually among the factories.
A second project is UNDP/GEF project in India promoting Solar Concentrator Based
Process Heat Applications, which was implemented in the 2012-2017 period. This was a
national project by the Ministry of New and Renewable Energy India (MNRE) in
conjunction with GEF and UNDP (Akker & Aggarwal, 2015). The project aimed to
strengthen awareness for promotion of use of concentrated solar heat (CSH) systems, to
strengthen capabilities for promotion of use of (CSH) systems, remove market and financial
barriers promotion of use of (CSH) systems, strengthen technical capabilities among
industry stakeholders by conducting training programs (for manufacturers, installers and
CSH users), supporting demonstration projects, and addressing financial barriers. The
project is ongoing but by 2016, 210 establishments were applying CSH systems and were
already attaining 6,200 tonnes of carbon emissions reduction annually. It is anticipated to
accomplish carbon savings of 32,900 tonnes and save 3.15 million litres of fuel oil annually
(UNDP, 2016).
In Malaysia UNIDO has initiated a project to minimize GHG Emissions through EE and
use of solar heat systems. This is a 60 months project whose key components include
awareness raising and capacity building for solar thermal utilization in targeted industrial
sectors. This would involve among other things improvement of skills and competences of
technicians, consultants and industry staff in solar heat technology. Another component is
the demonstrations and case studies of thermal energy utilization. The project involves 40

29
factories. Though results of the project have not yet been documented, 10 of the forty
factories are expected to implement solar thermal projects.
An electric CSP power generation project has been implemented at Holaniku, Hawaii,
USA. It is a parabolic trough which was commissioned in 2009 with a temperature range of
74-950C (Garud, 2014). The project is to attain carbon emissions reduction of 31ktCO2 over
its life time. A similar project is installed at Holcim, Mexico. This is a CSP cement cooling
system started in 2011 with a temperature range of 74-950C, and is expected to save
3.45ktCO2 over its life. At Watow, Germany there is a CSP process heat generation system
for a fish farm. It was initiated in 2007 with a maximum heat generation of 2500C. Another
CSP process heat system has been adopted at Chitale Dairy, India. It was commissioned in
2009 and has a maximum temperature range of 1520C. It has carbon emissions savings
potential of 130CO2 per annum and is able to replace 40,000 – 60,000 litres of fuel oil per
annum.
The above are just but a few of CSPTs adopted for industrial application. Several of them
will be mentioned in the following section when discussing individual determinants of
CSPT adoption.
2.3 Theoretical Literature Review
This study is rooted in the concept of adoption of novel innovations. However, Technology
adoption is rarely discussed in most literatures without a mention of technology diffusion.
As explained in chapter one the two concepts are related and most theories reviewed
expound on them together. Many technology adoption theories have been put forward
beginning around 1900. The first well documented contribution is that Gabriel Tarde of

30
around 1903. He was a French sociologist and is said to be the originator of the S-shaped
diffusion curve. (Shoeb A., 2014). Subsequent contributions were by Bryce Ryan and Neal
Gross around 1940, but most outstanding in diffusion literature is Everett M. Rogers’ model
of 1962. In this section theories in respect to this concept will be reviewed with a view to
clarifying the variables and relationships for this study.
2.3.1 Diffusion of Innovation Model
Everett M. Rogers is largely famous for inventing the diffusion of innovation theory which
he developed after his research on how farmers take up new agricultural innovations
(Shoeb, 2014). Rogers explained that diffusion is a social process in which adoption of a
technology starts slowly, followed by rapid adoption and ending with slow adoption as
product matures and new innovations emerge. The theory identified four components of the
diffusion process which were the innovation, communication channels, a time period, and a
social system.
As cited in (Sahin, 2006), Rogers defined innovation as an idea, process, or practice that is
considered as novel by individuals or groups or organizations. He claimed that uncertainty
about new innovations is a major hindrance to the adoption of innovations. This is because
the consequences of using an innovation may create uncertainty. Consequences refer to new
experiences that an individual or a social system is exposed to as a result of adopting an
innovation. Therefore, to minimize this uncertainty before adoption of a new technology,
individuals or organizations should be made aware of the advantages and disadvantages of
the new technology so as to prepare them for its consequences. He also identified five
characteristics of new innovations that are useful in minimizing uncertainty about an
innovation thereby increasing the chances of its adoption. These were relative advantage of

31
the innovation, compatibility with what is in use, its complexity, whether it is trialable, and
observability. Relative advantage is the extent to which a new technology is seen as being
better than the innovation it precedes (Sahin, 2006). Cost advantage, profitability and social
status of innovations are examples of aspects of relative advantage.
Compatibility of a new technology refers to the extent to which it is perceived to be
conforming to the current values, experiences from the past, and the needs of a potential
adopter (Shoeb, 2014; Sahin, 2006). When a technology is seen to conform to the needs of
an individual, its likely to reduce uncertainty which will in-turn raise the rate of adoption of
an innovation. The name of an innovation is a key factor in attaining compatibility. The
name of a new technology should have a clear meaning to the potential adopter, and this
may spur an adoption decision. Complexity of a new technology was the other attribute
cited by Rogers. This is the extent to which the technology is seen to be difficult to
understand and use. He finally stated that complexity and adoption have an inverse
relationship, and that high complexity of a new technology is a major hindrance to its
adoption.
The other attribute was trialability. This refers to the extent to which a new technology may
be tried before adoption on a limited basis (Shoeb, 2014; Sahin, 2006). The more an
innovation is triable, the more likely it is to be adopted. Finally was the observability
attribute. Rogers explained observability as the extent to which the outcomes of a new
innovation are evident to all. He concluded by citing role modelling and peer observations
as important motivational factors in enhancing adoption and diffusion of new technologies
(Sahin, 2006).

32
The second component of diffusion process highlighted by Rogers was Communication
Channels. As cited in (Sahin, 2006) Rogers referred communication as the process by
which members of a society or organization generate and distribute information among
themselves for the purpose of mutual understanding. The communication is enabled by
various channels or media between the members. Mass media and interpersonal
communication are two communication channels. Rogers identified mass media with its
element such as TV, radio, and newspapers as a prime channel of communication. He also
cited interpersonal communication as an equally useful channel for effective
communication among individuals.
Communication channels were strongly linked with the innovation decision making process
by potential adopters. Rogers identified five steps in the innovation-decision process. These
are knowledge stage, persuasion stage, decision stage, implementation stage, and
confirmation stage (Sahin, 2006). In the knowledge step, the potential adopter gets and
seeks more information about an innovation. In this stage, the potential adopter tries to
establish the nature of the innovation, how it works and how she can benefit from it.
According to Rogers, the types of knowledge addressed here are awareness knowledge,
how-to-knowledge, and principles knowledge. Awareness knowledge refers to information
on the innovation’s existence and its benefits. This may make an individual like the
innovation, seek more information and eventually decide to adopt. How-to-knowledge
refers to information on how to make use of an innovation correctly. To improve chances of
adoption of an innovation, a potential adopter need to have sufficient how-to-knowledge
before the trial of that innovation. Principles-knowledge includes the functioning principles
describing how and why an innovation works. The persuasion stage follows the knowledge
stage in the innovation decision making process. It helps the individual shape his or her

33
attitude about the innovation hopefully leading to adoption. The degree of uncertainty on
whether an innovation works and social approval (by colleagues, by peers, etc.) may
influence an individual’s assessment and final decision to adopt or not to adopt the
innovation.
The decision stage is where the individual chooses to adopt or reject the innovation
(Miranda, Farias, Schwartz, & Almeida, 2016). Rogers noted that if an innovation can be
given on some limited trial basis, it was adopted more quickly. This was because most
people wish to try an innovation in their own setup before making the adoption decision.
However, rejection is also possible in every stage of the innovation-decision process. The
next stage is implementation stage. This is a stage in which the innovation is put into
practical use. Existence of uncertainty on workability of the innovation in the mind of the
potential adopter is still a challenge in this stage and there is need for technical assistance to
help reduce the uncertainty about the innovation and its consequences. Re-invention, the
extent to which a new technology can be altered or modified by a potential adopter may
also happen at this stage. Rogers finally observed that more and more of reinvention of an
innovation steadily increases the adoption rate of that innovation. The final stage was the he
confirmation stage. By this stage the adoption decision already has been made, but
individual looks for support for his or her decision. According to Rogers as cited in (Sahin,
2006) the adoption decision can be rescinded if the individual experiences post adoption
dissonance about the innovation. There is, therefore, need for support by adoption agents to
improve on the attitude of the individual towards the innovation and adoption decision. This
support promotes later adoption, but if lacking may result in or discontinuance.
Discontinuance may occur when the individual rejects the innovation to adopt a better
innovation replacing it (replacement discontinuance) or because he or she is not satisfied
34
with its performance (disenchantment discontinuance). Another explanation commonly
made of discontinuance decision is that the innovation may not be meeting the needs of the
individual.
Time was the third component of diffusion in Rogers’ theory. Adoption process, from
awareness to final adoption, requires considerable time to occur (Rogers, 1976). A social
system was the last element of the new technology diffusion process. Rogers as cited in
(Sahin, 2006) defined a social system as a set of interconnected units involved in common
problem solving efforts that help them accomplish common goals. Organization structure is
a common name for such a system. He finally asserted that the nature of a social system
highly determine how innovative members of the system are.
Rogers further observed that people will take up new innovations at different times and at
differing rates. He classified the adoption process using the different rates of adoption. He
came up with a classification comprising of innovators (the first to adopt), early adopters,
early majority, late majority and laggards (the last to adopt). The technology diffusion
model is a derivative of the "bell-shaped" normal distribution curve, in which the curve
depicts the frequency of individuals or organizations adopting a product over time. When
the cumulative number of adopters is plotted, the result is an S-shaped (sigmoid) pattern.
This is illustrated in figure 2.1 below.
Beyond the above discussed factors that influence technology adoption, Rogers identified
another class of factors that apply to technology adoption by organizations. He referred to
them as organizational structural characteristics that influence innovativeness. These are

35
organization centralization, organization complexity, organization formalization,
organization interconnectedness and Organizational slack (Rogers, 2003).
Centralization refers to the extent to which power and control in an organization are
centralized in the hands of a few individuals. This centralization has been found to result in
negative innovativeness. This means that the more power is centralized in an organization,
the less innovative its members and the organization become. The variety of novel and
creative ideas in an organization tend to be limited when power and control are dominated
by a few central leaders. Complexity refers to the extent to which members of the
organization are perceived to possess a relatively high level of knowledge, skills and
expertise, which in-turn is measured in terms of members' spectrum of occupational
specialties and their levels of professionalism (Rogers, 2003). Complexity is said to
enhance organizational members’ potential for conception and generation of innovations.
Formalization is about the extent to which the organization emphasizes adherence to rules
and procedures in the various functions and roles of the members. Formalization is said to
hinder conception of innovations by members of the organization, but may encourage
Early adopters
Early majority
Late majority
Laggards
Ad
op
tio
n s
har
e
Tim
Figure 2.1: The S Curve of Technology (Source: Sahin, 2006)

36
implementation of innovations. Interconnectedness refers to the extent to members of an
organization are connected through interpersonal links. Novel ideas will permeate and
spread easily among organization members if there is a good level of interconnectedness,
and this will in-turn enhance organizational innovativeness. Organizational slack measures
the level of existence of uncommitted resources in an organization. It is positively
associated to organizational innovativeness, meaning the more uncommitted resources an
organization has, the more it is likely to make positive new technology adoption decisions.
Slack provides capacity for innovation that is otherwise lacking when there is scarcity in an
organization (Rogers, 2003).
In summary, according to Rogers, adoption of a new technology will first depend on its
attributes such as its advantages, ease of use, trial ability and observability. Another
attribute is economic attractiveness with indicators such as cost and profitability. Other
variables he brought out are information communication & promotion efforts by change
agents, and nature, norms and interconnectedness of the social system. For adoption by
organizations specifically, he highlighted the importance of organization structure
characteristics.
This study has to a big extent relied on the above discussed Roger’s theory. The concept of
CSPT adoption is aligned to this theory and the variables of CSPT attributes, CSPT
awareness creation and organization structure characteristics are derivatives of the theory.
2.3.2 Awareness Raising Model
This model was developed from theories, principles and techniques from experiences and
projects that succeeded in delivering desired results in the United Nations Literacy Decade

37
2003-2012 (Sayers, 2006). It posits that to create awareness of an idea or area of concern
involves endeavours to inform a community attitudes, behaviours and beliefs. Using
information you are able to change attitudes positively, direct desired behaviours and
entrench new desired beliefs that will help the organization attain commonly defined
objectives. The model identifies commonly used approaches for awareness creation and
groups them into five broad categories. These are person to person communication, mass
media communication, education process, public relations initiatives and advocacy.
Personal communication is considered the most powerful method of communicating and
persuading people buy a new idea. This is particularly so if the communication is from an
individual or organisation with recognised credibility (Sayers, 2006). The personal
communication can be implemented through various initiatives such as conducting
meetings for organization members and all stakeholders, conduct seminars and webinars,
educational and technical workshops, and social media interactions. Mass communication
involves use of printed materials (such as, billboards, brochures, cartoons, comics,
pamphlets, posters and resource books), audio-visual resources (such as pre-recorded
cassettes, videos, CDs and DVDs), electronic media (use of text and graphic websites,
emails prompts and discussions, and blogs) and media interviews. Others include feature
articles and announcements extracted from newspapers and magazines that can be accessed
from the internet. SMS messages made directly to individuals’ cel-phones are commonly
used.
Education is intended to give awareness for long-term benefits. It provides target subjects
with knowledge, skills, attitudes and motivation for change (Sayers, 2006) . To create
awareness for new ideas various activities are implemented. One of them is training of

38
trainers. Others are the formal education programs, and informal educational programs
which are conducted in secondary and high schools, post-secondary school colleges, and at
adult learning centres and libraries. Awareness is also enhanced in public idea or product
exhibitions and displays.
Public Relations involves activities targeting maintaining and promoting the reputation and
credibility of an organization. As cited in (Sayers, 2006) the Chartered Institute of Public
Relations in Britain describes public relation as the planned and sustained effort to establish
and maintain goodwill and mutual understanding between an organisation and its publics
(audience and stakeholders). Commonly practiced activities under public relations include
media briefs on the organization or the new idea, news creating activities (for example
clean-ups), and corporate responsibility initiatives.
Advocacy and lobbying efforts are also crucial to help garner continued support from the,
government, development organizations and the civil society. This involves efforts like
engaging in strategic alliances with the government, civil society organizations and other
stakeholders. Organization members also target politicians, government ministers and
officials that are in power to create a good rapport and goodwill that will spur support of
organizations initiatives and products by government and the public.
This model had a great input for this study in the analysis of awareness creation for CSPT
technology among tea factories. Even though it was not designed for technology diffusion
awareness creation, it spells out the key mechanisms and forums through which awareness
can be enhanced among public organizations, which the researcher felt were applicable to
awareness creation among tea factories.

39
2.3.3 Commercial Financial Instruments for Renewable Energy Model
This model was authored by Dr Peter Lindlein and Dr. Wolfgang Mostert for the World
Bank‘s Initiative, "Financing Renewable Energies in International Financial Cooperation”
(Lindlein & Mostert, 2005). The authors of this model first outlined the demand profile for
renewable projects financing. This demand is characterized by clients (investors,
entrepreneurs and households) that have minimal experience and track-record; need for
“patient capital” (both credit and equity); high external financing share; and very long term
maturity period. Other characteristics were low Interest rate and limited capacity for
security and collateral. For this profile the authors came up with benchmark commercial
finance tools that would be used in identifying financing mechanisms in funding renewable
energy projects. These tools are equity finance, debt financing, mezzanine finance and
subordinated debt, and sales-lease-back arrangements.
Equity funding may be capital injections from the owners or by third party capital gearing
schemes such as venture capital funds and family members’ contributions. This is important
because lenders expect borrowers to take an equity stake in their projects to show their
commitment and confidence in their project (Lindlein & Mostert, 2005). Lenders will
usually expect about 20% of the project cost to be raised by the borrower, and RET projects
which are perceived to have higher risks may be expected to have a higher equity ratio
requirement. Debt financing is to be in form of loans and other credit forms offered by
commercial banks and other finance institutions. Bonds are another tool in this
classification. They are borrowing instruments issued by companies to investors when they
want to raise capital for various purposes. Sales-Lease-Back arrangements will involve
financiers for RET equipment whereby the financier keeps ownership of the financed
assets, thereby obviating the need for other collateral security.

40
This model recommends access to finance mechanisms for renewable energy technologies,
a category befitting CSPT. Nevertheless, mezzanine finance and subordinated debt
initiatives are foreign in the Kenyan financial landscape and were therefore not investigated
in this study. Capital, debt, grants and insurance schemes mechanisms were investigated as
sources of funding for acquisition of CSPT for the tea factories.
2.3.4 International Organization for Standardization (ISO) Guide on Standardization
ISO defined a standard as a document that furnish rules, guidelines or characteristics of
activities or their expected results, for the purpose of attaining optimum level of order in a
given context (ISO, 2013). A standard for a specific product is, therefore, a document that
sets out provisions that enable reduction of unnecessary variety in the marketplace. This
may result in an organization enjoying economies and subsequent lower unit costs of
production. The lower costs should eventually (in efficient market conditions) trickle down
to the final consumer in the form of lower product prices. A standard has also been
explained as set of conditions, or requirements that a component of a system or technology
must meet in order to perform effectively, while standardization is the pursuit of those set
elements so as to develop standards (Adhiarna & Rho, 2009).
Use of standards provide an assurance that product or service offered in the market are fit
for a designated purpose, are safe and have value for their price (IRENA, 2013; ISO, 2013).
A key element of this assurance is to ensure that a product or service delivers as promised,
and that it works as per specifications. There is also need for assurance of the product
reliability, durability and safety. Several times set standards and their conformity on
sustainable energy technologies has been the driving force for switching from use of the
inefficient and polluting fossil fuel energy sources. This is attained through building

41
confidence and trust in renewable energy technologies and their supply chain players.
Further, standards enable technicians and users of renewable energies to fathom the
technologies and their installation and operation procedures, thereby promoting self-
reliance and less supervision. This is attained through the establishment of clear standards
and best practices on product designs, installations and maintenance of renewable energy
systems. International standards for rural electrification that have been in place for some
time now are a good example of such practice.
Further, standards give an effective platform that facilitate information flow,
comprehension of product designs, production and service requirements, as well as setting
up common rules and requirements (IRENA, 2013). Beyond this, the standardization
process has proven to be an effective tool for supporting energy reforms, energy
regulations, energy technologies trade, energy technologies performance and environmental
improvements. Last but not least international standards on energy technologies enhance
trading opportunities across the world and minimize dumping practice instances of poor
quality goods.
Despite the above discussed gains of standardization, the practice has been criticized for
being complicated, very formal, tardy and time wasting (IRENA, 2013). Further it is said
to pose several challenges for industries in the third world that may not be able to abide to
the international standards and may, therefore, lose market share to import products. A
recent report published by the United Nations Foundation on achieving universal energy
access by 2030 underlined the importance of standardization. It posited that without
standardization, energy technologies are likely to be unsafe, have poor performance, and
easily fail in their young market (IRENA, 2013). It further said that renewable technologies

42
that fail to perform because of poor quality or installation create negative attitudes in the
minds of consumers and destroy the renewable energy technologies market.
To ensure products meet set standards they are subjected to Conformity assessment
procedures. These are technical processes that include testing, verification, inspection and
certification. These procedures ascertain that the technologies meet the requirements
stipulated in regulations and standards (IRENA, 2013; ISO, 2013). Certification for
adherence to standards is done through verification and auditing processes that are
grounded on benchmarking against criteria and scheme documents. The verification and
auditing can be done by an organization’s employees or can be outsourced to conformity
assessment organizations which give an objective assessment. Finally, there is the third-
party conformity assessment. This is conducted by independent certification organizations
which include certification, inspection and laboratory accreditation organizations. These
organizations have themselves to be accredited, for the particular testing schemes they
offer, by an accreditation organization authorized to do so under international standards and
agreements. Good quality products are often attained through peer assessment, which
replaces conformity certification, inspection bodies and laboratories. These theoretical
contributions by ISO and IRENA provided a base for analysis of standardization concerns
in the adoption of CSPT among tea factories managed by KTDA.
2.4 Empirical Literature Review
This section comprises a discussion of various studies or projects results previously
conducted in technology adoption. Their findings were analysed to clarify the independent
variables outlined in the theories in the previous section, and help clarify this study’s
conceptual framework.

43
2.4.1 CSPT Attributes and the Adoption of CSPT
As articulated in Rogers diffusion theory reviewed earlier, an innovations important
attributes are relative advantage, compatibility, complexity, trialability, and observability.
These attributes have been showcased in many projects through awareness campaigns and
demonstrations. In the project, Energy Conservation in Small Sector Tea Processing Units
in South India, these attributes were emphasized in 35 awareness seminars, training
programmes, 15 quarterly newsletters, 15 meetings with associations, a project website,
and about 100 one-on-one meetings held between tea factory owners and experts
(Ocampo & Maithel, 2012). Beyond these, 30 demonstration projects were conducted.
Further, liaison with energy equipment manufacturers was conducted to customize
equipment for capacities required for the tea sector. This led to the acceptance of the
suppliers as ‘value-adding energy service providers’ rather than just ‘salesmen of
equipment’. The outcome was that 90 tea factories implemented energy reforms with
project support and another 24 factories without project support bringing to 114 the total
number of factories that adopted the new technologies.
In an on-going project, Market Development & Promotion of Solar Concentrators for
Process Heat Applications in India, one of the objectives of the project was to promote
enhanced understanding of CSH technologies and their applications. The attributes were
mainly exhibited through demonstrations. Component 3 in the implementation of this
project was pilot demonstration of CSH technologies for various applications (Akker &
Aggarwal, 2015). A number of activities were lined up for the purpose of showcasing the
viability of the CSH technologies. These were a website on CSTs, monthly newsletters and
publications, development of case studies & success stories, training manuals for installers
& manufacturers/suppliers, and a handbook on CSTs. Further, a technology assessment and

44
performance evaluation is done of existing projects (Singhal, 2017). Reports on the
evaluation aid policy makers identify salient features and limitations of CSTs when coming
up with CSTs adoption strategies.
Other studies have highlighted the pole position of an innovations attributes in influencing
adoption decision. One of these studies investigated the role of attributes in explaining
adoption of the interbank mobile payment service in an Indian context (Kapoor, Yogesh, &
Michael, 2013). The study examined the role of innovation attributes in the adoption of
interbank mobile service among 330 respondents in Delhi, Kolkata, Mumbai, and
Bangalore cities in India. The attributes investigated were as stipulated in Rogers’ diffusion
of innovation theory. These were relative advantage, compatibility, complexity, cost,
triability and observability. The study found that relative advantage, compatibility, cost,
complexity and triability had a significant influence on the adoption of the interbank mobile
payment service. However, observability attribute was found to have a poor relationship
with adoption of interbank mobile payment service.
Another study was carried out in Nairobi, Kenya, investigating the role of technology
characteristics in the adoption, rejection, and discontinued use of open source software for
development (Tully, 2015). It focused on organizational adoption decisions of a new ICT
platform known as Ushahidi, which was designed for collecting, aggregating and mapping
information. The study was carried out among seven firms in Nairobi between December
2008 and July 2012. The study report indicates that triability, observability, complexity and
compatibility were key influencers of the adoption of Ushahidi platform. Beyond this, the
study identified flexibility also as an important attribute to influence adoption.

45
There is another research study conducted on technological attributes that influence Radio
Frequency Identification (RFID) technology adoption in logistics organizations (Sibayan,
2015). The study investigated the technological factors considered when adopting RFID
technology which is an innovation that give visibility for the management process in
logistic organizations. The study was a review of cases from the past in various countries
and was aimed at enhancing managers and leaders insight in adoption decision making
concerning RFID technology in logistic organizations. It focussed on the compatibility,
complexity and competence attributes and their influence on the adoption of RFID
technology. The study found that compatibility, complexity and competence attributes
influenced decision makers in adopting RFID technology. Further, it was reported that the
effects of these attributes is mitigated when the innovation is made explicit to all members
of the organization, and that making the technology explicit minimizes uncertainty of the
technology. Finally the study found out that the more educated and knowledgeable an
organization is about the RFID innovation the more likely that the organization will adopt
the technology.
Another study was conducted on the role of innovation attributes on adoption of renewable
energy technologies. The study was carried out in Mexico with a purpose of analysing
innovation attributes and their effect on the adoption of solar renewable energy innovations
for town households (Pavel & Mercado, 2017). It was carried out among 291 town
consumers. The study report indicate that compatibility was found to be a major influencer
of adoption, but triability and relative advantage showed little influence on adoption of the
solar technologies.

46
In Taiwan a study was conducted in 2017 on drives of smart-watch adoption intention,
comparing Apple and non-Apple watches (Hsiao, 2017). The study targeted smart-watch
users in Taiwan with the purpose of identifying the different factors that affect users’
intention to adopt the Apple Watch or other smart-watches. The attributes investigated were
compatibility, relative advantage, complexity, and design aesthetics. On completion,
perceived compatibility, relative advantage, and design aesthetics were shown to have a
positive impact on adoption intention. Perceived complexity was found to have no
significant effect on smart-watch adoption decision.
The effect of relative advantage was particularly strong especially for the Apple smart-
watch group. The explanation was that quality and performance of Apple products were
usually better than those of other brands’, and therefore relative advantage helped users
better manage their adoption decision task (Hsiao, 2017). Complexity was negatively
associated to adoption intention in the non-Apple Smart-watch Group only. The reason was
that when users consider buying non-Apple smart-watches, they become concerned about
the complexity of the operating system since these other smart-watches are less well-
known. Complexity was, therefore, shown to be a key factor in the adoption of non-Apple
smart-watches. The design of the smart-watch was found important and had a positive
effect on adoption intention. A watch generally serves as an adornment, so design aesthetics
were also an important aspect of a smart-watch.
The results of this study affirm prior propositions of innovation adoption and diffusion
theories that perceived product attributes have a relatively strong influence on adoption
intention. Those found to have a positive effect on adoption in this study were relative
advantage, compatibility and design aesthetics.

47
Yet another study on product attributes and adoption of new products was carried out in
Shangai China in 2018 (Chao, Reid, Lai & Reimers, 2019). Amongst other objectives, the
study investigated influence of perceived new product characteristics (PNPCs) on Chinese
consumers’ new product adoption behavior. The focus was on the five innovation
characteristics articulated in the innovation diffusion model (Rogers, 2003) cited earlier in
this chapter namely relative advantage, compatibility, complexity, observability, and
trialability. The study also considered price sensitivity to new products and the brand
names of new products as additional characteristics. The respondents were randomly
selected from individuals passing by the front of shopping and comprised a final sample of
316.
Even though influence of individual attributes on adoption decisions were not documented,
the results of the study demonstrated that PNPCs were the primary drivers of new product
adoption (Chao et al, 2019). The results confirmed PNPCs affect Chinese innovative buying
behavior.
The above discussion on technological attributes and their influence on adoption of new
technologies bring out five common attributes that may be crucial in enhancing adoption of
new technologies. These are relative advantage, triability, compatibility, complexity and
cost. However, the different studies have highlighted differing combinations of these
attributes, and even in some rare cases, additional attributes in the name of flexibility and
competence were introduced.

48
2.4.2 CSPT Awareness and the Adoption of CSPT
Virtually all literatures previously reviewed have cited lack of awareness of solar
technologies as a barrier to their adoption. They expressed the view that awareness levels of
target markets is low on available solar technologies and their benefits, coupled with lack of
awareness on the hazards of continued use of fossil fuels. In response to this challenge
several initiatives implemented in different places are discussed below.
In the UNDP/GEF project currently being implemented in India focusing on growth and
advancement of solar concentrators for process heat (Akker & Aggarwal, 2015), one of the
main objects of the project was to promote enhanced understanding of CSH technologies,
their applications and markets. For this purpose a market development programme was laid
out and implemented for industrial, commercial and institutional sectors (Singhal, 2015).
By 2015 40 workshops on CSTs had been conducted and several video films on successful
CST projects placed on websites. A monthly newsletter was started and made available at
www.insolthermtimes.in and a quarterly magazine on CSTs, SUNFOCUS, developed and
distributed to about 700 stakeholders. Advertisements on CSTs were released on national
newspapers and magazines, and a national toll-free helpline 1800 2 33 44 77 was launched.
A new website www.chindia.in was developed and together with the ministry websites
made available information on CSTs suitability, costs and payback. Further, exposure trips
to show case installations of CSTs to potential users were organized in conjunction with the
University of Pune. The project is expected to result in 30 CSH demonstration and 60
replication projects. It is also expected to have successfully introduced five CSH
technologies in India complete with a supply chain. Further it is expected to have an
outcome of carbon savings of 39,200 tonnes per year and replace 3.15 million litres of fuel
oil annually (Singhal, 2017). These initiatives have highlighted the importance of CST and

49
raised confidence of investors. They also set international benchmarks for solar thermal
market strategy.
Another project has been carried out in India by UNDP and GEF in conjunction with the
India government. This is project, Energy Conservation in Small Sector Tea Processing
Units in South India project, commenced in 2008 and ended in 2012 (Ocampo & Maithel,
2012). The very first objective of this project was to create awareness among stakeholders
on efficient and sustainable energy technologies that are ideal for tea factories and the
benefits that accrue to the factories that adopt the technologies (Ocampo & Maithel, 2012).
On completion this goal achievement was classified as very satisfactory. The project was
highly praised for the vast awareness generated on energy efficiency and renewable energy
technologies by use of, technical seminars, meetings with various stakeholders, monthly
newsletters, video films and web-sites. A total of 35 awareness seminars were conducted,
several training programmes implemented, and many meetings carried out with all
stakeholders.
Through these awareness initiatives almost all the 266 tea production units in South India
were impacted. Over the project implementation phase, fifteen (15) newsletters were
published and circulated in the annual general meetings of the Tea Board. The project
initiatives captivated close to 250 of the 256 factories in the region via awareness
campaigns and personal visits by experts. The project website contained details on the
project features, current and past newsletters, various energy technologies presentations,
and other important information such as contact information of suppliers of the
technologies. The outcome of the project was awareness by all the 266 tea factories in
South India of energy efficiency and sustainability activities and technologies. The project

50
has cultivated an informative ecosystem in the region, introduced an energy score card
which is a tool for the factories to self-evaluate on their performance concerning energy
use, and a communication link to all interest groups.
Still in India, on realizing the importance of CSH technologies, UNDP in 2014 established
a centre for conducting awareness seminars on CST technologies at Brahma Kumaris, Abu
road. The centre is run by World Renewal Spiritual Trust (WRST), an organization that has
knowledge and experience of developing and demonstrating CST projects for over 20 years
(Jayasimha, 2017). The centre develops and demonstrates various CSH projects. This
provides opportunity for participants to learn and explore existing functional systems that
they can adopt. UNIDO has an on-going project in India titled ‘Promoting Business Models
for Increasing Penetration and Scaling up of Solar Energy’. Among its key components is
awareness creation (Rawlins & Ashcroft, 2013). Activities laid out for awareness creation
were awareness workshops for the business community; establishment of knowledge
sharing forums; and compilation of project results, successful case studies, and established
best practices to enable learning and enhance replications of the success cases.
Awareness creation is also a key ingredient of another UNIDO project in Malaysia titled
GHG Emissions Reductions in Targeted Industrial Sub-Sectors through EE and Application
of Solar Thermal Systems. The project is on-going having started in 2014 and expected
completion by 2019 (GEF, 2017). The project aims at reduction of GHG emissions through
promotion and demonstration of sector-specific energy efficiency enhancements and solar
heat energy technology usage in the industry. Targeted industries include rubber gloves,
textile, food & beverage, and agri-business industries. It targets enhanced awareness among
industry management to enable them make decisions to take up solar thermal technologies.

51
Through awareness and other initiatives at least 10 factories are expected to implement
solar thermal technology projects.
Awareness as a catalyst for adoption is highlighted in several other cases. One case is a
study done in Kenya on technology awareness and the adoption of improved pigeon pea
varieties (Simtowe, Muange, Munyua, & Diagne, 2012). The study aimed at analysing
patterns of adoption of improved pigeon pea varieties. Study was carried out among 414
households between August and September 2008 and the results presented in an
international agricultural economists’ conference in Brazil in 2012. The study report
indicated that awareness was a major determinant of adoption of the superior varieties. It
was noted that regions with non-exposure to the new varieties had lagged behind in
adoption by 12%. The study further found that most of the awareness was through informal
forums, especially socialization among farmers. However, potential for formal forums of
awareness creation was recognized and on-farm trials, demonstration plots, field days for
farmers, and agricultural shows were cited as important forums.
A similar study has been conducted in Ireland focusing on the adoption of microgeneration
technologies (Claudy, O’Driscoll, Michelsen, & Mullen, 2010). The study was done in
2009 among 1010 respondents investigating awareness of microgeneration technology and
its adoption. The study has a conclusion that awareness is a prelude for adoption of the
microgeneration technology. Schools, universities and the internet were singled out as very
important vehicles for awareness creation. Another study is the study on awareness and the
adoption of 3G phone technologies in India (Velmurugan & Velmurugan, 2014). The report
from this study highly underscores the significance of awareness creation for adoption
purpose. The authors emphasized the need for education on the 3G technology to improve

52
on its adoption. However, forums and mechanisms for awareness creation were not
suggested.
A technical consultant report by Asian Development Bank (ADB) in 2012 highlighted
awareness measures recommended for the promotion of CSP industry in China (ADB,
2012). The report was a summary of Peoples Republic of China (PRC) Concentrating Solar
Thermal Power Development Program funded by ADB. Among the constraints of CSP
technologies use and investment in PRC cited in the report was lack of knowledge,
especially among design institutions and authorities. To alleviate this situation, information
dissemination was recommended, particularly through workshops, conferences,
publications and study tours for main stakeholders and partners in the CSP value chain.
Other recommendations were establishment of technical and commercial demonstrations,
and encouragement of participation and contribution in international networks.
Investigation of importance of awareness creation was also a key objective in a study in
Lagos, Nigeria, on strategies for promotion of Green Building Technologies (GBTs)
adoption in the construction industry (Chan, Darko & Ameyaw, 2017). GBTs are
technologies that are made part of building design and construction to make the building
sustainable, such as solar system technology, green roof and wall technologies, and heat
pump technology. Adopting GBTs delivers a wide variety of economic, social, and
environmental benefits and, plus considering the growing awareness of climate change,
these benefits drive the push for the adoption and development of GBTs. The objective of
the study was to identify strategies that were important for promotion of GBTs adoption in
construction, among them availability of better information on cost and benefits of GBTs,
and public awareness creation through workshops, seminars, and conferences. A survey

53
was conducted to collect (through e-mail) and analyze the professional views of green
building experts from different countries around the world. In the findings, availability of
better information on cost and benefits of GBTs was scored the second best strategy,
implying that making relevant information available was considered a key means of
promoting GBTs adoption (Chan et al, 2017). Considering the high initial investment,
stakeholders with adequate, accurate, and better information on lifecycle benefits of
adopting GBTs are more likely to adopt GBTs.
The above cited studies and projects repeatedly underscore the importance of awareness
creation as a trigger of adoption of new technologies.
2.4.3 Organization Complexity and Adoption of CSPT
As indicated earlier one organization structure characteristic is Complexity. This refers to
the extent to which an organization's members are perceived to be knowledgeable and
skilful. Lack of adequate knowledge and skills have been cited in most of the literatures
reviewed in this chapter. Mitigating approaches from past studies and project reports are
now discussed in this section.
First are the findings of a study carried out in Asia on the role of education and training in
absorptive capacity of international technology transfer in the aerospace sector. This study,
a synthesis of several empirical studies, discussed education and training in connection to
absorption capacity (AC) in Newly Industrialized Countries (NIC's) in Asia (Heidena,
Pohlb, Mansorc & Genderen, 2015). It focused on the transition of aerospace and
technologies to NIC's and the central task education and training carries out in the
establishment of absorption capacity in the NIC’s so as to take up the aerospace technology

54
and knowledge being rendered. However, the authors posit that the guidelines and policies
they have prescribed may be applied in other technology areas and industries beyond the
aerospace industry.
As reported in these studies, absorption capacity precedes organizational learning because it
is about internal resources that energize an organization’s ability to comprehend, accept and
implement new ideas for commercial gain. Therefore, the uptake of new ideas is a product
of organizational capabilities that enable an organization to quickly identify and fully digest
outside sources of incoming knowledge which replace or modify existing information
(Heidena et al, 2015). The authors came up with seven important factors concerning
education and training in aerospace technology transition to NIC’s. The seven issues start
with recognition of the groups or individuals who need training such as decision-makers,
planners, managers, teachers, opinion leaders, Professionals, engineers, technicians,
researchers, students and the general public. Other factors were the number of target
trainees, identification of training venues, the period the training will take, the different
types of training to be offered, identifying the trainers of groups or individuals and
identifying financiers of the training programs. The above factors need clear policy
guidelines to enhance the success of the education and training programs.
Back to India and the solar concentrators for process heat applications in India project. The
project aimed to support initiatives of the Government of India to encourage the use of solar
concentrators for process heat generation. This was to be achieved through trying to
minimize existing barriers of the technology transfer such as, lack of awareness, lack of
technical capacity, and financial barriers (Akker & Aggarwal, 2015). Component 2 of the
project was to provide awareness and capacity building. One of the expected outcomes

55
from this component was more technical capability and awareness of all stakeholders of
CSH systems used in industries and institutions for heat generation. Training activities lined
out to achieve this goal included identifying training needs of various groups; compilation
of learning materials for training of potential consumers, technology installers, technology
dealers, technology manufacturers, etc; organization of learning programs for various
groups, human resource development of Ph.Ds and M.Techs in the area of CSTs at Solar
Energy Centres and several other academic organizations; and organization of global
learning trips for various groups to expose them to CSTs commercially successful in other
countries. A training centre on CSTs has also been established at Brahma Kumaris
Ashram, Mount Abu for skills improvement for manufacturers, installers and operators
(Singhal, 2015). As a result technological skills and knowhow have been enriched through
a technical training program on CSTs operations, CSTs maintenance and CSTs
troubleshooting, plus manuals have been developed for each of the six (6) CSH
technologies, both in English and Hindi. These efforts have helped generate over 100
trained operators and maintenance technicians of CSTs in India.
Significance of training in technology adoption was also emphasized in a study conducted
in Tanzania on the impact of technological training on the adoption of technologies in rice
farming (Nakano et al, 2015). The study investigated the influence of JICA training on the
adoption of rice cultivation technologies in an irrigation scheme in Tanzania. The authors
utilized a 5 year panel data and came up with a conclusion indicating that trained farmers
embraced the new technologies more easily and faster.
Centralization is another organization characteristic likely to influence organization
innovativeness. One firm whose innovativeness has been cited to have been hindered by

56
centralization is Samsung Electronics. Samsung Electronics is a company owned by the
South Korean multinational company, known as Samsung. Its key products include smart
phones, tablets, personal computers, and televisions. The company has been the global
leader in information technology products based on revenue generation since 2009 (Song &
Oliver, 2010). Samsung is a giant conglomerate (chaebol) which generates 17 percent of
GDP of South Korea. Despite its high rank in the world market, Samsung Electronics has
been highly criticised for lacking innovation. The company has faced legal action from her
competitor, Apple, for infringing on their patent in 2011 (Kane & Sherr, 2011). The legal
action was later dropped but, Samsung Electronics clients have continually complained of
lack of innovation in the company’s products.
A research conducted by Jeen Chun (2015) reported Samsung Electronics to be a
mechanistic organization whose mechanistic organizational structure has hampered the
organizational innovation. The Confucius culture of Korea influenced the company’s
culture, which embrace being collective, being risk averse and power distant. This culture
of Samsung Electronics caused its organizational structure to be mechanistic, which in-turn
does not encourage creativity of individuals and by extension hindering organizational
innovation of the company.
2.4.4 Access to Financial Resources and the Adoption of CSPT
Access to finance has been cited in the theoretical reviews discussed earlier in this chapter
as a major barrier and requirement for energy technologies adoption schemes. In this
section an analysis of past financing schemes is done, bringing out key parameters of the
concept of access to finance. To begin with is a study report from the Mediterranean
Countries titled Financial Support Mechanisms for Distributed Solar Technologies and

57
Energy Efficiency Deployment in Mediterranean Countries. This study was conducted in
October 2014 by Mediterranean Development of Support Schemes for Solar Initiatives and
Renewable Energies (MEDDESIRE) in November 2014 (Topo, Moretta, Glorioso &
Pansini, 2014). The objective of the study was to identify the financial support mechanisms
that stimulate the diffusion of solar technologies in the Mediterranean countries. The study
identified three ways to stimulate renewable energy investments. The first one was reducing
cost of the investment through fiscal incentives or direct subsidies, providing incentives for
the private sector to produce energy through renewable energy. These would include quota
based support mechanisms, tender systems, net metering, feed-in tariffs and tax credits. The
second mechanism recommended was increasing cash-flow through schemes like public
private partnership, credit lines, project loan facilities, private equity funds, venture capital
funds and project development grants. The last one was reducing the risk associated with
the project through soft loans, guarantees and contract guarantees.
In the UNDP ‘Energy Conservation in Small Tea Processing Units in South India’ project,
a key objective was to remove financial barriers that hinder adoption of renewable energy
technologies. As an intervention commercial lending for investment in RE technologies was
implemented. A risk insurance scheme was also developed and implemented. Nevertheless,
during the project the project team realized access to finance was not a key barrier in
investment in RE technologies (Ocampo & Maithel, 2012). Awareness of the technologies
and capacity to adopt were found to be more profound interventions. In the project in India
mentioned earlier, promoting solar concentrators for process heat applications in India,
component 4 involved encompassing a sustainable financing mechanism for adoption of
CSH technologies (Akker & Aggarwal, 2015). This in-turn involved promotion of
understanding of financial viability of CSH projects, and initiation of favourable financial

58
policies to encourage increased use of CSH technologies. Expected outputs were
documented financial viability cases of CSH investments and banks/financial institutions
identified to lend investors in CSH technologies at priority lending rates (as low as 5%)
(UNDP, 2015; Akker & Aggarwal, 2015). By the third year of the project there was not a
single documented case of CSH technologies financial viability. Though 15 banks/financial
institutions had been identified for lending, no project had been developed using this
benefit.
A study was recently conducted on Impact of political and economic barriers for
concentrating solar power in Sub-Saharan Africa (Labordena, Patt, Bazilian, Howells &
lilliestam, 2017). The study observed that CSP technologies are capital-intense investments,
and are especially sensitive to financing risks, which drive up the cost of capital. The study
highlighted that financing costs are also usually higher in developing countries than in
developed countries. This was attributed to the extra reward demanded by investors and
lenders to compensate them for perceived or actual higher risks emanating from matters
like politics, long and uncertain permission processes, poor administration and corruption.
For example actual weighted average cost of capital (WACC) in North Africa is more than
twice as high as in Europe, and policies bringing the North African WACC down to
European levels could decrease CSP costs by 40% (Labordena et al, 2017). To address this,
there have been international efforts to lower such barriers and help improve legal, policy
and regulatory environments to minimize such risks and enhance CSP technologies
investments. The study concluded that the key aspect to tackle for making CSP competitive
across SSA is finance. Policies to de-risk CSP finance to OECD levels could make power
from CSP competitive with coal power in every country in SSA. The measure that will
59
support CSP the most is the provision of low-risk finance, through schemes such as long-
term power purchase agreements, concessional loans, and loan guarantees.
In Ghana access to credit was found to influence adoption of new technology. This
conclusion was made in a study that sought to find out the effect of lack of credit on the
adoption of Cocoa Research Institute of Ghana (CRIG) recommended cocoa technologies
(Obuobisa, 2015). The study involved 600 farmers and access to credit was found to have a
significant influence on the technology adoption.
In South Africa a stakeholder’s workshop was held in 2009 on a planned large-scale roll out
of CSP technologies (Edkins, Winkler, & Marquard, 2009). The workshop identified the
key drivers that would ensure the large scale roll out of CSP technologies. Lack of financial
support was raised as a major drawback to the adoption of CSPs and financing mechanisms
were suggested. These mechanisms included venture capital, grants from international
development organizations, credit, equity, mezzanine debt and insurance covers.
From the above discussions it is apparent that access to finance is considered an important
factor in new technology adoption. This seems to be so in the needs analyses and pre-
implementation stages. However, as the projects matured it has been noted the access to
finance does not seem to have much significance in influencing adoption of new
technology.
2.4.5 Technology Standardization and the Adoption of CSPT
As explained earlier in this chapter standardization provides credence and belief in
sustainable energy technologies and all the players in their supply chain. Several

60
standardization initiatives have been remonstrated in the solar concentrators for process
heat applications promotion project in India. To minimize the fear of failure to perform of
CSH systems, a system of continuous monitoring of the CSH systems installed were set at
15 places (Akker & Aggarwal, 2015). Adequate testing equipment, some mobile and others
static, were set in these places for the monitoring. Performance data obtained from these
sites gave credibility information to potential CSH users which increased their confidence
in the CST technologies. The manufacturers also benefited from the information as they
used it for product improvements. BIS standards were also established to help in the testing
of procedures. Beyond these, performance norms for the several CSTs were made availed
for the different heat requirements and for different regions of the country. In general
standards were hinged on compatibility, minimum quality, safety, variety reduction and
information content.
In the same project the National Initiative of Solar Energy (NISE) and Savitribai Phule
Pune University (SPPU) established laboratories for testing and certification of CST
technologies (Singh, Kiran & Pathak, 2017). Through these the ministry (MNRE) has made
it mandatory for suppliers to test their CST systems to be accepted as channel partners. This
ensures that only quality products are supplied to customers which in-turn boost the
confidence of customers in the CST systems. Test data obtained is used to set product
benchmarks.
A regularly cited illustration of importance of standardization is the US solar heat industry.
In the 1970s, not having of standards for thermal technologies and for installation
procedures, have been blamed for a setback in the diffusion of solar technology for decades
(IRENA, 2013). Even though the solar heat market was moribund at the time, lack of

61
serious emphasis for standardized quality delivery, has been cited as a major culprit for
poor uptake of solar thermal systems in the US for the last four decades.
Other studies have also emphasized the role of standardization in new technologies
adoption. A study in the US on standardization and the adoption of broadcast TV
technologies aimed at finding out the effects of standards setting on the adoption of
broadcasting technologies (Kim, 2012). The study established that standardization issues,
especially compatibility and agreement between stakeholders were important in adoption of
the TV technologies. Committee based and defacto standards for TV technologies were
found to contribute to faster rollout of new broadcast services. Overall conclusion of the
study was that standardization creates a basis for development of new technologies. A
similar study was done on the impact of standardization on adoption of IT technologies
among 340 organizations from across the world (Grantz & Turner, 2002). The study
focussed on the benefits the organizations gained from using standardized systems. The
study reported lower costs and higher speeds of adoption of the technologies as the gains
from standardization. Standardization is also highlighted in a study on standardization and
global adoption of radio frequency identification (RFID) technologies in developing
countries (Adhiarna & Rho, 2009). The study focused on identifying strategic issues
concerning RFID standards and their importance in developing countries. Harmonization of
RFID standards was recommended as second best solution to ensure rapid adoption among
various industries.
2.5 Research Gap
A review of empirical research has revealed the potential and benefits of energy
innovations, particularly in India. It was found to reduce production costs of tea processing

62
and at the same time cut down on carbon emissions of the industry. Efforts of change
agents such as UNDP and UNIDO were not only fruitful in enhancing use of the
technology among the tea factories but also increased entrepreneurs dealing in the
technology. Before their interventions in India, the above named change agents had cited
likely hindrances to the adoption of CSPT technologies among tea factories. They included
lack of information on the technology and its benefits, technical capacity of factories and
dealers, access to financial resources and reluctance to take risk with the novel technology.
These challenges were countered in the projects through awareness creation about CSPT,
financial barriers removal, technical capacity building and pilot demonstration projects. The
completed projects were highly successful.
In Kenya, the next big world producer of tea after India, the CSPT technology had not been
adopted by a single factory by 2013 as indicated in the Carbon Trust report cited earlier in
this study. No further studies were found directly relevant to the adoption of CSPT in
Kenya and particularly to the tea factories run by KTDA. In this scenario it was necessary
to find and review credible theories and empirical studies that were likely to fit the case of
the tea industries in Kenya. Many were found and their review comprise the bulk of this
chapter.
Having reviewed the foregoing literatures, both theoretical and empirical, a number of
knowledge gaps were evident. Generally there was scanty information of CSPT adoption
and factors influencing its adoption, particularly so when it came to information on the
Kenyan scenario. Specifically various literatures were wanting contextually as they were
not conducted in Kenya or in the tea industry which were the focus of this study. Others

63
addressed concepts that were not congruent to adoption models embraced in this study, for
example addressing just a few of the concepts. Some other literatures’ methodologies were
insufficient for this study’s threshold. For instance some were just desk research with no
primary data collection, others targeted just a few respondents, and yet others based their
reports on interviews of a few energy technology experts. Lastly several of the study’s
analytical approach was wanting. Most were descriptive studies with no inferential input
and could therefore not deliver the likelihood relationships between the various
determinants and CSPT adoption sought for in this study. All these gaps cited in this section
were addressed in this study. Key literatures reviewed in this study and their knowledge
gaps are outlined in Table 2.1 below.
Table 2.1 Research Gaps
Author/year Theory/Study Findings Research Gaps
Rawlins &
Ashcroft,
2013
Report on a study on
status and potential of
Small-scale Concentrated
Solar Power
General approaches to
promote adoption of
Small-scale Concentrated
Solar Power:
- Access to finance
- Build capacity
- Awareness creation
- Contextual
- conceptual
- Methodological
- Analytical
Shoeb, 2014 Diffusion of innovation
theory
Determinants of Adoption
of innovations
- Contextual
- Methodological
- Analytical
Sayers, 2006 Awareness Raising
Model
5 awareness creating
approaches:
- person to person
- Contextual
- Methodological
- Analytical

64
- mass media
- education process
- public relations
- advocacy
Lindlein &
Mostert,
2005
Commercial Financial
Instruments for
Renewable Energy
Model
Mechanisms in funding
renewable energy
projects:
- Equity finance
- Debt financing
- Mezzanine finance
- Subordinated debt
- Sales-lease-back
arrangements.
- Contextual
- Methodological
- Analytical
ISO, 2013 Guide on Standardization Rules, guidelines or
characteristics of
activities or their
expected results, for the
purpose of attaining
optimum level of order
- Contextual
- Methodological
- Analytical
Ocampo &
Maithel,
2012
Project report on Energy
Conservation in Small
Sector Tea Processing
Units in South India
Innovation attributes
influencing adoption:
- relative advantage,
compatibility,
complexity, trialability,
and observability
- Contextual
- Analytical
Akker &
Aggarwal,
2015
Project report on
UNDP/GEF project in
India focusing on growth
and advancement of solar
concentrators for process
heat.
Awareness creation:
- Newsletter
- Website
- Films
- Advertisements
- Demonstrations
- Contextual
- Methodological
- Analytical

65
2.6 Conceptual Framework
A conceptual framework is a written or visual expression of the main concepts, constructs
or variables and their suggested relationship between (Vaughan, 2008). The framework
gives the structure and content of a study based on literature and personal experience,
placed in a logical and sequential design. It helps to clarify the concepts of the study and
their proposed relationship. Eventually it provides a context for interpreting study findings
and theory development that is useful to practice. This study investigates the relationship
between adoption of CSPT (dependent variable) and five independent variables. These are
CSPT attributes, CSPT awareness, organization complexity, access to finance, and
technology standards. This conceptual framework is illustrated in Figure 2.2.
Independent variables Dependent Variable
Figure 2.2 Conceptual Framework
2.6.1 CSPT Attributes.
These are the characteristics of the CSPT that may or may not entice potential adopters to
adopt the innovation. They include cost effectiveness of the innovation, profitability,
compatibility with an individual’s needs and the extent to which a technology may be
CSPT Adoption
Access to Finance
CSPT Technology
Standardization
CSPT Attributes
CSPT Awareness
Organization
complexity H03
H04
H05
H01
H02
H06

66
experimented (Sahin, 2006). Others are ease of use and extent to which results of an
innovation are visible.
2.6.2 CSPT Awareness.
Awareness creation is a means of making a group people aware of something (ESTIF,
2012). This is a communication campaign aiming at creating or developing a sustainable
market for CSPT technology. Potential adopters should be made aware of the advantages
and disadvantages of the technology so as to prepare them for its consequences (Sahin,
2006).
2.6.3 Organization Complexity
Complexity refers to the extent to which members of the organization are perceived to
possess a relatively high level of knowledge, skills and expertise, which in-turn is measured
in terms of members' spectrum of occupational specialties and their levels of
professionalism (Rogers, 2003). Complexity is said to enhance organizational members’
potential for conception and generation of innovations.
2.6.4 Access to Finance
Access to finance has been cited in all the theoretical and empirical reviews discussed
earlier in this chapter as a major requirement for entrepreneurs to engage in business. This
is particularly crucial when they are dealing with new innovations with presumed high risk
and substantial initial costs. This is the case with CSPT technology and financing schemes
were a major component of CSPT projects discussed in the empirical review. Such schemes
will promote the diffusion of CSPT technology.

67
2.6.5 CSPT Technology Standardization
Standardization involves developing and applying rules for a systematic approach to an
activity for the benefit of everyone, and particularly to promote optimum economy, taking
into consideration the functional conditions and safety issues (Emodi, et al, 2014).
Standardization can be used to specific products, or generalized product groupings. An
example is the norms, specific requirements, specific methods, specific terms, and specific
designations mostly applied in global trade and in science, engineering, industry,
agriculture, construction, transportation, culture, public health, and other areas of the
international economy. Standardization provides advantages such as improved product
quality, more reliable and long lasting service; lower costs of production of products
components; ease of access to spare parts for replacements and maintenance; and higher
human resource productivity for the manufacture.
2.7 Operational Framework
The operational framework shows the translation of abstracts into measurable indicators
(Vaughan, 2008). It brings out dimensions and elements through which a concept is
measured. In this study the operational elements of each of the independent variables CSPT
attributes, CSPT awareness, organizational complexity, access to finance and CSPT
standardization are laid out. It also shows the different stages of the adoption process,
which is the dependent variable. The indicators for the five independent variables for this
study are illustrated in figure 2.3.

68
Figure 2.3 Operational Framework
2.8 Hypotheses Development
In this section bases of the study hypotheses are discussed. A hypothesis is a statement, or
set of statements, put forward about the occurrence of some specific phenomena, usually
meant as a provisional conjecture to guide investigation or as probability in the light of
Organization
complexity
- Capital reserves adequacy
- Credit facilities availability
- Cost of credit
- Availability of Collateral
- Availability of Gov. Grants
- Availability of DP Grants
- Availability of Subsidies
- Availability of Tax credits
- Venture Capital funding - Public Private Partnerships - Insurance schemes
Adoption of CSPT
- Prior stage
- Knowledge stage
- Persuasion stage
- Decision stage
- Implementation stage
- Confirmation stage
Access to Finance
CSPT Attributes
- Cost effectiveness
- Carbon emission level
- Health hazard level
- 24 hour availability
- Heat range level
- Ease of installation
- Triability
- Brochures
- Posters
- Resource books
- Public presentations
- Public workshops
- Exhibitions & trade shows
- Newspaper advertising
- Magazines advertising
- Electronic publications
CSPT Awareness
- On-the-job training
- Overseas training
- Formal training
- Informal training
- University training
- VETI Training
- Quality assurance
- Installation procedures stds.
- KEBS marks of quality
- ISO certification
- KEREA accreditation
CSPT
Standardization

69
some established facts (Saunders, 2009). Five such propositions are made in this study and
are discussed below.
2.8.1 CSPT Attributes and Adoption of CSPT
One of the key contributions of Rogers diffusion theory discussed earlier is that new
innovations will be adopted or not based on their characteristics. These were relative
advantage over other technologies, compatibility with current systems, complexity of the
technology, how triable the technology is, and observability (Shoeb, 2014). Benefits of
CSPT for energy production have been discussed earlier in this study, and projects
implemented in India illustrated how allure for solar technologies was one of the factors
used to attract tea factories to adopt the new technologies. The Indian example may be
replicable in Kenya but there are factors that may indicate otherwise. For a start CSPT
technology is not the only technology that can deliver the said benefits. Other sources of
energy with a sustainability claim just like CSPT are taking a foothold in the market. They
include solar PV, wind energy, cogeneration, briquettes and small hydro. Solar PV is said to
have a lower cost appeal than CSPT while cogeneration, briquettes and small hydro are
likely to be seen as local, easier to generate and more certain products for the sector.
Main grid power supply has also been improving in Kenya. This has been occasioned by
enhancement of the hydroelectric plants to raise and make power supply more regular. This
has been augmented by the steep development of geothermal subsector which is expected to
substantially improve power supply in the country (Saidi, Laura & Seton, 2012). Nuclear
energy is also expected to make an entry in the same arena. Kenya also discovered oil in

70
Turkana in 2012 and it is expected this development might ease on the cost of fuel burden
that has been used to make a case for CSPT.
The above discussion identifies a plethora of alternative power sources that equal or better
the attributes of CSPT. This puts a doubt as to whether the tea factories will opt to adopt
CSPT, and made the study make the following proposition.
H01: There is no relationship between CSPT attributes and likelihood of adoption of
CSPT among the Kenyan tea factories run by KTDA.
2.8.2 CSPT Awareness and Adoption of CSPT
Awareness creation has been highly emphasized as key to inducing uptake of new
technologies. It is a communication perspective that assumes that novelty brings about
uncertainty and that potential adopters are risk averse (Miller & Garnsey, 2000). The
communication or awareness creation is meant to reduce uncertainty, minimize risk
aversion perception and actuate the benefits of the new innovation. This is a plausible
argument and has been practiced as illustrated in the CSH promotion project in India. Again
it may be or not be replicable in diffusion of CSPT among tea factories in Kenya.
First the awareness creation initiative assumes that its content is absent in the target market,
which may not be true. The management teams of the tea factories may be well aware of
this technology, its benefits and even more important, its shortcomings. After all,
information of this technology is highly available, especially on the internet. The said
initiative might therefore not be adding any value and will not make the tea factory
management make the adoption decisions. The tea factories management, who are the
decision makers, may be influenced by other factors beyond the risk and uncertainty

71
addressed here. Personal gains and established cultural practices in the organizations might
take centre stage in the source of power decision, regardless of any pleasant communication
on CSPT. Finally, suppliers of conventional sources of power (such as oil), and those of
other renewable energies will also be making their communications in the market. The
potential adopters will therefore be recipient of these different awareness schemes, many
made using huge resources that the novel CSPT players may not match, and may find CSPT
unconvincing. Based on these possibilities the study made the proposition that:
H02: There is no relationship between CSPT awareness creation and likelihood of
the adoption of CSPT among the Kenyan tea factories run by KTDA.
2.8.3 Organization Complexity and Adoption of CSPT
Training is said to increase the absorption capacity for adoption and diffusion of new
technology (Heidana et al, 2015). It was also a key component of the empirical review
cases discussed in this study. Just like with awareness it seemed to work with tea factories
in South India. However among the Kenyan tea factories some factors might put a spanner
into the works. First, training takes time to translate to behaviour. Exposing the tea factory
teams to facts, operations and gains of CSPT may not inspire them to act. Furthermore, they
may be tied up with long-term power projects that may be hard to abandon midstream just
because of the new technology they have just learnt. A case in point is the eucalyptus
forests project for supply of biomass fuel, which has been implemented by 34 tea factories
(Rawlins & Ashcroft, 2013). The tea factories were therefore not likely to adopt CSPT
leading to the following hypothesis:
H03: There is no relationship between organization complexity and likelihood of
the Adoption of CSPT among the Kenyan tea factories run by KTDA.

72
2.8.4 Access to Finance and Adoption of CSPT
In most of the empirical study reviews done above, access to finance has been highlighted
as the most serious hindrance to adoption of new technologies (Topo et al, 2014). In the
EE/RE energy promotion project in South India access to finance was a key address but by
midterm of the project the project managers discovered it was not a key barrier (Ocampo &
Maithel, 2012). This is likely to be the case in Kenya among tea factories. Financial
resources are highly available in Kenya, especially for corporate bodies, and the debate is
only on the cost. Financial incentives like zero rating of solar products imports, and feed-in
tariffs are already in place. Such initiatives can therefore not be seen as incentives and
would not spur adoption of CSPT, hence the conclusion:
H04: There is no relationship between access to finance and likelihood of the
adoption of CSPT among the Kenyan tea factories run by KTDA.
2.8.5 CSPT Standardization and Adoption of CSPT
Standardization is a process of formulating and applying rules so as to bring about order
(Emodi et al, 2014). It protects customers against sub-standard products. It also provide
confidence and trust in new products, and promote best practices in design, installation and
maintenance of new product systems. It therefore creates a conducive environment for
adoption. However, this might not always be the case. The search for quality products may
be circumvented by a number of factors. Budget shortages may make customers opt for
cheap products which are likely to be of poor quality, thereby promoting market spoilage
and by extension hinder diffusion. Related to this is that usually quality products are
expensive and standardization costs will make them even more expensive. The higher costs
and prices would mean fewer potential adopters will be attracted. Political influence might
also interfere with procurement decisions about quality. Tea factory directors are elected

73
through campaigns that are highly infiltrated by politicians and they would have their say
when it comes to making important decisions like the one on source of power energy. The
standardization efforts targeting these tea factories were likely to come to nothing, and
therefore:
H05: There is no relationship between CSPT technology standardization and
likelihood of the adoption of CSPT among the Kenyan tea factories run by
KTDA.
2.9 Chapter Summary
Chapter two presented the theoretical and empirical foundations of this study. It explored
literatures on theoretical models on adoption of new technologies pivoting on Everett M.
Rogers’ adoption model. Empirical studies on adoption of new technologies from different
parts of the world were also reviewed with particular emphasis on reports on adoption of
renewable technologies (especially concentrated solar technologies) and mechanisms
utilized to enhance their adoption. These analyses crystalized in to the conceptual and
operational frameworks of this study.

74
CHAPTER THREE
RESEARCH METHODOLOGY
3.1 Introduction
This chapter discusses research design and methodologies that were applied in this study.
These include research philosophy, research design, target population, and data collection
and analysis procedures.
3.2 Research Philosophy
Research philosophy refers to a researcher’s view on how knowledge is developed and the
nature of the knowledge developed (Saunders et al, 2009). It helps clarify researchers’ view
of the nature of reality (ontology), what makes up acceptable knowledge (epistemology),
and the role of values in research (axiology). In turn, this informs the direction of data
collection techniques appropriate for a study. There are several research philosophies but
the common ones used in social science are positivism and interpretivism.
Positivism adopts a stance of the natural scientists that emphasize working with observable
social reality that end up in law-like generalizations (Saunders et al, 2009). According to
this view only observable phenomena and a researcher independent of the process can
provide credible data. This means that data collection techniques are highly structured,
involve clear measurement units, and are quantitative (Saunders et al, 2009).
Interpretivism emphasizes understanding differences between humans in their role as social
actors. It is a view that peoples’ actions and their views of other actions will depend on their
interpretation of the social world (Zikmund et al, 2013; Saunders et al, 2009). This leads to
acceptance of subjective meanings of social phenomena. Focus on details of a situation,
reality behind the details, motivating actions, and subjective meanings are taken as credible

75
data sources. Subsequently in data collection small samples, in-depth investigations, and
qualitative approaches are emphasized.
Most of the concepts and constructs in this study were best served by the positivism
orientation. Investigations on attributes of CSPT, levels and sources of awareness, and
access to finance were statements of facts from the respondents rather than their
impressions. The same applied to enquiries on organization complexity and standardization
variables. The study, therefore, adopted a positivism philosophy.
3.3 Research Design
Research design refers to a master plan that specifies the methods and procedures for
collecting and analysing the needed information to answer research questions (Zikmund et
al, 2013; Bryman, 2012). It specifies the chosen research strategy, data collection
techniques and analysis procedures, and the time horizon over which research study is
undertaken.
This study was a cross-sectional survey serving descriptive and explanatory purposes. A
survey is a method of collecting primary data based on communication with a
representative sample of individuals (Zikmund et al, 2013). A survey is cross- sectional
when it involves examining the characteristics of several groups at one point in time. A
survey enables the researcher to obtain data about practices, situations or views at one point
in time through questionnaires or interviews, which can be examined to detect patterns of
association (Bryman, 2012). This method was used to get data from the tea factory unit
managers on the factory’s CSPT adoption status and on the factors that are likely to make
the factories adopt CSPT.

76
Exploratory study is undertaken to gain familiarity with a phenomenon situation which has
not been solved in the past (Sekaran, 2010). When data collected regarding phenomena of
interest reveals some pattern, theories can be developed and hypotheses developed for
subsequent testing. Exploratory studies can also be carried out where some facts are known
about a phenomenon but more information is required for developing a theoretical
framework. The area of investigation may also be new or vague that exploration is required
to learn something about the dilemma facing managers (Cooper & Shindler, 2011). The
focus of this study was to find out the factors likely to enhance the adoption of CSPT, a
novel product, by tea factories managed by KTDA. Several factors are documented in
various literatures cited earlier in this study, which affect adoption of various solar
technologies in various industries and localities. Whether all or some of these factors apply
to the subjects of this study was the object of the exploratory purpose of this study.
Descriptive approach is a method used to portray an accurate profile of persons, events or
situations (Saunders et al, 2009; Sekaran, 2010). It provides a clear picture of phenomena
on which one wishes to collect data on and it can be a prelude to explanatory research. It is
used to serve a variety of research objectives. A common one is a description of phenomena
or characteristics associated with a subject population (Cooper & Scindler, 2011). This
would involve answering who, what, when, where and how questions of a topic. Another
objective served by description is estimating of proportions of a population that has certain
characteristics, and description will also be used to discover associations among different
variables. The descriptive approach was used in this study to illuminate the process heat
energy quagmire facing the Kenya tea factories run by KTDA. It covers the response rate,
profiles of the KTDA factories and their managers, and the KTDA factory’s heat energy

77
uses and sources and the challenges facing the factories due to their current sources of
energy heat.
Explanatory research approach is used to establish existence or otherwise of relationships
between variables (Saunders et al, 2009). The emphasis is to study a situation or a problem
in order to explain the relationships between variables in play in the situation. In this study,
therefore, beyond describing phenomena, an analysis was made to establish the extent to
which each of the cited factors was likely to influence adoption of CSPT. This was
accomplished through an inferential statistics procedure (penalized logistic regression)
described later in this chapter.
3.4 Target Population
Population refers to any complete group of entities that share some common set of
characteristics (Zikmund et al, 2013). It is the total collection of elements about which one
would wish to make some inferences (Cooper & Schindler, 2011). This study’s target
population was made up of sixty six (66) tea factories in Kenya managed by KTDA. A list
of the sixty six factories is presented in appendix IV. The 66 tea factories were spread out in
13 counties in the country. They were divided into seven operational regions namely
Aberdare Ranges I, Aberdare Ranges II, Mt. Kenya, Mt. Kenya & Nyambene Hills,
Kericho Highlands, Kisii Highlands, and Nandi Hills & Western Highlands. The target
respondents of this study were the sixty six (66) unit managers of the tea factories run by
KTDA. The factories were serving a total farmers population of 599,032.

78
3.5 Sampling and Sampling Procedure
Sampling is a process for selecting a small proportion of the population for observation or
analysis (Best & Khan, 2011). The idea of sampling involves selecting some elements of a
population that can be used to draw conclusions about the entire population (Cooper &
Schindler, 2011). Use of sampling reduces the cost of conducting research, speeds up
execution and enables researcher convenience. However, these advantages of sampling are
less compelling when the population is small (Cooper & Schindler, 2011). When a
population is small any sample drawn from it may not be representative of the population
and values calculated from such samples may be incorrect estimates of the population
values.
The target population of this study was sixty six (66) tea factories run by KTDA. This is a
size considerably small and this suggested that a census was the feasible way to go. Census
is an investigation of all the individual elements that make up a population (Zikmund et al,
2013). In this study, therefore, all the sixty six factories managed by KTDA were studied.
3.6 Data Collection
Data collection refers to the activity of gathering data for the purpose of analysis, testing
hypotheses and answering research questions (Sekaran, 2010). There are several data
collection methods and the most commonly used include interviews, observations and
questionnaires.
3.6.1 Data Collection Tool
Data collection for this study was by use of questionnaires. Questionnaire is a technique of
data collection in which every person is asked to respond to the same set of questions in a
79
predetermined order (Saunders et al, 2009; Bryman, 2012). Particularly a self-completion
questionnaire was used. This is a procedure whereby the respondents answer questions by
completing the questionnaire themselves. The method is preferred to interviewing for being
quicker and faster (Bryman, 2012). It also enables minimal interference from the
researcher, no interviewer variability and accords respondents’ convenience. The
questionnaire composed of mostly closed-ended items and is presented in appendix III.
3.6.2 Data Collection Procedure
Drop and Pick technique was applied with the target population. The questionnaires were
dropped by the researcher at the respective factories and later picked on respondents’
agreed disposal. This method was preferred to mail and postal questionnaires as it enhanced
respondent’s response rate (Bryman, 2012).
3.7 Pilot Study
Pilot study involves testing the questionnaire on a small sample so as to identify and
eliminate likely problems (Maina, 2016; Zikmund et al, 2013; Bryman, 2012). It helps
refine the questionnaire such that respondents will have no problem in answering the
questions and there will be no problems in recording the data. The study is also used for
testing the validity and reliability of the research tool. Baker, Morall and Turkington (1988)
recommended a sample size for piloting purpose to be at least 5% of the study population.
For this study a pilot test was carried out with four private tea factories not managed by
KTDA. These were Maramba tea factory (Limuru), Emrok tea factory (Nairobi office)
Ngorongo tea factory (Kiambu) and Arrotek tea factory (Sotik).

80
A principal finding from the pilot was that all the four factories had not installed CSPT.
This informed the modification of the title of this study from ‘Market drivers for adoption
of CSPT among KTDA managed tea factories’ to ‘Determinants of Likelihood of CSPT
adoption by KTDA managed tea factories’. This was in recognition of the fact that many of
the KTDA run factories might not also have adopted CSPT. This eventually proved to be
the case. Further, inferential model for data analysis had to be modified to accommodate the
new complex data set. Penalized logistic regression (particularly Firth logistic regression)
was adopted instead of the earlier targeted standard logistic regression.
Beyond these, many questionnaire items were reframed to embrace the element of factories
that may have not adopted CSPT. Also some items in the questionnaire that seemed to be
the same to the respondents were collapsed into one.
3.7.1 Reliability of Data Collection Tool
Reliability is an indicator of a measure’s internal consistency (Zikmund et al, 2013). A
measure is reliable when its different attempts at measuring something converge on the
same result. If an investigation was repeated, in the same context, with the same methods
and with the same participants, similar results would be obtained (Shenton, 2004).
Cronbach’s Alpha statistic was used to test the reliability of this study’s reliability.
Cronbach’s Alpha statistic is a commonly applied estimate of reliability (Zikmund et al,
2013). It measures how well each item in a measuring tool correlates with other items in the
same tool. Coefficient Alpha statistic ranges in value from 0 (meaning no consistency) to 1
(meaning complete consistency). When applying the likert scale it is important to calculate
and report Cronbach’s Alpha for internal consistency reliability (Tavakol & Dennick,
2011). Generally a Cronbach’s alpha score of 0.7 to 0.9 or higher is considered good for

81
most studies. This study’s questionnaire reliability was tested using pilot study data,
whereby each independent variable’s questionnaire items were tested separately. The
predictor variable ‘attributes of CSPT’ sored 0.866, ‘awareness creation’ scored 0.873,
‘organization complexity’ scored 0.771, ‘access to finance’ scored 0.761 and
‘standardization’ scored 0.997. These were all in the acceptable range cited above and
therefore suggested a fairly good reliability of the data collection tool.
3.7.2 Validity of Data Collection Tool
Validity refers to the accuracy of a measure in truthfully representing a concept (Zikmund,
2013; Bryman, 2012). Therefore, a validity concern in a research investigation is a concern
of whether the tools and procedures applied in the investigation are accurately measuring
what they are said to measuring. Zikmund et al (2013) has identified four ways of trying to
assess validity. These are face validity, content validity, criterion validity and construct
validity. Face validity refers to the subjective agreement among professionals that a
measuring tool logically reflects the concept being measured (Zikmund et al, 2013). In this
study the questionnaire was presented to technology adoption experts for validation of the
questionnaire items.
Content validity refers to the degree to which a measure covers the domain of interest
(Zikmund el al, 2013; Sekaran, 2010). It is a question of whether the tool covers the whole
scope and does not go beyond. Shenton (2004) refers to this as internal validity. A number
of ways have been identified that help attain this validity. One of them is the use of correct
operational measures for the concepts being studied, which are derived from those that have
been successfully used in comparative projects. Another common approach is triangulation.
This involves use of different methods of data collection for a synergy that compensates for

82
their individual shortcomings and exploits their respective benefits (Shenton, 2004). It may
also involve use of a wide range of informants whose individual view points and
experiences can be verified against others to come up with a truthful construct. In this study
empirical studies on adoption of CSPT have been used in identifying the variables and their
expected relationships in the study. To further establish internal validity, interviews were
conducted with energy specialists at Dedan Kimathi University and at KTDA headquarters.
Criterion validity refers to how practical or pragmatic the measuring tool and its results are
(Zikmund et al, 2013; Sekaran, 2010). It addresses the concern that a measure overall
truthfully represents a unique concept. It is what is referred to as external validity by
Shanton (2004). This is the concern on the extent to which the findings of one study can be
applied to other situations. This may be attained by accumulation of findings from studies
staged in different settings to generate a more inclusive overall picture. An analysis of
CSPT adoption projects in India and particularly in the tea industry have been put together
in the previous chapter and are in a big way expected to deliver external validity for this
study. All questionnaire items on the different variables are developed through an analysis
of the empirical project reports in chapter two.
3.8 Measurement and Scaling Technique
Measurement is a procedure in which a researcher assigns numerals (numbers or symbols)
to empirical properties (variables) according to rules (Nachmias & Nachmias, 2009).
Measurement gives yardsticks for making distinctions between concepts and the basis for
more precise estimation of degrees of relationship between variables (Bryman, 2012). In
research four levels of measurement are recognized and classified as measurement scales.
These are nominal, ordinal, interval and ratio scales. The nominal scale assigns values to an
83
object for identification or classification only, for example male or female. Beyond
classification the ordinal scale enables ranking of objects or responses, for example good,
better, best. Interval scale has both nominal and ordinal properties but also capture
information about differences in quantities of a concept from one observation to the next.
Last is ratio scale which beyond having the properties of the other three scales already
discussed, measures variables that have a natural zero point.
Data collected in this study is of nominal and ordinal nature. The dependent variable is the
adoption of CSPT among tea factories run by KTDA in Kenya. Adoption of CSPT is a
dichotomous concept, meaning a factory will either have adopted CSPT or not. The
measurement at every factory was therefore classified either as ‘adopted CSPT or not
adopted CSPT’, or ‘installed CSPT or not installed CSPT’. This variable therefore bears
nominal data and a nominal scale was applied. A nominal scale assigns a value to an object
for identification or classification only. It involves collecting information on a variable that
can be grouped into two or more categories that are mutually exclusive and collectively
exhaustive (Cooper & Shindler, 2011). The independent variables were awareness creation,
CSPT attributes, organization complexity, access to credit and CSPT standardization. For
inference purpose it was important to measure the respondents’ views on the importance of
the individual independent variables in influencing the decision to adopt CSPT. To enable
this, the method of summated ratings, developed by Rensis Likert (Zikmund, 2013) was
adopted. This is a measure of attitudes designed to allow respondents rate how strongly
they agree or disagree with carefully constructed statements ranging from very positive to
very negative attitude towards a specific aspect. These summated ratings bear ordinal data.
Ordinal scale was therefore applied in measuring the five independent variables. This
measurement scale is useful for managers when the organization plans to undertake a

84
program of change or improvement (Cooper & Shindler, 2006). The operationalization and
measurement scales for the study is detailed in table 3.1.
3.9 Data Analysis and Presentation
Data analysis is the application of reasoning to understand the data that has been gathered
(Zikmund et al, 2013). It involves application of statistical techniques to the data that has
been collected to get a feel for the data, testing the goodness of data, and for testing
hypotheses developed for research (Bryman, 2012; Sekaran, 2010). For this study, data
analysis commenced with data processing involving the stages of data editing and coding.
Data editing is the process of checking the completeness, consistency and legitimacy of
data, making the data ready for coding and storage. Coding on the other hand involves
assignment of numerical scores or classifying symbols to previously edited data to give
meaning to the data.
The next stage was descriptive analysis. This is the elementary transformation of data in a
way that describes the basic characteristics of the subjects such as central tendency,
distribution, and variability (Sekaran, 2010). The results have been presented in form of
tables and figures in the next chapter. These are accompanied by prose interpretations of the
data.

85
Table 3.1: CSPT Adoption Variables and their Measurement Scales
Variable Variable
Type
Measurement
Scale
Parameters
Adoption of CSPT Dependent Nominal - Adopted CSPT
- Not adopted CSPT
CSPT attributes Independent Ordinal
- Cost effective
- Carbon emission
- No health hazard
- 24 hour availability
- Heat range
- Ease of installation
- Triability
Awareness creation Independent Ordinal
- Brochures
- Posters
- Resource books
- Public presentations
- Public workshops
- Exhibitions & trade shows
- Newspaper advertising
- Magazines advertising
- Electronic publications
Organization
complexity Independent Ordinal
- On-the-job training
- Overseas training
- Formal training
- Informal training
- University training
- VETI Training
Access to finance Independent Ordinal
- Capital reserves
- Credit facilities
- Cost of credit
- Collateral requirement
- Grants government
- Grants devpt. partners
- Subsidies
- Tax credits
- Venture Capital funding - Public Private Partnerships - Insurance schemes
CSPT Standardization Independent Ordinal
- Quality assurance
- Installation procedures
- KEBS marks of quality
- ISO certification
- KEREA accreditation
The last analysis stage was inferential analysis of the independent variables and the
dependent variable. This was an effort seeking to identify the extent to which each

86
independent variable under study was likely to influence the adoption of CSPT among the
KTDA managed tea factories. To accomplish this, a binary logistic regression analysis was
identified to generate a model on the likelihood of various indicator variables to influence
the adoption of CSPT technologies in the tea factories in Kenya. Logistic regression
determines the impact of multiple independent variables presented simultaneously to
predict membership of one or other of the two dependent variable categories (Menard,
2002; Gujarati & Porter, 2009). It is used instead of linear regression which has the crucial
limitation that it cannot deal with dependent variables that are dichotomous and categorical.
The two dependent variable categories in this study are adopted CSPT and not adopted
CSPT.
The goal of logistic regression is to find the best fitting model to describe the relationship
between the dichotomous characteristic of interest (dependent variable) and a set of
independent variables (Menard, 2002; Gujarati & Porter, 2009). Logistic regression
generates the coefficients of a formula to predict a logit transformation of the probability of
presence of the characteristic of interest, expressed as follows:
Logit(p) = β0 + β1X1 + β2X2 + β3X3 + ….. + βkXk (i)
where p is the probability of presence of the characteristic of interest. The β0, β1, β2, ...βk are
the logistic regression coefficients of the equation. They are used to predict the change in
the probability of the dependent variable taking the category of interest due to a one-unit
change in a specific independent variable. This is accomplished by using the coefficients to
compute the odd ratio. The odds ratio is equal to exp(b), sometimes written as eb.
Substituting the exponent constant (about 2.72) and raising it to the power of b, we get the
odds ratio. For example, if the regression coefficient of an independent variable is 0.75, the
odds ratio is .75(2.72) which is approximately 2.12. This would be interpreted to mean that a

87
change of the independent variable by one unit increases the likely hood of the dependent
variable assuming the desired category by 2.12 times, holding all other independent
variables constant.
For this study the logistic regression model is developed by letting Y = CSPT adoption,
where Y is a binary variable such that Y = 1 if the CSPT is adopted and Y = 0 if CSPT is
not adopted. The logistic regression equation for the study will be as follows:
logit(p) = β 0 + β 1X1+ β 2X2 + β 3X3 + β 4X4 + β 5X5 (ii)
Where p = probability of a tea factory adopting CSPT
X1 = Attributes of CSPT
X2= Awareness of CSPT
X3 = Access to Finance.
X4 = Organization complexity
X5 = Standardization of CSPT
β1….β5 are logistic regression coefficients which express the relationship between the
CSPT adoption and the respective independent variables.
Nevertheless, findings from the pilot test suggested adoption of CSPT by the tea factories
was a rare event. This was because out of the four tea factories investigated in the pilot,
none of them had adopted CSPT. When full data collection exercise was completed only
three factories were found to be in the process of CSPT adoption. The three had gathered
intelligence on CSPT and made the decision to adopted CSPT. They were in the evaluation
stage of alternative providers and financing mechanisms. This meant that the data collected
for the study was a rare event data. Rare event data consists of binary dependent variables
with thousands of times fewer ones (desired event) than zeros (undesired event) (Allison,

88
2012). The desired event in this study was ‘factory adopted CSPT’ and the undesired event
was ‘factory not adopted CSPT’.
Standard logistic regression explained above, which was targeted for inferential analysis in
this study, arrives at maximum likelihood estimates (MLE) of the relationship between the
dependent variable and the indicator variables. However, MLE algorithms analysis breaks
down when rare event data is run (Allison, 2012; Rasch & Waibel, 2013; Shen & Gao,
2008). This is firstly attributed to multicollinearity. This is the singularity of the design
matrix. Secondly failure is caused by occurrence of complete or quasi separation. This is
where linear combination of predicator variables perfectly predict the outcome, in which
MLE does not exist. This is common in binomial regression with binary predictors and
more common in unbalanced data or where absolute rareness occurs. This was the case of
this study’s data.
Fortunately statistical remedies exist for such a situation. There are sampling techniques
and special algorithms for dealing with rare events data. One such technique is under-
sampling, which involves reducing the number of observations from the dominant category
to make data more balanced (He & Garcia, 2009). Considering the rare observations of
CSPT adoption among tea factories, under-sampling would not have been of use. Another
technique is over-sampling which involves increasing the observations of the minority
category to balance the data. This can be done randomly or through generation of synthetic
data. Over-sampling may result in over-fitting in some algorithms (since it involves
duplication of data) but it does not do so in logistic regression (Paal, 2014; Altini, 2015).
Over sampling only shifts the intercept but does not affect the slope (parameter estimates).
Oversampling was applied in this study to improve on CSPT adoption category. Systematic
89
duplication of every 20th observation, beginning with the 6th observation, was done with
CSPT adoption assuming the value 1. This resulted in an additional four observation units,
giving a total of seven adoption category cases. This effectively made the data a complex
data set.
A complex data set from a survey is one that is arrived at through complex sampling
methods such as stratification, oversampling and multistage sampling, whereby
observations have an unequal probability of selection (Nielson & Seay, 2014). This kind of
data should not be analysed the same way as data arrived at through random sampling.
Doing so increases the probability of a type I error. Two approaches are commonly used to
deal with the analysis of complex data sets. The first is complex sample logistic regression
which caters for complex samples but does not deal with separation and quasi separation
problem. Thus attempt to use this approach resulted in results that are unreliable. The
alternative is to use penalized maximum likelihood algorithms such as Ridge, Lasso and
Firth.
Penalized logistic regression (PLR) is a variation of logistic regression developed to take
care of the complete and quasi-separation complications that arise when analysing complex
data using standard logistic regression and maximum likelihood estimation (MLE) (Fijorek
& Sokolowski, 2012: Allison, 2012). The procedure yields finite estimates of parameters
under complete or quasi-complete separation. It has farther been proved to largely reduce
the small sample bias of MLE estimates (Fijorek & Sokolowski, 2012). Firth penalized
logistic regression model was selected for this study. The model offers solution to the
problem of separation in logistic regression and small sample biases (Rahman & Sultsna,

90
2017; Eyduran 2008). Owing to this choice, the studies earlier standard regression model
expressed in equation (ii) is modified to reflect the firth model expressed in equation (iii).
Logistf (CSPT Adoption) = β 0 + β 1X1+ β 2X2 + β 3X3 + β 4X4 + β 5X5 (iii)
Firth penalized logistic regression modelling was done for each of the objectives. To
evaluate model fit McFadden R2 statistic was used. McFadden R2 statistic measures the
predictive power of a model. It measures how well one can predict the independent variable
using the independent variables. McFadden suggested a model with McFadden R2 statistic
of between 0.2 and 0.4 exhibits an excellent fit (Cole, Chu, & Greenland, 2013). The
statistical significance of the model and individual regression coefficients were tested using
the p value (based on likelihood ratio chi-square). The test is applied when a variable under
observation is categorical, and is used to determine whether data collected are consistent
with a hypothesized distribution (Johnson, 2017). A significance level threshold of 0.05
was set for testing hypotheses. A combination of IBM SPSS statistics 23 and STATISTICA
12 softwares were used to generate the above statistics. The outcomes of the analysis are
presented in form of tables and figures in the next chapter.
The first independent variable was attributes of CSPT. It was regressed against adoption of
CSPT using its elements (cost effectiveness, health friendly, twenty four availability, easy
to install, within acceptable heat range, minimize carbon emissions and triability) as
covariates. The model for CSPT attributes was expressed as:
Logistf(CSPT Adoption) = β + β1X1
= β + β1Costef + β2Hhzd + β3Twty4h+ β4EasyIn + β5Hrange+ β6MinCarb + β7Triabl (iv)
Where β = is constant level of adoption not influenced by the regressor, X1 = CSPT
attributes, β1…..β7 are regression parameters, while Costef, Hhzd, Twty4h, EasyIn,

91
Hrange, MinCarb and Triabl are abbreviations for attributes of CSPT predictors cost
effective, healthy, twenty four hours, easy to install, acceptable heat range, minimize
carbon emissions and triability respectively.
The second predictor variable was CSPT awareness. Predictors of CSPT under awareness
were use of brochures, posters, resource books, public presentations, public workshops,
exhibitions, newspaper advertisements, magazine advertisements, and electronic
publications. The model for CSPT awareness was expressed as:
logistf (CSPT Adoption) = β + β2X2
= β + β1Broch + β2Posters + β3ResBks + β4PublP+ β5Wkshop + β6Exhb+ β7NewsP
+ β8Mag+ β9ElectP (v)
Where β = is constant level of adoption not influenced by the regressor, X2 = CSPT
awareness, β1…..β6 are regression parameters, while Broch, Posters, ResBks, PublP,
Wkshop, Exhb, NewsP, Mag, and ElectP are abbreviations for awareness of the
awareness creation approaches CSPT predictors brochures, posters, resource books,
public presentations, workshops, exhibitions, newspaper advertising, magazine
advertising, and electronic publications respectively.
The third independent variable was organization complexity as a predictor of CSPT
adoption. The organization complexity factors investigated that would influence adoption
of CSPT were management skills, technician skills, engineering training, technician
training, and education levels. Beyond these, training delivery modes that would influence
adoption of CSPT were also investigated and these were on-the-job training, overseas
training, formal education programs, informal education programs, training & networking

92
with universities, and training &networking with vocational education training institutions
(VETIs). The model for organization complexity was as follows:
Logistf (CSPT Adoption) = β + β3X3
= β + β1OnJob + β2Ovseas + β3Formal+ β4Informal + β5UniversTr + β6VocITr (vi)
Where β = is constant level of adoption not influenced by the regressor, X3 =
organizational structure characteristics, β1…..β9 are regression parameters, while
OnJob, Ovseas, Formal, Informal, UniversTr, and VocITr are abbreviations for
organization complexity predictors on-the-job training, overseas training, formal
education programs, informal education programs, training &networking with
universities, and training &networking with VETIs respectively.
Another independent variable was access to finance. Subset variables were capital reserves,
access to credit, cost of credit, collateral, grants, subsidies, tax credits, venture capital,
public private partnerships, and insurance. Model developed for access to finance was as
follows:
Logistf (CSPT Adoption) = β + β4X4
= β + β1CostC + β2AcessC + β3CostCap+ β4Colat + β5GrntG + β6GrntD +
β7Subsd+ β8TaxC+ β9VentC + β10Ppp + β11Insur (vii)
Where β = is constant level of adoption not influenced by the regressor, X4 = access to
finance, β1…..β10 are regression parameters, while CostC, AcessC, CostCap, Colat,
GrntG, GrntD, Subsd, TaxC, VentC, Ppp, and Insur are access to finance predictors
capital reserves, access to credit, cost of credit, collateral, grants from government,
grants from development partners, subsidies, tax credits, venture capital, public private
partnerships, and insurance schemes respectively.

93
The last dependent variable was CSPT technology standardization. Important dimensions of
this variable were quality assurance, standard installation procedures, KEBS mark, ISO
standard, and KEREA accreditation. These developed into the following model:
Logistf (CSPT Adoption) = β + β5X5
= β + β1QualA + β2IstalP + β3KEBsM+β4ISOstd + β5KERaccr (viii)
Where β = is constant level of adoption not influenced by the regressor, X5 = CSPT
technology standardization, β1…..β5 are regression parameters, while QualA, IstalP,
KEBsM, ISOstd, and KERaccr, are standardization elements quality assurance,
standard installation procedures, KEBS mark, ISO standard, and KEREA
accreditation.
The combined effect of CSPT attributes, CSPT awareness, organizational structure
characteristics, access to credit and CSPT technology standardization on CSPT adoption is
represented as an aggregate of the above models. This is presented below:
Logistf (CSPT Adoption) = β0 + β1CSPT Attributes + β2CSPT Awareness + β3
Organization Complexity + β4 Access to Finance + β5CSPT Standardization (ix)
Where β1….β5 are logistic regression coefficients which express the relationship
between the CSPT adoption and the respective independent variables.
3.10 Chapter Summary
This chapter details the key foundations and procedures of this study. It first clarified the
research philosophy of positivism the study is aligned to. Then research design, target
population and data collection tools and procedures of the study were outlined. This was
followed by discussions of pilot study results, variables measurement characteristics and,
data analysis procedures and expected resultant models on likelihood of adoption of CSPT
by tea factories tea factories managed by KTDA.

94
CHAPTER FOUR
RESEARCH FINDINGS AND DISCUSSIONS
4.1 Introduction
This study focused on the determinants of the likelihood of the adoption of CSPT among
tea factories managed by KTDA in Kenya. This chapter first presents a descriptive analysis
of the study findings followed by an inferential analysis of factors likely to influence the
adoption of CSPT by factories managed by KTDA. The descriptive analysis covers the
response rate, profiles of the KTDA factories and their managers, and the KTDA factory’s
heat energy uses and sources. The inferential analysis section details results of the
regression procedures followed by tests of hypotheses in line with the objectives of the
study.
4.2 Response Rate
This study was a census survey targeting all sixty six (66) tea factories in Kenya managed
by KTDA. The researcher was able to get to all the 66 factories and got satisfactory
responses from the factory managers. A response rate of 100% was therefore attained. This
is attributed mainly to the clear structure of the industry and factory managers who were
generally highly available and engrossed in factory operations on a daily basis. Prior
contact and appointments scheduling also played a role in attaining the response rate.
4.2.1 Respondents and Factory Characteristics
A number of characteristics were investigated at the tea factories. These were the managers’
age and job experience, factory energy uses and sources, and the challenges the factories

95
are experiencing with their current source of energy heat. These characteristics are briefly
discussed below.
4.2.2 Factory Managers Age
The targeted respondents in the study were the 66 factory unit managers. The managers
were classified in respect to their age group. Most of the managers (80.3%) were in the 41-
50 years age bracket while 15.2% were above 50 years and 4.5% in the 31-40 years range.
None of the managers was below 30 years old. This can be attributed to the fact that to get
to the top manager level, one may be required to have substantial experience in the industry
which one may hardly get before 30 years of age. This age structure is detailed in Table 4.1.
Table 4.1: Distribution of Factory Manager’s Age
Frequency Percent
Below 30 years 0 0
31-40 years 3 4.5
41-50 years 53 80.3
over 50 years 10 15.2
Total 66 100.0
4.2.3 Factory Manager’s Experience
Another characteristic of the tea factory managers captured was their managerial
experience, in years, working at tea factories. The bulk of the managers (68.2%) had over
ten years of experience while the balance (31.8%) had an experience of between six and ten
years. None of the managers had an experience in the range of five years or less. This
depicts management profiles with profound experience in tea processing, and would
therefore be in a position to give credible information on the tea sub-sector. This manager’s
experience data is illustrated in Table 4.2.
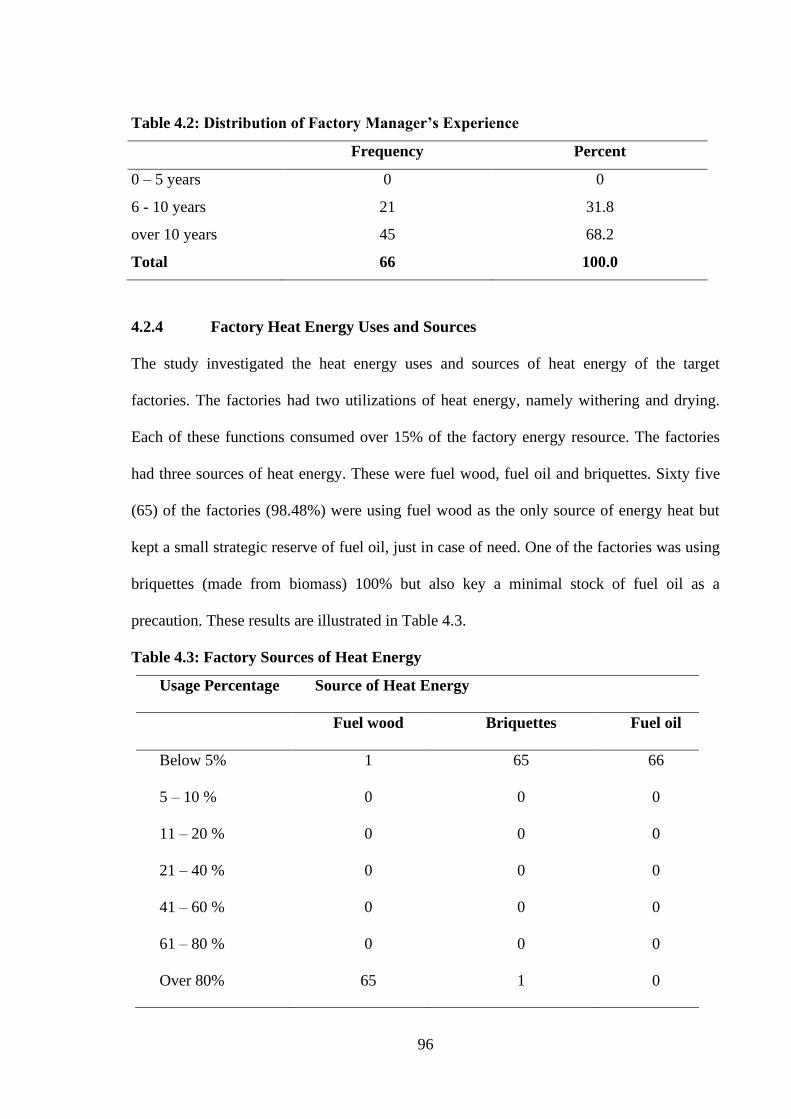
96
Table 4.2: Distribution of Factory Manager’s Experience
Frequency Percent
0 – 5 years 0 0
6 - 10 years 21 31.8
over 10 years 45 68.2
Total 66 100.0
4.2.4 Factory Heat Energy Uses and Sources
The study investigated the heat energy uses and sources of heat energy of the target
factories. The factories had two utilizations of heat energy, namely withering and drying.
Each of these functions consumed over 15% of the factory energy resource. The factories
had three sources of heat energy. These were fuel wood, fuel oil and briquettes. Sixty five
(65) of the factories (98.48%) were using fuel wood as the only source of energy heat but
kept a small strategic reserve of fuel oil, just in case of need. One of the factories was using
briquettes (made from biomass) 100% but also key a minimal stock of fuel oil as a
precaution. These results are illustrated in Table 4.3.
Table 4.3: Factory Sources of Heat Energy
Usage Percentage Source of Heat Energy
Fuel wood Briquettes Fuel oil
Below 5% 1 65 66
5 – 10 % 0 0 0
11 – 20 % 0 0 0
21 – 40 % 0 0 0
41 – 60 % 0 0 0
61 – 80 % 0 0 0
Over 80% 65 1 0

97
The above result indicates that none of the factories run by KTDA were making use of the
CSPT technology. In fact none of the factories was making use of any solar technology in
their tea processing.
4.2.5 Challenges of Current Sources of Energy Heat
The respondents were requested to identify the key challenges they experienced from using
their current source of heat energy. The challenges identified were high prices of the energy
source, volatility of energy source price, pollution by the energy source (carbon emissions),
depletion of source of energy, health hazard caused by the source of energy, intermittence
of the source and being messy. The threat of depletion of the energy source was ranked as
the number one challenge of the current energy source. It attained a mean score of 4.48 out
of a possible 5, with 50% of the respondents describing it to be a challenge to a high extent,
and 46% considered it to be a challenge to a very high extent. This was followed by high
prices of the energy source with a score of 4.36 from the respondents, and with 64% and
36% describing it as a challenge to a high extent and to a very high extent respectively. The
current source of energy being polluting and being a health hazard followed with scores of
3.64 and 3.47 respectively. The challenges of volatile price, being intermittent and being
messy were scored 2.79, 2.65 and 2.38 in that order. These responses are illustrated in
Table 4.4.

98
Table 4.4: Challenges of Current Sources of Energy heat
Factor Percentage Mean Std.
Dev Not at All Small
Extent
Moderate
Extent
High
Extent
Very High
Extent
High prices 0 0 0 64 36 4.36 0.485
Volatile price 2 6 44 18 0 2.79 0.755
Polluting 6 35 48 11 0 3.64 0.757
Getting depleted 0 2 2 50 46 4.48 0.561
Negative health 0 11 33 54 2 3.47 0.706
Intermittent 0 48 38 14 0 2.65 0.712
Messy 8 48 42 2 0 2.38 0.651
Average 3.39 2.52
The above challenges identified by the respondents are a good pointer to the potential of
CSPT in tea processing. The first ranked challenge of the sources of energy getting depleted
gets an outright remedy from CSPT. This is because CSPT is energy from the sun which is
abundant in Kenya and has no known limit. It is non-depletable and renewable source of
energy. Though the prices of CSPT technologies have generally been high (in the last
decade), evidence is there that its prices have come down tremendously and going forward
will have an edge against most other sources of heat energy. On the aspects of pollution and
health hazard, CSPT is one of the energy sources labelled as ‘clean energy’ that particularly
reduce carbon emissions of industrial processes (IRENA, 2015). It cannot be compared
with the fossil fuels, biomass or even some renewables sources such as briquettes that some
of the factories are using. Kenya is within the tropics ensuring sunlight availability
throughout the year, thereby overcoming the intermittence challenge. Overall CSPT fairly
circumvents the challenges cited by the respondents on their current sources of heat energy.

99
4.3 Adoption of CSPT by Tea Factories
As explained earlier in chapter two, adoption is a process involving five stages. These are
knowledge, persuasion, decision, implementation and confirmation stages. The managers
were asked to indicate at what stage their respective factories were in in the adoption
process. Sixty of the factories (91%) strongly agreed that their factories had not made any
move towards the adoption of CSPT process. They were not aware of any CSPT
information in the industry. This was an acknowledgement that of over ninety percent of
the factories had not started on the CSPT adoption process, a stage that is describe as Prior.
The other six of the factory managers were aware of the CSPT technology, and actually
three of them (4.5%) had made a decision to adopt the CSPT technology. However, they
had not implemented the decision. They were still in the procurement logistics. The other
three of the factories were aware of the technology, its benefits and possible challenges.
They were still evaluating the option of adopting but had not made the decision. These
results are illustrated in Table 4.5.
Table 4.5: Factories CSPT Adoption Stage
Factory Adoption Status Percentages
Mean Std.
Dev. SD D DK A SA
The factory management has made no effort in
CSPT adoption process (Prior) 9 0 0 0 91 4.64
1.149
The factory management is in information
search stage of CSPT adoption process
100 0 0 0 0 1.00 0
The factory management is in information
evaluation stage of CSPT adoption process 95.5 0 0 0 4.5 1.18 0.833
The factory management has made a decision to
adopt CSPT technology 95.5 0 0 0 4.5 1.18 0.833
The factory management has installed CSPT
technology
0 0 0 0 0 0
The factory management has installed CSPT
technology and is now in post installation
evaluation
0 0 0 0 0 0
Average 2.00 1.732

100
The above distribution of the tea factories in accordance with their CSPT adoption status
was tested for normalcy. This was by testing for skewness and kurtosis of the data.
Skewness is a measure of data asymmetry with the normal distribution having a skewness
value of zero (Hippel, 2010). A data distribution with skewness value two times or more of
the skewness standard error is considered asymmetric, and therefore not normal. Skewness
value for the CSPT adoption by tea factories status data was calculated at 2.809, with a
standard error of 0.295. This skewness value is almost ten times its standard error and
therefore implies that the distribution of data on CSPT adoption status of the tea factories is
not normally distributed. Kurtosis is a reference of the extent to which observations cluster
around a central point. For a normal distribution kurtosis is scored at zero. Any significant
departure from this score reflects a distribution that is not normal. The data on factory
CSPT adoption status was scored at 6.9. This finding supports the skewness measure results
for a conclusion that the factory CSPT adoption status data is not normally distributed.
These findings are illustrated in Table 4.6.
Table 4.6: Factory CSPT Adoption Status Skewness and Kurtosis
N Mean Std.
Deviation Skewness Kurtosis
Statistic Statistic Statistic Std.
Error Statistic
Std.
Error
CSPT
Adoption
66 1.2727 .75540 2.809 .295 6.900 .582
The factory CSPT adoption status data distribution was also assessed using a Q-Q plot
(quantile-quantile plot). This is a graphical tool used to test whether a data set is normally
distributed. It is preferred because it shows at a glance if normality assumption is plausible.
A normal distribution will usually result in a straight line plot, and a curved plot indicates
data that is not normally distributed. The Q-Q plot for the factory CSPT adoption status

101
data is illustrated in Figure 4.1 below. The observed values plots are way off the normal
distribution expected plot, again confirming the factory CSPT adoption status data is not
normally distributed.
Figure 4.1 Factory CSPT Adoption Status Q-Q Plot
4.4 Attributes and Likelihood of CSPT Adoption
The first objective of this study focused on the likelihood of CSPT attributes to influence
the adoption of CSPT technology among tea factories managed by KTDA. These attributes
were cost of CSPT, minimizing carbon emissions, minimizing health hazard, being a
twenty four hour source, being within required heat range, being easy to install, and being
triable.

102
4.4.1 Descriptive Statistics of Product Attributes
Responses on each of the product attributes on their likelihood to influence the adoption of
CSPT are detailed in Table 4.6 below. All the six attributes scored between 4 and 5 (out of
5), which is quite high. The most preferred attribute by the respondents, which would most
likely influence adoption of CSPT, was ‘being in the required energy range’ of the factory.
The tea factories require heat energy of a maximum 1000C for drying or withering. This
attribute attained a mean score of 4.62, with 62% factory managers strongly agreeing and
38% agreeing that it can enhance adoption of CSPT. This is a 100% agreement. It was
followed by ‘being a twenty four hour source’ with a mean of 4.61. This is the advantage of
CSPT being available day and night through sunlight during the day, and stored solar
energy at night. This attribute had a 61% strongly agree and 39% agree ratings on its
likelihood to influence the adoption CSPT. The third ranked attribute was ‘being cost
effective’ with a mean score of 4.47. This is the potential of CSPT being cheaper than
current sources of heat energy for the tea factories, namely wood fuel and fuel oil. This
attribute attained a 43% strongly agree and 57% agree ratings from the managers.
Beyond these three attributes the other four attributes also scored high mean scores of over
4.2. ‘Being easy to install’ had a mean of 4.37, with 50% strongly agree and 50% agree
ratings. The attribute ‘minimize carbon emissions’ scored 4.36, with 36% strongly agree
and 64% agree ratings. Ability to ‘minimize health hazards’ had a mean score of 4.29 with
strongly agree approval of 29% and 71% agreeing. The last one was ‘being triable before
purchase’ with a mean score of 4.24 and 24% strongly agree and 76% agree ratings. The
average of the mean scores is 4.44 (out of 5) with a standard deviation of 0.182. This is an
indication that of all the attributes were considered important and likely to influence CSPT
adoption by the respondents. The standard deviation implies that the distribution of

103
responses cluster around 4.44 with lowest possible score of 4.258 and highest possible
score of 4.622. As mentioned earlier CSPT is environmental friendly, poses no health
hazards to workers, and its cost regime has been plummeting and is therefore very
promising. It therefore seems CSPT has most of the attributes that respondents claimed
would make them make an adoption decision.
Table 4.6: Descriptive Statistics of CSPT attributes
CSPT Attribute
Percentage Mean Std.
Dev SD D DK A SA
More cost effective 0 0 0 53 47 4.47 0.503
Minimizes carbon
emissions 0 0 0 64 36 4.36 0.485
Minimizes health hazards
to employees 0 0 0 71 29 4.29 0.456
Is a twenty four hour
source of heat energy 0 0 0 39 61 4.61 0.492
Heat energy in the range
requirement of the factory 0 0 0 38 62 4.62 0.489
Is easy to install 0 0 0 50 50 4.50 0.504
Triable before purchase 0 0 0 76 24 4.24 0.432
Average 4.44 0.182
4.4.2 Inferential Statistics of Product Attributes and CSPT Adoption
The first objective of this study was to assess the likelihood of CSPT attributes to influence
the adoption of CSPT by the Kenyan tea factories run by KTDA. To enable measurement as
to whether CSPT attributes can influence CSPT adoption among the tea factories, a
hypothesis was derived that would be tested using the findings of the field study. The
hypothesis was:

104
H01: There is no significant relationship between CSPT attributes and likelihood of
adoption of CSPT among the Kenyan tea factories run by KTDA.
To test the hypothesis for the influence of all the attributes on CSPT adoption, the product
attributes data and CSPT adoption data were fitted in a Firth logistic regression model. The
results of the regression are detailed in Table 4.7.
Table 4.7: Model CSPT adoption and CSPT attributes Statistics
Model: Firth Logistic regression (logitf) (Attributes.sav1.saved)
Penalized log likelihood = -18.984802 Prob> chi2 = 0.0330
McFadden R²=0.4135
Constant
B0
Cost
Effect
Minim
Carbon
No Health
Hazard
Twenty
Hour hr.
Heat
Range
Easy to
Install
Triable
Estimate -3.8947 1.6837 0.4788 1.2464 1.9800 1.0119 0.3358 0.6554
p-value 0.5212 0.0483 0.0375 0.04028 0.0333 0.03175 0.07359 0.04083
Odds
ratio
0.0203 5.3854 1.6141 3.4778 7.2430 2.7508 0.7147 1.9260
The model attained R2 of 0.4135 of the McFaddens’ R2 static of model fitness. This was
slightly off the perfect fit of between 0.2 and 0.4, meaning the model slightly over-fits. This
measures how well the model can be used to predict CSPT adoption from the attributes. In
this case the model slightly exaggerates the Adoption likelihood. The model was
statistically significant with a Chi2 score of 0.0330, which is lower than the 0.05 threshold.
This implies that the model of the dependent variable and the covariates explains the
likelihood of the adoption of CSPT better than a model with only the intercept at a
confidence level of 95%. This conclusion leads to the rejection of the hypothesis to the first
study objective which stated that ‘There is no significant relationship between CSPT
attributes and likelihood of adoption of CSPT among the Kenyan tea factories run by

105
KTDA’. By implication then, according to the findings of this study the seven CSPT
attribute considered together have a likelihood of influencing adoption of CSPT by tea
factories in Kenya.
The other output of the analysis is parameter estimates (regression coefficients) of each
independent variable in the model. These parameters show extent to which a change in a
predictor variable would influence the response variable when all the other predictor
variables are in play. The attribute ‘being a twenty four hour source’ had the highest
coefficient of 1.98 followed by ‘being cost effective’ with 1.68, and the third was
‘minimizing health hazard’ with 1.25. These three attributes can therefore be considered to
be the ones likely to influence adoption of CSPT most. The other attributes would be less
influential with ‘being in the energy heat range’ at 1.012, ‘being triable’ at 0.655, and
‘minimize carbon emissions’ at 0.488. The last one, ‘easy to install’ has a negative
coefficient suggesting its contribution to adoption might be negative.
Further, the significance of each of the attributes in the model were calculated at 0.05 level
of significance. Six of the attributes had p-values of less than 0.05, meaning they were
statistically significant. These were ‘cost effective’ at 0.0483, ‘minimize carbon emission’
0.0375, ‘no health hazard’ at 0.040, ‘twenty four source’ at 0.0333, ‘being within heat
range’ at 0.03175 and ‘ being triable’ at 0.04083. All these six attributes were found to be
significant at 95% confidence level. The last attribute ‘being easy to install’, had a p-value
score of 0.07359, which exceeds the 0.5 threshold. It is therefore not statistically significant
which means it cannot be expected to influence the adoption of CSPT at 95% confidence
level. This particular attribute will therefore be excluded from the model. The model earlier
expressed in equation (iv) now crystalizes to equation (x) below.

106
Logistf (CSPT Adoption) = -3.8947 + 1.684Costef + 1.246Hhzd + 1.98Twty4h+1.012Hrange
+ 0.479MinCarb +0.6554Triabl (x)
Odd ratios for each of the attributes were calculated. Odd ratio shows the extent to which a
predictor variable can change the response variable when the predictor variable is changed
by one unit, all the other factors remaining constant. The ratios, therefore, indicate the
likely change in the dependent variable occasioned by variance of each independent
variable considered alone. In this respect the highest odd ratio was that of the ‘being
twenty four hour source’ attribute at 7.24. This means that if any contribution in making the
CSPT a twenty four hour source is likely to cause a rise in adoption of CSPT by over seven
times. The second attribute in this respect was ‘being cost effective’ at 5.385, while the
third was ‘no health hazard’ at 3.478. These three are the attributes that are individually
likely to spur higher adoption of CSPT among tea factories managed by KTDA. ‘Being
within heat range’, ‘being triable’ and ‘minimize carbon emissions’ also are likely to have
significant influence on CSPT adoption with their respective odd ratios of 2.75, 1.926, and
1.614. ‘Being easy to install is likely to have the least influence with a ratio of 0.7147.
The above results show that CSPT attributes individually and severally are highly likely to
influence adoption of CSPT among tea factories managed by KTDA. This assertion is
based on the high mean scores (all over 4 out of 5) and significances of the covariates. This
is in line with the emphasis by Rogers on the importance of product attributes in
influencing adoption, claiming they account for 49% to 87% of adoption variance (Feng,
2012). Though specific product features were not cited in the empirical studies discussed
earlier in this study, their importance was boldly underlined. In the two projects conducted
in India on CSTs, product attributes were showcased in pilot demonstrations (on viability of

107
CSTs), case studies and success stories (Ocampo & Marthel, 2012; Akker& Aggarwal,
2015; UNDP, 2015). Further reports were prepared on the salient features of CSTs.
4.5 CSPT Awareness and CSPT Adoption
Focus of the second study objective was on CSPT awareness and its likelihood to enhance
adoption of CSPT. The managers were investigated on their awareness of CSPT, its
benefits over other sources of heat energy, its suppliers and the disadvantages of the
factories current sources of heat energy. Further they gave their views on awareness
techniques that are likely to influence the likelihood of adoption of CSPT among tea
factories managed by KTDA.
4.5.1 Descriptive Statistics of CSPT Awareness.
The managers were first investigated on their awareness of CSPT itself, awareness of CSPT
benefits over other sources of heat energy, awareness of CSPT suppliers and awareness the
disadvantages of the factories current sources of heat energy (fuel-wood and fuel oil). Fifty
nine percent of the respondents (59%) strongly disagreed that there is adequate information
on CSPT in the industry, while 29% of them simply disagreed, making up a whopping 90%
confirmation that there is no CSPT information in the tea sub-sector. The full response on
this is captured in Table 4.8.

108
Table 4.8: Factory Managers General Awareness of CSPT of Current Sources of
Energy.
Awareness Status
Percentage (%) Mean
Std.
Dev. SD D DK A SA
There is adequate information on
CSPT among the KTDA factories
management 59 29 2 10 0 1.64 0.955
The factory management is aware of
the benefits of CSPT over other
sources of heat energy
26 21 3 41 9 2.86 1.429
The factory management knows the
suppliers of CSPT 62 28 5 5 0 1.52 0.789
The factory management is aware of
the disadvantages of fuel-wood as
sources of heat energy
0 0 0 67 33 4.36 0.482
The factory management is aware of
the disadvantages of fuel-oil as
sources of heat energy
0 0 0 68 32 4.33 0.475
Average 2.942 0.806
Most of the managers (90%) had no clue on the suppliers of CSPT, with 62% of them
strongly disagreeing and 28% disagreeing to be aware of the suppliers respectively. A
substantial proportion of the managers (47%) were aware of the benefits of CSPT while
50% answered to the contrary. All the managers (100%) averred that they were aware of the
disadvantages of fuel-wood and fuel-oil as sources of heat energy.
It is apparent from the above results that CSPT awareness is a major concern if the tea
factories were to adopt CSPT. Most of the managers agreed that they have little information
on the technology, its suppliers and benefits. Over 92% of the managers either didn’t know
whether there is any information of CSPT in the industry or outright averred there isn’t.
This is, therefore, a challenge that would need to be addressed in any effort to influence
adoption of CSPT among the tea factories. These scenario echoes findings of empirical
reviews done earlier. Virtually all reports cited earlier cited lack of awareness as a prime

109
deterrent to technology adoption (Ocampo & Marthel, 2012; IRENA, 2015; Akker &
Aggarwal, 2015). Subsequently awareness creation was a key component in renewable
energy technologies adoption promotion programs in UNDP/GEF projects in India, UNIDO
project in Malaysia (Rawlins & Ashcroft, 2013; Ocampo & Marthel, 2012). Awareness
creation would therefore be a key intervention to influence the adoption of CSPT among tea
factories in Kenya.
Beyond these general awareness of CSPT aspects, the mangers responded to CSPT
awareness creation approaches that would enhance the likelihood of CSPT adoption. These
were use of brochures, use of posters, use of resource books, public presentations, public
workshops, public exhibitions, newspaper advertisements, magazines advertisements and
electronic publications. Their responses were analysed using a summary of their mean
scores and percentages presented in Table 4.9. Eight of the approaches had a score between
4 and five. These were use of brochures, public presentations, public workshops,
exhibitions, resource books, newspapers, magazines and electronic publications. These
were therefore the most preferred awareness creation approaches by the factory managers.
These findings highly resonate with reports on approaches recommended and used in other
parts of the world. In the UNDP/GEF project in India 40 workshops on CSTs were
conducted and several video films on successful CST projects placed on websites (Akker &
Aggarwal, 2015). A monthly newsletter and a quarterly magazine on CSTs, SUNFOCUS,
was developed and distributed to stakeholders. Advertisements on CSTs were released on
national newspapers. A new website www.chindia.in was developed and together with the
ministry websites made available information on CSTs suitability, costs and payback. In
another project in south India by UNDP and GEF promoting use of renewable energy

110
technologies newsletters, public presentations (in form of films, seminars and meetings),
websites and exhibitions were used to create awareness among stakeholders (Ocampo &
Maithel, 2012). Most of the awareness creation approaches preferred by the tea factory
managers under KTDA were the ones utilized in the above described projects, except for
use of a toll-free telephone line, and foreign tours, which were not investigated in this
study.
Table 4.9: Awareness Creation Approaches
Awareness Creation Approach Percentage
Mean Std.
Dev SD D DK A SA Awareness through brochures influenced/will
influence factory to adopt CSPT 0 0 0 88 12 4.12 0.329
Awareness through posters influenced/will influence
factory to adopt CSPT 0 14 15 64 7 3.65 0.813
Awareness through resource books influenced/will
influence factory to adopt CSPT 0 0 32 64 4 4.12 0.373
Awareness through Public presentations influenced/
will influence factory to adopt CSPT 0 2 17 72 9 4.03 0.554
Awareness through Public workshops influenced/
will influence factory to adopt CSPT 0 2 0 84 14 4.11 0.434
Awareness through Public Exhibitions
influenced/will influence factory to adopt CSPT 0 0 0 80 20 4.20 0.401
Awareness through Advertisements in newspapers
influenced/will influence factory top adopt CSPT 0 0 0 89 11 4.11 0.310
Awareness through Advertisements in magazines
influenced/will influence factory top adopt CSPT 0 0 19 76 5 4.08 0.364
Awareness through Advertisements in electronic
publications influenced will/influence factory top
adopt CSPT 0 0 0 83 17 4.17 0.376
Average 4.07 0.210
4.5.2 Inferential Statistics of CSPT Awareness.
Second objective of the study was to find out the likelihood of CSPT awareness to
influence the adoption of CSPT by tea factories managed by KTDA. To enable the analysis

111
a hypothesis was formulated that would be tested using collected data, which was stated as
follows:
H02: There is no significant relationship between CSPT awareness and likelihood of
adoption of CSPT among the Kenyan tea factories run by KTDA
The manager’s responses on awareness creation were fitted in a Firth logistic regression
model whose key statistics are detailed in table 4.10.
Out of the nine awareness creation approaches investigated in the study on their likelihood
to enhance the adoption of CSPT, five were found to be statistically significant, with p
values of less than 0.05. These were ‘use of brochures’ with a p-value of 0.046, ‘public
workshops’ with 0.0382, ‘exhibitions’ with 0.0328, ‘newspaper advertising’ with 0.0248
and ‘electronic publications’ with 0.0213. The others, ‘posters’ with p-value of 0.0501,
‘resource books’ with 0.0592, ‘public presentations’ with 0.06084 and ‘magazine
advertisements’ with 0.0995 were found to be statistically insignificant at the 95%
confidence level. This means that at the said level they may not influence the adoption of
CSPT. The four variables will therefore be omitted from the model. The earlier model of
CSPT awareness and the adoption of CSPT expressed by equation (v) is now modified as
follows:
Logistf(CSPT Adoption) = -2.8930 + 0.255Broch + 1.057Wkshop + 1.485Exhb +
0.938NewsP + 1.118ElectP (xi)

112
Table 4.10: Model CSPT adoption and CSPT Awareness Statistics
N= 66 Model: Firth Logistic regression (logit) N of 0's: 63 1's: 3 (Awareness)
Penalized log likelihood = -10.45802 Prob> chi2 = 0.0482
McFadden R²=0.2683
Const. B0 Brochures Posters Books PublicP PublicW Exhibitions Newspaper Magazines Electronic
Estimate -2.8930 0.2546 0.3365 0.1720 -0.1876 1.0565 1.4846 0.9376 0.3074 1.1176
p-value 0.0460 0.0501 0.0592 0.6084 0.0382 0.0328 0.0248 0.0995 0.0213
Odds ratio 1.2899 1.4000 0.8419 0.8288 2.8762 4.4131 2.5538 1.3598 3.0575
The test of model fit was scored at 0.2683 McFaddenR², which is within the perfect fit range of 0.2-0.4 recommended by McFadden. It means
the awareness creation variables in the model can be used to predict adoption of CSPT. On the model’s statistical significance it had a Chi2p-
value score of 0.0482. This p-value is less than the 0.05 threshold, meaning the model is statistically significant at 95% confidence level. This
indicates that at 95% confidence level there is a relationship between CSPT awareness and the adoption of CSPT by tea factories managed by
KTDA. This leads to the rejection of the hypothesis to study objective two, which stated that ‘There is no significant relationship between
CSPT awareness and adoption of CSPT among the Kenyan tea factories run by KTDA’.

113
Odd ratios on the likelihood of each element of awareness to influence the adoption of
CSPT were also calculated. The highest was that for exhibitions (4.4), which suggests
that a change in exhibitions by one unit would increase the likelihood of CSPT adoption
4.4 times. The second one was electronic publication that would increase likelihood of
adoption of CSPT 3.0575 times, and the third one was workshops with an odd ratio of
2.8762. The lowest were those of resource books and public presentations with odd
ratios of 0.8419 and 0.8288 respectively. According to these results, to promote
adoption of CSPT among tea factories managed by KTDA, a key intervention would be
awareness creation. The key activities for this purpose in their order of importance
would be exhibitions, electronic publications, workshops, newspaper advertising and
brochures. The prime objectives of the awareness effort is to make CSPT and its
benefits known to potential users, and to remove uncertainty (create confidence) in the
new technology. These objectives are well served by the first three of the preferred
awareness creation activities.
The above findings on awareness creation activities highly correspond to facts reported
on empirical projects done in various parts of the world. First it corresponds to an
observation by IRENA (an international organization involved in the promotion of use
of sustainable energy) that most decision makers in industries do not have much
information or first-hand experience with solar industrial process heat systems (IRENA,
2015). The organization concluded that this is one of the barriers that hinder adoption of
the solar technologies, and therefore, recommended increased awareness and technical
information transfer. The United Nations (UN) in its global action agenda to promote
sustainable energy for all highlighted knowledge sharing as one of the enabling actions
(IISD, 2014). This is recognition importance of awareness creation at the highest level.

114
In the UNDP/GEF project in India, which was very successful in promotion of use of
energy reforms and renewable energy technologies by tea factories in south India, 35
seminars, 15 newsletters and over 30 demonstrations were used to promote awareness
(Ocampo & Marthel, 2012). Still in India there is the UNDP/GEF project on promotion
of use of CSH technologies. For awareness creation 40 workshops have been conducted,
several video films uploaded on websites, a monthly newsletter and a quarterly
magazine (SUNFOCUS) were launched, and advertisements released on national
newspapers and magazines (Akker & Aggarwal, 2015). Further over 30 demonstration
projects were conducted and exposure trips organized. Similar initiatives were reported
in the UNIDO project in Malaysia where workshops, a website and case studies were
used to hype up the need to adopt CSTs (Rawlins & Ashcroft, 2013). These initiatives
are similar to the ones preferred by the KTDA tea factory managers except the seminars
(public presentations) were not emphasized as in the empirical studies.
4.6 Organization Complexity and CSPT Adoption
The third study objective was to assess the likelihood of organization complexity
spurring the adoption of CSPT. Complexity is the degree to which an organization's
members possess a relatively high level of knowledge and expertise (Sahin, 2006). Tea
factory manager’s views on their organizations complexity are presented next.
4.6.1 Descriptive Statistics on Organization Complexity
The factory managers gave their opinions on the technical capacity of their engineers
and technicians for the installation and management of CSPT. The key aspects
investigated were the education background of the engineers and technicians. All of the
managers at least agreed the technicians and engineers they had, attained adequate level

115
of education to enable CSPT installation and management training. Sixty nine percent
(69%) of the managers felt the engineers and technicians in their factories had the
requisite knowledge and skills for the management of CSPT. Thirty one percent (31%)
of them either did not know or disagreed, which is a substantial proportion of the
managers. The managers also fully agreed (by either strongly agreeing or simply
agreeing) that there is need for specialized training of managers and technicians before
the installation of CSPT in the tea factories. These results are captured in Tables 4.11.
Table 4.11: Factory Managers Response on Factory’s Current Capacity Status
Current Capacity Status
Percentage (%) Mean Std.
Dev. SD D DK A SA
Factory engineers had/have the
knowledge to manage a CSPT facility 2 27 2 52 17 3.53 1.126
Factory engineers had/have the skills
to install and manage a CSPT facility 2 27 2 52 17 3.53 1.126
Need for specialized training on
CSPT installation for engineers
before installation of a CSPT facility
0 0 0 30 70 4.70 0.463
Need for specialized training on
CSPT operations for technicians
before installation of a CSPT facility 0 0 0 29 71 4.71 0.456
Need for specialized training on
CSPT maintenance for technicians
before installation of a CSPT facility 0 0 0 32 68 4.68 0.469
Level of education of the engineers
prepares them well for CSPT training 0 0 0 67 33 4.33 0.475
Level of education of the technicians
prepares them well for CSPT training 0 0 0 68 32 4.32 0.469
Average 4.257 0.271
A reflection on the above results suggests a need for major knowledge and skills
enhancement on CSPT for tea factory engineers and technicians to increase the
likelihood of the factories adopting CSPT. This would be made easy by the presence of

116
the requisite education levels. All the factory managers farther agreed there is need for
technical training for technicians and managers in regard to CSPT installation,
management and maintenance.
These findings echo recommendations and initiatives elsewhere targeting promotion of
new energy technologies. In Nepal, lack of know-how in CSH systems has been blamed
for lack of adoption of CSH systems in industries (Piya, Adhikari & Shreshtha, 2012).
In their report (Piya et al, 2012) claim most industry players in Nepal have not heard of
or seen CSH systems. IRENA in a technology brief on solar energy systems for
industrial processes reported that there are few industry professionals with skills and
experience on solar heat systems for industrial processes (IRENA, 2015). Therefore,
IRENA posited that there is need for training and dissemination of existing knowledge
and concepts on solar heat systems for industrial process heat.
A report on efforts to enhance transfer of aerospace technologies to NICs strongly
emphasized that technical training is key in creating an absorption capacity for the new
technologies (Heidena, Pohlb, Mansorc & Genderen, 2015). In the two UNDP/GEF
projects in India mentioned earlier in this study, capacity building of technical staff was
one of the key components in the programs to promote adoption of CSTs (Akker &
Aggarwal, 2015; Ocampo & Marthel, 2012). Further, the UN in its SE4ALL
(Sustainable Energy for All) initiative identified capacity building as the fourth enabling
action in a framework to upscale use of renewable energies (IISD, 2014). All these are
in agreement with the views of the respondents on the need for capacity building.

117
The managers also gave their opinion on the best training approaches to enhance the
adoption of CSPT. The specific approaches addressed on their likelihood to enhance
adoption of CSPT were on-the-job training, overseas training, formal education
programs, informal education programs, net-works with universities, and net-works with
vocational education institutes (VETIs). The mean scores of the various training
approaches are shown in Table 4.12.
Table 4.12: Factory Managers Responses on Technical Training Approaches
Technical Training
Approaches
Percentage (%) Mean Std.
Dev
SD D DK A SA
On-the-job training will
influence factory top adopt CSPT 0 0 0 86 14 4.14 0.346
Overseas training will influence
factory top adopt CSPT 0 0 0 74 26 4.26 0.441
Formal education programs will
influence factory top adopt CSPT 0 2 9 82 7 3.95 0.470
Informal education programs
will influence factory top adopt
CSPT
0 0 11 80 9 3.98 0.447
Training and networks with
Universities Research institutions
will influence factory to adopt
CSPT
0 0 0 79 21 4.21 0.412
Training and networks with
Vocational Education Training
Institutions will influence factory
to adopt CSPT
0 0 0 80 20 4.20 0.401
Average 4.12 0.172
The responses indicate that the most preferred training delivery methods as overseas
training, training and networks with universities, training and networks with VETIs, and
on-the-job training with each of them approved by a hundred percent of the factory

118
managers (either by strongly agreeing or simply agreeing). However, overseas training
comes out as the most preferred with 26% of the managers strongly agreeing, followed
by training and networks with universities at 21% and training and networks with
VETIs at 20%.
4.6.2 Inferential Statistics on Organization Complexity
The third hypothesis to this study was:
H03: There is no significant relationship between organization complexity and
likelihood of adoption of CSPT among the Kenyan tea factories run by
KTDA.
This hypothesis was to enable measure the third study objective which was to find out
the likelihood of organizational complexity to influence adoption of CSPT. On
subjecting the managers’ responses to Firth logistic regression, only three of these
approaches were found to be significant. These were ‘overseas training’, ‘net-works
with universities’ and ‘net-works with VETIs’. These results are detailed in Table 4.13.
Table 4.13: Technical Training Approaches and Adoption of CSPT
Model: Firth Logistic regression (logitf) N of 0's: 63 1's: 3
Penalized log likelihood = 3.06594 Prob> chi2 = 0.01642
McFadden R²=0.3177
Const.B0 On-the-job Overseas Formal Informal University VETI
Estimate -0.7138 -0.5570 2.7159 -0.7752 -0.9711 0.9603 1.2570
p-value 0.0704 0.0366 0.0634 0.0512 0.0325 0.0381
Odd
Ratio 0.5729 15.1182 0.4606 0.3786 2.6124 3.3148
First, the model fit score attained was McFadden’s R2 of 0.3177. This falls within the
McFadden acceptable range of perfect fit of 0.2-0.4. The model is therefore a powerful

119
tool for estimating predicting adoption of CSPT among the tea factories managed by
KTDA. Secondly, the model scored a Chi2p-value of 0.01642. This score meets the 0.05
threshold for 95% confidence level. It implies that there is a significant relationship
between organization complexity and the adoption of CSPT. This leads to the rejection
of the third study hypothesis which stated that ‘There is no significant relationship
between organization complexity and adoption of CSPT among the Kenyan tea factories
run by KTDA’.
Further, individual training methods statistical significance was tested and only three of
the training methods scored p-values below 0.05. These were overseas training with a p-
value of 0.0366, training and networks with universities with 0.0325, and training and
networks with VETIs with 0.0381. The others (on-the-job with a p-value 0.0704, formal
training with p-value of 0.0634, and informal training with p-value of 0.0512) scored p-
values above 0.05 and therefore were not found to be statistically significant at 95%
confidence level. These three were therefore removed from the initial model for
organization complexity and the adoption of CSPT. The regression model of
organization complexity likelihood to enhance the adoption of CSPT now changes from
the earlier equation (vii) to the following:
Logistf (CSPT Adoption) = -0.7138+2.716Ovseas + 0.96UniversTr + 1.257VocITr
(xii)
The odd ratios for the different training methods were also computed and they give the
training methods possibility of enhancing adoption of CSPT among tea factories if the
training methods are individually varied by one unit (all other factors remaining
constant). The odds reflect overseas training as the one more likely to increase adoption
of CSPT with the highest ratio of 15.12. This means that an increase in overseas training
by one unit would increase the likelihood of the adoption of CSPT 15.12 times. Training
120
and networks with VETIs was second with an odd ratio of 3.315, while the training and
networks with universities was the third with an odd ratio of 2.612. These three training
approaches are the ones more likely to increase the likelihood of adoption of CSPT by
tea factories managed by KTDA. The other three training methods had odd ratios less
than one (on-the-job training with odd ratio of 0.5729, formal training with an odd ratio
of 0.4606, and informal training with an odd ratio of 0.3786) and therefore their
possibility of raising adoption of CSPT are much less.
Empirical studies highlighted earlier in these study all emphasize capacity building as a
key intervention in endeavours to promote adoption of new technologies. The report on
efforts to enhance transfer of aerospace technologies to NICs emphasized that technical
training is key in creating an absorption capacity for the new technologies (Heidena,
Pohlb, Mansorc & Genderen, 2015). Nevertheless, the report does not specify specific
training delivery methods of preference. In the UNDP/GEF project in India promoting
use of CSH technologies, component 2 of the project was on capacity building and
emphasized manpower development of PhDs and Masters in the area of CSTs (Akker &
Aggarwal, 2015). This corresponds with preference for training and networking with
universities expressed by the KTDA managers. International trade tours were organized
and a training centre on CSTs established at Brahma Kumaris (Singhal, 2015). These
two correspond to overseas training and training and networking with VETIs. In their
report on small scale CSP technologies (Rawlins & Ashcroft, 2013) identified capacity
building as a key intervention in an effort to improve adoption of CSP systems for
industrial application. They recommended creation of training courses, university
courses and fellowships, and sponsorships.
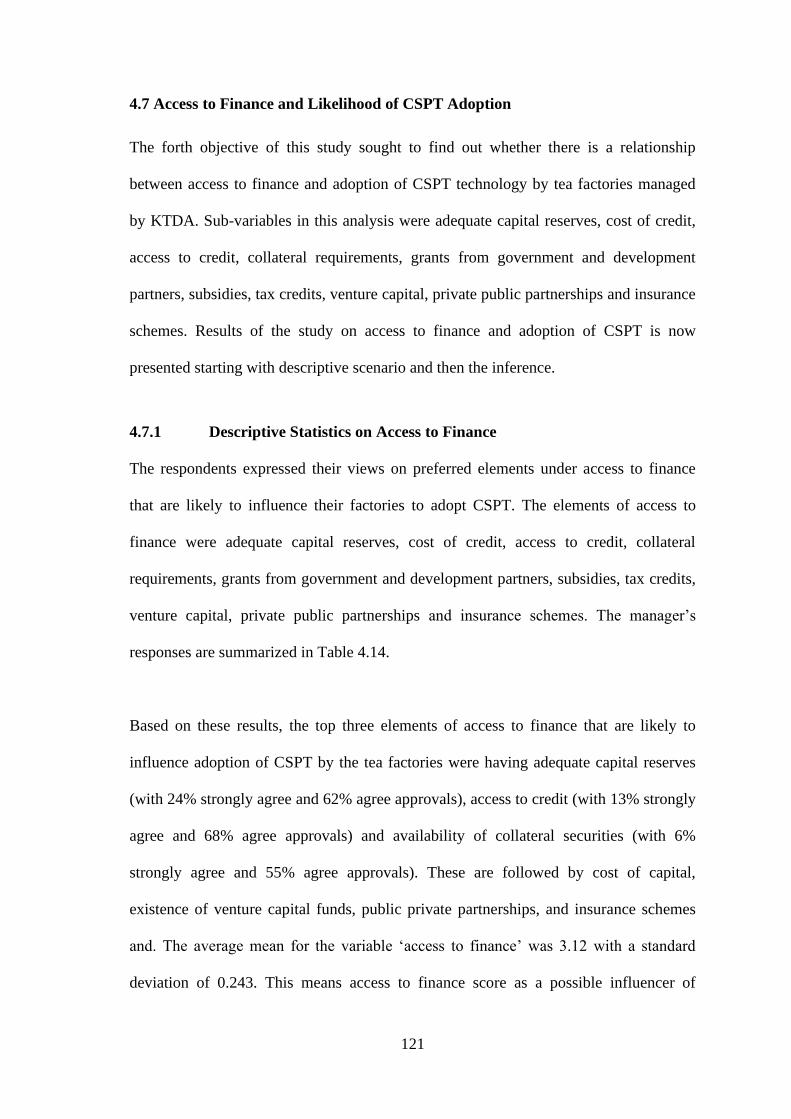
121
4.7 Access to Finance and Likelihood of CSPT Adoption
The forth objective of this study sought to find out whether there is a relationship
between access to finance and adoption of CSPT technology by tea factories managed
by KTDA. Sub-variables in this analysis were adequate capital reserves, cost of credit,
access to credit, collateral requirements, grants from government and development
partners, subsidies, tax credits, venture capital, private public partnerships and insurance
schemes. Results of the study on access to finance and adoption of CSPT is now
presented starting with descriptive scenario and then the inference.
4.7.1 Descriptive Statistics on Access to Finance
The respondents expressed their views on preferred elements under access to finance
that are likely to influence their factories to adopt CSPT. The elements of access to
finance were adequate capital reserves, cost of credit, access to credit, collateral
requirements, grants from government and development partners, subsidies, tax credits,
venture capital, private public partnerships and insurance schemes. The manager’s
responses are summarized in Table 4.14.
Based on these results, the top three elements of access to finance that are likely to
influence adoption of CSPT by the tea factories were having adequate capital reserves
(with 24% strongly agree and 62% agree approvals), access to credit (with 13% strongly
agree and 68% agree approvals) and availability of collateral securities (with 6%
strongly agree and 55% agree approvals). These are followed by cost of capital,
existence of venture capital funds, public private partnerships, and insurance schemes
and. The average mean for the variable ‘access to finance’ was 3.12 with a standard
deviation of 0.243. This means access to finance score as a possible influencer of

122
adoption of CSPT by tea factories managed by KTDA can be as low as 2.877 (out of 5),
and can be a maximum of 3.363.
Table 4.14: Managers Responses on Access to Finance Statistics
Access to Finance Methods
Percentage Mean Std.
Dev. SD D DK A SA
Factory had/has adequate capital reserves for
installation a CSPT facility. 0 8 6 62 24 4.03 0.706
Factory had/has adequate credit facilities available
for installation of a CSPT facility. 0 14 5 68 13 3.82 0.840
The cost of credit facilities influence the factory
top adopt CSPT. 0 36 3 55 6 3.30 1.037
Collateral requirements to guarantee credit for
installation a CSPT facility influences factory to
adopt CSPT.
0 33 6 55 6 3.33 1.053
Adequate grant facilities from government
available for procurement and installation of a
CSPT facility influences factory to adopt CSPT.
5 50 39 6 0 2.47 0.684
Adequate grant facilities from development
partners available for procurement and installation
of a CSPT facility influences factory to adopt
CSPT.
6 44 39 11 0 2.55 0.788
Subsidies offered for installation of a CSPT
facility influences factory to adopt CSPT. 6 44 45 5 0 2.48 0.685
Tax credits offered for installing a CSPT facility
influences factory to adopt CSPT. 6 41 47 6 0 2.53 0.706
Availability of venture capital funds for
installation of a CSPT facility influences factory
to adopt CSPT.
0 20 32 48 0 3.29 0.780
Availability of Public Private Partnerships for
installation of a CSPT facility 1influences factory
to adopt CSPT.
0 22 33 45 0 3.24 0.786
Availability of Insurance schemes on investments
in CSPT facility influences factory to adopt CSPT. 0 14 36 50 0 3.29 0.699
Average 3.12 0.243

123
In the UNDP/GEF project with south India factories, funding was 46% grant by GEF
while the balance 54% was co-financed by the government of India, Tea factories and
the private sector (Ocampo & Marthel, 2012). Grant was a major contributor unlike in
the KTDA manager’ preference case, whereby it was approved by only eleven percent
(11%) of the managers. Government contribution, factory capital reserves and public
private partnerships have a similarity in both scenarios. In a similar project by UNIDO,
GEF and MNRE in India promoting business models in concentrated heat energy
technologies a soft loan scheme was established as an incentive. It was collateral free,
interest at between 5-7%, a grace period of 1 year and repayment period of seven years
(Misra A. 2016).Then there is the UNDP ‘Energy Conservation in Small Tea Processing
Units in South India’ project, in which to remove financial barriers that hindering
adoption of renewable energy technologies a commercial lending for investment in RE
technologies was implemented. An insurance scheme was also developed and
implemented. In general there seems to be a good match of financial incentives that
would lure tea factories in Kenya to adopt CSPT with those that have been used for the
same purpose elsewhere.
4.7.2 Inferential Statistics of Access to Finance and Adoption of CSPT
The fourth objective of this study was to find out the likelihood of access to finance to
influence the adoption of CSPT among tea factories managed by KTDA. To enable
measurement of this objective using field data, a fourth study hypothesis was developed
which stated that:
H04: There is no significant relationship between access to finance and likelihood
of adoption of CSPT among the Kenyan tea factories run by KTDA.

124
The elements of access to finance were adequate capital reserves, cost of credit, access
to credit, collateral requirements, grants from government and development partners,
subsidies, tax credits, venture capital, private public partnerships and insurance
schemes. These sub-variables and CSPT adoption were regressed using the Firth
algorithm. Results of the firth logistic regression are detailed in table 4.15.
The model scored a McFadden R2 of 0.394. This falls within the perfect fit range of 0.2-
0.4, and the model can be used to predict adoption of CSPT by tea factories managed by
KTDA. However, the access to finance model was found to be statistically insignificant
in influencing the likelihood of the adoption of CSPT by tea factories managed by
KTDA, with a Chi2 p-value of 0.6253. This was beyond the 0.05 threshold. This implies
that access to finance was not significant in influencing the likelihood of the adoption of
CSPT by tea factories managed by KTDA at 95% confidence level. By implication it
would, therefore, not be one of the prime initiatives targeted to influence the adoption of
CSPT among tea factories by KTDA. This will in turn lead to the acceptance of the
forth hypothesis of this study which stated that ‘There is no significant relationship
between access to finance and adoption of CSPT among the Kenyan tea factories run by
KTDA’. Consequently the variable ‘access to finance’ will be expunged from this
study’s model expressed in equation (xi).
Out of the eleven elements of access to finance only three were found to be statistically
significant. These were grants from government (with a p-value of0.03423), grants from
development partners (with a p-value of 0.03125) and public private partnerships (with
p-value of 0.04901). The others were found to be insignificant in their likelihood to
influence the adoption of CSPT as they had p-values beyond 0.05.

125
This finding has an interesting comparison with scenarios in projects mentioned earlier
in adoption promotion efforts. All the project reports earlier from India and Malaysia
had a component of enhancing access to finance especially through development
partners’ grants and attractive credit schemes (Misra A. 2016; Ocampo & Marthel,
2012; Akker & Aggarwal, 2015; Topo, Moretta, Glorioso & Pansini, 2014; UNDP,
2015). Actually the UNDP and UNIDO projects in India to promote adoption of CSTs
started with grants from GEF. This highly corresponds with the expectations of the tea
factory managers in Kenya, meaning if finance was to be considered in efforts to spur
adoption of CSPT, then identification of organizations like UNDP and UNIDO would
be required to bankroll the initiative.

126
Table 4.15: Access to Finance & Likelihood to Enhance Adoption of CSPT
N=66 Model: Firth Logistic regression (logitf) N of 0's: 63 1's: 3 (Access to Finance)
Penalized log likelihood = -1.06594 Prob> chi2 = 0.6253
McFadden R²=0.3904
Const.B0 Finance Credit Cost of C Collateral Grant GrantD Subsidies Tax Venture PPP Insurance
Estimate -1.216653 0.94268 0.701705 0.054761 -1.200913 1.10249 1.217361 0.2004091 -0.17361 0.274923 0.5150226 -1.60901
p-value 0.05468 0.30136 0.48827 0.83884 0.03423 0.03125 0.08407 0.05674 0.381158 0.04901 0.72959
Odds
ratio
2.5668 2.0171 1.0562 0.03009 3.01165 3.3426 0.8183 0.8406 1.3164 1.6736 0.2000
The access to finance model earlier expressed in equation (vii) will now be modified to the representation in equation (xiii) below.
Logistf(CSPT Adoption) = -1.216653 + 1.102GrntG + 1.217GrntD + 0.515Ppp (xiii)
Odd ratios calculated show grants with highest scores of over 3. However, availability of credit and cost of credit had higher odds
than public private partnerships even though the two had been found to be statistically insignificant. This implies that when
considered individually they may influence adoption of CSPT whenever they are varied by one unit. However when considered
together with all the other covariates they are not likely to influence adoption of CSPT at 95% confidence level.

127
Further, just like in this study, access to finance was not found to be a key determinant in
making the adoption decision. In the UNDP ‘Energy Conservation in Small Tea Processing
Units in South India’ project, during implementation, project team realized access to finance
was not a key barrier in investment in RE technologies (Ocampo & Marthel, 2012). The team
had to adjust focus to other variables like awareness and technical capacity. In the other
project ‘Market Development and Promotion of Solar Concentrators for Process Heat
Applications in India Project’ in India, though friendly credit schemes were put in place, by
the third year of implementation not a single investor had taken these benefit in their CST
projects (UNDP, 2015). To a big extent, therefore, this study’s finding access to finance not a
key initiative in the greater effort to promote adoption of CSPT among tea factories in Kenya
is supported by these past relevant cases.
4.8 CSPT Standardization and Likelihood of CSPT Adoption
The last variable investigated in this study was CSPT standardization and its likelihood to
influence the adoption of CSPT among tea factories run by KTDA. The elements of CSPT
standardization addressed were quality assurance, assurance of installation procedures, KEBS
mark of quality, ISO standardization, and KEREA accreditation. The descriptive and
inferential findings are discussed in the following sections.
4.8.1 Descriptive Statistics for CSPT Standardization.
The respondents gave their views on the above mentioned elements of CSPT standardization
that are likely to influence them in making a decision to adopt CSPT. Their responses are
detailed in Table 4.16.

128
Table 4.16: Managers Responses on Standardization Elements Preferred
Elements of Standardization Percentages Mean Std. Dev.
SD D DK A SA
Needed/will need assurance on the quality
of the CSPT equipment. 0 0 0 59 41 4.40 0.498
Needed/will need assurance of standard
installation procedures of the CSPT
equipment.
0 0 0 55 45 4.45 0.479
KEBS mark of quality for imported goods
(ISM) influenced/will influence the factory
management decision to install CSPT.
0 0 0 58 42 4.40 0.498
ISO/TC 180 solar energy standard
influenced/will influence the factory
management decision to install CSPT. 0 0 0 58 42 4.40 0.498
KEREA accreditation influenced/will
influence the factory management decision
to install CSPT.
0 0 0 59 41 4.41 0.495
Average 4.412 0.197
All the elements of CSPT were scored very highly with all the managers approving
standardization would enhance the adoption of CSPT, whereby all the managers either agreed
or strongly agreed. Quality assurance as an influencer of adoption of CSPT was strongly
approved by 41% of the respondents while the balance 59% just agreed. Need for assurance of
installation procedures, ISO certification, KEBs marks of quality and KEREA accreditation,
all had ‘agree’ approvals by over 50% and ‘strongly agree’ approvals by over 40% of the
respondents. Each of these elements of standardization scored a mean of over 4.4 out of 5,
and their overall mean was 4.412. This indicates that the respondents felt all the elements of
CSPT standardization are almost equally important in assuring them of the CSPT and its
workability, and would therefore be required before they could make an adoption decision.

129
4.8.2 Inferential Statistics Standardization and CSPT Adoption.
The relevant objective for this section was to assess the likelihood of CSPT technology
standardization to influence the adoption of CSPT by Kenyan tea factories run by KTDA. The
elements of CSPT standardization investigated were quality assurance, assurance of
installation procedures, KEBS mark of quality, ISO standardization, and KEREA
accreditation. Data collected on these elements was regressed against the response variable
(CSPT adoption) using Firth logistic algorithm. Regression analysis results are detailed in
Table 4.17.
Table 4.17: CSPT Standardization & Likelihood to Enhance Adoption of CSPT
N=66 Model: Firth Logistic regression (logit) N of 0's: 63 1's: 3 (Standardization)
Penalized log likelihood = 4.27121 Prob> chi2 = 0.0222 McFadden R²=0.2277
Const.B0 Quality SIP KEBS ISO KEREA
Estimate 0.76685 2.375609 0.363614 0.592941 1.77454 1.732070
p-value 0.02631 0.04728 0.04524 0.03143 0.02991
Odds ratio (unit ch) 10.7575 1.4385 1.8093 5.8975 5.6523
The model scored a McFadden’s R2 of 0.2277. This falls within the 0.24 – 0.4 range of good
model fit. The model thus fits the data and it can be used to interpret the relationship between
standardization and CSPT adoption. The model was also statistically significant with a Chi2
score of 0.0222, which is below 0.05 the acceptable p-value at 95% confidence interval. This
means that CSPT standardization is likely to influence the adoption of CSPT among tea
factories managed by KTDA with a 95% confidence level. This implies the fifth study
hypothesis, which stated that ‘There is no significant relationship between CSPT
standardization and likelihood of adoption of CSPT technologies among the Kenyan tea
factories run by KTDA’, is rejected. All the elements of CSPT standardization (quality

130
assurance with p-value of 0.02631, assurance of installation procedures with a p-value of
0.04728, KEBS mark of quality with a p-value of 0.04534, ISO standardization with a p-value
of 0.03143, and KEREA accreditation with a p-value of 0.02991) were found to be significant,
all scoring p-values of below 0.05. This means that all the five elements of CSPT
standardization are likely to influence adoption of CSPT by tea factories managed by KTDA
at a 95% confidence level. Therefore, the model for relationship between CSPT
standardization and adoption of CSPT technologies among the Kenyan tea factories run by
KTDA expressed in equation (viii) is replaced by equation (xiv).
Logistf (CSPT Adoption) = β + β5X5
= 0.766 + 2.376QualA +0.364IstalP + 0.593KEBsM+1.775ISOstd + 1.732KERaccr
(xiv)
Odd ratios for the different elements of standardization were also computed. Quality assurance
had the highest ratio of 10.7575. This ratio implies that a unit change in quality assurance will
influence likelihood of CSPT adoption 10.7575 times, all other factors remaining constant.
The second influential variable was ISO certification with an odd ratio of 5.8975, followed by
KEREA accreditation with an odd ratio of 5.6523. The last two were KEBS mark of quality
with an odd ratio of 1.8093 and standardization of installation procedures with an odd ratio of
1.4385.
The above results suggest a high importance of standardization of the new technology to
enhance chances of its adoption. Generally the managers would seek assurance of the quality
of the product before they can think of installing it. More particularly they would wish to have
the product bear the KEBS mark of quality for imported goods, have suppliers be ISO
certified, and the technology be approved by KEREA (the local association of manufacturers

131
and dealers in renewable energy technologies). This strong requirement of standardization is
highly emphasized in previous initiatives to promote adoption of CST technologies. In the
‘Market Development and Promotion of Solar Concentrators for Process Heat Applications in
India’ (Akker & Aggarwal, 2015) project testing facilities were installed for monitoring CSH
applications. BIS standards were put in place for compatibility, safety and variability
reduction. Further a laboratory for testing and certification of CSH technologies was set up at
Pune University. The ministry (MNRE) also made it mandatory for suppliers to test their CST
systems to be accepted as channel partners. These are initiatives very much corresponding to
those suggested by the tea managers, only they were specific to India. Nevertheless, ISO
certification does not seem to have been considered in the Indian case.
Singhal (2017) in a report addressing barriers for accelerating the growth of CSTs in India
claimed that lack of standards for measuring performance creates lack of confidence in CST
systems in potential customers. To help raise confidence, therefore, he reported that test
facilities (mobile and immobile) had been established. Test standards for materials and
components of CSTs had also been established. This are measures in the direction of this
study’s respondents views. This is also supported by Choudhury (2014) when commenting on
CSTs application in industries. She identified a key challenge of use of CSTs in industries was
quality and standards. She said that market adoption is simplified when the customers have
reliable and trustworthy sources of CST products. She highly recommended steps be put to
ensure CST systems aligns to standards defined to central authorities. This well meshes with
findings of this study where KEBS, ISO, and KEREA would be the central authorities of
reference.

132
4.9 Determinants of the Likelihood of CSPT Adoption
Having investigated the likelihood of each of the five independent variables respectively to
influence the adoption of CSPT, the study turns to investigate the combined effect of the five
response variables on likelihood to influence adoption of CSPT by tea factories. This involves
measuring the general objective of this study which was to find out the factors likely to
influence the adoption of CSPT by tea factories managed by KTDA. In-turn, this requires
testing the hypothesis to the general objective which stated:
H06: The independent variables (CSPT attributes, CSPT awareness, organization
complexity, access to finance and standardization, have a combined effect on the
likelihood of the adoption of CSPT among the Kenyan tea factories run by
KTDA.
For this purpose aggregate scores were calculated for each of the independent variables. These
aggregate scores were then fitted in a logistic regression against the dependent variable,
adoption of CSPT. The results are show in Table 4.18.
Table 4.18: Combined Influence of the Determinants of Likelihood of Adoption of CSPT.
Model: Firth Logistic regression (logit) N of 0's: 63 1's: 3 (Unweighted means) Dep.
var: Adoption Loss: Penalized likelihood (MS-err. scaled to 1) Final loss:
22.856810392 McFadden R²=.31629 Prob> chi2=.0487
Constant Attributes Awareness Complexity Finance standardization
Estimate -5.274673 0.04503714 0.6330495 0.3710849 0.2342045 0.05385438
p-value 0.001277399 0.02724726 0.04480156 0.3881538 0.004278339
Odds Ratio 1.0460 1.8833 1.4493 0.7912 1.0553
The regression resulted in a McFadden R2 of 0.316. This is within the perfect fit range of
McFadden R2 model fit test of 0.2-0.4. This means the five predictor variables combined can
be used to predict the adoption of CSPT by tea factories. A test of significance of the model

133
attained a score of 0.0487. This is below the 0.05 threshold for 95% confidence implying the
model is statistically significant. This in-turn means that estimates of CSPT adoption gotten
using this model cannot be attributed to chance with a confidence level of 95%.
Individual variables’ significance was also measured. The predictor variables attributes,
awareness, complexity, and standardization scored p-values of less than 0.05. This means they
are statistically significant. However, access to finance had a score of 0.388 which is above
the 0.05 mark, and is therefore not significant at the 95% confidence level. This suggests
access to finance would not have a significant influence on the adoption of CSPT by tea
factories and the variable should, therefore, not be included in the CSPT adoption model.
This confirms the results of statistical tests of significance exercise carried out in sections 4.4
to 4.8, in which four of the variables were found to be significant and therefore are likely to
influence the adoption of CSPT among the tea factories. These were CSPT attributes, CSPT
Awareness, organization complexity and CSPT standardization. These variables become
covariates of the final study model. The variable, access to finance, was found to be
insignificant and will therefore not be included in the final model.
To get the final CSPT adoption model, the remaining four predictor variables are regressed
against the dependent variable, CSPT adoption. The results of this exercise are detailed in
Table 4.19.

134
Table 4.19: CSPT Adoption Model Parameters
Model: Firth Logistic regression (logit) N of 0's: 63 1's: 3 (Unweighted means)
Dep. var: Adoption Loss: Penalized likelihood (MS-err. scaled to 1)
McFadden R² =.3012 Prob> chi2 =.0373
Constant Attributes Awareness Complexity Standardization
Estimate 0.288 2.71845 1.63304 1.02223 1.0002
p-value 0.017773 0.035247 0.048802 0.038278
Odds Ratio 15.1568 5.1194 2.7793 2.7188
These CSPT model scored McFadden R2 of 0.3012 which is within the perfect fit expectation
of McFadden R2 between 0.2 and 0.4. Statistical significance sore was Chi squared p-value of
0.0373, which is within the 0.05 threshold. This means this model can be relied on in
estimating adoption of CSPT technology among tea factories managed by KTDA at a 95%
confidence level. This leads to the rejection of the null hypothesis H06 above, and a conclusion
that the combined effect of the independent variables CSPT attributes, CSPT Awareness,
organization complexity and CSPT standardization has an influence on the likelihood for the
adoption of CSPT among tea factories managed by KTDA in Kenya.
The parameters for the new model are β0 = 0.288, β1 = 2.718, β2 = 1.633, β3 = 1.023, and β4 =
1.002. Consequently the final study model expressing the likelihood of the adoption of CSPT
among tea factories in Kenya is shown in equation (xiv) below.
Logistf (CSPT Adoption) = 0.288+ 2.718CSPTAttributes + 1.633CSPTAwareness
+ 1.023OrganizationComplexity + 1.002CSPT Standardization (xiv)
The individual independent variable parameters in the above equation are measures by which
an independent variable is likely to vary the likelihood of the adoption of CSPT technology by

135
tea factories managed by KTDA, when varied by one unit within the model. CSPT attributes
has the highest coefficient of 2.71, meaning it is the variable that would have the greatest
effect in influencing the likelihood of adoption of CSPT by tea factories managed by KTDA.
The second variable is awareness with a coefficient of 1.633, followed by complexity with a
coefficient of 1.023 and finally standardization with a coefficient of 1.002. These, therefore,
are the initiatives that are likely to influence the adoption of CSPT among the tea factories,
and possibly in their priority order.
The same information is communicated through the odd ratios. These ratios give a measure of
the extent to which a predictor variable can influence the likelihood of the dependent variable
assuming a desired category, when varied by one unit, all other variables remaining constant.
Again CSPT attributes had the highest ratio of 15.1568, implying a change in attributes by one
unit will change the likelihood of the adoption of CSPT by over 15 times, all other things
remaining constant. The order of importance of the covariates in the model as per their
coefficients is repeated when odd ratios are considered. The second variable is awareness with
a ratio of 5.1194, organization complexity is third with a ratio of 2.7793, and last is
standardization with a ratio of 2.7188.
The significance of technology attributes emphasized in this study’s findings is highlighted in
Rogers’ adoption of technology model. He attributed likelihood of adoption of a new
technology to its relative to its attributes, followed by communication within a social set-up
(Sahin, 2006). Communication creates awareness of the technology and its benefits. The
attributes have also been found to have influence on faculty members’ likelihood of adopting a

136
new technology in their teaching. Further, just like in this study, Rogers identified the need for
organization complexity, which he described as the extent to which organization members
possessed skills and competences, as a perquisite to technology adoption. Nevertheless,
Rogers’ analysis does not indicate which attributes are more important in their influence on
adoption. He also was silent on technology standardization as a factor influencing technology
adoption.
More recent publications have highlighted all the determinants of technology investigated in
this study. Reports on renewable energy and concentrated solar technologies promotion
projects in India and Malaysia emphasized technology attributes (through demonstrations),
awareness creation, capacity building and standardization as key initiatives to promote
adoption (Akker & Aggarwal, 2015; Ocampo & Marthel, 2012: UNDP 2016). In these
projects access to finance was incorporated as one of the initiatives to spur adoption of new
technologies, but there was no reported strong connection of financial incentives and adoption
of new technologies. In fact in one of the project it was reported that energy reforms can be
initiated through awareness and technical support without any financial incentives. This is to a
big extent in tandem with the findings of this study.
4.10 Revised Conceptual Framework.
This study started with a conceptual framework indicating the proposed relationships between
the predictor variables CSPT attributes, CSPT awareness, organizational complexity, access to
finance, and CSPT standardization, and the adoption of CSPT by KTDA run factories in
Kenya. This framework was depicted in Figure 2.2. On completion of the investigation of the

137
relationship between the dependent variable and the independent variables, and as per the
results presented earlier in this chapter, the earlier proposed relationship slightly changes. One
of the initial proposed dependent variables, access to finance, was found not to significantly
influence the adoption of CSPT technology by tea factories run by KTDA. The variable was
therefore expunged from the CSPT adoption model, and was consequently removed from the
optimal conceptual framework. The optimal conceptual framework depicts the relationship
between CSPT adoption by tea factories run by KTDA in Kenya and the independent
variables that were found in the study to have an influence on the adoption of CSPT. These
were CSPT attributes, CSPT awareness, organization complexity, and CSPT standardization.
This modified framework is presented in Figure 4.2.
Beyond this revised framework a synopsis was done of the study conceptualization and
findings. This was an attempt to capture at a glance the propositions, foundations, findings and
conclusions of this study. This was done by highlighting these prime features of this study in a
table form. This synopsis is depicted in Table 4.20.
CSPT Adoption
CSPT Attributes
CSPT Awareness
CSPT Technology
Standardization
Organization
complexity
Figure 4.2 Revised Conceptual Framework

138
Table 4.20: Determinants of the likelihood of Adoption of CSPT by Tea Factories Run by KTDA
Objective Variable Hypothesis Model Results Conclusion
To analyse the effect of CSPT
attributes on the likelihood of
adoption of CSPT by tea factories
run by KTDA in Kenya.
CSPT Attributes
H01: There is no significant
relationship between CSPT
attributes and likelihood of adoption of CSPT among the
Kenyan tea factories run by
KTDA
Logistf (CSPT
Adoption) = β0 +
β1CSPTAttributes
McFadden R2 = 0.4135
Chi2 p- value score = 0.0330.
p- value < 0.005
Reject H01
To assess the effect of CSPT
awareness on the likelihood of
adoption of CSPT by tea factories
run by KTDA in Kenya.
CSPT
Awareness
H02: There is no significant
relationship between CSPT
awareness and likelihood of adoption of CSPT among the
Kenyan tea factories run by
KTDA.
Logistf (CSPT
Adoption) = β0 +
β1CSPTAwaneness
McFadden R2 = 0.2683
Chi2 p- value score = 0.0482
p- value < 0.005
Reject H02
To explore the effects of
organization complexity on the
likelihood of adoption of CSPT by
tea factories run by KTDA in
Kenya.
Organization
Complexity
H03: There is no significant
relationship between
organization complexity and
likelihood of adoption of CSPT
among the Kenyan tea factories
run by KTDA.
Logistf (CSPT
Adoption) = β0 +
β1Organization
Complexity
McFadden R2 = 0.3177
Chi2 p- value score =.01642
p- value < 0.005
Reject H03
To evaluate the effect of access to
finance on the likelihood of
adoption of CSPT by tea factories
run by KTDA in Kenya.
Access to
Finance
H04: There is no significant
relationship between access to
finance and likelihood of adoption of CSPT among the
Kenyan tea factories run by
KTDA.
Logistf (CSPT
Adoption) = β0 +
β1Access to Finance
McFadden R2 = 0.3904
Chi2 p- value score =0.6253
p- value > 0.005
Accept H04
To assess the effect of CSPT
technology standardization on the
likelihood of adoption of CSPT by
tea factories run by KTDA in
Kenya.
CSPT
Standardization
H05: There is no significant
relationship between CSPT
standardization and likelihood
of adoption of CSPT
technologies among the Kenyan
tea factories run by KTDA.
Logistf (CSPT
Adoption) = β0 +
β1CSPTStandardiza
tion
McFadden R2 = 0.2277
Chi2 p- value score = 0.0222
p- value < 0.005
Reject H05

xiii
4.11Chapter Summary
This chapter detailed the results of the study on the likelihood of the adoption of CSPT among
tea factories managed by KTDA influenced by CSPT attributes, CSPT Awareness,
organization complexity, access to finance and CSPT standardization. Four of these variables,
CSPT attributes, CSPT Awareness, organization complexity, and CSPT standardization were
found to have statistical significance in enhancing the likelihood of adoption of CSPT among
the tea factories. Nevertheless, access to finance was not found to be significant in this role.
xiv
CHAPTER FIVE
SUMMARY, CONCLUSIONS AND RECOMMENDATIONS
5.1 Introduction
This chapter presents the summary, conclusions and recommendations on the strategies for
CSPT adoption among tea factories managed by KTDA in Kenya. Summary is a recap of the
entire study highlighting the study objectives, process and findings. Based on the findings
relevant conclusions are made followed by recommendations.
5.2 Summary
The general objective of this study was to clarify the strategies that have can enhance CSPT
adoption by tea factories managed by KTDA in Kenya. Specific likely determinants of CSPT
adoption which were investigated were CSPT attributes, CSPT awareness, organization
complexity, access to finance and CSPT standardization. Specific objectives and
corresponding hypotheses were formulated for each of these proposed determinants as to their
likelihood to influence the adoption of CSPT.
This was followed by extensive review of theoretical and empirical literature on strategies for
CSPT adoption which culminated in a conceptual framework for the study. This highlighted
the causal likelihood relationship between CSPT adoption and the respective proposed
determinants. Subsequently a target population was identified for the study and a
questionnaire designed for the purpose of data collection. A pilot test was conducted at four
private tea factories to test the validity and reliability of the research tool, which informed
some adjustments in the tool and research topic. The questionnaire was applied in field data
collection from the sixty six (66) tea factories managed by KTDA, and a hundred percent

xv
(100%) response rate was attained. On completion of data collection, data analysis followed,
making use of IBM SPSS statistics version 23 and STATSTICA version 12 softwares. The
results of the analysis were used to test the six study hypotheses which were: There is no
significant relationship between CSPT attributes and adoption of CSPT among the Kenyan tea
factories run by KTDA; There is no significant relationship between CSPT awareness and
adoption of CSPT among the Kenyan tea factories run by KTDA; There is no significant
relationship between organization complexity and adoption of CSPT among the Kenyan tea
factories run by KTDA; There is no significant relationship between access to finance and
adoption of CSPT among the Kenyan tea factories run by KTDA; There is no significant
relationship between CSPT standardization and adoption of CSPT technologies among the
Kenyan tea factories run by KTDA; There is no significant relationship between CSPT
standardization and adoption of CSPT technologies among the Kenyan tea factories run by
KTDA; and There is no significant relationship between the combined effect of CSPT
attributes, CSPT awareness, organization complexity, access to finance and standardization,
and adoption of CSPT technologies among the Kenyan tea factories run by KTDA. Research
findings per every objective are highlighted below.
5.2.1 CSPT Attributes and the Adoption of CSPT
The first study objective was ‘to assess the effect of CSPT attributes on the adoption of CSPT
by the Kenyan tea factories run by KTDA’. The CSPT attributes investigated were CSPT cost
effectiveness, minimizing carbon emissions, minimizing health hazard, being a twenty four
hour source, being within required heat range, being easy to install, and being triable. All the
attributes were found to be significant in their likelihood to influence the adoption of CSPT

xvi
except ‘being easy to install’. CSPT attributes, therefore have a likelihood of influencing the
adoption of CSPT by the tea factories managed by KTDA. This result led to the rejection of
the null hypothesis ‘There is no significant relationship between CSPT attributes and the
adoption of CSPT among the Kenyan tea factories run by KTDA’.
5.2.2 CSPT Awareness and the Adoption of CSPT
The second study objective was ‘To assess the effect of CSPT awareness to influence the
adoption of CSPT among the Kenyan tea factories run by KTDA’. Most of the respondents
(89%) felt that there was no enough information on CSPT in the industry, but all of them were
aware of the disadvantages of their current sources of heat energy (fuel wood and fuel oil).
Farther, CSPT awareness creation approaches that would enhance the likelihood of CSPT
adoption were investigated. These were use of brochures, use of posters, use of resource
books, public presentations, public workshops, public exhibitions, newspaper advertisements,
magazines advertisements and electronic publications. Five of these approaches were found to
be statistically significant, which were use of brochures, public workshops, exhibitions,
newspaper advertising and electronic publications. The awareness model with these sub-
variables was also statistically significant which led to the rejection of the study’s second
hypothesis ‘There is no significant relationship between CSPT awareness and adoption of
CSPT among the Kenyan tea factories run by KTDA’.
5.2.3 Organization Complexity and the Adoption of CSPT
The third objective was ‘To explore the effect of organization complexity on the adoption of
CSPT among the Kenyan tea factories run by KTDA’. All the respondents agreed the

xvii
technicians and engineers they had, had adequate level of education for CSPT installation and
management training. However, only 67.2% felt the managers had adequate knowledge and
skills for the management of CSPT. Farther investigation on technical training approaches
identified three significant approaches, namely overseas training, net-works with universities
and net-works with VETIs. The likelihood of organizational technical capacity to influence the
adoption of CSPT model was also significant. This enabled the rejection of the third null
hypothesis, ‘There is no significant relationship between organization complexity and
adoption of CSPT among the Kenyan tea factories run by KTDA’.
5.2.4 Access to Finance and the Adoption of CSPT
The forth objective of the study was ‘To evaluate the effect of access to finance on the
adoption of CSPT among the Kenyan tea factories run by KTDA’. These were grants from
government, grants from development partners and public private partnerships. The others
were found to be insignificant in their likelihood to influence the adoption of CSPT. The
access to finance model was also overall found to be statistically insignificant in influencing
the likelihood of the adoption of CSPT by tea factories managed by KTDA. This meant that
though some elements of access to finance were significant, the overall variable performance
in likelihood to influence adoption of CSPT was not good enough to be included in the overall
study model. Consequently the independent variable ‘access to finance’ was dropped from the
‘determinants of likelihood of adoption of CSPT by tea factories managed by KTDA’ model.

xviii
5.2.5 CSPT Standardization and the Adoption of CSPT
The last objective was ‘To assess the effect of CSPT technology standardization on the
adoption of CSPT among the Kenyan tea factories run by KTDA’. The elements of CSPT
standardization were quality assurance, assurance of installation procedures, KEBS mark, IS
standard, KEREA accreditation and factory staff approval. All the elements of CSPT
standardization were found to be significant, and so was the overall model. This led to the fifth
study hypothesis, which stated that ‘There is no significant relationship between CSPT
standardization and adoption of CSPT technologies among the Kenyan tea factories run by
KTDA’, being rejected.
5.2.6 Determinants of the Adoption of CSPT
The general objective was evaluated last. It sought to ‘to assess the effect of combined effects
of CSPT attributes, CSPT awareness, organization complexity, access to finance and CSPT
standardization on the adoption of Concentrated Solar Power Technologies (CSPT) among the
Kenyan tea factories run by KTDA’. As explained above, access to finance was eliminated
from this combined effect, as it was found to be statistically insignificant. Thus, ultimate
model of determinants of CSPT adoption likelihood by tea factories managed by KTDA ends
with four co-variants namely of CSPT attributes, CSPT awareness, organization complexity,
and CSPT standardization. These final model was expressed by equation (xiv).
Logistf (CSPT Adoption) = 0.288+ 2.718CSPTAttributes + 1.633CSPTAwareness
+ 1.023OrganizationComplexity + 1.002CSPT Standardization (xiv)

xix
5.3 Conclusions
In the light of the results discussed above, several conclusions can be made. These are
discussed in this section, mostly following the study objectives’ sequence. The study found
out that no tea factory managed by KTDA was using CSPT. This is despite CSPT’s strong
attributes and appeal considering Kenya, and therefore the tea factories, have an above
average solar resource. Nevertheless, three of the factories were in the process of adopting the
technology. Results of this study have pointers to possible explanations of this paradox.
For a start the study found out that there is very little information available on CSPT to the
industry. As many as 89% of the managers attested to this fact. It was worse when it came to
awareness of CSPT suppliers where those without a clue were a whopping 92%. Considering
the foregoing, it can be logically concluded that lack of information on CSPT is likely to have
contributed to the non-adoption of CSPT technology. This is more so considering that most of
the respondents liked most of the attributes of CSPT (such as cost efficiency, less health
hazard, less pollution, and being a twenty four hour energy source). More information on
CSPT technology, its benefits and suppliers might entice the factories to install this novel
technology. The respondents also identified preferred vehicles for transmitting CSPT
information. Out of that result it can be conclude that the best media for disseminating CSPT
information in the industry are exhibitions, electronic publications, public workshops,
newspapers and brochures, in that order.
The respondents posited that most of the technical staff had the basic education level required
for CSPT training. However, according to the managers only 67% could be able to manage a
CSPT system. Though this is a substantially good proportion, in my view it was not consistent

xx
with the fact earlier stated that there is very little information on CSPT. This implies they
could have overestimated those that are likely to manage a CSPT system. All the same, there
is an indication of lack of specialized training and skills in CSPT. The proposition of this
study, therefore, is that there is need for specialized training on CSPT. Further, preferences of
delivery modes of this training were made by the respondents. Overseas training was most
preferred followed by training at the vocational training institutes and net-working with
universities.
Respondent gave their take on access to finance. Most of the managers indicated that the
factories have adequate capital reserves, access to credit, and have collateral security that
might be required for CSPT installation. Meaning lack of finance inform of organization
reserves and access to credit were not a contributor to non-adoption of CSPT. Yet they had not
adopted this technology. It can therefore be concluded that access to financial resources was
not among the more likely factors to have hindered adoption of CSPT. However, some of the
elements under access to finance were reported to be likely to influence adoption of CSPT.
These were grants (from government and development partners) and joint ventures. The grants
were also found to be a frequent tool in initiating CSPT projects especially in India
spearheaded by UNDP, UNIDO and GEF. It is, therefore, a path that can be investigated and
pursued in efforts to encourage adoption of CSPT among the tea factories.
Results on CSPT standardization showed the factory managers would highly need assurance
on CSPT standards before they can adopt the technology. ISO certification mark, KEREA
accreditation and KEBs mark of quality were top preferences in assuring the respondents on
CSPT quality. It can therefore be concluded that to enhance the likelihood of the adoption of

xxi
CSPT by tea factories managed by KTDA there is need to make sure CSPT is ISO certified,
accredited by KEREA or bearing KEBS mark of quality.
5.4 Recommendations
From the findings and conclusions of this study CSPT attributes, CSPT awareness, CSPT
standardization and organization complexity were found to have a likelihood to influence the
adoption of CSPT. In the view of the researcher, to enhance likelihood of adoption of CSPT
by the factories through influence of CSPT attributes, CSPT awareness is a prerequisite. The
factory management and the entire industry need to be knowledgeable about the CSPT
attributes for them to be persuaded to take up the technology. Massive awareness campaigns,
particularly through exhibitions, electronic publications, public workshops, newspapers and
brochures, are required to enhance the likelihood of the tea factories adoption of CSPT. This
can be an initiative all stakeholders especially CSPT suppliers, the Kenya government,
sustainable energy interest groups and development agencies.
It is also apparent there is little local specialized technical capacity on CSPT. To improve the
likelihood of the adoption of CSPT by the factories specialized technical training on CSPT for
engineers and technicians should be undertaken. This can be done in the short term by taking
existing staff for short courses overseas (to China, India, and Spain) where this technology is
developed and being used. Considering the factories did not seem to have financial
shortcomings, this is an initiative they can take up. For longer term impact CSPT training in
form of CSPT specialization options in universities and vocational training institutes should be
embarked on. This is more of a government and development agencies forte.

xxii
To enhance the likelihood of CSPT adoption the prospective customers (tea factories) will
need assurance of the quality and authenticity of the CSPT equipment. Assurance that the
CSPT equipment would deliver as alleged. This assurance will be midwifed by having the
CSPT suppliers, equipment and installation procedures being endorsed by ISO, KEREA and
KEBS. This onus falls in the hands of the CSPT manufacturers, the Kenya government,
KEREA and KEBS.
5.5 Areas for Further Research
This study heavily relied on Rogers’ theory on technology adoption to identify likely
determinants of CSPT adoption. However, not all variables proposed in the said theory were
investigated in this study. Particularly, Rogers emphasized on organizational structural
characteristics, which were centralization, complexity, formalization, Interconnectedness and
Organizational slack. Only the effect of organization complexity was investigated in this
study. There is room, therefore, for the investigation of these other variables in their likelihood
to influence the adoption of CSPT.
Finally, this study focused on the likelihood of adoption of CSPT in the tea industry. This is
only one sector using heat energy and that may benefit from this relatively new and
environmentally friendly source of heat. Studies can therefore be conducted in other sectors to
investigate the likelihood of industrial application of CSPT in Kenya.

xxiii
REFERENCES
ADB, (2012). People’s Republic of China: Concentrating Solar Thermal Power Development.
ADB Technical Assistance Consultant’s Report, Project Number: 43356 / TA 7402.
China.
Adhiarna, N., & Rho, J. J. (2009). Standardization and Global Adoption of Radio Frequency
Identification (RFID): Strategic Issues for Developing Countries. Korea Advanced
Institute of Science & Technology; IEEE DOI 10.1109/ICCIT.2009.300
Agritrade (2012) : Executive Brief update 2012. Retrieved from http://www.agritrade.cta.int/
Akker, J., & Aggarwal, D. (2015). Market Development and Promotion of Solar
Concentrators for Process Heat Applications in India: Mid-Term Review of the
UNDP/GEF Project. India: UNDP.
Alam, S. S., Nor M. F., Ahmad M., & Hashim N. H. (2014). A Survey on Renewable Energy
Development in Malaysia: Current Status, Problems and Prospects. Environmental
and Climate Technologies doi: 10.1515/rtuect-2016-0002
Allison, P. (2012). Logistic regression for rare events. Retrieved from http://www.
statisticalhorizons.com/logistic-regression-for-rare-events,.
Altini, M. (2015). Dealing With Imbalanced Data: Under sampling, Oversampling and Cross-
validation. Retrieved from https://www.marcoaltini.com/
ASBE, (2009). Entrepreneurship Opportunities in the Solar Industry. Report at 35th Annual
Conference, Jackson State University. Association for Small Business &
Entrepreneurship (ASBE)
Baker, R., Morall R., & Turkington, T. (1988). Sample Size in Relation to Forecasting
Sclerotinia Stem Rot of Canola. Canadian Journal of Plant Pathology, 10 159-165.
Baruah, B.P., Punja, K., & Rao, P.G. (2012). The Energy Utilization Pattern in Tea Factories
of NE and Environmental issues. In Two and a Bud 59(2) 9-13, 2012. Jorhat 785001,
Assam, India, North East Institute of Science and Technology.
Best, J. W., & Khan, J. V. (2011). Research in Education (10th Edition). New Delhi India: PHI
Learning Private Limited.
Bhutta, F., (2012). Solar Energy Applications in Industrial and Commercial Sectors in
Pakistan and Barriers in its Grow. Retrieved from
http://www.altenergymag.com/emagazine/2012/04/
Boldt, J., Nygaard, I., Hansen U. E., &Trærup S. (2012). Overcoming Barriers to the Transfer
and Diffusion of Climate Technologies. Denmark: UNEP Risø Centre, Roskilde.
Bossink, Bart A. G., (2014). Demonstration Projects for Diffusion of Clean Technological
Innovation: A Review. Clean Technologies and Environmental Policy, August 2015,
Volume 17, Issue 6, pp 1409–1427
Bryman, A., (2012). Social Research Methods (4th Edition). New York: Oxford University
Press.
Camco / EA Energy (2014). Literature Review of Market Barriers to Solar Technologies.
Retrieved from Page,http://www.kznenergy.org.za
xxiv
Chan, A. P. C., Darko, A. & Ameyaw, E. E. (2017). Strategies for Promoting Green Building
Technologies Adoption in the Construction Industry—An International Study.
Sustainability 2017, 9, 969; doi:10.3390/su9060969
Chao, C. W., Reid, M., Lai, P. H., & Reimers, V. (2019). Strategic recommendations for new
product adoption in the Chinese market, Journal of Strategic Marketing, DOI:
10.1080/0965254X.2018.1555545
Choudhury, R. R. (2014). CST for Industrial Applications: An Industry Perspective.
SUNFOCUS Volume 2, Issue 2, December 2014; New Delhi, India: SVS Press,.
Claudy, M. C., Odriscoll, A., Michelsen, C., & Mullen M. R. (2010). Consumer awareness in
the adoption of microgeneration technologies: An empirical investigation in the
Republic of Ireland. Renew Sustain Energy Rev (2010),
doi:10.1016/j.rser.2010.03.028
Cole, S. R., Chu, H., & Greenland, S. (2013). Maximum Likelihood, Profile Likelihood, and
Penalized Likelihood: A Primer. American Journal of Epidemiology. 2014 Jan 15;
179(2): 252–260.
Cooper, R. D., & Schindler, P.S. (2011). Business Research Methods (9th Edition). New
Delhi, India: Tata McGraw-Hill Education Private Limited.
Eeva, J., Hylli, O., Siltala, N., & Lanz, M. (2018). Utilizing SPIN Rules to Infer the
Parameters for Combined Capabilities of Aggregated Manufacturing Resources.
IFAC PapersOnLine 51-11 (2018) 84–89
Edkins, M., Winkler, H., & Maquard, A. (2009). Large Scale Rollout of CSP in South Africa.
Climate Strategies. Retrieved from www.climatestrategies.org
Emodi, V.N., Yusuf, S.D., & Boo, K.J, (2014). The Necessity of the Development of
Standards for Renewable Energy Technologies in Nigeria. Smart Grid and
Renewable Energy, 2014, 5, 259-274,
http://www.scirp.org/journal/sgrehttp://dx.doi.org/10.4236/sgre.
ESTIF, (2012). 2012 market statistics released at Intersolar Europe by ESTIF, the European
Solar Thermal Industry Federation. Retrieved from http://www.estif.org.
Eyduran, E. (2008). Usage of Penalized Maximum Likelihood Estimation Method in Medical
Research: An Alternative to Maximum Likelihood Estimation Method. JRMS/
November & December 2008; Vol 13, No 6. P 325-330, www.mui.ac.ir.
FAO, (2015). The State of Food Insecurity in the World 2015. Meeting the 2015 international
hunger targets: taking stock of uneven progress. Rome: Author.
Feng, (2012). Key Factors Influencing Users’ Intentions of Adopting Renewable Energy
Technologies. Academic Research International volume 2, No. 2, SAVAp
International.
Fijorek, K., & Sokolowski, A. (2012). Separation-Resistant and Bias-reduced Logistic
Regression: STASTICA macro. Journal of Statistical Software; April 2012, Volume
47, Code Snippet 2.
Forum for the Future, (2015). The Future of Tea: A hero Crop for 2030: a report on the
findings of the Tea 2030 project. Retrieved from http://www.forumforthefuture.org.

xxv
Flamos, A., Gaast, W., Doukas, H., & Deng, G. (2008). EU and Asian countries policies and
programmes for the diffusion of sustainable energy technologies. AEJ (2008) 6:261–
276, Published online: 21 May 2008, Springer-Verlag 2008.
Gajavelli, V. S. (2018) Technology Adoption & Innovation for SMEs: A Policy Perspective
http://smeworld.asia/Features.aspx?Features=Featu-340/technology-adoption-
innovation-for-smes---a-policy-perspective#.XCNFZc2IbIU
Garud, S., (2014). An International Scenario of a Few Solar Thermal Cooling Systems.
SUNFOCUS, Issue 4, April-June 2014.
GEF, (2017). Enabling Transformations. Retrieved from www.thegef.org/project/ghg
Government of Kenya. (2007). Kenya Vision 2030. A Globally Competitive and Prosperous
Kenya. Nairobi: Government Printers.
Grantz, J., & Turner, V. (2002). Standardization: The Secret to IT leverage. Retrieved from
www.idc.com
Groosman, (2011). Tea Sector Overview. IDH, The Sustainable Trade Initiative. Retrieved
from http://www .idhsustainabletrade.org
Gujarati, D. N., & Porter, D. C. (2009). Basic Econometrics (5th Edition). New York:
MacGraw-Hill.
Gunathilaka, R.P.D., & Tularam, G.A. (2016). The Tea Industry and a Review of its Price
Modelling in Major Tea Producing Countries. Journal of Management and Strategy
Vol. 7, No. 1; 2016
Han, J., & Park, C. (2017). Case study on adoption of new technology for innovation:
Perspective of institutional and corporate entrepreneurship. Asia Pacific Journal of
Innovation and Entrepreneurship, Vol. 11 Issue: 2, pp.144-158.
He, H., & Garcia, E. A. (2009). “Learning from Imbalanced Data”, Knowledge and Data
Engineering. IEEE Transactions vol. 21, no. 9, pp. 1263 – 1284.
Heidena, P., Pohlb, C., Mansorc, S.B., & Genderen, j. (2015). The role of education and
training in absorptive capacity of international technology transfer in the aerospace
sector. Progress in Aerospace Sciences 76 (2015) 42–54
Hippel, P. T. (2010). Skewness. International Encyclopedia of Statistical Science, 2010
Edition. New York: Springer.
Hsiao, K. L. (2017) "What drives smartwatch adoption intention? Comparing Apple and non-
Apple watches", Library Hi Tech, Vol. 35 Issue: 1, pp.186-206,
https://doi.org/10.1108/LHT-09-2016-0105
Hu, M.C., & Wu, C.Y. (2013). Concentrating Solar Power: China’s New Solar Frontier. The
Asia-Pacific Journal| Japan Focus Volume 11 | Issue 21 | Number 2 | May 2013
International Energy Agency. (2014). Heating Without Global Warming: Market
Developments and Policy Considerations for Renewable Heat. Paris, France: Author
International Energy Agency. (2010). World Energy Outlook 2010. Retrieved from
https://www.iea.org/publications/freepublications/publication/weo-2010
IEA-ETSAP, & IRENA, (2015). IEA-ETSAP and IRENA Technology Brief E10 Retrieved
from http://www.etsap.org – www.irena.org
xxvi
International Institute for Sustainable Development. (2014). A Summary Report of the First
Sustainable Energy for All Forum. Retrieved from http://www.iisd
Intergovernmental Panel on Climate Change. (2011). Special Report on Renewable Energy
Sources and Climate Change: Summary for Policy Makers and Technical Summary.
UK: Cambridge University Press.
International Renewable Energy Agency. (2013). International Standardisation in the Field
of Renewable Energy. Retrieved from http://www.irena.org
International Renewable Energy Agency. (2015). Solar Heat for Industrial Processes:
Technology brief E21. Retrieved from http:www.irena.org
International Organization for Standardization. (2013). National Standards Bodies in
Developing Countries, Fast Forward Series, 2ndedition, ISO Central Secretariat,
Genève Switzerland, Webwww.iso.org ISBN 978-92-67-10582
International Trade Centre. (2014). Mitigating Climate Change in Tea Sector. Technical paper
Doc. No. SC-14-245, Geneva: Author
Jayasimha, B. K., (2017). Awareness-cum-Training Centre for CST Technologies at Brahma
Kumaris, Abu Road. SUNFOCUS Volume 4 Issue 3, January-March 2017; New
Delhi, India: SVS press.
Jeen, C. (2015). How Samsung Electronics’ Organizational Structure and Culture Affect Its
Innovation. Retrieved from https://ibpunion.files.wordpress.com/2012/02
Johnson, M. (2017). Introduction to Hypothesis Testing. Australia, Sydney: Macquarie
University.
Kamau, J. N., Kiplagat, J. & Mwenda, I. J. (2015). Energy Consumption Trends in
Smallholder Tea Factories in Kenya. International Journal of Emerging Technology
& Research, volume2 issue 2 March – April 2015
Kapoor, K., Yogesh, K. D., & Michael, D. W. (2013). Role of Innovation Attributes in
Explaining the Adoption of Interbank Mobile Payment Service in an Indian Context.
UK: IFIP (Inernational Federation for Information Processing).
Kasim, A., & Altinay, L. (2016). How do Technology Orientation, Organizational Learning,
Market Conditions, and firm Growth Connect? A Preliminary Analysis on Small and
Medium Size Hotels in Peninsular Malaysia. International Review of Management and
Marketing, 2016, 6(S7) 121-126.
Kawira, M., Kinyua, R., & Kamau, J. N. (2012). A Prototype Parabolic Trough Solar
Concentrators for Steam Production. JAGST Vol. 14(2) 2012. Kenya, Jomo Kenyatta
University of Agriculture and Technology.
Kane, Y., Sherr, I. (2011). Apple: Samsung Copied Design. Wall Street Journal. Retrieved
from http://www.wsj.com/articles/SB10001424052748703916004576271210109389154
Kim, H., (2012). Standardization in technology adoption: A comparison of broadcast TV
cases, 19th ITS Biennial Conference 2012, Bangkok, Thailand, 18-21 November
2012: Moving Forward with Future Technologies: Opening a Platform for All

xxvii
Kimuyu, P., Mutua, J., & Wainaina, J. (2012). Role of Renewable Energy in Promoting
Inclusive and Sustainable Development in Kenya. Nairobi: School of Economics,
University of Nairobi.
Kenya National Bureau of Statistics. (2015). Republic of Kenya, Economic Survey 2015.
Author.
Labordenaa, M., Patta, A., Bazilian, M., Howells, M., & Lilliestam, J. (2017). Impact of
political and economic barriers for concentrating solar power in Sub-Saharan Africa.
Energy Policy 102 (2017) 52–72. Retrieved from www.elsevier.com/locate/enpol
Lindlein, P. & Mostert, W. ( 2005). Financing Renewable Energies: Instruments, Strategies,
and Practice Approaches. Frankfurt Main, KfW.
Maina, J.N., (2016). Networking and Firm Performance among Manufacturing Small and
Medium Enterprises in Kenya. PhD thesis, Nyeri: Kimathi University.
Malaviya, J. N., (2017). Information Awareness Proliferates Solar Thermal Market. SunFocus
Volume 4 Issue 3 Jan-March 2017, New Delhi, India: SVS press.
Margolis, R., & Zuboy, J. (2006). Nontechnical Barriers to Solar Energy Use: Review of
Recent Literature. Technical Report NREL/TP-520-40116 September 2006, USA,
Colorado: National Renewable Energy Laboratory.
Menard, S. (2002). Applied Logistic Regression Analysis (2ndedn). Thousand Oaks, CA, Sage
Publications.
Miller, D., & Garnsey, E. (2000). Entrepreneurs and technology diffusion: How diffusion
research can benefit from a greater understanding of entrepreneurship. Technology in
SocietyVolume 22, Issue 4, November 2000, Pages 445-465
Miranda, M. Q., Farias, J. S., Schwartz, C. A., & Almeida, J. P. L. (2016). Technology
Adoption in Diffusion of Innovations Perspective: Introduction of an ERP System in
a Non-profit Organization. RAI Revista de Administração e Inovação 13 (2016) 48-
57
Misra, A. (2016). GEF-UNIDO-MNRE Project on Promoting Business Models of
Concentrating Solar technologies. SUNFOCUS volume 4, Issue 2; New Delhi, India:
SVS Press.
Morse, J. M., Barrett, M., Mayan, M., Olson, K., & Spiers, J. (2002). Verification strategies
for establishing reliability and validity in qualitative research. International Journal
of Qualitative Methods 1 (2), Article 2.
Nachmias, C. F, & Nachmias, D. (2009). Research methods in the Social Sciences (5th
Edition). London: Hodder Education.
Nakano, N., Tsusaka ,W. T., Aida, T., & Pede, V. O. (2015).The Impact of Training on
Technology Adoption and Productivity of Rice Farming in Tanzania: Is Farmer-to-
Farmer Extension Effective? Tokyo, Japan: Japan International Cooperation Agency
Research Institute.
Nielson, R. B., & Seay, M. C. (2014). Complex Samples and Regression-Based Inference:
Considerations for Consumer Researchers. DOI: 10.1111/joca.12038

xxviii
Obuobisa, E. D., (2015). Credit Acess and Adoption of Cocoa Research Innovations in Ghana.
Research in Humanities and Social Sciences, Volume 5, No. 12; 2015
Ocampo, M., &Maithel, S. (2012). Energy Conservation in Small Sector Tea Processing Units
in South India: Terminal Evaluation (Te) Review Report, Undp/Gef Project
00057404
Paal, B. D. (2014). A Comparison of Different Methods of Modelling Rare Events Data.
Thesis Submitted in Fulfillment of the Requirements for the Degree of Master of
Statistical Data Analysis. Belgium: Ghent University.
Pável, R., & Mercado, R. (2017) Adoption of renewable energy technologies in Mexico:
The role of cognitive factors and innovation attributes. International Journal of
Energy Sector Management, Vol. 11 Issue: 4, pp.626-649,
https://doi.org/10.1108/IJESM-02-2017-0001
Peng, C.Y.J, Lee, K.L., & Ingersoll, G.M. (2002). An Introduction to Logistic Regression
Analysis and Reporting. USA, Indiana University-Bloomington: EBSCO
Publishing,.
Piya, R., Adhikari, M., &Shreshtha, N. (2012). Concentrated solar heating system for process
heating in Nepalese industry. Rentech Symposium Compendium, Volume 2,
December 2012
Rahman, M. S., & Sultana, M., (2017). Performance of Firth and Log-F Type Penalized
Methods in Risk Prediction for Small or Sparse Binary Data. BMC Medical Research
Series, BMC. https://doi.org/10.1186/s12874-017-0313-9
Rasch, A., & Waibel, C. (2013). What drives fraud in a credence goods market? Evidence
from a field study. Zurich, Centre of Economic Research, ETH.
Rawlins, J., & Ashcroft, M. (2013). Small-scale Concentrated Solar Power: A review of
current activity and potential to accelerate deployment. Stamford, London: Carbon
Trust.
Rogers, E. M., (2003). Diffusion of Innovations, 3rd edition. New York: The Free Press.
Rogers, E.M., (1976). New Product Adoption and Diffusion. Journal of Consumer Research.
Vol. 2 , March 1976
Sahin, I. (2006). Detailed Review of Rogers’ Diffusion of Innovations Theory and Educational
Technology-Related Studies Based On Rogers’ Theory. The Turkish Online Journal
of Educational Technology– TOJET April 2006 ISSN: 1303-6521 volume 5 Issue 2
Saidi, R., Laura, W., & Seton, S. (2012). Kenya’s Climate Change Action Plan: Mitigation.
Netherlands: IISD.
Saunders, M., Lewis, P. & Thornhill, A. (2009). Research Methods for Business Students, 5th
edition. Essex, Enland: Pearson Education limited.
Sayers, R. (2006). Principles of Awareness-Raising: Information Literacy, a Case Study.
Communication and Information (CI), Bangkok: UNESCO.
Solar Energy Industries Association. (2014). Solar Market Insight Report 2014 Q4. Retrieved
from https://www.seia.org/research-resources/solar-market-insight-report-2014.

xxix
Sekaran, U. (2010). Research Methods for Business: A Skill Building Approach (4th Edition),
New Delhi India: John Wiley & Sons.
Sharma, R., & Mishra, J. (2014). A Review of Evolution of Theories and Models of
Technology Adoption. Indore Management Journal, Volume 6, Issue 2, July –
December 2014
Shen, J., & Gao, S. (2008). A Solution to Separation and Multicollinearity in Multiple Logistic
Regression. Journal of Data Science 6, 2008, pg 515-531
Shenton, A.K., (2004). Strategies for Ensuring Trustworthiness in Qualitative Research
Projects. Education for Information 22 (2004) 63–75 63, UK: IOS Press.
Shoeb, A. (2014). Diffusion of Innovation. IJARES Volume 1 Issue 1 Jan 2014
Sibayan, L. (2015). Technological Attributes that Influence RFID Adoption in Logistics
Organizations. Manilla, Philippines: De La Salle University.
Silva, I.P., Batte, G, Ondraczek, J., Ronoh, G., & Ouma, C.A. (2014). Diffusion of Solar
Energy Technologies in Rural Africa: Trends in Kenya and the LUAV Experience in
Uganda. A presentation at the 1st Africa Photovoltaic Solar Energy Conference and
Exhibition, 27-29thMarch 2014, Durban, South Africa.
Simtowe, F., Muange, E., & Munyua, B., & Diagne, A. (2012). Technology Awareness and
Adoption: The Case of Improved Pigeonpea Varieties in Kenya. 2012 Conference,
August 18-24, 2012, Foz do Iguacu, Brazil 126760: International Association of
Agricultural Economists.
Singh, S. K., Kiran, D., & Pathak, A. (2017). CST Test Centres- Supporting CSH programme
of MNRE. SUNFOCUS Volume 4 Issue 3 Jan-March 2017, New Delhi, India: SVS
press.
Singhal, A. K., (2017). Impact of UNDP-GEF CSH Project in Addressing Barriers for
Accelerating the Growth of CSTs. SUNFOCUS Volume 4 Issue 3 Jan-March 2017,
New Delhi, India: SVS press.
Song, J., Oliver, C. (2010). Samsung Beats HP to Pole Position. Financial Times.
Retrieved from http://www.ft.com/intl/cms/s/2/c48d477a
Tavakol, M., & Dennick, R. (2011). Making sense of Cronbach’s alpha. International journal
of Medical Education, 2, pp.53-55
Topo, A., Moretta, S., Glorioso, C., & Pansini, A. (2014). Financial Support Mechanisms for
Distributed Solar Technologies and Energy Efficiency Deployment in Mediterranean
Countries. MEDDESIRE Project Mediterranean Development of Support Schemes
for Solar Initiatives and Renewable Energies.
Tully, M. (2015). Investigating the Role of Innovation Attributes in the Adoption, Rejection,
and Discontinued Use of Open Source Software for Development. Information
Technologies & International Development Volume 11, Number 3, Fall 2015, 55–69
United Nations Development Programme. (2015). Market Development and Promotion of
Solar Concentrator Based Process Heat Applications in India. Retrieved from
http://www.in.undp.org

xxx
United Nations Development Programme. (2016). Market Development and Promotion of
Solar Concentrator Based Process Heat Applications in India. Retrieved from
https://www.youtube.com/user/UNDPIndia
Vaughan, R., (2008). Conceptual Framework. Retrieved from http://www.bournmouth.ac.uk
Veena, J. (2009). Trade flows, Barriers and Market Drivers in Renewable Energy Supply
Goods: The Need to Level the Playing Field. Geneva, Switzerland: International
Centre for Trade and Sustainable Development.
Velmurugan, M. S., & Velmurugan, M. S., (2014). Consumers’ Awareness, Perceived Ease of
Use Toward Information Technology Adoption in 3G Mobile Phones Usage in India.
Asian Journal of Marketing, 8 (1): p 1-23, 2014
Vijay, M., Muller, E., Bass, F.M. (1990). New Product Diffusion Models in Marketing: A
Review and Directions for Research. The Journal of Marketing, Vol. 54, No. 1 (Jan.,
1990), pp. 1-26
World Economic Forum. (2014). New Growth Models: Challenges and Steps to Achieving
Patterns of More Equitable, Inclusive and Sustainable Growth. Geneva, Switzerland:
Author.
Zikmund, W.G., Babin, B.J., Carr, J.C., & Griffin, M. (2013). Business Research Methods,
9th Edition, Canada: South-Western, Cengage Learning.

xxxi
APPENDICES
APPENDIX I: INTRODUCTION LETTER
David M. Magu
P.O. Box 323 – 10100
Nyeri
Tel: 0722397902
Dear Sir/Madam,
RE: REQUEST TO OBTAIN INFORMATION ABOUT CONSENTRATED SOLAR
ENERGY TECHNOLOGY
As part of a process leading to the award of Doctor of Philosophy degree in Business
Administration and Management, I am undertaking a study entitled “Market Drivers for the
Diffusion of Concentrated Solar Power Technology among KTDA Run Tea Factories in
Kenya”. The aim of the attached questionnaire is to assist me develop an understanding of the
forces influencing the adoption of the CSPT technology by the target factories, and factors that
will influence entrepreneurs to participate in CSPT value chain. Your ideas will be helpful
towards my PHD qualification at Dedan Kimathi University of Technology, and also provide
useful insights for the tea industry in Kenya pursuit of a sustainable heat energy solution.
Please note the data obtained using this questionnaire is purely for academic purpose and your
identity with remain confidential.
Yours Faithfully,
David M. Magu
REG. B311-03-1569/2014

xxxii
APPENDIX II: FACTORY MANAGERS QUESTIONNAIRE
This questionnaire is designed purposely for academic research only. It is meant to help the
researcher draw valuable conclusions regarding the diffusion of Concentrated Solar power
Technologies (CSPT) among tea factories run by KTDA in Kenya. Your participation is
considered of great value towards the completion of this study. In addition the information
obtained from your organization remains confidential and adherence to research ethics is
going to be upheld. Thank you for your participation.
SECTION A: GENERAL INFORMATION
1. Age bracket of respondent
i) below 30 years
ii) 30 – 40 years
iii) 41 – 50 years
iv) Over 50 years
2. Respondent work experience in a tea factory
i) 0 - 5 years
ii) 6 – 10 years
iii) Over 10 years
SECTION B HEAT ENERGY USES AND SOURCES
This section has questions regarding the sources and uses of heat energy in your factory.
Kindly respond by ticking the option that best matches your opinion on the sources and usage.
1. The following are the key activities that use energy in a tea factory. Indicate the approximate
heat energy taken up by each of the following factory processes as a percentage of the total
energy use at your factory per year.

xxxiii
Use Tick as appropriate
Below
2.5 %
2.6 – 5% 5.1-7.5% 7.6-10 % 10.1-12.5 % 12.6-15% Over
15 %
Withering
Drying
2. The following are the main sources of energy in a tea factory. Indicate the approximate
contribution of energy heat by each of the following energy sources as a percentage of the
total factory day-to-day energy heat requirement.
Source Tick as appropriate
Below 5 % 5 – 10% 11-20 % 21-40 % 41-60 % 61-80 % Over 80%
Fuel wood
Briquettes
Fuel oil
3. Indicate to what extent each of the following factors are a challenge to your factory in using
the current sources of process heat?
Factor Not at all To a small
extent
To a moderate
extent
To a high
extent
To a very
high extent
High prices
Volatile price
Polluting (carbon
emissions)
Getting depleted
Negative health effects
Intermittent (not always
available)
Cumbersome/aesthetics
Other (specify)

xxxiv
SECTION C: CONCENTRATED SOLAR POWER TECNOLOGY (CSPT)
This section has statements regarding consideration for adopting CSPT.
CSPT ATTRIBUTES AND ADOPTION OF CSPT
Rate the characteristics of CSPT that influenced/can influence your factory to install CSPT
by indicating your level of agreement or disagreement with each of following statements on a
five point Likert scale where 1= Strongly Disagree, 2= Disagree, 3= Don’t Know, 4= Agree
and 5= Strongly Agree.
S/No
Characteristics
Strongly
disagree
Disagree Don’t
Know
Agree Strongly
Agree
1 2 3 4 5
1. CSPT is more cost
effective than other
sources of heat
energy the factory
has been using
2. CSPT is clean energy
that enables the
organization
minimize carbon
emissions
3. CSPT is clean energy
that enables the
organization
minimize health
hazards to employees
4. CSPT is a 24/7
source of heat energy
5. CSPT generates heat
energy in the range
requirement of the
factory (500-1200C)
6. CSPT is easy to
install
7. CSPT can be tried
before purchase and
installation

xxxv
SECTION D: CSPT AWARENESS
AWARENESS STATUS
Indicate the level to which you agree with the following statements on the status of awareness
of CSPT in your factory.
Status Strongly
disagree
Disagree Don’t
Know
Agree Strongly
Agree
1. There is adequate information on
what CSPT is among the KTDA
factories management
2. The factory management is aware of
the benefits of CSPT over other
sources of heat energy
3. The factory management knows the
suppliers of CSPT
4. The factory management is aware of
the disadvantages of fuel-wood as
sources of heat energy
5. The factory management is aware
of the disadvantages of fuel-oil as
sources of heat energy
AWARENESS AND ADOPTION OF CSPT
The following facts relate to approaches for creating awareness of CSPT. Kindly respond as to
the extent to which each statement would influence a decision to adopt CSPT by your factory.
Rate awareness creation approach that influenced/ would influence your factory to install
CSPT by indicating your level of agreement or disagreement with each of following
statements on a five point Likert scale where 1= Strongly Disagree, 2= Disagree, 3= Don’t
Know, 4= Agree and 5= Strongly Agree.
S/
No
Awareness Creation
Strongly
disagree
Disagree Don’t
Know
Agree Strongly
Agree
1 2 3 4 5
1. Awareness of CSPT through
brochures influenced/will
influence factory to adopt CSPT
2. Awareness of CSPT through
posters influenced/will
influence factory to adopt CSPT
3. Awareness of CSPT through
resource books influenced/will

xxxvi
S/
No
Awareness Creation
Strongly
disagree
Disagree Don’t
Know
Agree Strongly
Agree
1 2 3 4 5
influence factory to adopt CSPT
4. Awareness of CSPT through
Public presentations influenced/
will influence factory to adopt
CSPT
5. Awareness of CSPT through
Public workshops influenced/
will influence factory to adopt
CSPT
6. Awareness of CSPT through
Public Exhibitions
influenced/will influence
factory to adopt CSPT
7. Awareness of CSPT through
Advertisements in newspapers
influenced/will influence
factory top adopt CSPT
8. Awareness of CSPT through
Advertisements in magazines
influenced/will influence
factory top adopt CSPT
9. Awareness of CSPT through
Advertisements in electronic
publications influenced
will/influence factory top adopt
CSPT

xxxvii
SECTION E: ORGANIZATION COMPLEXITY
COMPLEXITY STATUS
Indicate the level to which you agree with the following statements on the status of technical
capacity for CSPT adoption in your factory.
1. The current factory
engineers have the
knowledge to manage a
CSPT facility
Strongly
disagree
Disagree Don’t
Know
Agree Strongly
Agree
2. The current factory
engineers have the skills to
install and manage a CSPT
facility
3. There is need for specialized
training on CSPT
installation for engineers
before installation of a
CSPT facility
4. There is need for specialized
training on CSPT operations
for technicians before
installation of a CSPT
facility
5. There is need for specialized
training on CSPT
maintenance for technicians
before installation of a
CSPT facility
6. The current level of
education of the engineers
prepares them well for
CSPT training
7. The current level of
education of the technicians
prepares them well for
CSPT training

xxxviii
COMPLEXITY AND ADOPTION OF CSPT
The following facts relate to approaches that would enhance organization complexity for
CSPT adoption. Kindly respond as to the extent to which each statement would influence a
decision to adopt CSPT by your factory
Rate the technical capacity improvement method that influenced/ would influence your
factory to install CSPT by indicating your level of agreement or disagreement with each of
following statements on a five point Likert scale where 1= Strongly Disagree, 2= Disagree,
3= Don’t Know, 4= Agree and 5= Strongly Agree.
S/No
Technical Capacity Approach
SD D DK A SA
1 2 3 4 5
1. Technical skills training on CSPT through
On-the-job training will influence factory
top adopt CSPT
2. Technical skills training on CSPT through
Overseas training will influence factory
top adopt CSPT
3. Technical skills training on CSPT through
formal education programs will influence
factory top adopt CSPT
4. Technical skills training on CSPT through
informal education programs will
influence factory top adopt CSPT
5. Technical skills training on CSPT through
Networks of Factories with Universities
Research institutions will influence
factory to adopt CSPT
6. Technical skills training on CSPT through
Networks of Factories with Vocational
Education Training Institutions will
influence factory to adopt CSPT

xxxix
7 SECTION F: ACCESS TO FINANCE
The following facts relate to access to finance. Kindly respond as to the extent to which each
statement would influence a decision to adopt CSPT by your factory
Rate the importance of access to finance facts that influenced/ would influence your factory to
install CSPT by indicating your level of agreement or disagreement with each of following
statements on a five point Likert scale where 1= Strongly Disagree, 2= Disagree, 3= Don’t
Know, 4= Agree and 5= Strongly Agree.
S/No
Characteristics
SD D DK A SA
1 2 3 4 5
1. The factory had/has adequate capital reserves for installation
a CSPT facility.
2. The factory had/has adequate credit facilities available that
influenced/will influence installation of a CSPT facility.
3. The cost of credit facilities available for installation of a
CSPT facility were/are low and influenced/will influence the
factory to adopt CSPT.
4. Collateral requirements to guarantee credit were available
and influenced/will influence factory to adopt CSPT.
5. Adequate grant facilities from government available
influenced/will influence factory to adopt CSPT.
6. Adequate grant facilities from development partners
available influenced/will influence factory to adopt CSPT.
7. Subsidies available for installation of a CSPT facility
influenced/will influence factory to adopt CSPT.
8. Tax credits offered for installing a CSPT facility
influenced/will influence factory to adopt CSPT.
9. Availability of venture capital funds for installation of a
CSPT facility influenced/will influence factory to adopt
CSPT.
10. Availability of Public Private Partnerships for installation of
a CSPT facility influenced/will influence factory to adopt
CSPT.
11. Availability of Insurance schemes on investments in CSPT
facility influenced/will influence factory to adopt CSPT.

xl
8 SECTION G: CSPT TECHNOLOGY STANDARDIZATION
The following facts relate to CSPT technology standardization. Kindly respond as to the
extent to which each statement would influence a decision to adopt CSPT by your factory
Rate the importance CSPT products standardization facts that influenced/ would influence
your factory to install a CSPT facility by indicating your level of agreement or
disagreement with each of following statements on a five point Likert scale where 1=
Strongly Disagree, 2= Disagree, 3= Don’t Know, 4= Agree and 5= Strongly Agree.
S/No
Characteristics
SD D DK A SA
1 2 3 4 5
1. The factory management needed/will
need assurance on the quality of the
CSPT equipment.
2. The factory management needed/will
need assurance of standard
installation procedures of the CSPT
equipment.
3. CSPT equipment bearing KEBS
mark of quality for imported goods
(ISM) influenced/will influence the
factory management decision to
install CSPT.
4. CSPT equipment meeting ISO/TC
180 solar energy standard
influenced/will influence the factory
management decision to install
CSPT.
5. CSPT and supplier accredited by
KEREA influenced/will influence the
factory management decision to
install CSPT.

xli
SECTION H: CSPT INSTALLATION FACTORY STATUS
The following facts relate to CSPT adoption status of your factory. Kindly respond to each of
the statements as best as you can.
Rate the CSPT adoption status of your factory in the adoption process stages by indicating
your level of agreement or disagreement with each of following statements on a five point
Likert scale where 1= Strongly Disagree, 2= Disagree, 3= Don’t Know, 4= Agree and 5=
Strongly Agree.
S/No
Characteristics
SD D DK A SA
1 2 3 4 5
1. No effort made in CSPT adoption
process (Prior)
2. The factory management is in
information search stage of CSPT
adoption process
3. The factory management is in
information evaluation stage of CSPT
adoption process
4. The factory management has made a
decision to adopt CSPT technology
5. The factory management has installed
CSPT technology
6. The factory management is now in post
installation evaluation

xlii
APPENDIX III: THE 66 TEA FACTORIES RUN BY KTDA BY REGION
REGION FACTORIES NUMBER
1. Aberdare Ranges I Kambaa, Mataara, Kagwe, Theta, Ngere, Ikumbi,
Ndarugu,Gachege,Njunu, Nduti,Makomboki,Gacharage 12
2. Aberdare Ranges II Githambo, Kanyenyaini, Kiru, Gatunguru, Chinga,
Iriaini, Gitugi, Gathuthi, Ragati 9
3. Mt. Kenya Ndima, Kangaita, Mununga, Kimunye,Thumaita,
Kathangariri, Mungania, Rukuriri 8
4. Mt.Kenya &
Nyambene Hills
Weru, Kinoro, Kionyo, Imenti,
Githongo,Igembe, Michimikuru, Kiegoi 8
5. Kericho Highlands
Toror, Tegat, Momul, Litein, Chelal, Kapkatet,
Mogogosiek, Kobel, Kapset, Rorok, Kapkoros,
Tirgaga.
12
6. Kisii Highlands
Sanganyi, Tombe,Gianchore, Nyansiongo, Kebirigo,
Nyankoba, Rianyamwamu, Itumbe, Nyamache,
Ogembo, Eberege. Kiamokama
12
7. Nandi Hills &
Western Highlands Chebut, Kaptumo, Mudete, Kapsara, Olenguruone 5
http://www.ktdateas.com/index.php/factories-regions/196-kanyenyaini-tea-factory-company-limited.html

xliii
APPENDIX IV: LETTER OF RESEARCH AUTHORIZATION

xliv
APPENDIX V: RESEARCH PERMIT