
A theory of the spatial and temporal dynamics of plant communities
11
Vegetatio 83: 229-239, 1989. © 1989 KluwerAcademic Publishers.Printedin Belgium. 229 The effect of spatial pattern on community dynamics; a comparison of simulated and field data T. Cz/tr~m ~ & S. Bartha 2 1 Department of Plant Taxonomy and Ecology, L. Ertvrs University, Budapest, Kun B. tOr 2, Hungary-1083 ; 2Research Institute of Ecology and Botany, Hungarian Academy of Sciences, V{tcrdttrt, Hungary-2163 Accepted 8.5.1989 Keywords: Dispersal, Local competition, Pattern and process, Species coalition, Succession, Vital attribute Abstract The effect of the spatial limits of dispersal and competition on plant community dynamics was studied using Monte-Carlo simulation. The model generates community point patterns, using life-table data, dispersion parameters and radii of competitive effects. These data have been estimated in a field situation, for the 11 most abundant weed species growing on the refuse soil dumps of a strip coal mine. In a simulation experiment, the patterns produced by two versions of the model were compared. The first was based on the field situation as much as possible; the other used the same input parameters except for dispersal, which was randomized in this case. We found considerable differences regarding the temporal changes of species abundances, the realized competitive abilities and the spatial patterns generated by the two versions. An important conclusion of this comparison is that the realized competitive effect (both intra- and interspecific) of a species is dependent not only on constant competition parameters, but on the abundance relations and on the spatial patterns of the competing populations as well. It is concluded that the spatial limits of dispersal and competition may result in the increased persistence of weak competitors, moderate the realized competitive effects of strong species, and shape the spatial coalition structure of the community. Nomenclature: So6, R. & J~tvorka, S. 1951. A magyar nOvrnyvilfig krzik0nyve I-II. (Manual of the Hungarian flora) Akadrmiai Kiad6, Budapest. Introduction Since the classical paper on pattern and process in the plant community by Watt (1947), many theoretical and field studies have appeared under similar titles. The pair of concepts 'pattern and process' has become an accepted terminus techni- cus in ecology. The term 'pattern' is not always used in a topographical sense. (Occasionally, even physiological 'character sets' are called pat- terns). Watt's original interpretation of the word is strictly topographical and stochastic: he showed that the spatially determined dynamical features like the patch-forming growth of clonal plants, canalize community dynamical processes in an inherently stochastic (statistical) manner.
-
Upload
independent -
Category
Documents
-
view
3 -
download
0
Transcript of A theory of the spatial and temporal dynamics of plant communities

Vegetatio 83: 229-239, 1989. © 1989 Kluwer Academic Publishers. Printed in Belgium. 229
The effect of spatial pattern on community dynamics; a comparison of simulated and field data
T. Cz/tr~m ~ & S. Bartha 2 1 Department of Plant Taxonomy and Ecology, L. Ertvrs University, Budapest, Kun B. tOr 2, Hungary-1083 ; 2Research Institute of Ecology and Botany, Hungarian Academy of Sciences, V{tcrdttrt, Hungary-2163
Accepted 8.5.1989
Keywords: Dispersal, Local competition, Pattern and process, Species coalition, Succession, Vital attribute
Abstract
The effect of the spatial limits of dispersal and competition on plant community dynamics was studied using Monte-Carlo simulation. The model generates community point patterns, using life-table data, dispersion parameters and radii of competitive effects. These data have been estimated in a field situation, for the 11 most abundant weed species growing on the refuse soil dumps of a strip coal mine. In a simulation experiment, the patterns produced by two versions of the model were compared. The first was based on the field situation as much as possible; the other used the same input parameters except for dispersal, which was randomized in this case. We found considerable differences regarding the temporal changes of species abundances, the realized competitive abilities and the spatial patterns generated by the two versions. An important conclusion of this comparison is that the realized competitive effect (both intra- and interspecific) of a species is dependent not only on constant competition parameters, but on the abundance relations and on the spatial patterns of the competing populations as well. It is concluded that the spatial limits of dispersal and competition may result in the increased persistence of weak competitors, moderate the realized competitive effects of strong species, and shape the spatial coalition structure of the community.
Nomenclature: So6, R. & J~tvorka, S. 1951. A magyar nOvrnyvilfig krzik0nyve I-II. (Manual of the Hungarian flora) Akadrmiai Kiad6, Budapest.
Introduction
Since the classical paper on pattern and process in the plant community by Watt (1947), many theoretical and field studies have appeared under similar titles. The pair of concepts 'pattern and process' has become an accepted terminus techni- cus in ecology. The term 'pattern' is not always
used in a topographical sense. (Occasionally, even physiological 'character sets' are called pat- terns). Watt's original interpretation of the word is strictly topographical and stochastic: he showed that the spatially determined dynamical features like the patch-forming growth of clonal plants, canalize community dynamical processes in an inherently stochastic (statistical) manner.
230
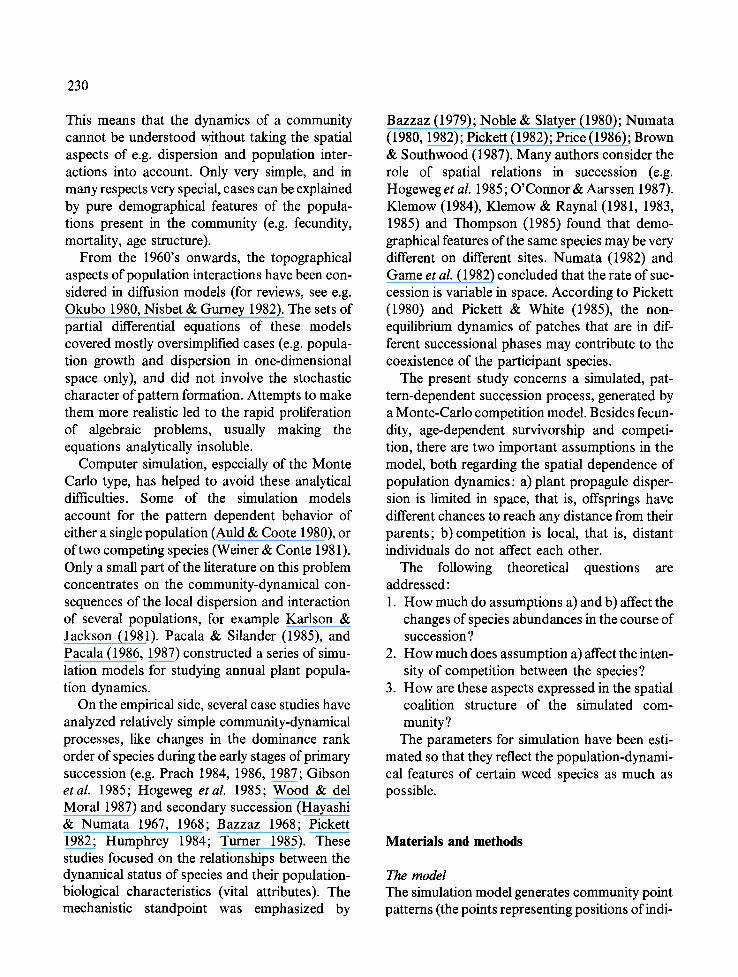
This means that the dynamics of a community cannot be understood without taking the spatial aspects of e.g. dispersion and population inter- actions into account. Only very simple, and in many respects very special, cases can be explained by pure demographical features of the popula- tions present in the community (e.g. fecundity, mortality, age structure).
From the 1960's onwards, the topographical aspects of population interactions have been con- sidered in diffusion models (for reviews, see e.g. Okubo 1980, Nisbet & Gurney 1982). The sets of partial differential equations of these models covered mostly oversimplified cases (e.g. popula- tion growth and dispersion in one-dimensional space only), and did not involve the stochastic character of pattern formation. Attempts to make them more realistic led to the rapid proliferation of algebraic problems, usually making the equations analytically insoluble.
Computer simulation, especially of the Monte Carlo type, has helped to avoid these analytical difficulties. Some of the simulation models account for the pattern dependent behavior of either a single population (Auld & Coote 1980), or of two competing species (Weiner & Conte 1981). Only a small part of the literature on this problem concentrates on the community-dynamical con- sequences of the local dispersion and interaction of several populations, for example Karlson & Jackson (1981). Pacaia & Silander (1985), and Pacala (1986, 1987) constructed a series of simu- lation models for studying annual plant popula- tion dynamics.
On the empirical side, several case studies have analyzed relatively simple community-dynamical processes, like changes in the dominance rank order of species during the early stages of primary succession (e.g. Prach 1984, 1986, 1987; Gibson etaL 1985; Hogeweg etaL 1985; Wood & del Moral 1987) and secondary succession (Hayashi & Numata 1967, 1968; Bazzaz 1968; Pickett 1982; Humphrey 1984; Turner 1985). These studies focused on the relationships between the dynamical status of species and their population- biological characteristics (vital attributes). The mechanistic standpoint was emphasized by
Bazzaz (1979); Noble & Slatyer (1980); Numata (1980, 1982); Pickett (1982); Price (1986); Brown & Southwood (1987). Many authors consider the role of spatial relations in succession (e.g. Hogeweg et al. 1985; O'Connor & Aarssen 1987). Klemow (1984), Klemow & Raynal (1981, 1983, 1985) and Thompson (1985) found that demo- graphical features of the same species may be very different on different sites. Numata (1982) and Game et al. (1982) concluded that the rate of suc- cession is variable in space. According to Pickett (1980) and Pickett & White (1985), the non- equilibrium dynamics of patches that are in dif- ferent successional phases may contribute to the coexistence of the participant species.
The present study concerns a simulated, pat- tern-dependent succession process, generated by a Monte-Carlo competition model. Besides fecun- dity, age-dependent survivorship and competi- tion, there are two important assumptions in the model, both regarding the spatial dependence of population dynamics: a)plant propagule disper- sion is limited in space, that is, offsprings have different chances to reach any distance from their parents; b)competition is local, that is, distant individuals do not affect each other.
The following theoretical questions are addressed: 1. How much do assumptions a) and b) affect the
changes of species abundances in the course of succession?
2. How much does assumption a) affect the inten- sity of competition between the species?
3. How are these aspects expressed in the spatial coalition structure of the simulated com- munity?
The parameters for simulation have been esti- mated so that they reflect the population-dynami- cal features of certain weed species as much as possible.
Materials and methods
The model The simulation model generates community point patterns (the points representing positions ofindi-
viduals) within a rectangular, continuously scaled plot. Time is measured in discrete units (say, generations).
Invasion: The plot is assumed to be invaded by propagules of the potential flora in every genera- tion. I i is the number of the invading seeds of species i. Invasion is represented by a Poisson point process, i.e., the spatial arrangement of the invaders is randomized within the plot. They germinate and grow up to produce offspring.
Survivah The age group structure of the species is considered in the model by specifying the proba- bility Po of the survival of an individual from age group j of species i to t he j + 1 th age group. Pio is set to the value 1.0, that is, only viable propagules are considered, which all germinate for sure if there are no interactions. Competition affects Pio values as described later in this section.
Fecundity and dispersal: ~ is the offspring num- ber of an individual from age group j of species i (age specific fecundities). They disperse around their parents. Two different mechanisms for dis- persal can be considered in the model. In the first one, the distance of dispersion is a random varia- ble of a Gaussian distribution with zero mean; the dispersive potential is represented by the standard deviation ae of the Gaussian, given for each species. This case is referred to as Gaussian in the sequel. In the second kind of simulation, referred to as the Poisson case, offspring positions are independent of the location of their parents, i.e., they are randomly arranged within the plot. The temporal order of seedling recruitment is given by ranks assigned to each species.
Competition: The survival probabilities of the seedlings (P;o values) are supposed to be reduced by the competitive effect of neighbouring indi- viduals. The measure of the reduction of P~o depends on which age group of which species the competitor belongs to, and how far it is situated from the seedling in question. To see this in detail, suppose there is a seedling of species i~ and an individual from age group j of species i2. Let the
231
distance between them be d. Let further An,i2,j be the radius of the competitive action of an indi- vidual from age group j of species i 2 upon a seedling of species i r If dis greater then this value, no competitive effect is exerted on the seedling by that individual. I fd < Ai,,ez,j, then the probability of survival for the seedling is
P = d/Ai,,i2, J.
If there are other competitors in the neighborhood of the seedling, their effects are multiplicative. If j = 0, that is, if the competitor is another seedling, the competitive effect is bilateral, but the same rules apply otherwise.
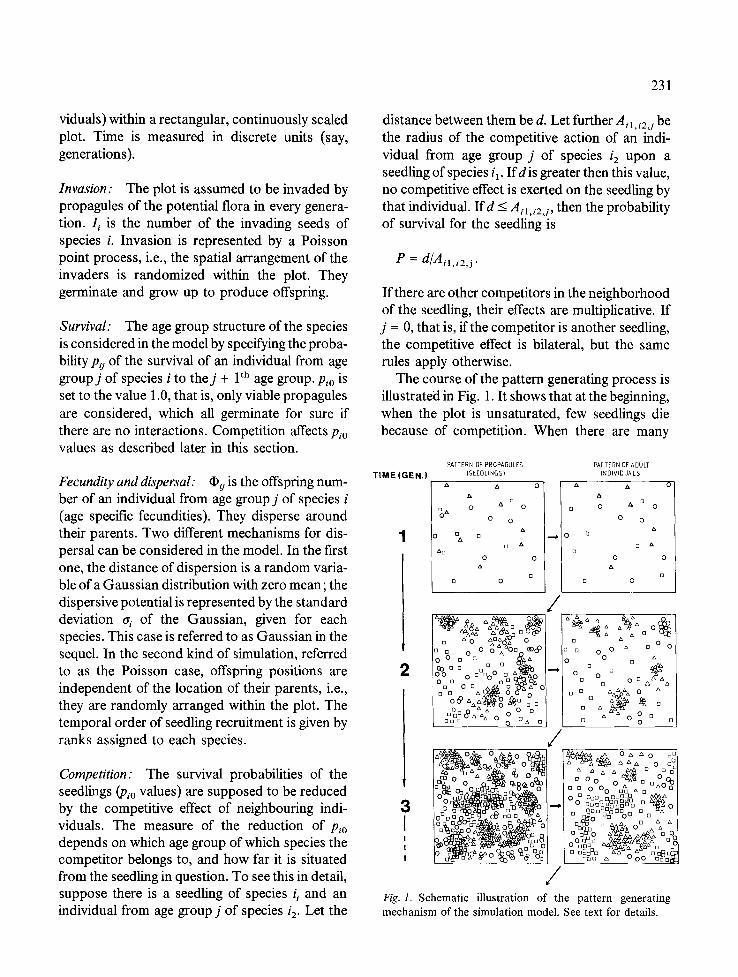
The course of the pattern generating process is illustrated in Fig. 1. It shows that at the beginning, when the plot is unsaturated, few seedlings die because of competition. When there are many
T I M E ( G E N . )
2
3 I I t
I
PATTERN OF PROPAOULES PATTERN OF ADULT (SEEDLINGS) INOIVIDUALS
o o 0 & 0
o o
~o o o
o o o
[]
0
/
g o o O o~o,
,;°~ o~ o ~!o ,°o oo OoOo%
ooo o a o
/
p o o L ' ~ %~o% ° o ~ o~ ° _ - - - , ~ ° ~ : & o o , . - - ~ . '
o o DO
Oz~ 0
) ~ o o 8
~orfoN~s~ 1 /
0 & o 0
o o z~
o
o
o o zx
[] o o
~ , ~ ~ oK,~
0 0 0 ~ o 0 0
0 [] o o ~
0 o 0 O°& Z~
o ~F~%
tx n n z~ D r
a 0 0 O ~ o o000 o [] 0 n 60
0 0 oo ~o 0
o ooo~o~oo o ~ o Ooo Oooo o ~
o o o o [] ~Dc~ 0 o 0
OoO 0 ~.'~, o O
IO%°o°o ~ - ~ oo8oq: uSo 6 u O 0 a-~o
Fig. 1. Schematic illustration of the pattern generating mechanism of the simulation model. See text for details.
232
seedlings, close to each other and to adult com- petitors, only a smaller proportion survives. Monospecific aggregates (patches) are the results of small dispersal values (a-s).
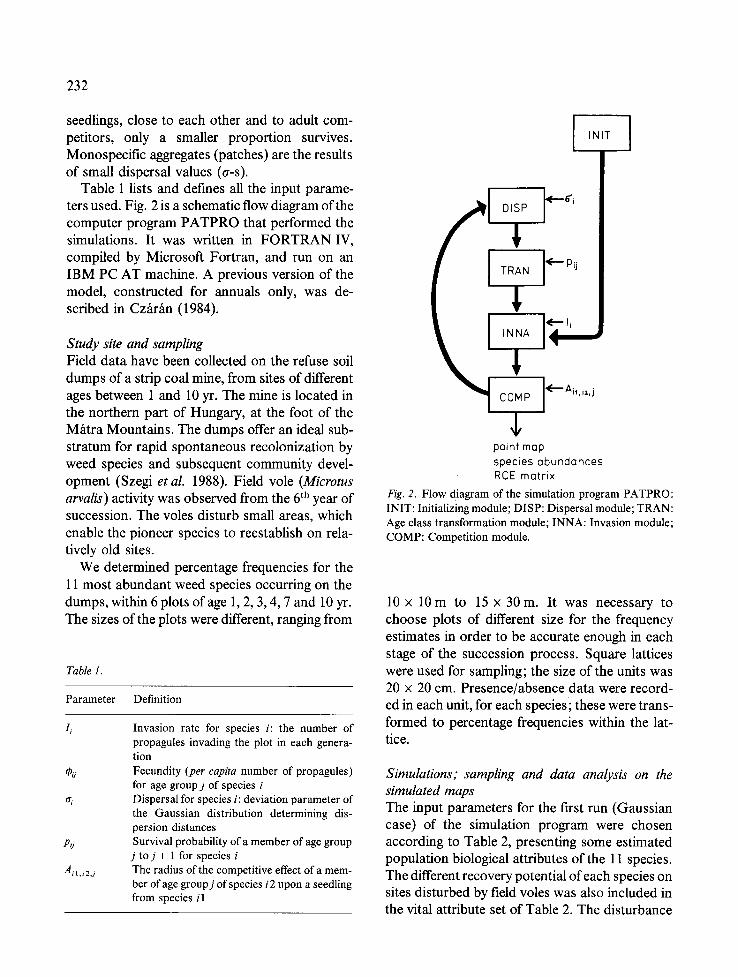
Table 1 lists and defines all the input parame- ters used. Fig. 2 is a schematic flow diagram of the computer program PATPRO that performed the simulations. It was written in FORTRAN IV, compiled by Microsoft Fortran, and run on an IBM PC AT machine. A previous version of the model, constructed for annuals only, was de- scribed in Cz~tr~n (1984).
Study site and sampling Field data have been collected on the refuse soil dumps of a strip coal mine, from sites of different ages between 1 and 10 yr. The mine is located in the northern part of Hungary, at the foot of the M~ttra Mountains. The dumps offer an ideal sub- stratum for rapid spontaneous recolonization by weed species and subsequent community devel- opment (Szegi etal. 1988). Field vole (Microtus arvalis) activity was observed from the 6 th year of succession. The voles disturb small areas, which enable the pioneer species to reestablish on rela- tively old sites.
We determined percentage frequencies for the 11 most abundant weed species occurring on the dumps, within 6 plots of age 1, 2, 3, 4, 7 and 10 yr. The sizes of the plots were different, ranging from
Table 1.
Parameter Definition
I,
P,7
Ail.i2,j
Invasion rate for species i: the number of propagules invading the plot in each genera- tion Fecundity (per capita number of propagules) for age group j of species i Dispersal for species i: deviation parameter of the Gaussian distribution determining dis- persion distances Survival probability of a member of age group
j to j + 1 for species i The radius of the competitive effect of a mem- ber of age groupj of species i2 upon a seedling from species il
INIT
DISP I TRAN~, 1<'" Pij I
CO~MP I Ail'i2'J $
point map species abundances RCE metrix Fig. 2. Flow diagram of the simulation program PATPRO: INIT: Initializing module; DISP: Dispersal module; TRAN: Age class transformation module; INNA: Invasion module; COMP: Competition module.
lOx lOm to 1 5 x 3 0 m . It was necessary to choose plots of different size for the frequency estimates in order to be accurate enough in each stage of the succession process. Square lattices were used for sampling; the size of the units was 20 x 20 cm. Presence/absence data were record- ed in each unit, for each species; these were trans- formed to percentage frequencies within the lat- tice.
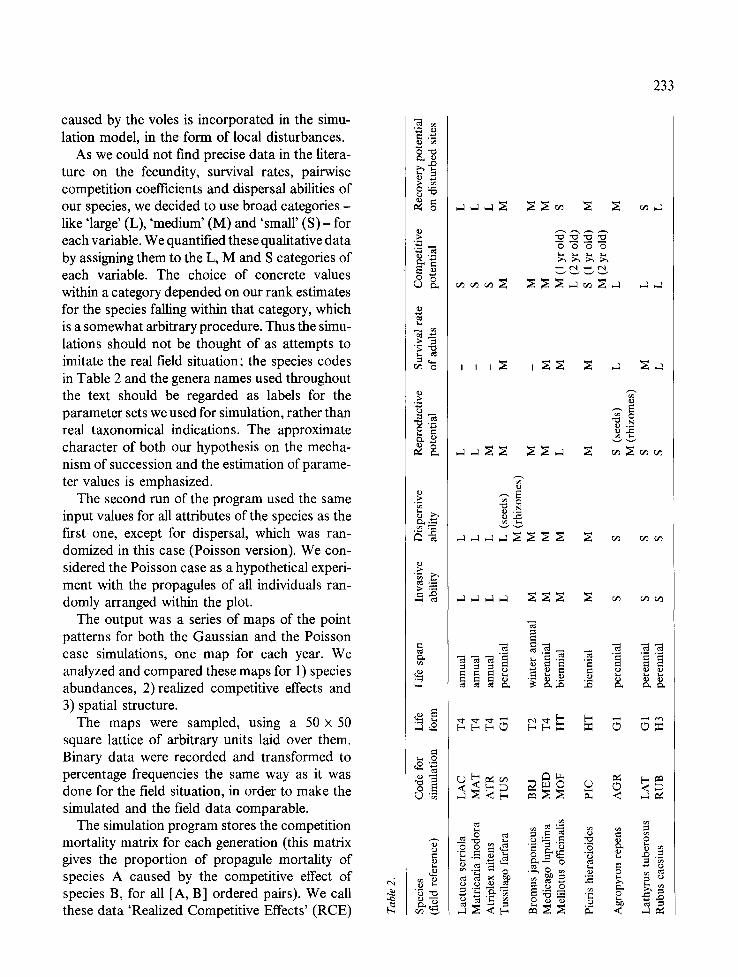
Simulations; sampling and data analysis on the simulated maps The input parameters for the first run (Gaussian case) of the simulation program were chosen according to Table 2, presenting some estimated population biological attributes of the 11 species. The different recovery potential of each species on sites disturbed by field voles was also included in the vital attribute set of Table 2. The disturbance
caused by the voles is incorporated in the simu- lation model, in the form of local disturbances.
As we could not find precise data in the litera- ture on the fecundity, survival rates, pairwise competition coefficients and dispersal abilities of our species, we decided to use broad categories - like 'large' (L), 'medium' (M) and 'small' (S) - for each variable. We quantified these qualitative data by assigning them to the L, M and S categories of each variable. The choice of concrete values within a category depended on our rank estimates for the species falling within that category, which is a somewhat arbitrary procedure. Thus the simu- lations should not be thought of as attempts to imitate the real field situation; the species codes in Table 2 and the genera names used throughout the text should be regarded as labels for the parameter sets we used for simulation, rather than real taxonomical indications. The approximate character of both our hypothesis on the mecha- nism of succession and the estimation of parame- ter values is emphasized.
The second run of the program used the same input values for all attributes of the species as the first one, except for dispersal, which was ran- domized in this case (Poisson version). We con- sidered the Poisson case as a hypothetical experi- ment with the propagules of all individuals ran- domly arranged within the plot.
The output was a series of maps of the point patterns for both the Gaussian and the Poisson case simulations, one map for each year. We analyzed and compared these maps for 1) species abundances, 2)realized competitive effects and 3) spatial structure.
The maps were sampled, using a 50 × 50 square lattice of arbitrary units laid over them. Binary data were recorded and transformed to percentage frequencies the same way as it was done for the field situation, in order to make the simulated and the field data comparable.
The simulation program stores the competition mortality matrix for each generation (this matrix gives the proportion of propagule mortality of species A caused by the competitive effect of species B, for all [A, B] ordered pairs). We call these data 'Realized Competitive Effects' (RCE)
~4
~ o
. ,~
"~. "0
r~ 0
0
0 0 0 0
233
o
e~

234
in the sequel. Average RCE-s were calculated for all species, according to the proportion of total seedling mortality attributable to each of them.
To analyze the spatial relations of the 11 species, each map was sampled once more with the program ELSAM2 (Podani 1988). This sampling process was different from the one per- formed on the same maps using a square lattice, because in ELSAM2 the sampling units are posi- tioned at random. Binary (presence/absence) data were recorded from 500 square units placed on the maps of each generation (year), for both runs. In order to get dynamically interpretable results, we chose the length of the edges of the sampling units so that it matched the average of the radii of competition, A;1,i2, j - s. Chi-square values were calculated for each pair of species (see e.g. Greig-Smith 1983, Kershaw & Looney 1983). Associations exceeding the significance levels of P < 0.01 and P < 0.001 were accepted as signifi-
cant (McIntosh 1973). Both positive and negative associations were visualized on plexus graphs.
Results and discussion
Neighbourhood effects and species abundances
The Gaussian simulation produced results quite similar to the field case regarding abundance trajectories, but the Poisson version differed markedly (Fig. 3). However, in the first 2 -3 generations the abundance rank order of the species is the same for the Gaussian and the Poisson case, suggesting that spatial aspects do not much affect the initial dynamics of the com- munity. This period is dominated by annuals with high dispersal and fecundity values, and weak competitive abilities ( Lactuca, Matricaria, A triplex ) which may be regarded as r-strategists.
100"
9 0 "
80
70
60
50"
t,O-
30"
20"
10"
70
60
>_ 50
"~ 20
10 ¸
90 '
B0
70'
60,
50'
~0-
30-
20-
10"
0 :
FIELD DATA
[] LAE + MAT 0 ATR A TUS
10
. . . . . . . . . . 0 .~ _
/ / % , ~o Q BRJ 18
0 MO 1¢ 12 10
D pie 2 c, + ADR 22 0 LAT
. . . . . . . . O~ 2 ~ 6 8 10 0
0AUSSIAN CASE
28 26 [] LAC 2~ ' + MAT 22 1 ¢ ATR 2oi ATUS
16
n BRJ + tiED
n PIC / + AGR /
2 /, 6 8 10
POISSON CASE
30i 28 26 [] LAC 2t* + MAT 22 O ATR
14 12 10
i i 0 _-=---~, , . -~ . . . . . $
'if 2O 18 D BRJ 16 + MED It, O MOF 12 10
Om C ~ • , ~ ~ 2 ~ 28 26 ¢ . , . 2~ r l P I C / ~ 22 + AGR / 20 0 LAT
/
16
12 10
g
6
2 0 . . . . . . . . .
0 2 z, 6 8 10
YEARS GENERATIONS GENERATIONS
Fig. 3. Temporal changes of abundance for 11 species - data for the field reference and the two simulated cases.

From the third generation onwards, as the site becomes saturated, and the importance of com- petitive interactions increases, the structuring (patch forming) effect of limited propagule dis- persion and neighbourhood-competition is mani- fested in the abundance relations. In the field case and the Gaussian simulation, this period is domi- nated by more competitive species; interaction is the decisive dynamical feature, strongly affected by spatial limitations. As a result of randomized propagule dispersion, some weak species like Lactuca and Matricaria, become abundant on dis- turbed sites to the end of simulation, but Bromus, not able to re-establish itself quickly enough, can- not perform as well as it could in the Gaussian case. Medicago and Melilotus, subordinated but persistent in the Gaussian version, go extinct by the eight generation of the Poisson case. Picris and Lathyrus, both present with many individuals in the Gaussian version, become sparse. The strong competitor Agropyron is not too much affected, except that another strong species, Tussilago occu- pies part of its 'territory', which it could not do in the Gaussian case.
Pattern and the intensity of competition The difference in the abundance relations of the species between the two simulated cases is a result of changing the mode of propagule dispersion. Although the competition parameters did not dif- fer in the two runs, the RCE values of the species were very different (Fig. 4). RCE is dependent not only on the pre-defined competition parameters, but on the abundance relations and, most impor- tantly, on the spatial patterns of the competing populations as well.
Thus, species with small dispersal values (weak dispersers) suffer the most from intraspecific competition in the Gaussian simulation version. But eliminating the structuring effect of limited dispersion (in the Poisson case) results in dif- ferent dynamical consequences for strong com- petitors and for weak ones. For example, for Agropyron, and aggregating competitor (small dis- persal, large radii of competition) realized intra- specific competition decreases when dispersal is randomized, and the interspecific effect increases
235
against all other species. Melilotus, a somewhat weaker species, with an intermediate dispersive potential, did not change its RCE against any of the species, including itself. The same seems to apply to Laetuca, a weak competitor and good disperser species, despite the fact that its temporal abundance trajectories are very different in the two simulations. Tussilago is an aggregating species (tr i small), quite a strong competitor, and it has relatively great fecundity. Thus it can exclude the dominant species of the initial period of succession. In the Poisson case, it beats Bromus as well, and becomes the second most abundant species. As Bromus is suppressed, its realized competitive ability is reduced against all species. Picris is associated to and protected by Agropyron clumps, but since in the Poisson version no Agropyron patches appear, in the absence of refuges it goes extinct in generation 7.
More generally, random propagule dispersion makes strong competitors even stronger, and weak ones weaker, which in turn tends to reduce the diversity of the community (Fig. 5). In other words, aggregation contributes to the coexistence of species within the community by increasing the intensity of intraspecific and decreasing that of interspecific competition.
Spatial associations According to our own field experience and the population biological features of the 11 species, the emergence of the following coalitions can be expected: 1. The group of the first colonizers (Lactuca,
Matricaria, Atriplex, Tussilago); each of these species are characterized by good invasive and dispersive abilities (large I i and a,. values), short life span, large reproductive potential. With the exception of Tussilago, they are weak com- petitors.
2. The second coalition of stronger competitors, with more limited invasive and dispersive potential, longer life span and smaller fecun- dity (Bromus, Medicago, Melilotus). They appear abundant in the middle of the suc- cession gradient, and are outcompeted later.
3. The third group consists mostly of strong

>.- t-.-- _..I
or" 0
236
0,2
0,1 N
LAC HAT ATR TUS BRJ HOD HOF
0,3
0,2
0,1
0 , ,r-+_F;t__ i i i i
LAC HAT ATR TUS BRJ MOO HOF PIC
0,9-
0,8-
0,7-
0,6-
0,5-
0,~-
0,3-
0,2-
0,1-
0 ~,-~ ~ ~ ~ r,-A~
LAC HAT ATR TUS BRJ HOD HOF PI[ AGR
0,7 -
0,6-
O,S-
0,(,
0,3
0,2
0,I
0
MOF I 1 0,9
.. . . . . , ' r ~ t~7~ 0,8 PIC AI]R LAT RUB 0,7
0,6- PIC
0,5-
0,~.-
0 ,3-
0 ,2 - , A~R LAT RUB
0,I
RUB
0,9 I
0,8R 0 , 7 -
0 , 6 -
0 , 5 -
0 , 4 -
0 , 3 - LAT RUB
0,2
0,1
LAC
/•/ LAT
Z / /
Z
LAT R'UB
,
HAT
LAC HAT
f i J i
ATR TUS BRJ NOD MOF
TUS
i i i
PIC AGR LAT RUB
0,3
0,2
0,1
0 LAC
A(iR
i i i
ATR TUS BRJ HOD MOF PIE AGR LAT RUB
BRJ
,o LAC HAT ATR TUS BRJ I"101] HOF PIC A R HAT ATR TUS BRJ HOD HOF PIC AGR LAT
F77--,71 (]aussJancase ~ Poissan case I ~ Gaussian case I ~ Poisson case
i
RUB
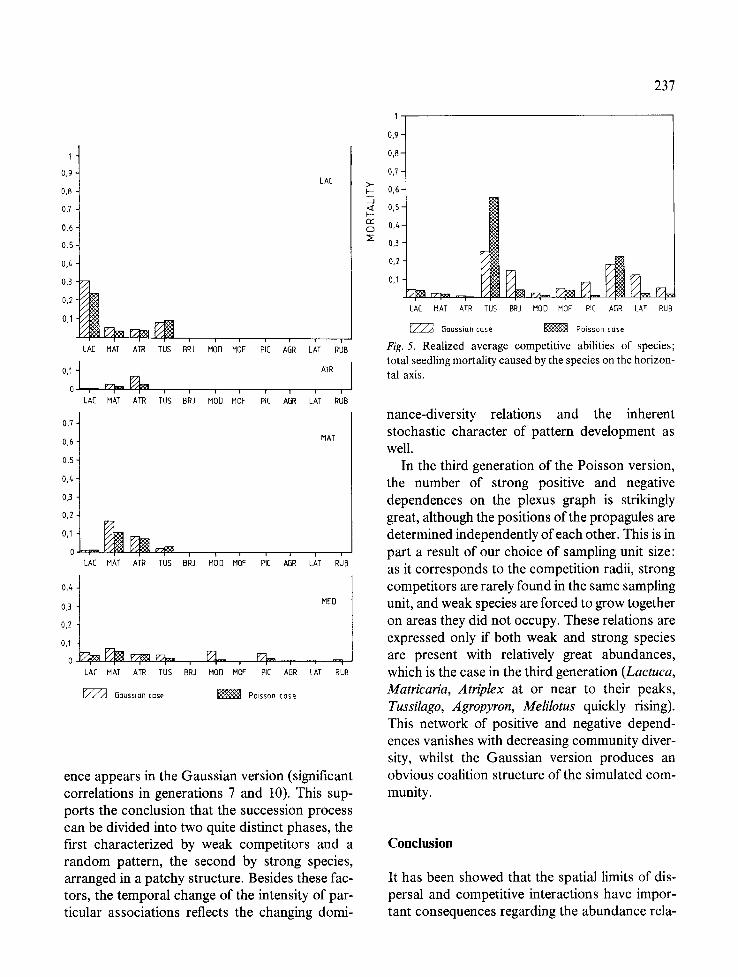
Fig. 4. Realized competitive relations of species; codes on the horizontal axes represent the species undergoing the competitive effect from the species indicated in the upper right corner of diagrams. Mortality ratios for the Gaussian and Poisson cases on the vertical axis.
perennial species (Agropyron, Picris, Lathyrus, Rubus), dominating the last generations. They invade by relatively small numbers of seeds, and gain territories by vegetative propagation mostly.
These coalitions differ regarding their recovery potential on sites disturbed by field voles as well: the pioneer species (as r-strategists) perform the
best; the perennials are the worst in this respect. The pairwise dependance relations found for
the two runs are shown on the plexus graphs of Fig. 6. There are no detectable associations in the first generations of either the Gaussian, or the Poisson case. Both produce fragments of the expected coalitions in the third generation. These structures collapse later in the Poisson case, whilst a weak trend of increasing spatial depend-
I '
0,9.
0,8
0,7
0,6
0,5.
0,t,
0,3
0,2'
0,1
i i i i
LA[ HAT AIR TUS BR]
0,1 i
0 , ~ ~ I I I i
LAC MAT ATR TUS BRJ
0,7-
0,6
0,5
0,4-
03
0,2
0 ~ ~ , I
LAC HAT ATR TUS BRJ
0,4 ~
0,3
0,2
0,1
0 i i i i i
LA[ HAT ATR Tug BRJ
I ~ Gaussiall case
LAC
I I i / i I
MaD MOF PIC A(]R LAT RUB
A'rR
i i i i | w
HOD MOF PIE AGR LAT RUB
MAT
J i l I i
HOD MOF PIC A6R LAT RUB
MED
r T ~ O F J i i I
HOD M PIC AGR LAT RUB
Poisson case
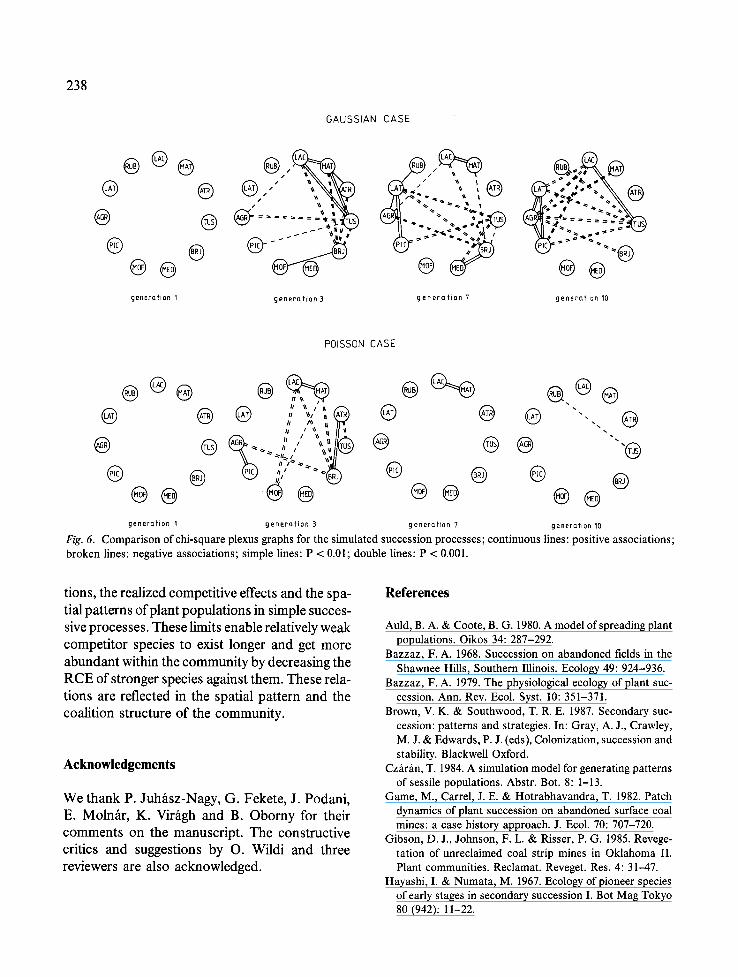
ence appears in the Gaussian version (significant correlations in generations 7 and 10). This sup- ports the conclusion that the succession process can be divided into two quite distinct phases, the first characterized by weak competitors and a random pattern, the second by strong species, arranged in a patchy structure. Besides these fac- tors, the temporal change of the intensity of par- ticular associations reflects the changing domi-
-q
:E
237
0,9
0,6-
0,7-
0,6-
0,5-
0,4-
0,3-
0,2-
0,1
LA[ MAT ATR TUS BRJ MOO MOF PI[ AGfl LAT RUB
Gaussiancase ~ Poisson case
Fig. 5. Realized average competitive abilities of species; total seedling mortality caused by the species on the horizon- tal axis.
nance-diversity relations and the inherent stochastic character of pattern development as well.
In the third generation of the Poisson version, the number of strong positive and negative dependences on the plexus graph is strikingly great, although the positions of the propagules are determined independently of each other. This is in part a result of our choice of sampling unit size: as it corresponds to the competition radii, strong competitors are rarely found in the same sampling unit, and weak species are forced to grow together on areas they did not occupy. These relations are expressed only if both weak and strong species are present with relatively great abundances, which is the case in the third generation (Lactuca, Matricaria, Atriplex at or near to their peaks, Tussilago, Agropyron, Melilotus quickly rising). This network of positive and negative depend- ences vanishes with decreasing community diver- sity, whilst the Gaussian version produces an obvious coalition structure of the simulated com- munity.
Conclusion
It has been showed that the spatial limits of dis- persal and competitive interactions have impor- tant consequences regarding the abundance rela-
238
GAUSSIAN CASE
@ ®
@ @
® ® @ ®
@ @@ generation 1 generation 3
e
generat ion 7
@@ generation 10
POISSON CASE
@ ® ® : ",,,,~,~ @ @ @ II I I "~'~\. ~ e ,,, , , ~ @ @ @
@ @ ~,' ---.- @ @ @ @ ® ~®@ @ ® generation 1 generation 3 generation 7
@.®@ - .
-@
@ @@ generation 10
Fig. 6. Comparison of chi-square plexus graphs for the simulated succession processes; continuous lines: positive associations; broken lines: negative associations; simple lines: P < 0.01; double lines: P < 0.001.
tions, the realized competitive effects and the spa- tial patterns of plant populations in simple succes- sive processes. These limits enable relatively weak competitor species to exist longer and get more abundant within the community by decreasing the RCE of stronger species against them. These rela- tions are reflected in the spatial pattern and the coalition structure of the community.
Acknowledgements
We thank P. Juh~tsz-Nagy, G. Fekete, J. Podani, E. MolnAr, K. Virfigh and B. Obomy for their comments on the manuscript. The constructive critics and suggestions by O. Wildi and three reviewers are also acknowledged.
References
Auld, B. A. & Coote, B. G. 1980. A model of spreading plant populations. Oikos 34: 287-292.
Bazzaz, F. A. 1968. Succession on abandoned fields in the Shawnee Hills, Southern Illinois. Ecology 49: 924-936.
Bazzaz, F. A. 1979. The physiological ecology of plant suc- cession. Ann. Rev. Ecol. Syst. 10: 351-371.
Brown, V. K. & Southwood, T. R. E. 1987. Secondary suc- cession: patterns and strategies. In: Gray, A. J., Crawley, M. J. & Edwards, P. J. (eds), Colonization, succession and stability. Blackwell Oxford.
Czfir~n, T. 1984. A simulation model for generating patterns of sessile populations. Abstr. Bot. 8: 1-13.
Game, M., Carrel, J. E. & Hotrabhavandra, T. 1982. Patch dynamics of plant succession on abandoned surface coal mines: a case history approach. J. Ecol. 70: 707-720.
Gibson, D. J., Johnson, F. L. & Risser, P. G. 1985. Revege- tation of unreclaimed coal strip mines in Oklahoma II. Plant communities. Reclamat. Reveget. Res. 4: 31--47.
Hayashi, I. & Numata, M. 1967. Ecology of pioneer species of early stages in secondary succession I. Bot Mag Tokyo 80 (942): 11-22.
Hayashi, I. & Numata, M. 1968. Ecology of pioneer species of early stages in secondary succession II. The seed pro- duction. Bot Mag Tokyo 81 (956): 55-66.
Hogeweg, P., Hesper, B., van Schaik, C. P. & Beeftink, W. G. 1985. Patterns in vegetation succession, an ecomorpho- logical study. In: White, J. (ed.), The population structure of vegetation. Junk, Dordrecht.
Humphrey D.L. 1984. Pattern and mechanisms of plant succession after fire on Artemisia-grass sites in South- eastern Idahoo. Vegetatio 57: 91-101.
Karlson, R. H. & Jackson, J. B. C. 1981. Competitive net- works and community structure: a simulation study. Ecology 62: 670-678.
Kershaw, K. & Looney, J. H. H. 1983. Quantitative and dynamic plant ecology, 3rd, ed. Edward Arnold, London.
Klenow, K. M. 1984. Plant community development in an abandoned limestone quarry; a demographic assessment. In: Veziroglu, T. N. (ed.). The biosphere: problems and solutions. Elsevier Science Publishers B. V., Amsterdam.
Klenow, K. M. & Raynal, D. J. 1981. Population ecology of Melilotus alba in a limestone quarry. J. Ecol. 69: 33-44.
Klenow, K. M. & Raynal, D. J. 1983. Population biology of an annual plant in a temporally variable habitat. J. Ecol. 71: 691-703.
Klenow, K. M. & Raynal, D.J. 1985. Demography of two facultative biennial plant species in an unproductive habitat. J. Ecol. 73: 147-167.
McIntosh, R.P. 1973. Matrix and plexus techniques. In: Whittaker, R.H. (ed.), Ordination and classification of communities. Junk, The Hague.
Nisbet, R. M. & Gurney, W. S. C. 1982. Modelling fluctuat- ing populations. Wiley, NY.
Noble, I. R. & Slatyer, R, O. 1980. The use of vital attributes to predict successional changes in plant communities sub- ject to recurrent disturbance. Vegetatio 43: 5-21.
Numata, M. 1980. Facts, causal analyses and theoretical considerations on plant succession. In: Miyawaki, A. & Okuda, S. (eds), Vegetation und Landschaft Japans. Festschrift fiir Prof. Dr. R. Tuxen, Yokohama.
Numata, M. 1982. Experimental studies on the early stages of secondary succession. Vegetatio 48: 141-149.
O'Connor, I. & Aarssen, L.W. 1987. Species association patterns in abandoned sand quarries. Vegetatio 73: 101-109.
Okubo, A. 1980. Diffusion and ecological problems: mathe- matical models. Biomathematics, Vol. 10.
Pacala, S.W. 1986. Neighborhood models of plant popula- tion dynamics 2. Multispecies models of annuals. Theor. Pop. Biol. 29 (2): 262-292.
239
Pacala, S. W. 1987. Neighborhood models of plant popula- tion dynamics 3. Models with spatial heterogeneity in the physical environment. Theor. Popul. Biol. 31 (3): 359-392.
Pacala, S.W. & Silander, J.A. Jr. 1985. Neighborhood models of plant population dynamics I. Single-species models of annuals. Am. Nat. 125: 385-411.
Pickett, S. T. A. 1980. Non-equilibrium coexistence of plants. Bull. Torrey Bot. Club 107: 238-248.
Pickett, S. T. A. 1982. Population patterns through twenty years of oldfield succession. Vegetatio 49: 45-59.
Pickett, S. T. A. & White, P. S. (eds) 1985. The ecology of natural disturbance and patch dynamics. Acad. Press, NY.
Podani, J. 1988. SYN-TAX III. A package of programs for data analysis in ecology and systematics. Coenoses 3.
Prach, K. 1984. Selected results of the study of succession on dumps from brown coal mining (most Region, N.W. Bohemia). Acta Bot. Slov. Acad. Sci. Slov., Ser. A., Suppl. 1,257-261.
Prach, K. 1986. Colonization of dumps from coal mining by higher plants. Ecologia, Bratislava, 5: 421-424.
Prach, K. 1987. Succession of vegetation on dumps from strip coal mining, N.W. Bohemia, Czechoslovakia. Folia Geobot. Phytotax. 22: 339-354.
Price, M. V. 1986. Introduction to the symposium: mechanis- tic approach to the study of natural communities. Amer. Zool. 26: 3-4.
Szegi, J., Ol~th, J., Fekete, G., Hal~tsz, T., V~rallyay.Gy. & Bartha, S. 1988. Recultivation of the spoil banks created by open-cut mining activities in Hungary. Ambio 17 (2): 137-143.
Thompson, J.N. 1985. Within-patch dynamics of life his- tories, populations, and interactions: selection over time in small spaces. In: Pickett, S. T. A. & White, P. S. (eds) 1985. The ecology of natural disturbance and patch dynamics. Acad. Press, New York.
Turner, D. P. 1985. Successional relationships and a com- parison of biological characteristics among six north- western conifers. Bull. Torrey Bot. Club 112 (4): 421-428.
Watt, A. S. 1947. Pattern and process in the plant com- munity. J. Ecol. 35: 1-22.
Weiner, J. & Conte, P. T. 1981. Dispersal and neighbourhood effects in an annual plant competition model. Ecol. Modelling 13: 131-147.
Wood, D. M. & del Moral, R. 1987. Mechanisms of early primary succession in subalpine habitats on Mount St. Helens. Ecology 68: 780-790.