A texton-based approach for the classification of lung parenchyma in CT images
8
A Texton-Based Approach for the Classification of Lung Parenchyma in CT Images Mehrdad J. Gangeh 1 , Lauge Sørensen 2 , Saher B. Shaker 3 , Mohamed S. Kamel 1 , Marleen de Bruijne 2, 4 , and Marco Loog 5 1 Department of Electrical and Computer Engineering, University of Waterloo, Canada, {mgangeh, mkamel}@pami.uwaterloo.ca 2 Department of Computer Science, University of Copenhagen, Denmark, {lauges, marleen}@diku.dk 3 Department of Respiratory Medicine, Gentofte University Hospital, Hellerup, Denmark 4 Biomedical Imaging Group Rotterdam, Erasmus MC, the Netherlands 5 Pattern Recognition Laboratory, Delft University of Technology, the Netherlands [email protected] Abstract. In this paper, a texton-based classification system based on raw pixel representation along with a support vector machine with radial basis function kernel is proposed for the classification of emphysema in computed tomography images of the lung. The proposed approach is tested on 168 annotated regions of interest consisting of normal tissue, centrilobular emphysema, and paraseptal emphysema. The results show the superiority of the proposed approach to common techniques in the literature including moments of the histogram of filter responses based on Gaussian derivatives. The performance of the proposed system, with an accuracy of 96.43%, also slightly improves over a recently proposed approach based on local binary patterns. 1 Introduction Computerized quantitative analysis in pulmonary computed tomography (CT) images is a vital tool in the analysis of chronic obstructive pulmonary disease (COPD). The disease is projected to become the fifth most burdening disease worldwide by 2020 [1]. COPD is a chronic lung disease characterized by limitation of airflow, and it comprises two components: small airway disease and emphysema, which is characterized by gradual loss of lung tissue. Current methods for the diagnosis and quantification of COPD suffer from several limitations. Common computerized methods on CT images do not use all the information available in a CT image. For example, the relative area of emphysema below a threshold (RA) [2] considers only independent pixel intensity values and relies on a hand-picked parameter, the threshold. The primary diagnostic tool for COPD is spirometry by which various pulmonary function tests (PFTs) are performed [1]. These are cheap and fast to acquire, but they have a low sensitivity to early stages of COPD. This work focuses on improving the assessment of emphysema in CT images. Emphysema lesions, or bullae, are visible in CT images as areas of abnormally low
Transcript of A texton-based approach for the classification of lung parenchyma in CT images

A Texton-Based Approach for the Classification of
Lung Parenchyma in CT Images
Mehrdad J. Gangeh1, Lauge Sørensen2, Saher B. Shaker
3,
Mohamed S. Kamel1, Marleen de Bruijne2, 4, and Marco Loog
5
1 Department of Electrical and Computer Engineering, University of Waterloo, Canada,
{mgangeh, mkamel}@pami.uwaterloo.ca 2 Department of Computer Science, University of Copenhagen, Denmark,
{lauges, marleen}@diku.dk 3 Department of Respiratory Medicine, Gentofte University Hospital, Hellerup, Denmark
4 Biomedical Imaging Group Rotterdam, Erasmus MC, the Netherlands 5 Pattern Recognition Laboratory, Delft University of Technology, the Netherlands
Abstract. In this paper, a texton-based classification system based on raw pixel
representation along with a support vector machine with radial basis function
kernel is proposed for the classification of emphysema in computed
tomography images of the lung. The proposed approach is tested on 168
annotated regions of interest consisting of normal tissue, centrilobular
emphysema, and paraseptal emphysema. The results show the superiority of the
proposed approach to common techniques in the literature including moments
of the histogram of filter responses based on Gaussian derivatives. The
performance of the proposed system, with an accuracy of 96.43%, also slightly
improves over a recently proposed approach based on local binary patterns.
1 Introduction
Computerized quantitative analysis in pulmonary computed tomography (CT) images
is a vital tool in the analysis of chronic obstructive pulmonary disease (COPD). The
disease is projected to become the fifth most burdening disease worldwide by 2020
[1]. COPD is a chronic lung disease characterized by limitation of airflow, and it
comprises two components: small airway disease and emphysema, which is
characterized by gradual loss of lung tissue.
Current methods for the diagnosis and quantification of COPD suffer from several
limitations. Common computerized methods on CT images do not use all the
information available in a CT image. For example, the relative area of emphysema
below a threshold (RA) [2] considers only independent pixel intensity values and
relies on a hand-picked parameter, the threshold. The primary diagnostic tool for
COPD is spirometry by which various pulmonary function tests (PFTs) are performed
[1]. These are cheap and fast to acquire, but they have a low sensitivity to early stages
of COPD.
This work focuses on improving the assessment of emphysema in CT images.
Emphysema lesions, or bullae, are visible in CT images as areas of abnormally low
attenuation values close to that of air, and it is often classified into three subtypes [3].
These subtypes are the following: centrilobular emphysema (CLE), defined as
multiple small low-attenuation areas; paraseptal emphysema (PSE), defined as
multiple low-attenuation areas in a single layer along the pleura often surrounded by
interlobular septa that is visible as thin white walls; and panlobular emphysema
(PLE), defined as a low-attenuation lung with fewer and smaller pulmonary vessels.
As the texture of lung tissue is affected by the type of disease, texture analysis can
be used for quantitative assessment of different subtypes of emphysema. Classifying
emphysema in CT images of the lung using texture features was first introduced in
[4]. Since then, various features have been used for the classification of emphysema
and other disorders in lung CT images including moments of histograms computed on
the outputs of filter banks consisting of Gaussian derivatives [5], measures on gray-
level co-occurrence matrices (GLCM), measures on gray-level run-length matrices
(GLRLM), and moments of the attenuation histogram [4, 6, 7].
Recently, it was shown that small-sized local operators like local binary patterns
(LBP) [8] and the patch representation of small local neighborhood in texton-based
approaches [9] yield excellent texture classification performance on standard texture
databases. It should be noted here that small-sized local operators are desirable in
situations where the region of interest (ROI) is rather small, which is often the case in
texture analysis in medical imaging, where pathology can be localized in small areas.
This is because of two reasons: first, convolution with large support filter banks
suffers from boundary effects; second, more patches can be extracted using small-
sized local operators that makes the estimation of image statistics more reliable [9].
In this paper, we propose to use small patch representation in texton-based
approaches along with support vector machines (SVMs) for the classification of
emphysema in CT images of the lung. To our knowledge, this technique has never
been used for the classification of CT lung images.
The effectiveness of small-sized local operators in medical imaging is shown in
[10] using LBP texture features and k-NN classifier with similar results to filter bank
approaches based on Gaussian derivatives. In this work, we also show that texton-
based approaches using a SVM with radial basis function (RBF) kernel produces
better results than common filter bank approaches and slightly better results than
LBP, which can be considered as the state of the art in emphysema classification [10].
2 Texton-Based Texture Classification
In this section, the principle of texton-based texture classification is reviewed [9, 11,
12]. This approach is independent of the representation used to describe local image
information, i.e., it could be raw pixel representation, outputs of filter banks
convolved with the patches, or even more complex representations. The texton-based
approach can be divided into three stages: 1) construction of a codebook of textons
using a clustering algorithm such as k-means, 2) learning texton histograms from the
training set, and 3) classification of the test set by finding the histogram of textons in
the test set and comparing to those found during stage two to find the nearest pattern.
These three steps are explained in the remaining of this section.
2.1 Construction of Texton Codebook
To construct the texton codebook, small-sized local patches are randomly extracted
from each image in the training set. These small patches are then aggregated over all
images in a class and clustered using an unsupervised algorithm such as k-means.
Obtained cluster centers form a dictionary that represents the class of textures used. It
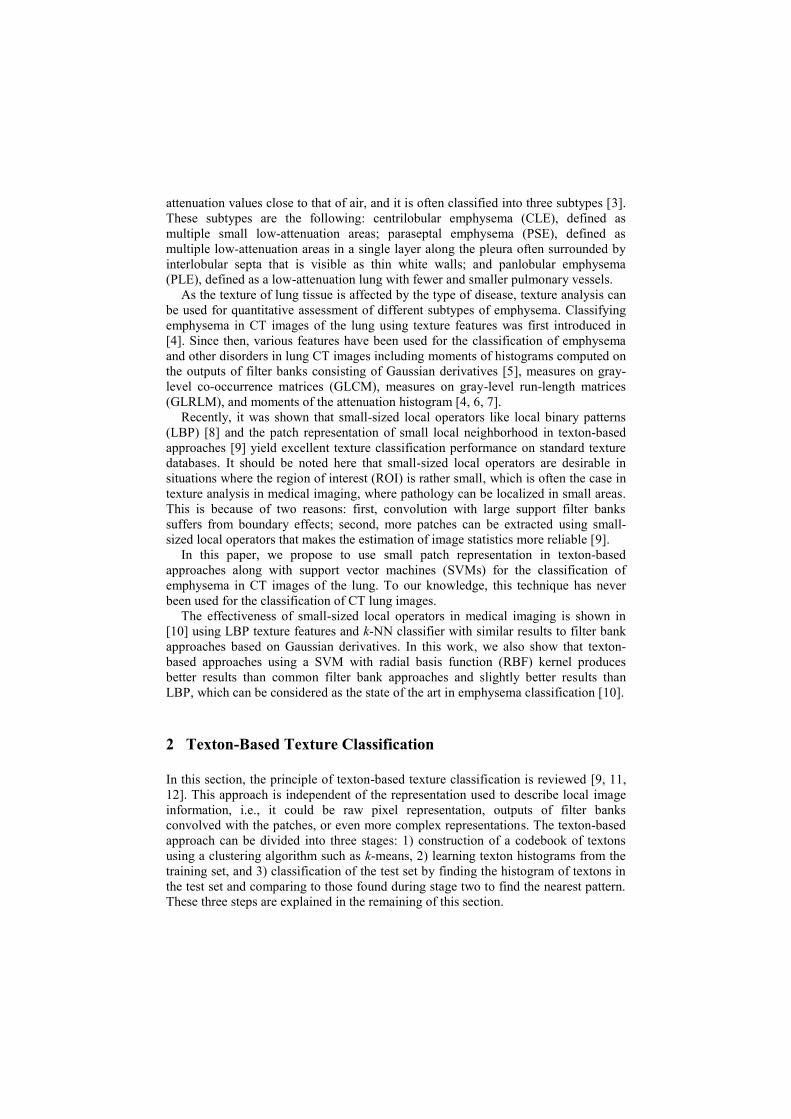
is saved as the codebook to be used in the next stage. Fig. 1 displays sample images
of lung CT ROIs used in this paper and the codebook dictionary computed over all
ROIs using the texton size of 7 × 7 pixels and k = 40 in k-means.
2.2 Learning the Model
The next stage is to find the features (learn the model) using the images in the training
set. To this end, these steps are followed: first, extract small patches of the same size
as the previous stage by sliding a window over each training image in a class. Second,
find the distance between each patch to all textons in the dictionary to find the closest
match. Third, update a histogram of textons accordingly for each image based on the
closest match found. This yield a histogram for each image in the training set, which
is used as the features representing that image after normalization. These features are
used for training a classifier such as SVM. Fig. 2 illustrates the construction of the
codebook and learning the model in a texton-based classification system.
2.3 Classification
To classify a test image, the same steps as in the learning stage are followed to find
the features for the test image. This includes extraction of small patches from each
test image in a class, finding the closest match to these patches from the dictionary,
and computing the normalized histogram of obtained closest textons to define a
feature vector for the image. The trained classifier in the learning stage is used to find
the class of the test image.
Both k-NN and SVM are tested in this paper for the classification of texton-based
features. In SVM, a RBF kernel as given in (1) is used as it is recommended as the
first kernel choice in [13]. In (1), γ is the kernel width and xi and xj are two sample
patterns.
. (1)
3 Experimental Setup
Data Preparation. The data used for the experiments is the same as in [10], which is
collected from a set of thin-slice CT images of the thorax from an exploratory study
carried out at the Department of Respiratory Medicine, Gentofte University Hospital,

Denmark [14]. The slices were reconstructed using a high spatial resolution (bone)
algorithm. Each subject was scanned in the upper, middle, and lower lung, resulting in
three 1.25 mm thick slices with a resolution of 0.78 × 0.78 mm per subject.
The leading pattern in 75 CT slices from 25 subjects, 8 healthy non-smokers, 4
smokers without COPD, and 13 smokers diagnosed with moderate or severe COPD
according to PFTs [1], was visually assessed by an experienced chest radiologist and
a CT experienced pulmonologist independently. The leading pattern could either be
normal tissue (NT), CLE, PSE, or PLE, in each of the slices, and consensus readings
were obtained in all cases of disagreement. 168 non-overlapping ROIs of size 50 × 50
pixels were subsequently annotated in the slices representing the three classes: NT (59
ROIs), CLE (50 ROIs), and PSE (59 ROIs). The NT ROIs were annotated in the non-
smokers and the CLE and PSE ROIs were annotated in the two smokers' subject
classes, within the area(s) of the leading pattern. PLE was excluded due to very few
cases in the data set (only 2 out of 20 subjects diagnosed with COPD).
Fig. 1. Sample ROIs of size 50 × 50 pixels (left) in three classes, i.e., normal lung (top left
row), CLE (middle left row), and PSE (bottom left row). The constructed codebook using texton
sizes of 7 × 7 pixels and k = 40 in k-means (right).
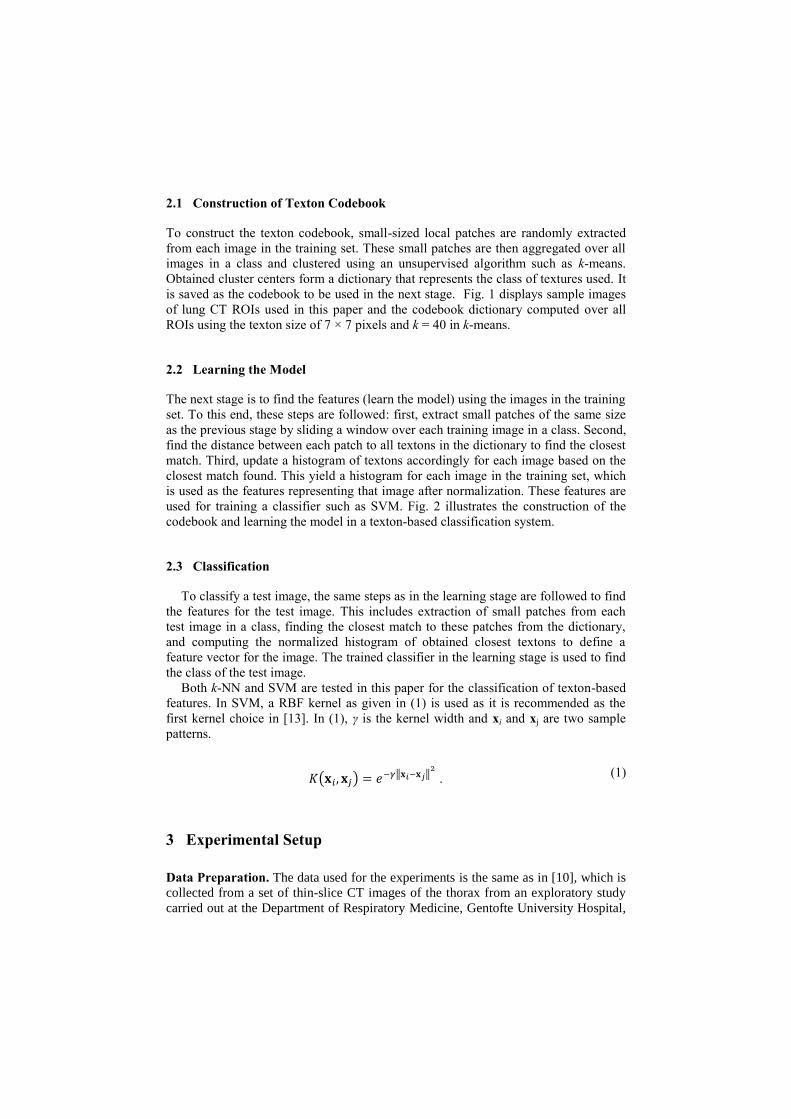
Fig. 2. The illustration of different stages of a texton-based texture classification system: the
generation of texton codebooks using k-means clustering (left) and the generation of features by
computing the texton histograms of training set (right).
Computation of Texton-Based Features. For the construction of the codebook, 500
random patches are extracted from each ROI in each class. Patch sizes of 3 × 3 to 8 ×
8 pixels are used in the experiments. No filter banks are applied and raw pixel
representation is used instead. Since in CT images, the mean of the intensity in the
images indicate a physical property of the tissue displayed, it should not be removed.
The patches extracted from different ROIs of each class are clustered using k-means
to find the codebook that represents a class. Two different values of k, i.e., k = 10 and
k = 40 are tested in the experiments leading to 3 × 10 = 30 or 3 × 40 = 120 (3 is the
number of classes) textons in the codebook, respectively (refer to Fig. 1). After
construction of texton codebook, the texton frequency histograms of the ROIs are
computed to find the model. In this stage, small overlapping patches with the same
size as what was used in the clustering stage are systematically extracted from each
ROI. As in the clustering stage, no filter bank is used and raw pixel representation is
considered. Euclidean distance between the resulting textons (collection of small
patches) and the textons in the codebook is computed in order to identify the most
similar texton in the codebook and the corresponding histogram of textons is updated
accordingly. The histograms are normalized and used as the features.
Classifier and Evaluation. Both k-NN and SVM are used in the experiments. The
crucial issue in using SVMs is finding a suitable kernel and the optimum trade-off
parameter C. RBF kernel is used and the optimum kernel width, i.e., γ in (1) and C are
found by a grid search on the training set at each specific texton size and k value (in k-
means) used in the experiments. This grid search is performed by leave-one-subject-
out on the training set. The computation of the texton codebook is performed each
time on the training set, excluding the validation set. The proposed texton-based
classification system using SVM as classifier with RBF kernel and optimal C and γ is
evaluated using leave-one-subject-out. This means that, at each trial, all ROIs from
one patient are held out as the test set and the remaining ROIs as the training set.
4 Results and Discussions
In this section, we first present the results for the proposed texton-based texture
classification system using SVM as classifier with the parameters chosen as explained
in previous section. Then comparison with other techniques is provided.
After finding the optimal C and γ at each texton size and k value (of k-means), the
accuracy of the classification system is evaluated using leave-one-subject-out for the
particular texton size and k. The results are shown in Table 1 for various texton sizes
and two different values of k in k-means. It can be seen from these results that using k
= 40 in k-means improves the performance of the classification system over k = 10.
The best result is obtained at the texton size of 4 × 4 pixels with k = 40. It can be
observed from the results that the accuracy of classification system decreases with
increasing texton size. This can be because increasing the texton size leads to a higher
dimensional space in k-means, requiring more data for reliable clustering. Also, fewer
patches can be extracted from the ROIs at higher texton sizes that may degrade the
estimation of model as explained in Section 2.2.

Comparison with Other Techniques. The first comparison is made between texton-
based classification system using SVM and k-NN classifiers. The optimal parameter k
of the k-NN classifier is found using a validation set in the training set in a similar
way as the grid search performed for the parameters in the SVM classifier. The results
are shown in Table 1, and as can be seen, the SVM classifier performs much better
than the k-NN classifier. The superiority of SVM over k-NN was also reported on
standard texture databases such as Columbia-Utrecht (CUReT) database [15].
The second comparison is made between the proposed texton-based classification
system using SVM as classifier and the results published in [10]. Since the same data
as in [10] is used in our experiments, the results are directly comparable. In [10], the
results are provided for the following approaches:
1) GFB1 (Gaussian filter bank 1): using the moments of histogram computed on
the outputs of convolved Gaussian filter banks with four rotation invariant
filters obtained from linear combination of Gaussian derivatives at five scales.
2) ICR (intensity, co-occurrence, and run-length): the feature vector consists of
the first four moments of the intensity histogram; the contrast, correlation,
energy, entropy, and homogeneity computed on GLCM; and short-run
emphasis, long-run emphasis, gray-level; nonuniformity, run-length
nonuniformity and run percentage computed on GLRLM.
3) INT: intensity histograms.
4) GFB2: similar to GFB1 but instead of using moments of histograms, the
histograms themselves are used. Hence they are richer in information.
5) LBP1 (local binary pattern 1): Basic rotation invariant LBP histograms.
6) LBP2: joint 2D LBP and intensity histograms.
For more information on each method the reader is urged to refer to [10] and the
references therein. The results based on the above techniques are provided in Table 2
along with the best result obtained from the proposed approach based on texton
signatures with SVM classifier.
The confusion matrix for the best results in [10], i.e., the results of LBP2, and our
best results are provided in Table 2. The proposed approach attains performance
better than LBP2 though McNemar's test does not indicate the difference to be
significant (p = 0.75). The specificity of texton-based and LBP2 approaches are
98.31% and 93.33%, while their sensitivity are 95.41% and 97.25%, respectively
(when comparing NT versus CLE and PSE).
Table 1. The results of texton-based classification system on CT images of lung used in this
paper for k = 10 and 40 and various texton sizes using SVM and k-NN classifiers.
Texton Size
SVM Accuracy
(k(a) = 10)
SVM Accuracy
(k(a) = 40)
k-NN Accuracy
(k(a) = 10)
k-NN Accuracy
(k(a) = 40)
3 × 3 94.05 95.24 90.48 88.1
4 × 4 93.45 96.43 86.31 86.9
5 × 5 92.86 95.83 85.12 88.1
6 × 6 92.26 94.05 82.74 90.48
7 × 7 91.67 90.48 83.33 89.29
8 × 8 88.10 92.86 82.74 89.88 (a)
k here refers to the k in k-means clustering not the k in k-NN classifier.

Table 2. The comparison between the best results obtained from the proposed approach and the
results of other techniques on the same data (left); the confusion matrix of LBP2 (middle) and
texton-based approach with k = 40, texton size of 4 × 4 pixels, and SVM classifier (right).
5 Conclusion
In this paper, a texton-based texture classification system using a SVM with RBF
kernel is proposed for the classification of emphysema in CT images of the lung. It is
shown that the proposed approach performs significantly better than common
approaches based on moments of histograms of filter bank responses using Gaussian
derivatives and slightly improve the performance over a recently proposed approach
based on LBPs. LBP operators are, by design, invariant to monotonic intensity
transformations. While this is desirable in some applications, in the classification of
Lung CT images, the mean of intensity is important and this explains the poor
performance of LBP1 in Table 2 as it discards the mean of intensity in the ROIs. Due
to this drawback of LBPs, in [10], the joint intensity and LBP histograms are
considered (LBP2). This improves the performance of the LBPs in this application at
the cost of adding to the complexity of the approach. The texton-based approach does
not suffer from this problem as it is not invariant to intensity transformations. It is
also shown that using SVM in the proposed approach yields higher accuracy than a k-
NN classifier.
As the state of the art in examination of lung is volumetric chest CT scans, one
may wonder whether texton-based approach can be extended to 3D data. As the
computation of texton signatures is fast especially when raw pixel representation is
used, we expect that the approach can easily be extended to 3D data. The main
obstacle might be the computational cost for optimizing the SVM parameters in a grid
search that can be reduced by using an m-fold cross-validation at patient level instead
of leave-one-subject-out used in our experiments.
In future work, combining the classification outputs at different texton sizes using
multiple classifier systems (MCS) will be investigated for possible improvement of
the results. This improvement is expected if the misclassification is done on different
ROIs in different texton sizes such that the MCS yield better results due to the
diversity of the classifiers [16].
Acknowledgments. The first author is funded by the Natural Sciences and
Engineering Research Council (NSERC) of Canada under Canada Graduate
Scholarship (CGS D3-378361-2009). The first author would also like to thank
Technique Accuracy
GFB1 61.3
ICR 89.3
INT 87.5
GFB2 94.0
LBP1 79.2
LBP2 95.2
Texton-based 96.4
Estimated Labels
True Labels NT CLE PSE
NT 55 0 4
CLE 1 49 0
PSE 2 1 56
Estimated Labels
True Labels NT CLE PSE
NT 58 0 1
CLE 3 47 0
PSE 2 0 57

Laurens van der Maaten from Delft University of Technology, the Netherlands for
useful discussions on texton-based approach in texture classification.
References
1. Rabe, K.F., Hurd, S., Anzueto, A., Barnes, P.J., Buist, S.A., Calverley, P., Fukuchi, Y.,
Jenkins, C., Rodriguez-Roisin, R., van Weel, C., Zielinski, J.: Global Strategy for the
Diagnosis, Management, and Prevention of Chronic Obstructive Pulmonary Disease:
GOLD Executive Summary. Am. J. Respir. Crit. Care Med. 176(6) 532--555 (2007)
2. Müller, N.L., Staples, C.A., Miller, R.R., Abboud, R.T.: Density Mask-An Objective
Method to Quantitate Emphysema Using Computed Tomography. Chest 94(4) 782--787
(1988)
3. Webb, W.R., Müller, N., Naidich, D.: High-Resolution CT of the Lung, Third Edition.
Lippincott Williams & Wilkins (2001)
4. Uppaluri, R., Mitsa, T., Sonka, M., Hoffman, E.A., McLennan, G.: Quantification of
Pulmonary Emphysema from Lung Computed Tomography Images. Amer. J. Respir. Crit.
Care Med. 156(1) 248--254 (1997)
5. Sluimer, I.C., Prokop, M., Hartmann, I., van Ginneken, B.: Automated Classification of
Hyperlucency, Fibrosis, Ground Glass, Solid, and Focal Lesions in High-Resolution CT of
the Lung. Medical Physics 33(7) 2610--2620 (2006)
6. Chabat, F., Yang, G.Z., Hansell, D.M.: Obstructive Lung Diseases: Texture Classification
for Differentiation at CT. Radiology 228(3) 871--877 (2003)
7. Xu, Y., Sonka, M., McLennan, G., Guo, J., Hoffman, E.A.: MDCT-based 3-D Texture
Classification of Emphysema and Early Smoking Related Lung Pathologies. IEEE Trans.
Med. Imag. 25(4) 464--475 (2006)
8. Ojala, T., Pietikainen, M., Maenpaa, T.: Multiresolution Gray-Scale and Rotation
Invariant Texture Classification with Local Binary Patterns. IEEE Trans. on PAMI 24(7)
971--987 (2002)
9. Varma, M., Zisserman, A.: A Statistical Approach to Material Classification Using Image
Patch Exemplars. IEEE Trans. on PAMI 31(11) 2032--2047 (2009)
10. Sørensen, L., Shaker, S.B., de Bruijne, M.: Quantitative Analysis of Pulmonary
Emphysema Using Local Binary Patterns. IEEE Trans. Med. Imag. 29(2) 559--569 (2010)
11. Leung, T., Malik, J.: Representing and Recognizing the Visual Appearance of Materials
Using Three-Dimensional Textons. Int’l J. Computer Vision 43(1) 29--44 (2001)
12. Varma, M., Zisserman, A.: A Statistical Approach to Texture Classification from Single
Images. International Journal of Computer Vision: Special Issue on Texture Analysis and
Synthesis 62(1-2) 61--81 (2005)
13. Fan, R.E., Chen, P.H., Lin, C.J.: Working Set Selection Using the Second Order
Information for Training SVM. Journal of Mach. Learning Research 6, 1889--1918 (2005)
14. Shaker, S.B., von Wachenfeldt, K.A., Larsson, S., Mile, I., Persdotter, S., Dahlbäck, M.,
Broberg, P., Stoel, B., Bach, K.S., Hestad, M., Fehniger, T.E., Dirksen, A.: Identification
of Patients with Chronic Obstructive Pulmonary Disease (COPD) by Measurement of
Plasma Biomarkers. The Clinical Respiratory Journal 2(1) 17--25 (2008)
15. Caputo, B., Hayman, E., Fritz, M., Eklundh, J.O.: Classifying Materials in the Real World.
Image and Vision Computing 28(1) 150--163 (2010)
16. Kuncheva, L.I.: Combining Pattern Classifiers Methods and Algorithms. John Wiley &
Sons, New Jersey (2004)