
A System for an Accurate 3D Reconstruction in Video Endoscopy Capsule
16
Hindawi Publishing Corporation EURASIP Journal on Embedded Systems Volume 2009, Article ID 716317, 15 pages doi:10.1155/2009/716317 Research Article A System for an Accurate 3D Reconstruction in Video Endoscopy Capsule Anthony Kolar, 1 Olivier Romain, 1 Jade Ayoub, 1 David Faura, 1 Sylvain Viateur, 1 Bertrand Granado, 2 and Tarik Graba 3 1 D´ epartement SOC—LIP6, Universite P&M CURIE—Paris VI, Equipe SYEL, 4 place Jussieu, 75252 Paris, France 2 ETIS, CNRS/ENSEA/Universit´ e de Cergy-Pontoise, 95000 Cergy, France 3 Electronique des syst` emes num´ eriques complexe, Telecom ParisTech, 46 rue Barrault, 75252 Paris, France Correspondence should be addressed to Anthony Kolar, [email protected] Received 15 March 2009; Revised 9 July 2009; Accepted 12 October 2009 Recommended by Ahmet T. Erdogan Since few years, the gastroenterologic examinations could have been realised by wireless video capsules. Although the images make it possible to analyse some diseases, the diagnosis could be improved by the use of the 3D Imaging techniques implemented in the video capsule. The work presented here is related to Cyclope, an embedded active vision system that is able to give in real time both 3D information and texture. The challenge is to realise this integrated sensor with constraints on size, consumption, and computational resources with inherent limitation of video capsule. In this paper, we present the hardware and software development of a wireless multispectral vision sensor which allows to transmit, a 3D reconstruction of a scene in realtime. multispectral acquisitions grab both texture and IR pattern images at least at 25 frames/s separately. The different Intellectual Properties designed allow to compute specifics algorithms in real time while keeping accuracy computation. We present experimental results with the realization of a large-scale demonstrator using an SOPC prototyping board. Copyright © 2009 Anthony Kolar et al. This is an open access article distributed under the Creative Commons Attribution License, which permits unrestricted use, distribution, and reproduction in any medium, provided the original work is properly cited. 1. Introduction Examination of the whole gastrointestinal tract represents a challenge for endoscopists due to its length and inaccessi- bility using natural orifices. Moreover, radiologic techniques are relatively insensitive for diminutive, flat, infiltrative, or inflammatory lesions of the small bowel. Since 1994, video capsules (VCEs) [1, 2] have been developed to allow direct examination of this inaccessible part of the gastrointestinal tract and to help doctors to find the cause of symptoms such as stomach pain, disease of Crohn, diarrhoea, weight loss, rectal bleeding, and anaemia. The Pillcam video capsule designed by Given Imaging Company is the most popular of them. This autonomous embedded system allows acquiring about 50 000 images of gastrointestinal tract during more than twelve hours of an analysis. The off-line image processing and its interpretation by the practitioner permit to determine the origin of the disease. However, recent benchmark [3] published shows some limitations on this video capsule as the quality of images and the inaccuracy on the size of the polyps. Accuracy is a real need because the practitioner makes an ablation of a polyp only if it exceeds a minimum size. Actually the polyp size is estimated by practitioner’s experience with more or less error for one practitioner to another. One of the solutions could be to use techniques of 3D imagery, either directly in the video capsule or on a remote computer. This later solution is actually used in the Pillcam capsule by using the 2–4 images that are taken per second and stored wirelessly in a recorder that is worn around the waist. 3D processing is performed off-line from the estimation of the displacement of the capsule. However, the speed of video- capsule is not constant; for example, in the oesophagus, it is of 1.44 m/s, and in the stomach it is almost null and is 0.6 m/s in the intestine. Consequently, by taking images at frequencies constant, certain areas of the transit will not be rebuilt. Moreover, the regular transmission of the images by the body consumes too much energy and limits the autonomy of the video capsules to 10 hours. Ideally, the quantity of information to be transmitted must be reduced
-
Upload
independent -
Category
Documents
-
view
4 -
download
0
Transcript of A System for an Accurate 3D Reconstruction in Video Endoscopy Capsule
Hindawi Publishing CorporationEURASIP Journal on Embedded SystemsVolume 2009, Article ID 716317, 15 pagesdoi:10.1155/2009/716317
Research Article
A System for an Accurate 3D Reconstruction inVideo Endoscopy Capsule
Anthony Kolar,1 Olivier Romain,1 Jade Ayoub,1 David Faura,1
Sylvain Viateur,1 Bertrand Granado,2 and Tarik Graba3
1 Departement SOC—LIP6, Universite P&M CURIE—Paris VI, Equipe SYEL, 4 place Jussieu, 75252 Paris, France2 ETIS, CNRS/ENSEA/Universite de Cergy-Pontoise, 95000 Cergy, France3 Electronique des systemes numeriques complexe, Telecom ParisTech, 46 rue Barrault, 75252 Paris, France
Correspondence should be addressed to Anthony Kolar, [email protected]
Received 15 March 2009; Revised 9 July 2009; Accepted 12 October 2009
Recommended by Ahmet T. Erdogan
Since few years, the gastroenterologic examinations could have been realised by wireless video capsules. Although the images makeit possible to analyse some diseases, the diagnosis could be improved by the use of the 3D Imaging techniques implementedin the video capsule. The work presented here is related to Cyclope, an embedded active vision system that is able to givein real time both 3D information and texture. The challenge is to realise this integrated sensor with constraints on size,consumption, and computational resources with inherent limitation of video capsule. In this paper, we present the hardwareand software development of a wireless multispectral vision sensor which allows to transmit, a 3D reconstruction of a scenein realtime. multispectral acquisitions grab both texture and IR pattern images at least at 25 frames/s separately. The differentIntellectual Properties designed allow to compute specifics algorithms in real time while keeping accuracy computation. We presentexperimental results with the realization of a large-scale demonstrator using an SOPC prototyping board.
Copyright © 2009 Anthony Kolar et al. This is an open access article distributed under the Creative Commons Attribution License,which permits unrestricted use, distribution, and reproduction in any medium, provided the original work is properly cited.
1. Introduction
Examination of the whole gastrointestinal tract represents achallenge for endoscopists due to its length and inaccessi-bility using natural orifices. Moreover, radiologic techniquesare relatively insensitive for diminutive, flat, infiltrative, orinflammatory lesions of the small bowel. Since 1994, videocapsules (VCEs) [1, 2] have been developed to allow directexamination of this inaccessible part of the gastrointestinaltract and to help doctors to find the cause of symptoms suchas stomach pain, disease of Crohn, diarrhoea, weight loss,rectal bleeding, and anaemia.
The Pillcam video capsule designed by Given ImagingCompany is the most popular of them. This autonomousembedded system allows acquiring about 50 000 images ofgastrointestinal tract during more than twelve hours of ananalysis. The off-line image processing and its interpretationby the practitioner permit to determine the origin of thedisease. However, recent benchmark [3] published showssome limitations on this video capsule as the quality of
images and the inaccuracy on the size of the polyps. Accuracyis a real need because the practitioner makes an ablationof a polyp only if it exceeds a minimum size. Actually thepolyp size is estimated by practitioner’s experience with moreor less error for one practitioner to another. One of thesolutions could be to use techniques of 3D imagery, eitherdirectly in the video capsule or on a remote computer.
This later solution is actually used in the Pillcam capsuleby using the 2–4 images that are taken per second and storedwirelessly in a recorder that is worn around the waist. 3Dprocessing is performed off-line from the estimation of thedisplacement of the capsule. However, the speed of video-capsule is not constant; for example, in the oesophagus, itis of 1.44 m/s, and in the stomach it is almost null and is0.6 m/s in the intestine. Consequently, by taking images atfrequencies constant, certain areas of the transit will not berebuilt. Moreover, the regular transmission of the imagesby the body consumes too much energy and limits theautonomy of the video capsules to 10 hours. Ideally, thequantity of information to be transmitted must be reduced
2 EURASIP Journal on Embedded Systems
at the only pertinent information like polyps or other 3Dobjects. The first development necessary to the deliveryof such objects relies on the use of algorithm of patternrecognition on 3D information inside the video capsule.
The introduction of 3D reconstruction techniques insidea video capsule needs to define a new system that takes intoaccount the hard constraints of size, low power consumption,and processing time. The most common 3D reconstructiontechniques are those based on passive or active stereoscopicvision methods, where image sensors are used to provide thenecessary information to retrieve the depth. Passive methodconsists of taking at least two images of a scene at twodifferent points of view. Unfortunately using this method,only particular points, with high gradient or high texture,can be detected [4]. The active stereo-vision methods offeran alternative approach when processing time is critical.They consist in replacing one of the two cameras by aprojection system which delivers a pattern composed by aset of structured rays. In this latter case, only an image ofthe deformation of the pattern by the scene is necessary toreconstruct a 3D image. Many implementations based onactive stereo-vision have been realised in the past [5, 6] andprovided significant results on desktop computers. Generally,these implementations have been developed to reconstruct3D large objects as building [7–14].
In our research work, we have focused on an integrated3D active vision sensor: “Cyclope.” The concept of this sensorwas first described in [4]. In this new article we focus onthe presentation of our first prototype which includes theinstrumentation and processing blocks. This sensor allowsmaking in real time a 3D reconstruction taking into accountthe size and power consumption constraints of embeddedsystems [15]. It can be used in wireless video capsules orwireless sensor networks. In the case of video capsule in orderto be comfortable for the patient, the results could be storedin a recorder around the waist. It is based on a multispectralacquisition that must facilitate the delivery of a 3D texturedreconstruction in real time (25 images by second).
This paper is organised as follows, Section 2 describesbriefly Cyclope and deals with the principles of the activestereo-vision system and 3D reconstruction method. InSection 3 we present our original multispectral acquisition.In Section 4 we present the implementation of the opticalcorrection developed to correct the lens distortion. Section 5deals with the implementation of a new thresholding andlabelling methods. In Sections 6 and 7, we present theprocessing of matching in order to give a 3D representationof the scene. Section 8 deals with wireless communicationconsideration. Finally, before a conclusion and perspectivesof this work, we present, in Section 9, a first functionalprototype and its performances which attest the feasibility ofthis original approach.
2. Cyclope
2.1. Overview of the Architecture. Cyclope is an integratedwireless 3D vision system based on active stereo-visiontechnique. It uses many different algorithms to increase
Cyclope
VCSEL
CMOS imagerInstrumentation
block
FPGA
Processing block
μP
RF block
Figure 1: Cyclope Diagram.
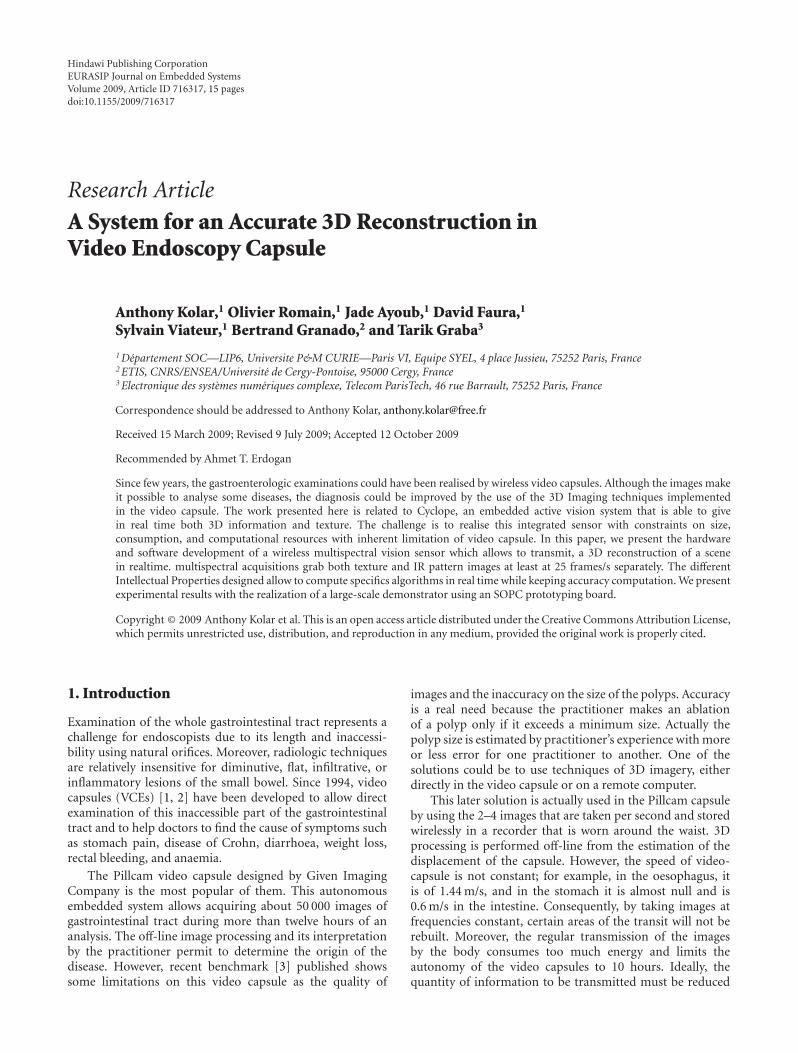
accuracy and reduce processing time. For this purpose, thesensor is composed of three blocks (see Figure 1).
(i) Instrumentation block: it is composed of a CMOScamera and a structured light projector on IR band.
(ii) Processing block: it integrates a microprocessor coreand a reconfigurable array. The microprocessor isused for sequential processing. The reconfigurablearray is used to implement parallels algorithms.
(iii) RF block: it is dedicated for the OTA (Over the Air)communications.
The feasibility of Cyclope was studied by an implemen-tation on an SOPC (System On Programmable Chip) target.These three parts will be realised in different technologies:CMOS for the image sensor and the processing units,GaAs for the pattern projector, and RF–CMOS for thecommunication unit. The development of such integrated“SIP” (System In Package) is actually the best solution toovercome the technological constraints and realise a chipscale package. This solution is used in several embeddedsensors such as The “Human++” platform [16] or SmartDust [17].
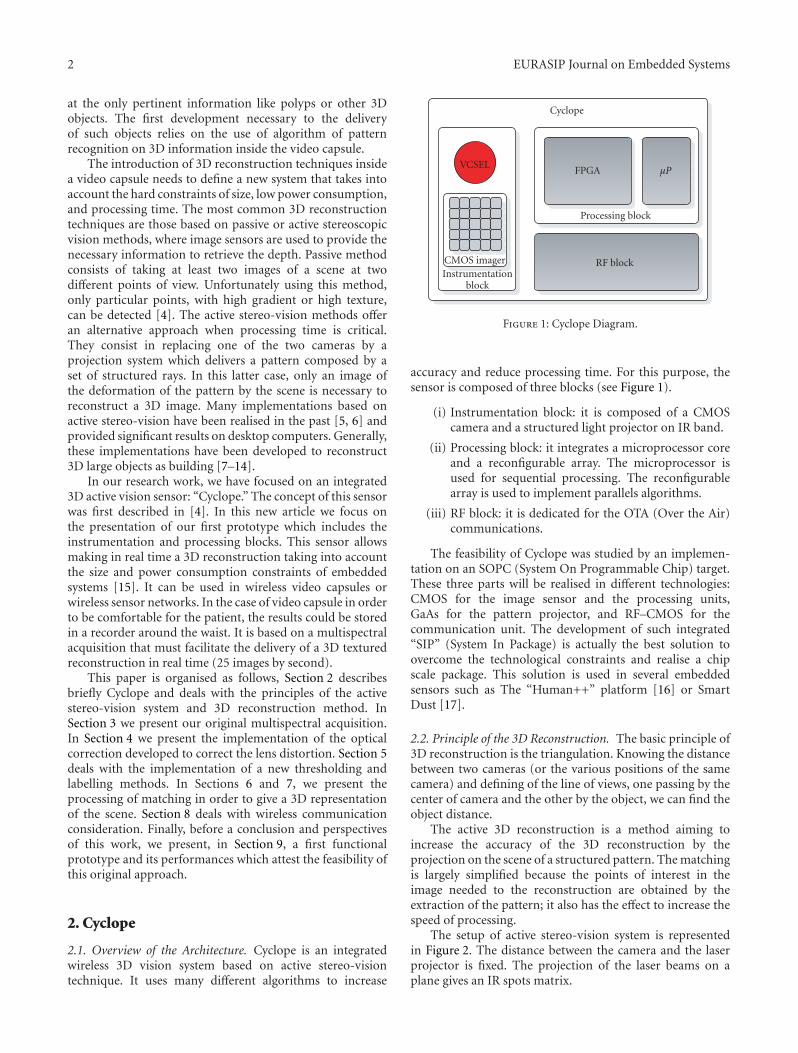
2.2. Principle of the 3D Reconstruction. The basic principle of3D reconstruction is the triangulation. Knowing the distancebetween two cameras (or the various positions of the samecamera) and defining of the line of views, one passing by thecenter of camera and the other by the object, we can find theobject distance.
The active 3D reconstruction is a method aiming toincrease the accuracy of the 3D reconstruction by theprojection on the scene of a structured pattern. The matchingis largely simplified because the points of interest in theimage needed to the reconstruction are obtained by theextraction of the pattern; it also has the effect to increase thespeed of processing.
The setup of active stereo-vision system is representedin Figure 2. The distance between the camera and the laserprojector is fixed. The projection of the laser beams on aplane gives an IR spots matrix.
EURASIP Journal on Embedded Systems 3
Central ray
Laserprojector
Camera
P1
Pk
O
y
xz
Figure 2: Active stereo-vision system.
Image planP
Oc
eCL
Projectorcenter
Epipolar plan
P
zc
Figure 3: Epipolar projection.
The 3D reconstruction is achieved through triangulationbetween laser and camera. Each point of the projectedpattern on the scene represents the intersection of two lines(Figure 3):
(i) the line of sight, passing through the pattern point onthe scene and its projection in the image plan,
(ii) the laser ray, starting from the projection center andpassing through the chosen pattern point.
If we consider the active stereoscopic system as shown inFigure 3, where p is the projection of P in the image plan ande the projection of CL on the camera plan OC , the projectionof the light ray supporting the dot on the image plan is astraight line. This line is an epipolar line [18–20].
To rapidly identify a pattern point on an image we canlimit the search to the epipolar lines.
For Cyclope the pattern is a regular mesh of points. Foreach point ( j, k) of the pattern we can find the correspondingepipolar line:
v = ajk · u + bjk, (1)
Image plan
Cf
B
P
p
z2
z1
p2
p1
π2 π1
Figure 4: Spot image movement versus depth.
where (u, v) are the image coordinates and the parameters(ajk, bjk) are estimated through an off-line calibration pro-cess.
In addition to the epipolar lines, we can establish therelation between the position of a laser spot in the image andits distance to the stereoscopic system.
On Figure 4, we consider a laser ray (5) projected ontwo different plans π1 and π2 located, respectively, at z1 andz2, the trajectory d of the coordinates in the image will beconstrained to the epipolar line.
By considering the two triangles CPp1 and CPp2, we canexpress d as
d = B
[(z1 − f
z1
)−(z2 − f
z2
)]= B f
(z1 − z2)z1z2
, (2)
where B is the stereoscopic, f the focal length of the cameraand d the distance in pixels:
d =√
(u1 − u2)2 + (v1 − v2)2. (3)
Given the epipolar line we can express d as a function of onlyone image coordinates:
d =√
1 + a2 (u1 − u2). (4)
From (2) and (4), we can express, for each pattern point( j, k), the depth as a hyperbolic function:
z = 1αjku + βjk
, (5)
where the αjk and βjk parameters are also estimated duringthe off-line calibration of the system [21].
We can compute the inverse of the depth z to simplifythe implementation. Two operations are only needed: anaddition and a multiplication. The computation of the depthof each point is independent of the others. So, all the laserspots can be computed separately allowing the parallelisationof the architecture.
3. An Energetic Approach forMultispectral Acquisition
The main problem when you design a 3D reconstructionprocessing for an integrated system is the limitation of
4 EURASIP Journal on Embedded Systems
Multispectralimage
acquisition
Distortioncorrection
Thresholding Labeling
Centerdetection
Matching3Dreconstruction
Wirelesscommunication
Figure 5: Acquisition and 3D reconstruction flow chart.
Texture image Patternimage
400 nm 700 nmVisible Near IR
λ
Figure 6: Multispectral image sensor.
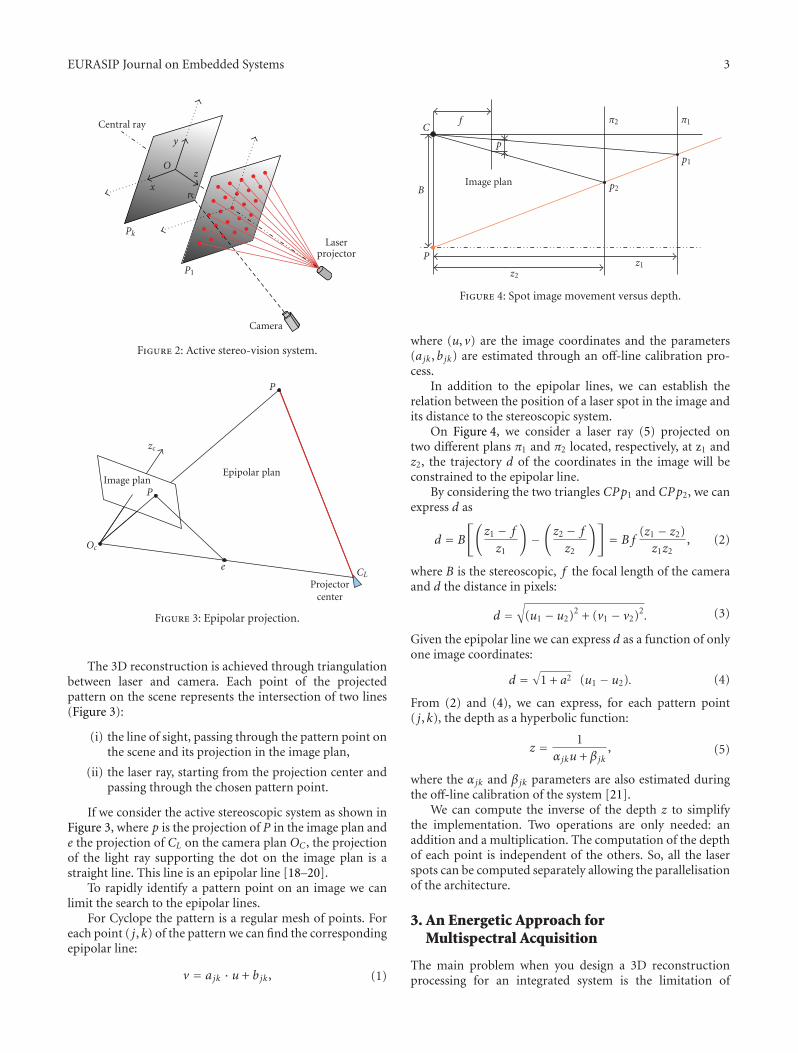
the resources. However, we can obtain a good accuracyconsidering hard constraints by using the following methodwhich is shown in Figure 5:
(1) the multispectral acquisition which makes the dis-crimination between the pattern and the texture byan energetic method;
(2) the correction of the error coordinates due to theoptical lens distortion;
(3) the processing before the 3D reconstruction asthresholding, segmentation, labelling, and the com-putation of the laser spot center;
(4) the computation of the matching and the thirddimension;
(5) the transmission of the data with a processor core andan RF module.
The spectral response of the Silicon cuts near 1100 nmand it covers UV to near Infrared domains. This importantcharacteristic allows defining a multispectral acquisition bygrabbing on the visible band the colour texture image and,on the near infrared band, the depth information. Cyclopeuses this original acquisition method, which permits toaccess directly at the depth information’s independently fromtexture image processing (Figure 6).
The combination of the acquisition of the projectedpattern on the infrared band, the acquisition of the textureon the visible band, and the mathematical model of theactive 3D sensor makes it possible to restore the 3Dtextured representation of the scene. This acquisition needsto separate texture and 3D datas. For this purpose we havedeveloped a multispectral acquisition [15]. Generally, filtersare used to cut the spectral response. We used here an
Figure 7: 64× 64 image sensor microphotograph.
energetic method, which has the advantage of being genericfor imagers.
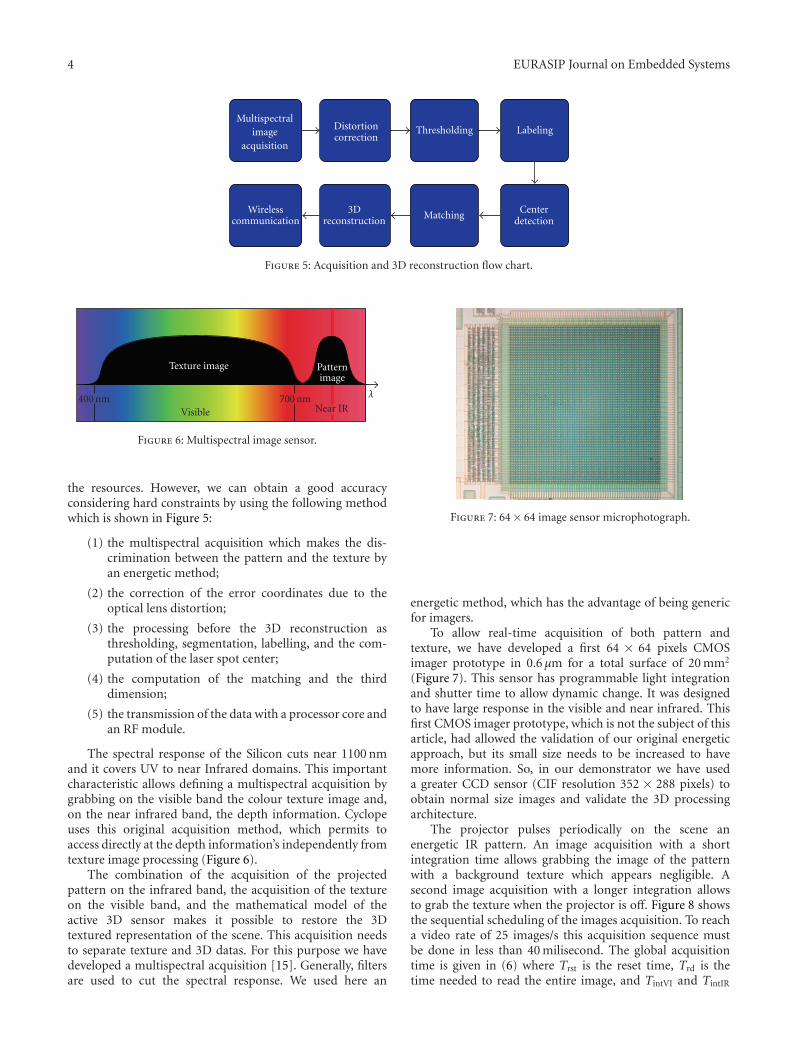
To allow real-time acquisition of both pattern andtexture, we have developed a first 64 × 64 pixels CMOSimager prototype in 0.6 μm for a total surface of 20 mm2
(Figure 7). This sensor has programmable light integrationand shutter time to allow dynamic change. It was designedto have large response in the visible and near infrared. Thisfirst CMOS imager prototype, which is not the subject of thisarticle, had allowed the validation of our original energeticapproach, but its small size needs to be increased to havemore information. So, in our demonstrator we have useda greater CCD sensor (CIF resolution 352 × 288 pixels) toobtain normal size images and validate the 3D processingarchitecture.
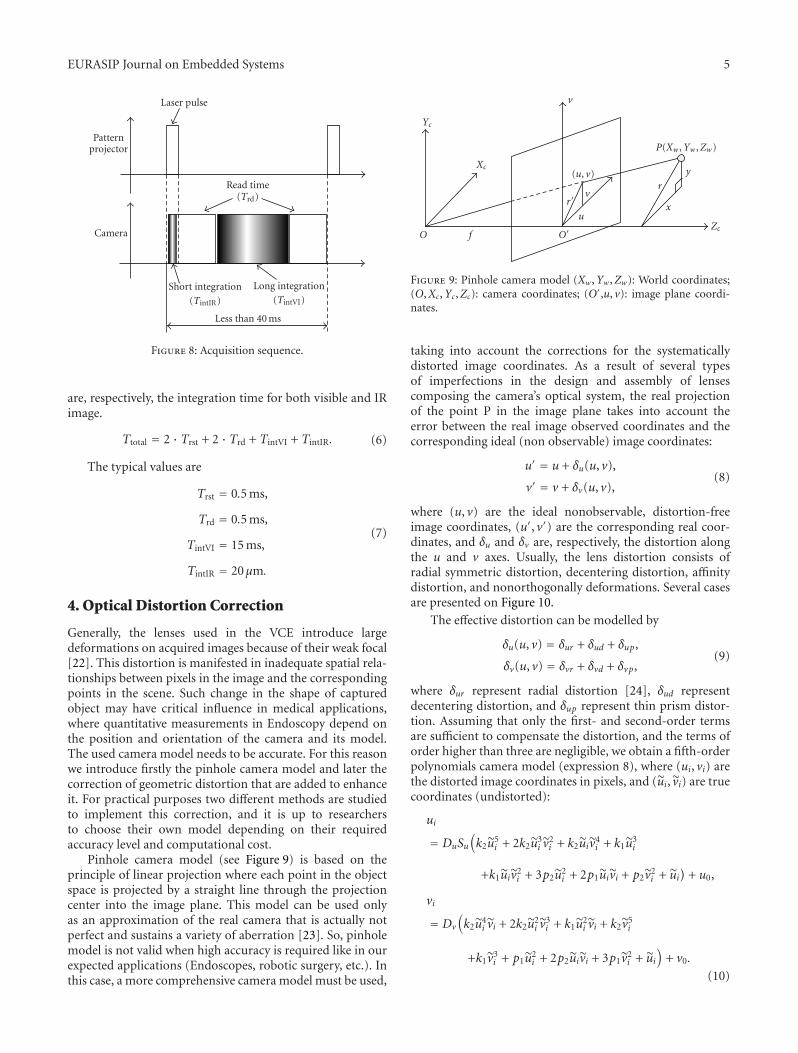
The projector pulses periodically on the scene anenergetic IR pattern. An image acquisition with a shortintegration time allows grabbing the image of the patternwith a background texture which appears negligible. Asecond image acquisition with a longer integration allowsto grab the texture when the projector is off. Figure 8 showsthe sequential scheduling of the images acquisition. To reacha video rate of 25 images/s this acquisition sequence mustbe done in less than 40 milisecond. The global acquisitiontime is given in (6) where Trst is the reset time, Trd is thetime needed to read the entire image, and TintVI and TintIR
EURASIP Journal on Embedded Systems 5
Laser pulse
Read time(Trd)
Short integration
(TintIR)
Long integration
(TintVI)
Less than 40 ms
Camera
Patternprojector
Figure 8: Acquisition sequence.
are, respectively, the integration time for both visible and IRimage.
Ttotal = 2 · Trst + 2 · Trd + TintVI + TintIR. (6)
The typical values are
Trst = 0.5 ms,
Trd = 0.5 ms,
TintVI = 15 ms,
TintIR = 20μm.
(7)
4. Optical Distortion Correction
Generally, the lenses used in the VCE introduce largedeformations on acquired images because of their weak focal[22]. This distortion is manifested in inadequate spatial rela-tionships between pixels in the image and the correspondingpoints in the scene. Such change in the shape of capturedobject may have critical influence in medical applications,where quantitative measurements in Endoscopy depend onthe position and orientation of the camera and its model.The used camera model needs to be accurate. For this reasonwe introduce firstly the pinhole camera model and later thecorrection of geometric distortion that are added to enhanceit. For practical purposes two different methods are studiedto implement this correction, and it is up to researchersto choose their own model depending on their requiredaccuracy level and computational cost.
Pinhole camera model (see Figure 9) is based on theprinciple of linear projection where each point in the objectspace is projected by a straight line through the projectioncenter into the image plane. This model can be used onlyas an approximation of the real camera that is actually notperfect and sustains a variety of aberration [23]. So, pinholemodel is not valid when high accuracy is required like in ourexpected applications (Endoscopes, robotic surgery, etc.). Inthis case, a more comprehensive camera model must be used,
Yc
Xc
O f O′u
vr′
(u, v)
v
r
x
y
Zc
P(Xw ,Yw ,Zw)
Figure 9: Pinhole camera model (Xw ,Yw ,Zw): World coordinates;(O,Xc,Yc,Zc): camera coordinates; (O′,u, v): image plane coordi-nates.
taking into account the corrections for the systematicallydistorted image coordinates. As a result of several typesof imperfections in the design and assembly of lensescomposing the camera’s optical system, the real projectionof the point P in the image plane takes into account theerror between the real image observed coordinates and thecorresponding ideal (non observable) image coordinates:
u′ = u + δu(u, v),
v′ = v + δv(u, v),(8)
where (u, v) are the ideal nonobservable, distortion-freeimage coordinates, (u′, v′) are the corresponding real coor-dinates, and δu and δv are, respectively, the distortion alongthe u and v axes. Usually, the lens distortion consists ofradial symmetric distortion, decentering distortion, affinitydistortion, and nonorthogonally deformations. Several casesare presented on Figure 10.
The effective distortion can be modelled by
δu(u, v) = δur + δud + δup,
δv(u, v) = δvr + δvd + δvp,(9)
where δur represent radial distortion [24], δud representdecentering distortion, and δup represent thin prism distor-tion. Assuming that only the first- and second-order termsare sufficient to compensate the distortion, and the terms oforder higher than three are negligible, we obtain a fifth-orderpolynomials camera model (expression 8), where (ui, vi) arethe distorted image coordinates in pixels, and (ui, vi) are truecoordinates (undistorted):
ui
= DuSu(k2u
5i + 2k2u
3i v
2i + k2uiv
4i + k1u
3i
+k1uiv2i + 3p2u
2i + 2p1uivi + p2v
2i + ui
)+ u0,
vi
= Dv
(k2u
4i vi + 2k2u
2i v
3i + k1u
2i vi + k2v
5i
+k1v3i + p1u
2i + 2p2uivi + 3p1v
2i + ui
)+ v0.
(10)
6 EURASIP Journal on Embedded Systems
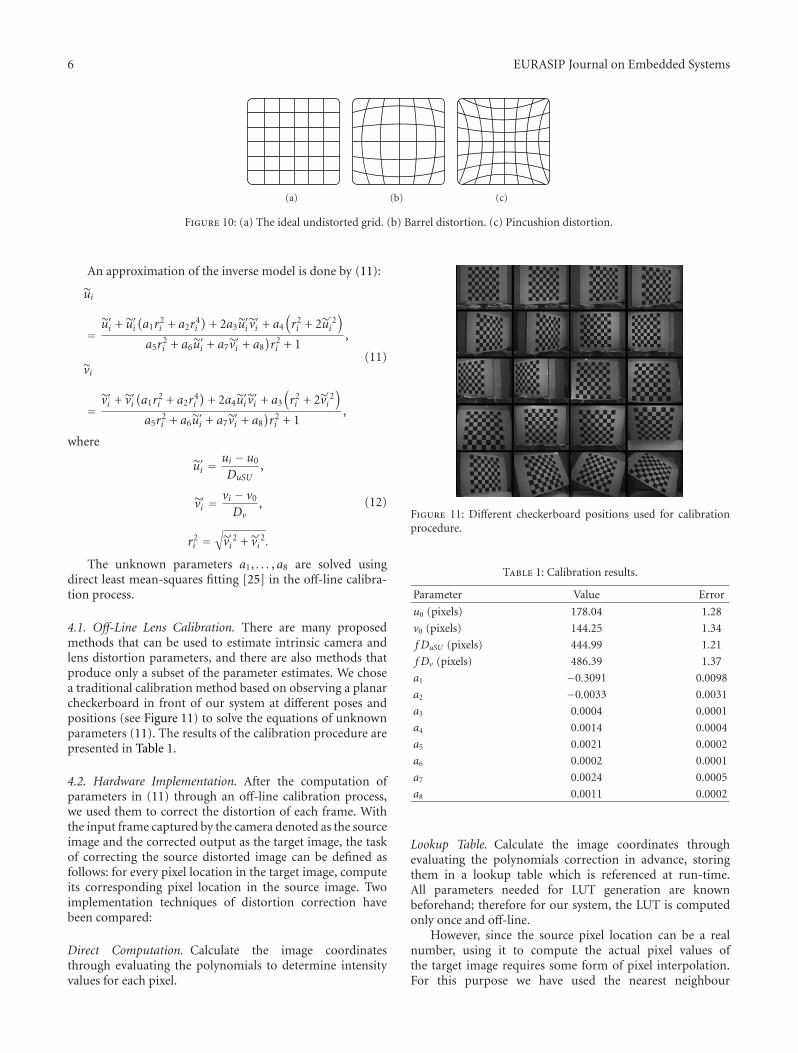
(a) (b) (c)
Figure 10: (a) The ideal undistorted grid. (b) Barrel distortion. (c) Pincushion distortion.
An approximation of the inverse model is done by (11):
ui
=u′i + u′i
(a1r
2i + a2r
4i
)+ 2a3u
′i v′i + a4
(r2i + 2u
′2i
)a5r
2i + a6u
′i + a7v
′i + a8
)r2i + 1
,
vi
=v′i + v′i
(a1r
2i + a2r
4i
)+ 2a4u
′i v′i + a3
(r2i + 2v
′2i
)a5r
2i + a6u
′i + a7v
′i + a8
)r2i + 1
,
(11)
where
u′i =ui − u0
DuSU,
v′i =vi − v0
Dv,
r2i =
√v′2i + v
′2i .
(12)
The unknown parameters a1, . . . , a8 are solved usingdirect least mean-squares fitting [25] in the off-line calibra-tion process.
4.1. Off-Line Lens Calibration. There are many proposedmethods that can be used to estimate intrinsic camera andlens distortion parameters, and there are also methods thatproduce only a subset of the parameter estimates. We chosea traditional calibration method based on observing a planarcheckerboard in front of our system at different poses andpositions (see Figure 11) to solve the equations of unknownparameters (11). The results of the calibration procedure arepresented in Table 1.
4.2. Hardware Implementation. After the computation ofparameters in (11) through an off-line calibration process,we used them to correct the distortion of each frame. Withthe input frame captured by the camera denoted as the sourceimage and the corrected output as the target image, the taskof correcting the source distorted image can be defined asfollows: for every pixel location in the target image, computeits corresponding pixel location in the source image. Twoimplementation techniques of distortion correction havebeen compared:
Direct Computation. Calculate the image coordinatesthrough evaluating the polynomials to determine intensityvalues for each pixel.
Figure 11: Different checkerboard positions used for calibrationprocedure.
Table 1: Calibration results.
Parameter Value Error
u0 (pixels) 178.04 1.28
v0 (pixels) 144.25 1.34
f DuSU (pixels) 444.99 1.21
f Dv (pixels) 486.39 1.37
a1 −0.3091 0.0098
a2 −0.0033 0.0031
a3 0.0004 0.0001
a4 0.0014 0.0004
a5 0.0021 0.0002
a6 0.0002 0.0001
a7 0.0024 0.0005
a8 0.0011 0.0002
Lookup Table. Calculate the image coordinates throughevaluating the polynomials correction in advance, storingthem in a lookup table which is referenced at run-time.All parameters needed for LUT generation are knownbeforehand; therefore for our system, the LUT is computedonly once and off-line.
However, since the source pixel location can be a realnumber, using it to compute the actual pixel values ofthe target image requires some form of pixel interpolation.For this purpose we have used the nearest neighbour
EURASIP Journal on Embedded Systems 7
0
50
100
150
200
250
BR
AM
s-K
B
0 20 40 60 80 100 120
Image size-KB
LUTReal time calculation
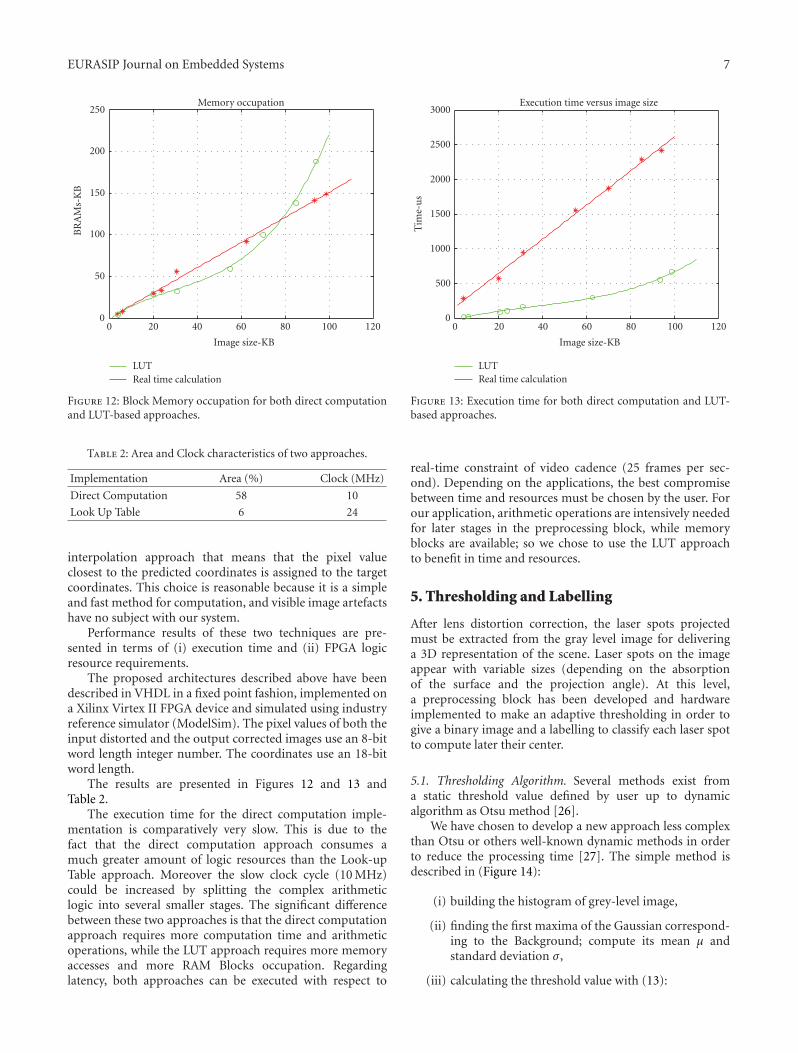
Memory occupation
Figure 12: Block Memory occupation for both direct computationand LUT-based approaches.
Table 2: Area and Clock characteristics of two approaches.
Implementation Area (%) Clock (MHz)
Direct Computation 58 10
Look Up Table 6 24
interpolation approach that means that the pixel valueclosest to the predicted coordinates is assigned to the targetcoordinates. This choice is reasonable because it is a simpleand fast method for computation, and visible image artefactshave no subject with our system.
Performance results of these two techniques are pre-sented in terms of (i) execution time and (ii) FPGA logicresource requirements.
The proposed architectures described above have beendescribed in VHDL in a fixed point fashion, implemented ona Xilinx Virtex II FPGA device and simulated using industryreference simulator (ModelSim). The pixel values of both theinput distorted and the output corrected images use an 8-bitword length integer number. The coordinates use an 18-bitword length.
The results are presented in Figures 12 and 13 andTable 2.
The execution time for the direct computation imple-mentation is comparatively very slow. This is due to thefact that the direct computation approach consumes amuch greater amount of logic resources than the Look-upTable approach. Moreover the slow clock cycle (10 MHz)could be increased by splitting the complex arithmeticlogic into several smaller stages. The significant differencebetween these two approaches is that the direct computationapproach requires more computation time and arithmeticoperations, while the LUT approach requires more memoryaccesses and more RAM Blocks occupation. Regardinglatency, both approaches can be executed with respect to
0
500
1000
1500
2000
2500
3000
Tim
e-u
s
0 20 40 60 80 100 120
Image size-KB
LUTReal time calculation
Execution time versus image size
Figure 13: Execution time for both direct computation and LUT-based approaches.
real-time constraint of video cadence (25 frames per sec-ond). Depending on the applications, the best compromisebetween time and resources must be chosen by the user. Forour application, arithmetic operations are intensively neededfor later stages in the preprocessing block, while memoryblocks are available; so we chose to use the LUT approachto benefit in time and resources.
5. Thresholding and Labelling
After lens distortion correction, the laser spots projectedmust be extracted from the gray level image for deliveringa 3D representation of the scene. Laser spots on the imageappear with variable sizes (depending on the absorptionof the surface and the projection angle). At this level,a preprocessing block has been developed and hardwareimplemented to make an adaptive thresholding in order togive a binary image and a labelling to classify each laser spotto compute later their center.
5.1. Thresholding Algorithm. Several methods exist froma static threshold value defined by user up to dynamicalgorithm as Otsu method [26].
We have chosen to develop a new approach less complexthan Otsu or others well-known dynamic methods in orderto reduce the processing time [27]. The simple method isdescribed in (Figure 14):
(i) building the histogram of grey-level image,
(ii) finding the first maxima of the Gaussian correspond-ing to the Background; compute its mean μ andstandard deviation σ ,
(iii) calculating the threshold value with (13):
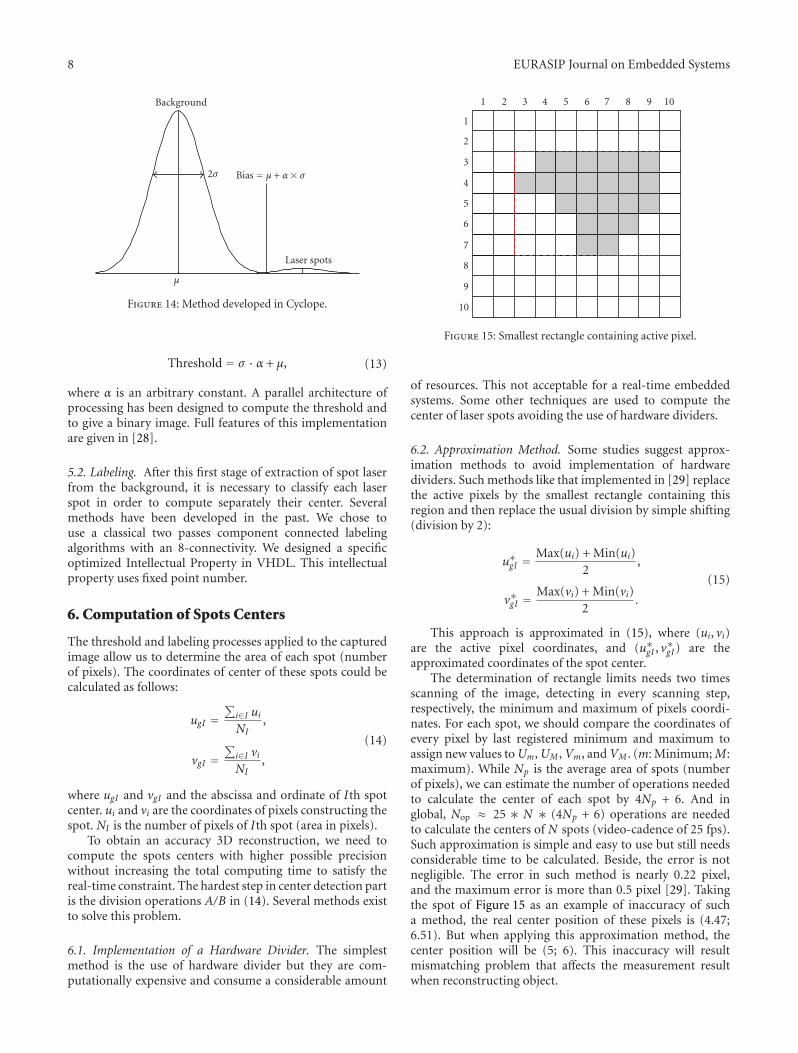
8 EURASIP Journal on Embedded Systems
Background
2σ Bias = μ + α× σ
Laser spots
μ
Figure 14: Method developed in Cyclope.
Threshold = σ · α + μ, (13)
where α is an arbitrary constant. A parallel architecture ofprocessing has been designed to compute the threshold andto give a binary image. Full features of this implementationare given in [28].
5.2. Labeling. After this first stage of extraction of spot laserfrom the background, it is necessary to classify each laserspot in order to compute separately their center. Severalmethods have been developed in the past. We chose touse a classical two passes component connected labelingalgorithms with an 8-connectivity. We designed a specificoptimized Intellectual Property in VHDL. This intellectualproperty uses fixed point number.
6. Computation of Spots Centers
The threshold and labeling processes applied to the capturedimage allow us to determine the area of each spot (numberof pixels). The coordinates of center of these spots could becalculated as follows:
ugI =∑
i∈I uiNI
,
vgI =∑
i∈I viNI
,
(14)
where ugI and vgI and the abscissa and ordinate of Ith spotcenter. ui and vi are the coordinates of pixels constructing thespot. NI is the number of pixels of Ith spot (area in pixels).
To obtain an accuracy 3D reconstruction, we need tocompute the spots centers with higher possible precisionwithout increasing the total computing time to satisfy thereal-time constraint. The hardest step in center detection partis the division operations A/B in (14). Several methods existto solve this problem.
6.1. Implementation of a Hardware Divider. The simplestmethod is the use of hardware divider but they are com-putationally expensive and consume a considerable amount
1 2 3 4 5 6 7 8 9 10
1
2
3
4
5
6
7
8
9
10
Figure 15: Smallest rectangle containing active pixel.
of resources. This not acceptable for a real-time embeddedsystems. Some other techniques are used to compute thecenter of laser spots avoiding the use of hardware dividers.
6.2. Approximation Method. Some studies suggest approx-imation methods to avoid implementation of hardwaredividers. Such methods like that implemented in [29] replacethe active pixels by the smallest rectangle containing thisregion and then replace the usual division by simple shifting(division by 2):
u∗gI =Max(ui) + Min(ui)
2,
v∗gI =Max(vi) + Min(vi)
2.
(15)
This approach is approximated in (15), where (ui, vi)are the active pixel coordinates, and (u∗gI , v
∗gI) are the
approximated coordinates of the spot center.The determination of rectangle limits needs two times
scanning of the image, detecting in every scanning step,respectively, the minimum and maximum of pixels coordi-nates. For each spot, we should compare the coordinates ofevery pixel by last registered minimum and maximum toassign new values toUm,UM ,Vm, andVM . (m: Minimum; M:maximum). While Np is the average area of spots (numberof pixels), we can estimate the number of operations neededto calculate the center of each spot by 4Np + 6. And inglobal, Nop ≈ 25 ∗ N ∗ (4Np + 6) operations are neededto calculate the centers of N spots (video-cadence of 25 fps).Such approximation is simple and easy to use but still needsconsiderable time to be calculated. Beside, the error is notnegligible. The error in such method is nearly 0.22 pixel,and the maximum error is more than 0.5 pixel [29]. Takingthe spot of Figure 15 as an example of inaccuracy of sucha method, the real center position of these pixels is (4.47;6.51). But when applying this approximation method, thecenter position will be (5; 6). This inaccuracy will resultmismatching problem that affects the measurement resultwhen reconstructing object.
EURASIP Journal on Embedded Systems 9
uv
a0b0
a1b1
a2b2
aNbN
......
Estimation
Estimation
Estimation
Estimation
Compare
Compare
Compare
Compare
Coderαi
βiPara
met
erm
emor
y
1/z
com
pute
Figure 16: 3D unit.
6.3. Our Method. The area of each spot (number of pixels)is always a positive integer, while its value is limited ina predeterminate interval [Nmin,Nmax], where Nmin andNmax are, respectively, the minimum and maximum areasof laser spot in the image. The spot areas depend onobject illumination, distance between object and camera,and the angle of view of the scene. Our method consistsin a memorisation of 1/N where N represent the spot pixelnumber and can take value in [1,Nlimit]. Nlimit represent themaximum considered size, in pixels, of a spot.
In this case we need only to compute a multiplication,that is resume here:
ugI = (u1 + u2 + · · · + uI)∗ 1NI
,
vgI = (v1 + v2 + · · · + vI)∗ 1NI
.
(16)
The implementation of such a filter is very easy, regardingthat the most of DSP functions are provided for earlierFPGAs. For example, Virtex-II architecture [30] provides an18 × 18 bits Multiplier with a latency of about 4.87 ns at205 MHz and optimised for high-speed operations. Addi-tionally, the power consumption is lower compared to a sliceimplementation of an 18-bit by 18-bit multiplier [31]. ForN luminous spots source, the number of operations neededto compute the centers coordinates is Nop ≈ 25 ∗ N ∗ NP ,and Np is the average area of spots. When implementing ourapproach to Virtex II Pro FPGA (XC2VP30), it was clear thatwe gain in execution time and size. Comparison of differentimplementation approaches is described in the next section.
7. Matching Algorithm
The set of parameters for the epipolar and depth modelsare used during run time to make point matching (identifythe original position of a pattern point from its image) and
calculate the depth using the coordinates of each laser spotcenter.
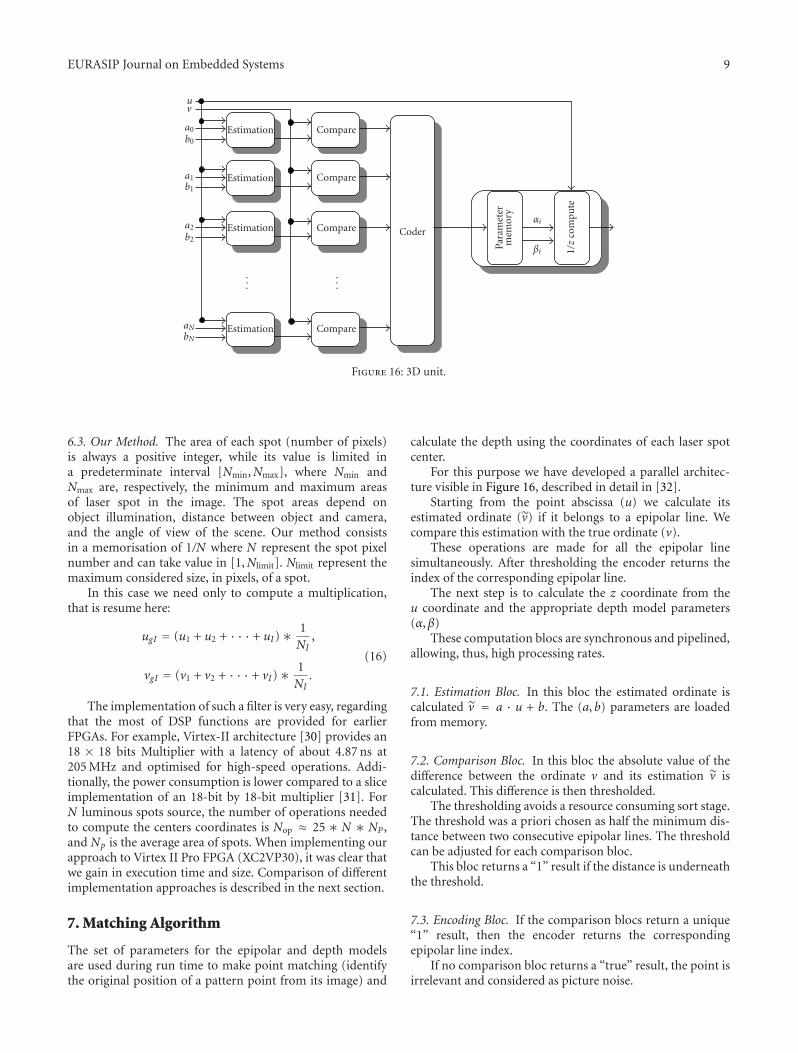
For this purpose we have developed a parallel architec-ture visible in Figure 16, described in detail in [32].
Starting from the point abscissa (u) we calculate itsestimated ordinate (v) if it belongs to a epipolar line. Wecompare this estimation with the true ordinate (v).
These operations are made for all the epipolar linesimultaneously. After thresholding the encoder returns theindex of the corresponding epipolar line.
The next step is to calculate the z coordinate from theu coordinate and the appropriate depth model parameters(α,β)
These computation blocs are synchronous and pipelined,allowing, thus, high processing rates.
7.1. Estimation Bloc. In this bloc the estimated ordinate iscalculated v = a · u + b. The (a, b) parameters are loadedfrom memory.
7.2. Comparison Bloc. In this bloc the absolute value of thedifference between the ordinate v and its estimation v iscalculated. This difference is then thresholded.
The thresholding avoids a resource consuming sort stage.The threshold was a priori chosen as half the minimum dis-tance between two consecutive epipolar lines. The thresholdcan be adjusted for each comparison bloc.
This bloc returns a “1” result if the distance is underneaththe threshold.
7.3. Encoding Bloc. If the comparison blocs return a unique“1” result, then the encoder returns the correspondingepipolar line index.
If no comparison bloc returns a “true” result, the point isirrelevant and considered as picture noise.
10 EURASIP Journal on Embedded Systems
Cyclope
Di (data in)
/CTS
Do (data out)
/RTS
Xbee module Xbee module PC
Di (data in)
/CTS
Do (data out)
/RTS
Figure 17: Wireless communication.
If more than one comparison blocs returns “1”, then weconsider that we have a correspondence error and a flag is set.
The selected index is then carried to the next stage wherethe z coordinate is calculated. It allows the selection of theright parameters to the depth model.
We compute (1/z), rather than z as we said earlier, to havea simpler computation unit. This computation bloc is thenidentical to the estimation bloc.
8. Wireless Communication
Finally, after computation, the 3D coordinates of the laserdots accompanied by the image of texture are sent to anexternal reader. So, Cyclope is equipped with a block ofwireless communication which allows us to transmit theimage of texture, the coordinates 3D of the centers of thespots laser, and even to remotely reconfigure the digitalprocessing architecture (an Over The Air FPGA). Whileattending the IEEE802.15 Body Area Network standard [33],the frequency assigned for implanted device RF communica-tion is around 403 MHz and referred to as the MICS (MedicalImplant Communication System) band due to essentiallythree reasons:
(i) a small antenna,
(ii) a minimum losses environment which allows todesign low-power transmitter,
(iii) a free band without causing interference to otherusers of the electromagnetic radio spectrum [34].
In order to make rapidly a wireless communication ofour prototype, we chose to use Zigbee module at 2.45 GHzavailable on the market contrary to modules MCIS. Weare self-assured that later frequency is not usable for thecommunication between the implant and an external reader,due to the electromagnetic losses of the human body. TwoXbee-pro modules from the Digi Corporation have beenused. One for the demonstrator and the second plugged on aPC host where a human machine interface has been designedto visualise in real-time the 3D textured reconstruction of thescene.
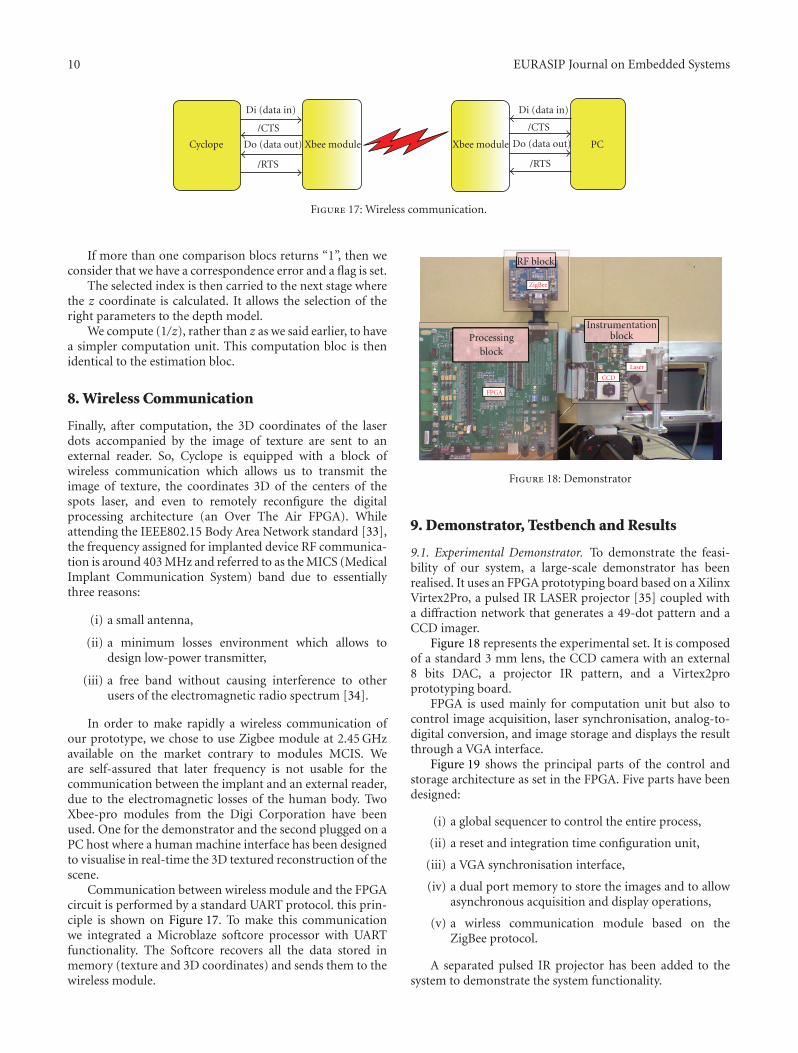
Communication between wireless module and the FPGAcircuit is performed by a standard UART protocol. this prin-ciple is shown on Figure 17. To make this communicationwe integrated a Microblaze softcore processor with UARTfunctionality. The Softcore recovers all the data stored inmemory (texture and 3D coordinates) and sends them to thewireless module.
RF block
Processingblock
Instrumentationblock
ZigBee
FPGA
CCD
Laser
Figure 18: Demonstrator
9. Demonstrator, Testbench and Results
9.1. Experimental Demonstrator. To demonstrate the feasi-bility of our system, a large-scale demonstrator has beenrealised. It uses an FPGA prototyping board based on a XilinxVirtex2Pro, a pulsed IR LASER projector [35] coupled witha diffraction network that generates a 49-dot pattern and aCCD imager.
Figure 18 represents the experimental set. It is composedof a standard 3 mm lens, the CCD camera with an external8 bits DAC, a projector IR pattern, and a Virtex2proprototyping board.
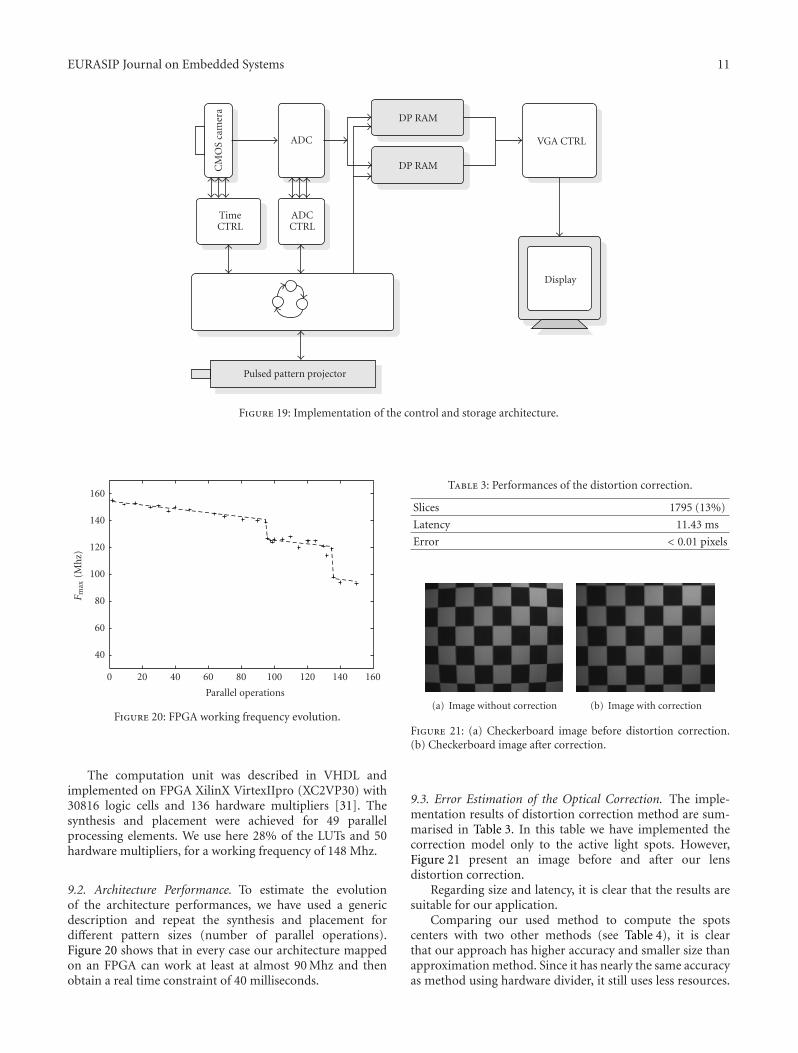
FPGA is used mainly for computation unit but also tocontrol image acquisition, laser synchronisation, analog-to-digital conversion, and image storage and displays the resultthrough a VGA interface.
Figure 19 shows the principal parts of the control andstorage architecture as set in the FPGA. Five parts have beendesigned:
(i) a global sequencer to control the entire process,
(ii) a reset and integration time configuration unit,
(iii) a VGA synchronisation interface,
(iv) a dual port memory to store the images and to allowasynchronous acquisition and display operations,
(v) a wirless communication module based on theZigBee protocol.
A separated pulsed IR projector has been added to thesystem to demonstrate the system functionality.
EURASIP Journal on Embedded Systems 11
Pulsed pattern projector
TimeCTRL
ADCCTRL
Display
CM
OS
cam
era
ADC
DP RAM
DP RAM
VGA CTRL
Figure 19: Implementation of the control and storage architecture.
40
60
80
100
120
140
160
Fm
ax(M
hz)
0 20 40 60 80 100 120 140 160
Parallel operations
Figure 20: FPGA working frequency evolution.
The computation unit was described in VHDL andimplemented on FPGA XilinX VirtexIIpro (XC2VP30) with30816 logic cells and 136 hardware multipliers [31]. Thesynthesis and placement were achieved for 49 parallelprocessing elements. We use here 28% of the LUTs and 50hardware multipliers, for a working frequency of 148 Mhz.
9.2. Architecture Performance. To estimate the evolutionof the architecture performances, we have used a genericdescription and repeat the synthesis and placement fordifferent pattern sizes (number of parallel operations).Figure 20 shows that in every case our architecture mappedon an FPGA can work at least at almost 90 Mhz and thenobtain a real time constraint of 40 milliseconds.
Table 3: Performances of the distortion correction.
Slices 1795 (13%)
Latency 11.43 ms
Error < 0.01 pixels
(a) Image without correction (b) Image with correction
Figure 21: (a) Checkerboard image before distortion correction.(b) Checkerboard image after correction.
9.3. Error Estimation of the Optical Correction. The imple-mentation results of distortion correction method are sum-marised in Table 3. In this table we have implemented thecorrection model only to the active light spots. However,Figure 21 present an image before and after our lensdistortion correction.
Regarding size and latency, it is clear that the results aresuitable for our application.
Comparing our used method to compute the spotscenters with two other methods (see Table 4), it is clearthat our approach has higher accuracy and smaller size thanapproximation method. Since it has nearly the same accuracyas method using hardware divider, it still uses less resources.
12 EURASIP Journal on Embedded Systems
0
0.5
1
1.5
2
2.5
Err
or(%
)
45 50 55 60 65 70
Depth (cm)
Distorted imageCorrected image
Depth estimation error
Figure 22: Error comparison before and after applying distortioncorrection and centers recomputing.
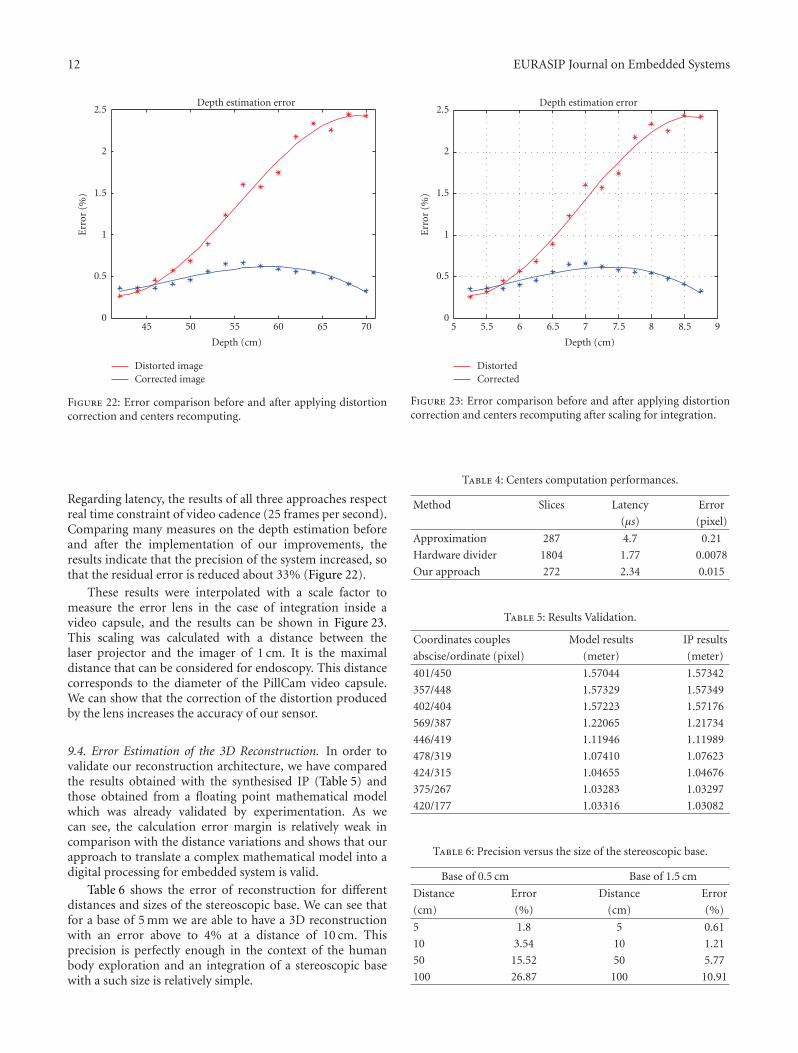
Regarding latency, the results of all three approaches respectreal time constraint of video cadence (25 frames per second).Comparing many measures on the depth estimation beforeand after the implementation of our improvements, theresults indicate that the precision of the system increased, sothat the residual error is reduced about 33% (Figure 22).
These results were interpolated with a scale factor tomeasure the error lens in the case of integration inside avideo capsule, and the results can be shown in Figure 23.This scaling was calculated with a distance between thelaser projector and the imager of 1 cm. It is the maximaldistance that can be considered for endoscopy. This distancecorresponds to the diameter of the PillCam video capsule.We can show that the correction of the distortion producedby the lens increases the accuracy of our sensor.
9.4. Error Estimation of the 3D Reconstruction. In order tovalidate our reconstruction architecture, we have comparedthe results obtained with the synthesised IP (Table 5) andthose obtained from a floating point mathematical modelwhich was already validated by experimentation. As wecan see, the calculation error margin is relatively weak incomparison with the distance variations and shows that ourapproach to translate a complex mathematical model into adigital processing for embedded system is valid.
Table 6 shows the error of reconstruction for differentdistances and sizes of the stereoscopic base. We can see thatfor a base of 5 mm we are able to have a 3D reconstructionwith an error above to 4% at a distance of 10 cm. Thisprecision is perfectly enough in the context of the humanbody exploration and an integration of a stereoscopic basewith a such size is relatively simple.
0
0.5
1
1.5
2
2.5
Err
or(%
)
5 5.5 6 6.5 7 7.5 8 8.5 9
Depth (cm)
DistortedCorrected
Depth estimation error
Figure 23: Error comparison before and after applying distortioncorrection and centers recomputing after scaling for integration.
Table 4: Centers computation performances.
Method Slices Latency Error
(μs) (pixel)
Approximation 287 4.7 0.21
Hardware divider 1804 1.77 0.0078
Our approach 272 2.34 0.015
Table 5: Results Validation.
Coordinates couples Model results IP results
abscise/ordinate (pixel) (meter) (meter)
401/450 1.57044 1.57342
357/448 1.57329 1.57349
402/404 1.57223 1.57176
569/387 1.22065 1.21734
446/419 1.11946 1.11989
478/319 1.07410 1.07623
424/315 1.04655 1.04676
375/267 1.03283 1.03297
420/177 1.03316 1.03082
Table 6: Precision versus the size of the stereoscopic base.
Base of 0.5 cm Base of 1.5 cm
Distance Error Distance Error
(cm) (%) (cm) (%)
5 1.8 5 0.61
10 3.54 10 1.21
50 15.52 50 5.77
100 26.87 100 10.91
EURASIP Journal on Embedded Systems 13
Texture IRLaser spots
3D-VRML
Figure 24: Visualisation of the results by our application.
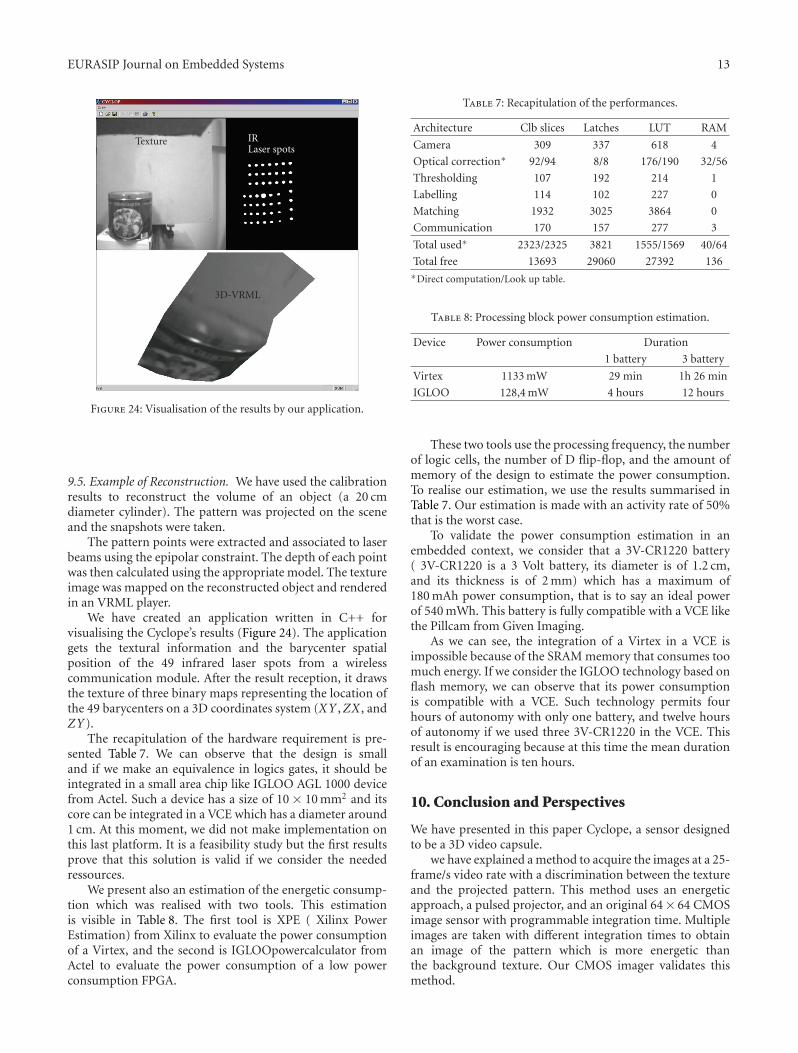
9.5. Example of Reconstruction. We have used the calibrationresults to reconstruct the volume of an object (a 20 cmdiameter cylinder). The pattern was projected on the sceneand the snapshots were taken.
The pattern points were extracted and associated to laserbeams using the epipolar constraint. The depth of each pointwas then calculated using the appropriate model. The textureimage was mapped on the reconstructed object and renderedin an VRML player.
We have created an application written in C++ forvisualising the Cyclope’s results (Figure 24). The applicationgets the textural information and the barycenter spatialposition of the 49 infrared laser spots from a wirelesscommunication module. After the result reception, it drawsthe texture of three binary maps representing the location ofthe 49 barycenters on a 3D coordinates system (XY ,ZX , andZY).
The recapitulation of the hardware requirement is pre-sented Table 7. We can observe that the design is smalland if we make an equivalence in logics gates, it should beintegrated in a small area chip like IGLOO AGL 1000 devicefrom Actel. Such a device has a size of 10 × 10 mm2 and itscore can be integrated in a VCE which has a diameter around1 cm. At this moment, we did not make implementation onthis last platform. It is a feasibility study but the first resultsprove that this solution is valid if we consider the neededressources.
We present also an estimation of the energetic consump-tion which was realised with two tools. This estimationis visible in Table 8. The first tool is XPE ( Xilinx PowerEstimation) from Xilinx to evaluate the power consumptionof a Virtex, and the second is IGLOOpowercalculator fromActel to evaluate the power consumption of a low powerconsumption FPGA.
Table 7: Recapitulation of the performances.
Architecture Clb slices Latches LUT RAM
Camera 309 337 618 4
Optical correction∗ 92/94 8/8 176/190 32/56
Thresholding 107 192 214 1
Labelling 114 102 227 0
Matching 1932 3025 3864 0
Communication 170 157 277 3
Total used∗ 2323/2325 3821 1555/1569 40/64
Total free 13693 29060 27392 136∗Direct computation/Look up table.
Table 8: Processing block power consumption estimation.
Device Power consumption Duration
1 battery 3 battery
Virtex 1133 mW 29 min 1h 26 min
IGLOO 128,4 mW 4 hours 12 hours
These two tools use the processing frequency, the numberof logic cells, the number of D flip-flop, and the amount ofmemory of the design to estimate the power consumption.To realise our estimation, we use the results summarised inTable 7. Our estimation is made with an activity rate of 50%that is the worst case.
To validate the power consumption estimation in anembedded context, we consider that a 3V-CR1220 battery( 3V-CR1220 is a 3 Volt battery, its diameter is of 1.2 cm,and its thickness is of 2 mm) which has a maximum of180 mAh power consumption, that is to say an ideal powerof 540 mWh. This battery is fully compatible with a VCE likethe Pillcam from Given Imaging.
As we can see, the integration of a Virtex in a VCE isimpossible because of the SRAM memory that consumes toomuch energy. If we consider the IGLOO technology based onflash memory, we can observe that its power consumptionis compatible with a VCE. Such technology permits fourhours of autonomy with only one battery, and twelve hoursof autonomy if we used three 3V-CR1220 in the VCE. Thisresult is encouraging because at this time the mean durationof an examination is ten hours.
10. Conclusion and Perspectives
We have presented in this paper Cyclope, a sensor designedto be a 3D video capsule.
we have explained a method to acquire the images at a 25-frame/s video rate with a discrimination between the textureand the projected pattern. This method uses an energeticapproach, a pulsed projector, and an original 64× 64 CMOSimage sensor with programmable integration time. Multipleimages are taken with different integration times to obtainan image of the pattern which is more energetic thanthe background texture. Our CMOS imager validates thismethod.
14 EURASIP Journal on Embedded Systems
Also we present a 3D reconstruction processing thatallows a precise and real-time reconstruction. This process-ing which is specifically designed for an integrated sensorand its integration in an FPGA-like device has a low powerconsumption compatible with a VCE examination.
The method was tested on a large scale demonstratorusing an FPGA prototyping board and a 352 × 288 pixelsCCD sensor. The results show that it is possible to integratea stereoscopic base which is designed for a integrated sensorand to keep a good precision for a human body exploration.
The next step to this work is the chip level integration ofboth the image sensor and the pattern projector. Evaluate thepower consumption of the pulsed laser projector consideringthe optical efficiency of the diffraction head.
The presented version of Cyclope is the first step towardthe final goal of the project. After this, the goal is to realisea real-time pattern recognition with processing-like supportvector machine or neuronal network. The final issue ofCyclope is to be a real smart sensor that can realize a partof a diagnosis inside the body and then increase its fiability.
References
[1] G. Iddan, G. Meron, A. Glukhovsky, and P. Swain, “Wirelesscapsule endoscopy,” Nature, vol. 405, no. 6785, pp. 417–418,2000.
[2] J.-F. Rey, K. Kuznetsov, and E. Vazquez-Ballesteros, “Olympuscapsule endoscope for small and large bowel exploration,”Gastrointestinal Endoscopy, vol. 63, no. 5, p. AB176, 2006.
[3] M. Gay, et al., “La video capsule endoscopique: qu’en atten-dre?” CISMEF, http://www.churouen.fr/ssf/equip/capsules-videoendoscopiques.html.
[4] T. Graba, B. Granado, O. Romain, T. Ea, A. Pinna, and P.Garda, “Cyclope: an integrated real-time 3d image sensor,” inProceedings of the 19th International Conference on Design ofCircuits and Integrated Systems, 2004.
[5] F. Marzani, Y. Voisin, L. L. Y. Voon, and A. Diou, “Activesterovision system: a fast and easy calibration method,” inProceedings of the 6th International Conference on ControlAutomation, Robotics and Vision (ICARCV ’00), 2000.
[6] W. Li, F. Boochs, F. Marzani, and Y. Voisin, “Iterative 3dsurface reconstruction with adaptive pattern projection,” inProceedings of the 6th IASTED International Conference onVisualization, Imaging, and Image Processing (VIIP ’06), pp.336–341, August 2006.
[7] P. Lavoie, D. Ionescu, and E. Petriu, “A high precision 3d objectreconstruction method using a color coded grid and nurbs,” inProceedings of the International Conference on Image Analysisand Processing, 1999.
[8] Y. Oike, H. Shintaku, S. Takayama, M. Ikeda, and K.Asada, “Real-time and high resolution 3-d imaging systemusing light-section method and smart CMOS sensor,” inProceedings of the IEEE International Conference on Sensors(SENSORS ’03), vol. 2, pp. 502–507, October 2003.
[9] A. Ullrich, N. Studnicka, J. Riegl, and S. Orlandini, “Long-range highperformance time-of-flight-based 3d imaging sen-sors,” in Proceedings of the International Symposium on 3DData Processing Visualization and Transmission, 2002.
[10] A. Mansouri, A. Lathuiliere, F. S. Marzani, Y. Voisin, and P.Gouton, “Toward a 3d multispectral scanner: an applicationto multimedia,” IEEE Multimedia, vol. 14, no. 1, pp. 40–47,2007.
[11] F. Bernardini and H. Rushmeier, “The 3d model acquisitionpipeline,” Computer Graphics Forum, vol. 21, no. 2, pp. 149–172, 2002.
[12] S. Zhang, “Recent progresses on real-time 3d shape measure-ment using digital fringe projection techniques,” Optics andLasers in Engineering, vol. 48, no. 2, pp. 149–158, 2010.
[13] F. W. Depiero and M. M. Triverdi, “3d computer vision usingstructured light: design, calibration, and implementationissues,” Journal of Advances in Computers, pp. 243–278, 1996.
[14] E. E. Hemayed, M. T. Ahmed, and A. A. Farag, “CardEye: a3d trinocular active vision system,” in Proceedings of the IEEEConference on Intelligent Transportation Systems (ITSC ’00),pp. 398–403, Dearborn, Mich, USA, October 2000.
[15] A. Kolar, T. Graba, A. Pinna, O. Romain, B. Granado, andE. Belhaire, “Smart Bi-spectral image sensor for 3d vision,”in Proceedings of the 6th IEEE Conference on SENSORS (IEEESENSORS ’07), pp. 577–580, Atlanta, Ga, USA, October 2007.
[16] B. Gyselinckx, C. Van Hoof, J. Ryckaert, R. F. Yazicioglu,P. Fiorini, and V. Leonov, “Human++: autonomous wirelesssensors for body area networks,” in Proceedings of the IEEECustom Integrated Circuits Conference, pp. 12–18, 2005.
[17] B. Warneke, M. Last, B. Liebowitz, and K. S. J. Pister, “Smartdust: communicating with a cubic-millimeter computer,”Computer, vol. 34, no. 1, pp. 44–51, 2001.
[18] R. Horaud and O. Monga, Vision par Ordinateur, chapter 5,Hermes, 1995.
[19] O. Faugeras, Three-Dimensional Computer Vision, a GeometricViewpoint, MIT Press, Cambridge, Mass, USA, 1993.
[20] J. Batlle, E. Mouaddib, and J. Salvi, “Recent progress in codedstructured light as a technique to solve the correspondenceproblem: a survey,” Pattern Recognition, vol. 31, no. 7, pp. 963–982, 1998.
[21] S. Woo, A. Dipanda, F. Marzani, and Y. Voisin, “Determinationof an optimal configuration for a direct correspondence inan active stereovision system,” in Proceedings of the IASTEDInternational Conference on Visualization, Imaging, and ImageProcessing, 2002.
[22] O.-Y. Mang, S.-W. Huang, Y.-L. Chen, H.-H. Lee, and P.-K. Weng, “Design of wide-angle lenses for wireless capsuleendoscopes,” in Optical Engineering, vol. 46, October 2007.
[23] J. Heikkila and O. Silven, “A four-step camera calibrationprocedure with implicit image correction,” in Proceedings ofthe IEEE Computer Society Conference on Computer Vision andPattern Recognition, pp. 1106–1112, San Juan, Puerto Rico,USA, 1997.
[24] K. Hwang and M. G. Kang, “Correction of lens distortionusing point correspondence,” in Proceedings of the IEEE Region10 Conference (TENCON ’99), vol. 1, pp. 690–693, 1999.
[25] J. Heikkila, Accurate camera calibration and feature based3-D reconstruction from monocular image sequences, Ph.D.dissertation, University of Oulu, Oulu, Finland, 1997.
[26] N. Otsu, “A threshold selection method from gray level his-togram,” IEEE Transactions on Systems, Man, and Cybernetics,vol. 9, no. 1, pp. 62–66, 1979.
[27] J. N. Kapur, P. K. Sahoo, and A. K. C. Wong, “A new methodfor gray-level picture thresholding using the entropy of thehistogram,” Computer Vision, Graphics, & Image Processing,vol. 29, no. 3, pp. 273–285, 1985.
[28] D. Faura, T. Graba, S. Viateur, O. Romain, B. Granado, andP. Garda, “Seuillage dynamique temps reel dans un systemeembarque,” in Proceedings of the 21eme Colloque du Groupede Recherche et d’Etude du Traitement du Signal et des l’Image(GRETSI ’07), 2007.
EURASIP Journal on Embedded Systems 15
[29] T. Graba, Etude d’une architecture de traitement pour uncapteur integre de vision 3d, Ph.D. dissertation, UniversitePierre et Marie Curie, 2006.
[30] M. Adhiwiyogo, “Optimal pipelining of the I/O ports of thevirtex-II multiplier,” XAPP636, vol. 1.4, June 2004.
[31] Xilinx, “Virtex-II Pro and Virtex-II Pro Platform FPGA:Complete Data Sheet,” October 2005.
[32] A. Kolar, T. Graba, A. Pinna, O. Romain, B. Granado, and T.Ea, “A digital processing architecture for 3d reconstruction,”in Proceedings of the International Workshop on ComputerArchitecture for Machine Perception and Sensing (CAMPS ’06),pp. 172–176, Montreal, Canada, August 2006.
[33] ieee802, http://www.ieee802.org/15/pub/TG6.html.[34] M. R. Yuce, S. W. P. Ng, N. L. Myo, J. Y. Khan, and W. Liu,
“Wireless body sensor network using medical implant band,”Journal of Medical Systems, vol. 31, no. 6, pp. 467–474, 2007.
[35] Laser2000, http://www.laser2000.fr/index.php?id=368949&L=2.

Photograph © Turisme de Barcelona / J. Trullàs
Preliminary call for papers
The 2011 European Signal Processing Conference (EUSIPCO 2011) is thenineteenth in a series of conferences promoted by the European Association forSignal Processing (EURASIP, www.eurasip.org). This year edition will take placein Barcelona, capital city of Catalonia (Spain), and will be jointly organized by theCentre Tecnològic de Telecomunicacions de Catalunya (CTTC) and theUniversitat Politècnica de Catalunya (UPC).EUSIPCO 2011 will focus on key aspects of signal processing theory and
li ti li t d b l A t f b i i ill b b d lit
Organizing Committee
Honorary ChairMiguel A. Lagunas (CTTC)
General ChairAna I. Pérez Neira (UPC)
General Vice ChairCarles Antón Haro (CTTC)
Technical Program ChairXavier Mestre (CTTC)
Technical Program Co Chairsapplications as listed below. Acceptance of submissions will be based on quality,relevance and originality. Accepted papers will be published in the EUSIPCOproceedings and presented during the conference. Paper submissions, proposalsfor tutorials and proposals for special sessions are invited in, but not limited to,the following areas of interest.
Areas of Interest
• Audio and electro acoustics.• Design, implementation, and applications of signal processing systems.
l d l d d
Technical Program Co ChairsJavier Hernando (UPC)Montserrat Pardàs (UPC)
Plenary TalksFerran Marqués (UPC)Yonina Eldar (Technion)
Special SessionsIgnacio Santamaría (Unversidadde Cantabria)Mats Bengtsson (KTH)
FinancesMontserrat Nájar (UPC)• Multimedia signal processing and coding.
• Image and multidimensional signal processing.• Signal detection and estimation.• Sensor array and multi channel signal processing.• Sensor fusion in networked systems.• Signal processing for communications.• Medical imaging and image analysis.• Non stationary, non linear and non Gaussian signal processing.
Submissions
Montserrat Nájar (UPC)
TutorialsDaniel P. Palomar(Hong Kong UST)Beatrice Pesquet Popescu (ENST)
PublicityStephan Pfletschinger (CTTC)Mònica Navarro (CTTC)
PublicationsAntonio Pascual (UPC)Carles Fernández (CTTC)
I d i l Li i & E hibiSubmissions
Procedures to submit a paper and proposals for special sessions and tutorials willbe detailed at www.eusipco2011.org. Submitted papers must be camera ready, nomore than 5 pages long, and conforming to the standard specified on theEUSIPCO 2011 web site. First authors who are registered students can participatein the best student paper competition.
Important Deadlines:
P l f i l i 15 D 2010
Industrial Liaison & ExhibitsAngeliki Alexiou(University of Piraeus)Albert Sitjà (CTTC)
International LiaisonJu Liu (Shandong University China)Jinhong Yuan (UNSW Australia)Tamas Sziranyi (SZTAKI Hungary)Rich Stern (CMU USA)Ricardo L. de Queiroz (UNB Brazil)
Webpage: www.eusipco2011.org
Proposals for special sessions 15 Dec 2010Proposals for tutorials 18 Feb 2011Electronic submission of full papers 21 Feb 2011Notification of acceptance 23 May 2011Submission of camera ready papers 6 Jun 2011