A study on Savings and Investment Patterns of Women in ...
123
A study on Savings and Investment Patterns of Women in Bangalore Submitted in partial fulfillment of the requirements for the degree of Master of Philosophy in Management by Iyer Anusha Srinivasan (Roll No. 1130004) Supervisor: Dr. Ganesh L Associate Professor Institute of Management CHRIST UNIVERSITY, BANGALORE 2012 Property of Christ University. Use it for fair purpose. Give credit to the author by citing properly, if your are using it.
-
Upload
khangminh22 -
Category
Documents
-
view
1 -
download
0
Transcript of A study on Savings and Investment Patterns of Women in ...
A study on Savings and Investment Patterns
of Women in Bangalore
Submitted in partial fulfillment of the requirements for the degree of
Master of Philosophy in Management
by
Iyer Anusha Srinivasan
(Roll No. 1130004)
Supervisor:
Dr. Ganesh L
Associate Professor
Institute of Management
CHRIST UNIVERSITY, BANGALORE
2012
Property of Christ University. Use it for fair purpose. Give credit to the author by citing properly, if your are using it.

i
ACKNOWLEDGEMENT
I take this opportunity to express my gratitude to the people who made it possible for me to
complete this dissertation.
I express my sincere gratitude to my guide, Dr Ganesh L for his step by step guidance throughout
the research. Even though the time span within which the research had to be conducted was short,
he ensured that the research was conducted in a meticulous and procedural manner.
I am extremely thankful to Ms. Keerti Mallela, Research Assistant, Christ University for
selflessly helping me with Data Analysis.
My heartfelt gratitude to my parents for the sacrifices they made to facilitate me complete this
course and to my husband for his constant support.
Property of Christ University. Use it for fair purpose. Give credit to the author by citing properly, if your are using it.

ii
DECLARATION
I, Iyer Anusha Srinivasan, hereby declare that the dissertation, entitled “A study on Savings
and Investment Patterns of Women in Bangalore” submitted to Christ University, in partial
fulfillment of the requirements for the award of the Degree of Master of Philosophy in
Management is a record of original and independent research work done by me during 2011-2012
under the supervision and guidance of Dr.Ganesh L of Christ University Institute of
Management, and it has not formed the basis for the award of any
Degree/Diploma/Associateship/Fellowship or other similar title to any candidate of any
University.
Date: Signature of the candidate
Property of Christ University. Use it for fair purpose. Give credit to the author by citing properly, if your are using it.

iii
CERTIFICATE
This is to certify that the dissertation, entitled “A study on Savings and Investment Patterns of
Women in Bangalore” submitted to Christ University, in partial fulfillment of the requirements
for the award of the Degree of Master of Philosophy in Management is a record of original
research work done by Ms. Iyer Anusha Srinivasan during the period 2011-2012 of her study in
the Institute of Management at Christ University, Bangalore, under my supervision and
guidance and the dissertation has not formed the basis for the award of any
Degree/Diploma/Associateship/Fellowship or other similar title to any candidate of any
University.
Date: Dr. Ganesh L
Associate Professor
Property of Christ University. Use it for fair purpose. Give credit to the author by citing properly, if your are using it.

iv
APPROVAL OF DISSERTATION
The Dissertation entitled “A study on Savings and Investment Patterns of Women in
Bangalore” by Iyer Anusha Srinivasan is approved for the degree of Master of Philosophy in
Management
Examiners:
1. ___________________ ___________________
2. ___________________ ___________________
3. ___________________ ___________________
Chairman:
___________________ (Seal)
Date: ___________
Place: __________
Property of Christ University. Use it for fair purpose. Give credit to the author by citing properly, if your are using it.

v
ABSTRACT
Economic growth of a nation is driven by savings and its transformation into investment. In the
last three decades, Indian economy has emerged as one of the fastest growing economies of the
world. Households are the biggest contributors to India’s savings rate; their savings equal 23
percent of India’s GDP. Though the percentage of savings by household sector in financial assets
is increasing year on year, what is worrying is that only around half of the household savings in
India are invested in financial instruments. Knowledge about saving and investment preferences,
gender-wise, will help to design effective investment instruments. Another area that requires
further examination is the role that a woman plays in influencing aggregate savings and
investment.
Till the last decade, considering the low earning potential of women to earn, save and invest, not
much research has been conducted on this subject. The coming decade, is going to see more and
more women getting higher education and aiming for heavy pay cheque jobs. There is an urgent
need to understand the savings and investment pattern of women, so as to frame policies and
develop financial products exclusively for women. Another reason for understanding the savings
and investment pattern of women is that, though they are good savers, they are unable to convert
all their savings into investments. They do not invest as much as the men do.
According to Barber (2001) though women are not active investors, they make more profits than
men when they trade because by trading more, men hurt their performance more than women.
Preda (2001) comments that women are always excluded from financial discussions, on the
explicit ground that they cannot understand investments. According to Chachoria (2000) women
are the next generation financial decision makers and they should be targeted from a financial
perspective. She suggests that marketing for financial products should be done differently for
women.
Through this study an attempt is made to understand the savings and investment pattern of
women. The factors which influence their investment decision making are identified. As 60
percent of women in India are house wives , they have been included in this study . The Property of Christ University. Use it for fair purpose. Give credit to the author by citing properly, if your are using it.

vi
variations in the investment pattern between working and non-working with respect to socio-
demographic attributes have been analyzed.
The sample size consisted of 225 women, who regularly save and invest. The study was
conducted in the city of Bangalore. Convenience sampling was used for the purpose of data
collection. Data was collected through questionnaires and was subjected to descriptive and
inferential analysis.
The major findings of the research are:
The most important reason why a woman saves is because of a “Precautionary” motive.
Saving money in Bank and in the house kitty (saving at home) are the most preferred
saving avenues.
Even though non-working women don’t have direct income of their own, they are able to
save a minimum of 5 to 10 percent from their household savings.
Safety of the principal is regarded as a very important criterion before investing, as
opposed to instruments with low initial investment.
The main motive behind investing is to fulfill their personal and financial goals. They also
recognize the importance of multiplying savings through investment.
Gold is the most preferred investment instrument, followed by real estate, insurance
products, bank deposits, chit funds, mutual funds, bonds, post office deposits, shares and
SIP.
The highest constraint in investing is found to be lack of awareness and advice. This
bursts a common myth: In India women are not able to invest as they are not able to take
decisions on their own. Property of Christ University.
Use it for fair purpose. Give credit to the author by citing properly, if your are using it.

vii
Occupation of a working woman has bearing over the choice of traditional investments
but has no effect over the choice of risky instruments. It can also be said that education
plays a role in the choice of risky instruments for a non-working women, however for the
safe- traditional investments, education has no bearing. Also, irrespective of the
occupational status (working or non-working) for safe –traditional instruments, age does
not play a role, whereas for risky instrument it plays a role.
The study will help the financial institutions in designing exclusive instruments for women and to
the Government in coming up with new policies for utilizing women’s savings for the betterment
of the economy.
Key words: Savings, Investment, Women, Working Women, Non-working women
Property of Christ University. Use it for fair purpose. Give credit to the author by citing properly, if your are using it.
viii
Table of Contents
1. Introduction
1.1 Savings and Investment in the present Indian Economy………………………………….2
1.2 Importance of Women as savers and Investors …………………………………………..4
1.3 Present position of women in India with regard to savings and investments……………..8
1.4 Challenges faced by Women in Saving and Investing…………………………………...11
1.5 Genesis of the problem…………………………………………………………………...12
1.6 Need and Relevance of the study………………………………………………………...14
1.7 Scope of the study………………………………………………………………………..16
1.8 Limitations……………………………………………………………………………….16
1.9 Chapeterization…………………………………………………………………………...16
2. Review of Literature
2.1 Review of Studies………………………………………………………………………...17
2.1.1 Studies regarding nature and pattern of savings……………………………………...18
2.1.2 Studies regarding nature and pattern of investment…………………………………27
2.2 Research Gap…………………………………………………………………………….31
3. Research Methodology
3.1 Statement of the problem…………………………………………………………………33
3.2 Research Objective……………………………………………………………………….33
3.3 Research Hypothesis……………………………………………………………………...34
3.4 Theoretical Framework…………………………………………………………………...37
3.5 Methodology……………………………………………………………………………..37
3.5.1 Data Collection……………………………………………………………………….37
3.5.2 Sampling Plan………………………………………………………………………..37
3.5.3 Survey instrument…………………………………………………………………….38
3.5.4 Reliability of the instrument………………………………………………………….38 Property of Christ University. Use it for fair purpose. Give credit to the author by citing properly, if your are using it.

ix
3.5.5 Scaling techniques……………………………………………………………………38
3.5.6 Statistical techniques…………………………………………………………………38
3.6 Operational Definitions…………………………………………………………………..40
3.7 Variables………………………………………………………………………………….41
3.8 Limitations………………………………………………………………………………..41
4 Analysis and Interpretation
4.1 Demographics of the Respondents……………………………………………………….44
4.2 Savings and Investment patterns of Women……………………………………………..45
4.2.1 Savings pattern ………………………………………………………………………...45
4.2.2 Investment pattern ……………………………………………………………………..52
4.3 Factor Analysis………………………………………………………………………….58
4.3.1 Factor Analysis for Independent Variables…………………………………………….58
4.3.2 Factor Analysis for Dependent Variables………………………………………………61
4.4 Variance in Investment pattern among working and non-working women……………..75
4.4.1 Differences in frequency of investing across socio-demographic attributes………....76
4.5 Variations in the choice of instrument across socio-demographic attributes…………..76
4..6 Descriptive statistics……………………………………………………………………77
5. Summary and Conclusion
5.1 Need and Rationale of the study………………………………………………………..90
5.2 Review of Literature…………………………………………………………………….91 Property of Christ University. Use it for fair purpose. Give credit to the author by citing properly, if your are using it.

x
5.3 Research Gap…………………………………………………………………………….91
5.4 Statement of the Problem………………………………………………………………..92
5.5 Research Objectives…………………………………………………………………...…92
5.6 Sampling plan…………………………………………………………………………....93
5.8 Survey Measurement……………………………………………………………………..93
5.9 Statistical Techniques…………………………………………………………………….93
5.10 Variables………………………………………………………………………………..94
5.11 Summary of findings……………………………………………………………………94
5.11.1 Savings pattern of women…………………………………………………………….94
5.11.2 Investment pattern of women…………………………………………………………95
5.11.3 Inferential Analysis……………………………………………………………………97
5.12 Implications of the Research……………………………………………………………99
5.13 Suggestions and Recommendations…………………………………………………...100
5.14 Scope for further Research…………………………………………………………….101
5.15 Limitations of the study………………………………………………………………..101
5.16 Conclusions……………………………………………………………………………102
Appendix
Questionnaire……………………………………………………………………………….103
References…………………………………………………………………………………. 108
Property of Christ University. Use it for fair purpose. Give credit to the author by citing properly, if your are using it.
xi
List of Tables
1.1 Percentage of savers by gender…………………………………………………………..9
1.2 Percentage of investor households by gender…………………………………………....9
1.3 Percentage of other households by gender……………………………………………….9
4.1 Demographic Characteristics of the Respondents……………………………………….44
4.2 Descriptive statistics for savings pattern of women…………………………………….46
4.3 Descriptive statistics for sources of saving and amount saved each month…………….50
4.4 Investment pattern …………………………………………………………………… ..53
4.5 KMO Bartlett’s Test for Independent Variables…………………………………………59
4.6 Communalities…………………………………………………………………………..59
4.7 Rotated Component Matrix……………………………………………………………..60
4.8 KMO Bartlett’s Test for Dependent Variables………………………………………….62
4.9 Communalities…………………………………………………………………………..62
4.10 Rotated Component Matrix…………………………………………………………….63
4.11 Karl Pearson’s Correlation ……………………………………………………………..65
4.12 Model Summary for Zero Risk Instrument…………..………………………………...66
4.13 Analysis of Variance for Zero Risk Instrument………………………………………..67
4.14 Co-efficients of Regression for Zero Risk Instrument…………………………………67
4.15 Model Summary for High Risk Instrument…………………………………………….69 Property of Christ University.
Use it for fair purpose. Give credit to the author by citing properly, if your are using it.
xii
4.16 Analysis of Variance for High Risk Instrument………………………………………..69
4.17 Co-efficients of Regression for High Risk Instrument…………………………………70
4.19 Model Summary for Low Risk Investment…………………………………………….72
4.20 Analysis of Variance for Low Risk Investment………………………………………..72
4.21 Co-efficient of Regression for Low Risk Investment…………………………………73
4.22 Differences in frequency of investing………………………………………………….76
4.23 Chi-square for working women (Occupation and Age)………………………………..77
4.24 Chi-square for non-working women (Education and Age)…………………………….78
4.24 Variations in Investment pattern of Working Women (Occupation)…………………..80
4.25 Variations in Investment pattern of Non-Working Women (Education)………………83
4.26 Variations in Investment pattern of Working Women (Age)…………………………..86
4.27 Variations in Investment pattern of Non working women (Age)………………………88
Property of Christ University. Use it for fair purpose. Give credit to the author by citing properly, if your are using it.

xiii
List of Figures
3.1 Conceptual Framework………………………………………………………………….38
4.1 Regularity of saving……………………………………………………………………..48
4.2 Monthly savings…………………………………………………………………………48
4.3 Saving Avenues………………………………………………………………………….49
4.4 Motives of Saving……………………………………………………………………….50
4.5 Sources of saving- Working women…………………………………………………….52
4.6 Sources of saving- Non-working women………………………………………………..52
4.7 Amount saved by non-working women…………………………………………………53
4.8 Frequency of investing…………………………………………………………………..55
4.9 Motives of investing……………………………………………………………………..56
4.11 Factors affecting a woman’s choice of investment………………………………………57
4.12 Investment Avenues……………………………………………………………………..57.
4.13 Histogram for Zero Risk Investment…………………………………………………….69
4.14 Normal P Plot for Zero Risk Investment………………………………………………. .69
4.16 Histogram for High Risk Investment……………………………………………………72
4.17 Normal P Plot for High Risk Investment………………………………………………...72
4.18 Histogram for Low Risk Investment…………………………………………………….74
4.19 Normal P Plot for Low Risk Investment…………………………………………………75
Property of Christ University.
Use it for fair purpose. Give credit to the author by citing properly, if your are using it.

xiv
List of Abbreviations
1. ABS: Ability to save
2. CSO: Central Statistics office
3. FLCC: Financial Literacy Counseling Center
4. GDS: Gross Domestic Savings
5. GDP: Gross Domestic Product
6. HIES: Household Integrated Economic Survey
7. ITS: Incentives to save
8. MIMAP: The Micro Impact of Macro and Adjustment Policies in India
9. NCAER : National Council of Applied Economic Research
10. ROSCAS :Rotating savings and credit associations
11. NCAER : National Council of Applied Economic Research
Property of Christ University. Use it for fair purpose. Give credit to the author by citing properly, if your are using it.

Chapter 1
1Introduction
This chapter discusses the importance of savings and investment in the Indian economy,
importance of women as savers and investors, the present position of women with regard to
investing, the challenges they face and the qualities they posses for becoming a good investor.
Economic growth of a nation is driven by savings and its transformation into investment.
Savings made by one section of the society can be lent to another section where there might
be a need for money for production purposes. This type of saving-investing cycle creates
economic growth across many sections of the society and results in job creation. By
increasing savings within the country, the dependence on foreign direct investment reduces.
Generally, when savings rate of a country are high, the investments increase and the economy
grows. But if investment opportunities are not identified within the country, the savings flow
out of the country. If savings are hidden in homes or used to buy Gold or Real Estate they
don’t get channeled into investments by businesses.
One thing which becomes very clear is the fact that there is a pressing need to study savings
and investment side by side for all strata of the society in order to turn valuable savings into
productive investment.
The following chapter discusses the importance of savings and investment in the Indian
economy, importance of women as savers and investors, the present position of women with
Property of Christ University. Use it for fair purpose. Give credit to the author by citing properly, if your are using it.

2
regard to investing, the challenges they face and the qualities they posses for becoming a good
investor.
1.1 Savings and Investment in the present Indian Economy
Aggregate saving is an important source of funds for domestic investment and economic
growth of a country. Likewise, savings is also important at the household level for fulfilling
the immediate requirements of the family members, for old age and to leave bequests to
children. In simple terms, ‘Saving’ is the money left over from income after the consumption
needs of a person are satisfied. Saving is a critical variable in economic growth hence its role
as a determinant of economic growth has been emphasized by classical economists like Adam
Smith and David Ricardo in Wealth of Nations (1776) and On the Principles of Political
Economy and Taxation (1817) respectively. In the formation of physical assets and capital of
a developing economy like India, household saving plays a major role. Not only is the volume
of saving of household sector important but the form in which it is held is also equally
important.
Since independence, savings and investment have been considered as two very important
macro-economic variables in promoting economic growth of India. In the last three decades,
Indian economy has emerged as one of the fastest growing economies of the world. India is
amongst the highest savers among the emerging market economies. Gross Domestic Saving
(GDS) of the Indian economy constitutes savings of public, private, corporate and household
sectors. India reported a 33.7 percent gross domestic savings as a percentage of Gross
Domestic Product (GDP) in fiscal year 2010 as its economy picked up pace following the
economic slowdown in 2009The economic slowdown in 2009 saw gross domestic savings fall
to 32.2 percent of the GDP, down from 36.9 percent in 2008. While the household share of
gross domestic savings declined from 74 percent to 69.6 percent of total gross domestic
savings, household savings showed overall improvements, contributing INR 15,361 billion in
gross domestic savings, up from INR 13,310 billion in 2008-2009
Property of Christ University. Use it for fair purpose. Give credit to the author by citing properly, if your are using it.

3
Households are the biggest contributors to India’s savings rate; their savings equal 23 percent
of India’s GDP. This sector occupies a position of dominance over the other institutional
sectors like private corporate sector and the public sector in terms of generating saving. It
comprises of individuals, non-government non-corporate enterprises of farm business and
non-farm business like sole proprietorships and partnerships, and non-profit institutions.
According to data given by CSO, financial assets constituted 50.2 percent of household
savings in 2009-10, and have remained around these levels for the past four years; financial
savings were merely 10.7 percent in 1950-51. Saving in physical assets, which had a
whopping share of 89.3 percent of total household saving in 1950-51, has come down to 49.8
percent by 2009-10, reflecting growing monetization of the economy.
Though the percentage of Savings by household sector in financial Assets is increasing year
on year, what is worrying is that only around half of the household savings in India is invested
in financial instruments. This is also an important reason for the low level of financial
deepening in the country. As per RBI report (2010), only 1 percent of these savings in India
are invested in the Capital Markets. The majority of the savings are invested in physical assets
like Real Estate, Gold, Currency or Bank Deposits. If the savings continue to be invested this
way without building up the necessary infrastructure or industries, the future economic
development of the nation will be hampered.
The Planning Commission has pointed out that to achieve 9 percent GDP growth in the 12th
Plan, gross capital formation GFC (investments) need to be raised to 40 percent of the GDP in
the 12th Plan from 35.8 percent in 2009-10. The ability to finance this level of capital
formation depends largely on domestic savings. India has had 8-9 percent growth in the past,
but this could not be sustained as the economy ran into capacity constraints leading to
overheating. Therefore, to achieve and sustain a high growth rate, capacity needs to be scaled
up and for this, domestic savings need to be raised by about 5 percentage points in the next
five years. This underscores the importance of stepping up financial savings in the economy.
While addressing a conference in Mumbai, Reserve Bank of India Governor D. Subbarao said
that there is a need to raise the level of national savings and channel those savings into Property of Christ University.
Use it for fair purpose. Give credit to the author by citing properly, if your are using it.
4
investment for a double-digit and inclusive growth rate to take place. A large share of
domestic savings is held in the form of physical assets like land and gold.
To reverse this situation the household sector needs to be encouraged to increase its savings in
the form of financial assets such as equities, insurance, pension products, etc. The Reserve
Bank of India has introduced Financial Literacy and Counseling Centers (FLCC) to provide
consumers with the tools to make better credit choices (Reserve Bank of India, 2008). They
have also targeted schoolchildren to cultivate financial literacy at an early stage via interactive
websites (Reserve Bank of India, 2007). There is a need to increase the Individual’s trust in
financial markets. One another way is by increasing the Household saving rate.
Indian Economy with its population accounting for 16.0 per cent of the global population, is
expected to benefit from the ‘demographic dividend’, as huge pool of younger population
enter into the labor force and gainfully employed in production, generating a larger national
income and high household saving rate. For capitalizing on demographic dividend, targeting
urban population seems to be a perfect choice. However, the task does not look to be very
easy. In an exercise conducted by NCAER, to know the composition of Savers, non savers
and investors from various cities of India, it was found that only 20.75 percent of urban
population consists of Investors. The rest 79.25 percent of them are non investors. This data
clearly shows that though the urban population, which we can safely assume to be better
educated, is lagging behind in undertaking investments. Studies point out that it is Risk
appetite and financial awareness of individuals which play a major role in determining the
Investment profile of the Urban Investor.
1.2 Importance of Women as Savers and Investors
According to Centre for Development Informatics, in the coming decade there will be a rise in
levels of women’s employment. Some reasons which substatiate this optimism are: India’s
IT/BPO exports have increased from USD 105 million in 1989-1990 to 50.41 billion in 2008-
09. The software and services segment accounted for 40.61 billion, or 55 percent. In a recent Property of Christ University.
Use it for fair purpose. Give credit to the author by citing properly, if your are using it.

5
Indian study domestic IT turnover by a Dutch economic information agency (EVD) predicts
USD 50 billion for 2012. The development of the Indian IT industry is closely linked with
improvement of the country’s (higher) education system, combining technical and analytical
(mathematic) skills and English language abilities. As per World Bank edstats, females
constitute about 40 percent of all students currently enrolled in institutions of higher education
and it may be estimated that yearly 40-50,000 of these “new” IT professionals will be female.
In an effort to recruit more women employees, some companies are offering 25 percent
bonuses for female employee referrals and many companies have started providing child care
facilities to women under the Factories Act of 1948 . Thus, compared to the previous years, in
the coming decade, women will have more disposable income.
The consumer base in India consisting of educated women in urban cities is growing
immensely. Year on year the sale for Diamonds, Gold, Women’s Apparels, Imported beauty
products, footwear etc has been increases. Urban Women in India have purchasing power
with or without earning.Whether they earn by themselves or use their pocket money, or
household expenditure money, they are buyers. This gives a small hint : Women have money.
In the words of Delia Passi Smalter, founder of Medelia Communications, “Women currently
make or influence up to 85 percent of all consumer purchases, so isn’t it the time you started
marketing all products to them?” With increasing literacy amongst women, slow
disappearance of joint family system in the urban cities of India, men have started consulting
women for many decisions of the household including financial decisions. Whether working
or not working, the urban woman gets to influence the financial decisions of her household.
Thus they should be targeted from a financial perspective.
Saving for future emergencies has been an inherited and intrinsic quality of a woman. All
over the world women are known for their saving habits. In all cultures, mother’s teach their
daughters to save money for a rainy day. The oldest find of a money box dates from 2nd
century B.C. Greek colony Priene, Asia Minor, and features the shape of a little Greek
temple with a slit in the pediment. Money boxes of various forms were also excavated
in Pompeii and Herculaneum, and appear quite frequently on late ancient provincial sites,
particularly in Roman Britain and along the Rhine (Hurschmann 2009). Property of Christ University.
Use it for fair purpose. Give credit to the author by citing properly, if your are using it.

6
Women in India are no different when it comes to savings. They usually save from their
salaries or household budget. They save for meeting emergencies or for specific goals.
Available evidence suggests that in India even young girls are more likely to save than boys,
although they are less likely to save in a bank. For example, findings of a study of adolescents
residing in the slums of Allahabad, Uttar Pradesh, India, indicate that although girls were less
likely than boys to work for pay, they were more inclined to save; and although more girls
than boys saved, a larger percentage of boys than girls saved in a formal banking institution
(Sebastian, Grant and Mensch, 2004).
As per Sibley & Law (2008) , men tend to be more optimistic than women about their
household’s ability to meet its financial obligations. This is probably because fewer men than
women have a realistic understanding of the household’s actual financial situation. Nearly
three quarters of women state that their household sometimes — or always — struggles to pay
bills and repay loans whereas less than half of men consider this to be a problem. A revealing
difference is that five times more men than women stated they do not know how well their
household is meeting its current financial commitments. Women are also more diligent at
managing household expenditures than men. They are three times more likely than men to
keep household records and are significantly more likely than men to check that household
bills and accounts are correct. Not only do more women budget than men, but women are
twice as likely to keep a written record of household income and expenditure as men.
Though women understand the importance of saving better than men, they are unable to
invest in great numbers. One reason could be that they, as mentioned above , save for a rainy
day. Hence the top priority in a woman’s mind when she invests is “Security of money”.
Thus, she is most of the times Risk averse when it comes to picking up of Investments.
Though the Risk averse nature of a woman is regarded as the greatest drawback for successful
investing in way it turns out to be their greatest strengths while investing
Of all the stereotypes about the sexes, perhaps the most enduring is that men are better with
money unless the contest is spending it. However, a research on the ways each gender earns, Property of Christ University. Use it for fair purpose. Give credit to the author by citing properly, if your are using it.

7
saves, and invests shows that women often come out ahead of men. A host of reasons why
women can be good investors are presented.
1. Women take the long view and they set goals
For most women, investment is a means of achieving life goals Goff (2003). Men want to get
rich. Women want to send their kids to college, build a house, etc. Belsky (2000) believes
that, since they match their investments with their goals, they tend to be more practical while
taking an investment decision.
2. Women sweat the details and do homework before investing
Female investors spend 40 percent or more time researching stocks than males do. They also
pay more attention to the general operations of the companies that they're putting their money
into. The result: Women -only investment clubs earn close to 7 percent more a year than all-
male groups do ( Goff 2003).
3. Women keep a close eye on household finances
Generally more wives than husbands handle the bill paying- hence they know exactly how
much cash flow is needed and where the budget can be nipped and tucked. (Goff 2003)
4. Women aren't afflicted with remote control disease
Once a woman buys a stock, she doesn't let go of it on a whim. So, she ends up earning more
in the market. (Goff 2003)
5. Women possess metaknowledge and manage overconfidence
Metaknowledge is an appreciation of what we do know and what we do not know may be
more important than primary knowledge. Women admit ignorance while taking investment
decisions. Thus they seek help. They also keep overconfidence at bay. Russo (1992). Property of Christ University. Use it for fair purpose. Give credit to the author by citing properly, if your are using it.

8
6. Women are Rational
Women stick to their investments. They can see through the emotional haze and weigh the
evidence in a detached way. Emotion and investing do not mix. Rothschild, Baruch,
Templeton, Buffett and others all understood that one should establish investment principles
that they believe in, stick to them and remain undaunted by the hysterical bleating of the
markets
7. Women are Risk Averse
Neurobiological research suggests that high testosterone levels lead to a greater sense of and a
higher likelihood of taking risks, a combination that can be toxic when it comes to securities
trading. Since the percentage of testosterone is less in women, they tend to take less risky
decisions.
Women are blessed with innate abilities to be a good saver and investor. The flip side is that
they are good spenders also. With more income in their hand, they become powerful savers
and spenders. Thus, their savings and investment is something that the economy can look
forward to.
1.3 Present Position of Women in India with regard to Savings
and Investments
Due to the increased disposable income ,even savings generated by women will increase in
the future. But, whether are they equipped to save and whether the savings will materialize
into investment is a question less pondered.Going by the current statistics from the National
Council of Applied Economic Research ‘s Report on “How Households Save and Invest :
Evidence from NCAER Household Survey (July 2011), it is understood that women lag much
behind ,when it comes to savings and investment
Property of Christ University. Use it for fair purpose. Give credit to the author by citing properly, if your are using it.
9
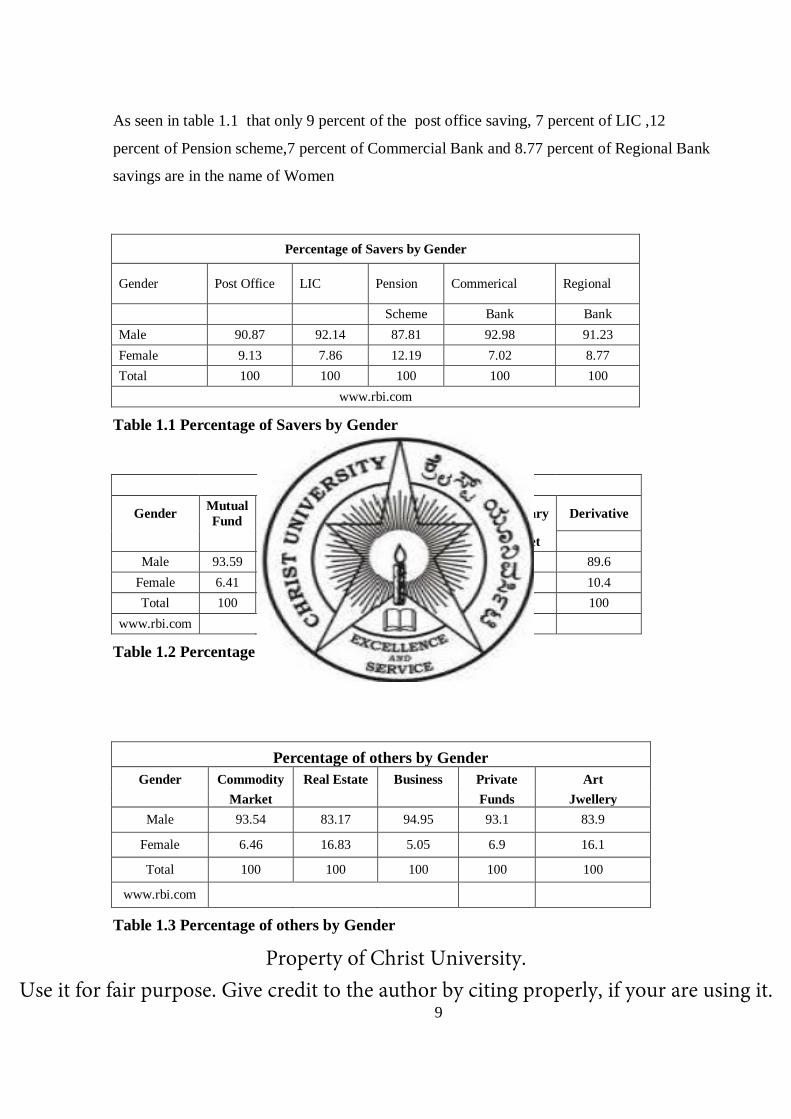
As seen in table 1.1 that only 9 percent of the post office saving, 7 percent of LIC ,12
percent of Pension scheme,7 percent of Commercial Bank and 8.77 percent of Regional Bank
savings are in the name of Women
Percentage of Savers by Gender
Gender Post Office LIC Pension Commerical Regional
Scheme Bank Bank
Male 90.87 92.14 87.81 92.98 91.23
Female 9.13 7.86 12.19 7.02 8.77
Total 100 100 100 100 100
www.rbi.com
Table 1.1 Percentage of Savers by Gender
Percentage of Investors by Gender
Gender Mutual
Fund
Bond
only Debentures IPO Secondary Derivative
Market
Male 93.59 92.55 94.42 96.43 94.77 89.6
Female 6.41 7.45 5.58 3.57 5.23 10.4
Total 100 100 100 100 100 100
www.rbi.com
Table 1.2 Percentage of Investors by Gender
Percentage of others by Gender
Gender Commodity Real Estate Business Private Art
Market
Funds Jwellery
Male 93.54 83.17 94.95 93.1 83.9
Female 6.46 16.83 5.05 6.9 16.1
Total 100 100 100 100 100
www.rbi.com
Table 1.3 Percentage of others by Gender
Property of Christ University. Use it for fair purpose. Give credit to the author by citing properly, if your are using it.

10
As seen in table 1.2 and table 1.3 that barring investment in Derivatives, Art Jewellery and
Real Estate which are at 10.40 percent, 16.10 percent,and 16.83 percent respectively the rest
of them are under 10 percent. The numbers are not flattering.
There is still a silver lining and optimism that investment will pick up in the women category.
Women in urban India, are far more educated than the rural areas, hence have started
contributing their thoughts and finances in the financial decisions of the household. They save
in Banks and Postoffices and invest in Mutual funds, Shares and Bonds. As most of them are
Computer literates, they are keen about investing in Stock Market. Some fairly educated
women, working and non-working both trade online and make good money. They invest in
equity of reputable companies.
Property of Christ University. Use it for fair purpose. Give credit to the author by citing properly, if your are using it.
11
1.4 Challenges faced by Women in Saving and Investing
Some of the constraints which stop women from investing successfully are presented below:-
1. Risk Aversion
A considerable stream of research suggests that women are more risk averse than men in
financial situations (Bajtelsmit, Bernasek, & Jianakoplos, 1999; Halek & Eisenhauer, 2001;
Hallahan, Faff, & McKenzie, 2004).Results about gender differences in risk taking in the
financial arena (Croson and Gneezy, 2009; Eckel and Grossman, 2003) are more nuanced. A
general tendency for greater risk aversion among women has been observed as early as
childhood (Hargreaves & Davies, 1996; Kass, 1964). It can also be believed that the
biological differences in women should be held responsible for their risk aversion (Olsen,
2001). This reason ranks number one as constraint for successful investing.
2. Financial Illetracy
A leading explanation for this behavior is that women are not financially literate—they lack
sufficient information about financial concepts and instruments to make informed financial
decisions. A growing literature has evaluated both the state of financial literacy and the
effectiveness of financial education programs aimed at improving financial decision-making.
Women have identified Financial Illiteracy as the main reason why they don’t fare as well as
men when it comes to investment planning. Lusardi (2008)
3. Feminine Mentality
Many women consider purchase of financial services as a masculine activity (Burton, 1995).
While they are single they, save and invest for their marriage. But once they get married, they
think planning for the future is a husband's job. The fact that they may not be able to continue
working and earning throughout their lives, stops them from long term investment planning.
Property of Christ University. Use it for fair purpose. Give credit to the author by citing properly, if your are using it.

12
4. Math Anxiety
Math anxiety is “a feeling of tension, apprehension, or fear that interferes with math
performance”. Related to this is gender and mathematics as women are thought to develop
anxiety towards mathematics and sciences when they become more interested in social
relations in their teen years. It is thought that women experience more anxiety in mathematics
as a group than men and this has also been suggested in regards computer programming who
explore computing and gender and especially have done experiments relating gender and
anxiety. (Copper, etal 2003). People who suffered from math anxiety as teen-agers often have
trouble making investment decisions later life, according to a survey by Dreyfus Corp. and the
national Center for Women and Retirement Research. The mail survey of nearly 1,300 people
found that those who were uncomfortable with math in their youth often put off personal
financial decisions for fear of making mistakes. Since as teenagers, women develop more
math anxiety than men (Dar-Nimrod & Heine, 2006), it can be concluded that, this may be
one of the reasons for them not turning out to be successful investors.
1.5 Genesis of the Problem
Inorder to chanelize the household Savings to productive Investment avenues, it becomes very
important to motivate and encourage women to invest in financial assets. The Government
,Banks and other Financial institutions are taking steps in this direction. Surveys are
undertaken to understand the Savings and Investment Pattern along with the Risk profile of
Individuals . Financial Literacy programmes are also undertaken by the Reserve Bank of
India to educate people in the Financial domain. However, these programmes and surveys
target the earning members of the household, which most of the times turn out to be a male
member. In houses where both the couples are earning , most of the times, it is the male
member’s Income, Saving and Investment which is reported. Housewive’s Savings or
Investment don’t get reflected in any of the surveys.
But, there are few reasons for not giving enough preference to women in such studies. Property of Christ University.
Use it for fair purpose. Give credit to the author by citing properly, if your are using it.

13
1. Since 1971, there has been a stabilization of women’s employment. The International
Labor Organization database shows no rise in women’s economic activity rates for India
1972-2002. These data show 31 percent of women working in 1970, 31 percent in 1980, 27
percent in 1990, and 30 percent for India in 2000. In other words there has been no
substantial change. Since women don’t have a regular income, it makes no point in taking
their perception or opinion about Savings and Investment. Perhaps this was the most
important reason why the focus for Savings and Investment have not been on women.
2. Women in India take breaks from employment for taking care of household
responsibilities, which suggests intermittent earning tenure.Thus more often, the financial
responsibility is on the shoulders of the Male members of the family. In such a situation, it
hardly makes sense to take opinion of the wife
3. Women are always excluded from financial discussions, on the explicit ground that
they cannot understand investments .(Prada ,2001)
4. A common myth that women don’t have a say in the Financial decisions of the
household.
But more than the above reasons, one concept in the Keynesian system of Saving, can be
blamed for excluding women from such studies: “Only those receiving income are "allowed"
to spend or to save.” Savings do result from income, but the fact that individuals who don’t
earn cannot save is not the truth. Walter C. Neale in his article “Who Saves? The Rich, the
Penniless, and Everyone Else” (1999) argues about this concept. Answering the question:
Who is “allowed” to save? leads to another question “Who is allowed to Spend” Thus one
who is allowed to spend can save. Going by this proposition, even housewives who don’t
earn, but get money to spend, can surely save. Studies of savings mobilization show that
economically active poor people, including women in the informal sector, can and do save but
they require services that are close to home, that do not require large opening balances or
regular deposits. In order to respond to these needs while recovering costs, institutions
recognize that they must employ innovative low-cost delivery channels (Hirschland, 2006;
Rutherford, 2006) But more importantly marketing for financial products should be done
differently for women.(Chachoria,2000) Property of Christ University.
Use it for fair purpose. Give credit to the author by citing properly, if your are using it.

14
It is in the benefit of the nation, if steps are taken to consider the savings of women, working
or non working and channelize them into productive investments. One more compelling fact
is that a quiet revolution has been altering greatly the mortality tables of many low-income
countries. Women are much more likely to be alone in old age, and elderly women are more
likely to be poor. The percentage of the female population over age 85 who are widows is
more than 85 percent compared to about 45 percent for men. An analysis of the National
Long Term Care Study data from 1984, 1989 and 1994 indicated that 20 percent of the
residual life expectancy at age 65 for men and 30 percent of the residual life expectancy at age
65 for women were spent in a state of chronic disability. Inflation affects people who live
longer more than those who live a shorter period so overall it is a greater issue for women. Its
impact grows over time.
1.6 Need of the Study
In order to formulate appropriate theories and policies to boost aggregate saving and
investment of the nation, it is important that economic planners have a true and fair idea about
the nature and volume of saving and investment, the behavior of people towards saving and
investment and the method by which saving can be improved for investment decisions. They
also need to know about the motives of saving and investment in order to frame policy
appeals accordingly. Knowledge about saving and investment preferences gender wise, will
help to design and implement saving and investment instruments which will effectively
stimulate investment. Sustained research in this field thus becomes imperative in order to
understand the patterns of savings and capital formation in our country.
Except for a few household surveys in the late 90s, very few studies estimate the profile of
households' saving and investment for both rural and urban areas in India. The Micro Impact
of Macro and Adjustment Policies in India (MIMAP) survey in 1996 and the detailed report
on "Household Savings and Investment Behavior in India in 2003" by EPW Research
Foundation and NCAER was an attempt in this direction. Although these studies describe
India's saving performance in detail, they do not sufficiently describe the analytical
framework of households' decision-making determinants and the factors that determine the
Property of Christ University. Use it for fair purpose. Give credit to the author by citing properly, if your are using it.

15
propensity to save and invest, which are important from a policy perspective. One area that
requires further examination is the role that women play in influencing aggregate saving and
investment.
Till the last decade, considering the low potential of women to earn, save and invest, not
much research has been conducted on this subject. Government surveys, policies, financial
awareness, marketing of financial products etc has been very less focussed towards woman.
The kind of enthusiasm shown by agencies and Governement for women’s development,
health, education, is yet to be seen in the subject motivating women to save and invest.
Marketing is heavily done on television ,radio or magazines for products that are bought by
women. Information regarding Women’s health or education, self-employment etc., is also
provided to them with wide coverage. However, except for Life Insurance there are very few
advertisements on investment products, financial services etc., targeting women.
The coming decade, is going to see more and more women getting higher education and
aiming for heavy pay cheque jobs. There is an urgent need to understand the savings and
investment pattern of women, so as to frame policies and develop financial products
exclusively for women. As 60 percent of women in India are house wives, they cannot be left
out of this study since they also get to save. Since working and non-working women have
different styles of living, earning and spending, their patterns differ. There is a need to bring
out these differences so that , accordingly financial products and programmes may be
designed. Above all, factors which influence them to save and invest have to be higlighted.
This study is an attempt to understand the above mentioned paradigms in depth.
Property of Christ University. Use it for fair purpose. Give credit to the author by citing properly, if your are using it.
16
1.7 Scope of the Study
The study focuses on financial saving and investment of women of Bangalore. The variables
tested in the empirical study are occupation, educational qualification, and age. The factors
that affect women’s investment making decision are identified. Through analysis the
differences are identified between working and non-working women with regard to their
savings and investment pattern.
1.8 Limitations
The major limitations of this study are with respect to the time frame within which the
research had to be carried out and the sample size from which it would be difficult to draw
accurate conclusions on the entire women population. The results may not be free from biased
figures as some of the responses may include deliberate falsification and incomplete
information.
1.9 Chapterization
The second chapter gives an insight into the literature reviewed for the area under study,
followed by the third chapter that provides details of the methodology used for the purpose of
this research. The fourth chapter deals with analysis and interpretation of data gathered for
the study and the last chapter summarizes the entire report, discusses the implications of the
study, the suggestions made and the conclusion arrived at the end of the study.
Property of Christ University. Use it for fair purpose. Give credit to the author by citing properly, if your are using it.

17
Chapter 2
2Review of Literature
The review of literature gives a fair idea about the work done in the subject area, the views
and observations made by different researchers and the gaps which need to be filled. In order
to understand and solve the research problem in question, it becomes important to get an
understanding of the various methodologies used by other researchers. During the process of
reviewing the past literature, various perceptions about the subject and concepts within the
subject get surfaced. This gives a direction to address the research problem from different
viewpoints. Several attempts have been made to explore the nature of Savings and Investment
done by people of various nationalities, cultures and age groups.
2.1 Review of Studies
The review of literature has been divided into two broad categories.
1. Studies regarding the nature and pattern of Savings
2. Studies regarding the nature and pattern of Investment
Property of Christ University. Use it for fair purpose. Give credit to the author by citing properly, if your are using it.

18
2.1.1 Studies Regarding Nature and Pattern of Savings
In an effort to study the saving patterns of people and the factors influencing the reasons for
saving and investment Anbarasu et al (2011), conducted a study on 1655 people of
Tiruchirappali city. Data was primarily collected through a questionnaire. The variables
considered were age, number of children, beliefs, opinions, Educational qualification and
income. Data was analysed through Econometric Analyses, Chi Square and Regression. It was
found that, out of all factors Educational Qualification played a major role for saving. Another
observation made was that people are not precise about their return and they invest their
savings carefully. The reasons for savings include Education, marriage, building a new house
and medical expenses. The amount of money saved depends on the Income level.
The socio economic and demographic factors influencing savings of various income groups
has been explored by Rehman (2011). For that purpose, data has been collected from 107
households of Multan from lower, middle and higher income group following per capita
income method. Life cycle hypothesis proposed by Ando and Modigliani in 1963 forms the
base of the study. The variables used were socio-economic and demographic in nature. It was
concluded that education, children’s educational expenditure, family size, liabilities and value
of house are reducing factors while total dependency rate and income are inducing factors for
household savings of lower income groups. Savings of middle income group was found to be
positively related to total dependency rate and total income was inversely affected by
children’s educational expenditures, liabilities, marital status, size of land holdings, and value
of house.
Dupas and Robinson (2011) conducted experiments on the participants to find whether there
was any effect of mental accounting on the psychology of saving. In one such experiment,
participants were provided with a simple metal box with a lock and key and a deposit slit in
the top. Just providing the box increased health savings by 68 percent. Based on interviews
with participants, it was concluded that this effect was due to mental accounting- meaning that
with the funds set aside, it was easier to refuse requests or it would limit consumption. It was Property of Christ University. Use it for fair purpose. Give credit to the author by citing properly, if your are using it.
19
found that the respondents felt less obligated to share funds with others when they were in the
box.
Based on primary data collected from one hundred households selected from three villages
from the state of Kerala (India), Unny (2010) tries to find the determinants of saving. After
running Regression on the data, he finds that the Level of income, value of assets and level of
education of the head of the household positively influence savings whereas number of male
children, number of earners and dependency ratio has negative influence. Among the
occupational groups, households engaged in non-farm sector have higher propensity to save.
The number of female children has been believed to have a positive influence on savings in
India due to dowry system. However; in this study this factor shows a negative influence.
Copur(2010) explored saving behavior of Turkish families in Ankara, Turkey. Data was
drawn from 600 families from the city of Ankar. This study used a trans-created adaptation of
the NCC 1172: The Complex Nature of Saving: Psychological and Economic Factors to
establish a better understanding of saving behaviour.The independent demographic variables
consisted of gender, age, education, work, marital status, and income; Willingness to Take
Financial Risks: Financial Socialization and Negative Financial Events. Results indicated that
the vast majority of Turkish families were not saving and not willing to take any financial
risk. More than half of the participants did not discuss finance with their parents when they
were growing up. Majority of the families reported that over the past year their family’s
spending exceeded their income and the current economic situation significantly impacted
more than half of the families’ saving behavior and attitudes. Most of the families indicated
that their parents were savers while they were growing up. Interestingly, families who
reported both parents were savers while they were growing up were less likely to be saving
than those who reported neither were savers. An important finding was that having experience
of negative financial events in the last two years was significantly related to the likelihood of
saving.
The study undertaken to assess the level of financial literacy among people residing in Delhi
and National Capital Region (NCR) who invest in different financial instruments, like Post
Property of Christ University. Use it for fair purpose. Give credit to the author by citing properly, if your are using it.

20
Office Savings Scheme, Mutual Funds, Life Insurance, Stock market etc indicated that the
financial literacy of investors was different for different financial instruments. Around 96
percent of them had knowledge about Banks, 30 percent had knowledge about National
Savings Certificate & Public Provident Fund, 98 percent of the investors knew about Life
Insurance, 92 percent of the investors knew about Mutual Funds but only 24 percent preferred
them. A Chi-square analysis has been conducted to understand whether financial literacy is
found to be affected by age, income and educational level of the individuals. The results
indicated that there is a relationship between Financial literacy and income, however no
relationship between age and educational level. Seth (2010)
Using a sample composed of 167 individuals in Bangkok, Termprasertsakul (2009), explores
the associations between the saving behavior of individuals and variables, including
demography, perceived risks, and desired benefits. The demographic variables included
gender, age, marital status, employment status, education attainment, monthly income, and
number of dependants, public medical care program membership, company’s health insurance
provision, and spending behavior. The data was collected using self-administered
questionnaires in a survey. Chi-square tests were conducted to test the hypotheses of the
associations between saving behavior and independent variables .The research showed that,
all of the demographic variables, except gender, support the hypotheses of the association
with saving behavior in terms of saving method selection. It means that there is no difference
in the way men and women save.
Boring (2007) attempts to analyze the Household Savings Behavior in Uganda, using the
Finscope 2006 national survey data. Binomial probit models have been used and thereafter
probit regressions are run to test a number of characteristics ranging from education to trust in
financial institutions to attitudes about life in General. Findings suggest that the age of the
respondent (not just the age of the head of household), literacy, higher education, formal
sector employment, entrepreneurial activity, and attitudes about life’s current state to be the
determinants of saving behavior. It was also found that the marital status and whether or not
the respondent is solely responsible for the household financial decisions are statistically Property of Christ University.
Use it for fair purpose. Give credit to the author by citing properly, if your are using it.

21
insignificant regarding whether or not to save but quite important regarding institutional
choice.
To analyze the relationship between savings and age structure, Demery & Duck (2006) used
data derived from the FES, an annual cross-sectional survey of around 7,000 UK households.
Results point out that household data exaggerate savings rates of young adults and the elderly
whilst underestimating those of 45- to 60-year-olds. The individual saving rates follow more
closely the 'hump shape' of the life-cycle model, although the savings rates of the elderly
remain positive for some ages. It was also observed that there is a sample selection bias when
data refers to households and not individuals because most surveys provide consumption and
income data only at the household level.
Chowa (2006) investigates savings performance among participants in a matched savings
program in Uganda, modeled after the Individual Development Accounts (IDAs) in the
United States. Comparison of savings behavior by gender, level of education, marital status,
and type of work was performed. Participants save for a minimum of six months, and an
incentive is provided to them. After successfully reaching the savings goal the participants
had to purchase productive assets that could be used to generate income. The data sample size
for the analysis was 145. Average Monthly Net Deposit (AMND) was used as the dependent
variable in the analysis. This variable was used to measure the savings performance of
participants The AMND was calculated by adding total deposits plus interest (net of fees)
minus total unmatched withdrawals, divided by the number of months of participation The
results indicate that both male and female participants were saving in the project. However,
women were found to be saving more than their male counterparts across education,
employment, and type of work.
On a study on different cultures of household structures and saving patterns, De Laiglesia &
Morrisson (2006), finds that family relations shape saving institutions. Policies can alter
saving incentives and create the conditions for household structures themselves to change. It
was found that in many African countries, where men and women have different roles in
managing family finances, Roscas (rotating savings and credit associations) are often all-
Property of Christ University. Use it for fair purpose. Give credit to the author by citing properly, if your are using it.

22
female. This gender segregation allows women to render their savings illiquid, and even to
hide them from their partners. This allows women to save more in order to pay for school fees
and uniforms, or to buy kitchen ware and furniture. They are then better equipped to resist
pressures to draw on them when disagreements about saving and consumption choices erupt
in the couple. Another finding is that Polygamy plays a role in the amount savings done.
Wherever polygamy exists, men must pay an important bride-price to her father. This practice
diverts savings away from productive investment.
To examine the pattern of saving among cooperative farmers in southwestern Nigeria,
Adeyemo & Bamire (2005) collected data from 400 farmers. The data was analyzed using
descriptive statistics and multiple regression technique. Two functional forms, the linear and
Cobb-Douglas were fitted to the data. The model had savings as the dependent variable while
family size, gross income, cooperative experience, distance to the nearest bank, age, level of
education, source of initial capital, technology level, total consumption and household living
expenses were independent variables. Results show that cooperative farmers in southwestern
Nigeria are mostly males, literate and of average age of 47 years. Different factors influenced
their saving and investment patterns. Income, loan repayment and amount of money borrowed
were significant variables that influenced saving patterns. Age and loan repayment positively
influenced savings pattern while family size recorded a negative influence. Also it was found
that the farmers increase their savings, as they grow old. Though this negates the life cycle
hypothesis of savings, which claims that a person would be expected to save up to a point and
then start dissaving as he grows old, the results obtained show that most farmers in the study
area are not too old and therefore tend to save to cater for their household.
In order to understand how married women use their economic resources, Schmeer (2005),
uses data from Cebu, Philippines. This study finds that the more income women earn and
control; the more households spend on food. Multiple regression analysis has been used to
assess the effect of women's resource position on food expenditures, controlling for the
individual, house-hold, and community characteristics. One important point that surfaces is
that, providing employment opportunities may not be sufficient if women must relinquish
control over their earnings. For women, in better off households, improving their financial Property of Christ University.
Use it for fair purpose. Give credit to the author by citing properly, if your are using it.

23
management skills may increase the likelihood that household income will be turned over to
them and thus be used to improve child welfare.
Ahmad and Asghar (2004) estimated saving function based on HIES (1998-99) primary data
in Pakistan. 8933 rural and 5374 urban respondents were chosen from the survey. It was
found that saving was directly influenced by income, employment status, age square and sex
of rural and urban respondent. Wealth, dependency ratio, and age of the respondents were
found negatively affecting savings of rural and urban respondents
After exploiting data collected from the first wave of the SAVE panel, specifically collected
to understand economic, psychological and sociological determinants of saving, Börsch-
Supan & Essig (2003) study the savings patterns of Germans. The findings suggest that nearly
everyone - whether in the middle income bracket or richer - saves substantial amounts in old
age. The research points out that 40 percent of German households save regularly a fixed
amount. About 25 percent of German households plan their savings and have a clearly defined
savings target in mind. Most of German household saving is in the form of contractual saving,
such as saving plans, whole life insurance and building society contracts. This makes the flow
of saving rather unresponsive to economic fluctuations, such as income shocks. Most
households prefer to cut consumption if ends do not meet. In particular the elderly do not like
to use credit cards, and they eschew debt.
In order to examine the determinants of private saving in the process of economic
development, in India during the period 1954 -1998, Athukorala (2002). The data obtained
was compiled from various publications like National Accounts Statistics, Government of
India, Economic Survey & Reserve Bank of India, Monthly Bulletin The methodology
involved the estimation of a saving rate function derived within the life cycle framework
while paying attention to the structural characteristics of a developing economy. It was found
that the saving rate rises with both the level and the rate of growth of disposable income and
the magnitude of the impact of the former is smaller than that of the latter. The real interest
rate on bank deposits has a significant positive impact, but the magnitude of the impact is
modest. Public saving seems to crowd out private saving, but less than proportionately,
Property of Christ University. Use it for fair purpose. Give credit to the author by citing properly, if your are using it.

24
suggesting that public policy can influence the national saving rate. Among the other
variables considered, the spread of banking facilities in the economy and the rate of inflation
seem to have a positive impact and changes in the external terms of trade and migrant
remittances a negative impact on private saving
Khandker (2000) does an econometric analysis on the household survey data from three
villages of Bangladesh where micro-credit programme had been in operation for three years
or more. One of the observations made was that, women were saving more in such micro-
borrowing programmes and that the informal finance impact is more pronounced for men than
for women. Also by offering membership and opportunities for borrowing, many microcredit
programmes have been able to mobilize savings (largely involuntary) from their poor and
women members, who are not considered net savers by traditional financial institutions
For exploring the saving behavior of rural industry households, Brata (1999), collected
information from 93 respondents by conducting survey of small industries in Bantul Sub
district in 1996. In the survey, he found that respondents were more interested in keeping
financial assets than real assets as their savings. They preferred to save their financial assets in
non-banking institutions like co-operations, credit unions etc. It was concluded that Income,
Education, Sex and Industry type were found to have direct significant impact on savings
Baden (1996) examines gender issues in relation to financial liberalization and financial
sector reform. The objective of the study is to demonstrate that processes of financial
liberalization and financial sector reform are not gender-neutral and that, therefore, gender
analysis has a place in the design and implementation of financial sector restructuring. The
findings suggest that women have less access to formal sector’s financial savings facilities
than men and women hold real assets in different forms. Men’s financial assets are more
likely to be in interest bearing accounts, whereas women’s savings are often in forms where
no interest accrues or else is held as real assets.
Property of Christ University. Use it for fair purpose. Give credit to the author by citing properly, if your are using it.

25
Panikar (1992) has studied the rural household saving pattern in few villages of two states in
India, namely Kerala and Tamil Nadu. The study was conducted with an objective of looking
into the levels of saving and the manner of its disposition and to identify the factors
underlying the rates of saving. Data was collected from 300 households. Variables like
Income of the household, consumption, expenditure, indebtness, physical investment and
financial investment were introduced apart from the basic socio-economic variables. Data was
analysed using Multiple regressing, Chi-square tests and Anova. The study found that a high
proportion of saving was absorbed in unproductive assets leading to a vicious circle of low
income and low saving.
During an analytical review of the literature on saving capacity of rural households in India,
Desai (1981) found that the existing literature has neglected “incentives to save” (ITS)
hypothesis of savings behavior. After reviewing the estimates of rural household savings
published by Reserve Bank of India (1954), he reveals the fact that there has been a
pessimistic assumption about the saving capacity of rural households in India. Most studies
have considered the “ability to save”(ABS) hypothesis alone. He says most of the studies are
Keynesian and hence consider only current income as a measure of ABS. He agrees with
Bhatty et al (1977) on the thought that the Keynesian framework of savings which assumes
that the decisions to consume and save-invest are independent, does not work for rural
household savings
Repetto & Shah (1975) studied the demographic and other influences on long term saving
behavior in India. The data for the study was collected from surveys conducted in the Kaira
district of Maharashtra from 1930 to 1965. It was found that large family size has a depressing
effect on long term household saving rate also. The study also revealed that sons in rural India
serve as substitute assets in households.
In an attempt to study the saving behavior of Indonesian households, Kelley and Williamson
(1968) run a regression analysis on per capita household saving against per capita household
income for five household age groups. They have found that the age of the head of the
household is an important determinant of household saving in rural areas and that the average
Property of Christ University. Use it for fair purpose. Give credit to the author by citing properly, if your are using it.

26
and marginal saving rates rise with the share of agricultural income and the presence of
positive interaction between wealth and saving.
Johnson and Chiu (1968) ran time series regression for household saving on household
income and private saving on private income for 30 countries includes developed and
developing countries. Majority of the results show a positive correlation between saving and
income. These results suggest that at best both household saving and private saving are
proportional to household income and private income respectively.
With the purpose of throwing some light on the saving behavior of urban Indian households,
Ramanathan (1969) collected data from 600 households from Delhi. Data was collected on
components of income, net worth and saving, qualitative information on past and expected
income-change, liquid assets, debts, the extent of visitors to the households, occupation of
head, family size, number of earners, age, education of head, home-ownership status,
expenditure on durable goods and dowries, motives for and attitudes toward saving, etc The
effects of income and net worth on saving are examined in detail for different socio-economic
sub-groups. The results say that in- come and net worth significantly influence the level of
saving. Contrary to the studies in advanced countries, home-owners had a much lower saving-
income ratio than renters although the former had a slightly higher average income. A major
reason for this may be the uncommonness of amortized mortgages in India, with no
contractual commitment to save till the age of 45 savings steadily increased and then started
dropping. After the age of 65, again increases. The author attributes this to the joint family
system in India.
While describing the use of modern banks by women in SriLanka, Dissanaike (1968) finds
that women prefer informal sources of saving and lending that afford them more flexibility. In
addition to gold SriLankan women have adopted informal group savings method called
“seetu”, where each contributes to a common fund that is then given to one member each
month. In a bid to attract women, banks offer pawning facilities .Some rural banks have even
begun to design loan schemes to accept jewellery as a collateral in order to draw more women
to their doorstep. One of the reasons found for financial exclusion of women is that in male
Property of Christ University. Use it for fair purpose. Give credit to the author by citing properly, if your are using it.
27
dominated societies, particularly in south Asia, men traditionally handle cash and investible
funds, even when the funds arise from women’s economic activity. Another observation made
is that, it is very difficult for a poor woman to walk into a fancy looking commercial bank to
get a loan due to lack of confidence, moreover banks lack the patience to deal with their
ignorance. The very process of going to a bank in town neglecting the whole days work is not
a happy choice.
2.1.2 Studies regarding nature and pattern of Investment.
Issahaku (2011) conducted a study that was based on a microeconomic approach of estimating
the determinants of financial saving and investment in one of the most deprived district
capitals in Ghana, Nadowli.Primary data were collected from sixty households in Nadowli.
Questionnaires were designed so as to facilitate the collection of data from households about
saving and investment. Stratified random sampling technique has been used to ensure that the
various occupational groupings were fairly represented. A multiple linear regression model
adapted from Rogg (2000) and Kibet et al (2009) has been fitted into investment. The
independent variables were Age, Education, and Occupation, number of Dependents, Income,
Assets and Saving with the dependent variable being Investment. The study reveals that there
is propensity to save and invest in Nadowli in spite of low income and the factors that drive
Saving and Investment are occupation, expenditure, assets and saving.s
To gain knowledge about key factors that influence investment behavior among men and
women, Kabra et al (2010) conducted a study based on primary data collected from 700
individuals who invest regularly. A four page questionnaire consisting of six subscales was
used. In the first subscale, demographic information such as age, gender, marital status, region
to which they belong, profession, individual income levels were sought. In the remaining five
subscales, questions were designed to measure the investment pattern of individuals on the
five variables viz. investing background, opinion leadership, duration of investment,
awareness of investments, and security. Later the statements under these variables were
reduced into smaller number of manageable variables by exploring common dimensions
available among the variables. The study found that the modern investor is a mature and
Property of Christ University. Use it for fair purpose. Give credit to the author by citing properly, if your are using it.

28
adequately groomed person. In spite of the phenomenal growth in the security market and
quality Initial Public Offerings (IPOs) in the market, the individual investors prefer
investments according to their risk preference. It was concluded that investors’ age and
gender predominantly decides the risk taking capacity of investors.
To find out what affects individual investors’ willingness to invest in an asset, Choi et al
(2007), use administrative panel data on 25,000 401(k) accounts of five firms. It is found that
an investor’s 401(k) contribution rate increases more if he/she has recently experienced a
higher 401(k) portfolio return and/or a lower 401(k) return variance. The results are explained
by a naïve reinforcement learning heuristic: Investors expect that investments in which they
experienced past success will be successful in the future. In addition to that, it is found that —
when there is no salient reference purchase price — investors tend to be return chasers and
variance avoiders with respect to their idiosyncratic history with the asset.
In search of reasons for preferring investment in property over other investment, particularly
financial investments, Burns & Dwyer (2007), uses three sources of information – published
studies and a review of policy settings, interviews with individuals knowledgeable about
investment and savings behavior and attitudes, and interviews with eight consumers aged
between 30-50 years. The findings suggest that Investment and savings attitudes and behavior
are influenced by the structure, complexity, transparency and perceived past and future
performance of different kinds of investment options; the general lack of independent
financial advice; the recent superior performance of property investment; perceptions and
personal tolerance of risk; the often low level of financial literacy about products other than
property; the nature of the information people use when making financial decisions; the
personal or family experience people have with investment; a general wish to have personal
control over the investment and trust in the advice of friends and family over unknown
professional advisors were the reasons for preferring investment in property over other
investments.
Agarwal et al (2006) evaluate the financial literacy of a select group of residents in India that
participate in an on-line investment service provided by a Financial Advisory Services firm.
Property of Christ University. Use it for fair purpose. Give credit to the author by citing properly, if your are using it.
29
The findings on financial literacy are further related to self-reported information on
respondents’ other investment activity. It was observed that the participants were generally
financially literate. It was also found that a number of relationships between literacy and
socioeconomic variables; notably: the probability of getting all the survey questions correct is
higher for male respondents, and generally increases with education level and the
aggressiveness of the investor. Further, looking at an individual’s educational attainment, it
can be said that the number of investments increase with education, with the more highly
educated individuals having lower shares of equities in their portfolios.
Adeyemo & Bamire (2005) conducted a study to understand the savings and investment
pattern of cooperative farmers in southwestern Nigeria. Data collected from four hundred
cooperators was used for the Study. The questionnaire designed contained variables such as
family size, gross income, cooperative experience, and distance to the nearest bank, age, level
of education, source of initial capital, technology level, total consumption and household
living expenses. Data were analysed using descriptive statistics and the multiple regression
technique to explain the relationship between study variables. Two functional forms, the
linear and Cobb-Douglas were fitted to the data collected. Two models were fitted, one, had
savings as the dependent variable, while the other had investment as the dependent variable.
Both models contained the same set of independent variables. Findings suggest that Income,
farming experience, family size, loan repayment, and amount of fund borrowed positively
influenced farmers’ investment pattern, while only age (in one state) had a negative influence.
For the sake of understanding the Investment Behavior of High-Income Women in America
Hira & Loibl (2004) conducted 911 interviews with couples. The survey instrument designed
included a total of thirty-eight questions, which addressed the following five guiding themes
of our analysis: (a) demographic and economic characteristics; (b) financial management
behavior; (c) sources of investment information and the investment decision-making process;
(d) investor socialization/parents’ influence on respondents’ money management and
investing; and (e) predictors of investor intentions including respondents’ investment-learning
preferences, investor beliefs, attitudes, perceived behavioral control, and opinions about
investment advisors. The results showed that women were more likely than men to have fixed Property of Christ University.
Use it for fair purpose. Give credit to the author by citing properly, if your are using it.

30
income investments such as savings accounts, certificates of deposits, and life insurance with
cash value. When women were involved in investment decisions, many reported making them
with their partners rather than alone. Men, however, were more likely than women to invest
on their own. Both men and women found investing to be satisfying but time-consuming.
Women were more likely than men to handle routine money management tasks.
Barber and Odean (1999) construct a theory that predicts - Men will trade more excessively
than women. This theory draws from two places. First, from theoretical models that predict -
overconfident investors trade excessively and second, from Psychological research which
demonstrates that, in areas such as finance, men are more overconfident than women. To test
this prediction by partitioning investors on the basis of gender, account data for over 35,000
households have been used from a large discount brokerage. While analyzing the common
stock investments of men and women from February 1991 through January 1997 it is revealed
that men trade 45 percent more than women. Further it is observed that trading reduces men’s
net returns by 2.65 percentage points a year as opposed to 1.72 percentage points for women.
To answer an important question, whether lifestyle characteristics can be used to differentiate
investors by the size and nature of their investment holdings, Warren et al (1990), collected
data from 600 households located in a metropolitan area. The questionnaire asked about types
of investments held, amount of total investment and proportions of total investment in stocks
and bonds, as well as demographic and lifestyle characteristics. The demographic data
included sex, marital status, presence and age of children in the household, employment status
of respondent and spouse, education and income. Lifestyle measures were obtained by asking
respondents to indicate their level of agreement. With 29 lifestyle statements such as "I am
more independent than most people"; "I think I have a lot of personal ability"; and "I think I
have more self-confidence than most people." Respondents who showed a high degree of
agreement with such questions were classified as having higher self-confidence than
respondents who disagreed. A Multiple discriminant analysis is used to determine if
investment patterns differed according to demo-graphic and lifestyle dimensions. The result
of the study shows that, respondents with a heavy investment concentration in stocks and
bonds tended not to have children in the household. They and their spouses tended to be Property of Christ University.
Use it for fair purpose. Give credit to the author by citing properly, if your are using it.
31
employed full-time and to have incomes over $50,000. Also the respondents who had a light
concentration of their investments in stocks and bonds could be described as dress-conscious.
With an objective to investigate whether women exhibit greater financial risk aversion than
men Jianakoplos & Bernasek (1998) empirically verify the stated and popularly perceived
notion that there are gender differences in risk taking. They estimated the impact of household
wealth and other socio economic variables like Race, kids, Age, Work,Education,Income &
Homeownership on the proportion of risky assets held, comparing single women with single
men and married couples. The dependent variable is named as RATIO. It is the ratio of risky
assets to wealth. By using maximum likelihood Tobit Regression procedure the equation was
estimated. It was observed that single women are relatively more risk averse than single men.
Another finding confirms that relative risk aversion decreases as household wealth increases
when wealth is measured excluding residential housing and human capital. Single women
reduce the proportion of risky assets they hold as the number of children in their household
increases, holding the other factors constant. Single black women are willing to hold a larger
proportion of risky assets on average than single white women, single men and married
couples. It was noticed that given the women’s greater longevity and the increasing tendency
towards self directed pensions, greater risk aversion exhibited by women can have a
significant impact on resources available to them in retirement. However, there is a limitation
to this study. The gender of financial decision makers in married household could not be
determined.
2.2 Research Gap
Research on Savings and Investment patterns on households and on Individual groups has
been considerably done. Majority of the studies observe one serious concern i.e., Savings are
not getting invested productively. Since urban woman plays a major role in saving money in
the household and are in a position to influence the financial decisions, by including them in
such studies we may be able to find a reason for the above stated concern. While Investment
pattern has been studied intensely in a generic sense, far less research exists regarding
women’s mind-set towards investment as a subject. Also, since savings is a precursor to
Property of Christ University. Use it for fair purpose. Give credit to the author by citing properly, if your are using it.

32
investment, it is imperative to study savings and investment patterns side by side. The present
study aims to do so. Moreover, non-working women have not been included in any study due
to a crude proxy that since they don’t earn they don’t invest. This study surges an effort to
bridge the said gap.
Property of Christ University. Use it for fair purpose. Give credit to the author by citing properly, if your are using it.
33
Chapter 3
3Research Methodology
This chapter begins with the statement of the problem and the objectives of the study.
Thereafter, the theoretical framework, research design, methods and procedures used for
conducting the research have been discussed.
3.1 Statement of the Problem
In order to formulate appropriate theories and policies to boost aggregate saving and
investment of the nation, and to convert the available savings into investment, one has to
understand how individuals in the society save and invest. The fact that women are becoming
economically powerful calls for a need to exclusively study their savings and investment
patterns, and cater to them accordingly so that they are encouraged to contribute towards
Capital Formation for the Economy.
3.2 Research Objective
Primary Objective: To study the savings and investment pattern of working and non-
working women.
Property of Christ University. Use it for fair purpose. Give credit to the author by citing properly, if your are using it.

34
Specific Objectives: To achieve the primary objective, the specific objectives were
formulated as follows
1. To study the variation of savings and investment pattern across socio economic
characteristics among women
2. To identify the factors those affect the investment pattern of working and non working
women
3.3 Research Hypothesis
This research proposes the following hypothesis to be tested empirically based on the
literature review.
HYPOTHESIS01: Perceptual factors do not significantly influence the investment decision.
HYPOTHESIS02: There is no significant difference in the frequency of investing across
socio-demographic attributes for working and non-working women.
HYPOTHESIS03: There is no significant difference in the choice of investment instrument
across socio demographic attributes for working and non working women.
3.4 Theoretical Framework
The following theories have contributed towards the understanding of the research problem.
Non-Income related Savings
Property of Christ University. Use it for fair purpose. Give credit to the author by citing properly, if your are using it.

35
The dichotomous definition of savings, given by Keynes excluded several potential savers
including individuals in receipt of inheritances, estates or money or similar assets from other
non-income related sources of funds. This was pointed out by Neale (1991). Thus including
non-income related sources as sources of Savings and Investment a new dimension is added
to Savings and Asset creation.
The Life-Cycle Hypothesis of Saving
Ando & Modigliani’s life cycle hypothesis has a basic assumption that individuals spread
their lifetime consumption evenly over their lives by accumulating savings during earning
years and maintaining consumption levels during retirement. Tests of the life cycle
hypothesis are therefore mainly concerned with the effect of demographic variables such as
age groups, birth rates, occupation of the population, skill-sets of the population and
dependency ratios on savings behavior. The life cycle hypothesis implies that demographic
variables affect savings rates
Motives of Saving and Investment
Keynes, in the famous Chapter 9 of the General Theory of Employment, Interest and Money
(1936), had eight distinct motives for saving: : (1) “Precaution” (2) ‘‘Foresight’’ (3)
“Calculation” (which refers to the wish to earn interest) (4) “Improvement”, (5)
“Independence” (6) “Enterprise”(ability to invest where the returns are maximum (7) “Pride”,
(the bequest motive); (8) “Avarice” (miserliness). Other factors at work include, in addition
to length of retirement, the timing and size of other major expenditures for which provisions
must be made, such as for the purchase of a house, children’s education, or other major
durables. The need for accumulation will be increased in the presence of credit rationing.
Finally, the saving and investment rate will be affected by socio-demographic variables.
Property of Christ University. Use it for fair purpose. Give credit to the author by citing properly, if your are using it.

36
Life-Cycle Funds Theory
This theory advocates creation of portfolios that that are heavily concentrated in stocks at the
beginning of the work life and gradually shift holdings to bonds as retirement nears. Several
demographic and economic factors provide some rationale for life-cycle funds. But the most
important one deals with how the value of human capital varies over time as a fraction of total
wealth. Human capital is composed of elements that are fixed (innate ability), that are largely
fixed after a certain point (formal schooling), and that vary with time (experience). A good
proxy for measuring the value of human capital is the present value of wages over an
individual’s remaining working life.
The Framework
Neale’s theory of including potential savers, who may not be at par with the other income
receiving sections of the society with regard to savings generation, forms the base to address
the problem statement. The population for this study- Woman is one such unprobed section of
the society. The theory of Life cycle hypothesis and the Life-cycle funds is instrumental in
choosing socio-demographic variables as independent variables. The presented framework
emphasizes that Savings is expected to shape investment action and thereby affect the
investment pattern. Three relationships explored in this research study are Socio demographic
variables with Savings Pattern, Socio Demographic Variables with Investment Pattern and the
Factors influencing the Investment Pattern. However, how the Savings Pattern affects the
Investment is not the focus of the scope.
Property of Christ University. Use it for fair purpose. Give credit to the author by citing properly, if your are using it.
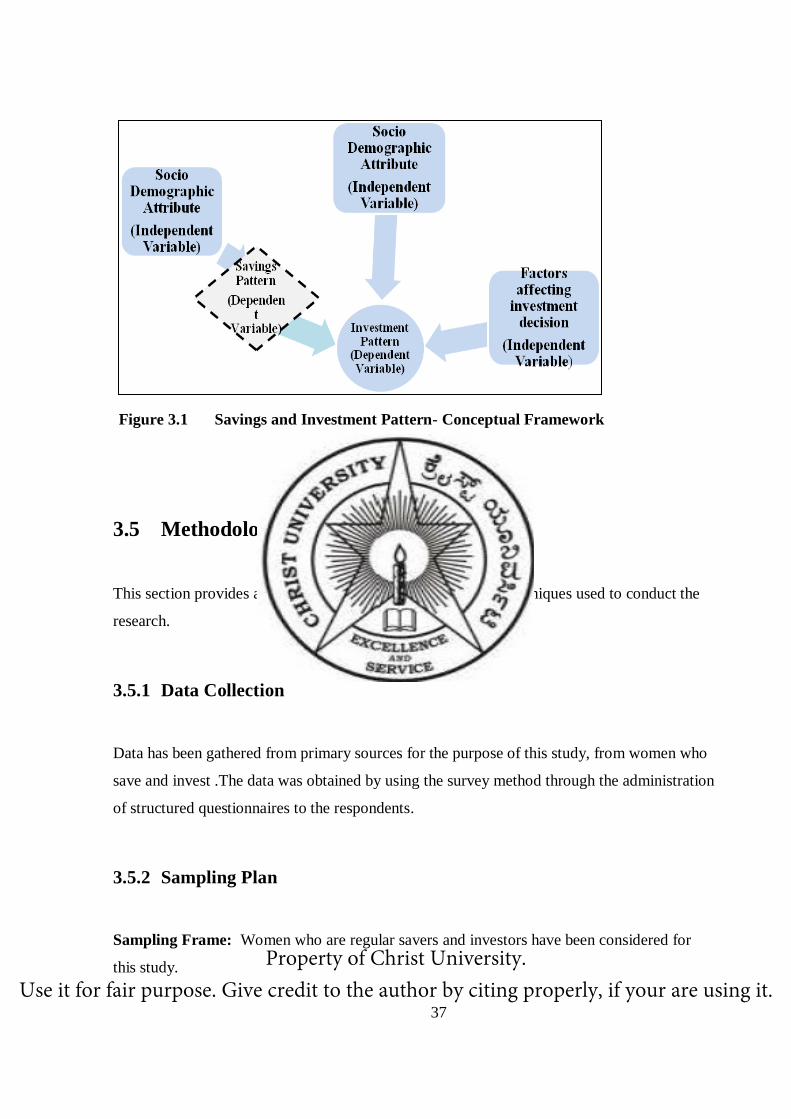
37
3.5 Methodology
This section provides a description of the methods, tools and techniques used to conduct the
research.
3.5.1 Data Collection
Data has been gathered from primary sources for the purpose of this study, from women who
save and invest .The data was obtained by using the survey method through the administration
of structured questionnaires to the respondents.
3.5.2 Sampling Plan
Sampling Frame: Women who are regular savers and investors have been considered for
this study.
Figure 3.1 Savings and Investment Pattern- Conceptual Framework
Property of Christ University. Use it for fair purpose. Give credit to the author by citing properly, if your are using it.
38
Sampling Size: A total of 250 respondents were considered for the study but only 225
responses were usable.
Sampling Area: This study was conducted in the city of Bangalore.
Sampling Technique: Non probabilistic, convenience sampling is used for the purpose of
data collection.
3.5.3 Survey Instrument
Questionnaires were used to collect data from the respondents. An original questionnaire
consisting of three sections was used for the purpose. Details of the three sections are as
follows:
Section A consists of questions that are used for collection of data that is of personal nature
pertaining to the respondent’s age, educational qualification, occupation and monthly income.
Section B consists of questions related to sources of saving, frequency of saving, constraints
and motives of saving, and saving avenues.
Section C consists of questions related to frequency of investing, investment preferences,
motives of investing and constraints to investing
3.5.4 Reliability Of The Instrument
Cronbach Alpha test was administered for the purpose of testing the reliability of items in the
questionnaire. The higher the score of the test the more reliable the generated scale is.
However 0.7 has been indicated to be an acceptable reliability coefficient with regard to such
studies. (Santos,1999).The reliability of the instrument was tested on this basis. A pilot study
was conducted for a sample size of 50 respondents and was tested for reliability with the help Property of Christ University. Use it for fair purpose. Give credit to the author by citing properly, if your are using it.
39
of Cronbach’s Alpha- test of reliability using SPSS and a reliability of 0.766 was derived
from the test.
3.5.5 Scaling Techniques
For questions related to savings and investment pattern, an ordinal scale was used. The
responses were measured on a five point Likert scale. Since the data was non-parametric,
collapsing the responses from a five point Likert scale to a two point scale was a good
technique in order to increase the intelligibility of the outcomes of analysis (Grimbeek, 2005).
Hence the categories “Strongly agree”, “Agree” were grouped under “Agree” and “Strongly
Disagree”, “Disagree”, “Neither Agree nor Disagree” were grouped under “Disagree”. As per
Beamish (2004), the method of collapsing should be constant across items when such a
method is used. Utmost care was taken so that all. Items may be collapsed in the same
manner. For questions related to frequency of saving and investment a nominal scale was
used.
3.5.6 Statistical Techniques
Data was analyzed using the following statistical tools namely Descriptive Statistics, Factor
Analysis, Correlation, Multiple Linear Regression and Chi-square. Since the ordinal data
collected does not have an inherent order or sequence, and the items on the Likert scale are
not equidistant, mode has been used as a descriptive technique for analyzing the responses.
Property of Christ University. Use it for fair purpose. Give credit to the author by citing properly, if your are using it.

40
3.6 Operational Definitions
The theoretical constructs for the study have been defined as follows:-
Investment pattern: This refers to the frequency of investing and the choice of
investment instrument
Bank Deposits: The savings made in Fixed Deposits, Savings Deposits and
Recurring Deposits with nationalized and private banks
Bonds: Investments in Bonds issued by the Government of India.
Post office
Deposits:
These represent savings account with post office, Monthly
income schemes, Public Provident Fund, National Savings
Scheme and other savings schemes like Kissan Vikas Patra,
and Indira Vikas Patra
Mutual Funds:
Investments made in mutual fund schemes floated by
private and foreign Asset Management Companies like
.Kotak Mahindra, Franklin Templeton, Birla Sunlife etc.
This does not include Mutual funds by Banks like State
Bank of India, Unit Trust of India, Bank of Baroda etc.
Systematic
Investment Plan:
These include SIP’s of mutual funds comprising of equity
funds, owned by private and foreign companies’ .Eg., Birla
Sunlife equity Fund, DSP BR equity fund, Reliance Growth
Fund, Franklin India Blue Chip Fund etc.
Chit Fund: The investments in registered and un-registered chit fund
companies have been considered
Property of Christ University. Use it for fair purpose. Give credit to the author by citing properly, if your are using it.

41
Gold: Investing in gold schemes with a jeweler, buying of gold
bars and gold jewelry
Insurance: This includes life insurance, growth plans, retirement plans,
and money back policies floated by private and foreign
companies like Max New York and Birla Sun life, and other
nationalized institutions like Life Insurance Corporation of
India and State Bank of India.
Real Estate: The money invested in buying a piece of land or apartments
for capital appreciation.
3.7 Variables
Independent variables: The socio demographic variables and the perceptual factors
influencing the choice of investment instrument are the independent variables.
Dependent Variable: The frequency of investing and choice of investment instrument are the
dependent variables.
3.8 Limitations
The major limitations of this study are with respect to
The time frame within which the research had to be carried out and the sample size
from which it would be difficult to draw accurate conclusions on the entire population.
The results may not be free from biased figures as some of the responses include
deliberate falsification and incomplete information. Property of Christ University. Use it for fair purpose. Give credit to the author by citing properly, if your are using it.
42
Chapter 4
4Analysis and Interpretation
The chapter focuses on the analysis and interpretation of the data collected for the purpose of
studying the savings and investment pattern of women.
This chapter is divided into two parts on the basis of objectives and the nature of analysis
Part A
Demographic characteristics of the respondents
Interpretation of savings and investment pattern of women in general using descriptive
statistics.
Part B
Identification of factors that influence the investment decision using Factor analysis
and Regression analysis. Property of Christ University. Use it for fair purpose. Give credit to the author by citing properly, if your are using it.

43
Analysis of investment pattern of working and non working women using Chi-square
tests to study the variations.
Property of Christ University. Use it for fair purpose. Give credit to the author by citing properly, if your are using it.
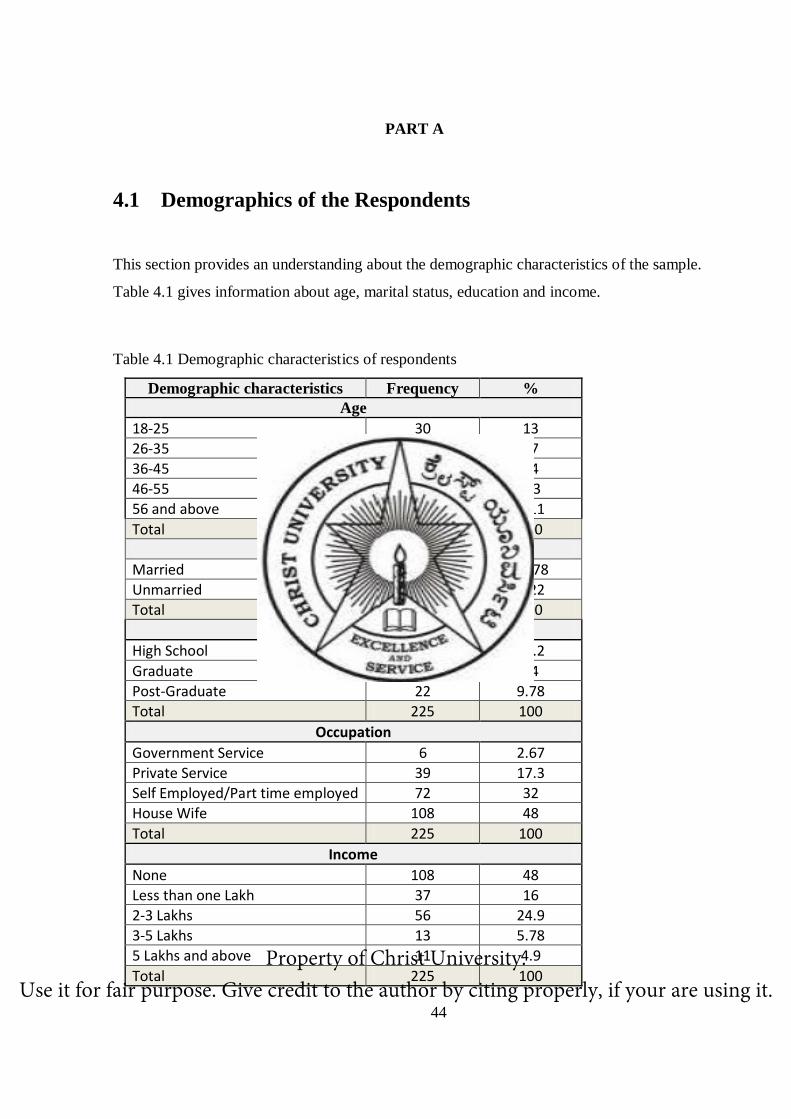
44
PART A
4.1 Demographics of the Respondents
This section provides an understanding about the demographic characteristics of the sample.
Table 4.1 gives information about age, marital status, education and income.
Table 4.1 Demographic characteristics of respondents
Demographic characteristics Frequency %
Age
18-25 30 13
26-35 105 47
36-45 53 24
46-55 21 9.3
56 and above 16 7.11
Total 225 100
Marital Status
Married 211 93.78
Unmarried 14 6.22
Total 225 100
Education
High School 149 66.2
Graduate 54 24
Post-Graduate 22 9.78
Total 225 100
Occupation
Government Service 6 2.67
Private Service 39 17.3
Self Employed/Part time employed 72 32
House Wife 108 48
Total 225 100
Income
None 108 48
Less than one Lakh 37 16
2-3 Lakhs 56 24.9
3-5 Lakhs 13 5.78
5 Lakhs and above 11 4.9
Total 225 100 Property of Christ University.
Use it for fair purpose. Give credit to the author by citing properly, if your are using it.

45
It can be inferred from the Table 4.1 that the majority of the respondents fall under the age
group of 26-35. 93 percent of the respondents are married and 6 percent of them are
unmarried. 34 percent of the respondents are Graduates and Post graduates, whereas 66
percent of the respondents have attended the high school.52 percent of the respondents are
working women and the rest 48 percent of them are non-working.48 percent of the
respondents who are non-working report no income, and the rest 52 percent of them have
reported income with 24 percent of them reporting an income of 2-3 lakhs per annum
followed by 16 percent of them reporting an income of less than 1 lakh.
4.2 Savings and Invest Patterns of Women
To get an understanding of women’s saving and investment pattern in general, the responses
from women were analyzed with the help of descriptive statistics. The analyzed data has been
presented in a graphical form followed by an interpretation.
4.2.1 Savings Pattern of Women
The savings pattern of women can be understood by analyzing the regularity of saving,
amount of money saved every month, saving avenues and motives of saving.
Property of Christ University. Use it for fair purpose. Give credit to the author by citing properly, if your are using it.

46
Table 4.2 Descriptive statistics for savings pattern of women
Description Frequency Total Percentage
Regularity of Saving
Regular Savers 39 225 17.3
Irregular Savers 186 225 83.00
Amount Varies each month 13 225 6.00
Amount Fixed each month 212 225 94.00
Saving Avenues
Keep/Save in the house 153 225 68.0
Gold schemes with jeweler 103 225 45.8
Post office 42 225 18.7
Chit fund 81 225 36.0
Savings/Fixed Deposits 172 225 76.4
Motives of saving
Higher Education 26 225 11.6
To build a house 144 225 64.0
For marriage purposes 26 225 11.6
Buying gold 167 225 74.2
To afford luxury 111 225 49.3
Emergency 210 225 93.3
Helping family members
during financial crisis 170 225 75.6
Kids education 208 225 92.4
Son/Daughter's marriage 152 225 67.6
Old age 200 225 88.9
Property of Christ University. Use it for fair purpose. Give credit to the author by citing properly, if your are using it.
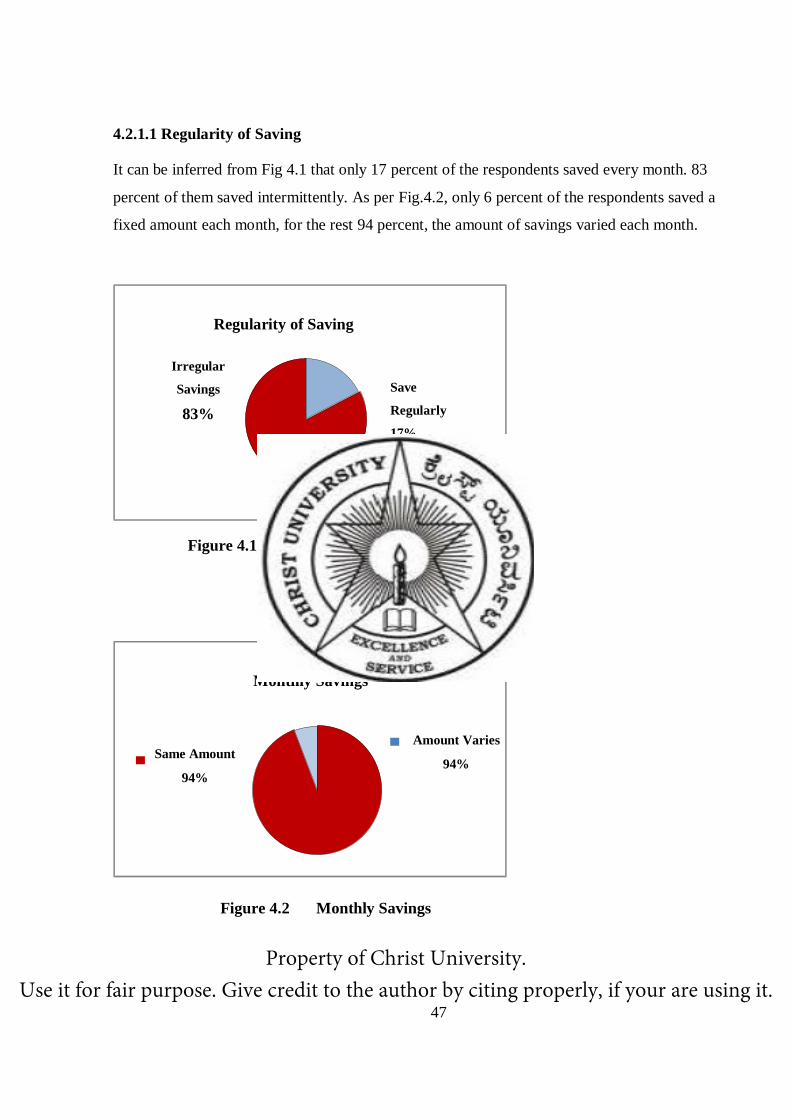
47
4.2.1.1 Regularity of Saving
It can be inferred from Fig 4.1 that only 17 percent of the respondents saved every month. 83
percent of them saved intermittently. As per Fig.4.2, only 6 percent of the respondents saved a
fixed amount each month, for the rest 94 percent, the amount of savings varied each month.
Monthly Savings
Amount Varies
94% Same Amount
94%
Figure 4.1 Regularity of Saving
Figure 4.2 Monthly Savings
Regularity of Saving
Irregular
Savings
83%
Save
Regularly
17%
Property of Christ University. Use it for fair purpose. Give credit to the author by citing properly, if your are using it.

48
4.2.1.2 Saving Avenues
It can be understood from fig.no 4.3 that Saving money in the Bank is a highly preferred
choice of saving at 76 percent followed by 68 percent who keep money in the house,48
percent with gold schemes,36 percent with Chit fund and 18 percent in the Post office.
4.2.1.3 Motives of saving
From Fig. no 4.4 it can be understood that saving for emergency purposes is main motive
behind saving with 93 percent of responses, then comes kid’s education at 92.44 percent
followed by saving for old age at 88.8 percent, Buying gold 74 percent, Helping family
members in need at 75 percent, kid’s marriage 67 percent and to afford luxury 49 percent.
Higher Education and saving for their own marriage was the lowest at 11 percent.
Figure 4.3 Saving Avenues
Property of Christ University. Use it for fair purpose. Give credit to the author by citing properly, if your are using it.

49
The findings indicate that majority of the women are irregular savers. Saving money either in
the bank or at home is a preferred mode. One of the reasons for saving money at home could
be for emergencies. Kids’ education, old age and Emergencies come up as the main motives
for saving. Women in this study have not considered their own education and marriage to be
one of the important motives for saving. This could be because majority of the respondents
were married and were in the age group of 26-35. Usually by 26 years of age, a woman in
India is through with her educational aspirations and is married.
12
64
12
74
49
93
76
92
68
89
Motives of Saving
Figure 4.4 Motives of Saving
Property of Christ University. Use it for fair purpose. Give credit to the author by citing properly, if your are using it.

50
Table 4.3 Descriptive statistics for sources of saving and amount saved every month
Non Working Women
Sources of Saving Frequency Percentage
Household Financial Budget 101 93.5
Pocket Money 1 0.9
Monetary Gifts Received 2 1.9
Income from any property, shares, ect 2 1.9
Income from Pension 2 1.9
Total 108 100
Working Women
Sources of Saving Frequency Percentage
Salary 53 45
Bonus & Incentives 29 25
Household financial budget 5 4
Monitary Gifts 11 9
Income from Property,Shares ect 19 16
Total 117 100
Non Working Women
Amount of Saving Frequency Percentage
Less than 5% 37 34
Less than 10% 32 30
10-20% 19 18
20-30% 11 10
Above 30% 9 8
Total 108 100
Working Women
Amount of Saving Frequency Percentage
Less than 5% 4 3
Less than 10% 12 10
10-20% 16 14
20-30% 4 3
More than 30% 81 69
Total 117 100
Property of Christ University. Use it for fair purpose. Give credit to the author by citing properly, if your are using it.

51
4.2.1.4 Sources of saving for working and non-working women
It can be understood from Table No.4.3 that the major source of saving for working women is
the salary 45 percent whereas for non-working women it is the household financial budget at
94 percent.
93%
2%
2% 2%
1%
Non-working Sources of invome
House budget
Income from pension
Shares
Monetary gifts
Pocket Money
Figure 4.5 Working women – Sources of income
Figure 4.6 Non Working Women – Sources of income
Property of Christ University. Use it for fair purpose. Give credit to the author by citing properly, if your are using it.
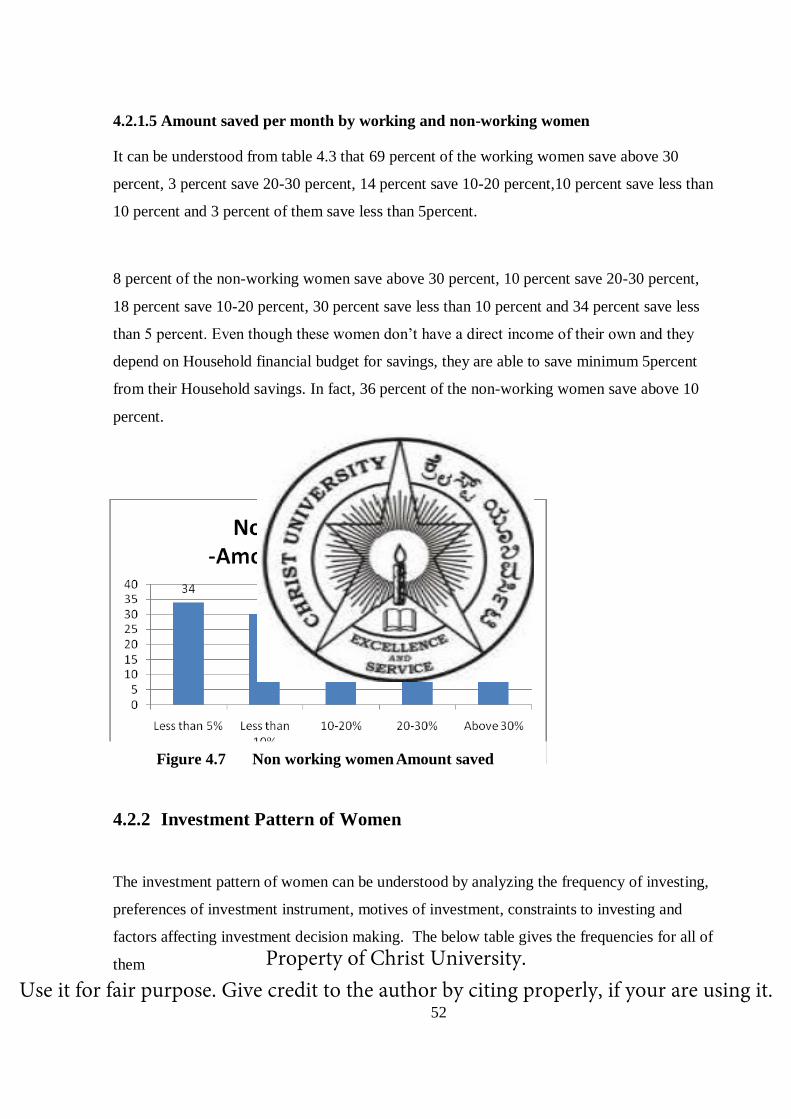
52
4.2.1.5 Amount saved per month by working and non-working women
It can be understood from table 4.3 that 69 percent of the working women save above 30
percent, 3 percent save 20-30 percent, 14 percent save 10-20 percent,10 percent save less than
10 percent and 3 percent of them save less than 5percent.
8 percent of the non-working women save above 30 percent, 10 percent save 20-30 percent,
18 percent save 10-20 percent, 30 percent save less than 10 percent and 34 percent save less
than 5 percent. Even though these women don’t have a direct income of their own and they
depend on Household financial budget for savings, they are able to save minimum 5percent
from their Household savings. In fact, 36 percent of the non-working women save above 10
percent.
4.2.2 Investment Pattern of Women
The investment pattern of women can be understood by analyzing the frequency of investing,
preferences of investment instrument, motives of investment, constraints to investing and
factors affecting investment decision making. The below table gives the frequencies for all of
them
Figure 4.7 Non working women Amount saved
Property of Christ University. Use it for fair purpose. Give credit to the author by citing properly, if your are using it.
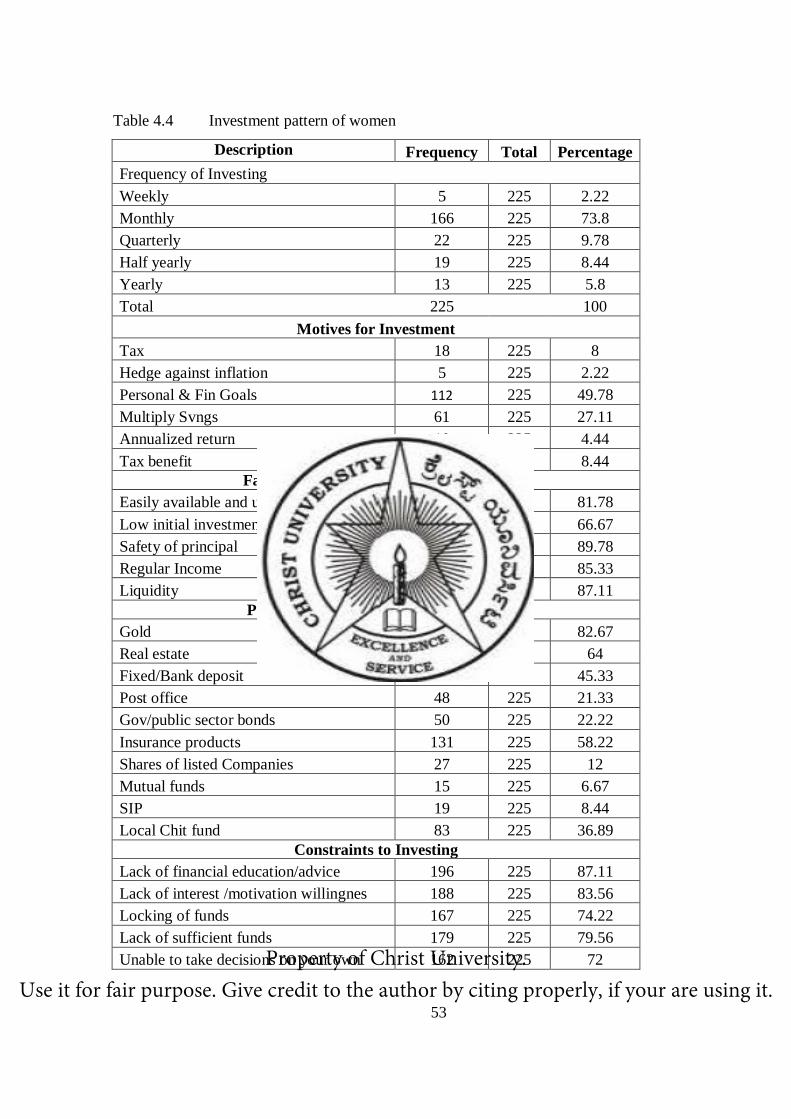
53
Table 4.4 Investment pattern of women
Description Frequency Total Percentage
Frequency of Investing
Weekly 5 225 2.22
Monthly 166 225 73.8
Quarterly 22 225 9.78
Half yearly 19 225 8.44
Yearly 13 225 5.8
Total 225
100
Motives for Investment
Tax 18 225 8
Hedge against inflation 5 225 2.22
Personal & Fin Goals 112 225 49.78
Multiply Svngs 61 225 27.11
Annualized return 10 225 4.44
Tax benefit 19 225 8.44
Factors Affecting Investment Decisions
Easily available and understandable 184 225 81.78
Low initial investment 150 225 66.67
Safety of principal 202 225 89.78
Regular Income 192 225 85.33
Liquidity 196 225 87.11
Preferences of Investment Instrument
Gold 186 225 82.67
Real estate 144 225 64
Fixed/Bank deposit 102 225 45.33
Post office 48 225 21.33
Gov/public sector bonds 50 225 22.22
Insurance products 131 225 58.22
Shares of listed Companies 27 225 12
Mutual funds 15 225 6.67
SIP 19 225 8.44
Local Chit fund 83 225 36.89
Constraints to Investing
Lack of financial education/advice 196 225 87.11
Lack of interest /motivation willingnes 188 225 83.56
Locking of funds 167 225 74.22
Lack of sufficient funds 179 225 79.56
Unable to take decisions on your own 162 225 72 Property of Christ University. Use it for fair purpose. Give credit to the author by citing properly, if your are using it.
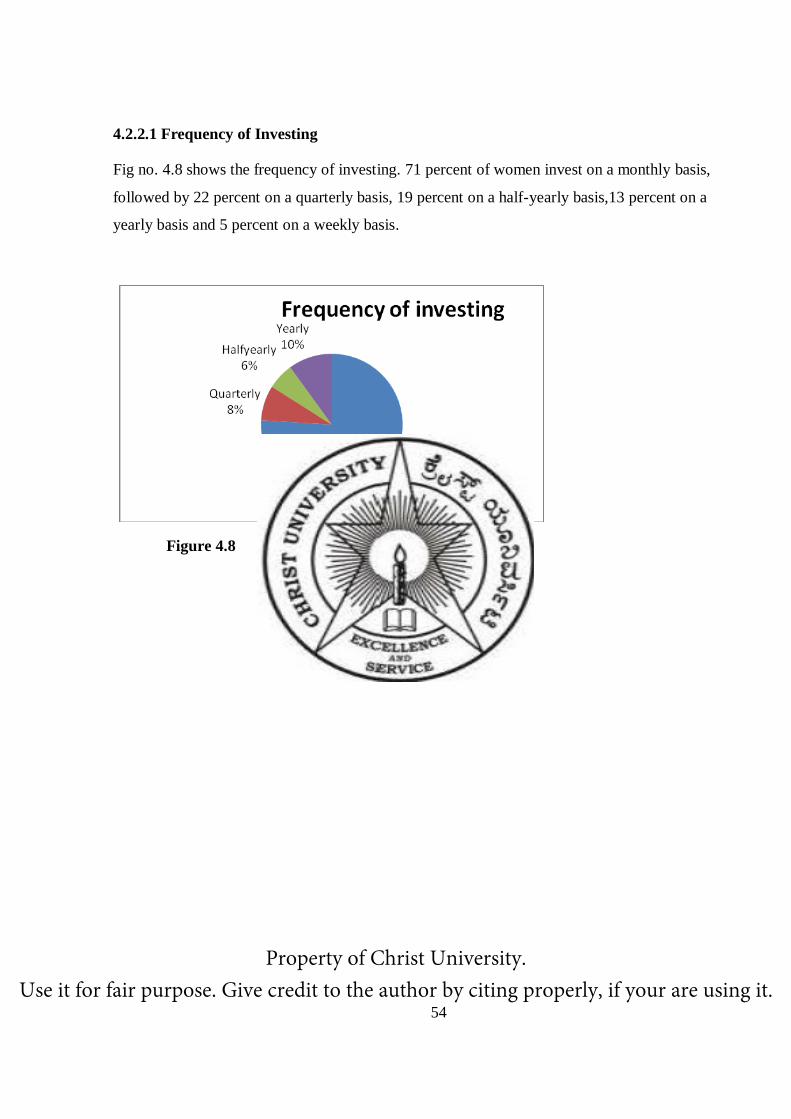
54
4.2.2.1 Frequency of Investing
Fig no. 4.8 shows the frequency of investing. 71 percent of women invest on a monthly basis,
followed by 22 percent on a quarterly basis, 19 percent on a half-yearly basis,13 percent on a
yearly basis and 5 percent on a weekly basis.
Figure 4.8 Frequency of investing
Property of Christ University. Use it for fair purpose. Give credit to the author by citing properly, if your are using it.

55
4.2.2.2 Motives of investing
It can be interpreted from Fig no 4.9 , that for 58 percent of the women, the motive behind
investing is to fulfill their personal and financial goals followed by 27 percent of them to
multiply their savings.8 percent for tax benefits, 5 percent for for Annualized return and 2
percent for hedge against inflation Annualized return and 2 percent for hedge against
inflation.
Figure 4.9 Motives of Investing
Property of Christ University. Use it for fair purpose. Give credit to the author by citing properly, if your are using it.
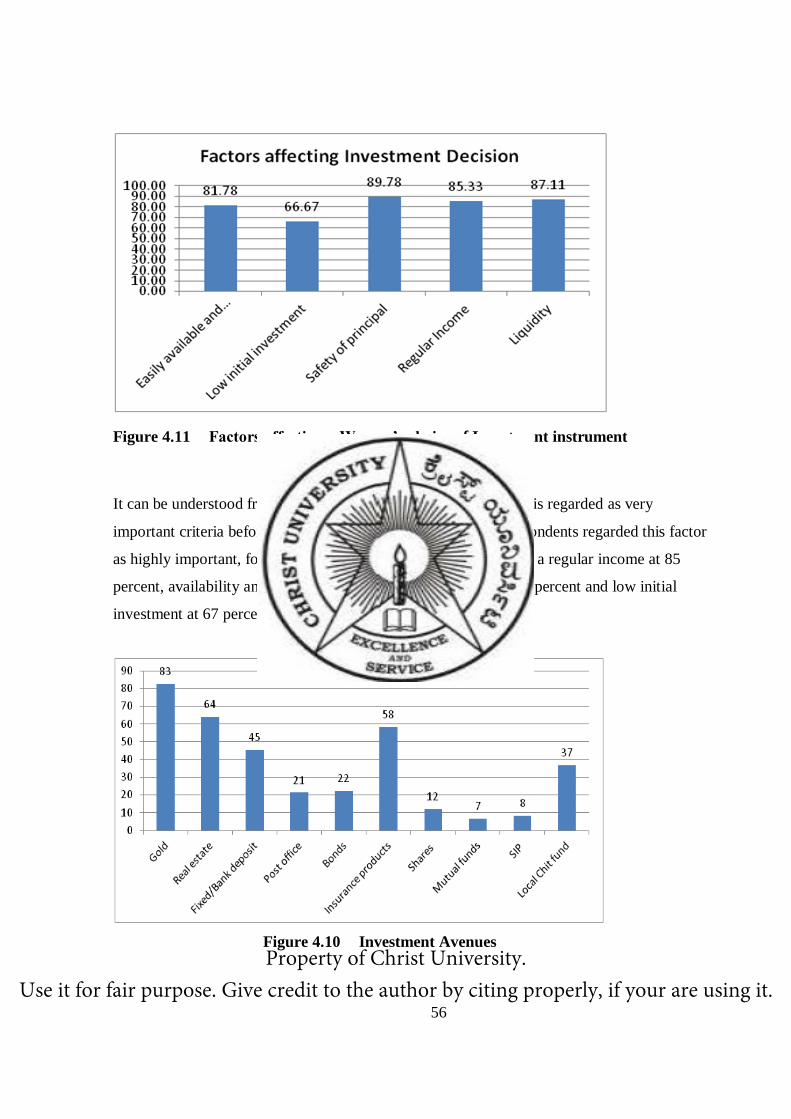
56
It can be understood from Fig no 4.11 that Safety of the principal is regarded as very
important criteria before investing. Almost 89 percent of the respondents regarded this factor
as highly important, followed by liquidity at 87 percent, receiving a regular income at 85
percent, availability and understandability of the instrument at 81 percent and low initial
investment at 67 percent.
Figure 4.10 Investment Avenues
Figure 4.11 Factors affecting a Women’s choice of Investment instrument
Property of Christ University. Use it for fair purpose. Give credit to the author by citing properly, if your are using it.
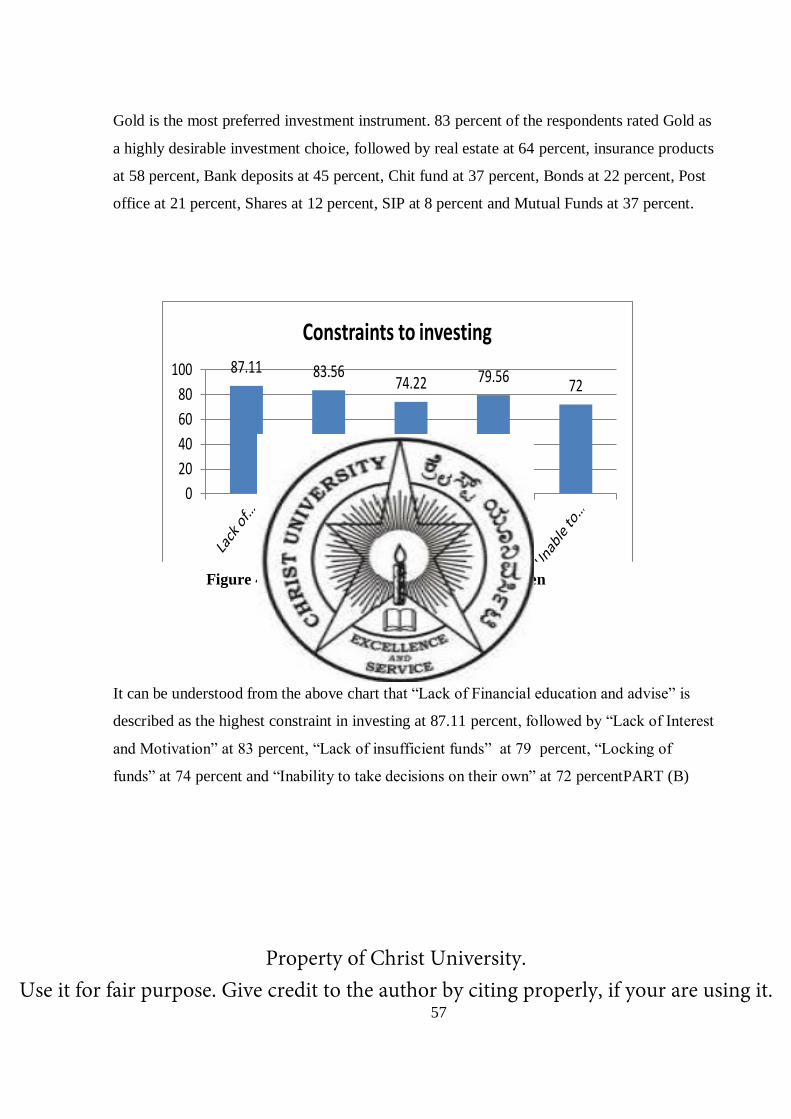
57
Gold is the most preferred investment instrument. 83 percent of the respondents rated Gold as
a highly desirable investment choice, followed by real estate at 64 percent, insurance products
at 58 percent, Bank deposits at 45 percent, Chit fund at 37 percent, Bonds at 22 percent, Post
office at 21 percent, Shares at 12 percent, SIP at 8 percent and Mutual Funds at 37 percent.
It can be understood from the above chart that “Lack of Financial education and advise” is
described as the highest constraint in investing at 87.11 percent, followed by “Lack of Interest
and Motivation” at 83 percent, “Lack of insufficient funds” at 79 percent, “Locking of
funds” at 74 percent and “Inability to take decisions on their own” at 72 percentPART (B)
87.11 83.5674.22 79.56
72
0
20
40
60
80
100
Constraints to investing
Figure 4.12 Constraints to investing for Women
Property of Christ University. Use it for fair purpose. Give credit to the author by citing properly, if your are using it.
58
4.3 Factor Analysis
In order to identify the factors that influence the investment decision, Factor Analysis was
conducted on independent as well as the dependent variables.
4.3.1 Factor Analysis of Independent Variables
1. Identification of factors from Independent Variables
To understand the factors that influence the investment decision of women, 8 statements were
identified. These statements were formed as questions on a five point scale and respondents
were asked to answer them. These eight statements are the independent variables which then
get reduced to three factors. The eight statements are listed below-
1. Interest /Willingness and Motivation to Invest
2. Availability of Funds
3. Financial decision making capacity
4. Easily available and Understandable investment
5. Safety of Principal
6. Liquidity
7. Low Initial Investment
8. Regular income
Factor analysis was used to reduce dimensions of the above mentioned eight independent
variables into three components using Principal Component Analysis
Property of Christ University. Use it for fair purpose. Give credit to the author by citing properly, if your are using it.

59
2. Factor analysis was used to reduce dimensions of the above mentioned eight
independent variables into three components using Principal Component Analysis.
Table 4.5 KMO and Bartlett's Test
KMO and Bartlett's Test
Kaiser-Meyer-Olkin Measure of Sampling
Adequacy. .706
Bartlett's Test of
Sphericity
Approx. Chi-
Square 323.976
Df 28
Sig. .000
Based on the above output, the KMO = 0.706. This shows that the degree of common
variance among the variables is quite high; therefore factor analysis can be conducted. The
Chi-Square value for Bartlett’s test of Sphericity is 323.976 and the significant value is 0.000
indicating that the data is suitable for factor analysis.Using Principal Component Analysis as
the Extraction Method Communalities were found
Table 4.6 Communalities
Initial Extraction
IPEasily 1.000 .770
IPLow 1.000 .680
IPSecu 1.000 .351
IPIncome 1.000 .707
IPCash 1.000 .784
Ipmot 1.000 .493
Ipfunds 1.000 .457
IPDecsns 1.000 .690
Property of Christ University. Use it for fair purpose. Give credit to the author by citing properly, if your are using it.
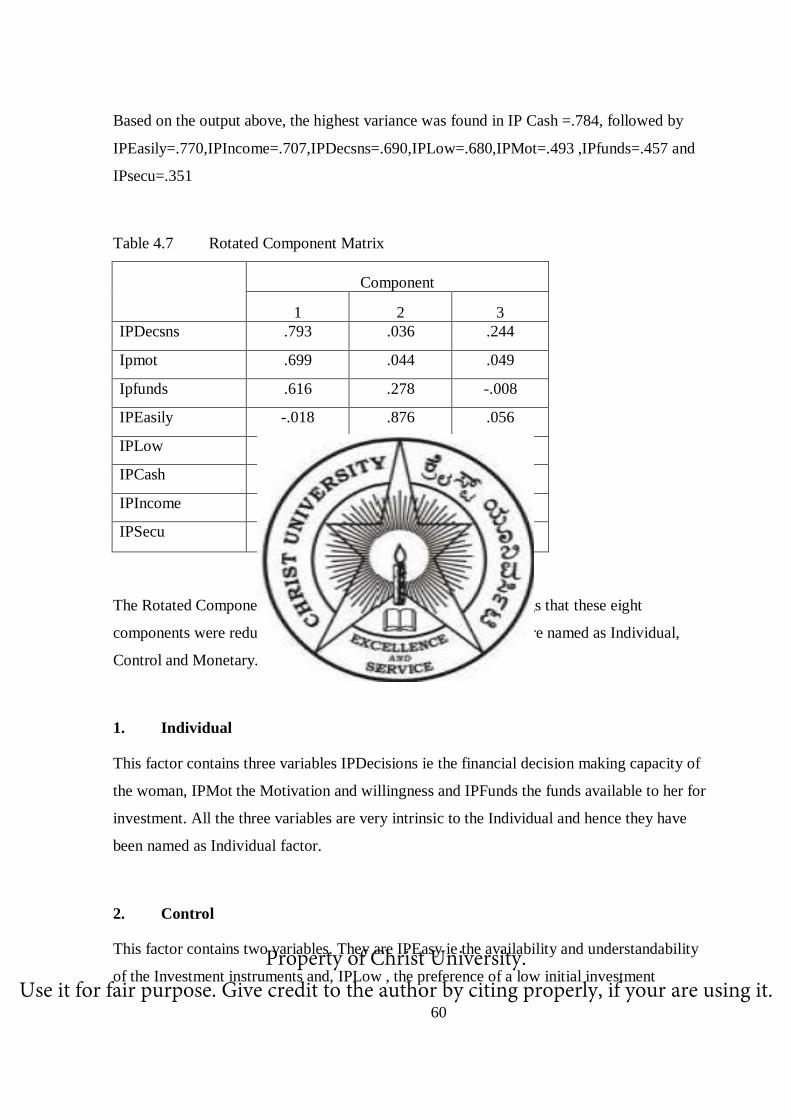
60
Based on the output above, the highest variance was found in IP Cash =.784, followed by
IPEasily=.770,IPIncome=.707,IPDecsns=.690,IPLow=.680,IPMot=.493 ,IPfunds=.457 and
IPsecu=.351
Table 4.7 Rotated Component Matrix
Component
1 2 3
IPDecsns .793 .036 .244
Ipmot .699 .044 .049
Ipfunds .616 .278 -.008
IPEasily -.018 .876 .056
IPLow .281 .759 .159
IPCash -.055 -.030 .883
IPIncome .273 .268 .749
IPSecu .284 .350 .384
The Rotated Component Matrix indicates, based on factor loadings that these eight
components were reduced into three factors. The three factors were named as Individual,
Control and Monetary.
1. Individual
This factor contains three variables IPDecisions ie the financial decision making capacity of
the woman, IPMot the Motivation and willingness and IPFunds the funds available to her for
investment. All the three variables are very intrinsic to the Individual and hence they have
been named as Individual factor.
2. Control
This factor contains two variables. They are IPEasy ie the availability and understandability
of the Investment instruments and, IPLow , the preference of a low initial investment Property of Christ University.
Use it for fair purpose. Give credit to the author by citing properly, if your are using it.
61
instrument. This factor has been named as “Control” as the variables under this factor are pre-
requisites to taking control over an investment, which, from a women’s point of view is very
important.
3. Monetary
This factor contains three variables namely IPCash ie Liquidity, IPIncome- the need for
regular income and IPSecu- the Safety of Principal. This factor has been named as
“Monetary”
4.3.2 FACTOR ANALYSIS OF DEPENDENT VARIABLES
1. Identification of factors from Dependent Variables
To understand the choice of investment instruments ten statement about investment
instruments were identified. The opinions about these instruments were collected on a five
point Likert scale. The ten instruments are listed below-
1. Fixed Deposits/Savings Deposits
2. Government of India Bonds
3. Post office Deposits
4. Mutual Funds
5. Shares
6. Systematic Investment Plan
7. Chit Fund
8. Gold
9. Insurance
10. Real Estate Property of Christ University.
Use it for fair purpose. Give credit to the author by citing properly, if your are using it.
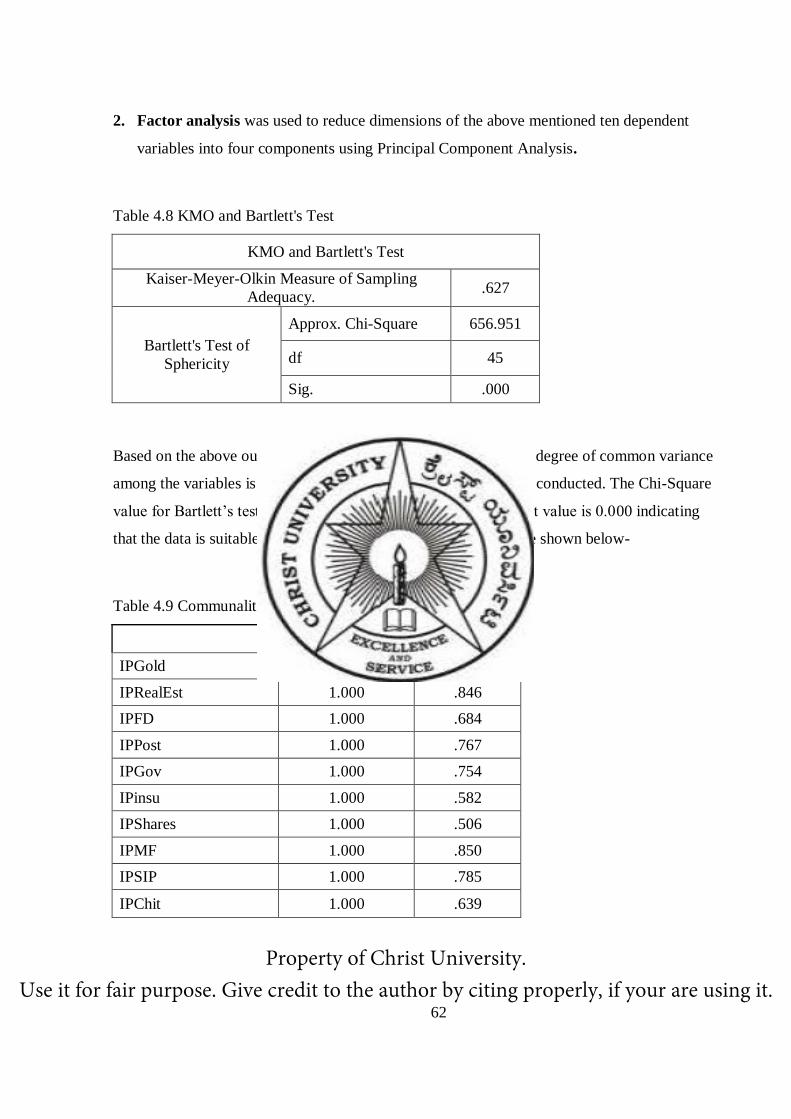
62
2. Factor analysis was used to reduce dimensions of the above mentioned ten dependent
variables into four components using Principal Component Analysis.
Table 4.8 KMO and Bartlett's Test
KMO and Bartlett's Test
Kaiser-Meyer-Olkin Measure of Sampling
Adequacy. .627
Bartlett's Test of
Sphericity
Approx. Chi-Square 656.951
df 45
Sig. .000
Based on the above output the KMO = 0.627. This shows that the degree of common variance
among the variables is quite high; therefore factor analysis can be conducted. The Chi-Square
value for Bartlett’s test of Sphericity is 656.951 and the significant value is 0.000 indicating
that the data is suitable for factor analysis. The Communalities are shown below-
Table 4.9 Communalities
Initial Extraction
IPGold 1.000 .757
IPRealEst 1.000 .846
IPFD 1.000 .684
IPPost 1.000 .767
IPGov 1.000 .754
IPinsu 1.000 .582
IPShares 1.000 .506
IPMF 1.000 .850
IPSIP 1.000 .785
IPChit 1.000 .639
Property of Christ University. Use it for fair purpose. Give credit to the author by citing properly, if your are using it.

63
Based on the output above, the highest variance was found in IPRealEst= .846, followed by
IPMf=.850, IPSIP=.785, IPGold=.757, IPPost=.767, IPGov=.754, IPFD=.684 IPchit=.639,
IPinsu=582 and IPshares=.506
Table 4.10 Rotated Component Matrixa
Component
1 2 3 4
IPPost .867 .121 -.015 -.009
IPGov .827 .141 .208 -.077
IPFD .668 .156 -.349 .303
IPMF .139 .901 -.130 -.033
IPSIP .039 .882 -.008 -.078
IPShares .152 .627 -.057 .294
IPChit -.058 -.047 .761 -.235
IPGold .044 -.124 .725 .463
IPinsu .521 -.060 .552 .059
IPRealEst .014 .072 -.018 .917
The Rotated Component Matrix indicates, based on factor loadings that these ten components
were reduced into four factors.
Property of Christ University. Use it for fair purpose. Give credit to the author by citing properly, if your are using it.

64
1) Zero Risk
This factor consists of investments in Post Office,Governement Deposits, and Deposits in
Bank .
2) Low Risk
This factor consists of Investments in Real Estate.
3) Moderate Risk
This factor consists of Investments in Gold,Chit Fund and Insurance.
4) High Risk
This factor consists of Investments in Mutual Funds, Shares and SIP.
1. Regression Analysis
To identify the factors that influence the choice of investment instrument, in the first phase
Karl Pearson’s Correlation Analysis was conducted to find the association between
Independent and Dependent Factors.
Property of Christ University. Use it for fair purpose. Give credit to the author by citing properly, if your are using it.

65
Table 4.11 Karl Pearson’s Correlation for association between factors affecting investment
decision
Individual Control Monetary
Zero Risk
High Risk
Moderate Risk
Low Risk
Individual
Pearson Correlation
1 0 0 .162* -.253** .391** 0.1
Sig. (2-tailed)
1 1 0.015 0 0 0.136
N 225 225 225 225 225 225 225
Control
Pearson Correlation
0 1 0 .323**
0.073 .242**
-.158*
Sig. (2-tailed) 1
1 0 0.274 0 0.017
N 225 225 225 225 225 225 225
Monetary
Pearson Correlation
0 0 1 .167* -.135* .210** 0.049
Sig. (2-tailed) 1 1
0.012 0.043 0.002 0.465
N 225 225 225 225 225 225 225
Zero Risk
Pearson Correlation
.162* .323** .167* 1 0 0 0
Sig. (2-tailed) 0.015 0 0.012
1 1 1
N 225 225 225 225 225 225 225
High Risk
Pearson Correlation
-.253**
0.073 -.135* 0 1 0 0
Sig. (2-tailed) 0 0.274 0.043 1
1 1
N 225 225 225 225 225 225 225
Moderate Risk
Pearson Correlation
.391** .242** .210** 0 0 1 0
Sig. (2-tailed) 0 0 0.002 1 1
1
N 225 225 225 225 225 225 225
Low Risk
Pearson Correlation
0.1 -.158* 0.049 0 0 0 1
Sig. (2-tailed) 0.136 0.017 0.465 1 1 1
N 225 225 225 225 225 225 225
*Co-relation is significant at the 0.05 level (2- tailed)
**Co-relation is significant at the 0.01 level (2-tailed)
Property of Christ University. Use it for fair purpose. Give credit to the author by citing properly, if your are using it.

66
Table No. 4.11 indicates that there is an association between the below listed factors
1. ‘Individual’ Factor
‘Individual’ factor has positive correlation with “Zero risk” and “Moderate”
risk investment instruments
‘Individual’ factor has negative correlation with “High risk” investment
instrument
2. ‘Control’ Factor
‘ Control’” factor has positive correlation with “Zero risk” and “Moderate
risk” investment instrument
‘Control’ factor has negative correlation with “Low Risk” investment
instrument
3. ‘Monetary’ Factor
‘Monetary’ factor has a positive correlation with “Zero risk” and “Moderate
risk” investment instrument
‘Monetary’ factor has a negative correlation with “High Risk” investment
instrument.
In the second phase, to find the influence of the independent factors on each dependent factor,
Multiple Linear Regression was conducted.
A. Regression Analysis for “Zero Risk” Investment
Table 4.12 Model Summary for “Zero Risk” investment
Model Summaryb
Model R R Square Adjusted R
Square
Std. Error of the
Estimate
1 .398a 0.159 0.147 0.9235
Property of Christ University. Use it for fair purpose. Give credit to the author by citing properly, if your are using it.

67
a. Predictors: (Constant), IV_INV_Monetary, IV_INV_Control,
IV_INV_Individual
b. Dependent Variable: DV_FAC_ZeroRisk
Table 4.13 Analysis of Variance for “Zero Risk” investment
ANOVAb
Model Sum of
Squares df
Mean
Square F Sig.
1
Regression 35.51 3 11.835 13.876 .000a
Residual 188.5 221 0.853
Total 224 224
a. Predictors: (Constant), IV_INV_Monetary, IV_INV,Control, IV_INV_Individual
b. Dependent Variable: DV_FAC_ZeroRisk
Table 4.14 Coefficients of Regression for “Zero Risk” investment
Coefficientsa
Model
Unstandardized Coefficients
Standardized Coefficients
Sig.
95.0% Confidence
Interval for B
B Std.
Error Beta t
Lower Bound
Upper Bound
1
(Constant) -2.10E-17 0.062
0 1 -0.121 0.121
IV_INV_Individual 0.162 0.062 0.162 2.623 0.009 0.04 0.283
IV_INV_Control 0.323 0.062 0.323 5.238 0 0.202 0.445
IV_INV_Monetary 0.167 0.062 0.167 2.703 0.007 0.045 0.288
a. Dependent Variable: DV_FAC_Zero risk
Property of Christ University. Use it for fair purpose. Give credit to the author by citing properly, if your are using it.
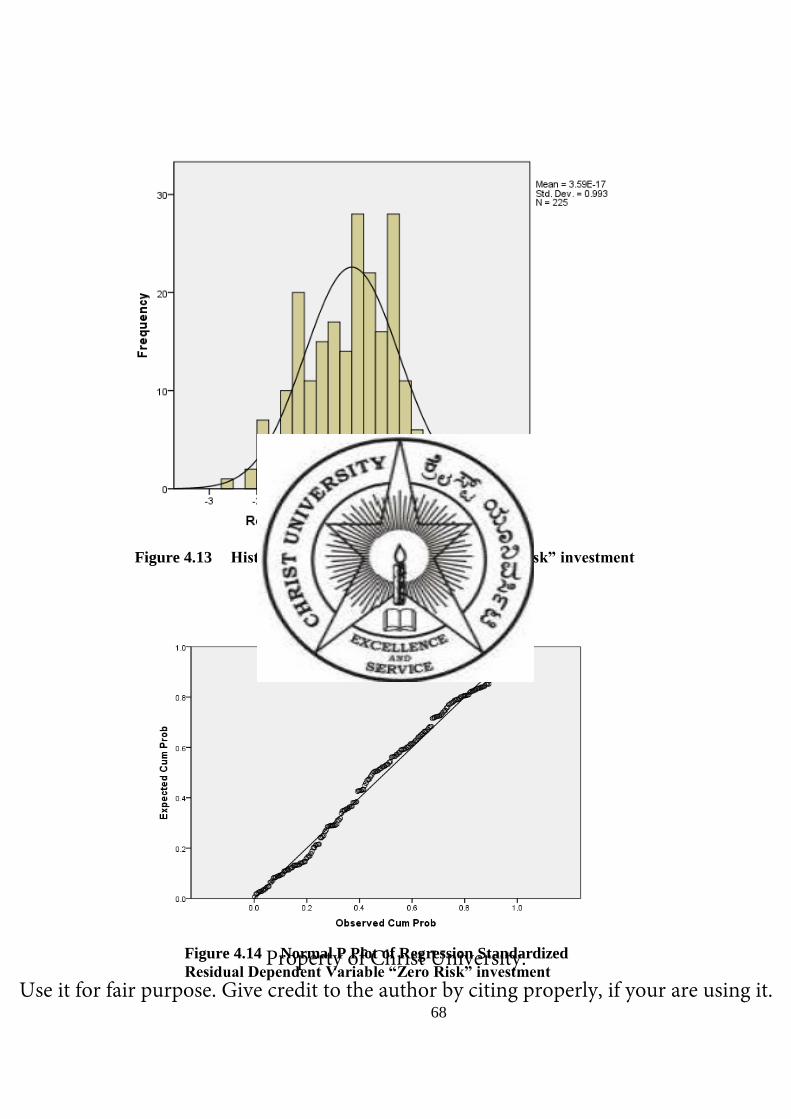
68
Figure 4.13 Histogram for Dependent Variable “Zero Risk” investment
Figure 4.14 Normal P Plot of Regression Standardized
Residual Dependent Variable “Zero Risk” investment Property of Christ University.
Use it for fair purpose. Give credit to the author by citing properly, if your are using it.

69
Results indicate that the explained variance is 13.876 percent ( F statistic is 13.876 ) which is
found to be significant at 1 percent. It can also be said that all the three factors namely
“Individual”,”Control” and “Monetary” significantly influence the dependent factor “Zero
Risk”investment.Though the results indicate the existence of a fit to the relationship, it may
not be sufficed, because of a non-prominent value of adjusted R2 (0.14 ).
B. Regression Analysis for “High Risk” Investment
Table 4.15 Model Summary for “High Risk” Investment
Model Summaryb
Mod
el R R Square
Adjusted
R Square
Std. Error of the
Estimate
1 .286
a 0.082 0.074 0.96241
a. Predictors: (Constant), IV_INV_Monetary, IV_INV_Individual
b. Dependent Variable: DV_FAC_High Risk
Table 4.16 Analysis of Variance for “High Risk” Investment
ANOVAb
Model Sum of
Squares df
Mean
Square F Sig.
1
Regression 18.377 2 9.189 9.92 .000a
Residual 205.623 222 0.926
Total 224 224
a. Predictors: (Constant), IV_INV_Monetary, IV_INV_Individual
b. Dependent Variable: DV_FAC_High Risk
Property of Christ University. Use it for fair purpose. Give credit to the author by citing properly, if your are using it.
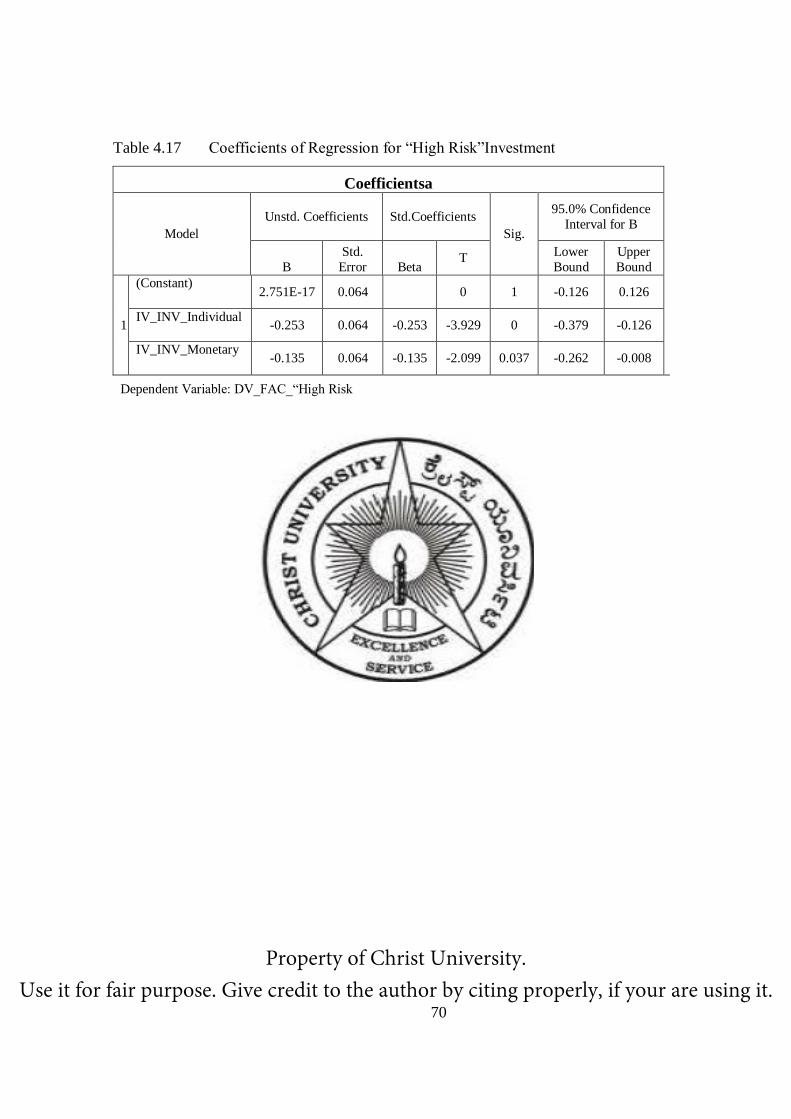
70
Table 4.17 Coefficients of Regression for “High Risk”Investment
Coefficientsa
Model
Unstd. Coefficients Std.Coefficients
Sig.
95.0% Confidence
Interval for B
B
Std.
Error Beta T Lower
Bound
Upper
Bound
1
(Constant) 2.751E-17 0.064
0 1 -0.126 0.126
IV_INV_Individual -0.253 0.064 -0.253 -3.929 0 -0.379 -0.126
IV_INV_Monetary -0.135 0.064 -0.135 -2.099 0.037 -0.262 -0.008
Dependent Variable: DV_FAC_“High Risk
Property of Christ University. Use it for fair purpose. Give credit to the author by citing properly, if your are using it.

71
Figure 4.16 Histogram Dependent Variable: “High Risk” investment
Figure 4.15 Normal P Plot of Regression Standardized Residual
Dependent Variable “High Risk ” investment
Property of Christ University. Use it for fair purpose. Give credit to the author by citing properly, if your are using it.
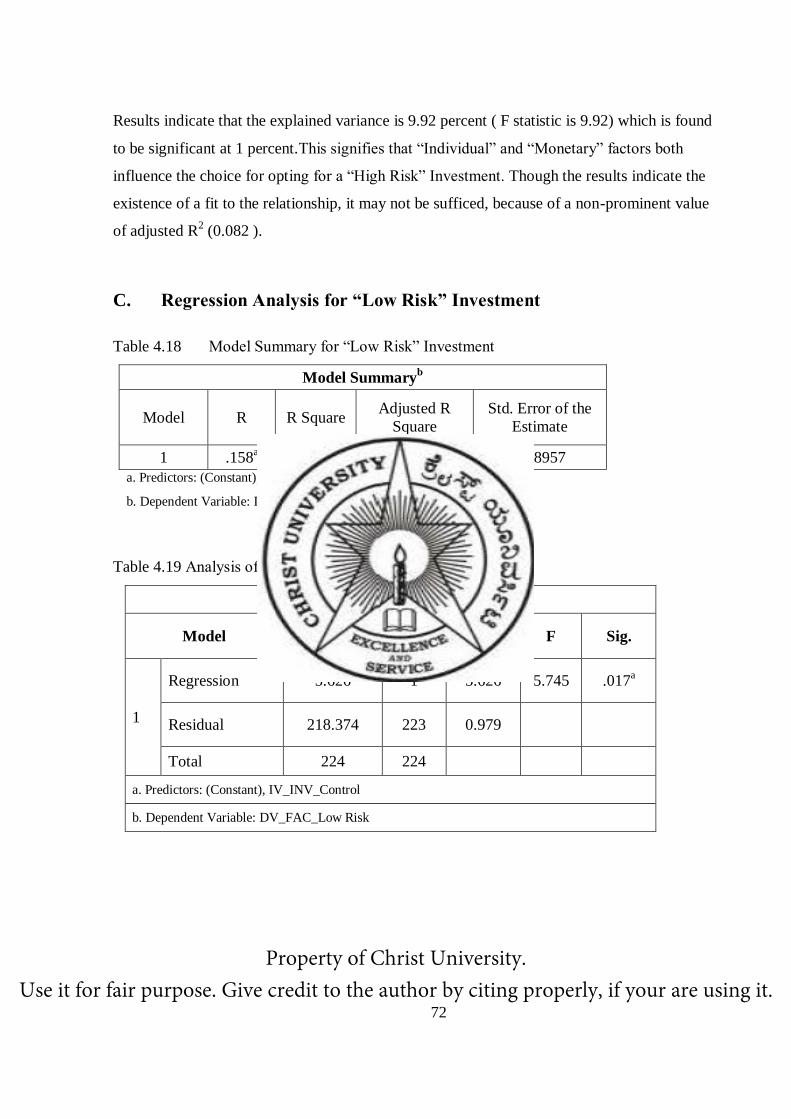
72
Results indicate that the explained variance is 9.92 percent ( F statistic is 9.92) which is found
to be significant at 1 percent.This signifies that “Individual” and “Monetary” factors both
influence the choice for opting for a “High Risk” Investment. Though the results indicate the
existence of a fit to the relationship, it may not be sufficed, because of a non-prominent value
of adjusted R2 (0.082 ).
C. Regression Analysis for “Low Risk” Investment
Table 4.18 Model Summary for “Low Risk” Investment
Model Summaryb
Model R R Square Adjusted R
Square
Std. Error of the
Estimate
1 .158a 0.025 0.021 0.98957
a. Predictors: (Constant), IV_INV_Control
b. Dependent Variable: DV_FAC_4RN
Table 4.19 Analysis of Variance for “Low Risk” Investment
ANOVAb
Model Sum of
Squares df
Mean
Square F Sig.
1
Regression 5.626 1 5.626 5.745 .017a
Residual 218.374 223 0.979
Total 224 224
a. Predictors: (Constant), IV_INV_Control
b. Dependent Variable: DV_FAC_Low Risk
Property of Christ University. Use it for fair purpose. Give credit to the author by citing properly, if your are using it.

73
Table 4.20 Coefficients of Regression for “Low Risk” Investment
Coefficientsa
Model
Unstandardized
Coefficients
Standardized
Coefficients Sig.
95.0%
Confidence
Interval for B
B Std.
Error Beta t
Lower
Bound
Upper
Bound
1 (Constant)
2.21E-17
0.066
0 1 -0.13 0.13
IV_INV_Control -0.158 0.066 -0.158 -2.397 0.017 -0.289 -0.028
a. Dependent Variable: DV_FAC_Low Risk
Figure 4.17 Histogram Dependent Variable: “Low Risk” investment
Property of Christ University. Use it for fair purpose. Give credit to the author by citing properly, if your are using it.

74
Results indicate that the explained variance is 5.745 percent ( F statistic is 5.745 ) which is
found to be significant at 1 percent. It signifies that “Control” factor is responsible for the
investment decision of women while investing in a “Low risk” investment.
Figure 4.19 No Normal P Plot of Regression Standardized
Residual Dependent Variable “Low Risk” investment
Property of Christ University. Use it for fair purpose. Give credit to the author by citing properly, if your are using it.

75
4.4 Variance in Investment Pattern across Working and Non-
working Women
In order to study the differences in the investment pattern across working and non-working
women, two different indicators were tested
1. Frequency of investment interval
2. Choice of investment instrument
The two hypotheses framed for the study are as follows-
H05: There is no significant difference in the frequency of investing across socio-
demographic attributes
H06: There is no significant difference in the choice of investment instrument across socio-
demographic attributes
The following steps were followed for chi-square analysis.
Firstly, the differences in investment pattern for the working women were analyzed
with “Occupation” as the reference variable
Secondly, the differences in investment pattern for the non-working women were
analyzed with “Education” as the reference variable
Finally, the differences in investment pattern for both the above mentioned groups
were analyzed with “Age” as a common reference variable.
Property of Christ University. Use it for fair purpose. Give credit to the author by citing properly, if your are using it.

76
4.4.1 Differences in frequency of investing across socio-demographic
attributes
Table 4.21 Chi-Square Values for frequency of investing
Working Women (Occupation)
Sl.
No Description Chi-square Sig Hypothesis
1 Frequency of
investing 25.27 0.14 Accept
Working Women (Age)
2 Frequency of
investing 18.983 0.27 Accept
Non Working (Education)
3 Frequency of
investing 46.097 0 Accept
Non Working (Age)
4 Frequency of
investing 46.097 0 Accept
The table 4.22 indicates that the frequency of investing does not differ with respect to
Occupation or Age for working women and with respect to Education or Age for non-working
women. Thus, the null Hypothesis H05: “There is no significant difference in the frequency of
investing across socio-demographic attributes” is accepted.
Property of Christ University. Use it for fair purpose. Give credit to the author by citing properly, if your are using it.
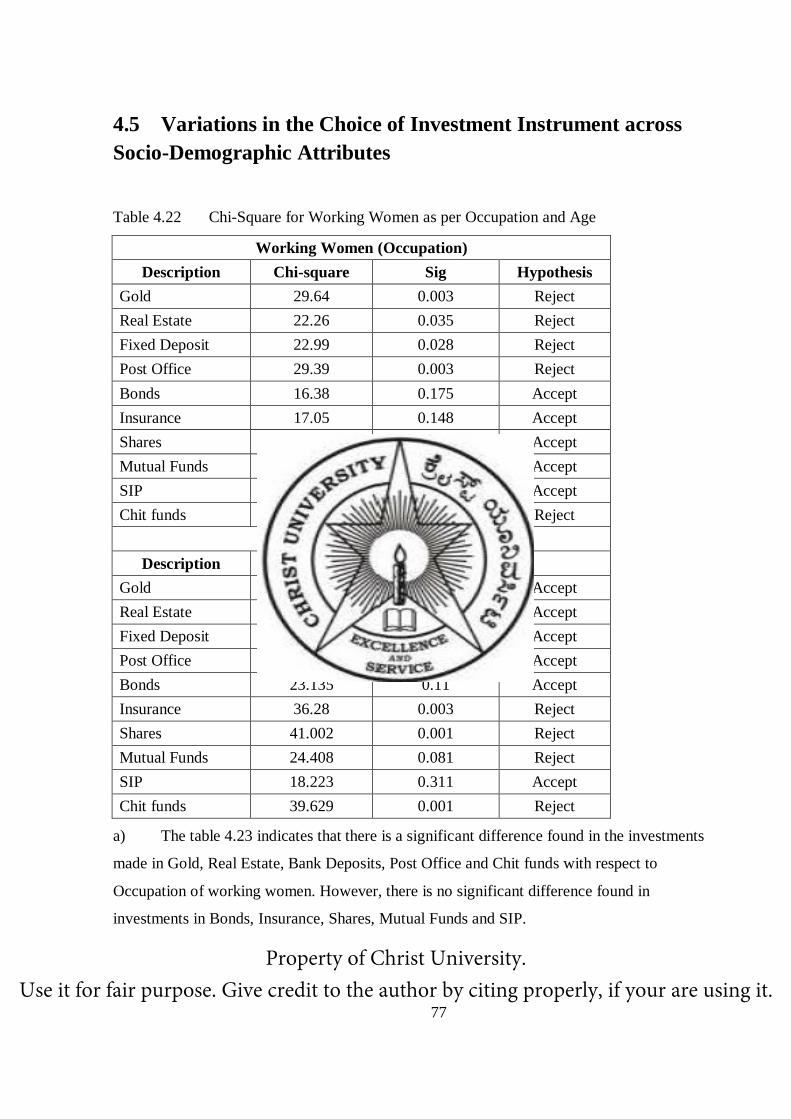
77
4.5 Variations in the Choice of Investment Instrument across
Socio-Demographic Attributes
Table 4.22 Chi-Square for Working Women as per Occupation and Age
Working Women (Occupation)
Description Chi-square Sig Hypothesis
Gold 29.64 0.003 Reject
Real Estate 22.26 0.035 Reject
Fixed Deposit 22.99 0.028 Reject
Post Office 29.39 0.003 Reject
Bonds 16.38 0.175 Accept
Insurance 17.05 0.148 Accept
Shares 4.39 0.975 Accept
Mutual Funds 13.08 0.363 Accept
SIP 14.51 0.27 Accept
Chit funds 28.03 0.005 Reject
Working Women (Age)
Description Chi-square Sig
Gold 19.107 0.263 Accept
Real Estate 14.54 0.559 Accept
Fixed Deposit 19.355 0.251 Accept
Post Office 19.197 0.259 Accept
Bonds 23.135 0.11 Accept
Insurance 36.28 0.003 Reject
Shares 41.002 0.001 Reject
Mutual Funds 24.408 0.081 Reject
SIP 18.223 0.311 Accept
Chit funds 39.629 0.001 Reject
a) The table 4.23 indicates that there is a significant difference found in the investments
made in Gold, Real Estate, Bank Deposits, Post Office and Chit funds with respect to
Occupation of working women. However, there is no significant difference found in
investments in Bonds, Insurance, Shares, Mutual Funds and SIP.
Property of Christ University. Use it for fair purpose. Give credit to the author by citing properly, if your are using it.

78
b) The table 4.23 indicates that there is a significant difference found in the investments
made in Insurance, Shares, Mutual funds and Chit funds with respect to Age of working
women. However, there is no significant difference found in investments in Gold, Real Estate,
Bank Deposit, Post Office, Bonds, and SIP.
Table 4.24 Chi-Square Values for Non- working Women as per Education and Age
Non Working (Education)
Description Chi-square Sig Hypothesis
Gold 26.52 0.047 Reject
Real Estate 13.254 0.654 Accept
Fixed Deposit 23.339 0.105 Accept
Post Office 16.16 0.442 Accept
Bonds 14.762 0.542 Accept
Insurance 13.017 0.671 Accept
Shares 15.998 0.453 Accept
Mutual Funds 26.679 0.045 Reject
SIP 29.201 0.023 Reject
Chit funds 23.16 0.11 Accept
Non Working (Age)
Description Chi-square Sig Hypothesis
Gold 26.52 0.047 Reject
Real Estate 13.254 0.654 Accept
Fixed Deposit 23.339 0.105 Accept
Post Office 16.16 0.442 Accept
Bonds 14.762 0.542 Accept
Insurance 13.017 0.671 Accept
Shares 15.998 0.453 Accept
Mutual Funds 26.679 0.045 Reject
SIP 29.201 0.023 Reject
Chit funds 23.16 0.11 Accept
Property of Christ University. Use it for fair purpose. Give credit to the author by citing properly, if your are using it.

79
c) The above table indicates that there is a significant difference found in the investments
made in Gold, Mutual funds and SIP with respect to Education of non- working women.
However, there is no significant difference found in investments in Real Estate, Bank Deposit,
Post Office, Bonds, Chit funds and Insurance.
d) The table 4.24 indicates that there is a significant difference found in the investments
made in Gold, Mutual funds and SIP with respect to age of working women. However, there
is no significant difference found in investments in Real Estate, Bank Deposit, Post Office,
Bonds, Shares and Insurance
Thus, the null hypothesis H06: “There is no significant difference in the choice of investment
instrument across socio-demographic attributes” is rejected.
4.6 Descriptive statistics
With the help of frequency tables, data has been analyzed to understand whether there is any
variation in the frequency of investing and choice of investment instrument across socio-
demographic attributes.
Property of Christ University. Use it for fair purpose. Give credit to the author by citing properly, if your are using it.

80
Table 4.23 Variations in Investment pattern of Working Women w.r.t Occupation
Variations in Working Women (Occupation wise)
Frequency of Investing
Gov % Private %
Self/Part
-time %
Weekly 0 0 2 5 2 3
Monthly 5 83 22 56 65 90
Quarterly 0 0 5 13 4 6
Half yearly 1 17 8 21 1 1
Yearly 0 0 2 5 0 0
Total 6 100 39 100 72 100
Motives of Investing
Tax benefits 0 0 18 46 1 1
Hedge against inflation 0 0 0 0 1 1
Pers/fin goals 5 83 11 28 52 72
Multiply savings 1 17 8 21 16 22
Receive annualized return 0 0 2 5 2 3
Total 6 100 39 100 72 100
Preferred Investment Instrument
Gold 5 83 23 59 69 96
Real Estate 3 50 18 46 53 74
Bank Deposits 5 83 15 38 23 32
Post Office 2 33 6 15 5 7
Bonds 3 50 9 23 8 11
Insurance 5 83 16 41 45 63
Shares 0 0 2 5 7 10
Mutual Funds 0 0 3 8 2 3
SIP 1 17 6 15 3 4
Chit fund 4 67 9 23 37 51
Total No of Employees 6
39
72
Property of Christ University. Use it for fair purpose. Give credit to the author by citing properly, if your are using it.

81
Based on the table 4.27 the following facts about variations in investment pattern about
working women with regard to Occupation can be recognized.
1) Frequency of Investing
Investing on a monthly basis is more prevalent amongst all types of employees. Almost 76
percent of the working women invested on a monthly basis. As per occupation, 83 percent of
Government employees and 90 percent of self employed/part time employed women invested
on a monthly basis. Compared to this, only 56 percent women employed in private sector
invest on a monthly basis. 21 percent of these employees invest half-yearly and 13 percent of
these on a quarterly basis. Half yearly investing is also popular amongst employees of Private
sector
2) Motives of investing
46 percent of women employed in private sector invest for tax benefits. Investing for tax
saving is not seen as a motive for investment for women working with Government sector and
Self employed women. 83 percent of women working with Government sector, 28 percent of
women working with Private sector and 72 percent of women who are self employed/part
time employed invest for fulfilling their personal and financial goals. Across all the
occupational groups, the need to multiply their savings is felt almost in the same magnitude.
This suggests that, irrespective of the occupation, their understanding about the fact that
investing helps in multiplying the savings is the same. Where private sector and Self-
employed/part time employed women look forward to annualized return, the Government
sector employees don’t seem to have such a necessity. To undertake investments as a hedge
against inflation does appears as an insignificant motive across all occupations. One reason
could be that, since they are working they assume that there will be a flow of income for few
more years and hence inflation may not pinch them.
3) Preferred Investment Instrument
The portfolio of investments of a women Government employee heavily consists of
traditional investment instruments like Gold, Insurance and Bank Deposits. Risky instruments Property of Christ University.
Use it for fair purpose. Give credit to the author by citing properly, if your are using it.

82
like Mutual funds and Shares are not preferred by them. Chit fund is a popular choice
amongst Government Employees. The portfolio of a Private sector employee is a fine balance
of risky, moderately risky, and safe traditional instruments. However, here too the traditional
investment instruments are more pronounced. Risky instruments like Mutual funds and Shares
form a tiny share. The portfolio of a Self-employed women consists of a good mix of all types
of instruments. 93 percent of Self Employed/ Part time employed women have rated Gold to
be the maximum preferred choice. Though, here too, the majority of the investments are
traditional and very safe in nature. Across all occupations, Gold is the topmost preference,
followed by Real estate and Insurance.
Property of Christ University. Use it for fair purpose. Give credit to the author by citing properly, if your are using it.
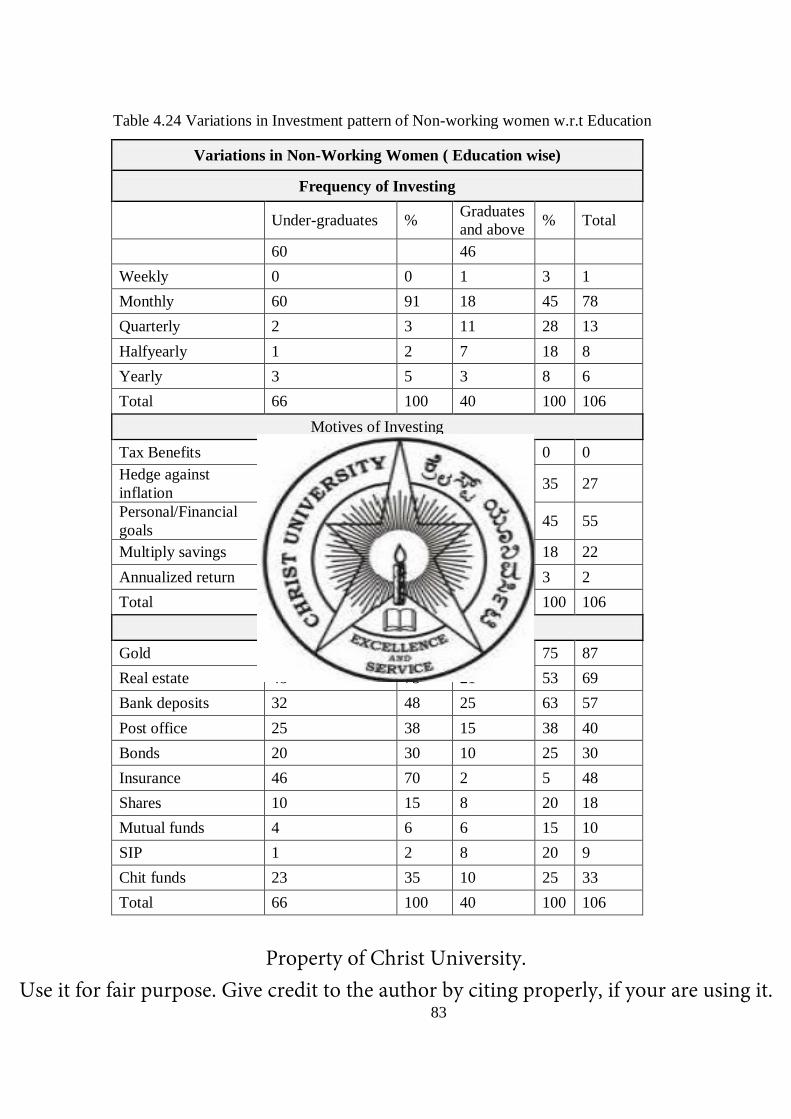
83
Table 4.24 Variations in Investment pattern of Non-working women w.r.t Education
Variations in Non-Working Women ( Education wise)
Frequency of Investing
Under-graduates %
Graduates
and above % Total
60
46
Weekly 0 0 1 3 1
Monthly 60 91 18 45 78
Quarterly 2 3 11 28 13
Halfyearly 1 2 7 18 8
Yearly 3 5 3 8 6
Total 66 100 40 100 106
Motives of Investing
Tax Benefits 0 0 0 0 0
Hedge against
inflation 13 20 14 35 27
Personal/Financial
goals 37 56 18 45 55
Multiply savings 15 23 7 18 22
Annualized return 1 2 1 3 2
Total 66 100 40 100 106
Investment Instrument
Gold 57 86 30 75 87
Real estate 48 73 21 53 69
Bank deposits 32 48 25 63 57
Post office 25 38 15 38 40
Bonds 20 30 10 25 30
Insurance 46 70 2 5 48
Shares 10 15 8 20 18
Mutual funds 4 6 6 15 10
SIP 1 2 8 20 9
Chit funds 23 35 10 25 33
Total 66 100 40 100 106
Property of Christ University. Use it for fair purpose. Give credit to the author by citing properly, if your are using it.

84
Based on the Table No. 4.25, the following facts about variations in investment pattern about
Non-working women with regard to Education can be recognized.
1) Frequency of Investing
There is a striking difference spotted in the frequency of investing with regard to educational
qualification of women. 91 percent of undergraduate women prefer investing on a monthly
basis, compared to a low figure of 45 percent of Graduate women.
28 percent of Graduates invest on a quarterly basis, followed by 18 percent of them on a half-
yearly basis and 8 percent on a yearly basis. Data shows that under-graduate women are in
the favor of monthly investments.
As the frequency of investments also depends on the choice of investment instrument, the
variance between both the groups can be justified. However, looking at the preferences of
investment instrument, it can be said that monthly investments like SIP’s and mutual funds
are not the preferred choice of these under-graduate women, rather they go for chit funds, Post
office deposits, Bank deposits and Gold. Thus it can be said that , in this case the frequency of
investment does not hold a bearing on the choice of investment instrument.
2) Motives of investing
Investing to fulfill personal and financial goals is found to be the main motive behind
investment, with 56 percent of under graduate women and 45 percent of graduate women
quoting so. 23 percent of under graduates and 18 percent of graduates find the “multiply
savings” to be an important motive for investment. Since the differences in these percentages
are not high, it can safely assume that both groups understand the need to multiply savings
through investment. Annualized return is not found to be a significant motive.
Property of Christ University.
Use it for fair purpose. Give credit to the author by citing properly, if your are using it.

85
3) Preferred Investment Instrument
The portfolio of investments of undergraduate women mostly consists of traditionally safe
investment instruments like Gold, Real Estate, Bank Deposits and Insurance. The investment
preferences of Mutual funds and SIP are low at 6 percent and 2 percent respectively.
The portfolio of investments of graduate women is a mix of risky, moderately risky and safe
investments. 15 percent of the graduates invest in mutual funds, 20 percent in SIP and 20
percent in shares. However, the majority of the investments revolve around safe instruments
like Gold at 75 percent and Bank Deposits at 63 percent.
While comparing the figures of investment in Gold, Real Estate and Chit funds between both
the groups, it can be said that they are more popular amongst undergraduates. One reason
could be that, these traditional investments are getting slowly replaced by instruments like
Mutual funds and SIP’s in the graduate group.
Only 2 percent of undergraduate women have rated SIP as a preference compared to 20
percent of the graduates. Likewise, only 6 percent of the undergraduates favor Mutual funds
in comparison to 15 percent of the graduates. Thus it can be said that awareness amongst
undergraduates with respect to SIP’s and Mutual Funds is low or that their risk appetite is
low.
Property of Christ University. Use it for fair purpose. Give credit to the author by citing properly, if your are using it.

86
Table 4.25 Variations in the Investment pattern of working women with respect to age
Variations in Working Women (Age wise)
Working Women age
group
18-
25 %
26-
35 %
36-
45 %
46-
55 %
56 &
abov
e
%
Total
no of
women
Total no of women 18
47
36
11
5
117
Frequency of Investing
Weekly 1 6 2 4 0 0 1 9 0 0 4
Monthly 9 50 36 77 34 94 9 82 5 100 93
Quarterly 3 17 3 6 2 6 1 9 0 0 9
Half yearly 4 22 5 11 0 0 0 0 0 0 9
Yearly 1 6 1 2 0 0 0 0 0 0 2
Total 18 10
0 47
10
0 36
10
0 11
10
0 5 100 117
Motives of Investing
Tax Benefits 7 39 11 23 0 0 0 0 1 20 19
Hedge against
inflation 0 0 0 0 1 3 0 0 0 0 1
Personal/Financial
goals 9 50 25 53 22 61 10 91 2 40 68
Multiply savings 2 11 9 19 11 31 1 9 2 40 25
Annualized return 0 0 2 4 2 6 0 0 0 0 4
Total 18 10
0 47
10
0 36
10
0 11
10
0 5 100 117
Investment Instrument
Gold 11 61 38 81 34 94 10 91 5 100 98
Real estate 10 56 27 57 25 69 9 82 4 80 75
Bank deposits 5 28 24 51 7 19 5 45 2 40 43
Post office 7 39 8 17 2 6 4 36 2 40 23
Bonds 2 11 9 19 17 47 2 18 4 80 34
Insurance 7 39 20 43 24 67 7 64 3 60 61
Shares 2 11 5 11 1 3 2 18 4 80 14
Mutual funds 0 0 4 9 0 0 2 18 0 0 6
SIP 1 6 8 17 0 0 1 9 0 0 10
Chit funds 1 6 18 38 23 64 7 64 1 20 50
Total 18
47
36
11
5
117
Based on the Table No 4.29 the following facts about variations in investment pattern about
working women with regard to Age can be recognized. Property of Christ University. Use it for fair purpose. Give credit to the author by citing properly, if your are using it.

87
1) Frequency of Investing
Across all age groups, investing on a monthly basis is very popular. Almost 80 percent of the
total working women respondents invest on a monthly basis. However, it seems to be more
prevalent across the 36-45 age groups with 94 percent of them investing on a monthly basis.
2) Motives of investing
Investing for personal and financial goals is the main motive behind investing for working
women with 68 percent, followed by 25 percent to multiply savings and 19 percent for tax
benefits. Under the age group of 18-25, 38 percent of them save for tax purposes followed by
23 percent of women under the age group of 26-35 percent. This motive has no significance
in the age group of 36-45 and 46-55. For the age group 36-45 and 46-55, investing for
personal and financial goals supersedes other motives at 61 percent and 91 percent
respectively.
3) Preferred Investment Instrument
Gold is the most preferred investment instrument with 98 percent of the working women
invest in Gold, followed by 75 percent in Real Estate and 61 percent in Insurance. Across all
age groups the preferences for investing in Mutual funds and SIP is low at 6 percent and 10
percent respectively. From the age group 36- 45 onwards investing in insurance holds a
significant importance, whereas in the age group of 18-25 and 26-35 it is comparatively low
at 39 percent and 43 percent respectively. This suggests that middle-aged women and above
prefer investing insurance related products.
Property of Christ University. Use it for fair purpose. Give credit to the author by citing properly, if your are using it.

88
Table 4.26 Variations in Investment pattern of Non-working w.r.t to Age
Variations in Non-Working Women (Age wise)
18-25 % 26-35 % 36-45 % 46-55 %
56 &
above % Total
Total 10
51
18
9
18
Frequency of Investing
Weekly 0 0 1 2 1 6 0 0 0 0 2
Monthly 8 80 35 69 10 56 8 89 6 33 67
Quarterly 1 10 6 12 1 6 0 0 2 11 10
Half
yearly 0 0 5 10 4 22 0 0 1 6 10
Yearly 1 10 4 8 0 0 1 11 9 50 15
Total 10 100 51 100 18 100 9 100 18 100 106
Motives of Investing Tax
Benefits 0 0 0 0 0 0 0 0 0 0 0
Hedging 0 0 2 4 12 67 0 0 0 0 14
Per/Fin
goals 7 70 28 55 5 28 6 67 9 50 55
Multiply
savings 5 50 23 45 17 94 3 33 0 0 48
Annualize
d return 0 0 5 10 0 0 1 11 0 0 6
Total 10 100 51 100 18 100 9 100 18 100 106
Investment Pattern
Gold 10 100 44 86 16 89 9 100 6 33 85
Real estate 7 70 35 69 13 72 6 67 8 44 69
Bank
deposits 6 60 31 61 8 44 6 67 6 33 57
Post office 4 40 18 35 7 39 7 78 3 17 39
Bonds 1 10 16 31 10 56 4 44 3 17 34
Insurance 8 80 34 67 13 72 8 89 4 22 67
Shares 3 30 12 24 3 17 2 22 2 11 22
Mutual
funds 1 10 5 10 2 11 0 0 2 11 10
SIP 0 0 7 14 2 11 0 0 0 0 9
Chit funds 3 30 18 35 6 33 3 33 3 17 33
Total 10
51
18
9
18
106
Property of Christ University. Use it for fair purpose. Give credit to the author by citing properly, if your are using it.

89
1. Frequency of Investing
Investing on a monthly basis is the most preferred way of investing, with 67 percent, followed
by 15 percent on a yearly basis and 10 percent on a quarterly and half yearly basis.
2. Motives of investing
Investing for personal and financial goals is the main motive behind investing across all age
groups at 55 percent, followed by 48 percent to multiply their savings and 14 percent for
hedging against inflation.
3. Preferred Investment Instrument
Gold is the most preferred investment instrument with 85 percent of the non -working women
investing in Gold, followed by 69 percent in Real Estate and 67 percent in Insurance. Across
all age groups the preferences for investing in Mutual funds and SIP is low at 10 percent and
9 percent respectively.
Property of Christ University. Use it for fair purpose. Give credit to the author by citing properly, if your are using it.

90
Chapter 5
5Summary and Conclusion
This chapter summarizes the entire dissertation on the study of savings and investment pattern
of women covering the need and relevance of the study, review of literature, research
methodology, results of the study and the scope for further research ending with conclusions
for the study.
5.1 Need and Relevance of the Study
Till the last decade, not much research has been conducted on savings and investment of
women ,considering the low potential of women to earn, save and invest,. Government
surveys, Policies, Financial awareness, Marketing of financial products etc has been very less
focussed towards women. This research studies the investment pattern of women along with
their savings pattern.The factors which influence the investment decision making of women
have been identified along with the constraints.As non working-women also get to save, their
savings and investment pattern has also been included as a part of the study. The findings thus
can be used by financial institutions to design products exclusively for women population, for
Government to formulate appropriate policies to boost aggregate saving and investment, and
for the research community to find out why disparities exist between what a women saves and
what she invests.
Property of Christ University. Use it for fair purpose. Give credit to the author by citing properly, if your are using it.

91
5.2 Review of Literature
Women are quite known for their saving habits. But they generally don’t convert all of their
savings into investments. Maltby (2006) explored the role of women in finance from
eighteenth century till date. Certain fascinating facts that come out are, women were
managing the household expenses, savings and investments and were active traders too. In
the same article, they have stressed the need for research on topics such as women’s attitude
towards money, their savings and investment patterns keeping the changing times in mind.
Chachoria ( 2000) points out that women are the next generation financial decision makers
and they should be targeted from a financial perspective. She suggests that marketing for
financial products should be done differently for women. Despite being risk averse and less
financially knowledgeable, women have made more profits than men in the stock markets and
other financial investments. Barber( 2001) points out that though women are not active
investors, they make more profits than men. He says that by trading more, men hurt their
performance more than women. Preda (2001) comments that Women are always excluded
from financial discussions, on the explicit ground that they cannot understand investments.
5.3 Research Gap
While Investment pattern has been studied intensely in a generic sense, far less research exists
regarding Women’s mind-set towards investment as a subject. Also, since Savings is a
precursor to Investment, it is imperative to study savings and investment patterns side by side.
The present study aims to do so. Secondly, Non working women have so far been kept out of
such studies. The fact that they get to save and hence can invest has been the philosophy
behind including them in this study
5.4 Statement of the Problem
In order to formulate appropriate theories and policies to boost aggregate saving and
investment of the nation, and to convert the available savings into investment, one has to
Property of Christ University. Use it for fair purpose. Give credit to the author by citing properly, if your are using it.

92
understand how individuals in the society save and invest. The fact that women are becoming
economically powerful calls for a need to exclusively study their savings & investment
patterns, and cater to them accordingly so that they are encouraged to contribute towards
capital formation of the economy.
5.5 Research Objectives
Primary objective
To study the savings and investment pattern of working and non working women.
Specific Objectives:
To achieve the primary objective, the specific objectives were formulated as follows
To study the variation of savings and investment pattern across socio economic characteristics
among women
To identify the factors those affect the investment pattern of working and non working
women
5.6 Research Hypothesis
This research proposes the following hypothesis to be tested empirically based on the
literature review.
H01: Perceptual factors do not significantly influence the investment decision. Property of Christ University. Use it for fair purpose. Give credit to the author by citing properly, if your are using it.

93
H02: There is no significant difference in the frequency of investing across socio-demographic
attributes for working and non-working women.
H03: There is no significant difference in the choice of investment instrument across socio
demographic attributes for working and non working women.
5.7 Sampling Plan
Women who are regular savers and investors have been considered for this study. A total of
250 responses were considered for the study but only 225 responses were usable. This study
was confined to the city of Bangalore. Non probabilistic, convenience sampling was used for
the purpose of data collection.
5.8 Survey Measurement
Questionnaires were used to collect data from the respondents. An original questionnaire
consisting of three sections was used for the purpose. The first section consisted of questions
that were used for collection of data of personal nature pertaining to the respondent’s age,
educational qualification, occupation and monthly income. The next section consisted of
questions related to sources of saving, frequency of saving, constraints and motives of saving,
and saving avenues. The third section comprised of questions related to frequency of
investing, investment preferences, motives of investing and constraints to investing.
5.9 Statistical Techniques
Data was analyzed using the following statistical tools namely Descriptive Statistics, Factor
Analysis, Correlation, Multiple Linear Regression and Chi-square. Since the ordinal data
collected does not have an inherent order or sequence, and the items on the likert scale are not
equidistant, mode has been used as a descriptive technique for analyzing the responses.
Property of Christ University. Use it for fair purpose. Give credit to the author by citing properly, if your are using it.

94
5.10 Variables
Independent Variable: The socio demographic Variables and the perceptual factors
influencing the choice of investment instrument are the independent variables.
Dependent Variable: The frequency of investing and choice of investment instrument are the
dependent Variables.
5.11 Summary of Findings
The findings are presented in four parts. They are findings with respect to
1. Savings pattern of women
2. Investment pattern of women
3. Factors that influence the investment decisions of a woman
4. Variations in the investment pattern of working and non-working women
5.11.1 Savings pattern of women
Only 17% of the respondents saved each month rest 83percent of them saved
intermittently. Also only 6percent of the respondents saved a fixed amount each month, for
the rest 94%, the amount of savings varied each month.
Property of Christ University. Use it for fair purpose. Give credit to the author by citing properly, if your are using it.

95
Saving money in the Bank is a highly preferred choice of saving at 76 percent
followed by 68 percent who keep money in the house.
Saving money for emergency purposes is main motive behind saving with 93 percent
of responses.
Even though non-working women don’t have direct income of their own, they are able
to save a minimum of 5 percent from their household savings. In fact, 36 percent of the non-
working women save above 10 percent.
5.11.2 Investment pattern of women
Safety of the principal is regarded as a very important criterion before investing,
followed by liquidity, receiving regular income, availability and understandability of the
instrument and finally comes the preference for a low initial investment. Thus, it can be
inferred, once a woman is satisfied about safety of the principal she will be ready to invest
further considering surplus funds.
Considering investment pattern by frequency, investing on a monthly basis is
prevalent amongst working and non-working women across all occupations, age and
education.
The main motive behind investing for women is to fulfill their personal and financial
goals. They also recognize the importance of multiplying savings through investment
Using investment as a mode to fight against inflation is not a recognized motive in the
working women category. However, non-working women are appreciative about this aspect.
Property of Christ University. Use it for fair purpose. Give credit to the author by citing properly, if your are using it.

96
Gold is the most preferred investment instrument, followed by real estate, insurance
products, bank deposits, chit fund, mutual funds, bonds, post office, shares and SIP.
While employees in private sector and self-employed women show some interest in
mutual funds and shares, employees in Government sector are not experimental with these.
However, this statement cannot be generalized as the sample size of Government employees
is small.
SIP’s are the least explored amongst both the groups.
It can be understood that “Lack of Financial education and advise” is described as the
highest constraint in investing , followed by “Lack of Interest and Motivation” , “Lack of
insufficient funds” , “Locking of funds” and “Inability to take decisions on their own”. This
bursts a common myth: Women are not able to invest as they are not able to take decisions or
rather they are not allowed to take decisions on their own. This also shows that there is a need
to educate and advise women particularly on the subject of investment.
The findings suggest that across all categories women prefer Chit-funds than mutual
funds or shares.
The finding suggests that occupation of working women has no bearing over the
choice of risky investments. The study also shows that non working women’s education plays
a role in investing in risky instruments.
All women under the age group of 36-45 are in favor of insurance products
Property of Christ University. Use it for fair purpose. Give credit to the author by citing properly, if your are using it.

97
5.11.3 Inferential Analysis to identify the factors that affect the investment
decision of a woman – Karl Pearson’s correlation
The outcome of the correlation analysis indicates that there is a good association between the
independent variables (factors affecting investment decision) and dependent variables (choice
of investment instrument). Factor Analysis:
On subjecting the independent variable (factors that affect the investment decision) to factor
analysis three components were extracted. The variables of the components were named
Individual, Control and Monetary factors.
After subjecting the dependent variables (choice of investment instrument) to factor analysis
four components were extracted. The variables of the components were named Zero Risk,
Low Risk, Moderate Risk and High Risk.
5.11.4 Regression Analysis
a) Hypothesis related findings for “Zero risk” investment
It is evident from the regression analysis that all the three factors namely
“Individual”,”Control” and “Monetary” significantly influence the dependent factor “Zero
Risk”investment.
b) Hypothesis related findings for “Low risk” investment
It is evident from the regression analysis that “Control” factor is responsible for the
investment decision of women while investing in a “Low risk
c) Hypothesis related findings for “Moderate Risk” investment Property of Christ University. Use it for fair purpose. Give credit to the author by citing properly, if your are using it.

98
It is evident from the regression analysis “Individual” ,”Control” and “Monetary” factors
influence the choice of a “Moderate Risk” Investment.
d) Hypothesis related findings for “High risk” investment
Results of regression analysis shows that “Individual” and “Monetary” factors both influence
the choice for opting for a “High Risk” Investment.
From the above inferential analysis , it can be understood that “Individual Factor” i.e., the
interest and willingness of a women to invest, ability to take decisions on own and availability
of funds has a positive influence on investing in “Zero Risk” investments like Post office,
Government Bonds and Bank deposits.
The “Control Factor” i.e. the availability and understandability of an instrument and
preference of a low initial instrument, has a negative influence over “Low Risk” instrument
like Real Estate. It can thus be inferred that the more knowledgeable she becomes about
investment instruments in the market, and the more accessible they become, the investments
in Real Estate falls. Another important inference is that, while the preference of starting with a
low investment amount goes up, the investing preference for Real Estate comes down.
The “Monetary factor” i.e. the preference of getting regular income, safety of principal and
liquidity has a negative influence over “High Risk” investment instrument like mutual funds,
shares and SIP. It can be understood that the more she prefers a safe instrument with regular
income and liquidity, the less she prefers risky instruments. The “Monetary factor” also has a
positive influence on “Zero Risk” investment instrument. Therefore it can be said that, the
preference for safe instrument with regular income and liquidity, raises the demand for Zero
Risk investments.
Property of Christ University. Use it for fair purpose. Give credit to the author by citing properly, if your are using it.

99
5.11.5 Inferential Analysis to Study the Variations in the Investment Pattern
of Woman Across Socio Demographic Attributes
1. Chi-square Analysis
The Chi-square analysis was conducted to study the variations in the investment pattern of
woman across socio demographic attributes
a. Hypothesis related findings for the difference in the frequency of investing across
socio-demographic attributes
It is evident from the chi-square analysis that the frequency of investing does not differ with
Occupation or Age for working women and with Education or Age for non working women.
b. Hypothesis related findings for the difference in the choice of investment
instrument across socio-demographic attributes
Chi-square analysis shows that there is a significant difference in the choice of investment
instrument with regard to occupation and age for working women and with regard to
education and age for non-working women.
Through this statistical test, it can be said that occupation of a working women has bearing
over the choice of traditional investments but has no effect over the choice of risky
instruments. It can also be said that education plays a role in the choice of risky instruments
for a non-working women, however for the safe- traditional investments, education has no
bearing. Also, irrespective of the occupational status, working or non working, for safe –
traditional instruments, age does not play a role, whereas for risky instrument it plays a role.
5.12 Implications of Research
The implications of the study with regard to various stake-holders are as follows- Property of Christ University. Use it for fair purpose. Give credit to the author by citing properly, if your are using it.

100
1) Financial Institutions
The study points out the constraints and the current pattern of savings and investment. Both
the findings are very useful to financial institutions in designing products exclusively for
women. For instance, one finding suggests that occupation of working women has no bearing
over the choice of risky investments; another says women in the age group of 36-45 favor
insurance products etc.
2) Government
This research, by providing insights into the savings and investment pattern will be useful to
the Government to raise the share of women in the productive financial investment zone. With
60 percent of women population being house-wives, with a good potential to save, if
motivated to invest would bear good results.
3) Women
Through this study, an attempt is made to understand what a women’s preferences, constraints
and wants are when it comes to investing. The Life-expectancy of women is greater than a
man and hence she outlives a man. As inflation affects them who live longer, women will face
more financial troubles in old age than men. By making the society aware about the present
condition, the first step towards empowerment of women is taken.
4) The Research Community
“Women are good savers but poor investors”. This question has baffled many researchers. So
far no research has been conducted by studying the savings and investment pattern of women.
This study becomes an useful source of information to future researchers who wish to get an
answer to the question.
5.13 Suggestions and Recommendations
Lack of Awareness and advice is found to be the main constraint in investing. The fact that
they “know” what they “don’t know”, itself suggests that they have the prerequisites of being Property of Christ University.
Use it for fair purpose. Give credit to the author by citing properly, if your are using it.
101
a good investor. Financial institutions and Government organizations can take initiatives in
this regard.
Marketing of financial products to women through advertisements in T.V, women’s
magazines can raise their awareness level. Attractive schemes and gifts can also persuade
women to invest.
Lack of interest and motivation to invest is also found as a constraint in investing. One big
problem which the financial advisors or insurance company agents face is in pulling women
to listen about the financial products. A Tie up with companies which sell products like
Amway, Tupperware can help marketing of financial products also.
5.14 Scope for Further Research
So far literature from Behavioral finance gives a mixed opinion about why women are good
savers but poor investors. One school of thought believes that as women are irregular savers
they don’t get to invest, another believes that it is the biological differences which make them
less interested in investing. However the third school of thought says that since they are risk
averse they don’t take up investment in risky assets and hence are poor investors. Research in
future can be conducted by studying the savings, investment and risk behavior of women so
as to get an answer to the question, “why women are good savers but poor investors”
5.15 Limitations of the Study
The major limitations of this study are with respect to
The time frame within which the research had to be carried out and the sample size
from which it would be difficult to draw accurate conclusions on the entire women
population.
Property of Christ University. Use it for fair purpose. Give credit to the author by citing properly, if your are using it.

102
The results may not be free from biased figures as some of the responses may include
deliberate falsification and incomplete information.
5.16 Conclusions
Analysis shows that women invest in safe traditional investments. Though risky investments
are picking up amongst the educated women, it needs to go a long way to find a considerable
share for itself in the portfolio of investments held by a woman. To get them out of this
traditional investment zone, can be a challenge. But probably the answer lies in addressing
one major constraint across all groups of women “Lack of financial awareness and advice”.
6
Property of Christ University. Use it for fair purpose. Give credit to the author by citing properly, if your are using it.

103
REFERENCES
1. Annamarie Lusardi, O. M. (2008). Planning and financial literacy: How do women
fare? NBER Working Paper Series , Vol w13750.
2. Athukorala, P.-c., & Sen, K. (1998). The Determinants of Private Saving in India.
World Development Vol 32 .
3. Anbarasu (2011). An emprical study on some demographic characteristics of investors
and its impact on pattern of their savings and risk coverage through insurance
schemes. The IUP journal of risk and insurance , Vol VIII 7-25.
4. Baden, S. (1996). Gender issues in financial liberalisation and financial sector reform.
Directorate General for Development (DGVIII) of the European Commission.
5. Barber. (2001). Boys will be Boys: Gender,Overconfidence and common stock.
Quarterly Journal of Economics .
6. Bernasek, A. (1996). Why do women invest differently than Men? Financial
Counseling and Planning , Volume7.
7. Beamish. W. (2004). Consensus about program quality: An Australian study in early
childhood special education. Griffith University, Queensland, Australia.
8. Bhatty, K. (1998). Educational deprivation in India. A Survey of field investigations.
Economic & Political Weekly Vol. 33, No. 27, pp. 1731-1740.
Property of Christ University. Use it for fair purpose. Give credit to the author by citing properly, if your are using it.

104
9. Boring, I. E. (2010). An Empirical Analysis of Household Savings Behavior in
Uganda. Uganda: Andrew Young School of Policy Studies.
10. Burton, D. (1995). Women and Financial Services: some directions for future
research. International Journal of Bank Marketing , Vol 13.
11. Chachoria, S. (2000). Targeting Women:A Financial Perspective. IBS Research .
12. Copper, L. R. (1991). CAI with Home-Bound Students Proves Successful in Model
Program. T H E Journal (Technological Horizons In Education), Vol. 18, .
13. Dar-Nimrod, I., & Heine, S. J. ( 2011). Genetic essentialism: On the deceptive
determinism of DNA. Psychological Bulletin, Vol 137(5) .
14. Demery, D., & Duck, N. W. (n.d.). Savings–age profiles in the UK. Journal of
population economics , Volume 19 Number 3 521-541.
15. Deolalikar. (1990). “The demand for Dowries and Bride Characteristics in Marriage:
Empirical Estimates for Rural South-Central India. Oxford: Oxford University Press.
16. Floro, M. S. (2002). Gender Effects on Aggregate Saving. Washington.D.C: The
World Bank.
17. Friedman, M. (1957). A Theory of Consumption Function. Princeton, NJ: Princeton
University.
18. Goetz, G. (1996). Who Takes the Credit? Gender, Power, and Control. World
Development , Vol 24.
Property of Christ University. Use it for fair purpose. Give credit to the author by citing properly, if your are using it.

105
19. Grimbeek, F. B. (2005). Use of Data Collapsing Strategies to Identify Latent
Variables in Questionnaire Data:Strategic Management of Junior and Middle School
Data on the CHP Questionnaire. Centre for Learning Research, Griffith University.
20. Jejeebhoy, S.J. and M. Sebastian, (2003). “Actions that protect: Promoting sexual and
reproductive health choice among young people in India,” Regional Working Paper
No. 18. New Delhi: Population Council
21. Kabra, G. (2010). Factors Influencing Investment Decision of Generations in India.
Asian Journal for Management Research .
22. Keynes.J.M (1937). The General Theory of Employment. The Quarterly Journal of
Economics .
23. Keynes, J. (1936). “The General Theory of Employment, Interest and Money”. New
York: Harcourt race and World.
24. Krishnamurthy, K. (1981). Determinants of saving rate in India. Indian Economic
Review, Vol XIV.
25. Laiglesia, J. R. ( 2006). Institutional bottlenecks for agricultural development. OECD
DEVELOPMENT CENTER.
26. Maltby, R. (2006). Editorial: Women Accounting and Investment.
Accounting,Business & Financial History , Vol 16.
27. Modigliani, A. A. (1963). The "Life Cycle" Hypothesis of Saving: Aggregate
Implications and Tests. The American Economic Review .
Property of Christ University. Use it for fair purpose. Give credit to the author by citing properly, if your are using it.

106
28. Neale, W. C. (1991). Who Saves? The Rich, the Penniless, and Everyone Else.
Journal of Economic Issues , Vol 25, No 4 1160-1166.
29. Olsen, C. (2001). The influence of gender on the perception and response to
investment risk: The case of professional investors. The Journal of Psychology and
Financial Markets , Vol.2.
30. Panicker, P. (1992). “Rural Household Savings and Investment”, A study of Some
selected villages. Trivandrum: Center for development studies, Occasional Paper
series.
31. Preda. (2001). The rise of popular investor: financial knowledge and investing in
England and France . Sociological Quarterly .
32. Ramanathan, R. (1969). An Econometric Exploration of Indian Saving Behavior.
Journal of the American Statistical Association Vol. 64, No. 325 , 90-101.
33. Rehman, H. U. (2011). Saving Behavior among Different Income Groups in Pakistan:
A Micro Study. International Journal of Humanities & Social Science , Vol 1 No 10
268.
34. Repetto, M., & Shah, L. (1979). Some aspects of structural change in Indian
agriculture. Indian Journal of Agricultural Economics .
35. Russo, J. (1992). Managing Overconfidence. Sloan Management Review , Volume 3.
36. Schmeer, K. K. (n.d.). Married women's resource position and household food
expenditures in Cebu, Philippines. Journal of Marriage and Family .
Property of Christ University. Use it for fair purpose. Give credit to the author by citing properly, if your are using it.
107
37. Schubert. (1999). Financial decision-making: Are women really risk averse? AEA
Papers and Proceedings , Vol. 89.
38. Seth1, P. & Krishnan, K.(2011) “Financial Literacy & Investment Decisions of Indian
Investors". New Delhi NCR.
39. Sebastian, M.P., M. Grant and B. Mensch. (2004) Integrating Adolescent Livelihood
Activities in a Reproductive Health Programme for Urban Slum Dwellers in India.
New Delhi: Population Council.
40. Self Employed Women’s Association (SEWA). 2004–05. Annual; Report, 2004–2005.
Ahmedabad: SEWA.
41. Schoemaker, J. E. (1992). Managing Overconfidence. Sloan Management Review .
42. Supan, A. B., & Essig, L. (2005). "Household Saving in Germany: Results of the First
SAVE Study".
43. Termparsertsakul, S., & Kulsiri, P. (2009). Demography, Perceived Risks, Desired
Benefits, And Saving Behavior Of Thai Consumers. International Business &
Economics Research Journal .
44. Weiss, M. G., Chowa, G. A., & Casalotti, A. M. (2010). Individual Development
Accounts for Housing Policy: Analysis of Individual and Program Characteristics.
Housing Studies , Volume 25 Issue 1.
45. Williamson, G. (1968). Household saving behaviour in developing economies: The
Indonesian Case Economic development and cultural change Vol 16 No 3.
46. http://www.rbi.org.in/scripts/AnnualReportPublications.aspx;07/01/2012;09:36 am Property of Christ University.
Use it for fair purpose. Give credit to the author by citing properly, if your are using it.

108
47. http://www.ncaer.org/;09/01/2012;11:15am
48. http://planningcommission.nic.in/reports/genrep/index.php?repts=b_repgen.htm;09/01
/2012; 10:00am
49. http://web.worldbank.org/wbsite/external/topics/exteducation/extdatastatistics/extedsta
ts/0,,menupk:3232818~pagepk:64168427~pipk:64168435~thesitepk:3232764,00.html
07/02/2012;11:51am
50. http://www.dutch-industry.com/evd23/021/2012 00:16am
51. http://www.catalyst.org/publication/461/women-in-the-labour-force-in-
india29/01/2012;07:19am
52. http://www.icmrindia.org/free%20resources/Articles/Marketing%20to%20Women1.ht
m14/9/2011;03:25am
53. http://en.wikipedia.org/wiki/Piggy_bank16/03/2012;09:05am
Property of Christ University. Use it for fair purpose. Give credit to the author by citing properly, if your are using it.